characterisation of foxp1 in striatal development and the
TRANSCRIPT
Characterisation of Foxp1 in
striatal development and the
adult brain
This dissertation is submitted for the degree of Doctor of Philosophy
at Cardiff University
Amy Elizabeth Evans
Supervisors:
Professor Anne E. Rosser
Dr Michael V. Taylor
September 2013

i
Submission of thesis declaration and statements
DECLARATION
This work has not been submitted in substance for any other degree or award at this or any other university or place of learning, nor is being submitted concurrently in candidature for any degree or other award. Signed ………………………………………… (candidate) Date …………………………
STATEMENT 1
This thesis is being submitted in partial fulfilment of the requirements for the degree of …………………………(insert MCh, MD, MPhil, PhD etc, as appropriate) Signed ………………………………………… (candidate) Date …………………………
STATEMENT 2
This thesis is the result of my own independent work/investigation, except where otherwise stated. Other sources are acknowledged by explicit references. The views expressed are my own. Signed ………………………………………… (candidate) Date …………………………
STATEMENT 3
I hereby give consent for my thesis, if accepted, to be available for photocopying and for inter-library loan, and for the title and summary to be made available to outside organisations. Signed ………………………………………… (candidate) Date …………………………
STATEMENT 4: PREVIOUSLY APPROVED BAR ON ACCESS
I hereby give consent for my thesis, if accepted, to be available for photocopying and for inter-library loans after expiry of a bar on access previously approved by the Academic Standards & Quality Committee. Signed ………………………………………… (candidate) Date …………………………
ii
Summary
The aim of the research presented in this Thesis was twofold; firstly to further
understand the role of Foxp1 in the development of striatal medium spiny neurons
(MSN) and secondly its role the adult brain. Understanding the role of Foxp1 in MSN
development may allow more accurate in vitro protocols to be generated for use in
directing renewable cell sources for use in cell replacement therapies for diseases such
as Huntington’s disease (HD). Additionally, its functional role in MSN development
may not be exclusive, and thus have a more generalised role transferable to other
neuronal processes. Thus what is learnt about its function can possibly be applied to cell
transplantation protocols in general, as well as be useful in the drug discovery field.
In mice, the transcription factors (TF) Foxp1 and Mef2c were shown to be significantly
up-regulated during peak MNS development (embryonic day (E) E12-16) in a genetic
screen carried out in the host lab in 2004. Consequently the majority of work in this
thesis was focused on the characterisation of the most significantly up-regulated gene,
Foxp1. Experiments initially focused on a Foxp1 knock out (KO) line, both in vitro and
following transplantation into the quinolinic acid (QA) lesioned adult mouse brain.
Additionally, owing to embryonic lethality at E14, a conditional Foxp1 KO (CKO) line
was also developed to study the effects of the loss of Foxp1 in the adult brain with a
focus on the loss of Foxp1 from the cortex. Owing to lethality at E9 a Mef2c CKO line
was also developed and initial in vitro findings from this line are presented in Appendix
8 of this Thesis.
Chapter 3 characterised the wild type (WT) expression pattern of FOXP1 from E10 to
P7 through the co-localisation of FOXP1 with the established MSN markers CTIP2 and
DARPP-32. In vitro characterisation of cultures generated from striate of Foxp1-/-
mice
showed a decrease in the number of CTIP2 and DARPP-32 positive cells compared to
littermate controls but that there were no differences in the proliferation of these cells
between groups. Finally, results from immunohistochemistry on selected striatal KO
brain sections suggested that Foxp1 may function downstream of Ascl1 and Gsh2 in
striatal development.
iii
In Chapter 4 E14 or E12 striatal tissue from all three genotypes was grafted into an
adult QA-lesion mouse model. Such experiments allowed striatal neurons from Foxp1-/-
mice to survive for much longer periods than was possible in vitro and provided them
with the opportunity to make some of their normal connections. Results showed that
there were fewer DARPP-32 positive cells in grafts from Foxp1-/-
compared to controls,
as with in Chapter 3. Moreover, FOXP1 was identified as a novel maker of P-zones in
grafts derived from whole ganglionic eminence.
Chapter 5 addressed the generation of a Foxp1 CKO mouse model under the control of
an hGFAP-Cre line (Foxp1 CKO). Histology showed that FOXP1 was lost from all
layers of the cortex, but expression was maintained in the striatum. Mice appeared
hyperactive in the home cage compared to littermate controls, and as mutations in
FOXP1 have been associated with autism spectrum disorders, of which ADHD falls
under, led to directed behavioural analysis targeting the symptoms of ADHD. Analysis
revealed Foxp1 CKO mice were significantly hyperactive (activity boxe and open-field
data) and inattentive (5 choice serial reaction time task) but had no anxiety problems
(elevated plus maze and marble burying task). These symptoms were shown to be
reduced following the administration of atomoxetine, a drug prescirbed to patients with
ADHD. Results collectively suggested that the Foxp1 CKO line is a new mouse model
of ADHD.

iv
Acknowledgements
“When life gives you lemons make lemonade” (Elbert Hubbard, 1915).
I heard this at a conference and I think it reflects the work outlined in this thesis well!
Firstly a big thank you to my supervisors, Anne Rosser and Michael Taylor. Thanks for all
your supervision over the last 4 years. Anne, I don’t know how you manage to fit in being a
wife, mum, researcher, clinician and P.I on a daily basis, you are a real life superwoman, and
all that you have accomplished is an inspiration to me!
Thanks to the AER group past and present: Anne, Rike, Claire, Sophie, Susannah, Ngoc-
Nga, Nan and Vicky, for all your advice, help and importantly laughs and cake! I have
thoroughly enjoyed Friday AER meetings. Claire and Soph, you are both great scientists and
now both beautiful mothers! Thank you both for all your support and encouragement over
the years. Ngoc-Nga, I am so grateful for all your help and advice, I would not have
completed this thesis without your molecular and dissection expertise, and secondly, for
opening my eyes to the world of expensive handbags and shoes; Sam will never forgive you!
Thanks to my past officemates, Gaynor, Zubeyde and Andreas. Gayn and Zubs it was a
pleasure sharing an office with two brilliant scientists. Andreas thanks for always listening
and for the continuous encouragement- ich danke Ihnen sehr für Ihre Hilfe! And to my
current officemates; Nan, Harri, Emma and Vicky. It is a pleasure sharing an office with so
many fun people, thanks for your support and for the continuous laughs, sweets and above
all for your patience for when I “lose” things! I do apologise for rendering the white board
useless! Nan, you are one of the most generous and smiley people I have met,good luck with
finishing! Em, keep up the enthusiasm for the rest of your PhD and I have no doubts you’ll
do brilliantly! Harold thanks so much for your continued help with all things behaviour,
Excel and general precision, and for having to put up with an office full of excitable, loud
ladies! Good luck with the rest of your PhD!
Victoria (Vic, Vicky, Toria, VicoiR) what can I say? You are one of the cleverest and hard
working people I know. I would not have got here without your continued help in the lab, or
our shopping, pub and dinner jaunts, and not forgetting conference trips! Thank you for your
help with everything, it has been a pleasure working with and getting to know you! Good
luck with finishing- you’re nearly there!

v
Thanks to my two undergraduate students James and Aimee, for all their hard work and to
Becca for all your help -good luck with your thoroughly deserved PhD!
Anne-Marie thanks for our laughs running, I will not forget “evil road” or “evil pig!”
A big thank you to the rest of the BRG; Steve, Simon, Mariah, Jane, Claris, Marija, Damla,
Kate, Yat, Lu, Jess and Ed.
This thesis would not be possible without my friends and family. Mam and dad you have
always encouraged me and I am very grateful to you both for your continued support and
love (and food!) throughout my PhD, and in everything I have done. Thanks also to Granny
Ad and little bro Dave and recently Lisa, I am finally done to come visit the calves and
lambs! Also a big thanks to the Reddingtons et al for their encouragement over the past 7
years, it has been a pleasure joining such a welcoming and loving family.
And finally Sam, my wonderful fiancé, thank you so much for everything and above all your
patience! Without your calming influence, trust me when I say I would not have made it this
far without you! A massive well done on becoming a Dr (even though you beat me!), I am
very proud of everything you have achieved -we can finally get back to normality and I
cannot wait until May 17th 2014!
vi
Abbreviations List
5-CSRTT 5 choice serial reaction time task
AchE Acetylcholinesterase
ADHD Attention Deficit Hyperactivity Disorder
AMPA Amino-3-hydroxy-5 methylisoxazole-4-propionic acid hydrate
ANOVA Analysis of Variance
AP Anterior-Posterior
ASDs Autism Spectrum Disorders
BDNF Brain Derived Neurotrophic Factor
bHLH Basic helix-loop-helix
BMP Brain Morphogenic protein
BP Base Pair
BrdU Bromodeoxyuridine
BSA Bovine Serum Albumin
CAG Glutamate
CKO Conditional knock out
CNS Central nervous system
CTIP2 COUP TF1-interacting protein 2
DA Dopamine
DAB Diaminobenzidine
DARPP-32 Dopamine and cyclic AMP-regulated phosphoprotein
DBD DNA binding domain
DIV Days in vitro
DMEM Dulbecco’s modified eagle’s medium
DNA Deoxyribonucleic acid
Dsh Dishevelled
E Embryonic Day
EPM Elevated Plus Maze
ESC Embryonic stem cells
FCS Foetal calf serum
FOXP1 Forkhead Transcription Factor 1
vii
FGF Fibroblast growth factor
GABA γ-Aminobutyric acid
GSK-3β Glycogen synthase kinase 3β
GPi/e Globus pallidus (internal/external)
HD Huntington’s disease
HDACs Histone Deacetylases
hGFAP human Glial Fibrillary Acid Protein
Htt Huntingtin gene
HTT Huntingtin Protein
ICM Inner cell mass
IM Intra-muscular
IP Intra-peritoneal
iPSC Induced pluripotent stem cells
ITI Inter Trial Interval
Kainate Kainic acid monohydrate
KO Knock out experiment
L Lateral
LGE Lateral Ganglionic Eminence
MBT Marble burying task
MEF2C Myocyte Enhancer Factor 2C
MGE Medial Ganglionic Eminence
MOR1 µ-opioid receptor 1
MSNs Medium Spiny Neurons
MZ Mantle Zone
NeuN Neuronal nuceli
NLS Nuclear localisation signal
NMDA N-Methyl-D-aspartic acid
O/N Overnight
P Post-natal day
P19 cells embryonic carcinoma cell line as a model system
PBS Phosphate saline buffer
PCR Polymerase Chain Reaction
PFA Paraformaldehyde
PLL Poly-L-Lysine
viii
QA Quinolinic acid
QPCR Semi-quantitative RT-PCR
RA Retinoic Acid
RALDH Retinaldehyde dehydrogenase 2
RAR Retanoic Acid Receptor
RNA Ribonucleic Acid
RNAi RNA interference
RT Room Temperature
RT-PCR Reverse transcription PCR
RXR Retinoic X receptor
SHH Sonic Hedgehog
ShRNA Short hairpin RNA
SNc/r Substantia Nigra (pars compacta/pars reticulate)
SNP Short Nucleotide Repeat
STN Sub Thalamic Nucleus
SVZ Sub-Ventricular Zone
TBS Tris Buffered Saline
TBST/TxTBS Triton X-100 TBS
TF Transcription Factor
TG Transgenic
TNS Tris Non Saline
VZ Ventricualr Zone
WGE Whole Ganglionic Eminence
Wnt Wingless
WT Wild Type

ix
Disclaimer
Miss Ngoc Nga Vinh assisted with striatal dissections in Chapters 3 and 4.
Calcium imaging studies in Chapter 3 were largely undertaken by Dr Alex Harrison.
Aimee Leadbetter, an undergraduate project student, conducted the stereology outlined
in Chapter 5.
x
Original publications achieved during course of PhD
Evans AE, Precious SV, Kelly CM and Rosser AE. Molecular Regulation of Striatal
Development: A Review Anatomy Research International Volume 2012 (2012), Article
ID 106529
Roberton, V. H., Evans, A. E., Harrison, D. J., Precious, S. V., Dunnett, S. B., Kelly, C.
M. and Rosser, A. E. (2013). Is the adult mouse striatum a hostile host for neural
transplant survival? Neuroreport 24:1010-1015.
Previous SV, Kelly, CM, Vinh, NN, Evans AE , Pekarik, V., Scherf, C, Jeyasingham, R,
Glasbey J, Holeiter M, Jones L, Taylor MV, Rosser AE
¶ Foxp1 in MSN differentiation
Submitted to BRAIN September 2013
Deletion of murine cortical Foxp1 induces a behavioural phenotype resembling ADHD.
Amy E Evans, David J Harrison, Rebeccca Openshaw ,Victoria H Roberton, Aimee E
Leadbetter, Stephen B Dunnett, Simon P Brooks and Anne E Rosser.
(Currently in preparation)
Grants awarded during the course of PhD
Charles Cole Scholarship - Work in Professor Josep Canals Lab at the University of
Barcelona
MRC Centenary Award- Microarray analysis on the Foxp1-/-
mouse line at E14
Wellcome Trust Seedcorn Award - Microarray analysis on Foxp1 CKO mouse model

xi
Contents
1 Introduction ............................................................................................................... 1
1.1 Foxp1 .................................................................................................................. 3
1.1.1 Why Forkhead Box Protein 1 (Foxp1)? ...................................................... 3
1.2 The Foxp family – .............................................................................................. 4
1.2.1 Background, Structure and Function .......................................................... 4
1.2.2 Foxp1- Interactions, Function and Expression in Cancer ........................... 6
1.2.3 The Role of Foxp1 in the Developing Brain ............................................... 9
1.3 Organisation of the Adult Striatum and Cortex ................................................ 11
1.3.1 The Adult striatum .................................................................................... 11
1.3.2 Striatal Neurons ......................................................................................... 12
1.3.3 Adult Cortex .............................................................................................. 14
1.3.4 The Direct and Indirect Pathways- Linking the Cortex and the Striatum . 14
1.4 Telencephalon Development .............................................................................. 1
1.4.1 The nervous system ..................................................................................... 1
1.4.2 Regional Pattering of the Developing Telencephalon ................................. 2
1.4.3 Radial Glia (RG) ......................................................................................... 4
1.4.4 Early Signals involved in Telencephalic Development............................... 9
1.4.5 FGF8 ......................................................................................................... 10
1.4.6 SHH ........................................................................................................... 11
1.4.7 Retinoic Acid (RA) ................................................................................... 14
1.4.8 Wnt Signalling .......................................................................................... 16
1.4.9 BMPs ......................................................................................................... 17
1.4.10 Foxg1 ........................................................................................................ 17
1.4.11 Dorsal Ventral Patterning of the Developing Striatum ............................. 20
1.4.12 Introducing the Homeobox Genes-Pax6 and Gsx1/2 ................................ 22
1.4.13 Ascl1 ......................................................................................................... 23
1.4.14 The Dlx Family ......................................................................................... 25
1.4.15 Nkx2.1 ....................................................................................................... 25
1.4.16 Nolz1 (Znf503) .......................................................................................... 27
1.4.17 Ctip2 (Bcl11b) ........................................................................................... 27
1.4.18 Ebf1 (Olf1) ................................................................................................ 28
xii
1.4.19 Helios (Ikzf2) ............................................................................................. 28
1.5 Huntington's Disease ........................................................................................ 30
1.6 HD genetics ...................................................................................................... 31
1.6.1 Foxp1 and HD ........................................................................................... 35
1.7 Autism Spectrum Disorder (ASD) and associated disorders ........................... 36
1.7.1 Animal models of ADHD.......................................................................... 37
1.8 Genetic Knockouts (KOs) ................................................................................ 38
1.9 Aims of thesis ................................................................................................... 41
2 Materials and Methods ........................................................................................... 43
2.1 Mouse Lines ..................................................................................................... 43
2.1.1 Mouse Lines and Breeding........................................................................ 43
2.2 In vitro methods- Embryonic Analysis ............................................................. 45
2.2.1 Cell Culture – Plate Preparation and Dissection of Primary Mouse Tissue
45
2.2.2 WGE primary mouse cultures ................................................................... 46
2.2.3 Immunocytochemistry- Cell culture ......................................................... 46
2.2.4 Immunocytochemistry – BrdU .................................................................. 47
2.2.5 Calcium Imaging ....................................................................................... 48
2.2.6 Brain Slices-Preparation for Immunohistochemistry ................................ 49
2.2.7 Quantification of Immunohistochemistry/ immunocytochemistry ........... 50
2.2.8 Statistical Analysis- Cell counts and Grafting .......................................... 51
2.3 Molecular Methods ........................................................................................... 52
2.3.1 RNA extraction for RT- PCR and qPCR ................................................... 52
2.3.2 Primer Sequences ...................................................................................... 52
2.3.3 cDNA Synthesis ........................................................................................ 52
2.3.4 RT-PCR- Reverse Transcription -Polymerase Chain Reaction ................. 52
2.3.5 DNA Extraction for Genotyping ............................................................... 53
2.3.6 Genotyping-PCR ....................................................................................... 53
2.3.7 Agarose Gel Electrophoresis ..................................................................... 54
2.4 In vivo Methods ................................................................................................ 55
2.4.1 Animal care and Anaesthesia .................................................................... 55
2.4.2 Quinolinic Acid (QA) Lesion .................................................................... 55
2.4.3 Unilateral Striatal Grafts ........................................................................... 56
2.4.4 Perfusions and Sectioning ......................................................................... 56

xiii
2.4.5 Cresyl Violet Staining ............................................................................... 57
2.4.6 Immunohistochemistry on Free-Floating Tissue Sections ........................ 57
2.4.7 Stereology ................................................................................................. 58
2.5 Behaviour ......................................................................................................... 60
2.5.1 Automated Activity Boxes ........................................................................ 60
2.5.2 Rotarod ...................................................................................................... 60
2.5.3 Inverted Cage Grip Test ............................................................................ 61
2.5.4 The Elevated Plus Maze (EPM) ................................................................ 61
2.5.5 Open Field Activity ................................................................................... 62
2.5.6 Marble Burying Task ................................................................................. 62
2.5.7 Operant Testing - Operant Boxes .............................................................. 62
2.5.8 Operant Training ....................................................................................... 65
2.5.9 5-choice serial reaction time task (5-CSRTT) ....................................... 65
2.5.10 Pharmacological Intervention ................................................................... 68
2.5.11 Behavioural Data Statistical Analysis ....................................................... 68
3 The Characterisation of Foxp1 in the Developing Mouse Brain ........................ 69
3.1 Summary .......................................................................................................... 69
3.2 Introduction ...................................................................................................... 70
3.3 Experimental Design and Procedures ............................................................... 73
3.4 Results .............................................................................................................. 74
3.5 Discussion ...................................................................................................... 103
3.6 Conclusion ...................................................................................................... 109
4 In vivo Characterisation of Primary Striatal Tissue Transplanted into a
Quinolinic acid (QA) Mouse Model of HD ................................................................. 111
4.1 Summary ........................................................................................................ 111
4.2 Introduction .................................................................................................... 113
4.3 Experimental Procedures ................................................................................ 116
4.4 Results ............................................................................................................ 118
4.5 Discussion ...................................................................................................... 134
4.6 Conclusion ...................................................................................................... 142
5 Characterisation of a Mouse Model that lacks Foxp1 in the Adult Brain ....... 143
5.1 Summary ........................................................................................................ 143
5.2 Introduction .................................................................................................... 144
5.3 Results ............................................................................................................ 147
xiv
5.4 Discussion ...................................................................................................... 169
5.5 Conclusion ...................................................................................................... 179
6 General Discussion ................................................................................................ 181
6.1 Foxp1 is a marker of immature and mature MSNs ........................................ 182
6.2 Foxp1 is required for correct development and maturation of at least one
population of DARPP-32 expressing MSNs ............................................................. 183
6.3 Do Foxp1 and Ctip2 work together in MSN development? ........................... 187
6.4 A Foxp1 CKO model in the cortex is a new mouse model of ADHD .......... 190
6.5 Where Next? ................................................................................................... 194
6.6 Concluding Remarks ...................................................................................... 195
7 References .............................................................................................................. 196
8 The Characterisation of Mef2c in the Developing Mouse Brain ...................... 222
8.1 Summary ........................................................................................................ 222
8.2 Introduction .................................................................................................... 223
8.3 Experimental Procedures ................................................................................ 226
8.4 Results ............................................................................................................ 230
8.5 Discussion ...................................................................................................... 243
8.6 Conclusion ...................................................................................................... 247
9 Appendices ................................................................................................................. a
9.1 Appendix 1 ......................................................................................................... a
9.2 Appendix 2 ......................................................................................................... d
9.3 Appendix 3 ......................................................................................................... e
9.4 Appendix 4 ......................................................................................................... g
9.5 Appendix 5 .......................................................................................................... i
9.6 Appendix 6- ......................................................................................................... l
9.7 Appendix 7 ......................................................................................................... p
Chapter 1 Introduction
1
1 Introduction
Foxp1 is a transcription factor (TF) that is implicated in many aspects of development
and primarily functions as a transcriptional repressor. As of yet the function of Foxp1 in
the brain is unknown, however mutations in the human FOXP1gene have been linked to
some cases of autism spectrum disorder (ASD), a disease which is thought to primarily
affect the cortex. It has been extensively shown that Foxp1 is expressed in the
developing and adult striatum where it co-localises with markers of medium spiny
neurons (MSNs), the main projection neurons of the striatum. Foxp1 is also expressed in
the cortex, preferentially being associated with projection neurons located in layers 111-
V1. Therefore it is anticipated that Foxp1 has an important role in neuronal
development.
Huntington’s disease (HD) is an autosomal, dominantly inherited disorder leading to
the loss of MSNs in the striatum, as well as neuronal loss in the cortex. There is no
known cure for HD but the specificity of cell loss seen in the disease makes cell
transplantation an attractive therapeutic option. The use of human foetal striatal cells
has shown ‘proof of principle’ in clinical trials; however, the practical and ethical
difficulties associated with this approach demand the need for an alternative donor cell
source. The requirement of an alternative cell source is that it has the means to generate
the mature phenotype of the cells lost in the disease and therefore needs to be
“directed” along a specific lineage. Understanding the genetics of the MSN
differentiation pathway is therefore crucial for the generation of accurate protocols and
thus understanding more about Foxp1 will b be important for such protocols. Moreover,
DARPP-32 is the most commonly used marker of MSNs but its expression is restricted
to terminally differentiated MSNs; thus differentiation protocols would be greatly
improved by having a battery of MSN markers that can be used throughout the protocol,
of which Foxp1 would be an obvious candidate as is known to be expressed in the
developing striatum in mice from E12. Additionally understanding more about Foxp1 in
the adult brain will be useful in understanding more about disorders it is known to be
associated with such as ASDs and other similar diseases that fall under this umbrella
terminology.

Chapter 1 Introduction
2
This thesis attempts to further characterise the expression of Foxp1, with the addition of
understanding its functional role in both the developing mouse striatum and adult
mouse cortex, through in vitro and in vivo approaches, mainly through the use knocking
out Foxp1 in mice.
Chapter 1 Introduction
3
1.1 Foxp1
1.1.1 Why Forkhead Box Protein 1 (Foxp1)?
MSNs are the main output projection neurons of the striatum and constitute
approximately 95% of all of the striatal neurons in the rodent (Gerfen 1992). The
remaining 5% of neurons are aspiny interneurons (Freeman et al. 1995). In addition to
the characteristic morphology such as size and spine density, MSNs express the
dopamine and cyclic adenosine 3’, 5’-monophosphate-regualted phosphoprotein, 32kDa
(DARPP-32). Understanding how and when MSNs are born was a specific interest to
the host lab, and to enhance what was already known from the literature, an affymetrix
screen (Affymetrix technology, MAS5.0) was carried out in 2004 to look at gene
expression changes during the development of the mouse striatum.
Specifically, the screen used whole ganglionic eminence (WGE) tissue (the region in
which the striatum arises from) to compare differential gene expression changes
between embryonic day (E) 12- E16 and between E14-E16, ages coincident with
striatal neurogenesis. The WGE was dissected according to Dunnett et al (Dunnett
1996) and dissections were carried out at the same time of day to minimize variation
and were validated using reverse transcription polymerase chain reactions (RT-PCRs)
to ensure no cortical tissue had been included in the dissections and thus analysis. RNA
was extracted from three replicates for use in the array and the fold changes between
E12 and E16 and between E14 and E16 were looked at. Results were analysed and 175
genes were significantly up regulated (p<0.05) between E12 and E16.
The results of the gene array analysis appeared in line with existing literature and
public databases (e.g. Allen Brain Bank) on striatal development, with up-regulation of
known striatal-associated developmental genes, such as Ctip2 (Bcl11b), Drd2, Ebf1 and
Foxp2 as well as those associated with general neuronal functions such as neuroblast
migration and neurite outgrowth. As expected multiple genes associated with
pluripotency and cell proliferation were down regulated and were not chosen for
further study.
More stringent statistical analysis revealed that the transcription factor Foxp1 was the
most significantly up-regulated gene between E12-E16 and between E14-E16
Chapter 1 Introduction
4
(p<0.0001). This result was confirmed through in situ hybridisation and qPCR and was
shown to be consistent with published data that shows that Foxp1 is expressed in the
developing and adult striatum (Ferland et al. 2003; Tamura et al. 2003) where it co-
localises with DARPP-32 positive projection neurons in the striatum (Tamura et al.
2004). These results are presented in a paper that is currently being submitted
(Precious et al., 2013). From these findings Foxp1 was selected for further study with
an initial focus on its functional role in striatal development.
It is evident that Foxp1 is involved in many developmental processes and therefore its
functional role is likely not restricted to MSN development. As mutations in the human
Foxp1 gene have been linked with autism spectrum disorders (ASDs) (Hamdan et al.
2010; Horn et al. 2010; Palumbo et al. 2013), a disease thought to preferentially the
cortex, the role of Foxp1 in the adult mouse cortex will also be looked at. Another
gene, Mef2c, was also significantly up regulated between E12-16 (p<0.05) and was
also considered for further study and preliminary data is shown in Appendix 8.
1.2 The Foxp family
1.2.1 Background, Structure and Function
The Forkhead (Fox) family of transcription factors are a large family of proteins that
can commonly be identified by a winged helix/forkhead DNA-binding domain. The
forkhead gene, the founder member of the group was first identified in drosophila
(Kaufmann and Knochel 1996) and several Fox genes have since been identified of
which examples include Foxa1, Foxa2, Foxf1 and Foxj1 (Shu et al. 2001). Foxp1 (first
cloned from the BCL1 leukaemia cell line), and Foxp2 are two distinct members of the
Fox family and were discovered for their interacting roles in proximal epithelial cell
differentiation in mouse lung development where they were shown to restrict expression
of CC10 via binding to its promoter (Shu et al. 2001). On-going research has further
shown that these genes are crucial regulators of lung airway morphogenesis and
differentiation through direct repression of T1alpha, specifically by binding Foxp
consensus sites (common region TTATTTRT) in its promoter region. Moreover, Foxp1
and Foxp4 similarly associate to control epithelial cell fate in lung development through
Chapter 1 Introduction
5
regulation of Arg2 (Li et al. 2012). Foxp1 and 2 also interact in oesophageal muscle
development (Shu et al. 2007).
It was initially thought that there were three possible Foxp1 isoforms in the mouse (Shu
et al. 2001), but subsequent analysis has shown there to be four (Wang et al. 2003),
whereas there have been at least nine alternatively spliced transcripts identified for the
human Foxp1 gene (Banham et al. 2001; Brown et al. 2008a; Brown et al. 2008b), with
more likely as cloning has not yet been exhausted.
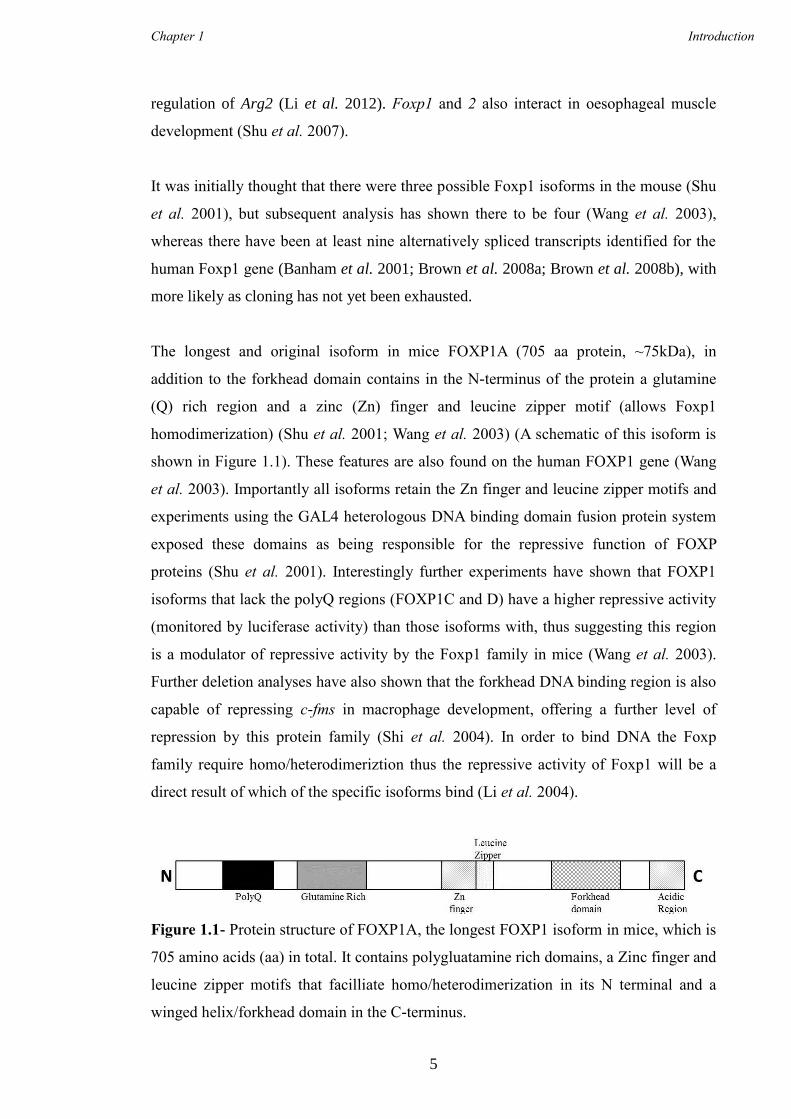
The longest and original isoform in mice FOXP1A (705 aa protein, ~75kDa), in
addition to the forkhead domain contains in the N-terminus of the protein a glutamine
(Q) rich region and a zinc (Zn) finger and leucine zipper motif (allows Foxp1
homodimerization) (Shu et al. 2001; Wang et al. 2003) (A schematic of this isoform is
shown in Figure 1.1). These features are also found on the human FOXP1 gene (Wang
et al. 2003). Importantly all isoforms retain the Zn finger and leucine zipper motifs and
experiments using the GAL4 heterologous DNA binding domain fusion protein system
exposed these domains as being responsible for the repressive function of FOXP
proteins (Shu et al. 2001). Interestingly further experiments have shown that FOXP1
isoforms that lack the polyQ regions (FOXP1C and D) have a higher repressive activity
(monitored by luciferase activity) than those isoforms with, thus suggesting this region
is a modulator of repressive activity by the Foxp1 family in mice (Wang et al. 2003).
Further deletion analyses have also shown that the forkhead DNA binding region is also
capable of repressing c-fms in macrophage development, offering a further level of
repression by this protein family (Shi et al. 2004). In order to bind DNA the Foxp
family require homo/heterodimeriztion thus the repressive activity of Foxp1 will be a
direct result of which of the specific isoforms bind (Li et al. 2004).
Figure 1.1- Protein structure of FOXP1A, the longest FOXP1 isoform in mice, which is
705 amino acids (aa) in total. It contains polygluatamine rich domains, a Zinc finger and
leucine zipper motifs that facilliate homo/heterodimerization in its N terminal and a
winged helix/forkhead domain in the C-terminus.
Chapter 1 Introduction
6
1.2.2 Foxp1- Interactions, Function and Expression in Cancer
Concurrently to the finding that Foxp1 had a role in lung development another group
showed that at a protein level it also contained motifs capable of binding CDK2
(Banham et al. 2001), a gene implicated in cell cycle regulation, and that FOXP1
directly represses interleukin 2 (IL2) and SV40 (Wang et al. 2003) by directly binding
to specific consensus sequences in their promoters. Subsequent to this the first
physiological gene target for Foxp1 was identified through retroviral overexpression in
HL60 cells. As mentioned c-fms was directly repressed by Foxp1 (expression regulated
by Mac-1) leading to aberrant macrophage adhesion and phagocytosis (Shi et al. 2004).
This research also suggested that the NF-Kβ pathway might offer a level of regulation
on the Foxp1 gene as the repressive activity of Foxp1 was reduced when this pathway
was blocked (Shi et al. 2004).
To first understand the functional role of Foxp1, Philip Tucker and colleagues created a
Foxp1 null mouse (Foxp1-/-
), which revealed that the loss of Foxp1 caused embryonic
lethality at E14.5, thus restricting analysis to this age. This group showed that Foxp1
was needed to ensure the correct development of aspects of the cardiac system including
outflow tract development and septation, cardiac cushion development, and myocardial
maturation and differentiation (Wang et al. 2004a). Advanced research has further
showed that Foxp1 interacts with Smrt, and that both are needed for correct myocardial
development as the deletion of either causes the same phenotype (Jepsen et al. 2008).
Further knock out (KO) studies have also shown that Foxp1 promotes early
cardiomyocyte proliferation in a non-direct way through regulating the expression of
Fgf16 and Fgf20 in the endocardium via inhibition of Sox17, but at a later time point
restricts proliferation by directly repressing Nkx2.5 (Zhang et al. 2010), therefore
emphasising the importance of temporal and spatial expression of gene function. It is
not yet known if Smrt interacts with Foxp1 to repress Nk2.5 expression, further research
is needed to investigate this link.
As a TF, Foxp1 is normally localised to the nucleus, however cytoplasmic mis-
localization is commonly characteristic of malignant tissues, for example in types of
endometrium cancers (Banham et al. 2001; Giatromanolaki et al. 2006). In humans the
Foxp1 gene is located on chromosome 3p14.1 (in mice chromosome 6), a region that
Chapter 1 Introduction
7
commonly shows mutations in a wide range of tumours, and thus Foxp1 is also closely
associated with cancer. For example, Foxp1 is reduced in colon tumour samples but
alternatively is increased in stomach tumour samples (Banham et al. 2001).
Extensive research has been carried out, and is ongoing to study the role of Foxp1 in B-
cell development and associated cancers. Specifically Foxp1 is expressed in normal
activated B-cells, and its overexpression has been associated with B-cell like prognosis
subtype of diffuse large B-cell lymphomas (DLBCL) (Banham et al. 2001; Banham et
al. 2005). Genetic alterations, including chromosomal breakpoints and translocations
affecting the FOXP1 gene have also been linked to specific cases of B-cell related
lymphomas as well as mucosa-associated lymphoid tissue (MALT) lymphomas
(Haralambieva et al. 2006; Sagaert et al. 2006; Streubel et al. 2005; Wlodarska et al.
2005). Specifically, analysis from biopsies of patients with a subtype of de novo
DLBCL showed those with an increased number of FOXP1 positive cells had a decrease
in overall survival (Banham et al. 2005), advocating the presence of Foxp1 was linked
with the cancer, and was not, as first supposed a tumour suppressor gene (Banham et al.
2001). Advanced research has since suggested that smaller FOXP1 isoforms (N-
truncated versions) may be the prominent isoform in lymphomas and thus oncogenic,
whereas the longer isoform may still act as a tumor suppressor (Brown et al. 2008a;
Goatly et al. 2008), but further work is needed to refute or confirm this.
FOXP1 has also been linked to breast cancer where expression correlated with both the
alpha and beta oestrogen receptors (ERα/β) in the familiar subtype, notably with nuclear
ERβ. Subsequently it has been thought that in familiar breast cancers FOXP1 expression
is associated with improved survival i.e. it does function as a tumour suppressor gene,
therefore opening up Foxp1 as a possible therapeutic treatment option (Fox et al. 2004;
Rayoo et al. 2009). Nevertheless, further work needs to be carried out to look the role of
FOXP1 in sporadic breast cancer.
Foxp1 and B-cell development
To further understand the functional roles of Foxp1 additional transgenic (TG) mouse
models have been created. A similar Foxp1-/-
model to Philip Tucker’s was developed
(also lethal at E14) to look more closely at the role of Foxp1 in B-cell development
given its prominence in lymphomas. Specifically liver cells from either E14 Foxp1-/+
or
Chapter 1 Introduction
8
Foxp1-/-
mice were removed and injected intravenously (i.v) into a RAG2-/-
mouse and
analyzed in the thymus, lymph nodes, spleen and bone marrow 8 weeks post
transplantation. Cells from the Foxp1-/-
mouse had less mature B-cells in the lymph
nodes and spleens than those from Foxp1-/+
mice, and RT-PCR also showed that there
was a decrease in B-cell lineage genes, notably Tcfe2a and Ebf1. Further analysis
showed that Foxp1 was needed to ensure the correct proB-pre-B-cell transition in the
bone marrow through binding of the Erag enhancer, thereby regulating Rag1/2 and
subsequent V(D)J recombination (Hu et al., 2006). Additionally a Foxp1 conditional
knock out (CKO) model has been created by Feng et al (2010) to look at the role of
Foxp1 in T-cell development. This model concluded that Foxp1 is an essential
transcriptional regulator for thymocyte development and the generation of quiescent
naïve t cells (Feng et al. 2010).
Owing to its functional role in B-cell development the role of Foxp1 in mature B-cells
was also investigated by the creation of another transgenic (Tg) mouse that expresses
human Foxp1 in lymphoid cells (Sagardoy et al. 2013). Activated B-cells can either
become antibody-secreting plasma cells or migrate inside lymphoid follicles and
become germinal centers (GCs); the genetics that control such decisions are not fully
known. Results showed that unlike Bcl6, which is needed to ensure the correct
formation of GC cells, aberrant expression of Foxp1 impaired this formation, which the
authors suggest could contribute to B-cell lymphomagenesis (Sagardoy et al. 2013). It
has also been shown that overexpression of human FOXP1 protein impaired monocyte-
macrophage maturation in the spleen and reduced selected macrophage functions (Shi et
al. 2008). Taken together this research shows that the right levels and spatial expression
of Foxp1 during development are crucial.
Foxp1 and the CNS
In addition to their co-operative roles in lung development Foxp1 and Foxp2 show
overlapping cortico-striatal expression patterns in songbirds, of which a similar
expression pattern has been observed in the associated areas of the human brain
(Teramitsu et al. 2004). A unique FOXP1 isoform has also been identified in human and
mouse embryonic stem cells (ESCs) (includes exon 18b, FOXP1-ES), which enhances
the expression of pluripotent genes such as Oct4 and Nanog by directly binding to their
promoters whilst simultaneously repressing the genes that control differentiation (Gabut
Chapter 1 Introduction
9
et al. 2011). What controls the FOXP1-FOXP1-ES switch is unknown but when
understood will be important for on-going work that looks at directing ESCs to
functional neurons.
Foxp1 has also been implicated in an aspect of CNS development; it has been shown to
be an essential accessory factor in Hox transcriptional output, whereby it regulates
motor neuron diversity and connectivity to target muscles in a dose dependant manor
with expression levels being gated by upstream Hox factors such as Hoxc6 and Hox10
(Dasen et al. 2008; Rousso et al. 2008). Furthermore it has also been shown that the
microRNA, miR-9, is important in fine-tuning the regulation of Foxp1 expression in
motor neuron specification, which importantly may be useful for applying to stem-cell
based therapies for motor neuron injuries (Otaegi et al. 2011). Genetic studies have also
revealed that certain Foxp1 mutations in humans can persist in speech and language
deficits (Hamdan et al. 2010; Horn et al. 2010) and as mentioned links with Foxp1 and
ASDs have been reported (discussed in 1.7) (Hamdan et al. 2010; Palumbo et al. 2013).
1.2.3 The Role of Foxp1 in the Developing Brain
Foxp1 expression has been detected from E12.5 in the developing telencephalon and
expression persists into the adult (Ferland et al. 2003). In addition to the striatum and
cortex Foxp1 expression is also evident in the CA1 neurons of the hippocampus
(Ferland et al. 2003) from E17.5 and is seen in the hypothalamus, the deep cerebellar
nuclei, the anterior olfactory nucleus, the olfactory tubercle and sporadically in the
amygdala (Ferland et al. 2003). However, the developmental timings of Foxp1
expression in these areas are largely unknown.
Expression of Foxp1 in the adult striatum is restricted to the projection neurons with no
expression detected in striatal interneurons (Ferland et al. 2003; Tamura et al. 2004). It
has been shown that FOXP1 is also expressed in the developing human striatum over
an equivalent gestational window, and with a similar anatomical distribution to that
seen in the mouse and rat, and that it co-localises with DARPP-32 and CTIP2
(Precious et al., submitted 2013). Recent work by a group in Milan have also shown
comparable levels of Foxp1 expression in the developing human striatum (Carri et al.
Chapter 1 Introduction
10
2013). Foxp1 expression is also shown in the monkey striatum and cortex (Takahashi
et al. 2008).
From E12, Foxp1 is expressed in the SVZ of the developing striatum and expression at
an mRNA and protein level is detectable in the SVZ and MZ of the striatum from E14
(Tamura et al. 2003). Foxp1 expression was largely observed in the ventral region of
the LGE and therefore has been associated with post migratory, differentiating neurons
of the striatum rather than with the earlier proliferating neurons in the VZ or the SVZ
(Ferland et al. 2003; Tamura et al. 2004). Specifically, it is thought that Foxp1 is
associated with the projection neurons of the matrix region of the striatum as patch
projection neurons are specified by E12.5 (Tamura et al. 2004). It has also been
suggested that Foxp1 acts downstream of the TFs Dlx5/6 as both genes have
overlapping expression profiles (Tamura et al. 2004). However, it is also plausible that
Foxp1 could act upstream to these genes and more research is needed to fully
understand the role of this gene in the context of MSN development.
To date, no functional analysis of Foxp1 in the developing or adult brain has been
carried out in vivo or in vitro, although recent in vitro work using mESCs has shown
that Foxp1 is a novel marker of midbrain dopamine neurons and has hinted at Foxp1
having a functional role in their development. It was shown that the addition of Foxp1
to ESCs activates the expression of Pitx3, a homeobox protein that is exclusively
expressed in midbrain dopaminergic neurons and is vital for their differentiation and
survival during development both in vitro and in vivo (Konstantoulas et al. 2010).
Chromatin immunoprecipitation (IP) and electrophoretic mobility shift assays showed
that Foxp1 binds upstream of the Pitx3 promoter to induce transcription. This study
demonstrates for the first time a transcription regulatory role for Foxp1 on the Pitx3
gene in mammalian stem cells (Konstantoulas et al. 2010). It is therefore possible that
Foxp1 has a similar role in regulating the differentiation of MSNs.
Chapter 1 Introduction
11
1.3 Organisation of the Adult Striatum and Cortex
1.3.1 The Adult striatum
The adult striatum is composed of two histologically identical nuclei, the caudate and
putamen, that are separated by the internal capsule (this is not found in rodents) and
together, with other core nuclei, make up the basal ganglia (Jain et al. 2001). The core
nuclei in the basal ganglia in addition to the striatum are the sub thalamic nuclei
(STN), the internal and external segments of the globus pallidus (GPi/e respectively)
and the substantia nigra (SN) pars compacta and pars reticulata (SNc and SNr) (Jain et
al. 2001). This is shown in Figure 1.2. Specifically, the striatum plays a vital role in the
co-ordination of movement (primary motor control), emotions, and cognition (Jain et
al. 2001) and forms links with widespread areas of the cortex, the thalamus and the
brainstem through independent pathways (Jain et al. 2001).
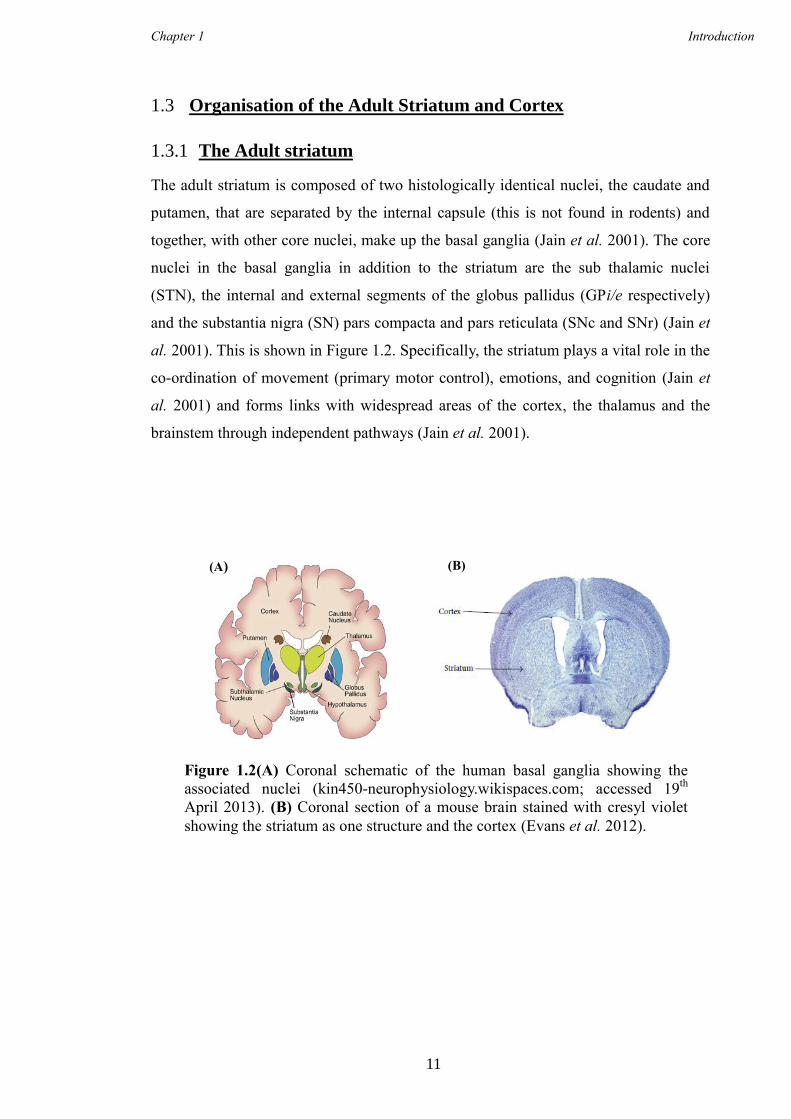
Figure 1.2(A) Coronal schematic of the human basal ganglia showing the
associated nuclei (kin450-neurophysiology.wikispaces.com; accessed 19th
April 2013). (B) Coronal section of a mouse brain stained with cresyl violet
showing the striatum as one structure and the cortex (Evans et al. 2012).
(A) (B)
Chapter 1 Introduction
12
1.3.2 Striatal Neurons
Striatal neurons are heterogeneous and can be subdivided according to size, density of
spines, and utility of neurotransmitters and neuropeptides. MSNs are the main output
projection neurons of the striatum and principally utilise the inhibitory transmitter
gamma-amino butyric acid (GABA). MSNs constitute approximately 95% of all of the
striatal neurons in the rodent (Gerfen 1992), an example MSN is shown in Figure 1.3A.
The remaining 5% of neurons are aspiny interneurons (Freeman et al. 1995).
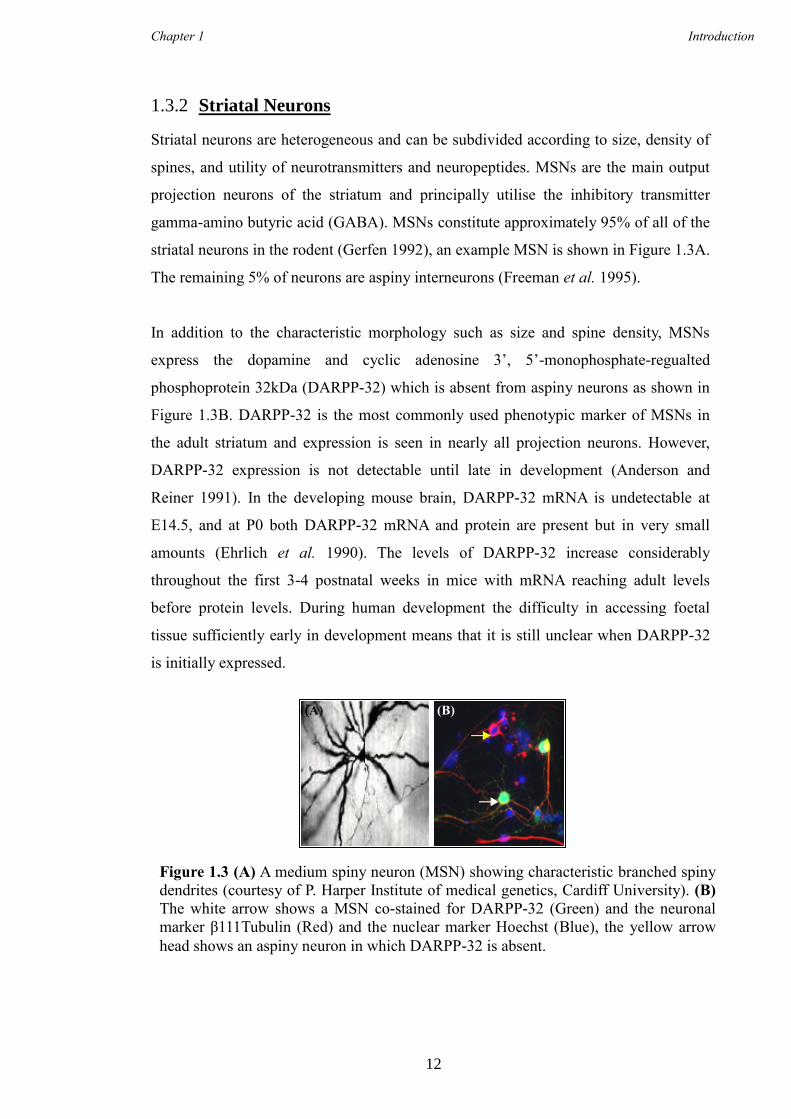
In addition to the characteristic morphology such as size and spine density, MSNs
express the dopamine and cyclic adenosine 3’, 5’-monophosphate-regualted
phosphoprotein 32kDa (DARPP-32) which is absent from aspiny neurons as shown in
Figure 1.3B. DARPP-32 is the most commonly used phenotypic marker of MSNs in
the adult striatum and expression is seen in nearly all projection neurons. However,
DARPP-32 expression is not detectable until late in development (Anderson and
Reiner 1991). In the developing mouse brain, DARPP-32 mRNA is undetectable at
E14.5, and at P0 both DARPP-32 mRNA and protein are present but in very small
amounts (Ehrlich et al. 1990). The levels of DARPP-32 increase considerably
throughout the first 3-4 postnatal weeks in mice with mRNA reaching adult levels
before protein levels. During human development the difficulty in accessing foetal
tissue sufficiently early in development means that it is still unclear when DARPP-32
is initially expressed.
Figure 1.3 (A) A medium spiny neuron (MSN) showing characteristic branched spiny
dendrites (courtesy of P. Harper Institute of medical genetics, Cardiff University). (B)
The white arrow shows a MSN co-stained for DARPP-32 (Green) and the neuronal
marker β111Tubulin (Red) and the nuclear marker Hoechst (Blue), the yellow arrow
head shows an aspiny neuron in which DARPP-32 is absent.
((A) (B)
Chapter 1 Introduction
13
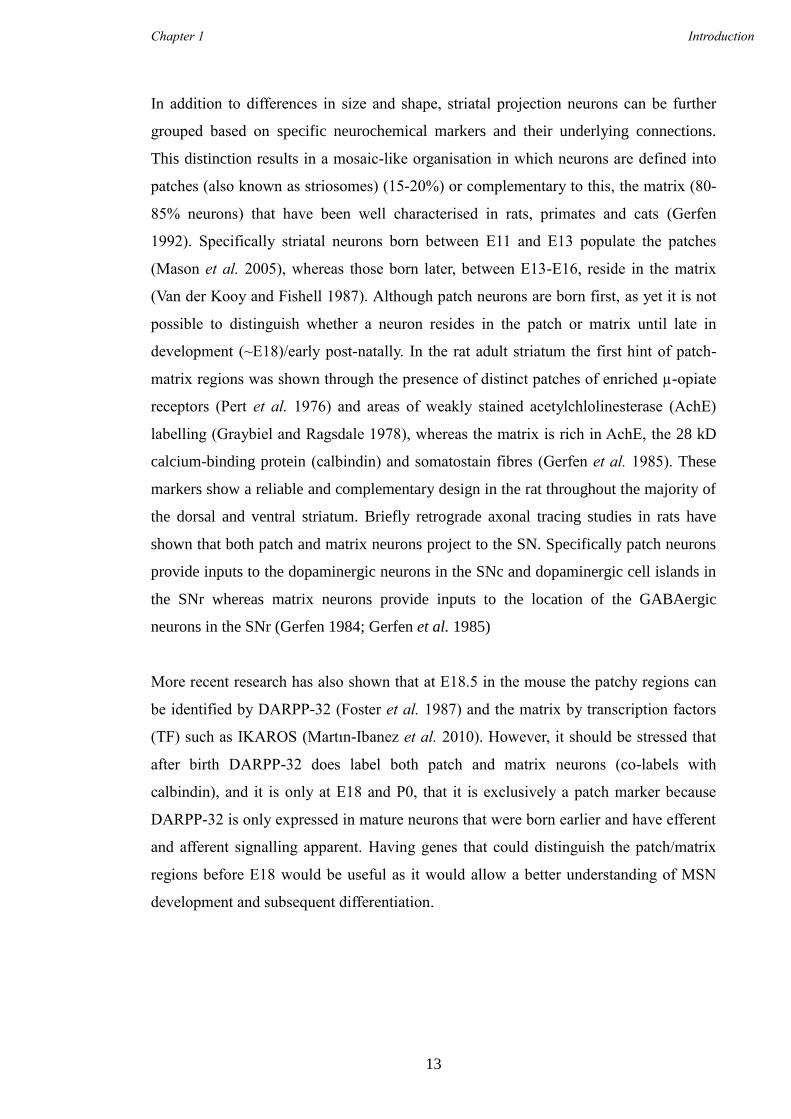
In addition to differences in size and shape, striatal projection neurons can be further
grouped based on specific neurochemical markers and their underlying connections.
This distinction results in a mosaic-like organisation in which neurons are defined into
patches (also known as striosomes) (15-20%) or complementary to this, the matrix (80-
85% neurons) that have been well characterised in rats, primates and cats (Gerfen
1992). Specifically striatal neurons born between E11 and E13 populate the patches
(Mason et al. 2005), whereas those born later, between E13-E16, reside in the matrix
(Van der Kooy and Fishell 1987). Although patch neurons are born first, as yet it is not
possible to distinguish whether a neuron resides in the patch or matrix until late in
development (~E18)/early post-natally. In the rat adult striatum the first hint of patch-
matrix regions was shown through the presence of distinct patches of enriched µ-opiate
receptors (Pert et al. 1976) and areas of weakly stained acetylchlolinesterase (AchE)
labelling (Graybiel and Ragsdale 1978), whereas the matrix is rich in AchE, the 28 kD
calcium-binding protein (calbindin) and somatostain fibres (Gerfen et al. 1985). These
markers show a reliable and complementary design in the rat throughout the majority of
the dorsal and ventral striatum. Briefly retrograde axonal tracing studies in rats have
shown that both patch and matrix neurons project to the SN. Specifically patch neurons
provide inputs to the dopaminergic neurons in the SNc and dopaminergic cell islands in
the SNr whereas matrix neurons provide inputs to the location of the GABAergic
neurons in the SNr (Gerfen 1984; Gerfen et al. 1985)
More recent research has also shown that at E18.5 in the mouse the patchy regions can
be identified by DARPP-32 (Foster et al. 1987) and the matrix by transcription factors
(TF) such as IKAROS (Martın-Ibanez et al. 2010). However, it should be stressed that
after birth DARPP-32 does label both patch and matrix neurons (co-labels with
calbindin), and it is only at E18 and P0, that it is exclusively a patch marker because
DARPP-32 is only expressed in mature neurons that were born earlier and have efferent
and afferent signalling apparent. Having genes that could distinguish the patch/matrix
regions before E18 would be useful as it would allow a better understanding of MSN
development and subsequent differentiation.
Chapter 1 Introduction
14
1.3.3 Adult Cortex
The cerebral cortex forms the outer layer of the cerebral hemisphere and comprises over
three quarters of the human brain (Figure 1.2) and is the centre for conscious thought,
memory and intellect (Finlay and Darlington 1995). It is the highest level at which
motor functions are represented, and is the area where sensory modalities are
interpreted. The cortex consists of six layers (layers I-VI, with layer VI being the
innermost layer), each containing specific subtypes of neurons, characterised by their
distinct projection and gene expression patterns (Molyneaux et al. 2007). The two major
types of neurons present in the cortex are the interneurons and the projection neurons.
Inhibitory γ-aminobutyric acid (GABA)-ergic interneurons make local connections
within the cortex, whereas projection neurons, which are excitatory (glutamatergic),
extend to form connections with other regions within the cortex and to other regions of
the brain including the basal ganglia (Molyneaux et al. 2007).
1.3.4 The Direct and Indirect Pathways- Linking the Cortex and the
Striatum
The cortex, striatum and associated basal ganglia nuclei are all inextricably linked to
ensure the correct regulation of two key pathways needed for processing everyday tasks
such as movement, these are the- the direct and indirect pathways (Kita and Kitai 1988).
Both pathways comprise separate, but equal, numbers of striatal projection neurons that
have received excitatory input from the cortex and can be grouped depending on their
targets. Striatonigral neurons are implicated in the direct pathway and project to the SNc
and SNr whereas striatopallidal neurons project to the GPi and GPe and are concerned
with the indirect pathway (Gerfen 1992). Striatal neurons can also be classified into
groups based on expression of different neuropeptides. The majority of striatopallidal
neurons express enkephalin, whereas striatonigral neurons express substance P and
dynorphin (Gerfen and Young 1988); both pathways are shown in Figure 1.4.
Differences in the physiological activity of striatal output pathways modulate the
GABAergic neurons in the SN. Striatal output neurons are physiologically quiescent at
rest whereas nigral GABAergic neurons are tonically active (Gerfen 1992). In the direct
pathway, gluatmatergic input from the cortex to the striatum promotes activity in the
quiescent neurons, which phasically inhibit the tonic action of the nigral GABAergic
Chapter 1 Introduction
15
neurons, causing excitatory input to the cortex via modulation of the GPi and the
thalamus; this is outlined in Figure 1.4. Alternatively, in the indirect pathway,
corticostriatal input onto striatopallidal neurons leads to the disinhibition of the STN
increasing the activity of the GABAergic nigral neurons (Kita and Kitai 1987), therefore
repressing the excitatory signals from the thalamus to the cortex; again this is shown in
Figure 1.4. Additionally, the indirect pathway can decrease nigral output activity by
direct pallidal (GPe) GABAergic input onto the SNr. Therefore the responsiveness of
either striatonigral or striatopallidal neurons to corticostriatal input has a direct effect on
output neurons of the basal ganglia to the SN.
Striatal inputs from the SN are dopaminergic whereas neurons projecting from the
cortex and thalamus express glutamate and provide excitatory input to the MSNs.
Dopaminergic projections from the SNc act on either dopamine receptor 1 or 2 (D1 or
D2) of the GABAergic MSNs. Projections on to the D1 receptors results in activation of
the direct pathway, whereas projections on to the D2 receptors activates the indirect
pathway (Gerfen and Young 1988; Jimenez-Castellanos and Graybiel 1987). Although
neurons normally contain either D1 or D2 receptors there may be a subtype of neurons
that express both (Gerfen 1992).
Chapter 1 Introduction
16
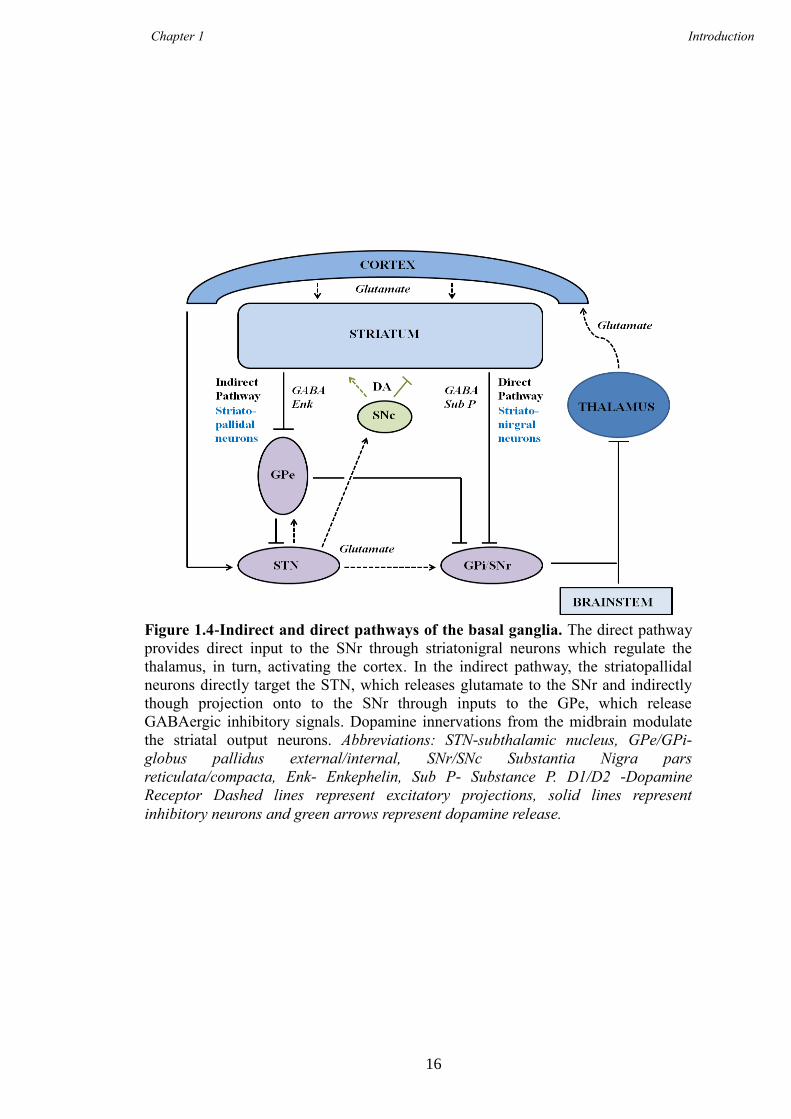
Figure 1.4-Indirect and direct pathways of the basal ganglia. The direct pathway
provides direct input to the SNr through striatonigral neurons which regulate the
thalamus, in turn, activating the cortex. In the indirect pathway, the striatopallidal
neurons directly target the STN, which releases glutamate to the SNr and indirectly
though projection onto to the SNr through inputs to the GPe, which release
GABAergic inhibitory signals. Dopamine innervations from the midbrain modulate
the striatal output neurons. Abbreviations: STN-subthalamic nucleus, GPe/GPi-
globus pallidus external/internal, SNr/SNc Substantia Nigra pars
reticulata/compacta, Enk- Enkephelin, Sub P- Substance P. D1/D2 -Dopamine
Receptor Dashed lines represent excitatory projections, solid lines represent
inhibitory neurons and green arrows represent dopamine release.
Chapter 1 Introduction
1
1.4 Telencephalon Development
1.4.1 The nervous system
Precise transcriptional control of neuronal development is critical for generating
diversity and regional specificity in the brain, and the defined orchestration of genetic
interactions needed to ensure correct striatal development and associated neurons is
crucial to prevent neuronal disorders. Understanding the roles of genes involved in
striatal development and, in particular, the role of genes implicated in MSN
development is an area of interest to our laboratory and my PhD. The multitude of
genetic tools now available has helped to establish novel genes involved in MSN
development as well as elucidating more precise genetic pathways involved in striatal
development.
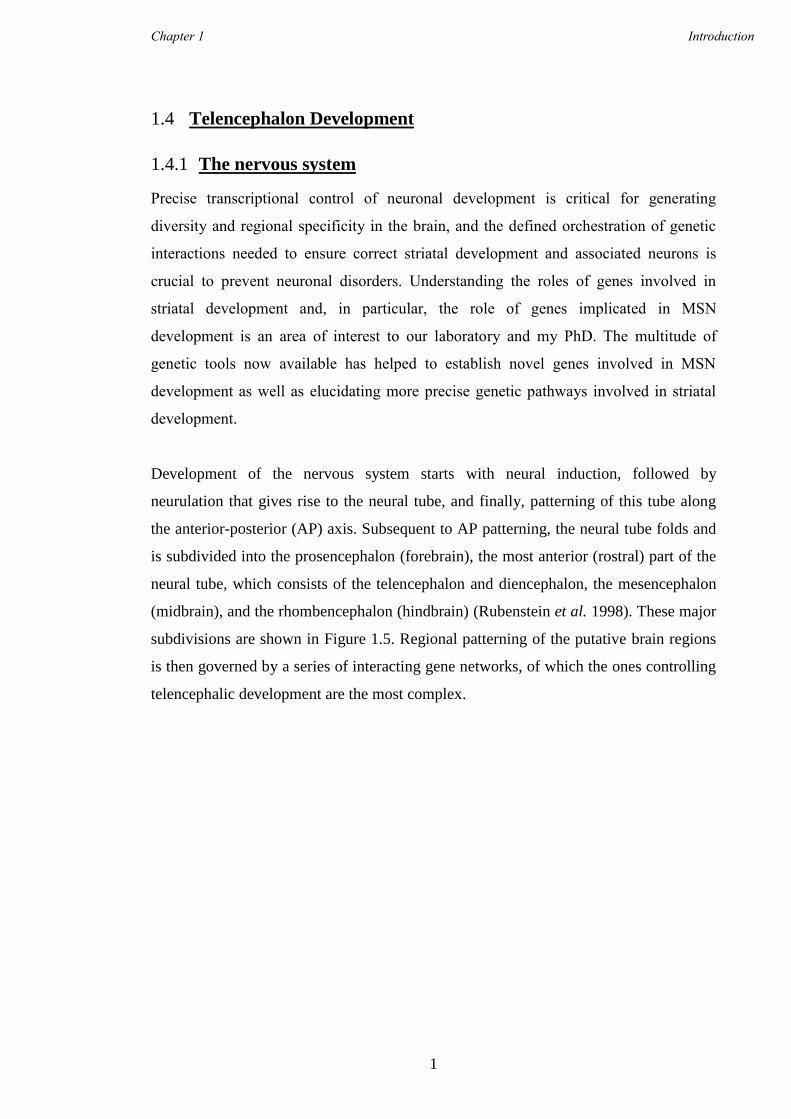
Development of the nervous system starts with neural induction, followed by
neurulation that gives rise to the neural tube, and finally, patterning of this tube along
the anterior-posterior (AP) axis. Subsequent to AP patterning, the neural tube folds and
is subdivided into the prosencephalon (forebrain), the most anterior (rostral) part of the
neural tube, which consists of the telencephalon and diencephalon, the mesencephalon
(midbrain), and the rhombencephalon (hindbrain) (Rubenstein et al. 1998). These major
subdivisions are shown in Figure 1.5. Regional patterning of the putative brain regions
is then governed by a series of interacting gene networks, of which the ones controlling
telencephalic development are the most complex.
Chapter 1 Introduction
2
1.4.2 Regional Pattering of the Developing Telencephalon
Following neural induction, the embryonic telencephalon, is divided into the dorsal
telencephalon (also called pallium), which gives rise to the neocortex, and the ventral
telencephalon (also called the subpallium) which forms the striatum, and is the origin of
cells that populate the olfactory bulb, GP, and a small population of cortical cells (Jain
et al. 2001). Even though the adult striatum is diverse between mammalian species, the
initial subdivisions observed in the telencephalon are similar (Puelles et al. 2000;
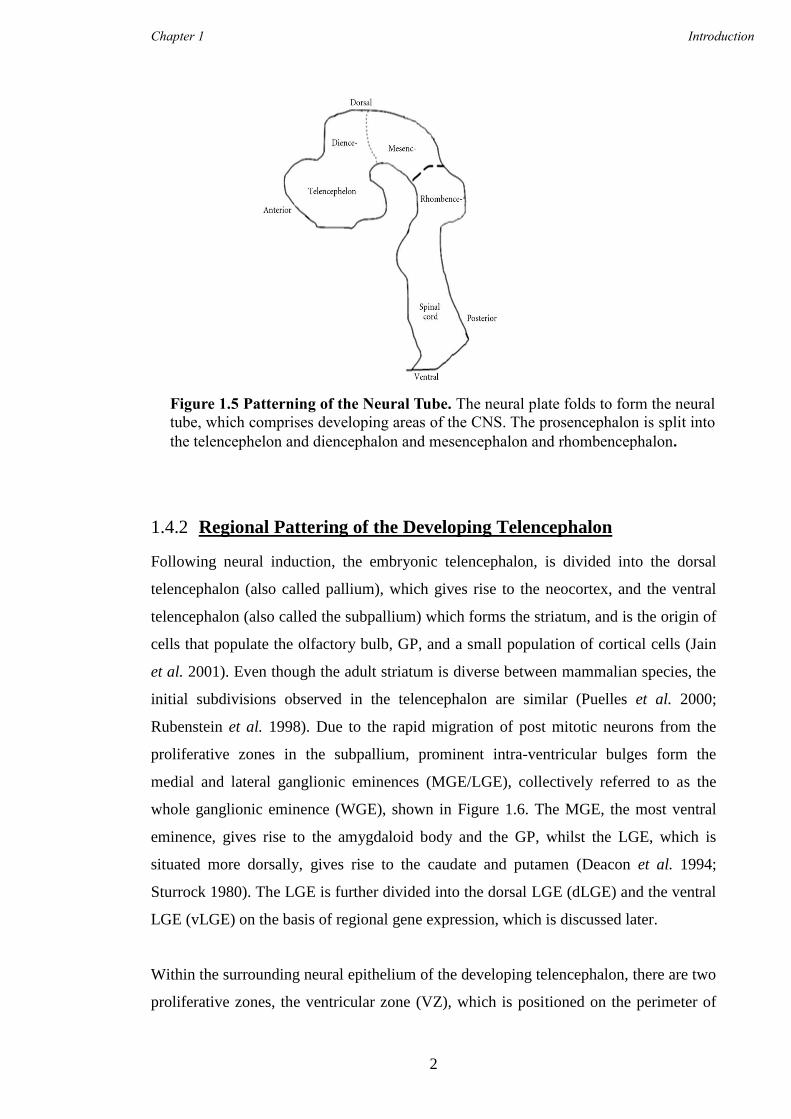
Rubenstein et al. 1998). Due to the rapid migration of post mitotic neurons from the
proliferative zones in the subpallium, prominent intra-ventricular bulges form the
medial and lateral ganglionic eminences (MGE/LGE), collectively referred to as the
whole ganglionic eminence (WGE), shown in Figure 1.6. The MGE, the most ventral
eminence, gives rise to the amygdaloid body and the GP, whilst the LGE, which is
situated more dorsally, gives rise to the caudate and putamen (Deacon et al. 1994;
Sturrock 1980). The LGE is further divided into the dorsal LGE (dLGE) and the ventral
LGE (vLGE) on the basis of regional gene expression, which is discussed later.
Within the surrounding neural epithelium of the developing telencephalon, there are two
proliferative zones, the ventricular zone (VZ), which is positioned on the perimeter of
Figure 1.5 Patterning of the Neural Tube. The neural plate folds to form the neural
tube, which comprises developing areas of the CNS. The prosencephalon is split into
the telencephelon and diencephalon and mesencephalon and rhombencephalon.
Chapter 1 Introduction
3
the lateral ventricles, and the subventricular zone (SVZ) (unique to the telencephalon),
which extends from the basal region of the VZ. Both are shown in Figure 1.6 (Campbell
2003). Striatal projection neurons are born primarily in the VZ and SVZ of the ventral
LGE and make up nearly 90% of LGE neurons (Olsson et al. 1995; Stenman et al.
2003; Wichterle et al. 2001), whereas the dorsal LGE is mainly associated with the
production of striatal, cortical and olfactory bulb interneurons (Corbin et al. 2000;
Toresson et al. 2000). Interneurons are also born from the MGE and migrate to the
cortex, GP, and striatum (Anderson et al. 1997; Campbell et al. 1995; Olsson et al.
1998). Subsequent to proliferation, neurons migrate to the mantle zone (MZ) of the
developing striatum where they differentiate, shown in Figure 1.6.
Figure 1.6 Coronal hemi sections of the mouse telencephalon at E12.5 showing
morphologically defined structures and the progenitor subdomains. The VZ extends
along the DV axis and contains proliferative neuronal precursor cells. The SVZ (shown by
the blue dashed lines) also contains precursor cells. Progenitor cells migrate radially and
tangentially from these zones to populate the MZ, an area associated with post-mitotic
neurons. The dashed red lines indicate the approximate boundaries between distinct
telencephalon progenitor domains. Abbreviations: MP- medial pallium, DP- Dorsal Pallium
LP- Lateral pallium, VP-ventral pallium Picture adapted from (Campbell 2003).
Chapter 1 Introduction
4
1.4.3 Radial Glia (RG)
Although it is known where in the developing telencephalon striatal and cortical
neurons arise, it is also important to know which specific cell type the neurons arise
from, especially if a CKO model is to be considered. Since 2000, it has widely been
accepted that RG can act as progenitor cells for over 80% of neurons, in addition to glia
in the CNS (Malatesta and Gotz 2013; Malatesta et al. 2000; Noctor et al. 2002). RG
express the hallmarks of astrocytes, GFAP, glial high affinity glutamate transporter
(GLAST), and brain lipid binding protein (BLBP), and this latter marker can be used to
distinguish the switch of neuroepithelial cells to RG, and furthermore, the onset of RG
neurogenesis, which occurs concurrently around E10.5-E11 (Anthony et al. 2004).
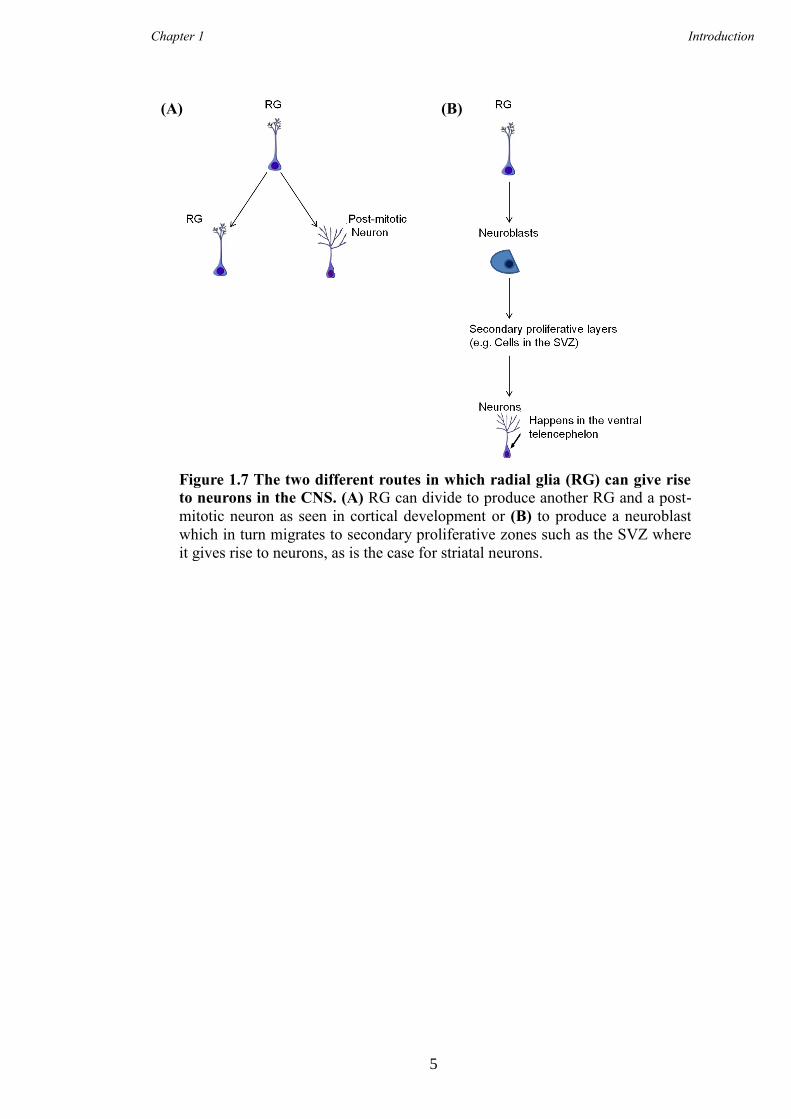
It has been suggested by Anthony et al (2004) that RG can give rise to neurons through
one of two routes as outlined in Figure 1.7 (Anthony et al. 2004). Either RG can directly
give rise to heterogeneous progeny; RG and a post mitotic neuron in the VZ, as is the
case in cortical neurogenesis (Noctor et al. 2002) or alternatively, RG produce
neuroblasts which migrate to secondary proliferative layers, i.e. the SVZ where division
then occurs to produce neurons, the latter is the case in the ventral telencephalon, shown
in Figure 1.7. Precursors within the SVZ are normally devoid of BLBP staining.
However, fate mapping using a TG mouse for a BLBP-Cre crossed to a ROSA- LacZ
(R26R) mouse showed X-Gal staining in the adult striatum, suggesting these neurons
were derivates of RG. As striatal neurons are known to be born principally from the
SVZ of GEs (Anderson et al. 1997), it was believed that these SVZ precursors were
indirectly produced from RG (Anthony et al. 2004). Numerous lineage tracing
experiments have been carried out to exactly determine what areas of the CNS are
populated by neurons that originate from RG, and these experiments have presented
differing results in the question of whether MSNs are derived from these cells or not;
this is discussed below (Anthony et al. 2004; Malatesta et al. 2003; Malatesta et al.
2000).
Chapter 1 Introduction
5
Figure 1.7 The two different routes in which radial glia (RG) can give rise
to neurons in the CNS. (A) RG can divide to produce another RG and a post-
mitotic neuron as seen in cortical development or (B) to produce a neuroblast
which in turn migrates to secondary proliferative zones such as the SVZ where
it gives rise to neurons, as is the case for striatal neurons.
(A) (B)
Chapter 1 Introduction
6
When the human GFAP (hGFAP)-Cre was crossed with R26R mice to trace progeny it
was shown that the adult striatum and layers 1 and V1 of the cortex were mainly devoid
of X-Gal staining. Out of the positive striatal X-Gal cells, the majority co-stained with
glia markers. Of the few that were identified as neurons only 10% co-stained with
DARPP-32, 3% with calretinin and 1% stained with calbinidn (Malatesta et al. 2003).
However, within the cortex, Er81 and Parvalbumin interneurons did co-stain with X-
Gal. These cortical neurons arise from the dorsal VZ where neurogenesis is known to
occur at a later stage than striatal neurons born from the GE’s, which is from E11
(Mason et al., 2005). Results from these tracing experiments therefore suggested that
striatal neurons are born independent of a RG phase. Or alternatively, as suggested by
Anthony et al, that the majority of striatal neurons pass through a RG phase but before
appreciable recombination of the hGFAP-Cre has occurred which is at E15.5 (Anthony
and Heintz 2008).
It has been proposed that the heterogeneity observed in RG by the hGFAP-Cre tracing
studies reflects temporal aspects of RG development rather than an underlying
difference in potential (Anthony et al. 2004). As a means of validating this both the
BLBP-Cre (Anthony and Heintz 2008; Anthony et al. 2004) and the GLAST-Cre lines
(Anthony and Heintz 2008) also expressed in RG, but from E10.5, were crossed with
R262 mice to trace neuronal progeny in the adult CNS. These experiments showed
extensive X-Gal staining in the postnatal (PO) and adult striatum (Anthony and Heintz
2008; Anthony et al. 2004). In addition S100, a glia marker, showed that by E16.5
gliogenesis was occurring in the LGE, but expression was absent in the dorsal
telencephalon until P0. Therefore the recombination patterns of X-gal using these two
different Cre lines strongly suggested that MSNs do arise from RG, but at an earlier
time point than when hGFAP-Cre is active, i.e. between E11.5 and E12.5. Therefore, it
has been suggested that RG go through two phases:
an early (before E12) neurogeneic BLBP +ve, GLAST +ve and GFAP- ve
phase and a
later ( after E13) gliogenic BLBP +ve, GLAST +ve and GFAP + ve
phase
Chapter 1 Introduction
7
Anthony and Heinz suggest that a BLBP-Cre is the best line to use in order to trace all
progeny arising from RG in the CNS. They argue that using the hGFAP-cre to trace or
knock out striatal neurons is inadvisable, as it does not accurately reflect the normal
developmental pattern of RG in mice (Anthony and Heintz 2008). However, the exact
timings of striatal neurogenesis, especially in the mouse, are not fully understood and it
is possible that reporter lines or subsequent staining protocols are not identifying all
recombined cells. Specifically, caution should be taken when inferring negative tracing
results using any Cre-line as results could be recognized as weak promoter activity
rather than restricted potential. Recombination efficiency can be directly linked to
promoter strength and it has been shown that doubling the copy number of the promoter,
i.e. two copies instead of one, can result in an increase in recombination (Anthony and
Heintz 2008). For example, tracing studies carried out by Casper and McCarthy utilised
the same and different hGFAP lines to Malatesta and colleagues showed higher reporter
expression in the adult striatum; 54% of striatal neurons displayed X-Gal and NeuN
expression (Casper and McCarthy 2006). However, of the 54% of striatal neurons that
were positively stained for X-Gal, the majority co-localised with interneuron makers
(Casper and McCarthy 2006).
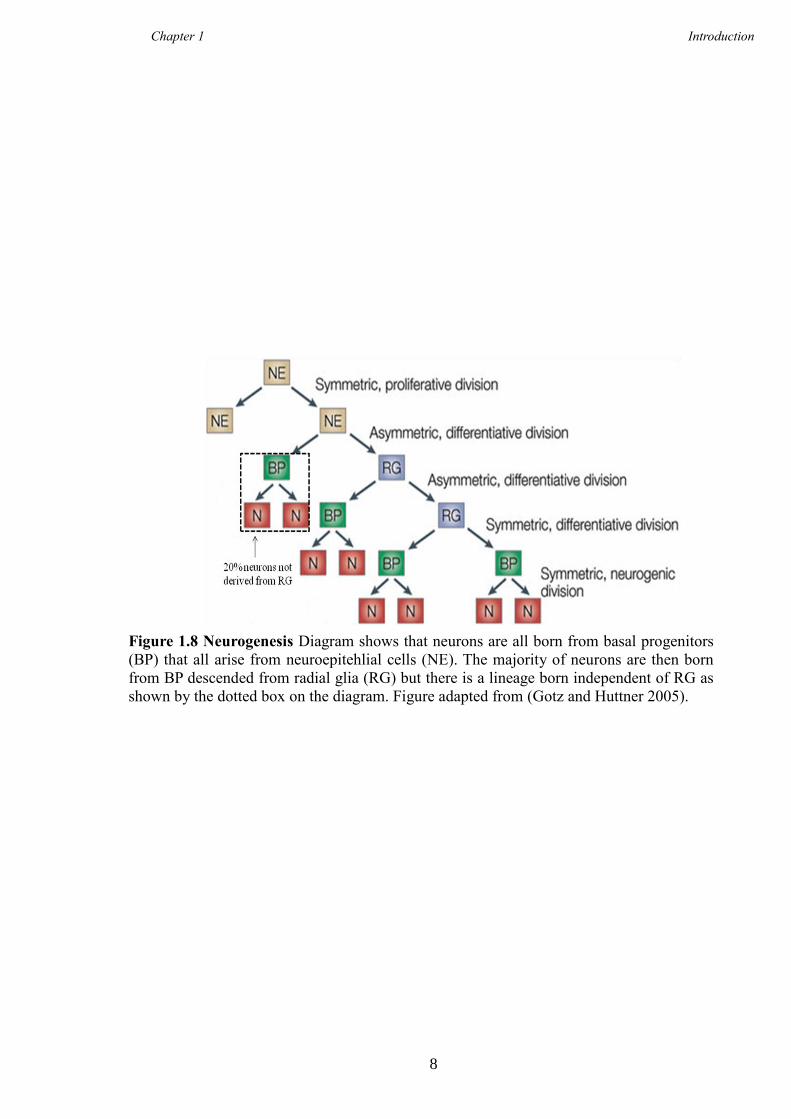
It can be concluded from all the described tracing experiments that RG housed in the
ventral telencephalon are directly or indirectly responsible for approximately 80% of
neurons found in the adult striatum (Anthony et al. 2004). The remaining 20% are not
likely to be descendants of RG, and are instead directly born from basal progenitors
descended from nestin positive neuroepithelial cells (Anthony et al. 2004; Gotz and
Huttner 2005), shown in Figure 1.8.
Chapter 1 Introduction
8
Figure 1.8 Neurogenesis Diagram shows that neurons are all born from basal progenitors
(BP) that all arise from neuroepitehlial cells (NE). The majority of neurons are then born
from BP descended from radial glia (RG) but there is a lineage born independent of RG as
shown by the dotted box on the diagram. Figure adapted from (Gotz and Huttner 2005).
Chapter 1 Introduction
9
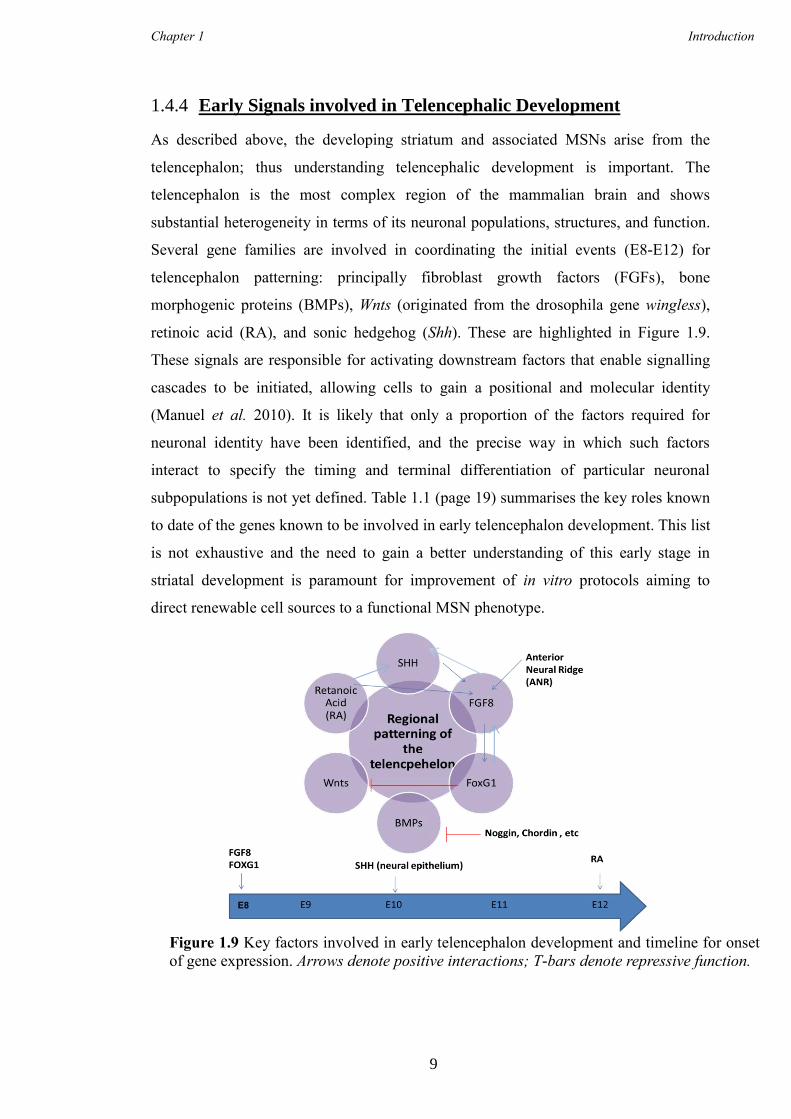
1.4.4 Early Signals involved in Telencephalic Development
As described above, the developing striatum and associated MSNs arise from the
telencephalon; thus understanding telencephalic development is important. The
telencephalon is the most complex region of the mammalian brain and shows
substantial heterogeneity in terms of its neuronal populations, structures, and function.
Several gene families are involved in coordinating the initial events (E8-E12) for
telencephalon patterning: principally fibroblast growth factors (FGFs), bone
morphogenic proteins (BMPs), Wnts (originated from the drosophila gene wingless),
retinoic acid (RA), and sonic hedgehog (Shh). These are highlighted in Figure 1.9.
These signals are responsible for activating downstream factors that enable signalling
cascades to be initiated, allowing cells to gain a positional and molecular identity
(Manuel et al. 2010). It is likely that only a proportion of the factors required for
neuronal identity have been identified, and the precise way in which such factors
interact to specify the timing and terminal differentiation of particular neuronal
subpopulations is not yet defined. Table 1.1 (page 19) summarises the key roles known
to date of the genes known to be involved in early telencephalon development. This list
is not exhaustive and the need to gain a better understanding of this early stage in
striatal development is paramount for improvement of in vitro protocols aiming to
direct renewable cell sources to a functional MSN phenotype.
Figure 1.9 Key factors involved in early telencephalon development and timeline for onset
of gene expression. Arrows denote positive interactions; T-bars denote repressive function.
E8
Chapter 1 Introduction
10
1.4.5 FGF8
FGFs are growth factors that can activate several different pathways once bound to their
appropriate receptors. For example, binding of FGFs to FGF receptor (FGFR) 1, 2 or 3
can activate the Ras Map Kinase (MAPK) pathway, initiating a signalling cascade to
start (Mason 2007). Fgf8 is expressed rostrally from the anterior neural ridge (ANR) in
mammals from ~E8 and has roles in proliferation and cell survival. In addition, it has
been shown that Fgf8 regulates the expression of forkhead box protein G1 (Foxg1;
previously Bf1), a rostral forebrain marker that is also expressed in the ANR at ~E8.
These genes function through a tightly linked feedback loop (Shimamura and
Rubenstein 1997). It was shown that Fgf8 could renew Foxg1 expression in mouse
explants that had the ANR removed. Furthermore inhibitors of Fgf8 reduced Foxg1
expression in neural plate explants (Shimamura and Rubenstein 1997; Ye et al. 1998). In
addition, reduction in Fgf8 leads to rostral truncations and midline defects in the
developing forebrain (Shanmugalingam et al. 2000). In Fgf8 knock out (KO) mice
(Fgf8-/-
) the telencephalon was smaller than in littermate controls and exhibited
patterning abnormalities (Shanmugalingam et al. 2000; Storm et al. 2006; Wilson and
Rubenstein 2000). In particular, the MGE and LGE were absent and there was loss of
genes that are typically found in the ventral region, e.g. Dlx2 and Nkx2.1, but an
expansion of the dorsal marker Pax6 (Storm et al. 2006). These results suggested a role
for Fgf8 in ventralisation of the telencephalon.
Regulation of development at this early stage is vague; FGF8 is implicated but it would
appear other factors are also implicated due to the continued presence of the
telencephalon in Fgf8-/-
or FGFR null mutants (Shanmugalingam et al. 2000). One
suggestion for the telencephalon remaining in these mutants is through compensation of
other Fgfs expressed at the same time. Nevertheless, some in the field are of the opinion
that overlapping Fgf expression profiles do not exist and that each Fgf has exclusive
roles in telencephalon development (Borello et al. 2008; Cholfin and Rubenstein 2007).
They would postulate that the reason the telencephalon is not lost completely in the Fgf8
mutant is not due to compensatory mechanisms by other family members, but because
Fgf8 is not essential for telencephalon generation and that other genetic families and
ligands are also needed (Borello et al. 2008; Cholfin and Rubenstein 2007).
Nevertheless, the fact that beads soaked in FGF8 that were added to anterior neural
Chapter 1 Introduction
11
explants lacking an ANR promoted expression of Foxg1 suggests FGFs are necessary
for telencephalon induction (Shimamura and Rubenstein 1997) .
Recently, work supporting gain of function studies has allowed greater insight into the
role of FGFs and FGFRs in telencephalon development. Triple FGFR KOs have shown
that at E10.5 embryos showed abnormalities in the anterior structures and, by E12.5, a
time at which the telencephalic structures are morphologically distinguishable, mutants
lacked all anterior head structures and had no visible telencephalon except for the dorsal
midline (Paek et al. 2009). In addition, Foxg1 was not expressed, together with
complete absence of the ventral markers (Dlx2 and Nkx2.1). Unexpectedly, the dorsal
marker Emx1 was also absent, suggesting that FGF has a role in forming the dorsal
telencephalon in addition to the ventral telencephalon (Paek et al. 2009).
The phenotype of the FGFR triple KO was much more severe than the phenotype
observed in single or double receptor mutants (Mason 2007), thus supporting the
argument that different FGFs compensate for each other and do not have exclusive roles.
However, this compensation is not absolute, given that a mild phenotype was still
evident in single or double mutants. This suggests the compensating ligands and
corresponding receptors can function, but are not optimum and therefore, the signalling
cascades are less efficient (Paek et al. 2009). Subtractive results suggest that FGFR1 is
responsible for the majority of signalling in early telencephalon development, and that it
is the overall levels of FGF signalling that operate to initiate, pattern and sustain
development as a whole, rather than specific ligands patterning different areas (Paek et
al. 2009).
1.4.6 SHH
SHH is a member of the hedgehog (Hh) family of secreted proteins and typically acts as
a morphogen during development, therefore signalling is by means of a concentration
gradient. During telencephalon development SHH spans the dorsal ventral (DV) axis at
different embryonic time points to promote different neuronal phenotypes; the highest
concentration is seen ventrally. SHH is initially secreted from the notochord, following
which, expression is from the overlying neural plate (Echelard et al. 1993; Roelink et al.
1995; Rubenstein et al. 1998). By E9.5 Shh is expressed in the neural epithelium of the
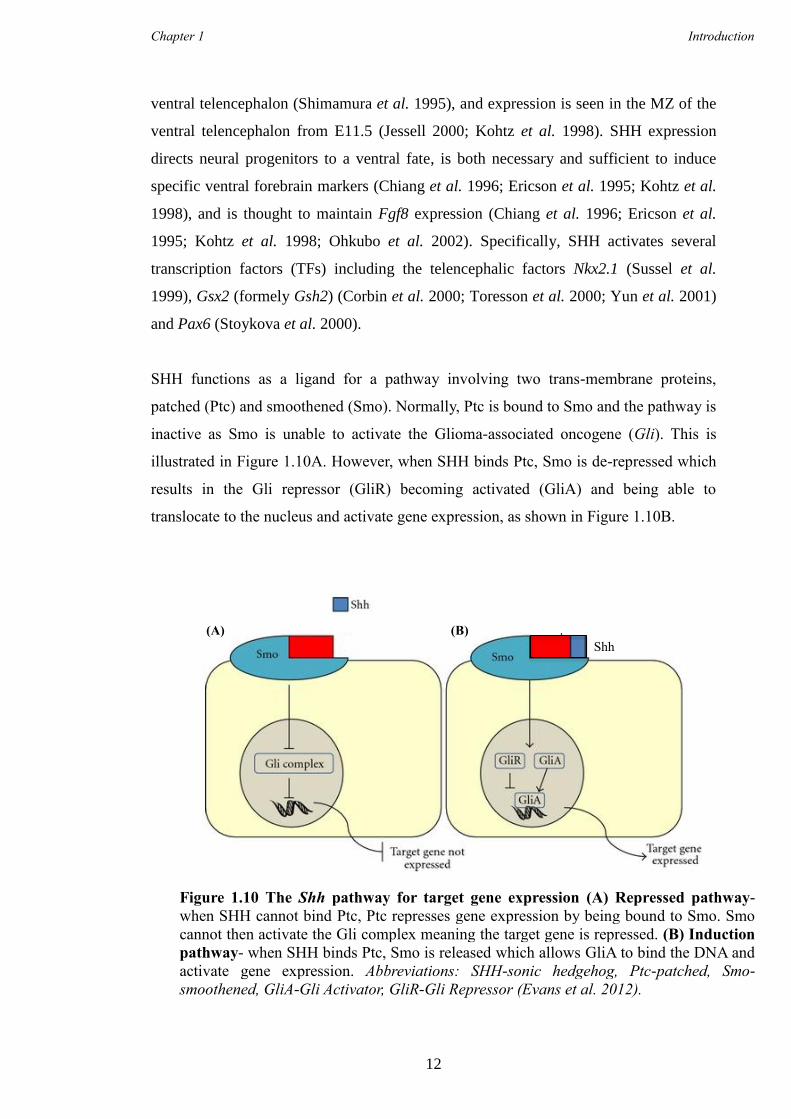
Chapter 1 Introduction
12
ventral telencephalon (Shimamura et al. 1995), and expression is seen in the MZ of the
ventral telencephalon from E11.5 (Jessell 2000; Kohtz et al. 1998). SHH expression
directs neural progenitors to a ventral fate, is both necessary and sufficient to induce
specific ventral forebrain markers (Chiang et al. 1996; Ericson et al. 1995; Kohtz et al.
1998), and is thought to maintain Fgf8 expression (Chiang et al. 1996; Ericson et al.
1995; Kohtz et al. 1998; Ohkubo et al. 2002). Specifically, SHH activates several
transcription factors (TFs) including the telencephalic factors Nkx2.1 (Sussel et al.
1999), Gsx2 (formely Gsh2) (Corbin et al. 2000; Toresson et al. 2000; Yun et al. 2001)
and Pax6 (Stoykova et al. 2000).
SHH functions as a ligand for a pathway involving two trans-membrane proteins,
patched (Ptc) and smoothened (Smo). Normally, Ptc is bound to Smo and the pathway is
inactive as Smo is unable to activate the Glioma-associated oncogene (Gli). This is
illustrated in Figure 1.10A. However, when SHH binds Ptc, Smo is de-repressed which
results in the Gli repressor (GliR) becoming activated (GliA) and being able to
translocate to the nucleus and activate gene expression, as shown in Figure 1.10B.
Ptc
Figure 1.10 The Shh pathway for target gene expression (A) Repressed pathway-
when SHH cannot bind Ptc, Ptc represses gene expression by being bound to Smo. Smo
cannot then activate the Gli complex meaning the target gene is repressed. (B) Induction
pathway- when SHH binds Ptc, Smo is released which allows GliA to bind the DNA and
activate gene expression. Abbreviations: SHH-sonic hedgehog, Ptc-patched, Smo-
smoothened, GliA-Gli Activator, GliR-Gli Repressor (Evans et al. 2012).
(A) (B)
Shh
Chapter 1 Introduction
13
There are three members of the Gli family of zinc-finger TFs: Gli1, Gli2 and Gli3, and
all three have been shown to regulate Shh dependant gene expression. Gli proteins have
both activator and repressor properties, the N-terminal region has a repressor function
whereas the C-terminal region is required for activation (Rallu et al. 2002). It is
believed that Gli3 functions principally in its repressor form and that its activity is
negatively regulated by Shh (Marigo et al. 1996; Wang et al. 2000), whereas Gli1 and 2
function primarily as transcriptional activators (Bai and Joyner 2001; Dai et al. 1999).
Analysis of mouse KOs for each of the Gli genes (Gli1−/−
,Gli2−/−
, and Gli3−/−
) has
revealed that mice lacking Gli1 or Gli2 show only slight defects in telencephalon
development (Park et al. 2000), whereas mice lacking Gli3 have strong defects in dorsal
telencephalon patterning (Grove et al. 1998; Theil et al. 1999; Tole et al. 2000). At the
dorsal region of the telencephalon, where the concentration of SHH is restricted, the
Gli3 protein is cleaved into a repressor form and promotes dorsal patterning (Rallu et al.
2002). It is the inhibition of the Gli3 repressor complex in the ventral telencephalic
region that facilities correct development; therefore, one of the functions of Shh is to
prevent the translation of Gli3 to its repressor form.
The relationship between Shh and Gli3 has been shown functionally through varying
combinations of mutants. For example, in Shh-/-
KO mice the expression of the ventral
markers Dlx2 and Gsx2 was reduced, whereas in Gli3-/-
KO mice the expression pattern
of these genes was extended into dorsal regions (Rallu et al. 2002). In accordance with
the loss of ventral markers in the Shh-/-
mouse, there is a loss of ventral telencephalic
cells leading to an altered morphology of the ventral telencephalon together with the
ectopic expression of dorsal forebrain markers (Chiang et al. 1996; Ericson et al. 1995;
Ohkubo et al. 2002). Complementary gain-of-function experiments carried out in
zebrafish and mice has shown that SHH promotes the ventral identity of dorsal
telencephalic cells in vivo with subsequent expression of the ventral forebrain markers
Gsx2, Dlx2 and Nkx2.1 (Sussel et al. 1999). Moreover, conditional Shh KO mice under
the control of a Foxg1-Cre revealed the optimal window of Shh signalling in
telencephalon development. If Shh is knocked out at E8.5 there are severe defects of all
ventral telencephalic regions (Fuccillo et al. 2004), whereas, when Shh is knocked out
in mice from E10 using a Nestin-Cre, there are only partial defects in ventral
telencephalic patterning (Xu et al. 2005).
Chapter 1 Introduction
14
In the Shh-/-
and Gli3-/+
KO mice telencephalon morphology is largely restored to that of
the wild type (WT), but regional gene expression is not fully restored. The expression of
the ventral markers Nkx2.1, Dlx2 and Gsx2 was not restored to a WT level unless both
copies of Gli3 were lost, suggesting these genes are highly receptive to the antagonism
between Shh and Gli3 (Wilson and Houart 2004). In summary, between E9 and E12.5,
Shh acts mainly by inhibiting the formation of the Gli3 repressor (Rallu et al. 2002) and
contributes to the establishment of DV patterning (Chiang et al. 1996; Fuccillo et al.
2004). Secondly, SHH signalling also supports the expansion of progenitors of the
ventral telencephalon by inducing and maintaining the expression of Nkx2.1 until at
least E14 and later into neurogenesis (Xu et al. 2005). However, the fact that in the Shh
KO mice ventral gene expression was reduced rather than lost suggests that other genes
and signalling pathways, independent to Shh signalling, have a role in regional DV
patterning of the telencephalon (Rallu et al. 2002).
1.4.7 Retinoic Acid (RA)
RA is the biologically active form of vitamin A and has been implicated in survival,
specification, proliferation, and differentiation during forebrain development (Haskell
and LaMantia 2005; Marklund et al. 2004; Schneider et al. 2001). For RA to function
correctly, and to bind and activate its associated RA receptors (RARs) (RARα, RARβ
and RARγ (RARβ is preferentially expressed in LGE)) or retinoid X receptors (RXRα,
RXRβ, and RXRγ), two oxidation events occur (Mark et al. 2006). Initially, retinol
dehydrogenases oxidise retinols to retinaldehyde before the rate-limiting enzymes,
retinaldehyde dehydrogenases (Raldh), are required to oxidate retinaldehyde to RA
(Duester 2008).
The first known source of RA in the developing striatum, specifically in the LGE, is at
E12.5 and is produced from reactions mainly catalysed by Raldh3 (Molotkova et al.
2007), but, it is not until E14 that RA and Raldh3 are noticeably expressed. At this
stage, RA initiates GABAergic neuronal differentiation by inducing Gad67, an enzyme
needed for GABA synthesis (Chatzi et al. 2011). GABAergic differentiation is ongoing
at E18.5, and RA continues to be expressed into adulthood (Chatzi et al. 2011).
Notably, in RARβ−/−
mutant mice there is a loss of striatal-enriched tyrosine
phosphatase mRNA, and a reduction of DARPP-32 positive neurons compared to WT
Chapter 1 Introduction
15
mice (Mark et al. 2006; Schneider et al. 2001). RA in the LGE is not solely obtainable
from Raldh3-mediated reactions as Raldh3-/-
mutant mice do not show an obvious
telencephalic phenotype (Dupe et al. 2003). Retinoids secreted from radial glia (RG) in
the LGE are also a known source of RA (Toresson et al. 1999) and ensure that
differentiating neurons do not lose a source of RA when migrating out of the
proliferative VZ and SVZ.
The role of RA in early striatal neuronal development has been shown in vivo and in
vitro. In Raldh3−/−
mouse embryos, LGE progenitors fail to differentiate into
GABAergic striatal projection neurons whereas in vitro, addition of RA to the media
has been shown to induce GABAerigc differentiation in both mouse LGE-derived
neurospheres and human ESC cultures (Chatzi et al. 2011). Additionally,
supplementation of RA to mouse LGE cultures showed an increase in DARPP-32
positive neurons, independent of an increase in the overall number of neurons, therefore
showing that RA specifically enhances the striatal neuron phenotype (Toresson et al.
1999). There was no difference seen in MGE cultures despite increasing doses of RA
(Toresson et al. 1999). It has also been shown that when chick LGE explants are treated
with RAR antagonists, LGE specification is prevented (Marklund et al. 2004). The
complementary experiment showed that when exogenous RA was added to dorsal
explants, an LGE phenotype was evident (Marklund et al. 2004). Moreover, blocking
RA in chick embryos prevents the expression of Meis2, the earliest known marker of
striatal precursors (Toresson et al. 1999). Taken together, these results confirm the
importance of RA in LGE specification.
As well as being important in embryonic development, RA expression remains in the
forebrain throughout adult life and has been shown to maintain the expression of Fgf8
and Shh in this region, as when RA is removed, Fgf8 and Shh expression is lost (Haskell
and LaMantia 2005; Schneider et al. 2001). It has recently been proposed that Nolz1, a
zinc finger TF that is expressed in the SVZ of LGE precursor cells, is implicated in RA
signalling (Urban et al. 2010). At E12.5 Nolz1-induced neurogenesis partially depends
on RA signalling. It has been shown that Nolz1 activates the RARβ receptor in LGE-
derived neural precursor cells and that this effect was inhibited when RA was removed
(Urban et al. 2010). However, Nolz1 expression was not affected in Raldh3 KO mice
(Raldh3−/−
), which lack RA in the LGE, nor when a vitamin A deficient diet was fed to
Chapter 1 Introduction
16
the mothers (Molotkova et al. 2007; Verma et al. 1992), suggesting RA is not essential
to Nolz1 expression throughout development and that it is only needed to induce early
expression. In summary RA activates Nolz1 to induce initial neurogenesis during peak
striatal development at E12.5 but is not required for its maintenance beyond this time
(Urban et al. 2010). It has also been shown that Nolz1 contributes to later striatal
development by working downstream of Gsx2 to activate the RARβ receptor.
1.4.8 Wnt Signalling
Wnts belong to the wingless protein family and are a class of ligands that are crucial in
embryogenesis, and have been implicated in CNS development and can signal through
three different pathways: the canonical pathway, the planar cell polarity pathway, and
the calcium pathway. It is the canonical pathway that is important in telencephalon
development (reviewed in Evans et al. 2012).
Wnts are part of the cohort of caudalizing factors that are involved in the initial anterior
posterior (AP) orientation of the neural plate and are crucial for the generation of the
dorsal telencephalon (Houart et al. 2002). WNT signalling is active in the pallium at
E11.5 and E16.5 but not in the subpallium (Backman et al. 2005; Maretto et al. 2003)
and is needed to further refine regional patterning and to induce the expression of Pax6,
a dorsal telencephalon marker (Gunhaga et al. 2003). In the absence of canonical
signalling in mice, there was ectopic expression of Gsx2, Dlx2, and Ascl1 (formerly
Mash1) in the dorsal telencephalon together with down-regulation of the dorsal markers
Emx1, 2 and 3 (Backman et al. 2005). This ectopic expression of ventral genes led to
cells of the dorsal telencephalon adopting a ventral fate with the potential to adopt a
GABAergic fate (Backman et al. 2005). Furthermore, using chick explant cultures,
Gunhaga et al. (Gunhaga et al. 2003) showed that the addition of Wnt3 or Wnt8
expression can convert the ventral telencephalic cells into Pax6 and Ngn2 positive cells
at the expense of Ascl1 and Nkx2.1. Thus, WNT signalling is necessary for ensuring the
correct molecular characterisation and morphology of the dorsal telencephalon and that
inhibition of WNT signalling is necessary for subpallidal development (Backman et al.
2005).
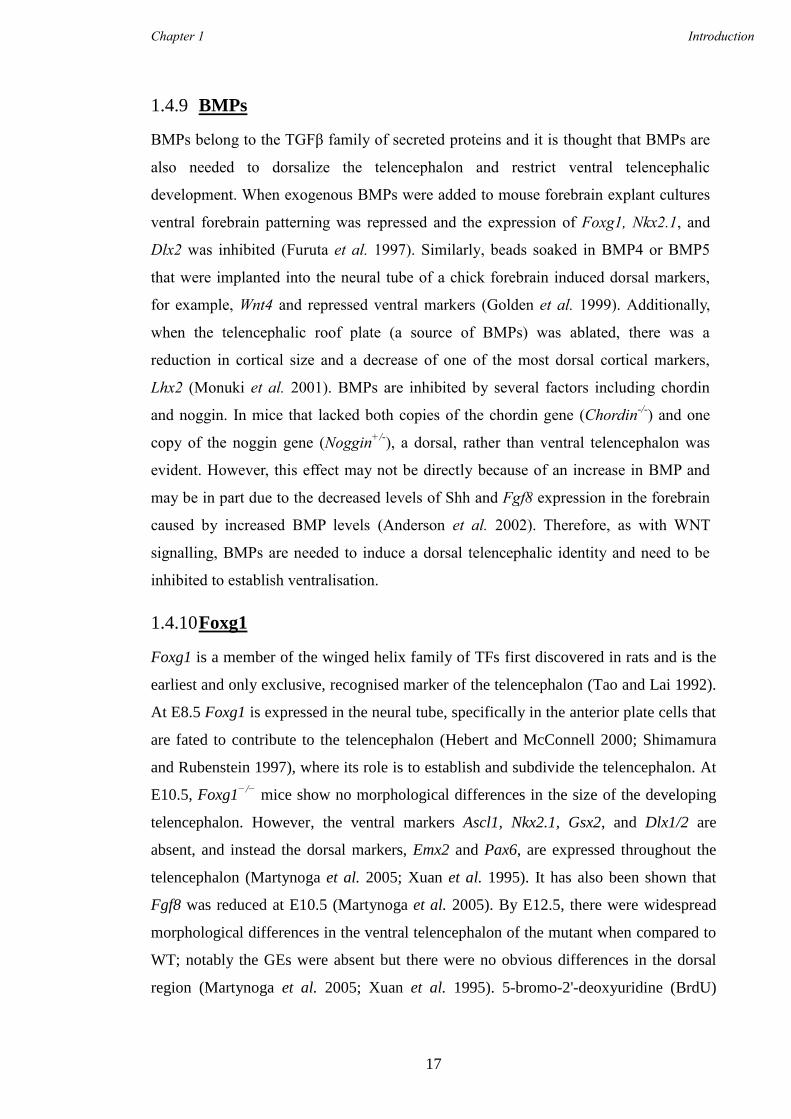
Chapter 1 Introduction
17
1.4.9 BMPs
BMPs belong to the TGFβ family of secreted proteins and it is thought that BMPs are
also needed to dorsalize the telencephalon and restrict ventral telencephalic
development. When exogenous BMPs were added to mouse forebrain explant cultures
ventral forebrain patterning was repressed and the expression of Foxg1, Nkx2.1, and
Dlx2 was inhibited (Furuta et al. 1997). Similarly, beads soaked in BMP4 or BMP5
that were implanted into the neural tube of a chick forebrain induced dorsal markers,
for example, Wnt4 and repressed ventral markers (Golden et al. 1999). Additionally,
when the telencephalic roof plate (a source of BMPs) was ablated, there was a
reduction in cortical size and a decrease of one of the most dorsal cortical markers,
Lhx2 (Monuki et al. 2001). BMPs are inhibited by several factors including chordin
and noggin. In mice that lacked both copies of the chordin gene (Chordin-/-
) and one
copy of the noggin gene (Noggin+/-
), a dorsal, rather than ventral telencephalon was
evident. However, this effect may not be directly because of an increase in BMP and
may be in part due to the decreased levels of Shh and Fgf8 expression in the forebrain
caused by increased BMP levels (Anderson et al. 2002). Therefore, as with WNT
signalling, BMPs are needed to induce a dorsal telencephalic identity and need to be
inhibited to establish ventralisation.
1.4.10 Foxg1
Foxg1 is a member of the winged helix family of TFs first discovered in rats and is the
earliest and only exclusive, recognised marker of the telencephalon (Tao and Lai 1992).
At E8.5 Foxg1 is expressed in the neural tube, specifically in the anterior plate cells that
are fated to contribute to the telencephalon (Hebert and McConnell 2000; Shimamura
and Rubenstein 1997), where its role is to establish and subdivide the telencephalon. At
E10.5, Foxg1−/−
mice show no morphological differences in the size of the developing
telencephalon. However, the ventral markers Ascl1, Nkx2.1, Gsx2, and Dlx1/2 are
absent, and instead the dorsal markers, Emx2 and Pax6, are expressed throughout the
telencephalon (Martynoga et al. 2005; Xuan et al. 1995). It has also been shown that
Fgf8 was reduced at E10.5 (Martynoga et al. 2005). By E12.5, there were widespread
morphological differences in the ventral telencephalon of the mutant when compared to
WT; notably the GEs were absent but there were no obvious differences in the dorsal
region (Martynoga et al. 2005; Xuan et al. 1995). 5-bromo-2'-deoxyuridine (BrdU)
Chapter 1 Introduction
18
staining showed that there was a loss of proliferating cells in the ventral region which
could be a direct consequence of the lack of Foxg1 expression or could be due to
downstream effectors of Foxg1 not functioning optimally (Xuan et al. 1995).
It has also been shown that Foxg1 coordinates signalling pathways of SHH and WNTs,
which as mentioned, are required for the development of the subpallial and pallial
telencephalon, respectively (Danesin et al. 2009). Manuel et al. (Manuel et al. 2010)
cultured cells from Foxg1−/−
mice and showed that they were specified abnormally with
loss of ventral markers which could not be restored by the addition of SHH and FGF8
alone (Manuel et al. 2010). Manuel et al. (Manuel et al. 2011) have suggested that the
reason for Foxg1−/−
cells behaving abnormally is due to an increase in cell cycle activity
which was initially suggested by Martynoga et al. (Martynoga et al. 2005). Specifically,
Manuel and colleagues have shown that this is due to a decrease in Pax6 expression, a
cell cycle organiser. Upon addition of Pax6 to Foxg1-/-
cells, the mutant phenotype was
partially rescued (Manuel et al. 2011). This work suggests that Foxg1 not only promotes
ventralising cues, but has a cell autonomous role in regulating Pax6 (Manuel et al.
2011). Foxg1 is therefore crucial in forebrain development and is absolutely required
for the regulation of telencephalic identity.
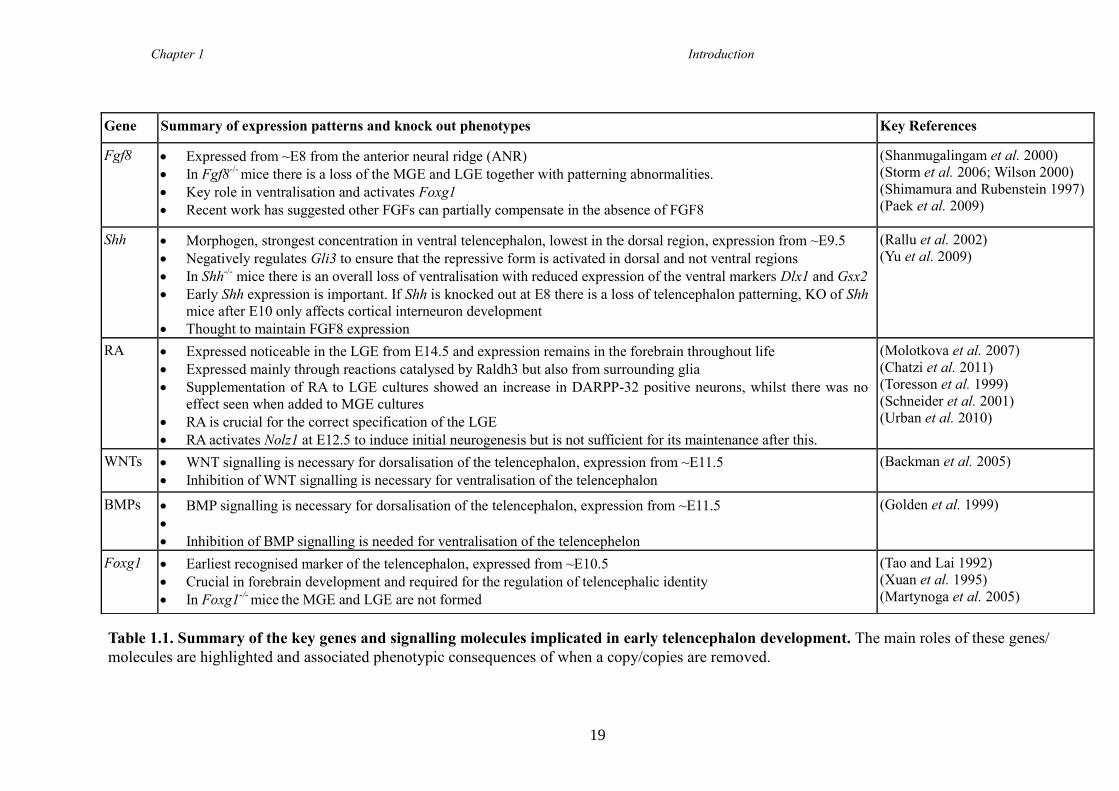
Chapter 1 Introduction
19
Gene Summary of expression patterns and knock out phenotypes Key References
Fgf8 Expressed from ~E8 from the anterior neural ridge (ANR)
In Fgf8-/-
mice there is a loss of the MGE and LGE together with patterning abnormalities.
Key role in ventralisation and activates Foxg1
Recent work has suggested other FGFs can partially compensate in the absence of FGF8
(Shanmugalingam et al. 2000)
(Storm et al. 2006; Wilson 2000)
(Shimamura and Rubenstein 1997)
(Paek et al. 2009)
Shh Morphogen, strongest concentration in ventral telencephalon, lowest in the dorsal region, expression from ~E9.5
Negatively regulates Gli3 to ensure that the repressive form is activated in dorsal and not ventral regions
In Shh-/-
mice there is an overall loss of ventralisation with reduced expression of the ventral markers Dlx1 and Gsx2
Early Shh expression is important. If Shh is knocked out at E8 there is a loss of telencephalon patterning, KO of Shh
mice after E10 only affects cortical interneuron development
Thought to maintain FGF8 expression
(Rallu et al. 2002)
(Yu et al. 2009)
RA Expressed noticeable in the LGE from E14.5 and expression remains in the forebrain throughout life
Expressed mainly through reactions catalysed by Raldh3 but also from surrounding glia
Supplementation of RA to LGE cultures showed an increase in DARPP-32 positive neurons, whilst there was no
effect seen when added to MGE cultures
RA is crucial for the correct specification of the LGE
RA activates Nolz1 at E12.5 to induce initial neurogenesis but is not sufficient for its maintenance after this.
(Molotkova et al. 2007)
(Chatzi et al. 2011)
(Toresson et al. 1999)
(Schneider et al. 2001)
(Urban et al. 2010)
WNTs WNT signalling is necessary for dorsalisation of the telencephalon, expression from ~E11.5
Inhibition of WNT signalling is necessary for ventralisation of the telencephalon
(Backman et al. 2005)
BMPs BMP signalling is necessary for dorsalisation of the telencephalon, expression from ~E11.5
Inhibition of BMP signalling is needed for ventralisation of the telencephelon
(Golden et al. 1999)
Foxg1 Earliest recognised marker of the telencephalon, expressed from ~E10.5
Crucial in forebrain development and required for the regulation of telencephalic identity
In Foxg1-/-
mice the MGE and LGE are not formed
(Tao and Lai 1992)
(Xuan et al. 1995)
(Martynoga et al. 2005)
Table 1.1. Summary of the key genes and signalling molecules implicated in early telencephalon development. The main roles of these genes/
molecules are highlighted and associated phenotypic consequences of when a copy/copies are removed.
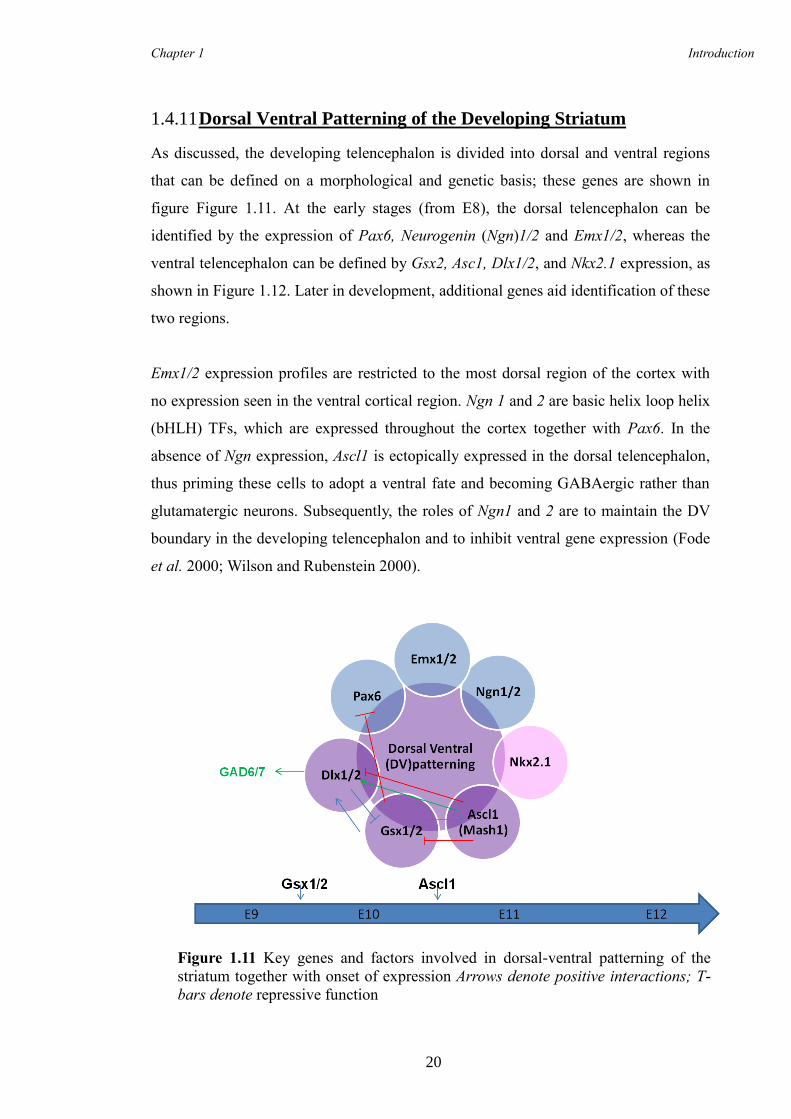
Chapter 1 Introduction
20
1.4.11 Dorsal Ventral Patterning of the Developing Striatum
As discussed, the developing telencephalon is divided into dorsal and ventral regions
that can be defined on a morphological and genetic basis; these genes are shown in
figure Figure 1.11. At the early stages (from E8), the dorsal telencephalon can be
identified by the expression of Pax6, Neurogenin (Ngn)1/2 and Emx1/2, whereas the
ventral telencephalon can be defined by Gsx2, Asc1, Dlx1/2, and Nkx2.1 expression, as
shown in Figure 1.12. Later in development, additional genes aid identification of these
two regions.
Emx1/2 expression profiles are restricted to the most dorsal region of the cortex with
no expression seen in the ventral cortical region. Ngn 1 and 2 are basic helix loop helix
(bHLH) TFs, which are expressed throughout the cortex together with Pax6. In the
absence of Ngn expression, Ascl1 is ectopically expressed in the dorsal telencephalon,
thus priming these cells to adopt a ventral fate and becoming GABAergic rather than
glutamatergic neurons. Subsequently, the roles of Ngn1 and 2 are to maintain the DV
boundary in the developing telencephalon and to inhibit ventral gene expression (Fode
et al. 2000; Wilson and Rubenstein 2000).
Figure 1.11 Key genes and factors involved in dorsal-ventral patterning of the
striatum together with onset of expression Arrows denote positive interactions; T-
bars denote repressive function
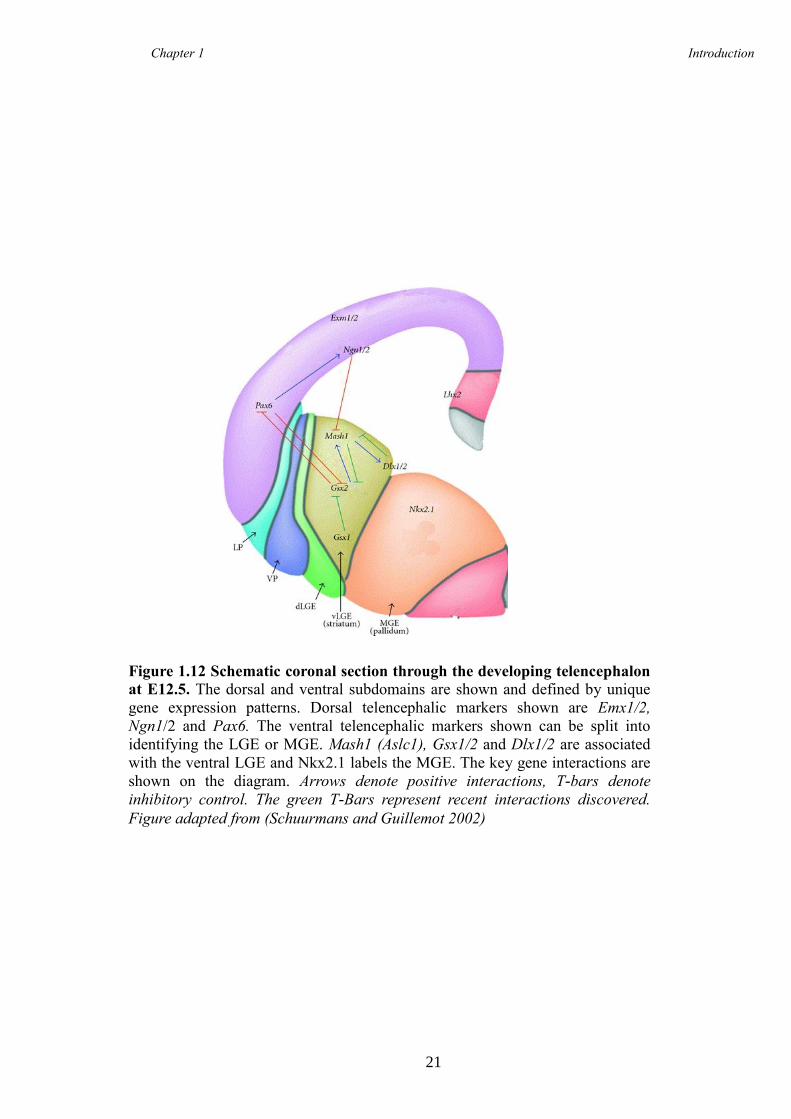
Chapter 1 Introduction
21
Figure 1.12 Schematic coronal section through the developing telencephalon
at E12.5. The dorsal and ventral subdomains are shown and defined by unique
gene expression patterns. Dorsal telencephalic markers shown are Emx1/2,
Ngn1/2 and Pax6. The ventral telencephalic markers shown can be split into
identifying the LGE or MGE. Mash1 (Aslc1), Gsx1/2 and Dlx1/2 are associated
with the ventral LGE and Nkx2.1 labels the MGE. The key gene interactions are
shown on the diagram. Arrows denote positive interactions, T-bars denote
inhibitory control. The green T-Bars represent recent interactions discovered.
Figure adapted from (Schuurmans and Guillemot 2002)
Chapter 1 Introduction
22
1.4.12 Introducing the Homeobox Genes-Pax6 and Gsx1/2
Homeobox genes, first identified in Drosophila, are TFs that code for proteins that have
a homeodomain fold capable of binding to RNA or DNA. Homeodomain protein
interactions are crucial in mediating DV patterning and importantly, in setting up
regional subdivisions within the developing telencephalon, and are principally regulated
through Shh (Corbin et al. 2000; Kimura et al. 1996; Sussel et al. 1999; Toresson et al.
2000; Yun et al. 2001). Pax6 and Gsx2 are both homeobox genes (Hsieh-Li et al. 1995)
with overlapping, complementary expression profiles to ensure that the dorso-ventral
border is maintained (Toresson et al. 2000). Pax6 is expressed in a dorsal (high) to
ventral (low) gradient and Gsx2 is expressed in a ventral (high) to dorsal (low) gradient
(Hebert and Fishell 2008).
The embryonic patterning role of Pax6 was initially identified through genetic mapping
of the classical “small eye” (sey) mouse mutant (Hill et al. 1991). Pax6 is initially
detected in the developing forebrain at E8 and is crucial for cortical development and as
mentioned, to establish the dorsal-ventral border (Stoykova and Gruss 1994). Within the
neural tube, Pax6 expression is down regulated in ventral regions, simultaneous with
the up regulation of Nkx2.1 in this region, thus instantaneously setting up the DV border
on the basis of differential gene expression (Crossley et al. 2001; Sussel et al. 1999;
Toresson et al. 2000). In Pax6 KO mice (Pax6−/−
), there is a shift in the cortical-striatal
boundary (Stoykova et al. 1997), the cortical markers Ngn1/2 and Emx1 are down
regulated at the expense of ectopic expression of the ventral markers, Dlx1/2, Ascl1 and
Gsx2 in dorsal regions of the telencephalon (Stoykova et al. 1996; Stoykova et al. 2000;
Toresson et al. 2000). Nkx2.1 also expands dorsally into the LGE shifting the LGE-
MGE border (Stoykova et al. 2000).
Gsx2 is first detected in the developing forebrain between E9 and E10 and is expressed
in the vLGE. Gsx2 KO mice (Gsx2−/−
) have the opposite phenotype to Pax6 KO mice;
there is ectopic expression of Pax6 and Ngn2 in the LGE together with the subsequent
loss of Ascl1 and Dlx2 from this region (Corbin et al. 2000; Toresson et al. 2000; Yun
et al. 2001). There was a reduction in the size of the LGE at E12 (Szucsik et al. 1997),
which by E18.5 led to a reduction in the size of the striatum and a decrease in striatal
projection neurons, which was confirmed through a decrease of DARPP-32 32 and the
Chapter 1 Introduction
23
earlier MSN marker, Foxp1 (Corbin et al. 2000; Toresson et al. 2000; Yun et al. 2001).
However, there was a slight increase in the striatal-matrix marker calbindin. These
results suggest that Gsx2 is a crucial inducer of Ascl1, Dlx1, and Dlx2, genes associated
with the development of patch neurons. However, in mice that lack both Gsx2 and Pax6
(Gsx2−/−
and Pax6−/−
), the phenotype observed was more subtle than either single
mutation, as in the in Shh−/−/
Gli3−/−
double KO mice (Corbin et al. 2000).
Gsx1, a gene closely related to Gsx2, is also expressed in the ventral telencephalon,
where its expression is restricted to the ventral most region of the LGE (Toresson and
Campbell 2001; Valerius et al. 1995; Yun et al. 2003). Expression is also evident in the
MGE (Long et al. 2009). It is thought that Gsx1 can partially compensate for the
phenotype observed in Gsx2−/−
mice (Toresson and Campbell 2001; Yun et al. 2003). In
the Gsx2−/−
KO mice, Gsx1 expression expands throughout the LGE between E11 and
E14.5 and shows a similar expression pattern to Ascl1. Until recently, the role of Gsx1
has remained elusive as no phenotype has been discovered through using genetic KO
mice. Pei et al. (Pei et al. 2011) have shown that Gsx1 and Gsx2 differentially regulate
the maturation of LGE progenitors. Gain-of-function experiments revealed that Gsx2
maintains LGE progenitors in an undifferentiated position before Gsx1, in part through
the down regulation of Gsx2, directs the progenitors to acquire a mature neuronal
phenotype (Pei et al. 2011). This is shown in Figure 1.12. These novel results indicate
that the Gsx genes regulate LGE patterning through a controlled balance of signalling
allowing proliferation and differentiation of neuronal progenitors.
1.4.13 Ascl1
Ascl1 is a basic helix loop helix (bHLH) TF that has a primary role in the correct
development of the ventral telencephalon and relies on Gsx2 for normal expression
(Casarosa et al. 1999; Corbin et al. 2000; Toresson et al. 2000; Yun et al. 2001). Ascl1
is expressed throughout the ventral telencephalon but its associated protein, ASCL1, is
only present in the VZ and SVZ, the area where neuronal precursor cells reside
(Porteus et al. 1994). When Ascl1 was ectopically expressed in the dorsal
telencephalon, it was able to induce neurons to express Dlx1/2 at the expense of
cortical markers (Wilson and Rubenstein 2000). It was concluded that Ascl1 can
interact with Dlx1/2, that in turn activates GAD/67, the rate-limiting enzyme for
Chapter 1 Introduction
24
GABAergic synthesis, and the two combined, function to facilitate aspects of
GABAergic differentiation in the telencephalon (Casarosa et al. 1999; Fode et al.
2000). However, in Ascl1 KO mice (Ascl1−/−
), Dlx1/2 and Gad/67 are still expressed
in the ventral telencephalon (Casarosa et al. 1999). Together with the fact that these
developing neurons can still acquire a GABAergic phenotype, it seems that there is an
element of redundancy in this signalling pathway and/or the involvement of other
genes not yet identified. Expression of Gsx2 in Ascl1−/−
KO mice is unchanged at
E12.5, but by E18.5 there is an increase in Gsx2 expressing cells suggesting that Ascl1
has the additional role of repressing Gsx2 later in development (Wang et al. 2009).
This suggested interaction is shown in Figure 1.12.
Ascl1−/−
KO mice also show a reduction in the number of early born striatal
(cholinergic) and cortical (GABAergic) interneurons and a reduction in size of the
MGE (Casarosa et al. 1999). This phenotype can be explained by the initial loss of
precursor cells in the SVZ, which subsequently leads to a decrease in neurons
populating the MZ (Casarosa et al. 1999; Marin et al. 2000). Expectantly, tyrosine
hydroxylase (TH), DR2 and enkephalin positive neurons were only slightly reduced in
the mutants (Marin et al. 2000). From these experiments, it can be concluded that
Ascl1 has the dual role of specifying precursors and controlling the timing of their
differentiation, principally in the MGE, and possibly has a role in the LGE, although it
is not crucial in this later eminence (Marin et al. 2000; Yun et al. 2003).
Recent experiments by Castro and colleagues have looked more closely at the precise
mechanisms by which Ascl1 controls proliferation of neuronal precursors (Castro et al.
2011). Gene expression analysis from mouse primary tissue and neural stem cell
cultures showed that Ascl1 had a role in regulating cell cycle progression and that there
was a direct association between neural progenitor expansion and the corresponding
phases of cell cycle exit and neuronal differentiation (Castro et al. 2011). In summary,
Ascl1 is autonomously involved in patterning of early telencephalic progenitors
(~E10.5) and non-autonomously involved in repressing the differentiation of adjacent
progenitors (Casarosa et al. 1999). Following Ascl1 aiding neurogenesis, Dlx1 and 2
repress Ascl1 and to promote terminal neuronal differentiation (Yun et al. 2002). The
relationship between these TFs is crucial for MSN development and triple KO mice
have shown aberrant MSN differentiation (Long et al. 2009).
Chapter 1 Introduction
25
1.4.14 The Dlx Family
The Dlx family bears homology to the drosophila distal less-homeobox gene family of
which there are 6 murine members, 4 of which are expressed in the developing MGE
and LGE (Liu et al. 1997). Dlx1 and Dlx2 are expressed by subsets of progenitor cells
in the VZ by E10.5 and by the majority of cells in the SVZ with expression switching
off as cells start to migrate and differentiate in the MZ. (Nery et al. 2003; Porteus et al.
1994; Yun et al. 2002). Dlx5 and Dlx6 are expressed in the SVZ and MZ only
(Anderson et al. 1997). Single Dlx1 or Dlx2 KO mice show no noticeable forebrain
defects; although in the absence of both genes there is arrested migration of matrix-born
neurons within the SVZ, yet striatal development is not stopped completely, and this
phenotype suggests other genes are involved in neuronal differentiation and migration.
(Anderson et al. 1997; Nery et al. 2003).
Dlx1 and 2 activate GAD67, an enzyme needed for GABA synthesis which is found in
neuronal precursors of the SVZ, and in differentiating neurons of the MZ of the ventral
telencephalon (Casarosa et al. 1999). In Dlx1/2−/−
KO mice there are decreased levels of
GAD67 in the dLGE (Long et al. 2007). It is has been suggested that Dlx1/2 indirectly
activate GAD67 and that cooperation with other proteins is needed to promote a GABA
neuronal phenotype (Kuwajima et al. 2006).
1.4.15 Nkx2.1
Nkx2.1 is expressed exclusively in the MGE and is another homeodomain protein.
Nkx2.1 is needed for ventral specification of the telencephalon where it acts to repress
LGE identity, and it is also important in the development of striatal interneurons (Jain et
al. 2001; Sussel et al. 1999). Nkx2.1 is induced by Shh at E8 (Ericson et al. 1995), and
as earlier mentioned, inhibition of Shh leads to reduced expression of Nkx2.1 and
dorsalisation of the ventral embryo (Chiang et al. 1996). In the Nkx2.1 KO mouse
(Nkx2.1−/−
), the MGE is poorly formed and a DV switch is evident; the aberrant MGE
shows properties similar to the LGE rather than the MGE, for example some cells have
been shown to express DARPP-32 (Sussel et al. 1999). The loss of Nkx2.1 also showed
a reduction of GABA and calbindin positive neurons from the cortex (Sussel et al.
1999) as well as loss of early migration of Dlx2-expressing progenitors (Nery et al.
2003).
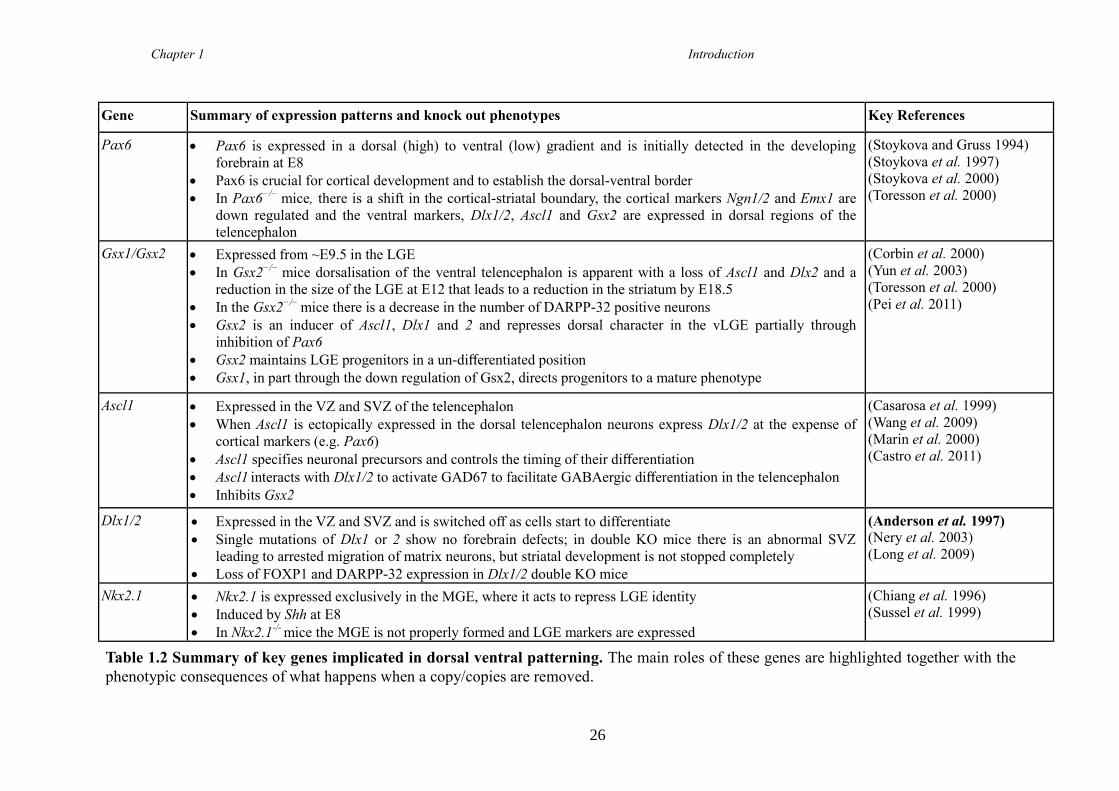
Chapter 1 Introduction
26
Gene Summary of expression patterns and knock out phenotypes Key References
Pax6 Pax6 is expressed in a dorsal (high) to ventral (low) gradient and is initially detected in the developing
forebrain at E8
Pax6 is crucial for cortical development and to establish the dorsal-ventral border
In Pax6−/−
mice, there is a shift in the cortical-striatal boundary, the cortical markers Ngn1/2 and Emx1 are
down regulated and the ventral markers, Dlx1/2, Ascl1 and Gsx2 are expressed in dorsal regions of the
telencephalon
(Stoykova and Gruss 1994)
(Stoykova et al. 1997)
(Stoykova et al. 2000)
(Toresson et al. 2000)
Gsx1/Gsx2 Expressed from ~E9.5 in the LGE
In Gsx2−/−
mice dorsalisation of the ventral telencephalon is apparent with a loss of Ascl1 and Dlx2 and a
reduction in the size of the LGE at E12 that leads to a reduction in the striatum by E18.5
In the Gsx2−/−
mice there is a decrease in the number of DARPP-32 positive neurons
Gsx2 is an inducer of Ascl1, Dlx1 and 2 and represses dorsal character in the vLGE partially through
inhibition of Pax6
Gsx2 maintains LGE progenitors in a un-differentiated position
Gsx1, in part through the down regulation of Gsx2, directs progenitors to a mature phenotype
(Corbin et al. 2000)
(Yun et al. 2003)
(Toresson et al. 2000)
(Pei et al. 2011)
Ascl1 Expressed in the VZ and SVZ of the telencephalon
When Ascl1 is ectopically expressed in the dorsal telencephalon neurons express Dlx1/2 at the expense of
cortical markers (e.g. Pax6)
Ascl1 specifies neuronal precursors and controls the timing of their differentiation
Ascl1 interacts with Dlx1/2 to activate GAD67 to facilitate GABAergic differentiation in the telencephalon
Inhibits Gsx2
(Casarosa et al. 1999)
(Wang et al. 2009)
(Marin et al. 2000)
(Castro et al. 2011)
Dlx1/2 Expressed in the VZ and SVZ and is switched off as cells start to differentiate
Single mutations of Dlx1 or 2 show no forebrain defects; in double KO mice there is an abnormal SVZ
leading to arrested migration of matrix neurons, but striatal development is not stopped completely
Loss of FOXP1 and DARPP-32 expression in Dlx1/2 double KO mice
(Anderson et al. 1997)
(Nery et al. 2003)
(Long et al. 2009)
Nkx2.1 Nkx2.1 is expressed exclusively in the MGE, where it acts to repress LGE identity
Induced by Shh at E8
In Nkx2.1-/-
mice the MGE is not properly formed and LGE markers are expressed
(Chiang et al. 1996)
(Sussel et al. 1999)
Table 1.2 Summary of key genes implicated in dorsal ventral patterning. The main roles of these genes are highlighted together with the
phenotypic consequences of what happens when a copy/copies are removed.
Chapter 1 Introduction
27
It is apparent that DV patterning of the telencephalon requires the precise orchestration
of several genes and TFs that work in synergy to ensure the correct development of the
striatum. The genes outlined below are largely expressed later in striatal development,
and are downstream of the genes previously described.
1.4.16 Nolz1 (Znf503)
Nolz1 (Znf503) is a zinc finger TF that has been shown to be exclusively expressed in
the ventral LGE and is absent from the MGE and the developing pallium (Urban et al.
2010). This TF has RA response elements (RARE) in its promoter region, and, as
mentioned, is a downstream target of this morphogen. It is also reduced in Gsx2 KO
mice suggesting that it is downstream of this TF (Urban et al. 2010). In situ
hybridisations showed that Nolz1 expression was high in the SVZ and VZ with limited
expression in the MZ. Expression in mice was highest throughout embryonic stages in
proliferating neurons only, peaking at E14.5, with expression decreasing upon neuronal
differentiation. Therefore, it can be concluded that Nolz1 indirectly contributes to
striatal neurogenesis by promoting RA signalling in the LGE (Urban et al. 2010).
Expression is still seen in adulthood but is greatly reduced. This pathway is shown in
Figure 1.13.
1.4.17 Ctip2 (Bcl11b)
Ctip2 (B cell leukemia/lymphoma 11B) is a TF that is expressed in the developing
striatum and cortex and its expression persists throughout adulthood. CTIP2 has been
used as a marker of MSNs as it co-localizes with DARPP-32 in the adult striatum
(Arlotta et al. 2008). Additionally it is used to label layer V of the cortex (Arlotta et al.
2005). At E14.5 in the Ctip2 -/-
KO mice, there was no difference in the expression of
Nolz1 but there was a decrease in Foxp1,thus implying neuronal birth is not affected in
the KO mice but migration and differentiation of MSNs are (Arlotta et al. 2008). This
result is consistent with the understanding that in the developing striatum Ctip2 is
expressed in the MZ and is therefore associated with early post-mitotic MSNs (Arlotta
et al. 2008). At P0 in the Ctip2-/-
KO mice, MSNs failed to differentiate and mature into
MSNs when compared with WT littermates. Specifically, the MSNs failed to form into
patches leading to disrupted patch-matrix organization (Arlotta et al. 2008). CTIP2
expression has not been associated with interneurons and thus neuronal subtype was not
Chapter 1 Introduction
28
affected in the Ctip2-/-
KO mice. In summary, Ctip2 is an important regulator of MSN
differentiation, striatal patch development, and the organization of the correct cellular
architecture of the striatum.
1.4.18 Ebf1 (Olf1)
Ebf1 (Olf1) is a TF that is expressed in the MGE and LGE from E11 to E17.5;
expression in the MGE is down regulated at the later stage (Garel et al. 1999). At E17.5
Ebf1 expression is seen throughout the MZ of the LGE, and also in a few post mitotic
cells in the SVZ. This expression is maintained at birth (P0) with the exception of
groups of cells that resemble striatal “patches” which was confirmed through TH
staining (Garel et al. 1999). In the Ebf1 KO (Ebf1-/-
), cell proliferation in the VZ or SVZ
was not affected, but there was rostro-caudal expansion of the SVZ markers such as
SCIP/OCT6, RARα, EphA4 and Dlx5 into the MZ at the expense of two MZ markers,
CRAPB1 and cadherin-8 (Garel et al. 1999). These results show that Ebf1 is an
important gene needed for the correct transition and differentiation of neurons from the
SVZ to the MZ during development. Furthermore, in the KO mice from E18.5 there is a
decrease in the size of the striatum; this phenotype continues to P20 where it is very
profound and the cells appear less dense than in controls which was attributed to an
increase in cell death at E18.5.
At birth, TH and DARPP-32 (patch markers) were not altered in the Ebf1-/-
when
compared to controls; however, calbindin (CaBP) a matrix marker was reduced in the
Ebf1-/-
mutant when compared to controls. Interneurons were not affected. Therefore,
the role of Ebf1 is to ensure the correct migration and differentiation of matrix neurons
from the SVZ to the MZ. As the Dlx1/2 double mutant also affects the matrix
compartment (Anderson et al. 1997) of the developing striatum, it is thought perhaps
that Ebf1 is downstream of these genes. This proposed pathway is shown in Figure 1.13.
1.4.19 Helios (Ikzf2)
Recently the Canals’ group in Barcelona detected a novel marker of MSNs. Helios
(Ikzf2) is a member of the Ikaros (Ikzf) family of TFs, which is expressed in the LGE
from E14.5 with expression peaking at E18.5 before disappearing during post natal
development (Martin-Ibanez et al. 2012). It was shown that Helios is associated with
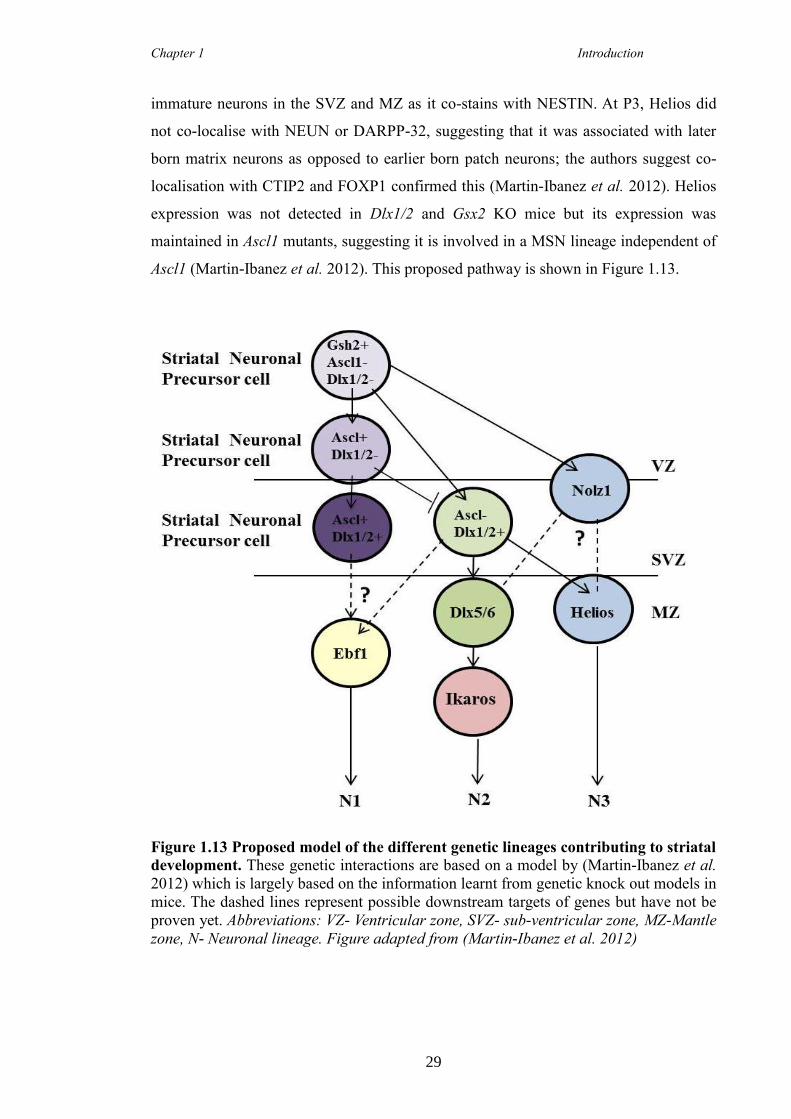
Chapter 1 Introduction
29
immature neurons in the SVZ and MZ as it co-stains with NESTIN. At P3, Helios did
not co-localise with NEUN or DARPP-32, suggesting that it was associated with later
born matrix neurons as opposed to earlier born patch neurons; the authors suggest co-
localisation with CTIP2 and FOXP1 confirmed this (Martin-Ibanez et al. 2012). Helios
expression was not detected in Dlx1/2 and Gsx2 KO mice but its expression was
maintained in Ascl1 mutants, suggesting it is involved in a MSN lineage independent of
Ascl1 (Martin-Ibanez et al. 2012). This proposed pathway is shown in Figure 1.13.
Figure 1.13 Proposed model of the different genetic lineages contributing to striatal
development. These genetic interactions are based on a model by (Martin-Ibanez et al.
2012) which is largely based on the information learnt from genetic knock out models in
mice. The dashed lines represent possible downstream targets of genes but have not be
proven yet. Abbreviations: VZ- Ventricular zone, SVZ- sub-ventricular zone, MZ-Mantle
zone, N- Neuronal lineage. Figure adapted from (Martin-Ibanez et al. 2012)
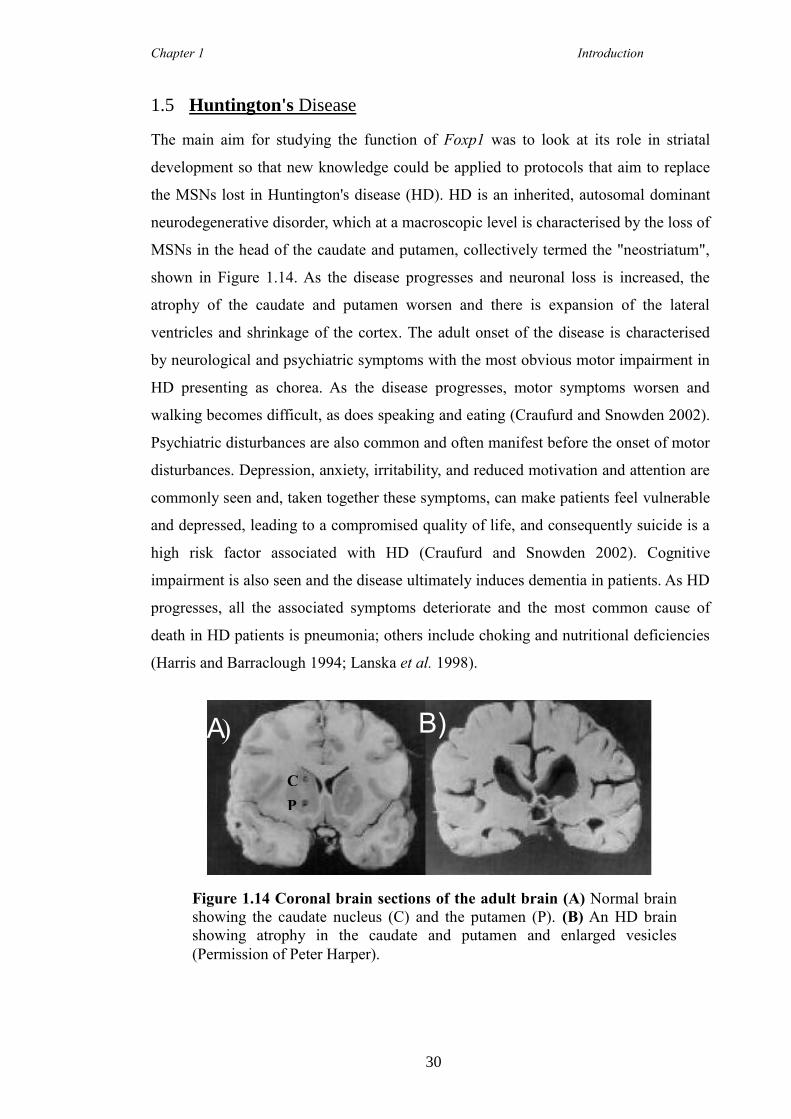
Chapter 1 Introduction
30
1.5 Huntington's Disease
The main aim for studying the function of Foxp1 was to look at its role in striatal
development so that new knowledge could be applied to protocols that aim to replace
the MSNs lost in Huntington's disease (HD). HD is an inherited, autosomal dominant
neurodegenerative disorder, which at a macroscopic level is characterised by the loss of
MSNs in the head of the caudate and putamen, collectively termed the "neostriatum",
shown in Figure 1.14. As the disease progresses and neuronal loss is increased, the
atrophy of the caudate and putamen worsen and there is expansion of the lateral
ventricles and shrinkage of the cortex. The adult onset of the disease is characterised
by neurological and psychiatric symptoms with the most obvious motor impairment in
HD presenting as chorea. As the disease progresses, motor symptoms worsen and
walking becomes difficult, as does speaking and eating (Craufurd and Snowden 2002).
Psychiatric disturbances are also common and often manifest before the onset of motor
disturbances. Depression, anxiety, irritability, and reduced motivation and attention are
commonly seen and, taken together these symptoms, can make patients feel vulnerable
and depressed, leading to a compromised quality of life, and consequently suicide is a
high risk factor associated with HD (Craufurd and Snowden 2002). Cognitive
impairment is also seen and the disease ultimately induces dementia in patients. As HD
progresses, all the associated symptoms deteriorate and the most common cause of
death in HD patients is pneumonia; others include choking and nutritional deficiencies
(Harris and Barraclough 1994; Lanska et al. 1998).
Figure 1.14 Coronal brain sections of the adult brain (A) Normal brain
showing the caudate nucleus (C) and the putamen (P). (B) An HD brain
showing atrophy in the caudate and putamen and enlarged vesicles
(Permission of Peter Harper).
A ) B)
C
P
Chapter 1 Introduction
31
1.6 HD genetics
HD was first characterised by George Huntington in 1872. Over one hundred years
following his initial discovery a considerably amount more is known about the disease
and its genetic cause. It is believed that the disease affects approximately 5-8 people
per 100,000 in the Caucasian community with no gender preference (Harper 1997) and
commonly becomes prevalent in the third and fourth decades of life with death
occurring approximately 20 years following the onset of motor symptoms (Ross and
Margolis 2001).
In 1993 the Huntington's Disease Collaborative Research Group (1993) isolated and
cloned a novel gene found on the short arm of chromosome 4 (4p16.3) that today is
known as Huntingtin (Htt). In exon 1 of the normal Htt gene there is a repeated tri-
nucleotide CAG (glutamine), which on average has 10-29 (median 18) consecutive
repeats. HD patients have a mutation in this exon and have an expanded number of
CAG repeats, ranging from 36-121 (median 44), which results in a longer protein being
translated (Craufurd and Snowden 2002). Those with an intermediate repeat length
(27-35 repeats) are unlikely to manifest the disease but their children have an increased
risk of inheriting HD (Squitieri and Jankovic 2012). There are reports of late onset
disease patients with intermediate repeat lengths (Groen et al. 2010); however, not all
people in this range will present with the disease suggesting that other factors may be
contributing to disease onset. Longer repeats, normally over 70, are associated with
juvenile onset of the disease. Although the age of onset cannot be directly correlated to
the number of repeats for an individual, on a population basis the number of repeats is
inversely correlated with age of onset (Kremer et al. 1994). Currently, there are some
symptomatic treatments for patients with severe chorea such as tetrabenezine (Walker
2007) but there are no disease modifying drugs.
One possible therapeutic being explored is cell transplantation, the aim of which is to
replace the neurons lost in the disease with donor cells that will develop new
connections and thus reform the circuitry within the host brain to alleviate disease
symptoms and bring about functional improvements. The specificity of cell loss in HD
makes it a good target for cell transplantation as a viable therapeutic option (Rosser
and Dunnett 2003). Transplants using primary human foetal striatal tissue have
Chapter 1 Introduction
32
demonstrated ‘proof of principle', have shown to be safe and not accelerate disease
progression (Rosser et al. 2002), and importantly demonstrate partial functional
recovery in at least some patients (Bachoud-Levi et al. 2006; Bachoud-Levi et al.
2000; Kelly et al. 2009).
However, there are ethical issues associated with the use of human foetal tissue that is
obtained from elective termination of pregnancies, as well as logistical issues arising
from the amount of foetal tissue required per patient (on average 1-2 foetal donors per
side per HD patient). To date, all clinical transplants in HD have used tissue obtained
from surgical terminations. Some subsequent trials will now also utilise tissue from
medical terminations of pregnancy (MTOPs) (Kelly et al. 2011). Although the MTOPs
have increased throughput of tissue, there is still a problem of tissue availability, as
well as a problem of ensuring a high degree of standardisation with cell transplantation
protocols. Hence the need for alternative, renewable cells sources such as ESCs and
induced pluripotent stem cells (iPSC), recently reviewed for their use in cell
transplantation (Perrier and Peschanski 2012; Precious and Rosser 2012).
ESCs are generated from the inner cell mass (ICM) of the developing embryo, are
pluripotent and have the potential to become any cell of the three germ layers,
ectoderm, endoderm or mesoderm (Evans and Kaufman 1981; Martin 1981; Thomson
et al. 1998).iPSCs were discovered in 2006 by Yamanaka and colleagues. These are
somatic cells that are capable of being re-programmed, initially by the addition of four
factors, to a pluripotent stage, whereby they share the same properties as ESCs
(Takahashi and Yamanaka 2006). iPSC research is currently a “hot topic” and there is
an imperative to limit the number of re-programming factors used, and to understand
the extent to which these cells are comparable to ESCs. Having a bank of renewable,
properly specified cells would facilitate a stable source for use in transplantation
(Perrier and Peschanski 2012). Despite their ability to generate large numbers of cells,
hESCs must be further differentiated into specific neural phenotypes. In the case of
HD, the target cells are MSNs. This remains the major obstacle to their clinical
application (Dunnett and Rosser 2013; Rosser et al. 2011). The development and
differentiation of striatal MSNs is a complex process that requires tight genetic
regulation. Fully understanding the spatial and temporal expression of all the genes
involved and subsequent interactions will be crucial for optimising protocols to direct
Chapter 1 Introduction
33
the fate of renewable cell sources to a fully functional MSN phenotype. DARPP-32 is
not expressed until later in MSN development, which is a major problem for the
regenerative medicine field, where there is a need to identify MSNs at immature stages
for transplantation strategies. Identifying specific genes to detect MSN precursors,
such as Foxp1, rather than relying on markers of terminally differentiated MSNs,
would accelerate the process of generating donor MSNs. Moreover, earlier markers of
putative MSNs could be used to track progressive neuronal differentiation in grafts
over time.
The potential for ESCs to be directed to MSNs has been demonstrated in animal models
and there are published protocols for the generation of DARPP-32 positive neurons
from human ESCs (hESCs) (Aubry et al. 2008; Carri et al. 2013; Ma et al. 2012;
Nicoleau et al. 2013; Song et al. 2007) and are summarised in Table 1.3. Briefly, hESC
generated from the different protocols were all successfully grafted into quinolinic acid
(QA) lesioned (mimics HD by depleting MSNs in the striatum, sparing the interneurons
(Beal et al., 1987) rat or mouse brains. The differentiated cells in all the reports were
grafted at various time points during the differentiation protocol, but consistently once
there was down regulation of proliferation markers and up-regulation of early neuronal
makers such as nestin. Differences in the number of DARPP-32 positive neurons
occurred as a direct result of the stage of the differentiation protocol at which the cells
were transplanted at. This highlights the need for proper in vitro characterisation of
renewable cells to determine the crucial stage between proliferation and differentiation,
at which the cells need to be transplanted.
The main issues with all these published methods are the reproducibility within groups
and the length and complexity of protocols which increases the room for error and
makes GMP translation difficult, therefore emphasising the need for a standardised,
simplified protocol. Additionally, the functionality of these cells also needs to be fully
characterised to ensure a correct and mature phenotype is achieved. It is also likely that
more specific MSN factors are required within the culture system to increase the
number of MSNs for use in cell transplantation. More thorough behavioural
characterisation post transplantation, using larger cohorts and extended behavioural
assessments, is also needed if one is to definitively associate motor and cognitive
recovery with cell transplantation therapy.
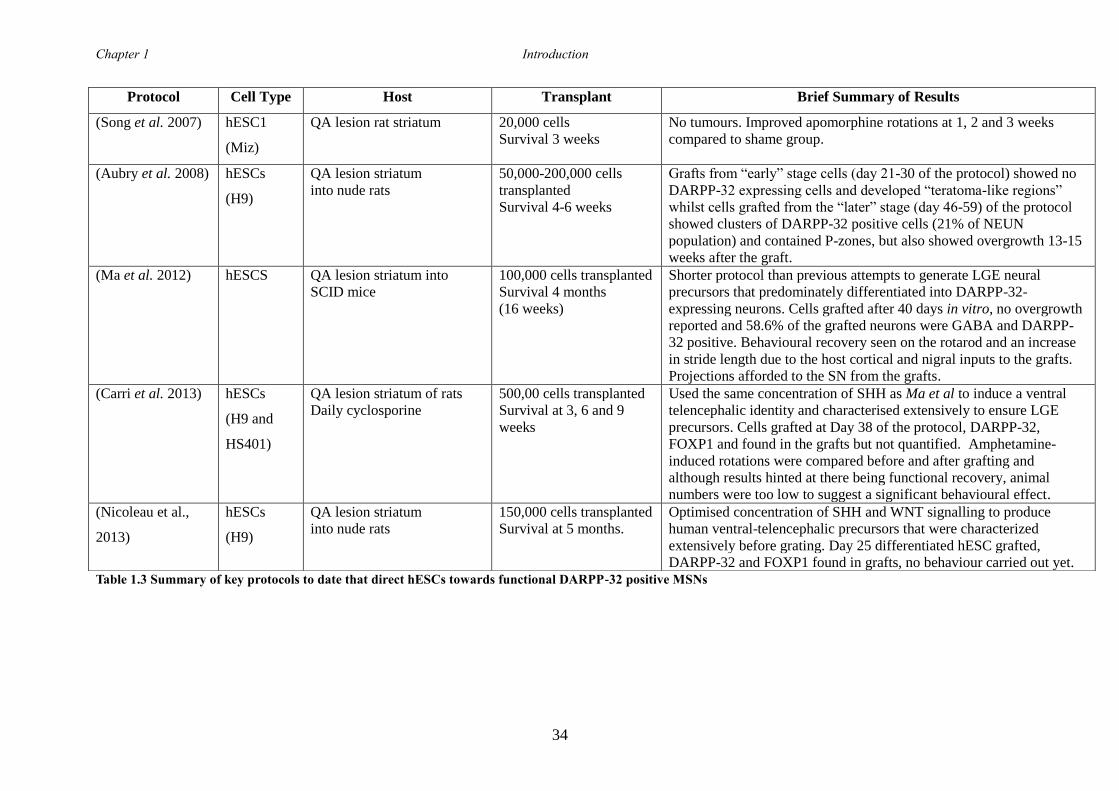
Chapter 1 Introduction
34
Table 1.3 Summary of key protocols to date that direct hESCs towards functional DARPP-32 positive MSNs
Protocol Cell Type Host Transplant Brief Summary of Results
(Song et al. 2007) hESC1
(Miz)
QA lesion rat striatum 20,000 cells
Survival 3 weeks
No tumours. Improved apomorphine rotations at 1, 2 and 3 weeks
compared to shame group.
(Aubry et al. 2008) hESCs
(H9)
QA lesion striatum
into nude rats
50,000-200,000 cells
transplanted
Survival 4-6 weeks
Grafts from “early” stage cells (day 21-30 of the protocol) showed no
DARPP-32 expressing cells and developed “teratoma-like regions”
whilst cells grafted from the “later” stage (day 46-59) of the protocol
showed clusters of DARPP-32 positive cells (21% of NEUN
population) and contained P-zones, but also showed overgrowth 13-15
weeks after the graft.
(Ma et al. 2012) hESCS
QA lesion striatum into
SCID mice
100,000 cells transplanted
Survival 4 months
(16 weeks)
Shorter protocol than previous attempts to generate LGE neural
precursors that predominately differentiated into DARPP-32-
expressing neurons. Cells grafted after 40 days in vitro, no overgrowth
reported and 58.6% of the grafted neurons were GABA and DARPP-
32 positive. Behavioural recovery seen on the rotarod and an increase
in stride length due to the host cortical and nigral inputs to the grafts.
Projections afforded to the SN from the grafts.
(Carri et al. 2013) hESCs
(H9 and
HS401)
QA lesion striatum of rats
Daily cyclosporine
500,00 cells transplanted
Survival at 3, 6 and 9
weeks
Used the same concentration of SHH as Ma et al to induce a ventral
telencephalic identity and characterised extensively to ensure LGE
precursors. Cells grafted at Day 38 of the protocol, DARPP-32,
FOXP1 and found in the grafts but not quantified. Amphetamine-
induced rotations were compared before and after grafting and
although results hinted at there being functional recovery, animal
numbers were too low to suggest a significant behavioural effect.
(Nicoleau et al.,
2013)
hESCs
(H9)
QA lesion striatum
into nude rats
150,000 cells transplanted
Survival at 5 months.
Optimised concentration of SHH and WNT signalling to produce
human ventral-telencephalic precursors that were characterized
extensively before grating. Day 25 differentiated hESC grafted,
DARPP-32 and FOXP1 found in grafts, no behaviour carried out yet.
Chapter 1 Introduction
35
1.6.1 Foxp1 and HD
Interestingly a direct link between Foxp1 and HD has also been reported. An
Affymetrix screen using tissue from the striate of the TG R6/1 HD mice showed that
FOXP1 was significantly down regulated when compared to control samples.
Similarly, this same result was identified in the post mortems of HD patients (Desplats
et al. 2006). Last year, a genome-wide association study (GWAS) was undertaken
using samples from a TG Q111 HD cell line in which Foxp1 was over expressed. The
genes that were significantly up regulated were grouped and were shown to be
associated with signalling pathways connected with HD or with immune signalling
(Tang et al. 2012). As a way to validate the in vitro GWAS study, transcriptional
analysis was also studied in vivo in a different TG HD mouse line (YAC128) in which
Foxp1 expression has not shown to be differentially expressed when compared with
age-matched WT control mice. To look at the in vivo effects of FOXP1 on HD, a virus
either over expressing FOXP1 or expressing GFP (control) was injected bilaterally into
the striatum of YAC128 HD TG mice at 3 months of age. Subsequent microarray
analysis showed that the genes that were significantly up regulated were also
associated with the immune signalling (Tang et al. 2012).
When the results were compared with previous microarrays from other TG HD mouse
lines or from human brain post mortems (where Foxp1 is down regulated) (Desplats et
al. 2006), there was a negative correlation between the genes that were down regulated
in the disease samples compared to the samples in which Foxp1 was over expressed
i.e. genes involved in inflammation and gliosis were up regulated in diseased brains but
down regulated in the samples over expressing Foxp1 (Tang et al. 2012). Similarly
histological analysis from YAC128 mouse sections in which Foxp1 was over
expressed, showed a decrease in GFAP staining and microglia markers. This suggests
that loss of optimal FOXP1 expression leads to less repression of immune related
genes, resulting in an increase in the damaging cytokines observed in the HD brain. As
FOXP1 staining has been shown within HTT inclusions commonly found throughout
the brains of R6/1 mice (Tang et al. 2012), immunopercipitation (IP) of FOXP1 and
HTT was undertaken and showed that FOXP1 and HTT are capable of binding with
each other. It was therefore suggested that the reduced FOXP1 levels in HD brains is
caused by HTT-mediated sequestration of FOXP1 and subsequent loss of FOXP1 self-
Chapter 1 Introduction
36
regulation. Overall these results suggest that FOXP1 is a repressor of gliosis and that in
WT conditions FOXP1 has a neuroprotective role whereby it counteracts the stimuli
that are associated with glia response to pathogens (Tang et al. 2012).
1.7 Autism Spectrum Disorder (ASD) and associated disorders
As well as being associated with HD, de novo and micro-deletions in the human
FOXP1 gene have been identified and associated with ASDs (Palumbo et al. 2013),
(Hamdan et al. 2010; Horn et al. 2010). ADHD is a clinically heterogeneous
neurodevelopmental disorder and the DSM-IV diagnostic criteria for ADHD include
inattention, hyperactivity and/or impulsivity (Biederman and Faraone 2005). ADHD
shares a high degree of comorbidity, and as suggested by twin studies, shares inherited
factors with ASD (Lichtenstein et al. 2010; Ronald et al. 2011; Thapar et al. 2013). For
example some ASD patients have been shown to be associated with poor attentional
switching, resembling the inattention seen in ADHD patients (Polderman et al. 2013).
ADHD is the most prevalent psychiatric disorder diagnosed in youths with a global
prevalence of 3-7% in children and adolescents (Nair et al. 2006) but since no formal
objective tests for its diagnosis exist, this may be an underestimation (Polanczyk et al.,
2007).
ADHD is highly heritable and may result from several different gene mutations,
together with environmental factors (reviewed in (Thapar et al. 2013)). From
concordant twin studies, it has been estimated that the heritability of ADHD is 76%
(Faraone et al. 2005). Following candidate gene studies based on case-control and
family-based studies odds ratios (ORs) for the association between gene mutation and
ADHD phenotype were analysed (Faraone et al., 2005). From these studies a number of
genes, many of which relate to catecholamine function were found to be associated with
the aetiology of ADHD; the dopamine D4 receptor gene (DRD4), the dopamine D5
receptor gene (DRD5), the dopamine active transporter gene (DAT), the dopamine beta
hydroxylase gene (DBH), the serotonin transporter gene (5-HTT), the serotonin receptor
HTR1B gene and the synaptosomal associated protein-25 gene (SNAP-25) (Faraone et
al. 2005). The ORs for the association between gene mutation and ADHD phenotype
were small stressing that ADHD is likely caused by many genes of little effect. Thus it
is highly likely additional genes may be found through future candidate gene studies
Chapter 1 Introduction
37
with larger population sizes that will enhance understanding of the complexity of the
genetics involved in ADHD.
The precise aetiology of ADHD is unknown but it is widely thought that at the
physiological level, ADHD is caused by dysregualtion of the catecholaminergic system
leading to imbalances in the dopamine (DA) and noradrenaline (NA) neurotransmitter
systems (Arnsten 2009; Biederman and Faraone 2005). Indeed, current treatment
focuses on agents that interfere with these systems, such as catecholaminergic re-uptake
inhibitors that increase extracellular concentration of DA and/or NA. Specifically the
CNS stimulants methylphenidate (Ritalin) (DA and NA re-uptake inhibitor) and
atomoxetine (NA re-uptake inhibitor) can be prescribed for the treatment of children
with severe and persistent symptoms of ADHD. The later drug is not processed in the
nucleus accumbens and thus does not have the addictive element associated with it that
Ritalin does.
1.7.1 Animal models of ADHD
To gain a better understanding of the pathology of disease states and to develop
therapeutic platforms for clinical trials, animal models with good construct
(physiologically mimic the disease) and face validity (shown similar phenotype to the
disease) are required that can provide the necessary predicative validity (respond to the
drugs associated with the disease) for the study of neuropathology and associated
therapeutic efficacy in clinical trials. Current animal models of ADHD include those
induced chemically (such as postnatal exposure to alcohol) and environmentally (rat
pups reared in isolation), and importantly for this highly heritable condition, a variety of
genetic models.
The most widely used genetic model is the spontaneously hypertensive rat (SHR)
(Sagvolden et al. 1993), which displays an ADHD-like behavioural phenotype and has
predictive validity, although the high blood pressure also associated with this model is
problematic as it has not been associated with ADHD. Attempts to breed out the
hypertension resulted in animals with reduced hyperactivity that no longer responded to
Ritalin. Additionally, the control line used in behavioural testing is questionable, as they
are a typically lethargic species (Drolet et al. 2002). The DA transporter KO (DAT-KO)
Chapter 1 Introduction
38
mouse lacks the DA transporter gene (Giros et al. 1996) and shows increased DA levels
and hyperactivity that can be reduced by psycostimulants (Gainetdinov et al.
1998),(Jones et al. 1998). However, Ritalin and Amphetamine both target DAT, thus the
mechanistic processing of these drugs in this model are unknown. Secondly, there is no
evidence for hyper-dopaminergic tone in ADHD patients (Arime et al. 2011; Cheon et
al. 2004). Another model, the thyroid hormone receptor (TR)-beat (1) TG mouse that
carries a mutant human TRβ1 gene meets face, predicative and construct validity for a
model of ADHD, but the role of the thyroid system in ADHD is still unknown (Arime et
al. 2011). A number of other models exist, such as the coloboma mouse (Searle 1966)
(mutation in the SNAP-25 gene), the alpha synuclein lacking mouse, the acallosal
mouse strain, and the Naples high excitability strain (bred for excitability), which
provide face validity and construct validity to variable degrees, but in which predictive
validity is lacking or low (reviewed in (Sontag et al. 2010)). Recently, astrocyte-specific
disruption of SynCAM1, thought to lead to deficits in astrocyte adhesion, has produced
a mouse that is hyperactive and impulsive and shows a reduction in hyperactivity when
amphetamine is administrated in the open field task (Sandau et al. 2012). However, to
date, attention deficits and impulsivity have not been properly characterised in this
model and it is currently unclear which brain regions were affected by this genetic
disruption. To summarise, many animal models of ADHD already exist but owing to the
heterogeneity of the disease, and the likelihood it is caused by many genes of little
effect, offer the opportunity for novel models to be generated.
1.8 Genetic Knockouts (KOs)
In order to study transcriptional regulation in discrete populations of developing cells,
gene-targeting strategies can be employed. To study the function of a gene, it can be
knocked out during development and changes in the immature or adult phenotype can
be assessed. Genetic KO studies are routinely undertaken in mice but are frequently
used in other model organisms such as Caenorhabditis elegans and recently
Dictyostelium discoideum. For the purposes of my PhD, I will discuss the use of genetic
KOs in mice. Mice are commonly used to study the function of genes in neuronal
development as they show many similarities in their nervous system to humans as well
as convenience as a lab animal. A conventional genetic KO arises from mating two mice
together that are heterozygous for the gene of interest (GOI). This will, according to
Chapter 1 Introduction
39
Mendelian inheritance, produce a quarter of first generation (F1) offspring that are
homozygous KOs for the GOI, a quarter of offspring that are WT and half that are
heterozygotes. However, this breeding strategy knocks out the gene everywhere it is
expressed, therefore if the gene is crucial for development it is possible the embryo will
die without its expression, these KOs are termed embryonically lethal. To bypass such
lethality’s a CKO can be made which is commonly mediated through the Cre-Lox
method. Specifically this method utilises the Cre tyrosine recombinase enzyme (Cre)
that was originally isolated from the bacteriophage P1. This enzyme has the ability to
catalyse recombination between two 34 base pair (bp) LoxP sites also located in the
DNA of the bacteriophage (Gaveriaux-Ruff and Kieffer 2007). When the Cre enzyme
and LoxP sites meet, there is an irreversible excision of the DNA located between the
two LoxP sites. This system was first trialled in mammalian cells in 1988 (Sauer and
Henderson, 1988) and has successfully been manipulated for use in mouse genetic KO
technology, as there are no endogenous LoxP sites present in the mouse genome. Briefly
to create a “floxed” allele the isolated genomic clone is engineered so that two LoxP
sites flank a critical exon(s). Upon successful ESC selection and subsequent breeding,
“floxed” mice have two functional alleles as if WT, as the presence of the LoxP sites
alone do not affect the phenotype. The “Cre” mouse is created via pronuclear injection,
whereby a Cre enzyme is attached to a specific promoter, i.e. a promoter that drives
gene expression in an area in which you want to study. When a “Cre” and a “floxed”
mouse are subsequently bred together a quarter of the offspring should have the GOI
conditionally knocked out.
If one has decided that a CKO is needed, the next question is if the gene needs to be
continuously turned off from a specific developmental time, i.e. “Cre-mediated
recombination” which is directly dependant on the choice of promoter used to drive the
Cre expression. Or, alternatively, if the gene of interest needs to be induced, which
requires the Cre to be on at specific developmental time points only. Characterising the
functional roles of Foxp1 in MSN development would require the earlier approach i.e.
developing a “Cre-mediated” CKO mouse line as Foxp1 is embryonically lethal at E14.5
(Wang et al. 2004a). Therefore choosing the correct Cre line to drive recombination is
important to ensuring that recombination occurs in the correct location and at the right
time.
Chapter 1 Introduction
40
As previously mentioned, Foxg1 is a TF that shows widespread expression throughout
the telencephalon by E10.5 (Martynoga et al. 2005; Xuan et al. 1995). The Foxg1-Cre
has shown to be expressed from E9.5 in the neuroepithelial cells of the telencephalon,
and would be an obvious choice for striatal deletion of Foxp1 (Hebert and McConnell
2000). This Cre has been used successfully to conditionally KO Fgf8 in the developing
telencephalon to study Notch signalling (Mason et al. 2005), and, recently, to KO
Arl13bin (Higginbotham et al. 2013). However, there are several caveats to using
Foxg1-Cre mice to produce conditional mutations. Firstly, the Foxg1-Cre allele is
predicted to be a null allele for FOXG1 function, due to replacement of the Foxg1
coding sequences with the Cre gene (Herbert and McConnell, 2000). Therefore, it is a
possibility that any phenotype seen is from the heterozygosity of Foxg1. Of note, work
carried out by Eagelson (2007) and colleagues showed that the presence of the Cre-
recombinase downstream of the Foxg1 promoter in C57BL/6J mice resulted in a
reduction in the volume of the neocortex, striatum and hippocampus (Eagleson et al.
2007). Secondly, when crossed with either a ROSA26 (R26R) line (Soriano 1999) or a
Z/AP line (Lobe et al. 1999) considerable differences were seen in reporter expression
pattern. The R26R line showed expression comparable to Foxg1 normal expression.
However, the expression pattern from the Z/AP mouse line was inconsistent, and when
backcrossed onto six different mouse strains, showed various expression patterns in
tissues not known to express Foxg1, which in some instances encompassed the whole
body (Hebert and McConnell 2000). Therefore, even though this Cre is preferentially
expressed consistent with MSN development, its expression pattern inconsistencies
would be problematic for conditionally knocking out Foxp1, which is widely expressed
in many developing tissues including the lung and heart (Shu et al. 2007; Wang et al.
2004a). At the commencement of the project, in the absence of any commercially
available, embryonic striatal specific Cre lines the Nestin-Cre and hGFAP-Cre lines,
known to be expressed in neuronal precursor cells in the telencephalon, and have
previously been reported to knock out genes during cortical development (Barbosa et al.
2008; Li et al. 2008), were chosen to KO Foxp1 in the developing telencephalon.
The Nestin-Cre mouse line is expressed from E9 in all neuroepitehlial cells and
subsequently all neurons (Tronche et al. 1999), and the hGFAP-Cre line is expressed in
RG and is active from E13.5 (Malatesta et al. 2003; Zhuo et al. 2001). The opinion that
a Cre attached to a promoter synonymous with glia should only KO the GOI in cells
Chapter 1 Introduction
41
fated to become astrocytes, and not neurons, should not be assumed. As discussed
earlier, since 2000, considerable work, largely by Magdelana Gotz and colleagues, has
shown that at least 80% of neurons are born from RG and thus this Cre should knock
out Foxp1 from E13.5. However, as eluded to earlier, even though striatal neurons are
born largely from RG, they pass through this stage before the onset of hGFAP
expression, thus it is likely that a CKO using this Cre would KO Foxp1 from all of the
cortex, allowing the link between Foxp1 and ASDs to be explored, but only from a
small population of cells in the striatum. However, it was anticipated that the Nestin Cre
would KO Foxp1 from both the striatum and cortex.
1.9 Aims of thesis
It is evident from the research outlined in this introduction that the transcriptional
repressor Foxp1 is implicated in many areas of development of which telencephalon
development is likely included. Results from the affymetirx screen carried out in the
host lab together with the current literature and public databases have shown that Foxp1
is highly up regulated during peak striatal development and that co-localisation is
restricted to striatal projection neurons. It is also known that Foxp1 is expressed in the
developing and adult cortex, where like in the striatum, expression is restricted to
cortical projection neurons, thus suggesting a general function of this TF in neuronal
development.
Firstly I aim to understand the function of Foxp1 in striatal development with the
expectation that expanded knowledge of MSN differentiation will be important in
identifying earlier markers of MSN precursors for use in cell protocols for cell
replacement therapies in HD. Secondly, as it has already been shown that addition of
Foxp1 to hESC enhances the number of TH positive neurons, and that it is also
expressed during cortical development, understanding the function of Foxp1 may also
provide a more over-arching functional role of this gene during development. For
example, in other developmental areas such as myocyte development it is an important
factor in mediating the switch from proliferation to differentiation thus a further
understanding of function could be translatable to a variety of for cell replacement
therapy protocols and also interesting for drug discovery research. The final aim will be
to study the effects of the loss of Foxp1 from the mouse cortex by creating a Foxp1
Chapter 1 Introduction
42
CKO model and linking any behavioural and or histological differences seen to diseases
associated with Foxp1, such as ASD and associated disorders. Providing a new mouse
model, caused by the loss of a single gene will also serve as an excellent platform for
testing existing drugs associated with the phenotypic otucomes as well as allowing
novel drugs to be tested.
Main Objectives
To further characterise the expression pattern of FOXP1 throughout embryonic and
postnatal development and how this relates to current MSN markers.
To investigate in vitro differences in MSN development in the absence of Foxp1
compared to controls, specifically looking at any differences in differentiation,
proliferation and the electrophysiology of the cells.
As Foxp1-/-
embryos die at E14 in vitro experiments were restricted to this age.
Therefore it was decided to look at how striatal cells from E14 WT, Foxp1+/-
and
Foxp1-/-
embryos survive and mature once transplanted into the adult QA lesioned
mouse striatum and to see if there are any genotypic differences between the grafts.
Although in principal this experiment can only show how the cells survive and
mature in a graft scenario, it will still facilitate one to look at how striatal neurons
develop in the absence of Foxp1 for a longer period than is possible in vitro,
however it is understood that development will not be completely akin to as if the
cells were left to mature in the mouse. It will also allow differences in DARPP-32
to be more readily identifiably as the grafted cells will have the chance to mature
and to make some of their normal connections with host neurons.
To generate and maintain a Foxp1 CKO mouse colony that selectively depletes
Foxp1 in the adult cortex. Once the colony is developed a series of behavioural
tests will be carried out that investigate specific phenotypic differences in the mice
that would strengthen the link between Foxp1 and ASDs. Suitable drugs will also
be tested on the animals if specific behavioural phenotypes are found. Histological
differences will also be looked for.
Chapter 2 Materials and Methods
43
2 Materials and Methods
2.1 Mouse Lines
2.1.1 Mouse Lines and Breeding
All animal experiments were performed in agreement with local ethical guidelines and
accepted animal care according to the UK Animals (Scientific Procedures) Act 1986 and
its subsequent amendments.
When required to maintain colony numbers female C57BL/6 mice were bought from
Charles River. When Fox het time mates were required breeding pairs were set up over
night (O/N). The next morning females were removed and checked for the presence of a
vaginal plug (before 9:30am); a plug suggested that mating had been successful. The
hGFAP-Cre mouse line (FVB-Tg (GFAP-Cre) 25Mes/J) (stock #4600) and the Nestin-
Cre line (B6.Cg-Tg (Nes-Cre)1Kln/J(stock#3771) were purchased from JAX
laboratories. The Foxp1 KO mouse and the Foxp1 “floxed” mouse (Foxp1fl/fl
) were gifts
from Professor Tucker at the University of Texas. For work outlined in Chapters 3 and 4
time mating’s were set up between two Foxp1 heterozygote mice (Foxp1+/-
), maintained
on a C57BL/6 background. Females were checked daily for a vaginal plug, the day of
plug discovery was recorded as E0. Pregnant dams were sacrificed at the required
embryonic age and pups were dissected from the uterine horn as outlined in Chapter
2.1. Embryos were either snap frozen, or individual striate were dissected and
individually cultured or grafted. Animals were genotyped using the tail biopsies taken
during dissections.
For the Foxp1 CKO line (discussed in Chapter 5) mice heterozygous for the Foxp1
floxed gene (Foxp1fl/+
) and hGFAP-Cre were bred to mice of the same genotype, as
shown in Figure 2.1. The floxed mouse has been previously engineered to have a Loxp
sites either side of exons 11 and 12 on the Foxp1 gene (Feng et al. 2010). These mice
were on a Swiss 129 background strain. The possible offspring from this breeding
strategy are shown in Table 2.1.
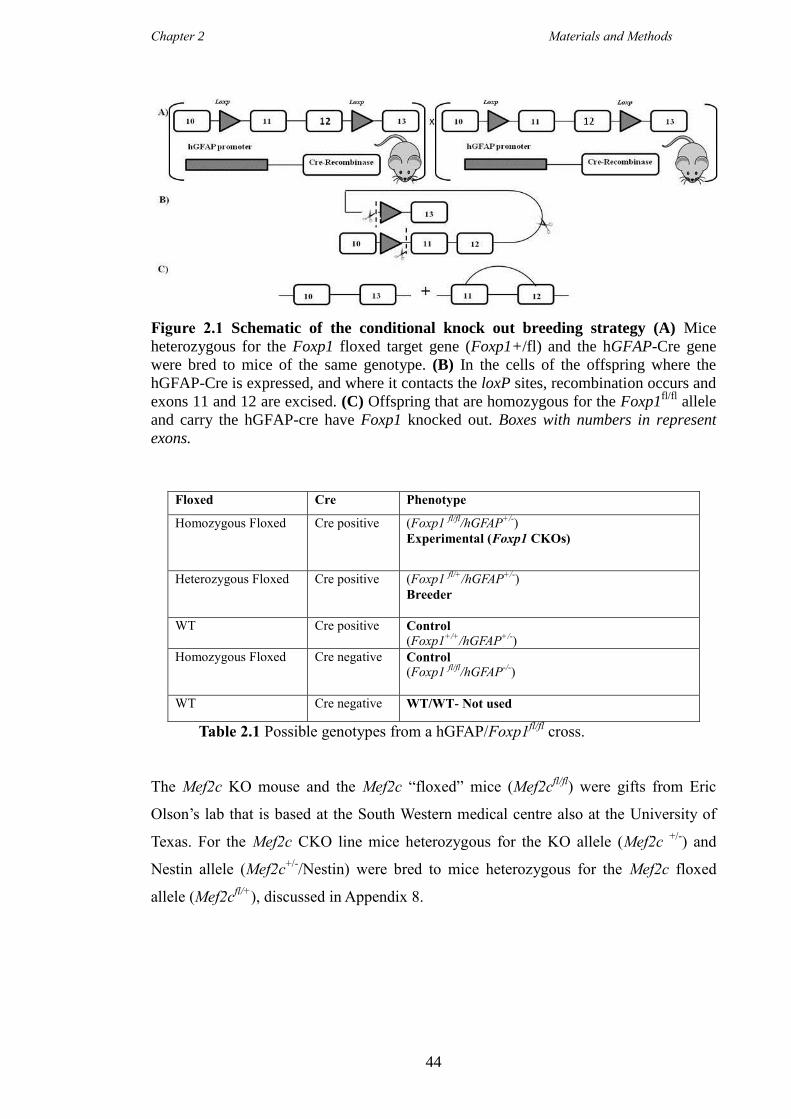
Chapter 2 Materials and Methods
44
Figure 2.1 Schematic of the conditional knock out breeding strategy (A) Mice
heterozygous for the Foxp1 floxed target gene (Foxp1+/fl) and the hGFAP-Cre gene
were bred to mice of the same genotype. (B) In the cells of the offspring where the
hGFAP-Cre is expressed, and where it contacts the loxP sites, recombination occurs and
exons 11 and 12 are excised. (C) Offspring that are homozygous for the Foxp1fl/fl
allele
and carry the hGFAP-cre have Foxp1 knocked out. Boxes with numbers in represent
exons.
Table 2.1 Possible genotypes from a hGFAP/Foxp1fl/fl
cross.
The Mef2c KO mouse and the Mef2c “floxed” mice (Mef2cfl/fl
) were gifts from Eric
Olson’s lab that is based at the South Western medical centre also at the University of
Texas. For the Mef2c CKO line mice heterozygous for the KO allele (Mef2c +/-
) and
Nestin allele (Mef2c+/-
/Nestin) were bred to mice heterozygous for the Mef2c floxed
allele (Mef2cfl/+
), discussed in Appendix 8.
Floxed Cre Phenotype
Homozygous Floxed
Cre positive (Foxp1 fl/fl
/hGFAP+/-
)
Experimental (Foxp1 CKOs)
Heterozygous Floxed Cre positive (Foxp1 fl/+
/hGFAP+/-
)
Breeder
WT Cre positive Control
(Foxp1+/+
/hGFAP+/-
)
Homozygous Floxed
Cre negative Control
(Foxp1 fl/fl
/hGFAP-/-
)
WT Cre negative WT/WT- Not used
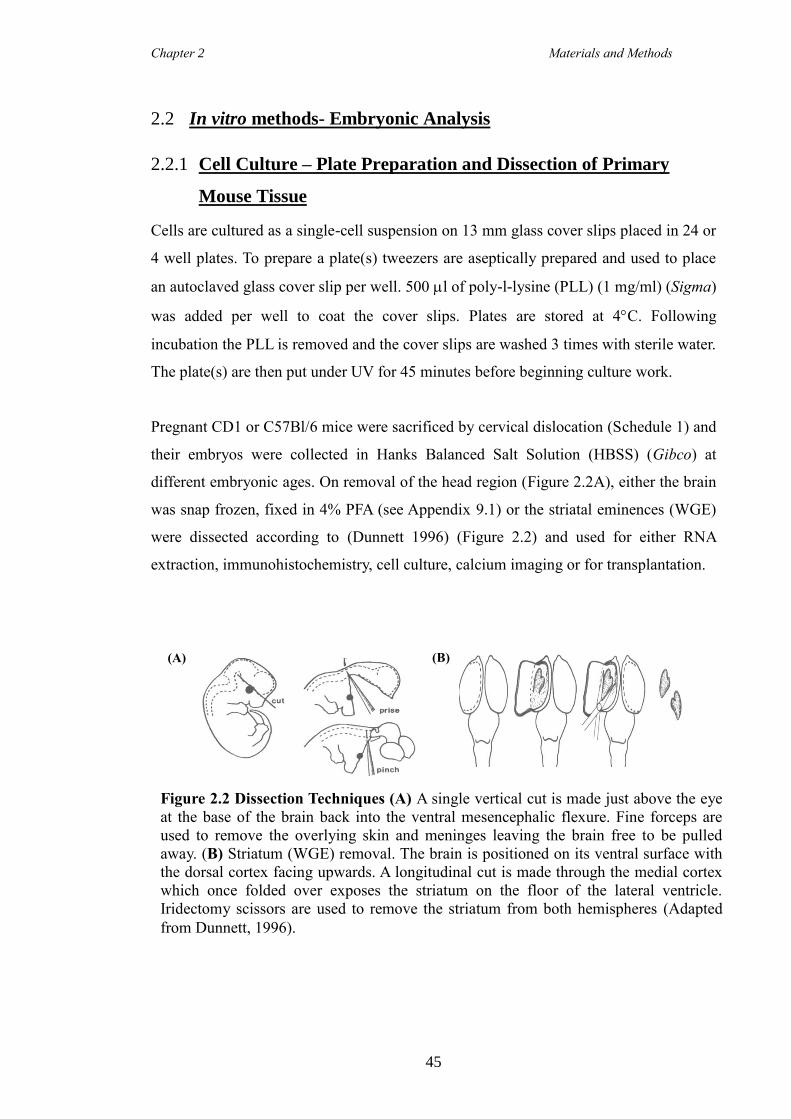
Chapter 2 Materials and Methods
45
2.2 In vitro methods- Embryonic Analysis
2.2.1 Cell Culture – Plate Preparation and Dissection of Primary
Mouse Tissue
Cells are cultured as a single-cell suspension on 13 mm glass cover slips placed in 24 or
4 well plates. To prepare a plate(s) tweezers are aseptically prepared and used to place
an autoclaved glass cover slip per well. 500 l of poly-l-lysine (PLL) (1 mg/ml) (Sigma)
was added per well to coat the cover slips. Plates are stored at 4C. Following
incubation the PLL is removed and the cover slips are washed 3 times with sterile water.
The plate(s) are then put under UV for 45 minutes before beginning culture work.
Pregnant CD1 or C57Bl/6 mice were sacrificed by cervical dislocation (Schedule 1) and
their embryos were collected in Hanks Balanced Salt Solution (HBSS) (Gibco) at
different embryonic ages. On removal of the head region (Figure 2.2A), either the brain
was snap frozen, fixed in 4% PFA (see Appendix 9.1) or the striatal eminences (WGE)
were dissected according to (Dunnett 1996) (Figure 2.2) and used for either RNA
extraction, immunohistochemistry, cell culture, calcium imaging or for transplantation.
Figure 2.2 Dissection Techniques (A) A single vertical cut is made just above the eye
at the base of the brain back into the ventral mesencephalic flexure. Fine forceps are
used to remove the overlying skin and meninges leaving the brain free to be pulled
away. (B) Striatum (WGE) removal. The brain is positioned on its ventral surface with
the dorsal cortex facing upwards. A longitudinal cut is made through the medial cortex
which once folded over exposes the striatum on the floor of the lateral ventricle.
Iridectomy scissors are used to remove the striatum from both hemispheres (Adapted
from Dunnett, 1996).
(B) (A)
Chapter 2 Materials and Methods
46
2.2.2 WGE primary mouse cultures
HBSS media was removed from the tissue and replaced with 0.1 % Trypsin
(Worthington Biochemical Corporation) (Sigma) (see Appendix 9.1) and 0.1 % DNAse
for an incubation period of 20 minutes at 37C. Trypsin inhibitor (Sigma) was then
added to the tissue for a further 5-minute incubation period. The tissue was then washed
with Dulbecco’s modified Eagle’s medium (DMEM-F12) (Life technologies)
supplemented with 1% PS (penicillin, streptomycin) (Life technologies), and collected
by centrifugation at 1000 rpm for 3 minutes. The supernatant was discarded and the
remaining pellet (cells) was re-suspended in 200 l of DMEM/F-12 and triturated ~ 15
times with a 200 l Gilson pipette to produce a quasi-single cell suspension. Cells were
counted using a trypan blue (0.4% trypan blue solution) (Sigma) exclusion assay in
order to assess cell viability. Specifically, 10 l of cell suspension was diluted through 3
x 40 l drops of DMEM/F-12 (1:5, 1:25, 1:125 dilutions) and 1 x 10 l drop of trypan
blue (final dilution of 1:250) and transferred to a haemocytometer with a glass cover
slip and viewed under the microscope. Cells in the centre square and the 4 corner
squares were counted and the number of cells per l was calculated, as well as total cell
number, taking the dilution factor into consideration. The following formula was used:
Cells/Number of squares x 10 x Dilution Factor = cells/µl
Cells were re-suspended in neuronal differentiation media and seeded onto PLL coated-
cover slips at a 100,000 cells/cm2
in a total volume of 30 l. After the cells had adhered
to the coverslips (~ three hours) the wells were flooded with 500 l of differentiation
media (Appendix 9.1) and were incubated at 37C in humidified 5% CO2 and 95%
atmospheric air. Differentiation media was replaced after 3 days of incubation.
2.2.3 Immunocytochemistry- Cell culture
Following differentiation for the required time period (24hrs or 7 days in vitro (DIV))
cells were fixed. Firstly, the differentiation medium was removed and cells were washed
in 1 X PBS (Appendix 9.1) for 5 minutes. On removal of PBS the cells were fixed for
20 minutes using fresh 4% paraformaldehyde (PFA) (Appendix 9.1) followed by 3 x 5
minute washes in 1 X PBS. For different antibody stains, the cells underwent one of two
protocols. For protocol A, cells were permeabilised with 100% ethanol for 2 minutes or,
Chapter 2 Materials and Methods
47
for protocol B, with 0.05M lysine (freshly made) for 15 minutes, both followed by 3 x 5
minute washes in 1 X PBS. To prevent non-specific binding of the antibody the cells
were blocked for 1 hour (3% normal horse/goat serum (NHS/NGS), 3% bovine serum
albumin (BSA) (Sigma) in 1 X PBS-T (0.5% Triton) (Sigma). After blocking the
primary antibody(s) was added (if double labelling was required, both primary
antibodies were added at the same time provided they were raised in different species)
in block solution, and left to incubate at 4C O/N. A full list of antibodies used and
details of relevant concentrations and protocols are outlined in Appendix 9.1. Removal
of the primary antibody (retained and re-used up to 3 times) was followed by 3 x 5
minute washes in 1 X PBS. Secondary antibodies (all 1:200) made in block solution
(Appendix 9.1) were then added to the cells for 2 hours in the dark. The secondary
antibody was removed and kept and cells were washed for 3 x 5 minutes in 1 X PBS
before the nuclear stain Hoechst (10µg/ml) (1:10:000) (Sigma) was added for 10
minutes. Cells underwent final washes in 1 X PBS (3 x 5 minutes) and then the cover-
slips were mounted onto glass slides using Fluroment (Sigma), and stored in the dark at
4C until cell counts were carried out.
2.2.4 Immunocytochemistry – BrdU
BrdU (2 µg/ml) was added to the cells 24 hours before fixation. Cells were either fixed
at 48 hours or 7 DIV as described previously. Cells were initially treated for 30 minutes
in K-PBS with 0.4% Triton to aid permeability. Cells were then washed in 1 X PBS for
5 minutes before being treated with 2M hydrochloric acid (HCL) for 10 minutes at 37ºC
and then with 0.1M sodium borate for 10 minutes. Cells were subsequently washed for
3 x 5 minutes in 1 X PBS before being blocked for 1 hour in PBS-T (0.1% Triton) plus
1% NGS. Following blocking, primary antibodies were added (Anti-rat BrdU with
either anti-mouse TUJ1 or anti-rabbit GFAP), in block solution and left to incubate O/N
at 4C.
The next day the primary antibody was removed and kept and coverslips were washed
for 3 x 5 minutes in 1 X PBS. The secondary antibody was made in block and put on the
coverslips for a 2-hour incubation period in the dark. Following incubation the cells
were washed for 3 x 5 minutes in 1 X PBS before the nuclear stain Hoechst was added
to the cells for 10 minutes. A further 3 washes (5 minutes each) in 1 X PBS took place
before cover slips were mounted and analysed as described previously.
Chapter 2 Materials and Methods
48
2.2.5 Calcium Imaging
Striatal cultures from a Foxp1 Het (Foxp1+/-
) x Foxp1+/-
cross were cultured for 24
hours and analysed to look for any differences in their responses to common
neurotransmitters. The ratiometric Ca2+
sensitive dye Fura-2-AM (Molecular Probes,
Eugene, OR, USA, dissolved at 1 mg/ml in DMSO (Sigma) and covered to avoid
exposure to light) was used to measure intracellular free Ca2+
. 1 μl of Fura-2-AM was
added to 250 μl of differentiation media, applied to the cells 30 minutes prior to testing
and incubated at 37oC in a humidified incubator. This incubation allowed for Fura-2-
AM to be taken up by the cells, cleaved and turned into the active dye Fura-2. Fura-2-
loaded cells were placed in a specialised perfusion chamber, designed to allow direct
access of the microscope oil-immersion lens with the bottom of the coverslip, mounted
upon an Olympus IX71 equipped with a Cairn monochromator-based fluorescence
system (Cairn Instruments, Faversham, UK). Extracellular solution (ECS) (Appendix
9.2) was applied to the coverslip to stop the cells drying out. Fura-2 was alternately
excited using fluorescence light emitted from the monochromator at 340 and 380 nm.
Images at 510 nm were acquired at 0.33 or 0.2Hz by a slow-scan CCD camera (Kinetic
Imaging Ltd, Nottingham, UK). Solutions, agonists and antagonists were applied to the
cells using the gravity-driven rapid solution changer (20 ms solution change time). The
solutions used were high K+ (50 mM KCl in an equimolar replacement of NaCl from
standard ECS), GABA (50 µM), GABA (50 μM in a low chloride ECS (equimolar
replacement of all NaCl with sodium isethionate in standard ECS)), NMDA (50 µM),
AMPA (50 µM) and Kanite (50 µM), all in standard ECS unless stated otherwise
(further information can be found in Appendix 9.2). Raw data in the form of emission
intensities at 510 nm alternate excitation at 340 or 380 nm were recorded and stored
using the Andor 1Q 1.3 software package (Andor Technology, Belfast). Following
background subtraction, emission ratios (340/380 nm) were calculated off-line using
Microsoft Office Excel.

Chapter 2 Materials and Methods
49
2.2.6 Brain Slices-Preparation for Immunohistochemistry
To assess FOXP1 during development in WT mice, time mates were ordered from
Harlen and pregnant dams were sacrificed when embryos were at the required
embryonic age. Whole embryos (E10, E12, and E14) or just heads (from E16 onwards)
were snap frozen and sectioned at 15 µm on the cryostat. Brains were removed as
described in 2.2.1 from a range of embryonic ages (E10-PO) and were snap frozen using
iso-pentane (Sigma) on dry ice and stored at -80C. The brains were cut on a cryostat
(14 m) onto superfrost plus slides (Fisher) and left to air dry at 37C before being
stored at -80C.
Day 1
Slides were brought out of the freezer and put into ice cold, 100% acetone (Fisher
Scientific) for 2 minutes and then left to dry at 37C for 20 minutes. For Di-
aminobenzidine (DAB) reactions slides were quenched with 1% H2O2 (VWR) in 100%
methanol (Fisher Scientific) for 30 minutes to make the reaction slower and were
subjected to 3 x 5 minute washes in 1 X PBS. Antigen retrieval then took place whereby
the slides were placed in citrate buffer (Appendix 9.3) for 20 minutes at 95C and left to
cool down at room temperature (RT) before being washed in 1 X PBS for 5 minutes.
Slides were blocked (3% NHS)/NGS) in 1X PBS-T (0.1% Triton) for 1 hour. Slides
were then incubated with various antibodies; see Appendix 9.3, made up with 1%
NHS/NGS in 1X –PBS-T (Appendix 9.3), covered with parafilm strips and incubated at
4C O/N.
For fluorescent staining, slides were put in Acetone for 10 minutes and then left to dry
for 30 minutes. Slides were washed in ice cold 1 X PBS (3 x 5 minutes) before being
blocked for 1 hour in 1 X PBS-T (0.3% Triton) and1 % BSA. Primary antibodies were
made up in the block solution (see Appendix 9.3).
Day 2
Parafilm strips were removed and slides were washed in 1 X PBS for 5 minutes. For
diaminobenzidine (DAB) stains slides were incubated with a biotinylated secondary
antibody (see Appendix 9.3) made with 1% NHS/NGS in 1 X T-PBS (0.1% Triton) for
2 hours at RT. For fluorescent staining the secondary antibodies were made in 1 X T-
Chapter 2 Materials and Methods
50
PBS (0.3% Triton) with 1% BSA and also left on for 2 hours. All slides were then
washed in 1 X PBS for 3 x 2 minutes. For DAB staining, an avidinbiotin-complex
solution (AB-C complex) was added (1:200) with 1% NHS/1%NGS in 1 X T-PBS for 2
hours, this step was not needed in the fluorescent protocol and slides were washed in 1
X PBS following the removal of the secondary antibody and the nuclear stain Hoechst
was added for 10 minutes. The slides then underwent a final 3 washes in 1 X PBS and
were cover slipped using PBS: DABCO. Following the ABC step in the DAB protocol,
slides were washed in 1 X PBS for 3 x 5 minutes and were equilibrated in 1 X Tris Non
Saline (TNS) (Appendix 9.6) for 5 minutes and then for at least 20 minutes. The
antibody stain was visualised using DAB. A 1:5 dilution of DAB was used to have more
control over development. Slides were left in DAB until a clear reaction could be seen.
To stop the DAB reaction, slides were placed in 1 X PBS. Finally dehydration of slides
took place through decreasing concentrations of ethanol (75%, 95% and 100%), 5
minutes per concentration. Slides were then placed in xylene (Lab3) and cover slipped
using DPX (Fisher) mounting medium.
2.2.7 Quantification of Immunohistochemistry/ immunocytochemistry
Fluorescent and non-fluorescent staining was visualised using a Leica DRMBE
microscope. The wavelengths used to visualise each fluorescent stain were 594 nm
(red), 488 nm (green) and 356 nm (blue). For immunocytochemistry, cell counts were
taken at 40 X magnification using a counting grid. In order to prevent bias, 5 random
fields were chosen to take counts from. On all occasions there were at least 3 replicate
coverslips for each condition. Colour images were visualised under a Leica DRMBE
fluorescent microscope and images were captured using a Leica DFC420 camera and
Leica Application Suite image analysis software. Images were processed using Adobe
Photoshop. Immunohistochemistry analysis was qualitative to look at where and when
expression took place. For non-fluorescent microscopy, images were visualised at the
required magnification on the Leica DRMBE microscope. For work carried out at the
University of Barcelona, a confocal microscope was used and the nuclear stain DAPI
was used instead of Hoechst. Image J was used to process the pictures from the confocal
microscope.

Chapter 2 Materials and Methods
51
2.2.8 Statistical Analysis- Cell counts and Grafting
PAWS Statistics (SPSS) V.18 was used to carry out statistical analysis of all cell
counting and grafting data. For all experiments, where applicable, a one-way analysis of
variance (ANOVA) was used in analysis with Tukey-krammer post-hoc analysis when
applicable. In addition, this test was used in analysis of the ACCC’s between genotypes.
Chapter 2 Materials and Methods
52
2.3 Molecular Methods
2.3.1 RNA extraction for RT- PCR and qPCR
WGE were dissected as described in 2.2.1 and snap frozen on dry ice and stored in RNA
later (Sigma) for RT-PCR and qPCR. At the start of the protocol, the sample tissue was
weighed and RNA was extracted using the Qiagen RNAeasy Mini Kit, RNAse-free
DNAse set and QiaShredder (all Qiagen, West Sussex,UK) according to manufacturer’s
instructions. Following extraction, the RNA yield and quality was tested using a
Nanodrop Spectrophotometer (2µl) and used for subsequent cDNA synthesis. For pure
RNA, 260/280 is ~2.
2.3.2 Primer Sequences
All qPCR primers were previously designed and calculated to melt at 60˚C, be 18-22 bp
and generate a transcript of 80-120 bp. qPCR primer sets are found in Appendix 9.5.
Briefly, primer pairs were generated using the Mouse Genome Informatics and Ensembl
websites for sequence information and primer 3 Input for design.
2.3.3 cDNA Synthesis
For first strand synthesis, RNA samples were standardised and a maximum of 1 μg of
DNase-treated RNA was incubated with random primers (100ng) (Invitrogen) and
10mM dNTP mix (Bioline) for 5 minutes at 65˚C. Following a brief chill on ice, 5X first
strand buffer, 0.1M DTT and RNase OUT (40 u/µl) (all Invitrogen) were added and
incubated for 2 minutes at 25˚C. Finally, Superscript II (200 u) (Invitrogen) was added
and incubated at 25˚C for 10 minutes, 42˚C for 50 minutes and finally 70˚C for 15
minutes. cDNA was used for subsequent PCR reactions. RT-ve controls were also
carried out by substituting superscript with water.
2.3.4 RT-PCR- Reverse Transcription -Polymerase Chain Reaction
For PCR amplifications, cDNA from first strand synthesis was used and a PCR mix was
used that consisted of 10X Bioline NH4 Reaction Buffer (Bioline, London UK), 50mM
MgCl2 (Bioline, London UK), 10mM dNTP, BioTaq DNA polymerase (1u/µl) (Bioline),
oligo pair at 0.5 pmol each (MWG Eurofins) and RNAse-free water (Sigma), to make a
Chapter 2 Materials and Methods
53
25µl reaction. A GADPH PCR (Appendix 9.5) was carried out on all samples to test
quality and to optimise cDNA reaction volumes. PCR products were analysed by
electrophoresis on a 1.5 % agarose gel and visualised with Ethidium Bromide (Sigma).
A 100 bp ladder (Promega) was used as a reference for band size.
2.3.5 DNA Extraction for Genotyping
Mice were genotyped using PCR to determine whether the gene (Foxp1) was present
and to determine the presence of the Cre (hGFAP or Nestin). Specific primer
combinations used for the different stages of breeding are outlined in Appendix 9.5.
DNA was extracted from tail biopsies for use in genotyping. 500 µl of lysis buffer
(Appendix 9.4) was added to each tail and samples were vortexed and left O/N at 55˚C
in an incubated shaker. The next day, 500 µl of Phenol/Choloroform/Isoamylalcohol
(24:24:1) (Sigma) was added to the samples before being added to Eppendorf Phase
Lock tubes (Lab3) and spun for 5 minutes at full speed (210000g). The upper phase was
added to fresh eppendorf tubes and 500 µl of Propan-2-ol (isopropanol) (Sigma) was
added. Samples were mixed well and centrifuged on maximum speed for 10 minutes.
The upper phase was discarded and the pellet was washed with 70% molecular grade
Ethanol (Sigma) and spun for a further 10 minutes at full speed. Following washing, the
supernatant was discarded and the pellet was left to dry at 37˚C for 15 minutes and then
re-suspended in 1 ml of distilled water. The samples were left at 55˚C for 30 minutes
and stored at -20˚C.
2.3.6 Genotyping-PCR
DNA was extracted from the tail biopsies obtained on dissections and the relevant PCRs
were carried out. For PCR amplifications the DNA extracted from the embryos, 10 X
NH4 Reaction Buffer (Bioline), 50mM MgCl2 (Bioline), 10mM dNTPs, an oligo pair
(0.5 pmol), BioTaq DNA polymerase (1u/µl) (Bioline) and water were added to make a
25 µl reaction. Briefly, to identify the correct genotype of the Foxp1 embryos two
primer sets were used, one that showed the presence of the TG allele (~280 base pairs
(bp) that is not evident in WT embryos, whereas the second set identified a larger band
(~ 430bp) which is present in both heterozygous and WT embryos. An example gel is
shown in Figure 2.4. Two separate PCRs were carried out per tail to determine the
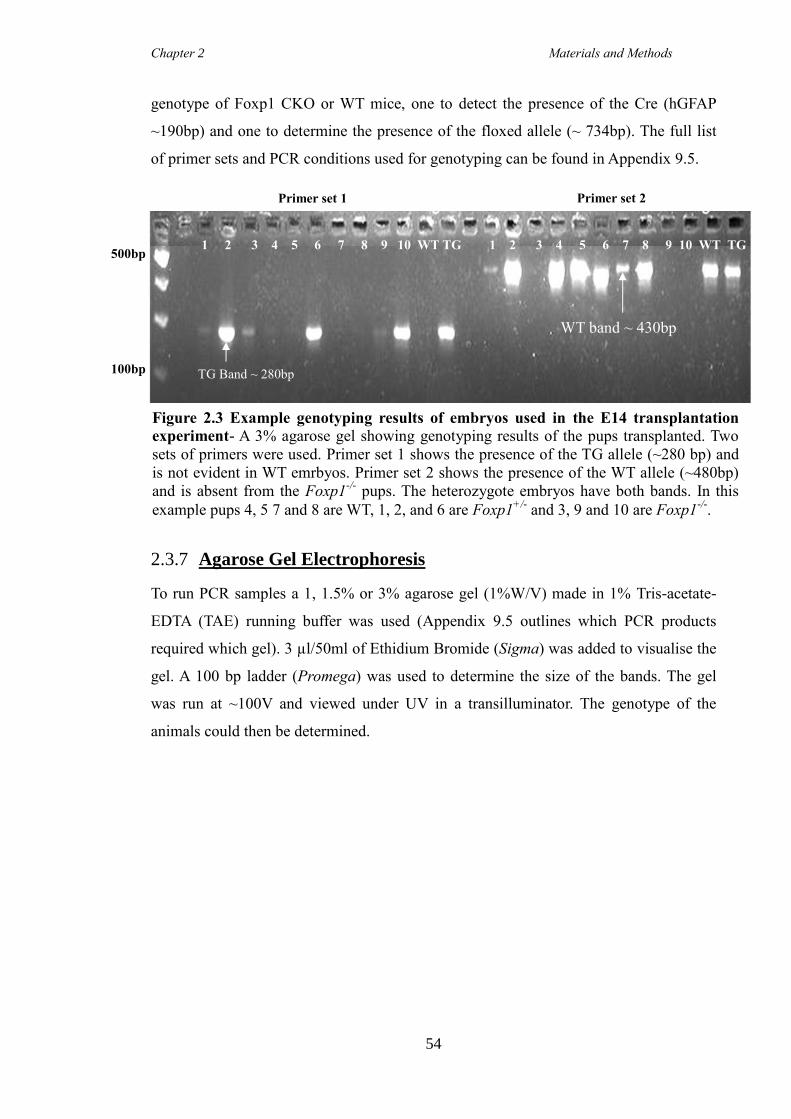
Chapter 2 Materials and Methods
54
genotype of Foxp1 CKO or WT mice, one to detect the presence of the Cre (hGFAP
~190bp) and one to determine the presence of the floxed allele (~ 734bp). The full list
of primer sets and PCR conditions used for genotyping can be found in Appendix 9.5.
.
2.3.7 Agarose Gel Electrophoresis
To run PCR samples a 1, 1.5% or 3% agarose gel (1%W/V) made in 1% Tris-acetate-
EDTA (TAE) running buffer was used (Appendix 9.5 outlines which PCR products
required which gel). 3 µl/50ml of Ethidium Bromide (Sigma) was added to visualise the
gel. A 100 bp ladder (Promega) was used to determine the size of the bands. The gel
was run at ~100V and viewed under UV in a transilluminator. The genotype of the
animals could then be determined.
Figure 2.3 Example genotyping results of embryos used in the E14 transplantation
experiment- A 3% agarose gel showing genotyping results of the pups transplanted. Two
sets of primers were used. Primer set 1 shows the presence of the TG allele (~280 bp) and
is not evident in WT emrbyos. Primer set 2 shows the presence of the WT allele (~480bp)
and is absent from the Foxp1-/-
pups. The heterozygote embryos have both bands. In this
example pups 4, 5 7 and 8 are WT, 1, 2, and 6 are Foxp1+/-
and 3, 9 and 10 are Foxp1-/-
.
500bp
100bp
Primer set 1 Primer set 2
1 2 3 4 5 6 7 8 9 10 WT TG 1 2 3 4 5 6 7 8 9 10 WT TG
TG Band ~ 280bp
WT band ~ 430bp

Chapter 2 Materials and Methods
55
2.4 In vivo Methods
2.4.1 Animal care and Anaesthesia
All animal experiments were performed in agreement with local ethical guidelines and
accepted animal care according to the UK Animals (Scientific Procedures) Act 1986 and
its subsequent amendments. For surgery, adult C57BL/6 female mice (Charles River,
UK) weighing 20-30g at the start of the experiment were used, and were housed in
cages of up to 5 in a natural light (06:00-18:00)-dark cycle (18:00-06:00) with access to
food and water ad libitum.
All surgery was performed under gaseous isoflurane anaesthesia. Anaesthesia was
induced in an induction chamber with isoflurane (5%) and oxygen (0.8%) and
maintained by passive inhalation of isoflurance (1-2%) and a mixture of oxygen (0.8%)
and nitrous oxide (0.4%). Animals were recovered in a warmed recovery cage following
surgery.
2.4.2 Quinolinic Acid (QA) Lesion
Quinolinic acid (QA) (stored at -20˚C) was dissolved in 0.1M phosphate-buffer saline
making a final concentration of 90 mM solution. The skull was exposed, a small burr
hole drilled (drill bit size ½) and QA was injected into the right striatum through a
cannula attached to a 10 µl Hamilton syringe driven by a mechanical pump
For QA lesions in mice, 0.75 µl of 90 mM QA was infused at one site for 6 minutes at a
pump rate of 15. The stereotaxic coordinates for injection sites were 0.0 tooth bar (TB),
+0.8 mm rostral to Bregma (AP), -2.0 mm lateral to midline (L) and -3.0 ventral from
dura (DV). The needle was left at the lesion site for a further 3 minutes to prevent reflux
of the toxin up the needle tract. The incision was sutured (Vicryl Rapide (Ehticon)) and
animals were administered a subcutaneous injection of 0.5 ml saline glucose into the
scruff of the neck and an intramuscular (IM) injection of 30 µl Diazepam and 50µl of
Meloxicam (Metacam).

Chapter 2 Materials and Methods
56
2.4.3 Unilateral Striatal Grafts
10 or 6 days (largely dependent on timed matings) following lesions grafting took place.
WGE from E14 or E12 Foxp1-/-
, heterozygotes or WTs was grafted into the lesioned
adult mouse brains. 2 µl of cell suspension (250,000cells/µl) (for E14 grafts) or 2 WGE
(quasi suspension) (for E12 grafts) per mouse were delivered at a rate of 1 µl/min at two
different heights below the dura, (-3.2 and -2.8mm) (2 minutes in total) using a 10 µl
Hamilton syringe. Grafts were placed ipsilateral to the side of the lesion using the
stereotaxic co-ordinates outlined in 2.4.2. Following grafting, the needle was left at the
graft site for a further 3 minutes before being withdrawn. For the E12 grafts a further
refinement was also made so that between grafts the Hamilton syringe was flushed
through with boiling water to ensure less cross contamination from the other
suspensions The incision was sutured and the animals were administered with a
subcutaneous injection of 0.5 ml saline glucose and 50 µl of meloxicam.
2.4.4 Perfusions and Sectioning
Mice were terminally anaesthetised by intraperitoneal (i.p) administration of 0.2
mg/ml sodium pentobarbital (Euthatal) and transcardially perfused with a
prewash solution (PBS, pH 7.3) (Appendix 9.6) for 3 minutes followed by 1.5%
PFA solution, pH7.3 for 3 minutes (Appendix 9.6). The flow rate used would
suggest animals received ~90 ml of prewash and PFA per animal. The brains
were removed, post-fixed in 1.5% PFA O/N and transferred to 25% sucrose
(Sigma) in prewash solution until they sank and remained in this solution until
they were sectioned.
Brains were cut in the required orientation on a corkboard using a single sided
razor blade (4 cm) to remove the cerebellum. The brains were then frozen using
distilled water onto a freezing platform of a calibrated sledge microtome and
were sectioned coronally at a thickness of 40 µm and sections were stored in
0.2% sodium azide in Tris-buffered saline (TBS) or anti-freeze (Appendix 9.6),
in 96/24 or 36 well plates at -20°C until needed for immunohistochemistry.
Chapter 2 Materials and Methods
57
2.4.5 Cresyl Violet Staining
Brain sections (1 in 12 series) were mounted onto glass microscope slides, previously
double-subbed with 1% gelatin and allowed to dry. Cresyl violet (CV) (Appendix 9.6)
staining was automated on a Shandon tissue processing machine that firstly dehydrated
the sections through increasing levels of alcohol from 70% to 95% to 100% and then
agitation for 20 minutes in chloroform/alcohol. Sections were then subjected to
decreasing concentrations of alcohol (95%, 70%), before being placed in distilled water
for 5 minutes and then in the CV stain (Sigma) for another 10 seconds. Following this,
slides were put back into distilled water for a minimum of 30 minutes before being
dehydrated in the alcohols once again (70%, 95%). If the sections were considered “too
dark”, a 1-2 minute step in acid alcohol (Appendix 9.6) was introduced at this stage.
Sections then went into 100% ethanol, followed by xylene, and were mounted using
DPX.
2.4.6 Immunohistochemistry on Free-Floating Tissue Sections
Day 1
A 1 in 12 or 1 in 6 series of brain sections were washed in TBS and then quenched with
10% hydrogen peroxide (VWR) and 10% methanol (Fisher) in distilled water for 5
minutes followed by three 5 minute washes in TBS, pH 7.4. Blocking solution of 3%
NHS/NGS serum in 0.2% Triton X-100 in TBS (TXTBS) (Appendix 9.6) was added for
1 hour, and then, without washing, block was discarded and primary antibody was added
at the appropriate concentration (Appendix 9.6) in 1% serum in TXTBS and incubated
overnight at RT on a shaker. If being left for the weekend, sections were left on a shaker
at 4ºC.If primary antibodies were newly bought in then antibody validation was carried
out. This involved the protocol being carried out as normal but the sections being left
in1% serum in TXTBS with 1% NHS/NGS O/N without the addition of the primary
antibody. The second day protocol was carried out as normal (described below).
Day 2
Sections were washed 3 times in TBS before biotinylated secondary antibodies were
added for 3 hours at a concentration of 1:200 in 1% serum in TBS. The secondary
antibody solution was washed off with 3 washes in TBS and streptavidin ABC (A and B
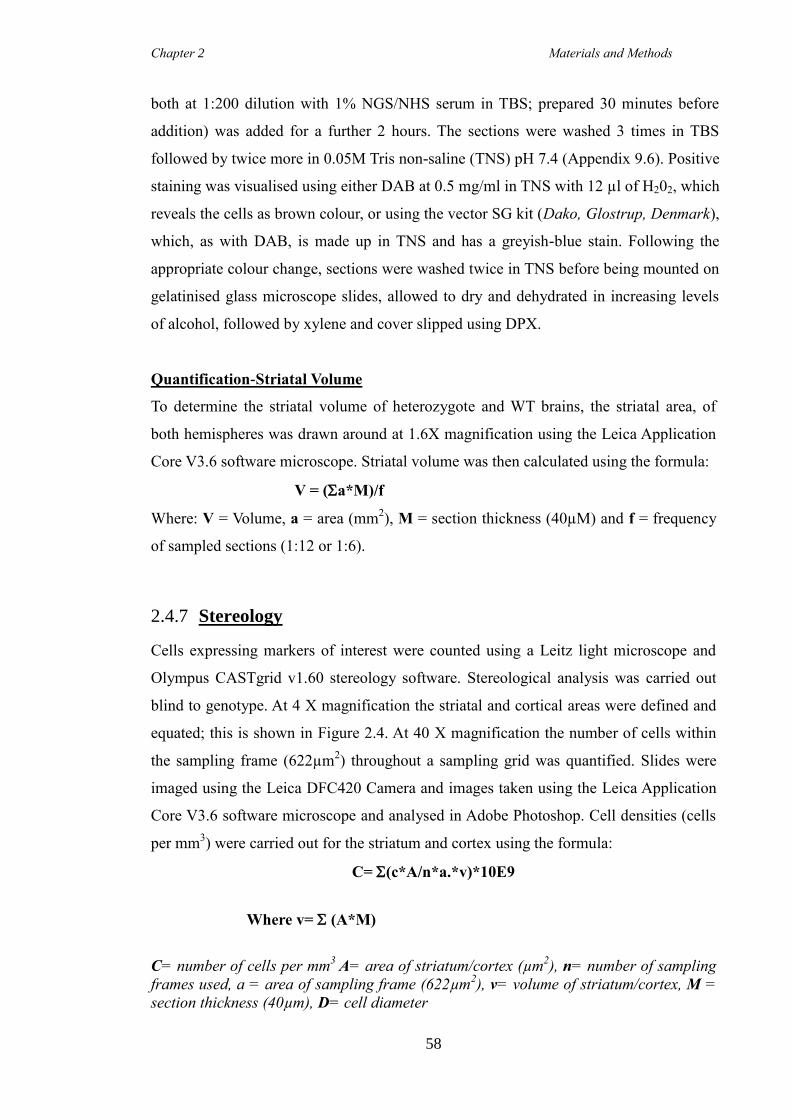
Chapter 2 Materials and Methods
58
both at 1:200 dilution with 1% NGS/NHS serum in TBS; prepared 30 minutes before
addition) was added for a further 2 hours. The sections were washed 3 times in TBS
followed by twice more in 0.05M Tris non-saline (TNS) pH 7.4 (Appendix 9.6). Positive
staining was visualised using either DAB at 0.5 mg/ml in TNS with 12 µl of H202, which
reveals the cells as brown colour, or using the vector SG kit (Dako, Glostrup, Denmark),
which, as with DAB, is made up in TNS and has a greyish-blue stain. Following the
appropriate colour change, sections were washed twice in TNS before being mounted on
gelatinised glass microscope slides, allowed to dry and dehydrated in increasing levels
of alcohol, followed by xylene and cover slipped using DPX.
Quantification-Striatal Volume
To determine the striatal volume of heterozygote and WT brains, the striatal area, of
both hemispheres was drawn around at 1.6X magnification using the Leica Application
Core V3.6 software microscope. Striatal volume was then calculated using the formula:
V = (a*M)/f
Where: V = Volume, a = area (mm2), M = section thickness (40µM) and f = frequency
of sampled sections (1:12 or 1:6).
2.4.7 Stereology
Cells expressing markers of interest were counted using a Leitz light microscope and
Olympus CASTgrid v1.60 stereology software. Stereological analysis was carried out
blind to genotype. At 4 X magnification the striatal and cortical areas were defined and
equated; this is shown in Figure 2.4. At 40 X magnification the number of cells within
the sampling frame (622µm2) throughout a sampling grid was quantified. Slides were
imaged using the Leica DFC420 Camera and images taken using the Leica Application
Core V3.6 software microscope and analysed in Adobe Photoshop. Cell densities (cells
per mm3) were carried out for the striatum and cortex using the formula:
C= (c*A/n*a.*v)*10E9
Where v= (A*M)
C= number of cells per mm3
A= area of striatum/cortex (µm2), n= number of sampling
frames used, a = area of sampling frame (622µm2), v= volume of striatum/cortex, M =
section thickness (40µm), D= cell diameter
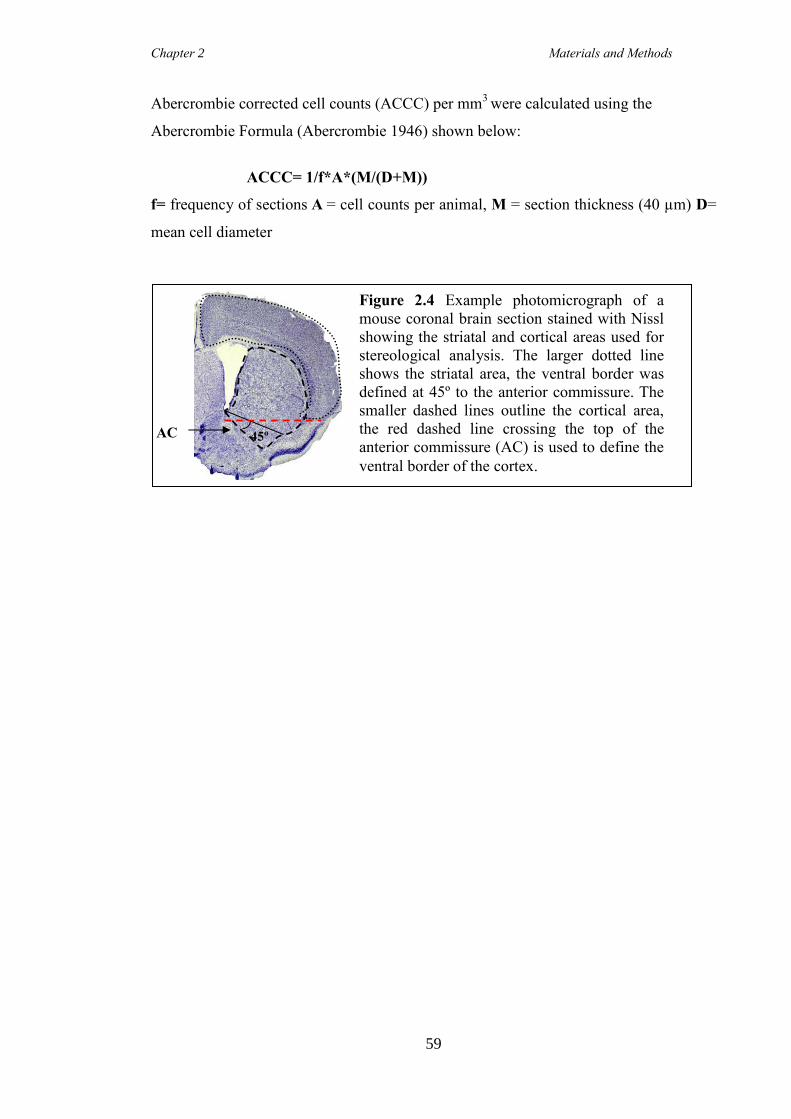
Chapter 2 Materials and Methods
59
Abercrombie corrected cell counts (ACCC) per mm3
were calculated using the
Abercrombie Formula (Abercrombie 1946) shown below:
ACCC= 1/f*A*(M/(D+M))
f= frequency of sections A = cell counts per animal, M = section thickness (40 µm) D=
mean cell diameter
Figure 2.4 Example photomicrograph of a
mouse coronal brain section stained with Nissl
showing the striatal and cortical areas used for
stereological analysis. The larger dotted line
shows the striatal area, the ventral border was
defined at 45º to the anterior commissure. The
smaller dashed lines outline the cortical area,
the red dashed line crossing the top of the
anterior commissure (AC) is used to define the
ventral border of the cortex.
AC 45º

Chapter 2 Materials and Methods
60
2.5 Behaviour
2.5.1 Automated Activity Boxes
Animal activity was assessed using automated Med Associate hardware (Med
Associates, St Albans VT, USA) and MED-PC (IV) software over a period a 32 hours.
16 animals were housed in individual plastic cages (L42 cm, W26 cm and D 19cm) with
3 infrared beams crossing the base of each box. Animals were allowed to acclimatise in
the cages before the start of the experiment and were given access to food and water.
Beam breaks were recorded from each animal crossing and were totalled and averaged
per animal for 32 hours and ultimately grouped according to genotype.
2.5.2 Rotarod
The rotarod apparatus (Ugo Basile, Varese, Italy) was used to provide an overall
assessment of motor coordination and balance. Mice received 5 days of training with 3
trials a day at varying speeds. For the first day, training was set at 4 rev per minute
(rpm) to allow the mice to acclimatise to the exercise and on the remaining training days
the speed gradually accelerated from 4 rpm to 22 rpm. On the test day the speed was set
to accelerating (speed: 4 to 44 rpm over 300s). The time when the mouse fell was
recorded as the outcome measure and the average of the two best trials calculated. The
apparatus is shown in Figure 2.5.
[Type a quote from the document
or the summary of an interesting
point. You can position the text
box anywhere in the document.
Use the Text Box Tools tab to
change the formatting of the pull
quote text box.]
Figure 2.5 Mouse Rotarod
apparatus. 5 mice were tested
on the apparatus simultaneously.
When the animal’s fall onto the
panels at the bottom, the
automated counter stops and re-
sets to 0.

Chapter 2 Materials and Methods
61
2.5.3 Inverted Cage Grip Test
The inverted grip test is a measure of the grip strength of the fore and hind limbs of the
mouse. To start the trial animals were placed onto the centre of a metal cage lid where a
square (20 cm x 20 cm) was taped off. The grid was then slowly inverted and placed 30
cm above the workbench with towels placed underneath to soften falls. The time the
mouse spent grasping the grid without falling was recorded, a maximum cut off of 1
minute was used and analysed.
2.5.4 The Elevated Plus Maze (EPM)
The elevated plus-maze is used for the assessment of anxiety in rodents. The maze
consisted of four cross-shaped arms, two open arms measuring 50 cm x 8 cm, and two
enclosed arms measuring 50 cm x 8 cm x 10 cm (Figure 2.6). The platform was elevated
90 cm from the floor. There was a central area that the mouse started the task from.
Prior to each trial the EPM was cleaned with 70% ethanol in distilled water. The
experimenter remained in the room for the duration of the task (5 minutes) given the
mouse may fall and need to be placed back onto the maze. Entries into and time spent
on enclosed and open arms were measured. An entry occurred whenever the mice
crossed from one arm to another with all four paws. The number of entries into, and
time spent on the open arms were evaluated as a percentage of total arm entries and the
total time spent on all four arms respectively.
Figure 2.6 Picture of the Elevated
Plus Maze (EPM) for mice. There
are 4 arms, 2 open “safe arms” and 2
enclosed arms. There is a central
platform where the task starts. Photo
accessed by www.mpipsykl.mpg.de
on 25th
July 2013.

Chapter 2 Materials and Methods
62
2.5.5 Open Field Activity
Animals were tested in an arena (80 cm x 80 cm), which was white with a video camera
positioned overhead, linked to a computer to record the activity. The programme works
by calculating the contrast differences between the white background of the arena and
the coat colour of the animals (black and brown). Animals were habituated for 2
consecutive days in the arena and then tested on the third day. The programme used to
analyse the animal’s behaviour was EthoVision (Noldus).
2.5.6 Marble Burying Task
For the assessment of anxiety related behaviour 20 glass marbles were evenly spaced
out in 5 rows of 4 (5 cm apart) in the centre of a novel cage with enough sawdust to
allow burying; a mouse’s normal response is to bury marbles (Archer et al. 1987;
Broekkamp et al. 1986). The test was conducted in a plastic box measuring 30 cm by 50
cm by 15 cm which was filled with 5 cm of non-allergenic bedding sawdust. 10 test
stations were set up, allowing 10 mice to be tested simultaneously. Animals were left for
30 minutes in the cage, with a plastic lid over the top so that they could not escape or
climb on it. The experimenter was not in the room whilst testing occurred. Following
the 30 minutes, individual cages were photographed and the number of marbles buried
and counted analysed.
2.5.7 Operant Testing - Operant Boxes
Testing was conducted using sixteen mouse 9-hole operant chambers under the control
of a computer operating the Cambridge Cognition Control System (BNC
Control,Campden Instruments, Loughborough); an example box is shown in Figure
2.7A. The dimensions of each chamber were 14 cm x 13.5 cm x 12.5 cm in which the
curved rear wall was fitted with a horizontal array of nine response holes (11 mm
diameter, separated by 2 mm) positioned 15 mm above the stainless steel floor. Each
hole had a photocell detector at the front to detect entries into holes (i.e. nose pokes) and
an LED stimulus light (24V). In the present experiment, the 5 choice serial reaction
time task (5-CSRTT), 5 of the 9 response holes were used (holes 1, 3, 5, and 7 and 9),
and the remaining un-used holes were blocked. On the opposite wall, a reward
magazine was fitted into which 2.5 µl of strawberry milk (Yazoo, Campina, UK) could

Chapter 2 Materials and Methods
63
be delivered as a reward via a peristaltic pump, shown in Figure 2.7. A horizontal
infrared beam across the entrance of the magazine detected entries by the mice when a
reward was collected. The chamber was also fitted with two additional “house” lights on
the sidewalls, which illuminated to signal the end of a trial and time-out periods. Each
chamber was housed in a sound-attenuating box with continuous airflow.

Chapter 2 Materials and Methods
64
(A) (B)
Figure 2.7 (Previous page) An example nine-hole operant box chamber for
behavioural testing in mice. (A) An example photograph of one of the operant
boxes used showing the 9 holes on the rear of the apparatus. Strawberry milk
(shown in the small bottle) is delivered through the plastic tubing via a peristaltic
pump into the magazine on completion of a correct response by the animal.(B)
Schematic diagram of the nine-hole box set up for the 5-CSRTT with holes 2, 4,
7 and 9 covered up. 24V bulbs are at the rear of each hole and act as a visual
stimulus for poking. Infra red photocell beams at the front of each hole, and
magazine record entries made by the mouse.
Chapter 2 Materials and Methods
65
2.5.8 Operant Training
Behavioural testing was started 3 days after the introduction of the food restriction
regime (mice were food restricted to no more than ~ 85% of their initial body weight to
ensure motivation on the operant task). Training for the operant task was split up into
different elements. Firstly, the mouse was introduced to the test chamber and the
magazine light was left on continuously for the duration of the programme (20 minutes)
and a 25 µL reward was delivered into the magazine, i.e. no poking was required at this
stage. This initial shaping session served to habituate the animal to the environment and
reward. The next days of training were to enhance magazine reward. The house light
was turned off with the magazine light illuminated to show there was a 5 µL reward, on
retrieval of the reward the magazine light was extinguished, and there was delay of 10
seconds before the magazine light was illuminated once more, this pattern was repeated
for the duration of the session (30 minutes). The next stage of the training involved
the mice learning to poke a specific hole and associate poking with a reward. A
small amount of strawberry milk was painted around the perimeter of hole 5 during
this task to encourage the mice to nose-poke. At the start of the trial, the house light
was turned off, followed by illumination of hole 5. A correct nose poke into this
hole caused the light to be extinguished and the delivery of strawberry milk into the
magazine. On retrieval of the reward, the magazine light was extinguished and the
house light was turned off for 10 seconds before hole 5 was illuminated once more,
this sequence was repeated for the duration of the trial (20 minutes). This session
was carried out once a day until the mice retained a high level of accuracy (~80%) ,
i.e. had learnt to associate poking with a reward.
2.5.9 5-choice serial reaction time task (5-CSRTT)
Once all animals learned to respond to the stimuli, they were tested on the 5 choice
serial reaction time task (5-CSRTT), which is outlined in Figure 2.8. The 5-CSRTT
provides an effective test of vigilance and attention (Robbins 2002). Following
training, all animals began the 5-CSRTT. This required the mice to respond to the
illumination of different holes. As mentioned, holes 1, 3, 5, 7 and 9 were
uncovered, and each test began with the illumination of the house light, followed by
it being extinguished and one of the 5 holes being illuminated at random, initially

Chapter 2 Materials and Methods
66
for 10 seconds. A correct nose poke into the illuminated hole saw the extinction of
the light with simultaneous illumination of the magazine and delivery of 5 µl of
strawberry milk. On collection of reward the magazine light was extinguished
followed by a fixed inter trial interval (ITI) of 2 seconds before the next trial began.
Incorrect nose-pokes into a non-illuminated hole, poking before the onset of
illumination (impulsivity) or not poking at all (omission) were all were recorded
and were punishable by a 5 second time-out period in which the house light was
illuminated and no reward was delivered. The duration that the stimulus light was
illuminated for was altered as the task progressed. Initially, the illumination period
was 10 seconds (5 days) before being reduced to 1 second (5 days), and finally half
a second (10 days). The number of correct responses/total responses determined
accuracy and reaction time and total number of omissions (no response) was also
recorded and analysed.
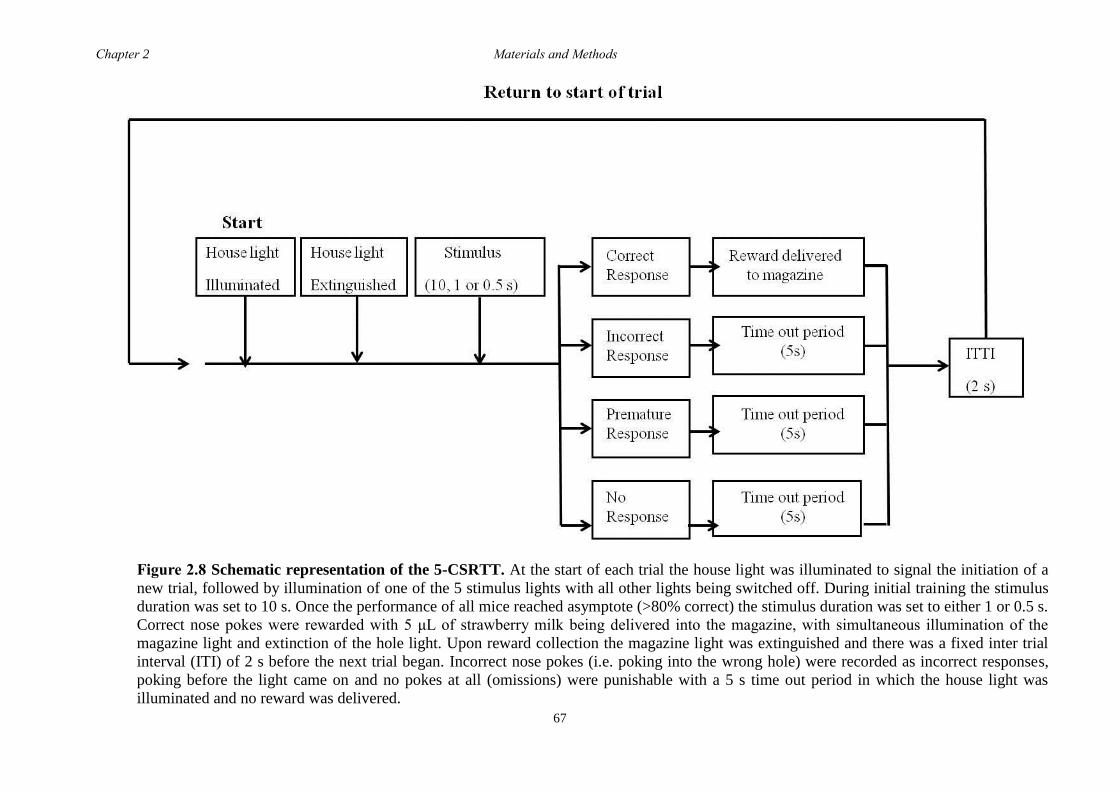
Chapter 2 Materials and Methods
67
Figure 2.8 Schematic representation of the 5-CSRTT. At the start of each trial the house light was illuminated to signal the initiation of a
new trial, followed by illumination of one of the 5 stimulus lights with all other lights being switched off. During initial training the stimulus
duration was set to 10 s. Once the performance of all mice reached asymptote (>80% correct) the stimulus duration was set to either 1 or 0.5 s.
Correct nose pokes were rewarded with 5 μL of strawberry milk being delivered into the magazine, with simultaneous illumination of the
magazine light and extinction of the hole light. Upon reward collection the magazine light was extinguished and there was a fixed inter trial
interval (ITI) of 2 s before the next trial began. Incorrect nose pokes (i.e. poking into the wrong hole) were recorded as incorrect responses,
poking before the light came on and no pokes at all (omissions) were punishable with a 5 s time out period in which the house light was
illuminated and no reward was delivered.

Chapter 2 Materials and Methods
68
2.5.10 Pharmacological Intervention
Methylphenidate (Ritalin) (Tocris) (5, 10 or 30 mg/kg) (doses established from a
preliminary Latin square dose-response trial) and atomoxetine (Tocris) (1, 2 or 4 mg/kg)
(Bymaster et al. 2002) were, on separate occasions, administered to mice via an i.p
injection. Both drugs were dissolved in a 0.9% isotonic saline solution (0.9% NaCl).
Ritalin was made up to be in a final volume of 10 ml/kg (i.e. 30g mouse- 30µl of the
dose) whereas problems with atomoxetine dissolving required it to be made at a final
volume of 20 ml/kg. Directly following the injection, mice were tested in the locomotor
activity boxes as outlined in 2.5.1, but on a 2 hour programme which started at 18:00-
start of the dark phase of the animal’s cycle. All animals in the task received all doses of
drugs over a period of 4 days. Animals were also given Ritalin (5 mg/kg) and tested on
the 5-CSRTT.
2.5.11 Behavioural Data Statistical Analysis
PAWS Statistics (SPSS) V.18 was used to carry out statistical analysis of all data. To
look at differences in behavioural tasks either a one way analysis of variance was used
(rotarod, grip strength, open field, EPM, MBT) or a 2-way ANOVA (activity box data
and operant data) with genotype always the between subject factor. For the marble
burying task a Man-Whitney non-parametric analysis was also carried out. A 2-way
ANOVA needed to be used in the later behavioural tasks to account for the additional
levels of hole number, stimulus delay and/or drug as well as genotype for the 5-CSRTT
and similarly for locomotor activity to account for drug and period of time as well as
genotype. The alpha level for significant F-ratios was set at 0.05 for all analyses.
Chapter 3 In vitro characterisation of Foxp1
69
3 The Characterisation of Foxp1 in the
Developing Mouse Brain
3.1 Summary
Foxp1 is a TF identified as having a fundamental role in many aspects of development
and has shown to be expressed in both the developing and adult brain. Foxp1 was the
most highly up-regulated gene in an Affymetrix screen carried out by the host lab, which
used mouse WGE to look for significant differences in gene expression over peak
striatal development (E12-E16). The purpose of this Chapter was to further
characterise Foxp1 levels during embryonic and early post-natal development using
immunohistochemistry, before attempting to understand the functional role of this TF in
MSN development using Foxp1 KO mice. However, Foxp1 homozygous KO mice are
embryonic lethal at E15 due to cardiac defects. The possibility of using adult Foxp1+/-
was considered, however, when compared to WT mice the Foxp1+/-
mice had no obvious
phenotype, therefore experiments in this Chapter were limited to analysis at E14.
In vitro experiments showed that in the absence of Foxp1 there was a significant
decrease in the number of CTIP2 and DARPP-32 positive cells after 7 DIV, but that
there was no effect on proliferation or neuronal homogeneity as shown through calcium
imaging studies. Fluorescent immunohistochemistry also suggested that FOXP1 is
reduced in Gsh2 KO mice, and in the SVZ of Ascl1 KO mice, suggesting that Foxp1
could possibly function downstream of these important striatal TFs.
.
Chapter 3 In vitro characterisation of Foxp1
70
3.2 Introduction
MSNs develop from the telencephalon, identifiable at E8.5 by Foxg1 expression
(Hebert and McConnell 2000; Shimamura and Rubenstein 1997). The developing
telencephalon is subsequently divided and regions discernible by differential gene
expression. The dorsal telencephalon gives rise to the developing cortex; whereas the
ventral telencephalon is concerned with striatal development and further divides into the
LGE, MGE and CGE. MSNs principally originate from the LGE as a population of
Ascl1+, Gsh2
+ and Dlx1/2/5/6
+ precursors that reside, and proliferate in the VZ and SVZ
(Campbell 2003). These striatal precursors migrate out of the VZ and differentiate in the
MZ of the developing striatum between E11 and E15, in two different waves, and are
identifiable by TFs such as Ctip2 (Arlotta et al. 2008), Helios (Martin-Ibanez et al.
2012)Ikaros (Martın-Ibanez et al. 2010) and Foxp1 (Tamura et al., 2004) and will
eventually mature to become GABAergic, DARPP-32 positive MSNs. An affymetrix
screen which used mouse WGE to look for significant differences in gene expression
over peak striatal development (E12-E16) identified many genes as being differentially
expressed, of which the above mentioned genes were included (Precious et al,
submitted 2013). As mentioned, Foxp1 as the most highly up-regulated gene suggesting
a role in MSN differentiation.
Foxp1 is a TF that has been implicated in several developmental processes including
heart and lung development (Shu et al. 2001; Wang et al. 2004a), in which its role in
heart development was identified through utilisation of Foxp1 KO mice (Wang et al.
2004a). Foxp1 has also shown to be important in aspects of CNS development;
specifically, it has shown to be an accessory factor in Hox transcriptional output which
regulates motor neuron diversity and connectivity to target muscles (Dasen et al. 2008;
Rousso et al. 2008). In vitro work using mESCs has also shown that Foxp1 has a
functional role in DA neuron development. It was shown that the addition of Foxp1 to
mESCs activated the expression of PITX3; a protein exclusively expressed in midbrain
dopaminergic neuron that is vital for their correct differentiation and survival during
development in vitro and in vivo (Konstantoulas et al. 2010). Recently, mutations in the
human FOXP1 gene have suggested it is also required for the speech and language
development (Hamdan et al. 2010; Horn et al. 2010).
Chapter 3 In vitro characterisation of Foxp1
71
Of importance to the work outlined in this thesis, and in support of the Affymetrix
results obtained by our lab group, is that Foxp1 has shown to be expressed in both the
developing and adult striatum and co-localises with DARPP-32 (Ferland et al. 2003;
Tamura et al. 2004). Specifically in mice, Foxp1 mRNA has shown to be expressed in
the developing striatum from E12.5 in the SVZ and MZ of the LGE (Ferland et al.
2003), a region synonymous with differentiating, post-mitotic neurons (Campbell 2003;
Stenman et al. 2003). Consistently, Foxp1 is also expressed in the developing human
striatum over an equivalent gestational window and with a similar anatomical
distribution to that seen in the mouse (Precious et al., submitted 2013). FOXP1
immunohistochemistry also showed co-localisation with CTIP2, another routinely used
MSN marker also expressed in developing and adult MSNs (Arlotta et al. 2008).
However, although Foxp1 is expressed during MSN development, its function, and its
relationship to the genetic pathways already known in striatal development are largely
unknown but are likely to be important for the optimisation of in vitro protocols that aim
to direct renewable cells sources, such as ESCs, to functional MSNs for use in cell
replacement therapies (Kelly et al. 2009). Information from mouse models in which key
genes involved in striatal development have been knocked out have hinted at what TFs
may be functioning downstream of Foxp1 but no functional analysis has been
undertaken. Rubenstein’s group used an Affymetrix screen to look at differences in the
expression profiles of over 100 genes in the LGE of Dlx1/2 KO mice and notably
showed a severe reduction in FOXP1in the SVZ and MZ (Long et al. 2009). Similarly,
when the TF Ctip2 was knocked out there was a decrease in both DARPP-32 and
FOXP1 at P0 (Arlotta et al., 2008).
The Foxp1 KO mouse has been valuable in understanding the function of this gene in
several systems. However, homozygous Foxp1 KO mice (Foxp1-/-
) are embryonically
lethal by E15 due to heart defects, and Foxp1 heterozygote embryos did not show any
obvious differences from the WTs (although adult mice were not studied) (Wang et al.
2004a). Therefore, studying the function and looking at downstream or upstream targets
of Foxp1 after E14 is challenging and it ideally requires a conditional KO (CKO) mouse
line to be developed. A striatal specific CKO is being developed by myself, but
unfortunately was not available during the time course of this Thesis. Nevertheless, one
Chapter 3 In vitro characterisation of Foxp1
72
can attempt to explore the function of Foxp1, by studying differences up to the point of
lethality.
First this Chapter looked at the expression profile of Foxp1 in the developing WT
striatum and this was characterised from early in development (E10) through to
adulthood. A phenotypic comparison between WT and Foxp1+/-
adult mice showed no
obvious phenotypic differences, and therefore, analysis was undertaken using the
Foxp1-/-
mice. Analysis focused on the characterisation of the Foxp1 KO line with an
emphasis on characterising differences in MSNs at E14, as this age was coincident with
peak MSN neurogenesis (Mason et al. 2005). To determine differences in MSNs
between the genotypes, the striatal markers CTIP2, and where possible, DARPP-32
were used. Following 7 DIV, E14 striatal cultures generated from Foxp1-/-
striate were
shown to have significantly fewer DARPP-32 and CTIP2 positive cells than cultures
generated from WT or Foxp1+/-
striate. Differences in proliferation were also explored
and as a means of assessing neuronal homogeneity calcium imaging was also carried
out on E14 striatal cultures. In addition on a visit to the Canal’s group at the University
of Barcelona I carried out immunohistochemistry using an anti-FOXP1 antibody on
brain slices of known striatal KO mice to gain a further understand what genes Foxp1
may be functioning up or downstream of.
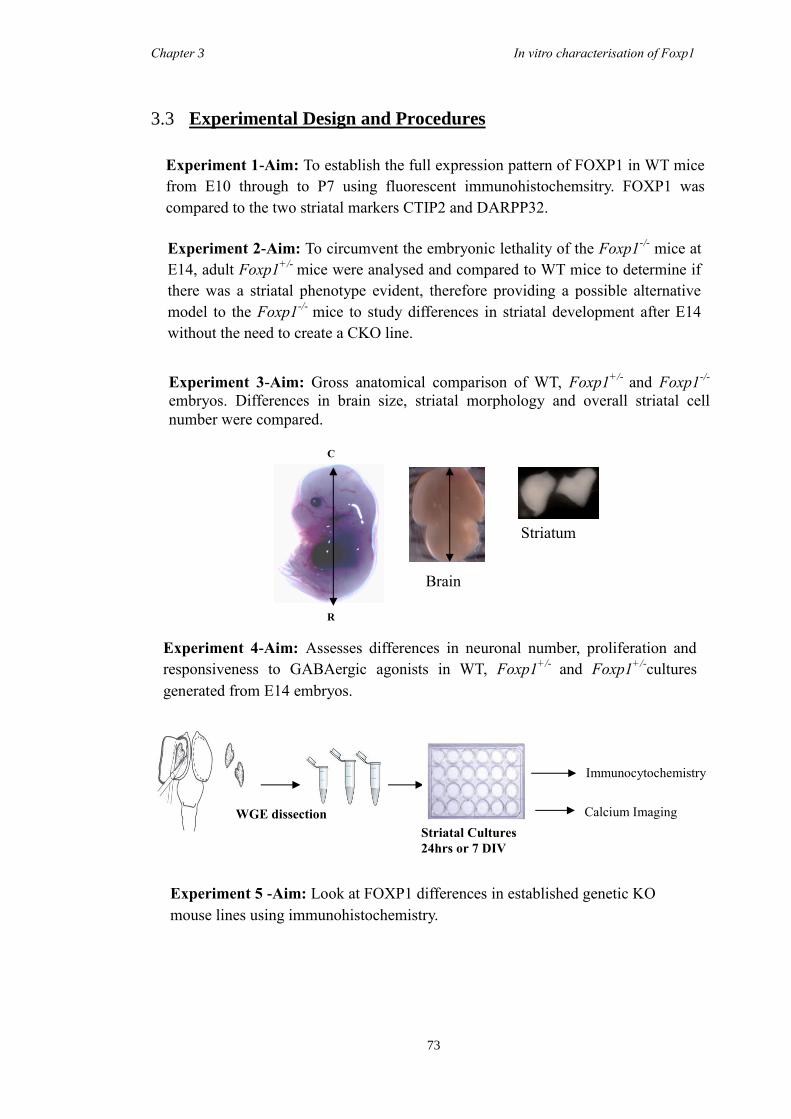
Chapter 3 In vitro characterisation of Foxp1
73
Embryo
Brain
Striatum
R
C
3.3 Experimental Design and Procedures
Experiment 4-Aim: Assesses differences in neuronal number, proliferation and
responsiveness to GABAergic agonists in WT, Foxp1+/-
and Foxp1+/-
cultures
generated from E14 embryos.
Experiment 3-Aim: Gross anatomical comparison of WT, Foxp1+/-
and Foxp1-/-
embryos. Differences in brain size, striatal morphology and overall striatal cell
number were compared.
Experiment 1-Aim: To establish the full expression pattern of FOXP1 in WT mice
from E10 through to P7 using fluorescent immunohistochemsitry. FOXP1 was
compared to the two striatal markers CTIP2 and DARPP32.
WGE dissection
Striatal Cultures
24hrs or 7 DIV
Immunocytochemistry
Calcium Imaging
Experiment 5 -Aim: Look at FOXP1 differences in established genetic KO
mouse lines using immunohistochemistry.
Experiment 2-Aim: To circumvent the embryonic lethality of the Foxp1-/-
mice at
E14, adult Foxp1+/-
mice were analysed and compared to WT mice to determine if
there was a striatal phenotype evident, therefore providing a possible alternative
model to the Foxp1-/-
mice to study differences in striatal development after E14
without the need to create a CKO line.
Chapter 3 In vitro characterisation of Foxp1
74
3.4 Results
The expression pattern of FOXP1 in the embryonic and postnatal striatum
compared to the MSN markers CTIP2 and DARPP-32.
To look at the protein levels of FOXP1 in the developing and postnatal mouse brain
fluorescent immunohistochemistry using anti-FOXP1, anti-CTIP2 and anti-DARPP-32
was carried out on WT brain sections from E10 (when the ganglionic eminences are
emerging), through to P7. At E10 there were patches of FOXP1 positive staining in the
area likely to be the SVZ (Figure 3.1A, B). There were no identifiable CTIP2 positive
cells at this age. At E12, FOXP1 staining was once again evident in the SVZ with few
positive cells also being identified out of this proliferative region. CTIP2 staining was
absent from the proliferative regions but positive staining was seen in the perspective
MZ, the area where post-mitotic neurons migrate to and differentiate, however there
was no co-localisation seen with FOXP1 (Figure 3.1C, D). By E14, CTIP2 and FOXP1
clearly show co-localisation within the MZ of the striatum (Figure 3.1E, G), although
complete co-localisation is not apparent with FOXP1 positive/CTIP2 negative patches
evident in the MZ and the SVZ (Figure 3.1.E. F).
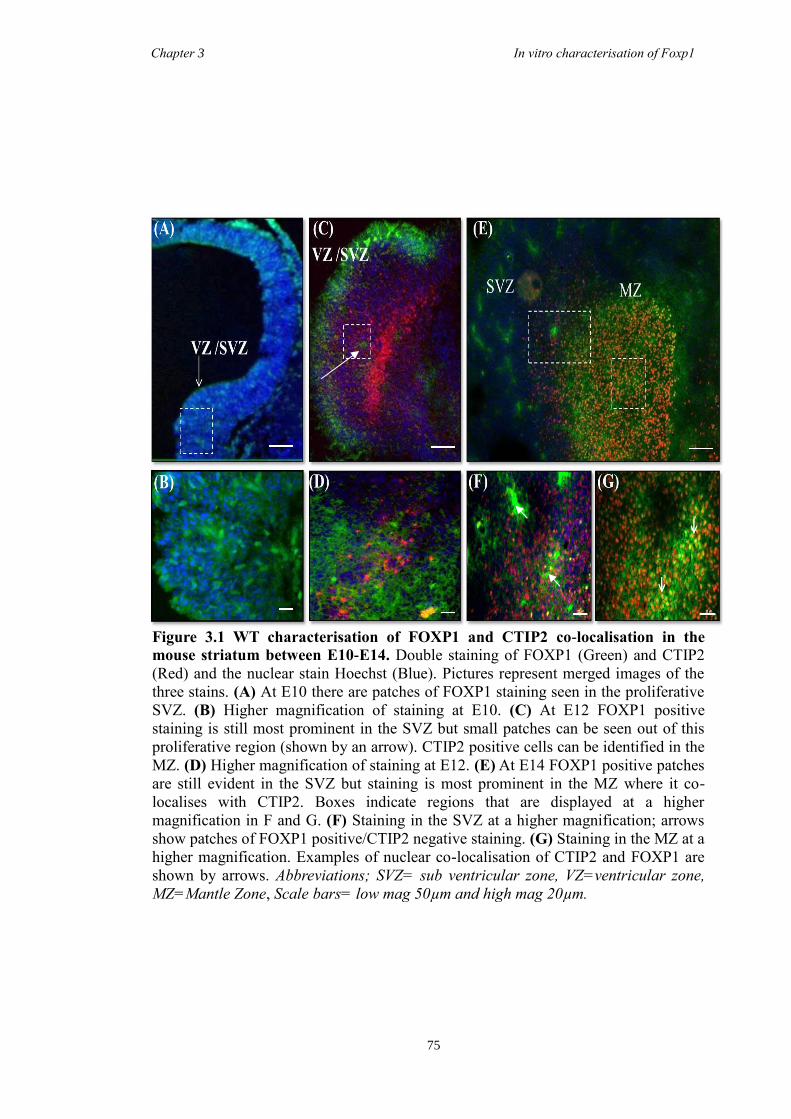
Chapter 3 In vitro characterisation of Foxp1
75
(C)
Figure 3.1 WT characterisation of FOXP1 and CTIP2 co-localisation in the
mouse striatum between E10-E14. Double staining of FOXP1 (Green) and CTIP2
(Red) and the nuclear stain Hoechst (Blue). Pictures represent merged images of the
three stains. (A) At E10 there are patches of FOXP1 staining seen in the proliferative
SVZ. (B) Higher magnification of staining at E10. (C) At E12 FOXP1 positive
staining is still most prominent in the SVZ but small patches can be seen out of this
proliferative region (shown by an arrow). CTIP2 positive cells can be identified in the
MZ. (D) Higher magnification of staining at E12. (E) At E14 FOXP1 positive patches
are still evident in the SVZ but staining is most prominent in the MZ where it co-
localises with CTIP2. Boxes indicate regions that are displayed at a higher
magnification in F and G. (F) Staining in the SVZ at a higher magnification; arrows
show patches of FOXP1 positive/CTIP2 negative staining. (G) Staining in the MZ at a
higher magnification. Examples of nuclear co-localisation of CTIP2 and FOXP1 are
shown by arrows. Abbreviations; SVZ= sub ventricular zone, VZ=ventricular zone,
MZ=Mantle Zone, Scale bars= low mag 50µm and high mag 20µm.
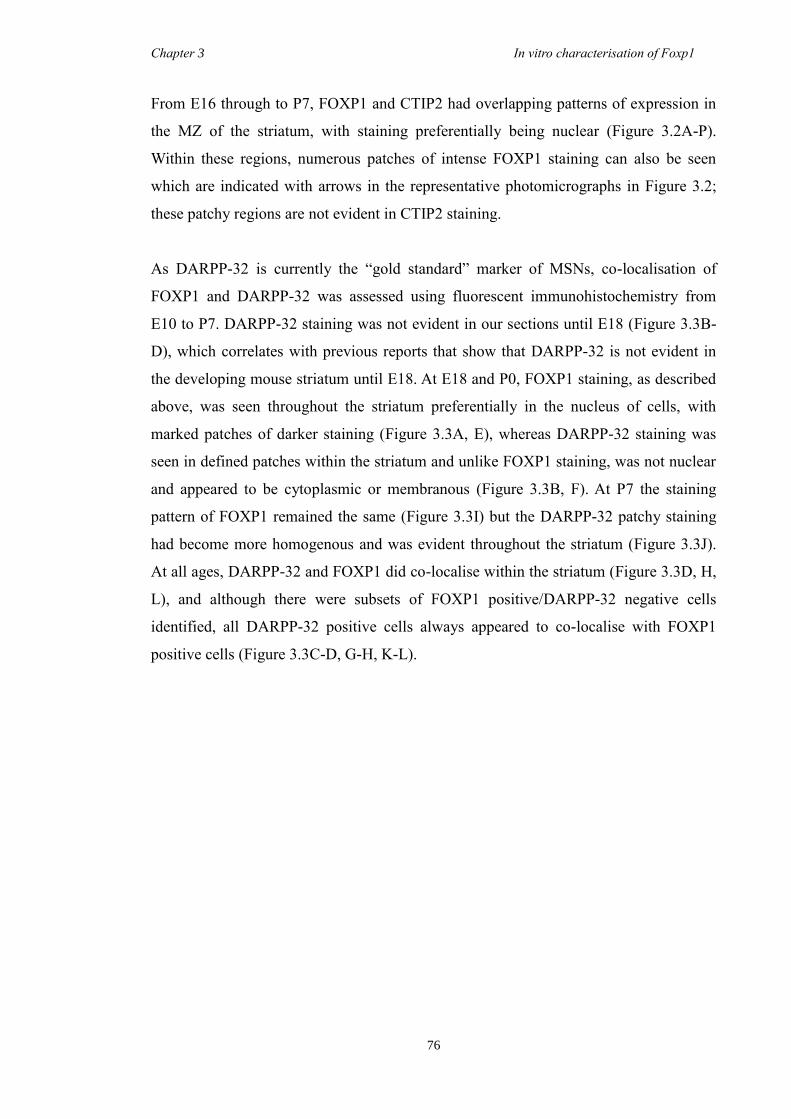
Chapter 3 In vitro characterisation of Foxp1
76
From E16 through to P7, FOXP1 and CTIP2 had overlapping patterns of expression in
the MZ of the striatum, with staining preferentially being nuclear (Figure 3.2A-P).
Within these regions, numerous patches of intense FOXP1 staining can also be seen
which are indicated with arrows in the representative photomicrographs in Figure 3.2;
these patchy regions are not evident in CTIP2 staining.
As DARPP-32 is currently the “gold standard” marker of MSNs, co-localisation of
FOXP1 and DARPP-32 was assessed using fluorescent immunohistochemistry from
E10 to P7. DARPP-32 staining was not evident in our sections until E18 (Figure 3.3B-
D), which correlates with previous reports that show that DARPP-32 is not evident in
the developing mouse striatum until E18. At E18 and P0, FOXP1 staining, as described
above, was seen throughout the striatum preferentially in the nucleus of cells, with
marked patches of darker staining (Figure 3.3A, E), whereas DARPP-32 staining was
seen in defined patches within the striatum and unlike FOXP1 staining, was not nuclear
and appeared to be cytoplasmic or membranous (Figure 3.3B, F). At P7 the staining
pattern of FOXP1 remained the same (Figure 3.3I) but the DARPP-32 patchy staining
had become more homogenous and was evident throughout the striatum (Figure 3.3J).
At all ages, DARPP-32 and FOXP1 did co-localise within the striatum (Figure 3.3D, H,
L), and although there were subsets of FOXP1 positive/DARPP-32 negative cells
identified, all DARPP-32 positive cells always appeared to co-localise with FOXP1
positive cells (Figure 3.3C-D, G-H, K-L).
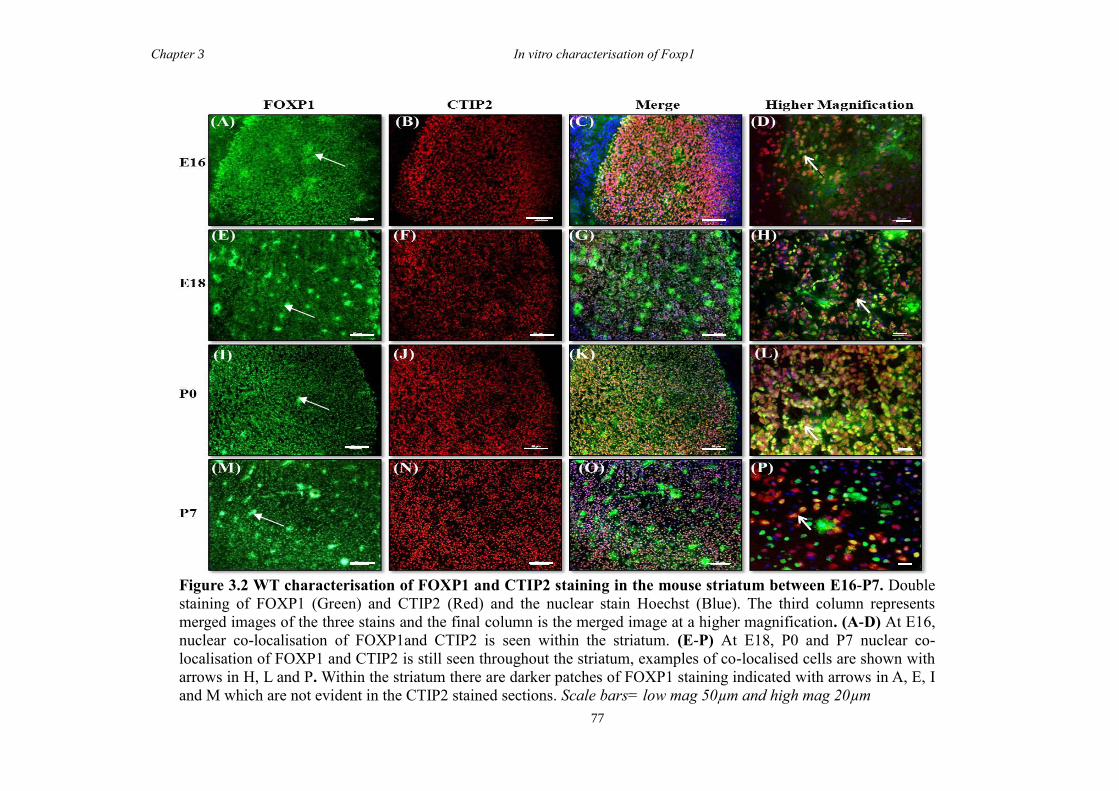
Chapter 3 In vitro characterisation of Foxp1
77
Figure 3.2 WT characterisation of FOXP1 and CTIP2 staining in the mouse striatum between E16-P7. Double
staining of FOXP1 (Green) and CTIP2 (Red) and the nuclear stain Hoechst (Blue). The third column represents
merged images of the three stains and the final column is the merged image at a higher magnification. (A-D) At E16,
nuclear co-localisation of FOXP1and CTIP2 is seen within the striatum. (E-P) At E18, P0 and P7 nuclear co-
localisation of FOXP1 and CTIP2 is still seen throughout the striatum, examples of co-localised cells are shown with
arrows in H, L and P. Within the striatum there are darker patches of FOXP1 staining indicated with arrows in A, E, I
and M which are not evident in the CTIP2 stained sections. Scale bars= low mag 50µm and high mag 20µm
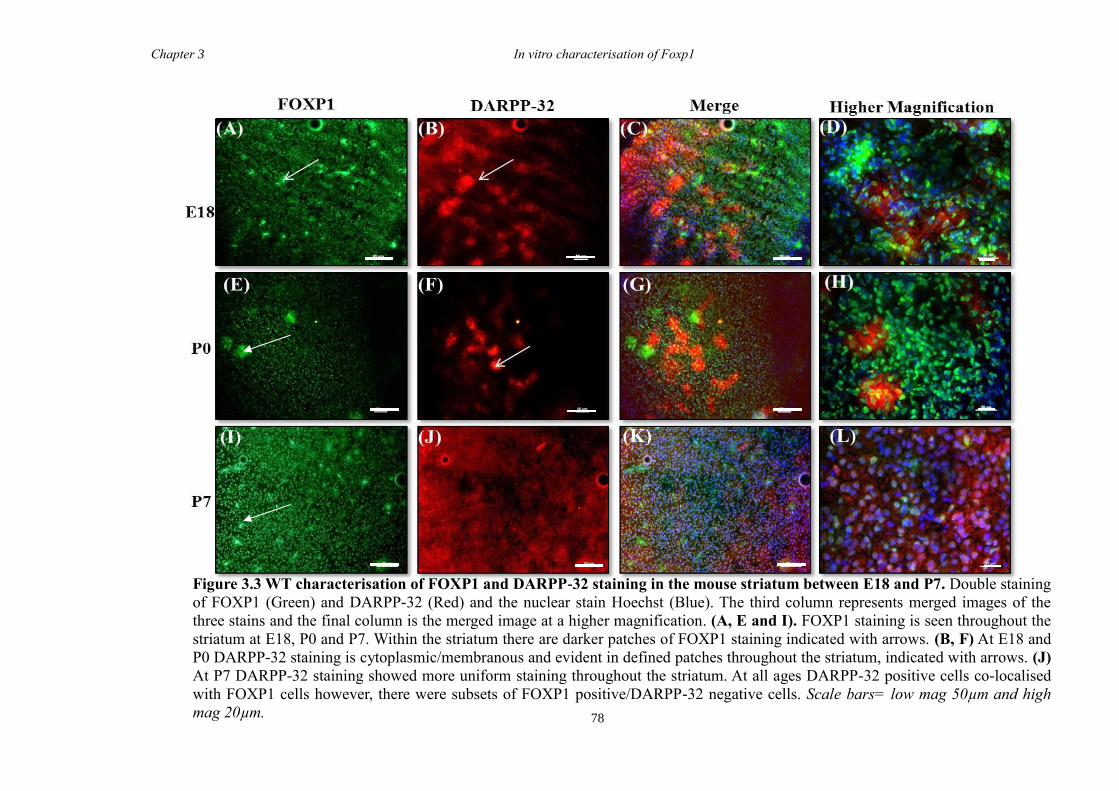
Chapter 3 In vitro characterisation of Foxp1
78
Figure 3.3 WT characterisation of FOXP1 and DARPP-32 staining in the mouse striatum between E18 and P7. Double staining
of FOXP1 (Green) and DARPP-32 (Red) and the nuclear stain Hoechst (Blue). The third column represents merged images of the
three stains and the final column is the merged image at a higher magnification. (A, E and I). FOXP1 staining is seen throughout the
striatum at E18, P0 and P7. Within the striatum there are darker patches of FOXP1 staining indicated with arrows. (B, F) At E18 and
P0 DARPP-32 staining is cytoplasmic/membranous and evident in defined patches throughout the striatum, indicated with arrows. (J)
At P7 DARPP-32 staining showed more uniform staining throughout the striatum. At all ages DARPP-32 positive cells co-localised
with FOXP1 cells however, there were subsets of FOXP1 positive/DARPP-32 negative cells. Scale bars= low mag 50µm and high
mag 20µm.
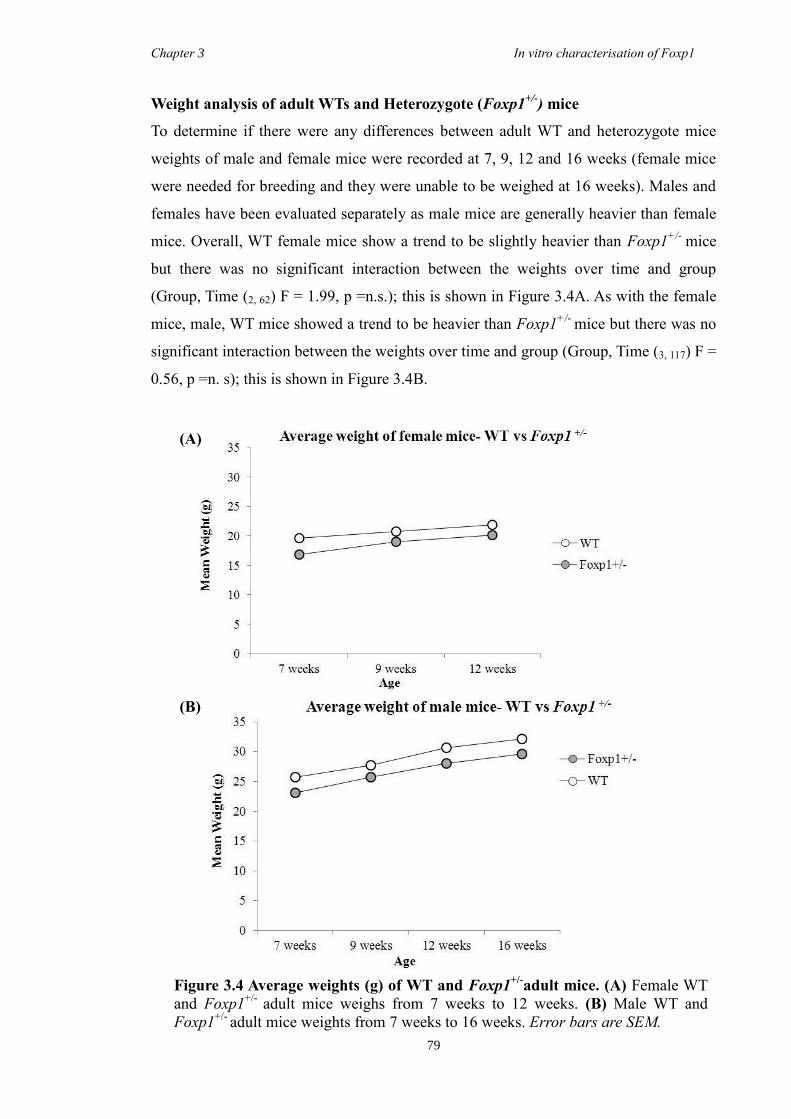
Chapter 3 In vitro characterisation of Foxp1
79
Weight analysis of adult WTs and Heterozygote (Foxp1+/-
) mice
To determine if there were any differences between adult WT and heterozygote mice
weights of male and female mice were recorded at 7, 9, 12 and 16 weeks (female mice
were needed for breeding and they were unable to be weighed at 16 weeks). Males and
females have been evaluated separately as male mice are generally heavier than female
mice. Overall, WT female mice show a trend to be slightly heavier than Foxp1+/-
mice
but there was no significant interaction between the weights over time and group
(Group, Time (2, 62) F = 1.99, p =n.s.); this is shown in Figure 3.4A. As with the female
mice, male, WT mice showed a trend to be heavier than Foxp1+/-
mice but there was no
significant interaction between the weights over time and group (Group, Time (3, 117) F =
0.56, p =n. s); this is shown in Figure 3.4B.
Figure 3.4 Average weights (g) of WT and Foxp1+/-
adult mice. (A) Female WT
and Foxp1+/-
adult mice weighs from 7 weeks to 12 weeks. (B) Male WT and
Foxp1+/-
adult mice weights from 7 weeks to 16 weeks. Error bars are SEM.
(B)
(A)
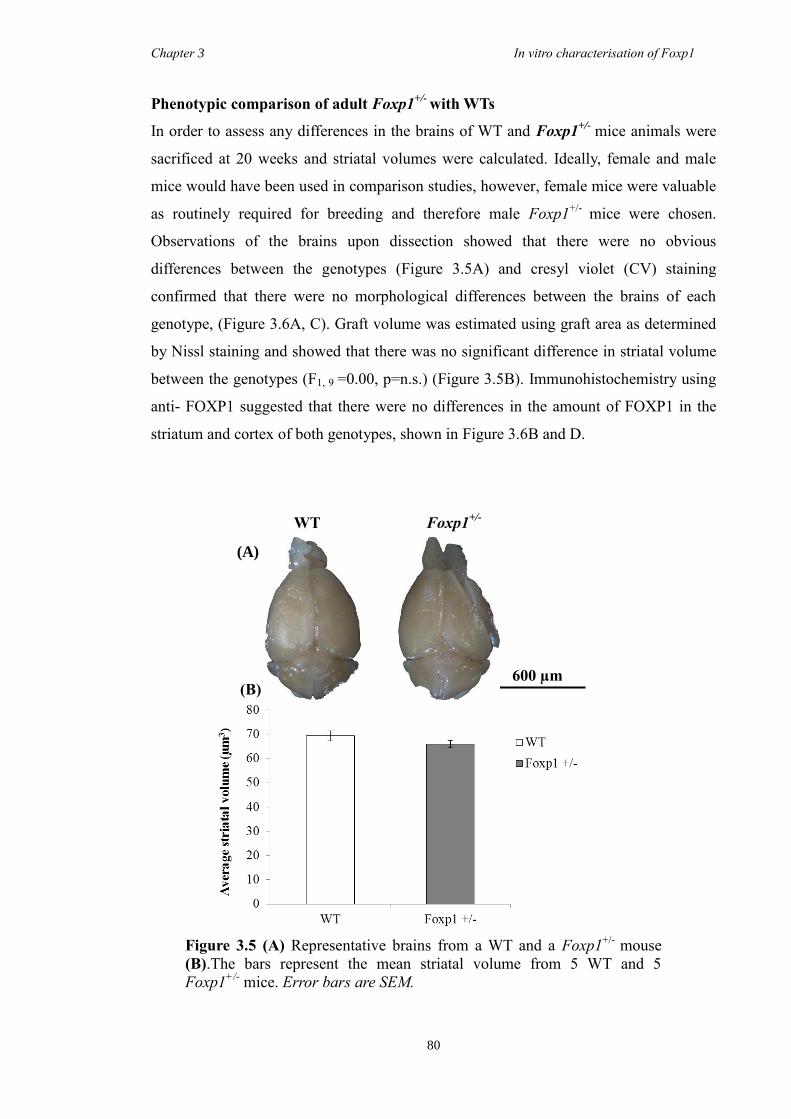
Chapter 3 In vitro characterisation of Foxp1
80
Phenotypic comparison of adult Foxp1+/-
with WTs
In order to assess any differences in the brains of WT and Foxp1+/-
mice animals were
sacrificed at 20 weeks and striatal volumes were calculated. Ideally, female and male
mice would have been used in comparison studies, however, female mice were valuable
as routinely required for breeding and therefore male Foxp1+/-
mice were chosen.
Observations of the brains upon dissection showed that there were no obvious
differences between the genotypes (Figure 3.5A) and cresyl violet (CV) staining
confirmed that there were no morphological differences between the brains of each
genotype, (Figure 3.6A, C). Graft volume was estimated using graft area as determined
by Nissl staining and showed that there was no significant difference in striatal volume
between the genotypes (F1, 9 =0.00, p=n.s.) (Figure 3.5B). Immunohistochemistry using
anti- FOXP1 suggested that there were no differences in the amount of FOXP1 in the
striatum and cortex of both genotypes, shown in Figure 3.6B and D.
Figure 3.5 (A) Representative brains from a WT and a Foxp1+/-
mouse
(B).The bars represent the mean striatal volume from 5 WT and 5
Foxp1+/-
mice. Error bars are SEM.
600 µm
(A)
WT Foxp1+/-
(B)
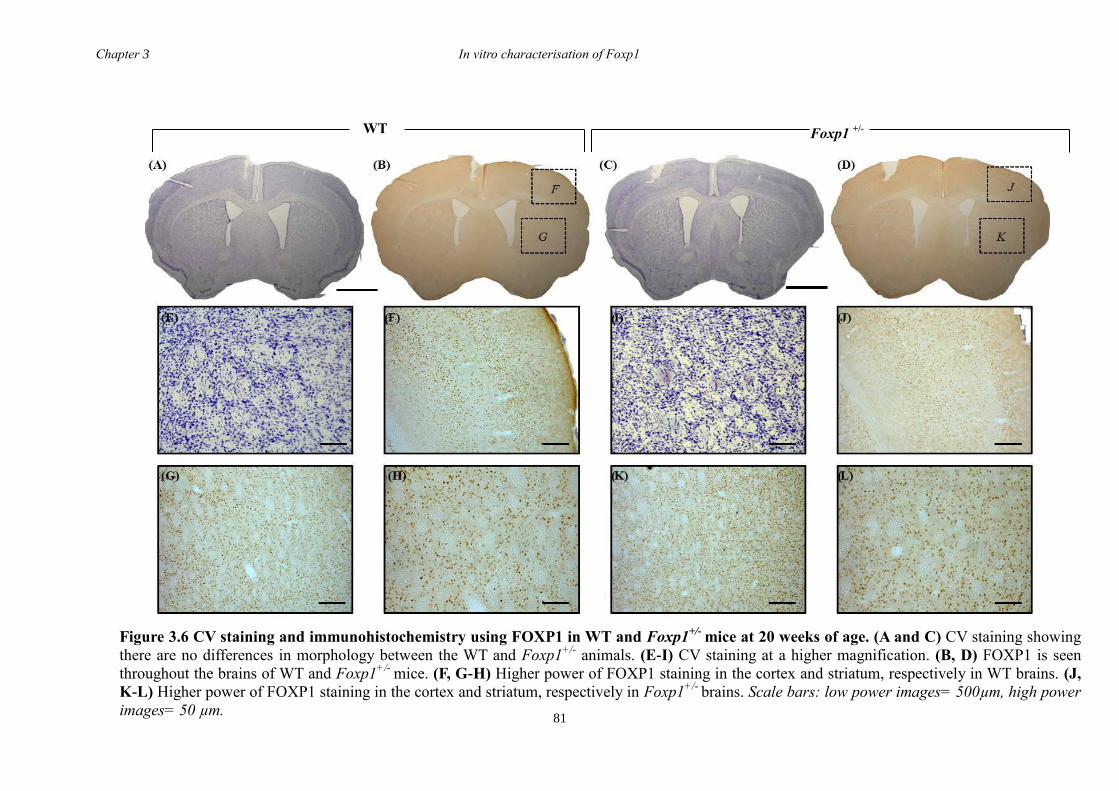
Chapter 3 In vitro characterisation of Foxp1
81
(
Figure 3.6 CV staining and immunohistochemistry using FOXP1 in WT and Foxp1+/-
mice at 20 weeks of age. (A and C) CV staining showing
there are no differences in morphology between the WT and Foxp1+/-
animals. (E-I) CV staining at a higher magnification. (B, D) FOXP1 is seen
throughout the brains of WT and Foxp1+/-
mice. (F, G-H) Higher power of FOXP1 staining in the cortex and striatum, respectively in WT brains. (J,
K-L) Higher power of FOXP1 staining in the cortex and striatum, respectively in Foxp1+/-
brains. Scale bars: low power images= 500µm, high power
images= 50 µm.
Foxp1 +/-
WT
(
( ( (
(
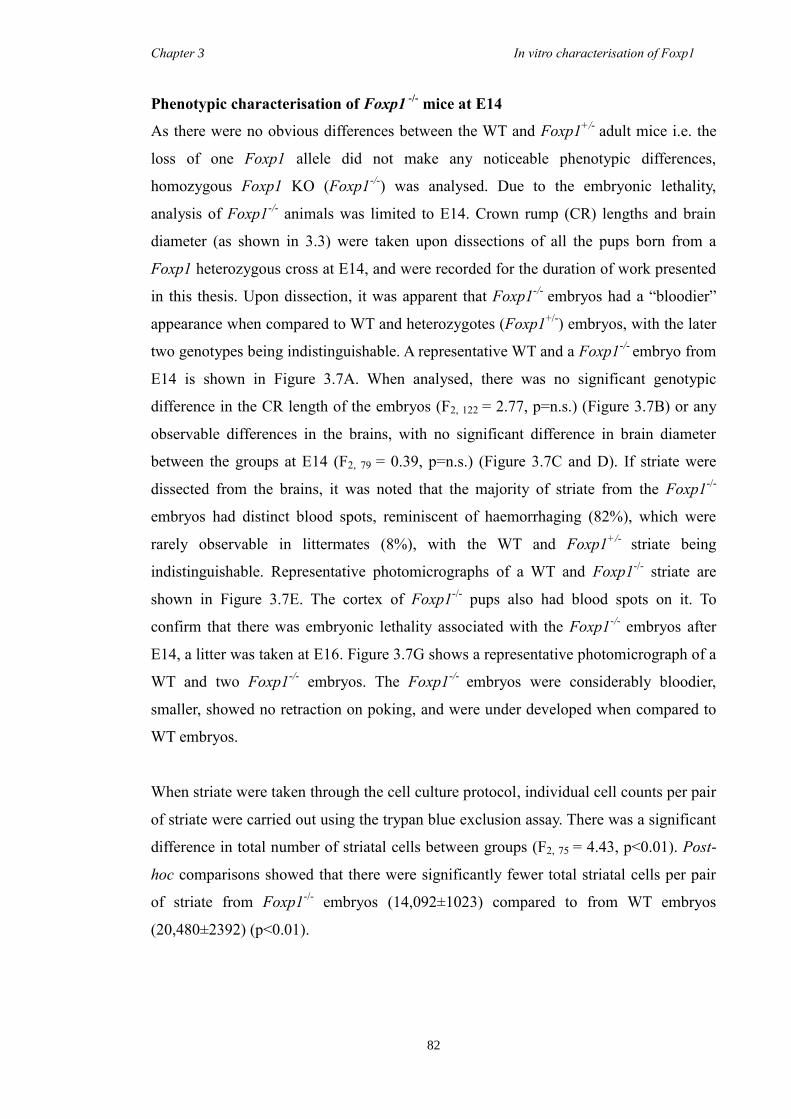
Chapter 3 In vitro characterisation of Foxp1
82
Phenotypic characterisation of Foxp1 -/-
mice at E14
As there were no obvious differences between the WT and Foxp1+/-
adult mice i.e. the
loss of one Foxp1 allele did not make any noticeable phenotypic differences,
homozygous Foxp1 KO (Foxp1-/-
) was analysed. Due to the embryonic lethality,
analysis of Foxp1-/-
animals was limited to E14. Crown rump (CR) lengths and brain
diameter (as shown in 3.3) were taken upon dissections of all the pups born from a
Foxp1 heterozygous cross at E14, and were recorded for the duration of work presented
in this thesis. Upon dissection, it was apparent that Foxp1-/-
embryos had a “bloodier”
appearance when compared to WT and heterozygotes (Foxp1+/-
) embryos, with the later
two genotypes being indistinguishable. A representative WT and a Foxp1-/-
embryo from
E14 is shown in Figure 3.7A. When analysed, there was no significant genotypic
difference in the CR length of the embryos (F2, 122 = 2.77, p=n.s.) (Figure 3.7B) or any
observable differences in the brains, with no significant difference in brain diameter
between the groups at E14 (F2, 79 = 0.39, p=n.s.) (Figure 3.7C and D). If striate were
dissected from the brains, it was noted that the majority of striate from the Foxp1-/-
embryos had distinct blood spots, reminiscent of haemorrhaging (82%), which were
rarely observable in littermates (8%), with the WT and Foxp1+/-
striate being
indistinguishable. Representative photomicrographs of a WT and Foxp1-/-
striate are
shown in Figure 3.7E. The cortex of Foxp1-/-
pups also had blood spots on it. To
confirm that there was embryonic lethality associated with the Foxp1-/-
embryos after
E14, a litter was taken at E16. Figure 3.7G shows a representative photomicrograph of a
WT and two Foxp1-/-
embryos. The Foxp1-/-
embryos were considerably bloodier,
smaller, showed no retraction on poking, and were under developed when compared to
WT embryos.
When striate were taken through the cell culture protocol, individual cell counts per pair
of striate were carried out using the trypan blue exclusion assay. There was a significant
difference in total number of striatal cells between groups (F2, 75 = 4.43, p<0.01). Post-
hoc comparisons showed that there were significantly fewer total striatal cells per pair
of striate from Foxp1-/-
embryos (14,092±1023) compared to from WT embryos
(20,480±2392) (p<0.01).
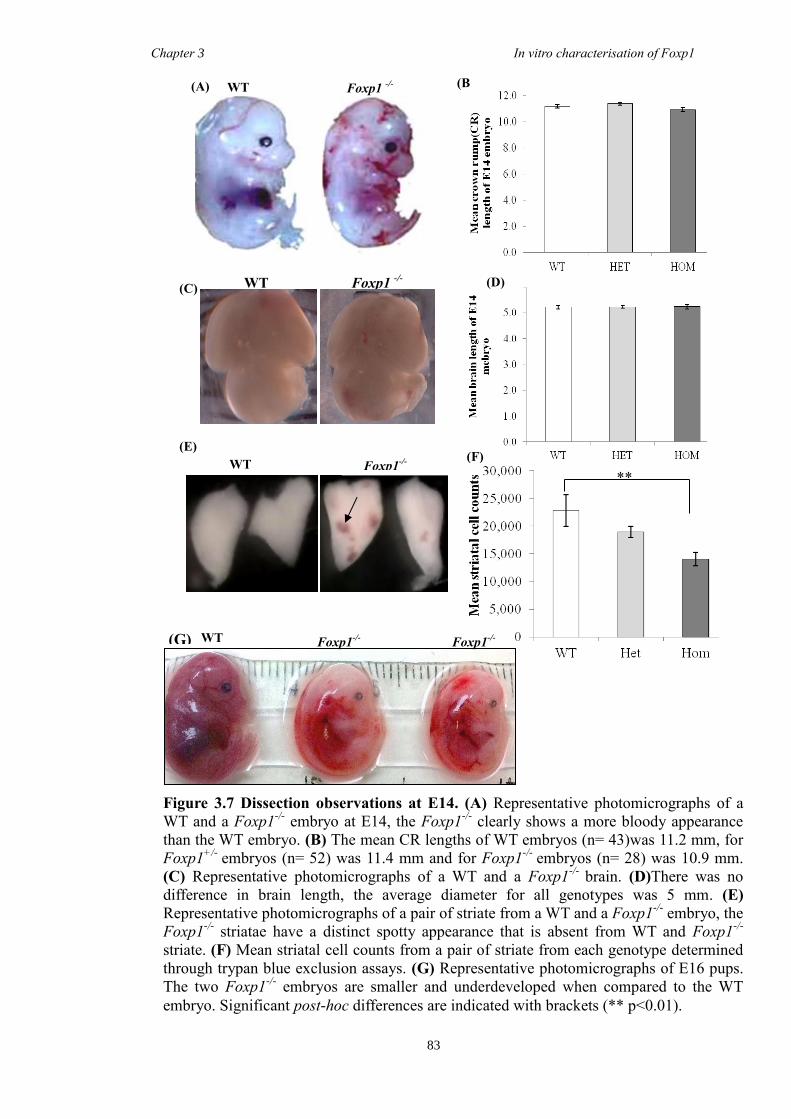
Chapter 3 In vitro characterisation of Foxp1
83
Figure 3.7 Dissection observations at E14. (A) Representative photomicrographs of a
WT and a Foxp1-/-
embryo at E14, the Foxp1-/-
clearly shows a more bloody appearance
than the WT embryo. (B) The mean CR lengths of WT embryos (n= 43)was 11.2 mm, for
Foxp1+/-
embryos (n= 52) was 11.4 mm and for Foxp1-/-
embryos (n= 28) was 10.9 mm.
(C) Representative photomicrographs of a WT and a Foxp1-/-
brain. (D)There was no
difference in brain length, the average diameter for all genotypes was 5 mm. (E)
Representative photomicrographs of a pair of striate from a WT and a Foxp1-/-
embryo, the
Foxp1-/-
striatae have a distinct spotty appearance that is absent from WT and Foxp1-/-
striate. (F) Mean striatal cell counts from a pair of striate from each genotype determined
through trypan blue exclusion assays. (G) Representative photomicrographs of E16 pups.
The two Foxp1-/-
embryos are smaller and underdeveloped when compared to the WT
embryo. Significant post-hoc differences are indicated with brackets (** p<0.01).
(B
Foxp1
-/- WT (A)
(C) Foxp1 -/- WT (D)
(E)
Foxp1-/- WT
(F)
**
(G) Foxp1-/- WT Foxp1
-/-
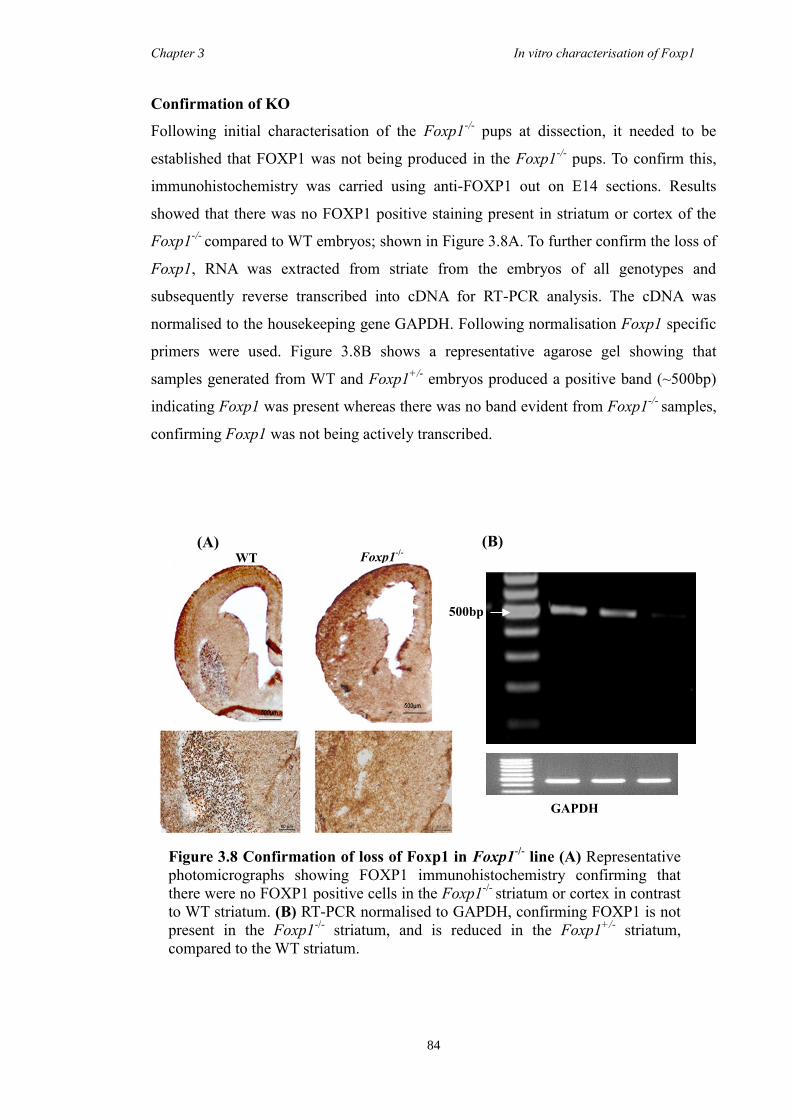
Chapter 3 In vitro characterisation of Foxp1
84
Confirmation of KO
Following initial characterisation of the Foxp1-/-
pups at dissection, it needed to be
established that FOXP1 was not being produced in the Foxp1-/-
pups. To confirm this,
immunohistochemistry was carried using anti-FOXP1 out on E14 sections. Results
showed that there was no FOXP1 positive staining present in striatum or cortex of the
Foxp1-/-
compared to WT embryos; shown in Figure 3.8A. To further confirm the loss of
Foxp1, RNA was extracted from striate from the embryos of all genotypes and
subsequently reverse transcribed into cDNA for RT-PCR analysis. The cDNA was
normalised to the housekeeping gene GAPDH. Following normalisation Foxp1 specific
primers were used. Figure 3.8B shows a representative agarose gel showing that
samples generated from WT and Foxp1+/-
embryos produced a positive band (~500bp)
indicating Foxp1 was present whereas there was no band evident from Foxp1-/-
samples,
confirming Foxp1 was not being actively transcribed.
(A) Foxp1
-/- WT
(B)
GAPDH
500bp
WT Het Hom
Figure 3.8 Confirmation of loss of Foxp1 in Foxp1-/-
line (A) Representative
photomicrographs showing FOXP1 immunohistochemistry confirming that
there were no FOXP1 positive cells in the Foxp1-/-
striatum or cortex in contrast
to WT striatum. (B) RT-PCR normalised to GAPDH, confirming FOXP1 is not
present in the Foxp1-/-
striatum, and is reduced in the Foxp1+/-
striatum,
compared to the WT striatum.
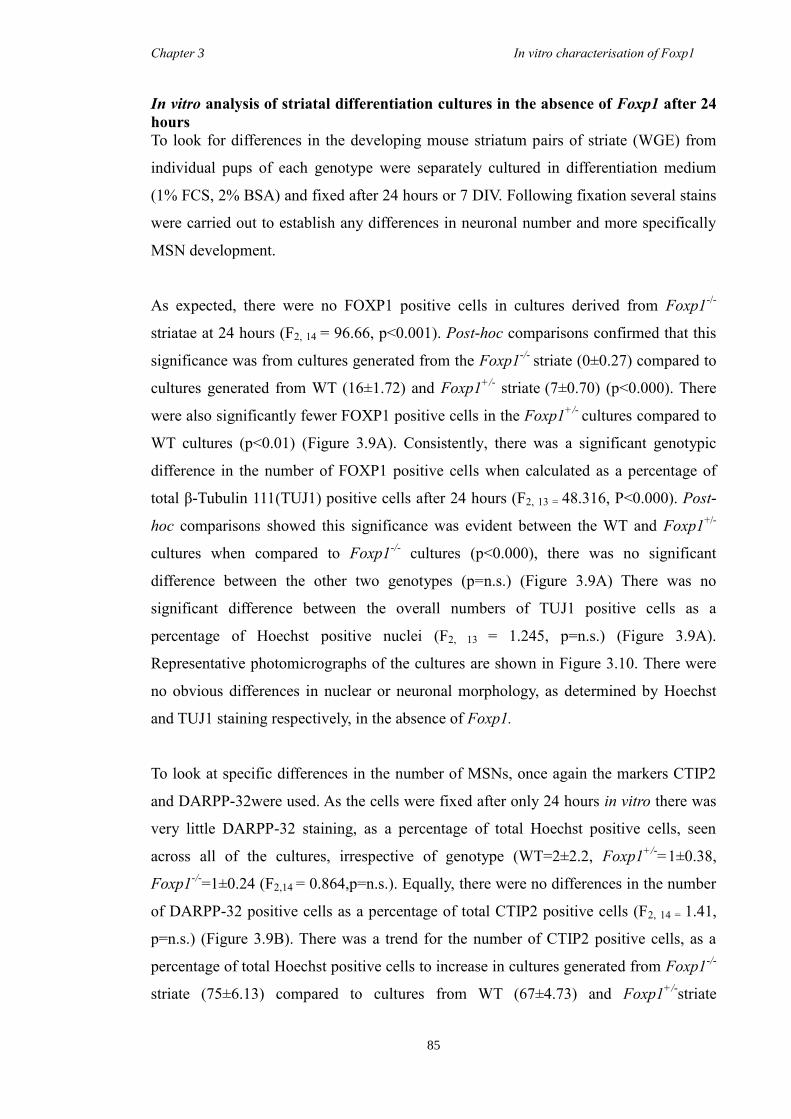
Chapter 3 In vitro characterisation of Foxp1
85
In vitro analysis of striatal differentiation cultures in the absence of Foxp1 after 24
hours
To look for differences in the developing mouse striatum pairs of striate (WGE) from
individual pups of each genotype were separately cultured in differentiation medium
(1% FCS, 2% BSA) and fixed after 24 hours or 7 DIV. Following fixation several stains
were carried out to establish any differences in neuronal number and more specifically
MSN development.
As expected, there were no FOXP1 positive cells in cultures derived from Foxp1-/-
striatae at 24 hours (F2, 14 = 96.66, p<0.001). Post-hoc comparisons confirmed that this
significance was from cultures generated from the Foxp1-/-
striate (0±0.27) compared to
cultures generated from WT (16±1.72) and Foxp1+/-
striate (7±0.70) (p<0.000). There
were also significantly fewer FOXP1 positive cells in the Foxp1+/-
cultures compared to
WT cultures (p<0.01) (Figure 3.9A). Consistently, there was a significant genotypic
difference in the number of FOXP1 positive cells when calculated as a percentage of
total β-Tubulin 111(TUJ1) positive cells after 24 hours (F2, 13 = 48.316, P<0.000). Post-
hoc comparisons showed this significance was evident between the WT and Foxp1+/-
cultures when compared to Foxp1-/-
cultures (p<0.000), there was no significant
difference between the other two genotypes (p=n.s.) (Figure 3.9A) There was no
significant difference between the overall numbers of TUJ1 positive cells as a
percentage of Hoechst positive nuclei (F2, 13 = 1.245, p=n.s.) (Figure 3.9A).
Representative photomicrographs of the cultures are shown in Figure 3.10. There were
no obvious differences in nuclear or neuronal morphology, as determined by Hoechst
and TUJ1 staining respectively, in the absence of Foxp1.
To look at specific differences in the number of MSNs, once again the markers CTIP2
and DARPP-32were used. As the cells were fixed after only 24 hours in vitro there was
very little DARPP-32 staining, as a percentage of total Hoechst positive cells, seen
across all of the cultures, irrespective of genotype (WT=2±2.2, Foxp1+/-
=1±0.38,
Foxp1-/-
=1±0.24 (F2,14 = 0.864,p=n.s.). Equally, there were no differences in the number
of DARPP-32 positive cells as a percentage of total CTIP2 positive cells (F2, 14 = 1.41,
p=n.s.) (Figure 3.9B). There was a trend for the number of CTIP2 positive cells, as a
percentage of total Hoechst positive cells to increase in cultures generated from Foxp1-/-
striate (75±6.13) compared to cultures from WT (67±4.73) and Foxp1+/-
striate

Chapter 3 In vitro characterisation of Foxp1
86
(51±9.29), although this difference was not significant (F2,14 = 0.15, p=n.s.) (Figure
3.9B). Representative photomicrographs of the cultures are shown in Figure 3.11.
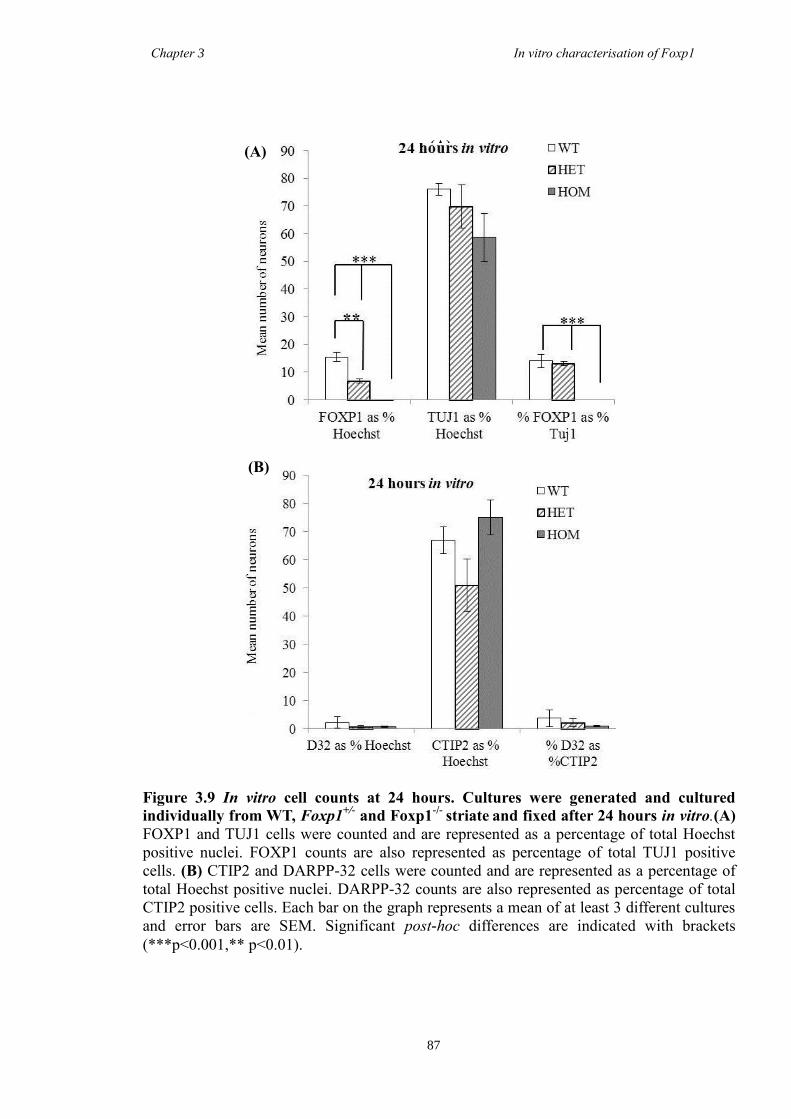
Chapter 3 In vitro characterisation of Foxp1
87
(A) (A)
Figure 3.9 In vitro cell counts at 24 hours. Cultures were generated and cultured
individually from WT, Foxp1+/-
and Foxp1-/-
striate and fixed after 24 hours in vitro.(A)
FOXP1 and TUJ1 cells were counted and are represented as a percentage of total Hoechst
positive nuclei. FOXP1 counts are also represented as percentage of total TUJ1 positive
cells. (B) CTIP2 and DARPP-32 cells were counted and are represented as a percentage of
total Hoechst positive nuclei. DARPP-32 counts are also represented as percentage of total
CTIP2 positive cells. Each bar on the graph represents a mean of at least 3 different cultures
and error bars are SEM. Significant post-hoc differences are indicated with brackets
(***p<0.001,** p<0.01).
(B)
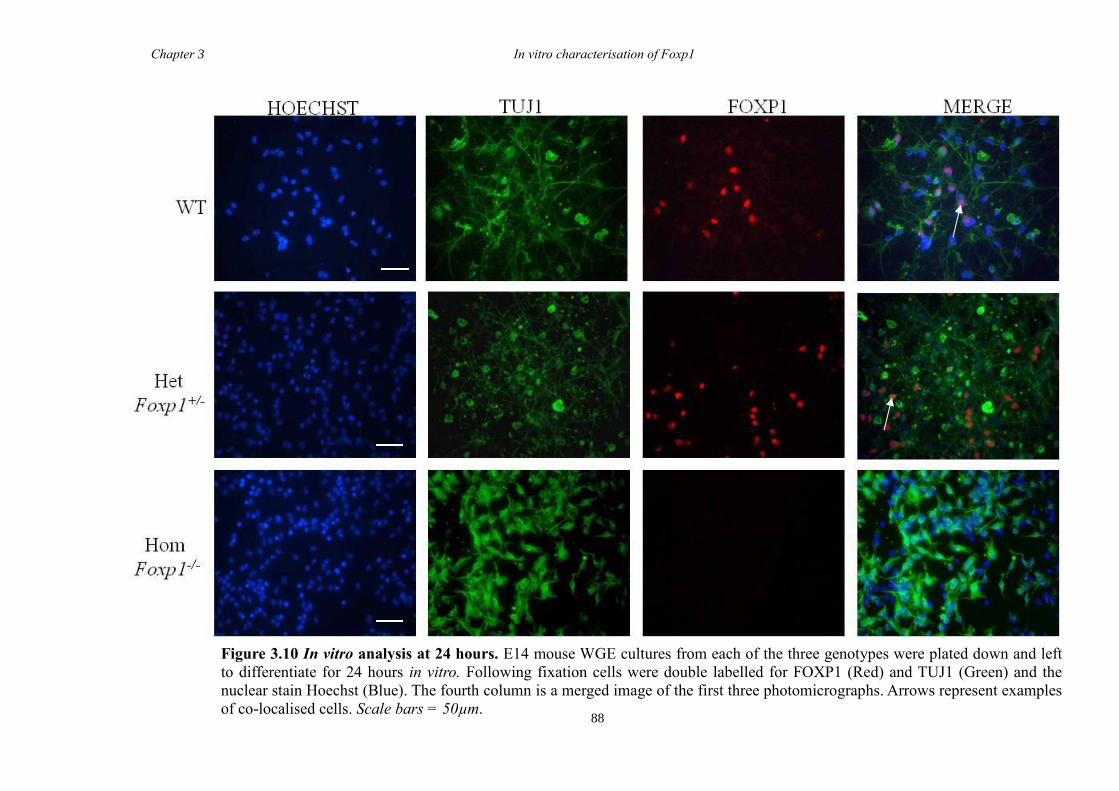
Chapter 3 In vitro characterisation of Foxp1
88
Figure 3.10 In vitro analysis at 24 hours. E14 mouse WGE cultures from each of the three genotypes were plated down and left
to differentiate for 24 hours in vitro. Following fixation cells were double labelled for FOXP1 (Red) and TUJ1 (Green) and the
nuclear stain Hoechst (Blue). The fourth column is a merged image of the first three photomicrographs. Arrows represent examples
of co-localised cells. Scale bars = 50µm.
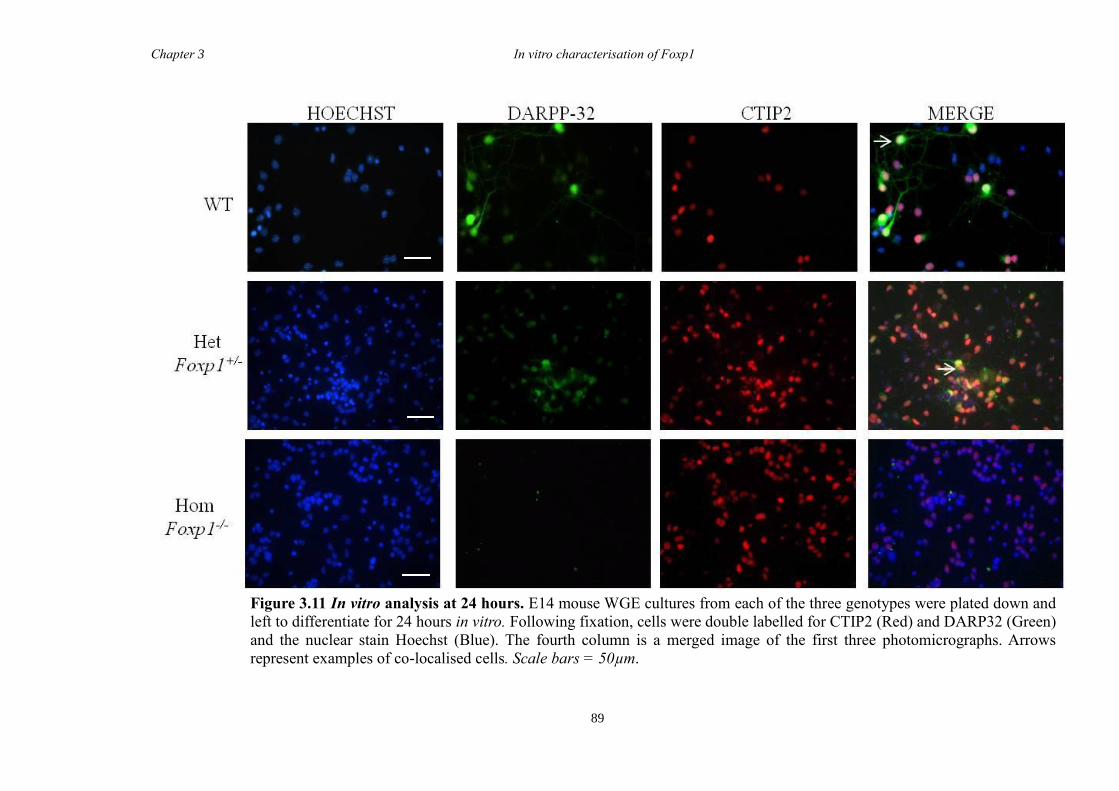
Chapter 3 In vitro characterisation of Foxp1
89
Figure 3.11 In vitro analysis at 24 hours. E14 mouse WGE cultures from each of the three genotypes were plated down and
left to differentiate for 24 hours in vitro. Following fixation, cells were double labelled for CTIP2 (Red) and DARP32 (Green)
and the nuclear stain Hoechst (Blue). The fourth column is a merged image of the first three photomicrographs. Arrows
represent examples of co-localised cells. Scale bars = 50µm.
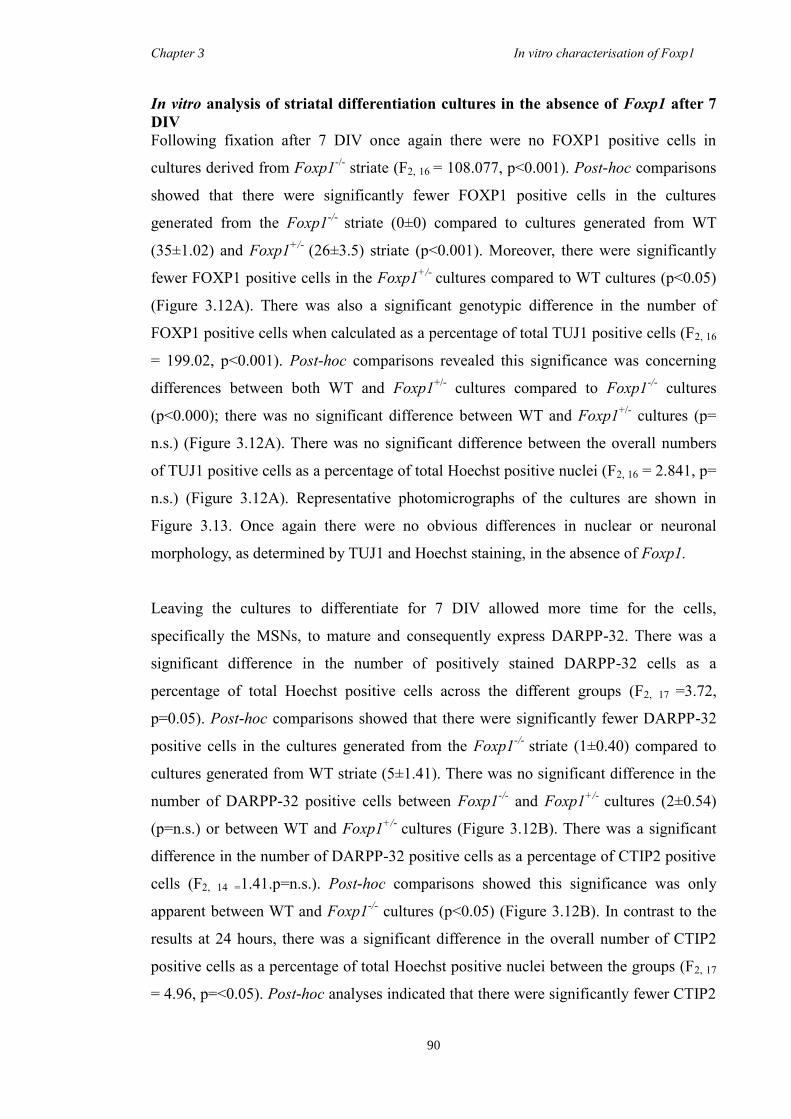
Chapter 3 In vitro characterisation of Foxp1
90
In vitro analysis of striatal differentiation cultures in the absence of Foxp1 after 7
DIV
Following fixation after 7 DIV once again there were no FOXP1 positive cells in
cultures derived from Foxp1-/-
striate (F2, 16 = 108.077, p<0.001). Post-hoc comparisons
showed that there were significantly fewer FOXP1 positive cells in the cultures
generated from the Foxp1-/-
striate (0±0) compared to cultures generated from WT
(35±1.02) and Foxp1+/-
(26±3.5) striate (p<0.001). Moreover, there were significantly
fewer FOXP1 positive cells in the Foxp1+/-
cultures compared to WT cultures (p<0.05)
(Figure 3.12A). There was also a significant genotypic difference in the number of
FOXP1 positive cells when calculated as a percentage of total TUJ1 positive cells (F2, 16
= 199.02, p<0.001). Post-hoc comparisons revealed this significance was concerning
differences between both WT and Foxp1+/-
cultures compared to Foxp1-/-
cultures
(p<0.000); there was no significant difference between WT and Foxp1+/-
cultures (p=
n.s.) (Figure 3.12A). There was no significant difference between the overall numbers
of TUJ1 positive cells as a percentage of total Hoechst positive nuclei (F2, 16 = 2.841, p=
n.s.) (Figure 3.12A). Representative photomicrographs of the cultures are shown in
Figure 3.13. Once again there were no obvious differences in nuclear or neuronal
morphology, as determined by TUJ1 and Hoechst staining, in the absence of Foxp1.
Leaving the cultures to differentiate for 7 DIV allowed more time for the cells,
specifically the MSNs, to mature and consequently express DARPP-32. There was a
significant difference in the number of positively stained DARPP-32 cells as a
percentage of total Hoechst positive cells across the different groups (F2, 17 =3.72,
p=0.05). Post-hoc comparisons showed that there were significantly fewer DARPP-32
positive cells in the cultures generated from the Foxp1-/-
striate (1±0.40) compared to
cultures generated from WT striate (5±1.41). There was no significant difference in the
number of DARPP-32 positive cells between Foxp1-/-
and Foxp1+/-
cultures (2±0.54)
(p=n.s.) or between WT and Foxp1+/-
cultures (Figure 3.12B). There was a significant
difference in the number of DARPP-32 positive cells as a percentage of CTIP2 positive
cells (F2, 14 =1.41.p=n.s.). Post-hoc comparisons showed this significance was only
apparent between WT and Foxp1-/-
cultures (p<0.05) (Figure 3.12B). In contrast to the
results at 24 hours, there was a significant difference in the overall number of CTIP2
positive cells as a percentage of total Hoechst positive nuclei between the groups (F2, 17
= 4.96, p=<0.05). Post-hoc analyses indicated that there were significantly fewer CTIP2
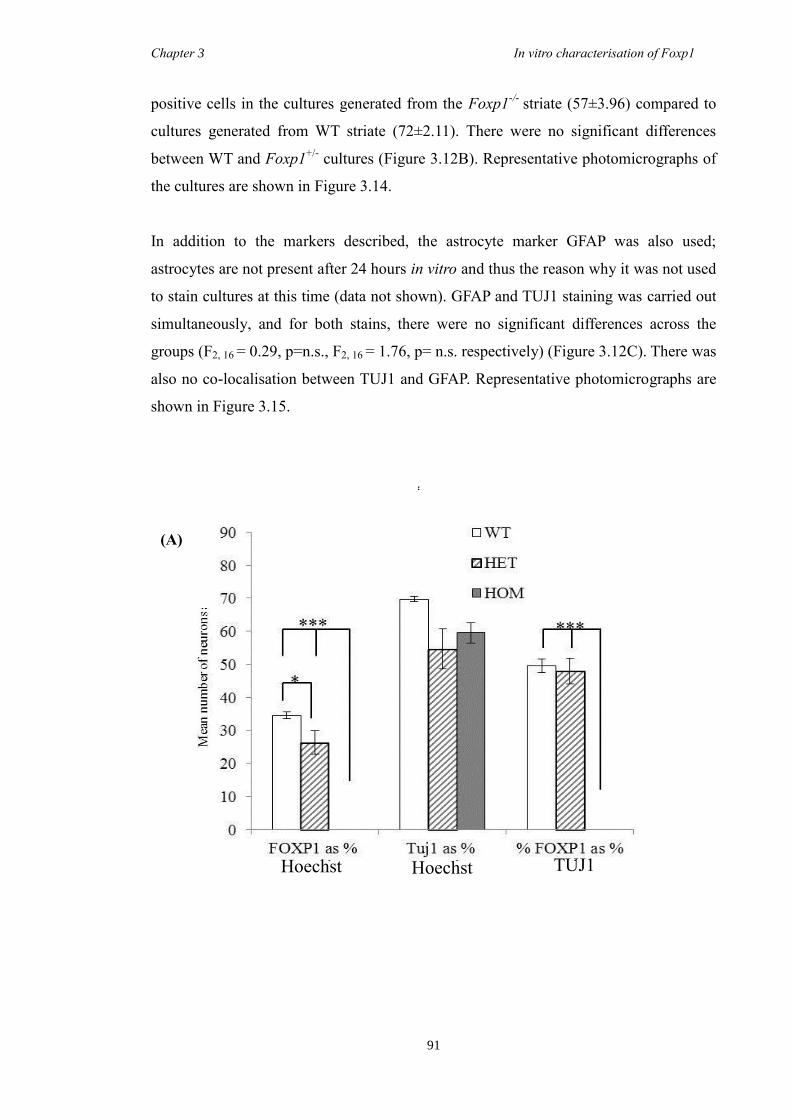
Chapter 3 In vitro characterisation of Foxp1
91
positive cells in the cultures generated from the Foxp1-/-
striate (57±3.96) compared to
cultures generated from WT striate (72±2.11). There were no significant differences
between WT and Foxp1+/-
cultures (Figure 3.12B). Representative photomicrographs of
the cultures are shown in Figure 3.14.
In addition to the markers described, the astrocyte marker GFAP was also used;
astrocytes are not present after 24 hours in vitro and thus the reason why it was not used
to stain cultures at this time (data not shown). GFAP and TUJ1 staining was carried out
simultaneously, and for both stains, there were no significant differences across the
groups (F2, 16 = 0.29, p=n.s., F2, 16 = 1.76, p= n.s. respectively) (Figure 3.12C). There was
also no co-localisation between TUJ1 and GFAP. Representative photomicrographs are
shown in Figure 3.15.
*
Hoechst TUJ1 Hoechst
(A)
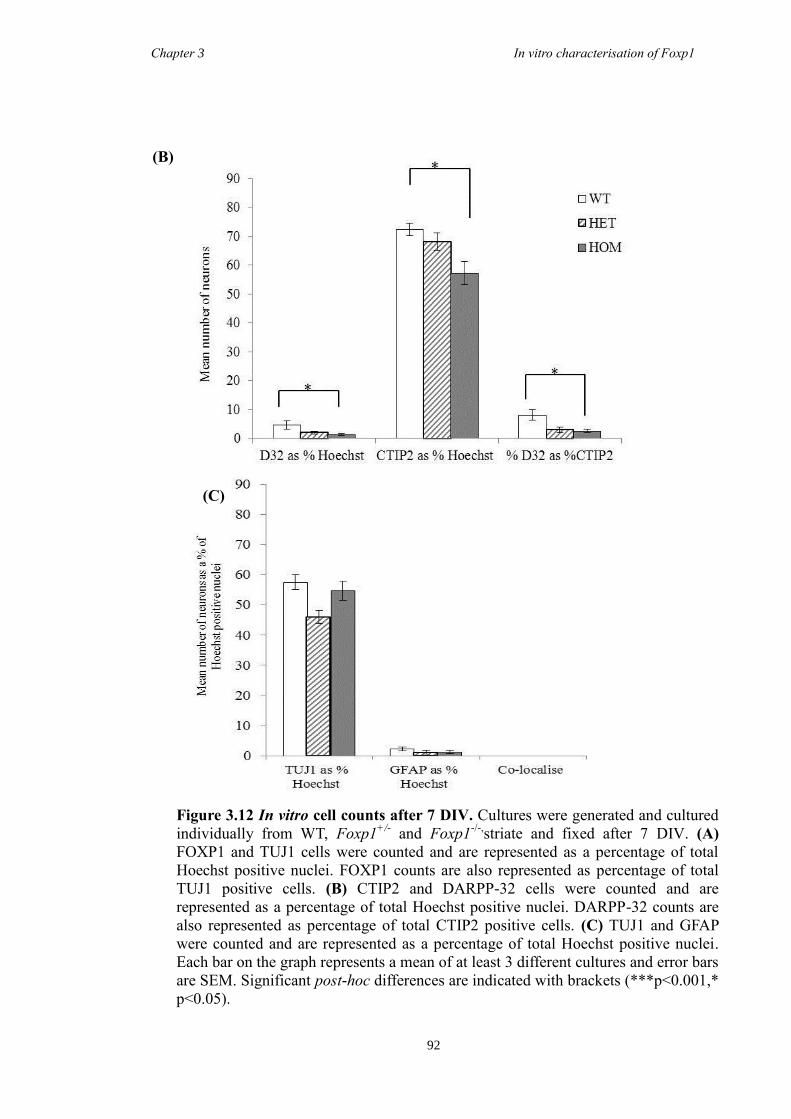
Chapter 3 In vitro characterisation of Foxp1
92
Figure 3.12 In vitro cell counts after 7 DIV. Cultures were generated and cultured
individually from WT, Foxp1+/-
and Foxp1-/-,
striate and fixed after 7 DIV. (A)
FOXP1 and TUJ1 cells were counted and are represented as a percentage of total
Hoechst positive nuclei. FOXP1 counts are also represented as percentage of total
TUJ1 positive cells. (B) CTIP2 and DARPP-32 cells were counted and are
represented as a percentage of total Hoechst positive nuclei. DARPP-32 counts are
also represented as percentage of total CTIP2 positive cells. (C) TUJ1 and GFAP
were counted and are represented as a percentage of total Hoechst positive nuclei.
Each bar on the graph represents a mean of at least 3 different cultures and error bars
are SEM. Significant post-hoc differences are indicated with brackets (***p<0.001,*
p<0.05).
(C)
(B)
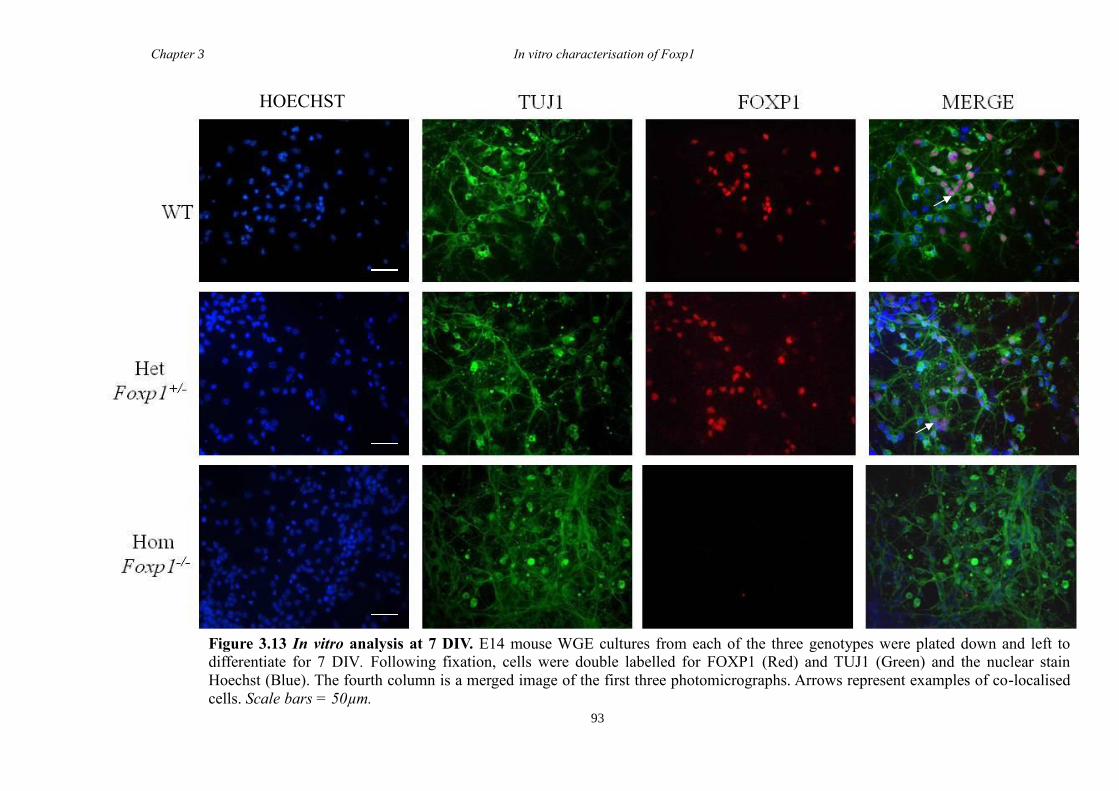
Chapter 3 In vitro characterisation of Foxp1
93
HOECHST
Figure 3.13 In vitro analysis at 7 DIV. E14 mouse WGE cultures from each of the three genotypes were plated down and left to
differentiate for 7 DIV. Following fixation, cells were double labelled for FOXP1 (Red) and TUJ1 (Green) and the nuclear stain
Hoechst (Blue). The fourth column is a merged image of the first three photomicrographs. Arrows represent examples of co-localised
cells. Scale bars = 50µm.
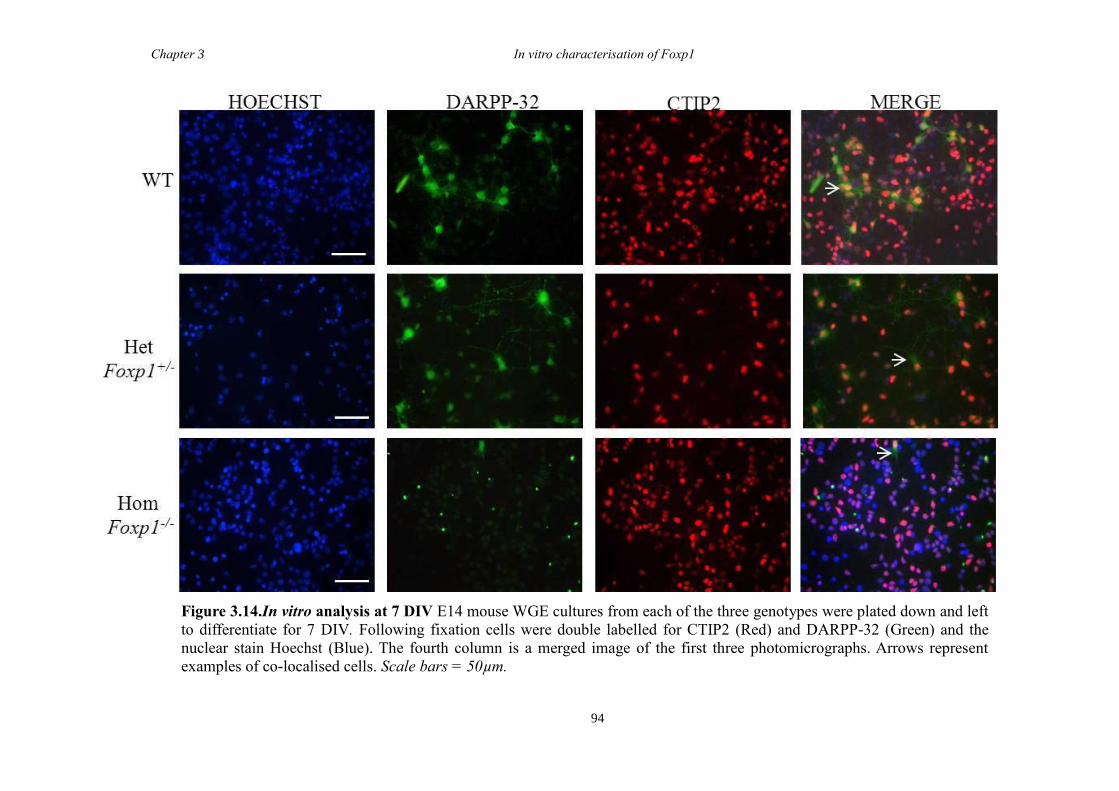
Chapter 3 In vitro characterisation of Foxp1
94
Figure 3.14.In vitro analysis at 7 DIV E14 mouse WGE cultures from each of the three genotypes were plated down and left
to differentiate for 7 DIV. Following fixation cells were double labelled for CTIP2 (Red) and DARPP-32 (Green) and the
nuclear stain Hoechst (Blue). The fourth column is a merged image of the first three photomicrographs. Arrows represent
examples of co-localised cells. Scale bars = 50µm.
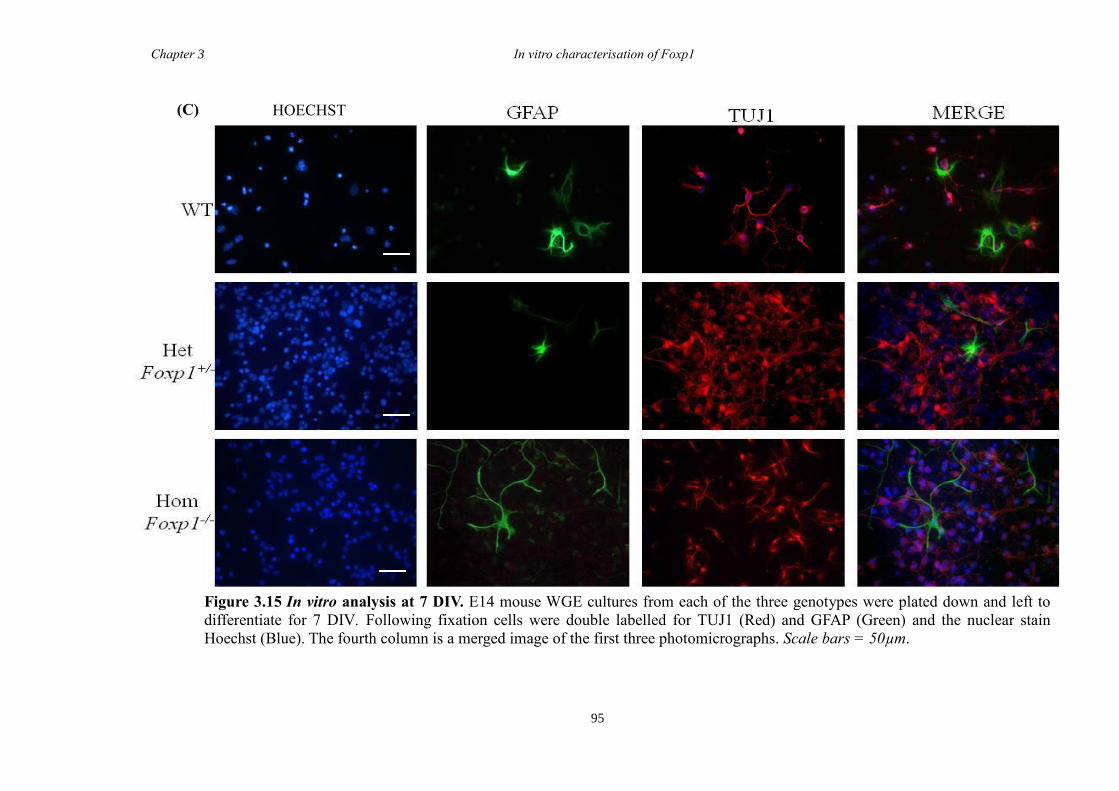
Chapter 3 In vitro characterisation of Foxp1
95
HOECHST
Figure 3.15 In vitro analysis at 7 DIV. E14 mouse WGE cultures from each of the three genotypes were plated down and left to
differentiate for 7 DIV. Following fixation cells were double labelled for TUJ1 (Red) and GFAP (Green) and the nuclear stain
Hoechst (Blue). The fourth column is a merged image of the first three photomicrographs. Scale bars = 50µm.
(C)
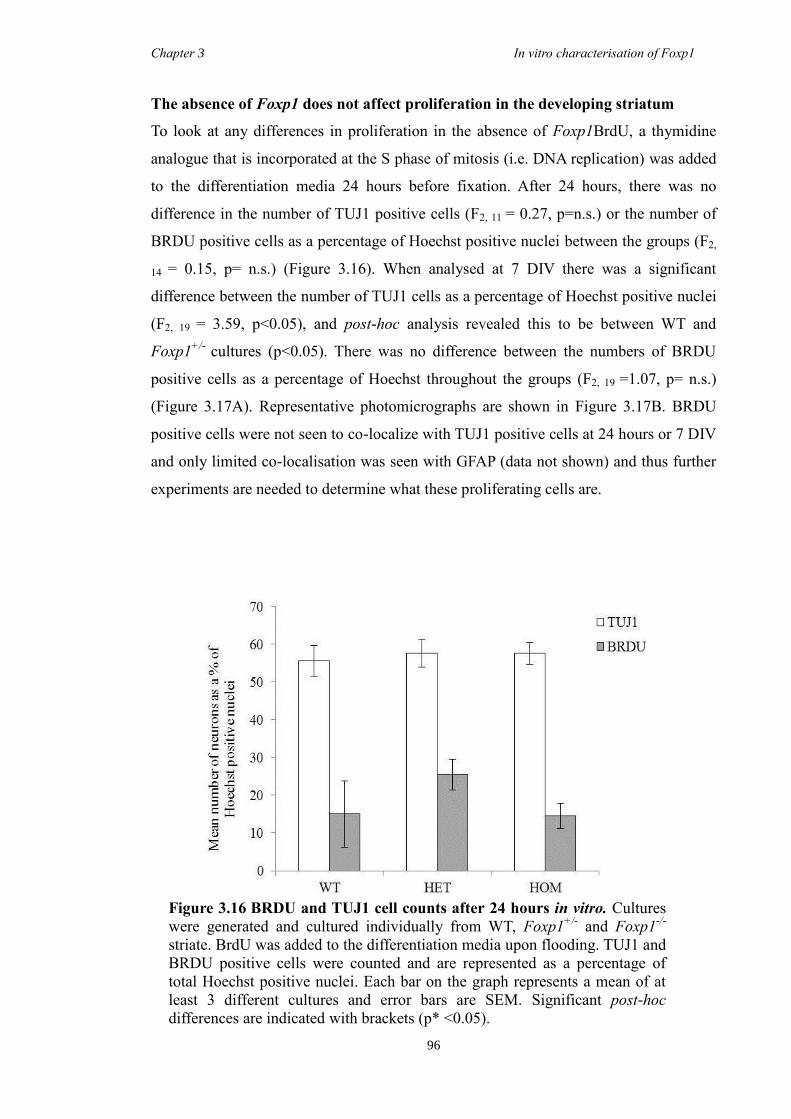
Chapter 3 In vitro characterisation of Foxp1
96
The absence of Foxp1 does not affect proliferation in the developing striatum
To look at any differences in proliferation in the absence of Foxp1BrdU, a thymidine
analogue that is incorporated at the S phase of mitosis (i.e. DNA replication) was added
to the differentiation media 24 hours before fixation. After 24 hours, there was no
difference in the number of TUJ1 positive cells (F2, 11 = 0.27, p=n.s.) or the number of
BRDU positive cells as a percentage of Hoechst positive nuclei between the groups (F2,
14 = 0.15, p= n.s.) (Figure 3.16). When analysed at 7 DIV there was a significant
difference between the number of TUJ1 cells as a percentage of Hoechst positive nuclei
(F2, 19 = 3.59, p<0.05), and post-hoc analysis revealed this to be between WT and
Foxp1+/-
cultures (p<0.05). There was no difference between the numbers of BRDU
positive cells as a percentage of Hoechst throughout the groups (F2, 19 =1.07, p= n.s.)
(Figure 3.17A). Representative photomicrographs are shown in Figure 3.17B. BRDU
positive cells were not seen to co-localize with TUJ1 positive cells at 24 hours or 7 DIV
and only limited co-localisation was seen with GFAP (data not shown) and thus further
experiments are needed to determine what these proliferating cells are.
Figure 3.16 BRDU and TUJ1 cell counts after 24 hours in vitro. Cultures
were generated and cultured individually from WT, Foxp1+/-
and Foxp1-/-
striate. BrdU was added to the differentiation media upon flooding. TUJ1 and
BRDU positive cells were counted and are represented as a percentage of
total Hoechst positive nuclei. Each bar on the graph represents a mean of at
least 3 different cultures and error bars are SEM. Significant post-hoc
differences are indicated with brackets (p* <0.05).
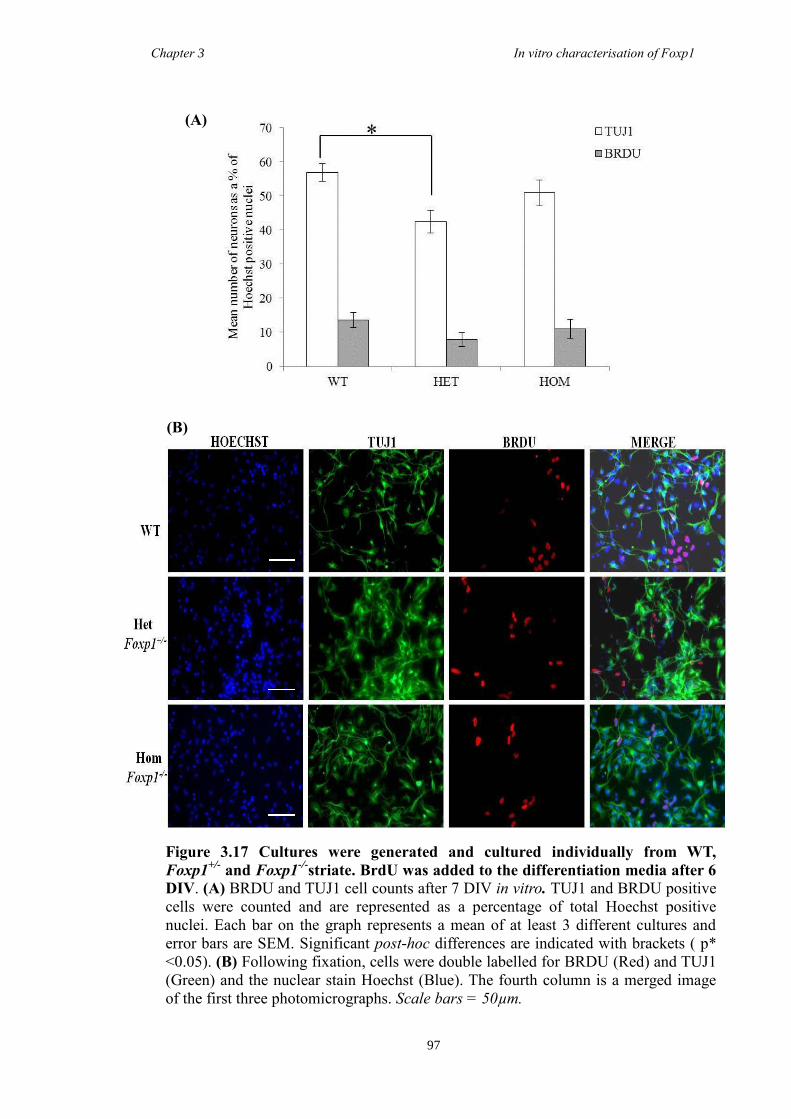
Chapter 3 In vitro characterisation of Foxp1
97
(A)
Figure 3.17 Cultures were generated and cultured individually from WT,
Foxp1+/-
and Foxp1-/-
striate. BrdU was added to the differentiation media after 6
DIV. (A) BRDU and TUJ1 cell counts after 7 DIV in vitro. TUJ1 and BRDU positive
cells were counted and are represented as a percentage of total Hoechst positive
nuclei. Each bar on the graph represents a mean of at least 3 different cultures and
error bars are SEM. Significant post-hoc differences are indicated with brackets ( p*
<0.05). (B) Following fixation, cells were double labelled for BRDU (Red) and TUJ1
(Green) and the nuclear stain Hoechst (Blue). The fourth column is a merged image
of the first three photomicrographs. Scale bars = 50µm.
(B)
Chapter 3 In vitro characterisation of Foxp1
98
Calcium Imaging
Subsequent to looking at differences in MSN maturation and proliferation functional
analysis of E14 derived striatal cultures following 24 hours in vitro was carried out to
determine whether there were measurable differences in key physiological readouts of
the cells, and thus test for differences in neuronal homogeneity. Ca2+
imaging was used
to assess the effect of intracellular Ca2+
upon the application of a depolarising 50 mM
K+ solution and of several known neuronal agonists, namely GABA normal chloride
(NC), GABA low chloride (LC), NMDA, AMPA, kainate and AchE.
The mean response to the different agonists by cells of each genotype is shown in
Figure 3.18A. For the context of this work, analysis was concentrated on differences in
GABA excitation peaks. Example traces (i.e. fluorescence ratio increases as a
percentage of baseline), and corresponding Fura-2 filled cells (fluorescent dye) are
shown in Figure 3.18B. Results showed that cells from all genotypes respond to high K,
GABA NC and GABA LC. The percentage excitatory response was worked out for each
of the genotypes by calculating the differences in the excitation peaks generated as a
response to GABA NC compared to GABA LC. There was a significant difference
between the response of the Foxp1-/-
cells to GABA LC (F2, 11 = 8.5, p<0.05), with post-
hoc tests displaying a significant increase compared to cells cultured from WT and
Foxp1+/-
cultures (p<0.05). There was no significant difference in the percentage
excitation between the genotypes (F2, 11 = 3.03, p= n.s.) (Figure 3.18C).
Figure 3.18 (overleaf) Ca2+
imaging studies on E14 striatal cultures at 24 hours
in vitro. (A) Mean rises in Ca2+
in response to high K+
and each agonist plotted as a
percentage increase in fluorescence above baseline for each genotype. (B) Rises in
intracellular Ca2+
in exemplar individual cells derived from each genotype in
response to brief application of solutions. Example photomicrographs of the cells
filled with the fluorescent dye Fura2. (B)(iii) The cells of the Foxp1-/-
cultures had
a higher overall response to GABA LC than (i) WTs or (ii) Foxp1+/-
cultures. (C)
The response of the cells to GABA LC and the percentage excitation. Bars
represent the mean of all the cells. Error bars are SEM. Significant post-hoc
differences are indicated with brackets (* p<0.05).
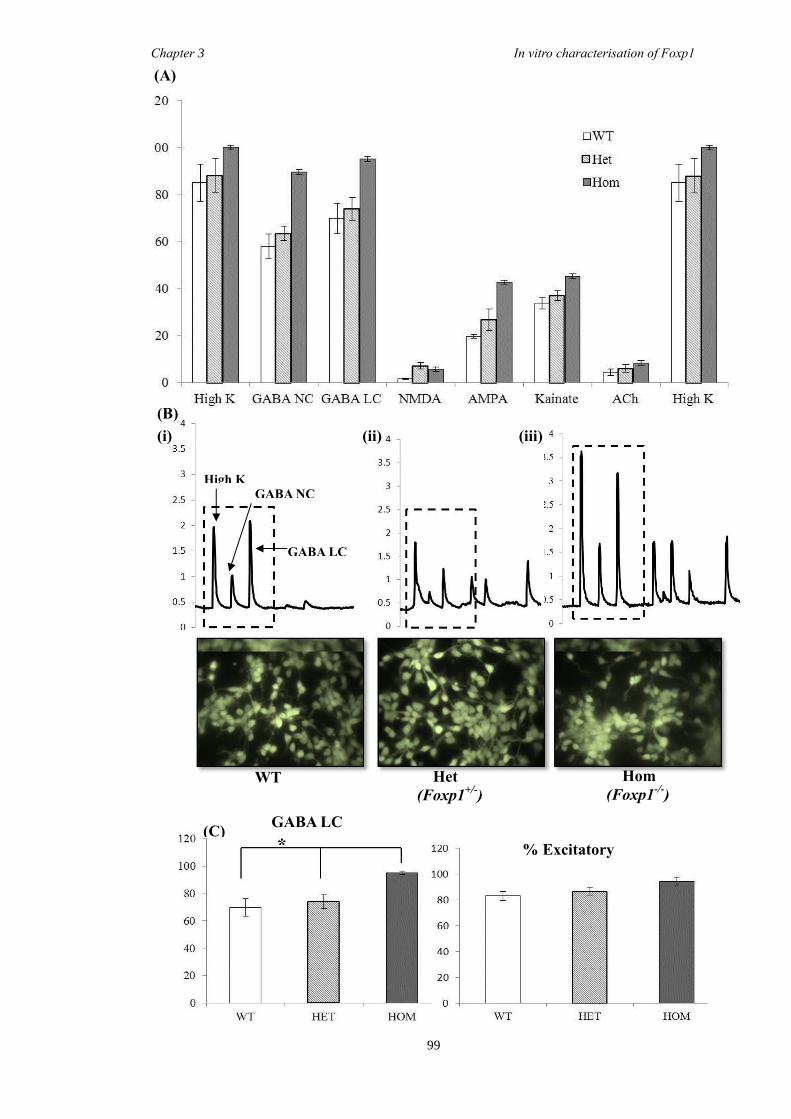
Chapter 3 In vitro characterisation of Foxp1
99
GABA LC
% Excitatory
(C)
(A)
GABA NC
GABA LC
High K
Het
(Foxp1+/-
)
Hom
(Foxp1-/-
) WT
(i) (ii) (iii)
(B)
Chapter 3 In vitro characterisation of Foxp1
100
Characterisation of FOXP1 in mouse models that have key genes associated with
striatal development knocked out
As mentioned in Chapter 1 there are many genes implicated in striatal development and
subsequently mouse models that have some of these genes knocked out have been
created. Josep Canals’ lab in Barcelona have access to sections from some of these
models and on a visit to his lab I carried out fluorescent immunohistochemistry on
embryonic brain sections from Ascl1-/-
and Gsh2-/-
mice at E14, and on Ikaros-/-
and
Helios -/-
mice at E18 in an attempt to learn more about the downstream targets of
Foxp1. In the Gsh2-/-
sections there appears to be reduced FOXP1 staining in the MZ of
the striatum compared to the WT sections (Figure 3.19A). In the Ascl1-/-
sections,
FOXP1 expression in the SVZ appeared to be reduced when compared to WT sections
but expression was retained in the MZ (Figure 3.19B).
There were no differences in FOXP1 staining in the Ikaros-/-
or Helios-/-
sections
compared to WT sections (Figure 3.20A). When CTIP2 positivity was looked at in the
E14 Foxp1-/-
sections, there was no obvious difference in expression (Figure 3.20B).
However of this occasion these stains could not be quantified and therefore the
qualitative analysis presented here should be interpreted with this in mind.
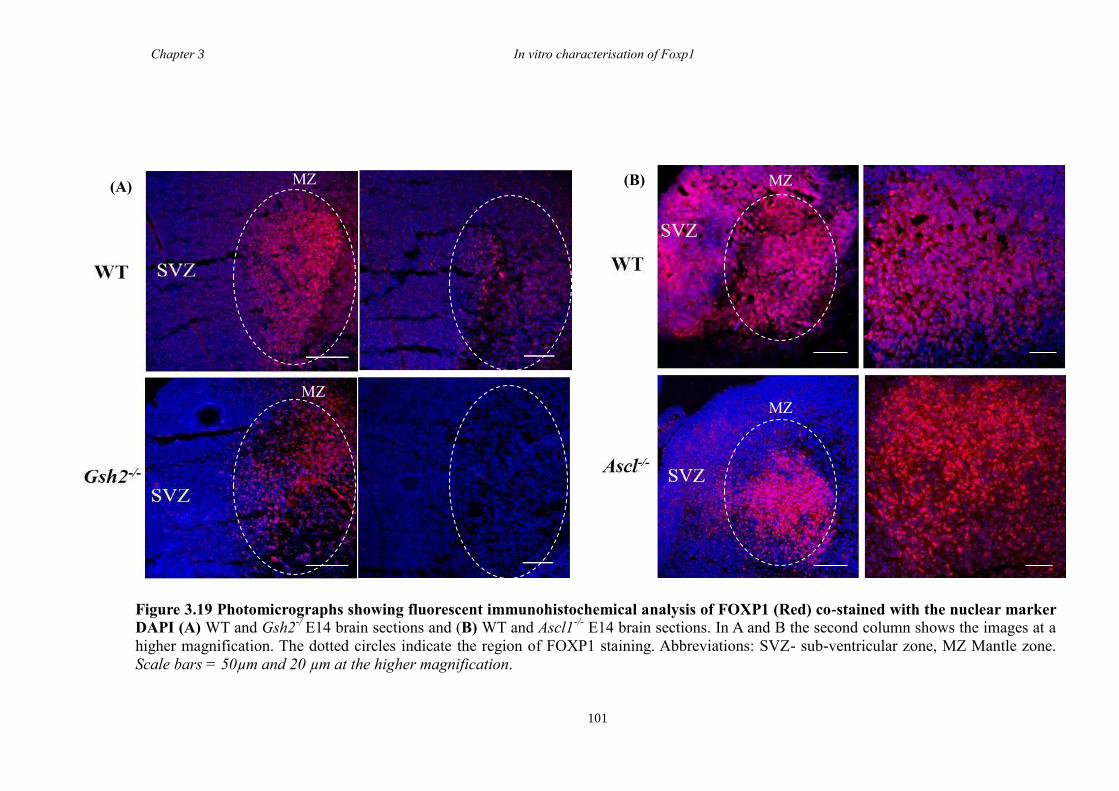
Chapter 3 In vitro characterisation of Foxp1
101
(A) MZ
MZ
Figure 3.19 Photomicrographs showing fluorescent immunohistochemical analysis of FOXP1 (Red) co-stained with the nuclear marker
DAPI (A) WT and Gsh2-/
E14 brain sections and (B) WT and Ascl1-/-
E14 brain sections. In A and B the second column shows the images at a
higher magnification. The dotted circles indicate the region of FOXP1 staining. Abbreviations: SVZ- sub-ventricular zone, MZ Mantle zone.
Scale bars = 50µm and 20 µm at the higher magnification.
(B) MZ
MZ
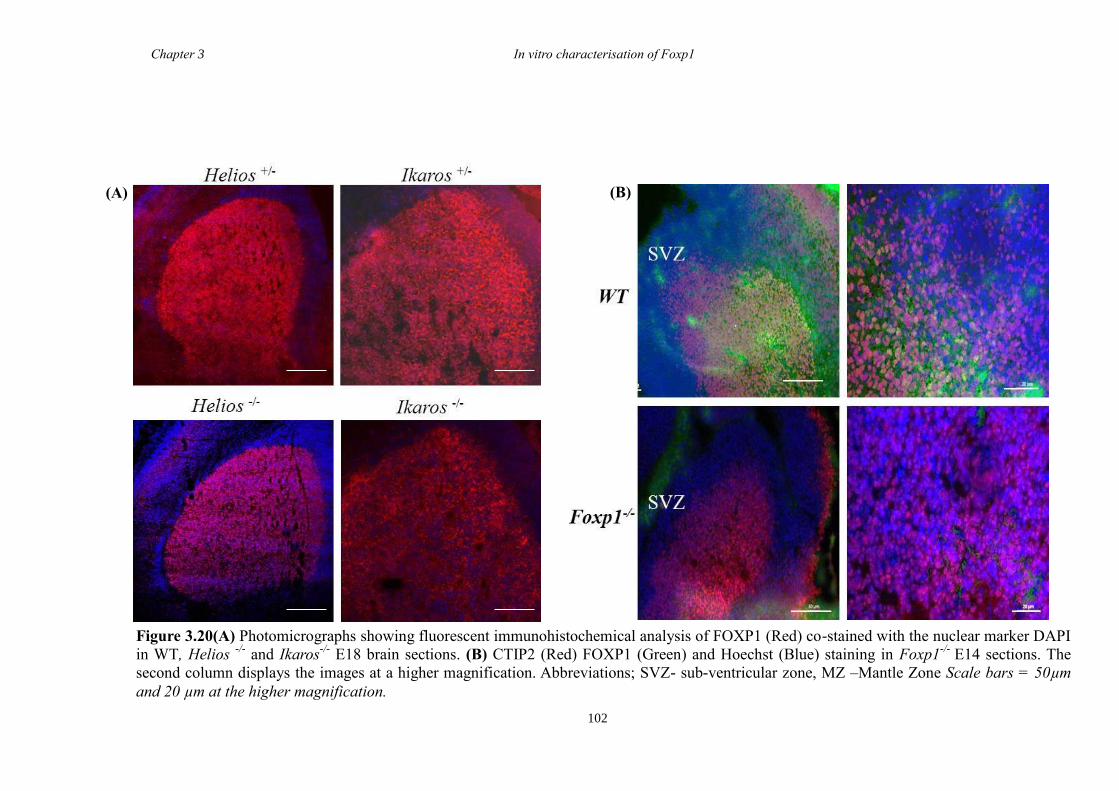
Chapter 3 In vitro characterisation of Foxp1
102
Figure 3.20(A) Photomicrographs showing fluorescent immunohistochemical analysis of FOXP1 (Red) co-stained with the nuclear marker DAPI
in WT, Helios -/-
and Ikaros-/-
E18 brain sections. (B) CTIP2 (Red) FOXP1 (Green) and Hoechst (Blue) staining in Foxp1-/-
E14 sections. The
second column displays the images at a higher magnification. Abbreviations; SVZ- sub-ventricular zone, MZ –Mantle Zone Scale bars = 50µm
and 20 µm at the higher magnification.
(A) (B)
Chapter 3 In vitro characterisation of Foxp1
103
3.5 Discussion
WT expression of FOXP1 from E10-P7
The WT profile of FOXP1 from E10 through to P7 was carried out using fluorescent
immunohistochemistry. Two commonly used striatal markers, CTIP2 and DARPP-32
were used for comparison with FOXP1 stains as expression of DARPP-32, the current
“gold-standard” marker of MSNs is not expressed until E18 in mice (Anderson and
Reiner 1991; Ehrlich et al. 1990), whereas CTIP2 has been reported to stain both MSN
precursors and mature MSNs from E12.5 (Arlotta et al. 2008).
Thus far the focus of FOXP1 research in the developing brain has been carried out to
determine in which CNS areas FOXP1 is expressed. Although Foxp1 mRNA expression
has been reported in the spinal cord from E9.5 (Tamura et al. 2003), mRNA expression
has not been reported in the developing telencephalon until E12.5 (Tamura et al. 2003)
and by another group not until E14.5, in which it was also reported to be seen at a
protein level (Ferland et al. 2003). Contrary to this data, results presented here show
that FOXP1 is seen from E10. Specifically, FOXP1 staining is evident on the medial
edges of the developing GEs, an area coincident with the developing proliferative zones.
As it is known that protein lags behind mRNA production it is possible that FOXP1 may
be being expressed before E10 at a time coincident with the emergence of the
telencephalon (Jain et al. 2001) but further experiments are needed to ascertain this.
This early expression of FOXP1 suggests that Foxp1 is present in neuronal precursor
cells, hinting that FOXP1is needed in striatal development.
By E12 FOXP1 staining is more defined in the SVZ, a proliferative zone that is unique
to the telencephalon (Campbell 2003). CTIP2 staining is also apparent at E12 but is
restricted to the MZ, an area in which post-mitotic neurons reside and differentiate. This
staining profile for FOXP1 and CTIP2 is in line with what was observed by Rubenstein
and colleagues (Long et al. 2009). At E14 FOXP1 and CTIP2 co-localise in the MZ of
the developing striatum and co-localisation in this region was seen through all the ages
studied in this work. However, as alluded to, the expression of these two genes does not
overall throughout the developing striatum as FOXP1, unlike CTIP2 is expressed in the
SVZ. Specifically, distinct patches of FOXP1 staining are evident within the SVZ and,
from E16; these patches are also easily recognisable within the MZ. It is known that
Chapter 3 In vitro characterisation of Foxp1
104
striatal projection neurons across mammals display a mosaic like organisation defined
into striosomes (“patches”) and matrices (Gerfen et al. 1985) and it has been established
that the “patches” are born first (Gerfen et al. 1985) and that in mice this is evident
between E11 and E13 (Mason et al. 2005). Therefore the distinct areas of FOXP1
shown could suggest FOXP1 to be the earliest known patch marker to date, as currently
the first unique marker for distinguishing striatal patches is DARPP-32 at E18 (Foster et
al. 1987). Failing that, one may suggest that the patches seen are in fact an artefact of
the antibody. This possibility was ruled out, as several different concentrations were
trialled to eliminate the chance that the staining was background and an additional
control was carried out in which no primary antibody was applied. When the FOXP1
antibody was used on sections from Foxp1-/-
embryos there was no staining present,
therefore serving as an extra control. As reported DARPP-32 is not detected until E18
(Foster et al. 1987), and this was also true of the results presented in this thesis, where
DARPP-32 staining was apparent in distinct patches from E18 and by P7 staining was
homogeneous throughout the striatum. FOXP1 co-localised with all DARPP-32 positive
cells at all stages, although there were regions of FOXP1 positive/DARPP-32 negative
cells that has been suggested to represent a proportion of striatal projection neurons that
are independent of DARPP-32 staining (Precious et al., submitted 2013; Arlotta et al.,
2008).
This lineage study of FOXP1 not only confirms that FOXP1 does co-localise with
established MSN markers, but promotes FOXP1 as an earlier, more specific MSN
marker than CTIP2, and suggests a specific function for FOXP1 in MSN development.
This interpretation is strengthened twofold; firstly by the fact that CTIP2 is
preferentially expressed in the cortex during striatal development and secondly,
expression of CTIP2 was not changed when Dlx1/2 and Ascl2 were simultaneously
knocked out at E15 (Long et al. 2009). Thus it is likely CTIP2 has a more general role
than FOXP1 in striatal development.
There are no differences in the adult Foxp1+/-
mice compared to WT mice
There were no differences in the weights of Foxp1+/-
mice when compared to WT
littermates and although no behavioural testing was undertaken on these animals
observational analysis of the animals in their home cage, and upon handling, showed
that Foxp1+/-
animals were indistinguishable from WT littermates. As the female mice
Chapter 3 In vitro characterisation of Foxp1
105
were needed for breeding and as a direct result sacrificed regularly to obtain E14
embryos only male mice were able to be sacrificed for phenotypic examination at 20
weeks. Gross dissection analysis showed that the brains from male Foxp1+/-
were not
obviously different to WT brains. Nissl staining using CV also confirmed that there
were no phenotypic differences in striatal morphology or striatal volume and there were
no noticeable differences in striatal, or cortical FOXP1 immunohistochemistry between
the groups. From these analyses it was concluded that no phenotype was evident in the
Foxp1+/-
mice and that any differences in the striatum beyond E14, caused by the loss of
Foxp1, would ideally require a Foxp1 CKO model to be used.
Gross dissection analysis of E14 pups
As with reported cases (Wang et al. 2004a) I showed that Foxp1-/-
pups at E16 were
pale, had no retraction when poked and were confirmed as dead. Thus, analysis as
expected was focused on E14 pups. Analysis was largely restricted to E14 as this time is
coincident with peak MSN neurogenesis (Mason et al. 2005), successful striatal cultures
are routinely and easily cultured from this age ((Martın-Ibanez et al. 2010) and the
developing striatum is easily identifiable upon dissection. However it is also planned to
look at differences earlier in development.
When E14 Foxp1 KO mice have been looked at previously, example photomicrographs
showed that there was a difference in embryo size and that embryos appeared bloodier
than littermates, coincident with cardiac defects (Wang et al. 2004a). For the duration of
this work CR lengths of E14 embryos were recorded upon dissection and showed no
differences between genotypes. However, as no measurements were available to support
the representative Foxp1-/-
photomicrograph presented by Wang and colleagues it is
possible this photo may not have been reflective of the groups. There were no
phenotypic differences in the brains at E14, however striate from the Foxp1-/-
embryos,
had a spotty appearance. It is unlikely that this spotty appearance is of relevance to the
questions addressed in this thesis (i.e. MSN development) and is more likely caused by
haemorrhaging due to the defects in the cardiac system associated with the loss of
Foxp1. Nevertheless this striatal phenotype is novel, and as was evident in over 80% of
Foxp1-/-
pups examined, served as an excellent indicator upon dissection that Foxp1-/-
pups were included in the litter being studied and thus in subsequent analyses.
Chapter 3 In vitro characterisation of Foxp1
106
A significant decrease in total cell number per pair of striate from Foxp1-/-
embryos was
also reported, suggesting that even though there was no difference in brain diameter
across the genotypes there was a difference in overall cell number that may influence
the overall number of DARPP-32 positive MSNs.
In vitro analysis
The cell culture system provides an excellent analytical tool to study gene function in
vitro as cells can be monitored and easily fixed at different developmental time points. It
also allows individual cells to be analysed in detail as well as comparisons to be made
on a population basis. Using this system I was able to plate down E14 WGE from the
different genotypes to look at differences in overall neuronal number using the marker
TUJ1, an isoform of β-Tubulin that is associated with post-mitotic neurons (Lee et al.
1990), and any differences in MSNs using DARPP-32 and CTIP2.
In vitro cell culture analysis following 24 hours and 7 DIV confirmed that there were no
FOXP1 positive cells in cultures from Foxp1-/-
embryos. TUJ1 analysis at both time
points showed no difference in neuronal number or neuronal morphology between the
genotypes. There were no obvious differences in Hoechst positive nuclei observed, and
specifically no differences in the incidence of fragmented nuclei, which are indicative of
cell death. This latter difference was not unexpected given that Foxp1 has not been
associated with apoptosis. After 24 hours in vitro there was very limited DARPP-32
expressed in all of the cultures, irrespective of genotype, which was expected as
expression is not routinely evident until E18 (Anderson and Reiner 1991; Ehrlich et al.
1990). After 7 DIV, which some people have suggested is equivalent to P0 (Olsson et al.
1995), there were more DARPP-32 positive cells present within the cultures.
Interestingly there were significantly fewer DARPP-32 positive cells in cultures
generated from Foxp1-/-
striate compared to cultures generated from WT and Foxp1+/-
striate. Coincident with this, there were also fewer CTIP2 positive neurons in cultures
generated from Foxp1-/-
striate compared to cultures generated from WT and Foxp1+/-
striate after 7 DIV.
There were no differences in proliferation after 24 hours or 7 DIV suggesting that early
stages of MSN development are not affected by the loss of Foxp1. This result is
opposite to what was observed when Foxp1 was knocked out in developing
Chapter 3 In vitro characterisation of Foxp1
107
cardiomyoctes in which proliferation was increased (Wang et al., 2004). Although in
subsequent experiments, loss of Foxp1 caused a decrease in proliferation in the heart
endocardium (Zhang et al. 2010) therefore emphasising the effect the local environment
can have on gene expression. At 7 DIV there were fewer TUJ1 cells identified in
Foxp1+/-
cultures compared to WT cultures but this result is likely caused by counting
errors as it has been shown from the above mentioned in vitro studies that there were no
differences in TUJ1 number between the groups at 7 DIV.
Several conclusions can be drawn from these results. Firstly the overall increase in the
number of DARPP-32, FOXP1 and CTIP2 positive cells in the WT cultures between 24
hours and 7 DIV suggest that the cells are differentiating normally in our culture system.
Secondly, that in the absence of Foxp1 there is a decrease in the number of DARPP-32
and CTIP2 positive MSNs after 7 DIV suggesting Foxp1 has a direct or indirect role in
MSN development. There are no known FOXP1 binding sites on the Darpp-32 gene,
but there is a known Foxp1 binding site upstream of the Ctip2 promoter (Tang et al.
2012), suggesting FOXP1 and CTIP2 could function in synergy in aspects of MSN
differentiation. Thirdly, that as no differences in overall neuronal number were seen this
could suggest that in WGE cultures, MSNs do not constitute the majority of the
neuronal populations. It is possible that if the cultures were derived solely from the
LGE, the main source of striatal projection neurons (Marin et al. 2000; Stenman et al.
2003; Wichterle et al. 2001), as oppose to WGE, the neuronal population would be
more biased towards MSNs thus likely to cause an overall loss in neuronal number, due
to the increased loss of MSNs apparent in Foxp1-/-
cultures. However, a more likely
reason is that the striatal neurons are still being born, are proliferating correctly but are
less mature and thus would still stain positively for TUJ1 in the Foxp1-/-
cultures. Due to
time restraints this hypothesis could not be explored thoroughly but further experiments
using specific markers of the cell cycle, and both immature and mature neuronal
markers (NESTIN and MAP2 respectively) will be carried out.
Calcium imaging was also carried out on the striatal cultures following 24 hours in
vitro. This technique allowed us to monitor any genotypic differences in the neuronal
homogeneity of the cells. Upon cellular uptake, and subsequent activation of the
membrane-soluble fluorescent dye Fura-2, GABA-evoked, depolarisation-mediated
activation of voltage-gated Ca2+
channels was measured indirectly and was used to
Chapter 3 In vitro characterisation of Foxp1
108
ascertain differences in action and resting membrane potentials of the cells of the
different genotypes. It is assumed that MSNs during embryonic development are largely
excitatory and become inhibitory upon maturation (Owens et al. 1996). Results showed
that the cells from all three genotypes had functional Ca2+
channels as they produced
excitatory peaks in response to high K. Likewise all neurons produced action potentials
(APs) in response to NC and LC showing that GABA at this stage, as expected, is still
being utilised as an excitatory neurotransmitter, thus showing, in the absence of Foxp1,
there are no significant differences in the normal physiology of MSNs. However, the
Foxp1-/-
neurons did have a significantly larger overall response to GABA LC than cells
from Foxp1+/-
and WT cells, possibly suggesting an increase in the number of GABA
channels. And secondly Foxp1-/-
cells showed a trend to have an increased excitatory
GABAergic response, suggesting possible immaturity of the Foxp1-/-
cells. However,
further tests must be carried out to confirm or refute this.
Analysis of FOXP1 in KO’s of genes associated with striatal development.
It is known that when Dlx1/2 were knocked out in the developing striatum there was a
“severe reduction” of Foxp1 in the SVZ and MZ, suggesting that Foxp1 may function
downstream of this signalling pathway (Long et al. 2009). However, as there wasn’t a
complete loss of MSNs in the absence of Dlx1/2, and disruption was only evident in the
dLGE, sparing neurons of the vLGE, other TFs that function independent and
simultaneous to Dlx1/2 are also needed for MSN development. Two such factors are
Ascl1 and Gsh2 that are primarily expressed in the vLGE and showed increased
expression when Dlx1/2 were KO (Long et al. 2009). Further analysis showed that
Dlx1/2 and Ascl1 work synergistically in MSN differentiation and to maintain the
dLGE/vLGE divide. Therefore, fluorescent immunohistochemistry was carried out to
look at the differences in FOXP1 in the Ascl-/-
and the Gsh2-/-
.
In the Ascl1-/-
sections, FOXP1 staining appeared reduced in the SVZ when compared to
WT sections. Unfortunately in the Ascl1, Dlx1/2 triple KO microarray differences in
Foxp1 were not reported in the publication (Long et al. 2009) but would have been
useful to corroborate this finding in the absence of quantification at this time point.
Nethertheless this apparent reduction of FOXP1 in the SVZ could suggest it functions
downstream of Ascl1 in MSN precursors. Additionally there was reduced FOXP1 in the
Gsh2-/-
brain section, exploring the idea that Foxp1 may be functioning downstream of
Chapter 3 In vitro characterisation of Foxp1
109
this TF, in addition to downstream of Dlx1/2 and Ascl1. Therefore as WT lineage results
presented in this Chapter clearly showed that FOXP1 is expressed throughout the MZ
with no dorsal/ventral bias it is possible that Foxp1 is a downstream target of all these
TFs, and thus would be implicated in various, and possibly independent genetic
pathways controlling different MSN lineages.
Relatively new markers of MSNs are Helios and Ikaros (Martin-Ibanez et al. 2012;
Martın-Ibanez et al. 2010). Ikaros has shown to be expressed in the MZ of the striatum
and results showed that this TF was a modulator of cell cycle exit for neuronal
progenitors born in the second wave of neurogenesis, and that it is expressed
downstream of Dlx1/2/5/6 (Martın-Ibanez et al. 2010). Helios is also a member of the
Ikaros family, and has shown to be associated with a subset of striatal projection
neurons that co-localise with Foxp1 and Ctip2 at E18.5 (Martin-Ibanez et al. 2012). The
authors suggest Helios is implicated in MSN neuronal lineage derived from the LGE
that ultimately populates the matrix region and suggest that Foxp1 and Ctip2 are
associated with the same lineage (Martin-Ibanez et al. 2012). However, when FOXP1
was analysed in either Helios-/-
or Ikaros-/-
sections there were no difference when
compared to WT sections. Finally, differences in CTIP2 were looked for in the FOXP1
KO at E14. There was no apparent difference in CTIP2 expression when compared to
staining in the WT. However, all these immunohistochemical results can only go as far
as suggesting differences/no differences as quantification was not undertaken on this
occasion. Nevertheless, results from an on-going microarray assessing independent
differences in the LGE and MGE, from Foxp1-/-
striate compared to WT striate will
optimistically yield more definitive answers, and narrow the genes that can function
up/downstream of Foxp1.
3.6 Conclusion
This Chapter characterised the expression profile of FOXP1 through co-localisation of
two routinely used MSN markers, CTIP2 and DARPP-32 and showed that FOXP1 co-
localised with both genes from the onset of their expression. Owing to the embryonic
lethality associated with the homozygous Foxp1 KO embryos and no reported
phenotypic differences between WT and Foxp1+/-
embryos, phenotypic differences in
Chapter 3 In vitro characterisation of Foxp1
110
Foxp1+/-
adult mice were looked for. Results showed no obvious differences when
compared to WT mice therefore limiting experimental analysis to E14.
Striatal cultures from E14 Foxp1-/-
embryos that had been left to differentiate for 7 DIV
had fewer CTIP2 and DARPP-32 positive cells than cultures from Foxp1+/-
or WT
embryos, with no differences identified in proliferation or neuronal homogeneity.
Finally immunohistochemical staining suggested that there was less FOXP1 in Ascl1-/-
and Gsh2-/ E14 brain sections, suggesting that FOXP1 may be acting downstream of
these genes. Taken together these results propose that, at least until E14, MSN
development is aberrant in the absence of Foxp1, and that Foxp1 has an important role,
likely downstream of Ascl1 and Gsh2, in later aspects of MSN development.
Chapter 4 Analysis of E14 WGE in the QA mouse model
111
4 In vivo Characterisation of Primary
Striatal Tissue Transplanted into a
Quinolinic acid (QA) Mouse Model of
HD
4.1 Summary
The in vitro experiments described in Chapter 3 strongly implicate Foxp1 in MSN
development and differentiation. However, these results relied to a large extent on
analysis of markers such as CTIP2, as detection of DARPP-32 is notoriously difficult in
cell culture. The reasons for this are likely to be because DARPP-32 is expressed in
mature MSNs and full expression may depend upon the MSNs making normal afferent
connections. One way to study this would be to generate striatal specific FOXP1 CKOs
and indeed this is underway but involves a complex and time consuming breeding
strategy which was unable to be completed in the time of this PhD. Therefore a
complementary approach was taken which was to transplant E14 striatal cells (before
they die) into the adult lesioned mouse striatum. This allows striatal neurons from
Foxp1-/-
mice to survive for much longer periods than is possible in vitro and to allow
them the opportunity to make some of their normal connections. Moreover it allows one
to see how striatal cells without Foxp1 develop in vivo once grafted.
Primary striatal tissue generated from E14 embryos from a Foxp1 heterozygote cross
was grafted into adult mice that had received a quinolinic acid (QA) lesion and the
tissue was left to mature in vivo for 12 weeks. Surviving grafts showed that there was a
decrease in DARPP-32 in the grafted tissue from the Foxp1-/-
embryos when compared
to grafts from WT and Foxp1-/+
embryos. However, although E14 is the generally
accepted gestational age at which to transplant primary striatal cells from rodents, the
E14 grafts were small, making confident analysis of graft cell content difficult.
Therefore further grafts were undertaken using donor tissue from E12 embryos on the
basis that the accepted age of E14 tissue is based largely on rat transplant data and the

Chapter 4 Analysis of E14 WGE in the QA mouse model
112
mouse gestational period is slightly shorter. As hypothesised, the E12 grafts were bigger
than those seen at E14, and showed comparable results to grafts using E14 donor cells
that in that the absence of Foxp1 there is a decrease in DARPP-32 staining.
Chapter 4 Analysis of E14 WGE in the QA mouse model
113
4.2 Introduction
Cell transplantation is a useful tool for studying donor cell differentiation, maturation,
and integration over prolonged periods of time, which in vitro methods, including cell
culture are unable to offer. Differentiation cultures using primary mouse striatal tissue,
allow differences in MSN precursors to be assessed, but are restricted to a maximum of
two weeks in vitro before considerable cell death is seen.
Chapter 3 of this Thesis addressed differences in striatal development in the mouse in
the absence of Foxp1 up to E14, the point of embryonic lethality in Foxp1 KO mice.
However, to adequately assess differences in expression of striatal DARPP-32, the
current “gold standard” marker of MSNs, it is necessary to look beyond E14, as
DARPP-32 expression is not evident until later in development (~E18) (Anderson and
Reiner 1991; Ehrlich et al. 1990), and isn’t optimally expressed until postnatal (P)
weeks 2-3 (Gustafson et al. 1992). Due to the embryonic lethality of Foxp1-/-
at E14 one
way of addressing differences in DARPP-32 was attempting through the use of CKO
mice, this approach will be discussed in Chapter 5. Here, cell transplantation is
employed in a novel to look at expanded development of striatal cells from embryos of
a Foxp1 heterozygous cross when grafted into a lesioned environment. This method
allows one to look at differences in developing tissue beyond that of their known
lethality, and beyond that available in the cell culture system permitting differences in
mature MSNs within the graft to be analysed using DARPP-32.
One of the best-used models for striatal transplantation is the HD quinolinic acid (QA)
striatal lesion model. When injected directly into the striatum of rodents, QA, a selective
NMDA receptor agonist, has shown to cause striatal atrophy and loss of MSNs, sparing
striatal interneurons and aspiny neurons (Beal et al. 1986; Schwarcz and Kohler 1983;
Schwarcz et al. 1983). It has also been shown by our lab group that the QA model
causes loss of DARPP-32 and FOXP1 expressing MSNs (Precious et al., submitted
2013) making it the ideal model to look at differences in MSN development in vivo.
Grafting considerations in mice are largely based upon what was trialled and shown to
be successful in the rat. For rat allograft experiments it was shown that E14 primary
striatal tissue produced bigger and more reliable grafts than those derived from E12
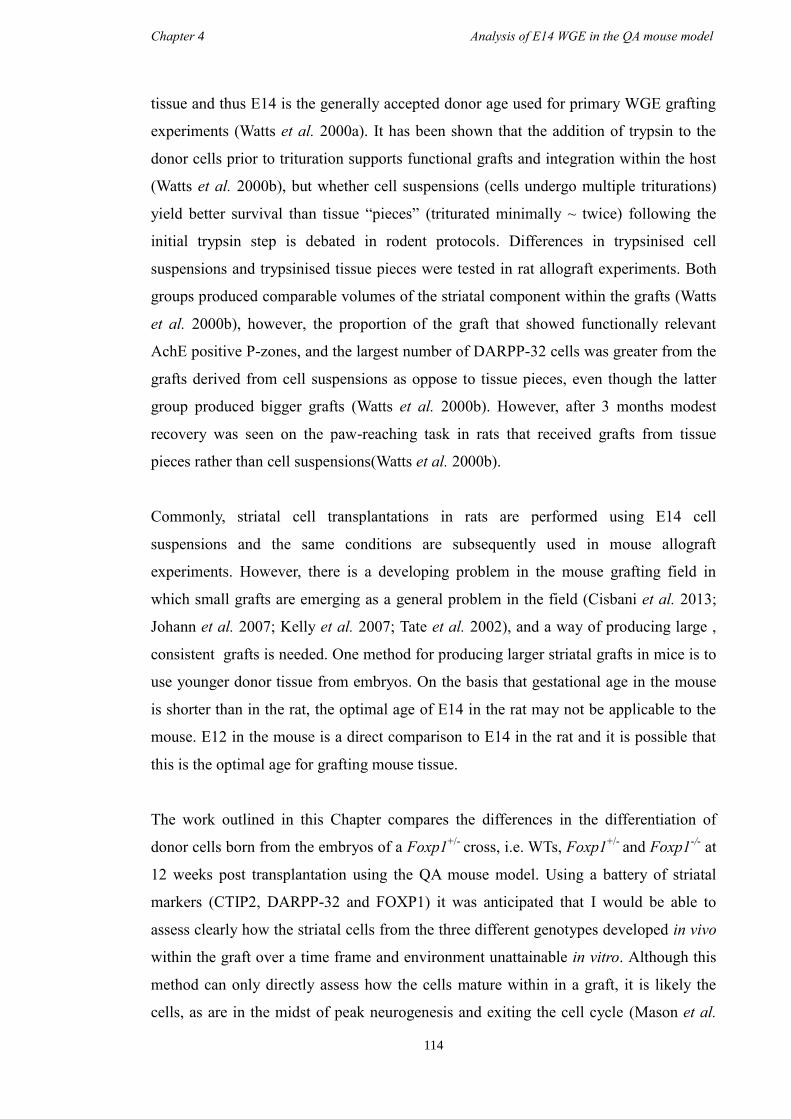
Chapter 4 Analysis of E14 WGE in the QA mouse model
114
tissue and thus E14 is the generally accepted donor age used for primary WGE grafting
experiments (Watts et al. 2000a). It has been shown that the addition of trypsin to the
donor cells prior to trituration supports functional grafts and integration within the host
(Watts et al. 2000b), but whether cell suspensions (cells undergo multiple triturations)
yield better survival than tissue “pieces” (triturated minimally ~ twice) following the
initial trypsin step is debated in rodent protocols. Differences in trypsinised cell
suspensions and trypsinised tissue pieces were tested in rat allograft experiments. Both
groups produced comparable volumes of the striatal component within the grafts (Watts
et al. 2000b), however, the proportion of the graft that showed functionally relevant
AchE positive P-zones, and the largest number of DARPP-32 cells was greater from the
grafts derived from cell suspensions as oppose to tissue pieces, even though the latter
group produced bigger grafts (Watts et al. 2000b). However, after 3 months modest
recovery was seen on the paw-reaching task in rats that received grafts from tissue
pieces rather than cell suspensions(Watts et al. 2000b).
Commonly, striatal cell transplantations in rats are performed using E14 cell
suspensions and the same conditions are subsequently used in mouse allograft
experiments. However, there is a developing problem in the mouse grafting field in
which small grafts are emerging as a general problem in the field (Cisbani et al. 2013;
Johann et al. 2007; Kelly et al. 2007; Tate et al. 2002), and a way of producing large ,
consistent grafts is needed. One method for producing larger striatal grafts in mice is to
use younger donor tissue from embryos. On the basis that gestational age in the mouse
is shorter than in the rat, the optimal age of E14 in the rat may not be applicable to the
mouse. E12 in the mouse is a direct comparison to E14 in the rat and it is possible that
this is the optimal age for grafting mouse tissue.
The work outlined in this Chapter compares the differences in the differentiation of
donor cells born from the embryos of a Foxp1+/-
cross, i.e. WTs, Foxp1+/-
and Foxp1-/-
at
12 weeks post transplantation using the QA mouse model. Using a battery of striatal
markers (CTIP2, DARPP-32 and FOXP1) it was anticipated that I would be able to
assess clearly how the striatal cells from the three different genotypes developed in vivo
within the graft over a time frame and environment unattainable in vitro. Although this
method can only directly assess how the cells mature within in a graft, it is likely the
cells, as are in the midst of peak neurogenesis and exiting the cell cycle (Mason et al.
Chapter 4 Analysis of E14 WGE in the QA mouse model
115
2005), will maintain some of their genetic cues and develop as if left in their natural
milieu, although it is known that results obtained cannot be directed attributable to the
normal developmental process.
Initially, the standard mouse allografting protocol was used in experiments, i.e. E14
striatal cell suspensions; but these grafts were small making confident assessment of the
cell content difficult. Consequently, a further round of transplantations was undertaken
using E12 donor tissue, which produced larger grafts. It was shown that cells grafted in
the absence of Foxp1 (Foxp1-/-
striate), using both E14 and E12 donor tissue, showed a
decrease in the number of DARPP-32 positive cells when compared to grafts derived
from WT and Foxp1+/-
donor cells.
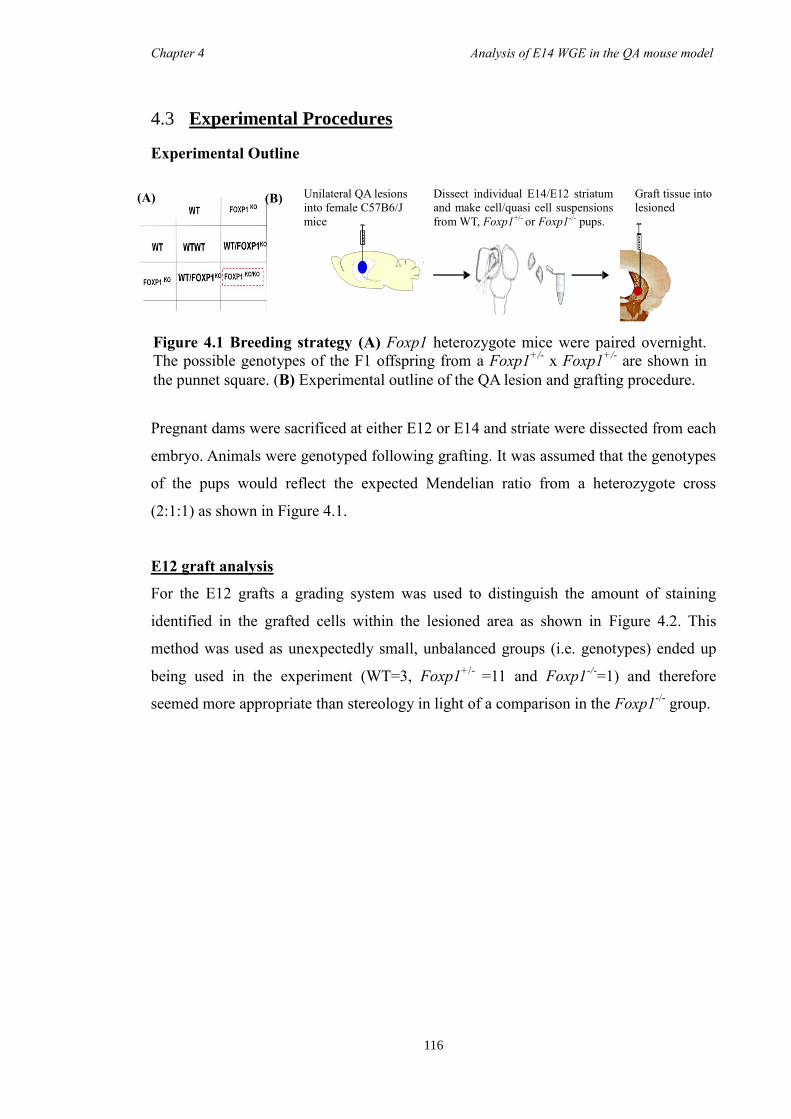
Chapter 4 Analysis of E14 WGE in the QA mouse model
116
4.3 Experimental Procedures
Experimental Outline
Pregnant dams were sacrificed at either E12 or E14 and striate were dissected from each
embryo. Animals were genotyped following grafting. It was assumed that the genotypes
of the pups would reflect the expected Mendelian ratio from a heterozygote cross
(2:1:1) as shown in Figure 4.1.
E12 graft analysis
For the E12 grafts a grading system was used to distinguish the amount of staining
identified in the grafted cells within the lesioned area as shown in Figure 4.2. This
method was used as unexpectedly small, unbalanced groups (i.e. genotypes) ended up
being used in the experiment (WT=3, Foxp1+/-
=11 and Foxp1-/-
=1) and therefore
seemed more appropriate than stereology in light of a comparison in the Foxp1-/-
group.
Figure 4.1 Breeding strategy (A) Foxp1 heterozygote mice were paired overnight.
The possible genotypes of the F1 offspring from a Foxp1+/-
x Foxp1+/-
are shown in
the punnet square. (B) Experimental outline of the QA lesion and grafting procedure.
(A) (B) Graft tissue into
lesioned
striatum
Dissect individual E14/E12 striatum
and make cell/quasi cell suspensions
from WT, Foxp1+/- or Foxp1-/- pups.
Unilateral QA lesions
into female C57B6/J
mice
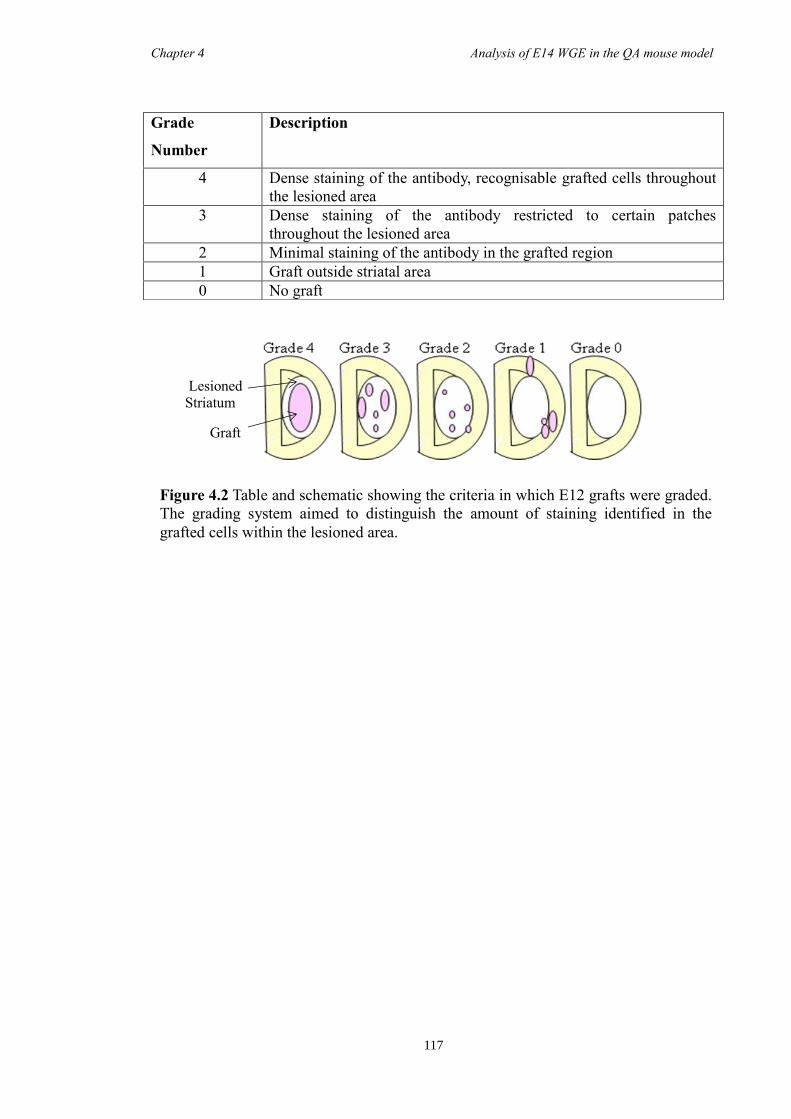
Chapter 4 Analysis of E14 WGE in the QA mouse model
117
Grade
Number
Description
4 Dense staining of the antibody, recognisable grafted cells throughout
the lesioned area
3 Dense staining of the antibody restricted to certain patches
throughout the lesioned area
2 Minimal staining of the antibody in the grafted region
1 Graft outside striatal area
0 No graft
Lesioned
Striatum
Graft
Figure 4.2 Table and schematic showing the criteria in which E12 grafts were graded.
The grading system aimed to distinguish the amount of staining identified in the
grafted cells within the lesioned area.
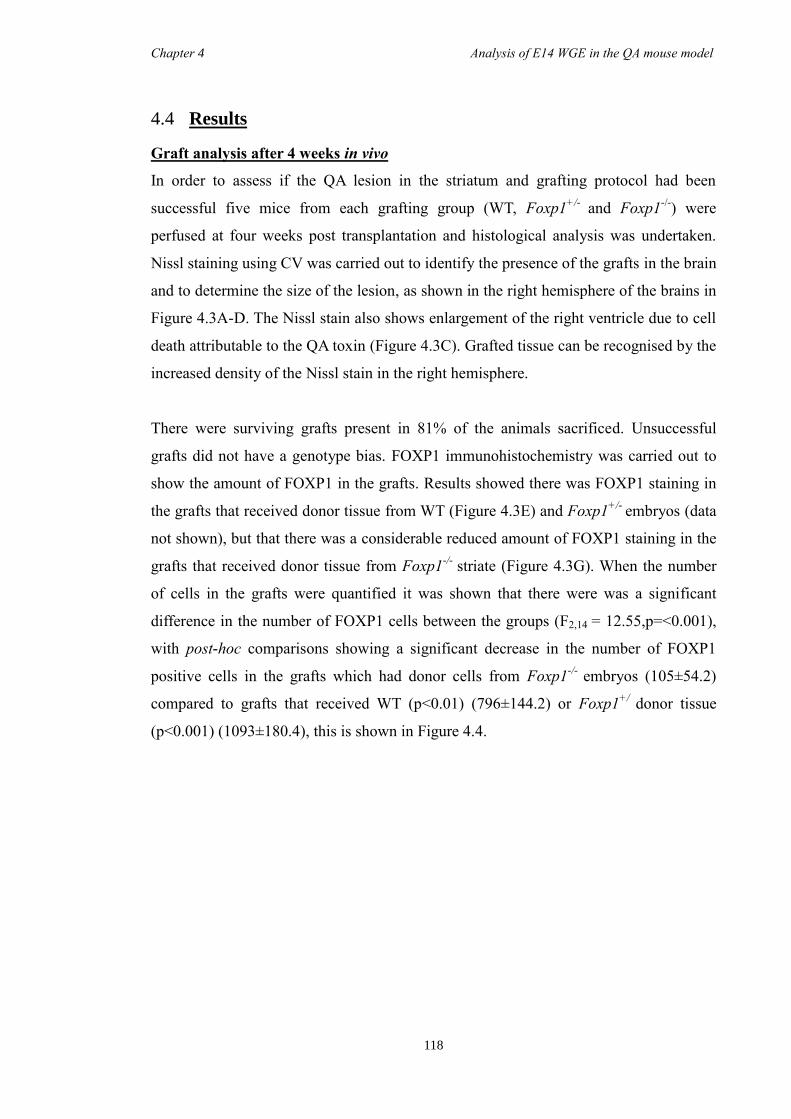
Chapter 4 Analysis of E14 WGE in the QA mouse model
118
4.4 Results
Graft analysis after 4 weeks in vivo
In order to assess if the QA lesion in the striatum and grafting protocol had been
successful five mice from each grafting group (WT, Foxp1+/-
and Foxp1-/-
) were
perfused at four weeks post transplantation and histological analysis was undertaken.
Nissl staining using CV was carried out to identify the presence of the grafts in the brain
and to determine the size of the lesion, as shown in the right hemisphere of the brains in
Figure 4.3A-D. The Nissl stain also shows enlargement of the right ventricle due to cell
death attributable to the QA toxin (Figure 4.3C). Grafted tissue can be recognised by the
increased density of the Nissl stain in the right hemisphere.
There were surviving grafts present in 81% of the animals sacrificed. Unsuccessful
grafts did not have a genotype bias. FOXP1 immunohistochemistry was carried out to
show the amount of FOXP1 in the grafts. Results showed there was FOXP1 staining in
the grafts that received donor tissue from WT (Figure 4.3E) and Foxp1+/-
embryos (data
not shown), but that there was a considerable reduced amount of FOXP1 staining in the
grafts that received donor tissue from Foxp1-/-
striate (Figure 4.3G). When the number
of cells in the grafts were quantified it was shown that there were was a significant
difference in the number of FOXP1 cells between the groups (F2,14 = 12.55,p=<0.001),
with post-hoc comparisons showing a significant decrease in the number of FOXP1
positive cells in the grafts which had donor cells from Foxp1-/-
embryos (105±54.2)
compared to grafts that received WT (p<0.01) (796±144.2) or Foxp1+/
donor tissue
(p<0.001) (1093±180.4), this is shown in Figure 4.4.
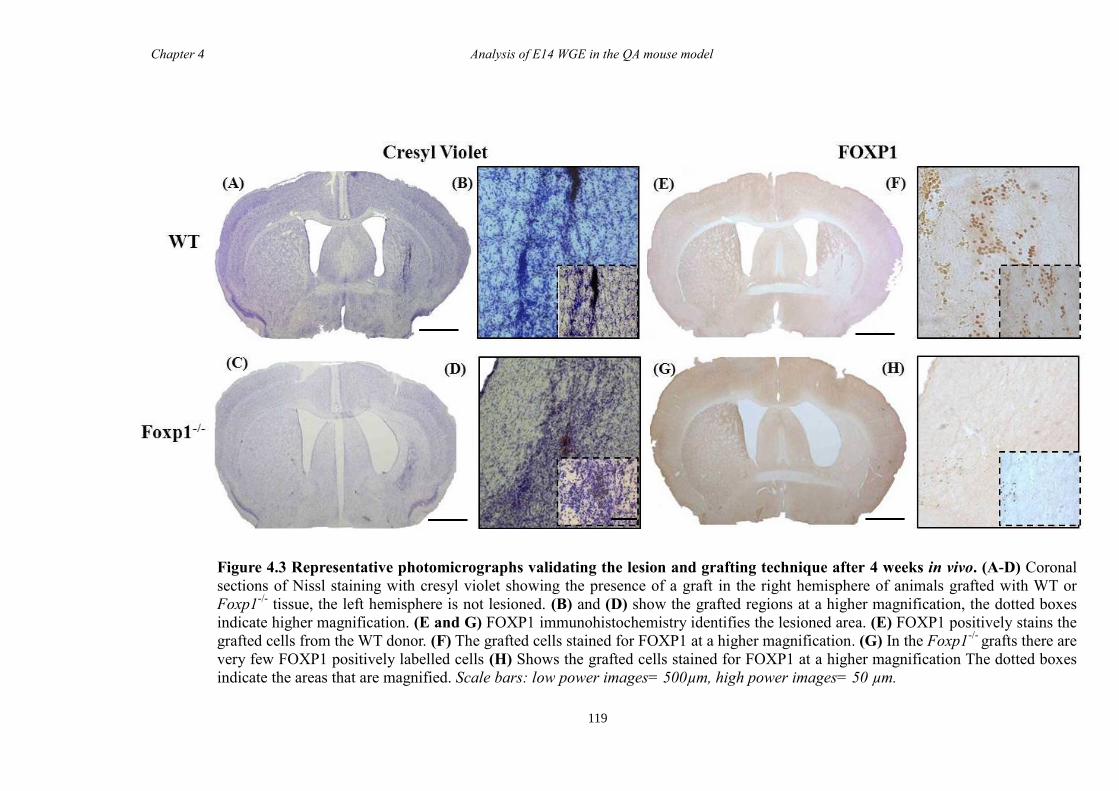
Chapter 4 Analysis of E14 WGE in the QA mouse model
119
(v)
Figure 4.3 Representative photomicrographs validating the lesion and grafting technique after 4 weeks in vivo. (A-D) Coronal
sections of Nissl staining with cresyl violet showing the presence of a graft in the right hemisphere of animals grafted with WT or
Foxp1-/-
tissue, the left hemisphere is not lesioned. (B) and (D) show the grafted regions at a higher magnification, the dotted boxes
indicate higher magnification. (E and G) FOXP1 immunohistochemistry identifies the lesioned area. (E) FOXP1 positively stains the
grafted cells from the WT donor. (F) The grafted cells stained for FOXP1 at a higher magnification. (G) In the Foxp1-/-
grafts there are
very few FOXP1 positively labelled cells (H) Shows the grafted cells stained for FOXP1 at a higher magnification The dotted boxes
indicate the areas that are magnified. Scale bars: low power images= 500µm, high power images= 50 µm.
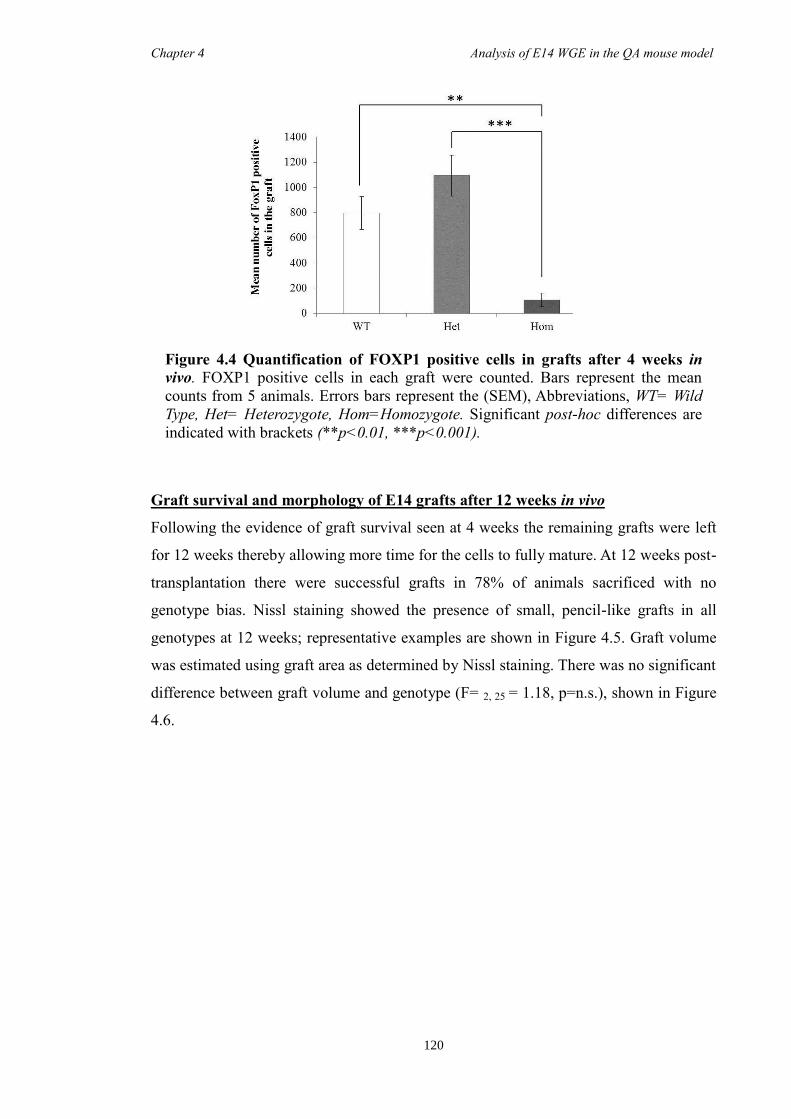
Chapter 4 Analysis of E14 WGE in the QA mouse model
120
Graft survival and morphology of E14 grafts after 12 weeks in vivo
Following the evidence of graft survival seen at 4 weeks the remaining grafts were left
for 12 weeks thereby allowing more time for the cells to fully mature. At 12 weeks post-
transplantation there were successful grafts in 78% of animals sacrificed with no
genotype bias. Nissl staining showed the presence of small, pencil-like grafts in all
genotypes at 12 weeks; representative examples are shown in Figure 4.5. Graft volume
was estimated using graft area as determined by Nissl staining. There was no significant
difference between graft volume and genotype (F= 2, 25 = 1.18, p=n.s.), shown in Figure
4.6.
Figure 4.4 Quantification of FOXP1 positive cells in grafts after 4 weeks in
vivo. FOXP1 positive cells in each graft were counted. Bars represent the mean
counts from 5 animals. Errors bars represent the (SEM), Abbreviations, WT= Wild
Type, Het= Heterozygote, Hom=Homozygote. Significant post-hoc differences are
indicated with brackets (**p<0.01, ***p<0.001).
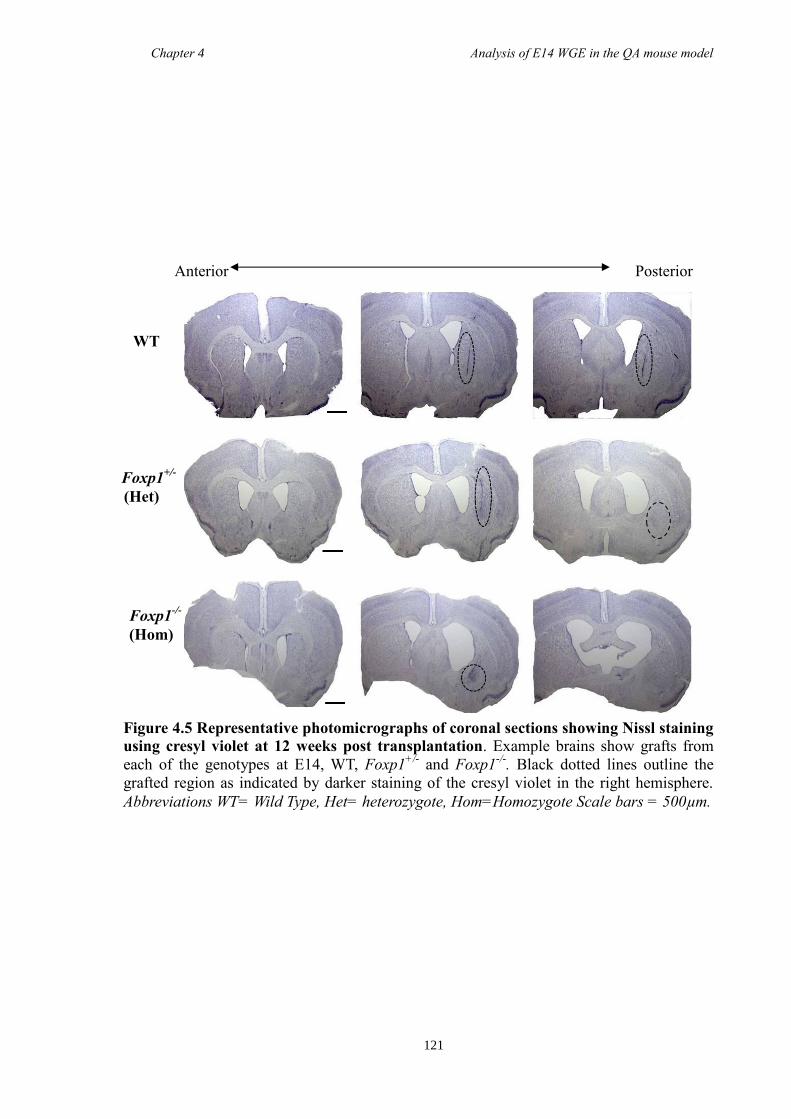
Chapter 4 Analysis of E14 WGE in the QA mouse model
121
Figure 4.5 Representative photomicrographs of coronal sections showing Nissl staining
using cresyl violet at 12 weeks post transplantation. Example brains show grafts from
each of the genotypes at E14, WT, Foxp1+/-
and Foxp1-/-
. Black dotted lines outline the
grafted region as indicated by darker staining of the cresyl violet in the right hemisphere.
Abbreviations WT= Wild Type, Het= heterozygote, Hom=Homozygote Scale bars = 500µm.
WT
Foxp1+/-
(Het)
Foxp1-/-
(Hom)
Posterior Anterior
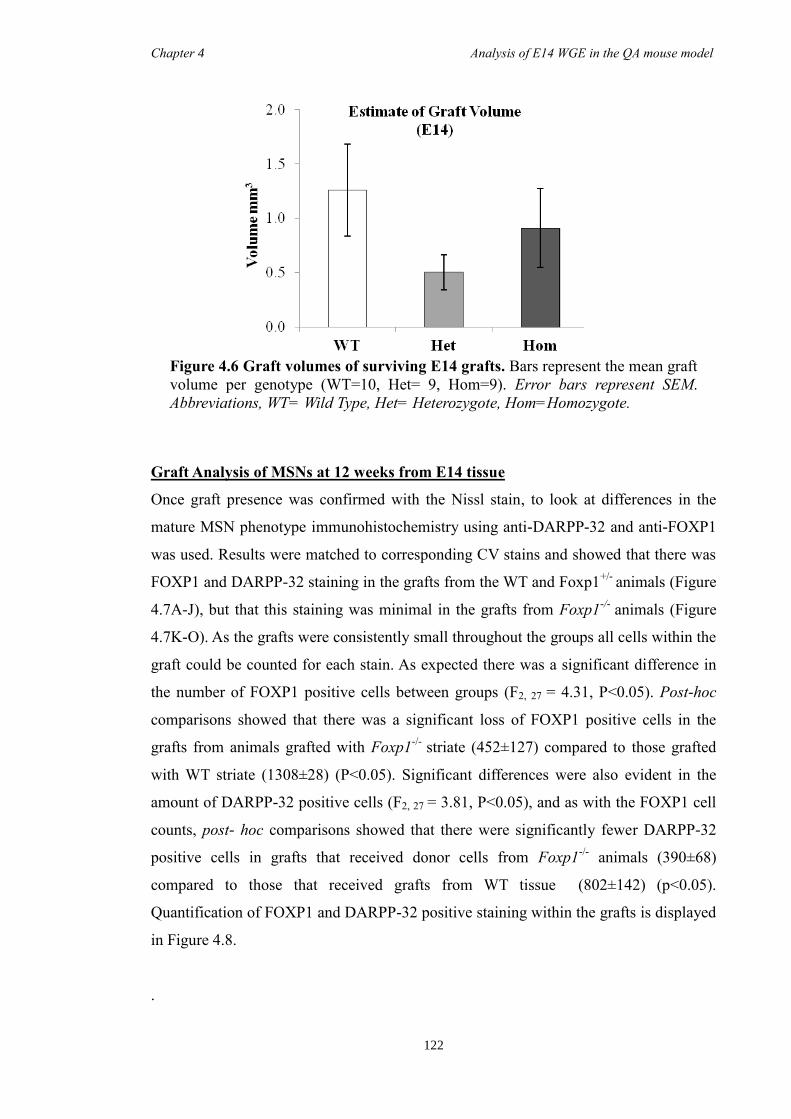
Chapter 4 Analysis of E14 WGE in the QA mouse model
122
Graft Analysis of MSNs at 12 weeks from E14 tissue
Once graft presence was confirmed with the Nissl stain, to look at differences in the
mature MSN phenotype immunohistochemistry using anti-DARPP-32 and anti-FOXP1
was used. Results were matched to corresponding CV stains and showed that there was
FOXP1 and DARPP-32 staining in the grafts from the WT and Foxp1+/-
animals (Figure
4.7A-J), but that this staining was minimal in the grafts from Foxp1-/-
animals (Figure
4.7K-O). As the grafts were consistently small throughout the groups all cells within the
graft could be counted for each stain. As expected there was a significant difference in
the number of FOXP1 positive cells between groups (F2, 27 = 4.31, P<0.05). Post-hoc
comparisons showed that there was a significant loss of FOXP1 positive cells in the
grafts from animals grafted with Foxp1-/-
striate (452±127) compared to those grafted
with WT striate (1308±28) (P<0.05). Significant differences were also evident in the
amount of DARPP-32 positive cells (F2, 27 = 3.81, P<0.05), and as with the FOXP1 cell
counts, post- hoc comparisons showed that there were significantly fewer DARPP-32
positive cells in grafts that received donor cells from Foxp1-/-
animals (390±68)
compared to those that received grafts from WT tissue (802±142) (p<0.05).
Quantification of FOXP1 and DARPP-32 positive staining within the grafts is displayed
in Figure 4.8.
.
Figure 4.6 Graft volumes of surviving E14 grafts. Bars represent the mean graft
volume per genotype (WT=10, Het= 9, Hom=9). Error bars represent SEM.
Abbreviations, WT= Wild Type, Het= Heterozygote, Hom=Homozygote.
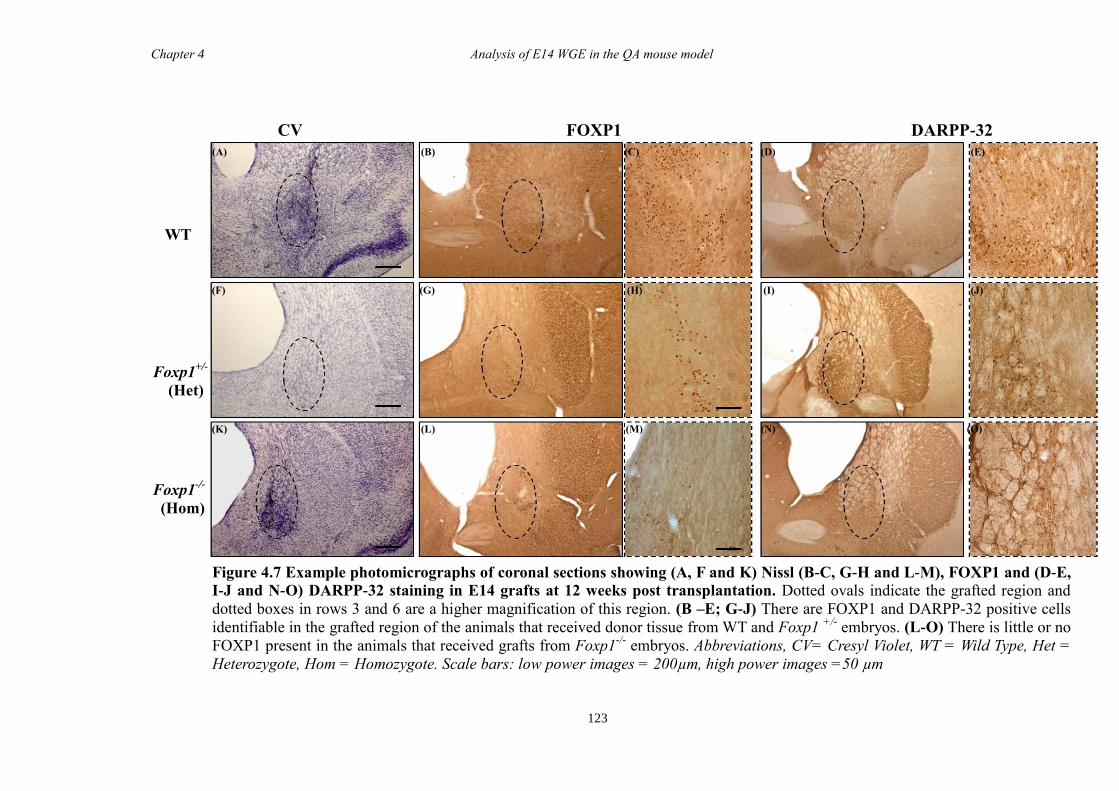
Chapter 4 Analysis of E14 WGE in the QA mouse model
123
CV FOXP1 DARPP-32
Foxp1-/-
(Hom)
(A)
(F)
(K)
(B) (C) (D) (E)
(G) (H) (I) (J)
(L) (M) (N) (O)
Figure 4.7 Example photomicrographs of coronal sections showing (A, F and K) Nissl (B-C, G-H and L-M), FOXP1 and (D-E,
I-J and N-O) DARPP-32 staining in E14 grafts at 12 weeks post transplantation. Dotted ovals indicate the grafted region and
dotted boxes in rows 3 and 6 are a higher magnification of this region. (B –E; G-J) There are FOXP1 and DARPP-32 positive cells
identifiable in the grafted region of the animals that received donor tissue from WT and Foxp1 +/-
embryos. (L-O) There is little or no
FOXP1 present in the animals that received grafts from Foxp1-/-
embryos. Abbreviations, CV= Cresyl Violet, WT = Wild Type, Het =
Heterozygote, Hom = Homozygote. Scale bars: low power images = 200µm, high power images =50 µm
WT
Foxp1+/-
(Het)
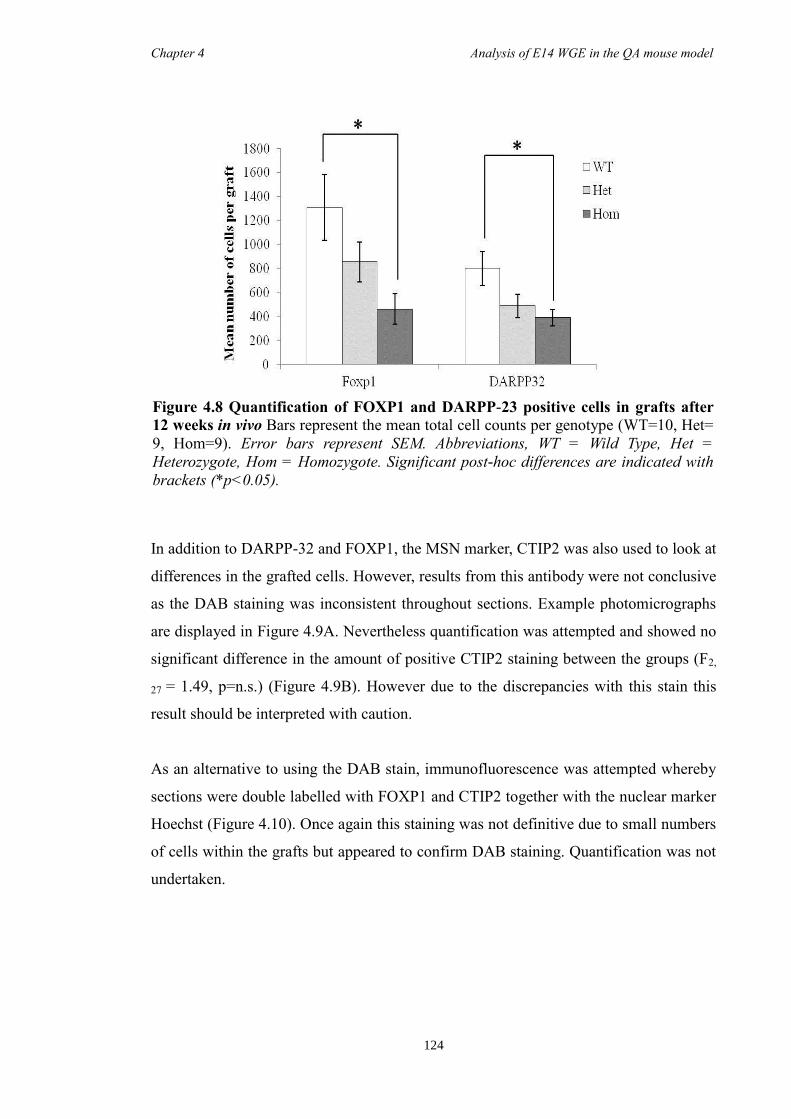
Chapter 4 Analysis of E14 WGE in the QA mouse model
124
In addition to DARPP-32 and FOXP1, the MSN marker, CTIP2 was also used to look at
differences in the grafted cells. However, results from this antibody were not conclusive
as the DAB staining was inconsistent throughout sections. Example photomicrographs
are displayed in Figure 4.9A. Nevertheless quantification was attempted and showed no
significant difference in the amount of positive CTIP2 staining between the groups (F2,
27 = 1.49, p=n.s.) (Figure 4.9B). However due to the discrepancies with this stain this
result should be interpreted with caution.
As an alternative to using the DAB stain, immunofluorescence was attempted whereby
sections were double labelled with FOXP1 and CTIP2 together with the nuclear marker
Hoechst (Figure 4.10). Once again this staining was not definitive due to small numbers
of cells within the grafts but appeared to confirm DAB staining. Quantification was not
undertaken.
(B)
Figure 4.8 Quantification of FOXP1 and DARPP-23 positive cells in grafts after
12 weeks in vivo Bars represent the mean total cell counts per genotype (WT=10, Het=
9, Hom=9). Error bars represent SEM. Abbreviations, WT = Wild Type, Het =
Heterozygote, Hom = Homozygote. Significant post-hoc differences are indicated with
brackets (*p<0.05).
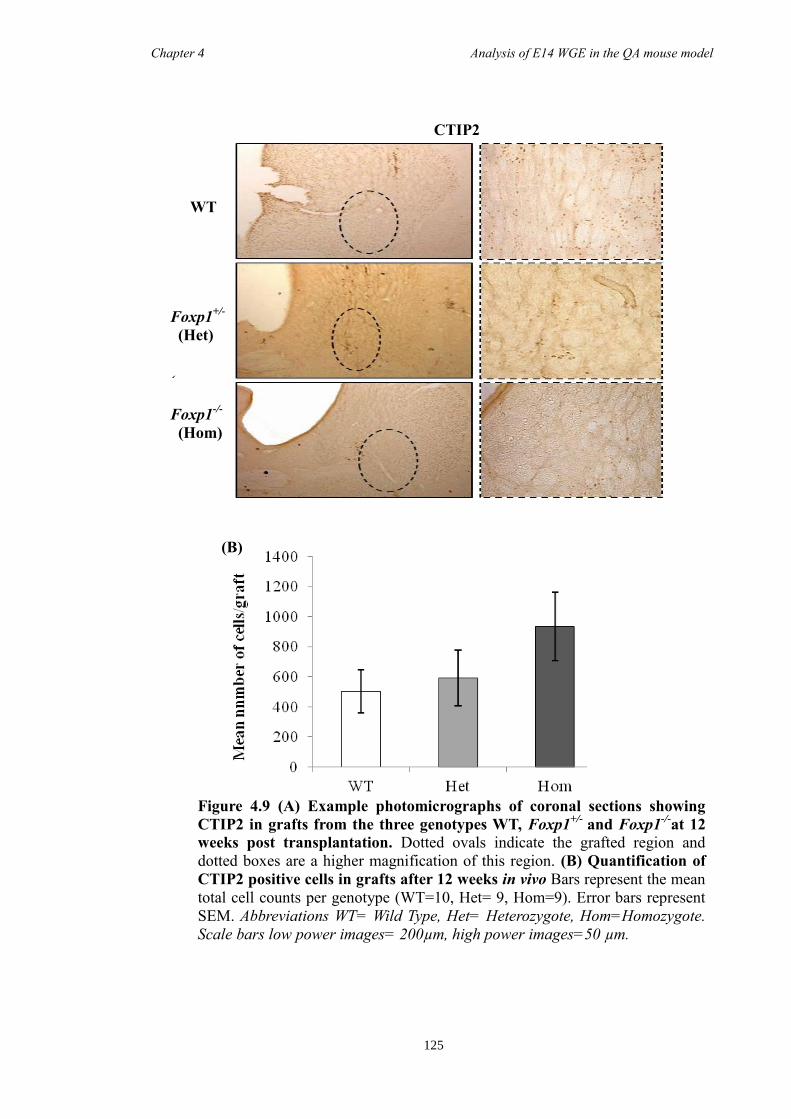
Chapter 4 Analysis of E14 WGE in the QA mouse model
125
Figure 4.9 (A) Example photomicrographs of coronal sections showing
CTIP2 in grafts from the three genotypes WT, Foxp1+/-
and Foxp1-/-
at 12
weeks post transplantation. Dotted ovals indicate the grafted region and
dotted boxes are a higher magnification of this region. (B) Quantification of
CTIP2 positive cells in grafts after 12 weeks in vivo Bars represent the mean
total cell counts per genotype (WT=10, Het= 9, Hom=9). Error bars represent
SEM. Abbreviations WT= Wild Type, Het= Heterozygote, Hom=Homozygote.
Scale bars low power images= 200µm, high power images=50 µm.
(B)
CTIP2
WT
Foxp1+/-
(Het)
(
Foxp1-/-
(Hom)
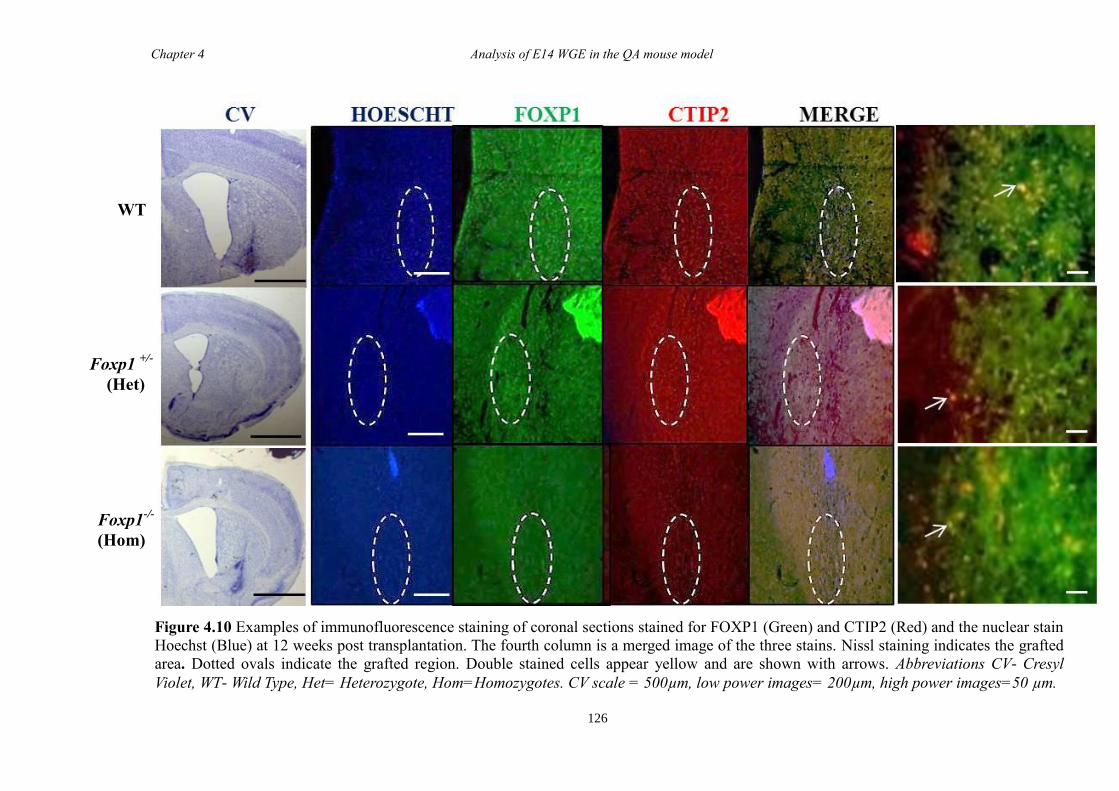
Chapter 4 Analysis of E14 WGE in the QA mouse model
126
Figure 4.10 Examples of immunofluorescence staining of coronal sections stained for FOXP1 (Green) and CTIP2 (Red) and the nuclear stain
Hoechst (Blue) at 12 weeks post transplantation. The fourth column is a merged image of the three stains. Nissl staining indicates the grafted
area. Dotted ovals indicate the grafted region. Double stained cells appear yellow and are shown with arrows. Abbreviations CV- Cresyl
Violet, WT- Wild Type, Het= Heterozygote, Hom=Homozygotes. CV scale = 500µm, low power images= 200µm, high power images=50 µm.
WT
Foxp1 +/-
(Het)
Foxp1-/-
(Hom)
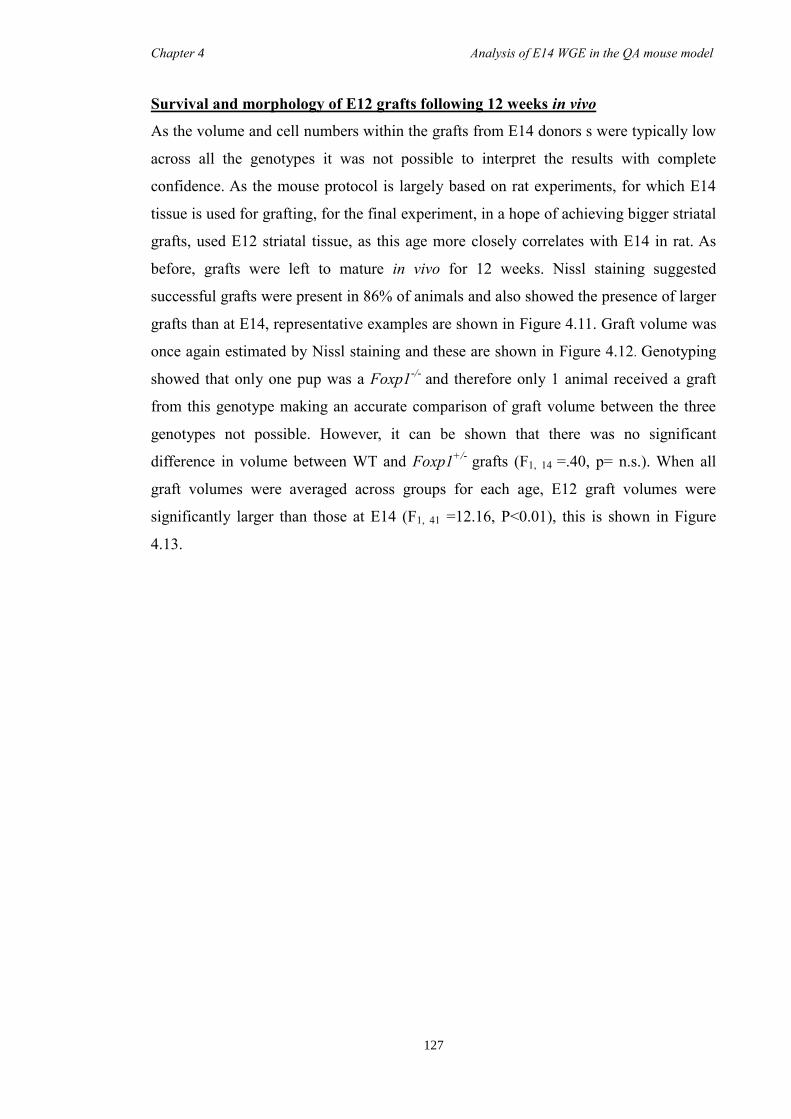
Chapter 4 Analysis of E14 WGE in the QA mouse model
127
Survival and morphology of E12 grafts following 12 weeks in vivo
As the volume and cell numbers within the grafts from E14 donors s were typically low
across all the genotypes it was not possible to interpret the results with complete
confidence. As the mouse protocol is largely based on rat experiments, for which E14
tissue is used for grafting, for the final experiment, in a hope of achieving bigger striatal
grafts, used E12 striatal tissue, as this age more closely correlates with E14 in rat. As
before, grafts were left to mature in vivo for 12 weeks. Nissl staining suggested
successful grafts were present in 86% of animals and also showed the presence of larger
grafts than at E14, representative examples are shown in Figure 4.11. Graft volume was
once again estimated by Nissl staining and these are shown in Figure 4.12. Genotyping
showed that only one pup was a Foxp1-/-
and therefore only 1 animal received a graft
from this genotype making an accurate comparison of graft volume between the three
genotypes not possible. However, it can be shown that there was no significant
difference in volume between WT and Foxp1+/-
grafts (F1, 14 =.40, p= n.s.). When all
graft volumes were averaged across groups for each age, E12 graft volumes were
significantly larger than those at E14 (F1, 41 =12.16, P<0.01), this is shown in Figure
4.13.
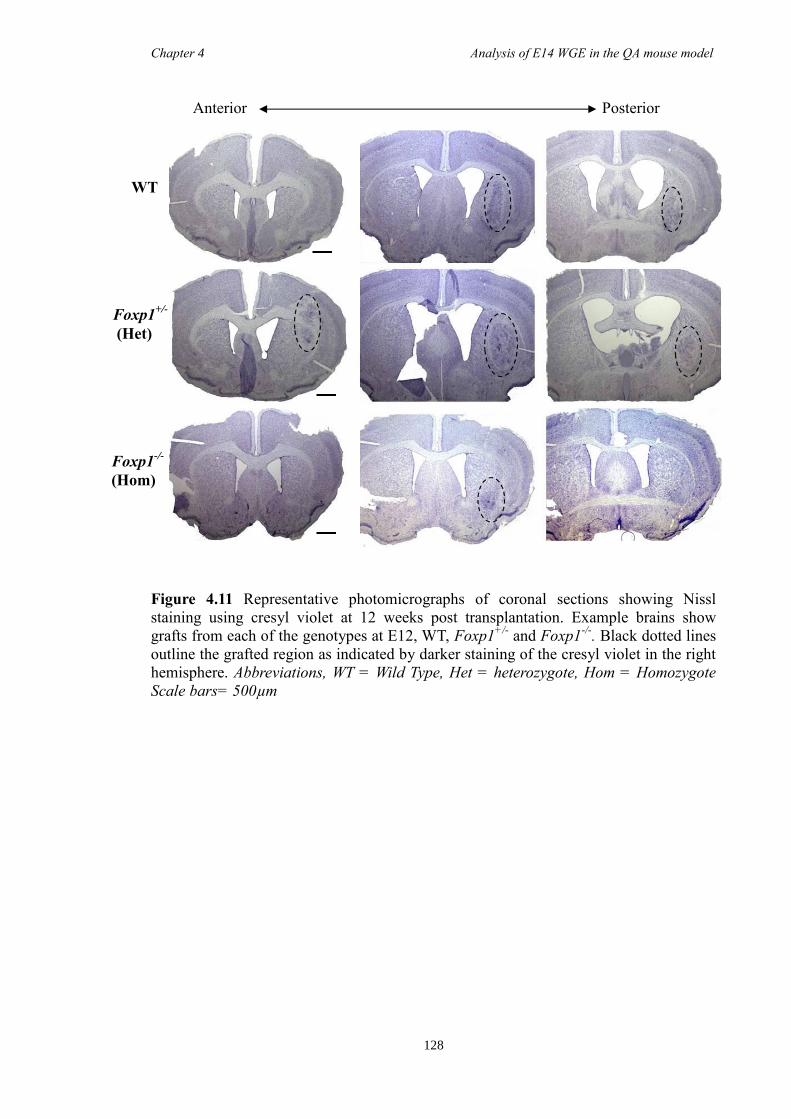
Chapter 4 Analysis of E14 WGE in the QA mouse model
128
Figure 4.11 Representative photomicrographs of coronal sections showing Nissl
staining using cresyl violet at 12 weeks post transplantation. Example brains show
grafts from each of the genotypes at E12, WT, Foxp1+/-
and Foxp1-/-
. Black dotted lines
outline the grafted region as indicated by darker staining of the cresyl violet in the right
hemisphere. Abbreviations, WT = Wild Type, Het = heterozygote, Hom = Homozygote
Scale bars= 500µm
WT
Foxp1+/-
(Het)
Foxp1-/-
(Hom)
Posterior Anterior
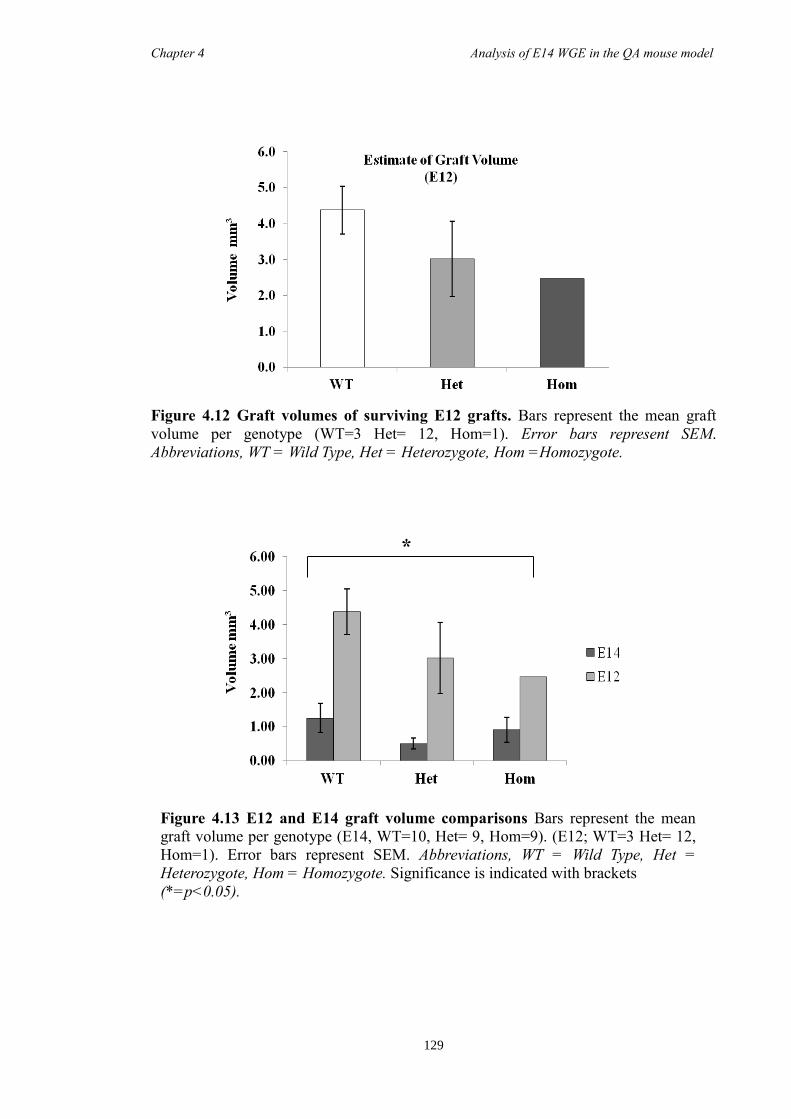
Chapter 4 Analysis of E14 WGE in the QA mouse model
129
Figure 4.12 Graft volumes of surviving E12 grafts. Bars represent the mean graft
volume per genotype (WT=3 Het= 12, Hom=1). Error bars represent SEM.
Abbreviations, WT = Wild Type, Het = Heterozygote, Hom =Homozygote.
Figure 4.13 E12 and E14 graft volume comparisons Bars represent the mean
graft volume per genotype (E14, WT=10, Het= 9, Hom=9). (E12; WT=3 Het= 12,
Hom=1). Error bars represent SEM. Abbreviations, WT = Wild Type, Het =
Heterozygote, Hom = Homozygote. Significance is indicated with brackets
(*=p<0.05).
*
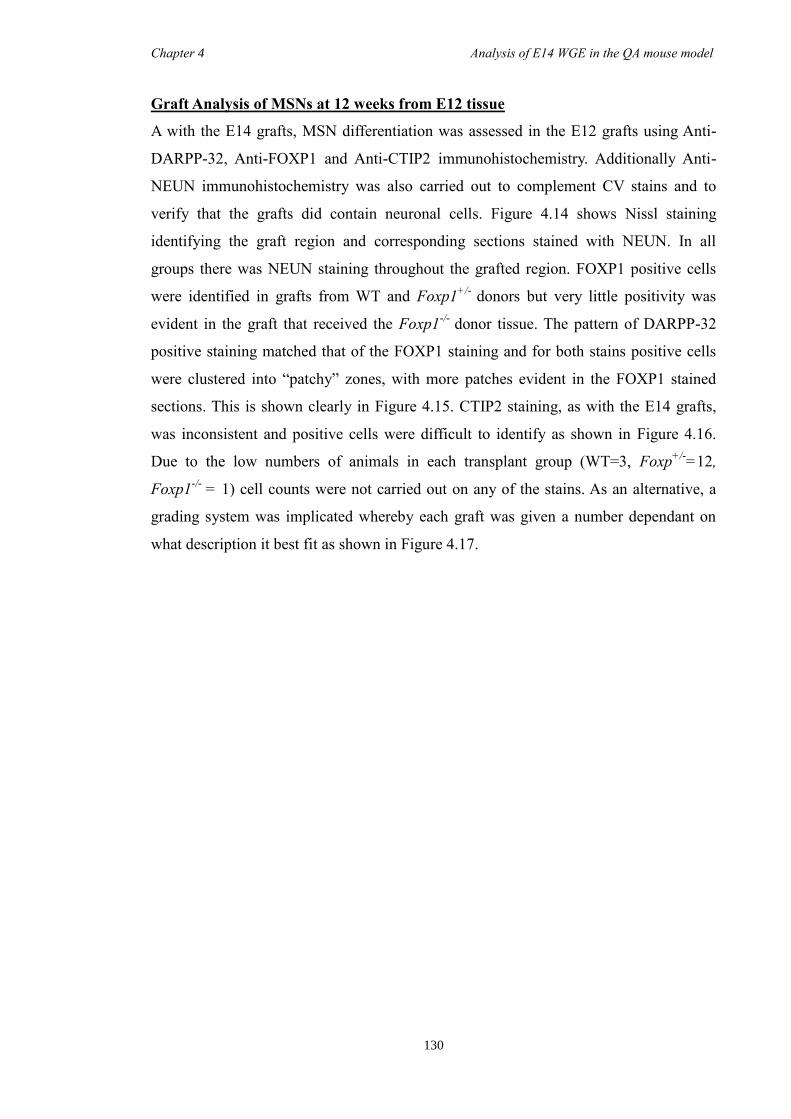
Chapter 4 Analysis of E14 WGE in the QA mouse model
130
Graft Analysis of MSNs at 12 weeks from E12 tissue
A with the E14 grafts, MSN differentiation was assessed in the E12 grafts using Anti-
DARPP-32, Anti-FOXP1 and Anti-CTIP2 immunohistochemistry. Additionally Anti-
NEUN immunohistochemistry was also carried out to complement CV stains and to
verify that the grafts did contain neuronal cells. Figure 4.14 shows Nissl staining
identifying the graft region and corresponding sections stained with NEUN. In all
groups there was NEUN staining throughout the grafted region. FOXP1 positive cells
were identified in grafts from WT and Foxp1+/-
donors but very little positivity was
evident in the graft that received the Foxp1-/-
donor tissue. The pattern of DARPP-32
positive staining matched that of the FOXP1 staining and for both stains positive cells
were clustered into “patchy” zones, with more patches evident in the FOXP1 stained
sections. This is shown clearly in Figure 4.15. CTIP2 staining, as with the E14 grafts,
was inconsistent and positive cells were difficult to identify as shown in Figure 4.16.
Due to the low numbers of animals in each transplant group (WT=3, Foxp+/-
=12,
Foxp1-/-
= 1) cell counts were not carried out on any of the stains. As an alternative, a
grading system was implicated whereby each graft was given a number dependant on
what description it best fit as shown in Figure 4.17.
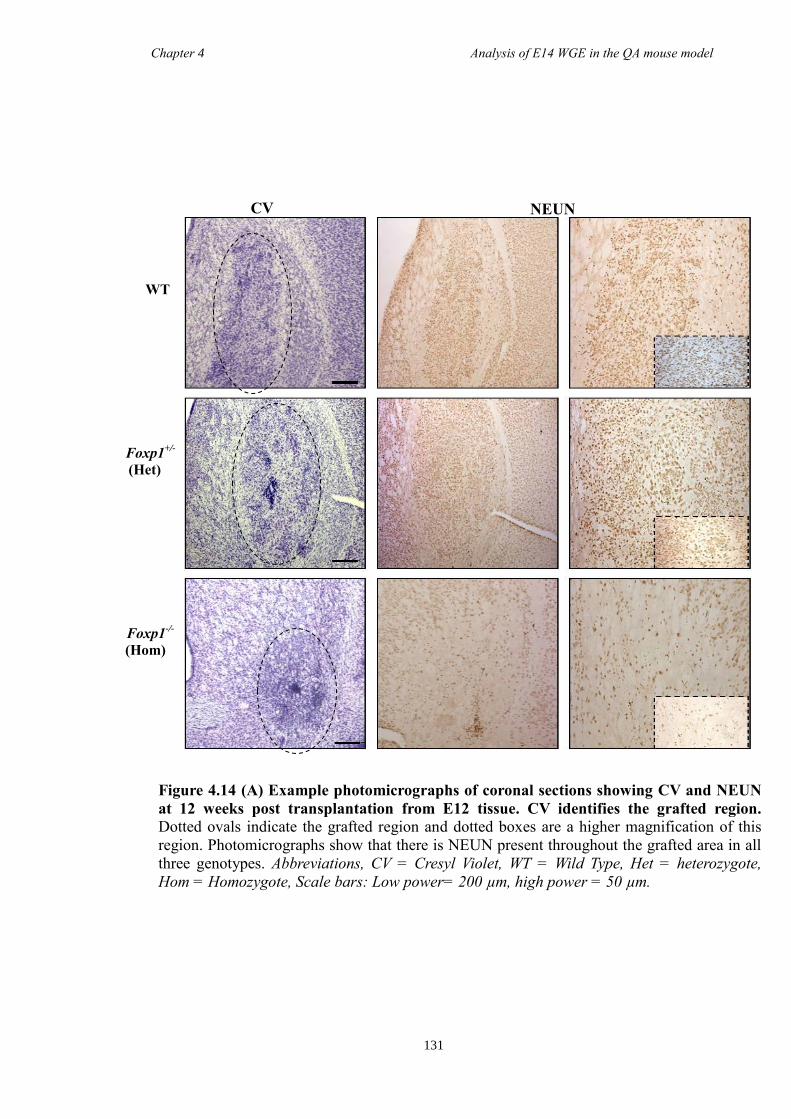
Chapter 4 Analysis of E14 WGE in the QA mouse model
131
NEUN
Figure 4.14 (A) Example photomicrographs of coronal sections showing CV and NEUN
at 12 weeks post transplantation from E12 tissue. CV identifies the grafted region.
Dotted ovals indicate the grafted region and dotted boxes are a higher magnification of this
region. Photomicrographs show that there is NEUN present throughout the grafted area in all
three genotypes. Abbreviations, CV = Cresyl Violet, WT = Wild Type, Het = heterozygote,
Hom = Homozygote, Scale bars: Low power= 200 µm, high power = 50 µm.
CV
WT
Foxp1-/-
(Hom)
Foxp1+/-
(Het)
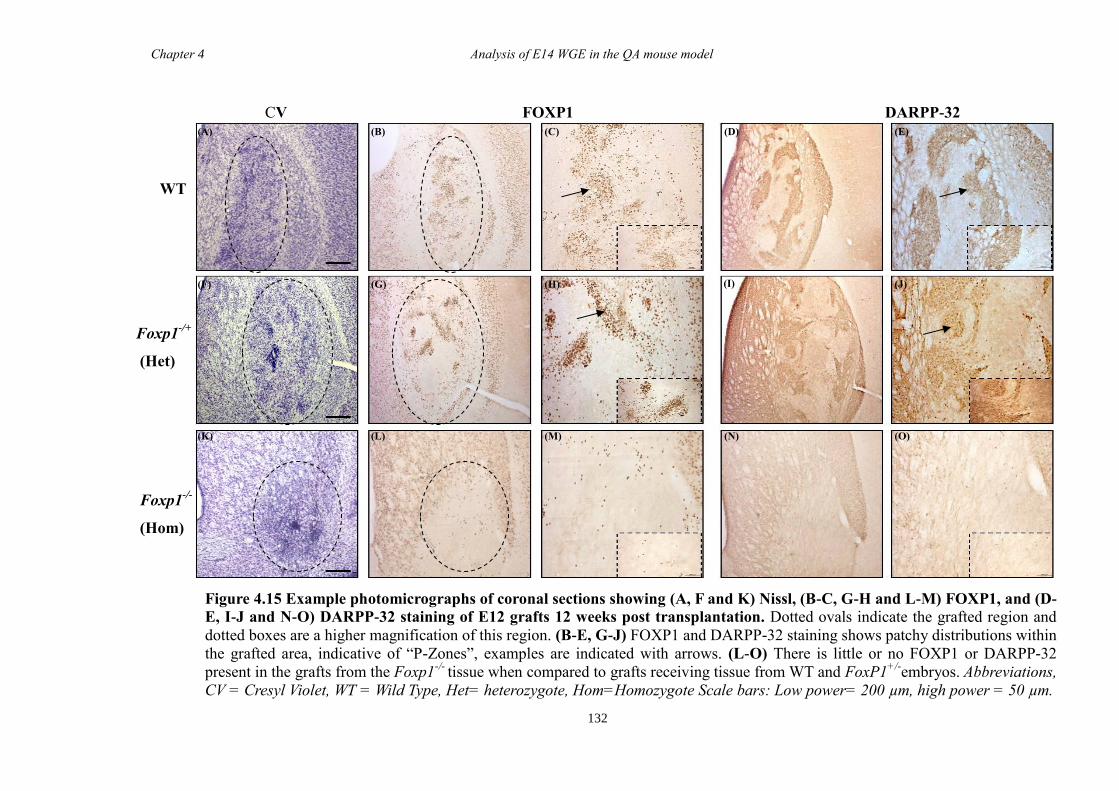
Chapter 4 Analysis of E14 WGE in the QA mouse model
132
CV FOXP1 DARPP-32
Figure 4.15 Example photomicrographs of coronal sections showing (A, F and K) Nissl, (B-C, G-H and L-M) FOXP1, and (D-
E, I-J and N-O) DARPP-32 staining of E12 grafts 12 weeks post transplantation. Dotted ovals indicate the grafted region and
dotted boxes are a higher magnification of this region. (B-E, G-J) FOXP1 and DARPP-32 staining shows patchy distributions within
the grafted area, indicative of “P-Zones”, examples are indicated with arrows. (L-O) There is little or no FOXP1 or DARPP-32
present in the grafts from the Foxp1-/-
tissue when compared to grafts receiving tissue from WT and FoxP1+/-
embryos. Abbreviations,
CV = Cresyl Violet, WT = Wild Type, Het= heterozygote, Hom=Homozygote Scale bars: Low power= 200 µm, high power = 50 µm.
WT
Foxp1-/+
(Het)
Foxp1-/-
(Hom)
(A) (B) (C) (D) (E)
(F) (G) (H)
(K) (L)
(I) (J)
(M) (N) (O)
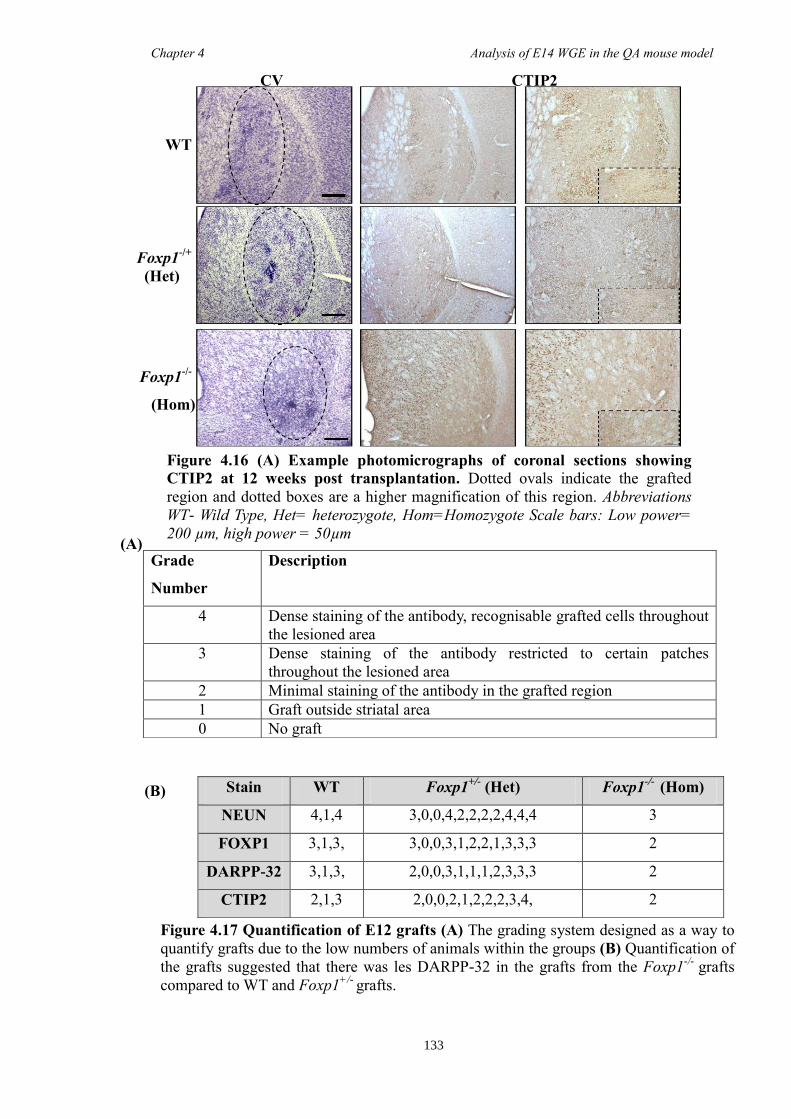
Chapter 4 Analysis of E14 WGE in the QA mouse model
133
Grade
Number
Description
4 Dense staining of the antibody, recognisable grafted cells throughout
the lesioned area
3 Dense staining of the antibody restricted to certain patches
throughout the lesioned area
2 Minimal staining of the antibody in the grafted region
1 Graft outside striatal area
0 No graft
Stain WT Foxp1+/-
(Het) Foxp1-/-
(Hom)
NEUN 4,1,4 3,0,0,4,2,2,2,2,4,4,4 3
FOXP1 3,1,3, 3,0,0,3,1,2,2,1,3,3,3 2
DARPP-32 3,1,3, 2,0,0,3,1,1,1,2,3,3,3 2
CTIP2 2,1,3 2,0,0,2,1,2,2,2,3,4, 2
(A)
Grade
Number
Description
4 Dense
staining of
the
antibody,
recognisable
grafted cells
throughout
the lesioned
area
3 Dense
staining of
the antibody
restricted to
certain
patches
throughout
the lesioned
area
2 Minimal
staining of
the antibody
in the
grafted
region
1 Graft
outside
Figure 4.16 (A) Example photomicrographs of coronal sections showing
CTIP2 at 12 weeks post transplantation. Dotted ovals indicate the grafted
region and dotted boxes are a higher magnification of this region. Abbreviations
WT- Wild Type, Het= heterozygote, Hom=Homozygote Scale bars: Low power=
200 µm, high power = 50µm
CV CTIP2
WT
Foxp1-/+
(Het)
Foxp1-/-
(Hom)
Figure 4.17 Quantification of E12 grafts (A) The grading system designed as a way to
quantify grafts due to the low numbers of animals within the groups (B) Quantification of
the grafts suggested that there was les DARPP-32 in the grafts from the Foxp1-/-
grafts
compared to WT and Foxp1+/-
grafts.
Figure 4.18 Quantification of E12 grafts (A) The grading system designed as a way to
quantify grafts due to the low numbers of animals within the groups (B) Quantification of
the grafts suggested that there was les DARPP-32 in the grafts from the Foxp1-/-
grafts
compared to WT and Foxp1+/-
grafts.
(B)
Grade
Number
Description
4 Dense
staining of
the
antibody,
recognisable
grafted cells
throughout
the lesioned
area
3 Dense
staining of
the antibody
restricted to
Chapter 4 In vivo analysis of E14 WGE in the QA mouse model
134
4.5 Discussion
Cell transplantation: a novel approach to a commonly used method
The aim of the experiments outlined in this Chapter were to circumvent the embryonic
lethality associated with Foxp1-/-
KO mice at E15 in order to look at differences in
mature MSNs, in a graft scenario, in the absence of Foxp1. Cell transplantation studies
in rodents are typically used to assess graft survival and functional recovery as a means
of validating cell replacement therapy for use in diseases such as HD and PD. Here it
was used in a novel way to look at phenotypic differences in MSN development. By
dissecting primary striatal tissue, before the onset of lethality, it was anticipated that the
tissue, once grafted, would continue to develop and differentiate in an environment
more akin to that of their natural milieu, as oppose to in the in vitro conditions outlined
in Chapter 3.
However, it is understood that grafting into a lesioned striatum is not identical to the
“natural” striatal environment as there are, for example, molecules such as
inflammatory cytokines circulating the lesioned area which could influence graft
survival and subsequent differentiation (Dunnett et al. 1997). Still, the approach can be
used to provide a good approximation of natural development, which is aided by the
fact that the majority of neuronal precursors by E14 “fated” to become MSNs are
undergoing their final mitotic cell divisions and have started differentiating into their
predetermined phenotype i.e. MSNs (Anthony et al. 2004; Dunnett et al. 1997;
Malatesta et al. 2003), thus one would predict that the cells would continue to develop
as if left in vivo. Another potential caveat is the distress caused to the cells during the
transplantation programme. Nevertheless, mouse allograft experiments have proven to
be successful and survive the transplantation process (Dobrossy et al. 2011; Dunnett et
al. 1998; Kelly et al. 2007). Consequently, using the cell transplantation method has
allowed cells from all genotypes the opportunity to develop and mature over a
prolonged period of time in vivo and answered questions unachievable from the
previous in vitro experiments, although it is known that results obtained cannot be
directed attributable to the natural process.
Chapter 4 In vivo analysis of E14 WGE in the QA mouse model
135
Graft Analysis- Differences in the MSNs in the absence of Foxp1
The donor age of the tissue commonly used in mouse allografting experiments (E14) is
based on what was shown to be successful in the rat (Watts et al. 2000a, b) and thus was
chosen for these experiments. Five animals from each genotype were sacrificed after 4
weeks in vivo to check for the presence of grafts as determined by Nissl staining using
CV, and thus validated that the transplantation protocol had worked. Nissl staining
showed that 78% of grafts survived across transplantation groups. Nissl staining also
showed an increase in ventricular volume ipsilateral to the graft caused by cell loss and
subsequent shrinkage of the striatum as a result of the QA (Dobrossy and Dunnett
2005). FOXP1 immunohistochemistry showed animals that had received donor cells
from Foxp1-/-
embryos had significantly fewer FOXP1 positive cells (105±54) than
those grafted with cells from WT (796±144) or Foxp1+/-
(1093± 180) embryos. It was
unexpected that FOXP1 positive cells were identified in grafts from the Foxp1-/-
embryos and reasons for this could be due to cross contamination from the other cell
suspensions within the grafting syringe, or that host cells could have been mistakenly
counted as grafted cells due to the absence of a donor specific label, an issue addressed
later. From these preliminary results, it was decided the remaining animals would be left
for an additional 8 weeks to allow further maturation of the grafted cells.
At 12 weeks post transplantation, average graft volumes (independent of genotype),
were 0.89 mm ± 0.3mm3. These are comparable with those reported in previous mouse
grafting studies, 0.80 ± 0.09 mm3
(Kelly et al. 2007), and similar graft volumes have
also been demonstrated by other colleagues using the mouse-mouse system within the
group (Roberton et al. 2013), and elsewhere (Cisbani et al. 2013; Johann et al. 2007;
Tate et al. 2002). However, there are studies that appear to contradict these small
mouse-mouse grafts. One study that grafted E13-14 LGE into the striatum of the TG
R6/2 mouse model showed photomicrographs suggesting the presence of a large graft in
both a WT and TG host 6 weeks post transplantation (Dunnett et al. 1998). Yet, no graft
volumes were included in this study suggesting the example photomicrographs chosen
for publication were perhaps not representative of the groups. Additionally, when
striatal tissue from the M4-BAC-GFP mouse line was grafted into the QA lesioned
striatum of mice a large graft was shown. Yet, graft volumes were once again not
displayed and thus photomicrographs may not represent all the groups (Dobrossy et al.
2011). Equally, when this method was trialled in our lab using either C57BL/6J or CD1
Chapter 4 In vivo analysis of E14 WGE in the QA mouse model
136
embryos as donors, grafts were not reproducible to the extent of those published
suggesting that donor strain, or the mouse brain as a suitable host for transplanted tissue
(Roberton et al. 2013), may have a role to play in the success of grafting in mice, and
this is actively being explored in the lab.
Nevertheless, the grafts from E14 donor tissue showed that there were significantly
fewer FOXP1 positive stained cells in the grafts from the Foxp1-/-
(461±127) donors
compared to those grafted with cells from WT (1308±275) or Foxp1+/-
(854±164)
embryos. To address differences in mature MSNs within the grafts DARPP-32 was
used. DARPP-32 expression in striatal neurons is not fully developed until the second
or third postnatal week (Gustafson et al. 1992), and in agreement with this DARPP-32
expression has been shown 2 weeks following transplantation of E14 tissue, which the
authors suggest is equivalent to P7 (Olsson et al. 1995). Striatal neurons 12 weeks post
grafting would therefore be expected to express DARPP-32. There was DARPP-32
staining in grafts although considerably less than FOXP1 staining irrespective of
genotype (Figure 4.8) and the reasons for differences in staining patterns are numerous.
Firstly, although FOXP1 has shown to co-localise with DARPP-32 (Tamura et al.
2004), FOXP1 has shown to stain MSNs from an earlier time point when the neurons
are more immature (Ferland et al. 2003). Secondly, it must also be considered that as
these grafts are WGE derived, rather than LGE derived, FOXP1 immunohistochemistry
could have labelled cells in the graft that were derived from the developing cortex,
where FOXP1 is known to be expressed at E14 (Ferland et al. 2003; Tamura et al.
2004). Thirdly, that DARPP-32 does not stain the entire population of MSNs (Arlotta et
al. 2008), an observation made by both Arlotta (2008) and Precious et al (2013,
submitted). These groups report that DARPP-32 co-localises with all CTIP2 and
FOXP1 positively labelled cells respectively, but that there were FOXP1/CTIP2
positive/DARPP-32 negative cells present. This subset of cells did not co-localise with
any known interneuron marker suggesting a population of striatal projection neurons
that do not express DARPP-32 (Arlotta et al. 2008). Fourthly, not all cells, fated to
become MSNs were mature enough to express DARPP-32 and longer in vivo periods
are needed for maturation, however as optimal expression is apparent by three weeks
after birth this is unlikely. Finally, it may be that if the donor cells were transplanted at
an early time point the number of DARPP-32 positive cells would be greater, as
proposed by Fricker-Gates (Fricker-Gates et al. 2004).
Chapter 4 In vivo analysis of E14 WGE in the QA mouse model
137
Despite low cell numbers within the grafts there were significantly fewer DARPP-32
positive cells in the grafts from the Foxp1-/-
embryos (390 ±68) compared to animals
grafted with cells from WT embryos (802±68). These initial experiments using E14
donor tissue for transplantation were comparable to the in vitro findings of Chapter 3
that in the absence of Foxp1 there is a decrease in the number of DARPP-32 positive
cells. In addition to DARPP-32, CTIP2, another MSN marker that has shown to co-
localise with FOXP1 in the striatum, was used. (Arlotta et al. 2008). Quantitative
analysis showed that there was no significant difference in the number of CTIP2
positive cells. However, staining was inconsistent throughout the sections, and results
should be interpreted with this in mind. CTIP2 was the last stain carried out and
inconsistencies in staining can perhaps be attributed to degradation of the tissue from
prolonged storage in the fridge. Fluorescent immunohistochemistry was attempted as a
means of validating the DAB staining, and although not quantified, observations
suggested the same pattern. However, the technical problems associated with the CTIP2
staining warrant caution and experiments need to be repeated to establish confidence in
these findings.
Grafts-Limitations and Alternative Strategies
Another limitation with allografts is being able to confidently identify cells as host or
donor within the lesioned area. In the absence of the donor cells being labelled in some
way e.g. with a fluorescent tag, it is possible that allograft experiments may be under or
over representative due to the difficulties in reliably identifying the cells. This problem
is exaggerated in small lesions where neuronal loss is limited making the host/lesion
boundary difficult to define. Labelling of the donor cells would therefore facilitate more
reliable and reproducible results. A mouse allograft experiment using M4-GFP tagged
donor cells, which express GFP in all MSNs implicated in the direct pathway, allowed
grafted cells to be easily identifiable up to 24 weeks following grafting (Dobrossy et al.
2011). However, donor cells from the M4-GFP line would not be possible for the
transplantation experiments described here as the importance of the work was to look at
specific differences in the development and differentiation of the donor cells from the
three different genotypes and therefore an alternative method would be needed to label
the cells used in these experiments. One alternative would be to transfect plasmids
carrying a label such as LacZ or GFP. However, successful transfection of plasmids into
primary cells is difficult due to the delicate nature of the cells. Where success has been
Chapter 4 In vivo analysis of E14 WGE in the QA mouse model
138
seen it is at very low efficiencies (Urban et al. 2010). Throughout this PhD several
different methods of transfection for experiments in primary E14 striatal cells were
trialled. Methods included electroporation (Neon Transfection system), Lipofectamine,
and a new delivery method, Nanofection, which uses magnetic resonance to drive the
plasmids into the cells and is reliant on endocytosis. Unfortunately, following several
attempts of optimization for each method the outcomes were either high transfection
rates but at the expensive of increased cell death, or very low transfection efficiencies in
favour of cell survival, none of which are ideal for differentiation or grafting studies.
Appendix 9.7 shows a table summarising results from these transfections. Thus from
this preliminary work it can be concluded that a virus, which doesn’t need an artificial
delivery method of entering the cells, would be one of the best options to label primary
cells, such as a LacZ virus as was shown by Kelly et al (2007), and something that will
be considered for future allograft experiments. Another possibility is grafting donor
cells from the Fox heterozygote cross into a mouse that globally expresses fluorescent
protein such as GFP or m-cherry. Therefore the cells from the donor would not stain
positively for GFP/RFP allowing one to confidently ascertain which cells was definitely
graft derived rather than host. This method would also one to confidently identify if
there was integration between the host and graft tissue.
In some instances, when a specific Cre is not available to create a regional specific KO,
or to look more closely at complex tissue-tissue interactions, chimeric mouse models
can be used. In this instance instead of grafting cells from a heterozygote cross, and
parallel to the creation of a CKO, Foxp1 chimeras could be created similar to the
aggregation chimeric model that looked at Pax6 during development of the eye
(Collinson et al. 2000; Quinn et al. 1996), as like Foxp1, knocking out this gene is also
lethal to development. Creating chimeras would mean the mouse would contain a
random mix of both WT and Foxp1 mutant cells thereby allowing the functional role of
Foxp1 to be investigated in the developing brain past the point of embryonically
lethality apparent in the homozygous nulls. Specifically one can compare the behavior
of WT and mutant cells in chimeras and assess the capability of mutant cells to
contribute to MSN development when in direct competition with WT cells. Of course,
in order for such analyses a label e.g. GFP, RFP or LacZ would first need to be added to
one or both of the lines to distinguish between the cells. The results could then be
directly compared to a striatal specific CKO of Foxp1. However, this approach will take
Chapter 4 In vivo analysis of E14 WGE in the QA mouse model
139
a long time and thus grafting the cells, but changing some of the parameters to increase
graft size was a better option in this instance given the time restraints of my PhD.
Increased graft volume and cell number within the graft using E12 donor tissue
Small graft size made interpretation of the results difficult and an attempt to achieve
transplants with greater cell volumes was trialled to increase the reliability of the results.
Two possible manipulations to the grafting protocol were considered; donor age and
preparation of donor tissue (cell suspension or “pieces”). It has been reported that
striatal grafts have an increased number of P-zones in grafts from younger donor tissue
(Fricker-Gates et al. 2004). Recently this has been supported by Döbrössy and
colleagues who showed that grafts from E13 rat embryos had more P-zones, showed the
highest amount of DA afferents (re-establishment of the nigrostrital projection pathway)
and the most consistent long term recovery on behavioural tests when compared to E14
or E15 grafts (Schackel et al. 2013). These results suggest that more immature striatal
progenitors, that have not yet formed afferent or efferent connections (Hamasaki et al.
2003) are capable of continuing maturation and differentiation in vivo and provide a
better donor source for striatal cell transplantation experiments (Fricker-Gates et al.
2004; Schackel et al. 2013). In support of this is what is understood about the equivalent
gestational time points between rats and mice. Based on rat studies, E14 is the most
commonly used donor age for mouse transplantation experiments. However, E14 in the
rat is equivalent to E12.5 in the mouse and therefore if this age was used it is possible
mouse allografts would be more comparable to rat allograft experiments.
It is also unknown whether tissue “pieces” or trypsinised cell suspensions should be
used to produce the best grafts. It has been shown that trypsinised, triturated cell
suspensions produced grafts with increased functional AchE positive zones and an
increased number of DARPP-32 positive cells compared to grafts from tissue pieces
(Watts et al. 2000b). However grafts from tissue pieces yielded larger graft volumes and
showed modest functional recovery on the paw-reaching task (Watts et al. 2000b).
Additionally, in human trials, patients that received transplants from tissue pieces,
showed better recovery than those that received grafts from cell suspensions (Bachoud-
Levi et al. 2006), although it is appreciated that the number of patients within this trial
was very small.
Chapter 4 In vivo analysis of E14 WGE in the QA mouse model
140
Therefore, for the final experiment E12 donor cells were used, and as the WGE in mice
at this age is very small, and not able to be pooled in the absence of a known genotype,
each pair of striatum were trypsinised minimally and grafted as “pieces” (1 striate pair
per lesioned animal) rather than as a trypsinised cell suspension as the E14 grafts. It is
recognized that this experiment was not designed to systematically address the issue of
optimal donor age and tissue preparation, but done in a way that would optimistically
yield the biggest grafts to confirm the results interpreted from the E14 grafts. A
thorough systematic assessment of the mouse-mouse grafting protocol is underway by
the host lab to determine the optimal donor age, tissue type and how much time post
lesion, are best for grafting. For the final experiments refinements were also made to the
grafting protocol as a measure of reducing cross contamination of the cell suspensions.
To achieve this multiple grafting syringes were used (it was not feasible to have a
different syringe for each animal) and flushed through with boiling water in-between
each graft.
E12 grafts
Due to small litter sizes (~5 pups/ mother) several different litters had to be used for this
experiment and unfortunately, by chance, there was only 1 Foxp1-/-
embryo, 3 WT and
11 Foxp1+/-
embryos born. Due to the small number of animals receiving tissue from
either the WT, or Foxp1-/-
donors, grafts were analysed qualitatively with a grading
system used in an attempt to quantify the grafts as oppose to stereology as this method
did not seen appropriate in the absence of any comparable results. As expected, based
on Nissl staining grafts were larger at E12 than at E14 and on average, across all
genotypes, produced significantly larger graft volumes (3.29±0.85mm3).
Immunohistochemistry for the mature neuronal marker NEUN was used to confirm the
neuronal content of the grafts and served as a way to confirm graft presence with the
Nissl stains. Within the grafted area, NEUN showed positive staining throughout the
grafts, although it was apparent that staining in the Foxp1-/-
graft was less dense
compared to grafts from the other genotypes. It is known from E14 striatal counts
(Figure 3.7) that on average there were fewer cells in a pair of WGE from Foxp1-/-
embryos when compared to WT or Foxp1+/-
embryos. It is anticipated that this result
would have been apparent at E12 and therefore in this experiment, as cell number
wasn’t controlled for, this maybe the reason for the apparent less dense NEUN staining
in the graft of the animal that received Foxp1-/-
cells.
Chapter 4 In vivo analysis of E14 WGE in the QA mouse model
141
As with E14 graft analysis, FOXP1 and DARPP-32 immunohistochemistry was carried
out on the E12 grafts. Specifically, it is known that P-zones make up one third of WGE
grafts and are identifiable as being AchE-rich, DARPP-32 positive patches of MSNs.
The remaining regions called NP zones do not stain for striatal markers (Graybiel et al.
1989; Pakzaban et al. 1993). In contrast to the results from the E14 grafts, P-zones were
readily identifiable within the grafts from animals that received WT and Foxp1+/-
donor
cells and positively stained for DARPP-32 and FOXP1. There was no FOXP1 or
DARPP-32 staining in the NP zones. To date FOXP1 has not been routinely used to
identify P-zones within a grafted region and these findings suggest it may be used in
addition to DARPP-32 as a marker of these areas. As a comparison to the cell counts
carried out on the E14 grafts, more FOXP1 positive P-zones could be seen than
DARPP-32 positive P zones. No FOXP1 or DARPP-32 positive P-zones were identified
in the grafts from the mouse that received cells from the Foxp1-/-
embryo. CTIP2 was
once again used, and, as with E14 grafts, staining was inconsistent throughout the grafts
and further experiments will be needed to learn more about the relationship between
FOXP1 and CTIP2.
Future Work
Work presented in this chapter highlights potential caveats to the mouse-mouse allograft
protocol and suggests the need for systematic assessment of the mouse striatum as a
viable host for transplantation and the age and type of donor cells used. For example by
grafting LGE as oppose to WGE it would be anticipated that the number of P-Zones
within the graft would increase (in LGE grafts P-zones can label 80-90% of the total
graft (Pakzaban et al. 1993)) and thus, for work presented in this chapter, would
enhance the genotypic differences concerning DARPP-32 staining.
Improvements to the mouse allograft field are needed to allow transplantation of
mESCs and iPSCs, directed towards the phenotype of interest to be trialled in TG
mouse models that offer a better physiological and behavioural comparison to
neurological diseases than those from excitotic lesions such as QA. Therefore a
thorough and systematic approach to the transplantation protocol will be needed to fully
understand the best combination of donor age, tissue type and if the donor source is
optimally delivered as a cell suspension or tissue pieces, in the aim of applying these
results to the mouse allograft protocol facilitating routine and successful grafts in mice.
Chapter 4 In vivo analysis of E14 WGE in the QA mouse model
142
Additionally the possibility that the adult mouse striatum is a hostile host for neural
transplant survival is also being explored as increased amounts of activated microglia
and thus graft rejection are re-occurring problems in both mouse allo- and xenografts
(Roberton et al. 2013).
4.6 Conclusion
In this Chapter cell transplantation was used to study differences in MSNs after E14, to
circumvent embryonic lethality, simultaneous to the CKO colony being established.
Individual cell suspensions consisting of E14 striatal tissue from one of three genotypes
was grafted into the mouse QA lesioned striatum. 12 weeks following transplantation
there was a significant decrease in the number of positively stained DARPP-32 cells in
grafts from Foxp1-/-
embryos compared to grafts from WT donors. However these grafts
were typically thin and contained few cells. Therefore it was decided as a means of
supporting these results; the protocol needed improving to ensure larger graft volumes.
Subsequently, tissue was grafted from E12 embryos (the gestational age most akin to
E14 in the rat) and the cells were in the form of a quasi-suspension (“pieces”) as
opposed to a fully triturated cell suspension. E12 grafts proved to have significantly
larger graft volumes than E14 grafts and also appeared to have less DARPP32 in the
absence of Foxp1. Grafts also displayed the typical P-Zones that indicate MSN rich
regions. For the first time, FOXP1 was shown to stain P-zones, offering itself as a
mature label of MSNs within grafts derived from WGE. However, owing to small grafts
at E14, and lack of quantification at E12, these results will need to be corroborated by
other experiments, such as results of the on-going microarray comparing WT and
Foxp1-/-
LGE and MGE at E14.
To conclude, we have shown that grafting at an earlier age (E12) with tissue pieces
rather than cell suspensions, has at least for these experiments proved to be more
successful than using the current mouse allo-grafting protocol that commonly uses E14
cell suspensions. Importantly the major conclusion from these results is that in the
absence of Foxp1 there is a decrease in DARPP-32 in cells grafted into the QA lesion
environment, which also suggest that Foxp1 is needed in MSN development.
Chapter 5 CKO of Foxp1 in the cortex
143
5 Characterisation of a Mouse Model that
lacks Foxp1 in the Adult Brain
5.1 Summary
CKO mice are considered a useful tool to study the loss of gene expression in a cellular
or regional specific manner. In an attempt to study the effect of the loss of Foxp1 in the
adult mouse striatum a conditional Foxp1 knock out mouse (Foxp1 CKO) was
developed by crossing a mouse heterozygous for the Foxp1 LoxP allele with a mouse
heterozygous for the hGFAP-Cre; hGFAP being expressed in radial glia, precursors for
the majority of neurons in the CNS. However, histological analysis revealed that there
was a complete loss of FOXP1 from all layers of the cortex in which Foxp1 is known to
be expressed (III-V1a), but contrary to expectations FOXP1 in the striatum was
retained. Although this pattern of loss was not what was aimed for the model appeared
interesting in that it demonstrated a hyperactive phenotype. Systematic behavioural
analysis demonstrated that the loss of cortical Foxp1 produced behavioural
(hyperactivity) and cognitive (impaired attention) abnormalities compared to littermate
controls. Further analysis showed that the behavioural phenotype associated with this
Foxp1 CKO mouse model was responsive to atomoxetine, a drug prescribed to children
with ADHD. Thus, taken together results suggest Foxp1 CKO mice to be a serendipitous
model of ADHD.
Chapter 5 CKO of Foxp1 in the cortex
144
5.2 Introduction
The development of MSNs, in the absence of Foxp1 was discussed in detail in Chapter
3 but due to the embryonic lethality of the homozygous Foxp1 KO mice no definitive
conclusions could be drawn. Chapter 4 attempted to look beyond the point of lethality
giving useful insights into differences in the mature MSNs in the absence of Foxp1;
however, the method used was still limited in that the cells were not left to mature and
develop normally and grafts were typically small. Foxp1+/-
mice were also explored, but
appeared to have no obvious behavioural or histological phenotype compared to WT
mice. Thus, it was necessary to generate a Foxp1 conditional knockout (CKO) mouse
model.
CKO mice are a popular model used to bypass embryonic lethality in order to study
genes of interest (GOI) and commonly utilise the Cre-Lox system in which the Cre
recombinase enzyme, attached to a specific promoter, has the ability to catalyse
recombination between two LoxP sites that flank the GOI (Gaveriaux-Ruff and Kieffer
2007). When the Cre enzyme and LoxP sites meet there is an irreversible excision of the
DNA located between the two LoxP sites. Conditional mouse models can be developed
to either have the GOI knocked out from when the promoter driving the Cre is initially
expressed, or can be inducible and thus drive recombination and subsequent deletion in
response to administration of a drug such as Tomixfen or Doxycycline. For the work
outlined in this Chapter, recombination was from when the promoter was initially
expressed.
CKO mice facilitate functional analysis by allowing behavioural characterisation of the
animals through the use of specific behavioural tests to assess differences compared to
littermate controls. Such tests can range from basic hand tests including the rotarod and
locomotor activity to more complex tasks such as the five choice serial reaction time
task (5-CSRTT) that looks at differences in the learning and attention of mice in operant
boxes (Robbins 2002). Foxp1 CKO mice have been created to look at spinal-motor
neuron formation (Rousso et al. 2008) and sensory-motor connections in the spinal cord
(Surmeli et al. 2011) but to date, no brain-specific CKO mouse models have been
generated.
Chapter 5 CKO of Foxp1 in the cortex
145
Developing CKO mice involves choosing the correct promoter to achieve successful
recombination in the region of interest at the desired time. It is therefore paramount that
the promoter driving the Cre expression is expressed in the same cells as the GOI or
else recombination will be inefficient, not work at all, or lead to erroneous
recombination at an undesirable region. For the work described in this Chapter we
attempted to create a constitutive Foxp1 CKO to investigate differences in striatal
development in the absence of the Foxp1 gene.
In the absence of an available, developmental striatal specific Cre line two of the most
commonly used and commercially available neural-specific Cre-lines, the Nestin-Cre
line, and the hGFAP Cre-line were chosen in an attempt to CKO Foxp1 in the
developing striatum. The Nestin-Cre line is expressed from E11 in all neuroepithelial
cells, a stage which all neurons pass through, and therefore it would be expected that if
Foxp1 was knocked out at this early stage it would subsequently be absent during MSN
development (Tronche et al. 1999). Secondly, the hGFAP-Cre line is expressed in radial
glia (RG) and switches on at E13.5 (Malatesta et al. 2003; Zhuo et al. 2001). It is
understood that the majority of neurons in the CNS pass through a RG stage in their
development (Malatesta and Gotz 2013; Malatesta et al. 2000; Noctor et al. 2002) and
thus it was supposed that this line would also knock out Foxp1 in developing striatal
neurons. Both Cre lines are expressed during MSN development and as the preferable
time to KO Foxp1 is largely unknown it was decided that both Cre-lines would be
crossed to the Foxp1fl/fl
mouse line. This would also allow phenotype differences, as a
direct result of knocking out Foxp1 at different developmental times to be compared.
However, for reasons discussed later only the hGFAP/Foxp1fl/fl
line was pursued.
Despite the reasoning above, the resulting Foxp1-/-
CKO using the hGFAP promoter did
not result in loss of Foxp1 in the striatum, but rather resulted in loss of Foxp1 in the
neocortex, sparing expression in the striatum and the animals displayed a clear
hyperactive phenotype. Combined with the recent reports of de novo and micro-
deletions in the FOXP1 gene in humans in autism spectrum disorders (ASDs) (Palumbo
et al. 2013), and in speech and language deficits (Hamdan et al. 2010; Horn et al. 2010),
the possibility that the Foxp1 KO mice represented an animal model of ADHD was
raised. This was felt to be of sufficient interest in terms of a broader understanding of
the actions of Foxp1 to justify further analysis of the behavioural and histological

Chapter 5 CKO of Foxp1 in the cortex
146
phenotype. Thus, this Chapter presents a detailed behavioural and histological analysis
of the conditional Foxp1 fl/fl
KO using the hGFAP promoter (from here on in referred to
as the Foxp1 CKO).
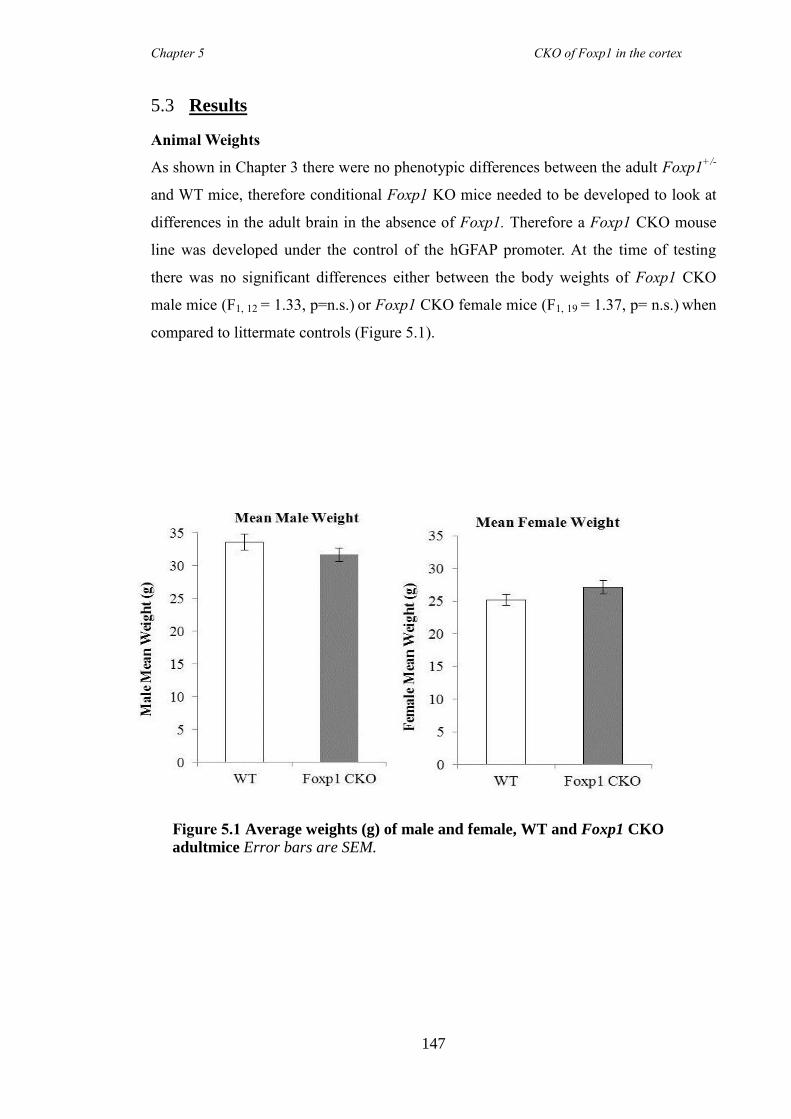
Chapter 5 CKO of Foxp1 in the cortex
147
5.3 Results
Animal Weights
As shown in Chapter 3 there were no phenotypic differences between the adult Foxp1+/-
and WT mice, therefore conditional Foxp1 KO mice needed to be developed to look at
differences in the adult brain in the absence of Foxp1. Therefore a Foxp1 CKO mouse
line was developed under the control of the hGFAP promoter. At the time of testing
there was no significant differences either between the body weights of Foxp1 CKO
male mice (F1, 12 = 1.33, p=n.s.) or Foxp1 CKO female mice (F1, 19 = 1.37, p= n.s.) when
compared to littermate controls (Figure 5.1).
Figure 5.1 Average weights (g) of male and female, WT and Foxp1 CKO
adultmice Error bars are SEM.
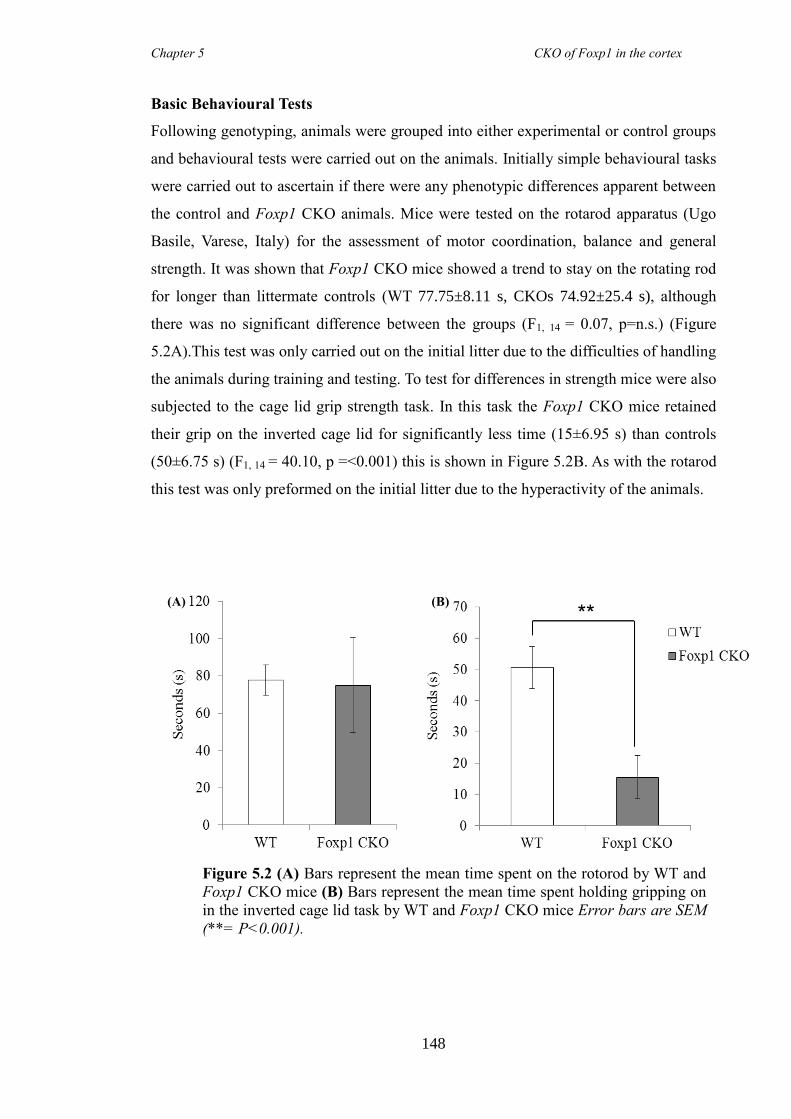
Chapter 5 CKO of Foxp1 in the cortex
148
Basic Behavioural Tests
Following genotyping, animals were grouped into either experimental or control groups
and behavioural tests were carried out on the animals. Initially simple behavioural tasks
were carried out to ascertain if there were any phenotypic differences apparent between
the control and Foxp1 CKO animals. Mice were tested on the rotarod apparatus (Ugo
Basile, Varese, Italy) for the assessment of motor coordination, balance and general
strength. It was shown that Foxp1 CKO mice showed a trend to stay on the rotating rod
for longer than littermate controls (WT 77.75±8.11 s, CKOs 74.92±25.4 s), although
there was no significant difference between the groups (F1, 14 = 0.07, p=n.s.) (Figure
5.2A).This test was only carried out on the initial litter due to the difficulties of handling
the animals during training and testing. To test for differences in strength mice were also
subjected to the cage lid grip strength task. In this task the Foxp1 CKO mice retained
their grip on the inverted cage lid for significantly less time (15±6.95 s) than controls
(50±6.75 s) (F1, 14 = 40.10, p =<0.001) this is shown in Figure 5.2B. As with the rotarod
this test was only preformed on the initial litter due to the hyperactivity of the animals.
(A) (B)
Figure 5.2 (A) Bars represent the mean time spent on the rotorod by WT and
Foxp1 CKO mice (B) Bars represent the mean time spent holding gripping on
in the inverted cage lid task by WT and Foxp1 CKO mice Error bars are SEM
(**= P<0.001).
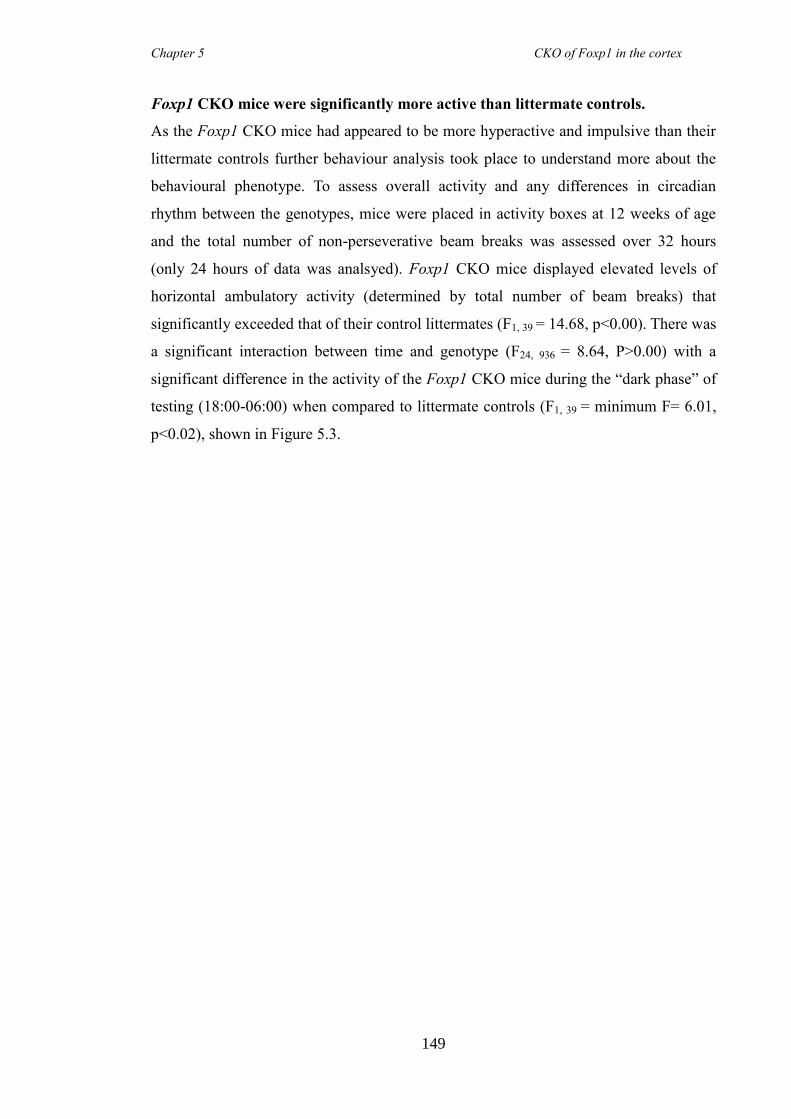
Chapter 5 CKO of Foxp1 in the cortex
149
Foxp1 CKO mice were significantly more active than littermate controls.
As the Foxp1 CKO mice had appeared to be more hyperactive and impulsive than their
littermate controls further behaviour analysis took place to understand more about the
behavioural phenotype. To assess overall activity and any differences in circadian
rhythm between the genotypes, mice were placed in activity boxes at 12 weeks of age
and the total number of non-perseverative beam breaks was assessed over 32 hours
(only 24 hours of data was analsyed). Foxp1 CKO mice displayed elevated levels of
horizontal ambulatory activity (determined by total number of beam breaks) that
significantly exceeded that of their control littermates (F1, 39 = 14.68, p<0.00). There was
a significant interaction between time and genotype (F24, 936 = 8.64, P>0.00) with a
significant difference in the activity of the Foxp1 CKO mice during the “dark phase” of
testing (18:00-06:00) when compared to littermate controls (F1, 39 = minimum F= 6.01,
p<0.02), shown in Figure 5.3.
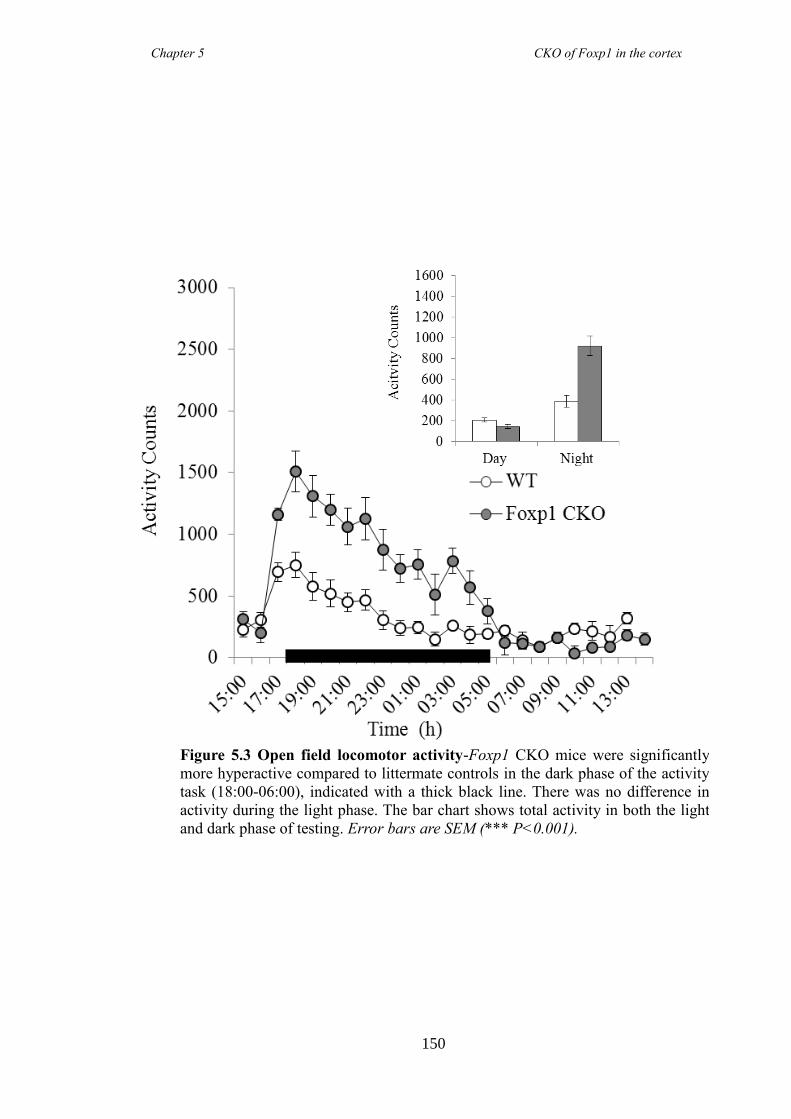
Chapter 5 CKO of Foxp1 in the cortex
150
Figure 5.3 Open field locomotor activity-Foxp1 CKO mice were significantly
more hyperactive compared to littermate controls in the dark phase of the activity
task (18:00-06:00), indicated with a thick black line. There was no difference in
activity during the light phase. The bar chart shows total activity in both the light
and dark phase of testing. Error bars are SEM (*** P<0.001).
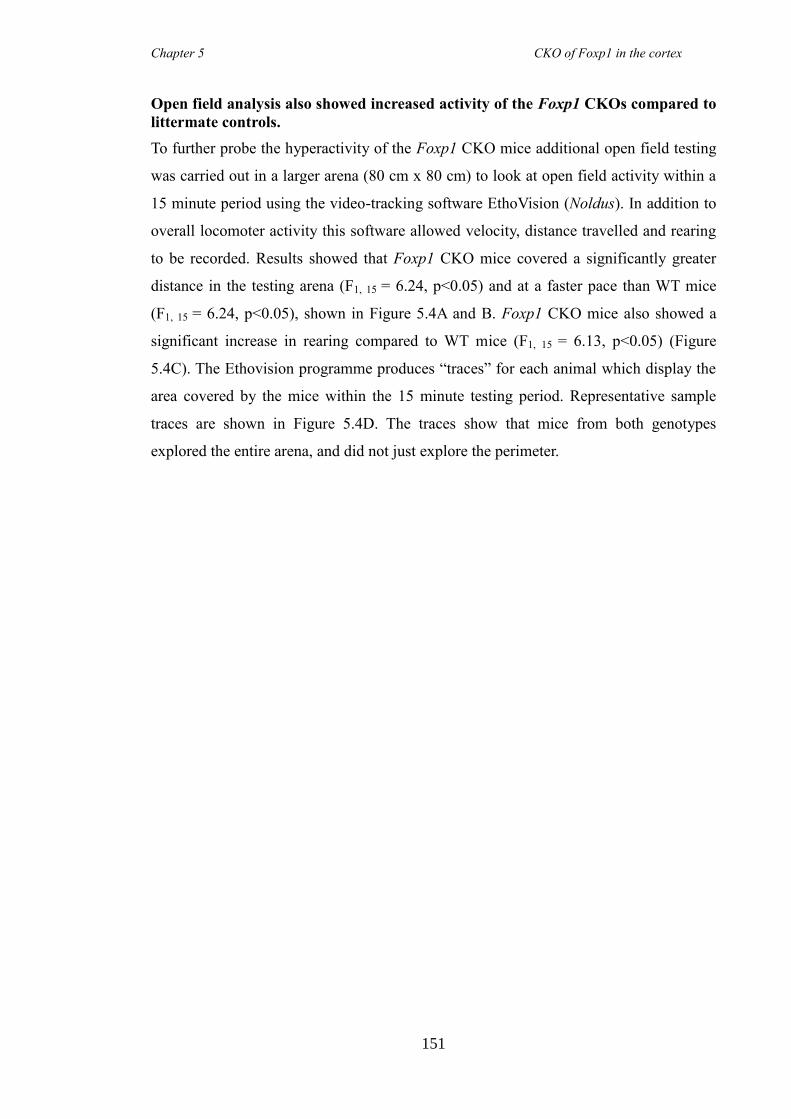
Chapter 5 CKO of Foxp1 in the cortex
151
Open field analysis also showed increased activity of the Foxp1 CKOs compared to
littermate controls.
To further probe the hyperactivity of the Foxp1 CKO mice additional open field testing
was carried out in a larger arena (80 cm x 80 cm) to look at open field activity within a
15 minute period using the video-tracking software EthoVision (Noldus). In addition to
overall locomoter activity this software allowed velocity, distance travelled and rearing
to be recorded. Results showed that Foxp1 CKO mice covered a significantly greater
distance in the testing arena (F1, 15 = 6.24, p<0.05) and at a faster pace than WT mice
(F1, 15 = 6.24, p<0.05), shown in Figure 5.4A and B. Foxp1 CKO mice also showed a
significant increase in rearing compared to WT mice (F1, 15 = 6.13, p<0.05) (Figure
5.4C). The Ethovision programme produces “traces” for each animal which display the
area covered by the mice within the 15 minute testing period. Representative sample
traces are shown in Figure 5.4D. The traces show that mice from both genotypes
explored the entire arena, and did not just explore the perimeter.
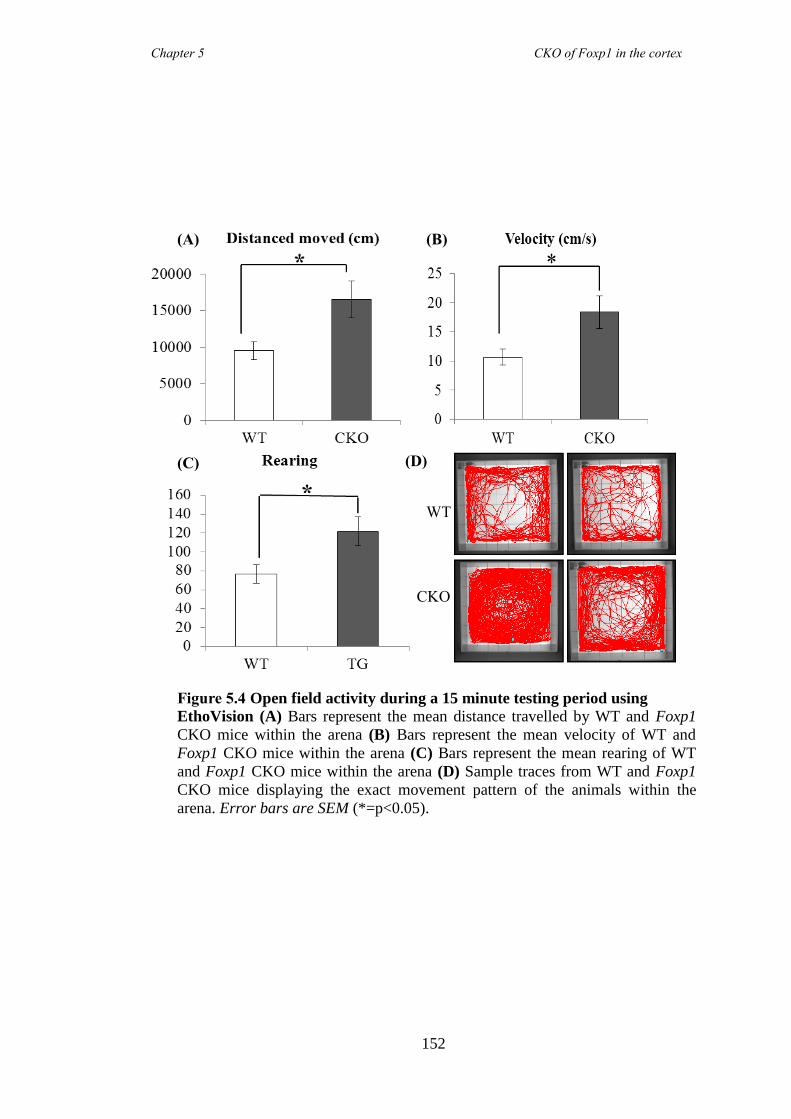
Chapter 5 CKO of Foxp1 in the cortex
152
(B) (A)
(C) (D)
WT
CKO
Figure 5.4 Open field activity during a 15 minute testing period using
EthoVision (A) Bars represent the mean distance travelled by WT and Foxp1
CKO mice within the arena (B) Bars represent the mean velocity of WT and
Foxp1 CKO mice within the arena (C) Bars represent the mean rearing of WT
and Foxp1 CKO mice within the arena (D) Sample traces from WT and Foxp1
CKO mice displaying the exact movement pattern of the animals within the
arena. Error bars are SEM (*=p<0.05).
Chapter 5 CKO of Foxp1 in the cortex
153
Foxp1 CKO mice did not display a phenotype associated with anxiety
As the Foxp1 CKO mice did not fear the centre of the open field arena this would
suggest the animals were not over anxious. Therefore to look specifically for any
differences in anxiety the marble burying task (MBT) and Elevated plus Maze Test
(EPM) were carried out. These two tasks are designed to take advantage of a rodent’s
innate response of burying unknown objects and fear of heights combined with exposed,
open arms, rather than safe enclosed arms. Example photomicrographs from the MBT
are displayed in Figure 5.5A and the mean number of marbles buried is shown in Figure
5.5B. Although the control mice buried more marbles than Foxp1 CKO mice
(WT=5.57±2.01, CKO=0.80±0.49) this did not reach conventional levels of significance
(F1, 11 = 3.805, p=0.08). Figure 5.5C shows the number of marbles buried per mouse and
clearly identifies the one outlying result, which shows that one WT mouse buried 17
marbles. Non-parametric analysis showed that there was a significant difference
between the numbers of marbles buried between the groups (U=2.00, p≤0.01). On the
EPM there was no difference in the number of open arm entries between the genotypes
(F1, 12= 3.81, p=n.s.) (Figure 5.5D) but the Foxp1 CKO mice spent significantly more
time on the open arms (F1, 12= 6.84, p=<0.05) than littermate controls (Figure 5.5E),
determined as a percentage of total arm entries and total time spent on all four arms
respectively. WT animals had a preference to stay in the enclosed “safe” arms.
(A)
(A)
Chapter 5 CKO of Foxp1 in the cortex
154
Figure 5.5 Foxp1 CKO mice showed reduced anxiety in unconditioned
environments (A) Representative photomicrographs of the MBT from a WT and
Foxp1 CKO mouse (B) Bars represent the mean number of marbles buried by the
WT and Foxp1 CKO mice (C) Line graph showing the number of marbles buried
by each animal and shows the outlier result that 1 WT mouse buried 17 marbles.
(D) Bars represent the mean number of crosses into enclosed or open arms (entry
as a % of total crosses), by the WT and Foxp1 CKO mice (E) Bars represent the
mean time spent on either the open or closed arms (as a percentage of total time,
on all four arms) by the WT and Foxp1 CKO mice Error bars are SEM. *P<0.05.
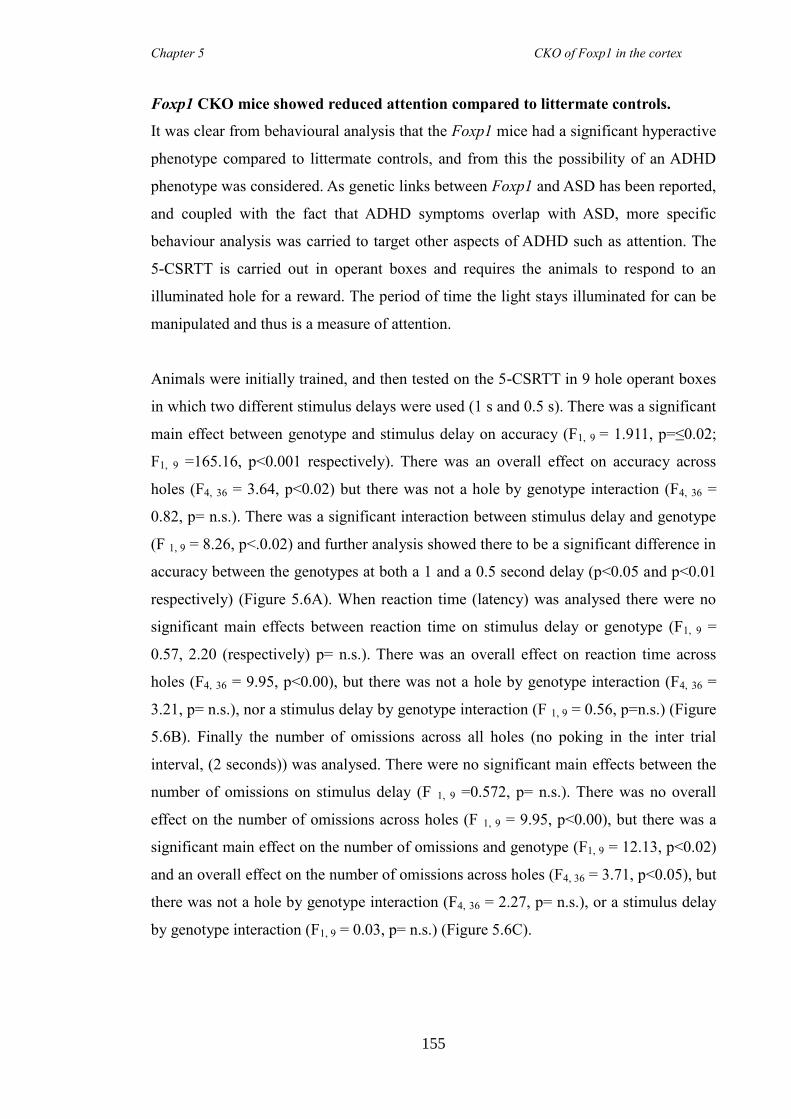
Chapter 5 CKO of Foxp1 in the cortex
155
Foxp1 CKO mice showed reduced attention compared to littermate controls.
It was clear from behavioural analysis that the Foxp1 mice had a significant hyperactive
phenotype compared to littermate controls, and from this the possibility of an ADHD
phenotype was considered. As genetic links between Foxp1 and ASD has been reported,
and coupled with the fact that ADHD symptoms overlap with ASD, more specific
behaviour analysis was carried to target other aspects of ADHD such as attention. The
5-CSRTT is carried out in operant boxes and requires the animals to respond to an
illuminated hole for a reward. The period of time the light stays illuminated for can be
manipulated and thus is a measure of attention.
Animals were initially trained, and then tested on the 5-CSRTT in 9 hole operant boxes
in which two different stimulus delays were used (1 s and 0.5 s). There was a significant
main effect between genotype and stimulus delay on accuracy (F1, 9 = 1.911, p=≤0.02;
F1, 9 =165.16, p<0.001 respectively). There was an overall effect on accuracy across
holes (F4, 36 = 3.64, p<0.02) but there was not a hole by genotype interaction (F4, 36 =
0.82, p= n.s.). There was a significant interaction between stimulus delay and genotype
(F 1, 9 = 8.26, p<.0.02) and further analysis showed there to be a significant difference in
accuracy between the genotypes at both a 1 and a 0.5 second delay (p<0.05 and p<0.01
respectively) (Figure 5.6A). When reaction time (latency) was analysed there were no
significant main effects between reaction time on stimulus delay or genotype (F1, 9 =
0.57, 2.20 (respectively) p= n.s.). There was an overall effect on reaction time across
holes (F4, 36 = 9.95, p<0.00), but there was not a hole by genotype interaction (F4, 36 =
3.21, p= n.s.), nor a stimulus delay by genotype interaction (F 1, 9 = 0.56, p=n.s.) (Figure
5.6B). Finally the number of omissions across all holes (no poking in the inter trial
interval, (2 seconds)) was analysed. There were no significant main effects between the
number of omissions on stimulus delay (F 1, 9 =0.572, p= n.s.). There was no overall
effect on the number of omissions across holes (F 1, 9 = 9.95, p<0.00), but there was a
significant main effect on the number of omissions and genotype (F1, 9 = 12.13, p<0.02)
and an overall effect on the number of omissions across holes (F4, 36 = 3.71, p<0.05), but
there was not a hole by genotype interaction (F4, 36 = 2.27, p= n.s.), or a stimulus delay
by genotype interaction (F1, 9 = 0.03, p= n.s.) (Figure 5.6C).
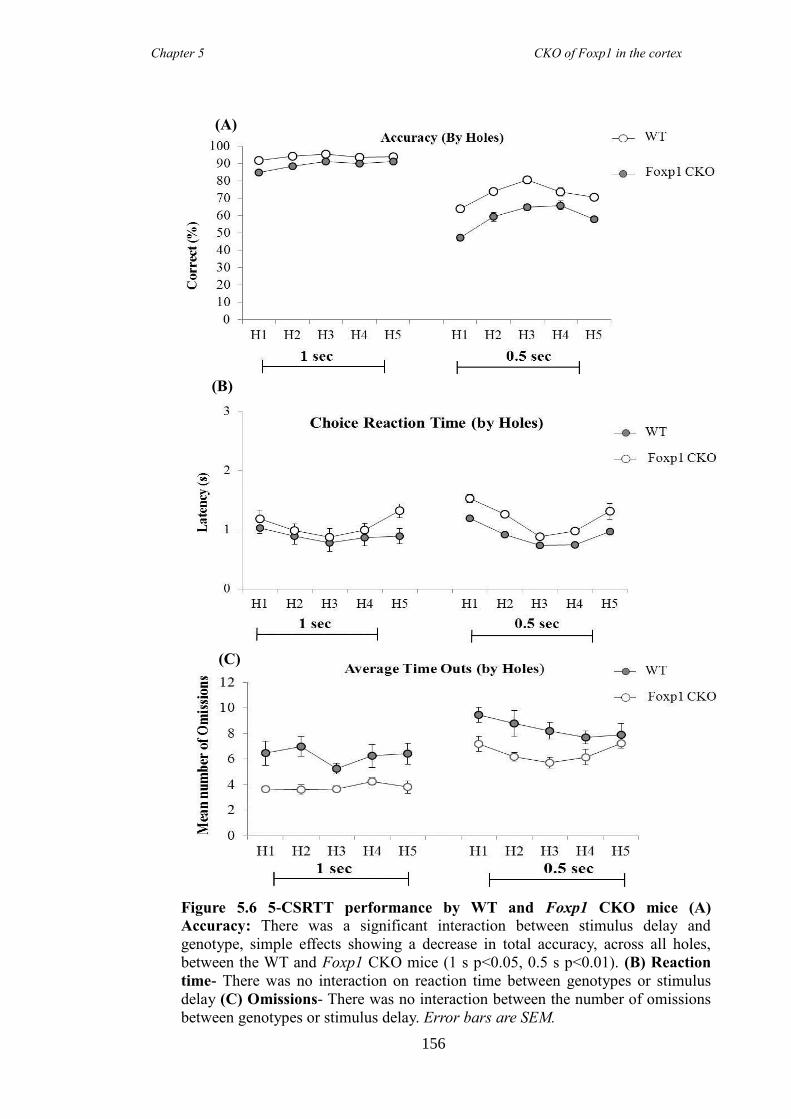
Chapter 5 CKO of Foxp1 in the cortex
156
Figure 5.6 5-CSRTT performance by WT and Foxp1 CKO mice (A)
Accuracy: There was a significant interaction between stimulus delay and
genotype, simple effects showing a decrease in total accuracy, across all holes,
between the WT and Foxp1 CKO mice (1 s p<0.05, 0.5 s p<0.01). (B) Reaction
time- There was no interaction on reaction time between genotypes or stimulus
delay (C) Omissions- There was no interaction between the number of omissions
between genotypes or stimulus delay. Error bars are SEM.
(A)
(B)
(C)
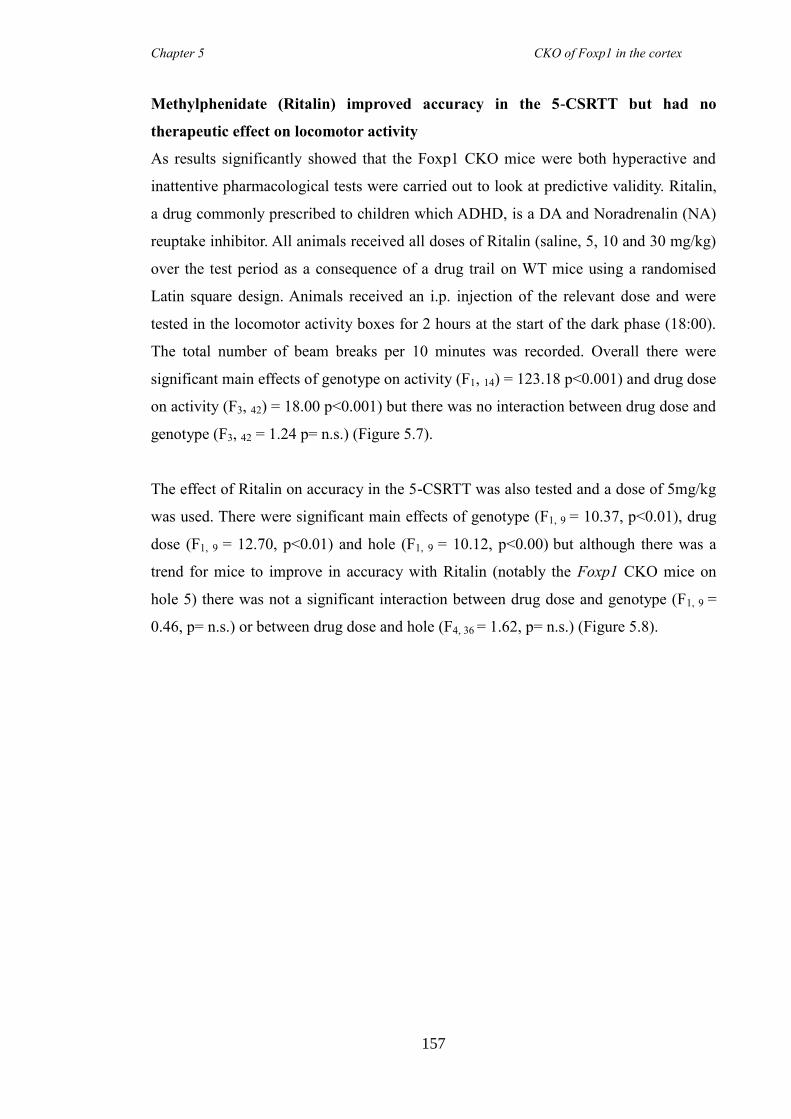
Chapter 5 CKO of Foxp1 in the cortex
157
Methylphenidate (Ritalin) improved accuracy in the 5-CSRTT but had no
therapeutic effect on locomotor activity
As results significantly showed that the Foxp1 CKO mice were both hyperactive and
inattentive pharmacological tests were carried out to look at predictive validity. Ritalin,
a drug commonly prescribed to children which ADHD, is a DA and Noradrenalin (NA)
reuptake inhibitor. All animals received all doses of Ritalin (saline, 5, 10 and 30 mg/kg)
over the test period as a consequence of a drug trail on WT mice using a randomised
Latin square design. Animals received an i.p. injection of the relevant dose and were
tested in the locomotor activity boxes for 2 hours at the start of the dark phase (18:00).
The total number of beam breaks per 10 minutes was recorded. Overall there were
significant main effects of genotype on activity (F1, 14) = 123.18 p<0.001) and drug dose
on activity (F3, 42) = 18.00 p<0.001) but there was no interaction between drug dose and
genotype (F3, 42 = 1.24 p= n.s.) (Figure 5.7).
The effect of Ritalin on accuracy in the 5-CSRTT was also tested and a dose of 5mg/kg
was used. There were significant main effects of genotype (F1, 9 = 10.37, p<0.01), drug
dose (F1, 9 = 12.70, p<0.01) and hole (F1, 9 = 10.12, p<0.00) but although there was a
trend for mice to improve in accuracy with Ritalin (notably the Foxp1 CKO mice on
hole 5) there was not a significant interaction between drug dose and genotype (F1, 9 =
0.46, p= n.s.) or between drug dose and hole (F4, 36 = 1.62, p= n.s.) (Figure 5.8).
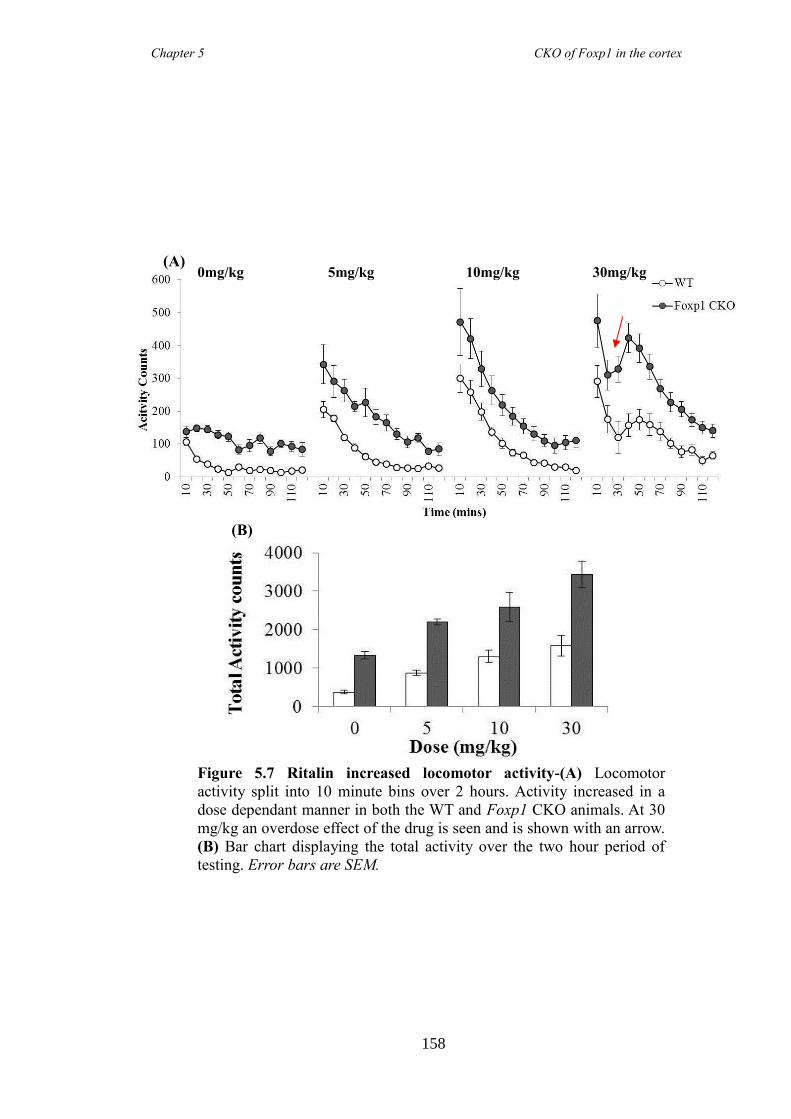
Chapter 5 CKO of Foxp1 in the cortex
158
0mg/kg 5mg/kg 10mg/kg 30mg/kg
(A)
(B)
(B)
Figure 5.7 Ritalin increased locomotor activity-(A) Locomotor
activity split into 10 minute bins over 2 hours. Activity increased in a
dose dependant manner in both the WT and Foxp1 CKO animals. At 30
mg/kg an overdose effect of the drug is seen and is shown with an arrow.
(B) Bar chart displaying the total activity over the two hour period of
testing. Error bars are SEM.
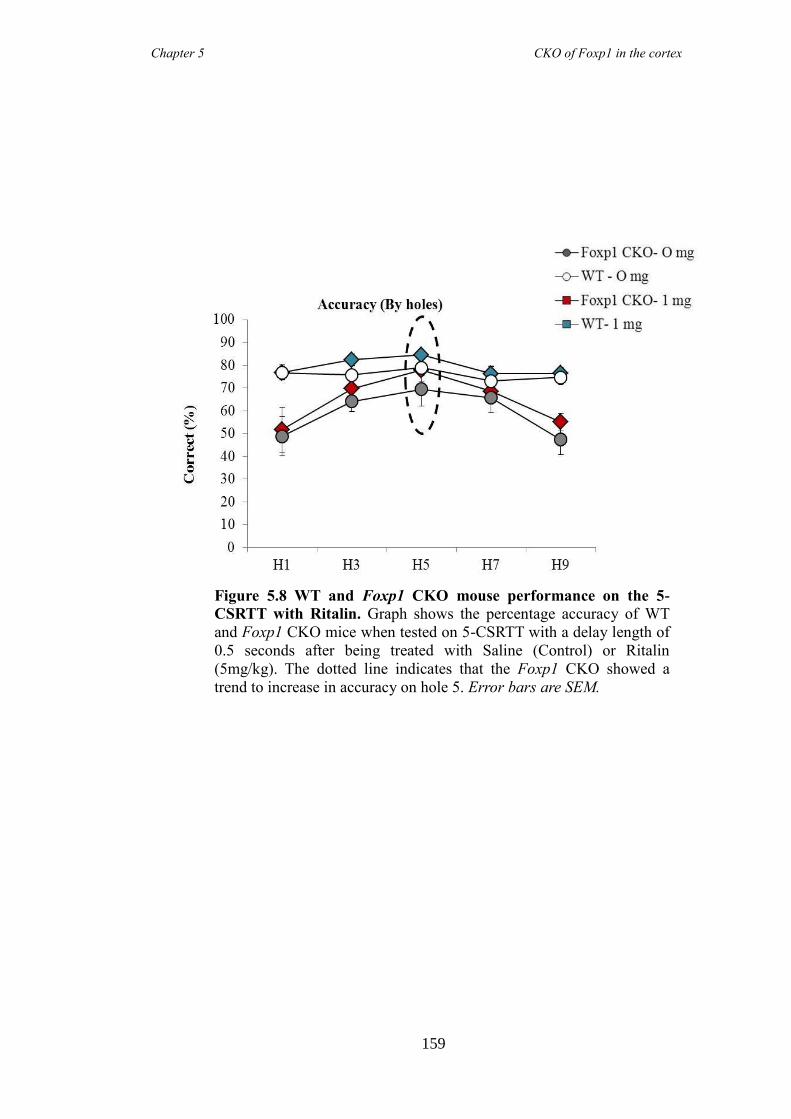
Chapter 5 CKO of Foxp1 in the cortex
159
Figure 5.8 WT and Foxp1 CKO mouse performance on the 5-
CSRTT with Ritalin. Graph shows the percentage accuracy of WT
and Foxp1 CKO mice when tested on 5-CSRTT with a delay length of
0.5 seconds after being treated with Saline (Control) or Ritalin
(5mg/kg). The dotted line indicates that the Foxp1 CKO showed a
trend to increase in accuracy on hole 5. Error bars are SEM.
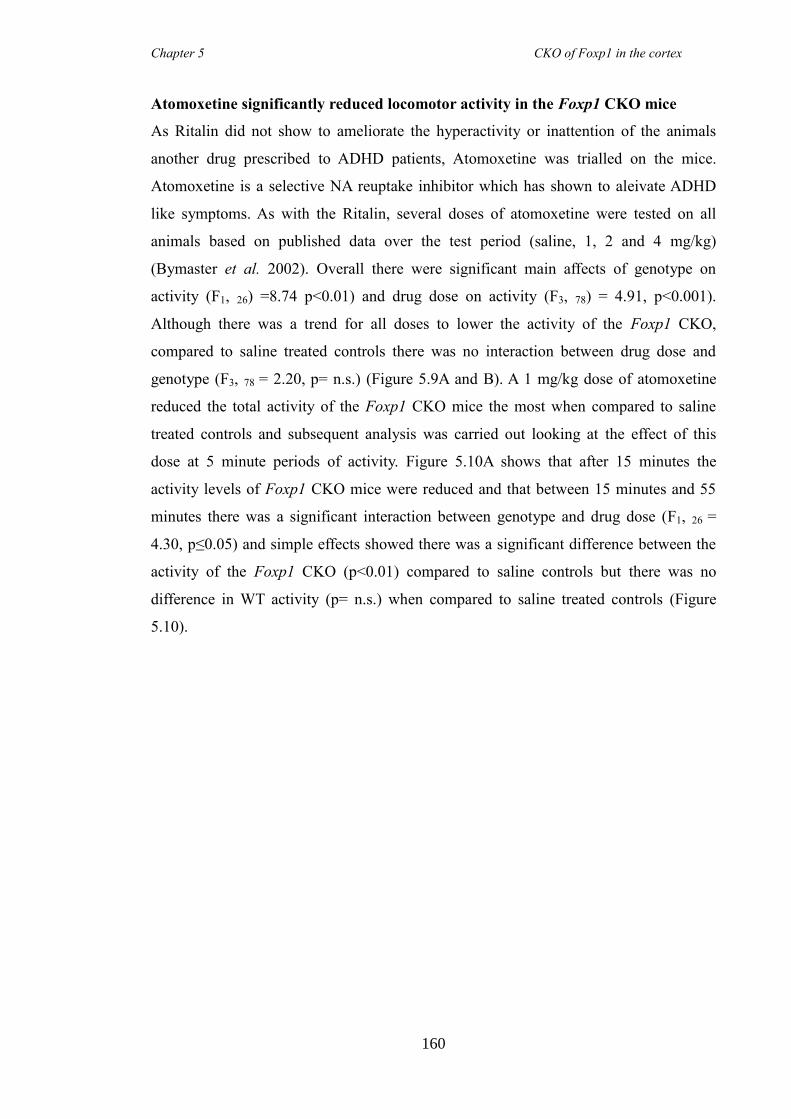
Chapter 5 CKO of Foxp1 in the cortex
160
Atomoxetine significantly reduced locomotor activity in the Foxp1 CKO mice
As Ritalin did not show to ameliorate the hyperactivity or inattention of the animals
another drug prescribed to ADHD patients, Atomoxetine was trialled on the mice.
Atomoxetine is a selective NA reuptake inhibitor which has shown to aleivate ADHD
like symptoms. As with the Ritalin, several doses of atomoxetine were tested on all
animals based on published data over the test period (saline, 1, 2 and 4 mg/kg)
(Bymaster et al. 2002). Overall there were significant main affects of genotype on
activity (F1, 26) =8.74 p<0.01) and drug dose on activity (F3, 78) = 4.91, p<0.001).
Although there was a trend for all doses to lower the activity of the Foxp1 CKO,
compared to saline treated controls there was no interaction between drug dose and
genotype (F3, 78 = 2.20, p= n.s.) (Figure 5.9A and B). A 1 mg/kg dose of atomoxetine
reduced the total activity of the Foxp1 CKO mice the most when compared to saline
treated controls and subsequent analysis was carried out looking at the effect of this
dose at 5 minute periods of activity. Figure 5.10A shows that after 15 minutes the
activity levels of Foxp1 CKO mice were reduced and that between 15 minutes and 55
minutes there was a significant interaction between genotype and drug dose (F1, 26 =
4.30, p≤0.05) and simple effects showed there was a significant difference between the
activity of the Foxp1 CKO (p<0.01) compared to saline controls but there was no
difference in WT activity (p= n.s.) when compared to saline treated controls (Figure
5.10).
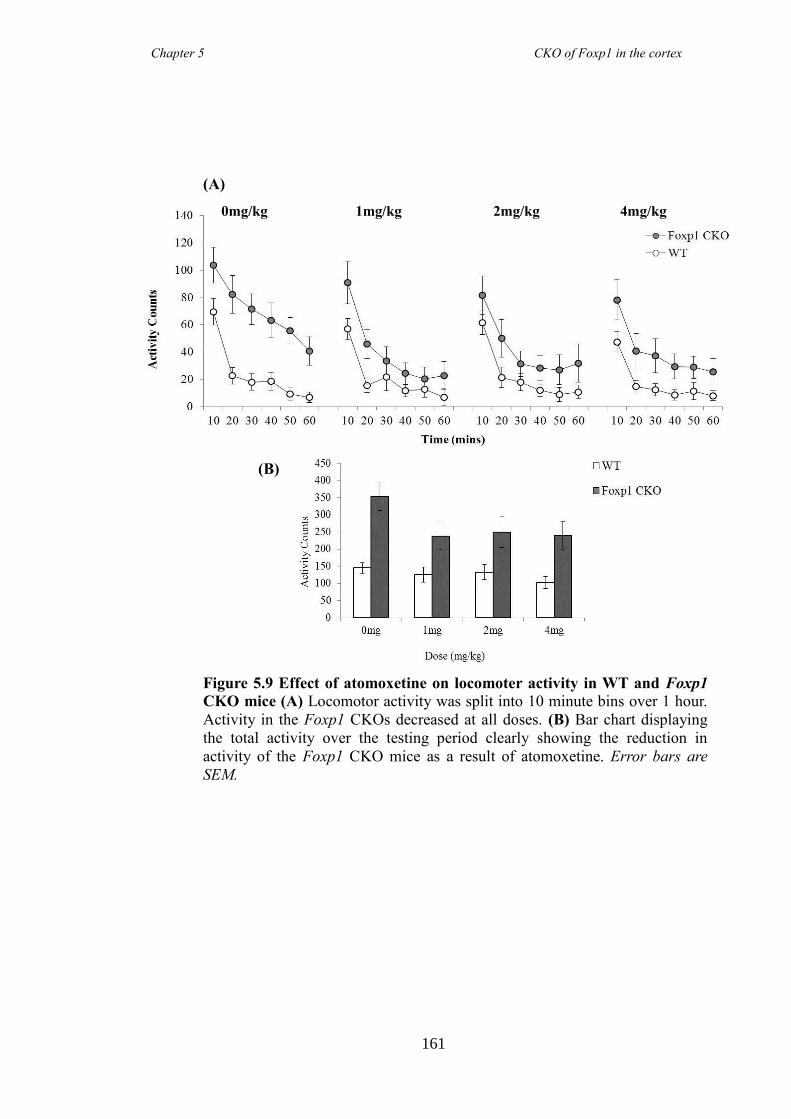
Chapter 5 CKO of Foxp1 in the cortex
161
0mg/kg 1mg/kg 2mg/kg 4mg/kg
(A)
a
(B)
a
Figure 5.9 Effect of atomoxetine on locomoter activity in WT and Foxp1
CKO mice (A) Locomotor activity was split into 10 minute bins over 1 hour.
Activity in the Foxp1 CKOs decreased at all doses. (B) Bar chart displaying
the total activity over the testing period clearly showing the reduction in
activity of the Foxp1 CKO mice as a result of atomoxetine. Error bars are
SEM.
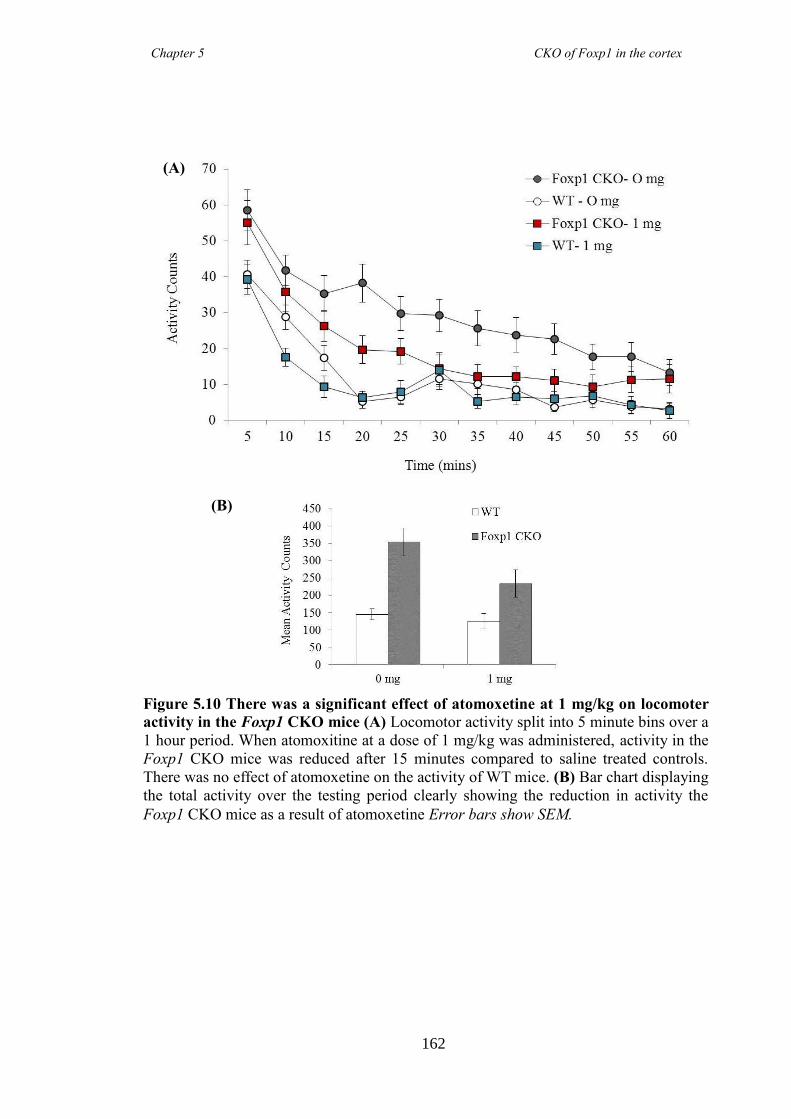
Chapter 5 CKO of Foxp1 in the cortex
162
(A)
(B)
Figure 5.10 There was a significant effect of atomoxetine at 1 mg/kg on locomoter
activity in the Foxp1 CKO mice (A) Locomotor activity split into 5 minute bins over a
1 hour period. When atomoxitine at a dose of 1 mg/kg was administered, activity in the
Foxp1 CKO mice was reduced after 15 minutes compared to saline treated controls.
There was no effect of atomoxetine on the activity of WT mice. (B) Bar chart displaying
the total activity over the testing period clearly showing the reduction in activity the
Foxp1 CKO mice as a result of atomoxetine Error bars show SEM.
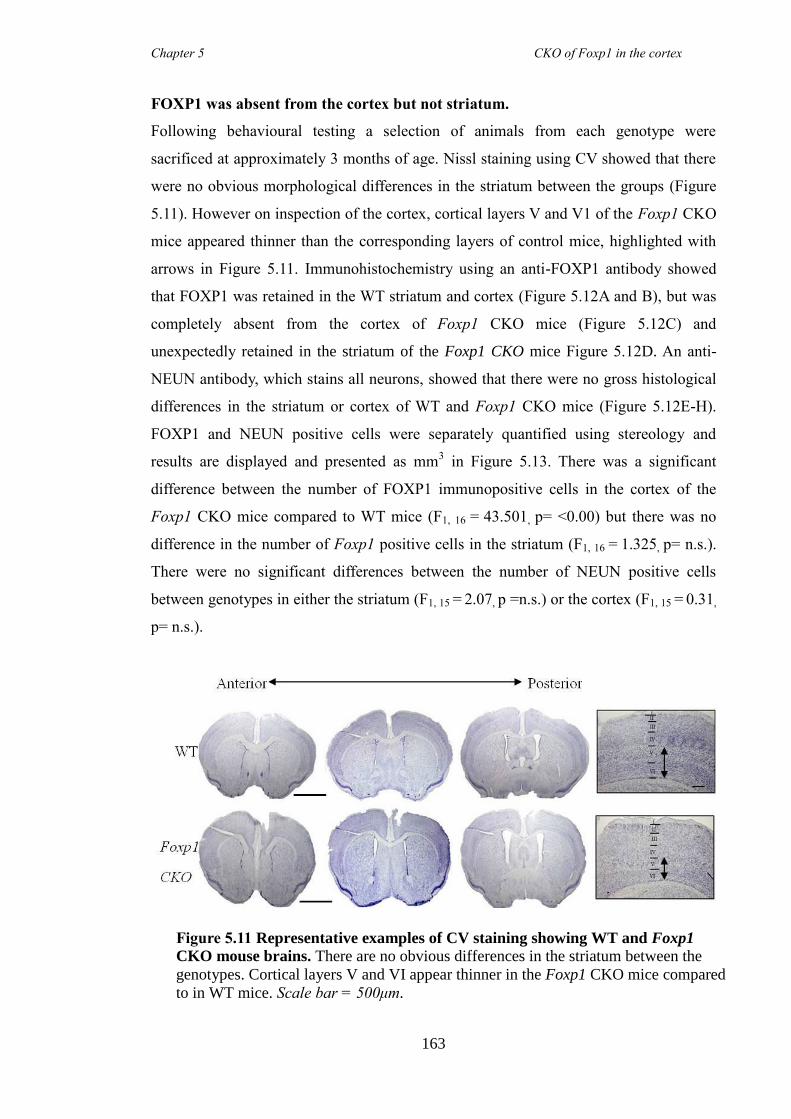
Chapter 5 CKO of Foxp1 in the cortex
163
FOXP1 was absent from the cortex but not striatum.
Following behavioural testing a selection of animals from each genotype were
sacrificed at approximately 3 months of age. Nissl staining using CV showed that there
were no obvious morphological differences in the striatum between the groups (Figure
5.11). However on inspection of the cortex, cortical layers V and V1 of the Foxp1 CKO
mice appeared thinner than the corresponding layers of control mice, highlighted with
arrows in Figure 5.11. Immunohistochemistry using an anti-FOXP1 antibody showed
that FOXP1 was retained in the WT striatum and cortex (Figure 5.12A and B), but was
completely absent from the cortex of Foxp1 CKO mice (Figure 5.12C) and
unexpectedly retained in the striatum of the Foxp1 CKO mice Figure 5.12D. An anti-
NEUN antibody, which stains all neurons, showed that there were no gross histological
differences in the striatum or cortex of WT and Foxp1 CKO mice (Figure 5.12E-H).
FOXP1 and NEUN positive cells were separately quantified using stereology and
results are displayed and presented as mm3 in Figure 5.13. There was a significant
difference between the number of FOXP1 immunopositive cells in the cortex of the
Foxp1 CKO mice compared to WT mice (F1, 16 = 43.501, p= <0.00) but there was no
difference in the number of Foxp1 positive cells in the striatum (F1, 16 = 1.325, p= n.s.).
There were no significant differences between the number of NEUN positive cells
between genotypes in either the striatum (F1, 15 = 2.07, p =n.s.) or the cortex (F1, 15 = 0.31,
p= n.s.).
Figure 5.11 Representative examples of CV staining showing WT and Foxp1
CKO mouse brains. There are no obvious differences in the striatum between the
genotypes. Cortical layers V and VI appear thinner in the Foxp1 CKO mice compared
to in WT mice. Scale bar = 500μm.
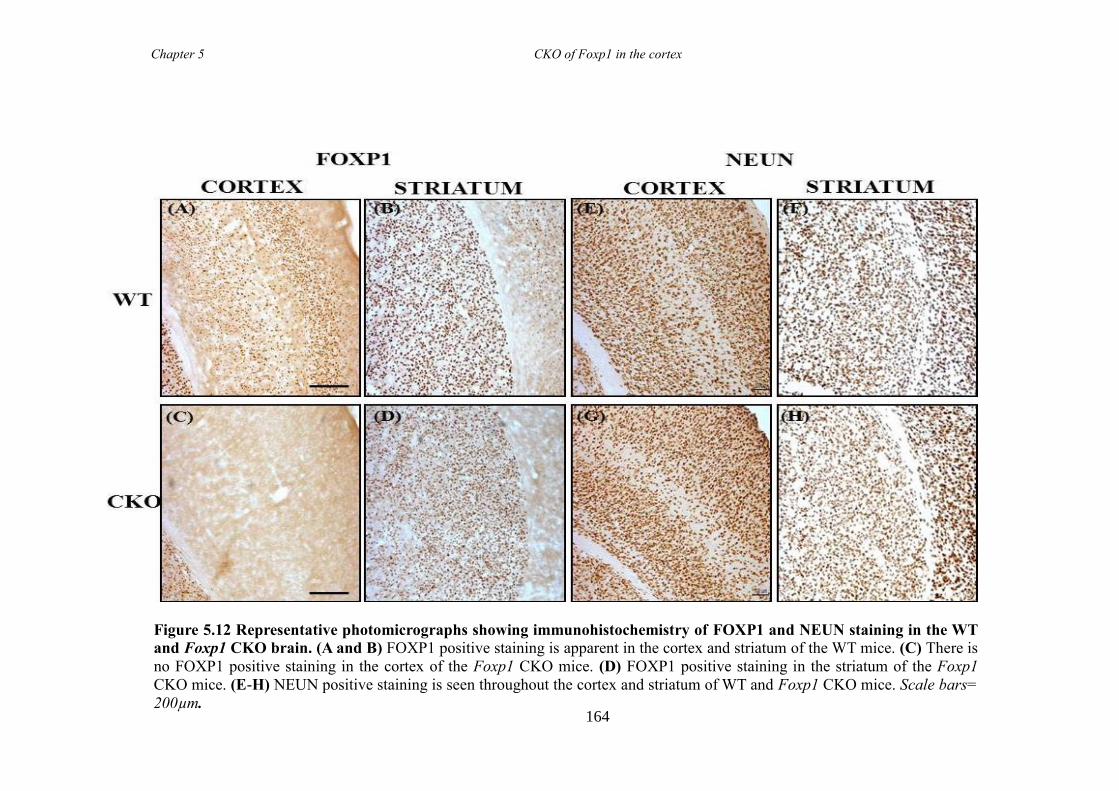
Chapter 5 CKO of Foxp1 in the cortex
164
Figure 5.12 Representative photomicrographs showing immunohistochemistry of FOXP1 and NEUN staining in the WT
and Foxp1 CKO brain. (A and B) FOXP1 positive staining is apparent in the cortex and striatum of the WT mice. (C) There is
no FOXP1 positive staining in the cortex of the Foxp1 CKO mice. (D) FOXP1 positive staining in the striatum of the Foxp1
CKO mice. (E-H) NEUN positive staining is seen throughout the cortex and striatum of WT and Foxp1 CKO mice. Scale bars=
200µm.
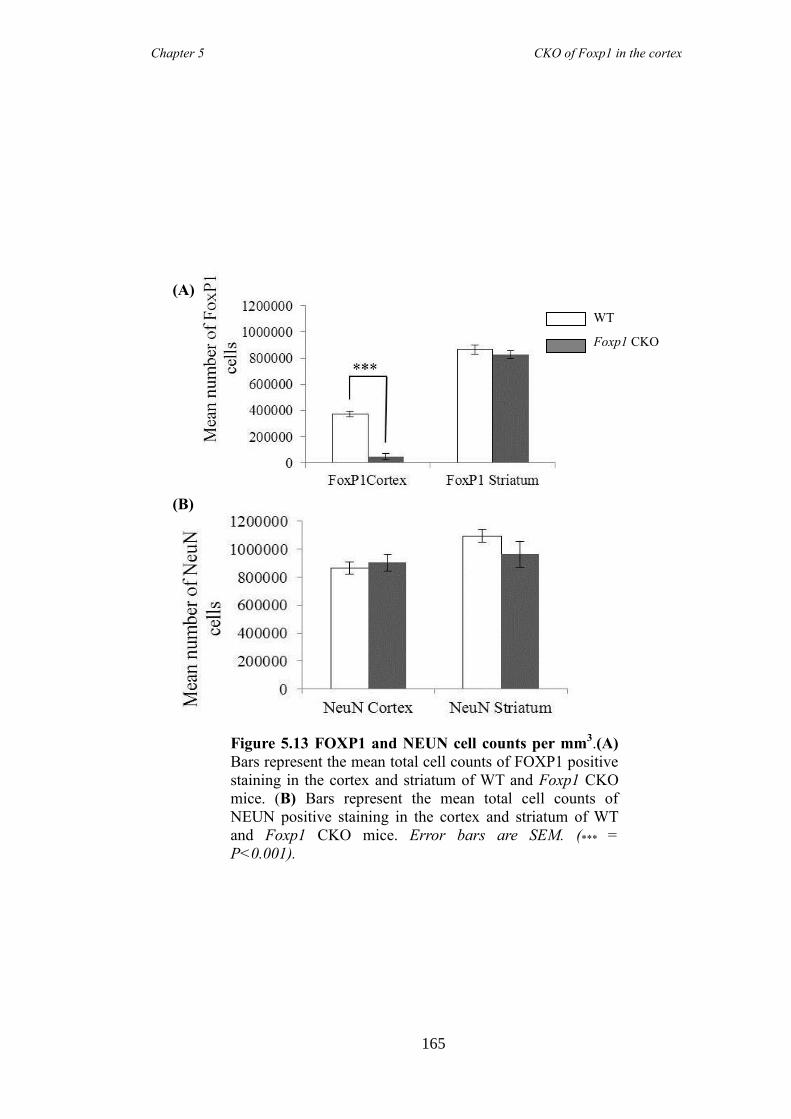
Chapter 5 CKO of Foxp1 in the cortex
165
(A)
WT
Foxp1 CKO
(B)
Figure 5.13 FOXP1 and NEUN cell counts per mm3.(A)
Bars represent the mean total cell counts of FOXP1 positive
staining in the cortex and striatum of WT and Foxp1 CKO
mice. (B) Bars represent the mean total cell counts of
NEUN positive staining in the cortex and striatum of WT
and Foxp1 CKO mice. Error bars are SEM. (*** =
P<0.001).
Chapter 5 CKO of Foxp1 in the cortex
166
Differences in cortical layer morphology
In an attempt to distinguish which specific cortical cells were affected by the loss of
Foxp1, antibodies specific to the different cortical layers were tested and were assessed
qualitatively. FOXP2 preferentially stains layer VI of the cortex, with some staining
seen in layer V of the motor cortex, the region where FOXP1 and FOXP2 show the
most overlap in staining. DARPP-32 was also used as a layer V1 marker and
preferentially stains pyramidal neurons. CTIP2 preferentially stains layer V of the
cortex but is also seen in layer V1. There was no difference in FOXP2 staining between
genotypes as shown in Figure 5.14. Ectopic CTIP2 staining was evident in layers 3 and
4 of the cortex in the Foxp1 CKO (Figure 5.15A and B). As anticipated from Chapter 3
there was little or no DARPP-32 staining evident in layer V1 of the cortex in the Foxp1
CKOs when compared to WTs shown in Figure 5.15C and D.
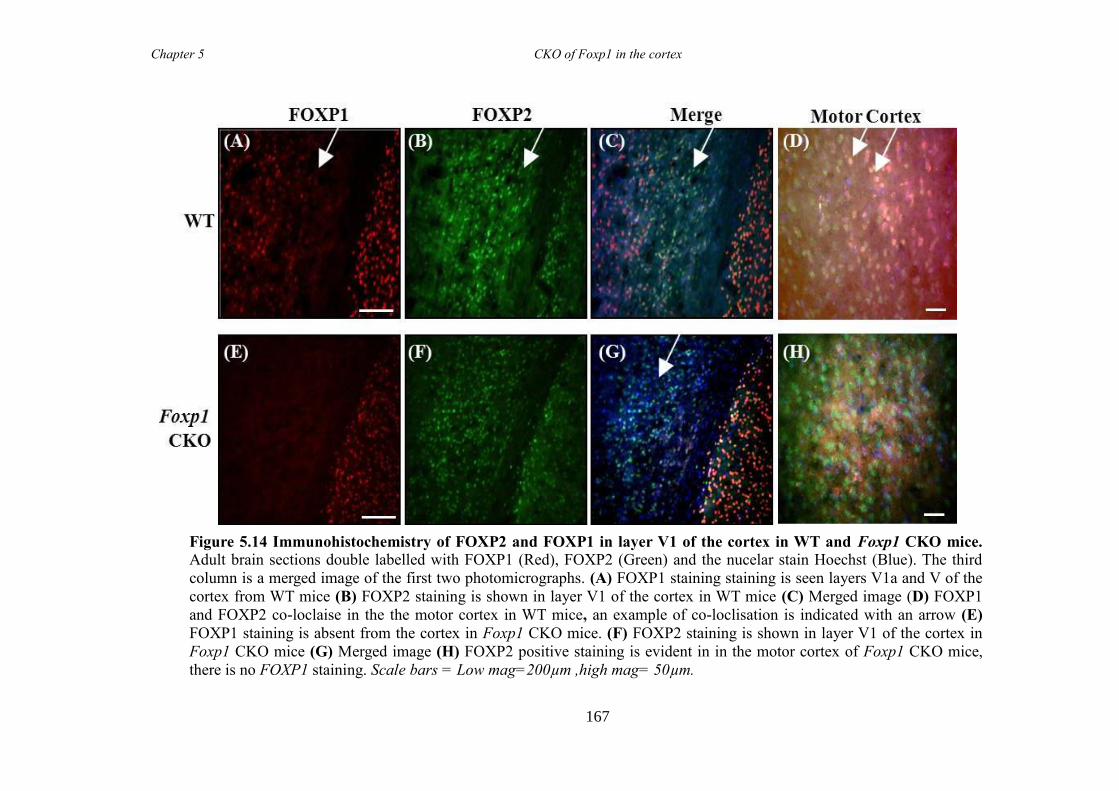
Chapter 5 CKO of Foxp1 in the cortex
167
Figure 5.14 Immunohistochemistry of FOXP2 and FOXP1 in layer V1 of the cortex in WT and Foxp1 CKO mice.
Adult brain sections double labelled with FOXP1 (Red), FOXP2 (Green) and the nucelar stain Hoechst (Blue). The third
column is a merged image of the first two photomicrographs. (A) FOXP1 staining staining is seen layers V1a and V of the
cortex from WT mice (B) FOXP2 staining is shown in layer V1 of the cortex in WT mice (C) Merged image (D) FOXP1
and FOXP2 co-loclaise in the the motor cortex in WT mice, an example of co-loclisation is indicated with an arrow (E)
FOXP1 staining is absent from the cortex in Foxp1 CKO mice. (F) FOXP2 staining is shown in layer V1 of the cortex in
Foxp1 CKO mice (G) Merged image (H) FOXP2 positive staining is evident in in the motor cortex of Foxp1 CKO mice,
there is no FOXP1 staining. Scale bars = Low mag=200µm ,high mag= 50µm.
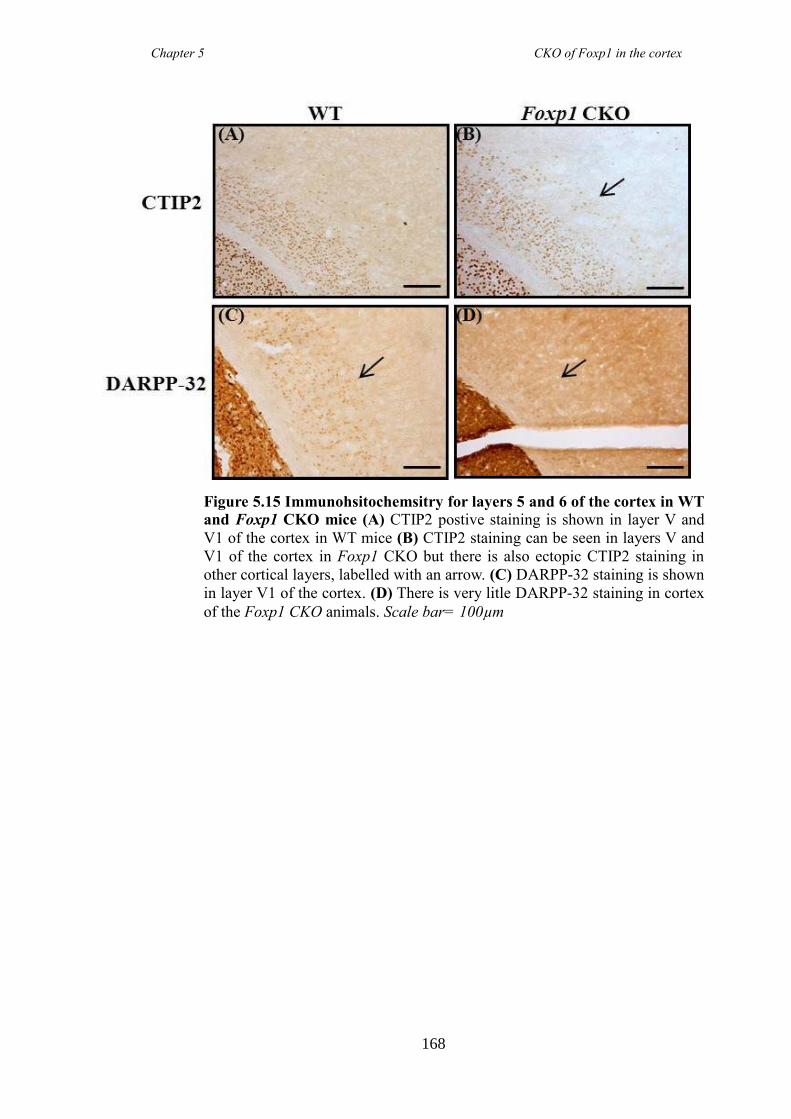
Chapter 5 CKO of Foxp1 in the cortex
168
Figure 5.15 Immunohsitochemsitry for layers 5 and 6 of the cortex in WT
and Foxp1 CKO mice (A) CTIP2 postive staining is shown in layer V and
V1 of the cortex in WT mice (B) CTIP2 staining can be seen in layers V and
V1 of the cortex in Foxp1 CKO but there is also ectopic CTIP2 staining in
other cortical layers, labelled with an arrow. (C) DARPP-32 staining is shown
in layer V1 of the cortex. (D) There is very litle DARPP-32 staining in cortex
of the Foxp1 CKO animals. Scale bar= 100µm

Chapter 5 CKO of Foxp1 in the cortex
169
5.4 Discussion
Choice of Cre line to conditionally KO Foxp1 in the developing striatum
There are a number of TG Cre-lines that can KO genes selectively in the adult striatum,
examples include the Drd1a-Cre, the Drd2-Cre, the Adensosine A2a receptor
(Adora2a)-Cre (Gong et al. 2007) and the TG (Camk2a-cre)2Szi which has been used to
conditionally KO DARPP-32 (Dragatsis and Zeitlin 2000). However, these Cre lines are
expressed too late to achieve KO of Foxp1 coincident with MSN neurogenesis.
Therefore achieving a specific and conditional striatal KO initiating early in striatal
development is difficult, as often the promoter driving the Cre is not exclusively
expressed in the striatum (not problematic if GOI is striatal specific) or is expressed in
the cells at the wrong time e.g too late. As discussed in detail in Chapter 1.7, the
expression pattern of the Foxg1-Cre line would have been an ideal option for a striatal-
specific deletions, however the inconsistencies reported with this line, such as a global
expression pattern, made it unfavourable for this work. A recent striatal-specific line t is
the Gsh2-Cre line (Kessaris et al. 2006). Gsh2 is expressed from E9 in the LGE with
limited expression in the MGE (Corbin et al. 2000; Toresson et al. 2000). Since being
developed, the Gsh2-Cre line has been used, for example, to look at the heterogeneity of
cells in the olfactory bulb (Young et al. 2007) and recently to look at the migration
patterns of GABAergic neurons (Wu et al. 2011). However as this line is not yet
commercially available it was difficult to source in the time restraints of this thesis.
The importance of selecting the correct promoter to drive specific recombination was
well considered for these experiments and two well established Cre lines were initially
chosen for this work; a Nestin-Cre (Li et al. 2008) and a hGFAP cre (Barbosa et al.
2008). It was anticipated that the Nestin-Cre line developed by Tronche et al (1999)
would conditionally KO Foxp1 in the striatum from E11. Specifically, this Cre-line has
shown to cause recombination in proliferating neural stem cells (Tronche et al. 1999).
However, for the present work, after several attempts of breeding (totalling over a year),
there were no pups born that had the desired genotype (pups with the other genotypes
were all born healthy), suggesting incompatibility between the Nestin-Cre and Foxp1
floxed mouse (data not shown). As with the Foxg1-Cre the Nestin-Cre line expression
pattern is inconsistent and has shown some expression in tissues other than the brain
including the heart and kidney (Tronche et al. 1999). As Foxp1 is also crucial in heart
Chapter 5 CKO of Foxp1 in the cortex
170
development, it may be that recombination is also occurring in the heart and thus
causing embryonic lethality that is associated with the Foxp1-/-
mice. Additionally it has
recently been shown that the Nestin-Cre line, which of note, is the only commercial
Nestin-line available, was poor in directing recombination in embryonic neural stem and
progenitor cells at E12.5 and that expression was largely confined to post-mitotic
neurons (Liang et al. 2012). In our hands, the Nestin-Cre was not able to conditionally
KO Foxp1 in the desired region and ultimately ended in embryonic lethality of the pups.
In parallel to the Nestin breeding regime, Foxp1 floxed mice were also crossed to
hGFAP-Cre mice. Initially breeding of hGFAP/Foxp1+/-
mice was attempted to Foxp1fl/fl
mice to ensure a more thorough genetic KO, but as with the Nestin-Cre line no pups of
the correct genotype were born using this method. Thus it was decided to cross
hGFAP/Foxp1fl/+
to mice of the same genotype. This later breeding strategy was
successful and all expected genotypes from the cross were born and thus this line was
pursued.
Although there were no differences in the weights between the pups there were clear
behavioural differences between genotypes when the mice were handled. The Foxp1
CKO mice were noticeably hyperactive in their home cages, and very difficult to catch,
compared to littermate controls. Often the animals cages needed to be placed in a deep
sink to retrieve them from their cages to prevent them escaping. However histological
analysis showed that FOXP1 staining was unexpectedly retained in the striatum but
completely lost in all layers of the cortex in which it is expressed (III-VIa).
It is now clear that the loss of expression from only the cortex is a direct result of the
pattern and timing of Cre-recombination. As stated previously, the hGFAP-Cre line is
expressed in all RG and it is now apparent that striatal precursors do go through a RG
stage in their development but before the hGFAP-Cre is expressed (i.e. before E14).
Secondly by E15.5 when appreciable recombination of the hGFAP-Cre is shown
(Anthony and Heintz 2008), RG in the developing striatum are largely gliogenic as
shown by the astrocyte marker S100β being evident, whereas in the cortex neurogenesis
from RG has only just begun (Anthony and Heintz 2008; Anthony et al. 2004) and
gliogensis doesn’t start in this region until P0 (Anthony et al. 2004). Although
unexpected, specific cortical loss in the Foxp1 CKO mice is interesting and unique and
represents a way in which we can segregate the cortical and striatal function of FOXP1.
Chapter 5 CKO of Foxp1 in the cortex
171
FOXP1 is lost from the cortex and not the striatum
Foxp1 is expressed in the developing cortex from E14.5, where expression is initially
seen in layers III-V. After P6 more FOXP1 expressing cells are seen in layer V1a
(Ferland et al. 2003). Results from histological analysis showed that there was a
significant loss of FOXP1 from all layers (87% loss) of the cortex. The remaining
FOXP1 positive staining (12%) could be from a population of neurons developing prior
to Cre expression, or secondly, from differential Cre expression as a result of copy
number differences or strain variation (Bai et al. 2013; Xu et al. 2012). It has recently
been reported that mice which carry the hGFAP-cre on a C57B6/J background displayed
weaker transgene expression than those on a FVB background (Bai et al. 2013). The
hGFAP-Cre animals used in these experiments were maintained on an FVB background
until the point of crossing to the Foxp1 floxed animals which were on a C57B6/J
background (Feng et al. 2010), thereby F1 offspring, and ultimately the breeders, would
produce an F2 generation with a mixed background. However, for all experiments
completed to date the loss of FOXP1 was consistent across all animals suggesting Cre
activity to be reliable and consistent.
There was a small reduction of FOXP1 in the Foxp1 CKO mouse striatum (4.5%)
compared to WTs but this is unlikely to produce any phenotypic difference as supported
by the Foxp1+/-
mice. Additionally, any phenotype that would have been seen would be
masked by the phenotype attributable to the significant cortical loss of FOXP1.
Interestingly it has been reported that 4% of the total DARPP-32 positive cells found in
the mature striatum derive from an Emx1 positive lineage (Cocas et al. 2009). Of this
lineage the majority of cells arise from Emx1 positive cells that have migrated ventrally
from the pallium (developing cortex) between E13.5 and E15.5, with a very small
proportion arising later in development (after E13.5) from Emx1 positive cells located in
the LGE (Cocas et al. 2009). Therefore it is possible that the minimal striatal FOXP1
loss outlined in this chapter is due to the conditional loss of Emx1 positive MSNs
migrating from the developing cortex, where the hGFAP-Cre has shown to successfully
recombine.
Although no significant differences in NEUN staining were found between the groups,
this does not necessarily indicate that there was no neuronal loss caused by the absence
of Foxp1. As Foxp1 was lost from early in development it is possible that if Foxp1
Chapter 5 CKO of Foxp1 in the cortex
172
positive neurons were not born at all, the developing cortical neurons and/or
interneurons could have condensed to fill the space, thus the reason why there were no
differences in NEUN counts between the groups. Therefore looking at differences in the
cortex during development in the Foxp1 CKO mice may be more informative and
identify if and when compaction occurred due to the loss of Foxp1.
Loss of FOXP1 in the cortex has an effect on layers V and VI of the cortex
Nissl staining using CV suggested apparent cortical thinning in the Foxp1 CKO mice
compared to in WT mice, specifically layers V and V1. To look more specifically at the
differences in layers V and V1 additional histological analyses were performed using
specific markers for these layers, and these were analysed qualitatively. Foxp2, unlike
Foxp1, preferentially stains layer VI of the mouse cortex and co-localisation of these
family members is not seen in this region until P14 (Hisaoka et al. 2010). However
before P14, Foxp1 and Foxp2 do show partial co-localisation in the motor cortex from
P0 (Hisaoka et al. 2010). Double fluorescent immunohistochemistry showed that there
was no difference in FOXP2 staining in the absence of Foxp1 throughout layer V1 of
the cortex. As FOXP2 and FOXP1 co-localisation is also evident in layer V of the motor
cortex this region was also closely examined, and similarly no marked differences were
found between genotypes. Therefore, even though these two TFs are known to function
together (Shu et al. 2007), the loss of Foxp1 has not caused aberrant expression of
FOXP2.
Ctip2, as mentioned is a TF that like Foxp1 is expressed in the cortex and striatum.
Unlike in the striatum, Foxp1 and Ctip2 rarely co-localise in the cortex and label
different populations of neurons in layer V. CTIP2 positive neurons project to the spinal
cord (Arlotta et al. 2005) whereas it is thought FOXP1 is a marker of cortical callosal
projection neurons (Hisaoka et al. 2010). Results from Chapter 3 which showed a
decrease in CTIP2 in striatum would suggest there would be alterations in
CTIP2expression in the cortex. Interestingly, CTIP2 was still present in layer V of the
cortex in the Foxp1 CKO mice but there were also ectopic CTIP2 positive cells evident
in other layers of the cortex, notably layer 4, and Nissl staining showed that layer V was
thinner in the cortex of Foxp1 CKO compared to WT mice. Therefore Foxp1 may be
needed to ensure the correct organisation of layer V neurons.
Chapter 5 CKO of Foxp1 in the cortex
173
In addition to labelling MSNs, DARPP-32 is known to stain dopamine-receptive,
pyramidal neurons in layer VI of the cortex (Ouimet et al. 1984; Rajput et al. 2009;
Wang et al. 2004b) and specifically in the motor cortex, it has been shown that
approximately 56% of DARPP-32 positive neurons co-localise with FOXP1 staining
(Hisaoka et al. 2010). Once again, as with CTIP2, results from Chapter 3 would suggest
there would be less DARPP-32 in the cortex in the absence of Foxp1as was the case in
the developing striatum. Results presented here showed that in the cortex of Foxp1
CKO mice there was a noticeable loss of DARPP-32 in layer V1. As there was no
obvious loss of FOXP2, another layer V1 marker, in the Foxp1 CKO mice further
experiments need to be carried out to determine what importance the loss of a subset of
layer V1 neurons has on the phenotype observed in this model. It is anticipated that the
results from on an on-going microarray experiment may serve to distinguish specific
gene expression changes in the cortex of WT and Foxp1 CKO mice that could assist in
explaining the phenotype associated with this novel Foxp1 CKO model.
Foxp1 CKO mice are hyperactive
Simple behavioural tasks highlighted that the Foxp1 CKO mice were hyperactive
compared to littermate controls. On average, WT mice stayed on the rotarod marginally
longer than Foxp1 CKO mice and the large standard error seen in the Foxp1 CKO mice
rotorod results is largely due to training difficulties associated with the phenotype.
When the Foxp1 CKO mice fell off during training, catching them was often difficult,
hence the animal would need to be put back in its home cage rather than back on the
rotarod due to the extent of hyperactivity, thus reducing the opportunity for these
animals to train. The balance beam was also attempted but training also proved difficult
and thus animals never progressed to the testing stage. In the cage grip strength test
CKO mice held on for significantly less time than WT mice. Given our characterised
phenotype, these results were unlikely due to a weakness in strength and are likely due
to increased impulsivity of the mice. Therefore all basic behavioural data are
confounded by the hyperactivity seen in these mice.
Foxp1 CKO mice were found to be have elevated total levels of horizontal ambulatory
activity within the dark phase of testing (18:00-06:00) compared to WT mice. This task
also highlighted that the animals have normal circadian rhythms, as there was no
significant difference between the animals’ total activity in the light cycle (06:00-
Chapter 5 CKO of Foxp1 in the cortex
174
18:00). In addition, the results from the EthoVision programme showed that Foxp1
CKO mice moved a greater distance in the testing arena and at a faster pace than WT
mice, further emphasising the hyperactive phenotype of the Foxp1 CKO mice.
Foxp1 CKO mice do not display an anxiety phenotype
Following motor behavioural characterisation, we also investigated whether CKO mice
have higher functioning cognitive deficits. It is known that rodents will bury
unconditioned objects such as food pellets and glass marbles and this is the rationale
behind the MBT (Archer et al. 1987; Broekkamp et al. 1986). Early studies suggested
that the MBT measures anxiety as the number of marbles buried by mice was reduced
when anxiolytics were administered (Broekkamp et al. 1986; Nicolas et al. 2006;
Njung'e and Handley 1991). However, it is debated if this “burying” action is a
defensive mechanism to a novel object, or an innate pre-determined response (Thomas
et al. 2009). In addition to anxiolytics, burying behaviour has shown to be reduced by
antipsychotics suggesting that marble burying alone has limited predictive validity for
anxiety (Broekkamp et al. 1986). Likewise, repeated exposure to marbles did not reduce
the amount of marbles buried suggesting that the “novelty” factor was not the rationale
behind burying the marbles (Broekkamp et al. 1986; Nicolas et al. 2006; Njung'e and
Handley 1991; Thomas et al. 2009). Instead it has been suggested that the reasoning for
burying the marbles is an innate, “digging” response, and that the MBT is a better
indicator of obsessive/compulsive disorders (Gyertyan 1995; Li et al. 2008). Results in
this Chapter show a trend for Foxp1 CKO mice to bury fewer marbles than WT mice
which could suggest the mice do not have an OCD phenotype (Gyertyan 1995),
however this test would need to be repeated. Alternatively the mice may not be typically
anxious, which is corroborated by both results seen in the open field activity traces and
EPM.
The EPM is an “ethological” model of anxiety involving spontaneous exploration by
rodents of an unconditioned environment with “natural” stimuli such as height, and is
ultimately based on an animal’s innate aversion to open spaces (Montgomery 1955;
Pellow et al. 1985; Rodgers and Johnson 1995). The EPM predicts how an animal
responds to an approach-avoidance situation involving “open” “potentially dangerous”
arms versus enclosed “safe” arms (Lister 1987; Pellow et al. 1985; Rodgers and
Chapter 5 CKO of Foxp1 in the cortex
175
Johnson 1995). Typically, anxiety-like behaviour is assessed by the percentage of
entries, and time spent on the open arms, (Dawson and Tricklebank 1995; Rodgers and
Johnson 1995), which has been shown to increase when anxiolytic drugs such as
Diazepam were given to animals. As motor impairments are known to influence results
the total number of closed arm entries is considered a measure of locomotor activity
(Cruz et al. 1994). Normal mice classically spend less than 25% of their time exploring
the open arms (Dawson and Tricklebank 1995). In agreement, the results outlined in this
work showed that WT mice spent 18% of their time on the open arms whilst the Foxp1
CKO animals spent 47% of their time on open arms. In addition the Foxp1 CKO mice
completed more open arm entries than littermates, suggesting an insensitivity to
unconditioned fear and a lowered state of anxiety (Pellow et al. 1985). It has also been
shown that a decrease in activity in the centre of the open field arena, coupled with a
decrease in rearing indicates less anxiety (Li et al. 2008). The Foxp1 CKO mice actively
explored the centre of the arena and showed increased rearing in comparison to WT
mice (CKOs 121.8±15.4, WT 76.8±9.7), supporting the results obtained in the MBT,
and EPM that the Foxp1 CKO mice are not over anxious.
Of interest is that in some instances the EPM has been used to look at differences in
impulsivity. It has been hypothesised that increased entry into the open arms, as seen by
the juvenile stroke prone spontaneously hyperactivity rat model (SHR) could be a direct
result of intense impulsivity by the animals (Ueno et al. 2003). Patients who suffer with
overanxious disorder (ANX) have shown comorbidity with ADHD and it has been
demonstrated that ADHD patients also diagnosed with ANX are less impulsive than
patients without ANX on tests such as the memory scanning test (Pliszka 1989).
Therefore the ‘reduced anxiety’ shown by the Foxp1 CKO mice could reflect increased
impulsivity.
Foxp1 CKO mice are inattentive
The 5-CSRTT originated from the continuous performance task (CPT) task in humans
(Robbins 2002) in which deficits have been shown to correlate highly with ADHD
(Epstein et al. 2003). To test for any differences in visuo-spatial attentional deficits we
used the 5-CSRTT in 9-hole operant chambers of which the key outcome measures are
response accuracy to the randomly presented light stimuli and response times. The
Foxp1 CKO mice demonstrated a stimulus light-dependent decline in performance
Chapter 5 CKO of Foxp1 in the cortex
176
accuracy relative to their WT littermates without a decline in response latencies
indicating that the performance deficits were due to increased attentional load.
Impulsivity can be measured in the 5-CSRTT by analysing the number of anticipatory
hole pokes during the ITI period, however in this instance the ITI was only 2 seconds,
and to properly measure impulsivity it has been suggested that the ITI has to be
minimum of 5 seconds (Robbins 2002). Therefore future experiments will have this ITI
parameter incorporated. The number of omissions, which is a measure of missed
responses within the stimulus period, was increased in the Foxp1 CKO mice compared
to WT mice suggesting the Foxp1 CKO mice are not pressing prematurely, or
incorrectly, but are uninterested in poking at all. Overall an increase in errors of
omission, coupled with the reduction in accuracy and increased reaction time, as a direct
consequence of decreasing the stimulus length of the probes, indicates that the mice
have a deficit in sustaining attention across the array (Robbins 2002; Trueman et al.
2012a).
A novel mouse model of Attention Deficit Hyperactivity Disorder (ADHD)
The results discussed thus far show that Foxp1 CKO mice are hyperactive, inattentive
and show some signs of impulsivity. ADHD is a clinically heterogeneous disorder
observed globally and the DSM-IV criteria for diagnosis states that the core features of
the disorder can include inattention, hyperactivity and/or impulsivity (Biederman 2005;
Nair et al. 2006). Due to the heterogeneous nature of ADHD it has been suggested that
its aetiology may result from a number of different gene mutations as well as
environmental factors (reviewed in (Thapar et al. 2013)). ADHD related gene mutations
have been identified in genome wide association studies (GWAS) and these mostly
relate to catecholamine function including the dopamine transporter (DAT), dopamine
receptors 4 (D4) and 5 (D5) (Faraone et al. 2005; Li et al. 2008) and noradrenalin
transporter (NET) (Hahn et al. 2009), but to date short nucleotide polymorphisms (SNP)
in FOXP1 have not been associated. However, the clear overlap of symptoms in ASDs
(in which FOXP1 has been linked) and ADHD has very recently been appreciated, and
as of May 2013, the new DSM scale (DMS-V) allows for patients to be diagnosed as
having both disorders simultaneously. Therefore results throughout this Chapter support
the notion that cortical loss of Foxp1 appears to match the face validity criteria needed
for a novel animal model of ADHD, and considering the association of ASDs and
Chapter 5 CKO of Foxp1 in the cortex
177
ADHD it is not unreasonable to hypothesise the role of Foxp1 in the aetiology of
ADHD.
At the physiological level, ADHD is thought to be caused by the dysregulation of the
catecholaminergic system leading to imbalances in the DA and Noradrenaline (NA)
neurotransmitter systems particularly in the prefrontal cortical regions (Arnsten 2009).
ADHD treatment has been dominated by the use of monoaminergic pyschostimulants
such as Ritalin and amphetamine and, of late, the catecholaminergic non-stimulant drug
atomoxetine. Atomoxetine does not increase dopamine in the nucleus accumbens, the
region associated with rewarding behaviours, and is therefore not associated with the
drug abuse danger found with pyschostimulants, making it a favourable choice for
ADHD sufferers (Bymaster et al. 2002). In all instances the dose of the drug prescribed
is the key to ensuring that the abnormal behaviours are selectively targeted. It must be
highlighted that such treatments can be therapeutic while not targeting the biological
origins of the disorders, as in the case of ADHD, of which the aetiology it is not fully
known.
The principal mode of action of the drugs prescribed to ADHD patients is to increase
the availability of monoamines in the synapse by reducing uptake rates (i.e. block the
transporters). Specifically, Ritalin, works as both a DA and NA reuptake inhibitor with
the aim of increasing the extracellular concentration of DA and NA, although the
precise mechanism by which Ritalin exerts its therapeutic affects is not known
(reviewed in (Tripp and Wickens 2009)). A detailed molecular basis underlying the
therapeutic effects of atomoxetine is still largely unknown. In rats it has been shown that
i.p administration of atomoxetine increases extracellular NA and DA in the prefrontal
cortex, occipital cortex, lateral hypothalamus, dorsal hippocampus, and cerebellum
(Bymaster et al. 2002; Koda et al. 2010; Swanson et al. 2006). It has been suggested
that atomoxetine selectively binds to the pre-synaptic noradrenalin transporter (NAT)
(Swanson et al. 2006) and consequently increases the extracellular concentration of NA
and DA (NAT non-selectively transports DA uptake in the cortex) in the prefrontal
cortex enabling noradrenergic modulation of the limbic cortico-striatal circuitry
(Chamberlain and Sahakian 2007). Recent microarray analysis has also been undertaken
in WT rats to understand what affect genetic changes are brought about in response to
atomoxetine (Lempp et al. 2013).
Chapter 5 CKO of Foxp1 in the cortex
178
When WT and Foxp1 CKO mice were administered with Ritalin, both groups showed
increased activity in a dose dependent manor. These results are consistent with those
observed by Koda et al (2010), which showed that higher doses of Ritalin (10 mg/kg)
induced hyper-locomotion in the animals (Koda et al. 2010). I believe the fact that
Ritalin did not ameliorate hyperactivity in Foxp1 CKO mice is not a reason to invalidate
its potential as a new ADHD mouse model. It is known that there are many subtypes of
ADHD, which respond differently to stimulant drugs (Solanto 1998), and both
responders and non-responders to Ritalin have been documented clinically (Heal et al.
2009). However, as Ritalin did not show any effect on reducing activity in the Foxp1
CKO mice results could also suggest that loss of Foxp1 has no effect on the
dopaminergic system.
Interestingly, when animals were tested on the 5-CSRTT with Ritalin (5 mg/kg) there
was a marked, although not a significant, improvement, in accuracy in both WT and
Foxp1 CKO mice, compared to saline treated controls. In particular Foxp1 CKO mice
displayed equivalent levels of percentage accuracy on hole 5 (central hole) as saline
treated WT mice (WT=79%, CKO = 78%). Across all holes, when Ritlain was
administered, the Foxp1 CKO mice showed a 9% increase in total accuracy whereas the
WT mice only improved by 4%. In line with this, it is known that lower doses of
Ritalin (0.25-1mg/kg i.p.) improve cognitive function with no effect on heightened
activity in open field analysis (Berridge et al. 2006). These experiments will need to be
repeated with a bigger cohort of animals to further ascertain if Ritalin will significantly
improve percentage accuracy in the 5-CSRTT. Furthermore testing animals with 1
mg/kg of Ritalin, rather than 5 mg/kg, on the 5-CSRTT may provide a more significant
improvement on percentage accuracy, and is something to consider for future testing.
Atomoxetine was also administered to the animals, and unlike Ritalin, caused a
significant decrease in locomotor activity in the Foxp1 CKO mice 15 minutes following
administration of the drug, with no effects on the locomotor activity of WT mice, in
agreement with Koda et al (2010). As testing was initiated simultaneously with the
mouse receiving an injection of atomoxetine it is likely that within the first 10 minutes
of activity the drug had not become fully active and for subsequent experiments a 15
minute habituation period will be initiated before testing. In rats it has been shown that
Chapter 5 CKO of Foxp1 in the cortex
179
after 1 hour the atomoxetine solution within the plasma has plateaued (Lempp et al.
2013). This plateau would likely be evident earlier in mice due to their increased
metabolism and could possibly explain why the effect of atomoxetine on locomotor
activity was lessened by 55 minutes following the injections.
Nevertheless, the decrease in activity seen in the Foxp1 CKO mice complement those in
a recent report that showed acute administration of atomoxetine (1, 3 mg/kg) reduced
activity in the, SHR rat model, a known model of ADHD (Umehara et al. 2013). The
fact that atomoxetine, and not Ritalin had an impact on reducing locomotor activity
suggests that the absence of Foxp1 maybe having at least some of its locomotor effects
via the Noradrenergic system rather than the DA system. On-going experiments are in
place to determine through which NA receptor atomoxetine is having its effect. While
this work does not show what affect atomoxetine has on the 5-CSRTT, it is a planned
experiment for the near future. From recent literature, one would expect atomoxetine to
improve both the accuracy and reduce the number of premature nose pokes on the 5-
CSRTT (Navarra et al. 2008).
Although a striatal specific Foxp1 KO was not created on this occasion, it is still
planned for future experiments. Apart from the Foxg1-Cre, in which its caveats have
already been addressed, there are no commercially available embryonic striatal Cre
lines. However, plans are underway to use the above mentioned Gsh2-Cre line from the
Kassaris’ lab to create a striatal KO phenotype which can be used in comparison to our
established cortical KO model.
5.5 Conclusion
The aim of this Chapter was to create a striatal specific Foxp1 conditional KO mouse.
However, the timing of the Cre-specific recombination caused the loss of FOXP1 in all
layers of the cortex, sparing the striatum. Behavioural analysis showed that homozygous
Foxp1 CKO mice were significantly hyperactive and inattentive when compared to
littermate controls in a series of behavioural tests, notably open field activity and the 5-
CSRTT. The MBT and EMP showed that Foxp1 CKO mice were not overtly anxious
and also hinted that these mice had increased impulsivity. Hyperactivity was
Chapter 5 CKO of Foxp1 in the cortex
180
ameliorated on administration of atomoxetine, a drug commonly used in the treatment
of ADHD.
For a model to be valid representation of a disease it must recapitulate cardinal
symptoms of a disorder (face validity) and respond to the affect of biochemical
therapeutics (i.e. the same drugs that are used to treat patients can be studied (predictive
validity)). Construct validity is also a desired criterion however this is a difficulty
accepted in the characterisation of animal models, such as those recapitulating ADHD in
the absence of a known pathophysiological aetiology. Therefore, work presented here
shows a serendipitous mouse model of ADHD that fulfils both predictive and face
validity. Future work will aim to explore disease mechanisms so that construct validity
can be achieved. Furthermore results from a microarray carried out at the time of thesis
submission should highlight gene expression differences apparent due to the conditional
loss of Foxp1 in the cortex.
Chapter 7 General Discussion
181
6 General Discussion
Foxp1 is an important TF that amongst other developmental roles, has been identified
in the literature, and confirmed by the host lab to be up regulated during peak MSN
development (E12-16). It is also expressed in both the developing and adult cortex.
Further understanding of the functional role of Foxp1 in neuronal development will be
useful for applying to directive cell protocols for use in cell transplantation therapies as
well as a more general role for drug trials targeting neurodegeneration. Furthermore
understanding the role of Foxp1 in the adult brain will also be useful for learning more
about psychiatric disorders, such as ASDs, in which mutations in Foxp1 have been
identified in patients.
HD is caused by the loss of MSNs in the striatum and as there is known cure one
therapeutic approach is cell replacement therapy, which aims to replace MSNs in the
hope the circuitry will reconnect with the relevant brain areas. The use of human foetal
striatal tissue, i.e the ‘natural’ cells, has shown ‘proof of principle’ in clinical trials.
However, this approach is associated with practical and ethical difficulties and
renewable cell sources are needed such as stem cells. One challenge of using
renewable stem cells is their differentiation to fully functional neurons. Hence, for the
treatment of HD an understanding of the specific genes important for the differentiation
of MSNs is crucial and thus in this Thesis I primarily looked at the expression profile
and function of Foxp1 during striatal development in an attempt to understand its role
in MSN differentiation.
Foxp1 was also conditionally knocked out in the adult brain, specifically in the cortex
where the link between Foxp1 and ASDs was explored. This CKO left mice with a
distinct phenotype reminiscent of ADHD which is genetically linked to ASDs. Thus this
model was systematically explored using several behavioural tasks, drug trials and
histology to explore its potential importance as a new model of neurological disease, in
particular as a new mouse mode of ADHD or for elements of ASDs.
Chapter 7 General Discussion
182
6.1 Foxp1 is a marker of immature and mature MSNs
One therapeutic option that has shown proof of principle for the treatment of HD is cell
replacement therapy, and specific protocols aiming to direct the differentiation of
renewable cells towards DARPP-32 positive MSNs in vitro are actively being explored
(Aubry et al. 2008; Carri et al. 2013; Ma et al. 2012; Nicoleau et al. 2013; Song et al.
2007). It is becoming increasingly apparent that DARPP-32 can no longer be used in
isolation as a marker of MSNs as expression is not apparent until E18 and is not
optimally expressed until 2-3 weeks post-natally in mice (Ehrlich et al. 1990). This
prompted the need for a panel of genes expressed before and simultaneous to DARPP-
32 to be used to identify MSNs at early and later stages of development. Therefore, for
current and future in vitro protocols, a full detailed characterisation of hESCs at a
genetic (specific markers) and functional level (electrophysiology) will be needed as
identifying cells at the correct developmental stage will be crucial to the success of
these cells for use in transplantation protocols.
Recently, Foxp1 has started to be used as part of a battery of markers recognising MSNs
in in vitro protocols (Carri et al. 2013), and subsequently, to label such cells following
transplantation into the lesioned striatum (Carri et al. 2013). Likewise, Foxp1 has also
been successfully used by our group to identify MSNs following primary WGE grafts
into the QA lesioned striatum (which has also shown to be devoid of FOXP1) (Precious
et al., submitted 2013) and following directed differentiation of hESCs (Vinh et al.,
unpublished observations). In a number of publications, Foxp1 has been associated with
labelling only later born matrix neurons (Arlotta et al. 2008; Martin-Ibanez et al. 2012;
Tamura et al. 2004) and reasons for this are two-fold. Firstly, Foxp1 expression has not
been shown to be visible until E12.5 in the developing telencephalon (Tamura et al.
2003), and secondly, co-expression of Foxp1 mRNA was only detectable in 70% of
DARPP-32 neurons following immunohistochemistry (Tamura et al. 2004).
In contrast to this, results presented in Chapter 3 showed that Foxp1 expression was
apparent in the developing striatum from E10 in the VZ/SVZ, before the onset of CTIP2
expression. Of note, is that this expression is coincident with the first wave of striatal
neurogenesis that gives rise to patch neurons (Mason et al. 2005). Additionally, from
E12 FOXP1 staining was shown in defined patches in the SVZ (Fig 3.1), in addition to
Chapter 7 General Discussion
183
the staining throughout the MZ from E14, suggesting the possibility that Foxp1 is a
novel marker of proliferating patch neurons (as well as matrix neurons) from E12,
which, until now, were not selectively identifiable until E18 in the MZ using DARPP-
32 (Foster et al. 1987; Mason et al. 2005). Furthermore, in Chapter 4 FOXP1 was used
to identify striatal cells that were transplanted in the mouse QA lesioned striatum. I have
shown for the first time that FOXP1 together with DARPP-32 can be used to identify P-
zones within the grafts (Fig 4.16), therefore offering itself as a mature label of MSNs
following transplantation of WGE into the lesioned mouse brain. As Foxp1 is also
expressed in the human striatum it is likely that it will also serve as marker of P-zones
in human primary WGE grafts. These results strongly suggest that Foxp1 is a reliable
marker of both patch and matrix neurons from early in development, and consistent
with the literature and public databases,i that co-localisation is apparent with the two
routinely used MSN markers, DARPP-32 and CTIP2, from the onset of their
expression. Moreover, FOXP1 is expressed throughout in the adult striatum, and in
WGE grafts, showing that it marks mature MSNs.
6.2 Foxp1 is required for correct development and maturation of at
least one population of DARPP-32 expressing MSNs
Foxp1 is an important TF implicated in many developmental processes and has been
studied in lung, blood and B-cell development (Hu et al. 2006; Shu et al. 2007; Shu et
al. 2001), and extensively in the heart where it has a specific role in the proliferation
and maturation of cardiac myocytes (Wang et al. 2004a). In addition, in vitro studies
using mESCs showed that Foxp1 has a functional role in DA neuron development.
Specifically, the addition of Foxp1 to mESCs activated the expression of PITX3, a
protein exclusively expressed in midbrain dopaminergic neurons that is vital for their
correct differentiation and survival during development in vitro and in vivo
(Konstantoulas et al. 2010). These key roles, together with its significant up-regulation
during peak MSN differentiation (Precious et al., submitted 2013) strongly suggested
that Foxp1 would have a similar functional role in MSN differentiation.
Chapters 3 explored phenotypic differences in MSNs in the absence of Foxp1 through
the use of the most readily used and accepted marker of MSNs, DARPP-32. In Foxp1-/-
cultures differentiated for 7 DIV there was a decrease in the number of DARPP-32
Chapter 7 General Discussion
184
positive cells compared to in WT cultures, but no differences in overall neuronal
number as determined by TUJ1 (Fig 3.12). No differences in the number of TUJ1
neurons together with no signs of increased cell death in the cultures (no fragmented
nuclei), or any differences in proliferation (BrdU analysis) (Fig 3.16 and 3.17), suggests
that the loss of Foxp1 has not affected the early stages of MSN differentiation. Calcium
imaging on cells from WT, Foxp1+/-
and Foxp1-/-
cultures showed that all neurons
responded to GABA and showed the expected excitatory response to this
neurotransmitter indicative of immature neurons (Owens et al. 1996). Foxp1-/-
cells,
although not significantly different, showed a trend for an increased excitatory response
(response in normal chloride/ response in low Cl), which, if confirmed could be taken as
an indicator of a greater degree of immaturity. More work is needed to confirm or refute
this.
The results from Chapter 3 suggest that Foxp1 is needed to ensure the correct
differentiation of at least one population of DARPP-32 positive neurons and that this
involvement is at a stage when the neurons have finished proliferation and have exited
the cell cycle. In support of this is the fact that Foxp1 has been reported to have a role in
coordinating transitions between cell proliferation and differentiation in several other
biological contexts including myocytes (Wang et al. 2004a; Zhang et al. 2010), neurons
(Ferland et al. 2003; Konstantoulas et al. 2010; Rousso et al. 2008), monocytes and
macrophages (Shi et al. 2008) and stem cells (Gabut et al. 2011). Furthermore at a
protein level Foxp1 has been shown to contain motifs capable of binding cyclin CDK2
(Banham et al. 2001), a gene implicated in cell cycle regulation. Additionally Foxp1 is
able to bind to the Foxp1 binding sites on the p21 promoter (Jepsen et al. 2008).
Increases in p21 expression are correlated with withdrawal of cells from the cell cycle
and with the differentiation of cardiomyocytes (Jepsen et al. 2008), therefore taken
together it is plausible that Foxp1 may also play a role in the transitional stages of
proliferation to differentiation of MSN development. Future work focusing on
differences in cell cycle markers such as p21 will perhaps give more answers to this
hypothesis as would looking more specifically at early (NESTIN) and mature (MAP2)
neuronal markers. Interestingly it has been shown that the miR-9 fine-tunes Foxp1
expression in motor neurons (Otaegi et al., 2011). miR-9 has also recently been
associated with aspects of neuronal development such as modulating neurite outgrowth
and neural lineage determination (Coolen et al. 2013; Liu et al. 2012) thus it may be
Chapter 7 General Discussion
185
possible that this micro-RNA may also fine tune Foxp1 expression in aspects of
neuronal specification, as with motor neurons.
Understanding what genes and subsequent genetic pathways Foxp1 is involved with
also needs to be answered, and results from this Thesis have hinted at some answers.
Dlx1 and Dlx2 are expressed by subsets of progenitor cells in the VZ by E10.5 and by
the majority of cells in the SVZ with expression switching off as cells start to migrate
and differentiate in the MZ (Nery et al. 2003; Porteus et al. 1994; Yun et al. 2002). In
Dlx1/2-/-
mice it was shown that Foxp1 expression was severely reduced in the SVZ and
MZ suggesting Foxp1 is downstream of these TFs (Long et al. 2009). Similarly Chapter
3 showed that in the Ascl1-/-
and Gsh2-/-
brain sections, FOXP1 staining was reduced,
prompting the idea that Foxp1 may also function downstream of these TFs in the VZ, as
shown in Figure 6.1. Although on this occasion the apparent loss of FOXP1 in the Gsh1-
/- and Ascl1
-/- brain sections was not quantified, results from an on-going microarray
assessing independent differences in the LGE and MGE, from Foxp1-/-
striate compared
to WT striate, will yield more definitive answers, comparable to results from the
microarray analysis conducted by Long and colleagues in the Dlx1/2 KO. It is known
that there are biding sites for FOXP1 on Foxp1 (Tang et al. 2012), thus it is possible that
once Foxp1 is expressed it can regulate its own expression in the MZ. Interestingly, it
has been shown that during B-cell development the loss of Foxp1 causes loss of
expression of the TF Ebf1 (Hu et al., 2006), a gene implicated in the development of
matrix born striatal neurons, thus it is possible that these two TFs are also interacting
similarly during MSN development. In future work it would be interesting to see if the
expression of Ebf1 is affected by the loss of Foxp1 in the developing striatum. More
molecular analysis, such as immunopreciptitation will also be useful in studying
specific Foxp1 interactions with genes known to be expressed at similar times in
development as well as novel ones identified from the microarray.
There were some limitations to the in vitro work in Chapter 3. Firstly, as experiments
were restricted to E14 due to the embryonic lethality of the Foxp1-/-
mice, DARPP-32
could not be looked for in coronal brain sections and thus differences relied on the
immature MSN maker CTIP2, in which no obvious differences were observed at E14
(Fig 3.20B). However further quantification is needed to confirm or refute this.
Secondly, even though differences in DARPP-32 were shown in the culture system after
Chapter 7 General Discussion
186
7 DIV, the number of DARPP-32 positive cells across all cultures was low owing to the
fact DARPP-32 is not fully expressed until 2-3 weeks after birth (Gustafson et al.
1992). Future experiments will focus on what can be added to the striatal cultures to
maintain survival for 14 DIV as it likely there will be an increase in DARPP-32
expression further emphasising the differences between the genotypes
However, on this occasion to look at differences in DARPP-32 expression at later
developmental stages striatal cells from the three genotypes (WT, Foxp1+/-
and Foxp1-/-
)
were transplanted into the QA lesioned striatum, which was discussed in Chapter 4.
Grafting potentially allowed the cells to mature, differentiate and make connections
with host circuitry over a 12 week period, which was unattainable using in vitro
cultures. These studies revealed a decrease in the number of DARPP-32 positive striatal
neurons irrespective of donor age (E12 or E14), in the absence of Foxp1, thus indirectly
supporting the findings from Chapter 3. Unfortunately, in this instance, differences in
mature MSNs in vivo, i.e. differences in DARPP-32, in the adult mouse striatum, in the
absence of Foxp1, were not able to be directly studied in the lack of a striatal specific
Foxp1 CKO. However, in addition to expression in mature MSNs, DARPP-32 is known
to be expressed in the layer V1 cortical neurons (Ouimet et al. 1984; Rajput et al. 2009;
Wang et al. 2004b) and results from the Foxp1 CKO showed there was a decrease in
DARPP-32 staining in layer V1 of the cortex. This result therefore further suggests that
in the absence of Foxp1, DARPP-32 is not properly expressed, irrespective of neuronal
subtype. This result therefore asks further questions as to whether Foxp1 is needed in a
general step that controls the maturity of neurons or whether its role is specific to
DARPP-32 development. This question is something that will be explored in future
work.
These studies demonstrate that Foxp1 is necessary for the generation of a population of
DARPP-32 positive MSNs. However, they do not distinguish whether Foxp1 is
necessary for the generation of MSNs, without which they do not develop; or if they
follow an aberrant differentiation pathway; or whether neurons with MSN
characteristics develop, but do not express DARPP-32 (and therefore presumably do not
synpase with incoming DA terminals). This questions what we really mean by a MSN.
Although DARPP-32 is the “gold standard” MSN marker, its loss does not necessarily
indicate absent and dysfunctional MSNs but could suggest a specific MSN feature is
Chapter 7 General Discussion
187
lost, i.e. loss of a specific subset of DA receptors, which could lead to a disconnected
striatum. In summary, it is clear that, in the absence of Foxp1, DARPP-32 expressing
cells in both the striatum and cortex are reduced or absent. However, what this means in
terms of precisely what neurons are remaining in the Foxp1-/-
striatum requires further
exploration.
6.3 Do Foxp1 and Ctip2 work together in MSN development?
Ctip2 is a TF that is expressed in the developing striatum and cortex and its expression
persists throughout adulthood where it has shown to co-localize with DARPP-32 and
FOXP1 in the adult striatum (Arlotta et al. 2008), these findings are also corroborated in
the Allen Brain Atlas. Additionally, it is used to label layer V cortical neurons (Arlotta et
al. 2005). In this Thesis I used CTIP2 mainly as a marker of MSNs (Chapters 3 and 4)
but also as a marker of layer V cortical neurons (Chapter 5). Our experiments showed
for the first time that CTIP2 was expressed after FOXP1 in the developing striatum at
E12 (Fig 3.1), and unlike FOXP1 staining, was restricted to the MZ where it appeared
to co-localise fully with FOXP1 from E14 onwards in agreement with Arlotta et al
(2008). These results suggest that FOXP1 is an earlier marker of MSNs than CTIP2, but
that both TFs stain the same populations of MSNs from E14 in the MZ of the striatum.
In addition to Ctip2 and Foxp1 being expressed at comparable times and spatial location
in the developing and adult mouse brain, Ctip2 is also closely related to the Bcl11A gene
which, like Foxp1 is associated with types of B-cell malignancies. Both genes are also
transcriptional repressors and there is a known binding site for Foxp1 upstream of the
CTIP2 promoter region thus an interaction between these two genes is very likely
during striatal and/or cortical development. After 7 DIV, there were fewer CTIP2
positive cells in the differentiation cultures from Foxp1-/-
striate compared to WT
cultures (Fig 3.12). This result is consistent with the loss of DARPP-32 staining after 7
DIV, supporting the idea that Foxp1 is needed to ensure the correct development of at
least a subset of MSNs, but also that Foxp1 is upstream of Ctip2 and is positively
regulating its expression. Conversely, results from Chapter 4, although not significant,
indicated after 12 weeks, the grafts that received donor tissue in the absence of Foxp1
had an increase in the number of CTIP2 positive cells (Fig 4.10), suggesting that Foxp1
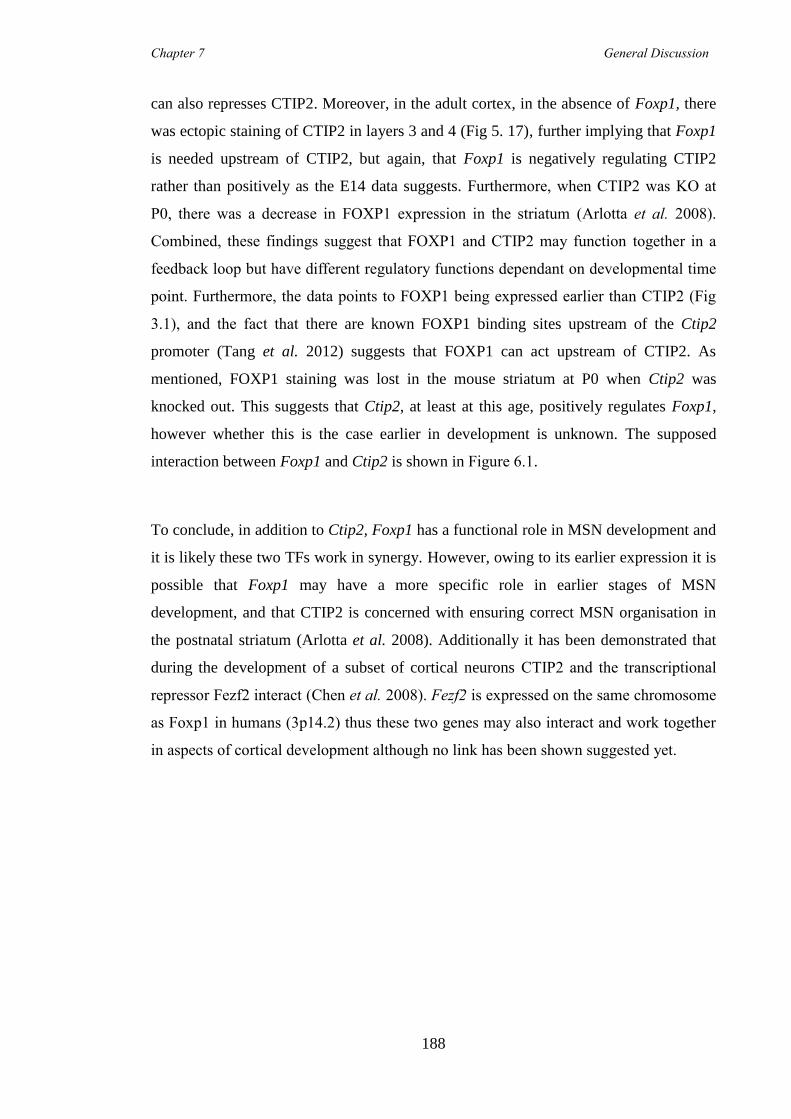
Chapter 7 General Discussion
188
can also represses CTIP2. Moreover, in the adult cortex, in the absence of Foxp1, there
was ectopic staining of CTIP2 in layers 3 and 4 (Fig 5. 17), further implying that Foxp1
is needed upstream of CTIP2, but again, that Foxp1 is negatively regulating CTIP2
rather than positively as the E14 data suggests. Furthermore, when CTIP2 was KO at
P0, there was a decrease in FOXP1 expression in the striatum (Arlotta et al. 2008).
Combined, these findings suggest that FOXP1 and CTIP2 may function together in a
feedback loop but have different regulatory functions dependant on developmental time
point. Furthermore, the data points to FOXP1 being expressed earlier than CTIP2 (Fig
3.1), and the fact that there are known FOXP1 binding sites upstream of the Ctip2
promoter (Tang et al. 2012) suggests that FOXP1 can act upstream of CTIP2. As
mentioned, FOXP1 staining was lost in the mouse striatum at P0 when Ctip2 was
knocked out. This suggests that Ctip2, at least at this age, positively regulates Foxp1,
however whether this is the case earlier in development is unknown. The supposed
interaction between Foxp1 and Ctip2 is shown in Figure 6.1.
To conclude, in addition to Ctip2, Foxp1 has a functional role in MSN development and
it is likely these two TFs work in synergy. However, owing to its earlier expression it is
possible that Foxp1 may have a more specific role in earlier stages of MSN
development, and that CTIP2 is concerned with ensuring correct MSN organisation in
the postnatal striatum (Arlotta et al. 2008). Additionally it has been demonstrated that
during the development of a subset of cortical neurons CTIP2 and the transcriptional
repressor Fezf2 interact (Chen et al. 2008). Fezf2 is expressed on the same chromosome
as Foxp1 in humans (3p14.2) thus these two genes may also interact and work together
in aspects of cortical development although no link has been shown suggested yet.
Chapter 7 General Discussion
189
Figure 6.1 Proposed model of the different genetic lineages contributing to
striatal development with an additional pathway based on work outlined in this
thesis. I suggest that Foxp1 may be implicated downstream of Gsh2/Ascl1 and
Dlx1/2 during striatal neurogenesis. I also propose that in the MZ of the developing
striatum, Foxp1 can regulate itself, in addition to CTIP2, for the development of
striatal neurons (this could also be true for the cortical neuron development). A
feedback loop between CTIP2 and FOXP1 has also been supposed. It is also
possible that Foxp1 regulates other genes, such as Ebf1 (N1) Abbreviations: VZ-
Ventricular zone, SVZ- sub-ventricular zone, MZ-Mantle zone, N- Neuronal lineage.
Dashed lines indicate possible interactions. Figure adapted from Figure 1.13
(Martin-Ibanez et al. 2012).
Chapter 7 General Discussion
190
6.4 A Foxp1 CKO model in the cortex is a new mouse model of
ADHD
In Chapter 5 we aimed to generate a conditional Foxp1 KO in the developing striatum
to study MSNs differentiation after E14 and to look at the role of Foxp1 in the cortex.
However, as a direct consequence of the timing of the hGFAP-Cre expression, Foxp1
was completely lost in the cortex but expression in the striatum was retained. This
cortical loss of Foxp1 resulted in mice that were hyperactive and inattentive in both the
home cage and in a novel environment when compared to littermate controls.
Hyperactivity and lack of attention are two of the key indicators of ADHD, a disorder in
which the precise aetiology is unknown, but has been suggested, at a physiological
level, to be caused by the dysregulation of the catecholaminergic system leading to
imbalances in the DA and NA neurotransmitter systems particularly in the prefrontal
cortical regions (Arnsten 2009). Interestingly when the NA reuptake inhibitor
atomoxetine was administered to the mice, the hyperactivity of the Foxp1 CKO mice
was significantly reduced with no effects on the locomotor activity of the WT animals
(Fig 5.14). Taken together, this data shows that Foxp1 CKO mice recapitulated key
symptoms of a disorder (face validity) and responded to biochemical therapeutics
associated with ADHD (predictive validity). Although construct validity i.e. comparable
physiological differences, was not achieved, this is a difficulty accepted in the
characterisation of animal models, such as those recapitulating ADHD in the absence of
a known pathophysiological aetiology. However, work looking into the precise
mechanisms of atomoxetine, i.e. if it is blocking alpha 1 or alpha 2 receptors, is on-
going together with histology addressing whether the NA system is involved.
In support of the supposed ADHD model created in Chapter 5 is that ADHD is known
to be highly heritable (concordant twin studies show it be 76% (Faraone et al. 2005))
and may result from several different gene mutations, together with environmental
factors. Candidate gene studies have shown a number of genes, many of which relate to
catecholamine function are associated with the aetiology of ADHD, however the
association between gene mutation and ADHD phenotype is small stressing that the
disorder is likely caused by many genes of little effect. Thus it is highly likely additional
genes such as Foxp1 may be associated with ADHD and that this new model will
enhance the understanding of aspects of the disease. Moreover, ADHD shares a high
Chapter 7 General Discussion
191
degree of comorbidity and inherited factors with ASD (Lichtenstein et al. 2010; Ronald
et al. 2011; Thapar et al. 2013). For example some ASD patients have been shown to be
associated with poor attentional switching, resembling the inattention seen in ADHD
patients (Polderman et al. 2013). Therefore as Foxp1 has been linked to several cases of
ASD ((Hamdan et al. 2010; Horn et al. 2010; Palumbo et al. 2013) and this further
strengthens the support for Foxp1 being genetically linked to ADHD.
Table 6.1 shows how this novel model fits in with three of the most studied ADHD
models. The most studied ADHD model is the spontaneous hypertensive rat (SHR)
originally developed in the 1960’s as a model of hypertension (Okamoto and Aoki
1963). In addition to hypertension this rat model showed symptoms of hyperactivity and
impulsivity that were attenuated with monoaminergic agents and thus became a valid
model of ADHD (Sagvolden 2000; Sagvolden et al. 1993). However, the rats have
increased blood pressure which has not been linked with ADHD and the control group
used in the behavioural studies are known to be poor responders, thus questioning the
reliability of the results (Drolet et al. 2002). Two other popular ADHD models are
caused by genetic mutations in mice. Firstly, the DAT KO mouse causes loss of DAT in
the brain leading to a decrease in DA clearance (Jones et al. 1998), and spontaneous
hyperactivity (Gainetdinov et al. 1999) that is responsive to pyschostimulants.
However, there are no indications that DAT is absent in ADHD. Indeed, the opposite
has been reported and several studies have shown increased DAT levels in the striatum
of ADHD patients (Cheon et al. 2004). Secondly, the thyroid hormone receptor (TR)-
beta (1) TG mouse has a mutant TRβ1 gene derived from a patient diagnosed with
resistance to thyroid hormone syndrome (RTH); 70% of children with this disorder are
also diagnosed with ADHD (Burd et al. 2003). This TG mouse line has increased
thyroid levels that induce impulsivity, inattention and hyperactivity in these mice and
these symptoms were sensitive to Ritalin treatment (Siesser et al. 2006). Although
predictive, construct and face validity have been achieved in this model, the role of the
thyroid system in ADHD is unclear and as abnormal thyroid levels can affect brain
development, this could be a direct cause of the ADHD behavioural phenotype.
In summary, the strong link between FOXP1 and the ADHD/ASD spectrum (Carr et al.
2010; Chien et al. 2013; Hamdan et al. 2010; Horn et al. 2010) and the behavioural
phenotype seen in the novel Foxp1 CKO model presented in this Thesis, make it a
Chapter 7 General Discussion
192
realistic mouse model of ADHD. Unlike previous ADHD models, it has an obvious
phenotype caused by selective loss of one gene in a specific area of the brain known to
be associated with ADHD.
Prominent features evident in HD patients are signs of impulsivity with absence of
forethought, difficulties in multi-tasking and inattention, which can be attributable to
both striatal and cortical cell loss (Craufurd and Snowden 2002; Rosas et al. 2008).
Additionally, on the 5-CSRTT, the TG HD Q92 mouse line showed a decrease in
accuracy from their baseline performance when compared to WT mice (Trueman et al.
2012b). These selective HD symptoms overlap with behavioural traits apparent in
patients with ASDs and thus some of the behavioural phenotypes associated with the
Foxp1 CKO model discussed in Chapter 5. Interestingly, parallels with Foxp1 and HD
have been published. Foxp1 is known to be down regulated in the striatum of R6/1 TG
mouse models of HD, which, as a direct result, leads to aberrant immune regulation and
increased gliogenesis, which are associated with the disease (Tang et al. 2012).
Specifically, mutant HTT protein can directly bind FOXP1, and as a direct result,
FOXP1 is present in the nuclear aggregates in the brains of HD patients, thus preventing
auto-regulation of Foxp1 (Tang et al. 2012). Although the most prominent cell loss in
HD is in the striatum, one of the earliest changes in the HD brain is thinning in specific
regions of the cortex (Rosas et al. 2002; Rosas et al. 2008). Thus taking the cortical
thinning, the nature of the behavioural changes and the loss of Foxp1 in the cortex, there
are interesting parallels between the HD and the Foxp1-/-
ADHD model that may be
deserving of further consideration in the future.
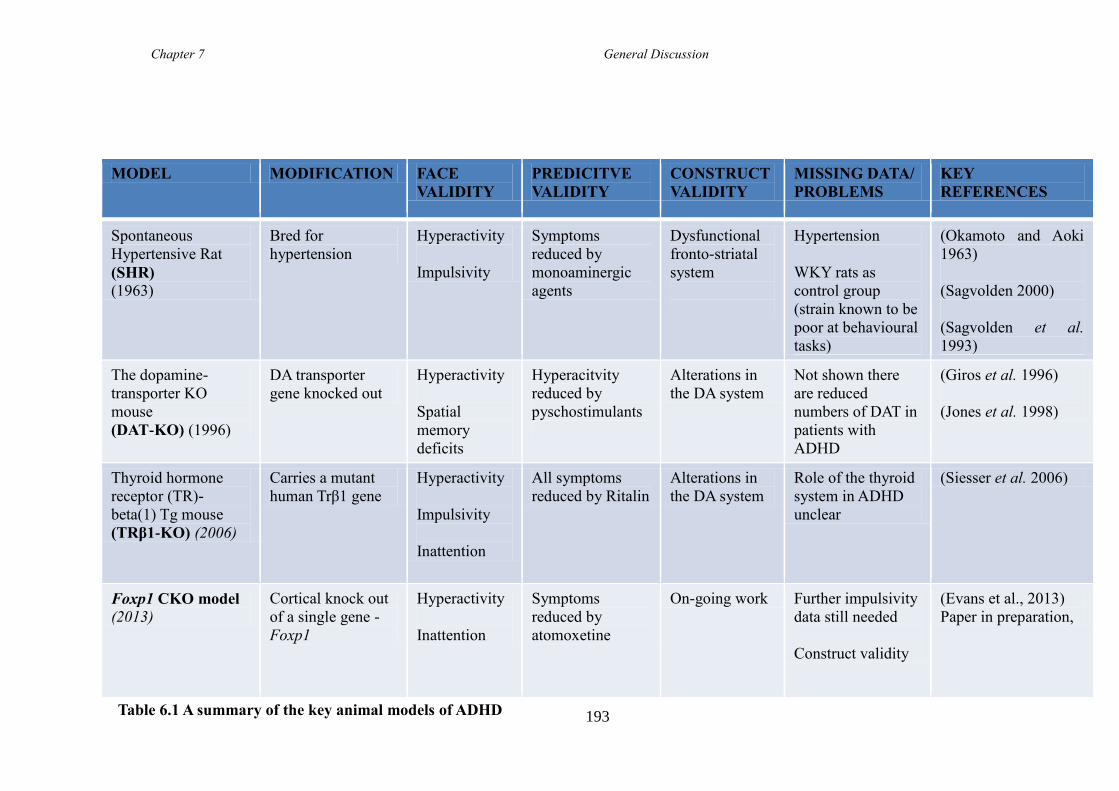
Chapter 7 General Discussion
193
MODEL MODIFICATION FACE
VALIDITY
PREDICITVE
VALIDITY
CONSTRUCT
VALIDITY
MISSING DATA/
PROBLEMS
KEY
REFERENCES
Spontaneous
Hypertensive Rat
(SHR)
(1963)
Bred for
hypertension
Hyperactivity
Impulsivity
Symptoms
reduced by
monoaminergic
agents
Dysfunctional
fronto-striatal
system
Hypertension
WKY rats as
control group
(strain known to be
poor at behavioural
tasks)
(Okamoto and Aoki
1963)
(Sagvolden 2000)
(Sagvolden et al.
1993)
The dopamine-
transporter KO
mouse
(DAT-KO) (1996)
DA transporter
gene knocked out
Hyperactivity
Spatial
memory
deficits
Hyperacitvity
reduced by
pyschostimulants
Alterations in
the DA system
Not shown there
are reduced
numbers of DAT in
patients with
ADHD
(Giros et al. 1996)
(Jones et al. 1998)
Thyroid hormone
receptor (TR)-
beta(1) Tg mouse
(TRβ1-KO) (2006)
Carries a mutant
human Trβ1 gene
Hyperactivity
Impulsivity
Inattention
All symptoms
reduced by Ritalin
Alterations in
the DA system
Role of the thyroid
system in ADHD
unclear
(Siesser et al. 2006)
Foxp1 CKO model (2013)
Cortical knock out
of a single gene -
Foxp1
Hyperactivity
Inattention
Symptoms
reduced by
atomoxetine
On-going work Further impulsivity
data still needed
Construct validity
(Evans et al., 2013)
Paper in preparation,
Table 6.1 A summary of the key animal models of ADHD
References
194
6.5 Where Next?
The main aim of this Thesis was to analyse the role of Foxp1 and its role in striatal
MSN differentiation as well as its functional role in the adult brain. The results strongly
indicated that Foxp1 is required for the correct development of the DARPP-32 positive
MSNs, as demonstrated by a decrease in DARPP-32 in Foxp1-/-
striatal cultures after 7
DIV (Chapter 3), after 12 weeks following transplantation of Foxp1-/-
tissue (Chapter 4),
and in layer V1 cortical neurons (Chapter 5). However, a striatal specific Foxp1 CKO
would be optimum in confirming these results and is planned using the Gsh2-Cre line
which should knock out Foxp1 in the striatum only from ~E10. It is also appreciated
that further in vitro experiments using the Foxp1-/-
line are needed to fully confirm the
suggested immaturity of the neurons in the absence of Foxp1 and will be carried out
following further rounds of breeding. Furthermore, the transplantation studies in
Chapter 4 will likely be repeated following optimisation of the mouse allografting
protocol, or alternatively carried out in rats (requiring daily immunosuppression).
In the absence of a known direct Foxp1 binding region on the Darpp-32 gene, the
mechanism by which Foxp1 could regulate DARPP-32 needs to be researched.
Downstream targets of Foxp1 have previously been studied in a striatal cell line and
showed that Foxp1 was capable of regulating its own expression, and that there are also
binding sites upstream of the Ctip2 promoter (Tang et al., 2010). In addition,
downstream targets of Foxp1 in the CNS have included Pitx3 in midbrain DA
development (Konstantoulas et al. 2010). Foxp1 also binds p21, a gene needed for cell
cycle exit (Jepsen et al. 2008), thus it is possible this interaction is also seen during
striatal development. It is anticipated that results from a microarray (currently being
analysed) to assess differences in gene expression between WT and Foxp1-/-
E14 LGE
and MGE, will be helpful in ascertaining downstream targets of Foxp1 in the
developing striatum and will form the basis of future work. Online databases such as the
Allen Brain Atlas will also be very useful in seeing if any of the genes from the
microarray are already associated with Foxp1 in human or mouse development and/or
in the adult brain.
Moreover, there will be on-going experiments to further characterise the Foxp1 CKO
line in order to fully establish it as a new mouse model of ADHD. Characterisation will
References
195
involve further behavioural testing using larger cohorts of mice together with more
comprehensive pharmacological testing to establish specifically what NA transporters
are being targeted by atomoxetine, thus establishing construct validity. Furthermore,
thorough histological analysis will be attempted.
Lastly, the Mef2c CKO mouse line needs to be fully characterised and results from
expression studies (Appendix 8) suggest that generating cultures from a later
developmental time point such as E16 or E18, in addition to E14 cultures, will give a
more accurate representation of differences in MSN differentiation due to the loss of
Mef2c.
6.6 Concluding Remarks
I have shown that Foxp1 is required for the development of a subset of DARPP-32
positive neurons, as in the absence of Foxp1 there were fewer DARPP-32 positive cells
in the developing striatum and in the adult cortex. The results presented throughout this
Thesis, together with published data, suggest that Foxp1 is a definitive marker of MSNs
at early and late stages of mouse striatal development. The data also suggests that the
functional role of Foxp1 is likely to ensure the correct maturation of at least a subset of
MSN precursors to DARPP-32 positive neurons following their exit from the cell cycle,
although further work is needed to confirm this. It is anticipated that results from the
on-going microarray will highlight whether there are any differences in the cell cycle
genes or genes associated with MSN migration, survival and differentiation giving more
specific clues about the function of Foxp1 in striatal development.
To conclude, these findings suggest that Foxp1 is required in aspects of MSN
development and that this should be considered in the development of in vitro protocols
aiming to direct renewable cells such as ESCs and iPSCs to functional DARPP-32
positive MSNs for their use in cell transplantation. The findings also suggest that Foxp1
is a gene that could be implicated in aspects of ADHD and that knocking it out from
E14 creates a CKO model that can be used to trial novel drugs to target disease
symptoms as well as to study possible pathways contributing to the disorder.
References
196
7 References
Abercrombie, M. (1946). Estimation of nuclear population from microtome sections.
Anat Rec 94:239-247.
Akhtar, M. W., Kim, M. S., Adachi, M., Morris, M. J., Qi, X., Richardson, J. A., Bassel-
Duby, R. et al. (2012). In vivo analysis of MEF2 transcription factors in synapse
regulation and neuronal survival. PLoS One 7:e34863.
Anderson, K. and Reiner, A. (1991). Immunohistochemical localization of DARPP-32
in striatal projection neurons and striatal interneurons: implications for the localization
of D1-like dopamine receptors on different types of striatal neurons. Brain Research
568:235-243.
Anderson, R. M., Lawrence, A. R., Stottmann, R. W., Bachiller, D. and Klingensmith, J.
(2002). Chordin and noggin promote organizing centers of forebrain development in the
mouse. Development 129:4975-4987.
Anderson, S. A., Qiu, M., Bulfone, A., Eisenstat, D. D., Meneses, J., Pedersen, R. and
Rubenstein, J. L. R. (1997). Mutations of the Homeobox Genes Dlx-1 and Dlx-2
Disrupt the Striatal Subventricular Zone and Differentiation of Late Born Striatal
Neurons. Neuron 19:27-37.
Anthony, T. E. and Heintz, N. (2008). Genetic lineage tracing defines distinct
neurogenic and gliogenic stages of ventral telencephalic radial glial development.
Neural Dev 3:30.
Anthony, T. E., Klein, C., Fishell, G. and Heintz, N. (2004). Radial Glia Serve as
Neuronal Progenitors in All Regions of the Central Nervous System. Neuron 41:881-
890.
Archer, T., Fredriksson, A., Lewander, T. and Soderberg, U. (1987). Marble burying and
spontaneous motor activity in mice: interactions over days and the effect of diazepam.
Scand J Psychol 28:242-249.
Arime, Y., Kubo, Y. and Sora, I. (2011). Animal models of attention-
deficit/hyperactivity disorder. Biol Pharm Bull 34:1373-1376.
Arlotta, P., Molyneaux, B. J., Chen, J., Inoue, J., Kominami, R. and Macklis, J. D.
(2005). Neuronal Subtype-Specific Genes that Control Corticospinal Motor Neuron
Development In Vivo. Neuron 45:207-221.
Arlotta, P., Molyneaux, B. J., Jabaudon, D., Yoshida, Y. and Macklis, J. D. (2008). Ctip2
controls the differentiation of medium spiny neurons and the establishment of the
cellular architecture of the striatum. J Neurosci 28:622-632.
Arnsten, A. F. (2009). The Emerging Neurobiology of Attention Deficit Hyperactivity
Disorder: The Key Role of the Prefrontal Association Cortex. J Pediatr 154:I-s43.
References
197
Aubry, L., Bugi, A., Lefort, N., Rousseau, F., Peschanski, M. and Perrier, A. L. (2008).
Striatal progenitors derived from human ES cells mature into DARPP32 neurons in
vitro and in quinolinic acid-lesioned rats. Proc Natl Acad Sci U S A 105:16707-16712.
Bachoud-Levi, A. C., Gaura, V., Brugieres, P., Lefaucheur, J. P., Boisse, M. F., Maison,
P., Baudic, S. et al. (2006). Effect of fetal neural transplants in patients with
Huntington's disease 6 years after surgery: a long-term follow-up study. Lancet Neurol
5:303-309.
Bachoud-Levi, A. C., Remy, P., Nguyen, J. P., Brugieres, P., Lefaucheur, J. P., Bourdet,
C., Baudic, S. et al. (2000). Motor and cognitive improvements in patients with
Huntington's disease after neural transplantation. Lancet 356:1975-1979.
Backman, M., Machon, O., Mygland, L., van den Bout, C. J., Zhong, W., Taketo, M. M.
and Krauss, S. (2005). Effects of canonical Wnt signaling on dorso-ventral specification
of the mouse telencephalon. Dev Biol 279:155-168.
Bai, C. B. and Joyner, A. L. (2001). Gli1 can rescue the in vivo function of Gli2.
Development 128:5161-5172.
Bai, X., Saab, S., Huang, A., Hoberg, I., Kirchhoff, F. and Scheller, A. (2013). Genetic
Background Affects Human Glial Fibrillary Acidic Protein Promoter Activity. PLoS
One. 8:e66873.
Banham, A. H., Beasley, N., Campo, E., Fernandez, P. L., Fidler, C., Gatter, K., Jones,
M. et al. (2001). The FOXP1 winged helix transcription factor is a novel candidate
tumor suppressor gene on chromosome 3p. Cancer Res 61:8820-8829.
Banham, A. H., Connors, J. M., Brown, P. J., Cordell, J. L., Ott, G., Sreenivasan, G.,
Farinha, P. et al. (2005). Expression of the FOXP1 transcription factor is strongly
associated with inferior survival in patients with diffuse large B-cell lymphoma. Clin
Cancer Res 11:1065-1072.
Barbosa, A. C., Kim, M. S., Ertunc, M., Adachi, M., Nelson, E. D., McAnally, J.,
Richardson, J. A. et al. (2008). MEF2C, a transcription factor that facilitates learning
and memory by negative regulation of synapse numbers and function. Proceedings of
the National Academy of Sciences of the United States of America 105:9391-9396.
Beal, M., Kowall, N., Ellison, D., Mazurek, M., Swartz, K. and Martin, J. (1986).
Replication of the neurochemical characteristics of Huntington's disease by quinolinic
acid. Nature 321:168-171.
.
Berridge, C. W., Devilbiss, D. M., Andrzejewski, M. E., Arnsten, A. F., Kelley, A. E.,
Schmeichel, B., Hamilton, C. et al. (2006). Methylphenidate preferentially increases
catecholamine neurotransmission within the prefrontal cortex at low doses that enhance
cognitive function. Biol Psychiatry 60:1111-1120.
Biederman, J. (2005). Attention-deficit/hyperactivity disorder: a selective overview. Biol
Psychiatry 57:1215-1220.
References
198
Biederman, J. and Faraone, S. V. (2005). Attention-deficit hyperactivity disorder. Lancet
366:237-248.
Borello, U., Cobos I, Long JE and JLR, M. C. a. R. (2008). FGF15 promotes
neurogenesis and opposes FGF8 function during neocortical development. Neural Dev
3:17.
Brand, N. J. (1997). Myocyte enhancer factor 2 (MEF2). The International Journal of
Biochemistry & Cell Biology 29:1467-1470.
Broekkamp, C. L., Rijk, H. W., Joly-Gelouin, D. and Lloyd, K. L. (1986). Major
tranquillizers can be distinguished from minor tranquillizers on the basis of effects on
marble burying and swim-induced grooming in mice. Eur J Pharmacol 126:223-229.
Brown, P. J., Ashe, S. L., Leich, E., Burek, C., Barrans, S., Fenton, J. A., Jack, A. S. et
al. (2008a). Potentially oncogenic B-cell activation-induced smaller isoforms of FOXP1
are highly expressed in the activated B cell-like subtype of DLBCL. Blood 111:2816-
2824.
Brown, P. J., Kagaya, R. and Banham, A. H. (2008b). Characterization of human
FOXP1 isoform 2, using monoclonal antibody 4E3-G11, and intron retention as a
tissue-specific mechanism generating a novel FOXP1 isoform. Histopathology 52:632-
637.
Burd, L., Klug, M. G., Coumbe, M. J. and Kerbeshian, J. (2003). Children and
adolescents with attention deficit-hyperactivity disorder: 1. Prevalence and cost of care.
J Child Neurol 18:555-561.
Bymaster, F. P., Katner, J. S., Nelson, D. L., Hemrick-Luecke, S. K., Threlkeld, P. G.,
Heiligenstein, J. H., Morin, S. M. et al. (2002). Atomoxetine increases extracellular
levels of norepinephrine and dopamine in prefrontal cortex of rat: a potential
mechanism for efficacy in attention deficit/hyperactivity disorder.
Neuropsychopharmacology 27:699-711.
Campbell, K. (2003). Dorsal-ventral patterning in the mammalian telencephelon.
Current opinion in neurobiology 13:50-56.
Campbell, K., Olsson, M. and Björklund, A. (1995). Regional incorporation and site-
specific differentiation of striatal precursors transplanted to the embryonic forebrain
ventricle. Neuron 15:1259 –1273.
Carr, C. W., Moreno-De-Luca, D., Parker, C., Zimmerman, H. H., Ledbetter, N., Martin,
C. L., Dobyns, W. B. et al. (2010). Chiari I malformation, delayed gross motor skills,
severe speech delay, and epileptiform discharges in a child with FOXP1
haploinsufficiency. Eur J Hum Genet 18:1216-1220.
Carri, A. D., Onorati, M., Lelos, M. J., Castiglioni, V., Faedo, A., Menon, R., Camnasio,
S. et al. (2013). Developmentally coordinated extrinsic signals drive human pluripotent
References
199
stem cell differentiation toward authentic DARPP-32+ medium-sized spiny neurons.
Development 140:301-312.
Casarosa, S., Fode, C. and Guillemot, F. (1999). Mash1 regulates neurogenesis in the
ventral telencephalon. Development 126:525-534.
Casper, K. B. and McCarthy, K. D. (2006). GFAP-positive progenitor cells produce
neurons and oligodendrocytes throughout the CNS. Mol Cell Neurosci 31:676-684.
Castro, D. S., Martynoga, B., Parras, C., Ramesh, V., Pacary, E., Johnston, C., Drechsel,
D. et al. (2011). A novel function of the proneural factor Ascl1 in progenitor
proliferation identified by genome-wide characterization of its targets. Genes Dev
25:930-945.
Chamberlain, S. and Sahakian, B. (2007). The neuropsychiatry of impulsivity. Curr
Opin Psychiatry 20:255-261.
Chatzi, C., Brade, T. and Duester, G. (2011). Retinoic acid functions as a key
GABAergic differentiation signal in the basal ganglia. PLoS Biol 9:e1000609.
Chen, B., Wang, S. S., Hattox, A. M., Rayburn, H., Nelson, S. B. and McConnell, S. K.
(2008). The Fezf2-Ctip2 genetic pathway regulates the fate choice of subcortical
projection neurons in the developing cerebral cortex. Proc Natl Acad Sci U S A
105:11382-11387.
Cheon, K. A., Ryu, Y. H., Namkoong, K., Kim, C. H., Kim, J. J. and Lee, J. D. (2004).
Dopamine transporter density of the basal ganglia assessed with [123I]IPT SPECT in
drug-naive children with Tourette's disorder. Psychiatry Res 130:85-95.
Chiang, C., Litingtung, Y., Lee, E., Young, K. E., Corden, J. L., Westphal, H. and
Beachy, P. A. (1996). Cyclopia and defective axial patterning in mice lacking Sonic
hedgehog gene function. Nature 383:407-413.
Chien, W. H., Gau, S. S., Chen, C. H., Tsai, W. C., Wu, Y. Y., Chen, P. H., Shang, C. Y.
et al. (2013). Increased gene expression of FOXP1 in patients with autism spectrum
disorders. Mol Autism 4:23.
Cho, E. G., Zaremba, J. D., McKercher, S. R., Talantova, M., Tu, S., Masliah, E., Chan,
S. F. et al. (2011). MEF2C enhances dopaminergic neuron differentiation of human
embryonic stem cells in a parkinsonian rat model. PLoS One 6:e24027.
Cholfin, J. A. and Rubenstein, J. L. (2007). Patterning of frontal cortex subdivisions by
Fgf17. Proc Natl Acad Sci U S A 104:7652-7657.
Cisbani, G., Saint Pierre, M. and Cicchetti, F. (2013). Single cell suspension
methodology favours survival and vascularization of fetal striatal grafts in the YAC128
mouse model of Huntington's disease. Cell Transplant.
References
200
Cocas, L. A., Miyoshi, G., Carney, R. S., Sousa, V. H., Hirata, T., Jones, K. R., Fishell,
G. et al. (2009). Emx1-lineage progenitors differentially contribute to neural diversity in
the striatum and amygdala. J Neurosci 29:15933-15946.
Collinson, J. M., Hill, R. E. and West, J. D. (2000). Different roles for Pax6 in the optic
vesicle and facial epithelium mediate early morphogenesis of the murine eye.
Development 127:945-956.
Coolen, M., Katz, S. and Bally-Cuif, L. (2013). miR-9: a versatile regulator of
neurogenesis. Front Cell Neurosci 7:220.
Corbin, J. G., Gaiano, N., Machold, R. P., Langston, A. and Fishell, G. (2000). The
Gsh2 homeodomain gene controls multiple aspects of telencephalic development.
Development 127:5007-5020.
Craufurd, D. and Snowden, J. (2002). Neuropsychological and neuropsychiatric aspects
of Huntington’s Disease. In: Bates, G. and Harper, P. and Jones, L. (eds.) Huntington's
Disease. Oxford: Oxofrd University Press
pp. 62-94.
Crossley, P. H., Martinez, S., Ohkubo, Y. and Rubenstein, J. L. (2001). Coordinate
expression of Fgf8, Otx2, Bmp4, and Shh in the rostral prosencephalon during
development of the telencephalic and optic vesicles. Neuroscience 108:183-206.
Cruz, A. P., Frei, F. and Graeff, F. G. (1994). Ethopharmacological analysis of rat
behavior on the elevated plus-maze. Pharmacol Biochem Behav 49:171-176.
Dai, P., Akimaru, H., Tanaka, Y., Maekawa, T., Nakafuku, M. and Ishii, S. (1999). Sonic
Hedgehog-induced activation of the Gli1 promoter is mediated by GLI3. J Biol Chem
274:8143-8152.
Danesin, C., Peres, J. N., Johansson, M., Snowden, V., Cording, A., Papalopulu, N. and
Houart, C. (2009). Integration of telencephalic Wnt and hedgehog signaling center
activities by Foxg1. Dev Cell 16:576-587.
Dasen, J. S., De Camilli, A., Wang, B., Tucker, P. W. and Jessell, T. M. (2008). Hox
repertoires for motor neuron diversity and connectivity gated by a single accessory
factor, FoxP1. Cell 134:304-316.
Dawson, G. R. and Tricklebank, M. D. (1995). Use of the elevated plus maze in the
search for novel anxiolytic agents. Trends Pharmacol Sci 16:33-36.
Deacon, T., Pakzaban, P. and Isacson, O. (1994). The lateral ganglionic eminence is the
origin of cells committed to striatal phenotypes: neural transplantation and
developmental evidence. Brain Research 668:211–219.
Desplats, P. A., Kass, K. E., Gilmartin, T., Stanwood, G. D., Woodward, E. L., Head, S.
R., Sutcliffe, J. G. et al. (2006). Selective deficits in the expression of striatal-enriched
mRNAs in Huntington's disease. J Neurochem 96:743-757.
References
201
Dobrossy, M., Klein, A., Janghra, N., Nikkhah, G. and Dunnett, S. B. (2011). Validating
the use of M4-BAC-GFP mice as tissue donors in cell replacement therapies in a rodent
model of Huntington's disease. J Neurosci Methods 197:6-13.
Dobrossy, M. D. and Dunnett, S. B. (2005). Training specificity, graft development and
graft-mediated functional recovery in a rodent model of Huntington's disease.
Neuroscience 132:543-552.
Dragatsis, I. and Zeitlin, S. (2000). CaMKIIalpha-Cre transgene expression and
recombination patterns in the mouse brain. Genesis 26:133-135.
Drolet, G., Proulx, K., Pearson, D., Rochford, J. and Deschepper, C. F. (2002).
Comparisons of behavioral and neurochemical characteristics between WKY, WKHA,
and Wistar rat strains. Neuropsychopharmacology 27:400-409.
Duester, G. (2008). Retinoic acid synthesis and signaling during early organogenesis.
Cell 134:921-931.
Dunnett, S. (1996). Neural Transplantation Neuromethods 32:55-87.
Dunnett, S. B., Carter, R. J., Watts, C., Torres, E. M., Mahal, A., Mangiarini, L., Bates,
G. et al. (1998). Striatal transplantation in a transgenic mouse model of Huntington's
disease. Exp Neurol 154:31-40.
Dunnett, S. B., Kendall, A. L., Watts, C. and Torres, E. M. (1997). Neuronal cell
transplantation for Parkinson's and Huntington's diseases. Br Med Bull 53:757-776.
Dunnett, S. B. and Rosser, A. E. (2013). Challenges for taking primary and stem cells
into clinical neurotransplantation trials for neurodegenerative disease. Neurobiol Dis.
Dupe, V., Matt, N., Garnier, J. M., Chambon, P., Mark, M. and Ghyselinck, N. B.
(2003). A newborn lethal defect due to inactivation of retinaldehyde dehydrogenase type
3 is prevented by maternal retinoic acid treatment. Proc Natl Acad Sci U S A
100:14036-14041.
Eagleson, K. L., Schlueter McFadyen-Ketchum, L. J., Ahrens, E. T., Mills, P. H., Does,
M. D., Nickols, J. and Levitt, P. (2007). Disruption of Foxg1 expression by knock-in of
cre recombinase: effects on the development of the mouse telencephalon. Neuroscience
148:385-399.
Echelard, Y., Epstein, D., St-Jacques, B., Shen, L., Mohler, J., McMahon, J. and
McMahon, A. (1993). Sonic hedgehog, a member of a family of putative signaling
molecules, is implicated in the regulation of CNS polarity. Cell 75 (7):1417-1430.
Ehrlich, M. E., Rosen, N. L., Kurihara, T., Shalaby, I. A. and Greengard, P. (1990).
DARPP-32 development in the caudate nucleus is independent of afferent input from
the substantia nigra. Developmental Brain Research 54:257-263.
References
202
Epstein, J. N., Erkanli, A., Conners, C. K., Klaric, J., Costello, J. E. and Angold, A.
(2003). Relations between Continuous Performance Test performance measures and
ADHD behaviors. J Abnorm Child Psychol 31:543-554.
Ericson, J., Muhr, J., Placzek, M., Lints, T., Jessell, T. and Edlund, T. (1995). Sonic
hedgehog induces the differentiation of ventral forebrain neurons: a common signal for
ventral patterning within the neural tube. Cell 81(5):747-756.
Evans, A. E., Kelly, C. M., Precious, S. V. and Rosser, A. E. (2012). Molecular
regulation of striatal development: a review. Anat Res Int 2012:106529.
Evans, M. J. and Kaufman, M. H. (1981). Establishment in culture of pluripotential
cells from mouse embryos. Nature 292:154-156.
Faraone, S. V., Perlis, R. H., Doyle, A. E., Smoller, J. W., Goralnick, J. J., Holmgren, M.
A. and Sklar, P. (2005). Molecular genetics of attention-deficit/hyperactivity disorder.
Biol Psychiatry 57:1313-1323.
Feng, X., Ippolito, G. C., Tian, L., Wiehagen, K., Oh, S., Sambandam, A., Willen, J. et
al. (2010). Foxp1 is an essential transcriptional regulator for the generation of quiescent
naive T cells during thymocyte development. Blood 115:510-518.
Ferland, R. J., Cherry, T. J., Preware, P. O., Morrisey, E. E. and Walsh, C. A. (2003).
Characterization of Foxp2 and Foxp1 mRNA and protein in the developing and mature
brain. J Comp Neurol 460:266-279.
Finlay, B. L. and Darlington, R. B. (1995). Linked regularities in the development and
evolution of mammalian brains. Science 268:1578-1584.
Fode, C., Ma, Q., Casarosa, S., Ang, S. L., Anderson, D. J. and Guillemot, F. (2000). A
role for neural determination genes in specifying the dorsoventral identity of
telencephalic neurons. Genes Dev 14:67-80.
Foster, G., Schultzberg, M., Hakfelt, T., Goldstein, M., Hemmings, H., Jr.,, Ouimet, C.,
Walaas, S. et al. (1987). Development of a Dopamine- and Cyclic Adenosine
3’5Monophosphate-Regulated Phosphoprotein (DARPP-32) in the Prenatal Rat Central
Nervous System, and Its Relationship to the Arrival of Presumptive Dopaminergic
Innervation. The Journal of Neuroscience 7:1994-2018.
Fox, S. B., Brown, P., Han, C., Ashe, S., Leek, R. D., Harris, A. L. and Banham, A. H.
(2004). Expression of the forkhead transcription factor FOXP1 is associated with
estrogen receptor alpha and improved survival in primary human breast carcinomas.
Clin Cancer Res 10:3521-3527.
Freeman, T. B., Sanberg, P. R. and Isacson, O. (1995). Development of the human
striatum: implications for fetal striatal transplantation in the treatment of Huntington's
disease. Cell Transplant 4:539-545.
References
203
Fricker-Gates, R. A., White, A., Gates, M. A. and Dunnett, S. B. (2004). Striatal neurons
in striatal grafts are derived from both post-mitotic cells and dividing progenitors. Eur J
Neurosci 19:513-520.
Fuccillo, M., Rallu, M., McMahon, A. P. and Fishell, G. (2004). Temporal requirement
for hedgehog signaling in ventral telencephalic patterning. Development 131:5031-
5040.
Furuta, Y., Piston, D. W. and Hogan, B. L. (1997). Bone morphogenetic proteins
(BMPs) as regulators of dorsal forebrain development. Development 124:2203-2212.
Gabut, M., Samavarchi-Tehrani, P., Wang, X., Slobodeniuc, V., O'Hanlon, D., Sung, H.
K., Alvarez, M. et al. (2011). An alternative splicing switch regulates embryonic stem
cell pluripotency and reprogramming. Cell 147:132-146.
Gainetdinov, R. R., Jones, S. R., Fumagalli, F., Wightman, R. M. and Caron, M. G.
(1998). Re-evaluation of the role of the dopamine transporter in dopamine system
homeostasis. Brain Res Brain Res Rev 26:148-153.
Gainetdinov, R. R., Wetsel, W. C., Jones, S. R., Levin, E. D., Jaber, M. and Caron, M.
G. (1999). Role of serotonin in the paradoxical calming effect of psychostimulants on
hyperactivity. Science 283:397-401.
Garel, S., Marin, F., Grosschedl, R. and Charnay, P. (1999). Ebf1 controls early cell
differentiation in the embryonic striatum. Development 126:5285-5294.
Gaveriaux-Ruff, C. and Kieffer, B. L. (2007). Conditional gene targeting in the mouse
nervous system: Insights into brain function and diseases. Pharmacol Ther 113:619-
634.
Gerfen, C. (1992). The neostriatal mosaic: Multiple levels of compartmental
organization. Trends in Neuroscience 15:133–139.
Gerfen, C. R. (1984). The neostriatal mosaic: compartmentalization of corticostriatal
input and striatonigral output systems. Nature 311:461-464.
Gerfen, C. R., Baimbridge, K. G. and Miller, J. J. (1985). The neostriatal mosaic:
compartmental distribution of calcium-binding protein and parvalbumin in the basal
ganglia of the rat and monkey. Proc Natl Acad Sci U S A 82:8780-8784.
Gerfen, C. R. and Young, W. S., 3rd. (1988). Distribution of striatonigral and
striatopallidal peptidergic neurons in both patch and matrix compartments: an in situ
hybridization histochemistry and fluorescent retrograde tracing study. Brain Res
460:161-167.
Giatromanolaki, A., Koukourakis, M. I., Sivridis, E., Gatter, K. C., Harris, A. L. and
Banham, A. H. (2006). Loss of expression and nuclear/cytoplasmic localization of the
FOXP1 forkhead transcription factor are common events in early endometrial cancer:
relationship with estrogen receptors and HIF-1alpha expression. Mod Pathol 19:9-16.
References
204
Giros, B., Jaber, M., Jones, S. R., Wightman, R. M. and Caron, M. G. (1996).
Hyperlocomotion and indifference to cocaine and amphetamine in mice lacking the
dopamine transporter. Nature 379:606-612.
Goatly, A., Bacon, C. M., Nakamura, S., Ye, H., Kim, I., Brown, P. J., Ruskone-
Fourmestraux, A. et al. (2008). FOXP1 abnormalities in lymphoma: translocation
breakpoint mapping reveals insights into deregulated transcriptional control. Mod
Pathol 21:902-911.
Golden, J. A., Bracilovic, A., McFadden, K. A., Beesley, J. S., Rubenstein, J. L. and
Grinspan, J. B. (1999). Ectopic bone morphogenetic proteins 5 and 4 in the chicken
forebrain lead to cyclopia and holoprosencephaly. Proc Natl Acad Sci U S A 96:2439-
2444.
Gong, S., Doughty, M., Harbaugh, C., Cummins, A., Hatten, M., Heintz, N. and
Campbell, K. (2007). Targeting Cre Recombinase to Specific Neuron Populations with
Bacterial Artificial Chromosome Constructs. The Jounral of Neuroscience 27(37):9817–
9823.
Gotz, M. and Huttner, W. B. (2005). The cell biology of neurogenesis. Nat Rev Mol Cell
Biol 6:777-788.
Graybiel, A. M., Liu, F. C. and Dunnett, S. B. (1989). Intrastriatal grafts derived from
fetal striatal primordia. I. Phenotypy and modular organization. J Neurosci 9:3250-
3271.
Graybiel, A. M. and Ragsdale, C. W., Jr. (1978). Histochemically distinct compartments
in the striatum of human, monkeys, and cat demonstrated by acetylthiocholinesterase
staining. Proc Natl Acad Sci U S A 75:5723-5726.
Groen, J. L., de Bie, R. M., Foncke, E. M., Roos, R. A., Leenders, K. L. and Tijssen, M.
A. (2010). Late-onset Huntington disease with intermediate CAG repeats: true or false?
J Neurol Neurosurg Psychiatry 81:228-230.
Grove, E. A., Tole, S., Limon, J., Yip, L. and Ragsdale, C. W. (1998). The hem of the
embryonic cerebral cortex is defined by the expression of multiple Wnt genes and is
compromised in Gli3-deficient mice. Development 125:2315-2325.
Gunhaga, L., Marklund, M., Sjodal, M., Hsieh, J. C., Jessell, T. M. and Edlund, T.
(2003). Specification of dorsal telencephalic character by sequential Wnt and FGF
signaling. Nat Neurosci 6:701-707.
Gustafson, E. L., Ehrlich, M. E., Trivedi, P. and Greengard, P. (1992). Developmental
regulation of phosphoprotein gene expression in the caudate-putamen of rat: an in situ
hybridization study. Neuroscience 51:65-75.
Gyertyan, I. (1995). Analysis of the marble burying response: marbles serve to measure
digging rather than evoke burying. Behav Pharmacol 6:24-31.
References
205
Hahn, M. K., Steele, A., Couch, R. S., Stein, M. A. and Krueger, J. J. (2009). Novel and
functional norepinephrine transporter protein variants identified in attention-deficit
hyperactivity disorder. Neuropharmacology 57:694-701.
Hamasaki, T., Goto, S., Nishikawa, S. and Ushio, Y. (2003). Neuronal cell migration for
the developmental formation of the mammalian striatum. Brain Res Brain Res Rev
41:1-12.
Hamdan, F. F., Daoud, H., Rochefort, D., Piton, A., Gauthier, J., Langlois, M., Foomani,
G. et al. (2010). De novo mutations in FOXP1 in cases with intellectual disability,
autism, and language impairment. Am J Hum Genet 87:671-678.
Haralambieva, E., Adam, P., Ventura, R., Katzenberger, T., Kalla, J., Holler, S.,
Hartmann, M. et al. (2006). Genetic rearrangement of FOXP1 is predominantly detected
in a subset of diffuse large B-cell lymphomas with extranodal presentation. Leukemia
20:1300-1303.
Harper, P. (1997). Huntgiton's Disease. WB Saunders company Ltd.
Harris, E. and Barraclough, B. (1994). Suicide as an outcome of medical disorders
Medicine(Baltimore) 73:281-296.
Haskell, G. T. and LaMantia, A. S. (2005). Retinoic acid signaling identifies a distinct
precursor population in the developing and adult forebrain. J Neurosci 25:7636-7647.
Heal, D. J., Cheetham, S. C. and Smith, S. L. (2009). The neuropharmacology of ADHD
drugs in vivo: insights on efficacy and safety. Neuropharmacology 57:608-618.
Hebert, J. and McConnell, S. (2000). Targeting of cre to the Foxg1 (BF-1) locus
mediates loxP recombination in the telencephalon and other developing head structures.
Dev Biol 222:296-306.
Hebert, J. M. and Fishell, G. (2008). The genetics of early telencephalon patterning:
some assembly required. Nat Rev Neurosci 9:678-685.
Higginbotham, H., Guo, J., Yokota, Y., Umberger, N. L., Su, C. Y., Li, J., Verma, N. et
al. (2013). Arl13b-regulated cilia activities are essential for polarized radial glial
scaffold formation. Nat Neurosci 1000-1007.
Hill, R. E., Favor, J., Hogan, B. L., Ton, C. C., Saunders, G. F., Hanson, I. M., Prosser,
J. et al. (1991). Mouse small eye results from mutations in a paired-like homeobox-
containing gene. Nature 354:522-525.
Hisaoka, T., Nakamura, Y., Senba, E. and Morikawa, Y. (2010). The forkhead
transcription factors, Foxp1 and Foxp2, identify different subpopulations of projection
neurons in the mouse cerebral cortex. Neuroscience 166:551-563.
Horn, D., Kapeller, J., Rivera-Brugues, N., Moog, U., Lorenz-Depiereux, B., Eck, S.,
Hempel, M. et al. (2010). Identification of FOXP1 deletions in three unrelated patients
References
206
with mental retardation and significant speech and language deficits. Hum Mutat
31:E1851-1860.
Houart, C., Caneparo, L., Heisenberg, C., Barth, K., Take-Uchi, M. and Wilson, S.
(2002). Establishment of the telencephalon during gastrulation by local antagonism of
Wnt signaling. Neuron 35:255-265.
Hsieh-Li, H. M., Witte, D. P., Szucsik, J. C., Weinstein, M., Li, H. and Potter, S. S.
(1995). Gsh-2, a murine homeobox gene expressed in the developing brain. Mech Dev
50:177-186.
Hu, H., Wang, B., Borde, M., Nardone, J., Maika, S., Allred, L., Tucker, P. W. et al.
(2006). Foxp1 is an essential transcriptional regulator of B cell development. Nat
Immunol 7:819-826.
Jain, M., Armstrong, R., Barker, R. and Rosser, A. (2001). Cellular and molecular
aspects of striatal development. Brain Research Bulletin 55(4):533-540.
Jepsen, K., Gleiberman, A. S., Shi, C., Simon, D. I. and Rosenfeld, M. G. (2008).
Cooperative regulation in development by SMRT and FOXP1. Genes Dev 22:740-745.
Jessell, T. (2000). Neuronal specification in the spinal cord:inductive signals and
transcriptional codes. Nature Reviews genetics 1:20-29.
Jimenez-Castellanos, J. and Graybiel, A. M. (1987). Subdivisions of the dopamine-
containing A8-A9-A10 complex identified by their differential mesostriatal innervation
of striosomes and extrastriosomal matrix. Neuroscience 23:223-242.
Johann, V., Schiefer, J., Sass, C., Mey, J., Brook, G., Kruttgen, A., Schlangen, C. et al.
(2007). Time of transplantation and cell preparation determine neural stem cell survival
in a mouse model of Huntington's disease. Exp Brain Res 177:458-470.
Jones, S. R., Gainetdinov, R. R., Jaber, M., Giros, B., Wightman, R. M. and Caron, M.
G. (1998). Profound neuronal plasticity in response to inactivation of the dopamine
transporter. Proc Natl Acad Sci U S A 95:4029-4034.
Kaufmann, E. and Knochel, W. (1996). Five years on the wings of fork head. Mech Dev
57:3-20.
Kelly, C., Dunnett, S. and Rosser, A. (2009). Medium Spiny neurones for
transplantation in Huntington's Disease. . Biochemical Society Transations 37:323-328.
Kelly, C., Precious, S., Penketh, R., Amso, N., Dunnett, S. and Rosser, A. (2007).
Striatal graft projections are influenced by donor cell type and not the immunogenic
background. Brain 130:1317-1329.
Kelly, C. M., Precious, S. V., Torres, E. M., Harrison, A. W., Williams, D., Scherf, C.,
Weyrauch, U. M. et al. (2011). Medical terminations of pregnancy: a viable source of
tissue for cell replacement therapy for neurodegenerative disorders. Cell Transplant
20:503-513.
References
207
Kessaris, N., Fogarty, M., Iannarelli, P., Grist, M., Wegner, M. and Richardson, W. D.
(2006). Competing waves of oligodendrocytes in the forebrain and postnatal elimination
of an embryonic lineage. Nat Neurosci 9:173-179.
Kimura, S., Hara, Y., Pineau, T., Fernandez-Salguero, P., Fox, C., Ward, J. and FJ, G.
(1996). The T/ebp null mouse: thyroid specific enhancer-binding protein is essential for
the organogenesis of the thyroid, lung, ventral forebrain, and pituitary. Genes and
Development 10 60-69.
Kita, H. and Kitai, S. T. (1987). Efferent projections of the subthalamic nucleus in the
rat: light and electron microscopic analysis with the PHA-L method. J Comp Neurol
260:435-452.
Kita, H. and Kitai, S. T. (1988). Glutamate decarboxylase immunoreactive neurons in
rat neostriatum: their morphological types and populations. Brain Res 447:346-352.
Koda, K., Ago, Y., Cong, Y., Kita, Y., Takuma, K. and Matsuda, T. (2010). Effects of
acute and chronic administration of atomoxetine and methylphenidate on extracellular
levels of noradrenaline, dopamine and serotonin in the prefrontal cortex and striatum of
mice. J Neurochem 114:259-270.
Kohtz, J., Baker, D., Corte, G. and Fishell, G. (1998). Regionalization within the
mammalian telencephalon is mediated by changes in responsiveness to Sonic
Hedgehog. Development 125:5079 –5089.
Konstantoulas, C. J., Parmar, M. and Li, M. (2010). FoxP1 promotes midbrain identity
in embryonic stem cell-derived dopamine neurons by regulating Pitx3. J Neurochem
113:836-847.
Kremer, B., Goldberg, P., Andrew, S., Theilmann, J., Telenius, H., Zeisler, J., Squitieri,
F. et al. (1994). A worldwide study of the Huntington's disease mutation. The sensitivity
and specificity of measuring CAG repeats. The New England journal of medicine
330:1401-1406.
Kuwajima, T., Nishimura, I. and Yoshikawa, K. (2006). Necdin promotes GABAergic
neuron differentiation in cooperation with Dlx homeodomain proteins. J Neurosci
26:5383-5392.
Lanska, D., Lanska MJ, Lavine, L. and Schoenberg, B. (1998). Conditions Associated
With Huntington's Disease at Death: A Case-Control Study. Archives Neurology 45:878-
880.
Lee, M. K., Tuttle, J. B., Rebhun, L. I., Cleveland, D. W. and Frankfurter, A. (1990).
The expression and posttranslational modification of a neuron-specific beta-tubulin
isotype during chick embryogenesis. Cell Motil Cytoskeleton 17:118-132.
Leifer, D., Krainc, D., Yu, Y. T., McDermott, J., Breitbart, R. E., Heng, J., Neve, R. L. et
al. (1993). MEF2C, a MADS/MEF2-family transcription factor expressed in a laminar
distribution in cerebral cortex. Proc Natl Acad Sci U S A 90:1546-1550.
References
208
Lempp, T., Toennes, S. W., Wunder, C., Russe, O. Q., Moser, C. V., Kynast, K. L.,
Freitag, C. M. et al. (2013). Altered gene expression in the prefrontal cortex of young
rats induced by the ADHD drug atomoxetine. Prog Neuropsychopharmacol Biol
Psychiatry 40:221-228.
Li, H., Radford, J. C., Ragusa, M. J., Shea, K. L., McKercher, S. R., Zaremba, J. D.,
Soussou, W. et al. (2008). Transcription factor MEF2C influences neural
stem/progenitor cell differentiation and maturation in vivo. Proc Natl Acad Sci U S A
105:9397-9402.
Li, S., Wang, Y., Zhang, Y., Lu, M. M., DeMayo, F. J., Dekker, J. D., Tucker, P. W. et al.
(2012). Foxp1/4 control epithelial cell fate during lung development and regeneration
through regulation of anterior gradient 2. Development 139:2500-2509.
Li, S., Weidenfeld, J. and Morrisey, E. (2004). Transcriptional and DNA binding activity
of the Foxp1/2/4 family is modulated by heterotypic and homotypic protein interactions.
Mol Cell Biol 24:809-822.
Liang, H., Hippenmeyer, S. and Ghashghaei, H. T. (2012). A Nestin-cre transgenic
mouse is insufficient for recombination in early embryonic neural progenitors. Biol
Open 1:1200-1203.
Lichtenstein, P., Carlstrom, E., Rastam, M., Gillberg, C. and Anckarsater, H. (2010).
The genetics of autism spectrum disorders and related neuropsychiatric disorders in
childhood. Am J Psychiatry 167:1357-1363.
Lin, Q., Schwarz, J., Bucana, C. and Olson, E. N. (1997). Control of mouse cardiac
morphogenesis and myogenesis by transcription factor MEF2C. Science 276:1404-
1407.
Lister, R. G. (1987). The use of a plus-maze to measure anxiety in the mouse.
Psychopharmacology (Berl) 92:180-185.
Liu, J., Githinji, J., McLaughlin, B., Wilczek, K. and Nolta, J. (2012). Role of miRNAs
in neuronal differentiation from human embryonic stem cell-derived neural stem cells.
Stem Cell Rev 8:1129-1137.
Liu, J. K., Ghattas, I., Liu, S., Chen, S. and Rubenstein, J. L. (1997). Dlx genes encode
DNA-binding proteins that are expressed in an overlapping and sequential pattern
during basal ganglia differentiation. Dev Dyn 210:498-512.
Liu, L., Cavanaugh, J. E., Wang, Y., Sakagami, H., Mao, Z. and Xia, Z. (2003). ERK5
activation of MEF2-mediated gene expression plays a critical role in BDNF-promoted
survival of developing but not mature cortical neurons. Proc Natl Acad Sci USA
100:8532-8537.
Lobe, C. G., Koop, K. E., Kreppner, W., Lomeli, H., Gertsenstein, M. and Nagy, A.
(1999). Z/AP, a double reporter for cre-mediated recombination. Dev Biol 208:281-292.
References
209
Long, J. E., Garel, S., Alvarez-Dolado, M., Yoshikawa, K., Osumi, N., Alvarez-Buylla,
A. and Rubenstein, J. L. (2007). Dlx-dependent and -independent regulation of
olfactory bulb interneuron differentiation. J Neurosci 27:3230-3243.
Long, J. E., Swan, C., Liang, W. S., Cobos, I., Potter, G. B. and Rubenstein, J. L.
(2009). Dlx1&2 and Mash1 transcription factors control striatal patterning and
differentiation through parallel and overlapping pathways. J Comp Neurol 512:556-572.
Lyons, G. E., Micales, B. K., Schwarz, J., Martin, J. F. and Olson, E. N. (1995).
Expression of mef2 genes in the mouse central nervous system suggests a role in
neuronal maturation. J Neurosci 15:5727-5738.
Ma, L., Hu, B., Liu, Y., Vermilyea, S. C., Liu, H., Gao, L., Sun, Y. et al. (2012). Human
embryonic stem cell-derived GABA neurons correct locomotion deficits in quinolinic
acid-lesioned mice. Cell Stem Cell 10:455-464.
Malatesta, P. and Gotz, M. (2013). Radial glia - from boring cables to stem cell stars.
Development 140:483-486.
Malatesta, P., Hack, M. A., Hartfuss, E., Kettenmann, H., Klinkert, W., Kirchhoff, F. and
Götz, M. (2003). Neuronal or Glial Progeny: Regional Differences in Radial Glia Fate.
Neuron 37:751-764.
Malatesta, P., Hartfuss, E. and Gotz, M. (2000). Isolation of radial glial cells by
fluorescent-activated cell sorting reveals a neuronal lineage. Development 127:5253-
5263.
Manuel, M., Martynoga, B., Yu, T., West, J. D., Mason, J. O. and Price, D. J. (2010).
The transcription factor Foxg1 regulates the competence of telencephalic cells to adopt
subpallial fates in mice. Development 137:487-497.
Manuel, M. N., Martynoga, B., Molinek, M. D., Quinn, J. C., Kroemmer, C., Mason, J.
O. and Price, D. J. (2011). The transcription factor Foxg1 regulates telencephalic
progenitor proliferation cell autonomously, in part by controlling Pax6 expression
levels. Neural Dev 6:9.
Mao, Z., Bonni, A., Xia, F., Nadal-Vicens, M. and Greenberg, M. E. (1999). Neuronal
activity-dependent cell survival mediated by transcription factor MEF2. Science
286:785-790.
Maretto, S., Cordenonsi, M., Dupont, S., Braghetta, P., Broccoli, V., Hassan, A. B.,
Volpin, D. et al. (2003). Mapping Wnt/beta-catenin signaling during mouse
development and in colorectal tumors. Proc Natl Acad Sci U S A 100:3299-3304.
Marigo, V., Johnson, R. L., Vortkamp, A. and Tabin, C. J. (1996). Sonic hedgehog
differentially regulates expression of GLI and GLI3 during limb development. Dev Biol
180:273-283.
Marin, O., Anderson, S. A. and Rubenstein, J. L. (2000). Origin and molecular
specification of striatal interneurons. J Neurosci 20:6063-6076.
References
210
Mark, M., Ghyselinck, N. B. and Chambon, P. (2006). Function of retinoid nuclear
receptors: lessons from genetic and pharmacological dissections of the retinoic acid
signaling pathway during mouse embryogenesis. Annu Rev Pharmacol Toxicol 46:451-
480.
Marklund, M., Sjodal, M., Beehler, B. C., Jessell, T. M., Edlund, T. and Gunhaga, L.
(2004). Retinoic acid signalling specifies intermediate character in the developing
telencephalon. Development 131:4323-4332.
Martin-Ibanez, R., Crespo, E., Esgleas, M., Urban, N., Wang, B., Waclaw, R.,
Georgopoulos, K. et al. (2012). Helios transcription factor expression depends on Gsx2
and Dlx1&2 function in developing striatal matrix neurons. Stem Cells Dev 21:2239-
2251.
Martın-Ibanez, R., Crespo, E., Urban N, S, S.-T., Herranz C, M, J., Valiente M et al.
(2010). Ikaros-1 Couples Cell Cycle Arrest of Late Striatal Precursors With
Neurogenesis of Enkephalinergic Neurons. The Journal of Comparative Neurology
518:329–351.
Martin, G. R. (1981). Isolation of a pluripotent cell line from early mouse embryos
cultured in medium conditioned by teratocarcinoma stem cells. Proc Natl Acad Sci USA
78:7634-7638.
Martynoga, B., Morrison, H., Price, D. J. and Mason, J. O. (2005). Foxg1 is required for
specification of ventral telencephalon and region-specific regulation of dorsal
telencephalic precursor proliferation and apoptosis. Dev Biol 283:113-127.
Mason, H. A., Rakowiecki, S. M., Raftopoulou, M., Nery, S., Huang, Y., Gridley, T. and
Fishell, G. (2005). Notch signaling coordinates the patterning of striatal compartments.
Development 132:4247-4258.
Mason, I. (2007). Initiation to end point: the multiple roles of fibroblast growth factors
in neural development. Nature Reviews Neuroscience 8:583-596
Molotkova, N., Molotkov, A. and Duester, G. (2007). Role of retinoic acid during
forebrain development begins late when Raldh3 generates retinoic acid in the ventral
subventricular zone. Dev Biol 303:601-610.
Molyneaux, B. J., Arlotta, P., Menezes, J. R. and Macklis, J. D. (2007). Neuronal
subtype specification in the cerebral cortex. Nat Rev Neurosci 8:427-437.
Montgomery, K. (1955). The relationship between fear induced by novel stimulation
and exploratory behaviour. J. Comp. Physiol. Psychol. 48:254-226.
Monuki, E. S., Porter, F. D. and Walsh, C. A. (2001). Patterning of the dorsal
telencephalon and cerebral cortex by a roof plate-Lhx2 pathway. Neuron 32:591-604.
Nair, J., Ehimare, U., Beitman, B. D., Nair, S. S. and Lavin, A. (2006). Clinical review:
evidence-based diagnosis and treatment of ADHD in children. Mo Med 103:617-621.
References
211
Navarra, R., Graf, R., Huang, Y., Logue, S., Comery, T., Hughes, Z. and Day, M. (2008).
Effects of atomoxetine and methylphenidate on attention and impulsivity in the 5-choice
serial reaction time test. Prog Neuropsychopharmacol Biol Psychiatry 32:34-41.
Nery, S., Corbin, J. G. and Fishell, G. (2003). Dlx2 progenitor migration in wild type
and Nkx2.1 mutant telencephalon. Cereb Cortex 13:895-903.
Nicolas, L. B., Kolb, Y. and Prinssen, E. P. (2006). A combined marble burying-
locomotor activity test in mice: a practical screening test with sensitivity to different
classes of anxiolytics and antidepressants. Eur J Pharmacol 547:106-115.
Nicoleau, C., Varela, C., Bonnefond, C., Maury, Y., Bugi, A., Aubry, L., Viegas, P. et al.
(2013). Embryonic stem cells neural differentiation qualifies the role of Wnt/beta-
Catenin signals in human telencephalic specification and regionalization. Stem Cells
31:1763-1774.
Njung'e, K. and Handley, S. L. (1991). Evaluation of marble-burying behavior as a
model of anxiety. Pharmacol Biochem Behav 38:63-67.
Noctor, S. C., Flint, A. C., Weissman, T. A., Wong, W. S., Clinton, B. K. and Kriegstein,
A. R. (2002). Dividing precursor cells of the embryonic cortical ventricular zone have
morphological and molecular characteristics of radial glia. J Neurosci 22:3161-3173.
Ohkubo, Y., Chiang, C. and Rubenstein, J. (2002). Coordinate regulation and synergistic
actions of BMP4, SHH and FGF8 in the rostral prosencephalon regulate morphogenesis
of the telencephalic and optic vesicles. . Neuroscience 111:1–17.
Okamoto, K. and Aoki, K. (1963). Development of a strain of spontaneously
hypertensive rats. Jpn Circ J 27:282-293.
Okamoto, S., Krainc, D., Sherman, K. and Lipton, S. A. (2000). Antiapoptotic role of
the p38 mitogen-activated protein kinase-myocyte enhancer factor 2 transcription factor
pathway during neuronal differentiation. Proc Natl Acad Sci U S A 97:7561-7566.
Olsson, M., Bjorklund, A. and Campbell, K. (1998). Early specification of striatal
projection neurons and interneuronal subtypes in the lateral and medial ganglionic
eminence. Neuroscience 84:867– 876
Olsson, M., Campbell, K., Wictorin, K. and Bjorklund, A. (1995). Projection neurons in
fetal striatal transplants are predominantly derived from the lateral ganglionic eminence.
Neuroscience 69:1169-1182.
Otaegi, G., Pollock, A., Hong, J. and Sun, T. (2011). MicroRNA miR-9 modifies motor
neuron columns by a tuning regulation of FoxP1 levels in developing spinal cords. J
Neurosci 31:809-818.
Ouimet, C. C., Miller, P. E., Hemmings, H. C., Jr., Walaas, S. I. and Greengard, P.
(1984). DARPP-32, a dopamine- and adenosine 3':5'-monophosphate-regulated
phosphoprotein enriched in dopamine-innervated brain regions. III.
Immunocytochemical localization. J Neurosci 4:111-124.
References
212
Owens, D. F., Boyce, L. H., Davis, M. B. and Kriegstein, A. R. (1996). Excitatory
GABA responses in embryonic and neonatal cortical slices demonstrated by gramicidin
perforated-patch recordings and calcium imaging. J Neurosci 16:6414-6423.
Paek, H., Gutin, G. and JM., H. (2009). FGF signalling is strictly required to maintain
early telencephalic precursor cell survival. Development 136:2457-2465.
Pakzaban, P., Deacon, T. W., Burns, L. H. and Isacson, O. (1993). Increased proportion
of acetylcholinesterase-rich zones and improved morphological integration in host
striatum of fetal grafts derived from the lateral but not the medial ganglionic eminence.
Exp Brain Res 97:13-22.
Palumbo, O., D'Agruma, L., Minenna, A. F., Palumbo, P., Stallone, R., Palladino, T.,
Zelante, L. et al. (2013). 3p14.1 de novo microdeletion involving the FOXP1 gene in an
adult patient with autism, severe speech delay and deficit of motor coordination. Gene
516:107-113.
Park, H. L., Bai, C., Platt, K. A., Matise, M. P., Beeghly, A., Hui, C. C., Nakashima, M.
et al. (2000). Mouse Gli1 mutants are viable but have defects in SHH signaling in
combination with a Gli2 mutation. Development 127:1593-1605.
Pei, Z., Wang, B., Chen, G., Nagao, M., Nakafuku, M. and Campbell, K. (2011).
Homeobox genes Gsx1 and Gsx2 differentially regulate telencephalic progenitor
maturation. Proc Natl Acad Sci U S A 108:1675-1680.
Pellow, S., Chopin, P., File, S. E. and Briley, M. (1985). Validation of open:closed arm
entries in an elevated plus-maze as a measure of anxiety in the rat. J Neurosci Methods
14:149-167.
Perrier, A. and Peschanski, M. (2012). How can human pluripotent stem cells help
decipher and cure Huntington's disease? Cell Stem Cell 11:153-161.
Pert, C. B., Kuhar, M. J. and Snyder, S. H. (1976). Opiate receptor: autoradiographic
localization in rat brain. Proc Natl Acad Sci U S A 73:3729-3733.
Pliszka, S. R. (1989). Effect of anxiety on cognition, behavior, and stimulant response in
ADHD. J Am Acad Child Adolesc Psychiatry 28:882-887.
Polderman, T. J., Hoekstra, R. A., Vinkhuyzen, A. A., Sullivan, P. F., van der Sluis, S.
and Posthuma, D. (2013). Attentional switching forms a genetic link between attention
problems and autistic traits in adults. Psychol Med 43:1985-1996.
Porteus, M. H., Bulfone, A., Liu, J. K., Puelles, L., Lo, L. C. and Rubenstein, J. L.
(1994). DLX-2, MASH-1, and MAP-2 expression and bromodeoxyuridine
incorporation define molecularly distinct cell populations in the embryonic mouse
forebrain. J Neurosci 14:6370-6383.
Precious, S. V. and Rosser, A. E. (2012). Producing striatal phenotypes for
transplantation in Huntington's disease. Exp Biol Med (Maywood) 237:343-351.
References
213
Puelles, L., Kuwan, a. E., Puelles, E., Bulfone, A., Shimamura, K., Kelehe, r. J., SmigaS
et al. (2000). Pallial and subpallial derivatives in the embryonic chick and mouse
telencephalon, traced by the expression of the genes Dlx-2, Emx-1,
Nkx-2.1, Pax-6, and Tbr-1. J. Comp. Neurol 424: 409–438.
Quinn, J. C., West, J. D. and Hill, R. E. (1996). Multiple functions for Pax6 in mouse
eye and nasal development. Genes Dev 10:435-446.
Rajput, P. S., Kharmate, G., Somvanshi, R. K. and Kumar, U. (2009). Colocalization of
dopamine receptor subtypes with dopamine and cAMP-regulated phosphoprotein
(DARPP-32) in rat brain. Neurosci Res 65:53-63.
Rallu, M., Machold, R., Gaiano, N., Corbin, J. G., McMahon, A. P. and Fishell, G.
(2002). Dorsoventral patterning is established in the telencephalon of mutants lacking
both Gli3 and Hedgehog signaling. Development 129:4963-4974.
Rayoo, M., Yan, M., Takano, E. A., Bates, G. J., Brown, P. J., Banham, A. H. and Fox,
S. B. (2009). Expression of the forkhead box transcription factor FOXP1 is associated
with oestrogen receptor alpha, oestrogen receptor beta and improved survival in familial
breast cancers. J Clin Pathol 62:896-902.
Robbins, T. W. (2002). The 5-choice serial reaction time task: behavioural
pharmacology and functional neurochemistry. Psychopharmacology (Berl) 163:362-
380.
Roberton, V. H., Evans, A. E., Harrison, D. J., Precious, S. V., Dunnett, S. B., Kelly, C.
M. and Rosser, A. E. (2013). Is the adult mouse striatum a hostile host for neural
transplant survival? Neuroreport 24:1010-1015.
Rodgers, R. J. and Johnson, N. J. (1995). Factor analysis of spatiotemporal and
ethological measures in the murine elevated plus-maze test of anxiety. Pharmacol
Biochem Behav 52:297-303.
Roelink, H., Porter. JA, Chiang, C., Tanabe, Y., Chang, D., Beachy, P. and Jessell, T.
(1995). Floor plate and motor neuron induction by different concentrations of the
amino-terminal cleavage product of sonic hedgehog autoproteolysis. Cell 81(3):445-
455.
Ronald, A., Larsson, H., Anckarsater, H. and Lichtenstein, P. (2011). A twin study of
autism symptoms in Sweden. Mol Psychiatry 16:1039-1047.
Rosas, H. D., Liu, A. K., Hersch, S., Glessner, M., Ferrante, R. J., Salat, D. H., van der
Kouwe, A. et al. (2002). Regional and progressive thinning of the cortical ribbon in
Huntington's disease. Neurology 58:695-701.
Rosas, H. D., Salat, D. H., Lee, S. Y., Zaleta, A. K., Pappu, V., Fischl, B., Greve, D. et
al. (2008). Cerebral cortex and the clinical expression of Huntington's disease:
complexity and heterogeneity. Brain 131:1057-1068.
References
214
Rosser, A. E., Barker, R. A., Harrower, T., Watts, C., Farrington, M., Ho, A. K.,
Burnstein, R. M. et al. (2002). Unilateral transplantation of human primary fetal tissue
in four patients with Huntington's disease: NEST-UK safety report ISRCTN no
36485475. J Neurol Neurosurg Psychiatry 73:678-685.
Rosser, A. E. and Dunnett, S. B. (2003). Neural transplantation in patients with
Huntington's disease. CNS Drugs 17:853-867.
Rosser, A. E., Kelly, C. M. and Dunnett, S. B. (2011). Cell Transplantation for
Huntington's Disease: Practical and Clinical Considersations. Future Neurology 6:45-
62.
Rousso, D. L., Gaber, Z. B., Wellik, D., Morrisey, E. E. and Novitch, B. G. (2008).
Coordinated actions of the forkhead protein Foxp1 and Hox proteins in the columnar
organization of spinal motor neurons. Neuron 59:226-240.
Rubenstein, J., Shimamura, K., Martinez, S. and Puelles, L. (1998). Regionalization of
the prosencephalic neural plate. Annu Rev Neurosci. 445–477.
Sagaert, X., de Paepe, P., Libbrecht, L., Vanhentenrijk, V., Verhoef, G., Thomas, J.,
Wlodarska, I. et al. (2006). Forkhead box protein P1 expression in mucosa-associated
lymphoid tissue lymphomas predicts poor prognosis and transformation to diffuse large
B-cell lymphoma. J Clin Oncol 24:2490-2497.
Sagardoy, A., Martinez-Ferrandis, J. I., Roa, S., Bunting, K. L., Aznar, M. A., Elemento,
O., Shaknovich, R. et al. (2013). Downregulation of FOXP1 is required during germinal
center B-cell function. Blood 121:4311-4320.
Sagvolden, T. (2000). Behavioral validation of the spontaneously hypertensive rat
(SHR) as an animal model of attention-deficit/hyperactivity disorder (AD/HD).
Neurosci Biobehav Rev 24:31-39.
Sagvolden, T., Pettersen, M. B. and Larsen, M. C. (1993). Spontaneously hypertensive
rats (SHR) as a putative animal model of childhood hyperkinesis: SHR behavior
compared to four other rat strains. Physiol Behav 54:1047-1055.
Sandau, U. S., Alderman, Z., Corfas, G., Ojeda, S. R. and Raber, J. (2012). Astrocyte-
specific disruption of SynCAM1 signaling results in ADHD-like behavioral
manifestations. PLoS One 7:e36424.
Schackel, S., Pauly, M. C., Piroth, T., Nikkhah, G. and Dobrossy, M. D. (2013). Donor
age dependent graft development and recovery in a rat model of Huntington's disease:
Histological and behavioral analysis. Behav Brain Res.
Schneider, R. A., Hu, D., Rubenstein, J. L., Maden, M. and Helms, J. A. (2001). Local
retinoid signaling coordinates forebrain and facial morphogenesis by maintaining FGF8
and SHH. Development 128:2755-2767.
References
215
Schulz, R. A., Chromey, C., Lu, M. F., Zhao, B. and Olson, E. N. (1996). Expression of
the D-MEF2 transcription in the Drosophila brain suggests a role in neuronal cell
differentiation. Oncogene 12:1827-1831.
Schuurmans, C. and Guillemot, F. (2002). Molecular mechanisms underlying cell fate
specification in the developing telencephalon. Current Opinion in Neurobiology 12:26-
34.
Schwarcz, R. and Kohler, C. (1983). Differential vulnerability of central neurons of the
rat to quinolinic acid. Neurosci Lett 38:85-90.
Schwarcz, R., Whetsell, W., Jr., and Mangano, R. (1983). Quinolinic acid: an
endogenous metabolite that produces axon-sparing lesions in rat braiN. Science
219:316-318.
Searle, A. (1966). New mutants,. Mouse News Letters 2.
Shanmugalingam, S., Houart C, Picker A, Reifers F, Macdonald R, Barth A, Griffin K et
al. (2000). Ace/Fgf8 is required for forebrain commissure formation and patterning of
the telencephalon. Development 127:2549-2561.
Shi, C., Sakuma, M., Mooroka, T., Liscoe, A., Gao, H., Croce, K. J., Sharma, A. et al.
(2008). Down-regulation of the forkhead transcription factor Foxp1 is required for
monocyte differentiation and macrophage function. Blood 112:4699-4711.
Shi, C., Zhang, X., Chen, Z., Sulaiman, K., Feinberg, M. W., Ballantyne, C. M., Jain, M.
K. et al. (2004). Integrin engagement regulates monocyte differentiation through the
forkhead transcription factor Foxp1. J Clin Invest 114:408-418.
Shimamura, K., Hartigan, D. J., Martinez, S., Puelles, L. and Rubenstein, J. L. (1995).
Longitudinal organization of the anterior neural plate and neural tube. Development
121:3923-3933.
Shimamura, K. and Rubenstein, J. (1997). Inductive interactions direct early
regionalization of the mouse forebrain. Development , 124:2709-2718.
Shu, W., Lu, M. M., Zhang, Y., Tucker, P. W., Zhou, D. and Morrisey, E. E. (2007).
Foxp2 and Foxp1 cooperatively regulate lung and esophagus development.
Development 134:1991-2000.
Shu, W., Yang, H., Zhang, L., Lu, M. and Morrisey, E. (2001). Characterization of a
New Subfamily of Winged-helix/Forkhead (Fox) Genes That Are Expressed in the Lung
and Act as Transcriptional Repressors. J Biol Chem. 276:27488–27497.
Siesser, W. B., Zhao, J., Miller, L. R., Cheng, S. Y. and McDonald, M. P. (2006).
Transgenic mice expressing a human mutant beta1 thyroid receptor are hyperactive,
impulsive, and inattentive. Genes Brain Behav 5:282-297.
References
216
Solanto, M. V. (1998). Neuropsychopharmacological mechanisms of stimulant drug
action in attention-deficit hyperactivity disorder: a review and integration. Behav Brain
Res 94:127-152.
Song, J., Lee, S. T., Kang, W., Park, J. E., Chu, K., Lee, S. E., Hwang, T. et al. (2007).
Human embryonic stem cell-derived neural precursor transplants attenuate
apomorphine-induced rotational behavior in rats with unilateral quinolinic acid lesions.
Neurosci Lett 423:58-61.
Sontag, T. A., Tucha, O., Walitza, S. and Lange, K. W. (2010). Animal models of
attention deficit/hyperactivity disorder (ADHD): a critical review. Atten Defic Hyperact
Disord 2:1-20.
Soriano, P. (1999). Generalized lacZ expression with the ROSA26 Cre reporter strain.
Nat Genet 21:70-71.
Squitieri, F. and Jankovic, J. (2012). Huntington's disease: how intermediate are
intermediate repeat lengths? Mov Disord 27:1714-1717.
Stehling-Sun, S., Dade, J., Nutt, S. L., DeKoter, R. P. and Camargo, F. D. (2009).
Regulation of lymphoid versus myeloid fate 'choice' by the transcription factor Mef2c.
Nat Immunol 10:289-296.
Stenman, J., Toresson, H. and Campbell, K. (2003). Identification of two distinct
progenitor populations in the lateral ganglionic eminence: implications for striatal and
olfactory bulb neurogenesis. J Neurosci 23:167-174.
Storm, E., Garel, S., Borello U, Hebert JM, Martinez S, McConnell SK, GR, M. et al.
(2006). Dose-dependent functions of Fgf8 in regulating telencephalic patterning centers.
Development 133:1831-1844.
Stoykova, A., Fritsch, R., Walther, C. and Gruss, P. (1996). Forebrain patterning defects
in Small eye mutant mice. Development 122:3453-3465.
Stoykova, A., Gotz, M., Gruss, P. and Price, J. (1997). Pax6-dependent regulation of
adhesive patterning, R-cadherin expression and boundary formation in developing
forebrain. Development 124:3765-3777.
Stoykova, A. and Gruss, P. (1994). Roles of Pax-genes in developing and adult brain as
suggested by expression patterns. J Neurosci 14:1395-1412.
Stoykova, A., Treichel, D., Hallonet, M. and Gruss, P. (2000). Pax6 modulates the
dorsoventral patterning of the mammalian telencephalon. J Neurosci 20:8042-8050.
Streubel, B., Vinatzer, U., Lamprecht, A., Raderer, M. and Chott, A. (2005).
T(3;14)(p14.1;q32) involving IGH and FOXP1 is a novel recurrent chromosomal
aberration in MALT lymphoma. Leukemia 19:652-658.
References
217
Sturrock, R. (1980). A comparative quantitative and morphological study of ageing in
the mouse neostriatum, indusium griseum and anterior commissure. Neuropathology
and Applied Neurobiology 6:51-68.
Surmeli, G., Akay, T., Ippolito, G. C., Tucker, P. W. and Jessell, T. M. (2011). Patterns of
spinal sensory-motor connectivity prescribed by a dorsoventral positional template. Cell
147:653-665.
Sussel, L., Marin, O., Kimura S and JL., R. (1999). Loss of Nkx2.1 homeobox gene
function results in a ventral to dorsal molecular respecification within the basal
telencephalon: evidence for a transformation of the pallidum into the striatum.
Development 126:3359-3370.
Swanson, C. J., Perry, K. W., Koch-Krueger, S., Katner, J., Svensson, K. A. and
Bymaster, F. P. (2006). Effect of the attention deficit/hyperactivity disorder drug
atomoxetine on extracellular concentrations of norepinephrine and dopamine in several
brain regions of the rat. Neuropharmacology 50:755-760.
Szucsik, J. C., Witte, D. P., Li, H., Pixley, S. K., Small, K. M. and Potter, S. S. (1997).
Altered forebrain and hindbrain development in mice mutant for the Gsh-2 homeobox
gene. Dev Biol 191:230-242.
Takahashi, K., Liu, F. C., Oishi, T., Mori, T., Higo, N., Hayashi, M., Hirokawa, K. et al.
(2008). Expression of FOXP2 in the developing monkey forebrain: comparison with the
expression of the genes FOXP1, PBX3, and MEIS2. J Comp Neurol 509:180-189.
Takahashi, K. and Yamanaka, S. (2006). Induction of pluripotent stem cells from mouse
embryonic and adult fibroblast cultures by defined factors. Cell 126:663-676.
Tamura, S., Morikawa, Y., Iwanishi, H., Hisaoka, T. and Senba, E. (2003). Expression
pattern of the winged-helix/forkhead transcritpion factor FOXP1 in the central nervous
system. Gene Expression Patterns 3:193-197.
Tamura, S., Morikawa, Y., Iwanishi, H., Hisaoka, T. and Senba, E. (2004). Foxp1 gene
expression in projection neurons of the mouse striatum. Neuroscience 124:261-267.
Tang, B., Becanovic, K., Desplats, P. A., Spencer, B., Hill, A. M., Connolly, C., Masliah,
E. et al. (2012). Forkhead box protein p1 is a transcriptional repressor of immune
signaling in the CNS: implications for transcriptional dysregulation in Huntington
disease. Hum Mol Genet 21:3097-3111.
Tao, W. and Lai, E. (1992). Telencephalon-restricted expression of BF-1, a new member
of the HNF-3/fork head gene family, in the developing rat brain. Neuron 8:957-966.
Tate, M. C., Shear, D. A., Hoffman, S. W., Stein, D. G., Archer, D. R. and LaPlaca, M.
C. (2002). Fibronectin promotes survival and migration of primary neural stem cells
transplanted into the traumatically injured mouse brain. Cell Transplant 11:283-295.
References
218
Teramitsu, I., Kudo, L. C., London, S. E., Geschwind, D. H. and White, S. A. (2004).
Parallel FoxP1 and FoxP2 expression in songbird and human brain predicts functional
interaction. J Neurosci 24:3152-3163.
Thapar, A., Cooper, M., Eyre, O. and Langley, K. (2013). What have we learnt about the
causes of ADHD? J Child Psychol Psychiatry 54:3-16.
Theil, T., Alvarez-Bolado, G., Walter, A. and Ruther, U. (1999). Gli3 is required for
Emx gene expression during dorsal telencephalon development. Development
126:3561-3571.
Thomas, A., Burant, A., Bui, N., Graham, D., Yuva-Paylor, L. A. and Paylor, R. (2009).
Marble burying reflects a repetitive and perseverative behavior more than novelty-
induced anxiety. Psychopharmacology (Berl) 204:361-373.
Thomson, J. A., Itskovitz-Eldor, J., Shapiro, S. S., Waknitz, M. A., Swiergiel, J. J.,
Marshall, V. S. and Jones, J. M. (1998). Embryonic stem cell lines derived from human
blastocysts. Science 282:1145-1147.
Tole, S., Ragsdale, C. W. and Grove, E. A. (2000). Dorsoventral patterning of the
telencephalon is disrupted in the mouse mutant extra-toes(J). Dev Biol 217:254-265.
Toresson, H. and Campbell, K. (2001). A role for Gsh1 in the developing striatum and
olfactory bulb of Gsh2 mutant mice. Development 128:4769-4780.
Toresson, H., Mata de Urquiza, A., Charlotta, F., Perlmann, T. and Campbel, l. K.
(1999). Retinoids are produced by glia in the lateral ganglionic eminence and regulate
striatal neuron differentiation. Development 126:1317-1326.
Toresson, H., Potter, S. S. and Campbell, K. (2000). Genetic control of dorsal-ventral
identity in the telencephalon: opposing roles for Pax6 and Gsh2. Development
127:4361-4371.
Tripp, G. and Wickens, J. R. (2009). Neurobiology of ADHD. Neuropharmacology
57:579-589.
Tronche, F., Kellendonk, C., Kretz, O., Gass, P., Anlag, K., Orban, P. C., Bock, R. et al.
(1999). Disruption of the glucocorticoid receptor gene in the nervous system results in
reduced anxiety. Nat Genet 23:99-103.
Trueman, R. C., Dunnett, S. B., Jones, L. and Brooks, S. P. (2012a). Five choice serial
reaction time performance in the HdhQ92 mouse model of Huntington's disease. Brain
Res Bull 88:163-170.
Trueman, R. C., Jones, L., Dunnett, S. B. and Brooks, S. P. (2012b). Early onset deficits
on the delayed alternation task in the Hdh(Q92) knock-in mouse model of Huntington's
disease. Brain Res Bull 88:156-162.
Ueno, K., Togashi, H. and Yoshioka, M. (2003). [Behavioral and pharmacological
studies of juvenile stroke-prone spontaneously hypertensive rats as an animal model of
References
219
attention-deficit/hyperactivity disorder]. Nihon Shinkei Seishin Yakurigaku Zasshi
23:47-55.
Umehara, M., Ago, Y., Fujita, K., Hiramatsu, N., Takuma, K. and Matsuda, T. (2013).
Effects of serotonin-norepinephrine reuptake inhibitors on locomotion and prefrontal
monoamine release in spontaneously hypertensive rats. Eur J Pharmacol 702:250-257.
Urban, N., Martin-Ibanez, R., Herranz, C., Esgleas, M., Crespo, E., Pardo, M., Crespo-
Enriquez, I. et al. (2010). Nolz1 promotes striatal neurogenesis through the regulation
of retinoic acid signaling. Neural Dev 5:21.
Valerius, M. T., Li, H., Stock, J. L., Weinstein, M., Kaur, S., Singh, G. and Potter, S. S.
(1995). Gsh-1: a novel murine homeobox gene expressed in the central nervous system.
Dev Dyn 203:337-351.
Van der Kooy, D. and Fishell, G. (1987). Neuronal birthdate underlies the development
of striatal compartments. Brain Res 401:155-161.
Verma, A. K., Shoemaker, A., Simsiman, R., Denning, M. and Zachman, R. D. (1992).
Expression of retinoic acid nuclear receptors and tissue transglutaminase is altered in
various tissues of rats fed a vitamin A-deficient diet. J Nutr 122:2144-2152.
Walker, F. O. (2007). Huntington's disease. Lancet 369:218-228.
Wang, B., Fallon, J. F. and Beachy, P. A. (2000). Hedgehog-regulated processing of Gli3
produces an anterior/posterior repressor gradient in the developing vertebrate limb. Cell
100:423-434.
Wang, B., Lin, D., Li, C. and Tucker, P. (2003). Multiple domains define the expression
and regulatory properties of Foxp1 forkhead transcriptional repressors. J Biol Chem
278:24259-24268.
Wang, B., Waclaw, R. R., Allen, Z. J., 2nd, Guillemot, F. and Campbell, K. (2009).
Ascl1 is a required downstream effector of Gsx gene function in the embryonic mouse
telencephalon. Neural Dev 4:5.
Wang, B., Weidenfeld, J., Lu, M., Maika, S., Kuziel, W., Morrisey, E. and Tucker, P.
(2004a). Foxp1 regulates cardiac outflow tract, endocardial cushion morphogenesis and
myocyte proliferation and maturation. Development 131:4477-4487.
Wang, W. W., Cao, R., Rao, Z. R. and Chen, L. W. (2004b). Differential expression of
NMDA and AMPA receptor subunits in DARPP-32-containing neurons of the cerebral
cortex, hippocampus and neostriatum of rats. Brain Res 998:174-183.
Watts, C., Brasted, P. J. and Dunnett, S. B. (2000a). Embryonic donor age and dissection
influences striatal graft development and functional integration in a rodent model of
Huntington's disease. Exp Neurol 163:85-97.
References
220
Watts, C., Brasted, P. J. and Dunnett, S. B. (2000b). The morphology, integration, and
functional efficacy of striatal grafts differ between cell suspensions and tissue pieces.
Cell Transplant 9:395-407.
Wichterle, H., Turnbull, D., Nery, S., Fishell, G. and Alvarez-BuyllA, A. (2001). In
utero fate mapping reveals distinct migratory pathways and fates of neurons born in the
mammalian basal forebrain. Development , 128:3759-3771.
Wilson, S., and Rubesntein JL,. (2000). Induction and dorsoventral patterning of the
telencephelon. Neuron 28:641-651.
Wilson, S. W. and Houart, C. (2004). Early steps in the development of the forebrain.
Dev Cell 6:167-181.
Wilson, S. W. and Rubenstein, J. L. (2000). Induction and dorsoventral patterning of the
telencephalon. Neuron 28:641-651.
Wlodarska, I., Veyt, E., De Paepe, P., Vandenberghe, P., Nooijen, P., Theate, I.,
Michaux, L. et al. (2005). FOXP1, a gene highly expressed in a subset of diffuse large
B-cell lymphoma, is recurrently targeted by genomic aberrations. Leukemia 19:1299-
1305.
Wu, S., Esumi, S., Watanabe, K., Chen, J., Nakamura, K. C., Nakamura, K., Kometani,
K. et al. (2011). Tangential migration and proliferation of intermediate progenitors of
GABAergic neurons in the mouse telencephalon. Development 138:2499-2509.
Xu, G., Green, C. C., Fromholt, S. E. and Borchelt, D. R. (2012). Reduction of low-
density lipoprotein receptor-related protein (LRP1) in hippocampal neurons does not
proportionately reduce, or otherwise alter, amyloid deposition in APPswe/PS1dE9
transgenic mice. Alzheimers Res Ther 4:12.
Xu, Q., Wonders, C. P. and Anderson, S. A. (2005). Sonic hedgehog maintains the
identity of cortical interneuron progenitors in the ventral telencephalon. Development
132:4987-4998.
Xuan, S., Baptista, C. A., Balas, G., Tao, W., Soares, V. C. and Lai, E. (1995). Winged
helix transcription factor BF-1 is essential for the development of the cerebral
hemispheres. Neuron 14:1141-1152.
Ye, W., Shimamura K, Rubenstein JLR, MA, H. and A, R. (1998). FGF and Shh
Signals Control Dopaminergic and Serotonergic Cell Fate in the Anterior Neural Plate
Cell 93:755-766
Young, K. M., Fogarty, M., Kessaris, N. and Richardson, W. D. (2007). Subventricular
zone stem cells are heterogeneous with respect to their embryonic origins and
neurogenic fates in the adult olfactory bulb. J Neurosci 27:8286-8296.
Yu, W., Wang, Y., McDonnell, K., Stephen, D. and Bai, C. B. (2009). Patterning of
ventral telencephalon requires positive function of Gli transcription factors. Dev Biol
334:264-275.
References
221
Yun, K., Fischman, S., Johnson, J., Hrabe de Angelis, M., Weinmaster, G. and
Rubenstein, J. L. (2002). Modulation of the notch signaling by Mash1 and Dlx1/2
regulates sequential specification and differentiation of progenitor cell types in the
subcortical telencephalon. Development 129:5029-5040.
Yun, K., Garel, S., Fischman, S. and Rubenstein, J. L. (2003). Patterning of the lateral
ganglionic eminence by the Gsh1 and Gsh2 homeobox genes regulates striatal and
olfactory bulb histogenesis and the growth of axons through the basal ganglia. J Comp
Neurol 461:151-165.
Yun, K., Potter, S. and Rubenstein, J. L. (2001). Gsh2 and Pax6 play complementary
roles in dorsoventral patterning of the mammalian telencephalon. Development
128:193-205.
Zhang, Y., Li, S., Yuan, L., Tian, Y., Weidenfeld, J., Yang, J., Liu, F. et al. (2010). Foxp1
coordinates cardiomyocyte proliferation through both cell-autonomous and
nonautonomous mechanisms. Genes Dev 24:1746-1757.
Zhuo, L., Theis, M., Alvarez-Maya, I., Brenner, M., Willecke, K. and Messing, A.
(2001). hGFAP-cre transgenic mice for manipulation of glial and neuronal function in
vivo. Genesis 31:85-94.
Chapter 6 Characterisation of Mef2c in the developing striatum
222
8 The Characterisation of Mef2c in the
Developing Mouse Brain
8.1 Summary
Mef2c is a TF involved in muscle development and has shown to be expressed in both
the developing and adult brain. Mef2c was shown to be significantly up-regulated in an
Affymetrix screen that used mouse WGE to detect significant differences in gene
expression over peak striatal development (E12-E16). Although Mef2c has been shown
to be expressed in the brain previously the specific temporal and spatial pattern of its
expression during striatal development is largely unknown. Therefore the initial aim of
this Chapter was to characterise Mef2c during embryonic and early post-natal
development at a mRNA level using in situ hybridisation and qPCR, and at a protein
level using immunohistochemistry. Following WT characterisation the functional role of
Mef2c in MSN development was attempted. However as homozygous Mef2c KO mice
are embryonic lethal at E9.5 it was necessary to develop a Mef2c CKO mouse line. The
CKO line was achieved by crossing a Mef2c+/-
mouse with a Nestin-Cre line (Mef2c+/-
/Nestin) and subsequent breeding to a homozygous Mef2cfl/fl
mouse.
Results showed that peak expression of Mef2c was between E18 and P0 and expression
is restricted to post-mitotic neurons residing in the MZ of the developing striatum;
neurons that will populate the matrix region of the adult striatum. Preliminary results
from in vitro experiments using the Mef2c CKO suggest that that in the absence of
Mef2c there are no differences in apoptosis, proliferation or the number of MSNs after
24 hours or 7 DIV. However, further experiments, derived from cultures at the same age
and derived from later stages of striatal development, will need to be carried out to
confirm initial results and to investigate if Mef2c has the same role at later stages of
development.
Chapter 6 Characterisation of Mef2c in the developing striatum
223
8.2 Introduction
The TF Mef2C was found to be significantly up regulated during peak MSN
development in the screen carried out in the host lab to find gene expression changes
associated with MSN development (Precious et al., 2013 submitted). Thus this increased
expression during MSN neurogenesis may suggest that, like Foxp1, Mef2c has a role in
MSN development and differentiation. Mef2c is a member of the MADS domain family
of TFs, which are involved in the development of many systems, notably muscle (Brand
1997), and although all Mef2 genes (Mef2A-D) are expressed in the developing CNS
(Lyons et al. 1995), Mef2c is the first expressed, and the most studied Mef2c gene in the
CNS.
Specifically Mef2c is expressed in the developing telencephalon from E11.5 (Leifer et
al. 1993; Lyons et al. 1995) and by E14.5 Mef2c expression is apparent in the cortex,
amygdala, hippocampus and midbrain (Lyons et al. 1995). Mef2c expression persists to
adulthood in some regions, notably the cortex (Lyons et al. 1995). Additionally Mef2c
has been detected in human foetuses at 14 weeks of gestation and is present throughout
the cortical plate, specifically in cell nuclei (Leifer et al., 1994), but there is limited, if
any, MEF2C found in the human striatum at this age (Leifer et al., 1994). In rodents
Mef2c expression is associated with post mitotic neurons (Mao et al. 1999) and in vitro
experiments have implicated Mef2c in neuronal differentiation, and as an anti-apoptotic
factor during cortical and cerebellar development (Mao et al. 1999). Conversely,
following birth, it has been reported that Mef2c acts as an apoptotic factor and acts to
limit neuronal number (Liu et al. 2003). Recently it has also been shown that over-
expressing MEF2C in hESC cultures significantly increases neuronal number (Cho et
al. 2011), specifically increasing the number of DA neurons.
Owing to the embryonic lethality associated with homozygous Mef2c KO mice at E9.5,
attributable to cardiac defects (Lin et al. 1997), the above mentioned functions of Mef2c
in neuronal development were largely identified through in vitro analyses. Therefore to
understand more about the functional role of Mef2c in vivo, Mef2c CKO mice were
generated. Specifically, conditional deletion of Mef2c in the brains of mice using the
hGFAP-Cre line showed a marked increase in the number of excitatory synapses, but
significant impairments in hippocampal-dependent learning and memory (Barbosa et al.
Chapter 6 Characterisation of Mef2c in the developing striatum
224
2008). In a separate study loss of Mef2c using a Nestin-Cre line was shown to impair
neuronal differentiation, be required in the correct development and organisation of
cortical layers, as well as control normal synaptic activity in the cortex (Li et al. 2008).
Collectively the in vivo data suggest that Mef2c has an important role in learning and
memory and in synaptic plasticity. Triple Mef2A, C and D KO mice have recently been
created and showed that all three genes can act redundantly in neuronal survival as post
natal neuronal death was not apparent in individual Mef2 KOs. However, it was also
shown that only Mef2c was sufficient to ensure correct hippocampal synaptic function
as when either Mef2A or D were knocked out there were no differences (Akhtar et al.
2012) which suggests Mef2c is particularly important in CNS development.
Although Mef2c is known to be expressed in the ventral telencephalon from E11 (Lyons
et al. 1995), a thorough characterisation of Mef2c mRNA and protein throughout
development has not been reported and thus this was the aim of the initial experiments
outlined in this Chapter. This analysis allowed the expression pattern of Mef2c to be
identified, and to observe if levels of Mef2c were reduced, maintained or increased
throughout development. In situ hybridisation was undertaken to analyse the spatial
distribution of mRNA expression from E12-P7 and expression analysis was supported
with semi-quantitative PCR (qPCR). Immunohistochemistry was used as means of
looking at the presence of MEF2C protein throughout development.
While functional roles for Mef2c have been shown in the cortex, cerebellum and
hippocampus, as mentioned, no-one has looked at the expression pattern or function of
Mef2c during striatal development and thus a conditional mouse model was developed
to selectively KO Mef2c in the developing striatum. The nestin-Cre line (Tronche et al.
1999), which has been fully described in Chapters 1 and 5, was chosen to drive specific
Cre expression and thus KO Mef2c in the developing striatum. Previous reports have
shown successful cortical KO of Mef2c with this line when it was crossed to the same
Mef2c KO mouse lines I am using (Li et al. 2008). Mef2c cortical loss has also been
reported when the hGFAP-Cre was used (Barbosa et al. 2008). However, as shown
extensively in Chapter 5, this Cre-line only knocked out Foxp1 in the developing cortex
and it was decided it was not suitable for knocking out Mef2c during striatal
development.

Chapter 6 Characterisation of Mef2c in the developing striatum
225
The aim of this Chapter was to use the Mef2c CKO line to analyse differences in MSNs
using specific markers throughout development, into adulthood and ultimately to dissect
the functional importance of Mef2c in striatal differentiation. However, I have only
recently established the Mef2c CKO line and maintained the colony, thus only limited
results are presented here. However, results do serve as an indication of what effect the
loss of Mef2c could have on MSN differentiation. Future work will aim to increase
sample numbers in order to analyse MSN development in the absence of Mef2c.
Chapter 6 Characterisation of Mef2c in the developing striatum
226
8.3 Experimental Procedures
In situ hybridisation
A biotinylated RNA probe was previously designed and made by Dr R.A Jeyasingham.
Briefly, probes were generated from plasmids of the gene through PCR cloned into
pCRIItopo vector (Invitrogen). Sense and antisense probes were generated by
linearization with appropriate restriction enzymes then reverse transcribed with either
SP6 or T7 polymerase (Roche) and labelled with DIG (Roche). Full details are outlined
in Precious et al., 2013 submitted.
Preparation
Whole heads were removed as described in 2.2.1 from E12, E14, E16, E18, P0 and P7
mouse embryos and were snap frozen in iso-pentane on dry ice and stored at -80C. The
heads were then cut on the cryostat (30 m) onto superfrost plus slides and were left to
dry at 37C and stored at -80C.
Day 1
Slides were fixed in 4% PFA at RT for 20 minutes. Slides were then washed in 1 X PBS
for 1 minute before carbethoxylation (0.1% Diethyl pyrocarbonate (DEPC) (Sigma) in 1
X PBS) was carried out for 10 minutes at RT. The slides were then washed again in 1 X
PBS for 1 minute and then twice in 2 X SSC, each wash for 2 minutes (Appendix 4).
Pre-hybridisation of the slides then took place in boxes lined with 50% formamide
(Fisher) and 5 X SSC. 300l of pre-hybridisation buffer (Appendix 4) was added per
slide for 3 hours at 56ºC. Approximately 10 minutes before the end of the incubation
period the probes were denatured for 5 minutes at 95C and either the sense (control) or
anti-sense probe (both 1:100) was added separately to 200 µl of hybridisation buffer on
ice. The buffer-probe mix was then added to the individual slides and these were
covered with parafilm and incubated O/N at 56C in wetted boxes.
Day 2
Slides underwent the following washes at 56C on a rocker, 5 X SSC for 2 minutes, 5 X
SSC for 5 minutes, 2 X SSC for 5 minutes, 0.2 X SSC for 5 minutes, 50%
Chapter 6 Characterisation of Mef2c in the developing striatum
227
formamide/0.2 X SSC for 20 minutes, followed by 0.2 X SSC wash for 5 minutes at RT,
and finally by 2 x 5 minute washes in 1 X TBS-T at RT. Next, slides were blocked in
3% milk solution (dried carnation milk powder) in 1 X TBS-T for 1 hour. During the
blocking step, the antibody binding solution was prepared; anti-DIG-AP (Roche)
(1:5000) was added to1 X blocking factor. Following blocking 500 l of antibody
solution was applied per slide. When blocking was complete the slides went through
further washes at RT; 1 X TBS-T for 2 minutes and 1 X TBS-T for 15 minutes twice.
Slides were then equilibrated in alkaline phosphatise (AP) buffer with MgCl2 (2.5%
MgCl/ml of AP) for 5 minutes at RT. During equilibration, the development solution
was prepared. To 5 ml of AP buffer the colour solutions were added, 17 µl of NBT
(100mg/ml) (Roche) and 18 µl of BCIP (50mg/ml) (Roche). 500 µl of this solution was
added per slide, covered with parafilm and left to develop O/N at RT.
Day 3
Upon colour developing, slides were subjected to 2 washes in 1 X TE buffer for 10
minutes. Slides were then left to dry O/N and dehydrated through decreasing
concentrations of ethanol (75%, 95% and 100%), 5 minutes per concentration. Slides
were then placed in xylene and cover slipped using DPX mounting medium. Staining
was visualised using a Leica DRMBE microscope. Analysis was qualitative to look at
where and when expression took place.
qPCR
For cDNA synthesis please see Chapter 2.3. For the qPCR reactions the fluorescent
probe SYBER Green (Finzymes) was used. For each cDNA sample analysed, 3 replicate
wells were prepared with 1 µl of cDNA (diluted 1:20), 10 pmol of each of the oligo
pairs (primers used in qPCR are outlined in Appendix 5), 10 µl SYBER green master-
mix and water (Sigma) to give a final 20 µl volume. Opticom Monitor 3 software was
used for qPCR analysis. For all primers amplification conditions used were 95˚C for 15
minutes followed by 40 cycles of 95˚C for 30 seconds, 60˚C for 30 seconds and 72˚C
for 30 seconds on an Opticon 2 (MG research) machine. Melt curves were generated
from readings every 0.5˚C between 53˚C and 95˚. Amplification of the target transcript
sequence was quantified using relative quantification, where the ratio between the Ct
Chapter 6 Characterisation of Mef2c in the developing striatum
228
value of the target transcript and that of GAPDH was determined using the 2−ΔΔ
CT
Method (Livak and Schmittgen, 2002).
Breeding Strategy of the Mef2c CKO Line
To establish the line, initial breeding pairs were set up to generate Mef2c+/-
/Nestin+/-
mice. Subsequent to this, time mating’s were set up between Mef2c+/-
/Nestin+/-
positive
mice and homozygous Mef2c floxed mice (Mef2cfl/fl
) (a gift from Professor Olson) to
ensure thorough genetic knock down. Females were checked daily for a vaginal plug,
the day of plug discovery was recorded as E0. Pregnant dams were sacrificed at E14 and
embryos were dissected from the uterine horn as outlined in Chapter 2. Embryos were
either snap frozen for use in immunohistochemistry or individual striate were dissected
and individually cultured. Due to time restraints for this line, animals were genotyped at
Laragen, California using the tail biopsies taken during dissections.
Chapter 6 Characterisation of Mef2c in the developing striatum
229
Cell culture
Primary Cell Suspensions
For WT analysis individual striatae from CD1 E14 pups were dissected, pooled and then
cultured. For Mef2c CKO experiments each pair of striate from E14 pups were cultured
separately. For both experiments the cells were triturated to produce single cell
suspensions and cell counts were performed as described fully in Chapter 2. Cells were
plated down at a density of 100,000 per coverslip and fixed with fresh 4% PFA
following 24 hours, or 7 DIV.
Immunocytochemistry
Fluorescent immunocytochemistry was undertaken according to the protocol detailed in
Chapter 2. Primary antibodies used were anti-NESTIN (1:400), anti-BRDU (1:200)
anti-FOXP1 (1:500), anti-CTIP2 (1:500), anti TUJ1 (1:2000), anti-GFAP (1:2000) anti
DARPP-32 (S.Cruz) (1:200) and anti MEF2C (1:4000) (gift from McrDermott lab) (for
full antibody details see Appendix 2).
Proliferation Assays
BrdU was added to the cells the day before fixation at a concentration of 2 µg/µl.
Immunohistochemistry was carried out according to the protocol outlined in Chapter 2.
Statistical Analysis
Statistical analysis was performed using a one-factor ANOVA with Tukey-Kramer post-
hoc comparisons when appropriate. The alpha level for significant F-ratios was set at
0.05 for all analyses.
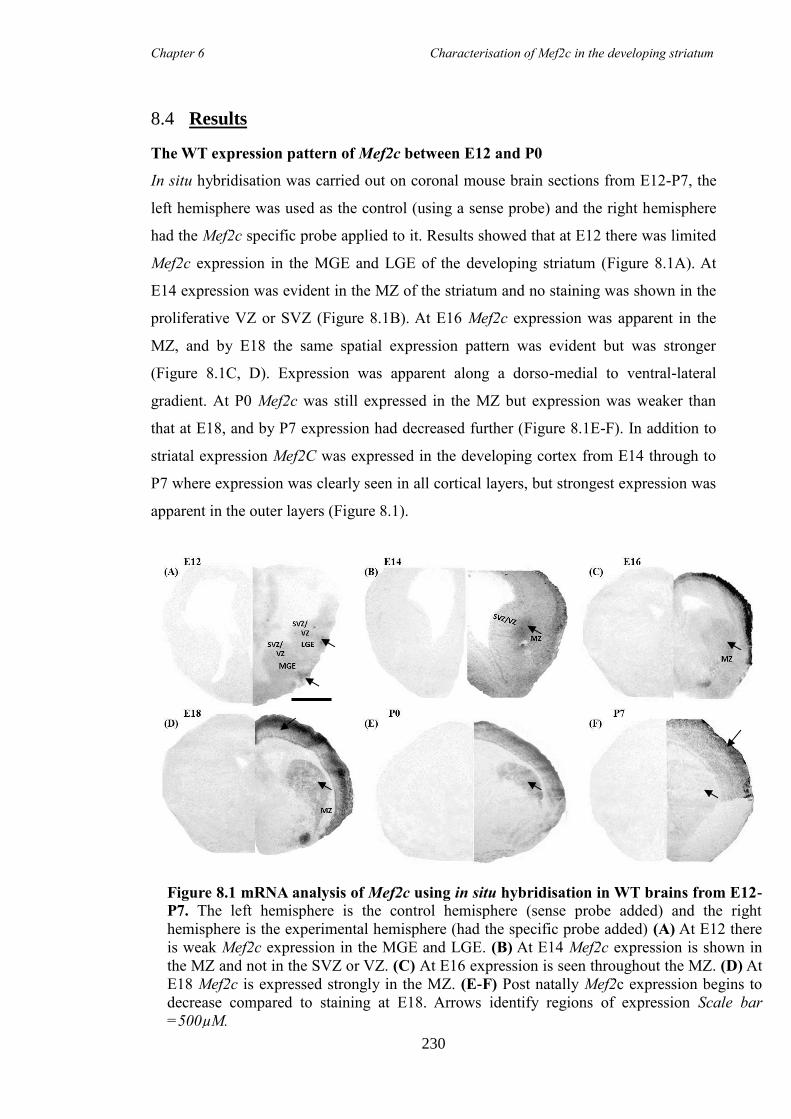
Chapter 6 Characterisation of Mef2c in the developing striatum
230
8.4 Results
The WT expression pattern of Mef2c between E12 and P0
In situ hybridisation was carried out on coronal mouse brain sections from E12-P7, the
left hemisphere was used as the control (using a sense probe) and the right hemisphere
had the Mef2c specific probe applied to it. Results showed that at E12 there was limited
Mef2c expression in the MGE and LGE of the developing striatum (Figure 8.1A). At
E14 expression was evident in the MZ of the striatum and no staining was shown in the
proliferative VZ or SVZ (Figure 8.1B). At E16 Mef2c expression was apparent in the
MZ, and by E18 the same spatial expression pattern was evident but was stronger
(Figure 8.1C, D). Expression was apparent along a dorso-medial to ventral-lateral
gradient. At P0 Mef2c was still expressed in the MZ but expression was weaker than
that at E18, and by P7 expression had decreased further (Figure 8.1E-F). In addition to
striatal expression Mef2C was expressed in the developing cortex from E14 through to
P7 where expression was clearly seen in all cortical layers, but strongest expression was
apparent in the outer layers (Figure 8.1).
Figure 8.1 mRNA analysis of Mef2c using in situ hybridisation in WT brains from E12-
P7. The left hemisphere is the control hemisphere (sense probe added) and the right
hemisphere is the experimental hemisphere (had the specific probe added) (A) At E12 there
is weak Mef2c expression in the MGE and LGE. (B) At E14 Mef2c expression is shown in
the MZ and not in the SVZ or VZ. (C) At E16 expression is seen throughout the MZ. (D) At
E18 Mef2c is expressed strongly in the MZ. (E-F) Post natally Mef2c expression begins to
decrease compared to staining at E18. Arrows identify regions of expression Scale bar
=500µM.
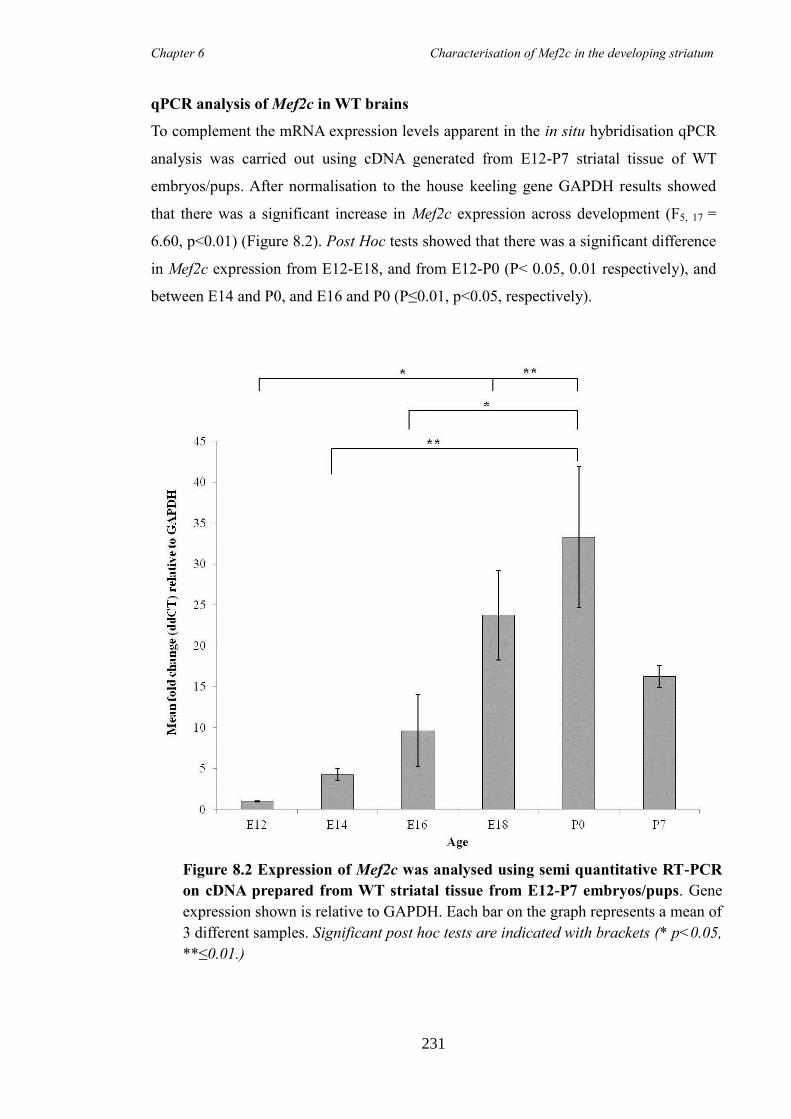
Chapter 6 Characterisation of Mef2c in the developing striatum
231
qPCR analysis of Mef2c in WT brains
To complement the mRNA expression levels apparent in the in situ hybridisation qPCR
analysis was carried out using cDNA generated from E12-P7 striatal tissue of WT
embryos/pups. After normalisation to the house keeling gene GAPDH results showed
that there was a significant increase in Mef2c expression across development (F5, 17 =
6.60, p<0.01) (Figure 8.2). Post Hoc tests showed that there was a significant difference
in Mef2c expression from E12-E18, and from E12-P0 (P< 0.05, 0.01 respectively), and
between E14 and P0, and E16 and P0 (P≤0.01, p<0.05, respectively).
Figure 8.2 Expression of Mef2c was analysed using semi quantitative RT-PCR
on cDNA prepared from WT striatal tissue from E12-P7 embryos/pups. Gene
expression shown is relative to GAPDH. Each bar on the graph represents a mean of
3 different samples. Significant post hoc tests are indicated with brackets (* p<0.05,
**≤0.01.)
Chapter 6 Characterisation of Mef2c in the developing striatum
232
The expression of MEF2C from E12 to adulthood
To analyse the presence and distribution of MEF2C protein during development,
immunohistochemistry was undertaken on coronal mouse brain sections from E12-P7
and staining was retrieved using DAB where relative intensity of staining was assessed
subjectively and validated by additional assessors, but quantification was not
performed. At E12 there was no detectable protein in the striatum (Figure 8.3A), but
starting at E14 through to P0, MEF2C staining became more intense in the MZ of the
striatum with levels peaking at P0 (Figure 8.3B-E). At P7 MEF2C intensity in the
striatum was reduced compared to E16, E18 and P0. MEF2C was also evident in the
cortex from E12 and expression continued throughout development (Figure 8.3A-F).
MEF2C protein was also assessed in the adult striatum and cortex. There was no
MEF2C staining in the adult striatum (Figure 8.3Gi,ii) but strong expression was
evident in the adult cortex, with the strongest staining seen in the outer layers (Figure
8.3Giii).
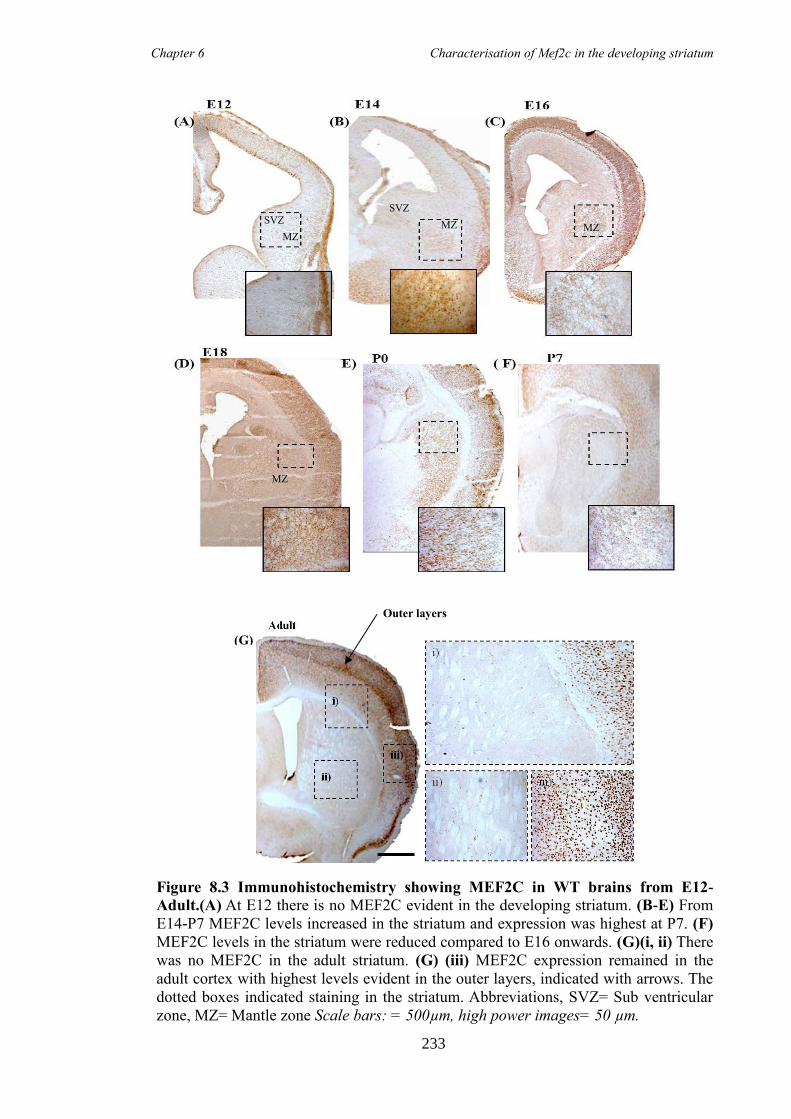
Chapter 6 Characterisation of Mef2c in the developing striatum
233
MZ
(G)
Outer layers
Figure 8.3 Immunohistochemistry showing MEF2C in WT brains from E12-
Adult.(A) At E12 there is no MEF2C evident in the developing striatum. (B-E) From
E14-P7 MEF2C levels increased in the striatum and expression was highest at P7. (F)
MEF2C levels in the striatum were reduced compared to E16 onwards. (G)(i, ii) There
was no MEF2C in the adult striatum. (G) (iii) MEF2C expression remained in the
adult cortex with highest levels evident in the outer layers, indicated with arrows. The
dotted boxes indicated staining in the striatum. Abbreviations, SVZ= Sub ventricular
zone, MZ= Mantle zone Scale bars: = 500µm, high power images= 50 µm.
MZ MZ MZ
MZ
SVZ SVZ
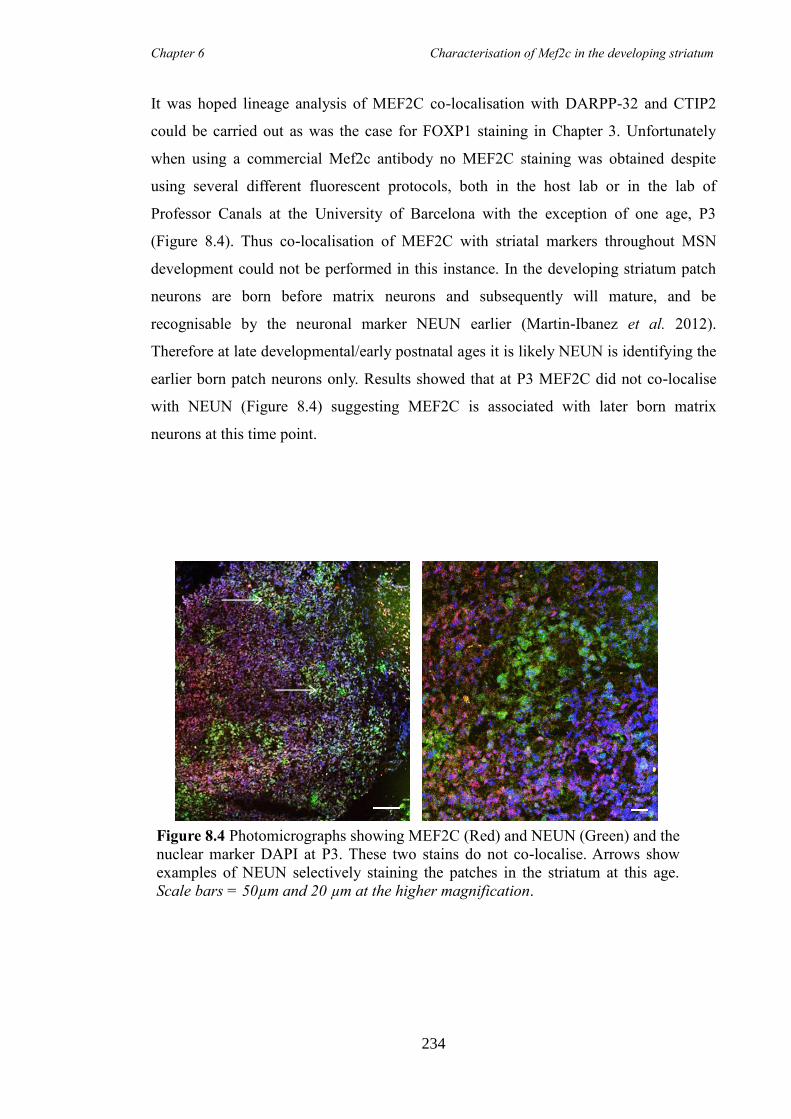
Chapter 6 Characterisation of Mef2c in the developing striatum
234
It was hoped lineage analysis of MEF2C co-localisation with DARPP-32 and CTIP2
could be carried out as was the case for FOXP1 staining in Chapter 3. Unfortunately
when using a commercial Mef2c antibody no MEF2C staining was obtained despite
using several different fluorescent protocols, both in the host lab or in the lab of
Professor Canals at the University of Barcelona with the exception of one age, P3
(Figure 8.4). Thus co-localisation of MEF2C with striatal markers throughout MSN
development could not be performed in this instance. In the developing striatum patch
neurons are born before matrix neurons and subsequently will mature, and be
recognisable by the neuronal marker NEUN earlier (Martin-Ibanez et al. 2012).
Therefore at late developmental/early postnatal ages it is likely NEUN is identifying the
earlier born patch neurons only. Results showed that at P3 MEF2C did not co-localise
with NEUN (Figure 8.4) suggesting MEF2C is associated with later born matrix
neurons at this time point.
Figure 8.4 Photomicrographs showing MEF2C (Red) and NEUN (Green) and the
nuclear marker DAPI at P3. These two stains do not co-localise. Arrows show
examples of NEUN selectively staining the patches in the striatum at this age.
Scale bars = 50µm and 20 µm at the higher magnification.
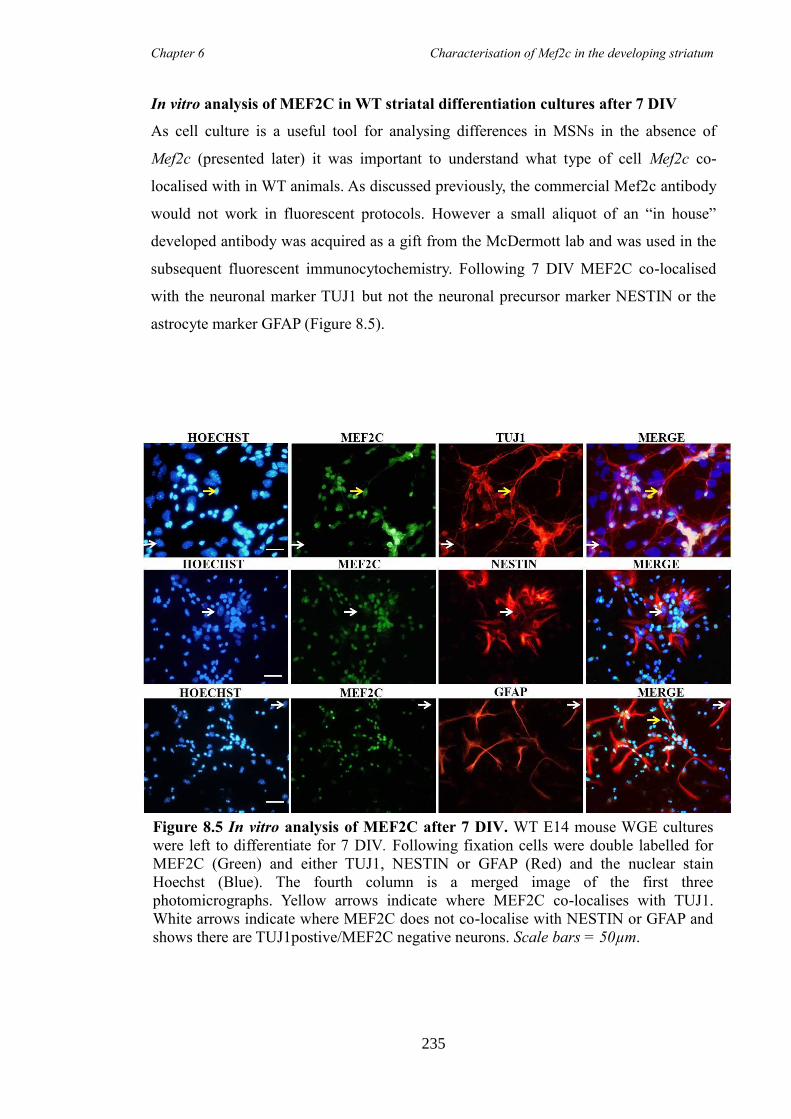
Chapter 6 Characterisation of Mef2c in the developing striatum
235
In vitro analysis of MEF2C in WT striatal differentiation cultures after 7 DIV
As cell culture is a useful tool for analysing differences in MSNs in the absence of
Mef2c (presented later) it was important to understand what type of cell Mef2c co-
localised with in WT animals. As discussed previously, the commercial Mef2c antibody
would not work in fluorescent protocols. However a small aliquot of an “in house”
developed antibody was acquired as a gift from the McDermott lab and was used in the
subsequent fluorescent immunocytochemistry. Following 7 DIV MEF2C co-localised
with the neuronal marker TUJ1 but not the neuronal precursor marker NESTIN or the
astrocyte marker GFAP (Figure 8.5).
Figure 8.5 In vitro analysis of MEF2C after 7 DIV. WT E14 mouse WGE cultures
were left to differentiate for 7 DIV. Following fixation cells were double labelled for
MEF2C (Green) and either TUJ1, NESTIN or GFAP (Red) and the nuclear stain
Hoechst (Blue). The fourth column is a merged image of the first three
photomicrographs. Yellow arrows indicate where MEF2C co-localises with TUJ1.
White arrows indicate where MEF2C does not co-localise with NESTIN or GFAP and
shows there are TUJ1postive/MEF2C negative neurons. Scale bars = 50µm.
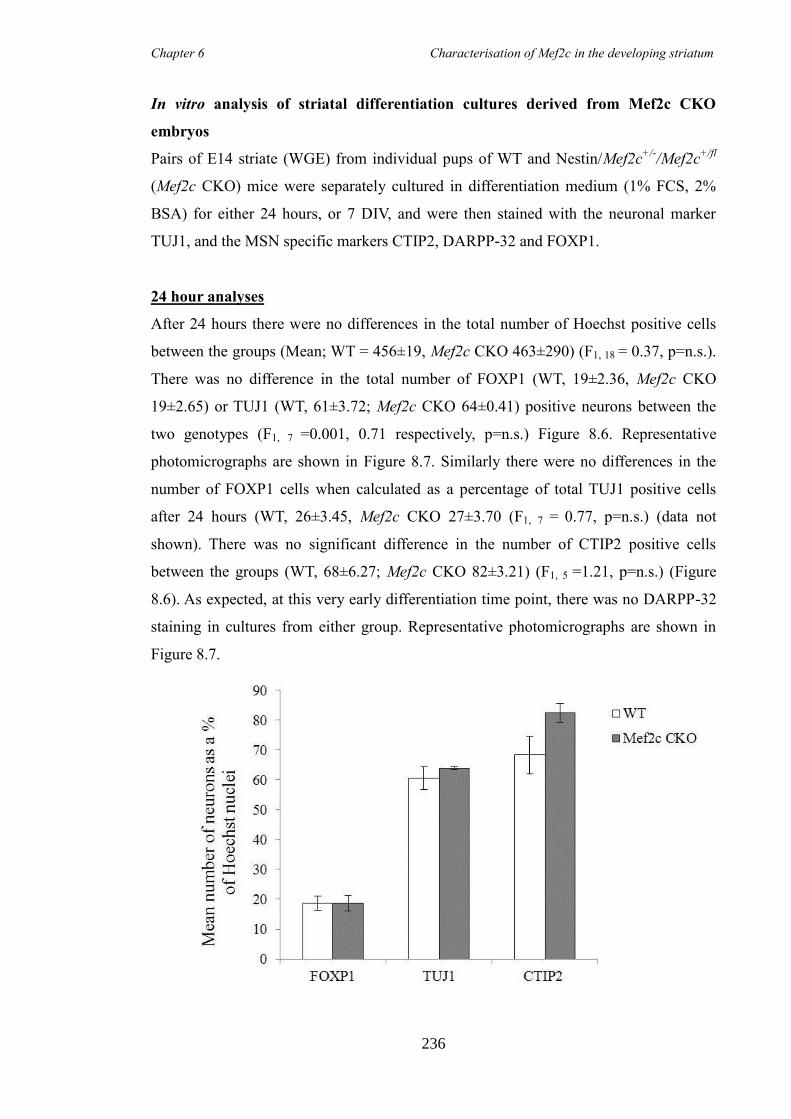
Chapter 6 Characterisation of Mef2c in the developing striatum
236
In vitro analysis of striatal differentiation cultures derived from Mef2c CKO
embryos
Pairs of E14 striate (WGE) from individual pups of WT and Nestin/Mef2c+/-
/Mef2c+/fl
(Mef2c CKO) mice were separately cultured in differentiation medium (1% FCS, 2%
BSA) for either 24 hours, or 7 DIV, and were then stained with the neuronal marker
TUJ1, and the MSN specific markers CTIP2, DARPP-32 and FOXP1.
24 hour analyses
After 24 hours there were no differences in the total number of Hoechst positive cells
between the groups (Mean; WT = 456±19, Mef2c CKO 463±290) (F1, 18 = 0.37, p=n.s.).
There was no difference in the total number of FOXP1 (WT, 19±2.36, Mef2c CKO
19±2.65) or TUJ1 (WT, 61±3.72; Mef2c CKO 64±0.41) positive neurons between the
two genotypes (F1, 7 =0.001, 0.71 respectively, p=n.s.) Figure 8.6. Representative
photomicrographs are shown in Figure 8.7. Similarly there were no differences in the
number of FOXP1 cells when calculated as a percentage of total TUJ1 positive cells
after 24 hours (WT, 26±3.45, Mef2c CKO 27±3.70 (F1, 7 = 0.77, p=n.s.) (data not
shown). There was no significant difference in the number of CTIP2 positive cells
between the groups (WT, 68±6.27; Mef2c CKO 82±3.21) (F1, 5 =1.21, p=n.s.) (Figure
8.6). As expected, at this very early differentiation time point, there was no DARPP-32
staining in cultures from either group. Representative photomicrographs are shown in
Figure 8.7.
Chapter 6 Characterisation of Mef2c in the developing striatum
237
Figure 8.6 In vitro cell counts at 24hours. Cultures were generated and cultured
individually from WT and Mef2c CKO striate and fixed after 24 hours in vitro. (A)
FOXP1, TUJ1 and CTIP positive cells were counted and are represented as a percentage
of total Hoechst positive nuclei. Each bar on the graph represents a mean of at least 2
different cultures. Error bars are SEM
Figure 8.7 (overleaf) In vitro analysis at 24 hours. E14 mouse WGE cultures from
both genotypes were plated down and left to differentiate for 24 hours in vitro.
Following fixation cells were labelled for (A) FOXP1 (Red) and TUJ1 (Green) or (B)
CTIP2 (Red) and DARPP-32 (Green) and the nuclear stain Hoechst (Blue). The fourth
column is a merged image of FOXP1, TUJ1 and Hoechst. Arrows represent examples of
co-localised cells. Scale bars = 50µm.
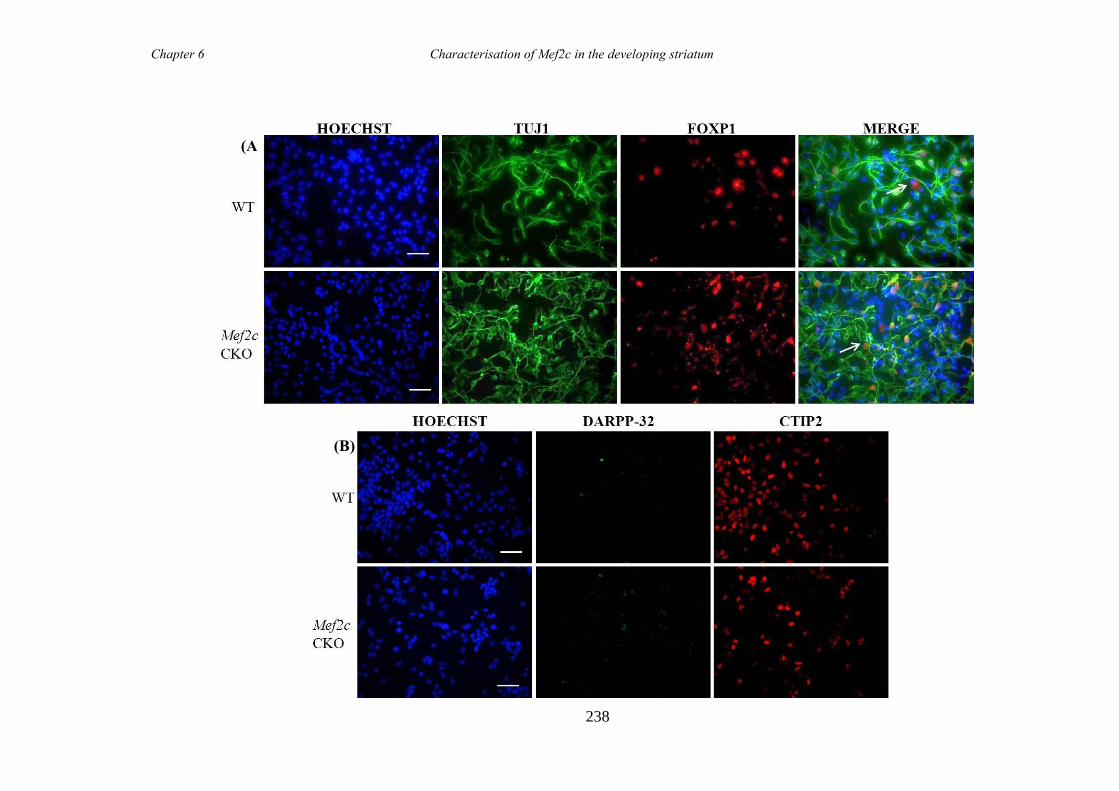
Chapter 6 Characterisation of Mef2c in the developing striatum
238
(A
)
(B)
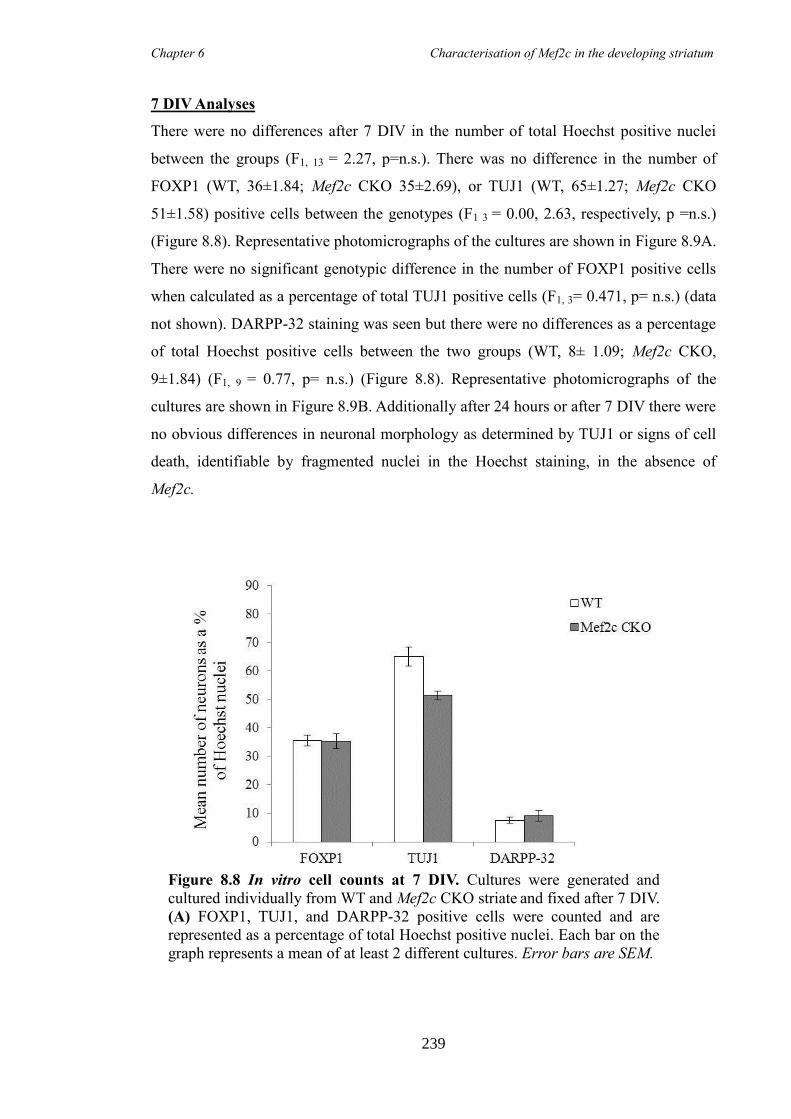
Chapter 6 Characterisation of Mef2c in the developing striatum
239
7 DIV Analyses
There were no differences after 7 DIV in the number of total Hoechst positive nuclei
between the groups (F1, 13 = 2.27, p=n.s.). There was no difference in the number of
FOXP1 (WT, 36±1.84; Mef2c CKO 35±2.69), or TUJ1 (WT, 65±1.27; Mef2c CKO
51±1.58) positive cells between the genotypes (F1 3 = 0.00, 2.63, respectively, p =n.s.)
(Figure 8.8). Representative photomicrographs of the cultures are shown in Figure 8.9A.
There were no significant genotypic difference in the number of FOXP1 positive cells
when calculated as a percentage of total TUJ1 positive cells (F1, 3= 0.471, p= n.s.) (data
not shown). DARPP-32 staining was seen but there were no differences as a percentage
of total Hoechst positive cells between the two groups (WT, 8± 1.09; Mef2c CKO,
9±1.84) (F1, 9 = 0.77, p= n.s.) (Figure 8.8). Representative photomicrographs of the
cultures are shown in Figure 8.9B. Additionally after 24 hours or after 7 DIV there were
no obvious differences in neuronal morphology as determined by TUJ1 or signs of cell
death, identifiable by fragmented nuclei in the Hoechst staining, in the absence of
Mef2c.
Figure 8.8 In vitro cell counts at 7 DIV. Cultures were generated and
cultured individually from WT and Mef2c CKO striate and fixed after 7 DIV.
(A) FOXP1, TUJ1, and DARPP-32 positive cells were counted and are
represented as a percentage of total Hoechst positive nuclei. Each bar on the
graph represents a mean of at least 2 different cultures. Error bars are SEM.
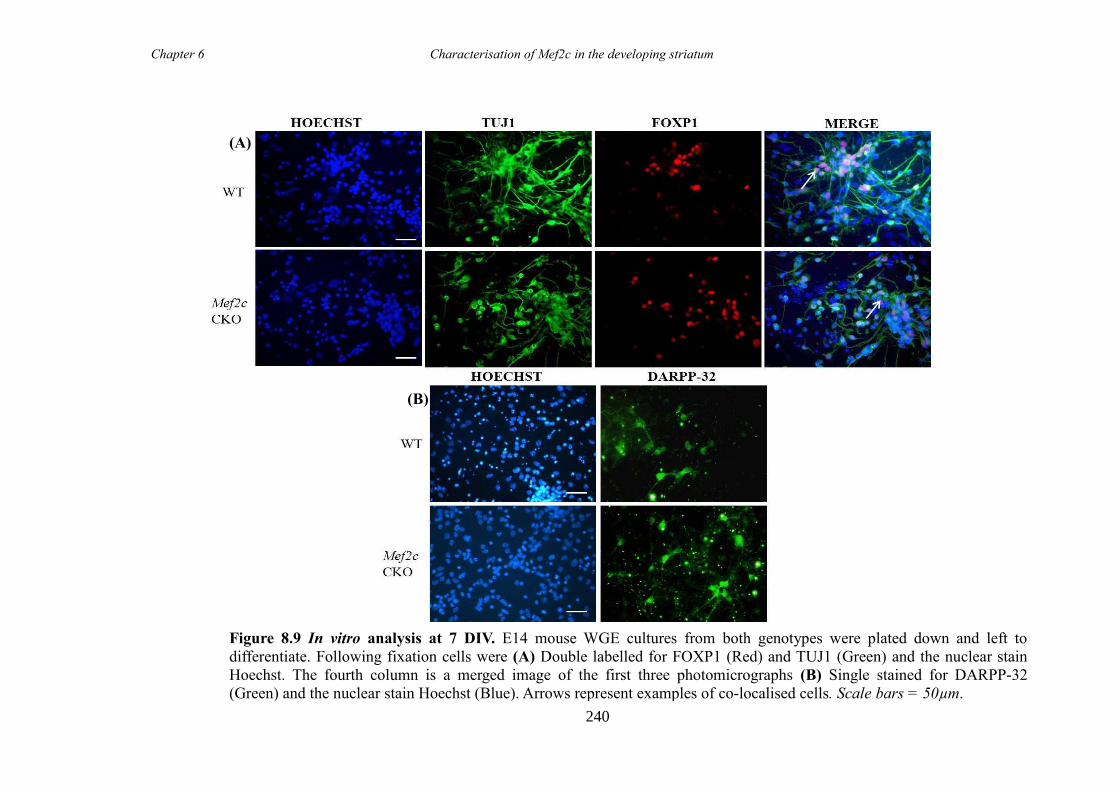
Chapter 6 Characterisation of Mef2c in the developing striatum
240
Figure 8.9 In vitro analysis at 7 DIV. E14 mouse WGE cultures from both genotypes were plated down and left to
differentiate. Following fixation cells were (A) Double labelled for FOXP1 (Red) and TUJ1 (Green) and the nuclear stain
Hoechst. The fourth column is a merged image of the first three photomicrographs (B) Single stained for DARPP-32
(Green) and the nuclear stain Hoechst (Blue). Arrows represent examples of co-localised cells. Scale bars = 50µm.
(A)
(B)
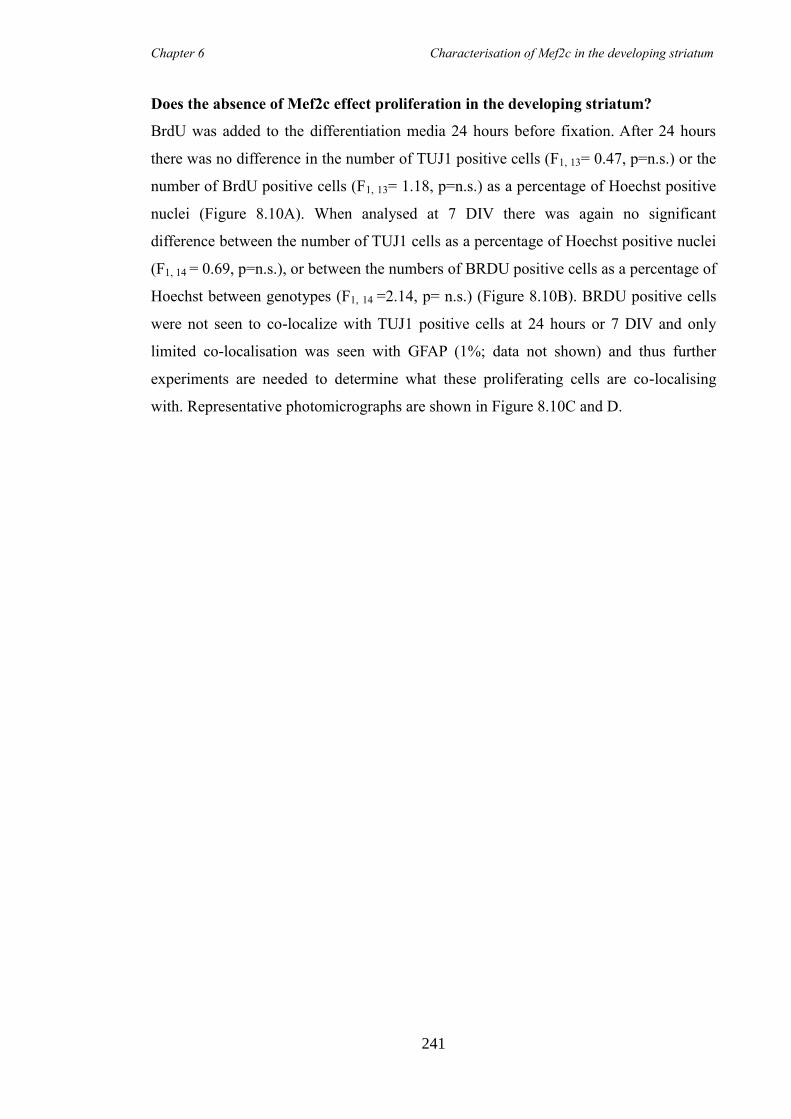
Chapter 6 Characterisation of Mef2c in the developing striatum
241
Does the absence of Mef2c effect proliferation in the developing striatum?
BrdU was added to the differentiation media 24 hours before fixation. After 24 hours
there was no difference in the number of TUJ1 positive cells (F1, 13= 0.47, p=n.s.) or the
number of BrdU positive cells (F1, 13= 1.18, p=n.s.) as a percentage of Hoechst positive
nuclei (Figure 8.10A). When analysed at 7 DIV there was again no significant
difference between the number of TUJ1 cells as a percentage of Hoechst positive nuclei
(F1, 14 = 0.69, p=n.s.), or between the numbers of BRDU positive cells as a percentage of
Hoechst between genotypes (F1, 14 =2.14, p= n.s.) (Figure 8.10B). BRDU positive cells
were not seen to co-localize with TUJ1 positive cells at 24 hours or 7 DIV and only
limited co-localisation was seen with GFAP (1%; data not shown) and thus further
experiments are needed to determine what these proliferating cells are co-localising
with. Representative photomicrographs are shown in Figure 8.10C and D.
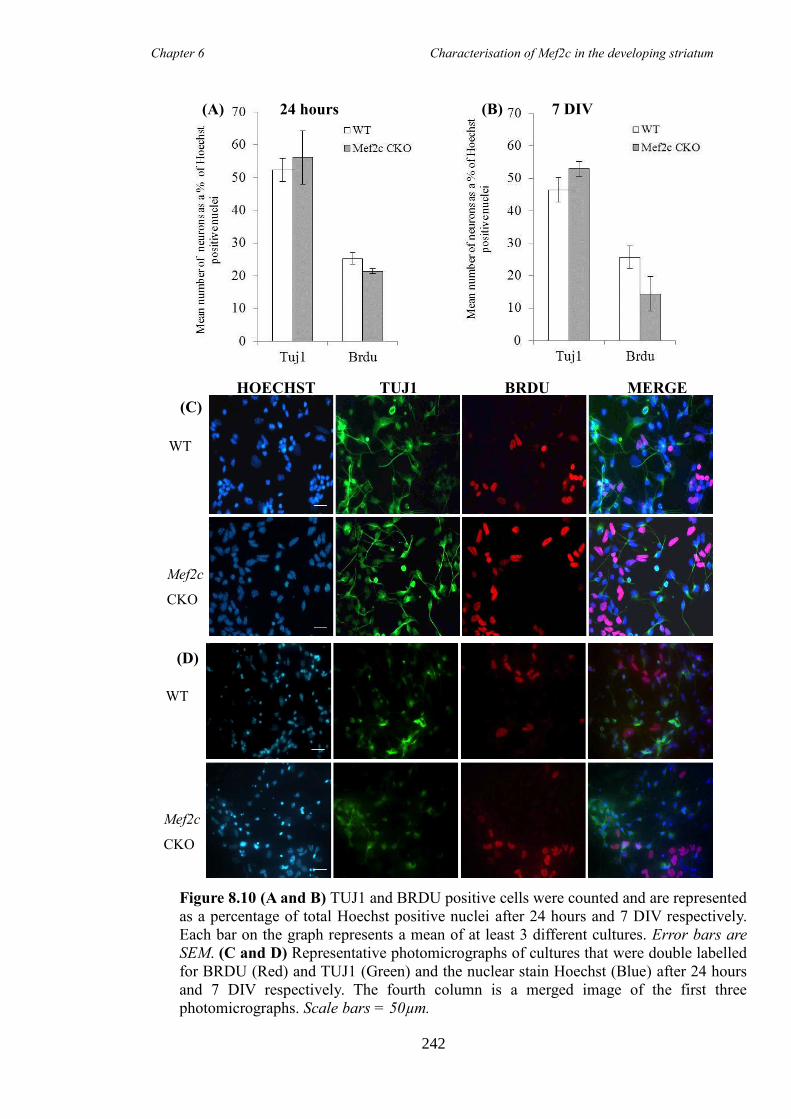
Chapter 6 Characterisation of Mef2c in the developing striatum
242
7 DIV (B) (A) 24 hours
WT
BRDU TUJ1 HOECHST MERGE
Mef2c
CKO
(C)
Mef2c
CKO
WT
(D)
Figure 8.10 (A and B) TUJ1 and BRDU positive cells were counted and are represented
as a percentage of total Hoechst positive nuclei after 24 hours and 7 DIV respectively.
Each bar on the graph represents a mean of at least 3 different cultures. Error bars are
SEM. (C and D) Representative photomicrographs of cultures that were double labelled
for BRDU (Red) and TUJ1 (Green) and the nuclear stain Hoechst (Blue) after 24 hours
and 7 DIV respectively. The fourth column is a merged image of the first three
photomicrographs. Scale bars = 50µm.
Chapter 6 Characterisation of Mef2c in the developing striatum
243
8.5 Discussion
Mef2c has a peak window of expression during striatal development
In vertebrates, all MEF2 isoforms are expressed at variable levels in distinct but
overlapping patterns in the embryonic and adult CNS (Lyons et al. 1995). It is known
that the temporal and spatial expression pattern of the Mef2 genes changes during
embryogenesis, specifically increasing during neuronal maturation and withdraw from
the cell cycle (Schulz et al. 1996). Mef2c expression has been studied in some areas of
the CNS but specific expression during striatal development has not. Thus in situ
hybridisation and immunohistochemistry was used to characterise the presence of
Mef2c mRNA and protein respectively, in WT mice during development.
At E12.5 small patches of Mef2c expression were apparent along the lateral edge of the
developing LGE and MGE, but expression was weak and there was no protein evident
at this stage, likely because translation of mRNA is not always immediate (Ferland et al.
2003). In the MZ of the developing striatum at E14 and E16 there was a gradual
increase in mRNA expression, and also in the intensity of the immunohistochemical
signal suggesting an increase in protein, there was no staining apparent in the
proliferative VZ or SVZ. These results are consistent with what was shown by
previously by our lab (Vinh et al., unpublished). Between E18 and P0 MEF2C mRNA
expression and corresponding immunohistochemical staining increased with a strong
signal in the striatal MZ coinciding with neuronal maturation (Schulz et al. 1996).
qPCR confirmed that there was a significant increase in expression at E18 and P0
compared to E12, and a significant increase from E14 and E16 compared to P0.
However, these results could not confirm the spatial expression of Mef2c shown in the
in situ hybridisation. These results suggest that between E18 and P0 there is a peak
window of Mef2c expression in the developing striatum as by P7 expression has started
to decrease and in the adult striatum it is no longer evident. These results are consistent
with Mef2c peak expression during cortical neurogenesis in the rat. Peak expression was
evident in the cortical plate between E18 and E21, the area associated with post-mitotic,
differentiating neurons with no expression evident in the VZ (Mao et al. 1999) .
Chapter 6 Characterisation of Mef2c in the developing striatum
244
Mef2c expression is coincident with the second wave of neurogenesis in the
developing striatum
There are two waves of peak neurogenesis in striatal development. Striatal neurons born
between E12 and E13 populate the patches (Mason et al. 2005), whereas those born
later, between E13-E16, reside in the matrix of the adult striatum (Mason et al. 2005;
Van der Kooy and Fishell 1987). It is believed that the neurons that populate the patch
and matrix transiently mix in the MZ of the striatum, and it is not until E18, through
differential gene expression, that segregation is apparent (Mason et al. 2005). Therefore
the later, peak expression of Mef2c could suggest that it is associated with matrix, rather
than patch born neurons. However although I have shown that MEF2C co-localises with
neurons (Fig 6.5), I was unable to show whether MEF2C co-stained with MSN markers
or, if it co-stained with interneurons, and thus further immunohistochemistry needs to be
carried out to answer these questions.
Between E16 and P0 Mef2c expression was apparent along a dorso-medial to vental-
lateral gradient, similar to that of the TF Ikaros, a modulator of cell cycle exit for a
subset of neuronal precursor cells that promotes neurogenesis of Enkephelin positive,
matrix neurons (Martin-Ibanez et al. 2012). Ikaros is expressed from E14.5, peaks at
E18.5 and has disappeared by P15, comparable to what we have shown for Mef2c
expression. Additionally like Mef2, Ikaros is expressed in neurons of the MZ, does not
co-localise with Nestin or GFAP and is not expressed in the VZ or SVZ of the
developing striatum (Martin-Ibanez et al. 2012). Furthermore we have shown that the
complementary pattern of expression between MEF2C and NEUN (which has shown to
be used as a patch marker at P3 (Martin-Ibanez et al. 2012)) is comparable to the
expression pattern shown by IKAROS and DARPP-32 at E18 (which has shown to be
used as a patch marker at E18 (Martın-Ibanez et al. 2010)). Taken together these results
are consistent with Mef2c being associated in the development of matrix born neurons
and the possibility of Mef2c and Ikaros functioning in the same genetic pathways
implicated in later born striatal neurons.
Dlx1/2 are two genes also associated with the development of later born striatal neurons
(Anderson et al., 1997, Yun et al., 2002) and in the Dlx1/2 double knock-out mouse,
expression of both Mef2c and Ikaros was lost from the MZ of the striatum (Long et al.
2009). Moreover when Mef2c is knocked out from multipotent progenitors derived from
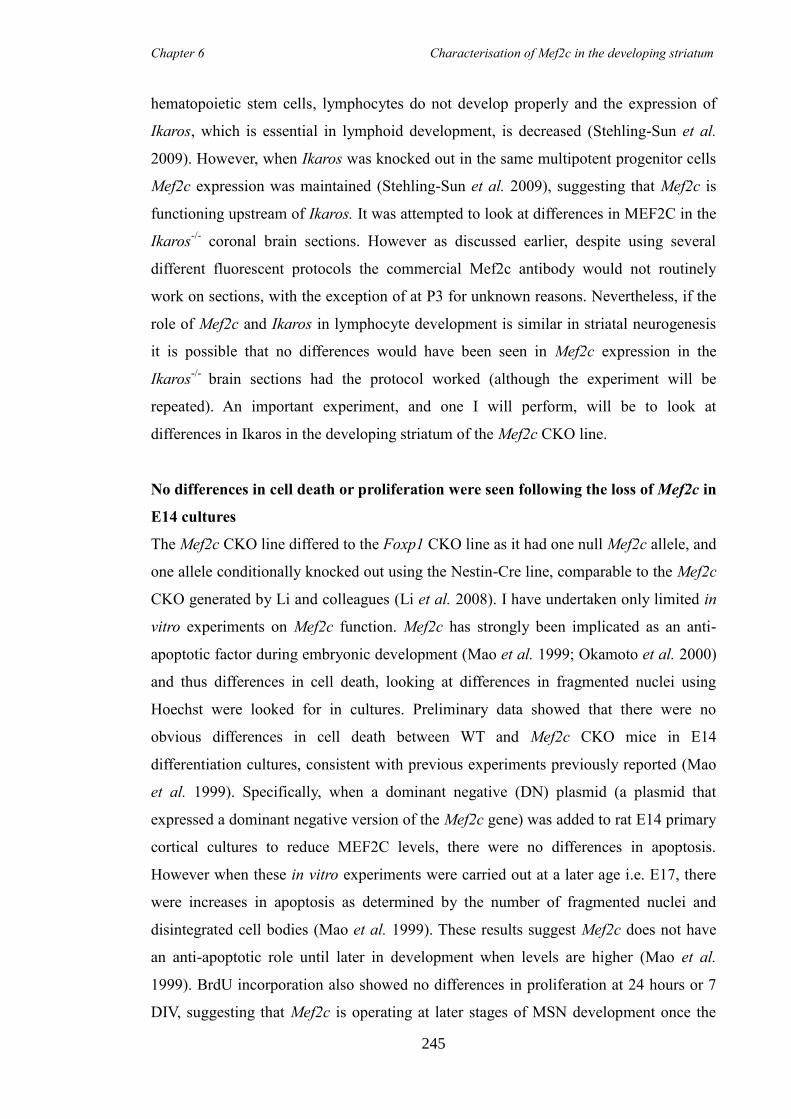
Chapter 6 Characterisation of Mef2c in the developing striatum
245
hematopoietic stem cells, lymphocytes do not develop properly and the expression of
Ikaros, which is essential in lymphoid development, is decreased (Stehling-Sun et al.
2009). However, when Ikaros was knocked out in the same multipotent progenitor cells
Mef2c expression was maintained (Stehling-Sun et al. 2009), suggesting that Mef2c is
functioning upstream of Ikaros. It was attempted to look at differences in MEF2C in the
Ikaros-/-
coronal brain sections. However as discussed earlier, despite using several
different fluorescent protocols the commercial Mef2c antibody would not routinely
work on sections, with the exception of at P3 for unknown reasons. Nevertheless, if the
role of Mef2c and Ikaros in lymphocyte development is similar in striatal neurogenesis
it is possible that no differences would have been seen in Mef2c expression in the
Ikaros-/-
brain sections had the protocol worked (although the experiment will be
repeated). An important experiment, and one I will perform, will be to look at
differences in Ikaros in the developing striatum of the Mef2c CKO line.
No differences in cell death or proliferation were seen following the loss of Mef2c in
E14 cultures
The Mef2c CKO line differed to the Foxp1 CKO line as it had one null Mef2c allele, and
one allele conditionally knocked out using the Nestin-Cre line, comparable to the Mef2c
CKO generated by Li and colleagues (Li et al. 2008). I have undertaken only limited in
vitro experiments on Mef2c function. Mef2c has strongly been implicated as an anti-
apoptotic factor during embryonic development (Mao et al. 1999; Okamoto et al. 2000)
and thus differences in cell death, looking at differences in fragmented nuclei using
Hoechst were looked for in cultures. Preliminary data showed that there were no
obvious differences in cell death between WT and Mef2c CKO mice in E14
differentiation cultures, consistent with previous experiments previously reported (Mao
et al. 1999). Specifically, when a dominant negative (DN) plasmid (a plasmid that
expressed a dominant negative version of the Mef2c gene) was added to rat E14 primary
cortical cultures to reduce MEF2C levels, there were no differences in apoptosis.
However when these in vitro experiments were carried out at a later age i.e. E17, there
were increases in apoptosis as determined by the number of fragmented nuclei and
disintegrated cell bodies (Mao et al. 1999). These results suggest Mef2c does not have
an anti-apoptotic role until later in development when levels are higher (Mao et al.
1999). BrdU incorporation also showed no differences in proliferation at 24 hours or 7
DIV, suggesting that Mef2c is operating at later stages of MSN development once the
Chapter 6 Characterisation of Mef2c in the developing striatum
246
cells have excited the cell cycle and completed mitosis. This is in agreement with
cultured cortical neurons (Mao et al. 1999) which did not co-loclasie with Nestin or
BrdU. Future work will need to include more specific apoptotic tests such as TUNEL
analysis and in addition to repeating analyses at E14, culturing cells at later
developmental time points, such as E16 or E18 which may be more representative of
Mef2c function in striatal development.
Similar to the discussed work in cortical neurons in vitro experiments using DN
plasmids to knock-down Mef2c expression in WT E14 striatal cultures was trialled
during the course of this thesis. However, as discussed in Chapter 4, and shown in
Appendix 7, successful transfection of plasmids into primary striatal cells that would
allow comparisons on a population rather than of single cell basis was attempted using
several strategies without success. Unfortunately the transfection method or efficiency
was not disclosed in the work carried out by Mao et al and therefore comparisons in
methods could not be made. Thus, knocking down/out Mef2c depended upon the
generation of Mef2c CKO mice.
The loss of Mef2c in E14 striatal cultures did not affect the number of cells
positively staining for MSN markers
The number of MSNs in cultures generated from E14 WT and Mef2c CKO mice was
assessed using the markers CTIP2 and DARPP-32. In addition, building on the results
in Chapters 3 and 4, FOXP1 was also used and considered as a new and robust marker
of MSNs. Preliminary results show that there were no differences in the number of
MSNs after 24 hours or 7 DIV although no results were obtained for CTIP2 at 7 DIV.
Increased sample numbers are needed to validate these results and cultures generated
from later born striatal neurons (E16 or E18), when Mef2c expression has shown to
peak may give a more accurate representation Mef2c function.
It has been shown that Mef2c can form heterodimers with the bHLH factors Ascl1 and
E-12, to synergistically regulate target gene expression, and thus transcription in
neuronal cells (Black et al., 1996; Black et al., 2000). It was shown that at a protein
level both Mef2c and Ascl1 can activate each other and only one of these TFs needs to
bind directly to DNA to regulate gene expression (Black et al., 1996). As Ascl1 is
needed to control the differentiation of at least one lineage of MSNs, it is possible that
Chapter 6 Characterisation of Mef2c in the developing striatum
247
Mef2c is also working up or downstream of this gene, in addition to Ikaros in
conjunction with other genes, in later aspects MSN development.
8.6 Conclusion
WT expression of Mef2c during striatal development is apparent from E12, peaks
between E18 and P0 and by adulthood is lost in the mouse striatum but retained in the
cortex. This peak in expression corresponds with that of the TF Ikaros, which is
implicated in promoting neurogenesis in the later born matrix neurons. Additionally, at
P3 MEF2C does not co-localise with NEUN, which at this time is a marker of patch
neurons, further suggesting that Mef2c is associated with post-mitotic matrix neurons.
Preliminary data from the Mef2c CKO mice suggests that there are no differences in
apoptosis, proliferation or MSN number in the absence of Mef2c, but an increase in the
number of biological replicates is needed to confirm this. Moreover as results presented
in this Chapter have suggested that peak Mef2c expression in the developing striatum is
apparent later than E14, it is likely that striatal cultures will need to be generated from
embryos at later time points i.e. E16 or E18, to obtain more specific and representative
results of the role of Mef2c in striatal development.

Appendix
a
9 Appendices
9.1 Appendix 1
Cell Culture Solutions
PLL:
1mg/kg dissolved in distilled 0.1 % DEPC H2O
Trypsin Solution:
Mix 0.1% Trypsin with 0.05% DNase in HBSS.
DNase solution:
Mix 0.05% DNase into Hanks Balanced Solution (HBSS)
Differentiation Media:
Basic DMEM-12 with the addition of 1% Foetal calf serum (FCS) and 2% B27
4% PFA:
For 50ml, 5.4ml of Paraformaldehyde and 2.5 ml of 20X PBS made up in with 0.1 %
DEPC H2O
Immunocytochemistry Solutions
20X Phosphate Buffered Saline (PBS) (pH 7.4):
Sodium Chloride- 160g
Potassium Chloride-4g,
Di-hydrogen sodium phosphate (NaH2PO4) - 28.84g,
Di-sodium hydrogen phosphate (Na2HPO4) - 4.14 g
Distilled Water – Up to 1L (+ 0.01% DEPC (diethyl pyrocarbonate); over night on
stirrer; autoclave for 45 min at 120 °C if used for in situ Hybridisation)
(Dilute in distilled water for 10X and 1X PBS)
PBS- T

Appendix
b
1X PBSTriton- Add 0.5% Triton* and let dissolve on a shaker. (* advisable to make in a
glass bottle even if only small amounts needed)
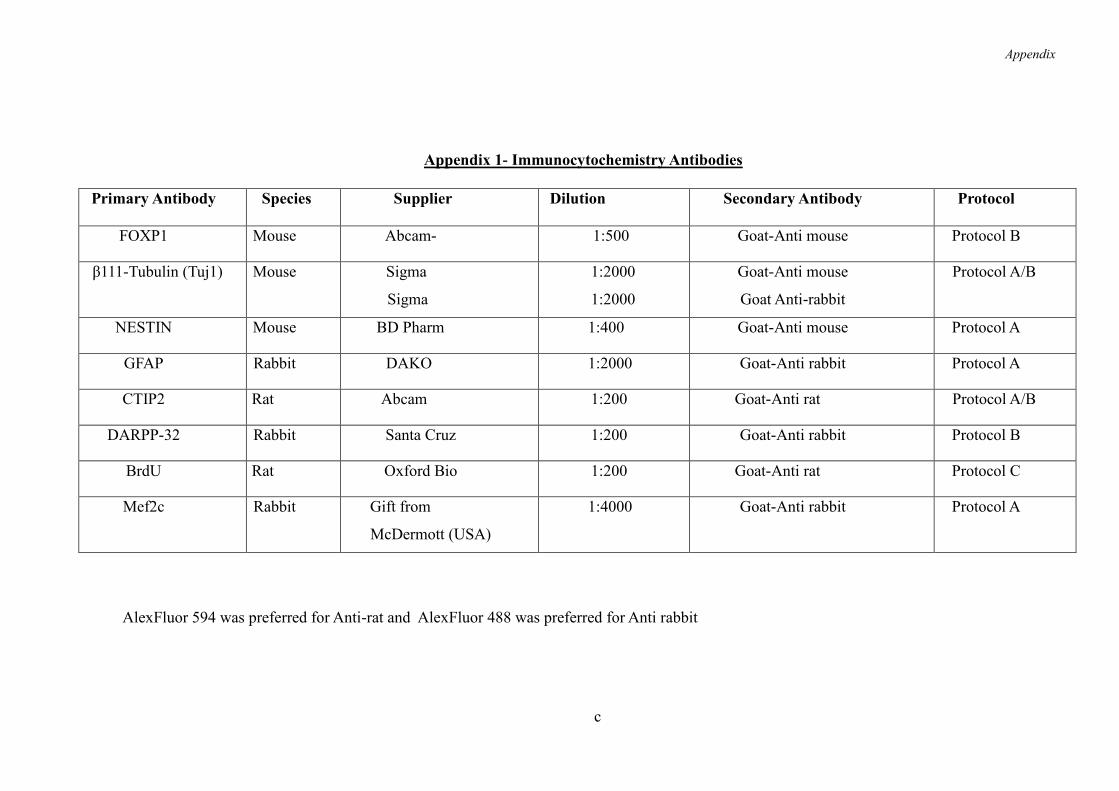
Appendix
c
Appendix 1- Immunocytochemistry Antibodies
AlexFluor 594 was preferred for Anti-rat and AlexFluor 488 was preferred for Anti rabbit
Primary Antibody Species Supplier Dilution
Secondary Antibody Protocol
FOXP1 Mouse Abcam- 1:500 Goat-Anti mouse Protocol B
β111-Tubulin (Tuj1) Mouse Sigma
Si Sigma
1:2000
1:2000
Goat-Anti mouse
Goat Anti-rabbit
Protocol A/B
NESTIN Mouse B BD Pharm 1:400 Goat-Anti mouse Protocol A
GFAP Rabbit DAKO 1:2000 Goat-Anti rabbit Protocol A
CTIP2 Rat Abcam 1:200 Goat-Anti rat Protocol A/B
DARPP-32 Rabbit Santa Cruz 1:200 Goat-Anti rabbit Protocol B
BrdU Rat Oxford Bio 1:200 Goat-Anti rat Protocol C
Mef2c Rabbit Gift from
McDermott (USA)
1:4000 Goat-Anti rabbit Protocol A
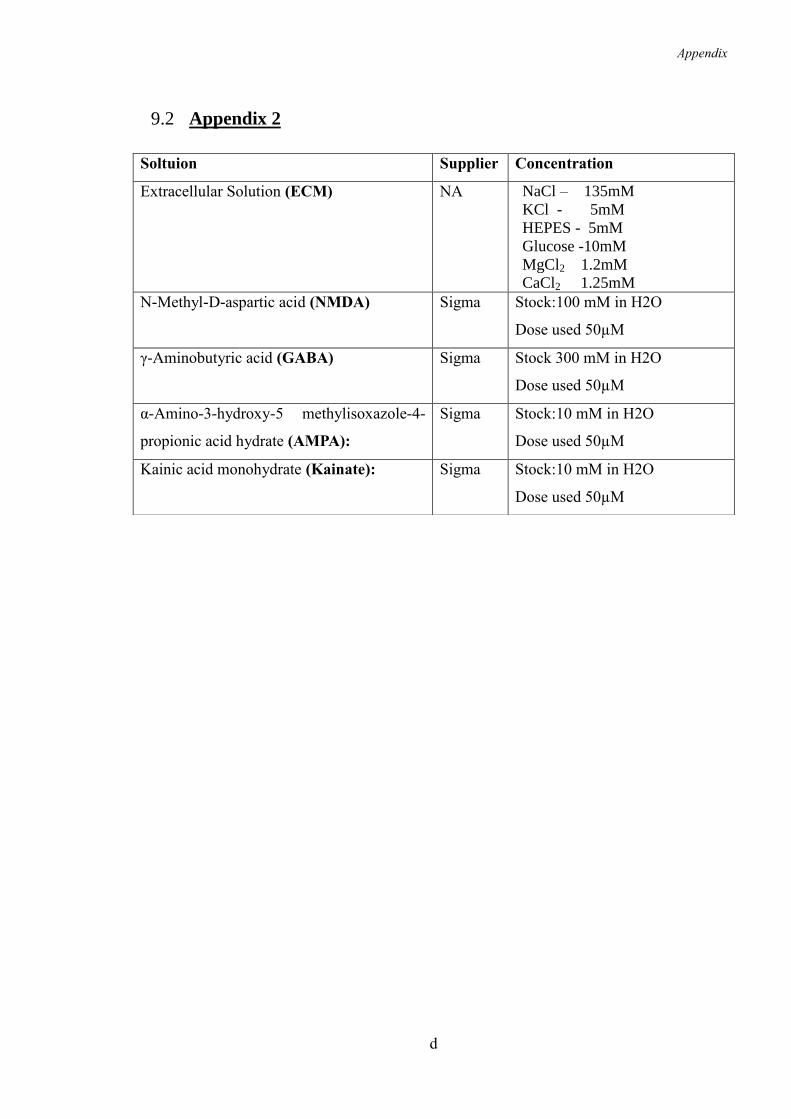
Appendix
d
9.2 Appendix 2
Soltuion Supplier Concentration
Extracellular Solution (ECM) NA NaCl – 135mM
KCl - 5mM
HEPES - 5mM
Glucose -10mM
MgCl2 1.2mM
CaCl2 1.25mM
N-Methyl-D-aspartic acid (NMDA) Sigma Stock:100 mM in H2O
Dose used 50µM
γ-Aminobutyric acid (GABA) Sigma Stock 300 mM in H2O
Dose used 50µM
α-Amino-3-hydroxy-5 methylisoxazole-4-
propionic acid hydrate (AMPA):
Sigma Stock:10 mM in H2O
Dose used 50µM
Kainic acid monohydrate (Kainate): Sigma Stock:10 mM in H2O
Dose used 50µM

Appendix
e
9.3 Appendix 3
Immunohistochemistry –Embryonic Sections
Citrate Buffer (pH6)
Citric Acid (Sigma) - 1.92g
Distilled Water - Up to 1000ml and then add 1 ml of Tween20 (Sigma),
PBS- T
1X PBS
Triton - Add either 0.1 or 0.3% Triton* and let dissolve on a shaker.
(* advisable to make in a glass bottle even if only small amounts needed)

Appendix
f
Appendix 3 Antibodies used on embryonic mouse sections
Primary Antibody
Species
Supplier Normal Serum
Dilution
Secondary Antiboy Dilution
FOXP1 Mouse Abcam Horse Horse
1:500 Horse-Anti mouse Goat-Anti mouse (α488/ α594)
1:200 1:200
FOXP1 Rabbit Abcam Goat Goat
1:4000
Goat-Anti Rabbit Goat-Anti Rabbit (α488/ α594)
1: 1:200 1:200
MEF2C Goat Santa Cruz Horse 1:1000 Horse-Anti Goat 1:2 1:200
CTIP2 Rat Rat Abcam Goat 1:500 Goat-Anti Rat Goat-Anti Rat (α594)
1:200 1:200
DARPP-32 Mouse Mouse
Santa Cruz BD transduction Lab
Goat 1:200 Goat-Anti Rabbit (α594/ α 488) Goat-Anti Mouse (α 488)
1:200 1:500
NEUN Mouse Abcam Goat 1:200 Goat-Anti Mouse (α 594) 1:200

Appendix
g
9.4 Appendix 4
Molecular Solutions
In situ Solutions
20X SSC (pH 7)
Sodium Chloride -175g ,
Tri-sodium citrate dehydrate - 88.3g
0.01% DEPC Water – Up to 1L (O/N on stirrer at RT; autoclave for 45 min 120 °C)
10x TE (pH8) 1 litre
Tris-base – 12.1g
EDTA - 3.72g
0.01% DEPC Water – Up to 1L
50x Denhardt solution
1 % Ficoll
1 % BSA (non-acetylated)
1 % PVP (polyvinylpyrrolidone)
Pre-hybridisation/hybridisation buffer
50% Formamide,
0.25% yeast total RNA/ml,
0.5% herring sperm DNA/m,
2.5% 5XSSC/ml,
1% / ml of 5X Denhardts/ml in 10ml of distilled water
Genotyping
Lysis Buffer (50ml)
10% Tris HCL (pH8.4) (Fisher),
1% 0.5M EDTA (Sigma),
4% 5M NaCl (Fisher),
1% SDS (20%) (Sigma),
2.5 % PK (20mg/ml) (Roche)
In distilled water

Appendix
h
20 X TAE (500ml)
121 g Tris Base
285.5 ml HCL
50 ml EDTA (pH8)
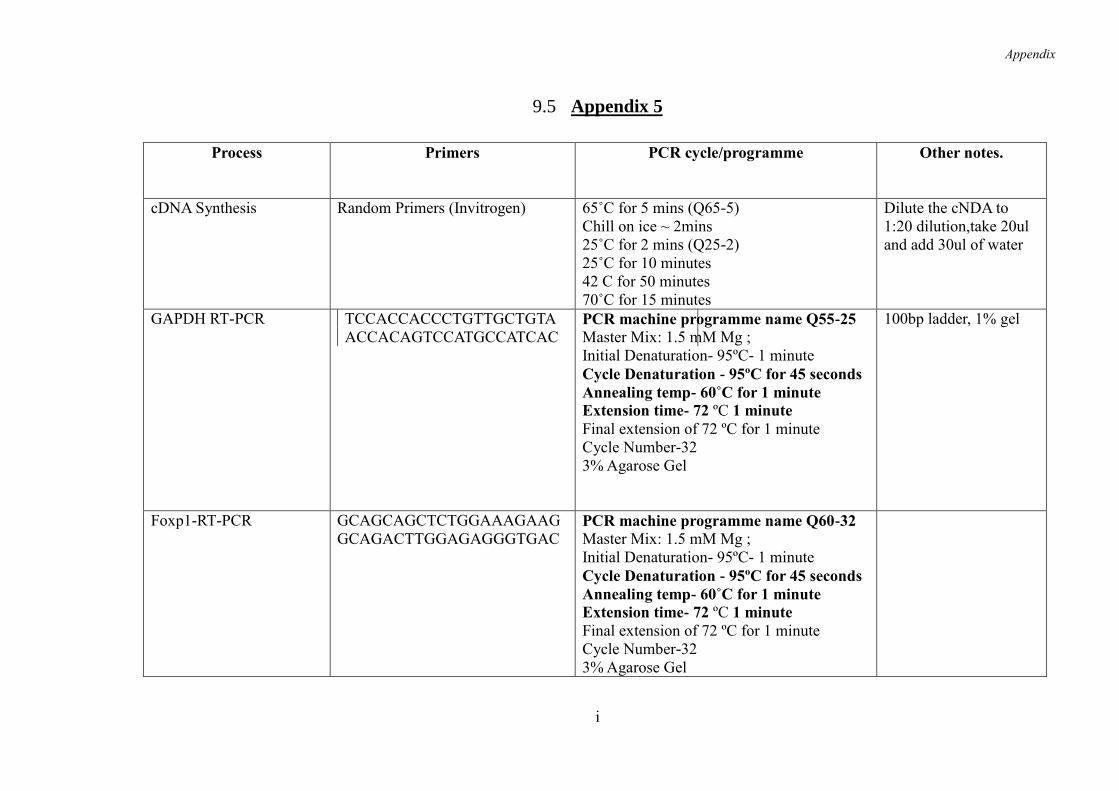
Appendix
i
9.5 Appendix 5
Process
Primers PCR cycle/programme Other notes.
cDNA Synthesis Random Primers (Invitrogen) 65˚C for 5 mins (Q65-5)
Chill on ice ~ 2mins
25˚C for 2 mins (Q25-2)
25˚C for 10 minutes
42 C for 50 minutes
70˚C for 15 minutes
Dilute the cNDA to
1:20 dilution,take 20ul
and add 30ul of water
GAPDH RT-PCR
TCCACCACCCTGTTGCTGTA
ACCACAGTCCATGCCATCAC
PCR machine programme name Q55-25
Master Mix: 1.5 mM Mg ;
Initial Denaturation- 95ºC- 1 minute
Cycle Denaturation - 95ºC for 45 seconds
Annealing temp- 60˚C for 1 minute
Extension time- 72 ºC 1 minute
Final extension of 72 ºC for 1 minute
Cycle Number-32
3% Agarose Gel
100bp ladder, 1% gel
Foxp1-RT-PCR GCAGCAGCTCTGGAAAGAAG
GCAGACTTGGAGAGGGTGAC
PCR machine programme name Q60-32
Master Mix: 1.5 mM Mg ;
Initial Denaturation- 95ºC- 1 minute
Cycle Denaturation - 95ºC for 45 seconds
Annealing temp- 60˚C for 1 minute
Extension time- 72 ºC 1 minute
Final extension of 72 ºC for 1 minute
Cycle Number-32
3% Agarose Gel
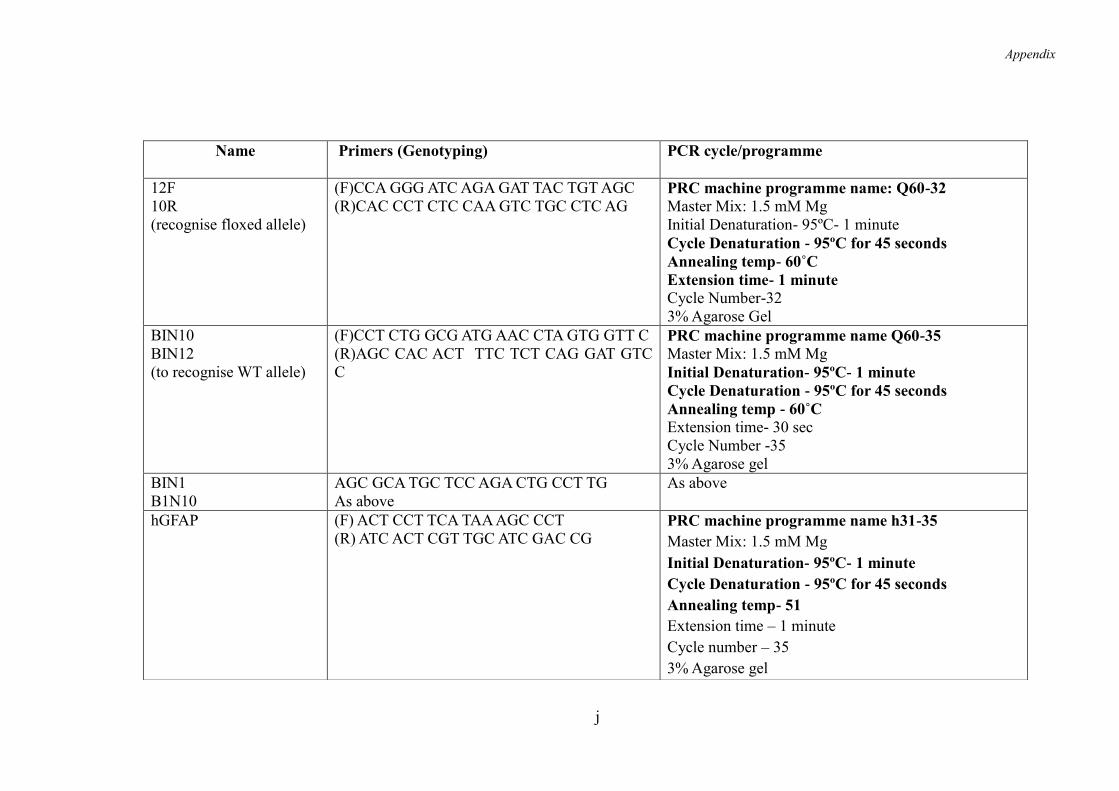
Appendix
j
Name
Primers (Genotyping) PCR cycle/programme
12F
10R
(recognise floxed allele)
(F)CCA GGG ATC AGA GAT TAC TGT AGC
(R)CAC CCT CTC CAA GTC TGC CTC AG PRC machine programme name: Q60-32
Master Mix: 1.5 mM Mg
Initial Denaturation- 95ºC- 1 minute
Cycle Denaturation - 95ºC for 45 seconds
Annealing temp- 60˚C
Extension time- 1 minute
Cycle Number-32
3% Agarose Gel
BIN10
BIN12
(to recognise WT allele)
(F)CCT CTG GCG ATG AAC CTA GTG GTT C
(R)AGC CAC ACT TTC TCT CAG GAT GTC
C
PRC machine programme name Q60-35
Master Mix: 1.5 mM Mg
Initial Denaturation- 95ºC- 1 minute
Cycle Denaturation - 95ºC for 45 seconds
Annealing temp - 60˚C
Extension time- 30 sec
Cycle Number -35
3% Agarose gel
BIN1
B1N10
AGC GCA TGC TCC AGA CTG CCT TG
As above
As above
hGFAP (F) ACT CCT TCA TAA AGC CCT
(R) ATC ACT CGT TGC ATC GAC CG
PRC machine programme name h31-35
Master Mix: 1.5 mM Mg
Initial Denaturation- 95ºC- 1 minute
Cycle Denaturation - 95ºC for 45 seconds
Annealing temp- 51
Extension time – 1 minute
Cycle number – 35
3% Agarose gel
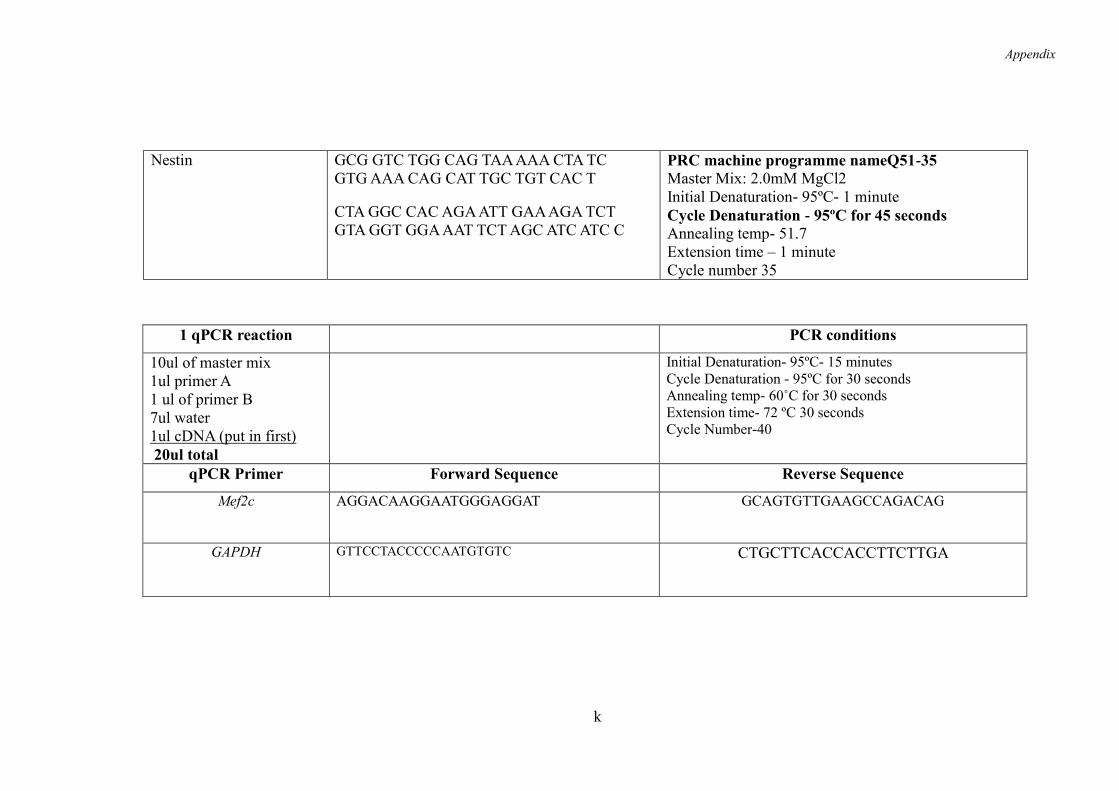
Appendix
k
Nestin GCG GTC TGG CAG TAA AAA CTA TC
GTG AAA CAG CAT TGC TGT CAC T
CTA GGC CAC AGA ATT GAA AGA TCT
GTA GGT GGA AAT TCT AGC ATC ATC C
PRC machine programme nameQ51-35
Master Mix: 2.0mM MgCl2
Initial Denaturation- 95ºC- 1 minute
Cycle Denaturation - 95ºC for 45 seconds
Annealing temp- 51.7
Extension time – 1 minute
Cycle number 35
1 qPCR reaction PCR conditions
10ul of master mix
1ul primer A
1 ul of primer B
7ul water
1ul cDNA (put in first)
20ul total
Initial Denaturation- 95ºC- 15 minutes
Cycle Denaturation - 95ºC for 30 seconds
Annealing temp- 60˚C for 30 seconds
Extension time- 72 ºC 30 seconds
Cycle Number-40
qPCR Primer Forward Sequence Reverse Sequence
Mef2c AGGACAAGGAATGGGAGGAT
GCAGTGTTGAAGCCAGACAG
GAPDH GTTCCTACCCCCAATGTGTC
CTGCTTCACCACCTTCTTGA
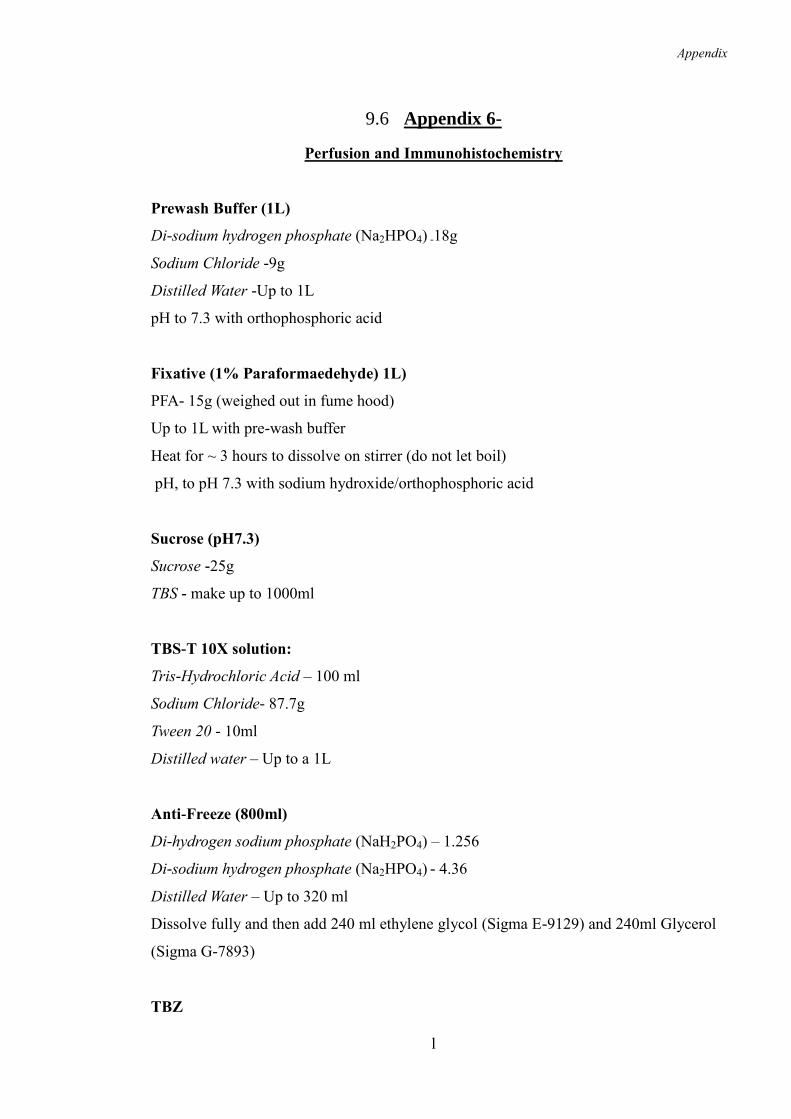
Appendix
l
9.6 Appendix 6-
Perfusion and Immunohistochemistry
Prewash Buffer (1L)
Di-sodium hydrogen phosphate (Na2HPO4) -18g
Sodium Chloride -9g
Distilled Water -Up to 1L
pH to 7.3 with orthophosphoric acid
Fixative (1% Paraformaedehyde) 1L)
PFA- 15g (weighed out in fume hood)
Up to 1L with pre-wash buffer
Heat for ~ 3 hours to dissolve on stirrer (do not let boil)
pH, to pH 7.3 with sodium hydroxide/orthophosphoric acid
Sucrose (pH7.3)
Sucrose -25g
TBS - make up to 1000ml
TBS-T 10X solution:
Tris-Hydrochloric Acid – 100 ml
Sodium Chloride- 87.7g
Tween 20 - 10ml
Distilled water – Up to a 1L
Anti-Freeze (800ml)
Di-hydrogen sodium phosphate (NaH2PO4) – 1.256
Di-sodium hydrogen phosphate (Na2HPO4) - 4.36
Distilled Water – Up to 320 ml
Dissolve fully and then add 240 ml ethylene glycol (Sigma E-9129) and 240ml Glycerol
(Sigma G-7893)
TBZ

Appendix
m
0.02% Sodium Azide in 1 X TBS
Cresyl Violet
Cresyl Violet Acetate (Sigma)- 7g
Sodium Acetate (anhydrous)- 5g
Distilled water- up to 600ml
Acid Alcohol
Add 5 ml of Glacial Acetic Acid to 200ml of 95% alcohol
4X Tris Buffered Saline (TBS)
TRIS base – 96g
Sodium Chloride – 72g
Distilled Water – Up to 1000ml
Adjust to pH7.4 with conc HCL (~50ml)
Working solution is 250 ml of 4X + 750 ml of distilled water, check pH
TxTBS
Add 0.2% Triton to TBS
Once dissolved pH to 7.4 with HCl
TNS (pH7.4)
Trizma Base (Sigma) – 6g
Distilled water- Up to 1L,
DAB
DAB (5%) – 2ml
TNS - 40ml
H2O2 - 12 l
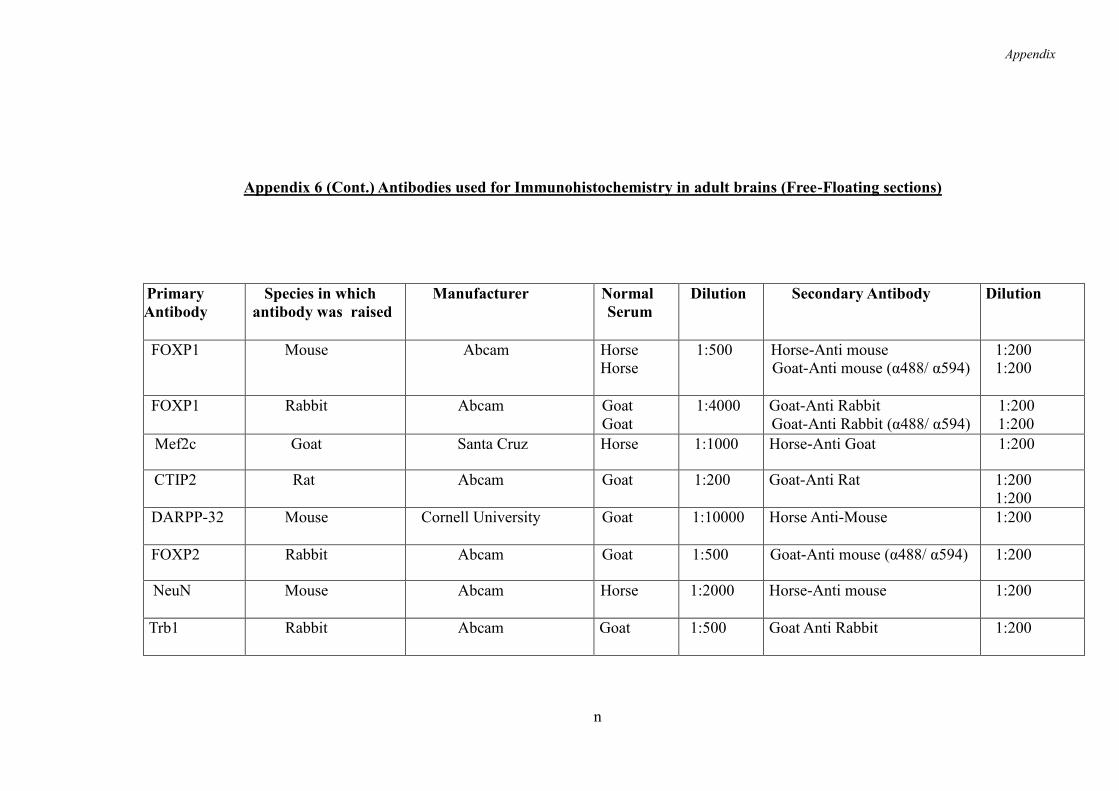
Appendix
n
Appendix 6 (Cont.) Antibodies used for Immunohistochemistry in adult brains (Free-Floating sections)
Primary
Antibody
Species in which
antibody was raised
Manufacturer Normal
Serum
Dilution
Secondary Antibody Dilution
FOXP1 Mouse Abcam Horse
Horse
1:500 Horse-Anti mouse
Goat-Anti mouse (α488/ α594)
1:200
1:200
FOXP1 Rabbit Abcam Goat
Goat
1:4000
Goat-Anti Rabbit
Goat-Anti Rabbit (α488/ α594)
1: 1:200
1:200
Mef2c Goat Santa Cruz Horse 1:1000 Horse-Anti Goat 1:2 1:200
CTIP2 Rat Rat Abcam Goat 1:200 Goat-Anti Rat
1:200
1:200
DARPP-32 Mouse Cornell University
Goat 1:10000 Horse Anti-Mouse
1:200
FOXP2 Rabbit Abcam Goat 1:500 Goat-Anti mouse (α488/ α594) 1:200
NeuN Mouse Abcam Horse 1:2000 Horse-Anti mouse
1:200
Trb1 Rabbit Abcam , Goat 1:500 Goat Anti Rabbit
1:200
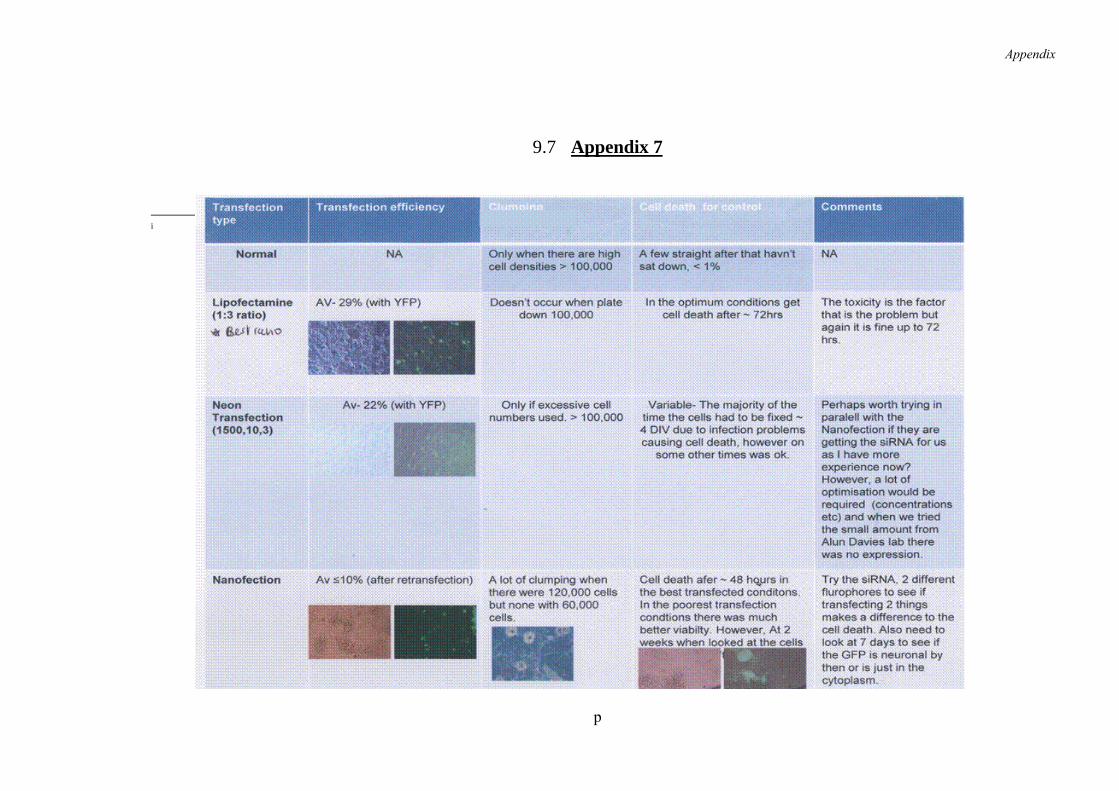
Appendix
p
9.7 Appendix 7
i