preparation and characterisation of the platinum
TRANSCRIPT

PREPARATION AND CHARACTERISATION OF THE PLATINUM
GROUP METAL FLUORIDES.
A thesis presented for the degree of
DOCTOR OF PHILOSOPHY
in the
Faculty of Science
by
GILLIAN STANGER
University of Leicester
1988

UMI Number: U013894
All rights reserved
INFORMATION TO ALL USERS The quality of this reproduction is dependent upon the quality of the copy submitted.
In the unlikely event that the author did not send a complete manuscript and there are missing pages, these will be noted. Also, if material had to be removed,
a note will indicate the deletion.
Disscrrlation Publishing
UMI U013894Published by ProQuest LLC 2015. Copyright in the Dissertation held by the Author.
Microform Edition © ProQuest LLC.All rights reserved. This work is protected against
unauthorized copying under Title 17, United States Code.
ProQuest LLC 789 East Eisenhower Parkway
P.O. Box 1346 Ann Arbor, Ml 48106-1346

STATEMENT
The experimental work described in this thesis has been carried out by the author in the Department of Chemistry of the University of Leicester between October 1985 and September 1988. The work has not been submitted, and is not currently being submitted, for any other degree at this or any other university.

Dedicated to my Parents.

ACKNOWLEDGMENTS
I would like to thank my supervisor Prof. J.H.Holloway, whose continued help and encouragement proved so vital in the production of this thesis.
Thanks must also go to Dr. M. Pogson without whose support this thesis would never have been completed, and to my family and friends who have always encouraged me.
I also wish to thank Dr. D.M. Adams and my colleagues in the department.
I am indebted to Dr. E. Hope and the staff at Southampton University for the use of their matrix rig and for all their help, and to Johnson Mat they Technology centre for financial support.

ABSTRACT
PREPARATION AND CHARACTERISATION OF THE PLATINUM GROUP METAL FLUORIDES
G. STANGER
An extensive reveiw of the platinum group metal fluorides has been carried out and in the light of this, new preparative routes have been developed and characterisation has been significantly improved.
The preparation of the platinum group metal fluorides in both static and dynamic systems is discussed in chapter two. The fluorinations of ruthenium, rhodium and platinum sponges in dynamic systems proved to be of greatest interest. In these studies large amounts of ruthenium hexafluoride and platinum hexafluoride were produced and traces of rhodium hexafluoride were noted, where as previously more forcing conditions had been employed in the preparation of these compounds. It is believed that rigorous drying of the flow line and hydrogenation of the metal in situ are responsible for the success of this new preparative route.
When ruthenium is fluorinated in the dynamic system ruthenium hexafluoride and tetrameric ruthenium pentafluoride are produced in large quantities, and smaller amounts of a red glassy material is also formed. There have been no previous reports of any red material forming during this reaction. It is now believed that this material is a trimeric form of ruthenium pentafluoride.
The charaterisation of these fluorides was carried out using a large variety of techniques, the most useful being mass spectrometry and matrix isolated infrared spectroscopy. Mass spectrometry proved invaluble in the characterisation of the trimeric ruthenium pentafluoride, while matrix isolation enabled good quality infrared spectra of the reactive hexafluorides to be recorded. These techniques were also utilised to give the first insight into the behaviour of the tetrameric pentafluorides in the gas phase. Iridium pentafluoride has been shown to be monomeric at elevated temperatures, under similar conditions ruthenium and osmium pentafluorides decompose to the metal and fluorine. Platinum pentafluoride is known to be unstable at room temperature and thought to decompose to the hexafluoride and tetrafluoride. Using matrix isolation, direct evidence of this has been obtained.

LIST OF CONTENTSPage No.
CHAPTER 1 A Review of the Platinum Group Metal Fluorides1.1 Ruthenium 1
1.2 Osmium 11
1.3 Rhodium 22
1.4 Iridium 29
1.5 Palladium 40
1.6 Platinum 46CHAPTER 2 Fluorination of Platinum Group Metals
2.1 Introduction 59
2.2 Present Work 59
2.3 Static Systems 59
2.4 Dynamic Systems 612.5 Initial Fluorination of a Mixture of P.G.M's 66
CHAPTER 3 Analysis of Platinum Group Metal Fluorides3.1 Introduction 68
3.2 Mass Spectrometry 68
3.3 Infrared Spectroscopy 71
3.4 X-ray Powder Diffraction 75
3.5 Raman Spectroscopy 75
CHAPTER 4 Matrix Isolation Spectroscopy4.1 Introduction 78
4.2 Hexafluorides 78
4.3 Pentafluorides 84
CHAPTER 5 A New Form of Ruthenium Pentafluoride5.1 Introduction 87
5.2 Infrared Spectroscopy 87
5.3 Mass Spectrometry 88

5.4 E.S.R Spectroscopy 88
5.5 Conclusion 89
CHZUr-rmt 6 Experimental6.1 General Preparative Techniques 90
6.2 Vacuum Systems, Reaction Vessels and Flow Systems 91
6.3 Characterisation of Products 93
6.4 Chemicals, Sources and Purification Procedures 95
REFERENCES 96

Chapter 1
A Review of the Platinum Group Metal Fluorides
Chapter 1
A Review of the Platinum Group Metal Fluorides
1.1 Ruthenium
1.1.1 Ruthenium Octafluoride
The existence of ruthenium octafluoride has been reported by only one group [1,2] and thus we await further independent verification of its existence.
Preparation
Ruthenium octafluoride is reported to be produced by the fluorination of both ruthenium and ruthenium dioxide and is separated from the principle product, RuF , by microsublimation at low temperatures.
Appearance and Physical Properties
Ruthenium octafluoride is a bright yellow solid. Its vapour pressure has been reported over a limited temperature range and the variation with temperature is given by logp = 7.67-1636/T.
It is thermally unstable and decomposes to lower fluorides at temperatures above -50°C.
Spectroscopy
The infrared spectrum of the octafluoride shows bands at 1030 and 385 cm' with a combination band at 1285 cm'\
1.1.2 Ruthenium Hexafluoride
Preparation
Ruthenium hexafluoride was first prepared in 1961 by the

Table 1.1.2 Redox Reactions of RuF, [2]
Reagent Product
PF^/AHF
AsF.
[Ru(PF,)F ]„, FF,y y
RuF .AsF,
SbF,BiF*
RuFg, SbFgb RuFg, BiFgb
ClF a
CS,
ClFj.RuFj, ClFj.RuFg
CF,, SF,
H^/AHF RuF, — » RuF.c 5 4
Ru/AHF
Ru/KH/AHF
RuFg
KRuF.
a: Only volatile products listed
b: Only pentafluoride reported, no attempt made to determine if an adduct formed.
c: RuFg was slowly reduced to RuF .

induction heating of ruthenium metal in a fluorine atmosphere at 300mm Hg pressure. The reaction was carried out in a quartz reactor fitted with a cold finger [3]. A 49% yield of RuF^ was obtained. Recently, Burns and O'Donnell [4] reported a new method of preparing RuF^ using a very simple apparatus. This consisted of a reaction vessel, furnace and cooling collar containing an acetone and solid CO^ slush which facilitated rapid cooling of RuF^ to a temperature at which dissociation does not occur. In this apparatus ruthenium powder is heated (350-400®C) with a slight deficiency of F for 1 hour. The RuF^ formed is used directly from the reactor as the lower fluorides and unreacted metal are involatile and so remain behind. Due to the simplicity of the equipment this is the best known preparative route for RuF .
Appearence and Physical Properties
Solid RuFg is dark brown. Its vapour is brownish red and the vapour pressures over a selected temperature range are given below (table 1.1.1)[3];
Table 1.1.1. Vapour Pressure of RuF^
Temp (°C) 0.0 4.6 8.6 11.1 14.4 17.6
Pressure 23 32 40 46 56 67(mmHg)
Although RuFg is thermally unstable, decomposing completely to RuFg and F at 200®C, it can be stored for weeks at room temperature in a nickel can. However, it will rapidly attack Pyrex and to a slightly lesser extent, quartz [3].
Chemical Properties
The oxidation-reduction reactions of RuF^ with a selected series of reductants have been studied [4]. The reactions follow a simple pattern, the reductant being oxidised to a higher fluoride and the hexafluoride being reduced to oxidation states V or IV. The solid

products containing ruthenium are rarely the penta- or tetrafluoride but are usually adducts or complexes (table 1.1.2).
The hydrolysis of RuF^ in HF produces the oxonium salt H^O^RuF^ [5]. RuFg is condensed at -196°C on to HF containing trace amounts of water. When the mixture warms to room temperature the red colour due to RuF^ spontaneously disappears, an almost colourless solution with a tint of green is produced and oxygen is evolved. On removal of the HF a white solid remains, which is H O' RuF “. X-ray powder photography shows this to be isostructural with H O IrF^ and H^O^PtF^ both of which have a rhombohedral unit cell. The oxonium salt gradually darkens and eventually turns black.
Both NOF and NO react with RuF^ at 25°C over a period of 21 hours to give NORuF^ [6]. The infrared spectrum of this material has been recorded and peak positions are given in table 1.1.3.
Table 1.1.3. Infrared absorption Frequencies for NORuF (cm“)
RuFe" NO"
'’l (*lg> x», (Eg) \) (N0+)
660.3 600 277 2330578 266
254
The halogen exchange reactions of RuF^ with BCl^ and BBr^ have been investigated. In both cases mixed halides were formed, but stoicheiometric products were not produced [7]. These reactions are highly exothermic and require conditions to moderate their rate. Inert n-perfluoroalkane solvents can be conveniently used to dissipate the heat of reaction.
Structure
Ruthenium hexafluoride undergoes a solid-solid transition at 2.5°C and atmospheric pressure. The high-temperature modification is

cubic; tï=6.11±0.01Â at 25°C, Z=2 with a calculated density D=3.13±0.03 gcm' . The low-temperature modification is orthorhombic; o=9.44±0.02Â, at -30°C, Z=4 with a calculated density D=3.50±0.03gcm‘ [8].
Spectroscopy
The infrared spectrum of gaseous RuF^ has been recorded between 230-4000cm'^ [73]. Bands were observed at 275 (v^), 735(v^) and combination bands at 997(v^+v^) and 1410(v^+v^)cm , from which and Vg were estimated tO be at 675 and 262cm' respectively. The spectrum of RuF^ can be interpreted in terms of it being a regular octahedron with 0 symmetry. However, less bands are observed than for any other hexafluoride, the vibration being broadened due to the Jahn-Teller effect to an extent where some bands cannot be resolved.
1.1.3 Ruthenium Pentafluoride
Preparation
Ruthenium pentafluoride was first prepared in 1925 by Ruff and Vidic [9] by the reaction of fluorine on ruthenium sponge. This method was later developed by Holloway and Peacock [12] and remains the best known synthetic route. A mixture of fluorine and nitrogen is passed over the metal at 280-900°C and a dark green viscous liquid containing RuFg is collected in a Pyrex trap. RuF^ is separated from impurities, usually Ru metal or RuO , by vacuum distillation. The fluorination of ruthenium dioxide also yields RuF^ [10], as does the treatment of Ru sponge with BrF^ [11]. The latter reaction is extremely vigorous at room temperature, a brownish solution being formed from which a pale cream solid is obtained after the removal of excess of solvent. This solid has a composition RuBrF^ and when heated to 120®C in a vacuum, melts with decomposition forming emerald green droplets of RuF^ and evolving BrF . Unfortunately, small amounts of RuOF^ are also produced and this is difficult to separate completely from the pentafluoride.
Appearance and Physical Properties
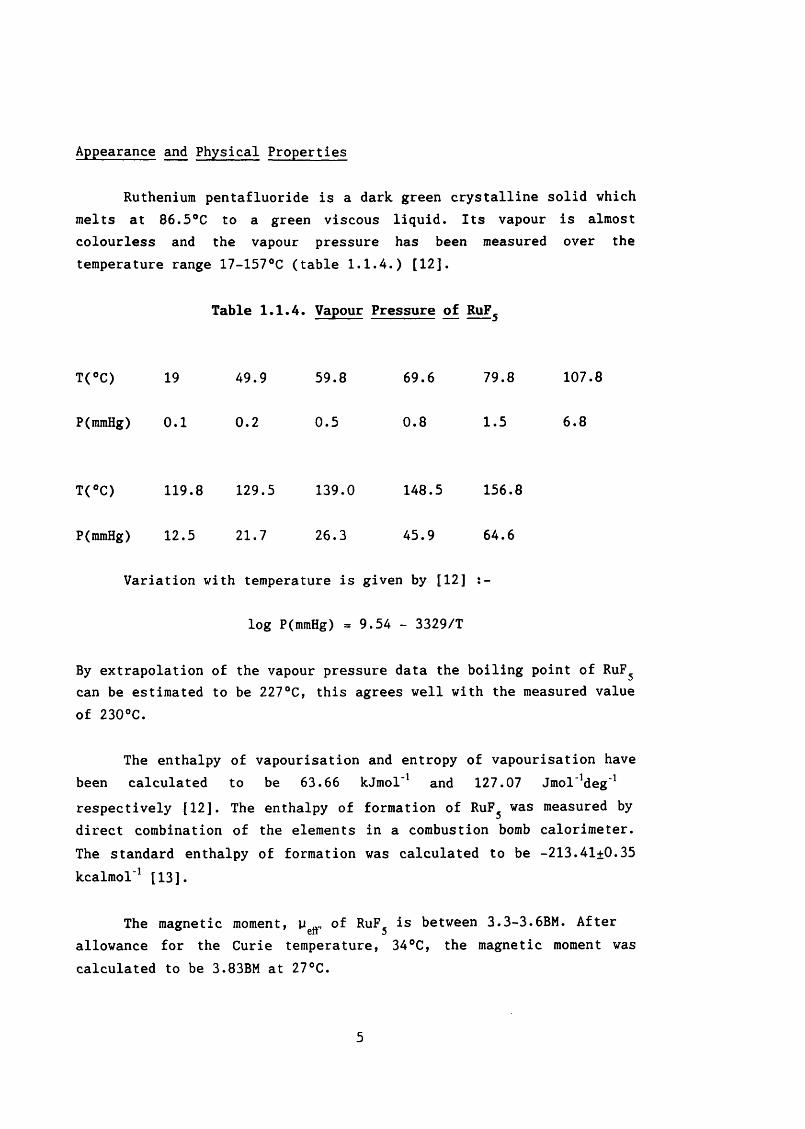
Ruthenium pentafluoride is a dark green crystalline solid which melts at 86.5®C to a green viscous liquid. Its vapour is almost colourless and the vapour pressure has been measured over the temperature range 17-157°C (table 1.1.4.) [12].
Table 1.1.4. Vapour Pressure of RuF^
T(°C) 19 49.9 59.8 69.6 79.8 107.8
P(mmHg) 0.1 0.2 0.5 0.8 1.5 6.8
T(°C) 119.8 129.5 139.0 148.5 156.8
P(mmHg) 12.5 21.7 26.3 45.9 64.6
Variation with temperature is given by [12] :-
log P(mmHg) = 9.54 - 3329/T
By extrapolation of the vapour pressure data the boiling point of RuF^ can be estimated to be 227°C, this agrees well with the measured value of 230°C.
The enthalpy of vapourisation and entropy of vapourisation have been calculated to be 63.66 kJmol’ and 127.07 Jmol'Meg'^ respectively [12]. The enthalpy of formation of RuF^ was measured by direct combination of the elements in a combustion bomb calorimeter. The standard enthalpy of formation was calculated to be -213.41+0.35 kcalmol'i [13].
The magnetic moment, of RuF^ is between 3.3-3.6BM. After allowance for the Curie temperature, 34°C, the magnetic moment was calculated to be 3.83BM at 27°C.

Chemical Properties
Dry RuFg can be stored and handled in glass at room temperature but attacks it slowly at 100°C and at 180®C reaction between RuF^ and glass is fast, producing a black deposit and a red liquid [12]. RuF^ is extremely sensitive to atmospheric moisture and rapidly blackens in its presence. With water, rapid hydrolysis occurs to produce a brown solution, a voluminous black precipitate of hydrated dioxide RuO^.nH^O and RuO^ is evolved [11,12]. Treatment of the hydrolysis products with F produces RuO^ [14].
If RuF^ is treated with a large excess of iodine at 150°C, iodine pentafluoride and ruthenium trifluoride are produced [15,16] (equation i).
5RuFg + Ij > SRuFg + ZIFg (i)
When an excess of RuF^ dissolved in pure IF^ is allowed to react with I , however, reduction takes place according to equation (ii):
lORuFg + Ij ----- lORuFj + 2IFg (ii)
Little heat is evolved and after IF^ and the excess of RuF^ are removed, a non volatile sandy yellow residue remains which is pure RuFj [17].
Ruthenium pentafluoride reacts with SF to give a pink solid SF^.RuFg which melts at 150®C to a red liquid [18]. By mixing solutions of RuFg and thallous fluoride both in SeF , the thallous hexafluororuthenate (V), TlRuF , is formed [11].
Xenon difluoride reacts with RuF^ to produce three adducts (table 1.1.5). The adduct formed is dependent on the stoicheiometry of the reagents [19,20].

Table 1.1.5. XeF^ Adducts of RuF^
Adduct Mpt.(°C) Colour Reference
XeFyRuF; 115-125 Pale yellow green [19,20]
XeF2*2RuF^ 52-56 Bright green [19,20]
2XeF2*RuF^ 98-99 Pale yellow green [20]
The physical and spectroscopic properties of the XeF adducts of RuFp+Ru"
Xe^F^^RuFg [20]. The adducts XeF^RuF^ and XeF^Ru F " were prepared by melting stoicheiometric amounts of XeF^ and RuF^ in a Pyrex reactor [19]. All three adducts were prepared by mixing stoicheiometric amounts of XeF^ and RuF^ in BrF^ [20]. Attempts to prepare and isolate XeFj adducts of RuF^ have so far proven unsuccessful.
RuFg reacts with KrF^ to form KrF^.RuF^ and KrF^.2RuF^ which, according to their Raman spectra, can be formulated KrF^RuF^ and KrF^Ru^P^ respectively. These adducts are unstable in HF forming F , Kr and RuF , and also decompose in BrF^ [21].
If carbon monoxide is passed over RuF^ a yellow brown moisture- sensitive, non-volatile solid of composition [Ru(CO)F^^] is formed [22] (equation iii);
show that all three have ionic structures XeF RuF^ , XeF Ru F ,
Flow
System
4RuFg + 9C0 ------------ > [Ru(CO)^F^.RuF^]^ + CF^O (iii)200° C
Further reaction occurs at high pressure (lOOatms.) and 200®C to yield a pale involatile crystalline solid [Ru(CO)^F^]^ which has a tetragonal unit cell of dimensions; o=11.055Â, o=9.376Â, [23].Thestructure consists of tetrameric rings of Ru(C0)^F2 units. This compound can be compared with the compound reported in the work of Misra on IrF^ [24].

Structure
RuFg was the first tetramer to be found with bent Ru-F-Ru bridges [25]. X-ray powder photographs show RuF^ to be isostructural with OsFg [12], RhFg [74],IrF; [104],and PtF,. The structure, adistorted version of the MoF^ structure [26], is monoclinic with dimensions o=12.47±0.01, fr=10.01±0.01, o=5.42±0.0lA, fk90®50'±30'belonging to the space group P^ya=C^^^; Z=8 [25].
Mass Spectrometry
Using molecular beam mass spectrometry it has been shown that the vapour phase of RuF^ is associated. Signals due to monomeric, dimeric, trimeric and tetrameric ions have been observed [27,28,60].
1.1.4 Ruthenium Tetrafluoride
Preparation
When an excess of RuF , dissolved in pure iodine pentafluoride, is allowed to react with iodine, reduction takes place according to equation (iv):
lORuFg + Ij ----- lORuFj + 2IFg (iv)
Little heat is evolved and after the IF and excess of RuF^ have been removed, an involatile, sandy yellow residue remains which is pure RuF^ [17].
Physical Properties
Magnetic properties of RuF^ from -183-27®C have been studied. The observed effective magnetic moment at ordinary temperatures is higher than the spin only value for two unpaired electrons [17].
Chemical Properties
Ruthenium tetrafluoride is blackened immediately by moist air, but it can be conveniently handled in Pyrex glass apparatus under dry
8

conditions [17]. It reacts violently with water, depositing RuO^ but no tetroxide is formed, as happens for RuF^ [17]. Samples of RuF^ heated to 280®C in Pyrex do not melt, but above 280®C they attack the glass, forming a volatile compound and a black residue which is probably RuO^ [17].
Structure
Ruthenium tetrafluoride is poorly crystalline, but powder- diffraction photographs suggest that it has a simple structure [17].
1.1.5 Ruthenium Trifluoride
Preparation
Ruthenium trifluoride is prepared by the reduction of RuF . The best route is the treatment of RuF^ with a large excess of I at 150®C. IF is produced and the involatile RuF^ is left [15]. This residue should then be heated to 500®C and pumped on for 12 hours to remove traces of I , IF or RuF^ still present and to facilitate crystal growth [16]. RuF^ can also be reduced by sulphur at temperatures above 200®C, [15] by passing it over Ru metal at elevated temperatures [29], and by perfluorocyclobutene in perfluoro-1,2 dimethyl cyclohexane at 70®C [29].
Appearance and Physical Properties
Ruthenium trifluoride is a dark brown solid which is visibly crystalline [15].
Chemical Properties
Ruthenium trifluoride is insoluble in water and dilute acids and alkalies, but is decomposed by boiling sulphuric or nitric acids [15].
Structure
Ruthenium trifluoride must be classed with VF , FeF^ and CoF^ since the fluorine atom arrangement is distorted from a closed-packed

hexagonal arrangement. It is indexed on a bimolecular rhombohedral unit cell, but the unit cell dimensions vary depending on the conditions of the preparation (table 1.1.6) when prepared by the reduction of RuF^ with I or S.
Table 1.1.6 Cell Dimension for RuF^
Method of preparation a (A) a (®) V (A)
Excess of RuFg 5.386 54.79 97.1
Excess of RuFg 5.392 54.78 97.4
Small excess of I 5.403 54.67 97.7
Large excess of I 5.408 54.67 98.0
Large excess of S 5.407 54.66 97.9
When excess of reducing agent is used the unit cell values are at their greatest. It is thought unlikely that this is due to iodine or sulphur replacing fluorine as the elemental analysis shows only Ru and F and the variation is constant. This is probably the "ideal" RuF . When a deficiency of reducing agent is present it is probable that a small proportion of the Ru atoms are not reduced to the trivalent state but remain in the tetra- or pentavalent state.
10

1.2. Osmium
1.2.1 Osmium Heptafluoride
Preparation
Osmium heptafluoride is reported to be prepared by the union of fluorine and osmium metal 500-600*0 under a pressure of AOOatms. in a nickel bomb [160]. Very recently, the existance of OsF^ was independently verified when it was prepared by heating (250*0) 0s0^2 with elemental fluorine (30atm. pressure) for 72 hours [162].
Appearance and Physical Properties
Osmium heptafluoride is only stable under a high pressure of fluorine and above -100*0 it dissociates to OsF^ and F . The magnetic moment at -183*0 is about 1.08 BM [160].
Spectroscopy
The infrared spectrum shows bands at 715, 550, 483, 366, and 282cm' [160]. This was initially interpreted as showing apentagonal pyramidal structure. However, recently an identical infrared spectrum was observed using the technique of matrix isolation [162]. This result has been interpreted as showing a capped trigonal prismatic structure. However, the structure appears to fluctuate even at 14K and, thus, no definite assignment can be made [162]. The mass spectrum shows the presence of the ions OsF^^, OsFj" , OsFj+, OsF^+, OsF%+, Os + , [160].
1.2.2 Osmium Hexafluoride
Preparation
In 1913 Ruff and Tishirch reported the formation of OsF , OsF^ and OsFg by the direct fluorination of osmium powder at elevated temperatures [30]. The compound that they had identified as "OsF^" was later shown to be OsF^ [31]. In this and all subsequent preparations OsF^ is prepared by direct fluorination of osmium metal [32-38].
11

Weinstock and Malm [31-32] carried out their fluorinations in a flow system, passing fluorine at 250mmHg pressure over osmium powder heated in a Pyrex furnace. The OsF^ was collected in cool traps and purified by vacuum distillation. Yields of 84-100% were reported. Similar methods were reported by Cady and Hargreaves [36] and by Hargreaves and Peacock [35]. Producing OsF^ in a flow system remains the best synthetic route.
Other groups [33,34] carried out their fluorinations in static systems, heating the metal to 350-400*0 with an excess of fluorine for 3 hours. In one instance [33] the metal was heated inductively in a hydrogen atmosphere prior to fluorination in order to reduce traces of oxide.
Appearance and Physical Properties
Osmium hexafluoride is a volatile yellow solid with a colourless vapour. Its melting point has been recorded as 32.1*0[31] and 33.4*0 [36] and its boiling point as 45.9*0 [31] and 47.5*0 [36]. The latter value in each case is probably the more accurate due to improved manipulation and purification procedures. Both values of the boiling point were obtained by extrapolation of the vapour pressure measurements. Various thermodynamic values have been calculated [36] (table 1.2.1) from these vapour pressure measurements.
The magnetic behavior of OsF^ has been measured over thetemperature range -193 to 24*0. The results vary as expected for a sexivalent osmium with two unpaired spins. The magnetic momentfollows the Ourie-Weiss relationship (i):
)CA cc l/(T+0) (i)
with the Ourie-Weiss constant, 0, equal to 66*0 [35]. The magnetic moment, yeff, is 1.50BM at 24*0.
The force constant of OsF^ has been calculated to be 4.91md/Â [39]. The solubility of OsF^ in HF has been determined to be 0.97 molg' of HF and the electrical conductivity and Raman spectrum of the solution have been recorded [159].
12

Table 1.2.1. Thermodynamic Data for OsF t361
Afus H- (306.6K) .7.36 -)I
\rs “° (272.8K) =8.23 |I
^ap (320.7K) =28.1 }kJmol ‘I
ûgyb (>272.8K, cubic pfg) =35.4 |
^sub (<272.8K, orthorhombic -» pfg) =43.7 J
ûfus H° (306.6K) =23.90 )I
\rs (272.8K) =30.10 }jmol ‘deg'I
\ap (320.7K) =87.8 J

Chemical Properties
Oxidation-reduction reactions of OsF^ with selected reductants have been studied [40]. The reductant, if gaseous, is condensed on to the OsFg at -196®C. For solid reductants the reverse occurs, the OsF^ being condensed on to the reductant. The mixture is then allowed to warm to room temperature. The reaction products are shown in table 1.2.2 and a general trend is observed, the hexafluoride being reduced to either the penta- or tetravalent state and the reductant being oxidised to a higher fluoride. The isolated product of the reduction of OsF^ is rarely a simple fluoride, it is usually an adduct or complex.
OsFg reacts with OsO^ at 150°C to produce OsO^Fj [149]? and undergoes oxygen-fluorine exchange with boric acid to form OsOF^ and BF^ [40]. The halogen exchange reactions of OsF^ with BCl , BBr , BI^ and CCl^ have been studied [7,34]. The reaction of OsF^ with BClg produces a binary chloride, OsCl , whereas the other reagents produce mixed halides. The reaction of BBr^ and OsF^ produce the stoicheiometric mixed halide, Os Br F , but neither BI^ or CCl^ produce stoicheiometric mixed halides. All of these reactions are very exothermic and are, therefore, carried out at low temperatures in the presence of an inert solvent. Usually an n-perfluoroalkane is used to dissipate the thermal energy. The compound, OsBrF , has been isolated and characterised by infrared and u.v. spectroscopy. X-ray methods and magnetic measurements. It is know to be polymeric.
Tungsten carbonyl reacts vigorously with an excess of OsF^ at 0°C, carbon monoxide is evolved and a green suspension is observed below a green liquid. Once the excess of OsF^ and WF^ (produced during the reaction) are pumped away, a grey-green mixture of OsF , OsF^ and osmium metal is produced [43]. This mixture can be separated by vacuum distillation. Osmium hexafluoride is also reduced to OsF^ by iodine in IF^ (equation ii):
IF^(solvent)
10 OsFg + Ij -----------> 10 OsFg + IFg (ii)
For a clean reaction OsF^ must be in excess because, if an excess of I is present, a black compound of composition OsIF^ is produced.
13

Table 1.2.2 Redox reactions of OsF.
Reagent Product Ref.
PF.
PFj/AHF
AsF,
Os, PF a [40 ]
Os(PF ) F , PFg [40]
AsF^.OsFg, AsFg [40]
SbF. no reaction b [40]
SF
SeF
CS,
SF4.OSF3, SFg
CF,, SF,
[41]
SeF,.OsF^, SeFg [42]
[40]
H^(100°C) Os,HF [40]
H/AHF
Metal/AHF
Metal/AHF/KF
OsF.
OsF,
KOsF,
[40]
[40]
[40]
a: Other unidentified Os-containing compounds.
b: No reaction at room tenperature or on heating to 100°C.

When OsFg is placed in an evacuated glass vessel filled with Pyrex wool and kept at 25®C for two days, very little reaction occurs, but when the temperature is raised to 80°C, OsF^ immediately reacts with the moisture on the glass to produce a yellow solid OsOF, [44]. Hydrolysis of OsF^ in HF also leads to the formation of OsOF, [45].
Various groups have investigated the reaction of OsF^ with NO and NOF [6,41,46,48,50] and all are in close agreement (equations iii and iv).
OsF, + NO ------ > NOOsF^ (iii)6 D
OsFg + NOF ------ > NOF + NOF^ + NOOsF^ + NOOsF^ (iv)(excess)
The reaction of OsF^ with NOF (equation iv) is complex. The quantities of NOF^ formed indicate the existence of an unstable fluorine intermediate, since, NOF^ is not produced from NOF and 0 . The compounds NOOsF^ and NOOsF^ are also produced, both of which have a cubic unit cell with values of a being 10.126 and 5.14 A respectively [46,48]. Raman spectra of NOOsF^ (table 1.2.3) showthis compound to be NO^OsF/ [6].
Table 1.2.3 Raman Data for NOOsF (cm *)
Species OsF^ NO^
Designation
Symmetry (A ) (E ) (F )Species
Ref. [4] 688 623 261 2334605 247
Ref. [47] 691 624 262606
14

Structure
X-ray diffraction studies [8,31,48] have shown OsF^ to exhibit two crystalline forms, a cubic modification near room temperature, with 0=6.23Â and 7^1 and a low-temperature orthorhombic modification with 0=9.59, 6=8.75 and o=5.04Â, Z=4. The transition temperature has been reported to be 1.4°C at atmospheric pressure [31,48].
The ^ F nuclear magnetic resonance spectra and spin relaxation times of OsF^ show tetragonal distortion of the hexafluoride octahedra at low temperatures as would be expected for an orthorhombic cell.
Spectroscopy
The infrared and Raman spectra of OsF^ have been recorded [31,37,49,51,52,53,54]. As expected for an octahedral molecule of 0 symmetry there are two infrared active fundamentals and v,, three Raman active fundamentals Vj, and and one inactive fundamental
In the infrared spectrum several combination bands are also observed and from these the other fundamentals have been calculated. A list of fundamentals determined by various groups is given in table 1.2.4.
A typical infrared spectrum was recorded by Weinstock, Claassen and Malm [51] who observed peaks due to fundamentals at 720 (v ) and 268 (v,) cm' and combination bands at 1453 1352cm'\ Claassen and Selig [54] observed a typical Raman spectra, with peaks being recorded at 730.7 (v ), 643 (v ) and 272 (v ) cm \ being the most intense.
The infrared spectrum of OsF^ differs from those of otherP.G.M. hexafluorides; the band due to is missing ,is weak and although intense, is very broad. Thisbroadening of the mode is of particular interest because acharacteristic feature of the infrared spectra of the P.G.M. hexafluorides is that ( almost identical in shape and intensity. In the Raman spectrum vas not observed under conditions where and were clearly visible. This behaviour of
15

Table 1.2.4 Fundamental Vibrational Frequencies for OsF
Designation 2 3 5
SymmetrySpecies
Eg P.u Flu Flu
SpectralActivity
RamanPol
Ramande-pol
i.r. i.r. RamanPol
inactive
Ref. [51] (733) (632) 720 268 (252) (230)
[49] 732 640 -- -- -- --
[52] (733) (632) 720 -- (249) --
[53] (733) (668) 720 272 (276) (205)
[54] 730.7 643 -- -- 272 --
[55] 730.7 (668) 720 268 (276) (205)

and its combination bands is a consequence of the Jahn-Teller effect [157].
U.v.-visible spectrum of OsF^ has been recorded in the gas phase, [56] and when isolated in a nitrogen matrix [57], table 1.2.5 shows the values observed and their assignment.
These two data sets differ significantly. The peak at 40,800 cm* is probably due to OsO, [163] which is a persistent impurity in OsFg, and the peak at 35,700cm'^ is a composite of the second OsO, band at ca. 35,000cm" and the genuine OsF^ band at 36,200 cm"\
Electron diffraction experiments show good evidence for the symmetrical octahedral structure of OsF . From this study the Os-F bond length was calculated to be 1.831 A [58]. Further evidence for the octahedral structure of OsF^ is produced by electron diffraction experiments [33] in that a molecular beam of OsF^ was not defocused when an electric quadropole field was applied.
1.2.3 Osmium Pentafluoride
Preparation
The best preparative route for OsF^ appears to be the reaction of OsF^ with iodine pentafluoride [59,43] (equation v).
+ 10 OsF^ ----------► 10 OsFg + 2IF^ (v)
It is essential that the hexafluoride is present in excess to prevent the formation of osmium iodotetrafluoride.
Hargreaves and Peacock [43] investigated two other possible preparations : firstly, the reaction of OsF^ with hexacarbonyltungsten [59,43,60,61] where presumably either tungsten is oxidised to WFg (equation vi) or the CO is oxidised to COF^ and the tungsten to WF^ (equation vii). There is also the possibility that a carbonyl fluoride may form which ultimately decomposes. It is known for example that [Os(CO)^Fj, exists [21]. Secondly, the irradiation of OsF^ with u.v. light at 25°C also yields OsF^ (equation viii)
16

Table 1.2.5 Ultra violet-visible Spectra of OsF
Gas Phase [56] Matrix Isolated [57] Assignment
> 51,000 n(F)— % 2g(0s)
45,435 (630) H(F)-- ^^^(Os)
40,800 see text
36,230 (660) H(F)— ^^^(Os)
35,700 see text
17.300 17,340 4 (r )—
8,500
4.300
3,930 Hot Band ?
(E max/cm' and AWcm'^)

W(CO)^ + 60sF^ ----- > 60sFg + 6C0 + WF^ (vi)
W(CO)g + 180sF^ ------> 180sFg + ÔCOF, + WF^ (vii)
OsF^ ----- > OsF^ + % F^ (viii)
Osmium pentafluoride can also be produced by the reduction of OsFg vapour on a hot tungsten filament [62]. The reaction temperature is controlled by immersion in an ethylenedichloride slush (-36®C) to provide a vapour pressure of OsF^ in the 10-20 mmHg range. Small amounts of tungsten fluorides are found in the product.
In another preparation of OsF^ O'Donnell and Peel [63]condensed OsF^ onto a frozen sample of HF containing NaF and Hg. Onmelting, a rapid reaction occurred producing a colourless solution of NaOsF^ and a precipitate of Hg F . The NaOsF^ was decanted intoan empty tube and stoicheiometric amounts of SbF^ were added. Afterstanding at room temperature for one hour the HF was distilled off and the tube warmed to 85®C. A blue-grey sublimate formed on the upper portion of the tube which was cooled to -80®C.
Paine and Asprey have prepared OsF^ by simple one-electron reduction reaction of OsF^ using either silicon powder or hydrogen [64,65,66]. The OsF^ in anhydrous HF was condensed on to silicon powder in anhydrous HF. The mixture was then allowed to warm to room temperature and stirred. The reaction was assumed to be complete when the silicon powder disappeared. Vacuum distillation of the volatile products (HF and SiF,) left OsF . A similar one electron redox reaction occurs with hydrogen. Osmium hexafluoride and anhydrous HF are combined with H , which is admitted to the solution at room temperature while the mixture is stirred slowly.The OsF^ is reduced over one or two days. The reaction rate can be enhanced by the presence of platinum gauze and u.v. irradiation so that the reaction is complete in 3-4 hours. This reaction can also be carried out in the gas phase without HF but the rate is much slower.
Xenon difluoride dissolved in anhydrous HF is a moderately
17

strong oxidant which can be used to prepare fluorine-containing compounds [67]. It will react with either osmium metal or OsBr^ to produce OsF^ and OsF . However, the reaction is complex because the OsFg forms an adduct with XeF^ and this OsF^.XeF^ adduct is observed in the HF solution. On removal of volatile materials there is also evidence of OsF^ and OsFg.ZXeFy. Thus, unlike the case of Ir, where IrFg is produced, this is not a valid method for the production ofOsFg.
Physical Properties
Osmium pentafluoride is a blue-grey crystalline solid whichmelts at 70°C to a green viscous liquid. This does not easily recrystallize when cooled below its melting point. Liquid OsF^changes colour reversibly as it is heated. At its boiling point (233®C by direct measurement, 225.5®C by extrapolation of vapour pressure measurements) it is bright blue and gives a colourless vapour [43,59,64]. It has been reported that at 180®C, OsF^disproportionates to give OsF^ and OsF, but, as yet, this has not been verified by an independent investigation [61].
The enthalpy and the entropy of vapourization of OsF^ have been calculated to be 65.61 kJmol^ and 143.9 Jmol Meg respectively [61].
The magnetic moment, of OsF^ is 2.31BM at roomtemperature. This value is much smaller than that required for three unpaired electrons (3.88BM) and so is indicative that the compound is not a simple five covalent structure.
Chemical Properties
OsFg can be handled in glass if it is rigorously dry, but it is very sensitive to moisture and blackens rapidly, evolving OsO, in its presence. In water it dissolves exothermically forming a brown solution in which some of the fluorine is retained as a complex fluoro-ion; a black precipitate of hydrated OsO^ is formed and OsO, is evolved [43].
Osmium pentafluoride is soluble in anhydrous HF [65,68]. It has18

a higher Lewis acidity than the pentafluorides of rhenium, tantalum, molybdenum or niobium, but no [OsF ]' ions were detected in the solution by Raman spectroscopy [68]. If OsF^ is allowed to stand for more than one week as a powder it is difficult to dissolve it in anhydrous HF [65] this is probably due to the formation of lower fluorides, oxides or oxide fluorides on the surface.
Xenon difluoride in BrF^ as a solvent will react with OsF^ to produce two adducts XeF^^OsF^ and 2XeF2*0sF^ [5,6]. These have been shown by Raman spectroscopy, to have ionic character associated with the ionic formulation XeF^OsF^ and Xe^F^^OsF^ f the XeF^ ion being characterized by a doublet in the 600-612 cm* region and Xe F ion by strong bands at ca, 575 and 591 cm' (stretch) and 160cm‘ (bend) [20]. All XeF^ species are thermally stable except XeF^OsF^^ which decomposes at 20°C (equation ix).
3XeF.0sF^ ---------> Xe^F^OsF^ + Xe + OsF^ (ix)
Holloway and Knowles [19] studied the direct reaction of XeF^ and OsFg. They also found the reaction to be complex. The adduct XeFg.OsFg was isolated but was found to decompose readily at room temperature evolving OsF^ and Xe and leaving a dark brown residue which was presumably Xe F OsF *.
Structure
From its X-ray powder diffraction pattern OsF^ has been shown to be isostructural with RuF^ [25]. It is now known, also to be isostructural with IrF , RhF^ and PtF^ [70]. All these pentafluorides possess crystal structures containing tetrameric units in which the metal atoms lie at the corners of a rhombus, with nonlinear bridging fluorine atoms. The fluorine atoms are arranged about the metal atom in a distorted octahedral arrangement and are nearly hexagonal close packed. From the single crystal study [59] it is evident that OsF^ has a monoclinic cell with o=5.53±0.03Â, 6=9.91±0.10Â, c=12.59±0.15Â, 0=99®3O'±2O' and 3=8. The space group is P2j/c.
19

Spectroscopy and Mass Spectrometry
The infrared spectra of a thin film of OsF^ at -196®C [65] and of a nujol mull of OsF^ at room temperature [4] have been recorded. The data is shown in table 1.2.6 but the peaks have not been assigned.
Table 1.2.6 Infrared bands of OsF_ (cm*)
Nujol Mull 710 690 655 530 Ref.[64]
Thin film 712 691 657 530 Ref.[65]
The peak at 530 cm' is probably due to the bridging F.
The mass spectrum of OsF^ vapour has been recorded [27,28,62]. Peaks due to monomeric, dimeric and trimeric species have been observed. It has been shown [62] that when the source temperature is raised a decrease in the intensity of the dimer and trimer relative to the monomer results. The extent of the association of the neutral species is difficult to ascertain quantitatively because of fragmentation caused by electron impact ionisation.
1.2.4 Osmium Tetrafluoride
Osmium tetrafluoride is best prepared by the reduction of OsF^ dissolved in AHF using H . The solution is stirred in the presence of platinum gauze, irradiated by u.v.light and heated to 50°C. The OsF, precipitates from the solution [65]. The same reaction can be carried out using OsF^ in place of OsF^ but in this case there is a risk of producing a mixed-valent product [65].
A small amount of OsF,, mixed with metallic osmium is left behind when the residue from the osmium hexafluoride-tungsten carbonyl reaction is warmed to 120®C under a good vacuum to remove OsFg. When the temperature is raised to 280-300°C the OsF, distills as a viscous yellow liquid [43].
20

Appearance and Physical Properties
Osmium tetrafluoride is a yellow-brown solid which melts at about 230®C [43,65].
Chemical Properties
Osmium tetrafluoride is very sensitive to moisture. It dissolves in water to give a clear yellow solution [43,65].
Spectroscopy and Mass Spectrometry
The mass spectrum of OsF, shows peaks due to monomeric, dimeric and trimeric species. This would appear to suggest that in the vapour phase OsF, is polymeric. However, since there is a peak due to MFg^ reported it seems probable that some OsF^ may be present as an impurity [65], or that the OsF, is disproportionating to OsF^ and OsF .
The infrared spectrum of OsF, has been recorded, peaks are reported at 719, 702, 660 and 535 cm' but no assignment has been made [65].
21

1.3 Rhodium
1.3.1 Rhodium Hexafluoride
Preparation
Rhodium hexafluoride has only been prepared by burning a rhodium wire in a fluorine atmosphere in a quartz reactor cooled by liquid nitrogen [33,71]. Unfortunately, yields are low, since, the wire once ignited tends to extinguish itself and cannot be reignited once the circuit is open.
Appearance and Physical Properties
Rhodium hexafluoride is a very dark red-brown solid which appears almost black in bulk. The vapour is red-brown and its vapour pressure at various temperatures has been recorded [71] (table 1.3.1).
Table 1.3.1. Vapour Pressure of Rhodium Hexafluoride
Temperature (®C) 0 5 11 16 20
Pressure (mm) 15 19 29 40 49.5
Like all other P.G.M. hexafluorides, RhF^ undergoes a solid-solidtransition, the transition temperature being about 7®C at atmosphericpressure. The triple point of RhF^ is 70®C at atmospheric pressure [71].
Chemical Properties
Rhodium hexafluoride is the most reactive of all the platinum group metal hexafluorides. It is also thermally unstable, decomposing to fluorine and lower fluorides at room temperature [71]. The hydrolysis of RhF^ in HF has been studied, the RhF^ being condensed onto HF (containing traces of water) at -196®C. As the mixture isallowed to warm to room temperature the dark red colour of thehexafluoride
22

disappears and a yellow-green solution results. After removal of the HF at -78®C a yellow solution remains, however, this solution darkens rapidly and has not been characterised [5].
Rhodium hexafluoride does not appear to oxidise krypton but it does oxidise xenon [72]. The reaction product has a composition closeto XeRhF, with a combining ratio Xe:RhF, of 1:1.05. From the X-ray
. + - diffraction patterns very faint sharp lines indicate that XeF RhF^ ispresent as a minor component. This suggests that an excess of RhF ,like PtF^ interacts with Xe^ to produce XeF* [48].
When RhFg reacts with an excess of NOF and F at 25°C, NORhF^ is formed and when it reacts with an excess of NOF, (NO)^RhF^ is produced [6]. Both products have been studied using Raman spectroscopy and the results are shown in table 1.3.2.
Table 1.3.2: Raman Data for NORhP and (NO)
NORhF^
(NO),RhF2 6
2(Eg) v(NO*)
632 554 262 2338248
2(:2g) ^/^2g) v(NO*>
292 500 242 2312480
Structure
From X-ray diffraction studies [8,71] it is known that RhF^ has acubic form at room temperature with, 13±0.02À, 3=2, and acalculated density of 3.13±0.03gcm'^. At lower temperatures RhF^ has an orthorhombic modification and at -23®C, o=9.40, 6=8.54,0=4.96+0.02Â, 3=4 and the density is calculated to be 3.62±0.03gcm'^ [8]. The transition temperature is about 7®C but, because of the high reactivity of RhF , this value is only approximate [71].
23

(F “) (FJ (Fig) (Flu)
634 595 724 283 269 192634 592 724 283 269 189
Spectroscopy
The infrared spectrum of RhF^ can be interpreted in terms of a regular octahedral structure with point group 0 [53,71,73]. Twointense bands due to v and are observed at 722 and 283.5 cm
3 4respectively. Combination bands are also observed, the two strongest (v +v ) and are reported at 1314 and 1358 cm' respectively,from these the other fundamentals are calculated. The six fundamentals of RhF^ are shown in table 1.3.3.
Table 1.3.3. Fundamental Vibrations of RhF,
Ref.
[73][53]
The deflection of a molecular beam in an electric quadropole field has been studied. No refocusing of the molecular beam was observed when an electric field was applied. This is characteristic of a nonpolar molecule and supports the assignment of octahedral structure [33].
1.3.2 Rhodium Pentafluoride
Preparation
The best known method of preparation of RhF^ is the fluorination of rhodium sponge with gaseous fluorine (6 atms. pressure) at 400°C for 12 hours [60,74]. It is also produced from the combination of a rhodium wire in a fluorine atmosphere [75] or from RhF^ and fluorine at high pressures [76].
Appearence and Physical Properties
Rhodium Pentafluoride is a dark red solid with a melting point of 95.5±0.5°C. It is paramagnetic and its magnetic properties are consistent with the d" non-bonding electron configuration expected for
24

Rh(V) [74,76]. The magnetic susceptibility is temperature dependent, this may be due to a distortion of the octahedra [77]. At 20°C the effective magnetic susceptibility, is 2.93BM. Theoreticalcalculations of the enthalpy and entropy of RhF^ have been made but further independent verification is required.
Chemical Properties
Rhodium Pentafluoride is a powerful oxidizing and fluorinating agent. It reacts violently with water to yield an ozone like smelling gas and it fluorinates carbon tetrachloride, chlorine monofluoride being among the products [74]. Caesium fluoride and RhF^ in a 1:1 stoicheiometry react in iodine pentafluoride solution to yield caesium hexafluororhodate V [74]. This brown solid is isomorphous and almost isostructural with CsPtF^ [72].
Structure
The crystal structure of RhF^ has been determined by three dimensional X-ray data. The unit cell is monoclinic, P2 /a, with ct=12.3376(13), / :9.9173(8), c^5.5173(6)Â, 3=100.42(2)®, V=663.85ÂS3=8 and the calculated density D=3.95 gcm' . The structural unit is afluorine-bridged tetramer similar to that reported for RuF , OsF , IrF^ and PtF . Each rhodium atom is coordinated by six fluorine atoms in an approximately octahedral arrangement. Each of the cis pairs of F-atoms in the RhF^ group is shared with another Rh-atom the Rh-F-Rh angle being 135±1® [74,78]. The ^ F n.m.r. of RhF^ has been recorded.A triplet with intensities 1:2:2 suggests that at low temperatures the compound is composed of polymers with M-F-M bridge bonds arranged cis to one another [79].
Mass Spectrometry
The mass spectrum of RhF^ has been recorded [27,28,60]. Signals due to monomeric, dimeric, trimeric and tetrameric species have been observed. However, the extent of the association of the neutral species is difficult to ascertain because of fragmentation caused by electron impact ionisation.
25
1.3.3 Rhodium Tetrafluoride
Preparation
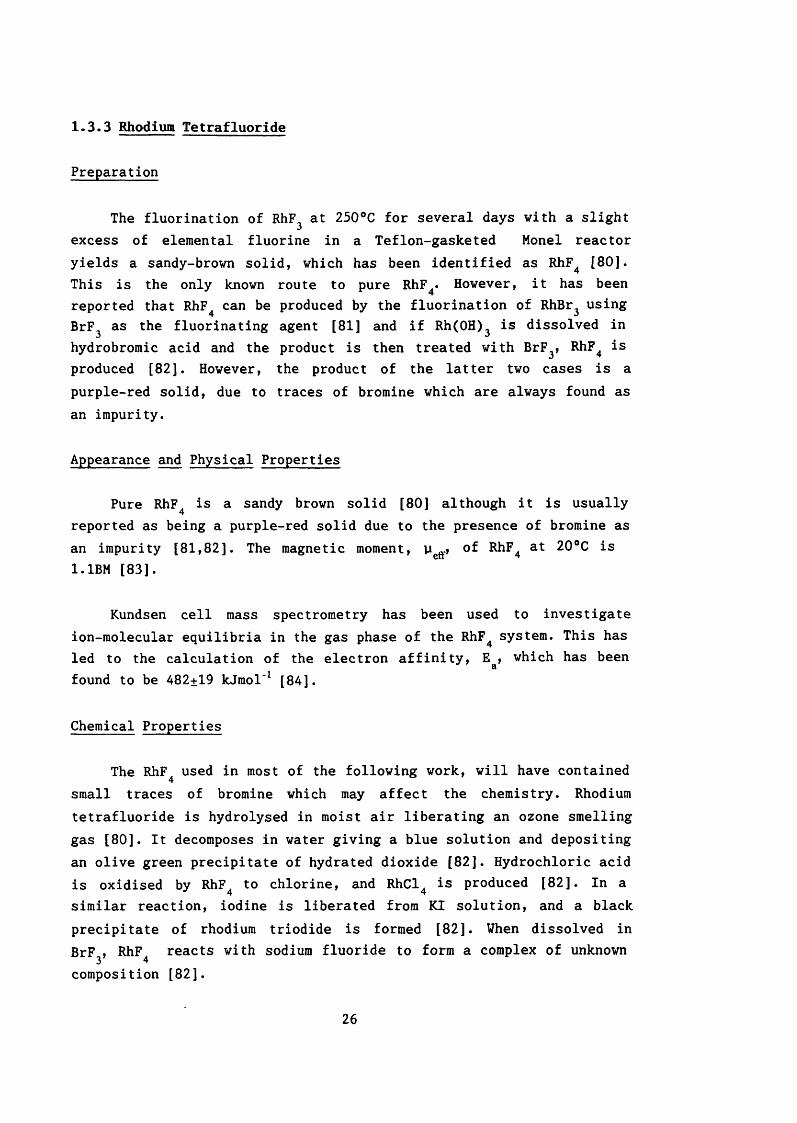
The fluorination of RhF^ at 250°C for several days with a slight excess of elemental fluorine in a Teflon-gasketed Monel reactor yields a sandy-brown solid, which has been identified as RhF, [80]. This is the only known route to pure RhF,. However, it has been reported that RhF, can be produced by the fluorination of RhBr^ using BrFg as the fluorinating agent [81] and if Rh(OH)^ is dissolved in hydrobromic acid and the product is then treated with BrF , RhF, is produced [82]. However, the product of the latter two cases is a purple-red solid, due to traces of bromine which are always found as an impurity.
Appearance and Physical Properties
Pure RhF, is a sandy brown solid [80] although it is usually reported as being a purple-red solid due to the presence of bromine as an impurity [81,82]. The magnetic moment, of RhF, at 20®C isI.IBM [83].
Kundsen cell mass spectrometry has been used to investigate ion-molecular equilibria in the gas phase of the RhF, system. This has led to the calculation of the electron affinity, E , which has been found to be 482+19 kJmol' [84].
Chemical Properties
The RhF, used in most of the following work, will have contained small traces of bromine which may affect the chemistry. Rhodium tetrafluoride is hydrolysed in moist air liberating an ozone smelling gas [80]. It decomposes in water giving a blue solution and depositing an olive green precipitate of hydrated dioxide [82]. Hydrochloric acid is oxidised by RhF, to chlorine, and RhCl, is produced [82]. In a similar reaction, iodine is liberated from KI solution, and a black precipitate of rhodium triodide is formed [82]. When dissolved in BrFg, RhF, reacts with sodium fluoride to form a complex of unknown composition [82].
26

Attempts have been made to reduce RhF, with SeF,, this led to the isolation of a pink complex, (RhFJ^SeF,, which undergoes thermaldecomposition to form a metal [81].
4 ' 2dark-coloured mixture of RhF^ and rhodium
Structure
Rhodium tetrafluoride is isostructural with PtF,, IrF, and PdF, the unit cell is orthorhombic with a=9.71(2), 6=9.05(2), o=5.63(l)Â and 3=8. Of the six fluorine atoms coordinated to each metal atom, four are shared 1:1 with four other octahedra. Thus, the stoicheiometric requirement (MF,) is fulfilled as each metal atom is uniquely coordinated to two fluorine atoms and has a half share in four others. The unique fluorine ligands are cis to one another. The M-F-M angle is, ideally, 135® [80].
1.3.4 Rhodium Trifluoride
Preparation
A detailed study of the preparation of RhF^ by the fluorinationof RhClg or Rh metal using either elemental fluorine or CIF^ as the fluorinating ager table 1.3.4 [84].
3 ■" " ■ ---- ■" " 3fluorinating agent has been carried out. The results are shown in
Table 1.3.4. Study of methods of Preparing RhF,
Starting Fluorination Temp. Time n(Rh) X-ray Ph;Material Agent (°C) (hrs.) n(F) Analysis
Rh F, 320 24 2.97 RhF3RhClj Fz 360 5 2.99 RhFjRh CIF3 160 8 1.00 Rh+RhF3Rh CIF3 345 8 2.91 RhF3RhClj CIF3 350 6 2.94 RhF3
It was concluded from these results that fluorination of RhCl^ by elemental fluorine was the best synthetic route. A related method of preparation is the fluorination of RhI at about 400®C using elemental
27

fluorine [16]. Jesse and Hoppe also prepared RhF, from Rh powder and fluorine. The reaction was carried out at 550®C but took 24 hours for completion [85]. The nonahydrate and the hexahydrate of RhF^ have also been prepared [86,87] but, no details will be given here.
Physical Properties
The saturated vapour pressure and heat of sublimation of RhF^ have been determined by high temperature mass spectrometry to be 1.87 Pa and 327.6±7.9kJmol'^ respectively [88].
Structure
Conflicting interpretation of the structural data on RhF^ were published by the earliest workers in this area. Some [89,90] considered "RhF " to be a rhorabohedrally distorted ReO^ structure with a unimolecular cell, and thus isostructural with FeF^ and CoF . Others [91,92] claimed that the structure was similar to that of AlF , with a bimolecular unit cell. Later, quantitative X-ray investigations were carried out [16] and these showed that RhF^ should be indexed on a bimolecular rhombohedral unit cell with 330+0.OOlA, ot=54.42±0.01®. It is not isostructural with FeF^ or CoF^ but has a closest packed hexagonal fluorine atom arrangement, (as do IrF^ and PdF ) successive close packed planes being compressed along the trigonal axis.
Mass spectrometry
The mass spectrum of RhF^ has been recorded and the results are shown in table 1.3.5 [84].
Table 1.3.5. Relative intensities of Ions formed from RhF,
Ion RhFj* RhF* Rh*
Rel.Intensity 21 100 88 92
28

1.4. Iridium
1.4.1 Iridium Hexafluoride
Preparation
Iridium hexafluoride is always prepared by the direct fluorination of iridium sponge [33,36,58,93-96]. However, the conditions employed vary greatly. The best preparation involves the passage of a mixture over the iridium sponge held in analumina boat and heated to 300-400°C [95]. The yellow hexafluoride is collected in a Pyrex trap at -65®C and is purified by trap totrap distillation under vacuum. It has also been prepared in astatic system where iridium powder is heated (300®C) for 3 hours in an excess of fluorine at 20 atms.[33].
Appearance and Physical Properties
Iridium hexafluoride is a bright yellow volatile solid at room temperature. It has a melting point of 44®C and a boiling point of 53®C. The vapour is deep yellow and stable to red heat [95].The magnetic moment of IrF^ at room temperature is 3.3BM [95]. Thisvalue indicates that the fluorine atoms are octahedrally coordinatedabout the iridium. The variation of the magnetic susceptibility of IrF with temperature has been shown to obey the Curie-Weiss law with a Weiss constant, 9, of 30® and a magnetic moment at 27®C approximately equal to 2.90BM [97]. However, due to the scattering of the data, the accuracy of this result is uncertain.
Cady and Hargreaves [36] studied the vapour pressure of IrF^ by a static method using a diaphragm gauge of high sensitivity. They found a solid-solid phase transition at 0.4®C and 61.7mmHg pressure, and calculated the following thermodynamic data (table 1.4.1.). The triple point occurs at 43.8®C and 518.8 mmHg.
Charge transfer transitions are reported for IrF^ with Xe [98]. Based on this spectroscopic data, estimates of the electron affinity (Ea = 7.84eV) have been made. The electron affinity has also been
29

Table 1.4.1 Thermodynamic Data for IrF, [36]
^fus (317.OK) 4.97 1I
\rs (273.6K) 7.11 |I
A H« (326.8K) 30.85 )kJmol-1
A^ub H° 0272K, cubic--- ipfg) 35.82 |I
Asub H° (<272K, orthorhombic >pfg) 42.93 )
^fus (317.OK) 15.63 )I
*trs (273.6K) 25.96 }jmol''deg'*I
A S° (326.8K) 94.47 )vap

estimated using values for collision ionisation energy between fast alkali atoms and IrF . The value using this method is %5.14eV [99] which is in line with the spectroscopic value. The force constant for IrF^ has been calculated to be 4.85md/Â [39].
Chemical Properties
Iridium hexafluoride is extremely reactive and behaves as a strong fluorinating agent. Most of the reactions of IrF , therefore, result in its reduction to a lower valency state. Several examples of such reactions are shown in table 1.4.2. In each of these cases IrF^ is condensed on to the reactant at -196*C and the reaction mixture is allowed to warm to room temperature [42,95,100,101]. The reaction of PF and IrF^ is extremely exothermic, causing the reduction of IrF^ to iridium metal [100]. However, if the reaction is carried out in anhydrous hydrogen fluoride at low temperature IrF and PF, are produced.
4 5
Other, less well documented reactions, include the reactions of IrF^ with either SO aiq) or PCl^ [95]. The former produces a dark blue solid which has the approximate composition IrF^S^O^ and the latter produces a dark green solid of variable and uncertain composition.
IrFg is rapidly hydrolysed by water, evolving ozone, and it is also known to attack moist glass [95]. Hydrolysis of IrF^ in HF results in the formation of the oxonium salt [H^O^IrF^ ] [5]. In the presence of u.v. light IrF^ is slowly photolysed to IrF^ [95].
Several groups have examined the reactions of IrF^ with NO, NO,, NOF and NO^F [46,48,95,102]. At 20°C, IrF^ reacts with NO to produce (NO)^IrF^ and NOIrF . This reaction is spontaneous and occurs if the ratio of IrF^zNO is 1:1 or if there is an excess of NO [46]. (NOO^lrFa is a pale yellow solid [95] and has a hexagonal unit cell £*=10.01Â, 03.53Â [48]. With N O, the white solid, (N0 )2lrF ' is formed [95].
IrF^ is the only hexafluoride other than PtF^ that has been
30

Table 1.4.2 Redox Reactions of IrF. 6
Reagent
PF,
PF3/HF
AsF.
SbF,
BiF.
SF
SeF
CS,
H CIOO C)
H/AHF
Metal/AHF
Metal/AHF/KF
CO or NH,4
so.
i^CR-T.)
I2(120°C)
F0C X25°C)
Product
Ir, PF,
IrF,, PF,
IrF .AsF,
IrF .SbF,
SF,.IrF,,SF,
SeF,* IrF^
OF,, SF,
Ir, HF
IrF,
IrF,
KrIrFg
Ir
IrF,.S02
IrF,(some IF,)
(ClOj)' IrF -
Ref.
[100]
[100]
[100]
[100]
[100]
[95]
[42]
[100]
[100]
[100]
[100]
[100]
[95]
[42]
[42]
[95]
[101]

shown to liberate fluorine [46,48] during the oxidation of NOF. WhenNOF and IrF^ are mixed in approximately equimolar amounts at 20°Cthe reaction occurs spontaneously and the overall stoicheiometry is approximately that shown by equation (i).
NOF + IrF^ > NOIrF^ + %F% (i)
Some NOF, is also formed. The yield of NOF, increases greatlywhen the ratio of NOF:IrF^ is increased. When the ratio is 3:2 morethan 60% of the theoretical yield is obtained (equation ii).
3N0F + 2IrF, ---► 2N0IrF\ + NOF. (ii)6 o ^
No reaction occurs between NOF, and IrF^ [48]. If NO^F and IrF^ are allowed to react in a stoicheiometric ratio the white solid NO^IrF^ is produced [102].
Structure
IrFg exhibits a cubic structure near room temperature and a phase of lower symmetry (orthorhombic) at reduced temperatures (table 1.4.3.). The phase change occurs at -1.2°C and atmospheric pressure [8].
Table 1.4.3. Crystallographic Data [8]
Cubic Phase Orthorhombic Phase
Temperature 25°C -11°C
Cell dimensions o=6.23±0.02Â o=9.58±0.02Âi^8.73±0.02Ât^5.04±0.02Â
Calculated density 4.20gcm'^ 4.82gcm‘
31

Spectroscopy
The infrared spectrum of IrF^ was first recorded in 1955 [94]. Two infrared active fundamentals v, and v, were observed at 718 and 276 cm' respectively, and from the combination bands the other fundamentals were calculated (table 1.4.4.).
Table 1.4.4. Fundamental Vibrations of IrF^
2 ''S '’s refs.
(\g) (Eg) (Flu) (Flu) (F,.)
(696) (643) 718 276 (260) (205) [92]
(705) (644) 720 276 (208) [101]
Calculated Data ( )
The spectrum is similar to the other heavy metal hexafluorides of 0 symmetry. Claassen and Weinstock [103] later examined IrF^ for evidence of Jahn-Teller effects using i.r. spectroscopy. Since, the electronic ground state of the molecule is a quartet they expected to find anomalies in the spectra due to Jahn-Teller vibrionic coupling. However, the combination bands ("v+'v) and (v +v,) were equal in shape and intensity indicating that no Jahn-Teller effect was present. The observed and calculated fundamentals are shown in table 1.4.4.
An incomplete Raman spectra of IrF^ was obtained by Claassen and Weinstock [103] using a 20% solution of IrF^ in n-C F . Only was observed; coincided with the 5677 mercury line and v, was obscured by absorption and background scattering. Later Claassen and Selig [54] observed all three Raman active fundamentals. One was intense and highly polarised the other two were weaker and depolarised (v 701 cm' (intense), 645 cm' , v, 267 cm' ). The work of Shamir and Malm agrees with these findings [49]. Here thefundamentals were observed at 704 cm"\ 647 cm' and 273-1cm .
32

The u.v.-visible spectra of the vapour phase of IrF^ was recorded between 4,000 and 40,000 cm' by Moffitt, Goodman, Fred and Weinstock [56]. The u.v.-visible spectra of IrF^ in a nitrogen matrix has also been recorded and the results are compared in table1.4.5 [57].
Electron diffraction [33,58] also indicates that the binary hexafluorides have electrically centrosymmetric structures with Oj symmetry. The Ir-F distance has been found to be 1.830Â.
1.4.2 Iridium Pentafluoride
Prior to 1965 iridium pentafluoride was confused with iridium tetrafluoride. It is now known [104] that the "IrF," of Ruff and Fischer [93] and Robinson and Westland [95] is, in fact, the pentafluoride. Thus, the earlier work will be discussed below as pertaining to IrF,.
Preparation
IrF, has been prepared in many ways but the best preparative route is by the direct fluorination of iridium metal, the elements being in stoicheiometric amounts and the mixture heated to 350-380°C [104]. All the other preparative routes, except, one involvereductions of IrF,. Ruff and Fischer [93] first prepared IrF by the6 ^reduction of IrF^ using Ir metal in a sealed quartz tube heated to 150°C. A similar method was used by Misra [24] but here the reaction was carried out in a flow line the IrF^/N^ mixture being passed over Ir sponge at 280°C. At just over 200°C, IrF^ readily attacks Pyrex to produce IrF, [95]. This method was also tested by Bartlett and Rao [104] who heated IrF^ with powdered glass to 350°C to produce IrF,. Paine and Asprey [65,66,105] have prepared IrF, by the one electron reduction of IrF^ using either or Si powder. When IrF^ is in solution in anhydrous HF both reagents react rapidly, reaction rates being enhanced by the presence of platinum gauze or u.v. irradiation. Hydrogen can also be used when IrF^ is in the gaseous state but here the reaction is much slower. IrF, can also be
33

Table 1.4.5 u.v.-Visible Data for IrF^
Gas Phase [56] Matrix Isolated [57] Assignment
42,000 43,000 n(F)—
35,500 35,700 n(F)— t g(Ir)
28,200 30,400 n(F)— >tj (Ir)
16,000 16,400
13,000 13,000
9,000
6,400
(E max/cm' and Av/cm' )

obtained by the reaction of a solution of XeF^ in anhydrous HP vith metallic Ir [66].
Photolysis of IrF^ using u.v. light can also be used to prepare IrPg [95] but yields are low.
Apperance and Physical Properties
IrPg is a yellow crystalline solid which melts at 104.5°C [104] to a dark yellow liquid, and boils at just above 300®C [95]. The magnetic suseptibility has been measured from -196-23°C [104]. The values obtained vary little with temperature as expected of a d'* electronic configuration in an octahedral or near octahedral 3rd row transition series metal fluoride. The magnetic moment calculated from these suseptability data is 1.32 BM at 296K [106].
Some thermodynamic data have been calculated for IrF^ [141] but further independent verification is required.
Chemical Properties
IrPg is rapidly hydrolysed in moist air to produce hydrated iridium dioxide and hydrofluoric acid. With excess of water a violet colloid of IrOg is formed [95]. Misra [24] has studied the reaction of IrFg with CO at 260-280®C in a flow system. The stoichiometry claimed for the product is Ir(C0)2gF2' further reaction with CO in a steel bomb at lOOatm pressure and 200®C, a fluffy fibrous brown product with the stoicheiometry Ir(C0) F2 and a black lustrous solid of stoicheiometry Ir(C0)2F2 formed. These products have been analysed by chemical methods, and using i.r. and mass spectral data.
The reactions of IrF^ in solution in BrF^ with xenon fluorides have been well documented [20,69]. With XeF , two adducts, Xe F^ [IrF ] (mp. 135®C) and XeFg^[IrF^]' (mp. 116®C), have been reported. The latter is isomorphous and almost isodimensional with XeFg^[PtF^] . The salt produced is dependent on the stoicheiometry of the reactants. The same is true of the products of the reaction
34
of IrF and XeF * Here three possible salts are produced,(m-P- 92®C), XeF+[IrF^]" (m.p. 152®C) and
XeF"‘’[Ir^F^(m.p. 69®C). No evidence has been obtained for adduct formation between XeF, and IrF,.
Robinson and Westland [95] have reported that, if SF is passed over IrFg at 100°C, the IrF^ becomes brown; while , at 350-400°C, a rapid reaction produces the brownish-black IrF .
It has been shown that IrF^ is soluble to at least IM concentration in anhydrous HF. There is some trouble, however, in dissolving the IrF^ if it has stood as a powder for more than a week [65]. This may be due to dissociation of IrF^ and formation of IrF .
Structure
X-ray powder diffraction has shown that IrF^ is isomorphous and nearly isodimensional with RuF , having a tetrameric molecular structure with nonlinear fluorine bridges [104]. IrF^ adopts a monoclinic lattice; o=12.5, 6=10.0, o=5.4Â and (3=99.8®, with Iratoms almost octahedrally coordinated.
The fractional magnetic field shift of the nuclear magnetic resonance of ^ F in IrF^ has been observed [79]. The three line absorption spectra, with intensity ratio 1:2:2 suggests that, at low temperature, this compound is composed of polymers with metal-fluorine-metal bridge bonds arranged cis to one another. This is in agreement with Bartletts [104] earlier solid-state work.
Spectroscopy and Mass Spectrometry
The infrared (-196®C,thin film), Raman (melt) and visible (solution in HF) spectra of IrF^ have been recorded and the results are tabulated below (table 1.4.6) [65].
35

Table 1.4.6 Spectroscopic Data for IrF.
I.R. (cm Raman (cm' ) visible (nm)
840683
715 s,sh 718 s (p)699 s,sh 705 w678 vs 701 w642 s 687 w533 m,br 673 w
646 m258 m237 w224 w
Using molecular beam mass spectrometry Vasile, Jones and Falconer[27,28] detected signals due to monomeric, dimeric, trimeric and tetrameric ions, however, the extent of association of the neutral species is difficult to ascertain quantitatively because of fragmentation caused by electron impact ionization.
1.4.3 Iridium Tetrafluoride
Preparation
The best preparation of IrF^ involves the interaction of Ir metal with an excess of IrF^ [80], however, the procedure is quite long. An excess of IrF^ and Ir metal are placed in a reaction vessel which is heated to 350°C at the bottom and 400°C at the top. These temperatures are maintained for 12 hours then the reaction vessel is allowed to cool slowly to 180°C, and the reactor is maintained at this temperature for 10 hours to facilitate crystallization of the IrFj from liquid IrP * The reaction vessel is then placed, open in a larger container which is heated under vacuum to 260°C in order to separate the IrF^ and IrF .
36

There are several other methods of preparation. When is admitted to a solution of IrF^ dissolved in anhydrous HF and the resultant solution is stirred in the presence of platinum gauze and u.v. radiation for 1 to 12 hours, IrF^ precipitates as a red-brown solution [65]. The same reaction can also be carried out using IrF^ in place of IrF^ but a mixed valence product results.
Reduction of IrF^ on a hot filament of iridium or tungsten, using a technique similar to that described by Schroder and Grewe [107,108] to synthesis WF . can also be used to produce IrF^ [109]. This method is useful because IrF^ is made directly from IrF^ without the need to first produce IrF . Recently, IrF^ has been reduced by PF in anhydrous HF to produce IrF^ [100].
Appearance and Physical Properties
IrF^ is a light brown solid [80] which sublimes at approximately 180®C [109]. It is paramagnetic and its magneticsusceptibility obeys the Curie-Weiss Law over the temperature range -173 - 27°C [80]. The magnetic moment, peff, is 1.89BM. Below -173*C the deviation from the Curie-Weiss Law is consistent with antiferromagnetic coupling between adjacent Ir atoms.
Chemical Properties
Very little is known of the chemistry of IrF . However, IrF^ hydrolyzes slowly in moist air to give a violet product [80]. Up to 400°C it is stable under dynamic vacuum but above this temperature disproportionation occurs [80](equation iii),
2IrF -----> IrF, + IrF, (iii)4 j J
Structure
X-ray powder photography has shown IrF^ to be isostructural with PtF . The unit cell is orthorhombic ^ 8, a=9.64(2), 6=9.25(2), o=5.67(2)Â, and V=505.8A^ [80]. Six fluorine atoms octahedrallycoordinate each Ir atom, four being shared (1:1) with four other
37
octahedra. Thus, the stoicheiometric requirements (MF ) are fulfilled, in that each metal atom is coordinated uniquely to two fluorine atoms and has a half share in four others. The unique fluorines are in the cis relationship to one another.
Spectroscopy and Mass Spectrometry
The infrared spectrum of a powdered sample of IrF^ has been recorded at 23°C. This shows three peaks at 691 cm' (m,sh), 688 cm (s) and 545 cm' (s) respectively.
A sample of IrF^ was examined using molecular beam mass spectroscopy [111]. Between 100-200®C the spectrum of IrF , a possible contaminent of the synthesis, was observed but on further heating this disappeared. At 300-500®C the spectrum contained no IrFg^ component and no evidence of association in the saturated vapour was observed at this temperature. However, it seems unlikely that polymeric species would be stable enough to be detected.
The mass spectrum recorded by Paine and Asprey [65] of the vapour above solid IrF^ at (100-200®C) suggested that neutral oligomers are present. However, since IrF^^ peaks were observed, it is probable that some IrF^ is also present in their IrF^ sample.
1.4.4 Iridium Trifluoride
Preparation
The best preparation of IrF^ is via the thermal decomposition of IrFg (initially reported as "IrF^") [16,95]. The IrF^ produced is pure, but poorly crystalline and yields are low. It is possible to produce more crystalline IrF^ by passing a mixture of IrF^/N^ over Ir powder heated to 500®C. The IrF^ is very crystalline but unreacted metal remains as an impurity [16].
If IrF^ is heated (400°C) under two atmospheres of argon in a Monel bomb with no cooled section for four hours, a black powder is produced. This is reported to be IrF^ but no information on its purity has been given [109]. Reactions of SF and IrF^ &Tso produce
38

IrFj, as does the reaction of IrF^ with S or In the latter three cases the product is reported to be impure [95].
Recently, Misra prepared IrF^ by reacting IrF^ with an excess of CO at 200 atmospheres pressure and 200®C [24].
Appearance and Physical Properties
IrFg is a brownish black or black solid. Thermally it is not very stable. Above 250®C it begins to lose fluorine and eventually decomposes to iridium metal [95].
Chemical Properties
IrFg is unaffected by water and attacked only very slowly by concentrated acids or alkalis [95].
Structure
IrF^ is isostructural with PdF^ and RhF . The rhomboheral unit cell contains two molecules and has dimensions <^5.42Â and ot=54.3® [95]. The fluorine atoms are in a closer-packed hexagonal arrangement, successive close-packed layers being slightly compressed along the trigonal axis so that the axial ratios are less than the ideal value of 1.633. Each fluorine has six equidistant fluorines as neighbours in its own plane and six others at shorter distances in adjacent planes. The metal atoms occupy one third of the octahedral sites in an ordered manner [16].
39

1.5 Palladium
1.5.1 Palladium Tetrafluoride
Preparation
Palladium tetrafluoride can be prepared via the direct fluorination of Pd^'^[PdFg]using BrF^ [80,112]. In an account giving precise details of the reaction conditions necessary to obtain a relatively pure product [112] it was noted that, during the preparation of Pd^+[PdF^]^\the BrF^.PdF^ complex should be decomposed at as low a temperature as possible (210°C) under vacuum in a quartz bulb. The resulting Pd *[PdFg] is poorly crystalline and suitable for the moderate pressure (7 atmospheres) fluorination at 300°C to yield PdF . It was also suggested that the bomb should be recharged with fluorine during the reaction and that the reaction should be allowed to proceed for several days. If recommendations are followed it is possible to prepare reasonably pure PdF^ without serious contamination with unreacted Pd^^[PdF^]^^ as found previously [112].
Appearance and Physical Properties
PdFj is a brick red, diamagnetic solid [112].
Chemical Properties
Raman data suggests that the adducts formed from PdF^ with XeF^ are [XeF^‘] [PdF ] and [Xe F ^ ] [PdFg ]. The X-ray crystal structure of [XeFg^]2[PdF^^] shows these yellow crystals to have an orthorhombic unit cell with a=9.346(6), b=12.786(7), c=9.397(6) A,
z=4 and the density D has been calculated to be 3.91 gcm' [150].
Structural Data
X-ray powder diffraction studies [80,112] and neutron powder diffraction studies [113] have been undertaken in order to elucidate
40

definitively the structure of PdF^.
In their early work Bartlett and Rao [112] suggested that PdF^ has a tetragonal unit cell and is structurally similar to PtF^ [114]. Platinum tetrafluoride in turn , was thought to be structurally related to UCl^ [115] in which each uranium atom is coordinated by eight chlorine atoms arranged in two flattened tetrahedral sets. This implies that all the fluorine atoms in PdF^ are equivalent. Later, Rao, Tressaud and Bartlett suggested that a different structure was probable [80], in which octahedral coordination of the metal was possible. In this case the fluorine atoms would no longer be equivalent. Of the six fluorine atoms octahedrally coordinating each metal atom, four are shared (1:1) with four other octahedra and two are uniquely coordinated to the metal. The two terminal fluorines are arranged in the cis configuration.This latter structure has been confirmed by neutron powder diffraction studies [113] and the Pd-F-Pd bridging angle was found to be 134±2.4®. This angle agrees well with that expected (135®) for ideal hexagonal close packing of octahedra.
1.5.2 Palladium Pifluoride
Preparation
There have been many methods reported for the synthesis of PdF^[116,117,118]. However, in all the preparations carried out by Ruff and Ascher[116] the PdF^ was contaminated with palladium metal. In the early work of Bartlett and Hepworth the same problem occurred [117]. Eventually, Bartlett and Hepworth [117] developed the following reaction sequence in order to prepare pure violet PdF^ (equations i-iii);
r.t.
Pdl^ + BrFj --------> PdFj.BrFj (i)reflux
PdF^.BrF^ + SeFj --------> PdF^.2SeF^ (ii)reflux in excess
PdFy2SeF^ ----------------- > PdF^ (iii)SeF. 220'C 4
41

Another convenient preparative route is the thermal decomposition of PdGeF^ in vacuo at 350®C [112](equation iv).
350'C
PdGeFg --------► PdF^ + GeF^ (iv)
The most useful method for preparing PdF » however, is the reduction of palladium II hexafluoropalladate IV with SeF^ [118] since the intermediate fluoroselenium hexafluoropalladate decomposes directly to the difluoride at 155°C.
Appearance and Physical Properties
PdFj is a pale violet powder [117]. It is the only paramagnetic compound of divalent Pd II. The effective magnetic moment at R.T. is 1.84BM [119]. This low value is probably due to antiferromagnetic effects.
Chemical Properties
Palladium difluoride is hydrolysed rapidly in moist air to give the brown colour characteristic of the oxide [117]. With water, heat is evolved and a gelatinous precipitate of palladium hydroxide is formed. In hydrochloric acid, PdFg dissolves completely to give an orange-brown solution. PdF^ reacts with CaF^ and CdF i at 820®C over 20-30 days in sealed platinum tubes [120], to form CaPdF^ (purple) and CdPdF^ (dark blue) respectively. Both compounds are crystalline, CaPdF^ giving tetragonal crystals (KBrF^-type) and CdPdF^ giving cubic crystals (CaF^-variant). HgPdF^ has also been formed, this is isostructural with HgPtF^ and both are black. CdPdF^ is diamagnetic whereas CdPdF^ is antiferromagnetic.
Structural Data
Several X-ray powder diffraction studies have been carried out[91,116,117,118]. Ruff and Ascher [116] first characterised PdF^ by X-ray powder diffraction. Their results indicated that PdF^ forms tetragonal crystals with the rutile structure. Ebert [91] confirmed this and obtained unit cell dimensions, but could not complete the structural determination. Similar values of the unit-cell dimensions
42

were also found by Bartlett and Hepworth [117].More recent studies by Bartlett and Maitland [119] have
produced further structural information (table 1.5.5). PdF^ is isostructural with MnF » FeF » CoF , NiF^ and ZnF * Each palladium atom has six fluorine atoms forming an almost regular octahedron around it. The PdF^ coordination octahedra are joined by sharing corners.
Table 1.5.1. Interatomic Distances
4 Pd-F 2.155Â2 Pd-F 2.171Â8 F-F 3.060Â2 F-F 2.664Â2 F-F 3.389Â
A second, high-pressure form of PdF^ is also known and this has been the subject of close structural investigation [120-125]. PdF^ exhibits the fluorite structure at pressures exceeding 15 kbar at room temperature. This high pressure form, when quenched to atmospheric pressure, retains its fluorite structure as a metastable phase[120,122,123]. This transformation has been followed in situ by resistivity measurements [121,124]. X-ray diffraction methods have been used to check these results. X-ray and neutron diffraction methods have been used to study the structure of the high pressure phase. However, these measurements were carried out at atmospheric pressure [124]. The high pressure form of PdF^ crystallises in the cubic system with a=5.329±0.002Â.
1.5.3 Palladium II Hexafluoropalladate IV
Preparation
Early workers reported the preparation of "PdF "[16.32.116.117] but this was later shown to be palladium II hexafluoropalladate IV [Pd^^(PdF^)^J [112]. There are several reports of the preparation of Pd[PdF^] [16,82,112,116,117] but there are basically only two methods:
i) Fluorination of palladium dihalide using elemental fluorine[16.116.117].
43

ii) Fluorination of palladium dihalide using bromine trifluoride [82,112,117].
In the work carried out using elemental fluorine as the fluorinating agent a large variety of conditions are employed. Temperatures vary from room temperature [117] to 400®C [16] and no indication of fluorine pressure is given. The best route for the preparation of Pd[PdF^] is the fluorination of PdX^ (X=C1, Br, I) with BrFy. The initial product is PdF^.BrF^. This is decomposed at 180®C to give Pd[PdFg]. In this reaction an addition compound is formed in solution between PdX^ and the solvent , thereby ensuring a rapid and quantitative reaction. The whole reaction can be carried out in a quartz flask without significant damage to the vessel [82] thus, avoiding the need for expensive equipment.
Appearance and Physical Properties
Palladium II Hexafluoropalladate IV is a black crystalline solid. The magnetic moment of Pd[PdF^] at 20®C is 2.05BM [83]. Since Pd[PdF^] had been reported initially as being "PdF " this result was misinterpreted in terms of a low spin electron configuration, d(t g) , d(e^)\ for the octahedrally coordinated Pd^^ ion. This was in direct conflict with ligand-field theory which predicts a distorted environment for an ion with such a configuration. The problem was later resolved when it was demonstrated that "PdF " is in fact Pd2 [PdFg]^ [112]. Thus the Pd^^ ion is assigned the high spin electron configuration and Pd*^ is given the low spin electron configuration d(t ) , (6 )° associated with the [PdF ] ion, as in the hexafluoropalladates which are diamagnetic.
Chemical Properties
Pd[PdFg] is rapidly hydrolysed by water,
Structural Data
Conflicting interpretations of the structural data on PdF^ were published by the earliest workers in the area. Some [89,90] considered "PdF " to have a rhombohedrally distorted ReO^ structure
44

with a unimolecular cell being isostructural with FeF^ and CoF . Others [91,92] claimed that the structure was similar to that of AlFj, with a bimolecular cell. Later, quantitative X-ray investigations were carried out [16] and it is now known that "PdF " should be indexed on a bimolecular rhombohedral unit cell. It is not isostructural with FeF^ or CoF , but has a closest packed hexagonal fluorine atom arrangement, successive close packed planes being compressed along the trigonal axis. Pd[PdF^] is isostructural with a series of compounds of general formula Pd^^[MF^]^ in which M= Ge, Pt, Sn [112].
45

1.6 Platinum
1.6.1 Platinum Hexafluoride
Preparation
There are five reported methods of preparation for platinum hexafluoride [75,102,126-129]. By far the best is that of Weinstock, Malm and Weaver [127], who heated a platinum wire electrically in a fluorine atmosphere, adjacent to a surface cooled by liquid nitrogen, the reaction being carried out in a brass container. Yields of PtF^ were typically of the order of 70%. This was a great improvement on the group's initial reactions in Pyrex [126] where yields of PtF^ were only about 10%.
Platinum hexafluoride has also been prepared from platinum and elemental fluorine at 500®C [128] but the yield varied from 10-90% [129]. Later, the reaction was repeated more successfully at 200°C [129] after Weinstock et al [127] reported that the rate of thermal decomposition of PtF^ in the presence of fluorine at high pressure is only significant above 200°C. Under these conditions the yield of PtF^ was 40-50%, the remainder being lower fluorides (PtF^ and ptpp.
PtFg can also be prepared, together with PtF^ [102], by heating Pt metal and F (210 atm. at R.T.) for 12 hours in a 70 cc Monel bomb. It can also be prepared in small quantities in quartz apparatus by passing F /N mixture over platinum metal in a shallow nickel boat [75]. The boat is heated to a few hundred degrees in an electrical furnace and is placed as close as possible to a liquid oxygen trap in order to prevent decomposition of the PtF .
The powerful oxidative fluorinating ability of KrF^ has also been used to obtain platinum hexafluoride in solution in anhydrous HF or BrFg [21]. A solution of the metal oxide or lower fluoride in
46

KrF^ gives the complexes KrF^'PtF^ and KrF^'ZPtFg which, when heated slightly, decompose vigorously with the quantitative formation of PtF .
Another reported method for the formation of PtF^ involves the use of atomic fluorine [130]. The reaction, at temperatures above 100®C, is reported to be rapid. Further independent verification is needed in the cases of these last two preparations.
Appearance and Physical Properties
Platinum hexafluoride is intensely coloured, appearing bright red when viewed under a microscope and black in massive amounts. It has a melting point of 61.3®C [8] and, in the liquid phase, it is dark red in colour. The vapour of PtF^ is brownish red, being much more intensely coloured than bromine vapour. The approximate solid vapour pressures at 0®C and 21®C are 29 and 96 mmHg respectively [32,126]. Platinum hexafluoride is less stable than OsF^ and IrF^but more stable than RuF, and RhF . When stored in Pyrex or quartz6 oit decomposes slowly leaving a red residue. However, it may be stored for weeks at room temperature in a nickel can [126]. There is virtually no thermal decomposition until 200®C but at 280®C decomposition is rapid and complete.
The enthalpy of formation of PtF^ has recently been reported [131]. Knudsen-cell mass spectrometry was used to investigate the gas-phase equilibrium: PtF^ + F ^ PtF . The following values at 298.15 K were calculated:
A^H®m = -(152±12) kJmol-'
A^H®m (PtFggas) = -(676±28) kJmol-'
A^H®m (PtFgS.i.) = -(714±28) kJmol-'
AjH®m (PtFgS.ii.) = -(722±28) kJmol-'
All other thermodynanic data is summarised in table 1.6.1
47

Table 1.6.1 Summary of Thermodynamic Data and PhysicalConstants for PtF,
M pt
B pt
Transition temp.
Liquid Density
61.3°C
69.14®C
3°C
3.826 gem-3
'"sub «°
"'sub «°
"sub «°
"vap «°
"fus
"trs
"sub
"sub
"sub
"vap
"fus S°
"trs
(276.IK, orthorhombic >pfg) 47.82 'j
(276.15K, cubic--->pfg)
(334.45K, cubic--->pfg)
(334.45K)
(334.45K)
(276.15K)
38.87
35.91
7.51
4.51
8.95 J
kJmol-1
(276.15K, orthorhombic >pfg) 173.1
q(276.15K, cubic >pfg)
(334.45K, cubic >pfg)
(334.45K)
(334.45K)
(276.15K)
140.9
107.4
94.1
13.4
32.6 J
^mol'Meg'

Chemical Properties
Platinum hexafluoride has extraordinary oxidising properties. This was demonstrated in 1962 when Bartlett and Lohmann [50] showed that PtFg would oxidise oxygen gas at 21°C to give 0^ [PtF ] . They had earlier prepared 02^[PtF^]~ when fluorinating PtCl^ at 350®C in silica apparatus but had thought that they had prepared PtF^ and PtOF^ [132]. It was only later that they discovered that their 'oxyfluoride' was in fact 0 '''[PtFg]” [133]. The salt can also be prepared by fluorinating platinum sponge or platinum salts in the presence of oxygen [50,151]. The dioxygenyl salt is a red, dimorphic, paramagnetic solid which sublimes without decomposing in vacuum above 90°C.
Bartlett recognised that, since, xenon has a first ionisation potential just less than that of oxygen it should also be oxidised by platinum hexafluoride. He showed that PtF^ oxidises gaseous xenon spontaneously to give a yellow-orange solid [158]; initially thought to be Xe'*’[PtF ]~. The product, however, was not as simple as first formulated [72]. The reaction has been repeated many times and followed tensimetrically and gravimetrically [41]. The combining ratio Xe:PtFg always lies between 1:1 and 1:2, with the former favoured when xenon is in excess and the concentration of reactants is low [48]. Mahieux [135,136] may have produced similar products by exploding a platinum wire in Xe/F^ gas. Products of composition PtXeFg and (PtF^)^^^ have been suggested. Unfortunately, since "XePtF^" is amorphous it has been impossible to compare powder photographs with those of [XeF]‘‘'[PtFg]” [20]. Consequently, it is still not certain whether the compounds designated [Xe]* [PtF ] and Xe[PtF^]^ contain [Xe]*, [Xe] '*’ or [Xe^F]^ or whether "XePtF^" is in fact XePtF and "XePtF^" and Xe[PtF ]2 are the compounds [XeF] + [PtF ]" and [XeF] + [Pt^F^]" [ 34].
Platinum hexafluoride can be used as an oxidative fluorinator for the synthesis of coordinatively saturated complex fluoro-cations CIF^^ and NF'*’ [101,153-156]. The CIF '*’ cation can be prepared in the form of its PtF ” salt from the reaction of PtF, with either6 o
48

FClOj [101] or ClFg [101,156]. If PtF^ and GIF, are left to react in their gaseous state then irradiation with u.v. light is required to initiate the reaction, however, when dissolved in HF they react readily at 25°C [156] (equation i).
2ClFg + 2PtFg ---> ClF ' PtFg" + ClF^’PtF ' (i)
Attempts to prepare BrF ' PtFg" in an analogous manner from BrF^ and PtFg were unsuccessful [156]. The best method of preparation for NF^ PtFg is the reaction of PtF^ with a large excess of F and NF^ at 125°C under a pressure of about 140 atms.(equation ii).
2NFj + F; + 2PtF^ ---> ZNF^PtF^ (ii)
Platinum hexafluoride reacts with bromine trifluoride, plutonium tetrafluoride and neptunium fluorides to yield the highest fluoride of each [127]. It also reacts violently with uranium metal to form UFg [32] and with finely divided plutonium when the solid is brought to red heat and a platinum mirror is deposited on the quartz reactor [127],but no PuF^ is found. This is probably due to the absence of a cold surface onto which the thermally unstable PtF^ can be quenched.
In the gas phase, sulphur tetrafluoride reacts with platinum hexafluoride forming a product containing platinum in both oxidation states IV and V [41].
In contrast to the hexafluorides of osmium and iridium, which are reduced by selenium tetrafluoride to the pentavalent state, platinum hexafluoride is reduced to the tetravalent state [42].
Platinum hexafluoride reacts with chlorine trifluoride [137] to form the adduct ClF^.PtFg with evolution of fluorine. Reaction with bromine pentafluoride yields elemental fluorine and leaves a black viscous liquid of uncertain composition which contains platinum, bromine and fluorine [137].
49

Weinstock, Malm and Weaver attempted to investigate the lysis chemistry of PtF^ [127
the stoicheiometric reaction (iii)hydrolysis chemistry of PtF^ [127]. The results are summarised by
PtF^ + HjO --- > HjPtFj + (iii)
When larger samples of PtF^ are used, however, some of the platinum is reduced further than the tetravalent state. This is probably due to the heat produced in the decomposition causing more vigorous reaction. Hydrolysis of PtF^ in hydrogen fluoride, however, yields the oxonium salt H,0‘ PtF~ [41]. If excess of water isI 2“present (H O can also be isolated.
Reactions of platinum hexafluoride with NO and NOF carried out in the 1960's by Bartlett and Beaton [46,47] and independently by Gortsema and Toeniskoetter [138] appear to give inconsistent results.Bartlett and Beaton [46,47] report that the overall reaction is close to that represented by equation (iv):
NOF + PtFg ---► NOPtF^ + YzF (iv)
Minor amounts of NOF^ are also produced. It is further stated [48] that there is no evidence that a salt-like adduct is formed. The ability of PtF^ to liberate fluorine on reaction with NOF was observed independently by Gortsama and Toeniskoetter [138]. However, they made no mention of NOFy They also noted that further interaction of NOF with NOPtF^ takes place with further liberation of fluorine, (equation v):
NOPtF^ + NOF ---> (N0)2PtF^ + %F^ (v)
Bartlett did not report the formation of (NO)^?!^^ via this method but found that it was formed from NO and PtF , (equation vi):
NO(excess) + PtF^ ---> (NO^^PtF^ (vi)
This is not reported by Gortsama and Toeniskoetter.
Work carried out by Griffiths and Sunder [102] on the reaction
50

of excess of nitrosyl fluorine with platinum hexafluoride suggests that the reaction proceeds via two distinct steps (equations vii and viii):
NOF + PtF, --- > NOPtF^ + %F_ (vii)6 o ^
NOPtFg + NOF ---> (N0)2PtFg + YzF (viii)
in agreement with the work of Gortsema and Toeniskoetter.
Griffiths and Sunder [102] also found the reactions of NO^ and NO^P with PtF^ were more complex than previously reported [138]. Gortsema and Toeniskoetter [138] reported that the following reaction (equation ix) occurs;
N O +PtF^ ---> (N0)(N02)PtFg + V2O2 (ix)
whereas Griffiths and Sunder found that NOPtF^ and (NO),PtF^ were formed. If(x) occurs;formed. If NO^P is reacted with PtF^ the reaction shown in equation
NO^P + PtPg ---> NO^PtPg + V2F2 (x)
However, if the ratio NO^P : PtF^ is increased to 2.2:1 then at room temperature the reaction can be explained by the following sequence;
NO^P + PtPg --- > NO^PtP^ + V2F2 (xi)
NOF + NO^PtF^ ---> (NO^^PtPg + O2 + %P2 (xii)
The overall stoicheiometry was not exactly predicted by equations(xi) and (xii) as a small amount NOPtF^ could also be detected.
Structural Data
X-ray powder diffraction studies have shown that PtF^ isisostructural with OsF, and IrF, [126], and more recent work6 0indicates that x-ray powder patterns of PtF^ can be indexed on the basis of a body centered cubic cell [8]. At reduced temperature
51

(3°C) a phase transition to lower symmetry occurs. The powder pattern of the low temperature phase appears to be similar to that of UF^ which is reported to be orthorhombic.
The ^ F nuclear magnetic resonance spectrum and the spin-lattice relaxation times of polycrystalline PtF^ have been studied as a function of temperature and magnetic field. The chemical shift is large, exceeding the dipole-dipole broadening in the solid, thus, allowing determination of the extent of tetragonal distortion of the hexafluoride octahedra in the low-temperature phase. The solid-solid transition to the cubic phase of PtF^ is found to be accompanied by a very sharp increase in spin lattice relaxation time and a lowering of the activation energy for molecular motion.
Spectroscopy
The infrared spectrum of the gaseous platinum hexafluoride has been measured between 4000-200 cm' [51]. Observation of bands at 273 cm' (v ) and 705 cm' (v ) and combination bands at 1306 cm"
and 1360 cm' indicate that in the gas phase thePtFg molecule is octahedral. The derived fundamentals are shown in table 1.6.2.
Table 1.6.2. Fundamental Frequencies of PtF (cm‘)
'’l '’2 3 '’5(A.,) (E®) (flu)655 601 705 273 242 211
Claassen and Selig [54] attempted to record the gas-phase Raman spectrum of platinum hexafluoride but, because of its relatively low vapour pressure and high reactivity at room temperature, they observed only the intense fundamental. Their value of = 656.4 cm' agrees well with that calculated from the infrared spectrum.
Claassen [39] used the fundamental frequencies to determine the force constants for PtF , to be +0.141 md/A. The u.v.-visible spectra for gaseous platinum hexafluoride (2,500-40,000 cm' ) [56]
52

and the matrix isolated hexafluoride have also been recorded [57]. The results of each are shown in table 1.6.3.
The deflection of a molecular beam of PtF^ in an electric quadropole field has been studied. No refocusing of the molecular beam was observed when an electric field was applied [33]. The results were characteristic of a non polar molecule and support the assignment of centrosymmetrie structure for PtF .
1.6.2 Platinum Pentafluoride
Preparation
Platinum pentafluoride is prepared by the fluorination of either platinum sponge or platinum dichloride [60,114,132]. The fluorination of platinum difluoride is the most commonly used route, the fluorine and nitrogen (3:1) being passed over PtCl » in a platinum boat, in a quartz tube. At 350®C a vigorous reaction yields PtF^ [114]. Unfortunately, dioxygenyl hexafluoroplatinate V (originally thought to be PtOF^ [132]) is also formed due to the presence of oxygen which originates from the attack of fluorine on the silica. This can be removed by vacuum sublimation at 100°C. However, since PtF^ dissociates to PtF^ and PtF, very easily, it is likely that some dissociation of PtF^ occurs. It should be possible, however, to avoid the formation of dioxygenyl hexafluoroplatinate V by carrying out the reaction in an all metal apparatus. This method would then undoubtedly be the best method of preparing PtF .
Falconer, Jones, Sunder and Vasile reported a preparation of platinum pentafluoride via the fluorination of platinum sponge with an excess of elemental fluorine at 6.5-7.5 atms. pressure for 12 hrs at 350®C [60]. They reported that the small amounts of PtF^ formed were removed at room temperature to leave PtF . If this is correct then this route could be the most useful preparation for PtF . However, the purity of the product was only measured using mass spectrometry, and this would give no evidence of unreacted metal which would be difficult to separate from the PtF .
53
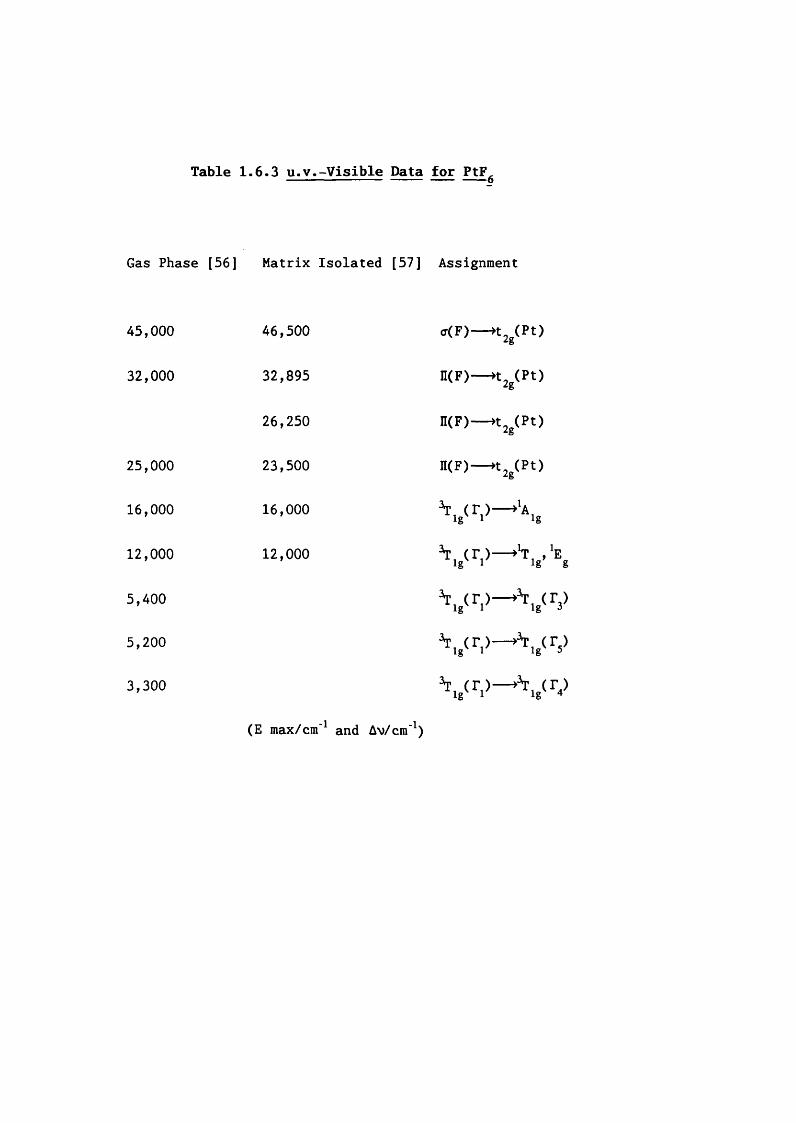
Table 1.6.3 u.v.-Visible Data for PtF^
Gas Phase [56] Matrix Isolated [57] Assignment
45,000 46,500 <t(F)— »t2j (P t )
32,000 32,895 n(F)— »t2g(Pt)
26,250 n(F)— ^tjg(Pt)
25,000 23,500 n(F )— »tj^(Pt)
16,000 16,000
12,000 12,000
5,400
5,200
3,300
(E max/cm' and Av/cm' )

Appearance and Physical Properties
Platinum pentafluoride is a dark red solid, which melts at 80°C to a dark red liquid with a high viscosity and a high surface tension [114,132]. The boiling point has not been determined due to its rapid dissociation into PtF^ and PtF,. The pentafluoride is paramagnetic with a magnetic moment of 2.05BM [140]. The entropy and reduced free energy of PtF^ have been calculated in the ideal gas state (p = 1 atm.) in the range 298-3200K [141]. Until experimental evidence to support these results is produced they should be viewed with some scepticism.
Chemical Properties
Platinum Pentafluoride is a very powerful oxidising agent. It reacts exothermically with water and a gas is evolved which is probably oxygen [114,132]. Approximately 25% of the platinum is precipitated as the dioxide whilst the remaining 75% goes into solution as the hexafluoroplatinate IV ion.
Xenon reacts with PtF^ (in ratio 1:1) in the presence of excess of F2 (80 psi) at 180-220°C [140]. Yellow needle, shaped crystals are produced with a melting point of approximately 100®C and an empirical formula F PtXe. X-ray diffraction studies on a singlecrystal show the formula to be XeF,^ PtF^ . The infrared spectrum
-1also suggests the same structure, the band at 640-650 cm' being indicative of the vibrational mode of PtF^ . The crystals are orthorhombic a=8.16Â, 6=16.81Â, c=5.73Â and V=785.4Â^. When theXe:PtFg molar ratio exceeds one a second compound is formed which is thought to have the composition P^^PtXe2*
PtF dissolves in BrF^ to give a deep red solution. When an excess of solvent is removed under vacuum the residue is the 2:1 bromine trifluoride-platinum tetrafluoride adduct [ (BrF,).,*PtF,], which can be identifided by X-ray photography [114].
IF dissolves PtF^ under reflux to produce a deep red solution.
54

When the solvent is removed under vacuum at 23°C a pale orange solid is isolated. Analysis and X-ray photography show this compound to be the 1:1 iodine pentafluoride-platinum pentafluoride adduct [PtFg.IFg] [114]. This adduct has a melting point of 140°C, it begins to decompose at 180°C and at 300°C decomposition is complete, the residue being PtF,. The compound is paramagnetic (y = 0.65BM). Water reacts vigorously with it to give a solution containing the hexaf luoroplatinate IV ion. The same complex has been prepared by dissolving dioxygenyl hexafluoroplatinate V in iodine pentafluoride [50].
PtFg reacts with CIF^ to give the 1:1 chlorine trifluoride-platinum pentafluoride adduct [PtF^.ClF^]. This is a pale orange solid with a melting point of around 170°C and can be sublimed under vacuum at 100®C [114]. It is paramagnetic and X-ray studies show that it has low symmetry. It reacts vigorously with water to give a pale yellow solution which can be seen from the infrared spectrum to contain hexafluoroplatinate IV ions.
SeF, reduces PtF^ to the quadripositive state. The adduct produced is (SeF,)^'^!^, [114]. Nitrosyl fluoride reacts with PtF^ to produce NOPtF^, the reaction occurring rapidly at 35®C .
Structural Data
Platinum pentafluoride is thought to be isostructural with RuF^and RhF^ but, so far, no single crystal data has been obtained[140].
Spectroscopy and Mass Spectrometry
PtFg has been examined by molecular-beam mass spectrometry [27,28,60]. It is known that PtF^ rapidly decomposes to form PtF^ and PtF,. However, using this technique evidence of monomeric,dimeric and trimeric species in the vapour phase of PtF^ is produced. Since, evidence of PtF^ is also found these resultsprovide no quantitative information about the vapour phase
55

composition of PtF^.However, the data does suggest that a series of polymers are present.
1.6.3 Platinum Tetrafluoride
Preparation
The best preparative route for platinum tetrafluoride is thefluorination of PtCl^ or PtBr^ using BrF^ [82]. Vigorous reaction occurs on the addition of BrF^ and a clear red solution forms. Evaporation of this solution under vacuum at room temperature yields a red product of empirical formula PtBr F . This is the adduct(BrF ) PtF . At 180-200°C this adduct undergoes rapid decompositionto liberate BrF^ and leave a yellow brown residue of PtF . Small traces of bromine remain and these can be removed by low temperature (250°C) fluorination (F^N^ mixture) of the residue. The bromine being evolved as BrF^ [114].
PtFj can also be prepared by the fluorination of platinumdichloride at temperatures higher than 200*C [132], the interaction of platinum metal and ClF^ in a bomb [142] and the action of SF at 5-50 atm pressure on platinum sulphide at 150-350®C. If a stream of hydrogen fluoride diluted with is passed over PtCl^ in a platinum boat in a nickel reactor, PtF^ and platinum are produced [114]. Pure PtF^ can also be obtained by heating a PtF^/PtF^(4<x<5) mixture at about 200°C for several hours and removing excess of fluorine under vacuum [71].
Appearance and Physical Properties
Platinum tetrafluoride is a yellow-brown crystalline solid [114], and is known to be diamagnetic [114]. Previous reports that it was paramagnetic with a magnetic moment of I.IBM are possibly due to the presence of a small amount of a bromine trifluoride-platinum trifluoride adduct, in the impure material. This would be expected to show similar properties to the analogous palladium compound [81].
56

A thermodynamic study of gaseous PtF , formed by introducing fluorine into the effusion cell compartment of a mass spectrometer at 518-960K is reported to show that for the reaction shown in equation (xiii) the change in the Gibbs free energy is -158 kJmol'\
Pt(solid) + F^(gas) --- > PtF^(gas) (xiii)
and the enthalpy of formation of gaseous PtF^ at 793K is -214 kJmol' [144]. However, when platinum is fluorinated using elemental fluorine at elevated temperatures (250-700®C) some PtF^ and PtF^ are also formed which will decompose to PtF^ due to the high temperature. Therefore, until further independent measurements are made we cannot be fully confident of the interpretation of these results.
The enthalpy of formation of gaseous PtF^ was reported using a similar method in the temperature range 860-980K involving exchange reactions in the MnF^-MnF^-Pt system. At 298K the enthalpy of formation of PtF (gas) is -410±40 kJmol’ and the dissociation energy is 330+40 kJmol' [145]. Again further independent confirmation of these results is required.
Chemical properties
Platinum tetrafluoride is hydrolysed slowly by water [114], some platinum being precipitated as hexafluoroplatinate (IV) ion. Hydrogen reduces PtF^ to platinum metal at 100®C [114], but no reaction appears to occur below this temperature.
Platinum tetrafluoride dissolves in selenium tetrafluoride to give a pale yellow solution. After refluxing for 15mins at 100®C the PtFj is converted to a yellow solid which is recovered by removing any excess of solvent. The yellow solid is the adduct PtF^.2SeF^ [114], which is diamagnetic and rapidly hydrolysed by water. It decomposes without melting at 350®C to give platinum metal and selenium hexafluoride. The X-ray powder pattern of PtF^.2SeF^ has been indexed on the basis of an hexagonal unit cell, o=15.74+0.03Â,
57

<^4.93±0.01Â, Z=4, and density being calculated as 3.66 gcm' .
Platinum tetrafluoride also dissolves in bromine trifluoride under reflux, to give a deep red solution. After excess of BrF^ is removed by vacuum distillation a red-brown solid remains which is the 2:1 bromine trifluoride-platinum trifluoride adduct [PtF .2BrF^] [114]. This compound was initially prepared by Sharpe by the reaction of bromine trifluoride on platinum tetrachloride [82], or tetrabromide. The diamagnetic solid melts at 136®C and decomposes between 180-200®C to give PtF .
PtFj was initially thought to react with CO under pressure to form Pt(C0)2Fg [146], but this was later shown to be Pt(C0)2Br2 [176]. PtF^ in acetone reacts at 0®C with a small quantity of water, forming H Pt(OH) F and with CH^OH in acetone it forms PtF2<0CH )2 which is explosive at 90®C [147]. Liquid XeF2 at 137-147®C oxidises PtFj, forming [148].
Structural Data
X-ray powder diffraction patterns indicate that PtF^ adopts a monoclinic unit cell with a=6.68, 6 6.68, c*5.71Â and r*92.02®[114]. There are 4 molecular units in the cell and the structure is similar to that of UCl^ in which each uranium atom is coordinated by eight chlorine atoms arranged in 2 flattened tetrahedral sets [115].
Spectroscopy
An infrared spectrum of the tetrafluoride in a nujol mull shows peaks at 675cm' (sharp) and 576cra' (broad).
58

Chapter 2
Fluorination of Platinum Group Metals

Chapter 2
Fluorination of Platinum Group Metals
2.1 Introduction
The previous chapter details all known preparative routes for the platinum group metal, P.G.M., fluorides. Ruthenium pentafluoride [9,12], osmium hexafluoride [31-38], rhodium pentafluoride [60,74] iridium hexafluoride [33,36,58,93-96] and pentafluoride [104] and platinum pentafluoride [60] can easily be made by direct fluorination. Ruthenium hexafluoride [3,4], rhodium hexafluoride [60,74,75] and platinum hexafluoride [75, 102, 126-129] can also be prepared by combination of the elements but more extreme conditions are required.
2.2 Present Vork
The metals were each fluorinated in both static and dynamic systems, and the products were carefully analysed. Since, the aim of the work was to test the feasibility of separating the P.G.M.'s via their volatile fluorides, the hexafluorides and pentafluorides were of most interest. Careful note was made of the ratio of these compounds to the involatile lower fluorides and unreacted metal remaining after each fluorination.
2.3 Static System
2.3.1 General Procedure
All reactions were carried out in 3/4" metal reactors (chapter 6). In each case the reactor was connected to the manifold via a needle valve, [AE-30 series. Autoclave Engineers], evacuated and baked at about 300°C for 2-3 hours under dynamic vacuum. Fluorine at 400-500 mmHg pressure was admitted to the reactor and it was again baked to 300®C for 2-3 hours. It was then evacuated and taken into a
59

dry box where it was loaded with a carefully weighed amount of metal powder. The reactor was returned to the manifold and the nitrogen admitted while in the dry box was pumped out. When the vacuumreached 10'"* mmHg the reactor was left under dynamic vacuum for a further 1-2 hours.
The metal powder was then hydrogenated in situ by heating to 300®C in the presence of 400-500 mmHg of hydrogen for 2-3 hours. The reactor was then re-evacuated and held under dynamic vacuum for at least 12 hours to remove all traces of hydrogen. A known pressure of fluorine was condensed from the line on to the metal at -196®C. The reactor was warmed to room temperature and then heated in an electric furnace to the reaction temperature. This temperature differed for each metal (table 2.1). The reaction was allowed tocontinue for 3-8 hours, again depending on the metal. The reactor was then cooled to the room temperature and the products were studied (table 2.1).
2.3.2 Results and Discussion
The present results are similar to those previously reported. However, additional quantitative information has been obtained andfull characterization of all the products has been achieved.
Osmium and iridium were the first metals to be studied and as expected [31-38,58,93-96] the major products were the hexafluorides. In the iridium case a small amount of iridium pentafluoride was formed, but this accounted for less than 5% of the metal. In both cases all the metal was fluorinated but, as the yields of hexafluorides (table 2.1) were lower than expected, it appears that some of the hexafluoride decomposed during transfer from the reactor to the weighing can.
Ruthenium and rhodium reacted as expected [9,12,60,74] the pentafluoride of each being the only product. Unfortunately, not all the metal was fluorinated and in each case the pentafluoride formed in the reactor was contaminated with unreacted metal.
Only 1-3% of the platinum was fluorinated to the hexafluoride, the residue being a mixture of PtF , PtF^ and unreacted metal. More
60

Table 2.1 Reaction Conditic«is Employed During Fluorinationsin Static' System
Reaction Ru Os Rh Ir PtConditions
Initial Pressure of 5-6 3-4 5-6 3-4 6Fluorine at 25®C (atm).
Temperature of 250 300 200 300 180-190*Reaction (®C).
Time of Reaction (hours) 5-6 3-4 7-8 4-6 6-7
% Hexafluoride 85-95 75-85 1-3
Residue RuF , none RhF , PtF , PtF^Ru(m) Rh(m) ~5% Pt(m)
(m)=metal
* During the fluorination of platinum the temperature is kept below 200®C as above this temperature rapid decomposition occurs [127].

fluorine was condensed on to the residue and the reaction repeated several times, but each time only 1-2% of the residue was fluorinated to the hexafluoride. After fluorinating the residue 4 or 5 times unreacted metal still remained. Thus, it seems likely that an equilibrium between the metal and its fluorides exists in the static system. This is probably due to the decomposition of PtF^ and PtFg, which are both very unstable at elevated temperatures; PtF^ decomposes to PtF^ and fluorine while PtF^ decomposes to PtF^ and PtF .4
It appears improbable that the P.G.M.'s can be separated by fluorination of the ore in a static system, since, Ru, Rh, and Pt are not totally fluorinated but leave unreacted metal in the reactor.
2.4 Dynamic System
2.4.1 General Procedure
A flow line was designed and constructed (chapter 6). Each metal was loaded into a nickel boat which was placed in the reactor and the glassware was assembled. The designed of the glassware differed depending on the metal being studied. The whole line was evacuated and checked for leaks. Once leak tight the line was heated (100°C) under dynamic vacuum for 10-15 minutes, and then under a nitrogen stream for about an hour to drive off moisture on the surfaces of the line. The metal was hydrogenated in situ by passing a stream of hydrogen through the line and heating the reactor to about 400°C for 1 hour. The metal was allowed to cool under hydrogen and then the line was flushed with nitrogen for at least 12 hours to remove all traces of hydrogen. In all earlier work hydrogenation had been carried out in a crucible and then the sample transferred to the reactor through the atmosphere, allowing the metal to be exposed to atmospheric oxygen and moisture.
A F /N mixture was passed through the line for about 1 hour, and the glass traps were warmed to passivate their surfaces. Cooling baths were placed around each trap and the reactor was heated to ~400®C. Once the reaction was completed the fluorine flow was stopped and the line flushed with nitrogen for 2-3 hours before the
61

glass traps were sealed off under about 600mmHg
2.4.2. Osmium
Only the volatile OsF^ was expected to be produced by the fluorination of osmium [31->38]. Accordingly the apparatus was assembled as shown in figure 2.1 and dry ice cold traps were used to collect the products. Almost immediately after heating the reaction began, dense pale yellow fumes were produced and these collected in the cold traps, as a bright yellow solid. Reaction was very rapid and approximately Ig of osmium was fluorinated in 1 hour.
The yellow solid was found to be OsF^ and, when the reactor was opened, the nickel boat was completely empty, thus, all the osmium had been transferred from the boat as volatile material.
During the initial experiments the osmium was not hydrogenated and the glass traps were not warmed in the presence of a F /Ng stream. Thus, much lower yields (70-80%) of OsF^ were produced than had been expected. Three observations help to explain this low yield. Firstly, a small amount of white material was deposited prior to the deposition of OsF , this material may have been OsO . Secondly, a small amount of greenish material was observed at the neck of the reactor, this was probably OsF^ formed by the reduction of OsFg on the hot glass, and finally about 50mmHg SiF^ was released from the traps when they were opened to the line. This was produced by the attack of the OsF^ on the unpassivated glass.
A modified procedure involving hydrogenation of the metal and seasoning of glass, resulted in approximately 90% yields of OsF .
2.4.3. Iridium
Iridium was expected to behave similarly to osmium, the hexafluoride being the only product. Therefore, the same preparative conditions were employed. Immediately on heating dense yellow vapours appeared which solidified in the cold trap. A 90% yield of IrFg was obtained, a small amount being lost when some IrF^ decomposes on the hot glass at the exit of the reactor.
62

LU en
u00

2.4.4. Platinum
There has been only one previous report of the fluorination of platinum in a flow system [75]. Small quantities of PtF^ were reported to be formed but few other details were given.
It was expected that PtF^ and PtF^ would form as well as PtF^ so the glassware was adapted (figure 2.2) to allow any liquid lower fluoride to flow from the copper reactor. On heating, dense yellow brown fumes appeared. These passed through the first trap, which was cooled to -24°C (ice/salt) and condensed in the trap cooled by dry ice as a deep red (almost black) crystalline solid (PtF^).Thus, in all subsequent reactions two dry ice baths were used to prevent the loss of any PtF . A red glassy material (PtF ) and a fine yellow powder (PtF ) were also found to collect slowly on the sidearm of the first trap. The reaction was completed in 1-2 hours, 60-70% of the platinum being converted to PtF . More importantly all the metal was transferred from the boat as volatile fluoride.
Platinum tetrafluoride is not volatile thus it is possible that the PtF^ formed results from the decomposition of PtF , or was carried by the stream of F^N^ through the reactor as soon as it formed.
2.4.5. Ruthenium
It has been reported that when a F^N^ mixture is passed over ruthenium metal a dark green viscous liquid containing RuF^ is produced [12]. It was also expected that tiny traces of RuF^ would be formed. With this in mind the apparatus was assembled as shown in figure 2.2 and an ice bath and a dry ice bath were placed round traps 1 and 2 respectively. On heating, greenish brown fumes were immediately evolved and a glassy green material (RuF ) began to form and trickle down into the first trap. Further down the side arm of the first trap a bright orange-red glassy material (chapter 5) began to form and in the second trap a buff brown solid (RuF ) collected. The brown RuF^ was extremely difficult to manipulate and could not be stored in a nickel can at room temperature. The percentage yield of RuFg produced could not, therefore, be accurately determined,
63

<N
U
I
o.n>

although it was observed to be 40-60% of the product. The reaction was complete in 2-3 hours and on opening the reactor it was found that no metal was left in the boat, indicating that all theruthenium had been fluorinated to volatile fluorides.
The first fluorination of ruthenium was conducted using Pyrex traps. However, large amounts of RuF^ were produced which attacked the Pyrex and hence, all further preparations were carried out using quartz collection vessels and the design of the collection apparatus was adapted in order to aid the collection of the red glassy material (figure 2.3).
2.4.6. Rhodium
Having observed that RuF^ and RuF^ were formed when Ru metalwas fluorinated it was expected that RhF^ and RhF^ would besimilarly produced when Rh metal was fluorinated. Like RuF , RhF^ is an extremely powerful fluorinating agent which rapidly attacks Pyrex. Thus, the collection apparatus were constructed of quartz and assembled as shown in figure 2.2. A red glassy material (RhF > began to form on the side arm of the first trap about 10-15 minutes after fluorination began and then a red brown powder collected in the second trap (RhF ). The fluorination was stopped after 4-5 hours, but it was found that 80% of the metal was still in the boat. The second reaction was allowed to continue for over 12 hours. This time only 30% of the metal remained in the boat. Thus, if the reaction was allowed to continue for a sufficient period it would be expected that all of the rhodium would be volatilised as a fluoride.
2.4.7. Palladium
After fluorinating palladium for several hours, without producing a volatile product, reaction was stopped and the reactor was taken into the dry box where it was opened. It was found to contain a black solid (Pd[PdF^]) and unreacted metal. It should be noted that palladium metal is not hydrogenated before fluorination because at 400®C palladium reacts with hydrogen to form a hydride.
64

tow
l l
M n>i
r
H*g
l a
gD) rTH-M (D
IR

2.4.8. Discussion
Previous preparative procedures for the fluorination of P.G.M.'s have involved the prefluorination of a glass and metal apparatus, the hydrogenation of powdered metal at red heat in a (usually) porcelain crucible and the introduction of reduced metal into the fluorination apparatus by transfer through the atmosphere. These procedures have resulted, inevitably, in both the interior of the apparatus and the reduced metal being exposed to atmospheric moisture and oxygen.
The procedures developed in the present work have resulted in total elimination of water and oxygen and, in a number of cases, this has resulted in the products of the reaction being significantly different from those reported in earlier work. In particular, it appears that the higher oxidation state fluorides are produced in higher yields. The current work has also yielded quantitative data on the various products obtained.
In the osmium and iridium cases the fluorinations proceeded essentially as previously reported [31->38,93->96]. Hexafluorides are produced in high yields and the yields have been recorded. Platinum gave the hexafluoride, pentafluoride and the tetrafluoride but the hexafluoride was produced in 69-70% yield. This is in sharp contrast to earlier work [75] where only very low yields of PtF^ were obtained.
Previous work on the dynamic fluorination of ruthenium metal powder has always yielded black tars which contain significant quantities of RuO^-ZH^), but from which RuF^ could be distilled. The early stages of this reaction produced a pale yellow volatile material, which was recently shown to be RuO^ [163]. Using the new preparative technique the main product is RuF , which is produced as a volatile brown solid, and there are smaller quantities of RuF , which appears as a clear grass green liquid and glass, and a previously unknown red material which is believed to be a new form of RuFg (chapter 5).
Efforts to prepare volatile rhodium fluorides in dynamic systems have not been very successful. The hexafluoride has not
65

previously been obtained in a flow system and attempts to prepare the pentafluoride by direct fluorination of the metal powder at low temperatures have produced only small quantities. The new preparative procedure has produced a volatile brown vapour which has the physical properties attributed to RhF^ together with larger quantities of a deep red liquid which appears to be RhF . Both compounds are exceptionally powerful oxidative fluorinating agents and definitive characterization has been difficult. Nevertheless, it is clear that the new preparative method produces high yields of volatile rhodium fluorides.
2.4.9. Conclusion
It was possible to transfer all the metals except palladium from the boat into the collection traps. Thus, it may be possible to use dynamic fluorination to separate a mixture of P.G.M.'s.
The next step is to try to fluorinate a mixture of P.G.M's.
2.5. Initial Fluorination of a mixture of P.G.M's
2.5.1. Preparation of P.G.M. Mixture
A mixture of P.G.M's was prepared with the following ratio:-
Pt 100Pd 200Rh 13Ru 15Os 3Ir 3
This ratio was chosen because it is a close approximation to that commonly obtained in ores.
66

2.5.2. Fluorination
The mixture was loaded into a nickel boat and placed in the reactor. The glassware was then assembled as shown in figure 2.3, the line was passivated as previously discussed and the metal was fluorinated for 2 hours. Each trap was then sealed, its contents hydrolysed and the hydrolysis products and residue in the reactor were sent for analysis to Johnson Matthey Technology centre.
2.5.3. Results
Residue from boat
Pt(mg)
46
Pd(mg) Rh(mg) Ru(mg)
938 9 2
Ir(mg)
1
Residue from reactor 28 ------ 22 16 1
Trap 1 0°C 103 --------— 9 12 --------—
Trap 2 -78°C 145 ------------- 6 10 6
Trap 3 -183° 48 ------------- 4 9 6
Total 369 938 50 49 14
Total metal out (except Os) = 1.420g
Metal in (-Os)= 1.475g.
The results are very encouraging since, the majority of each metal with the exception of palladium, was removed from the boat as a volatile fluoride. It should be noted that the proportions of each metal left in the boat bears a close resemblance to thé ease of production of the volatile fluorides, a much higher percentage of rhodium being left in the boat than Ir, Pt, or Ru. From these results it appears likely that if the fluorination is allowed to continue for 5-6 hours only palladium will remain in the boat.
67

Chapter 3
Analysis of Platinum Group Metal Fluorides
Chapter 3
Analysis of Platinum Group Metal Fluorides
3.1. Introduction
After each fluorination the products were characterized using a variety of techniques and as much spectroscopic data as possible was compiled for each. It was hoped that a method could be found to clearly identify each of the fluorides, so that when a mixture of metals was fluorinated, the fluorides collected in each fraction could be easily identified.
3.2. Mass Spectrometry
3.2.1. Introduction
Mass spectrometry was a very useful technique. It was used to study hexafluorides and pentafluorides and provided a good method for assessing the purity of the products as well as providingdefinitive identification. The natural abundances of the isotopes of the P.G.M's are shown in table 3.1.
3.2.2. Hexafluorides
The hexafluorides were admitted into the mass spectrometer directly from the storage cans via a copper spray-on tube with a Teflon end, which acted as an electrical insulator. Fluorine,followed by several doses of the hexafluoride was passed down thetube and pumped out through the mass spectrometer to season the tubeand the ionization chamber of the mass spectrometer before the spectra were recorded.
This method worked well for OsF , IrF^ and PtF^ and good spectra were obtained for each (figure 3.1, 3.2, 3.3,and table 3.2). Unfortunately, a spectrum of RuF^ could not be obtained using this method. RuF^ is very reactive and cannot be stored in nickel storage cans at room temperature as it will rapidly decompose. It is therefore taken directly from the quartz collection vessels.
68

Before entering the mass spectrometer the RuF^ attacked the Teflon tip producing spectra which showed only the fragmentation pattern of a (CF ) chain. The Teflon tip was replaced with a quartz tip, and the RuF^ was taken directly from the quartz collection vessel into the mass spectrometer, but it was still not possible toobtain spectra of RuF . Peaks due to SiF , RuO , WF^ and (CF ) , were observed. The SiF^ and RuO^ were probably formed due to attack of the RuF^ on the silica. The WF^ is thought to result from the RuF^ fluorinating the tungsten filament and (CF ) may be formed via attack of RuF^ on the Teflon o-rings inside the mass spectrometer. Therefore, although RuF^ must be reaching the source, no spectrum is observed because of its powerful oxidative fluorinating ability and rapid decomposition.
It was anticipated that the MF^ ion would be the most+abundant, and this is the case for OsF^ and PtF . However, the IrF^
ion appears to be the most abundant species in the IrF^ case. This is probably due to the relative stabilities of the MF^^ and MF * species and the kinetics of the reactions in the mass spectrometer.
3.3.3. Pentafluorides
Attempts were made to obtain mass spectra of RuF , OsF , IrF^ and PtF . It was expected that signals due to the monomeric, dimeric, trimeric and tetrameric species would be observed for RuF^ [27,28,60]. However, the tetrameric species for IrF , OsF^ and PtF^ would be outside the mass range of the spectrometer, hence, these would not be observed.
It has previously been reported that monomeric, dimeric and trimeric species have been observed for PtF^ [27,28,60], using molecular beam mass spectrometry, but a signal due to PtF^^ is also observed. It is known that PtF^ is very unstable and rapidly decomposes under vacuum to PtF^ and PtF^ and this may explain the presence of the PtF^^ ion. It seems unlikely that polymeric species would be observed in the present study as the PtF^ is vapourised prior to its entrance into the spectrometer and because only very small amounts enter the mass spectrometer, all the PtF^ would decompose to PtF^ and PtF^ before reaching the source.
69
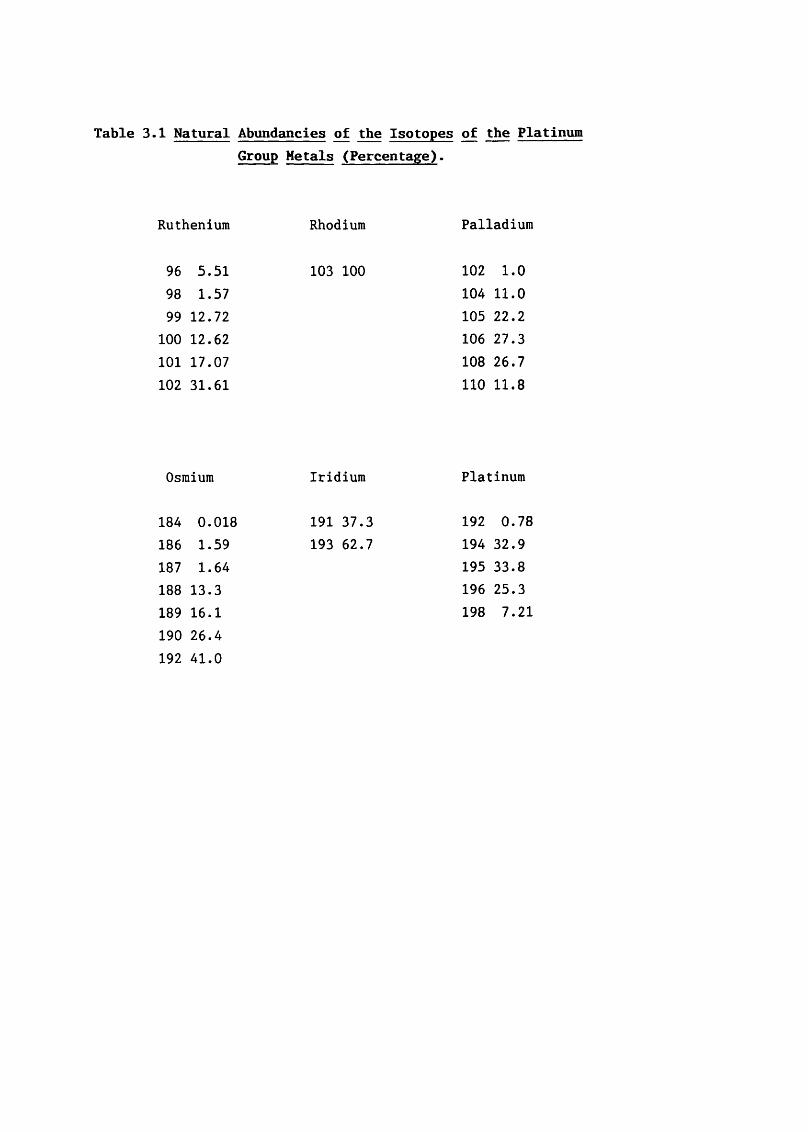
Table 3.1 Natural Abundaincies of the Isotopes of the PlatinumGroup Metals (Percentage).
Ruthenium Rhodium Palladium
96 5.5198 1.5799 12.72 100 12.62101 17.07102 31.61
103 100 102 1.0104 11.0105 22.2106 27.3 108 26.7 110 11.8
Osmium Iridium Platinum
184 0.018186 1.59187 1.64188 13.3189 16.1190 26.4 192 41.0
191 37.3 193 62.7
192 0.78194 32.9195 33.8196 25.3 198 7.21

Figure 3.1 Mass Spectrum of OsF (Conditions 70ev, 4kV, 70“C)
jji joiWJ J180 200 220 240 260 280 300

Figure 3.2 Mass Spectrum of IrF (Conditions 70eV, 4kV, 70°C)
Jv\ J l
200 220 240 260 280 300

Figure 3 ^ Spectrum of (Conditions 70eV, 4kV, 70°C)
200 220 240I
260 280 300

Table 3.2 Relative Abundancies of the Ions of the Hexafluorides
% Relative abundance (largest peak in each being 100%)
OsF,* IrF* PtFg*
16.0 11.4 37.5
MF' 13.1 11.0 21.4
mf; 27.6 28.3 23.7
MF3" 37.9 44.9 38.6
mf; 89.4 100 55.3
mf; 100 35.4 100
hf/ 15.8 9.0 50.8
* all recorded at 70eV, 4kV and 70°C

The pentafluoride was placed in the mass spectrometer and the source temperature was increased until a good spectrum was observed. At 90°C good spectra of RuF^ were obtained and the monomeric, dimeric, trimeric and tetrameric species were observed (figure 3.4). Good spectra of OsF^ and IrF^ were also obtained at 120 and 140®C respectively, each showing signals due to monomeric, dimeric and trimeric species (figure 3.5 and 3.6). Several samples of each pentafluoride were studied and the resulting spectra were reproducible, (tables 3.3, 3.4, 3.5).
The acceleration voltage at which these spectra were run gave highest sensitivity at 4kV, whilst, the mass range was greatest at 2kV. Thus, in order to detect the tetrameric species, spectra were recorded at 2kV, but to obtain good sensitivity and to detect impurities, samples were run at 4kV. It can be shown from these results that RuF^ exists as a tetramer in the gaseous state. However, the occurrence of vapour phase trimeric, dimeric or monomeric species is uncertain, since, it is possible that these species result from fragmentation of the RuF^ tetramer within the mass spectrometer. Similar conclusions are drawn for OsF^ and IrF^ but, since the mass range was limited the tetramer, cannot be observed. It can only be concluded,therefore, that OsF^ and IrF^ exist as polymeric structures in the gas phase.
By running the spectra at much higher temperatures it was anticipated that an increase in the concentration of monomeric and a reduction in the concentration of the polymeric species would occur. However, at 210°C, very little difference was observed for RuF^ or OsFg, but when IrF^ was studied significant differences were observed. No trimeric species were found and only tiny traces of the dimeric species were recorded. The electron energy was reduced from 70eV to 50eV to check if this was partly responsible for the fragmentation, but the intensities remained the same. It, therefore, seem likely that at 210°C, IrF^ is virtually monomeric.
Attempts were also made to record the spectra of PtF^ (table3.6.). Unfortunately, the spectra obtained were similar to those obtained for PtF , no polymeric species were observed and peaks due
70

Figure 3.4 Mass Spectrum of (Conditions 70eV, 90°C)
u Monomer
(4kV)
dimer (4kV) '
trimer
(3kV)
tetramer(2kV)

Figure 3.5 Mass Spectrum of OsF (Conditions 70eV, 120°C)
J Monomer(4kV)
dimer(3kV)
trimer(2kV)

Figure 3.6 Mass Spectrum of IrF^ (Conditions 70eV, 140°C)
A j X. Monomer(4kV)
dimer(3kV)
trimer(2kv)

Table 3.3 Mass Spectroscopic Data For (RuF )
% Relative Intensity (Highest peak = 100%)
90°C 4kV 90°C 3kV 90°C 2kV
Ru^ 5.8 6.5RuF+ 19.5 23.7RuF " 28.7 34.4RuF " 69.9 74.4RuP/ 100 100RuFg" 4.0 40.9
Ru// 3.2 3.7Ru f/ 10.3 11.2Ru Fg'" 65.5 65.8Ru/,o" 10.3 10.0
"3 14,RU3F 3
6.2 6.1 5.3 6.120 25.3 19.2 20.028.9 35.8 26.7 30.068.9 80.5 60.5 70.2100 100 100 97.749.7 41.4 48.9 40.9
1.4-- 7.4 3.0 6.18.3 17.2 10.5 17.485.5 92.1 74.8 10015.9 13.9 16.5 11.6
2.8 4.7 1.1 3.726.2 29.8 18.4 37.76.2 8.8 4.9 6.9
RU4FW 0.7
===== Limit of mass range

Table 3.4 Mass Spectroscopic Data for (OsF
X Relative Intensity (Highest Peak = 100%)
4kV 3kV 2kV
60°C 100°C 120*C 120°C 120°
Os+ 6.5 8.7 2.8 2.6 2.8OsF+ 2.4 5.9 3.5 3.2 3.5OsF '" 14.4 15.1 15.1 14.6 14.4OSF3'" 53.2 49.0 46.6 45.3 44.2OsF/ 100 100 100 100 100OsFg' 9.7 11.1 11.1 10.0 13.0
Os/j'" 3.2 4.4Os/,* 43.5 56.3Os/,,* 9.4 10.7
Os/,/ 13.5Os/,/ 1.4
==== Limit of mass range

Table 3.5 Mass Spectroscopic Data for (IrF X,
% Relative Intensity (Highest Peak =100%)
140°C 210°C
4kV 3kV 2kV 3kV 2kV
Ir+ 5.6 7.0 10.4 15.05 26.5IrF+ 6.1 7.0 7.9 14.6 12.4IrF "' 28.9 26.0 28.6 36.9 32.7IrF'*' 84.1 75.6 71.9 100 100IrF/ 100 100 100 56.8 62.8IrF/ 4.2 6.3 5.5 0 0
I"::", + ^^2 10
9.5 6.8 0 044.9 27.5 1.7 2.717.2 10.9 0 0
3.03.0
— — —
==== Limit of mass range

Table 3.6 Comparision of the Mass Spectroscopic Data of(PtFj). and PtF^
% Relative Intensity (Highest Peaks = 100%)
ion
Pt+PtF+PtF 'PtFs""PtF/4+PtF^PtFô"
PtFg PtFg
4kV 4kV
o°c 70°C 110°C 70°C
32.8 41.2 52.5 37.519.7 22.7 29.5 21.424.6 26.8 32.2 23.734.4 40.0 47.1 38.649.2 55.1 61.7 55.3100 100 100 10068.9 54.9 54.4 50.8

to PtF ion were observed. On removal of the sample from the source, a yellow powder (PtF ) remained in the capillary. Thus, it appears that the PtF^ decomposes to PtF^ and PtF , before it reaches the source of the spectrometer.
3.3 Infrared Spectroscopy
3.3.1 Introduction
Infrared spectra of all the P.G.M. hexafluorides have been previously recorded and analysed [31,37,49,51-54,71,73,94,101,103]. In the present work, infrared spectroscopy has been used as an aid to determining the purity of each hexafluoride. Very little infrared data has been recorded for the pentafluorides. Data has been published for osmium and iridium pentafluoride [64,65] and the infrared spectrum of RuF^ has been recorded (table 3.7)[163].
Table 3.7 Infrared spectra of Osmium, Iridium and Rutheniumpentafluoride (cm *).
OSF3 IrFg RUF3
Thin film Thin film Room temp.(196°C) (196*0
750 s,sh712 m,sh 715 s,sh 715 vs619 s 699 s,sh
678 vs657 s 642 vs 657 vs530 s 533 m,br 525 s,br
The spectra recorded were of poor quality and, due to the complexity of the structures of the compounds, no group theoretical analysis has been attempted on them. In the present study efforts were made to obtain better quality spectra which would aid spectral assignment.
71

3.3.2 Hexafluorides
In the gas phase the P.G.M. hexafluorides have 0 symmetry, and each molecule is therefore expected to show two infrared active fundamentals of symmetry in the regions 700-750 cm" and 200-300 cm'\ In the present work the gas cell was fitted with AgCl windows. These have an infrared window above only 400 cm' and thus, we would expect to see only one infrared fundamental. Table 3.8 shows the values obtained in this work for the fundamental and those previously recorded. Figure 3.7 shows a typical spectrum for a P.G.M. hexafluoride. This was recorded with only 1mm Hg pressure of the hexafluoride in the cell. In order to look for impurities in the samples further spectra were recorded with higher pressures of hexafluoride in the cell.
Table 3.8 Infrared fundamentals for P.G.M. Hexafluorides (cm *).
V3 (Present work) (Previous work)
RuFg 733 735 [73]
OsF6 719 720 [51,53]
IrFe 718 718 [94]
PtFe 705 705 [54]
In all cases the samples were found to be pure. Small traces of (peak at 960 cm' ) were observed in an early spectrum of OsF , after the cell had become well seasoned by the OsF , no sign of OsO^ appeared. Therefore, the OsO^ must have formed from the
OsO.4
hydrolysis of the OsF^ on the interior surfaces of the cell. In all cases peaks due to CIF^ were observed; these occurred at 1273(s), 1022(m) and 957(m) cm' [164]. The CIF^ is undoubtedly due to attack of the hexafluorides on the AgCl windows.
When 20mm Hg pressure of the hexafluoride was introduced into the cell, bands were observed for the ('v+'v) and combinations. This is in accord with previous work (Table 3.9). The spectra of OsF^ showed a broadening of the (\> +"V ) combination with
72

LO
CO
I

an accompanying loss of intensity. In the case of RuF^ the broadening is so severe that no peak was observed. This phenomenon is due to the Jahn-Teller effect [165,166] which has been previously discussed several times in connection with the hexafluorides [73,103,51].
Table 3.9 Combination Bands of the P.G.M. Hexafluorides (cm“).
Present Previous(Vj+Vj) (Vj+Vj) (V^+Vj) (Vj+Vj)
RuFg 1411 1410 --- [73]
OsF^ 1450 1350 1453 1352 [51]
IrFg 1420 1365 1425 1364 [94,103]
PtF^ 1360 1306 1360 1306 [51]
It should be noted that the fundamentals were also very broad being about 40cm' wide at the base line. Under closer examination the fundamentals in OsF^ and IrF^ were found to be triplets. The peak positions are listed in Table 3.10.This is probably due to the rotational effects of the molecule giving PQR splitting. If this is the correct assumption, much sharper peaks should be found in the matrix isolated infrared spectra since, here the individual molecules will be held at 14K in an inert matrix and no rotational motion will be possible.
Table 3.10 v Fundamentals of P.G.M. Hexafluorides (cm *)
OsF^ 712 718 725
IrFg 713 718 725
73

3.3.3 Pentafluorides
Attempts were made to record the infrared spectra of RuF^ and OsF . The powdered samples were placed between two dry KBr discs in the dry box, then compressed in a cell holder and quickly taken to the spectrometer. However, air and moisture immediately began to attack the samples at the edges of the plate and the whole sample decomposed before analysis was complete. A special plate holder was therefore designed (chapter 6) to hold the KBr discs in an atmosphere of dry nitrogen. This proved more successful and permitted infrared spectra to be recorded (Table 3.11). As with the previous work, a broad band is observed between 500-530 cm'\ this can be assigned as the v(M-F-M) stretching mode. Due to the complexity of the structure, none of the other bands have been definitively assigned, although tentative assignments can be made. The bands at ~700cm' may be due to the axial terminal Ru-F stretches and those at 600-650cm'^ to the equatorial Ru-F stretches.
Table 3.11 Infrared spectra of OsF and RuF »
OsF, RuF^
720 m 735 m,sh665 s,sh 705 s645 s,br 655 m620 m 580 m,br525 m,sh 515 s,br
The spectra were not of good quality, and so it was decided to attempt to obtain spectra using matrix isolation infrared spectroscopy. Here the sample is sprayed as a vapour on to a cold window (14K) with a large excess of an inert gas (N or Ar). The sample is immediately frozen in an inert matrix and, since no decomposition occurs, the spectra can be recorded at high resolution. The spectra obtained should be of much better quality as the peaks should be much sharper. This will aid spectral assignment. Matrix isolation will also enable us to ascertain whether the pentafluoride is polymeric in the vapour phase. The sample is sprayed into the spectrometer as a vapour (chapter 4)and is immediately frozen on the window.
74

3.4 X-ray Powder Diffraction
X-ray powder diffraction photography was used as a finger printing method for the pentafluorides. The photographs obtained were compared with existing data to ascertain if the samples were pure. It was noted that when RuF^ and RhF , prepared in the static system, were studied spurious lines were observed in the photographs. These lines were identified as being due to unreacted metal. However, the RuF^ prepared in the dynamic system was found to be pure, no unidentifiable lines being observed. Attempts were made to record the powder pattern of PtF . However, the pattern obtained was identical to that of PtF , thus, the PtF^ must have decomposed in the X-ray beam to PtF^ and PtF . No lines due to PtF^ would be observed as this would be present as a vapour.
X-ray powder diffraction was also used to study the hexafluorides of Pt, Ir, and Os. The hexafluoride was distilled into a pre-seasoned capillary, cooled in liquid nitrogen, the capillary was sealed using a micro-burner and allowed to warm to room temperature. Enough hexafluoride must be distilled into the capillary to leave a solid sample when the sample warms to room temperature and exerts a vapour pressure of 200mmHg. The powder patterns obtained confirm that the hexafluorides have a cubic structures at room temperature [8,31,48,126].
3.5 Raman Spectroscopy
3.5.1 Hexafluorides
Previously, the gas phese spectra of some of the P.G.M. hexafluorides have been recorded [54,103]. In the present work it was decided to cool the hexafluoride in a cryostat to a temperature at which the solid state spectra could be recorded. No attempt was made to record the spectra of PtF , RuF^ or RhF . It was not possible to transfer RuF^ or RhF^ into capillaries as they are too reactive. Although, PtF^ can be distilled into a capillary, it is dark red and so will decompose in the laser light.
75

Attempts were made to record the Raman spectra of IrF^. A small amount of IrF^ was distilled into a capillary, cooled under liquid nitrogen and sealed using a micro-burner. The capillary was then loaded into a cryostat (figure 6.6) and cooled to 94-98K. The sample was found to decompose easily at laser powers above 80mW but, if the laser power was kept low, typically 50mW, good quality spectra were obtained.
The factor group analysis has been carried out for MF^ and an attempt has been made to assign the results. The hexafluorides are known to have 0^ molecules, with site symmetry and a D2j^^^=Pnma space group [8].
Table 3.12. Correlation Table for MF. in the Solid State
A. Internal Modes
Molecules > Site-x4
-^nit cell
0. C^(xz) “ah*'
Vj, Ajg A' Ag + B^g + BjU + B^u
Eg A'+ A" Ag+B^g+B^g+B^g+A^u+B^u+B^u+B^u
T f 2k'+ A" 2Ag+B^g+2B^+B^g+A u+2B^u+B^u+2B^u
2(2A'+A") 2(2Ag+B^g+2B^+B^g+A^u+2B^u+B^u+2B^u)
A'+ 2A" Ag+2B^g+B^g+2B^g+2A^u+B^u+2B^u+B^u
There should be 12 Raman active internal fundamentals, 2A^g,4Eg, and 6T^,
76

B. Lattice Modes
Molecules > Site---------> Unit cell
Oh V
3 Trans" Tu 2A'+ A" 2Ag+B^g+2B^+B^g+A^u+2B^u+B^u+2B u
3 Rot" Tjg A'+ 2A" Ag+2B^g+B2g+2B3g+2AjU+B^u+2B2U+B3U
There should be 6 Raman active translations and 6 Raman active rotations. Attemps can be made to assign the peaks (table 3.13).
Attempts were also made to record the Raman spectra of OsF ,but these proved unsuccessful, the OsF^ rapidly decomposing in thelaser beam at all available powers.
77

Table 3.13 Assignment of Raman Data of Iridium Hexafluoride
A. Lattice Modes (cm'*)19.7 (m)26.7 (s)30.3 (s)35.2 (s)45.6 (m/w)53.7 (v)61.2 (s)66.0 (m/w)69.5 (w)75.5 (m)84.0 (w)92.0 (w)
B. Internal Modes (cm'*)220.2 (w)267.0 (s)279.0 (w)288.6 (w)299.0 (w)
643.2 (m)647.8 (m)
693.9 (w) 696.0 (vw)
702.2 (vs)707.4 (m)
1344.8 (m)1349.4 (w)1403.5 (w)1431.4 (w)1437.4 (w)1475.4 (w)
Assignment
Translations
Rotations
v , T gf but the spread of frequencies is too great to be accounted for by factor group splitting alone, components of \) have show through due to site selection rules (267.0(s)= v )
Eg. (2 of the 4 allowed components)
Combination bands
A g (702.2 Ag, 707.4Bjg)
Combination bands.

Chapter 4
Matrix Isolation Spectroscopy

Chapter 4
Matrix Isolation Spectroscopy
4.1 Introduction
In the present study, matrix isolation has been used to permit high resolution spectroscopic studies of the extremely reactive P.G.M. fluorides to be undertaken with minimal corrosion and contamination problems. The sample is frozen at 10-14K in an inert matrix, the ratio of sample to matrix gas being about 1:1000. Hence, individual molecules of the fluorides are isolated and decomposition does not occur.
It is vital when carrying out matrix isolation studies to ensure that the sample is well isolated in the matrix gas. To achieve this, samples must be sprayed on slowly. The hexafluoridesmust be cooled to a temperature at which their vapour pressures arelow enough to allow slow spray-on, whilst the pentafluorides require heating. The spray on rate can be monitored using infrared spectroscopy because it is possible, using a triangular Csl window (figure 4.1) to scan a narrow region of the spectrum repeatedlywhile spraying on the sample. Once the deposition rate has been established the same conditions are used to spray the sample on to the LiF window, used to record the u.v.-visible spectrum.
4.2. Hexafluorides
4.2.1. Preparation of Samples
The preparation of Os, Ir, and Pt hexafluorides was described in chapter 2. Rhenium hexafluoride was prepared by direct fluorination of the metal in a pre-fluorinated nickel reactor. To prevent contamination with the heptafluoride a 5% excess of thereduced metal sponge was heated (300®C) with Satms. of fluorine.
78

Figure 4.1 Triangular Window
spray - on
i.r beam

Samples of ReF , OsF , IrF^ and PtF^ were stored in pre-seasoned nickel cans fitted with Hoke bellows valves. These were sprayed directly from the can down a copper spray-on tube (figure4.2). The rate at which the samples were sprayed onto the cold window was controlled using slush baths, ReF , OsF , IrF^ and PtF^ were maintained at 190, 195, 200, 232K respectively.
Unfortunately, RuF^ is more unstable than the other hexafluorides and must be stored at -196® as it will decomposequickly at room temperature. Thus, it was sprayed on to the window directly from the quartz trap along a quartz tube. Initialexperiments failed but it was later found to be possible to obtain a spectrum of RuF^ using special conditions, which permitted the spray-on tube to be pre-seasoned with F and CIF . The quartzcollection trap was attached to a specially constructed tube (figure4.3), which was connected to the main vacuum manifold via a Chemcon connector. The apparatus was evacuated, heated to about 80®C, and repeatedly seasoned, first with fluorine and then with CIF . The tube was then re-evacuated and sealed at A. The apparatus wasconnected to the matrix rig and the dome evacuated to 10‘ mmHg. The displex head was then rotated causing the end of break-seal A to shatter, break seal B was then broken using nickel balls and the nitrogen inside (600mmHg) was pumped away. The Dewar of liquid nitrogen was lowered from around the trap and the RuF^ was sprayed on to the cold window. The rate at which the sample was sprayed on to the window was controlled by raising and lowering the Dewar.
4.2.2 Infrared Spectroscopy
The vibrational fundamentals of ReF , OsF , IrF , PtF^ and RuF^ have been reported previously [53-55,73] and the main reasons forcarrying out matrix isolation infrared studies were, firstly tocheck sample purity, and secondly to establish suitable depositionconditions in preparation for further spectroscopic work. All fivehexafluorides have 0 symmetry, and each molecule is thus expectedto show two infrared active fundamentals (T symmetry). The spectrain argon and nitrogen matrices showed characteristic absorptions inthe regions 700-750 cm' and 200-300 cm' due to these modes.
79

Figure 4.2 Matrix Rig
displex head
spray-on domewindow

MI
J/
/ \
m
g

Figures 4.4 and 4.5 show typical survey spectra obtained from these hexafluorides. Table 4.1 compares the gas phase and matrix data.
Matrix spectra obtain from ReF , IrF , PtF^ and RuF^ indicate that the samples were essentially free from impurities. However, in the case of OsF , OsO^ was found to be present (band at ca. 960cm’). This, almost certainly arises from hydrolysis in those parts of the spray on system which cannot be adequately seasoned. Fortunately, as deposition proceeds, the growth of this impurity diminishes, and its formation can be eliminated by passing OsF^ through the spray-on tube prior to cool-down.
Examination of the T stretching modes under higher resolution revealed band splittings which were too large to be accounted for simply by metal isotope effects. Thus, for OsF^ and RuF^ in nitrogen two components were observed at 724.9, 712.3 cm' and 736.5 and726.5 cm' respectively with an approproximate intensity ratio 1:2. This splitting may be due to a lifting of the T degeneracy. There are two possible explanations for this, one being that the origin of these splittings lies in static Jahn-Teller distortions [51], the other that it is a result of matrix perturbations [164].
Iridium hexafluoride in argon shows an almost equal doublet at 719.3, 716.0 cm'\ but here and in some of the other systemsstudied, the splitting is probably due to multiple trapping sites.
These infrared studies established the conditions under which the title compounds could be satisfactorily isolated in low temperature matrices. They were generally carried out prior to the u.v.-visible experiments and usually immediately afterwards in order to check the integrity of the sample.
4.2.3 U.V.-Visible Spectroscopy
Introduction
Electronic spectra were recorded over the range ca. 190-900nm (52 000-11 OOOcm" ) for Re, Os, Ir and Pt hexafluorides isolated in nitrogen matrices at 12K. Several u.v.-visible experiments were performed on each compound, and reproducibility between runs was
80

Figure 4.4 I.r. Spectra of Matrix-isolated Hexafluorides (a) ReF; in N,, (b)OsF, in N , (c)IrF in N , (d) PtF^ in Ar
v/cm'*
0)ucoJDomX)<
300900
(C)
900 300 I_______I_______I______ I_
id)

Figure 4.5 I.r. Spectra of Matrix-isolated RuF jji N
800 400600 200

Table 4.1 Principle Infrared Absorptions (cnf ) of P.G.M.Hexafluorides
Compound Gas Phase N2 Matrix Ar Matrix Assignnment
ReF^ 715 716.4,712.7 719.4,714.0 stretch)
257 262.7 258.6 stretch)
OsFg 720 724.9,712.3 726.5,712.2 V3
268 266.2 273.8,260.4 v4
IrFg 719 719.1,717.2 719.3,716.0 V3
276 279.1 283.3 4
PtFg 705 704.4 705.2
273 273.8 274.2 4
RuF^ 735 733.0,719.1------
275 275.0 --- 4

excellent. In order to record the complete spectrum deposits were examined at various stages during deposition. The very intense bands in the u.v. were detectable after a relatively short spray-on time (ca. 10 mins), but, thicker deposits were needed to observe the sharp, weak bands at low energy. Unfortunately, it was not possible to measure absolute values for the absorption coefficient of any of the bands.
Many of the more intense bands showed extensive vibrational structure which could be satisfactorily resolved using second derivative recording. The spectra are shown in figures 4.6 and 4.7. This matrix data was compared with previous data and assignments made in table 4.2.
Three types of electronic transitions are expected for these molecules: intra-configurational bands arising from a redistribution of electrons within the spin-orbit split t^levels; d-d transitions between the t and e levels; and charge transfer (c.t.)
2g gtransitions F(H or o)— ► MCt or e ).
Theoretical treatment of the spectra of 5d elements is difficult, since, the large spin orbit coupling means that relativistic effects must be explicitly considered in addition to ligand-field components. Here assignment of the intra- conf igurational bands, which appear as weak, sharp, features at low energy, are based on the strong field 0 double group approach of Allen and Warren [167].
The charge transfer bands may be assigned via a molecular orbital approach [168,169]. In the present study Jorgensen's model will be used [170]. Jorgensen has proposed that the charge transfer bands in many hexahalide species may be rationalised in terms of theexpression; II (X) ---- ► t g (M) = V + KD + q (A-E), where A and Dare related to the corresponding Racah parameter, E represents the variation in orbital energy with occupation number (q), and V and K are parameters dependent upon the metal (primarily oxidation state and atomic number) and ligand. The applications of this model to MF^ and MF "' spectra has been discussed by Allen and Warren [167]. A second approach is to use the orbital electronegativity concept[171], which can be expressed as II (X)--- > t g (M) = 30 000 [ Xopt
81

Figure 4.6 U.v.-visible Spectra of Matrix Isolated ReF and OsP l(a) ReF^ in (b) ReF^ in after prolonged deposition, (c) OsF^ in (inset: 200-300nm region with derivation recording), (d) OsF^in after prolonged deposition.
JD
200 300 500
Id)
200 300 500 600X /nm

Figure 4.7 U.v.-visible Spectra of Matrix Isolated IrF and PtF :(a)IrP^ in (inset: 200-350nm region with derivation recording),(b)IrF^ in after prolonged deposition, (c) PtF in (inset: 280-380nm region with derivation recording), (d) PtF^ in after prolonged deposition.
(C)ucoiDoin<
200 600 800X/nm

Table 4.2 U.v.-visible Data for P.G.M. Hexafluorides
ReF.
OsF.
IrF.
PtF.
Gas Phase [56] 56,404 (700)
49,322 (660) 47,687
32,5005,000
Matrix Isolated [57] Assignment
40,800
35,700
17.3008,5004.300 3,930
42.00035,500 28,20016.00013.0009.0006.400
45.00032.000
25.000
16.00012,0005.400 5,2003.300
50,70046,800
30,190
> 51,000 45,435 (630)
36,230 (660)
17,340
43.00035,70030.40016.40013.000
46.500 32,895
26,250
23.500
16,00012,000
n(F) n(F)
2g' 8n(F)
n(F)
see text
n(F)
see text
t, (Os)
t, (Os)
A.
Ig' 3 ”lg' Hot Band ?
n(F)n(F)
n(F)
' 2g(r8) -2g
<j(F)-n(F)-
n(F)-
n(F)-
\,g(r.)
►t2g(Pt)n2g(Pt).t2g(Pt)t,g(Pt)
^.g(r ^,g(r ^.g(r ^.g(r
Ig
(E max/cm' and Av/cm' )
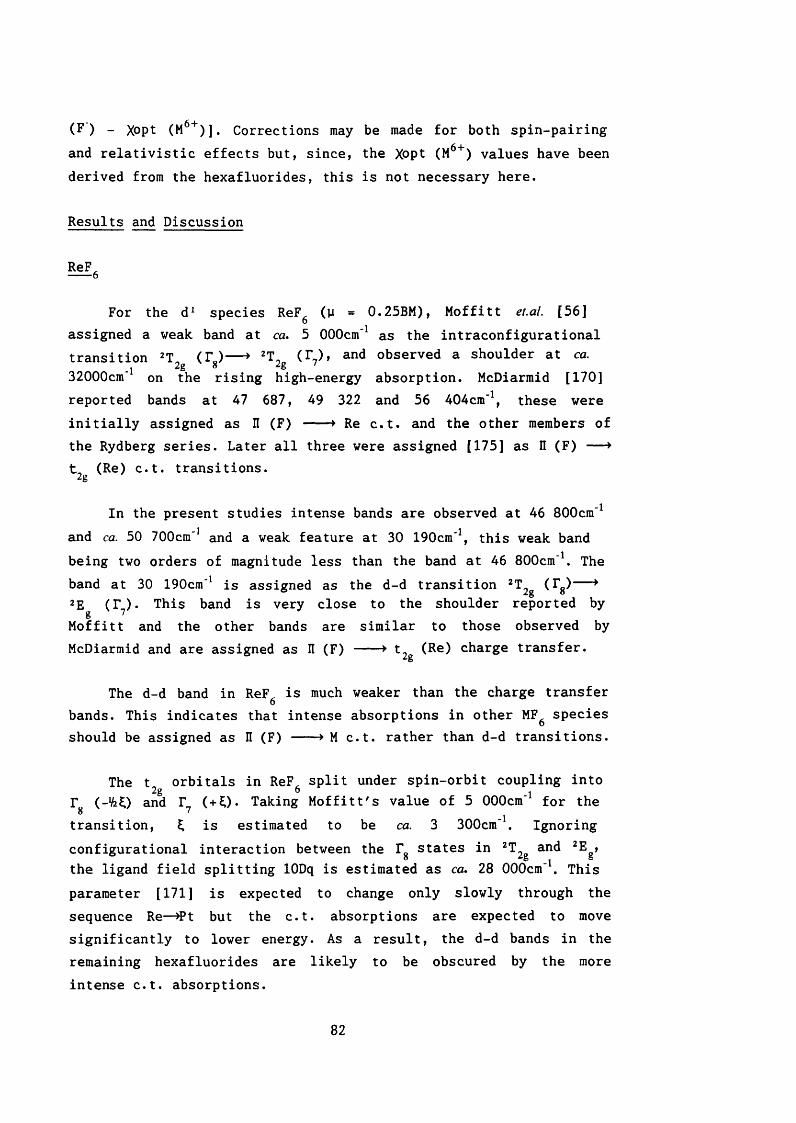
(F) - Xopt Corrections may be made for both spin-pairingand relativistic effects but, since, the Xopt (M ) values have been derived from the hexafluorides, this is not necessary here.
Results and Discussion
ReF^
For the d species ReF^ (p = 0.25BM), Moffitt et.al. [56] assigned a weak band at ca. 5 OOOcm' as the intraconfigurational transition (F)-- > (T ), and observed a shoulder at ca.
2g 8 2g /32000cm‘ on the rising high-energy absorption. McDiarmid [170] reported bands at 47 687, 49 322 and 56 404cm'\ these wereinitially assigned as II (F) > Re c.t. and the other members ofthe Rydberg series. Later all three were assigned [175] as II (F) — >
(Re) c.t. transitions.
In the present studies intense bands are observed at 46 800cm' and ca. 50 700cm' and a weak feature at 30 190cm'\ this weak band being two orders of magnitude less than the band at 46 800cm"\ Theband at 30 190cm" is assigned as the d-d transition T (Fg) ^2g ( r^). This band is very close to the shoulder reported by Moffitt and the other bands are similar to those observed byMcDiarmid and are assigned as II (F) ---> t g (Re) charge transfer.
The d-d band in ReF^ is much weaker than the charge transfer bands. This indicates that intense absorptions in other MF^ species should be assigned as II (F) ---> M c.t. rather than d-d transitions.
The t orbitals in ReF^ split under spin-orbit coupling intor (-%t) and r ( + t). Taking Moffitt's value of 5 OOOcm' for the -1 transition, is estimated to be ca. 3 300cm . Ignoring
configurational interaction between the states in T and the ligand field splitting lODq is estimated as ca, 28 000cm"\ This parameter [171] is expected to change only slowly through the sequence Re— >?t but the c.t. absorptions are expected to move significantly to lower energy. As a result, the d-d bands in theremaining hexafluorides are likely to be obscured by the moreintense c.t. absorptions.
82

OsF^
For the OsF^ (p = 1.50BM) Moffitt et.al. [56] identified three intra-configurational bands in the electronic spectra. These originated from the ground state T ( F^)« Higher energyabsorptions at 35 700 and 40 800 cm' were also observed. These are assigned as d-d transitions (t ^ — > ^2%^ SubsequentlyEisenstein [173] confirmed the assignment of the lower energy band but; suggested that the absorptions above 35 OOOcm* were due to charge transfer.
The present spectra of matrix isolated OsF^ differs significantly from that of Moffitt et.al. [56]. Here bands were observed at 36 230, 45 435 and ca. 51 000, but no band was observed at 41 000cm'\ Extensive vibrational structure was observed on the 45 435 and 36 230cm' bands with average spacings ca. 630 and 660 (±50) respectively. All three high energy bands were assigned as II(F)--> t (Os) c.t. For OsF^ in the ground state (Os-F, A g)lies at 7^3cm"\
The band observed by Moffitt at ca. 41 OOOcm' arises from OsO^ [174]. This is a persistent impurity in osmium fluoride chemistry, its u.v.-visible spectrum showing absorptions at 40 800 and 35 000 cm'\ Thus, the band at 40 800 reported by Moffitt is due to OsF^ and the band at 35 700cm' is a composite of the second OsF^ band at ca. 35 000 and the genuine OsF^ band at 36 200cm \
IrFg
For the d IrF^ (p = 2.9BM) the structured absorptions lying below 20 OOOcm' are assignable as intra-configurational bands arising from a ground state "A (F ) [56]. In the present nitrogen matrix work spectra in this region (11 000 - 18 000) show several weak sharp features which agree with the earlier work. The intense bands at 43 400 and ca. 35 700cm' show vibrational progressions of ca. 650cm' which correlate with the ground state A mode in IrF^ at 702cm'% and are assigned as c.t. bands. A distinct, relatively intense shoulder at ca. 30 400cm' is assigned as II (F) — > t g (Ir) c.t. rather than d-d (\^ — > \^ ) since a bathochromic shift in
2g 2gthe lowest energy c.t. band is expected compared to OsF . This
83
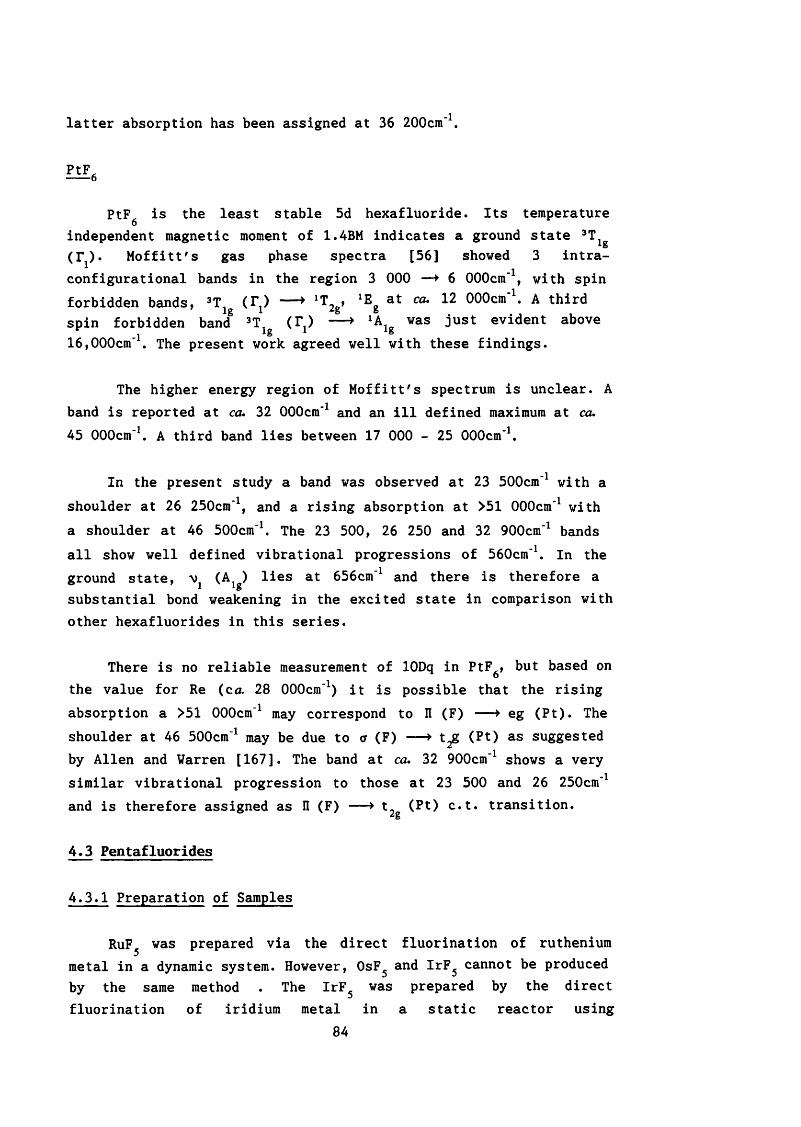
latter absorption has been assigned at 36 200cm"\
PtFg
PtFg is the least stable 5d hexafluoride. Its temperatureindependent magnetic moment of 1.4BM indicates a ground state ( r ) . Moffitt's gas phase spectra [56] showed 3 intra-configurational bands in the region 3 000 — ► 6 OOOcm' , with spinforbidden bands, (F ) — 000cm . A thirdspin forbidden band (F ) — > A was just evident above16,000cm' . The present work agreed well with these findings.
The higher energy region of Moffitt's spectrum is unclear. A band is reported at ca. 32 OOOcm' and an ill defined maximum at ca.45 000cm'\ A third band lies between 17 000 - 25 000cm'\
In the present study a band was observed at 23 500cm' with a shoulder at 26 250cm'\ and a rising absorption at >51 OOOcm' with a shoulder at 46 500cm'\ The 23 500, 26 250 and 32 900cm‘ bands all show well defined vibrational progressions of 560cm'\ In the ground state, (A ) lies at 656cm' and there is therefore a substantial bond weakening in the excited state in comparison with other hexafluorides in this series.
There is no reliable measurement of lODq in PtF , but based on the value for Re (ca, 28 OOOcm' ) it is possible that the rising absorption a >51 OOOcm' may correspond to II (F) — > eg (Pt). The shoulder at 46 500cm’ may be due to a (F) — > t g (Ft) as suggested by Allen and Warren [167]. The band at ca. 32 900cm' shows a very similar vibrational progression to those at 23 500 and 26 250cm' and is therefore assigned as H (F) — > t (Ft) c.t. transition.
4.3 Pentafluorides
4.3.1 Preparation of Samples
RuFg was prepared via the direct fluorination of ruthenium metal in a dynamic system. However, OsF^ and IrF^ cannot be produced by the same method . The IrF^ was prepared by the direct fluorination of iridium metal in a static reactor using
84

stoicheiometric amounts of iridium and fluorine [104]. OsF^ was prepared by the reduction of OsF^ using iodine in iodine pentafluoride [43,59].
The samples were loaded into glass sample tubes fitted with Young valves, and these were glass blown directly on to glassspray-on domes which connected directly into the matrix rig. The samples were electrically heated to about 100°C where they were found to slowly deposit on the matrix window. Unfortunately, largeamounts of SiF^ were also found to deposit on the window (peak at 1025cm' ). This was formed when the pentafluoride attacked the Pyrex tube. This problem was overcome by loading the samples into metal reactors fitted with high temperature Autoclave Engineers valves which allowed high vacuum to be maintained at elevated temperatures.
4.3.2 Results and Discussion
Spectra were recorded for RuF , IrF , OsF^ and PtF . The spectra for Ru, Os and Ir pentafluorides were very complex (figures 4.8, 4.9, 4.10) and the results are shown in table 4.3. Each of these pentafluorides is known to be tetrameric in the solid state and from the results of the mass spectroscopic studies tetrameric, trimeric, dimeric and monomeric species would be expected in the gaseous phase. Due to the complexity of the tetrameric structure and the uncertainty of the dimeric and trimeric structures, no definitive assignment can be made. However, the peaks at ~700cm' will be v(M-F) of the terminal F atoms, those at 560-580cm‘ will be bridging F-M stretches and those at 280-320cm^ will be S(M-F) deformations. This shows that the vapourisation of the P.G.M. pentafluorides does not only give monomeric species.
It was hoped that if the spray-on temperature was raised the spectra would simplify due to a decrease in the amount of tetrameric species and in increase in the amount of lower polymers, until eventually only monomeric species would be observed. RuF^ and OsF^ were heated to ~300°C with little change in their spectra, but above this temperature no further growth in the peaks was observed as the pentafluorides decomposed to metal and fluorine. The metal residue being observed to deposit on the walls of the spray-on tube. However, as IrF^ was heated most of the initial peaks stopped
85

Figure 4.8 I.r. Spectra of Matrix-isolated (RuF^^
600800 200400

Figure 4.9 I.r. Spectra of Matrix-isolated (IrF^^
600800

Figure 4.11 I.r. Spectra of Matrix-isolated IrF Recorded at 366°C
400600 200800

ZigHEî Spectra of Matrix-isolated (PtFj^
600 400 200800

Chapter 5
A New Form of Ruthenium Pentafluoride

Chapter 5
A Nev Form of Ruthenium Pentafluoride
5.1 Introduction
When ruthenium powder was fluorinated in a dynamic system, a red glassy material was observed which had not previously been reported. The compound was found to be extremely difficult tomanipulate. Not only is it very sensitive to moisture but it decomposes under dynamic vacuum at room temperature and under static vacuum at temperatures in excess of 35°C to (RuF ) * The redcompound is deposited in flow fluorinations of ruthenium metal on the glass side arm of the collection apparatus alongside the green pentafluoride. Before investigations of the red product were carried out it had to be separated from the green (RuF ) * The glassware was assembled as shown in figure 5.1, pumped out, fluorinated and the break-seal to trap A broken. The whole apparatus was held understatic vacuum and trap A was warmed to about 26-27*0. Heating was continued over a period of 3-4 days until, gradually, the red material moved along the glass tubing leaving most of the green pentafluoride in trap A. It was impossible to obtain total separation since, even at room temperature, the green pentafluoride has a vapour pressure of about 2mm Hg, but the red material is sufficiently more volatile than the pentafluoride to obtainreasonably pure samples.
5.2 Infrared Spectroscopy
This red ruthenium decomposed over about % hour in a dry box and even when a powdered sample was held between KBr discs in a specially designed holder (chapter 6) which enclosed the sample in an atmosphere of dry nitrogen, the spectra had to be recorded rapidly before decomposition occured. The peak positions obtained are recorded in table 5.1 and the spectrum is shown in figure 5.2.
87
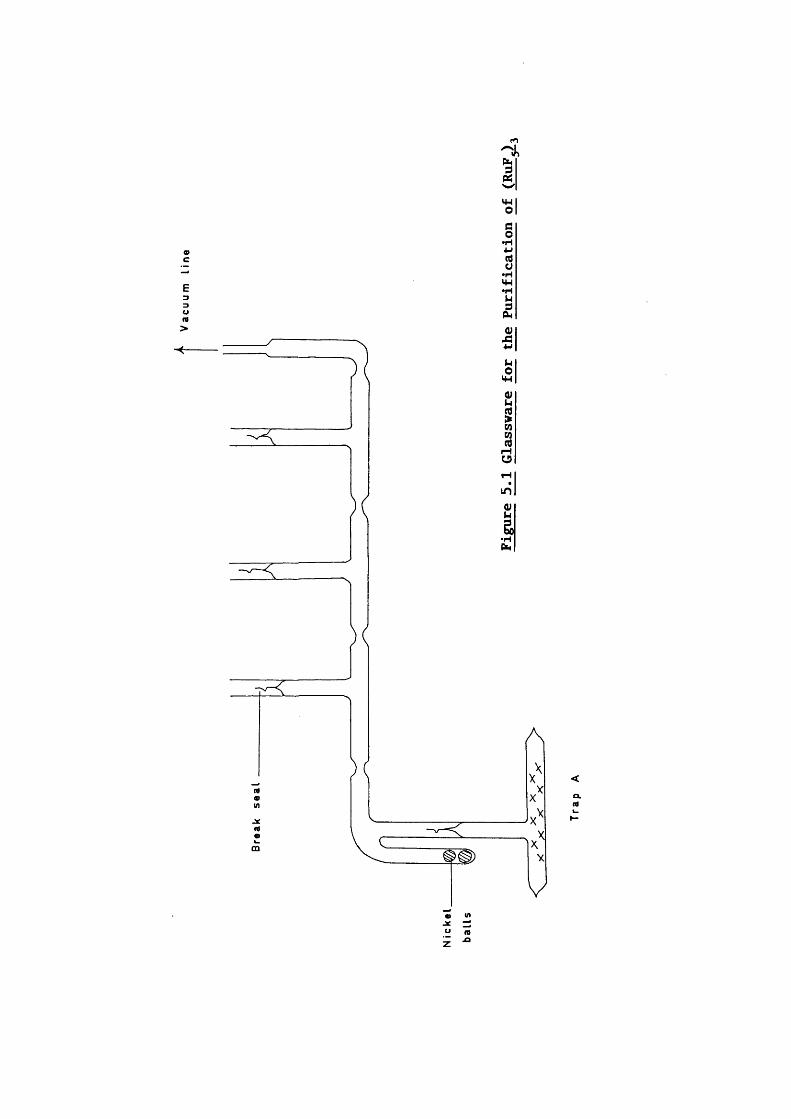
m■s«n%
m>
§•H4-)S3•HM2
m
je 12 « n

Figure 5.2 Infrared Spectra of (RuF^^
cm500600700-I
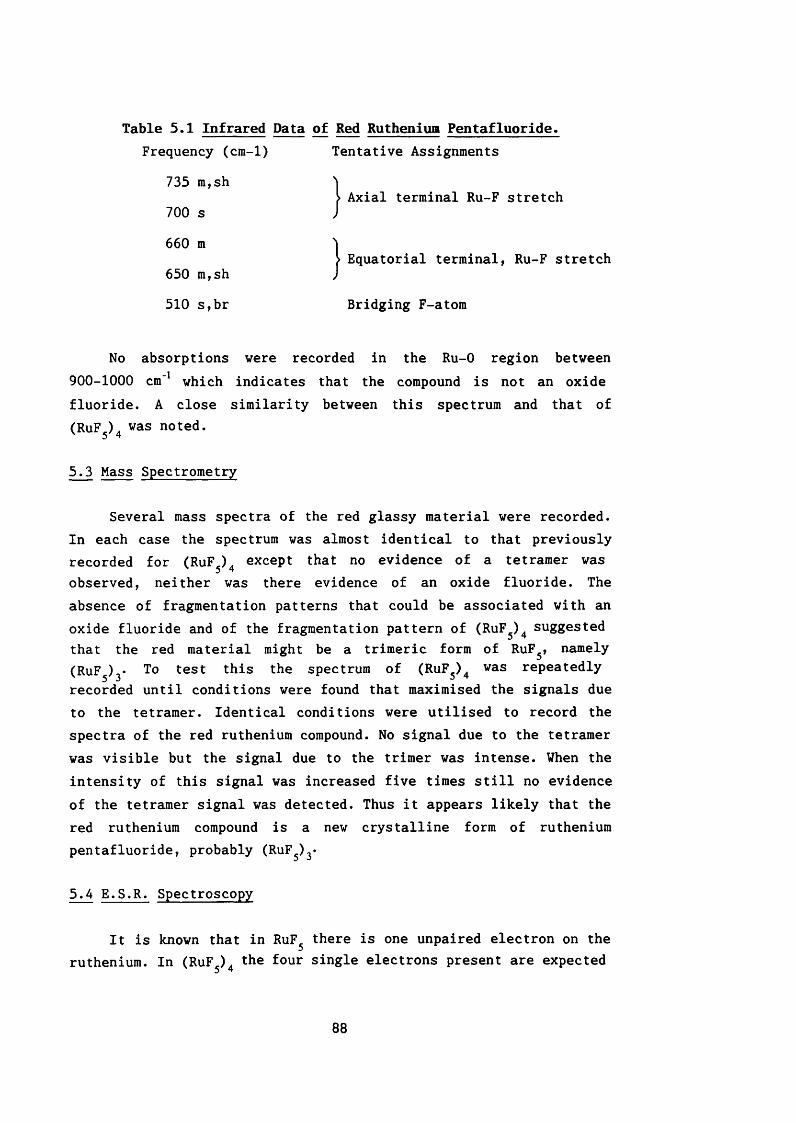
Table 5.1 Infrared Data of Red Ruthenium Pentafluoride.Frequency (cm-1) Tentative Assignments
735 m,sh 'j> Axial terminal Ru-F stretch
700 s J
660 m ^
650 m,sh J
510 S;br Bridging F-atom
Equatorial terminal, Ru-F stretch
No absorptions were recorded in the Ru-0 region between 900-1000 cm' which indicates that the compound is not an oxide fluoride. A close similarity between this spectrum and that of (RuFj), vas noted.
5.3 Mass Spectrometry
Several mass spectra of the red glassy material were recorded. In each case the spectrum was almost identical to that previously recorded for (RuF^)^ except that no evidence of a tetramer was observed, neither was there evidence of an oxide fluoride. The absence of fragmentation patterns that could be associated with an oxide fluoride and of the fragmentation pattern of (RuF^)^ suggested that the red material might be a trimeric form of RuF , namely (RuFg)y To test this the spectrum of (RuF^)^ was repeatedly recorded until conditions were found that maximised the signals due to the tetramer. Identical conditions were utilised to record the spectra of the red ruthenium compound. No signal due to the tetramer was visible but the signal due to the trimer was intense. When the intensity of this signal was increased five times still no evidence of the tetramer signal was detected. Thus it appears likely that the red ruthenium compound is a new crystalline form of ruthenium pentafluoride, probably (RuF ) *
5.4 E.S.R. Spectroscopy
It is known that in RuF^ there is one unpaired electron on the ruthenium. In (RuF^), the four single electrons present are expected
88

to be coupled so that no e.s.r. signal would be observed. However, if the red material ij give an e.s.r. signal.if the red material is (RuF ), the single unpaired electron should
Samples of the green pentafluoride and the red ruthenium compound were loaded into pre-seasoned quartz e.s.r. tubes in a dry box. The samples were both run at liquid nitrogen temperatures and the results are shown in figure 5.3.
A clear signal was recorded for the red compound but no signal was found for the green pentafluoride which constitutes further evidence in support of the theory that the red compound is (RuF ) »
5.5 Conclusion
It seems probably that a new binary fluoride has been prepared and isolated. It is believed that this red material is (RuF ) * This could be confirmed by a x-ray study of a single crystal but as yet no single crystals have been obtained.
89

b3
«w I ol(Qi-i*->O(Uex00CtSxÀum ILD I(UU3bO

Chapter 6
Experimental

nickel cans fitted with Hoke bellows valves [Model 4171 M2B]. Thermally unstable samples were stored at -196°C in a cryostat [British Oxygen Co. Ltd.] or at -78°C in solid carbon dioxide.
6.2. Vacuum Systems, Reaction Vessels and Flow Systems
Vacuum line or flow line methods were used to prepare all the compounds studied.
6.2.1. Vacuum Line
The vacuum line consisted of a metal manifold with high and low vacuum facilities which formed the basic system (figure 6.1).This was constructed from /s" o.d, /s" i.d. nickel tubing[H.Wiggin & Co. Hereford] and argon welded "U" traps (=25cm3 capacity). The manifold was completed with AE-30 series hard drawn stainless steel needle valves, crosses and tees [Autoclaves Engineers Inc. Erie, Pennsylvania, USA.].
The low vacuum system (10' mmHg) consisted of a single stage rotary pump [Model PSR/2, NGN Ltd., Accrington, Lancashire] with a large metal trap filled with soda lime (5-10 mesh) between the pump and the manifold. This chemical trap collected any fluorine or volatile fluoride exhausted from the manifold. The low vacuum system served to remove large quantities of gases before opening the manifold to the high vacuum system. The high vacuum (lO^mmHg) was maintained by a single or double stage rotary pump [Genevac type GRS2 or GRD2 , General Engineers Co.,Radcliff, Lancashire] which was connected to the manifold via a mercury diffusion pump and a liquid nitrogen cold trap(-196°C). Facilities for admission of argon and hydrogen,directly into the manifold from cylinders, were provided and fluorine was introduced to the line from welded nickel cans (Idm^ capacity) fitted with AE-30 stainless steel needle valves.
Manifold pressure of plus or minus 1 atmosphere (0-1500mmHg) were measured using a stainless steel bourdon tube gauge [type 1F/66Z, Budenberge Gauge Co. Ltd., Broadheath, Greater Manchester]. The vacuum was monitored using a cold-cathode Penning gauge [Model 2A, Edwards High Vacuum Ltd., Crawley, West
91

«Q
I§
«t7» fd Q) QJÜiüSü) ü)
in ü)V) Ü1Q> «
xn toI I I I Iu O 2 H >
IU|•HalI ItHVO2

Sussex], capable of measuring pressures in the range 10' to 10 mmHg.
Leaks in the manifold and in constructed reaction systems were located with a helium leak detector [Edwards High Vacuum Ltd., mass spectrometer model LT 104].
6.2.2 Reaction Vessels
A variety of metal, fluoroplastic. Pyrex or silica reaction vessels could be attached to the vacuum line. Glass reaction systems were designed and fabricated as required and were attached to the manifold by precise %"o.d. glass connector to%"o.d. stainless steel tubing machined to Autoclave Engineers AE-30 series fittings, by Chemcon Teflon connectors [type STD/4 EIP, Production Techniques Ltd., Fleet, Hampshire] using Tefloncompression unions. Greaseless glass valves [Quickfit 'Rotaflo' type TF2/13 and TF6/13 or J.Young, Scientific Glassware Ltd., Acton, London] fitted with Teflon stems were used where glass systems were employed or, alternatively, glass reaction vessels were fitted with Chemcon Teflon needle valves [Type STD/VC 4/P].
Fluoroplastic reactors of / 'o.d. Kel F with approximately 30cm3 volume, [obtained from Argon National Laboratory] were fitted with Chemcon Teflon needle valves via a stem fabricated from a Teflon FEP block [Trimflex corporation U.S.A] (figure 6.2). Stainless steel or nickel reactors of approximately 30cm^ volume, employed in thermal reactions, were fitted with gold seals and closed with an AE-30 series stainless steel needle valve (figure 6.3).
6.2.3. Flow Line
The flow line consisted of a metal manifold with a low vacuum facility (figure 6.4). It was constructed of /s" o.d., /8" i.d. stainless steel tubing, AE-30 series hard drawnstainless steel needle valves, crosses, tees and elbows[Autoclave engineers Inc., Erie, Pennsylvania, USA.].
Vacuum was obtained using a single stage rotary pump [Model92

Che me om va l ve
K e l - F r e a c t o r
Figure 6.2 Cross-sectional View of a KelJ* Reactor

Stainless — steel connector
Locking nut
Stainless steel reactor
Gold seal
Figure 6.3 Cross-sectional View of a metal reactor

IIu•H&I
VD

PSR/2, NGN Ltd., Accrington, Lancashire], with a large metal trap filled with soda lime (5-10 mesh) between the pump and the manifold used to collect any fluorine or volatile fluorides exhausted from the manifold. Facilities for the admission of nitrogen, hydrogen and fluorine from cylinders were provided.
Reactions were performed in a copper reaction tube and products were collected in silica or Pyrex traps. The reaction and collection apparatus varied depending on the nature of the products (figures 2.1, 2.2, 2.3). When only volatilehexafluorides were expected a very simple apparatus was sufficient (figure 2.1), but for the fluorination of Ru, Pt, Rh where the pentafluoride was also expected the glassware was modified (figure 2.2) to help the flow of the products from the reactor. Later the glassware was again modified (figure 2.3) in order to trap very reactive less volatile products.
6.3. Characterisation of Products
6.3.1. X-Ray Powder Diffraction
Non volatile samples were ground to a fine powder in a dry box and loaded into seasoned glass capillaries. These were sealed temporarily in the dry box using modelling wax [AD International Ltd., Waybridge] and then sealed using a micro-torch [Model H164/1, Jencons, Hemel Hempstead, Hertfordshire] immediately on removal from the dry box. Volatile samples were condensed from the storage vessels into pre-seasoned capillaries and sealed using a micro torch [model H164/1] whilst the sample was kept at -196°C.
Photographs were taken in a Philips 11.64cm diameter camera, on a Kodirex KD 59T film [Kodak Ltd.]. Nickel filtered Cu-Ka radiation (28kV, ISAmps) was used with exposure times of two to five hours.
6.3.2. Infrared Spectroscopy
A Perkin Elmer 580B spectrometer was used to obtain infrared spectra . Solid samples were ground to a fine powder in a dry box
93

and pressed between discs of KBr (4000-350cm'^). Highly sensitive samples were held between KBr discs in an atmosphere of dry nitrogen in a specially constructed holder (figure 6.5). Gas phase spectra were obtained using a 10cm path-length copper cell, fitted with AgCl windows (4000-400cm'^), which could be attacheddirectly to the main manifold. Teflon gaskets provided an airtight seal between the windows and the cell body.
6.3.3. Raman Spectroscopy
Raman spectra were recorded with a Coderg T800 spectrometer, with a 250 mW Ar laser [Model 52, Coherent Radiation Laboratories] which provided 5145 Â (green) and 4880 Â (blue) radiation. Solid and volatile samples were contained in Pyrex capillaries, those which were likely to decompose in the beam were run at low temperatures in a cryostat (figure 6.6) [ModelDN704 Oxford Instruments Ltd. Osney mead, Oxford].
6.3.4. Matrix Isolated Infrared and Ultra Violet-VisibleSpectroscopy
Infrared studies were carried out using a Perkin Elmer 983G spectrometer, and a Matrix rig fitted with Csl optics, whilst u.v.-visible experiments employed LiF optics and a Perkin Elmer 554 spectrometer interfaced with a microcomputer. Details of the spray-on conditions are given in chapter 4.
6.3.5. Mass Spectroscopy
Mass Spectra were recorded on a V.G. Micromass 16B instrument, the samples being introduced directly into the ionising chamber. Solid samples were admitted in glass capillaries mounted on the end of a stainless steel probe. The capillary end was broken off just prior to insertion of the probe. Volatile samples were admitted through a pre-seasoned copper pipe with either a Teflon or Pyrex insulating tip depending on the nature of the sample. In order to minimise decomposition of the sample during passage through the mass spectrometer, the entire system was pre-seasoned by flushing with small amounts of fluorine.
94

O)cd) ô(d L_qI 0>.aL_ _oCQ 30:
uIIïG“S
§1“SI
i•Ht!g1(A
ginV£>
2•H

Figure 6.6 Liquid Nitrogen Cryostat
SAMPLE ACCESS PORT
TOP PLATE INCLUDING VAC/RELIEF VALVE EXHAUST VLNp FILL \ELECTRICAL \CONNECTOR \ VAC/RELIEF VALVE
LIQUID NITROGEN RES/R
CHARCOALSORB
HEAT EXCHANGE AND TEMP. SENSOR
SAMPLE SPACE
WINDOWS
6.3.6. Elemental analysis
All elemental analyses were performed by Johnson Mat they Technology Centre. The samples were loaded into pre-seasoned glass tubes in the dry box then evacuated on the manifold and sealed under vacuum.
6.3.7. Electron Spin Resonance Spectroscopy
E.S.R. spectra were recorded on a Bruker ER 200D.
6.4. Chemicals, Sources and Purification Procedures
6.4.1. Starting Materials
Fluorine [99.8% purity, Matherson Gas Products]; for use on the manifold was used without purification from the cylinder. For safety and convenience the gas was transferred to welded nickel cans (Idms capacity) when used on the vacuum line.
Chlorine Trifluoride [Fluorochem Ltd.]; was used for seasoning without further purification directly from cylinder.
Metals [Johnson Matthey Spec. Pure Grade]; obtained as fine powders.
Iodine [Aldrich Chemical Co. Ltd.]; purified by vacuum distillation.
6.4.2. Solvents
Iodine Pentafluoride [Ozark Mahoning]; was vacuum distilled from the cylinder into a /4" Kel-F tube. To remove traces of iodine approximately 400mmHg of fluorine was distilled onto the IrFg and agitated for several hours, periodically more fluorine was added to replace that lost during conversion of iodine to iodine pentafluoride. Reaction was known to be complete when the tube contained a colourless liquid, this was pure iodine pentafluoride.
95

References1) C.Courtois ; CEA Report 1977, CEA-R-4818 (CA 90:114283h)
2) C.Courtios, T.Kikindai ; C. R, Hebd. Seances Acad. Sci. Ser, C,1976, 283, 679.
3) H.H.Claassen, H.Selig, J.G.Malm, C.L.Chernick, B.Weinstock ; J. Amer. Chem. Soc.f 1961, 83, 2390.
4) R.C.Burns, T.A.O'Donnell ; J. Inorg. nucl. Chem.f 1980, 42, 1613.5) H.Selig, W.A.Sunder, F.A.DiSalvo, W.E.Falconer ; J. Fluorine
Chem., 1978, 11, 39.6) W.A.Sunder, A.L.Wayda, D. DiStefano, W.E.Falconer, J.E.Griffiths
; J. Fluorine Chem., 1979, 14, 299.7) R.C.Burns,T.A.O'Donnell ; J. Fluorine Chem., 1983, 23, 1.8) S.Siegel, D.Northrop ; Inorg. Chem., 1966, 5,(12), 2187.
9) O.Ruff, E.Vidic ; Z. Anorg. Chem., 1925, 143, 171.10) M.A.Hepworth, P.L.Robinson ; J. inorg. Nucl. Chem., 1957, 4, 24.11) M.A Hepworth, R.D,Peacock, P.L.Robinson \J. Chem. Soc., 1954,
1197.12) J.H.Holloway, R.D.Peacock ; J. Chem. Soc., 1963, 527.
13) H.A.Porte, E.Greenberg, W.N.Hibbard ; J. Phys. Chem., 1965, 69(7), 2308.
14) T.Sakurai, A.Takahashi ; J. Inorg. Nucl. Chem., 1979, 41, 681.
15) E.E.Aynsley, R.D.Peacock, P.L.Robinson ; Chem. and Ind., 1952,1002.
16) M.A.Hepworth, K.H.Jack, R.D.Peacock, G.J.Westland ; Acta. Cryst., 1957, 10(1), 63.
17) J.H.Holloway, R.D.Peacock ; J.Chem. Soc., 1963, 3892.
18) N.Bartlett, P.L.Robinson ; J. Chem. Soc., 1961, 3417.
19) J.H.Holloway, J.G.Knowles ; J. Chem. Soc. (A), 1969, 756.
20) F.O.Sladky, P.A.Bulliner, N.Bartlett ; J. Chem. Soc. {A), 1969,2170.
21) V.B.Sokolev, Yu.D.Drobyshevskii, V.N.Prusakov, A.V.Ryshkov,S.S.Khoroshev ; Dokl. Acad. Nauk. S.S.S.R., 1976, 229, 641.
22) A.J.Hewitt, J.H.Holloway, R.D.Peacock, J.B.Raynor, I.L.Wilson ;J. Chem. Soc. Dalton, 1976, 579.
23) C.J.Marshall, R.D.Peacock, D.R.Russell, I.L.Wilson ; Chem. Comm.,96

1970, 1643.24) S.N.Misra ; Indian J. Chem., 1980, 19A, 1191.
25) J.H.Holloway, R.D.Peacock, R.W.H.Small ; J. Chem. Soc., 1964, 644.
26) A.J.Edwards, R.D.Peacock, R.W.H.Small ; J. Chem. Soc., 1962, 4486.
27) M.J.Vasile, G.R.Jones, W.E.Falconer ; Adv. Mass Spec., 1974, 6, 557.
28) M.J.Vasile, G.R.Jones, W.E.Falconer ; Int. J. Mass Spec. Ion.Phys., 1973, 10(4), 457.
29) R.L.Farrar, E.J.Barber, R.H.Capps, M.R.Skidmore, H.A.Barnhardt ;AECD-3468, 1950/2, 1/20; NSA 7, Nr. 529.
30) O.Ruff, F.W.Tishirch ; Ber., 1913, 46, 929.31) B.Weinstock, J.G.Malm ; J. Amer. Chem. Soc., 1958, 80, 4466.32) B.Weinstock, J.G.Malm ; Proc. U.N. Conf. Peaceful Uses of At.
Energy 2nd Geneva, 1958, 28, 125.
33) E.W.Kaiser, J.S.Munter, W.Klemperer, W.E.Falconer, W.A.Sunder ;J. Chem. Phys., 1970, 53(4), 1411.
34) R.C.Burns, T.A.O'Donnell ; Inorg. Chem., 1979, 18(11), 3081.35) G.B.Hargreaves, R.D.Peacock ; Proc. Chem. Soc., 1959, 85.
36) G.H.Cady, G.B.Hargreaves ; J. Chem. Soc., 1961, 1563.37) K.H.Hellberg, A.Muller, O.Glemser ; Z. Naturforsch., 1966, 21b,
118.
38) J.Slivnik, A.Smalc, A.Zemlijic ; NIJS-R-472, 1965, CA66, 1967, No 71978.
39) H.H.Claassen ; J. Chem. Phys, 1959, 30(4), 968.
40) R.C.Burns, T.A.O'Donnell ; J. Inorg. Nucl. chem. 1980, 42, 1285.
41) N.K.Jha ; PhD. Thesis Univ. of British Columbia, 1965.
42) M.A.Hepworth, P.L.Robinson, G.J.Westland ; Chem. Ind., 1955, 1516.
43) G.B.Hargreaves, R.D.Peacock ; J. Chem. Soc., 1960, 2618.
44) R.T.Paine ; Inorg. Chem., 1973, 12(6), 1457.
45) W.E.Falconer ; J. Fluorine Chem., 1978, 11, 39.
46) N.Bartlett, S.P.Beaton, N.K.Jha ; Chem. Comm., 1966, 168.
97

47) S.P.Beaton ; PhD Thesis Univ. of British Columbia 1966.48) N.Bartlett ; Angew. Chem. Int. Edit., 1968, 7(6), 433.
49) J.Shamir, J.G.Malm, J. Inorg. Chem. Suppl., 1976, 107.
50) N.Bartlett, D.H.Lohmann ; J. Chem. Soc. 1962, 5253.
51) B.Weinstock, H.H.Claassen, J.G.Malm ; J. Chem. Phys., 1960, 32(1), 181.
52) R.C.Burns, T.A.O'Donnell ; Inorg. Synth., ???
53) B.Weinstock, G.L.Goodman ; Adv. Chem. Phys., 1965, 9, 169.
54) H.H.Claassen, H.Selig ; Isreal. J. Chem., 1969, 7, 499.
55) H.H.Claassen, G.L.Goodman, J.H.Holloway, H.Selig ; J. Chem.Phys., 1970, 53(1), 341.
56) W.Moffitt, G.L.Goodman, M.Fred, B.Weinstock ; Mol. Phys., 1959,2, 109.
57) J.H.Holloway, G.Stanger, E.G.Hope, W.Levason, J.S.Ogden ; J.Chem. Soc. Dalton, 1988, 1341.
58) M.Kiraura, V.Schomaker, D.W.Smith, B.Weinstock ; J. Chem. Phys.,1968, 48(9), 4001.
59) S.J.Mitchell, J.H.Holloway ; J. Chem. Soc., (A), 1971, 2789.
60) W.E.Falconer, G.R.Jones, W.A.Sunder, M.J.Vasile, A.A.Muenter, T.R.Dyke, W.Klemperer ; J. Fluorine Chem., 1974, 4, 213.
61) G.H.Cady, G.B.Hargreaves ; J. Chem. Soc., 1961, 1568.
62) W.E.Falconer, G.R.Jones, W.A.Sunder, I.Haigh, R.D.Peacock ; J.Inorg. Nucl. Chem. Suppl., 1973, 35, 751.
63) T.A. O'Donnell, T.E. Peel ; J. Inorg. Nucl. Chem. Suppl., 1976,61.
64) R.T. Paine, L.B. Asprey ; Inorg. Synth., 1979, 19, 137.
65) R.T. Paine, L.B. Asprey ; Inorg. Synth.,\91'S, 14, 1111.
66) L.B. Asprey, R.T. Paine ; U.S. Patent 1975 No.3 929, 601.
67) R.C. Burns, I.D. Macleod, T.A. O'Donnell, T.E. Peel, K.A. Phillips, A.B. Waugh ; J. Inorg. Nucl. Chem., 1977, 39, 1737.
68) R.T. Paine, L.A. Quartermann ; Inorg. Nucl. Chem. Suppl., 1976,85.
69) N. Bartlett, F.O. Sladky ; J. Amer. Chem Soc., 1968, 90, 5316.
70) R.D. Peacock ; Advances in Fluorine Chemistry, 1973, 7, Pub. Butterworth and Co.
98

71) C.L. Chernick, H.H. Claassen, B. Weinstock ; J. Amer. Chem. Soc.,1961, 83, 3165.
72) N. Bartlett, N.K. Jha, in H.H. Hyman Nobel Gas Compounds,University of Chicago Press, Chicago-London, 1963, 23.
73) B. Weinstock, H.H. Claassen, C.L. Chernick ; J. Chem. Phys., 1963, 38(7), 1470.
74) J.H. Holloway, P.R. Rao, N. Bartlett ; Chem. Comm., 1965, 14,306.
75) N. Bartlett ; Preparative Inorganic Reaction, 1965, 2, Ed. Jolly, Interscience Publishers J. Wiley and Son.
76) G. Thiele, K. Broadersen ; Forschr. Chem. Forsch., 1968, 10, 631.77) N.P. Galkin, Yu. N. Tumanov, Yu P.Butylkin ; Russ. J. Phys.
Chem., 1970, 44(10), 1976.
78) B.K. Morrell, A. Zalkin, A. Tressaud, N. Bartlett ; Inorg. Chem., 1973, 12(11), 2640.
79) T. Cyr ; Ccut. J. Spectrosc., 1974, 19(5), 136.80) P.R. Rao, A. Tressaud, N. Bartlett ; J. Inorg. Nucl. Chem.
Suppl., 1976, 23.
81) M.L. Hair, P.L. Robinson ; J. Chem. Soc., 1960, 3419.
82) A.G. Sharpe ; J. Chem. Soc., 1950,3444.83) R.S. Nyholm, A.G. Sharpe ; J. Chem. soc., 1952, 3579.84) N.S. Chilinggarov, M.V. Korobov, L.N. Sidorov, V.N. Mit'kin, V.A.
Shipachev, S.V. Zemskov ; J. Chem. Thermodynamics, 1984, 16, 965.
85) R.R. Jesse, R. Hoppe ; Z. Anorg. Chem., 1977, 428, 83.86) R.D. Peacock ; J. Chem. Soc., 1965, 3291.
87) J. Meyer, H. Kienitz ; Z, Anorg. Chem., 1939, 242, 281.88) I.E. Rychkova, M.V. Korobov, L.N. Sidorov ;
Russian J. Inorg. Chem., 1982, 56(6), 931.
89) N. Wooster ; Z. Kristallogr., 1933, 84, 320.90) W. Nowacki ; Z. Kristallogr., 1939, 101, 273.91) F. Ebert ; Z. Anorg. Chem., 1931, 196, 395.92) J.A. Ketelaar ; Z. Kristallogr., 1933, 85, 119.93) 0. Ruff, J. Fischer ; Z. Anorg. Chem., 1929, 179, 161.
94) H.C. Mattraw, N.J. Hawkins, D.R. Carpenter, W.W. Sabol ;J. Chem. Phys., 1955, 23, 985.
99

95) P.L. Robinson, G.J. Westland ; J. Chem. Soc., 1959, 4481.96) G. Brauer ; Handbook of Prep. Inorg. Chem., Acedemic Press, New
York, 2nd Edition 1963, 1, 270.97) B.N. Figgis, J. Lewis, F.E. Mabbs ; J. Chem. Soc., 1961, 3138.98) J.D. Webb, E.R. Bernstein ; J. Amer. Chem. Soc., 1979, 100(2),
483.
99) R.N. Crompton, P.W. Reinhardt, C.P. Cooper ; J. Chem. Phys.,1978, 68(5), 2023.
100) R.C. Burns, T.A. O'Donnell ; Inorg. Nucl. Chem., 1980, 42, 1285.101) K.O. Christe ; Inorg. Chem., 1973, 12(7), 1580.102) J.E. Griffiths, W.A. Sunder ; J. Fluorine Chem., 1975, 6, 533.103) H.H. Claassen, B. Weinstock ; J. Chem. Phys., 1960, 33(2), 436.104) N. Bartlett, P.R. Rao ; Chem. Comm., 1965, 12, 252.105) L.B. Asprey, R.T. Paine ; J.C.S. Chem. Comm., 1973, 920.106) Gemelin Handbook "Iridium" p.98.
107) J. Schroder, F.J. Grewe ; Angew. Chem. Internat, edit., 1968, 7,132.
108) J. Scrôder, F.J. Grewe ; Chem. Ber., 1970, 103, 1536.109) W.A. Sunder, W.E. Falconer ; Inorg. Nucl. Chem. Letters, 1972, 8,
537.
110) N. Bartlett, A Tressaud ; C.R. Acad. Sci. Paris, 1974, 278c,1501.
111) M.J. Vasile, G.R. Jones, W.E. Falconer ; Chem. Comm., 1971, 1355.112) N. Bartlett, P.R. Rao ; Proc. Chem. Soc., 1964, 393.113) A.F. Wright, B.E. Fender, N. Bartlett, K. Leary ; Inorg. Chem.,
1978, 17(3), 748.
114) N. Bartlett, D.H. Lohmann ; J. Chem. Soc., 1964, 619.
115) L. Mooney ; Acta Cryst., 1949, 2, 189.
116) 0. Ruff, E. Ascher ; Z. Anorg. Chem., 1929, 183.117) N. Bartlett, M.A. Hepworth ; Chem. and Ind., 1956, 1425.118) N. Bartlett, J.W. Quail ; J. Chem. Soc., 1961, 3728.119) N. Bartlett, R.T. Maitland ; Acta Cryst., 1958, 11, 747.
120) B.G. Muller ; J. Fluorine Chem., 1982, 20, 291.100

121) G. Demazeau, F. Langlais, J. Portier, A. Tressaud, P. Hagenmuller ; High Pressure Sci. Technol. Proc. Int. AIRPT Conf. 7th Meeting, 1979, 1, 579, Pergamon, Oxford, England.
122) A. Tressaud, F. Langlais, G. Deraazeau, P. Hagenmuller ;Mater. Res. B u ll., 1979, 14, 1147.
123) B.G. Muller ; Naturwissenchqften, 1979, 66, 519.124) A. Tressaud, J.L. Soubeyroux, H. Touchara, G. Demazeau, F.
Langlais ; Mater. Res. B u ll., 1981, 16, 207.125) A. Tressaud, G. Demazeau ; High Temp-High Pressure, 1984, 16,
303.
126) B. Weinstock, H.H. Claassen, J.G. Malm ; J. Amer. Chem. Soc., 1957, 79, 5832.
127) B. Weinstock, J.G. Malm, E.E. Weaver ; J. Amer. Chem. Soc., 1961,83, 4310.
128) J. Slivnik, A. Smalc, A. Zemlijic ; 3rd Internat. Symposium ofFluorine Chem. Muchen., 1965.
129) J. Slivnick, B. Zemva, B. Druzina ; J. Fluorine Chem., 1980, 15,351.
130) Yu.V. Drobyshevskii, V.F. Serik, V.B. Sokolov ; Summaries of papers presented at the 5th all-union symposium on the chemistry of inorganic fluorides, Izd. Nauka. Mosco, 1978, 101.
131) M.V. Korobov, V.V. Nikulin, N.S. Chilingarov, L.N. Sidorov ; J. Chem. Thermodynamics, 1986, 18, 235.
132) N. Bartlett, D.H. Lohmann ; Proc. Chem. Soc., 1960, 14.133) N. Bartlett, D.H. Lohmann ; Proc. Chem. Soc., 1962, 115.134) H. Selig, J.H. Holloway ; Topics in Current Chemistry, 124 Edit
F.L. Boschke, Pub. Springer-Verlag, Berlin.
135) F. Mahieux ; C.R. Hebd. Séances Acad. Sci., 1963, 257, 1083.
136) F. Mahieux ; C.R. Hebd. Séances Acad. Sci., 1964, 258, 3497.
137) F.P. Gortsema, R.H. Toeniskoetter ; Inorg. Chem., 1966, 5, 1925.
138) F.P. Gortsema, R.H. Toeniskoetter ; Inorg. Chem., 1966, 5, 1217.
139) R. Blinc, E. Pirkmajer, J. Slivnik, I. Zupancic ; J. Chem. Phys., 1966, 45(5), 1488.
140) N. Bartlett, F. Einstein, D.F. Stewart, J. Trotter ; Chem. Comm., 1966, 550.
141) N.P. Galkin, Yu.N. Tumanov, Yu.P. Butylkin ; Russ. J. Phys. Chem., 1970, 44(12), 1724.
101

142) W. Huckel ; Nachr, Akad. Wiss. Goettingen Math. Physik. K l.,1046, 36.
143) U.S. Patent 2,952,514.
144) M.V. Korobov, L.N. Sidorov, I.E. Rychkova ; Summaries of papers presented at the 5th all union symposium on the chemistry fo Inorganic fluorides (Dnepropetrovsk) Izd. Nauk. Moscow, 1978, 14.
145) M.V. Korobov, E.B. Badtiev, L.N. Sidorov ; Dep. VINITI No. 613-79.
146) D.W.A. Sharp ; Proc. Chem. Soc., 1960, 317.147) L.N. Kolditz, J. Gisbier ; Z. Anorg. Chem., 1969, 366, 265.148) N. Bartlett, B. Zemva, L. Graham ; J. Fluorine Chem., 1976, 7,
301.149) W.E. Falconer, F.J. Disalvo, J.E. Griffiths, F.A. Stevie, W.A.
Sunder, M.J.Vasile ; J. Fluorine Chem., 1975, 6, 499.150) N. Bartlett, F. Einstein, D.F. Stewart, J. Trotter ;
J. Chem. Soc. (A), 1967, 1190.151) A.J. Edwards, W.E. Falconer, J.E. Griffiths, W.A. Sunder, M.J.
Vasile ; J. Chem. Soc. Dalton, 1974, 1129.152) K. Leary, D.H. Templeton, A. Zalkin, N. Bartlett ; Inorg. Chem.,
1973, 12(8), 1726.153) F.Q. Roberts ; Inorg. Nucl. Chem. Lett., 1972, 8, 737.154) K.O. Christe ; Inorg. Nucl. Chem. Lett., 1972, 8, 741.155) K.O. Christe, J.F. Hon, D. Pilipovich ; Inorg. Chem., 1973, 12,
84.
156) K.O. Christe, W.W. Wilson, R.D. Wilson ; Inorg. Chem., 1984, 23(14), 2058.
157) B. Weinstock, H.H. Claassen ; J. Chem. Phys., 1959, 31(1), 262.
158) N. Bartlett ; Proc. Chem. Soc., 1962, 218.159) B. Frlec, H.H. Hyman ; Inorg. Chem., 1967, 6(8), 1596.160) 0. Glemser, H.W. Roesky, K.H. Hellberg, H.V. Werther ;
Chem. Ber., 1966, 99, 2652.161) A.A. Trinakov, V.N. Prusakov, Yu.V. Drobshevskii ; Russ. J.
Inorg. Chem., 1982, 12.
162) E. Hope, W. Levason, J.S. Ogden; Private communication.
163) N. Freestone, J.H.Holloway; Private Communication.
164) 0. Christe, N.Paslath; Z. Anorg. Chem., 1965, 355, 210.102

165) H.A. Jahn, E. Teller; Proc. Roy. Soc. (London), 1967, A161, 220.166) H.A. Jahn; Proc. Roy. Soc. (London), 1938, A164, 117.167) G.C. Allen, K.D. Warren; Struct. Bonding (Berlin), 1974, 19, 105.168) D.E. Ellis, A. Rosen; Z.Phys., 1977, 283, 3.169) J.E. Bloor, R.E. Sherrad; J.Amer.Chem. Soc., 1980, 102, 4333.
170) C.K. Jorgensen; "Absorption Spectra and Chemical Bonding in Complexes",Pergamon, Oxford, 1962; Prog. Inorg. Chem., 1970, 12,101.
171) See for example A.B.P. Lever "Inorganic Electronic Spectroscopy, 2nd Edit. Elsevier, Amsterdam, 1984.
172) R.C. McDiarmid; J. Mol. Spectrosc., 1971, 39, 332.173) J.C. Eisenstein; J. Chem. Phys., 1962, 34, 310.174) E.G. Hope, W. Leavason, J.S. Ogden; J. Chem. Soc. Dalton Trans.,
1988,61.
175) R.C. McDiarmid; J. Chem. Phys., 1974, 61, 3333.176) R.D.W. Kemmitt, R.D.Peacock, I.L.Wilson; Chem. Comm, 1968, 772.
103

ABSTRACT
PREPARATION AND CHARACTERISATION OF THE PLATINUM GROUP METAL FLUORIDES
G. STANGER
An extensive reveiw of the platinum group metal fluorides has been carried out and in the light of this, new preparative routes have been developed and characterisation has been significantly improved.
The preparation of the platinum group metal fluorides in both static and dynamic systems is discussed in chapter two. The fluorinations of ruthenium, rhodium and platinum sponges in dynamic systems proved to be of greatest interest. In these studies large amounts of ruthenium hexafluoride and platinum hexafluoride were produced and traces of rhodium hexafluoride were noted, where as previously more forcing conditions had been employed in the preparation of these compounds. It is believed that rigorous drying of the flow line and hydrogenation of the metal in situ are responsible for the success of this new preparative route.
When ruthenium is fluorinated in the dynamic system ruthenium hexafluoride and tetrameric ruthenium pentafluoride are produced in large quantities, and smaller amounts of a red glassy material is also formed. There have been no previous reports of any red material forming -during_this_reaction. It is now believed that this material is a trimeric form of ruthenium pentafluoride.
The charaterisation of these fluorides was carried out using a large variety of techniques, the most useful being mass spectrometry and matrix isolated infrared spectroscopy. Mass spectrometry proved invaluble in the characterisation of the trimeric ruthenium pentafluoride, while matrix isolation enabled good quality infrared spectra of the reactive hexafluorides to be recorded. These techniques were also utilised to give the first insight into the behaviour of the tetrameric pentafluorides in the gas phase. Iridium pentafluoride has been shown to be monomeric at elevated temperatures, under similar conditions ruthenium and osmium pentafluorides decompose to the metal and fluorine. Platinum pentafluoride is known to be unstable at room temperature and thought to decompose to the hexafluoride and tetrafluoride. Using matrix isolation, direct evidence of this has been obtained.