dendritic calcium encodes striatal neuron output during up-states
TRANSCRIPT

Dendritic Calcium Encodes Striatal Neuron Outputduring Up-States
Jason N. D. Kerr and Dietmar Plenz
Unit of Neural Network Physiology, Laboratory of Systems Neuroscience, National Institute of Mental Health, Bethesda,Maryland 20892
Striatal spiny projection neurons control basal ganglia outputsvia action potential bursts conveyed to the globus pallidus andsubstantia nigra. Accordingly, burst activity in these neuronscontributes importantly to basal ganglia function and dysfunc-tion. These bursts are driven by multiple corticostriatal inputsthat depolarize spiny projection neurons from their resting po-tential of approximately �85 mV, which is the down-state, to asubthreshold up-state of �55 mV. To understand dendriticprocessing of bursts during up-states, changes in intracellularcalcium concentration ([Ca2�]i ) were measured in striatal spinyprojection neurons from cortex–striatum–substantia nigra orga-notypic cultures grown for 5–6 weeks using somatic whole-cellpatch recording and Fura-2. During up-states, [Ca2�]i tran-sients at soma and primary, secondary, and tertiary dendriteswere highly correlated with burst strength (i.e., the number ofspontaneous action potentials). During down-states, the actionpotentials evoked by somatic current pulses elicited [Ca2�]i
transients in higher-order dendrites that were also correlatedwith burst strength. Evoked bursts during up-states increaseddendritic [Ca2�]i transients supralinearly by �200% comparedwith the down-state. In the presence of tetrodotoxin, burst-likevoltage commands failed to elicit [Ca2�]i transients at higher-order dendrites. Thus, dendritic [Ca2�]i transients in spiny pro-jection neurons encode somatic bursts supralinearly duringup-states through active propagation of action potentials alongdendrites. We suggest that this conveys information about thecontribution of a spiny projection neuron to a basal gangliaoutput specifically back to the corticostriatal synapses involvedin generating these outputs.
Key words: action potential backpropagation; forward prop-agation; calcium; Fura-2; organotypic culture; spiny projectionneuron; dendritic processing; up-state; down-state; cortex; stri-atum; substantia nigra; electrophysiology; imaging
Spiny projection neurons in the striatum play a major role inlinking cortical activity to basal ganglia outputs. Their dendritesreceive the majority of basal ganglia inputs from the cortex andtheir axons directly innervate basal ganglia output neurons (forreview, see Gerfen and Wilson, 1996). Action potential bursts inspiny projection neurons correlate with important aspects of basalganglia function, such as movement initiation and regulation ofongoing movements (DeLong, 1973; Crutcher and DeLong, 1984;Hikosaka et al., 1989; Kimura et al., 1992; Jaeger et al., 1993).Furthermore, changes in spiny projection neuron firing correlatewith behavioral learning that relies on basal ganglia function(Tremblay et al., 1998; Jog et al., 1999). Similarly, dysfunction ofstriatal activity is directly linked to diseases of the basal ganglia(for review, see Albin et al., 1989). Given the importance of thisburst activity in basal ganglia function, the question arises as tohow information about bursts is processed within these neurons.
Somatic bursts are critical for modification of glutamatergicsynapses in the cortex (Magee and Johnston, 1997; Markram etal., 1997) and are likely to be important for modification ofcorticostriatal glutamatergic synapses as well, which have been
shown to be highly plastic (Lovinger et al., 1993; Calabresi et al.,1994; Akopian et al., 2000; Reynolds and Wickens, 2000; Kerr andWickens, 2001). For corticostriatal synapses to take advantage ofinformation about somatic bursts in spiny projection neurons, thisinformation must be present in the dendrites, which are the maintargets of corticostriatal inputs. One mechanism for conveyingthis information would involve changes in dendritic [Ca2�]i at-tributable to backpropagation of somatic action potentials intodendrites (for review, see Hausser et al., 2000).
Bursts in spiny projection neurons only occur during up-states,which are signaled by a transition in intracellular membranepotential from �85 mV to a subthreshold range at approximately�55 mV. Up-states occur in vivo (Wilson and Kawaguchi, 1996;Stern et al., 1997; Reynolds and Wickens, 2000) and in striatalcultures receiving cortical inputs (Plenz and Aertsen, 1996; Plenzand Kitai, 1998). They are blocked by decortication (Wilson et al.,1983) or glutamate antagonists (Plenz and Kitai, 1998) and there-fore indicate critical periods in dendritic processing that resultfrom multiple corticostriatal inputs.
The restriction that bursts only occur during up-states in spinyprojection neurons poses several potential problems for back-propagation of somatic action potentials. In cortical pyramidalneurons, backpropagation occurs at rest in vitro (Stuart and Sak-mann, 1994; Stuart et al., 1997b; Hausser et al., 2000) but can failin the presence of many synaptic inputs in vivo (Svoboda et al.,1999). Striatal neurons receive numerous inhibitory inputs fromfast-spiking interneurons during up-states (Plenz and Kitai, 1998;Koos and Tepper, 1999), which could potentially suppress back-propagation, as shown in the hippocampus (Kim et al., 1995;
Received Aug. 28, 2001; revised Nov. 26, 2001; accepted Nov. 30, 2001.We thank Veronica Karpiak for expert technical assistance with the preparation
of cultures; Drs. J. Beggs, U. Czubayko, J. Diamond, C. Gerfen, and S. Wise forcomments on a previous version of this manuscript; and Dr. R. Ravin for helpfuldiscussions early in the study.
Correspondence should be addressed to Dr. Dietmar Plenz, Unit of NeuralNetwork Physiology, Laboratory of Systems Neuroscience, National Institute ofMental Health, Building 36, Room 2D-26, 9000 Rockville Pike, Bethesda, MD20892. E-mail: [email protected] © 2002 Society for Neuroscience 0270-6474/02/221499-14$15.00/0
The Journal of Neuroscience, March 1, 2002, 22(5):1499–1512

Buzsaki et al., 1996; Tsubokawa and Ross, 1996). Finally, spinyprojection neurons express A-currents (Surmeier et al., 1989;Nisenbaum and Wilson, 1995) that are active during the up-stateand, if present at dendrites, might prevent backpropagation(Hoffman et al., 1997).
MATERIALS AND METHODSPreparation of organotypic cultures. For the preparation of cortex–striatum–substantia nigra organotypic cultures (Plenz and Kitai, 1998),coronal sections from rat brains (Sprague Dawley, Taconic Farms, MD)at postnatal days 0–2 were cut on a vibroslicer (VT 1000 S; LeicaMicrosystems Inc., Allendale, NJ). Slices containing striatum (500 �mthickness) and cortex (350 �m thickness) were used for dissection ofdorsal or dorsolateral cortical and striatal tissue. For the substantia nigra(including the pars compacta and pars reticulata), ventrolateral sectionsfrom 500-�m-thick mesencephalic slices were taken; medial tissue re-gions were avoided. The tissue was submerged in 25 �l of chicken plasma(Sigma, St. Louis, MO) on a coverslip and 25 �l of bovine thrombin wasadded (1000 National Institutes of Health units/0.75 ml; Sigma). Afterplasma coagulation, individual cultures were placed in tubes (Nunc Inc.,Naperville, IL) with 800 �l of culture medium consisting of 50% basalEagle’s medium, 25% HBSS and 25% horse serum, 0.5% glucose, and 0.5mM L-glutamine (all from Invitrogen, Grand Island, NY). Cultures wererotated in a “rollertube” incubator (0.6 rpm; Heraeus, Gottingen, Ger-many) at 35.5°C in normal atmosphere. After 3 and 27 d in vitro, 10 �l ofmitosis inhibitor was added for 24 hr (4.4 mM cytosine-5-b-arabino-furanosid, 4.4 mM uridine, and 4.4 mM 5-fluorodeoxyuridine; calculated toa final concentration; all from Sigma). Medium was changed every 3–5 d.
Whole-cell patch recordings. For electrophysiological recording, thecultures were submerged in artificial CSF (ACSF) containing (in mM):126 NaCl, 0.3 NaH2PO4, 2.5 KCl, 0.3 KH2PO4, 1.6 CaCl2, 1.0 MgCl2, 0.4MgSO4, 26.2 NaHCO3, and 11 D-glucose saturated with 95% O2 and 5%CO2. The osmolarity of the ACSF was at 300 � 5 mOsm. Bath temper-ature was continuously monitored and maintained at 35.5 � 0.5°C (TC-20; NPI, Tamm, Germany). The recording chamber was mounted on aninverted microscope (IX-70; Olympus Optical, Tokyo, Japan) that hadbeen placed on a custom-made sliding table allowing for a change in fieldof view during the experiment.
Patch pipettes for somatic whole-cell recordings were pulled (1.5 mmouter diameter, 0.75 inner diameter; P-97; Sutter Instruments, Novato,CA) and fire polished (MF-830; Narishige, Tokyo, Japan). The intracel-lular patch solution contained (in mM): 132 K-gluconate, 6 KCl, 8 NaCl,10 HEPES, 2 Mg-ATP, 0.39 Na-GTP. The solution was supplementedwith 100 �M Fura-2 (pentapotassium salt; Molecular Probes, Eugene, OR)and 0.2% Neurobiotin (Vector Laboratories, Burlingame, CA). The pHwas adjusted to 7.2–7.4 with KOH and the final osmolarity of the pipettesolution was at 290 � 10 mOsm. The open resistance of the pipettes was4–6 M�. To reduce degradation of ATP, GTP, and Fura-2, the intra-cellular working solution was kept on ice in a darkened room throughoutthe experiment before backfilling of electrodes.
Intracellular signals were recorded using an Axopatch 1-D amplifierwith a CV-4 1� head stage (Axon Instruments, Foster City, CA). Afterthe formation of a Giga-seal, electrode capacitance was compensated forand serial resistance compensation was switched off. Data were recordedin current clamp (I-clamp), if not stated otherwise, preamplified (Cyber-amp380; Axon Instruments), digitized at 10 kHz for voltage and 5 kHzfor current, and stored in continuous-stream mode using the CED1401plus (Cambridge Electronic Design, Cambridge, UK). Electrophys-iological data analysis was performed in Spike2 (Cambridge ElectronicDesign), Origin version 6.0 (Microcal, Southampton, MA), and Excel(Microsoft, Seattle, WA). All membrane potential values were correctedfor K-gluconate liquid junction potential (Neher, 1992).
Striatal spiny projection neurons were identified by a spherical somasize of 10–12 �m diameter using Hoffmann modulation contrast optics(40�). A Fura-2 fluorescent image, taken 5–10 min after break-in, wasused to further identify spiny projection neurons based on the presenceof dendritic spines. Neurons were accepted for recordings if (1) theresting membrane potential was more negative than �75 mV, (2) su-prathreshold current pulse injection resulted in a ramp-like depolariza-tion that delayed action potential discharge by several hundreds ofmilliseconds, and (3) neurons could fire action potentials repetitively upto 50 Hz.
For tetrodotoxin (TTX) experiments in voltage clamp (V-clamp), acommand voltage protocol was designed that mimicked a somatic
depolarization-induced action potential burst from a holding potential of�80 mV stepped to �50 mV for 500 msec and five action potentialsspaced at 100 msec (temporal resolution, 0.01 msec). The action potentialcommand voltage trajectory was obtained from averages of 100 actionpotentials taken from 10 spiny projection neurons.
Fluorescence measurement. Neurons were loaded with the calcium-sensitive indicator dye Fura-2 (100 �M) via the patch pipette. After breakin, the filling was monitored with a 60� water immersion objective (1.2numerical aperture; working distance, 260 �m; Olympus Optical) andthe neuron was scanned for dendrites within the horizontal plane ofinterest. Usually one to two primary dendrites and corresponding higher-order dendrites were analyzed simultaneously. Fluorescence measure-ments were started 10–15 min after break in (Helmchen et al., 1996).
Dye excitation was achieved with a polychromatic illumination systemcoupled to the microscope via a quartz light guide and wavelengthselection via diffraction grating (12 nm bandwidth; T.I.L.L. Photonics,Munich, Germany). For all experiments, a beam splitter at 400 nm and awide long-pass filter at 510 � 20 nm were used (Omega, Brattleboro,VT). Fluorescence measurements were made with a thermoelectricallycooled CCD camera with a 0.5 inch interline transfer chip and on-chipbinning of 4 � 4 (Imago, 640 � 480 pixels; T.I.L.L. Photonics). Imageswere collected using commercially available software (Tillvision version3.3.1; T.I.L.L. Photonics) and stored on computer hard-drive.
Definition of reg ions of interest. An overview picture (1000 msec expo-sure; 2 � 2 binning) was taken at completion of the experiment. Indi-vidual regions of interest (ROIs) were grouped into primary, secondary,and tertiary dendrites, with each area defined by dendritic branchingpoints. For tertiary dendrites, ROIs were only taken for segments thatwere clearly in the plane of focus as well as within the frame of view(average segment length, 10–20 �m). Background was defined as thearea adjacent to each ROI that was located outside the neuron ofinterest. Calculations for ROIs and associated changes in [Ca 2�]i weremeasured with dual-wavelength imaging (340/380 nm) and expressed asa ratio or measured with single-wavelength imaging (380 nm) and ex-pressed as �F/F.
�F/F and ratio calculations. �F/F values for ROIs were calculated foreach frame as (Fi � F0)/F0 and expressed as percentage of change, whereF0 indicates the baseline fluorescence obtained from the average of10–20 frames during the down-state and Fi indicates individual fluores-cence measures at frame i. Background correction was calculated foreach image frame and subtracted from both Fi and F0. For ratio imaging,pixel intensities from images taken at 340 nm were divided by pixelintensities from subsequent images taken at 380 nm after backgroundsubtraction for each ROI. �F/Fmax was taken at the time point at which�F/F values reached maximum and was usually within the same framebetween ROIs.
[Ca2�]i during down-state. [Ca 2�]i concentrations were calculated ac-cording to the following equation: [Ca 2�]i � Keff � [(R � Rmin)/(Rmax �R)], where Rmin and Rmax are ratio values obtained during the calibra-tion under 0 [Ca 2�] and saturating 39.8 �M [Ca 2�] (theoretical satu-ration for Fura-2), respectively, and R indicates ratio values measuredduring the recording. All values were corrected for background fluo-rescence. Calibration was performed at the same temperature asexperiments using a Fura-2 calcium-imaging calibration kit rangingfrom 0 to 10 mM Ca-EGTA and 50 �M Fura-2 (Molecular Probes). AKd estimated as 185.4 nM for 36°C was used for the calculation of Keff(Groden et al., 1991).
On-line detection and measurement of spontaneous up-states. Initialattempts to identify up-states by fitting membrane potential distributionswith Gaussian functions were abandoned because membrane potentialsin successive sample points at 2 msec were not independent (membranetime constant) and membrane potentials were rectified at depolarized(spike threshold) and hyperpolarized (anomalous rectification) levels.Therefore, routines written in assembly language for speed were de-signed to scan the intracellular membrane potential on-line to detectup-state transitions as well as down-state periods. The detection wasbased on on-line statistical membrane potential analysis, where a thresh-old was calculated at 5� SD during periods of low spontaneous activity.Positive threshold crossing by the membrane potential indicated a tran-sition to the up-state, whereas negative threshold crossing indicated areturn to a down-state. Threshold crossings were discarded if the timefrom positive threshold crossing to negative crossing was �50 msec. Onaverage, cells spent 90% of their time below threshold.
The amplitude of spontaneous membrane potential fluctuations in thedown-state was analyzed off-line. Using a threshold at 2 mV above
1500 J. Neurosci., March 1, 2002, 22(5):1499–1512 Kerr and Plenz • Calcium Transients in Striatal Neurons

average resting value with successive positive peak detection, averageamplitudes were calculated for peak-aligned spontaneous events.
Down-state imaging (20–40 frames; 20–40 msec duration each; 380and 340 nm, respectively) was performed when the cell was in a down-state for at least 1.5 sec. This ensured that [Ca 2�]i transients from theprevious up-state did not bias down-state measurements. After down-state fluorescence measurements, threshold crossing by a spontaneousup-state subsequently triggered up-state measurements. On average,120–300 consecutive images (20–40 msec duration each; 380 nm or380/340 nm) were collected to measure a down-state and subsequentup-state. To exclude possible additive effects of [Ca 2�]i transients, up-states that occurred closer than 1.5 sec to a preceding negative thresholdcrossing were not included in the analysis.
Measurement of fluorescence change during current injection. Responsesduring the down-state were measured at least 1.5 sec after return from anup-state. One to 10 pulses of depolarizing current injection (500 msec)were given at increasing steps (0.01 nA minimum; 0.01–0.02 nA stepsize), resulting in subthreshold or both subthreshold and suprathresholdresponses. Either a sequence of images was taken for a single currentpulse (10 images of 380 and 340 nm for F0 and 50 images of 380 and 340nm for Fi) or a continuous sequence of images was taken for multiplecurrent pulses (10 images of 380 and 340 nm for F0 and 150 images of 380and 340 nm for Fi). Because of the strong effect of the A-current afterdepolarization in spiny projection neurons, �F/Fmax values for subthresh-old membrane depolarizations were usually taken from the last frameduring the current pulse and compared with average �F/Fmax valuestaken before current injection.
Dye concentration, bleaching, resting base line, drug application. Initialexperiments using different concentrations of Fura-2 revealed thatFura-2 concentrations of �100 �M severely interfered with the internalcalcium dynamics (Neher and Augustine, 1992) and were detrimentalduring repetitive action potential firing. A concentration of 100 �Mallowed recording for at least 25 min, did not significantly change actionpotential width, and allowed single-sweep optical recordings from sec-ondary and tertiary dendrites. Frames taken at the beginning and end ofthe imaging period near the isofluoremetric point of Fura-2 (358 nm)were used to monitor dye bleaching. Data were rejected if dye bleachingexceeded the average baseline fluctuations during the imaging period.TTX (1 �m; Sigma) was dissolved to final concentration in gassedrecording solution and bath applied.
Data are expressed as mean � SEM. For statistical data analysis,ANOVA with Scheffe’s post hoc test was used unless stated otherwise.Correlation and partial correlation was estimated by linear regressionanalysis (StatView; SAS Institute, Inc., Cary, NC).
RESULTSMembrane properties and spontaneous up-states ofcultured spiny projection neurons recorded inwhole-cell patch configurationSpiny projection neurons (n � 55) showed a polarized restingmembrane potential of �82.5 � 0.9 mV and neurons displayedinward and outward rectification as well as delayed action poten-tial firing in response to somatic current injections (Fig. 1A–C).Their spontaneous activity in cortex–striatum–substantia nigracultures was characterized by irregular up-states with delayedbursts of action potentials separated by down-states, as describedpreviously (Fig. 1D) (Plenz and Kitai, 1998). In the present study,up-states lasted on average for 1.28 � 0.10 sec and occurredirregularly at an average interval of 11.7 � 1.4 sec (n � 10neurons; 10 up-states per neuron). During up-states, spiny pro-jection neurons were depolarized by 38.8 � 1.0 mV to reachthreshold (n � 40). In the down-state, the spontaneous membranepotential trajectory was characterized by numerous depolariza-tions with an average peak value of 4.3 � 1.3 mV (Figs. 1A, 2A)
Figure 1. Membrane properties, spontaneous activity, and morphologicalcharacteristics of spiny projection neurons recorded in whole-cell patchconfiguration. A, Membrane potential responses to somatic current injec-tions during the down-state are characterized by anomalous rectification athyperpolarized potentials (arrow), early outward rectification with depo-larization (closed arrowhead), ramp-like trajectory toward threshold (openarrowhead), and delayed action potential firing (maximal depolarizationpulse repeated 3 times, 15 min after break in). Note fluctuations indicativeof irregular spontaneous synaptic inputs. B, Nonlinear steady-state I–Vrelationship (from the time indicated by the bar in A). C, Characteristicdelay in burst firing by somatic current injections (open arrowhead). D,Spontaneous, suprathreshold up-state. Note the fast transition to the up-state, delay in burst firing onset during the up-state (open arrowhead), andrelatively slow return to the down-state. E, Bimodal membrane potentialdistribution that reflects the relatively fast transition between down- andup-states. Values were taken from the trace in D at 2 msec time resolution.F, Fluorescence image 35 min after break in at 380 nm (100 �M Fura-2;
4
1 sec exposure; composite from 9 individual images). Circle, Soma; square,primary dendrites; triangle, secondary dendrites; diamond, tertiary den-drites. Note spines on dendrites (inset, asterisks).
Kerr and Plenz • Calcium Transients in Striatal Neurons J. Neurosci., March 1, 2002, 22(5):1499–1512 1501

(1 sec per neuron; n � 10 neurons). Peak depolarizations duringdown-states were significantly smaller compared with depolariza-tions reached during up-states ( p 0.0001). Transitions betweenup- and down-states were relatively fast, resulting in bimodalmembrane potential distributions (Fig. 1E). Dye-loading withFura-2 (100 �M) during the recording also allowed for identifica-tion of spiny projection neurons based on their spherical somaand spiny higher-order dendrites (Fig. 1F). Action potentialthreshold, amplitude, width, slopes, and afterhyperpolarizationdid not significantly differ for both evoked and spontaneousconditions (Table 1).
Up-states correlate with large [Ca2�]i transients insoma and dendritesThe time course and spatial distribution of [Ca2�]i transientsduring spontaneous up-states in spiny projection neurons wasaddressed by simultaneously measuring somatic and dendritic[Ca 2�]i transients as well as somatic membrane potential duringspontaneous activity (Fig. 2A–C).
[Ca2�]i transients followed the overall time course of thesomatic membrane potential (Fig. 2A) when analyzed using ei-ther dual-wavelength comparison (ratiometric, 340/380 nm) orsingle wavelength (380 nm, relative percentage change as �F/F).Thus, for reasons of higher time resolution, most experimentswere performed using single-wavelength �F/F.
At the single-neuron level, the spatial distribution of �F/Ftransients during individual up-states showed two characteristics.First, dendritic �F/F transients reached higher �F/Fmax valueswhen compared with soma ( p 0.001; n � 21), and second,dendritic �F/Fmax values tended to increase from primary totertiary dendrites, regardless of the absolute �F/Fmax reachedwithin each compartment (Fig. 2C,D). These relations in �F/Fmax
for soma and dendrites during up-states were also present at thepopulation level (see Fig. 4A). Across neurons, �F/Fmax at thesoma was significantly lower than in dendrites ( p 0.001) and�F/Fmax values increased from primary to tertiary dendrites (seeFig. 4A) (two to three up-states per neuron; n � 21 neurons).During down-states, both �F/F and ratio values were stable insoma as well as in dendrites; [Ca2�]i was estimated to rangebetween 30 and 60 nM in soma and primary dendrites (Fig. 2B)(n � 4 neurons).
4
a period in the down-state indicated by the lef tmost segments (shaded; 20frames). Frames were collected at 340 and 380 nm wavelength (�42 mseceach), allowing background corrected calculation of both ratio (�120msec; dotted lines) and �F/F values (380 nm; �120 msec; solid lines). Notethe similar time course of estimated [Ca2�]i transients with both methods.Measurements were arbitrarily scaled to first soma peak values, respec-tively, to facilitate comparison. Up-states that occurred within 1.5 sec ofprevious up-states (*) and depolarizations above threshold for 50 msec(**) were discarded from analysis. Numbers of action potentials areindicated for each up-state. Circle, Soma; square, primary dendrites;triangle, secondary dendrites; diamond, tertiary dendrites. B, Changes insomatic and dendritic �F/F are small during the down-state when com-pared with up-state periods (340 and 380 nm; �62 msec each). C, Rela-tionship between �F/Fmax values during up-states at higher temporalresolution (taken from A, bar). D, Summary of �F/Fmax values for the firstfour up-states shown in A. E, Averaged normalized decay from �F/Fmaxfor each region (3 neurons; 3–4 up-states each). Note the slower timecourse at soma compared with dendrites. F, Dendritic �F/Fmax values andthe number of somatic action potentials are linearly correlated duringspontaneous up-states (same neuron as in A). Dashed lines indicateregression functions for each compartment.
Figure 2. Spontaneous up-states in spiny projection neurons correlatewith large [Ca 2�]i transients in soma and dendrites. A, Simultaneous,single-sweep measurement of [Ca 2�]i transients in soma and dendrites(upper traces) and corresponding spontaneous intracellular membranepotential activity at the soma (bottom trace). F0 values were taken during
1502 J. Neurosci., March 1, 2002, 22(5):1499–1512 Kerr and Plenz • Calcium Transients in Striatal Neurons

The time course in �F/F during the return to the down-statewas relatively uniform and was analyzed by fitting a single expo-nential function to the decay from normalized �F/Fmax values(Fig. 2E) (r � 0.92–0.99; three to four up-states per neuron; n �3 neurons). Dendritic decay in �F/F revealed a single time con-stant of 790 � 10 msec that was not different between dendriticcompartments ( p � 0.518–0.953). In contrast, the somatic decayof [Ca2�]i transients had a time constant of 1100 � 40 msec,which was significantly slower when compared with dendrites( p 0.0001).
In neurons that showed a wide range in the number of spon-taneous action potentials during up-states, a surprisingly highcorrelation, particularly in dendrites, was revealed when plottingspontaneous action potential number against �F/Fmax (Fig. 2F)(r � 0.97 � 0.01; two to eight action potentials; n � 3 neurons).This correlation was also present at the population level (Fig. 3C)(r � 0.79–0.83; n � 21 neurons; three to four up-states perneuron). Average slope values in �F/Fmax ranged from 24 � 3%to 36 � 4% per 10 action potentials and were similar in dendrites
but significantly lower at the soma (Fig. 3C) ( p 0.001; n � 21neurons).
To summarize, up-states in spiny projection neurons werecorrelated with large [Ca2�]i transients that decayed within 1 secafter reaching maximum. The corresponding �F/Fmax valueswere highly correlated with the total number of spontaneousaction potentials during the up-state.
Dendritic [Ca2�]i continuously encodes subthresholdand suprathreshold activity during up-statesTo discriminate between effects of synaptic activity and somaticaction potential firing on [Ca 2�]i transients, subthreshold up-states were compared with suprathreshold up-states.
In the absence of action potentials, prominent [Ca2�]i tran-sients were visible during up-states in both soma and dendrites(Fig. 3A) and �F/Fmax modestly correlated with membrane po-tential peak values for all regions (Fig. 3C) (r � 0.49–0.69; n � 10neurons; one to two up-states per neuron). Within the up-state
Table 1. Spontaneous action potentials during up-states are similar to action potentials elicited by somatic current injection (I-clamp, whole-cellpatch configuration including 100 �M Fura-2; n � 40 neurons)
Time(sec)
Threshold(mV)
Max(mV)
Amplitude(mV)
Width(msec)
�dV/dt(V/sec)
�dV/dt(V/sec)
Sloperatio
AHPmax(mV)
Up-state 504 � 98 �45 � 1.5 31 � 2.7 75 � 2.1 1.28 � 0.1 134 � 8.93 56 � 4 2.4 � 0.1 9 � 1Current injection 524 � 123 �43 � 1.4 32 � 2.7 76 � 2.1 1.20 � 0.1 137 � 9 53 � 4 2.6 � 0.1 15 � 3
Time, Time of measurement after break in. Action potential parameters and significance: threshold, p � 0.336; absolute maximum (max), p � 0.795; amplitude, p � 0.738;half width (width), p � 0.575; positive/negative maximal slope (�dV/dt), p � 0.814, 0.599; ratio between positive and negative slope (slope ratio), p � 0.165;afterhyperpolarization (AHPmax), p � 0.067. Values are mean � SEM.
Figure 3. Dynamic range of �F/Fmax values reveals linear correlation within and continuity between subthreshold and suprathreshold up-states. Circle,Soma; square, primary dendrites; triangle, secondary dendrites; diamond, tertiary dendrites. A, Time course of �F/F during subthreshold up-states. Notethe increase in �F/Fmax from soma to higher-order dendrites. B, �F/Fmax values in suprathreshold up-states are correlated with the number ofspontaneous somatic action potentials. Note the similar overall time course of up-states but different number of action potentials (4 and 2, respectively).C, �F/Fmax values continuously encode the transition from subthreshold to suprathreshold up-states. Left, �F/Fmax values are linearly correlated withpeak membrane potential depolarization during subthreshold up-states (open symbols). Right, �F/Fmax values are linearly correlated with the number ofspontaneous action potentials during suprathreshold up-states (closed symbols). Center, Broken vertical lines indicate a population action potentialthreshold of �44.7 mV aligned to 0 action potentials. Linear regression is indicated by dashed lines.
Kerr and Plenz • Calcium Transients in Striatal Neurons J. Neurosci., March 1, 2002, 22(5):1499–1512 1503

membrane potential range of �60 to �45 mV, �F/Fmax changedbetween 0 and 20%, resulting in an average slope of 4 � 2% to10 � 4% �F/Fmax per 10 mV that was not significantly differentbetween compartments (Fig. 3C) ( p 0.52; n � 10 neurons).Similar to suprathreshold up-states, average �F/Fmax values dur-ing subthreshold up-states increased toward higher-order den-drites (Fig. 4A).
However, average �F/Fmax values during subthreshold up-states were significantly lower compared with suprathreshold up-states (Fig. 4A, p 0.0001), which raised the question of whether[Ca2�]i transients show a discontinuity at the transition fromsubthreshold to suprathreshold up-states. Therefore, we pre-dicted �F/Fmax values at this transition based on regression func-tions. Linear regressions based on subthreshold up-state mem-brane potential values or suprathreshold up-states predictedincreasing �F/Fmax values from 10 to 20% (soma to higher-orderdendrites) at �44.7 � 1.5 mV (population action potential thresh-old) or when extrapolated to 0 action potentials, respectively (Fig.4B). Both predictions highly overlapped for each compartment( p � 0.3–0.84).
Thus, [Ca 2�]i transients were two to three times smallerduring subthreshold up-states compared with suprathresholdup-states. Nevertheless, [Ca 2�]i transients continuously en-coded excitation in spiny projection neurons despite a qualita-tive discontinuity when moving from subthreshold to suprath-reshold up-states.
Action potentials elicit [Ca2�]i transients in higher-order dendritesContinuous encoding of [Ca2�]i transients during subthresholdand suprathreshold up-states could simply reflect the dependencyof [Ca2�]i on synaptic inputs (Regehr and Tank, 1994). In thisview, a rise in synaptic inputs will increase dendritic [Ca2�]i aswell as trigger more action potentials, resulting in a correlationbetween action potential number and [Ca2�]i. Alternatively, ac-tion potentials could directly contribute to dendritic [Ca2�]i bypropagating along dendrites (Hausser et al., 2000). Dendritic[Ca2�]i transients were therefore measured during repetitivebursts of action potentials evoked by somatic current injectionsduring the down-state (Fig. 5).
Action potentials from suprathreshold current injection evokedlarge [Ca2�]i transients at soma and primary, secondary, andtertiary dendrites (Fig. 5A,B). At a fixed burst strength (i.e.,
number of action potentials per 500 msec), these [Ca2�]i tran-sients were reliably elicited and did not change over the period ofmultiple bursts, resulting in stereotypical transients throughoutthe neuron (Fig. 5B). The �F/F time course during each burstrevealed a fast onset that was correlated with the first actionpotential (Fig. 5C). At burst termination, the decay from �F/Fmax
was fitted by a single exponential decay (r � 0.97–0.99; soma totertiary dendrites; n � 4 neurons). On average, dendritic [Ca2�]i
transients decayed to 37% within 504 � 12 msec after bursttermination, which was faster compared with the somatic [Ca2�]i
decay ( p 0.002) and dendritic [Ca2�]i decay during up-states(Fig. 5D) ( p 0.0001).
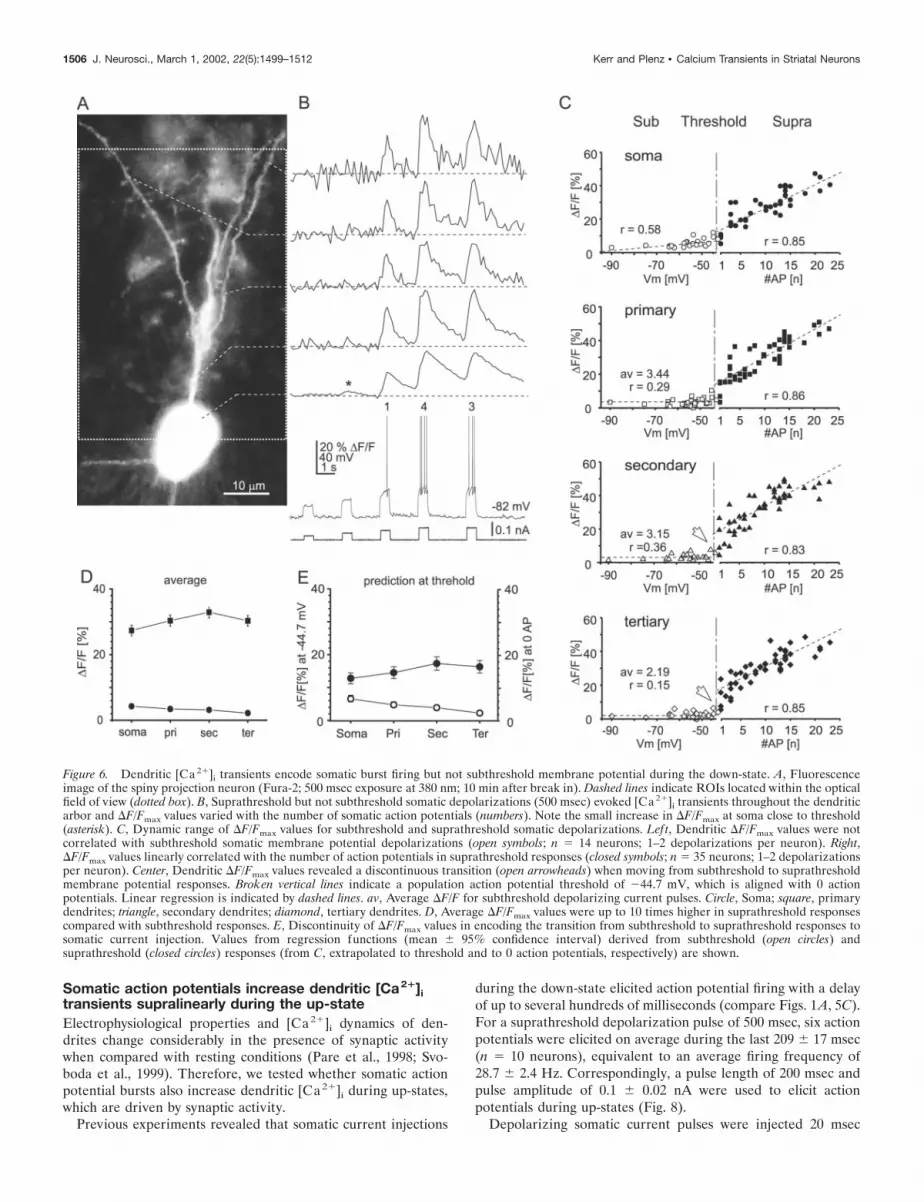
To test whether evoked [Ca2�]i transients encode somaticsubthreshold membrane potential and burst strength, currentpulses of 500 msec duration at varying amplitudes were appliedduring down-states (Fig. 6) (n � 12 neurons). Subthreshold de-polarizations evoked small but significant [Ca2�]i transients atsoma (4.82 � 0.60% �F/Fmax; p 0.0001) and primary dendrites(3.58 � 0.46% �F/Fmax; p 0.01) (Fig. 6B–D). However, they didnot elicit [Ca2�]i transients at higher-order dendrites ( p � 0.100and p � 0.255, respectively). Thus, �F/Fmax values during sub-threshold somatic depolarizations were significantly lower in alldendritic compartments when compared with �F/Fmax valuesfrom subthreshold up-states ( p 0.0001), despite covering asimilar voltage range for both conditions (current injection,�50 � 1 mV; range, �58 to �55 mV; up-state, �55 � 2 mV;range, �60 to �43 mV). No difference was found for bothconditions in somatic �F/Fmax values ( p � 0.61).
In contrast, suprathreshold current injections resulted in�F/Fmax values throughout the dendritic arbor that were highlycorrelated with the number of action potentials across all neuronsexamined (Fig. 6B,C) (r � 0.83–0.86; y � a � b � x; n � 26neurons). This correlation was not improved when using a simplesaturation function [r � 0.81–0.84; y � a � (1 � e�bx)]. Withinthe range of 1–20 action potentials per 500 msec duration,�F/Fmax increased by 14 � 1% to 16 � 2% �F/Fmax per 10action potentials for all compartments. This slope was signifi-cantly lower when compared with suprathreshold up-states( p 0.005, soma and dendrites). Average �F/Fmax values duringsuprathreshold current injections were relatively high in soma anddendrites (27–33%) and were not significantly different betweendendrites ( p � 0.22–0.66), but were significantly higher comparedwith �F/Fmax during subthreshold depolarizations ( p 0.001)(Fig. 6D).
To understand the dynamic range of [Ca2�]i transients at thetransition from subthreshold to suprathreshold somatic currentinjection, �F/Fmax values at this transition were predicted basedon regression functions. Based on membrane potentials duringsubthreshold down-states, decreasing �F/Fmax values from 7 to 3%(soma to higher-order dendrites) were predicted at a membranepotential threshold of �44.7 � 1.5 mV. In contrast, �F/Fmax valuesof between 12 and 16% (soma to higher-order dendrites) werepredicted when based on action potentials during suprathresholdcurrent injections and extrapolated to 0 action potentials (Fig. 6E).Both predictions were significantly different for each compartment,respectively ( p 0.001) (Fig. 6E).
To summarize, subthreshold somatic depolarization by cur-rent injection only elicited [Ca 2�]i transients at the soma,which is markedly different compared with subthreshold up-states. However, somatic action potentials temporarily raisedintracellular [Ca 2�]i throughout the dendritic arbor of spinyprojection neurons. These [Ca 2�]i transients were highly cor-
Figure 4. Summary of the dynamic range in �F/Fmax during up-states. A,Average �F/Fmax values were two to three times higher during supra-threshold up-states compared with subthreshold up-states. B, [Ca 2�]itransients continuously encoded the transition from subthreshold to su-prathreshold up-states in soma and dendrites. Values are based on re-gression functions (mean � 95% confidence interval) derived from sub-threshold (open circles) and suprathreshold (closed circles) up-statesextrapolated to membrane potential threshold and 0 action potentials,respectively.
1504 J. Neurosci., March 1, 2002, 22(5):1499–1512 Kerr and Plenz • Calcium Transients in Striatal Neurons

related with somatic burst strength (i.e., number of actionpotentials per 500 msec), which is similar to suprathresholdup-states.
Somatic action potentials elicit dendritic [Ca2�]itransients by active propagation along dendritesduring the down-stateSomatic action potentials have been shown to actively back-propagate and elicit [Ca 2�]i transients in higher-order den-drites (Stuart and Sakmann, 1994; Stuart et al., 1997b; Hausseret al., 2000). However, for neurons with relatively short den-drites, such as striatal spiny projection neurons, passive prop-agation might be sufficient, assuming standard cable properties(Turner, 1984). Alternatively, spiny projection neurons mightbe highly shunted at soma and dendrites, which would requirethe presence of dendritic sodium channels for action potentialsto propagate and elicit [Ca 2�]i transients throughout the den-dritic tree.
Dendritic [Ca2�]i transients were first measured in response tosomatic suprathreshold current injections (Fig. 7) (n � 3). Next,the sodium channel blocker TTX (1 �M) was bath applied andrecording was switched to V-clamp. Voltage commands wereapplied that forced the somatic membrane potential through asimilar trajectory to bursts recorded in I-clamp with suprathresh-old depolarizing current (Fig. 7E,F). In the presence of TTX,spontaneous activity was abolished and somatic current pulsesthat were suprathreshold under control conditions increased[Ca2�]i in the soma but not in higher-order dendrites (Fig. 7C).After switching to V-clamp, burst-like voltage commands in-creased [Ca2�]i at the soma but failed to elicit [Ca2�]i transientsat distal dendrites (Fig. 7D,G). No significant difference wasfound in somatic [Ca2�]i between both conditions (Fig. 7G) ( p �0.883). Dendritic [Ca2�]i responses recovered partially duringwashout of TTX (Fig. 7I) (n � 3).
Additional quantification of the spatial decay in �F/Fmax
revealed that in the presence of TTX, �F/Fmax values decayedto 37% within 17.5 � 0.5 �m distance from soma (Fig. 7H )(n � 3 neurons). No significant difference was found for thedecay obtained in the presence of TTX under I-clamp andV-clamp conditions, respectively ( p � 0.52; data not shown).In contrast, the spatial decay of �F/Fmax was minimal, and insome cases �F/Fmax was even increased under control condi-tions (Fig. 7H ).
Thus, in the presence of TTX, burst-like voltage commandsonly elicit [Ca2�]i transients near the soma, but not at higher-order dendrites, suggesting that dendrites in spiny projectionneurons are active. This would allow somatic action potentials toactively backpropagate into the dendrite.
4
by somatic current injection reliably induced [Ca 2�]i transients through-out the neuron. a–e are same as in A. A simultaneous, single-sweepmeasurement of [Ca 2�]i transients in soma and dendrites (upper traces,380 nm; �42 msec illumination; �120 msec temporal resolution) andcorresponding somatic burst firing (bottom traces) are shown. C, Onset of[Ca 2�]i transients correlated with the first action potential (from B, lef tbar). Symbols indicate center times for each frame acquisition. Circle,Soma; diamond, tertiary dendrites. D, Averaged normalized decay from�F/Fmax for each region (3 neurons; 3–4 up-states each). Note the slowertime course at soma compared with dendrites and delayed action potentialfiring (arrow).
Figure 5. Action potentials elicit stereotypical [Ca 2�]i transients inhigher-order dendrites during the down-state. A, Composite fluorescenceimage of the spiny projection neuron (Fura-2; 1 sec exposure at 380 nm;40 min after break in). Dashed lines indicate centers of ROIs locatedwithin the optical field of view (dotted box). B, Repetitive burst discharge
Kerr and Plenz • Calcium Transients in Striatal Neurons J. Neurosci., March 1, 2002, 22(5):1499–1512 1505
Somatic action potentials increase dendritic [Ca2�]itransients supralinearly during the up-stateElectrophysiological properties and [Ca2�]i dynamics of den-drites change considerably in the presence of synaptic activitywhen compared with resting conditions (Pare et al., 1998; Svo-boda et al., 1999). Therefore, we tested whether somatic actionpotential bursts also increase dendritic [Ca2�]i during up-states,which are driven by synaptic activity.
Previous experiments revealed that somatic current injections
during the down-state elicited action potential firing with a delayof up to several hundreds of milliseconds (compare Figs. 1A, 5C).For a suprathreshold depolarization pulse of 500 msec, six actionpotentials were elicited on average during the last 209 � 17 msec(n � 10 neurons), equivalent to an average firing frequency of28.7 � 2.4 Hz. Correspondingly, a pulse length of 200 msec andpulse amplitude of 0.1 � 0.02 nA were used to elicit actionpotentials during up-states (Fig. 8).
Depolarizing somatic current pulses were injected 20 msec
Figure 6. Dendritic [Ca 2�]i transients encode somatic burst firing but not subthreshold membrane potential during the down-state. A, Fluorescenceimage of the spiny projection neuron (Fura-2; 500 msec exposure at 380 nm; 10 min after break in). Dashed lines indicate ROIs located within the opticalfield of view (dotted box). B, Suprathreshold but not subthreshold somatic depolarizations (500 msec) evoked [Ca 2�]i transients throughout the dendriticarbor and �F/Fmax values varied with the number of somatic action potentials (numbers). Note the small increase in �F/Fmax at soma close to threshold(asterisk). C, Dynamic range of �F/Fmax values for subthreshold and suprathreshold somatic depolarizations. Left, Dendritic �F/Fmax values were notcorrelated with subthreshold somatic membrane potential depolarizations (open symbols; n � 14 neurons; 1–2 depolarizations per neuron). Right,�F/Fmax values linearly correlated with the number of action potentials in suprathreshold responses (closed symbols; n � 35 neurons; 1–2 depolarizationsper neuron). Center, Dendritic �F/Fmax values revealed a discontinuous transition (open arrowheads) when moving from subthreshold to suprathresholdmembrane potential responses. Broken vertical lines indicate a population action potential threshold of �44.7 mV, which is aligned with 0 actionpotentials. Linear regression is indicated by dashed lines. av, Average �F/F for subthreshold depolarizing current pulses. Circle, Soma; square, primarydendrites; triangle, secondary dendrites; diamond, tertiary dendrites. D, Average �F/Fmax values were up to 10 times higher in suprathreshold responsescompared with subthreshold responses. E, Discontinuity of �F/Fmax values in encoding the transition from subthreshold to suprathreshold responses tosomatic current injection. Values from regression functions (mean � 95% confidence interval) derived from subthreshold (open circles) andsuprathreshold (closed circles) responses (from C, extrapolated to threshold and to 0 action potentials, respectively) are shown.
1506 J. Neurosci., March 1, 2002, 22(5):1499–1512 Kerr and Plenz • Calcium Transients in Striatal Neurons

Figure 7. Action potential-evoked dendritic [Ca 2�]i transients are blocked by TTX. A, Fluorescence image of the spiny projection neuron (Fura-2; 1sec exposure at 380 nm; 50 min after break in). Dashed lines indicate ROIs located within the optical field of view (dotted box). B, Simultaneous,single-sweep measurement of [Ca 2�]i transients in soma and dendrites (upper traces; 380 nm; �42 msec each frame; �60 msec resolution) andcorresponding spontaneous intracellular neuronal activity at the soma (bottom trace). For the control (I-clamp), Spontaneous up-states and evokedsomatic action potentials were correlated with [Ca 2�]i transients throughout the neuron. C, TTX (I-clamp): In the presence of TTX (1 �M), the samesomatic current injection elicited only weak [Ca 2�]i transients at soma and primary dendrites (asterisks). D, For TTX (V-clamp), a V-clamp commandthat mimicked an action potential burst elicited strong [Ca 2�]i transients at the soma, but failed to elicit [Ca 2�]i transients in higher-order dendrites. E,Enlarged time view of the V-clamp command applied in D. F, Overlay of the average evoked action potential obtained in I-clamp (dotted line) and thesimulated action potential (solid line) used in the V-clamp command in D. G, In the presence of TTX, �F/Fmax values were reduced in higher-orderdendrites compared with controls but not in the soma. Dark bars, Control I-clamp with three neurons (3 trials per neuron, average of 5 action potentials).Light bars, TTX V-clamp, same ROIs and neurons as in the control. H, In the presence of TTX, action potential-evoked �F/Fmax values decayed to 37%within 17 �m from soma (r � 0.96; single exponential fit). Closed circles, Control I-clamp with three neurons (5 trials per neuron, same ROIs). Opencircles, TTX V-clamp, same neurons as in the control. I, Action potential-evoked dendritic [Ca 2�]i responses before (long dashed line), during (solid line),and after partial washout of TTX (10 min, dotted line). Each line is an average of three responses from the same neuron.
Kerr and Plenz • Calcium Transients in Striatal Neurons J. Neurosci., March 1, 2002, 22(5):1499–1512 1507

after up-state onset in six neurons (Fig. 8A,B). In addition,up-states without current injection were sampled from each neu-ron (total of two to four up-states per neuron), and �F/Fmax
values were pooled for both conditions and all neurons (Fig.8C,E), which averaged possible differences in synaptic inputsbetween both groups. These experiments revealed that somaticand dendritic [Ca2�]i were not saturated during spontaneousup-states, but were further increased by additional action poten-tials. On average, current injection increased the number ofaction potentials per up-state by 6.1 � 0.8 (from 2.5 � 0.5 to 8.6 �0.9 action potentials), which resulted in an increase in �F/Fmax of22–28% (Fig. 8E) (soma to higher-order dendrites; p 0.001).Similar to current injection experiments in the down-state, theseincreases in �F/Fmax were highly correlated with the total number
of action potentials (Fig. 8C) (r � 0.79; 0.80; 0.85; 0.92; soma totertiary dendrite).
[Ca 2�]i transients have been shown to correlate with actionpotential frequency (Helmchen et al., 1996); therefore, we testedwhether the increased �F/Fmax during up-states with currentinjections resulted from transient firing rate increases that werenot reflected in the total number of action potentials. Averagefiring frequency ( fmean) during up-states with injected currentsranged from 10 to 30 Hz, whereas maximal firing rates ( fmax)ranged from 20 to 57 Hz. The time course of average firing ratefor all neurons is given in Figure 8D. We then tested which ofthese parameters accounted best for the observed increases in�F/Fmax, using data from tertiary dendrites. Action potentialnumber correlated most strongly with �F/Fmax (r � 0.92) (Fig.
Figure 8. Supralinear dendritic [Ca 2�]i transients encode somatic bursts during up-states. A, Dendritic [Ca 2�]i transients (380 nm; �42 msec eachframe; �60 msec resolution) during up-state alone (lef t) or with suprathreshold somatic current injection (right). Note the absence of [Ca 2�]i transientsin higher-order dendrites, when the depolarizing pulse occurs in the down-state. B, Detail of the resulting [Ca 2�]i transient in tertiary dendrites fromup-state with somatic current injection. Note �F/Fmax at the end of the action potential burst (expanded from A, bar). C, Increasing the number of actionpotentials by somatic current injection increases �F/Fmax linearly in tertiary dendrites during up-states. Spontaneous up-states without somatic currentinjection averaged 2.5 � 0.5 action potentials; spontaneous up-states with somatic current injection averaged 8.7 � 0.9 action potentials. D, �F/Fmax isreached after termination of somatic current injection. Individual �F/Fmax values (filled squares) are related to the time after up-state onset (tertiarydendrite). A peristimulus histogram of action potential frequency distribution (solid line) in relation to both up-state onset and somatic current injectionis shown (shaded box). E, �F/Fmax values from up-states with injected action potentials were highly similar to population values reached duringspontaneous up-states with identical numbers of action potentials. Dark bars, Up-states without somatic current injection and an average of 2.5 � 0.5spontaneous action potentials (n � 6 neurons). Medium bars, �F/Fmax from up-states with somatic current injection that resulted in an average of 8.7 �0.9 action potentials (n � 6 neurons). Light bars, Up-states without somatic current injection and 8.7 � 0.9 spontaneous action potentials (n � 21 neurons;population data from regression analysis; *p 0.0001). F, Supralinear effect of backpropagating action potentials and synaptic inputs during up-statessummarized for all compartments. Bottom solid line, Measured �F/Fmax for up-states without current injection and an average of 2.5 action potentials.Bottom broken line, Expected increase in �F/Fmax from 2.5 to 8.7 action potentials during the down-state. Middle broken line, Linear sum of bothfunctions. Top solid line, Measured �F/Fmax during up-states with on average 2.5 spontaneous action potentials and 6.2 additional action potentials bysomatic current injection (*p 0.0001).
1508 J. Neurosci., March 1, 2002, 22(5):1499–1512 Kerr and Plenz • Calcium Transients in Striatal Neurons
8C) compared with fmax (r � 0.20) or fmean (r � 0.26). This strongcorrelation between the number of action potentials and �F/Fmax
was present even when considering possible interactions witheither fmax or fmean (r � 0.918; partial correlation). The strongcorrelation with the total number of action potentials, whichimplies an accumulated increase of [Ca2�]i during the burst, wasalso supported by the finding that �F/Fmax on average occurredafter termination of current injection (Fig. 8D).
Action potentials elicited by injecting current during up-statesincreased dendritic �F/F through propagation along the dendrite.This should be in contrast to dendritic �F/F during up-states withsimilar numbers of spontaneous action potentials driven by syn-aptic inputs. However, �F/Fmax values from up-states with currentinjections were very similar to �F/Fmax values reached duringup-states with identical numbers of spontaneous action potentials(Figs. 3C, 8E). More specifically, �F/Fmax values were identical inhigher-order dendrites ( p � 0.81–0.99) and only slightly butnonsignificantly different at the soma ( p � 0.21). This similaritysuggests that dendritic [Ca2�]i during up-states is largely deter-mined by the number of action potentials and not synaptic inputs.
Finally, predicted increases in �F/Fmax systematically underes-timated actual �F/Fmax increases during the up-state (Fig. 8F).Predictions in �F/Fmax for additional action potentials were ob-tained from down-state measurements. The predicted increase in�F/Fmax from three to nine action potentials during the down-state ranged between 8 and 10% (Figs. 6C, 8F). The linear sum of�F/Fmax for spontaneous up-states without current injection pluspredicted �F/Fmax values resulted in final �F/Fmax values of25–37% (soma, primary to tertiary dendrites). In contrast, actual�F/Fmax values measured during the up-state were �10%�F/Fmax higher than predicted (Fig. 8F). This supralinearity,when expressed as a ratio between measured increase in theup-state and predicted increase from the down-state, was highlysignificant and reached �200% for all compartments ( p 0.0001;two-tailed t test).
To summarize, dendritic [Ca2�]i transients supralinearly en-code somatic bursting in spiny projection neurons during up-states, which suggests an interaction between synaptic inputs andaction potentials propagating along dendrites.
DISCUSSIONThe main result from this study shows that during spontaneousup-states, information about somatic action potentials is presentat higher-order dendrites. This information is likely to be com-municated to dendrites through active backpropagation (Stuartand Sakmann, 1994; Stuart et al., 1997b; Hausser et al., 2000).The supralinear [Ca2�]i signal represents a relatively simple codethat contains information about a spiny projection neuron’s con-tribution to basal ganglia output. This interaction between syn-aptic inputs, backpropagating action potentials, and correspond-ing dendritic [Ca2�]i shows three characteristics. First, thedynamic range of dendritic [Ca2�]i during up-states is balanced,allowing for continuous encoding of both synaptic inputs andsomatic burst strength. During subthreshold up-states, the so-matic peak membrane potential predicted [Ca2�]i transients withrelatively low corresponding �F/Fmax values (20%) throughoutthe dendritic tree. Bursts during up-states further correlated withadditional increases of �F/Fmax by up to 40%, a dynamic rangeincrease of 200%. Thus, synaptic inputs that depolarize spinyprojection neurons into up-states do not saturate [Ca2�]i. Thiswas also confirmed by the increase of �F/Fmax by additional action
potentials through somatic current injection during up-states.Second, propagating action potentials rather than synaptic inputsdominate dendritic [Ca2�]i transients during up-states. This in-terpretation is supported by the similarity of �F/Fmax betweenup-states with additional action potentials and spontaneous up-states with the same final number of action potentials. Finally,propagating action potentials increased dendritic [Ca2�]i supra-linearly during up-states, because down-state measurements ofevoked dendritic [Ca2�]i transients significantly underestimatedup-state measurements.
Potentially, action potentials could be initiated in dendrites andpropagate forward to the soma (Hausser et al., 2000). However,our results on subthreshold current injection show that the cal-cium signal decays within 17 �m from the soma, suggesting acorresponding fast decrement in membrane potential over space(Figs. 6, 7). If the spike initiation zone is located far in higher-order dendrites, eliciting spikes by somatic current injections isdifficult, unless the spike-initiation zone has a low threshold. Theexistence of subthreshold up-states, however, makes this possibil-ity unlikely. Therefore, we conclude that the spike-initiation zonein spiny projection neurons is probably located close to the soma.
The present study used organotypic cultures containing cortex,striatum, and substantia nigra grown for 5–6 weeks. This in vitromodel possesses several features that allow for the study ofdendritic processing in mature striatal spiny projection neurons.First, spiny projection neurons can be studied during up-statesand down-states with corticostriatal and nigrostriatal inputspresent (Plenz and Kitai, 1998), although these inputs might bemarkedly reduced in overall numbers given the limited size oftissue taken for culturing. Second, the relatively thin cross sectionof the culture allows for the study of dendritic processing inhigher-order dendrites without averaging and at relatively lowconcentrations of Fura-2.
Propagation of action potentials in dendrites of spinyprojection neuronsThe failure to elicit dendritic [Ca 2�]i transients in the pres-ence of TTX using action potential trajectories as V-clampcommands implies that dendritic sodium channels are neces-sary for action potential propagation in spiny projection neu-rons. This finding extends previous ideas about nonlineardendritic properties in these neurons (Wilson, 1995). Thenormalized spatial decay of [Ca 2�]i transients with distancefrom soma is close to the lengths of primary dendrites, sug-gesting that without regenerative sodium channels, higher-order dendrites in spiny projection neurons would be de-coupled from somatic firing. Similar findings have beendescribed for cortical neurons (Schiller et al., 1995) in whichsubsequent dendritic recordings showed the existence of actionpotential backpropagation (Stuart et al., 1997a).
The finding that action potential backpropagation in spinyprojection neurons is actively maintained is consistent withother reports that show action potential backpropagation to behighly regulated (Stuart et al., 1997b). Action potential back-propagation is frequency dependent in hippocampal neurons(Callaway and Ross, 1995; Spruston et al., 1995; Larkum et al.,1999), is regulated by dendritic A-currents (Hoffman et al.,1997), depends on dendritic morphology (Vetter et al., 2001),and can be suppressed by inhibitory inputs (Kim et al., 1995;Buzsaki et al., 1996; Tsubokawa and Ross, 1996). The presentstudy, by showing the existence of backpropagation duringup-states, now allows additional investigation into the modu-
Kerr and Plenz • Calcium Transients in Striatal Neurons J. Neurosci., March 1, 2002, 22(5):1499–1512 1509

lation of backpropagation under conditions similar to those invivo.
Supralinear [Ca2�]i transients during up-statesThe supralinear increase in dendritic [Ca2�]i during up-stateswas highly correlated with the number of action potentials andless with average firing or peak firing frequency during theup-state. This finding is supported by the decay time constant of500 msec for dendritic calcium signals in our study. Such a timeconstant would favor the accumulation of the dendritic calciumsignal over the relatively short duration of the up-state.
In cortical neurons, the coincidence of a backpropagating ac-tion potential with a subthreshold synaptic event gives rise to a[Ca2�]i transient that is up to 200% larger than the sum of eitherevent alone, which links somatic spikes with activated dendriticsynapses (Denk et al., 1995; Yuste and Denk, 1995; Magee andJohnston, 1997; Markram et al., 1997; Koester and Sakmann,1998; Schiller et al., 1998; Stuart and Hausser, 2001). In thepresent study, the magnitude in supralinearity was similar, but thesource of this supralinearity is currently unclear in spiny projec-tion neurons. In cortical pyramidal neurons, calcium, in additionto entering through voltage-gated calcium channels (VGCCs),also enters through NMDA channels, particularly when synapticinputs coincide with backpropagating action potentials (Koesterand Sakmann, 1998; Schiller et al., 1998). In addition, activationof IP3 and ryanodine receptors supralinearly increases dendritic[Ca2�]i by releasing calcium from internal stores (Nakamura etal., 1999, 2000).
NMDA channels most likely contribute to dendritic [Ca2�]i inspiny projection neurons. NMDA receptors have been immuno-histochemically localized along their dendrites (Bernard and Bo-lam, 1998; Gracy et al., 1999), local NMDA application depolar-izes spiny projection neurons (Cepeda and Levine, 1998; Cepedaet al., 1998), NMDA antagonists reduce evoked depolarizations(Kita, 1996), and calcium entry through NMDA receptors trig-gers immediate early gene expression (Konradi et al., 1996).Furthermore, VGCCs and internal stores could contribute todendritic [Ca2�]i during up-states. Whole-cell recordings fromacutely isolated spiny projection neurons established the presenceof L-, N-, P-, Q-, and R-type VGCCs at the soma (Hoehn et al.,1993; Bargas et al., 1994; Song and Surmeier, 1996; Mermelsteinet al., 1999; Foehring et al., 2000), some of which activate duringaction potential firing (Hernandez-Lopez et al., 1997; Vilchis etal., 2000). Similarly, receptors that release calcium from internalstores in pyramidal neurons have also been located in spinyprojection neurons (Martone et al., 1997).
Linking basal ganglia output to corticostriatal inputthrough backpropagationThe anatomical position of the striatum (for review, see Ger-fen and Wilson, 1996) implies that spiny projection neuronsplay a major role in linking cortical activity to basal gangliaoutputs (Alexander et al., 1986; Wurtz and Hikosaka, 1986;Albin et al., 1989; Chevalier and Deniau, 1990; Wise et al.,1996). Corticostriatal synapses are highly plastic (Lovinger etal., 1993; Calabresi et al., 1994; Akopian et al., 2000; Reynoldsand Wickens, 2000; Kerr and Wickens, 2001), which suggeststhat modification of these synapses is a potential way to changebasal ganglia outputs as a function of cortical inputs. Theproblem arises as to how to maintain corticostriatal inputspecificity given the highly convergent and divergent projec-tions in the corticostriatal pathway (Percheron et al., 1984;
Bergman et al., 1998). Our findings suggest that spiny projec-tion neurons influence both basal ganglia output and cortico-striatal inputs directly. The encoding of somatic action poten-tial bursts by dendritic [Ca 2�]i provides direct evidence forinformation flow that is in opposite direction to the traditionalidea of information processing in the basal ganglia. First, as weshowed in this study, dendritic [Ca2�]i levels correlate with thenumber of action potentials in spiny projection neurons (Fig.3C). This would allow synapses from one corticostriatal pro-jection neuron that terminate on different spiny projectionneurons to independently experience [Ca2�]i levels directlyrelated to the output. Second, the supralinear increase indendritic [Ca2�]i during suprathreshold up-states in a singlespiny projection neuron (Fig. 8E,F) might allow for the selec-tion of those synapses that, through their activity, contributedto the up-state. In the cortex, synaptic activity through NMDAchannels increases dendritic [Ca2�]i locally (Regehr and Tank,1994; Garaschuk et al., 1996; Finch and Augustine, 1998;Schiller et al., 1998; Emptage et al., 1999) that is both input-specific (Muller and Connor, 1991) and supralinear when com-bined with a backpropagating action potential (Yuste andDenk, 1995; Koester and Sakmann, 1998; Maeda et al., 1999).Our findings suggest a similar mechanism for localizing plas-ticity to corticostriatal synapses in spiny projection neurons.
This interruption is supported by the findings that corticostria-tal synaptic plasticity in spiny projection neurons is dependent on[Ca2�]i as it is blocked by intracellular calcium chelators (Cala-bresi et al., 1994; Charpier and Deniau, 1998) and L-type VGCCantagonists (Akopian et al., 2000). Burst discharge during up-states that evoke supralinear [Ca2�]i transients in higher-orderdendrites therefore could be crucial in controlling this type ofplasticity.
REFERENCESAkopian G, Musleh W, Smith R, Walsh JP (2000) Functional state of
corticostriatal synapses determines their expression of short- and long-term plasticity. Synapse 38:271–280.
Albin RL, Young AB, Penney JB (1989) The functional anatomy ofbasal ganglia disorders. Trends Neurosci 10:366–375.
Alexander GE, DeLong MR, Strick PL (1986) Parallel organization offunctionally segregated circuits linking basal ganglia and cortex. AnnuRev Neurosci 9:357–381.
Bargas J, Howe A, Eberwine J, Cao Y, Surmeier DJ (1994) Cellular andmolecular characterization of Ca 2� currents in acutely isolated, adultrat neostriatal neurons. J Neurosci 14:6667–6686.
Bergman H, Feingold A, Nini A, Raz A, Slovin H, Abeles M, Vaadia E(1998) Physiological aspects of information processing in the basalganglia of normal and parkinsonian primates. Trends Neurosci21:32–38.
Bernard V, Bolam JP (1998) Subcellular and subsynaptic distribution ofthe NR1 subunit of the NMDA receptor in the neostriatum and globuspallidus of the rat: co-localization at synapses with the GluR2/3 subunitof the AMPA receptor. Eur J Neurosci 10:3721–3736.
Buzsaki G, Penttonen M, Nadasdy Z, Bragin A (1996) Pattern andinhibition-dependent invasion of pyramidal cell dendrites by fast spikesin the hippocampus in vivo. Proc Natl Acad Sci USA 93:9921–9925.
Calabresi P, Pisani A, Mercuri NB, Bernardi G (1994) Post-receptormechanisms underlying striatal long-term depression. J Neurosci14:4871–4881.
Callaway JC, Ross WN (1995) Frequency-dependent propagation of so-dium action potentials in dendrites of hippocampal CA1 pyramidalneurons. J Neurophysiol 74:1395–1403.
Cepeda C, Levine MS (1998) Dopamine and N-methyl-D-aspartate re-ceptor interactions in the neostriatum. Dev Neurosci 20:1–18.
Cepeda C, Colwell CS, Itri JN, Chandler SH, Levine MS (1998) Dopa-minergic modulation of NMDA-induced whole cell currents in neo-striatal neurons in slices: contribution of calcium conductances. J Neu-rophysiol 79:82–94.
Charpier S, Deniau JM (1998) In vivo activity-dependent plasticity atcortico-striatal connections: evidence for physiological long-term po-tentiation. Proc Natl Acad Sci USA 94:7036–7040.
1510 J. Neurosci., March 1, 2002, 22(5):1499–1512 Kerr and Plenz • Calcium Transients in Striatal Neurons
Chevalier G, Deniau JM (1990) Disinhibition as a basic process in theexpression of striatal functions. Trends Neurosci 13:277–280.
Crutcher MD, DeLong MR (1984) Single cell studies of the primateputamen. I. Functional organization. Exp Brain Res 53:233–243.
DeLong MR (1973) Putamen: activity of single units during slow andrapid arm movements. Science 179:1240–1242.
Denk W, Sugimori M, Llinas R (1995) Two types of calcium responselimited to single spines in cerebellar Purkinje cells. Proc Natl Acad SciUSA 92:8279–8282.
Emptage N, Bliss TV, Fine A (1999) Single synaptic events evokeNMDA receptor-mediated release of calcium from internal stores inhippocampal dendritic spines. Neuron 22:115–124.
Finch EA, Augustine GJ (1998) Local calcium signaling by inositol-1,4,5-trisphosphate in Purkinje cell dendrites. Nature 396:753–756.
Foehring RC, Mermelstein PG, Song WJ, Ulrich S, Surmeier DJ (2000)Unique properties of R-type calcium currents in neocortical and neo-striatal neurons. J Neurophysiol 84:2225–2236.
Garaschuk O, Schneggenburger R, Schirra C, Tempia F, Konnerth A(1996) Fractional Ca 2� currents through somatic and dendritic gluta-mate receptor channels of rat hippocampal CA1 pyramidal neurones.J Physiol (Lond) 491:757–772.
Gerfen CR, Wilson CJ (1996) The basal ganglia. In: Handbook of chem-ical neuroanatomy: integrated systems of the CNS, part III (SwansonLW, Bjoerklund A, Hoekfelt T, eds), pp 371–468. Amsterdam:Elsevier.
Gracy KN, Clarke CL, Meyers MB, Pickel VM (1999) N-methyl-D-aspartate receptor 1 in the caudate-putamen nucleus: ultrastructurallocalization and co-expression with sorcin, a 22,000 molecular weightcalcium binding protein. Neuroscience 90:107–117.
Groden DL, Guan Z, Stokes BT (1991) Determination of Fura-2 disso-ciation constants following adjustment of the apparent Ca-EGTA as-sociation constant for temperature and ionic strength. Cell Calcium12:279–287.
Hausser M, Spruston N, Stuart GJ (2000) Diversity and dynamics ofdendritic signaling. Science 290:739–744.
Helmchen F, Imoto K, Sakmann B (1996) Ca 2� buffering and actionpotential-evoked Ca 2� signaling in dendrites of pyramidal neurons.Biophys J 70:1069–1081.
Hernandez-Lopez S, Bargas J, Surmeier DJ, Reyes A, Galarraga E(1997) D1-receptor activation enhances evoked discharge in neostria-tal medium spiny neurons by modulating an L-type Ca 2� conductance.J Neurosci 17:3334–3342.
Hikosaka O, Sakamoto M, Usui S (1989) Functional properties of mon-key caudate neurons. III. Activities related to expectation of target andreward. J Neurophysiol 61:814–832.
Hoehn K, Watson TW, MacVicar BA (1993) Multiple types of calciumchannels in acutely isolated rat neostriatal neurons. J Neurosci13:1244–1257.
Hoffman DA, Magee JC, Colbert CM, Johnston D (1997) K � channelregulation of signal propagation in dendrites of hippocampal pyramidalneurons. Nature 387:869–875.
Jaeger D, Gilman S, Aldridge JW (1993) Primate basal ganglia activityin a precued reaching task: preparation for movement. Exp Brain Res95:51–64.
Jog MS, Kubota Y, Connolly CI, Hillegaart V, Graybiel AM (1999)Building neural representations of habits. Science 286:1745–1749.
Kerr JND, Wickens JR (2001) Dopamine D-1/D-5 receptor activation isrequired for long-term potentiation in the rat neostriatum in vitro.J Neurophysiol 85:117–124.
Kim HG, Beierlein M, Connors BW (1995) Inhibitory control of excit-able dendrites in neocortex. J Neurophysiol 74:1810–1814.
Kimura M, Aosaki T, Ishida A, Watanabe K (1992) Activity of primateputamen neurons is selective to the mode of voluntary movement:visually guided, self-initiated, or memory guided. Exp Brain Res89:473–477.
Kita H (1996) Glutamatergic and GABAergic postsynaptic responses ofstriatal spiny neurons to intrastriatal and cortical stimulation recordedin slice preparations. Neuroscience 70:925–940.
Koester HJ, Sakmann B (1998) Calcium dynamics in single spines dur-ing coincident pre- and postsynaptic activity depend on relative timingof back-propagating action potentials and subthreshold excitatorypostsynaptic potentials. Proc Natl Acad Sci USA 95:9596–9601.
Konradi C, Leveque JC, Hyman SE (1996) Amphetamine anddopamine-induced immediate early gene expression in striatal neuronsdepends on postsynaptic NMDA receptors and calcium. J Neurosci16:4231–4239.
Koos T, Tepper JM (1999) Inhibitory control of neostriatal projectionneurons by GABAergic interneurons. Nat Neurosci 2:467–472.
Larkum ME, Kaiser KM, Sakmann B (1999) Calcium electrogenesis indistal apical dendrites of layer 5 pyramidal cells at a critical frequencyof back-propagating action potentials. Proc Natl Acad Sci USA96:14600–14604.
Lovinger DM, Tyler EC, Merritt A (1993) Short- and long-term synapticdepression in rat neostriatum. J Neurophysiol 70:1937–1949.
Maeda H, Ellis-Davies GCR, Ito K, Miyashita Y, Kasai H (1999) Su-
pralinear Ca 2� signaling by cooperative and mobile Ca 2� buffering inPurkinje neurons. Neuron 24:989–1002.
Magee JC, Johnston D (1997) A synaptically controlled, associative sig-nal for Hebbian plasticity in hippocampal neurons. Science275:209–213.
Markram H, Lubke J, Frotscher M, Sakmann B (1997) Regulation ofsynaptic efficacy by coincidence of postsynaptic action potentials andEPSPs. Science 275:213–215.
Martone ME, Alba SA, Edelman VM, Airey JA, Ellisman MH (1997)Distribution of inositol-1,4,5-trisphosphate and ryanodine receptors inrat neostriatum. Brain Res 756:9–21.
Mermelstein PG, Foehring RC, Tkatch T, Song WJ, Baranauskas G,Surmeier DJ (1999) Properties of Q-type calcium channels in neo-striatal and cortical neurons are correlated with � subunit expression.J Neurosci 19:7268–7277.
Muller W, Connor JA (1991) Dendritic spines as individual neuronalcompartments for synaptic Ca 2� responses. Nature 354:73–76.
Nakamura T, Barbara JG, Nakamura K, Ross WN (1999) Synergisticrelease of Ca 2� from IP3-sensitive stores evoked by synaptic activationof mGluRs paired with backpropagating action potentials. Neuron24:727–737.
Nakamura T, Nakamura K, Lasser-Ross N, Barbara JG, Sandler VM,Ross WN (2000) Inositol 1,4,5-trisphosphate (IP3)-mediated Ca 2� re-lease evoked by metabotropic agonists and backpropagating actionpotentials in hippocampal CA1 pyramidal neurons. J Neurosci20:8365–8376.
Neher E (1992) Correction for liquid junction potentials in patch clampexperiments. Methods Enzymol 20:123–131.
Neher E, Augustine GJ (1992) Calcium gradients and buffers in bovinechromaffin cells. J Physiol (Lond) 450:273–301.
Nisenbaum ES, Wilson CJ (1995) Potassium currents responsible forinward and outward rectification in rat neostriatal spiny projectionneurons. J Neurosci 15:4449–4463.
Pare D, Shink E, Gaudreau H, Destexhe A, Lang EJ (1998) Impact ofspontaneous synaptic activity on the resting properties of cat neocor-tical pyramidal neurons in vivo. J Neurophysiol 79:1450–1460.
Percheron G, Yelnik J, Francois C (1984) A Golgi analysis of the pri-mate globus pallidus. III. Spatial organization of the strio-pallidalcomplex. J Comp Neurol 227:214–227.
Plenz D, Aertsen A (1996) Neuronal dynamics in cortex-striatum co-cultures. II. Spatio-temporal characteristics of neuronal activity. Neu-roscience 70:893–924.
Plenz D, Kitai ST (1998) “Up” and “down” states in striatal mediumspiny neurons simultaneously recorded with spontaneous activity infast-spiking interneurons studied in cortex-striatum-substantia nigraorganotypic cultures. J Neurosci 18:266–283.
Regehr WG, Tank DW (1994) Dendritic calcium dynamics. Curr OpinNeurobiol 4:373–382.
Reynolds JN, Wickens JR (2000) Substantia nigra dopamine regulatessynaptic plasticity and membrane potential fluctuations in the rat neo-striatum in vivo. Neuroscience 99:199–203.
Schiller J, Helmchen F, Sakmann B (1995) Spatial profile of dendriticcalcium transients evoked by action potentials in rat neocortical pyra-midal neurones. J Physiol (Lond) 487:583–600.
Schiller J, Schiller Y, Clapham DE (1998) NMDA receptors amplifycalcium influx into dendritic spines during associative pre- and postsyn-aptic activation. Nat Neurosci 1:114–118.
Song WJ, Surmeier DJ (1996) Voltage-dependent facilitation of calciumchannels in rat neostriatal neurons. J Neurophysiol 76:2290–2306.
Spruston N, Schiller Y, Stuart S, Sakmann B (1995) Activity-dependentaction potential invasion and calcium influx into hippocampal CA1dendrites. Science 268:297–300.
Stern EA, Kincaid AE, Wilson CJ (1997) Spontaneous subthresholdmembrane potential fluctuations and action potential variability ofrat corticostriatal and striatal neurons in vivo. J Neurophysiol77:1697–1715.
Stuart G, Schiller J, Sakmann B (1997a) Action potential initiation andpropagation in rat neocortical pyramidal neurons. J Physiol (Lond)505:617–632.
Stuart G, Spruston N, Sakmann B, Hausser M (1997b) Action potentialinitiation and backpropagation in neurons of the mammalian CNS.Trends Neurosci 20:125–131.
Stuart GJ, Hausser M (2001) Dendritic coincidence detection of EPSPsand action potentials. Nat Neurosci 4:63–71.
Stuart GJ, Sakmann B (1994) Active propagation of somatic action po-tentials into neocortical pyramidal cell dendrites. Nature 367:69–72.
Surmeier DJ, Bargas J, Kitai ST (1989) Two types of A-current differingin voltage-dependence are expressed by neurons of the rat neostriatum.Neurosci Lett 103:331–337.
Svoboda K, Helmchen F, Denk W, Tank DW (1999) Spread of dendriticexcitation in layer 2/3 pyramidal neurons in rat barrel cortex in vivo. NatNeurosci 2:65–73.
Tremblay L, Hollerman JR, Schultz W (1998) Modifications of rewardexpectation-related neuronal activity during learning in primate stria-tum. J Neurophysiol 80:964–977.
Kerr and Plenz • Calcium Transients in Striatal Neurons J. Neurosci., March 1, 2002, 22(5):1499–1512 1511

Tsubokawa H, Ross WN (1996) IPSPs modulate spike backpropagationand associated [Ca 2�]i changes in the dendrites of hippocampal CA1pyramidal neurons. J Neurophysiol 76:2896–2906.
Turner DA (1984) Segmental cable evaluation of somatic transients inhippocampal neurons (CA1, CA3, and dentate). Biophys J 46:73–84.
Vetter P, Roth A, Hausser M (2001) Propagation of action potentials indendrites depends on dendritic morphology. J Neurophysiol 85:926–937.
Vilchis C, Bargas J, Ayala GX, Galvan E, Galarraga E (2000) Ca 2�
channels that activate Ca 2�-dependent K � currents in neostriatalneurons. Neuroscience 95:745–752.
Wilson CJ (1995) Dynamic modification of dendritic cable propertiesand synaptic transmission by voltage-gated potassium channels. J Com-put Neurosci 2:91–115.
Wilson CJ, Kawaguchi Y (1996) The origins of two-state spontaneousmembrane potential fluctuations of neostriatal spiny neurons. J Neuro-sci 16:2397–2410.
Wilson CJ, Chang HT, Kitai ST (1983) Disfacilitation and long-lasting inhibition of neostriatal neurons in the rat. Exp Brain Res51:227–235.
Wise SP, Murray EA, Gerfen CR (1996) The frontal cortex-basal gan-glia system in primates. Crit Rev Neurobiol 10:317–356.
Wurtz RH, Hikosaka O (1986) Role of the basal ganglia in the initiationof saccadic eye movements. Prog Brain Res 64:175–190.
Yuste R, Denk W (1995) Dendritic spines as basic functional units ofneuronal integration. Nature 375:682–684.
1512 J. Neurosci., March 1, 2002, 22(5):1499–1512 Kerr and Plenz • Calcium Transients in Striatal Neurons