stabilizing soft fine-grained soils with fly ash
TRANSCRIPT
Stabilizing Soft Fine-Grained Soils with Fly AshTuncer B. Edil, M.ASCE1; Hector A. Acosta, M.ASCE2; and Craig H. Benson, M.ASCE3
Abstract: The objective of this study was to evaluate the effectiveness of self-cementing fly ashes derived from combustion of sub-bituminous coal at electric power plants for stabilization of soft fine-grained soils. California bearing ratio �CBR� and resilient modulus�Mr� tests were conducted on mixtures prepared with seven soft fine-grained soils �six inorganic soils and one organic soil� and four flyashes. The soils were selected to represent a relatively broad range of plasticity, with plasticity indices ranging between 15 and 38. Twoof the fly ashes are high quality Class C ashes �per ASTM C 618� that are normally used in Portland cement concrete. The other ashes areoff-specification ashes, meaning they do not meet the Class C or Class F criteria in ASTM C 618. Tests were conducted on soils andsoil–fly ash mixtures prepared at optimum water content �a standardized condition�, 7% wet of optimum water content �representative ofthe typical in situ condition in Wisconsin�, and 9–18% wet of optimum water content �representative of a very wet in situ condition�.Addition of fly ash resulted in appreciable increases in the CBR and Mr of the inorganic soils. For water contents 7% wet of optimum,CBRs of the soils alone ranged between 1 and 5. Addition of 10% fly ash resulted in CBRs ranging between 8 and 17 and 18% fly ashresulted in CBRs between 15 and 31. Similarly, Mr of the soil alone ranged between 3 and 15 MPa at 7% wet of optimum, whereasaddition of 10% fly ash resulted in Mr between 12 and 60 MPa and 18% fly ash resulted in Mr between 51 and 106 MPa. In contrast,except for one fly ash, addition of fly ash generally had little effect on CBR or Mr of the organic soil.
DOI: 10.1061/�ASCE�0899-1561�2006�18:2�283�
CE Database subject headings: Fine-grained soils; Fly ash; California bearing ratio; Soil stabilization; Recycling; Sustainabledevelopment; Subgrades.
Introduction
Every year large amounts of coal are burned in electrical powerplants in the United States. Air pollution control systems at theseplants produce large amounts of fly ash. Some fly ashes have beenused for many years as a partial replacement for Portland cementin concrete, but most are disposed in landfills at considerable cost�ACAA 2000�. In recent years, however, environmental regula-tions in many states have promoted other reuse applications of flyash, as well as many other industrial byproducts, in the interestsof sustainable construction. These applications include using flyash as an embankment or fill material, as a soil or aggregatestabilizing agent, as filler and/or cement in flowable fill, and asmineral filler in asphalt paving mixtures �ACAA 1999�.
Combustion of sub-bituminous coal produces a self-cementingfly ash that can be used for soil stabilization without activators
1Professor and Chair, Geological Engineering Program, Dept. of Civil& Environmental Engineering, Univ. of Wisconsin-Madison, 1415Engineering Dr., Madison, WI 53706 �corresponding author�. E-mail:[email protected]
2Project Engineer, Ramón E. Zequeira & Associates, Asunción 513Puerto Nuevo, San Juan, Puerto Rico 00920. E-mail: [email protected]
3Professor, Geological Engineering Program, Dept. of Civil andEnvironmental Engineering, Univ. of Wisconsin-Madison, 1415Engineering Dr., Madison, WI 53706. E-mail: [email protected]
Note. Associate Editor: Hilary I. Inyang. Discussion open untilSeptember 1, 2006. Separate discussions must be submitted for individualpapers. To extend the closing date by one month, a written request mustbe filed with the ASCE Managing Editor. The manuscript for this paperwas submitted for review and possible publication on February 15, 2005;approved on July 29, 2005. This paper is part of the Journal of Materialsin Civil Engineering, Vol. 18, No. 2, April 1, 2006. ©ASCE, ISSN
0899-1561/2006/2-283–294/$25.00.JOURNAL OF MATE
�Ferguson 1993; Misra 1998�. In most subgrade applications, flyash is used to stabilize a soft soil so that a stable working platformis provided for construction equipment �Ferguson 1993;Nicholson and Kashyap 1993�. Reducing plasticity and shrink-swell potential of fine-grained soils is also a common objective�Nicholson and Kashyap 1993; Cokca 2001�. The stabilized ma-terial typically is strong and stiff �Kaniraj and Havanagi 1999,2001; Edil et al. 2002; Pandian and Krishna 2003; Bin-Shafiqueet al. 2004; Trzebiatowski et al. 2004�.
This paper describes a laboratory study conducted to evaluatethe improvement in mechanical properties relevant to highwaydesign and construction that can be obtained when soft fine-grained subgrade soils are stabilized with fly ash. The experimen-tal program included California bearing ratio �CBR� tests toevaluate the bearing strength of stabilized soils used as workingplatforms during highway construction and resilient modulus�Mr� tests to evaluate the subgrade modulus that is important forsupporting long-term vehicular traffic loads. Field behavior of flyash stabilized soils is beyond the scope of this paper, and is ad-dressed elsewhere �Bin-Shafique et al. 2004; Trzebiatowski et al.2004�.
Materials and Methods
Fly Ashes
Four fly ashes were used in this study: Columbia, Edgewater,Dewey, and King. The Columbia, Edgewater, and Dewey ashesare from power plants in Wisconsin, whereas the King ash is fromMinnesota. Physical and compositional properties of the fly ashesare summarized in Table 1 along with typical physical properties
of Class C and F fly ashes. All four ashes are derived from com-RIALS IN CIVIL ENGINEERING © ASCE / MARCH/APRIL 2006 / 283

bustion of sub-bituminous coal and were collected using electro-static precipitators. The Columbia and Edgewater ashes are frompulverized boilers, whereas the Dewey and King fly ashes arefrom cyclone boilers.
The Columbia and Edgewater fly ashes are Class C fly ashesfollowing ASTM C 618, whereas the Dewey and King fly ashesare referred to as “off-specification” fly ashes because they do notmeet the Class C or Class F criteria in ASTM C 618. The King,Columbia, and Edgewater fly ashes have high calcium oxide�CaO� content �23.7, 23.1, and 20.8%, respectively� and high sili-con dioxide �SiO2� content �27.3, 31.1, and 38.7%, respectively�,whereas the Dewey ash has lower CaO content �9.8%� and SiO2
content �19.8%�. The CaO/SiO2 ratio, which is indicative of ce-menting potential �Janz and Johansson 2002�, varies between 0.54�Edgewater� and 1.15 �Dewey� and the loss on ignition �LOI�,which is indicative of the amount of unburned coal in the ash,varies between 0.1% �Edgewater� and 53.4% �Dewey�.
Particle size distributions for the fly ashes are shown in Fig.1�a�. The King, Edgewater, and Columbia fly ashes have similarparticle size distributions, with the Columbia ash being slightlyfiner than the other ashes. All three of these ashes primarily con-sist of silt-size particles �75�m�particle size�2 �m�. Deweyfly ash is appreciably coarser than the other fly ashes and is gapgraded.
Subgrade Soils
Seven subgrade soils were used that represent the range of softsubgrades typically encountered in Wisconsin highway construc-tion. Samples of each soil were collected along highway shoul-ders at a depth of 0.6–0.9 m. Index properties, compactioncharacteristics, and classifications of the soils are summarized inTable 2. All of the soils are fine grained and classify as CL, CH,or OH according to the Unified Soil Classification System. Thenames of the soils are from USDA soil surveys. Theresa silt loam,Joy silt loam, red silty clay till, and Plano silt loam are lowplasticity clays, whereas brown silt and Lacustrine red clay arehigh plasticity clays in the Unified Soil Classification System.Organic Theresa silt loam is a highly plastic organic clay�LOI=10% �. All of the other soils have LOI�4%, and are con-sidered to be inorganic soils.
Particle size distributions for the soils are shown in Fig. 1�b�.The Theresa silt loam, organic Theresa silt loam, Plano silt loam,
Table 1. Chemical Composition and Index Properties of Fly Ashes
Parameter Columbia Dewey
CaO 23.1 9.8
SiO2 31.1 19.8
Al2O3 18.3 13.0
Fe2O3 6.1 6.0
MgO 3.7 3.1
SO3 3.7 11.8
CaO/SiO2 ratio 0.74 1.15
Loss on ignition �%� 0.7 53.4
Specific gravity 2.70 2.53
Percent fines �%� 95.3 39.6
Classification �ASTM 618� C Off specificationaFrom Bin-Shafique et al. �2004�.
Percent of composition
Edgewater KingTypicala
Class CTypicala
Class F
20.8 23.7 24.3 8.7
38.7 27.3 39.9 54.9
15.8 16.3 16.7 25.8
7.8 5.9 5.8 6.9
3.4 1.8 4.6 1.8
1.0 6.4 3.3 0.6
0.54 1.08 0.61 0.16
0.1 5.4 6 6
2.71 2.68 — —
92.8 91.9 — —
C Off specification C F
brown silt, and Joy silt loam have similar particle size distribu-
284 / JOURNAL OF MATERIALS IN CIVIL ENGINEERING © ASCE / MARCH
Fig. 1. Particle size distributions of the fly ashes �a� and soils �b�
/APRIL 2006
tions and contain at least 90% fines. The red silty clay is coarser�70% fines� and more well graded than the other soils and theLacustrine red clay is finer than all of the soils.
In situ water contents of the soils are shown in Table 2. The insitu water contents typically are about 7% wet of optimum watercontent, which is typical for Wisconsin subgrade soils �an excep-tion is Theresa silt loam, which has an in situ water content 1%wet of optimum water content�. Thus, when specimens were pre-pared to simulate the natural wet condition observed in the field,they were prepared approximately 7% wet of optimum watercontent.
Compaction curves corresponding to standard Proctor effortwere determined for each soil following the procedure in ASTM D698. Typical bell-shaped compaction curves were obtained for allof the soils �Acosta et al. 2003�. The maximum dry unit weightsand the optimum water contents are summarized in Table 2.
Test Procedures Soils and Soil–Fly Ash Mixtures
CBR Test
Unsoaked CBR tests were conducted on the soils and soil–fly ashmixtures following the methods described in ASTM D 1883 to
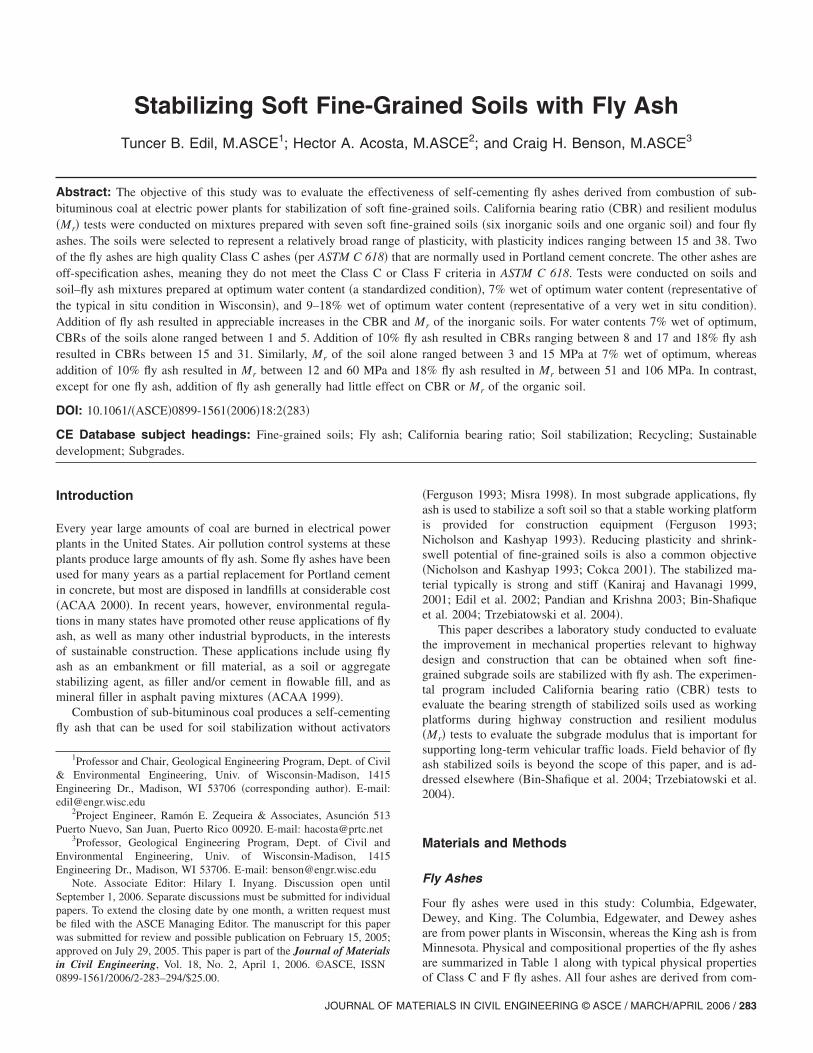
Table 2. Index Properties of Soils
Soil name LL PIPercent
fines Gs
L�%
Org. Theresa silt loam 61 19 97 2.24 1
Theresa silt loam 45 19 99 2.58
Brown silt 60 35 97 2.58
Lacustrine red clay 69 38 97 2.71
Red silty clay till 47 22 71 2.69
Joy silt loam 39 15 96 2.70
Plano silt loam 44 20 96 2.71
Note: LL�liquid limit; PI�plasticity index; Percent fines�percentaCBR�California bearing ratio �performed approximately 7% wet of optiand wOPT�optimum water content �ASTM D 698�.
Table 3. CBR of Soil and Soil–Fly Ash Mixtures Compacted 2 h after M
Soilname
Soil optimum water content �wOPT�
Soilalone
Columbia
Fly ash content �%�
0 6 10 12 14 16 18 20 10
RSCT 26�−1.0�
— 33�2.0�
— — — 35�4.0�
— 24�2.0�
LRC 17�−0.9�
— 19�2.0�
— — — 20�4.0�
— 25�2.0�
BS 17�1.0�
— - — — — — — 20�2.0�
OTSL 2�0.5�
— 2�2.0�
— — — 5�4.0�
— 4�2.0�
TSL 12�−0.4�
15�2.0�
25�2.0�
— 23�3.0�
— 30�3.0�
— —
JSL 5�1.0�
— 32�2.0�
— 36�2.7�
— 38�3.4�
— —
PSL 5 — - 34�2.4�
— 51�3.2�
— 56�4.0�
—
Note: RSCT�red silty clay till; LRC�Lacustrine red clay; BS�brownloam; and PSL�Plano silt loam. Number in parenthesis indicates water
content �wSOIL−wOPT�.JOURNAL OF MATE
assess the subgrade soils and soil–fly ash mixtures in the contextof a working platform �i.e., a short term condition, where soakingover a wet season would not occur�. Specimens were prepared inaccordance with ASTM D 1883 at water content 7% wet of opti-mum water content using standard Proctor effort to simulate thewet and soft condition typically observed in the field. Specimenswere also prepared near optimum water content as a standardizedcondition. All water contents reported herein are soil water con-tents �i.e., weight of water � weight of soil solid�. Soil watercontents are used instead of soil–fly ash water contents because,in construction applications, the engineer normally must designfor the existing in situ water content of the soil. Standard Proctorcompaction procedure was used for compacting the specimens.
During construction, a delay lasting 1–2 h normally occursbetween moistening/blending of the soil–fly ash mixture andcompaction �ACAA 1999�. To simulate this effect in the labora-tory, soil–fly ash mixtures sat for 2 h between moistening/blending and compaction. This 2 h delay was adopted in all casesso that specimens would be prepared consistently.
Soil specimens were subjected to CBR testing shortly aftercompaction without soaking. Soil–fly ash specimens, however,were left in the mold after compaction, sealed using plastic wrap,and cured at 25°C and 100% relative humidity for 7 days. The
Classification
CBRwN
�%��d
�kN/m3�wOPT
�%�USCS AASHTO
OH A-7-5 0.3 35 13.5 29
CL A-7-6 3 19 15.9 18
CH A-7-6 0.4 32 16.4 19
CH A-7-6 2 35 15.7 24
CL A-6 5 19 18.4 13
CL A-6 3 25 16.5 19
CL A-7-6 1 27 16.2 20
ssing No. 200 sieve; Gs�specific gravity, LOI�loss on ignition;ater content�; wN�in situ water content; �d�maximum dry unit weight;
and Cured for 7 Days
7% wet of wOPT
y EdgewaterSoil
alone
Columbia Dewey King
Fly ash content �%�
18 10 18 0 10 18 10 18 10 18
20�4.0�
— — 5�4.7�
11�7.0�
30�7.0�
17�7.0�
23�7.0�
14�7.0�
26�7.0�
20�4.0�
— — 2�7.0�
8�7.0�
24�7.0�
14�7.0�
26�7.0�
9�7.0�
27�7.0�
25�3.0�
— — 3�5.0�
12�7.0�
15�7.0�
10�7.0�
31�7.0�
9�7.0�
20�7.0�
10�4.0�
2�2.0�
2�4.0�
0.3�6.9�
— — — — — —
— — — 3�6.3�
— — — — — —
— — — 3�6.0�
— — — — — —
— — — 1�7.0�
— — — — — —
TSL�organic Theresa silt loam; TSL�Theresa silt loam; JSL�Joy siltt of the soil prior to fly ash addition relative to the soil optimum water
OI�
0
2
4
2
2
1
2
ge pamum w
ixing
Dewe
14
—
—
20�3.0�
—
—
—
—
silt; Oconten
RIALS IN CIVIL ENGINEERING © ASCE / MARCH/APRIL 2006 / 285
286 / JOURNAL OF MATERIALS IN CIVIL ENGINEERING © ASCE / MARCH
CBR tests were conducted immediately after the 7-day curingperiod. A 7-day curing period was adopted to simulate the rela-tively short period between subgrade preparation to provide aworking platform and pavement construction activities in practice�Bin-Shafique et al. 2004�.
Resilient Modulus Test
Specimens for resilient modulus testing were prepared using thesame compactive effort as specimens prepared using the standardProctor procedure. The mold used to prepare the resilient modulusspecimens had a diameter of 102 mm and height of 203 mm.Specimens were compacted in the mold in 6 layers with 22 blows/layer using a standard Proctor hammer, which provided the sameenergy per volume �600 kN m/m3� as standard Proctor compac-tion. As with the CBR tests, the soil–fly ash mixtures wereblended and moistened, and then allowed to sit for 2 h beforecompaction to simulate the delay that typically occurs in the field.
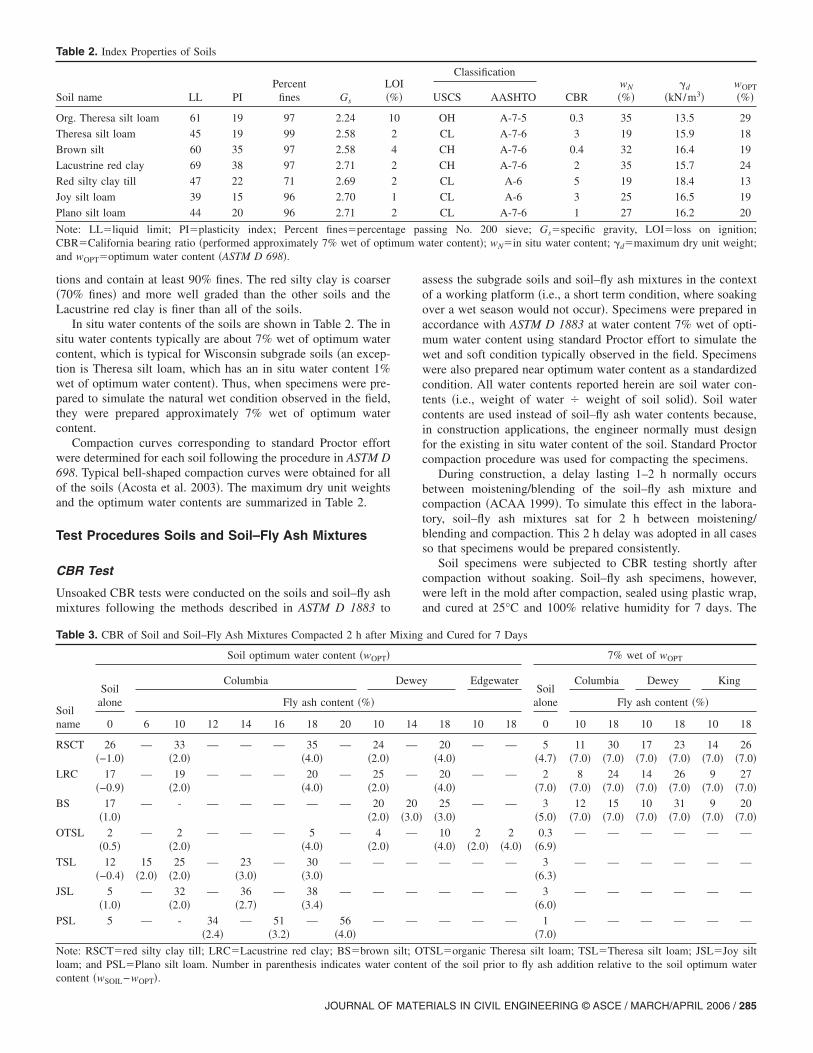
Fig. 3. Typical curves showing resilient modulus versus deviatorstress for soil compacted at optimum water content �a� and soil–flyash mixture prepared 7% wet of optimum water content �b�
Fig. 2. CBR gain as function of fly ash content for red silty clay till�a�; Lacustrine red clay �b�; and brown silt �c� prepared withColumbia, Dewey, and King fly ashes. Soils were 7% wet ofoptimum water content.
As with the CBR tests, specimens were prepared at optimum/APRIL 2006

water content and 7% wet of optimum water content. Specimenswere also compacted at a very wet condition �9–18% wet of op-timum water content�.
Soil specimens were subjected to resilient modulus testingshortly after compaction. In contrast, specimens prepared withsoil–fly ash mixtures were extruded from the mold after compac-tion, sealed with plastic wrap, and cured at 25°C and 100% hu-midity. Most specimens were cured for 14 days as suggested byTurner �1997�, but some specimens were cured for as long as 56days to evaluate how the resilient modulus changes as curingoccurs. The procedure described in AASHTO T 292-91 was fol-lowed for the resilient modulus tests using the loading sequencefor cohesive soils.
Results
General Effects of Fly Ash Stabilization
CBRThe CBRs are summarized in Table 3. CBRs of the soils prepared7% wet of optimum water content range from 0 to 5 with most ofthem less than 2, indicating that the soils are very poor subgradesin their in situ condition �Bowles 1992�. These CBRs are consis-
Table 4. Coefficients K1 and K2 in Eq. �1� for Soil and Soil–Fly Ash M
Soil name
Fly ashcontent
�%�
Curingtime
�days�
wSOIL-wOPT
�%�
Co
K1
Red silty clay till 0 1 −0.1 185.0
10 7 9.0 6.6
10 14 7.0 4.2
18 7 11.0 12.4
18 7 7.0 161.7
18 14 7.0 68.8
18 28 7.0 77.5
18 56 7.0 73.3
Lacustrine red clay 0 1 1.0 124.0
10 7 10.0 9.0
10 14 10.0 33.7
10 14 7.0 40.1
18 7 13.0 7.7
18 14 13.0 89.8
18 14 7.0 90.5
Organic Theresa silt loam 0 1 −0.9 12.5
10 7 10.0 F
18 7 13.5 F
30 7 — —
30 7 — —
Theresa silt loam 0 1 −1.0 21.1
Brown silt 0 1 7.0 150.0
10 14 7.0 115.0
18 14 7.0 83.0
Plano silt loam 0 1 −3.0 36.7
12 7 −1.0 879.8
12 7 3.0 983.1
12 7 5.0 1550.2
Note: wSOIL-wOPT�water content of the soil prior to fly ash addition rela
tent with CBRs reported by other investigators for soft subgrades
JOURNAL OF MATE
�e.g., Ferguson 1993; Nicholson et al. 1994�. Soil–fly ash mix-tures compacted 7% wet of optimum water content typically haveCBRs ranging between 10 and 20. These CBRs are comparable tothose obtained on the soils alone compacted at optimum watercontent, suggesting that fly ash stabilization has similar benefits interms of bearing strength as drying and compacting the soil.
The general effect of fly ash stabilization on CBR is illustratedin Fig. 2, which shows CBR of the soil–fly ash mixture normal-ized by the CBR of untreated soil �this ratio is referred to as the“CBR gain”�. The data are from tests conducted on specimenscompacted 7% wet of optimum water content. Data for red siltyclay till, Lacustrine red clay, and brown silt are shown in Fig. 2 torepresent the range of typical inorganic soft subgrade soils �lowerto higher plasticity�. In general, the CBR gain increases with anincrease in fly ash content. Addition of 10% fly ash caused theCBR to increase by a factor of 4, on average, whereas 18% fly ashcaused the CBR to increase by a factor of 8. The CBR gain is alsoaffected by soil type. The largest CBR gain generally was ob-tained with the highly plastic Lacustrine red clay, and the smallestwith the more well-graded red silty clay till. More discussion ofthe influence of soil type is in a subsequent section.
Resilient ModulusThe Mr curves for the soils compacted at optimum moisture con-
a wSOIL
-wOPT
�%�
Dewey wSOIL-wOPT
�%�
King
K2 K1 K2 K1 K2
0.306 — — — — — —
0.251 9.0 12.3 0.070 — — —
0.349 7.0 25.5 −0.062 7.0 22.0 0.001
0.166 11.0 87.3 −0.242 — — —
0.305 7.0 186.7 −0.299 — — —
0.019 7.0 135.5 −0.189 7.0 167.0 −0.199
0.063 7.0 124.5 −0.129 — — —
0.098 7.0 160.5 −0.185 — — —
0.346 — — — — — —
0.039 10.0 35.2 −0.276 — — —
0.127 — — — — — —
0.115 7.0 238.3 −0.529 7.0 62.2 −0.225
0.138 13.0 87.9 −0.408 — — —
0.253 — — — — — —
0.191 7.0 123.0 −0.166 7.0 144.6 −0.101
0.040 — — — — — —
F 10.0 F F — — —
F 13.5 F F — — —
— 9.0 31.9 −0.072 — — —
— 18.0 21.7 0.423 — — —
0.151 — — — — — —
0.210 — — — — — —
0.277 7.0 334.5 −0.565 7.0 22.0 −0.054
0.050 7.0 125.0 −0.136 7.0 83.4 −0.066
0.026 — — — — — —
0.241 — — — — — —
0.482 — — — — — —
0.779 — — — — — —
the soil optimum water content. F�Failed during testing.
ixtures
lumbi
−
−
−
−
−
−
−
−
−
−
−
−
−
−
−
−
−
−
tive to
tent �Fig. 3�a�� had the characteristic shape for cohesive soils �i.e.,
RIALS IN CIVIL ENGINEERING © ASCE / MARCH/APRIL 2006 / 287

a monotonic decrease in Mr with increasing deviator stress, �d��Acosta et al. 2003�. In contrast, Mr curves for the soil–fly ashmixtures showed much less dependency on deviator stress for therange of deviator stresses employed �21–103 kPa� �Fig. 3�b��.Cementing of the soil particles by fly ash is believed to be theprimary factor responsible for the reduced effect of stress on Mr
of the soil–fly ash mixtures. In some cases, fly ash stabilizationcauses a reversal in the slope of the Mr curve. Slope reversalshave also been reported by Trzebiatowski et al. �2004�.
For all tests, a power function was used to describe theMr−�d relationship
Mr = K1�dK2 �1�
The parameters K1 and K2 for each test are summarized in Table4. The reduced sensitivity to stress exhibited by many of the flyash mixtures is reflected in the smaller magnitude of the param-eter K2.
Resilient moduli of the soils and soil–fly ash mixtures at adeviator stress of 21 kPa �a typical subgrade condition� are sum-marized in Table 5. For the soils �i.e., without fly ash� compactedat optimum water content, Mr varies between 13 and 80 MPa.These Mr are comparable to Mr reported in the literature for soilshaving similar properties �Fredlund and Wong 1977; Lee et al.1997; Muhanna and Rahman 1999�. A comparison of Mr of thesoils �without fly ash� compacted at optimum water content and at7% wet of optimum water content and the soil–fly ash mixturescompacted 7% wet of optimum water content is shown in Fig. 4.A summary of all of the data is in Table 5. All of the modulicorrespond to a deviator stress of 21 kPa. The Mr of the soil–fly
Table 5. Resilient Moduli �MPa� of Soil and Soil–Fly Ash Mixtures �De
Soilname
Curingtime
�days�
wOPT
Curingtime
�days�
7% we
Soilalone
Columbia
Soilalone
Columbia
Fly ashcontent
�%�Fly
0 12 0 10 12 18
RSCT — 72.7�−0.1�
— 14 15.0�7.0�
12.1�7.0�
— 65.0�7.0
LRC — 43.3�−1.0�
— 14 6.0�7.0�
28.3�7.0�
— 50.6�7.0
BS — 79.0�−1.2�
— 14 9.0�7.0�
49.4�7.0�
— 71.4�7.0
OTSL — 14.1�−0.9�
— — 0.9�7.0�
— — —
TSL — 13.3�1.0�
— — 9.0�7.0�
— — —
JSL — — — — 9.0�7.0�
— — —
PSL 7 34.0�−3.0�
422.5�−1.0�
7 3.0�7.0�
— 144.9�5.0�
—
226.1�3.0�
Note: RSCT�red silty clay till; LRC�Lacustrine red clay; BS�brownloam; and PSL�Plano silt loam. Number in parenthesis indicates watercontent �wSOIL-wOPT�. F�Failed during testing.
ash mixtures prepared with 10% fly ash typically fall below the
288 / JOURNAL OF MATERIALS IN CIVIL ENGINEERING © ASCE / MARCH
moduli of the soils compacted at optimum water content. At 18%fly ash content, however, Mr of the soil–fly ash mixtures rangebetween 0.8 and 2.5 times the Mr of the soils compacted at opti-mum water content. That is, addition of 18% fly ash to a soft andwet subgrade soil results in comparable or higher Mr than thesame subgrade soil dried and compacted at optimum watercontent.
Effect of Fly Ash Type
A comparison of the effect of fly ash type is shown in Fig. 5,which shows CBR of the soil–fly ash mixtures prepared with theoff-specification Dewey and King fly ashes normalized by theCBR of similar mixtures prepared with Class C Columbia fly ash.CBRs of the soil–fly ash mixtures prepared with the off-specification fly ashes are similar to or higher than those obtainedwith the typical Class C fly ash �Columbia�. Soil–fly ash mixturesprepared with 10 and 18% Dewey or King fly ashes have CBRsranging between 0.8 and 2.0 times the CBR obtained using Co-lumbia fly ash. Thus, these off-specification ashes are as effective,if not more effective, for stabilizing soft soils.
The Mr data also show that “off-specification” ashes are effec-tive stabilizers, even though they would not be acceptable forPortland cement concrete applications and are normally landfilled�Fig. 6�. In Fig. 6, resilient moduli of soil–fly ash mixtures pre-pared with the Dewey and King fly ashes relative to Mr of themixtures prepared with the Class C Columbia fly ash are shownfor fly ash contents of 10 and 18%. Except for the mixtures of
Stress=21 kPa�
OPT
Curingtime
�days�
Very wet condition
ewey King Columbia Dewey
ontent Fly ash content�%�
18 10 18 10 18 10 18 30
�76.3�7.0�
22.0�7.0�
90.9�7.0�
7 14.2�9.0�
20.7�11.0�
15.2�9.0�
41.8�11.0�
—
�74.2�7.0�
31.3�7.0�
106.3�7.0�
7 10.1�10.0�
11.7�13.0�
15.2�10.0�
25.4�13.0�
—
14 22.9�10.0�
41.6�13.0�
— — —
�82.8�7.0�
18.7�7.0�
68.3�7.0�
— — — — — —
— — — 7 F�10.6�
F�13.5�
F�10.6�
F�13.5�
25.6�9.0�
7.8�18.0�
— — — — — — — — —
— — — — — — — — —
— — — — — — — — —
TSL�organic Theresa silt loam; TSL�Theresa silt loam; JSL�Joy siltt of the soil prior to fly ash addition relative to the soil optimum water
viator
t of w
D
ash c�%�
10
�21.1�7.0
�47.7�7.0
�60.0�7.0
—
—
—
—
silt; Oconten
brown silt with King fly ash, higher Mr were obtained with the
/APRIL 2006

JOURNAL OF MATE
off-specification ashes than the Columbia Class C ash, with thehighest Mr in all cases obtained using the Dewey fly ash.
The effectiveness of these fly ashes appears to be related to theCaO/SiO2 ratio �Table 1�. Of these three ashes, the CaO/SiO2
ratio is highest for Dewey �1.15�, lowest for Columbia �0.74�, andintermediate for King �1.05�. The Dewey ash also resulted inmixtures with the highest CBR and Mr, whereas the Columbiaash generally resulted in mixtures with lower CBR and Mr.
Effect of Soil Type
Three index parameters were used when evaluating how soil typeinfluences the stabilization afforded by fly ash: liquid limit �LL�,plasticity index �PI�, and group index �GI�. Both the LL and PIare indices of the quantity and the activity of the clay minerals inthe soil. GI is an index property used in pavement engineeringwhich depends on three index properties: percent fines, liquidlimit, and plasticity index �Holtz and Kovacs 1980�. In general, asthe LL, PI, or GI increases, the subgrade usually becomes poorer
Fig. 5. CBR of soil–fly ash mixtures prepared with Dewey �a� andKing �b� fly ashes normalized to CBR for soil–fly ash mixturesprepared with Columbia fly ash. Fly ash contents of 10 and 18% wereused. Specimens compacted 7% wet of optimum water content.
in terms of pavement support.
Fig. 4. Resilient moduli of soil and soil–fly ash mixtures compactedat optimum water content and 7% wet of optimum water content: redsilty clay till �a�; Lacustrine red clay �b�; and brown silt �c�. Mixturesprepared with Columbia, Dewey, and King fly ashes using 10 or 18%fly ash.
RIALS IN CIVIL ENGINEERING © ASCE / MARCH/APRIL 2006 / 289

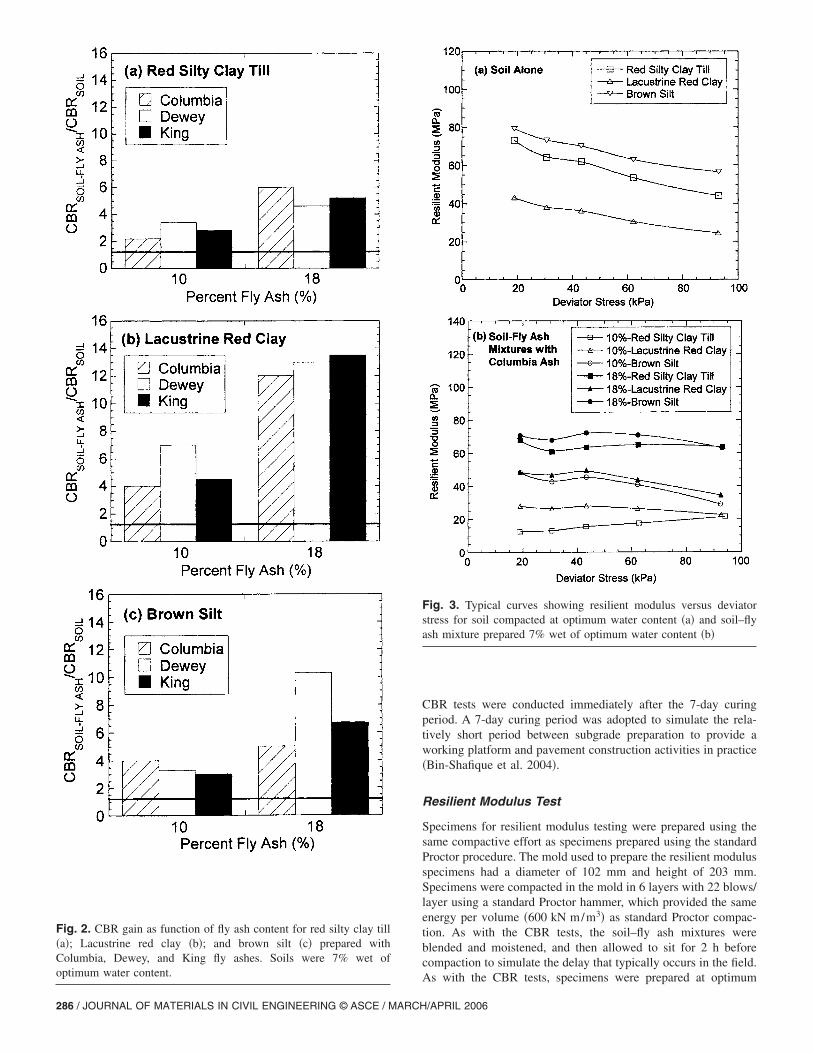
Relationships between CBR or Mr and each of these soil prop-erties are shown in Figs. 7–9 in terms of CBR ratio or Mr ratio �ata deviator stress of 21 kPa�. In all three cases, there is a generaltrend of increasing CBR ratio and Mr ratio as the soil becomesfiner grained or more plastic �i.e., higher LL, PI, or GI�, althoughthe data exhibit considerable scatter. This trend does not meanthat the cementing characteristics of fly ash improve as the soilsbecome finer grained or more plastic. Rather, stabilization withfly ash results in more comparable CBR and Mr regardless of soiltype �Tables 3 and 5�, and soils that are finer grained or moreplastic tend to have lower CBR or Mr prior to stabilization �re-sulting in greater CBR ratio and Mr ratio�.
Effect of Water Content
The general effect of water content on CBR is shown in Fig. 10 interms of compaction water content �wSOIL� relative to optimumwater content �wOPT�, i.e., wSOIL−wOPT. In general, CBR de-creases with increasing wSOIL−wOPT, and increases with increas-ing fly ash content. The sensitivity to water content is similar for
Fig. 6. Ratio of Mr of soil–fly ash mixtures prepared with Dewey �a�and King �b� fly ashes to Mr of the soil–fly ash mixtures preparedwith Columbia fly ash. All resilient moduli are at deviator stress of 21kPa.
both fly ash contents. Compaction water content has a similar
290 / JOURNAL OF MATERIALS IN CIVIL ENGINEERING © ASCE / MARCH
effect on the resilient modulus of soil–fly ash mixtures �Table 5�.In general, as the soil water content increases, the resilient modulidecrease, regardless of the curing time.
Effect of Curing Time
Resilient modulus is a property relevant to long-term performanceunder service loads and soil–fly ash mixtures are expected to gainstiffness with increasing curing time. Therefore, resilient modulustests were conducted on soil–fly ash mixtures cured for periods of7, 14, 28, and 56 days to evaluate how curing time affects theresilient modulus. The specimens were prepared with red siltyclay till �7% wet of optimum water content� mixed with 18%Columbia fly ash and 18% Dewey fly ash. These fly ashes wereselected to evaluate the effect of curing time for a Class C and anoff-specification fly ash.
The effect of curing time on the resilient modulus at a deviatorstress of 21 kPa is shown in Fig. 11. The resilient modulus at eachcuring time has been normalized by the resilient modulus mea-sured at 14 days. Between 7 and 14 days, the resilient modulusdid not increase significantly �ratio �1 for both Columbia andDewey�. A larger increase �ratio �1.44 for Columbia and 1.10 for
Fig. 7. Effect of liquid limit �LL� on CBR �a� and Mr �b� of soil–flyash mixtures prepared 7% wet of optimum water content and 9–12%wet of optimum water content. CBRs and Mrs are normalized byvalues for soil alone.
Dewey� occurred between 14 and 28 days, with a greater increase
/APRIL 2006
occurring for the Columbia fly ash. After 28 days, little additionalincrease in resilient moduli occurs �1.52 for Columbia and 1.20for Dewey�.
Effect of Organic Content
Addition of fly ash had a much smaller effect on the CBR and Mr
of the organic Theresa silt loam �LOI=10% � than the inorganicsoils �Tables 3 and 5�. For fly ash contents of 10 and 18%, CBRof the organic Theresa silt loam generally was between 2 and 5even when compacted at optimum water content �Table 3�. Inaddition, all of the resilient modulus specimens prepared with flyash contents of 10 and 18% failed during testing �i.e., they weretoo soft to test using the loading sequence for cohesive soils�.
The mixtures prepared with Dewey fly ash �LOI=53.4% andCaO/SiO2=1.15� are an exception. Mixtures of organic Theresasilt loam and Dewey fly ash prepared at optimum water contenthad a CBR�10 for fly ash contents �10% �Fig. 12�, whereasmixtures prepared with other fly ashes appeared to have little orno effect on CBR. Also, mixtures of organic Theresa silt loam andDewey fly ash were the only mixtures for which a Mr test could
Fig. 8. Effect of plasticity index �PI� on CBR �a� and Mr �b� ofsoil–fly ash mixtures prepared 7% wet of optimum water content and9–12% wet of optimum water content. CBRs and Mrs are normalizedby values for soil alone.
be successfully completed �Table 5�. However, even with 30%
JOURNAL OF MATE
Fig. 9. Effect of group index �GI� on CBR �a� and Mr �b� of soil–flyash mixtures prepared 7% wet of optimum water content and 9–12%wet of optimum water content. CBRs and Mrs are normalized byvalues for soil alone.
Fig. 10. CBR as function of soil water content relative to optimumwater content �wSOIL−wOPT� for fly ash contents of 10 and 18%
RIALS IN CIVIL ENGINEERING © ASCE / MARCH/APRIL 2006 / 291

Dewey fly ash, Mr of the organic Theresa silt loam was stillbelow the moduli typically obtained for the mixtures preparedwith inorganic soils and 18% fly ash �Table 5�.
Organic soils traditionally have been more difficult to stabilizechemically than inorganic soils due to lower solids content, higherwater content, lower pH, and chemical interferences that occur inthe cementing reactions �Janz and Johansson 2002�. The ineffec-tiveness of the Columbia and Edgewater fly ashes in stabilizingthe organic Theresa silt loam is believed to be caused by organicmatter inhibiting hydration of cementitious binders, as reportedby others for cement stabilization �Hampton and Edil 1988;Axelsson et al. 2002; Tremblay et al. 2002�. The stabilizationeffect obtained with the Dewey fly ash may be due its high carboncontent or high CaO/SiO2 ratio, or a combination thereof. Morestudy is needed to determine how these variables affect stabiliza-tion of organic soils.
Relationship between Resilient Modulus and CBR
Empirical correlations between modulus and CBR have been pro-posed for natural soils by a number of researchers. For example,Powell et al.�1984� developed an equation relating the elasticmodulus obtained by wave propagation techniques and CBR.After accounting for stress and strain level characteristic of pave-ments, Powell et al. �1984� obtained
E = 7.6 CBR0.64 �2�
where E �essentially equivalent of resilient modulus� is in MegaPascal and CBR is in percent. Another well-known relationshipthat is widely used in North America was proposed by Heukelomand Foster �1960�
Mr = 10 CBR �3�
where Mr�resilient modulus in Mega Pascal. Eq. �3� is includedin the AASHTO �1993� Guide for design of pavement structures.
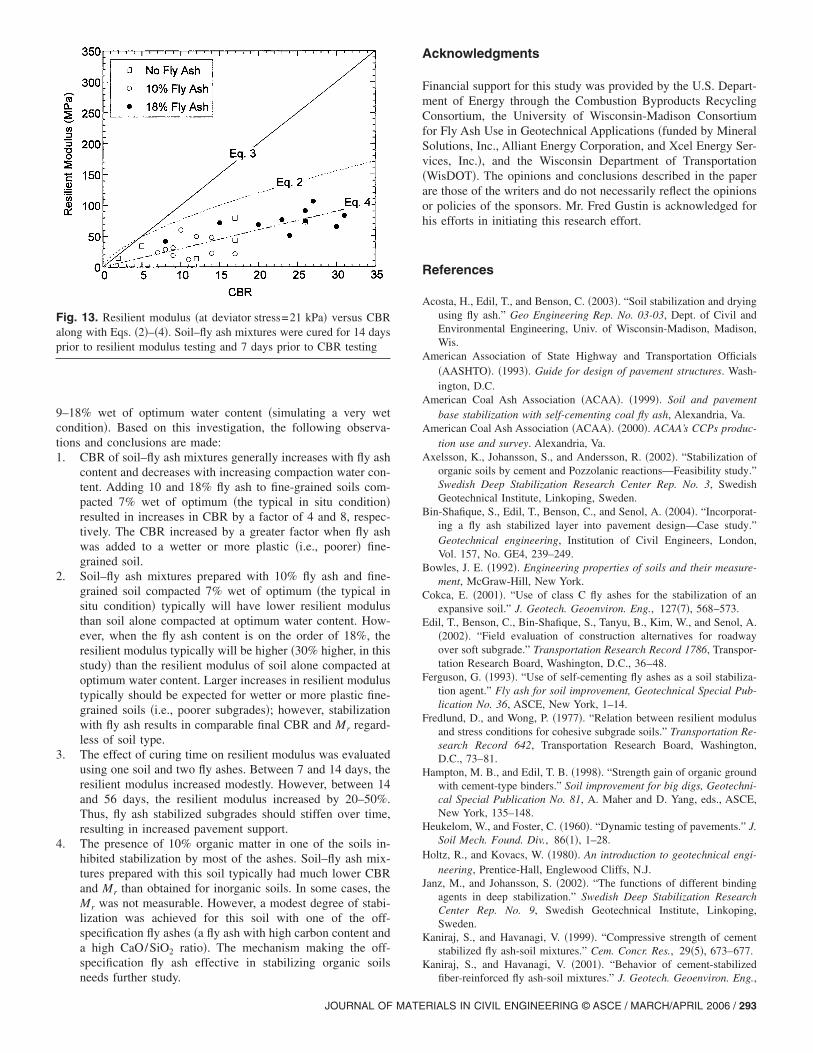
Eqs. �2� and �3� are shown with the data reported for soil–flyash mixtures in Tables 3 and 5 in Fig. 13. Both equations, devel-oped using natural soils, overpredict Mr for the soils and soil–flyash mixtures, with the overprediction being much greater for Eq.
Fig. 11. Effect of curing time of Mr of mixtures of red silty clay tillwith 18% Columbia or Dewey fly ash
�3�. Sawangsuriya and Edil �2005� also report that Eq. �3� tends to
292 / JOURNAL OF MATERIALS IN CIVIL ENGINEERING © ASCE / MARCH
overpredict Mr appreciably for natural soils. A better predictionfor the data from this study can be obtained with
Mr = 3 CBR �4�
Eq. �4�, which has R2=0.6, was obtained by linear least-squaresregression on the data shown in Fig. 13. These data are for thefine-grained soils alone and the mixtures of fine-grained soils andfly ashes used in this study. The suitability of Eq. �4� for othersoils and mixtures needs to be determined.
Conclusions
A laboratory study was conducted where soil–fly ash mixtureswere prepared at different fly ash contents �10–30%� to evaluatehow addition of fly ash can improve the CBR and resilient modu-lus �Mr� of wet and soft fine-grained subgrade soils. Specimenswere prepared at optimum water content, 7% wet of optimum
Fig. 12. CBR of soil–fly ash mixtures prepared with organic Theresasilt loam using Columbia, Dewey, and Edgewater fly ashes �a� andMr of mixtures prepared with Dewey fly ash �b�
water content �simulating the in situ condition in Wisconsin�, and
/APRIL 2006
9–18% wet of optimum water content �simulating a very wetcondition�. Based on this investigation, the following observa-tions and conclusions are made:1. CBR of soil–fly ash mixtures generally increases with fly ash
content and decreases with increasing compaction water con-tent. Adding 10 and 18% fly ash to fine-grained soils com-pacted 7% wet of optimum �the typical in situ condition�resulted in increases in CBR by a factor of 4 and 8, respec-tively. The CBR increased by a greater factor when fly ashwas added to a wetter or more plastic �i.e., poorer� fine-grained soil.
2. Soil–fly ash mixtures prepared with 10% fly ash and fine-grained soil compacted 7% wet of optimum �the typical insitu condition� typically will have lower resilient modulusthan soil alone compacted at optimum water content. How-ever, when the fly ash content is on the order of 18%, theresilient modulus typically will be higher �30% higher, in thisstudy� than the resilient modulus of soil alone compacted atoptimum water content. Larger increases in resilient modulustypically should be expected for wetter or more plastic fine-grained soils �i.e., poorer subgrades�; however, stabilizationwith fly ash results in comparable final CBR and Mr regard-less of soil type.
3. The effect of curing time on resilient modulus was evaluatedusing one soil and two fly ashes. Between 7 and 14 days, theresilient modulus increased modestly. However, between 14and 56 days, the resilient modulus increased by 20–50%.Thus, fly ash stabilized subgrades should stiffen over time,resulting in increased pavement support.
4. The presence of 10% organic matter in one of the soils in-hibited stabilization by most of the ashes. Soil–fly ash mix-tures prepared with this soil typically had much lower CBRand Mr than obtained for inorganic soils. In some cases, theMr was not measurable. However, a modest degree of stabi-lization was achieved for this soil with one of the off-specification fly ashes �a fly ash with high carbon content anda high CaO/SiO2 ratio�. The mechanism making the off-specification fly ash effective in stabilizing organic soils
Fig. 13. Resilient modulus �at deviator stress=21 kPa� versus CBRalong with Eqs. �2�–�4�. Soil–fly ash mixtures were cured for 14 daysprior to resilient modulus testing and 7 days prior to CBR testing
needs further study.
JOURNAL OF MATE
Acknowledgments
Financial support for this study was provided by the U.S. Depart-ment of Energy through the Combustion Byproducts RecyclingConsortium, the University of Wisconsin-Madison Consortiumfor Fly Ash Use in Geotechnical Applications �funded by MineralSolutions, Inc., Alliant Energy Corporation, and Xcel Energy Ser-vices, Inc.�, and the Wisconsin Department of Transportation�WisDOT�. The opinions and conclusions described in the paperare those of the writers and do not necessarily reflect the opinionsor policies of the sponsors. Mr. Fred Gustin is acknowledged forhis efforts in initiating this research effort.
References
Acosta, H., Edil, T., and Benson, C. �2003�. “Soil stabilization and dryingusing fly ash.” Geo Engineering Rep. No. 03-03, Dept. of Civil andEnvironmental Engineering, Univ. of Wisconsin-Madison, Madison,Wis.
American Association of State Highway and Transportation Officials�AASHTO�. �1993�. Guide for design of pavement structures. Wash-ington, D.C.
American Coal Ash Association �ACAA�. �1999�. Soil and pavementbase stabilization with self-cementing coal fly ash, Alexandria, Va.
American Coal Ash Association �ACAA�. �2000�. ACAA’s CCPs produc-tion use and survey. Alexandria, Va.
Axelsson, K., Johansson, S., and Andersson, R. �2002�. “Stabilization oforganic soils by cement and Pozzolanic reactions—Feasibility study.”Swedish Deep Stabilization Research Center Rep. No. 3, SwedishGeotechnical Institute, Linkoping, Sweden.
Bin-Shafique, S., Edil, T., Benson, C., and Senol, A. �2004�. “Incorporat-ing a fly ash stabilized layer into pavement design—Case study.”Geotechnical engineering, Institution of Civil Engineers, London,Vol. 157, No. GE4, 239–249.
Bowles, J. E. �1992�. Engineering properties of soils and their measure-ment, McGraw-Hill, New York.
Cokca, E. �2001�. “Use of class C fly ashes for the stabilization of anexpansive soil.” J. Geotech. Geoenviron. Eng., 127�7�, 568–573.
Edil, T., Benson, C., Bin-Shafique, S., Tanyu, B., Kim, W., and Senol, A.�2002�. “Field evaluation of construction alternatives for roadwayover soft subgrade.” Transportation Research Record 1786, Transpor-tation Research Board, Washington, D.C., 36–48.
Ferguson, G. �1993�. “Use of self-cementing fly ashes as a soil stabiliza-tion agent.” Fly ash for soil improvement, Geotechnical Special Pub-lication No. 36, ASCE, New York, 1–14.
Fredlund, D., and Wong, P. �1977�. “Relation between resilient modulusand stress conditions for cohesive subgrade soils.” Transportation Re-search Record 642, Transportation Research Board, Washington,D.C., 73–81.
Hampton, M. B., and Edil, T. B. �1998�. “Strength gain of organic groundwith cement-type binders.” Soil improvement for big digs, Geotechni-cal Special Publication No. 81, A. Maher and D. Yang, eds., ASCE,New York, 135–148.
Heukelom, W., and Foster, C. �1960�. “Dynamic testing of pavements.” J.Soil Mech. Found. Div., 86�1�, 1–28.
Holtz, R., and Kovacs, W. �1980�. An introduction to geotechnical engi-neering, Prentice-Hall, Englewood Cliffs, N.J.
Janz, M., and Johansson, S. �2002�. “The functions of different bindingagents in deep stabilization.” Swedish Deep Stabilization ResearchCenter Rep. No. 9, Swedish Geotechnical Institute, Linkoping,Sweden.
Kaniraj, S., and Havanagi, V. �1999�. “Compressive strength of cementstabilized fly ash-soil mixtures.” Cem. Concr. Res., 29�5�, 673–677.
Kaniraj, S., and Havanagi, V. �2001�. “Behavior of cement-stabilized
fiber-reinforced fly ash-soil mixtures.” J. Geotech. Geoenviron. Eng.,RIALS IN CIVIL ENGINEERING © ASCE / MARCH/APRIL 2006 / 293
127�7�, 574–584.Lee, W., Bohra, N., Altschaeffl, A., and White, T. D. �1997�. “Resilient
modulus of cohesive soils.” J. Geotech. Geoenviron. Eng., 123�2�,131–136.
Misra, A. �1998�. “Stabilization characteristics of clays using class C flyash.” Transportation Research Record 1161, Transportation ResearchBoard, Washington, D.C., 46–54.
Muhanna, A., and Rahman, M. �1999�. “Resilient Modulus Measure-ments of Fine Grained Subgrade Soils.” Transportation ResearchRecord 1687, Transportation Research Board, Washington, D.C.,3–12.
Nicholson, P. G., and Kashyap, V. �1993�. “Flyash stabilization of tropicalHawaiian soils.” Fly Ash for Soil Improvement, Geotechnical SpecialPublication No. 36, ASCE, New York, 15–29.
Nicholson, P., Kashyap, V., and Fuji, C. �1994�. “Lime and fly ash ad-mixture improvement of tropical Hawaiian soils.” Transportation Re-search Record 1440, National Research Council, Washington, D.C.,71–78.
Pandian, N., and Krishna, K. �2003�. “The pozzolanic effect of fly ash on
the California bearing ratio behavior of black cotton soil.” J. Testing294 / JOURNAL OF MATERIALS IN CIVIL ENGINEERING © ASCE / MARCH
and Evaluation, ASTM, Vol. 31, No. 6, 479–485.Powell, W., Potter, J., Mayhew, H., and Nunn, M. �1984�. The structural
design of bituminous roads, TRRL Laboratory Report 1132, Transpor-tation and Road Research Laboratory, Crowthorne, Berkshire,U.K., 62.
Sawangsuriya, A., and Edil, T. B.. �2005�. “Evaluating stiffness andstrength of pavement materials, geotechnical engineering.” Geotech-nical Engineering, Institution of Civil Engineers, London, Vol. 158,No. GE4, 217–230.
Tremblay, H., Duchesne, J., Locat, J., and Leroueil, S. �2002�. “Influenceof the nature of organic compounds on fine soil stabilization withcement.” Can. Geotech. J., Vol. 39, 535–546.
Trzebiatowski, B., Edil, T., and Benson, C. �2004�. “Case study of sub-grade stabilization using fly ash: State Highway 32.” Recycled Mate-rials in geotechs, GSP No. 127, A. Aydilek and J. Wartman, eds.,ASCE, Reston, Va., 123–136.
Turner, J. P. �1997�. “Evaluation of western coal fly ashes for stabilizationof low-volume roads.” Testing Soil Mixed with Waste or RecycledMaterials, STP 1275, ASTM International, West Conshohocken, Pa.,
157–171./APRIL 2006