ultrafine grained steel by innovative deformation cycle
TRANSCRIPT


ULTRA FINE GRAINED STEEL BY INNOVATIVE DEFORMATION CYCLES
ECSC Contract No. 7210.PR/288
SUMMARY
Recently, much attention has been devoted world wide in search of materials with superior strength
and ductility combination. Although many methods are available to improve strength, grain size is
perhaps the only method, as of known today, to improve the conflicting demands in properties as, for
example, strength and toughness.
This project was aimed to establish the best processing routes to promote the formation of ultrafine
ferrite (preferably 2-3 µm) and mixed (e.g. ferrite-cementite, ferrite-martensite) microstructures either
in the bulk or the external layers of strips/plates and rods for a wide range of chemical compositions
(0.05-1.6 %C). The experimentation was mainly focused on processing routes that do not require
extreme strains and significant plant changes, making use of microalloying additions (e.g. niobium)
when necessary, for producing these novel microstructures.
In addition, two severe plastic deformation techniques to produce ultrafine grains (Accumulative Roll
Bonding and Equal Channel Angular Pressing) were tested.
Of course different experiments were performed depending on material carbon content and for this
reason different work packages were created.
For low C steels (0.05-0.1%C), experiments were mainly carried out to assess the hot deformation
conditions for producing fine grain sizes through Strain Induced Dynamic Transformation mechanism
(SIDT) and to establish the influence of chemical composition, prior austenitic grain size, strain and
deformation temperature on grain refinement.
SIDT is a dynamic phase transformation occurring during deformation at temperature slightly higher
than Ar3 due to the strain energy accumulated in austenite phase that induces an early γ−α 伊phase
transformation.
Deformation-dilatometry tests confirmed that increasing the strain the amount of strain-induced
transformed ferrite and grain size refinement increase. The critical strain, required for SIDT to occur
is related to the deformation conditions and chemical composition. The increase of carbon content in
solution retards the SIDT and increases the critical strain. Small prior austenite grain size leads to an
increase of strain induced ferrite volume fraction and ferrite grain refinement.
After the determination of SIDT parameters, laboratory rolling tests were carried out to reproduce as
closely as possible the deformation schedules used in dilatometer experiments in order to get ultra fine
grains on sheets surface.
For microalloyed low C steels the static and dynamic precipitation effect of Nb on grain refinement
was studied.
These experiments were aimed at defining the processing window for hot rolling of Nb steels by
adjusting the steel composition and the process parameters (in particular the time between the last
rolling pass and the on-set of accelerated water cooling in the run-out table) in order to obtain the
finest ferrite grains.
The effects of soluble B and P additions were also investigated.
From the results it was concluded that to obtain fine grains in hot rolled Nb steel, all the Nb must be
dissolved at 1250 °C, strain accumulation must occur below Tnr and above Ar3 to induce dynamic
recrystallisation of deformed austenite grains. To reduce the NbC precipitation during cooling, and
also the austenite static recrystallisation, the last pass must be followed by fast cooling to the
γ−α transformation temperature.
Ultrafine ferrite (sub)grains (0.60 - 0.95µm) and uniformly distributed cementite particles were
produced in two plain C - Mn steels with 0.15% - 0.3% carbon and different Mn contents (0.7% and
1.5%). The experiments were carried out by using heavy warm deformation with a subsequently
3

coiling treatment, a process, which can generally be applied in the industry. The fine partially aligned
globular cementite particles (20 - 350nm) of two different size groups were detected in the final
microstructure. A higher Mn partitioning in the cementite of the Mn richer steel is useful to decrease
the pearlite growth rate. Moreover, apart of the decrease in the average ferrite grain size with increase
in the Mn content, it also leads to a change in the grain shape from an elongated to a more equiaxed
morphology. The fraction of high-angle grain boundaries rises from 64% to 74%. As a consequence of
these changes in microstructure, conditioned by the different Mn content, the ultimate tensile strength
increased from 595MPa to 678MPa, without significant difference in the total elongation of 22.7%
and 21.4%.
Other processing schedules were investigated aimed at producing a homogeneous ultra-fine ferrite and
spheroidised carbide aggregate microstructure structure in high carbon (CMn) steels (0.6-1.6wt%C),
via conventional ‘warm’ rolling and innovative Equal Channel Angular Extrusion (ECAE). Suitable
deformation schedules were determined from dilatometry and thermo-mechanical Gleeble simulations.
Evidence of an ultra-fine ferrite and carbide aggregate microstructure following ‘warm’ rolling was
given. A significant improvement in tensile strength, particularly proof stress (0.2%) was also noted in
comparison to material deformed at higher temperatures. Concurrent Equal Channel Angular
Extrusion (ECAE) experiments investigated microstructural evolution with incremental strain.
Extensive analysis was carried out using various techniques, including high resolution Electron Back
Scattered Diffraction (EBSD). Evidence of ferrite grain refinement was noted in an eutectoid
composition steel. A sub-micron ferrite structure was observed following high strains (ε~3.3) which
induced a marked increase in tensile strength.
Accumulative Roll Bonding experiments were conducted using a 0.15%C-1.37Mn steel strip. The
sheets (3.7 mm thick) were cut into two halves, ground/polished, overlapped (stacked), edge welded
and warm rolled at 615 °C. The process was repeated 5 times for a total strain of about 4 and then
annealed at different temperatures. After annealing at different temperatures final mean grain size
ranged between 0.8µm and 6 µm.
The experimentation showed that this severe plastic deformation method gives the possibility to
obtain customized microstructures with improved combination of strength and ductility/toughness
through adequate grain refinement (1-3 µm).
Results showed that the grain size of ferrite can be refined to 1-3 µm by different methods using
advanced thermomechanical processes that can be applied on already existent pilot mills or that can be
applied off line (Pony Mill). Innovative techniques like Accumulative Roll Bonding and Equal
Channel Angular Extrusion showed to be very effective in grain refinement, because they can easily
impose high deformations giving ultrafine grains but that, at this stage, are still in laboratory scale.
Further, the mechanisms of ultrafine grain refinement were clarified.
As expected, large enhancements in strength were observed in the ultrafine grained steels after tensile
tests at room temperature. However a reduced work hardening in the ultrafine grained steels was
detected.
The presence of a second phase such as globular cementite is beneficial to improve both strength and
work hardening rate of steels. Therefore, it is very attractive to produce a relatively coarser
microstructure (i. e. grain size of 2&3 µm) with a second phase (i. e. finer precipitates) in the matrix.
The ductility of steels is significantly improved due to a relative coarse microstructure and an increase
in work hardening rate by the second phase. On the other hand, in addition to grain refinement,
precipitation hardening can also contribute to strengthening.
4

CONTENTS
SUMMARY 3
CONTENTS 5
LIST OF FIGURES 7
LIST OF TABLES 14
KEYWORDS 14
1. INTRODUCTION 15
3.DESCRIPTION OF THE WORK PACKAGES
4. ULTRAFINE SURFACE GRAINED LOW C STEEL 19
4.1 Introduction 19
4.2 Strain Induced Dynamic Transformation 19
4.2.1 Experimental 19
4.2.2 Results 20
4.2.3 Discussion 32
4.3 Deformed undercooled austenite 34
4.4 Laboratory Rolling 36
4.5 Conclusions 43
5. ULTRAFINE LOW and MEDIUM C STEEL 45
5.1 Introduction 45
5.2 Experimental approach 45
5.2.1 Continuous-cooling-transformation diagrams
after deformation of C-Mn steels 46
5.2.2 Ultrafine grained steels produced by warm deformation 46
5.2.3 Microstructure and mechanical properties of ultrafine grained
steels 47
5.3 Results 49
5.3.1 Optimization of austenite deformation temperature 49
5.3.2 Continuous-cooling-transformation diagrams after deformation 49
5.3.3 Effects on microstructure and hardness of the ultrafine grained
steels after compression tests 51
5.3.4 Microstructure and mechanical properties of the conventional
steels 57
5.3.5 Microstructure and mechanical properties of the ultrafine
grained steels 59
5.3.6 Comparison of properties between the conventional and
ultrafine grained steels 72
5.3.7 Microstructure and texture evolution during warm deformation
and annealing 79
5.4 Discussion 86
5.4.1 Ultrafine grained steels produced by warm deformation 86
5.4.2 Formation of the ultrafine grained steels during warm
deformation and annealing 86
5
2. PROGRAM OBJECTIVES 17
17

5.4.3 Texture evolution during annealing of a 0.2%C steel 89
5.4.4 Effect of carbon and manganese on grain refinement 90
5.4.5 Mechanical properties of the ultrafine grained steels 92
5.4.6 Effect of carbon content on work hardening rate 96
5.5 Conclusions 97
6. ACCUMULATIVE ROLL BONDING 101
6.1 Introduction 101
6.2 Experimental 102
6.3 Results and discussion 102
6.3.1 Microstructure 102
6.3.2 Textures 105
6.3.3 Mechanical properties 107
6.3.4 Bonding 107
6.4 Conclusions 108
7. ULTRAFINE MICROALLOYED LOW C STEELS 109
7.1 Introduction 109
7.2 Experimental 109
7.3 Results and discussion 111
7.3.1 Dilatometry 111
7.3.2 Torsion tests 117
7.3.3 Hot rolling simulations 121
7.3.4 Hot rolling process parameters affecting the ferrite grain size 130
7.3.5 Further Processing: cold rolling and annealing 133
7.4 Conclusions 137
8. ULTRAFINE HIGH C STEEL 139
8.1 Introduction 139
8.2 Experimental 139
8.3 Results and discussion 141
8.3.1 Dilatometry 141
8.3.2 Gleeble tests 145
8.3.3 Rolling Tests 148
8.3.4 Mechanical properties 154
8.3.5 Laser Welding 157
8.4 Equal Channel Angular Extrusion 158
8.5 Conclusions 166
9. GENERAL CONCLUSIONS 167
10. RECOMMENDATIONS FOR FUTURE WORK 169
11. REFERENCES 170
6

LIST OF FIGURES
Fig. 1 Thermomechanical treatments carried out by dilatometer: , (a) verification of SIDT occurrence
(b) prior austenite grain size determination.
Fig. 2 Microstructure of CSM1 steel quenched after holding at Ar3 +25°C x 5s.
Fig. 3 Ferrite nucleation by deformation induced transformation at austenite grain boundaries in
CSM1 steel at: (a) 40% deformation; (b) 60% deformation.
Fig. 4 Microstructure of sample air cooled after 40% deformation (CSM1).
Fig. 5 Microstructure of CSM05 steel quenched after holding at Ar3 +25°C.
Fig. 6 Ferrite nucleation in CSM05 steel at (a) 40% deformation; (a) 60% deformation.
Fig. 7 Microstructure of CSM05 steel air cooled after 40% deformation
Fig. 8 Thermal cycles used to get different prior austenitic grain sizes (PAGS).
Fig. 9 Hot deformation thermomechanical cycles.
Fig.10 Microstructures of CSM1 steel after quenching, for different prior austenitic grain size and
reductions.
Fig. 11 Microstructure of CSM05 steel after quenching for different prior austenitic grain size and
reductions.
Fig. 12 Macrostructure of CSM1 steel after quenching deformed at 60%.
Fig. 13 Macrostructure of CSM05 steel after quenching deformed at 60%.
Fig. 14 Simulated equivalent strain distribution for samples deformed at 60%.
Fig. 15 Simulated equivalent strain distribution for samples deformed at 60%.
Fig. 16 Macrostructure of CSM1 steel after quenching deformed at 40% at : (a) Ar3+15 °C, (b) Ar3+35
°C.
Fig. 17 OIM of CSM1 sample deformed at 60% with wide prior austenite grain size. (a) Grains map, (b)
orientation map.
Fig. 18 Orientation maps.
Fig. 19 Thermal cycles used to get different prior austenitic grain sizes (PAGS) for samples 988 and
1022.
Fig. 20 Hot deformation thermomechanical cycles for samples 988 and 1022.
Fig. 21 Microstructure of 988 and 1022 steels after quenching for different deformations. (a)
deformation 40% steel 988, (b) deformation 60% steel 988, (c) deformation 40% steel 1022, (d)
deformation 60% steel 1022.
Fig. 22 Schematic illustration of temperature dependencies of the critical strain for SIDT and DRX [47].
Fig. 23 Free energy increase after deformation of austenite.
Fig. 24 Thermomechanical cycle for undercooled austenite.
Fig. 25 Microstructure of CSM1 steel having PAGS =133 µm, deformed of 60% at (a) 816°C, (b)
700°C.
Fig. 26 Microstructure of CSM05 steel having PAGS =160 µm, deformed of 60% at (a) 837°C, (b)
700°C.
Fig. 27 Macrostructure of CSM1 steel after deformation at 700°C.
Fig. 28 Hot rolling thermomechanical cycle carried out on laboratory mill.
Fig. 29 Microstructures at different through positions thickness of samples hot rolled at pilot Mill (1st
test).
Fig. 30 Microstructures at different through positions thickness of samples CSM1 And CSM05 hot
rolled at pilot mill.
Fig. 31 Hardness through the thickness for plain low-C steels.
Fig. 32 Microstructures at different through positions thickness of samples CSM1 And CSM05 hot
rolled at pilot mill.
Fig. 33 Hardness through the thickness for microalloyed low-C steels.
Fig. 34 Optimization of austenite deformation temperature (experiment I).
Fig. 35 Determination of continuous-cooling-transformation diagrams after deformation (experiment
II).
Fig. 36 Processing schedules for the compression tests. LSW: large strain warm deformation; Trh:
reheating temperature; Ar3: austenite to ferrite transformation temperature; Pf: pearlite finish
temperature; Bf: bainite finish temperature.
7

Fig. 37 Processing schedules for the plane strain compression tests. Trh: reheating temperature; Ar3:
austenite to ferrite transformation temperature; Pf: pearlite finish temperature (a) conventional
route (CR) for getting coarser microstructure, (b) ultrafine grain route (UFR) for producing
ultrafine microstructure, (c) investigation of microstructure evolution during warm deformation
(ε = 0.4, 0.8, 1.2, 1.6), (d) high temperature annealing after large strain warm (LSW)
deformation
Fig. 38 Water quenched microstructure after deformation at 1133 K for the 15C steel (a), and at 1143 K
for the 2C (b), 2CMn (c) and 3C (d) steel (dashed line shows an example of an equiaxed prior
austenite grain). CD: compression direction; TD: transverse direction.
Fig. 39 Continuous-cooling-transformation diagrams of the experimental steels after deformation (ε
=0.3, ε& =10s-1
) at the optimum temperatures (1133 K for the 15C steel, and 1143 K for the
other steels) and continuous cooling. The cooling rates varied from 2 to 64 K/s. F: ferrite; P:
pearlite; B: bainite; Ms: martensite start temperature. (a) 15C steel; (b) 2C steel; (c) 2CMn steel;
and (d) 3C steel.
Fig. 40 Comparison of the results from Fig.39 for all the steels. The cooling curves are omitted for
clarity. Fs: ferrite transformation temperature; Pf: pearlite finish temperature; F: ferrite; P:
pearlite.
Fig. 41 Microstructure changes with increasing cooling rate in the 3C steel. CD: compression direction;
TD: transverse direction. (a) 2 K/s, (b) 16 K/s and (c) 64 K/s.
Fig. 42 Optical micrographs of the 3C steel after the experiments in Fig. 36. CD: compression direction;
TD: transverse direction; Temp.: multi-step deformation and subsequent annealing
temperatures in the experiment III and experiment V, annealing temperature in the experiment
IV.
Fig. 43 SEM images (a) and EBSD maps (b) of the 3C steel after the large-strain deformation (ε = 1.6)
and subsequent 2 h annealing at different temperatures (experiment V). Details of the
processing are given in Fig. 36c. CD: compression direction; TD: transverse direction. The
black lines indicate grain boundary misorientations between 15° and 63°. The white lines
indicate grain boundary misorientations between 2° and 15°.
Fig. 44 Fraction of high-angle grain boundaries (HAGBs) of the 3C steel obtained for the three
different experiments in Fig. 36.
Fig. 45 Average ferrite grain and subgrain sizes in the CD (compression direction) and TD (transverse
direction), respectively, for the 3C steel. The right hand ordinate indicates the corresponding
values for the grain shape aspect ratio (GSAR), data are taken from the experiment V (Fig. 36c):
(a) only high-angle grain boundaries are considered in the measurement (15° ≤ θ < 63°), (b)
both high- and low-angle grain boundaries are considered in the measurement (2° ≤ θ < 63°)
Fig. 46 Average values for the grain shape aspect ratio (GSAR) of the 3C steel after the three different
processes in Fig. 36. (a) only high-angle grain boundaries are considered in the measurement
(15° ≤ θ < 63°), (b) both high- and low-angle grain boundaries are considered in the
measurement (2° ≤ θ < 63°)
Fig. 47 Effect of carbon content on average ferrite (sub)grain size after the experiments in Fig. 36. (a)
high-angle grain boundaries are considered in the measurements (b) high- and low-angle grain
boundaries are considered in the measurements
Fig. 48 Effect of the experimental routes in Fig. 36 on average ferrite (sub)grain size for the different
steels. (a) high-angle grain boundaries are considered in the measurement, (b) high- and low-
angle grain boundaries are considered in the measurement
Fig. 49 Macrohardness changes with temperature after the different experiments in Fig. 36 (Experiment
III: warm deformation of a ferrite-pearlite microstructure; Experiment IV and V: warm
deformation of a bainite microstructure). (a) 15C; (b) 2C; (c) 2CMn; (d) 3C.
Fig. 50 Optical micrographs of the experimental steels after the conventional route. Details of the
processing are given in Fig. 37a: (a) 15C steel; (b) 2C steel; (c) 2CMn steel; (d) 3C steel.
Fig. 51 Grain size of the experimental steels after the conventional route. Details of the processing are
given in Fig. 37a.
Fig. 52 Comparison of stress-strain curves of the experimental steels with different ferrite grain sizes.
The steels were processed by the conventional route (CR), as shown in Fig. 37a.
Fig. 53 Charpy impact properties for subsize specimens of the experimental steels after the
conventional route (CR). Details of the processing are given in Fig. 37a.
8

Fig. 54 SEM images of the experimental steels after large strain deformation and 2 h annealing at 823
K (Fig. 37b: ultrafine grain route):(a) 15C steel; (b) 2C steel; (c) 2CMn steel; (d) 3C steel.
Fig. 55 Average ferrite (sub)grain size (a) and grain shape aspect ratio (GSAR) (b) of the experimental
steels after large strain deformation and 2 h annealing at 823 K (Fig. 37b: ultrafine grain route).
Fig. 56 Fraction of high-angle grain boundaries (HAGBs) of the experimental steels after large strain
deformation and 2 h annealing at 823 K (Fig. 37b: ultrafine grain route).
Fig. 57 Grain boundary characterization of the 2CMn steel after large strain deformation and 2 h
annealing at 823 K (Fig. 37b: ultrafine grain route). (a) EBSD image: the red lines indicate
grain boundary misorientations between 15° and 63°; the green lines indicate grain boundary
misorientations between 2° and 15° (b) grain boundary misorientation distribution.
Fig. 58 Image quality map of the 2C steel after large strain deformation at 823 K and subsequent 2 h
annealing at 973 K (Fig. 37d).
Fig. 59 EBSD maps of the 2C steel processed by large strain deformation at 823 K and subsequent 2 h
annealing at 973 K (Fig. 37d). (a) image quality map; (b) carbon distribution; (c) manganese
distribution.
Fig. 60 Manganese content (mass%) in the matrix and in the cementite particles determined by the
STEM-EDS technique for the 2C (0.22 mass%C-0.74 mass%Mn) and 2CMn (0.23 mass%C-
1.52 mass%Mn) steels after warm deformation (ε = 1.6) and subsequent annealing.
Fig. 61 TEM micrographs of the 2C (0.22 mass%C-0.74 mass%Mn) and 2CMn (0.23 mass%C-1.52
mass%Mn) steels after large strain warm deformation (ε = 1.6) and annealing, respectively. The
arrows “1” point out the fine cementite particles inside the ferrite grains. The arrows “2” point
out the coarse cementite particles at the ferrite grain boundaries. (a) and (b) deformed
microstructure (c) and (d) annealed microstructure
Fig. 62 TEM micrographs of the dislocation structures in the 2C steel after large strain warm
deformation (ε = 1.6) and annealing, respectively. (a) dislocation structure after large strain
warm deformation (b) dislocation structure after annealing
Fig. 63 TEM micrographs of the 2C steel after large strain warm deformation and annealing. (a) mutual
crystallographic orientation of the local areas (adjacent grains and subgrains numbered with 1
to 6). The white arrows point out the cementite particles pinning the subgrain boundary
(misorientation θ = 7.5°),(b) dislocation structures and individual cementite particles inside the
ferrite matrix. The black arrows point out the cementite particles pinning the dislocations
Fig. 64 Comparison of stress-strain curves of the experimental steels with different ferrite grain sizes.
The steels were processed by the large strain deformation and subsequent 2 h annealing at 823
K (Fig. 37b: ultrafine grain route).
Fig. 65 Mechanical properties of the experimental steels after large strain deformation and subsequent
2 h annealing at 823 K (Fig. 37b: ultrafine grain route). (a) Strength; (b) ductility
Fig. 66 Lüders strain of the experimental steels after large strain deformation and subsequent 2 h
annealing at 823 K (Fig. 37b: ultrafine grain route)
Fig. 67 Yield to tensile ratio (LYS/UTS) of the experimental steels after large strain deformation and
subsequent 2 h annealing at 823 K (Fig. 37b: ultrafine grain route). LYS: lower yield stress;
UTS: ultimate tensile stress.
Fig. 68 True stress-strain curves of the ultrafine grained steels with different carbon contents.
Fig. 69 Work hardening rate θw versus true stress σt, both normalized by the temperature dependent
shear modulus µ = 80 GPa. dα: average ferrite grain size.
Fig. 70 Charpy impact properties for subsize specimens of the experimental steels after large strain
deformation and subsequent 2 h annealing at 823 K (Fig. 37b: ultrafine grain route).
Fig. 71 Specific upper shelf energy (related to the ligament area) (a) and ductile-to-brittle transition
temperature (b) of the experimental steels after large strain deformation and subsequent 2 h
annealing at 823 K (Fig. 37b: ultrafine grain route). All values were converted to those for full
size Charpy test specimens according to equation (1) and (2).
Fig. 72 Observation area of Charpy impact fracture surface – in the middle of the thickness (along ND)
and 1 mm away from the V-notch.
Fig. 73 Fracture surfaces of the Charpy impact specimens tested at room temperature (293 K) and -40°
(233 K). The impact specimens of the experimental steels were produced by the ultrafine grain
route (Fig. 37b). (a) 15C steel; (b) 2C steel; (c) 2CMn steel; (d) 3C steel.
9

Fig. 74 Comparison of average ferrite grain size of the experimental steels produced by the
conventional route (CR) (Fig. 37a), and the ultrafine grain route (UFR) (Fig. 37b), respectively.
Open symbols: results after the CR; filled symbols: results after the UFR.
Fig. 75 Comparison of stress-strain curves of the experimental steels with different grain sizes. The
different grain sizes were produced by the conventional route (CR) (Fig. 37a), and the ultrafine
grain route (UFR) (Fig. 37b), respectively. (a) 15C steel; (b) 2C steel; (c) 2CMn steel; (d) 3C
steel.
Fig. 76 Comparison of tensile properties of the experimental steels with different grain sizes. The
different grain sizes were produced by the conventional route (CR) (Fig. 37a), and the ultrafine
grain route (UFR) (Fig. 37b), respectively. Open symbol: results after the CR; filled symbol:
results after the UFR. (a) yield stress, (b) ultimate tensile stress, (c) ratio of lower yield stress to
ultimate tensile stress (LYS/UTS), (d) Lüders strain.
Fig. 77 Change of Charpy impact properties for subsize specimens of the experimental steels with
different grain sizes. The different grain sizes were produced by the conventional route (CR)
(Fig. 37a), and the ultrafine grain route (UFR) (Fig. 37b), respectively. DBTTsmall: ductile-to-
brittle transition temperature of subsize specimen. (a) 15C steel; (b) 2C steel; (c) 2CMn steel; (d)
3C steel.
Fig. 78 Fracture surfaces, taken by SEM, of the ultrafine and conventional 2C steels after Charpy V-
notch impact tests. A fracture surface of the ultrafine 2C steel after impact testing at 103 K (-
170°) (a) total view of the fracture surface; (b) brittle behavior; (c) border area between
cleavage fracture and ductile fracture; (d) ductile behavior, observation area is shown in (a) B
fracture surface of the conventional 2C steel after impact testing at 143 K (-130°) (e) total view
of the fracture surface; (f) appearance of the cleavage fracture, observation area is shown in (e).
Fig. 79 ND orientation maps (taken by EBSD measurement) of the ultrafine grained 2C steel after
Charpy impact testing at 103 K, the same specimen as shown in Fig. 45a but measured in the
transverse direction of the sample. (a) front of a crack: the circles with number “1” and “2”
point out two elongated grains with high-angle grain boundaries in between (b) aligned damage
below a ductile fracture: the ellipse highlights the alignment of microvoids along the grain
boundaries
Fig. 80 Converted full size Charpy impact properties. (a) Specific upper shelf energy (related to the
ligament area) and (b) ductile-to-brittle transition temperature of the experimental steels with
different grain sizes. The different grain sizes were produced by the conventional route (CR)
(Fig. 37a), and the ultrafine grain route (UFR) (Fig. 37b), respectively.
Fig. 81 Lower yield stress and ductile-to-brittle transition temperature of the experimental steels. The
filled symbol represents the results from the steels after ultrafine grain route (UFR) (Fig. 37b).
The open symbol represents the results from the steels processed by the conventional route (CR)
(Fig. 37a). The dot of number “1” indicates the best combination of strength and toughness.
Fig. 82 Optical microstructures of the 2C steel during warm deformation (Fig. 37c) and annealing (Fig.
37b) at 823 K. (a) initial microstructure before large strain warm deformation, (b)
microstructure after one warm deformation step (ε = 0.4), (c) microstructure after two warm
deformation steps (ε = 0.8), (d) microstructure after three warm deformation steps (ε = 1.2), (e)
microstructure after steps warm deformation four (ε = 1.6), (f) microstructure after four
deformation steps and 2 h annealing at 823 K
Fig. 83 Microstructure evolution of the 2C steel during warm deformation (Fig. 37c) and annealing
(Fig. 37b) at 823 K. Arrow “1” points out the large cementite particle at the ferrite grain
boundary. Arrow “2” points out the small cementite particle in the initial pearlite colony region.
Arrow “3” points out the cementite lamella in the initial pearlite colony region. (a) initial
microstructure before large strain warm deformation, (b) microstructure after two warm
deformation steps (ε = 0.8), (c) microstructure after four warm deformation steps (ε = 1.6),(d)
microstructure after four deformation steps and 2 h annealing at 823 K .
Fig. 84 Evolution of grain characteristic of the 2C steel during warm deformation (Fig. 37c) and
annealing (Fig. 37b) at 823 K, each deformation step with ε = 0.4 and ε& = 10-1
. 1.6-Ann.:
processed by four deformation steps and 2 h annealing at 823 K. (a) change of average ferrite
grain size and grain shape aspect ratio (b) change of fraction of high-angle grain boundaries
(HAGBs)
Fig. 85 Grain boundary misorientation distribution for the 2C steel during warm deformation (Fig. 37c)
and annealing (Fig. 37b) at 823 K, each deformation step with ε = 0.4 and ε& = 10-1
. (a)
10

misorientation distribution after two deformation steps (ε = 0.8), (b) misorientation distribution
after two deformation steps (ε = 1.2), (c) misorientation distribution after four deformation
steps (ε = 1.6), (d) misorientation distribution after four deformation steps and 2 h annealing at
823 K
Fig. 86 Total fraction of α-(<110> || RD) fiber and γ-(<111> || ND) fiber for the 2C steel during warm
deformation (Fig. 37c) and annealing (Fig. 37b) at 823 K, each deformation step with ε = 0.4
and ε& = 10-1
. 1.6-Ann.: processed by four deformation steps and 2 h annealing at 823 K.
Fig. 87 Texture evolution for the 2C steel during warm deformation (Fig. 37c) and annealing (Fig. 37b)
at 823 K, each deformation step with ε = 0.4 and ε& = 10-1
. (a) orientation image: α-(<110> ||
RD) fiber in blue and γ-(<111> || ND) fiber in red (b) observed texture in ϕ2 = 45° ODF section
Fig. 88 Sketch of the microstructure evolution during warm deformation.
Fig. 89 Influence of grain size on the cleavage fracture stress *
fσ and the yield stress σy of notched
impact test specimens. The subscript of number “1” indicates the results from the steel with fine
grains (solid lines). The subscript of number “2” indicates the results from the steel with coarse
grains (dashed lines). After [75]
Fig. 90 Schematic drawing of Accumulative Roll Bonding Process.
Fig. 91 Hot rolling conditions and microstructures for each pass of ARB.
Fig. 92 SEM image of the sample after the 5th pass before annealing.
Fig. 93 Microstructures of ARB samples annealed at 600°C x 3 min at different magnifications.
Fig. 94 Microstructures of ARB samples annealed at (a)650°C x 3 min (b) 700°C x 3 min.
Fig. 95 (a) Unique grain colour image of the sample annealed at 650°C x 3 min, (b) Misorientation
angle distribution.
Fig. 96 Orientation Distribution Function of the sample.
Fig. 97 γ - Fibre of the sample.
Fig. 98 Inverse polar figure maps according the colour code reported: (a) {hkl}, (b) <uvw>
Fig. 99 σ−ε curve of ARB samples.
Fig. 100 Bonding situations in (a) et mid-thickness after 5th pass and annealing (b) defect.
Fig. 101 Dilatometric cycles.
Fig. 102 Thermomechanical (torsion) schedules.
Fig. 103 Length change versus time during the γ−α transformation at 650 °C after different holding
times at 900 °C.
Fig. 104 Results of NbC precipitates quantification in dilatometer samples hold at 900 °C and
quenched.
Fig. 105 Kinetics of γ−α phase transformation at 650 °C in steel 419.
Fig. 106 Microstructures after holding at 900 °C for tp= 6, 200, 5000 and 10000 s (from top to bottom)
and for different initial Nb content: 0.041, 0.053 and 0.083 wt% (from left to right).
Isothermal transformation at 650 °C.
Fig. 107 Determination of n and k parameters of the JMA equation from the curves of Fig.105.
Fig. 108 Transformed fraction to ferrite after different times at 650 °C versus the Nb content in NbC
precipitates formed at 900 °C.
Fig. 109 Magnetometer signal recorded during cooling the steel without Nb from 900 °C at cooling
rates 1, 6, 20 and 60 °C/s, respectively.
Fig. 110 DCCT diagrams for steels 430 (top) and 431 (bottom) with and without holding 100 s at 900
°C. The DCCT diagram for steel 464 without Nb is also indicated.
Fig. 111 NbC quantification results in torsion specimens quenched after different steps.
Fig. 112 Measured ferrite grain diameter for different continuous cooling rates in steel 431 deformed
at 900 °C with and without 100 s holding at 900 °C.
Fig. 113 Microstructures after continuous cooling the steel 430 from 900 °C without (left) and with
(right) 100s delay after deformation at a) CR = 60 °C/s, b) CR = 20 °C/s and c) CR = 6 °C/s.
Fig. 114 Effect of NbC precipitation on the final ferrite grains size and hardness in Nb steels.
Fig. 115 Rolling forces and temperatures measured during the 5 rolling passes.
Fig. 116 Yield Stress (YS) and Tensile Strength (TS) measured after coiling the low C low Mn Nb
steel 806 at 500 °C, 550 °C, 600 °C and 650 °C, respectively.
Fig. 117 Microstructure and measured ferrite grain size in steel 806 coiled at 500 °C, 550 °C, 600 °C
and 650 °C, respectively.
11
Fig. 118 Rolling forces and temperatures measured during the 5 rolling passes (new rolling scheme
with higher reduction in the last passes).
Fig. 119 Microstructure and measured ferrite grain size in steel 1134 coiled at 500 °C, 550 °C and 600
°C, respectively.
Fig. 120 Microstructure and measured ferrite grain size in steel 1135 coiled at 500 °C, 550 °C and 600
°C, respectively.
Fig. 121 Microstructure and measured ferrite grain size in the B-bearing steel 1185 coiled at 500 °C,
550 °C and 600 °C, respectively.
Fig. 122 Microstructure and measured ferrite grain size in steel B-bearing steel 1186 microalloyed
with P, coiled at 500 °C, 550 °C and 600 °C, respectively.
Fig. 123 Rolling forces and temperatures measured during the 3 rolling passes (new rolling scheme
with the highest possible reduction in the last pass).
Fig. 124 Microstructure and measured ferrite grain size in steel 1135 coiled at 500 °C, after being
processed using 2 different rolling schemes.
Fig. 125 Microstructure and measured ferrite grain size in steels 1185 and 1186 hot rolled in 3 passes
with 70 % reduction in the last pass and coiled at 500 °C.
Fig. 126 Ferrite grain size measured after rolling and coiling the different low C low Mn Nb steels at
different CT.
Fig. 127 Effects of B and P additions on the ferrite grain refinement.
Fig. 128 Tensile Strength (TS) measured after rolling and coiling the different low C low Mn Nb steels
at different CT. Effects of Ti additions.
Fig. 129 Tensile Strength (TS) measured after rolling and coiling the different low C low Mn Nb-Ti
steels at different CT. Effects of B and P additions.
Fig. 130 Total elongation (A50) versus Tensile Strength (TS) plot for the 5 studied steel compositions
hot rolled following different rolling schemes.
Fig. 131 Hall-Petch relation from industrially produced steel (Carlam HSM) and laboratory rolled Nb-
steel.
Fig. 132 Tensile property improvement using ultra fast cooling between finishing and coiling
compared to conventional (laminar cooling) process.
Fig. 133 Temperature and rolling forces measured during hot rolling steels 1134 and 1135 with 3
different finishing rolling temperatures.
Fig. 134 Microstructures and measured ferrite grain size in steels 1134 and 1135 hot rolled with 3
different FRT.
Fig. 135 Total Elongation A50 versus TS for hot rolled, hot rolled and annealed, and cold rolled and
annealed specimens.
Fig. 136 Uniform elongation Au versus YS for hot rolled, hot rolled and annealed, and cold rolled and
annealed specimens.
Fig. 137 YS/TS ratio versus Au plot of hot rolled, hot rolled and annealed, and cold rolled and
annealed specimens.
Fig. 138 TS and YS variations after annealing and after cold rolling and annealing hot rolled steels 806,
1134 and 1135.
Fig. 139 Au versus YS plot for steels 1134 and 1135 cold rolled and annealed at 720 °C for different
times.
Fig. 140 A50 versus TS plot for steels 1134 and 1135 cold rolled and annealed at 720 °C for different
times.
Fig. 141 Thermomechanical processing cycle used in the rolling trials
Fig. 142 CCT diagram for 0.6wt.%C steel
Fig. 143 CCT diagram for 0.8wt.%C steel
Fig. 144 CCT diagram for 1.2wt.%C steel
Fig. 145 CCT diagrams for 1.2wt%C (a) and 1.6wt%C steels (b)
Fig. 146 Influence of strain on the microstructure of 0.8wt.% carbon steel deformed at 550°C (a) 0
strain, (b) 0.36 strain, (c) 0.72 strain and (d) 1.2 strain.
Fig. 147 Influence of cooling rate, (a) 200°C/s, (b) 1°C/s, on microstructure of 0.8wt% carbon steels
after deformation to a strain of ~1.2 at 650°C.
Fig. 148 Influence of cooling rate, (a) 200°C/s, (b) 10°C/s, (c) 1°C/s on microstructure of 0.8wt%
carbon steels after deformation to a strain of ~1.2 at 500°C.
12

Fig. 149 (a-c) Comparison of single and multiple deformation for 0.6wt.% carbon steel deformed at
650°C
Fig. 150 Through thickness hardness profile for 0.8wt.%C steel following rolling trials.
Fig. 151 (a-d) SEM micrographs illustrating the carbide structure present in the 0.6 wt.% C steel
following the rolling trials. Deformation temperature and finishing strain are given
Fig. 152 (a-d) SEM micrographs illustrating the carbide structure present in the 0.8 wt.% C steel
following the rolling trials. Deformation temperature and finishing strain are given
Fig. 153 (a-c) SEM micrographs illustrating the carbide structure present in the 1.2 wt.% C steel
following the rolling trials. Deformation temperature and finishing strain are given
Fig. 154 (a-b) SEM micrographs illustrating the grain structure present in the 0.6 wt. % C steel
following deformation at 600°C, to strains of ε ~ 1.2 and 2
Fig. 155 (a-b) SEM micrographs illustrating the grain structure present in the 0.8 wt. % C steel
following deformation at 600°C, to strains of ε ~ 1.2 and 2
Fig. 156 (a-b) SEM micrographs illustrating the grain structure present in the 1.2 wt. % C steel
following deformation at 600°C, to strains of ε ~ 1.2.
Fig. 157 EBSD band contrast (a) and orientation (b) maps of 0.6wt.%C steel following rolling at 600°C,
ε~2.
Fig. 158 Tensile properties for 0.6wt.%C steel following rolling trials
Fig. 159 Tensile properties for 0.8wt.%C steel following rolling trials
Fig. 160 Tensile properties for 1.2wt.%C steel following rolling trials
Fig. 161 Weld side of steel plate following laser welding
Fig. 162 Penetration side of steel plate following laser welding
Fig. 163 (a and b). Image illustrating the ECAE apparatus (a) and half of the 120° channel die (b)
Fig. 164 Schematic representation of the ECAE process, showing a cross section of a deformed billet,
the ram, the die set and the shear plane of the apparatus [131]
Fig. 165 SEM micrographs illustrating the microstructural evolution during ECAE processing (1 (i), 2
(ii), 3 (iii), 4 (iv) and 5 (v) passes) of 0.6, 0.8 and 1.2 wt. % C steels.
Fig. 166 (a+b). SEM micrographs etched to highlight the subgrain/grain boundaries of 0.8 wt. % C and
1.2 wt. % C (c+d) steel samples following 4 ECAE passes
Fig. 167 Sample B1, 0.8wt%C steel after 1 ECAE pass. Suspect points have been removed and the
data cleaned to remove non-indexed points. LAGB (grey) and HAGBs (black) also shown.
Fig. 168 Sample B3, 0.8wt%C steel after 3 ECAE passes. Suspect points have been removed and the
data cleaned to remove non-indexed points. LAGB (grey) and HAGBs (black) also shown
Fig. 169 Sample B5, 0.8wt%C steel after 5 ECAE passes. Suspect points have been removed and the
data cleaned to remove non-indexed points. LAGB (grey) and HAGBs (black) also shown
Fig. 170 Plot of EBSD statistical data showing the average transverse high angle grain boundary
spacing and high angle grain boundary area fraction (%HAGBs) in the 0.8wt.%C steel, as a
function of strain during ECAE processing.
Fig. 171 Sample A5, 0.6wt%C steel after 1 ECAE pass. Suspect points have been removed and the
data cleaned to remove non-indexed points. LAGB (grey) and HAGBs (black) also shown
Fig. 172 Sample C5, 1.2wt%C steel after 5 ECAE passes. Suspect points have been removed and the
data cleaned to remove non-indexed points. LAGB (grey) and HAGBs (black) also shown
Fig. 173 Tensile properties of 0.6wt.%C steel with increase in ECAE deformation
Fig. 174 Tensile properties of 0.8wt.%C steel with increase in ECAE deformation
Fig. 175 Tensile properties of 1.2wt.%C steel with increase in ECAE deformation
13

LIST OF TABLES
Table 1 Chemical compositions and critical temperatures measured by dilatometric tests for materials
cast at CSM.
Table 2 Chemical Composition of microalloyed steels received by CRM.
Table 3 Temperatures measured during pilot mill rolling.
Table 4 Hot rolling conditions during the 2nd
test.
Table 5 Grain size measurements at different positions through the thickness.
Table 6 Grain size measurements at different positions through the thickness.
Table 7 Chemical compositions (mass%) of the steels, calculated Ae3 (K) [26]
Table 8 Chemical composition of the material used for ARB tests.
Table 9 Steel compositions (10-3
wt%).
Table 10 Compositions (wt. %) of high carbon steels
Table 11 Hardness and microstructure of dilatometer samples
Table 12 EBSD statistical data for 0.6wt%C steel rolled at 600°C to a strain of ~2
Table 13 Tensile properties following rolling trials with finishing rolling temperatures of 600°C and
700°C and strains of ~1.2 and 2.
Table 14 Comparison of the average statistical boundary data for the 0.6, 0.8 and 1.2wt.%C steel
obtained from EBSD maps at different levels of ECAE deformation.
KEYWORDS
Ultrafine grain, Grain refinement, Severe Plastic Deformation, Warm Rolling, SIDT, DIFT,
Accumulative Roll Bonding, Equal Channel Angular Extrusion
14

1. INTRODUCTION
Steel is the most important structural material with a variety of applications across a wide range of
industries. Moreover, steel will continue to be the main structural material in the 21st century by
fulfilling requirements of: (1) higher strength and safety for high buildings, long bridges and high-speed
traffic, (2) longer and maintenance-free life and (3) environment friendly and recyclable. Social
demands such as energy saving, resource saving and environment conservation are increasing, therefore,
it is desirable to develop materials with high strength, long life and which are easy to recycle.
One solution is to produce and use ultrafine grained steel. Among different strengthening mechanisms,
grain refinement is the only method to improve both strength and toughness simultaneously. Therefore,
ultrafine grained steels with relatively simple chemical compositions, strengthened primarily by grain
refinement, show great potential for replacing alloyed high strength steels, thereby, avoiding additional
alloying. Meanwhile, complicated additional heat treatments like soft annealing, quenching and
tempering are not required, and the weldability of the steel is also improved due to a low carbon and
alloying element content compared to high strength quenched and tempered steels. Ultrafine grained
steels also offer other property advantages, such as high strain rate superplasticity at relatively high
temperatures.
For the past 50 years, the drive to produce finer grained steel has continued to obtain better mechanical
properties. So far, grain refining to the level of 5&10 µm has been realized in industrial production by
TMCP (Thermo-Mechanical Controlled Process). The further challenge of ultra grain refinement in
steels to 1 µm or below has been confronted in the recent several years.
Currently, there are two main groups of laboratory methods to refine ferrite grains down to the ultrafine
grain range in bulk steels. These are severe plastic deformation techniques and the advanced
thermomechanical process. Until recently the developed and applied severe plastic deformation
techniques were equal channel angular pressing (ECAP) [1,2], accumulative roll bonding (ARB) [3,4]
and bi-directional deformation [5]. The advanced thermomechanical processes include strain-induced
ferrite transformation (i.e. transformation during rather than after deformation) [6], dynamic
recrystallization of austenite during hot deformation with subsequent γsα (austenite to ferrite)
transformation [7], hot rolling in the intercritical region (i.e. in the austenite + ferrite two-phase region)
[8], and dynamic recrystallization of ferrite during warm rolling [9].
It appears that both severe plastic deformation and the advanced thermomechanical processing are
capable of producing ultrafine ferrite grain sizes, and that an ultrafine grained microstructure may, if
used wisely, be beneficial. However, the deformation and cooling conditions in these routes are often
extreme and outside the capabilities of large scale industrial processing lines.
Giving severe plastic deformation for instance, to produce an ultrafine grained steel with grain size of
0.3 µm, the essential strain is about 4.0 for equal channel angular pressing, 5.6 for accumulative roll
bonding process and 6.4 for bi-directional compression, respectively. This is a high requirement for
deformation tools, force and power. On an actual mass production scale, however, there are limitations
to the application of low temperature large scale deformation. Therefore, it is necessary to develop a
technology to achieve commercially meaningful grain refinement using existing rolling facilities.
The objective of this project is to produce ultrafine grains using processing routes that do not require
extreme strains and significant plant changes, making use of microalloying additions (e.g. niobium)
when necessary, for producing these novel microstructures.
15


2.PROGRAM OBJECTIVES
The objectives of this project are:
1. To establish the best processing routes to promote the formation of UF (preferably 2-3 µm) and
mixed (e.g. ferrite-cementite, ferrite-martensite) microstructures either in the bulk or the
external layers of strips/plates or rods of low and medium carbon steels.
2. To asses the benefits that can be achieved in terms of strength, ductility and toughness by the
formation of UF microstructures
3. To produce very fine bulky microstructure using two innovative deformation methods:
o Accumulative Roll Bonding to be applied for low-C steels
o Equal Channel Angular Pressing to be applied to high C steels
3. DESCRIPTION OF THE WORK PACKAGES
The program was addressed to assess the advantages of ultrafine microstructures for the following types
of steels:
• Low carbon: 0.04-0.16C; 0.15-0.3Si; 0.5-1.6Mn
• Medium carbon: 0.25-0.45C; 0.15-0.3Si; 0.8-1.3Mn.
• High carbon: from 0.8% up to 1.6 %.
The benefits of micro-additions of Nb and/or other elements (e.g. P) were also examined.
The project was focused on two different types of experimentation:
1. to develop advanced thermomechanical processes for producing ultrafine microstructures, that
do not require extreme strains and significant plant changes and that can be applied on existing
hot rolling mills.
2. To test two innovative severe plastic deformation methods to verify their potential in refining
the grains: Accumulative Roll Bonding and Equal Channel Angular Extrusion.
To carry out this experimentation, the following Work Packages were identified:
WP1. UF Surface Grained Steel
Steel grades with a carbon content ranging between 0.05 – 0.1 % C were studied in order to assess the
parameters for Strain Induced Dynamic Transformation occurrence and to study the feasibility of
ultrafine grains at the surface of steel products.
In particular two approaches, either individually or combined, were investigated:
a) intragranular nucleation in the deformed austenite through minimisation of grain boundary
nucleation during the strain induced transformation of austenite after hot/warm rolling by
single/multiple pass;
b) local warm rolling due to supercooling of austenite induced by intermediate water cooling and
roll chilling; combined with localisation of shear strain in a layer close to the surface;
In addition to the influence of C and Mn, the presence of microalloying elements, such as Nb, has
expected to modify the microstructure.
WP2. UF Low C Steel
Steel grades with a carbon content between 0.04 – 0.1 % C containing Mn (0.8 – 1.5 %) and Nb (0.04 –
0.1 %) were laboratory cast and hot rolled on the CRM pilot rolling mill. The rolling schedule together
with the Nb-content were adapted in order to reach an optimal amount of Nb in solution which retards
the ferrite transformation. A high coiling temperature (580 – 650°C) was applied for obtaining a fully
ferritic microstructure, ensuring additional precipitation hardening.
In a second step, the effect of Si (1.5 %) and P (0.1 %) was studied. Torsion and compression tests were
carried out to study the effect of temperature and reduction on the grain refinement.
17

MPI will concentrated their experiments on 0.15 C steel, exploring conditions to develop a uniform
distribution of second phases such as cementite and/or very small islands of martensite, in addition to 2-
3 µm ferrite grains.
Accumulative Roll Bonding (ARB) process was applied on 0.15 C steel by CSM.
WP3. UF Medium C Steel
The following aspects were investigated on medium C steels: optimum range of ferrite/pearlite fraction,
effect of cooling rate over the transformation region, necessary amount of deformation just below the
pearlite finish temperature PF to achieve the spheroidisation of the lamellar cementite (pearlite).
The main contribution of MPI was the simulation of the processing routes by the plane strain
compression test by WUMSI.
Laboratory rolling trials on the basis of the results were carried out.
Based on the PonyMILL concept, the fabrication of ultrafine grained steels is introduced in the present
work. In particular attention was paid to the possibility of its industrial application. For plain C-Mn
steels a rather moderate logarithmic strain of ε = 0.8 & 1.6 and cooling rates which are quite common in
an industrial production were used. At the same time, a simulated final coiling was employed to imitate
a complete industrial processing.
WP4. UF High C Steel
A range of carbon steels (with Nb to aid strain accumulation) were processed to ferrite/carbide
aggregate microstructures (i.e. non-pearlitic). A series of laboratory casts was prepared, of 0.4%, 0.8%,
1.2% and 1.6% C. A range of deformation schedules were applied by Gleeble thermomechanical
simulator and/or deformation dilatometry, from which microstructure and hardness were determined. A
selection of conditions were made on this basis for processing of larger volumes of material suitable for
obtaining tensile test data. Example material was also processed to very high strains by ECAE
processing at the Manchester Materials Science Centre, from which tensile test data were obtained.
The program was a strict co-operation between CSM (coordinator), CRM, Corus and MPI.
18

4.ULTRAFINE SURFACE GRAINED LOW C STEEL
4.1 Introduction
The possibility of making microstructures in which bands of Ultra Fine Ferrite (UFF) grains act as
strengthening component to more normal microstructural constituents was investigated in thin strips
characterised by very large austenite grains by Hodgson et al. [10,11].
Their method of producing a surface layer of UFF in thin strip required austenitisation at a high
temperature to form a coarse austenite grain. The strip was then cooled and hot rolled at a temperature
close to the Ar3 value (700-800 °C), using a modest reduction (30-40%). The supercooling of austenite
owing to roll chilling, combined with the strong shear strain at the strip surface, lead to a very high
nucleation density of ferrite on dislocations within the coarse austenite grains. It seemed that the UFF
grains resulted from strain-induced transformation of intragranular ferrite with nucleation occurring on
the austenite substructure. The reduction or minimisation of grain boundary nucleation by austenite
grain enlargement seemed to promote a substantially instantaneous transformation homogeneously over
the austenite. This process is called Strain Induced Dynamic Transformation (SIDT).
The layered microstructure consisting of ultra fine grained surface layers (generally penetrating to one
quarter of the strip thickness) in the plates were found to be beneficial for improving the YS/ UTS ratio.
In fact, Hodgson [12] used a modified version called the post roll quenching, specifically to produce a
steel with layered microstructures, with the surface having ultra fine grains less than 2 µm and the
centre showing martensite or bainite microstructure. They argued that the quenching produced enough
under-cooling of austenite at the surface by increasing the driving force for nucleation of ferrite.
However, other authors [13-16] showed completely different results showing difficulties to generate
this kind of UFF grains at surface using the methods of Hodgson, but they gave different indications
like high rolling strains, fast cooling and fine austenite grain size to create this type of structure.
It is clear that the key of the process is the understanding of SIDT mechanism, that is still unclear and
presently studied worldwide. Therefore main part of this work package was concerned to the study and
characterization of SIDT mechanism.
Finally, pilot mill rolling tests were carried out to obtain ultrafine surface grains.
4.2 Strain Induced Dynamic Transformation
Driving force for phase transformation is dependent on chemical composition and temperature change.
The typical phase transformations in steels are austenite to ferrite formation, austenite to pearlite,
austenite to bainite, austenite to martensite and precipitation of nitrides and carbides. If an external load
is applied to the system above the static transformation temperature, the free energy of the system will
be certainly raised. If the load (e.g. deformation) is applied to the austenite above transformation
temperature and the free energy of austenite is raised to the extent over the free energy of ferrite at the
same temperature, the transformation from austenite to ferrite will occur, which could not be found to
happen without deformation.
This kind of ferrite transformation induced by deformation has been called as Deformation Induced
Ferrite Transformation (DIFT) or Strain Induced Dynamic Transformation (SIDT).
The aim of this experimentation was to assess the hot deformation conditions in the austenite region for
producing fine grain sizes through SIDT mechanism, and to establish the influence of prior austenitic
grain size, strain, deformation temperature and chemical composition on grain refinement.
4.2.1 Experimental
Dilatometric experiments were carried out on samples cast at CSM and machined from laboratory hot
rolled plates, Moreover, other dilatometric tests were carried out in order to compare the refinement
ability of SIDT and deformation of undercooled austenite and to characterize the SIDT mechanism in
Nb microalloyed steels.
19

The chemical compositions of the steels used for these tests and the measured critical temperatures are
given in 1.
C Si Mn P S Al N Ar1 Ar3
(%) (%) (%) (%) (%) (%) (%) °C °C
CSM05 0.047 0.2 1.44 0.007 0.0023 0.0259 0.0028 625 823
CSM1 0.107 0.2 1.45 0.007 0.0021 0.0258 0.0032 610 790
Table 1- Chemical compositions and critical temperatures measured by dilatometric tests for materials
cast at CSM.
The hot deformation experiments were performed by a Theta Ind. Dilatronic III dilatometer. Samples
had 3.25 mm diameter and 6 mm length. The experiments were carried out in vacuum (2x10⁻⁵
mbar)
and quenching was done using He. The cooling rate was 130°C/s.
Before deformation, the samples were homogenised at Ar3+50°C for 10 min, then cooled at a rate of
2°C/s to the deformation temperature (Ar3+25°C). Samples were deformed at 40% and 60%. After
deformation, the samples were either helium quenched or cooled at the rate of 10°C/s.
Samples for metallographic examination were prepared from the deformed specimens by polishing the
longitudinal section down to centre of the sample.
4.2.2 Results
Verification of Deformation Induced Ferrite Transformation occurrence
In order to verify the occurrence of SIDT and to study the occurrence of ferrite formation (before
deformation, during deformation or in the later stages of cooling), the samples after the homogenization
Ar3+50°C for 10 min, were held at the respective Ar3+25°C without deformation for 5 s and then
quenched (Fig. 1a). They were then compared with samples transformed according the
thermomechanical cycle shown in Fig. 1b that were deformed at 40% and 60%.
Microstructure of CSM1 steel (Fig. 2), treated according the cycle shown in Fig. 1a, showed fully
martensitic structure and absence of ferrite nucleation.
T= Ar3+50°C
10 min
WQ
T= Ar3+25°C
Def=
40% or 60%
T= Ar3+50°C
10 min
WQ
T= Ar3+25°C
Def=
40% or 60%
(a) (b)
Fig. 1- Thermomechanical treatments carried out by dilatometer: (a) verification of SIDT occurrence (b)
prior austenite grain size determination.
t = 5s
T= Ar3+50°C
10 min
WQ
T= Ar3+25°C
T= Ar3+50°C
10 min
WQ
T=
20

The microstructure of CSM1 sample deformed to 40% at Ar3+25°C and then quenched is shown in Fig
3a. Ferrite that nucleated at the austenite grain boundaries can be clearly seen. Apart from the ferrite at
the austenite boundaries, the structure consisted of Widmanstatten ferrite (WF), allotromorphic ferrite
and a dark constituent interpreted as bainite. WF was present at the grain boundaries as well as at the
deformation bands. Volume fraction of deformation induced transformed ferrite was less than 30% at
the centre of the sample.
When the deformation was increased to 60% the microstructure consisted of predominantly fine ferritic
grains and some amount of bainite and martensite. The average grain size in 60% deformed samples
was 3 µm (Fig. 3b) and the volume fraction of strain induced ferrite was about 80%.
Samples cooled at 10°C/s after deformation showed typical transformation structure consisting of
homogeneous largely equiaxed polygonal ferrite (Fig. 4). The approximate grain size of these ferrite
grains was 7µm.
Fig. 2- Microstructure of CSM1 steel quenched after holding at Ar3 +25°C x 5s.
(a) (b)
Fig. 3– Ferrite nucleation by deformation induced transformation at austenite grain boundaries in
CSM1 steel at: (a) 40% deformation; (b) 60% deformation.
21
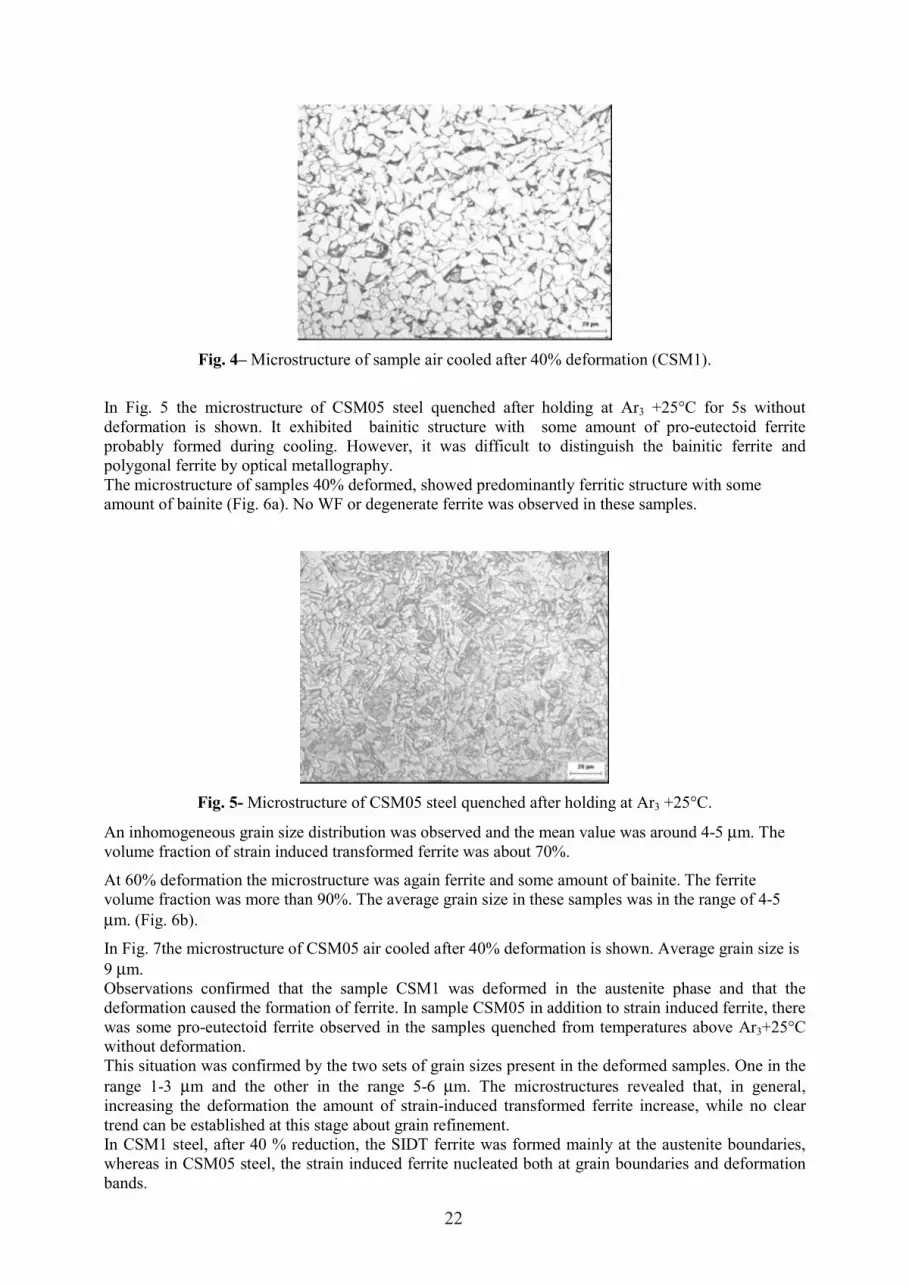
Fig. 4– Microstructure of sample air cooled after 40% deformation (CSM1).
In Fig. 5 the microstructure of CSM05 steel quenched after holding at Ar3 +25°C for 5s without
deformation is shown. It exhibited bainitic structure with some amount of pro-eutectoid ferrite
probably formed during cooling. However, it was difficult to distinguish the bainitic ferrite and
polygonal ferrite by optical metallography.
The microstructure of samples 40% deformed, showed predominantly ferritic structure with some
amount of bainite (Fig. 6a). No WF or degenerate ferrite was observed in these samples.
Fig. 5- Microstructure of CSM05 steel quenched after holding at Ar3 +25°C.
An inhomogeneous grain size distribution was observed and the mean value was around 4-5 µm. The
volume fraction of strain induced transformed ferrite was about 70%.
At 60% deformation the microstructure was again ferrite and some amount of bainite. The ferrite
volume fraction was more than 90%. The average grain size in these samples was in the range of 4-5
µm. (Fig. 6b).
In Fig. 7the microstructure of CSM05 air cooled after 40% deformation is shown. Average grain size is
9 µm.
Observations confirmed that the sample CSM1 was deformed in the austenite phase and that the
deformation caused the formation of ferrite. In sample CSM05 in addition to strain induced ferrite, there
was some pro-eutectoid ferrite observed in the samples quenched from temperatures above Ar3+25°C
without deformation.
This situation was confirmed by the two sets of grain sizes present in the deformed samples. One in the
range 1-3 µm and the other in the range 5-6 µm. The microstructures revealed that, in general,
increasing the deformation the amount of strain-induced transformed ferrite increase, while no clear
trend can be established at this stage about grain refinement.
In CSM1 steel, after 40 % reduction, the SIDT ferrite was formed mainly at the austenite boundaries,
whereas in CSM05 steel, the strain induced ferrite nucleated both at grain boundaries and deformation
bands.
22

(a) (b)
Fig. 6- Ferrite nucleation in CSM05 steel at (a) 40% deformation; (b) 60% deformation.
Fig. 7- Microstructure of CSM05 steel air cooled after 40% deformation
In addition to the strain induced ferrite, Widmanstatten ferrite was present in some regions in CSM1
steel. Because of increased hardenability and lower Ms temperature of this steel, WF formed at low
undercoolings close to the Ae3 temperature. On the other hand, in CSM05 steel, because of lower
carbon content and finer austenite grain size, the hardenability was lower compared to CSM1 steel.
Hence most of the austenite was transformed to ferrite during deformation and cooling and the
remaining austenite enriched in carbon transformed to bainite.
Determination of SIDT Parameters
After the preliminary results described above, the study of the effect of different parameters (prior
austenite grain size, strain, deformation temperature, carbon content) on SIDT mechanism were carried
out.
At first, various tests were performed in order to determine the thermal cycles to get very different prior
austenitic grain sizes for both materials, having a homogeneous grain size distribution as shown in Fig.
8.
In order to get different prior austenite grain sizes before deformation the samples were treated
according to the cycles showed in Fig. 8, then cooled at a rate of 2°C/s to the deformation temperature
of about Ar3+25°C and deformed giving 40% and 60% reductions (Fig. 9). After deformation, the
samples were helium-quenched.
Samples for metallographic examination were prepared from the deformed specimens by polishing the
longitudinal section and observed at the centre of the sample.
In Fig. 10 the microstructures of CSM1 sample are shown.
23

In Fig. 10a, the microstructure of the sample having a small prior austenitic grain size (13µm), 40%
deformed at 816 °C is reported. Ferrite that nucleated at the austenite grain boundaries can be clearly
seen.
When the reduction was increased to 60% (Fig. 10c) the microstructure consisted of predominantly fine
ferritic grains and small amount of bainite and martensite. The average ferrite grain size (FGS) was 3
µm.
In the case of larger prior austenitic grain size (133 µm) and 40% reduction (Fig. 10b), no polygonal
ferrite was detected. If the reduction is increased to 60% the microstructure consisted of some fine
ferritic grains at the austenite boundaries, Widmanstatten ferrite (WF) and bainite. The average ferritic
grain size in this case was 3.6 µm (Fig. 10d).
Fig. 8– Thermal cycles used to get different prior austenitic grain sizes (PAGS).
Fig. 9 – Thermomechanical cycles.
The very fine polygonal ferrite grains observed in quenched specimens after deformation were formed
during deformation. In fact, results from preliminary experimentation showed that the ferrite could not
be formed without deformation in the later stages of cooling. The presence of ferrite in the samples
showed in Fig. 10 means that the γ−α transformation occurred dynamically during deformation.
However, CSM05 steel showed some pro-eutectoid ferrite in the quenched samples due to its lower
hardenability.
In Fig. 11 the microstructures of CSM05 steel deformed at 837°C are shown.
HQ HR
20°C
t = 10min
T = 900¡
HR
20°CHQ
t = 5 min
T = 900¡
HR
20°CHQ
t = 10 min
T = 1150¡C
HQHR
20°C
t = 30 min
T =1150¡
160 µm
133 µm
14.3 µm
13.0 µm
0.05%C 0.1%C
Heating rate: 20°C/s
Helium Quenching
t = 10 min, 30 min
T = 900, 1150 °C
T = Ar3 + 25 °C
Red. = 40% , 60%
cooling rate: 2°C/s
24

The microstructure of sample strained to 40% reduction with small prior austenite grain size (14µm)
showed predominantly polygonal ferrite with a small amount of bainite. No WF or degenerate ferrite
was observed. In this sample, in addition to strain induced ferrite, there was some pro-eutectoid ferrite.
This was evident from the two sets of grain sizes present in the deformed samples. The average grain
size was 4.2 µm.
At 60 % deformation the microstructure was fully ferritic and the average grain size was 3.2 µm. In this
case higher SIDT ferrite volume fraction was detected.
In the case of the sample with coarse prior austenite grain size (160 µm) deformed 40% the
microstructure consisted of some fine ferritic grains at the austenite boundaries, Widmanstatten ferrite
(WF) and bainite. At higher reduction (60%) most of the structure consisted of polygonal ferrite but
some bainite and WF ferrite were still present. The average ferritic grain size in this case was 4 µm.
PAGS = 13 µm PAGS= 133 µm
40%
60%
FGS=3.6 µmFGS=3 µm
Fig. 10-Microstructures of CSM1 steel after quenching, for different prior austenitic grain size and
reductions.
25

PAGS = 14 µm PAGS = 160 µm
40%
60%
FGS=4.2 µm
FGS=3.2 µm FGS=4 µm
FGS=4.9 µm
Fig. 11– Microstructure of CSM05 steel after quenching for different prior austenitic grain size and
reductions.
It is evident that a critical strain for SIDT occurrence exists. It depends on carbon content and prior
austenite grain size.
In Fig. 12 and in Fig. 13 the macrostructure of samples after the thermomechanical cycles showed in
Fig. 9, with the highest prior austenite grain size, are reported. It is evident that the microstructure
inside the sample is quite inhomogeneous. For both samples, nearby the surface no ferrite is present and
it is true until a certain depth after that ferrite is present. It means that a critical strain for SIDT
occurrence exists.
Fig. 12– Macrostructure of CSM1 steel after 60% reduction and quenching.
26

Fig. 13– Macrostructure of CSM05 steel after 60% reduction and quenching.
Fig. 14– Simulated equivalent strain distribution for samples after 60% reduction.
In order to understand the strain distribution inside the sample and the correspondent microstructural
behaviour, a FEM simulation was carried out using MARC code. Simulated equivalent strain
distribution inside the sample is shown in Fig. 14 and quantitative distribution in the central line of the
sample is reported in Fig. 15.
Comparing the model results and the microstructure, it is clear that the microstructure follows the same
trend of the strain. In particular, measuring the deepness at which SIDT begins to occur, results say that
the critical strain for sample CSM1 is about ε=1.5, while for CSM05 it is about ε=1. Applying the same
method to samples having a smaller prior austenite grain size, critical strain resulted to be ε=0.8 for
CSM1 steel and ε=0.6 for CSM05 steel. It means that decreasing the carbon content and the prior
austenite grain size, the critical strain decreases.
27

0
0.5
1
1.5
2
2.5
0 0.5 1 1.5 2 2.5
Sample thickness (mm)
Eq
uiv
ale
nt
str
ain
Fig. 15– Simulated equivalent strain distribution for samples after 60% reduction (average strain ≈0.8).
(a) (b)
Fig. 16- Macrostructure of CSM1 steel after quenching deformed at 40% at : (a) Ar3+15 °C, (b) Ar3+35
°C.
Further tests regarding the effect of deformation temperature on the occurrence of SIDT were carried
out.
Two tests were performed giving 40% reduction at two different deformation temperatures: the first
specimen (Fig. 16a) was deformed at Ar3+15 °C and the other one at Ar3+35 °C (Fig. 16b) in order to
verify some differences in grain size and ferrite volume fraction.
Results showt that grain size decreases with the decrease of deformation temperature, and ferrite
volume fraction increases. It means that the critical strain for SIDT is decreased with the reduction of
temperature.
Textures in SIDT
In order to verify the textural properties of strain induced dynamic transformed ferrite, orientation
measurements on sample CSM1 after the thermomechanical cycle whose microstructure is shown in Fig.
10d were carried out.
28

(a) (b)
Fig.17– OIM of CSM1 sample deformed at 60% with wide prior austenite grain size. (a) Grains map,
(b) orientation map.
In Fig. 17a the grain map reconstructed by Orientation Imaging Microscopy is shown. The prior
austenite grain size that after quenching was transformed in martensite-bainite is dark and the
recrystallized ferritic grains are coloured. It can be noted that most of the ferritic grains were generated
on prior austenite grain boundaries. In Fig. 17b the orientations of the single grains are mapped. The
grains around the prior austenite grain boundaries, generated by SIDT show a homogeneous orientation
distribution. Most of the grains show typical recrystallization texture. It means that these grains are fully
recrystallized and not recovered and they were formed during deformation and not after, otherwise they
had to show deformation texture. Further they show high boundary angles.
29

Fig. 18– Orientation maps.
To confirm these results in Fig. 18 orientation map for planes //ND and the orientation map for
directions //RD, are shown. Both from Fig. 17 and Fig. 18 it is clear that the texture is made mainly by γ
fibres with a strong component at {111}<011>, the typical recrystallization textures of bcc crystals.
SIDT in microalloyed steels
Dilatometric experiments were carried out on samples received by CRM and machined from laboratory
hot rolled plates in order to asses the influence of Nb content on SIDT mechanism occurrence. The
chemical compositions, reported in Table 2, show two different carbon contents, comparable to the
previous plain C-Mn samples for determination of SIDT parameters.
In order to compare the microstructures with the C-Mn steel studied before, preliminary tests to have
the same prior austenite grain size were carried out. The final conditions to have different prior
austenite grain sizes are reported in Fig. 19. However, it was very difficult to find the conditions to have
a very large prior austenite grain therefore the following thermomechanical cycles were applied only on
samples with a fine prior austenite grain size.
Then thermomechanical cycles similar to the previous ones were carried out (Fig. 20).
Steel Code C Si Mn P Nb Al Ti AR3
988 0.121 0.02 1.61 0.012 0.03 0.055 0.007 755
1022 0.064 0.01 1.63 0.011 0.033 0.042 0.001 784
Table 2 – Chemical Composition of microalloyed steels received by CRM.
30

In Fig. 21 the microstructures of samples 988 and 1022, austenitized, deformed under different
conditions and quenched, are shown. Initial prior austenite grain sizes were 15 and 19 µm respectively.
In Fig. 21a, the microstructure of sample 988, 40% deformed at 780 °C is reported. Some ferrite that
nucleated at the austenite grain boundaries can be seen but its volume fraction is less than that of
sample CSM1 (Fig. 10a) with similar carbon content and similar prior austenite grain size.
When the deformation was increased to 60% reduction (Fig. 21b) the volume fraction of deformation
induced transformed ferrite increased but it remained less than 30%.
Fig. 19– Thermal cycles used to get different prior austenitic grain sizes (PAGS) for samples 988 and
1022.
Fig. 20– Hot deformation thermomechanical cycles for samples 988 and 1022.
Heating rate: 20°C/s
Helium Quenching
t = 10 min
T = 1020 °C
T = Ar3+25 °C
Red. = 40% , 60%
cooling rate: 2°C/s
HQ HR
20°C
t = 10min
T = 1020¡
HR
20°CHQ
t = 10 min
T = 1020¡
HR
20°CHQ
t = 10 min
T = 1150¡C
HQHR
20°C
t = 30 min
T =1150¡
106 µm
75 µm
15 µm
19.0 µm
0.06%C 0.12%C
31

40% 60%
0.12
%C
(a) (b)
0.06
%C
(c) (d)
Fig. 21– Microstructure of steels 988 and 1022 after quenching for different deformations: (a) steel 988
40% reduction, (b) steel 988 60% reduction, (c) steel 1022 40% reduction, (d) steel 1022 60%
reduction.
In Fig. 21c the microstructure of the sample 1022, 40% deformed at Ar3 +25°C (T=809°C) is reported.
In this case the SIDT volume fraction is higher (Fig. 21a) as expected from the influence of carbon
content. However if compared to Fig. 11a, the SIDT ferrite is quite less (about 50%). The same trend
can be detected in Fig. 21d, where the sample was subjected to 60% reduction.
4.2.3 Discussion
Before the discussion of the results it is necessary to point out that during the austenite deformation,
SIDT and dynamic recrystallization (DRX) compete with each other and one of them, the one that has
the smaller critical strain, will take place ahead. When the deformation temperature is below Ae3 the
critical strain for SIDT is smaller than for DRX and SIDT becomes the predominant softening
mechanism (Fig. 22).
Influencing factors in SIDT mechanism
From results it is evident that the processing parameters and initial microstructure can influence the
occurrence of SIDT, the final grain size of ferrite and the SIDT ferrite volume fraction. They will be
discussed hereinafter:
(a) – Critical strain
As explained before, deformation accelerates the phase transformation kinetics (Fig. 23). However if
the imposed strain is too small the dynamic transformation is not activated.
32

Ae3Ar3
SIDT of DRX of
Cri
tic
al
Str
ain
Temperature
Fig. 22– Schematic illustration of temperature dependencies of the critical strain for SIDT and DRX
[17].
Therefore, it is clear that there is a critical strain required for SIDT to occur and it is related to the
deformation conditions and chemical composition.
From the above results the increase in the content of carbon in solution increases the critical strain
retarding the SIDT mechanism, while smaller prior austenite grain sizes shows the smaller critical strain
value.
In addition, even the deformation temperature has an important influence on critical strain. It was found
that the critical strain required for SIDT to occur decreases with the deformation temperature, due to the
increase of the transformation driving force.
Gγ
γdeformed
α
Chemical Composition
Fig. 23– Free energy increase after deformation of austenite.
(b) - Strain
It can be confirmed that increasing strain, more and finer SIDT grains can be obtained. When the strain
is small, strain induced transformed ferrite starts to form along the prior austenite grain boundaries. As
the strain is increased, the interiors of austenite grains are activated as nucleation sites for SIDT ferrite,
which are probably deformation bands or twin boundaries.
Results found in literature show that the relationship between SIDT final grain size and strain shows an
asymptotic trend increasing the strain. In fact it can be observed from the above results that increasing
reduction from 40% to 60% the ferrite grain size decreases only of 20% (e.g. 4.2 µm to 3.2 µm), that is
in fully agreement with the other results [17-20].
It means that increasing and increasing the strain, grain size does not decrease significantly.
33

(c) - Prior austenite grain size
From Figs. 10 and 11, it is evident that the smaller prior austenitic grain size, the higher is the volume
fraction of SIDT ferrite under a given deformation condition. This is mainly because the prior austenite
grain boundary is a preferential nucleation site for SIDT ferrite.
A smaller prior austenite grain size has the longer grain boundary area in a given volume of material,
and this will result in the larger volume fraction of ferrite. Moreover, a finer austenite grain reduces the
critical strain for SIDT and therefore results in a finer ferrite grain size at a given strain.
(d) - Deformation Temperature
From our results deformation temperature influences the critical strain, grain size and ferrite volume
fraction. Lower the deformation temperature, lower is the critical strain. If the critical strain for SIDT is
reduced, a finer ferrite grain size and more volume fraction at given strain are observed.
The effect of low deformation temperature is important when the strain is relatively small, because
decreasing the deformation temperature is very effective in increasing the amount of SIDT, but at
relatively high strains decreasing the deformation temperature will affect only slightly the amount of
SIDT.
(e) Steel chemistry
The carbon content has an important role on ultrafine grains formation. The level of ferrite refinement
increases slightly when the carbon content increases, however even the critical strain increases.
Moreover, the presence of Nb retards the SIDT occurrence in terms of higher critical strain needed to
trigger the SIDT mechanism.
Therefore, results show that SIDT was inhibited in the presence of niobium in solid solution compared
to a non-niobium containing steel. However in the case the precipitates of Nb are not dissolved during
heating preceding deformation, SIDT occurs in the Nb steel in a very similar manner as in the non Nb
containing steel, except that the final structure is finer [21].
These elements show that the use of Nb could potentially favour a final refinement through SIDT in
industrial conditions, even if higher strain for SIDT occurrence is required.
(f) - Strain Rate
In this experimentation strain rate was not considered. It is generally thought that the rate of
deformation has a small or even negligible effect on refining grain size during SIDT. A strain rate in
the range of 0.1-10 s-1 was not found to affect significantly the grain size [22]
However Mintz et al. [18] showed that the strain rate can have a certain influence on the fraction of
SIDT ferrite especially when it is formed from a coarse austenite grain. If the strain rate is very low
then extensive dynamic recovery occurs, but if the strain rate is higher then the work hardening takes
place and the conditions for SIDT occurrence are verified; for a finer austenite grain size the strain rate
has less influence on the grain size and the fraction of SIDT.
For a given strain a higher strain rate and a lower deformation temperature are beneficial for the
formation of SIDT ferrite [19].
4.3 Deformed undercooled austenite
Another method to get ultrafine grains increasing the driving force of γ−α transformation is the
deformation of undercooled austenite.
Deformation in undercooled austenite increases the driving force for ferrite formation, contributing to
ultra refinement of ferritic grains.
Adachi et al. [23-25] intensively studied the effect of heavy deformation in undercooled γ region on the
transformation behaviour and revealed that deformation of undercooled austenite enhanced microband
formation rather than dislocation cells with boundaries of larger orientation difference and this is the
main cause for ultra grain refinement.
34

Helium
Quenching
Heating rate:
20 C/sT =700 C
T = 1150 C
t Def. 60%
Quenching to 700 C
Fig. 24–Thermomechanical cycle for undercooled austenite.
In order to compare the refinement ability between SIDT and deformation of undercooled austenite,
other dilatometric tests (Fig. 24) were carried out. In this case samples were heated in order to have the
large prior austenite grain size, rapidly cooled at the deformation temperature of 700°C (ferritic region),
60% deformed and quenched.
Microstructure of CSM1 sample after the thermomechanical cycle shown in Fig. 24 is reported inFig.
25. Fig. 25a shows the microstructure of the sample austenitized at 1150°C x 10 min, cooled at 816°C
and deformed at 60% (SIDT occurrence). Fig. 25b shows the microstructure of the sample austenitized
with the same conditions, quenched to T=700°C and reduced to 60%.
Fig. 26a shows the microstructure of the sample CSM05 austenitized at 1150°C x 30 min cooled at
837°C and 60% deformed. Fig. 26b shows the microstructure of the sample austenitized with the same
conditions, rapidly cooled to T=700°C and reduced of 60%.
Results show that the transformed ferrite volume fraction in the case of deformation of undercooled
austenite is higher, however the morphology and the location of ferrite are different.
Ferrite from deformed undercooled austenite is not polygonal but irregular. Average ferritic grain size is
in both cases around 3-4 µm, but the grain size distribution is different.
Grains starts from less than 1 µm size to arrive to 7-8 µm, while the grain size distribution for the SIDT
ferrite is much more homogenous. Moreover, the samples show a different topological distribution of
ferrite grains. SIDT is fully ferritic in the central part of the sample (Fig. 12) where the local strain is
higher (critical strain for SIDT to occur) while the other sample shows a more homogeneously
distributed ferrite on the sample surface (Fig. 27).
(a) (b)
Fig. 25– Microstructure of CSM1 steel having PAGS =133 µm, deformed of 60% at (a) 816°C, (b)
700°C.
35

(a) (b)
Fig. 26– Microstructure of CSM05 steel having PAGS =160 µm, deformed of 60% at (a) 837°C, (b)
700°C.
Fig. 27 - Macrostructure of CSM1 steel after deformation at 700°C.
Textural analyses were carried out to compare the samples. OIM analyses showed that a larger density
of grains having typical deformation texture is present in the undercooled sample.
4.4 Laboratory Rolling
Laboratory rolling was carried out to reproduce as closely as possible the schedules used in dilatometer
experiments in order to get ultra fine grains on surface.
A first hot rolling tests started from 20 mm initial thickness to 10 mm of final thickness according to the
rolling schedule shown inFig. 28. Samples were heated in a furnace at 1100°C for 40 min and then their
two surfaces were submitted to different cooling methods in order to produce different local
thermomechanical conditions and to understand the best cooling conditions to be used to get ultrafine
grains: one surface was cooled by compressed air and the other was left in still air. When the forced air
cooled surface achieved a temperature of about Ar3+25°C, the piece was rolled in one pass giving 50%
reduction.
Thermocouples were embedded at mid-thickness and close to the surface of the samples. Measured hot
rolling temperatures are shown in Table 3.
36

T = Ar3 + 25 C
Def. = 50%
T = 1100 C
Water Quenching
t = 40 min
Forced Air
cooling
T = Ar3 + 25 C
Def. = 50%
T = 1100 C
Water Quenching
t = 40 min
Forced Air
cooling
Fig. 28 – Hot rolling thermomechanical cycle carried out on CSMlaboratory mill.
Trolling (°C)
Heat Ar3
(°C)
Ar3+25
(°C) Mid-thickness Surface
CSM05 823 848 845 795
CSM1 790 815 800 750
Table 3 – Temperatures measured during pilot mill rolling.
Unfortunately, due to problems during the tests, the samples were hot rolled at too low surface
temperature going into the ferrite region at the surface (Table 4). At the centre of the sample the rolling
temperature was slightly greater than Ar3 and SIDT mechanism was detected. Further it is necessary to
notice that the real deformation was 40%.
In Fig. 29 microstructures of samples hot rolled at CSM pilot mill are shown.
37

CSM1 CSM05
Surface A
Mid-th.
Surface B
Fig. 29– Microstructures at different through positions thickness of samples hot rolled at pilot
Mill (1st test).
Surface “A” is the one cooled by forced air, surface “B” is the one cooled in still air. It can be noted that
the surface “A” shows a thicker layer of ferritic grains compared with the other surface. Grains have a
size around 10 µm and are elongated along the rolling direction due to the deformation in the ferritic
range. Going down to the mid-thickness, the hot rolling temperature increased greater than Ar3.
Therefore, strain induced transformation occurred at mid-thickness even if the volume fraction was low.
Ferrite grains formed at the prior austenite grain boundaries. Like outlined before about SIDT
mechanism, the SIDT ferrite volume fraction is higher when carbon content decreases.
After this first test, the rolling trials were repeated and the rolling conditions were modified.
From the results obtained from SIDT mechanism, it is clear that in order to get ultrafine grains
important parameters are the deformation temperature and the prior austenite grain size.
38

Lower the deformation temperature and finer prior austenite grain size, finer is the ferrite grain size and
more SIDT ferrite volume fraction is present.
However, the application of these rules must match with the possibility of the laboratory rolling mill.
Decreasing the hot rolling temperature causes an increase of the rolling force needed to give the same
reduction. Moreover, finer grain size is related to low temperature and short time thermal treatment
before deformation, that is in contrast with the temperature homogenisation of the sample in the furnace
(for thick samples).
In this test all the analysed grades (C-Mn and C-Mn-Nb) were warm rolled as shown in Table 4.
Rolling conditions
Heat Ar3
(°C)
Ar3+25
(°C)
T Surface
(°C)
Measured
Reduction (%)
CSM05 823 848 846 34
CSM1 790 815 828 34
988 760 785 790 30
1022 785 810 817 30
Table 4 – Hot rolling conditions during the 2nd
test.
The initial thickness was 10 mm and the heating time before deformation was 950°C x 30 min.
After rolling the samples were quenched in order to study the microstructural situation and to verify if
SIDT occurred at surface.
Final microstructures and hardness measures through the thickness are reported in Figs. 30 and 31 for
plain low C steels, and in Figs. 32 and 33 for Nb microalloyed steels respectively.
It can be seen that fine ferritic grains were found at the surfaces for all the materials, while at the centre
presence of quenched microstructure or coarse grains were found.
In Fig. 30 microstructures at different through thickness positions for CSM1 and CSM05 steels are
reported. It can be noted that for CSM1 at surface fine ferritic polygonal grains are detected until a
depth of around 400 µm, after that, mixed ferrite+bainite structure is revealed. Sample CSM05 shows a
ferrite+pearlite structure homogeneously distributed through the thickness showing grain size ranging
from about 4.5 µm at surfaces to 8-9 µm at centre, while CSM1 sample showed a slightly coarser grain
size at surface (around 6 µm) (Table 5).
Hardness measurements (Fig. 31) reflects the situation of grain sizes and microstructure measured at
surface and centre.
For microalloyed Nb steels (Fig. 32) microstructures at different through thickness positions for 988
and 1022 steels are reported. In this case sample 1022, having the lowest C content showed at surface
fine ferritic grains whose dimensions are reported in Table 6, which can be detected until a depth of
around 300 µm, after that, mainly bainitic structure is revealed. The grains at surface were around 2-3
µm but their shape is not polygonal. Sample 988 shows at very thin surface layer with fine ferritic
grains and their shape is not polygonal. Hardness measurements are reported in (Fig. 33).
From these results it can be concluded that SIDT was activated only in the case of plain low C steels
(CSM05 and CSM1), where the strain imposed at surfaces, given during hot rolling, was over the
critical strain for SIDT.
39

CSM1 CSM05
Surface.A Surface A
Center Center
Surface B Surface B
Fig. 30– Microstructures at different through positions thickness of samples CSM1 And CSM05 hot
rolled at pilot mill.
40

Ferritic Grain Size (µm)
CSM05 CSM1
Surface A 4.5 6
Centre 8-9 -
Surface B 5 7
Table 5 – Grain size measurements at different positions through the thickness.
Sample CSM05
100
150
200
250
300
350
0 2 4 6 8
HV
1
Distance traversed through thickness(mm)
Sample CSM1
100
150
200
250
300
350
0 2 4 6 8
Distance traversed through thickness (mm)
HV
1
Fig.31– Hardness through the thickness for plain low-C steels.
41

988 1022
Surface A Surface A
Center Center
Surface B Surface B
Fig. 32– Microstructures at different through positions thickness of samples CSM1 And CSM05 hot
rolled at pilot mill.
42

Sample 988
100
150
200
250
300
350
0 2 4 6 8
Distance traversed through thickness (mm)
HV
1
Sample 1022
100
150
200
250
300
350
0 2 4 6 8Distance traversed through thickness (mm)
HV
1
Fig. 33– Hardness through the thickness for microalloyed low-C steels.
Ferritic Grain Size (µm)
988 1022
Surface A 2 3
Centre - -
Surface B 2.5 3
Table 6 – Grain size measurements at different positions through the thickness.
4.5 Conclusions
SIDT route was confirmed to be a method to produce ultrafine grains.
Ultrafine grained ferrite, ranging between 3 and 4 µm, was obtained in all of the four tested low-carbon
steels: two plain low C-Mn, steel (0.05 and 0.1%C) and two microalloyed low C-Mn-Nb steels (0.06
and 0.12 %C and 0.03Nb).
In this work the factors influencing SIDT occurrence and grain size refinement were investigated. The
experimental results showed that the controlling parameters of SIDT route are: refined prior austenite
grain size, low deformation temperature and high strain.
43

In particular it was confirmed that:
(1) There is a critical strain required for SIDT to occur and it is related to the deformation conditions,
prior austenite grain size and chemical composition. Minimum strains required for ultrafine ferrite for
this experimentation were about 0.6, in the case of lowest carbon content (plain low C steel with
0.05%C) and finest prior austenite grain size (14 µm).
(2) When the strain is small, strain induced transformed ferrite starts to form along the prior austenite
grain boundaries. As the strain is increased, the interiors of austenite grains become activated as
nucleation sites for SIDT ferrite increasing the strain SIDT ferrite volume fraction increases.
(3) Higher strain applied results in a finer ferrite grain size and in higher deformation induced ferrite
fractions.
(4) Deformation at a low temperature, just above Ar3, results in finest grain sizes.
(5) Refining the prior austenite grain size highly enhances the ferrite grain size refinement, and it is
quite crucial in practice.
(6) The presence of Nb increases the critical strain compared to a niobium free steel.
The transformed ferrite volume fraction in the case of deformation of undercooled austenite is higher
than in SIDT samples, however the morphology and the location of ferrite are different. Ferrite from
deformed undercooled austenite is not polygonal but irregular and the grain size distribution is wider.
Grains ranges from less than 1 µm size to 8 µm, while the grain size distribution for the SIDT ferrite is
much more homogenous.
The results by deformation dilatometry were applied to pilot hot rolling mill in order to develop
ultrafine surface grained steels.
SIDT route was applied to plain and microalloyed low carbon steels using laboratory-scale pilot mill
and in plain low C steels surface grains whose size was around 4-5 µm were detected.
High shear strain at the surface and low deformation temperature are the main factors which promote
the formation of UFF surface layers, but differently from Hodgson et. al [10,11] we found that starting
from very coarse austenite grains is not beneficial for grain refining. Smaller the prior austenite, finer is
the SIDT ferrite grain. Exceeding the critical strain increased the volume fraction of ferrite.
It is evident that chemical composition of the steel influences the morphology and the volume fraction
of ultrafine grains formed at the surface layers of a strip and it significantly changes the microstructure
formed in the core.
A special note must be done regarding the influence of cooling path following deformation.
Cooling applied just after rolling is of common practice in order to limit the growth of ferrite and so
refine the final structure. This should be also true in the case of strain induced ferrite, and the role of the
cooling path following deformation is of major interest to be investigated.
Besides, cooling also controls the type and morphology of second phases, which has a direct influence
on the final strain hardenability of the steels.
However, in the industrial plants there exists a delay between rolling and cooling, that will also affect
the microstructure, since it enhances the growth of existing ferritic nuclei. Therefore the effect of static
recrystallization must be considered.
44

5. ULTRAFINE LOW AND MEDIUM PLAIN C STEELS
5.1 Introduction
Since on an actual mass production scale there are limitations to the application of low temperature
large scale deformation, it is necessary to develop a technology to achieve commercially meaningful
grain refinement using existing rolling facilities. If it is insufficient, additional special rolling mills (e.g.
Pony Mill) should be added to the already existing rolling lines.
The PonyMILL is a new technology which enables a conventional mill operator to produce a
percentage of the hot mill throughput as cold rolled substitute, economically and with low investment
costs. The physical process route briefly consists of a close coupled coiler after the tandem finishing
mill exit with rapid coil transfer to an un-coiler. The strip is then fed into a single high reduction stand
where the strip is reduced in a fully or partially ferritic state to the desired gage; a coiler then recoils the
strip before it is passed back into the existing coil handling system.
In the present investigation the mechanisms of producing ultrafine grained C-Mn steels under the
consideration of industrial application are described. In particular, the evolution of microstructure and
texture during warm deformation based on PonyMILL technique, the tensile properties at room
temperature and the Charpy impact properties of the ultrafine grained steels, the effect of carbon
contents on improving the work hardening rate (uniform elongation) of ultrafine grained steels, and the
effect of carbon and manganese contents on ultra-grain refinement were studied.
5.2 Experimental
Four plain C-Mn steels with different carbon and manganese contents were melted in a laboratory
vacuum induction furnace. Table 7 shows the chemical compositions of the steels. Compositions are
given in mass%. The study was concentrated on the steels with carbon contents of ≥ 0.15%. The effect
of carbon content (15C, 2C and 3C steel) and the effect of manganese content (2C, 2CMn steel) were
investigated.
Steel Fe C Si Mn P S Al N Ae3
15C bal. 0.17 0.22 0.76 0.004 0.004 0.031 0.001 1107
2C bal. 0.22 0.21 0.74 0.004 0.003 0.029 0.001 1093
2CMn bal. 0.23 0.22 1.52 0.004 0.004 0.03 0.001 1070
3C bal. 0.31 0.22 0.76 0.003 0.003 0.030 0.001 1071
Table 7 Chemical compositions (mass%) of the steels, calculated Ae3 (K) [26]
Each cast ingots had a weight of 70 kg and a size of 140 × 140 × 300 (width × length × height) mm3.
The laboratory samples were machined directly from the ingot into cylindrical specimens (∅5 mm × 10
mm (diameter × length)) for deformation dilatometry, and into rectangular parallelepiped samples, 18 ×
18 × 30 and 50 × 40 × 60 (width × length × height) mm3, for the plane strain compression tests which
were conducted in a large scale set-up with a maximum force of 2.5 MN [27]. This servohydraulic press
is capable of conducting large scale thermomechanical processes by performing multi-step plane strain
compression tests as a realistic approximation of industry-scale rolling operations.
Different experimental routes were tested in order to optimize the process conditions before during and
after deformation in order to get ultrafine structures.
In particular:
• Continuous-cooling-transformation diagrams after deformation of C-Mn steels
• Ultrafine grained steels produced by warm deformation
• Microstructure and mechanical properties of ultrafine grained steels
were studied.
45

5.2.1 Continuous-cooling-transformation diagrams after deformation of C-Mn steels
Optimization of austenite deformation temperature (experiment I)
In order to get a fine grained and homogeneous austenite, the optimum austenitization and deformation
temperatures prior to the γ → α (austenite to ferrite) transformation were determined by pre-tests.
According to this, the samples were austenitized at Ae3 + 100 K for 3 minutes, air cooling to 1013&1153
K, then deformed with a logarithmic strain of ε = 0.3 and a strain rate of ε& = 10 s-1
. The aim of using
different deformation temperatures is to optimize a fully recrystallized austenite as would be expected
after a conventional hot rolling. Water quenching was used immediately after the deformation in order
to study the resulting austenite microstructure. The experiment I is shown is Fig. 34.
Continuous-cooling-transformation diagrams after deformation (experiment II)
To establish a continuous cooling transformation diagram for each of steel, cooling rates from 2 to 64
K/s were used after deformation at the optimum temperature, i.e. 1133 K for the 15C steel, and 1143 K
for the other steels, which was determined by experiment I. Fig. 35 shows the experiment II.
Fig. 34. Optimization of austenite deformation temperature (experiment I).
Fig. 35. Determination of continuous-cooling-transformation diagrams after deformation (experiment
II).
5.2.2 Ultrafine grained steels produced by warm deformation
Warm deformation of a ferrite-pearlite microstructure (experiment III)
A large strain warm deformation was applied after the γ → α transformation in order to refine the ferrite
and to spheroidize the pearlitic cementite lamellae. The optimum cooling rates after the first austenite
deformation step were determined by the continuous-cooling-transformation diagrams after deformation
for each of steel in experiment II. They are 12 K/s, 6.5 K/s, 5 K/s and 5 K/s for the 15C, 2C, 2CMn and
3C steel, respectively. These values were applied in the controlled cooling experiment III (Fig. 36a), to
46

get a fine ferrite-pearlite microstructure (without bainite) prior to the large-strain multi-step warm
deformation. After holding the samples for 2 min, four deformation steps were exerted in the
temperature range between 773 K and 973 K. Each of the four subsequent steps imposed a logarithmic
strain of ε = 0.4 at a strain rate of ε& = 10 s-1
accumulating to a total strain of ε = 1.6, and an inter-step
time of 0.5 s. Subsequently an annealing treatment of 2 h was imposed at the respective deformation
temperature in order to mimic coiling conditions.
Warm deformation of a bainitic microstructure (experiments IV and V)
In experiments IV and V, a bainitic microstructure was produced by using a cooling rate of 50 K/s after
the deformation in the austenite regime. This treatment provided the starting microstructure for the
subsequent large strain deformation. In experiment IV (Fig. 36b), the large strain deformation was
performed below the bainite finish temperature. In order to obtain a recrystallized ferrite containing
homogeneously distributed cementite particles, the material was reheated after the large strain
deformation to different temperature levels in the range between 773 K and 1003 K, using a holding
time of 2 h to approximate coiling conditions. In experiment V (Fig. 36c), after the complete
transformation the material was first reheated to the respective deformation temperatures in the range
between 823 K and 1003 K. Coiling was simulated by holding the samples for 2 h at the deformation
temperature.
(a) (b) (c)
Fig. 36. Processing schedules for the compression tests. LSW: large strain warm deformation; Trh:
reheating temperature; Ar3: austenite to ferrite transformation temperature; Pf: pearlite finish
temperature; Bf: bainite finish temperature.
5.2.3 Microstructure and mechanical properties of ultrafine grained steels
Initial ferrite-pearlite microstructure before large strain warm deformation (experiment VI)
Since austenite refinement is essential for obtaining small grains after transformation the experiments
were in all cases carried out with a low austenitization temperature (experiment I). After reheating with
a heating rate of 10 K/s, the samples were austenitized at Ae3 + 100 K for 3 minutes to obtain a fine
austenite grain size. After air cooling to 1133 K (15C steel) or 1143 K (2C, 2CMn, 3C steel), a one-step
deformation was used for all materials with a true logarithmic strain of ε = 0.3 and a strain rate of ε& =
10 s-1
, in order to obtain a fully recrystallized austenite, as would be expected after a conventional
recrystallization controlled hot rolling. This was followed by the controlled cooling down to pearlite
finish temperature with cooling rates of 12 K/s (15C steel), 6.5 K/s (2C steel) and 5 K/s (2CMn, 3C
steel), which were determined by pre-tests of deformation dilatometry as maximum cooling rates to get
a bainite free ferrite-pearlite microstructure in each steel (experiment II).
In the following, different experimental routes were carried out after the same treatment (experiment
VI).
Conventional route (CR)
In order to study the initial pearlite-ferrite microstructure before large strain warm deformation and the
effect of grain size on mechanical properties, a conventional route was carried out as shown in Fig. 37a.
That is, the samples were water quenched at 823 K after the controlled cooling in order to get a bainite
free ferrite-pearlite microstructure.
47

Ultrafine grain route (UFR)
After 2 minutes holding at 823 K, which corresponds to the time necessary for some handling in the
industrial processing, the large strain warm deformation was performed by a four-step plane strain
compression with short inter-step times of 0.5 s. Each of the four subsequent steps imposed a
logarithmic strain of ε = 0.4 at a strain rate of ε& = 10 s-1
accumulating to a total strain of ε = 1.6.
Subsequently an annealing treatment of 2 h at 823 K was imposed in order to mimic coiling conditions.
The processing route is shown in Fig. 37b. It should be noted that for the 2CMn steel the sample was
first cooled to 673 K, then, reheated to the large strain warm deformation temperature. This is due to the
pearlite finish temperature which is below 823 K for the 2CMn steel.
Microstructure evolution during warm deformation
In order to study the evolution of microstructure and the formation of the ultrafine structure during the
large strain warm deformation, samples were water quenched after different strains, as shown in Fig.
37c. In this way, the microstructure variations with increasing strain (ε = 0.4, 0.8, 1.2, 1.6) were studied.
High temperature annealing
The 2C steel was annealed for 2 h at an elevated temperature of 973 K after the large strain warm
deformation at 823 K, Fig. 37d. The reason for the annealing at high temperature is to obtain a coarser
size of cementite particles. The coarser size of particles is required for the qualitative measurement of
carbon/manganese distribution in particles by energy-dispersive spectrometry (EDS). The particles with
a size of less than 100 nm can not be represented in an electron backscatter diffraction (EBSD) map
since the step size used in the present study is 50 nm. A smaller step size will lead to bad pattern quality
and lower resolution for the EBSD and EDS measurement.
Fig. 37. Processing schedules for the plane strain compression tests. Trh: reheating temperature; Ar3:
austenite to ferrite transformation temperature; Pf: pearlite finish temperature
(a) conventional route (CR) for getting coarser microstructure, (b) ultrafine grain route (UFR) for
producing ultrafine microstructure, (c) investigation of microstructure evolution during warm
deformation (ε = 0.4, 0.8, 1.2, 1.6), (d) high temperature annealing after large strain warm (LSW)
deformation
(a) (b)
(c) (d)
48

5.3. Results
5.3.1. Optimization of austenite deformation temperature
The optimum deformation temperatures to get a fine and recrystallized austenite are 1133 K for the 15C
steel, and 1143 K for the 2C, 2CMn and 3C steels. In all materials higher deformation temperatures lead
to coarse microstructures, whereas at lower temperatures, some pancaking phenomena indicate an
incomplete recrystallization. The water quenched microstructures of the steels after deformation at the
optimum temperatures are shown in Fig. 38. As shown by the dashed lines in the figure, the initial
austenite grain boundaries decorated by ferrite are equiaxed, which demonstrates that austenite
recrystallization occurred before transformation.
Fig. 38. Water quenched microstructure after deformation at 1133 K for the 15C steel (a), and at 1143
K for the 2C (b), 2CMn (c) and 3C (d) steel (dashed line shows an example of an equiaxed prior
austenite grain). CD: compression direction; TD: transverse direction.
5.3.2. Continuous-cooling-transformation diagrams after deformation
Fig. 39 shows the continuous-cooling-transformation diagrams of the steels after austenite deformation
at the optimum temperatures. If the cooling rate is smaller than 12 K/s, a fully ferrite and pearlite
microstructure can be obtained in the 15C steel. Similarly, the critical cooling rate to get a fully ferrite
and pearlite microstructure for the 2C, 2CMn and 3C steel is about 6.5 K/s, 5 K/s and 5 K/s,
respectively.
(a) (b)
(c) (d)
49

(a) (b)
(c) (d)
Fig. 39. Continuous-cooling-transformation diagrams of the experimental steels after deformation (ε
=0.3, ε& =10s-1
) at the optimum temperatures (1133 K for the 15C steel, and 1143 K for the other steels)
and continuous cooling. The cooling rates varied from 2 to 64 K/s. F: ferrite; P: pearlite; B: bainite; Ms:
martensite start temperature. (a) 15C steel; (b) 2C steel; (c) 2CMn steel; and (d) 3C steel.
Effect of chemical composition on phase transformation
Fig. 40 shows the ferrite and pearlite transformation diagrams of the experimental steels at the cooling
rates of 2&64 K/s. The illustration confirms that higher carbon content retards the diffusion controlled
transformation (austenite to ferrite), which is reflected in a shift of the beginning transformation curve
(ferrite start temperature Fs) to the lower temperatures and longer times with increasing carbon content.
On the other hand, the carbon content has little effect on the pearlite finish temperature curve (pearlite
finish temperature Pf, which is similar for the 15C, 2C and 3C steels.
Manganese is an element that enlarges the austenite region. It obviously retards ferrite formation and
the following pearlite and bainite formation, which can be seen from the curves (the lines with triangle)
of the 2CMn steel in Fig. 40.
50

Fig. 40. Comparison of the results from Fig.39 for all the steels. The cooling curves are omitted for
clarity. Fs: ferrite transformation temperature; Pf: pearlite finish temperature; F: ferrite; P: pearlite.
Effect of cooling rate on microstructure
As shown in Fig. 39 the microstructure changes with increasing cooling rate. As an example, Fig. 41
shows the microstructures of the 3C steel with increasing cooling rate. The main differences between
the microstructures produced by different cooling rates were the amount and the size of pro-eutectoid
ferrite, the thickness of pearlitic cementite lamellae and the presence of bainite and martensite. After a
slow cooling rate of 2 K/s, the microstructure contains coarse polygonal ferrite and thick lamellar
pearlite, Fig. 41a. After a faster cooling rate, the size of polygonal ferrite and the thickness of pearlitic
cementite lamellae are smaller. Increasing the cooling rates above 5 K/s, bainite (Fig. 41b) and later
martensite (Fig. 41c) are present in the microstructure. Therefore, the cooling rate of 5 K/s was used in
the experiment to get an initial fine and bainite free ferrite and pearlite microstructure before large
strain warm deformation.
Fig. 41. Microstructure changes with increasing cooling rate in the 3C steel. CD: compression direction;
TD: transverse direction. (a) 2 K/s, (b) 16 K/s and (c) 64 K/s.
5.3.3 Effects on microstructure and hardness of the ultrafine grained steels after compression tests
Effect of temperature on microstructure
In order to study systematically the microstructure of the steels produced by the different experiments
(Fig. 36), the 3C steel was selected as an example.
Fig. 42 shows the optical micrographs of the 3C steel processed by the experiments in Fig.36 at the
elevated temperatures. The temperature has different meanings for the different processes. It represents
the multi-step deformation and annealing temperature in the experiment III and experiment V, while it
represents only the annealing temperature in the experiment IV. The microstructures obtained for the
three processing schemes are similar, i.e. they consist of ferrite and globular cementite particles. The
microstructure after the experiment V is also shown as a SEM image (Fig. 43a) and EBSD map (Fig.
51

43b). The microstructure obtained for a heat treatment above 913 K reveals a more equiaxed grain
shape. Lower temperatures lead to finer ferrite grains and cementite particles (5&350 nm), but the grain
shape is more elongated than that after 973 K. An increase in the deformation temperature results in
coarser and more equiaxed ferrite grains. The distribution of cementite particles tends to be more
homogeneous and the particle size becomes larger (250&950 nm) at temperatures of 973 K.
Fig. 42. Optical micrographs of the 3C steel after the experiments in Fig. 36. CD: compression
direction; TD: transverse direction; Temp.: multi-step deformation and subsequent annealing
temperatures in the experiment III and experiment V, annealing temperature in the experiment IV.
52

Fig. 43b represents the EBSD maps from the same samples as shown in Fig. 43a. The maps show the
image quality index (IQ) of the pseudo-Kikuchi lines together with the grain boundaries. Black lines
indicate misorientations above 15° between adjacent points, i.e. they represent high-angle grain
boundary segments. The white lines indicate misorientations between 2° and 15°. The white spots at the
grain boundary triple points visible in the map taken on the sample treated at 973 K are cementite
particles with sizes in the range between 300 nm and 950 nm, i.e. they are larger than the step size (100
nm) of the EBSD measurement.
(a)
(b)
Fig. 43. SEM images (a) and EBSD maps (b) of the 3C steel after the large-strain deformation (ε = 1.6)
and subsequent 2 h annealing at different temperatures (experiment V). Details of the processing are
given in Fig. 36c. CD: compression direction; TD: transverse direction. The black lines indicate grain
boundary misorientations between 15° and 63°. The white lines indicate grain boundary misorientations
between 2° and 15°.
Effect of temperature on grain boundary orientation distribution
Fig. 44 shows the fraction of high-angle grain boundaries of the 3C steel for the three experiments in
Fig. 36. For the different deformations (experiment III and V) and annealing temperatures (experiment
IV) ranging from 773 K to 973 K, the fraction of high-angle grain boundaries increases with
temperature but remains between 55% and 70%. A detailed analysis of the grain boundary maps,
though, reveals that many grains are bordered by both, high- and low-angle grain boundaries.
Fig. 45 shows the EBSD analysis of the grain sizes together with the grain shape aspect ratios as
obtained by experiment V. The data reveal true grain sizes (only high-angle grain boundaries are
considered) in the range between 1 µm and 2 µm (Fig. 45a). The aspect ratio for these grains amounts
to 2 for the low temperature regime and drops to 1.5 for higher temperatures. Fig. 45b, the (sub)grains
(all the grains with both high- and low-angle grain boundaries) reveal a decreased aspect ratio of about
1.2 when the temperature increased to 913 K.
Fig. 46 shows the corresponding average data for the grain shape aspect ratio for all the processes in Fig.
36. All grains and subgrains are elongated perpendicular to the compression direction at low
temperatures, but more equiaxed at high temperatures. For the experiment IV the aspect ratio of the
grains and subgrains almost drops by a factor of two within the investigated temperature range.
53

Fig. 44. Fraction of high-angle grain boundaries (HAGBs) of the 3C steel obtained for the three
different experiments in Fig. 36.
Fig. 45. Average ferrite grain and subgrain sizes in the CD (compression direction) and TD (transverse
direction), respectively, for the 3C steel. The right hand ordinate indicates the corresponding values for
the grain shape aspect ratio (GSAR), data are taken from the experiment V (Fig. 36c): (a) only high-
angle grain boundaries are considered in the measurement (15° ≤ θ < 63°), (b) both high- and low-
angle grain boundaries are considered in the measurement (2° ≤ θ < 63°)
Fig. 46. Average values for the grain shape aspect ratio (GSAR) of the 3C steel after the three different
processes in Fig. 36. (a) only high-angle grain boundaries are considered in the measurement (15° ≤ θ
< 63°), (b) both high- and low-angle grain boundaries are considered in the measurement (2° ≤ θ < 63°)
54

Effect of carbon content on grain size
The effect of carbon content on the average ferrite (sub)grain size after the different experiments (Fig.
36) is shown in Fig. 47. With increasing carbon content the average ferrite (sub)grain size decreases in
the experiment III and IV (Fig. 47A and B). It is interesting to note that this phenomenon is not valid in
the experiment IV, Fig. 47C, when the temperature is between 823 K and 843 K. That means the
average grain size is similar for all the materials in the experiment IV at this temperature range.
(a)
(b)
Fig. 47. Effect of carbon content on average ferrite (sub)grain size after the experiments in Fig. 36. (a)
high-angle grain boundaries are considered in the measurements
(b) high- and low-angle grain boundaries are considered in the measurements
55

Effect of experimental procedures on grain size
The effect of the experimental routes in Fig. 36 on the average ferrite (sub)grain size of the steels is
shown in Fig. 48. It can be seen that the average grain size of each steel is similar after the different
routes.
Effect of temperature on hardness
The effect of temperature on macrohardness (HV5) is shown in Fig. 49 for the steels processed by the
different experiments in Fig. 36. The increase in temperature leads to a decrease in hardness. For each
of steel processed by the different routes, the macrohardness is quite similar. However, at the same
temperature, the increase in carbon and especially manganese content is effective in increasing hardness.
Fig. 48. Effect of the experimental routes in Fig. 36 on average ferrite (sub)grain size for the different
steels. (a) high-angle grain boundaries are considered in the measurement, (b) high- and low-angle grain
boundaries are considered in the measurement
56

Fig. 49. Macrohardness changes with temperature after the different experiments in Fig. 36
(Experiment III: warm deformation of a ferrite-pearlite microstructure; Experiment IV and V: warm
deformation of a bainite microstructure).
(a) 15C; (b) 2C; (c) 2CMn; (d) 3C.
5.3.4 Microstructure and mechanical properties of the conventional steels
Microstructure
The microstructures of the steels after the conventional route (Fig. 37a) consist of ferrite and pearlite
(Fig. 50). Higher carbon content leads to finer ferrite grains and a higher volume fraction of pearlite.
Compared to the lower manganese steel of 2C, a much finer ferrite microstructure can be observed in
the higher manganese steel 2CMn (Fig. 50c).
Fig. 51 shows the average ferrite grain size after the conventional route. A higher carbon content and
especially a higher manganese content results in finer ferrite
(a) (b)
(c) (d)
57

Fig. 50. Optical micrographs of the experimental steels after the conventional route. Details of the
processing are given in Fig. 37a: (a) 15C steel; (b) 2C steel; (c) 2CMn steel; (d) 3C steel.
Fig. 51. Grain size of the experimental steels after the conventional route. Details of the processing are
given in Fig. 37a.
Mechanical properties
The engineering stress-strain curves of the steels after the conventional route are shown in Fig. 52. The
tensile tests were carried out at room temperature. The average ferrite grain size of each of the steels is
also shown in the figure. It can be seen that higher manganese and carbon contents lead to smaller grain
sizes and subsequently higher strength. However, the total elongation hardly changes especially when
the carbon content increases from 0.15% to 0.3%.
(c) (d)
(a) (b)
58

Fig. 53 shows the results of Charpy impact testing on subsize specimens of the experimental steels after
the conventional route. With increasing carbon content the upper shelf energy decreases obviously in
the ferrite-pearlite steels.
Fig. 52. Comparison of stress-strain curves of the experimental steels with different ferrite grain sizes.
The steels were processed by the conventional route (CR), as shown in Fig. 37a.
Fig. 53. Charpy impact properties for subsize specimens of the experimental steels after the
conventional route (CR). Details of the processing are given in Fig. 37a.
5.3.5 Microstructure and mechanical properties of the ultrafine grained steels
Microstructure
Fig. 54 shows the SEM micrographs of the experimental steels after the large strain warm deformation
(ε = 1.6) and annealing at 823 K for 2 h (Fig. 37b). In all steels the microstructure consists of ferrite
with a small grain size and globular cementite. The finer cementite particles (5&90 nm) are distributed
inside the ferrite grains. The coarser ones (90&350 nm) are located at the ferrite grain boundaries, acting
as obstacles for the migration of ferrite grain boundaries in ND. Increasing carbon content from 0.15%
to 0.3% the chains of cementite particles locating at ferrite grain boundaries disappear. The cementite
59

particles are distributed more homogenously at both grain boundaries and inside the ferrite grains.
Meanwhile the ferrite grain size becomes smaller and the grain shape more equiaxed. Compared to the
2C steel, much finer and more equiaxed ferrite grains can be observed in the 2CMn steel.
The effects of carbon and manganese contents on the average ferrite (sub)grain (grain and subgrain)
size and grain shape aspect ratio (GSAR) are shown in Fig. 55. It can be seen that the increase in carbon
and manganese contents leads to a decrease in the average ferrite grain size and grain shape aspect ratio.
Especially the manganese shows a significant effect, a finer and nearly perfect equiaxed grain structure
is represented in the 2CMn steel. The fraction of high-angle grain boundaries is shown in Fig. 56. The
increase in carbon content leads to a slightly increase of the fraction of high-angle grain boundaries.
Comparably, the increase in manganese content is more effective to enhance the fraction of high-angle
grain boundaries. As an example, Fig. 57a shows the grain boundary misorientation map of the 2CMn
steel after the ultrafine grain route. The red lines represent high-angle grain boundaries and the green
lines low-angle grain boundaries. It can be seen that most of the grain boundaries are decorated by the
red line segments. The grain boundary misorientations with bimodal distribution characteristic can be
observed in Fig. 57b. The two peak values were represented at both low- and high-angle grain boundary
misorientation regions, i.e. one is in the range of 2&12° and the other is between 50° and 62°.
(a) (b)
(c) (d)
Fig. 54. SEM images of the experimental steels after large strain deformation and 2 h annealing at 823
K (Fig. 37b: ultrafine grain route):(a) 15C steel; (b) 2C steel; (c) 2CMn steel; (d) 3C steel.
60

Fig. 55. Average ferrite (sub)grain size (a) and grain shape aspect ratio (GSAR) (b) of the experimental
steels after large strain deformation and 2 h annealing at 823 K (Fig. 37b: ultrafine grain route).
Fig. 56. Fraction of high-angle grain boundaries (HAGBs) of the experimental steels after large strain
deformation and 2 h annealing at 823 K (Fig. 37b: ultrafine grain route).
(a)
(b)
61

Fig. 57. Grain boundary characterization of the 2CMn steel after large strain deformation and 2 h
annealing at 823 K (Fig. 37b: ultrafine grain route).
(a) EBSD image: the red lines indicate grain boundary misorientations between 15° and 63°; the green
lines indicate grain boundary misorientations between 2° and 15°
(b) grain boundary misorientation distribution
Effect of manganese on grain refinement
(a) EDS analysis
As shown in Fig. 54 and 55, very fine and more equiaxed grains were observed in the higher manganese
steel 2CMn. Due to the same experimental processing applied for all the steels, therefore, special
attention was paid on the effect of manganese on grain refinement, especially the effect of manganese
during large strain warm deformation and subsequent annealing.
Fig. 58 shows the image quality map of the 2C steel after large strain warm deformation (ε = 1.6) and
subsequent 2 h annealing at 973 K. The reason to use this high annealing temperature after warm
deformation at 823 K is to get a large cementite size. The cementite particles with a size of less than
100 nm can not be represented in an EBSD map (step size: 50 nm). A smaller step size will lead to bad
pattern quality and lower the resolution for EBSD and EDS technique to measure the distribution of
carbon and manganese. The image quality map, Fig. 58, represents the same microstructure components
as in the case of the annealing temperature of 823 K: ferrite and globular cementite. Nevertheless,
compared to the SEM micrograph of the 2C steel in Fig. 54b, some coarse ferrite grains appear in the
microstructure. A large number of cementite particles can be observed inside the coarser grains.
(a)
(b)
62

Fig. 58. Image quality map of the 2C steel after large strain deformation at 823 K and subsequent 2 h
annealing at 973 K (Fig. 37d).
Fig. 59. EBSD maps of the 2C steel processed by large strain deformation at 823 K and subsequent 2 h
annealing at 973 K (Fig. 37d).
(a) image quality map; (b) carbon distribution; (c) manganese distribution.
(b)
(a)
(c)
63

In order to study the distributions of carbon and manganese, a small area in Fig. 58 was selected for the
EBSD and EDS measurements. Fig. 59a shows the image quality map of the measured area. Fig. 59b
and c represent the distribution of carbon and manganese, respectively. The color band from blue to red
displays the increase of local carbon and manganese concentrations. In Fig. 59b and c, the arrows point
out red areas which indicate high carbon and manganese concentrations, respectively. It shows that
besides carbon, manganese is also preferred to locate at the same positions as the cementite particles,
shown in Fig. 59a.
(b) TEM analysis
Fig. 60. Manganese content (mass%) in the matrix and in the cementite particles determined by the
STEM-EDS technique for the 2C (0.22 mass%C-0.74 mass%Mn) and 2CMn (0.23 mass%C-1.52
mass%Mn) steels after warm deformation (ε = 1.6) and subsequent annealing.
The distributions of carbon and manganese can be qualitatively analyzed by the EBSD and EDS
measurements. Using TEM and scanning electron microscopy (STEM) with EDS technique, the amount
of manganese in solid solution in both the ferrite matrix and cementite particles can be quantitatively
determined. Fig. 60 shows the participation of Mn in both matrix and particles for the 2C and 2CMn
steels processed by the large strain warm deformation and subsequent annealing. Each value represents
an average value from between five to ten measurements. As expected, the manganese content in the
ferrite matrix is higher in the 2CMn steel if compared to that in the 2C steel, which is related to the
chemical compositions of each steel (Table 7). However, it is important to note that the manganese
content in the cementite particles of the 2CMn steel (~7.5%) is significantly higher than that in the 2C
steel (~3.1%).
The TEM micrographs of the 2C and 2CMn steels after large strain warm deformation and direct water
cooling are shown in Fig. 61a and b, and after large strain warm deformation and a subsequent
annealing are represented in Fig. 61c and d. All microstructures are characterized by ultrafine ferrite
grains and globular cementite particles. The ferrite grain size hardly changed after the post deformation
annealing (Fig. 61c and d), if compared with those in the microstructures directly after large strain
warm deformation (Fig. 61a and b). Only a slight coarsening of the cementite particles was observed
after annealing. However, much finer cementite particles were found in the 2CMn steel, especially after
annealing, if compared to those of the 2C steel (compare Fig. 61d with c).
64

Fig. 61. TEM micrographs of the 2C (0.22 mass%C-0.74 mass%Mn) and 2CMn (0.23 mass%C-1.52
mass%Mn) steels after large strain warm deformation (ε = 1.6) and annealing, respectively. The arrows
“1” point out the fine cementite particles inside the ferrite grains. The arrows “2” point out the coarse
cementite particles at the ferrite grain boundaries.
(a) and (b) deformed microstructure
(c) and (d) annealed microstructure
Fig. 62. TEM micrographs of the dislocation structures in the 2C steel after large strain warm
deformation (ε = 1.6) and annealing, respectively.
(a) dislocation structure after large strain warm deformation
(b) dislocation structure after annealing
(a) (b)
(c) (d)
(a) (b)
65

Fig. 63. TEM micrographs of the 2C steel after large strain warm deformation and annealing.
(a) mutual crystallographic orientation of the local areas (adjacent grains and subgrains numbered with
1 to 6). The white arrows point out the cementite particles pinning the subgrain boundary
(misorientation θ = 7.5°),(b) dislocation structures and individual cementite particles inside the ferrite
matrix. The black arrows point out the cementite particles pinning the dislocations
Two different size groups of cementite particles are presented in the 2C steel (Fig. 61a and c). The finer
cementite particles (5&90 nm) are distributed inside the ferrite grains (see arrows 1). The planar arrays
of larger cementite particles (90&350 nm) are located at the ferrite grain boundaries (see arrows 2),
acting as obstacles for the migration of ferrite grain boundaries. A lower number of small size particles
were observed in this steel after annealing (Fig. 61c). In contrast to this, in the 2CMn steel,
homogeneously dispersed fine cementite particles (5&120 nm) (not clearly dividable in two size groups)
could be observed (Fig. 61b and d).
Fig. 62a and b show the dislocation structures in the 2C steel after the large strain warm deformation
and annealing, respectively.
In Fig. 63a, the mutual crystallographic misorientations of local areas (adjacent grains or subgrains
numbered with 1 to 6) are determined by means of Kikuchi-line analysis in the TEM. The curvature of
the subgrain boundary (misorientation of 7.5°) demonstrates a pinning effect of the particles on the
ferrite grain boundary. Fig. 63b shows the dislocation structures and individual cementite particles
inside the ferrite matrix. The black arrows point out the cementite particles pinning the dislocations.
Mechanical properties
Fig. 64 shows the stress-strain curves of the ultrafine grained steels after tensile tests at room
temperature. The details of the tensile properties are shown in Fig. 65. Each dot represents an average
value from three tests. The increase of carbon and manganese contents leads to an increase in strength,
but less difference in ductility. Taking the manganese as an example, with increasing the manganese
content from 0.7% to 1.5%, the lower yield stress increases from 532 MPa to 622 MPa and the ultimate
tensile strength from 595 MPa to 678 MPa, while the total and uniform elongations hardly change, such
as the total elongation is 22.7% and 21.4%, the uniform elongation is 10.2% and 10.0% for the 2C and
2CMn steel, respectively. The Lüders strain decreases obviously with the increase of carbon content, as
shown in Fig. 66. The yield ratio (LYS/UTS) of the experimental steels is shown in Fig. 67. The ratio
firstly increases with increasing carbon content from 0.15% to 0.2%. However, it obviously decreases
when the carbon content reaches 0.3%.
Fig. 68 represents the true stress-strain curves (the part before necking starts) of the ultrafine grained
steels with different carbon contents. A fast increase of the true stress can be observed in the 3C steel.
Fig. 69 shows the data of stress-strain curves (Fig. 64) of the ultrafine grained steels (produced by the
ultrafine grain route in Fig. 37b) in Kocks-Mecking plots. The data were converted to true stress–true
strain and plotted in differential form. The figure displays the relationship between work hardening rate
θw versus true stress σt, both normalized by the shear modulus µ = 80 GPa. The curves shown in Fig. 69
are the part between the Lüders strain and the strain where the necking starts. An obvious feature of
Fig.69 is that the work hardening rate decreases with stress in all curves.
66

This decrease may be approximately described by the straight coarse lines. The value shown in the
figure (i.e. 21.59, 23.25 and 21.69) is the slope of each straight line (〉θw / 〉σt), which displays the
difference in work hardening behavior. On the right up of the figure, the grain sizes of the steels are
represented.
Fig. 64. Comparison of stress-strain curves of the experimental steels with different ferrite grain sizes.
The steels were processed by the large strain deformation and subsequent 2 h annealing at 823 K (Fig.
37b: ultrafine grain route).
Fig. 65. Mechanical properties of the experimental steels after large strain deformation and subsequent
2 h annealing at 823 K (Fig. 37b: ultrafine grain route).
(a) Strength; (b) ductility
(a)
(b)
67
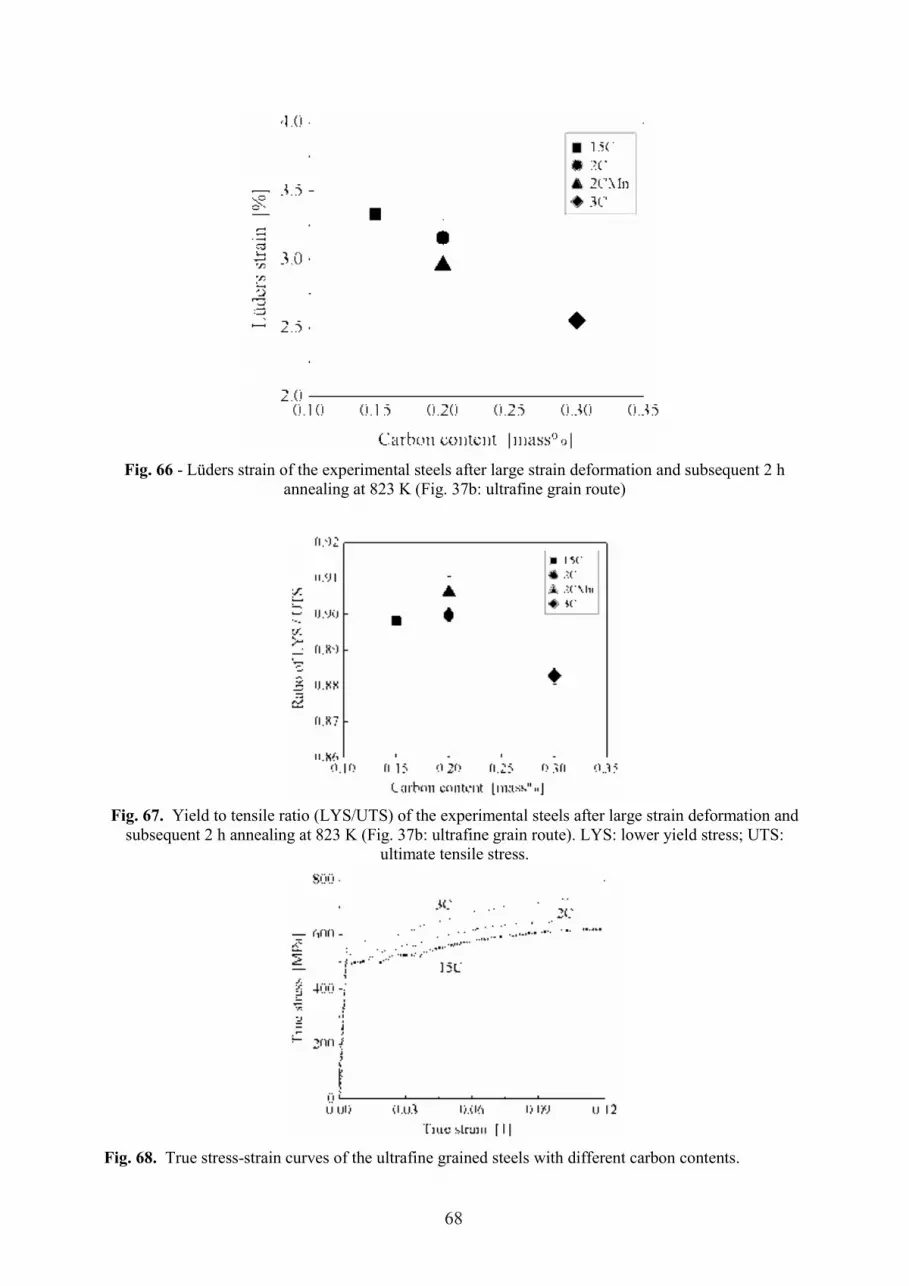
Fig. 66 - Lüders strain of the experimental steels after large strain deformation and subsequent 2 h
annealing at 823 K (Fig. 37b: ultrafine grain route)
Fig. 67. Yield to tensile ratio (LYS/UTS) of the experimental steels after large strain deformation and
subsequent 2 h annealing at 823 K (Fig. 37b: ultrafine grain route). LYS: lower yield stress; UTS:
ultimate tensile stress.
Fig. 68. True stress-strain curves of the ultrafine grained steels with different carbon contents.
68

Fig. 69. Work hardening rate θw versus true stress σt, both normalized by the temperature dependent
shear modulus µ = 80 GPa. dα: average ferrite grain size.
Fig. 70. Charpy impact properties for subsize specimens of the experimental steels after large strain
deformation and subsequent 2 h annealing at 823 K (Fig. 37b: ultrafine grain route).
69

Fig. 71. Specific upper shelf energy (related to the ligament area) (a) and ductile-to-brittle transition
temperature (b) of the experimental steels after large strain deformation and subsequent 2 h annealing at
823 K (Fig. 37b: ultrafine grain route). All values were converted to those for full size Charpy test
specimens according to equation (1) and (2).
Fig. 72. Observation area of Charpy impact fracture surface – in the middle of the thickness (along ND)
and 1 mm away from the V-notch.
(b)
(a)
70
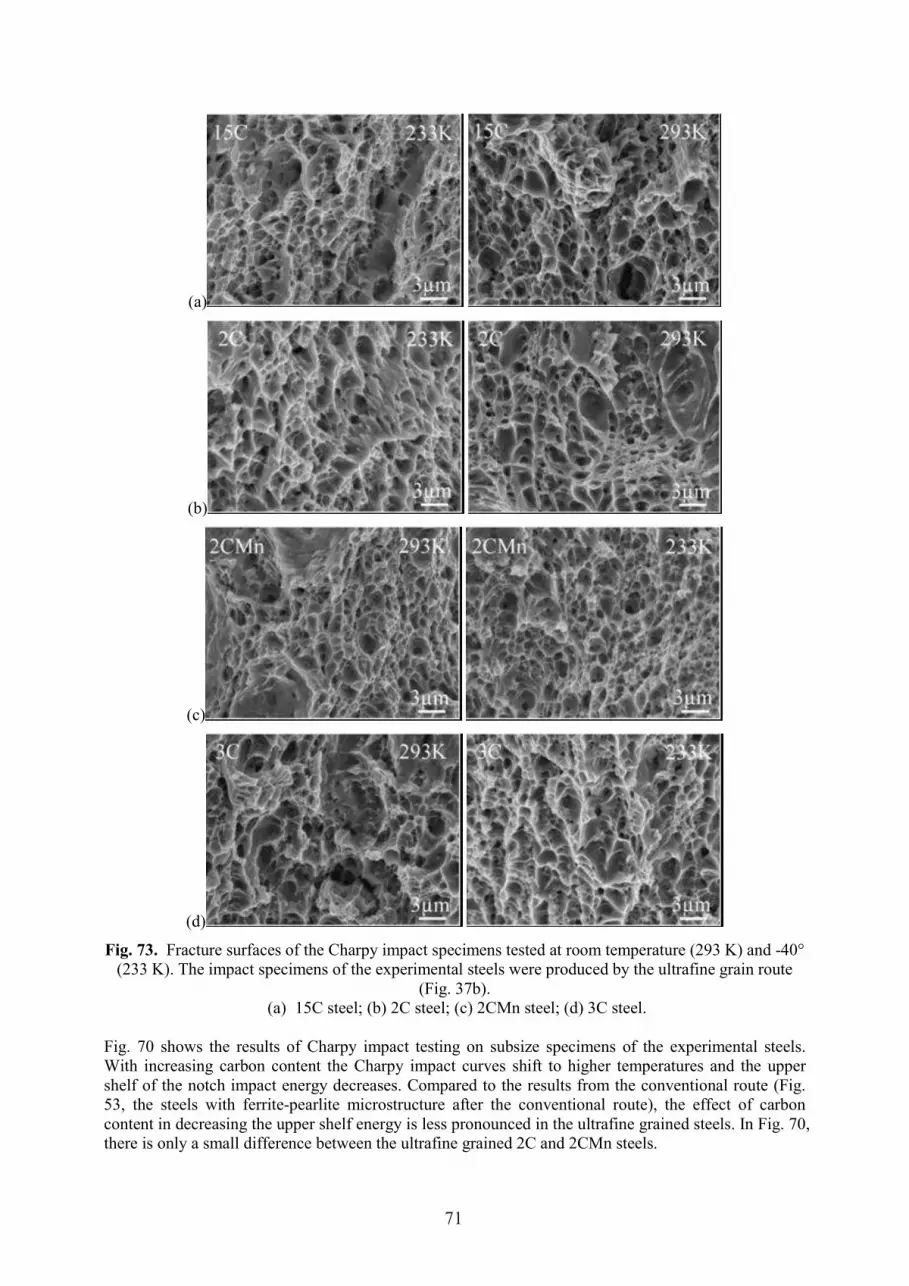
(a)
(b)
(c)
(d)
Fig. 73. Fracture surfaces of the Charpy impact specimens tested at room temperature (293 K) and -40°
(233 K). The impact specimens of the experimental steels were produced by the ultrafine grain route
(Fig. 37b).
(a) 15C steel; (b) 2C steel; (c) 2CMn steel; (d) 3C steel.
Fig. 70 shows the results of Charpy impact testing on subsize specimens of the experimental steels.
With increasing carbon content the Charpy impact curves shift to higher temperatures and the upper
shelf of the notch impact energy decreases. Compared to the results from the conventional route (Fig.
53, the steels with ferrite-pearlite microstructure after the conventional route), the effect of carbon
content in decreasing the upper shelf energy is less pronounced in the ultrafine grained steels. In Fig. 70,
there is only a small difference between the ultrafine grained 2C and 2CMn steels.
71

As described before, it is possible to use the Charpy impact properties of subsize specimen to predict
the ductile-to-brittle transition temperature (DBTT) and the upper shelf energy (USE) of full size
specimen. The correlations of Charpy impact properties between subsize and full size specimens are
shown in equation (1) and (2).
[USE/Bb]Charpy-V = -0.001175 [USE/Bb]2small + 5.029 [USE/Bb]small - 75.07 (1)
DBTTCharpy-V = 1.169 [DBTTsmall] + 61.35 (2)
According to these correlations, the values of the specific upper shelf energy and the ductile-to-brittle
transition temperature calculated for full size specimens are represented in Fig. 71. With increasing
carbon content the specific upper shelf energy decreases and the ductile-to-brittle transition temperature
increases. However, the ductile-to-brittle transition temperature decreases when the carbon content
increased from 0.15% to 0.2%.
The observation area of fracture surface after Charpy impact test was in the center of the sample and 1
mm below the V-notch, as shown in Fig. 72. The reason to select this location as the observation area is
because the stress state during impact testing at this position promotes a more brittle fracture. The
fracture surfaces of the impact specimens tested at 293 K and 233 K are shown in Fig. 73. It can be seen
that the fracture surfaces of all the experimental steels reveal dimples in conformity with a ductile
fracture. No significant difference in the appearance of dimples could be established in the fracture
surfaces of the steels with different compositions.
5.3.6 Comparison of properties between the conventional and ultrafine grained steels
Grain size
Fig. 74 shows the average ferrite grain size produced by the conventional route (CR) (Fig. 37a), and the
ultrafine grain route (UFR) (Fig. 37b), respectively. The UFR is effective to produce a finer
microstructure. The effect is even obvious when the initial microstructure (before large strain warm
deformation) is coarse, such as for the 15C steel.
Tensile properties
The effect of grain refinement on the tensile properties is represented in Fig. 75. It can be seen that,
compared to the steels produced by the conventional route, there are obvious increases in the lower
yield stress, ultimate tensile stress and Lüders strain in the ultrafine grained steels. The ductility of the
ultrafine grained steels decreases but the total elongation is still above 20%.
The details of the tensile properties are shown in Fig. 76. With decreasing average ferrite grain size of
each of the steel, the lower yield stress increases by 40&56% (Fig. 76a), the ultimate tensile stress
increases by 12&19% (Fig. 76b) and the yield to tensile ratio increases by 25&37% (Fig. 76c). The
decrease in grain size has evident effect on increasing the Lüders strain, i.e. 27&73% increment for the
different steels (Fig. 76d).
72

Fig. 74. Comparison of average ferrite grain size of the experimental steels produced by the
conventional route (CR) (Fig. 37a), and the ultrafine grain route (UFR) (Fig. 37b), respectively. Open
symbols: results after the CR; filled symbols: results after the UFR.
Fig. 75. Comparison of stress-strain curves of the experimental steels with different grain sizes. The
different grain sizes were produced by the conventional route (CR) (Fig. 37a), and the ultrafine grain
route (UFR) (Fig. 37b), respectively.
(a) 15C steel; (b) 2C steel; (c) 2CMn steel; (d) 3C steel.
(a) (b)
(c) (d)
73

Fig. 76. Comparison of tensile properties of the experimental steels with different grain sizes. The
different grain sizes were produced by the conventional route (CR) (Fig. 37a), and the ultrafine grain
route (UFR) (Fig. 37b), respectively. Open symbol: results after the CR; filled symbol: results after the
UFR. (a) yield stress, (b) ultimate tensile stress, (c) ratio of lower yield stress to ultimate tensile stress
(LYS/UTS), (d) Lüders strain.
(a) (b)
(c) (d)
74

Fig. 77. Change of Charpy impact properties for subsize specimens of the experimental steels with
different grain sizes. The different grain sizes were produced by the conventional route (CR) (Fig. 37a),
and the ultrafine grain route (UFR) (Fig. 37b), respectively. DBTTsmall: ductile-to-brittle transition
temperature of subsize specimen.
(a) 15C steel; (b) 2C steel; (c) 2CMn steel; (d) 3C steel.
Toughness
The Charpy impact transition curves of the ultrafine grained steel and the coarser grained steel are
represented in Fig. 77. In order to demonstrate the changes of the Charpy impact transition curves with
grain refinement, the 2C steel was chosen as an example since it has the best toughness (the lowest
ductile-to-brittle transition temperature) among the experimental ultrafine grained steels (Fig. 71b).
After impact testing on subsize specimens, the improvement of impact properties in the ultrafine
grained 2C steel is shown in Fig. 77b. A sigmoidal relationship exists between Charpy impact absorbed
energy and temperature. Compared to the coarser microstructure the upper shelf energy is decreased
and the transition curve is more flat in the ultrafine grained steel. In order to determine the ductile-to-
brittle transition temperature, the following criterion was used: the ductile-to-brittle transition
temperature is defined by the temperature at half of the upper shelf energy, Fig. 77b. It can be observed
that the ductile-to-brittle transition temperature of the ultrafine grained steel is lower than that of the
conventional steel. The change of the absorbed energy with temperature close to the ductile-to-brittle
transition temperature is quite small in the steel with finer microstructure.
(d)(c)
(b)(a)
75

Fig. 78. Fracture surfaces, taken by SEM, of the ultrafine and conventional 2C steels after Charpy V-
notch impact tests. A fracture surface of the ultrafine 2C steel after impact testing at 103 K (-170°) (a)
total view of the fracture surface; (b) brittle behavior; (c) border area between cleavage fracture and
ductile fracture; (d) ductile behavior, observation area is shown in (a)
B fracture surface of the conventional 2C steel after impact testing at 143 K (-130°) (e) total view of the
fracture surface; (f) appearance of the cleavage fracture, observation area is shown in (e).
76

Fig. 79. ND orientation maps (taken by EBSD measurement) of the ultrafine grained 2C steel after
Charpy impact testing at 103 K, the same specimen as shown in Fig. 45a but measured in the transverse
direction of the sample. (a) front of a crack: the circles with number “1” and “2” point out two
elongated grains with high-angle grain boundaries in between (b) aligned damage below a ductile
fracture: the ellipse highlights the alignment of microvoids along the grain boundaries
It is important to note that the lower shelf energy of the ultrafine grained steel is much higher than that
of the conventional steel. For example, in Fig. 77b, the absorbed energy is about 2 J for the ultrafine
grained 2C steel when the impact test temperature was 103 K, in contrast, it is only about 0.5 J for the
conventional steel tested at even higher temperature of 143 K. Fig. 78 A and B show the fracture
surfaces of the ultrafine grained and conventional 2C steel tested at 103 K and 143 K, respectively. It
can be seen from Fig. 78a that the fracture surface of the ultrafine grained steel consists of both ductile
and brittle areas and these two areas appear alternatively. Nearly 50% of the surface displays dimpled
fracture. If the ductile-to-brittle transition temperature is defined by the temperature at which 50% of
the fracture surface is covered with a brittle area, the ductile-to-brittle transition temperature of the
ultrafine grained 2C steel becomes lower than 103 K for the subsize specimen. The details of the brittle
and ductile behaviors are shown in Fig. 78b&d. The observation area is in the middle of the thickness
(along ND) and 1 mm away from the V-notch, as shown in Fig. 78a. In contrast to the ultrafine grained
microstructure, in the coarser microstructure of the 2C steel a fully cleavage fracture is shown already at
143 K (Fig. 78e). A large magnification of the cleavage fracture is displayed in Fig. 78f.
(b)
(a)
77

Fig. 80. Converted full size Charpy impact properties. (a) Specific upper shelf energy (related to the
ligament area) and (b) ductile-to-brittle transition temperature of the experimental steels with different
grain sizes. The different grain sizes were produced by the conventional route (CR) (Fig. 37a), and the
ultrafine grain route (UFR) (Fig. 37b), respectively.
Fig. 79 shows the orientation maps of the ultrafine 2C steel after Charpy impact testing at 103 K, the
same specimen as in Fig. 78a, but measured in the transverse direction of the sample. The maps were
taken by EBSD measurements and show orientation in ND. The correspondence between the colors and
the crystal orientations is represented in the stereographic triangle in Fig. 79b. At the tip of the crack,
Fig. 79a, there are two main colors, i.e. red and blue. This indicates that in Fig. 79a (the front of a crack)
the microtexture consists of ND || <111> (in blue) and ND || <001> (in red) texture components. It can
be seen that the crack separates the blue and red grains, which shows that the crack spreads along the
grain boundary of the grains numbered with “1” and “2”. Fig. 79b shows the ND orientation map below
the ductile fracture. Compared to Fig. 79a, however, colors close to green dominate in Fig. 46b due to
the bending during the Charpy test. The aligned damage (highlighted by the ellipse) below the ductile
fracture can be seen clearly.
The values of the Charpy impact properties, calculated for full size specimens, are summarized in Fig.
80 for both the ultrafine grained and conventional steels. It can be seen that the specific upper shelf
energy and the ductile-to-brittle transition temperature decrease in the ultrafine grained steels.
(b)
(a)
78
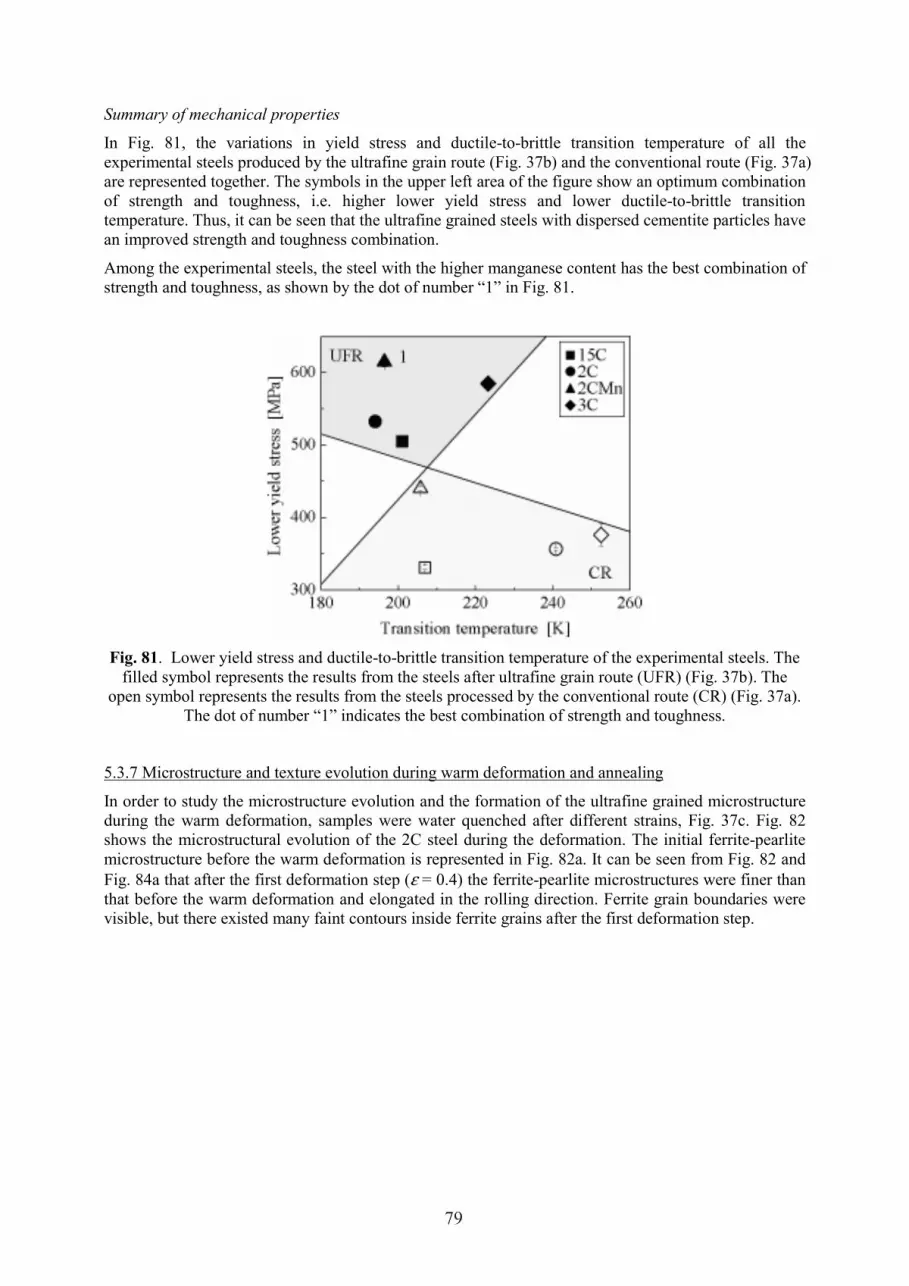
Summary of mechanical properties
In Fig. 81, the variations in yield stress and ductile-to-brittle transition temperature of all the
experimental steels produced by the ultrafine grain route (Fig. 37b) and the conventional route (Fig. 37a)
are represented together. The symbols in the upper left area of the figure show an optimum combination
of strength and toughness, i.e. higher lower yield stress and lower ductile-to-brittle transition
temperature. Thus, it can be seen that the ultrafine grained steels with dispersed cementite particles have
an improved strength and toughness combination.
Among the experimental steels, the steel with the higher manganese content has the best combination of
strength and toughness, as shown by the dot of number “1” in Fig. 81.
Fig. 81. Lower yield stress and ductile-to-brittle transition temperature of the experimental steels. The
filled symbol represents the results from the steels after ultrafine grain route (UFR) (Fig. 37b). The
open symbol represents the results from the steels processed by the conventional route (CR) (Fig. 37a).
The dot of number “1” indicates the best combination of strength and toughness.
5.3.7 Microstructure and texture evolution during warm deformation and annealing
In order to study the microstructure evolution and the formation of the ultrafine grained microstructure
during the warm deformation, samples were water quenched after different strains, Fig. 37c. Fig. 82
shows the microstructural evolution of the 2C steel during the deformation. The initial ferrite-pearlite
microstructure before the warm deformation is represented in Fig. 82a. It can be seen from Fig. 82 and
Fig. 84a that after the first deformation step (ε = 0.4) the ferrite-pearlite microstructures were finer than
that before the warm deformation and elongated in the rolling direction. Ferrite grain boundaries were
visible, but there existed many faint contours inside ferrite grains after the first deformation step.
79

Fig. 82. Optical microstructures of the 2C steel during warm deformation (Fig. 37c) and annealing (Fig.
37b) at 823 K.
(a) initial microstructure before large strain warm deformation
(b) microstructure after one warm deformation step (ε = 0.4)
(c) microstructure after two warm deformation steps (ε = 0.8)
(d) microstructure after three warm deformation steps (ε = 1.2)
(e) microstructure after steps warm deformation four (ε = 1.6)
(f) microstructure after four deformation steps and 2 h annealing at 823 K
(a) (b)
(c) (d)
(e) (f)
80

Fig. 83. Microstructure evolution of the 2C steel during warm deformation (Fig. 37c) and annealing
(Fig. 37b) at 823 K. Arrow “1” points out the large cementite particle at the ferrite grain boundary.
Arrow “2” points out the small cementite particle in the initial pearlite colony region. Arrow “3” points
out the cementite lamella in the initial pearlite colony region. (a) initial microstructure before large
strain warm deformation, (b) microstructure after two warm deformation steps (ε = 0.8), (c)
microstructure after four warm deformation steps (ε = 1.6),(d) microstructure after four deformation
steps and 2 h annealing at 823 K .
(c) (d)
(a) (b)
81

Fig. 84. Evolution of grain characteristic of the 2C steel during warm deformation (Fig. 37c) and
annealing (Fig. 37b) at 823 K, each deformation step with ε = 0.4 and ε& = 10-1
.
1.6-Ann.: processed by four deformation steps and 2 h annealing at 823 K.
(a) change of average ferrite grain size and grain shape aspect ratio
(b) change of fraction of high-angle grain boundaries (HAGBs)
(a)
(b)
82

Fig. 85. Grain boundary misorientation distribution for the 2C steel during warm deformation (Fig. 37c)
and annealing (Fig. 37b) at 823 K, each deformation step with ε = 0.4 and ε& = 10-1
.
(a) misorientation distribution after two deformation steps (ε = 0.8), (b) misorientation distribution after
two deformation steps (ε = 1.2), (c) misorientation distribution after four deformation steps (ε = 1.6), (d)
misorientation distribution after four deformation steps and 2 h annealing at 823 K
Fig. 86. Total fraction of α-(<110> || RD) fiber and γ-(<111> || ND) fiber for the 2C steel during warm
deformation (Fig. 37c) and annealing (Fig. 37b) at 823 K, each deformation step with ε = 0.4 and ε& =
10-1
. 1.6-Ann.: processed by four deformation steps and 2 h annealing at 823 K.
(a) (b)
(c) (d)
83

(a)
(b)
Fig. 87. Texture evolution for the 2C steel during warm deformation (Fig. 37c) and annealing (Fig. 37b)
at 823 K, each deformation step with ε = 0.4 and ε& = 10-1
.
(a) orientation image: α-(<110> || RD) fiber in blue and γ-(<111> || ND) fiber in red
(b) observed texture in ϕ2 = 45° ODF section
Fig. 88. Sketch of the microstructure evolution during warm deformation.
84

After two deformation steps (ε = 0.8), the microstructure is too fine to be resolved by the optical
micrograph, Fig. 49. Using a higher magnification, as shown by the SEM image in Fig. 83b, it can be
observed that the microstructure consists of ferrite and partially spheroidized cementite. The former
pearlite colonies are elongated and still can be distinguished clearly. The fraction of high-angle grain
boundaries decreases obviously, Fig. 84b.
After three deformation steps (ε = 1.2), the average ferrite grain size decreases slightly and the grain
shape aspect ratio hardly changes, Fig. 84a. On the other hand, the fraction of high-angle grain
boundaries increases, Fig. 84b. The details of the distributions of grain boundary misorientations are
shown in Fig. 85b. It can be seen that the number fraction of the misorientations of less than about 8°
decrease prominently if compared to that after two steps deformation, as shown in Fig. 85a. Meanwhile,
a strong α-(<110> || RD) fiber was formed, Fig. 86.
Most of the pearlite lamellae were spheroidized into cementite particles after four deformation steps (ε
= 1.6), Fig. 83c. The clear alignments of the cementite particles which decorate the ferrite grain
boundaries still can be seen (arrow “1”). Different sizes of cementite particles (arrows “1” and “2”) and
cementite fragments (arrow “3”) were inhomogeneously distributed in the ferrite matrix. Ferrite grain
size decreases and the grain shape becomes more equiaxed with increasing strain, Fig. 84a. The fraction
of high-angle grain boundaries hardly changes, Fig. 84b. The average misorientation angle increases to
27.2°, Fig. 85c, even the fraction of low-angle misorientation (i.e. less than 8°) increases simultaneously.
As shown in Fig. 86, the fraction of the γ-(<111> || ND) fiber increases.
After annealing the samples (processed by four deformation steps ε = 1.6) for 2 h, there is nearly no
change in the grain size. However, the grain shape becomes more equiaxed after annealing, Fig. 84a.
Nearly all cementite fragments are spheroidized into discrete particles and homogeneously distributed
in the ferrite matrix, Fig. 83d. The fraction of high-angle grain boundaries increases after annealing, Fig.
84b and Fig. 85d. After annealing, however, in contrast to interstitial free steels which show a strong γ-
fiber, a strong α-fiber was found, Fig. 86.
Fig. 87a shows the distributions of α- and γ-fiber during warm deformation and subsequent annealing.
The blue color indicates the α-(<110> || RD) fiber. The red color indicates the γ-(<111> || ND) fiber.
The gradient of color represents the angular deviation from a perfect α- or γ-fiber. Taking the α-fiber
for instance, when the color of blue changes to the light blue the orientation direction of <110> changes
from exactly parallel to [100] to with an angle of 15° to [100]. Black lines indicate misorientations θ ≥
15° between adjacent grains. The gray lines indicate misorientations between 2° and 15°. It can be seen
that the area fraction of blue color decreases when the logarithmic strain increases from 1.2 to 1.6.
However, it increases after annealing. This shows the same tendency as shown in Fig. 86, i.e. the α-
fiber first decreases when the strain increases from 1.2 to 1.6 then increases after annealing. The
corresponding texture evolution (ϕ2 = 45° section of ODF (orientation distribution function)) during
warm deformation and subsequent annealing is shown in Fig. 87b.
As shown above, during warm deformation the increase in strain affects the alignment of pearlitic
cementite lamellae or later the alignment of cementite stringers and the anisotropic ferrite grain growth.
The effect of deformation on the microstructure evolution during warm deformation can be simply
displayed by use of Fig. 88. The figure shows schematically the microstructure evolution during the
deformation of the 2C steel processed by the route in Fig. 37c. The initial ferrite-pearlite microstructure
is shown in Fig. 88a. After some deformation, the pro-eutectoid ferrite grains become elongated. The
pearlitic cementite lamellae rotate toward an alignment perpendicular to the compression direction. At
the same time, some pearlitic cementite lamellae disintegrate into short fragments, which decorate the
grain boundaries of pearlitic ferrite, seen in Fig. 88b. After large strain deformation, these fragments
spheroidize into discrete cementite particles. Smaller cementite particles are also observed inside ferrite
grains. Larger cementite particles are distributed at the ferrite grain boundaries and act as obstacles to
grain boundary migration. After a large strain deformation the cementite particles are aligned in rows
perpendicular to the compression direction. This makes grain boundary migration more difficult in the
compression direction, which leads to a more elongated grain shape. Most of the large flat pro-eutectoid
ferrite grains are divided into several subgrains (Fig. 88c).
85

5.4. Discussion
5.4.1. Ultrafine grained steels produced by warm deformation
The material contained a uniform dispersion of fine cementite particles (with an average size below 250
nm) which may contribute to a strong inhibition of grain boundary migration in terms of Zener pining,
thereby effectively preserving a deformation grain shape at temperatures lower than 873 K (Fig. 36).
Higher temperatures above 873 K lead to faster diffusion and Ostwald ripening of the cementite
particles. The classical Zener equation indicates that for a given volume fraction of particles the Zener
back driving force on the grain boundary is increasing proportional to the inverse diameter of particles.
If the cementite particles reach a diameter above 300 nm by ripening, they can be considered as weak
obstacles to the capillary driven motion of the ferrite grain boundaries so that higher temperatures entail
more equiaxed grain shapes of the ferrite (Fig. 36).
In comparison with alternative routes producing an ultrafine single phase ferrite microstructure, the
present results which show an uniform dispersion of cementite particles in a fine ferrite matrix are
advantageous. This is because such microstructures increase the work hardening rate and reduce the
tendency for plastic instabilities. This is important in particular if the grain size of the ferrite is very
small [28,29]. The increase in work hardening can be attributed to an increase in the rate of dislocation
multiplication at particles and to the decrease of the mean free path of dislocations.
Conventional approaches use a quenching and tempering heat treatment to obtain fine carbide particles
distributed homogeneously in the ferritic matrix [30]. This requires, especially for large scale samples, a
certain amount of expensive alloying elements to get the required hardenability. The present study
pursued a large strain warm deformation strategy below the γ → α transformation temperature of a
ferrite plus pearlite or a bainitic microstructure, respectively, to reach the same aim.
The dispersed globular cementite particles appear in all the microstructures due to the effect of the large
strain deformation. Most of the cementite particles are distributed on the ferrite grain boundaries and act
as obstacles to grain boundary migration (Fig. 43). The pronounced alignment of cementite particles
can be explained in terms of their position on the rims of the elongated ferrite grains. This effect also
explains the elongation of the ferrite grains, especially at lower deformation temperatures (Fig. 45 and
47). At higher deformation/annealing temperatures the cementite particles may coarsen significantly,
especially the particles located at grain boundary triple points (Fig. 43).
Quite similar results, such as the fraction of high-angle grain boundaries and grain size, were obtained
from three experimental routes at different cooling rates and temperatures. This makes the experimental
parameters flexible for industrial application. For example, experiment III with its moderate cooling
rate is favorable for rolling mills with a limited cooling rate on the run out table, experiment V with its
relatively high deformation and annealing temperatures is more interesting in cases where the rolling
forces may be the limiting factor. On the other hand, the average ferrite grain size maintained about 1
µm even after 2 h isothermal treatment at 823 K, which implies the obtained ultrafine ferrite and
cementite microstructures are relatively stable under these conditions.
The increase in macrohardness with decreasing temperature (Fig. 49) can be mainly attributed to the
effect of grain refinement. It is known that an addition of carbon and manganese results in a higher
hardness due to solid solution and/or precipitation hardening. On the other hand, this addition can also
refine the microstructure (Fig. 47), which increases hardness according to the Hall-Petch relationship.
The effect of carbon and manganese on grain refinement will be discussed in detail in section 5.4.4.
5.4.2. Formation of the ultrafine grained steels during warm deformation and annealing
Microstructural evolution of ferrite
The microstructural evolution of ferrite in Fig. 82 reveals several details regarding the role of strain
during multi-step warm deformation. After a slight deformation (ε = 0.4), the ferrite grain size
decreases and the grains become elongated along the rolling direction, Fig. 82b and Fig. 84a. The pro-
eutectoid ferrite grain boundaries are visible, but there exists many faint contours inside ferrite grains
which probably imply the fragmentation of ferrite grains due to the deformation.
86

With increasing the logarithmic strain to 0.8 the ferrite grain size decreases rapidly and the grain shape
is more elongate, Fig. 82c and Fig. 84a. Meanwhile, the decrease in the fraction of high-angle grain
boundaries suggests grain subdivision occurs during the deformation (Fig. 84b). The pearlite colonies
stretching in the rolling direction (Fig. 83b) demonstrates the grains rotated during deformation.
A further increase of the strain up to 1.6 leads to only a less refinement of the ferrite grains (Fig. 84a).
There seems to be an effective strain of ~0.8 for refining the microstructure effectively in the present
study. This phenomenon was also observed by Shin and Prangnell [31&33] in a low carbon and an Al-
Mg alloy, respectively, processed by severe plastic deformation. As reported by Tsuji [34] grain
subdivision is of essential importance in ultra-grain refinement especially for an initial coarse
microstructure. Large strain deformation could result in finer grain subdivision due to a large amount of
dislocations produced. The appearances of the more equiaxed grain structure and the increase in the
fraction of high-angle grain boundaries after the effective strain (Fig. 84 and 85b&d) can be attributed to
recovery (especially polygonization), called also continuous recrystallization or recrystallization in situ.
It is different from grain structures formed by primary recrystallization because the ferrite grains were
elongated (i.e. the grain shape aspect ratio is about 2.8 after the deformation of ε = 1.6) and dislocations
could be observed inside the grains (Fig. 65a). The reasons why only recovery but not primary
recrystallization takes place will be described in section 4.2.4.3. Recovery transforms the crystals
subdivided by deformation-induced boundaries into ultrafine grains surrounded by clear grain
boundaries (polycrystalline “grains”). Therefore, further increasing strain over the effective value is
beneficial for grain shape adjustment and high-angle grain boundaries formation. It can be concluded
that the ultra-grain subdivision is the essential process for ultrafine grained microstructure formation
and recovery is also necessary to form clear ultrafine grain boundaries.
After 2 h annealing at 823 K, the fraction of high-angle grain boundaries slightly increases, Fig. 84b
and 86d. As shown by other investigations [35,36], recovery clearly contributes to the formation of new
high-angle grain boundaries. The possible mechanisms are the accumulation of geometrically necessary
dislocations in the subgrain boundaries [37], the increase of misorientation angle by the merging of
lower-angle grain boundaries during subgrain coalescence [35,36] and the subgrain growth with
migration of low-angle grain boundaries via dislocation motion. From the results in this study it is not
possible to prove exactly which mechanism is really active or relevant for the microstructure
development in the present investigation. Nevertheless, some of the interesting features found in the
microstructures will be discussed to illustrate the possible mechanisms of recovery in the steels. As
shown in Fig. 84a, the ferrite grain size hardly changes but the grain shape is more equiaxed (i.e. the
grain shape aspect ratio is about 1.6) after annealing. The mechanism of this phenomenon can be
attributed to the accumulation of dislocations into subgrain boundaries in RD and/or subgrain growth in
ND.
The possibility of subgrain growth is shown in Fig. 63a. The curvature of the subgrain boundaries
(misorientation θ = 7.5°) indicates the tendency to grow of the subgrain “1”. As reported in [38], low-
angle grain boundaries in general have a low mobility. The reason is the difference in structure between
high- and low-angle grain boundaries. For high-angle grain boundaries, migration can occur easily by
single atom jumping across the rather open grain boundary structure. Low-angle grain boundaries
composed of dislocation arrays migrate by the motion of dislocations, i.e. a coordinated movement of
atoms. While the motion of an individual dislocation by glide is easy, the motion of an array might be
more difficult, since the motion of the arrays causes a change in the shape of two subgrains, which is
resisted by surrounding subgrains. As reported in [38], the limitative motion of the array is the climb of
edge dislocations and the activation energy of the process has the order of magnitude of the activation
energy for self-diffusion. On the other hand, even a rather low strain leads to a decrease of the self-
diffusion activation energy. In the present work, the large strain deformation (accumulative strain of 1.6)
facilitates the subgrain growth during annealing.
Spheroidization of lamellar pearlite
According to the work of Chattopadhyay and Sellars an excess of vacancy which formed during the
deformation promotes carbon diffusion [39]. After large strain deformation lamellae kinks are
characteristic for pearlite [40,41]. An important factor for the acceleration of the spheroidization
process can be a local difference between the equilibrium carbon concentrations in ferrite near the
surface of a deformed lamella with different curvature radii. The equilibrium carbon concentration in
87

ferrite in the vicinity of the lamella with a small curvature radius is higher than that of a larger one.
After a large strain deformation of pearlite the numerous kinks of the lamellae occur with small radii,
therefore, the carbon concentration in ferrite near kinks is essential higher than that close to the flat
parts of the lamellae. According to the Gibbs-Thompson equation and together with the high defect
density, the carbon diffusion leads to a rapid dissolution of lamellae kinks and a simultaneous
deposition of carbon on the flat cementite lamella.
It was reported that the fracture of lamellae in the pearlite colonies and lamellae oriented perpendicular
to the rolling direction can also accelerate the spheroidization. Fragments of the former lamellae located
at a prior austenite grain boundary can easily be formed because of an accelerated diffusion along the
boundary, which leads to a faster coarsening of these cementite fragments, which can be seen from
arrow “1” in Fig. 83c.
For the case of a large strain deformation the substructure of the pearlite lamellae can also exhibit an
essential effect on the spheroidization process. The interface adjacent to the sub-boundary in the
cementite lamella with a large local curvature and the surrounding ferrite provokes a quick carbon
dissolution that leads to a local lamella division.
The appearance of a typical former pearlitic cementite lamellae is shown by arrow “3” in Fig. 83c after
a large strain deformation (ε = 1.6). It indicates that the spheroidization is not fully finished after the
large strain warm deformation. The small spheroidized cementite particles are distributed in the initial
pearlite colony (arrow “2” in Fig. 83c) and the clear alignments of the cementite particles which
decorate the ferrite grain boundaries (arrow “1”) indicate that the large strain warm deformation without
the subsequent annealing is insufficient for a homogeneous distribution of cementite particles.
Distribution of cementite particles
Apart from the processes of spheroidization and coarsening of cementite, which are typical for eutectoid
steels [42], the process of a homogeneous distribution of cementite after the spheroidization can be
observed in the present ferrite-pearlite steel after annealing, Fig. 54 and 50d. This means that after a
large strain warm deformation with a subsequent annealing cementite particles can also be found even
within the former pro-eutectoid ferrite regions. During deformation/annealing, the fine cementite
particles may dissolve and some carbon atoms are assumed to diffuse from the areas of the former
pearlite colonies to the cementite free areas of the former pro-eutectoid ferrite followed by a subsequent
reprecipitation and coarsening. As a result the cementite particles are distributed rather homogeneously
in the ferritic matrix, Fig. 54 and 83d. Thus, it is not possible any more to distinguish between the initial
pearlite and pro-eutectoid ferrite regions, as shown in Fig. 88a.
The main condition for the redistribution of cementite, as shown in [43], seems to be a high dislocation
density in the heavily deformed initial pearlite colonies, which was estimated to be the order of 1016
m-2
for a low carbon steel. In case of a plain low carbon steel [43] with low recrystallization temperature,
recrystallization would slow down or even stop the redistribution of cementite by significantly reducing
the dislocation density. As a result, some pearlite colonies may still exist even after annealing [43].
However, a microalloyed low carbon steel with higher recrystallization temperature offers the
possibility that only recovery takes place even at fairly high temperatures. In this situation the
dislocation density will not be reduced very much, so that the redistribution of cementite can take place
rapidly assisted by a fast pipe diffusion along the dislocation cores.
The driving force for the cementite redistribution can be a gradient of the solute carbon. Inside the
initial pearlite colony around the cementite particles the carbon concentration is essentially higher
compared to that in the pro-eutectoid ferrite. The high density of dislocations and vacancies during or
after large strain warm deformation facilitates the solute carbon diffusion to the areas with lower carbon
concentration, i.e. pro-eutectoid ferrite, and subsequent reprecipitation in the most energetically
favorable places such as triple points of ferrite grain boundaries or dislocation nodes. Additionally, due
to a fast grain boundary diffusion, the particles located at the grain boundaries and triple junctions will
have a size advantage in the later Ostwald-ripening process.
88

Effect of cementite particles
(a) Grain size
Just after spheroidization the size of cementite particles can be below 100 nm. On one hand, these fine
cementite particles can increase the rate of dislocation generation and develop surrounding deformation
zones in the matrix that contain large local misorientation gradients [44]. New high-angle grain
boundaries can form within such deformation zones, therefore, a finer ferrite microstructure can be
produced. On the other hand, the presence of these fine cementite particles retards the softening of
ferrite in the areas of the former pearlite colonies (arrow “2” in Fig. 83c). The formation and growth of
ferrite subgrains are controlled by solute carbon and cementite particles which grow by diffusion of
carbon. The spacing of particles determines the size of the subgrains [43].
(b) High temperature stability
Once an ultrafine microstructure is formed, an average grain size of 1.3 µm was found to be stable in
the 2C steel after 2 h annealing at 823 K (Fig. 84a). This is due to the homogeneously distributed
cementite particles which are fairly stable even after the deformation/annealing at this temperature. The
fine particles lead to a high dragging force for the migration of grain boundaries due to Zener pinning.
(c) Inhibition of primary recrystallization
As shown in Fig. 65 and 63b, a large number of dislocations exist in both deformed and annealed
specimens for the 2C and 2CMn steels. This demonstrates recrystallization does not occur after the
deformation/annealing processing. The reasons that only recovery and not primary recrystallization
takes place here may be described as follows. Due to the spheroidization of pearlitic cementite lamellae
during deformation, a fine dispersion of cementite particles is present in the microstructure after the
large strain deformation. The fine particles lead to a high dragging force for the migration of grain
boundaries due to Zener pinning. On the other hand, it is known that due to the high stacking fault
energy the recovery in ferrite can proceed very fast. In this case the dislocation-rearrangement to form
energetically more favorable configurations starts everywhere, but the subsequent migration of high-
angle grain boundaries may be stopped very soon by the fine particles. The recovery process decreases
both the stored energy and the local stored energy gradient, which decreases the probability of the
successful nucleation of a recrystallized grain or slows down its growth.
The fine particles stabilize the ultrafine microstructure when it has formed. Further increasing the
annealing temperature to even higher temperature (i.e. 973 K) will speed up the diffusion of carbon
atoms. As shown in [36], for two-phase alloys the decomposition before recrystallization is controlled
by the lower activation energy for diffusion of interstitial atoms (carbon). The processes of
spheroidization and distribution of cementite might be assumed to be decomposition, since they can be
attributed to a local change of chemical composition, i.e. the change of carbon content in solid solution
during lamellae dissolution, cementite re-precipitation, as well as dissolution of the fine particles with a
coarsening of larger ones. The coarsening of the cementite particles leads to a reduction of the Zener
drag effect, so that primary recrystallization and grain growth can occur at high annealing temperatures
(Fig. 58). But the homogeneously distributed relatively fine cementite particles can still produce a
stabilizing effect on the fine grained ferrite matrix (Fig. 58). This confirms that the fine cementite
particles can stabilize the ultrafine microstructure as well as inhibit primary recrystallization.
5.4.3. Texture evolution during annealing of a 0.2%C steel
After large strain deformation the texture of the samples consists of the α-(<110> || RD) and γ-(<111> ||
ND) fibers typical for rolled ferritic steels. Annealing the samples after large strain deformation,
however, in contrast to interstitial free steels which show a strong γ-fiber, a strong α-fiber was found,
Fig. 86 and 87. The microstructure of the annealed material consists of still elongated ferrite grains with
high dislocation densities indicating that no recrystallization had occurred. The texture and
microstructure observations may be explained as follows: (i) The occurrence of recrystallization is
inhibited by cementite particles inhibiting either the nucleation or the growth of the recrystallized grains.
(ii) Due to the higher stored energy of γ-fiber grains as compared to α-fiber grains the latter slowly
consume their γ-fiber neighbors, thereby keeping their internal subgrain structure. The process
89

occurring during annealing may be addressed as continuous recrystallization, proceeding without
nucleation of new grains.
5.4.4. Effect of carbon and manganese on grain refinement
As shown above, a finer ferrite microstructure may be observed in the high carbon especially high
manganese steel after the same processing. The different size of ferrite grains and, as described below,
mechanical properties in the steels investigated can be related to the difference in the chemical
compositions. Therefore, the effect of carbon and manganese on the microstructure refinement will be
discussed.
Carbon
In Fig. 51 and 50, the increase in carbon content leads to a finer ferrite-pearlite microstructure after the
conventional route in Fig. 37a. This is due to the formation of ferrite and pearlite is retarded by
increasing carbon content, as shown by the DCCT diagrams in Fig. 39. The lower transformation
temperature leads to a finer transformation microstructure. Meanwhile, higher carbon content also
results in a higher volume fraction of pearlite in the transformed ferrite-pearlite microstructure.
When the experimental steels are processed by the ultrafine grain route (Fig. 37b), the increase in
carbon content also leads to a finer ferrite microstructure, a more equiaxed grain shape and a more
homogeneously distribution of cementite particles, Fig. 54 and 55.
One reason for the finer ferrite microstructure in the higher carbon steel can be the finer initial
transformed ferrite-pearlite microstructure. The other reason can be attributed to the higher volume
fraction of spheroidized cementite particles in the higher carbon steel. Since there exists an effective
strain to refine the initial especially coarse microstructure effectively, the second case of a large number
of particles seems to be more important in the study. During the deformation, pearlite lamellae
spheroidized into cementite particles which located at the most energetically favorable places such as
grain boundaries. As mentioned above, fine particles are effective to act as obstacles for grain boundary
migration during the large strain deformation and the subsequent annealing. This can, on one hand,
refine the microstructure by slowing down the grain growth rate. On the other hand, the primary
recrystallization process can be inhibited by particles, which leads to an increase in recrystallization
temperature. A higher dislocation density and a finer substructure can be saved in the higher carbon
steel which can facilitate the formation of subgrains or even polycrystalline “grains” by the
accumulation of dislocations at the subgrain boundaries during deformation/annealing.
A higher carbon concentration in steels led to a higher volume fraction of pearlite after phase
transformation. As a result, a homogeneous distribution of cementite particles was observed after the
whole processing (the ultrafine grain route, Fig. 37b) in the higher carbon steel. Meanwhile, the
homogeneous distribution means the cementite particles are located not only at grain boundaries but
also in the grain interior. During the large strain deformation, the ferrite grains were elongated along the
rolling direction. A large quantity of dislocations and substructures may exist in one elongated ferrite
grain. The cementite particles in the grain interior develop surrounding deformation zones in the matrix
that contain large local misorientation gradients. New high-angle grain boundaries can form within such
deformation zones, therefore, the grain shape is more equiaxed in the high carbon steel due to the effect
of particles (inside the grain) on the subdivision of an elongated grain.
Manganese
It is known that the transformation processes and the resulting microstructures in steel are sensitive to
the presence of further substitutional alloy elements. The addition of manganese retards the formation
of ferrite and pearlite significantly (Fig. 39). Thus, a finer transformed microstructure was found in the
higher manganese steel (Fig. 50 and 51). After the large strain deformation and subsequent annealing,
the higher manganese steel shows a prominent microstructure characteristic, i.e. ultrafine ferrite with an
average grain size of 0.8 µm (Fig. 55a), nearly equiaxed grain shape (grain shape aspect ratio of 1.1)
(Fig. 55b), a large fraction of high-angle grain boundaries (Fig. 56 and 57), and a homogeneous
distribution of cementite particles (Fig. 54c). Therefore, the effect of manganese on grain refinement
will be discussed in detail by comparison the results from different manganese contents of the 2C and
2CMn steels.
90

The TEM images, Fig. 61, represent the same microstructural components in the steels with different
manganese contents after large strain deformation and annealing processing: namely ultrafine grained
ferrite and globular cementite. Compared to the 2C steel, Fig. 61a and c, the ferrite grain size is smaller
and the grain shape is more equiaxed in the higher manganese 2CMn steel, Fig. 61b and d. The effect of
manganese on these microstructural characteristics is supposed to be manifold during the processing. At
equilibrium, manganese will partition differently between cementite and ferrite. As a carbide-forming
element, it will be more concentrated in the cementite [45]. However, during the formation of pearlite,
manganese will not participate in cementite very much since the transformation time is too short for a
significant diffusion of the substitutional solution of Mn. After the formation of pearlite, manganese
diffusion occurs during the warm deformation which will be enhanced by the deformation because of a
high dislocation density as well as an excess vacancy concentration produced by dislocation interaction
like cutting. During and after the restoration process, which may partially proceed dynamically, the
introduction of high-angle grain boundaries into the microstructure additionally facilitates the
manganese diffusion. Therefore, a cohenite Fe3C type phase (Fe3-XMnXC) [46] can easily be stabilized
by further substituting Fe by Mn in its lattice.
During the large strain warm deformation itself and in the course of the subsequent annealing, the
smaller particles of Fe3-XMnXC may go into solution and the larger particles grow at the expense of the
smaller ones. The Gibbs-Thomson equation [47] shows that smaller particles have a higher
concentration of solute atoms in the matrix at the interface boundary than bigger ones, so that a
redistribution of manganese occurs between smaller and larger particles. The finer particles, detected in
the 2CMn steel at the end of the processing, may be attributed to a sluggish dissolution [48] as well as
to a slow Ostwald ripening of the manganese richer, more stable cohenite particles (Fe3-XMnXC) in this
steel. Both processes are controlled by the substitutional diffusion of manganese. In the 2C steel, with a
lower manganese content, larger cementite particles were observed, Fig. 61a and c. Additional to this,
the coarse particles are mainly located in a few layers. Such “banding” phenomenon is supported by
higher diffusibility [49], which is more adequate in the 2C steel but not sufficient in the 2CMn steel.
However, the particles still seem to be fine enough to pin the ferrite grain boundaries during the long
time annealing even in the lower Mn steel (compare a and c in Fig. 61). Therefore, the ultrafine grained
ferrite microstructure produced is relatively stable against a rapid grain coarsening in the condition of
annealing.
In Fig. 63a, the curvature of the subgrain boundary (misorientation 7.5°) demonstrates a substantial
evidence that fine particles (pointed out by white arrows) may exert a strong Zener drag, even on
subgrain boundaries. This leads to the assumption that only recovery can be considered as the decisive
process responsible for the restoration of the severely deformed ferrite-pearlite structure in the steels
studied. A further subgrain growth process or even a recrystallization seems to be inhibited by a high
pinning force due to Zener drag.
The formation of ultrafine grained structure that occurs under large strain warm deformation is
frequently accompanied by the development of high internal stresses [50-52]. In addition to the high
dislocation density evolved, the grain boundaries due to their non-equilibrium character can
supplementary produce long-range stress fields inside the ultrafine grains. The TEM examination
indicated that the dislocation density evolved inside the ultrafine grained 2CMn steel is higher than that
in the 2C steel (Fig. 63b and Fig. 62b). The higher dislocation density in the manganese richer steel is
considered to be the result of the interaction of dislocations with the finer and more numerous cementite
particles observed (black arrows in Fig. 63b).
The large amount of dislocations inside the grains (Fig. 63b and 62b) demonstrates an incomplete
recovery process even after the long time annealing. Compared to the microstructure found just after
large strain warm deformation, the annealing did not result in a remarkable grain growth (Fig. 61), or a
significant dislocation density decrease inside the fine grains in the 2C and 2CMn steels (Fig. 63b and
63). This large amount of dislocations evolved in the fine grain interiors at the end of the processing is
rather contradictory to the state after a classical recrystallization mechanism. Obviously, another
restoration process must proceed to produce a high fraction of high-angle grain boundaries under the
condition of large strain warm deformation. The deformed substructure including subgrains and high
dislocation densities that developed in the fine-grain interiors can be essentially stable against annealing
as compared to the recovery of the fine-grain boundaries. Therefore, the static recovery (as relaxation
process) can be sub-classified into two sub-processes according to their kinetics. The first one leads to a
91

rapid restoration of the non-equilibrium grain boundaries, and the second one results in the recovery of
the deformed substructure. In the present study of ultrafine grained steels, the process develops more
readily at grain boundaries as compared to grain interiors due to a large number of grain boundaries,
leading to a more rapid release of lattice distortions associated with the non-equilibrium state of
ultrafine grain boundaries. However, in coarse grained steel it is more preferred that the recovery occurs
in the grain interiors [53] due to a small volume fraction of areas near the grain boundary.
It can also be referred to a study, carried out on the single phase IF steel [54], which showed that with
increasing strain (up to 5.6) the severe deformation, assisted by recovery, leads to a more and more
refined substructure with increasing misorientations of the developing subgrain boundaries. This results
in the formation of an increasing number of high-angle grain boundaries. In the current investigation a
similar microstructure development was found at a significantly lower strain (ε = 1.6). It seems that the
presence of fine particles supports this process. The reason for a finer microstructure (Fig. 54, 55a, 61b
and d) and a higher number of high-angle grain boundaries in the higher manganese steel (Fig. 56, 57)
can be attributed to the controlling effect of the Fe3-XMnXC particles. During the large strain warm
deformation the evolving substructure will be finer in the 2CMn steel due to the finer dispersion of the
particles and their impending effect on the displacement of subgrain boundaries. In accordance to this,
the finer average ferrite grain size and the higher fraction of high-angle grain boundaries were obtained
after large strain warm deformation/annealing in the manganese richer steel 2CMn with finer dispersed
Fe3-XMnXC particles.
5.4.5. Mechanical properties of the ultrafine grained steels
Tensile properties
In Fig. 75 typical tensile stress--strain curves are shown for the ultrafine grained steels and the
conventional steels with different ferrite grain sizes. A summary of the data obtained from the tensile
tests is shown in Fig. 76 where the lower yield stress, ultimate tensile stress, yield ratio and Lüders
strain are plotted against carbon content. It can be seen that grain refinement has led to a significant
increase in strength, yield ratio and Lüders strain.
(a) Strength
As similar to other ultrafine grained materials, it is evident that large enhancements in strength
especially in yield stress were observed in the ultrafine grained plain C-Mn steels after tensile tests at
room temperature. Numerous investigations have shown that the yield stress of unalloyed low-carbon
steel increases in inverse proportion to the square root of the ferrite grain size, that is the Hall-Petch
relationship.
However, it should be noted that the ultrafine grained steels, processed by the large strain deformation
and annealing (Fig. 37b), exhibit dislocations and substructures inside the ultrafine grains (Fig. 62 and
63) as well as an elongated grain morphology (Fig. 55b). This means that the increase in strength of
these ultrafine grained specimens might be affected not only by grain refinement strengthening but also
by work hardening and texture strengthening.
If only considering the ultrafine grained steels (with the same work hardening and texture strengthening)
processed by the ultrafine grain route (Fig. 37b) the increase in carbon and especially manganese
content results in the increase in strength (Fig. 65a). However, it was reported by Santos and Bruzszek
[55] that the variation in volume fractions of secondary phases does not affect the tensile properties to
the same degree as the variation in ferrite grain size. Thus, ferrite grain refinement is the main factor
increasing the strength in the investigated steels.
(b) Ductility
One of the more unusual aspects of the ultrafine grained steels is the nature of the stress-strain curves.
Typical examples (Fig. 75) indicate a reduced work hardening in the ultrafine grained steels. This is
reflected in the yield ratio (lower yield stress/ultimate tensile stress), which is between 0.88 and 0.90
(Fig. 76c), compared with 0.7 for the conventional steels. The reason for the decrease in tensile ductility
for the ultrafine grained steels can be explained as follows:
92

Firstly, dynamic recovery as a softening mechanism is able to reduce the apparent work hardening rate.
During tensile deformation, dislocations causing intragranular strain are trapped at grain boundaries.
Then, the kinetics of dynamic recovery is associated with that of the spreading of trapped lattice
dislocations into grain boundaries [56&58]. The change of the dislocation density during dynamic
recovery by the trapped lattice dislocations spreading into grain boundary was studied by K.-T Park and
Y.-S. Kim [59]. It showed that dislocations which contribute to the intragranular strain are trapped at
grain boundaries have enough time to spread into grain boundaries during deformation. This leads to no
significant accumulation of dislocations and, consequently, less work hardening. As mentioned before,
it is assumed that there are two kinds of recovery mechanisms: a slow recovery in the grain interior and
a much fast recovery in the vicinity of grain boundaries. In coarse grained materials the later one was
not clearly observed due to a lower volume fraction of area near grain boundaries. However, in ultrafine
grained materials the faster recovery near the grain boundaries seems to be significant.
Secondly, the decrease in tensile ductility can be simply explained in terms of plastic instability, which
leads to necking due to excessive localized deformation. The condition of necking in tensile test is
predicted by the Considère's criterion [60], σt = dσt/dεt. When the slope of the true-stress true-strain
curve (work hardening rate), dσt/dεt, is equal to the true stress σt, necking begins. As mentioned above,
ultra grain refinement greatly increases the flow stress of the materials, especially at the early stage of
plastic deformation. On the other hand, the present work also clarified that work hardening after
yielding becomes difficult to occur with decreasing grain size. As a result, a plastic instability (necking)
occurs at a very early stage during the tensile test in ultrafine grained materials, as can be easily
understood from the Considère's criterion, which results in a limited uniform elongation.
The yield ratio is high in the ultrafine grained steels. However, it is interesting to note that apart from
the high strength an acceptable ductility can still be found in the ultrafine grained steels investigated,
which is reflected in the total elongation of over 20% and the uniform elongation of about 10% (Fig.
65b). This is quite different from the results reported by other investigators, i.e. the total elongation is
no more than 10%. This can be attributed to the additional second phase – cementite particles offering
the opportunity to improve the work hardening capacity. The reason for the improvement in the work
hardening rate in the present ultrafine grained steels will be explained in section 5.4.6.
(c) Lüders strain
In Fig. 76d it can be seen that the Lüders strain increases dramatically in the ultrafine grained steels.
This might be, before tensile testing, the solute atmospheres already formed around dislocations in the
ultrafine grained steels after 2 h annealing (strain aging), as shown in Fig. 37b. Nevertheless, this can
not fully explain why the Lüders strain of the ultrafine grained steels is far in excess of that in the
conventional steels. Previous work shows that grain refinement is effective in increasing Lüders strain.
The Lüders strain can be plotted against the inverse square root of the grain size [61], which is similar
to the Hall-Petch type relation.
Large Lüders strain has been noted previously by Lloyd and Morris [62] in a fine grained (1&3 µm) Al-
6%Ni alloy that contained little magnesium in solution. They observed that ultrafine grain sizes
promoted yield drops and low work hardening. In the work of Hayes and Keyte [63] an inverse
relationship between the Lüders strain and grain size was proposed in an Al-3%Mg alloy. Pronounced
yield drops and very large Lüders strain thus appear to be a characteristic of ultrafine alloys. These
effects can be linked to a low density of mobile dislocations, dislocation sources within the grains, and
the low work hardening rate for ultrafine grained alloys. These result in yielding taking place by a very
rapid increase in dislocation density in a narrow band initiated at some local stress concentration. The
high yield stress combined with the low work hardening means that a high strain level must be reached
in the initial Lüders band before the local flow stress increases sufficiently for it to start to propagate
along the gage length, and this leads to a large Lüders strain in fine grained steels.
93

(d) Toughness
The microstructure evaluation and the tensile testing show that the increase in carbon and manganese
contents and/or the accompanying decrease in grain size improve the strength properties. Nevertheless,
different effects on toughness can be expected from the grain size and carbon content.
Smaller grain size leads commonly to a lower ductile-to-brittle transition temperature, as shown in Fig.
80b. This can be simply understood from the standpoint of cleavage crack initiation and propagation. It
is generally known that the grain size is one of the major factors determining the cleavage fracture unit
[64,65]. The cleavage fracture unit is reduced as the grain size decreases. When the cleavage crack
propagates across a field of grains, both of the crack-tip dislocation emission and the formation of the
cleavage facets are interrupted by the grain boundaries. If the cleavage cracking across a high-angle
grain boundary the crack front must be geometrically necessarily branched, which, together with the
separation of the grain boundary between the break-through points, results in the additional fracture
work. This toughening effect can lower the ductile-to-brittle transition temperature considerably and has
been noticed for decades in experiments where the behavior of the grain-sized microcracks was
dominant [66&68].
For example, when the cleavage crack paths are carefully observed at high magnifications, it can be
seen that the paths were changed by high-angle grain boundaries. Furthermore, it was observed that
cleavage cracks can also be arrested by high-angle grain boundaries [69]. Thus, the decrease in grain
size (increasing the volume fraction of grain boundaries) can limit the propagation of the initiated
cleavage crack and raise the fracture toughness in the transition region.
Fig. 89 shows schematically why grain refinement is beneficial to decrease the ductile-to-brittle
transition temperature. The ductile-to-brittle transition of a bcc alloy is accompanied by a change in
fracture mechanism from void coalescence to cleavage, and so the ductile-to-brittle transition
temperature can be quantitatively interpreted as a result of the competition between the flow stress and
cleavage fracture stress of the alloy [70]. In a simplified model the temperature, at which the yield stress
σy is equal to the cleavage fracture stress *
fσ , is the ductile-to-brittle transition temperature. According
to the Hall-Petch relation, grain refinement contributes to an increase in the yield stress (σy1 → σy2).
Simultaneously, the grain refinement is more effective in increasing the cleavage fracture stress (*
1fσ →
*
2fσ ). For example, a grain refinement of a steel with 0.1%C can lead to an increase in the cleavage
fracture stress four times more than the increase in the yield stress [71]. Due to a more significant
increase in the *
fσ than the σy, therefore, the ductile-to-brittle transition temperature is lowered by
grain refinement (T1 → T2).
Grain refinement leads to an improvement in toughness. A higher carbon content, however, has an
adverse effect on toughness. For example, according to [72], for medium carbon ferrite-pearlite steel
increasing carbon content from 0.1% to 0.2% leads to an increase of the ductile-to-brittle transition
temperature by about 25 K. However, in the current investigation, the ductile-to-brittle transition
temperature is obviously decreased in the ultrafine grained steels even if the carbon content increases
from 0.15% to 0.2%, Fig. 71b.
As mentioned above, the ductile-to-brittle transition temperature will generally be shifted to a lower
temperature if the cleavage fracture stress is increased or the flow stress is decreased. Since the flow
stress of the 15C steel is lower than that of the 2C steel (Fig. 65a), the decrease in ductile-to-brittle
transition temperature, can only be explained by increasing the cleavage fracture stress in the 2C steel.
Nevertheless, it is known that for steels without changing in grain size, the ductile-to-brittle transition
temperature increases with increasing carbon content. This is attributed to the precipitation of coarse
rod type and spherical type cementite particles, which are considered as initiation sites for damage
[73,74] and are major detrimental microstructural features in steels [70]. This is due to a low adhesion
between the particles and matrix and to differences in their elastic and plastic properties [75].
Therefore, the effect of grain size on the ductile-to-brittle transition temperature must be taken in
consideration. For the occurrence of cleavage fracture, the free distance of two neighbor high-angle
grain boundaries (Griffith type crack length) is assumed to be important. This distance decreases with
decreasing grain size in the ultrafine grained steels with higher carbon content and, therefore, the
cleavage fracture stress will actually rise. Therefore, the decrease in grain size reveals a surprisingly
strong effect on improving toughness even in the case of a higher carbon content.
94

The lower ductile-to-brittle transition temperature observed in the steel with higher carbon content can
be attributed to the grain refinement function by increasing carbon content.
Fig. 89. Influence of grain size on the cleavage fracture stress *
fσ and the yield stress σy of notched
impact test specimens. The subscript of number “1” indicates the results from the steel with fine grains
(solid lines). The subscript of number “2” indicates the results from the steel with coarse grains (dashed
lines). After [75]
(e) Shelf energy
The ductile-to-brittle transition in steels is associated with two different failure mechanisms. At high
temperature in the upper shelf toughness range, fracture occurs by nucleation and coalescence of
microvoids that produces ductile tearing. This process requires extensive plastic deformation and,
therefore, large amounts of energy. At low temperature, fracture occurs by cleavage which is the sudden
separation of atomic planes across the specimen.
In Fig. 77, the lower shelf energy in the ultrafine grained steels is significantly higher than that in the
coarse grained steels. This means the ultrafine grained steels show improved toughness and partially
ductile behavior even at very low temperatures (i.e. at 103 K). Another reason for this phenomenon
might be anisotropy of toughness properties in the ultrafine grained steels due to the large strain
deformation.
After the large strain deformation, a strong alignment of the microstructure was formed along the
rolling direction. Thus, the spread of the crack (below the V-notch) was retarded in the transverse
direction by the microstructure ligaments, which can be seen from Fig. 78a and 79a that the crack
spread also in the rolling direction. In Fig. 79a, the crack path is between two elongated grains with
high-angle grain boundaries in between (i.e. grain “1” and grain “2”), which demonstrates that the grain
boundary is a favorable path for crack propagation. This may be due to the alignment of cementite
particles at the grain boundaries, as shown in Fig. 79b, where the alignment of microvoids along the
grain boundaries is obvious.
On the other hand, the distribution of sulphides, which exist as manganese sulphides in most structural
steels, is different in the rolling, transverse and through thickness directions [76]. After the large strain
deformation, a higher notch impact energy is expected in the rolling direction due to a lower fraction of
interface between matrix and inclusions on the crack path (below V-notch and along TD). Due to the
very low sulphur content (0.004 mass%) in all the steels investigated, there should be no significant
effect of manganese sulphide on the isotropy.
In Fig. 80a, the specific upper shelf energy is higher in the coarse grained 15C, 2C and 2CMn steels.
This might be attributed to a higher ductility in the coarse grained steels, which is also reflected in the
larger area below the stress-strain curve in these steels (Fig. 75).
95

Evidence for optimization of strength and toughness in the ultrafine grained steels
The chemical composition, heat treatment and deformation have a complex effect on the mechanical
properties. Knowledge of the influence of the microstructure on strength-toughness properties makes it
possible to optimize the properties of the steel. In Fig. 81, the variations in yield stress and ductile-to-
brittle transition temperature of all the experimental steels produced by the ultrafine grain route and the
conventional route are represented together. The spots in the upper left area of the figure show an
optimum combination of strength and toughness, i.e. higher lower yield stress and lower ductile-to-
brittle transition temperature. Thus, it can be seen that the ultrafine grained steels with dispersed
cementite particles have a significant improvement in both strength and toughness.
Among the experimental steels, the ultrafine grained steel with the higher manganese content has the
best combination of strength and toughness, as shown by the spot of number “1” in Fig. 81. The
difference in the sizes of ferrite grains and cementite particles, as well as the mechanical properties in
the investigated steels can be related to the difference in the manganese content. In general, manganese
is a strong austenite stabilizer, depressing the A3 temperature. It is essential to cause a microstructure
refinement after the transformation. This is in accordance with the result in Fig. 50c that the finest
microstructure was observed in the 2CMn steel after transformation. As a carbide-forming element,
manganese will be more concentrated in the cementite after the large strain warm deformation. A
cohenite Fe3C type phase (Fe3-XMnXC) can be stabilized by further substituting Fe by Mn in its lattice.
During the large strain deformation itself and in the course of the subsequent annealing, the finer
cohenite particles, due to a sluggish dissolution as well as a slow Ostwald ripening, are more effective
to pin the ferrite grain boundaries against grain growth. On the other hand, the fine particles are also
beneficial to store the geometrically necessary dislocations and substructures inside the grains, which
make grain subdivision easily. Therefore, the finest microstructure (Fig. 54c) was observed in the
higher manganese steel after the ultrafine grain route.
5.4.6. Effect of carbon content on work hardening rate
In Fig. 68, when the true strain εt ≤ 0.09, the stress-strain curves of the ultrafine grained steels exhibit
work hardening. This is readily apparent in the 3C steel in which a high rate of work hardening
increases the flow stress from about 590 MPa to nearly 720 MPa within a strain increment of 0.1.
Fig. 69 shows the Kocks-Mecking plots, representing the work hardening rate θw = dσt / dεt versus the
true stress σt, for the ultrafine grained steels with different carbon contents. The curve presented is the
part between the Lüders strain and the strain where the necking starts. As expected from work
hardening theory, the results can be represented by straight lines. The slope of each straight line
(〉θw/〉σt) displays the rate of work hardening.
For example, a high value of 〉θw/〉σt means work hardening rate decreases rapidly for the same
increment of true stress. Therefore, the values of 21.69 and 21.59 suggest that the 3C and the 15C steel
have quite similar work hardening rate. On the right up of Fig. 69, it shows the average ferrite grain size
of the 3C steel (1.1 µm) is smaller than that of the 15C steel (1.4 µm). As mentioned above, the grain
refinement leads to an obvious decrease in work hardening rate. Thus, the similar work hardening rate
observed in the steels with different grain size can be attributed to the effect of carbon content. In brief,
if keeping steels with the same grain size the increase in carbon content leads to an increase in work
hardening rate. This is due to a large volume fraction of cementite particles which are effective in
increasing work hardening rate by the accumulation of geometrically necessary dislocations near the
particles.
Many two-phase alloys work-harden much faster than do pure single crystals. This is because the two
phases are not equally easy to deform. One component (often dispersed as small particles) deforms less
than the other, or not at all, so that gradients of deformation from with a wavelength equal to the
spacing between the phases or particles. Such alloys are ‘plastically non-homogeneous’, because
gradients of plastic deformation are imposed by the microstructure [77]. Dislocations are stored in them
to accommodate the deformation gradients, and so allow compatible deformation of the two phases.
These are called ‘geometrically-necessary’ dislocations to distinguish them from the ‘statistically-
stored’ dislocations which accumulate in pure crystals during straining.
Geometrically-necessary dislocations control the work hardening of the specimen when their density
exceeds that of the statistically-stored ones.
96

They contribute to hardening in two ways [78]: by acting as individual obstacles to slip, and
(collectively) by creating a long-range back-stress, with wavelength equal to the particle spacing.
In all dislocation models, work hardening is a consequence of the fact that some fraction of the mobile
dislocations that produce the strain do not exit through the surface, are not absorbed in grain boundaries,
and do not annihilate each other, but are stored in the crystals or react with other dislocations to form
new obstacles to continued slip [78].
For metallic crystals containing hard particles (A ‘hard’ particle is one that resists plastic shear, and
consequently can only deform elastically when the matrix shears plastically [79].), it is assumed by
Ashby [79] that work hardening occurs because of the interaction of geometrically necessary
dislocation loops (secondary dislocations) nucleated at the particle-matrix interface and dislocations
moving on the primary slip plane. That is, the interaction of primary, glide, dislocations with the
secondary dislocation loops that intersect the slip plane contribute to work hardening. On the basis of
the Ashby model in which the extra work hardening 〉σ, due to the accumulation of dislocation at the
particles, is expresses by the relationship [80]: 21
23
2ÕÖÔ
ÄÅÃ
=∆r
bfDM tε
µσ (3)
where M is the Taylor factor with an assumed magnitude of 2.75, µ is the shear modulus of iron (81
GPa), b is the magnitude of Burger's vector (0.248 nm), f is the volume fraction of particles, r is the
average particle radius and εt is the true strain. It can be seen that a large amount of fine particles are
beneficial to increase work hardening. D is a constant, from experimental data for polycrystalline b.c.c
alloys, varying from 0.35 to 0.52 [81,82]. Furthermore, the values of D appear to increase with
increasing temperature provided that recovery does not occur to a significant extent [81,82]. If recovery
occurs, then the magnitude of D should decrease as thermally activated plastic relaxation and/or
diffusion-controlled dislocation rearrangement and annihilation increase [83,84]. Thus at high
temperatures and low strain rates, particle hardening should increase the yield stress but have relatively
little effect on work hardening [84].
The rapid accumulation of dislocation substructures by particles, characterized by a high density of
geometrically necessary dislocations and high accompanying flow stresses, triggers the dynamic
recovery [80] during the tensile test. As mentioned before, the finer particles were found to pin the
dislocations. Thus, the 3C steel with a large amount of cementite particles (due to the high carbon
content and large strain deformation) can still maintain pronounced work hardening even with an
ultrafine microstructure. The extra work hardening is due to the accumulation of dislocations at the
particles.
As a result, the ultrafine grained steels investigated exhibit not only high strength but also acceptable
ductility, which can be seen from the total elongation of about 22% and the uniform elongation of about
10% in these steels (Fig. 65b). The strengthening effects of second-phase particles are well understood
in conventional grain size metals with regard to size, distribution, and mechanical properties of the
second phase. Hard dispersion particles increase the yield stress due to the Orowan mechanism and also
increase subsequent work hardening rates due to dislocation storage processes required for compatible
plastic strain [85]. The study of second phase particles with varying sizes is likely to provide additional
optimization of strength and ductility in ultrafine grained steels.
It can be concluded that the additional second phase – cementite particles offer the opportunity to
improve the work hardening capacity. This was reflected by the simultaneous increase of yield and
ultimate tensile stresses with decreasing the average ferrite grain size, while the elongations are nearly
the same in all the ultrafine grained steels.
5.5 Conclusions
Three new thermomechanical treatments were developed to produce ultrafine ferrite grains in plain C-
Mn steels using large strain warm deformation and subsequent annealing (as a laboratory simulation of
industrial coiling). The processing routes for producing ultrafine microstructures were found to be
flexible regarding cooling rates and the initial microstructures. This offers a large processing window
for the industrial application of the thermomechanical treatment suggested in this work.
97

Large scale specimens ~10 mm in thickness were produced in plain C-Mn steels by plane strain
compression. The final microstructure consisted of ultrafine ferrite and homogeneously distributed
cementite particles. The average ferrite grain size changed from 0.8 µm to 1.4 µm for the steels with
different carbon and manganese contents. These ultrafine microstructures were stable against
grain/particle coarsening during 2 h annealing at 823 K.
The mechanical tests showed that the ultrafine grained steels exhibit higher strength and improved
toughness than the conventional steels. A significant work hardening was found in the ultrafine grained
steels. This led to a reasonable ductility, such as 10% uniform elongation and 22% total elongation.
Grain refinement also results in an increase in the Lüders strain.
A second phase such as globular cementite is beneficial to improve both strength and work hardening
rate of steels. Therefore, it is very attractive to produce a relatively coarser microstructure (i. e. grain
size of 2&3 µm) with a second phase (i. e. finer precipitates) in the matrix. The ductility of steels will be
significantly improved due to a relative coarse microstructure and an increase in work hardening rate by
the second phase. On the other hand, in addition to grain refinement strengthening, precipitation
hardening can also contribute to an obvious improvement in strength.
Formation of the ultrafine microstructure
The grain refinement by large strain warm deformation can be attributed to deformation induced grain
subdivision and recovery. The grain subdivision is an essential process for the ultrafine grained
microstructure formation, and recovery is necessary to form high-angle grain boundaries. In order to
produce ultrafine grained steels by large strain deformation, it is important to avoid primary
recrystallization. Primary recrystallization will reduce significantly the dislocation densities and remove
the substructures which are important for the formation of subgrains and later the ultrafine grains.
During a 2 h annealing at 823 K, a further recovery occurred instead of grain growth. This facilitated
the formation of high-angle grain boundaries and the establishment of a more equiaxed grain shape. The
main mechanism of the recovery during annealing can be attributed to the accumulation of
geometrically necessary dislocations into (sub)grain (grain and subgrain) boundaries.
Spheroidization of pearlite during the large strain warm deformation was accelerated by the formation
of cementite lamellae kinks, subboundaries and fracture of lamellae. High equilibrium carbon
concentration in ferrite near these lamellar defects provoked a quick local dissolution of the lamella,
which led to the division of lamella as well as a subsequent or simultaneous spheroidization.
After the large strain warm deformation and annealing a rather homogeneous distribution of cementite
was found in an initial ferrite-pearlite steel, which can be due to several effects. Firstly, it can be
attributed to the spheroidization of cementite lamellae. Secondly, it is due to the locally partial
dissolution of cementite lamellae and cementite particles. This is enhanced by a high dislocation density
inside the ferrite and the dislocation cores increase significantly the carbon solubility in ferrite. Thirdly,
the solute carbon atoms may diffuse into the cementite-free proeutectoid ferrite areas with lower
equilibrium carbon concentration and re-precipitate. All of these processes were supported by a high
density of dislocations and lattice defects due to the large strain warm deformation. Therefore, primary
recrystallization is also not preferred for the homogeneous distribution of cementite particles.
The fine cementite particles are beneficial for the formation of a fine ferrite microstructure. Especially
they are effective in inhibiting the grain boundary migration due to Zener drag. This contributes to
stabilize the ultrafine microstructure against grain coarsening, as well as to inhibit primary
recrystallization which leads to an increase in recrystallization temperature. Therefore, the temperature
window for rolling/annealing is enlarged.
Abnormal texture evolution during annealing of the 0.2%C steel
After annealing the 0.2%C steel processed by the large strain warm deformation, a strong α-fiber was
found. The result in the present study can be attributed to the inhibition of primary recrystallization by
cementite particles. The process occurring during annealing may be addressed as continuous
recrystallization, proceeding without nucleation of new grains.
98

Effect of carbon and manganese
A finer ferrite and a more homogeneous distribution of cementite were found in the higher carbon steel
after the deformation and annealing process. It can be attributed to the initial finer ferrite-pearlite
microstructure before large strain warm deformation and the higher volume fraction of spheroidized
cementite particles during/after deformation in the higher carbon steel. In comparison, the large number
of particles seems to be more important for the formation of the final ultrafine grained microstructure
since the process included a large strain warm deformation. A higher carbon concentration in hypo-
eutectoid steels led to a higher volume fraction of pearlite after phase transformation. This facilitated a
more homogeneous distribution of cementite particles after the deformation and annealing processing in
the higher carbon steel.
Moreover, the increase in carbon content was beneficial to increase the work hardening rate. This is due
to a large volume fraction of cementite particles which are effective in increasing the work hardening
rate by the accumulation of geometrically necessary dislocations near the particles. The increase in
work hardening rate is important for improving the ductility (especially the uniform elongation) of the
ultrafine grained steels.
In contrast to carbon, the increase in manganese content had a more significant contribution to grain
refinement. This is, firstly, due to the initial finer transformed microstructure in the higher manganese
steel because of manganese depressing the transformation temperature obviously. Secondly, it can be
attributed to manganese substitutes iron in cementite and forms a more stable cohenite (Fe3-XMnXC).
During the large strain warm deformation itself and in the course of the subsequent annealing, the finer
cohenite particles, due to a sluggish dissolution as well as a slow Ostwald ripening, are more effective
to pin the ferrite grain boundaries against grain growth. Thirdly, the fine particles are also beneficial to
store the geometrically necessary dislocations and substructures inside the grains, which facilitate grain
subdivision. Therefore, the finest microstucture was observed in the higher manganese steel after the
deformation and annealing process.
The prominent combination of mechanical properties found in the ultrafine grained steel with higher
manganese content can be attributed to the effect of an obvious grain refinement by the extra
manganese.
99


6. ACCUMULATIVE ROLL BONDING OF LOW C STEELS
6.1 Introduction
Ultrafine structures are being studied world-wide on various materials using different types of processes
to give intense deformation like torsion straining, equal channel angular extrusion, mechanical milling
of powder metals, etc., But the majority of these processes also exhibits severe limitations because they
are generally restricted to small samples and are difficult to be implemented on an industrial scale.
A promising technique for industrial implementation is the Accumulative Roll Bonding (ARB) [86-89],
a process able to impose severe plastic deformation on large samples even at a lab scale.
The schematic drawing of Accumulative Roll Bonding (ARB) process is reported in Fig. 90.
In this process a strip is placed on top of another strip whose facing surfaces are cleaned both
mechanically and chemically to ensure good bonding. The two layers of the strip are rolled together and
the material is joined together. The rolled strip is then sectioned into two halves. The cut strips are again
stacked together and rolled. The whole process can be repeated again and again to accumulate strain.
In ARB, rolling is not only a deformation process but also a bonding process carried out to obtain one-
body solid final material. In order to obtain one-body solid material the sheets are heated before rolling
in order to realize good bonding and to reduce the rolling force. In such case the heating temperature
must be below the recrystallization temperature of the material because recrystallisation cancels out the
accumulated strain.
Fig. 90 – Schematic drawing of Accumulative Roll Bonding Process.
The issues concerning the accumulative roll bonding experiments were inadequate bonding at the first
pass, oxidation at the interface and time and rolling temperature optimisation in order to prevent
recrystallisation and to accumulate strain after each pass.
Oxidation of the surface during heat treatment has been minimised by welding the corners and sides
before annealing. Further the use of stainless steel foils to wrap the samples has been tested. Results
show that oxidation improved a little but presence of oxide was detected. The material used for
accumulative roll bonding tests is CSM_ARB whose chemical composition is reported in Table 8.
Steel code C Si Mn P S Al N
CSM_ARB 0.153 0.2 1.37 0.012 0.008 0.034 -
Table 8 - Chemical composition of the material used for ARB tests.
101

6.2 Experimental
Trial experiments have been carried out using a 0.15%C-1.37Mn commercial steel strip. The initial size
of samples was 300 mm in length, 50 mm in width and 3.7 mm in thickness. After degreasing and
wire-brushing the surfaces to remove the oxide scale, two strips were overlapped, edge welded, heated
and roll bonded by 50% reduction in thickness (ε=0.8) in one pass.
Initial technological difficulties were encountered in the production of ARB samples. The main
problems were: inadequate bonding due to oxidation at the interface, soaking time and rolling
temperature optimisation in order to prevent recrystallisation and to accumulate strain after each pass.
At first, oxidation of the surface during heat treatment was minimised by the use of stainless steel foils
to wrap the samples during heating. In this way oxidation between the strips a little decreased, however
technical problems in unwrapping the foils before rolling occurred.
So, welding the corners and sides before annealing was the method that gave the best results in terms of
oxidation and managing times.
Another problem was the perfect planarity of the strips. In our pilot mill planarity cannot be controlled,
so the overlapping of strips sometimes resulted in not good bonding.
In order to check the best condition of roll bonding temperature and soaking time to have deformation
accumulation without recovery or recrystallization, some tests were made at different temperatures in
the range 600-700°C and for different soaking times (1 - 15 min). The heating temperature before
rolling pass, defined as the best compromise among no recrystallization, deformation accumulation,
good bonding and decrease of rolling force was found to be T=615°C.
So, before each rolling pass the sample was heated to 615°C and maintained at this temperature for 2
min in order to homogenise the temperature of the sample. Using this rolling conditions, it was noted
that the minimum reduction needed for bonding was 40%.
The process was repeated 5 times for a total strain of about 4 (the total equivalent strain e after n cycles
of the 50% roll-bonding ARB is E 0.8n).
Further it is important to notice that the layers included in a sheet treated after n ARB cycles at 50%
deformation becomes 2n. In this case, after 5 passes there will be 32 layers having each one about
120µm thickness.
During rolling the main problem was to obtain for each pass a deformation of 50%.
6.3 Results and discussion
In Fig.91 the applied schedule and the corresponding microstructures are reported.
After the first pass, elongated grains due to deformation can be observed and after the second pass a
well deformed structure can be detected. Increasing the reduction, the structure is more and more
deformed and it is not possible to distinguish each layer by optical microscopy (except the central one
as showed in the 4th pass microstructure that sometime was not uniformly bonded). Each original layer
after the 5th pass is about 120 µm thick. Fig. 92 shows a SEM image of the deformed microstructure
after the 5th pass. From this figure no recrystallised structure can be detected.
6.3.1 Microstructure
Microstructural observations of as-ARB processed materials along the rolling direction (RD) showed
more and more deformed structures as shown in Fig. 91.
After the first pass elongated grains due to deformation can be observed and after the second pass a well
deformed structure can be detected. Increasing the reduction, the structure is more and more deformed
and it is not possible to distinguish each layer by optical microscopy. Fig. 92 shows a SEM image of the
deformed microstructure after the 5th pass. The specimen severely deformed up to 4.0 of total strain
exhibited the pancake shaped UFGs elongated along the rolling direction as shown in Fig.91e, which
have been typically observed in the ARB processed materials [87-89]. The mean thickness and length
of the elongated UFGs were 0.25 µm and 1.5 µm, respectively. Subsequent annealing procedure has
been carried out.
102

N° Pass Rolling T
(°C) Red (%)
1st pass 615 38.3
2nd
pass 615 47.3
3rd
pass 615 49.5
4th pass 615 54.3
5th pass 615 48.6
Fig. 91– Hot rolling conditions and microstructures for each pass of ARB.
103

Fig. 92– SEM image of the sample after the 5th pass before annealing.
Fig. 93– Microstructures of ARB samples annealed at 600°C x 3 min at different magnifications.
(a) (b)
Fig. 94– Microstructures of ARB samples annealed at (a)650°C x 3 min (b) 700°C x 3 min.
In order to macroscopically check if the material accumulated strain during passes, hardness was
measured after each ARB pass and it was characterized by a continuous increase from HV5= 230 to 270
(5th pass).
104

Samples after the 5th pass were annealed at 3 different temperatures: 600, 650 and 700°C for 3 minutes.
In Fig. 93 the microstructure of the sample annealed at 600°C x 3 minutes at different magnifications is
shown. Microstructure was quite homogeneous and polygonal grains were observed. Mean grain size
was 0.8 µm.
In Fig. 94a microstructure of the sample annealed at 650°C x 3 minutes was quite homogeneous and
polygonal grains were observed. In this case mean grain size was 1.7 µm, while in Fig. 94b the
microstructure of the sample annealed at 700°C x 3 min showed an inhomogeneous microstructure with
some coarse grains, indicating that abnormal grain growth occurred. For this annealing condition the
average grain size was 6 µm.
From these results it is clear that increasing the number of passes the non recrystallization temperature
decreases and during heating and warm rolling some microstructural changes must have occurred. In
fact after annealing at 600°C x 3 min deformed at ε = 4 recovery occurred.
6.3.2 Texture
In order to verify if a real ultrafine structure was obtained, orientation measurements were carried out.
Textural analyses were carried out in the central layers of the sample
In Fig.95(a) orientation map for planes //ND and in Fig.95(b) the orientation map for directions //RD,
are shown. In Fig.96 orientation distribution function of the same sample is reported. Both from Fig.95
and Fig. 96 it is clear that the texture is made mainly by α and γ fibres with a strong component at
{100}<011>, the typical deformation textures of bcc crystals. However, it is interesting to note how the
intensity distribution along the γ fibre (Fig. 97) has not peaks at {111}<110> (at 0° and 60°) as
expected in the case of deformation textures of ferritic steels, but it is exactly in the middle between
{111}<110> and {111}<112> that are the typical recrystallization textures of bcc steels.
In Fig. 98(a) the unique grain colour image of the sample annealed at 650°C x 3 min is shown. Border
lines between different colours represent high angle boundary grains with a misorientation angle
exceeding 15°, whereas the fine lines inside the same colour area delineate low angle grain boundaries.
This image shows that high angle boundary grains are not polygonal but elongated along the rolling
direction. Inside the elongated grains there are a lot of small grains with low boundary angles. This is a
typical situation of a recovered (and not recrystallised) material. It is confirmed in Fig.98(b) where
grain boundaries misorientation distribution shows a high fraction of low angles boundaries (53%
against the 47% of high boundary angle). If we fix the misorientation angle to 10° a higher fraction of
high boundary angles (63%) is detected.
(a) (b)
Fig. 95– (a) Unique grain colour image of the sample annealed at 650°C x 3 min, (b) Misorientation
angle distribution.
105

Fig. 96– Orientation Distribution Function of the sample.
Fig. 97– γ - Fibre of the sample.
(a) (b)
Fig. 98– Inverse polar figure maps according the colour code reported: (a) {hkl}, (b) <uvw>
106

6.3.3 Mechanical properties
Tensile tests showed that decreasing the annealing temperature of ARB specimens (εtot=4) from 700 to
600°C for 3 minutes, allows to increase the YS from 315 MPa (average grain size 6µm) to 600 MPa
(average grain size 0.8µm), without significant effects on ductility (A50%=14-15%). However, the yield
to tensile ratio increased from 0.73 to 0.96. The material annealed at 650°C (average grain size 1.7µm)
exhibited an intermediate behaviour with YS=510 MPa and YS/TS =0.92.
However, these values if compared with standard mechanical properties for this steel grade (TSE
420MPa and total elongation E13%) are quite good. It is interesting to notice that total elongation is
not badly deteriorated decreasing the grain size. Mechanical properties are reported in Fig. 99.
Tensile tests
0
100
200
300
400
500
600
700
0.00 0.02 0.04 0.06 0.08 0.10 0.12 0.14 0.16
strain
MP
a
650°C x 3 min
700°C x 3 min
600°C x 3 min
anticipated failure
Fig. 99- σ−ε curve of ARB samples.
(a) (b)
Fig. 100– Bonding situations in (a) et mid-thickness after 5th pass and annealing (b) defect.
6.3.4 Bonding
A cleaning procedure was set up in order to have good bonding among layers during rolling. Oxidation
of the surface during heat treatment has been minimised by welding the corners and edges before
annealing.
From microstructural observations interface among layers formed in the previous rolling passes are not
detectable anymore; it means that fully metallurgical bonding occurred. A bonded layer can be observed
107

at the left of Fig.100a. It can be noted that it works like a grain boundary even if in the right part the
bonded layer is not detectable anymore. Further, very seldom some oxide residuals have been detected
as shown in Fig. 100a.
Sometime situations like that shown in Fig. 100b occurred at the central layer of the sample. It can be
noted that in this case bonding was not so good because a lot of oxides were trapped between the layers
during hot rolling. Separation among layers are usually limited only at the last bounded boundary at the
centre. This means that the joining at the bonded boundaries becomes stronger and stronger during
rolling in subsequent cycles.
6.4 Conclusions
ARB process was applied to 0.15%C-1.37%Mn steel in order to obtain ultrafine grains. Different
annealing temperatures originated grain sizes ranging from 0.8µm to 6µm.
The experimentation showed that this severe plastic deformation method, that could be extended to
industrial scale, gives the possibility to obtain customized microstructures with improved combination
of strength and ductility/toughness through adequate grain refinement (1-3 µm).
Microstructure refinement and the relevant increase of tensile strength could be a solution to decrease
alloying elements at a given strength level, allowing the improvement of recyclability, weldability,
coatability and toughness.
The critical point for the production of ultrafine grained steels by ARB is the surface cleaning, which is
essential for a good bonding.
108

7. MICROALLOYED LOW C STEELS
7.1 Introduction
The grain refinement by means of dynamic recrystallisation, combined with the presence of Nb in
solution, has been already exploited by CRM to produce a very fine dual-phase microstructure,
beneficial to ductility, in hot rolled strips continuously cooled (DPCC) [90,91]. However, the ultra fine
dual phase (UFDP) route established during the previous ECSC project was though to be too
complicated and thus expensive for adoption commercially.
The present research will focus on ultra fine ferrite microstructure obtained in low carbon steel
microalloyed with Nb.
The key factor to refine the microstructure is to finish hot rolling below the non recrystallisation
temperature, Tnr, and above the transformation temperature Ar3. The temperature range between Tnr and
Ar3 should be enlarged to make practicable the rolling schedule on an industrial line, with consistent
results. Therefore a sufficient amount of Nb is added to avoid static recrystallisation between the rolling
passes.
During the hot rolling process of medium-low carbon steel containing Nb, several phenomena occur.
Nb retards static recrystallisation at lower rolling temperatures and smaller interpass times. It increases
the non-recrystallisation temperature, Tnr [92]. However, strain accumulation favours dynamic
recrystallisation, beneficial for the austenite grains refinement[93,94]. During cooling from the
austenitic region, NbC static precipitation can occur. Moreover, straining induces dynamic precipitation.
All these precipitation and recrystallisation phenomena take place more or less simultaneously,
depending on the initial steel composition and thermomechanical process. Schmitz et al. have found
that, for the same content of Nb in solution, the grain size of the ferrite which transformed from a
partially dynamically recrystallised austenite or from a pancaked austenite is the same [95]. This result
indicates that it is the Nb in solution rather than the occurrence of dynamic recrystallisation that
influences the ferrite grain refinement.
Dilatometry was combined to ICP (Inductively Coupled Plasma) analyses to study the static
precipitation of NbC at 900 °C in Nb steels. The results of NbC quantification are compared to the
kinetics of ferrite formation at 650 °C in 3 steels with different initial Nb contents.
Torsion tests were performed with Nb steels to study the effects of strain induced NbC precipitation on
the final ferrite grain size. These experiments aimed at reducing the processing window for further hot
rolling of Nb steels by adjusting the steel composition and the process parameters (in particular the time
between the last rolling pass and the cooling to the coiling temperature) in order to obtain the finest
ferrite grains.
Five steel compositions containing Nb and different amounts of Ti have been cast, hot-rolled and
processed by ultra fast cooling to different coiling temperatures. The effects of soluble B and P
additions have also been investigated. The mechanical properties and the final grain sizes have been
analysed.
Finally, several hot rolled plates have been cold rolled and annealed to study the heredity of the
improved tensile properties after further processing.
7.2. Experimental
The steel compositions used for the study of the ferrite grains refinement are given in Table 9. The
theoretical temperature for the end of static recrystallisation, Tnr [96] and the temperature of NbC
precipitation in austenite [97] are indicated and were calculated using the following equations:
Tnr,°C = 887+464wt%C+890wt%Ti-357wt%Si+6445wt%Nb-644wt%Nb1/2+363wt%Al (4)
TNbC, °C = -6770/(LOG((wt%Nb)*(wt%C))-2.26)-273 (5)
109

Cylindrical samples with 10 mm length and 4 mm diameter of the CMnNb steels 416, 419 and 568,
respectively, were reheated in the dilatometer to 1250 °C to dissolve all the Nb and subsequently cooled
to 900 °C, then held at 900 °C during different times tp (6 s, 200 s, 5000 s and 10000 s) in order to
precipitate different amounts of Nb. The samples were then quenched to room temperature or to the
isothermal transformation temperature 600 °C, 650 °C or 700 °C. The dilatometer cycles are
summarised in Fig.101.
Torsion specimens with 6 mm diameter of the CMnNb steels 430 and 431 and of the reference steel 464
without Nb, were subjected to different torsion schedules shown in Fig. 102. Specimens were reheated
to 1250 °C. A roughing pass was simulated at 1100 °C (ε = 0.5). A finishing pass of ε = 2 was given at
900 °C to simulate strain accumulation in the last rolling passes. One series was then immediately
cooled with a cooling rate between 1 °C/s and 60 °C/s. A second series was first held during 100 s after
finishing, before cooling. The phase transformations during cooling after hot torsion were monitored by
a thermomagnometer [98].
Torsion specimens and dilatometer samples quenched to room temperature were dissolved and filtered
in order to determine their amount of Nb precipitated by means of inductively coupled plasma (ICP)
analysis. The details of the procedure are given elsewhere [99].
Five steel compositions were cast to study the effects of Nb precipitation on the formation of ultrafine
ferrite during hot rolling. All steels contained 0.06 wt% C and 0.055 wt% Nb. The effects of Ti, B and P
were studied. Pieces with 150 mm width, 110 mm length and 30 mm thickness were reheated one hour
at 1250 °C. They were covered by stainless steel foils to prevent their oxidation during the
austenitisation treatment. Hot rolling experiments were performed using 5 passes or 3 passes with high
rolling reductions in the last passes above Ar3. The details of the rolling cycles are given in the
following paragraphs. Hot rolled plates with 3 to 4 mm thickness were cooled at 300 °C/s to the coiling
temperature using a mist jet cooling device. Coiling simulations were performed by cooling at 50 °C/h
in a furnace.
Casting nr. C Mn Si P Nb Ti B Al sol. N Tnr TNbC
416 87 1530 130 16 53 22 0 40 3.3 1108 1200
419 83 1410 124 15 83 22 0 40 3.5 1265 1258
568 82 1650 18 14 45 1 1 49 8.3 1091 1170
430 72 1540 23 16 41 2 0 40 3.7 1062 1140
431 34 1510 22 17 40 0 0 40 3.8 1038 1048
464 79 1470 23 15 0 0 0 40 4 930 /
806 62 500 6 11 59 3 0 43 4.8 1156 1168
1134 57 540 8 11 54 25 0 50 6.2 1146 1146
1135 58 520 14 11 54 57 0 52 8.8 1173 1148
1185 62 500 20 8 55 21 3.2 27 5 1141 11591186 65 500 14 91 55 26 4.1 45 5.1 1155 1165
Torsion tests
Rolling trials
Dilatometry
Table 9 - Steel compositions (10-3
wt%).
110

300 s at 1250 °C
60 °C/s
60 °C/s
tp at 900 °C
700 °C
650 °C
600 °C
tp = 6 s, 200 s, 5000 s and
10000 s
solution
treatment
precipitation
γ → α transformation
Fig.101 - Dilatometric cycles.
300 s
1250°C eps=0.5 at
1100°Ceps=2 at
900°C
100 s
delay
Fig. 102 - Thermomechanical (torsion) schedules.
Tensile specimens with 50 mm gauge length (A50) were machined from hot rolled plates and the
microstructures were investigated by light optical microscopy. The grains sizes were measured using
the line intercept method.
Finally, hot rolled plates were cold rolled to 1.5 mm thickness (67 % reduction). Tensile specimens A50
were machined and directly annealed to varied temperatures in salt bath.
7.3. Results And Discussion
7.3.1 Dilatometry
The change in length measured during holding at 650 °C the austenitic samples after different
precipitation times at 900 °C is shown for the 3 studied compositions in Fig. 103. Static precipitation of
NbC occurred at 900 °C. Those precipitates acted as nucleation sites for the γ - α transformation. On the
contrary, the presence of Nb in solution increased the Solute Drag Like Effect (SDLE) [100], thus
decreasing the kinetics of the γ - α transformation. Note that this effect was stronger in the steel 568
containing the lowest amount of Nb and no Ti. In the other steels, Nb was only partially dissolved at
1250 °C, or Nb was partially precipitated during the cooling to 900 °C, leading to the presence of some
111

NbC at 900 °C. In particular, the temperature of NbC dissolution calculated for the steel 419 by means
of the solubility product in Table 9 is above 1250 °C.
NbC quantification was done by means of ICP analysis carried out on dilatometer samples quenched
after holding each steel composition at 900 °C for 6 s, 200 s, 5000 s and 10000 s, respectively. The
results of ICP measurements are shown in Fig. 104. It is very clear that NbC statically precipitated
during holding at 900 °C. The amount of NbC precipitates present before the γ−α transformation acted
as nucleation sites and increased the kinetics of the phase transformation. The microstructures obtained
after the isothermal γ−α transformations at 650 °C are shown in Fig. 106 for the 3 steels with increasing
Nb content and for different holding times. The NbC precipitation at 900 °C clearly influences the
microstructures by providing nucleation sites for the ferrite formation, increasing the number of α
grains, thus reducing their size.
The volume fraction of transformed austenite y(t) corresponds to the fraction of ferrite formed, fα, and
was calculated from the dilatation curves at each time t using the relation:
0
0)(1)(
ll
ltlfty
f −
−=−= γ
(3)
where l(t), l0 and lf correspond to the sample length at time t, at the beginning of the transformation and
at the end of the transformation, respectively. The results of this procedure are shown in Fig. 105 for the
steel composition 419 isothermally transformed at 650 °C.
At each transformation temperature, the Johnson-Mehl-Avrami (JMA) analysis was carried out by
fitting the experimental data to the JMA equation [101]:
[ ]ntkty )(exp1)( −−= (6)
where
ÕÖÔ
ÄÅÃ −
=RT
QATk exp)(
(7)
and y(t) is the fraction of austenite transformed, t, the time, T, the temperature, A, the frequency factor,
Q, the activation energy, k(T), the temperature-dependent rate constant and n, the Avrami exponent. R
is the gas constant, 8.314 JK-1
mol-1
. The constants n and k were determined experimentally by
modifying equation (4) to:
)ln(ln)(1
1lnln tnk
ty+=ÕÕ
Ö
ÔÄÄÅ
ÃÕÕÖ
ÔÄÄÅ
Ã−
(8)
Fig. 107 shows the double logarithmic plot for the steel 419. Using this procedure for each steel
composition, the values of n and k were determined and the experimental dilatometric curves were
fitted to the JMA equation. The fraction of austenite transformed to ferrite was calculated for different
isothermal transformation times and was plotted against the NbC content before the start of the
transformation (NbC precipitated at 900 °C) in Fig. 108. A clear correlation between the Nb content in
the precipitates, i.e. the number of precipitates and the kinetics of phase transformation is observed.
112

419: 0.083 C - 0.083 Nb - 0.012 Si. 650°C
0
5
10
15
20
25
30
35
40
45
0 100 200 300 400 500 600 700 800 900 1000
Time (s)
Ch
an
ge
in
le
ng
th (
µm
)
10000 s
5000 s
200 s
6 s
416: 0.087 C - 0.053 Nb - 0.013 Si. 650°C
0
5
10
15
20
25
30
35
40
45
0 100 200 300 400 500 600 700 800 900 1000
Time (s)
Ch
an
ge i
n l
en
gth
(µ
m)
10000 s
5000 s
200 s
6 s
568: 0.082 C - 0.045 Nb. 650°C
0
5
10
15
20
25
30
0 100 200 300 400 500 600 700 800 900 1000
Time (s)
Ch
an
ge
in
le
ng
th (
µm
)
10000 s
5000 s
200 s
6 s
Fig. 103 - Length change versus time during the γ−α transformation at 650 °C after different holding
times at 900 °C.
113

0
5
10
15
20
25
30
35
40
45
50
55
60
0 1000 2000 3000 4000 5000 6000 7000 8000 9000 10000
time at 900 °C, s
Nb
in
pre
cip
itate
s,
10
-3 w
t%
53Nb-130Si-22Ti
83Nb-124Si-22Ti
45Nb-18Si
Fig. 104 Results of NbC precipitates quantification in dilatometer samples hold at 900 °C and quenched.
0
0.1
0.2
0.3
0.4
0.5
0.6
0.7
0.8
0.9
1
1 10 100 1000
t, s
f
tp = 200 s
tp = 5000 s
tp = 10000 s
tp = 6 s
tp = 6 s
tp = 10000 s
tp = 200 s
tp = 5000 s
Fig.105 - Kinetics of γ−α phase transformation at 650 °C in steel 419.
114

t p a
t 9
00
°C
Initial Nb content
80µm
Fig.106 - Microstructures after holding at 900 °C for tp= 6, 200, 5000 and 10000 s (from top to bottom)
and for different initial Nb content: 0.041, 0.053 and 0.083 wt% (from left to right). Isothermal
transformation at 650 °C.
115

y (6 s) = 1.5192x - 8.5881
R2 = 0.9988
y(200 s) = 1.034x - 5.4737
R2 = 0.9999
y (5000 s) = 1.2912x - 7.1411
R2 = 0.9992
y(10000 s) = 0.6664x - 3.1843
R2 = 0.9984
-4
-3
-2
-1
0
1
2 3 4 5 6
ln t
ln l
n (
1/(
1-f
))
6 s
200 s
5000 s
10000 s
Fig.107 - Determination of n and k parameters of the JMA equation from the curves of Fig.105.
0
0.1
0.2
0.3
0.4
0.5
0.6
0.7
0.8
0.9
1
1.1
0 100 200 300 400 500 600
ppm Nb
Ferr
ite f
racti
on
f
t at 650 °C = 100 s
t at 650 °C = 500 s
t at 650 °C = 200 s
Fig.108 -. Transformed fraction to ferrite after different times at 650 °C versus the Nb content in NbC
precipitates formed at 900 °C.
Dilatometric measurements showed that increasing the holding time, tp, at 900 °C increases the number
of NbC precipitates that act as nucleation sites for the γ−α transformation, which leads to the formation
of more, thus finer ferrite grains.
116

7.3.2 Torsion tests
The static precipitation of NbC during cooling (effect of cooling rate) and dynamic precipitation of NbC
after hot deformation were studied by means of hot torsion tests combined with ICP analyses for Nb
quantification.
The signal provided by the magnetometer allowed the determination of the start and finish temperatures
of the γ−α transformation during cooling. An example of curves measured experimentally in the Nb-
free steel 464 is shown in Fig. 109. The jump of potential is due to the paramagnetic-ferromagnetic
transformation that begins when ferrite starts to form during cooling from the austenite region. These
signal analyses permitted to plot DCCT (Deformation Continuous Cooling Transformation) diagrams
for the studied compositions with and without the holding time of 100 s at 900 °C. It can be seen in Fig.
110 that only at high cooling rates (> 20 °C/s) the start temperature of austenite decomposition is raised
after holding 100 s at 900 °C, likely due to the precipitation of Nb before cooling. At lower cooling
rates, Nb has enough time to precipitate during the cooling prior to the γ−α transformation.
464: 0.079C, no Nb
-2.5
-2
-1.5
-1
-0.5
0
0.5
1
100 200 300 400 500 600 700 800 900 1000 1100 1200
Temperature
Mag
neto
mete
r (V
)
1°C/s
6°C/s
20°C/s
60°C/s
Fig.109 -. Magnetometer signal recorded during cooling the steel without Nb from 900 °C at cooling
rates 1, 6, 20 and 60 °C/s, respectively.
Increasing the cooling rate after the deformation at 900 °C decreased the number of NbC precipitates.
However, coarser ferrite grains were obtained in the specimens containing higher amount of NbC
precipitates, i.e. those cooled at the slower rates. The coarse ferrite grains obtained at low cooling rates
were due to the fact that the ferrite grains had more time to grow. In specimens cooled at rates higher
than 15 °C/s, few differences in the NbC content were measured and no differences in the grain size
were observed.
To study the strain induced precipitation of NbC, torsion specimens were strained at 1100 °C with
ε=0.5, then cooled in air to 900 °C, then strained with ε=2. Specimens were quenched after the first
deformation, just after the second deformation or 100 s after the second deformation.
117

Steel 430: 0.07 %C - 0.04 %Nb
Ac1 Nb = 625 °C
Ac3 Nb = 762 °C
Ac1 No Nb = 653 °C
Ac3 No Nb = 768 °C
400
450
500
550
600
650
700
750
800
850
900
1 10 100 1000
Cooling time from 900 °C, s
Te
mp
era
ture
, °C
tp = 0 s
tp = 100 s
no Nb
60 °C/s 20 °C/s 1 °C/s6 °C/s
120
149
145
137
187
168
146
189
178
146
180
191
HV 5kg
no Nb
Nb, tp = 0 s
Nb, tp = 100 s
Steel 431: 0.03 %C - 0.04 %Nb
Ac1 = 638 °C
Ac3 = 761 °C
400
450
500
550
600
650
700
750
800
850
900
1 10 100 1000
Cooling time from 900 °C, s
Te
mp
era
ture
, °C
tp = 0 s
tp = 100 s
1 °C/s6 °C/s20 °C/s60 °C/s
HV 5kg
tp = 0 s
tp = 100 s
167
166
171
162
154
150
166
165
Fig. 110 -. DCCT diagrams for steels 430 (top) and 431 (bottom) with and without holding 100 s at 900
°C. The DCCT diagram for steel 464 without Nb is also indicated.
The results of NbC quantification are shown for both steels 430 and 431 in Fig.111. It can be seen that a
large part of NbC already precipitated at 1100 °C in both steels. After the second deformation, at 900
°C, some NbC again precipitated. Finally, the amount of Nb precipitated as NbC nearly doubled after
100 s holding at 900 °C. Considering that these NbC precipitates may act as nucleation sites for the
ferrite formation as observed previously with dilatometer experiments, finer ferrite grains are expected.
118

0
2
4
6
8
10
12
14
16
18
20
Nb
in
Nb
C p
rec
ipit
ate
s, 1
0-3
wt%
after 1st def, 1100 °C after 2nd def, 900 °C after 2nd def + 100s, 900 °C
Step
72C-41Nb
34C-40Nb
Fig. 111 - NbC quantification results in torsion specimens quenched after different steps.
Steel 431: 0.03 %C - 0.04 %Nb
0
1
2
3
4
5
6
0 10 20 30 40 50 60 70
Cooling rate, °C/s
Gra
in d
iam
ete
r, µ
m
tp = 0 s
tp = 100 s
Fig. 112 - Measured ferrite grain diameter for different continuous cooling rates in steel 431 deformed
at 900 °C with and without 100 s holding at 900 °C.
However, it was clearly seen that the holding time of 100 s at 900 °C led to coarser ferrite grains, as
shown in Fig. 112. Microstructure observations (Fig. 113) showed that after 100 s holding at 900 °C,
the ferrite formed from partially recrystallised austenite. Torsion experiments showed, that increasing tp
after the deformation at 900°C led to more recrystallised austenite, responsible for the formation of
coarser ferrite grains.
119

a) CR = 60 °C/s
b) CR = 20 °C/s
c) CR = 6 °C/s
no delay delay 100s
Fig. 113 - Microstructures after continuous cooling the steel 430 from 900 °C without (left) and with
(right) 100s delay after deformation at a) CR = 60 °C/s, b) CR = 20 °C/s and c) CR = 6 °C/s.
Fig. 114 shows the hardness and grain size as functions of the amount of NbC precipitated in steel 431.
The precipitation hardening due to NbC precipitation is not observed. It is very likely that the NbC
quantification technique involving a filtering of precipitates does not account for the finest precipitates
responsible for precipitation hardening. The clear correlation between grains size and hardness is
observed. This graph shows that in Nb steels hot deformed at 900 °C, Nb must be in solution to obtain
the finest ferrite grains.
20 µm
120

Effects of NbC precipitation on GS and hardness in 0.03 wt% C - 0.04 wt% Nb steel
140
145
150
155
160
165
170
175
180
50 100 150 200 250 300 350 400
Nb in (NbC) precipitates, ppm
Ha
rdn
ess, H
v5
3
3.5
4
4.5
5
5.5
6
6.5
7
Gra
ins s
ize, µ
m
Fig. 114 - Effect of NbC precipitation on the final ferrite grains size and hardness in Nb steels.
7.3.3 Hot rolling simulation
To obtain fine grains in Nb microalloyed steels, there is a compromise to find between:
- dynamic recrystallisation during high rolling reductions;
- static recrystallisation retarded by soluble Nb below Tnr, the non recrystallisation temperature;
- dynamic NbC precipitation during hot rolling;
- static NbC precipitation during cooling / coiling.
Fine recrystallised austenite grains are beneficial for the production of fine ferrite grains. Fine NbC
precipitates are beneficial for the production of fine ferrite grains as they act as nucleation cycles.
To obtain fine grains in hot rolled Nb steel, all the Nb must be dissolved at 1250 °C, strain
accumulation must occur below Tnr and above Ar3 to induce dynamic recrystallisation of deformed
austenite grains. To reduce the NbC precipitation during cooling, and also the austenite static
recrystallisation, the last pass must be followed by fast cooling to the γ−α transformation temperature.
First rolling trials were performed using steel 806 containing 0.06 wt% C, 0.5 wt% Mn, 0.06 wt% Nb.
That low C-Nb steel was hot rolled with the maximum reduction below Tnr but above Ar3, followed by
ultra fast cooling to the coiling temperature (CT) in the range 650 – 500 °C. The rolling forces and
temperatures measured during the trials are given in Fig. 115.
Fig. 116 shows the yield stress and tensile strength measured after coiling at temperatures between 650
°C and 500 °C. The maximum precipitation hardening due to fine NbC precipitation in the ferrite is
clearly seen after coiling at 600 °C. In spite of the small rolling reduction, the low finish rolling
temperature of 850 °C (before the last pass) followed by ultra fast cooling led to ferrite grains with 3 to
5.5 µm diameter. The microstructure was similar for all coiling temperatures and consisted in ferrite
and small amounts of pearlite, as seen in Fig. 117. The ferrite grain size was found to decrease with
decreasing CT, likely due to the presence of more nucleation sites provided by NbC precipitated, and
less time for the growth of coarser ferrite grains during the cooling down to CT.
121

600
650
700
750
800
850
900
950
1000
1050
1100
1150
1200
50 60 70 80 90 100 110
Time (sec)
Te
mp
era
ture
(°C
)
0
10
20
30
40
50
60
70
80
90
100
110
120
Ro
llin
g f
orc
e (
t)
Pass 1 Pass 2 Pass 3 Pass 4 Pass 5
Tin, °C 1100 1050 1000 950 900
thickness in, mm 20 16 12 9 6
thickness out, mm 16 12 9 6 4
reduction, % 20 25 25 33 33
Fig. 115 - Rolling forces and temperatures measured during the 5 rolling passes.
420
440
460
480
500
520
540
560
450 500 550 600 650 700
Coiling temperature, °C
YS
, T
S,
MP
a
Fig. 116 - Yield Stress (YS) and Tensile Strength (TS) measured after coiling the low C low Mn Nb
steel 806 at 500 °C, 550 °C, 600 °C and 650 °C, respectively.
122

600 °C
dα = 5.5 µm
650 °C
dα = 5.2 µm
500 °C
dα = 3.0 µm550 °C
dα = 4.3 µm
806: 600 ppm Nb, no Ti; 5 passes above 850 °C
Fig. 117 - Microstructure and measured ferrite grain size in steel 806 coiled at 500 °C, 550 °C, 600 °C
and 650 °C, respectively.
New rolling trials with higher rolling reduction in the last passes and higher finishing rolling
temperature in order to avoid ferrite formation during rolling have been performed on four steel
compositions 1134, 1135, 1185, 1186 containing Nb, Ti, B and P additions. The thermomechanical
schedule is given in Fig. 118 with the measured temperatures and rolling forces. It can be seen that
during the last pass a high rolling force was necessary to achieve the 50 % reduction. The
microstructures obtained with this rolling scheme are shown in Figs. 119 and 120 for the steels 1134
and 1135 with 0.025 and 0.057 wt% Ti, respectively.
In both steels the maximum grain size is measured after coiling at 550 °C, corresponding to the
maximum precipitation of NbC and TiC. The average ferrite grain size was coarser than in steel without
Ti. It is very likely that Ti additions led to TiN precipitates formed at high temperatures. These
precipitates should act as nucleation sites for the ferrite nucleation. However, as seen during torsion
experiments, the static recrystallisation of austenite is very fast at 900 °C and leads to coarser ferrite
grains, even if the number of precipitates is higher.
B additions in steels 1185 and 1186 aimed at reducing the nucleation sites for the ferrite formation by
segregation of soluble B at the austenite grain boundaries [102]. After hot rolling and fast cooling to the
transformation temperature, the sites available for the ferrite nucleation are the defects induced by
plastic deformation during rolling and TiN and NbC precipitates. Figs. 121 and 122 show the
microstructures obtained in steels 1185 and 1186, respectively. Before coiling at 500 °C, plates were
undercooled below 500 °C, and other plates were cooled to 600 °C. These differences in the cooling
cycle are indicated as UFC500 and UFC600, respectively. In both B-bearing steels the ferrite grain size
was finer than in steels 1134 and 1135. Note that the morphology of the ferrite grains is also different
(less isotropic). The finest ferrite grain size is achieved with the P-containing steel. This alloying
element promotes the γ−α transformation and contributes strongly to substitutional hardening.
Comparing the rolling schemes of Fig. 115 and Fig. 118, it can be seen that the finishing rolling
temperature (FRT) was higher in the second schedule. It is very likely that the FRT is responsible for
different recrystallisation rate and may be an important parameter to obtain fine grains. Due to the high
force needed to obtain the 50 % reduction the last rolling pass was given at 900 °C, also reducing the
risk of austenite to ferrite transformation during rolling.
123

600
650
700
750
800
850
900
950
1000
1050
1100
1150
100 110 120 130 140 150
Time (sec)
Te
mp
era
ture
(°C
)
0102030405060708090100110120130140150160170180190200210220
Ro
llin
g f
orc
e (
t)
Pass 1 Pass 2 Pass 3 Pass 4 Pass 5
Tin, °C 1100 1050 1000 950 900
thickness in, mm 30 20 15 10 6
thickness out, mm 20 15 10 6 3
reduction, % 33.33333 25 33.33333 40 50
Fig. 118 - Rolling forces and temperatures measured during the 5 rolling passes (new rolling scheme
with higher reduction in the last passes).
600 °C
dα = 5.8 µm1134:550 ppm Nb, 250 ppm Ti
5 passes above 900 °C
550 °C
dα = 5.9 µm
500 °C
dα = 4.8 µm
Fig. 119 - Microstructure and measured ferrite grain size in steel 1134 coiled at 500 °C, 550 °C and 600
°C, respectively.
124

600 °C
dα = 4.9 µm1135:550 ppm Nb, 570 ppm Ti
5 passes above 900 °C
550 °C
dα = 6.5 µm
500 °C
dα = 5.0 µm
Fig. 120 - Microstructure and measured ferrite grain size in steel 1135 coiled at 500 °C, 550 °C and 600
°C, respectively.
600 °C 550 °C
500 °C
UFC 600 UFC 500
1185
dα = 5.7 µm dα = 4.5 µm
dα = 5.1 µm dα = 4.3 µm
Hv: Hv:
179 167
Hv: Hv:
156 170
Fig. 121 - Microstructure and measured ferrite grain size in the B-bearing steel 1185 coiled at 500 °C,
550 °C and 600 °C, respectively.
125

500 °C
1186
600 °C 550 °C
UFC 600 UFC 500
dα = 6.2 µm dα = 3.8 µm
dα = 3.4 µm dα = 5.1 µm
Hv: Hv:
224 184
Hv: Hv:
172 212
Fig. 122 - Microstructure and measured ferrite grain size in steel B-bearing steel 1186 microalloyed
with P, coiled at 500 °C, 550 °C and 600 °C, respectively.
Pass 1 Pass 2 Pass 3
Tin, °C 1050 1000 950
thickness in, mm 30 20 10
thickness out, mm 20 10 3
reduction, % 33.33333 50 70
600
650
700
750
800
850
900
950
1000
1050
1100
120 130 140 150 160 170
Time (sec)
Te
mp
era
ture
(°C
)
0153045607590105120135150165180195210225240255270285300
Ro
llin
g f
orc
e (
t)
Fig. 123 - Rolling forces and temperatures measured during the 3 rolling passes (new rolling scheme
with the highest possible reduction in the last pass).
New rolling tests were performed on the steel compositions 1135, 1185 and 1186. Only 3 rolling passes
were given above 950 °C to obtain the maximum possible reduction of 70 % (with CRM laboratory mill
126

capacity) in the last pass. It can be seen in Fig. 123 that the limit of the rolling mill power was reached
with 300 t rolling force in the last pass. This high reduction was followed by ultra fast cooling and
coiling simulation from 500 °C. The microstructure is shown in Fig. 124 for the steel composition 1135
and is compared to the microstructure obtained with the 5 passes schedule. Fig. 125 shows the
microstructures obtained in steels 1185 and 1186 processed with the 3 passes rolling schedule. The
ferrite grain size was down to 1 µm finer with this high reduction rolling scheme.
1135:
550 ppm Nb, 570 ppm Ti500 °C
dα = 5.0 µm
5 passes above 900 °C 3 passes above 900 °C
500 °C
dα = 3.9 µm
Fig. 124 - Microstructure and measured ferrite grain size in steel 1135 coiled at 500 °C, after being
processed using 2 different rolling schemes.
500 °C 500 °C
1185 1186
3 passesdα = 4.4 µm
Hv: 167
dα = 2.9 µm
Hv: 188
Fig. 125 - Microstructure and measured ferrite grain size in steels 1185 and 1186
hot rolled in 3 passes with 70 % reduction in the last pass and coiled at 500 °C.
Fig. 126 is a summary of the obtained ferrite grain size in the 3 processed B-free steels in function of
the coiling temperature. It must be kept in mind that for the Ti-free steel 806, the FRT was lower than
for other steels. However, Ti additions to Nb steel seem detrimental for the grain refinement and for
127

NbC precipitation hardening efficiency. Some authors have shown, that during the casting stage, Ti
additions change the precipitation mode of Nb(C,N) in austenite and their composition [103].
In steel containing 0.1 wt%C, 0.005 wt%N, 0.03 wt%Nb and 0.001 wt%Ti TiN and AlN precipitate at
high temperature (T>1130 °C) and NbC0.7N0.3 form at T<980 °C. These precipitates precipitated along
prior austenite grain boundaries.
In steel with 0.018 wt%Ti and 0.005-0.0025 wt%N, Nb0.5Ti0.5(C0.5-0.8N0.5-0.2) precipitates formed at
T<980 °C. They precipitated on TiN nucleation sites inside γ grains. Ouchy et al. summarised the
improvement of high temperature ductility brought by Ti additions and/or reduction of N content in the
steel as follows [104]:
1. Suppression of AlN precipitation;
2. Change in chemistry of carbonitrides from Nb(C0.6N0.26) with molar ratio C/Nb > 2 to NbC0.86;
3. Complete suppression of NbN.
The effects of B and P additions on the ferrite grain size are shown in Fig. 127. Only 30 ppm B are
sufficient to refine the ferrite grain from 5.9 µm to 4.5 µm (coiling at 550 °C).
2
2.5
3
3.5
4
4.5
5
5.5
6
6.5
7
475 500 525 550 575 600 625 650 675
Coiling temperature, °C
Ferr
ite g
rain
siz
e, µ
m
No Ti
250 ppm Ti
570 ppmTi
570 ppm Ti, 3 passes
Increasing Ti
Increasing
reduction
Fig. 126 - Ferrite grain size measured after rolling and coiling the different low C low Mn Nb steels at
different CT.
128

2
2.5
3
3.5
4
4.5
5
5.5
6
6.5
475 500 525 550 575 600 625
Coiling temperature, °C
Ferr
ite g
rain
siz
e, µ
m
250 ppm Ti
250 ppm Ti + B
250 ppm Ti + B + 900 ppm P
Fig. 127 - Effects of B and P additions on the ferrite grain refinement.
Fig. 128 shows the tensile strength (TS) measured for the different steels using A50 tensile specimens. In
steels 806 (no Ti) and 1134 (250 ppm Ti), TS increases with decreasing CT, due to ferrite grain
refinement and precipitation hardening. In steel 1135 (570 ppm Ti), precipitation hardening contributes
more to TS than the grain size.
450
475
500
525
550
575
600
475 525 575 625 675
Coiling temperature, °C
TS
, M
Pa
No Ti
250 ppm Ti
570 ppm Ti
570 ppm Ti ,3 passes
Fig. 128 - Tensile Strength (TS) measured after rolling and coiling the different low C low Mn Nb
steels at different CT. Effects of Ti additions.
Fig. 129 shows the tensile strength (TS) measured for the steels 1134, 1185 and 1186. The TS increase
in B-bearing steel 1185 is mainly due to the lower ferrite grain size. Note that in steel 1186, the tensile
properties remain very stable with the coiling temperature. This would allow flexibility in the cooling
stop temperature. This consistency in mechanical properties is clearly seen in Fig. 130, which
summarises the tensile properties of the 5 steel compositions after different rolling cycles.
129
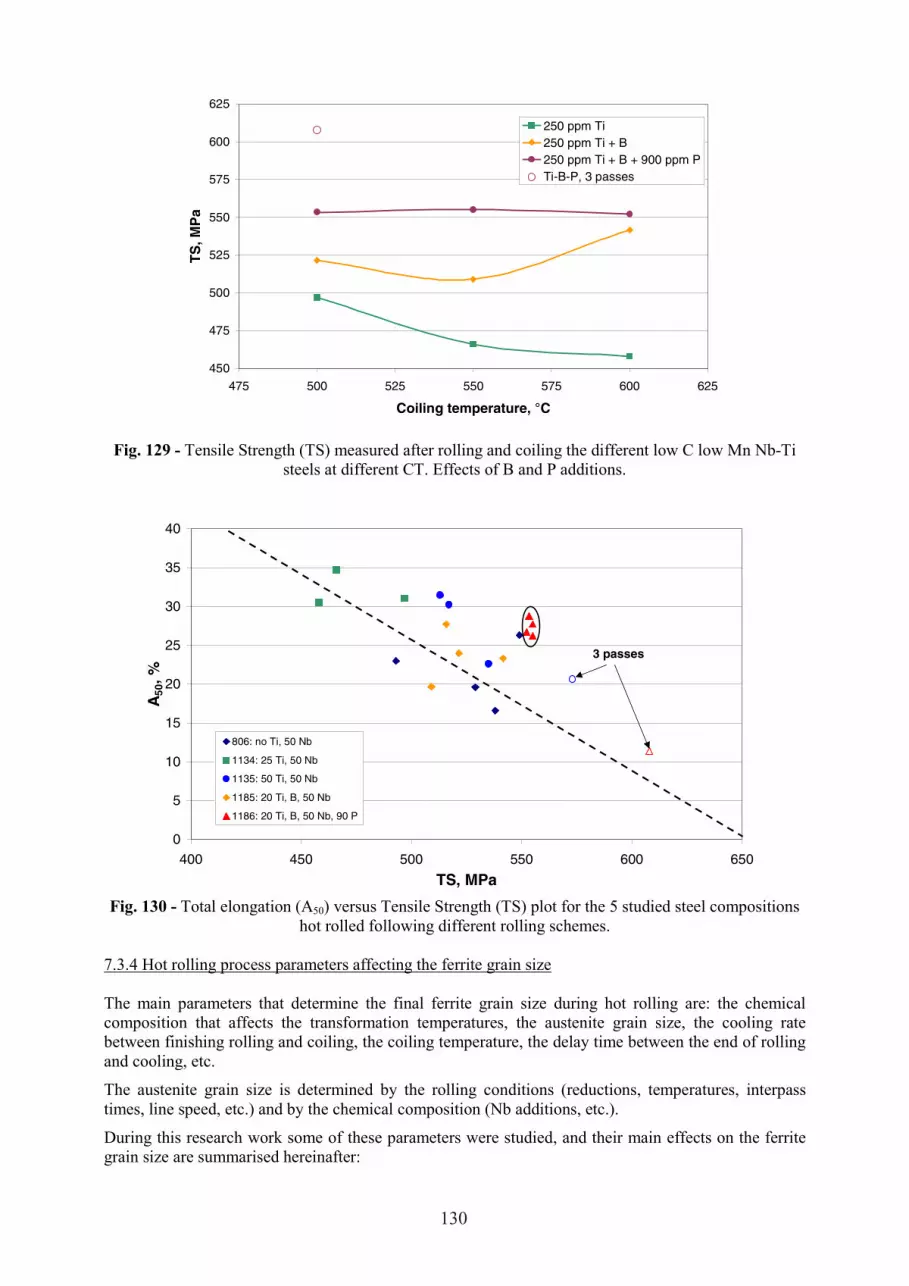
450
475
500
525
550
575
600
625
475 500 525 550 575 600 625
Coiling temperature, °C
TS
, M
Pa
250 ppm Ti
250 ppm Ti + B
250 ppm Ti + B + 900 ppm P
Ti-B-P, 3 passes
Fig. 129 - Tensile Strength (TS) measured after rolling and coiling the different low C low Mn Nb-Ti
steels at different CT. Effects of B and P additions.
0
5
10
15
20
25
30
35
40
400 450 500 550 600 650
TS, MPa
A5
0,
%
806: no Ti, 50 Nb
1134: 25 Ti, 50 Nb
1135: 50 Ti, 50 Nb
1185: 20 Ti, B, 50 Nb
1186: 20 Ti, B, 50 Nb, 90 P
3 passes
Fig. 130 - Total elongation (A50) versus Tensile Strength (TS) plot for the 5 studied steel compositions
hot rolled following different rolling schemes.
7.3.4 Hot rolling process parameters affecting the ferrite grain size
The main parameters that determine the final ferrite grain size during hot rolling are: the chemical
composition that affects the transformation temperatures, the austenite grain size, the cooling rate
between finishing rolling and coiling, the coiling temperature, the delay time between the end of rolling
and cooling, etc.
The austenite grain size is determined by the rolling conditions (reductions, temperatures, interpass
times, line speed, etc.) and by the chemical composition (Nb additions, etc.).
During this research work some of these parameters were studied, and their main effects on the ferrite
grain size are summarised hereinafter:
130

- Microalloy content:
Nb is a very important microalloying element, widely used for grain refinement. When in solid solution
in austenite, it retards recrystallisation during rolling, and also lowers the kinetics of the γ−α
transformation. Fig. 131 shows a tensile strength versus ferrite grain size plot for industrial coils (data
from Carlam hot strip mill). It is clearly seen that low carbon steels microalloyed with Nb exhibits finer
grains and consequently higher tensile strength.
The other effect of microalloying with Nb is precipitation hardening. The steel composition must be
optimised to benefit both from grain refinement and precipitation hardening with Nb. During this
research work it was shown in particular that Ti in combination with Nb was detrimental because TiN
precipitates formed at high temperatures increase the rate of NbC precipitation in the austenite and
change their composition.
300
325
350
375
400
425
450
475
500
525
550
575
600
625
650
7 8 9 10 11 12 13 14 15 16 17 18 19 20
d-1/2
, mm-1/2
TS
, M
Pa
7 8 9 10 11 12 13 14 15 16 17 18 19 20
d, µm
Industrial LC steel
Industrial LC-Nb steel
Hall-Petch relation
Laboratory Nb steels + UFC
TS = 24.9 d-1/2
+ 116
20.4 15.6 12.3 10 8.3 6.9 5.9 5.1 4.4 3.9 3.5 3.1 2.8 2.5
Fig. 131 - Hall-Petch relation from industrially produced steel (Carlam HSM) and laboratory rolled Nb-
steel.
60C-420Mn-60Nb steel (10-3 wt%)
464
548539
590
400410420430440450460470480490500510520530540550560570580590600
Conventional UFC (Carlam)
Hot rolling process
YS
, T
S, M
Pa
YS, MPa
TS, MPa
ASTM 12:
d = 5.4 µm
ASTM 14:
d = 2.8 µmdα ìσppt ê
Fig. 132 - Tensile property improvement using ultra fast cooling between finishing and coiling
compared to conventional (laminar cooling) process.
131

- Cooling rate:
Fig.131 shows that using accelerated cooling between the end of rolling and coiling increased the
precipitation hardening efficiency with similar grain size.
Fig.132 shows an industrial example of the ferrite grain refinement and tensile property improvement in
steel containing 60.10-3
wt%C, 420.10-3
wt%Mn and 60.10-3
wt%Nb, hot rolled and cooled to the
coiling temperature around 650 °C using the conventional (laminar cooling) process and the ultra fast
cooling pilot installation of Carlam. [105].
Accelerated cooling reduces the growth of ferrite grains during cooling, leading to finer microstructure
and prevents NbC precipitation during cooling. This very important result shows that the microalloy
content can be reduced to obtain similar strength level if fast cooling or ultra fast cooling is applied in
place of the conventional (laminar) cooling.
- Coiling temperature:
In all studied steels, decreasing the coiling temperature led to finer ferrite grains, provided ultra fast
cooling is applied. If slow cooling is applied after rolling, the reverse situation is observed, as ferrite
nucleates and grows during the cooling.
- Rolling reduction (strain accumulation):
Increasing the rolling reduction, especially in the last rolling passes cumulates the strain and reduces the
austenite grain size. To have the maximum efficiency, the last rolling reduction must be immediately
followed by fast cooling to avoid static recrystallisation of the austenite.
- Finishing rolling temperature:
This parameter determines the amount of accumulated strain, especially in microalloyed steel when it is
below Tnr and above Ar3. Steels 1134 and 1135, microalloyed with Ti and Nb were hot rolled in 5
passes following the rolling schedule of Fig.118, with different temperatures before the last pass, 900°C,
875 °c and 840 °C, respectively. The measured forces and temperatures are shown in Fig.133. The
rolling forces during the last pass were very close when finishing at 900 °C or 875 °C, likely due to the
smaller interpass time between the last 2 passes above 900 °C. The accumulated strain was very similar
in both cases and few differences in the final ferrite grain size were expected. The higher rolling force
measured during rolling at 840 °C indicates that more strain was accumulated and slightly finer ferrite
grains were expected.
132

600
650
700
750
800
850
900
950
1000
1050
1100
1150
100 110 120 130 140 150 160 170
Time (sec)
Te
mp
era
ture
(°C
)
0102030405060708090100110120130140150160170180190200210220
Ro
llin
g f
orc
e (
t)
Fig. 133 - Temperature and rolling forces measured during hot rolling steels 1134 and 1135 with 3
different finishing rolling temperatures.
Fig. 134 shows the microstructures obtained with the 3 different finishing rolling temperatures. Finer
grains were obtained in steel 1134 with the lowest FRT. It is however important to take into account the
transfer time between the finishing mill and the cooling device. In the course of the present experiments,
due to high reductions, the mill configuration did not allow short delay time before cooling. Therefore,
the benefit of strain accumulation with high reduction at low temperature may be partially lost due to
austenite recrystallisation and NbC precipitation before coolin
840 °C 875 °C 900 °C
1134
1135
3.9 µm 4.8 µm 5.0 µm 5.0 µm 4.8 µm 5.0 µm
Fig. 134 - Microstructures and measured ferrite grain size in steels 1134 and 1135 hot rolled with 3
different FRT.
- Time between the end of rolling and cooling (delay time):
Hot torsion experiments showed strong difference between cooling immediately after deformation or
100 s later. As mentioned before, during hot rolling experiments the transfer time between the last
rolling pass and the cooling device was quite long (between 5 and 10 s). The maximum efficiency of
accumulated strain and soluble Nb on the ferrite grain size was not achieved. To obtain ultra fine ferrite
grains, Nakayama Steel Works have developed a cooling system for strong cooling just after rolling
133

[106]. The delay time seems to be a major parameter for the control of the grain size and is worth being
studied more deeply.
7.3.5 Further processing: cold rolling and annealing
Steel 806, 1134 and 1135 were hot rolled to strips with 4 mm thickness and fast cooled (300 °C/s) to
different coiling temperatures. Tensile specimens with 50 mm gauge length (A50) were machined from
hot rolled strips. Some of these tensile specimens were directly annealed in salt bath for 100 s at
temperatures of 620 °C, 670 °C, 720 °C and 770 °C, respectively. This procedure was applied for the 3
steel compositions in order to estimate the potential in terms of precipitation hardening due to the Nb
remaining in solution after hot rolling.
Hot rolled strips of steels 1134 and 1135 were also cold rolled to 1.5 mm thickness. A50 tensile
specimens were machined and the same thermal treatments were applied.
Fig. 135 shows the tensile properties measured on hot rolled, hot rolled and annealed, and cold rolled
and annealed specimens. In all cases hot rolled strips contained enough Nb, kept in solution by using
ultra fast cooling, to obtain NbC precipitation hardening after annealing.
0
5
10
15
20
25
30
35
450 500 550 600 650 700 750 800
TS, MPa
A5
0,
%
As hot-rolled
Hot rolled and annealed
Cold-rolled and annealed
Fig. 135 – Total Elongation A50 versus TS for hot rolled, hot rolled and annealed, and cold rolled and
annealed specimens.
134

0
2
4
6
8
10
12
14
16
18
20
300 350 400 450 500 550 600 650 700 750 800
YS, MPa
Au,
%
As hot-rolled
Hot rolled and annealed
Cold-rolled and annealed
Fig. 136 – Uniform elongation Au versus YS for hot rolled, hot rolled and annealed, and cold rolled and
annealed specimens.
The uniform elongation (Au) versus yield stress (YS) for the same tensile specimens is reported in Fig.
136. For some specimens, annealing improved the tensile strength but reduced the yield stress. The
reason is that in specimens annealed above 720 °C, some austenite formed and dual phase ferrite +
martensite microstructures were obtained after subsequent cooling to room temperature. The YS/TS
ratio plotted against uniform elongation in Fig. 137 shows clearly both categories of microstructures
obtained after annealing.
0.4
0.5
0.6
0.7
0.8
0.9
1
0 5 10 15 20
Uniform elongation, %
YS
/TS
As Hot rolled
Hot rolled + annealed
Cold rolled + annealed
FERRITE
FERRITE + MARTENSITE
Fig. 137 - YS/TS ratio versus Au plot of hot rolled, hot rolled and annealed, and cold rolled and
annealed specimens.
135

0
50
100
150
200
250
300
-100 -50 0 50 100 150 200 250 300
YS, MPa
TS
, M
Pa
Cold rolled + annealed
Hot rolled + annealed
Dual Phase
Ferrite
(NbC precipitation hardening)
Fig..138 - TS and YS variations after annealing and after cold rolling and annealing hot rolled steels
806, 1134 and 1135.
Fig. 138 is a summary of the increase of TS after annealing, plotted against the variations of YS.
Distinction is clearly made between dual phase microstructures and ferrite microstructures. Specimens
annealed directly after hot rolling exhibit increased YS and TS up to 100 MPa, only due to NbC
precipitation hardening.
0
2
4
6
8
10
12
14
16
18
20
400 420 440 460 480 500 520 540 560 580 600 620 640 660 680 700 720 740 760 780
YS, MPa
Au,
%
30 s
60 s
100 s
200 s
500 s
Fig. 139 - Au versus YS plot for steels 1134 and 1135 cold rolled and annealed at 720 °C for different
times.
136

0
5
10
15
20
25
30
480 500 520 540 560 580 600 620 640 660 680 700 720 740 760 780
TS, MPa
A5
0,
%
30 s
60 s
100 s
200 s
500 s
Fig. 140 - A50 versus TS plot for steels 1134 and 1135 cold rolled and annealed at 720 °C for different
times.
In cold rolled specimens, more than 250 MPa increase of TS and YS was measured as a consequence of
NbC precipitation hardening and grain refinement by cold deformation. It must be noted that in this last
type of material, the microstructure was not fully recrystallised. As a consequence the uniform
elongation may be lower than 10 %.
Fig. 139 and Fig. 140 show the tensile properties of steels 1134 and 1135 cold rolled and annealed at
720 °C for different times. A large range of tensile properties was obtained by varying the annealing
parameters.
These very promising results obtained after combining fine grains and NbC precipitation hardening are
worth being studied further, with focus on Nb quantification and ferrite recrystallisation.
7.4. CONCLUSIONS
Dilatometry and hot torsion tests were performed on Nb-microalloyed low C steels. The results are
summarised as follows.
In dilatometric samples (no deformation):
- increasing tp at 900 °C increases the rate of γ−α transformation, finer ferrite grains are
obtained due to more nucleation sites;
- increasing the initial Nb content, with the same C content, increases the number of fine NbC
precipitates, leading to finer ferrite grains.
- grain refinement is due to NbC static precipitation in austenite: nucleation sites.
In torsion samples (hot rolling simulation):
- increasing tp after the deformation at 900 °C leads to more recrystallised austenite, producing
coarser ferrite grains;
- increasing the cooling rate reduces the growth of ferrite, producing finer ferrite grains;
- grain refinement is favoured when Nb remains in solution before the γ−α transformation.
In Nb microalloyed steels, there is a compromise to find between:
- dynamic recrystallisation during high rolling reductions;
- static recrystallisation retarded by soluble Nb below Tnr, the non recrystallisation temperature;
137

- dynamic NbC precipitation during hot rolling;
- static NbC precipitation during cooling / coiling.
To obtain fine grains in hot rolled Nb steel, all the Nb must be dissolved at 1250 °C, strain
accumulation must occur below Tnr and above Ar3 to induce dynamic recrystallisation of deformed
austenite grains. To reduce the NbC precipitation during cooling, and also the austenite static
recrystallisation, the last pass must be followed by fast cooling to the γ−α transformation temperature.
Hot rolling simulations were performed on steels microalloyed with Nb, Ti, B and P. Different rolling
schedules were applied to increase the rolling reduction in the last passes. Ultra fast cooling was applied
between the end of rolling and the coiling in order to keep Nb in solution to obtain the maximum
precipitation hardening efficiency.
Fully ferritic microstructures with grain size between 3 and 6 µm were obtained. The finest grains were
obtained with the low C steel 806, microalloyed with Nb without very high rolling reduction in the last
pass. Ti was found to reduce the beneficial effect of Nb on both grain refinement and precipitation
hardening.
The main hot rolling parameters that affect the ferrite grain size are listed below:
- Microalloy content: Nb must be in solution to refine efficently the grain;
- Cooling rate: must be high to avoid ferrite grain growth;
- Coiling temperature: must be low enough to avoid ferrite grain growth;
- Rolling reduction (strain accumulation): must be high to cumulate strain;
- Finishing rolling temperature: must be low (above Ar3) to cumulate strain;
- Time between the end of rolling and cooling (delay time): must be as short as possible to avoid
austenite recrystallisation.
Finally, hot rolled strips were cold rolled and annealed to study the benefit of fine grains and NbC
precipitation hardening. The very promising results show that high yield stress (> 600 MPa) and high
tensile strength fully ferritic steels can be obtained after cold rolling and annealing low C microalloyed
steel, provided ultra fast cooling has been applied after hot rolling.
138

8. ULTRAFINE HIGH C STEELS
8.1 Introduction
The objectives of this work package (WP4) within the overall project are to define suitable thermo-
mechanical processing conditions to produce ultra-fine grain microstructures in high carbon steels and
assess the microstructural evolution and mechanical properties of such materials.
The transformation behaviour and initial thermo-mechanical processing conditions to produce ultra-fine
microstructures have been determined using small-scale thermo-mechanical (Gleeble) simulations [113-
115]. This indicated that deformation was required below a temperature of ~650°C. These processing
conditions have been applied to rolling schedules to assess the repeatability on a larger scale and also to
enable further investigation into the structure-property relationships. The results of the application of
the thermo-mechanical processing conditions to the laboratory scale rolling trials are presented. The
influence of deformation temperature and strain on the resultant microstructure and tensile properties
was also assessed.
As a comparison, three further high carbon steels have been cast with a microalloying addition of
vanadium. It is envisaged that this addition will influence the microstructure and properties,
particularly the formation of fine cementite particles [116].
The use of Equal Channel Angular Extrusion (ECAE) has also been investigated within this work
package, as a comparative means to conventional rolling, of imparting severe plastic deformation to
produce an ultra-fine microstructure. Since its inception in the former Soviet Union in 1972 by Segal et
al [111] there has been extensive research into the relatively simple technique, the majority of which
has taken place in the 1990’s [e.g. 112-116], coinciding with an escalation in the interest in ultra-fine
grained materials. Due to the repeatable nature of the extrusion process, the technique is capable of
introducing very large amounts of strain, without fracture and with no overall change in dimensions.
The equipment used for this part of the work package was based at Manchester Materials Science
Centre (MMSC). The collaboration with MMSC enabled access to not only the ECAE equipment but
also world leading expertise [117-123]. This report evaluates the microstructural evolution during
ECAE and presents results obtained using High Resolution Electron Back Scattered Diffraction (EBSD).
8.2 Experimental
In accordance with the objectives, four high carbon (0.6 – 1.6 wt. %) 60 kg vacuum laboratory melts
were produced previously during the project with a base composition of 0.2 wt. % silicon and 0.7 wt. %
manganese. The compositions are given in Table 10. Such compositions were selected because previous
superplasticity work has demonstrated that ultra-fine structures can be achieved in these types of alloys,
when processed appropriately [124, 125].
C Si Mn P S Al N
0.61 0.20 0.69 0.016 0.005 0.031 0.0057
0.81 0.20 0.70 0.015 <0.005 0.031 0.0062
1.22 0.20 0.69 0.016 <0.005 0.030 0.0069
1.61 0.20 0.69 0.015 <0.005 0.029 0.0064
Table 10: Compositions (wt. %) of high carbon steels
The ingots were furnace reheated to 1250°C, held at temperature for four hours and then rolled to
75mm plate primarily to reduce segregation and consolidate porosity.
Samples for dilatometry were machined from each plate and transformation characteristics assessed in a
Bahr 105 dilatometer. The dilatometer samples were heated rapidly to 1150°C, held for 5 minutes and
then cooled to room temperature using cooling rates in the range of 64 to 0.25°C/s (800-500°C).
Transformation start and finish temperatures were determined by measuring the sample dilation.
139

Samples were prepared for metallographic examination and Vickers hardness values (HV30) were
determined according to BS EN ISO 6507-1.
Cylindrical samples (10mm long and 6mm) in diameter were prepared for uni-axial compression testing
on a Gleeble 1500 thermo-mechanical simulator. The ends of each sample were lubricated with 5 layers
of graphite to reduce friction. The samples were rapidly heated to 1150°C, held for 5 minutes and then
cooled to deformation temperatures in the range 700-500°C at a cooling rate of 10°C/s. The temperature
range and cooling rate were considered likely to generate ultra-fine structures, based on the dilatometry
results. After holding at deformation temperature for 15 seconds to equilibrate temperature within the
sample, the cylinder was deformed to a final length, equating to mean strains of 0.36, 0.72 and 1.2 at a
mean strain rate of 21/s. Immediately following deformation, cooling rates of 1°C/s, 10°C/s and
200°C/s were applied. Deformed samples were then sectioned, mechanically polished and etched in
picral and Villella’s reagent for metallographic examination by Scanning Electron Microscopy (SEM).
Cylindrical billets, 100mm x 15mm diameter, were machined from the plates in the rolling direction
and processed by Equal Channel Angular Extrusion (ECAE). The ECAE equipment was designed for
the processing of non-ferrous alloys, predominantly aluminium. Due to the large difference in material
flow stress values between that of steel and aluminium, processing was carried out with the dies heated
to a constant 500°C. Graphite lubrication was used and the billets were heated at 50°C/min and held at
temperature for 15 minutes prior to processing. Up to 10 passes were completed with no billet rotation
between extrusion cycles (Route A). A circular cross-section ECAE die was used with a die angle of
120°, giving a nominal von Mises’ effective strain of εvm ~ 0.67 per pass. Full details of the ECAE
equipment and deformation behaviour of the die can be found elsewhere [126].
The remainder of the rolled plates were cut into small blocks (150x75x75mm) for further rolling
experiments. Feedstock samples of the 0.6, 0.8 and 1.2wt.%C steels were furnace reheated and
homogenised at 1150°C. Samples were then rolled to either a plate thickness of ~62 or 50 mm, with an
aim temperature of 900°C, in preparation for strains of ~1.2 or ~2 (respectively) to be introduced during
finish rolling. The samples were then air-cooled until the temperature reached the final deformation
temperature, i.e. 700°C or 600°C before several finish roll passes were applied. The aim final thickness
of the plate was ~7mm, however the actual thickness was closer to ~9mm. Details of the thermo-
mechanical cycle are given in Fig. 141. It should be noted that it was not possible to complete rolling of
the 1.2wt.%C steel at a deformation temperature of 600°C to a strain of ~2, as the load approached the
maximum capability of the mill.
Fig. 141 - Thermomechanical processing cycle used in the rolling trials
6-12 finishing passes, i ~ 1.2/2
700°C
6-12 finishing passes, i ~ 1.2/2
600°C
Temperature
Time
1150°C
900°C
Ar3
Air cool
Roughing passes
140

The deformation structures of the ECAE processed billets and select rolled plates, were characterised at
the centre of the ND-ED plane (die symmetry plane) and RD-ND plane respectively, using SEM
metallography and high resolution Electron Back Scattered Diffraction (EBSD). SEM samples were
etched in a Picral and Villela’s solution for approximately 90 seconds to reveal the carbide structure
before secondary electron imaging in a Philips XL40 SEM. EBSD samples were mechanically polished
and given a light electropolish in 92% acetic and 8% perchloric acid solution, at ~70 Volts for
approximately 3 seconds. A Philips XL30 FEG-SEM and a Camscan Maxim 2040s FEG-SEM, both
fitted with automated HKL-EBSD pattern collection systems with a spatial resolution of ~50nm and
angular resolution of ~1°, were used for data acquisition. Data analysis was carried out using VMap, a
software package developed at MMSC by Prof. F. John Humphreys. A minimum misorientation cut-off
of 1.5° was used in all cases to eliminate excessive misorientation noise. High angle grain boundaries
(HAGBs) are defined as being equal to, or greater than 15° in misorientation and low angle grain
boundaries (LAGBs), a misorientation less than 15°.
Tensile properties were determined for both rolled and ECAE deformed material. Two tensile test
pieces were machined from the centre of each rolled plate and from each ECAE processed billet
(following longitudinal EDM wire cutting). Testing was carried out in accordance with BS EN 10002.
8.3 Results and discussion
8.3.1 Dilatometry
Continuous cooling transformation (CCT) diagrams were produced for all four experimental steels in
order to determine suitable cooling rates and temperatures for deformation experiments. The CCT
diagrams for the four steels are shown in Figs. 1422 to 145. Hardness measurements and
microstructural evaluation was carried out for each sample given in Table 11.
For the 0.6wt.% carbon steel, metallography indicated that the microstructure consisted of pearlite and a
small amount of ferrite for cooling rates of 10°C/s and below, and pearlite with increasing amounts of
martensite for cooling rates of 30°C/s and above. At a cooling rate of 10C/s, the transformation start
and finish temperatures were 620 and 600°C respectively. Very similar observations for the 0.8wt.%
carbon steel were made.
For the 1.2wt.% carbon steel, the microstructure consisted of pearlite and cementite at cooling rates of
9°C/s and below and pearlite with increasing amounts of martensite for cooling rates in excess of 9°C/s.
The transformation start and finish temperatures were 620 and 615°C respectively. Similar
microstructures were observed in the 1.6wt.% carbon steel, including a small amount of graphite.
Fig. 142 - CCT diagram for 0.6wt.%C steel
141

Fig. 143 - CCT diagram for 0.8wt.%C steel
Fig. 144 - CCT diagram for 1.2wt.%C steel
142

Fig. 145 - CCT diagrams for 1.2wt%C (a) and 1.6wt%C steels (b)
143

M=Martensite, P=Pearlite, F=Ferrite, Fe3C=Cementite, G=Graphite
Table 11 - Hardness and microstructure of dilatometer samples
Cooling rate, °C/s
(800-500°C)
Vickers Hardness
(HV30)
Microstructure
0.6wt.% Carbon steel
63.8 808 M+P
29.7 651 M+P
9.6 304 P+F
6.4 285 P+F
4 284 P+F
2 289 P+F
1 249 P+F
0.5 249 P+F
0.25 247 P+F
0.8wt.% Carbon steel
63.8 849 M+P
29.4 677 M+P
9.4 368 P+F
6.2 347 P+F
4 366 P+F
2 355 P+F
1 309 P+F
0.5 311 P+F
0.25 307 P+F
1.2wt.% Carbon steel
63.8 727 M+P
19.7 526 P+M
9.3 458 P+Fe3C
6.3 437 P+Fe3C
4 434 P+Fe3C
2 415 P+Fe3C
1 357 P+Fe3C
0.5 347 P+Fe3C
0.25 312 P+Fe3C
1.6wt.% Carbon steel
62.5 500 M+P+G
20.4 453 P+Fe3C+M+G
10 415 P+Fe3C+G
8 405 P+Fe3C+G
4 379 P+Fe3C+G
2 358 P+Fe3C+G
1 318 P+Fe3C+G
0.5 305 P+Fe3C+G
0.25 276 P+Fe3C+G
144

8.3.2 Gleeble
Hot compression testing was carried out using a Gleeble testing machine to establish the deformation
conditions, including the minimum strain and temperature, required to generate ultra-fine ferrite and
carbide structures. Fig. 146 illustrates the influence of strain on the microstructure of 0.8wt.%C steel
deformed at 550°C. It was apparent that spheroidisation of the pearlitic cementite was only partially
complete following strains of 0.36 (Fig. 146(b)) and 0.72 (Fig. 146(c)) at 550°C. A similar behaviour
was observed at deformation temperatures of 500 and 600°C in each of the three steels. By comparison,
a relatively homogeneous and spheroidised carbide structure was observed following an applied strain
of 1.2. This suggested that mean strains in excess of 0.72 were required to promote pearlite
spheroidisation and produce a ‘composite’ structure of ultra-fine ferrite and carbide aggregate (UFF-
CA) at deformation temperatures below the transformation temperature (~600°C). Similar values of
required strain were noted by Niikura et al [127] in heavy deformation experiments on grain refinement
in plain C-Mn-Si steel. The strain distribution at various positions in a deformed Gleeble sample was
estimated from a Finite Element Analysis (FEA) using the Abaqus© software package. Analysis
showed that when deforming the 10 x 6mm samples, consistent with inducing a mean average strain of
1.2, the strain is low in areas constrained by friction, i.e. near the sample surface. In contrast, the centre
of the sample experienced a strain approximately 2.3 times greater than the average strain. As a
consequence, rolling schedules to induce finishing strains of ~1.2 and 2 were used to try to induce
similar microstructures.
(a) (b)
(c) (d)
Fig. 146 – Influence of strain on the microstructure of 0.8wt.% carbon steel deformed at 550°C (a) 0
strain, (b) 0.36 strain, (c) 0.72 strain and (d) 1.2 strain.
145

(a) 200°C/s (b) 1°C/s
Fig. 147 - Influence of cooling rate, (a) 200°C/s, (b) 1°C/s, on microstructure of 0.8wt% carbon steels
after deformation to a strain of ~1.2 at 650°C.
(a) 200°C/s (b) 10°C/s
(c) 1°C/s
Fig. 148 - Influence of cooling rate, (a) 200°C/s, (b) 10°C/s, (c) 1°C/s on microstructure of 0.8wt%
carbon steels after deformation to a strain of ~1.2 at 500°C.
The influence of cooling rate following deformation on the microstructure was determined for each
steel. Samples were deformed to a mean true strain of 1.2 at either 650 or 500°C and then immediately
cooled at 200, 10 or 1°C/s. Example microstructures are shown in Figs. 147 (650°C) and 148 (500°C).
Irrespective of carbon content, it was evident that extensive carbide spheroidisation was present even
after very rapid cooling (200°C/s), this suggested that the spheroidisation of pearlitic carbides was an
extremely quick process. Evidence in support of this can be found in the literature [128] which states
that the spheroidisation process can occur in less than 1 second. Changes in cooling rate, following
deformation at 500°C (Fig. 148(a-c)), had no significant effect upon the microstructure. However,
146

following deformation at 650°C (Fig. 147(b)) the slowest cooling rate (1°C/s), led to significantly
coarser carbides.
Influence of multiple deformation on development of microstructure
The hot compression testing described thus far has used a single burst of deformation. To study the
influence of multiple deformation on microstructural development, two bursts of deformation were
introduced, both corresponding to a mean true strain of 0.6, with a 10 second interval between them.
Deformation was carried out at 650 and 550°C and the samples were cooled at 10°C/s following
deformation.
An example of the microstructures produced after a single burst and multiple burst of deformation at
650°C for the 0.6wt.% carbon steel is shown in Fig. 150. It can be seen that pearlite spheroidisation was
only partial after a strain of 0.6 Previous study had revealed that spheroidisation was largely complete
after a strain of 1.2 (e.g. Figs. 146(d), 147 and 148). After multiple deformation a uniform and highly
spheroidised distribution of carbides is observed (Fig. 149 (b)). It is considered that the greater time
involved in multiple deformation (10 second interval between deformation 'hits') has promoted a more
uniform and spheroidised structure, with slightly larger carbides. Fig. 149(c) has been etched to reveal
the boundaries after multiple deformation.
(a) Strain 0.6 (b) Strain 0.6 + 0.6
(c) Strain 0.6 + 0.6, etched to reveal boundaries
Fig. 149– (a-c) Comparison of single and multiple deformation for 0.6wt.% carbon steel deformed at
650°C
147

8.3.3 Rolling Tests
Deformation by warm rolling to conventional strains
Influence of deformation and temperature
Schedules for hot rolling were devised based upon the results of the Gleeble simulations. Deformation
temperatures of 700 and 600°C and finishing strains of ~1.2 and 2 were implemented with a cooling
rate of approximately <5°C/s, using the schedule defined in Fig. 141. The hardness was found to be
approximately 30HV (5kg) higher, for each composition, when the deformation temperature was
reduced from 700°C to 600°C. Consistent material hardness was observed through the thickness of all
the rolled plates, e.g. 0.8wt.%C steel, Fig. 150.
240
250
260
270
280
290
300
0 1 2 3 4 5 6 7 8 9 10
Distance traversed through thickness (mm)
Ha
rdn
ess
HV
(5k
g)
T Defmtn 700°C, i=1.2
T Defmtn 600°C, i=1.2
T Defmtn 700°C, i=2
T Defmtn 600°C, i=2
Fig. 150 - Through thickness hardness profile for 0.8wt.%C steel following rolling trials.
Electron micrographs that illustrate the structures formed in the rolled 0.6, 0.8 and 1.2wt.%C steel are
shown in Figs. 151-153. After deformation at 700°C (above the austenite to pearlite transformation
temperature), a typical pearlite microstructure was produced (e.g. Figs. 151-153(a) and (c)) in all cases.
Substantial areas of grain boundary ferrite were evident in the 0.6wt.%C steel. The 0.8wt.%C steel was
characterised by a fully pearlitic microstructure and increasing the carbon content to 1.2wt.%C led to
the formation of cementite laths at the prior austenite grain boundaries. Figs 151, 152 and 153 (a+c)
show the microstructure present at mid-thickness of the final gauge 0.6, 0.8 and 1.2wt.%C material,
illustrating a pearlitic transformation following finish rolling at 700°C.
By contrast, a partially spheroidised microstructure was often found at sub-surface regions in each of
the steels, e.g. Figs. 151, 152 and 153(b), particularly in the lower strained samples (i.e. ~1.2). This is
attributed to accelerated local cooling, possibly due to roll chill, which has lead to transformation during
deformation, and/or discrete strain localisation. Small ‘pockets’ of lamellar cementite, thought to be due
to localised temperature differences, were also apparent in the mid-thickness of a number of samples
deformed at 600°C.
148

Subsurface Mid-thickness
(a) 700°C, ε ~ 1.2
(b) 600°C, ε ~ 1.2
(c) 700°C, ε ~ 2
(d) 600°C, ε ~ 2
Fig. 151- (a-d) SEM micrographs illustrating the carbide structure present in the 0.6 wt.% C steel
following the rolling trials. Deformation temperature and finishing strain are given.
149

Subsurface Mid-thickness
(a) 700°C, ε ~ 1.2
(b) 600°C, ε ~ 1.2
(b) 700°C, ε ~ 2
(d) 600°C, ε ~ 2
Fig. 152 - (a-d) SEM micrographs illustrating the carbide structure present in the 0.8 wt.% C steel
following the rolling trials. Deformation temperature and finishing strain are given
150

Subsurface Mid-thickness
(a) 700°C, ε ~ 1.2
(c) 600°C, ε ~ 1.2
(d)
(b) 700°C, ε ~ 2
(c)
Fig. 153 - (a-c) SEM micrographs illustrating the carbide structure present in the 1.2 wt.% C steel
following the rolling trials. Deformation temperature and finishing strain are given
151

In general, an ultra-fine ferrite and spheroidised carbide structure was evident following deformation at
600°C to a strain of ~2 in all compositions (Figs. 151(d), 152(d), 154(b) and 155(b)). The samples
shown in Figs. 154-156 were etched in Marshall’s reagent to reveal the subgrain/grain boundaries. A
‘banded’ structure was observed in the 0.6wt.%C steel (Fig. 154), consisting of large pro-eutectoid
ferrite grains separated by more equiaxed and refined ultra-fine ferrite and carbide aggregate. A more
homogeneous ferrite microstructure was present in the higher carbon steels (0.8 and 1.2wt.%C, Figs.
155 and 156 respectively) after deformation at 600°C. Assessment of samples rolled at 600°C, and
preferentially etched to reveal the boundary structure, suggested that there was little subsequent
refinement in the ferrite grains size as a result of increased deformation strain.
Subsurface Mid-thickness
(a) 600°C, ε ~ 1.2
Subsurface Mid-thickness
(b) 600°C, ε ~ 2
Fig. 154 - (a-b) SEM micrographs illustrating the grain structure present in the 0.6 wt. % C steel
following deformation at 600°C, to strains of ε ~ 1.2 and 2
152

Subsurface Mid-thickness
(a) 600°C, ε ~ 1.2
Subsurface Mid-thickness
(b) 600°C, ε ~ 2
Fig. 155 - (a-b) SEM micrographs illustrating the grain structure present in the 0.8 wt. % C steel
following deformation at 600°C, to strains of ε ~ 1.2 and 2
Subsurface Mid-thickness
Fig. 156 - (a-b) SEM micrographs illustrating the grain structure present in the 1.2 wt. % C steel
following deformation at 600°C, to strains of ε ~ 1.2.
High resolution EBSD was carried out to determine the nature of the boundaries observed in the ferrite
matrix in the rolled sample, and corresponding statistics. Initial attempts were made to index both the
ferrite and cementite volumes. Unfortunately this proved ultimately unsuccessful, mainly due to
differential etching of the ‘soft’ ferrite matrix in comparison with the ‘hard’ cementite particles which
resulted in a ‘shadowing’ effect in addition to problems with accurate pattern indexing of the Fe3C. An
example EBSD Euler angle map for the 0.6wt.%C steel rolled at 600°C to a strain of ~2 is given in Fig.
153

154. A fine step size of 0.1µm was used so that accurate subgrain information could be obtained (Fig.
154).
Fig. 157 shows that after deformation by controlled rolling the ferrite did not have what could be
described as an ultra-fine grain structure, and predominantly contained elongated fibrous grains with
subgrains. Some relatively large grains containing low angle grain boundaries (LAGBs) were evident,
which were considered to correspond to areas of pro-eutectoid ferrite (Fig. 157). Some bands of finer,
ferrite grains were observed adjacent to these areas, aligned in the rolling direction (Fig. 157), formed
as a consequence of the pearlitic spheroidisation. EBSD statistical boundary data confirmed that an
ultra-fine structure consisting of both low angle and high angle grain boundaries was achieved
following deformation at 600°C to a strain of ~2. The majority of the boundaries present were low
angle; between 1.5 and 15° misorientation (~60%, see Table 12) and approximately 40% could be
described as high angle grain boundaries (HAGBs) i.e. in excess of 15° misorientation. The average
grain boundary spacing was 2.19µm and subgrain spacing 1.14µm. However, it should be noted that
>75% of the boundaries had a misorientation in excess of 5°, suggesting that the sub-structure was well
developed.
(a) (b)
Fig. 157 - EBSD band contrast (a) and orientation (b) maps of 0.6wt.%C steel following rolling at
600°C, ε~2.
Intercept Length (µm) Boundaries (%) Steel
(C wt%) HAGB HAGB X HAGB Y LAGB HAGB LAGB
0.6 2.19 1.20 3.17 1.14 42 58
Table 12 - EBSD statistical data for 0.6wt%C steel rolled at 600°C to a strain of ~2
8.3.4 Mechanical properties
Following the rolling trials at 600°C and 700°C, tensile properties were determined for each of the steel
compositions. The results are given in Table 13 and Figs.158-160 show plots of the results.
LAGBs
HAGBs
TD
RD
154

Carbon
(wt%)
0.2%
PS (MPa)
0.5%
PS (MPa)
UTS
(MPa)
Total Elong.
(%)
R of A
(%)
0.2%PS:UTS
ratio
Normal rolling 0.6 351 386 743 18 33 0.47
TDef 700, Strain=1.2 0.6 533 527 761 26 55 0.70
TDef 600, Strain=1.2 0.6 670 672 831 24 54 0.81
TDef 700, Strain=2 0.6 488 495 752 17 51 0.65
TDef 600, Strain=2 0.6 636 636 777 21 49 0.82
Normal rolling 0.8 418 475 878 13 11 0.48
TDef 700, Strain=1.2 0.8 472 500 902 14 39 0.52
TDef 600, Strain=1.2 0.8 724 728 911 18 38 0.79
TDef 700, Strain=2 0.8 466 496 897 20 42 0.52
TDef 600, Strain=2 0.8 750 750 891 18 43 0.84
Normal rolling 1.2 385 419 860 10 7 0.45
TDef 700, Strain=1.2 1.2 750 749 886 10 30 0.85
TDef 600, Strain=1.2 1.2 850 858 1045 17 34 0.81
TDef 700, Strain=2 1.2 694 682 857 14 35 0.81
Table 13 – Tensile properties following rolling trials with finishing rolling temperatures of 600°C and
700°C and strains of ~1.2 and 2.
0
200
400
600
800
1000
1200
Normal
rolling
TDef 700,
Strain=1.2
TDef 600,
Strain=1.2
TDef 700,
Strain=2
TDef 600,
Strain=2
Ten
sile
Str
eng
th (
MP
a)
0.2%PS
0.5%PS
UTS
Fig. 158 - Tensile properties for 0.6wt.%C steel following rolling trials
155

0
200
400
600
800
1000
1200
Normal
rolling
TDef 700,
Strain=1.2
TDef 600,
Strain=1.2
TDef 700,
Strain=2
TDef 600,
Strain=2
Ten
sile
Str
eng
th (
MP
a)
0.2%PS
0.5%PS
UTS
Fig. 159 - Tensile properties for 0.8wt.%C steel following rolling trials
0
200
400
600
800
1000
1200
Normal rolling TDef 700,
Strain=1.2
TDef 600,
Strain=1.2
TDef 700,
Strain=2
Ten
sile
Str
eng
th (
MP
a)
0.2%PS
0.5%PS
UTS
Fig. 160 - Tensile properties for 1.2wt.%C steel following rolling trials
In all cases a marked increase in proof stress (PS) was observed, particularly at deformation
temperatures of 600°C (Fig. 145). In general, UTS values were greater after deformation at 600°C in
comparison to the ‘Normal’ material (rolled at 1050°C) and 700°C (Figs. 158-160). No obvious
relationship was present between deformation and elongation in any of the steels. It should be noted that
samples deformed at 600°C exhibited higher PS:UTS ratios, however unstable yielding was not evident
and a substantial increment of work hardening was retained in contrast to many other ultra-fine
‘grained’ materials [129, 130].
156

8.3.5 Laser Welding
Preliminary bead-on-plate laser welding trials were carried out on four plain 0.8wt. %C steel plates,
following warm rolling to conventional strains. Welding was carried out using a Ferranti Photonics
AF5kW CO2 with the following parameters: 4kW laser power; 0.5m/min welding speed; beam focused
4mm into plate; 0.6mm focus spot diameter. The aim of the small weld study was to investigate the
laser weldability of such high carbon steels, assess its repeatability and in particular, evaluate the effect
of the weld process on ultra-fine microstructures. Laser welding was selected as the joining technique to
minimise the incident area, resultant welded volume of material and subsequent Heat Affected Zone
(HAZ). It was considered that laser welding would result in minimum disruption to the ultra-fine
structure developed during rolling. A full evaluation was not possible within the time constraints of the
study but successful welding and full penetration, with minimal HAZ in comparison to conventional arc
welding was achieved in each of the four cases. Examples are given in Figs. 161 and 162. It was
accepted however, that a substantial post weld heat treatment would be required to ensure material
performance.
Fig. 161 - Weld side of steel plate following laser welding
Fig. 162 - Penetration side of steel plate following laser welding
157

8.4 Equal Channel Angular Extrusion
ECAE processing was used to investigate the advantages of a shear deformation mode and to study
the effect of increasing the deformation strain beyond that achievable by rolling. In the work
presented here, the maximum deformation temperature was limited to 500°C by the design of the
equipment. The MMSC ECAE equipment and channel die are shown in Fig. 163(a and b)
respectively.
(a) (b)
Fig. 163 - (a and b). Image illustrating the ECAE apparatus (a) and half of the 120° channel die (b)
A simple schematic illustrating the ECAE process is shown in Fig. 164. Essentially, a hydraulic ram
forces a billet shaped volume of metal through the angle in the channel die.
Ram
Billet
Die
φ
Fig. 164 - Schematic representation of the ECAE process, showing a cross section of a deformed billet,
the ram, the die set and the shear plane of the apparatus [131]
158

Microstructural Evolution
Representative SEM images showing the microstructures of the three steels (0.6, 0.8 and 1.2 wt.%C),
processed using ECAE at 500°C and air-cooled are shown in Fig. 165. Following one ECAE pass,
evidence of shear banding and deformation of the pearlite lamellar was apparent in all three steel
compositions (Fig. 165(i)). This shear banding was particularly marked in the 0.6 wt.%C steel (Fig.
165(i)) where a large pearlite colony had been sheared into a number of smaller ones. After 2 ECAE
passes (Fig. 165(ii)), the increasing strain led to further break up of large pearlite lamellar colonies and
extensive shear banding is present. This was particularly noticeable in the 0.8wt.%C steel (Fig. 165(ii)).
Evidence of the onset of break-up and spheroidisation of the lamellar cementite is shown for the 0.6
wt.%C steel (Fig. 165(ii)). Spheroidisation was also observed in the 1.2 wt.%C steel following 2 ECAE
passes (equivalent to εvm~2) (Fig. 165(ii)). Spheroidisation continued in the 0.6 and 0.8 wt. % C steels
with increasing strain following 3 ECAE passes (Fig. 165(iii)). Further ECAE deformation to 4 passes
resulted in continued spheroidisation in all steels (Fig. 165 (iv)). Fully spheroidal carbides were clearly
visible in the 0.6 and 0.8wt.%C steels (Fig. 165 (iv)) following deformation. Heterogeneous flow of the
matrix and lamellar cementite around large primary cementite particles was also observed in the 1.2 wt.
% C steel (Fig. 165(iv)). On completion of 5 ECAE passes, an accumulation of deformation artefacts
was evident in the 1.2wt.%C steel (Fig. 165 (v)); i.e. deformed lamellar flow around large, ‘hard’
cementite particles and also shear banding. A mix of deformed pearlite and spheroidised carbides was
observed in the 0.6 and 0.8wt.%C steels (Fig. 165 (v)), suggesting that the ECAE deformation was
relatively inhomogeneous.
Similar microstructures to those shown in this report (Fig. 165) have been observed by other workers
following multi-pass rolling (6, 7). Spheroidisation and partial dissolution of pearlite has also been
observed following wire drawing at low temperatures. It is well known that spheroidisation is
accelerated by the break-up of the lamellar, which increases the surface area and the site density for
Gibbs-Thompson capillary driven diffusion. Dissolution has been attributed to either dislocation cores
being a more energetically favourable site for carbon atoms than cementite, or that the surface energy of
cementite is increased by dislocation interaction such that the cementite becomes thermodynamically
unstable [132, 133]. Shin et al [110] reported similar findings relating to pearlite partial dissolution and
spheroidisation following ECAE of low carbon steel at temperatures of 350°C.
Example SEM images following severe deformation, preferentially etched to illustrate the boundary
structure are shown in Fig. 166. The samples have been pre-etched in 2% Nital then etched in Marshalls
reagent for approximately 2 minutes. Secondary electron imaging is used at a small working distance
and high operating voltage (KeV). The images show that there was a submicron (<1µm) structure
present following severe ECAE deformation (Fig. 149). However, it is unclear whether the observed
boundaries and differences in orientation contrast correspond to discrete changes in misorientation of a
‘true’ grain structure or that of a refined subgrain structure.
Microstructural analysis using EBSD
High resolution (0.1µm step size) EBSD was carried out to determine the extent of grain refinement in
the 0.8wt.%C steel with increasing strain. Fig. 167 shows example Euler orientation maps that illustrate
the microstructural evolution for the 0.8wt.%C steel. Statistical boundary data is given in Table 12. As
the strain increased, a high density of HAGBs developed leading to a submicron HAGB spacing by a
strain of 3.3 (see Figs 150(a) – (c)) and Table 14). Considerable refinement was evident after 3 passes
(Fig. 168), with ‘ribbons’ of refined ferrite grains forming in the extrusion direction, containing well
defined subgrains. With increased deformation, the HA and LAGB spacing continued to reduce and the
structure became more equiaxed in appearance (Fig. 169 and Table 14). However, the EBSD maps
(Figs. 167–169) also indicated that this ‘refinement’ was quite heterogeneous in nature and that the
structure only became relatively homogeneous following large deformation strains (i.e εvm ~ 3.33).
Following a strain of εvm ~ 3.33 (5 passes), a sub-micron grain size was observed (~0.7µm) and the
HAGB content was approximately 60%. A plot illustrating the reduction of HAGB spacing and increase
in HAGB percentage area with increasing deformation is shown in Fig. 170. Apps et al [123] have
observed similar findings during the refinement of a particle containing aluminium alloy.
159
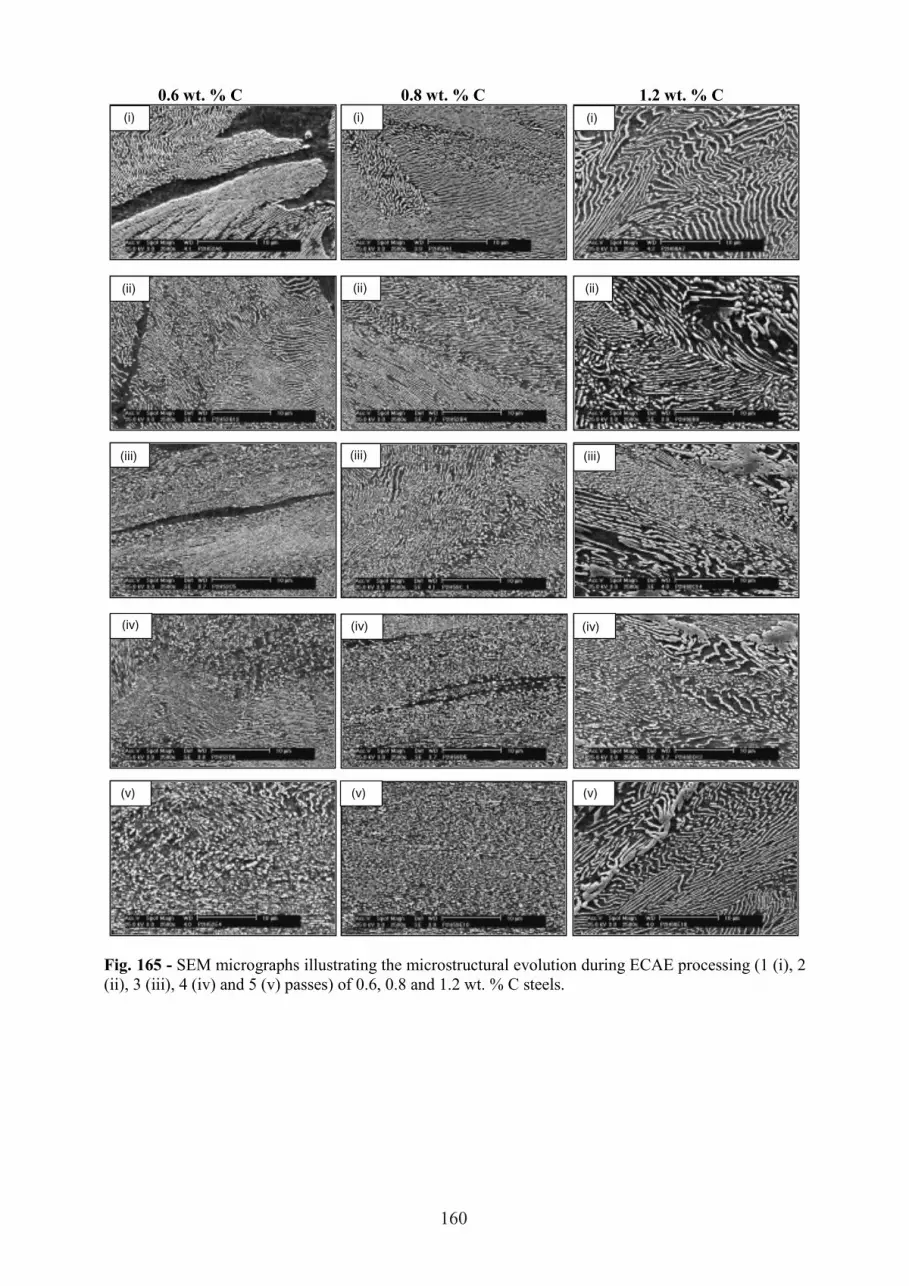
0.6 wt. % C 0.8 wt. % C 1.2 wt. % C
(i) (i)
(ii)
(i)
(ii)(ii)
(iii) (iii) (iii)
(iv) (iv)(iv)
(v) (v) (v)
Fig. 165 - SEM micrographs illustrating the microstructural evolution during ECAE processing (1 (i), 2
(ii), 3 (iii), 4 (iv) and 5 (v) passes) of 0.6, 0.8 and 1.2 wt. % C steels.
160

(a)
(b)
(c) (d)
Fig. 166 - (a+b). SEM micrographs etched to highlight the subgrain/grain boundaries of 0.8 wt. % C
and 1.2 wt. % C (c+d) steel samples following 4 ECAE passes
Steel Intercept Length (µm) Boundaries (%)
(C wt%)
No. of
ECAE
Passes
HAGB
(mean)
HAGB X HAGB Y LAGB HAGB LAGB
0.8 1 2.98 2.53 3.42 0.74 23 77
0.8 3 1.41 1.04 1.89 0.79 40 60
0.8 5 0.66 0.55 0.77 0.86 58 42
0.6 5 1.81 1.57 2.05 0.68 31 69
1.2 5 1.02 0.92 1.11 0.89 48 52
Table 14 – Comparison of the average statistical boundary data for the 0.6, 0.8 and 1.2wt.%C steel
obtained from EBSD maps at different levels of ECAE deformation.
161

Deformed pearlite lamellar
Fig. 167 - Sample B1, 0.8wt%C steel after 1 ECAE pass. Suspect points have been removed and the
data cleaned to remove non-indexed points. LAGB (grey) and HAGBs (black) also shown.
Large areas of LAGBs ultra-fine ferrite
Fig. 168 - Sample B3, 0.8wt%C steel after 3 ECAE passes. Suspect points have been removed and the
data cleaned to remove non-indexed points. LAGB (grey) and HAGBs (black) also shown.
Similar EBSD analysis was carried out on the 0.6 (Fig. 171) and 1.2wt.%C (Fig. 172) steels following
ECAE deformation to 5 passes (εvm~3.33). Statistical boundary data from the EBSD measurements is
given in Table 14. A refined substructure was evident in the 0.6wt.%C steel after 5 passes, yet there was
little HAGB content ~30%, particularly in comparison to the 0.8wt.%C steel (~60%) following the
same amount of deformation (see Table 14).
It is thought that this lack of HAGB generation and refinement may be due to the majority of the initial
deformation being concentrated in the areas of primary ferrite rather than the pearlite lamellar areas,
leaving a relatively large HAGB spacing or grain size. The boundary statistics for the 1.2wt.%C steel
after 5 ECAE passes (Table 14) also suggest that refinement proceeded at a ‘slower’ pace in
comparison to the 0.8wt%C steel (compare Table 14). No evidence for accelerated, homogeneous
refinement due to large cementite particles was noted, excluding the obvious matrix refinement
observed in the immediate vicinity of said particles.
162

Some large areas of LAGBs remain. Structure is generally ultra-fine
Fig. 169 - Sample B5, 0.8wt%C steel after 5 ECAE passes. Suspect points have been removed and the
data cleaned to remove non-indexed points. LAGB (grey) and HAGBs (black) also shown.
0
1
2
3
4
0 1 2 3 4Strain (von Mises)
Boundar
y S
pac
ing (
µm
)
0
20
40
60
80
100
0 1 2 3 4 5 6Number of ECAE passes
Per
centa
ge
HA
GB
(%
)
Grain Width
% HAGB
Fig. 170 - Plot of EBSD statistical data showing the average transverse high angle grain boundary
spacing and high angle grain boundary area fraction (%HAGBs) in the 0.8wt.%C steel, as a function of
strain during ECAE processing.
163

Large areas of LAGBs exhibiting ultra-fine substructure
Fig. 171 - Sample A5, 0.6wt%C steel after 1 ECAE pass. Suspect points have been removed and the
data cleaned to remove non-indexed points. LAGB (grey) and HAGBs (black) also shown
Large cementite particles area of deformed lamellar and
microstructural ‘flow’ Heterogeneous ferrite refinement
Fig. 172 - Sample C5, 1.2wt%C steel after 5 ECAE passes. Suspect points have been removed and the
data cleaned to remove non-indexed points. LAGB (grey) and HAGBs (black) also shown
Mechanical properties
After ECAE processing, similar tensile behaviour was observed in all the steels as a function of strain
(number of ECAE passes) as illustrated in Figs. 173-175. Values of 0.2% proof stress (PS), UTS and
elongation were recorded for each steel. In each case, a large increase in proof stress and a lesser
increase in UTS was observed following the first ECAE pass (Figs. 173-175). Subsequent passes
resulted in a slower increase in proof stress and plateau in UTS values with the two values tending to
164

converge at high levels of deformation, e.g. proof stress and UTS following five passes for 0.8wt.%C
steel are 1070MPa and 1105MPa respectively (Fig. 174). Further increase in strength was observed
with increasing strain and a second plateau in tensile strength was reached following seven passes.
Proof stress and UTS values were essentially identical after ten passes (εvm~6.67), i.e. 1239MPa and
1242MPa respectively (Fig. 174). Elongation values tended to show more scatter, but in general a
decrease with increasing deformation was observed. The results suggested that although an increase in
tensile strength was clearly apparent, it was somewhat to the detriment of work hardening, ductility and
also the advent of plastic instability and associated phenomena. Such high ratios of PS:UTS are
common in ultra-fine grained materials and occur as the subgrain size approaches that of the grain size.
0
200
400
600
800
1000
1200
1400
0 1 2 3 4 5Number of ECAE passes
Ten
sile
Str
eng
th (
MP
a)
0
5
10
15
20
25
30
35
Elo
ng
atio
n (
%)
0.2%PS (MPa)
UTS
Elongation
Fig. 173 - Tensile properties of 0.6wt.%C steel with increase in ECAE deformation
0
200
400
600
800
1000
1200
1400
0 1 2 3 4 5 6 7 8 9 10Number of ECAE passes
Ten
sile
Str
eng
th (
MP
a)
0
5
10
15
20
25
30
35
Elo
ng
atio
n (
%)
0.2%PS (MPa)
UTS
Elongation
Fig. 174 - Tensile properties of 0.8wt.%C steel with increase in ECAE deformation
165

0
200
400
600
800
1000
1200
1400
0 1 2 3 4 5Number of ECAE passes
Ten
sile
Str
ength
(M
Pa)
0
5
10
15
20
25
30
35
Elo
ngat
ion (
%)
0.2%PS (MPa)
UTS
Elongation
Fig. 175 - Tensile properties of 1.2wt.%C steel with increase in ECAE deformation
8.5 Conclusions
Efforts to produce a two-phase ultra-fine grained structure in high carbon (0.6-1.2wt.%) steels through
innovative deformation, i.e. heavy draft ‘warm’ rolling and ECAE, have proved successful. A
comprehensive programme of thermomechanical simulation was carried out to determine suitable
process parameters. It has been shown that deformation strains of ~1.2 induced during warm rolling at
~600°C are sufficient to promote carbide spheroidisation and refinement of the ferrite matrix.
Quantitative EBSD measurements record a grain size in the order of ~2µm and corresponding subgrain
size of ~1µm. A marked increase in strength, particularly proof strength, was noted following warm
rolling and a substantial increment of work hardening is retained with no loss in ductility.
ECAE deformation has illustrated that pearlite spheroidisation occurs in each steel following two ECAE
passes. An ultra-fine ferrite and carbide aggregate structure is observed after four passes. Ferrite grain
refinement occurs more rapidly in a pearlitic eutectoid composition (0.8wt.%C) steel, resulting in a
submicron grain size following moderate deformation strains (~5 passes). The presence of coarse
cementite particles in the 1.2wt.%C steel was observed to promote development of high misorientation
boundaries within their immediate vicinity. However, due to the large and relatively un-deformable
nature of the cementite particles in comparison with the ‘soft’ ferrite matrix, much of the initial grain
refinement was limited to these deformation zones and overall HAGB formation and refinement of
grain size proceeded at a slower rate. Slow grain refinement observed in the 0.6wt.%C steel is
considered a result of the single phase, primary ferrite regions ‘absorbing’ the majority of the imparted
deformation, leaving the pearlite deformed to a lower effective strain. A large increase in tensile
strength was observed following the initial ECAE pass. Subsequent deformation resulted in a lesser
increase in proof stress and UTS values plateau following two passes. In general, elongation values
decreased with increasing deformation for all steels.
The ability to form a relatively homogeneous ultra-fine ferrite and carbide aggregate microstructure
with improved tensile strength yet retain work hardening, in simple high carbon steels using
conventional rolling practices, is particularly attractive for future commercial application. EBSD has
proved invaluable in assessing the evolution of deformed microstructures, by allowing ultra-fine grain
structures to be rigorously distinguished from microstructures predominantly containing subgrains.
166

9 . GENERAL CONCLUSIONS
It has been shown in this work that the ferrite grain size can be refined to 1-3 µm by different methods.
They can be defined as advanced thermomechanical processes that can be applied on already existent
pilot mills or that can be applied off line (Pony Mill), and others that can be defined as new innovative
techniques like ARB and ECAE. The latter methods can impose high deformations giving promising
results but at this stage they still remain to a laboratory scale.
Different parameters were considered in designing a processing route to obtain fine grains and
simultaneously suitable mechanical properties. Mainly the carbon content and presence of
microalloying elements influenced the best processing route to be applied to the chosen material.
A finer ferrite and a more homogeneous distribution of cementite were found in the higher carbon steel
after the deformation and annealing process. It can be attributed to the initial finer ferrite-pearlite
microstructure before large strain warm deformation and the higher volume fraction of spheroidized
cementite particles during/after deformation in the higher carbon steel.
Moreover, the increase in carbon content was beneficial to increase the work hardening rate. This is due
to a large volume fraction of cementite particles which are effective in increasing the work hardening
rate by the accumulation of geometrically necessary dislocations near the particles. The increase in
work hardening rate is important for improving the ductility (especially the uniform elongation) of the
ultrafine grained steels.
Even by SIDT mechanism the level of ferrite refinement increased slightly when the carbon content
increased, but in this case the critical strain for SIDT occurrence increased. Critical strain becomes
higher and higher increasing the C content until it is quite difficult to activate this mechanism.
Results from literature [134] agree that over 0.2-0.3 %C the critical strain necessary to activate SIDT
becomes so high that dynamic recrystallization is more favourable. Therefore this mechanism can be
applied only for low C steels.
In contrast to carbon, the increase in manganese content had a more significant contribution to grain
refinement in the C content range of 0.15-03%C.
This is, firstly, due to the initial finer transformed microstructure in the higher manganese steel because
of manganese depressing the transformation temperature obviously. Secondly, it can be attributed to
manganese substitutes iron in cementite and forms a more stable cohenite (Fe3-XMnXC). During the
large strain warm deformation itself and in the course of the subsequent annealing, the finer cohenite
particles, due to a sluggish dissolution as well as a slow Ostwald ripening, are more effective to pin the
ferrite grain boundaries against grain growth. Thirdly, the fine particles are also beneficial to store the
geometrically necessary dislocations and substructures inside the grains, which facilitate grain
subdivision. Therefore, the finest microstucture was observed in the higher manganese steel after the
deformation and annealing process.
The prominent combination of mechanical properties found in the ultrafine grained steel with higher
manganese content can be attributed to the effect of an obvious grain refinement by the extra
manganese.
The tested processing routes that successfully produced ultrafine ferrite can be summarized as follows:
Nb microalloyed steels
In Nb microalloyed steels, there is a compromise to be found between different mechanisms occurring
during thermomechanical process, that act in different directions for grain refinement occurrence. They
are:
- dynamic recrystallisation during high rolling reductions;
- static recrystallisation retarded by soluble Nb below Tnr, the non recrystallisation temperature;
- dynamic NbC precipitation during hot rolling;
- static NbC precipitation during cooling / coiling.
The most important requirement for grain refinement is to keep Nb in solution to obtain the maximum
precipitation hardening efficiency. Ti was found to reduce the beneficial effect of Nb on both grain
refinement and precipitation hardening.
167

The main hot rolling parameters that affect the ferrite grain size are listed below:
- Microalloy content: Nb must be in solution to refine efficently the grain;
- Cooling rate: must be high to avoid ferrite grain growth;
- Coiling temperature: must be low enough to avoid ferrite grain growth;
- Rolling reduction (strain accumulation): must be high to cumulate strain;
- Finishing rolling temperature: must be low (above Ar3) to cumulate strain;
- Time between the end of rolling and cooling (delay time): must be as short as possible to
avoid austenite recrystallisation.
Plain and microalloyed low C steels by SIDT
SIDT mechanism can be exploited for grain refinement in plain or microalloyed low C steels having a
low C content (<0.2%C). The following hot rolling parameters should be controlled:
- Austenitization at low temperature in order to keep a small prior austenite grain size;
- Rolling reduction in the deformation temperature range Ar3-Ar3+30°C
- Minimum required strain of ε=0.6 to activate SIDT (depending on carbon and Nb content)
Plain C steels by large strain warm deformation
For plain C steels the main hot rolling parameters that affect the ferrite grain size are:
- Austenitization at low temperature or small deformation in austenite region in order to keep a
small prior austenite grain size;
- Rolling at deformation temperature under the pearlitic range
- Minimum strain of ε=0.8 to begin the spheroidisation of cementite
Mechanical Properties
As expected, large enhancements in strength and a reduced work hardening were observed in the
ultrafine grained steels. This is reflected in the yield ratio (lower yield stress/ultimate tensile stress),
which is around 0.9, compared with 0.7 for the conventional steels.
However, it is interesting to note that apart from the high strength an acceptable ductility can still be
found in the ultrafine grained steels investigated, which is reflected in the total elongation of over 20%
and the uniform elongation of about 10% for low-medium C steels. This is quite different from the
results reported by other investigators, i.e. the total elongation is no more than 10%. This can be
attributed to the additional second phase – cementite particles offering the opportunity to improve the
work hardening rate.
A second phase such as globular cementite is beneficial to improve both strength and work hardening
rate of steels. Therefore, it is very attractive to produce a relatively coarser microstructure (i. e. grain
size of 2&3 µm) with a second phase (i. e. finer precipitates) in the matrix for the ductility improvement.
On the other hand, in addition to grain refinement strengthening, precipitation hardening can also
contribute to strengthening.
Moreover, grain refinement also results in an increase in the Lüders strain, in a decrease of ductile-to-
brittle transition temperature, and in improvement in toughness.
Severe plastic deformation techniques
Accumulative Roll bonding and Equal Channel Angular Extrusion showed to be very effective to refine
grains imparting high strain.
Their results were in agreement with those on ultrafine grained materials obtained applying advanced
thermomechanical processes, e.g. large warm rolling. Those new deformation methods can help to
better understand the formation and the mechanisms that are involved in highly deformed materials.
168

10. RECOMMENDATIONS FOR FUTURE WORK
The ability to form a relatively homogeneous ultra-fine ferrite and carbide aggregate microstructure
with improved tensile strength yet retain work hardening using conventional rolling practices, is
particularly attractive for future commercial application.
This work was only the first stage for investigating the potential of the processing of ultrafine grained
steels. All the tested routes were shown to be successful to produce ultrafine microstructures and their
influencing factors were assessed.
In order to continue in the development work of ultrafine grained steels, practical steel manufacturing
processing must be performed with industry experts to verify the routes convenient for bulk production
in a steel mill.
Moreover, in this work the mechanical properties of the ultrafine structures were well tested, however
response to various application like welding were hardly begun. More extensive investigation would be
required to assess the properties achievable.
169

11. REFERENCES
[1] Valiev RZ. Mater Sci and Eng A 1997; 234: 59.
[2] Segal VM. Mater Sci and Eng A 1999; 271: 322.
[3] Saito Y, Utsunomiya H, Tsuji N, Sakai T. Acta Mater 1999; 47: 579.
[4] Tsuji N, Ueji R, Minamino Y. Scripta Mater 2002; 47: 69.
[5] Inoue T, Torizuka S, Nagai K. International Symposium on Ultrafine grained Steels
(ISUGS 2001). The Iron and Steel Institute of Japan, Fukuoka, Japan; 2001. p. 88–91.
[6] Hodgson PD, Hickson MR, Gibbs RK. Scripta Mater 1999; 40: 1179.
[7] Kaspar R, Distl JS, Pawelski O. Steel Research 1988; 59: 421.
[8] Matsumura Y, Yada H. ISIJ Int. 1987; 27: 492.
[9] Najafi-Zadeh A, Jonas JJ, Yue S. Metall Trans A 1992; 23: 2607.
[10] P.D. Hodgson et al., Patent Application PCT/AU94/00356, Publication WO 95/01459, 1995
[11] P.J Hurley, B.C. Muddle, P.D. Hodgson, Proc. “Thermomechanical Processing of Steels 2000”,
24-26 May 2000, London, p. 476
[12] M.R. Hickson and Hodgson, Materials Science and Technology, vol.15, (1999), p. 85
[13] Choi J.K., Seo D.H., Umk K. and Choo W.Y, ISIJ International vol. 43, (2003), p. 746
[14] Priestner R., Al-Horr Y.M. and Ibraheem A.K., Material Science and Tech., vol. 18, (2002), p.
973.
[15] Mintz B. Lewis J. and Jonas J.J., Material Science and Tech., voil. 13, (1997), p. 379
[16] Yang Z.M. and Wang R.Z., ISIJ International vol. 43, (2003), p. 761
[17] Choi JK, Seo DH, Lee JS, Umk K & Choo WY (2003) ISIJ International 43: 746-754.
[18] Mintz B, Lewis J & Jonas JJ (1997),Materials Science and Technology 13: 379-385.
[19] Yang ZM & Wang RZ (2003) ISIJ International 43: 761-766.
[20] Hurley PJ & Hodgson PD (2001) Materials Science and Engineering A 302: 206-214.
[21] S.C.Hong, S.H.Lim, H.S.Hong, K.J.Lee, D.H.Shin, K.S.Lee, Materials Science and Technology,
February 2004, vol. 20.
[22] Du LX, Caibei Z, Hua D, Xianghua L & Guodong W., ISIJ International vol. 42, (2002), p.1119.
[23] M.R. Hickson and P.D. Hodgson, Material Science and Technology, Vol. 15, 1999, p. 85
[24] M.Niikura, M. Fujioka,Y.Adachi, A. Matsukara, T.Yokota,Y. Shirota, Y. Hagiwara, Journal of
Materials Processing Technology, 117, 2001, p. 341
[25] P.D.Hodgson, M.R. Hickson and R.K.Gibbs,Proc. Conf. “Microalloying in steels”, 63, 1988,
Switzerland, Trans Tech.
[26] Jansson B, Schalin M, Sundman B. Phase Equilibria 1993;14:557.
[27] Kaspar R, Pawelski O. Materialprüfung 1989;31:14.
[28] Pawelski O, Gopinathan V. Mechanical Working Technology 1981;5:267.
[29] Kaspar R, Faul H. MP Materialprüfung 2001; 43: 18.
[30] Glez JC, Driver JH. Acta Mter 2003; 51: 2989.
[31] Shin DH, Kim BC, Kim YS, Park KT. Acta Mater 2000; 48: 2247.
[32] Apps PJ, Bowen JR, Prangnell PB. Acta Mater 2003; 51: 2811.
[33] Gholinia A, Humphreys FJ, Prangnell PB. Acta Mater 2002; 50: 4461.
[34] Tsuji N, Toyoda T, Minamino Y, Koizumi Y, Yamane T, Komatsu M, Kiritani M. Mater
Sci and Eng A 2003; 350: 108.
[35] Hornbogen E, Köster U. Recrystallization of Two-phase Alloys. In: Haessner F, editor.
Recrystallization of Metallic Materials. Dr. Riederer Verlag GmbH: 1978.
[36] Hornbogen E. Metall Trans A 1979; 10: 947.
[37] Hales SJ, Mcnelley TR, Mcqueen HJ. Metall Trans A 1991; 22: 1037.
[38] Doherty RD. Nucleation. In: Haessner F, editor. Recrystallization of Metallic Materials.
Dr. Riederer Verlag GmbH: 1978. p. 42.
[39] Chattopadhyay S, Sellars CM. Acta Metall 1982; 30: 157.
[40] Watanabe T, Karashima S. Physica Status Solidi 1970; 42: 749.
[41] Robbins JK, Shepard OC, Sherby OD. Iron and Steel Inst 1964; 202: 804.
[42] Kaspar R, Kapellner W, Lang C. Steel Research 1988; 59: 492.
[43] Shin DH, Park KT, Kim YS. Scripta Mater 2003; 48: 469.
[44] Humphreys FJ, Hatherly M. Recrystallization and Related Annealing Phenomen. UK.
Pergamon: 1995. p. 252.
170

[45] Portern DA, Easterling KE. Phase Transformations in Metals and Alloys. UK. Van Nostrand
Reinhold, Workingham, England, 1981.
[46] Zhang YC, Schleich DM. Solid State Chemistry 1994; 110: 270.
[47] Gottstein G. Physical Foundations of Materials Science. Springer-Verlag, Berlin Heidelberg, 2004.
[48] Björklund S, Donaghey LF, Hillert M. Acta Metall 1972; 20: 867.
[49] Kaspar R, Chen Q, Streißelberger A. Arch. Eisenhüttenwes 1983; 54: 273.
[50] Valiev RZ, Islamgaliev RK, Alexandrov IV. Progress in MaterSci 2000; 45: 103.
[51] Belyakov A, Sakai T, Miura H, Kaibyshev R. Scripta Mater 2000; 42: 319.
[52] Gertsman VY, Birringer R, Valiev RZ, Gleiter H. Scripta Metall et Mater 1994; 30: 229.
[53] Belyakov A, Sakai Y, Hara T, Kimura Y, Tsuzaki K. Scripta Mater 2001; 45: 1213.
[54] Tsuji N, Ueji R, Minamino Y. Microstructure, Texture, and Mechanical Properties of Ultrafine
Grained IF Steel. In: Takechi H, editor. IF Steels 2003. 2003, p347.
[55] Santos DB, Bruzszek RK, Rodrigues PC, Pereloma EV. Mater Sci and Eng A 2003; 346:
189.
[56] Valiev RZ, Kozlov EV, Ivanov YF, Lian J, Nazarov AA, Baudelet B. Acta Metall et Mater 1994;
42: 2467.
[57] Lian J, Baudelet B, Nazarov AA. Mater Sci and Eng A 1993; 172: 23.
[58] Lojkowski W. Acta Metall et Mater 1991; 39: 1891.
[59] Park K-T, Kim Y-S, Lee JG, Shin DH. Mater Sci and Eng A 2000; 293: 165.
[60] Reed-Hill RE, Abbaschian R. Physical Metall Principles. PWS Publishing Company:
1994. p. 158.
[61] Wang ZC, Prangnell PB. Mater Sci and Eng A 2002; 328: 87.
[62] Lloyd DJ, Morris LR. Acta Metall 1977; 25: 857.
[63] Hayes JS, Keyte R, Prangnell PB. Mater Sci and Tech 2000; 16: 1259.
[64] Kim S, Im YR, Lee S, Lee HC, Oh YJ, Hong JH. Metall and Mater Trans A: Physical
Metall and Mate Sci 2001; 32: 903.
[65] Brozzo P, Buzzichelli G, Mascanzoni A, Mirabile M. Metal Sci 1977; 11: 123.
[66] Hulla D. Acta Metall 1960; 8: 11.
[67] Ritchie RO, Knott JF, Rice JR. Mechanics and Physics of Solids 1973; 21: 395.
[68] Knott JF. Pressure Vessels and Piping 1995; 64: 225.
[69] Kim S, Lee S, Lee BS. Mater Sci and Eng A 2003; 359: 198.
[70] Im YR, Oh YJ, Lee BJ, Hong JH, Lee HC. Nuclear Mater 2001; 297:138.
[71] Pitsch W, Sauthoff G, Hougardy HP. Steel. In: Verein Deutscher Eisenhüttenleute, editor. A
Handbook for Mater Research and Eng, vol. 1. Springer-Verlag: 1992. p. 83.
[72] Pickerin FB. Physical Metallurgy and the Design of Steels. Applied Science Publishers LTD,
London: 1978.
[73] Broek D. Eng Fracture Mechanics 1973; 5: 55.
[74] Cai H, Evans JT, Boomer D. Eng Fracture Mechanics 1992; 42: 589.
[75] Petch NJ. Iron and Steel Inst 1953; 174: 25.
[76] Dahl W. Steel. In: Verein Deutscher Eisenhüttenleute, editor. A Handbook for Mater
Research and Eng, vol. 1. Springer-Verlag: 1992. p. 283.
[77] Ashby MF. Philo Magazine 1970;21:399.
[78] Kochs UF. Eng Mater and Tech 1976; 98:76.
[79] Ashby MF. Philo Magazine 1966;14:1157.
[80] Kosco JB, Koss DA. Mater Sci and Eng A 1993;169:1.
[81] Jones RH. Metall Trans 1973;4:2799.
[82] Jones RH. Metall Trans; 1974: 5: 970.
[83] Brown LM, Stobbs WM. Philo Magazine 1976;34:351.
[84] Humphreys FJ, Hirsch PB. Philo Magazine 1976;34:373.
[85] Koch CC. Scripta Mater 2003; 49: 657.
[86] Y. Saito, H. Utsunomiya, N. Tsuji, and T. Sakai, Acta mater., vol. 47, No.2, 1999, p579
[87] N. Tsuji, Y. Saito, H. Utsunomiya and S. Tanigawa, Script Materialia, vol.40, No.7, 1999, p795
[88] N. Tsuji, Y. Saito, S.H. Lee and Y. Minamino; Proceedings of Conference NANOSPD2,
December 2002, Vienna, Austria. Ed. M.J.Zehetbauer, R.Z. Valiev.
[89] N. Tsuji, Y. Minamino, Y.Koizumi and Y. Saito;”Int. Symp. On Processing and Fabrication of
Advanced Materials”, Materials Solution 2002, ASM&TMS Columbus (OH).
[90] A. Schmitz et al., Proc. Of 40th MWSP conf., Vol. 36, 1998, p.295
171

[91] J.C. Herman, Proc. Of the 'Thermomechanical processing of steels 2000' conf., 24-26 May 2000,
London, p. 585.
[92] T.M. Maccagno, J.J. Jonas, S. Yue, B.J. McCrady, R. Slobodian, D. Deeks: ISIJ International, 34
(11), 1994, p. 917.
[93] F.H. Samuel, S. Yue, J.J. Jonas. K.R. Barnes: Trans ISIJ, 30, 1990, p. 216.
[94] R. Kaspar, J.S. Distl, O. Pawelski: Steel Research, 59, 1988, p. 421.
[95] A. Schmitz, A. De Ro: Proc. of the 'Thermomechanical processing of steels 2000' conf., 24-26
May 2000, London, p. 702.
[96] F. Boratto, R. Barbosa, S. Yue, J.J. Jonas: Proc. Int. Conf. Physical Metallurgy of Processing of
Steels and Other Metals (THERMEC ’88); ed. I. Tamura, ISIJ, Tokyo, 1988, p. 383.
[97] R.C. Hudd, A. Jones, M.N. Kale: JISI, 209, 1971, p.121.
[98] J. Neutjens, A. Schmitz, Ph. Harlet: 'On the use of Torsion Testing for the study of Phase
Transformation after Austenite Pancaking in a Hot Strip Finishing Mill', Thermec 2000.
[99] Development of Methods for the Characterization and Modelling of Precipitation in Steels, ECSC
Project 7210-PR/160, Technical report N°3.
[100] W.T. Reynolds, Jr., F.Z. Li, C.K. Shui, H.I. Aaronson: Metallurgical Transactions A, vol. 21A,
June 1990, p. 1433.
[101] J. Burke: The Kinetics of Phase Transformation in Metals, Pergamon Press, Elmsford, NY, 1965.
[102] C. Mesplont, S. Vandeputte and B.C. De Cooman: Z. Metallkde 93, 2002, No. 11, pp.1108-1118.
[103] Ken-Ichiro Suzuki, Shoji Miyaga, Yoshiyuki Saito and Kazuhiro Shiotani: ISIJ International,
Vol.35 (1995), No.1, pp.34-41.
[104] C. Ouchy, T. Sanpei and K. Matsumoto: Tetsu-to-Hagané, 69 (1979), A293.
[105] Ultra Fast Cooling in the Hot Strip Mill (Phase I), ECSC contract number 7215-CA/204 (96-
T3.06).
[106] T. Morimoto et al. Proc. 2nd
Int. Conf. On Thermomechanical Processing of Steels, June 15-17,
2004, Liège, Belgium, p.415.
[107] D N Crowther: ‘Ultra-fine grained steel by innovative deformation cycles’, ECSC Agreement
No. 7210.PB/288 (D3.02/01), Report No. M8657-1(ST)012, Corus Research, Development &
Technology, Swinden Technology Centre, 2001.
[108] D N Crowther: ‘Ultra-fine grained steel by innovative deformation cycles’, ECSC Agreement
No. 7210.PB/288 (D3.02/01), Report No. M8657-1(ST)012, Corus Research, Development &
Technology, Swinden Technology Centre, 2002.
[109] D N Crowther: ‘Ultra-fine grained steel by innovative deformation cycles’, ECSC Agreement
No. 7210.PB/288 (D3.02/01), Report code STC/SMT CTE/CR/08657/2003/A, Ref. Source No.
108386, Corus Research, Development & Technology, Swinden Technology Centre, 2003.
[110] D H Shin, Y S Kim and E J Lavernia: ‘Formation of Fine Cementite Precipitates by Static
Annealing of ECAP Low C Steels’, Acta Mat., 2001, Vol. 49, pp2387-2393.
[111] V M Segal, V I Reznikov, A E Drobyshevskiy, V I Kopylov: ‘Plastic working of metals by
simple shear’, Russ. Metal., 1981, 1, pp99-105.
[112] R Z Valiev, N A Krasilnikov and N K Tsenev: ‘Plastic deformation of alloys with submicron-
grained structure’, Mat. Sci. Eng., 1991, A137, pp35-40.
[113] R Z Valiev, A V Korznikov and R R Mulyukov: ‘Structure and properties of metals with
submicrocrystalline structures’, The Physics of Metals and Metallography, 1992, Vol. 4, pp70-
86.
[114] V M Segal: ‘Materials processing by simple shear’, Materials Science and Engineering, 1995,
A197 [2], pp157-164.
[115] V M Segal: ‘Equal channel angular extrusion: from macromechanics to structure formation’,
Materials Science and Engineering, 1999, A271 [1], pp322-333.
[116] K Nakashima, Z Horita, M Nemeto and T G Langdon: ‘Influence of channel die angle on
development of ultra-fine grains in equal channel angular pressing’, Acta Mat., 1998, Vol. 46,
pp1589-1599.
[117] F J Humphreys, P B Prangnell, J R Bowen, A Gholinia and C Harris: ‘Developing stable fine-
grain microstructures by large strain deformation’, Philos. Trans. Royal Soc., 1999, A357,
pp1663-1680.
[118] A Gholinia, J Sarkar, P J Withers and P B Prangnell: ‘Ultra-fine grain structures formed by
thermomechanical processing of spray cast Al-Li alloys’, Mat. Sci. Tech., 1999, 15, pp605-615.
172

[119] A Gholinia, P B Prangnell and M V Markuchev: ‘The effect of strain path on the development of
deformation structures in severely deformed aluminium alloys processed by ECAE’, Acta Mat.,
2000, Vol. 48, pp1115-1130.
[120] A Gholinia, F J Humphreys and P B Prangnell: ‘Processing ultra-fine grain structures by
conventional routes’, Mat. Sci. Tech., 2000, Vol. 16, pp1251-1255.
[121] J S Hayes, R Keyte and P B Prangnell: ‘Effect of grain size on the tensile behaviour of a
submicron grained Al-3%Mg alloy produced by severe deformation’, Mat. Sci. Tech., 2000, Vol.
16, pp1259-1263.
[122] R Priestner and A K Ibraheem: ‘Processing of steel for ultra-fine ferrite grain structures’, Mat.
Sci. Tech., 2000, Vol. 16, pp1267-1272.
[123] P J Apps, J R Bowen, P B Prangnell: ‘The effect of coarse second-phase particles on the rate of
grain refinement during severe deformation processing’, Acta Mat., 2003, Vol. 54, pp2811-2822.
[124] O.D. Sherby, B Walser, C.M. Young and E.M. Cady, “Superplastic Ultra-High-C Steels”, Scripta
Metallurgica, Vol. 9, 1975, 569-573.
[125] B. Walser and O.D. Sherby, “Mechanical Behaviour of Superplastic Ultrahigh Carbon Steels at
Elevated Temperature”, Metallurgical Transactions A, Vol. 10A, 1979, 1461-1471.
[126] J.R. Bowen, A. Gholinia, S.M. Roberts and P.B. Prangnell, “Analysis of the billet deformation
behaviour in equal channel angular extrusion”, Materials Science and Engineering, A287 1, 2000,
87-99.
[127] Niikura et al, “new concepts for ultra refinement of grain size in Super Metal Project”, Journal of
Materials Processing Technology, 117, 2001, 341-346.
[128] S. Chattopadhyay and C.M. Sellars, “Kinetics of Pearlite Spheroidisation During Static
Annealing and During Hot Deformation”, Acta Materialia, 1982, 157-170.
[129] W.B. Morrison and R.L. Miller, “The Ductility of Ultrafine Grained Alloys”, Ultrafine-Grain
Metals, J.J. Burke and V. Weiss, Eds., Syracuse University Press, 1970, 183.
[130] P.D. Hodgson, M.R. Hickson and R.K. Gibbs, “The Production and Mechanical Properties of
Ultrafine Ferrite”, Materials Science Forum, Vols. 284-286, 1998, 63-72.
[131] J R Bowen: ’The formation of ultra-fine grained model aluminium and steel alloys’, PhD Thesis,
UMIST, 2000.
[132] J.Laguillaume, G.Kapelski and B.Baudelet, “Cementite Dissolution in Heavily Cold Drawn
Pearlitic Steel Wires”, Acta Materialia, Vol. 45, 1997,1201-1212.
[133] W.J. Nam et al, “Effect of Interlamellar Spacing on Cementite Dissolution during Wire Drawing
of Pearlitic Steel Wires”, Scripta Materialia, Vol. 42, 2000, 457-463.
[134] Yada H, Matsumura Y & Pnakajima K (1984) Ferrite Steel Having Ultra-fine Grains and a
Method for Producing the Same, United State Patent No. 4, 466842.
173

