nanometer and ultrafine aerosols from radon radiolysis
TRANSCRIPT
J. Aerosol Sci., Vol. 24, No. 3, pp. 393~407, 1993 0021-8502/93 $6.00+0,00 Printed in Great Britain. © 1993 Pergamon Press Ltd
N A N O M E T E R A N D U L T R A F I N E A E R O S O L S F R O M R A D O N R A D I O L Y S I S
MUKUND RAMAMURTHI, *t RIAN STRYDOM, *t PHILIP K. HOPKE *§ a n d ROBERT F. HOLUB II
*Institute for Environmental Studies, University of Illinois at Urbana-Champaign, Urbana, IL 61801, U.S.A. and IIGeophysics Division, Denver Research Center, U.S. Bureau of Mines, Department of the Interior, Denver,
CO 80225, U.S.A.
(Received 25 June 1992; and in final form 14 October 1992)
a
C a, dp d~
d~(50°/o) D E e
k m
M N
Ref R.
S
T
W
,t /t p
A~tract - -The ability of ionizing radiation to produce condensation nuclei aerosols in filtered air is well known. Recent studies have indicated that radiolysis results initially in the production of highly diffusive, nanometer-sized (< 2 nm) clusters. Aerosols in the 1-10 nm range are also produced by other processes mostly involving nucleation, e.g. for purposes of materials synthesis. Radiolytic nuclei can be formed by the binary ion-induced nucleation of the precursor vapors, such as sulfuric acid and water; ultrafine particles (> 5 nm) can then evolve by coagulation and growth processes. The nanometer nuclei are, however, poorly detected by condensation nuclei counters (CNCs) since ChIC efficiencies drop sharply for particle sizes < 5 nm. In this work, the formation of: (1) PoOx molecular cluster aerosols from the decay of radon, and (2) sulfuric acid nanometer nuclei and ultraflne aerosols from the radiolytic oxidation of SO2 in radon-air mixtures, were studied through wire screen-based size distribution measurements of the 21Spo radioactivity associated with the aerosols. Comparisons with conventional diffusion battery-CNC derived number size distributions are also presented.
N O M E N C L A T U R E
air molecule collision radius, 0.185 x 10 -7 cm Cunningham slip correction factor (dimensionless) screen wire diameter (pro) particle/cluster diameter (cm) semi-empirical correction factor (cm), equation (4) particle diameter of 50% penetration through GSA stage (nm) particle/cluster diffusion coefficient (cm 2 s- 1) counting efficiency (fractional) of TSI Inc. Model 3020 CNC elementary charge (1.6 x 10-t9 C) Boltzmann constant = 1.38 x 10⁻¹⁶ (erg K-1) molecular weight of gas (28.96 for air) molecular weight of duster number concentration of gas (2.51 x 1019 cm-3 for air, 293 K) wire Reynolds number = Updf/ll (6.6 Udf for air, 293 K) gas constant (8.314 x 10⁷ dyn cm K-1 tool-1) sum of cluster and air molecule radii (dp/2 +0.185)x 10-7 era absolute temperature (K) root-mean-square gas velocity=(3R, T/m) U2 (5.04 x 10⁴ cms-1 air, 293 K) wire screen thickness Om) solid volume fraction of wire screen (dimensionless) mean free path of gas molecules (6.54 x 10 -6 em for air, 293 K) viscosity of gas (1.819 x 10 -4 gm cm s- 1 for air, 293 K) density of gas (1.205 x 10 -a g crn -3 for air, 293 K)
I N T R O D U C T I O N
The ability of ionizing radiation, such as X-rays, ~t and ~ particles, to produce condensation nuclei aerosols in filtered air containing trace quantities of gases such as SO2, 03 and organic vapors is well-documented (e.g. Chamberlain et al., 1957; Megaw and Witfen, 1961;
* Present address: Battelle, 505 King Avenue, Columbus, OH 43201, U.S.A. : Present address: Atomic Energy Corporation of South Africa Ltd, P.O. Box 4587, Pretoria 0001, Republic of
South Africa. m Present address: Department of Chemistry, Clarkson University, Potsdam, NY 13699, U.S.A.
393

394 M. RAMAMURTHI et al.
Perrin et al., 1978; Leong et al., 1983; Subba Ramu and Muraleedharan, 1986). The role of reactive hydroxyl radicals, formed through radiolysis of water vapor by the ionizing radiation, in nucleus formation has also been demonstrated by a number of researchers (e.g. Wood et al., 1975, Coghlan and Scott, 1983).
All of the studies cited above have used condensation nuclei counters (CNC) for the detection of the radiolytic aerosols studied. However, the CNCs used in these previous studies suffered from limited response characteristics for particles in the 5-10 nm in diameter because of a combination of low counting efficiencies and high diffusional losses in the instrument (Bartz et al., 1985). The resultant operational definition of a "particle", as one that is detected by a CNC, may be partially responsible for the inadequate understanding of radiolytic nuclei formation processes.
Preliminary research results reported previously by us and our co-workers (Chu et al., 1987; Hopke and Ramamurthi, 1988) provided indications of radiolytic formation mechan- isms of sulfuric acid nuclei and ultrafine aerosols from the oxidation of SO2 added to radon-carrier gas mixtures. These studies utilized single wire screen methods to follow the formation of radiolytic aerosols by using as a tracer the radon progeny radioactivity size distributions (or "activity distributions") in the size range dp> 0.5 nm. The experimental methods of these studies were, however, of a preliminary nature necessitating further efforts to substantiate the results of the research. This paper reports the refinement of these techniques for characterizing the nanometer and ultrafine aerosols produced by radiolytic formation processes; comparisons of these measurements with conventional number- weighted size distributions, dp > 5 nm, using the diffusion battery (DB)--CNC method are also presented. In addition, highly diffusive PoOx molecular cluster aerosols resulting from radon decay under conditions without nuclei or ultrafine aerosol formation were also characterized.
The techniques discussed here for the sizing of radiolytic particles can be extended to other nanometer aerosols such as those generated for the purpose of manufacturing nanophase materials (discussed in more detail in this issue). Very few of these aerosols generated mostly by evaporation-condensation of metals have so far been characterized by standard aerosol methods.
MEASUREMENT METHODS
Graded Screen Array method
Graded (Wire) Screen Arrays (GSA) systems have evolved considerably over the past several years following their initial development by Holub and Knutson (1987). GSA systems consist of varying mesh number, single/multiple wire screen stages operated either in series or in parallel, with a selection of a wide range of screen parameters and sampling flow rates. The systems are typically coupled with a technique for determining the radio- activity that penetrates past or is collected by the wire screens when a radioactive aerosol is sampled. Using a numerical reconstruction algorithm then allows determination of the size distribution of radioactivity in a manner analogous to conventional diffusion battery analysis. A review of the development, parameterization and capabilities of GSA systems was presented recently by Ramamurthi (1989) and salient details are presented here.
The penetration theory developed by Cheng and Yeh (1980) and Cheng et al. (1980) has been found to adequately predict the wire screen penetration characteristics for GSA stages. A useful form of the diffusional penetration equation for parameterizing GSA stages by their dp (50%) or diameter leading to 50% penetration through the stage was presented by Ramamurthi and Hopke (1989). The penetration equation has been experimentally verified and found to be accurate within the domain Ref < 1-1.5 for a wide range of wire screens by Cheng and Yeh (1980) for dv > 15 nm, and Scheibel and Porstendorfer (1984) for dp > 4 nm. Recently, Ramamurthi et al. (1990) reported the verification of the penetration equation in the cluster size range using a 21Spo cluster aerosol (Davg = 0.078 + 0.003 c m 2 s - 1) for two low mesh number (30, 145 in-1) wire screens.

Nanometer and ultrafine aerosols from radon radiolysis 395
Sampling highly diffusive cluster aerosols was also found to necessitate consideration of diffusional deposition losses onto sampling surfaces (Ramamurthi, 1989). Careful design of samplers to minimize such losses and inclusion in the penetration characteristics of the wire screen samplers was hence needed. For the circular cross-section samplers used in this study, uniform flow penetration theory (Ingham, 1975) was found to be capable of estimat- ing the penetration of cluster aerosols through the sampler. The accuracy and region of applicability of this theory were also recently investigated in an experimental study using cluster aerosols by Ramamurthi et al. (1990). Details of the tube penetration equation and the experimental results are hence omitted from this paper.
Because diffusion is the primary mechanism that defines the wire screen penetration, the relationship between particle size and diffusion coefficient for the cluster size range was estimated by the Einstein equation,
kTC D=3n#d---- ~ , (1)
where C is the Cunningham slip correction factor given by Friedlander (1977) as,
with the substitution of
2 ['2.514 + 0.8 exp( - 0.55dp/2)] C = l + ~ (2)
d* = dp ['1 + 3 exp(-- 2.20x 10⁷dp)], (3)
where dp is in cm, for dp in equation (2) as suggested by Ramamurthi and Hopke (1989) to extend the useful range of equation (2) to 0.5 nm. This correction factor rapidly approaches unity for particle/cluster sizes, dp > 2 nm.
For molecular clusters, 0.5-2 nm in diameter, the kinetic theory can be utilized to determine the cluster diffusivity for uncharged clusters as (Loeb, 1961; Porstendrrfer, 1968; Raabe, 1969),
D = ~ - - . (4)
Porstend6rfer (1968) found good agreement between experimental measurements of the diffusion coefficient of Pb-212 atoms and kinetic theory predictions from equation (4). Ramamurthi et al. (1990) found similar agreement for 2XSpo.
Inferring particle size from diffusional penetration data for cluster aerosols must also include the consideration that the diffusivity of a charged cluster can be significantly different from that of an uncharged cluster of the same physical size and mass, especially for small cluster sizes. The potential existence of charged polonium-clusters among the radon progeny cluster aerosols makes the distinction is of significance. Chapmann and Cowling (1958) have used a model developed by Sutherland (1910) to derive a relation for the diffusion coefficient of charged clusters, as discussed by Porstendfrfer (1968),
D = [ 0.402 e2a 3"] " (5) 3roseN,_ 1 + 4s2k T .]
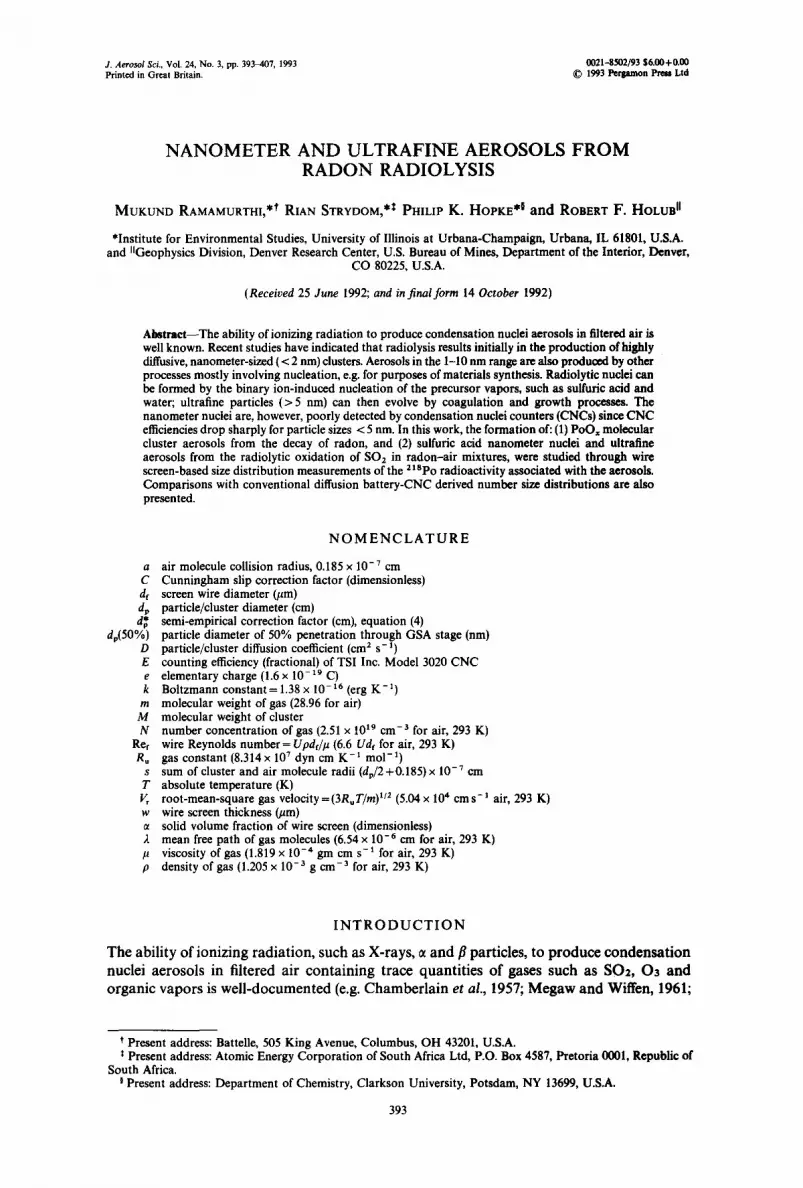
A comparison of the diffusivity of neutral and charged (+ 1 charge) clusters in the 0.5-2 nm size range obtained from equations (4) and (5), respectively, is presented in Fig. 1 as well as the unmodified and modified Einstein equation as given in equations (1)-(3). Figure 1 illustrates that a molecular cluster of a specific size may have more than one diffusion coefficient depending on it charge state (neutral, + 1, + 2, etc.). Aerosol distribu- tions are typically represented using particle size, and in keeping with this convention the diffusional penetration data from GSA systems can yield size distributions provided all clusters are assumed to be neutrally charged. However, it must be recognized the relation-
396 M. RAMAMURTHI et al.
u
o
0.20 --
0.18 l Einstein-Cunningham
0.16 (equations (1, 2))
2 Einstein-Cunningham 0.14 ~ 1 fitted to kinetic theory 0.12 ~ (equations (l, 2, 3))
v , 0.10 ~ 3 Kinetic theory
(equation (4))
0'08 ~ 2 ~ 4 Kinet ictheory 0.06 " ~ ~ charsed clusters (+ 1)
0.04 4 ~ , ~ . . ~ ~ t i o n (5))
0.02 --
0 l t I 0.5 1.0 1.5 2.0
P a r t i c l e / c l u s t e r d i a m e t e r (nm)
2.5
Fig. 1. Particle/cluster diffusion coefficient in the 0.5 2.5 nm size range. Kinetic theory equations (3) and (5) are plotted without the [(M +m) /M]I I2 factor.
ship between particle size and diffusion coefficient is non-unique in the presence of both charged and neutral clusters--GSA or diffusional data-derived cluster size distributions must hence be interpreted accordingly.
The optimum design of GSA systems was also subjected to careful review as part of our method development work. GSA systems offers a great deal of flexibility in the choice of a combination of operating parameters for each of the penetration/collection stages. Stage progression in the GSA has a significant influence on the ability of numerical algorithms to reconstruct size distributions from the diffusional stage penetration data obtained from GSA measurements.
Ramamurthi and Hopke (1990) studied the effect of GSA stage progression on the reconstruction efficiency of two commonly used algorithms, the Expectation-Maximization (EM) (Maher and Laird, 1986) and the Twomey algorithm (Kapadia, 1980), in a numerical simulation study. The study concluded that, for a general, unknown distribution, algorithm reconstruction effÉciency is optimized by apportioning the total aerosol concentration among a combination of dp (50%) stages that are in geometric progression within the size interval of interest, and ensuring that not more than 15-20% of the total concentration penetrates past the final stage. Algorithm solution stability and accuracy were found to be maximized when the diffusion coefficients of the mid-point diameters of successive size intervals used to infer the size distribution differed by approximately one order of magni- tude. A minimum number of GSA stages, with dp (50%) diameters differing consecutively by one order of magnitude in diffusion coefficient, were also found to be essential for adequate size resolution over the spectrum of interest. These concepts were utilized in the design of the GSA systems described in this paper. The activity and number size distributions reported in this paper were reconstructed using the EM algorithm; generally, good agree- ment was observed between the reconstructions from the EM and Twomey algorithms.
Diffusion battery--CN C method
Diffusion batteries with CNC detection (DB--CNC) methods are commonly used to determine the number-weighted size distribution measurements in the dp-,~ 10-350 nm (0.01-0.35/~m) size range. In particular, the TSI Inc. (St. Paul, MN) Model 3040 DB and Model 3020 CNC have been widely used for this purpose, although TSI Inc. has recently introduced CNCs with improved detection efficiency in the 2-5 nm size range. The applica- tion of the Model 3040/3020 DB--CNC for size distribution measurements in the

Nanometer and ultrafine aerosols from radon radiolysis 397
dp < 10 nm size range, as required in this study, necessitated further review of the important aspects of the measurement method.
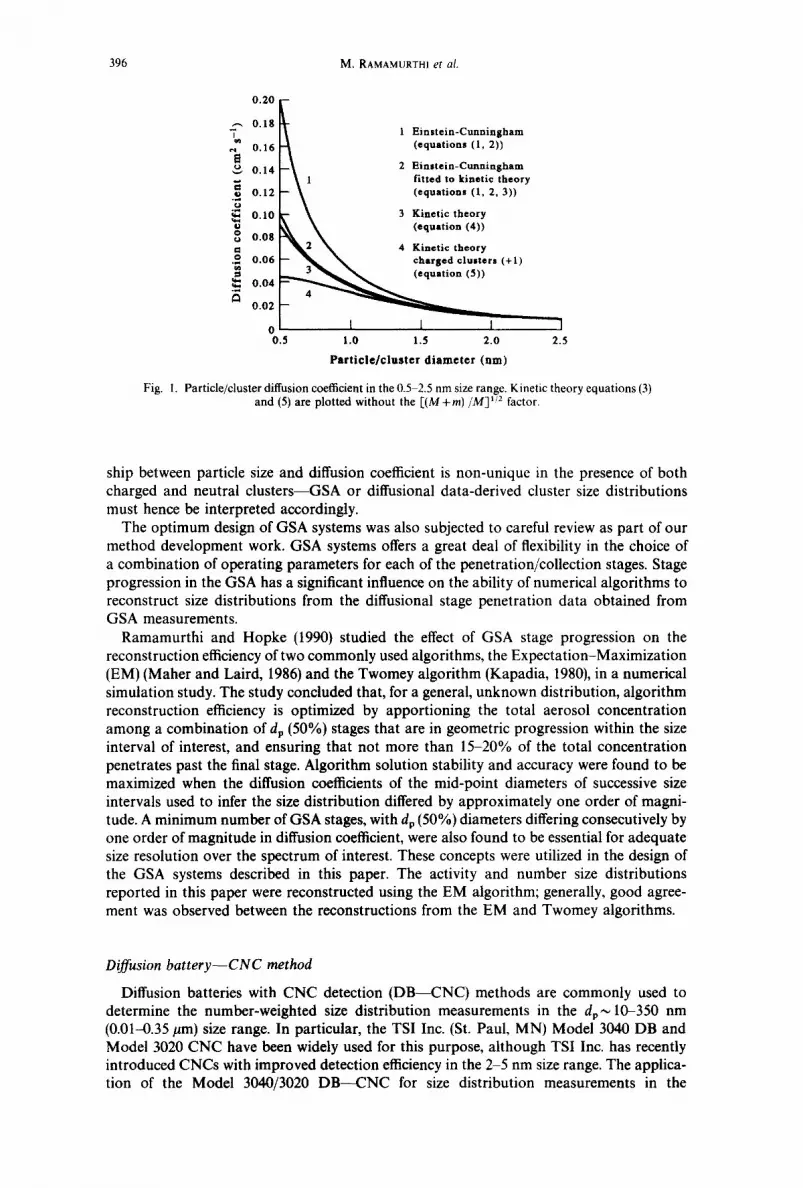
The detection efficiency of the TSI Model 3020 CNC has been the subject of a number of studies (Agarwal and Sem, 1980; Brockmann, 1981; Bartz et al., 1985; S u e t al., 1990). A review of these studies with a focus on the size range, dp< 10 nm, revealed that: (1) a general relation for the single count mode (the CNC's operating mode below concentrations of 1000 cm-3) efficiency cannot be expected to be applicable, particularly in the size range dp < 10 nm, because of intrinsic differences in the operating parameters of individual CNC units; (2) the photometric count mode (used by the CNC at concentrations above 1000 cm -3) efficiency is comparatively reproducible between individual units and for an aerosol flow rate of 300 cm 3 min-1 is best represented by,
E = e x p [ - 2 4 . 2 5 d ~ l 2 6 + 4 . 6 5 d p ° 7 7 ] , dp<25 nm
=0.97, dp>25 nm, (6)
a relationship derived from a least-squares fit to data for four different CNC units reported by Brockmann (1981) and S u e t al. (1989), as shown in Fig. 2; and (3) the absence of experimental studies using calibration aerosol concentrations greater than a few thousand per cm 3 for particle sizes < 10 nm necessitates the assumption that the CNCs photodetector output vs particle concentration dependence is adequately represented by the built-in linearizer for all particle sizes, i.e. linearizer settings derived for a 50 nm calibration aerosol up to a concentration of 105 cm-3 (Agarwal and Sem, 1980) must also be assumed to apply to < 10 nm particles. This latter assumption requires that no significant additional vapor depletion effects occur in the CNC for < 10 nm aerosols compared with the 50 nm calibration aerosol. The incremental vapor depletion from the growth in the CNC of a 5 nm particle, compared with the corresponding growth of a 50 nm particle, to a 10-12/~m final droplet is extremely small and equation (6) may hence be reasonably accurate.
The other consideration important to measuring number distributions in the dp < 10 nm size range from DB--CNC data is the rapidly decreasing response of typical D B ~ C N C systems for small particle sizes. For example, the TSI DB--CNC system with the CNC photometric mode efficiency given by equation (6), the Cheng and Yeh (1984) equation for the sampling efficiency of the TSI 3042 Switching Valve, and the Cheng-Yeh wire screen theory for the TSI 3040 Diffusion Battery (635 mesh wire screens, flow rate=6 lpm), has total (zeroth DB stage), first, and second DB stage aerosol number concentration response characteristics of: 18%, 8%, and 2%, respectively, for dp=6.3 nm; < 1%o, 0% and 0%,
1.0
;~ 0.8
~ 0.6 ¢o'~,
Z 0 2 O
~ ' / Soderholm (1983) c N c
O ~ Y trigser Brockmann (1981) ~/O ____level
~ o Brockmann (1981) 3~0 mV
7 A Suet al (1990) #40 300 mV
H I V Sue ta l (1990) #66 200mV
t J ~ , I S la ( , ~ 4 ~ m V 10 100
Particle diameter (nm)
Fig. 2. Compilation of TSI Model 3020 CNC photometric mode counting efliciencies from experi- mental studies in the literature, and comparison with fitted equations in the literature and in this
work.
398 M. RAMAMUR'rHI et al.
respectively, for dp=3.2 nm; and 0%, 0% and 0%, respectively, for dp= 1.5 nm. As a consequence of the rapid decrease in particle detection efficiency below 10 nm, the actual total number concentration of particles can be significantly higher than the instrument readout value. The total number concentration can be estimated as a result of the size distribution deconvolution at least for those particle sizes within the detection range of the instrument.
The consequence of these response characteristics is that the typical D B - - C N C measure- ment system is insensitive to the aerosol number distribution below a particle size of ~ 5 nm. More importantly, reconstructing D B - - C N C data using the EM and Twomey algorithms requires the use of a restriction on the lower end of the reconstructed size range to avoid unstable and initial estimate dependent solutions. Studies of EM and Twomey reconstructions using simulated penetration data indicated that for stable reconstructions using the algorithms, the smallest particle size reconstructed must have a total aerosol response characteristic of at least 15-20% and first and second DB stage responses of at least 5-10%. In the case of the TSI DB--CNC, this condition is generally met by choosing a size range dp> 5 nm, with a smallest particle size of 6.0-6.5 nm. Overall, as the above review indicates, conventional D B - - C N C measurement systems has significant limitations in the study of radiolytic aerosol formation. Raes and Reineking (1985) have shown that it is possible to design diffusion batteries that can extend the measurement range to a few nanometers. There are new CNC designs that have reasonable efficiency at 3 nm (Stolzenburg and McMurry, 1991) so that D B - - C N C systems can provide useful tech- niques for nanometer particle research.
E X P E R I M E N T A L
Aerosol 9eneration
The radon-aerosol chamber used to generate the radiolytic aerosols is described by Ramamurthi (1989) and by Hopke et al. (1993). A continuous flow through the 2.43 m 3 stainless-steel chamber was provided using house compressed air purified by passage through silica gel, activated charcoal, and 13X molecular sieve columns for the removal of moisture and organic vapors. The air stream was also filtered using multiple 0.2/~m pleated membrane filters (Gelman, Inc) for removal of particles. Radon was added using flow- through radon sources (Pylon Inc.). A nominal operating flow rate of 15 lpm was main- tained through the chamber yielding a radon concentrations of ~ 7400 Bq m - 3 (200 pCi/L) in the chamber. Two small fans run continuously to yield a well mixed aerosol reactor. Trace gases such as SO2, NO and NO/ can be added from commercially available calibrated compressed cylinders. The requisite chamber humidity was obtained through appropriate mixing of humid air from a bubbler with the dry air, and was monitored using a dew-point hygrometer (Model M 1, General Eastern). The detectable particle concentra- tion in the chamber was measured using a condensation nucleus counter (Model 3020, TSI Inc.). There is a 7.6 cm circular opening in the front of the chamber through which the GSA sampler can be inserted. Stainless steel tubes penetrate through a rubber stopper supporting the sampling heads. The stopper seals the chamber opening when the sampling heads have been inserted into the chamber. The pressure inside the chamber is adjusted so that there is only a small pressure difference (0.25 cm of H20) relative to the laboratory atmosphere so as to minimize air exchange when inserting or removing the GSA sampler.
Samplin9 and analysis
The GSA system utilized in the activity distribution measurements consists of multiple adapted filter holder samplers (Ramamurthi et al., 1990), each containing a specific com- bination of wire screens and a backup filter. The samplers were designed specifically to minimize the wall loss effects discussed earlier for screen combinations yielding dp (50%) < 5 nm. The various samplers were operated in parallel, and after a 5 min grab sampling
Nanometer and ultrafine aerosols from radon radiolysis
Table 1. Nominal design and operating parameters for the Graded Screen Array (GSA) sampler system
399
Number of wire screen samplers Sampling flow rate (lpm) Flow cross-sectional diameter (cm) Face velocity (cm s- 1) Sampling interval (rain)
Screen parameters
Combinations used and dp (50%)
Stage 4 (6) x 635~28.8 nm
4 (+ 1 sampler with filter only) 2.0 each 2.22 8.6 5 Mesh df 30 165.1 145 55.5 635 20.0
Stage 0 Stage 1 Stage 2 Stage 3
w Gt
346.9 0.145 163.9 0.176 50.0 0.345
Filter (total) 30==.0.9 nm 30 x 145=~2.8 nm 30 x 145 x 635==.8.8 nm
interval, the backup filters from each sampler were each analyzed for collected aerosol radioactivity using a three-count, total-alpha detection procedure (Nazaroff, 1984). The nominal parameters for the GSA system are listed in Table 1, with the equivalent stage dp (50%) diameters. The Po-218 activity distributions were reconstructed from the indi- vidual stage activity penetrations using five log-normally equal size intervals in the 0.5-158 nm range.
A TSI Model 3040 diffusion battery (DB) was used to measure the number distributions of the radiolytic ultrafine aerosols. The DB was coupled manually with a TSI Model 3020 CNC, without using a switching valve, in order to improve system response at small particle sizes. The DB--CNC number distributions were reconstructed using six log-normally equal size intervals in the 5-250 nm range.
In several experiments, a University of Vienna Differential Mobility Analyzer (DMA) (Reischl, 1991; Winklmayr et al., 1991) was used to measure the number distribution of the radiolytic aerosols in the range 3-100 rim. The DMA was operated without the 241Am neutralizer to avoid internal radiolytic particle formation (Winklmayr et al., 1990). The number distribution was then estimated from the charged-particle distribution measured by the DMA by assuming a charge equilibrium in the chamber and using a modified Fuchs charging theory (Fuchs, 1963; Reischl et al., 1983; Hussin et al., 1983). Based on estimates of the rate of charging calculated using Marlow's extension of the Fuchs equation (Marlow, 1980) relative to the average residence time in the chamber, it appears that such an assumption is appropriate. Estimates of the activity-weighted size distributions could then be calculated knowing the measured number size distribution of the particles in the chamber and the attachment coefficient for the radon progeny to particles of a given size (Porstend6rfer et al., 1979).
RESULTS AND DISCUSSION
218po Molecular cluster aerosols
An understanding of the behavior of the short-lived 2lapo (tu2 = 3.05 min) following its formation from the decay of radon is critical to its utilization as a tracer for studying radiolytic particle formation. WeUisch (1913) and Porstend6ffer and Mercer (1979) found that 88% of 21apo atoms are singly charged immediately following decay, with the remaining 12% neutral. In the presence of oxygen, a polonium oxide ion/molecule, PoO+/PoOx is formed (Busigin et al., 1981). The neutralization of the Po + ions is found to occur rapidly by several mechanisms, including charge transfer from the hydroxyl radical negative ions produced by radiolysis of water vapor in the vicinity of the recoiling 21SPo nucleus (Chu and Hopke, 1988; Payne et al., 1992). The presence of water, trace organic

400 M. RAMAMURTH1 et al.
vapors and other gases in the atmosphere surrounding the PoOx molecules could thus be expected to lead to the formation of both charged and neutral clusters. To characterize the POOx clusters formed from these processes, 218po activity size distributions were measured in various radon-ai r chamber conditions, prior to conditions involving the addition of SO2 for ultrafine particle formation.
The activity size distribution measurements under conditions of no ultrafine particle formation revealed that the 21Spo was completely associated in each case with clusters having a diffusion-equivalent size of < 1 nm in diameter. The diffusional nature of the GSA method limits the size resolution of the measurements to size intervals of --~0.5-1.6 nm, 1.6-5 nm, etc.; consequently, the use of a size distribution representation for molecular cluster 2 x Spo aerosols is not very informative. As an alternative, the 21Spo activity-average diffusion coefficient can be calculated from the penetration of the radioactive aerosol through the first stage of the GSA system (30-mesh wire screen, Stage 1 in Table 1), using the procedure detailed by Ramamurthi e t al. (1990). In each of the cases discussed using this analysis, the 21Spo activity-average diffusion coefficient thus calculated adequately charac- terized the penetration of the 21Spo radioactive aerosol through all GSA stages, even though it was derived solely from the Stage 1 penetration data. These results indicated the validity of representing the activity distributions by the 218po activity-average diffusion coefficients.
Table 2 shows the 218po activity-average diffusion coefficients, and equivalent neutral and charged cluster molecule diameters (from equations (1), (2), (4) and (5), respectively, or Fig. 1) measured for each of the radon-air chamber conditions; in each case the radon concentration was maintained at ~ 7400 Bq m - 3 (200 pCi 1-1). In all cases, the TSI Model 3020 CNC did not detect any ultrafine particles in the chamber. A comparison of the results in Table 2 for the first and second conditions: (a) dry air (silica gel columns), r.h. = 4%, 20°C, and (b) dry, purified air (silica gel, activated charcoal and molecular sieve 13 x columns), r.h. = 4%, 20°C, shows an increase in the diffusion coefficient in purified air. This increase in D is equivalent to a decrease in the size of PoOx cluster and is consistent with the role of impurities in the clustering process. Note that in both cases, the measured activity- average diffusion coefficient can be a result of a mixture of charged and neutral clusters, although charged clusters are likely to be only a small fraction ( < 5%) of all PoO~ clusters due to rapid neutralization in air (Chu and Hopke, 1988).
The third chamber condition, (c) dry, purified air, r.h. = 4% and 8%, 20°C, N O = 4.6 ppm + NO2 = 5 ppm, represented an attempt to produce a highly diffusive PoOx cluster aerosol by suppressing cluster formation and promoting neutralization of the PoO~ + ions. The application of N O and NO2 in the neutralization of 21Spo has been reported previously by Goldstein and Hopke (1985); Chamberlain e t al. (1957) and Wood e t al. (1975) have also
Table 2. 218po activity-average diffusion coefficients and equivalent cluster diameters measured in various radon-air mixtures under conditions without nuclei or uttrafine particle formation (no detectable CN)
Diffusion Cluster diameter coefficient Neutral Charged
Chamber conditions (cm 2 s- 1) (nm)
(a) Dried air (silica gel columns) r.h. =4% @ 20°C 0.044_+ 0.007 (b) Dried, purified air (silica gel, activated
charcoal, molecular sieve 13X); r.h=4% @ 20°C
Dried, purified air +NO=4.6 ppm+NO2=5 ppm i) r.h.=4% @ 20°C ii) r.h.=8% @ 20°C Dried, purified air r.h.=2.5% @ 20°C Dried, purified air, SO2 =2.5 ppm
r.h.=25% @ 20°C
(c)
(d) (e)
0.85 ~ 0.50
0.054 + 0.007 0.75 *
0.078 _ 0.003 0.60 * 0.074 __+ 0.004 0.60 * 0.052 __+ 0.004 0.80 *
0.038 +0.005 0.90 0.75
* Indicates diffusion coefficient-equivalent charged cluster size for this case would be less than 0.5 nm.

Nanometer and ultrafine aerosols from radon radiolysis 401
reported the suppression of "OH radical induced cluster formation by NO. As shown in Table 2, the 21apo activity-average diffusion coefficients of the PoOx cluster aerosol were considerably higher in condition c, than the cluster diffusion coefficients measured in the earlier two conditions, a or b. The diffusion-equivalent neutral duster/particle diameter for condition c is ,-, 0.6 nm, which is probably close to the actual size of a PoOx molecule.
The fourth chamber condition, (d) dry, purified air, r.h. = 25%, 20°C, represents a higher humidity than in condition b. Table 2 shows that the 21apo activity-average diffusion coefficient in this case was very close to that measured in condition b. This result indicates that the increase in water vapor concentration in condition d compared with condition b did not lead to significant additional clustering or neutralization that would have either decreased or increased the diffusion coefficient, respectively. This result suggests that the size of the polonium duster is relatively insensitive to the relative humidity. This behavior is in accord with the thermochemistry of ion hydration presented by Castleman (1991). He suggests that increasing the partial pressure of water vapor will only add a few additional water molecules and thus, will not substantially affect the diffusivity of the duster.
The final condition, (e) dry, purified air, r.h. = 25%, 20°C, SO2 = 2.5 ppm, is a case where ultrafine particle formation was anticipated but was not observed, suggesting that there was not a sufficient production rate of sulfuric acid vapor to permit nucleation as discussed in the next section. The 2tSPo activity-average diffusion coefficient in Table 2 for condition e is substantially lower than the diffusion coefficient measured in condition d, with the only difference between the two conditions being the addition of 2.5 ppm of SO2 in case e. The 2tSPo activity-average diffusion coefficient measured in condition e is equivalent to a neu- tral or charged cluster molecule diameters of ,-,0.9 nm or ~0.75 nm, respectively.
Recently, Yoon et al. (1992) observed under conditions of insufficient sulfuric acid partial pressure for ultrafine particle formation, that: (1) the neutralization rate of the PoO~ + ions is reduced by the reaction of SO2 with hydroxyl radicals, and (2) SO2 molecules can substitute for water molecules at low water vapor concentrations in clusters of PoO~ + thus leading to larger, and consequently, lower mobility cluster ions. Both of these effects would result in lower cluster diffusion coefficients, consistent with the observed decrease in the 2tSPo activity-average diffusion coefficient measured for condition e compared with that meas- ured for condition d.
Radiolytic ultrafine aerosols
The addition of SO2 to a humidifed radon-air mixture for certain conditions is known to result in the formation of ultrafine sulfuric acid aerosols through radiolytic oxidation, followed by nucleation and ultrafine particle formation (Chu et al., 1987; Hopke and Ramamurthi, 1988). Wood et al. (1975) investigated the various mechanistic pathways for this oxidation process using the beta radiolysis of water vapor and demonstrated the importance of the "OH reaction mechanism. The overall reaction, "OH+SO 2 (+ 02, H20)y~H2SO4 + HO2, can be described as (Stockwell and Calvert, 1983):
• OH + SO2(g) + ( + M)~HOSO2(+ M) (7)
HOSO2 + O2(g)~HO2 + SO3(g) (8)
SO 3 + H20 ~ H2SO,(g). (9)
Payne et al. (1992) reported recently that one .OH radical is produced for each of the 167,000 ion pairs formed in air by the passage of the alpha particle and recoiling 2tSpo nucleus resulting from the decay of a single radon-222 atom (Lind, 1961). The reaction of the hydroxyl radical with SO2 (equation (7)) and the subsequent reactions (equations (8) and (9)) can then result in the formation of sulfuric acid vapor. Homogeneous and ion-induced nucleation of the sulfuric acid vapor to form clusters has been studied by Raes and Janssens (1985, 1986). While homogeneous nucleation requires a high degree of supersaturation, binary, ion-induced nucleation involving charged clusters can occur in sub-saturation
402 M. RAMAMURTHI et al.
H 2 S O 4 and water vapor concentrations because of the lower free-energy barrier (Yue and Chan, 1979).
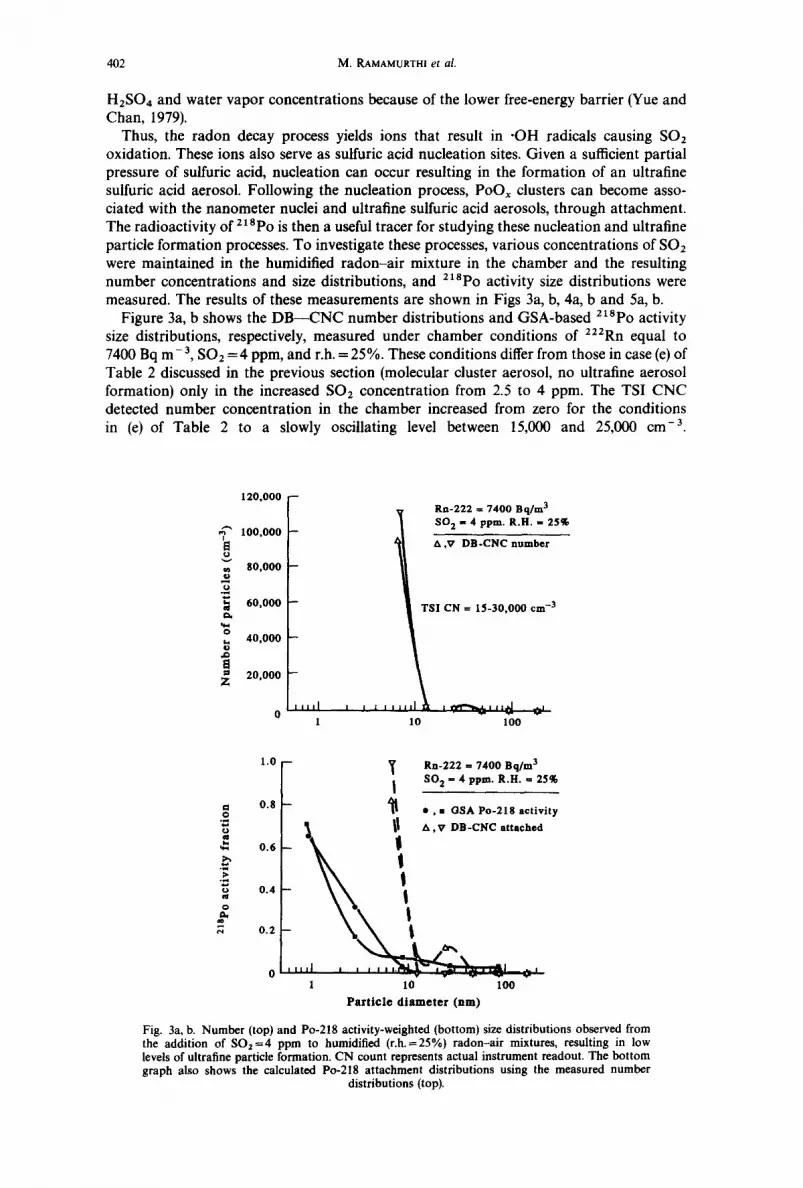
Thus, the radon decay process yields ions that result in "OH radicals causing SO2 oxidation. These ions also serve as sulfuric acid nucleation sites. Given a sufficient partial pressure of sulfuric acid, nucleation can occur resulting in the formation of an ultrafine sulfuric acid aerosol. Following the nucleation process, PoOx clusters can become asso- ciated with the nanometer nuclei and ultrafine sulfuric acid aerosols, through attachment. The radioactivity of 21Spo is then a useful tracer for studying these nucleation and ultrafine particle formation processes. To investigate these processes, various concentrations of SO2 were maintained in the humidified radon-air mixture in the chamber and the resulting number concentrations and size distributions, and 218po activity size distributions were measured. The results of these measurements are shown in Figs 3a, b, 4a, b and 5a, b.
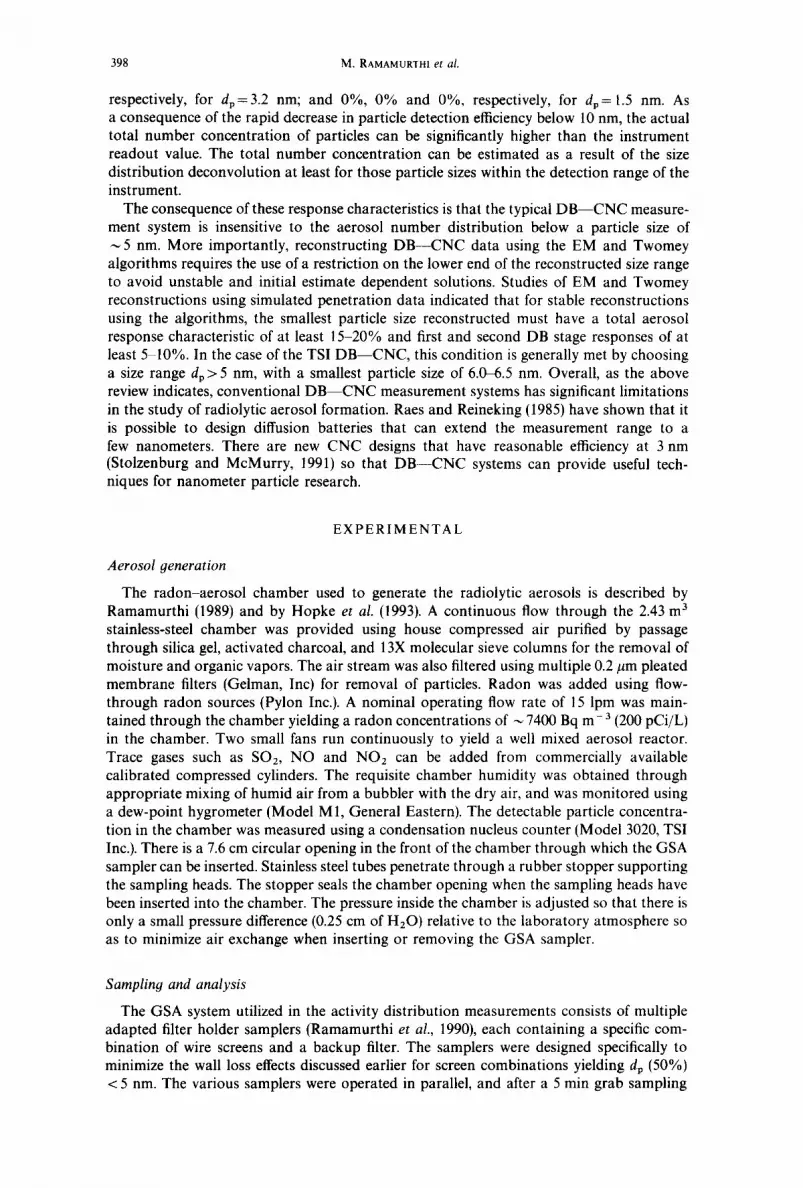
Figure 3a, b shows the DB---CNC number distributions and GSA-based 21Spo activity size distributions, respectively, measured under chamber conditions of 222Rn equal to 7400 Bq m- 3, SO2 = 4 ppm, and r.h. = 25%. These conditions differ from those in case (e) of Table 2 discussed in the previous section (molecular cluster aerosol, no ultrafine aerosol formation) only in the increased SO2 concentration from 2.5 to 4 ppm. The TSI CNC detected number concentration in the chamber increased from zero for the conditions in (e)of Table 2 to a slowly oscillating level between 15,000 and 25,000 cm -3.
120,000
~'~ 100,o00
~ so,ooo
~ 60,000
~ 40,000
~ 20 ,000 z
o
Rn-222 = 7400 Bq/m 3 SO 2 - 4 ppm. R.II. = 25%
A ,v DB-CNC number
TSI CN = 15-30,000 cm -3
l 10 100
1.0 -- ~ Rn-222 = 7400 Bq/m 3 SO 2 - 4 ppm. R.H. = 25%
0.8 - o * , • GSA Po-218 act iv i ty
" A, V DB-CNC attached
0 . 6 -
0 . 4 -
0.2 - , , , I
o . . . . . . . ~ , ~ - ~ - ~ - ~ _ i 1 10 100
P a r t i c l e d i a m e t e r (rim)
Fig. 3a, b. Number (top) and Po-218 activity-weighted (bottom) size distributions observed from the addition of SO2=4 ppm to humidified (r.h.=25%) radon-air mixtures, resulting in low levels of ultrafine particle formation. CN count represents actual instrument readout. The bottom graph also shows the calculated Po-218 attachment distributions using the measured number
distributions (top).

Nanometer and ultrafine aerosols from radon radiolysis 403
L)
e~
,0
Z
50,000
40,000
30,000
20,000
I0,000
i i l l l
1
Rn-222 ffi 7400 Bq/m 3 so2____S- . . _ _ t . .__-
~ ¢ U. Vienna DMA n u m b e r ' ~ \ V DB-CNC number
~ ffi 30-35,000 cm -3
, , , ~ , ~ d ' ~ " ~ ' " ~ V ' l0 100
o .=
.=
o t~ a o
e,I
1 .0 - -
0 . 8 - -
0.6
0.4
0.2
Rn-222 = 7400 Bq/m 3 SO 2 = 4.5 ppm. R.H. ffi 35--40%
• GSA Po-218 a c t i v i t y
V DB-CNC a t t a c h e d
-- ¢ U. Vienna DMA at tached
.o"' "~.'~_ "0"\ , , , , I , , ~ , , , , , , I , ~ , ~ . f , , ,'-~ v i -
I I0 100
Pa r t i c l e d i a m e t e r ( nm)
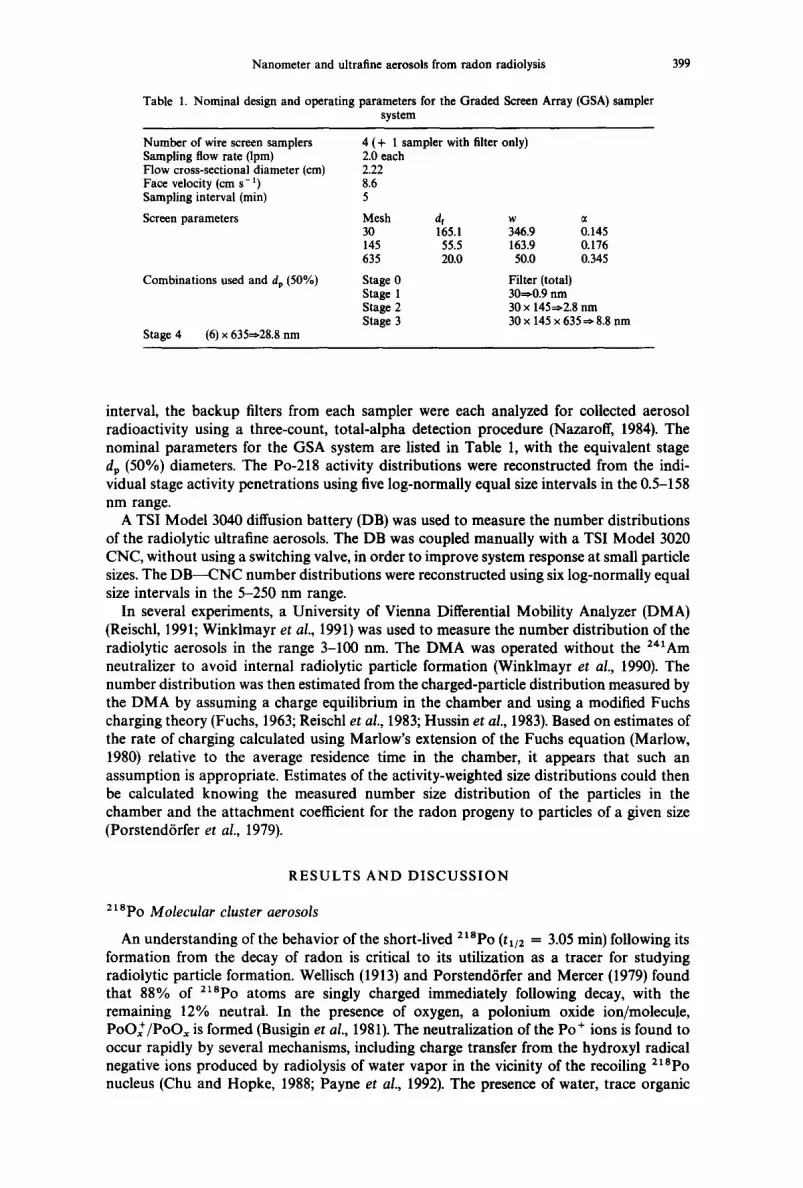
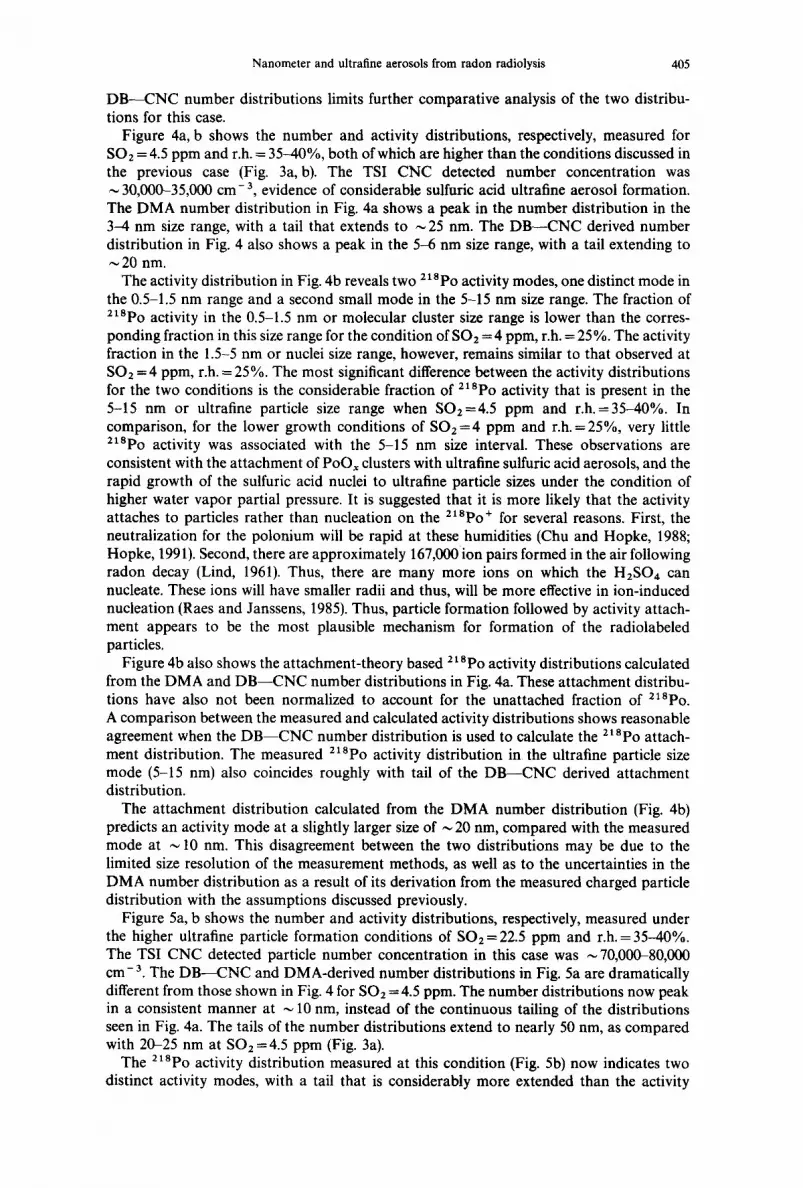
Fig. 4a, b. Number (top) and Po-218 activity-weighted (bottom) size distributions observed from the addition of SO2=4.5 ppm to humidified ( r .h .=35-40%) radon-a i r mixtures, resulting in moderate levels of ultrafine particle formation. CN count represents actual instrument readout. The bot tom graph also shows the calculated Po-218 at tachment distributions using the measured
number distributions (top).
Cyclic/oscillatory particle concentrations were also observed in previous number distribu- tion measurements of radiolytic sulfuric aerosols in the chamber at threshold nucleation conditions (Hopke, 1991) and may be characteristic of aerosol systems on the threshold of nucleation (Pratsinis et al., 1986).
At the increased SO2 concentration of 4 ppm, nuclei and ultrafine aerosol formation clearly begin to occur as manifested by the measured number and activity distributions. The two DB--CNC derived number distributions (Fig. 3a) show the total aerosol to be consistently ~5 nm in diameter. At 4 ppm SO2 and 25% r.h., the sulfuric acid partial pressure and the number of sulfuric acid nuclei being produced are clearly not sufficient for significant ultrafine particle growth. It should be noted that the reconstructed number size distributions in Fig. 3a show significantly higher total number concentrations than the TSI CNC readout because of the low CNC counting efficiency for dp < 10 nm.
The activity distributions in Fig. 3b show that the 21Spo is associated almost entirely with particles < 5 nm in diameter. The 0.5-1.5 nm size interval of the activity distributions can be interpreted as PoOx molecular clusters that are being continuously generated from radon decay in the chamber. The 1.5-5 nm size interval may correspond to PoOx clusters attached to ultrafine sulfuric acid droplets that were nucleated by the multitude of ions generated by the radon decay process.
The two GSA-based activity distributions measured at two different times in the chamber do show some differences, the most significant being the increase in activity in the 5-15 nm

404 M. RAMAMURTHI e t a l .
f v
e~
z
o
0 r~ oo
80,000
60,000
40,000
20,000
0
1.0
0.8
0.6
0.4
0.2
1 I I I I I I l l
10
Rn-222 = 7400 Bq/m 3 SO 2 = 22.5 ppm. R,H, = 35-40%
V DB-CNC number ¢ U. Vienna DMA number
TSI CN = 70-80,000 cm -3
• v
tO0
Rn-222 = 7400 Bq/m 3 SO 2 = 22.5 ppm. R.H. = 35 -40%
• GSA P0-218 activity
V DB-CHC attached
0 U. Vienna DMA attached
s~r~" ~'~
I * ~ 1 I I [ 11
1 10 tO0
P a r t i c l e d i a m e t e r ( n m )
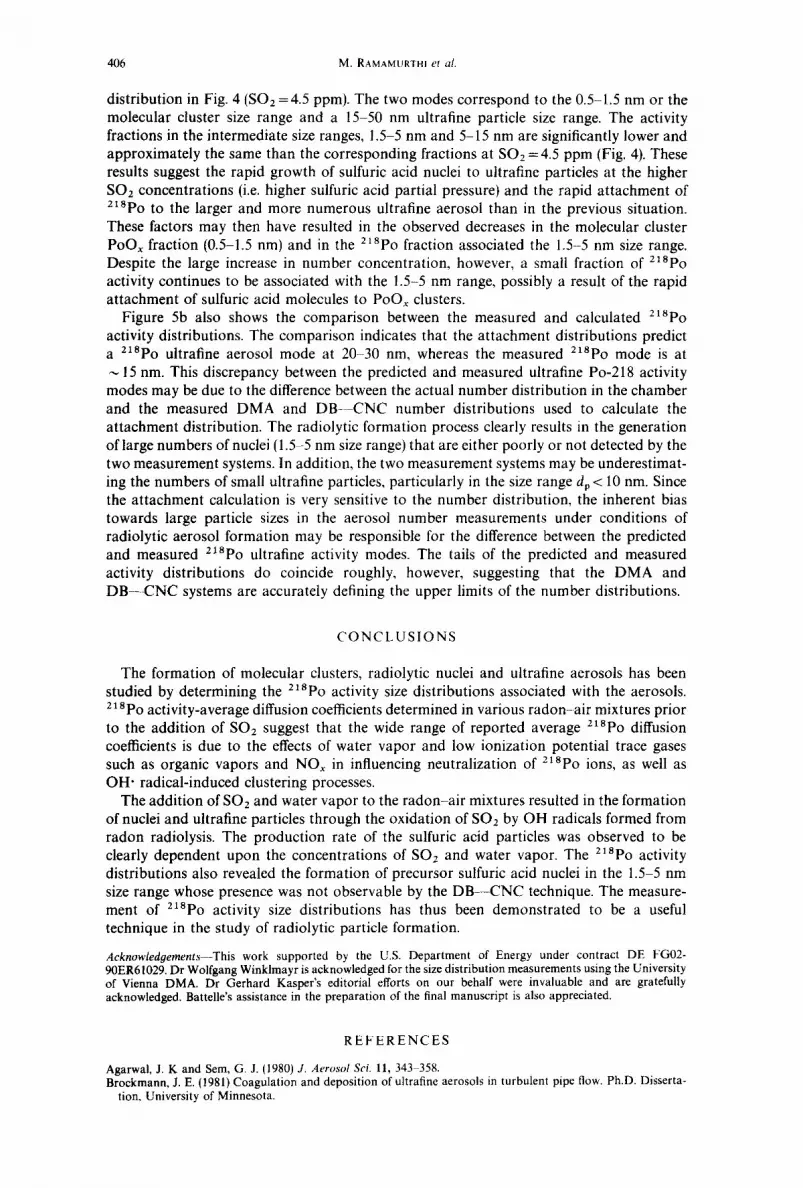
Fig. 5a, b. N u m b e r (top) and Po-218 ac t iv i ty-weighted (bot tom) size d i s t r ibu t ions observed from the add i t ion of SO 2 = 22.5 p p m to humidif ied (r.h. = 35-40%) r a d o n - a i r mixtures, resul t ing in high levels of ul trafine part icle formation. C N count represents ac tual ins t rument readout . The bo t tom graph also shows the calcula ted Po-218 a t t a chmen t d i s t r ibu t ions using the measured number
d is t r ibu t ions (top).
size range in one case, with a concomitant decrease in the activity in the 1.5-5 nm size range in this case. This observation is consistent with the oscillatory behavior of the TSI CNC detected total number concentration during this duration in the chamber. Further, previous size distribution measurements using the University of Vienna Differential Mobility Ana- lyzer (DMA) have also showed cyclic formation and disappearance of aerosol number modes at 5 and 10 nm at threshold sulfuric acid nucleation conditions (Hopke, 1991). The lack of any differences between the DB--CNC number distributions (Fig. 3a), unlike the activity distributions in Fig. 3b, may be related to the two specific sampling times when the measurements were conducted that do not coincide with those for the GSA measurements.
Figure 3b also shows the estimated 2X8po attached distribution calculated from the DB--CNC measured number distributions using the attachment theory of Porstend6rfer et al. (1979). Because the actual number of particles in the chamber cannot be determined because of the limitation of the TSI 3020 CNC, the actual rate of attachment to the particles cannot be calculated. Therefore, the calculated attachment distributions have not been normalized to account for 2tapo activity that is not attached to the aerosol (unattached fraction).
The calculated attachment distribution for SO: =4.5 ppm and r.h.=25% (Fig. 3b) is consistent with measured 2tSpo activity distribution in that all of the activity is predicted to be attached to particles < 10 rim. The lack of resolution below dp= 5 nm in the measured
Nanometer and ultrafine aerosols from radon radiolysis 405
D B - - C N C number distributions limits further comparative analysis of the two distribu- tions for this case.
Figure 4a, b shows the number and activity distributions, respectively, measured for SO2 = 4.5 ppm and r.h. = 35-40%, both of which are higher than the conditions discussed in the previous case (Fig. 3a, b). The TSI CNC detected number concentration was ~ 30,000-35,000 cm-3, evidence of considerable sulfuric acid ultrafine aerosol formation. The DMA number distribution in Fig. 4a shows a peak in the number distribution in the 3-4 nm size range, with a tail that extends to ~ 25 nm. The D B - - C N C derived number distribution in Fig. 4 also shows a peak in the 5-6 nm size range, with a tail extending to ~ 20 nm.
The activity distribution in Fig. 4b reveals two 21Spo activity modes, one distinct mode in the 0.5-1.5 nm range and a second small mode in the 5-15 nm size range. The fraction of 21Spo activity in the 0.5-1.5 nm or molecular cluster size range is lower than the corres- ponding fraction in this size range for the condition of SO2 = 4 ppm, r.h. = 25 %. The activity fraction in the 1.5-5 nm or nuclei size range, however, remains similar to that observed at SO2 = 4 ppm, r.h. = 25%. The most significant difference between the activity distributions for the two conditions is the considerable fraction of 21Spo activity that is present in the 5-15 nm or ultrafine particle size range when SO2=4.5 ppm and r.h.=35-40% . In comparison, for the lower growth conditions of S O 2 =4 ppm and r.h.=25% , very little 2XSpo activity was associated with the 5-15 nm size interval. These observations are consistent with the attachment of PoOr dusters with ultrafine sulfuric acid aerosols, and the rapid growth of the sulfuric acid nuclei to ultrafine particle sizes under the condition of higher water vapor partial pressure. It is suggested that it is more likely that the activity attaches to particles rather than nucleation on the 2~apo+ for several reasons. First, the neutralization for the polonium will be rapid at these humidities (Chu and Hopke, 1988; Hopke, 1991). Second, there are approximately 167,00Oion pairs formed in the air following radon decay (Lind, 1961). Thus, there are many more ions on which the H2SO4 can nucleate. These ions will have smaller radii and thus, will be more effective in ion-induced nucleation (Raes and Janssens, 1985). Thus, particle formation followed by activity attach- ment appears to be the most plausible mechanism for formation of the radiolabeled particles.
Figure 4b also shows the attachment-theory based 21Spo activity distributions calculated from the DMA and DB---CNC number distributions in Fig. 4a. These attachment distribu- tions have also not been normalized to account for the unattached fraction of 2tSpo. A comparison between the measured and calculated activity distributions shows reasonable agreement when the D B - - C N C number distribution is used to calculate the 2~Spo attach- ment distribution. The measured 2~Spo activity distribution in the ultrafine particle size mode (5-15 nm) also coincides roughly with tail of the D B - - C N C derived attachment distribution.
The attachment distribution calculated from the DMA number distribution (Fig. 4b) predicts an activity mode at a slightly larger size of ~ 20 nm, compared with the measured mode at ~ 10 nm. This disagreement between the two distributions may be due to the limited size resolution of the measurement methods, as well as to the uncertainties in the DMA number distribution as a result of its derivation from the measured charged particle distribution with the assumptions discussed previously.
Figure 5a, b shows the number and activity distributions, respectively, measured under the higher ultrafine particle formation conditions of SO2 = 22.5 ppm and r.h. = 35-40%. The TSI CNC detected particle number concentration in this case was ~ 70,000-80,000 cm-3. The DB---CNC and DMA-derived number distributions in Fig. 5a are dramatically different from those shown in Fig. 4 for SO2 = 4.5 ppm. The number distributions now peak in a consistent manner at ~ 10 nm, instead of the continuous tailing of the distributions seen in Fig. 4a. The tails of the number distributions extend to nearly 50 nm, as compared with 20-25 nm at SO2 = 4.5 ppm (Fig. 3a).
The 2 X Spo activity distribution measured at this condition (Fig. 5b) now indicates two distinct activity modes, with a tail that is considerably more extended than the activity
406 M. RAMAMURTHI et al.
distribution in Fig. 4 (SO2 = 4.5 ppm). The two modes correspond to the 0.5-1.5 nm or the molecular cluster size range and a 15-50 nm ultrafine particle size range. The activity fractions in the intermediate size ranges, 1.5-5 nm and 5-15 nm are significantly lower and approximately the same than the corresponding fractions at SO2 = 4.5 ppm (Fig. 4). These results suggest the rapid growth of sulfuric acid nuclei to ultrafine particles at the higher SO2 concentrations (i.e. higher sulfuric acid partial pressure) and the rapid attachment of 218po to the larger and more numerous ultrafine aerosol than in the previous situation. These factors may then have resulted in the observed decreases in the molecular cluster PoOx fraction (0.5-1.5 nm) and in the 21SPo fraction associated the 1.5-5 nm size range. Despite the large increase in number concentration, however, a small fraction of 218po
activity continues to be associated with the 1.5-5 nm range, possibly a result of the rapid attachment of sulfuric acid molecules to PoO,. clusters.
Figure 5b also shows the comparison between the measured and calculated 218po
activity distributions. The comparison indicates that the attachment distributions predict a 2~8po ultrafine aerosol mode at 20-30 nm0 whereas the measured 2~8po mode is at
15 nm. This discrepancy between the predicted and measured ultrafine Po-218 activity modes may be due to the difference between the actual number distribution in the chamber and the measured DMA and D B - C N C number distributions used to calculate the attachment distribution. The radiolytic formation process clearly results in the generation of large numbers of nuclei (1.5-5 nm size range) that are either poorly or not detected by the two measurement systems. In addition, the two measurement systems may be underestimat- ing the numbers of small ultrafine particles, particularly in the size range dp < 10 nm. Since the attachment calculation is very sensitive to the number distribution, the inherent bias towards large particle sizes in the aerosol number measurements under conditions of radiolytic aerosol formation may be responsible for the difference between the predicted and measured 2~apo ultrafine activity modes. The tails of the predicted and measured activity distributions do coincide roughly, however, suggesting that the DMA and D B - - C N C systems are accurately defining the upper limits of the number distributions.
C O N C L U S I O N S
The formation of molecular clusters, radiolytic nuclei and ultrafine aerosols has been studied by determining the 218po activity size distributions associated with the aerosols. 218po activity-average diffusion coefficients determined in various radon-air mixtures prior to the addition of SO2 suggest that the wide range of reported average 218p0 diffusion coefficients is due to the effects of water vapor and low ionization potential trace gases such as organic vapors and NOx in influencing neutralization of 218p0 ions, as well as OH" radical-induced clustering processes.
The addition of SO2 and water vapor to the radon-air mixtures resulted in the formation of nuclei and ultrafine particles through the oxidation of SO: by OH radicals formed from radon radiolysis. The production rate of the sulfuric acid particles was observed to be clearly dependent upon the concentrations of SO2 and water vapor. The 218p0 activity distributions also revealed the formation of precursor sulfuric acid nuclei in the 1.5-5 nm size range whose presence was not observable by the D B- -CN C technique. The measure- ment of 218p0 activity size distributions has thus been demonstrated to be a useful technique in the study of radiolytic particle formation.
Acknowledgements--This work supported by the U.S. Department of Energy under contract DE FG02- 90ER61029. Dr Wolfgang Winklmayr is acknowledged for the size distribution measurements using the University of Vienna DMA. Dr Gerhard Kasper's editorial efforts on our behalf were invaluable and are gratefully acknowledged. Battelle's assistance in the preparation of the final manuscript is also appreciated.
R E F E R E N C E S
Agarwal, J. K and Sere, G. J. (1980) J. Aerosol Sci. 11, 343 358. Brockmann, J. E. (1981) Coagulation and deposition of ultrafine aerosols in turbulent pipe flow. Ph.D. Disserta-
tion, University of Minnesota.

Nanometer and ultrafine aerosols from radon radiolysis 407
Bartz, H., Fissan, H., Helsper, C., Kousaka, Y., Okuyama, K., Fukushima, N., Keady, P. B., Kerrigan, S., Fruin, S. A., McMurry, P. H., Pui, D. Y. H. and Stolzenburg, M. R. (1985) J. Aerosol Sci. 5, 443-456.
Busigin, A., van der Vooren, A. W., Babcock, J. C. and Phillips, C. R. (1981) HIth Phys. 40, 333-343. Castleman, Jr, A. W. (1991) Envir. Sci. Technol. 25, 730-735. Chamberlain, A. C., Megaw, W. J. and Wiffen, R. D. (1957) Geofis. puru e appl. 36, 233-242. Chapmann, S. and Cowling, T. G. (1958) The Mathematical Theory of Non-uniform Gases. Cambridge University
Press, Cambridge. Cheng, Y. S. and Yeh, H. C. (1980) J. Aerosol Sci. 11, 313-319. Cheng, Y. S., Keating, J. A. and Kanapilly, G. M. (1980) J. Aerosol Sci. 11, 549-564. Chu, K. D. and Hopke, P. K. (1988) Envir. Sci. Technol. 22, 711-717. Chu, K. D., Hopke, P. K., Knutson, E. O., Tu, K. W. and Holub, R. F. (1987) In: Radon and Its Decay Products:
Occurrence, Properties and Health Effects (Edited by Hopke, P. K.), pp. 365-376. American Chemical Society, Washington, D.C.
Coghlan, M. and Scott, J. A. (1983) In Prec. Atmospheric Electricity (Edited by Ruhnke, L. H. and Latham, J.). A. Deepak, Hampton, VA.
Friedlander, S. K. (1977) Smoke, Dust and Haze. John Wiley, New York. Fuchs, N. A. (1963) Geofis. Pura Appl. 56, 185. Goldstein, S. D. and Hopke, P. K. (1985) Envir. Sci. Technol. 19, 146-150. Holub, R. F. and Knutson, E. O. (1987) In Radon and its Decay Products: Occurrence, Properties and Health Effects
(Edited by Hopke, P. K.), pp. 341-356. American Chemical Society, Washington, D.C. Hopke, P. K. (1991) In Indoor Air Pollution (Edited by Kay, J. G., Keller, G. E. and Miller, J. F.), pp. 141-169.
Lewis, Chelsea, MI. Hopke, P. K. and Ramamurthi, M. (1988) J. Aerosol Sci. 19, 1323. Hopke, P. K., Strydom, R., Ramamurthi, M., Knutson, E. O., Tu, K. W., Scofield, P., Holub, R. F., Cheng, Y. S., Su,
Y. F. and Winklmayr, W. (1993) Hlth Phys. 63, 560-570. Hussin, A., Scheibel, H. G., Becker K. H. and Porstend6rfer, J. (1983) J. Aerosol Sci. 14, 671-677. Ingham, D. B. (1975) J. Aerosol Sci. 6, 125-132. Kapadia, A. (1980) Ph.D. Thesis, University of Minnesota, Minneapolis, MN. Leong, K. H., Hopke, P. K., Stukel, J. J. and Wang, H. C. (1983) J. Aerosol Sci. 14, 23-27. Lind, S. C. (1961) Radiation Chemistry of Gases. Reinhold, New York. Loeb, L. B. (1961) The Kinetic Theory of Gases, 3rd Ed., p. 554. Dover New York, Maher, E. F. and Laird, N. M. (1986) J. Aerosol Sci. 16, 557-570. Marlow, W. H. (1980) J. Chem. Phys. 73, 6284-6287. Megaw, W. J. and Wiffen, R. D. (1961) Geofisica pura e appl 50, 118-128. Nazaroff, W. W. (1984) Hlth Phys. 24, 387-395. Nolan P. J. and PoUak, L. W. (1946) Prec. Royal Irish Acad. 51A, 9. Payne, M. G., Allman, S. L. and Chen, C. H. (1992) In FY-90 Radon Research Program. U.S. Department of Energy
Report No, DOE/ER-0488P, 130. Perrin, M. L., Margne, J. P. and Madelaine, G. J. (1978) J. Aerosol Sci. 9, 429-433. Porstend6rfer, J. (1968) Z. Physik 213, 384-396 (in German). Porstend6rfer, J. and Mercer, T. T. (1979) I-llth Phys. 37, 191-199. Porstend6rfer, J., R6big, G. and Ahmed, A. (1979) J. Aerosol Sci. 10, 21-28. Pratsinis, S. E., Friedlander, S. K. and Pearlstein, A. J. (1986) AICHE J. 32, 177-185. Raabe, O. G. (1969) Hlth Phys. 17, 177-185. Raes, F. and Janssens, A. (1985) J. Aerosol Sci. 16, 217-227. Raes, F. and Janssens, A. (1986) J. Aerosol Sci. 17, 715-722. Raes, F. and Reineking, A. (1985) Atmos. Envir. 19, 385-388. Ramamurthi, M. (1989) Detection and measurement of the activity size distributions (d~ > 0.5 nm) associated with
radon decay products in indoor air. Ph.D. Thesis, University of Illinois at Urbana-Champaign. Ramamurthi, M. and Hopke, P. K. (1989) Hlth Phys. 56, 189. Ramamurthi, M. and Hopke, P. K. (1990) Aerosol Sci. Technol. 12, 700-710. Ramamurthi, M., Strydom, R. and Hopke, P. K. (1990) J. Aerosol Sci. 21, 203-211. Reineking, A. and Porstend6rfer, J. (1986) J. Aerosol Sci. 17, 873-879. Reischl, G. P. (1991) Aerosol Sci. Technol. 14, 5-24. Reischl, G. P., Scheibel, H. G. and Porstend6rfer, J. (1983) J. Colloid Interface Sci. 91, 272. Scheibel, H. G. and Porstend6rfer, J. (1984) J. Aerosol Sci. 15, 549-556. Soderholm, S. (1983) In Aerosols--In the Mining and Industrial Work Environments, Vol. 3, Instrumentation (Edited
by Marple, V. A. and Liu. B. Y. H.), pp. 1095-1115. Ann Arbor Science, Ann Arbor, MI. Stockwell, W. and Calvert, J. (1983) Atmos. Envir. 17, 2231-2235. Stolzenburg, M. R. and McMurry, P. H. (1991) Aerosol Sci. Technol. 14, 48-65. Su, Y. F., Cheng, Y, S., Newton, G. J. and Yeh, H. C. (1990) Aerosol Sci. Technol. 12, 1050-1054. Subba Ramu, M. C. and Muraleedharan, T. S. (1986) J. Aerosol Sci. 17, 745-751. Sutherland, W. (1910) Phil. Mag. 19, 25-26. Wellisch, E. M. (1913) Phil. Mag. 6, 623-635. Winklmayr, W., Ramamurthi, M., Strydom, R. and Hopke, P. K. (1990) Aerosol Sci. Technol. 13, 394--398. Winklmayr, W., Reischl, G. P., Lindner, A. O. and Berner, A. (1991) J. Aerosol Sci. 22, 289-296. Wood, W. P., Castleman, A. W. and Tang, I. N. (1975) J. Aerosol Sci. 6, 367-374. Yoon, S. C., Marlow, W. H. and Hopke, P. K. (1992) Hlth Phys. 62, 51-57. Yue, G. K. and Chan, L. Y. (1979) J. Colloid Interface Sci. 68, 501-507.