nature medicine advance online publication gaba from reactive astrocytes impairs memory in mouse...
TRANSCRIPT
NATURE MEDICINE ADVANCE ONLINE PUBLICATION 1
1Department of Biological Sciences, Korea Advanced Institute of Science and Technology (KAIST), Daejeon, Republic of Korea. 2WCI Center for Functional Connectomics, Brain Science Institute, Korea Institute of Science and Technology (KIST), Seoul, Republic of Korea. 3Center for Neuro-Medicine, Brain Science Institute, KIST, Seoul, Republic of Korea. 4Neuroscience Program, Korea University of Science and Technology, Daejeon, Republic of Korea. 5Center for Neuroscience, Brain Science Institute, KIST, Seoul, Republic of Korea. 6Department of Anatomy and Neurobiology, School of Dentistry, Kyungpook National University, Daegu, Republic of Korea. 7Department of Science in Korean Medicine, Graduate School, College of Korean Medicine, Kyung Hee University, Seoul, Republic of Korea. 8Department of Bio and Brain Engineering, KAIST, Daejeon, Republic of Korea. 9Boston University Alzheimer’s Disease Center, Boston University School of Medicine, Boston, Massachusetts, USA. 10Department of Neurology, Boston University School of Medicine, Boston, Massachusetts, USA. 11VA Boston Healthcare System, Boston, Massachusetts, USA. 12KU-KIST Graduate School of Converging Science of Technology, Korea University, Seoul, Republic of Korea.13These authors contributed equally to this work. Correspondence should be addressed to C.J.L. ([email protected]) or D.K. ([email protected]). Received 10 January; accepted 23 June; published online 29 June 2014; doi:10.1038/nm.3639
GABA from reactive astrocytes impairs memory in mouse models of Alzheimer’s diseaseSeonmi Jo1,2,13, Oleg Yarishkin2,13, Yu Jin Hwang3, Ye Eun Chun2,4, Mijeong Park4,5, Dong Ho Woo2, Jin Young Bae6, Taekeun Kim2, Jaekwang Lee2, Heejung Chun2, Hyun Jung Park7, Da Yong Lee2, Jinpyo Hong2, Hye Yun Kim3, Soo-Jin Oh5, Seung Ju Park2, Hyo Lee2, Bo-Eun Yoon2, YoungSoo Kim3, Yong Jeong8, Insop Shim7, Yong Chul Bae6, Jeiwon Cho4,5, Neil W Kowall9–11, Hoon Ryu3,9–11, Eunmi Hwang2, Daesoo Kim1 & C Justin Lee2,4,5,12
In Alzheimer’s disease (AD), memory impairment is the most prominent feature that afflicts patients and their families. Although reactive astrocytes have been observed around amyloid plaques since the disease was first described, their role in memory impairment has been poorly understood. Here, we show that reactive astrocytes aberrantly and abundantly produce the inhibitory gliotransmitter GABA by monoamine oxidase-B (Maob) and abnormally release GABA through the bestrophin 1 channel. In the dentate gyrus of mouse models of AD, the released GABA reduces spike probability of granule cells by acting on presynaptic GABA receptors. Suppressing GABA production or release from reactive astrocytes fully restores the impaired spike probability, synaptic plasticity, and learning and memory in the mice. In the postmortem brain of individuals with AD, astrocytic GABA and MAOB are significantly upregulated. We propose that selective inhibition of astrocytic GABA synthesis or release may serve as an effective therapeutic strategy for treating memory impairment in AD.
AD is the most common cause of dementia and is characterized by a progressive decline of memory and other cognitive functions1. To date, the causes of memory impairment have been extensively investi-gated, and the proposed mechanisms include neuronal death induced by b-amyloid (Ab) oligomer toxicity, glutamate excitotoxicity, oxi-dative stress2, synaptic dysfunction by Ab3, and tau pathology4. Whereas neuronal death has taken center stage in many previous studies, a possible role of glia in memory impairment has been gen-erally overlooked. However, in the brains of subjects with AD, glia undergo prominent changes in morphology and gene expression5. Astrocytes become reactive, particularly around amyloid plaques, as indicated by a hypertrophy of the main processes and increased glial fibrillary acidic protein (GFAP) expression6,7. Moreover, astrocytes of Alzheimer’s model mice show an elevated resting Ca2+ level, more frequent Ca2+ transients and enhanced intercellular Ca2+ waves8, all of which may potentially lead to an enhanced release of various gliotransmitters, such as glutamate, d-serine, ATP and GABA9–12. Consequently, changes in gliotransmitter release are expected after reactive astrocytosis in AD, but to date, this research avenue has not been extensively explored.
Among these gliotransmitters, GABA is the major inhibitory transmit-ter in the adult mammalian brain13, and subjects with AD show elevated GABA levels in their cerebrospinal fluid14, although the mechanism of GABA elevation is unknown. In Alzheimer’s model mice, administra-tion of the GABAA receptor antagonist was shown to improve hippo-campal long term potentiation and memory15, suggesting that aberrant GABAergic inhibition impairs memory in patients with AD. However, antagonizing GABA receptors would not be an effective method of treat-ment owing to the risk of seizures. If the source of elevated GABA in the cerebrospinal fluid is found, this source could be specifically tar-geted for treatment. We recently reported that high levels of GABA are tonically released from glia in the cerebellum through Ca2+-activated, GABA-permeable bestrophin 1 (Best1) channels12, whereas a low level of tonic GABA release is observed in the hippocampus under normal conditions16. Therefore, we hypothesized that an abnormal increase in tonic GABA release from reactive astrocytes in the hippocampus may be directly responsible for the memory impairment in AD.
To investigate this issue, we examined APP/PS1 mice, a widely used model of AD in which the mice carry mutations in amyloid precursor protein and g-secretase. These mutations are associated with familial AD
A R T I C L E Snp
g©
2014
Nat
ure
Am
eric
a, In
c. A
ll rig
hts
rese
rved
.
2 ADVANCE ONLINE PUBLICATION NATURE MEDICINE
4 months (Supplementary Fig. 1a,b). Although the number of plaques grew with age (Supplementary Fig. 1b), most were concentrated in the lacunosum moleculare and the dentate gyrus (DG) before the age of 11 months (Fig. 1a and Supplementary Fig. 1c,d). At all ages, numer-ous reactive astrocytes were clustered around the amyloid plaques (Supplementary Fig. 2a,b). Other studies consistently report that DG is one of the first and most plaque-deposited areas both in Alzheimer’s model mice and in the brains of subjects with AD20–22. DG is known as the principal gateway of cortical input to the hippocampus and is critical for the formation and recall of memory23,24. In DG of APP/PS1 mice, neuronal death was not detected at all until 12 months of age21, even though cognitive impairments were readily observed as early as 8 months
in humans17. As they grow older, APP/PS1 mice show similar pathologi-cal characteristics to humans with AD, such as amyloid plaques, reactive astrocytes in the brain18 and impaired spatial learning and memory19, without significant neuronal loss20. To circumvent the possible limita-tions of using only one model of APP/PS1, we also employed the 5XFAD mouse model, a primary cell culture system and human tissue samples.
RESULTSTonic GABA release is aberrantly increasedFirst, we investigated the time course of amyloid deposition and the presence of reactive astrocytes in the hippocampus of APP/PS1 mice. Thioflavin-S staining showed that plaques began to appear at the age of
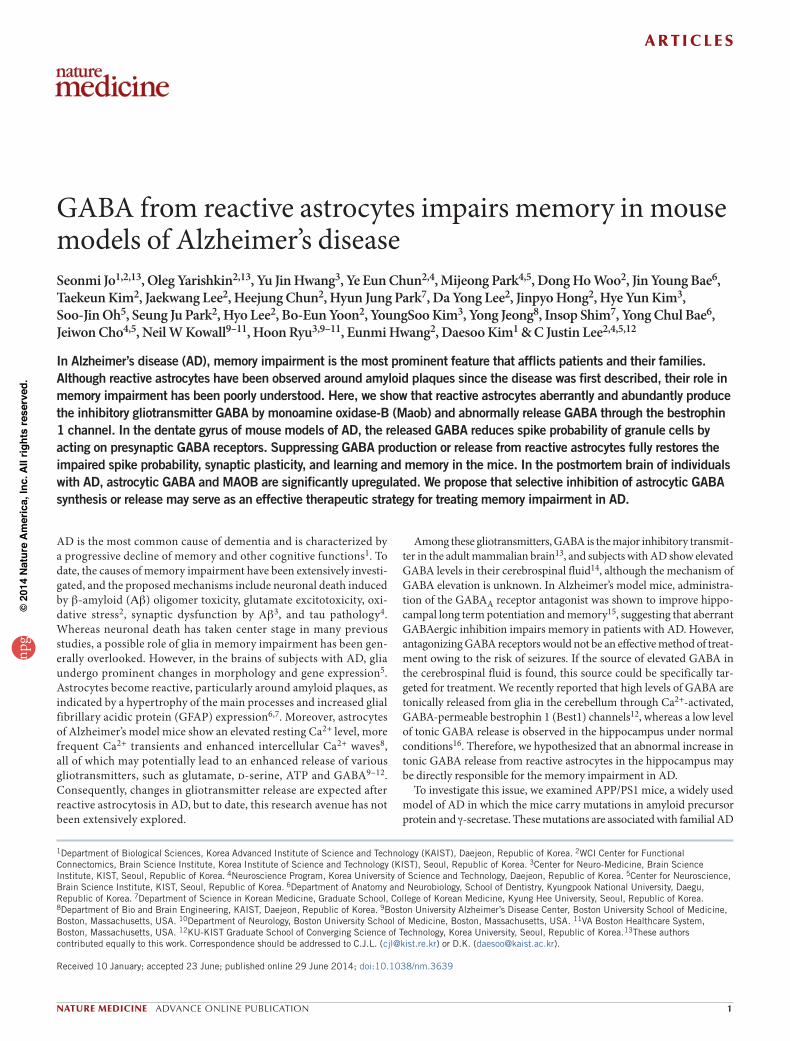
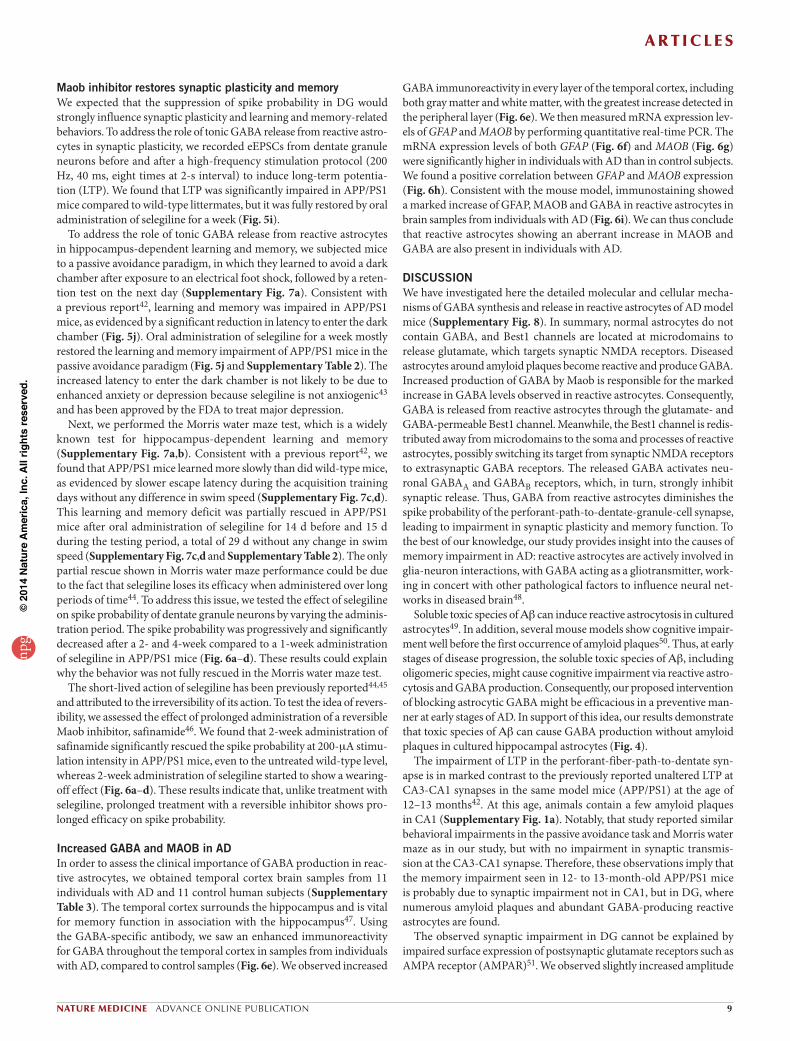
Figure 1 Increased tonic GABA release and GABA immunoreactivity in reactive astrocytes. (a) Thioflavin-S staining of amyloid plaques (yellowish green) in the hippocampus. Dotted line indicates DG (n ≥ 10 for each group; males at 10 months of age; scale bar, 200 mm). (b) In vivo microdialysis (males at 10–11 months of age). Left, validation of microdialyzed sites by cresyl violet staining (scale bar, 200 mm). Middle, GABA levels in dialysate measured by HPLC. ***P < 0.001 (Student’s t-test). Right, glutamate levels. NS, P > 0.05 (Student’s t-test). [GABA]o or [Glutamate]o, the concentrations of GABA or glutamate in outer space of cells. WT, wild type. (c) Representative trace of GABAA receptor–mediated current recorded from granule cells of the DG (n = 4 for WT; n = 7 for APP/PS1; both sexes at 8.5–13 months of age). Dashed lines and arrows indicate baseline shift with bicuculline (100 mM) application (gray bar). (d) Left, frequency of sIPSCs before bicuculline application. Right, amplitude of sIPSCs before bicuculline application. (e) Left, amplitude of tonic GABA current. *P < 0.05 (Student’s t-test). Right, density of tonic GABA current measured by dividing current amplitude by membrane capacitance. *P < 0.05 (Student’s t-test). (f–h) Immunostaining and quantification of images taken from the molecular layer of DG (n = 5 for each group; both sexes at 8–11 months of age). (f) Representative confocal images of Gfap-, GABA- and thioflavin-S–stained plaques (scale bar, 20 mm). SR, striatum radiatum; SLM, striatum lacunosum moleculare; Py, pyramidal neuron layer; MoDG, molecular layer of dentate gyrus; GrDG, granule cell layer of dentate gyrus. (g) High-magnification images of an astrocyte. Arrowheads indicate GABAergic neurons (scale bar, 5 mm). (h) Top, mean intensity of GABA in GFAP-positive areas. **P < 0.01, *P < 0.05 (Student’s t-test). AU, arbitrary units. Middle, mean intensity of interneuronal GABA. Bottom, mean intensity of Gfap. (i) Left, representative western blots of Gfap in the DG (n = 3 for each group; both sexes at 11–11.5 months of age). Right, quantification of Gfap by densitometry. *P < 0.05 (Student’s t-test). (j) Left, a graticule with 20-mm density (gray) focused at the center of plaque (asterisks) was applied to confocal images (scale bar, 20 mm). Right, normalized intensity of astrocytic GABA according to the distance from the center of a plaque. 0% indicates background intensity, and 100% indicates the mean intensity of neuronal GABA in the same confocal image. Number on each bar refers to the number of mice (b,i), slices (d), images (h top and bottom, j), and cells (h middle) analyzed. n refers to the number of animals studied. Data are means ± s.e.m.
Wild-type APP/PS1
Probe
WT APP/PS1 WT APP/PS10
0.025
0.050
0.075
0.100
[GAB
A]o (μ
g m
l—1 )
0
0.5
1.0
1.5
2.0 NS
[Glu
tam
ate]
o (μ
g m
l—1 )
Wild-type
APP/PS1
100 μM bicuculline
10 pA10 s
NS NS
0
1
2
3
sIPS
C fr
eque
ncy
(Hz)
0
10
20
30
40
WT
APP/PS1WT
APP/PS1
sIPS
C a
mpl
itude
(pA)
WT
APP/PS1WT
APP/PS10
5
10
15
0
0.2
0.4
0.6
Toni
c cu
rrent
(pA)
Toni
c cu
rrent
dens
ity (p
A pF
—1 )
Wild-type APP/PS1 Wild-type APP/PS1
Gfa
p G
ABA
Plaq
ue
WT
APP/PS1
WT
APP/PS1
WT
APP/PS1
NS
0
100
200
300
0
25
50
0
20
40
Inte
nsity
of
Gfa
p (A
U)
Inte
nsity
of
neur
onal
GAB
A (A
U)
Inte
nsity
of G
ABA
inG
fap+ p
ixel
s (A
U)
Wild-typ
e
APP/PS1
Gfap
Gapdh
WT
APP/PS10
0.5
1.0
1.5
2.0
Gfa
p ex
pres
sion
norm
aliz
ed to
Gap
dh Gfap GABA DAPI
0
30
60
90
120
20 40 60 80 WTDistance from plaque (μm)
Inte
nsity
of
astro
cytic
GAB
A (%
)
Wild-type (n = 11)APP/PS1 (n = 10)
a b c
d
e
f g h
i j
A R T I C L E Snp
g©
2014
Nat
ure
Am
eric
a, In
c. A
ll rig
hts
rese
rved
.
NATURE MEDICINE ADVANCE ONLINE PUBLICATION 3
in DG are due to an increase in phasic or tonic release, we performed whole-cell voltage-clamp recordings from granule cells of DG. To iso-late GABAA receptor–mediated currents, we made the recordings in the presence of the ionotropic glutamate receptor antagonists d-AP5 and CNQX (Fig. 1c), as described previously12. We found that the fre-quency and amplitude of spontaneous inhibitory post-synaptic currents (sIPSCs) were not altered in APP/PS1 mice compared to wild-type lit-termates (Fig. 1d). However, the tonic current, revealed by blocking with bicuculline (100 mM), was significantly larger in APP/PS1 mice (Fig. 1e). These findings suggest that an aberrant elevation of GABA levels in DG of APP/PS1 mice might be responsible for the increase in tonic GABA current.
Reactive astrocytes abnormally release GABAUnder normal conditions, cerebellar astrocytes contain high levels of GABA, whereas hippocampal astrocytes contain very little GABA, and the amount of astrocytic GABA positively correlates with the degree of
of age25. Consistent with a previous study21, we confirmed that at the age of 11 or 12 months, APP/PS1 mice showed no sign of neuronal death in their hippocampus, including DG (Supplementary Fig. 1e). For this reason, we focused our efforts on DG, where we observed many reactive astrocytes before 12 months of age with no observed neuronal death.
To determine whether GABA levels are altered in APP/PS1 mice, we collected interstitial fluid samples from DG of freely moving APP/PS1 mice and wild-type littermates by microdialysis, which enables mini-mally invasive sampling in vivo (Fig. 1b). HPLC analysis of the samples revealed that APP/PS1 mice showed significantly elevated GABA levels when compared with their wild-type littermates (Fig. 1b). Glutamate levels were unaltered (Fig. 1b).
In the central nervous system, GABA has two distinct modes of release: phasic and tonic. Phasic release refers to synaptic release from presynaptic terminals. Tonic release is a sustained form of inhibition13, which was recently demonstrated to be mediated by astrocytic release through the Best1 channel12. To discover whether elevated GABA levels
AstrocytePatch
TFLLRHEK 293TGABAC
Released GABA
Wild-type APP/PS1
APP/PS1 + NPPB5 s10 pA
1 nA10 s
100 μM GABA
% o
f ful
l act
ivat
ion
0
2
4
6
WTAPP/PS1
— NPPBWT
APP/PS1
— NPPB0
20
40
60%
of G
ABA-
rele
asin
gce
lls (c
riter
ia =
3%
)
WT
APP/PS10
1
2
3
4
5
Best
1 m
RN
A(re
lativ
e ex
pres
sion
leve
l)Wild-type APP/PS1 Wild-type APP/PS1
Cel
l bod
yPr
oces
sM
icro
dom
ain
Gfap-positive
Punctatestaining
0
204060
80
100
% B
est1
+ are
a
Cell body Process Micro–domain
Cell body Process Micro–domain
Wild-typeAPP/PS1
Wild-typeAPP/PS1
0
204060
80
100
0
204060
80
100
% o
f sur
face
cha
nnel
Best
1 de
nsity
(num
bers
μm
—2 )
Wild-typeAPP/PS1
a b
c d
e f
NS
NSNSNS NS
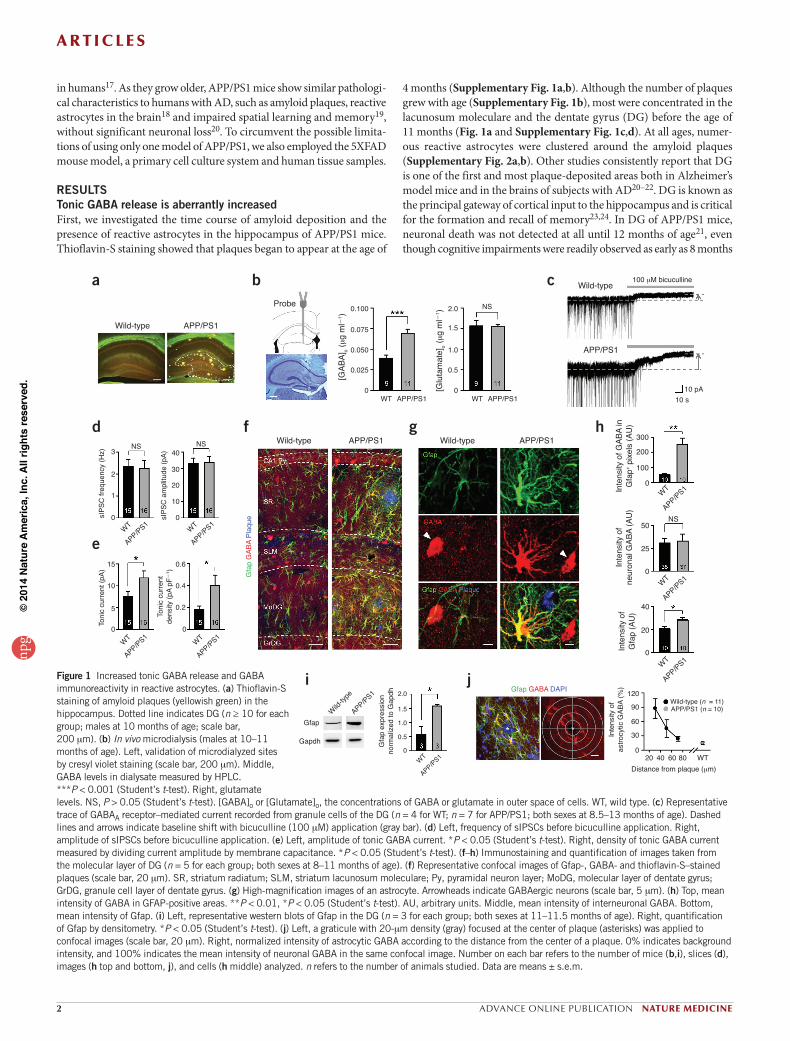
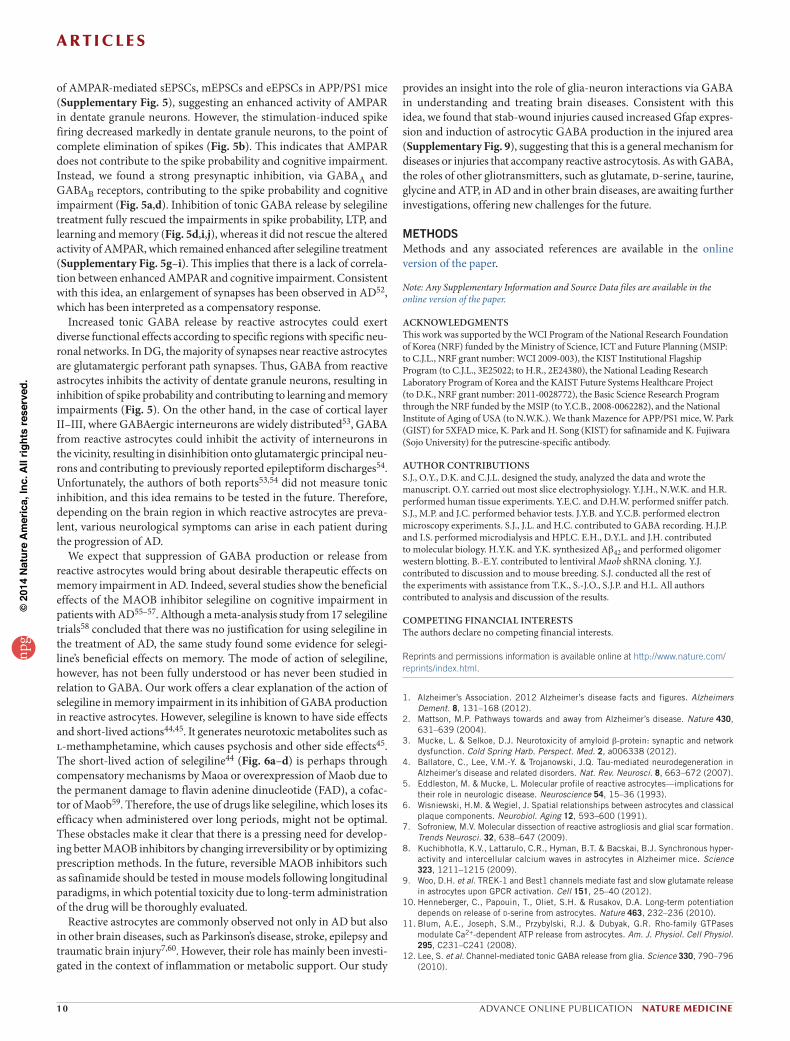
Figure 2 GABA is released from reactive astrocytes via redistributed Best1 channel. (a) Schematic diagram of sniffer-patch technique. Left pipette (yellow): pressure application of TFLLR to astrocyte (gray). Right pipette: recording pipette for HEK 293T cell expressing GABAC (green, sensor cell). (b) Representative trace of sensor current recorded in HEK 293T cell and induced by GABA from an astrocyte of wild-type, APP/PS1 and APP/PS1 with NPPB treatment (50 mM). Diamonds, TFLLR puffing (500 mM, 100 ms, 10 pounds per square inch (p.s.i.)). Inset, full activation of sensor by applying GABA (100 mM, red bar). (c) Left, peak amplitude of GABAC current normalized to full activation. *P < 0.05, ***P < 0.001 (Student’s t-test). Right, percentage of GABA-releasing astrocytes of which peak amplitude measured by sensor cell is higher than 3% of full activation. For b and c, n = 2 for WT; n = 4 for APP/PS1; n = 2 for APP/PS1 + NPPB; males at 8–18 months of age. (d) Quantitative real-time PCR (n = 5 for wild-type; n = 3 for APP/PS1; both sexes at 11–11.5 months of age). Relative expression level of Best1 mRNA in DG. (e) Immunostaining and quantification of Best1 in the molecular layer of DG (both sexes at 9 months of age; scale bar, 10 mm). Top, representative confocal images of an astrocyte. Bottom, percentage of Best1-positive areas in cell body and process or in microdomain over total area. **P < 0.01 (Student’s t-test). (f) Immunogold electron microscopy of Best1 in the molecular layer of DG (males at 12 months of age). Top, representative images of Best1 labeling (black dots indicated by arrowheads) in DAB-stained astrocytes (outlined with dashed lines). Pre, presynaptic terminal; Post, postsynapse; scale bar, 300 nm. Bottom left, density of gold particles for Best1 in cell body, process and microdomain. ***P < 0.001 (Student’s t-test). Bottom right, percentage of gold particles for Best1 located on the plasma membrane of cell body, process and microdomain. ***P < 0.001 (Student’s t-test). Number on each bar refers to the number of cells (c,e), mice (d) or images (f) analyzed. n refers to the number of animals studied. Data are means ± s.e.m.
A R T I C L E Snp
g©
2014
Nat
ure
Am
eric
a, In
c. A
ll rig
hts
rese
rved
.
4 ADVANCE ONLINE PUBLICATION NATURE MEDICINE
increasing diameter from the center of an amyloid plaque and analyz-ing the GABA intensity of Gfap-positive astrocytes within each circle (Fig. 1j). We found that astrocytic GABA immunoreactivity inversely correlated with the distance from amyloid plaques, within a distance ranging from 20 to 80 mm (Fig. 1j). Beyond 80 mm, it decreased to the level of astrocytes from wild-type mice (Fig. 1j). We observed a similar increased Gfap and GABA immunoreactivity in another AD model, 5XFAD mice, in which five familial AD-associated mutations are introduced (Supplementary Fig. 2d).
To confirm whether the GABA found in reactive astrocytes is able to be released, we acutely dissociated astrocytes from hippocampal slices and made direct measurements of GABA release from single astrocytes using the sniffer-patch technique9. Upon stimulation with TFLLR, a well-characterized peptide agonist for protease-activated receptor-1 (Par1), which increases intracellular Ca2+ in astrocytes9, we detected GABA release with a whole-cell patch-clamped sensor cell expressing GABAC receptors12 (Fig. 2a,b). TFLLR-induced GABA release from astrocytes of APP/PS1 mice was significantly higher (Fig. 2c) and more frequently observed (Fig. 2c) compared to that seen in astrocytes of wild-type littermates. Furthermore, TFLLR-induced GABA release from
tonic inhibition16. We used immunostaining procedures with antibodies against GABA12,16 to determine whether an aberrant increase in tonic GABA current originates from astrocytes in DG, as in the cerebellum. We found that normal astrocytes in wild-type mice showed minimal immunoreactivity for GABA, whereas reactive astrocytes in APP/PS1 mice were strongly immunoreactive (Fig. 1f,g). In the molecular layer of DG, the content of astrocytic GABA increased by a factor of 5 in APP/PS1 mice (Fig. 1h), along with a significant increase in immunoreactivity for Gfap (Fig. 1h). We confirmed the increased Gfap immunoreactivity in APP/PS1 mice by western blot analysis of the tissue homogenates from isolated dentate gyri (Fig. 1i). The intensity of neuronal GABA did not change significantly (Fig. 1g,h). Moreover, the intensity of immu-noreactivity for GABA in reactive astrocytes was as strong as that of GABAergic interneurons (Fig. 1g). We consistently observed abundant GABA immunostaining in reactive astrocytes in other regions of the hippocampus, wherever and whenever amyloid plaques were present (Fig. 1f and Supplementary Fig. 2a,b). We did not observe GABA immunoreactivity in other cell types, such as microglia (Supplementary Fig. 2c). We assessed the relationship between the distance from amyloid plaques and astrocytic GABA immunoreactivity by drawing circles of
Wild-type APP/PS1Homogenate
Mitochondira-richfraction
MaobBenzylamine Benzaldehyde
Amplex red reagentHRP at 570 nm
Resorufin
O2, H2O H2O2, NH3, H+
Wild-typeAPP/PS1
NS NS
Whole CA1–CA3 DG0
100
50
150
200
Mao
b ac
tivity
(% o
f con
trol)
APP/PS1
Water Selegiline
WT APP/PS10
100
200
300
Inte
nsity
of M
aob
in G
fap+ p
ixels
(AU)
WTWater Sele
APP/PS1
0
600
1,200
1,800
Inte
nsity
of G
ABA
in G
fap+ p
ixels
(AU)
APP/PS1
APP/PS1 + selegiline
10 pA5 s
APP/PS1 APP/PS1Sele— Sele—
0
2
4
6
0
20
40
60
% o
f ful
l act
ivatio
n
% o
f GAB
A-re
leas
ing
cells
(crit
eria
= 3
%)
a b c d
e f g
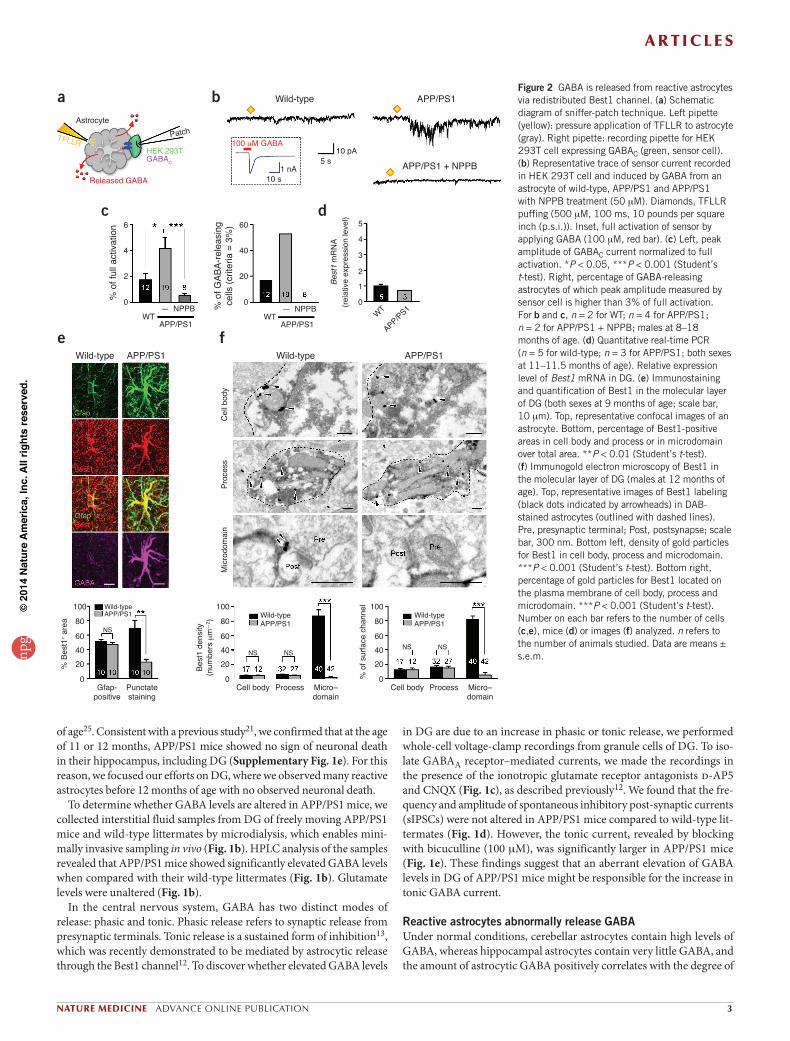
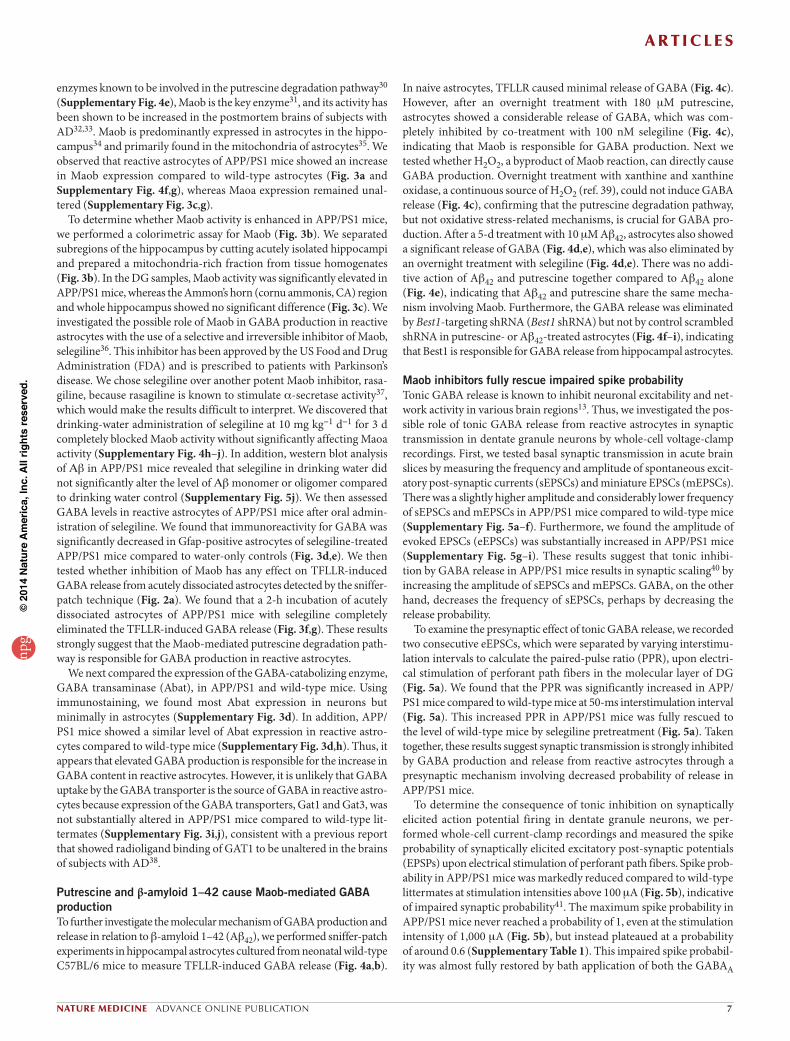
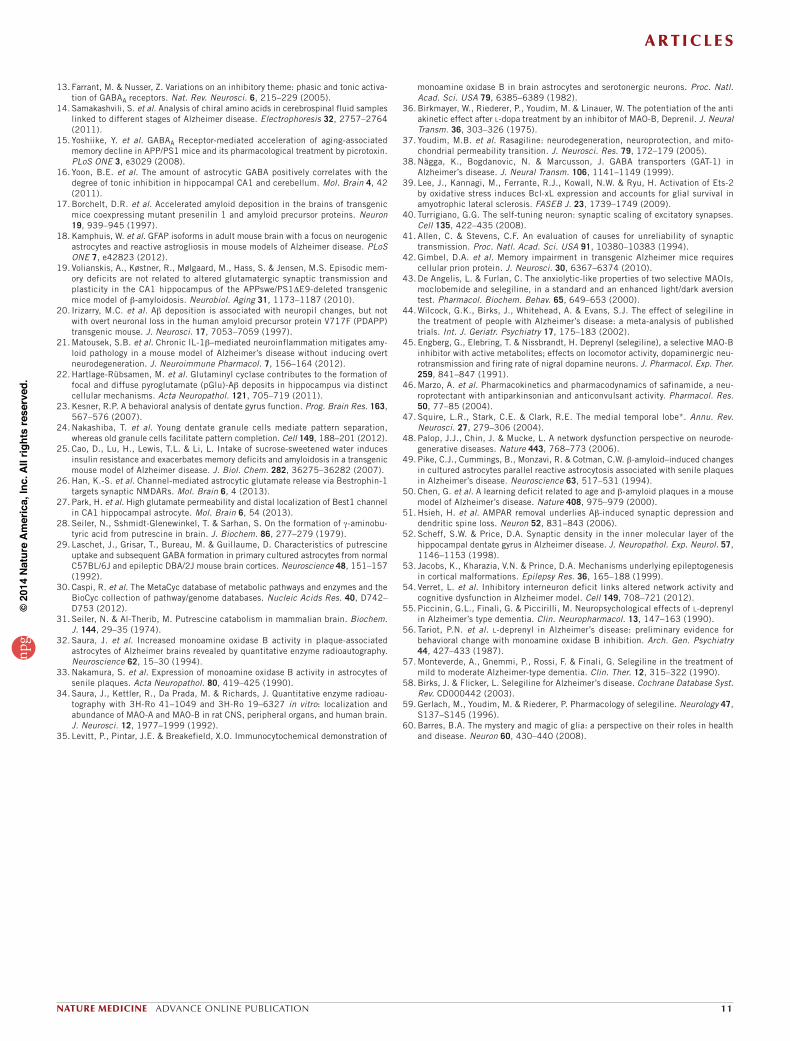
Figure 3 Maob is responsible for GABA production in reactive astrocytes. (a) Immunostaining and quantification of Maob in the molecular layer of DG (females at 10 months of age). Top, representative confocal images of an astrocyte (scale bar, 10 mm). Bottom, mean intensity of Maob in Gfap-positive areas. ***P < 0.001 (Student’s t-test). (b) Reaction diagram of the enzyme activity assay of Maob in the hippocampus. (c) Maob activity normalized to the activity of wild-type mice in the whole hippocampus or subregions (n = 7 for wild-type whole; n = 5 for other groups; For CA1–CA3 and DG groups, left and right hippocampus were analyzed separately; males at 12 months of age). *P < 0.05 (Student’s t-test). (d,e) Immunostaining and quantification of astrocytic GABA after oral administration of selegiline (Sele; 10 mg kg-1 d-1 for 3 d) in APP/PS1 mice (n = 1 for wild-type; n = 3 for APP/PS1 with water; n = 4 for APP/PS1 with Sele; males at 12 months of age). (d) Representative confocal images of Gfap and GABA in the molecular layer of DG. Inset, magnified images. Scale bars, 30 mm for both main images and the insets. (e) Mean intensity of GABA in Gfap-positive areas. ***P < 0.001 (Student’s t-test). (f,g) Measurement of GABA release from acutely dissociated hippocampal astrocytes (n = 4 for APP/PS1; n = 1 for APP/PS1 + selegiline; males at 8–18 months of age). (f) Representative trace of sensor current induced by GABA from an astrocyte of an APP/PS1 mouse and an astrocyte from an APP/PS1 mouse with selegiline treatment (100 nM). Diamonds, TFLLR puffing (500 mM, 100 ms, 10 p.s.i.). The APP/PS1 group is the same group from Figure 2b. (g) Left, peak amplitude of GABAC current normalized to full activation. ***P < 0.001 (Student’s t-test). Right, percentage of GABA-releasing astrocytes of which peak amplitude measured by sensor cell is higher than 3% of full activation. The APP/PS1 group is the same group from Figure 2c. Number on each bar refers to the number of hippocampi (c), images (e) or cells (a,g) analyzed. n refers to the number of animals studied. Data are means ± s.e.m.
A R T I C L E Snp
g©
2014
Nat
ure
Am
eric
a, In
c. A
ll rig
hts
rese
rved
.
NATURE MEDICINE ADVANCE ONLINE PUBLICATION 5
astrocytes as previously reported9,27, whereas in APP/PS1 mice, reactive astrocytes exhibited a remarkably decreased intensity and fewer instances of punctate staining in microdomains (Fig. 2e). Immunogold electron microscopic labeling gave similar results, confirming the markedly decreased Best1 expression in microdomains in APP/PS1 mice (Fig. 2f). Thus, Best1 seems to be redistributed to the soma and processes of reac-tive astrocytes for possible release of GABA in DG.
GABA synthesis by MaobThe increased GABA levels in reactive astrocytes could be due to elevated GABA production or a reduction in the catabolism or breakdown of GABA. To evaluate these possibilities, we exam-ined levels of glutamate decarboxylase (Gad), which is essential for the production of GABA in GABAergic neurons. Using antibod-ies against two isoforms of Gad, Gad67 and Gad65, we found that
astrocytes of APP/PS1 mice was completely blocked by pretreatment with natriuretic peptide B (NPPB), an anion channel blocker (Fig. 2b,c), suggesting that GABA release from reactive astrocytes might be medi-ated by GABA-permeable, NPPB-sensitive Best1 channels12.
In the cerebellum, Best1 channels are localized in the cell body and processes of Bergmann glia, and they release GABA12. In the hippocam-pus, Best1 is highly expressed at the astrocytic microdomains near syn-apses and releases glutamate to activate neuronal NMDA receptors that are synaptically localized9,26. Thus, we first checked the mRNA expres-sion level of mouse Best1 in DG and found that Best1 mRNA expres-sion in APP/PS1 mice was similar to that in wild-type mice (Fig. 2d). However, when we investigated the expression pattern of the Best1 chan-nel in astrocytes of DG, we found markedly different distribution patterns of this channel: in wild-type littermates, we found numerous occurrences of intense punctate staining, which was mostly in the microdomains of
Naive PutrescinePutrescine+ selegiline Xanthine +
xanthine oxidase20 s0.05
40 pA
GABA
Ca2+
100 μM GABA
Astrocyte
PatchTFLLRHEK 293TGABAC
Released GABA 100 pA10 s
PutrescineSelegiline
Sniffer-patchexperiment
Best1 shRNA
Aβ42
Day 1 Day 4 Day 5 Day 6
20 s0.0240 pA
Aβ42 Aβ42 + selegiline
Putrescine + scrambled Putrescine + Best1 shRNA
20 s0.0240 pA
20 s0.0240 pA
Aβ42 + scrambled Aβ42 + Best1 shRNA
Naive Put Put +Sele
Xan +XO
NS
Put Sele—Aβ42
0
3
6
9
12
% o
f ful
l act
ivat
ion
Scr Best1 sh
Putrescine
0
2
4
6
8
10
% o
f ful
l act
ivat
ion
Aβ42
Scr Best1 sh0
2
4
6
8
10
% o
f ful
l act
ivat
ion
a b
c
d e
f g
h i
NS
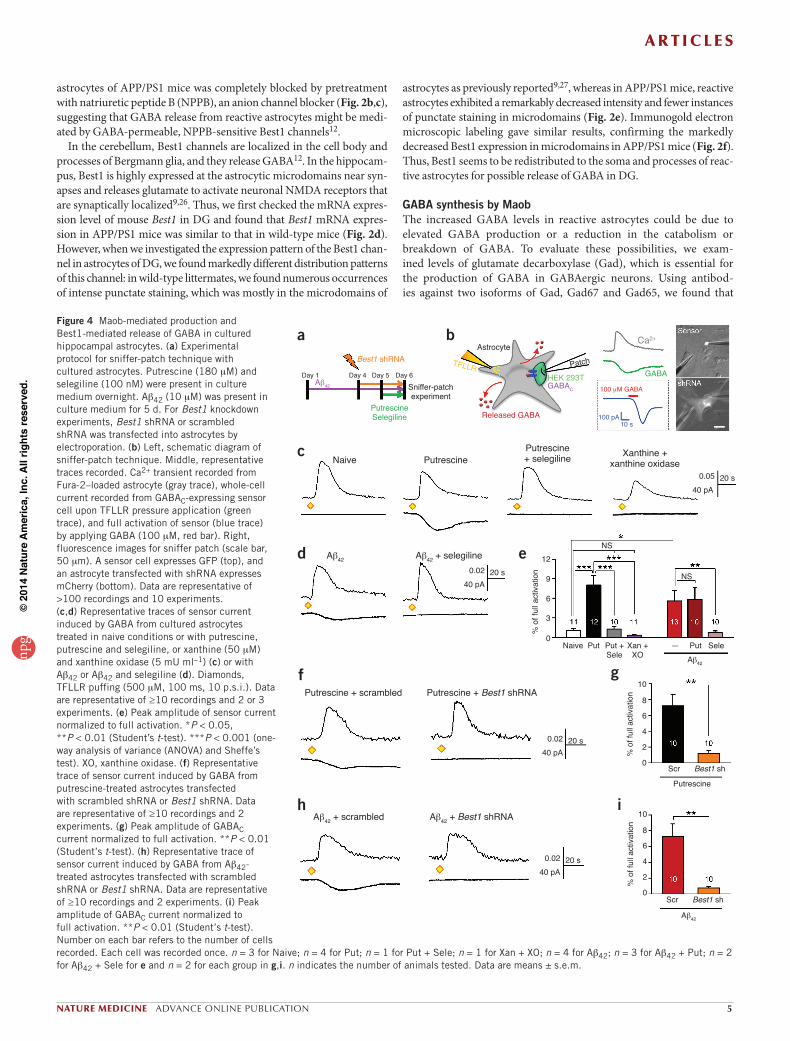
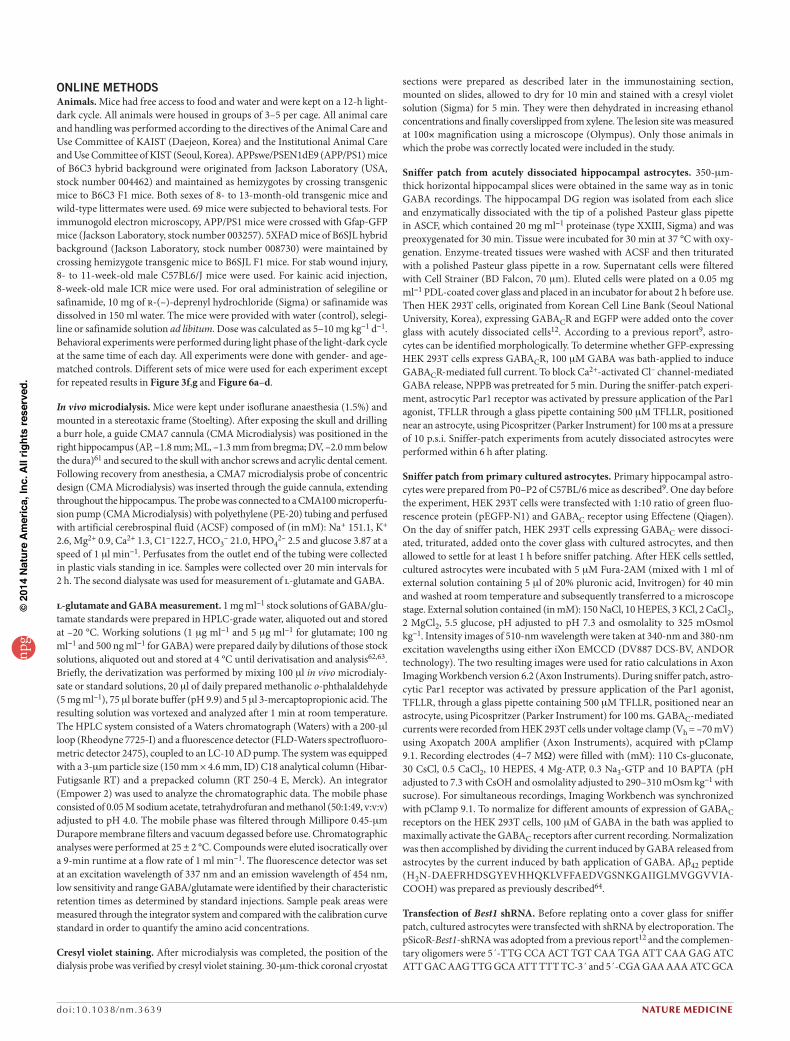
Figure 4 Maob-mediated production and Best1-mediated release of GABA in cultured hippocampal astrocytes. (a) Experimental protocol for sniffer-patch technique with cultured astrocytes. Putrescine (180 mM) and selegiline (100 nM) were present in culture medium overnight. Ab42 (10 mM) was present in culture medium for 5 d. For Best1 knockdown experiments, Best1 shRNA or scrambled shRNA was transfected into astrocytes by electroporation. (b) Left, schematic diagram of sniffer-patch technique. Middle, representative traces recorded. Ca2+ transient recorded from Fura-2–loaded astrocyte (gray trace), whole-cell current recorded from GABAC-expressing sensor cell upon TFLLR pressure application (green trace), and full activation of sensor (blue trace) by applying GABA (100 mM, red bar). Right, fluorescence images for sniffer patch (scale bar, 50 mm). A sensor cell expresses GFP (top), and an astrocyte transfected with shRNA expresses mCherry (bottom). Data are representative of >100 recordings and 10 experiments. (c,d) Representative traces of sensor current induced by GABA from cultured astrocytes treated in naive conditions or with putrescine, putrescine and selegiline, or xanthine (50 mM) and xanthine oxidase (5 mU ml-1) (c) or with Ab42 or Ab42 and selegiline (d). Diamonds, TFLLR puffing (500 mM, 100 ms, 10 p.s.i.). Data are representative of ≥10 recordings and 2 or 3 experiments. (e) Peak amplitude of sensor current normalized to full activation. *P < 0.05, **P < 0.01 (Student’s t-test). ***P < 0.001 (one-way analysis of variance (ANOVA) and Sheffe’s test). XO, xanthine oxidase. (f) Representative trace of sensor current induced by GABA from putrescine-treated astrocytes transfected with scrambled shRNA or Best1 shRNA. Data are representative of ≥10 recordings and 2 experiments. (g) Peak amplitude of GABAC current normalized to full activation. **P < 0.01 (Student’s t-test). (h) Representative trace of sensor current induced by GABA from Ab42-treated astrocytes transfected with scrambled shRNA or Best1 shRNA. Data are representative of ≥10 recordings and 2 experiments. (i) Peak amplitude of GABAC current normalized to full activation. **P < 0.01 (Student’s t-test). Number on each bar refers to the number of cells recorded. Each cell was recorded once. n = 3 for Naive; n = 4 for Put; n = 1 for Put + Sele; n = 1 for Xan + XO; n = 4 for Ab42; n = 3 for Ab42 + Put; n = 2 for Ab42 + Sele for e and n = 2 for each group in g,i. n indicates the number of animals tested. Data are means ± s.e.m.
A R T I C L E Snp
g©
2014
Nat
ure
Am
eric
a, In
c. A
ll rig
hts
rese
rved
.
6 ADVANCE ONLINE PUBLICATION NATURE MEDICINE
putrescine, we detected increased immunoreactivity in APP/PS1 brain, especially around amyloid plaques (Supplementary Fig. 4a), some in Gfap-positive astrocytes (Supplementary Fig. 4a,c) but mostly in Iba1-positive microglia (Supplementary Fig. 4b,d). Of the three
Gad is minimally expressed in reactive astrocytes of APP/PS1 mice (Supplementary Fig. 3a,b,e,f). Besides Gad, GABA can also be pro-duced by the degradation of putrescine, as previously reported in the brain and in cultured astrocytes28,29. With antibodies raised against
Patch Stim
PPControl Selegiline Control Selegiline
100%50 ms
Wild-type APP/PS1
50 ms50 mV
Stimulus intensity (μA)
Spik
e pr
obab
ility
0 200 400 600 800 1,0000
0.20.4
0.60.81.0
WT APP/PS1Cont Sele Cont Sele
0.8
1.2
1.6
2.0
0.8
1.2
1.6
2.0
50 100 150 200ISI (ms)
Wild-type + controlWild-type + selegilineAPP/PS1 + controlAPP/PS1 + selegiline
PPR
(P2
P1—
1 )
PPR
(P2
P1—
1 )
APP/PS1
Water
Before + BIC, CGPSelegiline
Before + BIC, CGP Scrambled
APP/PS1
Maob-sh Scrambled Best1-sh
50 ms50 mV
50 ms50 mV
50 ms50 mV 5XFAD
APP/PS1 APP/PS1 5XFAD
Stimulus intensity (μA) Stimulus intensity (μA) Stimulus intensity (μA)
Spik
e pr
obab
ility
0 200 400 600 800 1,0000
0.20.4
0.60.81.0
Spik
e pr
obab
ility
0 200 400 600 800 1,0000
0.20.4
0.60.81.0
Spik
e pr
obab
ility
0 200 400 600 800 1,0000
0.20.4
0.60.81.0
Before (n = 15) + BIC, CGP (n = 15)Before (n = 11) + BIC, CGP (n = 11)
WaterSelegiline
Scr (n = 13) Best1 sh (n = 14)Maob sh (n = 11)
Scr (n = 7) Best1 sh (n = 8)Scr (n = 11) Best1 sh (n = 11)
WT5XFAD
HFS
Wild-type + water APP/PS1 + water APP/PS1 + selegiline
100%50 ms
0 10 20 30 40 50 6050
100150200250
300350
eEPS
C a
mpl
itude
(% o
f bas
elin
e)
Time (min)
50
100
150
200eE
PSC
am
plitu
de(%
of b
asel
ine)
Water Water SeleWT APP/PS1
Wild-type + water
APP/PS1 + waterAPP/PS1 + selegiline
Wild-type + selegiline
Acquisition(before-shock)
Retention(after-shock)
0
100
200
300
Late
ncy
to e
nter
dark
cha
mbe
r(s)
Selegilineadministration
Acquisition Retention
Electricfoot shock
Day 1 Day 8 Day 9Handling
NS
a b
c
d
e
f
g
h
i
j
NS
Wild-typeAPP/PS1
10 10 10 10
7 78
718 15 6
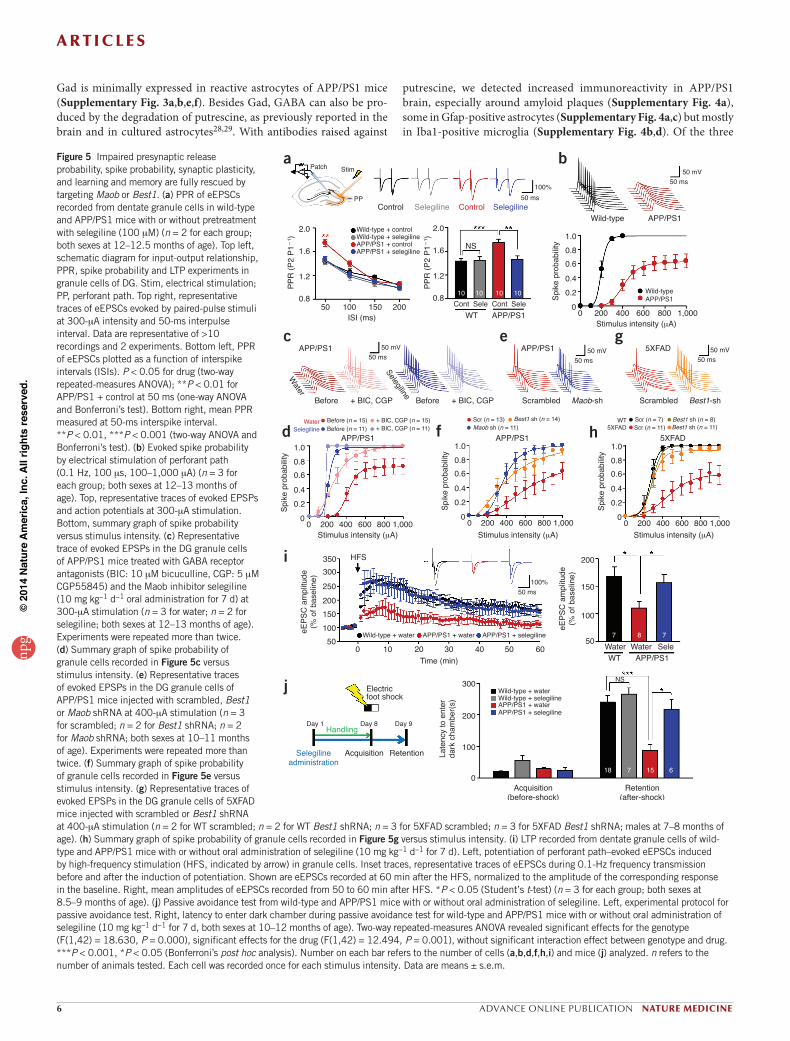
Figure 5 Impaired presynaptic release probability, spike probability, synaptic plasticity, and learning and memory are fully rescued by targeting Maob or Best1. (a) PPR of eEPSCs recorded from dentate granule cells in wild-type and APP/PS1 mice with or without pretreatment with selegiline (100 mM) (n = 2 for each group; both sexes at 12–12.5 months of age). Top left, schematic diagram for input-output relationship, PPR, spike probability and LTP experiments in granule cells of DG. Stim, electrical stimulation; PP, perforant path. Top right, representative traces of eEPSCs evoked by paired-pulse stimuli at 300-mA intensity and 50-ms interpulse interval. Data are representative of >10 recordings and 2 experiments. Bottom left, PPR of eEPSCs plotted as a function of interspike intervals (ISIs). P < 0.05 for drug (two-way repeated-measures ANOVA); **P < 0.01 for APP/PS1 + control at 50 ms (one-way ANOVA and Bonferroni’s test). Bottom right, mean PPR measured at 50-ms interspike interval. **P < 0.01, ***P < 0.001 (two-way ANOVA and Bonferroni’s test). (b) Evoked spike probability by electrical stimulation of perforant path (0.1 Hz, 100 ms, 100–1,000 mA) (n = 3 for each group; both sexes at 12–13 months of age). Top, representative traces of evoked EPSPs and action potentials at 300-mA stimulation. Bottom, summary graph of spike probability versus stimulus intensity. (c) Representative trace of evoked EPSPs in the DG granule cells of APP/PS1 mice treated with GABA receptor antagonists (BIC: 10 mM bicuculline, CGP: 5 mM CGP55845) and the Maob inhibitor selegiline (10 mg kg-1 d-1 oral administration for 7 d) at 300-mA stimulation (n = 3 for water; n = 2 for selegiline; both sexes at 12–13 months of age). Experiments were repeated more than twice. (d) Summary graph of spike probability of granule cells recorded in Figure 5c versus stimulus intensity. (e) Representative traces of evoked EPSPs in the DG granule cells of APP/PS1 mice injected with scrambled, Best1 or Maob shRNA at 400-mA stimulation (n = 3 for scrambled; n = 2 for Best1 shRNA; n = 2 for Maob shRNA; both sexes at 10–11 months of age). Experiments were repeated more than twice. (f) Summary graph of spike probability of granule cells recorded in Figure 5e versus stimulus intensity. (g) Representative traces of evoked EPSPs in the DG granule cells of 5XFAD mice injected with scrambled or Best1 shRNA at 400-mA stimulation (n = 2 for WT scrambled; n = 2 for WT Best1 shRNA; n = 3 for 5XFAD scrambled; n = 3 for 5XFAD Best1 shRNA; males at 7–8 months of age). (h) Summary graph of spike probability of granule cells recorded in Figure 5g versus stimulus intensity. (i) LTP recorded from dentate granule cells of wild-type and APP/PS1 mice with or without oral administration of selegiline (10 mg kg-1 d-1 for 7 d). Left, potentiation of perforant path–evoked eEPSCs induced by high-frequency stimulation (HFS, indicated by arrow) in granule cells. Inset traces, representative traces of eEPSCs during 0.1-Hz frequency transmission before and after the induction of potentiation. Shown are eEPSCs recorded at 60 min after the HFS, normalized to the amplitude of the corresponding response in the baseline. Right, mean amplitudes of eEPSCs recorded from 50 to 60 min after HFS. *P < 0.05 (Student’s t-test) (n = 3 for each group; both sexes at 8.5–9 months of age). (j) Passive avoidance test from wild-type and APP/PS1 mice with or without oral administration of selegiline. Left, experimental protocol for passive avoidance test. Right, latency to enter dark chamber during passive avoidance test for wild-type and APP/PS1 mice with or without oral administration of selegiline (10 mg kg-1 d-1 for 7 d, both sexes at 10–12 months of age). Two-way repeated-measures ANOVA revealed significant effects for the genotype (F(1,42) = 18.630, P = 0.000), significant effects for the drug (F(1,42) = 12.494, P = 0.001), without significant interaction effect between genotype and drug. ***P < 0.001, *P < 0.05 (Bonferroni’s post hoc analysis). Number on each bar refers to the number of cells (a,b,d,f,h,i) and mice (j) analyzed. n refers to the number of animals tested. Each cell was recorded once for each stimulus intensity. Data are means ± s.e.m.
A R T I C L E Snp
g©
2014
Nat
ure
Am
eric
a, In
c. A
ll rig
hts
rese
rved
.
NATURE MEDICINE ADVANCE ONLINE PUBLICATION 7
In naive astrocytes, TFLLR caused minimal release of GABA (Fig. 4c). However, after an overnight treatment with 180 mM putrescine, astrocytes showed a considerable release of GABA, which was com-pletely inhibited by co-treatment with 100 nM selegiline (Fig. 4c), indicating that Maob is responsible for GABA production. Next we tested whether H2O2, a byproduct of Maob reaction, can directly cause GABA production. Overnight treatment with xanthine and xanthine oxidase, a continuous source of H2O2 (ref. 39), could not induce GABA release (Fig. 4c), confirming that the putrescine degradation pathway, but not oxidative stress-related mechanisms, is crucial for GABA pro-duction. After a 5-d treatment with 10 mM Ab42, astrocytes also showed a significant release of GABA (Fig. 4d,e), which was also eliminated by an overnight treatment with selegiline (Fig. 4d,e). There was no addi-tive action of Ab42 and putrescine together compared to Ab42 alone (Fig. 4e), indicating that Ab42 and putrescine share the same mecha-nism involving Maob. Furthermore, the GABA release was eliminated by Best1-targeting shRNA (Best1 shRNA) but not by control scrambled shRNA in putrescine- or Ab42-treated astrocytes (Fig. 4f–i), indicating that Best1 is responsible for GABA release from hippocampal astrocytes.
Maob inhibitors fully rescue impaired spike probabilityTonic GABA release is known to inhibit neuronal excitability and net-work activity in various brain regions13. Thus, we investigated the pos-sible role of tonic GABA release from reactive astrocytes in synaptic transmission in dentate granule neurons by whole-cell voltage-clamp recordings. First, we tested basal synaptic transmission in acute brain slices by measuring the frequency and amplitude of spontaneous excit-atory post-synaptic currents (sEPSCs) and miniature EPSCs (mEPSCs). There was a slightly higher amplitude and considerably lower frequency of sEPSCs and mEPSCs in APP/PS1 mice compared to wild-type mice (Supplementary Fig. 5a–f). Furthermore, we found the amplitude of evoked EPSCs (eEPSCs) was substantially increased in APP/PS1 mice (Supplementary Fig. 5g–i). These results suggest that tonic inhibi-tion by GABA release in APP/PS1 mice results in synaptic scaling40 by increasing the amplitude of sEPSCs and mEPSCs. GABA, on the other hand, decreases the frequency of sEPSCs, perhaps by decreasing the release probability.
To examine the presynaptic effect of tonic GABA release, we recorded two consecutive eEPSCs, which were separated by varying interstimu-lation intervals to calculate the paired-pulse ratio (PPR), upon electri-cal stimulation of perforant path fibers in the molecular layer of DG (Fig. 5a). We found that the PPR was significantly increased in APP/PS1 mice compared to wild-type mice at 50-ms interstimulation interval (Fig. 5a). This increased PPR in APP/PS1 mice was fully rescued to the level of wild-type mice by selegiline pretreatment (Fig. 5a). Taken together, these results suggest synaptic transmission is strongly inhibited by GABA production and release from reactive astrocytes through a presynaptic mechanism involving decreased probability of release in APP/PS1 mice.
To determine the consequence of tonic inhibition on synaptically elicited action potential firing in dentate granule neurons, we per-formed whole-cell current-clamp recordings and measured the spike probability of synaptically elicited excitatory post-synaptic potentials (EPSPs) upon electrical stimulation of perforant path fibers. Spike prob-ability in APP/PS1 mice was markedly reduced compared to wild-type littermates at stimulation intensities above 100 mA (Fig. 5b), indicative of impaired synaptic probability41. The maximum spike probability in APP/PS1 mice never reached a probability of 1, even at the stimulation intensity of 1,000 mA (Fig. 5b), but instead plateaued at a probability of around 0.6 (Supplementary Table 1). This impaired spike probabil-ity was almost fully restored by bath application of both the GABAA
enzymes known to be involved in the putrescine degradation pathway30 (Supplementary Fig. 4e), Maob is the key enzyme31, and its activity has been shown to be increased in the postmortem brains of subjects with AD32,33. Maob is predominantly expressed in astrocytes in the hippo-campus34 and primarily found in the mitochondria of astrocytes35. We observed that reactive astrocytes of APP/PS1 mice showed an increase in Maob expression compared to wild-type astrocytes (Fig. 3a and Supplementary Fig. 4f,g), whereas Maoa expression remained unal-tered (Supplementary Fig. 3c,g).
To determine whether Maob activity is enhanced in APP/PS1 mice, we performed a colorimetric assay for Maob (Fig. 3b). We separated subregions of the hippocampus by cutting acutely isolated hippocampi and prepared a mitochondria-rich fraction from tissue homogenates (Fig. 3b). In the DG samples, Maob activity was significantly elevated in APP/PS1 mice, whereas the Ammon’s horn (cornu ammonis, CA) region and whole hippocampus showed no significant difference (Fig. 3c). We investigated the possible role of Maob in GABA production in reactive astrocytes with the use of a selective and irreversible inhibitor of Maob, selegiline36. This inhibitor has been approved by the US Food and Drug Administration (FDA) and is prescribed to patients with Parkinson’s disease. We chose selegiline over another potent Maob inhibitor, rasa-giline, because rasagiline is known to stimulate a-secretase activity37, which would make the results difficult to interpret. We discovered that drinking-water administration of selegiline at 10 mg kg-1 d-1 for 3 d completely blocked Maob activity without significantly affecting Maoa activity (Supplementary Fig. 4h–j). In addition, western blot analysis of Ab in APP/PS1 mice revealed that selegiline in drinking water did not significantly alter the level of Ab monomer or oligomer compared to drinking water control (Supplementary Fig. 5j). We then assessed GABA levels in reactive astrocytes of APP/PS1 mice after oral admin-istration of selegiline. We found that immunoreactivity for GABA was significantly decreased in Gfap-positive astrocytes of selegiline-treated APP/PS1 mice compared to water-only controls (Fig. 3d,e). We then tested whether inhibition of Maob has any effect on TFLLR-induced GABA release from acutely dissociated astrocytes detected by the sniffer-patch technique (Fig. 2a). We found that a 2-h incubation of acutely dissociated astrocytes of APP/PS1 mice with selegiline completely eliminated the TFLLR-induced GABA release (Fig. 3f,g). These results strongly suggest that the Maob-mediated putrescine degradation path-way is responsible for GABA production in reactive astrocytes.
We next compared the expression of the GABA-catabolizing enzyme, GABA transaminase (Abat), in APP/PS1 and wild-type mice. Using immunostaining, we found most Abat expression in neurons but minimally in astrocytes (Supplementary Fig. 3d). In addition, APP/PS1 mice showed a similar level of Abat expression in reactive astro-cytes compared to wild-type mice (Supplementary Fig. 3d,h). Thus, it appears that elevated GABA production is responsible for the increase in GABA content in reactive astrocytes. However, it is unlikely that GABA uptake by the GABA transporter is the source of GABA in reactive astro-cytes because expression of the GABA transporters, Gat1 and Gat3, was not substantially altered in APP/PS1 mice compared to wild-type lit-termates (Supplementary Fig. 3i,j), consistent with a previous report that showed radioligand binding of GAT1 to be unaltered in the brains of subjects with AD38.
Putrescine and β-amyloid 1–42 cause Maob-mediated GABA productionTo further investigate the molecular mechanism of GABA production and release in relation to b-amyloid 1–42 (Ab42), we performed sniffer-patch experiments in hippocampal astrocytes cultured from neonatal wild-type C57BL/6 mice to measure TFLLR-induced GABA release (Fig. 4a,b).
A R T I C L E Snp
g©
2014
Nat
ure
Am
eric
a, In
c. A
ll rig
hts
rese
rved
.
8 ADVANCE ONLINE PUBLICATION NATURE MEDICINE
scrambled shRNA in APP/PS1 mice (Fig. 5e,f). The resting membrane potential or input resistance of dentate granule neurons for each test condition and mouse type was not different (Supplementary Table 1). Consistent with the results observed in APP/PS1 mice, 5XFAD mice showed impaired spike probability that could be fully rescued by len-tiviral delivery of Best1 shRNA (Fig. 5g,h). These findings demon-strate that GABA production and tonic release from reactive astrocytes impairs spike probability at the perforant-path-to-dentate-granule-cell synapse and that a blockade of Maob or gene silencing of Best1 fully rescues the observed impairment.
receptor antagonist bicuculline and the GABAB receptor antagonist CGP55845 (Fig. 5c,d), suggesting that GABAergic inhibition is under-lying the impaired spike probability in APP/PS1 mice. Furthermore, impaired spike probability in APP/PS1 mice was fully rescued after oral administration of selegiline for a week (Fig. 5c,d) at a dose that had no apparent effect in wild-type littermates (Supplementary Fig. 6a–d). We found a similar effect of full rescue after direct incubation of slices with selegiline for 2 h (Supplementary Fig. 6e,f). Furthermore, gene silencing of Maob or Best1 by lentivirus carrying Maob shRNA or Best1 shRNA also resulted in full rescue of spike probability compared to the
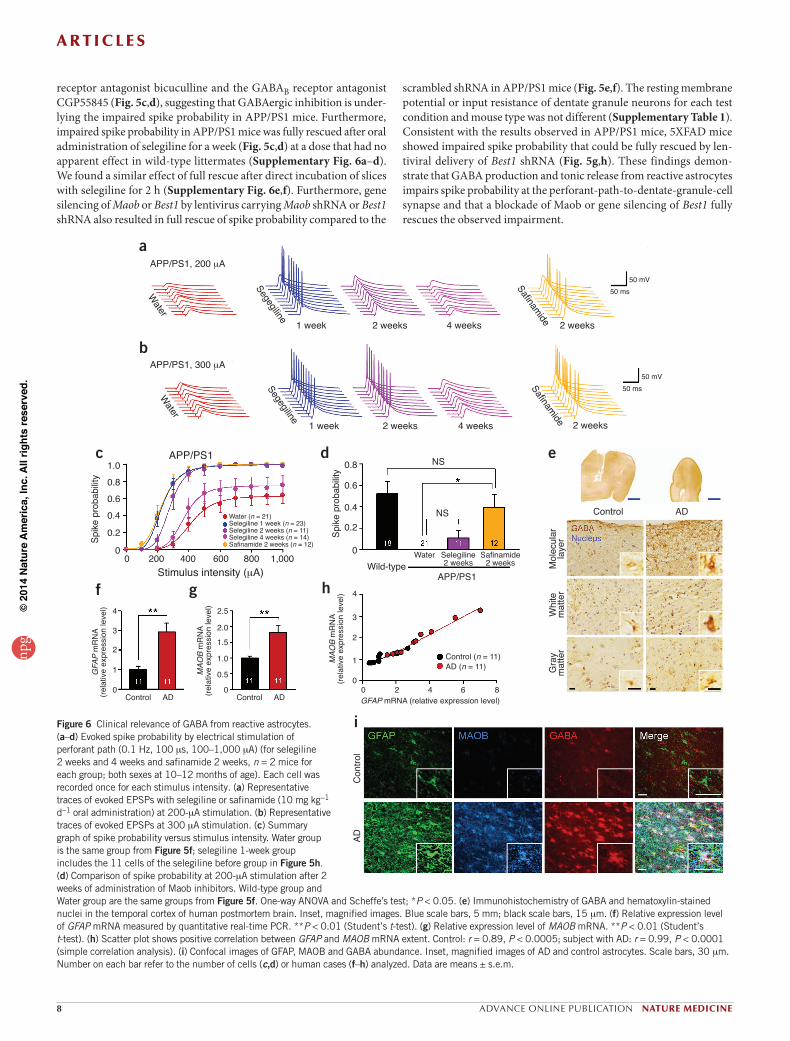
Figure 6 Clinical relevance of GABA from reactive astrocytes. (a–d) Evoked spike probability by electrical stimulation of perforant path (0.1 Hz, 100 ms, 100–1,000 mA) (for selegiline 2 weeks and 4 weeks and safinamide 2 weeks, n = 2 mice for each group; both sexes at 10–12 months of age). Each cell was recorded once for each stimulus intensity. (a) Representative traces of evoked EPSPs with selegiline or safinamide (10 mg kg-1 d-1 oral administration) at 200-mA stimulation. (b) Representative traces of evoked EPSPs at 300 mA stimulation. (c) Summary graph of spike probability versus stimulus intensity. Water group is the same group from Figure 5f; selegiline 1-week group includes the 11 cells of the selegiline before group in Figure 5h. (d) Comparison of spike probability at 200-mA stimulation after 2 weeks of administration of Maob inhibitors. Wild-type group and Water group are the same groups from Figure 5f. One-way ANOVA and Scheffe’s test; *P < 0.05. (e) Immunohistochemistry of GABA and hematoxylin-stained nuclei in the temporal cortex of human postmortem brain. Inset, magnified images. Blue scale bars, 5 mm; black scale bars, 15 mm. (f) Relative expression level of GFAP mRNA measured by quantitative real-time PCR. **P < 0.01 (Student’s t-test). (g) Relative expression level of MAOB mRNA. **P < 0.01 (Student’s t-test). (h) Scatter plot shows positive correlation between GFAP and MAOB mRNA extent. Control: r = 0.89, P < 0.0005; subject with AD: r = 0.99, P < 0.0001 (simple correlation analysis). (i) Confocal images of GFAP, MAOB and GABA abundance. Inset, magnified images of AD and control astrocytes. Scale bars, 30 mm. Number on each bar refer to the number of cells (c,d) or human cases (f–h) analyzed. Data are means ± s.e.m.
APP/PS1, 200 μA
Water
Segegiline
1 week 2 weeks 4 weeks 2 weeks
Safinamide
APP/PS1, 300 μA
Water
Segegiline
1 week 2 weeks 4 weeks 2 weeks
Safinamide
50 mV50 ms
50 mV50 ms
APP/PS1
Stimulus intensity (μA)0 200 400 600 800 1,000
0
0.2
0.40.60.81.0
Spik
e pr
obab
ility
Water (n = 21)Selegiline 1 week (n = 23)Selegiline 2 weeks (n = 11)Selegiline 4 weeks (n = 14)Safinamide 2 weeks (n = 12)
0
0.2
0.4
0.6
0.8
Spik
e pr
obab
ility
NS
NS
Wild-typeAPP/PS1
Water Selegiline2 weeks
Safinamide2 weeks
Control AD
Mol
ecul
arla
yer
Whi
tem
atte
rG
ray
mat
ter
Con
trol
AD
Control AD Control AD0
1
2
3
4
0
0.5
1.0
1.5
2.0
2.5
GFA
P m
RN
A(re
lativ
e ex
pres
sion
leve
l)
MAO
B m
RN
A(re
lativ
e ex
pres
sion
leve
l)
0
1
2
3
4
MAO
B m
RN
A(re
lativ
e ex
pres
sion
leve
l)
GFAP mRNA (relative expression level)0 2 4 6 8
Control (n = 11)AD (n = 11)
a
b
c d e
f g h
i
A R T I C L E Snp
g©
2014
Nat
ure
Am
eric
a, In
c. A
ll rig
hts
rese
rved
.
NATURE MEDICINE ADVANCE ONLINE PUBLICATION 9
GABA immunoreactivity in every layer of the temporal cortex, including both gray matter and white matter, with the greatest increase detected in the peripheral layer (Fig. 6e). We then measured mRNA expression lev-els of GFAP and MAOB by performing quantitative real-time PCR. The mRNA expression levels of both GFAP (Fig. 6f) and MAOB (Fig. 6g) were significantly higher in individuals with AD than in control subjects. We found a positive correlation between GFAP and MAOB expression (Fig. 6h). Consistent with the mouse model, immunostaining showed a marked increase of GFAP, MAOB and GABA in reactive astrocytes in brain samples from individuals with AD (Fig. 6i). We can thus conclude that reactive astrocytes showing an aberrant increase in MAOB and GABA are also present in individuals with AD.
DISCUSSIONWe have investigated here the detailed molecular and cellular mecha-nisms of GABA synthesis and release in reactive astrocytes of AD model mice (Supplementary Fig. 8). In summary, normal astrocytes do not contain GABA, and Best1 channels are located at microdomains to release glutamate, which targets synaptic NMDA receptors. Diseased astrocytes around amyloid plaques become reactive and produce GABA. Increased production of GABA by Maob is responsible for the marked increase in GABA levels observed in reactive astrocytes. Consequently, GABA is released from reactive astrocytes through the glutamate- and GABA-permeable Best1 channel. Meanwhile, the Best1 channel is redis-tributed away from microdomains to the soma and processes of reactive astrocytes, possibly switching its target from synaptic NMDA receptors to extrasynaptic GABA receptors. The released GABA activates neu-ronal GABAA and GABAB receptors, which, in turn, strongly inhibit synaptic release. Thus, GABA from reactive astrocytes diminishes the spike probability of the perforant-path-to-dentate-granule-cell synapse, leading to impairment in synaptic plasticity and memory function. To the best of our knowledge, our study provides insight into the causes of memory impairment in AD: reactive astrocytes are actively involved in glia-neuron interactions, with GABA acting as a gliotransmitter, work-ing in concert with other pathological factors to influence neural net-works in diseased brain48.
Soluble toxic species of Ab can induce reactive astrocytosis in cultured astrocytes49. In addition, several mouse models show cognitive impair-ment well before the first occurrence of amyloid plaques50. Thus, at early stages of disease progression, the soluble toxic species of Ab, including oligomeric species, might cause cognitive impairment via reactive astro-cytosis and GABA production. Consequently, our proposed intervention of blocking astrocytic GABA might be efficacious in a preventive man-ner at early stages of AD. In support of this idea, our results demonstrate that toxic species of Ab can cause GABA production without amyloid plaques in cultured hippocampal astrocytes (Fig. 4).
The impairment of LTP in the perforant-fiber-path-to-dentate syn-apse is in marked contrast to the previously reported unaltered LTP at CA3-CA1 synapses in the same model mice (APP/PS1) at the age of 12–13 months42. At this age, animals contain a few amyloid plaques in CA1 (Supplementary Fig. 1a). Notably, that study reported similar behavioral impairments in the passive avoidance task and Morris water maze as in our study, but with no impairment in synaptic transmis-sion at the CA3-CA1 synapse. Therefore, these observations imply that the memory impairment seen in 12- to 13-month-old APP/PS1 mice is probably due to synaptic impairment not in CA1, but in DG, where numerous amyloid plaques and abundant GABA-producing reactive astrocytes are found.
The observed synaptic impairment in DG cannot be explained by impaired surface expression of postsynaptic glutamate receptors such as AMPA receptor (AMPAR)51. We observed slightly increased amplitude
Maob inhibitor restores synaptic plasticity and memoryWe expected that the suppression of spike probability in DG would strongly influence synaptic plasticity and learning and memory-related behaviors. To address the role of tonic GABA release from reactive astro-cytes in synaptic plasticity, we recorded eEPSCs from dentate granule neurons before and after a high-frequency stimulation protocol (200 Hz, 40 ms, eight times at 2-s interval) to induce long-term potentia-tion (LTP). We found that LTP was significantly impaired in APP/PS1 mice compared to wild-type littermates, but it was fully restored by oral administration of selegiline for a week (Fig. 5i).
To address the role of tonic GABA release from reactive astrocytes in hippocampus-dependent learning and memory, we subjected mice to a passive avoidance paradigm, in which they learned to avoid a dark chamber after exposure to an electrical foot shock, followed by a reten-tion test on the next day (Supplementary Fig. 7a). Consistent with a previous report42, learning and memory was impaired in APP/PS1 mice, as evidenced by a significant reduction in latency to enter the dark chamber (Fig. 5j). Oral administration of selegiline for a week mostly restored the learning and memory impairment of APP/PS1 mice in the passive avoidance paradigm (Fig. 5j and Supplementary Table 2). The increased latency to enter the dark chamber is not likely to be due to enhanced anxiety or depression because selegiline is not anxiogenic43 and has been approved by the FDA to treat major depression.
Next, we performed the Morris water maze test, which is a widely known test for hippocampus-dependent learning and memory (Supplementary Fig. 7a,b). Consistent with a previous report42, we found that APP/PS1 mice learned more slowly than did wild-type mice, as evidenced by slower escape latency during the acquisition training days without any difference in swim speed (Supplementary Fig. 7c,d). This learning and memory deficit was partially rescued in APP/PS1 mice after oral administration of selegiline for 14 d before and 15 d during the testing period, a total of 29 d without any change in swim speed (Supplementary Fig. 7c,d and Supplementary Table 2). The only partial rescue shown in Morris water maze performance could be due to the fact that selegiline loses its efficacy when administered over long periods of time44. To address this issue, we tested the effect of selegiline on spike probability of dentate granule neurons by varying the adminis-tration period. The spike probability was progressively and significantly decreased after a 2- and 4-week compared to a 1-week administration of selegiline in APP/PS1 mice (Fig. 6a–d). These results could explain why the behavior was not fully rescued in the Morris water maze test.
The short-lived action of selegiline has been previously reported44,45 and attributed to the irreversibility of its action. To test the idea of revers-ibility, we assessed the effect of prolonged administration of a reversible Maob inhibitor, safinamide46. We found that 2-week administration of safinamide significantly rescued the spike probability at 200-mA stimu-lation intensity in APP/PS1 mice, even to the untreated wild-type level, whereas 2-week administration of selegiline started to show a wearing-off effect (Fig. 6a–d). These results indicate that, unlike treatment with selegiline, prolonged treatment with a reversible inhibitor shows pro-longed efficacy on spike probability.
Increased GABA and MAOB in ADIn order to assess the clinical importance of GABA production in reac-tive astrocytes, we obtained temporal cortex brain samples from 11 individuals with AD and 11 control human subjects (Supplementary Table 3). The temporal cortex surrounds the hippocampus and is vital for memory function in association with the hippocampus47. Using the GABA-specific antibody, we saw an enhanced immunoreactivity for GABA throughout the temporal cortex in samples from individuals with AD, compared to control samples (Fig. 6e). We observed increased
A R T I C L E Snp
g©
2014
Nat
ure
Am
eric
a, In
c. A
ll rig
hts
rese
rved
.
10 ADVANCE ONLINE PUBLICATION NATURE MEDICINE
provides an insight into the role of glia-neuron interactions via GABA in understanding and treating brain diseases. Consistent with this idea, we found that stab-wound injuries caused increased Gfap expres-sion and induction of astrocytic GABA production in the injured area (Supplementary Fig. 9), suggesting that this is a general mechanism for diseases or injuries that accompany reactive astrocytosis. As with GABA, the roles of other gliotransmitters, such as glutamate, d-serine, taurine, glycine and ATP, in AD and in other brain diseases, are awaiting further investigations, offering new challenges for the future.
METHODSMethods and any associated references are available in the online version of the paper.
Note: Any Supplementary Information and Source Data files are available in the online version of the paper.
ACKNOWLEDGMENTSThis work was supported by the WCI Program of the National Research Foundation of Korea (NRF) funded by the Ministry of Science, ICT and Future Planning (MSIP: to C.J.L., NRF grant number: WCI 2009-003), the KIST Institutional Flagship Program (to C.J.L., 3E25022; to H.R., 2E24380), the National Leading Research Laboratory Program of Korea and the KAIST Future Systems Healthcare Project (to D.K., NRF grant number: 2011-0028772), the Basic Science Research Program through the NRF funded by the MSIP (to Y.C.B., 2008-0062282), and the National Institute of Aging of USA (to N.W.K.). We thank Mazence for APP/PS1 mice, W. Park (GIST) for 5XFAD mice, K. Park and H. Song (KIST) for safinamide and K. Fujiwara (Sojo University) for the putrescine-specific antibody.
AUTHOR CONTRIBUTIONSS.J., O.Y., D.K. and C.J.L. designed the study, analyzed the data and wrote the manuscript. O.Y. carried out most slice electrophysiology. Y.J.H., N.W.K. and H.R. performed human tissue experiments. Y.E.C. and D.H.W. performed sniffer patch. S.J., M.P. and J.C. performed behavior tests. J.Y.B. and Y.C.B. performed electron microscopy experiments. S.J., J.L. and H.C. contributed to GABA recording. H.J.P. and I.S. performed microdialysis and HPLC. E.H., D.Y.L. and J.H. contributed to molecular biology. H.Y.K. and Y.K. synthesized Ab42 and performed oligomer western blotting. B.-E.Y. contributed to lentiviral Maob shRNA cloning. Y.J. contributed to discussion and to mouse breeding. S.J. conducted all the rest of the experiments with assistance from T.K., S.-J.O., S.J.P. and H.L. All authors contributed to analysis and discussion of the results.
COMPETING FINANCIAL INTERESTS The authors declare no competing financial interests. Reprints and permissions information is available online at http://www.nature.com/reprints/index.html.
1. Alzheimer’s Association. 2012 Alzheimer’s disease facts and figures. Alzheimers Dement. 8, 131–168 (2012).
2. Mattson, M.P. Pathways towards and away from Alzheimer’s disease. Nature 430, 631–639 (2004).
3. Mucke, L. & Selkoe, D.J. Neurotoxicity of amyloid b-protein: synaptic and network dysfunction. Cold Spring Harb. Perspect. Med. 2, a006338 (2012).
4. Ballatore, C., Lee, V.M.-Y. & Trojanowski, J.Q. Tau-mediated neurodegeneration in Alzheimer’s disease and related disorders. Nat. Rev. Neurosci. 8, 663–672 (2007).
5. Eddleston, M. & Mucke, L. Molecular profile of reactive astrocytes—implications for their role in neurologic disease. Neuroscience 54, 15–36 (1993).
6. Wisniewski, H.M. & Wegiel, J. Spatial relationships between astrocytes and classical plaque components. Neurobiol. Aging 12, 593–600 (1991).
7. Sofroniew, M.V. Molecular dissection of reactive astrogliosis and glial scar formation. Trends Neurosci. 32, 638–647 (2009).
8. Kuchibhotla, K.V., Lattarulo, C.R., Hyman, B.T. & Bacskai, B.J. Synchronous hyper-activity and intercellular calcium waves in astrocytes in Alzheimer mice. Science 323, 1211–1215 (2009).
9. Woo, D.H. et al. TREK-1 and Best1 channels mediate fast and slow glutamate release in astrocytes upon GPCR activation. Cell 151, 25–40 (2012).
10. Henneberger, C., Papouin, T., Oliet, S.H. & Rusakov, D.A. Long-term potentiation depends on release of d-serine from astrocytes. Nature 463, 232–236 (2010).
11. Blum, A.E., Joseph, S.M., Przybylski, R.J. & Dubyak, G.R. Rho-family GTPases modulate Ca2+-dependent ATP release from astrocytes. Am. J. Physiol. Cell Physiol. 295, C231–C241 (2008).
12. Lee, S. et al. Channel-mediated tonic GABA release from glia. Science 330, 790–796 (2010).
of AMPAR-mediated sEPSCs, mEPSCs and eEPSCs in APP/PS1 mice (Supplementary Fig. 5), suggesting an enhanced activity of AMPAR in dentate granule neurons. However, the stimulation-induced spike firing decreased markedly in dentate granule neurons, to the point of complete elimination of spikes (Fig. 5b). This indicates that AMPAR does not contribute to the spike probability and cognitive impairment. Instead, we found a strong presynaptic inhibition, via GABAA and GABAB receptors, contributing to the spike probability and cognitive impairment (Fig. 5a,d). Inhibition of tonic GABA release by selegiline treatment fully rescued the impairments in spike probability, LTP, and learning and memory (Fig. 5d,i,j), whereas it did not rescue the altered activity of AMPAR, which remained enhanced after selegiline treatment (Supplementary Fig. 5g–i). This implies that there is a lack of correla-tion between enhanced AMPAR and cognitive impairment. Consistent with this idea, an enlargement of synapses has been observed in AD52, which has been interpreted as a compensatory response.
Increased tonic GABA release by reactive astrocytes could exert diverse functional effects according to specific regions with specific neu-ronal networks. In DG, the majority of synapses near reactive astrocytes are glutamatergic perforant path synapses. Thus, GABA from reactive astrocytes inhibits the activity of dentate granule neurons, resulting in inhibition of spike probability and contributing to learning and memory impairments (Fig. 5). On the other hand, in the case of cortical layer II–III, where GABAergic interneurons are widely distributed53, GABA from reactive astrocytes could inhibit the activity of interneurons in the vicinity, resulting in disinhibition onto glutamatergic principal neu-rons and contributing to previously reported epileptiform discharges54. Unfortunately, the authors of both reports53,54 did not measure tonic inhibition, and this idea remains to be tested in the future. Therefore, depending on the brain region in which reactive astrocytes are preva-lent, various neurological symptoms can arise in each patient during the progression of AD.
We expect that suppression of GABA production or release from reactive astrocytes would bring about desirable therapeutic effects on memory impairment in AD. Indeed, several studies show the beneficial effects of the MAOB inhibitor selegiline on cognitive impairment in patients with AD55–57. Although a meta-analysis study from 17 selegiline trials58 concluded that there was no justification for using selegiline in the treatment of AD, the same study found some evidence for selegi-line’s beneficial effects on memory. The mode of action of selegiline, however, has not been fully understood or has never been studied in relation to GABA. Our work offers a clear explanation of the action of selegiline in memory impairment in its inhibition of GABA production in reactive astrocytes. However, selegiline is known to have side effects and short-lived actions44,45. It generates neurotoxic metabolites such as l-methamphetamine, which causes psychosis and other side effects45. The short-lived action of selegiline44 (Fig. 6a–d) is perhaps through compensatory mechanisms by Maoa or overexpression of Maob due to the permanent damage to flavin adenine dinucleotide (FAD), a cofac-tor of Maob59. Therefore, the use of drugs like selegiline, which loses its efficacy when administered over long periods, might not be optimal. These obstacles make it clear that there is a pressing need for develop-ing better MAOB inhibitors by changing irreversibility or by optimizing prescription methods. In the future, reversible MAOB inhibitors such as safinamide should be tested in mouse models following longitudinal paradigms, in which potential toxicity due to long-term administration of the drug will be thoroughly evaluated.
Reactive astrocytes are commonly observed not only in AD but also in other brain diseases, such as Parkinson’s disease, stroke, epilepsy and traumatic brain injury7,60. However, their role has mainly been investi-gated in the context of inflammation or metabolic support. Our study
A R T I C L E Snp
g©
2014
Nat
ure
Am
eric
a, In
c. A
ll rig
hts
rese
rved
.
NATURE MEDICINE ADVANCE ONLINE PUBLICATION 11
monoamine oxidase B in brain astrocytes and serotonergic neurons. Proc. Natl. Acad. Sci. USA 79, 6385–6389 (1982).
36. Birkmayer, W., Riederer, P., Youdim, M. & Linauer, W. The potentiation of the anti akinetic effect after l-dopa treatment by an inhibitor of MAO-B, Deprenil. J. Neural Transm. 36, 303–326 (1975).
37. Youdim, M.B. et al. Rasagiline: neurodegeneration, neuroprotection, and mito-chondrial permeability transition. J. Neurosci. Res. 79, 172–179 (2005).
38. Nägga, K., Bogdanovic, N. & Marcusson, J. GABA transporters (GAT-1) in Alzheimer’s disease. J. Neural Transm. 106, 1141–1149 (1999).
39. Lee, J., Kannagi, M., Ferrante, R.J., Kowall, N.W. & Ryu, H. Activation of Ets-2 by oxidative stress induces Bcl-xL expression and accounts for glial survival in amyotrophic lateral sclerosis. FASEB J. 23, 1739–1749 (2009).
40. Turrigiano, G.G. The self-tuning neuron: synaptic scaling of excitatory synapses. Cell 135, 422–435 (2008).
41. Allen, C. & Stevens, C.F. An evaluation of causes for unreliability of synaptic transmission. Proc. Natl. Acad. Sci. USA 91, 10380–10383 (1994).
42. Gimbel, D.A. et al. Memory impairment in transgenic Alzheimer mice requires cellular prion protein. J. Neurosci. 30, 6367–6374 (2010).
43. De Angelis, L. & Furlan, C. The anxiolytic-like properties of two selective MAOIs, moclobemide and selegiline, in a standard and an enhanced light/dark aversion test. Pharmacol. Biochem. Behav. 65, 649–653 (2000).
44. Wilcock, G.K., Birks, J., Whitehead, A. & Evans, S.J. The effect of selegiline in the treatment of people with Alzheimer’s disease: a meta‐analysis of published trials. Int. J. Geriatr. Psychiatry 17, 175–183 (2002).
45. Engberg, G., Elebring, T. & Nissbrandt, H. Deprenyl (selegiline), a selective MAO-B inhibitor with active metabolites; effects on locomotor activity, dopaminergic neu-rotransmission and firing rate of nigral dopamine neurons. J. Pharmacol. Exp. Ther. 259, 841–847 (1991).
46. Marzo, A. et al. Pharmacokinetics and pharmacodynamics of safinamide, a neu-roprotectant with antiparkinsonian and anticonvulsant activity. Pharmacol. Res. 50, 77–85 (2004).
47. Squire, L.R., Stark, C.E. & Clark, R.E. The medial temporal lobe*. Annu. Rev. Neurosci. 27, 279–306 (2004).
48. Palop, J.J., Chin, J. & Mucke, L. A network dysfunction perspective on neurode-generative diseases. Nature 443, 768–773 (2006).
49. Pike, C.J., Cummings, B., Monzavi, R. & Cotman, C.W. b-amyloid–induced changes in cultured astrocytes parallel reactive astrocytosis associated with senile plaques in Alzheimer’s disease. Neuroscience 63, 517–531 (1994).
50. Chen, G. et al. A learning deficit related to age and b-amyloid plaques in a mouse model of Alzheimer’s disease. Nature 408, 975–979 (2000).
51. Hsieh, H. et al. AMPAR removal underlies Ab-induced synaptic depression and dendritic spine loss. Neuron 52, 831–843 (2006).
52. Scheff, S.W. & Price, D.A. Synaptic density in the inner molecular layer of the hippocampal dentate gyrus in Alzheimer disease. J. Neuropathol. Exp. Neurol. 57, 1146–1153 (1998).
53. Jacobs, K., Kharazia, V.N. & Prince, D.A. Mechanisms underlying epileptogenesis in cortical malformations. Epilepsy Res. 36, 165–188 (1999).
54. Verret, L. et al. Inhibitory interneuron deficit links altered network activity and cognitive dysfunction in Alzheimer model. Cell 149, 708–721 (2012).
55. Piccinin, G.L., Finali, G. & Piccirilli, M. Neuropsychological effects of l-deprenyl in Alzheimer’s type dementia. Clin. Neuropharmacol. 13, 147–163 (1990).
56. Tariot, P.N. et al. l-deprenyl in Alzheimer’s disease: preliminary evidence for behavioral change with monoamine oxidase B inhibition. Arch. Gen. Psychiatry 44, 427–433 (1987).
57. Monteverde, A., Gnemmi, P., Rossi, F. & Finali, G. Selegiline in the treatment of mild to moderate Alzheimer-type dementia. Clin. Ther. 12, 315–322 (1990).
58. Birks, J. & Flicker, L. Selegiline for Alzheimer’s disease. Cochrane Database Syst. Rev. CD000442 (2003).
59. Gerlach, M., Youdim, M. & Riederer, P. Pharmacology of selegiline. Neurology 47, S137–S145 (1996).
60. Barres, B.A. The mystery and magic of glia: a perspective on their roles in health and disease. Neuron 60, 430–440 (2008).
13. Farrant, M. & Nusser, Z. Variations on an inhibitory theme: phasic and tonic activa-tion of GABAA receptors. Nat. Rev. Neurosci. 6, 215–229 (2005).
14. Samakashvili, S. et al. Analysis of chiral amino acids in cerebrospinal fluid samples linked to different stages of Alzheimer disease. Electrophoresis 32, 2757–2764 (2011).
15. Yoshiike, Y. et al. GABAA Receptor-mediated acceleration of aging-associated memory decline in APP/PS1 mice and its pharmacological treatment by picrotoxin. PLoS ONE 3, e3029 (2008).
16. Yoon, B.E. et al. The amount of astrocytic GABA positively correlates with the degree of tonic inhibition in hippocampal CA1 and cerebellum. Mol. Brain 4, 42 (2011).
17. Borchelt, D.R. et al. Accelerated amyloid deposition in the brains of transgenic mice coexpressing mutant presenilin 1 and amyloid precursor proteins. Neuron 19, 939–945 (1997).
18. Kamphuis, W. et al. GFAP isoforms in adult mouse brain with a focus on neurogenic astrocytes and reactive astrogliosis in mouse models of Alzheimer disease. PLoS ONE 7, e42823 (2012).
19. Volianskis, A., Køstner, R., Mølgaard, M., Hass, S. & Jensen, M.S. Episodic mem-ory deficits are not related to altered glutamatergic synaptic transmission and plasticity in the CA1 hippocampus of the APPswe/PS1DE9-deleted transgenic mice model of b-amyloidosis. Neurobiol. Aging 31, 1173–1187 (2010).
20. Irizarry, M.C. et al. Ab deposition is associated with neuropil changes, but not with overt neuronal loss in the human amyloid precursor protein V717F (PDAPP) transgenic mouse. J. Neurosci. 17, 7053–7059 (1997).
21. Matousek, S.B. et al. Chronic IL-1b–mediated neuroinflammation mitigates amy-loid pathology in a mouse model of Alzheimer’s disease without inducing overt neurodegeneration. J. Neuroimmune Pharmacol. 7, 156–164 (2012).
22. Hartlage-Rübsamen, M. et al. Glutaminyl cyclase contributes to the formation of focal and diffuse pyroglutamate (pGlu)-Ab deposits in hippocampus via distinct cellular mechanisms. Acta Neuropathol. 121, 705–719 (2011).
23. Kesner, R.P. A behavioral analysis of dentate gyrus function. Prog. Brain Res. 163, 567–576 (2007).
24. Nakashiba, T. et al. Young dentate granule cells mediate pattern separation, whereas old granule cells facilitate pattern completion. Cell 149, 188–201 (2012).
25. Cao, D., Lu, H., Lewis, T.L. & Li, L. Intake of sucrose-sweetened water induces insulin resistance and exacerbates memory deficits and amyloidosis in a transgenic mouse model of Alzheimer disease. J. Biol. Chem. 282, 36275–36282 (2007).
26. Han, K.-S. et al. Channel-mediated astrocytic glutamate release via Bestrophin-1 targets synaptic NMDARs. Mol. Brain 6, 4 (2013).
27. Park, H. et al. High glutamate permeability and distal localization of Best1 channel in CA1 hippocampal astrocyte. Mol. Brain 6, 54 (2013).
28. Seiler, N., Sshmidt-Glenewinkel, T. & Sarhan, S. On the formation of g-aminobu-tyric acid from putrescine in brain. J. Biochem. 86, 277–279 (1979).
29. Laschet, J., Grisar, T., Bureau, M. & Guillaume, D. Characteristics of putrescine uptake and subsequent GABA formation in primary cultured astrocytes from normal C57BL/6J and epileptic DBA/2J mouse brain cortices. Neuroscience 48, 151–157 (1992).
30. Caspi, R. et al. The MetaCyc database of metabolic pathways and enzymes and the BioCyc collection of pathway/genome databases. Nucleic Acids Res. 40, D742–D753 (2012).
31. Seiler, N. & Al-Therib, M. Putrescine catabolism in mammalian brain. Biochem. J. 144, 29–35 (1974).
32. Saura, J. et al. Increased monoamine oxidase B activity in plaque-associated astrocytes of Alzheimer brains revealed by quantitative enzyme radioautography. Neuroscience 62, 15–30 (1994).
33. Nakamura, S. et al. Expression of monoamine oxidase B activity in astrocytes of senile plaques. Acta Neuropathol. 80, 419–425 (1990).
34. Saura, J., Kettler, R., Da Prada, M. & Richards, J. Quantitative enzyme radioau-tography with 3H-Ro 41–1049 and 3H-Ro 19–6327 in vitro: localization and abundance of MAO-A and MAO-B in rat CNS, peripheral organs, and human brain. J. Neurosci. 12, 1977–1999 (1992).
35. Levitt, P., Pintar, J.E. & Breakefield, X.O. Immunocytochemical demonstration of
A R T I C L E Snp
g©
2014
Nat
ure
Am
eric
a, In
c. A
ll rig
hts
rese
rved
.
ONLINE METHODSAnimals. Mice had free access to food and water and were kept on a 12-h light-dark cycle. All animals were housed in groups of 3–5 per cage. All animal care and handling was performed according to the directives of the Animal Care and Use Committee of KAIST (Daejeon, Korea) and the Institutional Animal Care and Use Committee of KIST (Seoul, Korea). APPswe/PSEN1dE9 (APP/PS1) mice of B6C3 hybrid background were originated from Jackson Laboratory (USA, stock number 004462) and maintained as hemizygotes by crossing transgenic mice to B6C3 F1 mice. Both sexes of 8- to 13-month-old transgenic mice and wild-type littermates were used. 69 mice were subjected to behavioral tests. For immunogold electron microscopy, APP/PS1 mice were crossed with Gfap-GFP mice (Jackson Laboratory, stock number 003257). 5XFAD mice of B6SJL hybrid background (Jackson Laboratory, stock number 008730) were maintained by crossing hemizygote transgenic mice to B6SJL F1 mice. For stab wound injury, 8- to 11-week-old male C57BL6/J mice were used. For kainic acid injection, 8-week-old male ICR mice were used. For oral administration of selegiline or safinamide, 10 mg of r-(–)-deprenyl hydrochloride (Sigma) or safinamide was dissolved in 150 ml water. The mice were provided with water (control), selegi-line or safinamide solution ad libitum. Dose was calculated as 5–10 mg kg-1 d-1. Behavioral experiments were performed during light phase of the light-dark cycle at the same time of each day. All experiments were done with gender- and age-matched controls. Different sets of mice were used for each experiment except for repeated results in Figure 3f,g and Figure 6a–d.
In vivo microdialysis. Mice were kept under isoflurane anaesthesia (1.5%) and mounted in a stereotaxic frame (Stoelting). After exposing the skull and drilling a burr hole, a guide CMA7 cannula (CMA Microdialysis) was positioned in the right hippocampus (AP, –1.8 mm; ML, –1.3 mm from bregma; DV, –2.0 mm below the dura)61 and secured to the skull with anchor screws and acrylic dental cement. Following recovery from anesthesia, a CMA7 microdialysis probe of concentric design (CMA Microdialysis) was inserted through the guide cannula, extending throughout the hippocampus. The probe was connected to a CMA100 microperfu-sion pump (CMA Microdialysis) with polyethylene (PE-20) tubing and perfused with artificial cerebrospinal fluid (ACSF) composed of (in mM): Na+ 151.1, K+ 2.6, Mg2+ 0.9, Ca2+ 1.3, C1–122.7, HCO3
– 21.0, HPO42– 2.5 and glucose 3.87 at a
speed of 1 ml min-1. Perfusates from the outlet end of the tubing were collected in plastic vials standing in ice. Samples were collected over 20 min intervals for 2 h. The second dialysate was used for measurement of l-glutamate and GABA.
l-glutamate and GABA measurement. 1 mg ml-1 stock solutions of GABA/glu-tamate standards were prepared in HPLC-grade water, aliquoted out and stored at –20 °C. Working solutions (1 mg ml-1 and 5 mg ml-1 for glutamate; 100 ng ml-1 and 500 ng ml-1 for GABA) were prepared daily by dilutions of those stock solutions, aliquoted out and stored at 4 °C until derivatisation and analysis62,63. Briefly, the derivatization was performed by mixing 100 ml in vivo microdialy-sate or standard solutions, 20 ml of daily prepared methanolic o-phthalaldehyde (5 mg ml-1), 75 ml borate buffer (pH 9.9) and 5 ml 3-mercaptopropionic acid. The resulting solution was vortexed and analyzed after 1 min at room temperature. The HPLC system consisted of a Waters chromatograph (Waters) with a 200-ml loop (Rheodyne 7725-I) and a fluorescence detector (FLD-Waters spectrofluoro-metric detector 2475), coupled to an LC-10 AD pump. The system was equipped with a 3-mm particle size (150 mm × 4.6 mm, ID) C18 analytical column (Hibar-Futigsanle RT) and a prepacked column (RT 250-4 E, Merck). An integrator (Empower 2) was used to analyze the chromatographic data. The mobile phase consisted of 0.05 M sodium acetate, tetrahydrofuran and methanol (50:1:49, v:v:v) adjusted to pH 4.0. The mobile phase was filtered through Millipore 0.45-mm Durapore membrane filters and vacuum degassed before use. Chromatographic analyses were performed at 25 ± 2 °C. Compounds were eluted isocratically over a 9-min runtime at a flow rate of 1 ml min-1. The fluorescence detector was set at an excitation wavelength of 337 nm and an emission wavelength of 454 nm, low sensitivity and range GABA/glutamate were identified by their characteristic retention times as determined by standard injections. Sample peak areas were measured through the integrator system and compared with the calibration curve standard in order to quantify the amino acid concentrations.
Cresyl violet staining. After microdialysis was completed, the position of the dialysis probe was verified by cresyl violet staining. 30-mm-thick coronal cryostat
sections were prepared as described later in the immunostaining section, mounted on slides, allowed to dry for 10 min and stained with a cresyl violet solution (Sigma) for 5 min. They were then dehydrated in increasing ethanol concentrations and finally coverslipped from xylene. The lesion site was measured at 100× magnification using a microscope (Olympus). Only those animals in which the probe was correctly located were included in the study.
Sniffer patch from acutely dissociated hippocampal astrocytes. 350-mm-thick horizontal hippocampal slices were obtained in the same way as in tonic GABA recordings. The hippocampal DG region was isolated from each slice and enzymatically dissociated with the tip of a polished Pasteur glass pipette in ASCF, which contained 20 mg ml-1 proteinase (type XXIII, Sigma) and was preoxygenated for 30 min. Tissue were incubated for 30 min at 37 °C with oxy-genation. Enzyme-treated tissues were washed with ACSF and then triturated with a polished Pasteur glass pipette in a row. Supernatant cells were filtered with Cell Strainer (BD Falcon, 70 mm). Eluted cells were plated on a 0.05 mg ml-1 PDL-coated cover glass and placed in an incubator for about 2 h before use. Then HEK 293T cells, originated from Korean Cell Line Bank (Seoul National University, Korea), expressing GABACR and EGFP were added onto the cover glass with acutely dissociated cells12. According to a previous report9, astro-cytes can be identified morphologically. To determine whether GFP-expressing HEK 293T cells express GABACR, 100 mM GABA was bath-applied to induce GABACR-mediated full current. To block Ca2+-activated Cl– channel-mediated GABA release, NPPB was pretreated for 5 min. During the sniffer-patch experi-ment, astrocytic Par1 receptor was activated by pressure application of the Par1 agonist, TFLLR through a glass pipette containing 500 mM TFLLR, positioned near an astrocyte, using Picospritzer (Parker Instrument) for 100 ms at a pressure of 10 p.s.i. Sniffer-patch experiments from acutely dissociated astrocytes were performed within 6 h after plating.
Sniffer patch from primary cultured astrocytes. Primary hippocampal astro-cytes were prepared from P0–P2 of C57BL/6 mice as described9. One day before the experiment, HEK 293T cells were transfected with 1:10 ratio of green fluo-rescence protein (pEGFP-N1) and GABAC receptor using Effectene (Qiagen). On the day of sniffer patch, HEK 293T cells expressing GABAC were dissoci-ated, triturated, added onto the cover glass with cultured astrocytes, and then allowed to settle for at least 1 h before sniffer patching. After HEK cells settled, cultured astrocytes were incubated with 5 mM Fura-2AM (mixed with 1 ml of external solution containing 5 ml of 20% pluronic acid, Invitrogen) for 40 min and washed at room temperature and subsequently transferred to a microscope stage. External solution contained (in mM): 150 NaCl, 10 HEPES, 3 KCl, 2 CaCl2, 2 MgCl2, 5.5 glucose, pH adjusted to pH 7.3 and osmolality to 325 mOsmol kg-1. Intensity images of 510-nm wavelength were taken at 340-nm and 380-nm excitation wavelengths using either iXon EMCCD (DV887 DCS-BV, ANDOR technology). The two resulting images were used for ratio calculations in Axon Imaging Workbench version 6.2 (Axon Instruments). During sniffer patch, astro-cytic Par1 receptor was activated by pressure application of the Par1 agonist, TFLLR, through a glass pipette containing 500 mM TFLLR, positioned near an astrocyte, using Picospritzer (Parker Instrument) for 100 ms. GABAC-mediated currents were recorded from HEK 293T cells under voltage clamp (Vh = –70 mV) using Axopatch 200A amplifier (Axon Instruments), acquired with pClamp 9.1. Recording electrodes (4–7 MW) were filled with (mM): 110 Cs-gluconate, 30 CsCl, 0.5 CaCl2, 10 HEPES, 4 Mg-ATP, 0.3 Na3-GTP and 10 BAPTA (pH adjusted to 7.3 with CsOH and osmolality adjusted to 290–310 mOsm kg-1 with sucrose). For simultaneous recordings, Imaging Workbench was synchronized with pClamp 9.1. To normalize for different amounts of expression of GABAC receptors on the HEK 293T cells, 100 mM of GABA in the bath was applied to maximally activate the GABAC receptors after current recording. Normalization was then accomplished by dividing the current induced by GABA released from astrocytes by the current induced by bath application of GABA. Ab42 peptide (H2N-DAEFRHDSGYEVHHQKLVFFAEDVGSNKGAIIGLMVGGVVIA-COOH) was prepared as previously described64.
Transfection of Best1 shRNA. Before replating onto a cover glass for sniffer patch, cultured astrocytes were transfected with shRNA by electroporation. The pSicoR-Best1-shRNA was adopted from a previous report12 and the complemen-tary oligomers were 5´-TTG CCA ACT TGT CAA TGA ATT CAA GAG ATC ATT GAC AAG TTG GCA ATT TTT TC-3´ and 5´-CGA GAA AAA ATC GCA
doi:10.1038/nm.3639 NATURE MEDICINE
npg
© 2
014
Nat
ure
Am
eric
a, In
c. A
ll rig
hts
rese
rved
.
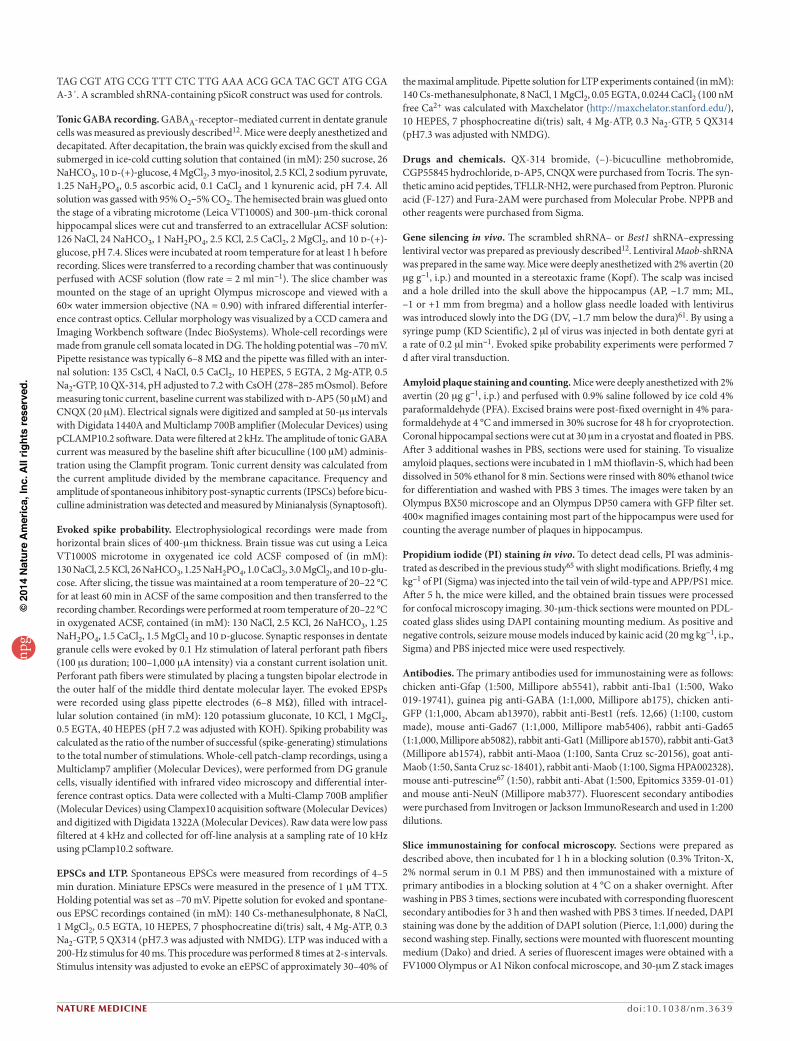
NATURE MEDICINE doi :10.1038/nm.3639
TAG CGT ATG CCG TTT CTC TTG AAA ACG GCA TAC GCT ATG CGA A-3´. A scrambled shRNA-containing pSicoR construct was used for controls.
Tonic GABA recording. GABAA-receptor–mediated current in dentate granule cells was measured as previously described12. Mice were deeply anesthetized and decapitated. After decapitation, the brain was quickly excised from the skull and submerged in ice‐cold cutting solution that contained (in mM): 250 sucrose, 26 NaHCO3, 10 d-(+)‐glucose, 4 MgCl2, 3 myo‐inositol, 2.5 KCl, 2 sodium pyruvate, 1.25 NaH2PO4, 0.5 ascorbic acid, 0.1 CaCl2 and 1 kynurenic acid, pH 7.4. All solution was gassed with 95% O2–5% CO2. The hemisected brain was glued onto the stage of a vibrating microtome (Leica VT1000S) and 300-mm-thick coronal hippocampal slices were cut and transferred to an extracellular ACSF solution: 126 NaCl, 24 NaHCO3, 1 NaH2PO4, 2.5 KCl, 2.5 CaCl2, 2 MgCl2, and 10 d-(+)‐glucose, pH 7.4. Slices were incubated at room temperature for at least 1 h before recording. Slices were transferred to a recording chamber that was continuously perfused with ACSF solution (flow rate = 2 ml min-1). The slice chamber was mounted on the stage of an upright Olympus microscope and viewed with a 60× water immersion objective (NA = 0.90) with infrared differential interfer-ence contrast optics. Cellular morphology was visualized by a CCD camera and Imaging Workbench software (Indec BioSystems). Whole‐cell recordings were made from granule cell somata located in DG. The holding potential was –70 mV. Pipette resistance was typically 6–8 MW and the pipette was filled with an inter-nal solution: 135 CsCl, 4 NaCl, 0.5 CaCl2, 10 HEPES, 5 EGTA, 2 Mg‐ATP, 0.5 Na2‐GTP, 10 QX‐314, pH adjusted to 7.2 with CsOH (278–285 mOsmol). Before measuring tonic current, baseline current was stabilized with d-AP5 (50 mM) and CNQX (20 mM). Electrical signals were digitized and sampled at 50-ms intervals with Digidata 1440A and Multiclamp 700B amplifier (Molecular Devices) using pCLAMP10.2 software. Data were filtered at 2 kHz. The amplitude of tonic GABA current was measured by the baseline shift after bicuculline (100 mM) adminis-tration using the Clampfit program. Tonic current density was calculated from the current amplitude divided by the membrane capacitance. Frequency and amplitude of spontaneous inhibitory post-synaptic currents (IPSCs) before bicu-culline administration was detected and measured by Minianalysis (Synaptosoft).
Evoked spike probability. Electrophysiological recordings were made from horizontal brain slices of 400-mm thickness. Brain tissue was cut using a Leica VT1000S microtome in oxygenated ice cold ACSF composed of (in mM): 130 NaCl, 2.5 KCl, 26 NaHCO3, 1.25 NaH2PO4, 1.0 CaCl2, 3.0 MgCl2, and 10 d-glu-cose. After slicing, the tissue was maintained at a room temperature of 20–22 °C for at least 60 min in ACSF of the same composition and then transferred to the recording chamber. Recordings were performed at room temperature of 20–22 °C in oxygenated ACSF, contained (in mM): 130 NaCl, 2.5 KCl, 26 NaHCO3, 1.25 NaH2PO4, 1.5 CaCl2, 1.5 MgCl2 and 10 d-glucose. Synaptic responses in dentate granule cells were evoked by 0.1 Hz stimulation of lateral perforant path fibers (100 ms duration; 100–1,000 mA intensity) via a constant current isolation unit. Perforant path fibers were stimulated by placing a tungsten bipolar electrode in the outer half of the middle third dentate molecular layer. The evoked EPSPs were recorded using glass pipette electrodes (6–8 MW), filled with intracel-lular solution contained (in mM): 120 potassium gluconate, 10 KCl, 1 MgCl2, 0.5 EGTA, 40 HEPES (pH 7.2 was adjusted with KOH). Spiking probability was calculated as the ratio of the number of successful (spike-generating) stimulations to the total number of stimulations. Whole-cell patch-clamp recordings, using a Multiclamp7 amplifier (Molecular Devices), were performed from DG granule cells, visually identified with infrared video microscopy and differential inter-ference contrast optics. Data were collected with a Multi-Clamp 700B amplifier (Molecular Devices) using Clampex10 acquisition software (Molecular Devices) and digitized with Digidata 1322A (Molecular Devices). Raw data were low pass filtered at 4 kHz and collected for off-line analysis at a sampling rate of 10 kHz using pClamp10.2 software.
EPSCs and LTP. Spontaneous EPSCs were measured from recordings of 4–5 min duration. Miniature EPSCs were measured in the presence of 1 mM TTX. Holding potential was set as –70 mV. Pipette solution for evoked and spontane-ous EPSC recordings contained (in mM): 140 Cs-methanesulphonate, 8 NaCl, 1 MgCl2, 0.5 EGTA, 10 HEPES, 7 phosphocreatine di(tris) salt, 4 Mg-ATP, 0.3 Na2-GTP, 5 QX314 (pH7.3 was adjusted with NMDG). LTP was induced with a 200-Hz stimulus for 40 ms. This procedure was performed 8 times at 2-s intervals. Stimulus intensity was adjusted to evoke an eEPSC of approximately 30–40% of
the maximal amplitude. Pipette solution for LTP experiments contained (in mM): 140 Cs-methanesulphonate, 8 NaCl, 1 MgCl2, 0.05 EGTA, 0.0244 CaCl2 (100 nM free Ca2+ was calculated with Maxchelator (http://maxchelator.stanford.edu/), 10 HEPES, 7 phosphocreatine di(tris) salt, 4 Mg-ATP, 0.3 Na2-GTP, 5 QX314 (pH7.3 was adjusted with NMDG).
Drugs and chemicals. QX-314 bromide, (–)-bicuculline methobromide, CGP55845 hydrochloride, d-AP5, CNQX were purchased from Tocris. The syn-thetic amino acid peptides, TFLLR-NH2, were purchased from Peptron. Pluronic acid (F-127) and Fura-2AM were purchased from Molecular Probe. NPPB and other reagents were purchased from Sigma.
Gene silencing in vivo. The scrambled shRNA– or Best1 shRNA–expressing lentiviral vector was prepared as previously described12. Lentiviral Maob-shRNA was prepared in the same way. Mice were deeply anesthetized with 2% avertin (20 mg g-1, i.p.) and mounted in a stereotaxic frame (Kopf). The scalp was incised and a hole drilled into the skull above the hippocampus (AP, –1.7 mm; ML, –1 or +1 mm from bregma) and a hollow glass needle loaded with lentivirus was introduced slowly into the DG (DV, –1.7 mm below the dura)61. By using a syringe pump (KD Scientific), 2 ml of virus was injected in both dentate gyri at a rate of 0.2 ml min-1. Evoked spike probability experiments were performed 7 d after viral transduction.
Amyloid plaque staining and counting. Mice were deeply anesthetized with 2% avertin (20 mg g-1, i.p.) and perfused with 0.9% saline followed by ice cold 4% paraformaldehyde (PFA). Excised brains were post-fixed overnight in 4% para-formaldehyde at 4 °C and immersed in 30% sucrose for 48 h for cryoprotection. Coronal hippocampal sections were cut at 30 mm in a cryostat and floated in PBS. After 3 additional washes in PBS, sections were used for staining. To visualize amyloid plaques, sections were incubated in 1 mM thioflavin-S, which had been dissolved in 50% ethanol for 8 min. Sections were rinsed with 80% ethanol twice for differentiation and washed with PBS 3 times. The images were taken by an Olympus BX50 microscope and an Olympus DP50 camera with GFP filter set. 400× magnified images containing most part of the hippocampus were used for counting the average number of plaques in hippocampus.
Propidium iodide (PI) staining in vivo. To detect dead cells, PI was adminis-trated as described in the previous study65 with slight modifications. Briefly, 4 mg kg-1 of PI (Sigma) was injected into the tail vein of wild-type and APP/PS1 mice. After 5 h, the mice were killed, and the obtained brain tissues were processed for confocal microscopy imaging. 30-mm-thick sections were mounted on PDL-coated glass slides using DAPI containing mounting medium. As positive and negative controls, seizure mouse models induced by kainic acid (20 mg kg-1, i.p., Sigma) and PBS injected mice were used respectively.
Antibodies. The primary antibodies used for immunostaining were as follows: chicken anti-Gfap (1:500, Millipore ab5541), rabbit anti-Iba1 (1:500, Wako 019-19741), guinea pig anti-GABA (1:1,000, Millipore ab175), chicken anti-GFP (1:1,000, Abcam ab13970), rabbit anti-Best1 (refs. 12,66) (1:100, custom made), mouse anti-Gad67 (1:1,000, Millipore mab5406), rabbit anti-Gad65 (1:1,000, Millipore ab5082), rabbit anti-Gat1 (Millipore ab1570), rabbit anti-Gat3 (Millipore ab1574), rabbit anti-Maoa (1:100, Santa Cruz sc-20156), goat anti-Maob (1:50, Santa Cruz sc-18401), rabbit anti-Maob (1:100, Sigma HPA002328), mouse anti-putrescine67 (1:50), rabbit anti-Abat (1:500, Epitomics 3359-01-01) and mouse anti-NeuN (Millipore mab377). Fluorescent secondary antibodies were purchased from Invitrogen or Jackson ImmunoResearch and used in 1:200 dilutions.
Slice immunostaining for confocal microscopy. Sections were prepared as described above, then incubated for 1 h in a blocking solution (0.3% Triton-X, 2% normal serum in 0.1 M PBS) and then immunostained with a mixture of primary antibodies in a blocking solution at 4 °C on a shaker overnight. After washing in PBS 3 times, sections were incubated with corresponding fluorescent secondary antibodies for 3 h and then washed with PBS 3 times. If needed, DAPI staining was done by the addition of DAPI solution (Pierce, 1:1,000) during the second washing step. Finally, sections were mounted with fluorescent mounting medium (Dako) and dried. A series of fluorescent images were obtained with a FV1000 Olympus or A1 Nikon confocal microscope, and 30-mm Z stack images
npg
© 2
014
Nat
ure
Am
eric
a, In
c. A
ll rig
hts
rese
rved
.
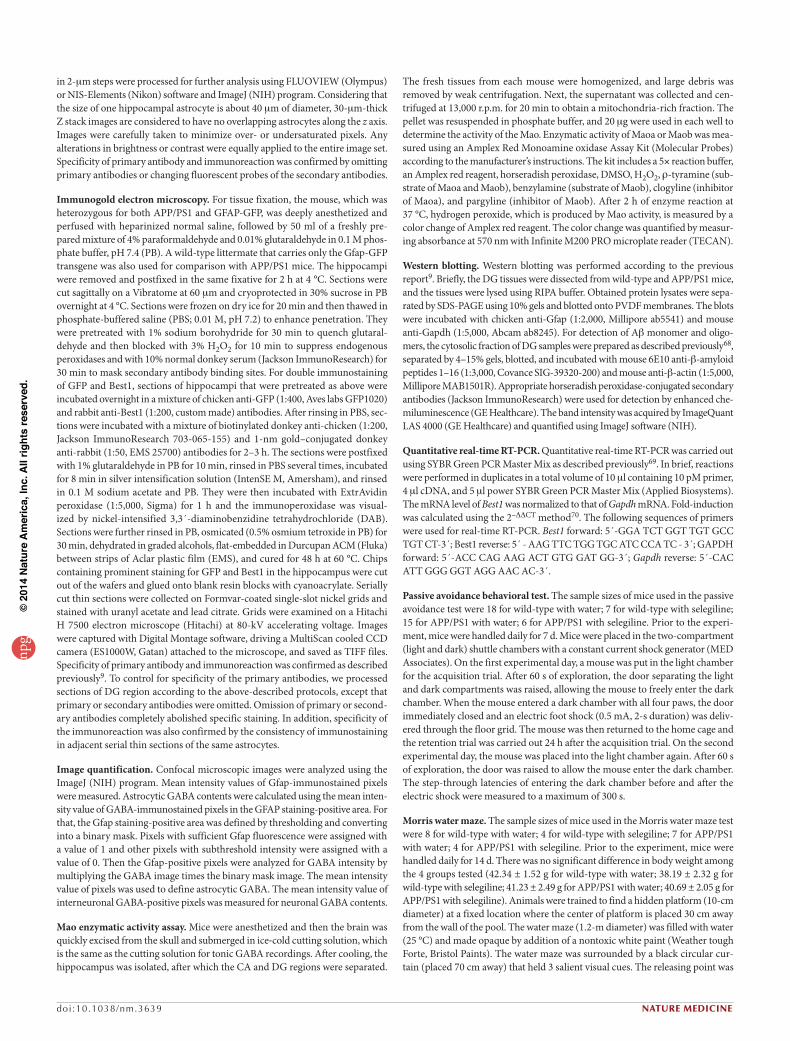
doi:10.1038/nm.3639 NATURE MEDICINE
in 2-mm steps were processed for further analysis using FLUOVIEW (Olympus) or NIS-Elements (Nikon) software and ImageJ (NIH) program. Considering that the size of one hippocampal astrocyte is about 40 mm of diameter, 30-mm-thick Z stack images are considered to have no overlapping astrocytes along the z axis. Images were carefully taken to minimize over- or undersaturated pixels. Any alterations in brightness or contrast were equally applied to the entire image set. Specificity of primary antibody and immunoreaction was confirmed by omitting primary antibodies or changing fluorescent probes of the secondary antibodies.
Immunogold electron microscopy. For tissue fixation, the mouse, which was heterozygous for both APP/PS1 and GFAP-GFP, was deeply anesthetized and perfused with heparinized normal saline, followed by 50 ml of a freshly pre-pared mixture of 4% paraformaldehyde and 0.01% glutaraldehyde in 0.1 M phos-phate buffer, pH 7.4 (PB). A wild-type littermate that carries only the Gfap-GFP transgene was also used for comparison with APP/PS1 mice. The hippocampi were removed and postfixed in the same fixative for 2 h at 4 °C. Sections were cut sagittally on a Vibratome at 60 mm and cryoprotected in 30% sucrose in PB overnight at 4 °C. Sections were frozen on dry ice for 20 min and then thawed in phosphate-buffered saline (PBS; 0.01 M, pH 7.2) to enhance penetration. They were pretreated with 1% sodium borohydride for 30 min to quench glutaral-dehyde and then blocked with 3% H2O2 for 10 min to suppress endogenous peroxidases and with 10% normal donkey serum (Jackson ImmunoResearch) for 30 min to mask secondary antibody binding sites. For double immunostaining of GFP and Best1, sections of hippocampi that were pretreated as above were incubated overnight in a mixture of chicken anti-GFP (1:400, Aves labs GFP1020) and rabbit anti-Best1 (1:200, custom made) antibodies. After rinsing in PBS, sec-tions were incubated with a mixture of biotinylated donkey anti-chicken (1:200, Jackson ImmunoResearch 703-065-155) and 1-nm gold–conjugated donkey anti-rabbit (1:50, EMS 25700) antibodies for 2–3 h. The sections were postfixed with 1% glutaraldehyde in PB for 10 min, rinsed in PBS several times, incubated for 8 min in silver intensification solution (IntenSE M, Amersham), and rinsed in 0.1 M sodium acetate and PB. They were then incubated with ExtrAvidin peroxidase (1:5,000, Sigma) for 1 h and the immunoperoxidase was visual-ized by nickel-intensified 3,3´-diaminobenzidine tetrahydrochloride (DAB). Sections were further rinsed in PB, osmicated (0.5% osmium tetroxide in PB) for 30 min, dehydrated in graded alcohols, flat-embedded in Durcupan ACM (Fluka) between strips of Aclar plastic film (EMS), and cured for 48 h at 60 °C. Chips containing prominent staining for GFP and Best1 in the hippocampus were cut out of the wafers and glued onto blank resin blocks with cyanoacrylate. Serially cut thin sections were collected on Formvar-coated single-slot nickel grids and stained with uranyl acetate and lead citrate. Grids were examined on a Hitachi H 7500 electron microscope (Hitachi) at 80-kV accelerating voltage. Images were captured with Digital Montage software, driving a MultiScan cooled CCD camera (ES1000W, Gatan) attached to the microscope, and saved as TIFF files. Specificity of primary antibody and immunoreaction was confirmed as described previously9. To control for specificity of the primary antibodies, we processed sections of DG region according to the above-described protocols, except that primary or secondary antibodies were omitted. Omission of primary or second-ary antibodies completely abolished specific staining. In addition, specificity of the immunoreaction was also confirmed by the consistency of immunostaining in adjacent serial thin sections of the same astrocytes.
Image quantification. Confocal microscopic images were analyzed using the ImageJ (NIH) program. Mean intensity values of Gfap-immunostained pixels were measured. Astrocytic GABA contents were calculated using the mean inten-sity value of GABA-immunostained pixels in the GFAP staining-positive area. For that, the Gfap staining-positive area was defined by thresholding and converting into a binary mask. Pixels with sufficient Gfap fluorescence were assigned with a value of 1 and other pixels with subthreshold intensity were assigned with a value of 0. Then the Gfap-positive pixels were analyzed for GABA intensity by multiplying the GABA image times the binary mask image. The mean intensity value of pixels was used to define astrocytic GABA. The mean intensity value of interneuronal GABA-positive pixels was measured for neuronal GABA contents.
Mao enzymatic activity assay. Mice were anesthetized and then the brain was quickly excised from the skull and submerged in ice‐cold cutting solution, which is the same as the cutting solution for tonic GABA recordings. After cooling, the hippocampus was isolated, after which the CA and DG regions were separated.
The fresh tissues from each mouse were homogenized, and large debris was removed by weak centrifugation. Next, the supernatant was collected and cen-trifuged at 13,000 r.p.m. for 20 min to obtain a mitochondria-rich fraction. The pellet was resuspended in phosphate buffer, and 20 mg were used in each well to determine the activity of the Mao. Enzymatic activity of Maoa or Maob was mea-sured using an Amplex Red Monoamine oxidase Assay Kit (Molecular Probes) according to the manufacturer’s instructions. The kit includes a 5× reaction buffer, an Amplex red reagent, horseradish peroxidase, DMSO, H2O2, r-tyramine (sub-strate of Maoa and Maob), benzylamine (substrate of Maob), clogyline (inhibitor of Maoa), and pargyline (inhibitor of Maob). After 2 h of enzyme reaction at 37 °C, hydrogen peroxide, which is produced by Mao activity, is measured by a color change of Amplex red reagent. The color change was quantified by measur-ing absorbance at 570 nm with Infinite M200 PRO microplate reader (TECAN).
Western blotting. Western blotting was performed according to the previous report9. Briefly, the DG tissues were dissected from wild-type and APP/PS1 mice, and the tissues were lysed using RIPA buffer. Obtained protein lysates were sepa-rated by SDS-PAGE using 10% gels and blotted onto PVDF membranes. The blots were incubated with chicken anti-Gfap (1:2,000, Millipore ab5541) and mouse anti-Gapdh (1:5,000, Abcam ab8245). For detection of Ab monomer and oligo-mers, the cytosolic fraction of DG samples were prepared as described previously68, separated by 4–15% gels, blotted, and incubated with mouse 6E10 anti-b-amyloid peptides 1–16 (1:3,000, Covance SIG-39320-200) and mouse anti-b-actin (1:5,000, Millipore MAB1501R). Appropriate horseradish peroxidase-conjugated secondary antibodies (Jackson ImmunoResearch) were used for detection by enhanced che-miluminescence (GE Healthcare). The band intensity was acquired by ImageQuant LAS 4000 (GE Healthcare) and quantified using ImageJ software (NIH).
Quantitative real-time RT-PCR. Quantitative real-time RT-PCR was carried out using SYBR Green PCR Master Mix as described previously69. In brief, reactions were performed in duplicates in a total volume of 10 ml containing 10 pM primer, 4 ml cDNA, and 5 ml power SYBR Green PCR Master Mix (Applied Biosystems). The mRNA level of Best1 was normalized to that of Gapdh mRNA. Fold-induction was calculated using the 2–DDCT method70. The following sequences of primers were used for real-time RT-PCR. Best1 forward: 5´-GGA TCT GGT TGT GCC TGT CT-3´; Best1 reverse: 5´ - AAG TTC TGG TGC ATC CCA TC - 3´; GAPDH forward: 5´-ACC CAG AAG ACT GTG GAT GG-3´; Gapdh reverse: 5´-CAC ATT GGG GGT AGG AAC AC-3´.
Passive avoidance behavioral test. The sample sizes of mice used in the passive avoidance test were 18 for wild-type with water; 7 for wild-type with selegiline; 15 for APP/PS1 with water; 6 for APP/PS1 with selegiline. Prior to the experi-ment, mice were handled daily for 7 d. Mice were placed in the two-compartment (light and dark) shuttle chambers with a constant current shock generator (MED Associates). On the first experimental day, a mouse was put in the light chamber for the acquisition trial. After 60 s of exploration, the door separating the light and dark compartments was raised, allowing the mouse to freely enter the dark chamber. When the mouse entered a dark chamber with all four paws, the door immediately closed and an electric foot shock (0.5 mA, 2-s duration) was deliv-ered through the floor grid. The mouse was then returned to the home cage and the retention trial was carried out 24 h after the acquisition trial. On the second experimental day, the mouse was placed into the light chamber again. After 60 s of exploration, the door was raised to allow the mouse enter the dark chamber. The step-through latencies of entering the dark chamber before and after the electric shock were measured to a maximum of 300 s.
Morris water maze. The sample sizes of mice used in the Morris water maze test were 8 for wild-type with water; 4 for wild-type with selegiline; 7 for APP/PS1 with water; 4 for APP/PS1 with selegiline. Prior to the experiment, mice were handled daily for 14 d. There was no significant difference in body weight among the 4 groups tested (42.34 ± 1.52 g for wild-type with water; 38.19 ± 2.32 g for wild-type with selegiline; 41.23 ± 2.49 g for APP/PS1 with water; 40.69 ± 2.05 g for APP/PS1 with selegiline). Animals were trained to find a hidden platform (10-cm diameter) at a fixed location where the center of platform is placed 30 cm away from the wall of the pool. The water maze (1.2-m diameter) was filled with water (25 °C) and made opaque by addition of a nontoxic white paint (Weather tough Forte, Bristol Paints). The water maze was surrounded by a black circular cur-tain (placed 70 cm away) that held 3 salient visual cues. The releasing point was
npg
© 2
014
Nat
ure
Am
eric
a, In
c. A
ll rig
hts
rese
rved
.
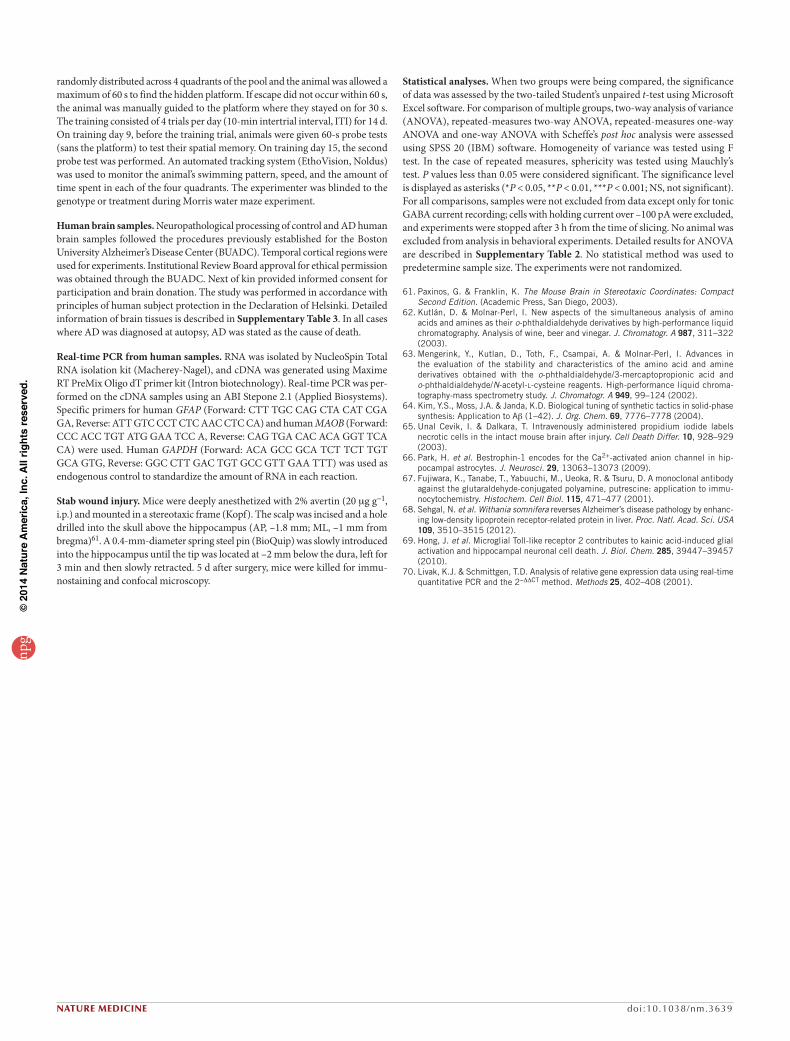
NATURE MEDICINE doi :10.1038/nm.3639
randomly distributed across 4 quadrants of the pool and the animal was allowed a maximum of 60 s to find the hidden platform. If escape did not occur within 60 s, the animal was manually guided to the platform where they stayed on for 30 s. The training consisted of 4 trials per day (10-min intertrial interval, ITI) for 14 d. On training day 9, before the training trial, animals were given 60-s probe tests (sans the platform) to test their spatial memory. On training day 15, the second probe test was performed. An automated tracking system (EthoVision, Noldus) was used to monitor the animal’s swimming pattern, speed, and the amount of time spent in each of the four quadrants. The experimenter was blinded to the genotype or treatment during Morris water maze experiment.
Human brain samples. Neuropathological processing of control and AD human brain samples followed the procedures previously established for the Boston University Alzheimer’s Disease Center (BUADC). Temporal cortical regions were used for experiments. Institutional Review Board approval for ethical permission was obtained through the BUADC. Next of kin provided informed consent for participation and brain donation. The study was performed in accordance with principles of human subject protection in the Declaration of Helsinki. Detailed information of brain tissues is described in Supplementary Table 3. In all cases where AD was diagnosed at autopsy, AD was stated as the cause of death.
Real-time PCR from human samples. RNA was isolated by NucleoSpin Total RNA isolation kit (Macherey-Nagel), and cDNA was generated using Maxime RT PreMix Oligo dT primer kit (Intron biotechnology). Real-time PCR was per-formed on the cDNA samples using an ABI Stepone 2.1 (Applied Biosystems). Specific primers for human GFAP (Forward: CTT TGC CAG CTA CAT CGA GA, Reverse: ATT GTC CCT CTC AAC CTC CA) and human MAOB (Forward: CCC ACC TGT ATG GAA TCC A, Reverse: CAG TGA CAC ACA GGT TCA CA) were used. Human GAPDH (Forward: ACA GCC GCA TCT TCT TGT GCA GTG, Reverse: GGC CTT GAC TGT GCC GTT GAA TTT) was used as endogenous control to standardize the amount of RNA in each reaction.
Stab wound injury. Mice were deeply anesthetized with 2% avertin (20 mg g-1, i.p.) and mounted in a stereotaxic frame (Kopf). The scalp was incised and a hole drilled into the skull above the hippocampus (AP, –1.8 mm; ML, –1 mm from bregma)61. A 0.4-mm-diameter spring steel pin (BioQuip) was slowly introduced into the hippocampus until the tip was located at –2 mm below the dura, left for 3 min and then slowly retracted. 5 d after surgery, mice were killed for immu-nostaining and confocal microscopy.
Statistical analyses. When two groups were being compared, the significance of data was assessed by the two-tailed Student’s unpaired t-test using Microsoft Excel software. For comparison of multiple groups, two-way analysis of variance (ANOVA), repeated-measures two-way ANOVA, repeated-measures one-way ANOVA and one-way ANOVA with Scheffe’s post hoc analysis were assessed using SPSS 20 (IBM) software. Homogeneity of variance was tested using F test. In the case of repeated measures, sphericity was tested using Mauchly’s test. P values less than 0.05 were considered significant. The significance level is displayed as asterisks (*P < 0.05, **P < 0.01, ***P < 0.001; NS, not significant). For all comparisons, samples were not excluded from data except only for tonic GABA current recording; cells with holding current over –100 pA were excluded, and experiments were stopped after 3 h from the time of slicing. No animal was excluded from analysis in behavioral experiments. Detailed results for ANOVA are described in Supplementary Table 2. No statistical method was used to predetermine sample size. The experiments were not randomized.
61. Paxinos, G. & Franklin, K. The Mouse Brain in Stereotaxic Coordinates: Compact Second Edition. (Academic Press, San Diego, 2003).
62. Kutlán, D. & Molnar-Perl, I. New aspects of the simultaneous analysis of amino acids and amines as their o-phthaldialdehyde derivatives by high-performance liquid chromatography. Analysis of wine, beer and vinegar. J. Chromatogr. A 987, 311–322 (2003).
63. Mengerink, Y., Kutlan, D., Toth, F., Csampai, A. & Molnar-Perl, I. Advances in the evaluation of the stability and characteristics of the amino acid and amine derivatives obtained with the o-phthaldialdehyde/3-mercaptopropionic acid and o-phthaldialdehyde/N-acetyl-l-cysteine reagents. High-performance liquid chroma-tography-mass spectrometry study. J. Chromatogr. A 949, 99–124 (2002).
64. Kim, Y.S., Moss, J.A. & Janda, K.D. Biological tuning of synthetic tactics in solid-phase synthesis: Application to Ab (1–42). J. Org. Chem. 69, 7776–7778 (2004).
65. Unal Cevik, I. & Dalkara, T. Intravenously administered propidium iodide labels necrotic cells in the intact mouse brain after injury. Cell Death Differ. 10, 928–929 (2003).
66. Park, H. et al. Bestrophin-1 encodes for the Ca2+-activated anion channel in hip-pocampal astrocytes. J. Neurosci. 29, 13063–13073 (2009).
67. Fujiwara, K., Tanabe, T., Yabuuchi, M., Ueoka, R. & Tsuru, D. A monoclonal antibody against the glutaraldehyde-conjugated polyamine, putrescine: application to immu-nocytochemistry. Histochem. Cell Biol. 115, 471–477 (2001).
68. Sehgal, N. et al. Withania somnifera reverses Alzheimer’s disease pathology by enhanc-ing low-density lipoprotein receptor-related protein in liver. Proc. Natl. Acad. Sci. USA 109, 3510–3515 (2012).
69. Hong, J. et al. Microglial Toll-like receptor 2 contributes to kainic acid-induced glial activation and hippocampal neuronal cell death. J. Biol. Chem. 285, 39447–39457 (2010).
70. Livak, K.J. & Schmittgen, T.D. Analysis of relative gene expression data using real-time quantitative PCR and the 2-DDCT method. Methods 25, 402–408 (2001).
npg
© 2
014
Nat
ure
Am
eric
a, In
c. A
ll rig
hts
rese
rved
.