underwater concrete abstract 1. introduction
TRANSCRIPT

- 167 -
UNDERWATER CONCRETE
Magne Maage, Dr.eng. SINTEF, Cement and Concrete Research Institute, The Norwegian Institute of Technology, Trondheirn, Norway
ABSTRACT
Concrete technology has been in a dramatic development the last years mainly due to different admixtures. In the same period the concrete activity in offshore has raised need for more reliable mixes and me
thods both for structures and repair at deep water. Anti-washout admixtures in concrete will prevent the washing out of cement when concrete is moving in water. From a testing of different anti-washout admixtures and ready mixed concretes/mortars wi th anti-washout admixtures, some interesting mixes are reported in this paper. In the tests, concrete fell freely through water up to 55 cm. A traditional good concrete for underwater concreting was cast in the same way. The results indicated that the mixes with anti-washout admixtures were performing much better than the tradi tional good concrete. The best mixes sustained the free fall through water very well. They leveled out close to a horizontal surface with almost no mud sedimented at the top of the concrete.
Key words: Underwater concrete, anti-washout admixtures, properties of fresh and hardened concrete
1. INTRODUCTION
Underwater concreting has a long tradition in Norway, first of all due to the need of bridges and quays. The Termie method was patented by A/S Høyer-Ellefsen in 1910 and has been the most used method up to now. The method has been looked upon as a reliable method provided that the workrnanship is good and the guidelines are followed. Contractors in Norway have learned to use the method with success during many years.
In spite of this, around 25% of underwater structures are consi derably darnaged. The reasons seem to be def i c i ent workmanshi p combined with a method susceptible to faults during casting.
Since the Tremie method was incorporated, no important change or development in mix proportions or methods have occurred until a few years ago. The method is suitable at small depths while purnping methods are used at deeper water. However, the pumping methods are susceptible to problems with the workers skill and concrete compositions like the Termie method.
Concrete technology has been in a d ramat i c deve lopment dur i ng the last years mainly due to different admixtures. In the same
- 168 -
period the concrete activity in offshore has raised the need for more re 1 iable mi xes and methods for both s truetures and repai r in deep water.
It is reasonable that pumping methods will be further developed for concreting in deep water. In addition to optimal mix design based on traditionel knowledge, concrete for underwater concreting will also include an anti-washout admixture. This will reduce the risk of an early deteriorated structure if something is wrong during the casting period.
In this paper a testing program including some of the commercially available anti-washout admixtures is described. Properties of such concretes are compared to a tradi tional good concrete for underwater concreting.
2. ADMIXTURES FOR UNDERWATER CONCRETE
In traditional UW-concrete, both plasticizers, retarders and air entraining agents are used.
Plasticizers improve the concretes compaction and mobility without increasing the segregation. Both plasticizers based on lignosulphona te, sulphona ted me lam i ne- formaldehyde condensa tes and sulphonated naphthalene-formaldehyde condensates are used in UWconcrete. The plasticizers based on lignosulphonate has a retarding effect. The plasticizing effect of the "superplasticizers" are limited in time.
Retarders are used especially when the rising speed is small. This will keep the concrete's compaction and mobility properties over a longer period. Also the temperature rise in the structure will be reduced.
Air entraining agents are used first of all in the splash zone to improve the frost resistance of the concrete. Due to the hydraulic pressure in pumping and in deep water, the air content should not be higher · than about 3%. Higher air contents will reduce the mobility of the concrete, especially in rich mixes.
Anti-washout admixtures are relatively new on the market. They consist of synthetic or natural polymers in combination with some other admixtures. They produce a kind of a gel in the water phase which surrounds the cement and other fine particles. The cohesion in the fresh mix increases and protects the finer particles from washout. The gel delays the initial setting time of the concrete mix but it does not prevent the normal cement to harden. The water demand will increase when using anti-washout admixtures and therefore a "superplasticizer" has to be used.
3. MATERIALS AND MIXES
In this paper, three åifferent mixes will be described: a tradi tional good one and two including anti-washout admixtures. The testing program comprised some additional mixes. However, they are of more J.imited interest. All the mixes are described in /15, 16/.
- 169 -
Mix O (Traditional UW-concrete)
This mix was designed as a good traditional concrete for under water concreting based on practical experience and /1/. The coarse aggregate was natural river gravel with maximum diameter of 20 mm. The concrete had following composition:
Cement, MP30 - 10% fly ash Silica fume (added as slurry) Coarse aggregate, 8-20 mm, FMrso= 6.42 c~arse sand, 0- -12 mm, FMrso= 3.20 Fine sand, 0-8 mm, FMrso= 1.20 Water Rescon P (water reducing admixture) Rescon HP(S) (equivalent to Melment L10) w/c = 0.47, w/c+s = 0.42, slump 22.5 cm,
3.2 M~x 4 (Rescon T)
This mix had the following composition:
Cement, MP30 - 10% fly ash Silica fume (added as slurry) Coarse aggregate, 8-20 mm, FMrso= 6. 42 Coarse sand, Q- "-'1 2 mm, FMrso= 3.20 Fine sand, 0-8 mm, FMrso= 1 . 20 Water Rescon T
362 36.2
858 860 146 1 69
7. 1 3
kg/m3 n
li
li
TI
TI
7. 13 air 1.8%
n li
448 kg/m3 44.8 ti
698 li
699 tf
119 li
256 ti
24.9 ti
w/c = 0.57, w/c+s = 0.52, slump 24 cm, air 2.3%
3.3 Mix 6 (Hydrocrete)
Hydrocrete is the trade name fora ready mixed concrete containing an anti-washout admixture. The information about the composition of the dry mix was very limited. According to the producer, the aggregate had a diameter up to 8 mm. The cement was sulfate resistant with 4000 Elaine. It is reasonable to suppose that the cement content was approximately 750 kg/m3. When mixing the concrete, water and Melment L10 had to be added. The quantity of water and Melment L10 was 0.11 kg and 30 ml respectively for each kg of the dry Hydrocrete. This corresponds to around 215 kg water and 60 1 Me lment L 1 0 per m3 concrete. I f the assumed cement content is correct the w/c-ratio was O. 35, including the water in Melment L10 (80% water,20% dry material). The slump and air content were measured to 27.5 cm and 3.5% respectively.
4. PLACING METHOD AND TEST SAMPLES
All of the concretes were mixed in accordance with the recommendations from the producers. An Eirich SWG1 mixer with capacity 50 liters was used. From each mix some of the concrete was castin-air and some under water.

- 170 -
4 • 1 Ca sting in air
Af ter mixi ng, 9 cubes 10 x 10 x 10 cm and one cylinder 1 O x 20 cm were cast-i n-air according to standard procedure. The day after, they were demolded and stored in water at 18-20°c until testing. The cubes were tested in compression after 1, 7 and 28 days of hardening. The cylinders were used for measuring water permeability after 21 days of hardening.
4.2 Casting in water
The main objective of this test program was the evaluation of different material properties of concrete under and after casting in water. In order to simulate the worst situation, the concrete fell freely through water.
The form for underwater casting is shown in Fig. 1. The bottom and the ends were made of plywood, the sides by transparent plexiglass. The form had the dimensions 15 x 60 x 60 cm. Different obstacles were placed inside the form. Approximately 30 mm from the bottom, four reinforcing steel bars with diameter 12 mm
Fig. 1.
WOODEN BLOCK
>\
FORM
FUNNEL
RE BARS, d = 12 mm
600mm 1
e E 0 0 CO
Form for underwater concreting with filling funnel.
were placed as shown in Fig. 1, one single and three in a bundle. A wooden block with dimensions 15 x 15 x 15 cm was placed 10 cm above the bottom at one of the ends of the form. Both the bl ock and the re bars were placed in order to make it di ffi cul t for the concrete to fill the form properly.
Before casting, the concrete was filled in a funnel as shown in Fig. 1. The opening of the funnel, which had a <iiameter of 15 cm, was closed with a steel plate connected to a steel string wi th which it could be removed. At the same time the form was filled with water.
- 171 -
The concrete filled the tional compaction being in video.
form by i ts carri ed out.
own The
weight with no addi· castings were filmed
One or two days after casting, the forms were removed. From then the concrete blocks were stored under wet burlaps and plastic sheets at around 20°c.
The concrete blocks were used for both visual inspection and special measurements. Samples were drilled and sawed from these blocks.
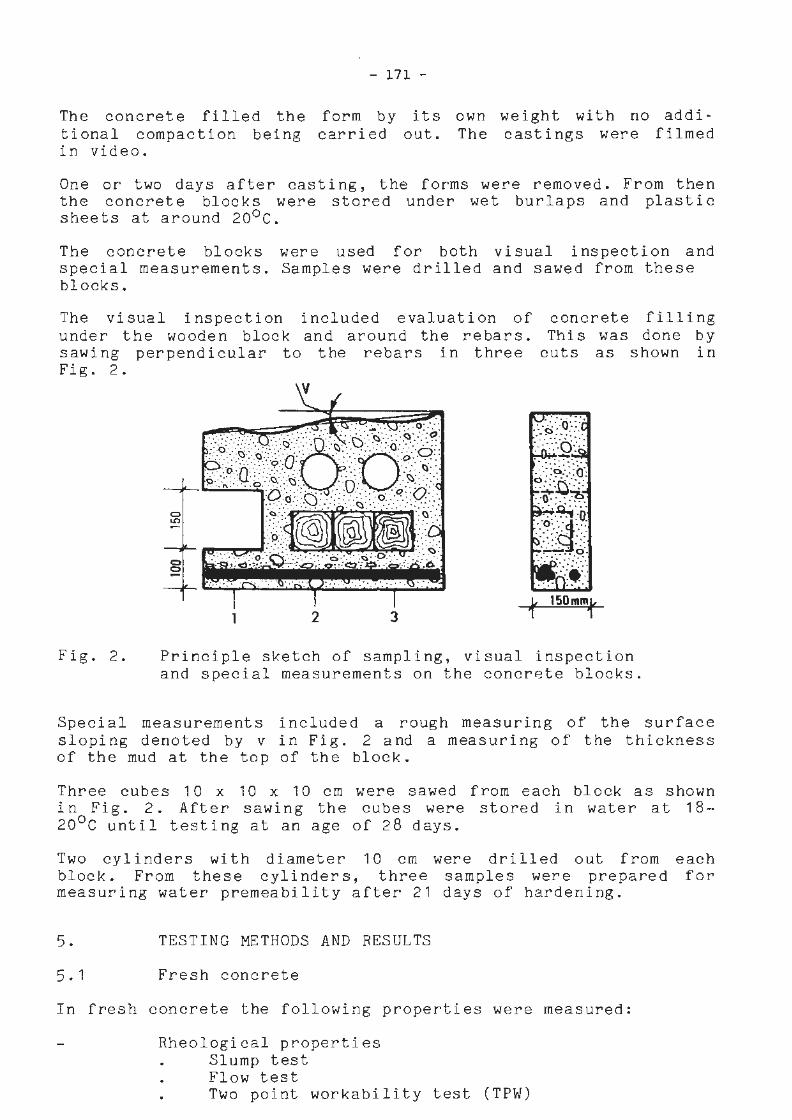
The visual inspection included evaluation of concrete filling under the wooden block and around the rebars. This was done by sawing perpendicular to the rebars in three cuts as shown in Fig. 2.
Fig. 2.
2 3 1' 150mmf
Principle sketch of sampling, visual inspection and special measurements on the concrete blocks.
Special measurements included a rough measuring of the surface sloping denoted by v in Fig. 2 and a measuring of the thick:ness of the mud at the top of the block.
Three cubes 10 x 10 x 10 cm were sawed from each block as shown in Fig. 2. After sawing the cubes were stored in water at 18-200c until testing at an age of 28 days.
Two cylinders with diameter 10 cm were drilled out from block. From these cylinders, three samples were prepared measuring water premeability after 21 days of hardening.
5.
5. 1
TESTING METHODS AND RESULTS
Fresh concrete
In fresh concrete the following properties were measured:
Rheological properties Slump test Flow test Two point workability test (TPW)
each for
- 172 -
Density Air content
5 • 1 • 1 Rheological properties
Concrete for underwater cast i ng must compact i tself. The rheological properties are therefore of great importance. The mobility has to be good and the concrete has to be stable. No single testing method can describe all these properties. The fresh concrete was therefore tested by using different methods.
Slump test Slump test was carried out according to standard procedure. A slump value of 20 cm or more was required in order to secure a self compacti ng concrete. The resul ts of the measurements are shown in Table 1.
Flow test The flow test was carried out according to German standard, DIN 1048. The concrete was filled in a cone which was placed on a table. The table was hinged on one side and could be lifted 40 mm at the opposite side. After the cone was removed, the table was lifted and dropped 15 times in 15 sec. The average diameter along two perpendicular diameters was measured. The flow test measures the stabi li ty and the flow propert i es of concrete. The test results are summarized in Table 1.
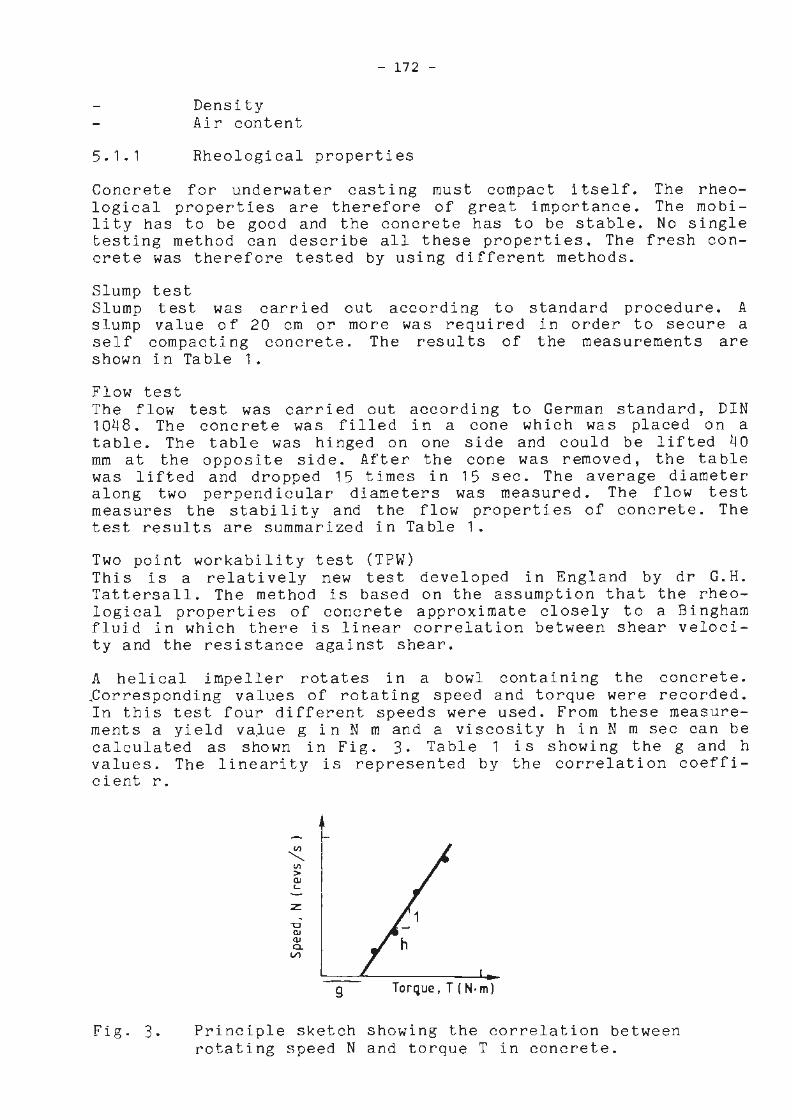
Two point workability test (TPW) This is a relatively new test developed in England by dr G.H. Tattersall. The method is based on the assumption that the rheological properties of concrete approximate closely to a Bingham fluid in which there is linear correlation between shear velocity and the resistance against shear.
A helical impeller rotates in a bowl containing the concrete . . ~orresponding values of rotating speed and torque were recorded. In this test four different speeds were used. From these measurements a yield value gin N mand a viscosity hin N m sec can be calculated as shown in Fig. 3. Table 1 is showing the g and h values. The linearity is represented by the correlation coefficient r.
Fig. 3.
z . "O {tj (IJ 0. V,
g Torque, T(N,m)
Principle sketch showing the correlation between rotating speed Nand torque Tin concrete.

- 173 -5. 1 • 2 Density
Dens i ty of fresh concrete test procedure. The values compositions of the mixes. Ta ble 1.
was measured according to standard were used for calculating the real The measured values are shown in
Table 1. Measurements on fresh concrete.
RHEOLOGICAL PROPERTIES Mix Flow Two point workability Density Air
Slump content No spread g n Corr.coett. kg/m3 % (cm) (cm) (N•m) (N •m•sec) r
0 22.5 42 2.10 2.62 0.9996 2450 1.8
4 24.0 45 2.43 2.87 0.9990 2290 2.3
6 27.5 51 0.90 1. 17 0.9996 2240 3.5
5.1.3 Air content
Air content was also measured according to standard procedures using the pressure approach.
5.2 Hardened concrete
The following properties were measured on hardened concrete:
5. 2. 1
Compressive strength Water permeability Porosity and pore size distribution Visual inspection Special measurements
Compressive strength
Cast in air cubes were tested after 1, 7 and 28 days and sawed cubes from cast in water concrete were tested after 28 days of hardening. The testing was carried out according to Norwegian Standard NS427A in a Galdabini machine with a capasity of 300 tons. The results are shown in Table 2.
Table 2. Compressive strength (MPa).
Cast in Ratio Mix w/c air water water cast/ No ratio air cast
1d 7d 28d 28d 28 days
0 0.47 28 .41) 48.9 71.3 12.7 0. 18
4 0.57 12. 7 35.5 52.2 41.5 0.80
6 0.35? 9.3 44.7 55.8 48.3 0.87
1)Tested after 2 days

- 174 -
5.2.2 Water permeability
Water permeabili ty is one of the most important factors regarding durability. The cylinders were hardened in wet conditions for 19 days before they were prepared for permeability testing. In thi s preparation, the cylinders were surface-dried before being cast in epoxy in a special cylindrical mold. From this, three specimens were sawed with a height equal to 50 mm. A test cell as shown schematically in Fig. 4, was used in which the specimens were subjected to a one dimentional hydraulic gradient of a ir-free water /17 /. On the output side there was water at atmospheric pressure. On the input side the pressure was 4 MPa (400 m water height). The test has to continue for 2-3 weeks before the water flow becorne steady state. The rate of water flow through each sample was observed in a water level tube on the output side. After a stable rate of water flow was reached, the water permeability was calculated on the basis of D'Arcy's law.
In tests like this, the dispersion of the measured values are relatively high. This is also demonstrated in Table 3 where all the results are listed.
"' : il I,' i g • ""1 •
5.2.3
t ---··-- ---·-----0 -----0
.---=::i__----'---1.-,.-,::;..---------0
å .) .J 0
0 To woter-level lt,be
0 Volve
0 Holder
-----0
-0
. -- --------0 -- -·-· ---0
0 Test spe(" i men
{2) Pressure chomber
Cell used for water permeability testing /17/.
Porosity and pore size distribution
Both porosity and pore size distribution are important factors when regarding durability.

- 175 -
Table 3. Water permeability coefficient, k.
1012 X k (m/s) Mix Cast in water Cast in air No
1 2 3 Middle Top Between Bottom Middle
0 30 30 4 21 2 3 30 12
4 0.01 0.01 0.01 0.01 2 2 0.7 1.5
6 0.06 0.5 0.06 0.2 0.001 20 0.4 7
The pore size distribution was measured by mercury intrusion porosimetry (MIP). Samples were taken from the inner part of cubes sawed from underwater cast concrete after the cubes had been test ed in compress ion. Crushed concrete was s ieved 'between 2.38 mm and 9. 5 mm from which pieces not containing coarse aggregate were selected. This means that the MIP-testing was carried out on the mortar part of the concrete. Several pieces were tested in each test run which means an averaging of the results. The mortar pi eces were dri ed to constant mass at 105°c and the contact angle in the Washb~rn equa ti on was set to 117°. Two individual test runs were carried out on each concrete. The MIPinstrument used was a Carlo Erba, model 200 in which pores
6with
diameters between 40 µm (4 x 10⁻² mm) and 58 Å (5.8 x 10- mm) were recorded. The results are shown in Table 4.
Porosity of concrete cast under water was measured in three different ways:
Helium gas pycnometer Mercury intrusion porosimetry Drying of water saturated samples
The dense volume of each sample tested in MIP was determined by a Beckman gas pycnometer before the MIP-testing. Bulk volume of the same sample was measured in the MIP-instrument and porosity was calculated. In the MIP-testing, porosity was also calculated from the intruded pore volume.
Porosity was also measured on the samples tested for permeability. During the testing for permeability, it was assumed that the samples became completely water saturated. From weight loss when dried to a constant mass at 105°c and bulk volume, the porosi ty was calculated.
The results from the porosity-measurements along with some characteristics from the MIP-testing are listed in Table 4.
5.2.~ Visual inspection
Visual inspection under the wooden shown in Fig. 2.
included evaluation of concrete being filled block and around the rebars in three cuts as In some rnixes, the corners under the wooden
- 176 -
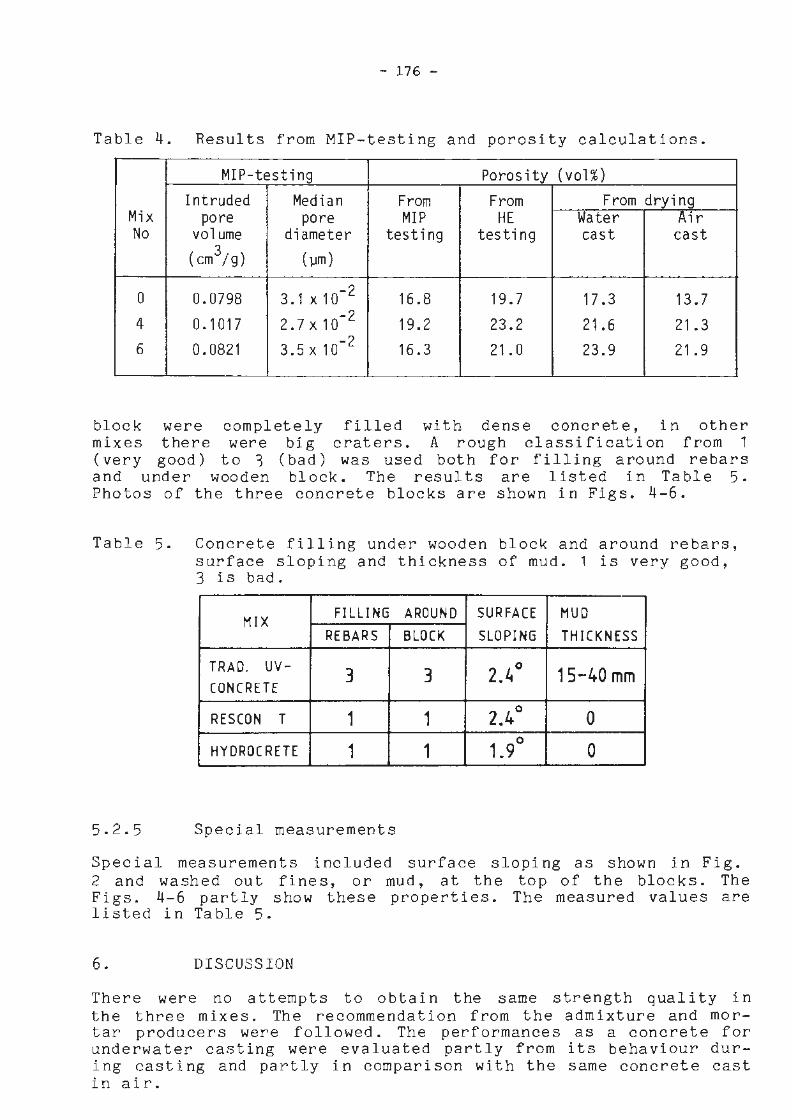
Table 4. Results from MIP-testing and porosity calculations.
MIP-testing Porosity (val%)
Intruded Median From From From dryi ng Mix pore pore MIP HE Water Air No volume diameter testing testing cast cast
(crn3/g) (µm)
0 0.0798 3.1 x10⁻² 16.8 19.7 17.3 13.7
4 0.1017 2.7 X 10 -2 19.2 23.2 21.6 21.3
6 0.0821 3.5x10 -2 16.3 21. 0 23.9 21.9
block were completely filled with dense concrete, in other mixes there were big craters. A rough classification from 1 (very good) to ~ (bad) was used both for filling around rebars and under wooden bl ock. The resul ts are 1 i sted in Ta ble 5. Photos of the three concrete blocks are shown in Figs. 4-6.
Table 5. Concrete filling under wooden block and around rebars, surface sloping and thickness of mud. 1 is very good, 3 is br.1d.
MIX FILLING AROUNO SUR FACE MUD
REBARS BLOCK SLOPING THICKNESS
TRAD. uv- 3 3 2.4 ° 15-40 mm CONCREH
RESCON T 1 1 2.4° 0
HYDROC RETE 1 1 1. 9° 0
5.2.5 Special measurements
Special measurements included surface sloping as shown in Fig. 2 and washed out fines, or mud, at the top of the blocks. The Figs. 4-6 partly show these properties. The measured values are listed in Table 5.
6. D!SCUSSION
There were no attempts to obtain the same strength quality in the three mixes. The recommendation from the admixture and mortar producers were followed. The performances as a concrete for underwater casting were evaluated partly from its behaviour during casting and partly in comparison with the same concrete cast in air.

- .177 -
Fig. 4. Mix O. Concrete block cast under water.
Fig. 5. Mix 4. Concrete block cast under water.

- 178 -
Fig. 6. Mix 6. Concrete block cast under water.
The results of measurements on fresh concrete are shown in Table 1.
The air contents and densities were within normal limits.
Mix O had the lowest spread values and had to be pushed through the funnel with flat hands.The other mixes passed easily through the funnel without such pushing. Mixes 4 and 6 were very tough and sticky, however, the mobility was very good. This is also confirmed in Table 5. The cleaning of the equipment was more difficult for these mixes.
It seems that none of the methods used for measuring the rheological properties in fresh concrete were reflecting the observed practical performance of the concretes. The visual inspection and the special measurements referred to in Table 5 seem to be more reliable. The table is showing that mix O did not fill around the rebars and under the wooden block as well as the other mixes. Mix O had a horizontal surface, however, the mu d cove ring th e top was very thick. The m ixe s 4 and 6 had the best combination of surface sloping, thickness of the mud and f illing around re bars and under the wooden block. However, the sticky behaviour of these mixes may be a problem in pumping, especially over longer distances. However, both the concretes have been pumped with success in actual jobs.
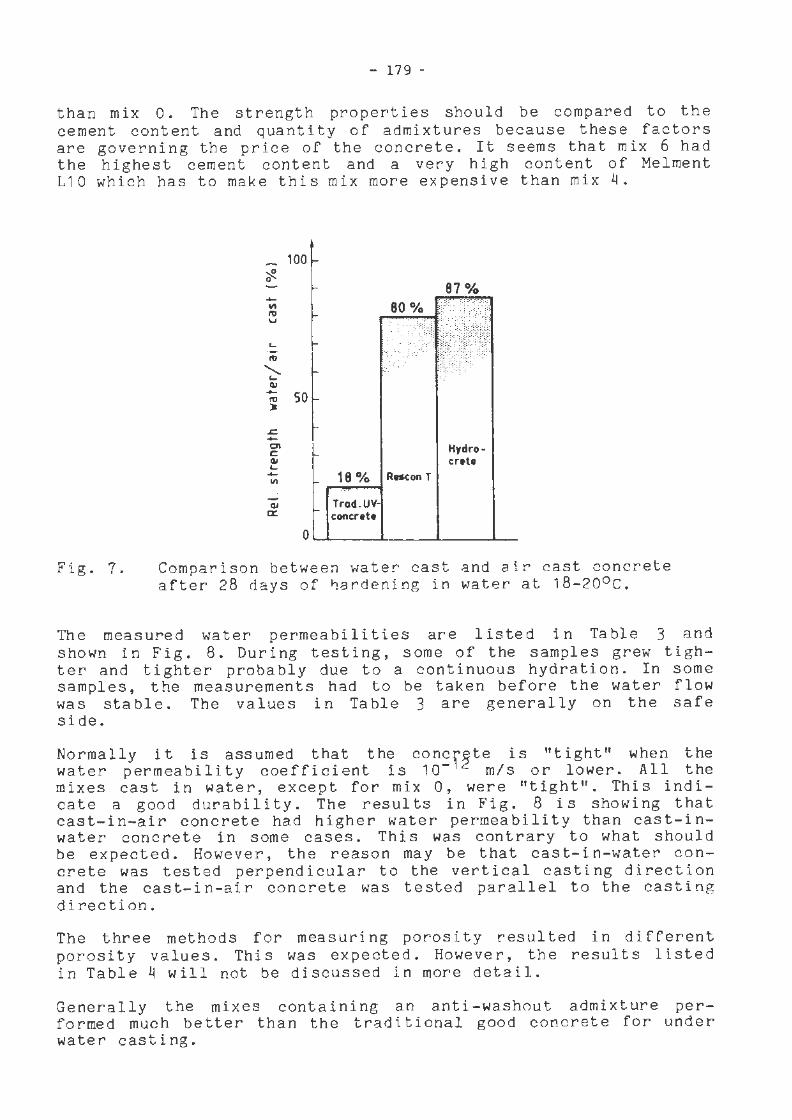
The compressive strengths are shown in Table 2. The ratio between compressive strengths after 28 days of hardening for water cast and air cast concrete is shown in Fig. 7. The mixes with anti-washout admixtures were showing much better performances
- 179 -
than mix O. The strength properties should be compared to the cement content and quant i ty o f admi xt ures because these factors are governing the price of the concrete. It seems that mix 6 had the highest cement content and a very high content of Melment L10 which has to make this mix more expensive than mix 4.
Fig. 7 .
~ 0
.... III ro u
L ·-ro
"--... Q.I .... ro )t
..c. .... Ol C QI L.. --III
-Q.I a:
100
50
0
80%
18 % Røcon T :··. ,: .
Trcd . UVconcnth
87%
Hydro crete
Comparison between water cast and air cast ~oncrete after 28 days of hardening in water at 18- 20°c.
The measured water permeabilities are listed in Table 3 and shown in Fig . 8. During testing , some of tbe sampl es grew tighter and tighter probably due t o a continuous hydrati o n . In some samples, the measurements had to be taken before the wat er flow was stable . The values in Table 3 are general ly o n the safe side .
Normally it is assumed tha t the concf~te is " tight " when the water permeability coefficient is 10- m/s or lo wer . All the mixes cast in water, except for mix 0, were " tight ". This indi cate a good durability . The results in Fig . 8 is sho wing that cast- in- air concrete bad higher water permeabi l ity than cast- inwater concrete in some cases . This wa s contrary to what should be expected . However, the reason may be that cast- in - wa ter concrete was tested perpendicular to the vertical casting direction and the cast- in- air concrete was tested parallel to the casting direction .
The three methods for measuri ng poros i ty resul ted in di fferent porosity values . Tbis was expected . However, the results listed in Table 4 will not be discussed in more detail .
Generally the mixes containing an anti - washout admixture per formed much better than the traditional good concrete for under water casting .
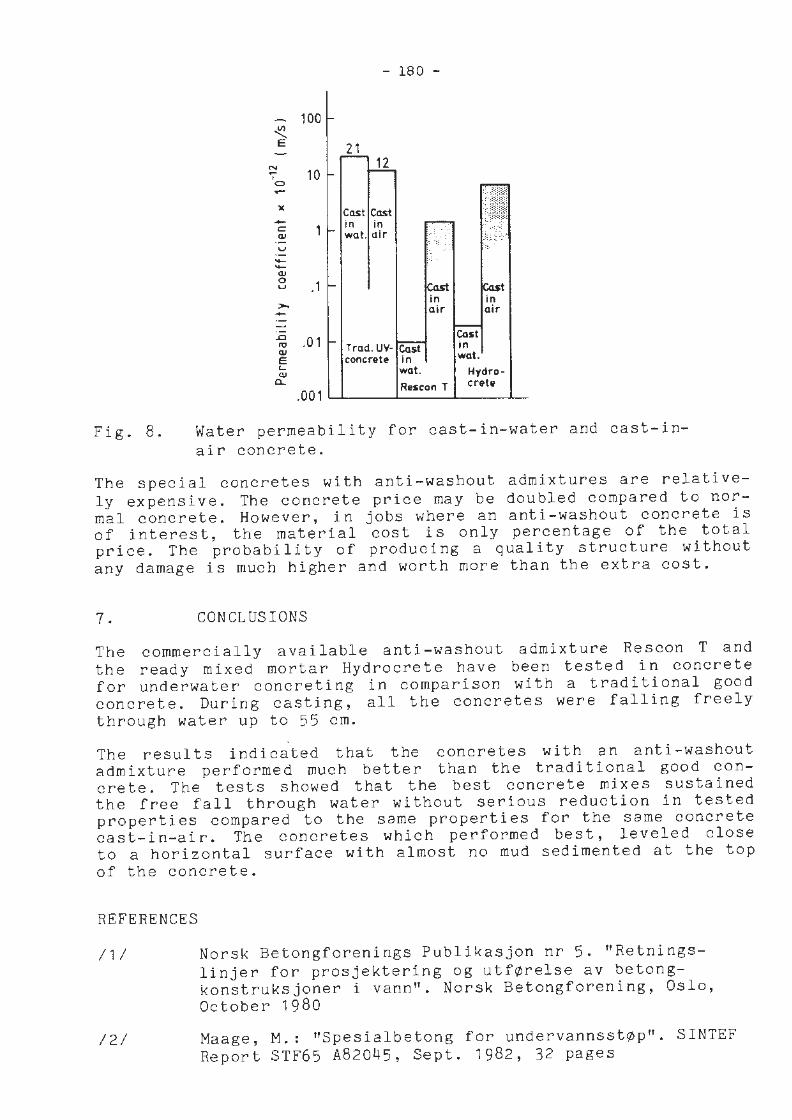
Fig. 8.
- 180 -
100 ~ E 21
N 12 - 10 I 0 ..-
')( Cast Ca.st .... in in
C 1 QJ wo.t. air u ·-...... "-QJ 0 ,1 u
in in >, - air air
..c .01 Cast
~ Trad. UY· Cast in QJ E concrete in wot. '- wat. Hydro-<l)
a.. Rescon T cr•t• .001
Water permeability for cast-in-water and cast-inair concrete.
The special concretes with anti-washout admixtures are relatively expensive. The concrete price may be doubled compared to normal concrete. However, in jobs where an anti-washout concrete is of interest, the material cost is only percentage of the total price. The probability of producing a quality structure without any damage is much higher and worth more than the extra cost.
7. CONCLUSIONS
The commerc i al ly a va i la ble anti-washou t admi xt ure Rescon T and the ready mixed mortar Hydrocrete have been tested in concrete for underwater concreting in comparison with a traditional good concrete. During casting, all the concretes were falling freely through water up to 55 cm.
The results indicated that the concretes with an anti-washout admixture performed much better than the traditional good concrete. The tests showed that the best concrete mixes sustained the free fall through water without serious reduction in tested properties compared to the same properties for the same concrete cast-in-air. The concretes which performed best, leveled close to a horizontal surface with almost no mud sedimented at the top of the concrete.
REFERENCES
/1/
/2/
Norsk Betongforenings Publikasjon nr 5. "Retningslinjer for prosjektering og utførelse av betongkonstruksjoner i vann". Norsk Betongforening, Oslo, October 1980
Maage, M.: "Spesialbetong for undervannsstøp". SINTEF Report STF65 A82045, Sept. 1982, 32 pages
- 181 -
/3/ "Betongstøp i vann". NIF-course, 1976, different papers
/4/ "Betongstøp i vann". NIF-course, 1979, different papers
/5/
161
/7/
/8/
/9/
/10/
/11/
/12/
/13/
/14/
/15/
/16/
Nygård, I. and Svensson, S.: "Undervattensbetong. Undersøkningar på laboratorium". Report R2 1979, Stockholm, 137 pages
Gjørv, O.E.: "Durability of Reinforced Concrete Wharves in Norwegian Harbours". Ingeniørforlaget, Oslo, 1 968, 208 pages
"Betongstøp i vanntt. NIF-course, 1980, di fferent papers
Brovold, S.: "Utnyttelse av nye materialkombinasjoner for utstøping under vann". Report BML 81.405, Diploms work, December 1 981 , Trondhe i m, 107 + 5 3 pages
Heron: "Underwater Conorete", Heron vol 19, No 3, · Delf t 1973
"Undervannsstøp med Rescon T-betong hos Stoltz Røthing & Co. A/S i Bergen i samarbeid med RESCON AS Brødrene Tjugum". Bergen, June 1983, Part of project no 8010. 10871
"Tests on reinforced underwater concrete test specimens manufactured by the SIBO technique (non-errosive underwater concrete)tt. Official materialtesting office for the building industry. Certificate No 299/79-Gr/Dy. Hannover, January 1980
ttPrUfung des Stabilisierers "Sicotan Stabilisator (ST)" ... " Amtliche Materialprlifanstalt rur des Bauwesen. Prlifungszeugnis nr 897/81 Gr/Schn. Hannover, April, 1982
"Hydrocrete. Collated Test Data and Results". Underwater Concrete Ltd., Glasgow and Osnabruck, June 1982, Part 1 and Part 2
Anderson, J.M.: "Underwater Construction; New Method of Using Cement Bound Building Materials 11
• ARBEM 2e Col. Int. sur la Tenue des Ouvrages en Beton en Mer. Paris, October 1982, pp 377-389
Hjøllo, O.E.: "Spesialbetong for støping under vann". Report BML 83.413 Diploma work, December 1983, Trondheim, 101 + 41 pages
Maage, M., Hjøllo, O.E.: "Special concrete for under water concreting". SINTEF Re port STF65 A83089, December, 1983, 28 pages

- 182 -
/17/ Gjørv, O.E., Løland, K.E.: "Effect of Air on th6 Hydraulic Conductivity of Concrete". Special Techn. Publ. 691, American Society for Testing and Materials, 1980, pp 410-422