underwater technology | wegemt
TRANSCRIPT

re
Fifteenth Graduate School
d UNDERWATER TECHNOLOGYOctober 14-18, 1991
2tV" r
WEGEMT SCHOOL of UNDERWATER TECHNOLOGY
Helsinki University of Technology October 14. - 18. 1991Lecture hall E, main building
FINAL PROGRAM/9.10.1991
. Monday 14.10.1991
Coordinator: Prof. Petri Varsta
0800 - 0900 Registration
0900 - 1000 Lecture I The Exploitation of Marine ResourcesDr. T.Patten
1000 - 1100 Lecture II Advances and Challenges of Working inInner SpaceProf. G. Owen
1100 - 1200 Lecture III Ecological Impact of Working in InnerSpaceProf. E. Sakshaug
i. 1200 - 1300 Lunch
1300 - 1500 Lecture IV Physical OceanographyDr. P. Collar
1500 - 1600 Lecture V Characteristics of the SeabedDr. R. Bijker
1600 - 1700 Lecture VI DivingDr. R. Allwood
1700 - 1800 Lecture VII Underwater VehiclesDr. R. Allwood

Tuesday 15.10.1991
Coordinator: Dr. Kaj Riska
0800 - 0900 Lecture VIII Surface Support VesselsMr. K. Sandaker
0900 - 1000 Lecture IX Underwater ConstructionMr. C. van Zandwijk
1000 - 1100 Lecture X Loads on Fixed and Moving StructuresProf. C. Aage
1100 - 1200 Lecture XI Loads and Motions of Flexible StructuresProf. C. Aage
1200 - Excursion to Turku, lunch onboard the bus
Wednesday 16.10.1991
Coordinator: Prof. Christian Aage
0900 - 1100 Lecture XII Control SystemsProf. M. Blanke
1100 - 1200 Lecture XIII Electrohydraulic and Elecric Control
Prof. M. Blanke
1200 - 1300 Lunch
1300 - 1500 Lecture XIV Theory and Application of UnderwaterAcousticsDir. J. 6degaard
1500 - 1600 Lecture XV Sensors and InstrumentationProf. E. Hammer
1600 - 1700 1. Case Study Two Applications of Acoustics
Dr. M.-E. Bouhier
Thursday 17.10.1991
Coordinator: Prof. John Billingham
0800 - 0900 Lecture XVI Introduction to Energy Systems and Needsof energyDr. I. Bryden
0900 - 1000 Lecture XVII Battery Systems and Fuel CellsProf. A. Trani
1000 - 1100 Lecture XVIII Closed Loop EnginesDr. A. Brighenti
1100 - 1200 2. Case Study Autonomous Underwater VehicleDr. J.-L. Michel
1200 - 1300 Lunch

Vt
1300 - 1400 Lecture XIX Products and Range -f Properties Avai-lableProf. J. Billingham
1400 - 1500 Lecture XX Interaction with Underwater EnvironmenzProf. J. Billingham
1500 - 1600 Lecture XXI Corrosion Prevention Techniques and Ins-pectionDr. J. Strutt
1600 - 1700 3. Case Study Development and Testing of MARLOK C 1650Dr. J. Liimatainen
Friday 18.10.1991
Coordinator: Dr. Kaj Riska/Prof. Petri Varsta
0800 - 1000 Lecture XXII Risk and Reliability Methods in Under-water EngineeringDr. S. Jensen
1000 - 1100 Lecture XXIII Quality Assurance in Design and Produc-tionDr. A.-P. Htilund
1100 - 1200 4. Case Study Application of Risk Analysis
Dr. S. Jensen
1200 - 1300 Lunch
1300 - 1400 Lecture XXIV Future Prospects for Research in Under-water Technology; the European Point ofViewDr. M. Weydert
1400 - Closure of the School
The lectures last 45 minutes so that there is a pause of 15 minutesbefore each hour. Coffee will be served during the 0945 - 1000 and1445 - 1500 pauses.

THE EXPLOITATION OF MARINE RESOURCES
Dr Tom Patten Engineering consultant Scotland, UK
ABSTRACT
In this general overview the various marine resources ofactual and possible concern are identified. Priority is givento the exploitation of offshore oil and gas and reference ismade to relevant issues including safety and research anddevelopment, particularly in tbe context of the North Sea.Attention is paid to other resources some of which areexploited currently and others are potentially exploitable.Consideration is also given to protection of the marineenvironment.
1. EXPLOITATION AND EXPLORATION
By its definition, a resource can be exploited, is
potentially exploitable, and if not exploited it is conserved,
provided of course it is neither destroyed nor dispersed.
Some may be aware of the sequence of events which surrounded
the exploitation of the natural resource uranium for peaceful
power production purposes. Before this could be finally
achieved a vast range of R&D was required across a whole range
of associated problems all of which had to be solved within
* the constraints of acceptable capital and operating
expenditures, a lifetime of twenty-five years at varying load
factors, high operating availabilities, safety for the staff
and protection for the environment and the general population.
It could be argued that nuclear power is an extreme exampleand that the outcome was somewhat short of the ideal.
Nevertheless for successful exploitation of a new marine
resource in this technological, financial and safety-conscious
age it will be necessary similarly for all pieces of the
jigsaw to be in place before operation on an industrial scale
should actually be sanctioned.
Exploration for resources not currently being exploited,
or for resources whose existence is still to be established,

2
will be touched upon briefly in the paper. On the other hand
depletion of reserves is a direct consequence of exploitation,
and therefore a company wishing to sustain an existing
position in resource production will probably regard
exploration, and therefore any associated R&D, as an integral
part of its operations.
A country which is committed to exploiting accessible
marine resources will preferably be in a position to
(a) identify the requirements for the potential
exploitation of ocean resources, especially those lying within
its Exclusive Economic Zone (EEZ) or the area of its
continental shelf; and
(b) to draw up the essential framework of basic,
strategic and applied research priorities strongly linked to
technological developments and industrial need. (This was
done recently in UK and was reported in Ref.l)
2. LIST OF MARINE RESOURCES FOR CONSIDERATION
The following is a reasonably comprehensive list of non-
living marine resources
oil and gas
other hydrocarbons, including coal and gas hydrates
sand and gravel
placer minerals
phosphorites
polymetallic nodules
polymetallic encrustations
polymetallic sulphides
dissolved solids
desalinated sea water
renewable energy, including OTEC, wave and tidal power
pharmaceutical substances
sea space as a resource, including leisure and
recreation.
In the United Kingdom in less than twenty years offshore
hydrocarbons have become a very significant component of the
national GNP, and not only are they economically the most

3
important marine resource being exploited currently but they
seem likely to remain so for a long time. Next in order of
size are fisheries, followed by sand and gravel extraction.
If only it could be evaluated, the worth of our coastal waters
and seas as a "sink" for sewage and other waste, and as
avenues for communication, transport and defence might prove
no less substantial. As will be appreciated these and other
resources are to be found in other and distant oceans, but
will be considered in less specific terms.
3. THE EXPLOITATION OF OFFSHORE OIL AND GAS AND ENABLINGISSUES
Very many countries throughout the world are engaged in
exploiting reserves of offshore oil and gas. In the UK this
activity is one of the country's great success stories
(Ref.2). At its peak in 1985, oil and gas production
accounted for 5 to 6% of GNP, and up to 25% of all UK
industrial investment. The life span of the UK's oil and gas
resources is now perceived as stretching well into the next
century. Exploration activity and the rate of new discoveries
remain encouragingly high. Many of the fields likely to be
developed in the coming decade will be small, requiring low-
cost solutions, frequently using subsea technology. Others
will be high pressure condensate reservoirs, which will
require new development approaches and sometimes new
equipment, with a greater than ever emphasis on safety. In
the long run, oil and gas may be discovered and developed in
deep water to the west and north-west of Scotland. It is
important to improve understanding of the geology of this
largely unexplored area of the United Kingdom Continental
Shelf (UKCS).
3.1 Technology
The UKCS has an importance extending beyond the
production of oil and gas. It is also a test-bed for offshore

4
technology, of both actual and potential benefit to industry
in this country. Experience of engineering for and in the
marine environment has developed rapidly in the North Sea over
the past twenty years, and much of this experience has accrued
to companies in the UK. The oil industry has traditionally
been dominated by US-based technology, and in many technical
areas such as drilling and downhole technologies it still is.
But the development of the North Sea is shifting the centre of
gravity of offshore oil and gas technology towards NW Europe,
particularly the UK and Norway. The UK offshore supplies
industry, now responsible for the major share of the value of
UKCS development projects, is starting to export to oil and
j gas projects elsewhere in the world. A further dimension of
potential importance to UK industry is that technology
developed for the oil and gas industry, particularly subsea
technology, may be transferable to the exploitation of other
marine or seabed resources.
In its approach to technology the oil industry is widely
regarded as conservative by those who give precedence to the
potential benefits over the risks inherent in new and untried
technology. The timescale for the commercialisation of new
offshore technology is longer than commonly realised.
Nonetheless it is moving forward rapidly on a wide variety of
fronts, to ensure that offshore developments remain viable in
a world of low oil prices and inherently safe throughout the
lifetime of a field. Whilst at the development stage there is
a need to enhance existing technology to ensure reliable,
cost-effective and safe solutions, a pressing priority has
* emerged to upgrade operational systems and procedures by
developing appropriate methodologies and philosophies to
minimise risks to personnel, facilities and the environment.
3.2 Legislation and Political Considerations
It was in 1964, having ratified the United Nations
conventions regarding the exercise of sovereign rights over
the continental shelf, that the British Parliament passed the
Continental Shelf Act giving the Ministry of Power authority

'5
to issue licences to explore for and produce gas and oil
resources in the seabed and the subsoil. The same Act also
covers sand and gravel. once gas and oil had been discovered
various other Acts and Statutory Instruments and Orders became
necessary to cover related financial, regulatory and safety
aspects. It should be noted that UK's Government has not
acceded to the United Nations Law of the Sea Convention
(UNLOSC) nor has it declared an Exclusive Economic Zone (EEZ)
for itself or for its dependencies. The Government's present
* view is that there is no practical nor general need to declare
such EEZs.
In the UK and on the UKCS, the Department of Energy has
* the prime Government responsibility for R&D directed towards
exploitation of offshore oil and gas. Through its Petroleum
Engineering Department it commissions research to enable it to
fulfil its statutory functions with respect to the efficient
exploration and exploitation of UKCS oil and gas reserves.
In respect of the industry active in the of fshore supply
market, it is important that the UK Government be strongly
aware of the economic significance of this market, both in the
short and long term.
3.3 Costs and Economics
In respect of the large-scale exploitation of any natural
resource, a critical factor is the state of the relevant
economic environment from first investment through to eventual
depletion. From the early 1970s for about 15 years,
* international oil prices first rocketed up from $2 per barrel
to $40, then fluctuated around the latter value for a few
years, with the result that UK offshore oil production
flourished, shooting up to a maximum daily average in excess
of 2.6 million barrels. A weakening of the spot oil price
down to $10 per barrel during 1986 and much of 1987 proved
very difficult for the exploration and production end of the
oil business, and it temporarily inhibited plans for new
development. Business picked up in 1988 with a slow increase
in oil prices followed by further stabilisation in 1989. The

6
outbreak of the Gulf War in 1990 raised prices once more to
$40 per barrel but only briefly. The current price of $20 per
barrel (at the time of writing these notes) may be difficult
to justify or sustain but recent political uncertainties in
the Soviet Union have played a part.
The middle 1980s saw a general, if unorchestrated, drive
by the major operating oil companies to restrain costs through
reduction both in capital and operating expenditures, through
earlier return on capital invested, and through improved
efficiency in oil recovery. For example, substantial effort
was devoted to examining the detailed design of the steel
jackets required to support the offshore production platforms.
In 1988, in the UK sector, Shell Expro installed two slimline
steel jackets, one each in the Eider and Tern fields in 170 m
of water depth, having achieved a reduction of nearly a
quarter in steel content through cleaner design and by
utilising underwater pile hammers. There are indications in
1991 that once again operating companies are pressing for
major savings, of up to 30%, in the costs of future offshore
developments. In my opinion savings on this scale are only
possible through the combined efforts of operators and their
contractors and through smarter engineering. Throughout the
world, conventional offshore oil development is still based
largely on a fixed steel jacket carrying a substantial
platform incorporating drilling gear, wellheads, production
-* plant, power and pumping equipment, personnel accommodation, a
helipad for personnel transfer, and craneage for all other
supplies.
* The broad parameters affecting exploitation of offshore
oil include:- the existence of technology to produce the oil
within the governing price, the minimum size of a marginal
field which is worth exploiting at a given depth at the
present oil price, the nature and properties of the oil/gas
mixture, the distance from field to shore, wind wave weather
and seabed conditions at the site, and a notional maximum sea
depth of 1000 m. Few of these parameters have absolute
limits. Host interact with each other and some even conflict.
Future developments will always be vulnerable to political

7
circumstances, to adverse variations in world oil price, to
the rate of exchange between the dollar and the relevant local
currency, and to estimates of these variations and rates
applicable throughout the field lifetime. offshore gas is
often produced for relatively local consumption and therefore
its future demand and supply could depend significantly on
indigenous policies regarding transportation, combined heat
and power installations, and the environment.
The development of the UKCS oil and gas resources is
expected to continue well into the next century. Exploration
activity and the rate of new discoveries remain encouragingly
high. The emphasis on safety will intensify. Through this
decade, many of the fields likely to be developed will be
small, will require low-cost solutions, and will use subsea
technology to an increasing extent. By the end of this
century, there could be more than 300 subsea completions in
the North Sea alone. other fields will be high pressure
condensate reservoirs requiring new development approaches and
new equipment. Oil and gas discovered in deep water to the
west and north-west of Scotland and Norway may be developed in
the long run. Offshore oil and gas will remain one important
key to the growth of many countries, Scotland included.
3.4 Infrastructure
*If offshore oil and gas is e xploited on a large scale
then inevitably this will be ref lected in the services and
installations needed for the economic qrowth and functioning
of the country. Two aspects which seem to me relevant in the
UK context are the provision of education and training of
skilled personnel and the availability of R&D facilities and
capability. Here the Government has the prime responsibility
for maintaining and raising the standard of education and R&D
training of engineers and of support scientists capable of
tackling a wide range of future marine problems. The offshore
hydrocarbon industry and the supporting supply industry
recruit mainly from the engineering and scientific
disciplines. The highest levels of recruitment will probably

8
be in chemical, electrical, mechanical, marine and structural
engineering and naval architecture and computing. The numbers
of scientists will be smaller but much wider spread and will
include geologists, geophysicists, oceanographers and marine
biologists. The source of graduates may be mainly from
traditional courses but a strong case can be made for updated
interdisciplinary courses at both undergraduate and post-
graduate levels to maintain the necessary supply of soundly-
educated and trained interdisciplinary engineers. Employers
* may choose to provide specialist training in applications
relevant to their particular industry either in-house, or
conjunction with educational establishments which have the
necessary expertise.
A country which wishes to derive maximum technologicaland economic benefit from its oil and gas resources should
probably ensure that it has a strong research capability. In
UK the universities and research institutions are able to meet
many of the long-term needs of the oil industry. The oil
companies already support a large and growing body of research
in Universities and Institutes with a proven track record.
One objective of the new Petroleum Science and Technology
Institute in Edinburgh is to bring greater coherence to the
research effort by developing collaborative programmes between
Edinburgh University, Heriot-Watt University and the British
Geological Survey, and with other centres. The Marine
Technology Directorate Ltd (MTD) has a long and successful
record in achieving directed and collaborative programmes of
research in marine technology and science and in bringing
together industry, academic institutions, Research Councils
and Government. Ideally in my opinion the national framework
for necessary R&D in marine science and technology is a
structure founded on three main columns of Basic Science,
Resource Exploitation and Exploration, and Requirements to
meet Government Responsibilities, each having explicit links
with the others.

9
3.5 Safety Regime
In 1988, Piper Alpha, a first generation North Sea
installation of relatively conventional design, was virtually
destroyed through explosion and fire with the tragic loss of
167 lives. This tragedy has underlined the complex and
concentrated nature of offshore production facilities, and the
inherent need to consider aspects from the earliest stages of
specification and design of a field development. One
consequence of the Public Inquiry (Ref.3) led by Lord Cullen
has been to transfer to the Health and Safety Executive
responsibility for the regulation for offshore safety.
03.6 Environment
To many engineers concerned with offshore matters the
word "environment" at first conjures up consideration of wind,
wave, current, corrosion and temperature, all the result of
natural forces which must be resisted or overcome. The word
has been introduced here as a brief reminder to engineers that
there are many other aspects of the environment which are at
risk from their endeavours and which nevertheless should be
preserved and protected. For example, in the design of
process systems for production platforms and for onshore
terminals, professional attention must be directed at ensuring
*that oil or oily effluent should not be discharged into the
sea or into coastal waters. Unfortunately there is sufficient
human error around for fail-safe devices and procedures for
good practice to be negated or circumvented. Therefore to
deal with operational failures it is important to have
response plans and clean-up facilities in place to cope with
accidental spillage. As with safety there is no room for
complacency in matters of environmental protection.
3.7 Research and Development.
It is largely true that in response to market pressures
industry will itself bring forward the technologies necessary

10
for the development of the UXOS. However the oil industry is
highly mobile and much of it is US-based; and the market will
not necessarily ensure that technology will be developed in a
country for that country's benefit.
Relevant developments of particular importance to offshore
oil and gas are set down below along with an indication of
needs and opportunities for R&D.
3.7.1 As regards drilling, oil and gas operations
* are not currently limited by the depths to which it
is possible to drill, and the technologies of
horizontal and extended-reach drilling are being
developed rapidly. Drilling accounts for a high
proportion of exploration and appraisal costs, and
of the order of one-third of development costs, and
consequently one thrust for technological advance is
towards reducing these costs, notably by increased
automation and mechanisation of the drilling
process.
3.7.2 The development of the North Sea has led to
substantial advances in the design of fixed and
floating structures. For example the first full-
scale tension leg platform (TLP) was installed on
the UKCS. Technologies such as flexible risers,
* lightweight moorings and offshore loading systems
have also contributed to the range of installation
options now available. Fixed steel and concrete
structures, semi-submersibles, TLPs and mono-hulls
will continue to have a place in future
developments.
3.7.3 Subsea technology has been arguably the area
of most rapid technical advance over the last ten
years, and is expected to continue so for another
ten at least. Major oil company programmes have
developed detail designs and prototype components
for completely diverless systems. Substantial

progress has been made in the generic technologies
of subsea communications and remote manipulation,
and a wide range of subsea tasks can now be carried
out by remotely-operated vehicles (Rays). Future
advances will be sought in areas such as the subsea
use of fibre optics, the development of intelligent
systems on subsea wellheads and on-board ROVs, and
in subsea power supplies. This is an activity in
which the lead comes from the industrial needs.
0 3.7.4 Reservoir characterisation and modelling
provide major opportunities for theoretical advances
leading to better and earlier characterisation of
reservoirs, for the application of faster and more
flexible computing technology, and improved hardware
and techniques for data collection. This area has
become an increasingly important focus of research
activity calling on interdisciplinary contributions
from geophysicists, geologists, computer scientists,
reservoir engineers and others.
The oil industry is a major investor in R&D. Returns to
the UK Department of Energy in connection with the 11th
Licensing Round suggest that in 1988 the oil industry spent
over £86 million on R&D in the UK. Just over half of this was
* expended on in-house R&D by the small group of companies with
UK research facilities. over £23 million was spent in other
companies, nearly £6 million in research institutions and
* £11.5 million in universities.
In the widest respect our concern is with R&D relating to
the seas and oceans, their resources and the environment. The
seeds for such R&D originate within a wide spectrum of
committed professionals, ranging from the pure scientist at
one end to the industrialist planning an exploitation prospect
at the other. Where exploitation is concerned R&D is
primarily industry or technology led.

12
4. OTHER RESOURCES CURRENTLY EXPLOITED COMMERCIALLY
Exploitation of the physical resources of shallow seas is
now commonplace and most are referred to below, except for
sea space itself, a resource for leisure and recreation.
4.1 Pelagic Fisheries. Demersal Fisheries and Shellfish
* Because fishing is such an ancient and worldwide activity
it seemed impossible to make a general summary of it in these
notes. As far as UK is concerned fish landings can be
classified in three categories, with the pelagic fisheries
(herring, mackerel etc) having the highest volume (40%
approx.) but lowest unit value, through the demersal fisheries
(cod, plaice etc) to the low volume, high value shellfish
(lobsters, oysters etc). In UK shellfish are to be found
mainly within coastal waters, but finfish are more widely
distributed and migrate freely across national fishing limits
between adjacent countries. UK pelagic fisheries are largely
confined to the northern North Sea and west of Scotland with
landings in Scotland being the greatest. In 1987 fish
landings by the UK catching industry totalled nearly 800
thousand tonnes with a first sale value of over 400 million
pounds sterling from an estimated capital involved of £4,000
million. There is of course substantial added value in terms
of employment and in supporting industries.
Areas of general interest in fisheries technology which
* are capable of improvement and development include :
the efficiency of fishing vessels and their fishing
gears,
the handling, processing, transport and purification of
fish and shellfish,
the further development of fisheries through the
improvement of local fisheries, changes in fleet
structure, and through the provision of better local
facilities for landing and marketing fish,

13
mathematical modelling of fishing industry systems to
measure economic performance and benefits.
4.2 Mariculture
The idea that man could farm the sea probably originated
with the French author Jules Verne. Early this century it was
believed that farming could replace fishing but in practice
only the more valuable species of fish have been cultivated
commercially. Marine fish farming has developed rapidly in
the Far East over the past fifty years. For example Japanese
production had reached almost one million tonnes by the mid
1970s including fish, molluscs, crustacea and seaweeds.
Developments have geen much slower in the West and most of the
advances in commercial production and technology have been
with freshwater fish, principally rainbow trout.
This technology has now been applied to salmon for which
the final stages of cultivation occur in the sea. Although UK
interest in salmon farming began twenty years ago the real
momentum of the industry only became apparent in the 1980s.
The production of farmed Atlantic salmon in Scotland is
currently more than ten times the catch of wild salmon and
worth more than £200 million. Norway has shown the most
spectacular growth (47,000 tonnes in 1987) at which time the
Scottish industry produced 12,700 tonnes. Comparable figures
for some other countries were Ireland 2,500 tonnes, Iceland
800 tonnes, Faroe 2,500 tonnes and Canada 1,000 tonnes.
Turbot and Dover sole cultivation has also been
* investigated with some success in the case of turbot.
Prospects for an expension of shellfish farming in British
waters are thought to be good. There is an unprecedented
demand for shellfish products and with its position in
hatchery technology Britain offers good opportunities for
further development of the shellfish industry, not only
through intensive farming, but also through the enhancement of
natural stocks.
The relationship between fish farming and the
environment, wild fish resources, the fishing industry,

14
tourism and wildlife attracts considerable interest. Future
development of farming industry must be undertaken in a way
which balances concern for the environment and wildlife with
the socio-economic benefits the industry has brought to
coastal communities.
In the case of mariculture it is possible to distinguish
between R&D requirements of Government, which may be necessary
to permit effective management of a growing new industry, and
R&D done by the industry itself, to support the technical
development of the industry. On the Government side issues
meriting research could include :
the containment and elimination of diseases which could
affect fanning or wild stocks of fish and shellfish,
the prevention of environmental pollution from excreta,
excess food materials and noxious chemicals (including
those employed as antifoulants and medicaments),
evaluation of the risks to stocks of wild fish and
shellfish from the deliberate or accidental release of
large numbers of cultivated or non-native species,
monitoring the effects of mariculture upon other forms of
wildlife, including mammals and birds.
Although some may regard the industry's R&D interests as
near market or short tern they include such topics as
improved disease prevention and control,
optimisation of diet and feeding regime,
the effects of stress,
the need for efficient and humane predator control
* techniques,
the assessment and control of the environmental impact of
fish farming to maintain a good public image,
the control of maturation in fish to enhance flesh
quality.
The future of this new and developing area of mariculture
is difficult to predict. It seems likely that the salmon
farming industry may move further of f shore as most of their
shore sites are occupied. There may be increasing attention

15
to extensive, in contrast to intensive, forms of aquaculture
where cultivated juveniles or seed are stocked out in the
natural environment. Examples include the enhancement of
lobster stocks by planting out tank-reared juveniles, the
ranching of scallops by planting out seed collected from other
areas, and the sea ranching of salmon by releasing reared
smolts and subsequently harvesting them on their return to the
release sites. As farming has become more widespread prices
have fallen because of over-production. Hence efficiency and
*effectiveness of production will become increasingly important
because of the competition. Improved husbandry through
disease reduction, growth rate improvement, delay in
maturation, reduction in feeding costs and general reduction
in waste etc, will assume greater importance. New species of
fish for consideration could include halibut, code and sole.
There may be scope for the extraction of fine chemicals,
pharmaceuticals and other high-value products from cultivated
marine organisms
4.3 Sand and Gravel
Some 17 million tonnes of the sand and gravel used
annually in the construction business in England and Wales is
dredged from the seabed. The major source is the east coast
which is close to the main market. Although we know quite a
lot about the distribution of sand and gravel on the UKCS from
the systematic mapping carried out over the past twenty years,
we do not know much about the thickness and quality of these
deposits. The existing database is clearly inadequate as the
basis for planning for the supply of aggregates from offshore
and consequently the British Geological Survey (BGS) is
investigating the resource potential of other prospective
areas. There appears to be a need for further R&D on the
understanding of coastal processes and marine sediment
transport.

16
4.4 Metal-rich Minerals (Placer Deposits)
Some beaches and river channels and their drowned
counterparts offshore contain mineable concentrations of
metal-rich minerals such as rutile (for titanium), ilmenite
(for iron and titanium), magnetite (for iron), zircon (for
zirconium), monazite (for rare earths), garnet, gold,
platinum, diamonds, cassiterite (for tin), and scheelite (for
tungsten). Most of these so-called placer deposits are
overseas. Worldwide the industry exploiting metal-rich
minerals offshore is small, and dominated by the production of
cassiterite (for tin) in Indonesia.
* Research into the controls on the formation of these
various deposits by changes in sea level over the past two
million years would improve geological models used to guide
the planning of further exploration of both aggregate and
placer deposits. Technological developments in mining methods
are required to allow these two industries to operate in water
50 to 250m deep, and improvements are needed in coring and
drilling techniques for sampling unconsolidated sandy
deposits.
4.5 Dissolved Solids
Of all the dissolved solids, salt is present in the
* greatest concentration and it is exploited on the largest
scale, usually by means of solar evaporation. Magnesium,
bromine and potassium are recovered to a much lesser extent,
* also in coastal plants.
4.6 Water
Fresh water is recovered from the sea by desalination,
primarily in the Middle East, but also in North America,
Europe and Africa. For many islands and arid countries
desalinated water can be the largest source. The biggest
desalination plants in the world are to be found in countries
surrounding the Persian Gulf and have a daily production rate

17
of nearly 30,000 cubic metres of drinking water, at a cost of
the order of $2 per cu.m. There are two principal techniques
for desalination of water. In the first and oldest method the
briny liquid is first heated and then the resulting vapour is
distilled to produce pure water. The modern large-scale
distillation plant involves a multi-stage flash (MSF) process
in which the brine input stream, having been heated, undergoes
a progressive series of pressure reductions so that vapour is
generated although its temperature is falling. In the
* alternative filtration method the salty and clean water
streams are separated by a semi-permeable membrane through
which only water molecules can pass. At present 14SF systems
* make up the majority of the world desalination capacity.
4.7 Sulphides
A fascinating exploitation project due to commence in
1982 is the mining of elemental sulphur at a depth of 450m
below the seabed in the Gulf of Mexico. Mining will be
carried out using the Frasch process in which superheated
water is injected and the resultant molten mixture is flushed
out. The installation, to be carried out in 65m of water, is
based on earlier experience with a smaller venture based on
platforms and towers arrayed in 15m of water. The major
problem is that as mining progresses the seabed will subside.
Consequently the steel jackets, platforms and interconnecting
* bridges have not only to be higher than originally required to
allow for subsidence but contain provisions for being raised
later in their lifetime. As the seabed soils will also deform
* laterally it may be necessary to relocate the support
jackets. The expected operational life of the Main Pass
offshore sulphur mine is 35 years by which time it is
predicted that the seabed will have subsided some 20 metres.
Some technical information on the structural configuration and
design is provided in Ref.4.

18
5. POTENTIALLY EXPLOITABLE RESOURCES
At the present there is no economic case for exploiting
deep-ocean minerals. The case for ocean energy is somewhat
different, and there is a belief that, because of the saving
in cost of transporting diesel fuel for generators, small-
scale plants could operate economically and in an
environmentally acceptable way in remote locations.
* 5.1 Resources
Polymetallic nodules containing manganese and iron oxides
and varying percentages of copper, cobalt and nickel can be
found on the seabed at water depths of 4 to 5 km. They are
more likely to occur at lower latitudes, particularly the
equatorial regions of the Pacific and Indian Oceans. The deep
sea floor is carpeted with small potentially mineable nodules
the shape and size of potatoes or tennis balls, made of iron
and manganese oxides and rich in strategically useful metals
like cobalt, copper and nickel. Nodules are regarded as
economically interesting when the total combined content of
copper, cobalt and nickel exceeds 2.5% and the density of
nodules exceeds 10 kg/sg.m. Cobalt-rich encrustations form on
the slopes of seamounts and on rocky outcrops, but they would
be difficult to recover on an industrial scale. Phosphorites
have different compositions, and they may exist as nodules or
crusts at more readily accessible depths, less than 1 km.
Phosphates are used primarily as agricultural fertilisers, but
* undersea deposits cannot compete on price with onshore
resources. Polymetallic sulphides form mainly in the mid-
ocean ridge areas, but, exceptionally, in the special
conditions of the Red Sea, there are metal-rich sulphide muds
and brines which may become the first deep ocean deposits to
be exploited.
In 1987, France, India, Japan, and the Soviet Union were
registered under the UNCLOS framework as "pioneer investors"
with exclusive rights over designated areas in the North
Pacific and Central Indian Oceans for the development of

19
manganese nodule mining operations. Hydrathermal vents, that
is plumes of hot water expelled from volcanic areas, continue
to excite considerable interest from both biological and
geological scientists. Clearly areas of inactive and dead
vents offer the prospect of adjacent mineral-rich mounds
containing gold, copper and other metals, and therefore a
better understanding of the geological record may provide
clues for further exploitation. only relatively recently has
it also been appreciated that large volumes of natural gas are
* trapped in deep ocean sediments and at shallower depths in
polar regions. The gas is to be found in an ice-like mixture
of methane and water known as gas hydrate. In its solid form,
gas hydrate will "cap" the underlying gas trying to pass
upwards through it and create a reservoir particularly in the
thick sediment layers of the continental margins. When energy
costs start soaring the time may come for closer attention to
the problems of recovering marine gas hydrates.
Constraints on exploitation of these different kinds of
deposit are the costs of mining in deep water (50 to 5000m
deep), the variability of ore grades, the distance to markcet,
and the competing cost of mining onshore deposits. Currently
metal prices are depressed globally, and hence deep sea mining
is unattractive at the moment.
In the sea itself, tiny amounts of metals and other
chemical elements are dissolved. Man has long toyed with the
idea of extracting gold from seawater, but the hard commercial
reality is that such processes are much too costly to consider
even as pilot ventures. Recently it has been reported that
* Japan has begun extracting uranium from seawater.
5.2 R&D Needs.
The following is a selection of R&D needs and possible
opportunities relevant to the more important physical
resources mentioned above.
5.2.1 Phosphorites
Phosphate is in biggest demand as a fertiliser

20
in industrialised countries with advanced
agricultural technologies which for the most part
are well-served from known onshore deposits of
phosphorite. Developing countries might find it
expedient to exploit their own offshore resources.
The most probable location of offshore mining before
2000 AD is thought to be of f the East coast of New
Zealand at water depths of around 400m.
To facilitate the exploration for, and
evaluation of, phosphate resources in deep water,
technology developments are required, and especially
of :
*a) a near-bottom instrumented survey package,
b) a remotely-operated seabed drilling system,
c) a large area grab sampler,
d) a large remotely-manoeuvrable vibratory box corer
equipped with underwater TV.
Exploitation will require improved mining
technology, especially techniques for subsurface
borehole excavation, and for screening out coarse
material at the seabed.
5.2.2 polvmetallic Nodules. Encrustations and
Sulphides
Several industrial consortia have identified
potential sites for the mining of polymetallic
nodules, developed prototype mining systems, devised
ways of transporting the nodules to port, and tested
methods for extracting Co, Cu and Ni from the
manganese and iron oxide base. The prototype mining
systems remain to be proved capable of continuous
strip mining and there will undoubtedly be room for
further technological development of robust mining
systems once mining becomes commercially viable
(probably after 2000 AD). (Japan is investing
heavily in a nodule mining feasibility programme).
To fully assess potential reserves a variety of
technological developments is needed, including an

21
improved near-bottom instrumented survey package,
and a seabed crawler system for collecting and
analysing nodules at the seabed. In addition
further surveys are warranted in order to re-
evaluate quantitatively the relative potential of
existing and newly-discovered nodule fields.
The mining of polymetallic (cobalt-rich)
encrustations presents a more complex technical
challenge than does nodule collection and might not
* warrant expensive investment meantime.
In contrast the metal-rich muds and brines of
the the deep basin of the Red Sea may well be the
* first deep sea metal deposits to be exploited.
Sudan and Saudi Arabia have financed a feasibility
study, carried out by Preussag, which suggests that
these muds and brines can be extracted and processed
commercially. A practical test of these concepts is
needed although developments in pumping systems and
riser pipes are still required.
The metal-rich sulphides of the mid-ocean ridge
appear to be mostly beneath the seabed and
inaccessible with existing seabed mining technology.
Most of the known deposits are far outside EEZs.
Little is known about the extent of these deposits
because only about 1% of their source (the axial
* valley of the mid-ocean ridge) has been explored in
any detail. Strategic research is needed to
establish the frequency of occurrence, extent, and
character of these kind of deposits. Development of
near-bottom survey packages and seabed drilling
systems is needed to facilitate this kind of
research, as well as for initial reserve evaluation.
However, because of the potential difficulties in
mining research, results are likely to be useful in
a conceptual rather than an actual sense. For
instance, improving our knowledge of how these
deposits are forming today will help us to improve
the accuracy of the conceptual models we use to

22
explore for analogous fossil deposits on land. The
international Ocean Drilling Programme (ODP) based
on the drillship JOIDES RESOLUTION continues to
provide relevant information.
5.2.3 Generic Enabling Technologies
Overlaps are obvious in the development of
mining systems for aggregates, and for metal-rich
placer minerals from deeper water (50 to 250m).
Near-bottom geological/geophysical surveying
packages are required for assessing (a) phosphorite,
(b) polymetallic nodule, and (c) mid-ocean ridge
sulphide deposits. Investment in both towed systems
and remotely-operated autonomous vehicles is
required.
Seabed drilling systems are needed for sampling
and assessing aggregates, placer minerals,
phosphorites, polymetallic nodules, and mid-ocean
ridge sulphides. A system is required which will
drill to 20m, retain rock and coarse sediment, and
operate in water depths down to 4000m.
Research on mid-ocean ridge sulphides would
contribute to exploration modelling in searching for
analogues on land.
5.2.4 Environmental Research
Research is also needed on the environmental
impacts of dredging or mining of all kinds of
seafloor deposits, so as to enable predictions to be
made of the consequences of disturbance. Before
mining operations commence it will be necessary to
develop a comprehensive guideline document and to
draw up environmental impact statements. For the
most part these deposits are strip-mined, involving
at least temporary environmental damage over large
areas.
Although large-scale exploitation of mineral deposits is
still some way off, there is a spectrum of interest with

23
differing degrees of commitment, strongest at the scientific
end and weakest at the mining company end. There is a
rational progression of R&D needs, starting off with basic
understanding of formation of the deposits, surveying and
sampling, quantitatively evaluating the deposits and
developing appropriate mining systems.
5.3 Ocean Renewable Energv
Looked at on a global scale, the available evidence seems
to suggest that the ocean energy technologies of greatest
promise are small-scale wave energy, small-scale tidal energy,
and ocean thermal energy conversion (OTEC). Estimates from a
number of sources for OTEC, and rather more uncertain guesses
for the other two technologies, have suggested that a
potential overseas market of several million pounds per year
could open up for UK industry in the course of the 1990s.
Most of the potential market for small-scale wave energy and
OTEC is in the developing countries, particularly island
states in the Pacific and the Caribbean. Significantly,
consideration of marine mineral deposits as well as renewable
energies serves to furtherhighlight the growing importance to
the world of the Pacific Basin and of the Southern Hemisphere
Seas. India, China, Argentina and Burma are regarded as
markets for small tidal energy systems.
In the UK, the Department of Energy funds research into a
number of renewable energy technologies which it considers
show some prospect of providing energy economically in the UK.
The systems which form part of this programme are tidal energy
and small scale shoreline wave energy devices. As regards the
former, the Department's present programme includes advanced
investigations and site exploration (now almost complete) for
a Severn Barrage; preliminary investigations to determine the
feasibility of a barrage on the Mersey; and a series of
generic studies including studies of small scale tidal energy.
The wave energy programme is centred on investigation of the
small-scale shoreline rock gulley system, which may have the
potential to supply electricity economically for island use.

24
In 1991 the 75kW prototype generator was inaugurated on Islay,
an island of f the west coast of Scotland.
5.4 Other Marine Resources
The other topics from the previous list of non-living
marine resources not already touched on are:-
other hydrocarbons, including coal, and
pharmaceutical substances.
6. PROTECTION OF THE MARINE ENVIRONMENT
The marine environment, clean and unpolluted, is itself a
marine resource. It is vital to mankind that the seas and the
oceans are able to accept waste on a sustainable basis with
proper concern for the preservation of marine life and for the
production of sea food, while permitting direct and safe
access to humans. Much of the waste may originate with humans
or animals, but it must be stressed also that every
manufacturing and process activity also produces waste in
addition to its planned product. The composition of the waste
depends on the nature of the process, and its amount depends
on the conversion efficiency, and clearly the dominant
quantity of waste of concern is not actually produced at sea.
The sea has an enormous capacity to accept wastes,
provided their disposal is based on sound scientific
principles and is carefully planned and monitored. The
possibility of deep ocean disposal of radioactive and toxic
* wastes is unlikely to gain international acceptance in the
face of the public pressure for environmental improvement.
The Regional Seas programme of the United Nations
Environment Programme (UNEP) aims to promote sound
environmental management of coastal areas. Ten regional
programmes each develop action plans for co-operation, legally
binding conventions and detailed protocols.
The current priority of UK marine environment policy is
the North Sea which requires close collaboration with the
European community, and with the North Sea Task Force

25
established following the North Sea Ministerial Conference of
1987. R&D topics relating to the marine environment which are
actively being tackled in the UK include :-
basic work focused on understanding the processes
and dynamics controlling water quality, and applied
work concentrating on the assessment of the inputs
to the North Sea and its quality status,
the conservation and protection of living and
natural resources including fish, birds and other
wildlife and their habitats,
the role of the oceans as a sink for carbon dioxide,
atmospheric/ocean interactions and their part in
global climate change - a related and important
issue is the assessment of potential impact of sea
level rise on coastal defences and flood protection
etc.
Although R&D programmes in which different agencies become
involved are primary national it will be appreciated that,
because the marine environment and its inherent resources are
international, strong collaborative international links should
be maintained.
Because exploitation at sea produces some waste which is
potentially damaging to the marine environment, it behoves
exploiter and explorer to carry out the necessary R&D to
facilitate prediction of consequences of their activity and to
devise protective measures.
7. TAIL-PIECE
The purpose of this overview has been to promote the
sustainable exploitation of marine resources, which is wholly
dependent upon the responsible solution of many engineering
problems in the full light of social and environmental
repercussions.

26
It is recommended that a country committed to marine
resource exploitation on a substantial scale should weigh up
the desirability of having a national framework in order to
underpin effective, efficient and economic
operations and pay due regard to conservation of
resources, amenity of environment and safety in all
respects, namely personnel, installations and
environment,
recognise that the R&D required may turn out to be
either "applied" or "strategic", or to verge on the
*"near-market", and should permit a degree of
flexibility when weighing up applications for
assistance for marine technology,
reflect the importance of raising the quality and
technology of both product and service of the
majority of the small and medium-size marine
companies, and support these companies and
industries not for what they presently are, but as
them wish them to be in the future,
appreciate that in the case of non-living marine
resource exploitation, as in many other industry-
driven activities, R&D usually requires multi-
disciplinary contributions and is prosecuted in
circumstances in which the problem and not the
*discipline defines the necessary skills,
provide adequately for the possibility of
international collaboration on a regional or a
Community scale, while allowing for the special
difficulties introduced by commercial imperatives.

27
8. ACKNOWLEDGEMENT
This paper is based in part on material in Ref.l provided
by the author and on its Annexes, and also on information
contained in Refs 2 & 5.
9. REFERENCES
1 CO-ORDINATING COMMITTEE ON MARINE SCIENCE ANDTECHNOLOGY, "Report on Marine Science and Technology inthe UK", HMSO 1990.
2 PATTEN,T D, "The first twenty years of oil and gasdevelopment offshore UK - an engineer reflects". Proc.Inst. Mech. Engrs., 1985, Vol 199 (Part A), 151-176.
3 LORD CULLEN, "The Public Inquiry into the Piper AlphaDisaster", HMSO Nov 1990.
4 CAMP,J J, and LANGLEY,W E, "Main Pass 299 Sulphur Mine:Offshore Design in a Soil Subsidence Bowl". Paper OTC6666, Offshore Technology Conference, May 1991.
5 PATTEN,T D, "Undersea Resources". Mike Adye MemorialLecture, MTD Ltd Publication 90/100, 1990.
30 August 1991 Tom Patten

1
0
S0
SS
0
SS
0
S0

West European Graduate Education Marine Technology
Fifteenth Graduate School
UNDERWATER TECHNOLOGY
"Advances and Challenges of Working
in Inner Space"
by
Professor D Gareth Owen
Heriot-Watt University
Helsinki University of Technology (HUT)Espoo - Finland
October 14-18, 1991
0

INTRODUCTION
Since time immemorial man has sought to overcome the problemsassociated with exploring and then working in the subseaenvironment. Even in the earliest times, much of man'sendeavours in this area were related to the need to exploitthe resources contained within the oceans and on the sea bed(viz pearls and sponges).* This need to harness the treasuresof the oceans is reflected today in the fact that the majorityof those persons employed as divers work for an industry whoseaim is to develop economically the natural resources of oiland gas located offshore.
* This lecture begins by reviewing the historical development ofsubsea and underwater technology, beginning with the earliestattempts of man to dive unaided and then, with theintroduction of a variety of equipment, to work effectivelyundersea under increasingly more arduous and more hazardousconditions.
The lecture concludes with an appraisal of some of the moreimportant challenges that have been faced by those involvedwith subsea activities in recent years as well as assessinghow these challenges have been addressed through thedevelopment of new technologies.
Working in Inner Space - An Historical overview
For centuries man has has the desire to leave his normalhabitat and descend beneath the surface of the waters of theworld. This desire has been prompted by a number of reasons:the search for food and treasure, naval operations and, inmore recent times, the desire to unravel the mysteries of theoceans and the ocean basins. Man must have learned to divealmost as soon as he learned to swim. However, he soonlearned that his physiological structure, as an air-breathingland creature, imposed very definite and narrow limits upon0 his activities and his ability to work under water. Theselimits to the ability to work under water, either by manhimself or with use of machines controlled by man, have onlybeen extended in comparatively recent times. For example, it
* is not until the Middle Ages that we find inventors attemptingto supply air to a man under water, whereas the history ofmodern diving as we know it is only about 150 years old(dating, say, from the appearance in 1837 of the "closed"diving-dress and helmet invented by Augustus Siebe).
Natural Diving and the First Bells
Some of the earliest records of divers date from 4500 BC inMesopotania. Much of this early evidence for diving relatesto the recovery of pearls in, for example, Thebes in Egypt(3200 BC) and in China (2250 BC).
Homer, writing perhaps as early as 1000 BC, refers to theactivities of sponge divers who had to go down deeper than 22m(7Oft) to get the best specimens.

2
The British Museum in London has a frescoe dating from 900 BC(Figure 1) which allegedly shows that the Assyrians wereunderwater swimmers. They appear to be breathing air fromgoat skins (perhaps the first diving device) although morelikely they are swimming on the surface using the goat skinsas buoyancy aids.
The most famous ancient diving team was undoubtedly Scylliasand his daughter, Cyana, and documented in Herodotus. Duringthe 5th Century BC, Scyllias and Cyana were engaged by thePersian King, Xerxes, to bring up sunken treasure.
Greek mythology has many references to underwater activities.* Aristotle was the first person to describe a diving bell in
which Alexander the Great was supposed to have gone down in332 BC.
By the 1st Century BC there had developed an active salvageindustry across the major parts of the eastern Mediterranean.These divers were in essence the first "demolition frogmen"who appear to have developed a profitable business in whichthey received a percentage of the value of the recovered goodsdepending on the depth of the wrecks.
Diving unaided, without the use of an air supply, is of courselimited to dives of very short duration. Nonetheless, it isnot unusual for a sponge or pearl skin diver to descend todepths in excess of 20 m.
The practice of skin diving has changed little over thecenturies (see Figure 2).
Early Diving Technology
The logical step that was needed to increase the capability ofthe diver was to provide an air supply. Unfortunately, themajority of the many early designs were impractical. Leonardodu Vinci depicted, amongst his hundreds of inventive ideas,various types of diving appliances (see Figure 3). In 1532,Vegetious describes a personal ambient pressure diving dress.His drawing (Figure 4) shows a man with his head in a leatherhelmet from the top of which a tube leads to the surface.
Around this time, we have the first well documented account ofa diving bell, which was said to have been used in an attemptin 1531 to raise Caligula's pleasure galleys that had beensunk in the lake of Nemi. The record of this event is givenin a passage in the "Architecttura militare" of Francesco deMarchi (c 1490 - 1574). De Marchi gives a description of themachine (Figure 5), designed by one Guglielmo de Lorena. Thediving bell appears to have been very small, just large enoughin fact to contain the upper half of the operator's body.Most of the weight of the bell is taken by slings, the rest bya yoke resting on the divers shoulders. A glass windowallowed him to look ahead and he could put his hands out underthe rim of the bell.

3
In 1665, a bell was used f or the salvage of valuable cargofrom a Spanish galleon which had been sunken in Tobermory Bayin Scotland 7 years previously. This operation was successfuland lead to the building of a larger bell ("Spanish Bell") forthe recovery of large sums of money in 1677 from two cargovessels that had sunk at the Port of Cadaque. It consisted ofa wooden bell, about 4 m high and 3 m in diameter strengthenedwith iron hoops (Figure 6). Attached to the rim were ironballast weights of about 30 kg apiece. The diver sat in themiddle of the bell, astride a cross-bar. The bell wassuspended by a rope from a gallows frame carried on two largebarges. Excursions from the bell had to be carried out whilstholding ones breath.
* One of the first well documented and researched proposals fora self-contained diving apparatus (the forerunner to the'diving suit') was that published in 1680 by Giovanni AlfonsoBorelli. It comprised a metal helmet, with a pipe attached to"regenerate" the exhaled air, a leather dress, and a means ofaltering the diver's displacement, allowing him to sink orrise at will (Figure 7).
In 1690, a major development took place in the history ofman's ability to work underwater. This was the arrival on thescene of Halley's bell, designed and constructed by Dr EdmundHalley (later to become Astronomer Royal from 1720 to 1742,during which time he discovered the periodic nature of what isnow called "Halley's Comet") . Halley understood many of theproblems of pressure underwater. His bell (Figure 8) wasconstructed of wood coated with lead and was refuelled withtwo barrels of about 160 litres each which were sent down toit where the divers could turn a tap to allow the air from thebarrels to refresh them. Divers also worked away from thebell for short periods. Halley himself descended with hisbell in 1690 to a depth of 18 m and stayed down for 90minutes.
Soon after this time Denis Papin, a French professor of* mathematics, suggested that diving bells should be supplied
with fresh air continuously using tubes and powerful bellowsor pressure pumps. This observation was not in fact realizeduntil 1788 with the construction of a bell by John Smeaton.His was the first really modern bell. The bell was of castiron and at last a sufficient supply of air was availablethrough a force pump. An air reservoir was provided, as werenon-return valves to prevent air being sucked out of the tube(see Figure 9).
Coincident with Halley's later achievements in belldevelopment, around 1715, John Lethbridge designed, built andoperated what is generally considered to be the firstatmospheric diving suit (ADS) (Figure 10). It was little morethan a watertight barrel, with two holes for the arms and aglass window. No authoritative drawing of Lethbridge'sapparatus exists, but Figure 10 is a conjectural drawing byPesce based on Lethbridge's own description of his invention.

4
Lethbridge claims to have made dives to beyond 20 m for aduration of 34 minutes, without air change. When air waslater supplied to the system from the surface it is claimedthat dives of up to 6 hours took place. Over the same periodas the developments in the diving bell were taking place,emerged the submarine. William Bourne, an Englishman, iscredited with one of the first descriptions of the concept ofa submarine (in 1578). However, the first man who is quitedefinitely known to have constructed what may be termed asubmarine boat was a Dutchman, Cornelias van Drebbel. Hebuilt tow boats the large of which was propelled by 12 oars,entering the hull through watertight leather joints. The hullwas of wood, covered with greased leather and strengthenedwith iron bands. To an American named David Bushnell belongs
* the dubious honour of having built the first submarine inwarlike operations (1776). During the War of AmericanIndependence it made a number of unsuccessful attempts to blowup various British men-of-war. The submarine, named "Turtle"was built of wood, egg-shaped, with a conning-tower at the top
* and was propelled by a primitive form of screw-propeller(Figure 11). Submersion was effected by a similar propellermounted vertically, the boat having first been trimmed awashby f looding a tank. "The operator, who was at once hercaptain, navigator and crew, could not complain of inaction,for in addition to working with both propellers by means ofhand-cranks, he had to steer with a tiller under his arm, workthe inlet-valve and expulsion pump of the tank with his feet,keep a look-out through the windows of the conning tower, and,when alongside the enemy, screw to her side a magazinecontaining 150 lb of powder, start a clockwork mechanismarranged to explode after a short interval, and make a rapidget-away (Davis) ."
In 1801, The American Robert Fulton built the submarine"Nautilus", which was in many ways the forerunner of themodern submarine.
. Developments in Diving suits
The invention of the first practical diving suit is generallyaccredited to Augustus Siebe (1788-1874). Actually there werea number of other successful systems at this time. John andCharles Deane (in 1828) developed a Patent Diving Dress,S consisting of a heavy suit and an open bottomed helmet. Aircould be pumped down, with exhaust/surplus air simply passingout under the edge of the helmet. Such a system wassatisfactory as long as the diver remained upright.
Siebe (in 1829) developed a similar system to the PatentDiving Dress. This consisted of a copper helmet with glassparts and a heavy canvas jacket extending to the waist. Hethen sealed the helmet to the jacket, so that now the exhaustgasses escaped around the bottom of the jacket (thereby givingthe diver additional safety). Figure 12 shows Siebe's firstdesign (on the left) as well as the first "open" diving helmet(on the right). By 1840, Siebe had adopted a full lengthwaterproof suit and added an exhaust valve to it. Known asSiebe's "Improved Diving Dress" (Figure 13), it kept the diver

dry, permitting the wearing of warm undergarments. It isgenerally regarded as the ancestor of the diving suits thatwere used for almost 100 years following.
PHYSIOLOGICAL PROBLEMS ENCOUNTERED FOR THE FIRST TIME
Steel open bells were built by the Siebe-Gorman Company.Large chambers were constructed enabling several men to workat the sea or on the river bed.
It was during this time that 'caisson disease' (as it came tobe called) was encountered for the first time. Aftercompleting a shift and returning to the surface, they wouldbegin to experience pain in the joints, difficulty inbreathing and dizziness. "Caisson disease" became more severeas the depth of the projects increased and sometimesfatalities occurred. This is know today as "decompressionsickness." The actual cause of decompression sickness wasfirst identified in 1878 by the French physiologist, PaulBert. He recommended that caisson workers should be graduallydecompressed when returning to the surface. Within a fewyears, specially designed "Ire-compression chambers" wereconstructed and situated at job sites.
BREATHING SYSTEMS
Divers were still tied to the surface by a hose supplying air.* Various inventors were looking for ways of eliminating this
hose. A necessary component for such a system was the DEMANDREGULATOR. This was invented in 1866 by Benoist Rouquayrol, itadjusted the flow of air from the supply tank to meet thediver's breathing and pressure requirements. At the time ofits invention the high pressure tank did not yet exist and itsinclusion in a self contained diving system had to wait foranother 60 years.
* The first self contained and duel circuit breathing system wasdeveloped by H A Fleuss in 1878. Using 02, the quantity ofgas required was less than what would have been needed ofcompressed air and thus the need for high strength gascontainers was avoided . The effects of breathing pure oxygen
* at high pressures were not know at this time. Despite this,in 1880 an English diver, Alexander Lambert, walked 300 m in adark flooded tunnel beneath the River Severn to operatecrucial valves.
MAJOR DEVELOPMENTS IN DIVING SINCE 1900
J S Haldane (at the turn of the century) drew up decompressiontables which still form the basis of today's tables. Diversat this time were beginning to experience anotherphysiological problem, that of "nitrogen narcosis."
The limit for air diving was probably established in 1915 whenan American submarine CUSS F-4) was salvaged-.from 93 m. A few

6
years after this operation, Elihu Thomson and Dr Edgar Endeseparately theorized that Helium could be used beneficially toreplace the nitrogen in the diver's breathing supply. Thefirst test took place in 1927. The depth advantage of usingthis gas was soon established and by 1937 a diver using a'heliox' breathing supply was compressed to a record simulateddepth of 152 m in a pressure chamber. The first practicaltest of heliox came two years later when an American submarinewas successfully salvaged from a depth of 74 m.
Depth records (using HELIOX) were frequently being made, asnoted below:-
1937 - a civilian reached a depth of 74 m (Lake* Michigan)
1946 - a civilian made a simulated dive to 168 m1948 - an RN diver made an open sea record of 164 m1956 - an RN diver made an open sea record of 183 m
(decompression time of 12 hours)1962 - a Swiss diver reached a depth of 305 m off the
coast of Southern California
Over these years that records were repeatedly beenestablished, things were also happening in relation to thedevelopment of diving bells. In 1928, Sir Robert H Davisdesigned the Davis Submersible Decompression Chamber (SDC), abell with inward opening hatches that was capable of retaininginternal Pressure when raised to the surface. The vessel wasconceived as a method of reducing the time diver would have toremain in the water during lengthy decompression. Thisconcept was not applied until the advent of "saturationdiving".
The saturation diving technique was first considered followingthe work of George F Bond in 1957 with the first practicaldemonstrations taking place in 1962. At present the deepestsimulated pressure chamber dive stands at 585.5 m and thedeepest working dive stands at 530 m.
Advances in Underwater Robotics
For some years, it has been the ambition of a number ofa researchers in a number of countries to develop an entirelyW -autonomous underwater vehicle that could operate entirely
without an umbilical from a mother-vessel. Such a vehiclewould have many attractions in a wide variety of applicationssuch as sea-bed survey and underwater inspection.
Since 1985, a collaboration project was launched between theUK and Italy aimed at developing two such advanced vehicles.One of these vehicles is called WIR and is a semi-autonomouswork and inspection robot. The other ALRUS (Autonomous Robotfor Underwater Survey), which is a fully autonomous robot forunderwater survey. The project has completed its projectdefinition stage and is now proceeding with the vehicledevelopment phase.

7
To realize a vehicle that is both capable of getting to a siteaccurately, performing useful work on site and returning tobase, certain enabling technology have to be developed. Theseare
- navigation- mission control- power generation- communications- sensors- man/machine interface
In addressing these problems, the project researchers havemade significant advances in the development of underwater
* technologies that have application in other areas as well.
To avoid risk of collision, ARUS, will employ a combination ofposition-fixing systems such as inertia-guidance, doppler log,acoustic correlation log, onboard sensors and gravimeters.
* One of the major problems in this area is the effectiveintegration of the various inputs in a form which takes intoaccount the operational limitations of the different systems.
The concept of a pre-programmed mission is in principle fairlystraightforward but the vehicle will need to cope with changesin the local environment. Consequently, the vehicle needs tohave its own intelligence to react to changes. In essence,the control system required is not unlike that needed forother robotic systems working in space, air or on land.However, there are some special problems in working subsea.Whereas for other robots the sensor information needed andreceived can be of a high quality, in the case of ARUS it hasto operate with a rather imprecise model of its environmentbecause sonar/acoustic images as well as TV images tend to beof relatively poor or at least unrealistic quality at times.
"Whilst the limitations of through water communications arethe driving force behind the development of fully autonomous
* vehicles, this in turn is limited by the development of thenecessary artificial intelligence. Therefore a continuingneed for high level communications is foreseen, to be employedfor the purposes of emergency signalling and mission Programmealteration (Ref SUT Vol 23)."1 Communication systems that have0 been assessed include the use of low frequency acoustic andextra low frequency radio. The need to communicate locallywith the vehicle could be assisted by utilising a high datarate acoustic link deployed from a surface vessel or "dunked"from a helicopter.
The development of sensor technology form an important part ofthe ARUS project. For many of the tasks envisaged for thevehicle, visual sensor information will be very limited andreliance will need to be placed on acoustic imaging devices."Unfortunately, because of the physics of acoustic propagationit is impossible to combine high spatial resolution with goodrange and a multiplicity of sensors is required to equip anunderwater robot with comprehensive 'vision'. Also the

8
disparate nature of the available images poses significantsensor integration problems (Ref SUT Vol 23)."
ARUS will make use of a wide range of. acoustic 'viewing'systems such as side-scan sonar, swath bathymetry and sub-bottom profiling.
Advances in Subsea Production Systems
Since the first installation of a subsea completion in theGulf of Mexico some thirty years ago in a mere 17 metres waterdepth, by the end of the '80s more than 600 subsea completionshad been installed worldwide by 40 operators (about 2/3rds ofthis total being installed within the past decade).
The trend towards an increasing utilization of subseaproduction systems by the oil and gas industry has beeninfluenced by two major factors:-
i. The need to develop satellite fields and to make use ofexisting infrastructure (pipelines and productionfacilities)
ii. The need to develop deep-water fields cost-effectively
The majority of deep-water subsea developments have occurredin Brazil, but more recently activity has intensified in thisarea in the Gulf of Mexico and the North Sea.
Diverless Technology
As operators increasingly look to develop fields in deeper anddeeper water, considerable attention has been devoted to thedevelopment of diverless technology. It is now technicallypossible to install a subsea template or subsea completion aswell as all the associated equipment (eg control modules,valves, manifolds etc) entirely without the use of divers.In addition the techniques are available and indeed proven for0 subsequent intervention activities such as well-workovers,removal and replacement of components and/or modules,replacement of umbilicals/flowlines etc.Such diverless technology makes use of "running tools" (vizguidelines) as well as ROVs. ROVs are, in fact, being usedincreasingly for a wide variety of subsea operations and nowsubsea systems are being designed to take advantage of thecapabilities of the ROV in this area. Apart from theirobvious capabilities for inspection of subsea equipment, ROVscan make and break hydraulic lines and electrical connectors.They can also open and close isolation valves and overrideactuator functions. "Current programmes are developing tooffer ROV capabilities to retrieve and install major parts ofsubsea systems. The emphasis is to use smaller, commerciallyavailable ROVs, getting away from the capital intensivesystems used on projects, such as the UMC and Snorre, wherelarge dedicated Remote Maintenance systems need to be deployedon specially designed structures."

9
Autonomous Systems
One of the major capital items in subsea developments are theumbilicals, In addition during service the possibility offailures can occur with the umbilicals due to physical damageby anchors/trawiboards and to loss of integrity at connectionsand interf aces. On account of this operators have taken akeen interest in the development of autonomous systems subsea.In order to achieve the goal of a totally autonomous systemone needs to provide the capabilities of:-
- subsea power generation (both electrical andhydraulic)
- cableless control of the system from the platform(eg by acoustics)
Both of these topics will be discussed in more detail in thecoming lectures.
Advances in Pipeline Technologyv
Pipeline technology has come a long way since its earlybeginnings in the early 140s when undersea pipelines were laidacross the channel to supply the Allied Armies in NorthernFrance. Since that time, pipelines have been laid in almostevery corner of the world where offshore oil and gasproduction has been active. Important developments took placein the late seventies when the oil and gas industry saw theintroduction of semi-submersible lay-barges that were capableof laying pipelines in deeper water and under more extremeweather conditions. During the last decade, the industry hasseen a variety of novel methods of laying pipes and flowlines,including methods employing the use of reelships, such asApache. The advantage of using reelships (or reel-barges)lies in the fact that the pipeline can be welded together asan entity onshore and then wound onto a reel. This cansubsequently be unreeled on location at a rate which vastly
* exceeds that obtainable by other, more traditional, methods.
There have been a variety of new developments in pipelinetechnology in recent years, and these have included thefollowing:-
i) The need to install subsea safety valves in existingpipeline systems as a consequence of the recommendationsmade in the Cullen enquiry into the Piper-Alpha disaster.
ii) A better understanding of the structural behaviour andintegrity of composite pipelines (and flowlines) andmarine umbilicals under a variety of loading conditions.
iii) The use of stainless steels in pipeline construction asan alternative to mild steels.
iv) A better understanding of such mechanisms as:
-upheaval buckling of pipelines

10
- pipeline reburial- scouring
v) The use of hyperbaric welding techniques for pipeline
repairs.
vi) Deepwater tie-ins.
vii) The utilization of various techniques for inspection ofsunken pipelines.
CONCLUSION
Mankind has made significant progress in addressing theproblems associated with harnessing the resources containedwithin, a hostile and alien environment, such as encounteredsubsea. In principle, the technologies required to meet thechallenges of working in this environment have largely beendeveloped. However, the constraints of "cost effectiveness"and "return on capital invested" have focussed attention onthe need to provide both efficient and effective technologiesin subsea activities.
The last decade has seen many exciting innovative developmentsthat tend to support the view that mankind is only beginningto harness effectively and comprehensively the "wealth fromthe oceans".

11 '
REFERENCES
Davis R H ; Deep Diving and Submarine Operations, The SaintCatherine Press Ltd, London, Fifth Edition.
Marine Technology Reference Book (Article by R Allwood)
Society for Underwater Technology (SUT), Advances inUnderwater Technology Ocean Science and Offshore Engineering,Volume 8, Exclusive Economic Zones, 1986.
Society for Underwater Technology (SUT), Advances inUnderwater Technology Ocean Science and Offshore Engineering,Volume 19, Diverless and Deepwater Technology, 1989.
Society for Underwater Technology (SUT), Advances inUnderwater Technology Ocean Science and Offshore Engineering,Volume 7, Subsea Control and Data Acquistion for Oil and Gas. Production Systems, 1986.
Society for Underwater Technology (SUT), Advances inUnderwater Technology Ocean Science and Offshore Engineering,Volume 23, Subtech '89, "Fitness for Purpose," Proceedings ofa Conference, Nov 7-9, 1989.
Society for Underwater Technology (SUT), Advances inUnderwater Technology Ocean Science and Offshore Engineering,Volume 24, Advances in Subsea Pipeline Engineering andTechnology, 1990.
Subsea '90, "Subsea Achievements and Challenges," Proceedingsof a Conference, London, 11-12 December 1990.
Subsea '89, "Subsea in the 1990s : Cost-Effective Solutions,Proceedings of a Conference, London, 5-6 December 1990.
Society for Underwater Technology (SUT), Advances in* Underwater Technology Ocean Science and Offshore Engineering,
Volume 16, Oceanography '88, Proceedings of a Conference,London, 5-6 December 1989.
Subsea Isolation Systems, Proceedings of a Conference, 3October 1990, London, Organisers - Subsea Engineering News.

From an Assyrian bas-900 B.C.) in the British
Museum
Figure1

I
lb -.
I V.
4%
S
* N
C-
Figure 2

Nn
__C
vI>* cc
Fig. 458. Designs by Leonardo da Vincia. From the "Codex Atiantkub. ,, - -vC. From "MS. a." foi. uSJt-d, . From.the Codae Admndu,,."
Figure 3
*
.... . .... .
....... ........ ,.,...*.
Figure 4
From the zix editionof Vegetius

Th Caaqe -e c 67
FigureFiur 6 oea(51

Fig.
-AR
.Halley's bell (zx6go)
Figure 8

00
Ia.n -d es (c 71 )
~~~~~~~Figure 9Sean'dvngbl(1788

Bushnell's Turtle (1776)
* Figure I11
Siebe's first "open" diving bhelet(18 19). In zhe possession of Siebe, Gormnan & C6.
Ltd.
Figure 12

•Siebe's first "closed"dress and helmet (.1837.). Theoriginal helmet is in theNational Science Museum,
London
Figure 13
~ -.

2
S
S
S
SU
0
aS
S
SS

1
MARINE ECOLOGY, CLIMATE
Egil Sakshaug
Trondhjem Biological Station, The Museum, University of Trondheim
Bynesveien 46, N-7000 Trondheim, Norway
Oceans: Area 36 million kmi2, average depth: 3800 m, volume: 1370 million km 3
Freshwater: Volume: 35 million km 3 (2.5% of oceans)
Of this, 87% is ice; mainly in the Antarctic and Greenland
Surface salinity depends on freshwater supply and evaporation:
Atlantic, 35-35.5 ppt; Red Sea: 36-40 ppt; Norwegian Coast: 33-35 ppt; fjords:
=0-34.5 ppt, depending on input from rivers
This paper deals with some of the basic features of marine ecology and the role of
oceans in determination of climate. The reader should bear in mind that even if the
effect of each single factor is easy to comprehend, interaction by many factors
simultaneously can cause intricate patterns of variation in Nature that are nearly
impossible to analyze.
PELAGIC ECOSYSTEMS, GENERAL
In terms of biomass, pelagic ecosystems are typically dominated by zooplankton, then
phytoplankton, bacteria and fish. Birds and mammals constitute but a tiny fraction of
total ecosystem biomass (Table 1). Generally, the smaller the organism, the shorter
the generation time. Growth rate is the inverse of generation time.
Phytoplankton harvests energy (light) by means of chlorophyll. Dark reactions
in photosynthesis combine energy and matter into energy-rich compounds.Ecosystems
are dynamic: energy and matter is transported from one trophic level in the food
chain to the next by grazing (Fig. 1). Energy is dissipated in the food web; matter
is excreted by all living organisms and can be reused by phytoplankton (regenerative

2
production). Microscopic dead matter is attacked by bacteria which in turn are eaten
by colourless microscopic flagellates which in turn are eaten by protozoans, etc... (the"microbial" loop). Both colourless flagellates and protozonas excrete nutrients andthereby indirectly make nutrients in dead matter available for phytoplankton. At times
and in certain areas the miicrobial loop is the predominant system.
Typically, about 90% of matter and energy is lost by transfer (grazing) to the
next trophic level. The lost fraction constitutes energy and matter spent to maintain
life, to carry out reproduction, etc. This large loss makes food chains short: usually
there cannot be more than 5-6 trophic levels. The commonly used analogy between
an ecosystem and a clockwork consisting of cogwheels is therefore not adequate, acomparison to a system with very sloppy belt drives (large losses in energy transfer is
* more adequate.
Production is defined as growth rate times biomass. Production of algae is
termed primary production and of zooplankton secondary production. In a production
pyramid the higher trophic level has to have lower production than the lower trophic
level; otherwise the law of conservation of energy is broken. A biomass pyramid,
however, can be inverted. Typically, there is more zooplankton than phytoplankton
in the ocean; however, the growth rate of phytoplankton is far higher than that of
zooplankton, so the production pyramid is not inverted.
For each trophic level, the biomass (standing stock) is a function of the
difference between growth and loss rates:
* dB/dt = (,y - R)B
Figuratively: if the amount of water in a bucket is biomass (B), a flow of water into
the bucket is growth GaB), and a flow of water out of the bucket is loss (RB), we seeeasily that the amount of water in the bucket corresponds to the difference betweeninflow and outflow. In periods, biomass may not change appreciably from day to day;
this means that the system is close to steady state (dB/dt = 0). This does not mean
that / and R are zero; it rather means that both /i and R are about equally large or
equally small.
If a stock of commercially harvested fish dwindles, one may justifiably raise
the question "Did we overfish (R too large), or did something lower the growth rate

Table 1. Average population density of different trophic levels
in the Barents Sea (kg C k-2) and scale of generation time.
Population density of Norway and Japan is given for comparison.
Biomass Generation time
Bacteria 400 hours - days
Phytoplankton 2000 days
Zooplankton 3000 months - 2 years
Capelin (Mallotus villosus) 4001 1 - 4 years
Cod (Gadus morhua) 3002 several years
Whales 35 several yearsSeals 20 several years 0Seabirds 1 several years
Polar bears 0.07 several years
Man (in Norway) 80 several years
Man (in Japan) 1600 several years
1 variation between years: 30 - 7002 variation between years: 150 - 700
polar bears man
whales
seals s eabirdscod -
Polar cod capelin
ice fauna zooplankton------- I
ice algae Phytoplankton
light regen.z nyujtrients )
new nutrients
Figure 1. Food webs in the Barents Sea: ice biota (left half),
pelagic system (right half)

Table 1. Average population density of different trophic levelsin the Barents Sea (kg C km-2) and scale of generation time.Population density of Norway and Japan is given for comparison.
Biomass Generation time
Bacteria 400 hours - days
Phytoplankton 2000 days
Zooplankton 3000 months - 2 years
Capelin (Mallotus villosus) 4001 1 - 4 years
Cod (Gadus morhua) 3002 several years
Whales 35 several years* Seals 20 several years
Seabirds 1 several years
Polar bears 0.07 several years
Man (in Norway) 80 several yearsMan (in Japan) 1600 several years
1 variation between years: 30 - 700
2 variation between years: 150 - 700
polar bears -;5 ma
/ whales\ /
seals seabirds* I' cod
Polar cod capelin
ice fauna ZOOplankton
ice algae Phytoplankton
light regen.I ,. ... nUtrients
new nutrients
Figure i. Food webs in the Barents Sea: ice biota (left half),
pelagic system (right half)

3
(u too small)?". We cannot decide as long as we only know changes in the standing
stock and none of the rates. This is one of the more difficult fields of fisheries
management; study of rates have had second priority for years. Therefore everyone
can blame everyone. Rates, however, are more difficult to study than monitoring of
standing stocks. Capelin provides an extreme example of a composite loss rate: apart
from natural death it is harvested by man, seabirds, seals, whales and, most important,
by cod. It is, however, an opportunistic species which can have a rapid comeback
provided the right conditions.
The phytoplankton loss rate is the sum of respiration and extracellular
production rates, grazing rate, and sinking (sedimentation rate). A high grazing rate
is necessary for rapid growth in the whole ecosystem (and for the well-being of the
4' fisherman), while a high sedimentation loss is climatologically interesting, because
sedimentation implies transport of carbon from the atmosphere/upper ocean to the
bottom, where at least part of the carbon will be stored in the long-term sense.
The question of sedimentation vs grazing is related to the distribution of
phytoplankton and grazers: phytoplankton blooms and large zooplankton stocks have
to be at the same place and at the same time to ensure efficient grazing. The
question of match/mismatch in this sense is one of the more important with regard
to fisheries management, but is difficult to study due to the vast areas that have to
be investigated and the enormous amount of data which have to be collected.
NEW vs REGENERATIVE PRODUCFION
The paradigm of new vs regenerative production (Fig. 2) was introduced in the
late sixties and is a very important one. First, one defines a system, usually the upper
waters down to the discontinuity layer (pycnocline). If there is no transport of
nutrients upward through the pycnocline and no supply from land (natural or man-
made), the only nutrients available for algal growth are those excreted by organisms
living in the upper layers. The system is then 100% regenerative. Such a system hardly
exists, but about 70% of the world's oceans are about 90% regenerative. These
systems, covering all the central and warm parts of the oceans, are characterized by
small biomasses and therefore low production even if the rates in the system may be

C02A
S0 0 0- T
C 2 _ ý-- regen. nutrients
pycnocline
new nutrients export production
Fig. 2. Regenerative nutrients are regenerated from biological activity in the euphoticzone. New production is based on nutrients from below the pycnocline or supply fromland. Much of the produced material sinks (export production) when production ishigh (i.e. high incidence of supply of new nutrients) and carries organic carbon todeep water and bottom sediments.

3A
I C 0 2
00
90
0 1" -regen. nutrients
pycnocline
new nutrients export production
Fig. 2. Regenerative nutrients are regenerated from biological activity in the euphoticzone. New production is based on nutrients from below the pycnocline or supply fromland. Much of the produced material sinks (export production) when production ishigh (i.e. high incidence of supply of new nutrients) and carries organic carbon todeep water and bottom sediments.
0w

4
high. In principle one cannot harvest from such systems, because we are then breaking
into a closed loop of nutrient transport - we simply remove part of the system (the
same is true for tropical rain forests; they have high production, but nearly all of it
is regenerative). Sedimentation is negligible.
Large productivity requires supply of new nutrients; either from the deep water
masses or from land. All marine areas where large-scale fishing and hunting has
traditionally been important, are characterized by a large incidence of new production;
for instance the Norwegian Coast and the Barents Sea. Typical features are at least
one bloom of phytoplankton per year and large sedimentation during the bloom(s).
In the open sea, usually 60-70% of the algal biomass sediment during a bloom; during
the earliest blooms in fjords (February-March) more than 90% may sediment (grazers
have not developed large stocks this early in the season). Thus new production are
the important feature both fishery- and hunting-wise as well as climatologically.
Processes that can bring new nutrients from depth towards the surface layers
(by breaking down the pycnocline) are (i) shear forces between currents with different
velocity (typical along the borderline between the North Atlantic Current and the
Norwegian Coastal Current); (ii) turbulent mixing induced on the lee ("wake") side
of banks and islands were currents flow, and formation of eddies around banks (both
very common along the Norwegian Coast); (iii) upwelling caused by constant off-shore
wind (e.g. the passats at the coasts of Peru and West Africa. Wind-driven upwelling
happens rarely along the Norwegian West Coast because the prevailing winds have
an onshore direction - it may be more common along the coasts of Telemark and
Agder. Far offshore, winds may blow waters from one place to another causing
upwelling at the place from which the water was transported blown away. This is
probably a very important process in open waters along the Norwegian Coast (Fig. 3).
Entrainment (iv) ("water-driven" upwelling) is very important in fjords at times when
freshwater discharge from rivers is high (May-June in particular). River water entrains
salt water by friction and they flow together out of the fjord as a brackish surface
current. Water from depth is transported upward to replace the outflowing salt water.

A A 4A
NAD_ _
NCC wn
brackish layer0
Fig. 3. A: Shear between two different currents (Norwegian Coastal Current andNorth Atlantic Drift); B: Turbulent mixing on the lee side of banks and islands; C:upwelling; D; Entrainment.
0.4 -
C _ 0p
A,
0.0 L9S6•A~N000.0 0.1 0.2 0.3 0.4
qMIiniO coofcidenr 0 (% day')6 dFig, ,K'0PQ sYsicoit Efleci "t ""Xiing COefficient fDj ,foodweb structure Shading as in Pig. I. The UI)per border line oftlie Shaded a.... flow 0epresun is eq nhifib tarn nU (ricat enrich -
(n 'l(N,,.)

AA
NCC wn
brackish layer
Fig. 3. A: Shear between two different currents (Norwegian Coastal Current andNorth Atlantic Drift); B: Turbulent mixing on the lee side of banks and islands; C:upwellxng; D; Entrainment.
F
; 0.2 C
8p
OA A ,
0. u 0.1 0.2 0.3 0.4
q/ M uung COO ficient D N% day')ýVteb struClitre Shading as in Fig. 3. The "PPer border line ofth~e shaded a roes 110% represcit CIs q'iIlI~i Llo nUn trienI enrich-
menez INI

5
STriUCrUR,1 OF ECOSYSTEM BASED) ON NEW NUtRIENrTS
In Fig. 4 is. shown a mathematical model of a simple system consisting of a small
algae good at taking up nutrients in low concentrations (A1), a small zooplankton (P)
feeding on the small algae, a large zooplankton C feeding both on P and A,, a fish
(F) feeding on C and a large, bloom-forming algal species (A2) which is eaten by C
and which can grow well only in high nutrient concentrations. N is nutrients left in
the water, and the Y-axis is nutrients in the organisms. On the X-axis is a mixing
coefficient, i.e. the degree of upward transport of nutrients through the pycnochine
(e.g. the degree of new production). The mixing coefficient might be replaced by an
indicator of eutrophication (preferably the sum of nutrients in water and organisms).
It appears that when mixing is small (system mainly regenerative) total biomass
is small, but as mixing increases, total biomass increases. However; only a small
fraction remains in the alga A, and in the water. Through grazing most of the
nutrients (and biomass) is partitioned among other trophic levels. As the system
becomes more and more enriched with nutrients, the fish stock increases. When the
small alga A1 is so saturated with nutrients that its growth rate cannot increase
further, the large algae A, takes over and forms a bloom. This very simplified
scenario is similar to what is observed in Nature; however, in Nature there would be
a large number of algal species with different nutrient strategies and many species of
<zooplankton and fish.
The Chrysochromulina polylepis bloom in Skagerrak/Kattegat in May-June 1988
is a good example of what can happen if the food web is disrupted. By being toxic,
it was not grazed and by being able to swim, it did not sink - thus the loss rate R
was close to zero. Therefore the bloom, after it was established, could persist for
more than a month without a large growth rate.
IMPORTANrr PHIYTOPLAN'KTON GROUPS
The most important group of phytoplankton in northern areas is diatoms. They cannot
swim, they are unicellular, and they have a a silicate shell. They therefore require
silicate for growth. Chemically, they are closely related to brown seaweeds (most

6
important pigments: Chla, Chic, and fucoxanthin, and storage compound 13 1,3- glucan,also called chrysolaminarin and, to a variable extent, fat). They are particularlyimportant in spring blooms. They have formed fossil layers of diatom shells(Kieselguhr).
Dinoflagellates are typical in summer and spring. They have two flagellae andcan therefore swim. Some species have shells of cellulose, the more importantpigments are Chla, Chic and peridinin (which is mahogany red), and the storagecompund is starch-like. Some species are notoriously toxic and cause mass death orshellfish poisoning. Other species are bioluminescent. Many of the harmless spcciesdo not have photosynthetic pigments and are, functionally, animals rather than plants.Dinoflagellates are unimportant in polar oceans.
Prymnesiophytes are chemically close to diatoms, but they do not have siliceousshells, and the majority of species are naked, have flagellae and can swim. Moreover,they have a third organelle, a haptonema, which looks like a flagellum but is passive.The function of the haptonema is unclear. Quantitatively, the by far most importantspecies is Phzaeocystis pouchetii, which forms ill-smelling (acrylic acid) and gelatinouscolonies. It is the single most important species on the Atlantic side of the Arctic andin Norwegian fjords south to Stadt. In the southernmost part of the North Sea offBelgium and the Netherlands it has formed annoying blooms in recent years. It iscommon also in the Antarctic Ocean. Two toxic species are Chrysochromulina polylepisand Prymnesiun parvum. The former avoids brackish waters and formed a mostpublished bloom in Skagerrak/Kattegat in summer 1988, while the latter prefersbrackish waters and has formed blooms in fjords in Rogaland in the last two years.
An important group of Prymnesiophytes is the coccolithophorids. They arecovered with calcareous shells (coccoliths). They are unimportant in polar oceans, but aone species, Emiliania hutxleyi, is particularly important in fjords of southwest Norwaywhere it often forms blooms which colour the water bluegreen. The colour is exactlythe same as seen in rivers and fjords influenced by glaciers, because it is formed byreflection of light from the coccoliths and does not derive from pigments. Duringparticularly dense blooms, the waters turn milky white (e.g. Hafrsfjord). Becausecoccolithophorids have sedimented in amounts large enough to form rich layers offossil coccoliths (calcareous carbon), they should be of climatological interest.

6
important pigments: Chla, Chic, and fucoxanthin, and storage compound B 1,3- glucan,also called chrysolaminarin and, to a variable extent, fat). They are particularlyimportant in spring blooms. They have formed fossil layers of diatom shells(Kieselguhr).
Dinoflagellates are typical in summer and spring. They have two flagellae andcan therefore swim. Some species have shells of cellulose, the more importantpigments are Chla, ChIc and peridinin (which is mahogany red), and the storagecompund is starch-like. Some species are notoriously toxic and cause mass death or0 shellfish poisoning. Other species are bioluminescent. Many of the harmless speciesdo not have photosynthetic pigments and are, functionally, animals rather than plants.Dinoflagellates are unimportant in polar oceans.
Prymnesiophytes are chemically close to diatoms, but they do not have siliceousshells, and the majority of species are naked, have flagellae and can swim. Moreover,they have a third organelle, a haptonema, which looks like a flagellum but is passive.The function of the haptonema is unclear. Quantitatively, the by far most importantspecies is Phaeocystis pouchetii, which forms ill-smelling (acrylic acid) and gelatinouscolonies. It is the single most important species on the Atlantic side of the Arctic andin Norwegian fjords south to Stadt. In the southernmost part of the North Sea offBelgium and the Netherlands it has formed annoying blooms in recent years. It iscommon also in the Antarctic Ocean. Two toxic species are Chrysochroinulina polylepisand Prymnesium parvum. The former avoids brackish waters and formed a mostpublished bloom in Skagerrak/Kattegat in summer 1988, while the latter prefersbrackish waters and has formed blooms in fjords in Rogaland in the last two years.
An important group of Prymnesiophytes is the coccolithophorids. They arecovered with calcareous shells (coccoliths). They are unimportant in polar oceans, butone species, Eniliania huxleyi, is particularly important in fjords of southwest Norwaywhere it often forms blooms which colour the water bluegreen. The colour is exactlythe same as seen in rivers and fjords influenced by glaciers, because it is formed byreflection of light from the coccoliths and does not derive from pigments. Duringparticularly dense blooms, the waters turn milky white (e.g. Hafrsfjord). Becausecoccolithophorids have sedimented in amounts large enough to form rich layers offossil coccoliths (calcareous carbon), they should be of climatological interest.

7
MINIMUM FACrORS FOR ALGAL GROWTh
Temperature sets an upper limit for the growth rate. As a rule of thumb, phytoplank-
ton do not grow faster than predicted by the equation
,u (doubl. d- 1) = 0.85" 100.0275T
where T is temperature in centigrades (Eppley 1972). This equation implies a
maximum growth rate of 0.85 doubl. d- ' at 00C and 3.0 doubl. d-' at 200C.
In reality phytoplankton in Nature seldom grow this fast: The light regime is
suboptimal (short day, low irradiance) or a nutrient is limiting by being supplied at
a too low rate. Nutrient limitation of the growth rate is most pronounced for high
biomasses, e.g. at the end of a bloom, because above a certain algal biomass, nutrient
supply necessarily becomes becomes insufficient to support the ever growing stock. In
systems with high grazing pressure, e.g. regenerative systems of the warm oceans,
nutrient supply is near sufficient to support a maximum algal growth rate because the
predominant algal species have a high affinity for uptake while algal biomass is kept
low by extremely high grazing pressure.
LiGirr AS MINIMUM FACTOR
Light varies with season, and more so the higher the latitude; on the other hand,
diurnal variation is smaller at high latitudes (Fig. 5). The growth season in polar is
maximum 6 months long. Light in the sea also depends on the ice cover in polar
areas. Ice, and in particular, its snow cover, is so opaque to light that growth under
the ice can take place only in or at the underside of the ice and not in the waters
below. In principle, the higher the latitude, the shorter the season, because ice melts
later.
Light is strongly attenuated in water. In clearest ocean water, blue light
penetrates the deepest and red the least (Fig. 6). Algae absorb primarily blue and red
light (Fig. 7). If a bloom forms, more and more of the blue light will be absorbed,
leaving green, and the light regime becomes less optimal (self-shading). At the same

o ' 'I/-
°
6-' 65
0
7
4.00
820
E
C
o B B
0 E
0 <
o a-
4.0
1.0-
C:
o0
.10 1000
>B
C,1 CC
oo
Ca
0 41010S f Pt
4.01-
•2
Fig. Vertical diffuse attenuation coefficient of" light and 1% light depth in (A)
"clearest" (blue) occan water (Smith and Baker 1981) and (B) "clearest" green water
in the TroandheirnsfJord, Norway, early March (aeir Johnsen, unpublished data).

• A
00
S N
'2
S................
4.0-
2
10.00
'5 5
CC
E- 10
o B =C
UA
o6 0 --
U -
._2 o O0o
0 300
4.0-
rim
Fi. Vertical diffuse attenuation coefficient qjl" lig•l and 101 light depth in (A)
.¢clarest* (blue) occan1 wateri (Smith and Baker 1981~) andtL (B) "clearest" g~reen water
in the Trondheirrnsford. Norway, early March (Gcir Johnien. unpublished data).

8
time, ocean water will turn from blue to green colour. However, in northern waters
nutrients become limiting before algal stocks become dense (self-shaded) enough to
stop growing. In the Antarctic Ocean, self-shading may occur before nutrients are
exhausted unless the depth of mixing is <10 m.
Ocean waters are blue unless an algal bloom has formed. Waters along the
Norwegian Coast, however, are distinctly bluegreen-to-green even if algae hardly are
present. This is due to the vast input of dissolved yellow substances mainly from theBaltic. Waters along the Norwegian Coast are as green as blue ocean waters would
be if they contained 10-15 mg Chia m- 3, which might be considered a dense bloom.
This will "fool" satellites photographing Chia in Norwegian waters unless correction
algorithms are employed. Moreover, the light regime in green water is, photosyntheti-
cally speaking, less efficient than in blue water.
To the extent that waters are homogeneous, light is attenuated down the water
column in an exponential fashion (Fig. 8). The figure shows the low attenuation in
Atlantic water (blue), the higher attenuation in Coastal water (bluegreen-to-green),
and the high attenuation in the Trondheimsfjord (green + higher in Chia). As a very
crude rule of thumb, light is sufficient for photosynthesis down to the depth where
surface irradiance is reduced by 99% (1% light depth). The layer down to the 1%
light depth is termed the euphotic zone and is typically 15-25 m deep in fjords; 30-40
m deep in the Coastal Current, and >50 m deep in North Atlantic waters. In
extremely low-productive (regenerative) deep-sea areas such as the Sargasso and
Mediterranean Seas the 1% light depth may be situated as deep as 100-150 m.
The algal growth rate responds both to day length and irradiance (Figs 9 and
10). A simple model accounting for both irradiance and day length variations has been
proposed for Barents Sea diatoms and is valid for -0.5°C provided the cells are not
nutrient limited (Sakshaug 1990):
* (doubl. d- 1) = 1.1 D/(12.4 + D)[1 - exp(-E 0 /20)] - 0.07
D is day length (h) and E. is irradiance (,umol m- 2 s-1). The effect of day length has
been modelled as a rectangular hyperbola where 12.4 is the half saturation constant,
and the effect of irradiance is derived from the Poisson probability for a photon
hitting an open photosynthetic unit.

0.04 Tn-HL Tn -LL
0.03 °ac
- 0.02
0E a
0.01
500 600 500 600 nm
Fig-.YIn vivo Chia-specific light ahsorption spectra for the large centric diatom
Thalassiosira nordenskioeldii (Barents Sea clone) grown at 0.50C and at 400 (Tn-HL.)
and 25 umol m- ' s' (Tn-LL). %*,: total ahsorption. F.: chlorophyll a-fluorescence
excitation spectrum (emission 730 nm) scaled to "a, at 675 nm (Sakshaug et al. 1990).
p. cet, 0.e 4 surface,,readl~an~l
03.
u 0l20
02 0 7
S* 0090
- . / /e, ,.Sn.'"' ""' -idt-' ( '
26 / ' '" 90.,25n
"C 'C'C oi / t-t6,i30 ' Grn " ofGrip
II II 'lilt tIlI I II mill
Fig. $ Downward irradiance (on a quantum-scale base) in Atlanticwaters, coastal waters, and the Trondheinsfjord, August 1976. The
attenuation coefficient for downward irradiance is indicated.
sa'k-aljz al ) ýWJ

I I
0.04 - Tn-HL Tn-LL
0.03
c
1 ! 0 .0 2 --
E
0.01 F
I~ oLi
500 600 500 600 nm
Fig.In vivo Chla-specific light absorption spectra for the large centric diatom
Thalassiosira nordenskiceldii (Barents Sea clone) grown at 0.5"C and at 400 (Tn-HL)
and 25 umol m-2 s' (Tn-LL). 'a,: total ahsorption. F1: chlorophyll a-fluorescence
excitation spectrum (emission 730 nm) scaled to "a, at 675 nm (Sakshaug et al. 1990).
ntcenIlg. CI IsuC*,Vdacl ra te
I0~ 00ý 00%
2 Augus.. On7
0,403'
0 '0
6
'0 0 20
0S5" 0015 0090
22 -tn
26 7. ( n 2
41 la iii c.30o- 66p of Grnp
mli lmi iltI Iii mI I II
Fig. Downward irradiance (on a quantum-scale base) in Atlantic
waters, coastal waters, and the Trondheimsfjord, August 1976. The
attenuation coefficient for downward irradiance is indicated.
50&ksbAugz at )I731

Dý - -
Da le 17
~Fig. 9. Relative growth rate as function of day length (Gilstad and Sakshaug 1990)
I oX
K0c/-K
01 0
©K
E *
-c
.V
C4,
C5
It Inl~ -5 I I
LI) o 5-c ___ ______ _____ _____,__ -___ __ -,_

9
VERTICAL MIXING
Vertical mixing affects the light regime of the algae profoundly. It can be easilycalculated that the deeper the phytoplankton are distributed due to vertical mixing,the less light they on average receive. Studies of this relationship is one of the mostimportant contributions from Norwegian biological oceangoraphers (H.H. Gran; T.Braarud: H.U. Sverdrup). Because depths of mixing are as small as 20-25 m inNorwegian fjords, spring blooms may start as early as February-March. In the CoastalCurrent, depth of mixing is closer to 40-50 m and the spring bloom will not startuntil the second half of April. In the Norwegian Sea mixing may be as deep as >200m until late May - June, when warming stabilizes the upper waters. Only then doesthe spring bloom start. Still, the three areas receive about the same amount ofradiation at the sea surface.
Nu-rRJENFS
Seawater contains virtually all naturally occurring elements. The more abundant ionsare sodium, chloride, magnesium and sulphate (Table 2). The nutrient-relevant ionscalcium and potassium occur in concentrations so high that any consumption byphytoplankton is not high enough to affect the concentration measurably. Althoughtotal salinity may vary from part to part of the ocean, the relative amount ofmacroions remains constant.
Seawater is a mixture of ions derived from strong and weak acids (mainlybicarbonate) and is therefore a buffer. The typical pH is 8.0-8.5. The amount ofdissolved inorganic carbon in seawater is about 7 times the content in freshwater atthe same temperature. Because seawater is nearly incompressible, the partial pressureof dissolved gases is about the same as in the atmosphere save variations caused bybiological activity (affects mainly CO, and 02).
Although algae need about 30 elements for growth, the discussion aboutnutrient limitation is concerned with variations in the concentration of some"macronutrients", i.e. nitrate, ammonia, urea, phosphate and silicate. Iron may also at
times be limiting.

9
VERTICAL MIXING
Vertical mixing affects the light regime of the algae profoundly. It can be easilycalculated that the deeper the phytoplankton are distributed due to vertical mixing,the less light they on average receive. Studies of this relationship is one of the mostimportant contributions from Norwegian biological oceangoraphers (H.H. Gran; T.Braarud: H.U. Sverdrup). Because depths of mixing are as small as 20-25 m inNorwegian fjords, spring blooms may start as early as February-March. In the CoastalCurrent, depth of mixing is closer to 40-50 m and the spring bloom will not startuntil the second half of April. In the Norwegian Sea mixing may be as deep as >200m until late May - June, when warming stabilizes the upper waters. Only then doesthe spring bloom start. Still, the three areas receive about the same amount ofradiation at the sea surface.
NUruENTS
Seawater contains virtually all naturally occurring elements. The more abundant ionsare sodium, chloride, magnesium and sulphate (Table 2). The nutrient-relevant ionscalcium and potassium occur in concentrations so high that any consumption byphytoplankton is not high enough to affect the concentration measurably. Althoughtotal salinity may vary from part to part of the ocean, the relative amount ofmacroions remains constant.
Seawater is a mixture of ions derived from strong and weak acids (mainlybicarbonate) and is therefore a buffer. The typical pH is 8.0-8.5. The amount of0 dissolved inorganic carbon in seawater is about 7 times the content in freshwater atthe same temperature. Because seawater is nearly incompressible, the partial pressureof dissolved gases is about the same as in the atmosphere save variations caused bybiological activity (affects mainly CO, and 02).
Although algae need about 30 elements for growth, the discussion aboutnutrient limitation is concerned with variations in the concentration of some"macronutrients", i.e. nitrate, ammonia, urea, phosphate and silicate. Iron may also attimes be limiting.

Table 1. Dissolved ions in seawater of salinity 35 ppt, g/kg
Sodium 10.77Magnesium 1.30Calcium 0.409Potassium 0.388Chloride 19.37Sulphate 2.72Bicarbonate 0.14Bromide 0.065
* Boric Acid 0.026
pH: 8.0-8.5
Table 2: Typical concentrations of macronutrients in winter, mmol m- 3, open ocean(Sakshaug 1989)
Barents Sea Bering Sea Antarctic Ocean
Nitrate 11.4 27 33Phosphate 0.75 1.7 2.0Silicate 6.2 35 100
N/P (atoms) 15.2 15.9 16.0Si/N (atoms) 0.55 1.3 3.1
After bloom 0 0 1/2 winter conc.
Max Chla, bloom, mg m-3 8-10 40-100 10-15

10
Well below the euphotic zone macronutrients are abundant all time of the year.
In the uppermost layers they are most abundant in winter, when weather causes
strong vertical mixing and algae do not consume appreciable amounts. Ammonia and
urea differ from the others in being more abundant in the growth season, because
they derive from biological activity. Maximum (winter) concentrations are highly
different from one region to another (Table 3). The smallest nutrient concentrations
are found in the Northeast Atlantic, the reason being that bottom water is formed inthe Arctic and the Norwegian Sea. This water is necessarily young and little enriched.
The highest concentrations are in the Antarctic and the Bering Sea - reflectinginfluence by very old and enriched bottom water. The Antarctic concentrations are
almost as high as those observed in the inner Oslofjord.
Compared to winter seawater in the Northeast Atlantic, rainwater, at least in
Southern Norway and farther south, has more ammonia and nitrate (but nophosphate). Rivers do not differ much from rainwater except from having a little more
phosphate (if non-polluted). The river Rhine is exceptional in having both a large
water discharge and high amounts of pollutants (500 mmol nitrate m- 3, 13 mmol
phosphate m-3). The concentration of pollutants has multiplied severalfold in the last
30 years, and effects cand be traced all the way up to Jutland (Figs 11 and 12).
Seawater has a ratio between nitrate and phosphate of 16 (atoms). The same
ratio is typical for the average phytoplankton. Therefore, seawater is a well balanced
growth medium for phytoplankton. In freshwater, however, phosphate is strongly
limiting (N/P typically > 100). Sewage acts the opposite way (N/P <8). In Skagerrak
and Kattegat N has become strongly limiting at times, because the high loading of O
fertilizing pollutants has generated large activity of denitrifying bacteria which remove
nitrogen as N, from seawater. In brackish fjord waters growth can be strongly P-
limited due to the influence of freshwater. Thus marine areas may exhibit both N-
and P-limited as well as balanced growth. Far from land, oceans are presumably a
trifle on the N-limiting side rather than the other way around. Note that individual
species may have different requirements, so that unialgal blooms cannot be evaluated
on basis of average properties of phytoplankton.
Far offshore, algal uptake of nitrate vs ammnonia/urea can be used to estimate
new vs regenerative production, because nitrate is the predominant nitrogen species
in deep waters while ammonia/urea exclusively are derived from biological activity.

10
Well below the euphotic zone macronutrients are abundant all time of the year.In the uppermost layers they are most abundant in winter, when weather causesstrong vertical mixing and algae do not consume appreciable amounts. Ammonia and
urea differ from the others in being more abundant in the growth season, because
they derive from biological activity. Maximum (winter) concentrations are highly
different from one region to another (Table 3). The smallest nutrient concentrations
are found in the Northeast Atlantic, the reason being that bottom water is formed inthe Arctic and the Norwegian Sea. This water is necessarily young and little enriched.
The highest concentrations are in the Antarctic and the Bering Sea - reflectinginfluence by very old and enriched bottom water. The Antarctic concentrations are
almost as high as those observed in the inner Oslofjord.
Compared to winter seawater in the Northeast Atlantic, rainwater, at least in
Southern Norway and farther south, has more ammonia and nitrate (but nophosphate). Rivers do not differ much from rainwater except from having a little morephosphate (if non-polluted). The river Rhine is exceptional in having both a large
water discharge and high amounts of pollutants (500 mmol nitrate M- 3, 13 mmol
phosphate m-3). The concentration of pollutants has multiplied severalfold in the last
30 years, and effects cand be traced all the way up to Jutland (Figs 11 and 12).
Seawater has a ratio between nitrate and phosphate of 16 (atoms). The sameratio is typical for the average phytoplankton. Therefore, seawater is a well balanced
growth medium for phytoplankton. In freshwater, however, phosphate is strongly
limiting (N/P typically >100). Sewage acts the opposite way (N/P <8). In Skagerrak
and Kattegat N has become strongly limiting at times, because the high loading of
fertilizing pollutants has generated large activity of denitrifying bacteria which remove
nitrogen as N, from seawater. In brackish fjord waters growth can be strongly P-
limited due to the influence of freshwater. Thus marine areas may exhibit both N-
and P-limited as well as balanced growth. Far from land, oceans are presumably atrifle on the N-limiting side rather than the other way around. Note that individual
species may have different requirements, so that unialgal blooms cannot be evaluated
on basis of average properties of phytoplankton.
Far offshore, algal uptake of nitrate vs ammonia/urea can be used to estimate
new vs regenerative production, because nitrate is the predominant nitrogen species
in deep waters while ammonia/urea exclusively are derived from biological activity.

Figuren Orthophosphate and nitrate concentra-tion In the River Rhine at Lobith (German-Dutchborder) since 1950 (24).
20
o 10
0
00
19-0
1950 1960 1970 1980
200
100
1950 1960 1970 19830

lob
VM..:
Fig.~~~~lor 13. Annua cyle , of w ytopla nklton i•n~l~ the Trnhimfo.Sipldboosvrfrom year to yne ar,• Sdependingh o n N rswtrb dic ag ( nri me t.(a.h u n
J1\
/ go
r -
, 1~~ 120 I J
F M A M J J A S 0
Fig. 13. Annual cycle of phytoplankton in the Trondheimsfjord. Stippled blooms varyfrom year to year, depending on freswater discharge (entrainment). (Sakshaug andTangen 1988).

lob
oh.
3
*"40
Figw* 2& ýM "ti d . onf Ia nslt. t tai
F M A M J J A S 0
Fig. 13. Annual cycle of phytoplankton in the Trondheimsfjord. Stippled blooms varyfrom year to year, depending on freswater discharge (entrainment). (Sakshaug andTangen 1988).

11
Near land, this becomes impossible because discharges (which by definition carry new
nutrients) include all three species of nitrogen.
Supplies of silicate are of interest, because they are necessary for diatoms.
River waters generally have a high content, whereas sewage contain only trace
amounts. Thus enrichment from sewage may favour other algal groups than diatoms,
and these other groups may include harmful species.
0THE DOUBLE-EDGED SWORD
All northern areas have a spring bloom of phytoplankton based on winter nutrients.
After the bloom, however, primary production is based on the day-to-day supply of
nutrients. Then the processes mentioned earlier for erosion of the pycnocline become
important. In some areas there is little erosion of the pycnocline, so that the primary
production becomes small and regenerative after the spring bloom. Grazers get only
one albeit large meal per year. This is typical in the northern half of the Barents Sea.
On the shallow (60 m) Svalbard Bank, in contrast, vertical mixing ensures adequate
supply of new nutrients all year. In deeper areas, however, vertical mixing is a double-
edged sword. On one hand, vertical mixing ensures supply of new nutrients; on the
other it ruins the light regime.
Ideally, deep vertical mixing (stormy weather) should take place regularly with
pauses of stable waters (calm weather) in between. Passing of atmospheric low
pressures yields such a cyclic weather pattern and is typical for the Norwegian Coast
and the southern half of the Barents Sea as well as for the Antarctic Ocean. Although
this has been far too little studied, there is reason to believe that "nastiness" of
Norwegian coastal weather is important in ensuring a high incidence of new
production.
AN ANNUAL PIrYTOPLANKTrON CYCLE
The Trondheimsfjord may illustrate the annual cycle of phytoplankton in fairly non-
polluted waters (Fig. 13). The first spring bloom occurs in March, it develops

12
exponentially, there is very little grazing, and it culminates when the winter nutrientsare exhausted. The phytoplankton stock sediments. Dynamically, the first spring bloomis analogous to a laboratory batch culture. The production during the first springbloom corresponds to about 500 kg carbon per hectare or 2.5 tonnes of organicmatter (dry weight).
After a short pause, another bloom starts in May and may ends some time inJune. This bloom is driven by the maximum freshwater discharge in May (entrain-ment); it is partly based on new nutrients and partly on regenerative nutrients because .the grazing pressure is high. It is analogous to a continuous laboratory culture, e.g.a sloppy chemostat, and ends as soon as the period of maximum freshwater dischargeis over. One should be aware that in the sheltered inner parts of some fjords ofWestern Norway, where rivers are fed from glaciers, a second spring bloom may notarise. The sailinity at the surface becomes too low for marine phytoplankton, andbelow it is too dark because of the high content of particles in the bgrackish layer.
In a dry, warm summer, freshwater supply is at minimum and there is amarked discontinuity layer (thermocline) at 15-20 m depth. This causes lowproduction and standing stocks of algae which are almost entirely based onregenerative nutrients. Various flagellates are predominant. In areas with high primaryproduction at this time of the year, pollution is a likely source (Southern Norway),and particularly so if the predominant species in blooms are not diatoms (deficit in
silicate).In the autumn the phytoplankton cycle depends on weather. Dry, warm
autumns yield sparse, regenerative communities dominated by dinoflagellates andcoccolithophorids, while wet autumns with large freshwater supplies (including silicate)to the fjord triggers of diatom blooms of short duration (entrainment).
CLIMATE AND THE OCEAN
We live in a period with ace ages. For the last milllion years, ice ages of a durationof about 100 000 yr have alternated with interglacials with a duration of about 20 000yr. We live at the end of an interglacial.
The Milankovitch theory - that glacial ages and interglacials are determined

12
exponentially, there is very little grazing, and it culminates when the winter nutrientsare exhausted. The phytoplankton stock sediments. Dynamically, the first spring bloomis analogous to a laboratory batch culture. The production during the first springbloom corresponds to about 500 kg carbon per hectare or 2.5 tonnes of organicmatter (dry weight).
After a short pause, another bloom starts in May and may ends some time inJune. This bloom is driven by the maximum freshwater discharge in May (entrain-ment); it is partly based on new nutrients and partly on regenerative nutrients becausethe grazing pressure is high. It is analogous to a continuous laboratory culture, e.g.a sloppy chemostat, and ends as soon as the period of maximum freshwater dischargeis over. One should be aware that in the sheltered inner parts of some fjords ofWestern Norway, where rivers are fed from glaciers, a second spring bloom may notarise. The sailinity at the surface becomes too low for marine phytoplankton, andbelow it is too dark because of the high content of particles in the bgrackish layer.
In a dry, warm summer, freshwater supply is at minimum and there is amarked discontinuity layer (thermocline) at 15-20 m depth. This causes lowproduction and standing stocks of algae which are almost entirely based onregenerative nutrients. Various flagellates are predominant. In areas with high primaryproduction at this time of the year, pollution is a likely source (Southern Norway),and particularly so if the predominant species in bloom§ are not diatoms (deficit insilicate).
In the autumn the phytoplankton cycle depends on weather. Dry, warm0 autumns yield sparse, regenerative communities dominated by dinoflagellates andcoccolithophorids, while wet autumns with large freshwater supplies (including silicate)to the fjord triggers of diatom blooms of short duration (entrainment).
CLIMATE AND THE OCEAN
We live in a period with ace ages. For the last milllion years, ice ages of a durationof about 100 000 yr have alternated with interglacials with a duration of about 20 000yr. We live at the end of an interglacial.
The Milankovitch theory - that glacial ages and interglacials are determined

13
by astronomical cycles - has by and large been supported by recent data. There are
3 astronomical rhythms which are decisive: Eccentricity of the earth's orbit around tile
sun (periodicity 100 000 yr); variations in the angle of the earth's rotational axis withthe orbital plane (periodicity 41 000 yr), it is now 23.50 and varies from 21.5-24.5',and the time of the year the earth is closest to the sun (periodicity 23 000 yr). It isnow closest to the sun in January, e.g. when it is winter in the Northern Hemisphere.
Ice ages are supposed to begin as a result of milder winters in combination
with cooler summers in the Northern Hemisphere, i.e. a smaller difference between
winter and summer climate. Milder winters mean more precipitation as snow in high-
lying areas, while cooler summers mean less melting. A small angle between the earth
axis and the orbital plane contributes to this, as does the minimum distance between
earth and sun in the northern winter. On basis of astronomy, one should expect a new
glacial age in less than 1000-2000 yr. In general, any mechanism that will cause more
warming in winter than in summer (global warming?) may be relevant with this
respect because it may trigger off the next ice age prematurely.
According to studies of 'fossil' climate (ice cores, marine sediments), a fully
developed ice age differ strongly from a fully developed interglacial. Not only was
large parts of North America and Northwest Europe covered by ice during the last
ice age, the snow line was about 1000 m lower globally than today (Fig. 14).
Moreover, the atmosphere was lower in CO2 and richer ihi dust, and the climate must
have been generally much drier than today (more deserts and tundra; Fig. 15). Most
important, the North Atlantic Drift turned from the Southern United States straight
east towards Spain; thus warm water was not transported towards Northern Europe.
It is obvious that the change from ice age to interglacial is -rapid on a
geological scale (few hundred years). The start and end of the Dryas period, which,however, is not well explained yet, indicate rapid changes on a 20-year scale.
Mathematical models of the North Atlantic indicate that this ocean has two quasi-
stable states: with and without a North Atlantic Drift. Considering that other states
are unstable, it is not surprising that climate changes are rapid. While a full fledged
new ice edge may be centuries away, one should be aware that even a modest
worsening of the climate of Northern Europe in the very beginning of glaciation may
ruin agriculture conipletely.
Astronomical cycles do not change thle energy distribution onl earth by more

90 - - -ARCIIC OCI AN
BHOCWS
RANGE ALASkA
CASCADE*ALc(
b SIERRAs (w VAOA
NV30
-o 5A151CAANC1 OLCANOES
• CENTRAL
,.
ANDES
30 -
£0 I ~ '*j5Z~PATACONIA
60
ANTARCTICA
0 2,000 4.000 6.000 8.000ALTITUDE (METERS)
ICE SHtETS AND MOUNTAIN GLAkrJS expanded in both hendt because the sea level was lower.) The graph races the aver-
spheres during the last Ice age. The map (an unusual equal. age elevation of mountain snow lines on the Aenrican cordi-
area projection) shows the extent of land ice lred) and sea Ice ,era. plotted along the noltth south transect indicated on the
t(yelow) on all ithe contlneni at peak glaciation some 19.500 map. Ice-age snow line, (blue line) were about 1.000 meters
vears ago.4 Land Ice extended beyond some present roastlines lower than snow tines are today (red), regardless of Latitude.
S CItO 1t IC AtU AIf'CAN J annslry 0990 45
MOUNTAINv 'NO, LINES
ICE SHEETS
DUST
AT MOSPHERIC CARBON
yOUNCER DM05ototo
0 5 THOUSANDS OF YEARS AGO
I,,) or Isti LST ICE AGE brought global Changtes. summarized here, that b•ean
at the same time about I,.00 D eDrt ago eveg though they proceeded at different3 rates. The cstrcsaaLon of the North Atlantic shifed abruptly Iron gtacil to i otteiga-
dal conditiOnS (with brie relapse during the Younger Drvas cold snapt 55 deep-water pruoctr I ton retsumed, At the same time. the amo
u n t ol LIdust in the atmosphere
droltpd and the cnnntration of carbon dioudestarted o increase. The shills
m a, ha se be en part o f a larger r e..rga . a. t iu n of the m eean and atm ospbere th at
ar tse d site sI ) d , iew an d . au ,Ld m o un ta in gla cers an d Ice sh e e, t to start te tr el ml i

4 9 AKgCSIC MEIAN
C 2227 ALASKA
a CASCADE
RAC
It NEVADA
V0LCANOLI
- ~CENTRAL.2 CLAMECRICA
a2 ANR
30
00~~ PATACONIA -
60
ANTrARC TICA
flg.I9I0 2,000 4.000 6.000 5.000
AAITFIJOC (METERS$
ICE Sn~sANO IdOtJfALN CL.ACIIEKS exp~andedl In bocth he".t because the sea level was tower.) Th11e graph traces lbe aver.sphere during the LasE ice age. The map (.a nUn...s u... eal .ag elevation of osouniata snow lines on.the American cordil-area projection) shows she extent of ,and Ice (red) and ala Ire erag plotted along the noAh-south transec t inidicated on helreflnwI on all the conistnat, at peak glaciation sonme 19300 maep. Ice-a ge snow tines th~se tUngg were about 1.000 eterg.s
year. g. (andiceexindedbn-nd omepreenicoastlines lower than snow lines are today Iredl, regardless of latitude.
S(ttNIItIC AiljetAN January 090J .4S
uotJNTAI N'01 ItN(ý
NCt(S)' AT' *S i
youn~t ORYAS A¶M0SPIIRIC CARBON
0 5 THOUSANDS OP yIARS ACO
A I ND or fleE LAS ICE ACE brought global chngel. gargroarizEdo beer. thai begain
rt tItesate lie aoutstO yers go ee though they proceededi .t differ,.'
ratais. 111e crcoula ion of the North Atlantic shiftedi abptipii tront glasciai todneepl
U cal con~~~E.dili.n tisib a. brief relapse during the yoNge a odiata ep
walte product Ion resume&. Al the tatte time, the amount of dust in the atmosphmeredroped nd te cats nirtlonof arbo di std uarted to urcrage. The shutls
drtape base bee shr sare ntgai ICreearg alai. id the ncgr n and aarIress phere that
wa INtde,tla.-,iandsa..I d nmountain gairand~r Iche.t, to start 1etea-Mn

14
than 1%. The grave consequences folowing from such a small change indicates theexistence of a strengthening (positive) feedback. The increase in the earth's albedodue to ice covering ever larger areas has been the traditional explanation. Changesin the ocean currents, however, may provide a more dramatic and rapid change inclimate. Moreover, the global cooling during the last ice age indicates that the oceanshave played a major role.
Europe is at the receiving end of a large oceanic conveyor belt carrying heatnorthwards (Fig. 16). One of the major 'engines" driving this belt is bottom waterformation in the Norwegian Sea and the Arctic. By being very salt after having pa~seddry areas such as the Saharan coast and by becoming cold after giving its heat off toEurope, the imported seawater sinks in the Norwegian Sea due to its high densityand thereby pulls more water northwards. From there it spreads as bottom water inall oceans. In a sense, the heat given off to Europe has been paid by the cold abyss.The average net transport is about 6 million m 3 s-1 and the current appears to bestronger in winter than in summer.
Small changes in transport may have large consequences for the climate ofEurope and this may be mediated through small changes in the density of the water.The density of the water is determined by salinity and temperature. 1 ppt increase insalinity equals about 6-70C decrease in temperature density-wise. While a change intemperature this magnitude is hardly likely, a I ppt change in salinity can easily resultfrom modest changes in the hydrological cycle including melting of land ice, forinstance in Greenland, which is the proximate neighbour of the Norwegian Sea.0 Evaporation from the sea surface increases steeply with increasing temperature;increased evaporation in turn implies not only more precipitation in Scandinavia, butalso increased salinity in the surface layers. In fact, the required changes are so smallthat they are close to the technically feasible.
It is much too early to predict what will happen, for instance due to globalwarming; it is quite clear, however, that if global warming affects the transport ofwarmn water to Europe, it also affects the climate, possible in ways that are notobvious a priori. A scenario might be suggested (with no claim of being correct):
A. Global warming causes particularly mild winters and continuous passagingof low pressures across Scandinavia wvhere they dump large amounts of snow in high-lying areas. High evaporation from the sea Surface causes high salinity which in turn

15
increases bottom water formation which pulls in more warm water in winter. This isa positive feedback which we would like to avoid. We want cold winters (high
pressures) with a minimum of precipitation; i.e. a smaller North Atlantic Drift inwinter rather than a larger. This scenario may be the mechanism that triggers off an
ice age on basis of astronomical cycles.
B: Global warming does not affect the summer as much as the winter;therefore the increase in the North Atlantic Drift will not increase appreciably. Incase of large heating, however, enough Greenland ice may melt to freshen theNorwegian Sea and stop the formation of bottom water. That is the worst casescenario. In summary, we want no increase in the North Atlantic Drift in winter and
only a moderate increase in summer. Astronomy and global warming, however, bothappear to provide a worst case winter situation.
CAR-BON DIOXIDE
The ocean conitatins 60 times more carbon than the atmosphere, so it is obvious thatthe ocean plays the paramount role in the global carbon cycle. Even dissolved organiccarbon in the sea represents more carbon than we have in the atmosphere (Table 3).
The scenario involving changes in the bottom watdr formation i the Norwegian
Sea does not taken into account changes in the carbon flux and does therefore notpredict a change in the content of CO2 in the atmosphere. Mathematical modelsaindicate that the balance between atmospheric and inorganic oceanic carbon may notWchange much if climate changes, so that the environmental variable of interest is the
biogenic carbon flux. Considering that nutrients in the upper layers in the NorthernaHemisphere are depleted completely, it is difficult to create scenarios which implyWincreased new production and thus export (sedimented) production in northernregions. Possibly coccolithophorids may have a more northerly distribution in summer
and thereby become more important as export producers.
Apart from that equatorial seas possibly can increase their export productionif a climate change takes place, the more likely candidate for increasing its exportproduction is the Antarctic Ocean: Today the primary production in the Antarctic
Ocean is low relative to the abundance of macron utrie nts. There are two scenarios

15
increases bottom water formation which pulls in more warm water in winter. This isa positive feedback which we would like to avoid. We want cold winters (highpressures) with a minimum of precipitation; i.e. a smaller North Atlantic Drift inwinter rather than a larger. This scenario may be the mechanism that triggers off anice age on basis of astronomical cycles.
B: Global warming does not affect the summer as much as the winter;therefore the increase in the North Atlantic Drift will not increase appreciably. Incase of large heating, however, enough Greenland ice may melt to freshen theNorwegian Sea and stop the formation of bottom water. That is the worst casescenario. In summary, we want no increase in the North Atlantic Drift in winter andonly a moderate increase in summer. Astronomy and global warming, however, bothappear to provide a worst case winter situation.
CARBON DIOXIDE
The ocean contatins 60 times more carbon than the atmosphere, so it is obvious thatthe ocean plays the paramount role in the global carbon cycle. Even dissolved organiccarbon in the sea represents more carbon than we have in the atmosphere (Table 3).
The scenario involving changes in the bottom wdtdr formation i the NorwegianSea does not taken into account changes in the carbon flux and does therefore notpredict a change in the content of CO, in the atmosphere. Mathematical models
*indicate that the balance between atmospheric and inorganic oceanic carbon maynot~change much if climate changes, so that the environmental variable of interest is thebiogenic carbon flux. Considering that nutrients in the upper layers in the NorthernHemisphere are depleted completely, it is difficult to create scenarios which implyincreased new production and thus export (sedimented) production in northernregions. Possibly coccolithophorids may have a more northerly distribution in summer
and thereby become more important as export producers.
Apart from that equatorial seas possibly can increase their export productionif a climate change takes place, the more likely candidate for increasing its exportproduction is the Antarctic Ocean. Today the primary production in the AntarcticOcean is low relative to the abundance of macronutrients. There are two scenarios

IA
Table 3. Distribution of carbon, 1012 tonnes
Atmosphere 770
Ocean 38 000
Ocean; includes
Dissolved organic 1 400"Particulate organic 55
0 *may be 2-3 times higher according to new analytical methods
Annual increase in atmosphere: =6 1 i0 9 tonnes
is
F-.'I Global thermohaline circulationcell associated with NADW production(modified after ref. 21). solid arrows
mark the interred warm-water route *cfor return flow of upper,layef water tothe northern Atlantic. Suggestedvolume fluxes (Sv)"' a'e based on uni- 0 . ..
form upwelling of NADW with a produc-tion rate of 20 Sv. The alternative cold-water route through the DrakePassage is assumed to be minor. Theatmospheric water-vapour flux across .5
the Isthmus of Panama is estimatedfrom data in refs 19, 20. Dep-wettellow , n upper-Layerfhow
St OCold-wa ter igmnstei Net almosphe ....nr -tN
.10 he. AWanc Ocean about t'ranport
• ATURE - VOL 343 - 15 FEBRUARY 1990 -trec/- terto 'r . /% /,-y'o l7t 607
0

16
for how export production might increase: one implies that the Antarctic today ischaracterized by limitation of phytoplankton growth by iron; the other implieslimitation by light (too deep vertical mixing).
The iron hypothesis presumes that iron is limiting, because there is too little
iron-supplying dust in the Antarctic atmosphere because of its large distance from ice-free continents. It has actually been suggested recently (Martin et al. 1990) that
dumping of dissolved iron into the Antarctic Ocean might increase export productionso much that it amounts to removal of the annual input of anthropogenic CO 2 to theatmosphere. In the ice age scenario, the dust-rich atmosphere would, of course, dothis without human assistance. That scenario might imply, however, that the ice agecame first and the removal of carbon afterwards.
The more 'classical" light-limitation hypothesis presumes that export production
will increase if an increase in the melting of Antarctic ice in summer makes watersmore stable; i.e. the mixing less deep. Mathematical models indicate that if the macro-nutrients of the upper waters are to be depleted completely, adding iron (if limiting
at all) is not enough; one has to ensure that mixing seldom is deeper than 20 m -
otherwise algae will stop growing because of self-shading. One should bear in mindthat the Antarctic Ocean due to astronomical rhythms is entering a period with coldwinters and warm summers, i.e. the opposite of the Northern Hemisphere, and thatglobal warming in addition to this may cause winters like they are now, but summers
warmer than predicted from astronomy. In this scenario removal of CO, takes placein parallel with changes in the bottom water formation of the Norwegian Sea, and
both processes represent the positive feedbacks which are required if the theory aboutastronomical determination of climate is correct. The more scary part of thsescenarios, however, is that "global warming" may enhance the astronomical impactinstead of dampening it.
Still confused? Not after this episode of "As The Gulf Stream Turns"

3
S
S
S
S
0
SSS
S0

PHYSICAL OCEANOGRAPHY
Physical and Chemical Properties of Seawater
Approximately 3.5% of seawater consists of dissolved solids (salts) such as sodium chloride,together with relatively small amounts of dissolved gases. The salinity - expressed as parts per
thousand (%.) - is defined as the total amount of solid material in grams contained in one kilogram of
seawater when all carbonate has been convented to oxide, the bromine and iodine replaced bychlorine and all organic matter oxidized. In the open ocean salinity varies from about 3404 to 380/..Land-locked adjacent seas may have much lower salinity - e.g. Baltic Sea (<8-20%.), although in ardd
0 areas where evaporation exceeds precipitation salinity can be much higher (e.g. Red Sea 43-45%.).Regardless of absolute concentration, relative proportions o1 the different major constituents are
remarkably similar - to within the second decimal place of salinity expressed in %.Major constituents. are given in Table 1.
Table 1
Cations gm/kgmn
Sodium 10.752Magnesium 1.295Calcium 0.416Potassium 0.39Strontium 0.013
Anions
Chloride 19.345Sulphate 2.701Bromide 0.066Bicarbonate 0.145Borate 0.027
In the form of salts, four of the main constituents are:
NaCI : 28.014%.; MgCi 2 :3.812%o; MgSO 4 :1.752%/.; CaSO4 :1.283%o.
At one time the constancy of composition provided the only basis for determining salinity. In
this method the chlorinity of seawater is determined by titration with silver nitrate. To standardize the
amount of silver present in the silver nitrate solution which is used, the titration is first carried out on
Standard Sea Water, prepared by Ocean Scientific International at the Institute of Oceanographic
Sciences, Worrnley, U.K.
Salinity, S, is related to Chlorinity, Ci, by the empirical relationship

Salinity, S, is related to Chlorinity, Cl, by the empirical relationship
So = 1.80655 Clt,.
There are a number of properties of sea water which are closely related to salinity and whichcould in principle provide a means of measurement both in the laboratory and in situ - e.g. refractiveindex, electrical conductivity. The parameter used nowadays is electrical conductivity. In thelaboratory salinometers incorporating conductivity cells are standardized using Standard Sea Water ofknown salinity at a standard temperature and pressure. At sea, the use of the CTD (Conductivity,
* •Temperature, Depth) probe, lowered from a ship or towed behind a ship is virtually universal. Theaccuracies commonly achieved in measurement are -3 in 106 in conductivity and -0.0010C in
temperature, permitting determination of density to within a few parts in 106.
Stability within the water column depends upon density and the movement of water massesdepends upon density gradients. Density is related to salinity, S, temperature, I (in 0C) andpressure, p (bars) ,through the equation of state (UNESCO, 1981). This takes the form of a seriesof polynomial expressions in S and t. These are evaluated in a series of steps, taking first the densityof pure water (pw = pw(t)), followed by calculation of p(S,t,0) = Pw + S.a(t) + S3'2 b(t) + cS 2.
The density at pressure, p, is given by
p(S,t,p) = p(S,t,0) / ( - P
where K is the secant bulk modulus, likewise derived from Kw(t) with the addition of polynomials in S, I
.and p.
The effect of temperature and salinity on the density of seawater and fresh water relative tothe density at 00 are shown in fig. 1. It may sometimes be necessary to consider the effect of pressureon density, also (fig. 2). A deep diving submersible, for example, if neutrally buoyant at the surface,would need to reduce its displacement by -3% in diving to 6000 metres depth. Note that in referringto density in situ it is customary to make use of a quantity 0 (s,t,p) = (Ps.t.p - 1) x 103 . Since laboratory
measurements are invariably made at atmospheric pressure, density values are usually expressed interms of at(-- -(s tjo)).
Amongst other physical properties of sea water which are dependent on salinity and pressure
is thermal expansion, a. This increases with salinity and increases strongly with both pressure and
1 bar = 105 Pascals.
-2-

0-0
0L-0 -
04.
C,
OL 0 0
(cw/wON)) OOOI.-c
cmcm
0s -
0 0
-3--

temperature. For example,
a35,0,0) = 526 x 10-7-C-1; as= 31 X 10-7C-Ias
C.(35,0,600) = 1954 X 1 0-7.0 1; as'= 18 X 1 0-7.0-1as
o.(35,20o0) = 2570 x 10"7,C-1; =13 X 10-7. -1
Adiabatic temperature change - resulting from the compressibility of sea water - can besignificant in oceanographic processes relating to stratification. It a water sample is raised from the
deeper layers the pressure decreases and the water sample increases in volume, thus doing work
against the external pressure. A decrease in temperature results. Conversely, moving a water parcelto great depth produces a temperature increase. Oceanographers frequently make use of theconcept of potential temperature, which is the temperature which would be attained by a parcel ofwater at a given depth if it were raised to the surface without heat gain or heat loss.
The electrical conductivity of seawater which has salinity of 355, is of order
4 Siemens/metre. This relatively high value - more than 3 orders of magnitude greater than for freshwater - has profound implications for marine technology because it effectively precludes the use ofradio waves for communications, other than at very low frequencies.
The so-called skin depth, 8, for electromagnetic wave propagation in seawater (i.e. the
distance at which a wave is attenuated by 1/e of its transmitted amplitude)
8= ..JT where p. = permeability of free space = 41r.10-7
a = conductivity
a) = angular frequency.
The optical properties of seawater vary according to position and often vary in time also.
They are dependent on absorption and scattering by suspended matter and water soluble
substances. Light is attenuated rapidly with depth even in clear ocean water. At a depth of 50 m,intensity is -5% of that entering the surface: in turbid coastal waters, extinction can be complete within
a few metres.
Generally, intensity at depth, z, can be expressed as
I(z) = Io exp (-kz)
-4-

The absorption coefficient, k, varies considerably with wavelength. In clear ocean water least
absorption is at the blue/green end of the spectrum: in more turbid waters yellow/green light
penetrates furthest.
Vertical Structure of the Water Column
The surface layers of the oceans are heated by incoming solar radiation, which leads to a
characteristic decrease of temperature with depth. This decrease takes place in a step or sometimes
as a series of steps as shown in fig. 3. The surface mixed layer is usually somewhat less than 200 m
deep and is bounded by the main thermocline, which is a permanent feature at middle and low
latitudes (fig. 4). During the winter months, strong mixing creates an almost isothermal mixed layer.
Seasonal warming can result in a shallow warmed layer that can be broken down in storm conditions.
By mid summer surface warming creates a strong seasonal thermocline at depths typically 50-100 m,
before surface cooling and strong winds together produce a cool, well mixed deep surface layer in
winter. During the summer months, also, shallow diurnal thermoclines may also develop, typically at
depths -10 m. The surface layer of the ocean thus provides temporary storage of large quantities of
thermal energy and this is extremely important in terms of global climate. It has been estimated that
the uppermost 3 metres of the oceans has a greater heat capacity than the entire atmosphere.
Beneath the stable, permanent thermocline in which temperatures fall typically from 150 or
more to about 50, a further slow decrease takes place from 50C to less than 20. (At the very great
depths associated with ocean trenches, an increase in temperature may take place, caused by
adiabatic compression).
The speed of sound increases with both temperature and pressure. The decrease in
temperature with depth in the ocean results in a minimum in the sound velocity profile, thus creating a
deep sound channel (SOFAR) which enables long range propagation to take place.
This effectively two layer system is extremely stable. Deep water residence times have been
estimated to be in excess of 500 years for various areas of the global ocean. Nevertheless mixing
does occur: on a global scale warmed surface waters in the tropics are transported polewards. In polar
regions intense surface cooling causes water to sink and flow towards the equator. This
thermohallne cycle is completed by the upwelling of cold water in a few temperate and tropical
regions and by very slow transport across the thermocline. In this global circulation the structure and
movements of intermediate and deeper water are not uniform - there exists considerable variability
over a range of spatial scales. Water mass types are characterized by fairly specific temperatures and
salinities, which reflect their origin: they tend to mix along Isopycnal (constant density) surfaces rather
-5-

Temperature Salinity DensityCo0 10 20 34 35 36 24252627
2000-
4000.
6000-m
Fig. 3(a) Vertical structure of th e deep ocean ____Polar
.......................... .......... TemperateT ---- Tropical
A C B D
Surface-Layer
z Thrmo in Thermocline
SDeepwater
0Fig. 3(b) Surface layer schematic
60 S 40& 20* equator 21 40 - 60 N
?E 500- hnoln
-a, 1000deep layer - - - - - -
15001
F- g 6

than across them. For example, salty Mediterranean water flows out into the Atlantic above NorthAtlantic Deep Water and can be detected in the Western Atlantic.
Fronts are the boundaries between differing water masses with differing characteristics.These occur in any pant of the ocean and over a wide range of scales and are characterized by anabrupt change in temperature, current shear, turbulence and possibly vertical water motion.
At scales o1 order 100 km considerable variability exists. Mesoscale eddies with rotationalvelocities of '-0.1 ms-1 have been found in all the world's oceans and contain a very high proportion ofthe kinetic energy associated with currents.
Hydrothermal Vents
Hydrothermal vents results from the interaction between seawater and the magma underlying
the ocean floor at active boundaries (mid ocean ridges). Water rich in metalliferous compounds (Mn,Co, Ni) is expelled at elevated temperatures from fissures to form plumes. Examples found so far havebeen several km long and -1 km in vertical extent. Mn is a key tracer since it is present in vastlyenriched levels: traces have been detected up to 1000 km from the point of origin.
Whilst hydrothermal vents do not provide a major input to the ocean they have attractedconsiderable (multidisciplinary) scientific interest within the last 5 years and are currently the subject ofinternational exploratory programmes. For the marine technologist the challenge is to provide meansof detecting hydrothermal systems in routine surveys - and to devise the rugged instrument systemswhich will be needed to investigate them. Problems include high temperatures, corrosion, need for
accurate emplacement, etc.
Mixed Layer
The principal processes at work in the mixed layer are concerned with the transfer orexchange of momentum, heat and mass, including water vapour and various gases. Knowledge ofthese processes is particularly important in understanding the role of the oceans in global climate.Ultimately the accuracy with which the physics of small scale processes can be incorporated(parameterized) in large scale numerical models of heat transfer and ocean circulation will determinethe success of climate prediction. Understanding of the way in which the momentum of the wind istransferred to the ocean is important also in a range of practical engineering problems.
A fundamental question to be answered concerns the nature of the turbulence beneath thesea surface. Some of the processes involved are shown in fig. 5.
-7-

fki
-Zn
II
Nv8

Current shear results from the downward transfer of momentum. There is as yetuncertainty concerning the nature of the near-surface profile - discussed below.
Langmulr Circulations
Langmuir circulations can appear at the sea surface within minutes of wind increasing above athreshold of a few rns - a near-surface process potentially important in the downward transfer of wind
generated momentum and heat. Row spacings can be 2-300 m in the ocean - a hierarchy of cell sizescan co-exist. The cause has not yet been established but is believed to result from wave-current
shear interaction.
Recent work (Smith et al., 1987) found intermittent but strong three-dimensional flows downto 35 metres and vertical currents exceeding 20 cm/s. How frequently such strong overturnin gmotions occur is unknown - or indeed how they can be incorporated in models of the upper ocean.
Internal Waves occur along a pycnocline at any depth and can be produced, for example,by the interaction of the M2 tide with a Continental Shelf Edge (New, 1990). Amplitudes can be tens
of metres, periodicities extend from minutes to hours. Phase speed, c, in a two layer system is given
by
c2 = g(Pi - Po)/(Po coth kh0 +pj coth kh1) k. (k = 27I.X)
For a typical density difference of -0.4 kg.mn3 across a thermocline near a shelf edge, thepropagation velocity for an internal wave of wavelength -1.5 km, period 1 hr, is -0.5 m/s.
In calm conditions the surface expression of internal waves can suppress short capillary wavesoften present, so producing visible bands of calm water. In windy conditions, the currents associated
with internal waves can stimulate breaking of gravity waves.
Breaking Waves
Little is yet known of the nature of wave-induced turbulen ce, though undoubtedly wave
breaking contributes substantially to the transfer of horizontal momentum and gases through the seasurface: laboratory experiments have shown that wave groups can lose as much as 30% of their
momentum flux during a single breaking event. Measurements made comparatively recently suggestthat intense turbulent activity can extend downwards to a depth of -10 x mean wave height.
-9-

A principal difficulty in investigating the role of any of the near-surface processes has been
that of devising appropriate measurements which can provide a three-dimensional picture of what is
happening - and give an indication of the frequency of events in lime and space.
A lot of progress has been made in recent years with narrow beam acoustic techniques -
towed sidescan sonars and upward looking sonar moored within a few tens of metres of the surface.
These are being used to investigate the turbulent clouds of bubbles accompanying breaking waves -
in particular the vertical distribution of bubbles with time, dependence of bubble cloud properties on
wind speed and to enable their space-time properties to be resolved (Thorpe, 1988). Additionally,
multifrequency sonar provides information on bubble size distribution. Such observations, coupled
with analytical work, provide a possible way to measure turbulence and to parameterize it for input into
predictive numberical models (Griffiths, 1989). However, there yet remain a number of areas for
O further study including:
- bubble size distribution and variation with depth
- effects of surface active films which may inhibit gas absorption and hence extend bubble
lifetimes.
In addition there is a more general need to develop a better understanding of the spatial statistics of
wave breaking. This has important applications, also, in microwave remote sensing - whitecapping
(not necessarily synonymous with wave breaking) has a significant effect on the reflectivity and
emissivity of the sea surface.
-10-

CURRENTS
In both shelf seas and in the deep ocean currents include periodicities ranging from a fewseconds to hundreds of days (fig. 6). Some of the frequency components are discrete anddeterministic - such as tidal motions - the majority are not so and cover a range of frequencies. Thecharacteristics of most of the known current motions are summarized in Table 2.
days hours minutes seconds
20 4 1 12 3 1 30 5 1 30 10 225 1 I 1 1 1 1 1 1 1 1 25
20 -20
E
U.
'0 15 - 15
IC)Lu .Y 10 -10
5 ,
01 ,1 1 10 100 10oo
Frequency, Cycles per hour
Fig. 6
The driving forces for currents (velocity vector V) in the sea may be represented by:
DV
-D-tpVp g V- - x V + F1" 1 1 1" 1"
(Pressure) (Gravity) (Tide) (Coriolis) (Friction)(producing) (force)
(force)
where 92 is Earth's angular velocity,
DV aVand - -+ (.•7)V
-11 -

0) C
a))
)0) 0
0 0 (0 0o co0a) 'D 0D 'D C) CL :3 'a ' 'acm r ) 4) (0 cc - u C4
o o 0 0 cc C 0 E 0
co tm m ac 0 uC
(0 ~ ~ ~ a 0o to Vcu (0 (t 0m cc m DO)a
a) 04) a cu 0
nn
00 Cu
4) Cu0 1 D C) a.0. 0) 4) 9 W0 0
ca 0> aaO U)
CuCm muD0
C ~0mc E
CMu
V_ m) cu- ca CV (D V V c0 C
N 0 0 t
Cu
4)
0 po C>L0r C) Cu f 0 Cu C0o t
E~~~~C c u .2 0 u i4r ~ a >Lb0) u u C
Cu Cu V' = 3
CU
E c 83 Em E 0 a)B
cc$ c-12-

i.e. in Cartesian coordinates with velocity components u, v, w in x, y, z directions (z vertically upwards)
du a= au vaU + u\ andu irilaryfordv dwdt-t + U+x ay+ 2zan dt 'odT
au represents the local rate of change. The terms in brackets are advective rates of change due to
motion).
To solve for current V(x,y,z,t) we need
* ,(a) other equations:
Dconservation P2= -pV.V (= 0 in the sea) or in Cartesian coordinates-u 0.Mass or atsa oriaxe 3-~, ay +a-z- = O
- Equations for temperature, T, salinity, S, and an equation of state p = p(p,S,T) for density.
(b) boundary conditions:
- frictional stresses caused by wind at sea surface bottom friction,
- lateral boundaries of a limited sea area, e.g. North Sea.
(c) initial conditions:
Flow can then in principle be computed.
Consider some special cases (neglecting tides for the moment):
(i) Inertial motions (found in current meter records):
Assume zero friction and zero pressure gradient aP/2x = ap/ay = 0,
x and y equations become:
du dv-t = 20vsin@; L- = -212usino where 0 = latitude,
i.e. circular motion is produced at period idQ sin0 a i-/2f (= 16.93 hours at 450,0 at equator).
-13-

(ii) Geostrophic balance:
(DVIn the steady state Y- = 0)
x and y equations become
0 = 2.Qvsin0 - oap/ax
0 = 20usino - aap/ay,
z equation approximates to 0 = -a a- g; or p = -pgz,
i.e. Coriolis force is balanced by the pressure gradient.
Order of magnitude: 1 - 7.3 x 10⁻⁵ rad.s-1
Lat. -450
Current -0.5 m/sec
Hence slope -0-5 or -1 m in 100 km.
Geostrophic balance provides opportunity to determine large scale current shear dV/dz and -provided a reference current is available at some level - absolute current profile by measuring
density profiles.
(iii) Friction is important in current shear, e.g. at surface due to wind forcing, horizontal
equations become:
0au f a -2 +F 0at ax
in steady state conditions,2 1 =fu - aty + Fy
i.e. Coriolis + Friction + Pressure = 0.
Before the equations can be solved, it is necessary to know more about the frictional forces.
au MduFor a Newtonian fluid in x direction frictional stress tx = I- = p•-z where g is viscosity
(10-3 kg/mVsec) (or u = kinematic viscosity 106 m2/s).
-14-

In the sea non linear frictional stresses greatly exceed molecular effects. However, we look to
a similar form of representation to describe shear stress arising from turbulent fluctuations,
ie.eddy friction stress ' = pA-- (If we represent fluid motion u by a mean u and a
Hence the force/unit mass fluctuating part u', i.e. u = u + u', and similarly fora2U
PA 2- v and w, it can be shown that A- = -uw etc.)
(so called Reynolds stresses)
If we assume linear superposition of driving forces (wind and density gradients) then twocomponents of v can be identified, due to wind friction (ve) and geostrophy (vg) respectively.
For the wind friction component
fve + Az Z= i.e. Coriolis force + Friction = 0.
82Ve ~'Equations first derived by Ekman, who assumed-fve + Az 2 - = no boundaries, infinite depth, constant eddy
viscosity (A.) and steady state conditions.
For wind blowing in the y direction solutions are of the form
ie = Vo cos 4 + 11-) exp (-Vo in Southern Hemisphere)
ve=Voi nQS + QPD d
v.b W=n strss siW 2 E- x
where Vo is the total Ekman transport - Dpn s e. - W2
and DE is the depth of frictional influence - 7 Illz 1/2
The form of solution is shown graphically (fig. 7). At the sea surface the current flow is at 450 tothe wind; to the right in the Northern Hemisphere. The magnitude decreases with depth, the
vector rotating clockwise - the so-called Ekman spiral.
-15-

wind
9, d epth
Fig. 7 The Ekman Spiral (NH)
0 -Field observations analysed by Ekman suggested that surface current and wind speed are
related as
= 0.0127W(sin10 1)
and that the depth of frictional influence, DE , is
DE = 4.3W metres (W in m/s).(sin 1• 1)2
Regardless of the way in which turbulence is parameterized theory predicts mass transport ofthe sea surface frictional layer at 900 to the right (N. Hemisphere) of the wind. Experimental
evidence also supports a rightward turning and a magnitude at the surface generally within the
range 1-3% of the wind speed measured at 10 metres height. However, the precise form of
the current structure remains uncertain.
Basically two types of model are commonly used to describe current shear in the upper ocean
(see for example Gordon, 1982):
(a) the slab model which relates velocity gradient to the density gradient, and
(b) a logarithmic dependence of velocity on depth:
u(z) = -q In(z) + constant (analogous to the bottom boundary layer of the atmosphere),
-16-

where u*, the friction velocity = wind stress 1/
and K = von Karman's constant = 0.4
which holds well for turbulent flow in the vicinity of a solid boundary.
But neither type of model takes into account the presence of waves.
Stokes Drift is one complicating factor. In the presence of waves but absence of currents a
particle of water will still progress in the direction of propagation i.e. wave orbits are not closed.This is, however, a Lagrangian displacement: a truly fixed (Eulerian) current meter will not
measure the drift, but will measure net forward transport between wave trough and wavecrest. Measurement of current in the near-surface region (uppermost 10-20 metres) is difficult
because
- stable, fixed point mooring is impossible
- the measurement lacks a truly fixed frame of reference
- motion of flow sensors in turbulent oscillatory flow can introducesubstantial rectification errors -
- moorings, instruments are subjected to heavy stresses.
However, within the past 4 years, progress has been made in understanding the current
structure. One approach has been to use a string of current meters, designed for use in
oscillatory near surface flows, suspended under a surface buoy (Richman & de Szoeke,1987). At lOS the technique of mooring an upward-looking acoustic doppler current profiler
(adcp) just beneath the wave zone has been investigated - together with a downward looking
adcp mounted in a surface following buoy. This has been supplemented with measurementsmade from a waveslope following buoy beneath which is rigidly attached an electromagnetic
sensor (see Current Measurement section). Wave tank measurements and theory haveshown that such systems include in the measurement the value of the Stokes drift at the
surface, but with an error dependent on the physical dimensions of the buoy relative to the
wave length.
In the case of the adcp, this will in principle provide an approximation to a fixed Eulerian frame
for the upward-looking measurement; and a pseudo Lagrangian frame for downwardmeasurement - because over a wave cycle the buoy tends to follow the local water mass.
-17-

The present state of knowledge can be summarized as:
- measured surface currents are generally -3% of wind speed
- logarithmic current profiles have been observed on a number of occasions
- slab-like flow has also been observed, any shear present being related to density
(temperature) gradient
- relatively large current shears measured in the uppermost 2-3 metres are probably
associated with Stokes drift currents
- fully conclusive evidence relating to a range of ocean conditions does not yet exist.
-18-

CURRENT MEASUREMENT
Measurement techniques may be described as either Eulerian - measurement at a fixed point
- or Lagrangian, in which a parcel of water is tagged in some way and its path is followed with time.
Choice of technique depends largely on the use to which data are to be put. For example,
assessment of loading on structures calls ideally for Eulerian measurement, but Lagrangianmeasurements may be more appropriate for pollutant dispersal studies. The two techniques are
essentially complementary. Caution is needed in attempting to interrelate them.
Eulerlan methods have traditionally relied upon current meters attached to a verticalmooring supported by subsurface buoyancy (fig. 8(a)). In shallow continental shelf waters a surface
marker buoy may often be used (fig. 8(b)). In the deep ocean the subsurface buoyancy is usually
maintained below the wave zone so as to reduce mooring motion, which can produce instrument
errors. Reliance is placed upon an acoustic command release system to effect recovery of the
mooring. The mooring line is usually 6 or 8 mm dia. galvanised steel wire although synthetic fibres areoften used. Buoyancy is supplied by steel or glass spheres. Mooring durations of two years are now
not unusual.
Current meters have evolved steadily in the past two decades. Many mechanical current
meters use a rotor to measure current magnitude and a vane/compass combination to determine
direction. Digital sampling is used and data are stored on magnetic tape or in solid state memory. Insituations in which substantial oscillatory flow will be encountered - e.g. in the wave zone - it is highly
desirable that independent linear sensors are used to measure two mutually orthogonal components
of the flow. A true vector averaged flow can then be formed by rotational transformation of each pair ofsamples into North-South axes before summing, i.e. if instantaneous samples Xi, Yi are taken with theX axis inclined at angle 0i to North, then the vector averaged flow icomponents are given by:
n nY=1• (Xi cos 0,+ Yi sin0 i ) ; • = 1 (-x0 sin 0i + Yi cos 0)i0 i=1 =
The averaged magnitude and direction are:
V= (E2+N 112 0= -tan -1 (E1N).
The frequency of sampling f. should follow the Nyquist criterion, i.e. that fs Ž 2 x the highest
frequency of interest. Typically samples might be taken at 2 Hz and averaged over 2 minutes.
Examples of mechanical current meters are shown in fig. 8(c).
-19-

13m dia sphere
1. 13nvn chain CageSW •
30 6mm jkl.wire
ACM
rmegral Ont>oqoeal799m 6mrm jk. wire RPade r AtoOr Vane
ACM
2135m k222 Keolar poly jkt.Sw
1OKhz transpondere • "7-3 ACM s..
Aanderaa RCM 7
1703m K222 Kevlar Doly ikt.
.ACM
973m 8mm Polyester 16 Plait Soocotus - -
W ACM92m lOvn Polyester 16 plaitACMVACM
0 Command release VMCM7m 10mm polyester 16 Plait Fig. 8(c)600kg. Scrap Chain•
Fig. 8(a)0.CRIIINIO a•nONc
in, 13mm chain CO,' CMIIlSw.
0o' lIlaG
ACM
I-.1 i.lC,.o oD
hAD.
SSw
S w B r u c e . CeI
ChC11-01 1
-20- Fig. 9Fig. 8(b)

Electromagnetic current meters apply a magnetic field to the moving seawater and, usingorthogonal electrode pairs, sense the voltages induced by the flow (Faraday eff ect). An alternatingfield is used in order to eliminate electrochemical eff ects at the electrode surfaces. The linearity of theinstrument is very dependent upon the form of the structure close to the electrodes. Two alternativeapproaches to sensor design are the spherical Inter~cean $4 sensor - which has a ridged surface soas to help maintain boundary layer attachment around the body and so provide a linear response - andthe open form of construction favoured by lOS (shown in fig. 9 together with a discus form). Equallyimportant in terms of hydrodynamics is the response to off-axis flow, particularly when this is oscillatory(so called vertical cosine response).
Acoustic current meters usually measure the travel time or phase or frequency differencebetween a pair of transducers. This can be simply shown to be linearly dependent on the componentof fluid velocity along the common axis.
Both acoustic and electromagnetic sensors are easily provided with flexible vector averagingsampling and offer the advantage of having no moving parts.
Development in microprocessor and data storage technology within the past decade hasundoubtedly stimulated the development of acoustic doppler sonar (fig. 10). This allows greatlyincreased data collection, non-invasive measurement and, in shelf waters, permits seabed mooring,thus reducing vulnerability. The instrument measures the doppler shift of sound backscattered fromindividual pulses by particulate mailer in the water. Range gating of the returned signal permits theflow component resolved along the beam to be measured in a series of range cells, cell depth, AR,and current resolution, Au, being related approximately by AR .Au = c2 f being the transmission
frequency and 6 the angle made by the beam with the vertical.
Measurement ranges extend from metres to several hundred metres, depending on thetransmission frequency used. Shipboard doppler sonars have become a major survey tool within the
* past 5 years and will play a large part in large scale data gathering programmes such as the WorldOcean Circulation Experiment. Current technological research in this technique aims to improveperformance by applying coherent processing to muhtiple pulse transmissions, using coding to avoidambiguity.
Acoustic tomography has received much attention in the past decade but has yet to fulfilits full potential. Accurately timed acoustic transmissions (to within ±1 millisec) are made between Mtransceivers, hundreds of km apart, moored in an array, thus generating M(M - 1) sound paths. Use ofpseudo randomly coded long pulses at low frequency are used to aid detectability over long ranges.Application of inverse methods permits computation of the temperature structure from the
-21-

0:O'
Fig. 10
16i-
OFi
322
-40
DOPPL-ER FREQUENCY (HZ)
-2-

measurements of sound velocity - and hence density structure can be inferred, providing estimates of
geostrophic current.
More direct measurements can be made using two-way travel time differences. The
technique is currently being applied by lOS, for example, to measure the mean flow through the Faroe
Bank Channel, which represents a major source of Arctic Water for the Atlantic.
The interaction of radio/microwave electromagnetic radiation with the sea surface providesnew remote methods for measuring surface currents. The spectrum of backscattered radiation shows
* "(fig. 11) two strong first order peaks caused by Bragg scattering from surface waves of half the radio
wavelength. In conditions of zero current, the spectral lines are symmetrically disposed about zero,
corresponding to the phase velocity of advancing and receding waves. The presence of an
underlying surface current produces an asymmetrical distribution which can be measured, thus
yielding the current component resolved along the beam. Two independent beams provide anestimate of the surface current vector. HF radio frequencies (15-30 MHz) are well matched to the
surface wave spectrum and using the groundwave mode can be used to map surface currents to
ranges of typically many tens of km from a coast (fig. 12) with a spatial resolution of -1 km and current
resolution of -1 cm/sec. Use of VHF (-50 MHz) can provide higher spatial resolutions needed for
example in defining flow regimes in estuaries and around sandbanks and small islands. Microwave
systems (MIROS) make use of backscatter from centimetric capillary waves and are particularly well
suited to measurement from platforms and towers. A number have been installed on oil rigs in the
North Sea.
Lagranglan techniques have long been used in the form of drift bottles, and cards for
obtaining essentially statistical information about large scale flows, but usefulness of Lagrangian
techniques has been greatly increased in recent years by developments in tracking systems.
Large scale, slow flows at depth in the ocean can be measured by floats whose
* " compressibility and ballasting is so adjusted as to provide neutral buoyancy at a predetermined (within
±40 m) depth. Coded pulses, transmitted in the deep sound channel, are received by moored
listening stations over ranges of 0[103 km]. Long baseline acoustic position fixing has also been used
for surface and midwater floats over ranges of tens of kilometres.
Surface drifters can be tracked on one of several radio location systems, e.g. retransmission
of signals received from standard LORAN or DECCA hyperbolic navigation systems. In some cases
positions can be resolved to within a few metres and updates can be made continuously. For
measurement over larger scales, the ARGOS system based on polar orbiting NOAA satellites has
provided a major new tool for worldwide measurement. Position resolution is 0[100 metres]; 2-3 fixes
- 23 -

per day are possible at the equator, up to about 8/day at temperate latitudes, increasing totheoretically 27 at the poles. Drifting buoy networks equipped with ARGOS transmitters have beenused in several large scale oceanographic/meteorological experiments (e.g. First GARP GlobalExperiment (FGGE); Tropical Ocean Global Atmosphere (TOGA)) for both data collection (256bits/transmission) and position location). Future systems will undoubtedly exploit the potential of theGlobal Positioning System (GPS), which potentially provides high position resolution and near-continuous updating.
................. ::t
. . . . . . . . . . . . . . .. 11:i::.
...............~~..........
n~u :3, ...... ............ .....
..................D ::t:,::..::.......:::8:....... .....
. . . . . . . . . . ::.:.......................4
.............
,~~~~..... .........'A-~.-- ~ ..............
... ... .. . ... ...
Yerf r Current 100 ce/s-
C.. ..........
450 45 0 0
Fig. 12
- 24 -

TIDES
Tides may be defined as periodic water movements - manifest in both currents and sea levelchanges -which are directly related to some periodic geophysical force. The predominant forcing functionarises from the regular movement of moon-earth and earth-sun systems.
In terms of change in level, L,
L(t) = 7o(t) + T(t) + S(t)
0 ,where Zo(t) is mean sea level which changes only slowly with time
T(t) change due to tides
S(t) is change caused by meteorological forcing (surge).
The effective tide generating potential at the Earth's surface caused by, say, the Moon
1 a2RP =•Grn1r-•3(3 cosO- 1)
where mm is the mass of the moon
G is the universal gravitational constant
and a, R, and 0 are as defined in the diagram (fig. 13(a)).Tide generating forces - given by the gradient of the potential, VP - are small compared with Earth'sgravity. Their distribution is as shown in fig. 13(b).
0 Earth
--
Moon
Fig. 13(a) c
luna ttracon Cacenfrdl 1...MOON
- 25-

Once this has been related to suitable astronomical variables (e.g. declination of the moon,latitude of P .... etc.) it can be used to calculate the Equilibrium Tide i.e. water elevation which wouldexist if the Earth were covered in water and response to changes were instantaneous. This concept ofstatic equilibrium is useful as a reference for amplitudes and phases of predicted tides - and because itgives an indication of important constituents for inclusion in a tidal prediction model. But it does notprovide an accurate description of the dynamic response of the oceans to tidal forcing.
A similar equilibrium tide can be defined for the sun, solar tidal force being -0.46 weaker than thelunar forces.
Simple circular orbits of Earth and Moon and orbits totally in Earth's equatorial plane wouldproduce a simple semi diumal tidal behaviour in which the periodicity of the lunar tide is 12 hr 25 min andthe solar component 12 hrs; the beat frequency between these causing the spring : neap cycle. In
practice the inclinations of the orbits, the variations in distance and angular speeds provide a spectrum ofharmonics. Expansion of the Equilibrium Tide into a series of harmonic terms produces a number of
groups of spectral lines at diurnal and semidiurnal frequencies (fig. 14).
DIURNAL"1, K
0," M, 0' 0,
A0r.4-
cpd
SEMIDIURNAL0, M,
SI
-z.4N,
.3
cpd
Fig. 14
-26-

Analysis
The method generally used for tidal prediction is harmonic analysis, which treats tides as the sum
of a finite number of harmonic constituents whose angular frequencies and phases are derived directly
from astronomical forcing. Observational data are fitted using a function of the form:
Ni.e. q (t)=Zo + XHn COS (ant - gn)
although allowance is made in the amplitude and phase terms for certain long period modulations). The
0time/phase reference is by convention taken as the Greenwich Meridian.
Schematically
[Observations] =[Equilibrium Tide][Hn.0n]
and matrix inversion, applying least squares fitting techniques enable amplitudes and phases of
constituents to be evaluated.
Some of the larger tidal constituents are shown in the table below for the Equilibrium Tide,relative to M2.
Table 3
Diurnal
Constituent Relative Amplitude Frequency (cpd)
01 0.0794 0.893201 0.4151 0.9295P, 0.1932 0.9973K, 0.5838 1.0027
O Semldlurnal• " M2 1.000 1.9322
N2 0.1915 1.8960S2 0.4652 2.0000K2 0.1266 2.0055
K1 includes both lunar and solar contributions.
K1, 01 arises from the inclination of the lunar orbit (declination)(1 cycle/lunar day ±1 cycle per month).
K, , P1 from the solar declination (1 cycle/solar day ±1 cycle per year).
0, arises from changing lunar distance.
M2 , S2 are the principal lunar and solar semidiumal tides.
N2 , K2 result from changing lunar distance and lunar/solar declination, respectively.
- 27 -

Selection of constituents for an analysis depends greatly upon the length of time series of data
available. This determines whether closely spaced constituents can be resolved. The usual criterion
adopted is that the resolution of two constituents separated in frequency by Atl requires 1/Af, e.g.resolution of M2 and S2 requires -15 days. Sometimes it is possible, also, to use a relationship between
two constituents which is already known from a local reference station or from the Equilibrium Tide in order
to achieve resolution.
Shallow Water Tides
Direct astronomical forcing is relatively unimportant for continental shelf waters or semi-enclosed
seas, where what is observed is essentially the response of the local water mass to the oscillations of the
adjacent ocean. Bottom friction becomes important in shallow water and since this creates non linear
effects involving (amplitude) or higher power terms a substantial number of additional shallow waterharmonic constituents may be present in the tidal signal up to and beyond the sixth diurnal band.
Examples include:
Table 4
Constituent Species Origin Frequency (cpd)Msf Long term S2-M2 0.0677
MP1 Diurnal M2-P1 0.9506SO1 Diurnal S2-O1 1.0883MNS 2 Semidiurnal M2 +N2 -S2 1.8587
MO3 Third diurnal M2+0 1 2.9095
MN4 Fourth diurnal M2+N2 3.8921
0Tidal Currents
Vector current V(t) can be decomposed into East and North components U(t),V(t) such that
IV I = (U2 + v2)"2
0 = tan-' (uIV) direction relative to North
U(t) and V(t) can then be subjected to harmonic analysis.
- 28 -

- 100.100.0Sn2C/d S2/d
I '0 0
We.0 fS eS/. n*C / d 1 c'd -- no
j fuly. cyb$ ithy'F !00I ©~l$•rh
0" ,0°
0 l ae j ,o' j a0 , r.
,0 Co ` 0 cy'd ' , .,• rJ ...... 1' :,-., "1I I *'t' ' I I•I• ••A'i
adCdldd
- on
Io o,
BE'
6 North 120 North
.1.1
e Mo
SpeIis I SHocics 2
e 6 North 6 North
- 6 lost -6 ' 6 Ede,
-6 • -6
Sp••$4 Spec..$ 6
Fig. 15
-29-

For a given harmonic constituent (U,V) can be expressed as a vector. Over one cycle, the locus of the tipis an ellipse. An example of a tidal analysis of currents measured at a site off Eastern England is given infig. 15 and corresponding current ellipses for species 1, 2, 4 and 6.
Alternatively, the ellipse may be replaced by rotary current components of constant amplitude butrotating at the angular speed of the constituent in opposite directions. The relative phases are such thatreinforcement occurs along the major axis, opposition along the minor axis. Rotary decomposition is
particularly useful in current analysis when looking for inertial currents.
Residual currents
Non tidal contributions to the total current can be extracted from a record by subtracting predictedtide from the observations - or alternatively by applying a low pass or bandpass numerical filter. This. suppresses all energy at tidal frequencies whether or not it is tidally coherent.
Various types of digital filter exist (see e.g. Godin, 1972) and can be realised practically byapplying a set of multipliers X~, to the set of observations Ult) such that the filtered value UFMt is
mUFt) = X,3.U(t) + XM[U(t + m) + Ult - in)]
Measurement of tidal elevation
Tides (including surges) are measured both at coastal sites and in the open sea. Coastal gaugesare often permanent installations and consist of a stilling well connected to the sea through a narrow orificewhich acts as a low pass fihter, thereby removing wave fluctuations. The traditional mechanical system issimple and measures the displacement of a float, recording this on a moving chart. An alternative system,the bubbler gauge, passes nitrogen from a gas storage cylinder on shore through a narrow tube to anunderwater container open at the bottom. A very small excess pressure is created, Pg just sufficient to
* maintain a small gas flow. The gas pressure equates to hydrostatic and atmospheric pressure, Pa: relative
elevation, h, can be deduced from
Pg = P. + pgh.
More recent developments have used laser and acoustic methods to measure the position of the watersurface. Inverted echosounders mounted on the sea bed in shallow water have also been used.
In the open ocean tides can now be measured over periods of two years or more using deep seapressure recording capsules. These are equipped with strain gauge - or quartz pressure transducerswhich exhibit drift rates, typically equivalent to 50 cm in 4000 metres depth over a period of 3 months.
- 30 -

WAVES
Basic considerations
We consider two dimensional motion with respect to rectangular axes as shown and very small
amplitude waves.
0X
Fig. 16
Wave elevation; = a sin(kx - ot) (ak << 1)
Wavenumber k(= 27ravelength)
and angular frequency a(= 21t/period) are connected through the dispersion relationship
o=2 gk tanh kh.
Defining deep water by h > i, or hk > n,
phase speed in deep water C 2=
i.e. longer waves travel faster.
Phase speed in shallow water C = (a/k) - (gh) 1/2
i.e. shallow water waves are non-dispersive and travel at a speed governed by the depth.
-31 -

Table 5 shows the horizontal and vertical velocity components for deep and shallow water.
Table 5
Deep water Shallow water
Horizontal velocity U a& sin(kx - ot).e -kz aa .kh sn(kx - at)
Vertical velocity V ac cos(kx - ot).e -kz aca(1 + g) cos (kx - at)
In deep water the particle paths are circles* whose radii decrease exponentially with depth. Inshallow water the paths are ellipses, becoming rectilinear approaching the sea bed.
* Spectral representation of sea waves
If the height of the sea surface ; is measured as a function of time, t, the resulting time series
of observations can be modelled as the linear superposition of an infinite number of small amplitude
sinusoids.
;(t) = • Cn cos(2i fnt + O0)no1
where frequencies fn are densely distributed in the interval (0,c) and phases On are randomlydistributed between 0 and 2n. The amplitudes Cn are such that in interval df
f+df
02C = S(f) df.
fn=f
*S(f) is the energy spectrum of ;(t), which is the frequency domain description of a linear, random
process. [More generally the directional wave spectrum is defined as
f+Af
e+Ae
E(fO) fA G =O X C5 2
* Not strictly true if Stokes' Drift (-a 2ake-2kz) is considered.
- 32 -

In many practical applications the significant wave height is used, defined by
hs= 4. (S(f) dfJ1 and is close to the mean of the one-third highest waves in a narrow0
spectrum.
Wave Measurement
Techniques can be broadly classified as sub-surface, surface and above surface.
Surface measurements may be used from a fixed platform: wave staffs provide a variableresistance or capacitance directly proportional to the depth of immersion.
In deep water measuring systems which sense vertical acceleration are used. From linear.theory
S(t) = 47 212 (t)
An example is the widely used Waverider buoy, in which an accelerometer is mounted on a lightsuspended disc which is arranged to be nearly neutrally buoyant in a spherical fluid filled housing.The mounting arrangement thus forms a stable platform at wave frequencies. The Waverider buoy ismoored using a compliant tether. It telemeters the acceleration signal ashore by radio. The morerecently developed Wavec buoy adopts similar techniques and measured pitch and roll, also. Theshlpborne wave recorder measures vertical acceleration and pressure fluctuations due to wavesat a point below the surface on a ship's hull. Pressure fluctuations measured by transducers on thesea bed can be related to elevation. Stereophotography is currently being used as a research tool.
A complete description of surface waves requires measurement of E(f,O). In shallow water,arrays of pressure transducers or wave staffs can be used in principle. But the usual technique is touse a wave slope following buoy, measuring vertical acceleration and two components of slope. Byconsidering the cross-spectra between vertical acceleration and wave slopes it is possible todetermine the Fourier coefficients of the directional spectrum up to order 2. The directional resolutionachieved is poor, though some improvement has been achieved using a cloverleaf buoy, whichenables estimates of wave surface slope to be made to higher order.
A currently very active area of research is the measurement of directional spectra usingbackscattered h.f. radio waves (e.g. Wyatt, 1991). The relationship between the doppler spectrum ofthe backscattered signal and the ocean wave directional spectrum can be expressed as a non linearintegral equation. An iterative inversion technique, starting with an assumed energy spectral form(Pierson-Moskowitz) - see below - and directional distribution is applied and repeated until thedifference between measured and computed spectra becomes sufficiently small.
- 33 -

Measurement and Analysis Methodologies
The typical useful sampling scheme in wave measurement is 2048 or 4096 samples of waveheight at intervals of 0.5 seconds, the measurement sequence being repeated at 3 hour intervals.
Sampling rate is high enough to avoid 'aliasing',
i.e. f, = -> 2fx (where fma is highest frequency of interest)
The length of record (T) determines the frequency separation Af of successive spectral estimates
(i.e. resolution). Also the standard error of the spectral estimate = It is therefore
advantageous for the wave record to be as long as possible, but a balance is necessary between this
and statistical stationarity.
The spectrum is computed using standard Fourier analysis techniques. Sometimes the
record is multiplied by a tapering function (e.g. ½ (1 - cos where i is the ith sample point in N
total) which reduces leakage (in which variance associated with a particular frequency leaks into a band
of harmonics in the Fourier series).
oo
The nth moment of the resulting frequency spectrum is defined as mn = JS(f)fndf.0
(For most engineering purposes this can be replaced by
kmn' = YSi fin Af over a frequency band of approximately 0.05 - 0.5 Hz).
Several wave parameters of interest can then be calculated from the moments e.g.:
Significant waveheight H, = 4"•--
Mean zero crossing period T, =
- 34 -

Spectral Forms
Parameterized representations of wave spectra are often used in engineering calculations. Anumber of spectral forms are available for use, of which the most common is the Pierson-Moskowitzspectrum for fully developed seas:
S(f) = ipm g2(2)t4 f-5 exp [-B(fo/f) 4]
where a.m = 0.0081 (equilibrium range constant)
o = 0.74
fo = 9/2n U
U = mean wind speed measured at 10 m height
Significant wave height H, = 0.0213 U2.
Fig. 17 shows the form of the spectra for 3 wind speeds. A more recent form, the JONSWAPspectrum - derived from a major study in the North Sea - is more appropriate for fetch limited situationssuch as close to coastal boundaries and in storms in the open ocean.
S(f) = ag2 (27)-4 Us exp {-5 2 + loge(y). exp( (f- f- -J
where a= aaforf< f
a= 0 b for f> fm
f, is the frequency of the spectral peak,y, G, ,crb describe the shape of the spectrum with ydefined as the ratio of the maximum of the
energy spectrum to the max. of the corresponding P-M spectrum with the same values of a and fm.The scale parameters a, fm were found to follow power laws of the form
0 a = 0.076 8-.22
Ufm = 3.5 5-03g
where 8 is the normalized fetch gx/u2 (x = fetch; U = wind speed).
At small fetches a is several times larger than for the Pierson-Moskowitz spectrum. y, 0a and
o were found to be relatively independent of fetch and average values were
7 = 3.3
o, = 0.07
Cb = 0.09
-35 -

30-
10 r/s12-5 r/s
------------------------------ 15 rn/s
CID'
10 d
0--
aSe
0 IFig. 18
I-36

Spectral forms very similar to those measured in JONSWAP have been observed for highwave conditions in the North Sea. Wave spectra measured in storms in the North Atlantic have alsocorresponded closely to a JONSWAP spectrum, due to generating winds being of finite extent.
The directional spectrum E(t, 0) is conveniently expressed as the product of the one
dimensional spectrum S(f) and a normalized directional distribution, G(8), about a mean direction, such
that:
-nE(f,e) = S(f)G(e) where JfG(e)de = 1
The simplest form for G(0), sometimes used, is
G(O) = (2/1 ) cos 26 for lel • •'2 and 0 otherwise.
Another form is G(0) = N coss ( 1) IO< r,
where N is a normalizing factor.
(This form can also be used to describe the directional distribution of swell waves, the
direction of which, however, will generally differ from the wind direction).
The parameter s is known to vary with frequency, having large values (small spread) at the
peak of the spectrum and small values (large spread) at high frequencies.
Various parameterizations for s have been proposed as a function of wind speed and fetch -
this remains an important subject for research.
Wave prediction and modelling represents an active area of research, particularly inview of the forthcoming availability of global satellite data sets. A third generation model has been
developed by the WAM Group (Hasselmann et al., 1988) and implemented on a 30 lat.-long. grid(global) with regional versions at higher spatial resolutions. Comparisons made thus far have been
encouraging.
Satellite Remote Sensing
Satellites now provide powerful new tools for global measurement in physical oceanographyespecially for wave related parameters. The first major step in satellite oceanography was taken with thelaunch of the short lived SEASAT in 1978. Instruments now important in surface oceanography are:
- 37 -

Multlbeam Scatterometer measures the backscatter coefficient at typically 15 GHz over a
range of incidence angles. Wind speed ±2 rn/s and direction ±100 (SEASAT) were inferred
from the angular variation in surface roughness.
Microwave Radiometer measures sea surface temperature.
Synthetic Aperture Radar provides high resolution (e.g. 25 m) imagery of the sea
surface by coherently summing echoes received from a target over a period of time, with a
view to deriving directional energy spectra.
Altimeter The altimeter measures the distance from its orbit to the sea surface, but the
requirement is for a measurement of the sea surface relative to the geoid (fig. 18) (i.e.
equipotential surface which the sea surface would assume if there were no disturbing forces).Accurate knowledge of the geoid is therefore necessary; also the height of the orbit above
the reference ellipsoid. In practice satellite position can be tracked, and long wavelength
undulations of the geoid can be determined from long period changes in satellite orbits, but
short wavelength undulations are more difficult to determine. Although absolute
measurement has associated difficulties, changes in sea level can be monitored by repeated
measurement over the same track. Altimetry thus has application to tide and surge
measurement, and will also enable currents to be inferred from sea surface slopes. Long term
trends in sea level change, however, call for measurement of datum stability to 0.01 m over
decades -well beyond present capabilities.
Ahtimetry also allows measurement of wave heights. The backscattered signal received at the. satellite has a sharply defined leading edge if the sea surface is smooth. The effect of waves,
however, is to extend the rise time, and from this significant wave height can be inferred.
Comparisons of satellite data with established instruments represent a vital part of data validation,
*requiring substantial effort. In the case of GEOSAT altimeter data, for example, comparison with buoy
measurements have recently produced the result:
H, (tuoy) = 1.13 Hs (a.t)
The reasons for the discrepancy are as yet unknown.
Satellite altimetry thus represents an important new development in permitting global wave
climate to be studied and any long term trends to be identified. Significant developments can be
expected in this field - and in satellite measurements generally - in the next few years, stimulated by
the launch of ERS-1 in July 1991.
- 38 -

PHYSICAL OCEANOGRAPHY AND CLIMATE CHANGE
The oceans play a major part in regulating global climate and much of the thrust of presentresearch - increasingly interdisciplinary in nature - is directed towards a better understanding of themechanisms involved.
The present balance between atmosphere and ocean is maintained by ocean circulationcontrolling the heat supply; and by ocean biology managing the carbon dioxide concentration in theatmosphere. The processes involved are strongly coupled. Uptake of 002 is associated with
* biological productivity in the upper regions of the ocean, especially in temperature and polar regions.This in turn is limited to the physical processes that determine the structure of the upper ocean - andto the large scale circulation patterns.
As yet, only a broad outline of many of the relevant physical and biological processes isknown. Two large international programmes which seek to quantify relationships are the Joint GlobalOcean Flux Study (JGOFS), the goals of which are to understand the processes controlling the time-varying fluxes of carbon on a global scale; then to develop a capability to predict the response ofoceanic biogeochemnical processes to future man-induced climate perturbations.
The second programme presently involving 43 countries is the World Ocean CirculationExperiment (WOCE), itself a component of the World Climate Research Programme. WOCE willextend throughout the 1990s and will locus on the prediction of ocean circulation on a scale ofdecades. Running in parallel with theoretical work and the development of numerical models arethree core projects. The first is the collection of a comprehensive data set relating to global circulation,formation and modification of water masses and ocean variability. Essentially this will represent a
' snapshot' of the physical properties of the oceans. The second is concerned with a study of the dlata-sparse Southern Ocean, important in terms of the processes in which heat is transported fromequatorial to polar regions and released to the atmosphere in the cooling and sinking of surface
* waters. The third project seeks to quantify the physical processes critically important in modellingcirculation - for example the processes governing downward mixing from surface waters into the bodyof the ocean.
Future development of large scale predictive models will require provision of global data setson a seasonal basis for initialization and validation purposes. the need for a Global Ocean ObservingSystem - which could provide an international framework - has already been acknowledged and thefirst steps have been taken towards its implementation.
- 39 -

In terms of observational coverage the sea surface is being increasingly well served by
satellite techniques. Mapping the three dimensional structure of the ocean interior in the context of
an operational Global Ocean Observing System is, however, a vast undertaking demanding
application of a range of new measurement techniques. In addition to the development of techniques
such as acoustic tomography, use will have to be made of robotic systems - and indeed development
of these has already begun: examples include the SLOCUM float which will drift through the world's
oceans, making measurements between midwater and the ocean surface, powered by a novel heat
engine which uses as its energy source the temperature difference between the two levels. In the UK
the development of unmanned autonomous underwater vehicles is taking place within the Autosub* Project. The ultimate goal of this project is to produce a fully autonomous vehicle capable of making
measurements of temperature, conductivity and chemicaL/biological parameters along a transoceanic
section, with periodic surfading in order to receive navigational fixes (Global Positioning System) and
to telemeter data ashore via satellite links. Over the next decade the development of these and other
advanced measurement systems presents a major challenge for the marine technologist.
040

References
Godin, G., 1972 The Analysis of Tides. Liverpool University Press.
Gordon, R.L., 1982 Coastal ocean current response to storm winds.
Journal of Geophysical Research, 87, C3, 1939-1951.
Griffiths, G., 1989 Estimates of eddy diffusion in the upper ocean based on backscatter strengthmeasurements of an acoustic doppler current profiler. Ch. 18 in Advances in water modelling
and measurement, British Hydraulics Research Association, 401 pp (Palmer, M.H., Ed.).
Cranfield, UK.New, A.L., 1990 Evidence for internal tidal mixing near the shelf break in the Bay of Biscay.
Deep-Sea Research, 37, 12, 1783-1803.
Richman, J.G. and de Szoeke, R.A., 1987 Measurements of near-surface shear in the ocean.
Journal of Geophysical Research, 92, C2, 2851-2858.
Smith, J., Pinkel, R. and Weller, R.A., 1987 Velocity structure in the mixed layer during MILDEX.
Journal of Physical Oceanography, 17(4), 425-439.
Thorpe, S.A., 1988 The horizontal structure and distribution of bubble clouds.
Sea Surface Sound, pp. 173-183 (Kerman, B.R., Ed.).
Kluwer Academic Publishers.
UNESCO, 1981 Tenth report of the joint panel on oceanographic tables and standards.
UNESCO Technical Papers in Marine Science, No. 36, UNESCO, Pads.The WAMDI Group - Hasselmann, K. et al., 1988 The WAM Model - A third generation ocean wave
prediction model.
J. Physical Oceanography, 18, 12, 1775-1810.
Wyatt, L.R., 1991 High frequency radar measurements of the ocean wave directional spectrum.
IEEE J. of Oceanic Engineering, 16(1), 163-169.
General References
O Bowden, K.F., 1983 Physical Oceanography of Coastal Waters.
Ellis Horwood (Wiley), Chichester, U.K.
Collar, P.G., 1991 A review of observational techniques and instruments for the measurement of
currents in the open sea. IOSDL Report (in press).
Ewing, J.A., 1990 Wind, wave and current data for the design of ships and offshore structures.
Marine Structures, 3, 421-459.
Geemaerl, G.L. and Plant, W.J. (Eds.), 1990 Surface Waves and Fluxes, Vol. I.
Kluwer Academic Publishers.
Le Mdhaut4, B. and Hanes, D.M. (Eds.), 1990 The Sea, Vol. 9, Pts. A and B: Ocean Engineering
Science. Wiley.
-41-

Pond, S. and Pickard, G.L., 1983 Introductory Dynamical Oceanography (2nd Ed.).
Pergamon Press.
Pugh, D.T., 1987 Tides, Surges and Mean Sea-Level.
John Wiley & Sons.
- 42 -

0 4
S
0
SS
0
SS
0
S0

O SUBSEA ENVIRONMENT
CHARACTERISTICS OF THE SEABED
by Romke Bijker
15th WEGEMT
UNDERWATER TECHNOLOGY
* October 14-18, 1991
Espoo - Finland delft hydraulics

* CONTENT* objective and limitation" the seabed* object/seabed interaction" prediction of seabed changes" conclusions and recommendations
delft hydraulics

CHARACTERISTICS OF THE SEABED
Romke Bijker DELFT HYDRAULICS The Netherlands
Manager Offshore Section Emmeloord
1. OBJECTIVE AND LIMITATION
The objective of the presentation is to demonstrate the importance ofconsidering the seabed as a transition between "sea" and "bed", rather
then considering it as solid or static.
Many underwater activities are taking place near or on the seabottom.
It is therefor quite relevant for persons working in the field of under-water technology to understand and appreciate the typical characteristics
of the seabed.
The presentation will focus on the characteristics of the seabed withrespect to underwater technology in relation with the following objects or
subjects and problems:
" subsea installations,
a submarine pipelines,
" submarine parts of jackets and platforms,
* anchor technology,
* aggregate mining,
*dredging,
etcetera.
The main items to be considered are stability and scouring/backfil-
ling. These aspects may be relevant during all phases of a project:
* installation,
* operation,
* maintenance and repair,
* removal.

As the emphasis of this course is on specific aspects of underwater
technology the seabed is considered as a boundary conditions for under-
water technology.
This presentation will therefor have a general character and will notgo into much detail. The purpose is to present sufficient information to
avoid underestimating the potential hazards but also the potential benefitwhich may be the result of the interaction between underwater activities
and the seabed.
0
0
0

OBJECTIVE (1)presentation of relation between
UNDERWATER TECHNOLOGY* and
THE SEABED
delft hydraulicsr
OBJECTIVE (2)To demonstrate that SEABEDas "transition" between
"SEA"- and -"BED"is not as solid and static as itsometimes looks
delft hydraulicsym

2. THE CHARACTERISTICS OF THE SEABED

THE SEABED IS CHARACTERIZED BY:
hap ... ........s.... ... ....
.................. ......... ........................................ .. .......................... ............................. ............ ............. ....... .................... ...............% ...... .......... I ......-x.%. -I .... I ........... ...... . ............................................................ .... ........ .. . ............................. . ............... ................................. , , " %::::%::: th ::.a .' b. d,:::: t v ................................... .: ': % .. % ..%% ... % .%% ...:-, -:-e ... % ............................... %% .............................. .................................................. ........................ ................ .....
........... .... ...................... .....
.... ....... ...................................... .......... ....... %%
.................... ....... %.% % ....... %v ......
.% .............................................
........................... .........
-%....................................... ....................................................................................
..... .....
........................ ............ ........
..................... ............................... -
MAEdelft hydraulicsym
THE SEABED IS CHARACTERIZED BY:
1 d............ ..... ..... ......... ... ............................
.......................... ...........%-.%-- OG.......... . ......... ............................. I ................ ........%. % ........................... .............. ..%v ... .... ..............% V................................ .......... ......... ...... ........ ............... - % ...... ....................... .. ................... ....................% ............ ...................% ... %%
%% %:
%: .%%,.
Xv
X.: XX X N ......... ........... . ...... . %%
% ...
... ....... % . .%
.............. ... .... ......
..........
.................%
. .................. .................... ............
%% % , % , : % %
%: %%% ....................... q ........ ................................. % .......
...................... .... .
% . % ................
k WN A
delft hydraulicsym

THE SEABED IS CHARACTERIZED BY:
* Ibed conditions
...................... ............. ~.......... .................... ........................... ......... ..
........................
S. .. .. .......................... ..... ..,• ~ i i .!i~i: iii~ ii .i•ii .iiii~l~ii:~ii•! ...T O O G .......i ..i ...
............................
deift hydraulics
waterlevel.. wave...urrnt.seal codt o niin....
bedcoditon..........beadng capaciy eroclibijit
deif hydrulic

THE SEABED IS CHARACTERIZED BY:
SEABED LEVEL OR WATERDEPTH
- shallow 0 - 30 m- intermediate : 30 - 200 m- deep water > 200 m m
delft hydraulicsi
THE SEABED IS CHARACTERIZED BY:
SEABED TOPOGRAPHY
* flat" megaripples
" sand waves* pockmarks* rocky
delft hydraulicsm

SEABED CHARACTERISTICS
SANDWAVES ON THE NORTH SEA

THE SEABED IS CHARACTERIZED BY:S
* SEABED SOILS
* sands* clays* rocks* and everything in between
delft hydraulics

SEABED STABILITY
BEARING CAPACITY* soil failure
delft hydraulics m
SEABED STABILITY
BEARING CAPACITY* soil failure* liquefaction
delft hydraulicsm

SEABED STABILITY
BEARING CAPACITY* soil failure* liquefaction
ERODIBILITY
S
delft hydraulics m
SEABED STABILITY
erodible
.. ... . .. .
.................... .. I...
non - erodibledeift hydraulics

3.oBJECT/SKABED INTERACTION

OBJECT/SEABED INTERACTION
ANCHORS:e holding powere penetration depth
* * dragging behaviour
delft hydraulics=
OBJECT/SEABED INTERACTION
PIPELINES (including cables)
* * route optimizatione trenching/ploughing/dredging
* o self-lowering/self-buriale free span developmento fishing gear impact
delft hydraulics-

SCOUR DEVELOPMENT- -
................. ................... ..... .................................................... ..... ......... .................. ......................... ... ... ...... .. ....-...... ....... .............................. ............................. .... ............................-............. ............ .... .............. .......... .......................... ................I ............................ .... ....................................................... ......... ....... .. ........... --- ..... - ............ ............... .................... ............. .......................................................................... ........................ ....
........ ....... ...... ............... ....... ............ .................. ................ .... ....... ý 66....... ......... ... .............................. ....... ....... . . . .. . . .... . . .......
MAMAdelft hydraulicsym-
.......... .................... ....... ...... ............ ....................... ...... .... ....... .. ..... ............................................. . ........... ...... ......................... ........ ............... ...... ..... ... ......................................... ... .......... ....... ........... .............................................................. ............ .. ...... ..................................... ....................................................... ............ ........... ........................................... ................ ..... ............................... ....... ......... ........I .............. ......I .................................... ....... ....... ........................... ............................ .......... .................... ................... .......... . ........... ........................................... ....................... ............................................... ............................................................... .... .................................................................................... ...... ................ ................................... ..................... ...... .................................. ...................... ......... .......................... ............. .............-............. ........... ...... .................................. .............. .......................... ............................ ...................... .......................... ........................ ................. .................I ...........- - .......... .......... ................. .... ... ..................... ........... ............ .............. ... ............................. .......... ........................... ............ ............ ....... ..................- ..... ..................................... ...... ..1 1 .ý ................. ........ .......................................... ........... ............... .................... ........................ ... ......... ....................... ....... ............ ............................ ........ ............................. ......
......................... .................. ......... .......... ................ ........... ................ .............
.... ....... v X% ........... %%
.......... v .............. % ............% ......................... .......... .............
............ ......................... ........... ............... .... 4'. - - ..................... X..... ... ............. .. ....... ................................................ N ....X . ...........
X . ..... ....
....................... ....... .... % ... ........ . . . ý . ý . ý . :.:.:............................................ ............................ ............. . .............
delft hydraulicsrw

OBJECT/SEABED INTERACTION
SUBSEA STRUCTURES* subsea completion systemso equipment protection structures
(domes, open frames etc.)* for well heads, valves, manifolds
etc.
delft hydraulics=
OBJECT/SEABED INTERACTION
* PLATFORMS" scouring around platform legs
* (jacket/jack-up)" scouring around gravity based
platforms
delft hydraulics•

OBJECT/SEABED INTERACTION
0
DREDGING
o nautical dredging* aggregate mining* seabed preparation
9 Mdelft hydraulics;

4. PREDICTION OF SEABED CHANGES
: ... ... .:.:: ] : .........
ea

PREDICTION OF SEABED CHANGES:
FIELD INVESTIGATION
* "SEA" bathymetry
hydro surveys waves: height/direction
currents: velocity/direction/profilewaterlevels: tides/surges
* "BED" erodibilitysoil invetigations cone penetration tests
boringsspt's
* laboratory testsdelft hydraulics

PREDICTION OF SEABED CHANGES
PHYSICAL SCALE MODELS
* scouring and scour protectione pipeline self lowering* bearing capacity/liquefactiono calibration of numerical models
delft hydraulics a
servo cylinderopen cylindrical riser
piston 0.3 mcross
cylindrical riser section 1.10 m
_ test section
... .. ... ....
&..dolt t ... hydrau

PREDICTION OF SEABED CHANGES
NUMERICAL MODELS* 2-D and 3-D flow calculation" sediment transport* scouring prediction models
* e self lowering modele sand wave model
delft hydraulics m

NUMERICAL MODELS
2D FLOW AROUND SUBMARINE PIPELINE
in In
o x 0Xo
41,t -, 'Icu 3n
Ln inCcu
o 0
in a a0u' n rCu In cu4u
o 0
In an
o 0
an tnN N
o a 0
1 o 0tn cn
an tn
o " 0
* 0
In i n
in O o 0 =L 0 to
o 0
ow A0w

4 N
S
.3'4C.NC.
.4I4aC2
N'4
-IH4'4'I
* __ a
S
Oc~ ___
-Jo.
I' ___
20) ___

NUMERICAL MODELS
VELOCITY FIELD FROM FLOW MODEL
-- -- -.I -_:.o'_ --"-."-( ' " -- , . .
- - - jN.N{\. Y/- - - A --- ." 7--'.
.••-~~', "- . .- - - - -, j --_.. - _ - -I - ." .~I" ;;;"~- - c - d -- -- " -" -- - "
/•- • \X;• .-- .- --
-- A -% _, 0 " - "--"
- , ..Z \s-.--.-_-,.-- , -% . . N. N N ", N-
-A-/-j; >( - --.tL_.-
- --.• _ ,, /- - . . / _ _ ,- . ,-. _ _
- A / N .p
scale :3A0/veo~t~ sal: c --. / /$

PREDICTION OF SEABED CHANGES
by means of >physical (scale) numericalmodels modelsprototype
representation g... .t .rti
flexibility t soIflx - very flexible
convincing the ively easy not alay easyclient ...
cost exenive relativel he
delf t hydraulics•
delft hydraulics

5. CONCLUSIONS AND RECOMMENDATIONS
0

CONCLUSIONS & RECOMMENDATIONS
1. The seabed should in principal beconsidered dynamic
delft hydraulicsy
CONCLUSIONS & RECOMMENDATIONS
* 2. Soil investigation must fit its purpose.Attention should be given to thedetermination of erodibility.
delft hydraulics

CONCLUSIONS & RECOMMENDATIONS
3. Subsea activities should be prepared andsubsea constructions should be designedwith specific attention to the seabed.
0
0
delft hydraulicsy
CONCLUSIONS & RECOMMENDATIONS
* 4. With the right combination of field data,physical scale models and/or numerical
* models, reliable prediction of seabedchanges can be made.
delft hydraulics•

S
* 5
0
SS
S
SSS
SS

DMVNG
Dr. R. L Aitwood Cranlield Institute of Technology EnglandSenior Lecturer Cranfleld, Bedford
ABSTRACT
In underwater operations, particularly those which are concerned with construction,the diver is heavily relied upon to undertake the multitude of tasks which have to bedone underwater.
The lecture will commence with a summary of the relevant basic physics. Thephysiological implications that follow from the different environment in which he hasto work will be examined, and it will be shown how these affect the diving proceduresand routines adopted.
Air diving, permitted to a maximum depth of 50m in most civilised countries, is themost widely used and least costly mode of diving. The equipment and routinesassociated with air diving will be discussed.
Beyond 50m it is necessary for divers to use other, more costly, breathing mixtures.'Mixed gas' diving will be discussed and it will be shown how the 'saturation diving'technique has been developed in order to maximise efficiency and simultaneouslyreduce the risks to the diver.
0 The lecture will conclude with a discussion of the limitations of saturation diving.

1. INTRODUCTION
The diver is defined as a person who enters the water, submerges and experiences
the ambient pressure of that water on his body. For this reason he is often referred
to as an ambient pressure diver to distinguish him from others involved in similar
activities where this is not the case.
In the commercial world, diving is regarded as simply a means to an end and divers
will be judged in their ability to carry out a given task safely and efficiently at the work
site.
2. DIVING PHYSICS
The human body has evolved to function optimally at the earth's surface where the
atmosphere is rich in the vitally necessary oxygen. The diver must abandon these
safe surroundings and enter a totally different world consisting of a dense liquid
medium devoid of gaseous oxygen. To survive he must make alternative
arrangements for his breathing and ensure that his body is not damaged by the
higher and rapidly changing pressure that he will experience.
In order to understand the technical and physiological problems that the diver has
to face, it is necessary to consider some basic physical laws relating to matter. The
most significant physical difference between air and water as far as the diver is
concerned is that of density. This difference alone is responsible for many of the
*problems which face the diver.
2.1 Hydrostatic Pressure
At the Earth's surface the pressure of the atmosphere (1 bar) results from a column
of air some 30km high. By contrast in water, because of its much greater density,
such a pressure results from a column just 1Im high. Therefore it can be seen that

as man descends in the water, the pressure he will experience will increase rapidly
by the following relationship:
Pressure at dmetres 1 ( + d bar
2-2 Buoyanc
The density of water has another major effect upon an immersed body. Archimedes'
principle states that an object immersed in a liquid will experience an upward or
buoyant force equal to the weight of liquid it displaces. The density of the object will
determine whether At floats or sinks. A body that tends to rise to the surface and float
is said to be positively buoyant whilst one which sinks is said to be negatively
buoyant. A body which experiences a buoyant force exactly equal to its weight (out
of water) neither rises nor sinks and is said to be neutrally buoyant. In this case its
overall density must be identical to that of water.
Seawater, because of the various dissolved solids it contains, has a density greater
than that of fresh water (1 .025kgr1'). Therefore objects immersed in seawater will
experience a correspondingly greater buoyant force than when immersed in fresh
water.
The human body has an overall density very close to that of water and consequently
will experience a condition close to neutral buoyancy, although there can be a
significant difference between individuals.
2.3 The Gas Laws
Gases are subject to three inter-related factors; temperature, pressure and volume.
A change in any one of these factors will result in at least a change in one of the
other two. In diving, where gases are necessary for life support and large variations
2

in pressure are encountered, the rules which predict the behaviour of gases when
the above factors are changed, must be well understood.
2-3.1 Boyle'sLa
Boyle's Law states that the pressure and volume of a gas are inversely related.
Expressed as a formula:
PV = Constant
where P = absolute pressure, and V = volume. This law enables one to calculate
how a given volume of 1 litre of gas measured at the surface changes with depth.
It is important to note that the most pronounced volume changes occur close to the
surface.
TABLE 1 - Change in Volume of a Gas as Depth is lncreased
Depth Pressure Volume(in) (bar) (litres)
Surface 1 1.0
10 2 0.5
20 3 0.33
30 4 0.25
40 5 0.20
50 6 0.16
0 ~2.3.2 Charles'La
Charles' Law states that the amount of change in either the pressure or the volume
of a gas is directly proportional to its absolute temperature. Expressed as a formula:
3

PV =RT or P = R
where T = absolute temperature = ~O + 273and R = a universal constant for all gases.
As an example, if a gas is enclosed in a rigid container (constant V) and its absolute
temperature is doubled, then its pressure will be doubled.
2-3.3 The General Gas Law
It is usual to express both Boyle's and Charles' Law in a single relationship generally
referred to as the General Gas Law. This law enables the behaviour of a gas to be
predicted when changes are made to any or all of the factors. It is normally written:
Tl1 T2v
where the subscript1 refers to initial values
and the subscript 2 refers to final values
At this point it is perhaps worth stating the fact that liquids and solids do not obey
this law. Liquids and solids are virtually incompressible and obey different laws of
expansion with temperature.
2.3.4 Dalton's Law
Dalton's Law, often referred to as the law of partial pressures, states that the total
pressure exerted by a mixture of gases is equal to the sum of the pressures of each
of the gases making up the mixture - each gas acting as if it alone was present.
4

The pressure of each gas in the system is called its partial pressure(PIP) and the total
pressure of the system is simply the sum of the partial pressures, iLe.:
P =PPA +PPB3+ PPO ....... etc.
The partial pressure of a constituent gas in a system is simply proportional to the
number of molecules of that gas present and is obtained by multiplying the total
pressure by the % volume of that gas in the system, iLe.:
PPA 100
The atmosphere consists approximately of 79% nitrogen and 21 % oxygen by volume.
0 Its total pressure is 1 bar. Therefore the partial pressure of nitrogen is 0.79 bar and
the partial pressure of oxygen is 0.21 bar.
At a depth of 1 in, provided that the volume composition of this air is unchanged,
then the partial pressures of nitrogen and oxygen will be doubled, viz. 1.6 bar and
0.42 bar respectively.
2.4 Gases In Upuids
Whenever a gas is in contact with a liquid then a portion of its molecules will enter
into solution with the liquid. (The same is also true to a lesser extent for solids). The
0 amount of gas which dissolves will be very dependent on both the gas itself and the
liquid in question, the solvent. Apart from the nature of the gas and the solvent
liquid, both temperature and pressure are also important factors to be considered.
2.4.1 Henry'sLa
Henry's Law states that at a given temperature the amount of gas which dissolves
in a liquid will be almost directly proportional to the partial pressure of that gas.
5

In diving, the gases and the solvents - the tissues of the body - are unlikely to
undergo any significant temperature changes and thus the effect of this variable need
not be considered in detail. It is sufficient to say that the amount of gas in solution
is reduced as temperature is increased.
As molecules of gas enter a liquid, they add to a state of gas tension, a term which
identifies with, and is analogous to, the partial pressure of the gas external to the
liquid. The difference between the gas tension and the partial pressure is referred
to as the pressure gradient and its magnitude determines the rate of flow of gas into
(or out of) solution.
After a certain time, an equilibrium will be reached when the gas tension is equal to
the partial pressure and no more gas will enter the liquid. The liquid is said to be
saturated with the gas. A reduction of partial pressure will then result in gas leaving
the liquid.
2-4.2 Graham's Law
Graham's Law states that the diffusion rate of a dissolved gas is proportional to the
reciprocal of the square root of the molecular weight of the gas. It is of importance
in the selection of the inert gas used in the diver's breathing mixture. Table 2 shows
the calculated diffusion rates for various gases relative to that of nitrogen.
6

TABLE 2 - Relative Diffusion Rates of Gases Used in Diving
Gas Calculated DiffusionRate
Kr 0.58
C02 0.80
Ar 0.84
S02 0.94
N2 1.00
He 2.65
H2 3.74
7

3. OWVING PHYSIOLOGY
Diving physiology is the study of the effects on the body resulting from going to,
staying in, and returning from the alien underwater environment. It is a complex
subject and must address the following areas:* Direct effect of pressure on the body.
* Effects of gases on the body at high pressure.
* Depressurisation of the body.
3.1 Direct Effects of Pressure
The tissues of the body, being virtually incompressible liquids and solids, can
withstand extremely high pressures without any adverse effects or damage.
However, the human body contains a number of natural air spaces surrounded by
rigid walls which could tend to collapse under external pressure. These spaces are
the inner ears, the sinuses, and, of course, the lungs. To prevent damage, not least
pain when diving, it is necessary to ensure equalisation of the pressure in these
spaces with the external or ambient pressure. This should not normally be a
problem as all these spaces are naturally vented to the outside of the body.
Air spaces that are formed external to the body, for example by a face mask, are
also susceptible to collapse if not equalised in pressure. The general term describing
this tendency to collapse, whether internal or external, is squeeze. Squeeze affects
only spaces which have rigid walls. Gas pockets in the intestine, for example, are
not a problem as they are easily compressed.
3.2 Effects of Gas at Hi-gh Pressure on the Human Body
Apart from the direct physical effects that pressure has on the body, it has other
consequences of extreme importance to the diver. Gases which are normally
8

harmless and even essential to the body, become toxic when their pressures are
increased.
3.22 Nitrogen Narcosis
As the partial pressure of nitrogen in the diver's breathing gas is increased and a
greater amount of nitrogen enters into solution in his body, there comes a point at
which it has a narcotic effect comparable to that which arises from drinking alcohol.
Uke that of alcohol, the effect is complex. Firstly, ft is responsible for a personality
change where the normally careful and cautious diver becomes carefree anduninhibited. Such a condition is extremely dangerous in this situation where an error
of judgement is likely to have disastrous effects. Different individuals respond in
different ways and whilst some may be affected at depths of less than 30m, others
may reach 60m before any perceptible change in personality.
Also the ability to reason is impaired. This condition affects all divers withoutexception. It is for this reason all tasks for deep air divers must be made as simple
as possible and that they must be well briefed and supervised very closely at all
times. Discussion of the detailed mechanism by which nitrogen narcosis occurs is
beyond the scope of this lecture. It is sufficient to know that the abnormally high
tension of nitrogen affects the nerve synapses in such a way that impairs the
transmission of messages to and from the brain.
3.2-2 Oxygen Poisoning
If the partial pressure of oxygen in the breathing mixture is increased to more than
1.6 bar, then it becomes poisonous to the human body. The first symptoms of acuteoxygen poisoning are twitching of the facial muscles, dizziness, nausea, tiredness,
and breathing difficulties. If the partial pressure is high enough and exposure is long
enough then unconsciousness will occur followed by convulsions and fits. Such a
condition is obviously extremely dangerous to a diver and for that matter anyone else
9

working in his vicinity. However, the condition itself, provided no muscular or tendon
damage has occurred, is completely reversible causing no permanent neurological
injury to the diver.
Chronic oxygen poisoning is a long term effect and can occur from breathing oxygen
at partial pressures lower than those that would lead to acute oxygen poisoning (0.6
to 1.6 bar). The symptoms are soreness of the chest, coughing and discomfort as
the lungs become irritated by the oxygen.
3.3 Depressurisation of the Bod
During pressurisation (descent) the breathing gas will flow into the spaces within the
body and will also dissolve in increased quantities in the tissues of the body. At
atmospheric pressure, the body tissues contain about 1 litre of nitrogen. According
to Henry's Law, the amount of nitrogen dissolved or released will be almost directly
proportional to the change in partial pressure. Therefore at a depth of 20m (3 bar),
the dissolved nitrogen content of the body could be as high at 3 litres.
During depressurisation (ascent), the body must give up this additional gas, and it
is during this phase that a number of problems can occur. Depressurisation of the
voids within the body should be straightforward provided there are no blockages.
The consequences of such blockages in relation to the middle ear and the sinuses
0 have already been mentioned. By far the largest cavity of the body is the lung. On
ascent, the gas within the lung will expand and therefore must be exhaled in order
to prevent damage. If, for any reason, the gas is not exhaled, then the diver will
0 suffer a condition known as burst lung or pulmonary baroirauma. As the greatest
volume changes occur within the first ten metres or so of the surface, burst lung is
as much a potential hazard to the sport diver in shallow water as it is to the
professional diver.
10

The gases dissolved in the tissues of the body present an even great er potential
hazard to the diver during depressurisation, as too rapid an ascent will result in theformation of bubbies of gas within the tissues with probably dire consequences.Such a condition is prevented by adhering to strict decompression routines.
3.3.1 Decompression
Whereas during pressurisation, breathing gases can only enter the tissues of thebody through the body surfaces - alveolar surfaces and the skin - in decompression
gas may leave the body's tissues at any point by the formation of bubbles. The
formation of such bubbles must be avoided as they exert pressure on organs and
nerves resulting in decompression sickness, commonly referred to as the bends.
The object when decompressing a diver is to ensure that all the dissolved gas within
the tissues leaves the body via the same route by which it entered, i.e. usually via thelungs. Fortunately, the body can apparently hold gas in what is similar to a super-
saturated solution before bubbles appear. This permits the diver to ascentprogressively while allowing the excess gases to diffuse out of the body. Provided
that the pressure of gases in the tissues does not exceed the ambient pressure by1 bar, then the formation of sizeable and potentially dangerous bubbles is unlikely.
It is on such a premise that the various standard decompression tables are based.
* These tables have been composed to provide guidelines for controlled
decompression for a wide range of diving circumstances. There are many versions
of such tables and often the larger diving companies develop their own with a view
to minimising time spent by divers in decompression and hence cost. However,
because of the differences in individuals and the statistical nature of gas diffusion
processes, it must be stated that no table can be regarded as being infallible and
cases of bends will occur even when tables have been strictly adhered to.
11

Decompression can be speeded up by administering pure oxygen, thus decreasing
the partial pressure of nitrogen in the lungs, at low pressures.
If decompression of the body is too rapid, then gas bubbles will begin to form in the
tissues of the body. The degree of formation and their location will result in
numerous symptoms of varying severity referred to collectively as decompression
sickness or the bends. Symptoms may range from skin rash and mild discomfort,
to severe pain in the joints and muscles, causing the victim to bend his limbs
involuntarily (hence the term 'bends'). More serious symptoms are numbness in the
legs, paralysis, loss of hearing and vision, and unconsciousness. Type I Bends refer
to first set of symptoms, and Type II Bends refer to the second, more serious, set of
symptoms caused by pressure of gas bubbles on the central nervous system (Table
3). It is important for the diver with all but the most minor symptoms to seek medical
advice as soon as possible. Generally, treatment begins by immediate
recompression to the working depth, which forces all offending bubbles back into
solution and should relieve all symptoms. Decompression must then be carefully
controlled and generally follows a more conservative so called therapeutic table.
12

TABLE 3 - Symptoms of Decompression Illness
Symptom Type Name Urgency/Action Required
Slight pain in I Niggle Observe/possibly recompresslimb
Rash, Itching I Skinbend Observe/possibly recompress
Localised soft I Lymphatic Observe/possibly recompressswelling decompression
*. _sickness
Intense joint I Bend Urgentlrecompresspain
Swelling I Interstitial Observe/do not recompressunder skin emphysema
'Pins and II Spinal bend Very urgent/recompress/seekneedles' in medical attentionfeet
Excessive II Decompression Very urgent/recompress/seektiredness sickness medical attention
Unsteadiness, II Staggers/ Extremely urgent/recompress/dizziness, Cerebral bend seek medical attentionnausea
Headache, II Cerebral bend Extremely urgentlrecompress/Unconscious- seek medical attentionness, speechdefects
13

4. AIR DMING
in air diving the diver breathes natural air (21 % oxygen, 79% nitrogen by volume), but
at a total pressure equal to that of his surroundings. Because of the narcotic effect
of nitrogen at elevated partial pressures and to some degree the increasing
resistance to flow of compressed air, air diving in the UK, and in most civilised
countries, is restricted to a maximum depth of 50m. Within this range two modes of
air diving have evolved:
(i) Surface demand diving (or surface orientated) - The diver is supplied by air
compressed at the surface through a flexible hose or umbilical.
(ii) SCUBA (self-contained underwater breathing apparatus) - As its name
suggests, the diver carries his own independent air supply and requires no
physical link with the surface. Because of safety implications, SCUBA diving
finds few applications offshore and thus will not be covered in this lecture.
4.1 Surface Demand Air Di~nq - Equipmen
The basic components of a surface demand air diving system are shown in Figure
1. The compressor used must be capable of supplying clean air at a sufficient rate
which is dependent on the number of divers the system is designed to serve. The
*pressure itmust produce must be such that after making allowances for pressure
drops caused by the flow of the gas through the umbilical and its components and
that caused by the demand regulator, it is at least equal to the ambient pressure at
which the diver is working. For example, if a maximum depth of 50m is chosen then
the compressor must be capable of supplying gas to a pressure of greater than 8
bar. Such a compressor must also be backed up by a ballast tank or reservoir of
such capacity that it is capable of supplying air to the divers for a reasonable
duration in the event of compressor failure. The intake pipe of the compressor must
be positioned such that it receives uncontaminated air, e.g. not next to an engine
14

exhaust pipe. Compressors also incorporate drying stages and filters to remove
moisture and other contaminants at their intakes.
As a further safety precaution there is usually a bank of high pressure cylinders from
which air can be introduced into the system through a high pressure reducing valve.
It is usual to control all operations at the dive control panel on which the various
valves and gauges are mounted with diagrammatic indication of the interconnecting
pipework to aid safe operation. The main feature of this panel is the accurately
calibrated pressure gauge which often reads directly in units of depth.
0 The umbilical consists of the air hose, a separate hose with an open end at the diver
which is connected to the pneufathometer on the control panel, a communications
cable, a strain member (usually rope), and sometimes a hose which carries warm
water for diver heating.
The demand valve is a crucial part of the equipment and its function is to control the
pressure of breathing gas at the diver to be close to ambient pressure.
In commercial air diving operations, it is nearly always necessary to have a
decompression chamber on site (Figure 2). In such operations this can be a simple
single compartment pressure vessel with a single sealing hatch. Such a chamber
* has two uses:
(i) In emergencies if, for example, a diver suffers from the bends, it can be used
to recompress the diver to relieve the symptoms and then for carrying out
therapeutic decompression.
(ii) It can be used for the diver's normal decompression routine. On completion
of a dive or at a certain stage during decompression whilst in the water, the
diver surfaces and enters the chamber. He is then recompressed to an
15

appropriate level, after which decompression is then continued in a controlled
manner. Surface decompression, whilst reducing the time the diver is in the
water, almost certainly allows the initiation of small gas bubbles in his body.
For this reason, this technique has fallen out of favour and it is now more
common for air divers to be transported to the surface under pressure in a
closed bell which is then mated to the chamber.
0
16

5. MDCED GAS DIVMNG
When any mixture of gas other than that identical to that of naturally occurring air is
used for breathing in diving operations, the mode of diving is referred to as mixed
gas divng.
It was the problems caused by breathing air at elevated pressures that prompted
researchers to seek an alternative, more agreeable breathing gas mixture. By
replacing the nitrogen dilutant by helium it was found that the narcotic effect was
eliminated and the resultant mixture, referred to as heliox, offered a correspondingly
lower resistance to breathing. Below 50m, where the use of air is prohibited by
legislation, heliox has become the standard breathing gas in the diving industry.
Unlike air diving, where atmospheric air is simply compressed to the required
pressure after minimal processing, heliox gas mixtures are blended specifically to
meet the requirements for a given depth. In this way the oxygen content is kept
within safe working limits as the total gas pressure is increased. As the diver
requires more or less the same number of oxygen molecules per breath irrespective
of depth, i.e. partial pressure, then it is necessary to decrease the percentage of
oxygen by volume in the breathing gas mixture as depth increases. Figure 3 shows
the percentage by volume of oxygen in heliox as a function of depth.
In practice it is usual to use a slightly higher partial pressure of oxygen than the 0.21
bar of the atmosphere at the surface. Partial pressures in the range of 0.4 to 0.7 bar
are usually used dependent on whether the diver is at rest or working hard.
Having now significantly extended the depth of diving by the use of heliox, then
decompression times have also increased correspondingly. In all but the very
shortest duration dives, decompression on ascent in the water is not practical. For
this reason, this increase in depth now demands sophisticated diving equipment in
the form of closed diving bells and deck decompression chambers (DOG).
17

Because of the extended decompression times required for deeper depths, two
different modes of heliox diving have evolved; bounce diving and satumiffon divng.
5.1 Bounce Diving
The object in this mode of diving is to limit the time during which the diver
experiences the elevated pressure to a minimum, hence minimising the
decompression time required.
0 The bounce diving technique is illustrated by Figure 4. Usually two divers are
transported to the work shte in a closed diving bell at atmospheric pressure. On
reaching the work site, the bell is then pressurised with the required heliox mixture
from the surface via the diving bell's umbilical. When the pressure inside the bell
equals the ambient pressure, the hatch can be opened and a diver leaves the bell
and sets about undertaking the task in hand. Pressurisation is undertaken as rapidly
as the divers can withstand.
After a set period has passed, the diver re-enters the bell, closes the hatch and
decompression is commenced. The bell is winched to the surface and then mated
with the DOG. The divers then transfer to the DOG, its pressure now corresponding
to that of their first decompression stop. Decompression then takes place in the
normal manner. Figure 5 indicates the total decompression time as a function of
depth for both half-hour and one-hour bottom time durations.
It can be seen that this technique is not efficient in terms of bottom working time to
0 total operation time (including decompression), especially when depths exceed
150m. For this reason, bounce diving is only suitable for certain short duration
underwater tasks.
18

5.2 Saturation Diving
This mode of diving takes advantage of the fact that after a certain length of time at
a given pressure, the body's tissues will become saturated with gas. At this point no
more gas can be absorbed by the body and longer exposure to this pressure will not
further increase decompression time.
Although for the given depth the total decompression time is at a maximum, far
greater than that say for a half-hour bounce dive at the same depth, in this technique
the divers are maintained under pressure over such a period (usually 28 days) that
decompression time becomes less significant. The ability to increase the percentage
of useful diving time in this way is only possible because there is a limit to the
amount of gas that can be dissolved in the body's tissues at any given pressure, i.e.
saturation at that pressure has occurred.
As depth increases, total decompression times become lengthy (Figure 6).
Saturation diving requires heavier, more complex and more sophisticated equipment.
Unlike air diving and bounce diving, it normally requires the use of a dedicated
surface support vessel. Figure 7 shows a typical saturation diving system or
satumailon spread as they are known. Such systems vary in size and complexity, and
in the number of divers they can support at any one time. Modern systems can
0 often possess two bells and can support more than 12 men under pressure.
52-1 The Saturation Di~ng System
A typical system consists of four main parts:
(i) Diving Bell or Submersible Decompression Chamber (SDC)
The closed diving bell may be either a two or three man unit, the latter
becoming more common in recent years. It is essentially a pressure vessel,
19

generally spherical in shape and constructed from a high strength steel in
order to minimise the necessary wall thickness required. It has an inward
opening hatch at the bottom through which the divers pass into the water. It
will often possess a number of small clear viewports around its side.
The bottom hatch entry port of the bell is capable of being mated in a
pressure tight manner to the deck decompression chamber (ODOC).
Alternatively, bells will possess a side hatch to permit horizontal docking with
the ODO.
On-board breathing gas, for use usually in exceptional circumstances, is
carried in a number of cylinders external to the bell. The diving bell chamber,
because of its volume, is usually positively buoyant. It is therefore necessary
to add a ballast weight below it. The ballast weight is jettisonable to enable
a buoyant ascent in an emergency.
The typical modern diving bell carries a large amount of equipment essential
to the well being and safety of the divers. Figure 8 shows the layout of a
typical bell.
(i) Bell Handling System
Of all the major component systems, provision for bell handling and
* deployment is perhaps the most varied.
The diving bell may be launched over the side of the vessel or through a
dedicated moonpool.
To launch over the side, an extendable A-frame gantry or davit may be used
to lift the bell clear of the side of the vessel (Figure 9). The arrangement of
the DDC must be such that it allows mating of the bell to be performed with
minimum translational movement.
20

When a moonpool is available, then the diving system is almost certainly anintegral part of the vessel. A moonpool is a clear opening through the decksand hull of a vessel providing access to a comparatively sheltered area of
water.
Deployment through a moonpool was introduced in order to reduce downtime
lost because of bad weather. Usually the bell runs down through the
moonpool restrained by a vertical rail system. Where the bell is mechanicallydriven up and down these rails through the interface, it is known as an active
cursor system.
When in the water, the bell is usually restrained by a previously deployed
guidewire system. The guidewires are run from a separate winch and support
a heavy weight which is lowered to the seabed.
The dive control cabin, from which the winches are operated, is positioned
alongside the launching point.
The configuration of the bell umbilical is dependent on the design of the bell
itself and the mode of diving for which it is intended. Connecting the surface
support to the bell, the modern composite umbilical will have a diameter of upto 1Ocm. Although not normally used for lifting the bell, it should possess this
capability in an emergency. The umbilical possesses the following
components:
(a) Hoses for the supply, and often return, of breathing gas to the bell.
(b) Communications lines - voice and instrumentation.
(c) Pneumofathometer hose for the accurate measurement of pressure
(and hence depth) of the bell/divers.
21

(d) Hot water hose for the heating of divers and their breathing gas.
(e) Power cable to supply bell lighting, instrumentation, and carbon dioxidescrubber.
(iii) The Deck Compression Chamber (DDC)The deck decompression chamber (DDC) is a multi compartment pressurevessel mounted on the surface support platform. Generally constructed fromsteel, compartments tend to be cylindrical with hemispherical ends in shape.Systems are often modular in construction to simplify their transportation andprovide for system flexibility.
The modern ODO may consist of up to five or more interconnecting chambersdepending on the number of occupants ft is designed to house. Onechamber, referred to as the entrance lock or transfer chamber is designed toreceive the bell's mating flange. It is often used to store wet clothing and kit.
(iv) Life Support System
To provide a safe and as comfortable as possible environment for the diversinside the DODC, a number of properties of the atmosphere must be carefullymonitored and controlled. The systems required for this are located externalto the DDC, either mounted directly on its outside to minimise piping, or in a
0 separate module. The chamber operator or life support technician isresponsible for the operation of this equipment and therefore the safety of thedivers. The following conditions must be closely monitored and controlled:
(a) Gas pressure and composition.
(b) Temperature.
(c) Humidity.
(d) Sanitation.
22

5.3 Saturation Oivna - Procedure
At the beginning of a saturation operation, divers enter the DDC. The system is then
pressurised in a slow and controlled manner, especially when Working at depths in
excess of 200m. In this way the effects of HNPS are minimised (see section 5.4) and
the diver has chance to become assimilated with the hew conditions.
When working pressure has been attained and the divers are comfortable, two or
often nowadays three divers transfer under pressure to the bell. Hatches are closed
and the bell is physically separated from the DOC. Breathing gas is pumped to the
bell through its umbilical. The bell is winched down to the work site at which point
its internal pressure is equal to the ambient pressure and its inward opening hatch
can be opened. One diver stays in the bell to tend umbilicals and monitor various
instrumentation for the working diver or divers outside the bell. The time between
which the bell leaves and returns to the surface, the bell run, can last up to eight
hours. Divers spend up to four hours working in the water at any one time.
When the bell is winched to the surface it is mated to the DDC and the divers transfer
from the bell to what becomes their temporary living accommodation in which they
are maintained at a constant pressure.
In this way, the team of two or three divers will make a dive perhaps once each day
with 16 hours rest time between dives. During this time the other divers under
saturation will be utilised ensuring that work continues almost uninterrupted for 24
hours per day.
At the end of the working period the divers are then decompressed, a process for
deep dives which will take several days to complete. The total time, from initial
pressurisation to the end of decompression, is normally restricted to 28 days. Even
though decompression times are so lengthy, it can be seen that the saturation diving
technique has a great advantage in terms of efficiency over bounce diving.
23

Divers in a saturation complex require much in terms of surface support. The
composition of their gas supply must be constantly monitored and kept within strict
limits. The humidity and temperature of their living quarters must also be carefully
controlled in order to maintain a reasonable degree of comfort and prevent infection
or injury. Meals and drinks, the taste of which cannot properly be appreciated in
hyperbaric conditions, must be prepared and passed into the DDC through special
purpose 'locks' in the system. Facilities for showering and toilets must also be
provided. This support requires a team of highly qualified dedicated personnel to be
* ever present.
Because pressurisation and depressurisation take place in a very carefully controlled
manner, the saturation diver is less likely to suffer any of the adverse pressure related
effects than the air diver or bounce diver. Saturation diving in the North Sea today
enjoys a very good safety record which surpasses those of many of the other so-
called dangerous occupations.
5.4 Umitations of Heliox DiVina
The extension in diving depth by the saturation technique has, however, not been
without penalty and a number of new problems have arisen:
(i) High Pressure Nervous Syndrome (HPNS)
High pressure nervous syndrome is a condition which begins to affect divers
on reaching a depth of about 200m. Symptoms include tremors of the hands,
involuntary jerky movements of the limbs, dizziness, nausea and sleepiness.
Researchers have found that changes in the electrical activity of the brain
accompany these symptoms. Tremors may be followed by convulsions,
which in -animals even after immediate decompression, have proved to be
fatal. HPNS is therefore a serious problem and even the initial mild symptoms
will dramatically reduce the work capability of the diver.
24

The cause of HPNS is still not known with certainty. It has been attributed to
the helium at high pressure and also to pressure alone on the nervous
system. It is found that individuals tend to vary in their susceptibility to HPNS.
Despite the fact that the mechanism of HPNS is not fully understood, the
diving industry has managed to find methods of reducing its occurrence.
It has been found that a slow rate of compression can often avoid onset of
HPNS and for this reason, a compression rate of not greater than 3m/sec and
preferably as low as 1 m/sec is recommended for dives beyond 200m. Staged
compression, with stops to allow the diver to assimilate to a given depth, is
also helpful in avoiding this problem.
The addition of other gases into the breathing mixture, for example nitrogen
(to form trimix) and more recently hydrogen, has also proved to be helpful in
this respect.
For the very deepest of diving operations, it is necessary to select those
individuals, through trials, who are least susceptible to HPNS.
(ii) Speech Distortion in a High Pressure Helium Atmosphere
The human voice becomes seriously distorted by the presence of a helium
rich atmosphere. It takes on what can only be described as a 'Donald Duck'
characteristic which becomes more marked and hence less intelligible to the
listener when the partial pressure of helium is increased. For the heliox diver,
such an effect can have serious consequences in that important
communications from the diver to his surface support may be misunderstood.
Beyond 200m, the distortion of speech by helium is a major problem to the
diving industry.
25

There are several commercial electronic helium speech 'unscramblers'
available, the better of which do, for moderate depths at least, offer a definite
benefit. However, as depths increase to well beyond 200m where the
problem becomes very severe, it is found that presently available systems are
none too effective. With practice, divers and tenders will learn to understand
helium-distorted speech with reasonable efficiency and in many situations they
prefer not to use an electronic unscrambler.
(iii) Temperature Control - Hyperthermia and Hypothermia
In normal circumstances the human body controls its temperature to a steady
37C. The mechanisms by which it does this when surrounding conditions
(and internal conditions) change, are well known. Provided such changes are
not too severe, the body will be maintained at this temperature at which it
functions optimally.
A significant change in surrounding temperature will stimulate one of the
body's mechanisms for control and at the same time, if large enough, result
in a degree of discomfort. If these mechanisms fail to bring the body
temperature under control, then the resulting change will cause further
discomfort and other symptoms. In such a situation it is wise to assist the
body's mechanisms in some way, e.g. by wearing insulating clothing in cold
weather.
Hypothennia is the condition when for any reason the core temperature of the
body falls abnormally low. Hyperthermia is the condition when the body
temperature is abnormally high. For various reasons, divers can experience
both of these conditions. For the heliox diver, surrounded by gas which can
carry heat away very rapidly, hypothermia is normally of greater concern.
26

The capacity of a fluid for removing heat from a body, through conductive and
convective processes, is related to its thermal conductivity (K), its specific heat
(0), and its density (p).
The product KCg, provides a good indication of this capacity and Table 4
gives these quantities for the various components of the environment
encountered in heliox diving. Because the conductivity of helium is six times
that of air and its specific heat is three times that of air, the heliox atmosphere
is capable of removing heat from the diver's body rapidly. The problem is
then further exaggerated as depth and hence gas density is increased.
From the figures in Table 4 it can be seen how the hyperbaric heliox
atmosphere can be a potential problem if a sufficient temperature difference
between the diver's body and his surrounding atmosphere is allowed to
develop.
In practice the greatest heat loss to the heliox diver is through respiration, and
it is for this reason that for depths exceeding 1 50m, it is mandatory in the UK
to provide heating for the diver's breathing gas. Figure 10 shows how the
minimum allowable breathing gas temperature must be increased as depth is
increased.
0 The increasing capability of heliox to extract heat from the diver's body as a
function of depth, makes the diver very sensitive to changes of temperature
thus narrowing the band of temperature of the surrounding atmosphere in
which he will feel comfortable (Figure 11). At a depth of 300m, a change in
the surrounding temperature of only two degrees centigrade will produce in
the diver the complete range of temperature sensation.
27

TABLE 4 - Physical Properties of a Diver's Environment
Cgkg1' 'C-) K(Wm1 c01 p QKCgL) KCp
Air 1000 0.024 1.2 x 10⁻³ 0.029
Hefiox 50m 3650 0.112 1.4 x 10⁻³ 0.57
200m 4650 0.151 3.8 x 1i-3 2.67
600m 5000 0.157 10.2 x 10⁻³ 8.00
Sea Water 1 4200 1 0.600 1025 2585
28

Air intake
Pressure Accumulator (reservoir)
Compressor
f •HP R eg. LP
High Divepressure 7controlbackup ( X ()Z, • ae
air A p
Accumulator
pressure
Valve Diver 2
*, Pressure gauge
Pneumofathometerhose IDemand valvehose
Diver 1
Figure 1 Components of a surface demand air divingsystem

0
Figure 2 Typical simple decompression chamber,•, (COMEX)
*d

202- Surface
* 20
N 180
C)
•- 8
6
5 4
2 3 6X
100 200 300 4 G0
Depth (m)Figure 3 Percentage volume 02 content in a diver'sbreathing mixture - 0.5 bar partial pressure
0db

E01LaL
033
a)
0 c

150 30 min 60 min
140 bottom time bottom time
130
120
0 110
100
* 90
70
60
50
40
30
20
10• 0 I I I I
5 10 15 20 25Decompression time (h)
Figure 5 Bounce diving decompression times

180
170
160
150
0 140
130
120
110-E 100
9c0
80
70
60
50
40
*30
20
* 10
0 1 2 3 4 5Decompression time (d)
Figure 6 Approximate total decompression time forsaturation diving as a function of depth

0,
m m C
C~cc
-CC
U u.
00
CL ',
0 1624, M
__ _0__ 0
E E0c0 u 0
C) 00. L--CC
~~0
. .04,Z
EC-E
frc

Umbilical SCC primary lift wire
Acoustic beacon Hyrdraulic umbilical cutter
Through water communications
Strobe light
Oil box
Side mate
View porns
Manway
______,_ -I- Flange profile
0• -_ Bonom door
Battery
~Stand off
capability
Onboard gas
Buffer
(a)
Figure 8 Typical closed diving bell showing (a)main external and (b) internal features (courtesy of Sub-mex)

Primary lift wire First aid kit
release
". . ,Gas panel
Radio
SDiver recovery winch
Gas reclamation
C02 scrubber
Diver's umbilical• '-Inner door
0
(b)

tz.0
Figure 9 Typical A-frame bell deployment system(lUc)

30
= 20
10I-
100 200 300 400 500Depth (i)
* Figure 10 Minimum allowable breathing gas tempe-rature for heliox diving

*33MU
32
S30(5 29C.E
28 -
.2 27n0E< 26
25
50 100 150 200 250 3000 ~Depth (in)
Figure 11 Range of comfortable ambient temperature* for heliox diving

0
S6
0
S
S
0
SS
0
S0

UNDERWATER VEHICLES
Dr. R. L Allwood Cranfield Institute of Technology EnglandSenior Lecturer Cranfield, Bedford
ABSTRACT
As underwater operations move into deeper waters, if not impossible, it certainlybecomes less feasible to use the diver both on grounds of safety and economics.One alternative is to utilise some kind of underwater vehicle equipped with anappropriate tool to undertake the task in hand.
Underwater vehicles have been in existence for some time now and are available inmany forms. In this lecture we will be concerned mainly with three types of vehicle -the remotely operated vehicle (ROV), the atmospheric diving system (or suit) (ADS),
and the manned submersible.
A brief account of the history of some of these vehicles will be given and the generalfeatures of their design and the relevant physics will be discussed. A number of themore widely used commercially available ROVs and ADSs will be describedspecifically including the RCV225, Scorpio, and WASP.
Finally, the roles of these various vehicles and their capabilities in relation to variousunderwater tasks will be discussed.

1.INTRODUCTION
The term underwater vehicle, although self-defining, is a general term that is used todescribe a multitude of systems, some of which bear little similarity to one another.Before describing some of these systems in detail and discussing their history, it isinstructive to categorise the various types of system in existence. Figure 1 attempts
to do this and show the relationship between the different types of vehicles.
The major distinction is usually made between the so-called manned vehicles and the
remotely controlled systems.
The manned vehicles are those which transport one or more persons within them,either in a standard atmospheric environment or hyperbaric environment. They are
usually, but. not always, under the control of their occupants.
The remotely operated vehicle usually carries no persons and is under the control
of an operator situated in a remote location, usually on a surface support vessel.
Untethered, sell-powered systems which operate in a near neutrally buoyant mode
represent an important group within the manned vehicles. The larger systems of this
type are generally known as submarines and have displacements up to 10,000
tonnes, and such vessels find few if any applications outwith the military sector. Their
power requirements are extremely large which can only be met through the use of
diesel engines and nuclear reactors. Military submarines will not be discussed in this
lecture.
The smaller systems, designed and built to support scientific research or more
recently the offshore oil and gas industry, are generally referred to as manned
submersibles. Although they share one important characteristic with the submarine
in tha t they incorporate a pressure resistant hull to provide a one-atmosphere
environment for their occupants, their power requirements are much smaller. Banks

of lead-acid accumulators usually provide such vehicles with sufficient energy to
undertake their mission.
A variation of the manned submersible is the diver lock-out submersible. This vehicle
possesses a second separate pressure chamber which can be internally pressurised
to match the ambient pressure at the working depth. This chamber becomes
effectively a diving bell as it is used to transport divers to the work site. In some
systems the two pressure hulls are connected by a transfer tube to provide greater
flexibility and safety.
The manned vehicles which are connected to the surface support by a cable or
umbilical, or both, can either possess their own means of propulsion or not. Those
which do not possess a means of propulsion are invariably configured and operated
in a negatively buoyant mode. The diving bell, discussed in the previous lecture, falls
within this category. Systems which have a means of propulsion and are neutrally
buoyant include some of the atmospheric diving systems (ADS) which are designed
to have a mid-water working capability.
The remotely controlled systems presently in existence can be classified in fewer
groups. To control any system remotely requires the passage of information to and
from the system. For systems operating underwater, the simplest way of providing
this communications link is through an electrical conductor or more recently via an
optical fibre. Either method demands a physical link in the form of a tether or
umbilical between system and controller. Although there are systems in existence.
albeit mainly experimental in nature, that do not possess this physical link, the vast
majority of these systems do have tethers.
These tethered vehicles generally possess their own means of propulsion, although
there are some vehicles which are towed by the surface vessel. By far the largest
group of tethered vehicles possess thrusters and operate near neutrally buoyant.
Capable of being manoeuvred in three dimensions in the water column by a remote
2

pilot, they are universally known as remotely operated vehicles or ROVs.
Development of this type of vehicle has been rapid over recent years as it has been
seen by some as a means of replacing the diver in certain operations.
Not all of these remotely controlled tethered systems are of the free swimming
variety. Some are constrained to move and carry Qut tasks upon a structure, in
which case they are known as stmcture reliant systems or tools, and others move
along the seabed, viz. the seabed crawlers.
By now it should be apparent to the reader that there are endless possible
configurations of underwater vehicle. However, by no means all of these
configurations would be sensible and only a few, those mentioned above which find
certain specific applications, have been developed.
2. MANNED SUBMERSIBLES
2.1 History of Manned Submersibles
The history of the underwater vehicles which have become known as manned
submersibles is relatively short. In 1948, Auguste Piccard designed and built the first
manned vehicle of this type called FNRS2. Tested unmanned, under remote control
it achieved a depth of 1220m before suffering irreparable damage.
By 1953 Piccard had built a modified vessel, FNRS3, which in August of that year
0 . achieved a depth of 1080m. The submersible was by no means small although it
could only accommodate a crew of two persons in its 1.94m inside diameter, 90 -
150mm thick spherical steel pressure hull. It was over 18m in length and had a
displacement of some 150 tonnes. Because part of this vessel was built at Trieste,
it was to inherit that name. One month later it achieved a depth of 3150m. The
3

vessel was used in several oceanographic missions in the Mediterranean until 1958
when it was sold to the US Navy.
Following the acquisition of Trieste by the US Navy, a most notable operation took
place when Jacques Piccard (the son of the designer) and Ueutenant Don Walsh
descended into the Challenger Deep in the Marianas Trench to a record depth of
10,910m in January 1960.
From 1965 to 1966 the Trieste underwent extensive modifications which included a
new buoyancy unit, a new propulsion system and a new pressure hull. Renamed the
Trieste II, it was re-rated for 6060m, and was to take part in the search for the sunken
submarine Scorpion in 3000m off the Azores in 1969.
2.2 Manned Submersibles - Construction
The manned submersible consists of six major components:
(i) The Pressure Hull
The pressure hull is the enclosure which accommodates the crew members
and certain items of equipment in a one atmosphere environment. It must
possess sufficient strength to resist the external hydrostatic pressure that will
be encountered and there should be no leakage of water into it. It must
obviously also incorporate an entry hatch, and preferably it should possess
one or more viewports to allow its crew to see outside the vessel.
(ii) Variable Buoyancy System
Ascent and descent of this nearly neutrally buoyant vehicle is almost always
effected by a variable buoyancy system.
4

(iii) Propulsion System
Usually consists of a number of electrically operated thrusters under the
control of the pilot.
(iv) Power Source
Almost always a bank of batteries/accumulators housed within their own
pressure resistant enclosures.
(v) Uife Support System
To maintain atmosphere similar to that encountered at the surface, i.e. in terms
of oxygen level, carbon dioxide level, temperature, humidity, pressure and
* contamination.
(vi) Instrumentation
Can be associated with vehicle status, navigation, or execution of tasks.
2.3 QOperation of Manned Submersibles
The size and weight of manned submersibles makes their operation impossible from
anything other than a dedicated support vessel fitted with a suitable deployment
system. The vehicles are nearly always launched over the stern of the vessel by
using a high lift capacity swinging A-frame (Figure 2). Over-the-side deployment of
such heavy systems could cause an unacceptable amount of roll on the size of
* vessel likely to be used in these operations.
On launching, the submersible is attached at its main lift point by as short a line as
possible to the centre of the A-frame. The A-frame is raised hydraulically and the
submersible is lifted and swung clear of the stern of the vessel. Various lines are
often attached to the submersible to prevent it from swinging uncontrollably. Once
in the water, all lines are removed and the vessel steams ahead slowly to leave the
submersible clear. On orders from the operations controller via the radio link, and
5

provided all is well on board the submersible, the pilot will dive the submersible away
from the surface so that it is no longer affected by the wave motion.
Once away from the surface, all navigation of the submersible must be done 'on
instruments' only, until features are visible through the viewports. In practice, when
visibility is low, the pilot must rely extensively on sonar systems, acoustic tracking
systems and depth sensors to find the work site. Only when very close will vision by
of any use.
0 At the worksite the crew will have a predetermined length of time during which to
attempt to undertake the task in hand. It may only involve the use of an external
television or stills camera or it could require the skilled operation of a manipulator.
During this period, the atmosphere within the pressure hull will be constantly
monitored and remedial action taken manually if necessary, depending on the type
of submersible in use. If provision is made, battery charge level will also be closely
watched.
On completion of the task or after the predetermined dive duration, the pilot will
signal the surface support if possible and ascend the submersible. It is usual for the
support vessel to move a little off station after launch and it will therefore be
necessary for the submersible when at the surface to make its way towards the stern
of the vessel. Such a manoeuvre is generally accomplished through use of the
viewports in the conning tower.
0 Once in position behind the vessel, the A-frame is swung over and the lift line let out.
Attachment of the hook to the submersible is usually undertaken by a team of
swimmers operating from a rubber boat. The submersible is then lifted from the
water and lowered onto the deck of the vessel where it is then secured. Some
submersible operators prefer to launch and retrieve when the vessel is slowly under
way, as this has been found to improve stability.
6

The launch and retrieval of manned submersibles, especially those which include a
diver lockout facility in which divers will be pressurised, must be undertaken with the
utmost care and strictly according to any procedures laid down by the operators.
Despite the obvious dangers involved, the safety record in this field, albeit small and
diminishing, has been exemplary.
2.4 An Example Commercia] Manned Submersible - LR2
LR2 is a glass reinforced plastic (GRP) submersible with a depth rating of 366m and
accommodation for two crew members. The GRP construction significantly increases
the payload of the vehicle therefore allowing a greater battery capacity. Besides
being non-corroding, the GRP hull provides superior insulation to the crew from the
cold seawater. An acrylic front dome some 1 m in diameter provides the crew with
an excellent view.
The propulsion system of the vehicle combines a single 7.3kW main thruster at the
rear driven by a single internal motor, and four 3.5kW thrusters, each independently
operated. Together with the vehicle's dual ballast system, the thruster capability
makes LR2 exceptionally manoeuvrable and well suited for underwater survey tasks.
Its ability to change depth rapidly and accurately makes ft particularly suited to
structural surveys, where the vehicle, free of any tether, can safely enter the
innermost parts of the structure.
Externally mounted sensors for acquiring the survey information include pipetracker,
cathodic protection probe, echo sounder, depth sensor, television cameras, seabed
profiler, sonar array, and acoustic navigation transponders. Inside the vehicle there
is a gyrocompass, a videorecorder and a data logger for storing the survey
information.
The vehicle is also fitted with a six degree of freedom manipulator which has a lift
capacity of some 90kg and is jettisonable in an emergency.
7

Oxygen content, carbon dioxide content, temperature, humidity, pressure and gas
contaminants are constantly monitored within the accommodation. Carbon dioxide
is removed in the usual way by a scrubber containing either lithium hydroxide or
Soda SorbTM . Oxygen, stored in external cylinders, is bled into the atmosphere as
required. Temperature and humidity are controlled by an air-conditioning system of
2kW capacity.
Specification of LR2
Builder - Slingsby Engineering
Length - 7.3m
Width - 3.0m
Height - 2.6m
Weight - 14 tonnes
Payload - 455kg
Crew -2
Maximum operating depth - 366m
Collapse depth - 550m
Maximum speed - 2 knots
Life support - 7 days per crew member
Pressure hull:
Material - GRP
Shape - cylindrical
Dimensions - 1.3m inside diameter
(Command module) - 50mm wall thickness
2.8m long
Power source:
* Position -Pods either side of pressure hull
Battery type - 120V Oldham OTH6 providing 438Ah
24V Oldham OTH8 providing 584Ah
Total power - 67kW
Emergency power - Drycell, 24V, 36Ah
8

Buoyancy/trim control:
4 x GRP ballast tanks providing 7000N lift with high pressure air available
Two internal trim tanks providing ±8° on pitch control
External Ughting:
5 front mounted quartz halogen lamps
1 rear mounted quartz halogen lamp
Communications:
Underwater telephone - Subcom 2005 20B (10 or 27KHz)
VHF radio, range 3 miles (channels 16/33/13)
UHF radio, range 2 miles (44.6MHz)
3. ATMOSPHERIC DMNG SUITS AND SYSTEMS (ADS)
Even before the effects of hyperbaric atmosphere on man were properly understood,
the possibility of developing a diving suit that would protect him from the hydrostatic
pressure appeared attractive. As more was learnt about the effects of pressure and
diving reached deeper and deeper depths, the advantages of such a system became
more significant. If a rigid diving suit of sufficient strength with the necessary
articulated joints that allowed movement of the limbs could be constructed, then it
would totally eliminate many of the problems encountered during ambient pressure
diving. The advantages of such a system are both physiological and economical,
and they will be discussed (together with certain disadvantages) later in this lecture.
3.1 An Example of Commercial ADS - WASP
The WASP ADS is a one-man submersible with mid-water work capabilities (Figure
3). It possesses articulated arms with interchangeable claws but unlike JIM has no
legs. Mobility is from 4 DC motor-powered thrusters which are actuated by the
operator's feet. The main body consists of an aluminium casting with a clear
9

hemispherical polycarboflate dome at the top. The dome is protected by a
renewable outer clear Macrilon TM cover.
A built-in fully automatic life support system provides 8 hours endurance although
this was increased to 12 hours in the later series 11 vehicles.
In normal operation the vehicle is attached to its umbilical which supplies power,
provides for two-way communication and serves as the lifting cable during
* deployment and retrieval.
In an emergency the umbilical and all external equipment including the thrusters can
be jettisoned providing some 450N of buoyant force. In this situation the operator
reverts to using a back-up breathing system which incorporates an oronasal mask
and provides between 36 and 54 hours endurance. Back-up batteries housed in a
pressure resistant container provide 20 minutes of full thrust.
Specifications
Builder OSEL Group
Height 2.13m
Width (front) 1.06m
Width (rear) 0.81mr
In-air weight (with operator) 470Kg
Maximum operating depth 61 Omn
Operating team 4 -5 men
03.2 Comparison Of The ADS With The Other Forms of Intervention
Before being able to determine the safest and most efficient way of carrying out a
particular underwater operation, it is necessary to fully understand the pros and cons
of the various forms of underwater intervention that are available. Because the
10

capabilities of the ADS lie between that of the ambient pressure diver and that of the
ROV, it is both natural and necessary to make comparisons with both techniques.
The following points are among those which must be considered when making such
an assessment:
(i) The ADS operator normally experiences no increase in pressure and is
therefore free of all the pressure related effects and problems that face an
ambient pressure diver. This is a considerable advantage in terms of safety.
0 Also it is a considerable advantage economically, arising from the fact that
neither the expensive equipment nor decompression time are required.
0 (ii) The ADS operator's view of his surroundings can be almost as good as that
of a diver and certainly far superior than that relayed via even the best
available TV camera supported by an ROV. Vision, as in everyday life, is an
important sense for the underwater operator.
(iii) Mobility and manoeuvrability of the ADS is somewhat restricted when
compared with that of the diver. However, there are considerable differences
between the various ADS available and much is dependent on the operator's
ability.
(iv) In terms of manual dexterity the ADS is generally thought to lie between that
of a diver and that of an ROV supporting one or more manipulators. This is
a fair assumption although ideally the comparisons should be made for
specific tasks. A good ADS operator can usually complete a most complex
task but he will take a much longer time that the diver. The presence of the
ADS operator at the worksite with the resulting direct vision and often direct
mechanical control over the end effectors provides an advantage over the
manipulator equipped ROV. There are many tasks for which one would not
contemplate using even the most advanced of ROVs.
11

(v) it is arguable whether it is the ADS operator or the diver who faces the higher
personal risk actually during the operation. Both lives are totally dependent
on mechanical and electronic systems and the competence of all the required
supporting personnel. However, the ADS does give added mechanical
protection to its operator and risk of a severed breathing gas carrying
umbilical is not present. Certainly the ADS operator who becomes trapped
has a greater chance of survival with perhaps 72 hours of breathing gas and
no problems of the extremely rapid heat loss resulting from a hyperbaric
helium atmosphere.
(vi) Whilst in terms of surface support the saturation diver's requirements are
great, that of a typical ADS is by no means insignificant (Figure 4). Launch
and retrieval of an ADS is crucial and it is therefore necessary to have a
launch system well capable of operating up to the desired sea state limit. This
will mean a substantial hydraulic crane or A-frame.
In any deep water ADS operation it is also necessary to have a 'back-up'
system which must include a spare tether.
(vii) A major advantage of the ADS over the diver is its maximum depth capability.
At present many ADSs are capable of operation in excess of the normal
maximum divable depth. Thus, along with manned submersibles, they offer
a solution to a category of tasks, often short duration - perhaps emergencies -
in deep water that could not otherwise be economically accomplished.
12

4. THE ROV - CONSTRUCTION
The ROV is best considered as a system which comprises several components:
(i) Buoyancy module - to give the vehicle the desired buoyancy, usually close to
neutral.
(ii) Propulsion system - to give the vehicle manoeuvrability.
(iii) Instrumentation - for: (a) vehicle status indication
(b) navigational purposes.
(iv) Control station - at which the pilot operates the vehicle.
(v) Tether or umbilical - for supplying power to the vehicle and transmitting
communications in each direction.
(vi) Vehicle/tether handling system - for use in vehicle deployment and retrieval.
(vii) Tools and instruments - carried by the vehicle to enable tasks to be
undertaken.
4.1 Buoyanc
Net buoyancy is provided by any part of an ROV which displaces a volume of water
0 of greater weight than itself. This will be achieved if the overall density of the item is
less than that of water. Solid metal components cannot therefore provide net
buoyancy, but metal walled tanks containing gas can provide a great amount of
buoyancy.
13

Most essential components of an ROV will be negatively buoyant although any
pressure resistant housings for electronics or instrumentation, depending on their
content, may well be buoyant. However, the essential components of an ROV are
likely to be strongly negatively buoyant overall and the addition of artificial buoyancy
is almost always required to bring the ROV to the desirable near neutrally buoyant
state.
Unlike the manned submersibles which generally rely on variable buoyancy to
provide the forces necessary for descent and ascent, the modern ROV almost always
* possesses fixed buoyancy with suitable thrusters to provide the vertical motion.
Overall buoyancy is, however, not the only important factor to be considered; the
stability of the vehicle within the water is also of major importance. A submerged
vehicle is stable only when its centre of gravity is vertically below its centre of
buoyancy (Figure 5). Whilst centre of gravity of an object is well understood, the
term centre of buoyancy perhaps deserves some explanation. It is the 'centre of
volume' of an object or, put more simply, the centre of gravity of the displaced water
if it could be made to retain the same shape as the object displacing it.
If forces disturb the attitude of a stable vehicle, a righting couple is set up by the
buoyant and gravitational forces which tends to restore the vehicle to its original
attitude. The distance between the centres of gravity and buoyancy, commonly
referred to as metacentfc height, is an index of stability; the greater this distance, the
greater the stability of the vehicle.
In any underwater vehicle that supports sensors, stability in the water is of major
importance. For this reason it is necessary to position any artificial buoyancy
towards the top of the vehicle and keep heavy, non-buoyant components towards
the bottom of the vehicle.
14

Whilst some early ROVs used closed metal tanks and fishing floats to provide
buoyancy, today almost every vehicle in operation uses a material specially
developed for deep water buoyancy called a syntactic foam. It is manufactured by
blending micro-spheres with rigid resin systems. The resultant product is impervious
to water and its mechanical properties can be tailored to suit specific depth
requirements. Foams suitable for deep water, for example 6000m, need to be
extremely strong and resistant to compression. Such a requirement in practice
means that foams developed for deep water have to be denser and therefore give
less buoyancy than foams developed for shallow water use. A useful figure of merit
for buoyancy materials or systems may be defined in terms of an efficiency as
follows:
Effciecy f boyacy ystm -Buoyant force providedEffiieny o buoanc sytemIts weight in air
4.2 The Umbilical (Tether)
To an ROV the umbilical is its lifeline. It has several functions:
(i) To transmit power to the vehicle for its thrusters, instrumentation and tools.
0(ii) To support the transmission of information both to the vehicle, e.g. control
commands, and from the vehicle to the surface, e.g. television picture of task
* in progress.
(iii) As a physical link to aid deployment and retrieval of the ROy.
Umbilicals tend to be custom designed and manufactured to meet the requirements
of a specific ROV system. In general they will comprise of at least some, if not all,
of the following elements (Figure 6):
15

(i) Power conductors - usually of copper but nowadays occasionally of new
lighter highly conductive alloys in suitable numbers and of cross-section to
match the power requirements of the vehicle. All conductors must, of course,
be individually insulated to suit the working voltage of the system.
(ii) Co-axial cables - mainly for the transmission of television signals.
(iii) Twisted pairs - of varying types for signal transmission.
(iv) Optical fibres - recently introduced by some manufacturers to increase
information transmission capacity and reduce interference from power
* sources.
(v) Strain members - to provide mechanical strength especially when the umbilical
is used for lifting the vehicle out of the water.
4.3 Propulsion Systems
Propulsion on the majority of free-swimming underwater vehicles is effected by the
use of motor driven propellers or thruster units. There is a wide variation in the
designs of such propellers and their driving motor. Motors used in ROV thrusters
tend to be one of three types:
(i) Low voltage, DC motors with nowadays often solid-state brushless
commutation. Such motors are typically used on the smaller, observation type
of vehicle, e.g RCV 225.
(ii) High voltage, brushless AC induction type motors. These motors have been
used on the larger ROVs.
16

(iii) Hydraulic motors - the use of hydraulic motors requires a suitable hydraulicpower pack on board the ROY. The power pack is energised usually with a
high power, high voltage, AC electric motor. Hydraulically operated thrusters
are generally only found on the larger ROVs.
Whilst the choice of low voltage, 'brushless' DC electric motors is the only sensible
choice for small ROVs, the choice of motor on the larger ROV is not so clear cut.
The various advantages and disadvantages of both electric and hydraulic motors are
set out in Table 1.
17

TABLE 1 - Comparison of Hydraulically Driven Thrusters and AC Motor DrivenThrusters on Large ROVs
AC Electric Motors Hydraulic Motors
Advantages: Advantages:
Simple, cheap, easy to put together Built from standard components
Good range of standard motors Little required for pressurereadily available compensation
High powers available from physically
small motor units
Electrically quiet
Present day systems givencontinuously variable power outputs
Disadvantages: Disadvantages:
Require to be housed, sealed and System more expensive and requiresusually pressure compensated more maintenance
Variable drive through the use of Much pipework required on the ROVvariable autotransformers iscumbersome and often does not give Usually produces more acoustic noisefine enough control
Variable drive through the use of0 static variable frequency inverters canproduce unacceptable electricalinterference
18

At present, the vast majority of large ROVs are propelled by hydraulically driven
thrusters although it is likely that this situation has arisen as a result of a few bad
experiences with electric motors in the early days of development of the large ROy.
The theory of propeller design is complex and beyond the scope of this lecture.
Ideally the number of blades on the propeller, their area, their shape and their pitch
are carefully chosen for optimum thrust at the available power. It is important to
match the rotational velocity of the propeller with the driving motor whilst ensuring
it is kept low enough to avoid efficiency reducing cavitation within the water.
In order to maximise efficiency, it is desirable to mount the propeller in a
hydrodynamically shaped duct or Kodt nozzle as it is known (Figure 7). Also, care
must be taken to avoid restricting the flow of water past the propeller. When in-line
motors are used, it is therefore necessary to keep their diameter to a minimum and
extend the drive shaft so that motor and propeller are well separated.
4.4 Control Station
The control station, usually situated on board the surface support platform, is the
operator's interface to the ROV and as such its design and layout are of paramount
importance.
Figure 8 shows a typical layout. Common to all such systems is the television
monitor which displays the view as seen by a vehicle mounted camera, and some
form of control stick by which the thrusters are operated. Other facilities will include
indicators regarding the vehicle and equipment status, navigational indicators and
various switches for powering up the system and its subsystems.
The current trend in modern commercial systems has been to dispense with various
indicators, for example the compass repeater and depth readout, and display this
information as an overlay on the television picture. Provided it is not detrimental to
19

the picture or too distracting it does have certain advantages. The pilot does not
need to look away from his screen and the information can, if required, be easily
recorded.
Control sticks or joysticks differ widely in design but they are generally configured
in such a way that control of the ROV is simple and intuitive. Some ROV systems
utilise a single joystick with all the degrees of freedom required, similar to that which
controls a helicopter, whilst others utilise two simpler joysticks. Whilst some joysticks
are integral with the control console, others are mounted on a separate smaller box
or 'buddy box' which can be used some distance away from the console, e.g. on the
deck of the vessel whilst viewing the ROV directly. There is no standard layout
adopted and training on a specific ROV is necessary before the pilot becomes
efficient.
If the ROV is fitted with a manipulator then there will be a master controller at the
work station. For a modern advanced space-equivalent manipulator this would take
the form of a scaled down version of the slave arm (Figure 9).
4.5 ROV Deployment and Retrieval
Because ROVs can vary tremendously in both design and size, their deployment and
retrieval, unlike manned submersibles, can be undertaken in a number of ways.
Also, because of their smaller size, dedicated support vessels for ROVs alone are not
common and, in general, maximum use is made of 'vessels of opportunity'.
•0 Motion of the support vessel and relative motion between it and the surface of the
sea will increase the risk of damage to the ROV and will determine the limiting
weather conditions during which the ROV can be safely launched. Any way in which
these motions can be reduced will therefore increase the operability of the ROV and
hence its cost-effectiveness. For this reason operators generally launch ROVs over
the side of the support vessel closest to the position which is least affected by heave
20

motion. Usually either a hydraulically operated multi-jointed crane or a purpose-built
A-frame is used to lift the ROV in and out of the sea.
A recent trend has been to operate ROVs from a framed enclosure or 'garage'
(Figure 10). The ROV is housed within its garage, which is negatively buoyant, and
the system is lowered to the working depth on its lifting cable/umbilical. When at the
required depth, the ROV, after undocking from the garage, can be 'flown' out to the
work site. The garage will contain a reel system which usually incorporates a slip
ring assembly and is capable of paying out and taking in the umbilical, or tether as
0 it is more commonly called which in this configuration, on command. Whereas the
main lift cable must be of adequate strength and possibly armoured, the tether
between vehicle and garage will normally be neutrally buoyant.
Originally, garage launching systems were only used with the smaller observational
or 'eyeball' type of ROV; today they are being used increasingly with the larger work
type ROV.
Although garaged ROVs speed up and simplify the transition through the water
interface, the vehicle still has to be flown in and out of the suspended garage that will
be undergoing the same heave motion as the supporting vessel. To reduce the
possibility of damage during this operation, some of the larger systems now
incorporate heave compensation in their lifting winch.
4.6 Commercial ROVs In Operation
From the early seventies to the present day there have been many ROVs developed
for numerous purposes. An exhaustive catalogue, and there are well over 100
different types of system that have been produced, is beyond the scope of this
lecture. Two systems, an 'eyeball' system and a 'workhorse' system will be
described.
21

4.6.1 RCV 225 (Figures 11 and 12)
The RCV 225 built by Hydroproducts was the originator of the 'eyeball' type ROV.
Having gained a reputation for good performance and reliability, over 80 of these
vehicles have now been produced.
The small, neutrally buoyant vehicle is roughly spherical in shape consisting of a
block of syntactic foam in two halves housing a central electronics/television camera
pressure housing. The six DC electric motor operated thrusters are mounted
externally as are the lights on some models.
* ,The low-light television camera incorporates a novel lens mechanism which enables
the picture to be scanned vertically whilst not moving the camera body itself.
Horizontal motion, or panning, is achieved by turning this highly manoeuvrable
vehicle about its own axis. Recent models possess an automatic heading facility
utilising an on-board rate-gyro.
The majority of RCV 225s are operated from a garage or launcher although, if the
application requires, the vehicle system can be configured to operate without it.
RCV 225 System Specifications
Vehicle: Builder - Hydroproducts Inc.
Length - 0.51m
Width - 0.66m
Height - 0.51 m
Weight - 82kg
Maximum operating depth - 400m
Maximum operating current - 2.5 knots limited manoeuvrability
1.5 knots full manoeuvrability
Speed - Forward - 2.5 knots
Reverse - 2.0 knots
22

Lateral - 1.7 knots
Up/down - 0.5 knots
Rotation - 180/sec
Control Station:
Displays - video with information over!ay of vehicle depth, heading,
lens pitch angle, number and direction of tether twists,
tether payout length, elapsed time, date and time.
Meter reading of cable continuity, voltage and insulation
to seawater.
Stills camera frame counter.
Controls - Joystick giving proportional control for all degrees of
freedom.
Automatic heading and depth control with manual back-
up.
Television CameraControls - lens pitch angle (tilt), focus, 35mm camera actuation.
DeploymentControls - Launcher lock, tether winch.
, PowerRequired - 220V 3-phase or 440V 3-phase, 5kW maximum
* Deployment Unit:
Consists of winch, skid, A-frame and launcher.
Armoured lift cable capacity - 400m.
Winch rate - variable up to 36m/minute.
Hydraulic power supply - 20kW maximum.
Launcher tether capacity - 120m.
23

Launcher tether winch rate - 18m/minute.
Maximum pull - 220N
4.62 SCORPIO
Amongst the ROV work systems, SCORPIO and more recently its successor SUPER
SCORPIO, must rate as the most successful vehicles of this type, with some 59 of
these vehicles having been built.
SUPER SCORPIO is a powerful, conventionally designed, open frame ROV. It
possesses five hydraulic thrusters and can support an extensive range of
instrumentation, manipulators and special tool packages. The standard system also
includes the operator control unit and the umbilical on a hydraulically operated winch.
Although garages are not standard equipment with this large vehicle, a number of
manufacturers are able to supply such systems on request.
SUPER SCORPIO Specifications
Builder - Ametek Inc.
Length - 2.48m
Width - 1.48m
Height - 1.5m• "- Weight - approximately 1450kg
Maximum operational depth - 1 000m standard
1500m optional
Some earlier vehicles have been modified
for deeper operation.
Propulsion - 2 horizontal, 2 lateral, 1 vertical hydraulic thrusters
Speed - 2.5 knots
Control - Single joystick
Television - 3 TV channels
24

Sonar - Ametek 25 CTFM scanning sonar range up to 610m
Lights - 6 x 250W variable intensity tungsten
Heading sensor - Gyro compass 1% accuracy (0.1% optional)
Depth control - 0.28m in automatic mode
Multiplexer - 64 channels up and down
Manipulators - 7 function manipulator, 5 function grabber
Optional features - Second 7 function manipulator, navigational and tracking
system interfaces, stills camera, sidescan sonar, profiler,
pipe tracker, cable cutter.
25

C > 0
D nc030
(00
O--o
>t
* 00
mo
c-
C, CL
Lin
a) CL CL -u ---
-J L

S 4~- ~.
t *~J."p I
I
U-A¾? 4 A
-~ 1,4>7k -u
* LI 'II
~
0~
cC 0
2~~~
I-.--.-a a,
44.
(JL..
C 4 -.
-V 1'~#~- Cu
0 - 0-~1~ - - ~ -
A zEEj~¶jO

Figure 3 The WASP ADS (OSEL Group)

• Two
Moonpool winches
LJIM (stacked)
Handwinch Power 7 m
pack
*aBoxes qA~quad]
Figure 4 Typical deck layout for an ADS spread(note the use of a second system as backup)

IOCG
0 C
(a)
OCB
•CG
d
(b)
Figure 5 Stability in buoyancy (a) body is stablebecause the centre of gravity, CG, lies directly belowthe centre of buoyancy, CB (b) Unstable body, a right-ing couple proportional to the lateral separation, d, ofCG and CB exists

Filler,•, Coaxial
~~cable .
pair
00
'Power
conductor0Figure 6 Cross-section of typical multiconductorROV umbilical (Angus 002)

0
p ,-Kort nozzle
Propeller
0 Figure 7 Cross-section showing propeller in a Kort
nozzle
0d

N%.5E
7i
J,
E60
ICL
0 0o~c a 4

Figure 9 Master controller for underwater mani-pulator (Schilling HV5F/HV6F)

Control statioflDeployment unit
11Winch/skid aframe
ControI~dusrulay Hand£Ofmnltole,
Vehicle
TV come,, dome
Figure 1o RCV 225 system, showing launcher or gar-age ope .ration (Hydroproducts Inc.)

S
S
S
SS
SS

SURFACE SUPPORT VESSEL
Kjell Sandaker Stolt-Nielsen Seaway A/S NorwayEngineering Manager Haugesund
ABSTRACT
The paper discusses the role of surface support vessels in subsea ventures. Especially thevessel as an operation base for deployment of tools and application of different workingmethods. Some typical work tasks are described and the requirement they set to thevessel. The consequence class system for dynamically positioned vessels is presentedtogether with selected features of diving support vessels. In appendices to the paperspecifications and data for selected vessels and equipment is presented.
1. INTRODUCTION
2. TYPICAL OPERATIONS
Discussing the support operations related to drilling and completion of subseacompleted wells, inspection and maintenance, construction activities, installation ofpipe-spools and risers and the associated hyperbaric welding. Survey operations.
3. VESSEL REQUIREMENTS
0 Discussing the requirements to the vessel given by the characteristics of operationand the different methods and tools.
4. DYNAMIC POSITIONING, RULES AND REGULATIONS
Presenting the consequence class system given by the Norwegian Maritime
Directorate.
5. VESSEL FEATURES
Discussing vessel features such as accommodation, navigation and tracking, deckspace, layout, strength, stability, cranes, diving system, module handling and ROVoperations.

6. MONOHULL VERSUS SEM[ISUBMERSIBLE RIG
7. TRENDS OF DEVELOPMENT
Briefly presenting seaway's Diving Support Vessel Development Programme.
APPENDICES
Presenting specifications and particulars for selected vessels and equipment.

15TH WEGEMT GRADUATE SCHOOL
"UNDERWATER TECHNOLOGY"
HELSINKI UNIVERSITY OF TECHNOLOGY
OCTOBER 14TH-18TH, 1991
SURFACE SUPPORT VESSELS
by Kjell Sandaker, Engineering ManagerStolt-Nielsen Seaway A/S
Haugesund, Norway.
TEKNO\ENG\KS A\KS A 143-N Page 1.1

SURFACE SUPPORT VESSELS
TABLE OF CONTENTS
Section One INTRODUCTION
Section Two TYPICAL OPERATIONS2.1 - Drilling and Completion2.2 - Inspection and Maintenance2.3 - Construction2.4 - Survey Operations
Section Three VESSEL REQUIREMENTS
Section Four DYNAMIC POSITIONING,RULES & REGULATIONS
Section Five VESSEL FEATURES5.1 Accommodation5.2 Navigation and Tracking System5.3 Deck Space and Area/Layout
Deck StrengthVessel Deadweight and Stability
5.4 Crane5.5 Diving System5.6 Module Handling5.7 ROV - Launch and Recovery
System
Section Six MONOHULL VERSUSSEMISUBMERSIBLE RIG
Section Seven TRENDS OF DEVELOPMENT
TEKNO\ENG\KSA\KSA 143-N Page 1.1

APPENDICES
Appendix A SPEC. DSV "SEAWAYPELICAN", GA + PARTICULARS
Appendix B GA + PARTICULARSDSV "SEAWAY OSPREY"
Appendix C GA + PARTICULARSDSV "SEAWAY HARRIER"
Appendix D GA + PARTICULARSDVS "SEAWAY CONDOR"
Appendix E GA + PARTICULARS
SMIT SEMI 1 & 2
Appendix F MODULE HANDLING SYSTEM
Appendix G HEAVY COMPENSATED CRANE"SEAWAY PELICAN"
Appendix H ROVSV BERGEN SURVEYOR
0
TEKO\NG\SA\KSA143-N Page 1.2

Section One
1.0 INTRODUCTION
In this lesson we shall talk about the role of surface support vessels in subseaventures. During different phases of development of offshore oil and gasfields there are great varieties of different operations and work tasks that willhave to be done to get all the equipment installed and connected.
Many of these operations are very complex operations that may involve tools0 and equipment operating close to the seabed and midwater as well as at thesurface and in the wave-zone.
A successful operation depends on good planning, reliable tools andequipment, accurate position control, very close surveillance and monitoringand what is most important is that the choice of equipment and tools fit tothe purpose of the job to be done. The challenge is to establish a system ofvessel, tools, equipment and personnel and to select method of performingwork so that the job is done in a most cost-efficient way.
This paper will highlight and discuss selected problem areas related to supportvessels for underwater work. Technical data and details of vessels andequipment is presented in the Appendices.
TEKNO\ENG\KSA\KS A143-N Page 1. 1

Section Two
2.0 TYPICAL OPERATIONS
2.1 DRILLING AND COMPLETION (SUBSEA COMPLETED SYSTEMS)
The operations to drill and complete offshore oil or gas wells require a vesselthat has all equipment necessary to control the high pressure in the well. Thisis heavy equipment and these operations are always done by specialiseddrilling rigs. The rig will have to do all the work that is necessary toestablish a well and secure it with a minimum of two barriers. Normally thismeans that the christmas tree will have to be installed on the wellhead.
When the well is drilled and completed the remaining installation works maybe carried out by other vessels than the rig. The type of operations and thesequence of operations will be depending on the design and layout of thetotal subsea completion installation, but typical operations that follow thecompletion will be connection of flowline and connection of umbilicals to thewellhead. See fig. 2.1.1.
In shallow water these operations can be done by divers, but when the waterdepth gets deeper, it is preferably to use diverless connections. Toolingmodules for pull-in and connection of flowlines and umbilicals can easily bearranged for operation from e.g. diving support vessel. Also when it comesto maintenance operations like installation or retrieval of control pod modules,such operations can easily be done from diving support vessel (DSV).
TEKNOENG\KSA\KSA 143-N Page 2.1

ýMX-nTm+-CmftrrbTod
tj inSt
Cwn~Nd Tool, 50=3i Lmds
t-m. rdT-m o A-/*jnp~W~ffkdlGut~ks A Sybset Production
Fig. 2.1.1

2.2 INSPECTION AND MAINTENANCE
The major part of the inspection work being done offshore is inspection ofthe steel structures of jacket-type platforms. Normally this work is done intwo phases. First the cleaning of the worksite and then comes the inspection.Traditionally, this work has been performed by divers and a variety of toolshave been developed for the cleaning and preparation of the structures andseveral different inspection methods have been developed for crack detection.
Methods and equipment have also been developed so that many of thesetasks now can be performed by remote operated vehicles, (ROV), or acombination where the ROV can do the cleaning and the diver comesafterwards to do the inspection. Seaway has developed a so-called DIVEROV,which is a remote operated vehicle that has been specially equipped tosupport the diver. The DIVEROV will supply e.g. hydraulic power, allnecessary tools, light and surveillance and a stable platform and all this willmake the diver work more efficient.
2.3 CONSTRUCTION -
Examples of construction operation can be e.g. See fig. 2.3.1 - 2.3.3
- installation of spoolpieces,- hyperbaric welding of spools and pipelines,- installation of flexible flowlines and control cables,- preparation of pipeline crossings,- installation of protection structures over pipelines and cables.
Among these operations the hyperbaric welding of pipelines is by far the
most complicated operation to be done.
2.4 SURVEY OPERATIONS
Another area of activities is the seabed mapping and survey of pipelines.These operations can be done by use of smaller vessels, but they need tohave very accurate navigation and positioning systems as well as computersystems for processing the survey data.
TEKNO\ENG\KSA\KSA 143-N Page 2.2

AA
n4
Fig. 2.3.1Installation of riser sectionson Statfjord C.Snorre - Statfjord Tie-In

CLI-
(I,2
H- ~
:5 8---- x- ~ ~
I- -
(OLfi A(flU
a \- ~- g A'(4 "I-
-~
0 .2Kr Kr
p(0r'd
ri
1-
*0

\
0\ \
0
0

Section Three
3.0 VESSEL REQUIREMENTS
When we are looking at the different operations and tasks to be performedin the offshore petroleum activities we see that they differ very much in type.The different types of operations set different requirements to the surfacesupport vessel.
Seaway has specialised in light to medium size offshore construction, and ourvessels have been developed and equipped to meet requirements from suchoperations.
71Ypically the vessel as such can do very few of the tasks, but the vesselcarries a variety of equipment and tools and is the operational base forapplication of methods for doing underwater work.
It is the operational methods and equipment that set requirements to thevessel. The vessel together with equipment, tools and personnel should be afunctional entity.
It should be noted that as the different tasks require different methods ofoperation, the vessel layout should allow for flexibility in choice of equipmentand tools to be carried along for each project. Cost efficiency requires thatto the extent practicable all equipment that is not intended to be used in theproject operations should be left on shore and possibly be utilized by othervessels.
Often a work task can be done in many different ways by different selectionsof methods and tools - more or less efficient. The challenge to the offshoreengineer is to select vessel, methods and tools that in total makes the mostcost-efficient solution.
Fig. 3.0.1 illustrates different methods of workting. The vessel is a platformor operational base for deployment of equipment and tools:
- Crane- Heavy structure installations- Pipe spool installation- Riser installations- Welding habitat deployment
TEKNO\ENG\KSA\KSA 143-N Page 3.1

- Remote Operated Tools (ROT), Module Handling System- Tooling modules deployment- Connection of cables and flexible pipes- Control pod installation/retrieval- Well intervention
- Diving, hyperbaric and air diving- Inspection- Installation and repair- Tool operation- Welding
- Remote operated vehicle ROV- Survey and mapping0 - Cleaning- Inspection- Observation- Service and assistance by manipulator operations- Operation of tools and tooling modules
For each of these methods the link between the vessel and the end effectoris of vital importance for successful operation. This link can be characterisedby the following headlines:
- Deployment system- Position control and monitoring- Surveillance and communication- Motion compensation
Each of these links are highly specialised systems. They will be highlightedfurther below.
0
TEKNO\ENG\KS A\KS A143-N Page 3.2

0 7
z t z
>71
71
CL. C
.- 4
71
z
p 7
zz 9z
I-M
C4C

Section Four
4.0 DYNAMIC POSITIONING, RULES AND REGULATIONS
Generally, a vessel will have to comply with a set of rules and regulations
- National Authority requirements- Classification Society Rules- Client's requirements
The Norwegian Maritime Directorate, NMD, have issued Guidelines onPositioning Systems for Mobile Offshore Units.
In order to balance the reliability requirements against the consequence offailure in the position keeping systems, a concept of consequence classes hasbeen adopted. Thus a given type of operation will be assigned a consequenceclass to be evaluated for acceptance by NMD based on a proposal from theowner.
Based on an assessment of operational consequence potentials the conse-quence classes are defined as follows:
Class 0: Operations where the positioning function is notconsidered to endanger human lives, or cause majordamage in case of failure.
Class 1: Operations where damage or pollution of smallconsequence may occur in case of failure of thepositioning capability.
Class 2: Operations where failure of positioning capability maycause pollution and damage with large economic
* consequences, or personnel injury.
Class 3: Operations where fatal accidents, or severe pollution anddamage with large economic consequences are probableresults of loss of position.
Associated with each of the consequence classes the DP-systein must be ableto meet the following single failure situations without losing position.
TEKNO\ENG\KSA\KSA 143-N Page 4.1

1. For consequence class 0, it is accepted that a single failure may leadto the vessel losing position keeping capability.
2. For consequence class 1 the single failure should include all componentsimportant for positioning measuring and thruster control.
3. For consequence class 2, the single failure includes any one componentor system. Non-moving components such as cables, pipes, manual valvesetc. may not need to be considered to fail if the systems are wellprotected from mechanical damage, and adequate reliability can bedocumented. A single act of maloperation is defined as a single failure.
4. For conseuqnece class 3, the single failure has not exemptions. Itincludes any one component or system and failures due to fire in anyone room where fire can occur and failures due to leakage from pipesin any one room or flooding of any one room adjacent to the sea. Thesingle failure includes failure of cables and piping etc. in any of therooms considered for fire, leakage or flooding that in any way can beaffected by such a failure. A single act of maloperation is defined asa single failure.
On this basis the requirements to vessel equipment and arrangement has beenderived. The requirements or the different consequence classes aresummarized in the following table.
TEKNO\ENGNKSA\KSA 143-N Page 4.2

Subsystem or Minimum requirementscomponent
0 1 2 3
Power SystemGenerators and Non-red. Non-red. Redundant Redundantprime movers separate
compartments
Main switchboard 1 1 1 with 2 (bus-tiebus-tie normally open)
separate comp.
Bus tie-breaker 0 0 1 2
Distribution Non-red. Non-red. Redundant Redundant,system through separate
Ship power compartmentsmanagementw. thrustpreference No No Yes Yes
Thrusters Non-red. Non-red. Redundant Redundant,Arrangement, separate,no.of thrusters compartments
Control 3 whereofAuto control:No. of control 1 1 2 1 in altern.computers cont.station
Man.control: Yes andJoystick with No indepen- Yes Yesauto. head dent
Single levers Yes Yes Yes Yesfor eachthruster
Pos. ref. syst. 1 2 3 3 whereof 1 inalt.cont.stat.
Ext.sensors Wind 1 2 3 2 where of 1in alt. cont.station
VRS 1 2 2 2"Gyro 1 2 2 3 "
Other necessary 1 2 2 2 "Sensors
UPS 0 1 1 2 whereof 1 inalt cont.station
Altern. control No No No Yesstation forback-up unit
Printer for reg.& explain.alarms No Yes Yes Yes
TEKNC\ENG\KSA\KSA143-N Page 4.3

Det norsk Veritas have class notation for Dynamic Positioning Systems. Thesystems for dynamic positioning of vessels are divided into five groupsdependent on DP-system layout:
Group T A semi-automatic position keepingsystem without redundancy.
Group AUTS An automatic position keeping sys-tem without redundancy.
Group AUT An automatic position keeping sys-tem, with a remote thrust controlback-up and a position reference
_ _ __- back-up.Group AUTR An automatic position keeping sys-
tem with redundancy in technical de.sign.
Group AUTRO An automatic position keeping sys-0 ____ tern with redundancy in technical de-sign and physical arrangement.
These class notations arc equivalent and correspond to the NMD class systemas follows:
NMD consequence glass DnV class notation
not applicable DYNPOS TNMD Class 0 DYNPOS AUTSNMD Class 1 DYNPOS AUTNMD Class 2 DYNPOS AUTRNMD Class 3 DYNPOS AUTRO
TEKNO\ENG\KSA\KSA 143-N Page 4.4

The DnV requirements are summarized in the following table
Table El System arrangement.Subsystem or component Minimum requirements for group designations
T AUTS AUT AUTR AUTROPower sys- Generators and prime Non- Non- Non- Redundant Redundant separatetern movers redundant redundant redundant compartments
Main switchboard I I i with bus- 2 w•itn normally opentie bus-ties in separate com-
_partments
Bus-tie breaker 0 0 0 IDistribution system Non- Non- Non- Redundant Redundant. through seo-
redundant -redundant redundant arate compartmentsPower management No No No Yes Yes
Thrusters Arrangement of thrusters Non- Non- Non- Redundant Redundant. in separateredundant redundant redundant cumpartments
Control Auto control; no. of 0 I 1 2 2 - I in alternate con-computer systems trol stationManual control: joystick Yes No Yes Yes Yeswith auto headingSingle levers for each Yes Yes Yes Yes Yes
_ thrusterSensors Pos. ref. systems 0 1 2 3 3 whereof I in alternate
control stationExternal Wind 0 I I 2 2 Whereof Isensors VRS .I 2 2 in alternate
- controlGyro corn- I I I 2 3 stationpass
Other nec- n.a I2essarv sen-;ors
UPS 0 0 1 I I - I in separate com-_I :partment
Alternate control station for back-up No No No No Yes* unit _
TEKNO\ENG\KSA\KSA 143-N Page 4.5

A vessel that is built to obtain a certain class may also be operated in lowerclasses at any time when the vessel is intact. This may also be the case whenfor instance maintenance is going on and certain components are out ofoperation.
A consequence analyses shall be carried out to evaluate the effect of failuresthat may occur. The analysis shall clearly identify the effect on the vesselsoperational class of any configuration of components that are out of operation.
Examples of operations that may be carried out under the different0 consequence classes, according to our understanding:
NMD Class 0:
Vessel waiting on weatherVessel in transitLoading/unloading and bunkering vessel/vessel and platformnvesselROV operations outside platform safety zones.
NMD Class 1
- ROV operations within platform safety zones, depending on winddirection being towards or away from the fixed installation.
NMD Class 2:
- Normal diving operation when the divers have free retreat route fromworking position to diving bell.
- Crane operations, small to medium size.
NMD Class 3:
- Habitat welding with dry transfer of divers.- Diving inside structures where the divers retreat route to the bell is
narrow or restricted.- Crane operations with large load.- DP accommodation platforms that are positioned close to other structures
will be Class 3 due to the high number of people on board.
TEKNO.ENG\KSA\KSA 143-N Page 4.6

- Drilling platforms will be Class 3 when they are in contact withhydrocarbons, but also in the early phase of drilling due to risk ofshallow gas pockets.
- Well stimulation is regarded as Class 1 operation if the vessel systemsare connected to another installation and not to the well. If, however, thevessel is connected directly to the well it will be a Class 3operation.
In addition to the above it is the privilege of the one who pays the bill toset his own requirements. Thus the oil companies issue their own "Standardsfor Marine Operations". These requirements may go further than the nationalauthorities.
We have lately seen requirement that all diving to be carried out within thesafety zone around a structure shall be Class 3.
We have also seen tendency to increase class requirements for other jobs tobe done within the safety zones.
'For foreign vessels operating in the Norwegian sector the Norwegian oilcompanies will normally require a "Letter of Compliance" which basicallymeans that the vessel shall be classified in a "recognized" classificationsociety and comply with NMD requirements.
TEKNO\ENG\KSA\KSA 143-N Page 4.7

Section Five
VESSEL FEATURES
5.1 ACCOMMODATION
Underwater operations often are very complicated and require specialisedequipment and personnel. It is important that the accommodation and cateringsystem has the necessary capacity to serve a large number of people on a 24hour per day basis.
The number of people required on board will vary within wide rangesdependent on the type of operation and equipment involved.
For a deepwater construction job that involves hyperbaric welding thepersonnel requirement on board could amount as follows:
Marine Crew and Riggers 32Divers and Diving Support Personnel 35Hyperbaric Welding System 11Obs-ROV and Work-ROV 10Project Management and Engineers 6Service Personnel for Specialised Equipment 4Clients' representatives 6
Total 104
On many vessels accommodation capacity can be a limiting factor for some0. operations. Seaway had to rebuild the Seaway Pelican and increase theaccommodation capacity in order to get a long term diving support contract.
5.2 NAVIGATION, TRACKING SURVEILLANCE AND0 -COMMUNICATION
Two aspects of position control are of equal vital importance.
- maintain correct position of the surface vessel- control and monitor the position of underwater equipment relative to the
vessel
TEKNO\ENG\KSA\KSA 143-N Page 5.1

For efficient and safe conduct of the project it is important to have goodsurveillance and communication between the different operational groups. Theproject management needs to communicate efficiently with
- Vessel master and bridge- Diving control- Obs - ROV control- Work - RQV control- Field engineer- Deck/foreman- Specialist subcontractor, if any- Client rep.- Platform, if the vessel is working close to a platform- Other vessels
5.3 DECK AREA, STRENGTH, CARRYING CAPACITY
The deck space available for project equipment can be a limiting factor, Itis important that the deck strength and carrying capacity is high. Heavypieces of equipment often may impose large concentrated loads on the deck.As the available space often is limited one is not always free to choose thisexact position for the cargo. Another restriction may be the handling routeand the reach of the crane.
Equipment like reels for cable and flexible pipe give high concentrated loadsand high centre of gravity. On such installation projects we have been closeto the limits on deadweight, stability and local deck strength at the sametime.
.5.4 CRANE
The capacity and characteristics of the cranes often are limiting factors for
certain operations. Several factors have to be taken into consideration suchas
- weight of cargo- requirements to hook height due to spreader beam and sling
arrangement- horisontal reach- possibility to control the cargo motions during swing-out- cargo sensitivity to vertical motions at set down.
TEKNO\ENG\KSA\KSA 143-N Page 5.2

\I
(-
"H
g
-J -o----P -H'
- I'

4-li;3
Cr - -
ct.-- -~ 40 5E
7 I -
S
/1 ~lo~ * *
it,*~
K --- 2
I 1± - 'I-C' -,
K ] / ii-I
~¾
-
4In
/
0

C0
I i t A
------t .. . . ~j

The crane capacity required to do certain lifting operations offshore arenormally evaluated by calculating the Dynamic Lifting Weight according toDet norske Veritas "Standard for Insurance Warranty Surveys in MarineOperations". This calculation includes a weight inaccuracy factor, materialfactor, design factor and a dynamic amplification factor. As a result of thisthe SWL of the crane will have to be significantly higher than the estimatedweight of the cargo.
The control of cargo motions during swing-out is usually done by use oftugger winches. But this may not always be easy.
It is of great help if the vessel is equipped with more than one crane. The"Seaway Harrier" has two 60T cranes located 28 m apart. This has provento be a very efficient and workable arrangement. See fig. 5.4.1 and 5.4.2.
5.5 DIVING SYSTEM
The diving systems can be configurated in many ways, as can be seen fromthe technical data sheets.
The arrangement of the diving system affects the whole lay-out of this vessel.The corresponding safety requirements are reflected in the NMD regulationsand consequence class system.
Safety as well as operation efficiency calls for two independent diving bells.The vessels should have cursor system to take them safely through the splashzone.
In order to reduce weather sensitivity the bell handling systems should beheave compensated. But when it comes to docking the diving bell onto awelding habitat for dry transfer of divers, heave compensation on the bellhandling system is a must.
5.6 THE MODULE HANDLING SYSTEM ON "SEAWAY CONDOR"
Seaway has together with Elf Aquitaine Norge A/S developed a modulehandling system for installation/recovery of subsea well modules. Thehandling system is designed to be operated on board the DSV "SeawayCondor", ref. Fig. 5.6.1 and 5.6.2. See also Appendix F.
TEKNO\ENG\KSA\KSA143-N Page 5.3

The system has been successfully used on the East Frigg Field since 1989.In addition to module handling the system also has been utilised for cablelaying and connection.
The system consists of horizontal and vertical module handling equipment,operated on the deck and through the working moonpool. It includes all thenecessary equipment for the following operations:
- Longitudinal and transverse transportation of modules and tools on deck,without free lifting operations.0 - Lifting of modules and tools through moonpool. During these operationsthe modules/tools are guided by a cursor system.
- Deployment of modules/tools in an actively heave compensated mode(motion compensation of a freely suspended load) or in uncompensatedmode.
- Establishment of a low constant tension in the lift wire after landing ofmodule/tool on template.
- Controlled increase in lift wire tension during the pick-up sequence,while the system compensates for vessel vertical movements.
- Retrieval of modules/tools in a passively compensated mode or acombination of active and passive compensation, where the passive partfunctions as a back-up shock absorber.
OPERATIONAL CRITEIIA
Max. wave height for operations: 3 mMax. pitch/roll for operations: +/- 5 deg.Active compensator stroke selection. Load amplitude +/- 2.0 inPassive compensator stroke selection. Load amplitude 1.12 m
The following gives design details of the handling system.
DESIGN CRITERIA
Design heave velocity 1.5 m/sDesign heave acceleration 1.7 m/s2Design roll +/-4 deg.Design pitch +/- 4 deg.Max. load to be handled with passive compensator 550kNCorresponding significant wave height 2.0 m
TEKNO\ENG\KSA\KSA143-N Page 5.4

Max. load to be handled with active compensator 200 kNCorresponding significant wave height 3.0 mNominal lifting speed at max. load 15 m/minMax. module size in moonpool 5.5 x 5.5 m wide
DESCRIPTION OF THE HORIZONTAL MODULE HANDLING SYSTEM
The horizontal module handling system consists of the following maincomponents:- Deck rail system
0w - Tugger winches- Module pallets- Moonpool doors
The deck rails consist of steel HE-B beam sections laid out and bolted to thedeck in a network system, to skid the modules on their pallets from theirstorage positions to the moonpool. The network has seven sidetracks forstoring modules and tools.
Two 10 ton tugger winches are used as pull and holdback means for theskidding of the modules on their pallets. The winches are mounted on eitherside of the aft deck, welded to the deck supports.
The wires lead forward and can be rigged in various configurations, over andaround specified roller guides to provide a pull and holdback arrangement tothe module pallets in both lateral and longitudinal horizontal directions.
Module pallets are designed to support the various modules during skiddingand storage.
The main moonpool door consists of two main 'I' beam steel sectionssupporting steel plate. The door is secured when closed by two door stopperswhich are operated hydraulically from the moonpool door control console.
DESCRIPTION OF THE VERTICAL MODULE HANDLING SYSTEM
The vertical module handling system consists of the following maincomponents.
- Main winch- Heave compensation system
TEKNO\ENG\KSA\KSA1 43-N Page 5.5

-Guideline system- Umbilical handling system- Cursors- Control and power pack containers
The main lifting winch has a single looped block with SWL of 65 tonnes anda depth capability in a double wire mode of 180 meters. The system can beused in a single wire mode with a SWL of 32.5 tonnes and a depthcapability of 380 metres.
The heave compensation system consists of one active and one passivecompensator. The two systems are completely independent of each other.
The active compensator alone is used for stabilising a freely suspended load.The load shall be between limits 5 tons and 20 tons.This compensator is usedonly during the last phase of a deployment, when landing the load.
The passive compensator is in effect a taut-wire device, in which the wiretension may be varied between 2OkN and 200kN. During deployment thepassive compensator is "dead", i.e. in its extreme outer position, correspon-ding to a low system pressure. When the load is situated on the template,the passive compensator maintains a low or moderate wire tension. Prior toa lift-off operation the system pressure may be increased, by pumping gasinto the accumulator, to pit-tension the wire before lift-off is initiated.
The guideline system consists of four guideline compensators, four winches,a common accumulator section and a common power pack for the fourwinches.
The guideline compensator will maintain the tension between an upper anda lower limit of 1-5 tons as the vessel heaves.
A hydraulically powered friction sheave is mounted on the derrick topplatform for umbilical handling. This system is designed to keep a constanttension in the umbilical during deployment or retrieval. The constant tensionfunction is obtained whether the module is stationary at the seafloor or isbeing deployed/retrieved.
The cursor system consists of two cursor frames (upper & lower) and fourvertical guide rails running down the derrick corner beams from the topplatform down to the bottom of the moonpool.
TEKNO\ENG\KSA\KSA 143-N Page 5.6

ACTI1VE UBLCLSEV
PASSIVE
I V EAVE COMPENSATO
LIPPER QJROR
FiG. LEVE
HANDLING DERRICK - GENERAL ARRANGEMENT

(no
U-z
(N 0
I6Li- i- -
Oz

The upper cursor function is to stabilize the main lifting block as it is movedup and down in the derrick and moonpool, and to prevent it from beingaffected by vessel and marine environment movements.
The lower cursor main function is to stabilise tools and modules connectedto the main block as they hang in the derrick and pass through the moonpool.
The Control and Power Pack Containers contain all control and powerfacilities to operate the module handling system. The handling system canthus easily be mobilised and demobilised on the vessel according to needs.
5.7 ROV LAUNCH AND RECOVERY SYSTEM (LARS)
Seaway use TRITON as WORK-ROV. The TRITON is eqnipped with aTeather Management System, TMS. At launch and recovery the Triton isconnected to the TMS and lifted by the umbilical which is an armouredcable.
When the vessel is heaving the TMS will follow the motions even if it is atlarge waterdepth. The teather (umbilical) between the TMS and the ROV islight and not intended for heavy loads. When the vessel is heaving it hasbeen a problem to dock the ROV to the TMS without damaging thingsbecause it is impossible to swim the ROV so that it follows the TMS heavemotions.
This problem appeared to be limiting operational factor in heavy seastate.
Together with a crane manufacturer Seaway developed the ROV Launch andRecovery System, LARS. See the figures 5.7.1 and 5.7.2. The LARS is a
0heave compensated handling system. It is designed to attach the TMS 6 mout from the ship's side and 6 mn below deck level. From this position theTMS/ROV is lifted without pendulum action direct into the parking positionwithin the LARS A-frame.
The first LARS was delivered in March 1991 and the experience so far isthat operational safety is significantly improved and launch/recovery is nolonger a limiting factor for the operations.
TEKNO\ENG\KSA\KSA 143-N Page 5.7

The design parametres for the LARS are:
Safe Working Load 5.5 t
Vertical amplitude +/- 3.8 mMax. accelleration 1.6 m/S 2
Corresponding waveheight I-:, = 4,5 m
TEKNO\ENG\KSA\KSA 143-N Page 5.8

/
VESSEL DECK -- - /
POSITION: TRANSPORT VESSEL SIDE
POSITION: ROV PARKED
+i• . TMS
POSITION: INTERMEDIATE
TRITON-ROV
Fig. No. 5.7.1
ROV Launch and Recovery System

POSITION: WORKING CLOSE(Heave comp.)
POSITION: WORKING EXTREME(Heave comp.)
Fig. No. 5.7.2
ROV Launch and Recovery System

Section Six
MONOHULL VERSUS SEMISUBMERSIBLE RIG
6.0 The features required for efficient surface support can obviously beaccomplished in different vessel layouts.
The two main concepts are monohull and semisubmersible rig. The layoutand arrangements will be different, but both concepts can offer good workingplatforms and efficient solutions.
A rig will normally have better motion characteristics than a monohull anda square and functional deck layout. Good and efficient functionalities maybe arranged, and the motion characteristics makes it less weather sensible.Thus a rig could have more operation days per year.
However, the question is not always that simple. The offshore work in theNorth Sea is mainly summer season work. The vessels usually lie idle duringseveral months in the winder due to the way the oil companies scheduletheir work.
Due to this the rigs do not get the full challenge to their capability ofworking in bad weather so the difference in number of efficient working daysper year compared to a well equipped monohulls is not so very big.
The problem of working in bad weather is mainly the problem of motionsand handling of equipment on deck and through the wave zone as well asthe problems of station keeping.
The problem of motions was previously solved by use of passive motioncompensators and by building the vessels as semisubmersible platforms.However, the later years have brought to the market computerized activeheave compensation systems, and these systems now allow a variety ofhandling operations to be performed safely also from monohulls.
The problem of handling equipment on deck is less on a rig than on amonohull due to better motion characteristics. However, the use of crane forlifting and moving equipment around on deck will always be a dangerousoperation, also on a rig. Even rig motions will cause pendulum effects, andtugger winches will always have to be used to control the motions.
TEKNO\ENG\KSA\KSA 143-N Page 6.1

Crane operations for moving cargo and equipment on deck and through thewave zone very often are the limiting factors for operation due to weathersensitivity.
The problem may often be solved when the cargo is well down into thewater. And in this respect the monohull has a preference as the distance oflifting from deck to sea is shorter. The distance of handling the uncontrolledpendulum can be made short. Reference is made to the ROV launch andrecovery system.
When the cargo is well down in the water the hydrodynamic drag and theactive heave compensation system on the crane will together make theoperation feasible.
0 With respect to handling of cargo on deck reference is also made to the"Seaway Condor" module handling system where the modules are moved ondeck on skidding beams instead of being lifted. With this system the modulescan be moved around on deck in any weather.
The problem of station keeping is a question of anchoring and/or dynamicpositioning. Some of the rigs have anchoring systems in addition to DRAnchoring is a very reliable and good solution in locations where the waterdepth is suitable, the space allows deployment of the anchor pattern and thejob will last so long that the cost of the anchor handling can be justified.
A semisub. will have relatively low transit speed compared to a monohull.This is of importance when going from one small job to another.
However, in congested areas, in locations with templates and pipelines on the0 seabed, in deep waters, for short duration jobs and for jobs with movingvessel as for instance cable laying, the DP positioning and station keepingwill be preferred.
Often the support vessel must work very close to fixed platforms. This ispartly due to the limited distance a diver can swim away from the bell. Arig will have larger draught and pontoons protruding subsea, but will also behigher above the sea level and have problems of getting under the decks ofthe platforms. So for these reasons it often can be easier to position amonohull on a worksite close to a platform.
TEKNO\ENG\KSA\KSA 143-N Page 6.2

When we then consider the requirements to a consequence class 3 DP-vesselwith full redundancy the requirements to deck area, deadweight and carryingcapacity and study the corresponding dimensions of hull size, light shipweight and building costs in order to comply with a given set of require-ments, one may well end up with a preference for monohull.
The final preference will probably be dependent on the market segment thevessel is intended for, the main geographical area and the potential forutilisation days per year.
TEKNO\ENG\KSA\KSA143-N Page 6.3

Section Seven
TRENDS OF DEVELOPMENT
7.0 Seaway has studied the trends in development of offshore obil and gass fieldsand combined with our own experience from working in the field we havean ongoing programme for development of new technology. Within thisdevelopment programme we are also looking at a new generation of subseasupport vessel.
The development project "Subsea Support Vessel for the 1990'ies" was statedin 1988 in order to coordinate our development efforts within several areasrelated to diving and ROV operations. The aim has been to provide results
* "from the different development areas in such a form that they can be appliedto specify Seaway's underwater support vessel and work procedures for thefuture. Some sub-projects have already resulted in systems and methods inoperation on our existing vessels.
Primary functions for the vessel have been defined as follows:- Diving related to IMR, construction work and contingency, especially for
deep water diving.-ROV-operations related to the diving operations and intervention work
where the ROV is used as a stand-alone vehicle.Also module handling, well services and laying of cables and flexibleflowlines have been defined as functions possible to adopt to the vessel.
Today, the status is as follows for the different sub-projects which have beendefined into this project.
GENERAL ARRANGEMENT AND SPECIFICATION FOR A NEWMONOHULL VESSEL FOR UNDERWATER OPERATIONS
A concept has been developed and is now being further detailed in order toprepare a specification for the vessel.
Today, the vessel measures 100 x 20 m, has 6 azimuth thrusters for optimalstation keeping capabilities and a flush working deck of approx. 1800 M 2.Lifting capacity is 2 x 150 tons. The diving system consists of 8 chambers,
each containing 3 divers. The two bells can be mated on the top of thechambers through utilizing a turret system. Diving capabilities are down to450 m.s.w.
TEKNO\ENG\KSA\KSA 143-N Page 7.1

Two ROVs with dedicated handling systems will be implemented in thevessel. These are one work-ROV type for complicated work tasks and divingassistance (DIVEROV), and one observation ROV.
The design of the hull is innovative and has been optimilized for bestpossible motion characteristics when staying in a fixed position.
The creative new hull design and heave and roll movement compensationsystems are configured to achieve work ability near to a senmi submersiblevessel.
CREW OPTIMIZING THROUGH IMPLEMENTATION OF NEWTECHNOLOGY AND MULTI FUNCTION POSITIONS
MAKE THE CHAMBER CONTROL AND DIVING CONTROL MOREEFFECTIVE THROUGH POSSIBLE AUTOMIZATION OF FUNCTIONSAND ERGONOMIC STUDIES
A preliminary report has been prepared stating possible functions that can beautomatically controlled, logged and documented. Further, a possible lay-out for the chamber control and the diving/ROV-control has been proposed.The study has been based on utilizing a modem computer based controlsystem, similar to what is being used in the process industry. We havedeparted from mechanical connections and valves, and have replaced themwith electronics. Still manual override from decentralized panels will bepossible.
IMPROVE THE "LIVING STANDARD" AND ENVIRONMENTAL0CONDITIONS IN THE HYPERBARIC CHAMBERS
IMPROVE THE TOTAL WORK EFFICIENCY THROUGH THE USE OF0 DIVERS AND ROV IN COMBINED OPERATIONS
TEKNO\ENG"\KS A\KS A 143-N Page 7.2

WIDEN THE WEATHER WINDOW BY THE USE OF HEAVE COMPEN-SATED LIFTING SYSTEMS
These results and of course our operational experience with alreadyimplemented systems (module handling system on the DSV "Seaway Condor",new 120 t crane on the DSV "Seaway Pelican" and new bell handling systemon "Seaway Pelican") will be used to specify the lifting- and handlingsystems for the new vessel. The module handling system on "SeawayCondor" has been described more in detail in Ch. 5.6.
In fact, as we can see it today, the rolling of the vessel will in many casesbe more critical than the heave. We have therefore started to look at possiblemeans to counteract the rolling movements, and have some new ideas thatnow are being evaluated.
IMPROVE EFFICIENCY BY IMPLEMENTING NEW COMMUNICATIONSYSTEMS
IMPROVE EFFICIENCY FOR BRIDGE AND ENGINEI CONTROLFUNCTIONS BY AUTOMIZATION OF FUNCTIONS AND UTILIZATIONOF MULTI FUNCTION POSITIONS FOR THE PERSONNEL
TEKNO\ENG\KSA\KSA 143-N Page 7.3

* APPENDICES
ThKNO\ENG\KSA\KSA143-N Page 1. 1

Appendix A SPEC. "SEAWAY PELICAN", GA+ PARTICULARS
TEKNO\ENG\KSA\KSA 143-B Page AI.1

Jr - V. f ~ -~' ITI
I I ý I I '
~' ~ '1¾4
.bI_....... I.i
*:. II I
( 4j jIJ4$..a. 9 #27' I f:~1
o;T'',J ' 1 ,I, P

MODIFIED OUTLINE SPECIFICATION
"SEAWAY PELICAN"
INSPECTION, MAINTENANCE, DIVING SUPPORT VESSEL
REBUILDING MARCH 1990
GENERAL
Seaway Pelican is a diving support vessel (DSV) that has been designed to effectivelyperform inspection, maintenance and repair of platforms, pipelines and other installa-tions. The diving system can support 18 divers under working pressure and has two3-men diving bells launched through individual moonpools. The main components ofthe diving system are concentrated in one area and arranged to provide the best possible .safety and living comfort for the divers and simultaneously facilitate efficient divingoperations.
The compact arrangement allows for a spacious accommodation section for 107 persons.and 800 mt deck area.
The vessel is equipped with diesel-electric propulsion with full redundancy throughout,so that no single failure of a main component will disable the vessel. This ensures thatthe vessel can always remain in position and safely recover and support the diversshould a failure of a main component occur.
CLASSIFICATION AND REGULATIONS
* Det norske Veritas + lAl, DSV I, DSV M, DYNPOS, EO, F-AMC, HELDK, SF withregister notations: AUTRO (ERN 99,99,99), bis, dk + hl(1,7), pwdk.
The vessel meets all applicable regulations of Norwegian Regulatory Authorities for allloading and working conditions and for worldwide service. The vessel. also satisfiesNMD's demands for operation in consequence-class 3 with no comments in Annex 2.
OMB043-O.WP5 Rev.: 27.06.91 Page 1 of 5

RIVESSEL PARTICULARS AND CAPACITIES
Length overall 94.10 mLength Pr. 79.50 mBreadth 18.00 mDepth to main deck 9.0/9.50 mDepth to upper deck 15.00 mDraft 6.25 m
, Free deck area 800 mn2
Deck load 130 n = 1tm670 n9 = 10 tOn?
Deadweight abt. 2.000 tS Gross tonnage 4763 tFuel oil 1.200 mn3
Water oil 1000 tPotable water 400 mn'Stabilizing tank 250 in'Anti heeling tank 1475 t mCargo Hold (BxLxH) 7.2 m x 5.4 m
x5.4 mHatch cover opening (BxL) 7.1 m x 5.29 m
POWER AND PROPULSION
Diesel electric power plant 4 x 3000 kwAzimuth thruster, stem 2 x 2757 kw' Side thruster, stem 1 x 912 kw
,0 Side thruster, forward 3 x 1100 kwMax speed (supply mode) 14.3 knotsFuel consumption at cruising speed14 knots 28 t/dayS Fuel consumption in dyn.pos. mode 13 t/dayFuel consumption at stand-by 4 - 7.5 t/dayLubricant consumption 1% of fuel cons.
OMB043-O.WP5 Rev.: 27.06.91 Page 2 of 5

DYNAMIC POSITIONING SYSTEM (MAIN SYSTEM)
The vessel is fitted with SIMRAD Albatross 503 MK II Dynamic Positioning Systemthat includes dual computers and basic reference systems: Hydroacoustic system (HRP)with two retractable transducers, two vertical taut wire systems of moonpool type,Artemis position reference system and interface for Microfix and Syledis referencesystems.
0 The vessel can also be operated by a secondary computer system ADP-700 from theemergency bridge and is supported by a redundant battery system with 30 minuteslifetime, in case the main power supply should fail.
DIVING SYSTEM
The diving system meets classification requirements of Det norske Veritas and allNorwegian Regulatory Authorities. The system is rated for 450 meters waterdepth andincludes two diving bell launched through separate moonpools. The diving systemcomprises the following main components:
- Two diving bells, each for three men- Two transfer locks with sanitary facilities- Two living chamber sections, each for 6 men- One decompression chamber for 6 men with sanitary
facilities- Two equipment locks (dia 600 mm) mounted on the transfer locks- Two 16 men hyperbaric lifeboats.- Independent bell handling system for both bells with active and passive
heave compensation- Complete back-up facilities for the life support system- Permanent gas storage 12.300 mn- One decompression air chamber
MOONPOOLS
Two diving moonpool each 3.6 x 3.4 mOne work moonpool 6.6 x 7.2 m
OMB043-O.WP5 Rev.: 27.06.91 Page 3 of 5

WORKING AREAS
Approximately 670 m2 unobstructed deck space on main deck with 10t/r 2 loadcapability, and an additional deck space above winch house with 1 trnm load capability.
LIFTING CAPACITY
One 120 tonn actively motion-compensated crane (100 t/10 m or 50 t/20 m). Wirecapacity for operation to 450 meters water depth. An optional, extended boom for 30035 m above deck or 34 m outreach can be fitted Two fixed telescopic cranes, each. 5 t/8 - 12 m.
MOORING WINCHES AND ANCHORS
Two electro-hydraulic windlasses with disengageable cable lifters for 44 m K-3 anchorchain. Storage capacity for 900 meters of K-3 chain. Two anchors, each weighing2.300 kg.
ACCOMMODATION
The vessel has been provided for 107 persons in single and double cabins, each withshower and toilet. A 2-bed hospital has been installed in addition to a 1-bed treatmentroom.
STABILIZING/ANTI HEELING SYSTEM
One passive stabilizing tank is located below main deck. The tank is operated by usingballast water. One active anti-heel system has also been installed with capacity of1475tm in 15 minutes. Pump capacity 1500 m3/h.
NAVIGATION EQUIPMENT
The vessel has been fitted with required navigation equipment which includes; tworadars, gyro compass, echo sounder, autopilot and satellite navigation.
OMB043-O.WP5 Rev.: 27.06.91 Page 4 of 5

COMMUNICATION EQUIPMENT
The vessel has been provided with satellite communication, two main radio transceivers,telex, weather chart facsimile, helicopter radio plant, audio-visual entertainment systemfor the accommodation section, and telephone system to all cabins and rooms onboard.
HELIDECK
The vessel is equipped with a helideck suitable for Super Puma helicopters andstrengthened for Sikorsky S-61. Lashing/lugs for both types is provided anddispensation for S-61 has been obtained.
R
S
0
0MB043-Q.WP5 Rev.: 27.06.91 Page 5 of 5

0 Appendix B GA + PARTICULARS"SEAWAY OSPREY"
0
0
TEKNQ\ENGKS A\KS A 143 -N Page B1.1

64.
Ilk -
S *tlln D~hdrnm
-o ' deep
Stolt-Nielsen Seaway I

-. 6 0 " 0 .
Seaway Osprey is managed and operated byStolt-Nielsen Seaway. She is a modern 100 metreclass diving support vessel and ranks as one of themost versatile and efficient vessels for subseaconstruction and IRM work (Inspection, Repair andMaintenance). With impressive station-keeping andstabilisation capabilities, Seaway Osprey has the
* highest possible rating for rough weather operation.The vessel's Dynamic Position (DP) system holds theNorwegian Maritime Directorate Class 3. Otherfeatures include dual cranes, 70 + 40 tonnes, and aunique moonpool arrangement.
,
F . ' .
. . . . . . . . . . .-.... ........:.< ~: .
~~a)
04

330,
,:~ ' ••60'
-1,%--. .,-. 90
V /
4 azimuth thrusters and 2 tunnel /thrusters /
210"
W •Dynamic positioning
Ir capability graph
"' " 8 x 7.8 m work moonpoolIncreased versatility and safety in theEMhandling and deployment of modulesare achieved by the unique horisontalsliding door over the moonpool. Inorder to facilitate handling operations,underwater tools and equipment. (e.g.hydraulic hoses, HP water-jetting,oxy-arc burning umbilical) are locatedin moonpoot walls.
Two heavy-duty and one servicecrane. 900m2 unobstructed deck area.
.. . .. . ... . .. . .. ...... .
2. L t 5mt. .5M

General Living chiihomers - DDC 5 and 6The diving system meets classification requirements of Two identical units with accommodation for a total of 16 divers.Det Norske Veritas and all Norwegian Regulatory Max. working pressure 45 barAuthorities. The system is today rated for water depth External diameter 2300 mm
of 450 metres and accomodates 16 divers in two, Unit length 8700 mmspacious living chambers. 2 large 3-men diving bells Unit volume 33.25 m'
(7.5 m3) are deployed through two separatemoonpools. Both bell handling systems are heave Decompression chamber - DDC 7compensated and comprise separate power packs, Max. working pressure 45 bar
winches, cursors and bell guide-wires. External diameter 2300 mmThe two diving bells are sidemounted, which keep bell Unit length 5400 mmturn-around time to a minimum. The bells are mounted Unit volume 16 m3
on two separate transfer chambers, allowing for Unit capacity four diverssplit-level diving in a time-efficient manner. Thechamber environment is controlled by a completely Transfer chambers -welpots 3 and 4external Life Support System. Max. working pressure 45 bar
External diameter 2300 mmUnit length 4000 mm"• ~~~Gas reclaimUntvlm1.8m
A gas reclaim system for both chamber and bell-diver gas is Unit volume 13.8 i3installed. Trunking
Gas storage Max. working pressure 45 bar
Permanent storage for 12,000 M3 of gas is provided below External diameter 800 mhe.Unit length 5500 mmTwo spheres (golf balls):
Mix-maker Diameter 1500 mm
A Gyro Star mix-maker is litted for onboard preparation of Total volume 7 in
requisite gas mixes. Hyperbaric lifeboat - HBL
Monitoring Type Draeger 45-16
A deep dive computer-controlled monitoring system handles MaxL working pressure 45 bar
atmosphere data collection, processing and transfer to the Length 10040 mm
corresponding control stations located in: Max. height 40 mm
dive control Maxt 4400 mm
saturation office Draft 1300 mm
operations office Volume 10.6 M3
Diver capacity 16
Communication Crew capacity 3
A current loop technology communication system combined Max. speed 6.0 knotswith staton and modular concept, permits exceptionally good Weight incl. 19 divers/crew 17.8 tonnes
communication under hyperbaric conditions. Range (approx.) 250 miles at max.speed500 miles ateconomic speed
Diving bells (2)Max. working pressure 45 barUnit capacity three divers
- Unit volume 7.5 m3
Bottom and side door diameter 800 mmApprox. weight, air 11000 kg
I' ¾., . 4 14$Approx. weight, water 1830 kg
Distance between bell axies 8000 mmBell handling system- two cursors with cursor winches
LForward - two constant tension bell winches
- two guide-wire winches (one constant tension)- two umbilical winches- two hydraulic power packs
0 Transfer trunklng - one emergency power packLi Uving chambers Both systems are fitted with heave compensators and are
f-. 0 Sanitary chambers deployed through separate diving moonpools.
[] Decompression chamber

General Propulsion Martime Hydraulics 40 tonnes SWL craneSeaway Osprey is a multipurpose, Diesel elecrtc - main hook 40 tonnes at 10 m outreachconstruction diving support vessel (DSV) power plant 6 x 1200 kW, 3-phase, 30 lonnes at 14 m outreachthat has been designed to effectively 660 V. 60 cycles Max. hoisting speed 40 nrminperform various heavy subsea work tasks. Emergency generator 1 x 440 kW. 3-phase. - auxiliary hook 5 tonnes at 20 m outreachThe vessels large aft deck. combined with 440 V. 60 cycles Max. hoisting speed 120 nrnintwo heavy- duty cranes with a total lifting Cruising speed 1.2 knorscapacity of 110 tonnes. make Seaway Fuel consumpion at Marilime Hydraulics 5 tonnes SWL creOsprey the ultimate monohull alternative cruising speed 22 Uday 5 tonnes at 16 m outreachtor subsea construction, such as spool Fuel consumption Max. hoisting speed 100 mmin
atP 5 -l12Udaypiece installation and hyperbaric tie-ins. Luortcation oil Working areaA large work moonpool (8 Y 7.8 m) is. consumption 1 % of fuel cons. About 900 sq.m of unobstructed deck area isequipped with a sliding door arrangement. Endurance at provided on the first and second to'c sle deck,This moonpool arrangement ensures safe cruising speed 80 days capable of taking live tonnes/m 2
and efficient handling of heavy loads, suchas subsea completion modules. Thrusters MoonpoolsThe vessel is equipped with diesel electric Azimuth thrusters Two diving moonpools 4 x 3.9 mpropulsion with full redundancy - forward (two) 1100kW (excluding expansion tank)throughout, so that no single failure of a - alt (tvo) 1620 kW One work moonpool B . 7.8 mmain component will disable the vessel, Tunnel thrustersThis ensures that the vessel can always - forward (one) 590 kW Wireltning capabilitiesremain in position and salely recover and - alt tone) 590 kW The moonpool area is reinforced tosupport the divers should a failure of a Total thruster output 6620 kW accommodate a 110 s onne SWL icting der.ckmain component occur. Longitudinal thrusl 98.5 tonnes for wit lning or associated activities.Seaway Osprey has an impressive Transverse thrust 120.5 lonnes Accommodallonstation-keeping capability. The forward Quarters cerilied for 95 persons plus divers inand aft thruster sets comprise two azimuth Stabitising system saturation:and one tunnel thruster each. All azimuth An Intering computer-controlled roll damping -4 suaitsthrusters are placed below the keel which system comprising a series of flume tanks - - 10 single cabinsreduces the loss of thrust in wave surge to total volume 668 cu.m - improves the vessels - 33 double cabinsa minimum, outstanding handling capabilities. -5 four-berth cabins
Principal dimensions and capacities Dynamic positioning Helicopter deckLength overall 101.7 mattes Kongsberg Albatross Mark II system, including: Complies with civil aviation rules, suitable for:Length between - Simrad 309 SSB hydro-acoustic, including - Sikorsky S-61N
perpetndiculars 90.0 metres track-following system Super PumaBreadth moulded 19.6 metres - moonpool taut wire 'Bell 212Depth to main deck 8.0 metres lightweight taut wire - Bell 214 STDepth to 2nd to'c'sle deck 10.7 i - Artemis microwave reference systemDraft (torward thruster) 8.5 m - Syledis interface (SR3) DarkroomDeadweight 2500tonres A darkroom with E6 slide and photographicGross tonnage 5904 tones Cranage processing kits is available on request.Free deck area 1100 M2
Two heavy-duty and one service crane. Both 70Load on cargo deck 5 yM2 and 40 tonnes SWL units can be usedFuel oil 1021 ml simultaneously for installation ot spool pieces- * ,Waler ballast 1543 m3 heavy lifts up to maximum loads ofI 10 tonnes.
Potable water 513 M3
Trimming tank 688 m3 All cranes have minimum wire capacity foroperation to minimum water depth o1350 Haugesund (Main office)Classificatlon metres. Stoltenberggt. I
Hull and machinery Bureau Veritas 13/3 E P.O. Box 370PDY/MA/CAJR Pinguelv 70 tonnet SWL crane 5501 Haugesund, NorwayDP system Norwegian Maritime - main hook 70 lonnes at 14 m outreachDirectorale Class 3 40 tonnes at 20 m outreach Tel: +474 7141 0ERN 99.99.99 28 tonnes at 25 m outreach Telex: 42 483
Diving system Oet Norske Veritas max. hoisting speed 30 mramin Telefax: +474 71 36 11DSV III StavangerFlag Norwegian - auxiliary hook 15 lonnes at 26 m outreach Ovre Stokkavei 42
Max. hoisting speed 64 "Minm P.O. BOX 740
4001 Stavanger, Norway, y Tel: +474 52 75 40
Telex: 33 146 or 33 331Telelax: +474 53 44 80
AberdeenNational Hyperbaric Centre123 Ashgrove Road WestAberdeen AB2 5FA
Stolt-Nielsen SeawayA/S ScotlandTel: (0224) 662300
Haugesund TIx: 739171 NHCLGTelefax: (0224) 6843 78
Stolt-Nielsen Seaw ay (UK) Ltd. ______(22)_847
Aberdeen

0 Appendix C GA + PARTICULARS"SEAWAY HARRIER"
P
TEKNO\ENG\KSA\KSA 143-N Page C1.1

,,II
Seaway Harrier
Stolt-Nielsen.Seaway
MARINE AND SUBSEA CONTRACTORS FORSERVICES CONNECTEDWITH CONSTRUCTION,INSPECTION AND MAINTENANCE OF OFFSHORE INSTALLATIONS

............*L*MEr
wL... .... LA M
I*LNc6rI
..... .... Ash
..........

Section One
GENERAL DESCRIPTION AND SPECIFICATION
1.1 INTRODUCTION
The "SEAWAY HARRIER" has been designed and constructed as an offshorediving support, fire fighting vessel for world wide operations, but withspecial attention to the North Sea environmental condition.
The vessel was delivered in January 1985 from Framnes Mek. Verksted,Sandetlord, Norway. The hull is of a new design, based on 10 yearsexperience as a diving operator in the North Sea.
Accommodation is arranged in single or double cabins, each with separatetoilets, for a total number of 86 persons.
The vessel is equipped with two engine rooms each having two dieselgenerators delivering power to two separate switchboard rooms.
Three tunnel thrusters in the forward part of the vessel and two azimuththrusters and one tunnel thruster in the aft ship, all connected to adynamic positioning system arranged on the bridge giving "SEAWAY HARRIER"an extremely high dynamic position keeping performance.
The diving system consists of four double lock chambers, two 3-men divingbells, one hyperbaric lifeboat for 16 persons and two launch and recoverysystems on two moonpools. The design of the system allows operation atthree levels of saturation at the same time.
Four fire monitors are installed at the aft end of the ship for external firefighting. The monitors are remotely operated from the bridge. Water isdelivered from two electrical driven pumps, one in each engine room.
The vessel is fitted with one 30 tonnes crane and one 60 tonnes crane, bothat stb. side which is the vessel's working side. In adition 2 small servicecranes of 3 tonnes are arranged on upper deck stb. side covering the workingarea.
A helideck for Super Puma helicopters, or similar, is forming a part of theupper deck forward.
PSW037-X.WPT Outline specification H Rev. 3 Page 1.2

C-10 sive stbilizing tanks a installed. one fore and one aft above Ele
lower tween deck level.
1.2 CLASSIFICATION
The vessel is classified by Det norske Veritas and has been assigned thefollowing class:
0 +1AI Fire Fighter-lU DSV-I DSV-IUI DYNPOS E0 HELDKwith the following register notations:dk+, autr(99,99,99)
1.3 REGULATIONS
The vessel fulfills the Norwegian Maritime Directorate's regulations relevantto this type of vessel.
Additionally, the diving installations fulfils the relevant regulations of theNorwegian Pentoleum Directorate as well as the Department of Energy (UK).
1.4 RECOMMENDATIONS
The vessel fulfills the recommendations put forward for a diving vessel andcan stay on location with full redundancy up to sea state 7 (40 knots wind,1,6 knots current and 6 metres significant wave-height, all acting from theside).
1.5 DIMENSIONS AND PARTICULARS
Length over all 83,40 metresLength between p.p 73,07 metresBreadth moulded 19,50 metresDepth moulded to main deck 8,60 metresDraft to summer freeboard 5,75 metresAir draft at summer freeboard 25,00 metresFree deck space 1000 m2Covered deck area 140 m23 Moonpools 3,60 m x 3,60m
PSW037-X.WPT Outline specification H Rev. 3 Page 1.3

1.6 POWER AND PROPULSION
Diesel elect-ic power plant 4 x 2100 kWAzimuth thrusters, stem 2 x 1"40/680 kWSide thruster forward No. 1 and 2 2 x 920/590 kW
" 3 1 x 590 kW4 1 x 590 kW
Cruising speed loaded to summer freeboard 12 knotsFuel consumption at cruising speed 18 r/dFuel consumption (average) dyn pos 10 t/dFuel consumption at stand-by 4 - 7 t/dLubrication oil consumption 1% of fuel consumptionEndurance at cruising speed 70 daysBollard pull 50 tonnes
1.7 STEELWORK AND HULL OUTFITTING
Deadweight at summer freeboard 2354,00 connesTonnage gross 4782,00 tonnesLoad on main deck 1,5 t/m2Fuel oil 1747,3 m3Water ballast 1290,0,3Potable water 284,5 m3Lub oil 54,8 m3
CONSTRUCTION
0 The vessel is built as an offshore vessel with bulkheads arranged to coverSOLAS convention as one compartment vessel for the aft part and twocompartment vessels for the forward part. The vessel has nine transversebulkheads from tank to upper tween deck, and four continuous decks with theaft part of the main deck strengthened for 5 t6nnes per square metre.
The main deck has a number of flush mounted lugs for strapping down deckcargo.
PSW037-X.WPT Outline specification H Rev. 3. Page 1.4

1.8 HEATING AND VENTILATION
The vessel has an air condition system for the accommodation allowing
comfortable operation in bort arctic and ntopical climates.
The system is based on the following parametres:
- winter external temp - 20"Cinside temp + 20"C
- summer external temp + 35"C 70% humidityinternal temp + 29"C 50% humidity
In addition, all control rooms are separately cooled by airconditioning units.
All other compartments are mechanically ventilated.
1.9 ACCOMMODATION AND STORES
Accommodation for 86 persons is arranged as follows:
17 x 2 man cabins on lower tween deck2 x 2 man cabins on main deck5 x I man cabins on main deck
13 x 1 man cabins on upper tween deckI I x 2 man cabins on upper tween deck2 x I man cabins on upper deck6 x I man cabins on captain's deck
All cabins have a private toilet and shower room.
One large mess for 43 persons is arranged on main deck, as well as separateday room and TV-room.
Four ship offices are arranged on upper tween deck.
One office, conference room and large constu'ction drawing room arearranged on upper tween deck specially equipped for client's inspection,construction and maintenance work.
PSW037-X.WPT Outline specification H Rev. 3 Page 1.5

A sauna is installed together with a changeroom and a trimroom on tank top.
The vessel is fitted with a workshop area on maindeck, as well as a large
sentral store.
The ship's workshop is arranged with necessary tools for ship maintenance.
The ship's laundry, officer's laundry and crew's laundry are on the lowertween deck together with a clean linen room.
The bell control room is arranged on upper tween deck containing saturationbell control, air dive control and ROV control.
The chamber control room is arranged on lower tween deck.
The diving work shops store, photos and lab are arranged on the divingmachinery deck.
0
PSW037-X.WPT Outline specification H Rev. 3 Page 1.6

1P.k
.1t IL IL
JI _____ I' '-- L-4
- I __
Hrr
41. r7 -f l,+

* Appendix D GA + PARTICULARS"SEAWAY CONDOR"
TEKNO\ENG\KSA\KSA 143-N Page Di.1

R M-
-e
1 - 7.-
q~ -
runs deep
Stol-Ni-e Sewa

e away, Cndor
Seaway Condor is owned, managed and operated byStolt-Nielsen Seaway. She is a modern 100-metre class divingsupport vessel and ranks as one of the most versatile andefficient vessels for subsea construction and IRM work(Inspection, Repair and Maintenance). Seaway Condor has aspecially designed hull shape, which is optimised for "zerospeed" motions. This, together with a powerfulpropulsion/thruster configuration, gives the vessel impressivestation-keeping and stabilisation capabilities.Seaway Condor has excellent diving capabilities. At the sametime, three different diving systems can be utilised. The vesselhas a flexible 16-man, dual bell saturation diving system, twointegrated air diving systems and a purpose-built dive boatsupporting splash zone diving.
- - - - . -- - -- - . r,.•- - -_.o+ -*.
-- . -; +. +
-
7~
7E
:7-z •

O"
330", 30"
30' 4 li60'...;0jil 240' • 120'
•210' 150'
-160
Dynamic positioning capability graphZ
IP' "
The Zodiac air diving splash zone dive boat X-ray view of starboard side, showing The starboard air diving station. A similar stationcan operate 1500 m from the mother vessel, the configuration for the saturation is placed on the port side. Each station consistsThe dive boat is equipped with an aluminium diving system. of an overlooking control room, an A-framesheltered dive control, 20 m3 air bank. dual based handling system, a wet belt and an airoutlboards and communication. divin decompression chamber.
... .. r.. .. .-i ----- --.Y
- - - - - - - - - - - - - - - -I -- - - - -- - - -- - - - L ----- -
-1_ý70 1 •x. at1,"ý, 4 ta
L on",, Lyout main deck O t at 33 m A."'ir: diving station

DIVIGS S SPE IIA IN *
General Gas storageSeaway Condor's diving systems comprise a dual bell, Permanent storage for 14.100 m3 of gas is provided below16-man saturation diving system, two air diving deck.stations and one Zodiac air diving splash zone diveboat. Living chambers (3) DDC 1 DDC 2 DOC 3All systems meet classification requirements of Det Max working pressure 30 30 30 barnorske Veritas and all Norwegian Regulatory Internal diameter 2134 2134 2160 mmAuthorities. Unit length 3404 4105 3360 mm
Unit volume 11 14.5 10 m3
Unit capacity 4 4 4 diversSaturation diving systemThe saturation diving system is today rated for water depthsof 300 metres, but can easily be modified for 450 metres. Decompression chamber (1) DDC 4Observation dives can be carried out to water depths of 450 Max. working pressure 30 barmetres. 2 large 3-man diving belts (fabricated and installed in Internal diameter 2134 mm1988-90) are deployed through two separate moonpools. Unit length 3810 mmsupported by two independent bell handling systems. Heat Unit volume - 13 m3loss from the bells is kept to a minimum with only one bottom Unit capacity 4 diversdoor (dia: 800 mm) in each bell. The bells are mated to twotransfer chambers, which connect to three living chambers. Transfer chambers (3) TUPC 1 &2 TUPC 3This makes the system very flexible and allows for split-level Max. working pressure 30 30 bardiving in a time efficient manner. The chamber environment Internal diameter 2134 2160 mmis controlled by a completely external Life Support System. Unit length 2388 2240 mm
Air diving system Unit volume 8 6 miThe Air Diving System consists of two integrated air diving Hyperbaric Lifeboat (HBL)stations one on each side of the vessel, both placed Type Mollerodden/amidships. Each station is equipped with an overlooking Hardingdive control room, last and efficient A-frame based handling Max. working pressure 30 barsystem, a wet bell fitted with transparent plexi-glass hood Length 8120 mmand an air decompression chamber. Width 3160 mm
Draft 800 mmAir diving splash zone dive boat Volume (chamber) 7.2 m3The air diving splash zone dive boat is a 22 feet purpose- Diver capacity 16built Zodiac which is deployed by an integrated handling Crew capacity 3system. The dive boat supports splash zone diving Max. speed 5 knotsindependently of Seaway Condor within a range of 1500 Weighp incl. 19 divers/crew 9.5 konnesmetres. The diver communication and gas controls are Range (approx.) 200 nautical milesshielded by an aluminium housing. The dive boat is alsoequipped with a 20 m3 air bank, two 70-metre umbilicals, two Diving bells (2)50 HP outboards and VHF communication. Max. working pressure 30 barGas reclaim Unit capacity 3 diversA gas reclaim system for both chamber and bell-diver gas is Unit volume 6 m3
Bottom door diameter 800 mm0 itApprox. weight, air 9000 kgApprox. weight, water 1800 kgDistance between bell axis 7000 mmBell handling system
two cursors with cursor winches-two bell traction winchestwo bell wire storage winchesfour adjustable pull guide wire winchestwo umbilical power sheaves
two independent hydraulic power packsTO J -one emergency hydraulic power pack
F ICýWAR°
E3 Diving bells
0 Living chambers
o Sanitary/transfer chambers0 Decompression chamber

General Propulsion Working areaSeaway Condor is a multipurpose, Diesel electric About 850m 2 of unobstructed deck area isconstruction diving support vessel (DSV) power plant 6 x 1290 kW. 3-phase, provided on main deck capable of taking fivethat has been designed for efficient 660 V. 60 cycles tonnes/m2.performance of various subsea work Emergency generator 1 x 500 kW, 3-phase.
440 V, 60 cycles Moonpoolstasks. The vessel's large aft deck and Cruising speed 11.0 knots Two diving moonpoots 3 x 3.4 m70-tonne heavy-duty crane make Seaway Fuel consumption at One work moonpool 7 x 6.5 mCondor one of the most attractive cruising speed 20 tday The work moonpool is equipped with amonohull alternatives for subsea Fuel consumption hydraulically operated hatch system whichconstruction, such as spool piece on DP 6 -8 t/day covers the entire moonpool.installation and hyperbaric welding Lubrication oil Module handling propertiesoperations. consumption 1 % of fuel cons. The moonpool area is reinforced and preparedThe vessel is equipped with diesel electric Endurance at to accomodate a 60 tonnes SWL derrick withpropulsion with full redundancy cruising speed 60 days heave compensated lifting assembly and 40throughout, sothat no single failure of a Thguidewires tor module handling or associated
f Thrusters activities.main component will disable the vessel. Azimuth thrustersThis ensures that the vessel can always -ah (two) 2 x 1620 kW Accommodationremain in position and safely recover and Tunnel thrusters Quarters certified for 100 persons plus divers insupport the divers should a failure of a - forward (three) 1 x 590 kW saturation:main component occur. 2 x 1100 kW -28 single cabinsLaying of electric cables, control umbilicals - alt (one) I x 590 kW -36 double cabinsand small-diameter flowlines are other Total thruster output 6620 kW A 4-bed hospital is installed in addition to awork tasks which are suitable for Seaway Longitudinal thrust 50 tonnes treatment room.Condor. Transverse thrust 110 tonnes Helicopter deckExtremely good hydro-stabilisation Complies with civil aviation rules. suitable for:capabilities enable reels of various Slabilising system - Sikorsky S-61NSenmactive stabitising tank of total volume 700 - Super Pumadiameters and weight to be placed on the m3 - improves the vessers outstanding handling - Bell 212large aft deck. Cables, umbilicals and properties. The system reduces the vessel's roll - Bell 214 STflowlines are deployed over the 15O-tonne by 50 pct.heavy-duty stern roller which is also Darkroomsuitable for other marine operations. Dynamic positioning A darkroom is fitted with slide and print
Kongsberg Albatross Mark It system, including: processing facilities.Principal dimensions and capacities Simrad 209 HPR with 2 retractableLength overall 101.0 metres transducers Stem rollerLength between - moonpool taut wire (300 m) One heavy duty roller with diameter 1500 mmPerpendiculars 90.0 metres - lightweight taut wire (40gm) and length 1000 mm suitable for 150 t pull.Breadth moulded 19.6 metres - Artemis MK III-S microwave relerence system FrefghtngDepth to main deck 10.7 metres The vessel is fitted with an external lire-lightingDraft 5.5 m Cranage sste d to aner FiFigigDeadweight 2600 tonnes One heavy-duty crane and one pipe davit which system which corresponds to DnV's FiFi 11Gross tonnage 4513 tonnes can be used simultaneously for installation of Kongsberg gas turbines, and the four waterFree deck area 1000 M 2
spool pieces, risers etc. Both units are fitted monitors are remotely operated from the bridge.Load on cargo deck s I/m2
with an auto tension system for variable loadFuel oil 1377 m
3 setting, and have minimum wire capacity for
Water ballast 1750 m 3 operation to water depth of 300 metres. * r -
Potable water 639 m3
Trimming tank 700 m3
Liebherr 70 tonnes SWI craneTransit speed 11.0 knots - main hook 70 tonnes at 10 m outreach
20 tonnes at 25 m outreach Haugesund (Main office)Classification max. hoisting speed 28 nmin Stoltenberggt. 1Hull and machinery Det norske Veitas P.O. Box 370
+1AI. Crane, DSV Ill. - auxiliary hook 10 tonnes at 33 m outreach 5501 Haugesund, NorwayDYNPOS. EO, HELDK, Max, hoisting speed 40 m/ain Tel: .474 71 41 00*MV Telex: 42 483DP system ERN 99.99.95 ydtral. t Lgi, dayt Telefax: +474 71 36 11Diving system Del norske Venrtas - main hook 40 tonnes at 4 m outreachDSV Ill, DSV I max. hoisting speed 28 "nmin StavangerFlag Norwegian Ovre Stokkavei 42
P.O. Box 740---------------------------- --------------------------- ---t, • ,•• 4001 Stavanger, Norway
- Tel: +474 52 75 40
Telex: 33 146 or 33 331Telefax: +474 53 44 80
AberdeenSouter Head Road,Altens
Stolt-Nielsen SeawayA/SAberdeen AB 4LF,
Haugesund Tel: (0224) 87 97 97Telex: 73 305Stolt-Nielsen Seaway (UK) Ltd. Telefax: (0224) 89 54 65
Aberdeen

* Appendix E GA + PARTICULARS
SMIT SEMI 1 & 2
TEKNO\FENG\KSA\KS A 143-N Page El.1

INTRODUCTION
The Smit Semis are a new multi purpose semi-submersible concept with fullyredundant D.P. and 6-point mooring. The design provides a stable and spaciouswork platform from which to undertake both topside and subsea projects insevere weather conditions worldwide. The vessel's stability is superior to • -compatible monohulls and allows greater work utilization, which will result in highcost effectiveness.
AdvantagesThe Smit Semis are built to work under severe Weather conditions in deep andremote areas. The ERN number for the North Sea is calculated to be 99.95/99.95/99.3 which means that the vessels have the statistical probability of holding - ;Alocation on D.P. in all weather conditions in the North Sea. The vessel's cranage *and large free deck space allow work to be carried out, that previously required alarger and more expensive semi-sub. The twin diving bells also allow for greater,flexibility and efficiency during diving operations.
Mlarket ApplicationsThe design of the Smit Semis allows them to perform a wide range of offshoreactivities at a competitive price level, including but not limited to:
1. Inspection, Maintenance and Repair, both underwater and topside.2. Construction and installation work (light and medium) including:
. platform upgrading and hook-up- riser/spoolpiece installationw well stimulation and work-over services,ý subsea completion9 SPM/CALM installation3 installation of flexible pipelines and submarine cabless logistical support, accommodation etc.

0q
0
0
0

PARTICULARSClass and Regulations:Lloyd's Register of Shipping + OU 100 Al+ LMC UMS DP (AA) PC column stabilized
multi/purpose vessel.
Dimensions Machinery
Lower hulls (two) Main engineslength o.a. : 54.00 m 2 x 3 Stork 6 SW 280 dieselsbeam o.a. incl. anchor racks 49.00 m output 1895 Kw (2600 hp) each,depth : 6.60 m total 11,370 Kwwidth (each) 12.48 mMaindeck AlternatorMainengt o2 x 3:2250 Kva, 6 Kv, 3 phase, 60 Hzlength o.au 50.00 m 2 switchboards 6 Kv voltagebeam moulded :43.20 mnclear deck area 1200 m2 Auxiliary enginesworking moonpool :9.6 m x 9.6 m 1 x 440 Kw 550 KvaHeight/Length 440 V. 60 Hz standby generator set1 x 90 Kw, 120 Kva, 440 Vkeel to main deck 22.60 m 60 Hz, emergency generator setmain deck to helideck 11.00 m 2 transformers, 1600 Kva, 6 Kv to 440 Vmain deck to top of crane : 28.50 mlength o.a. complete unit : 63.45 mDraught Positioningdraught operational :12.60 m Dynamic Positioning Systemdraught transit/survival : 6.20 m Kongsberg ADP 703 voting system.
This system is based on the triple modularN.B: The retractable thrusters extend redundancy (TMR) concept in which 3 inde-3 metres below the bottom pendent and separate microprocessorsof the hulls and should be added to the continuously monitor input data fromabove. gyrocompasses, windsensors and referencesystems and use voted info for thruster
Displacement/Payload commands. A power management system istransit/survival displacement: 7,440 tons fitted for economics of diesel-generatorsetsoperational displacement 10,470 tons and fuel consumption.variable payload 1,750 tons Reference systemsCapacities 2 x light weight tautwireheavy fuel tanks : 695 tons 1 x Artemis microwave systemdiesel oil tank : 62 tons 1 x Simrad Acousticpotable water tanks :300 tonsmax. deckload : 750 tons Mooring system
(minimum 5 tons M2) 6-point mooring system4 aft and 2 forward located winches
Propulsion each fitted with 1200 m of 54 mm diam. wire4 x 1250/1375 Kw Azimuthing thrusters 6 x 8 tons Delta Flipper anchors2 x 1250/1375 Kw tunnel thrusters The mooring system can be deployed inmaximum speed : 8 knots conjunction with the D.P system for max. fueleconomy and fulfils the requirements of DnVPOSMOOR-V notation.

PARTICULARS
Navigation and Communication GangwayThe vessel is fitted with the following The vessels are provided with a hydraulicallynavigation and communication equipment. operated pedestal type gangway for safe-two radars of which one of bright track transfer of personnel to and from fixed
view type with a performance monitor and platforms. The total extended length of thean extra slave unit gangway is 32 m. A working stroke of 12 m
- autopilot with gyro and magnetic compass allows the gangway to be connected in up to,complete with a number of repeaters 5 m significant waves (seastate 6).
- speed log and echosounder- satellite marine navigation, video plotter Visual Control Station (VCS)
and an AP navigator Due to the arrangement of the maroeuvring- modern type radio telephone installation station a D.P. VCS is located on the maindeck
with telex over radio at the bow of the vessel.- satellite communication with telex and
telefax equipment Fire fighting (Fifi)- facsimile recorder and transmitter Smit Semi 2 is certifided to fifi class 1.- a combined talkback and automatic N.B. With the addition of a third monitor the
telephone system in all cabins, service Smit Semi 2 can be upgraded to class 2.areas, engine room, diving and controlcentres.
Ufeboat and launching systemThree free-fall type lifeboats, each able toaccommodate 39 persons, are installed atthe stern of the vessel. For safedisembarking operations, even at themaximum allowable heeling angle forwaterline damage according to DOE (NMD),the lifeboats are either safely above thedamaged waterline or can be launchedwithout hitting any part of the vessel.
ieicopteraecKHelicopterdeck is designed for SikorskyS61 N operations under all conditions and iscomplete with refueling system with two fuel0 .storage tanks. A separate arrival anddeparture room is available on bridgedecklevel.
Fully airconditioned accommodation to ahigh standard is available for upto 89persons in single and double cabins.Appropriate facilities such as messroom,galley, gymnasium, cinema and conferencerooms are also on board.
N.B.: Additional temporary accommodationcan be provided as lifeboat and safetyfacilities are available for 110 persons.

CRANAGEMain craneMast head typeMain hoist: max. load 225 tons, ,max. radius 30 mMaximum hook travel: 350 m, single fall ov ",
Auxiliary hoist: max. load 60 tons,max. radius 50 mMain and auxiliary hoists fitted with self-tensioning device and heave compensation(active and passive, systems). 1 "' \
Seabed lifts through working moonpool:. o150 tons upto seastate 7 od200 tons upto seastate 4 dP i ..h , v h " =. ,
latform lifts 150 tons at 28 m. - .-,0- -" S upply boat lifts seastate 1 - 2 ... .... ... .. .. .. ..* Platform lifts seastate 3 - 4 ----- ------ Supply boat lifts seastate 3 - 4" Platform lifts seastate 5 - 6* Supply boat lifts seastate 5 - 6* Platform lifts seastate 7 - 8 6.5 ,0 ,. . 0* Supply boat lifts seastate 1 - 2 ,,J* Platform lifts seastate 3 - 4
Secondary craneExtendable knuckle boom typeMaximum hook travel 350 mActive and passive heave compensationsystems
40 - Outreach capabilities of the cranesFor light to medium construction and
/ ., I i/ installation jobs, the horizontal and verticaloutreach of the cranes is an important factor.The majority of fixed offshore platforms inthe central part of the North Sea have an
V I Iairgap of around 22 m; platforms in thesouthern North Sea have an airgap of.o around 17 m. As heavy lift operations will be
carried out in mild seastates, the vessel can_ .be positioned near to the platform. This202o leaves sufficient crane outreach, horizontally
and vertically, to cover the fixed platform.
0
0
[0I
Radius (in m). 32 23 24 20 16 12 a 4
Supply boat liftsSeastate 1 7.7 10.8 .. tonsSeastate 2-3 6 8.4 2 tonsSeastate 4 5.7 8 11.5 tonsSeastate 5-6 5 7 10 20 tons

DIVING SYSTEM
The vessels are equipped with an 18 man Gas transfer, low pressure air compressorssaturation diving system rated to a 450 m and inflatable rubber bag for the gas reclaimwater depth, which is located on the lower system are located in the starboard columndeck of the vessel. The system consists of while diving store compartments are locatedtwo triple lock deck decompression in the portside columnn. A dedicated datachambers (DDC) for three six-man living collection room, offices, photographicchambers (max. working pressure 45 bar), laboratory and laundry are fitted adjacent tothree entry locks which can be paired in the dive control area.various arrangements and two three-mansubmersible decompression chambers For emergency evacuation a self-propelled(SDC), which can operate independently of 18-man rated Hyperbaric Rescue Vesseleach other. The two bell (SDC) handling (HRV) is installed.systems each consist of the following:- A cursor winch with the cursor running Fixed gas storage of 10,000 m3 is provided inalong a vertical guiderail, a bell (SDC) 23 bottles fitted in the forward columns ofhoisting/lowering winch, a guidewire winch the vessels. There are also provisions forcomplete with clumpweight and the umbilical additional deckstorage.winch.- A passive heave compensation system is A divers gas recovery system complete withprovided to keep the bell (SDC) at a more or bell (SDC) equipment, helmets, topsideless constant altitude in relation to the control and reprocessing units is fitted.seabed and hence permits safe operations inup to 7 m significant waves.
0
go 01\ý
\\ | ati " nMai l !..,L..• • • H .,"
i

SIDE VIEW
N 1 715M- C mn n
rrc o.
It C I
- -mr' n

TOP VIEW
LOWERDECK I
InI
MAINDECK F LEVEL 2m LSYE
I ILI
0I r__
Fu r=1

CHARACTERISTICSHeave in irregular long crested Heave in irregular long crested Roll-Pitch in irregular longseas, head seas, zero speed seas, beam seas, zero speed crested seas, zero speed
S" Beuot"Bafot0Bafr1 Diin monpo 0 Diin mo o 0 olbemsa
•~ ~ ~ ~ ~ ~~~~~~~are outiicn amltd i ) infcn mltd i ) ignifcanlmpiudin moion testgurent)
• Sinifiant aveheigt (i m).• Sgnifcantwaveheihta(nam)terist iicsa ntwae so nitheigrah s ( inm.
• ~~~~~ yai DiigoonposiDvigmonooi onin beampsabiiy• Working moondooleeWoraing moonpootedPitcheheadtsea
.•-• \• .'thec a mred oLirecluigtion, 1estst current.
1hrceit Thrsee failur :5 xh 1250h in1 Swthor faiurs 3axagraph.
Note:Dynmi Positioning levlpability.keein100%, speed and assoiate resers ofcting0Intact system :6 x 1250 kW
* Sigificntaplitde( Noin). *on Sigen ifc antve ampsitude keeingi)- infiatapiue i ere)SSigificnt wve hight(in0n). , Significantwarreeve hegh (inin. *Sgiiatwv egt(ni)
BeaufortKnots c i i u o t c
characeristisnare hown i thengaphs i
Widnpedontnos

0 Appendix F MODULE HANDLING SYSTEM
P
0
0
TEKNO\ENG\'KS A\KS A 143 -N Page F1.1

Seaway CondorHeave Compensated Handling System
for installation/retrieval of subsea well modules
• C.--
runlsdep
Stolt-Nielsen Seaway
- 'tr'-b. •

Seagrway Conaor
Stolt-Nielsen Seaway Module Handling System is designed tobe operated onboard the monohull intervention vessel MSVSeaway Condor.The system consists of horizontal and vertical module handlingequipment, operated on the deck and through the workmoonpool of the Seaway Condor.The horizontal module handling system transports the modulesand related tools on the deck, from storage to the deploymentposition over the moonpool.The vertical heave compensated module handling systemtransports the modules from the deck to the subsea template.The entire system is designed to be operated as divertess usinga work type ROV (e.g. TRITON) to carry out various monitoringand manipulation tasks.
el
"" !f

-.-.- -1. Seaway Condor showing general layout of themodule handling system.
2. Derrick and deck rails system, with modules andintervention tools in their storage positions.
3. An intervention tool is skidded onto the Ioonpooldoor and connected to the vertical handling system.
44. A module is deployed through the work moonpoolguided by the upper and lower cursors.
0 1
-:-~F,

Main data The moonpool door system consists of a main doorDesign heave velocity 1.5 m/s 7.14 m long and 2.8 m wide made up of two main I beamDesign heave acceleration 1.7 m/s2 steel sections and steel plate. The main door supportsDesign roll ./- 4 deg the load over the moonpool prior to and after verticalDesign rollh 14 deg. handling. The secondary door consists of six hydraulicDesign pitch +1- 4 deg. and eight manual side flaps. They open upwards andMax. load to be handled outwards while the main door opens downwards towardswith passive compensator 550 kN the aft of the vessel.Corresponding significant wave height 2.0 mMax. load to be handled Vertical Module Handling Equipmentwith active compensator 200 kN The vertical module handling equipment based aroundCorresponding significant wave height 3.0 m the derrick system, consists of the following main
Nominal lifting speed at max load 15 rnmin components.
Max. module size in moonpool 5.5 x 5.5 m Main lifting winch, SWL 65 ton with single looped liftingWork moonpool size 7 x 6.5 m block, lifting wire lead sheaved, wire length counter, wire
tension recorder and heave compensating system.WeightsDerrick structure, Two Independent systemsincl. foundations, winches etc. 90 tonnes The heave compensating system has two independent
systems, one active and the other passive. The activeCursor (upper + lower) 8 lonnes system is used for stabilising a freely suspended load.Moonpool door, total 8 tonnes The passive system is in effect a taught wire deviceMoonpool hatches 4 tonnes used only after a module has been landed to maintain
wire tension.Operational limitationsMax. significant wave height for operations 3 m The guideline system is made up of four guidelineMax. pitch/roll for operations -5 deg. winches with 360 metres of line which have individual
Active compensator stroke selection heave compensators.
Load amplitude +/- 2.0 m The umbilical system consists of a hydraulically poweredPassive compensator stroke selection friction sheave on the derrick top platform, with guideLoad amplitude +1. 1.2 m rollers leading down to the umbilical bin.
Horizontal Module Handling Equipment The cursor system consists of two independant cursorThe horizontal module handling equipment consists of the frames and four vertically running guide rails within thedeck skidding system and the moonpool door system. derrick and moonpool. The cursors function is to
stabilise modules hanging on the main block from theThe deck skidding equipment consists of a deck rails system vessel movements and also to stabilise the main blockwhich is a network of steel HE-B beam sections fastened to itself.the deck and used to skid modules on their pallets. Thepallets are to support the modules during skidding and The system controls and machinery are housed instorage. They are moved on the rails by winch wires rigged containerised systems forward of the derrick andfrom two tugger winches on the aft deck, through guide overlooking the moonpool and deck.rollers to the pallets, providing pull and hold back.
Stolt-Nielsen SeawayA/SHaugesund
Stolt-Nielsen Seaway (UK) Ltd.Aberdeen
Haugesund (Main office) Stavanger AberdeenStoltenberggt. I 0vre Stokkavei 42 Souter Head RoadP.O. Box 370 P.O. Box 740 Aliens5501 Haugesund, Norway 4001 Stavanger, Norway Aberdeen ABI 4LFTel: +474 71 41 00 Tel: +474 52 75 40 ScotlandTelex: 42 483 Telex: 33 146 or 33 331 Tel: (0224) 87 97 97Telefax: +474 71 36 11 Telelax: +474 53 44 80 Telex: 73 305
Telefax: (0224) 89 54 65

* Appendix G SEAWAY PELICANHEAVE COMPENSATED CRANE
TEKNO\ENG\KSA\KSA 143-N Page G1.1

TECHNICAL INFORMATIONS
HYDRALIFr ELECTROHYDRAULIC 120 TON OFFSHORE DECK CRANE WITH 10 TON TELESCOPICWHIP LINE.
TYPE : OMCVCT 3447-(50-120)-(20-8,3)(10-24(20))Constant moment heavy lift.Active Heave Compensation.
MAIN DA:
Winches : The crane has three winches.
Winch I : A 510 ton fully heave compensated winch with autotension
Winch II : A 60 ton standarc Hydralift offshore crane winch, with auto tension.
Winch III : A 10 ton standard Hydralift whiplinn crane winch, with auto tension.
Lifting capacity of crane 50 ton at 20 m Single line120 ton at 8,3 m Double line, two winches working.A constant moment load control system will increasethe 50 ton load up to 120 ton. 120 ton can be liftedat about 8,3 m (see load curve)
Whip line telescopic system10 ton - 24 m telescope out
. - 10 ton - 20 m telescope in
Working radius - 20 m at 50 ton8,3 m at 120 ton24 m at 10.ton4,5 m R min Main Hook4,5 m R min Aux Hook
* Winch !: ..
Hoisting speeds 24 ,/min at 60 ton full speed60 t heave compensated 60 m/min at abt. 0-20 ton full speedwinch. This winch has autotension and active heave
compensation
At intermediate loads, hoisting speed is a function
of the load.
Auto tension speed : 0-94 m/min
Auto tension pull : Variable

Winch II:
Hoisting speeds 22 m/mmn at 60 t (Double action)60 t winch. 45 m/min at abt. 25 ton (Double action)
At intermediate loads, hoisting speed is afunction of the load.
Auto tension speed : 0-45 m/min ( 0-25 ton)0-22 m/min (25-60 ton)
Auto tension load : 10-60 ton adjustable.
Hoisting speeds : 10 m/min at 120 ton2 x 60 t - 120 t 20 m/min at abc. 50 tondouble linesynchronous operation
Winch III:
Hoisting speeds 0-80 m/min at 10 ton10 ton whipline Autotension 0-80 m/min at pull force
about 2000 kp.
For all sysems the hoisting speed can vary a little due to temperature of oil,volumetric efficiency, and setting of the variable dusplacement motor. A 10-15%unaccuracy can thus occur.
Hoisting height 450 m at all loads and all winches.
'Luffing time . 145 seconds at normal single action.90 seconds at double actions
Luffing time is calculated at no load conditions.
List 8 5 degrees
*, Slewing speed . 0,5 r.p.m.
Slewing sector Max 3600 limited. Crane cannot slew in access of 360degrees due to el. cables onto the rotating part.
Total power consumption The crane el. motors2 x 240 kW motors main pumps1 x 210 kW motor main pump1 x 18 kW motor for sirculation pump2 x 2,4 kV oil cooler motor
Voltage 4 40 V 60 Hz 3 ph

Heave compensation.
The system is built to comply with requirements as follows:
Load, SWL, single line 50 tHeave of vessel +/-2 mHeave period 8 sekMax. displacement +/- 3,5 mMax. speed 70%
Experience from offshore operations indicate compensation performance inthe order of 90% or better.
TEKNO\ENG\,KSA\KSA 143-N Page G1.2

112 LEE::: H!QIMP .... :tt it
f R. Im I MIg -AMM"llOWN
.... .. .. ... ..'ONM M I i 24
1: M -05 1' WE
.23W Mnrl
2Ztit --------- t
M ým A
tit-!:q, r- it. tit Jýd ......:1 -A -U Eton; H -. 17
:nv It:J: .1 L! I+it it. ::+Pit Atnl:A... ýPTMW-! ItiF I :I- 't, itbl. ImL: ;Nit: im;
k 71:tw; iiz) 12
It= ýtti ;:tp
tr
it .+ m MEN Em. 26 i
n I;t mo.,7
1, ... ...t. w,i V
rt j:Lill ! :z I
Main++--. it
DECK pit5 6 7 o 9 10 11 12 13 14 15 16 17 M 19 20 21 22 23 24
HOOK HEIGHT ABOVE DECK LEVEL

ci,
Z65
ZA-
U-a
Uat.
C3,U
* rr,.o.j.........
LJ -. LIzi
~~o0
A v't'% & T
i :. pi: i:: i

0Appendix H ROVSV BERGEN SURVEYOR
TEKNO\ENG\KSA\KSA143.N Page Hid1

ra
M/S 4cBergen Surveyor,, stry over the last decade, and pro- positioning system with follow-sub'
The EM1 00 Multibeam Echosounder vides a cost effective support for the mode, remote joystick facility and hasis permanently installed in the hull of offshore data acquisition phase of a 2 reference systems installed (HPRBergen Surveyor. seabed mapping project. 309 (1") and lightweight taut wire) withThe vessel has extensively been used The vessel is eEluipped with Simrad the facility ot work with 2 more (Arte-for survey work for the offshore indu- Albatross ADP 311 mk 11 dynamic mis and Syledis).
Particulars: Stolt-Nielsen SeawayNationality British is a major marine and subsea con-Port of registry Nassau tractor providing project manage-
ment, diving, underwater engineering.,,Lengt o.a. 66.0 m and marine survey service to the Haugesund (Main office)•readth 12.3 m offshore industry world wide. In con- Stoltenberggt. 1
Draft max. '5.1 m junction with the seabed mapping 5501Bo 370sud Nra
Tonnage 1502 GRT sytmSaa smreigadTel.: + 47 4 71 41 00contracting the system to the offshore Telex: 42483
Weed 10 knots industry, providing project manage- Telefax: + 47 4 71 36 11ýTluel Steaming 5.5 t/day ment, surveyors, offshore operations,Stvne
Fuel Survey 2.5 t/day navigation chains and is responsibleSavnefor the final products towards the Ovre Stokkavei 42
Accommodation 40 persons_ client. P.O.Box 7404001 Stavanger, Norway
••,,,,.•,,•.•:.•.••,• i:••.•l.,=•,,LU .•r.•.:•,.1.•. •Tel.: + 47 4 52 75 401Telexý 33146 or 33331
Telefax: + 47 4 53 44 80• 1111•Aberdeen
Souter Head Road,Altens
,,--.y =/=- •e wa•"•/•Aberdeen AB1 4LF,Stolt-Nielsen SaaASSolnHaugesund Tel.: (0224) 87 97 97
Telex: 73305Seaway Technology Ltd. Telefax: (0224) 89 54 65
Aberdeen

S
08
S
I
0
SSS
SS

UNDERWATER CONSTRUCTION
Kees van Zandwijk HeereMac v~of. The NetherlandsManager Foundation Engineering Leiden
ABTRCT
This paper describes the underwater construction phases of a Tension Leg Platform1 (TLP)development in 1000 mn water depth, seen from the viewpoint of an Installation Contractor. Only0 the work scope for heavy lift vessels is discussed. State - of - the - art options are given forthe various phases of the offshore installation. The paper is set-up in the form of a casestudy, using a typical development scenario. The case study also covers pipelaying in a waterdepth of 1000 m, by means of J-lay.
1.0 INTRODUCTION
This paper describes the various aspects of underwater construction of a TIP in 1000 m waterdepth. First, it Is described what the capability requirements are for the Installation equipment,and how existing equipment can be adapted for deep water tasks. Then the installation Isfollowed step by step, highlighting possible solutions for every installation phase, indicating onwhich basis choices are made. Throughout the paper, ft Is illustrated how and where theconcept of the structure Is influenced by Installation requirements.
0 The scope of work is fictitious, but for every step of the Installation an Impression Is given ofthe present state - of - the - art. Speculation on possible execution methods has beenavoided. Even the description of construction work and pipelay In a record water depth of1000 m follows closely the preparations presently In progress for an actual project. It will beevident that the total field of underwater construction is much wider than the type of workdescribed herein. However, a paper like this can only cover a small sector of ft.
Notes refer to a glossary of offshore construction terminology in Par. 15.0.

2.0 THE PROJECT
2.1 Project Description
The scope of work addressed in this case study is the installation of a TLP in 1000 m water
depth and associated export pipeline2 to a nearby shallow water platform (Figure 1).
The TLP consists of a 90 x 90 m hull carrying production, process and accommodation
topsides. The TIP is moored to the seabed by means of twelve 762 mm O.D. x 50 mm W.Th.
tethers3 , three per corner, locked into four pre-installed foundation templates4. Each template
weighs 500 tonnes, and is piled to the seabed with four 1830 mm O.D. x 50 mm W.Th. piles,driven to a penetration of 120 m. The soil consists of normally consolidated clay. The TLP Is
connected to an existing platform in 100 m water depth by a 15 km long 20" diameter export
*pipeline.
2.2 Scope of Work for the Installation Contractor
A typical scope of work for the Installation Contractor is given here below. Firstly, the
foundation templates must be set on the seafloor within strict tolerances with respect to each
other and with respect to a number of pre-drilled wells. No physical contact Is allowed
between any structural element and the wells. After placement, the templates must be piled
to the seabed. The piles are to be driven to a penetration of 120 m, and at penetration, the
pile tops are not allowed to protrude more than 0.5 m above the tops of the pile sleeves' .
Before fixing the piles, the templates must be level within specifications. The connection
between sleeve and pile is to be made by swaging , but grouting7 may be proposed.
0 "Upon installation of the foundation elements, the TIP hull is to be manoeuvred above its
foundation, and connected to the templates by means of the tethers.
Finally, the pipeline must be installed between the TLP and a platform 15 km away, in 100
m of water. The pipeline scope includes the end termination at the TLP and the welding of
an expansion loops between the pipeline and a pre-installed riser9 on the shallow water
platform.
Usually, the scope of work for the Installation Contractor involves the engineering of all marine
operations and installation activities, as well as the seafastening10 of items to be transported
and the transportation of the elements to be installed. These parts of the scope are. not
addressed here as they are not specific for underwater construction work.

*3.0 REQUIREMENTS TO THE INSTALLATION VESSEL
It Is assumed that the installation will be done with a semi-submersible crane vessel (SSCV)11
of the type shown In Figure 2. These SSCVs have two cranes with capacities of 3000 to 6000tonnes each.
In this section it Is discussed what the main requirements are for the Installation vessel, andhow existing equipment can be made suitable for these.
3.1 Station Keeping (Figure 3)
In shallow water depths an SSCV keeps station on a pattern of eight to twelve anchor wires.The drum capacity of the anchor winches is approximately 2500 m of 75 mm diameter steelwire. With its standard anchor wires the SSCV can anchor in water depths as deep asapproximately 300 m (Figure 3a) the precise water depth depending on type of anchor,maximum anchor forces and make-up of the anchor lines.
When the water depth Increases beyond 300 m, the standard anchor wire Is not long enoughto approach the anchor point along a horizontal line. A solution to still make use of anchors,is to pre-lay a pattern of extension wires in the field, and to connect the SSCV's anchor linesto these extension wires (Figure 3b). With this technique use can be made of anchors downto approximately 500 m of water. There beyond the extension wires become so long thathardly any anchor handling tugs are available with sufficient drum capacity for storing andhandling them.
In waters deeper than 500 m, the vessel must keep station on a dynamic positioning (DP)system. Position and heading of the vessel are continuously monitored with respect to fixedhydro-acoustic beacons on the seabed or surface reference systems, and corrected bycomputer controlled propulsion.
The choice between dynamic positioning and anchoring with extension wires in 300 to 500 mwater depth is a matter of economics. The longer time involved in anchor deployment
operations is weighed against the increased fuel cost of station keeping on DIP.
For this case study, assuming a water depth of 1000 m, only one option is feasible: a DIPvessel.

3.2 Reaching Depth of the Crane
None of the SSCVs available on the market today has been built to reach to 1000 m below
water. Additional measures are required to the hoisting system.
One option Is to change the reeving of the crane blocks. Assume (1) that the main block ofthe crane has a capacity of 6000 tonnes; (2) that with the crane jib at 120 m above the
water line, the main block is able to reach to sea level; and (3) that the design tension ofthe wires is 75 tonnes. In this condition the main block is reeved over 6000 + 75 + 2 = 40
sheaves, whereas the total length of wire between crane jib and main hoist is 40 x 2 x 120
= 9,600 m. When using only 4 sheaves, the same length of wire can be used to increase thedistance between crane jib and main hoist to 9,600 - 4 + 2 = 1200 m, enabling the block
to reach to 1200 -120 = 1080 m under water. At this reeving, the capacity of the crane blockIs reduced to 4 x 2 x 75 = 600 tonnes. In this example the weight of the crane wires Is
neglected for simplicity.
If re-reeving does not provide sufficient capacity at the required depth, it Is an option toincrease the capacity of the hoisting drums. Usually this option Is unattractive as it affects the
entire hoisting system: the torque of the drums must be Increased due to the enlargedmoment arm of the wire package, and the structural fundaments are to be modified. Amaximum permitted number of layers finally dictates the technical limit.
The problem of capacity loss at increased drum diameter may be overcome by the use of
so-called traction winches: a friction element provides the pulling force, whereafter the wire Is
stored under low tension. By separation of the pulling and storage functions, the wire lengthcan be increased almost infinitely (i.e. to what rope factories can make).
An alternative to increasing the length of the crane wires, is to place more drums on the
crane. It will be clear that this option involves also major structural and mechanical0 modifications.
When working in deep water the weight of the crane wires cannot be neglected. An option
often discussed in the light of deep water work, is the use of synthetic ropes, In order toavoid loss of crane capacity into the weight of steel wires. However, in the water depths
presently considered for exploitation the loss of crane capacity Is not dramatic (about 10 %
per 1000 in). At present only little is known about wear and tear, effects of dynamic loading,exposure to sunlight, rain and seawater, etc. This lack of track record makes Installation
contractors to refrain from using synthetic ropes to date.

3.3 Pipelay Ramp
Conventional pipelay barges all work with the principles of S-lay: the pipeline is welded in ahorizontal position on the deck of the vessel, subsequently guided downwards over a stinger
and bent back to the horizontal by support from the seabed. The geometry of the pipe shows
a large S. An advantage of this system is that the pipeline is welded, X-rayed and coated
horizontally, in a row of sequential stations. The pipelay is a more or less continuous process.
Below 400 to 500 m water depth the conventional S-lay becomes cumbersome, primarily on
account of increased pipe tension to be reacted In the vessel's station keeping system. In the
few cases pipes have been laid beyond this water depth, sofar solutions have been found inthe use of flexibles, in reeling, or in the tow of pre-assembled pipe sections.
0It is generally agreed however, that large scale pipelay operations in deep water require
investments into another pipelay process: the J-lay. In this process, the pipe Is welded in a
near vertical position, the overall configuration of the pipe showing the shape of a J. This
configuration involves a strongly reduced horizontal pipe tension component, allowing this
pipelay technique to be combined with DP.
As joints are welded vertically, welding can only take place in one station, at deck level. After
welding, X-ray and coating follow in the same station, on the critical path. This procedure
makes the J-lay to a discrete process, asking for the feature to add on long sections for still
having an effective operation.
Sofar only one ship in the world has been equipped with a J-lay ramp: HeereMac's SSCV
"Balderm (Figure 4). The semi-submersible hull of the vessel makes it possible to operate in
adverse sea states and ocean areas. The favourable motion behaviour enables the upending
of 72 m long pipe strings. Such string lengths in combination with an automatic welding
process make this J-lay outfit very effective. Shallow water and shore approaches can be made
by tilting the ramp from 100 ° (through - vertical) to 0° (horizontal). The vessel's crane capacityallows the reception of pre-assembled pipe strings In 1000 to 1500 tonnes packages.
The entire J-lay outfit has been built In modular form to be able to change quickly from
pipelay mode to heavy lift mode. The modular package can be easily installed on other
SSCVs.

4.0 POSMONING
The position of the Installation vessel is checked from one or more surface reference systems,and usually in addition a hydra-acoustic beacon on the vessel interrogating an array ofacoustic transponders12 on the seabed. The heading of the vessel is measured from the ship'sgyro. Commonly, software is available to translate the surface reference and beacon signalsinto a visual plot of the ship's position and heading with respect to the projected position ofthe structure to be installed.
The structure to be Installed is equipped with a hydra-acoustic beacon and a gyro, formeasuring its position and heading versus the target. The accuracy of a position measurementIs in the order of +/~- 3 m when using a surface reference system for determining the vessel's
geo co-ordinates, and in the order of + /- 0.25 m when using hydra-acoustic: beacons fordetermining relative positions of structures under water. The accuracy by which a structure canbe set by a crane vessel is dependent on the stiffness of the anchor system and methods oflateral control deployed. When keeping station on DP in steady state environmental conditions,
ft is estimated that a structure can at best be placed within a radius of 0.75 m from themeasured target. Thus, the overall accuracy by which a structure can be placed by cranemanoeuvring alone, using acoustic beacons, is within a radius of about 1.0 m from thetheoretical target. The accuracy of a gyro is within 0.1 degrees. However, the accuracy bywhich the heading can be controlled is very dependent on the geometry of the structure.
Commonly, an accuracy of 1 to 2 degrees from the target orientation Is achievable.
When Installing four individual templates within certain tolerances with respect to each otherand with respect to existing wells, each template can be lowered and positioned using theseabed transponder array if the relative position tolerances allow so. Should the relativetolerance requirements be too stringent for this, the Installation accuracies can be improvedby placing an extra acoustic beacon on each template installed. If the position tolerances arenarrower than what can be achieved by vessel control, physical installation aids as a guideframe13 or docking piles1 are required. This subject is worked out further In Par. 5.2.
5.0 LOWERING AND PLACEMENT
5.1 Handling Procedure
Further to Par. 3.2, ft is assumed that the main block of one crane can be reeved out to acapacity of 600 tonnes. Given the template weight of 500 tonnes and an estimated weight of

rigging of 20 tonnes, a tolerance of only 1.15 is left for dynamic effects. This is marginal. Itwill depend on detailed engineering analyses on behaviour under water (vertical wave loadsIn the splash zone, added mass effects, resonance effects in the elastic hoisting system), andbehaviour at touching the seabed (suction under mud mats) whether the lift can be done witha single crane.
An alternative is to lower the templates in a dual crane lift. A spreader frame Is constructedunder which the templates are hung, the frame having sufficient width to keep the two cranejibs apart. An additional advantage of the frame is that the template positioning beacons canbe placed on the frame, so that they are automatically retrieved after set-down of the0 templates. The dual crane lift has also advantages in the position control (see Par. 5.2) andin the prevention of spinning of the hoisting wires.
05.2 Position Control
Beside accurate monitoring of the template position. ft must also be possible to steer ft withinthe required tolerances. The method of position control depends on the accuracy required.When the templates must be positioned and oriented very accurately with respect to eachother (tolerances less than say 500 mm), use can be made of a guide frame (Hutton TILP,North Sea). First, the guide frame is placed on the seabed within the tolerances required forthe entire TLP. Subsequently each template is docked against the guide frame and piled tothe seabed. After all templates have been secured, the frame is retrieved. A variant to theguide frame method Is, to install docking piles through a guide frame, then retrieve the frameand finally dock the templates against and over the docking piles (Snorre TILP, North Sea).
When the tolerances allow so, it is most attractive to place the templates by nrianoeuvring withthe crane, whilst tracking their position from a subsea transponder system. When the relativeposition tolerances are in the order of say 1.0 to 1.5 m, this procedure Is well feasible.Horizontal control can be provided by tugger wires running down via dleadman anchors15 onthe seabed horizontally to the template (Figure 5), or by placing thrusters in two directions onthe template. Even simpler is it to lower the template with two cranes, enabling control of bothposition and heading by crane manoeuvring alone, eliminating the need for tugger wires orthrusters.
Here it Is Illustrated how design premises have a huge impact on the cost of Installation. Bydesigning the templates "Installation - friendly" the cost of an expensive guide frame can besaved. Moreover, every relief of position and heading tolerances will further reduce the durationof offshore positioning.

5.3 Sling Release
Diving Is inefficient below a water depth of 200 to 250 m. In 1000 m of water, all seabedoperations must be designed for diverless execution. Also the slings must be released without
the aid of divers. Several options are at hand.
Various options for sling release are based on the principle of hydraulically retractable pins,
engaging with a padeye or the eye of a sling. A disadvantage Is that hydraulic hoses must
be run to the lifting arrangement far activating the pins. This disadvantage may be obviatedby using accumulators, to be operated by a Remotely Operated Vehicle (ROV), or by hydra-
acoustic control.
Another approach Is slings that automatically fail off the lifting trunnions once the lifting
0 arrangement Is slacked off. Care is to be taken that slings do not prematurely disengage whenthe slings slack off early, for Instance at lift-off from the cargo barge, or at passage of thewater line. Premature release can be prevented by light securing pins, to be retrieved by an
ROy.
Also use can be made of pile lifting tools1 7, engaging with pipes built into the structure or
forming part of the lifting arrangement. Pile lifting tools make it easy to hook on to a structure
again for position correction or retrieval.
6.0 PILE INSTALLATION
6.1 Hammer Systems
Pile drivng under water is common practice since the early 80s. The principle is based on a
hydraulically driven hammer riding on the pile by means of a sleeve sliding over the pile top
(Figure 6). The hammer is kept dry by compressed air to below the level at which the energy
Is transferred. Vent holes in the pile ensure that the water inside the pile Is bled off, so as
to prevent hammering on the inside water column.
Two principle systems are used for driving submerged. The first system Is based on the use
of an underwater power pack (Figure 7a): electrically driven hydraulic pumps are placed on
the hammer, having a short hydraulic circuit with the hammer. The power pack Is fed by along electro-pneumatic umbilical reeled on the deck of the SSCV. The advantages of this
system are minimal energy losses and relatively easy handling of the single umbilical. Dis-

advantages are the vulnerability of the complicated umbilical and the sensitivity for breakdownsof the underwater power pack.
The second system is based on a power pack on deck and long hydraulic hoses (Figure 7b)running to the hammer. Advantages are the reliability of the power pack and the redundancyin the hydraulic hose bundle, which is built up from a lot of standard length hose sections.Disadvantages are energy losses along the hose bundle (which can be remedied by increasingthe cross-section of the hoses) and the complex reeling of a bundle of hoses.
Experience has been gained with both systems; with the underwater power pack to a water0 depth of 1000 m (Menck test in 1989); with hydraulic hoses In water depths of 400 to 600m (Bullwinkle - 410 m, Jolliet - 540 in). At this time there is no technical preference for eithersystem. The choice depends mainly on economics (investments required, expected future
* deployment of equipment).
A phenomenon to be accounted for when designing driven piles in deep water, is internalenergy losses in the hammer itself. The compressed air inside the hammer is to be makeequilibrium with the hydrostatic pressure outside ft. When working In 1000 in of water, thecompressed air Is 100 times denser than atmospheric air. This air gives resistance to the ramduring Its downward stroke. This resistance may reach significant values in deep water. In1000 m water depth some hammer types are expected to show 30 to 50 % energy loss asa result of this phenomenon.
6.2 Template Stability
As shown in Figure 6, an underwater hammer is freely riding on the pile. Pile and hammermust be kept vertical by the structure or the soil.
The soil can provide the stability when the self penetration of the piles Is deep enough to0 support the overturning moment from the pile / hammer system. When the stabilizing momentfrom the soil Is insufficient, or even absent, as is the case for instance In top sand layers, thetemplate must provide stability.
The template provides stability by gravity forces: basically by the template underwater weighttimes the distance from its centre of gravity to the nearest edge of the mud mats. It will beclear that a template with a small underwater weight (e.g. built from light almost buoyanttubulars), or a narrow base will easily topple over. Here again is shown how the design of

the underwater structure should account for the installation phase. An Instable template maybe very expensive to install.
Another threat of the template stability is failure of the mud mats. Especially in soft or loosetop salts the bearing capacity of the mud mats is a topic of concern.
6.3 P~e Drilving
Pile driving under water Is common practice nowadays. The hammer operations are continuallymonitored from a number of control sensors. Safety switches automatically stop the hammerwhen something essential is wrong (i.e. anvil not on pile, hammer lifted up by crane, leakageof oil). The penetration of the pile is monitored by ROVs.
7.0 LEVEWLNG
An underwater structure must always be installed within certain level tolerances. When It isexpected that the required tolerances can not be achieved by careful Installation procedures,a levelling provision must be available on the structure.
7.1 Levelling on Mud Mats
Levelling can be done by hydraulic jacks on mud mats18,when the top soil conditions are firm.Stroke and capacity of the jacks must be suitable for the maximum settlements, level correctionand load distribution to be expected.
It shall be noted that levelling after pile driving might involve extremely high friction forcesbetween the piles and the pile sleeves. Both jack and mud mat capacities shall take accountof these forces. In order to minimize the levelling forces after driving, the structure is preferably
set level before stabbing and driving the piles.
After the level of the structure has been brought within specification, the structure is fixed toIts foundation piles by grouting (Par. 8.1) or swaging (Par. 8.2).
7.2 Levelling on Piles
When the top soil has not enough strength to react the levelling forces, the structure must belevelled on piles.

If the level correction is to take place after installation of the foundation piles, the latter canbe used as reaction points for levelling (e.g. Balmoral, Togi). The levelling tool sits on the pileand engages with the top of the sleeve for pulling the structure upwards. The capacity of thetool should be enough to overcome friction forces between piles and structure, and suctionforces between structure and soil. The template level must be maintained until the structurehas been fixed to its foundation piles.
If the level requirements are such that the level must be corrected before piling, levelling Is
to be done on pme-driven levelling piles (e.g. Highlander, North Sea). Once level, the structureIs secured until It has been permanently fixed to its foundation piles.
Levelling is another subject needing close attention In the design phase. Flexible levelling
tolerances and a structure which is by nature stable might save a lot of trouble, and thuscosts, In the installation phase.
8.0 STRUCTURE - TO - PILE FIXATION
Two techniques are at hand to secure an underwater structure to Its foundation piles: bygrouting and by swaging. Techniques based on mechanical fixation as grippers, pin-through-hole and such-like are commonly only accepted if temporary.
8.1 Grouting
The grouting technique is widely used in the offshore technology. The basis Is an annulus
between two pipes which is filled with a grout slurry. After curing, both pipes are firmlyconnected to each other, whereby weld beads on both walls of the annulus may help
strengthening the connection (Figure 8a).
The great advantage of grouting is the simplicity of the principle. However, especially In deeperwaters the technique has a number of complications: the hoses must be strong to support theheavy grout fluid, and are thus expensive: the long hoses Involve the risk of separation of thegrout mix; restriction of the number of hoses requires ROV operated manifolding to direct the
flow to the different grout sleeves; the large volume of grout in the hoses versus the small
volume of the annulus Involves high grout losses and a long reaction time In case somethinggoes wrong. For these reasons, the grouting of subsea structures Is more or less outdated,
certainly for templates In deep water.

Grouting of underwater structures in shallower water can be done In various ways. The firstoption is, to stick a grout stinger directly into the annulus to be grouted. Another option isto address indivdcual receptacles in a manifold by a grout stinger, grout lines running from thereceptacles to the annuli to be grouted. A third option is to connect grout hoses to anunderwater manifold by means of an ROV. From this manifold the grout flow can be directedto the Individual annuli by ROV operation.
The quality control of a grout connection Is rather primitive. Samples are taken from the groutflow at the mixer at regular intervals. Densitometers monitor If and when the grout density atthe top of the grout sleeve agrees with the density pumped downwards, It is then assumedthat the entire annulus is filled up homogeneously with proper quality grout. Cube tests on thesamples taken above water have to confirm, after days or weeks, the quality of the connection.
8.2 Swaginig
The process of swaging has been introduced in the mid 80s. The principle is based on colddeformation of the pile, expanding the pile wall Into a recess section In the pile sleeve (Figure8b).
A swaging tool is stabbed into the pile. Radially expandable seals close off the inside of thepile at elevations above and below the groove in the sleeve. By pumping high pressure waterinto the chamber formed between the seals, the pile is radially deformed, first against thesleeve, then Into the recess, and finally as pile and sleeve together. An accurate quality controlon the process Is provided by comparing the pumped volume of water versus the pressurewith the predicted curve (Figure 9). A second control is a small calliper wheel, monitoring theshape of the deformation by measuring the radius of the pile versus the travel length of thewheel during retrieval of the tool. The data of both control functions are immediately available.
9.0 PILE CUT-OFF
A short length of pile (4 to 6 m) Is required for support of the hammer (Figure 6). This lengthprotrudes above the structure when the pile is at final penetration. For the TIP foundationtemplates considered these pile stick-ups may interfere with the TIP tendons19, requiring themto be removed after piling. Usually, the pile heads are driven flush with the grout sleeve byusing a short follower between hammer and pile, thus avoiding the removal of dummy pilelengths. In the event that no followers are used, the following techniques are at hand forcutting off the pile heads under water:

9.1 Explosives
Cutting off pipe ends by means of shaped charges is well-known In the well drillingtechnology, and has also been used with success for platform removals. However, the use ofexplosives is likely to raise some resistance when applied on a new structure in theneighbourhood of high-duty tendon receptacles and a just completed grout or swageconnection, even though the explosive process can be held under full control.
9.2 Abrasive Cutting
A high-pressure jet of water mixed with an abrasive material is directed to the pile wall froma very close distance, the let stream cutting through the steel. A tool is constructed aroundthis water jet ensuring that the jet nozzle is hung off at the proper elevation and rotatesaround the pile circumference at the proper speed. Usually the pile is cut from the inside tothe outside. It is even possible to cut piles below the seabed when the internal soil plug isremoved sufficiently deep.
9.3 Electrical Flame Arc
A conventional technique for cutting off pipes under water, is by means of an electrical flamearc. rhe pile wall Is punched through by a row of holes along the cut-line, melting the steelwith a special thermal electrode. Sofar, no remotely controlled tools have been built for thisprocess, so that to date it can only be operated by divers. The pile is cut from the outsideto the inside.
10.0 TLP HULL STATION KEEPING
Once the foundation elements are in place, the hull of the TLP with the topside facilities canbe connected to them. The connection of the hull is a critical stage of the TILP Installation:0 especially In the phases of tendon handling and engagement of the first few of them, thetendons and their end terminations are extremely vulnerable to damage. Therefore a longwindow of good weather is to be awaited before these operations can take place.
It is essential that the hull is accurately held in place from the moment that the first tendonis engaged until the time that sufficient tendons have been connected to safely let the structurego. As the hull station keeping Is a complicated marine operation rather than underwaterconstruction work, this phase of the TLP installation is not further addressed here.

11.0 TENDON INSTALLATION
For the two TLPs thusfar installed in the world, different tendon installation techniques have
been followed.
At Conoco's Hutton TLP (North Sea) the tendons were built up as drill pipe: in four chambers
built into the corner legs pipes of 260 mm diameter and 9.5 m length were screwed together
with torque tools, making up the string until the end connector could engage with the
receptacle in the template.
At Conoco's Jolliet TLP (Gulf of Mexico), the tendons were pre-assembled onshore as a 610
mm diameter, 20 mm wall thickness "pipeline" of approximately 515 m length. The complete
lengths of tendon were towed to location, upended by controlled ballasting, and engaged with
* foundation and hull by using a crane vessel.
It Is imaginable that other techniques will be developed once more TLPs will be installed. A
logic step seems to build up the tendon strings outboard an SSCV, just like conductor pipes
are welded. After a number of strings have been built up, they can be swung Into the TLP,
reducing the critical installation phase of tendon hook-up to a few hours, certainly when both
cranes are used. The DP system of the SSCV can also assist in keeping the TLP hull at
location.
12.0 PIPELAY
In Par. 3.3 the technique of deep water pipelay is described. In this section some specific
aspects of the case study scope of work are addressed. The pipe is to be laid between the
TLP in 1000 m of water and a platform, 15 kilometres away, in 100 m water depth.
0 .The pipelay is started at the 100 m W.D. platform (Figure 10). A wire Is rigged from the pipe
end via a start-up anchor on the seabed back to the SSCV. With this wire the pipe end is
pulled to the anchor whilst building up the pipe. Once the pipe end has reached the anchor,
it Is secured and the wire is cut. In this water depth the J-Iay ramp Is tilted under
approximately 60 degrees.
When laying the pipe down slope, the ramp is successively tilted upward until it has reached
an almost vertical position In a water depth of approximately 250 m. With the ramp almost
vertical, the pipe Is laid further until the TLP is reached. Here the SSCV turns around the

pipeline, on Its DIP system, for having the pipe oriented towards the TLP. During this movethe pipe moves through the vertical to an inclination of about 1000 with the vessel's horizontalaxis. Finally, the pipe is hung off from the TLP at the pipeline termination point by using theSSCV cranes.
13.0 UNDERWATER WELDCING
As required by the scope of work, a spool piece20 must be welded between the end of thepipeline and a riser pre-installed on the 100 m W.D. jacket. It is assumed that this spool pieceIs to be welded under water. Basically, two options can be considered:
iai1 Wet Welding
Wet welding techniques have been applied for many decades already. Both, electrodes andgas shielded processes can be used.
In general, welding in water is difficult. An over-amount of hydrogen Is available fromelectrolysis and chemical reactions in the welding process. As a result, the hydrogen contentof a wet Weld is almost invariably high, being a source of hydrogen cracking. This problemis worsened by quenching effects due to the rapid cooling rate, freezing the weld pool andprohibiting the hydrogen to escape.Nickel alloy electrodes have been attempted, as the nickel microstructure tends to bindhydrogen, and nickel alloys are known for giving a tough weld structure. However, wet weldednickel-based weldments appear to be susceptible to hot cracking.
0 These metallurgical complications have sofar prohibited a wide use of wet welding inunderwater construction work, most applications being in secondary weldments and in thewelding of low strength steels. The ease of the wet welding process as compared to the0 alternative - welding in a habitat - however forms a continuous incentive for further research.At present the research is directed to perfecting nickel-based systems; developing heatgenerating electrodes for welding or post - weld heat treatment with the purpose to achievelower cooling rates; and different tempering techniques to acquire a tougher heat - affectedzone.

13.2 Welding in a Dry Habitat
Dry hyperbaric welding is carried out in a habitat built around the object to be welded. This
technique is widely applied for critical welds under water as in bracing repairs and pipeline tie-
ins. Although hyperbaric welding takes place in a dry environment, it is more complicated than
welding above water. In the first place, the high moisture content in the chamber requires
special attention for the handling and storage of welding consumables. Secondly, the heliumused in the breathing gas is a good heat conductor, especially when its density Is Increased
under the hydrostatic pressure. The higher cooling rates resulting from this ask for special
attention to avoid a brittle weld.
The great draw-back of dry hyperbaric welding is the high costs Involved In the habitat andits handling. The great advantage is in the full control of the welding process and inspection
* of the weld in a dry environment.
14.0 CONCLUSIONS
The following conclusions are drawn from the paper:
1. Underwater construction work below a water depth of 250 m can not make use of
divers. Divedess procedures need thorough attention in the engineering phase.
2. Areas requiring close attention during the conceptual design of an underwater structure,
for ensuring a smooth offshore installation phase, are: position tolerances, level
tolerances and stability during pile driving.
3. The offshore installation equipment presently available with the Installation Contractors
Is in principle suitable for working in waters of 1000 m and deeper. Where the present
equipment is not fully tailored yet, solutions are at hand for adaptions.
0 4. Pipelay in deep water (J-lay) requires a completely different technique as compared to
shallow water (S-lay). Equipment for J-lay has been built already in preparation for the
step to deep water.
5. High quality welding under water is still to take place from a habitat. Wet welding
techniques are under intense research.

15.0 GLOSSARY OF OFFSHORE CONSTRUCTION TERMINOLOGY
1. Tension Leg Platform (rLP): a floating production platform anchored to be the seabedby vertical pre-stressed tension elements (tethers or tendons) at its four corners.
2. Export pipeline: a pipeline from a production platform to the shore or to anotherplatform, through which the produced gas or oil are carried off.
3. Tether. a tension element of a Tension Leg Platform, usually built up from structuralpipe or drill pipe.
4. Template: a small structural frame work on the seabed, totally under water.
5. Pile sleeve: a tubular element in a structure, through which a foundation pile Is driven,and to which the pile Is connected after installation.
6. Swaging: a process of connecting a pile to its pile sleeve, whereby the pile Is radiallyexpanded Into a recess in the Inside sleeve wall by creating a high water pressureinside the pile.
7. Grouting: a process of connecting a pile to its pile sleeve, whereby the annulusbetween pile and sleeve is filled with a grout mix. After curing of the grout, the pileIs rigidly connected to the sleeve.
8. Expansion loop: a loop in a pipeline, usually In the form of an S or a U, allowingthermal expansion of the pipeline due to hot oil or gas, without inducing high forces
In the pipeline or the structure to which the pipe Is connected.
9. Riser. a vertical tubular connecting a pipeline to the process equipment on the deck* of a platform.
10. Seafastening: structural elements temporarily connecting a structure to a cargo bargeduring transport over sea.
11. Semi-Submersible Crane Vessel (SSCV): a crane vessel consisting of a work deck,columns and floaters. The vessel can be submersed to half-way the height of thecolumns for achieving a favourable motion behaviour in adverse seastates.

12. Transponder a beacon, commonly powered by batteries, transmitting acoustic signals
under water.
13. Guide frame: a structural frame, mostly temporary, for physically Installing two or morestructures at narrow tolerances with respect to each other.
14. Docking piles: piles pre-installed at exact positions, used for indexing a structure to beInstalled at a later time. The exact positions of docking piles are mostly achieved byusing a temporary guide frame. Docking piles are frequently used for locating aplatform over pre-drilled wells.
15. Deadman anchor. an anchoring point consisting of a heavy weight, derivng its stabilityfrom gravity forces only.
16. Remotely Operated Vehicle ROV): an electrically powered, remotely controlled underwatercamera, often equipped with manipulators for executing simple tasks under water.
17. Pile lifting tool: a tool used for lifting piles, usually by gripping the pile Inside Its top.Pile lifting tools can be engaged and disengaged by remote - control.
18. Mud mats: plated areas at the base of a structure, acting as footings by which thestructure rests on the seabed in the non-piled phase.
19. Tendon: see tether (3).
20. Spool piece: a section of pipe, usually an expansion loop (8) to be welded betweenthe as-laid pipeline end and the riser on the platform.

o.0-
AA
WOOOD-0008

BALDER. _
71I -J
Figure 2Typical Semi-Submersible Crane Vessel (SSCV)
S.S.C.V. •EL 0 00
VESSEL'S ANCHOR WIRE-ACO
Figure 3aStation Keeping on Vessel's Anchor Wires
S.S.C.V.
_____________________________________ ______ EL. 0.00
U .NE ANCHOR \
2500M 2000M =, ,I W VESSEL'S ANCHR WIRE EXTENSION WIRE
Figure 3b
Station Keeping on Extended Anchor Wires
SSC.V. EL. 0.00
P. BEACON
•.P. BEACON MUDLINE
Figure 3c
Station Keeping on Dynamic Positioning

0
0
C,,CC
EC
~Cj,
a,C
0
0
0 0- I-*0 0- z
0- 0-N 0- a 0-

LhJD
zL
I?
Cuq
LD
~0'0

C.,
CD
:r r
-j <
0<0
Q~C&
0I -!j
z 0
LL1
Y/

SIGNAL CABLE - . ----- HIGH PRESSUIREWATER HOSE
$ WAGING4 TO0OL
- -- -ESITY PROBE I - STOPPER
SWAGE SLEEVE
GROUT SLEEVEDEFORMED S
PIlut RECESS SECTION-GROUT ANNULUS
SECONDARY I , WATER INLET
S~---WELD BEADS PRESSURE SENSOR
PRIIAARYGOTILTINFL.ATABLE PACKER - CALLIPER WHEEL
---PIL PILE
Figure Ba Figure 8bGrouted Pile - to - Sleeve Conniectioni Swaged Pole -to - Sleeve Connection
FULL SWAG(
~oo - FIALY SWACEO(
Soo
DOO~
PILE CONhACTISTHE BOTTOM OF THE GPGXA
U L
ELASTIC EXPANSIONJ
7 PILE CONTACTS SREEVE CORNERS
0 10 20 30 .0 SO 60 70 00
VOL L"l
Figure 9Typical Pressure -Volume Diagram of Swaging Process

IL c
z 2$

S
W9
S
S
0
SS0
S90

15th WEGEMT School "Underwater Technology"
4th Session
HYDRODYNAMICS AND CONTROL
:0

X. LOADS ON FIXED AND MOVING STRUCTURES
Christian Aage Technical University of Denmark Denmark
Assoc. Prof. Department of Ocean EngineeringPh.D. DK-2800 Lyngby, Denmark
ABSTRACT
This chapter deals with the hydrodynamic loads on underwater vehicles,
caused by the waves and currents in the ocean, or by the motions of thevehicle itself. Basic hydrodynamics and wave kinematics are presented, and
methods to determine lift, drag, and inertia forces are described.
1. INTRODUCTION
In order to determine the loads and motions of underwater vehicles an
understanding of some basic hydrodynamic principles is necessary. And as
ocean surface waves cause water motions well below the surface, a basic
description of wave theory is needed as well.
This section is only intended to be a rudimentary review of these very
complicated phenomena. A comprehensive treatment is given in e.g. Dean &
Dalrymple (1991), Chakrabarti (1987), Sarpkaya & Isaacson (1981), Susbielles
& Bratu (1981), and Clauss, Lehmann & Ostergaard (1988).

2. BASIC HYDRODYNAMICS
z
y
* Fig. 1 - Coordinate system and infinitesimal cube.
Conservation of mass leads to the continuity equation, which for anincompressible, irrotational fluid can be expressed as the Laplace equation:
a2l 02§ 02ýV2• = + + 02=
where f is the velocity potential, defined so that
all 0V 04u - = v = ;W -
Force equilibrium for an infinitesimal cube of fluid, as in Fig. 1, leads to the
Bernoulli equation, which connects the velocity and the vertical position to
the fluid pressure:
PV + p (u2 + v2 + w2) + p + p g z = Po
where p is the fluid density, p is the pressure, and g is the acceleration of
*gravity.
The Bernoulli equation is only valid in principle for an inviscid or perfect
fluid. If viscosity cannot be neglected, the much more complicated Navier-
Stokes differential equations must be used, which generally can only be solved
numerically. However, for a large number of practical problems including wave
motions and forces on underwater vehicles, the water can be considered as
inviscid.
A very important exception is the drag force on a submerged body, which
becomes zero in a perfect fluid (d'Alembert's paradox). Therefore, viscositywill have to be considered in the thin boundary layer close to the body, or
experimentally based corrections to the perfect fluid solutions must be intro-
duced.
2

3. BASIC WAVE KINEMATICS
The simplest possible theory for periodic water waves is the Airy linearwave theory, which will be described below.. In spite of its shortcomings, theAiry wave theory can be used with good accuracy on many types of prob-lems, as long as the waves are not too steep, and the water not too shallow.
A regular, periodic wave can be described by the characteristics indicated inFig. 2:
T'C
Fig. 2 -Characteristics of a regular water wave.
In order to find meaningful solutions to the Laplace equation we need a set
of boundary conditions, which in this case require that the vertical particlemotion at the seabed is zero, and that water particles at the surface remain
* at the surface. With the boundary conditions in linearized form we canobtain the following solution in terms of the velocity potential:
§ ' egsIijAfz +d' cosO
The velocity potential yields all velocities, accelerations, particle paths and,
together with the Bernoulli equation, also the pressures. The formulae for
these important wave properties are listed in Table 1.
3

C NoCO 0 7 Nt bO4
0 v . r4m CO +14 i" CO+.4 I.4 4 .
co v 3tIrL r4 CL
C..~~ do +~ 'aS
+ I 0 0 "C + "C+vN 4N
I +I III !
4' td
V~~~~L u 2 C t -
InC- C3-4 -$4 * 74 .~VIhV
C) C V V V COCO +V +r
w QQ 3c c. r 'is
4J 4J 3 3
C) C-P k-M 0; 04 i 4
.4. ccP S-P 0. 4wQ c w
$4 U) CO a)C d a
:it ad > 91. En .7. [>I44, C 4 tr-->

The column "intermediate water depth" gives the full Airy theory solution. In
very deep and very shallow water, some simplifications of the formulae are
possible without significant loss of accuracy, as indicated in Table 1.
Some important properties of the wave motion can be seen from the linear
wave theory solution:
The surface profile, as well as the particle motions, velocities, accelerations,
and the dynamic pressures, all vary sinusoidally with respect to time and
* distance in the wave direction (x-axis).
It is important to note the mutual phases of these variables, in this table
indicated by sine or cosine in connection with + or -. Velocities and accele-
ration have a phase difference of L- or 900, which will be brought out2
clearly in the next section.
In the general case the water particles move in ellipses which decay down-
wards. In deep water, the ellipses become circles, and the motion at the
seabed is zero. In shallow water, only the vertical motion decays to zero at
the seabed, whereas the horizontal motion has constant amplitude all the way
down to the seabed, as seen in Fig. 3.
*Q 0 c' Q 0) 0!) 0C Q
<= Ct) e0 4)g CV 8) t gt) =
Fig. 3 -Particle paths in different water depths.
If any current is present, the current and the wave particle velocities should
be added as vectors. The very simple approach to just add the separately
calculated wave and current forces will often underestimate the total force.

4. MORISON'S EQUATION
4.1 General
A body situated in the water mass under a surface wave, such as e.g.
a vertical pile, will influence the water velocities and accelerations, and so besubjected to drag and inertia forces. The simplest possible description of thisindeed complicated problem has been given by Morison, O'Brien, Johnson, &Schaaf (1950).
6D
///'//t//,. f /-77-,-/ ý//,/
Fig. 4 - A vertical pile in waves.
Morison et al. suggested that the horizontal wave force on a vertical cylin-
drical pile could be considered as composed of two independent components:
* I. A drag force proportional to the fluid velocity squared, corresponding
to the drag force in a stationary flow in a real (viscous) fluid.
H II. An inertia force proportional to the fluid acceleration in an ideal(inviscid) fluid. the inertia force stems from the acceleration of thedisplaced water mass plus the hydrodynamic (added) mass around the
body.
Morison et al. do not consider the two inertia force components separately,but for the applications below, it is important to understand their different
origin.
The body displaces a volume of water, which would otherwise be acceleratedby varying pressures in the wave in order to make this volume of water
6

follow the wave motion. The same pressures will now act on the body as aforce, which is known by naval architects as the Froude-Kriloff force.
The hydrodynamic or added mass of a body is a physical abstraction used inorder to describe the disturbance in the fluid caused by an accelerating body,
or equivalently as here, a stationary body in an accelerating fluid. Thus, thehydrodynamic mass can be defined simply as the additional fluid force divided
by the acceleration. However, as pointed out by Sarpkaya & Isaacson (1981),the hydrodynamic mass does have a real physical meaning, being equal inmagnitude to the total fluid mass transport when a body moves through an
inviscid fluid, "which unveils itself only if the body is accelerated".
4.2 Morison's equation for a cylindrical pile
Referring to Fig. 4 the force dF on a small section ds of a circular cylindri-cal pile is given by Morison's equation as:
dF =I p CDD uIuIds + p D2 fi ds + p C D2 A ds
wherep is the fluid density
CD is the drag coefficient
D is the pile diameteru is the horizontal fluid velocityi is the horizontal fluid accelerationC is the added mass coefficient.m
The coefficients CD and Ci can be determined theoretically or experimentally.
* In principle, but not always in reality, they are equal to the coefficientsfound in stationary viscous flow, and in accelerating inviscid flow, respectively.For the cylindrical pile CD is in the range 0.7 - 1.3 depending on the
Reynolds number. C is 1.0, and therefore the total inertia coefficient is 2.0
in this case.
7

4.3 Force variation over a wave cycle
If we insert the particle velocities and accelerations of the Airy wave
solution into Morison's equation, we can obtain an expression for the varia-
tion of the wave force on a cylinder element as a function of time:cosh k z+d)
dF p C z u . sinSlsinSl dsDr 2 cosh k(z+d)
- D2 (!+ )s cosO ds
The drag force is proportional to velocity squared, so it follows a sine
squared curve, with the sign preserved. The total inertia force is proportional
to the acceleration, so it follows a negative cosine curve. Over a wave period
0 the wave force varies as in Fig. 5.
/ \
0
Fig. 5 - Force variation over a wave cycle.
The maximum force can be determined by differentiation of the Morison
equation with the wave theory expressions inserted. Numerical or graphical
methods can also be used, especially if higher order wave theories are ap-
plied.
Depending on the wave height, frequency, and the pile dimensions, the total
wave force may be dominated by drag or inertia forces, as seen in Figs. 6
and 7.
8

~SUM
//
/ - InERTIA
Fig. 6 - Drag dominated wave forces.
V,/~ PrA
Fig. 7 -Inertia dominated wave forces.
O 4.4 Morison's equation for a fixed arbitrary 2-D body
Morison's equation can be extended to describe the wave forces on
O arbitrary 2-D bodies, not necessarily vertical, as follows:
dF =½p CD D u Iu I ds + p V fi ds + p C m V R fi ds
where
dF is the force perpendicular to the body axis
D is the width of the body perpendicular to the flow
V is body volume per unit length
VR is body reference volume per unit length
u is velocity perpendicular to the body axis
fi is acceleration per pendicular to the body axis.
9

A list of drag and inertia coefficients of common 2-D bodies is given inAppendices A and B. A very extensive list of hydrodynamic coefficients can
be found in Blevins (1977).
For the bodies where V and VR are equal (as e.g. the circular cylinder), wecan put the two inertia terms together and write CM = 1 + Cm. But in
general, that is not the case. The Froude-Kriloff term is always based on thereal volume of the body, whereas the reference volume can be arbitrarily
chosen.
Exercise: The added mass of a flat plate is
its circumscribed fluid cylinder.T-, Write Morison's equation for a
k\ J)vertical flat plate, and determine CM
'] I'/ in this case.
4.5 Morison's equation for a fixed 3-D body
Morison's equation can be extended also to describe the wave forces on
a fixed 3-D body, as follows:
F = p D A ulul + p V fi + p C VR f
where
* F is the force in the flow direction
A is body area as projected in the flow direction
V is body volume
* VR is body reference volume.
A list of drag and inertia coefficients of common 3-D bodies is given in
Appendices A and B, and more extensive tables can be found in Blevins
(1977).
4.6 Morison's equation for an oscillating 2-D body
If the body itself is oscillating, the wave velocities and accelerations
must be corrected accordingly in the drag and the added mass terms. The
10

Froude-Kriloff term, however; stemming only from the pressures in the
undisturbed wave, will not be changed. So, the force exerted on an element
ds of an oscillating 2-D body becomes:
dF = 4 p CD(U-ub)lu-ubIds + p V ft ds + p Cm VR (f-u1b) ds - M flb ds
where
u b is body velocity in the flow direction
ftb is body acceleration in the flow direction
M is body mass per unit length.
The body mass includes the structural mass, any mud, concrete or oil inside
* the body (pipe). Any marine fouling will also contribute to the body mass,
and usually also change the effective outer diameter and the hydrodynamic
coefficients.
Exercise: Morison's equation is normally used to determine the
hydrodynamic forces on a platform jacket duringlaunch. Assuming calm water and circular cylindrical
jacket members, can a total inertia coefficient
CM = 1 + C be applied in this case?
4.7 Morison's equation for an oscillating 3-D body
Similarly to the 2-D case, the force acting on an oscillating 3-D body
in waves becomes:
F = 1 P CD A (u-u b)lu-ub + p V fi + P C. VR (f-fib) -M flb
whereF is the force in the flow directionA is body area as projected in the flow directionV is body volume
VI R is body reference volume.
M is body mass.
11

4.8 Limitations of Morison's equation
It should be noted here that all the different versions of Morison'sequation above describe only the in-line forces, i.e. the forces in-line with theflow. For an inclined cylinder the equation gives a force perpendicular to thebody axis, but still in the sane vertical plane as the flow.
What has been neglected are the transverse forces, which in some cases may
be very important. For a flexible body the transverse forces due to vortexshedding may cause severe vibrations (strumnming), if the vortex sheddingfrequency is near the resonance condition of the body. In fact, the twofrequencies do not have to be very close for this problem to occur, because
the vortex shedding has a tendency to lock-in on the vibration.
More generally speaking, the lift forces have been neglected above. In manycases that can be fully justified. But in other cases, especially when thebodies or their appendages are designed to create a substantial lift force,Morison's equation is generally not applicable.
Determination of the hydrodynamic coefficients CD and CM is not as simple
as maybe indicated above. In reality they are not independent, and theirproper values for different flow conditions are still the subject of extensive
research.
The hydrodynamic coefficients in accelerating flow as here, have been foundto depend very much on two non- dimensional numbers, the Reynold's numberRe and the Keulegan- Carpenter number KG:
Re=T!LiD KC =umSxT0 1'
whereu is flow velocity, here usually Umax
D is a characteristic body length, e.g. diameter
V is the kinematic viscosity of the fluid
Umrax is the flow velocity amplitude
T is wave period, or period of oscillation.
12

5. DRAG AND LIFTi FORCES
5.1 Drag and lift forces in general
Drag forces on different types of bodies have been dealt with in con-
nection with Morison's equation. Lift forces on rudders, fins, propellers, or on
whole vehicles, such as ships, submarines or cables, are equally important.
Theoretical determination of drag and lift forces on arbitrary bodies is too
complicated to be described here. Instead, some references to experimental
data are given.
Drag and lift force data are usually presented as non-dimensional coefficients
CDand CL defined so that:
D =ip U2 CDA L=4 pU 2 C A
whereD is drag forceL is lift force
CD is drag coefficient
CL is lift coefficient
A is a representative area, frontal area, wing area, or wetted
surface.
The term q = i p U2 is the dynamic fluid pressure. By definition the drag
force is parallel to, and the lift force perpendicular to the direction of the
undisturbed flow, as seen in Fig. 8.
L1g
Fig. 8 -Definition of drag and lift forces
13

5.2 Frictional drag
For large streamlined bodies, such as ships and submarines, the purefrictional drag is important, as opposed to more blunt bodies, such as circularcylinders, where the pressure drag dominates, and pure friction can be ne-glected. A reasonably accurate formula for determination of the frictional dragcoefficient is the ITTC-57 formula:
C 0.0 75
whereCF is frictional drag coefficient based on wetted surface area
Re is Reynold's number based on wetted length.
5.3 Pressure drag
The pressure drag on a submerged body is the sum of other dragcomponents which together with the frictional drag gives the total drag.Relevant data must be found in the literature or by experiments.
5.4 Drag and lift, data
Drag and lift data can be found in several references, especially forgeometrically simple bodies. Specific data for practical vessels or structures aremore difficult to find, because they are commercially valuable. Hoerner (1965
* and 1975) has collected a wealth of drag and lift data, and his two booksare of great value to the designing engineer.
6. DESIGN LOAD *CONDITIONS
6.1 General
Determining the hydrodynamic design load conditions for an underwatervessel or fixed structure is a very complex problem. Here we shall only givesome very simple and practical guidelines related to the determination of aregular wave condition that will produce loads equivalent to the maximum
loads expected.
14

Design rules are based on certain statistical probabilities of failure, even if
that is not always clearly specified. In principle the probabilities deal with
the loads, but in this connection the probabilities are usually transferred to
the waves. In that way, an equivalent design wave spectrum can be deter-
mined, which can lead to a single regular design wave. Such a regular wave
can be applied directly to determine the loads by means of e.g. Morison's
equation.
This simplified approach is very much used in practical design, and it is the
O only method to be described here. However, it should be borne in mind that
the maximum wave heights and their associated periods do not always pro-
duce the maximum loads.
The design wave conditions can be found from wave statistics. They can also
be determined indirectly from wind statistics, or from a specific knowledge
about the wind conditions, from which the wave conditions can be calculated.
6.2 Design waves from wave statistics
The most comprehensive source of published wave statistics is "Global
Wave Statistics" by Hogben et al. (1986). For 104 areas covering the oceans
of the globe, see Fig. 9, wave statistics based on observations and measure-
ments are presented.
ISo so 0 U T NO 4 0 0 N 0 1U 50 W
Fig. 9 - Map of "Global Wave Statistics" areas.
S15

ALL DIRECTIONS
PERCENTAGE OF OBS = 100.007(INCLUDING 2. 37% DIRECTION UNKNOWN)
TOTAL 137 345 318 146 43 9 2 1000
>14 - - - - - - - -
13-14 - - - - - - - - - - -12-13 - - - - - - - - - - -
o 11-12 - - - - - - - - - - -
. 10-11 - - - - - - - - - - -: 9-10 - - - - - - - - - - -
8-9 - - - - - - - - - - -7-8 - - - - - - - - - - -
6-7 - - - - - - - - - - -S5-6 - - 1 1 1 - - - - - - 3
CP 4-5 - 2 6 5 2 1 - - - - - 16
L- 3-4 1 12 23 17 7 2 - - - - - 62
o 2-3 7 47 70 42 14 3 1 - 1851-2 34 137 140 61 15 3 1 - - - 3900-1 95 147 79 20 3 - - 345
4-5 6-7 8-9 10-11 12-13 TOTAL<4 5-6 7-8 9-10 11-12 >139 ZERO CROSSING PERIOD (s)
Fig. 10 - Statistics for Area 5 (the Baltic).
The statistics on significant wave heights and zero crossing periods are
subdivided in seasons and directions, but are given for all seasons, all
directions as well, see Fig. 10.
The maximum significant wave height, or more precisely, the significant wave
height that is exceeded with a chosen small probability, can be found by
plotting the statistical wave data in a Weibull-diagram, as done in Fig. 11
with the above data. With a probability of exceedance of e.g. 10-6 the
maximum significant wave height H1s is here 9 m. The associated zero cross-
ing wave period T02 can be estimated from Fig. 10 to be about 7 s.
16
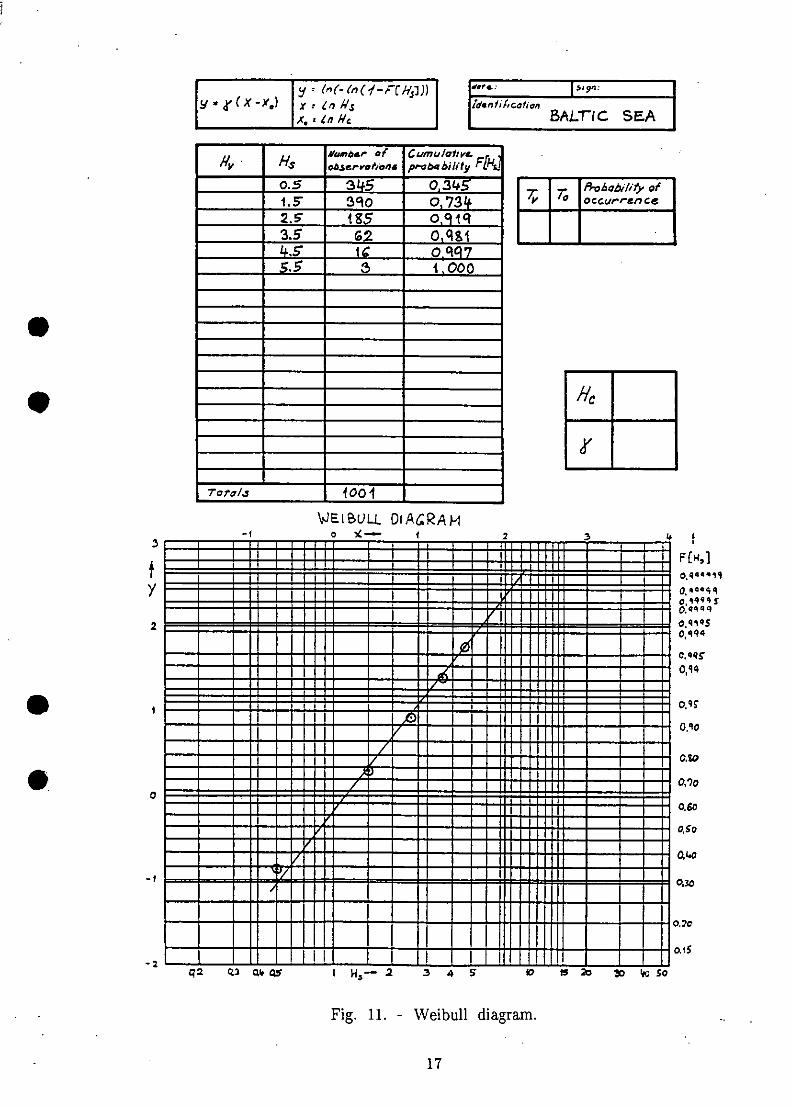
* . • ( x X - .) jx I [de'n, . Iif, c.,o tio ,nyi ( y n do BALTIC SEA
4 A'3 #,s,b of Cum•'u/ch/va,
0.5 345 0,137 P7, a,'JI, of11.5" 390 0,734 occarence265' 295 Io91R3.5 G• o1 $14S• 1; ao~qq7SS,3 3 o1s 000
Totla 1001WELBULL O'A&RAM
I J I Il I T I I I l i t l It I I I I • ,I I I IiI I I I I F 1,,1
2 I Ii. .It I I
I I ' "I O ,q q- -,-ro.qqg
Of I I-- -/
,/ O, t4
-I X .0,10
q23! Q Isi
I 0.6o
- t [ / iI 0.30
] ! •0.20
Fig. 11. - Weibull diagram.
17

AREA rno
Fig. 12 - Wave spectrum characteristics.
The significant wave height Hs is the mean of the highest one third of the
waves in the spectrum. It is related to the spectrum by the spectrum area,see Fig. 12.
Hs = 4 v/ m0
wherem0 is the spectrum area.
The zero crossing period T02 corresponds to the centre of inertia of the
spectrum, so that:
* T02 = 02
These figures, however, cannot be used directly to determine the maximumwave loads. In order to find the maximum wave height in the sea statecharacterized by given H. and T02, short-term wave statistics are necessary.
Assuming that the wave peaks follow a Rayleigh distribution, then the mostprobable maximum wave height out of N waves is given by:
H =max H JTniFNS
18

where N is the time period considered, when the sea state can be assumedstationary (2-4 hours), divided by TOT.
However, due to the very flat shape of the Rayleigh distribution, the mostprobable maximum wave height has a 63 per cent probability of beingexceeded, and so a somewhat higher value should be used as the designvalue. A common practice is to use the x per cent quantile, which is found
by replacing N above with:
N 100-N
For the 99 per cent quantile we get N. = iao N, which will give quite a
safe design value.
The wave period associated with this maximum wave height will most prob-
ably be close to the spectrum peak, which is about 1.4 times the zerocrossing period:
T = 1.4 T 02.
6.3 Design waves from wind data
Even if "Global Wave Statistics" covers the whole world, it does giveaverage values for the different areas. In coastal zones the variations within
each area may be very large, and in some specific areas of operation suchaverage data may be too inaccurate. In such cases, usable wave data can becalculated on the basis of wind statistics, which are usually much moredetailed than wave statistics.
The simplest possible method to calculate wave heights and periods on the
basis of wind speed is the SMB - formula. It was developed by Sverdrup,Munk and Bretschneider during World War II in order to forecast the wave
conditions before landing operations. The method as described here can befound in U.S. Army (1977).
19

The formuals give the significant wave height and the mean wave period (notT02' see below) as functions of wind speed at height 19.5 m above sea level,
water depth, and wind fetch over open water.
7 0 fgl 0 42gH = 0.283 tanh 0.530 r4d10 ta5 0.0125 IU2 jU12 [U2J tanh [0.530 f-Ld-]°'51
0•0:0.3750 0.077 lU IO2 5
=1.20 tani [0.833 {Ajý Th tanh 0.7 [y].20U23 tanh[ &] 0.375
where
H = H is significant wave height
T = To = 1.087 T02 is mean wave period
U - U19.5 -= 1.10 U10 is wind speed at 19.5 m above sea
g is acceleration of gravity
d is water depthF is wind fetch over open water.
Both formulas contain a repeated tanh [ ] term, which should be remem-
bered when programming this calculation. Both terms will vanish in deep
* water.
If the water depth is not constant over the fetch, an average estimate should
be made where the area near the field of operation should carry the greater
weight.
With complex coastal shapes with peninsulas, islands etc., the fetch should be
determined as a mean value within a 450 sector around the main wind
direction.
20

The 5MB-formula above gives wave height and period for fully developed sea.In the aopen oceans the sea state will be fully developed after 24 to 48hours, depending on the wind force. Also the not fully developed sea can becalculated, see U.S. Army (1975).
Exercise: Find H. and To with the following data:
U0 = 20m/s
d =l10mF = 25000 m
(Answer: H. = 1.76 mn and To = 5.02 s)
7. HYDRODYNAMICS OF DIVERS
A special, but important, subject of interest for the underwater
technology engineer is the hydrodynam-ics of divers. We shall not here go intothe propulsion hydrodynamics of swimming divers, but only look at the forcesexerted on the diver by waves and currents. These forces can be substantial,and they can often determine whether a diving job is feasible or not, undergiven weather conditions.
In calculating the hydrodynamic forces on the diver we can apply Morison's
equation for a fixed 3- D body (section 4.5). Water particle velocities andaccelerations can be found by Airy's wave theory. The horizontal max. valueswill always be larger than or equal to the vertical max. values, and they canusually be applied to determine the max. forces. In the case where the diveris lying horizontally in the water, the vertical force may be the larger one,however.
As is often the case, no specific measurements of the hydrodynamiccoefficients CDand CM for divers are available, so we must use data from
similar geometrical bodies. The data given in Fig. 13 have been estimated onthe basis of data found in the Appendices for cylinders and ellipsoids.

O.Sarn 0.S5mv
Co
C D= 1.5 L =13
C = 0.8 C = 0.1In m
Fig. 13 -Estimated hydrodynamic coefficients for a diver in horizontal flow.
Exercise:
The diver shown in Fig. 13 has a mass M = 120 kg including his equipment
and lead weights, which have been adjusted so that he is nearly neutrally
buoyrant in sea water of density p = 1025 kg/rn 3.
* The diver is going to carry out a difficult welding job at the seabed. He
must keep himself in position with one hand while welding with the otherhand. Therefore the maximum allowable hydrodynamic force on the diver
* himself is estimated to be F = 100 N.
The water depth at the work site is d = 40 mn. The significant wave heightis H S= 3.0 m, and the zero crossing wave period is T 2= 6.0 s. There is
no current.
a) For the given sea state, determine a regular wave corresponding to themost probable highest wave over a period of 8 hours.
b) For this wave, determine the water particle paths at the surface andat the seabed.
22

c) Calculate and plot the drag, inertia, and total hydrodynamic forces onthe diver standing upright on the seabed, over one wave period. Arethe forces dominated by drag or inertia?
d) Same question as c), supposing that the diver can place himself in ahorizontal position parallel to the wave direction.
e) Determine the maximum hydrodynamic forces on the diver in the twocases, and compare them with the given maximum allowable force.
f) Determine the approximate maximum allowable sea states and windspeeds in the two cases.
REFERENCES
Airy, G.B. (1845): "Tides and Waves", Encyclopedia Metropolitan, London.
Blevins, R.D. (1979): "Formulas for Natural Frequency and Mode Shape",Van Nostrand Reinhold Company, New York, 492 pp.
Chakrabarti, S.K. (1987): "Hydrodynamics of Offshore Structures", Computa-tional Mechanics Publications, Springer-Verlag, Berlin, 440 pp.
Clauss, G., Lehmann, E. & Ostergaard, C. (1988): "Meerestechnische Kon-struktionen", Springer- Verlag, Berlin, 559 pp.
Dean, R.G. & Dalrymple, R.A. (1991): "Water Wave Mechanics for Engineers
and Scientists", Advanced Series on Ocean Engineering, Vol. 2, World Scien-tific, Singapore, 353 pp.
DIF (1984): "Dansk Ingeniorforening's Code of Practice for Pile-Supported
Offshore Structures", 1st Edition 1983, Translation Edition 1984, Part 2,Annexes A-F, Teknisk Forlag, Kobenhavn, pp. 88.
Hoerner, S.F. (1965): "Fluid-Dynamic Drag", Hoerner Fluid Dynamics, Brick
Town, N.J., 454 pp.
23

Hoerner, S.F. & Borst, H.V. (1975): "Fluid-Dynamic Lift", Hoerner FluidDynamics, Brick Town, N.J., 505 pp.
Hogben, N., Dacunha, N.M.C. & Olliver, G.F. (1986): "Global Wave Statis-tics", British Maritime Technology Ltd., Unwin Brothers Ltd., Old Woking,661 pp.
Morison, O.R., O'Brien, M.P., Johnson, J.W. and Schaaf, S.A. (1950): "TheForce Exerted by Surface Waves on Piles", Petroleum Transactions, AIME,
* Vol. 189, New York, pp. 149-154.
Sarpkaya, T. & Isaacson, M. (1981): "Mechanics of Wave Forces on Offshore
Structures", Van Nostrand Reinhold Company, New York, 651 pp.
Susbielles, G. & Bratu, C. (1981): "Vagues et Ouverages P~troliers en Mer",Editions Technip, Paris, 501 pp.
U.S. Army (1977): "Shore Protection Manual", U.S. Army Coastal EngineeringResearch Center, Dept. of the Army Corps of Engineers, Washington D.C.,Vol. I, p. 3-46.
WEGEMT (1991): "Design and Analysis of Slender Marine Structures - Risersand Pipelines", 14th WEGEMT Graduate School, WEGEMT Secretariat,
Marine Technology Directorate Ltd., London.
24

APPENDIX
to Chapter X
25

-. DRAG OF SF-PHERS
tao 1-1 -7
0.14
0.01- __ _ _ _ _ _ _ _
01.0-2 13~ I0 I0 R V 100.01 0.1 1 10 I0ta14 t' ,1
1000 - I___
DRAG OF= SHooTI4 CYLINIDBJR-S
Ioa
0.0/ 0.1 1 o 1 0 0 t 0 Rd _ 0
* DRAG OF ROUGH CYLJIDE-RS
Ijcb.Ik/o - 6 7/fo'
.8 ~ ~ ~ ~ " -IT,03__________
.7 0 \O. A
57AOt6 -Rd V Vd/,
ALL PA-rA FROM- NOERMER (IqGS)
26

3-D 2--
SHAPE REF. .94SAPE RER Co
(g) 8 an 1.20
S(C) aL42 (p) 1.16
w(e) 0.5( ..
(e)
(+- 8so- C) 1.55
L17 1.98
L ., (C) 1.17 (a) 2+00
tb) I.2 V ) 2.3
(a) 138 (b) 2.2o
Laj ) 1.051 4
DRAG OF VARIouS 3-J) AND 2-DGEOMETrQICAL SHAPES
FROM HOEF-pM R (tqG5)
27

uL Or or000
000 00 u
ri-CO
'C-
ILI
Co -
C;C
A 0
*do A28

0.00
Ld dd 00-
0 C
1; C;o
4-
AQ -02 4
29

S
* 10
S
SS
0
S0

X1. LOADS AND MOTIONS OF FLEXIBLE STRUCTURES
Christian Aage Technical University of Denmark DenmarkAssoc. Prof. Department of Ocean EngineeringPh.D. DK-2800 Lyngby, Denmark
ABSTRACT
This chapter deals with the hydrodynamic loads and motions of under-water flexible structures, such as risers, umbilicals, and cables. Generally,reference is made to the notes of the 14th WEGEMT Graduate School.
1. INTRODUCTION TO FLEXIBLE STRUCTURES
Underwater flexible structures are here defined as structures which willdeflect more than their own diameter under normal load. They will usuallybe slender structures that are very thin compared to the wave length and totheir own length.
C UMBILICAL
TENSIONED FLEXIBL_._ RISER
Fig. 1 - Examples of underwater flexible structures.
I

Typically, the transverse stiffness will be governed by geometrical changes of
shape in connection with axial tension, and not by the bending stiffness.
Examples are risers, umbilicals, and cables.
An adequate theoretical treatment of the dynamic behaviour of flexible struc-
tures in waves is outside the scope of this school. The subject is rather
complex and requires much more time and space than given here. In fact,
the recent 14th WEGEMT Graduate School in January 1991 spent a whole
week and several hundred pages on this subject alone. A general reference is
therefore made to the lecture notes of that school.
On the other hand, however, it would be wrong not to mention some of the
important features of flexible structures in this school. Therefore a few
examples are discussed here. A more operational knowledge of flexible struc-
tures in waves can be obtained from WEGEMT (1991).
2. LOADS ON FLEXIBLE STRUCTURES
The hydrodynamic loads on flexible structures can be determined by Morison's
equation if the motions are small and slow compared to the body diameter
and to the particle motions. But very often, a substantial transverse oscilla-
tion of the structure is triggered and maintained by the flow separation,
alternating from side to side in a Karman's vortex street.
c- DRAG
EXC ITATIOIJ
DRAG-- = Do (I D
DAM PcMG 2%
Fig. 2 - Hydrodynamic loads on oscillating structures.
2

Morison's equation does not take the transverse motion into account, and
even the in-line motion of the body will be greatly influenced by the vibra-tion. The effective in-line drag will increase by up to a factor two, due to atransverse vibration of the structure of about one diameter amplitude.
The drag force on a flexible structure will be active in the wave excitationforce as well as in the motion damping. On a flexible riser as in Fig. 2, alarge drag coefficient will mean a large wave excitation force in the upper
part of the riser, but also a large damping in the lower part. Whether asmall or a large drag coefficient will give the largest total loads and motions,cannot be determined without a detailed dynamic analysis.
In general, loads and motions of flexible structures are mutual function ofeach other, and so a full dynamic analysis is required to determine both.
Very long flexible structures will not usually experience the same load simul-
taneously over their whole length, and consequently, their oscillations will notbe in phase over the whole length. This means an important relief in thetotal load on the structure, and so a determination of the correlation length
for each specific case is often attempted.
3. DRAG AND LIFT OF INCLINED CIRCULAR CYLINDERS
A special case with a large number of practical applications is the slender
S cylinder, inclined against the direction of flow. According to Hoerner (1965and 1975) the drag and lift forces at subcritical Reynolds numbers can bedetermined as shown in Fig. 3, because the hydrodynamic pressures correspondclosely to the velocity component in the direction perpendicular to the cylin-
der axis.
At supercritical Reynolds numbers, Hoerner (1965 and 1975) states that the
drag is approximately constant for an angle of inclination A between 00 and500.
3

% C,
v \(dL2D
C . "Da u o C "o W ME a (b .ýj~ 0 • .. o
10~
4 ý4
A/ KC
4- 1.,E .1.2 a.@
0 CLINMR. CA (60 3.. CABLEG.,iN OEA bf It)
Figt. 3 [•• Drag a rnd lit oefciet oficie clnes
4. DRAGOO TOWEDRMILISCALS ORm CABLES
0-.0- p. 3-11...o
4 A"l0.,..( -
o . .30 690 30 30 JR*
Fig. 3 - Drag and lift coefficients of inclined cylinders.
4. DRAG OF TOWED UMBILICALS OR CABLES
The shape and the total drag force of a long flexible cylinder, such as an
umbilical or a cable, can be determined in steady flow by the force equilib-
rium shown in Fig. 4, from Hoerner (1965).
F
W,
Fig. 4 - Forces on a towed cable.
4

The shape of a cable towed without a weight at the end will be a straight
line, except for possible oscillations. With a weight or a drag force at the
end, the equilibrium condition can be determined as shown in Fig. 4, by
taking the drag and lift forces on the cable itself into account.
REFERENCES
Hoerner, S.F. (1965): "Fluid-Dynamic Drag", Hoerner Fluid Dynamics, Brick
Town, N.J., 454 pp.
Hoerner, S.F. & Borst, H.V. (1975): "Fluid-Dynamic Lift", Hoerner Fluid
Dynamics, Brick Town, N.J., 505 pp.
WEGEMT (1991): "Design and Analysis of Slender Marine Structures - Risers
and Pipelines", 14th WEGEMT Graduate School, WEGEMT Secretariat,
Marine Technology Directorate Ltd., London.
5

S
0
S11
S
0
SS0
SS

15 th WEGEMT Graduate School- Underwater Technology
-* Hydrodynamics and Vehicle Control
Lectures XII and XIII onControl systems, Propulsion, and Steering
by
Mogens BlankeProfessor, Ph.D.
Department of Control EngineeringUniversity of Aalborg, Denmark
Helsinki October 1991

WEGEMTf Fifteenth Graduate School PageLectures on Control Systems
Table of Contents
Lecture XII - Control Systems............................1I
I. Control Systems - part 1 .............................. I1A. Design Principles....................................1
1. Linear Models ................................. 22. Closed loop control ............................. 33. Asymptotic Frequency Response Analysis .............. 4
*B. Optimal Filtering and Estimation ........................ 6C. Advanced Methods ..................... :............. ** *6D. Exercise: Calculation of Response Characteristic ............. 8
IL. Control Systems - Part 2 ............................. 9A- Control Systems.................................. 10
1. Machinery Automation, Manoeuvring Control,Integrated Control and Surveillance .............. 10
2. The Marine Engine Governor ..................... 34
III. Propulsion and Steering .............................. 42A. Dynamic Models for Propulsion, Steering, Manoeuvring, and
Track Control .................................. 431. List of symbols................................432. Propeller Performance .......................... 443. Control Surface Forces.......................... 55
*4. Steering and Manoeuvring Equations ................ 585. Speed and Propulsion Dynamics .................... 666. Appendixes: Linear equations of lateral motion and
nondimensional coefficients .................... 74B. Change in control characteristics when adding external
devices....................................... 821.Introduction .............. ' ' *............ ***........822. Method of Investigation ......................... 823. Modes of Operation............................834. Steering Dynamics ............................. 845. Propeller thrust and rudder forces .................. 856. Results..................................... 867. Summary .................................... 88
Mogens Blanke Aalborg University AUCOctober 1991 Department of Control Engineering

WEGEMT7 Fifteenth Graduate School Page iiLectures on Control Systems
8. References ................................. 889. Main Particulars for vessel ...................... 8910. Propeller characteristics Wageningen B series ....... 9011. Ship Parameters ............................. 91
C. Track Control for Ocean Mining ...................... 941. Optimal Fuel/Economy Track-Keeping Control ...... 94
© Copyright:
Department of Control Engineering, Aalborg University 1991Mogens Blanke 1991
No part of this material may be reproduced, by any means, without the writtenconsent of the copyright holders and the WEGEMT foundation.
Mogens Blanke Aalborg University AUCOctober 1991 Department of Control Engineering

WEGEMTf Fifteenth Graduate School Page 1Lectures on Control Systems
Lecture XII - Control Systems
I. Control Systems - part 1.
The following issues are dealt with in this lecture:
Design principles:Transform of mathematical model from hydrodynamic theory (from part X and XI)to one fitted for control system analysis and design. Frequency domainrepresentation. Analysis of steady state properties. Analysis of disturbance rejectionproperties of the control system. An exercise to illustrate the theory.
Optimal filtering and estimation:Kalman filter techniques for state estimation and optimal filtering.Robustness issues in using Kalman filters with closed loop control.
Advanced methods:System parameter identification used for modelling and control.Self tuning control loops and adaptive techniques.
A. Design Principles
Control systems design is based on knowledge on the physical process to becontrolled. Basic control objectives are part of the process design or the operationdesire i.e. they are predetermined. The physical plant is often modelled enddescribed in terms of differential equations. A complete description of the closedloop control system in terms of differential equations would be too complex tooverview and analyze, however. Various aspects of systems analysis theory can beused to overcome the complexity.
A first step, control systems analysis is most often based on decomposition of asystem into function blocks. The function of each block is then described in termsof differential equations or in terms of the frequency response properties of theblock.
Mogens Blanke Aalborg University AUCOctober 1991 Department of Control Engineering

WEGEMT Fifteenth Graduate School Page 2Lectures on Control Systems
1. Linear Models
Let us first consider a system which is purely linear. A description as differentialequations can be made as coupled first order equations. This formulation is referredto as state space form. The following notation is used:
x is an n dimensional column vector of states,u is an input vector of dimension m,y is a measurement vector of dimension k,A for an n,n matrix with real numbers as elements,B is an n,m matrixC is an k,n matrixD is an k,m matrix
Elements in matrixes are real numbers that may be time varying.i(t) = A(t) x() + B(t) u()y(t) = C(t) x(t) + D(t) u(t)
This equation is a state space model in its general, linear form. Many advanceddesign methods use this system description form as the basis.
In analyzing physical system performance, it is useful to be able to express theproperties of a control system in terms of response amplitude at differentfrequencies. This is both used in expressing the desired performance of the systemand the analysis of properties in practice. Load disturbance rejection (waves,current, work load) are important for control quality.
The Laplace transform is used to transform from the time domain to the frequencydomain. Use of the Laplace transform requires that the matrix elements in A, B, C,and D are time invariant. Recalling that with the Laplace operator s:
W(ID(t)) = s x(s) - x(0=0)(xW)) = x(s)
9(fJ(x(t) dt)) = -x(s)s
Iim(x(t),.. = lim(s x(s)),, o
Mogens Blanke Aalborg University AUCOctober 1991 Department of Control Engineering

WEGEMT Fifteenth Graduate School Page 3Lectures on Control Systems
The transform of the state space equation becomes:
s I x(s) - I x(t=O) = A x(s) + B u(s)y(s) = C x(s) + D u(s)y(s) = H(s) u(s)
The matrix I is the unity matrix. We can ignore the initial value part. Then
(sl - A) x(s) = B u(s) - x(s) = (sI - A) -' B u(s)y(s) = ( C (sI - A)-' B + D ) u(s)
H(s) is the transfer function matrix for the system. Stability properties of the systemare inherent in the eigenvalues - poles in control system language. They are thevalues of the complex variable s where the denominator of H(s) is zero.The system is stable if and only if all poles pi have a real part less than zero. Thiswill mean that an initial condition of x(t) at t=O will decrease to zero.The matrix H(s) introduced in this equation describes the relation between acommand signal, e.g actuator force or control valve position. H(s) has a set of
det(sI - A) = 0 -a. sR + a 1-l Sn-1 +...+ a, S + ao = 0 ,
(s - P1 ) (s - P2) ... (s - P.) = 0
transfer functions as elements. For a system description with v(t) and r(t) asmeasured variables. Input variables are control surface angle 8, force Y and MomentN. H(s) is a matrix with six transfer functions as elements. The salient feature aboutH(S) is that all transfer functions have the same poles. Stability is a systemproperty, not a feature associated with the single transfer function from one inputto another.
r -1 fraH a012 1 [vi Fbl dll d12 1 [ 8 1
* [tJ 1a21 a2 2 i Lr + [b 2 d21 d22J[NI
Lr YJ =1! 0 1 Vr~y2 t 1o i r J
fv(s) v(s) v(s) 1
H(s) 8(s) Y(s) N(s)
kr(s) r(s) r(s) j8(s) Y(s) N(s)
Mogens Blanke Aalborg University AUCOctober 1991 Department of Control Engineering

WEGEMT Fifteenth Graduate School Page 4Lectures on Control Systems
2. Closed loop control
The controller uses the input signals of a system to obtain desired output signals. Areference signal (vector) r(t) is the setpoint required for the output signals.Controllers can be based on state feedback or series compensators. Other principlesexist, but are not considered here.State feedback means a gain is applied on the difference between the state referenceand the states:
u(t) = -- t (x(t) - X,40))
A series compensator is a feedback using a dynamic element to amplify thedifference between an output signal and a reference value.
u(s) = -G(s) (y(s) - y,,J(s)) 0
With the state feedback we get
x(s) = (sl - A)-' BL (x,,/s) - X(s)) -
x(s) = (sl - (A - BL)) -1 BL x,,Is)
With the series compensator
y(s) = C (sf-A) - ' B G(s)(y,/s) - y(s))= H(s) G(s) (y,,ep) - y(s)) -
y(s) = (I + H(s) G(s))- ' H(s)G(s) y,,rs) -
y(s) - y,,is) = (I + H(s) G(s)) -' y,,(s)
The following quantities are defined from these relations
S(s) = (I+ H(s) G(s))-1
L(s) = (I + H(s) G(s))-1 H(s)G(s)
L(s) + S(s) = 1
L(s) express the ability of the system to follow the reference vector. L(s) is the
Mogens Blanke Aalborg University AUCOctober 1991 Department of Control Engineering

WEGEMT Fifteenth Graduate School Page 5Lectures on Control Systems
closed loop transfer function. The best performance is be obtained when I L(s) I isas close to 1 as possible.
S(s) is an expression for of the difference between the two. It is straightforward toshow that a disturbance on the system will be attenuated by the factor S(s). S(s) isthe sensitivity function. The best performance is obtained when I S(s) Iis as closeto 0 as possible.
It is noted, that since L(s) + S(s) = 1, disturbance suppression becomes less whenloop tracking of the reference is less. The properties of the state feedback loop canalso be expressed in terms of L(s) and S(s).
* The calculation of L(s) and S(s) is done as part of the control system designprocess. As users or designers of the processes, it is, nevertheless quite useful to beable to get a feeling and approximate quantification. The next section thereforeprovides a basic tool for rapid assessment that does not require anelaborate computing exercise.
In the actual realization of control systems, the controllers are computerized. Themeasurements and the control signals are then calculated at regular intervals,determined by a sampling time, T. Calculation of controllers then require a discreteanalysis. This is outside the scope of this single lecture introduction, but it is noted,that frequency response analysis is equally valid for performance assessment in thediscrete controller case.
3. Asymptotic Frequency Response Analysis.
Frequency response analysis means to substitute the complex variable s with theimaginary jca. Asymptotic characteristics are obtained as follows. Assume thetransfer function to be evaluated is given as
(`s-z 1)(s-z 2).(S-z,)
In each factor of the denominator, set s = wo, find out which is the largest of s andp, and disregard the smaller. Proceed in this way in all terms with the denominatorand the numerator. Straightforward multiplication and division of reals will thengive the asymptotic value at a certain frequency.
Mogens Blanke Aalborg University AUCOctober 1991 Department of Control Engineering

WEGEMT Fifteenth Graduate School Page 6Lectures on Control Systems
If pi and pi+, are complex conjugates, use [p, and 1pi,11 instead.The transfer function may instead be given as
(1 +st)(1 +sT)...(l +stJ)(1 +sC 1)(1 +s'2) .... (1 +s.)
The procedure is then similar. Calculate sr of each factor with s=co. If Wr is largenthan 1, use wr. Otherwise use 1. A mixture of the two representations is treatedsimilarly.
B. Optimal Filtering and Estimation
In some systems, available measurements are heavily corrupted with noise, or asufficient number of states can not be measured to realize a feedback controller. Insuch cases, one uses state estimation to reconstruct the state.
Examples on state estimators are Kalman filters and Luenberger observers.
Both can be implemented according to the following state reconstruction scheme
i(t) = A z(t) + B u(t) + K (y(O - CQ(t))A(t) = z()
The essence of this type of filters is that a model of the system dynamics is used.The estimated state z(t) is then used for feedback instead of the unmeasurable x(t).The control law is
"(t) = -L(t) ((t) - x,•O)•
The model is updated with the difference between the estimated and the measuredoutput. The feedback matrix K is determined to optimize noise suppression with theKalman filter. The noise intensities in the system are used to find the optimal K inthis case.
The Luenberger observer can be designed with considerable freedom, and is alsoavailable in more general forms to fit specific engineering purposes.
When using state estimation, serious difficulties may occur due to reduced stabilitymargins if the model does not match reality. This issue is dealt with in the theory
Mogens Blanke Aalborg University AUCOctober 1991 Department of Control Engineering

WEGEMT Fifteenth Graduate School Page 7Lectures on Control Systems
of robust control. In some cases, it may be required to update the parameters of thestate estimator.
C. Advanced Methods
Among the techniques available in more advanced designs are several that havealready proven their industrial validity. They include:
1. identification of system parameters offline or online
2. incorporate both state estimation and parameter estimation
3. make a series compensating controller that calculates the controllerparameters from on-line system parameter identification
4. let the controller make experiments in a startup phase to provide selftuning
Several promising, advanced techniques are currently available in researchlaboratories but lack genuine industrial testing.
Mogens Blanke Aalborg University AUCOctober 1991 Department of Control Engineering

WEGEMT Fifteenth Graduate School Page 8Lectures on Control Systems
D. Exercise: Calculation of Response Characteristic
The control object considered is a surveillance vessel. The details of its dynamicsare treated in lecture XIII.
In the example, state space models and transfer functions are provided. Based onthis information, the following is to be investigated:
1. With a periodic disturbance of 20 kN sway force (Y) and 200 kNm yaw moment(N) at frequency 0.2 rad/s , what is the resulting motion of the vessel at 5 kt andat 5 kt in survey mode 1. Hint: Use the asymptotic characteristics.
2. Calculate the closed loop poles with a state feedback to rudder angle:
6(t) = - 5.0 [deg/ deg/s] r(t) - 0.0 [deg/ m/s] v(t)
3. Calculate the answers to question 1 with this feedback applied, when the onlydisturbance is the 200 kNm yaw moment (N).
Mogens Blanke Aalborg University AUCOctober 1991 Department of Control Engineering

WEGEMTf Fifteenth Graduate School Page 9Lectures on Control Systems
HI. Control Systems - Part 2.
This lecture will deal with the following issues:
Control objectives:Requirements to the control system. What is the control task, which tasks are to beautomated, the accuracy is required. How is the control system specified such thatthe practical performance is in accordance with what we need. Consideration ofinterfaces, interlocks and failure mode reaction.
Components and subsystem interconnection:Sensors, actuators, control computer units. Electrical interfaces. Data-nets for theprocess level.
It is not intended to give a practical overview in this short presentation merely keyissues are covered.
Architecture of control systems:Principles behind distribution of functions. Combined surveillance and controlsystems. Totally integrated systems. Fault handling in control systems. Principlesfor secondary operation and local control.
Mogens Blanke Aalborg University AUCOctober 1991 Department of Control Engineering

WEGEMT Fifteenth Graduate School Page 10Lectures on Control Systems
A. Control Systems
The term control system is sometimes used in a broad sense which is too imprecisefor professional use. When acquiring or using these systems, a strict definition ofvarious functions are useful:
An automatic control system uses actuator(s) to keep the state of a processas desired. Measured value(s) and setpoint(s) are used to determine the stateof the process and the desired value.
A remote control system is one that enables an operator to change actuatorsas valve position from a remote location.
A safety system is one which is in principle independent of control systems.The purpose is to protect machinery from major damage by preventing thestate from exceeding defined values.
A surveillance system monitors the state of a process through transducersand provides operator display of these values. An alarm system is often partof a surveillance system.
The following section discusses various aspects of automatic control andsurveillance.
1. Machiner'y Automation, Manoeuvring Control, Inte grated Control andSurveillance
The material included below was presented at the ICMES Symposium in 1987 inShanghai.
Mogens Blanke Aalborg University AUCOctober 1991 Department of Control Engineering

WEGEMT Fifteenth Graduate School Page 11Lectures on Control Systems
Engine Room Automation, Ship Safety and Economy
by
Mogens Blanke
Lyngs0 MarineSoren T. Lyngso A/S
DK-2970 Horsholm, Denmark
Abstract
Engine room automation concepts are rapidly changing as a result of both re-cent developments in machinery configuration and the availability of in-expensive computing technology that makes coordination of various machi-nery controls possible. Such coordinated control and information is contri-buting to both ship safety and economy of operation provided new control-techniques are introduced.
This paper presents details of such new systems, presently installed only atfew vessels. The features offered by these integrated systems are addressed,and the close relations between machinery, control system design and philo-sophy of operation are discussed. Robustness issues are also addressed, andthe paper shows how a control hierarchy with well defined modes ofoperations, also for emergency cases, can contribute to the safe handling ofthe vessel. The close relations between machinery design and control systemarchitecture are further discussed from a redundancy point of view, andexamples show the virtues of distributing control in a multiprocessorhierarchy where processors are connected through a local area network.
Mogens Blanke Aalborg University AUCOctober 1991 Department of Control Engineering

WEGEMT Fifteenth Graduate School Page 12Lectures on Control Systems
1. Introduction
The degree of automation of ship machinery is a consequence of economyoptimization of the ship operation design, the machinery configuration, andthe philosophy of operation.
Machinery systems become ever more complex to meet the requirements ofcuts in fuel costs. Various advanced designs as an example utilize the mainengines production of cheep power in electricity generation with shaftgenerators and exhaust gass turbines, for efficiency increase in auxilary-engines, and for generation of steem. Coordinated control of such complexsystems is obvious both for the sake of power management and optimizationof energy production, but also for reasons of safety.The number of possiblemodes of operation of complex machinery are so many that an operator mayfail in properly setting up the conditions for individual items. Even thoughnot damaging the equipment, interlocks in various local controls and safetysystems may well prevent proper operation for some time. The consequencesare usually not significant, but ensurance reports nevertheless list manyevents.
The perception of plant state and the correct judgement of conditions by theoperator is a major factor when equipment conditions get unusual. Properpresentation of information is thus of prime concern in control andsurveillance systems.
With respect to expence budgets, the prime factors of ship operations economy
are:
fuel costs
- manning
- maintenence and repairs
- comercial efficiency
The way ship owners operate their ships differ a lot, but key factors behindcommercial success are those listed. The priority differs according e.g. to thecost of labour. An automation solution shall thus offer the following facilities:
- build in optimization with tools for performance analysis andplanning.facilities to enable operation by only very few people
Mogens Blanke Aalborg University AUCOctober 1991 Department of Control Engineering

WEGEMT Fifteenth Graduate School Page 13Lectures on Control Systems
tools for performance analysis for maintenance and repairs should
be included or linked to the surveillance part of the systemplanning facilities should meet high demands
Such considerations have led to the advent of the latest concept in marine
automation, integrated ship control (ISO).
2. Requirements of Integrated Ship Control-
Prime properties required by an integrated ship control system are:
1. The ISO shall make it possible for a single operator to handle, the ship,
including surveillance and control of all machinery running in passage
conditions. The control shall be possible from the bridge.
2. ISC shall ensure that the best possible performance is obtained and
maintained even in case of malfunction or breakdowm. on machinery
systems being controlled.
3. ISO shall ensure the alert of personnel when needed for ship handling or
safety.
4. The ISO shall ensure that all requirements for safe operation with un-
manned machinery space are met, and the ISO shall attempt to reduce
work in the machinery space to a minimum.
5. The ISC shall to a large degree interpret and give priority to alarms for
S better enabling ship's personnel to locate and relieve the cause of alarm.
6. ISO shall contain a condition and performance monitoring system or
give access for such systems to access transducer data and other
measurements available within the ISO.
7. Iso shall be simple in overview and perception and connections to the
systems controlled shall be easy.
8. Iso shall have a high degree of reliability and robustness to faults. As
an example all key parts of the system shall be at least duplicated.
Mogens Blanke Aalborg University AUCOctober 1991 Department of Control Engineering

WEGEMT Fifteenth Graduate School Page 14Lectures on.Control Systems
3. Systems under ISC-Control
All major systems in the ship are surveilled and controlled by the ISC. To
enable operation by a single person, the ISC does not barely control thevarious electrical or machinery items onboard, but coordinates the control ofthese to the extent needed. Among the systems controlled and operatedthrough the ISC are:
- Prime propulsion machinery- Propeller(s) with controllable pitch- Thrusters- Shaft generators- Auxiliary engines with generator- Switchboards- Cooling systems- Lubrication oil systems- Fuel oil systems (filters, separators etc.)- Bilge- and tank systems- Bearing systems- Pressure-air systems (compressors).- Hydraulic systems.- Systems for air condition and heating.- Fresh water system.- Cargo control (pumps, valves etc.).- Fire fighting.- Locking systems.
Major automatic control systems include:- Start sequencing of engines and systems.- Power management with features for energy optimization.
When manoeuvring and steering controls are included:
Manoeuvring control with force allocation to rudder(s) andthruster(s), propellor(s).
Track control with input from Navigation Planning System.- Automatic Heading control.
4. ISC Architecture
The overall structure and hierarchy of an integrated control and surveillancesystem is shown in figure 1. The system comprises consoles for operator ini-tiated control, and panels for manoeuvring control, changes of modes etc.Assuming a ship architecture where the engine control room is not present,
the facilities may be:
Mogens Blanke Aalborg University AUCOctober 1991 Department of Control Engineering

WEGEMT Fifteenth Graduate School Page 15Lectures on Control'Systems
At the Ship Control Center (Bridge):- Ship HandlingPanel.
- Bridge Wing Panels (BWP).
- System control console with double graphic colour displays.
Navigation console (NAC) of ISC integrates navigation devices.
Personal computer terminal.
Alarm printer.
At the ship's office:
- System control console.- Printer console.
- Personal computer terminal(s).
In the machinery space:- Single console for ISC control.
In the ship/machinery space:- Outstations for the ISC placed at strategic locations.
in the architecture, primary safety is built into the entire design. Well de-
fined alternatives exist for the use of both machinery and control system
paths in the event that faults occur. The redundancy, reversionary operation
facilities, and fall back operation are prime factors to obtain this. To get fulluse of such design features, the machinery systems need to be tailored to meet
similar strict requirements as the ISC concerning clearly defined interfaces,
well specified interlocks, and provision of alternative machinery for certain
functions. These issues are adressed below.
4.1 ISC Control Hierarchy
In figure 1, the hierarchy of the ISC is shown. At the lowest level, outside the
ISC, the machinery to be controlled is found. Each machinery system has a
possibility of local control, and all primary safety units protecting the parti-
cular engine from disasterous damage are situated locally. These safety and
shut down cabinets are not part of the ISC. The reason is the need of having a
fall back level of local manual control where the machinery can be manually
operated and still protected from hazards.
Some machinery may require local controls to allow safe local (manual)
control. In these cases, interface to the ISC are at the set point level.
Mogens Blanke Aalborg University AUCOctober 1991 Department of Control Engineering

WEGEMT Fifteenth Graduate School Page 16Lectures on Control Systems
4.2 'Outstation Level
Control functions in the ISC are distributed in the ship and machinery space.
The location of each outstation is determined by convenience of e.g. proximity
to groups of transducers and machinery to be controlled, but considerations
should also be given to the proper distribution on functions to various units.
Such considerations should be made in close collaboration with the control
systems vendor, who will have well tested standard modules available and
recommendations for the proper distribution. This has to do with system
robustness and redundancy issues discussed below.
The schematics of an outstation is shown in figure 2. Each outstation consists
of a number of computer units, each of which is independent, self contained
with power converter and a number of process inputs-outputs, and is
selfchecking. The units communicate through a duplicated industrial local
area network. Figure 3 shows facilities of the individual process computer
units of which normally 6 toS8 are gathered in one outstation.
4.3 Operator Level
Operation of the ISO takes place from workstations like the system console
shown in figure 4. It is equipped with
- graphical colour screens (VDIU)
- dedicated keyboards with hard and soft keys
- trackerballs for easy and safe selection of items
Panels with various dedicated levers are used for ship manoeuvring and speed
setting.
Concerning architecture, it should be noted that
- panels are connected via duplicated totally independent interfaces
- a direct control exists to either local controls or to particular outstations
- consoles have in principle identical structure with outstations. I.e.
double net connection, paralel computer units for driving graphical
colour VDUs
- the two display processors work independent of each other, i.e. control
can be taken from any of those at any time, provided the particular item
is not being controlled from elsewhere.
Mogens Blanke Aalborg University AUCOctober 1991 Department of Control Engineering

WEGEMT Fifteenth Graduate School Page 17Lectures on Control Systems
Figure 5 shows the principal architecture of a displayprocessor. Three paralel
computer units operate in parallel for display and data base purposes to
provide high performance to the operator. Man-machine studies have shown
that operators get tired if tight requirements to the time it takes to update or
change a picture are not met.
4.4 Safety Levels and Redundancy
System safety is to a large extent dependent on the facilities offered to the
operator in an emergency. If having designed machinery and control system
according to a well defined philosophy of operation, the ISO offers a clearly
defined set of modes of operation for normal conditions, reversionary
operation, and fall back modes for use in case of major faults. The hierarchy
and levels of redundancy are:
- 1. Normal operation. All systems work.
- 2. Dual connection of workstations and pannels. In case of
malfunction, change to the second system.
- 3. If both links of the dual net are damaged, change is made to the
direct mode from the Sill. Signals are transmitted to e.g. the
rudder servos independent of any other device. Thrust control may
be available from outstations with shaft control.
- 4. Local control is possible independent of the ISO
4.5 System Error Handling
Faults in the electronics of an ISO shall be diagnosed by the system itself, and
should be explained in clear language to enable rapid repair. For an ISO, the
aim should be 10 minutes mean time to repair, the class requirement for
unmanned machinery space. This duration should be judged with the
knowledge, that single failures in the ISC treated here will be handled by
changing to an alternative mode or use of equipment.
To enable a short time to repair, the ISO comprises a set of facilities in
software and hardware. The more essential are:
- hardware check with watchdog surveillance
- configuration control using the network- upload or download of code when changing a computer unit
Mogens Blanke Aalborg University AUGOctober 1991 Department of Control Engineering

WEGEMT Fifteenth Graduate School Page 18Lectures on Control Systems
The last issue is made possible by running a backup in both of twodisplayprocessors. When changing a unit e.g. in an outstation, theconfiguration control gets a message that a unit has been replaced. The code
formerly situated in that particular computer is then downloaded.
4.6 Robustness and ISC Machinery InterconnectionInterconnection to machinery is made at setpoint level or as actuator signals.The connections to typical machinery is shown in figures 6 and 7. Figure 6 is
the control of ballast tank content where the ISC interfaces a pump and -amotor controlled valve. Figure 7. shows an example of the control of a standby pump set. Two independent computer units are used. The particulararrangement assures that should the computer of the running pump fail, thepump continues running, and the other continues to be stand-by.
4.7 Personal Computer Interconnection
Transfer of measurements from machinery transducers is a part of improving
efficiency of ship management. Performance analysis, maintenance planningand fault diagnosis are only three of the uses expected. The ISC provides accesto a process net link such that available signals can be copied to associated
personal computer(s).
5.Manoeuvring and Steering Control from ISC
The detailed operational requirements, some of which were listed above, ledto a concept for ship handling and design of panels which may be regarded asuntraditional. The main objective has been to relieve the navigator fromindividual machinery command e.g. during manoeuvres, and insteadallowing him to concentrate on what motion he wants of his ship. The aim isthat handle commands to implement a particular motion should beindependent of machinery configuration to the extent possible. Selection ofthe mode of operation should be fast and safe, also in cases of reversionaryoperation. As an example, we consider the machinery configuration shown in
figure 10.
A variety of operator positions desired for possible ship handling further addsto the complexity of the problem. The positions are
Mogens Blanke Aalborg University AUCOctober 1991 Department of Control Engineering

WEGEMT Fifteenth Graduate School Page 19Lectures on Control Systems
* A Ship Handling Panel (SHP') at the bridge
* Bridge Wing Panels (BWrP) or similar portable units
In response to the basic aims, panels and levers have been designed such that
any particular motion of the ship is always possible from a certain type of
handle. Turning of the ship is hence always obtainable from a turning
knob,independent of whether the turn is generated by the autopilot at a
controlled rate of turn, the turn is achieved through combined effects of bow
thruster and rudders, or through direct demand to the rudders.
This emphasis on making the use of actual machinery transparent to the-
navigator, or at least much less in focus than at today's vessels, has made it
possible to obtain a fairly elegant solution to ship handling in different modes
of operation.
5.1 Modes of operation
Several normal modes of operation may exist, each characterized by the
machinery used for prime propulsion and manoeuvring. To examplify, a
machinery is shown in figure 10.
* Normal passage with fixed RPM
* Passage with varying RPM
* Manoeuvring
In addition, a number of modes exist for reversionary operation for use when
machinery is overhauled, defective, or if part of the control system should fail.
Examples on a two engine vessel (figure 10) are
* conventional mnanoeuvring
a manoeuvring with fixed revs.
* Console defined modes
The latter is a mode of operation that can be selected from a variety of
possibilities from a console. A dedicated pushbutton on the panels, referred to
as console defined, can be assigned a reversionary mode of operation.
Reversionary operation can hence be obtained as easily by the navigator as
the normal modes, once the selection has been made from one of the consoles.
Mogens Blanke Aalborg University AUCOctober 1991 Department of Control Engineering

WEGEMT Fifteenth Graduate School Page 20Lectures on Control Systems
The selection of mode of operation also involves the selection of station incontrol. Since not all stations may have levers to support all modes, and theselection of a mode is dependent on the machinery condition, this is a complex
task. This issue has become less involved with the introduction of a virtualpanel interface that defines a standard way of communicating ship motioncommands, irrespective of whether the command is issued from a visual
display unit or a panel equipped with dedicated levers and knobs. A virtual
interface further supports higher levels of control and the use of a unified
man-machine interface principles at different control stations.
5.2 Control
Within a mode of operation, different types of control may be applicable. In
manoeuvring for example, heading may be manually controlled through amanual demand turning moment or heading may be maintainedautomatically by automatic heading control. In passage modes, heading maybe determined manually by direct rudder command from a turning knob orautomatically by the ISO autopilot. The following manoeuvring and passage
controls are typically implemented.
* Controlled heading alterations* Controlled rate of turn
* Shaft thrust controls with shaft speed and pitch control where
applicable* Manoeuvring coordination with three axis force/moment control
5.2.1 Heading and turn rate control. The heading control accepts both
heading alteration and turn rate demands, with turn rate demand beingoverriding. When the turn rate knob is used, turn rate control takesimmediate command. The heading and rate controllers are integrated in a
commion controller based on non-linear Kalman filter technique.
Heading and turn rate control are obtained with the rudder in passage modes,
but with combined rudder and thruster action in manoeuvring modes. Thecoordination in manoeuvring modes is accomplished by amanoeuvring
coordinator that takes proper action e.g. when machinery power limits are
reached.
5.2.2 Mlanoeuvring coordination. The machinery available for
mnanoeuvring in a given mode of operation is treated according to its
Mogens Blanke Aalborg University AUCOctober 1991 Department of Control Engineering

WEGEMT Fifteenth Graduate School Page 21Lectures on Control Systems
capability while the operator interface remains unchanged. A graphical shiphandling picture provides readily perceptible information of state andutilization of machinery, and other essential information. This picture may beavailable at both the ship handling panel, the consoles, and on additionalhandling displays at the bridge.
5.2.3 Shaft Control. Control of individual shafts is a sound basic controlphilosophy for system architecture, both with respect to software, ISOhardware and machinery. From the operators point of view, the systemprovides automatic check on operation within safe areas for all individualmachinery, and economic load sharing is obtained between engines withoutoperator interference. Other modes may have built in schedules for optimal-coordinated use of the machinery. The operator is hence relieved from specificactions to obtain optimal performance. The performance criteria and strategyof how to obtain optimal performance are built in as parts of the definition ofthe mode. Figure 9 shows the control structure for one shaft.
5.3 Control StationsThe various control stations should be designed to meet the requirements andbe in accordance with the basic system philosophy.
5.3.1 Ship Handling Panel. The SHP is the preferred location for shiphandling in passage modes. The SEP further supports all control modes,including some which are normally operated from navigation consoles liketrack control. This feature enables the operator to take control from the SHPin an emergency irrespective of present mode of operation or station incontrol. The SHP has also a direct control possibility as part of the fall backoperation philosophy, or for use if manual control should be desired for otherreasons.
The SHIP facilities should include:
* lever for fore/aft thrust control* lever for athwartships force (bow thruster usage in direct control)* turning knob for either
- turn rate demand to autopilot-moment demand to manoeuvring coordinator-rudder angle demand to rudder control loop
* turning knob for heading alteration demand to autopilot* push buttons for mode selection e.t.c.* push buttons for autopilot selection
Mogens; Blanke Aalborg University AUCOctober 1991 Department of Control Engineering

WEGEMT Fifteenth Graduate School Page 22Lectures on Control Systems
* a ship handling display with all essential handling information
5.3.2 Bridge wing panels. The BWP's are preferred locations for
manoeuvring. They should contain
* two axis joy stick for fore/aft and athwartship force* turning knob for moment demand or turn rate control
* push buttons for mode selection e.t.c.
5.3.3 Consoles. The consoles are work stations for all machinery and
subsystem control and surveillance. Each console has two color graphic
display units. The control has been splitted in adequate groups of machinery
or subsystems. Control is exerted by a combination of pointing with tracker
ball, operation with softkeys and dedicated hardkeys. The picture hierarchy
and the operation has been made such that a single keystroke can always
bring the operator back to a part system overview picture, and a maximum of
two keystrokes are needed to pick an arbitrary device for operation.
5.3 Reversionary Operation
Reversionary. operation covers all modes of operation not included as part of
normal operation. Reversionary operation may be chosen during routine
service of machinery, repairs or if major faults should occur. The design and
operation philosophy of the ship has given the outlines for reversionary
operation, and various levels for fault management have been defined, and
the solutions given.
The strict definition and operational philosophy for reversionary operation is
considered a unique, salient feature of the combined machinery and control
system design which is made possible from introducing the integrated ship
control concept.
The discussion above has indicated that reversionary modes are selected from
a console. All levels of control are supported in the system
* manual control at individual machinery* operation from servo manual panel of individual components* direct mode control from the SHP of rudders and shafts* individual or normal control from one of the consoles* assignment of a selected reversionary mode to dedicated
pushbuttons at control panels
Mogens Blanke Aalborg University AUCOctober 1991 Department of Control Engineering

WEGEMT Fifteenth Graduate School Page 23Lectures on Control Systems
The system thus has a large flexibility yet simple structure in the choice of
reversionary operation, and normal stations of control are maintained in use
even under severe conditions of malfunction.
6. Conclusions
This paper has presented a control and systems design philosophy for a new-
generation of engine and ship controls using the concept of integrated ship
control.
The ultimate need of simplifying the handling of the ship, compared with
previous designs was discussed, and the solutions that allow simple, safe, and
efficient command of the complex ship were presented. Salient features of the
system were shown to be
" efficient and readily perceptible selection of mode* relief of the operator from machinery optimization" reliable and easily extendable system architecture* well defined strategy for graceful degradation and reversionary
operation* support of reversionary operation from usual handling stations* well defined and well understood interfaces to machinery* optimization facilities offered in the ISC* long term optimization and planning offered on PCs* efficient tools for performance analysis and selective maintenence
can access actual machinery condition through the ISC link
The advent of integrated ship control has thus been shown to offer features to
the owner or operator of the ship that contributes significantly to both safety
and economy of his vessel.
Mogens Blanke Aalborg University AUCOctober 1991 Department of Control Engineering

WEGEMT Fifteenth Graduate School Page 24Lectures on Control Systems
7. References
1. T. Munk and M. Blanke: Simple Command of a Complex Ship.Proceedings 8th Ship Control Systems Symposium, pp 1.81-1.100,The Hague, The Netherlands, October 1987.
2 Marwood,C.T., and T.Munk.: Flexible Controls for a Flexible Ship.Proceedings 7.th Ship Control Systems Symposium, Bath U.K.,1984.
3. Blanke,M., M.Gottlieb, J.S.Andersen, S.Nielsen, J.C.Bentzen.:Robust Distributed Control for Multirole Naval Vessel. Preparedfor 8. Ship Control Systems Symposium, Den Haag, Netherlands, -1987.
4. IijimaY. Ship Automation -past, present, and future. Proc.Symposium on Ship Operation Automation. Genova, Italy.E.Volta, ed. North Holland Publ. Comp. 1983.
5. Danish Ministry of Industry. Requirement Specification forIntegrated Ship Control. May 1987.
Mogens Blanke Aalborg University AUCOctober 1991 Department of Control Engineering

2uujaau!ju3q ioaJuoj jo iuamsiudaU 1661 naqopODfvX)!S~aAlufl iioqluV a~iuula suagow
wu1E20!Q A4q3JUL-aIH (981) l~oalo sdi 4 8 pwalua~auI -1 aan~!A
-- ------------------------- ---------SAiaies
suoll~elsl~nQ
SSG>OJ d 10lJ02o:SSB2)OJd
--------------- 11---------------------------- -------------SJoSS6:)oid
---------------------------------- ----------------
Iaofluo:)sIeJuet IJ1
sr asud looqaS awunpuio qluaalp!r 1~w303M

WEGEMT Fifteenth Graduate School Page 26Lectures on Control Systems
Duplicated network fordisplay processor and
other outstations
BETA BETA BETA t Net-switch
CP CPUcu Cp RAM II2
1 2 3 I
1 SubnetL
I. I d4
Unit Unit Unit Unit
Alpha Alpha Alpha Aloha
Delta Delta Delta De'ta
* ~Input / output for sensors!actuators
Figure 2. Outstation, Principle Diagram
Mogens Blanke Aalborg University AUCOctober 1991 Department of Control Engineering

WEGEMT Fifteenth Graduate School Page 27Lectures on Control Systems
%A
>5 001. CU
E :6o Ej
04 Q 00~ I-
%AA
cc)
C* C
- U
- 4- O
- a+1 CL 4
0 ~ CLCCL0 cc mm
0 0
-4-
rCrj
Mogens Blanke Aalborg University AUCOctober 1991 Department of Control Engineering

WEGEMT Fifteenth Graduate School Page 28Lectures on Control Systems
System Control Console - Bridge
0 • I DisplayBridge Wing ProcesWorPanel BWP I Trackball Keyboard
Ship Handling 1Panel SHP I Net switch 4 -net Trackball KeyboardI
I
1 /
Duplicated networkto additional Consoles
and Outstations
Figure 4. Integrated Ships Control. System Control Console onBridge (SCB) Principle Diagram
Mogens Blanke Aalborg University AUCOctober 1991 Department of Control Engineering

WEGEMT Fifteenth Graduate School Page 29Lectures on Control Systems
Sub net tonet switch Displayprocessor
r -----.-------...............--------------------------------.Power Supply 24Vdc
•-124/ 5112 V
Beta Beta Beta ROM RAM EEP CDC GDC GDC SIU --
CP CPUcu CPU ROM 1 2 3 01832 2 3
for PC-Net
7-U
VDU
Printer
Trackball Keyboard
Figure 5. Integrated Ships Control, Display Processor
Mogens Blanke Aalborg University AUCOctober 1991 Department of Control Engineering

WEGEMT Fifteenth Graduate School Page 30Lectures on Control Systems
- LOCAL- OPEN Motor valve.
- CLOSED Local hand-- OPEN
- CLOSE operation
possible
Computer
* LOCALRUNNING Motr
- START starter- STOP
71M Pump
LevelLEVEL -senSor
Tank
Figure 6. Control and monitoring of ballast tank configuration.
Mogens Blanke Aalborg University AUCOctober 1991 Department of Control Engineering

WEGEMT Fifteenth Graduate School Page 31Lectures on Control Systems
Non return valvessignals
remotecontrol
Ml Pump 1 M2 Pump 2
1 2 tqng'Wio Localo 2 control
oae o 0 0 b-oxes
2=
Controlled Twin Stand-by Pump System
-BLACK-OUT, COMMON TO CPU 1
RUNNING 1Computer - LOCAL 1PRESS. LOW 2
START 1STOP 1
BLACK-OUT, COMMON TO CPU 2
RUNNING 2Computer - LOCAL 2
2 PRESS. LOW 1START 2STOP 2
Figure 7. Robust Dual Processor Interconnection to a TwinStand-byPump System
Mogens Blanke Aalborg University AUCOctober 1991 Department of Control Engineering

WEGEMT Fifteenth Graduate School Page 32Lectures on Control Systems
toC4
I 0
[ M-1
050
to
EC4ýC

WEGEMT Fifteenth Graduate School Page 33Lectures on Control Systems
FUELPITCH INDEX RPM
MODE ST.RATEGYSELECTION +SUPERVISION
PITCH PITCH
I CONTRO L LIMIT
STRATEGY
THRUST LIMITSDEMAND CONTROL LIMITS
- v I STRATEGY
THRUSTESTIMATE
SHIP SPEED THRUST
(ESTIMATE) ESTIMATOR
Figure 9: Shaft Optimal Thrust Control
Mogens Blanke Aalborg University AUCOctober 1991 Department of Control Engineering

WEGEMT Fifteenth Graduate School Page 34Lectures on Control Systems
2. The Marine Engine Governor
The material presented in this section is written by M.Blanke and P.B.Nielsen(1991). The paper was presented at 2nd International Conference on MaritimeCommunications and Control, London Nov, 1990.
*M Blanke, PhD, MScEn and tP B Nielsen, MSCEE*Aalborg University and tLyngs0-Valmet Marine
SYNOPSISA marine engine of any size is exposed to many and large variations in load. These are due not only to weather. but
also to the type of fuel being burned and the acceptability of maintenance and vessel operational requirements. Anygovernor which is to be used on marine engines must be able to handle large loads and rapid variations in load forseveral years. In addition it must cope with a large variation in operational range of the diesel engine.
Today four main types of governor system exist which are able to jufil the requirement of the marine environment.These are mechanical, hydraulic, pneumatic, and electronic. Each system has its own special advantages anddisadvantages. However, rapidly changing operational requirements placed upon marine engines and their controlsystemns seem to imply that the electronic governor will be the one which survives the longest.This paper discusses the basic methods of operation of the governors of today. The requirements of the control systemare detailed with respect to functionality and performance. The characteristics of the different types of governors arefurther discussed with particular emphasis on safety and reliability aspects. The paper finally gives an example of thelatest advances in electronic governor techniques, taking the recent developments made by Lyngso-Valmet Marine asan example.
INTRODUCTIONMogens Blanke is Professor of Digital Systems at the
Department of Control Engineering, University ofThe advent of the modern long-wroke, low-speed diesel AtAboig. He is convener of the IFAC Working Group onengine hasprovided new challenges for governors. Becauscof Control Applications in Marine Systems. He was with thetheir low speeds, these large engines introduce speed vari- MarineDivisionofSoranTLyngsa,(nowLyngsa-Valmetations which occur as engine speed fluctuations between Marine).fmm1985-G0andmanagedthedevelopmentofcylinder firings. Furthermore the range of operation has been the electronic governor EQS 2000. He has wontrihuted topushed downwards by the requiremnetgs of adequately low literature on marine controls in various areas.manoeuvring speed for engines with only four or five cylin- Per Busk Nielsen is a senior systems analyst in theders. development department of Lyngso.-Valmet Marine. He
The desire for higer fuel efficieny and the subsequet use is responsiblefordiesel engine governorcontrol softwareof shaft alternators and built-in exhaust energy ulison development and has experine of both the peviousdint atof a generation of governor and the EGS 2000. He has alsodevices have pushed the role of the governor into that of a contributed to the development of a number of otherSystems componentL Interlocking. co-ordinated control and proucts for marine automation.interfacing with oiler control sub systems have become amajorconcen. Yet another step in thisdirection is therequire-ment to run low-manned ships without an engine contrl moom,by maintaining surveillanne and remote control from thebridge. Such ships require monitoring functionality which is CONTROL PERFORMANCEonly available in computer based governor systems. REQUIREMENTS
The marine engine governor is thus atapoint of technologi-cal change that started a few yewas back, when MAN B&W A marine governor must control the diesel engine so thatDiesel issued a license letter requiring thai a whole range of both steady state and transient conditions are met. The basictheir engines must be controlled by electronic or digital gover- requirements can be listed as follows:nor, and recommended the use of such equipment for a range 1. to provide smooth control against natural speed fluctua-of special installations. As Sulzer is also recommending the Lions hfm individual cylinder combustion and from theuse of such governor systems, a major change has taken place natural fluctuations following from the order of cylinderin the market. Electronic and digital governor systems have firing;been on the market for more than 12 years, manufactured by 2. to ensre a rapid reaction on fuel supply in the case of toothree to four large suppliers when considering large two-stroke high shaft speed (a full close down in less than 400 m/s isengines. In recent years other vendors have entered the market, required);and new generations of governors have been introduced that 3. to provide smooth control against load variations, formeet the new challenges. example in a seaway;
Mogens Blanke Aalborg University AUCOctober 1991 Department of Control Engineering

WEGEMT Fifteenth Graduate School Page 35Lectures on Control Systems
4. to enable the diesel engine to run steady at fairly low shaftspeed to enable manoeuvring of the ship at Low speed;5. to provide critical speed avoidance to prevent the enginefrom running at certain shaft speeds where engine orsystem resonances would be excited;
6. to provideprotecion against torque overload at any valueof shaft speed; -. -M
7. to provide protection against running with too low air tofuel ratio at any value of shaft speed and scavenging airpressure.
In addition to the seven basic requirements that all concernengine control pedtnnmance. many installations require inter-face, interlocks and co-ordination between the prime movercontrol system and associated sub systems.
Enhanced control ... .The need for both enhanced control and co-rdination of
control between sub systems has been brought about by anumber of design changes, and sophistication and optimisationof the diesel engine. Some of the key facnr are: Fg1: Main components of electronic governor with
1. increasingly low inertia and mass pa brake hore powerc F2. larger, highly efficient turbocharger and air systems giv- elacroea al actuator
ing a slower response than earlier, less efficient designs;3. fewer cylinders and longer piston snrke giving highertorque fluctuation from the combustion and eventually D olarger engine speed fluctuation,
4. recycling of exhaustpowerenergy in complex machineryconfigurations;
5. the use of very large prime movers for propulsion at highspeed while manoeuvring, requiring the same engine to 0run at very low power and shaft speed;
6. more emphasis on the use of shaft generators for produc-Lion of cheaper electric power to the ship. V u ,,• "D
In addition to these technical issues, environmental con-straints to exhaust products add further requirements to con-trol.
Control properties of large diesel engines Fig 2: Electro-mechanlcal actuator for EGS 2000 fromLyngsa-Valmet Marine (maximum force on connectionThe control propertiesoflarge, urbochargeddiesulengines rod Is 10 000N, full close down In 250 mis and 100mmhave changed considerably with the design improvements control stroke (depends on diesel engine type)]mentioned above. Prime factors are discussed in Blanke
(1986). One of the major changes has been the increase in sizeof the turbocharger system and a tight coupling between the in cylinder indicated pressure. Some governor systems mighttwo majorrotating systems of the engine. the tusbochargerand even react to torsional vibrations.the shaft. This phenomena was first reported in Blanke and Fluctuation in fuel rack position is basically undesired for aAndersen (1984), where a non linear model was shown to number of rensor.describe the phenomena, and Hendricks (1986) showed how 1. increased wear on fuel rack linkages and fuel pumps;this model relates to the physical relations and component 2. flucwtationin fuelsupplytoacylindercauseflucuationscharacteristics. in power and temperature. Some assume this will add toThe outcome of this new knowledge has been a revision of wear and accelerate the development of crackings incontroller design for governors, since neglecting this effect cylinder liners.will lead to a disturbance rejection of the controlled engine A traditional means to attemptavoiding fluctuation has beenwhich is wrong by a factor of 1.5-2 compared to the design. the application of a plain dead band. This will then give rise toThe lower inertia and larger kW/cyl has introduced in- a limit cycle in shaft speed that exceeds the value of the dead-creased fluctuation in torque and shaft speed. For the tradi- band-controlcycleswilldrivetherev~nin fromonesideofthetional mechanical governor, this led to undesirablejiggling and dead band to the other.hunting. Such a limit cycle in rev/min is highly undesirable as it has
a direct impact on the fuel consumption.Fuel rack fluctuations
Fluctuations in fuel rack position are commonly seen in Propulsion lossespractice. Some reasons for this are the responsiveness of the When shaft speed increases, so does the speed of the ship,governor to the natural fluctuations from individual cylinder and due to the non linear resistance characteristic of a ship,firings, and the torsional variation in shaft speed at the turning much more fuel is spent at instances of too high ship speed thanwheel, due to the order of firing and possible small imbalances is saved at instances when it is lower than the average.
Mogens Blanke Aalborg University AUCOctober 1991 Department of Control Engineering

WEGEMT Fifteenth Graduate School Page 36Lectures on Control Systems
actmu. the speed sensing device and the scavenging airprewssmr mmt.nit r.Inputs and intefaccs ame speed-setting
Jurý bworder, slowdown and shutdorwn signals, and output to theIbt~dt statutory alaum system.
-. I! Control unitSMNormally located in the ECR, this unit provides the engine
staff with a means of comfrnm tat with the governor. Thisunit may contain the eekcxmic required to convert incomingsignals and orders into correct movement of thi fuel rodsdepending upon the situaion. Monst vendors and the yardsinstalling the equipment, however, prefer to separate theoperator control panel from tie unit receiving the ship'scables.
rPower unitThis povides power for the actuator to position and move
the fuel rack as required.
Fig 3: Pick up arrangement for speed sensing by means Actuatorof proximity twitches (sensor pulse ar treated directly
by dedicated front end computer that enables This is the electro-mechanical device which converts elec-sophisticated signal processn and fault detection) trical coatl signals from thepower unit tomechanicalaction.
It is this device which acally exerts the required force on thefuel rods which causes them to move to the correct position.
The governor's reaction to added resistance in wind and Thesizeofactator depends on required conrol force and thewaves is yet another issue and was tackled in detail by Blanke inertia of die fuel rack, ie upon the engine make, the number(1980 and 81). The conclusions of thee investigations led, in ofcyinders and the bore.Conuol force required range from egcollaboration with major shipownem to the development of 300N to 4500N depending on the size of engine.EGS 900 and now EGS 2000 from Soren T Lyngs0, Lyngse-Valmet Marine. This governor has. as a unique feature on the Speed sensing tacho systemmarket, a constant power mode, where power delivered to the This system allows the controller to detect the speed ofpropeller is kept constant engine output shaft rotation. It is therefore located in close
proximity to the engine turning wheel. The system comprisesAdvanced control and signal processing redundant induction pick-ups mounted in a bracket. These
Due to the need to suppress natural fltuations while pick-ups sense the passing of the turning wheel teeth.having instant reaction in case of an approaching over-speedcondition, sophisticated signal processing and control tech- Scavenging air sensorniques are employed. An overview was given in Blanke Availableengineoutputpoweris afunction ofthescaveng-(1986), and later articles in Motorship (1988) reported on the ing air pressure. A scavenging air sensor is a sensor which.use of such technology, senses this air pressure and allows the controller to restrict
The possibility of employing a dedicated microprocessor engine output power to avoid too low air to fuel ratio.for processing of speed signals has been introduced by a few An example of the control component structure is given invendors. The features available include advanced fault detec- Fig I. Figure 2 is a sketch of a speed sensing system. Figure 3tion possibilities, automatic changeover to a redundant sensor is an outline of an actuator of electro-mechanical type.without any effecton speed regulation, and advanced filtering.
The discrete nature of the combustion process is also recog- Controller structurenised by a few vendors, who point to the fact that the amountof fuel injected in a cylinder is determined at a certain engine Internally, most vendors separate the control into twoangle relative to the top position of the piston. In between loops; an actuator position control and engine speed control.cylinder firings, moving the fuel rack has no effect at all on the Figure 4 depicts this twin loop control principle and associatedcontrol of the engine, limitation functions.
Static and dynamic non linearity in the diesel engine and thefuel pumps furthercontribute to make the control task difficultPrimarily the control dynamics must change with shaft speed THE GOVERNOR AS A SYSTEMto obtain adequate control responses over the entire operation, COMPONENTbut it is also necessary to take the actual load into account.
The requirements for co-ordinated control and interfacingGOVERNOR SYSTEM STRUCTURE with other sub systems are easily provided with microproces-
sor technology. The functions available in the latest governorsinclude:
The basic structure of most governors are quite similar. The I. External display of whetheran index limit is reached andmain components axe the control unit, the power unit, the pre-waming before reaching a LimiL
Mogens Blanke Aalborg University AUCOctober 1991 Department of Control Engineering

WEGEMT Fifteenth Graduate School Page 37Lectures on Control Systems
2. For plants with a comparably largeshaft generatur, the following mod- . c -ues are needed:a. consisnt speed order,b. generator engaged signal;c. generator feed-forward.
3. Instnnents offeed:a. rev/mmn insmecnt 4-20 mA;b. index insmmnamt4-20mA.
4. For cntrollablepitch puvpeller(Cpp)installations, the interface com prises: -------------- -------------------------------------------a. pitch angle signal;b. pitch aut-out;c. critical speed module;d. slope on revhnin order module.
5. Startstop logic functims amr neededfor some installatios without rmaotebridge control.
6. The VIT system on - engine assumesoptimal injection timing over the op-erationof theengine., be algorithmis Fig 4: Controller structure for many governors (speed control andmade as advised by the engine de- actuator position control are two coupled loops)signerand isapprovedforeach typeofdiesel engine.
7. Lubrication oil dosing may be variable in certain installa- pressure, air pressure or electric pump.tions. The EGS 2000 offers an output to drive such units 5. Elecuo-mechanical actuatorbased on planet gear box andaccording to the engine designers recommendations. DC servo motor.As apparent from the above list, several features are being 6. Elecizo-mechanical actuator based on one step gear andincluded to make the automation task easier for yards. The fist DC servo motor.also expresses that the status of the governor as a stand alone 7. Electro-mechanical actuator with one step epicyclic gearsub system is no longer valid when for example a shaft and brusiless DC motor.generatorinstallarion isat hand. Ihis essential thatrequirementsto both main engine control and electric power production are Controller typesmet oavoida blackoutdining, forexample, U emergencystopmanoeuvre. 1. The classic. mechanical hall head controller.
2. Electronic circuitry based on analog and digital comnpo-nents.
3. Digital processor based controllers.SAFETY, RELIABILITY AND FAILURE
MODES Failure modesThenatmreof the failuredifferssignificanuyaccording to theThe control loop of a ship's prime mover is subject to strong type of system in use. Actuators driven by air and hydraulic oilsafety requirements and reliabilityisofparamountimportance. may suffer from impurities or sudden leakage. Electric powerIt is therefore a requirement that no single point failure must will disappear suddenly in the case of power failure. In signal* endanger the ship by increasing or decreasing its speed. paths, air systems may suffer from leakages or the sudden lossTo assess the safety and reliability properties of various of pressure. Electrical signals are either short-circuited, wirestypes of governors, an attempt has been made below to list and break or periodic faults are caused by loose connections.calegorise the major types on the market. Since fault effectsand reliability analysis is considered commercial. proprietary Consequences of loss of power supplyinformation by the manufacturers and statistical and detailed The type 2 or type 3 air driven systems will be able tomaterial have not been available. The authors' assessment has maintain a. uator position for a shorter period while bufferthus certain elements of uncertainty and it is difficult to make tanks provide back up pressure. The position is better mapi -
a detailed evaluation for all types. tained by the hydraulic systems due to the higher stiffness of oilThe failure modes depend upon the type of actuator and compared to air.governor controller technology used. The types 1. 4.5 and 6 systems will have a built-in activatedbrake that will lock the fuel rack to its present position withinActuator types a fraction of a second.
I. The traditional mechanical-hydraulic governor with It is mandatory that the controllers for all these systems arepneumatic speed-setting signal. A hydraulic amplifier designed such that their outputs go to safe states immediatelymay provide sufficient control force, upon loss of supply power. This feature is a standard fordigital2. Electro-mechanical actuator based on roll-spindle and process control systems, and is easily obtained with computerDC servo motor. based governors.
3. Pneumatic actuator with registerof solenoid valves forairflow control. Consequences of loss of setpoint signal4. Hlydraulic actuator with hydraulic amplifierdriven by oil The sudden loss of the position reference signal is a major
Mogens Blanke Aalborg University AUCOctober 1991 Department of Control Engineering

WEGEMT Fifteenth Graduate School Page 38Lectures on Control Systems
The mechanical governors need regularUqM replacement of wear pats and hydraulicotqWay Leo and pneumatic actuatrs will suffer fromT --wo . any impurity in the power medium. Garer-40nction. ally, the elctro-mechanical actuators re-
quire less maintenance. At peseant mostgovernors use DC motors which need tohave brushes replaced on aone to th=e year
_______ ________________basis. With the brualiless; DC servo motor- available as an industrial standard compo-
-------' net that is replacing the nadizional DC
seno rmotr, theelectronic governorwill be----------------- thus literally maintenance free.I~~~V L b IL S U ith regard toreliability~essaidal pointsate die quality o the gear used and th self
fir-% r-b •protection featurs incorporated in the par-ticular actuator and power unit.
Ko. ,oe Pr=o:rMg MaCflee EGS 2000 - A THIRD_ _ _ _ _ _ _ _t__ _ _ _ _ _ GENERATION
Fig 5: Electronic governor providing efficient and easily comprehensive ELECTRONIC GOVERNORuser Interface at the control panel (communlcatlon Is In clear text and SYSTEM
measurements are In physical unfts)
The EGS 2000 carries out the job of anygovernor, ic to regulate the shaft speed of the
concern for the traditional hydraulic actuator. Two ypes of set engine to which it is attached. This of course means that thepoint systems exist: one that will return to zero speed if the EGS 2000musibeable toanslatethecommands givenbythesignal disappears; the other with the inver function will go to operator into adequat movement of the fuel rods controllingmaximum engine speed. Since this, is not acceptable, some the injection of fuel into the engine cylinders.systems use a ballhead backup topreventengine speedincrease. The engine in question may be anything from a two-stroke,
Electrically based systems have the advantage that they can slow-speed marine diesel to a four-stroke, meditwn-speedeasily sense electruoically whether a setpoint signal is valid or generator diesel. The main components are described in thenot. In case of a failure, the latest, valid seqpoint can be retained following.by the processor based system.
Power unitConsequences of loss of feedback signal The power unit contains the Stella® computer and all the
Lossof the feedback signal from the actuator output must not electronics required to translate the signals received from thecause any change in its output position. The detection of loss of control anit, bridge telegraph, ECR speed-seting handle, en-feedback signal is much more delicate than for the setpoint gine remote control system and external sensors into a move-signal. The reason for this is the rapid response and comse- mentoftheactuator. Theacratormovementcausestheenginequently high bandwidth required by the actuator. fuel pumps to inject the correct amount of fueL
If the position sensing signal is lost, the hydraulic and air The power unit contains facilities which allow the connec-pressure based systems are at a disadvantage. They will close don of a personal computer (PC), via a special adapter, crna-their valves, but leakage will evenmually decrease the pressure bling both adjustmentand faultdiagnosis to becarried out. Thisin the output cylinder. This. together with the load forces from allows the EGS 2000 system to be pre-adjusted for a particularthe fuelpumps, willchangetheposition.Incontrast, theelectro- engine. Thereby final adjustment on the engine test-bed ismechanical devices with a gear will lock their position by de- limited to a minimum.energising their brake.
Loss of the speed sensing signal from the engine shaft will Control unitprevent further control. The speed sensors should therefore be The contol unit is installed in the engine control roomduplicated on any system. The two speed measures derived The cnd unites alle inithe engine orolerooffrom the pick-up signals shall be evaluated and compared. consoleand pmvidesallthe ftiesrequired foroperatiorofAutomatic selection and detection of faults in a pick-up signal the EGS 2000 system. In additionit provides the operator withaxe well within the possibilities of today's signal algorithms in extensive facilities for diagnosis, test and simulation. It dis-dedicated front end processors. plays messages in plain language. It also contains dedicated
lights - light emitting diodes - which instantly show the overallReliability and maintenance condition of the EGS 2000 system.
The control unit front panel is composed of a splash-proofThe reliability of electronic systems is generally very high, tactile keyboard and liquid crystal display (LCD). The tactile
and periodic maintenance is hardly ever required. However, if keys used have a specified life cycle of more than one milliona fault occurs, ships'crews have traditionally been less able to operations, which far exceeds their expected use over theremedy the fault. This is due partly to educational background, lifetime of the vessel.and also to Lack of clear and complete built-in diagnosis facili- Regular checks on the EGS 2000 system functions ame notties in the controllers. necessary, because this is performed by the Stella ® computer.
Mogens Blanke Aalborg University AUCOctober 1991 Department of Control Engineering

WEGEMT Fifteenth Graduate School Page 39Lectures on Control Systems
Index max -Red lampvActuator blocked
Pre-adjustment during customising.det alr Buzzer
Manual cimitation from 30-100% ofpre-adjustment.
Load limit ceal"
Protection of engine from
tAut selectn
Manual cancellation isposs~possible.Pre-warning for both a and b
/M4ode Selection
Auto selectCalm sea Rough seaManual selection possible
Index: only manual selection
Fig 6: Control function access for EGS 2000 from Lyngsa-Valmet Marine
The flow of information between the control tuit and the supplied for remote display, for example at the bridge ifpower unit occurs on a network consisting of a twisted pair choosing the appropriate insmument option.connecting cable. The control unit only requires power and aseparate *BLOCKED' indicator signal, both of which are Speed-settingcoming from the power unit. T"e EGS 2000 system has inputs which enable it to receive
two speed-setting signals simultaneously. These signals nor-Actuator mally originate in the bridge speed-setning handle (telegraph)
The actuator controls the position of the engine fuel rack. and the ECR speed-setting handle (manoeuvring handle). TheThe correct actuator to be used on a particular engine is EGS 2000 system, however. may only use one of these signalsdependant upon the engine type. For this reason EGS 2000 has at any time to control the speed of the engine. The changeoveractuators available in three sizes. The choice of actuator is is synchronised with the change of control position betweenmade in collaboration with the engine manufacturer to assure bridge and ECRoptimal performance. All actuators contain a rugged, brushless The control unit can present both bridge speed-setting signalservo motor fovery fast responseandahigh torque rating.able value and ECR speed-setting signal value simultaneously onto lock the actuator during specific fault conditions. Gearboxes its display. This enables the operator to adjust one of the speed-are sealed and no periodical maintenance is required at all. The setting signals to match the other before the changeover takesactuator is protected against overload and other errors which place. This function is usually called 'bumpless transfer'.could cause it to malfunction.
Tachometer Modes of operationThis section gives a brief description of the control unit keysThe system contains a tachometer system for measurement and indicators which helps to explain the basic methods of
of the engine speed. This tachometer system consists of two operation of the EGS 2000 system. For legend to push buttons,electro-magnetic pick-ups installed close to the engine fly- see Figs 5 and 6.wheel. Only one pick-up is necessary to sense the engine speed, The governor system has four modes of normal operation.so each pick-up is the backup for the other. These pick-ups These modes are referred to as:sense the passing of each tooth on the fly-wheel and give a 1. automatic mode;pulse to the tachometer input circuits in the power unit. The 2. rev/oin mode;frequency of these pulses are converted to numbers represent- 3. power mode; anding the shaft speed in a dedicated internal computer in the EGS 4. index mode.2000. Automatic mode allows the system computer to selecteitherReadout of the shaft speed is available at the control unit the rev/min mode or power mode of operation automatically.display. An output lor ananalog rev/min instment can also be depending upon prevailing engine running conditions. Index
Mogens Blanke Aalborg University AUCOctober 1991 Department of Control Engineering

WEGEMT Fifteenth Graduate School Page 40Lectures on Control Systems
SIT Actuator Index / UN STL Actuator lnaex/ tIll
so - "+ -- -
60O 6 0 1
20 20Time in secoams Tim in seconas
S • II I 0-I I i0 40 to 120 0 40 to 120
Fig 7: Uploading to MCR condition from 75% load (the Fig 9: Engine running at in•imum revolution - 25upper curve Is shaft speed, the lower Is fuel Index); tests rev/nin (the upper curve show* the fuel pump Index
with MSCI=C diesel engine and the lower curve shows the main engine revhnin)
STL Actuator index / ll STL Attuator Index / RP
so -- ,t
60 60-
Tim in secoo•s T im in seconas0 0
0 40 to 120 a 40 go 120
Fig$8: Deloaing the waterrahke from 100% load; testin Fig 10: Governor performance regarding speed setthnoof the safety system's ovempeed function; testing of stop responses without slop:e unit (upper curve showsstarting level Index with engine activated by starting air rev/min and the lower curve shows the fuel pump
pressure only index)
mode is manually selected and allows the EGS 2000 system to Functions includedfix the engine fuel rack index as long as rev/min variations stay Load limitwithin pre-defined limits.
The rev/min mode is a fast mode of operation which adjusts To protect the engine from overload situations, the systemthe fuel rack to keep the engine at a constant rev/min. Optimal contains two load limit functions. One function ensures thatfuel consumption or wear of the fuel rack is given less priority the actuator index is Limited according to scavenging airin this mode of operation. pressure. The other ensures that the actuator index is limited
In power mode the regulator controls fuel rack motions in according to engine rev/min. The curves involved dependresponse to shaft speed variations. The power delivered by the upon the engine type. These curves are loaded into the EGSengine is kept at a constant value. This mode minimises 2000 during the factory acceptance test, but may be modifiedfluctuations in thermal loading of the engine in aseaway. It will later. The load limits may be cancelled by external switchesalso provide fuel savings, for example when the ship expen- in the engine remote control system or from the control unit.ences added resistance due to waves and wind. Full protection Two options contain curves of the same type as that of theof the engine is maintained in this mode of operation. Shaft load limit curves. These are the scavenge air limit pre-speed is only allowed to vary up to a cenain limit. where a more warning and overload pre-warning curves. When fitted, theytight control becomes active, give a warning when the engine approaches pre-defined limit
Index mode operation allows the EGS 2000 actuator to values.maintain its position withoutmoving as longas engine rev/minvariations are inside pre-set limits. These limits are fairly wide.which allows this mode to be used when carrying out measure- Index maxments on the engine which require die actuator index to be The Index max facility allows the operator to limit thefixed, actuator index available from 30%-100% of the preadjusted
Index mode is selected manually when the Index mode key maximum. Adjustment is made by using the up/down arrowis pressed. It cannot be selected automatically by the computer. on the control unit when the Index max function is selected.
Mogens Blanke Aalborg University AUCOctober 1991 Department of Control Engineering

WEGEMT Fifteenth Graduate School Page 41Lectures on Control Systems
Test The steady state control is extremely smooth, The actuatorThe EGS 2000 contain fairly advanced self test faciliies moves less than 0.3 mm peak to peak with cylinder firingsome of which run continually during nomal operation, to fireqtecyoutofafull strokeof 100mm.Tha goverracirsalanwarn of impending errors. Pressing the [ThST] key during able to run the engine stable at low speeds without anynormal operation causes the system to enter a test predure undesired hunting orjiggling.The reaction torfast lIoadciangeswhich checks parts of the control unit and power unit. and alteration in setpoint is nevertheless very rapid. The tests
are therefore considered a success for the optimal controlAcknowledge alarn algorithm and advanced filtering techniques used in the gover-
When the alarm is activated for any reason, the light in the nor.upper left hand corner of this key begins to flash. When thealarm is activated, the cause is displayed in clear text in thedisplay window. CONCLUSION
In case more than one airm is present. a list of the ainrms isavailable for display in the display window. Artrw keys may The paper has given a outine of operational requirementsbe used to scroll up and down in the list once this has been of cont for large diesel engines, Ithas been pointedouirtthatSelected via the [MEN]l key. Occurrence of an alarm will changes were neeled to the marine governor. This was shownactivate an oubytconneced to the statutoy alarm system. The to be a consequence of the changes made in air system designalert provided by the arm system can distinguish between a a nd the reduction m inertia for engines with long-stcrke andpower failure and an EGS alarm, The reason for the alarm can very few cylinders. Such engines can not be adequntely con-abe read in cleartexton the alpbanumericdisplay to enable rapid trolled by mechanical governors. Therefore electonic or dig-S remedy action. rhad governors are now requested by engine designers.The paper has further discussed control requirements andDiagnosis shown the structre of marine governors that meet these
This facility allows the privileged user to gain access to requirements. Emphasis was given to the changing role of theadvanced tools within the system. One is display of key figures marine engine governor forn a stand alone single loop systemand measurements from which proper control function can be to one that needs to interface with othersub systems. The paperverified. Another is automatic measurement of the actuator alsodenltwith safety, r aiability and failuremodesandpointedPerformancech te~risticundathrisautomatcrtuningof to implications for governor design. Reliability and mainte-the actuator control loop. These are needed after certainengine nance aspects were also considered. The electronic governorrepairs. with a bnrshless DC servo motor was shown to have salient
advantages in this respect.Finally the paper showed an example of the latest develop-Fment. the EGS 2000 from Lyngso-Valmet Marine. Field testsFIELD EXPERIENCE were reported and documented in the form of time series
recordings. These showed that both steady state and the tan-Results of recent field testingof EGS 2000 are shown in Figs slent Performance meet all requirements. The user interface7-10. was further examined. It was shown how improvements wereThe tests included both steady state and transientconditions. made that make the use and possible maintenance of theThe diesel engine is a 5SGOMC from MAN B&W builtby HHI electronic governor a simple task.EMD in Korea. Mcrconditions are95 rev/minand 10890 BHP.
The plots in Fig 7 show shaft speed and fuel index whenuploading from 75% load to 100% at ma condition. Theupload takes place over about I min and the shaft speed BIBLIOGRAPHYvariation is kept minute by the governor.
Figure 8 shows shaftspeed and fuel index at deloadingo f the I. D E Winterbone, C Thinjarooran and P Wellstead. A wholywaterbrake from 100% load. This takes place in the interval dynamic model of a turbocharged diesel engine for uansferfrom 20-35s. The speed increase is below 2 rev/min, a figure function evaluation'. Proc Internationai Congress and Expo.well below the required limit. At 35s the safety system uition, Cobo Halft Detroit, Michigan, February 1977.Societyofwellbelo hed lhutdownfunctimnisted. AT he spafety ssthem pAutomotive Engineers. SAE Technical Paper 770122 (1977).overspeed shutdowno function isrtested. The third part of the plot 2. M Blanie, 'Impvoving propolsiooen eciency by govetnordesign.is testing of the start level index sequence of the governor at Sympo sioneShp terigomatic no.verno'Presented 21 Symposium on Ship Steering Automatic Control.without fuel. The index is maintained at 55 mm fora specified Genova. Italy (June 1980).period If fuel had been applied, closed loop control would 3. N Watson. 'Transient performance simulation and analysis ofautomatically take over as soon as the shaft speed passed the turbocharged diesel engines'. Proc International Congress andspeed-setting demand. Erposition. Cobo HaHl, Detroit. Michigan. February 1981..F'igure9 isa testof the governorat lowenginespeed, 25 rev/ SocietyofAutomotive Engineers. SAE Technical Paper 10337min. There is a lack of any hunting orjiggling despite only two (1981).cylinder firings taking placeeach second. Theteststartsat4Os. 4. M Blanke and I S Andersen, 'On modelling large two strokeFigure 10 shows tests with step changes in speed-setting dieselengines:newresultsfromidentification'.Proceedingsfomdemand in the range 50-70 rev/min. Despite the change in IFAC 9rh Trnennrl World Congress. Budapest, Hungary. ppdynamic properties of the diesel engine, the governor has 2015-2020, Pergamon Press (1984).equallydyamiprpedrtesponsehisasbelenine achiegvedhrough an 5. M Blanke. 'Requirements of adaptive techniques for enhancedequally damped response. This has been achieved through an cnrlo ag islegns rceig f2dIAoptial onuol oncpt eploed n ES 200.control of large diesel enigines'. Proceedings of 2nd IFACoptimal control concept employed in EGS 2000. Workshop. Adaptive Systems in Control and Signal Processing.In conclusion the tests showed the governor to perform as pp 197-202. Pergamon Press. Lund. Sweden (1986).required in both steady state and as transient changes in load. 6. E Hendricks and N K Poulsen, 'Minimum energy control of a
Mogens Blanke Aalborg University AUCOctober 1991 Department of Control Engineering

WEGEMT Fifteenth Graduate School Page 41Lectures on Control Systems
large diesel engine'. Intenational Off-highway & Powerplant 8. M Blanke and P B Nielsen. 'Electrooic governorcoatrol fornew
Congress & Exposition. SAE Technical Paper 861191, generation of wo stroke engina Presented at ETAR in Ma-
Milwaukee. Wisaosin (September 1986). nine, Zadar. Yugoslavia (1987).7- Y Nisahimia and KI TiiM. 'Eogine idle stability analysis and 9. 'Feawn article on digital and electronic governor systems'.
control', SAE Technical Paper 860415 (1986). lowrship (April 1988).
Mogens Blanke Aalborg University AUCOctober 1991 Department of Control Engineering

WEGEMT Fifteenth Graduate School Page 42Lectures on Control Systems
WEGEMT Lecture XII - Propulsion and Steering
MII. Propulsion and Steering
This lecture covers the following subjects:
Mathematical model for dynamic control.Thrusters and propellers are added to the mathematical model of vessel motion.Control characteristics are discussed.
Prime mover and Propeller control.Prime mover control, thrust control, vessel speed control.
Steering and mnanoeuvring control.Steady state and dynamic properties in closed loop control. How to incorporate feed-forward to enhance characteristics. Disturbance rejection. Robustness to parameteruncertainty. Assessment of control characteristics with external devices attached tovessel. This is illustrated in an example.
Track and position control.Principles in track and position control. Control loop hierarchy. Coordinatemeasurement and transformation. Linear control versus nonlinear techniques.Techniques for overall optimization of given criteria.
0 Example: Optimal earnings control strategy for ocean mining.
Mogens Blanke Aalborg University AUCOctober 1991 Department of Control Engineering

WEGEMT Fifteenth Graduate School Page 43Lectures on Control Systems
A. Dynamic Models for Propulsion, Steering, Manoeuvring, and Track Control
This section deals with the performance of control devices used for propulsion andsteering. The basic physical relations are first treated. Thereafter a dynamic modelis derived for steering and manoeuvring, and speed and propulsion dynamics arefinally added. For the sake of simplicity, the presentation is given in 3 degrees offreedom. The extension to a full 6 degree of freedom model for a completeunderwater vehicle description was not considered adequate, when the objective isto illustrate the basic principles.
1. List of symbols
U ship's speedUo Ship's steady state speed 9u deviation of ship's forward velocity (surge velocity)v ship's side velocity (sway velocity)r ship's rate of turn (yaw rate)n propeller rate of revolutionsV. average inflow velocity at the propeller8 rudder anglem mass of the shipR ship's resistance (function of speed)T propeller thrust (function of n, VJ)X, x-force from towing survey equipmentY y-force acting on the ship (external)N yaw moment acting on the ship (external)Wo wake fractiont thrust deduction coefficientKC nondimensional thrust coefficient, propellerKq nondimensional torque coefficient, propellerJ advance number for propellercv,cr,rv,rr,r2 coefficients in sway and yaw dynamics.HI, b coefficients in yaw dynamics used for steering controller.The following issues are treated in the enclosed sections which originate fromBlanke (1982)
Mogens Blanke Aalborg University AUCOctober 1991 Department of Control Engineering

WEGEMT Fifteenth Graduate School Page 44Lectures on Control Systems
2. Propeller Performance
In this section the characteristics of the screw propeller isoutlined. Its performance as a thrust giving device is treatedwith emphasis on its response to the load changes met duringmanoeuvring and course keeping operation. The propeller char-acteristics are treated in terms of linearized lift force the-ory, but in sufficient detail to allow for the later analysisof propulsion efficiency.
1.4.1. Lift force calculation for the propeller.
A propeller blade forms part of a screwed surface with constantpitch over its diameter. Figure 1 .6 shows how a cross section ofthe blade can be compared to a section of a fin. The figurealso illustrates the basic mechanism of propeller operation.If the pitch angle 8 of a blade section at radius R is given by
nR tan 6 = VA
where n is the angular velocity of the propeller, then there isa zero velocity difference,or slip, between the blade elementand the water. Seen from the blade element the angle of inci-dence for the flow is zero, so the lift force has zero magnitude.
Figure 1.6. Propeller blade trajectory.
Mogens Blanke Aalborg University AUCOctober 1991 Department of Control Engineering

WEGEMT Fifteenth Graduate School Page 45Lectures on Control Systems
In order to treat the general case of the loaded propeller,
figure 1.7 shows the velocity and force components for the bladesection. The true velocity of the propeller through the wateris VA' the periferal velocity of the blade element is nR andthe flow velocity relative to the blade element is V. V has
an angle of incidence a with the section. The force on the
section is therefore, from 1.32
dLo =en V2 c dr tan a
o2
where c is the chord of the blade at the station considered.The components of lift and drag become
dA = j n V2c dr sin a
2 c dsin a tan a
SV 8•_"•_~~V __/. • siinn,
V VA
a0W nR
Figure 1.7. Velocity and force components for propeller blade.
The components of thrust and torque are seen to be
dT = dA cos B - dW sin B
dQ = R dS = RdA sinS + RdW cose
Mogens Blanke Aalborg University AUCOctober 1991 Department of Control Engineering

WEGEMT Fifteenth Graduate School Page 46Lectures on Control Systems
From the figure V cos B nR and to a first order approximation
we get, with a<<l
dT = 2 n cR dr nV sin a2
dQ i n c R2 dr nVsin a
:Now, again referring to the vector diagram in figure 1.7
VA + VB = nR tan (a+e)
and
VBcos (a+0) = V sin a
Hence we get
nV sin a = n 2R sin(a+a) - nVA cos(a+s)
The angle e--a+ 8 is the pitch of the blade section which is adesign parameter but otherwise a constant. The expressions forthrust and torque therefore become quadratic in n and bilinearin n and VA with constant coefficients
dT = nt cR dr(n 2 R sin 6 - nVA cos e)
dQ = n cR2dr(n2R sin e - nV cos e)2 drnnAIntegration of thrust and torque components over the propellerradius and multiplication by the number of blades finally gives
*developed propeller thrust T and the load torque Q as
T = Tnnn2 + T nV A
Q = Onnn 2 + Qnv nVA 1.50
The coefficients T n, Qnn' Tnv and Qnv are design parameters.
Note that Tnv and 0nv are negative.
The derivation of the thrust and torque, equation 1.50, has beenbased on lift force calculation without due regard to the inducedvelocities which are associated with the propeller race. Never-theless it gives a rather accurate assessment of the propellerperformance over a large load range. This is seen by comparingwith actual propeller characteristics.
Mogens Blanke Aalborg University AUCOctober 1991 Department of Control Engineering

WEGEMT Fifteenth Graduate School Page 47Lectures on Control Systems
1.4.2. Open water propeller characteristics.
0.5. 0.25 K,
0. L0.2 -80
0.a3 0.15 -60 .-.
0.2 0.10 -0 >-
01 - 0.05 20
0 0.1 0.2 0.3 0.4 0.5 0.6 037ADVANCE NUMBER 3
Figure 1 .8. Open water propeller characteristics.
Ship propeller performance is commonly presented in nondimen-
sional form by the torque and thrust coefficients K0 and KT -Their variation over the range of propeller loads are plottedin figure 1.8 where J is the advance number. It is apparent thateven for considerable load variations, KQ and KT can be ex-pressed satisfactorily accurate merely using a linear approx-
imation
K= '$o + Krj J 1.51
KQ = KOO + KQj J
where the nondimensional variables are
KT = T 4ný(pn2 D4 )
K1Q = Q 4it2 /(pn 2D5 )
J = VA2IT/(nD)
D is screw diameter
n is screw angular velocity in rad/sec
Mogens Blanke Aalborg University AUCOctober 1991 Department of Control Engineering

WEGEMT Fifteenth Graduate School Page 48Lectures on Control Systems
In dimensional form this gives
T KTo pD4 n 2 + KTj pD 5 nVA 1.52
-K70 2 nK~ 2 nnV
D5_ 2 POPD' n2 + KQJ 2InVAQ QO 4 n2 QJ 2 n
which is identical to equation 1.50 with the coefficients
'4 pD3T T =n 4T2 ' f2l
p5 pD'4Qnn = KQO 402 ' nv = KQj 2n
The efficiency of the propeller is also shown in the diagram.
It is expressing the efficiency in converting rotational power
to linear power
TVA J K T 1.53
on = --2n K Q
Typical values of propeller efficiency are in the range 50% to70% when operating at their design condition.
The propeller characteristics in figure 1.8 describe the pro-
peller performance in uniform flow, and the curves are refered
to as the open water characteristics. When situated behind the
ships hull, the flow is far from uniform, instead the velocity
pattern shows a wide variation over the propeller disc. This
pattern of inflow velocity in way of the propeller will change
its operational condition, and consequently the thrust and
torque will be different from the open water values.
Mogens Blanke Aalborg University AUCOctober 1991 Department of Control Engineering

WEGEMT Fifteenth Graduate School Page 49Lectures on Control Systems
1.4.3. Propeller performance in non uniform flow.
The flow pattern behind the ships hull is far from uniform.
Due to the adheadsion of water to the submerged surface of
the hull, the afterbody flow is dominated by a boundary layer
where the flow velocity gradually changes its magnitude between
the ship speed U near the vessel and zero far from the body.
Therefore the flow velocity at the propeller disc will be less
than ship speed,and VA in equation 1.50 must be taken as a
fraction of ship speed.
The difference between the ship speed and the'average flow ve-locity over the propeller disc is called the wake, and the wake
fraction w expresses the relative speed reduction through
VA = (1-w)U .1.54
The velocity distribution over the propeller disc will displayconsiderable variation, from 20% of ship speed to 80% is not
unlikely. The determination of the effective wake fraction is
in practice made by using the open water propeller characteristics.From a propulsion test with the vessel, the developed propeller
thrust T is derived. With the associated value of the thrustcoefficient KT as ordinate, the open water characteristics then
gives a value of the advance number J. As propeller revolutions
n and diameter D is known, this gives a value of VA, and by
using 1.51 the effective wake fraction w0 is determined.
Although the actual wake distribution is a function of both
afterbody geometry and propeller geometry, and thrust and torque
should be calculated with due regard to the entire propeller-stern-boundary layer interaction [14], the open water propeller
characteristics does provide a rather accurate description of
thrust and torque with stationary inflow to the propeller. The
performance is less predictable when the inflow velocity is vary-
ing, however.
Very few surveys have ever been made of the screw behaviour whensubject to varying sway velocity behind a ship, and due to com-
plex boundary layer interaction with propeller and stern, nosimple analytical expression describes the phenomena concisely.
Mogens Blanke Aalborg University AUCOctober 1991 Department of Control Engineering

WEGEMT Fifteenth Graduate School Page 50Lectures on Control Systems
Empirically the effect of local sway velocity at the propellercan be expressed by its influence on the average wake coefficient.
For a single screw vessel, typically a plot like figure 1.9 will
result, Jorgensen and Prohaska [16]. The odd shape of wake co-
efficient is understood to be caused by the build up of anti-
symmetric surge and pressure fields due to the one way screw
rotation.
00
00
U-c4
0
00
020
000
-1.15 -0.10 -. 05 0 0os 0.10 0..15RELATIVE SWAY VELOCITY
Figure 1.9. Wake coefficient as a function of relative
sway velocity vp/U.
Replotted from Jorgensen and Prohaska [16]
Sway velocity at the ship stern v is a composite of ship sway
velocity v and a yaw rate r when v is generated through hull
motions
Vp = v - LPGr 1.55
The coefficient LPG is the geometric distance from midship to
the screw post.
When considering only limited excursions in sway velocity at
the stern, first order expansion of the wake function suffice,
hence
v LpL rw = w° + wv U - WV U
Mogens Blanke Aalborg University AUCOctober 1991 Department of Control Engineering

WEGEMT Fifteenth Graduate School Page 51Lectures on Control Systems
and the average inflow to the screw disc, as used in the pro-
peller characteristics, is
VA.= (1-wo)U - wv(v-LpGr) 1.56
Equations 1 .50 and 1.56 then constitute the description of
screw performance. The developed thrust T, reduced by a thrustdeduction factor which is treated in section 1.4.5, will givea steady advance velocity of the ship according to the ship
resistance, and the number of revolutions is. determined by
the characteristics of the engine through the load torque Q
from the propeller.
1.4.4. Momentum theory for the propeller.
The previous sections have determined the propeller character-
istics. However, it has not been mentioned how the water flowingthrough the propeller disc is accelerated. The increased flow
velocity is important for the assessment of rudder forces and
also for explaining the occurance of increased resistance.
Figure 1.10 illustrates schematically the flow pattern in thevicinety of the propeller. The streamlines drawn indicate theenvelope of a part of streaming water. There is a flow through
either end of the streamline tube, whereas the flow has a tan-
gential velocity everywhere else at the envelope.
The flow velocity is VA in undisturbed water and it will increaseby amount UtA infinitely downstream. The velocity in the propel-ler disc is VA+Uo. The cross section area of the stream tube
shown is A1 upstream, Ao in the propeller disc,and A2 infinitely
downstream. Then because of continuity
AlVA = Ao(VA+U2) = A2 (VA+UA)
An expression relating propeller thrust to increase in flowvelocity is achieved through considering the change of momentumfrom cross section A1 to A2 . The momentum flow through A1 is
Mogens Blanke Aalborg University AUCOctober 1991 Department of Control Engineering

WEGEMT Fifteenth Graduate School Page 52Lectures on Control Systems
P1 = VA pA1 VA dt
and momentum out of A2 is
tP2 = (VA+uAf p VA+UA) dt
The propeller thrust is consequently
d (PI- P2)
0 p (VA+UA)2A2-PVA A1
and by using the continuity condition
T = PAo(VA+UA)UA
A2 A 0 Al
Figure 1.10. Flow through propeller disc.
By similary expressing propeller torque and the energy balanceover the propeller disc it is simple to find F29] that for this
ideal case
Mogens Blanke Aalborg University AUCOctober 1991 Department of Control Engineering

WEGEMT Fifteenth Graduate School Page 53Lectures on Control Systems
Vo =1VA = 2 UA 1.57
which means that half of the velocity increase is experiencedin the propeller disc. The relation between thrust and velocityincrease is then, using the diameter D for expressing propeller
disc area
itD2-~ C2VA+UA)UA 15T = p LD2(V AU 1.58
The presence of flow velocity increase in the propeller discdoes not invalidate the previously given characteristics in1.50, because this effect is included when determining the openwater characteristics and the effective wake fraction. 0
1.4.5. Thrust deduction.
The increase in flow velocity in the entire boundary layer be-hind the ship further has an effect on the pressure resistanceof the vessel. Recall from section 1.3.3.1 how the pressure re-sistance is a fraction of the Bernolli maximum value
00Bd = Bd IUIU + constant
When the flow velocity behind the ship is increased, then thepressure is reduced. The pressure balance between the bow andstern is disturbed such that an increased resistance is theresult. The increased resistance is closely related to the pro-peller thrust, and it is commonly accepted to describe this phe-nomena by a thrust deduction factor (i-t) such that the thrustactually available for ship propulsion is not T, but (1-t)T.The thrust deduction t is o.15 as a typical value but it dependson the fullness of the stern.The thrust deduction may be regarded as essentially independent
of ship speed.
Mogens Blanke Aalborg University AUCOctober 1991 Department of Control Engineering

WEGEMT Fifteenth Graduate School Page 54Lectures on Control Systems
1.4.6. Summary of propeller performance.
By using a lift force calculation it was shown in this section how,to a first order approximation, propeller thrust and torque varyquadratic in n but bilineary with respect to n and inflow velo-city VA,as seen in equation 1.50. When revolutions are suddenlyincreased,therefore, higher values of thrust and torque are ex-perienced, and the values eventually decrease with the gradualincrease of ship speed.
It was further shown from experimental data, that it is neces-sary to model the propeller performance in nonsteady inflowby a wake fraction which vary according to the sway velocityat the stern, w = w + w (v p/U). Finally the increase of flowvelocity behind the propeller was expressed, and the occuranceof thrust deduction was explained. The resultant thrust avail-able for ship propulsion was given by (1-t)T.
Inclusion of a varying wake fraction, which is not otherwiseconsidered in the literature was necessary for explainingresults from full scale trials. Chapter four details onthis point.
Mogens Blanke Aalborg University AUCOctober 1991 Department of Control Engineering

WEGEMT Fifteenth Graduate School Page 55Lectures on Control Systems
3. Control Surface Forces
The performance of a rudder at the stern of a ship may be de-
termined from considering the rudder as a fin with small as-
pect ratio. Equations 1.34 and 1.37 showed the flow velocity
to be a crucial parameter in assessing the magnitudes of for-
ces on a fin because employed by the square of its value. Being
situated behind the propeller, the flow past the rudder is very
much influenced by the propeller induced flow. The momentum
theory calculation and figure 1.10 indicated how the cross sect-
ion of the streamtube for induced velocity is becomming more
narrow as the velocity increases downstream. In order to find
an average flow at the rudder which gives the correct values
of forces, the geometry of propeller and rudder must be ac-
counted for. Figure 1.11 shows the velocity at the rudder to be
increased by amount kRUtA where UA is the propeller induced
velocity infinitely downstream. The constant kR may have va-
lues from 0.5 to 1 depending on the spacing between the screw
and the rudder stock, but rudder chord and span relative to
the value of propeller diameter are parameters.
h 0
-(UA.VA) -I -VkUA)
Figure 1.11. Geometry of propeller and rudder.
Mogens Blanke Aalborg University AUCOctober 1991 Department of Control Engineering

WEGEMT Fifteenth Graduate School Page 56Lectures on Control Systems
In order to obtain data for rudder characteristics for a rangeof propeller loadings, and to test the feasibility of using themomentum theory for estimating flow velocities at the rudder,van Berlekom r5) performed a series of model tests. He expres-ses the flow past the rudder T as
-2 = (VA+kRUA2 + 1.59
o~~ CVkRUA)2 + (i-o3VA
where a = D/h is the ratio between screw diameter and height
of rudder.
The term UA is the theoretical screw induced velocity infinite-ly downstream which is expressed from momentum theory in equation
1.58 as
AA +S A VA
The experiments showed the coefficient kR to have a typicalvalue of 0.9, meaning the propeller induced velocity has nearlyreached its maximum value of UA+VA at the rudder.
Using for convenience kR=1, equation 1.59 gives the square
of mean flow
T2 V2 8 T
TLpD
= VA + C2 T 1 .60*~ AT
Van Berlekom's experiments further showed this relation tooverestimate the effect of propeller loading and as an averagefor several rudder profiles he suggests a value of CT which is
less than the momentum theory result,
C 2 0.8 8 1.61T2 pD2 .
where
a is the ratio between screw diameter and height of rudder
D is the propeller diameter.
Mogens Blanke Aalborg University AUCOctober 1991 Department of Control Engineering

WEGEMT Fifteenth Graduate School Page 57Lectures on Control Systems
A relation between C and ship speed follows from the wakedefinition 1.54 and, in a static condition, from the identitybetween thrust and resistance
(1-t)T + X U2 U 0
so that the steady state value of U is given by
-2 F-Wo)2 Cx uu- U2 I
• TT--J .62Having obtained the flow velocity, the lift and drag force fromthe rudder follows from 1.34 and 1.37 as
XR = X cc6 22
I P-2 ch .2n t 2 622 TA C+ 21A 1.63
YR = Ycc6 u 2 6
1 -2 _ch 27LSp (ch 1+2/-"72A) 6
The moment exposed to the hull from the rudder is expressedthrough the distance 1RG from the rudder to the centre of gravity
"R = RG YR = N c6 -2, 1.64
The term YR represents the control force from the rudder and
X is the drag force associated with rudder activity. Note thatXR increases by 6 , and that rudder forces increase with thesquare of ship speed.
Mogens Blanke Aalborg University AUCOctober 1991 Department of Control Engineering

WEGEMT Fifteenth Graduate School Page 58Lectures on Control Systems
4. Steering and Manoeuvring Equations
The previous sections have provided the physical backgroundfor the mathematical modelling of steering performance.
This section is devoted the dynamics of steering with spe-cific attension to the limited operational range which is re-levant when considering propulsion performance.
1.6.1. Manoeuvring equations.
From the preceeding sections, the set of nonlinear relations,which describe a fairly large envelope of ship manoeuvres,
were derived.
By returning to the fundamental equation of motion 1.1, andutilizing these results, the complete manoeuvring equation
is obtained.
The horizontal motion in sway and yaw is
m(•+ru+PxG) = + Y + Yurur + Yuvuv + Y Iviv
+ Yvr vl r + Yccb 726 + Yext 1.65
IzP + mxG(4+ru) =Npt + Nr' + NurUr + NuvUV + NvvV v
+ Nvr Ivr + Ncc 6 C26 + Next
The surge equation is
m(ýi -vr- xGr2) = XuuU2 + XvrVr + Xrrr2 + Xcc&G2 62
+ (1-t)T + Xext 1.66
where the propeller gives the thrust and torque relations
T = T n2 + Tnn nv flVA
Q = Qnn n2 + ±nv nVA
Mogens Blanke Aalborg University AUCOctober 1991 Department of Control Engineering

WEGEMT Fifteenth Graduate School Page 59Lectures on Control Systems
The flow velocity past the propeller was related to the shipspeed as
VA -(1-w 0 )u - w Vv-.LmPGr)
and the average flow past the rudder is
U2 V2 +2T
The constraint between propeller revolutions and load torqueis simple. With I m being the inertia of propeller, shaft androtating parts of the prime mover, and Q. the developed enginetorque, shaft speed follows from
-o QM 1.670
Characterizing the ship as a control object, these equationsshow it to be nonlinear and of order four with two controlinputs, the rudder angle and the applied shaft torque.The outputs of the system are primarily the ship speed andthe yaw rate. Course control, track control or dynamic position-ing may further increase the order of the system to be controlled.
An outline of the entire system, as it mostly appears, is pro-vided in figure 1.12. The course is controlled by autopilot, therudder is activated through a hydraulic steering gear, and theprime mover is controlled by a governor for maintaining therequired shaft speed. In the figure a diesel engine is theprime mover. Its fuel rack setting Y is the control input whichdetermine shaft torque.
The block Tabled drag force in the figure accounts for thesurge resistance generated by hull motions and rudder de-flections.
The mnanoeuvring equation may be isolated by restricting mo-tional excursions., Steady course keeping as example will onlyinduce minor changes in ship speed. The sway and yaw equationcan therefore be separated from the speed dynamics.
Mogens Blanke Aalborg University AUCOctober 1991 Department of Control Engineering

WEGEMT Fifteenth Graduate School Page 60Lectures on Control Systems
ODSSIIR8AACEFORCEO AN MOMENT
U r I 4
STEERINGP L
DYNAMICS
Figure 1.12. Manoeuvring and propulsion dynamics.
1.6.2. Steering dynamics.
Considering ship speed to be slowly varying, it appears as
a parameter in the steering equations, and by not regarding
excessive hull motions, they may be linearized to show the~dynamical steering performance.
The coupled sway and yaw equations are then expressed oneither state variable form
[4]=
[anl a12][] + E bl ] 1.68
where the parameters are functions of average speed, or in
the frequency domain as
Mogens Blanke Aalborg University AUGOctober 1991 Department of Control Engineering

WEGEMT Fifteenth Graduate School Page 61Lectures on Control Systems
kv(S+Z V ) Cv(z+s v )
=~v6~s) = _ j1s2G S = 11s+ - (1+sT 1)(1+st 2 )1 .69
C(s) = kr(S+Z r ) C r(cl r)Gr(S ) s2+0s+6 - (1+s'r1)(1+sr2)
Consise expressions for the parameters are given in appendix Awhere adequate approximations are also introduced.
Approximations to the frequency domain parameters are summa-rized in table 1.1, where the distances Lr and Lv are used.Recall from 1.42 and 1.45 that Lr is the distance between CGand the point of application of a yaw force, and Lv the equi-valent for the sway force. The principal variation of parameterswith ship speed U is given in the table. When finding the re-lation of parameters to speed, the results from section 1.3.2.3
were utilized.
TABLE 1.1
Approximate values of transfer function parameters.
Sym- Approximation Speed Sym- Approximation Speedbol var. bol var.Y6 I-N U 2Y V (U)
kIT-N._ ~ U0 - F-r___0 v L6
6 U 2ur-m Um-Y* U( ) z -- W (Lr-L6 )u (U°
kvm-Y (Uo v T N. rUV0 z r0
Yuv(Yur-m)U2 N urU Yuv U U(M-Y"ý)C(z-Nf) uncer- a -Iz• +_ NP -- t9 (U 0
r aino
*(Lr - LV)
It is noted, that only very few hydrodynamic terms appear inthe approximate parameters, and that key data such as mass,inertia and rudder force are essential figures.
Mogens Blanke Aalborg University AUCOctober 1991 Department of Control Engineering

WEGEMT Fifteenth Graduate School Page 62Lectures on Control Systems
The eigenvalues in the steering equation are of specificconcern. From table 1.1 it is apparent that the coeffici-entta in the characteristic polynomium
2S + s + 0O
will always be positive because Nut and Yuv are both nega-tive expressing large reactions against motion and the en-tire inertia Iz-Nt and the mass m-Y4. are both positive.
The coefficient a by contrast, contains the factor (Lr-Lv).Stability of the system requires B to be positive. Providedm-Yur>O, which is commonly satisfied,the criterion for dy-namic steering stability on a straight course is
Lr-Lv>O 1.70
The hydrodynamic force due to yaw must apply forward to thesway force in order to have directional stability.
The interpretation of the term directional stability is, thata disturbance in either sway or yaw will be counteracted sothat sway velocity and yaw rate return to their undisturbedvalues.
Directional instability is very often experienced with largetankers. On these vessels, rudder motions must actively keepthe ship on a straight course. If no rudder is applied, theunstable ship will enter a turn and will eventually end upmoving in a large circle, the radius of which is determinedby the nonlinear hydrodynamic forces.
1.6.3. The steering characteristic.
The dynamic between rudder angle and rate of turn is, from 1.69
r(t) + aP(t) + Br(t) = kzr( 6(t) +1 6(t) ) 1.71r
Mogens Blanke Aalborg University AUCOctober 1991 Department of Control Engineering

WEGEMT Fifteenth Graduate School Page 63Lectures on Control Systems
Bech and Smitt [4] described how to determine the parametersin this steering equation from sea trials. The parameter.
s/Kr2 Zr is the static characteristic between r and 6. Itis measured in practice through the Bech inverse spiral test.In this experiment r is kept constant and the associatedaverage value of 6 provides one reading for the characteri-
stic.
Through such experiments it was shown to be feasible to havea function H(r) replacing s/Krzr. H(r) is referred to as thesteering characteristic. Examples for a stable and unstable
tanker are plotted in figure 1.13.
= 3
BALLAST 8 m/3
RATE OF TURN
FULL LOAO 8 M/3
Figure 1.13. Steering characteristics for a large tanker atfull load and in ballast.
Equation 1.71 has achieved widespread use as the basis of auto-pilot design, and the steering characteristic has sometimes
been used for demonstration of the vast nonlinearities pre-sent in ship steering. However, the steering characteristic isa static relation and the loss of gain due to speed reduction
in a turn is participating to the nonlinearity.
Mogens Blanke Aalborg University AUCOctober 1991 Department of Control Engineering

WEGEMT Fifteenth Graduate School Page 64Lectures on Control Systems
During rapid manoeuvres, the speed reduction will not deve-lop , and a linearized steering equation as 1.69 is in factuseful over the envelope relevant for describing propulsionloss phenomena. In chapter four results of actual oscillat-ing experiments with a large tanker at different amplitudesand frequencies further show the linearity assumption to beappropriate.
1.6.4. Frequency response of steering.
The disturbancies from waves and wind are in chapter 2 charact-erized by their spectral properties. Therefore, and as con-venient reference, it is feasible to present the frequencyresponse data of steering. It is most relevant then to consi-der course control.
From 1.69
Sk r(s+z r)S 6( s(s2 +as+8
Cr(+sr) 1.72s(l+s-1 )(l +s-r2)
This characteristic is plotted in figure 1.14 for the unstablefull loaded tanker. G v(s) and G r6(s) are also shown. The para-meters are listed in the figure.
The eigenvalues of a ship are as usual real, and most shipsdisplay frequency response functions similar to this althoughscaled according to size and speed. Due to this similarityan average attainable bandwith for a PID autopilot is foundto be slightly higher than 1/-c2 .
The sway velocity from rudder movements was given in 1.69.By taking the ratio of the two transferfunctions in 1.69, weobtain v(s) expressed by r(s) when both are generated by the rud-der VS kv(s+zv) Cv(1+s Cv )
k~sz = Cr7l+ 1.73
Mogens Blanke Aalborg University AUCOctober 1991 Department of Control Engineering

WEGEMT Fifteenth Graduate School Page 64Lectures on Control Systems
Because zr -0.3 zv as a common value,this relation is an inte-
grating operator with three times increase in gain at low freq-
uencies.
PARAMETERS:
C,=O.O2 2 deg/sdegC, = -0.31 m/sdegT, = -192 sT2 = 16 sT,= 38 sT = 10 S S
< TI
x: 6(s)
•on~ r~s6(s)
o22~AR vIls).
... 1, _ .. . -i 2 1. . 0, _ .... 10FREQUENCY (RAD/SEC)
Figure 1 .14. Frequency response functions for V'16, r/6 and v/6for 348.000 m3 tanker at 15.5 knots.
Mogens Blanke Aalborg University AUCOctober 1991 Department of Control Engineering

WEGEMT Fifteenth Graduate School Page 65Lectures on Control Systems
5. Speed and Propulsion Dynamics
This section considers the speed and propulsion part of themanoeuvring equation, with specific emphasis on added re-
sistance generated by steering or external disturbancies.
1.7.1. The nonlinear speed equation.
From the manoeuvring equation, the part associated with shipspeed was seen to be essentially decoupled from the steeringdynamics when considering minor excursions from steady advance.
The nonlinear speed equation was
mo = Xuuu 2 + (1-t)T + (m+Xvr)vr + Xcc6bT262
+ (Xrr+mxG)r2 + Xext 1.74
The two major terms are the resistance and the propeller thrust,
which will outbalance each other in steady state,when added
resistance is zero. Note that tuu is negative.
The remainder force terms constitute the added resistance, orloss terms, of which the r2 term may be disregarded. Hence
T loss= (m+X vr)Vr + Xcc 6 6 262 + Xext 1.75
It represents the excess drag force on the hull from combined
sway and yaw motions, rudder deflection and external compo-
nents such as waves and wind. Note that excess resistance ap-
pear as a negative drag force. The sway velocity and the rateof turn are literally inputs to the surge equation although theyare generated partly by antecedent rudder movements.
When subject to drag forces the ship will suffer a loss of speedaccording to 1.74. The propeller thrust will not remain constantin this case. The amount of change is determined by propeller
characteristics and by the stiffness of the prime mover toload variations. Figure 1.15 shows a block diagram of the connect-
ions between the speed and propulsion system.
Mogens Blanke Aalborg University AUCOctober 1991 Department of Control Engineering

WEGEMT Fifteenth Graduate School Page 66Lectures on Control Systems
DIESEL
GOVERNORCARCERSTC
Figure 1.15. Block diagram of ship speed and propulsion system.
From the figure a change in Tosis seen to give rise to achange in speed which in turn affects the thrust and torqueof the propeller. When the load torque is changed, shaft speedis affected, and it remains on the shaft speed control systemto outweight the load change. The combined change in n and ad-vance speed VA finally determine the change in propeller thrust.
Due to the tight coupling between speed and the propulsionsystem, a closer view of the dynamics of the prime mover andits control system is necessary.
1.7.2. Characterization of the prime mover.
The dynamic of large propulsion plants has been duly presentedin the literature. Steam turbine systems are treated in [31]and large diesel engines in [2]. We assume the prime mover tobe a diesel engine, but some general conclusions will not beaffected by this specific choice. A support for this choice isthe comparatively low bunker consumption for the diesel whichcauses diesel engines to be used in the majority of new ships.
Mogens Blanke Aalborg University AUCOctober 1991 Department of Control Engineering

WEGEMT Fifteenth Graduate School Page 67Lectures on Control Systems
DIESEL
a n
Figure 1.16. Diesel engine dynamics from fuel index toshaft revolutions.
In this context, a simple model of the prime mover is requiredwhich provides the basic relations between fuel pump index Y,
shaft speed ni, and developed shaft torque n
Complete descriptions, such as Andersen [2], include turbochar-
ger dynamics in a multivariable model, but only small dif-ferences are found between the advanced model and the basic usedhere when regarding governor design and propulsion performance.
It is a prerequisite, however, that limited dynamic excursionsin RPM are made and also that abrupt changes in propeller load
do not occur.
This implies a restriction on operation environment to the lower
sea states where propulsion economy is of concern but seakeep-
ing ability of the vessel is not seriously affected.
The basic relation for the shaft speed is the balance
of rotating energy. With Im denoting the inertia of rotating
parts, including the propeller and added inertia from thewater, and with friction torque of, we have
Mogen Blanke Aalborg University AUC
October 1991 Department of Control Engineering

WEGEMT Fifteenth Graduate School Page 68
Lectures on Control Systems
dl1 Z( Imn 2 )=mn - Q n - Qfn 1.76
or
Imn•= mn-Q n- Q- n
The fuel pump gives an average oil flow which is proportionalto both the index setting Y and shaft. revolutions, becausethe fuel inlet in each cylinder stroke is determined by theindex. In average, the developed power is then proportionalto the product Yn.
E[Q n] = k1E[Yn}
In the dynamic model of the engine, the discrete nature of cy-linder firings and the gradual build up of cylinder pressuremust also be accounted for.
In a continuous model, the sampling effect from index settingto fuel led into each cylinder may be approximated as an averagedelay time Td which is half the period between consequtive cy-linder firings. An engine with N cylinders rotating with n rad/shas the delay time
1 2n 1 nTd = n N R Nn 1.77
Pressure build up in large diesel engines is not instaneous asfuel inlet is maintained over a considerable part of the cylinderprocess. This gradual pressure build up is reflected in a gra-dual change of shaft torque, analogue to the precense of a timeconstant in the dynamic model. The value of the time constantmay be found empirically to be
c 0.-9 1.78c n
The basic relation involving n, Y and Qm is derived usingthese observations, and the equation may be linearized at anoperating point no, Yo and Q (no). The resulting small signal
Mogens Blanke Aalborg University AUCOctober 1991 Department of Control Engineering

WEGEMT Fifteenth Graduate School Page 69Lectures on Control Systems
61
representation is shown in figure 1.16. where the torque con-stant has been introduced as
Q (n 1.79Y~0
It expresses the shaft torque developed by an increase offuel index.
The dashed lines in figure 1.16 show terms which are unimnport-ant in the frequency range of interest here.
It should be noted, that the diesel engine is a torque givingdevice. The shaft speed as obtained for a certain fuel indexis therefore entirely determined by the propeller characteristic.A governor may be used, as shown in figure 1.15, however, tomaintain shaft speed at a desired value.
1.7.3. Linearized speed and propulsion dynamics.
An adequate means for analysis of propulsion loss effects is ob-tained by linearizing the coupled equations for ship speed andscrew revolutions given above. Consecutive change to frequencydomain description by taking Laplace transforms of the result-ing differential equations then enables convenient treatmentand characterization of wave and wind excitement, and discus-sion of the influence of governor parameters on propulsion per-formance is possible. In the process of linearization, thosebilinear and square low terms which contribute to propulsionlosses will be retained in the equations and considered as ex-ternal sources of drag force or load torque.
Mogens Blanke Aalborg University AUCOctober 1991 Department of Control Engineering

WEGEMT Fifteenth Graduate School Page 70Lectures on Control Systems
The nonlinear speed-propulsion equations are for conveniencerepeated below. They were
mQ = Xuu 2 + (1-t)T + Tloss
Tloss= (m+Xvr)vr + X cc 6 262 + Xex t
T = Tnnn2 + TnvnVA
Q = Qn n 2 + OnvnVA 1.80
VA = (1-wo)u - Wv pU2= V2 + C2OA +T T
IL = Qm Q
Linearization is done at a steady state value U0 , no, To, Q00The deviations in speed, revolutions, thrust and load torqueare denoted u,n,AT, AQ.The deviation in developed enginetorque is 6Om"
The linearized speed-propulsion equation becomes
ma = 2XuuUou + (1-t)AT + TSQ + T loss1.81
I mA = A6m - 6Q - QSQ
where
6T = (2Tnnn° + T nv(1-w°)U)n + Tnv(1-w )n0u -Tnvn°wv p
OQ = 20nnnon+Q nvno(1-wo)u + nv(i-w )Uo n -0 n w v v p
TSQ = (1-t)(Tnv (1-wo)nu + Tnnn2 - Tnvwvnvp)
QSQ = Qnv(1-Wo)nu + Qnnn2 - QnvWvnvp 1.82
Tloss= (m+Xvr)vr + Xcc66C262 + Xex t
z 2 6 .4a Xuu ) 2
= ((1-w )2 + 6 -- 1-t o
Mogens Blanke Aalborg University AUCOctober 1991 Department of Control Engineering

WEGEMT Fifteenth Graduate School Page 71Lectures on Control Systems
The upper two differential equations in u and n are seento be mutually coupled by the 6T and kQ terms. The physicalreality in the couplings is that any change in e.g. speed willchange both thrust and torque, hence changing shaft RPM andvice versa.
From the equations, two distinct mechanisms appear to gene-rate pertubations of signals in the speed propulsion complex.
One is the excess drag force due to hull motions,rudder movements, wave resistance in a seaway andwind pressure, all contained in Tloss0The other is the wake variation with sway velocitywhich causes simultaneous variations in thrust andtorque, and therefore also in ship speed and in pro-peller revolutions. This in turn is the origin ofthe square terms TSQ and QSQ"
The structure of the speed propulsion dynamics is illu-.strated in figure 1.17 where Laplace transform operatorsare used. In relation to the figure, table 1.2 gives ex-pressions for the abbreviated coefficients used togetherwith calculated values for a container ship.The transfer functions below are obtained from the figure. Forthe sake of readability, the terms D(s) and 1+szm have beenomitted because they do not influence response characteristicsregarding load variations
The fluctuations in n, u and Y from sway velocity vp at thepropeller are
kvk m+kTvksalkm/(1+st s )n(s) = 1_ala 2km ks/(l+Ss)+kyk mG(s) Vp(S) 1.83
u(s) = S kTv(1+kmkyG(s)) + kQvka 2 v (s)1+sT s -a 1a2 kmks/(1+STs)+kkyG(S) p
LY(s) = -G(s)n(s)
Mogens Blanke Aalborg University AUCOctober 1991 Department of Control Engineering

WEGEMT Fifteenth Graduate School Page 72Lectures on Control Systems
y-- (S) +•n G"-ref.
Vvp__
k T V
TSQ
TLOSS
Figure 1.17. Small signal dynamics for ship speed and pro-pulsion system. D(s) denotes diesel engine dy-namics.
The contributions to u and n from Tloss, TsQ and QsQ are
ks (1+kkmG(s))(TsQ(s)+Tloss(S))-kma2Qs)(S)U.Q(s) = TWs l-ala 2 k k/(l+Sts)+mkyG(s) 0
(ks/(1+STs))kma1 (TsQ(s)+T loss(s)) - kmQsq(S)nsQ(S) = _ala 2kmks/(1+Scs)+kmkyG(s)
AYsQ(s)= -G(s)nsQ(S) 1.84
In the above expressions, Tloss, TsQ and QsQ are the spectralrepresentations of the forces and the moment.
Mogens Blanke Aalborg University AUCOctober 1991 Department of Control Engineering

WEGEMT Fifteenth Graduate School Page 73
Lectures on Control Systems
Data for speed and propulsion system.
Term Magnitude Unit 'Term Magnitude Unit
Po 12.15 m/s Tnn 2.16"104 Ns /rad2
VA 10.0 m/s Tnv -1.81-10 Ns2/m-rad
no 12.2 rad/s Onn 2.15-104 Nms2/rad 2
1-w0 0.82 Qnv -1.65"104 Nms2/m-rad
WV 0.2-3 1/s To 9.95"105 N
1-to 0.83 Qo 1.19"106 Nm
m+Xvr 2.6*107 Ns 2/(m-rad) Xuu -5.59-103 Ns2/m3
Xcc66 2 -2.2"106 N/rad2 Im 2.50"105 kg m2
Data for speed equation
wv = 1.0 has been used.
Term Expression Magnitude Unit
kTV -WvTnv no(1-t o ) 1.83-105 Ns/m
kQv wv Qnvno -2.01"105 Nms/rn
km (2Qnnno+0nvVA)-1 2.77-10-6 rad/Nms
k s -(2XuuUo+(1-to)Tnvno(1-Wo)) -' 3.48.10-6 m/Ns
a1 -Q nv no(1-Wo) 1.66'105 Nms/m
a2 (1-t)(2Tnnn o+TnvVA) 2.85"105 Ns/rad
Tm Imk m 0.76 s
T s m ks 72 s
kmkykR maximum loop gain in PI 3.8governor
TI minimum integral time 5 5in governor
Table 1.2. Data for container ship, length 175 m,
displacement 20.000 m3 .
Mogens Blanke Aalborg University AUCOctober 1991 Department of Control Engineering

WEGEMT Fifteenth Graduate School Page 73Lectures on Control Systems
From 1 .84 we can assess the speed reduction and the power con-sumption associated with a drag force on the ship. The gover-nor characteristic is seen to have considerable impact on theresponse of the propulsion system to changes in drag force.The open loop transfer function to be considered for governordesign is also provided by the speed propulsion equation. Itis the operator from fuel index Ly to shaft speed n
1+s s k..D(s) Yn1+5T T- ( ~a2).8T71O + m no a .8lThe coupling to ship speed accounts for a pole zero pair atlow frequencies. If neglecting the coupling, and the contri-bution to k. and rM from propeller characteristics, a char-acteristic as shown by the dotted line in figure 1.18 results.If using this for governor design, the load suppression cap-ability will be overestimated by a factor 2 or more over awide range of frequencies.
1 1
:" = •AMPLI TUDE
Z--o
011: 2(--/4.)L (eq.1.85) PHASE
2: NO COUPLING TO SHIP SPEED
FREQUENCY (RAD/SEC)Figure i.18. The transferfunction n(s)/zAY(s)with and
without coupling to ship speed.Data fromtable I.i were used.
Mogens Blanke Aalborg University AUCOctober 1991 Department of Control Engineering

WEGEMT Fifteenth Graduate School Page 74Lectures on Control Systems
6. Appendixes: Linear equations of lateral motion and nondimensional coefficients
In chapter 1 the linear steering equations were given. Heretheir-representation in state variable form, and a set oftransferfunctions are derived.
Linearization followed from assuming forward speed constantand neglecting nonlinear terms as Ywlvlv etc. Then thedifferential equations of sway velocity and rate of termwere
(M-Y•,) (in (Yr-mU°)
1(:G N) t]Np [1ý = (Nr-mx o) ]V+ 6A.1
Transformation of this expression to a state variable repre-sentation
[v ] = A [ v ] + B6 A.2
yields
•(mxcYt)1 (Yr-m ) F a,A = -Nv (Iz-N.) j V (Nr-mx Gu )] a21a 21
zxr-NL•v ([z-a 2 6 2
where
Mogens Blanke Aalborg University AUCOctober 1991 Department of Control Engineering

WEGEMT Fifteenth Graduate School Page 75Lectures on Control Systems
(Iz-N.')Yv -(mxG;-Y)&Nvall -A
(Iz- NP) (Yr-mUo)- (mxG-Y.)( Nr-mxGUo)a 1 2 = A
(m-Y ) -0 v - (mXG- N)Y v
a Cm-Yv)CN,-mx 0U.)Cmx 0-Nv(yrmu 0)a22 = A
(Iz-N. )Y6 - (mxG-Y) N6b, - GA
(m-Y.) N6- (mxG- 0 v)yYb2= A
n = (m-Y)C (2Iz:- N.) (mxG_ NO (mxGY.)
Transformation to transferfunctions then follows fromLaplace transform of the state equations, that is
rv(s)] (sI _A)-I1B6(s)
r(s)] -
As a result we obtain
k v(S+Z V ) A.3= C v ( S = " -
k +(s+z
SG(s) kr(S+z)S r6 = 2s--2-+as+SA.4
Mogens Blanke Aalborg University AUCOctober 1991 Department of Control Engineering

WEGEMT Fifteenth Graduate School Page 76Lectures on Control Systems
A3
Alternatively we may use a different parameterization
V+s Cv(l+stv) A.5
767s= (+st 1)(l+sx 2)
((1) • A.6
Before expressing values of parameters by the hydrodynamicderivatives, the ratio of different torques to correspond-
ing forces is introduced as this allows for simple geometric
interpretation.
The ratio of rudder torque to force is the distance IL6 1 .
N6L6 = _ (< 0)
Y6
Similarly
Lv = r (> 0)
and
Nr-mXGUoLr =r-xU (> 0)~Yr-mUo
Mogens Blanke Aalborg University AUCOctober 1991 Department of Control Engineering

WEGEMT Fifteenth Graduate School Page 77
Lectures on Control Systems
Nonlinear equations of lateral motion.
The nonlinear equations for steering add the viscous hydro-dynamic terms to the linear equations given in A.1. Further-more arbitrary forces and moments from wind and waves maycontribute to ship motions.
The most important contributions were listed in equation1.48. With the external terms we add to A.1
Y = Ylvlv + Yvrl v l r + Yext A.9
N = Nlvviv + Nvr[V~r + Next A.16
It is feasible to combine those with A.1 and obtain the non-linear state equations as
[all [:;:al;3~ + [b136 + E::: :;2][t;1va21 a22Lr b2J L21 c22JL'vilr
A.11
+ [d l d 12] Yextl
hd2 1 d2 2J [N eJ
It is easy to show that the nonlinear contributions are
c11 = ((Iz-Nt)Y wv - (mxG-Yp)Nw)/A
c12 = ((Iz-Nt)Yvr - (mxG-Y0 )Nvr)/A
e21 = ((m-Y 4 )N w - (mxG-N 4)Yvv)/A
022 = ((m-Y)Nvr - (mxG-N 4)Yvr)/A
d11 = (Iz-NP)/A
d12 = -(mxG-Y,)/A
d2, = -(mXG-N0)/m
d2 2 = (m-Y9)/t
Mogens Blanke Aalborg University AUCOctober 1991 Department of Control Engineering

WEGEMT Fifteenth Graduate School Page 78Lectures on Control Systems
The remaining elements were listed on page A.2.
As already mentioned, Yw. Nw, Yvr and Nvr are independantof ship speed. The c elements are seen to be speed indepen-
dant also.
0
Mogens Blanke Aalborg University AUCOctober 1991 Department of Control Engineering

WEGEMT Fifteenth Graduate School Page 79Lectures on Control Systems
APPENDIX D
Non dimensional coefficients.
In the literature by naval architects and marine engineers,it is commonplace to use nondimensional variables and coef-ficients. The nondimensional numbers are used for conveniencebecause they give similar magnitudes for the individual vari-ables and coefficients, independent of ship speed and sizeof the vessel. The set of nondimensional normalization factorsused in the commonly accepted "prime" system is listed here.The nondimentional figures are denoted by a'. Below U is shipspeed, L is length between perpendiculars and p is mass den--sity of salt water, p=lo 26 kg/m3 .
Unit Expression
length 1 = l'L= pp
time t = t'L pp/U
velocity1 1vo~ oo tl~ ulacceleration U1j =
angular velocity r = r
angular acceleration P = P' U 2/L2pp
mass m = m' L3pp
inertia I = I' L5
ppforce J = .j U2
y, Y U2 L2
moment N = N' 12 U2 L32 pp
Mogens Blanke Aalborg University AUCOctober 1991 Department of Control Engineering

WEGEMT Fifteenth Graduate School Page 80Lectures on Control Systems
Coefficients in manoeuvring equations.
x = X' U L3
Ur UV ppX' N' UL 2
Xu,v = u,v U Lpp
,= 3
xu• = K'V • 2 L•p= 251
XP 2 L3p
XN = vr ppX6' 2 L2 p
Xuu uu pp
= XA P 4LXrr r XrL p
Propeller characteristics
T KT y 2 D4 with n in rad/sec
Q n2D5QQ 4 KQ-
VA2n
Mogens Blanke Aalborg University AUCOctober 1991 Department of Control Engineering

WEGEMT Fifteenth Graduate School Page 81Lectures on Control Systems
Coefficients in nonlinear steering equations.
a11 = all U/Lpp
a12 1al2 U
a•1 = al1 U/L 2
a2 2 =a•1 U/Lpp
b I = b U 2U/Lp PI
b 2 = b • O / L p p
a =a' U/L @
0 ý=I' (U/L PP)2
C11 = C,'i/L pp
C12 = c12
C2 1 = c~,/(ULpp)
c22 = cý2/L pp
2ppd12 = d1'2( 2Lp 4
a21 = a'21/(-2E UL3 )
d22 = dL2/( pp)
Mogens Blanke Aalborg University AUCOctober 1991 Department of Control Engineering

WVEGEMT Fifteenth Graduate School Page 82Lectures on Control Systems
B. Change in control characteristics when adding external devices
1.Introduction
The change of control characteristics when adding external devices is illustratedthrough an example. T'his is an investigation of the steering properties of avessel with appendages attached. The purpose of the example is to illustrate theuse of the mathematical model for vessel motion. As example is chosen a surveyvessel. The survey vessel may sail alone, or dragging paravanes and air guns.
The objective is to estimate of the steering properties of the vessel in different* conditions, in order to allow a judgement to be made of the feasibility of fitting
a steering controller.
T'he example is based on somewhat sparse information, some of which may notbe quite consistent. However, a control system must be sufficiently robust tocope with such uncertainty, and the example is thus illustrative for practicalassessment.
2. Method of Investigation
Model or full scale tests have not been conducted with the vessels at hand.Hence, the steering properties have to be assessed through comparison withvessels of similar hull form, and the data are to be scaled with the ratios ofdimensions of the vessels considered.This technique is used to provide the major part of the kinematic andhydrodynamic coefficients needed to describe the steering properties. The rudderforces are estimated directly from propeller characteristics, the propeller loadingin the different modes, and the geometry of propeller and rudder. The load onthe ship from streamer and air gun devices are treated as appendages of thevessel. The force/moment terms are added to the hydrodynamic terms to givea description of the combined performance. Some assumptions need to be made,in particular about the paravanes since no detailed information is normallyavailable.
Mogens Blanke Aalborg University AUCOctober 1991 Department of Control Engineering

WEGEMT Fifteenth Graduate School Page 83Lectures on Control Systems
3. Modes of Operation
The operation modes of interest are the following four:
1. At 16 kt, ship alone.2. At 5 kt, ship alone.3. At 5 kt, survey mode 1 with streamer, air-guns separated 50 m,
and paravanes.4. At 5 kt, survey mode 2 with streamer and air-guns, separation of
air-guns 15 m.
The first two modes are included to establish a reference and a basis of
comparison with steering performance data from other sources. The two survey Smodes are detailed as follows:
Survey mode 1: Streamer towed behind ship. Towing force 22 kN at 5 kt.Towing point CG - 29 m. Air guns separated 50 m. Paravanes towedfrom CG + 27 m. Towing force 32 kN. Towing force 20 kN for each airgun at 5 kt.
Survey mode 2: Streamer towed behind ship. Towing force 22 kN at 5 kt.Towing point CG - 29 m. Air guns towed from wings 30 m behind CG.Separation is 15 m. Towing force 20 kN for each air gun at 5 kt.
4. Steering Dynamics
The steering dynamics in yaw is expressed by the non-linear differentialequations in r, v, and yaw. Since the rate of turn to yaw angle equation is merelyan integration in this context, the latter equation is omitted.
The remaining second order equation is
r f I ral, a12 1 rvi +b 1 1 r cli c12 1 f rI1I[iJta2, a22I Lr ILb 2 1 I [c21 c22I L8W+ J
r d,, d12 1 r Y I
L Lda d22 jL N J
Mogens Blanke Aalborg University AUCOctober 1991 Department of Control Engineering

WEGEMT Fifteenth Graduate School Page 84Lectures on Control Systems
The coefficients in this equation are speed dependent, and also non-linear ingeneral.The controller is well able to cope with the nonlinear steeringcharacteristic given the linear steering dynamics. The coefficients change withthe mode of operation of the vessel.
In the survey mode, forces and moments due to streamer, air guns, andparavanes add to the hydro-dynamic forces on the hull. As these additionalcontributions are functions of sway velocity and yaw rate, the "a' coefficientschange with the mode. Thie '"b" coefficients express primarily the rudder forceper degree of deflection. In the survey modes, propeller thrust is much biggerthan for the ship alone at the same speed. T'herefore, the "b" coefficients havea large variation too.
For assessment of control system properties, a state space and a frequencydomain description of the ship dynamics is calculated. Thie frequency domainenables straightforward analysis of disturbance rejection properties and controlaccuracy. Assuming operation within the linear range of the steering equations,
Mogens Blanke Aalborg University AUCOctober 1991 Department of Control Engineering

WEGEMT Fifteenth Graduate School Page 85
Lectures on Control Systems
the rate of turn of the ship as a function of the rudder angle is given by
r(s) (1 + s r)
8(s) r (1 + s )(1 + s r2)
In part of the literature, b and H1 parameters are used (Bech (1983)). They arerelated to the above coefficients as follows.
H, = 1/Crb = r/(Hl r, z2)r = U0
The H, parameter is the slope of the steering characteristic. The b parameterexpresses the ability of the rudder to accelerate a turning of the vessel expressedper ship length travelled, i.e the ratio between rudder force and ship's inertia.The quantity r is the time it takes to travel one ship-length.
A list of the estimated steering dynamics is given in the summary of steeringdynamics for the four modes of interest.
5. Propeller thrust and rudder forces
In the steady state with zero values of rudder angle, rate of turn, and swayvelocity, the propeller thrust outbalance the hull resistance and the x-force fromthe towing of survey equipment
R(U) + Xs = - (1-t) T(n,V.)
The coefficient t in 1-t is the thrust deduction factor. The flow velocity at thepropeller and the ship speed define the wake fraction w. through
V3 = (1-wo)U
The wake fraction and the thrust deduction factors are calculated from propellerand hull dimensions and from Harvald (1979).
Mogens Blanke Aalborg University AUCOctober 1991 Department of Control Engineering

WEGEMT Fifteenth Graduate School Page 86Lectures on Control Systems
The results obtained are listed below. These values, together with the estimatedefficiency of the propeller, give a value of the shaft power that is somewhatlower than anticipated. The reason may be a too optimistic propeller efficiencyfrom the Wageningen B-series data.
Assuming instead an overall efficiency of 0.48, T can be estimated to 82 kN(18.2 tons force) at 16 kt, and the flow velocity past the rudder is 9.7 m/s.Using the rudder area 6.44 m, a likely lift coefficient for the rudder, and amirror effect of the hull of some 20%, a rudder lift force of 10.8 kN/deg rudderangle is found. This value is comparable with scaled data from other vessels.
In mode 1, air-guns and streamer are assumed to give a resistance at 5 kt ofabout 82 kN. The hull resistance is 18 kN at this speed. Due to the largepropeller thrust, the flow velocity past the rudder is high and the lift force ismuch higher than when moving the ship alone. The rudder is thus extremelyefficient in the survey modes. This is reflected in the "b" coefficient whichincreases by 5 times when the ship operates in one of the survey modes.
6. Results
Ship only, speed 16 kt:Denominator in r/6 0.0169 + 0.396 s + 1.00 sNumerator in r/6 -0.00529 + -0.0330 s
T, = 21 secT2 = 3 sec
=r = 6.2 secH1 = -3.2 secr = 7.5 secb = -1.9
Ship only, speed 5 kt:Denominator in r/6 0.00165 + 0.124 s + 1.00 sNumerator in r/6 -0.000161 + -0.00322 s
r, = 66 secr2 = 9 secrr = 20 secH1 =-10 secr = 24 secb = -1.9
Mogens Blanke Aalborg University AUCOctober 1991 Department of Control Engineering

WEGEMT Fifteenth Graduate School Page 87Lectures on Control Systems
With streamer and air guns, mode 1, ship speed 5 kt:Denominator in r16 0.00283 + 0.141 s + 1.00 sNumerator in r/6 -0.000946 + -0.0187 s
ri = 41 secT2 = 9 secrr = 20 secH1 = -3 secr= 24 secb =-11
With streamer and air guns, mode 2, ship speed 5 kt:Denominator in r16 0.00283 + 0.141 s + 1.00 sNumerator in r16 :-0.760E-03 + -0.0150 s
ri = 28 secI"2 = 8 secrr = 20 secH, = -6 secr = 24 secb = -9
Mogens Blanke Aalborg University AUC
October 1991 Department of Control Engineering

WEGEMT Fifteenth Graduate School Page 88Lectures on Control Systems
7 Summary
The example has provided insight in estimating steering properties of a surveyvessel in four different modes of operation:
1. At 16 kt, ship alone.2. At 5 kt, ship alone.3. At 5 kt, survey mode 1 with streamer, air-guns separated 50 m,
and paravanes.4. At 5 kt, survey mode 2 with streamer and air-guns, separation of
air-guns 15 m.
Due to sparse information available, certain approximations and assumptionswere made with respect to e.g. paravanes and propeller efficiency. Details weregiven in the text.The results show the r2 and r, values change very little with the mode - notconsidering speed changes. By contrast, the other parameters changesignificantly. The "b" parameter is in particular about five times larger whentowing the survey equipment.
& References
Bech, M. I.(1983): The Racal Decca Adaptive Autopilot R-DP 780. Proceedingsfrom international lASTED symposium ACI'83, Lyngby Denmark.
Blanke, M.(1981): Ship Propulsion Losses Related to Automatic Steering and* Prime Mover Control. Dissertation. Technical University of Denmark, Lyngby,
Denmark. December 1981.
Harvald, Sv. Aa.(1979): Prediction of Power of Ships. Dept. of OceanEngineering. Technical University of Denmark. Sept.1977. Journal of ShipResearch 1979.
Mogens Blanke Aalborg University AUC
October 1991 Department of Control Engineering

WEGEMT Fifteenth Graduate School Page 89Lectures on Control Systems
9. Main Particulars for vessel
LM Length over all 73. mI_ Length between perpendiculars 65. mB Beam 12. mT Draught 4. mV Displacement 1700. M 3
S Wetted surface 880. m2
Cbl Block coefficient 0.56h Rudder height approx. 2.8 mc Rudder chord 2.3 mD Propeller diameter 2.8 m
Propeller expanded area ratio 0.473Propeller pitch ratio at 100% 0.887Number of blades 4.Nominal speed at 100% pitch 16.5 kt = 8.6 m/s
PW Shaft power at 16 kt 3345 SHP = 2.5 MWN. Shaft speed at nominal ship sp. 250. RPM
Survey mode:
U, Speed at 100% pitch, streamerandair guns load, approx. 5 kt 2.6 m/s
N, Shaft speed at survey, 100% pitch 180. RPMX. Resistance of survey equipment 8.2 ton force
Mogens Blanke Aalborg University AUCOctober 1991 Department of Control Engineering

WEGEMT Fifteenth Graduate School Page 90Lectures on Control Systems
10. Propeller characteristics Wageningen B series
calculation
No. propellers, rudders.................1.1Propeller diameter..................... 2.78 mPitch ratio............................ .8870Expanded area ratio.................... .4730Number of blades......................... 4.Wake fraction estimated.................1715Thrust deduction estimated..............2097Rel. rotative efficiency estimated .. 1.0049
j ,Kq efficiency0.000 .36431 .04627 .000000.100 .34130 .04385 .123870.200 .31419 .04112 .243210.300 .28333 .03804 .355630.400 .24906 .03457 .458660.500 .21173 .03067 .549330.600 .17166 .02631 .623160.700 .12921 .02143 .671680.800 .08472 .01601 .673700.900 .03851 .01000 .551531.000 -.00905 .00337 -.42784
Mogens Blanke Aalborg University AUGOctober 1991 Department of Control Engineering

WEGEMTr Fifteenth Graduate School Page 91Lectures on Control Systems
11. Ship Parameters
Nondimensional parameters
Vessel vessel Survey mode Suvymd2
Parameter f Speed 16 tId Speed 5 kt. Speed 5 kd Speed 5 3d
Nondimens ional
y'uv -. 2321E-01 -.2321E-01 -.2478E-O01 -. 2761E-01y'del .6400E-02 .6400E-02 .3798E-01 .3038E-01Y'ur .5500E-02 .5500E-02 .6760E-02 .8360E-02Y'rdot -.65OOE-03 -.6500E-03 -.ESOOE-03 -. SSOOE-03Y'vdot -. 1339E-01 -.1339E-01 -. 1339E-01 -. 1339E-01N'guv -. 4800E-02 -. 4800E-02 -. 4100E-02 -. 2820E-02N'del -.3100E-02 -.3100E-02 -. 1800E-O1 -. 1440E-01N'ur -.3800E-02 -.3800E-02 -.4370E-02 -. 5090E-02N'rdot -. 7660E-03 -. 7660E-03 -. 7660E-03 -. 7660E-03N'vdot -. 3000E-O3 -. 3000E-03 -. 3000E-03 -. 3000E-03xG' -. 3000E-O1 -.3000E-O1 -.3000E-OI. -. 3000E-O1X'udot -. 7900E-03 -.7900E-03 -. 7900E-03 -.7900E-03X'dd .OOOOE+00 .OOOOE+00 .OOOOE+00 .OOOOE+00
X'r.OOOOE-4-O .OOOOE+00 .OOOOE+00 .OOOOE+00X'~vrr .3970E-02 .3970E-02 .3970E-02 .3970E-02
Mogens Blanke Aalborg University AUCOctober 1991 Department of Control Engineering

WEGEMT Fifteenth Graduate School Page 92Lectures on Control Systems
Transfer function data
Ship only, speed 16 kt.Denominator A : 0.order 1.order 2.order
.169E-01 .396 1.00
Numerator Bv6 : O.order 1.order .152 .273Numerator Br6 : O.order 1.order -. 529E-02 -.330E-01Numerator BvY : O.order 1.order .784E-07 .274E-06Numerator BvN : 0.order 1.order -.276E-08 -.710E-09Numerator BrY : O.order 1.order -.172E-08 .270E-09Numerator BrN : O.order 1.order .129E-09 .116E-08
Ship only, speed 5 kt.Denominator A : O.order 1.order 2.order
.165E-02 .124 1.00
Numerator Bv6: 0.order 1.order .463E-02 .267E-01Numerator Br6 : O.order 1.order -.161E-03 -.322E-02Numerator BvY : 0.order 1.order .245E-07 .274E-06Numerator BvN : 0.order 1.order -.863E-09 -.710E-09Numerator BrY : O.order 1.order -.537E-09 .270E-09Numerator BrN : 0.order 1.order .403E-10 .116E-08
Survey mode 1, ship speed 5 kt.Denominator A : O.order 1.order 2.order
.283E-02 .141 1.00
Numerator Bv6 : O.order 1.order .271E-01 .158Numerator Br2 : O.order 1.order -.946E-03 -.187E-01Numerator BvY : O.order l.order .286E-07 .274E-06Numerator BvN : O.order l.order -.722E-09 -.710E-09Numerator BrY : O.order 1.order -.458E-09 .270E-09Numerator BrN : O.order 1.order .430E-10 .116E-08
Survey mode 2, ship speed 5 kt.Denominator A : O.order 1.order 2.order
.456E-02 .164 1.00
Numerator Bv6 : O.order l.order .215E-01 .126Numerator Br6 : O.order l.order -.760E-03 -.150E-01Numerator BvY : O.order l.order .338E-07 .274E-06Numerator BvN : O.order 1.order -.543E-09 -.710E-09Numerator BrY : O.order 1.order -.315E-09 .270E-09Numerator BrN : O.order l.order .479E-10 .116E-08
Mogens Blanke Aalborg University AUCOctober 1991 Department of Control Engineering

WEGEMT Fifteenth Graduate School Page 93Lectures on Control Systems
Ship only, speed 5 kt
State equations, dimensional coefficients
ship"s A matrix
matrix 2* 21.column 2.column
1.row -.3362E-01 -.69072.row -.1989E-02 -.90OOE-01
ship's B matrixmatrix 2* 1
1.columnl.row .2669E-012.row -.3223E-02
ship"s D matrixmatrix 2* 2
1.column 2.column1.row .2744E-06 -.7098E-092.row .2702E-09 .1157E-08
Survey Mode i:
State equations, dimensional coefficients
ship's A matrix1.column 2.column
1.row -.3615E-01 -.55982.row -.1706E-02 -.1048
ship's B matrix 2*11.column
1.row .15812.row -.1871E-01
ship's D matrix1.column 2.column
1.row .2744E-06 -.7098E-092.row .2702E-09 .1157E-08
Mogens Blanke Aalborg University AUCOctober 1991 Department of Control Engineering

WEGEMT Fifteenth Graduate School Page 94Lectures on Control Systems
C. Track Control for Ocean Mining
This section presents an example of a control system that uses all of the aforementionedmodels. The example delt with is from a public domain study on optimization of track controlfor harvest of manganese nodules from deep sea.
1. Optimal Fuel/Economy Track-Keeping Control
The paper enclosed was written by P.Vadstrup and M.Blanke (1986) and presented at theOffshore Mechanics and Arctic Engineering Conference, Tokyo 1986.
Mogens Blanke Aalborg University AUCOctober 1991 Department of Control Engineering

0
S
0
S* 12
0
SS
0
S0

qIj
Luu
ccuC-
LL.

THEORY
*Sonar equation
- sound propagation- attenuation
* - noise- reflection- scattering- transmissionlreception
* Non-linear effects
- cavitation- non-linear attenuation
* Sonar performance
- range- resolution
t~BENTECH

APPLICATIONS0
0
Acoustic positioning
Seabed mapping
Sub-bottom profiling
Fisheries acoustics
Defence.
0
t• BEN TECH

00
(UU
(DU
00-
0 AlcoU
&C0

Directivity index DI
The directivity index DI is a measure of the consentrationof acoustic intensity along the acoustic axis compared toan omnidirectional transmission.
directional
acoustic axi,
omni
Beam pattern
hL0' sin½( sine0)
2-L sin e*" 7
Beamwidth 6. = 50 [ fdegrees]L
4DADI =lO0 gP

- FAR-FIELD --
NEAR -FIELD
2ay
21 a2
_ TO

Source Level SL
0The source level is the apparent acoustic intensity at theacoustic axis 1 meter from the sonar transducer.0
SL = k + lOIgP + DI + lOlg7
P = electrical power
Dt = directivity index of transducer
77 = electro-acoustic efficiency0
k = 170.8
0SL [dB repIJPa atl1m]

Transmission Loss TL
The transmission loss is a measure of the total reduction* in intensity due to propagation back and forth to the target
*" The loss is due to
* geometric spreading
* attenuation
* non-linear effects
* ray-bending
Geometric spreading:0
Plane Cy 'indrical Spherical
no loss I- I--r r

10 Il-/-
1 -1 ÷ Electromagnetic
-62 suft
Freshwater
160Sea water /
//Boric acid
T = 1400--10 • /
0.1 1 10 100 1000 10000
Frequency (kHz)
t% BENTECH '

Resonance frequency 38 kHz
Water depth 8 m
E•-10000
8> 6
C-
*.2"L.cO'
' 1000- / -
E 6
.2
C: 6-
n
-o 4
-n
E 101 2 4, 6 8 10 2 4, 6 8 100
Wind force [knot I
~BENTECH

100 A
4 -7 12 - z
2 ___
6-'
4 8 )
00
4----
*8 O n_ __ _ _ _
6o
4
2
012
0 5 10 15 20 25 30 35- 40Wind f orce [knot]

CC
cum
U) - -'-
r.)
000
-. 0
*o 0 -
0 0
co -
0cuc0

100.
0-
0
0- 20460 00
Son4-b~y ms
BE TC

II
Cm)IIIr 1mm
* wm
00
* I-
on
>1 O~.4
o =~0o
* 2 -
> ~.
.4C ~
20
(0
a a 3 .~ a

2000
t~BEN TECH

- --
T.
1
Tn. Tv.i7..~.t.i..ltf
-. I I***~
±rI~r* hi>LiruB: h
*1..4I: .i . ~. I.
~I>Iv~ I.i.}:zj~ ft
* DI
* ~h.
~no-
-4,0a-0~

I.7
t ~
;: I ''l

ii
QIL'
*m
* 43
*n3
U)I. 0
B-* 0
wino
1:2.C
0
a -- --
4
S 2 0 ~. a

Target Strength TS
The target strength is a measure of the reflected or backscattered intensity from a target
0 reflectedTS = 10 Ig
lincoming
measured 1 m from tfe target
The target strength is a function of the geometry, structureand acoustic properties of the target in relation to thewavelength.
0
0

1000
*- r 400
0
8" 100*SU,LI
-- 10
.-- 4E0
F 1----
03ubie Riid,2 0.1 sphere(ua)e (ka)4
LI)
•'0.01 0.1 1.0 10
2aka -
a = radius of bubble/sphere

*c* U
u~ 4-
* 0 ci
Cci
A V
UN
* 0 0
owc
0 0x- *- 0

Noise Level NL
The noise level is a measure of the received noise by thesonar.
Contributions:
* ambient sea noise
* self noise from vessel
* electronic noise
Limitations:
* received bandwidth
* directive receiver
0• NL =NSL-DI+10IgB
NSL = noise spectrum level
B = bandwidth

140-
N Thruster noise120-
Q .
CLK Drilling noise
Wind force80Ship noise bafr
00
C)
20-
0 1 10 100 1000 100.000Frequency Hz

0
0
mU
* C
0

0) E0 0
0COIM
0 I
01

0
0
at
*1' I* 4..
* £4a- 9
art* S-
S -'A.
t.~. -)
t,-.
t
I."S

~6-
-- C4
~~0
-- 3
iGAB] WflJ4:)dS

-Shipi1A2
-20 -
*,. -30
> -40 level
-500
-50 5 10 is
Vs-knop

CAVITATION
Acoustic cavitation occurs when tie local low pressurecauses the nuclei to grow and collaps.
Cavitation threshold increases w'th frequency and ambientpressure.
L.D. ROSENBERG 0
GALLOWAY
E KURflE
0 (
ST R A S SR G1ITEN G AR M O -
I-. RICHARDSON
10 102 103
FREQUENCY (kHz)

- ~.,%-. .- ~.. -r*.~.~4Ž -'~- -
-',-~ -. ~v* ~ - ¼
:m-'~
~ t-
-< ~ ~:~- *
~'½. *~p
.v S~rr- '-~~*'* - -' 'k-- "S.--.."T,- A0 ,r...4t
14, '~. -~ -.
At.
0 :'~Ct'- -c.,dt--.~ -- '-S
-
rt#.c2.-- t"' 4- -w

0MIAMI-'

* rsuýIsmrn~mm
*4 kEM..,VO

Sonar performance
Long range is achieved by
* high source level
* low frequency
* low noise level
High resolution is achieved by
* high directivity
0 * good signal/noise ratio
* broad bandwidth

Ii
cm)III'mm.
ma)I-
6.*
f ui I
0
Cw I
* I1~ I0
4-o Ia)
4-
r S* 03
0E ph..
SS'I
So oz ui

Matched filter
1 kHz bandwidth
0.5
*I
4-.
-2SID
.2.
210
.3 Signal/noise10-
]a 20 30 .0 dB
t~BENTECH

Matched fibter
00
03,
0.-~
0.3
Signal/noise
2 1 B t 12 ft. 16 16 20 dB
P., Probability for detection
t BEN TECH

Range Maximum range
10000km -M ResolutionMIL.S. Mwave Length
1000kmn WJ-LOJ.
M
100km-C.2M
1 OkmLO.S.
1kmI I R MMlO0m FS M.A.F.F.
* iom
1omm I \ \1I
10 '100 1 10 100 1Hz Hz kHz kHz kHz MHz
Frequency

* ACOUSTIC POSITIONING
Basic systems
Streamer tracking
t BENTECH

BASIC SYSTEMS
* • Long base line
hydrophone separation >> wavelength
Short base line
hydrophone separation > wavelength
Super short base line
hydrophone separation < wavelength
t% BENTECH

In0'-C
0'-Cc
I ~0)
CL
R-2c ct
VI-C"C
a)a
~0G)U
.00
Sc 3

02Ca,.
C L4
b L L
00 C) -C
PQc
aaU) 0)t) C I L
oQIL0

Short/super short baseline
Hydrophone
Vertical angieuncertainty
A (a) d
Depth•, uncertainty
0 dh
Hydrophone
Vertical angleuncertainty
Cb ) Slant- rangeuncertainty
a.l 4 , H ydr oph rne V r i a
aa ngte• uncertaointy SS[ccnnt-rancge
(cep.uncertainty
ODepth
u ncertainty
d

0i
a,0
VV
o-a
(L' -'-
0 /
in/

0
0
STREAMER ACOUSTIC POSITIONING SYSTEM
t% BENTECH

=2%E8- L)CL 59'u
ANTm

0 Co
coa
CfU
'mm

II
• l • e~ oool6 • "~4) •
jlJ ml rlm t• -V
W •J 0aLl 4
01 C)lwC
III
* S* tt
ca-
* )W2
V *.-. .

,_ IIc-
.o 0
.,.,
* C
Q- 1-
-C /rJ
C3 e .C1)• -, ,
-v ', ;'
4) C- :
* C 3 /70•m

Cm)III
.0- Na CI- C
a.UUI-
* - Lu
* Ca, IC'
a 3WC
0~,Ge
C .0-nC) .0
I-
w
C*a.Ca.CCa C'*
U) C0.0
C

-8 9-_IrT~r 7! i . Tn
I7. I 44
i T
4:. .: ..I
*I LII
CL o

0
SEABED MAPPING
Sidescan sonar
Multibeam swathe bathymetry
tŽBEN TECH

*~~~~ ~ ~~~~~~~~ ME IIIIIIIIIIIIIIIIIIIIIIIIIIIIIII/IIIIIII
Wate Gls lm o n and Mar
th .a o - . ...
VidoC mer.
I'IGAP

F &
0
a0(0 4,, NC)(0Lu
(0

-. ~4 C 9 ~ '~~'r
i~aVIVOEN~t.
7.'A.
'.
K.I Ir-'----ime.

I,
vTSZ'
N>,"~6~
I F *
I.-
I;'I
//// >2'/
.7*
.4
ir t
'-C.
-p .~
A:L .c
4
Air
$1
2
* - -- *\ 6-<'I
~2.
"a:. ~~Sc.vLi5; 4,',
_ KK
-~1~
4~*t
_________ ±9!''
-- - - . -.

'rwA
19..
........................ ....................................
74740~~ -
. ... ....

FIG. 9 ?HOTOGRýAH OF A TYPIC:.j ..... FT)A "S *SZCUWRECK

-)r-
C C3

o o
104 .4U)LL
V3S U.0)
*Z *C n
MAO
70
%;;
c a
CS ID
it

Xý4.
tt

i r
lit1

Iig I
is ~i
SIPt

I p ~ L FFF~;.Lif:I ~i~iI T ~1~1
333: - IIj- ri~1L.
III II!~ ~ L. ~ F'
__________________ I I I II:1. I
I II~ ~ - -
- -~ I I
~Z £
0
~~v-,-~---- A - - (---S
'~~'i~- -
-~ i Ct
t~A ( ~ - NI=•> *-*t--> -,*-- &~
'Er r-Cs- VN--'-"~ ~ * 'asc-~--r----.
"-'I 4~ I -~ -N--.-~ A '-za~--'--.
z~rt.s~ r-.N-<N-~~ I
~ t ~Th'' '0-* ** #2:25-'--
C'-~ I* 'N-4 A ~tI- -~ .0 -
* ~ ~ _ mJ~~&~z~=. sr'- *e~,<'N-z-.
'-*z--z~.~ ~*.- I .- ' -. ZI~S~~r~mcZThN~- *~~'5- _ ' -4.
-~ -- V ~C c~~-ZJ ~ '-flz$ - I Ctja £ -S* 'r 4~ N-
- * ~ ~-Zz::'*.-J -
' N--. '~fCC>.1 -$4-- ¾Ž~Ž~ &Ls-. I Tx -in
N-~ *--.~Ia I*~ cic ~ ~ -
-~
-, ---L * ~r#'
~ *-.K~47~v~ II *t1 2 3K
~ -N- * - I
-- - -
I-sc

/
/ _________
0 / ____/ C/
______________
0/
~4 ~A/ %Z:
I
0
0 '1 ~-
/
K]

* SUB-BOTTOM PROFILING
Background
Sources
Parametric array
Pipeline survey
t BENTECH

INTEGRATE GEOPHYSICA4I GEOTECHNICAL
AND GEOLOGICAL DATA TO DETERMINE
* SUB-SEABED SOILS COMPOSITION
* THICKNESS
* LATERAL EXTENT
* * GEOTECHNICAL CONDITIONS
*• * ZONES OF POTENTIAL PROBLEMS OR
HAZARDS

- -,p.I
C --- ? - 1.- I .7.-. 4- -
- I-I - -I
r
irI-'
-2-s--~ - -~ -<--N-
C;
'4---
a *I- ~ rl4 #3-~ a-
I t- I£r~4.
.4
C)
a k r4:4 t I p
0
2Iii
z
S
r4-0-'SC
t'S4-C
4-'S'S at
I-c -
0+
C

sit M~~Si r 44' -
-it- - - S
,
-4
t -5~'* -, -. ,. s*~ 1,~
4 -- ..~ SN...
S - t -
- -. r it. - S.
5' - I... *A *~t '
5'.' I¶
$ S -
- 'It'.*
*1*
--U.
-. & A
95
.5
5.-
- 44$
'-'5-'-'.. - t&S II. -.
.a.~ ~* 4 * .& .5'. ... -
* 'l~~~r{' "'4w" 5, - Cu - 5~1.~ .4r 1 *1
.5 U tS'Ct,..;'. - st.jis,...55......t.,55.t.. .5 Sir '.5
....- ~~ ~ - .v..± .. S
S ;~s.- ~ S.s-~54'.¾.*CS

eOUCE
Impulse; sp re .me -e
V-SW
F I i Ma de
Para etri antnna
Copoe tSransduc.ra

0000
MC
I0
uo~onlosr00

Ani
'a'LCV
00
0~~0
ooto
<0)0 4-40
u~.41
_ _ _ _ _ _ 0 -DC
0
LI-
00
COD

41
.0
j4441-
C)
r-qH
UOT~tTOS~a

Parametric array
* good resolution
- broad bandwidth
- high directivity
* moderate penetration
* stable and repetitive wavelet
0.

wU T
--- - --- -- --- - . ...... .
.. .. .. .. .. -------
------ ----(.
.. .. ....j ' T -------- NI
w . V
I zNk* MK
L0.sal 2 lI:

*~~~7 ehk *$rr~
LINEAR MODULATION
00 -
PULSED MODULATION
0 HAVERSINE MODULATIN:;,
t~BEN TECH

...... -. ....... ... ....- --.
... . ... ..- - - ..- .. ...... . .. -..----: .... ...........-.. ..- ..:.... .. .i .- -- .-- --. --.-..-... .... ... ..-.--*..........
.. ..... . .. .. .. . . .. ... " ......... ........... .. " . .. ... . .. . .. ... . .""• • . . .. : ' " : /
.... .. ...... ... .. : a : : : : : : a
. . . .. . . . . . •................ :
j:;,[. ~ ~ ... --:---. ---.---.-...... •-::----:......... ..:. .-:. -.:. ..•. ..-. .--.....................:.-. ---- .- - •: .. .. ---.. •...
: : :............-..i ....... : ... ....... ..
id.cJ.
: .. ... ... ..........:.. ....-.... .. .....'? "! "'" "' ' ".""? ".0 .L ,N : : : . . . n... .. ... .... ... .. .. ....... ...... .. ....- ,:.,
... . .. .... ... - - .......................... ..... ...... .. . , .
~~~~. .. .. . . . .. ' ,
. . . . . . .. L. . . ... .0 : :.
o.. : . U.. . U. . ... .. C... .... . .S,. :. ..- . .-- -... . - :. .- ..
* : : : a.. .... .. .... ...a .. .-a " ... .. .. . . . . . . . .: % r: : : : : : -4 : ~ : :f: :C : : .4
iI

•/•
sEA
TECHOLOGY!
Unique 3-D Topographyand seismic profiling Sonar
TOPAS0
C
-4-
44
0 E-TE/0;
a---
" •. :. mber I 1 the BIRD GROUP

LAOU OF .H TOA SSE
RecordeSeismc diplaySeismc di3lay
Recorder
Naviatio
pro .cesso R cr
0 ~ ~~ .. seismic dSPla Sesi0,j ecre
procssorReceiver-.
proesoress107or
Power
Printer
±~~'~-*Transducer array
hmb - of Ow BIRD GROUP

-t
- . --.
- . ~ . -
....................
(3~,tt2
* 1 -' tfm
~1*p luir* IL~
I 4 liii;~1;~~'~V 1~;( ij¶ U w* I ~ -, ~jJ4 ~ ,,. $.t~.~ I / 7 t
(B I
I * a -~ ~ ~'2.~'.; ~ If
I 1 r~iI I~ / 'ii 'I-I
2 S
- -' - ---. 4.-. -
.raLt.~ . - --~ -
- ~-~w4--,- .--
-4--'

Caw 17 OCT '91 09:22 rIPCAPThEY P/S +,45 75117220 P2
.~ ... .
;i ~ 4 1i V6. U 77A/S h nt-y UK-67I ES~bjeig) 1.I:.5 272 mac dk
t~(7 Y,,icjer-waterTtzcnoIC9Y 'inrh_________

1-1 (CT '91 09:-- MIACARTHEY P/S +45 751171220 P.3/16
FOCUS 400 INSPECTOR
CONTENTS
* Introduction
* System Description
* Component Description
1. Power Supply2. Control Console3. Winch System4. Tow Cable5. Underwater Vehicle
* Photo Surface Control Unit
* Photo Underwater Vehicle
* Winch Layout
5 * Performance Curves

17 OCT '91 09:25 IlACARTr-EY A/S +45 751171220 P.4/18
FOCUS 400 INSPECTOR
INTRODUCTION
The FOCUS 400 steerable towed inspection vehicle is a new generation system
based on the successful FOCUS 300 fisheries inspection vehicle. The system was
developed and built by MacArtney A/S in co-operation with the Danish Maritime
Institute for the Danish Fisheries Technology Institute - D.F.T.I.
The 300 system, delivered in 1988, is used to observe the behaviour of fish and
trawls during fishing and has operated in many countries without failure.
The success of the project and the remarkable stability of the towed body prompted
MacArtney A/S to investigate the subsea pipeline and cable inspection market. Theresults of the survey resulted in a financial commitment to produce a prototype
based on the 300 concept but introducing the latest control, transmission, display
and software techniques. The prototype project received a Danish government grant
and was developed and built by MacArtney in close co-operation with the Danish
Maritime Institute and Kruse Elcktronik.
The FOCUS 400 design parameters were discussed in detail with major survey and
oil companies and the results called for a highly stable and manoeuverable platform
with automatic positioning and easy handling. The vehicle pitch, yaw and roll had to
be minimal even up to speeds of five knots.
The first system has been manufactured, tested and documented and the sea trials
proved that the design parameters were met and, in some cases, exceeded.
O The com tr.Ol "m,*e o.rrijA nitt ;" rnnjitnrt;nn with P.T SAM. the lanish electricity
authority, on the power cable which has been laid between Norway and Denmark.
The equipment deployed on the vehicle included a Klein simultaneous dual fre-
quency side scan sonar, two Osprey SIT low light cameras with variable lighting, a
customer supplied cable tracking system and an altimeter.
The purpose of the survey was to study the cable route prior to trenching and the
results clearly showed sea bed conditions and obstacles that are to be removed
before trenching work can commence. Although four days were allocated for the job
it was completed in two days.
MacArtney A/S will retain the production prototype for leasing and demonstration
and commence on a new build program through 1991/1992.

17 OCT '91 09:-6 MP1CARTNEY A/S +45 75117"=0 P.5/16
FOCUS 400 INSPECTOR
SYSTEM DESCRIPTION
The system is comprised of the following basic components which are described in
more detail under component descriptions
1. Power Supply Unit.This unit, which is built in to the control and display console, supplies all
* the power required by the complete system.
2. Control and Display Console.The control unit contains all the controls anu visual aids required to "fly"
the vehicle in either manual or auto modes, control the winch, adjust lightintensity, switch parameters and control the display graphics.
3. Winch SystemThe electro-hydraulic variable speed standard winch has a capacity for
1.200 m. of electro-mechanical fibre optic tow cable and can be controlled
both locally and from the control console. The cable is deployed-over a
sheave system which displays line out and cable deployment speed at thecontrol console. The winch drum houses the fibre nptir. nnvertors and aFocal electrical slip ring.
4. Fibre Optic Tow CableThe tow cable is constructed from three insulated copper armoured multi-
mode fibres with an overall steel contrahelical armour. The copper armour
on the fibres arc used for vehicle power and the fibres carry multiplexer and
broad band signals. The cable has a diameter of 9,6 mm. and a break
strength of 55 kN.
5. Underwater VehicleThe towed vehicle is a "hox kite" type of construction with parallel verticaland horizontal control flaps for manoeuvering the vehicle under tow. There
are a number of standard components buit in to the frame which include the
cable termination, the electronics bottle housing the power supplies, control
electronics, multiplexer, dual axis clinometer, heading sensor and dual depth
sensors. The acoustic altimeter is mounted on the base frame. Also inter-
faced in the system are dual frequency side-scan sonar transducers and
electronics and an obstacle avoidance sonar. Interfacing is also supplied for
optional equipment including television, analog sensors, camera-pan unit,still cameras, strobc3 ant vatLiabic intcn3ity liiht. Intcrfacing does not
include hardware, cable assemblies etc. but does include internal wiring and
bulkhead connectors.

17 '-CT '91 09: 34 MACART1 EY A/3 +415 717-220 P. 6/IS6
FOCUS 400 INSPECTOR
COMPONENT DESCRIPTION
1. Power Supply Unit.
The system power supply is mounted in the control console stand andcontains all power 'requirements for the system.
Input Voltage :220 V. AC, 50 or 60 Hz.Vehicle Output :440 V. nominalControl Output : 220 V.Effect :1.500 VA at max. V.Enclosure : IP 55Voltmeter Input : 0 - 250 V.Amp Meter :0 - 10 Amp
2. Control and Display Console.
The control and display unit are incorporated in a single stand alone cabinetcontaining the vehicle and winch controls, the computer and keyboard, the
multiplexer unit and the display screen.
The Control Panel, which is mounted below the display unit is user friendly
and has the following controls and displays:
Vehicle :Joystick for vertical and horizontal control withtrigger for auto modes.
Winch ;Joystick for controlling cable haul and deployment
Pan Unit : Two individual push button switchesCamera Focus :Push button switches for camera 1 & 2Light intensity :Push button intensity control with light bar
intensity indicatorAuto Mode Select :Two push buttons for selecting auto depth or auto
altitude. The auto set trigger is mounted in thevehicle joystick. The system is prepared for ahorizontal auto function.
User Switches :Three extra switches for user selected options e.g.still camera trigger
Depth Reset : Single push button for ressetting depth on bothdepth sensors
Indicator Lamps : All functions in operation are shown by LEDdisplays

17 OCT '91 09:35 IIPCPRThEY P/S +45 753117220 P.7/16
FOCUS 400 INSPECTOR
COMPONENT DESCRIPTION
Alarm Cancel : Accepts the alarm and resets the audio alarm.Cable Status :Led indicators of cable deployed or speed with
reset and select buttons
aThe Display Console, mounted above the control panel, houses the computer,Wmultiplexer, control electronics and a colour VGA display screen. The comiputer
keyboard is mounted on a slide out drawer below the screen. All relevent informa-tion canl be displayed on the screen and by using the keyboard the pilot call select
* display options from the menu.The following displays are standard
Test Program Input and local voltages are displayed withnominal and actual values. All manually enteredparameters for side scan sonar gain and selectedgain for auto pilot ioop are displayed.
Status Indicators :The following data is displayed on the top of thescreen:
-altitude and depth-vertical speed through water-flap positions-water temperature-heading
-vehicle pitch and roll-cable deployed and deployment speed-real time-user options
Warning Indicators :The following warning indicators are displayedtogether with an audio alarm:
-leak
-serial communication-preset minimum altitude
Flap Position The actual and requested flap positions aredisplayed graphically
Vehicle Position :The vehicle position is displayed graphically
relative to the sea bedShips Data : Navigation data from the onboard survey computer
is displayedOperational Data :Details entered via the keyboardVideo (Optional) :Normal real time video is displayed onl the screen
and frames can be "frozen" and stored, together

17 OCT '91 09:38 IMACARTHEY A/S +45 75117220 P.8/16
FOCUS 400 INSPECTOR
COMPONENT DESCRIPTION
with all data on the screen, on a computer disk forlater evaluation
Outputs/Inputs . Connections are available for the following- video recording- VGA monitor- side scan sonar- avoidance sonar- optional analog channels- computer- printer- serial data to survay computer in RS 232 format
including on-scrcen data e.g. heading, pitch, roll,altitude, depth, cable deployed etc.
- serial data from survey computer in RS 232format including ship heading, UTM position(shipor vehicle), D.O.L., D.A.L. etc.
The Multiplexer, which runs over a single optical fibre, has the following
parameters:
Format RS 422Digital Up : 32 channels
a Analog Up - 8 Bit :15 channelsW Analog Up - 12 Bit : 8 channels
Analog Down - 8 Bit 8 channelsBroad Band Up : Side scan 4 channel simultaneously
Optional scanning sonarOptional video channel
Broad Band Down 4 real time triggers
Baud Rate : 62.500 bpsCycle Time 100 ms. maximum

17 OCT '91 09:37 MACARTHEY A/S +4 ' 75117=20 P.9/16
FOCUS 400 INSPECTOR
COMPONENT DESCRIPTION
3. Winch SystemThe winch is a self contained electro-hydraulic unit, all steel welded with drum,hydraulic pump and motor, electric motor and hydaulic reservoir. The winch
system includes the fibre optic convertor junction box and a Focal 24 way
electrical slip ring.
Overall Dimasions : Width 1650 mmHeight 1150 mmDepht 1100 mm
Drum Dimentions : Core length 650 mmCore diam. 400 mmFlange diam. 650 mm
Cable Capacity : 1.200 m. of 9.60 mm. cable 02217Weight : 650 kg. exl. cable and oilPull/Speed : First layer 750 kp 0-38 m/min.
Top layer 500 kp 0-60 m/win.Level Wind : Diamond lead screw gear driven from drum with guide
roller releaseBrake : Fail safe - hydraulic off/spring on
Bearings : Housed ferrous roller bearingsHydraulic Tank : Includes filters, safety valve, oil level and temperature
indicatorsElectric Motor :3x380V 50Hz,3x440V 60Hz
1750 rpm. 7,5 kW. IP 56
Started Box : Electric start/stop, overload relay and emergency stop.Protection IP 56
Controls : Manual manoeuvre valve on winch and remote control* from console
Finish : Sandblasting - SA 2,5Primer - 20 muUndercoat -. 80 muTop coat - 60 mu

17 OCT '91 09:37 MACARTNEY A/S +45 75117220 P. 18/16
FOCUS 400 INSPECTOR
COMPONENT DESCRIPTION
4. Fibre Optic Tow Cable.
The composite fibre optic, electrical and mechanical cable is constructed using
the latest proven technology. The FOCUS 300 system has used this same cable
for over two years without a single faliure except for two minor incidents of
physical damage.
.L Cross Section.
Optical Fibre (3)Conductor (3)InsulationInner JacketOuter ArmourInner Armour
Constuction Characteristics.
Optical Fibre : 62,5/125/245 GI Multimode (3)
Fibre Buffer : Hytrel 0,18 mm. wallConductor : 0,82 sq.mm. served copper (3)
Inner Jacket : Hytrel 0,85 mm. wall
Inner Armour : 26 x 0,80 mm. diam. SGIPS RllL
Outer Armour : 27 x 1,00 mm. diam. SGIPS LHL
Mechanical Characteristics.
Outer Diameter : 9,6 mm.Weight in Air :330 kg/km.Weight in Seawater 256 kg/km.Breaking Strength 55 kN.Safe Working Load :12 kN.Rec. Bending Radius 200 mm.
Electrical/Optical Characteristics.
Conductor Resistance : 20.7 Ohm/km.Voltage Rating : 600 Vac.Insulation Resistance : 3.000 MegOhm.km.Fibre Attenuation : 4,5 dB/km at 850 rm.

17 C',CT '91 09:38 ['CARTH'EY A/S +45 75117220 P.11/16
FOCUS 400 INSPECTOR
COMPONENT DESCRIPTION
: 2,5 dBlkm at 1300 nm.Fibre Bandwidth : 160 MHz.km at 850 nm.
: 800 MHz.km at 1300 nm.Numerical Aperture -.0,21Fibre Proof Test : 100 kpsi.
The cable is terminated with a Subconn "Hybrid" composite fibre/electricalunderwater connector with 4 expanded beam inserts and 11 electrical contacts. The
termination includes a mechanical stress termination with a weak link shackle
which will break before the cable should the vehicle become entangled.
5. Underwater Vehicle.
The towed vehicle is a "box kite" type of construction with the parallel control
surfaces, both vertical and horizontal, mounted on the forward edge of the frame.
The stabilizing fins are at the rear and the towing point is at the centre of the
forward end. The vehicle has a low centre of gravity to increase stability and
buoyancy, weight can be adjusted according to payload. The control flaps are
driven by two underwater rotators.The frame houses and protects the electronics bottle which contains all the
electronic and power components. The fibre optic tow cable is terminated via a
Subcoun "Hybrid" expanded beam fibre optic and electrical connector with a
mechanical strain termination.The standard dual frequency side scan sonar transducers are built in to the lower
frame together with the relevant electronics and an obstacle avoidance sonar is
mounted on the front of the vehicle.
S The standard system is supplied with the following components and interfaces
Altimeter : Mesotech Model 807Depth Sensor : High Accuracy dual range
Fluxgate Compass : KHVTemperature probe : Standerd rangeClinometer : Schaevitz dual axisTrigger Channels : Four on line triggersTracking System : Interfaced for standard systems e.g. Trackpoint,
HPR, Nautronic oct.
The following optional paukagcb are available and can be ,upplied individually or
combined in accordance with customer requirements

17 OCT '91 09:3S9 ACARTiEY A/S +45 75117220 P.12/16
FOCUS 400 INSPECTOR
COMPONENT DESCRIPTION
Video Option
Video Channels : 2 at 10 MHz.bandwidth simultaneously
Lighting : Prepared for 2 x 250W variableCamera Focus : Prepared for 2 camerasPan Unit : Prepared for ROS R 10
Side Scan Sonar Option
Transducer System : Klein dual frequencyRecorder : Klein 595 digital recorderSonar Channels : 4 in real time
Scanning Sonar Option
Sonar System Tritech ST 325 with surface unit
Scan Sonar Channel 1 full duplex

17 OC(T '91 09:-10 IPCPFTflEY q/S +d5 7P122 . 13/16
FOCUS 400 INSPECTOR
SURFACE CONTROL UNIT
0.....

* 17 OCT '91 09:41 MACPRTNEY P'S +45 75ý1171220 P. 14/16
FOCUS 400 INSPECTOR
UNDERWATER VEHICLE

17 OCT 391 09:41 MPACRRTHEY P/S +45 75117220 P. 15/ 16
FOCUS 400 INSPECTOR
WINCH LAYOUT
'n7 15
W o i m I 1 6 3 '7? 2 7
-1-150 - 4-o
IE

17 OCT '91 09:42 IGACARThEY A/S +45 75117220 ' P.16/16
FOCUS 400 INSPECTOR
PERFORMANCE CURVES
1I
G7n
g ~E•
4a e
C, - -1 2
Eg
5'E
tQ
.r.
----
II

S
S
U/13/-N
0
~6S
0
SS

WEGEMT lecture, Helsinki
14 - 18 October, 1991
Sensors and Instrumentationfor Subsea Wells
by
*. Professor Erling A. HammerEngineering Center, Department of Physics,
University of Bergen, Norway

CONTENT
ABSTRACT
1. INTRODUCTION
2. BACKGROUND - SUBSEA INSTRUMENTATION
3. SENSOR FOR SUBSEA WELLS3.1 Pressure Sensors
3.1.1 Sensor Elements3.2 Temperature Sensors
3.2.1 Temperature Sensor Elements3.3 Valve Position3.4 Sand Detection3.5 Gas Detection
4. ELECTRICAL POWER AND TRANSMISSION4.1 Introduction4.2 Power Line Connectors
4.2.1 Conductive Connectors4.2.2 Inductive Couplers
4.3 Signal Transmission and Data Aquisition Systems
REFERENSESACKNOWLEDGEMENT

SENSORS AND INSTRUMENTATION FOR SUBESA WELLS
Erling A. Hammer Engineering Center NorwayProfessor Department of Physics
University of Bergen
ABSTRACT
The sensors applied in subsea oil/gas production systems are in principle the samesensors as traditionally used at top side installation. However, as the water depth increasesthe need for Remotely Operated Vehicle (ROV) retrievable sensors increases. The sensorsused subsea should therefore preferably be of the non-intrusive type. This lecture deals withthe different sensors applied and under development needed to obtain reliable informationabout the process and thus gain safety and economically optimized production.The principle of data acquisition system and the signal transmission systems used to collectthe information at the control room topside are explained and the man/machine interfaceproblems and possibilities will be discussed.
1. INTRODUCTION
There is little literature available on this subject and it is therefore difficult to give
a general review covering all the different solutions that actually exist. It should be realised
that the demand for reliability and possibility for intervention of the sensors and signal
transmission systems is very high in subsea systems. All service should preferably be done
by Remote Operated Vehicles (ROy's) and the sensors should therefore be designed in such
a way that they can be replaced using manipulator held tools. For safety reason the sensor
used should preferably be non-intrusive, and of the clamp on type, whenever possible. This
will also simplify the ROV-operation and reduce operation costs.

2. BACKGROUND - SUBSEA INSTRUMENTATION
The pressures in the production pipe and in the annulus are considered to be the
most important variables to measure and monitor in a subsea production system.
The instrumentation will vary from field to field, from only pressure transducers on simple
subsea systems to detectors for sand, leakages, corrosion etc. at more complex installations.
The different type of sensors one may wish to install in a subsea production systems may
be:
-Pressure sensors
S- Temperature sensors
- Valve position sensors
- Sand detectors
- Flowmeters
- Hydrocarbon leak. detectors
- Errosion/corrosion detectors
- Scale formation detectors
- Pig detectors
These sensors must be connected to a data collecting and transmission system for topside
transfer and processing. The most frequently used telemetry system is frequency shift
keying (FSK) on a twisted pair cable, integrated in the umbilical or modulated on the power
line. Although other data transmission systems like fiberoptic-, ultrasonic-, radio-
transmission systems do exist they are less common for subsea use.

3. SENSORS FOR SUBSEA WELLS
The ROV retrievable sensor technology developed is suitable for process pressure,
flow and temperature measurement as well as pig and sand detection. Only the pressure,
flow (for water injection only) and temperature sensor have so far been developed to
commercial stage for ROV retrievement.
3.1 Pressure Sensors
Production and annulus pressure are considered to be the most important parameters at
subsea installations. Figure 3.1 shows an isolation arrangement which a pressure transducer
can be connected to or retrieved from by means of a ROV [3]. This isolation mechanism
is located on the production equipment subsea and connected to the production pipe and/or
the annulus. The pressure sensor can be guided along the sensor entering funnel and locked
to the isolation arangement in such a way that it will be directly exposed to the pipe fluid
when the isolation ball valve is opened. The test pressure is for many sub sea installations
specified to 690 bar (10000 psi).
API FGEAR Box
0 'FUNNEL FOR TORQUE TOOL
~ISOLATION
BALL VALVE
SENSOR ENTERING FUNNEL
Figure 3.1 The pressure sensor isolation valve arangement (Kongsberg Offshore A/S (KOS)).

The pressure sensor itselves is shown in Figure 3.2
MILT aWLVJEt
M57 LINE STAB (MEP7C
I~ TYAL~r
Figure 3.2 Example of a pressure sensor for measuring the pressure in the production pipe and in the
annulus, subsea (KOS).
The main parts of this pressure sensor are:
S- Sensor element
- Inductive signal coupler
- Signal conditioning electronics.
- Collet type clamp connector.
3.1.1 Sensor Elements
The sensor element can consist of:
- Piezoresistive elements
- Strain gauge elements

Piezoresistive Elements
Piezoresistive effect is defined as the change in resistivity p of a material with
applied mechanical strain e, and is represented by the term (l/e) (Apip) in the equation for
gauge factor of a strain gauge. Silicon doped with small amounts of N or P type material
exhibits a large piezoresistive effect and is used to manufacure strain gauges with high
gauge factors. The traditional way of making diaphragm pressure sensors is to cement metal
foil strain gauges onto the flat surface of a metal diaphragm. In piezoresistive pressure
sensors the eleastic element is a flat silicon diaphragm. The distortion of the diaphragm is
sensed by four piezoresistive strain elements made by introducing doping material into areas
of the silicon, where the strain is greatest. The four strain gauges are connected into a
deflection bridge circuit in the normal way. Figure 3.3 shows a piezoresistive pressure
sensor where P-type doping material is introduced into an N-type silicon diaphragm using
ion implementation technology. Four piezoresistive strain elements are thus produced (two
in tension, two in compression), which are connected into a deflection bridge circuit. Figure
3.3 b shows how the element may be used to measure absolute, differential and gauge
pressures. A typical sensor of this type has an input range of 0 to 100 kPa (1 bar), a
sensitivity of around 1 mV/kPa (for 12 V bridge supply voltage), typical combined non-
linearity and hysteresis of +0.1% [9]. ,•ressure
P-typepiezoresistive Sealed
Bonding pads for elements vacuum referenceelectrical connection Thermal Absolute sensor (A)
Pressure oxide ressure
N-type ealed vacuumsilicon referencediaphragm absolute devices
PressureDifferential sensor (D)
Pressure
Inpu port(gauge anddifferential devices)
Atmosphere
(b) Gauge sensor (0)
Figure 3.3 Piezoresistive pressure sonsor (Bentley).

It is obvious that a pressure transducer which can measure pressure up to 100 kPa (1 bar)
can be used only as a differential pressure sensor subsea. The absolute pressures at the
christmas tree on the sea buttom, range often up to 30000 kPa (300 bar). Pressure
transducers for measuring absolute pressure in the production pipe or annulus must
therefore be built around a solid steel diaphragm which can withstand pressure up to 100000
kPa (1000 bar) without being damaged.
A diaphragm of high quality steel can be designed as shown in Figure 3.3. Piezoresistive
elements can still be used to obtain high sensitivity. N-type silicon is then evaporated on
the steel membrane and P-type piezoresistive element is introduced into the silicon substrate
using ion implantation techniques.
Strain Gauge Elements
A diaphragm-type metal strain gauge element is shown in Figure 3.4
t ,/- ,•
V-+ Stresses S+ le s~on
S,-Stressescompression
+'Pressure ------
Figure 3.4 Diaphragm-type strain gauge pressure element (Doebelin).

To faciliate construction of such a pressure transducer the strain gauge elements may be
replaced by a rosette available in various sizes from several strain gauge manifacturers.
Figure 3.4 b gives an example of an strain gauge arrangement which take advantage of
radial strains at the diaphragm edge and tangential strains near the centre.
Notice that the solder tabs are located in the low strain region of the diaphragm to increase
reliability of the solder joints. Using a pressure-diaphragm like this, the radius R can be
made quite small and usually the diaphragm is machined from solid, thereby improving
0 accuacy and hysteresis. Since the resistance of both the piezoresistive and the metal resistive
elements are temperature dependent, these transducers will be equipped with temperature
compensating elements to increase the accuracy. For sub sea use it is mainly metal resistive
• lstrain gauge transducers which are used.
For fluid pressure above 100000 lb/in2 (6895 bar) electrical sensing elements based on
resistance change of magnesium or gold-chrome wire with hydrostatic pressure are generally
utilized. Figure 3.5 shows a typical gaugeDetails of electrode• . ('pressure seal not shown
Pressure : :
~Kerosene B •ridgman
high-pressurepockino
Figure 3.5 Very high pressure transducer (Doebelin).
The sensitive wire is wound in a loose coil, one end of it is grounded to the cell body and
the other connected to a high pressure terminal. The coil is enclosed in a flexible kerosene
filled bellow which transmit the measured pressure to the coil. When the pressure increases
the wire will be squeezed in such a way that the cross section will decrease and the length
increase and hence, the resistance will increase. As for all strain gauge sensors the change
of resistance is detected using a conventional ac-powered Wheatstone bridge. Although its
sensitivity is lower the gold chrome wire is prefered in many cases because of its much

smaller temperature dependency. Gauges of the above type are commercially available up
to 14000 bar with an accuracy of 0.1%-0.5% of full scale.
There exist many other sensing principles which are used in pressure transducers. Table 3.1
gives an overview of different principles and their pressure range.
Table 3.1 Representative pressure transducing mechanisms.
MECHANISM ACCURACY IN % OF PRESSURE SENSI- OPERATING RANGE
FULL SCALE TIVE ELEMENT
Strain gauge 0.1 Piezo resis- 0 - 350 bar
tive, diaphragm
Strain gauge 0.1 Metal resis- 0 - 1400 bar
tive, diaphragm
Capacitive 0.1 Diaphragm 0 - 700 bar
Potentiometric 0.5 Bourdon tube 1 - 700 bar
Reluctive 0.25 Diapragm 0 - 700 bar
Kerosene filled 0.1 - 0.5 Pressure sensi- 100 - 14000 bar
bellow tive wire
3.2 Temperature Sensors
Everything can be turned into a thermometer. Very often the temperature
dependency of the different components used in a sensor system will be a nuisance. Every
different component in a transducer will be dependent on temperature in one way or another
so a great deal of effort has been put into different methods to compensate for these effects.
When a temperature sensor is being designed it is a question of finding a material which
will respond at highest possible degree to changes in temperature and has a suitable long
term stability and frequency responce. The choice of sensor element is also very often
determined by the temperature range. If high errosion activity inside a production pipe is
expected, then the temperature sensor must be made non-intrusive i.e no parts of the
thermometer must intrude into the flow. Since the temperature in the flow changes very
slowly, good experience has been obtained by measuring the outside pipe wall temperature.

To prevent the influence on the pipe wall temperature from sourrounding seawater the
sensor element is clamped on the naked pipe wall and the piping is thermally insulated over
a short section of the sensor area. Tests have confirmed the feasability of the concept and
established the difference between "cold face" and bulk temperature [1].
3.2.1 The Temperature Sensor Elements
There are two different principles utilized for sub sea application:
- Thermal expansion element
- Electrical resistance element
0 Thermal Expansion Element
The thermal expansion elements used for subsea application is the liquid filled and
the gas filled pressure element. The principle is shown in Figure 3.6
Pressuresensor
4SS
00Instrument c s e'•,,l
L-_---
Figure 3.6 Pressure thermometer
In Figure 3.6 the bourdon tube act as a detector of the pressure which is dependent on the
temperature of the fluid in the sensing bulb. Diaphragm-type strain gauge pressure

transducers, giving out an electricl signal, are often used to messure the pressure in the
sensing bulb. The system can be completely filled with mercury or xylene under an initial
pressure.
The liquid filled sensor is linear with respect to the temperature over a defined temperature
range. That means that the pressure in the bulb will be proportional to the temperature
according to the equation:
P=Po+kl0
Where P is the pressure in the bulb, 6 the temperature of the liquid in 'C, Po is the
pressure when 6=00 C, and k, is a constant. For gas filled sensors the pressure as a
function of temperature can be found by using the ideal gas law:
PV = nRT
Where n is the number of mol gas in the bulb volume V and the R is the universal gas
constant. T is the temperature in 'K. V can be made approximately constant by making the
pressure transducer volume displacement small compared to the volume of the bulb. Thus:
SP = nR T = kCITV
where k. is a constant.
Taking the initial pressure P. at a given temperature To into account we will get the
equation:
P _- PoTF

Liquid filled systems cover a range of -100'C to 400'C with xylene and -390 C to 590'C
with mercury. The response is esentially linear over ranges up to about 150'C. Gas filled
systems operate over the range -240'C to 650'C with linear ranges as great as 540'C [4].
The accuracy of pressure thermometers is of the order +0.5% of scale range.
Electrical Resistance Element
The variation of resistance R with temperature 0 for most metallic materials can
*w be represented by:
R = Ro(1 +a1 6+a262+...a60")
where Ro is the temperature at 6=0.
Platinium is the most used metal in resistance thermometers where Ro=1 000 . The accuracy
of a platinium element is +0,2% from -18'C to 1000 C and +1,2% from 260'C to 800°C
[4]. The platinium resistance element Pt-100 is linear from 00C to 900°C. The sensing
elements are made in different forms (See Figuret3.7)
2 N
..... .. ......... .....
W i
Figure 3. 7 Resistance temperature detector constructions (Courtesy Rosemount Engineering).

The resistance wire itself is usually encased in a stainless steel bulb to protect it from
erosive liquid or gases. Various flat grid vindings are available for measuring surface
temperatures and can be applied for "cold face" mounted temperature sensors. A typical
bridge circuit used with resistance temperature sensors is shown in Figure 3.8
us U.ýThree lead sensor cable
aR
R2A
Figure 3.8 typical bridge circuit for a resistance temperature sensor.
The circuit shown in Figure 3.8 will not be influenced of changes in resistance of the
element cable. It is important to be aware that a Wheatstone bridge circuit like this is non
linear with respect to variation in the sensor element resistance R., according to the
following equation:
U~0 = U,( Rn)PR1 +R3 R2+R~2
with highest .sensitivity when R1 =R2=R 3 =R,. The bridge resistance R3 can be adjusted for
calibration of the bridge. Linearity can be obtained using automatic balancing of the bridge
(Automatic adjusting R3 until Uo..=O) and measure the deflection of the balancing circuit.
3.3 Valve Position
The manipulation of the different valves in a sub sea system will be done by direct

hydraulic power. The valves will be operated by means of a hydraulic servo which will be
actuated by a fluid pressure of 200-400 bar. The most used valve position measurement
system is inferential and consists simply of a pressure switch and flow meter on each servo
cylinder indicating if the cylinder has been actuated (P> 80 bar) or not. Such a system is
sketched in Figure 3.9. More advanced systems use LVOT (Linear Variable Differential
Transformer) for more accurate measurement.
SERVO CYLINDER
IFLOW ELEETL
* P-200 ERR
SUBSER RCCUMULRTOR
PRESSURE SWITCH FOR VRLVE POSITION INOICRTOR
Figure 3.9 Electra hydraulic system for valve control and valve position indication.
3.4 Sand Detection
Sand particles in the hydrocarbon flow, if present, will cause erosion of flowlines,
valves, flowmeters, etc. The formation itself may also collaps from the instability caused
by sand removal. These problems make it important to monitor continuosly formation sand
in the flow stream.
Sand particles colliding with the pipe inner surface will generate impulses causing
oscilliations of the pipe's bulk. This produces high frequency displacements (300-800 kHz)
which will be picked up by the piezoelectric transducer via the spring loaded wave guide
(See Figure 3.10). Figure 3.11 shows the transducer signal amplitude versus frequency for
an oil flow in a laboratory rig with no sand and 10 ppm by yolume sand at oil flow velocity
of 5 m/s. The acoustic emission signal is integrated over the frequency band 300-800 kHz

and thus gives a significantly better signal to noise ratio.
~WITH LOCK NUTr• ......................... SPRING ADJUSTMENT SCREW
TRANSDUCER HOUSING
_ _- SPRING WASHER STACK
SPRING HOUSING
_"" TRANSDUCER
- --- FLON RING
WAVE GL/IDE
"'-.• PIPE WALL •
Figure 3.10 Clamp on sand monitor (SAM) (Fluenta AIS).
Transducer response around central frequency*
[F1 La Without sand, 450 khz center frequency . Fe With 6 g of sand, 450 khz center frequency
He, z I,' A "F
.. .II! : • J. ,
Reler-e velocit . .5 e I', 1,A'. ! ._ IN:• .,,,"'.
Figure 3.11 Laboratory test result of a clamp on acoustic sand detector at 10 ppm by volume sand and the
oil flow velocity at 5 rn/s [6J.

Figure 3.12 shows an example from the clamp-on acoustic sand monitor (SAM) mounted
on one of the prodction lines at Gullfaks B platform. During the test controlled amounts of
sand from Gullfaks B reservoir were injected into the production line as shown in Figure
3.13. The amount of sand injected was 1.4g/sec and the pipe flow velocity was 2m/s. The
formation sand size from Gullfaks B field lies between 25-150Mzm. By means of in line
calibration this sand detector can be used to estimate the amount of sand in the product
stream, since the integrated signal from the transducers is proportional to the content of
sand in the oil or gas.
* Gullfaks B integrated signal
,.. 205
so I
17. .S •
't`666 00IiqI 0;;r'
*g'0 , 195.6 . 0'1 0
Figure 3.12 Results from Gullfcýc B (SAM) [6].
ar Nap'iý;ýF.jiftwl vaNe :
1 7 0p .. ...
F•-E snq,oi,:a;
J?0G
Figure 3.13 Gultsaks B Gest layout [6( .
3.4 Gas Detection
Several electrical devices are available, and generally installed under the tree cap.

They measure an electrical capacitance or resistance difference when hydrocarbones (liquid
or gas) are trapped under the tree cap. One installation (TOOL), uses ultrasonic transducers
to discriminate gas leakages from other disturbing elements in the sea water, to estimate the
leakage rate and position. The acoustic leak detector is basically an echo sounder. The
transducer has four elements. One element is an acoustic transmitter and the other three are
used to pick up any reflected signal. In principle we can think that the receiving transducers
are positioned around the transmitter as shown in Figure 3.14.
TRRNSM ITTER
RECE I VER RECEIVER
Figure 3.14 Principle of the ultrasonic gas leakage detector head (front view).
0 The transmitting and the receiving transducers have a beam width of 600 to 1200 dependent
on the watching distance needed. Gas bubbles within the conical sector of the transmitter
will produce echos which will increase in strength and echo rate dependent on the amount
of gas in the sea water. The sensor head is pointing upwards and the position of the
detected gas bubbles can be found by utilizing the time of arrival of each echo at the
receiving transducers. This is illustrated in Figure 3.15.

CR5 BUBBLES
R, T 2 IL/ORS PIPE
Figure 3.15. The principle of de teriion of leakage position.
In Figure 3.15 the echo received by R, will occur lather than the echo received by R.2 from
one and the same gas bubble. This time difference can be used to calculate the angle a and,
hence by utilizing this time difference from all the three receivers, a three dimentional
vector pointing towards the bubble can be calculated. Depending on the amount of leakage
echoes from a cluster of bubbles will be detected for each transmitted pulse.
Comprehensive signal processing is therefore necessary to calculate the position of the
bubble stream. It is worth mentioning that the seawater, even clear and clean, is full of life,
0 small particles and bubbles which will give a certain noise level or back- scattering. This
back-scattering is, however, somewhat different from the echos caused by leakage of gas.
Again, proper signal processing can increase the sensitivity of this sensor.
The acoustic leak detectors have been developed as gas leakage detectors [7]. However,
since there is always gas present in unprocessed oil which will occur at the lower pressure
outside the pipe, this equipment can therefore also be used for leakage detection at oil
producing wells.

4. ELECTRICAL POWER AND SIGNAL TRANSMISSION
4.1 Introduciton
The electrical power needed for a subsea installation is transferred through power
lines in the umbilical between the control room and the subsea equipment. The umbilical
also contains high pressure hydraulic hoses to supply hydraulic energy to the actuators and
signal transmission lines for telemetry to control and monitor the installation. A cross
section of a typical umbilical is shown in Figure 4.1
UMBILICAL 6 ArorPOLYURETKAjVEOUTER LINER
1/2' 5000psiWP 255bar Cher-ctaI n,/Scare ZH,2nJ.
O M8
+ 1/2' 35O0ps;WP 207bcr Low zres,/Return o;1
+ 0 3/8" 7500ps;
./P 517bar High :res./SQCre hngn zres
4 power wire s;gnat strand
twisted pair * Sgnal wire(w)
0 POLYETh'YLENE signal conrductor
CROSS- SECTION
Figure 4.1 Cross section of an electrohydraulic umbilical.
The different actuators can be powered by:
Direct hydraulic systems, where the hydraulic power is fed directly through
the hydraulic hoses to the actuators.
Piloted hydraulic systems, which improve the response time of the valve
actuators compared with direct hydraulic system.

- Electro hydraulic system where the hydraulic pressures is supplied from the
surface and the directional control valves are operated electrically.
- Multiplexed electro-hydraulic. As above but telemetry signals are
multiplexed.
Direct hydraulic systems can be used up to a distance of 3000m with acceptable response
time. For longer distances piloted or electro hydraulic systems will be prefered.
The total power consumption for a subsea system will be dependent on the number of well
0 slots in the template. Due to improved efficiency of solenoid valves, sensor electronics and
micro controllers, the power consumption lies in the region of a few kW per template
(approx. 60 Watt per wellslot).
There are two types of connectors used for the power line:
- Conductive connectors
- Inductive couplers
There are two types of signal transmission through the umbilical:
- Direct transmission on dedicated lines in the umbilical
- Transmission on the power lines
4.2 Power Line Connectors
4.2.1 Conductive Connectors
The majority of power line connectors are inductive and designed for diver less
made operation. However conductive interconnection is now being metered but one of the
disadvantages of a conductive distribution power net is that protection and isolation circuits
have to be incorporated to avoid break down in power transfer [2]. The reason for this is
that sooner or later corrosion will occur in the connectors due to sea water leakage resulting
in either short circuiting or connector break. However, modem subsea connectors seem to
be very reliable and can function properly for years without service.

4.2.2 Inductive Couplers
Inductive couplers function as power transformers which in principle are built as
sketched in Figure 4.2.
TRRNSFORMER CORE-- "/ POLL
POWERLINE TO POWER
FROM UMBILICAL CONSUMERS AT
Figure 4.2 Principle of inductive couplus for power transmission.
0- Inductive couplers provide the most reliable soulution due to their superior waterblocking
capacity and self limiting power characteristic. As we will see in chapter 4.3 the power line
can also be used as a signal transmission line. Inductive couplers have limitations with
respect to power transmission and signal transmission frequency bandwidth. The inductive
power and signal distribution network worked out for the BP DISPS-project is shown in
Figure 4.3 (Only one of two equivalent circuits is shown) [2]. The circuit in Figure 4.3 is
capable of serving 4 well slots including a pigging cross-over module. The maximum power
required for this circuit is 360W and the efficiency of the template power system is 77%
with all couplers at 0.2mm gap.

4.3 Signal Transmission and Data Acquisition Systems
The signal transmisssion and data acquisition systems designed for subsea use are in
principle built up like onshore systems. It is common though, to use a micro controller,
placed on the subsea template, which according to a preprogrammed sequence, read the
signals from the different sensors, preprocess them, if desireable, and transmitt them to the
main computer in the control room, topside.
. .. . . . . . . . . . .. . . ..---- -- -- ----- -- r -- - - - - - - - -w
I I, I t I I-t
•II ' I LJ to1
II I I I I a
o I I I
I-III
z0
2' 00 1
Z
Figure 4.3 The principle of the power and signal distribution network (BP-DISPS) [8].
The transmission between the microcontroller and the top side computer will be done
through dedicated signal cables or by modulation into the main power line. The modulation
method frequently used is an ordinary frequency shift keying (FSK) which by frequency
modulation transmit the different bits in serial from the microcontroller to the main
computer. The centre frequency of the FSK-signal lies in the region of 10 kHz (KOS). Such
a signal can be modulated directly on the power line frequency (400 Hz) and a signal
transmission line can be saved. Figure 4.4 is a block diagram of a typical acquisition and
transmission system, subsea.

POE 00H IGH PASS P EMODU J
56R10KzFILTER LRTOR
LOW PASS - POWER
FILTER SUPPLY
PRODUCTION FLUID I,&•
PRESSURE TPRESSURE•TRANSDUCER • RO
ANNULUS
PRESSURE PRESSURERTRANSDUCER
~PRODUCTION FLUID•TRANSDUCER C ER
SFN4 PdRTICLE iu mItrODEN51TY S5AND / MIRO- MODU-DETECTOR /ESSOR LATOR
HYDROCARBON [ FSK)LEAKAGE •HYDRO CRAB.
•DETECTOR
VALVE SERVO
VALVE~T SERVSWTCH
CONTROLS
,allFigure 4. 4 Subsea data acquisition and control computer system.
The main computer in the control room is connected to data screens and keyboards for
communication with the operator. Very often there will be one dedicated screen for the
alarms and one for the overview of the process (flow charts) and process variables. A
printer records the events, operator interrupts, alarms etc. for documentation. For a screen
based process control system a number of diagrams for data presentation and
communication with the process are available. When an alarm signal occurs, many other
alarm signals may pop up on the screen caused by the first one. To prevent the operator to
be distrurbed by this secondary triggered alarms, "first up" alarms are separately indicated.
A great deal of research has been put into alarm filtering, and artificial intelligence is
providing the tool to pick out only the alarm signal which is indicating the main reason of

the failure. One principle is also to divide the different alarm in priority levels. The
operator then finds it easier to pick out the alarm with highest priority. Priority "first up"
alarms have been used for at least 20 years. However, operators will experience a number
of "first up" alarms in crisis. To detect the first of the "first up" a sequence-of-event-
recorder will be required.
REFERENCES
1. L.A. Adriaansen: "ROV Retrieveable sensors", BP/SAGA-KOS-rapport.
2. L.A. Adriaansen: " Production control systems for deepwater applications", SUT
0 .paper.
3. Sigurd Moe: "ROV Retrievable sensors" Report Ferranti Offshore Norge A/S.
4. Ernest 0. Doeblin: "Measurement Systems, Application and Design " Fourth
Edition. McGraw Publising Company 1990.
5. Douglas M. Considine: "Process Instruments and Controls Handbook, Third
Edition.McGRAW-HILL BOOK COMPANY.
6. Trond Folkestad, Kanaga S. Mylvaganam; "Acoustic measurements detect sand in
North Sea flow lines" Oil & Gas Journal, August 27, 1990.
7. Helge N. Minken et al: "An acoustic gas detector - Its design principle and
application" Underwater Technology Conference (UTC) Bergen 1988.
8. Odd Arild Olsen: "Instrumenteringsteknikk" TAPIR 1988.
9. John P. Bentley: "Principle of Measurement Systems" John Wiley & Sons, Inc.,
New York, Second Edition 1988.
ACKNOWLEDGMENT
The author acknowledge the advices and help received from Mr. L.A Adriaansen, Veritas
Offshore Technology and Services A/S.

S
0
S
314
0
SS0
S0

S
S
S
S
15
S
SS
S
SS

DESIGNING A NAVIGATION SYSTEM FOR UNDERWATER VEHICLES
M.E. Bouhier IFREMER FRANCEEngineer La Seyne sur Mer
INTRODUCTION
Underwater navigation systems are used for acoustical localization of ships,underwater vehicles, or immersed structures in reldtion to the sea bottom or a surface ship(1).
When "short" or "ultra short" baseline navigation systems operate in the open sea,they are faced with various limitations : ambiant noise, radiated noise, Doppler effect,multipath and reverberation (6) (10). Usually, their performances are defined by theprecision (1%) on the underwater vehicle angular localization.
In order to improve this precision (0.1%), we design three types of receiverarchitectures based on correlation and matched filtering, then we especially compare theirperformances with regards to the noise.
ANGULAR LOCALIZATION BY MEANS OF RECEIVERS WITH IMPOSED ARCHITECTURE
Short or ultra-shord baseline navigation systems
For some oceanographic applications, short or ultra-short baseline navigationsystems are preferred because of their simple and fast installation (1) (2).
The angular positioning of an acoustic responder,, set on' the sea bottom or on theunderwater vehicle, is obtained either by measuring the propagation time delay or bymeasuring the differential phase between the signals (with constant frequency andduration of about 10 ms) received on the two sensors of the baseline (fig. 1). The precisionof these systems is about one percent of the vertical depth for a responder set in theacoustic axis. We want to Increase this precision (around 0.1%) by using wide-band signalswith correlation and matched filtering techniques (3] (4] (5).
Receivers architecture
Because of the limited number of sensors, the classical beamformers cannot givesignificant improvement.
Supposing far acoustic field and plane waves, the angular localization of aresponder can easily be deduced from measuring the propagation time delay F (fig. 2)by

do = -sin a
C
with d = distance between sensorsc = sound velocity in the water
In order to increase the precision of such systems, we oriented ourselves towardsthree types of architecture (9) (fig. 2) :
* matched filtering behind the two hydrophones and angular positioning bymeasuring (on the autocorrelation function envelope) the propagation time delay: FAreceiver
. correlation between the sensors signals and angular localization by estimatingthe maximum (propagation time delay) of the intercorrelation function envelope: CORreceiver
. combination of the two previous receivers (matched filtering and correlation)and angular positioning by estimating, after correlation, the propagation time delay:('COR receiver
This angular estimation is perturbed by various phenomena existing in naturalenvironment.
We particularly study the noise Influence on the estimation variance of thepropagation time delay Oro .
Receivers performances
For each receiver, it is necessary to take account of two configurations for noise:
correlated noises on the two sensors* uncorrelated noises on the two sensors
According to the baseline size in relation to the spatial coherence of noise, weconsider one or the other case.
Nevertheless, noises are assumed gaussian, centred, stationary and wideband (withregards to the signal bandwidth).
Receivers performances are evaluated by the estimation variance of thepropagation time delay. In order to compute theoretical expressions, we modelize theautocorrelation function of the emitted signal like a gaussian envelope with a constantcanier frequency.
With the assumption of high signal to noise ratio outside of the receivers(Ps > 10 dB), we can use a second order development of the envelope correlationfunction around the maximum 'lV(resp 'T' 1 or Z2 for the FA receiver) (9).
We can simplify the expressions (9)
- correlated noises
FA receiver
2 .2yo 22roA w E,B2" (-e 2 .(1-(roB.)) (1)

* COR receiver
2 2yo .2a r.'(1 E . - e 2 ( l - (roB ,) (2)
" PCaR receiver
2 8 2yo ( (roi,)hr (Do ' )2rroR ,EL 1 -e (3)kaUJJ
- uncorrelated noises
,, FA receiver
2 2yoA ESBE
(4)
0 c0R receiver
a2 27oa rcoR - •(5rLRE,B,2(5
* PCOR receiver
02ro 8 2y oa o 3F3 E,B,
with Bs = signal bandwidthEs = signal energy
yE5 (y) = Y. noise power spectrum
The estimation precision (or variance) of these three receivers is defined by theproduct of the "Woodward" function (estimation variance outside of only one matchedfilter) and a weighting function dependent on the B IV parameter (i.e. the angularposition of the acoustic responder and the angular andlor range resolution proportional toI/Bs) then :
a 0

with
02 - Wood - -2E,S•
The theoretical results, with correlated noises, are shown in fig. 5. This one lets uscompare the three receivers "behaviour', on the assumption of high output signal to noiseratio, i.e. the "noise-noise" interaction outside of the correlator Is neglected (fig. 2).
For uncorrelated noises the weighting function is equal to a constant characteristicof each receiver.
To verify or not the model we set up lab experiment for these three receivers withdifferent types of frequency modulated signals (9).
LAB EXPERIMENT WITH FA, COR and rCOR receivers
Signals used
The signals were chosen mainly for their Doppler effect tolerance (4) (7) (8]
signal with hyperbolic frequency modulation (Bs Ts = 32) (7) (9)
3(t - .. L.Q 2,rbLogt/to
S(t) - A(t)e .Cos Log g U(t)
with. bandwidth (at -40 dB): Bs = 25 kHzduration (at -40 diB) : Ts = 1,28 msgeometrical centred frequency: fo = 61,2 kHzgeometrical centred duration : to = 3,15 msconstants : b = -0.85, g = 1.004472
signal with V-frequency modulation (BsTs = 256) (8)
S(t)- D.Cos(2zvot- jra(t-' -' _) DoCOs(2xt. na(t-- -
with bandwidth Bs = 25 kHz and Bs = 10 kHzduration Ts = T = 10.24 ms
T = 25.6 msarithmetical centred frequency : Yo = 62.5 kHz and Yo = 26 kHzmodulation slope :C = - 2BsiTsreal constant: Do

Experiment
To evaluate the receivers, we introduce, outside of matched filters, an envelopedetector in order to prevent the assumption chosen for theoretical computations(paragraph Receivers performances) (9).
The maximum detection of this envelope is obtained by an analogical derivatorassociated with a zero detector.
The experimental data are:
correlated noises on the two sensors
fig. 5 displays the evolution of the experimental weighting coefficient accordingto Re (input signal to noise ratio) and Bs leo (,'o = propagation time delay, Bs = signalbandwidth).
In addition, with an acoustic responder set in the receiving axis, the estimationvariance is nearing a null value according to (1) (2) and (3); limitations are due to inherentfluctuations in systems without additive noises (standard deviation C,_ 0.20ps).
uncorrelated noises on the two sensors
The comparison with logarithmic scales between theoretical and experimentalvalues of the standard deviation with Pe and Pea is displayed on fig. 6. The estimationvariance (according to (4) (5) and (6) is really inversely proportional to Pe and almostdoesn't depend on the propagation time delay eo (for fe and Bs fixed).
Other limitations
In addition to noise, two other limitations will reduce the navigation system'sprecision : Doppler effect and multipaths.
Differential Doppler is neglectible as long as the baseline dimension "'d" is small (afew centimeters to a few meters), compared to the the propagation path (a fewIdlometers). Absolute Doppler influence can be reduced by suitable signal design as in thelong baseline system.
Multipaths "performance" can be expressed as distance resolution A r and angularresolution A c. Table 1 summarizes the receiver architecture' multipaths performance"forhigh output signal to noise ratio (8).
Ar Acc
FA receiver 1/B undefined
COR receiver 1 /T 1/B
r COR receiver 1/B 2/B
Table 1 : mulflipaths "performance"
To increase the systems' precision we will have to increase the signal energy andthus (for a given peak level) the signal duration. The advantage of the F COR receiver, inthis case, is that the angle and range resolution will not be affected.

Operational system capabilities
Derivations, computations and laboratory experiments have shown the wide-bandsystem's ability to increase the precision of short baseline systems. As an illustration table 2gives examples of the modulated signals we could use to obtain high performance forvarious baseline dimensions (d) and ranges. The precision desired is 0.1% (Ac = 0.001 rad.)for a transponder set on the acoustical axis, for an input signal to noise ratio of 20 dB (insuch a case, typical precision Is 1% for commercial systems).
The positioning error is assumed to be Gaussian (which has been experimentallyverified, given high output signal to noise ratio). Positions are given with a confidenceinterval of 68%.
d B(kHz) T(ms) BT
10 92 92050 cm 15 27 400
30 3.4 1[00
10 23 2301 m 15 6.8 100
30 0.85 26
Table 2: some examples of operational applicationshort baseline systems input signal to noise ratio = 20 dB
Table 2 shows that the precision required can be obtained with reasonablebaseline size. The price paid is widening the transmitted responses' bandwidth. This can bea limitation if we want to localize a great number of transponders at the same time. In thiscase, we will have to narrow the bandwidth and increase the signal's duration. The signaltime-bandwidth product, needed for such receivers is compatible with the actualprocessing chips. Digital signal filtering can be achieved, in real time, with a "reasonable"amount of hardware,
CONCLUSION
We have shown that a substantial increase in the performance of underwateracoustical localization systems can be obtained with wide-band receiving architectures(frequency modulated signals, matched filtering and correlation techniques).
In the case of short baseline systems, derivations, computations and laboratoryexperiments have shown that, for "operational conditions", the PCOR receiver architecturecan lead to a compromise in performance (with respect to various disturbances: noise,Doppler, multipaths). It can easily operate, in real time, with a reasonable amount ofelectronics and a reasonable baseline size, and provide a precision of 0.1% (in similarconditions, whereby commercial systems give 1%).
This paper has mainly been oriented towards the precision of the signal processingand electronics of a short baseline system. For a real operational system such a precisionincrease should be accompanied by an increase of the precision of all of the ports of thesystem. Particular attention should be paid to the velocity profile correction. In addition tothe signal processing development, a great effort should be necessary to develop aprecise passive trajectography system (gyro, accelerometers, ...) for the baseline platforminstrumentation, In agreement with the precision requirements of the acoustical positioningsystems.

Such a processing can now be real-time available by using specializedmicroprocessors. For practical applications it Is important to get a precision around 0.1% forthe other parameters: sound velocity, pitch, roll, acoustic baseline rigidity ...
REFERENCES
(1) J.L. MICHEL, J.F. KARCZEWSKI "Positionnement, tilbtransmisslon. t6l•mesure parsatellite". Journ6es 6quipements pour les g6osciences marines, Etats etperspectives, 9-10 mai 1984.
(2) C. LEROY : "Localisation par bases courte et super-courte. R4sultats par petits fonds
et trhs grands fondsP. ASTEO, janvier 1980.
(3) F. de COULON : "Th6orie et traitement des signauxt. Dunod, 1984.
(4) L. VAN TREES : "Detection, estimation and ondulation theory. Tome I, Tome Ill, JohnWiley and Sons Inc., New York 1968.
(5) C. BARD : "R~ponse angulaire des interf6rom6tres acoustiques ou radio 6lectriques6 corr~lation pour des signaux 6 large bande". Those D.I. INPG, Grenoble, juillet1976.
(6) R.J. URICK : "Principles of underwater sound". McGraw Hill Book Company, 3rdEdition, 1983.
(7) M.E. ZAKHARIA : "Contribution 6 la caractdrisation et 6 I'identification de formessimples par sonar actif : application 6 un sonar de pCche". Those D.I., Univ. Ab-Marseille II, 1982.
(8) A.W. RIHACZEK "Principles of high resolution radar'. McGraw Hill Book Company,1969.
(9) M.E. BOUHIER "Am6lioration des performances en port&e et en priecision delocalisation angulaire des systdmes de navigation sous-marins". Those D.I., INPGGrenoble, d6cembre 1986.
(10) J.W. CARUTHERS : "Fundamentals of marine acoustics". Elsevier Scientific PublishingCompany, New-York 1977.
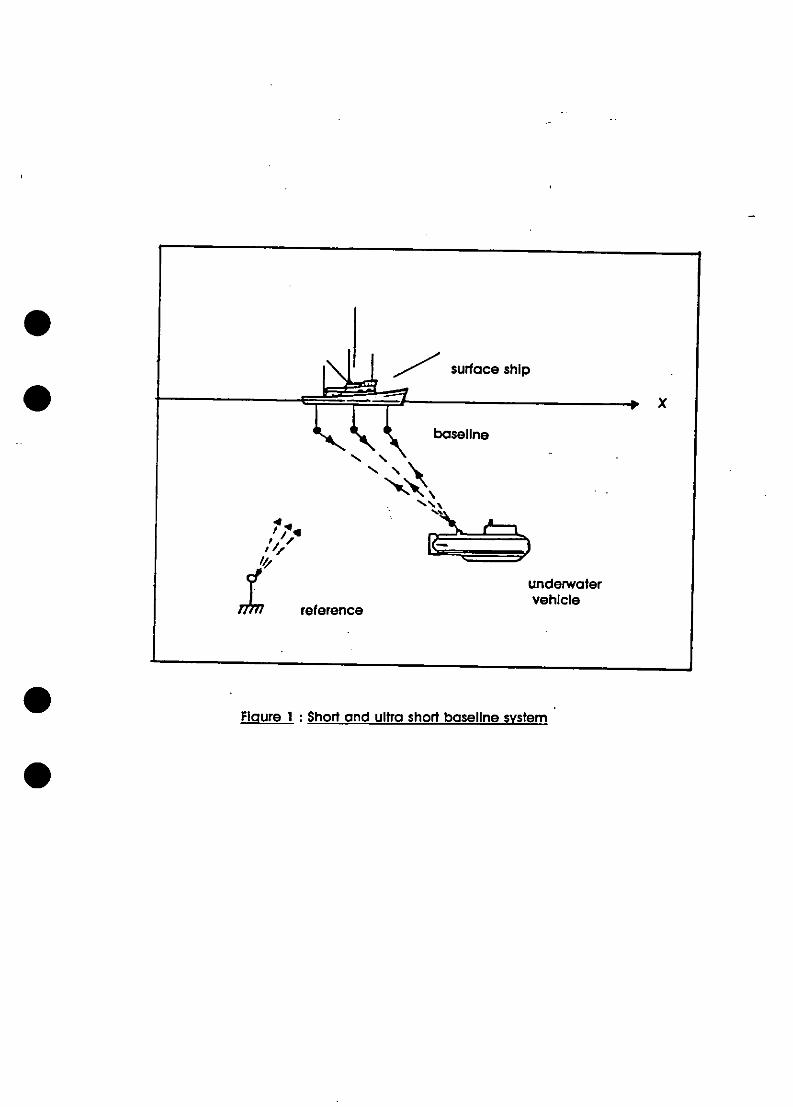
Ssurface ship
p X
rfecunderwaterreference vehicle
FIgure I : Short and ultra short baseline system
0

S(t-rz) S(t-n2)
matched matchedfilter filter
Figure 2a: FA receiver
SO) S(t-'ro) SQt) S(c-70)
linear linear matched matchedfiler filt er filter filter
delay T delayr
x x0J. '
Figure 2b COR receiver 2c : rCOR receiver

-0)
cmm
* 'I0 .v0f .
/ I k c tot a0
/ rCD.R V -4 CDC
Q4 04Q c;

0 5 10 15 20
-90
,db
0' -
0
% -I
-120 NA
-130- ,*N
-140 20log K
014
Figure 6: Evolution of the estimation variancewith regards tot, (uncorrelated noises)
a theoretical valueA experimental value FAX experimental value COROexperimental value rCOR

THE USE OF A SYNTHETIC APERTURE SONAR IN SEA FLOOR MAPPING
M.E. Bouhier IFREMER FRANCEEngineer La Seyne sur Mer
ABSTRACT
Synthetic Aperture techniques have been used successfuIty over the last few years inthe radar environment in order to obtain high resolution imaging.
The main advantage of these synthetic aperture systems is a fine resolution obtainedwith a "small" array by integrating the sonar trajectory.
After reminding the principle of the synthetic aperture imaging we will analysenumerical simulations and the possibilities of using such techniques in underwater acoustics.
INTRODUCTION
The Synthetic Aperture techniques have been used successfully over the last fewyears in the radar environment in order to obtain high resolution imaging.
Their main originality is based on the "conception" of a large array with theInformation (amplitudes and phases) received by an elementary array of standarddimension placed on a moving platform (plane or satellite).
SYNTHETIC APERTURE
Principle
In order to achieve a synthetic aperture imaging the moving platform is equippedwith a small side scan elementary array. The latter given a large azimuthal beamnwidthwhich, assuming a straight line track at a constant speed, "sweeps" the ground floor(figure 1).
For each successive platform position, the elementary array (a few meters) transmitsa pulse which, after reflection on the ground floor, is stored without distortion of theinformation (amplitudes and phases).
All these raw data are postprocessed in the same way as the classical arrays, that isto say :weighted and coherent summation of the received pulses. Thus the effectiveaperture of a long antenna (several meters) can be synthesized with higher a resolutionImaging than that obtained with a classical antenna of the same dimension.
We must notice that this technique is more complex than a standard imaging with alinear array for It requires a large data storage, a complex data processing and an inertialnavigation unit, to know exactly the platform trajectory.

Resolution
Ranae resolution
For synthetic array the slant range resolution depends on either the pulse duration (asthe linear array) or the transmitted signal bandwidth so:
r .= C. or 5§r = C2 2B
Azimuthal resolution
For synthetic array with length Lsa, the azimuthal angular resolution is given by the-3dB beamwidth of the main lobe beam pattern so:
Gsa 2Lsa
with XL: wave length
The linear azimuthal resolution, for targets located at the same slant range Ro, isgiven by:
s =R o (1)0 2Lsa
As for such synthetic arrays we must take into account the up and downpropagation (two-way response), the beamwidth (at -3dB) being twice smaller than thatof a real linear array of the same length.
If considering the synthetic array length equal to that of the area swath e.g. the -3dBelementary array aperture we obtain :
Lsa = 0 X so rsa
Lr 2
The linear azimuthal resolution becomes independant of the wave length and of theslant range Ro.
A high azimuthal resolution may be obtained with a small elementary array.
Ambiauities
Ranqe ambiqulties
When the pulse rate frequency (PRF) is so high that the return echoes from twosuccessive transmitted pulses arrive at the same time to the receiver, this results in a rangeambiguity.

The superior limit of PRF, also called range ambiguity limit, is given by rangebeamwidth of the elementary array so:
PRF sup = C2 (Rmax - Rmin)
In the, practical case this higher limit is chosen such as:
PRF sup = C2 Rmax
e.g. that the pulse Is transmitted only after receiving the last echo.
Azimuthal ambipuity
When the pulse rate frequency (PRF) is so low that the spatial sampling is not correctany longer, this results in an azimuthal ambiguity.
Thus, In order to obtain a continuous ground floor "sweep" with the synthetic aperturebeam, the value & (given the travel track of the platform between two successivetransmitted pulses) must verify the following inequation (figure 2):
A 1R( a withA =v/PRF
The inferior limit of PRF, also called azimuthal ambigulty limit, becomes with (1):
PRF inf = 2vLr
In order to obtain high definition images, we must avoid such ambiguities e.g. wemust impose for PRF the following condition
2 v < PRF < CL r 2 (Rmax - Rmin)
SYNTHETIC APERTURE IMAGING
The synthetic aperture technique takes into account the two following concepts:
* The Doppler effect : the platform movement during transmission and reception
introduces a Doppler "compression or dilatation" of the received echoes;
. The propagation delay : when the elementary beam sweeps the ground floor, theslant range changes between a stationnary punctual target and the platform. This rangevariation introduces a variable propagation delay for the up and down path of the signals(figure 3).

Assuming a straight trajectory with a constant platform speed, the synthetic aperturetechnique then realizes a propagation delay compensation e.g. focussing the syntheticarray at all postulated targets.
Principle
For each platform position (X = m ti). the elementary antenna transmits a pulse Sm(e). The received punctual echo Is then:
Sr,m (S) = Sm ( -Atmk)
with A tm, k = propagation delay such as
tmk = 2 * Rm,k
,all C
Rm,k = slant range between the platform position m and the punctual target seenwith a slant range Rk.
All the data received for a given punctual target can be described by figure 3.It is important to remark that the same punctual target is seen with various slant
ranges and various elevation angles during the platform trajectory.
Range matched filtering
The echoes received are, In a first step, processed with a matched filter in order tomeasure the echoes' propagation time delay and so to calculate the targets' slant ranges(figure 4).
These processes (called range matched filter) contribute to the definition of therange cells over the survey area; the cell dimension Is even less than half of the requiredrange resolution.
These range measurements suppose that the platform is quasi stationary during thetransmission and the reception. Was this conditions not true any longer we would have totake into account the Doppler effect on the echoes received (using Doppler filters bank).
Azimuthal matched filtering
After calculating the various range cells, the azimuthal matched filter achieves thedynamic focussing of the synthetic aperture over all of the postulated punctual targets ofthe survey area.
Supposing only one punctual target, the echo received after ranged matchedfiltering Is given by:
Yr,em rPs (1t9 t tmnk)
where Ps (19) is the autocorrelation function of the transmitted signal S (e).

Figure 4 shows for m = mo that the platform-target range is minimal e.g. that thepunctual target is in the acoustical axis of the synthetic array.
We can write Rm,k as follows:
Rm,k = (Rmo i)2 + (m - mo)2 A 2
such as:
- for the platform position m the punctual target is seen in the range cell no k;
- for the platform position mo the punctual target is seen in the range cell no I.
In the near field of the synthetic array, the range variation Rm,k can be written:
RmkR 2 moj + (m - mo)A
true for: -Lsa< (m -mo)A< + Lsa (2)2 2
with :Lsa =Rmol I.Lr
Lsa = length of the focussed synthetic aperture array.
To focus on a punctual target (mo, Rmo, I) comes to sum up (assuming phasecoherence between the platform position) the echoes received at the platform positionsm satisfying (2) offer propagation delay compensation such as:
Atm,k ^ 2 Rmol + (m-o).&C C Rmo,l
THE USE OF A SYNTHETIC APERTURE SONAR IN UNDERWATER ACOUSTICS
Synthetic aperture imaging allows to obtain a high resolution with coherentprocessing of the echoes received over a long time span, assuming a straight trajectorywith a constant speed of the platform.
The transposition of the radar techniques to the underwater acoustics must take intoaccount the following limitations :
" absorption and propagation phenomena due to an unhomogeneous medium;
* phase coherence related to medium stability and resulting from the difficulty of
maintaining a straight trajectory over the whole length of the synthetic aperture;
" slow mapping rate due the the relatively low speed of sound in sea water;
accuracy measurements of the platform attitudes and of the platform trajectory.

In a first step we will analyse the possibilities and the constraints on the elementary
array length, on the platform speed ... , for underwater applications.
Feasibilil
Parameters
v = platform speedPRF = pulse rate frequency
2v•< PRF < CLr 2 (Rmax - Rmin)
tau = pulse durationB = modulation bandwidth of the signal transmittedLr = length of the elementary arrayRmax = maximal slant rangeRmin = minimal slant rangeC = sound velocitya = elevation angleTE = total duration over the survey areaZ = Xmax - Xmin = area azimuthal dimensionW = swath
Characteristic values
required slant range resolution
ECr = C._. or g'r =C
B2
required azimuthal resolution
(sa = Lr02
number of slant range cells
ND = Rmax - Rmin5.'r
number of azimuthal cells
NA = Xmax - Xmin

travel track between two successive platform positions
vPRF
mapping rate
A = v.W
Numerical applications
The sonar geometry is such as:
H = 1000 m Beta = 20r amax = 45° do = 100 kHzRmax =1414 m Rmln = 1104 m W = 533 m OI1 = 10 kHz
Table 1 points out the necessity to develop software tools in order to optimize theparameters required for underwater applications.
Software simulations
As shown in table 1 software simulations are necessary. They allow to analyse and tostudy the various limitations encountered in underwater applications.
Thus we are able to find a compromise between the elementary array length, theplatform speed and stability, the reasonable synthetic array length, the resolution .... inorder to reach high sea floor imaging.
CONCLUSION
This paper presents the synthetic aperture techniques and points out that theunderwater navigation applications are not as easy as we would have thought.
Extensive studies also are necessary both on the attitudes of the towed fish and onthe measurement accuracy of the fish attitudes (roll, pitch, yaw, ...) and on the platformmotion.
In order to demonstrate the feasibility of the synthetic aperture sonar, the AC.I.D.project, supported by the Commission of the European Community, is currently under wayas part of the MAST programme.
REFERENCES
TOMIYASU K. (1978) : "Tutorial Review of Synthetic Aperture Radar (SAR) withapplication to imaging of the ocean surface". Proc. IEEE 66 (5), 563-583.
CUTRONA L.J. (1977) : "Additional Characteristics of Synthetic Aperture Sonar Systemsand a further comparison with non Synthetic Aperture Sonar Systems". J. Acoust. Soc. Am.61 (5), 1213-1217.

ROLT D.K. (1991) : "Ocean, Platform and Signal Processing. Effects on SyntheticAperture Sonar Performances". Scientific Magister at the Massachusetts Institute ofTechnology Cambridge MA 02139.
CHATILLON J., BOUHIER M.E.. ZAKHARIA M.E. (1991) Synthetic Aperture Sonar : wideband vs narrow band". UDT Conference, Paris, 1220-1225.
0P

Table I
V 1 m/s 5 m/s = 100 kHz
0 10 kHz
LR I m 5m. 5m
PRFin f 2 Hz 0.4 Hz 2 Hz
PRFsu p 2.4 Hz 2.4 Hz 2.4 Hz
g9sm 0.5 m 2.5 m 2.5 m
9&rm 0.5 rn 2.5 m 2.5 m
tims 0.67 ms 3.33 ms 3.33 ms
BHz 1500 Hz 300 Hz 300 Hz
ND 620 124 124
& supm 0.4 0.4 0.4
NA 250 250 250
Lsa max 21 m 4m 4m210 m 40 m 40 m
Lsa min 17 m 3 m 3 m170m 30m 30m

V
0 " Platform trajectory
Fliure I: Synthetic Aperture Geometry
Lr - length of the elementary arrayH - vertical depthV - platform speedR - Slant range
- azimuthal beam width- beam width range
a - elevation angleW - swath
Platform•
0H1. II
Taret a
W

Insanlfled area
&. -V/ PRy Plajetory
Fiaure 2 :Azimuthal Ambiguity

o i•*- ..9
/ NI
KZ
a-a
0 SC/\ \ '
0* -- ÷+
_ _'_ _ _ ci_ _ _
01 \ \/ 1 , \ "\ .

/
I I K\ a
I I -\ 0
I IDo 0
oo -E2

*0a z
-J ____________
*0
ft I 0I'
~*1~--- - - *8
1~ I 0
I S
U
9 ---- (~)
-9---- 1/-pt----
a 'I \ /r \ I \ I0 U
'I.0 0 E
E

0
S
0
S
S
* 16
S
0
S0

An Introduction to Underwater Energy Systems
Dr Ian G. Bryden
Department of Civil and Offshore Engineering
Heriot-Watt University
Edinburgh

1: Introduction
The choice and use of energy sources f or underwater
systems is governed by two fundamental factors:
1: The power and total energy requirements of the
systems in question.
2: The special constraints posed by the underwater
environment.0Both of these factors must be taken into account by even
the most casual investigation of underwater energy
sources.
On land, as in water, power requirements can be
met by two fundamental methods. Power can be supplied
from remote sources via energy guides ( eg electrical
or hydraulic umbilicals ) or released locally from
stored energy reserves ( eg electrical batteries or
heat engines ).
Both of these approaches have been used with a high
degree of success on land to satisfy the first factor.
• The simultaneous satisfaction of the second factor
requires, however, some more careful thought.
This paper considers the power requirements of two
fundamental types of underwater systems. The first
being static sea bed installations which are
typically involved in the production of petroleum. The

second being mobile vehicles which are free to move in at
least two degrees of freedom and as such pose
rather different limitations.
2: Power Requirements
2.1 Subsea Production Hardware
The principle power requirements in a subsea facility
0relate to the actuating of valves. A single wellhead
might, for example, have eight valves. A diagram
showing how these valves might be actuated is shown
in figure 1. The valves themselves are actuated by
hydraulic fluid stored at high pressure in a subsea
accumulator. The fluid is directed to the appropriate
actuator by pilot valves which can themselves be
activated either by a remotely controlled solenoid or
by hydraulic fluid.
A few simple calculations and a little bit of guess-
work enable a rough estimate of the power requirement to
be made.
Assume that, on average, one valve is operated twice
daily and, in operation, requires one litre of hydraulic
S oil *.at a pressure of 30 MPa. This will require the
transfer of 730 litres of hydraulic oil in one year.
Most commercially available pilot valves have a quoted
maximum leakage of less than 0.15 mi/mmn. Using this
worst case assumption eight pilot valves will leak
approximately 6301 annually. If a similar leakage rate

is assumed for the rest of the hydraulic system then
the total hydraulic 'consumption' will be approximately
21001 per year.
If this fluid is to be supplied using a pump with a flow
rate of 31/min at 30 MPa then, assuming an efficiency
of 50% , the power requirement will be 3kW. To achieve
21001/year the pump will have to operate for 700 minutes
0 giving a total annual energy consumption of 35 kWh/year.
The power requirements of the electronic components
S should be as low as 3W resulting in an annual
energy consumption of 26kWh contributing to a total
energy requirement of approximately 60kWh.
It should be realised, however, that although the
average total power requirement is low, peak loads
during the re-charging of the subsea hydraulic
accumulator are at least 3kW.
2.2 Subsea Vehicles
It is not possible to demonstrate, by simple
calculations, typical power requirements for submersible
vehicles because of the very wide range of systems
S required by the offshore industry. The following
list gives, however, a very brief summary of the power
consumption of some broad classifications of commercial
underwater vehicles.
Tethered free swimming ROVs (eg RCV 225, Rigworker,
Scorpio) typically require up to 200KW of power to

operate. The power is required for propulsion, control
systems, lighting, tools and instruments. In conventional
systems this power is supplied through umbilical cables
giving effectively unlimited endurance at the expense of
handling.
The power to weight ratios of small submersible vehicles
tend to be high when compared to surface vehicles. The
reasons for this are well known. Submersibles tend to be
small leading to disproportionate drag forces. They use
thrusters for propulsion and control. These thrusters
tend to be located within the outer envelope of the
vehicle resulting in interaction between the thrusters
and the vehicle structure. This reduces their efficiency.
Similarly thrusters must be capable of operating under a
wide range of conditions so that they cannot readily be
tuned for maximum efficiency.
The umbilical cable on a tethered submersible contributes
greatly to the drag on the vehicle. Much of the design
and control effort for these vehicles has been directed
* towards minimising the operational problems associated
with this effect.
Sea-bed vehicles (eg Seabug) as might be used for
trenching operations have somewhat higher power
requirements up to 1500kW.
Untethered manned submersibles (eg LR2, Pisces Viii)
require power up to 600kW at present. This is

typically supplied by batteries when submerged and by
heat engines (usually Diesel) on the surface.
Diving bells (eg Ocean ARMS, Comex MOB) generally receive
their power, which may be up to 70kW, by umbilical
cable.
2.3 Underwater Navigational Aids
Subsea acoustic beacons generally have low power
requirements but must be capable of very long
operational periods. At present they can be supplied,
where possible, by umbilical or alternatively by
batteries.
3. Underwater Power Systems
3.1 Battery Systems
3.1.1 Generic Battery Considerations
Battery Systems can be divided into two fundamental
types:
a: Primary Batteries:- Based on non reversible
electro-chemical processes. Recharging is not
* possible.
b: Secondary Batteries:- Based on reversible
electrochemical processes.
There are at least four principle factors which must be
considered in the choice of batteries.

(i) Discharge characteristics
An ideal battery would provide a constant voltage over
its entire discharge period. In practice this is not the
case.
(ii) Energy density
What is the size and weight of a battery for a given
power output and energy storage.
(iii) Cycle life (Secondary Only)
Expresses the normal life of a battery in terms of the
number of charge/discharge cycles during which the unit
achieves the desired performance.
(iv) Cost
The selection of any specific system requires
compromises to be made with respect to these
considerations. There is a wide range of both primary and
secondary battery types available and the choice for a
* particular application might not always be clear.
3.1.2 Battery Types
3.1.2.1 Primary Batteries
Primary batteries often yield the simplest
solution. Once in place no maintenance is required
with the exception of replacement once the battery is
exhausted. Energy ratings are generally higher than
those achievable by rechargeables. As the costs related

to subsea intervention are high the time interval
between each intervention should be as high as possible.
Lithium-Thionyl Chloride are one advanced form of primary
battery which appears to be suitable for some ROV uses.
They have a high energy density (more than 500Wh/kg) and
a practically unlimited shelf life. They can, however,
explode if treated incorrectly.
3.1.2.2 Secondary Batteries
* Most of these have energy densities much lower than
primaries. In a subsea production facility, if the
size is to kept to a manageable level, the battery
should only be used as a power back-up or as a
storage system in conjunction with some other power
source. There is a wide variety of types of secondary
battery available but as yet the perfect system with a
long cycle length, low cost and high energy density has
still to be developed.
Figure 2 shows a summary of the characteristics of some
of the most common battery types.
Lead acid batteries have a good electrical efficiency and
are cheap. They have, however, a low energy density, high
discharge rate and a short shelf life.
Silver-zinc oxide batteries have a higher energy density.
They operate well at low temperatures and have a long
shelf life but they cost more than fifteen times as much
as lead acid types.

The new Lithium Aluminium/iron Sulphide systems have high
energy densities of around 10OWh/kg but require operating
temperatures of between 350 and 550 degrees Celsius.
3.1.3 Battery Containment
If a battery is to be used for an underwater application
it must be suitably contained. There are two
* philosophies for this:
Atmospheric Containment
The battery is held within a container at atmospheric
pressure. These are usually cylindrical to resist the
effects of high ambient pressures. This implies that
the vessel is rather larger than the battery itself.
This can prove problematic is space is limited.
Pressure Balanced Containment
The battery is held in a vessel containing a light
mineral oil extending to all voids within the vessel. The
interior of the vessel is kept at the ambient pressure.
This type of housing can be much smaller than an
atmospheric type and can be quite lightly
*constructed.
Most liquid electrolyte batteries give off hydrogen
gas as a by-product of the conversion process. In an
atmospheric container this build up can become
explosive. Ambient pressure balanced containers can be

fitted with bleed of f valves and the presence of oil can
help reduce temperature rises.
3.2 Fuel Cells
A fuel cell is an electrochemical device that transforms
chemical energy directly into DC electric current. In
this sense they are a form of battery. The reactants are
* continually supplied in liquid or gaseous form to an
electrode which takes no part in the chemical reaction
although it may act as a catalyst.
The fuel is supplied to the anode and the oxidant to the
cathode. The mechanical components of the cell do not
directly enter into the reaction and as such the cell can
have a very long working life.
Fuel cells are more efficient at partial load than close
to their maximum rating and as such they are best suited
as steady sources as electricity. They can, however be
used to charge conventional batteries which can then
be used to give sudden bursts of power.
They suffer from two principle problems. They are very
expensive due their platinum or palladium catalysts and
they tend to be heavy.
Very little maintenance is required for a fuel cell and
intervention is generally only required for the refilling
of fuel tanks. The technology of fuels cells is being
continually developed and it is possible that such

systems will have a long term future in the powering of
underwater systems.
Figure 3 shows a summary of the characteristics of some
fuels cell types.
3.3 Radio-isotope Thermal Electric generators
A radio-isotope thermal electric generator uses heat from
the decay of radio-active material to produce electric
power. A sufficient quantity of the radio-isotope fuel to
* produce the necessary heat energy for the required
performance is sealed in a capsule made of a special high
strength alloy.
Thermo electric devices (effectively thermocouples)
convert the heat from the decay directly to electricity
utilising the temperature difference between the hot core
of the isotope and the cold outside.
Generators are commercially available in the range from
25W to 500W. Although a generator could be provided which
was capable of providing peak loads it would be more
practical to use a generator to charge up batteries which
could be used for high power applications.
It should be commented upon that there may be substantial
problems in getting approval for the use of radio-
generators for commercial subsea use.
Figure 4 shows a schematic diagram of a radio-isotope
generator.

3.4 The Seawater Battery
This is a form of primary battery in which the electrodes
are exposed to sea water which is used as the
electrolyte. The anode, which is consumed during the
operation, is made of magnesium alloy.
The system consists of three parts:
S The power cell
The DC/DC converter
The buffer accumulator
The DC converter is used to convert the low voltage
output into a higher voltage for convenient use. The
buffer accumulator is generally a lead acid battery to be
used to supply high currents when required.
A cell of approximately 1 cubic metre might have an
average power output of 5W and a weight in air of up to 2
tonnes. The lifetime of such a system might be 2 years.
Figure 5 shows a schematic diagram of a sea water
battery.
03.5 Heat Engines
3.5.1 Introduction
The potential energy densities from hydrocarbon fuels are
considerably greater than for battery systems. The
equipment needed to release this energy is much more

complicated and efficiencies are generally lower. It is,
for example, necessary to provide combustion chambers and
thermodynamic converters to provide mechanical energy
which can be used directly or converted to electricity in
a generator.
Heat engines can be divided into internal and external
combustion devices and into reciprocating systems and
turbines. Turbines are generally preferred for very high
power applications and are not considered suitable for
subsea applications.
In an internal combustion engine the fuel is oxidised in
the engine so that the combustion gasses form part of the
working fluid. In external combustion engines, the
working fluids are separate from the combustion fluids
and enable the use of a wider range of fuels.
All heat engines are limited by the Carnot condition in
theory and by material technology in practise. The
maximum efficiency of a heat engine is unlikely to exceed
*40%.
Conventional hydrocarbon fuels have been found to be very
favourable for energy storage even when the requirement
to store an oxidant is considered. Most
Hydrocarbon/Oxygen bi-propellant combinations have an
approximate specific energy of 2 kWh/kg. Pure hydrogen
exceeds this value by about 50% at the expense of cost
and ease of containment.

Mono-propellants in which the fuel and oxidant are
combined in a substance are available. The have energy
ratings of up to 200kWh/kg but they are expensive and it
is anticipated that they might suffer from exhaust
disposal problems at high pressures.
The most sensible operational mode for a heat engine is
working in parallel with a secondary battery system so
that the engine is only operated to charge the battery
when its stored energy level falls below a pre set level
* or the external load exceeds that which can be supplied
by the battery.
3.5.2 The Stirling Engine
The Stirling engine, which is an external combustion
device, operates around a process in which heat energy is
supplied to an enclosed working fluid. In its simplest
form the expanding gas when heated is used to drive a
piston. Figure 6 shows a simple schematic diagram of a
Stirling engine. In the first diagram the gas in the
cylinder is allowed to expand and to drive a piston in a
separate cylinder. Once the piston has reached the limit
of its excursion a porous heat storage device called a
regenerator is passed through the primary cylinder to
cool the contained gas resulting in contraction allowing
the piston in the drive cylinder to return. The
regenerator is then passed through the working fluid,
releasing its stored thermal energy, allowing the process
to repeat.

The continual transfer of heat and the absence of valves
ensures a smooth cyclic operation. The heat can be from
any source.
3.5.3 The Diesel Engine
Internal combustion engines are the most widely used
power sources in almost all conventional mobile marine
and land power system applications. Of the various
internal combustion engines available the diesel engine
appears to be the most convenient for subsea operation.
Although the specific power output of a diesel is
generally lower than that of a petrol engine its
efficiency can be significantly higher and the fuel
itself is safer to handle. Diesel engines are also
available commercially and are comparatively cheap when
compared to most alternatives.
Closed cycle diesel engines need the working fluid to
carry the fuel and oxygen mixture around the cycle and to
recirculate uncombusted oxygen. Nitrogen is often used as
*the working fluid, although argon mixes have been
developed to improve the cycle thermodynamic efficiency.
Argon is also more easily separated from the exhaust
carbon dioxide so that it can be recirculated. A
schematic diagram of a nitrogen-diesel engine is shown in
figure 7. Note that the nitrogen must be continually
topped up as a result of small amounts being oxidised.
A major problem with operating diesel engines underwater
concerns the expulsion of the exhaust gases. The

combustion process must always take place at between one
and three atmospheres to avoid excessive stresses in the
engine. The expulsion of carbon dioxide at such low
pressure to the sea at ambient pressure is difficult.
Potassium hydroxide can be used to absorb the carbon
dioxide rather than expel it but the high mass and volume
of the liquid make it unattractive. An alternative is to
use a centrifugal sea water absorber to clean the working
fluid. This is used in the argon-diesel system because
argon is comparatively insoluble in water and is easily
separated from the carbon dioxide. After waste products
have been removed, the working fluid continues on the
cycle around the system.
3.5.4 Comparisons between Stirling and Closed Cycle
Diesel Engines
The efficiency of a Stirling engine should, in theory,
closely approach that of an ideal Carnot cycle and as
such yield the maximum achievable thermodynamic
efficiency. In practice the actual efficiency of a
practical Stirling engine producing 100kW (suitable for a
large ROV) is virtually identical to that of an
equivalent conventional Diesel engine (around 40%).
The Stirling engine has the advantage of easier expulsion
of its exhaust. It's working fluid is continually
recycled in a closed system and the remote combustion
process could take place at any pressure. The exhaust
products can therefore be discharged by maintaining a

small pressure difference between the combustions chamber
and the ambient pressure. As has been previously been
discussed combustion in a Diesel engine cannot take place
at much more than 3 atmospheres and as such a carbon
dioxide absorption system must be used.
The speed and power control of a Diesel is relatively
easy while that of a Stirling engine suffers from slow
response times.
A Stirling engine should be smoother and quieter in
operation than a Diesel but it is a more complex device
requiring expensive materials in its construction. At
present the Diesel appears to have commercial advantages
over the Stirling but this may not be a permanent
situation.
3.6 Flow Intrusive Power Generating Devices
3.6.1 Introduction
A subsea production facility is in close proximity to a
potential power source which might be tapped. The well
fluids themselves possess both kinetic and, in the case
of a production flowline, thermal energy. Systems
utilising such sources cannot, of course, operate during
shut down periods but any of the previously discussed
battery systems could be used during such times.

3.6.2 Flow Energy Turbines
The fluid flow drives a turbine connected to an AC
generator. The turbines would have to operate under mixed
phase flow conditions and be subject to both erosion and
corrosion.
During the early stages in a field's production life the
* drive potential would most likely be sufficiently high
for the kinetic energy lost to the turbine to be
negligible. At later stages in the reservoir's life the
extraction of kinetic energy from the flow might reduce
the production life of the reservoir. In addition the
reduced availability of energy might cause operational
problems.
It would be sensible if a turbine could be used to charge
a battery system and the flow by-passed around the
turbine when not required.
3.6.3 Thermo-mechanical Energy Extraction From Flow
Lines
In principle a heat engine can be used to extract energy
from a hot flow line. Such as system could be similar in
operation to the Stirling engine previously discussed but
operating with a rather lower input temperature. A more
feasible alternative would be based around the Rankine
cycle (figure 8).
Any such energy extraction system would have a very low
efficiency (4%-5%) due to the low input temperature and a

1kW generator would have to be very large (some proposed
devices are up to 8m high).
3.6.4 Direct Thermo Electric Devices
In a manner analogous to the conversion of thermal energy
in a radio-isotope generator the thermal energy in a
flow-line can be utilised to generate electricity
0 directly. Figure 9 schematically shows such a system.
Such a generator is highly reliable due to its lack of
moving parts and laboratory tests have shown that a
single device can generate about 2W for a temperature
difference of 60% between the production fluid and the
sea water. obviously a large number of such devices would
be required for a practical system
4: Conclusions
This paper has made no attempt to suggest particular
systems for particular applications. Instead the
limitations and capabilities of some of the most common
power systems have been presented and the requirements
summarised.
It must be obvious to even the most casual observer that
the convenience of an umbilical power supply is difficult
to approach using a local generation system. An umbilical
gives unlimited endurance to an ROV and comparatively

easy control of the power supply to fixed subsea
installation.
It is likely that, as the range of underwater operations
is increased, eventually there will be a greater need for
a wider range of alternative power sources.
S

I "
Electronic unitFluid container Accumulator
0 ' Pump Pesr euao
valve actuator I
.• • Solenoid valves
vcrtuator
Figure 1: Subsea Valve Control System

Cu an
-D 00 1- CV0
C 0D
>- NCO (0 0 1 I
CO ILO - n -
C 0D
0
o to0
In
0 0
z -- N to, I
EiE
0 0 0
0) -. U7
o~t Z
V7 ) 0 0(n-1C oZ l C C '
-- rW-0 -0 -1 cm
0- E a. 2 .I CM
W B- . >o3 MECLC
Figure 2: Characteristics of Secondary Batteries.

CO
0 a CCISCY CO 0 '
C) 0 C)
Cu3
0 o 0 0
0v) < 0 c 0 Ex*5, 0 O0U)C
0,a>
o 0 LC)000 E 0
C-4 0 D CIC)0 a a 0 LA o 't w
>, = 60 LO COU
* 0 a. (a _ _ LO 0 a
CL-
~0-
o CO_ 0
o0C 0 0c 0 0 CD 3(D73Jh 0C N) LA 0 6n0
0~ Ua 1 00
CD CM cc 0I CuC)L
CL LO LO0 3
co N o
C~j a, ca
Cm Co
C1 EE0 Cu a c) (0 CO(
w0 C CD 0 - 0 ); 0 CD
>%0 0 4a oLC -I-) 0) a. c 0 O.
>0 c
Figre : harctrisic ofFul Cll

ThEA.ELECTAIC
MVL CUtS
SNIELO 310MIM
Figure 4:shmtcDaga faRdoIsotope Generator
WPressure resistantcontainer
I Current' I
I~ srnerAnodic conductor
Cathodicor codco
Se be
Figure~~~~~~~~ 5:shmtcDarmofaSaae atr

Expansion Phase
0 drive cylinder
regenera tor-4
drv istonpr~rmary cylinder cre P
Sjheat source
Oontraction Phase
Fiue60h trigEgn

airboa
Waste/
nitrogen filud
Figure 7: Closed Cycle Nitro-Diesel. Engine
IPressure
Conenston/ Heaty
Figure 8: The Rankine cycle

COOLING FINS (4 OFF
THERMOELECTRICDEVICE
FIN FIXING BLOCK
DEVICE MOUNTING(W EDTPI)0 PLATFORM
STRAPPING
OIL !LOW85 *C
Figure 9: Direct Thermo-Electric Generation

6th SESSION - ENERGY SYSTEMS
Ledt. XVII - BATITERY SYSTEMS AND FUEL CELLS
Trani Attilio FINCANTIERI ITALY
Cantieri Navali Italiani S.p.A.
Trieste
O GENERALUnderwater operations, offshore as well as military, depend significantly on
supply of large amounts of energy. The solution for the propulsion and the life supportservices, sensors capability of under-water vehicle is energy systems which can providestored energy for a large cruising radius independent of the atmosphere or for high speedson short term discharge.
Surface independent energy supply systems have during the years been subjectto considerable development effects in order to reach the required submerged endurance.Battery systems, fuel cell systems, Stirling engine, closed - cycles Diesel and mini -nuclear power plants are the means to reach the demanded performances.
During the talk are presented the rechargeable batteries and the fuel cell systems.The battery is a device that converts the chemical energy contained in its active
materials directly into electrical energy by means of an electrochemical oxidation -reduction reaction. This type of reaction transfers electrons from one material to anotherthrough an electrical circuit.
While the term battery is often used, the basic electrochemical unit being referredto is the cell. A battery consists of one or more cells, connected in series or paralleldepending on the desired output voltage and capacity. The cell consists of three majorcomponents: the anode or negative electrode, the cathode or positive electrode and theelectrolyte which provides the medium for transfer of electrons between the anode andcathode, inside the cell.
The fuel cell is a device where a gaseous or liquid fuel reacts with oxygen or air,which acts as oxidant. In the fuel cells the electrode materials are inert and they havecatalytic properties, which activate the reaction of the fuels fed in to the cells from anexternal source when power is desired.

BATTERIES
Introduction and Classification
The batteries are identified as rechargeable or non rechargeable, depending on
their capability of being electrically recharged. Whithin this classification, other
classification are used to identify particular structures or designs.
The electrochemical operation of a cell during discharge is schematically
represented in Fig. 1.
The electrons flow from the anode through the external load to the cathode, where
the electrons are accepted and the cathode material reduced. Conventionally theelectrode at which the reduction occurs is called out cathode and anode the one where
oxidation takes place. The electrical circuit is completed in the electrolyte by the flow
of anions to the anode and the cations to the cathode.
The rechargeable batteries can be recharged electrically after discharge to their
original condition by passing current through in the opposite direction to that of the
discharged current.
The electrochemical operation of a cell during char-ge is schematically represented
* in Fig. 2.
During the charge the current flow is reversed, compared to the discharge, and
oxidation takes place at the positive electrode and reduction at the negative electrode.
The rechargeable batteries are storage devices for electrical energy and are also
known as "storage batteries" or "accumulators".
The selection and the combination of the anode and the cathode materials are
connected with the opportunity to be light weight material and give a high cell voltage
and capacity. Cost, difficulty in handling, reactivity with othercell components seta limit
.to the selection of the anode/cathode couples.
-2-

In the industrial systems the anode is selected with high efficiency as a reducing
agent, good conductivity, stability, ease of fabrication and low cost; metals are normally
used as anode materials.
The cathode must be capable as oxidising agent, stable when in contact with the
electrolyte and assure a useful working voltage. In standard conditions the cathode
materials are metallic oxides.
The many and varied requirements for battery power and the different
environmental and electrical conditions under which they must operate request the use
of a number of different types of batteries and designs each having determinate
performance under certain operational conditions. Many advances have been made in
battery technology, but there is no one battery that gives optimum performance under all
operating conditions. A relatively small number have accomplish large production and
sales.
GENERAL APPLICATIONS OF STORAGE BATTERIES
The most common storage batteries applications widely used in submarine
service, as power source for electric vehicles and emergency and standby power are:
Type Anode, Cathode, Volt/cell.
Lead - acid Pb PbO2 2,1
Applications: for the low cost, long life, good high rate
discharge, easiness of recharge these cells are used for
marine and vehicles propulsion, emergency power and
far small and portable equipment power supply. They
were developed in 1859 by Plane6 and they are still
now the most widely used battery.
-3 -

Silver - Zinc Zn AgO 1,85
Applications: for the high cost, low cycle life but
highest specific energy these cells are used for torpedo
propulsion, radio - controlled airplanes or boats,
lightweight portable electronic equipments.
Nickel - Zinc Zn Ni Oxide 1,73
Applications: for the high specific energy and modema-
te life this cell is in development stage for electric
vehicles, energy storage and emergency power
applications.
Nickel - Iron Fe Ni Oxide 1,4
Applications: for the long life, durable construction
but with low specific energy this cell is used in railroad
cars, materials handling and stationary applications.
They were introduced by Edison in 1908 as a power
source for a electric car.
Silver - Cadmium Cd AgO 1,4
Applications: for high specific energy, good charge
retention, moderate cycle life and in spite of high cost
this cell is used in portable equipment requiring a light
weight and high - capacity battery.
Nickel - Cadmium Cd Ni Oxide 1,35
Applications: for excellent cycle life, good high rate
capability is normally used in aircraft batteries,
industrial and emergency power applications,
communication equipment.
4-

Other combinations of anode/cathode couples are under development to increase
the specific energy, the charge retention, the cycle life and in the same way to reduce the
cost of construction and maintenance.
The important characteristics of storage batteries are that the charge and discharge,
transformation of electrical energy to chermical energy and back again to electrical
energy, should proceed reversibly with a good energy efficiency.
The above mentioned storage batteries are divided in two groups as regards to the
characteristics of the electrolyte. The lead batteries have like electrolyte a sulphuric acid
(H 2 S0 4 ) about 1.285 specific gravity by weight in a fully charged condition, which
decrease in proportion to amper-hours discharge.
All other conventional type of storage batteries use an aqueous alkaline solution
(KOH or NaOH) as the electrolyte. Electrode materials are less reactive with alkaline
electrolytes than with acid electrolytes. The charge/discharge mechanism in the alkaline
electrolyte involves only the transport of oxygen or hydroxil ions from one electrode to
the other. The composition or concentration of the electrolyte does not change.
The storage batteries are characterised by a flat discharge profiles which are
compared in Fig. 3. The lead acid battery has the highest cell voltage of the conventional
systems and the discharge profile is nearly flat except for silver oxide systems which
have a double plateau profile due to discharge of the silver oxide electrode.
The low temperature performance of the alkcaline batteries is better than the
performance of the lead acid batteries, with the exception of the nickel - iron system.'The
lead - acid system shows better characteristics at the higher temperatures. This element
is very important to define the favourable discharge conditions and consecutively the
recharge operations.
The storage batteries are recharged on periodic basis or maintained on "float"
charge if they are to be in a state of readiness for emergency power supply. (Fig. 4)
There is a very important difference between the lead - acid batteries and the
-5-

alkaline batteries. The first can not be stored in a discharged state because sulfation of
the plates, which is detrimental to battery performance, will occur. Sulfation means the
transformation of normal lead sulfate into granular crystalline lead sulfate normally
occuring when the battery has not been properly serviced. Sulfation reduces the electrode
active surfaces and consequently brings a reduction in capacity. The alkaline batteries,
especially the Nickel -Cadmium and Nickel - Iron, can be stored for long periods of time
even in a discharged condition without damage and can be recharged when required for
use.
Battery's life strongly depends on the particular design of the cell components,
the condition under which the battery is discharged and the charging methods. The lead
- acid batteries do not match the performance of the best alkaline batteries with regard
to cycle life and total lifetime.
All the storage batteries can be charged following to typical charge curves:
normal constant -current in two rate charging or constant - potential methods, which are
strongly limited by the range of the temperature increasing rapidly during the charge. The
efficiency of the recharge operation changes between 90% for lead - acid batteries and
80%/70% for alkaline batteries.
The cost of a secondary battery may be evaluated on several bases, depending on
the mode of operations. The initial cost is one of the bases for consideration, the number
of charge/discharge cycles, the cost of charging and maintenance are entitled to enter in
this evaluation.
The lead - acid traction and stationary batteries, having more expensive
constructional features and not a broad production base, are less expensive than the other
storage batteries. Tbe nickel - cadmium batteries are the next lowest in cost.
The most expensive are the silver batteries, the cost and the low cycle life have limited
the use to special application mostly in the military and in portable equipment, which
require very high energy density.
6 -

LEAD-ACmD BATITERIES AS POWER SUPPLY FOR SUBMERGED VEHICLES
Introduction
Thbe submerged endurance of modem Diesel-electric submarines used for
underwater operations, off-shore as well military, is limited by the power available from
the surface independent energy supply systems.'
When used lead-acid batteries, the required power capacity is much more
complex and is related to the required endurance at slow speed, the high speed endurance
and the allowable rate of charging by the Diesel engines under different conditions, all
related to the electrical loads required for propulsion, life support services and sensors
uses.
The lead-acid accumulator system is the most important system for electric drive
of submerged vehicles.
Practically lead-acid batteries began with the research and inventions of Raymond
Gaston Plante' in 1860. Two long strips of lead foil and intermediate layers of cloth were
wound spirally and immersed in a solution of about 10% sulphuric acid. The amount of
stored energy depended on the corrosion of one lead foil to lead dioxide to form the
positive material and the negative electrode was formed by making rough the other foil
0 to form an extended surface. The capacity of Plant6 cell was increased on repeated
cycling which raised the surface area of the electrodes. The early use maked of the lead-
acid batteries was to provide load levelling in central electric plants.
Improvement in design, manufacturing equipment and methods, active material utilization
and production, supporting structures and components, and nonactive components such
as separators, cases, and seals continue to better the economic and performance
-7

characteristics of lead-acid batteries.
As regards weight, volume and economy the lead accumulator offers the best
solution for operating the propeller motor, the auxiliary equipment and the lighting of a
under water going submarine. Today the concept of the battery as regards to construetion,
electrical and mechanical lay - out, performance and production, is in line with latest
advances in technology.
Definitions
Before going into details of the battery and the related auxiliary circuits there are
recollected aseries of definitions which normally occur in the accumulators application.
Components
- Accumulator - It is an energy store in which charged electric eners- is converted
into chemical energy, the latter is stored (charge) and reconverted into electrical energy
(discharge) when the accumulator is connected to a current user.
- Battery - It consists of several cells connected one to the other.
- Cell - It is the smallest unit of a battery of accumulators. It consists of positive and
negative electrodes, the parts required for the assembly and connection, the cell
container and the electrolyte.
- Plate set - It is an assembled unit consisting of positive and negative plates,
mechanical and electrical connected together, and separators.
-8-

- Plate -At is the electrode and consists of the active mass and its current conductor.
- Active mass - It is the component of the plate which is submitted to a chemical
transformation process when electric current is applied.
- Separators - They are situated between each positive and negative plate and they
are permeable to acid. Their function is to prevent the conduction of current between
positive and negative plates, in this case we have plates short - circuit.
-Electrolyte - It is the ion conductor and accomplish the connection between the
electrodes.
Measuring units
Capacity -At expresses in ampere-hours the quantity of current which the accumulator
can supply. The capacity depends on the discharge current, the discharge final voltage,
the specific weight and the temperature of the acid as well as the state the battery is in.
Curentquatiy eficenc =discharged quantity of current (Ah)
charged quantity of current (Ahi)
Energy efficiency = dshre nry(h
charged energy (Wh)
Charging factor - It is the ratio between the charged - in and the before this
discharged Ahi.
-9-

Chemical - physical expressions
Spongy lead (Pb) - It is the active mass of the negative plate.
Lead dioxide (PbO2) - It is the active mass of the positive plate.
Lead sulphate (PbS0 4) - It is the combination of lead with sulphuric acid and builds on
the positive and negative plates during the discharge.
Reactions Packing Place in The Lead - Acid Accumulators
In a charged lead - acid cell the active positive mass consists of lead - dioxide
(PbO2) and the negative mass of spongy lead (Pb). The electrolyte consists of sulphuric
acid diluted with water (H2SO4 + H2 0).
As the cell discharges, both electrodes are converted to lead sulphate; the process
reverses on change.
dischargeNegative electrode Pb > Pb2+ + 2 e
<ch-age
discharge
Pb12+ + S042- > PbS04
charge
dischargePositive electrode PbO2 + 4H + + 2e > Pb2+ + H20
<charge
dischargeP1,2+ + SQ42- > PbSO4
<charge
The energy storable in this system is governed by the cell reaction:
chargePbO2 + 2I 4S0 4 + Pb > PbSO 4 + 21120 + PbSO4
discharge
- 10 -

When the accumulator is discharged both the lead dioxide of the positive plate and
the spongy lead of the negative plate are transformed into lead sulphate (PbSO4). This
process consumes acid (H2S0 4) and builds water (Hf20).
The acid concentration diminishes and the acid density is reduced according to
quantity of electric current discharged.
When the accumulator is charged the lead sulphate of the positive plate is
transformed into lead - dioxide and the lead sulphate of the negative plate into spongy
lead. This process consumes water and builds sulphuric acid, increasing the acid density.
The result is a voltage increase, at first slow then quicker.
During the discharge the masses transformed by the chemical process are
proportional to the discharged current quantity in Ah. The capacity is proportional to the
existing quantity of active plate mass and sulphuric acid present in the form of on
aqueous solution. The water must be regarded as inactive but necessary constituent.
Part of this mass only can be used because it is not conductive any more when it
is discharged and so the active mass cannot be utilised to the full.
In the ting pores of the active mass, when the discharge progresses, acid of lover
density builds, which spreads in the acid of higher density existing between the plates.
This progress of diffusion is the basic condition required for the discharge. The discharge
takes place to a final density of 1,03 g/ml with 100 A discharge rate.
The voltage will collapse because of impoverishment of acid.
With all lead - acid accumulators, the active masses are only utilized to a certain
extent even with small discharge currents. This limitation is caused by the chemical
processes of dissolution and re - precipitation of the active mass in the accumulator.
Dissolution changes the electronic contact of the active masse with the contacts
increasing the internal resistance.
WVith the re - precipitation a part of the undischarged active mass can be insulated by lead
sulphate from the electrolyte.

As soon as contact between the active mass and the electrolyte or the conductor is
interrupted, discharge cannot be continued.
The open circuit voltage of the lead - acid cell is ready calculated by adding the
acid density inside the plate to a constant value of 0,84. For a full loaded cell the acid
density is 1,285 and to open circuit voltage is 1,285 + 0,84 = 2,125 V.
The end voltage on moderate - rate discharges is 1,75 V per Cell but may range
to as low as 1,0 V per cell at extremely leigth discharge. The current losses and various
other secondary reactions occuring during the charge are the reason why a higher number
of Ah is recharged into the battery than has been discharged before. The discharge rate
or the ratio of the recharged number of Ah to the previously discharged Ai is
approximately 1,1 to 1,15.
Each cell has a very low selfdischarge depending on chemical corrosion of the
spongly lead or on creepage current through dirt or humidity or on loos of insulation
between adjacent cells.
Accumulator Design
Lead acid batteries consist of several basic components like plate elements,
electrolyte, rubber lines, cell container, cell cover, pole bridges and connector system
(Fig. 5).
Plate Elements
Each element forms an unit consisting of two sets of positive and negative plates,
mechanically joined together and electrically connected in parallel, including separators
and pole bridges.
The major starting material is highly purified lead. The lead is used for production
- 12 -

of alloys for conversion to grids and for production of lead oxides for subsequent
conversion to lead dioxide positive and spongy lead negative. Pure lead is generally too
soft to use in a grid material and is hardened by the addition of antimony metal.
The amount of antimony varies between 1,5% and 6%. The advantages from this alloy
are high mechanical strength, increased stability under load, low susceptibility to
corrosion, and H2 gas development reduction.
Submarine vehicles of the Diesel electric type require cycling batteries for propulsion
made with very low antimony or nonantimonial lead grids because stibine and arsine
produced on charge are, if not absorbed, dangerous for personal health in closed
environment.
Positive plate
The positive plates are generally of two types: flat pasted type and tubular type
in which the current conducting lead rods are attached to the top of the frame. In the
tubular type the rods are enclosed by an active porous material, which is held together
mechanically by tubular sheathing of acid resistant glass and artificial silk web.
Use of positive tubular plates have the advantages of greater life expectancy,
lower self discharge and increased shock resistance.
0Negative plate
IThe negative plate is a grid-type plate of the flat pasted type. The grid which is
surrounded by a frame holds the active material and acts as a current conductor. To reduce
the conductor resistance of the negative plate some builders have selected as grid
material copper covered with a thin coat of lead.
- 13 -

Separator
The separator lies between the positive and negative plates.
With the flat pasted positive plate two different types of separators are fitted
between each pair of plates of opposite polarity. Pelted glass wool mats are placed against
the faces of the positive plates, which effectively retain the lead dioxide active material.
Grooved microporous sheets are fitted against the faces of the negative plates.
With the tubular type the separator is microporous acid - permeable material
which does not effect either acid exchange and flow of current
Normally the separators are corrugated to provide a definited plates distance to
prevent conductive connections (short circuits) between adjacent plates.
Pole Bridees and Pole Bolts
The pole bridges are the conductive connection between the plates and cell poles
and they are done by a several millimetre thick lead - coated copper tube, serving as a
heat exchanger for connection to external cooling system since they are in the electrolyte
full immerged.
The positive and negative pole bridges are solid connected normally with two
bolts, which protrude out the cell cover.
The pole bolts are drilled through into to copper pipe of the pole bridges. At the
top of the drilling there is a thread for the connecting nipple for the cooling system. The
cooling liquid flows through the hole of one pole bolt into the pole bridge and out through
the other one.
Electrolyte
The electrolyte used in the lead accumulator as conducting and electrochemically
- 14 -

active liquid is diluted sulphuric acid (H 2SO 4 ), whose specific gravity in a charged cell
at normal acid level and a temperature of 30'C is 1,285 ± 0,01 g/cm 3.
The acid must be of high purity to avoid corrosion, bad working and life
shortening of the accumulators.
Cell Container and Cover
Each complete cell is a compact block held under compression by the walls of the
flameproof glass fibre reinforced polyester resin able to withstand high levels of
mechanical shock. The container is resistant to diluted sulphuric acid and theconstruction
methods guarantee that the cells cannot swell.
The cell cover is also made of glass - fibre reinforced material and is at same time
highly flexible. The cover is glued under pressure to the walls of the container.
The container and the cover are provided inside with a rubber bag wrapping up
the plates block. The rubber layer of the cover is vulcanised under pressure onto the
rubber liner of the container.
So we have a completely liquid proof inner container thus avoiding a penetration
of the acid between the lining and the container or cover.
Openings in the cell cover accommodate the service fittings comprise the acid
level indicator with filter plug, the plugs for acid circulation system, and the pole bolts.
The filter plug has three different functions:
0 .- protection against explosions by preventing break-throug ignition
- drying of the cell gasses by means of a filter
- protection against floading by means of an incorporated valve.
- 15 -

Accumulator Auxiliary Systems
Thbe rise in power and the necessity to reduce the expenditure for service and
maintenance, in order to increase operational safety and reliability, has promoted the use
of some additional systems such as:
Acid Circulation System
The acid must be circulated in each cell to obtain the necessary uniform
distribution of acid density and temperature.
During discharge sulphuric acid is absorbed by the active materials, lead sulphate
forms in both electrode. The charging procedure consists in changing the lead sulphate
into lead (negative pole) and into lead dioxide (positive pole) making sulphuric acid with
a high gravity; which flows out through the plate pores and meets the external acid
between the plates having lower density.
The air produced by a compressor is conducted to the bottom of the individual
cells via the regulating devices and hose system. The acid. being circulated by the
movement of bubbles according to the "Air lift" principle.
0 Cooling System
0 ~The battery cooling system removes the heat from the cells arising during battery
operation, especially during charging.
The heat loss occurs inside the cell through which the charge or discharge current
flows. The upper part of the cell becomes very warm by high current loads. The
electrolyte above the plates has a higher temperature and stores a greater part of the heat
existing in the cell.
- 16 -

Demineralized water flows as cooling liquid through the hollow pole - bridge in
the cell. The pole - bolts convey through plastic pipes the hot demineralized water to a
heatexchanger connected with the ship's cooling system.
Connector System
The inter - cell connectors connect the individual cells in the battery tanks. The
cells of the battery section are switched successively in series. The connection are made
from high conductivity copper with a section sized for a current density on an average
of 2 A/mm2. The connectors are clamped to the pole bolts by means of screws, nuts,
washers and spring washers to assure an uniformly distributed pressure and to secure the
system against loosening when vibration or shock occure. The connectors are insulated
and only the contact surfaces remain free.
Each cell have a voltage between the poles of 2 Volts at the beginning of the
discharge and 2,4 Volts at the end of the charge, but each partial battery is constituted of
hundred cells connected in series and so the voltage between the positive bolts of the first
cell and the negative bolts of the last cell is very high, in some cases more than 400 Volts.
For these reasons the most important problem in the battery tank is to have a high
insulating level in the connectors system, which is possible only with a high cleanliness
of the cover of the cells.
0 Battery Monitoring Systems
In modem submarine a continuous availability of all relevate battery data is
necessary for reliable, uninterrupted operation and permanent operational readiness.
The most important data are the voltage of the battery, of battery sections and of
individual cells, the charged and discharged energy, the acid temperature and gravity. All
- 17 -

this data must be continuously determined, recorded and kept an call.
Another parameter to maintain under control is the H-2 evolution. In a new ceUl the
quantity of hydrogen evolved per cell/hour at 380C 12 hours after completion of a full
charge is on the average 300 ml. The purpose of the measuring system for 112
concentration is to measure the hydrogen concentration in the air of the battery tanks and
other points in the submarine to estimate the danger potential. A mixture of air and 4%
of hydrogen becomes explosive, and for security the percentage of 2% cannot be
exceeded.
A H2 recombination system is normally installed to consume the hydrogen issued
from the battery to form steam through catalyti c oxidation. This system increases
operational safety on board.
An improvement on the reduction of gas evolution during discharge is obtained
by means of:
- keeping all parts clean during production and assembly
- utilisation of a antimony grid alloy
- utilisation of all parts completely acid resistant
- reduction of internal resistance by means of optimization of the current -
canrying parts of cells.
0 Maintenance
The length of life and thus also the economy of lead accumulators depend largely
on correct handling and if charge and discharge are carried properly.
The normal charging method, represented in Fig. 7, is:
- charge at constant current in the first and third charging stage
- charging at constant voltage and variable current in the second charging stage.
The following charging processes can be used:
-18-

-Partial Charge
Partial charge is the most frequent kind of charging during travelling.
It can be part of charging stage 1, run to the end of charging stage 1 or continue
into charging stage 2.
It depends on the state of discharge of the battery, the amount ofeurrent flowing
in from generators and length of time is available.
Mfter every discharge the battery should be recharged at least to the end of
charging stage 1, as soon as possible.
-Ooerational charge
These charge are to made every 2 weeks during the submarine is in operation.
In the first charging stage is the maximum output of the generators, the charge
goes on in the second charging stage, but the voltage should not become higher
than 2,35 Volts pro cell at 300C while the charging current is reduced keeping
the voltage constant.
When the current has fallen to a small value, fixed by the builder, the batten-
is charged for two hours with these Amperes. During that last 2 hours the
charging voltage will be raised over the gassing voltage and so the battery tank
must be very well airy.
0-NormalchreThe purpose of the Normal charge is to reach the full capacity in all cells.
It follows the same procedures of the Operational charge with the difference
that the charge has to be continued until the value of the avenage voltage is
constant during two hours or the charge has to be finished at 5 hours after
reaching the current of the third charging stage.
- 19 -

6 hours after the end of the charge following measurements at every cell have
to be taken: acid density, acid level, temperature.
- Equalizing charge
The Equalizing charge is an extended charge which is given to the battery to
insure the complete restoring of the active materials in the plates of the cells.
This type of charge has to be made every 4 month with new batteries; after three
or four years this operation shall be performed every 2 month.
The Equalizing charge is a supplementary charge to go on with the same
constant current we have at the end of Normal charge for four cycles of 2 hours
charge and 1 hour rest. At the end of the cycles at every cell must be made acid
density, acid level, temperature and voltage measurements.
A battery is in a good condition if the deviation of single cell is • 0,10 Volts
from the average of all cell voltage. During this charge measurement of voltage
is to be carried out at all cells and of acid temperature and gravity is to becarried
out at the pilot cells (normally 4 for each group of cells) directly on the control
console locate on the propulsion control console.
- Floating charge
A battery is said to float, when connected to a constant potential where voltage
is slightly higher than the open circuit voltage of the battery.
Submarine batteries may be floated either to maintain them in a fully charged
condition or to reduce theeffect of the electric propulsion motor power demand
variation in a rough sea, maintaining so a constant engine load.
This two type of performances request different starting conditions. To
maintain the battery in a substantially fully charged condition we have to start
from a fully charged batteries, the voltage should be adjusted to a value
- 20 _

corresponding to a current input required to replace only internal losses.
If the battery is floated to maintain a constant engine load and reduce so racing
of the propeller in a rough sea, the battery should be approximately 20%
discharged. The voltage for floating a partly discharged battery is less than the
proper floating voltage for a fully charged battery and should be adjusted to a
value which does not result in excessive charging current when the engine
tends to reduce the power consumption.
Installation
Forpermanent operational safety on the submarine battery all question concerning
the location and the installation must be correctly clarified at the technical level. While
the basic function of the submarine propulsion battery is to provide the overall energy
requirements in submerged cruising, at the same time the battery does act as ballast
which the design engineer cannot forget. The full battery with a weight in some case still
more than 200 tons and a lowlying centre of gravity of the all systemmay have a great
importance in the general distribution of the weights in the ship project.
The battery tanks have a great importance in the arrangement plans of the ship,
but is to take care also of all the required volumes for the auxiliary systems and control
devices of the battery.
The auxiliary systems of a battery are:
-Acid circulation system consisting of electric compressors with intake air filtres,
regulating devices, reduction and stop valves and air supplies tubes to connect
each cell of the battery.
- Battery cooling system consisting of electric pumps for demineralized water,
heat exchanger demineralized water/sea water ship's cooling system, purity
demineralized water control system, regulating and distribution devices, stop
-21 -

valves and pipes connecting demnineralized water manifolds to the positive and
negative bolts of each cell.
- Hydrogen evolution control system consists of sensors installed in battery tanks
and in ventilation ducts and control equipment fitted in the battery control rack
normally built in the ship propulsion console.
- Battery ventilation system with dedicated electric fans controlled from the
battery control rack.
- H2 recombination systems with catalytic oxidation devices located in the battery
vent circuits.
The service fittings comprise the following devices:
- a mechanical acid level indicator with filter accommnodated on each cell cover
- electric connections, protected by fuses, to wire the positive and negative cell
bolts of each cell to voltage scanner
- a plug on each cell cover to contain the sensor of the electrolyte remote
controlled temperature. This device is installed only in the cells used as pilot
elements
- a plug on each cell cover for the electrolyte remote controlled gravity. Also in
this case the device is installed only in pilot elements
- a plug on each cell cover for the electrolyte remote controlled level also used
only in pilot elements.
All the above instrumentation provide data for battery control in operational
condition.
The conception of a modem technical marine command uses a battery computer
which records and monitors, calculates and evaluates the data for rating the operational
condition.
- 22-

Its large storage capacity enables a large quantity of data to be recorded and called
up by the crew when required. Output occurs on the monitor or are printed and also
graphics are possible.
The service life of a lead acid battery depends very much on the good maintenance
and on the correct charge and discharge the battery is submitted to.
After the end of an operational period, which is mostly dependent on the over-haul
periods of the ship, measurements show that the residual battery capacity after six or
seven years is far more than 70%.
FUEL CELLS
General
Fuel cells are a device for obtaining direct current electricity at high efficiencies.
For long time fuel cells have been neglected as energy sources for small as well
as large electrical power requirements. Such cells for example would give conventional
submarines the option of remaining submerged for extended periods without the need to
put in services Diesel for battery charge. For land they could produce any desiderable
amount of electricity silently and without detectable signature.
The name "cells" belies their size and concept as they have very little in common
with the storage battery.
0 Essentially they are chemical motors which operate silently, while delivering
electrical power outputs according to the cell's size.
The Gemini space capsule, the Apollo spacecraft and the Shuttle derived their
electrical power from the fuel cells.
-23-

Fuel Cell Technology
Two basic types of fuel cells have been developed: high - temperature and low -
temperature cells. The low - temperature cell can be fed fuel and will almost istantly
produce electricity. The high- temperature Cell generally needs to be heated first before
it can produce energy.
A fuel cell is an electrochemical device which converts the firee energy of a
chemical reaction directly to electrical energy. In contrast to conventional batteries it
consumes a low cost fuel and an oxidant that is continuously fed into the system. The
operating principles of a fuel cell is illustrated in Fig. 8 .
A fuel cell is fundamentally composed of two electrodes separated by an
electrolyte. Fuel and oxygen are combined electrochemically to produce an electrical
Output.
A hydrogen rich fuel is supplied to the anode chamber and oxygen to the cathode
chamber. A catalyst on the porous anode facilitates the splitting up of the hydrogen
molecules (El2) into hydrogen ions (H+) and electrons (e-), which move separately toward
oxygen, where they combine to form water.
With an acid electrolyte the hydrogen ions are attracted to the catode, where they react
with electrons supplied from external circuit. The electrolyte transmits ions only and not
electrons, therefore the ion migration depends on the specific electrolyte used and the
type of ion present.
An other operating principles in illustrated in Fig. 9 . The cell consists of an
electrolyte which conducts an electric charge in the form of oxygen ions, but it is an
insulator to electrons. The electrolyte is sandwiched between two electrodes. Apotential
difference is created across the electrode - electrolyte sandwich when the oxygen is at
different concentrations at the two electrodes. This type of cells are called an oxygen
concentration cell.
- 24 -

Since fuel cells which operate on this simplified principle are quite desiderable,
but is very difficult to construct, the fuel cells today involve more complicated electrode
reactors and are very restricted in the fuel they can use.
Some characteristic cells are:
Fuel Electrolyte Operating temp.
Hydrogen/Oxygen Aqueous ailcaline 2000 - 240°C
50 atm
0Hydrogen/Oxygen Solid ionexchange < 500C
membrane-1 atm
Hydrogen/Air Aqueous alkaline 50 ° + 80'C
1 +5 atm
Hydrogen/Air Aqueous chemical < 800 C
intermediate -1 atm
Carbonaceous/Air Aqueous chemical < 80°C
intermediate-I atm
Carbonaceous gasses Molten salt 5000 + 580*C
1 atm
AU fuel cells operating below 250'C can use only hydrogen or other special fuels;
all are subject to critical catalyst problems since a catalyst is required to accelerate the
- 25 -

electrode reaction.
One possibility of improving the economics of present fuel cells operating at low
temperature is to find a cheap source of hydrogen.
A single cell can produce between 0,6 and 1,0 V d.c. The current levels depend
on the rate of cell reactions and the area available for these reactions. The efficiencies
expected from the various types of fuel cells are around 9096, which decrease today to
5 1% including hydrogen generators.
The high - temperature fuel cells are one of the more promising approaches far
larger power output requirements.
The high operating temperature introduces some severe requirements for the
components of the system like electrolyte and electrodes. These components must be
highly resistant to corrosion for a long period at high temperature. T'hese elements are
very important for military submarines because the system contains no moving parts and
can operate silently; efficiency is independent of the size of the cell over a wide range
of power output.
The modular construction of the fuel cell battery provides, by means of electric
control, the advantages that the system can be operated at optimum efficiency, below the
rated load, depending on the power.
Difficulty with the stowage of a large quantity of oxidant and fuel at the present
is such that limits the possible submerged endurance, because the chemical charge
cannot be regenerated on board.
However, if another means of storing in great quantities could be found, the
system had definite possibilities.
-26 -

MINfnlMX OF Y T ZlU rýrnXA.rxon>
r-er-ati n o a- c>X1 <: 3 ell
a-i sctr-arge
C- la r- rc en- t- r- C--1 aL r cg eý
Fig -s Le --aa CiPcida-< C EI
Fi g 6 \Iolta=Lcje< N -ra ri Xationa-s rL
0 s C* l laL r- <g<e r- 0D 5 essE5
Fig - 7 Norm - ixal C:li1aLr- gigte
-27-

Elect rons- flow
0 ___Load
Flow* of anions_0 Co 0C
< CO
Flow of cat ions
0 Electrolyte
FXC;G- 4lmcmrIc<eiCmaIerp ato ofL(:prx aL cell1 (d-
X3<a1kC chrge ) e
-28 -

-DG- +
power supply
Electrons flow* +
Flow of anions01
0,0
Flow of cations
* Electrolyte
EXG 2~~~~ El c r c - ~aL
-29-

2.5-
2 .
L7ýýýýe a d -a c i d
C) Ni-ZnNi-C
o Ag-Zn
0.5-
020 40 60 80 :100%of apaitydischarged
0, FX G 3 fID sa1ibaLr-sj e U -: L3 eof, tbeAz1 co inv entional: < e Es e 4-ConX-1
(a rry ý6 : atte4ary s stem <n atS-a pr-roc cI matEý1v c/-5 aiscn-laLr- g e
rat CAlz4
-30-

2,8 1
Pb-acid 0.07 x C
2,4-
20
1, NI-Cd vented 2x
0 20 440 60 80 100 120 140 160
% of capacity
a:1G 4 my: '-c:a1- carg e: cl--a
t>DL tt-erxy E EysIte<:xns -- .I--Consta5rn3Lrlt-
<- A 4rent rC- 7 aLtXarge at -r 0
-31-

- Vent plug2 - Electrolyte circulation System Plug3 - Gravity control*4 -Electrolyte level indicator
5 - Remote electrolyte level indicator6 - Cupper-pole7 - Rubber vibration protection8 - Insulation control -
9 - Fuse holder
10 - Positive plate
11 - Separator
12- Negative plate
F1G _ LeadC Acid. Cel a
- 32 -

21,2
I~ *3
cesse -
-33-

V -Stage
Stag.2 Stag. 32a
010
a2,0
.20
A0(
5 00
0 Hours
0 FI~~~~G-- 7 Nomlca ngtt.
-34-

0
00 0
ANODOE2Fi-+2en...
401 *0
0H 0,N All 0
0~ ~ FIG 8 LOaAaD1 of ti
Or- 35

Electrodea. Cathode : 0z + 4e- 20SReactian Anode : 20_ 0Z + 4e
CATHODE ANODE
Oxygen I Electrolyte Oxygen at
at on 0z Lower PressurePressure P_ 0- " Pz
"FT-G 9 <Oerating principle
of a fuel cel:
- 36 -

WEST 15th Graduate SchoolEUROPEAN UNDERWATER TECHNOLOGYGRADUATE 14-18 October 1991EDUCATION in Helsinki University of TechnologyMIARIh4ETECHNOLOGY
6th SESSION - ENERGY SYSTEMS
- Lect. XVIII -
Closed loop enginesAttillo Brighenti
Abstract
0 Closed loop engines are a broad area of engines working on a fluid performing thermodynamic workby total recycle. They are either external or internal combustion engines. In the latter case the term".closed loop" is usually, although improperly, applied also to recycle systems featuring a miiinimum,mass exchange with the environment, to dispose outboard the excess gas produced by combustion
* and avoid pressure build up in the loop.The lecture gives definitions and describes the types of these engine systems, including Diesel,Stirling, Rankine and Brayton cycle systems.State of the art and developments in course are presented in the various areas.The main areas of application of closed loop engines are examined, namely manned submersibles,autonomous underwater vehicles (AUVs); the basic energy and operational requirements of theseapplications for various mission scenarios are highlighted and exemplified.Emphasis is first given to problem areas common to the various systems. Thermal energy systems areillustrated and compared, as well as techniques to manage the combustion products. Type of fuelsand oxidants suitable to feed the engines are compared with respect to energy density, specific energyachievable and applicability to the systems identified.Some peculiar aspects encountered in this area of engineering are however strictly dependent on thetype of system; the case of Closed Cycle Diesel Systems is therefore exemplified in more detail,mentioning problems, solutions and performances when the engine is run on a "syntheticatmosphere" and the applicable CO2 management systems applied or under development. The effectsof a high percentage of CO2 in the gas is studied in relation both with the engine thermodynamic cycleand the C02 management system.A weight and cost comparison of the most promising systems with respect to electrochemical systems(batteries and fuel cells) is finally outlined.
* ------------------------------------------------------
Attilia Brighenti, born in Ferrara (Italy) in 1952, graduated in Mechanical Engineering at the University ofBologna (Italy) in 1976.After one year at the Research & Testing Facilities of E. WEHER Carburettors SpA (Bologna) he joinedTECNOMARE SpA (Venice, Italy) in 1979.At Tecnomnare, Company for the Development of Marine Technologies, he led the Marine Systems Section, then theMechanical Technologies Section of the Research Division until 1990. He afterwards has been R&D Manager forSystems Development in the Research Division of Tecnomnare.He has also been collaborating with the University of Bologna in research topics relevant to engines and energysystems.In August 1991 he started an independent activity, based in Venice, as consultant in Systems Engineering andApplications of Advanced Technologies.Attilio Brighenti's main experience and research interests span over a wide spectrum of marine technologies, mainlyrelated to offshore hydrocarbon production and subsea systems. He gained a specific expertise in underwater robotics,energy systems and unmanned vehicles design. Since 1983 he participated to and coordinated various projects for thedevelopment of undersea vehicles, both tethered and autonomous.

Attilio Brighenti
1 INTRODUCTION
The problem of supplying electric energy on board underwater vehicles for propulsion, utilities andlife support, arose first for defence submarines, but recently became important, with great differencesin operative requirements, also for small manned and unmanned vehicles for civil applications, eitherscientific or industrial.Conventional submarines are equipped with large stacks of electric batteries which are rechargedduring surface navigation by on board Diesel generating sets or, for small crafts, by the support ship.This solution is showing its limits in both fields, for a large vehicle displacement is implied whenlong submerged endurance or deep water missions are foreseen. Indeed recent studies by variousNavies [28] are focused towards the enhancement of subsea endurance capabilities of existingconventionl submarines, typically requiring a power of about 1000 kW during surface navigation and150 kW subsea. Fig. 1 shows some of the alternatives considered for this purpose.It is qualitatively evident from the figures how much of the internal volumes and weight of the ship
* " are taken by the whole energy apparatus, although a great part of ship's mass and volume is stillrequired by crew accommodation and payload.The energy system is even relatively more important for unmanned autonomous underwater vehicles(AUVs, Fig. 2) which are studied and developed for various civil and defence tasks, exemplified inTable 1. AUVs' payload is usually light (between 200 and 1200 kg, following mission'sspecification), and, for long endurances, is as low as 10 to 20 % of the overall vehicle mass, whichranges between 6 and 12000 kg. The remaining part is taken by the whole energy system and thebuoyancy foam to neutrally balance the vehicle [7]. Pressure resistant vessels are usually required tokeep the greatest part of the equipment at nearly atmospheric pressure and dry conditions, thus are aweight penalty caused mainly by the energy system volume. Therefore, to be practical means forexploration and cheap enough to be commercial, AUVs need adequate innovative solutions to theenergy generation problem. Solutions may not be chosen among those conceived for otherapplications such as for torpedos; these are inherently AUVs on their own, but show totally differentmission profiles. Just as an example torpedos feature generally short endurance requirements andrelatively high speeds. Even if the power required by propulsion may reach some kW the energydeveloped during the mission is relatively small. High speed allows also to rely on lift generated byvehicle's body to compensate for weight-buoyancy unbalance. Unlike exploration or mine-huntingAUVs, torpedos do not alternate between cruising and hovering around a fixed position. Torpedos'power demand profile is therefore smoother than exploration vehicles'. In the end torpedo energyrequirements are presently satisfied either by advanced batteries or by sophisticated, open cyclethermal engines; these are too costly for most AUVs' missions, require highly trained crews and aredangerous at some stage of their use.Instead the large family of closed loop engines offers the system engineer various adequate solutions
* . for large submarines, small manned submersibles or AUVs.
* - Exploration of the ocean floor for scientific research and natural resources assessment- Wide range search of wrecks and lost objects on the sea floor- Bottom survey and detailed bathymetric survey prior to sealine or cable installation
- Subsea ice keel profiling for arctic or antarctic surveys- Bottom and sea space surveillance and environmental monitoring- Mines search and neutralization
Tab. 1 - Typical fields of application of Autonomous Underwater Vehicles (AUV).
-2-

Attilio Brighenfi
r9,~, she d'ese/c¢lccst•c uMstn t ssln 4A~ Pptopu4,oshcnsisyn•.es'. : . ." " " . . ... .; " . "•
Fig te Contycnhonel d•e-eeltcrc csub,; e•-,,,,,'.
Fig. I b: Fuel cells ..4'
FiI.,-i27 57: z,',:, •length 9 miFig. I c: Stuvlung e nginesdine r1. mIFdiameter 1.2 mdisplacement 100 kNwater depth 6000 mrange 2000 kmspeed 2.5 nVs
Fi.,*: ........ras.,,os 240 hours
Fig. 1 - Alternative solutions under study for the Fig. 2 - Example of AUV for long rangeenhancement of submerged endurance of surveysubmarines [28]
(ARUS - Eureka Project - EU 191)
2 DEFINITIONS
Some useful parameters have been in the years defined and largely used to identify the performancequalities of energy systems. Their use in the literature is not always correct or accompanied bydefinition of the meaning understood. In the following some of the main concepts and terms referredto in the lecture are summarized.
Energy system parts
An underwater energy system in broad sense can be considered made of:
Main energy systemEmergency energy system
For most applications the latter is usually an electric battery set, maintained charged by the mainsystem.A constant weight main energy system must be considered in general subdivided into the followingunits [7]:
Energy storage unit, including:
Reactants (storage of the primary energy);Reactants storage vessels, resisting pressure both inside and outside;Reaction products storage vessels (for closed systems)Water ballast storage vessels (for open systems)
-3-

Attilio Brighenti
Power generatdon unit, including:
Engine or fuel cell;Auxiliary plant (heat exchangers, scrubbers, compressors, pumps and piping),
Dimensions and mass of the former unit are determined by the energy capacity or the endurance of thesystem at the rated power, whereas the latter's are determined by maximum continuous powerdemand.
Performance parameters
Standard endurance of an The ratio between the total useful energy (e.g. electrical orenergy system mechanical) deliverable by a system and its maximum continuous[hours] power output. It is equal to the Energy/Power ratio (E/P) [Wh/W].
* Specific energy of a The ratio between the total useful energy (e.g. electrical orcomplete system mechanical) delivered by a system and its total mass, sum of the[Wh/kg] energy and the power unit's. Due to its definition this parameter is
not a constant for a given system but varies, increasing, withstandard endurance1.
Specific energy of the The ratio between the total useful energy (e.g. electrical orenergy unit mechanical) delivered by a system and the total mass of the energy[Wh/kg] unit. This parameter is fairly 2 constant for a given system and
geometrical shape of the vessels and is the asymptotic value of thefonner (E/P --- > cc).
Energy density of a The ratio between the total useful energy (e.g. electrical orcomplete system mechanical) delivered by a system and its total volume, sum of those[Wh/m3] of the energy unit and the power unit. Due to its definition this
parameter is not a constant for a given system but varies, increasing,with standard endurance. Unless otherwise specified the volume isthe external one, i.e. the displacement of the system, withoutbuoyancy balancing.
Energy density of the The ratio between the total useful energy (e.g. electrical orenergy unit mechanical) delivered by a system and the total volume of the energy
a [WhIm 3] unit. This parameter is fairly constant for a given system andV geometrical shape of the vessels and is the asymptotic value of the
fanner (E/P --- > -c). Unless otherwise specified the volume is theexternal one, i.e. the displacement of the system, without buoyancybalancing.
* Specific power of a The ratio between the maximum continuous power (electrical orcomplete system mechanical) delivered by a system and its total mass, sum of those of[W/kg] the energy unit and the power unit. Due to its definition this
parameter is not a constant for a given system but varies, decreasing,with standard endurance.
Specific power of the power The ratio between the maximum continuous power (electrical orunit mechanical) delivered by a system and the total mass of the power[W/kg] unit. This parameter is fairly constant for a given system and
geometrical shape of the vessels and is the maximum value of theformer (E/P ---> 0).
Note that also electric batteries feature a similar variation of this parameter, their capacity being function of the rate ofdischarge.
2 Variations may arise due to different construction technology constraints at very different sizes.
-4-

Attilio Brighenti
Power density of a complete The ratio between the maximum continuous power (electrical orsystem mechanical) delivered by a system and its total volume, sum of those[W/m3] of the energy unit and the power unit. Due to its definition this
parameter is not a constant for a given system but varies, decreasing,with standard endurance. Unless otherwise specified the volume isthe external one, i.e. the displacement of the system, withoutbuoyancy balancing.
Power density of the power The ratio between the maximum continuous power (electrical orunit mechanical) delivered by a system and the total mass of the power[W/m 3] unit. This parameter is fairly constant for a given system and
geometrical shape of the vessels and is the maximum value of theformer (E/P --- > 0).
aAll the above parameters can be referred to systems housed in a dry atmospheric environment or,Wmore correcfly, to systems inclusive of dedicated pressure resistant vessels for the rated water depth.
It is this distinction that often misses in the literature, misleading about the relative pros/cons of thevarious systems, above all when comparison with electric batteries are implied [7].
* ypes of thermal energy systems
Closed energy systems Energy systems which do not exchange mass with the environment,with the sole exception of cooling water. All reactants stored are partof the system. Reaction products are processed and stored on board.No water ballast is needed to maintain the system at constant weightif reactants and products are stored in non collapsable tanks or inpressure vessels.
Open energy systems All systems not complying with previous definition.
Closed loop engines Energy systems, either closed or open, based on engines in whichthe working gas is recirculated after cooling. This definitionencompasses all the following subclasses.
External combustion engines Energy systems in which the working gas is heated by thermalconvection in a heat exchanger, without direct contact with the heatsource, either hot fluid or solid. Rankine, Stirling and closedBrayton cycle engines fall into this cathegory.
Recycle or semiclosed i.c. Internal combustion engines, usually Diesel type, in which the gasesengines exhausted after combustion are cooled, cleaned, reintegrated with
oxygen and sent back to the engine inlet. Excess gas produced by thecombustion reaction is exhausted into the environment after suitabletreatment or simple compression. Many improperly called "closedcycle diesel systems" fall in this category. Since the oxidant used ispure oxygen, the working inert gas can be choosen among a varietyof components and mixtures; this makes one of the distinguishingaspects among various systems proposed so far.
Closed cycle i.c. engines Recycle engines, complying with the closed energy systemsdefinition, in which not only the working gas is recirculated butcombustion products are processed and kept on board to keep systemmass constant. This function can be of different difficulty followingthe nature of the inert gas.
-5-

Attilio Brighenti
3 STATE OF THE ART ON UNDERWATER THERMAL POWER SYSTEMS
Genera]
Large energy quantities can be stored and generated by light and small equipment by conversion ofchemical or nuclear energy into thermal energy, subsequently converted into useful work by athermodynamic cycle of a fluid. Fig. 3 shows some typical values of the theoretical energy densityand specific energy of various reacting compounds.Among these, Hydrocarbons combustion (DF/0 2) feature somewhat lower values than advancedchemical systems. However the application of a specific energy conversion system is dependent notonly on the energy density of the reactants or heat source but also from other aspects, strongly relatedto vehicle mission and requirements, such as:
efficiency of the conversion system and actual overall energy density and specific energy* -possibility of safe shop storing of the rectants for a suitable time
- possibility of power regulation during operationsafety during storage, operation and maintenancetype of and system required to manage the reaction productsnecessity of a ballast system to keep overall mass constant (for open systems)
- necessity of continuous cooling (e.g. for radioisotope systems)investment and operating cost
THEORETICAL ENERGY DENSITY OF REACTANTSPOTINTIAL
WITH HEME
ADEPS WIT /160 CRYOGENIC OXYGEN
ISO
4/ SCEPS II
130 - DEP 111 (MgAILI/CIO 3 F)HIGH-PRESSURE
120 OXYGEN
110
100120
Q ~HYDRAZINENso 10 A FUEL CELL SCEPS
CARBON (LI/SFT70 / '/LOCK40 CRYOGENIC H2 AND
S02/ 0 2 COMBUSTOR OR
,. aFUEL CELL> 40 LiSOCL2 CHIGH PRESSURE
" BATTERY H, AND 0O COMBUSTOR
30 - OR FUEL CELLHUSCAL
20 - BATTERY
to 1LEADIACID BATTERIESI I I I I I I I I I
a 0.2 0.4 as 0.s 1.0 1.2 1.4 1.4 1.6 2.0 2.2 2.4 2.6 2.8 3.0
WEIGHT ENERGY DENSITY, kWWIb
Fig. 3 - Theoretical values of energy developedby various reacting systems [35]
In this respect, closed loop engines based on HC combustion with pure oxygen diluted with variousinert gases, often being the combustion products themselves, are competitive for most subseaapplications mentioned in Tab. 1. This is mainly due to the relatively ease of handling and storage ofthe reactants, the consolidated and diffused technology and the high efficiency and ruggedness of theengines available. Radioisotope power generation systems feature very high energy density, but lowpower density, due to radiation shielding and secondary fluid circulation (two stage heat exchange).
-6-

Attilio Brighenti
Hence are most convenient only when very long endurances are required, in the order of severalthousand hours. Not all AUVs mission specifications are such to justify this option.Table 2 lists some of the most recent projects on underwater closed loop engines. Before entering amore detailed discussion on closed cycle Diesel engines and exhaust gas management, a briefoverview of other competing concepts for underwater application is given in the following sections.
COMPANY TYPE POWER DEPTH STATUSRATING 1991
kW m
PLESSEY ISO PROPYL 50 200 PROTOTYPE(U.K.) NITRATE TURBINE
RICARDO CLOSED CYCLE 50 200 ABANDONED(UK) DIESEL
HITACHI CLOSEDCYCLE 24 50 N.A.(JAPAN) DIESEL (HYRUP)
GARRETT CLOSED BRAYTON 30 NA. BENCH TESTED(U.S.A.) CYCLE ENGINE (HOLD)
MAN B&W, CLOSED CYCLE 20 200 BENCH TESTEDBRUKER(G) DIESEL 100 300
SSOS / MARITALIA CLOSEDCYCLE 50 450 OPERATIVE(ITALY) DIESEL 150 PROT.(600 m)
OOSWORIH CLOSEDCYCLE 50 450 UNDER TEST(U.K.) DIESEL RDMrrHYSSEN
UNITED STIRLING AB STIRLING ENGINE 75 600 UNDER FIELDKOCKUMS AB TESTS(SWEDEN) (COMEX, SwN)TRW RADIO ISOTOPE 2.5 6000 PRELIMSpace & Tech RANKINE CYCLE DESIGN(USA) (ORCEPS)
BERTIN METHANOIJOXY. 30 600 UNDER DEV.(FRANCE) RANKINE CYCLE EEC FUND.
Tab. 2 - Recent developments in subsea power generation systems
Stirling engines
The Stirling engine is an external combustion engine, thus the working gas is different from theheating one and is sealed within the engine; compression and expansion occur at nearly isothermalconditions, while heating and cooling occur at almost constant volume [4,23,24,25]. The workinggas is closed within cylinder/piston pairs; its volume varies alternatively thanks to crank angle 900phase shift between the pistons in the coupled cylinders (Fig. 4), originating a cycle close to thethoretical Stirling cycle. Following combustion gas management this type of system can be eitheropen or closed 3. Therefore as far as this issue is concerned the problems are similar to othercombustion engines, i.e. Diesel ones.
3 Present systems known are only of the open type.
-7-

Attilia Brighenti
This engine features the highest theoretical efficiency among the extreme temperatures achievable.However the actual efficiency, between 28 and 39 %, is significantly lower than the theoretical, dueto friction losses in the piston rod seal and piston rings. Work per cycle is small unless highpressures are used. Operating speeds are generally one quarter of internal combustion engines, tominimize pumping losses. Peak temperatures are limited to about 700 `C by materials in the heater,which is continuously exposed to high temperature gases, unlie i.c. engines. Also substantial heatlosses occur at the cylinder walls.For the above reasons and the small volumetric compression a Stirling engine is heavier and largerthan a Diesel engine of the same power output. Weight and mass can be similar, instead, to someclosed cycle Diesel systems'.Reliability problems are still limiting an extensive application of this type of engine, above allunderwater. They arise mainly from piston rod seals and piston rings, so that if higher efficiencies aresought, by increasing pressure and temperatures, reliability is generally decreased.The major advantages of the Stirling engines over i.c. ones are their lower noise and vibration level,due to smoother combustion and continuous exhaust gas flow and the possibility to be coupled with avariety of thermal sources, either chemical or nuclear.Another advantage of the Stirling engine, common to all external combustion engines, is thepossibility to set the combustion pressure at a different value than the working gas'. In underwaterapplications this allows exhausting at a pressure higher than the maximum hyperbaric pressure; henceopen systems do not waste power for this function. However this advantage apply up to a certainlimit, around 20 bar, corresponding to present design of underwater Stirling engines [4,23,24,25];therefore for operation beyond 200 m these engines need an exhaust disposal or treatment plantssimilar to those for Diesel engines, which will be discussed in the following.These advantages justify the higher interest of some defence programs towards this engine rather thanother technologies, like closed cycle Diesel, which are instead closer to the commercial world'srequirements.Stirling engines have a lower commercial diffusion and available model variety of the engine4, whichis a drawback in the latter market.The most recent Stirling engine development for underwater applications is due to United Stirling ARand Kockums AB (Sweden) who developed an experimental unit for the Swedish Navy, as asubmarine add-on concept, and are studying a system for installation on autonomous unmannedvehicles. One operational unit for the french divers support submarine SAGA 1 has been delivered toComex in 1987.
H EAT ER
HOT VOLUME R REGENERATOR
7
COOLER COLDVOLUME
12 3 t
Compression Displacement Expansion Displacementcold gas cold to hot side hot gas hot to cold side
ýPRESSURE L
Fi.4-Schematic of a Stirling Engine [23].
4 Although it is "commercial", is still fabricated by small series, mainly for demontstation programs, and its investment
and maintenance costs are obviously much higher than Diesel's.
-8-

Attilio Brighenti
Rankine cycle engines
Another type of engine based on external combustion or radioisotope heating works on a changingphase fluid; this is heated and evaporated at high pressure and cooled and condensed after expansion,usually through a turbine. This class of systems includes well known steam energy systems ofnuclear submarines. Most recently organic compounds of high molecular weight5 have been proposedas the working fluid, mainly for small systems to power AUVs [1,2,3,16]. These compounds allowregeneration (heat recovery), thanks to the temperature-entropy characteristics near the vapour curve(Fig. 5), and high flow rates and velocity ratios in the turbine; the consequent higher turbineefficiency allows an increase of the cycle efficiency, otherwise low because of maximum fluidtemperature which can be accepted before its decomposition (370 *C). This characteristic renders thissystem compatible with most heat storage systems, very simple in principle but with low specificenergy.
ioo 00 I I I
ITAT[ CTCLI
gooAAIO _U POWW NOII.~
0 86*18 OUTLI
So•-0 I-- -N --- ...
IT. ¢ utMI.. U. , Ul i7~~~00 -,1uuI mt
SaoHu 7,.1
400
300 - - - - -.
.0.20 0.11 -0.12 .0.08 .0.04 0 0.04 '0.06 '0.12 '0.16 '0.18 '0.20ENTROPY IBtU/Ib. F.
Fig. 5 - Typical T-s diagram for Toluene (CP-25) and Organic Rankine Cycle [2]'ALTERNATE HEAT SOURCES
* CHEMICAL REACTANTS Ii.e.. USF6 of U.-SOC1 2 )* POWER PLANT WASTE HEATa GAS GENERATORS (Mono .nd SipropIII~ntl
V UVHIGH PRESSURE
SREGENERATOR ACCUMULATOR
~PRESSURE0VALVE
PERMANENT CONDENSER FLOW'BOILER MAGNET CONTROL VALVE
Pu 238HYDRAULIC POWER TORUDDER AND DIVING
TU UHEAT EXPAGE PLANE CONTROLSHEAT EXCHANGER
z{ALTERNATE
HEAT SINK}
b-•THERMOELECTRIC •
GENE.RATOR I
SUBMERSIBLE PAYLOAD RETURN VALVE
Fig. 6 - Schematic of prototype integrated undersea propulsion and power system (JUPPS) [1,2]
5 CP-25 (Toluene), CP-34 CThophene), Fluorinol, FC-75, PP-9, CP-9 (MIPH) [2].
-9-

Attilio Brighenti
PUMP OUTLET 0,250 DIA TUBE
JPARTAL AMISSION
- •T'OED Cfl-- ccn - NOTE: CCW ROTATION WHENLOOKING IN DIRECTION
PU PP AINLET - --- TURBIN E
/ LEADS OTTBLz
OT _G24 PMAALEADS OUT O OUT
Fig. 7 - Typical arrangement of turbopump-generator for 2.5 kWe (ORCEPS) [1,2]
Organic Rankine Cycle systems feature in the end fairly low efficiencies (17-20 %) which can beaccepted if the reactants' specific energy is high enough. This usually leads to exotic fuels andoxidants or to nuclear systems.TRW (USA) has recently proposed a variety of alternative underwater energy system concepts basedon an integrated 2.5 kW turbopump-generator, rotating at up to 84000 rpm, purposely designed fororganic fluids. This unit, which was originally developed as a low power space system, can becoupled with either a Pu 238 heat source or Li+SF 6 or Li+SOCl2 reactions [1,12,13] (Figs. 5,6,7).
Closed Bravton cycle (CBC) engines
Also closed Brayton cycle engines were first developed for compact, low power space applicationsand subsequently studied for underwater systems. Garrett has developed a number of systems since1962 in the 2-10 kW range and a 30 kW system for underwater application (Fig. 8), reported as thesole established and available in the USA [13,18].
Fig. 8 - Demonstrated CBC engines [18]. Fig. 9 - CBC engine schematic [ 18].
- 10-

Attilio Brighenti
These engines, work preferably with monoatomic gases due to the higher efficiency achievable forsame temperature extremes. The selection among these gases is based on an overall optimizationtaking into account the influence of the molecular weight to the engine power/shaft output speedcharacteristics. Argon and Helium-Xenon mixtures are preferred for small single stage turbines toyield high recuperator effectiveness with minimum surface areas. Helium is preferred for large units,above all when the engine is coupled with nuclear heat sources.A typical scheme of a CBC energy system is shown in Fig. 9. Power regulation is based on gasmass control in the loop. Speed control is obtained by diverting some of the gas from the compressorexit to the turbine exit, by-passing the turbine. For low power systems a parasitic resistive load on thegenerator is best suited for simplicity.The demonstration unit made by Garrett works on pure Argon. Compressor's inlet pressure was 2.7bar absolute. The net cycle efficiency achieved at 20 kW power output were 32.7% and 27%, withturbine inlet temperatures of 870 and 760 'C respectively. This engine is not yet available forunderwater applications and hundreds of hours of operating life, since during tests some reliability
* problems arose from shaft seals. Nevertheless space systems showed high reliability within theiroperational time.The heat source can be any of various chemical or nuclear systems, like those considered for Rankineand Stirling systems. The advantage with CBC engines is that higher temperatures are acceptable (upto 870 'C), which allow a wider heating systems choice and higher cycle efficiency. The most
* promising solution for CBC is at present the Li+SF6 reaction which has been demonstrated, althoughit has not been developed for hundreds of hours of operation as required for reliable underwatervehicles. The advantage is that reaction products are Li2S and LiF which solidify when cooled andcould be stored on board within the same Lithium pot type combustor (Fig. 10); this allows constantmass and volume achievement, recovery of products solidification enthalpy and Li melting before itsreaction. This technology is feasible but has not been developed yet.Li and SF 6 can be stored safely until use. Li reacts energetically with water but can be stored in asimple moisture proof container until it is required. SF 6 is stored at a moderate pressure in a similarmanner to refrigerants [13].Contrarily, when Li is melted to start the reaction (initially by an intermediate medium like Sodium),the process becomes very dangerous. A leakage of molten Li coming in contact with water or watervapour will react violently, so that the Li storage container, Li piping and the reaction chamber willrequire considerable design and development effort to avoid dangerous operation.
HMEATIER DUCT
HEAT EXCII&NCE RUBSED
NLt
UAMA- .I" KA"
SJ r
Fig. 10 - Li/SF 6 Pot Combustor Concept [18]. ---- A A
TRACTION HA OR[SA PCTXLANK
BATHCOMMUSTOR
-.. - Fig. 12 - 21-inch Diameter AutonomousUnderwater Vehicle Power System layout basedon CBC engine and Li/SF 6 combustor [18].ALTERNATOR EGN
Fig. 11 - Integrated CBC/Diesel-fired Heatsource [18].
-11I-

Attilio Brighenti
A more 'friendly" solution (Fig. 11) is to use Diesel fuel combustion with pure oxygen as the heatsource [18]. This concept was proposed by Garrett themselves as an alternative power system for theUSS Dolphin, to replace the current Diesel engine/generator set. This system, which incorporatesexhaust gas recirculation, needs a combustion products management system, similar to those whichwill be discussed for Diesel engines in the following.Both systems could probably be fit in a 21-inch cylinder to match Navies requirements (Fig. 12),although a 25-inch solution seems more feasible, according to the conceptual studies performed sofar.The current status of CBC engines is uncertain since development work is apparently no longerfunded, although some units may be available for experimental purposes.
4 PREMISES ON RECYCLE AND CLOSED CYCLE DIESEL ENGINES
Like any other engine operating on Diesel fuel combustion in airless environments, internala combustion engines must be fed with pure oxygen stored in suitable vessels, as liquid or compressedW gas6. The inert gas, which in air is made by Nitrogen, may be this same or any other gas, provided itis recovered and recycled to the engine inlet, to avoid its loss.Exhaust gas recycling, after cooling and oxygen enrichement, is possible only partially as combustionproducts, i.e. water vapour and carbon dioxide, are added continuously to the gas mass; this wouldresult in pressure increase in the limited volume of a closed loop system. Water vapour can be easilyseparated at near atmospheric pressure and temperature by condensation, in sea water cooled heatexchangers. CO2 cannot. It is therefore necessary to either dispose at sea or process part of the gas tokeep constant the plant's pressure.In the former case (Fig. 13.a), relevant to semiclosed or recycle systems, some of the inert gasesbeing part of the exhaust mixture are also lost, thus dedicated storage of these gases is needed, unlessthe inert is the CO2 itself.In the latter case, relevant to truely closed system, it is necessary to send part or all of the exhaust gasto a processing plant to allow CO2 separation by a chemical (Fig. 13.b) or physical (Fig. 13.c)process, suitable for storage within vessels of reasonable volumes on board the vehicle. After eachmission therefore the vehicle shall be in general refilled with fuel, oxygen, inert gases other than CO2(recycle, open systems) and reactants needed in case of CO2 chemical management (closed systems);moreover it shall be emptied of the combustion water and of the subproducts of the treatment plant.The type of inert gas mixed with oxygen for engine's operation affects not only its performances andthermodynamics but also those of the exhaust management plant. It can be stated in general that ahigh partial pressure and concentration of CO2 in the gas used by the engine and sent to the exhaustmanagement system, renders easier or more efficient its separation both by physical and chemicalprocesses. Therefore in general all recycle or closed cycle engines developed run with an inlet mixturericher of the triatomic gas to some extent. The basic engines used are instead made to run on air
* which is biatomic.Two main alternatives are therefore available to the designer of a closed cycle Diesel system:
- to accept prevailing characteristics of a triatomic gas (COh) in the mixture feeding the engine, withconsequent engine performances variation and need of geometry modification, but with highersimplicity and efficiency of the treatment system;
- to balance the presence of CO2 by adding considerable amounts of biatomic (Nitrogen) ormonoatomic (Argon) inerts until air-like characteristics are achieved; in this case no enginemodification is needed, but at the same time there is an increase of consumables mass to store anda reduction in the performances of the treatment system;
From a few basic typologies (closed or semiclosed systems, internal or external combustion) a varietyof systems can therefore be conceived as the literature and patents pending demonstrate.The following description and discussion will encompass the most promising systems and their mainproblem areas, which are listed in Fig. 14.
6 Oxidant supply by air would indeed need five times larger and heavier storage systems.
- 12-

Attilio Brighenti
Firstly the relationships will be discussed between the gas mixtures characteristics (mainly densityand k = c_/c,), the engine compression ratio, its efficiency and the end compression temperature,which in some conditions may be insufficient for fuel self-ignition.The problem of exhaust gas treatment will then be dealt with comparing various solutions, with ahigher detail on the system deemed most promising because of compactness and efficiency undervery deep water conditions, i.e. the CO2 liquefaction system.Noteworthy this problem area can be common to other thermal engines based on HC combustion,e.g. Stirling or Brayton cycle engines. A thorough discussion of these cases is however outside thescope of this lecture.
Surplus gos
nreszp Engine La
~Exhaust (Suc~tion gos )gas CO
Oxygen meering dev.ce -Il - J c • 2a)Co E Itous' Recycled
gs gas Oxygen Oxygenumr mixr
-at, Recycled woiking gas c tnrofler
""'•'L•''O UT LE• T
Schleuts of recycle diesel engine c
Engine Load
Exh s; Carl= diosid fmll I ,' .t .p im . .Ilt ., = €li l i gas.
b) gm meroang deviceypn
/NytEn
c l., o'obr mixecr )y ,-i•o~enwd wamr. [
Schema or closed-cycle diesel engine
* 02
-Engine-,- Load -- -
• wExhaust suction gasgas
) cooley" Ox•en Problem areas related to:
engine: exhaust gas management:
epr 0 .St. 2 o2 starting phase complexity.evp. 02 ignition weight
max pressure volumeefficiency reliability
Fig. 13 - Semiclosed (a) and closed Diesel Fig. 14 - Problem areas in closed cycle Dieselengines, (b) by CO2 absorption and (c) by CO2 engine technology.liquefaction [elaborated after 22].
- 13-

Attilio Brighenti
5 SYNTHETIC ATMOSPHERE DIESEL ENGINES
The main problems arising for the recycled operation of a Diesel engine stem from the selected inertgas and its concentration in the mixture to moderate oxygen reactivity and limit the combustiontemperature; this would be unacceptably high, should pure oxygen be sent directly to the engine. Inthis type of systems oxygen concentration is not constrained to the atmospheric value, but can be set,within a reasonable range, to any convenient value.The effect of various inert gases combinations, with the same atmospheric oxygen concentration, onthe density () and isentropic compression factor (k = cficv) is shown in Fig. 15. The mixture closestto air characteristics is made by 21% 02, 39% CO2 and 40% Argon. Any conventional Diesel enginebreathing such a mixture would feature the same end compression temperature and efficiency since kis the same as with air. On the other hand, due to the higher density and the different specific heat ofthe gas (either cp or c,), a change in the indicated diagram and torque at any given fuel injection ratecan be expected.
* . In front of this simplicity Argon limits the partial pressure of CO 2, with consequent higher difficultyto its separation.
0 K p*..-i b~r; T..-.SOOK.i Tý -M5K ; T, -54,3t2 t15 - costatita; %ý varimifteK rk- T- -'•= 44 bar a cosLasta. eg variabiLe
I.t
4,4 0 " 4
"4•¢
to <
T, T€ e T 2t D P,
T 1. 7.*,//i 1o 0 100
00 A 02LimaýS so7G
\ 72% Cot 7 N a o ,"0
'• ~ ~~~Cot 0.4 " -- PC- LPJI, --- -_- 00,5 0 3
L0,2 to0±21% lC 0 VW 0-
2 .....-.
0'1 4,2 46S 4&4 4e% 4,6 f,7 K
Fig. 15 - Density (7) and isentropic compression Fig. 16 - Effects, in the ideal Diesel cycle, of thefactor (kt = c/c.) of some mixtures of inert gases variation of k (cI/c,) on pressure andwith oxygen. temperature at the end of the compression (2)
and combustion phases (3) and on the theoreticalefficiency (es).
- 14-

Attlio Brighenri
On the opposite with a mixture made by 21% 02 and 79% CO2 , which implies less separationproblems, a k lower than air's reduces both the efficiency and the end compression temperature andpressure. These effects are shown in Fig. 16 where said quantities are plotted vs k for the ideal Dieselcycle1 , under the hypotheses of either constant compression ratio (pg = 15) or constant maximumcycle pressure (p, = 44 bar). The fuel self-ignition temperature bound is also shown in the figure,Monoatomic gases give the best efficiency and fuel ignition characteristics, while triatomic gases justreach the theoretical ignition condition.In practice however engines working on CO2 would not reach self ignition conditions for thefollowing reasons:
- in a real gas k decreases with the increase of temperature, its average value being thus lower thanthat used for this simplified comparison8 ,
- in a real engine the compression is not isentropic but follows an irreversible politropic curve withexponent k' lower than the average k itself,
- in a real engine the actual volumetric compression ratio is lower than the geometric one (Fig. 17):
Pe =i < LV-2 < Pg= V2
This happens because the compression starts beyond the BDC (bottom dead centre), thus from aninitial volume of the gas lower than the theoretical (Ve < VI), due to the opening phase overlap ofthe exhaust and inlet valves.
3
2 gox0.6 (k9lkW_
0.4
* 0.3 Li" " thi""t: vl e 0.10 0 (xOxm3)
0.10 0.20 0.30 0.40 0.50
vi voV2 ' .•-
Fig. 17 - Schematic representation of the Fig. 18 - Variation of 02 mass concentrationindicated cycle of a 4 stroke Diesel engine, (go.) as function of molar concentration (xox)(supercharged in the example) [14]. when mixed with either N2 or CO2 .
7 This simpler cycle is taken as reference to show the main phenomena and trends, being known that Sabathd's cycleefficiency follows a similar trend, with practical values of the combustion ratio at constant volume.
8 The average k between 0 and 500 0C is ca 1.25 instead of 133 for the 21% 02/79% CO2 mixture.
- 15-

Attilio Brighenti
One can counteract these negative effects of CO2 by various means, exploiting the possibility tochange the set point of the mixture regulators:
- increase of oxygen concentration, beyond the atmospheric,- increase of the engine compression ratio,- gas electric pre-heating in the manifold during cold starting,- increase of engine's inlet temperature (TI),- trade-off among the above.
These will briefly be discussed in the following.
Increase of oxygen concentration
* Oxygen mass concentration is different for a same molar concentration when it is mixed with eitherN2 or CO2 and varies following the trend shown in Fig. 18. For a same molar composition anddensity 0 2/CO 2 mixtures have a mass of oxygen available for the combustion lower than 02/N2 ones.The former must be enriched up to about 30% by volume to have the same mass of oxygen thatwould be available with air in the same volume (xJo = 21%).
* This has also effect on the fuel/gas ratio in the engine at a given fuel injection rate.This is shown in Fig. 19 where the gas/fuel mass ratio (a) is plotted as function of the oxygen molarconcentration (xo,), for a same oxydant ratio (X) and mixtures with either N2 or CO2 . The abovementioned parameters are defined by the following equations:
Definitions:
a gas mass per unit mass of fuel burnt(kg/kg)
m mass of fuel burnt per unit cilindera = A• (1 + Pin 1 • -xx' swept volume (kg/m3)
pox -XOT) P molar mass (kg/kmol; suffixes: ox =02, in = inert gas)
a0ox stoichiometric O2/fuel mass ratio (equalto 3,48 kg/kg for Diesel fuels)
i = Pox 1P LO LXA A oxidant ratio9:a50 - To Po T 02 actual/02 stoichiom.
p inlet pressure (Pa)T absolute inlet temperature (K)Po standard pressure (101325 Pa)
M R Pox A Xox To absolute standard temperature (273.15asox R OT ;L "0
Vo standard molar volume (22.41m3/kmol)
Ro gas constant (8314.3 J/kmolK)
9 This parameter, with conventional air engines, is also referred to as the inverse of the "equivalence ratio" (F = 1/•),which is nul when pure air is in the cylinder (A = -,).
- 16-

Attilio Brighenti
a (kg/kg) M g ox100 0.10 (kg/rn3) 0.50 0104T) 1.29 k
60 ..\. A= 2 0.. 1.27
40 0 06__ 0.30_iO... * 0 0 C" 338.... 0140 .___ __o. ox
0.20 .26___20 !" 0.02 0.10 1.25
0- 0.00 0.00 1.240.10 0.20 0.30 0.40 0.50 xox 0.10 0.20 0.30 0.40 0.50 XOX
(WndtS) (nt?-3)
Fig. 19 - Gas/fuel mass ratio (a) and fuel mass Fig. 20 - Compared variation of k (c/lcv) andper unit cilinder swept volume (m) for O0/CO2 oxygen mass concentration (g..) vs 62 molarmixtures at varying 02 molar concentration concentration in O2/CO 2 mixtures.(Xo0 ).
* From the above it follows that the oxygen molar concentration should be ca 30% to allow acombustion heat release per unit gas mass (fuel calorific value / a) equivalent to that exhibited by theengine when running on air at the same A. (A = 2). At the same time however the heat release per unitcilinder volume is increased by ca 40% since m goes from ca 35 to 50 g/m3 at Tj = 338 K.This means that increasing the oxygen concentration, other conditions being unchanged, has an effectequivalent to supercharging the engine. This benefit cannot be pursued at will, since high oxygenconcentrations have a detrimental oxydant effect also to lubricating oil, piston ring seals and injectors,which reduces engine life; in practice an upper limit is around 40% [22]. Safety aspects are alsoimplied as metals and lubricants even outside the engine could bum very rapidly when in contact withan oxygen reach gas.Oxygen enrichement has at last a minor effect on the variation of k (see Fig. 20), which within therange of interest for O2/CO 2 mixtures changes only from 1.25 to 1.27; this is insufficient for selfignition after compression.In conclusion oxygen enrichment may have a positive effect on the unit power and mechanicalefficiency of the engine, but other actions must be added to let the engine spontaneously startcombustion.
Increase of engine's compression ratio
This modification to the engine geometry can solve the problem of rising the end compressiontemperature above the self ignition threashold under warm working conditions. The dependence fromthe compression ratio of the end temperature, pressure, and efficiency of the Diesel ideal cycle, with21%0 2/79%CO 2 (molar) mixtures is shown in Fig. 21. Dotted lines show the temperature curvesa also for oxygen enriched mixtures. To guarantee regular end compression temperatures in the orderof 700 K it is necessary to use 30% 02 mixtures with a compression ratio equal to 30. In principlehigher values of the latter would even improve the performance, but too small and thin combustionchambers would result, hence problems to arrange and operate the injectors.
Gas electric nre-heating in the manifold during cold startn
The previous remedial may still be insufficient under cold starting conditions as shown in Fig. 21(T2 ,,) for the 30%Ofi70%CO 2 (molar) mixture. Indeed, in these conditions, compression occursboth with a lower initial temperature and a lower k, which results in insufficient end temperature withany realistic compression ratio and enrichment. Preheating is fearly easy by means of a batterypowered resistor in the inlet manifold or in the oxygen enrichment chamber upstream the engine; thismust be activated only before starting, until a suitable temperature is reached.
- 17-

Attilio Brighenti
Increase of the initial temperature of the gas
This remedial can be applied by adding, upstream the engine, a counterflow surface heat exchanger inwhich the hot exhaust gases warm up the inlet mixture after it has been cooled, cleaned and enrichedof oxygen' 0 . This preheating, working of course only on a warm engine, must however be moderatesince a higher inlet temperature implies lower density of the gas and reduction of the fuel that can beburnt for assigneda and , (see also Fig. 19). Engine's specific power, therefore, decreases slightlywith preheating.
Trade-off
As usually happens in the engineering practice the most convenient solution to solve the enginerecycle problem is to properly combine the lines of action outlined in the preceeding paragraphs, so
* that none of them is pushed to extremes where drawbacks would overhelm advantages. Thiscompromise shall be sought in view of the optimization of the whole system and not only of theengine itself, as these options have impact also on the technique adopted for exhaust gasmanagement. The "optimum" depends also on vehicle's mission profile and operative water depth,consequently a number of different systems have been designed and developed.
•Y TZ P •Disposal outboard the vehicle
- compression to hyperbaric pression anddirect disposal(Puttick, 1971 [29]);
Soo s0
ir,,v riv,, - CO 2 absorption by sea water introduced ingoo. .0 .,the vehicle and subsequently pumped
outboardS40% Co"- (Santi, 1983 [30]; Fowler & Boyes, 1987
9k- 1 . . ' ,, -To [1 ]
o --3olt;.soc.-" Disposal onboard the vehicle
-. chemical reaction of the CO2 with KOH andBoo. "" fstorage of precipitates onboard
(Thompson & Fowler, 1978-1980 [33,34];40 P 0 Haas, 1988 [17]);
Co, CO 2 absorption by MEA (Monoetha-S nolammine)
o0, (Nagai & Asada, 1969-80 [22]; Obara &b to others, 1989 [26]);
.40 C02 liquefaction by sea water cooling, atambient temperature and subcritical pressure
0,1° (Brunner, 1974 [11]);
10o tO So PI- CO 2 liquefaction by cryogenic cooling by
liquid 02 at low temperature and pressure(Brighenti, 1986 [5,6,8,10])
Fig. 21 - Variation of the end compressiontemperature T2 and of the efficiency (SD) vs Tab. 3 - Proposed exhaust gas managementengine's geometric compression rtio (Pg). systems.
10 Exhaust gases must in any case be cooled as much as possible to condensate and separate combustion water vapour.
- 18-

Attilio Brighenti
6 EXHAUST GAS TREATMENT AND MANAGEMENT
In all types of systems now being discussed, combustion water vapour is condensed and stored in adedicated tank. Due to previous contact with a CO2 rich gas, this water is slightly acid and must beseparate from any other water system, to limit plant's corrosion problems.The various recycle and closed cycle Diesel systems proposed so far differ mainly by the processmanging the CO2 produced by the engine, as much as by 90 kg per 100 kg of oxygen consumed.Table 3 outlines the solution proposed by various authors, grouping them into two main cathegories:
a) disposal outboard (semiclosed or open systems)
b) disposal onboard (closed systems)
6.1 Outboard disposal (semiclosed systems)
S Compression and direct disposal in gaseous ohase
The first solution proposed [26,29], consists of excess gas compression and venting outboard athyperbaric pressure (Fig. 13-a). This simplest alternative is limited to application in relatively shallowO water depths (typically around 100 m) to avoid excessive power and efficiency losses due to thecompressor. The disposed gases contain also some residual oxygen, hence the useful energy actuallyobtainable from the stored mass is lower than in theory. For the same reason inert gases other thanCO 2 are not convenient and indeed this management system was the first to be coupled with CO 2running engines.Disposal of compressed gas generates noise which is usually incompatible with some vehicle'sequipment, like acoustic instrumentation and communication systems, or mission requirements.In conclusion the field of application of this concept is fairly limited.
Absorption in sea water
A solution more efficient than the above is based on absorption of the CO2 in sea water (Fig. 22). Seawater is loaded and sent to an absorber (Fig. 25) where a pressure from I to 2 bar absolute ismaintened and where the exhaust gases are in turbulent counterflow with water. This mixing allows afast absorption of the C0 2, very soluble in water, with the absorption process as faster as thepressure increases. This makes also the engine run like in supercharged conditions, with noturbocompressor. At normal temperature about 300 kg of sea water are needed under these conditionsto absorb 1 kg of CO2 [19]. This water is subsequently pumped outboard by a water management
a system made by twin accumulators and spool valves allowing the exchange of the water mass,U , exploiting the expansion of the incoming water [15]. This implies that because of inevitable energylosses of the system and the effects of water compressibility, considerable at high water depths, themass of the incoming water is larger than that pumped out, which partly compensates the vehicleweight-buoyancy unbalance due to CO2 mass loss.
a At ocean floor depths (e.g. 6000 m) water compressibility effects imply a net mass inlet of some 3%W , of water throughput, thus a progressive increase of vehicle's weight. This would require the vehicleto be equipped with a water de-ballast system, otherwise unnecessary if the payload is constantduring the mission like in many AUVs. For these water depths ballast systems are preferablyavoided, because high differential pressure across valves and pumps reduce reliability unlesscomplexity is increased with consequent weight penalties. Moreover the power loss for pumping maygo beyond 10% of engine's under these conditions.The system described was originally developed both for combination with CO2 or air-like mixturesengines [15,33]. In present applications however it is proposed only to run with ternary mixturesO2/CO2/A, whose composition is controlled such as to maintain k (cp/c,) close to air's value [32,33].This is obtained by measuring the pressure at the injection start angle (Fig.24).Argon and oxygen are also absorbed in sea water, yet to a lower amount; therefore a proper storageallowance is necessary to compensate these losses.
- 19-

Attilio Brighenti
WA TER XC
WA 7
S Fig. 22 - Recycle Diesel system with CO2 Fig. 23 - Closed cycle Diesel system with CO2management by absorption in sea water [15]. management by reaction with KOH [15].
MANIFOLO PRE SU0
C LI.C PIC
ENGINE ORIVEN PRESWI EG*
Fig. 24 - Inlet gas k control system (c./c0, Fig. 25 - Rotary CO 2 absorber of the system
O idicated as "gamma") for the system of Fig. 22 shown in Fig. 221[15].[15].
6.20Onboard disposal (closed systems)
.C em absorption or chemical reaction
So far at least two system configurations were proposed to manage CO2 by means of additionalcompounds stored on board [17,21,22,26,33,34]. One uses Monoethanolammine (MEA) to absorbthe gas, the other is based on the reaction of CO2 with a water solution of KOH in a suitable scrubberwhere precipitates of KHCO 3 and K2COQ are generated. In both cases there is a large weight penalty,inacceptable for AUVs, since additional liquids alone amount to as much as 2.3 to 2.5 times the massof the oxygen needed for the required energy capacity.Despite this disadvantage, these systems were very early proposed and developed, as they can beeasily used with Nitrogen or Argon mixtures, thus with unmodified engines, to operate both atsurface with air and underwater. This is a requirement for manned submarines, not for AUVs.
- 20 -

Attilio Brighenti
Liquefaction at ambient temperature
A system lighter and more compact than the above (Fig. 26 [11]) separates the CO2 from the exhaustgaseous mixture by compression and subsequent condensation, using sea water as the cooler. Theengine in this case runs on a O2/CO2 mixture, to make condensation easier, yet at a pressure as highas 60 to 80 bar. The condensation process is not isothermal, because of the presence ofincondensable oxygen in the mixture; it starts at a temperature higher than the final. To allowcondensation to start in the heat exchanger downstream the compressor and keep sufficiently low thespecific volume of the liquified C0 2, thus of the storage vessel, it is necessary that the compressordelivers a flow rate at least 1.6 times the theoretical minimum" (Fig. 27). With the compressionratios considered, this implies a loss as high as 20% of engine shaft power. Moreover the liquefactioncannot happen with any water temperature but only below 15 `C. At higher values the processproduces the sole compression and storage of the exhaust gaseous mixture, with CO2 close to thecritical point. Under these conditions large storage volumes are needed and it is more difficult to
* separate and utilize the residual oxygen1 2.
p (bar) POSSIBILITY OF LIQUEFACTION140,r (partial pressure CO < 73.5 bar)-- 1 120i Pt
- ,ox 100 %Ot Ppi
.. ...... . 0 . .. . . . . . . . -_ - ._ 2 _ _ ..40
20 mn tnmin practicalPp1.theoretical (v < 1.3 /kg)
1.1 1.3 1.5 1.7 1.9
Fig. 26 - Close cycle Diesel system operating on Fig. 27 - CO 2 condensation pressure variationCO2 liquefaction by sea water cooling [11]. vs compressor's flow rate ratio (plot = total, pi =
partial at start, ppf= partial at end)13.
Crvogenic liauefaction
* q The preceeding system does not ask for any requirement on the state in which oxygen is stored onboard, either gaseous or liquid. However to minimize volume and mass of its storage vessel,particularly important for deep water long range vehicles, storage of liquid oxygen (LOX) attemperature of ca -180 0C is more convenient. In this case LOX must be evaporated and superheated
* before being sent to the engine's oxygen control system.It becomes therefore possible and convenient to combine this oxygen heating function with that ofCO 2 cooling, in order to descrease as much as possible its condensation temperature and pressure,thus the exhaust compression power. Also surface and mass of the heat exchanger and condenser canbe reduced considerably, due to the high temperature difference between the coolant (oxygen) and the
11 This comes from the need of venting the incondensable oxygen, which, accumulating in the condenser, would increasethe gas total pressure and the unit compression work (see also similar discussion about cryogenic liquefaction whichfollows). If the gas total pressure overcomes a certain value, which depends on exhaust composition, the partial pressureof the CO2 at the heat exchanger inlet goes above the critical pressure (73.5 bar) and liquefaction cannot start.
12 It is possible in principle to recover part of this oxygen by venting from the upper part of the storage vessel, whereoxygen, lighter than CO2 , tends to accumulate. However this implies a compressor's flow rate much above the theoreticalvalue.
13 This is the ratio between the actual flow rate and the minimum thoretically needed, corresponding to a CO 2 flow in thecondenser equal to that produced by combustion; for the theoretical value (flow rate ratio f = 1) pure oxygen ventingwould result from the uncondensed gas port, which is of course an ideal condition.
- 21 -

Attilio Brighenti
warm compressed exhaust gas. Finally residual oxygen in the exhaust gas can always be recovered,since the process performance is practically 14 independent from environmental conditions.This system (Fig. 28) is most efficient with 02/CO 2 mixtures. However, with a CO2 enrichment unit,e.g. membrane or inertial (cyclone) separator, this system could also work on ternary O2/CO2/Armixtures.
4 dl
33S
M" LOXVLOX
/ QOc
Fig. 28 - Closed cycle Diesel system operating on Fig. 29 - Boundaries, input and output of thecryogenic CO2 liquefaction by liquid oxygen cryogenic system [6].(LOX) [5,6,8,9,10].
-30 t *)20 ' br
22
-40 fI1 . . .. ...
-450
V -50............................. . . . . f
2. .2 1.3 1:4 1.5 116 1:7 1.8 1:9 2.0 1.10 1.20 1.30 1.40 1.50 1.60 1.70 1.80 1.90 2.00
* Fig. 30 - Variation of CO2 liquefaction Fig. 31 - Variation of CO2 liquefaction pressuretemperature as function of the compressogs flow as function of compressor's flow rate ratiof (totrate ratio f (i = start, f = end; see note to Fig. 27) = total, pi = partial at start, pf = partial at end)[6,8,9]. [6,8,9].
Process thermodynamics can be studied considering the dotted box balance of Fig. 29. From itsenthalpy and mass balance the results shown in Fig. 30 and 31 are derived. They show thedependance of the CO2 liquefaction temperature and pressure from the compressor's flow rate ratiot5
14 A minor influence of the enviromnent is related to heat leakage through the walls of the heat exchanger, piping andcondenser; these leakages however, in the enthalpy balance of the system, account for a few percent of oxygenevaporation and superheating enthalpy.
15 To explain the trend shown, one must consider that while approaching the theoretical minimum flow rate (f = 1) theventing gas tends to be pure oxygen. Since CO 2 partial pressure is finite and equal to liquid's vapour pressure, total gasmixture pressure would tend to infinity. By venting a higher rate of gas from the condenser, some of he CO 2 vapour isvented also, which results in a reduction of oxygen concentration and partial pressure in both the venting pipe and the
- 22 -

Attillo Brighenti
(see the definition in the note to Fig. 27). It can be seen that both pressure and compressor's flow rateare considerably lower than with seawater liquefaction, thus a lower power loss can be expected.Indeed this difference is highlighted in Fig. 32 in terms of percentage of the engine's shaft power atconstant torque and speed conditions.The exhaust gases change of course with engine operating conditions, therefore the efficiency of thecryogenic process changes also as shown in Fig. 33 [8]. The higher losses at low torque, howeverlower than 13%, are acceptable since correspond to a low absolute engine and compressor power.The reduction of net energy capacity in a typical mission profile is therefore minimal.
% COMPR. POW.SAATRa)30 NGIE PW. LIQUEFACTION 13 Iapemj. t.ion r.
25 1 enin o a .Po..,) 11'ý P
Ipractical main, with 12 OtPa)20 sea water at 10OC I 360
1003010j CRIOGENIC
ILIQUEFAMTON9
0 f(Pnuin) !f~-11.5 2 2.5 3 5 to I5 20 25 30 3S 40
Fig. 32 - Comparison of compression loss factor Fig. 33 - Variation of Compression Loss Factor(% of engine shaft power) of the sea water and the (CLF) of the cryogenic system vs torque and speedcryogenic liquefaction systems [9]. conditions for a 12 kW engine [8].
In conclusion the main aspects suggesting the use of cryogenic liquefaction, above all for deep waterlong range vehicles, can be summarized as in Fig. 34. This process allows to increase the efficiencyof the system, to minimize size and mass of compressor, heat exchangers and piping and to maximizethe utilization of boarded oxygen. All these aspects result in substantial improvement of theendurance/displacement ratio of an underwater vehicle and should suggest a higher interest in theapplication of closed cycle Diesel engines.
7 CONCLUSIONS
a The overview of the various systems that have been proposed in the years to power underwaterV vehicles shows advantages and disadvantages of each. There is no unique winner in the scene and alot of development work is still necessary to acquire the confidence in the processes, in theperformances and in the systems for field and operational application. The relatively poor fieldexperience with new technologies, particularly thermal engines, determines sometimes an uncleara picture in comparing the performances and the characteristics of the various systems with moreW conventional electric batteries. These are some reasons why electric batteries, also of poor specificenergy are still dominating the market.Market considerations should be split into two big, separate segments, the submarines' and theAUVs'.As to the former there is a trend towards a change from traditional energy systems, which is slowedby recent cuts in the MoDs budgets and some reluctancy to accept novelties on board well establishedships, unless improvements are dramatic and demonstrated.As far as the AUV market is concerned, this differs strongly from the former, although sometechnologies might be applicable to both segments. A part from technical requirements this market is
condenser. For low values of venting flow rate and of the flow rate ratio (I < f < 1.3) the total gas pressure decreases bythis effect, since in ths range C0 2 vapour pressure and temperature are not affected appreciably. For higher venting rates(beyond a value depending slightly on exhaust gas composition, thus on engine torque and speed) the total pressureincreases above the minimum, because the excess warm gases circulated in the condenser reduce the amount of LOXcooling power available for Co 2 condensation. This can therefore occur only at lower condensation enthalpy, thus athigher temperature (Fig. 30) and partial and total pressure (Fig. 31).
-23-

Attilio Brighenti
only in part determined by defence programs and very much by science, social services(environmental control) and industry.Robotic, navigation, sensors technologies have been developed dramatically in the last years and areready to converge towards a line of products, like the ROVs in the offshore industry; AUVs willbecome a real market and not just a research or technological exercise. The uncertainty is still on"when" this will come into practice.
Necessity to compress gases up tohyperbaric pressure
High power losses
COMPRESSION AND DIRECT Loss of die residual oxygen in theOUTBOARD DISPOSAL exhaust gas
Noise disturbances to acousticinstrumentation and communications
Noise signature
lo Necessity of water ballast system tobalance the vehicle
High pressure load onto valves, pipingand vessels of the ballast system
C02 ABSORPTION Need of water pumping system toBY SEA WATER dispose excess inflow at high water
LOADED/F NLOADED depth for compressibility effectsTO/FROM THE VEHICLE
Need of onboard storage of largeC02 REACTION WITH KOH volume and mass of reactants withAND STORAGE ONBOARD vehicle weight and displacement
penalty
C02 ABSORPTION BY MEA Health problems due to toxicity of theAND ONBOARD STORAGEE reactants
High condensation pressure andcompression power demand
C02 LIQUEFACTION BY SEA Large heat exchangers due to lowWATER COOLING! temperature difference between gas and
cooling water
Difficulifinefficient operation in warmseas
CLOSED CYCLE DIESEL WITHCRYOGENIC LIQUEFACTION OF C02
Fig. 34 - Summary of the drawbacks of existing c.c. Diesel exhaust management systems that
suggest cryogenic liquefaction, above all for deep water, long range missions [9].
-24-

Attilio Brighenti
However as soon as the "intelligent or soft side" of the AUV will be ready to go in the sea, there willbe a strong demand for the "power or hard side".At that point it will be evident that something better or cheaper than batteries is needed to satisfy thatdemand, that solutions could exist as well as various application segments in which different winningtechnologies could be applied.For requirements around those summarized in Fig. 2 representing one of these segments, it is theauthor's opinion that future competition will be between fuel cell systems, advanced closed cycleDiesel and Stirling engines. A comparative picture of the specific energy and energy densityachievable with these systems and the most promising or known batteries is shown in Figs. 35 and36, while Figs 37 and 38 compare the overall mass, buoyancy and cost of various systems for a fixedenergy requirements similar to those of the AUV in Fig. 2.
a Es [W h/g] DE (Wh~t]1 0 0 [ N / k g L I H F .C . 1 0 0 D"[h t L H F .C .
3 1000 1000*
CCD Cr. Liq. CCD Cr. Liq.a t*z ii-: - CCD W. Uq. - CCD W. Liq.
100- - FcTiH F.C. 100 FeTiH F.C.AgO-Zn AgO-Zn
Ni-Fe - Ni-FePb-acid Pb-acid
10 10-0 100 200 300 ElF [h 0 100 200 300 (h]
Fig. 35 - Specific Energy [Wh/kg] vs Fig. 36 Energy density [Wh/lt)] vsEnergy/Power ratio for some systems of interest Energy/Power ratio for some systems of interest(see list of abbreviations in appendix)[7]. (see list of abbreviations in appendix)[7].
2 0 Mass Mt) COMPARISON OF DIFFERENT CAPITAL COST PER MISSIONDispl. (m3) UNDERWATER POWER SOURCES (1000 $/cycle)
15 se, -at., 33$0
Ia .. ..... 230
1 W 152
.300 eNERy 00 w'w
-Z $1. E 4fOWIR 12 0 l G 1 M
WATTE R
S OEPTH £000 t000
Nd$40 AgO-Zn LI. LI. 0t***I DleseI Fuel Hi- Fa AgO-Zn LI.- L t Diesel Diesel Fuel50 2 0 2 C.c. o,. c0lls a 202 50 2.. ,. ISO
Cryog~enic C. al
Fig. 37 - Mass and displacement comparison of Fig. 38 - Investment cost comparison ofdifferent energy systems for the same set of different energy systems for the same set ofrequirements [6]. requirements [6].
Stirling engine systems are almost overlapped to advanced c.c. Diesel as far as mass/buoyancyaspects; the former might have some advantages over the latter when noise generation is a concern,but it is questionable whether they will be silent enough when noise signature limitation is a real must;
- 25 -

Attilio Brighenti
both systems might be unsatisfactiry with respect to electrochemical systems'6 . Instead the problemsthey pose for exhaust gas management for operation at 3000 or 6000 m water depth are very similarto Diesel systems. Reliability, maintainability and prospective cost are instead in favour of the latter.As far as the closed cycle Diesel technology the preceeding chapters have tried to explain the past andpresent evolution; this could change some negative ranking that this system was given so far, mainlywith respect to exotic thermal systems, when advanced exhaust gas processing were lacking.It has been highlighted the difficulty to combine effectively both a simple exhaust gas managementsystem and a conventional, unmodified engine. In the earliest developments of recycle and closedcycle Diesel technology, mainly finalized to manned submarines, the objective was to allow a sameunmodified engine to operate alternatively at surface, by air/open cycle, or underwater, by recycle orclosed cycle. This required ternary mixtures as engine working gas, with high concentrations ofeither Nitrogen or Argon. Exhaust management systems based on CO2 absorption with MBA orchemical reaction with KOH were adopted because allow total recirculation of the inert gases.Subsequently more compact, semiclosed cycle systems based on CO2 absorption by sea water weredeveloped; they are suitable for application in intermediate water depths (up to 600 - 1000 in).
* The systems to be installed on autonomous unmanned vehicles (AUVs), operating mostlyunderwater, should preferably work always on synthetic atmosphere, since mass and volume issuesare in this case prevailing to dual mode functioning' 7. Closed systems are moreover preferrable indeep water.Exhaust gas management by CO2 liquefaction is in this view more convenient than the preceedingones, although it requires engine modifications to operate correctly with CO2/02 mixtures.Cryogenic liquefaction allows a further process, mass and volume optimization of this technology,which is most promising for deep water and long range missions, for which vehicles wouldpreferably store the oxygen as liquid.
Acknowleditementl
The author thanks the organization of the WEGEMT School for the invitation to read this lecture and Tecnomare SpAfor the past encouragement to his studies on energy systems and closed cycle Diesel technology and for the hospitalityduring preparation of the manuscript.
List of abbreviations
CCD Cr. Liq. Closed Cycle Diesel System using cryogenic oxygen storage and low temperature and pressurecarbon dioxide liquefaction and storage;
CCD W.Liq. Closed Cycle Diesel System using high pressure gaseous oxygen storage and ambient temperaturecarbon dioxide liquefaction and storage;
FeTiH F.C. Fuel cells using Iron/Titanium Hydrides as Hydrogen fuel storage;* LIH F.C. Fuel cells using Liquid Hydrogen as fuel;
References
[1] Boretz J.E.: "Combined propulsion and power systems for remotely piloted submersibles", Offshore Mechanics
and Arctic Engineering (OMAE) '86 Conf.
[2] Boretz J.E.:"Unmanned Submersible Nuclear Propulsion System", Proc. ROV '84 Conf., S. Diego Cal (USA);
[3] Boy-Marcotte J.L. & others:"Ddv6loppement d'une unitt de generation d'energie sous-marine a masse constanteutilisant la combustion methanol/oxygtne a haute pression associ6e a un cycle Rankine"; Proc. 2nd E.C.Symposium, Luxembourg, 1987
[4] Bratt C., Dahlander P.:"Stirling energy system for autonomous underwater vehicles", Defence OceanologyInternational Conference, Brighton (UK), 6-8 March 1991.
16 However one should not forget in this discussion the possibility and maybe the need of hybrid systems, i.e. thermal andelectric energy systems, which could be compatible with noise limitation in the critical phases of the mission.
17 In the event that surface navigation phases are important also for some missions of these vehicles, an independent airDiesel set could be more easily coupled with the closed cycle one. The whole system would also be lighter and withhigher degree of availability than a single multiatmosphere closed cycle Diesel system based on CO 2 absorption orchemical reaction.
- 26 -

Attilio Brighenti
[5] Brighenti A.: "System for the Treatment and Cryogenic Storage of Combustion Products of Thermal Engines",1987 Italian Patent n. 22885 (extensions pending);
[6] Brighenti A., Dalla Rosa A., Minelli G.: "The Cryo-thermal Engine underwater power system: performances,dynamics and control", Oceans '89 Conf., Seattle (WA), Sep. 1989;
[7] Brighenti A.: "Parametric Analysis of the Configuration of Autonomous Underwater Vehicles", IEEE Journal ofOceanic Engineering, Vol. 15, n. 3 July 1990, pp. 179-188;
[8] Brighenti A., Cantore G., Osti P.: "The Cryothermal closed cycle Diesel engine. Detailed analysis of stationaryworking conditions", Defence Oceanology International Conference, Brighton (UK), 6-8 March 1991.
[9] Brighenti A., Ciliberto G.: "Closed cycle reciprocating engines for electric energy generation in underwaternavigation of subsea vehicles", 1991 Conference of the Italian Thermotechnical Association (ATI), Gaeta 25-27September 1991;
[10] Brighenti A., Cantore G., Dalla Rosa A., Osti P.: "Dynamic simulation of a closed cycle Diesel system withcryogenic liquefaction of the exhaust gases", 1991 Conference of the Italian Thermotechnical Association (ATI),Gaeta 25-27 September 1991;
[11] Brunner G.: "Internal combustion engine with exhaust gas recycling system and method for operating suchengine", 1974 U.S. Patent n. 1,513,958;
[12] Carmichael A.D.:"Power plants for small undersea vehicles: Executive summary"; Aug. 1987, presented at theMIT workshop on "Power Systems for Underwater Vehicles", Boston (Mass.), 5-6 Oct. 1988;
[13] Carmichael A.D., Labak SJ.:"A study of power plants for small undersea vehicles"; Aug. 1985, presented at theMIT workshop on "Power Systems for Underwater Vehicles", Boston (Mass.), 5-6 Oct. 1988;
[14] Ciliberto G. "I grandi motori diesel per la propulsione navale e terrestre e per la produzione di energia elettrica";text book published by the author,
[15] Fowler A., Boyns A.:"The Argo-Diesel Enhanced Underwater Power Source", Underwater TechnologyConference, Bergen (N), 1987;
[16] Goffe D. & others:"Rankine cycle immersed energy source with high pressure combustion chamber and constantmass operation"; Proc. 3rd E.C. Symposium, Luxemburg, 22-24 Mar. 1988;
[17] Haas J.:"Air Independent Power Sources of High Energy Storage Density. The Bruker-Man Argon Diesel and theBruker C02-Diesel", 3rd Hydrocarbon Symposium, Luxembourgh, Mar 1988;
[18] Harper A.D.:"Heat source integration of CBC powerplants for UUV missions"; Proc. of the Symposium onAutonomous Underwater Vehicles Technology, 5-6 June, 1990, Washington DC (USA)a (19] Hawley G. & others:"Exhaust gas management of synthetic atmosphere Diesel engine systems", Defence
Oceanology International Conference, Brighton (UK), 6-8 March 1991.
[20] Hoffman L.C. & others: "Psychrocycle", Marine Technology Society Journal, v.4 n.6 Nov.-Dec. 1970;
[21] Nagai M., Asada T.: "Investigations on Recycle and Closed Cycle Diesel Engines", 12th International Congresson Combustion Engine, Tokyo, May 1977;
[22] Nagai M., Asada T.: "Investigations on Recycle and Closed Cycle Diesel Engines", SAE paper n. 800964;
[23] Nilsson H.:"Deep Water Air-Independent Power Sources Based on Stirling Engines", Underwater TechnologyConference, Bergen (N), Apr. 1984.
[24] Nilsson H.:"Submarine Power System Using the V4-275 R Stirling Engine", IMechE, Jan 1987;
[25] Nilsson H., Gummesson S.:"Air-independent stirling engine powered energy supply system for underwaterapplications"; MIT workshop on "Power Systems for Underwater Vehicles", Boston (Mass.), 5-6 Oct. 1988;
- 27-

Attilio Brighenti
[26] Obara T. & others: "A New Closed Circuit Diesel Engine for Underwater Power", ROV '89 Conference, SanDiego (Cal), Mar '89;
[27] Parson O.B.:"The Stirling submarine ower system"; MIT workshop on "Power Systems for UnderwaterVehicles", Boston (Mass.), 5-6 Oct. 1988;
[28] Prins C.A., Ham A.A. "In search of air independence", Maritime Defence, Mar. 1988;
[29] Puttick J.R.:"Recycle Diesel Underwater Powerplants", Paper 710827 SAE National Combined Fuels andLubricants, Powerplants and Truck Meeting, St Louis (Ma) Oct. 1971;
[30] Sand G.:"PHX Submersible", Subtech 1983 International Conference, Society of Underwater Technology,London, 1983;
[31] Sauzade D.: "SAGA 1. New Technologies for a New Generation of Autonomous Submarines", 3rd HydrocarbonSymposium, Luxembourgh, Mar 1988;
[32] Sedor G.:"An evaluation of energy systems for an unmanned underwater vehicle application"; Jan. 1988,presented at the MIT workshop on "Power Systems for Underwater Vehicles", Boston (Mass.), 5-6 Oct. 1988;
a [33] Thompson R.V. & others "The Development of a Microprocessor Controlled Depth Independent PowerGeneration System", Pergamon Press Oxford & N.Y. 1980;
[34] Thompson R.V., Fowler A. "Development of a Depth Independent Closed Cycle Diesel Engine", OffshoreTechnology Conference Paper n. 4031, Houston, May 1981.
[35] Unknown author from Garrett Corp. (USA):"Prospects for extended endurance closed cycle power systems fornaval undersea applications"; Aug. 1987, presented at the MIT workshop on "Power Systems for UnderwaterVehicles", Boston (Mass.), 5-6 Oct. 1988;
- 28-

STATE OF THE ART ON AUTONOMOUS UNDERWATER VEHICLES
KEY TECHNOLOGIES
Jean- Louis MICHELMarc NOKIN
IFREMERCentre de Toulon-La Seyne
83507 LA SEYNE Sur MERTO : 94.30.48.83Fax : 94.30.13.72
Prepared for the Fifteenth Graduate SchoolUNDERWATER TECHNOLOGY
14-18 Oct 91 - WEGEMTESPOO - FINLAND
1 - Autonomous Underwater Vehicles (AUVs) : Definition and Interest
Autonomous Underwater Vehicles are generally self-propelled vehicles equipped with theirown energy package and with no solid communication link with the support vessel. This shortdefinition does not apply to only one type of vehicle.
When considering for instance the guidance mode of operation, one may distinguish two
possibilities :
- teleoperated vehicles which are controlled via an acoustic link,
- telerobot vehicles which have a preprogrammed mission to accomplish whereas theacoustic link is used to high level communications at the mission level,
- fully autonomous robot vehicles for most specific missions.

2
In France, IFREMER, with the support of french firms, has conducted the studies, thepredevelopment and the development of vehicles mainly teleoperated in a first step.
The main interests foreseen for this concept are the potential following possibilities
- the use of a banalized support vessel possibly free for other tasks,
- a precise and efficient survey of the areas defined a priori.
Of course this concept has to be compared with other subsea intervention systems (mannedand tethered). The coherences and the complementaries of such means have to be carefullyconsidered.
2 - AUV developments and classes
If one excepts the particular class of torpedos which have been existing for a century, thefirst untethered free swimming vehicles appeared in the sixties and seventies. Only few of them havereached the operational status. Let's mention for instance the SPURV (63-73) built by the AppliedPhysis Laboratory (USA) and the Epaulard (76-80) built for IFREMER (France).
At the beginning of the 90's, a growing interest for AUVs appears in countries such asJapan, -USSR, Sweden, G.B., Canada (cf 1.1). Appendix 1.2 gives the description of the Autosubproject currently under way in Great Britain. In the USA the main source of funding for the AUVR&D is the Department of Defence.
In France, after the development of the Epaulard with two french firms : ECA and CITAlcatel (now Thomson Sintra), IFREMER with several french companies, conducted studies atdifferent systems levels (conceptual or predevelopments) concurrently with the analysis of thecritical basic technologies (energy sources, positioning, acoustic transmissions, guidance).
We have distinguished three classes of AUVs for civil applications by using a geometriccriteria (cf appendix 2)
class 1 surfacic vehiclesclass 2 linear vehiclesclass 3 punctual vehicles
Surfacic vehicles are intended to achieve horizontal sweeping so as to scan a systematic coverage ofa defined surface in order to provide a map of a phenomena.
p This is for instance the case when creating a map of the sea floor or of an hydrothermal~plume.
In this class the energy source is one of the actual limitations ; so is the capacity ofnavigating autonomously.
Linear vehicles are mainly intended for the execution of most long range flights (thousands ofkilometers) with options on vertical or horizontal profiles required by the global planet knowledge.The navigation precision is not very accurate (several kilometers) in this class.
This is for instance the case of transoceanic vehicles or even drifting buoys.
In this class the energy source is one of the main constraints in the development of AUVs.
Ponctual Vehicles : manoeuvre in areas limited both vertically and horizontally.

3
This is for instance the case of vehicles performing TV observations or measurements on thesea bottom with a specific requirement for the capacity of stabilizing the vehicle with respect to avisual target.
In this class the predominance of manned submersibles, and above all ROVs (RemotelyOperated Vehicles), with the advent of fiber optic links is well established.
3 - The french experience in the sea floor exploration
3.1 - An exploration at different scales
The exploration of the seafloor at great depths follows a series of steps at different scaleswith increasing resolution :
(1) a bathymetric map of the seabed obtained by means of a multibeam sounding apparatus(formerly via a Sea Beam and more recently via an EM12 Dual mounted on the navireocdanographique L'ATALANTE").
le SA(2) a medium scale survey by acoustic images typically obtained via a side scan sonar like
le SAR" towed by means of an electromechanical cable.
(3) an optical. survey : taking photographs as it has been done with the Epaulard, or with aslow towed remote TV transmitted to the surface via a cable as it is done with the SCAMPI.
(4) the use of submarines in local areas of interest as it is done with the CYANA and theNAUTILE possibly associated with specialized tools such as the ROBIN ("ROBot d'INspection duNautile") and NADIA ("NAvette de DIAgraphie").
These complementary means have been used mainly for science deep operations on slopes,ridges, nodules and hydrothermal vents areas.
3.2 - Survey Experience
When considering a new system, such as the AUVs, one must take into account its insertionin this general scheme and its dynamic. We thus propose to develop the experience on abyssalsurveys which are potential areas of interest for AUVs.
The medium scale acoustic survey is currently executed with the SAR (Syst~me Acoustique* •Remorqud).
The deep towed side scan sonar and sub bottom profiler SAR have been developed in 84 byfrench companies : Thomson Sintra for the acoustic equipment, and the "Socidtd ECA for the fisnand the overall integration.
This system has been thoroughly tested since 1985 while laying emphasis on its capacity ofcreating large mosaics of the sea floor (Appendix 3).
The data are now recorded on an optical disk.
IFREMER has developed a data processing software package called TRIAS able to achievegeometric corrections to enhance qualitatively the images (Appendix 4). The final product is mainlya mosaic representing the sonar images in their geographical position, correlated with thebathymetry.

4
This simple and efficient sonar is nevertheless limited in terms of speed andmanoeuvrability, and, excepting the optimization of a wreck search, the real time access to the datais not of an absolute necessity.
The final product being an image on a bathymetry it is also logical to consider for futurAUVs a payload which associates these two functions.
The other missions which are presently analysed for the AUVs concern all general mappingsuch as those involving physical or chemical sensors and the necessity to associate sampling.
3.3 - Means comnlementarity
The place of the AUV's must be considered taking into account the other technics present orpotential in the subsea intervention activities :
Manned submersibles : these are the unique means which authorize the presence of the manin situ, but they are limited by short autonomies, safety problems, and the associated high costsconnected to the presence of the man in the medium.
Towed Vehicles : when they are towed sub surface they are unbeatable except when theweather is rough or in presence of ice. When the towing depth is high the equipment becomes heavyand slow to operate. These limitations leave a great chance to AUVs which may justify a betterefficiency.
Remotely Onerated Vehicles (ROVs) :they are rapidly limited in their capacity ofmovements relatively to their mother ship and they are more fit to work in local areas with atremendous capacity of telepresence in vision and manipulation since the advent of fiber optic links.
Taking into account these technics the untethered vehicles may be mainly justified for taskswell defined, repetitive and programmable, especially in extreme environments (high pressure, badweather, under ice) providing that the technologies enable to reach the autonomy necessary to thesevehicles.
4 - VEGA: Global Parametric Analysis
We consider that, in the preliminary stage of a project, some global analyses must beundertaken in order to enhance and modestly help to quantify the main guidelines of its feasibility.
This method applied to AUVs leads us to conduct a parametric analysis of a longe rangeautonomous vehicle called "VEGA" standing for "VEhicule A Grande Autonomie" (Great AutonomyVEhicle).
4.1 - Objectives of the VEGA Global Parametric Analysis
The scale of the range for this vehicle was comprised between 500 and 1500 kilometers forspeeds between 3 to 10 knots.
On grounds of competitiveness with other means this type of vehicle was provided with anautonomy of several days for depths beyond - 500 M, for a weight ranging between 10 to 20 tonnesthus at least allowing for the use of oceanographic ships able to handle manned submersibles.
The objective of the parametric analysis was to set some order of magnitude for parametersconnected to the performances and the architecture of the vehicle, such as to estimate their influenceand to apprehend the technological break through which may be opposed to the state of the artfeasibility.

5
4.2 - Case of an Ultra Simplified Model
A first model was worked out in order to estimate the relative influence of the speedregarding the range of the vehicle.
The following parameters where used
R = range on the sea floorV = speed on the sea floorT = time on the sea floorPp = power required by the main propulsionP = power required, the main propulsion exceptedFp = propulsive forceEc = energy capacity for sea floor explorationK = hydrodynamic coefficient
The range (R) is expressed by
R = TxV
with T EcP+Pp
assuming that Pp = Fp Vand that Fp = KV 2 thus Pp = KV3
we thus obtain
T = Ec (1)P + KV 3
and R = Ec.V (2)P + KV 3
Equations (1) and (2) show the existence of an optimal speed V for which the range R ismaximum: Rmax.
For a more universal exploitation we may choose to use adimensional data RV , T Rmax
Rmax Topt
One result is shown in appendix 5 which enhances the existence of an optimal speed which permits
to maximize the range R.
4.3 - Prolongation of the parametric study
We have pursued this first approach which a more complete belt simplified model.
The general form of the vehicle has been taken as a slender body.
The components housing was assumed to consist of one main cylindrical body withhemispherical terminations. Inside this main body, resistant to the external pressure, we haveassumed that could take place the equipment necessary for the mission sensors and recording as forthe guidance of the vehicle and its energy and propulsion requirements.
This housing was assumed to be the main pan of the body prolonged with an outer hullelliptic at the bow and conical at the stern.

6
The mass of the vehicle is assumed to consist of three main sub-assemblies
- the mass of the main housing- the mass of the energy source- the mass of the equipments.
This conducts to a vehicle the general forms of which are shown in appendix 6.
4.4 - Main Results of the VEGA
The parametric analysis permits to give some quantification regarding for instance the size andweight of the vehicle with respect to some parameters. Appendixes 7.1, 7.2 and 7.3 give thevehicle's weight sensitivity to
*- the speed (V),
- the performance of the energy source simplified to a simple Wh/kg ratio (E),
- the performance of the main housing reduced to its density parameter defined as the weight in theair to its volume ratio (d).
We have noted M, the total system weight excluding the pressure housing and the energy sourcemasses, and P the total power required excluding the propulsion.
Compromise time range
The existence of an optimal speed is liable to whether decrease the weight of the vehicle orto increase its range or to decrease the time spent on the sea floor.
Generally we have assumed that the vehicle optimum speeds were comprised between 3 and4 knots.
Energy source
The energy source is as expected the main limiting factor for the range of the vehicle. R & Din this domain may be important if ranges in the order of 500 km and above are researched.
Buoyancy
The buoyancy of the vehicle may be obtained whether by the main housing or by synta cticfoam. If the density of the main housing matches the density of the foam then the advantage is thatequipment could be fit inside of it.
4.5 - Limits of this parametric analysis
Several factors have not been taken into account in this first approach.
One must consider the mission sensor requirement and the navigation autonomy.
Sensor Platform Design and Associated Controls
This parametric analysis has not taken in account the dynamic behaviour of the vehicleregarding the sensor requirements, this may be important with respect to the sensors to beconsidered.

7
Navigation
Besides the autonomy of energy, another limiting factor to the AUVs concept is its capacityto be independent of the mother ship which involves specific analysis in terms of autonomousnavigation capacity.
Navigation includes generally horizontal preset path following and vertical seabed followingwith obstacle avoidance. Path following may be achieved by external position data and vehicle statusprovided by standard or inertial sensors.
5 - Towards autonomous underwater vehicles : the ASVs project
Truly autonomous underwater vehicle does not exist for civil applications. Several criticalpoints have been pinpointed in this short analysis.
From this analysis we are considering presently the feasibility of an Abyssal Survey Vehiclecalled A.S.V. which consists in the development of basic generic technologies. The interest ofpotential users is examined at an international level.
The main caracteristics of the A.S.V. are
Mission : mappingDepth : 6000 mRange over 100 kilometersWeight : around 5 tonnes.
0"

APPENDIX 1.1
AUV Development.::.A Chronology by F. Bu~sby anfd.J.R. Vaidu
:Ya: VhcePurpose :Depth Developer:
1963 SPURV I water measurements 6,000 University of Washington Applied Physics Laboratory
1972 UARS under-ice mapping 457 UW/APL1973 SPURV 2 water measurements 6,000 UW/APL1975 SKAT ocean research n/a Shirshow Institute of Oceanology, USSR Academy of Science
OSR-V ocean research 250 Japan Society of Promotion Marine Industry (Tokyo)1977 (unnamed) testbed 100 Japan Marine Science & Technology Center (Yokosuka)
1979 EAVE mn testbed 914 University of New Hampshire Marine Systems Engineering LabEAVE West testhed 610 Naval Ocean Systems Center
RUMIC mine countermeasures n/a Naval Coastal Systems Center
UFSS search 357 Naval Research Laboratory
1980 Pinguin Al search 200 MBB GmbH (Bremen, W-Germany)
CSTV submarine control tests n/a Naval Coastal Systems Center
1982 Rover structure inspections 100 Herio-Watt University (Edinburg, Scotland)Robot II bottom surveys 91 Massachusetts Institute of TechnologyB-I studies of drag characteritics 90 Naval Underwater Systems Center
1983 AUSS search 6,000 Naval Ocean Systems Center
Telemine vessel destruction 150 Teksea (Lugano, Switzerland)
TM 308 structure inspections 400 Tecnomare SpA (Venice, Italy)Epaulard bottom photography/topography 6,000 IFREMER (Paris)
1984 ARCS under-ice mapping 400 Intl. Submarine Engineering Ltd (Port Moody, P.C. Canada)
AUV hydrodynamic drag studies n/a Rockwell International (Anaheim, California)
1985 Submarine Robot testhed/hydrodynamic flow 500 JAMSTEC (Yokosuka, Japan)PLA 2 nodule collection 5,000 CEA/IFREMER
1986 ELIT structure inspections 1,000 IFREMER/Comex (Paris)(unnamed) feasability study n/a Simrad Subsea A/S (Horten, Norway)
1987 LSV submarine testing n/a Naval Coastal Systems Center
1988 XP-21 testbed 610 Applied Remote Technology (San Diego)MUST testbed 610 Martin Marietta Corp. (Baltimore, Maryland)
Sea Squirt testbed 61 MIT Sea GrantRUV krill research 250 University of Washington
ACTV water measurements 250 UW/APL
1989 UUV (1) testbed n/a Draper Laboratory (Cambridge, Massachusetts)
FSMNV mine neutralization n/a Naval Ocean Systems Center
MT-88 bottom/water surveys 6,000 Institute of Marine Technology Problems (Vladivostok, USSR)
PTEORA survey 6,000 Institute of Industrial Science (Tokyo)Waterbird survey 100 Sasebo High Tech Company (Sasebo, Japan)
1990 UUV (1I) testbed n/a Draper Laboratory (Cambridge, Massachusetts)
UROV-2000 bottom survey 2,000 JAMSTEC (Yokosuka, Japan)(unnamed) testbed/precise control vehicle 10 JAMSTEC
1991 AROV search, mapping n/a SUTEC (Linkoping, Sweden)
1992 Mine Avoidance mine countermeasures n/a Lockheed Missiles & Space Co. (Sunnyvale, California)
AUVDoggie bottom/sub-bottom survey 6,000 Yard Ltd. (Glasgow, Scotland)Dolphin temperature/salinity/depth 6,000 Yard Ltd. (Glasgow, Scotland)
monitoring 30-day periods
1993 ARUS bottom survey n/a EUREKA (European consortium)
MAY 1990 / SEA TECHNOLOGY / 67

APPENDIX 1.2
0
U-1c
2 2
C 0 4 , -~o,=z z CAo
Ci 0 10
000
Zi = oý 0= j - 0 -5-
a -.
4,
-~ = m

-d J
W~ 0n.to0
0 9 2oz
EIif ~ - ~
0 , C-t, -rn - u
- U O~~ U E-- 60
, 0 0)> 0 ) -
Q 0, 2 0~~=t ~
z ' C; --
*U Z; 0 '
(0 0
0c -0 ~ '
Z- Q'1 0- MC ,>.±. .2 uO 20 K", w
wa ýS L m. ;i -2 t. at;
U E- W> C,
ca 0.
VII !2 .O 2 I 0 '0
4Z w_9,0H
-- S

APPENDIX 2
A.U.V. CLASSES
1 2 3
CLASSES Surfacic Linear Punctual
Mapping:MISSIONS - Bathymetry Remste
- Sonar imaging Data collecting Observation- Measures and Measures
Search
RANGES 100-200 km 1000-5000 km 5 km
AREAS 20 x 20 km Linear 200x200 m
30 x 30 km
COVERAGES Till 100 %
DEPTHS 6000 m 1000-6000 m 1000 m - 6000 m
CYCLES I cycle/day 1 mission 4-6 hours/dive
SENSORS SL sonar CTD TVMultibeamCTD

APPENDIX 3
SAR PROFILES ON DEEP SLOPES(4000m)
9197/85
.4, __ __ __ _ _ ___I _ __ _18\ 5__
1771&85

A1?ENDPLX 4
. -- SAR MOSAIC: TRIAS SOFTWARE PROCESSING
Small portion area of Fournaise mosaic
0.S - •4
0 .,
0it•

APPENDIX 5
I ,FREMERC~entre de TOULON __________
tOO
IIR1 1 .1 1Hi lIIIIIIIIII I I [-I I I I I I
HIT
0 II I I H l I I I I I
I~I IIIII I- I I I I71 F F I IIIIIIIII0I 1-
a 5 I. II it .5'~ ~ 2. 2. I.0
IC S N Io I L I ORE No 2 u I I l

APPENDIX 6
CIO
C:C
cnV z
Cn cn

APPENDIX 7.1
Total System Weight (1) R =1500 km
R= 1000 km
E = 100 wh/kgd = 0,51 t/M3
P= 3 kwM= 3 t
100-
so-
80-
R =500 km
50-
030"
O 20-
10- Speed (knc
0 ----
101
1u2 3 4 5 6 7 8TT V10
Figure 3 :SENSITIVITY TO VEHICLE SPEED

APPENDIX 7.2
Total System Weight (t)R=1000km R=1500km
d = 0,5 tIm3
V = 6 knotsP = 3 kw
d"•M =3 t
100
R500 km
. 30
20-
OO10-
0 20 40 60 80 100 120 140 150 (wh/kg)Energy density
Figure 4 : SENSITIVITY TO ENERGY PERFORMANCES
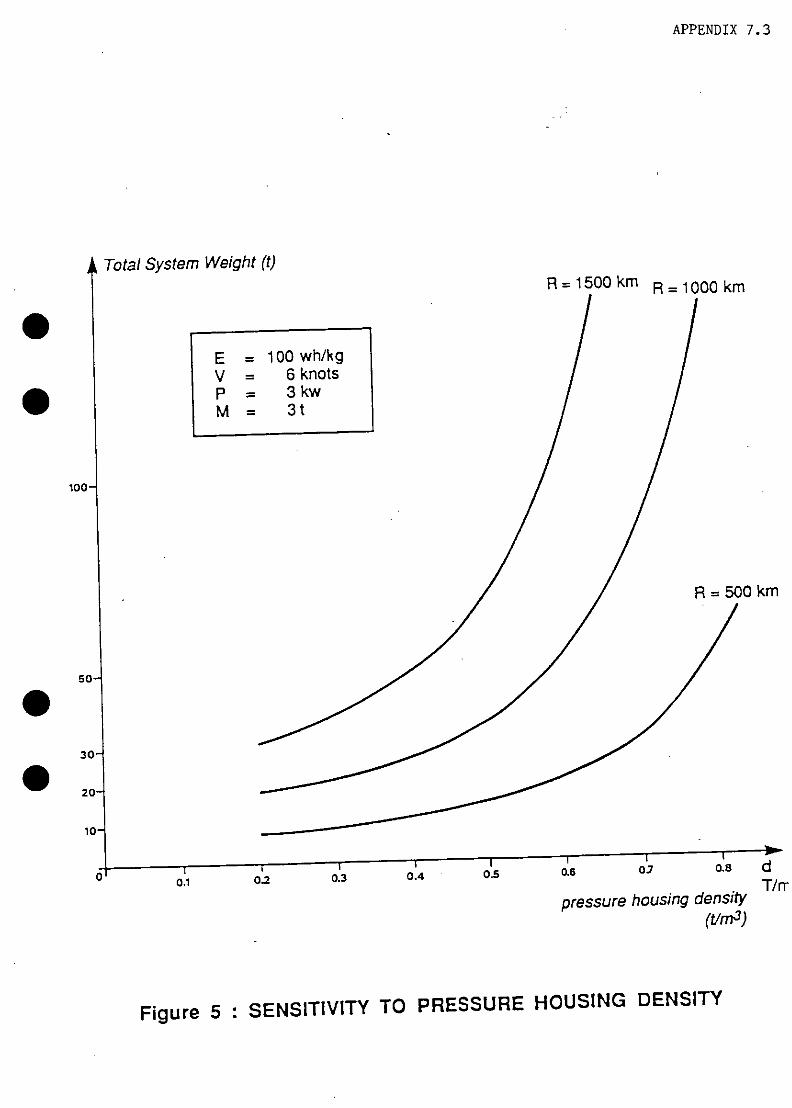
APPENDIX 7.3
Total System Weight (t)R=1500km R=1000km
E = 1oo wh/kgV = 6 knotsP 3 3kwM= 3t
100
50R
30"
20"
10-
f0.1 0.2 0.3 0.4 0.5 0.7 0.8 dT/i,pressure housing density
Figure 5 : SENSITIVITY TO PRESSURE HOUSING DENSITY

MATERIALS IN THE ENVIRONMENT-PRODUCTS AND RANGE OF PROPERTIES AVAILABLE
Professor J. Billingham Cranfield Institute of Technology EnglandDirector - Marine Technology Cranfield, BedfordCentre
ABSTRACT
The selection of suitable materials for use underwater in fixed offshore installationsand pipelines, and in ships and submarines is reviewed.
Structural steels are considered in detail and their properties in both plate andtubular constructions examined in terms of strength, ductility, resistance to brittlefracture and fatigue, and in particular their ability to be satisfactorily welded on site.High strength steels for use in pipelines and submarines are examined and theadvantages and disadvantages of different steel processing routes considered. Theperformance and mechanical properties of as rolled, normalised, quenched andtempered, and thermomechanically treated steels are discussed.
The use of stainless steels and other more corrosion resistant materials arediscussed and in particular the use of duplex stainless steels for subsea pipelinesand pumping applications considered. Examples are given of the use of corrosionresistant cladding alloys such as Monel and cupronickel.
0

1. INTRODUCTION
The marine environment is one of the most severe natural environments in which
materials have to operate. Significant loads can be generated by wind, waves and
currents, a wide range of temperatures can be encountered and seawater is
extremely corrosive. This latter point is illustrated in Figure 1 which shows the
corrosion rate of most common metals and alloys in quiet seawater. It can be seen
from this diagram that mild steel, the most commonly used marine structural material,
exhibits the poorest corrosion performance. Although improved corrosion
performance is desirable in such circumstances it is achieved not by selecting a
more corrosion resistant material but by ensuring that the material used is protected
against corrosion. The various codes of practice and design rules which operate in
this field specify how such protection should be accomplished. Underwater the two
most common techniques are the use of cathodic protection and use of protective
coatings. Corrosion protection techniques will be dealt with in detail in a separate
lecture within the School and therefore will not be discussed further here.
The widespread usage of mild steel within the marine industries is based on other
factors than its resistance to corrosion, namely its ability to be readily produced in
a variety of forms and readily fabricated, usually by welding, into the size and shape
of component required while at the same time satisfying the general overall
mechanical property requirements for the particular application ehVisaged. Other
0 more corrosion resistant materials are usually much more expensive to produce, are
not available in the large tonnages required, and cannot be as readily fabricated.
0 Vast quantities of structural steel are used in the marine industries in shipping,
offshore structures and pipelines, and in submarines. Table I lists typical
compositions and mechanical properties for the various types of steel used in marine
environments. The strength of such steels can vary from the weakest mild steel
(200MPa yield strength) used in some parts of ships and offshore structures, to very
high strength steels (700MPa yield) used in submarines and some tethering devices.
A primary requirement for all specifications is that the steels must be readily weldable

on site with the minimum precautions since this is the major fabrication route utilised
in the construction of such structures. This latter requirement does pose particular
restrictions on alloy selection for high strength applications since, in general, as the
strength of steel increases, its toughness and weldability decrease.
The vast majority of tonnage used in marine engineering comprises relatively simple
carbon manganese structural steels such as, for example, those complying with
BS4360 or EMMUA specification. A reasonable understanding has been built up
* concerning the mechanical behaviour of such materials in relation to their
metallurgical structure which, in turn, is related to their composition and processing
history. Particular steel compositions and/or process routes have been developed
to satisfy the more stringent requirements of, for example, high strength, with
excellent weldability and toughness for pipelines in deepwater environments, or with
additional resistance to shock loading which is required for submarine hulls. The
general principles controlling strength, toughness and weldlability are now well
understood.
The mechanical properties of a particular metallurgical component are determined
by the microstructure of the alloy concerned, in particular the volume fraction and
morphology of the various phases that are present within that microstructure which,
in turn, are controlled by the composition and thermal and mechanical processing
history. Most alloys also contain impurities which take the form of small inclusions
in the alloy microstructure and can play a significant role in the overall performance
of the alloy. This is particularly true in respect of alloy ductility and toughness.
The carbon manganese structural steels used in marine structures are designated
metallurgically as ferrite pearlite steels. Such steels consist of a matrix comprising
a soft ductile phase known as ferrite, which is essentially pure iron containing a small
amount of dissolved carbon, in which a small volume fraction of a stronger but more
brittle phase, known as cementite (Fe3C) is distributed in a particular lamellar
arrangement which is referred to as pearlite (see Figure 2). As the volume fraction
2

and morphology of the Fe3C varies, the resulting mechanical properties vary. For
example, in general as the volume fraction of Fe3C increases the strength increases,
and as the shape of the Fe3C particles changes from a plate-like to a more rounded
shape the ductility increases. There are well developed relationships to determine
how both composition and microstructure can affect the resulting mechanical
properties of such alloys and these can be written down in the form of empirical •
mathematical equations such as those given below:
Yield Strength
0 oy(MPa) = 88 + 37(%Mn) + 83(%SO + 2918(%Nfree) + 15.1 (d- I/)
SoUTS(MPa) = 294 + 28(%Mn) + 83(%S/) + 3.8(%pearlite) + 7.7(d - /2)
Imoact Transition Temperature
ITT(°C) = -19 + 44(%SO + 700(%Nfree) + 2.2(%pearlite) - 111.5(d -C / )
d = grain size in mm
NFree = free nitrogen content, i.e. nitrogen not combined in the form of a stable
nitride compound.
Examination of these simple equations indicates why refinement of grain size has
been the major driving force in steel development over the past few years. Refiningthe grain size not only increases the strength of the steels but simultaneously lowers
the impact transition temperature. All other techniques for strengthening steels result
in a simultaneous increase in impact transition temperature which explains why they
0 are less favoured. Refinement of the grain size is usually accomplished by
normalising, which involves heating the steel to temperatures above AC3 (=9500C)
and then cooling in air. This is most effective if the steel also contains microalloying
additions such as aluminium, niobium or vanadium in very small quantities (<0.1%).
Such additions form stable precipitates of, for example, VCN in the alloy
microstructure which control the austenite grain size at high temperatures during
3

processing and also promote the formation of small ferrite grains on cooling to room
temperature. There are alternative methods for producing fine grained steels such
as thermomechanical treatment (TMT) procedures, which are sometimes simply
referred to as controlled rolling. Such processing techniques are even more effective
in developing fine grain sizes within the steel. However, the method works most
effectively for thinner section materials (<30mm thick)and is predominantly used in
the manufacture of high strength pipeline steels (350 - 50OMPa yield).
The equations also indicate that if a combination of high yield strength and good
toughness is required, then steels with low volume fractions of pearlite and hence low
carbon content, are to be preferred. Since such steels also have improved
0, weldability it is not surprising that another trend in recent years has been a significant
reduction in the carbon content of steels. Steels for critical regions of offshore
structures nowadays usually contain 0.10 to 0.15% carbon whereas 20 years ago
they contained 0.15 to 0.20% carbon.
The primary design requirements for ships and offshore structures are moderate
strength levels, resistance to brittle failure, and ability to be welded on site with the
minimum of precautions. This latter fact is of utmost importance when cost
considerations are involved.
Cold cracking, which is also referred to as hydrogen cracking, or HAZ cracking, is
0 a significant factor in site welding. It can be controlled by careful control of the
welding processes and procedures used, such as the use of low hydrogen
electrodes and preheating, but can also be controlled by modifying the composition
of the steel. The propensity for cracking under such conditions is related to the
ability of the steel to form particular hard macrostructures under given cooling
conditions which in turn is related to the chemical composition of the steel.
Equations such as the IIW carbon equivalent equation given below are used to
indicate the likelihood that a steel will crack under given conditions.
4

CE1W= +Mn +Cr +Mo±+V + Nhi +CuCEw= 6T 5 15
In general the lower the carbon equivalent volume of the steel the less likely is the
possibility of hydrogen cracking. Examination of this equation indicates the major
influence played by carbon in promoting such cracking and indicates again why
carbon levels are generally falling within the industry. For pipelines where field
welding offers a greater potential for hydrogen damage, the steel specifications used
are usually much more stringent in terms of allowable carbon content. Modern high
strength pipeline steels rarely have carbon levels above 0.1%. Indeed, high strength
pipeline steels have been developed which contain virtually no carbon (0.02%) and
yet satisfy stringent strength (up to X70 grade 482MPa yield), toughness, and
weldability requirements.
Many older metallurgical textbooks report that the strength of steel is most easily
increased by increasing the carbon content and indeed, in general as the carbon
content of steel increases the tensile strength does increase. However, the
toughness correspondingly decreases and for applications where combinations of
high strength and toughness are required, particularly where welding is involved, the
trend is to reduce carbon levels. Such an application occurs in pipelines where, in
recent years, the trend has been to increase strength while retaining general
toughness and weldability. This has been achieved by strict metallurgical control of
the steel composition and processing routes. Figure 3 illustrates how the carbon
content has decreased significantly with increasing strength in recent years. It is
interesting to note that the specification widely used in the industry (API) lags behind
0 current industrial practice, a not uncommon feature in a rapidly changing industry.
As a further example of the importance of good weldability, the case of preheating
can be sited. Preheating of the joint before welding is specified for welding high
strength steels currently used in submarine construction such as QIN. Such
preheating is necessary to ensure the production of sound crack-free welds with
such alloys but is both expensive, time consuming, and difficult to monitor and
5

control. If a steel could be developed with similar mechanical properties but which
did not require preheat, it is estimated that cost savings well in excess of 10% of the
total fabrication costs could be made. Such steels are currently under development.
2a STRUCTURAL STEEL REQUIREMENTS
Structural steel plate can be produced by a variety of process routes as shown in
Figure 4, the simplest and cheapest form being simply as-rolled plate. More stringent
requirements can be met by normalising which involves an additional heat treatment
procedure. Normalised steels have improved notch ductility and uniformity of
properties compared to as-rolled material. Even more stringent property
requirements can be met by controlled rolling but such procedures are only possible
with certain steel compositions and section sizes, typically <30mm thick material.
More advanced processing routes have recently become more widely available,
especially in Japan which produce 'accelerated cooled' steels. Such steels usually
undergo rapid cooling in specialised equipment following extensive
thermomechanical treatments as shown in Figure 5. The techniques are now widely
used for linepipe steel and will increasingly be used in the future for thicker section
structural materials. The equipment required to carry out such treatments is,
however, very expensive and is not yet available to all steelmakers. The major
advantage in terms of structural steels is that steels can be produced to the same
0 level of properties with leaner chemistries, i.e. they usually contain less alloying
additions, particularly carbon, and hence have the advantage of improved weldability
at the same strength level.
6

2.1 As-Rolled and Normalised Steels
Steels for offshore structures usually comply to specifications such as BS4360 for
weldable structural steels. This standard covers a range of steels with yield strengths
varying from 210 to 450MPa. Most steels used in structures have strengths less than
35OMPa which corresponds to the 50D grade. For such steels the Charpy Vee
minimum value of 27J is specified at -300C. The steels are carbon manganese steels,
silicon killed, grain refined with niobium and produced to a specified minimum carbon
equivalent of 0.4 to ensure good weldability. The production of a large offshore
jacket requires the production of thick section steel plate which is welded into
tubulars following cold or hot forming of the plate. The joints at the complex tubular
intersections known as nodes are particularly difficult to fabricate and inspect. There
must be a careful selection of the steel itself and of the whole welding procedure
used, including the joint design, welding process and welding consumable. Usually
there are more stringent materials specifications for such joint areas which include
restrictions on the level of impurities allowed in the alloy. Manganese sulphide
inclusions can cause cracking during fabrication known as lamellar tearing. Such
defects are difficult to detect and extremely time consuming and costly to repair but
by careful selection of starting material the incidence of such cracking can be
significantly reduced. It has been shown that if the reduction in area in a through
thickness tensile test is low (<30%) then there is a greater likelihood of lamellar
tearing. This low ductility has, in turn, been associated with high inclusion content
and high inclusion elongation within the microstructure. If the sulphur content of the
steel is reduced from the typical levels found in conventional structural steel (0.02 -
0.05%) to levels of 0.01% or below, then high through thickness ductility is achieved
and no lamellar tearing occurs (see Figure 6). Such steel only became available in
the early 1970s but is now available from all major steelmakers. It is known under
various names including z-quality, nodal quality, or lamellar tearing resistant steel.
Additional specifications for better quality material commonly call for improved levels
of fracture toughness which is achieved by grain refinement and by increased steel
7

cleanliness including a reduction in adverse carbide morphologies. Most steel is now
made by the continuous casting process route and is specially treated by processes
such as vacuum degassing and argon stirring to improve its cleanliness.
2-2 Accelerated Cooled Steels
Increased demand for the development of steel structures for use in Arctic regions
is likely to require steels with guaranteed impact properties at even lower
temperatures such as -6O0C. The use of low carbon, low sulphur, fine-grained, clean
steels in the normalised condition could satisfy this requirement but there are also
additional developments to consider. Japanese steelmakers have recently developed
accelerated cooled steels in thick sections, i.e. thermomechanically treated steel plate
with low carbon equivalent values, which it is claimed will obviate the need for
preheat during welding of thick sections and hence will give significant economic
advantage. Such steels have fine grain size, low carbon content and a bainitic
microstructure, a typical composition in weight percent being: C 0.06; Si 0.23; Mn
1.27; P 0.014; S 0.002; Al 0.04; Ni 0.39; Nb 0.010; Ti 0.010; B 0.0008; and N 0.0032.The carbon equivalent of this steel using the conventional 11W equation is 0.30 with
a yield strength of 355N/mm 2. Such steels also show good HAZ toughness even
after high heat input welding because of their low carbon equivalent values. The
steels are usually rapidly cooled after the rolling treatments and the process is
referred to as OLAC (on line accelerated cooling) or MACS (multi-purpose
0 accelerated cooling system). Such steels can also exhibit very good low temperature
toughness by the combination of controlled roiling and controlled cooling after rolling
because of their fine grain size, especially steels containing titanium nitride additions.
2.3 Castinas
It has been widely proposed that high integrity steel castings could provide a viable
alternative to fabricated welded nodal joints largely on the basis of their superior
performance in fatigue. This is related to the ability to smoothly contour chord-to-
8

brace connections in the case of castings in comparison to welded connections
where the weld contour and weld toe produce a high stress concentration factor and
often also contain small defects. The steel type and composition are usually chosen
to be compatible with the rest of the structure or to have adequate mechanical
properties combined with good castability. Typical compositions are given in Table
1. Although most of the impetus for the development of castings for use offshore has
been in respect of critical nodal joints, they have not yet been widely specified for
such components. However, they have found other applications based on their
fatigue performance or on their excellent through-thickness properties. Thus casting
alloys have been used at fatigue prone locations on the Hutton TLP at the
intersections between the columns and the square pontoons, and they have also
been more widely specified for lifting points for heavy htems such as modules. An
example of high strength castings being used as a pressure hull for deep sea
vehicles is discussed in another paper at the School.
3. HIGH STRENGTH STEELS
Higher strength steels find application in a number of different areas in marine
engineering. Firstly as pipelines, which usually utilise controlled rolled steels with
yield strengths ranging from approximately aQOMPa to 500MPa yield strength, which
call, in addition, for good fracture toughness and.weldability. Secondly, in submarine
* pressure hulls where quenched and tempered steels are usually specified in
strengths up to 75OMPa and where service requirements are particularly severe in
that all welds must be capable of surviving high plastic deformation under explosive
loads without pressure hull rupture. Quenched and tempered high strength steels
are also finding increasing application as structural components on topside facilities
in offshore structures where their weight saving capability offers considerable
advantage. Such steels are not currently utilised under fatigue loading conditions in
the main structures. There have been reports which indicate that certain steels can
9

show improved fatigue performance and it is likely that such steel will increasingly be
used in the future in major structural components.
3.1 Controlled Rolled Steels
Pipeline specifications throughout the world are based on the American Petroleum
Industry (API) standards, specifically API 5L which covers grades from X42 to X70
based on the yield strength of the pipe. For example, X42 has a yield strength of42,000 psi (29OMPa) and X70 has a yield strength of 70,000 psi (482MPa). In the
case of gas lines, in order to increase throughput and lower the operating cost, many
large diameter high pressure lines have been constructed. These higher operating
*l pressures in turn demand higher yield strength steel and/or steels with greater wall
thickness. A given pipe yield strength and wall thickness only ensure that the line
can operate at a particular pressure and do not guarantee that the line will arrest a
propagating fracture. Several failures led to the development of tests such as the
drop weight tear test (dwtt) to define the transition between brittle propagation and
ductile arrest. Fully killed steels have become widely accepted for linepipe
production because of their lower transition temperatures. The specifications in
recent years have also become much more demanding in terms of toughness
requirements.
Unepipe development in recent years has been closely associated with attempts to
refine the grain size of steel. Techniques which have been used are normalising after
rolling, controlled rolling and/or fast cooling. Normalising after rolling has been used
for many years to give a more uniform product and to improve the toughness by
refining the grain size. Controlled rolling is a thermomechanical treatment which,
when carefully controlled, can lead to a considerable refinement of grain size
primarily by limiting the austenite grain size prior to transformation. If the steel
composition is chosen to produce a stable dispersion of particles at elevated
temperatures, typically niobium carbonitride Nb(CN), vanadium carbonitride V(CN)
or titanium nitride TiN, then recrystallisation is retarded and the precipitates limit the
10

growth of the recrystallised austenite producing a finer grained product. Such steels
are known as microalloyed steels. To optimise the properties achieved by controlled
rolling, a largely empirical understanding of the solubilities of such compounds at
different temperatures, their effect on recrystallisation kinetics under rolling conditions
and their precipitation strengthening effects under different mill processing conditions,
have been developed. In general terms, the best combination of properties is
achieved by low slab reheating temperatures, large deformations at low rolling
temperatures, and by rapid final cooling. Microalloyed steels usually contain more
than one addition in order to achieve desirable property combinations. Niobium, and
to a certain extent titanium, can act as grain refining and precipitation strengthening
additions, whereas vanadium is usually added to improve the yield strength. While
current steels typically contain more than one addition, the exact role of each element
in any particular steel composition is strongly dependent on the composition and
thermomechanical treatment involved.
Most pipelines for use offshore are produced by the controlled rolled route which is
the production route usually specified when more stringent property requirements
have to be met. For a given composition, controlled rolling can give a useful strength
increment with respect to normalising. However, a more significant factor is that a
given yield strength can be achieved with a much leaner chemistry (lower carbon
equivalent) in a controlled rolled product which means that improved weldability is
achieved at the same strength level.
In recent years, the need for improved toughness in linepipe steels has become
more important. An impact transition temperature below the operating temperature
is required, which is achieved mainly by refining the grain size. In addition, to avoid
long running fractures in lines operating at high gas pressures, the energy absorbing
capability of the steel above the transition temperature must be high. The Charpy
test has gained some acceptance in providing a measure of the energy absorbed
during fracture in a linepipe. Fracture usually occurs along the longitudinal axis of
the pipe, which is commonly the rolling direction of the plate, and by studying the
11

fracture process and modifying the steel chemistry accordingly the transverse
toughness has been improved. The importance of inclusions in modifying thefracture behaviour has long been recognised. The most important inclusion speciesin fully killed carbon manganese steels are Type II manganese sulphides. These
inclusions are elongated during the rolling process giving rise to marked anisotropyin ductility and notch toughness properties. In order to improve transverse ductility,the aim has been to reduce the total volume fraction of inclusions or to minimise theanisotropy. In reducing the volume fracture, the beneficial effect of lowering carboncontent is well known. Sulphide and oxide contents can also be beneficially reducedby various desulphurisation and deoxidation procedures. In high quality material the
sulphur content should be limited to 0.005%, and even better properties are obtainedat lower sulphur levels. Such steels are finding increasing use in applications wherehigh Charpy energy values are specified or where resistance to hydrogen induced
cracking is required.
If the inclusions occur as small isolated non-deformable particles, then the anisotropyis largely eliminated. This is achieved by modifying the morphology of the sulphidesby incorporating within the steel elements which form more stable sulphides and/oroxy-sulphides than manganese but which have reduced plasticity at the working
temperatures. Common inclusion shape control additions are calcium, cerium in theform of rare earth metal (rem), zirconium and titanium. The amount of the additionmust be controlled to achieve the best properties and there are sometimes problems
commercially in achieving uniformity in the distribution of the additions.
The problem of corrosion in environments containing wet hydrogen sulphide has led
to further stringent requirements for linepipe for operation in sour oil or sour gasfields. Stepwise cracking and/or blistering can occur related to the diffusion of
hydrogen through the matrix and its entrapment at inclusion interfaces. Suchcracking was found to be strongly dependent on inclusion morphology particularlythe extent of manganese sulphide elongation. Improvements can be brought aboutby a reduction in sulphur content or by a reduction in inclusion elongation, generally
12

by inclusion shape control. Modern steels for such applications contain low sulphur
levels (<0.002%) and calcium shape control additions. Copper is also often added
at levels of 0.3% which is effective in reducing hydrogen uptake of the steel by
forming a stable protective film on the surface. Unfortunately, such additions are not
effective under very severe acidic conditions. Sulphide stress corrosion cracking can
also occur, usually initiated at hard areas in the weld zone. Decreasing hardness is
effective in reducing this type of attack and again a decrease in carbon content is
advantageous.
Although seamless pipe may be used for smaller diameter pipelines, most pipe for
pipelines exceeding 450mm in diameter is made from hot rolled plate which is cold
formed and longitudinally seam welded by the submerged arc process. The down-
vertical method of welding is used almost exclusively for the end to end welding of
pipes in the field. This technique is characterised by low thermal input which gives
rise to rapid quench rates in the HAZ which, in turn, can lead to cold cracking. The
development of resistance to cold cracking has been achieved by the use of low
hydrogen electrodes and by the development of steel compositions with low carbon
equivalents (<0.4) to avoid the development of hard microstructures in the heat
affected zones. Steels of higher carbon equivalent levels will require a degree of
preheat, especially in thicker sections, which is difficult to provide under site
conditions and should be avoided if possible. The carbon equivalent relationship
traditionally used is that given by the International Institute of Welding (11W) given
previously. This equation was developed for structural steels and gives good
correlation when the carbon content is greater that 0.17%. Most modern pipelines
have much lower carbon contents than this and modified equations have been
developed which place more emphasis on the carbon content and give better
correlation with cracking behaviour. Equations such as that given by Ito-Bessyo are
often used defining a Pcm value as outlined below. Pcm levels are often restricted
to 1.8 where Pcm is defined as:
13

Pcm =C+ Mn+Cr+Cu Si V Mo Ni30 10 15 60
There are, however, many other equations which have been developed and there isdanger in applying such equations too rigidly because hydrogen, which is the mostimportant factor in assessing the susceptibility to cracking, does not feature in anyof them. In practice, an awareness of all factors affecting hydrogen cracking needsto be exhibited such as hydrogen availability from consumables and environment,heat input of the particular welding process used, applied stress and temperature atjoint, detailed HAZ microstructure, and whether or not preheat or post weld heat
treatment are involved.
If the corrosive conditions are very severe in terms of increased H2S, C02, orchloride contents, then stainless steel material may be specified. Currently suchmaterial has principally been used down hole in process tubing or in flow lines, butit is being considered increasingly for pipelines. The steels used are usually duplexstainless steels or highly alloyed austenitic steels for the most severe conditions.Both alloys have excellent resistance to attack by sour oil and gas combined withexcellent corrosion resistance in the marine environment. Typical compositions forthe austenitic alloy are 27 Cr; 31 Ni; 3.5 Mo; 1 Cu; and 0.02 C, and for the duplexalloy 22 Cr; 5.5 Ni; 3 Mo; 0.14 N; and 0.03 C. By using such materials it may bepossible to make substantial savings in dehydration equipment or on inhibitors. Inthe future when greater numbers of small fields are brought into production, suchmaterials will be increasingly considered.
3.2 Quenched and Tempered Steels
Quenching and Tempering is normally specified when higher strength materials arerequired for submarine hulls, tethering attachments, or non-fatigue loaded structuralcomponents in offshore topsides when weight is critical. Typical compositions andproperties are given in Table I. The necessary combinations of properties areachieved by refinement of the structure in low carbon bainitic type material or by
14

increased alloy hardenability in alloys such as QIN which contain significant amountsof elements such as nickel and chromium, and require additional controls during
welding with respect to preheat requirements and hydrogen levels generated by thewelding procedure.
4. CORROSION RESISTANT MATERIALS
Large volumes of seawater are handled on offshore platforms and in ships in heat
exchangers and fire fighting equipment. In these situations and in water injection
plant, more corrosion resistant materials are required. In addition, if the product
contains certain impurities such as carbon dioxide, hydrogen sulphide or large
quantities of produced water then again special measures have to be taken to
reduce corrosion damage.
Heat exchangers can utilise commercial purity titanium in plate exchangers whereascupro nickel alloys, both 70/30 and 90/10 types, or aluminium brass are usually
specified for tube condensers. Titanium has excellent resistance to seawater attack
and it is also resistant to impingement and cavitation damage, but of course is very
expensive. The cupro nickel alloy has good resistance, to corrosion coupled with
anti-fouling properties and is generally the better tube material. Tube plates are
commonly brass, aluminium brass or aluminium bronze.
Many early platforms in the North Sea had bare carbon steel or cement lined steel
piping systems for carrying seawater in their fire fighting systems. These were prone
to early breakdown and were replaced by cupro nickel systems, usually 90/10 cupro
nickels. The material must be resistant to corrosion over 20 - 40 years, often with
long periods of stagnation, and cupro nickels have proved most satisfactory. More
recently, consideration has been given to stainless steels containing molybdenum
which has good resistance to pitting and crevice corrosion. Stainless steels are also
often specified for instrumentation tubing.
15

Materials for equipment such as pumps and valves are often forged or cast and this
often means different specifications from the associated pipework. A wide range of
corrosion resistant materials can be used including many copper base alloys such
as nickel aluminium bronze, cast irons, stainless steels, and nickel based materials
such as Monel and Inconel. In situations offshore where replacement costs are very
high, it is prudent practice to install the highest quality material possible.
Seawater injection systems handle water which is de-aerated and contains a biocide
and therefore does not impose severe corrosion problems. Carbon manganese steel
can therefore be used for this application but because of the importance of the
reinjection pumps to such a process, manufacture usually involves a much more
corrosion resistant material such as duplex austenitic/ferritic stainless steels.
Carbon manganese steels are the predominant material selected for the equipment
in the production of hydrocarbons. However, the hydrocarbons may contain
produced water which contains chlorides, carbon dioxide and possibly hydrogen
sulphide at high pressures. If the water has low pH of 5 - 7 and a high temperature
50 - 1000C and is flowing at perhaps 15m/s, then care must be exercised in handling
such products. Due to the low oxygen content it is possible to use carbon steel with
inhibitors but stainless steel may also be specified. If H2 S is present, then materials
must be selected which are resistant to blistering and stress corrosion cracking.
Stress corrosion cracking is avoided if steel grades have comparatively low yield
strength and hardenability. The specification recommends that hardness at welded
joints should be kept below Rc 22 (250Hv) but often this is considerably modified
dependant on the H2S content involved. Expensive postweld heat treatment is often
the only way to achieve such low hardness values. Blistering and hydrogen induced
cracking may be avoided by having steels with fee elongated inclusions. The steels
for such service usually have very low sulphur content (<0.002%) and are treated
with calcium. Copper addition at the 0.3% level also improved performance by
restricting the amount of hydrogen absorbed by the steel.
16

In gas production and two phase oil and gas production where sweet corrosion is
a problem, 13% chromium steels (AISI 410 and 420) are often specified to tacklesevere problems of corrosion/erosion in wellhead areas.
Other specified uses of materials include the use of Monel 400 and cupro nickelalloys for sheathing critical components such as risers in the splash zone to prevent
corrosion damage. Work is also in hand to develop cupro nickel cladding systemswhich are also anti-fouling in order to reduce maintenance costs in such areas.
Inconel 625, a highly corrosion resistant nickel base alloy containing 9%
molybdenum, is also being used for flare tips where additional corrosion resistance
at high temperatures is required during gas flaring. This alloy also has excellentweldability and can be deposited on surfaces using weld overlay techniques. Thealloy also has excellent wear resistance and it is possible for it to be used on bearing
surfaces.
5. USEFUL REFERENCES
British Standard Specification for Weldable Structural Steels BS4360:19.
Engineering Equipment and Materials Users Association (EEMUA) - Steel
Specification for Offshore Structures, Publication 150, 1987.
Rules for the Design, Construction and Inspection of Offshore Structures, Det Norske
Veritas 1977.
Specifications For Line Pipe, American Petroleum Institute, API specification 5L, 1983
Honeycombe R W K, Steels Microstructure and Properties, Edward Arnold 1980.
Pickering F B, Physical Metallurgy and the Design of Steels, Applied Science 1978.
17

Cotton H C, Welded Steels for Offshore Construction, Proc.lnst.Mech.Eng., 1979,
193, 193.
Noordhook C and de Bach J, Steel in Marine Environments, Proc. of 3rd Offshore
Conf. on Steel in Marine Structures, Elsevier 1987.
Steels for Unepipe and Pipeline Fittings, Conf. Proc. London, Metals Soc. 1981.
Smith C S and Dow R S, Advances in Marine Structures, Conf.Proc. Dunfermline,
Elsevier 1991.
18

C? 0 o 0 0d E 6 6i 6i 6 6 6
I(0 9 t 0 co
0 00
CC
6 660) _ _ t - t
CC'Cl
00
8 2a
Uo V 0 ) Ci c
E8
Ln 0 L LO cIT 6o 6~ li
8 U)
t8 a
-- N a) a) )
0~ t N)
0 N 0) a) '2 crco O ai O
0l) E)m - CL ma0D :3 :0 < ( 1 r

0
-,CD b .
ELIa
N9 B 0 0q 0 0oNU N~ - U) CM N -
LO 0 0CD
0 CL_ 0_ _ _ _ _
U-U
S 0 0 W C)D) N NO C') C')O
CV L o O Liw
aU ) U) N N) a)C') ~ ' a) =' ) U I t* a5
CU
0nf ZC a~) V)Om
'cOo ~ o C LQ

Hastelloy* "C"
Titanium
Type 316 stainless steel Nil except for deep pitting
Type 304 stainless steel Nil except for deep pitting
Nickel chromium alloys Nil except for deep pitting
Nickel copperom alloys Usully except fordp pittingNickel copper alloy Usually <1 mpy except for pitting
70Jickel Usually <1 mpy except for deep pitting
70 - 30 copper nickel 0.5 Fe :::::::::::::::
IW O - 10 copper nickel 1.5 Fe
Copper ........ :.: ::.: :
............. I... i .i......" "Admiralty brass.............
Aluminium brass
G bronze
Nickel aluminium bronze :.::::::::::::...
Nickel aluminium manganese bronze
Manganese bronze ....... Dezincifies
f ustenitic nickel cast iron
Carbon steel
Nil 2.5 12.5 25 50 125 250
Typical average corrosion rates, pm/year
*Trademark Union Carbide Corporation NB. 1 mpy is 25pim/year
FIGURE 1 - Corrosion of Metals and Alioys by Quiet Seawater - Less than 2ft/sec.

FIGURE 2 - Microstructure of ferrite/peartite steel X1 000

Yield Strength. ksl
5 5 r.51 0 65 70
~Data from
0.28 ,28 manufacturers.... maximum carbon content by API
0.2
0.20
CS.0
0.12
0.08.a .. ... ..
0.04 00o *0 I 0
360 380 400 420 440 460 480
Yield Strength, MPa
FIGURE 3- Showing How Carbon Content Has Decreased Significantly WrthIncreasing Strength Grade Over The Last 15 Years

V)
0z06
CLza-000 LA
C> ~w
Ou
S~ m 2
4-'0
> w
*0 C--
L M L4 0a.E 000
a C t
w Lw
cr (D

0u
C,
CE ~ 00
0 ucc 0
zzrN
a L.EE
ý w 0
*az 0.
I
r) -)
4'4, 0 , I- *ZI- < "Ccc

07( ,)0 - - -•
60-0
so
40
30 --- __ _ - - - -
20 --- r -
10-
2 4 6 8 10 12 14 16 18 20 22 24
Sulphur content (%) xIO"
Figure 6 - Relationship Between Sulphur Content and Reduction in Area in ThroughThickness Direction RA(Z)

INTERACTION WITH UNDERWATER ENVIRONMENT
Professor J. Billingham Cranlield Institute of Technology EnglandDirector - Mauine Technology Cranlield, BedfordCentre
ABSTRACT
The performance of materials in the marine environment is examined particularly fromthe point of view of corrosion and corrosion fatigue behaviour. The build-up ofcorrosion scales and marine fouling is also considered and the influence of alloycomposition on resulting performance reviewed.
The resistance to high impact loads or explosions is discussed and the influence oftemperature on the ductile/brittle behaviour of steels examined.
The corrosion fatigue performance of materials is examined particularly for tubularspace frame structures and the influence of initial construction defects andsubsequent fatigue crack growth is outlined.
Alloys with improved corrosion performance, including copper and nickel basedalloys and stainless steels, are described and specific applications where theirimproved performance has proved beneficial are considered.

1. INTRODUCTION
Such features as adequate strength, resistance to brittle failure, resistance to fatigue
and protection against corrosion are prime design requirements which influence
materials selection considerations in marine environments. However, the sheer size
of the structures involved, implying large tonnages and thick section materials,dominates materials selection requirement and explains why structural steels are the
most wideiy specified material. Nevertheless, the performance of such materials in
the marine environment must also be carefully considered and addressed,particularly from the point of view of corrosion, corrosion fatigue, and the possibility
of brittle fracture. Numerous major maritime disasters have been associated with
materials/environment interaction problems including the brittle fracture of Liberty
ships during World War 11, and of several vessels since that time including the jack-up
drilling rig, Sea Gem, in 1956. The Alexander Kielland disaster in 1980 was due in
part to corrosion fatigue failure of a tubular member. Such disasters dictate that the
greatest care must be taken when working in the marine environment to ensure that
such materials related failures do not occur. However, the marine environment is one
of the most demanding environments in which to operate and constant vigilance is
required.
The corrosion performance of materials is seawater has been extensively studied.
Figure 1 lists the corrosion rate of most common metals and alloys in quiet seawater.
On the basis of this diagram, structural steel, the most widely used material in marine
environments, is seen to have the poorest performance of the materials listed. Its
widespread usage is based on other factors such as its ready availability, its low
price, and the ease with which it can be fabricated into numerous types of structural
components. In service it must be protected against corrosion and this is usually
accomplished underwater either by the application of protective coatings or by the
use of cathodic protection techniques.
The structures must be designed so that brittle fracture should not occur. To achieve
this the structural component must have adequate notch ductility at the design

temperatures in question under all loading regimes which might exist in service. The
material must be selected so that it behaves in a ductile manner at the design
temperature. This can be achieved by a combination of selecting the current material
and ensuring that it is satisfactorily fabricated. In terms of the material itself it should
have good notch ductility at the temperature in question which usually implies that
the steel must have a iow ductile brittle transition temperature. A further materials
related failure phenomena that must be carefully considered is corrosion fatigue.
There is still considerable debate as to the importance of this possible failure mode
especially when cathodic protection techniques are applied and full scale test data
is still somewhat limited. Concern about such failures has necessitated the use of
somewhat conservative design data and a restriction on the use of higher strength
steels on the basis that in the welded condition at least their performance is no better
in fatigue than lower strength steel.
This paper will address the corrosion behaviour of steels and more corrosion
resistant materials in seawater. ft will also discuss how structures are designed to
avoid brittle fracture and failures related to fatigue and corrosion fatigue in service.
2- CORROSION IN MARINE ENVIRONMENTS
2-i Corrosion Behaviour of Steels
The corrosion of steel in seawater is primarily governed by the diffusion of oxygen
in the water to the steel surface. La Que reviewed data from various locations
throughout the world and showed that the corrosion rates varied between 0.025 and
0.2mm/year with an average of 0. 1mm/year. As can be seen from Figure 2, these
corrosion rates refer to measurements when the steel was allowed to form a thick
layer of rust over a long exposure period. When structures are subject to abrasion
and mechanical damage and a very oxygen rich environment, higher rates can
therefore be expected possibly as much as ten times faster. Figure 3, for example,
2

indicates how the corrosion on an offshore platform varies with depth from which it
can be seen that corrosion problems are much more severe in the splash zone than
for either the submerged zone or atmospheric zone on the structure. The splash
zone is a region where the oxygen concentration is high, and where rust scales
forming on the structure are continuously removed by the mechanical action of the
waves. Table I lists corrosion rate data from experience offshore in the North Sea.
In addition to general overall corrosion attack, a more dangerous form of attack
known as pitting can occur. The pitting rate of a number of steels was measured
over a 16 year period and was as high as 1mm in the first year, although it
subsequently reduced dramatically and over a long period was comparable with the
overall corrosion attack. Pitting has been associated with the presence of millscale
on the steel surface and inclusions within the steel microstructure, particularly
manganese sulphide inclusions. Such pitting attack can be reduced substantially by
the use of cleaner steels and better quality control procedures and in the case of
painted steel, by specific precleaning procedures. Pitting is obviously more of a
problem in pipelines or storage vessels, where loss of fluid could occur, than on
structures and more care must be taken for such applications.
For applications on land, minor additions of elements such as chromium, nickel,
phosphorus and copper to simple ferrite-pearlite steels can result in improved
corrosion behaviour of structures particularly in the as-painted condition, see Figure
4. However, this improvement is not retained when the steels are fully immersed in
seawater, when only very minor gains are achieved. It has been reported that the
presence of several percent nickel and/or chromium would be needed to provide a
* beneficial effect in this immersed condition and this would incur obvious cost
penalties.
Other microstructural features such as variations in grain size, the presence of
martensite or changes in the cementite particle size and distribution have been
reported to have very little effect on the corrosion behaviour. This, at first sight,
3

seems at variance with the often reported inferior performance of welds and weldheat affected zones on structures. Askheim, for example, quoted a corrosion rateof 4mm/year for a weld region in a floating structure and Kato and others reportedsevere grooving corrosion in ERW welded pipe. Such corrosion behaviour can beparticularly dangerous if fatigue and corrosion are acting simultaneously. It is likelythat such enhanced attack is due, at least in part, to galvanic interaction effectsbetween the weldment area and the main steel structure rather than being due solelyto compositional and microstructural variations within the weldment region. Work atOranfield and elsewhere has been able to measure the galvanic interactions betweenthe various weidment regions that occur during corrosion attack in seawater.
The corrosion behaviour of steels in seawater is strongly dependent on flow rate, thecorrosion rate increasing as the flow rate increases, Figure 5. This effect was seenpreviously in the enhanced attack which occurred in the splash zone. In addition,seawater cooling systems associated with the processing or fire protectionequipment will therefore suffer enhanced corrosion attack if made from ordinarycarbon manganese structural steels. For such applications, non-ferrous alloys withtheir improved corrosion performance can be utilised (see Table 11) and these will beconsidered later.
In pipelines and risers, any bends, flanges, valves or other flow restrictions maycause accumulation of a water phase and promote internal corrosion. In addition,turbulence, erosion and bacterial activity may lead to localised enhanced corrosionattack. Carbon dioxide and hydrogen sulphidle are the most common corrosivespecies found in hydrocarbons. Inhibition is the most common means of corrosion
* control together with operational modifications such as dehydration and control ofpressure. In situations where oil and particularly gas containing water and H2 arebeing produced, i.e. under sour conditions, materials with adequate resistance tosuch attack are required. Such conditions lead to the generation of hydrogen at thesurface of the steel which can enter the steel, causing blistering or stepwise cracking.
Such attack can have catastrophic consequences. Specifications attempt to counter
4

this danger of hydrogen cracking by recommending steels with low yield strength
and low hardenability and a common recommendation is that no welds hardness
should be above HRc 22 (Hv10 250). Expensive post weld heat treatments are
commonly the only way of achieving such low hardness values. These steels,
although resistant to internal corrosion, usually have very similar external corrosion
performance in seawater to mild steel, and the same corrosion protection methods
must be used.
* Recently more corrosion resistant stainless steel alloys have been used for some
submarine flow lines linking subsea wells with the treatment platforms. These steels
are duplex ferrite austenitic or highly alloyed austenitic stainless steels and have
*" excellent corrosion resistance but are very expensive.
2.2 Corrosion Behaviour of Other Materials
Although the principal material for marine engineering structures is steel, for certain
applications where better corrosion resistance is required, the use of other metals
can be justified. This applies to protection from the marine environment generally
where alloys such as stainless steel and aluminium are becoming more widely utilised
under conditions where the structure is exposed to the marine environment but not
immersed in it such as deck structures etc. Although much more expensive than
steels, such materials do not have to be constantly maintained by repainting and
hence in terms of lifetime economies, can prove more cost effective as shown in
Figure 6 for stainless steel cladding. Non-ferrous materials are also used for
protection in the splash zone and for use underwater in critical components.
At a flow rate of 3m/second, a velocity often used in piping systems, it can be seen
from Figure 5 that the corrosion rate of steel is approximately 0.75m/year. At higher
velocities such as might be achieved in fast moving vessels or near propellers, the
corrosion rate continues to increase to about 5mm/year at 40m/s, velocities which
can be obtained in areas of very high local turbulence. Table II compares the
5

behaviour of carbon manganese steels in seawater under flowing conditions with that
of more corrosion resistant materials and the resistance to pitting corrosion is
indicated in Table III. Sometimes the importance of a component to the operation
necessitates use of the highest quality material in its manufacture. For example,
seawater injection systems handle water which is de-aerated and contains a biocide
and therefore do not impose severe corrosion problems. Carbon manganese steel
could be used for this application but because of the importance of the continuous
operation of reinjection pumps to the overall operation, manufacture usually involves
a much more corrosion resistant material such as duplex austenitic/ferritic stainless
steels.
Copper based alloys are widely used for fasteners, moving machinery and pipe
systems because of their excellent corrosion resistance, particularly to fast flowing
conditions and their ability to prevent fouling settlement (see Table IV). Brasses,
bronzes, aluminium bronzes and cupro-nickels all show good corrosion resistance.
Cupro-nickel alloys, particularly the 90 : 10 alloy with iron, find wide applications in
seawater pipelines, for example in fire dousing systems, in heat exchangers and in
cladding of mild steel for corrosion prevention in high pressure systems. The alloys
have good resistance under flowing seawater conditions as they contain iron, the
optimum level being 1.6% in the most commonly used 90 : 10 alloy. There are
certain applications where their resistance to fouling is very important, such as
condenser tubes, and they have also been used on ship hulls because of this
property. More recently there has been a move to specify cupro-nickel alloys (90/10)
for the protection of structural members in the splash zone of offshore installations
where very rapid corrosion attack of the steel work can occur and where
maintenance work is very difficult and expensive. Monel 400, a nickel-rich copper
alloy (67Ni, 32Cu) is currently widely specified for the more critical marine risers in
such areas but is expensive, and because of this is not generally used to protect the
structural members in the splash zone. It has been proposed, however, that cupro-
nickel could offer fouling resistance as well as corrosion resistance at a competitive
price for such an application.
6

Currently extensive fouling occurs on structures which results in increased wave
loadings and considerable difficulties in carrying out inspection procedures. The
fouling therefore has to be periodically removed at a very high cost. However, in
order for the cupro-nickel to be successful in its fouling role, it must be capable of
corroding and hence must be separated electrically from the rest of the structure
which is protected by a cathodic protection system. Suitable methods of attaching
the cupro-nickel to the structure in such a way as to allow it to function in both an
anti-fouling and anti-corrosion mode are currently under development.
Austenitic stainless steels can also be considered for service in marine environment
applications but care must be taken to avoid the possibility of localised crevice
corrosion. Chloride ions can cause film breakdown and therefore movement of
seawater across the surface acts to reduce pitting. A velocity of 1.2m/s is needed
to prevent pitting in seawater. Other stainless steels are commonly specified for
service where sweet corrosion and particularly erosion/corrosion is a problem at sites
such as bends near valves in wellhead areas. Typically martensitic stainless steels
of the AlSI 410 or 420 series containing 13% chromium are specified.
Nickel base alloys have been widely used in marine applications for many years, the
best known example being Monel 400, an alloy of nickel and copper. This alloy finds
extensive application in seawater pump and valve components, in propellers and as
a sheathing material.
The composition of such alloys can be readily modified to improve the mechanical
properties while retaining the excellent corrosion resistance leading to alloys such as
0Monel K-500 which, in addition to the applications outlined above, is widely used in
high strength bolts and flanges. The Inconel alloys which are essentially
nickel/chromium/molybdenum alloys were developed to provide resistance to pitting
corrosion and to stress corrosion cracking. Such alloys are widely used in bellows
and heat exchangers in marine environments, and for marine cable applications. The
use of weld overlay techniques, particularly for Inconel 625, is now being actively
7

promoted for severe environments where crevice corrosion, pitting, or extremely high
flow rates may occur.
The nominal compositions of the nickel rich alloys most commonly used offshore are
given in Table V. Monel 400 is a solid solution alloy of nickel and copper which is
readily fabricated to a variety of shapes. A small addition of aluminium and titanium
to this base, as in K-Monel 500, gives considerable strengthening by a precipitation
hardening mechanism, the precipitate itself being Ni3 (AIli), the y' precipitate widely
used in superalloys. The Incoloy alloys are essentially single phase alloys but in the
case of IN625, a carbide rich precipitate is distributed throughout the matrix. All the
alloys have good formability and can be welded by the standard techniques of MMA,
MIG and TIG.
The corrosion rates for all of the nickel base alloys in flowing seawater environments
are less than 0.025mm/year (0.001 inches/year) compared to 0.1 mm/year for carbon
steel. The Inconel alloys show even less corrosion, typical rates being less than
0.0025mm/year. However, under stagnant or crevice conditions, localised pitting can
occur. Typical pit depths after immersion for several years are given in Table VI.
From this data it can be seen that the IN625 alloy is virtually immune to this type of
attack and any component surface will remain essentially free from any deposit build-
up.
*It is well known that the corrosion rate generally increases with water velocity or asoxygen availability increases and many applications in pumps, valves, etc. require
resistance to high velocity seawater flow. Table VII summarises the results of
impingement tests at velocities up to 43m/sec. Once again it can be seen that the
nickel base alloys in general and IN625 in particular show excellent resistance to this
type of attack.
Monel 400 has been widely used in the Gulf of Mexico, the Arabian Gulf and the
North Sea as a sheathing material for offshore risers and has proved highly effective.
8

Usually it is only the hot risers which are protected in this way but there are examples
where all the structural members passing through the splash zone are similarly
protected. In addition to being resistant to corrosion attack, such coatings must
withstand abuse from impact and abrasion by vessels and mooring lines.
Experience in all regions of the world has indicated that virtually no corrosion takes
place over the period up to 20 years and moreover such Monel clad risers are free
from expensive maintenance.
The claddings are usually 2-3mm thick for strength and mechanical property
considerations and are attached by welding onto steel bands, forming a cylinder
around the pipe in question and welding into position. Great care must be exercised
when making any attachments to the riser pipe. Monel is noble to steel, so galvanic
interactions have to be considered. The risers are always cathodically protected in
addition to any cladding which is used and this results in the Monel becoming
polarised and coated with a calcareous deposit. The upper and lower interfaces with
the steel pipe are usually painted with a coal tar epoxy to reduce any galvanic effects
in these regions.
Inconel 625 is an established alloy for use in chemical plant and marine environments
because of its exceptional corrosion resistance. Weld over-laying provides an
economic means of utilising such expensive materials in many situations where
otherwise it could not be considered. Such layers are virtually immune to crevice
corrosion and although not excessively hard (250Hv), can work harden during
service to provide good wear resistant as well as corrosion resistant claddings. For
example, valve and shaft surfaces can be readily clad with IN625 using any of the
0standard welding techniques to provide satisfactory components. Hasson deposited
Inconel 625 clad layers on a 3% nickel steel and reported satisfactory corrosion and
fatigue properties if the iron level in the clad layers was less than 9% and at least 8%
molybdenum was present. Most clad components usually consist of two or three
layers in order to reduce iron pick up from the substrate and this obviously increases
the cost of the operation. However, recent work by Dimbylow and others at AMTE
9

Laboratories, Portsmouth, has shown that high quality single clad layers of IN625 canbe deposited using an automatic TIG technique which have excellent properties.
Applications for IN61 5 weld overlays include Christmas tree valves, joints for singlepoint mooring buoys and tanker loading systems, pump casings and ball valves.
3. FRACTURE FATIGUE AND CORROSION FATIGUE
Steels can fail under a variety of situations where failure would not normally beexpected, so called brittle fracture, fast fracture or cleavage failure being a particularlyimportant case. When structures are welded, a number of features exist which makebrittle failure more likely as evidenced by the failures experienced by the Liberty shipsin World War 11. Since that time, improvements in materials, in design and inconstruction techniques have reduced the incidence of such catastrophic failures inlarge structures to a minimum, but they can still occur unless stringent precautionsare taken. Many design specifications address this matter by calling for materialswith an appropriate standard of notch toughness to be used usually assessed by theCharpy V-notch test (0w) or Crack Opening Displacement (COD) test. The level ofnotch ductility required usually varies with the design temperature envisaged, thestrength of steel used, and with specimen size. Figure 7, for example, taken from theDepartment of Energy Guidance Notes on Design and Construction of OffshoreInstallations indicates that levels of absorbed energy in the Charpy V-notch test of27J and 34J respectively are required for mild steels (280N/m 2 yield steel) and forhigh tensile steels (355 N/in2 yield). These values must be obtained at a test
* temperature defined by the diagram based on the particular design situationenvisaged. For example, the horizontal lines on the diagram depict typical North Seadesign temperatures of +40C (submerged areas), and -10OOC (surface air zone) and50mm thick material must meet the requirements specified above at a testtemperature of -350C and -500C respectively.
10

Most requirements ask for comparable properties in weld metal and heat affected
zone as well as in the parent material and it is usually these former regions which
pose most problems in meeting the specifications. Operations in more severe
environments such as Arctic regions will of necessity call for more stringent notch
ductility requirements and correspondingly specifications in the Middle East will be
less stringent.
3.1 Brittle Fracture
0 Cleavage failure associated with very little plastic deformation occurs in steels at low
temperatures. The propagation of such a cleavage crack requires much less energy
than that associated with the growth of a ductile crack as can be easily illustrated by
measuring the absorbed energy in an impact test such as the Charpy test, Figure 8.
As the mode of fracture changes from brittle to ductile there is often a marked
change with temperature leading to the concept of a ductile-brittle transition
temperature. However, it must be emphasised that there is widespread scatter in
such a test with most commercial steels and the transition more usually occurs over
a range of temperatures. In addition, the majority of steels are anisotropic in fracture
behaviour as indicated in the diagrams for specimens tested in the longitudinal and
transverse directions with respect to the parent plate. Moreover, the transition
temperature is not fixed; it varies with the test procedure in particular changing as the
specimen size (Figure 9) and rate of straining are modified. It is nevertheless widely
used because it is cheap and easy to carry out and can provide a useful quality
control function. More sophisticated fracture toughness tests are now often used
utilising notched and fatigue pre-cracked specimens. The stress intensity factor K
at the root of the crack is defined by K = o(nc)'/ 2 where o is the applied stress, and
c the crack size. the transition to rapid fracture occurs when a critical stress intensity
factor Kc is reached.
All body centred cubic materials show a marked dependence of the yield stress on
temperature due to the variation of the Peirls-Nabarro stress (the stress to move
11

dislocations through the microstructure) with temperature. As the temperature islowered below room temperature, the yield stress is increased and the firstdislocation to move, will do so rapidly, as the velocity is proportional to the stressand the possibility of forming a crack nucleus by dislocation pile-ups at interesting
slip plane interactions is therefore increased, Figure 10. Strong impurity dislocationinteraction effects with the carbon and nitrogen additions in such steels lead to
strong yield paint effects, rapid movements of dislocations and likely crack
nucleation. Micro cracks have also been shown to nucleate at grain boundarycementite particles, at cementite lamellae in pearlite, and at brittle oxide inclusionssuch as alumina and silicate particles, and to subsequently propagate to cause brittle
failure. It is well known that the ductile brittle transition temperature can be reduced
by refining the grain size and this technique is commonly used in practice to produceimproved materials, Figure 11. If cracks are formed by dislocations piling up at grain
boundaries as indicated in Figure 10, then the smaller the grain size, the smaller will
be the dislocation pile-up length, the resulting local stress concentration and the
number of micro cracks.
Griffith showed that a crack would propagate if the increase in surface energy
generated by crack growth was less than the resulting decrease in elastic energy.
In order to propagate
Of= (2YE 1/2
where y =surface energy
2c =crack length* E =Young's modulus
As the crack propagates the stress that is required is reduced and therefore the
crack accelerates. Crack propagation is extremely rapid.
12

The local stress field at the tip of a Crack is characterised by the para meter K the
stress intensity factor (K = aCrnc)T which reaches a critical value KC when
propagation takes place:
Kc af (noC) '
Figure 12 indicates that af the tensile stress for propagation varies linearly with d1'A
where d is the grain diameter and clearly indicates the benefit of fine grain size in
steels for increasing the resistance to crack propagation.
By examining how the fracture stress and yield stress of a particular steel vary with
temperature, a qualitative explanation of many of the physical and metallurgical
factors which modify brittle fracture behaviour can be formulated. An examination of
Figure 13(a), for example, shows that both af and ay in general increase with
decreasing temperature with a Y showing the greatest effect. At relatively high
temperatures the material yields macroscopically prior to fracture whereas at low
temperatures the material is completely brittle. At the transition temperature Tc the
yield and fracture stress are coincident. Any feature which increases the yield
strength, other than grain refinement, causes an increase in ai (friction stress in the
Petch equation ay, = a1i + kyd-12 and a resulting, increase in the transition
temperature as indicated by Figure 13(b). Thus, solid solution strengthening,
precipitation hardening and work hardening all raise the transition temperature. On
the other hand, reducing the fracture stress by introducing notches into the test piece
by welding the sample, for example, or by providing crack nuclei from fractured
carbides, or from fatigue, results in a decrease of af as shown in Figure 13(c) which
again results in an increase in the transition temperature. Examination of the
equations controlling fracture and yielding behaviour indicates that grain refinement
results in an increase in both at and oay although it has a greater effect on at than on
ay as shown in Figure 13(d). The net effect is to move the fracture transition to lower
temperatures. In comparison with other methods of increasing strength, grain
13

refinement is the only one which enables both strength and toughness to be
increased simultaneously and for this reason is the one that it widely used in practice.
Other metallurgical features which reduce transition temperature behaviour are the
removal of interstitial elements such as nitrogen from solution (Figure 14), a reduction
of carbon content of the steel (Figure 15), and a reduction in the carbide thickness
which can be achieved by fast cooling (Figure 16).
In order for brittle failures to occur in practice a defect or notch of some sort is
usually required together with a tensile stress, and as both of these factors are likely
to be present in many welded structures it is not surprising that brittle failure is more
likely in such cases. Regions of high stress concentration due to poor design, poor
welding practice or the presence of residual stress combined with notches in the
form of weld defects or heat affected zone cracks can usually be identified as the
cause of the failure. Such failures can only be overcome by continual attention to
design detail, stringent non-destructive testing and quality control procedures and
the provision of the most notch ductile materials.
The formation of martensitic or bainitic structures in the heat affected zone regions
of welds provides microstructures which can crack more easily and encourages
cleavage fracture. This aspect is usually controlled by reducing steel hardenability
usually through the provision of a steel composition with reduced carbon equivalent
where:Carbon equivalent = C + Mn (Cr + Mo + V) + (Ni + Cu)
Carbon-equivalent = C + +
6 5 15
The presence of hydrogen in the steel also encourages failure by precipitating at
inclusion/matrix or carbide/matrix interfaces where it forms voids or cracks which
grow until the critical crack length for instability is reached when rapid failure occurs.
The use of low hydrogen electrodes and preheating can reduce the incidence of
such failures. Satisfactory performance initially does not guarantee that brittle failure
14

will not occur during the lifetime of the structure because small defects can grow to
a critical size under fatigue loading conditions or a sudden stress concentration can
occur.
3.2 Fatigue and Corrosion Fatiaue
Fatigue analysis is an essential element in the design of offshore structures,particularly those in the North Sea where the wave loads are much more significant
than in some other areas of the world such as the Gulf of Mexico and the Middle
East where in contrast, the maximum wave height during storms controls the strength
aspects of the design. Typical waves in the North Sea have periods of 9 - 18seconds giving some 108 wave encounters during typical design periods. The
procedure used in carrying out a fatigue analysis is illustrated in Figure 17. The
process is fraught with difficulties in predicting loads induced by wind, waves and
structural mass over 20 to 50 years design lives, in estimating the stress
concentration factors CSCF) at particular nodal positions, in determining the size and
position of any defects that are present in the structure, and in predicting the
corrosion fatigue properties of the connections under the relevant operating
conditions. The procedure that is adopted is to make the best estimates of loads
and stress and then to use fatigue design curves and cumulative damage rules to
determine estimated joint lifetimes. If the lifetime is too short then means must be
adopted to reduce the stress by increasing joint thickness, by advantageous
placement of reinforcement stiffeners, or by reducing the stress concentration by
grinding weld toes.
In practice the loading in offshore structures is random in nature. Cumulative
Damage rules such as that due to Miners are used to estimate damage accumulation
and estimated lifetimes. Mines Law states that the cumulative damage (D) due to
cycling within various stress ranges during the lifetime of the structure should be less
than 1 where:
15

where ni = number of load cycles occurring in stress range Si
Ni = number of load cycles with stress range Si to cause failure
In offshore structures the low stress range cycles make a significant contribution to
D because of their frequent occurrence. In practice, D is usually greater than 1 so
adopting a value of 1.0 or even 0.5 which is used in some cases ensures a
conservative and hence safer lifetime estimations.
The service life can also be calculated using fracture mechanics considerations.
Fatigue failure occurs in two stages, crack initiation and crack growth. In the case
of offshore structures it is generally assumed that the crack initiation stage is usually
very small or absent completely because of the presence of defects from the welding
process and that most of the lifetime is spent in crack propagation.
If the resulting fatigue crack growth rate is plotted against the stress intensity factor
as shown in Figure 18, three distinct regions can be identified. In the low stress
intensity region (Region 1) there is a threshold stress intensity below which crack
growth does not occur, this corresponds to the normal fatigue limit in the S-N curve.
In the Region l1 the Paris Erdlogan power low fits data for a wide range of materials
* and geometries:
dN
where both C and rn are materials constants, typical values of mn range from 2.5 to
5. The stress intensity factor AK = fAo~fna where a = dimensions of crack and Aa
=stress range. At high values of stress intensity (Region 111) cracks propagate
rapidly to failure.
16

if we assume that the crack initiation phase is very short we can calculate the service
life using the fracture mechanics approach. The Paris Erdlogan equation can be
transferred with the standard S-N form by taking the integral:
CCA&K)m
where Nf =service lire
ai =initial defect size
at final or critical defect size
Welded joints often represent severe stress concentrations due to the weld itself
producing an increase in stress, or because small cracks or intrusions are often
present at the toes of the welds which is usually also the point of maximum stress
concentration. The stress concentration effect is different for different types of
welded joint and therefore the S-N curves produced can be classified according to
their relative fatigue performance. In order to improve the fatigue performance of a
welded joint the stress concentration inherent in the weld must be reduced. This can
be done by machining or grinding, typical improvements in fatigue strength at 2
million cycles being 80% by toe grinding, 100% overall grinding, and 140% by TIG
dressing. The introduction of compressive residual stresses at the point of cracking,
thereby suppressing crack growth is another method that can be used and thus
heavy grit blasting, for example, can also lead to 100% improvement in fatigue life.
In order to reduce the danger of fatigue, the best approach is to ensure that the
stress is reduced as much as possible. This can be accomplished in the design
0 stage by reducing hot spot stresses by good design practice, by thickening sections,
and by utilising smooth contours such as in castings. At the fabrication stage,
improvements can be made by careful selection of materials, welding consumnables
and welding practices and the application of strict NOT and quality assurance
practices to ensure that less defects are present. However, this is not the end of the
story and the structure must be continually inspected and maintained to find any
cracks that are present as rapidly and cheaply as possible, and to repair them either
17

by grinding out the defect or by replacing the component with a new component -
this could involve underwater welding which is a difficult and costly exercise to
undertake.
REFERENCES
Recommended Practice - Corrosion control on Steel, Fixed Offshore Platforms
Associated with Petroleum Production, NACE Standard RP-01-76.
Recommended Practice 'Control of Internal Corrosion in Steel Pipelines and Piping
*lw Systems', NACE Standard RP-01-75.
NACE Standard MR-01-75 Sulphide Stress Cracking Resistant Materials for Oil Field
Service.
La Que F L, Corrosion Handbook, Edited by Uhlig H H John Wiley, 1948.
Evans U' R, 'The Corrosive Oxidation of Metals' 2nd Ed., Edward Arnold, 1967.
Askheim N E, European Offshore Petroleum Conference, Paper 222, 1980.
* Kato C, Otogi R 0, Kado A, and Histamatsu Y, Corrosion Science, 1978, 18, 61.
Strutt J E, Billingham J, and Turner W H D, T'echniques for the Assessment and
Presentation of Weld Corrosion Data', IRM 82, Edinburgh, November 1982.
Hockenhull B S, Joint Offshore Conference, February 1976, published Metals Society.
Bernhardsson S 0, and Oredsson J, UK National Corrosion Conference, November
1982, p.63, publ. Inst. Corr. Sci. and Tech.
18

Gilbert P T, British Corrosion Journal 1974, 14, 1, 20.
Glover T J, and Moreton J B, UK National Corrosion Conference, London 1982, Pub].
Inst. Corr. Sci. and Tech.
Creamer E V, 'Splash Zone Protection of Marine Structures, Offshore Technology
Conference, OTC 1274, 1970, p485.
Powell C A, and Davies R V, Inconel 625 - Weld Overlaying for Corrosion Resistance,
UK National Corrosion Conference, London, November 1982, publ. Inst. Corr. Sci.
and Tech.
Hasson D F, Zanis C, Aprigliano L, and Fraser C, Welding Research Supplement,
January 1978, iS.
Dimbylow C S, and Chipperfield K M, AMTE Portsmouth, Private Communication.
Honeycombe R W, Steel Microstructure and Properties, Ed. ? 1980.
Knott J F, Fundamentals of Fracture Mechanics, Butterworth, London 1973.
Graft W J, Introduction to Offshore Structures, Golf Publishing, 1981.
Offshore Installations - Guidance on Design and Construction, ISBN 0-11-7011185,
Department of Energy, HMSO, London, 1984.
Rules for the Design, Construction and Inspection of Offshore Structures, Det Norske
Veritas, 1977.
Recommended Practice for Planning, Designing and Constructing Fixed Offshore
Platforms, ARI-RP2A, January, 1981.
19

Crooker T W, and Leis B N, Corrosion Fatigue, STP801, ASTM 1983.
Faulkner D, Cowling M J, and Freize, Integrity of Offshore Structures, Appl. Sci. 1981.
Salama M M, OMAE Symposium on Offshore and Arctic Frontiers, ASME, 1986.
Salama M M, et al, Proceedings Eighth International Conference on Offshore
Mechanics and Arctic Engineering, ASME 1989.
0 Noordhoek C, and de Bach J, Steel in Marine Structures, Elsevier, 1989.
20

TABLE ICorrosion in the Marine Environment
Corrosion Rate
General Behaviour:
General subsea corrosion 0.1 - 0.2mm/year
Atmospheric zone corrosion 0.05 - 0.5mm/year
Splash zone 1 mm/year
Special Problems:
Splash zone risers (1000C) 5mm/year
0 Localised corrosion at welds 4mm/year
Ekofisk riser 7mm/year

TABLE IIComparison of Corrosion Behaviour in Seawater pm/year
for Various Alloys as a Function of Flow Rate
Corrosion in pm/yr under conditions indicated
Static Conditions Flow rate Flow rate
1Om/s 40m/s
Carbon Steel 125 2500 5000
Copper Base 25 250 500Alloys
Stainless Steels 2 with some deep < I < 1and Monel pitting
Inconel 625 <1 <1 <1(Ni/Cr/Mo alloy)
TABLE IIIResistance to Pitting for Alloys in Quiet Seawater (<1rm/s)
Material Typical Penetration Ratein Pits (pm/year)
90/10 Cupro Nickel 25 - 130
70/30 Cupro Nickel 25- 130
Brass 150-300
* Aluminium Bronze 76
Carbon Steel 400 - 800
Stainless Steel (316) 1830
Inconel 625 (Ni/Cr/Mo) 0

TABLE IVFouling Resistance of Materials in Quiet Seawater
Arbitrary Rating Scale of MaterialsFouling Resistance
90 - 100 Best Copper90/10 copper-nickel alloy
70 - 90 Good Brass and bronze
50 Fair 70/30 copper-nickel alloy,aluminium bronzes, zinc
10 Very slight Nickel-copper alloy
0 Least resistant Carbon and low-alloy steels,stainless steels, 59% Ni-Cr-Moalloy, titanium
Above 1m/s (3ft/s) continuous velocity (about 1.8 knots) fouling organisms haveincreasing difficulty in attaching themselves and clinging to the surface unless alreadyattached securely.
TABLE VComposition of Nickel Based Alloys Used Offshore
Alloy Ni Cr Cu Mo Fe Mn Al "i C INbTaMonel 400 65 - 32j- 1.5 1.0 - - 0.12 -
Monel K-500 64 - 30 - 1.0 0.8 2.8 0.6 0.13 -
Incoloy 825 42 21 2.0 3.0 3.0 - - 1.0 0.04 -
Inconel 625 61 21.5 - 9:0 2.5 0.3 0.2 0.2 0.05 3.65

TABLE VIPit Depth After 3 Years Exposure In Stagnant Seawater
Conditions For Nickel Base Alloys
Maximum Pit Depth After
Alloy 3 Years Exposure
(mms) (inches)
Inconel 625 0.000 0.000
Incoloy 825 0.25 0.001
Monel K-500 0.864 0.34
Monel 400 1.067 0.042
Stainless steel type EN58J 1.575 0.062
Carbon Steel 1.778 0.070
TABLE VIICorrosion/Erosion Under Impingement Conditions
(Velocities Up To 140ftlsec)
Corrosion/Erosion RateAlloy (mm/year) (inches/year)
Inconel 625 0.000 0.0000
Incoloy 825 0.008 0.0003
Monel 400 and K-500 0.013 0.0004
70/30 Cupro Nickel 1.27 0.0500
Carbon Steel 3.05 0.1200

Hastelloy ° "C"
Titanium
Type 316 stainless steel Nil except for deep pitting
Type 304 stainless steel Nil except for deep pitting
Nickel chromium alloys Nil except for deep pitting
Nickel copper alloy Usually <1 mpy except for pitting
vNickel Usually <1 mpy except for deep pitting
70 - 30 copper nickel 0.5 Fe -
W90 - 10 copper nickel 1.5 Fe
Copper
Adm iralty brass ... ........ .....
Aluminium brass -
G bronze ..........
Nickel aluminium bronze
Nickel aluminium manganese bronze :
Manganese bronze : ::.: Dezincifies
VAustenitic nickel cast iron :
Carbon steel ......
Nil 2.5 12.5 25 50 125 250Typical average corrosion rates, pm/year
'Trademark Union Carbide Corporation NB. 1 mpy is 25prm/year
FIGURE 1 - Corrosion of Metals and Alloys by Quiet Seawater

0.3
a E9
E
w
Dl 0.20
0Lii
Crz0
In
00o
'0 1.2 3 4
EXPOSURE PERIOD.(years)
FIGURE 2 - Effect of Exposure lime on Corrosion of Mild Steel

MARINE
ATMOSPHERE
SPLASH ZONE
- - HIGH TIDE
___ --------- LOW TIDE
CUIETSEAWATER
MUD LINE
Corrosion of steel piling.o 100 20D 300 400 500 Pira
o 5 10 1S 20 lo'in/a
TYPICAL CORROSION RATE OF STEEL
FIGURE 3 - Variation of Corrosion Rate in Splash and Tidai Zones

* 0.20
V)c 0.15CCuAUX 0.10 Cr
0 0.05 ptI I
0.2 0.4 0.6 0.8 1.0 1.2 1.4
Alloy Element(%)
(a) Atmospheric Exposure Test for 15.5 Years
0.20bL
cic 0.15
0.10
. . 05 S!0.5S P Si C
0.2 0.4 0.6 0.8 1.0 1.2 1.4
Alloy Element (%)
(b) Atmospheric Exposure Test for 17 Years
FIGURE 4 - Effect of Alloy Elements on Atmospheric Corrosion

- =E-. 0.- 1000
30 750 -
wJ20 CD 500
-10 .2 250'I/0
0 u 0 Z* 0 1 2 3 4 m/s
Velocity0 5 10 ft/s
FIGURE 5 - Effect of Seawater Velocity on Corrosion of Steel

CLADDING COSTS300-
250
E-=
Pointed2Mild Steel
OgýC- 200-o
2 _Stainless Steel0I--
150
100 .. ..... . ,! !_ L.
5 10 15 20 25
Life Yrs.
FIGURE 6 - Comparative Costs of Stainless Steel and Painted Mild Steel ModuleWalls

0"+1
+10 Material
thickness
Z-
I- 01 --- -- -- -- - --- -- - - - - - - -
-20 -
z -30 /
-40.-60 -50 -40 -30 -20 -10 0 +100. CHARPY TEST TEMPERATURE (°C)
FIGURE 7 - Materials Cv Requirements for Use on Offshore Installations

100
80Transverse
60
40 %,
20Longitudinal '
0
32Longitudinal
28 - -
1 If
Transverse
o I
-'*0 60 -40 -0 0 20 40Test Temperature, "C
FIGURE 8- Typical Charpy-V Notch Curve For Steel. Note Different Values inLongitudinal and Transverse Directions.
We notch . & 7Fatigue precrack
Ductile tearing./ :' 7Ductile tearing
Britleess LEGENDDuctile tearing withbrittle cleavage
Cr)0 1-ý Note: At temperature, Tm,LU the small specimen may
behave in a ductile mannerOnset of whereas the large specimen0 ductile tearing may be brittle.
tBrittle cleavage
Brittle. cleava~ge
Tmn
TEMPERATUREFIGURE 9- Effect of Specimen on Size Experimentally Determined Impact
Transition Curve.

Obstacle
N,, CCrack
,y- ,,1.-- Glide plane
FIGURE 10 - Schematic Diagram of Dislocation Mechanisms For Crack Nucleation
GRAIN SIZE- MICRONS415 40 16 10 6 4-5 3 23.5 .50
.0
*YIELD 300 -50 IMPACTSTRESS TRANSITIONMN/m 2 TE MPERATURE
S-)00 C
150 STRESS -150
10 1 1'5 2'0GRAIN SIZE. d'- (mmin)
FIGURE 11 - Effect of Ferrite Grain Size on the Impact Transition Temperature andYield Strength of a 0.1%C Steel

0 1500Mild steel 0
SUv 0
N A 0 AEa AA
z AA-1000 A v
A A A 0'a 0 V
U
-500 -
uim
0 1 2 3 4 5 6 7 8 9
(Grain diameter, d)-F½2 (mm)- 1/2
FIGURE 12 - Dependence of the Local Fracture Stress a1 on the Grain Size of MildSteel (after Knott)

ýuts oo-fI.
-rire-c
(a) showing derivation of Tc .(b) effect of increasing ay
ar,
• "•,2 r Te•, r
(c) effect of decreasing a f , (d) effect of grain refinement
FIGURE 13 - Schematc Variation of Fracture Stress (of) and Yield Stress (ay) wtTemperature for Steel

OwrTEMPEIAA"uRt ( C. )
0 1 - 0.002%N; 2 - 0.0037%N; 3 - 0.0047%N4 - 0.007%N; 5 - 0.010%N; 6 - 0.016%N
0FIGURE 14 - Effect of Nitrogen in Solution on Charpy-V Transition Curves
200- 0-11% C
S150 -0-2% C
C,
'=100 -E0 0"31% C
0-41% C0-49% C
50 060% C
0.69% C0"8% C
-150 -100 -50 0 50 100 150 200Test temperature (°C)
FIGURE 15 - Effect of Carbon Content (Pearlite Volume Fraction) on the ImpactTransition Temperature and Charpy-V Notch Transition Curves forNormalised Steels

3 0 -7 4 , 4 -
017 I I
200 030pin j024p PM0 m70 /O7ff1iir
water ar f. urniace10Co 9 `c 1 "1o / cooIQd
X (a)W 0zW 052pnm.
U 0.7liim15 0 0l0.75 wm
-80pm1.73 sam
o I I (b)-60 -20 20 60
TEST TEMPERATURE, C
(a) Coarse-grained C-Mn steels(b) Fine-grained Tltreated Steels
FIGURE 16 - Influence of Increasing Carbide Thickness on Shelf Energy andTransition Temperature

DATA INPUT
STAGE 1 Predict Wave Climate Wind Dataat Final Jacket Location
Sea Bed* Calculate Wave Loads Topography
Full ScaleSiteMeasurements
STAGE 2 Determine Stress Ranges Finite Elementand Number of Cycles Idealisation of
Structure~(Dynam Ana )
STAGE 3 Calculate and Accumulate Sfress Concntra-Damage and Estimate Ufe tion Factors for
Joints
Material S-N Data
FIGURE 17 - Flow Chart of Typical Fatigue Analysis

PRIMARY MECH4ANISMSTII - REGIME A REGIME 6IQ-___
FINAL__
NON.CONI'INUUN CONTINUUM MECHANISM F AILURE
MECHANISMS I (STRIATION GROWTH) I
LARGE INFLUENCE OF: I LITTLE INFLUENCE OF: C
(1) MICROSTRUCTURE (1 MI ICROSTRUCTURE I
III) MEAN STRESS f ill NE AN STRESS I(illI ENVIRONMENT I Jlul) DILUTE ENVIRONMENTI
dI./dN ASK'
I1 SSTATIC NOOE'o NEENAW-ISMS
(CLEAVAGE. INTERGftAWU-
(SLl TACNESS990
LITTLE INFLUENCE OF:
I0.1 ENVIRONMENT
LOG &X
FIGURE 18 - Fatigue Crack Growth Curve For Steel

CORROSION PREVENTION TECHNIQUES AND INSPECTION
Dr. J. E. Strutt Crantield Institute of Technology EnglandDirector - Marine Technology Cranfleld, BedfordCentre
ABSTRACT
Seawater is highly corrosive fluid which can cause steel parts to degrade unless thecorrosion process is effectively controlled. Experience has shown that the applicationof corrosion, prevention techniques is essential to the long term integrity ofunderwater equipment. However, the effectiveness of corrosion control schemescannot usually be guaranteed for the life of underwater systems and inspection andmonitoring techniques must be applied to assess the condition and performance ofthe corrosion control systems.
This lecture will outline the most important seawater corrosion processes, the mainmethods of controlling these processes and the role of inspection and monitoring inthe avoidance of corrosion damage.
The lecture will introduce the main seawater corrosion problems related to offshorestructures and seawater systems on process plant. This will include a description ofthe oxygen corrosion process together with the principle factors affecting corrosionrate, the special factors affecting corrosion at welded joints and a brief introductionto microbially induced corrosion effects. This will be followed by a description of thecurrently used methods for control of corrosion offshore and how they are appliedon offshore structures and on seawater systems for oil and gas processing plant.
Finally the lecture will overview the philosophy of inspection and the main techniquesused by the offshore industry for inspection and monitoring of corrosion andcorrosion control systems on offshore platforms and submarine pipelines.

1. SEA WATER CORROSION
Seawater is a highly conductive liquid which becomes corrosive in the presence of
oxygen. When seawater makes contact with structures and equipment manufactured
from carbon steels, corrosion may well occur at an unacceptable rate unless
corrosion prevention measures are taken.
Oxygen dissolved in the sea water is the main factor responsible for the high
corrosivity of seawater and corrosion rates increase with increasing flow rate and
temperature. Organic growths, slines or bacterial activity can adversely influence the
corrosion behaviour and complicate the corrosion control measures to be taken.
1.1 Basic Mechanism Of Seawater Corrosion
The main factors which influence the rate of corrosion of carbon steels in seawater
are:-
* concentration of oxygen
* formation of calcareous deposits
* rate of flow of seawater
* temperature
* salinity
* galvanic coupling
12 Corrosion As An Electrochemical Process
The basic electrochemical processes involved in seawater corrosion are summarised
below:-
Fe - .Fe 2+ + 2e- at Anodic sites
4e' + 02 + 2H 20 -ý 4(OHf- at Cathodic sites

Ca++ + HCOj3 + OH -- CaCO 3 ý + H20 calcareous deposits
Mg+ + + HC0 3 + OH -- MgCO 3J, + H20 will form at
Ca+ + + 20H- -- Ca(OH) 24 cathodic sites
Mg + + + 20H' - Mg(OH)2,
The complex mixture of CaC035, MgCO 34, Ca(OH) 24 and Mg(OH) 2 4 is collectively
referred to as calcareous deposit and these form on the surface of the steel reducing
the corrosion rate and reducing current demand on cathodically protected steel
structures.
The oxygen molecules consumed in the cathodic reaction have a low concentration
(=5-1 Oppm) and so diffusion of oxygen to the cathodic sites is the rate controlling
process.
0 2(b) - 0 2(ads) + 2H2 0 + 4e- -- 4(OH)"
It follows that the corrosion current icorr is equal to the limiting diffusion current for
oxygen. For unfilmed surfaces the appropriate rate expression is (see Fig. 1):-
icorr = iL = zFCbD/6D [1]
where 6D is the thickness of the diffusion layer
D is the oxygen diffusion coefficient
Cb is the bulk concentration of oxygen
z is the number of electrons involved in the cathodic reaction and
F is Faradays constant
Under flowing conditions, oxygen is delivered to the cathodic sites more rapidly. The
current is then controlled by the diffusion of the oxygen across a thin stagnant layer
of solution called the hydrodynamic boundary layer (6 H)-
2

The hydrodynamic boundary layer is velocity dependent and generally follows a
power law of the form:-
aH a V-n
where n = 0.5 for laminar flow
and n = 0.9 for turbulent flow
Allowing for a finite rate of corrosion at zero flow, the corrosion rate at 150C for filmed
steels in seawater is very nearly proportional to velocity. After converting current
density into equivalent mm/yr it can be shown that the corrosion rate is approximately
given by:-
CR(mm) = 0.0067 Cb (V + 1.95) [2]
The effects of environmental conditions on the corrosion rate can be deduced from
equation [1].
1.3 Effect Of Fluid Flow
An increase in flow rate reduces the hydrodynamic boundary layer thickness,
increases the limiting current density, iL, (equation [1]) and hence the corrosion rate.
For carbon steel corrosion rates under stagnant conditions at ambient temperatures
are about 0.1mm yr"1, increasing to 0.75 mm yr"1 at 3 m.sec "1t At still higher veloci-
ties, the corrosion rate continues to increase until at 40 m.sec-1 it is about
5mm/yr"',(see Fig. 2). At these velocities the corrosion process is more accurately
*= described as erosion corrosion.
1.4 Effect Of Temperature
Temperature influences the corrosion rate through three principle factors (Fig.3),
namely:-
(a) Through the effect of temperature on the solubility of oxygen.
3

(b) Through the effect of temperature on the viscosity of seawater, which
influences the boundary layer thickness.
(c) Through the effect of temperature on the diffusion coefficient.
An increase in temperature will increase the mass transport processes i.e. reducesolution viscosity and increase diffusion, however, solubility of oxygen decreases withincreasing temperature and so for a constant partial pressure of oxygen in theatmosphere, the concentration of oxygen in solution will decrease at increased
temperatures and result in a lower corrosion rate.
1.5 Effect Of Oxvaen
The corrosion rate is directly proportional to the bulk concentration of oxygen.
Consequently, halving the oxygen concentration will halve the corrosion rates.
1.6 Effect Of Salinity
Salinity affects the solubility of oxygen which decreases as the concentration of salts
increases. Consequently, the rate of oxygen corrosion tends to decrease with
increasing salinity (Fig.3).
1.7 Effect Of Scaling
When calcareous scales form, the effect will be to insert an additional resistance tooxygen mass transfer (t/Dr) over and above the resistance to mass transfer through
the seawater (6/Dh). This will reduce the corrosion rate and cause the corrosion
process to be less sensitive to flow.
icorr = iL = zFCb/t{6/Dh + t/Dfi [3]
4

Thus when a steel component is first immersed in seawater, the corrosion rate willbe high and given by equation [1]. With time the corrosion rate will fall as thecalcareous scale reduces the sensitivity to flow effects, In practice however, the filmnever grows sufficiently thick for the corrosion rate to become independent of flowas increasing velocities will also tend to remove scales by erosion.
1.8 Galvanic Effects
A situation which must be avoided whenever possible is the coupling of carbon0 steels to materials which have potentials noble to the steel and which have large
surface areas as this can dramatically increase the corrosion rate (Fig. 4). Becausemarine structures tend to be made of similar carbon steels, this is not generally aproblem. However, topside seawater systems contain many different materials andgalvanic effects need to be carefully considered. Where galvanic corrosion occursthe corrosion rate will be determined by the cathode to anode area ratio and by the
current density on the cathodic component.
2- OFFSHORE SEAWATER CORROSION PROBLEMS.
Seawater corrosion problems divide into two main areas:
* External corrosion of steel structures, submarine pipelines and risers.* Internal corrosion of seawater facilities.
2.1 External Corrosion
External corrosion of carbon steels usually takes the form of a general but uneven
profile. The rate of metal loss is controlled by the factors described above. Witheffective and reliable corrosion control systems, described below, the corrosion rate
can maintained at a very low level, but without such controls, corrosion will eventually
weaken a marine structure by reducing the load bearing cross section of members.
5

However, at certain locations, for example at welds, the corrosion may be highly
localised then a detailed assessment of the effect of the corrosion process on the
integrity of the structure will be required.
2.1.1 Corrosion At Welded Nodes
Localised corrosion has been observed in low alloy carbon manganese steels in a
number of marine applications (in extreme cases rates of attack have been as high
as 2.5 - 4mm/year):-
S * Ship building steels (early 1970s)
* Welds at nodes on offshore structures (1980s).
0 Welds on water injection lines.
The attack may take a number of different forms dependent on the composition and
microstructure of the weld. For example, pitting corrosion at or near the heat affected
zones (HAZ), wide shallow pitting in the weld metal (WM), grooves of corrosion in the
HAZ and knife-line attack in the fusion zone (FZ) (Fig.5).
Under conditions where an adequate corrosion protection system is employed,
preferential weld corrosion is not normally a major problem (assuming correct weld
cleaning procedures have been carried out). However, in certain instances,
enhanced HAZ corrosion can occur as a result of galvanic effects associated with
cathodic weld metals. Nickel and to a lesser extent copper, are the main elements
producing cathodic weld metals.
The course grained region of the HAZ is the most susceptible to HAZ corrosion. The
higher heat input welds often produce more cathodic weld metals and produce
greater corrosion in the HAZ. The latter appears to be due to unfavourable
distributions of carbon within the coarse grained region of the HAZ and thereby
producing local galvanic cells between the carbides and ferrite matrix.
6

The chemical composition of the steel can also have a dominant effect on thecorrosion behaviour of the weld metal which influences whether the weld metal isanodic or cathodic. For example, a weld metal filler which is cathodic to a low alloysteel could exhibit anodic behaviour if used with a more highly alloyed steel.
A cathodic weld metal appears to be a pre-requisite for weld metal groovingcorrosion. However, increasing the concentration of "cathodic" elements in the weld
metal does not appear to increase the severity of attack in the HAZ.
0 The effect of microstructure on the corrosion behaviour and rate of the HAZ isdependent on the chemical composition of the steel. However, the greater the alloy
content of the steel, the less important is the microstructure to HAZ corrosion. Onlywhen a cathodic weld metal is present does microstructure influence the corrosionbehaviour of the HAZ.
Under conditions where stress corrosion cracking might occur, weld areas must becarefully considered. Defining safe hardness levels to avoid stress corrosioncracking (SOC) and designing against corrosion fatigue are major considerations.
2-2 Corrosion Control On Structures And Pipelines
Three principle methods are used to control of corrosion on offshore structures.
These are:-* corrosion allowance on wall thickness* cathodic protection
* use of anti-corrosion coatings.
The following general strategies are used to control corrosion in the various zones
(Fig.6).
7

splash zone: In this region the corrosion rate is relatively high and it is difficult
to apply cathodic protection. The solution is to use a thicker
steel section with splash zone coatings.
submerged zone: In this zone the corrosion rates are more moderate and can be
controlled by cathodic protection.. In this zone, for structures,
the use of anti-corrosion coatings is optional.
mud zone: Problems and solutions are similar to submerged zone but
there is an increased susceptibility to Microbial corrosion in this
zone. Corrosion is controlled principally by cathodic protection
and thicker steel sections. This area is very difficult to inspect.
pipelines: Corrosion rates for submerged pipelines are similar to those of
submerged structures when operating at ambient temperatures.
However, it is the practice to use both cathodic protection and
coatings together as a corrosion control system.
2.2.1 Corrosion Allowance
Corrosion allowance can be used to help a structure achieve its design life and is
useful when there is a degree of uncertainty in the effectiveness of other corrosion
control systems. The wall thickness, xw, is calculated as:-
=W ritd + Xu +)(S
where r is the rate of corso, xU is an additional wall thickness to allow for
0 uncertainty in the rate of corrosion, and xS is the wall thickness required to withstand
the loads. The term (r'td + xu) represents the corrosion allowance.
8

22-2 Cathodic Protection
Cathodic protection (CP) is widely used to control corrosion on underwater andburied structures and on marine vessels. it has applications in many industries but
one of the most important is the offshore industry which uses cathodic protection
widely on all subsea structures and pipelines.
Cathodic protection is commonly used in conjunction with organic coatings andprovided that appropriate coatings are selected, the two methods are verycomplementary providing a highly reliable corrosion control system.
Subsea pipelines always use cathodic protection in conjunction with coatingswhereas for offshore structures of the Jacket type, OP is usually (but not exclusively)applied directly to bare steel surfaces for steel surfaces in the submerged zone. Forfloating structures CP is generally used in conjunction with coatings.
2.2.21 Theory Of Cathodic Protection
Corrosion is an electrochemical process in which the overall reaction can beconsidered as two half cells involving an anodic and a cathodic reaction. For steelin seawater, the anodic reaction comprises the anodic dissolution of Fe to form Fe2+
and at the cathode oxygen is reduced to form hydroxyl ions. The anodic andcathodic sites associated with a corrosion process are distributed across the steelsurface. Because metal loss only occurs at the anodic sites, it follows that if thewhole surface can be made into a cathode then corrosion can be completelystopped. The metal surface can be made cathodic by simply reducing the potential
of the metal from the free corrosion potential to a protection potential (Fig. 7).The thermodynamic basis for cathodic protection can be illustrated (Fig. 8) by the
Pourbaix diagram corresponding to the Fe-H 20 system. Under free corrosion
conditions at a pH of 8, the free corrosion potential will, at pH 8, lie somewhere
between the two dotted lines marked (a) and (b), i.e. will lie between -400 and +800
9

mV (SHE). By reducing the potential to below -600 mV (SHE), corresponding to the
line marked (c), the steel enters the zone of corrosion immunity. In this zone the
thermodynamically stable species is atomic Fe rather than Fe2+ and corrosion
cannot occur.
In practice it is not necessary to reduce the potential completely into the zone of
immunity as there will be a continuous decrease in corrosion rate as the potential
is reduced from Ecorr to some protection potential.
222.2 Recommended CP Potential Criteria
It is now well established that "normal" strength steels in aerobic environments can
be protected from oxygen corrosion by depressing the steel to potentials below -800
mV (Ag/AgCI) whereas for steels in anaerobic environments the criterion potential is
-950mV (Ag/AgCl) to reduce the risk of microbially induced corrosion (Fig. 9).
It is however possible to overprotect steel. As the potential is reduced below about
-1000 mV(Ag/AgCl) the risk of hydrogen cracking increases and to prevent this
occurrence a lower limit of potential has been set at -11 OOmV (Ag/AgCl).
As very high strength steels with ultimate tensile stresses (UTS) in excess of 700
N/mm 2 are more susceptible to hydrogen cracking, the lower limit of the cathodic
protection potential for these materials is set to -1000 mV (Ag/AgC!).
222.3 Cathodic Protection Systems
There are two principle cathodic protection methods. These are:-* sacrificial anode cathodic protection
* impressed current cathodic protection
10

The fundamental principles of the two methods are identical but the equipment usedto achieve protection is different.
22.293.1 Sacrificial Mnode Method
In the sacrificial anode method, the structure to be protected is physically (i.e.
electrically) connected to a material which is less noble than itself and which will
therefore be anodic to the structure. Provided that the (ionic) path between the two
metals is conductive, positive current will flow from the less noble metal (the anode)
to the structure being protected (the cathode). The circuit is completed by the
corresponding flow of electrons from the anode to the structure. Obviously a good
electrical contact is required to ensure a reliable protective current.
The relative potential difference between the anode and the structure (the driving
voltage) will determine the final potential of the structure and the current required to
achieve that potential. For steels, the usual anode alloys are magnesium, zinc or
aluminium. For copper alloys, iron is frequently used as a sacrificial anode material,
e.g. in sea water cooled heat exchangers with copper alloy tubing.
22-2.32 Impressed Current Method
In this method the driving voltage is provided by a power supply. If an ac power
supply is all that there is available the power will first need to be rectified. The
terminals are then connected to the structure (the cathode) and to the auxiliary
electrode (the anode). Some offshore structures are protected by impressed current
0 systems but protection of long subsea pipelines is not feasible using this method.
There are some inherent dangers in using the impressed current method as it is
possible to switch off the system (accidentally or deliberately!) or even to connect the
terminals the wrong way round inadvertently, If this occurs, instead of reducing the
corrosion rate, the corrosion rate will increase dramatically! Because of cost and
11

cabling requirements on offshore structures, it is necessary to minimise the numberof impressed current anodes and this introduces current distribution problems. Ingeneral, impressed current systems offer significant weight savings but in practiceappear to suffer from problems of unreliability and sacrificial anode systems tend tobe preferred. Some platforms use hybrid systems.
2.3 Paint And Coa-ting Systems
The area between the low water level and the module support frames includes thetidal and splash zones and an atmospheric zone. In these regions, cathodicprotection cannot be used (because a continuous seawater electrolyte path betweenthe anodes and structure is required) and so coatings and paints are the primarymeans by which these areas are protected from corrosion.
22-3.1 Formulation And Function Of Paints
The main constituents of paints are a binder or vehicle oil which controls the basicphysical and chemical properties of the paint. Dispersed in the binder is the pigment,the main function of which is to provide protection to the substrate metal and colourto the final top coat. The viscosity of the paint is usually controlled by a thinnerwhich is added to assist the application of the paint and to control the paintthickness. Some paints contain catalysts or chemicals which speed up the drying
process.
Paint systems often consist of several coats, namely; a primer, an undercoat and atop coat. The function of the primer is to give good adhesion for the top coat and toprovide protection for the substrate.
The top coat or finish coat protects the primer and gives a colour gloss. Theundercoat gives colour uniformity and additional paint thickness.
12

Paint schemes thus operate on a double protection principle. The primer protects the
substrate and the top coat protects the primer. Consequently, the top coat needs to
be chemically and physically durable and neither coat alone provides an adequate
protection against corrosion. Table 3 lists the main characteristics that an offshore
paint system should possess.
2.932 Offshore Paint System
Table 1 shows the characteristics that an offshore paint system should have.
BS5493 2 recommend a number of paint systems suitable for use in marine
applications (Table 2).
22-3.3 Surface Preparation Of Steel
The performance of a coating or coating system depends on the surface profile and
to a large extent on the cleanliness of the steel. The cleanliness of steel surfaces is
usually specified by the pictorial surface preparation standards SIS 05 5900 of the
Swedish Standards Institution, BS 4232 and the American SSPC standard (Table 3).
Surface profile is important as roughening of a steel surface by abrasives or acids
can improve the degree of bonding by effecting a cleaner surface which is both
easier to wet and increases the surface area for bonding with primers. Sa2½/ is
generally specified for offshore painting.
2.23.4 Painrtina Stratealies
No known paint system can last the full life of a structure without deterioration or
damage. Consequently, maintenance painting will be necessary, usually within 5-7
years of service. This however does not apply to pipelines which are coated before
they are installed and cannot easily be repaired.
13

The aim of maintenance painting is to preserve the structure free of corrosion. Inpractice some corrosion is inevitable. Repainting should ideally be carried out beforethe finishing coats have ceased to protect the primer coat or before they cease toprovide a suitable surface base for new paint. Even before any maintenance paintingis carried out, repair painting will be required to patch up damage introduced duringsite welding and construction. Consequently it is important to select paints which areeasily maintained and easily applied, even in the severe marine atmospheresencountered offshore.
Because maintenance painting may need to be carried out in adverse weatherconditions, it is important that the first coating applied on shore is applied to as higha standard as possible. If this is achieved then the only maintenance required is thatof repairing small mechanically damaged areas and the application of additionalcoats before advanced degradation of the primer. A typical strategy is summarised
in Table 4.
2.3 Internal Corrosion
Seawater is widely used on offshore platforms for fire water sprinklers, production ofpotable water for galley, laundry washing and drinking, and for water injection etc..
Water may be injected into wells to enhance production of the hydrocarbonproducts. This water needs to be treated to avoid corrosion of injection lines, whichcould lead to plugging of the well formation and to prevent the well from turning sour
and causing down stream problems of sour gas/oil corrosion.
A simplified block diagram for a typical platform seawater facility is shown in Fig. 10.The corrosion problems which can occur in seawater systems are:-
(a) Oxygen corrosion, accelerated by high flow and turbulence, in pipes, heatexchangers, pumps and valves, etc.
14

(b) Galvanic corrosion in pumps and valves which tend to be manufactured from
various materials.
(c) Bacterial corrosion in stagnant regions, under deposits and within crevices. A
corrosion control scheme for an injection cooling water system would involve
a treatment combining the use of biocides, de-aeration and coatings.
2-3.1 Corrosion Control On Seawater Systems
Internal corrosion can be controlled by a variety of techniques including:-
* de-aeration of sea water
* inhibition by application of scavengers
* application of biocides
* internal coatings
* materials selection.
* various galvanic corrosion control methods.
To combat general seawater corrosion:-
Eliminate oxygen by de-aeration and use of oxygen scavengers to control corrosion
on seawater injection lines. Use coatings upstream of the de-aerators or more
corrosion resistant materials.
To combat bacterial corrosion:-
Use strainers to prevent contamination entering the injection system. Chlorinate at 1 -
3mg/I at the seawater intake by continuous injection. The latter may need to be
backed up by injection of biocide.
The main areas of concern are stagnant zones beneath scales and deposits and in
the filters. All areas following the de-aerator are susceptible to bacterial activity. If
SRB are permitted to establish themselves, they will produce H2S. Unless these
organisms are destroyed before injection, they can turn a sweet well sour, resulting
15

in sour gas corrosion problems in the process equipment and pipelines. Virtually all
seawater floods eventually turn sour.
To combat galvanic corrosion:-
In many cases, the problems of galvanic corrosion can be minimised or avoided by
the adoption of some simple rules (Fig.1 1):-
(i) Where possible use materials of similar electrode potential in seawater.
(ii) Where compatible materials cannot be used, make the key component the
more noble material and as far as possible ensure that the base material
has a larger area than the more noble constituent.
(iii) When coating or painting, paint the cathode (noble material) not the
anode. An imperfect paint film on the anode will lead to rapid attack at the
breaks in the paint film.
(iv) Electrically isolate anodic components from the cathodic components.
(v) If possible separate anodic and cathodic components where electrical
isolation is not feasible.
3. THE ROLE OF INSPECTION AND MONITORING
All operators of offshore structures in the North Sea are now subject to regulations
which require that a certificate of fitness or approval be applied for on completion of
the installation of a structure. The certificate must be renewed every five years. The
maintenance of this certificate of approval requires, amongst other things, that the
structure is subjected to periodic surveys or inspections, and that files containing
data for, and details of, the running of inspection programmes together with any
remedial actions taken, should be made available to the authorities. The introduction
16

of such regulations is based on the strong belief that the risk of failure and accidentcan be avoided by inspection.
The aims of Inspection can be interpreted to mean:-
(i) The detection of any defects, damage or dleterioration which may impairlocal or overall structural safety and serviceability.
(ii) The identification of reasons for the existence of such defects.
(iii) The evaluation of possible consequences to justify repair or furthermonitoring of defects.
The most critical part of this is the need to find defects and this relies heavily onvisual recognition using either the eye of a diver or a camera carried by a diver oran ROV. Before considering the techniques and procedures of inspection it ispertinent to consider the type of defects which will need to be found during aninspection programme.
3.1 Structural Defects
The nature and number of defects found on a structure significantly influences theinspection programme. Table 1 summarises typical defects found on structures. Themost common are surface breaking cracks in or near to the HAZ of a weld. Thesedefects are potentially the greatest risk. Other defects which may need to bedetected include:-
* Subsurface cracks* Internal cracks
" Corrosion pits* Knifeline/grooving corrosion at welds* Dents and gouges.
17

together with*The extent and type of fouling.
*Cathodic protection potentials.
3.2 Causes Of Defects
Damage or deterioration on a structure arises from one or more of the followingcause categories:
* Deterioration of materials as a result of the environment e.g. corrosion,fatigue, SOC. wear! erosion.
* Overload of the environment* Accidental or third party damage
* Human or Gross error.
There is clearly some overlap in these categories. For example, human error can leadto the selection of the wrong materials which results in more rapid deterioration of thematerials by the environment.
3.3 Effect Of Damaage Cause On Failure Avoidance Mechanism
Not all failures can be avoided by inspection or monitoring. The detection of incipientfailure depends to a certain extent on the cause or reason for the damage, see Table5. For example, because of the extreme suddenness and the unpredictability offorces associated with accidents and acts of god, such as fires, explosions,hurricanes, dropped objects, ship collisions etc., inspection is not a practical meansof failure prevention. In these cases, built in redundancy appears to be moreappropriate. Similarly, operational overload is more appropriately avoided by safetyfactors.
Evidently the main role of inspection is in the avoidance of failures which have theirprimary cause in either metallurgical deterioration, eg corrosion, corrosion fatigue,
18

fouling etc. or in gross errors such as human error, lirmitations of knowledge orincorrect materials selection.
3.4 Summary Of Inspection Activilties
The methods of categorising and classifying the inspection tasks are different in theUK and Norwegian sectors but the approach is essentially similar.
The inspection programmes carried out on offshore structures usually involve thefollowing general activities:-
(i) Initial Visual Inspection
(ii) General Visual InspectionsSeabed SurveyDebris Survey
Marine growth survey(iii) Corrosion Inspection(iv) Cleaning of Marine Growth
(v) Critical Inspections
In the North Sea area the details of the operators inspection programme will varyconsiderably, However they all follow the same basic pattern, namely; a generalvisual survey of the structure and the risers, a representative sample of OP readings,a close visual inspection of about 10% of the nodes every year, concentrated on thecritical nodes, preparation of a scour map and a visualI survey of the pipelines, tie-ins,risers and connections within about 20m of the platform.
3.5 The Underwater Inspection Proaramme
Underwater inspection is expensive for the operators and any underwater activityrepresents a risk to the divers who carry out the work. Consequently careful planning
19

is essential. All underwater inspection is essentially a combination of visualinspection backed up by NDT techniques for detailed assessment of suspect areaspreceded by any cleaning of the steel that may be necessary in order to carry outthese activities.
On offshore structures the areas that need to be inspected include; subsea risersand conductors, sea water intakes and Caissons, oil and gas flow lines, supply boatmooring systems, jacket members and legs, Conductor guide frames, nodes.
The areas which are susceptible to corrosion on a steel jacket structure include; theunderside of the deck, the tidal/splash zone, the upper and lower end of anysheathing or special coating, welded joints particularly at nodes and any water filledbraces.
The areas on subsea pipelines and risers which are susceptible to corrosion include;spool pieces or pup pieces, hyperbaric welds, bends in the pipeline, flanges andwelded joints, external splash zone, areas within sleeves and clamps etc..
Virtually all the operators split the inspection work up so that the work is distributedover the 5 yr period. That is, the sum of five annual inspection surveys will make up
the information required for recertification.
3.6 Corrosion lnsDection
For this lecture attention will focus primarily on the corrosion inspection activity,although it should be realised that this is only one of the inspection surveys whichhave to be carried out.
The main objectives of the corrosion inspection are" To ascertain that the CP system is operating as designed
* To find and assess any corrosion damage
20

* To provide information for maintenance of the corrosion control system
employed.
and the following components of the corrosion control system should be checked:-
* Protective coatings (check condition where used)
* Sacrificial anodes (should be in place)
* Electrical continuity between anodes and structure (should be intact).
* Cathodic Protection Potentials (should be within the prescribed limits -800
to -1100 mV (Ag/AgCl))
0 * Measure the steel thickness for general corrosion at specified locations (eg
splash zone)
* Measure depth of pits if necessary
* Measure the dimension of anodes.
All offshore structures are required by legislation to apply an effective corrosion
control system. The two main components of an offshore structure corrosion control
system being the cathodic protection system and/or a coating system.
A combination of several techniques can be used to assess corrosion and the
effectiveness of the CP system. These are as follows:-
* Visual inspection of the surface after cleaning
* Visual checks on items for any other evidence of corrosion.
* CP potential measurement for checking anode
* Flux density measurement for continuity and effectiveness
* Ultrasonic thickness monitors
* pit gauges
* moulds and replicas
For visual checking, the diver or an ROV can be used. For CP measurements some
ROVs have the capability for potential measurement. On pipeline inspections ROVs
are regularly used both for visual assessment of pipeline damage and potential
21

measurements. For Ultrasonic thickness measurement and the taking of replicas the
surfaces require prior cleaning. These measurements are too complex for ROV
manipulators at the current state of the technology.
BIBLIOGRAPHY
1 "Corrosion" Edited by L L Shrier, Newnes-Butterworth London 1976.
2 F L LaQue,"Marine Corrosion" Wiley, New York, 1975
3 "Corrosion and Marine Growth" edited by J R Lewis and A D Mercer, publishedfor the Society of Chemical Industries by Ellis Horwood 1984
4 "Cathodic protection: Theory and practice" edited by V Ashworth and C J L
Booker.
5 'The Professional Divers Handbook", Edited by D. Sisman, Publ. Submex 1982.
22

* MUST BE HIGHLY WATER RESISTANT WITH A VERY LOWWATER ABSORPTION AND MOISTURE VAPOUR TRANSFERRATE
S* MUST ACT AS A BARRIER TO THE PENETRATION OFCHLORIDE, SULPHATE, CARBONATE TO PREVENT UNDERFILMCORROSION
S* MUST BE HIGHLY DIELECTRIC (i.e. POOR ELECTRONCONDUCTOR) TO RESIST ACCELERATION OF CORROSION ATBREAKS IN THE FILM (SMALL ANODE)
* GOOD CHEMICAL RESISTANCE TO DIESEL, OIL, CRUDE,
ALKALINE DRILLING MUDS, etc.
* .HIGHLY ADHERENT
* MUST NOT BE SUSCEPTIBLE TO UNDERCUTTING IN DAMAGEDAREAS
* MUST BE EASILY APPLIED
* MUST BE EASILY 'TOUCHED UP'
* DURABILITY
* MAINTAIN PROTECTIVE FUNCTION EFFECTIVELY OVER MANYYEARS
TABLE 1 - Required Properties for Offshore Paint Systems

PRIMER dft TIE COATS dft TOP COATS dft(pm) I - I (pm) (pm)
a None - Coal Tar Epoxy 450
b Epoxy + 35 3 Coats of 440Pigments Chlorinated
Rubber or VinylResin
c Zinc Silicate 75 1 25 3 Coats of 475ChlorinatedRubber or Vinyl
*, -_Resin
LOCATION PREFERRED SYSTEM COMMENTS
Splash Zone (a) see below
Jacket Above Splash (a) possibly (b) or (c)Zone
Topside (b) or (c)
DISADVANTAGES OF COAL TAR EPOXY
* INADEQUATE FILM THICKNESS IN ONE COAT
* SLOW CURING BELOW 10C
* HIGH STANDARD OF SURFACE PREPARATION REQUIRED
"* LONG TIME REQUIRED BETWEEN PAINT COATINGS
TABLE 2 - Typical Offshore Painting Systems

THE PERFORMANCE OF A COATING IS CRITICALLY DEPENDENT ON THESURFACE PREPARATION OF THE STEEL
STANDARDS: BS 4232 (BRITISH)SIS 05 5900 (SWEDISH)SS PC (AMERICAN)
SSPC BS4232 SIS 05 5900 GRADE
SP 5 1st Quality Sa 3 White Metal
SP 10 2nd Quality Sa 21/2 Near White Metal
SP 6 3rd Quality Sa 2 Commercial
SP 7 Sal Brush Off
BLASTING PROCESSES:
* VACUUM BLASTING
* WET SAND BLASTING
* AUTOMATIC BLASTING
* MANUAL BLASTING
TABLE 3 - Surface Preparation of Steel

(a) JACKET ABOVE SPLASH ZONE
* First maintenance 6 - 7 years (subject to inspection)
* Subsequent maintenance at 4 year intervals
A * Corrosion allowance 0 -- 3mm (for particularly corrosive region,
treat as per splash zone)
* (b) SPLASH ZONE
* First maintenance after five years
* Subsequent maintenance every 4 - 5 years (on this cycle corrosion
will occur in 2 - 5 years)
* Corrosion allowance 12mm for 25 year life (NB: corrosion ratetypically 20m.p.y.)
(c) TOPSIDE
* Maintenance controlled by visual appearance
* Cosmetics more important than corrosion
S* Corrosion allowance nil
TABLE 4 - Paint Strategies

FAILURE AVOIDANCE MECHANISMCAUSECINSPECTION SURVEILLANCE MONITORING REDUNDANCY SAFETY
INSJTURMEN- FACTORTATION
Materials H H H L Mdeg.
Overload M M M M H
Accident L L L H L
Gross Error H M M L L
TABLE 5 - Level of Influence of Avoidance Method on Failure Cause TypeH = very signficiantM = some influenceL = insignificant influence

1F~Fe- )Fe2 + 2e - .... anodic
e~0 +-F ~) 21-120 + 4e- 4OH .... cathodic
OHFe 2+ +' OH-+ Fe (OH)a
Ads. Diffn.
Cb~ ii. ZF D C/
f' (velocity)
to D f (Temp)
Cb =f (Temp)
* distance
1 corr = L =ZF DCb/S
EDA
* L1
Ln ji ~
FIGURE 1 -Basic Mechanism Concentration Profile and Evans Diagram ForOxygen Corrosion

bg
•/ isncreain IO
.5S/
to
--------- -----flow
0
ea/
current
5
4
* /1 2
0/
I4 I f I
-4 6 8 12 16 20 24 28 32 364O
seawater velocity (rn/nec)
FIGURE 2- Concentration Profile, Evans Diagram, and Corrosion Rate versusSeawater Velocity Illustrating Effect of Fluid Flow on Oxygen Corrosion

14
13
I I
20 30 40 so Go 70 so go 100I 110
Tz Seawater
a)
--• . C o n c en t ra t i o n
3.0¢
2.0 From Saline Water
Conversion En~sne ling I - -• •0
Data' aooka$ Cyigo
32 36 40 44 48 52 56 60 64 68 72 *6 60 4 8aI(b) Temperatue., .r [.o~at CCl-- (c)
FIGURE 3 - (a) Effect of Tempe•ratur on Solubility of Oxygen in Se.awater(b) Effect of Temperature on Vizscosity of Seawater(c) Effet of Salinity on Solubility of Oxygen in Seawater and Corrosion
Rate

r Mc
-" r -Ecorr (MA)
Scorr corr MA uncoupled
rr (Mr) jnrn,,p1,,d
galvanic
'galv I current
0 wtime
contactmade
FIGURE 4 - Effect of Galvanic Coupling on Corrosion

PIT7ING ...ISOLATED GROUPS OF PITS
... WIDE, SHALLOW PITS EXTENDINGINTO PARENT PLATE
GALVANIC CORROSION ... ANODIC HAZ MICROSTRUCTURE
... COMPOSITIONAL DIFFERENCESBETWEEN WM AND HAZ
CORROSION FATIGUE ... INITIATED BY PITS AND HAZ* CORROSION
vK-v'
1 I'
~v
,c IC
WM H Z pp
+
RATES OF PITTING ATTACK 2.5 nn.yr-l 4 mm.yr-1
FIGURE 5- Weld Corrosion Damage Mechanisms

ABOVE WATER LEVEL
ATMODSP HERIC.ZONE. ATMOSPHERIC
CORROSION.
I...G H _ _II:) -- ' X IN T E R M IT T {L 11E TIDPLASH ZONE , CATMOSPHE
EAl E EE TIDAL ZONE . . . .. •.• QEU
--- -AQUEOUS
CI DL C O R R O S ION
p77• ••CONTINUOUSLY QEU
CONTI_SUBMERGED CORROSION.
'zo , .4
Si I I f , i
/0 1 0 .2 0.3 • 0 .4 0 "5 0-6 0 .7 0-8 0-9 1CORROSION (m /Year)RATE.
FIGURE 6 - Effect of Depth on Seawater Corrosion Rate on Offshore Structures

ACA CAC A A A 'CR Wi.) UNPROTECTED
- +j 2 ) eSACRIFICIAL ANODE(Mg)
ORPOWER SUPPLY
C
(LCORR -l) (LCORR4i 2)(a) (II) PROTECTED.
E
ECORR
-0.10 Li. L2 -- PROTECTION' ' POTENTIAL.PROTECTION --CURRENT LOG L
S=(LCORR -'1) iCORR L ('CORR + [2),
AN EVANS DIAGRAM
AT THE NODE B, THE PROTECTION CURRENT FROMTHE EXTERNAL SOURCE SPLITS INTO PARTIAL CURRENTSih AND i2 'THE ANODIC CURRENT IS REDUCED FROM
(b) iCORR JO ('CORR - ii1 THE CATHODIC CURRENT ISINCREASED FROM LCORR TO (i CORR + i2
FIGURE 7 - (a) Principle of Cathodic Protection(b) Evans Diagram Illustrating Cathodic Protection

(a) H++e - = 1/2H 2 E=000-'059pH-'03{ogPH2
(b) 02+2H2 O+4/- -' a (OH)- E=1"23-.O59pH--015logPo 2
"(c) Fe2 -+2- .' Fe E: -04+0"03 log aFe2+
(d) 2H++ Fe(OH) 2 + 2e- ' Fe+H 20 E=0'047- 0'059 pH
(e) H+÷ Fe(OH) 3 +e- Z Fe (OH) 2+H20 E= 0-271-0059pH
',f) Fe(OH) 3+3H++e- Fe2*+3H20 E: 10 6 -I-177pH--0591OogaFC2
1t61.2 -......,..11-2• 8 """"" .8
"4 (f+F(H3 -- . -4
E (SH.E) 0 • PASSIVITY 10
r., ,
S-1-2 (Fe) CORR SION
-1.6 IMMUNITY
-2 0 2 4 6 8 10 12 14 16pH
FIGURE 8 - Pourbaix Diagram

REFERENCE ELECTRODE
METAL Cu/CuSO4 Ag/AgCI Zinc
(volts) (volts) (vots)
* SteelAerobic Environment:
. Positive Limit -0.85
-0.80 +0.25
0 Negative Limit -1.10 -1/05 + 0.00
SteelAnaerobicEnvironment:
Positive Limit -0.95
-0.90 +0.15
Nagative Limit
-1.10 -1.05
+0.00
Steel -
Positive Limit -0.85 -0.80 + 0.25
Negative Limit -1.00
-0.90 +0.10
A For Temperatures Between 25CC and 1 00°C Potentials More Megative by 1lmV PC00t
FIGURE 9 - Classification Society Recommended Potentlias For Protection of Fixed
Offshore Steel Platforms

A 0ý
~~II0"0E

1. ELECTRICAL ISOLATION insulating
sleeve
Noble
insulating..base gasket
Electrically isolate (electronscannot pass from Noble ÷ Base
2. ANODE - CATHODE SEPARATION
Noble
Intermediate potential[Compatible with both]
'•Ilase
=.---------Long ionic pathbetween Anode and Cathode
3. PAINTING CATHODE
Base (eg. C.Steel)
Noble(eg. Stainless
Steel)
Paint cathode(NOT ANODE 8
FIGURE 11 -Techniques For Avoiding Galvanic Corrosion

1(11)
DEVELOPMENT AND TESTING OF CAST ULTRA HIGH STRENGTH MARAGING
STEEL MARLOK C 1650 FOR USE IN DEEP SEA RESEARCH VEHICLE
Jari Liimatainen Rauma Oy Finland
Research and development Materials Technologymanager
. ABSTRACT
The principal requirements for structural materials to beused in deep sea structural application are strength,fracture toughness, corrosion resistance, modulus ofelasticity, strength/weight ratio as well as material andmanufacturing costs. So far, the structural materials usedin crew pressure hulls of deep sea vehicle have been quenchedand tempered steels, titanium alloys and maraging steels.
For the construction of the crew pressure hulls ofRauma-Repola's deep sea research vehicles, Lokomo Steel Worksmanufactured cast maraging steel half spheres. Unlike in themanufacture of pressure hulls of titanium alloy or quenchedand tempered steels, cast maraging steel pressure hulls weremanufactured without welding. This paper describes thedevelopment program of cast maraging steel for crew pressurehulls.
O BACKGROUND
For the research and utilization of resources in the seareliable and efficient equipments are needed. Seawater
* environment in addition to tremendous hydrostatic pressuresset stringent requirements for materials and components usedin subsea installations and vehicles. The risks of losinghuman lifes, environmental influences and damage for expensiveequipments enhance manufacture of products with high safetymargins.
The aim of Rauma-Repola's development program for subseavehicles was to manufacture vehicles able to operate at thedepth of 6500 m. All previously used materials were naturallyinitially considered as structural materials for one of themost critical components of the vehicle, crew pressure hulls.Properties based on which material selection was to be madewere

2(11)
- strength to weight ratio
- fracture toughness
- modulus of elasticity
- corrosion resistance
- fabrication characteristics (machinability,weldability,castability etc.)
- costs
O MATERIAL ALTERNATIVES
Titanium alloys
Titanium and its alloys are characterized by high strength* to weight ratio, excellent corrosion resistance in sea water
and good ductility. The modulus of elasticity for titanium isabout half the value of steel. The availability of titaniumin very heavy components is not as good as for steelseventhough all product forms including plates, forgings andcastings have been produced. The physical and mechanicalproperties for titanium are presented in Table 1.
Table 1.
Physical and mechanical properties for titanium
Modulus of elasticity 10.8 x 10⁵ MPaDensity 4.5 g/ccCoefficient for thermal expansion 9.1 x 10- 6/KThermal conductivity 17 W/Km
Ti - 6 % Al - 4 % V
Yield strength 820 MPaTensile strength 890 MPaElongation 8 % (for 1.5-5 mm)
Titanium is a common material in aerospace and aircraft* industry where its high strength to weight ratio is beneficial.
Furthermore, its resistance to corrosion, especially pittingcorrosion in chloride environments have led to its extensiveuse in pulp and paper, offshore and marine applications.Titanium has excellent resistance to stress corrosion. However,alloyed titanium (Ti-6Al-4V) has increased sensitivity forstress corrosion. Higher price of titanium has limited itswider use in engineering applications. Additionally,difficulties related to welding have caused some concern.
Quenched and tempered steels
Quenched and tempered steels used in deep sea vehicleshave been low carbon Ni-Cr-Mo-steels with varying micro-

3(11)
alloying contents. The heat treatment of these steelsconsists of quenching of the components into the water withsubsequent tempering to improve toughness and to reduceresidual stresses. Quenching to water is required in orderto achieve good microstructure and sufficient mechanicalproperties. Water quenching may, however, induce dimensionalchanges to components and increase residual stresses.
Welding of ultra high strength quenched and tempered steelsrequires extra low hydrogen consumables and welding processas well as preheating and/or post weld heat treatment inorder to avoid hydrogen induced cracking. TIG welding isusually recommended in order to achieve weld deposit withhigh toughness.
. Quenched and tempered steels are not resistant to seawaterand should be protected with coatings or cathodic protection.Especially low resistance to stress corrosion cracking inseawater is a major drawback.
S Maraging steels
Maraging steels are precipitation hardening Ni-Co-Mo-Tialloys. Their heat treatment consists of solution annealingwith subsequent air cooling and low temperature aging whichproduces fine dispersion of intermetallic precipitates intothe low carbon lath martensitic matrix. Due to its excellenthardenability cooling rate obtained via air cooling isenough for producing lath martensitic structure into heavycomponents. Consequently, dimensional changes during heattreatment remain small. Aging treatment results in smalland predictable shrinkage due to precipitation reactions.
The greatest advantages of maraging steels are
- excellent toughness accompanied with good toughness- good weldability e.g. preheating not necessary- best stress corrosion resistance among ultra high strength
*steels
In Figure 1 are presented fracture toughness of variousengineering alloys as function of the yield strength.
* Maraging steels obviously show the best combination of theseproperties especially at high yield strengths. Excellenttoughness of maraging steels is a result of fine dispersionof intermetallic precipitates, ductile low carbonmartensitic matrix and high nickel content.
Toughness of maraging steels is naturally further improvedby lowering the impurity contents. Critical impurities tobe minimized are carbon, sulphur, phosphorus, nitrogen andhydrogen. Carbon and nitrogen forms embrittling grainboundary precipitates with titanium unless their amount isreduced via process metallurgical means. Carbon contentsare usually reduced below 0.03 w-% and contents below0.01 w-% are necessary for large forged or cast componentswhich cool slowly throught temperatures were precipitation

4(11)
reactions occurs. The situation is even more demanding forcast material because in the case of forged or rolledmaterials deformation cuts up possible continuous Ti-(CN)layers in the grain boundaries.
In welding soft ductile martensite is formed in thereaustenitized area of the heat affected zone.Consequently, residual stresses are low and hydrogencracking does not occur. The strength of the softenedzone can be restored by low temperature aging. Usually,TIG welding is used because of the highest toughnessobtainable.
Like other ultra high strength steels maraging steels* are susceptible to stress corrosion cracking. However,
as shown in Figure 2 resistance of maraging steels issomewhat higher than for other steel at the samestrength level. Decrease of the impurity contents isessential for further improved stress corrosion cracking
aresistance. Surface treatments like shot peening, painting,Wcoating as well as cathodoc protection improve the
performance.
Chemical compositions of most common maraging steels arepresented in Table 2. The physical and mechanicalproperties of maraging steels are presented in Table 3
Table 2
Chemical compositions of common maraging steels
(w-%)Grade 200 250 300 350
C <0.03 <0.03 <0.03 <0.03Ni 18 18 18 18Mo 3.3 5.0 5.0 4.2Co 8.5 8.5 9.0 12.5Ti 0.2 0.4 0.7 1.6Al 0.1 0.1 0.1 0.1
Table 3
Physical and mechanical properties of maraging steels
Modulus of elasticity 1.9 x 10⁵ MPaDensity 8.2 g/ccCoefficient of thermal expansion 10 um/m°CThermal conductivity 29 W/mK
Grade 200 250 300 350
Yield strength (MPa) 1400 1700 2000 2400Tensile strength (MPa) 1500 1800 2050 2450Elongation (%) 10 8 7 6Reduction of area (%) 60 55 40 25

5(11)
In general, increase of the strength of maraging steels isobtained by addition of titanium and cobalt. Simultanuously,ductility is lowered. Furthermore, for highest strengthmaraging steels there appears some difficulties inmanufacture of thick materials due to increased titaniumcontent.
MANUFACTURE OF CAST HALF SPHERES
Maraging steel was chosen for the material to be used inpressure hulls. In the following the manufacturing stepsfor cast half spheres is described.
O Melting
The requirement for ultra high cleanliness in cast maragingsteels made it necessary to use melt refining processcalled VODC (Vacuum Oxygen Decarburization Converter) to
* decrease the impurity contents as low as possible. Becausecasting was chosen to be the manufacturing route forpressure hull half spheres special consideration was givento reduce the carbon content in order to minimize formationof embrittling titanium carbides and -carbonitrides intothe grain boundaries. Other impurity contents critical toeither material properties of soundness were sulphur,nitrogen and hydrogen. Excessive hydrogen contents inheavy castings may cause serious cold cracking orporosity, and reduce ductility of the material. Sulphurand oxygen reduces fracture toughness due to theformation of non-metallic inclusions.
Chemical composition of Marlok C 1650 maraging steel ispresented in Table 4.
Table 4
Chemical composition of Marlok C 1650 maraging steel
*W-%obtained puritylevel
C <0.01 0.002Si <0.10 0.01Mn <0.10 0.05P <0.010 0.005S <0.010 0.001Ni 18Mo 5Co 11Ti 0.30N 0.1 0.003

6(11)
Product form
No weldments were used in the manufacture of crew pressurehulls. Half spheres were manufactured as entire castings.Collars for viewports and hatches were integral parts ofthe cast pressure hull. This allowed e.g. wider windowsfor the vehicle. Absence of welding eliminateduncertainties related to welding residual tensile stresses,welding defects and changes in material properties.Residual stresses of the magnitude of the yield strengthmay severely reduce stress corrosion resistance and fatigueperformance.
In pressure hulls manufactured from either titanium or* quenched and tempered steel welding is used in fabrication.
In addition to reduction in the resistance against stresscorrosion and fatigue, dimensional tolerances are moredifficult to achieve.
. Heat treatment
Heat treatment of cast half spheres consisted of homogenizing,austenitizing and precipitation hardening. Homogenizing athigh temperatures was carried out in order to minimizecompositional changes induced by segregation duringsolidification. Solution annealing after homogenizing isapplied to refine the grain size. After solution annealingthe hardness is roughly 30-35 HRC and machining is carriedout in this condition before aging and subsequent increasein hardness.
Precipitation hardening is carried out to produce finedispersion of intermetallic precipitates into the lathmartensitic matrix. Hardness amd strength of the materialcan be modified by the selection of precipitation hardeningtemperature. Due to the slow aging reactions uniformmechanical properties can be achieved throughout the wallthickness of thick castings. Typical time-temperature
* precipitation hardening curves for Marlok C 1650 arepresented in Figure 3.
Because solution annealing was followed by slow air cooling* dimensional changes were small. Additionally, residual
stresses are smaller as compared to components waterquenched after solution annealing. The small shrinkagecaused by precipitation reactions (-0.0005 mm/mm) can beeasily taken into account.
machining
Machining of Marlok C 1650 is easy to carry out becauseit can be carried out already in solution annealedcondition when hardness is ca. 30 HRC. Machinability iscomparable to that of AISI 4340 martensitic steel temperedto the same hardness level. In precipitation hardenedcondition machining speed is almost twice as high as for

7(11)
AISI 4340 tempered to the same hardness level. Usuallymaching is not carried out in hardened condition becauseof small dimensional changes induced by precipitationhardening.
Machining practice applied for Marlok C 1650 results inless machining induced residual stresses which may cause someuncertainties relating to e.g. stress corrosion resistance.
Non destructive testing
The soundness of the pressure vessel half spheres wasdetermined by 100% ultrasonics, magnetic particle and liquidpenetrant inspection.
O Coating
The crew pressure hull sections were coated in order toeliminate corrosion (uniform,pitting ad stress corrosion
* cracking).
Pressure testing
The entire pressure vessel was tested prior the actual deepsea testing in the pressurized water vessel. Testing pressurewas higher than to be applied in actual conditions in 6000 mdepth.
MATERIAL PROPERTIES
The testing programme for Marlok C 1650 consisted of variousmechanical testing methods. In addition conventional tests,fracture mechanical testing was carried out.
Specified properties
Specified mechanical properties for Marlok C 1650 are* presented in Table 5. Minimum yield strength of 1650 MPa was
obtained by selection of suitable aging parameters. Due tothe slow aging behaviour uniform mechanical properties couldbe achieved across the wall thickness of the casting.
*Table 5
Specified minimum mechanical properties for Marlok C 1650
Yield strength 1650 MPaTensile strength 1730 MPaElongation 6 %Reduction of area 25 %Charpy-V-notch 15 Jimpact toughness (+200C)

8(11)
Fracture toughness
Fracture toughness of the material was tested by KIC- andKiic-methods, where former one represents fracture toughnessin crack opening situations and latter one representsfracture toughness in crack shear mode. In deep seaapplications, due to the hydrostatic pressure, opening modeof the crack may not be crucial one. On the contrary,shearing mode of the crack could be more relevant.
Critical stress intensity factors both in opening andshearing mode determined at the temperature of 20"C arepresented in Table 6. Values for the shear mode areconsiderably higher than for opening mode.
*Table 6
Critical stress intensity factors for Marlok C 1650
KIC >80 MPa V m
KIIC >140 MPa V m
Based on the Kic-values, the critical crack depth for variousstress levels can be determined. In Table 7 are presentedcritical crack depths for semielliptical surface cracks.Various stress levels and critical stress intensity factorsare used.
Table 7
Critical cracks depths for semielliptical cracks
KIC 158 125 100 79 60 46 35(MPaVm)
stress(MPa) (mm)
300 21.2 11.8 6.5 3.6 1.8 0.9 0.5600 11.0 5.6 3.3 1.9 1.00 0.5 0.3900 7.4 4.1 2.3 1.3 0.6 0.3 0.21200 5.7 3.0 1.7 0.9 0.5 0.3 0.14
Fracture toughness is sufficient for reliable operation andenables detection of subcritical cracks by non destructiveexamination.
CONCLUSIONS
Based on the entire development program both technicallyadvanced and cost effective solution for deep sea vehiclefor developed. Material development formed an crucial partof the success of this work.

9(11)
25o ksi in.'s Yield strength, MN/m2
1,000. 1,200 1,600 1,800 2,000 2,2002001
1ONi-SCo-Cr-Mo
200HP 9-4-20
160 -AFC-77TRIP -160
_. AFC-26018Ni-Co-Mo
maraging 120HP 9-4-30
so- x
Pyromet X-23
40 40• • ••----4340 H-11 40
\ PH stainless steelsMetastable fl-Ti alloys
16~ 200 24 203 00 I. .k -
- Yied stirengt~h, XV "~Psi
Figure 1. Fracture toughness of various engineeringalloys as a function of the yield strength.

10(11)
Yield strength, ksi
1 50 175 200 225 250 275 300I0
i o I on I Io BSNi managing steels 140
* 1253
140 0 A 43400 AM 355
aoW oW 0 U 410SS 1200 91744PH
0 o PH 13-0-Mo120 - D0-ac
eA 9Ni.4Co
AW Denotes veld data I00
200
0- .sA0 0 * OW 0
0 80 50A
06
60 AO o £00
00w A IN e w
e o o
Qowoaoow
0 A 0
tiw %g0, 0 00 .
1000 1200 1400 1600 180 2000 2200Yield strength, MWe
Figure 2. Stress corrosion resistance of variousengineering alloys.

I-4R I-45
40 -40O
35 35
2 4 6 a 10 12 i L& 16 t-
Figure 3. Time temperature precipitationcurves for Marlok C 1650.

0WEGEMT
* Fifteenth Graduate School
UNDERWATER TECHNOLOGY
Risk and Reliability Analysis Methods
Stein B Jensen, ProfessorSINTEF Safety and Reliability
0
Laboratory of Naval Architecture and Marine Engineering
Helsinki University of TechnologyEspoo - Finland
October 14 -18, 1991

15th WEGEMT Graduate School "Underwater Technology"Risk and Reliability Methods Page 2
TABLE OF CONTENTS
1. INTRODUCTION ............................................ 3
2. RELIABILITY AND ITS PARAMETERS ........................... 52.1 Reliability and Availability Definition ....................... 52.2 The Reliability Function ................................. 62.3 A vailability ........................................... 8
3. RISK ASSESSM ENT ......................................... 113.1 Risk Definition ....................................... 113.2 Risk Analysis Procedure ................................ 11
0 4. METHODS FOR SYSTEM RISK AND RELIABILITY ANALYSIS ....... 144.1 Preliminary Hazard Analysis ............................ 144.2 Failure Mode and Effects Analysis (FMEA) ................. 174.3 Fault Tree Analysis (FTA) ............................... 204.4 Event Tree Analysis ................................... 23
5. SYSTEM RELIABILITY CALCULATIONS ........................ 265.1 Probability evaluation based on Fault Tree Models ........... 265.2 Availability and Production Regularity Assessment ........... 27
6. RELIABILITY DATA SOURCES ................................ 29
7. RELIABILITY REQUIREMENTS FOR NEW SUBSEA PROJECTS ....... 30
8. REGULATORY REQUIREMENTS FOR PERFORMING RISK ANDRELIABILITY ANALYSIS .................................. 33
Stein B Jensen SINTEF Safety and Reliability

15th WEGEMT Graduate School 'Underwater Technology'Risk and Reliability Methods Page 3
1. INTRODUCTION
Subsea production systems often represent large investments, and as for other typesof field developments, they represent potential for accidents and uncontrolled lossesof hydrocarbons. Due to their location, the subsea production systems are costly torepair, and in some cases the repair dines may be considerable long due to badweather conditions. These are all factors that make it essential that the subseasystem should operate reliable when it is installed. Accidents have to be avoided,and the production loss and the number of necessary repair operations should notexceed the limits which may disqualify the subsea field development scheme frombeing an economic viable solution.
Since the early days of the Norwegian oil and gas epoch, system safety engineering0 was applied as a separate activity in the oil and gas development projects. Thenecessity to create safe installations, led to the development of a separate safetydiscipline within the oil companies as well as within the engineering companies.Techniques and methods to acquire knowledge about the risks and hazards involvedin the offshore developments have been developed. As time has passed by, theauthorities have issued rules and regulations concerning the implementation and theuse of risk analyses in the petroleum activities.
As underwater systems were introduced, the oil and gas industry also understoodquite early the importance of introducing reliability engineering as a separateengineering discipline in their subsea design teams. Reliability analyses are nowperformed routinely as a part of subsea engineering. The Norwegian PetroleumDirectorate has included in several of their regulations and guidelines requirementsfor verifying the reliability of important sub systems.
The Reliability Engineer is not only dealing with the subsea system reliability, butalso the subsea system availability and productivity. The availability or the time asystem is functioning while in operation depends both on the reliability and themaintainability. The term availability shall be discussed later, while we here onlywill mention that maintainability is a measure of the speed with which loss of0 performance is detected, diagnosed and made good. Planning for maintainability isa key factor for a successful subsea field development, and to some extent themaintenance philosophy selected would govern the entire subsea system design. Inthis lecture, we will only refer to expected repair times found from maintenanceanalysis. During day one of this course, you have dealt with some important aspectsrelated to the subsea maintenance, namely the subsea intervention systems (divers,ROVs, surface support vessels, etc).
Stein B Jensen SINTEF Safety and Reliability

15th WEGEMT Graduate School 'Underwater Technology'Risk and Reliability Methods Page 4
It is essential to 'build-in" safety and reliability by sound design and constructionand to carry out tests to make sure that this has been done. The safety and reliabilityinherent in a system will not be increased only by perform-ing various analyses. Theonly way to manage the risk and the unreliability is to anticipate what can go wrongand make timely attempts to design the system to overcome failures. Themanagement process necessary to achieve the safe and reliable subsea system, mustconsist of the following steps.
1. Identify the failures likely to occur by analyses such as design reviews;preliminary hazard analysis; failure-mode, effects, and criticality analysis. Formore detailed investigations fault tree analysis or cause consequence chartscan be used.
2. Develop alternatives to control the failures. Control by design is usuallycheaper than testing equipment and systems.
3. Implement the acceptable solution without creating additional risk or type offailures which could lead to reduced reliability or safety.
4. Control the system risk and reliability through a closed loop managementsystem.
In this lecture the most commonly used methods in reliability and risk analyses shallbe introduced. For a more thorough explanation, the reader is referred to text booksin risk and reliability analyses.
Stein B Jensen SINTEF Safety and Reliability

15th WEGEMT Graduate School 'Underwater Technology"Risk and Reliability Methods Page 5
2. RELIABILITY AND ITS PARAMETERS
2.1 Reliability and Availability Definition
The generally accepted definition of reliability is:
Reliability - the characteristic of an item expressed by the probability that itwill perform a required function under stated conditions for a stated periodof time.
A failure is any inability of a part or equipment to carry out its specified function.0 An item may fail in many ways and these failures can be classified as follows / 1/
(a) Causes of failure:
(i) Misuse failureFailures attributable to the application of stresses beyond the statedcapability of the item.
(ii) Inherent weakness failureFailures attributable to weakness inherent in the item itself whensubjected to stresses within the stated capabilities of that item.
(b) Times of failure:
(i) Sudden failureFailures that could not be anticipated by prior examination, i.e. thesudden loss of function.
(ii) Gradual failureFailures that could be anticipated by prior examination, i.e. gradual"drifting out" of the specific range of performance values.
(c) Degree of failure:
(I) Partial failureFailures resulting from deviations in characteristic(s) beyond specificlimits not such as to cause complete lack of the required function.
GOi Complete failureFailures resulting from deviations in characteristic(s) beyond specificlimits such as to cause complete lack of the required function. Thelimits referred to in this category are special limits for this purpose.
Stein B Jensen SINTEF Safety and Reliability

15th WEGEMT Graduate School "Underwater Technology"Risk and Reliability Methods Page 6
In most reliability analyses, the general assumption is that the item considered maytake only two states; it either is functioning or it is in a failed state. Most analysesare including in their system modelling inherent weakness failures only.
An important criterion that the operator often wants. to know is how often the itembreaks down, or the mean time to failure (MTTF). From a reliability system model andknowledge about the various item failure rates it is possible to estimate the systemsreliability and MITF.
When a system is repairable, i.e. when failed parts are replaced, we can still speakabout its reliability and MM . However, the probability that the system isfunctioning at a specific time is often more interesting, and this is called the system'savailability. The availability, both assuming corrective maintenance as well aspreventive maintenance strategies, can be estimated from the system reliabilitymodel when in addition to the system component failure rates, information aboutthe expected time to repair often called MTrR (mean time to repair) is available.
2.2 The Reliability Function
Any reliability analysis of a system must be based on precisely defined concepts.Since it is readily accepted that a population of supposedly identical systemsoperating under similar conditions fail at different points in time, then it follows thata failure phenomenon can only be described in probabilistic terms.
If we call the time from an item is put under stress to it fails T, then this time-tofailure, T, is obviously a random variable. The probability of failure as a functionof time can be defined by:
P(T • t)= F(t), t>O
Then F(t) is the probability that the system will fail by time t. In other words, F(t),is the failure distribution function. The reliability is by definition the probability ofsuccess, or the probability that the item will perform its intended function at acertain time t. Then the reliability function can be written as
R(t)= 1-F(t)= 1-P(T:t)= P(T>t)
If the time to failure random variable T has a density function f(t), then
R(t)= 1-F(t)= 1-J0t f(t) dt= ft- f(t) dt
Stein B Jensen SINTEF Safety and Reliability

15th WEGEMT Graduate School "Underwater Technology"Risk and Reliability Methods Page 7
For example, if the time to failure is described by an exponential density function,then
f(t)=X, exp(- ?.t) for t> 0, X> 0
It should be easy to show that the reliability function then can be written as
R(t)= exp (-Xt)
The rate at which failures occur in a certain time interval [t1,t2] is called the failurerate during that interval. It is defined as the probability that a failure per unit timeoccurs in the interval, given that a failure has not occurred prior to t,. Thus thefailure rate can be expressed as
0 R(t1) - R(t2) F(t 2) - F(t1)
(t2-t,)R(tl) (t2 - t) R(t)
It should be noted that the failure rate is a function of time. If the time intervalconsidered is redefined as [tt+At], and if the interval, At, approaches zero, then thefailure rate is found to be
z(t)= f(t)/R(t)
The quantity z(t)dt represents the probability that an item will fail in a small intervalof time [t,t+At].
From the example above where the time to failure is described by an exponentialdensity function, it is found that the failure rate is
* z(t)= X
Thus, when the time to failure is exponential distributed, the failure rate is constantand independent of time.
The practical meaning of the constant failure rate assumption is that the probabilityof failure in a given period of time is independent of the operational life of the item.Such an assurntion is -bviously not true at least for mechanirql compv-nentc.However, this assumption is frequently found in most reliability analyses mostlybecause current data banks normally only contains constant failure rate information.Furthermore, when a system is maintained over a period of time, the age of thecomponent population in that system will be widely distributed. It has beenexperienced and it can also be shown mathematically, that the overall system failure
Stein B Jensen SINTEF Safety and Reliability

15th WEGEMT Graduate School 'Underwater Technology"Risk and Reliability Methods Page 8
rate will appear to be constant, regardless of the underlying individual failure ratedistribution.
The expected time during which an item will perform successfully, is defined as
E(T)= Jj"t f(t) dt
This is normally called the Mean Time To Failure (MTrF), and an other moreconvenient method for determining the expected life is given by
MTrF= E(T)= "o- R(t) dt
In order to arrive at the above equation, use integration by parts to solve the* equation defining E(T).
When the time to failure is exponential distributed (constant failure rate), then theexpected life is expressed as:
MTTF= 1/X
The MTTF should be used only when the failure distribution function is specified,because the reliability level implied by the MTrF depends on the underlying failuredistribution. This might be illustrated by a case where the MTTFs are equal, but thefailure distributions are normal and exponential. The normal failure distribution issymmetrical about its mean, thus
R(t=MrTF)= P(cx.0)=0.5
where a is a standard normal deviate. For the exponential failure distribution, thereader should recognize that
R(t=MrTF)= exp(-1)= 0.368
Clearly, the reliability in the case of the exponential distribution is about 75 % of0that for the normal failure distribution with the same MTrF.
2.3 Availabilitv
For repairable systems, not only the MTrF, or rather the MTBF (Mean Time BetweenFailures), is of interest, but also the information of what part of the total time thesystem has been operable. This is called the availability, and it is defined as
Stein B Jensen SINTEF Safety and Reliability

15th WEGEMT Graduate School "Underwater Technology"
Risk and Reliability Methods Page 9
A(t)= P (The item is functioning at time t)
For non-repairable systems A(t)= R(t), otherwise A(t) > R(t).
In order to find the availability for a system, both failure and repair rates arenecessary. The repair rates will have to be found from maintenance analyses, andas for the failure rates, it is normally difficult to find exact information on theprobability distribution for the tine to repair an item. However, if we can assumethat the distribution of the time between failures in a system is not periodic, and ifthe repair times are short compared to the MTI'Fs, then we can find a simpleexpression for the availability which is conredt regardless of the underlyingdistribution both for the failure rates as well as for the repair rates.
Assume that we have observed a system until maintenance (replacement) numbernis completed. Let the time to failure observed be denoted T, T2,.,Tadtetm
to repair each failure be denoted as D1, D2 .... ,D.. The reader may agreed that as napproaches infinity (becomes large), the Mean Time To Repair (MMIT) can beexpressed as follows
M'ITR= Cl /n) D 1)
in the same manner as the M=IT can be expressed as
MlTF= (1/ n) 7Lali T,
The "average" probability that the system is operating at any point in time can nowbe expressed as the proportion of the time the system has been operating, which isoften called the average availability
MNr+M1TR
This equation should not be used when the system is subject for periodic testing andpreventive maintenance. It is beyond the scope of this lecture to explain how tocalculate the availability in such cases, however, the theory as well as the tools exist,and the reader may find these described in one of the many reliability text books.
When calculating the availability of a subsea system, the selected maintenancephilosophy and the weather dependencies of any repair intervention often willintroduce difficulties for quick analytical approaches. To overcome this, simulationprograms have been developed.
Stein B Jensen SINTEF Safety and Reliability

15th WEGEMT Graduate School "Underwater Technology"Risk and Reliability Methods Page 10
The production regularity for a subsea system is dependent on the availability ofeach of the major components in the subsea system. However, other factors than thetechnical availability will affect the productivity in a real system. Such factors arethe possibility to produce when repairing neighbouring wells, interdependenciesbetween various parts of the control system, limitation concerning maintenanceresources as surface vessels, ROV, ROTs, etc.
As a first approach the production regularity, PR, may be calculated as follows.
,m Single satellite wells.
PR• = Aý
*PR, = satellite well productivity
Aý = availability of the total satellite system
Multiwell/Manifold System assuming equal production rate from each well.
Pk= A.x A
PR, = cluster productivity
Am = manifold availability
A4 = well availability
0
Stein B Jensen SINTEF Safety and Reliability

15th WEGEMT Graduate School 'Underwater Technology"Risk and Reliability Methods Page 11
3. RISK ASSESSMENT
3.1 Risk Definition
There exist several definitions of the term risk:
-Risk is a combination of uncertainty and damage.-Risk is a ratio of hazards to safeguards.-Risk is a triplet combination of event, probability, and consequences.
The definition most commonly used in Norway by the offshore industry is:
Risk - the expression of the probability and the consequences of anuncontrolled event which may lead to loss of human life, personal injury,damage to the environment and loss of assets and financial interests.
It is important to recognize that the risk definition includes two parameters as riskis a measure of loss in terms not only of the event likelihood, but also in terms ofthe magnitude of the loss resulting from the event.
3.2 Risk Analysis Procedure
The Norwegian "Regulations concerning implementation and use of risk analysesin the petroleum activities" states that the purpose of the regulation, throughrequirement with regard to risk analyses, is to contribute to establishing andmaintaining a fully satisfactory level of safety for people, for the environment and0 for the assets and financial interests in the petroleum activities. Such a contributioncan only be achieved through a management decision process.
Risk analyses shall provide knowledge concerning risks connected with the activitiesand constitute a basis for the decision making process so as to plan and implementthe activities in accordance with applicable legislation and with the operator's ownsafety requirements. It has to be emphasized that a clear definition of the riskanalysis goal has to be established before any analysis is started. Risk assessment isa major tool in system safety which is not only a function of engineering but anintegral part of top management activities. Participation from top management indefining the risk analysis goals is important to assure the timely identification andthe resolution of hazards.
Stein B Jensen SINTEF Safety and Reliability

15th WEGEMT Graduate School 'Underwater Technology"
Risk and Reliability Methods Page 12
Typical goals for risk analysis are:
- Identify range of risk for further study.- Evaluate a range of risk reduction measures.- Prioritize safety investments.- Estimate financial risk.- Estimate risks to employees, the public, and for environmental damages.- Verify compliance with regulatory requirements.- Assist with emergency planning.
0When the risk analysis goals are dlearly described, a complete analysis will gothrough several steps. Not all these steps are needed for all kinds of risk analysis.The procedure and procedural steps are flexible and can be applied selectively andin various orders. Consequence estimation can be used as a screening tool toidentify hazards of negligible consequence to avoid detailed frequency estimation.Similarly, frequency estimation can identify hazards of sufficiently small likelihoodof occurrences that consequence estimates are unnecessary.
The following steps are normally indluded in a risk analysis:
Step 1 Describe the system.Compile system information needed for the risk analysis. For example,site location, water depth, current, fishing activities, weather data,piping and instrumentation diagrams, layout drawings, operating andmaintenance procedures, technology documentation~etc.
Step 2 Identify hazards.This is a critical step in any risk analysis. A hazard omitted is a hazardnot analyzed. Many aids are available, including experience,engineering codes, checklists,detailed system knowledge, equipmentfailure experiences, formal analyses as Hazard and Operability studies,Preliminary Hazard Analysis, and Failure Mode and Effects Analysis.The two latter will shortly be described in this lecture.
0Step 3 Select events/incidentsWhen the hazards are identified one or more significant unwantedevents (critical events), are to be chosen to represent all the identifiedunwanted events. These critical events are the basis for the further riskanalysis.
Step 4 Consequence estimationThis task shall determine the potential for damage or injury from thespecific critical events.
Stein B Jensen SINTEF Safety and Reliability

15th WEGEMT Graduate School "Underwater Technology"Risk and Reliability Methods Page 13
Step 5 Likelihood estimation.This step utilize different methods to estimate the frequency or theprobability of occurrence of an critical event outcome case. Estimatesmay be obtained from historical incident data on failure frequencies orfrom failure sequence models as fault trees and event frees.
Step 6 Risk estimation.In risk estimation the consequences and likelihood of all the selectedcritical events are combined to provide a measure of risk. The risks ofall selected events are individually estimated and summed to give anoverall measure of the risk. The sensitivity and the uncertainty of riskestimates and the importance of the various contributing events toestimates should be discussed.
Step 7 Utilization of risk estimatesThe process by which the results from a risk analysis are used to makedecisions, either through relative ranking of risk reduction strategiesor through comparison with specific risk targets. This is strictly not apart the risk analysis. However, whether or not the analyst takes partin the decision process, he or she should have this in mind when theresults of the analysis is presented.
Stemn B Jensen SINTEF Safety and Reliability

15th WEGEMT Graduate School "Underwater Technology'Risk and Reliability Methods Page 14
4. METHODS FOR SYSTEM RISK AND RELIABILITY ANALYSIS
Several methods have been developed for the various steps both in risk andreliability analysis. These methods range from more qualitative techniques useful foridentification of hazards to the establishment of more complex logical systemmodels suitable for system reliability calculations. Several of the methods are usedboth in risk analysis as well as in rellaiblity analysis. Below we have shortlydescribed four basic methods used both in system reliability analyses as well as insystem risk assessments. These methods are
* Preliminary Hazard Analysis (Mainly for identification ofhazards)
0 Failure Mode and Effects Analysis (Both for identification of hazards aswell as verification of reliability)
* Fault Tree Analysis (Logic model suitable for calculationof event occurrence probability)
* Event Tree Analysis (Logic model for calculaiton ofprobability of particularconsequences from an initiatingevent)
4.1 Preliminary Hazard Analysis
0 4.1.1 General Description
The Preliminary Hazard Analysis (PHA) is a method for identifying potentialhazards and evaluating the associated risks. PHA is normally done at the conceptstage so that safety considerations are included during early design. The methodsupport the identification of aritical events which are to be further studied. Theprime purpose is to obtain initial risk assessment of a concept and to make sure theconceptual framework is found.
The potential hazards that will impede the midssion objectives must be identified,and the hazards should not be limited to hardware. At system level the followingshould in general be considered:
Stein B Jensen SINTEF Safety and Reliability

15th WEGEMT Graduate School "Underwater Technology"Risk and Reliability Methods Page 15
- Hardware hazards- Software hazards- Procedural hazards- Human factors- Environmental hazards- Interface hazards
4.1.2 Procedure
The procedure to be followed throughout the PHA is as shown below:
- Definition of subsystems and operational modesS - Identification of potential hazards- Definition of unwanted events- Evaluation in the PHA sheet- Identification of critical and subcritical events
PHA is basically a brainstorming technique, but some kind of organized approachhelps in starting the process as asking questions as:
Are there any hardware hazards?Are there any software hazards?Are there any human-induced hazards?Are there any procedure-related hazards?Are there any obvious interface hazards among software, hardware andhumans?
All the information gathered are recorded on a PHA form. There are numerous0 yariation of such forms, one of which is shown in figure 4.1.
Stein B Jensen SINTEF Safety and Reliability

15th WEGEMT Graduate School "Underwater Technology"Risk and Reliability Methods Page 16
a a
- Ca
o -
FiguC 4. PA-o
Stein Jn__ SI__FSaftyanRelibilit

15th WEGEMT Graduate School 'Underwater Technology"Risk and Reliability Methods Page 17
4.2 Failure Mode and Effects Analysis (FMEA)
4.2.1 General Description
The FMEA was one of the first systematic approaches for system failure analyses.It was developed by reliability engineers in the early fifties, and the method isintended to identify failures which have significant consequences affecting thesystem performance in the application considered.
The FMEA is based on that defined component or sub-assembly level exist wherethe basic failure ariteria (primary failure modes) are available. Starting from thebasic element failure characteristics and the functional system structure, the FMEAdetermines the relationship between the element failures, malfunctions, operationalconstraints and degradation of performance or integrity.
In a narrow sense, the FMEA is limited to a qualitative analysis of failure modes ofhardware, and does not include human errors and software errorscdespite the factthat current systems are subject to both. In a wider sense, these factors could beincluded /2/.
4.2.2 Procedure
The FMEA is a tabulation of the systems' components, their failure modes, and eachfailure mode's effect on the system. The FMEA may generally be performedaccording to the following procedure:
1 The system is divided into subsystems that can be handled effectively.
2 System functional diagrams and drawings are reviewed to determineinterrelationship between the various subsystems.
3 A complete component list for each sub-system is prepared.The variousfunctions and operational modes of each component are entered in the samelist.
4 The operational and environmental stresses affecting the system areestablished. These are reviewed to determine the adverse affects that theycould generate on the systems and its components.
Stein B Jensen SINTEF Safety and Reliability

15th WEGEMT Graduate School 'Underwater Technology"Risk and Reliability Methods Page 18
5 For each component's function and operational mode all failure modes areidentified and recorded. Possible failure mechanisms (causes) which mayproduce the identified failure modes are also recorded.
6 All main effects of the identified failure modes on other components , sub-assemblies and on the primary function of the system are recorded.
In addition, other types of information could be recorded if found necessary. Suchadditional information could be possible failure mode detection methods, failurerates, or possible actions to correct the failure and restore the function.
Stein B Jensen SINTEF Safety and Reliability

C)f
uE
- -
.0 EuUc
U i r0o
-"LLJ*W CC 4
ra
in &I Q, 5 -4

15th WEGEMT Graduate School "Underwater Technology"Risk and Reliability Methods Page 20
All information gathered and provided through the FMEA are recorded on a FMEAform (see figure 3.1). There are numerous variations for such forms, and the analystsshould select a FMEA format which is most suitable for her/his purposes.
SINTEF Safety and Reliability has developed a commercial available FMEA programcalled FMECA. This program has several FMEA forms as well as it contains PHAand FMECA forms. The latter forms include information which allows the analystto evaluate the criticality of a failure event. The forms can be edited and completedon a PC screen, and the results stored in a data base.
4.3 Fault Tree Analysis (FTA)
4.3.1 General
The FTA is a deductive technique that focus on one particular unwanted systemevent and provides a method for determining causes for that event. The FTA wasintroduced in 1962 by the Bell Telephone Laboratories in connection with safetyevaluation of the launching system for the intercontinental Minutemann missile.
The fault tree itself is a graphic model that displays the various combinations ofequipment faults and failures that can result in the unwanted system event. TheFTA can include contributing human/operator errors as well as equipment failures.
4.3.2 Procedures
The analysis of a system by the FTA is normally carried out in five steps.
1 Definition of the problem and the boundary conditions
2 Construction of the fault tree
3 Identification of minimal cut or path sets, i.e. the list of minimumcombination of failure events which will result into the event subject for theanalysis
4 Qualitative assessment
Stein B Jensen SINTEF Safety and Reliability

15th WEGEMT Graduate School 'Underwater Technology"Risk and Reliability Methods Page 21
5 Quantitative analysis; i.e. calculation of the system un-reliability andunavailability.
For a complete description of all aspect of the FTA, the reader is referred to textbooks in reliability, risk or safety /3/. A brief description of how to construct a faulttree shall be given.
The fault tree is a graphical representation of the interrelationship betweenequipment failures and the specific unwanted system event, defined as the TOPevent. To display these relationships, several symbols are used (see figure 4.3) forlogic combinations (AND-gate; OR-gate), input events , description of states andtransfer symbols.
Fault free construction always begins at the TOP event and proceeds until all faultevents have been developed to their basic contributing causes. The analyst beginswith the TOP event and determines the immediate, necessary, and sufficient causesthat result in the TOP event. Normally, these are not all basic causes, and at leastsome are intermediate faults that require additional development (see figure 4.4).
The limrnediate causes of the TOP event are shown in the fault tree with theirrelationship to the TOP event. If any one of the immediate causes results directly inthe TOP event, the causes are connected to the TOP event with an OR-logic gate. Ifall the immediate causes are required for the TOP event to occur, then the causesare connected to the TOP event with an AND-logic gate. Each of the immediatecauses is then treated in the same manner as the TOP event, and its immediate,necessary, sufficient causes are determined and shown in the fault tree with theappropriate logic gate. This development continues until all immediate fault treeevents have been developed into their basic causes.
Stein B Jensen SINTEF Safety and Reliability

15th WEGEMT Graduate School "Underwater Technology"Risk and Reliability Methods Page 22
SYMBOL DESCRIPTION
AThe "OR"-gate indicates that the output event A
"OR" gate occurs if any of the input events Ej occurs.
LOGIC GATES
AThe "AND"-gate indicates that the output event A
"AND" gaoccurs only when all the input events Ei occurs si-"AND"gatemultaneously.
"BASIC" event The basic event represents a basic equipment faultS or failure that requires no further development
into more basic faults or failures.
INPUT EVENTS "HOUSE" event
The house event represents a condition or anevent which is TRUE or FALSE (not true).
"UNDEVELOPED" event The undeveloped event represents a fault eventythat is not examined further because informationis unavailable or because its consequence is insig-nificant.
DESCRIFTION "COMMENT" rectangleOF STATE The comment rectangle is for supplementary infor-
[ I mation.
SoutThe transfer out symbol indicates that the faultTRANSFER Sym- "TRANSFER" out tree is developed further at the occurence of the
BOLS corresponding transfer in symbol.
0'"TRANSFER" in L _
Figure 4.3 FTA Symbols
Stein B Jensen SINTEF Safety and Reliability

15th WEGEMT Graduate School 'Underwater Technology'Risk and Reliability Methods Page 23
SINTEF Safety and Reliability has developed a commercial available FTA programcalled CAFTAN-C. This is a program for fault tree construction. From a graphic userinterface the analyst is able to construct and edit a fault tree, enter input data andgenerate hard copies of the fault tree.
L ci
IdkW
I.-~~co Wd1 *M'
* Ux2
-1--.-
kMn ~fl
MnWo 2e
Figure 4.4 Sample Fault Tree
Stein B Jensen SINTEF Safety and Reliability

15th W-EGEMT Graduate School 'Underwater Technology'Risk and Reliability Methods Page 24
4.4 Event Tree Analysis
4.4.1 General
Event Tree Analysis is a graphical logic model that identifies and quantifies possibleoutcomes following an initiating event. The event tree models provides systematiccoverage of the time sequence of an event propagation. The event trees arecomplements to fault frees. A specific technique combining the two methods wasdeveloped by the Danish Atomic Energy Commission and called CauseConsequence Analysis.
The event tree structure is the same as used in the decision tree analysis. Each eventfollowing the initiating event is conditional on the occurrence of its precusor event.Outcome of each precusor event are most often binary (SUCESS or FAILURE, YESor NO), but can also include multiple outcomes.
4.4.2 Procedures
Generally, the procedure to perform a Event Tree Analysis is as follows:
1. Identification of relevant initiating event.
2. Identification of barriers, controll or safety functions which are design toprevent propagation of event sequences which may give rise to unwantedconsequences.
3. Draw the Event Tree.
4. Describe the resulting event sequences and consequences.
5. Calculation of probability /frequencies for the identified consequences.
An example of an Event Tree is shown in Figure 4.5. This general tree was
developed to evaluate various protective measures on a subsea installation.
Stein B Jensen SINTEF Safety and Reliability

15th WEGEMT Graduate School "Underwater Technology"Risk and Reliability Methods Page 25
ROV inspection
No damages -ROT/ROv clean-up
LDiver clean-up
Protective Minor damagesStructure - diver intervention
,• [ damaged/da e -Major damages- diver intervention
Dropped -No leaks rROT repairobjectsI
Diver repair
Module changeout/RIG
Production Small leaks ROT repairsystemTdamaged LDiver repair
IModule changeout/RIG
Blowout -- ROT repair
Rig on location
LDeviation drilling
Figure 4.5 General Event Tree for Subsea System Protective StructureEvaluation.
Stein B Jensen SINTEF Safety and Reliability

15th WEGEMT Graduate School 'Underwater Technology"Risk and Reliability Methods Page 26
5. SYSTEM RELIABILITY CALCULATIONS
5.1 Probability evaluation based on Fault Tree Models
If it is assumed that the basic events are statistically independent, and that we knowthe probability of occurrence of each of the basic events in the fault tree, then it ispossible to calculate the probability of occurrence of the TOP event.
Assuming a system with only one AND-gate, and let Bi(t) denote that the event Biis occurring at time t, i = 1, 2 ......, n. The event B, is normally a component failure.The probability that the event is occurring at time t is defined as
cq(t)= P(B,(t))
and consequently a4(t) is the un-reliability or the unavailability of the component iif the basic event is a component failure.
The probability of the TOP event to occur at time t, Q(t), is then
Q(t) = P(BI(t)n)B2(t)n ...... nB,(t))
= P(B1(t))'P(B2(t))".-..P(B.(t))
q1(t)'Ci(t)'.""q.(t )'
If a fault tree consist of only one OR-gate we have what often is called a seriessystem. In this case any of the basic events will lead to the TOP event to occur, i.e.all components have to function shall the system be functioning. The reader may tryto show that the probability of occurrence of the TOP event at time t is
* Q(t) = 1-(1-q,(t))(1-c2(t))""(1-q(t))]
It is beyond the scope of this lecture to provide complete algorithms for calculationof system reliability/availability parameters. The reader is referred text books withinthis discipline.
There are numerous computer programs available which assist the analyst incalculating the various reliability parameters once a fault tree has been constructedand the input data are defined.
Stein B Jensen SINTEF Safety and Reliability

15th WEGEMT Graduate School "Underwater Technology"Risk and Reliability Methods Page 27
SINTEF Safety and Reliability has developed a commercial available program calledCAFTAN-C which accept data files from CAFTAN-A. This program calculates thesystem un-availability, survival probability, mean time to failure, performs anuncertainty analysis and investigate the reliability importance of all the systemcomponents.
5.2 Availability and Production Regularity Assessment
To assess the operational features of a subsea concept, several factors may have tobe included in the system model which makes it difficult to arrive at results ofsufficient accuracy applying the analytical approach. To find reliability parametersfor the more complex system, several computer simulation programs for reliabilitycalculations have been developed. One program especially developed for subseafield operation simulations has been developed by SINTEF Safety and Reliability.The program is called pcFOSP and it is based on a Shell developed program calledFOSP (Field Operations Simulation Program).
The field model mi,, include platforms, manifold templates, multi-well manifoldtemplates and satellite wells. The wells are production wells, gas or water injectors.
Each of these field elements may consist of one or several "modules" which may failin one or several failure modes. In addition periodic operations as DHSV testing canbe defined and included into the model. When a "module" has to be repaired or aperiodic operation shall be undertaken, a specific job will be executed. Each job canbe executed by a defined set of resources.
Stein B Jensen SINTEF Safety and Reliability

15th WEGEMT Graduate School 'Underwater Technology'Risk and Reliability Methods Page 28
The resources could be various vessels or crews. It is possible to define a numberof resource items available in the field, each capable of performing one job at thetime. Job durations and weather conditions affecting the job duration can be defined.
It is also possible to define job priorities and replacement strategies specifyingmodules to be replaced during any job or intervention on the subsea system.
The actual production profile for each well can be defined (plateau rate andexponentially decreasing rate). The gas/oil ratio can be constant or be linearlydecreasing. Any process limitations on exported oil, exported/flared gas, or totalamount processed fluids can be defined.
From the simulations a variety of reports can be generated as number of producingwell days, total amount produced, deferred production, number of repair jobs,resource utilization, etc.
The figures 5.1 and 5.2 are giving example of the graphical output from pcFOSP.
Fig 5.1 pcFOSP Graphic Report MSV Figure 5.2 pcFOSP: Actual versusActions Potential Production.
Stein B Jensen SINTEF Safety and Reliability

15th WEGEMT Graduate School 'Underwater Technology"Risk and Reliability Methods Page 29
6. RELIABILITY DATA SOURCES
Access to reliability data is one of the main problems in reliability analyses. The lackof suitable data has been used as an argument against quantitative reliabilityanalyses. However, the decisions will be taken anyway, and they are hardly moreuncertain with a quantitative analysis as part of the basis for the decision thanwithout this information, even though the data and consequently the results of theanalyses are uncertain.
0w There exist several open data banks containing failure rate information onequipment used in the subsea field.
In 1984 the "Offshore Reliability Data Handbook" was published by the OREDA0 project. This handbook was a result of a multi-oil-company project which wasestablished to compile a basis for reliability information from failure and repairrecords existing in the company files. Even though only a few of the OREDAcomponents have been used subsea, this book is a valuable source of information.Unfortunately, the book has been withdrawn by the OREDA project. Copies maystill be available.
The OREDA project which is as per today funded by ten oil companies, is stillcollecting data. These data are, however, only available for the OREDA Participants.Discussions among the OREDA Participants may lead to a decision to issue a newOREDA handbook next year.
For control system components the most well known data source is the US MilitaryHandbook 217. This is an open source for reliability data on electronic equipment,and it has found widespread use also within the subsea reliability engineering.
0 Furthermore the Reliability Analysis Center in USA has issued the following databooks:
"Electronic Equipment Reliability Data"0"Nonelectronic Parts Reliability Data"
Stein B Jensen SINTEF Safety and Reliability

15th WEGEMT Graduate School "Underwater Technology'Risk and Reliability Methods Page 30
7. RELIABILITY REQUIREMENTS FOR NEW SUBSEA PROJECTS
The reliability specifications for subsea systems may vary dependent on the location,water depth, current oil price etc. In a regime with extremely high oil prices, everyfailure causing deferred production may turn out to be costly, while at low oil pricesdeferred production due to failures may not play an important role.
Simple solutions are often reliable solutions, but such simple solutions have to rely* on reliable components. The investment in reliability cost money and has to be
weighted against the expected savings in later maintenance costs. Theoretically,optimum reliability requirements for the system as well as for the sub-assembliesare possible to find. In practice, such an optimum may require a considerable effortespecially into data collection and in establishing functional relationship between theequipment reliability and its purchase costs.
In most of the subsea projects the author have participated, the various projectteams have defined MrrF-requirements for the more failure prone sub sea systemcomponents. For example, there has been a five year MTTF requirement onproduction tree control pods (EX-MUX). It was also a common practice to base thecalculation of the field economics on an average production of 85 - 90 % of thenominal production.
One approach for stating reliability or availability requirements may be to comparewith real field experiences. The author has had the possibility to look into theproduction reports from a few subsea wells which have accumulated more than 17years of production in the late eighties. In average these wells have been closed inabout 20 % of the total time (see figure 7.1). However, the wells have been closedin only 7 % of the total time due to subsea system related failures (see figure 7.2).
Stein B Jensen S-INTEF Safety and Reliability

15th WEGEMT Graduate School 'Underwater Technology"Risk and Reliability Methods Page 31
PRODUCTION AND SHUT IN17, 4 PROD. YEAR
PRODUCTION
(79.6W-
Figure 7.1 Production and Shut in - Subsea Production System.
Stein B Jensen SINTEF Safety and Reliability

15th WEGEMT Graduate School "Underwater Technology"Risk and Reliability Methods Page 32
SHUT IN CAUSES% of total time
SAFETY SD SYSTW
PR0=S/AXrSYSTM
~SS WELJ. SYSTEM4S
ERNAL CAUSES
0 0.02 0.04 0.06 0.08 0.1 0.12
Figure 7.2 Distribution of Causes for Shut in of the Subsea ProductionSystem
Stein B Jensen SINTEF Safety and Reliability

15th WEGEMT Graduate School "Underw'ater Technology'Risk and Reliability Methods Page 33
8. REGULATORY REQUIREMENTS FOR PERFORMING RISK ANDRELIABILITY ANALYSIS
The Norwegian Petroleum Directorate issued in 1990 "Regulations concerningimplementation and use of risk analysis in the petroleum activities with guidelines".
In this regulation it is stated that the operator shall plan the implementation of riskanalyses in any project development, and also shall the operator implement thisactivity in various stages of a field development. It further entails theimplementation of risk analyses e.g. in connection with major modifications andreorganizations.
It is further required that requirements applicable to the implementation and the useof risk analyses shall be stipulated in order to assure the quality of the basis for thedecision-making process. This means that a number of items must be clarified beforea risk analysis is carried out as for example:
a) the acceptance criteria for risks in the activities are defined.
b) the purpose of the risk analysis is dearly defined and in accordance with theidentified needs of the activities.
c) the scope of the analysis and the delimination of what is to be analysed aredlearly defined.
d) the data material is adapted to the purpose of the analysis; assessment ofwhich data bases are relevant.
Lately, the Norwegian based offshore operators have joined forces through a specifictask group, to establish a comnmon understanding on how to define acceptancecriteria.
Also in UK new regulations are coming as a result of the Piper Alpha accident. Thesocailed Cullen Report recommends that the operator should be required byregulation to submit to the regulatory body a 'Safety Case" in respect of each of itsinstallation.
The Safety Case should demonstrate that certain objectives have been met, including
"that the potential major hazards of the installation and the risks to personnel
have been identified and appropriate controls provided".
Stein B Jensen SINTEF Safety and Reliability

15th WEGEMT Graduate School '"Underwater Technology"Risk and Reliability Methods Page 34
Although most of these regulations are aimed at platform installations, they will alsohave impact on subsea facilities planned to be installed in the future. One examplerelated to a subsea device is already mentioned as the Cullen report concludes that
"there should be no immediate requirement that a subsea isolation valve(SSIV) be fitted on a pipeline connected to an installation. However, theoperator should demonstrate in the Safety Case that adequate provision hasbeen made, including if necessary the use of SSlVs, against hazards fromrisers and pipelines."
REFERENCES
/1/ G. W. A. Dummer and R. C. Winton: An Elementary Guide to Reliability.Pergamon Press.
/2/ IEC Standard 812 Analysis techniques for system reliability - Procedures forfailure mode and effects analysis (FMEA).
/3/ Holen, Heyland, Rausand: PAlitelighetsanalyse. TAPIR.
Stein B Jensen SINTEF Safety and Reliability

pcFOSP- A tool for Availability and Production Regularity Assessment
When establishing plans for subsea systems for its own job duration distribution.oil/gas production, one task is to assess the opera-tional features of a given concept. In order to Resources: Neccessary for replacingevaluate/compare various failed modules or performing operations on
field elements. The user may define alayout concepts number of different resources, with dif-maintenance and repair strategies ferent characteristics and capabilities. Of
each defined resource, a number of re-
it is necessary to have suitable methods for predict- source items may be available in the field,ing production regularity and availability, each capable of performing one job at a
time. An item typically corresponds to a
Tools for calculating such parameters are helpful in vessel or a crew.the process of finding economically optimal solu-tions. Due to the complexity of this class of prob- Major model features:lems, exact analytical solutions does not exist.Approximate calculations may be carried out at For each module and each failure mode,various levels of accuracy, simulation giving the different effects of the failure may bemost detailed and accurate results, specified, both for the element containing
the module and other elements. Also, forSINTEF has developed a computerprogram named each repair job or operation performing,pcFOSP (Field Operations Simulation Program), different element shut-in strategies may bewhich uses the simulation approach. specified.
pcFOSP is an evolution of the mainframe computer Each job also has its own replacementprogram FOSP, developed by Shell during 1984 to strategy, specifying modules to be replac-1989. pcFOSP allows the user to describe the ed or removed, conditionally or uncondi-behaviour of the system under study in consid- tionally during the job. Also, operationserable detail, while at the same time being easy may be performed as part of the job.and self-explanatory to use thanks to a sophisti-cated user interface. Operations are performed periodically,
while time to module failure is drawn ran-pcFOSP is under continuous development. Minor domly according to e.g. the Weibull or theenhancements and improvements are done on a Exponential model.regular basis, and plans exists for development ofa number of program modules which will widen the Job execution durations are random, forarea of application still further. example uniformly distributed between a
maximum and minimum time, season de-The main components in pcFOSP's field model are: pendent lognormally distributed, or drawn
according to a weather matrix specifying aField elements: Physical (main) units in piecewise linear repair time distribution forthe system: Platform, Manifold Template, each month of the year.Multi-Well Manifold Template, and Wells,which may be used for either production, Intelligent job priority logic for determininggas injection or water injection, the allocation of resources to jobs.
Modules and Operations: Each field ele- Support for mobilizing additional resourcement has associated a set of Modules, items during periods of high workload onwhich may fail in one of several failure the items operating in the field.modes according to certain distributions,and a set of Operations that must be per- Production wells has the following prop-formed periodically on the element. Each erties:intervention job thus specified may be Production profile is modelled asexecuted by a selected set of Resources. constant during the first few yearsEach job/resource combination can have
General information. pcFOSP SINTEF Safety and Reliability July 3. 1991

(the piateau), 'nen exionentially - ,decreasingConstant or lineary decreasing IGas/Oil-ratioInitial watercut determines the ._total (gross) fluid produced
Fi.:
m' ] •~ •pcFOSP Report specification
0 [* Event log for one simulation (for verifica-
Ak • c _____tion purposes)Well activity (well-time spent in differentstates, availability etc.)Production / Injection (potential, actual,threshold, lost, deferred, regained etc.)
pcFOSP Field layout drawing screen
The field layout is input using a graphical drawingprogram module. Input of parameters is done -.interactively, using forms-type screens.
To assist the user in the construction of the fieldmodel, pcFOSP offers a context-sensitive help lllasystem that reduces the need for consulting thedocumentation. ' I.I
Sample pcFOSP graph
Resource activity and utilization (timespent in different states, number of ac-tions, utilization etc.)Module and Operation activity (number ofmodule replacements, failures, and opera-
pcFQSP Help system tion performings)
The pcFOSP model and program system is underpcFOSP also supports the use of a mouse. The continuous development. In order to ease the tasksgraphics system operates with a large number of for subsea field developers even further, plansgraphics displays and printers, including VGA dis- exists for enhancing the system with modules for aplays and the HP LaserJet. HP pen plotters and number of different purposes. in addition to suchPostscript printers. Graphics and textual reports major enhancements, the program is subject togenerated from pcFOSP may be imported to a word regular maintenance in order to improve functional-processing program. ity.
Also, result presentation is done interactively. The pcFOSP runs on IBM PC AT or compatible ma-user may inspect the simulation results on the chines (386SX up recommended), with a mathe-screen, either as tables or as graphs. The user matical co-processor and a graphical monitor (EGAmay compose a report consisting of desired groups or VGA). In order to increase simulation speed, theof results, at a desired level of detail. program is able to utilize EMS memory and/or
RAM-disk.Main result groups are:
Description of the field
SINTEF Satety and Reliability, N-7034 Trondheim, NORWAY Phone: .47-7-59 27 56 Fax: .47-7-59 28 96

I Ragnar Aare. M.Sc.Enq.,Pesearcn •nqtneer
C A "'A SINTEF Satetv an d Reliaoiiitv
AODRESS: N-7034 Tdonhelm. NORWAY HOME . 47 7-
PHOE. A77930)O'TELX: 55 620 5 rThe CARA Toolkit DIoECTUNE 7 7 59 ý301ETLINE: 4"47 759 4475 FAX: . 47 79 Sg C
CARA is a PC package which enables engineers to carry out reliability assessment quickly andefficiently. CARA is based on practical analytical reliability techniques coupled with the powerand usability of the modern PC.
CARA contains an integrated set of modules which meet the needs of engineers conductingvarious Forms of reliability analysis. The modules are menu driven and have a common userinterface.
Modern reliability methods are systematic and involve recordinc and manipulation of a largeamount of system information. CARA increases the efficiency or reliability engineers leaving timefor more detailed sensitivity studies to be carried out.
The four modules that make up the CARA toolkit may be used individually or in combinationdepending on the nature of the study.
Failure mode, effect and criticality analysis Module FMECA
A Failure Mode, Effect and Criticality Analysis (FMECA) is often the First step in a reliability study.The objective is to record and organise information of relevance to the intended function of asystem and the effect of all single failures.
The module applies a semi-quantitative approach to FMECA by including the frequency of thefailure modes, the repair time and a severity classification number. The results are presented intabular form.
A FMECA is an important part of any kind of reliability analysis, contributing to activities such asgeneration of maintenance procedures, training operating personnel and re-assessment of design.
Fault Tree Analysis Module CAFTAN
Fault tree analysis is the most commonly used technique For analysing the effect of multiple fail-ures. The technique is based on a tree model describing the Functional relationship betweenmultiple Failures and a critical system function. Quantitative results are obtained in the form ofunavailability, mean time to failure and measures of reliability importance.
The fault tree model is generated graphically to let the analyst establish a tree model whichreflects the analysing strategy. A thorough structuring of a large tree model is essential to thereadability of the Fault tree.
Automatic tree modularisation is used to generate the minimal cut sets. Even complex trees areanalysed within a few seconds. A special algorithm for exact calculations and efficient sensitivityanalyses has been implemented.

Cause Consequence Diagrams and Event Tree Anaiysis Moauie C:.A
Cause consequence diagrams and event trees are commonly used to find ana document meconseauences arising From u critical event in a system. These inductive techniques a.enrify ad mepossible chains of events or consequences Following a potentially dangerous event or hazard.
CCA can use initiating events identified from a FMECA case and the quantitative reliabilitycharacteristics are often derived from CAFTAN.
Using CCA the cause consequence diagram is constructed page by page with standard symbolsFom the CCA library or by importing pages from previously constructed diagrams.
The results appear as tables or graphs and include barrier probabilities and the frequencies ofresulting consequences.
Analysis of Exponential Failure Rate Data Module ANEX
Reliability data are derived From statistical analyses of experiments on large numbers of individualcomponents. In its raw Form this scattered data cannot be used in a quantitative reliability analy-sis.
ANEX takes such experimental data and fits it to an exoanential distribution curve. The modulecarries out the analysis with respect to each failure mode or an arbitrarily specified subset of thefailure modes.
The data may come from a homogeneous sample or from multiple samples. In one case thefailure rare is constant for all items. In the other data from more than one sample are pooled andan estimate of confidence limits is calculated.
ANEX may also serve as a database From which data dossiers may be extracted.
-n-
For further information about CARA call
Technica Ltd, Technica International,Lynton House, Suite 800,7/12 Tovistock S* IQ1 4 N Harbor Blvd,London WCI H 9LT . ,=. 38822684 Fullertan CA 92635 Te it:(71.) 447 .9 0
TechnicaLondon Aberdeen Stavanger Los Angeles Columbus Houston

CARAThe CARA User Interface
CARA is a suite of PC programs which enables engineers to carry out quantitative reliability assess-ment quickly and efficiently. It uses practical analytical reliability techniques, coupled with the powerand usability of the modern PC, to address all the common analysis techniques which the reliabilityengineer needs to use.
The objective of CARA is to reduce the time taken in analysing large amounts of reliability data andthereby release the reliability engineer for the more creative task of interpreting the results of theanalysis and improving the operati'-T, -f his plant.
The input is intuitive and easy to learn. CARA programs shore a consistent input format using menusand a pointer. They run on industry standard IBM PCs or compatibles. Outputs are by tabular orgraphical representation on screen or on hard copy.
The programs in the CARA suite ore: CAFTAN For fault tree analysis; CCA for cause consequenceanalysis; FMECA for failure modes, erects and criticality analysis; and ANEX for estimation of failurerates.
Date 89.05.30 Fault Tree Analysis
[ Tree: DM..FT CAFTAN fault trees are con-F SYSIT MENU structed using a pointer acfi-
[ WPILW vated b a mouse or by cursorffloorT TRM control ýeys.
MMNf1 F READ F1SOEcsPAM Li ML [ Construction mode is selected
[ UT ,P.rr from the menu on the right hand~ S n .,n side of 'h~e screen, the ?ault tree
A B bTim .17 symbols from the menu in the
I L....J LJ~' ILEL ~ middle and the tree built up an* 4- A r~ ci~ EXITc the left.
M No L ..•. A library of standard Fault treesmay be stored and used as asource for regular cases, or faulttrees may be imported from
.o previous cases.
Cause ConsequenceAnalysis <-Es tNG->
The CCA program uses the L _________________
pointer, in the same way as F E 1DCAFTAN does, to construct the CC*E_ U D iicause consequence diagram. F E=
At any time the user can re- L--J •L_ • Lii P•
quest calculation of the proba-bility of reaching each barrier; a__ _ Lii =2
this wi be shown on the screen. A 0W= fF1 Ma
L2_J mmr IL1lC-cALCULATE
53AR1S-SETuP
MN I Paqe nto:ed?

~zsan raes. ffects andi40CN - 2 RD... .Naiy
mxoowM OF )Eor nium !AflZRE EF7F=SNU)M ?UM OPUATON t L SYSTEM LEV•L The crccrcm FMECA mimics a- . tiiure rrcce. e~ect and criticci-
iN anaivsis rorm on the screen.The input works on a spread-sheet principle and completedforms a:re screrd on a data base.
MFWfZrE c IMM=IIsL•U•Y s .SN.. s mm Forms rrom earlier studies mayýW6N OCH be retrieved. modified and re-
Life Data Analysis Failure mod distz•bution for one tnm Pro3-t: DDC
ANEX accepts data either from
keyboard or from text files F= (18.2%)
imported from a commercialdata base management systemsuch as dBase. E= (3.0%)A variety of output graphs can
be requested from a pop upmenu. The graph can be plot-ted on the screen or directed to tzm (69.7%) IAOO (9.1%)a hard-copy device.
VALV34 - Choke valve
CARA 'hardware Requirements
The CARA suite of programs may be run on a wide variety of personal computers and printers. A
typical configuration is given here. Call Technica to check that your hardware is suitable For use with
CARA.
Computer Printer
IBM PC or compatible with: One of:640 Kb RAM Facit 4514 (132 columns)Hard disk with at least 5Mb free storage HP7475A plotterMath co-processor HP LaserJetEnhanced Graphics Display or compatible
For further information about CARA call
Technica Lid, Technica International,Lynton House, Suite 800,7/12 Tavistock Sq, 1440 N Harbor Blvd,London WCIH 9LT Tel: 01 388 26b, Fullerton CA 92635 Tel (7141 447 9400
Technica Abexdwi Suvanger Los Anges Columbus Houston

CARA Users
Type ofCompany Country business
Aker Engineering United Kingdom ConsultantAquidneck Management Associates USA IndustryBOFORS AB Sweden IndustryBritish Gas plc United Kingdom ResearchBritish Rail Research United Kingdom ResearchBrown & Root (Vickers) United Kingdom ConsultantCentral Environmental Agency, Rijnmond The Netherlands GovernmentalChalmers Insitute of Technology Sweden UniversityCTEMAT Spain IndustryCommercial Polymers Australia IndustryDELAB Norway ResearchDNV Industrial Development AS Norway ConsultantDutch Ministry of Housing, Planning and Envinronment The Netherlands GovernmentalITMMEC India ResearchJohnson Controls, Stennis Space Center USA IndustryKongsberg Automotive AS Norway IndustryKvaerner Engineering AS Norway ConsultantLubrizol USA IndustryLuleA Institute of Technology Sweden UniversityMarathon Interational Petroleum United Kingdom IndustryMobil Research & Development Corp. USA ResearchNational Chiao Tung University Taiwan UniversityNaval Underwater Systems Center USA MilitaryNorsk Hydro AS Norway IndustryNorwegian Underwater Technology Center (NUTEC) Norway ResearchNorwegian Petroleum Directorate Norway GovernmentalNorwegian Petroleum Consultants AS Norway Industry
* Norwegian Institute of Technology Norway UniversityN. V. Nederlandse Gasunie The Netherlands IndustryPhillips Petroleum Company United Kingdom IndustryRasmussen Offshore Norway IndustryRaufoss AS Norway IndustryRogaland RegionalCollege Norway UniversityRohm and Haas USA IndustryRoyal Norwegian Navy Norway MilitarySaga Petroleum AS Norway IndustryShell, SIPM B. V. The Netherlands IndustrySikteC AS Norway ConsultantSimrad Albatross AS Norway IndustrySINTEF Norway ResearchSTATOIL Norway IndustryTechnica UK, US and Norway ConsultantTelemark Regional College Norway UniversityTrondheim Regional College Norway UniversityVIF Finland Research
SINTEF Safety and Reliability September, 1991

SAREPTA
SAREPTA (Survival and Repair Time Analysis) is a program for analysing life- andrepairtime data. The program, which runs on IBM AT, accepts i= iltiple censored datawith a high number of failure modes. SAREPTA integrates a number of modules whichmay be selected from menues using the keyboard. SAREPTA has a user-friendlyinterface, and may be run without detailed knowledge of reliability technology. Theinterpretation of the program output should, however, be left to skilled reliabilityanalysts.
Input section
* Data may be entered from the keyboard or from textfiles. Data from a dBASE III file isfor instance easy to use. Before entering data the actual failure modes must be specifiedand identified by a three-letter code.
Once data have been entered, it is easy to edit data, rename failure modes etc.
Parameter estimation
The parameters of the following distributions are rapidly estimated:
- Exponential distribution- Weibull distribution- Gamma distribution- Lognormal distribution- Normal distribution- Birnbaum-Saunders distribution- Extreme Value (Gumbel) distribution
In our selection or estimation procedures, effort has been put into finding efficientprocedures accepting multiple censored data.
Plotting section
The analysis may be carried out with respect to each individual failure mode or anarbitrary specified subset of the failure modes. The program may thus be used foranalysing most types of competing risk models.
The following plots may be supplied:
- ~Kaplan-Meier plot- Hazard plot- Total Time on Test (7TT) Plot- Failure rate plot (histogram)

Overlay curves for the various plots may be selected from a pop-up menu. The overinvcurves may be used to visualize the goodness of fit to the various distributions. The
=TT-plot is established on the basis of multiple censored data by combining the Kaplan-Meier estimate with the =lT-transforn. The =TT-plot may also be used to determineoptimal strategies for replacement of components according to a technique proposed byProfessor Bo Bergman, University of Lindk6ping, Sweden.
Goodness of fit
In addition to the curve overlay techniques described above, SAREPTA includes aformal goodness of fit test. This test was proposed by Barlow and Proschan and is oneof the very few relevant formal tests accepting censored data.
* Repair time plotting
Repair times are commonly assumed to be governed by a lognormal distribution. Thissection provides a plot of the cumulative distribution function together with alognormal overlay curve to check the assumption.
Kaplan-Meier plot
Veibull (4.303E-04,1.58)- ---------- Gamma (1.118E-03.2.32)
-.-" 0.75
.0
C* 0.50
€=
U,.
0
0 2.00 4.00 6.00 8.00bowrs x&03
Example of output from the SAREPTA program

ROCOF
ROCOF is a program for analyzing repairable systems. ROCOF is an acronym for rateof occurrence of failures. This indicates that failures are modelled as . process on the timeaxis, rather than viewing the 'time to failure' as we do in standard life time analysis.Because systems are repaired when they fail, we may observe several failures for eachsystem.
Several systems may be analyzed simultaneously. It is also possible to define strata,where systems within the same stratum is assumed to have the same pattern of failures.The ROCOF program also offers a method to define covariates or explanatory variablesfor each system.
0Input section
ROCOF has its own full screen data editor, making it easy to enter data from thekeyboard. Data can also be imported from text files and from dBASE Iln files.
Parameter estimation
Parameters in the power law, and the log linear non homogeneous Poisson process canbe estimated. If covariates, or explanatory variables has been entered, the effect of thecovariates may also be estimated.
Plotting section
* The ROCOF program is capable of producing a Nelson-Aalen plot (similar to theHazard plot available in SAREPTA)
Overlay curves may be selected from a pop-up menu. The overlay curves may be usedto visualize the goodness of fit to the two non homogeneous Poisson processesmentioned above.
Goodness of fit
In addition to the curve overlay techniques described above, ROCOF includes a twodifferent formal goodness of fit tests for testing if there is a trend in the data. These twotests are the Laplace test and the Military Handbook test.

Pump dataNelson Aalen plot
10.0-AUpOng"
8.0-
4.0
2.0-
0.00 0.50 1.00 1.50
drys ul&C
Example of plot from the ROCOP program

INTRODUCTION TO QUALITY ASSURANCE
IN SUB SEA PRODUCTION
Alfred Smlid Det Norske Veritas Norway
Alf Petter Hoilund Classification A/s
Principal Surveyors Oslo
ABSTRACT
The importance of quality assurance in sub sea production systems isdiscussed. Cost of corrective actions and cost of novel designs will forcethe industry to standardization, simpler solutions and reuse of equipment.Quality Assurance is a "tool" to obtain more cost-effective solutions.
INTRODUCTION
Before 1970 the term "Quality Assurance'CQA) was hardly known in the
industry. The expression was mainly used in some special industrial sectors,
like aerospace, nuclear power and in connection with military supplies. Not
being directly involved in any of these sectors, QA terms and principles were
paid very little attention.
This fact does of course not mean that other industrial sectors were not
engaged in ensuring quality of their products and services. However, the
attention was given to quality control which traditionally had relied heavily
on post-production inspection and correction, and dealt with both design and
production problems after the event, when they were most difficult and most
expensive to put right.
0 Limited attention had been paid to a systematic planning and administration
of measures having importance and relevance for the quality of products and
services.
The application of more and more advanced tecnology combined with more
serious hazards and consequences involved when this technology fails, has
brought about general requirements for a system arnproach to quality assurance
to minimize the probability of such technological failures. Further, a
tougher competitive situation has enforced more consciousness about quality
by company management, company employees etc.

Various national authorities and licensing bodies have also established
requirements to the administrative control and verification of work of
importance to quality and safety.
Activities related to production, transport and processing of petroleum and
petroleum products world wide have led to considerably increased attention
to matters related to QA. The commercial exploitation of oil and gas
resources has led to the application of new and quite complex offshore
installations.
Stringent safety and reliability requirements for equipment and operations
* are being set because of the substantial potential hazards to human life and
health, environmental quality and property.
SUBSEA DEVELOPMENT
Quality Assurance (QA) is considered to provide systematic applications of
discipline, a systems approach to quality, as well as effective accumulation
and feedback of expertise and experience for all offshore activities - cover
topside and subsea equipment/structure requirements
To maintain strict control of all activities of large and complex projects,
clear lines of responsibility are considered essential. A systematic
application of disciplines in all project phases such as design,
construction, operation and maintenance is required - for subsea systems
maintenance is provided to be set to a minimum of Cost during the systems
life-time.
The systematic control as well as assurance of quality on such projects
should thus include measures to control quality and find weaknesses and their
base in management, organization or administrative controls and not be
limited to traditional inspection work.
Assuring qruality of subsea installations
The classic way of assuring quality of complex installations has mainly been
through:
- Rules and regulations laid down by Authorities
- International Codes and Standards
- Oil Company's specifications
It has been noted that failures do occur despite strict specifications and
inspection arrangement to code requirements. One must assume that further
improvement in quality and performance can not be achieved merely by
increased inspections and tests.

To secure quality, the basic items are as follows:
- Proper procedures
- verifications work
- Quality audits
- Non-conformance treatment
Authority Requirement
On the Norwegian Continental shelf the term "internal control" was laid down
in NPD (Norwegian Petroleum Directirate) regulations f or drilling and
production (1975/76) which means that the offshore operators has the
* obligations to adhere to provisions stipulated in acts or regulations and to
ensure that such provisions are adhered to. The main point of the internal
control system is a clearly placed responsibility with the licensee.
Consequently, NPD (the Norwegian Petroleum Directorate) will limit their
* involvement with the internal control to a supervision of the establishment
and operation of the system. This is done through system audits. The
implementation of the internal control system in practice has forced the
licensees (operator) to take full responsibility for all aspects of quality
assurance in offshore projects.
From an administrative point of view, this is a rational arrangement which
takes care of the government's control responsibility, while at same time
opening for flexibility in the choice of solutions and giving room for
technical innovation.
These factors are extremely important at a time both the industry and
national governments are focusing on cost effectiveness.
DOCUM4ENTATION AND COST OF COMPONENTS AND SYSTEMS
In the light of new developments, documentation of components during the
design/production phases have been increased to an uncontrollable level.
Such 'documentation-aspects" are not specific for subsea plant but are more
or less an offshore problem.
In the early stage, quality assurance have been blamed for too much
bureaucracy in performance and too strict requirements to documentation.
Mainly technical recognized codes and standards are used as reference
documents in addition to the operators own specifications for developments
of subsea plants.
Every new subsea installation is traditionally looked upon as a "one off"
design, leading to extremely sophisticated technical and expensive solutions.

Reuse of existing equipment may be the key issue to cut cost.
Cost and quality
For the subsea installation the general objectives apply, with special
emphasis on environment and total costs in all phases of a project
development from concept to demolition.
The subsa industry is a relative young industry that has been, for the better
and the worse, part of the oil industry where money has been plentyful.
This has sometimes led to unnecessary preferential engineering and new
design, and perhaps not througout enough evaluation of w hat is required in
the front end of developments.
Being a relatively young part of the industry reasonably low on the learning
curve has also to do with this quality problem.
Every industry that develops will sooner or later develop standards in their
field. This is a necessity in order to rationalise the energy spent and to
ensure a certain degree of interchangeability within that industry.
This is perhaps more important in an industry with the nature of the subsea
industry. Here we are dealing with equipment that must have a high degree
of reliability.
This is only achieved by an evolution whereby some of the Possible variables
are kept still and further improvements are made where experience has proved
this to be advantageous.
Being part of a large context where the supply of subsea equipment is only
a small fraction of the turnover, has clearly caused some quality assurance
problems. The use of equipment subsea is causing special requirements which
* easily can drown in the usual run of the mill equipment.
The need to have a better controlled process when designing and producing the
subsea equipment is evident. It Must work properly when it is deployed.
It is too costly to do corrective actions subsea. Therefore the quality
control is highlighted with respect to reduce in-service problems.
These requirements necessitate some standards that are specific to the subsea
part of the industry.
The timeframe allowed when a development is started has possibly been too
short for some of the work in the past. It could be wise to examine the
decision process in order to achieve a more natural development. Another
possible angle of attack could be to restructure the front end of development
projects to more clearly identify the design baseline for the following
phases.

This requires that experienced system designers are put to work at these
early stages.
The industry has struggled with a competence problem in some of the
organisations involved in the work performed.
it is important to alleviate this problem by trying to maintain the
competence by a reasonably continuous activity level. An identification of
training requirements relative to future work would be an Important factor.
This can only be achieved by a more open attitude in the industry. A lot can
be learnt from other industries on this topic e.g. the aerospsce industry.
The quality assurance principles are still the same, but the administration
cost to perform quality control have been reduced in the past. As a
consequence of experience and requirements to reduce cost in all phases,
equipment and components intended for subsea plants seems to be more
* standardized compared to top side facilities.
Problems /corrective actions given by the quality assurance system have raised
the question for standardization.
STANDARDIZATION
The Value of Standards
Managers Will face increasingly complex challenges as economies and
marketplaces become more globally involved.
Business plans will have to be changed frequently, leaving little time to
adjust.
Staying competitive in such an environment requires the ability to:
--control cost
- manage change
- make the most effective use of resources
- take advantage of opportunities fast
A resonable degree of standardization is a necessity in order to be in a
position to achieve the above. The clue is to standardize in a manner that
will allow future development where this proves advantageous based upon
experience.
one way to achieve this could be to standardize on some interfaces.
Interface standards will make reuse of earuiiprent Possible.
This and other obvious advantages are bound to give more cost effective
solutions. This has proved so in other industries and is probably the main
driving force behind standardization.

A clear parallel to interface standardizing as proposed above is today
happening in the computer industry. The big companies in this industry
developed their own standards. They have now realised that in order to stay
competitive they have to conform to what has been called "open system
interconnection" (OSI). This means that computer systems will be
interconnectable and information stored in the data base in one system will
be accessable by another system through standard communiation protocols.
International standards are now available on this, and are accepted as a
necessity for competitivness by the makers of systems that had their own
"standard solutions". When a development like this is possible in the
computer/information industry with complexed interfaces, it is definitely
possible in subsea industry.
The question is in other words not whether it should be standardising, but
- what should be standardized..
- how can standardization be achieved...
- which aspects of subsea work are needing standards etc.
The last question implies that it is not only equipment interfaces that need
be considered as candidates for norms or standards. Experience has shown
that the engineering/design process needs to be structured better and a
methodology found to ensure a better controlled process.
This does not necessarily mean killing creativity as often stated, but rather
ensuring that all available information is utilised instead of only portions
of as carried by individuals.
Experience strongly indicates that as much as 80% of all problems can be
traced back to engineering.
What should be standardized in subsea activities ?
- Documentation.
* Technical specifications/functional requirements (supplier's
documentation of equipment should be reduced to a minimum by using
standards. In Norway, NS 5820 apply, issued August 1989)
0 Standard contracts should be used. Today there exist a number of
different contract forms that have to be read carefully and
commented on by the suppliers every time a bid is issued or before a
contract is signed.
- Components
Equipment important to safety/environmental pollution
- Systems.
Control modules with basic capability and possible spare capacity e.g.
monitoring functions

- Interface.
hydrauMotw&thmesatdatdhsta~tdag toee" "EffctifietiocupjAns spabecifoicsfnte
functions)
Pull-in i.e. use of standard guide posts with standard spacing.
- Intervention
Space requirements for intervention within structures and norms for how
to interface with equipment.
Equipment Status
0The equipment available today is to a large extent surface equipment adapted
for subsea use. A generation of equipment that is designed specifically for
subsea use is needed.
* Adaptation often introduces faults due to inaccuracies introduced in an
engineering that it is not thorough enough.
The reason for problems with adaption is that adaptation is considered to be
a too easy a task, and is often complicating equipment and thereby lowering
the orginal level of reliability.
Surface equipment is designed to be inspected/maintained and repaired
(I.M.R.) by humans and not by remotely operated vehicles (ROV) and tools.
A generation of equipment adapted to I.M.R. by remotly operated means is
needed for deeper waters e.g. from 200 m waterdepth and downwards in order
to operate such systems effectively and economically.
These conclusions are based upon experience from operation of systems with
equipment adapted for remotely installation and operation.
Norms for Underwater Intervention
A better match between equipment and possible inspection/maintenance and
repair methods is needed.
Design guides/standards to achieve a proper match between equipment design
and ROV manipulator/remotely operated tool design need to be developed in
0order to improve the present situation.A proper understanding of the possibilities and utilisation of robot
technology used for some time on the surface like e.g. use of remote center
compliant mechanisms.
Improved manipulators are now available. By improved is here meant e.g. a
smaller distance between the elements that gives the movements similar to the
degrees of freedom in the human wrist. This will make the necessary
movements equivalent to the human elbow.
The standardization of test/installation equipment will make a similar
standardization of auxiliary equipment possible. This will in turn make the

use of subsea solutions more cost effective.
Some people may say that this is not in their intrest since this will cause
less work. This is not the case since more cost effective systems will mean
that more marginal fields will be developed.
Standardization of Operation
standardized equipment will make operations like running of equipment easier
to standardize. This in turn means that it will be easier to run operations
more effectively and safe. Rig time or other vessel time is reduced and
efficiency is increased.
A set of operations suited for ROy's or remotely operated tools or other
intervention means will eventually develop.
People doing the operations will be familiar with what to do and work
effectively and safely.
Commissioning of equipment will have to be done as before. A better method
to find faults and weaknesses earlier should also be commonly used.
A more analytic approach would benefit the industry greatly in order to catch
problems early.
From a quality point of view, the following postulate is not far from the
truth:
COST OF CORRECTIVE ACTIONS,
- 1 NOR on the drawingboard
- 10 NOR in the workshop
- 100 NOR at the customer
- 1000 NOR offshore
IT IS GREAT INCENTIVES FOR ALL PARTIES TO CORRECT FAULTS AS EARLY AS POSSIBLE
Quality Assurance can help to ensure this by still improving the quality of
engineering, and in a constructive way cause a controlled evolution.
SIMPLIFICATION OF SUB SEA INSTALLATIONS
The road to simple designs seems to go via complexed solutions and
experience. We should have advanced far enough along the learning curve to
dare to make simpler solutions now.

Adaptation of surface equipment is causing a further complication of such
equipment and thereby lowering it's original reliability level.
Reliability and simplicity are synonymous since the simpler the fewer failure
modes. Simple equipment in a branch of the industry where reliability is of
outmost importance is an important goal.
If further additions to equipment than the bare minimum is considered, then
these additions must either be to learn for further work or to simplify the
operations of the equipment drastically.
All such additions should ideally be possible to replace by remotely operated
means.
RELIABILITY AND RISK ASSESSMENTS
This topic is covered by others. The importance of reliability in sub sea
* solutions cannot be underestimated
The definition of reliability (according to BS 4778):
"The ability of an item to perform a required function under stated
conditions for a stated periode of time."
Although Used in the context of the probability of future events based upon
past observations and probabilistic design methodology, reliability is
fundamentally a characteristic of design.
A systematic approach has to be applied in all phases of a product life in
order to ensure the required level of this fundamental design
characteristic.
This aspect must not only be considered on component level but also on system
level.
The field economy is dependant on a production preferably with minimum of
* equipment and system failures.
By applying probable failure causes, statistical data and engineering
judgement on the reliability of components and sub-systems, the productional
reliability of the total subsea system can be stipulated using recognised
0 analytical methods.
Further maintenance - and repair strategy as well as operational limitations
can be incorporated in order to stipulate the length of periods with lost
production.
The result may be used for comparing concepts, planning of maintenance and
to identfy weak links in the Systems. Further the sensitivity from
variations of input parameters on the final result can be carried out. This
may identify components and subsystems for which improvement in reliability
may be particulare beneficial.
Reliability is perhaps one of the most important aspects Of underwater

technology because once installed underwater, the facilities;
- are less easy to inspect
- are more costly to maintain and/or replace
- could have a direct impact on the environment in the event of failures, and
mos 't safegard continuous production to justify the high unit costs of
development.
Risk assessment may be carried out in the same manner as for the reliability,
but consentrated on failures and events that may endanger man and
environmental and incorporate the consequence.
The way the technology goes will depend on the state of the art and
cost/benefit analysis. Many avenues need to be further explored, including
serious review of the need for technology to be underwater at all.
A simple system design is perhaps the best effort in achieving a reliable
solution.
It is quite clear that the achievement of this does not occur by chance; it
Must be planned for and rigourously pursued at all stages.
Experience from several subsea projects underline these statements strongly.
A PROPOSAL FOR A SIMPLE SYSTEM
A proposal for a simple System would be to chain simple satellite wells
together in a manner such that freedom of rig movements is maintained. Such
patterns exist. The proposals for such systems have been developed based
upon experience with earlier projects.
Such a system would have a universal guide frame placed upon e.g. a heavy 42
inch casing to take up the loads possibly experienced during installation and
operation.
A protective frame can be placed upon the guide frame after drilling when a
* well test will have proved if the location is right for an operational well.
This will minimise investments till after much of the risk is passed in the
context of developing a well.
The completion of the well can be done before or after placing of the
structure. A possible combination of exploration wells with a high
probability of being a future producer or injector will also be easier with
such a system.
The requirement for piling should be taken care of by the heavy 42 inch
casing.
The structure for such a system could be in the range of 60 tons.

The future control system for this type of well would probably bean
autonomous system with local generation of power. Several components for
this type Of system already exist (like e.g. seawater batteries)
Local generation of hydraulic power should not be a very difficult task.
The subsystems for this type of control system should be installed by light
surface support. This will ensure a quick mobilisation if intervention is
required.
Active heave compensation system is an important part of such a concept of
light surface vessels for intervention.
These systems are now being realised.
Simple systems are cost effective and reliable and will thereby cause the
investments per well to go down. This again will cause more marginal fields
to be developed which again results in more business in the industry.
We are far enough alongthe learning curve to be able to achieve this
now ......
GENERAL COMMENTS TO INSPECTION EFFORTS
It must be recognized that it is not posssible to inspect quality into a
product, unless all quality affecting activities have been identified and
considered during planning, design and fabrication of the construction or
subsea plant to be inspected.
The inspection required and carried out should give adequate confidence that
the construction or subsea plant is built in accordance with the assumptions
made in rules, standards, specifications etc. Whether the subsea plant will
perform satisfactorly during service, depends on a number of factors - but
mainly of fact that the correct design criteria *) are used.
*) design criteria for subsea plants are not given in detail in any API
Standard or equivalent documents. Criteria for the different
component /systems are mainly based on experience from operators
manufacturers of subsea plants.
During the actual fabrication of subsea equipments the main contractor should
be required to perform the control activities. The requirements should
comprise general elements such as:
- Systems to assure that a satisfactory quality control is planned and
carried out during fabrication.

- Systems to assure that all quality related requirements are transfered to
sub-contractors and suppliers.
- Systems to assure that materials are identified, controlled, preserved and
protected during storage and that the identification is maintained during the
fabrication process
- Systems to assuree that all control activities can be documented.
SAFETY CONSIDERATIONS
Safety priorities for underwater projects are identical to those above the
surface. The basic philosophy is to protect human life, the wells and
hydrocarbon reservoirs, the surrounding environment and the production
facilities i.e. "no single equipment failure or operator error shall cause
catastrophic damage to personnel, equipment or environment".
In addition to good design and construction, it is taken as good practice to
conduct safety audits and "Hazop" studies (hazard and operability).
In the safety audit, an independent safety team conducts a review of the
design and construction work, concentrating on safety aspects.
In the Hazop studies, a special review is made of the impact on the entire
system of mishaps and combinations of mishaps within minor elements.
Hazop studies are highly specialized work, but essential for understanding
of complex safety systems. It is most strongly recommended that underwater
projects should be the subject of both safety audits and Hazop studies.
VERITAS INVOLVEMENT
The involvements are mainly related to:
- risk assessment studies for field developments
*- feasibility studies for special applications
- verification of components/equipment
- certification of components/equipment
- type approval of components/equipment
Above evaluations are based on National and International Regulations, API
Standards etc. and our own Rules and Guidelines.
Veritas have a ongoing rule development project. The rules proposal are
dealing with verification/ certification of subsea production systems

intended to cover most aspects related to subsea production systems and not
only the well completion systems. This document seems to be the first
document of such a kind ever published. This has caused many questions
concerning the technical details and the general philosophy.
That means that the API 17D etc. will be refered in general but hopefully,
this will result in a publication which is regarded as:
- A systematic approach for verification/certification of a certain safety
levels/accept criteria
- A presentation of minimum requirements / guidelines reasonable both to
operators and authorities• • -Assistance for operators during the design and manufacturing process phases
when ordring from suppliers.
In order to shape this publication and make it as suitable as possible,
Veritas will continue the close cooperation with parties concerned and is
open minded to any comments.
0w

S
S
S
0
SS
26
SS

15th WEGENT GRADUATE SCHOOL
UNDERWATER TECHNOLOGY
CASE STUDY
"LOCATION OF SUBSEA BARRIER VALVE"
0d

PROBLEM DESCRIPTION
In the wakes of the Piper Alpha accident particular attention is being paid to therisk of gas leakage in the riser or the gas pipelines close to a platform (fixed orfloating). Gas leakages below or close to a platform may have devastatingconsequences.
Assume that an offshore operator has decided to indlude a subsea barrier valveon his gas export pipeline. The problem then is to find an optimum location ofthis valve. Such an optimum location is in general found only when all aspects assafety, installation and operating costs, gas exporting regularity etc. have beenconsidered. In this case study, the optimum location shall be discussed from asafety point of view only.
a) Discuss what should be the criteria for an optimum location of the subseabarrier valve.
b) Discuss various parameters which should be indluded into the evaluation.
The lecturer will present some general conclusions drawn from earlier studies.

15th WEGENT GRADUATE SCHOOL
UNDERWATER TECHNOLOGY
CASE STUDY
"LOCATION OF SUBSEA BARRIER VALVE"

PROBLEM DESCRIPTION
In the wakes of the Piper Alpha accident particular attention is being paid to therisk of gas leakage in the riser or the gas pipelines close to a platform (fixed orfloating). Gas leakages below or close to a platform may have devastatingconsequences.
Assume that an offshore operator has decided to include a subsea barrier valveon his gas export pipeline. The problem then is to find an optimum location ofthis valve. Such an optimum location is in general found only when all aspects assafety, installation and operating costs, gas exporting regularity etc. have beenconsidered. In this case study, the optimum location shall be discussed from asafety point of view only.
a) Discuss what should be the criteria for an optimum location of the subsea
barrier valve.
b) Discuss various parameters which should be included into the evaluation.
The lecturer will present some general conclusions drawn from earlier studies.

LOCATION OF BARRIER VALVE
Criteria for an optimum location of the barrier valve.
If a gas export pipeline starts leaking, the gas released will escape from the leak point through thewater and to the open air and, eventually, form a cloud of gas/air mixture. This cloud might undercertain conditions, reach the platform. If the gas concentration is above a ceratin limit, the gas cloudmay be ignited, and the flash fire and/or explosion represents in such a case a threat to the personnelon the platform and to the platform itself in terms of escape ways, sheltered areas and, ultimately, thestructural strength.
The risk might be expressed by the product: P x D; where the probability of occurrence of such adangerous cloud is P, and D) represents the damages (consequences) from the fire and/or explosion.Generally speaking the damages will be dependent on the amount of gas released and the distancefrom the platform where the leakage occur. The probability of a gas export pipeline leakage is alsoto a certain degree dependent on the distance from the platform.I
The closer the subsea barrier valve is located the platform, the smaller will be the gas volume releasedbe should a riser/pipe leakage occur upstream the valve, while the effect of any pipe leakage-downstream -the valve will increase as the distance from a possible leak location where substantialamount of gas will be released is reduced. In order to reduce the risk from leakages downstream thevalve, the barrier valve can be moved away from the platform. In doing this, the amount of gasreleased from a leak located upstream the valve is increased. As such a leak might occur in the riserjust below the platform deck, the consequences will be increased as well as the probability of failure.Theoretically, the optimum location should be where the risk due to upstream pipe/riser failures is thesame as the risk due to downstream pipe failures.
Parameters to be included
The probability that a dangerous situation shall develop is dependent on an extensive list of differentparameters as e.g.:
- the probability of events occurring on the platform which are possible causes for riser0 damages
- the probability of riser or pipe leaks due to material defects or external imposed loads.The consequences of such leak is dependent both on the location of the leak origin aswell as the leak rate (hole diameter).
- the probability that the barrier valve itself should start leaking to the environment
- the probability that the cloud reach the platform with an inflammable concentration whichis dependent on the leak origin, the wind velocity (speed and direction), to a less degreealso on the sea current and direction, the pipe and platform geometry, and the timeconsidered
- the probability of detecting the gas before an dangerous concentration levels are reached
- the probability that the subsea barrier is activated and do not fail to close upon activation
- the probability that the cloud will ignite

On the consequence aspects if the cloud has been ignited, several effects are to be envisaged:
- immediate effects; due to flash fires, jet fires or pooi fires or explosions
- long term effects due to continuous leak and burning gas on the sea; the long term effects
on the operators and the structure etc.
Simple approach
In order to establish a method to find or indicate an optimum location of the sub sea barrier valve, thefollowing approach has been selected:
I . Establish leak scenarios for various locations of the subsea barrier valve
2. Calculate the gas discharge rate and leak duration
3. For each leak scenario, calculate the expected average amount of released gas
4. For each leak scenario, an Hazard Index is calculated based on the following parameters:
- probability of occurrence of a leak- expected amount of gas released during the leak- distance factor equivalent to calculated heat flux at the analyzed leak
locations
Leak scenario
The gas export riser and pipe are divided into four different zones as follows
ZONE A: riser above sea level (platform ESD - sea level)ZONE B: riser sea level to templateZONE C: pipe vicinity of platform (100 mn off)ZONE D: 100 mn and beyond ( for calculation only, 1000 mn)
The alternative subsea barrier valve locations analyzed am:Location 1: at the template (end of ZONE B)Location 2: at 200 mn off templateLocation 3: at 1000 mn off template
For each of these zones, the probability of a leak is estimated. As the accurate distribution of failureprobability as function of the distance is not known, it is assumed that the avenage leak in each zoneoccurs in the middle of the zone.
Gas discharge rate and leak duration
The mass of gas released will be dependent on the hole size and pressure in the pipeline. An averagehole size is found based on the distribution of the occurrences of the various hole sizes.

The leak duration is estimated to the time from the leak occurs until the gas discharge rate is 59% ofthe initial rate. In the case when the barrier valve fails to close on demand, or the valve itself leaks.or has no effect due to downstream location of the leak, the leak duration will be very long. For thisevaluation, we assume that it is enough to study the effects during the first hour, and consequently theleak duration considered is limited to one hour (t = 3600 seconds). The assumption is that after I hourexposure of gas, the total effects will probably not escalate any further at least for leaks occurring inthe vicinity of the platform.
Amount of gas released
The total expected amount of gas released through the average hole is calculated for each leaklocation. This mass of gas will consist of the amount released until the barrier valve is closed, theamount released from the pipe segment leaking to the sea, and the expected volume due to valveleakage to the environment. It should be noticed that the leak through the valve itself is calculatedseparately as the leak origin in this case is deterministic parameter and not subject to any probabilitydistribution.
Hazard Index
The Hazard Index is calculated based on the expected amount of gas released, the probability of
occurrence of a leak in a specific zone and the effect of distance.
The calculation is based on the following assumptions:
- the consequences from an accident involving the ignition of a gas cloud is "proportional"with the amount of gas released. Some authors claim that the level of damage isproportional with the cubic root of the mass of gas in the cloud when it reach theplatform.
- the effect of distance is included as a "distance factor" based on estimations on heat fluxfrom the burning gas on different distances from the platform.
The Hazard Index for one barrier valve location is thus:
HI= Y, pi x d., x M,
where
pi probability of leak in zone
=f distance factor for zone
=i expected amount of gas released if leak occurs in zone

Example calculation
The following mass flow rates are used:
1. Leak above sea level: (190 bar)
G,,=5 [kg/cm2s]
2. Leak at middle water depth: (170 bar)
G,--4.5 [kg/cm2s]
3. Leak at sea bottom (155 bar)
Glb--4.0 [kg/cm 2s]
The initial leak rate mo at each leak location will then be given by:
mo=A*Gv. [kg/si
where A is the area of the hole.
Hole area, A:
Based on the table below showing the distribution of hole size, an expected equivalent hole sizediameter is calculated as follows:
Category: Hole size range: Average hole size: Pct. distribution:
1 0- 1" 1/2" 70%2 1 -3" 2" 20%3 > 3" 15 1/2" 10%
d,=YX(Pct. x (average hole diam.)1 )h'/
d.,=(0. x 1.252+0.2 x 52+0.1 x 392)"2 [cm]
d.,=12.5 cm [4.95"]
The expected hole area is then
A,,,=n x (dj2)2=124 [cm 2]
The initial average leak is then:
1) Gas leak above sea level:
mo.=620 [kg/s]
2) Gas leakage at middle water depth:
m,,=558 [kg/si

3) Gas leakage at sea bottom:
m0b=496 [kg/s]
Total amount gas released
The leak rate will be a function of time, and for this study purpose, the rate is calculated as follows:
m(t) = mo x Exp(-mo/m. x 0 (2)
where
t=time in seconds
mt,=total mass of gas in a pipe segment
mRo=A•. x p. x L (3)
Api,=cross sectional area of pipe=0.398 m2
L=length of pipe segment
p,=mean density (kg/s)=149.5kg/m3 for the whole pipe
The total amount of gas which has been released during time t, is estimated as follows:
M(t) = 4'm(t)dt=mt.(l-Exp(-mo/m. x t) (4)
The folowing pipe segments have been used for calculation:
0 1) total line 210 ki2) pipe segment upstream sub sea barrier valve
a) located on template 380mb) located 200m off template 580mc) located 1000m off template 1380m
The total gas stored in each of these segments are
m., =12 471 900 kgmItoa = 22 570 kgmUMb = 34 450 kgm1OCC = 81 960kg

Leak duration
According to equation (2) above, the leak rate decrease exponentially. The duration of a leak isestimated as the time until the leak rate is 5% of initial leak rate. This time is found as follows:
t=mý, / m0 ln(mJO.05m o ) (5)
Leak cut-off times in seconds
mtotl M2,,a mto(b mt'a.•
M,. 60375(16.8 hours) 110 168 397
67080(18.6 hours) 121 185 440
mob 75470(21 hours) 137 208 496
It should be noted that effects of barrier valve closure time delay have not be included.
If the total pipe volume can be released during the leak - i.e. barrier valve fails to close, or the leakoccurs downstream the valve, if it is assumed that the total effects would not significantly change after1 hour. Therefore, we are using one hour (3600 seconds) in the following evaluations.
The rate will be averaged at
m(t)=0.92m0
Gas release scenario
For each of the gas release scenarios , the expected amount of gas has been calculated averaged on
a yearly basis.
The scenarios are as follows:
- Leak from riser above sea level
- Leak from riser at middle water depth
- Leak through valve
- Leak from pipe in the vicinity of the platform
- Leak from pipe away from platform
The effect of locating the valve has been included for each leak scenario.

Results
Expected amount of gas (kglvear) released due to pipe/riser failure:---- -VALVE LOCATION--- -
Template: 200 m:- 1000 m:
Ball valve:-Leak above sea level: 126 140 197Riser leak below sea level: 116 130 187Leak zone C: 740 49 69Leak zone D: 419 419. 57Leak through valve: 428 428 428
The "Hazard Indexes" for each valve location has been found as follows:
Hazard Index---VALVE LOCATION -- -
Template: 200 m: 1000 m:
BALL VALVE: 1069 489 462
The conclusions which can be drawn based on the above calculations are:
1. There is a decrease in hazard index by moving the valve some what away from the platform.The benefit seems though to level out pretty soon. This calculation is too coarse to decide anoptimal location; it indicates though that going further out than 200 meter do not result insignificant gain.
2. The more reliable valve and the shorter valve closing time will result in an optimum locationfor such a valve is closer to the template than for a valve with longer closing time and anunreliable valve.
4. The valve represent an increase in expected amount of gas released to the sea due to the factthat the valve is not self sealing. Leaks from the valve will empty the whole line. As the effectsof such a leak are severe, this gives a further reason to move the valve away from the template.

FUTURE PROSPECTS FOR RESEARCH IN UNDERWATER TECHNOLOGY:THE EUROPEAN POINT OF VIEW
Marco WeydertDirectorate Genera! for Science Research and Development
Marine Science and Technologv programmeSDME 3/46
200 rue de ]a Loi.B - 1049 Bruxelles
ABSTRACT
After a review of the current status of the (Western) European oceanographic industries,of the on-going research leading to technological developments and of the developmentsneeded for the marine sciences, the author will discuss efforts to prepare for the post-1992 EC wide single market. Special attention will be given to the EUREKA/EUROMAR initiatives and the EC framework programme for RTD. The economies ofthe various sectors of the marine industries in Europe are often less profitable than thosein Asia of the USA/Canada. This is in strong opposition to the RTD which is of thehighest standard in Europe. The presentation will be concluded with a look at marketingissues - and the need for marketing - if the industries want to survive in the big Europeanand world markets.

FUTURE PROSPECTS FOR RESEARCH IN UNDERWATERTECHNOLOGY: THE EUROPEAN POINT OF VIEW
INTRODUCTON
In recent years, technological development and research have become key factors inworldwide competition. Research is becoming an increasingly important cost factor forcompanies. Production and innovation cycles are becoming ever shorter, while the costof technological development continues to rise.
The prospect of a single internal market in 1993 has created a new spirit of adventurein Europe, and represents a great challenge to companies in all fields of trade andindustry. It offers .a unique opportunity to cut costs, expand markets, rationalise and
* exploit new potential. This applies as much to research, technology and innovation as tobusiness aspects such as cost structure, market positioning and export capacity.
Currently, Europe is still divided into a number of national markets. This is as well thecase for research related underwater technology as for any other domain. But in view ofthe 1993 single market, industries are regrouping, European standards are being adoptedand a single market for the EC member countries with its 350 million people arisesgradually.
It is in this framework that we shall have to think in the future. In principle, this meansthat
1) we have to develop products we can sell Europe-wide;
2) we have to compete at all times with all industries from all member countries, notonly with the national companies;
* 3) using a single European standard, a single European (or national) homologation andregistration procedure, a single currency, a single tax declaration, etc., will meanreduced cost and a better basis for international competition;
4) engineers, scientists and students will move around throughout Europe much in thesame way as they have done so far in their "home country" and will compete in asingle job market with, helas!, some language barriers.
In this context, we shall have to think of all disciplines, including RTD in the marineenvironment. In order to address this question properly, I shall first briefly assess thestand of the marine industries, the market place, its products. then go over to the EC'sefforts to further increase industrial competitivity and, finally point out some more(marketing) issues which will have to be addressed if European industries are to becomeeven stronger on the world market.

2
PART I
Current status of the European marine technologies and industries
Statistical offices look at the turnover of the industry as a whole as well as of some sub-sets. Unfortunately, no details are available about marine technology as an entity, butonly for certain aspects such as maritime transport, or offshore exploitation andexploitation. In a market survey late 1989, it was tried to get a good overview of theinstrument and sensor industries in Europe (in the USA a similar survey was done earlierlooking at marine high technology industries). A total of 365 manufacturers respondeddeclaring some 131 instruments or sensors.
Generally, single pieces as they are often used by scientists have not been reported andit will be very difficult to assess them in their totality although their existence is reported0 in the scientific literature. From the more recent European achievements in the marinetechnology sector, the following should be mentioned (slides available)
-ERS -1- SPOT- HYDROSWEEP/FANSWEEP and SIMRAD- GLORIA
There are no equivalent American or Japanese (civilian) competitors at this moment forany of these products.
If we look in other areas, e.g. big ROVs for science, the European situation is not sobright as can be seen from the following table :
VEHICLE OPERATOR COUNTRY DEPTH
O DEEP TOW SCRIPPS USA 7000 mDOLPHIN 3K JAMSTEC JAPAN 3000 mHYSUB 5000 D.W.S. CANADA 5000 mS GEMINI EASTPORT INT USA 6000 mCURV III N.O.S.C. USA 6000 mA.T.V. N.O.S.C. USA 6000 mRUWS N.O.S.C. USA 6000 mDOLPHIN 10K JAMSTEC JAPAN 10 000 m
Here Europe must catch up.

3
I do not have a list of the many patents deposited by European scientists and engineers.It should be just mentioned that not always do the Europeans sell the products they havepatented. This is e.g. the case for the acoustic Doppler current profilers for which theoriginal patent was filed in 1974 by a European manufacturer and for which an USAmerican company controls virtually the whole market. This brings us to the next points:what are the problems we have to deal with when we want to sell outside Europe?There is first the marketing and with it the advertising. In the August 1991 issue of a wellknown marine technology journal (in the English language) there are 81 advertisementsfrom organisations of the USA, 19 from the EC, 5 from EFTA and 7 from the rest of theworld. This picture is typical. RTD in Europe is very strong and first class. Even when
* some top scientists might leave to the USA because of greater scientific freedom and ahigher salary (at least when the dollar is high), this cannot explain why Europeanindustries have been in the past, and often are still today, less well represented on theworld markets than US industries are. Even in the USA, European industries are still
* struggling. This has a number of reasons:
- The transfer of marketable knowledge from research to the industry is less rapid andless developed in Europe than on the North American continent.
- Marketing is often only half-heartedly done in Europe while in the USA it is of primeconcern, even for small companies.
- In spite of GATT and the pledge of freedom in the USA (Japan is a different casesince it is essentially a closed market), there are many barriers an Europeanmanufacturer has to overcome before he can sell in the USA. In many cases ofinterest in marine technology, rules requiring USA technology on US Navy vesselsare difficult to overcome as one large European manufacturer noted recently whenhe offered a product exceeding by far the 10-year old american counterpart. Othernew barriers are aimed at products which have come out of the (nationally)supported EUREKA projects which the Americans claim are to be considered as"subsidized". Developments subsidized (or better: paid for) under the cover of themilitary, are not of this category, though, and are therefore strong competitors.
From the above, it can be easily concluded that all the single engineer or scientist can* do to better market his products is to improve his products or his marketing and get the
results of his work rapidly patented, and subsequently industrialized.

4
Needs and issues in RTD and for RTD
After a discussion on some marketing issues and of the current inventory ofoceanographic instruments, let's look briefly at technologies needed solely for researchand at research for technological developments.
As indicated in the MAST-Il programme and recently confirmed by a committee whichis both advisory to the CEC and to the ESF, it is believed that the most pressing needsfor further developments are in the following fields:
O -underwater robotics- underwater 3d-vision
samplers for fluids, sediments and water- underwater vehicles, especially autonomous unmanned vehicles which can operate
under the Arctic ice0 - a whole range of new sensors- unmanned deep sea stations (especially these require substantial development in view
of a complexity identical to that of space stations)- various generic technologies e.g. improved horizontal acoustic transmissions, new
environmentally benign and well-behaved robust materials and energy sources- European standards
0L
0"

5
PART 11
EC efforts to support and promote research
It was a logical step when the EC created its own independent technological competencewith the 1987 reform of the Treaty of Rome (Single European Act).
Although research is not basically new to the EC, during the first years of theCommunity's history it was concentrated in the key areas of community competence: coal,
* steel and nuclear energy. In the meantime, the Community's influence has grown to suchan extent that it affects almost all areas of business and society, so that it is now obligedto grapple with the problems of securing and maintaining our living conditions. Viewedagainst this background, science and research have taken on a key role which the
* Community cannot ignore.
In the early eighties the necessity for coordinating science and research in a broadstructure had already become obvious. The Community's first step in this direction wasthe First Framework Programme (1984-1987), which introduced medium-term planningof research activities at EC level. However, the decisive breakthrough to a comprehensivepolitical strategy on technology was the (1988-1992) Second Framework Programme. Thebasis for this was the revision of the EC Treaty in 1987 by the Single European Act. Theaddition of a special section (Title VI - Articles 130f-130g) resulted in the formulationof a research and technological development policy which, for the first time, wasaccorded equal status with the other areas of Community policy such as economic andsocial policy.
The main aim is to maintain and strengthen the international competitiveness ofEuropean industry in high technologiy sectors, in the face of competition on globalmarkets, above all from USA and Jap~an.
* However, this does not mean that the EC wants to corner the market in all areas offeringfuture potential. The intention is to deal only with projects that can be carried out morerationally. more cost-effectively and more efficiently at Europ~ean level, and which
* promise real added value as a result of cross-bdrder cooperation.
It is important to:
become more aware of opportunities for European cooperation,
-relax structures which have been developed through decades of limitation by nationalborders, and
-create framework conditions for cooperation between industry and science at EClevel.

6
We need more transparency, information and coordination to avoid duplication of effortand to promote cooperation and synergy - in short we need to exploit all theopportunities that the "1992 perspective" offers to the dynamic entrepreneur.
This is why the EC's research and technological development policy is mainly aimed at:
- cross-border cooperation, coordination, and mobility between industry and science;
- supporting basic research, which is becoming increasingly important, and for whichmedium-sized companies frequently do not have the necessary personnel or capital;
- integrating research and technology into the concept of completing the single internalmarket in Europe. This applies especially to standardisation, which often requireshigh levels of research and development. Note that in this area a lot of progress hasbeen made since the publication of the white paper on the internal market. TheCommission has transmitted all the necessary proposals to Parliament and Council.
In recent years, both industry and the scientific community have recognised the value ofEuropean cooperation for research and technological development. An uncoordinatedmuddle of individual national programmes, together with a lack of information, mobilityand overall strategy, leads to social and commercial losses which endanger Europeancompetitiveness in the long term. Therefore, more and more interested parties fromresearch and industry take advantage of European research programmes.
Research at Community level is advisable for the following reasons:
- You can cooperate with specialists from all over Europe to find the righttechnological solution for your particular problem. The spectrum of technologicaldevelopment is so wide nowadays that no country or branch of industry can dispensewith international or transnational cooperation.
- You will acquire valuable know-how, which will enable you to take advantage of theopportunities offered for your products in the single internal market.
- You will gain access to the results of the research and development work carried outby partners, and will be able to develop new fields of work and sources of financing.
EC research support will become increasingly interesting from a financial point of view.Currently some 1500 MECU are available annually. As a result of a decision taken bythe Heads of State and Government in February 1988, this sum will rise to around 2500MECU by 1992. It is therefore reasonable to assume that. in certain areas, the mainsource of public funding will shift from national to EC level.
However, the financial aspect should not be the decisive factor; there is more at stake.The aim is to create a "European Technology Community", which will be one of themainstays of the single internal market.

7
3. The 1987-1991 and 1990-1994 Framework Programmes for RTD
The medium term Framework Programme is both the basis and instrument of Europeanresearch and technology policy. It sets priorities and outlines the financial volume ofresearch support.
The First Framework Programme (1984-1987) was followed in September 1987 by theSecond Framework Programme (1987-1991). This covers eight high priority areas, whichare in turn subdivided into specific programmes. Together these form the basis for alarge number of projects in which industry, universities and research centres from various
* countries cooperate.
The Council of Ministers agreed in December 1989 to launch a Third FrameworkProgramme (1990-1994), overlapping the Second Framework Programme to some degree.
* ~All Community programmes must follow the basic principle that everyhing that can becarried out privately should not be taken over by the public sector, and everything thatcan be carried out at national level should not be carried out at a European level.
Despite its growth in recent years, research support at EC level has remained relativelymodest in comparison to research spending at national level. It corresponds to about 4%of public, or 2% of public and private, research expenditure in the twelve membercountries. This alone results in a demand for a more rational utilisation of funding, anda more intelligent allocation of funds to projects promising real added value on aEuropean b~asis.
The Second Framework Programme (1987-1991)
The Second Framework Programme, comprising 32 specific programmes, opens up awide spectrum of opportunities for taking part in research and technological developmentin the Community. The grouping into eight focal areas makes the priorities clear. Support
* will be given to key areas that will be decisive for the structural changes in the nineties.Some 60% of the funding is therefore allocated to industrial research. This does notmean that only new branches of industry are supported; most of the funding is intended
* to promote the introduction of new technologies in traditional sectors of industry, whichstill form the backbone of Europe's economic strenglth and export capacity :carmanufacturing, engineering, the construction sector, etc. These sectors account for almosthalf of the gross national product and 75% of the industrial workforce of the EuropeanCommunity.
The total funds devoted to the Second Framework Programme (1987-1991) amount tosome 5500 MECU.

8
The Third Framework Programme (1990-1994)
In December 1989, the Council of Ministers agreed upon a Third Framework Programme(1990-1994), with a total funding of 5500 MECU, which will overlap the currentprogramme by two years. In order to keep up with the pace of technologicaldevelopment, the EC has thus introduced the principle of flexible programme planning.The basic guidelines of the Second Framework Programme will, of course, continue toremain valid, as long as they are not replaced by new or wider objectives. Above all, theindividual programmes agreed in the context of the Second Framework Programme willbe fully executed. With the new Framework Programme, Council wants to update andstreamline its research activities. This is illustrated by the six areas of emphasis. 15
Specific programmes have been defined during 1991.
A comparison between the Second Framework Programme and the Third FrameworkProgramme reveals clear shifts of emphasis to take account of current priorities. Forinstance, the proportion of funds allocated to "Environmental Research", "Biotechnology'and "Mobility of Research Personnel" is increased appreciably, while support forindustrial competitiveness (information and communications technologies; industrial andmaterials technologies) remains at the high level of the Second Framework Programmein absolute terms. In contrast, the level of support for energy research, which was a toppriority in the mid seventies, has been clearly reduced.
Marine Technologzy in the Framework programme
In two of the specific programmes, namely Environment and MAST-Il, the developmentof technologies for the marine environment is supported. Especially in MAST, a bigeffort is being done to develop new and better instruments to study the oceans and todevelop generic technologies for the marine environment.
Participation is open to every natural or legal person under public or private law who isresident or established in an EC member state, i.e.:
- industrial companies- universities- private and public research institutes
* Especially welcome:- small and medium-sized enterprisesCondition: usually you need at least one other partner from another member state. Thisis a basic principle of cross-border research cooperation as discussed above.
The success of the single internal market in Europe depends not only on largecompanies, but especially on small and medium-sized enterprises. There is a largeinnovation potential here, which often remains untapped in Europe. At the same time,small and medium-sized firms often face difficulties in finding the necessary capital andpersonnel for research. They are therefore especially dependent on cooperation, butencounter difficulties at international level. Also national restrictions often render difficultthe creation of a new company by the young bright engineer. This is in big contrast tothe USA, where more than one Ph.D. student does not finish his thesis because hiscompany is running very well.

9
For your information, EC research support is available in three different forms:
- contracted research with cost sharing- concertation of research activities- the community's own research
Over and above this, grants are given for some programmes to promote the training andmobility of scientific personnel.
a. Contracted research with cost sharing
* This is the predominant form of research support. Some 80% of the financial resourcesof the Framework Programme fall under this category, and all large scale programmes(e.g. ESPRIT, BRITE/EURAM, Environment, MAST) are carried out in this form.
The MAST 89-92 programme, on which right now MAST-I1 (1991-1994) is added,contains a marge marine technology section. The list of the projects supported so far canbe found in the table below:
- Acoustical imaging development (A.C.I.D.) (MAST-002)- Behaviour of materials in the deep sea (MADS) (MAST-004)- Wideband acoustic imaging classification system (W.A.I.C.S.) (MAST-005)- A new technology instrument system for the measurement of the optical properties
of marine waters (MAST-007)- Enhanced acoustic tomography and its application to circulation and deep convection
in the western Mediterranean (MAST-008)- Barotropic and baroclinic flow measuring station. Deep sea electrometer and VCTD-
yoyo (BABAS) (MAST-009)- Modular instrument package and its application in Mediterranean hydrothermal
research (MIPAMEHR) (MAST-0010)- A computer-aided design environment for underwater acoustic transducers, for
scientific and engineering applications (CADACOUST) (MAST-014)- Optimised power supply system techniques for free swimming vehicles (MAST-023)- Multi-sensor high-resolution intelligent marine observation of ocean floor on
continental shelves (MOBIUS) (MAST-028)-"Shipping noise evaluation in coastal waters (SNECOW) (MAST-029)
Combined sensor and information technology for subsea positioning, imaging andcontrol for task implementation (MAST-030)
- Mapping of sea bottom topography in a multi-sensor approach for morphodynamicstudies (MAST-040)
- Development of an automatic instrument to determine the quantity of organicnitrogen soluble in sea water (MAST-045)
- A geophysical in situ probe for physical properties of sediments (GISP) (MAST-057)- Velocity and refraction index profiling by acoustic remote sensing (VERIPARSE)
(MAST-058)- DevIelopment and test of an autonomous long term in-situ monitoring UBC system
(underwater bottom crawler) (MAST-059)

10
b. Concertation of research activities
c. The Community's own research
The Community carries out its own research in the Joint Research Centre (JRC) whichis located on four sites: Ispra (Italy), Geel (Belgium), Petten (Netherlands), andKarlsruhe (Germany). For many years the emphasis was on nuclear research under theEuratom Treaty. But in recent years there has been a shift towards other areas, such asresearch into safety, agriculture surveying, environmental protection and satellite remotesensing. The reform of 1988 resulted in the JRC being divided into nine institutes. In the
* future, the JRC will concentrate on the main priority areas of the Framework Programme(industrial technologies, environmental protection, energy and standardisation inpreparation for the single internal market in Europe), and will systematically developcooperation with industry.
S.
0d

*1_1
FRAMEWORK PROGRAMME 1987 - 1991
Focal areas Sums in Proportionmillion ECU of total
budget (%)1.Quality of life 375 6.9
2.Towards a large market0 and an information and 2 275 42,3communications society
O 3.Modernization ofindustrial sectors 845 15.6
4.Exploitation andoptimum use of biologicalresources 280 5.2
5.Energy 1 173 21,7
6.Science and technologyfor development 80 1.5
7.Exploitation of the seabed and use of marineresources 80 1.5
8.1mprovement of*w' European Sf1"
cooperation 288 5.3
TOTAL 5 396 100.0

12
FRAMEWORK PROGRAMME 1990 - 1994
Focal areas Sums in Proportionmillion ECU of total
budget (%)1.Enabling Technologies 3 109 54.5
2.Management of naturalO resources 2 073 36.4
3.Management ofintellectual resources 518 9.1
TOTAL 5 700 100.0

713
Research for scientific progress is nice, but this is not enough. Its results must betransferred to industry or made available in some other way. Through its technologytransfer activities the EC promotes the practical application of research results, especiallythrough following programmes which serve to disseminate research results and createinfrastructures for their practical implementation.
- Pilot and demonstration project's, e.g. in the field of environmental protection and theTHERMIE programme
- The strategic programme to support innovation and technology transfer - SPRINT
* - STAR and VALOREN for developing regional infrastructures in the fields oftelecommunications and energy
- The European network for technology transfer in the field of environmental* protection
- STRIDE for the development of regional research infrastructures
- The development of databases and information systems - CADDIA, INSIS, TEDIS,IMPACT
Cooperation in research and technology beyond the EC
Research in Europe has many facets. The Community's Framework Programme is acentral component, but it is only a part of the total spectrum. The EC makes no claimto monopolise cooperation in European research. It encourages all forms of Europeancooperation, e.g. in basic research in the natural sciences, as carried out in majorresearch institutes. Many of these cooperative ventures have also given important
* impulses to the Framework Programme.
Beyond the European "framework" the Commission supports bi- and multinationalcooperation with certain third countries. Activities relating to "International ScientificCooperation' for example concentrate on joint research work between the EC and Asian,Latin America and Mediterranean countries and more recently between EC and centraland eastern Europe countries.
Let me briefly talk about two special programmes: COST and EUREKA-
COST
COST has existed since 1971. All European OECD countries participate, i.e. the twelvecountries of the European Community, 6 of the 7 EFTA countries (Norway, Sweden,Finland, Austria, Iceland and Switzerland) and Yugoslavia and Turkey. Cooperation cantake place in all areas of research, as long as enough proposers can be found for a jointactivity.

14
Two basic factors distinguish COST projects from Community research:
- Planning is carried out jointly, but financing is on a national basis; the Commissiononly supports the services of the secretariat and provides occasional financing forstudies.
- COST projects are not confined to programmes, but function "A la carte", i.e. thereis a full freedom of choice.
EUREKA
EUREKA was created in 1985 as the result of a French-German initiative in responseto the US SDI (Ronald Reagan's star wars). With the active participation of theCommission of the European Communities, EUREKA has developed parallel to EC
* research. Both initiatives have the same basic aims: the promotion of cross-bordercooperation in European research and technology. However, their procedures aredifferent. This is intentional; Community research and EUREKA should complement, notcompete with each other.
Basic approach: Whereas EC research is mainly concerned with precompetitiveand basic research, EUREKA projects are nearer to the market. However, there arecertain EUREKA projects concerned with basic research.
Countries inzvolved: EUREKA consists of the EC countries and the Commission, as wellas the EFTA countries and Turkey (a total of 20 partners).
Organisation: Whereas EC research is based on fixed institutional rules and jointly agreedlong-term specific aims, EUREKA projects arise spontaneously without detailed overallplanning.
Financinzg The na tional governments of the partners concerned decide whether supportwill be given, and fix the extent of the subsidy. This offers the advantage of greaterflexibility, but there are limits on the degree to which a coherent strategy is possible. Thefunding given to EUREKA projects has now reached the sum of approximately. 1000 MECU annually.
From the very beginning, the Commission of the European Communities has supportedthis new form of European cooperation in research work, and has also participatedfinancially, e.g. the following important Eureka projects :HDTV (European standard forhigh-definition television), JESSI (Development of 64-Mb memories and theirapplications) and EUROMAR which is an umbrella project for the development ofmarine technologies.

15
CONCLUSION
In this presentation, the current activities in marine technology, the needs for today andthe near future, as well as some marketing aspects have been assessed. Further theactivities of the E.C. to europeanise and hence render more efficient RTD disseminationand industrialization of marine technologies have been discussed. All over, the tools inplace have proven effective, and Europe is holding, if not improving its position on theinternational scene.
0d