assessment of washout resistance of underwater concrete: a comparison between crd c61 and new mc-1...
TRANSCRIPT
Materials and Structures/Mat6riaux et Constructions, Vol. 32, May 1999, pp 273-281
Assessment of washout resistance of underwater concrete: a comparison between CRD C61 and new MC-1 tests.
M. Sonebi 1, P.J. M. Bartos I and K. H. Khayat 2 (1) The Advanced Concrete and Masonry Centre, Department of Civil, Structural and Environmental Engineering, University of Paisley, Scotland, UK
(2) Department of Civil Engineering, Universit6 de Sherbrooke, Sherbrooke, Canada
Paper received: May 26, i998; Paper accepted:June 3, 1998
A B S T R A C T R I~ S U M I~
An investigation was carried out to compare the per- formance and, in particular the repeatability and sensitiv- ity of assessment of workability and washout resistance of underwater concrete using two test methods based on different principles. The first method is the plunge test (CRD C61), used in North America, and the second is the new spray test (MC-1), developed at the University of Paisley. The sensitivity of the test results to variation of dosage of the anti-washout admixture and of super- plasticizer, was investigated.
Workability in terms of the slump and slump flow, and the washout resistance measured by the two methods, were particularly sensitive to changes in dosages of the anti- washout admixture and the superplasticizer. The assess- ment of the repeatability of the washout resistance indicated that the coefficient of variation of the loss of mass after 3 drops in the plunge test was lower than the coefficient of variation of the spray test. The workability and washout measurements by the two methods were sensitive to varia- tions of the dosage rate of the anti-washout admixture and the dosage of the superplasticizer. In general the new spray test was found to be more severe test which showed higher washout results than the plunge test. The investigation seeked to establish a relationship between both tests.
1. I N T R O D U C T I O N
The objective of the research reported in this paper was to compare the performance, namely the repeatabil- ity and sensitivity, of two different methods for assess- ment of washout resistance of fresh underwater con- crete, namely the US standard test CRD C61 [1] and the new test MC-1 [2, 3]. The effect of dosage of the anti- washout admixture (AWA), the superplasticizer (SP), and of the workability measured by the slump and the slump flow tests was also investigated. The relationship
Cette 6tude vise a comparer la r6pdtabilit~, la sensibilit6 d'6valuation de l'ouvrabilit6 et la r6sistance au lessivage mesur& par deux m6tkodes bas&s sur diJff~rents principes, du b6ton coul6 sous l'eau. La premi&e m6tkode est l'essai au plongeon, utilis8 en Am6rique du Nord, et la deuxi~me est le nouvel essai de lessivage par arrosage d6velopp~ l' universitd de Paisley.
L'6tude de la sensibilit6 porte sur l'effet de la variation des dosages en agent colloidal et du superplast~'ant. Une corr61ation entre le lessivage mesur~ par l' essai au plongeon et celui par l'essai par lessivage a ~td &ablie.
La fluidit~ mesur& par l'affaissement et le diam~tre d'6talement ainsi que le lessivage mesur~ par les deux essais est particuli~rement sensible aux variations des dosages de l'agent colloidal et du superplastifiant. L'6va- luation de la r6p~tabilit~ de l'essai de lessivage a montr6 que le coefficient de variation apr& 3 plongeons est inf~- rieur a celui de l'essai par arrosage. La fluidit~ et la perte de masse par lessivage obtenue par les deux essais sont sen- sibles aux variations des doses d' agent colloidal et du super- plastifiant. Le lessivage obtenu par arrosage est g&&ale- ment plus grand que celui de l'essai au plongeon. Cette 6tude a aussi permis d'3tablir une correlation entre les deux essais de lessivage.
between washout loss obtained by the standard test CRD C61 and the MC-1 test was established. Among the investigated parameters were the concentrations of the AWA and dosage of the SP, and the W/C ratio.
1.1 Review of washout tests
1.1.1 Stream test This test was developed in Belgium [4]. It is a simple
test which gives a visual assessment of the degree of
E~t~ia i~ ie4~/ / / )4) / / / ) 5 / ) / ; i ) L / / / ) / 7 ) / / Ba~os i~ a Sehio~ Me~ber and the Chairrndn ~ the RILEM !,lSi WSM: Workabi!ity ~speda! conirete miXes: He is also a member of
i 74~SCCi Se~compacting conCrete.
1359-5997/99 �9 RILEM 2 7 3
Materials and Structures/Mat6riaux et Constructions, Vol. 32, May 1999
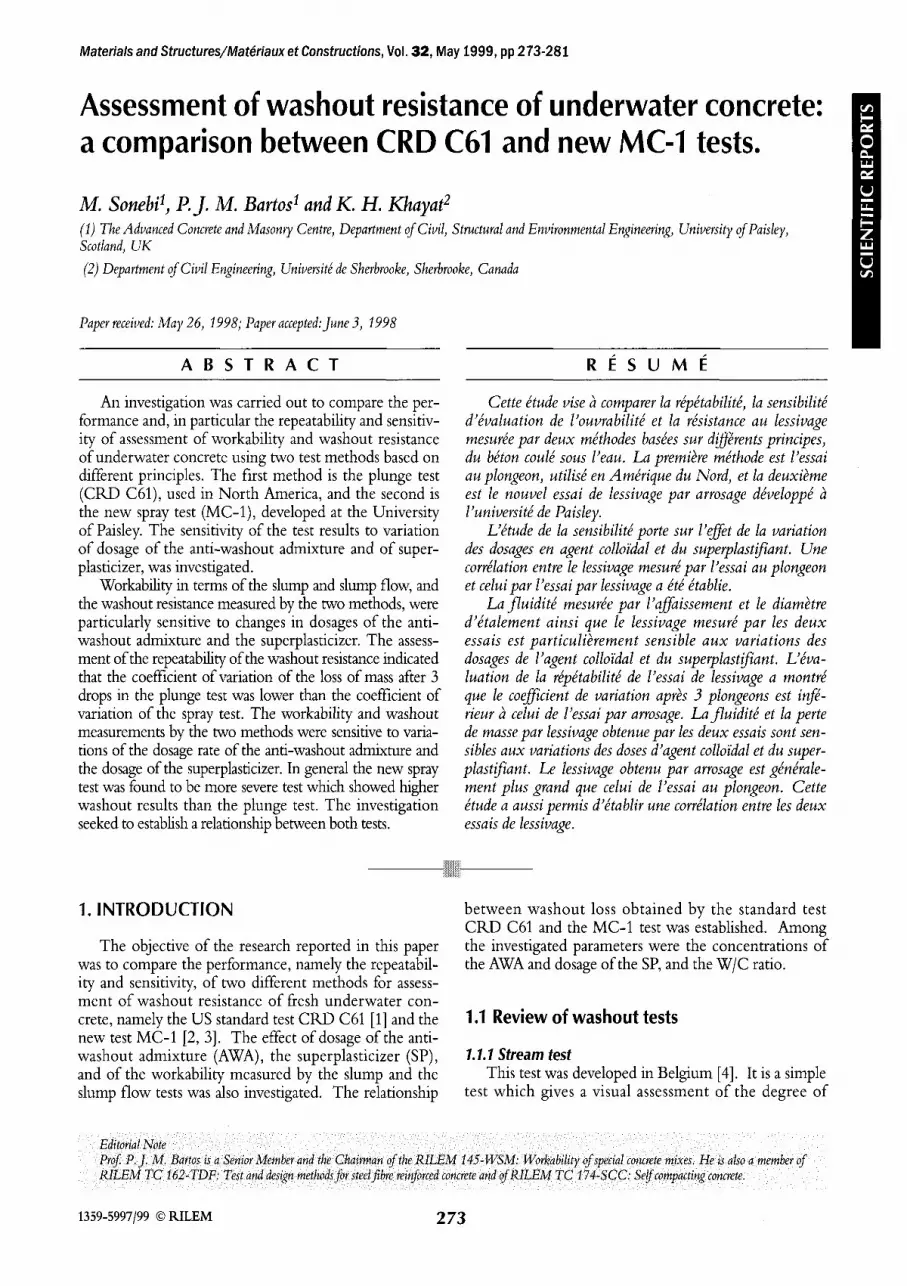
washout resistance. The test can be used in a laboratory and on site.
The test procedure uses a 100-150 mm diameter gut- tering channel 2 m long set at a slope of 15-20 ~ to the horizontal (Fig. 1). A sample of test concrete is placed 300 mm from the raised end of the channel. Water is then poured down the pipe and over the concrete sam- ple. The amount of washout is determined visually.
Although a useful test, it is strongly operator-sensi- tive when different concretes are compared. This is due to the rate at which the water is poured over the sample. Obviously, the faster the flow of water the greater is the washout. An operator therefore must possess a substan- tial previous experience in order to interpret correctly the results of this test. It is very important that the same volume of water be poured down the channel from the same point in each of the tests.
1.1.2 Drop test The basic equipment is a graduated cylinder filled
with water. A small scoop-full of concrete (300-500 g) is dropped through the water. The resultant turbidity of the water is to be visually assessed to determine the degree of washout [4, 5]. It is a quick and simple quali- tative test applicable in the laboratory. Instead of the visual assessment, the degree of turbidity can be mea- sured by the use of a spectrophotometer or similar equipment.
1.1.3 pH factor test This method was proposed in the Recommendation
for washout-resistance of underwater concrete in Japan [6]. The procedure begins with a beaker filled with water. A fresh concrete sample of an appropriate size is divided into several parts and then dropped into the beaker. Three minutes after the addition of the mixture, a unit volume of the supernatant solution is decanted into another beaker. The pH factor of this solution, rounded to one digit below the decimal point, is then determined and recorded. The higher the pH the higher is the washout loss.
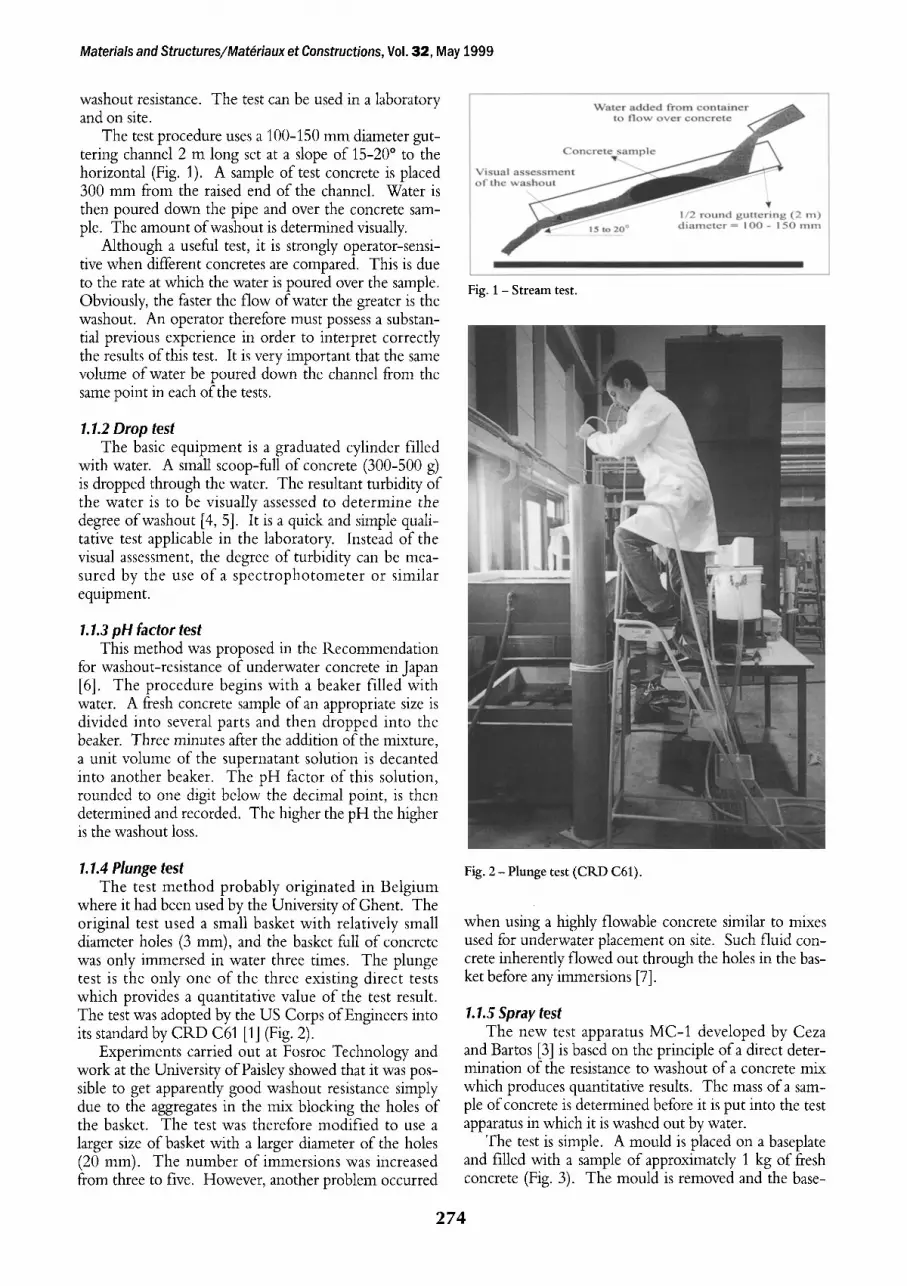
1.1.4 Plunge test The test method probably originated in Belgium
where it had been used by the University of Ghent. The original test used a small basket with relatively small diameter holes (3 mm), and the basket full of concrete was only immersed in water three times. The plunge test is the only one of the three existing direct tests which provides a quantitative value of the test result. The test was adopted by the US Corps of Engineers into its standard by CRD C61 [1] (Fig. 2).
Experiments carried out at Fosroc Technology and work at the University of Paisley showed that it was pos- sible to get apparently good washout resistance simply due to the aggregates in the mix blocking the holes of the basket. The test was therefore modified to use a larger size of basket with a larger diameter of the holes (20 mm). The number of immersions was increased from three to five. However, another problem occurred
Fig. 1 - S t r e a m test .
Fig. 2 - P l u n g e test (CRD C61).
when using a highly flowable concrete similar to mixes used for underwater placement on site. Such fluid con- crete inherently flowed out through the holes in the bas- ket before any immersions [7].
1.1.5 Spray test The new test apparatus MC-1 developed by Ceza
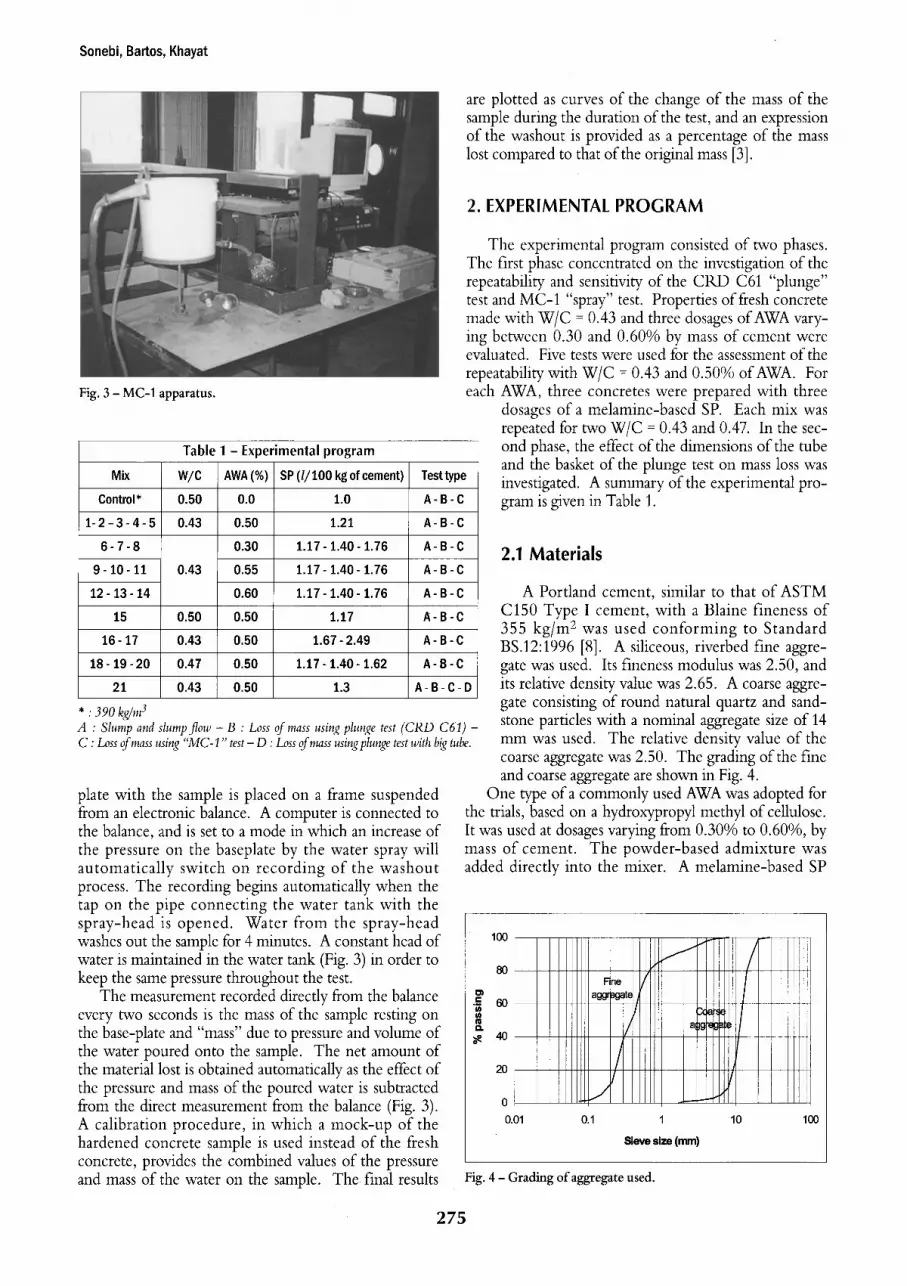
and Bartos [3] is based on the principle of a direct deter- mination of the resistance to washout of a concrete mix which produces quantitative results. The mass of a sam- pie of concrete is determined before it is put into the test apparatus in which it is washed out by water.
The test is simple. A mould is placed on a baseplate and filled with a sample of approximately 1 kg of fresh concrete (Fig. 3). The mould is removed and the base-
2 7 4
Sonebi, Bartos, Khayat
are plotted as curves of the change of the mass of the sample during the duration of the test, and an expression of the washout is provided as a percentage of the mass lost compared to that of the original mass [3].
2. E X P E R I M E N T A L P R O G R A M
Fig. 3 - MC-1 apparatus.
Tab le 1 - E x p e r i m e n t a l p r o g r a m
Mix W/C AWA (%)
Control* 0 .50 0.0
1- 2 - 3 - 4 - 5 0 .43 0 .50
6 - 7 - 8 0 .30
9 - 10 - 11 0 .43 0 .55
12 - 13 - 14 0 .60
15 0 .50 0 .50
16 - 17 0 .43 0 .50
18 - 19 - 20 0 .47 0 .50
21 0 .43 0 .50
: 390 kg/m 3
SP (I/100 kg of cement) Test type
1.0 A - B - C
1.21 A - B - C
1 . 1 7 - 1 . 4 0 - 1 . 7 6 A - B - C
1.17 - 1 .40 - 1 .76 A - B - C
1.17 - 1 .40 - 1.76 A - B - C
1.17 A - B - C
1.67 - 2 .49 A - B - C
1 . 1 7 - 1 . 4 0 - 1 . 6 2 A - B - C
1.3 A - B - C - D
A : Slump and slumpflow - B : Loss of mass using plunge test ( C R D C61) - C : Loss of mass using "MC-1" test - D : Loss of mass usingplunge test with big tube.
plate with the sample is placed on a frame suspended from an electronic balance. A computer is connected to the balance, and is set to a mode in which an increase of the pressure on the baseplate by the water spray will automatically switch on recording of the washout process. The recording begins automatically when the tap on the pipe connecting the water tank with the spray-head is opened. Water from the spray-head washes out the sample for 4 minutes. A constant head of water is maintained in the water tank (Fig. 3) in order to keep the same pressure throughout the test.
The measurement recorded directly from the balance every two seconds is the mass of the sample resting on the base-plate and "mass" due to pressure and volume of the water poured onto the sample. The net amount of the material lost is obtained automatically as the effect of the pressure and mass of the poured water is subtracted from the direct measurement from the balance (Fig. 3). A calibration procedure, in which a mock-up of the hardened concrete sample is used instead of the fresh concrete, provides the combined values of the pressure and mass of the water on the sample. The final results
The experimental program consisted of two phases. The first phase concentrated on the investigation of the repeatability and sensitivity of the CRD C61 "plunge" test and MC-1 "spray" test. Properties of fresh concrete made with W/C = 0.43 and three dosages of AWA vary- ing between 0.30 and 0.60% by mass of cement were evaluated. Five tests were used for the assessment of the repeatability with W/C = 0.43 and 0.50% of AWA. For each AWA, three concretes were prepared with three
dosages of a melamine-based SP. Each mix was repeated for two W/C = 0.43 and 0.47. In the sec- ond phase, the effect of the dimensions of the tube and the basket of the plunge test on mass loss was investigated. A summary of the experimental pro- gram is given in Table 1.
2.1 Mater ia ls
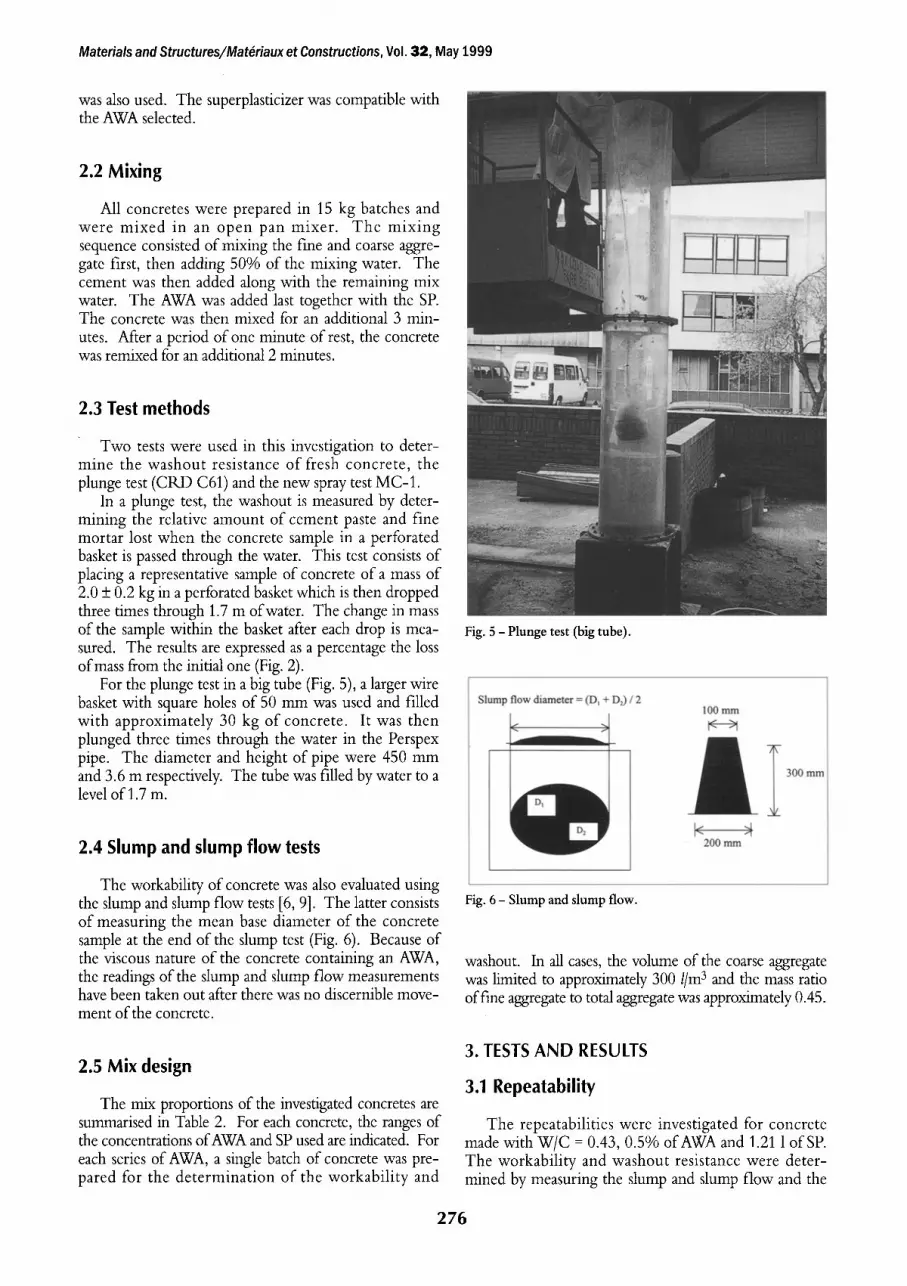
A Portland cement, similar to that of ASTM C150 Type I cement, with a Blaine fineness of 355 kg/m 2 was used conforming to Standard BS.12:1996 [8]. A siliceous, riverbed fine aggre- gate was used. Its fineness modulus was 2.50, and its relative density value was 2.65. A coarse aggre- gate consisting of round natural quartz and sand- stone particles with a nominal aggregate size of 14 mm was used. The relative density value of the coarse aggregate was 2.50. The grading of the fine and coarse aggregate are shown in Fig. 4.
One type of a commonly used AWA was adopted for the trials, based on a hydroxypropyl methyl of cellulose. It was used at dosages varying from 0.30% to 0.60%, by mass of cement. The powder-based admixture was added directly into the mixer. A melamine-based SP
100
8O
.~ 6o
8. = 40 i
20
0 ~
0.01 0.1 1
Sieve size (ram)
10 100
Fig. 4 - Grad ing o f aggregate used.
2 7 5
Materials and Structures/Mat~riaux et Constructions, Vol. 32, May 1999
was also used. The superplasticizer was compatible with the AWA selected.
2.2 Mixing
All concretes were prepared in 15 kg batches and were mixed in an open pan mixer. The mixing sequence consisted of mixing the fine and coarse aggre- gate first, then adding 50% of the mixing water. The cement was then added along with the remaining mix water. The AWA was added last together with the SP. The concrete was then mixed for an additional 3 min- utes. After a period of one minute of rest, the concrete was remixed for an additional 2 minutes.
2.3 Test methods
Two tests were used in this investigation to deter- mine the washout resistance of flesh concrete, the plunge test (CRD C61) and the new spray test MC-1.
In a plunge test, the washout is measured by deter- mining the relative amount of cement paste and fine mortar lost when the concrete sample in a perforated basket is passed through the water. This test consists of placing a representative sample of concrete of a mass of 2.0 + 0.2 kg in a perforated basket which is then dropped three times through 1.7 m of water. The change in mass of the sample within the basket after each drop is mea- sured. The results are expressed as a percentage the loss of mass from the initial one (Fig. 2).
For the plunge test in a big tube (Fig. 5), a larger wire basket with square holes of 50 mm was used and filled with approximately 30 kg of concrete. It was then plunged three times through the water in the Perspex pipe. The diameter and height of pipe were 450 mm and 3.6 m respectively. The tube was filled by water to a level of 1.7 m.
Fig. 5 - Plunge test (big tube).
2.4 Slump and slump flow tests
The workability of concrete was also evaluated using the slump and slump flow tests [6, 9]. The latter consists of measuring the mean base diameter of the concrete sample at the end of the slump test (Fig. 6). Because of the viscous nature of the concrete containing an AWA, the readings of the slump and slump flow measurements have been taken out after there was no discernible move- ment of the concrete.
2.5 Mix design
The mix proportions of the investigated concretes are sumrnarised in Table 2. For each concrete, the ranges of the concentrations of AWA and SP used are indicated. For each series of AWA, a single batch of concrete was pre- pared for the determination of the workability and
Fig. 6 - Slump and slump flow.
washout. In all cases, the volume of the coarse aggregate was limited to approximately 300 l/m 3 and the mass ratio off'me aggregate to total aggregate was approximately 0.45.
3. TESTS AND RESULTS
3.1 Repeatability
The repeatabilities were investigated for concrete made with W/C = 0.43, 0.5% of AWA and 1.21 1 of SP. The workability and washout resistance were deter- mined by measuring the slump and slump flow and the
276
Sonebi, Bartos, Khayat
Mix
Natu re of test
w/c Cement (kg/m 3)
Water (kg/m 3)
Coarse A. (kg/m 3)
Fine A. (kg/m 3)
AWA (%)
SP (//100 kg of cement)
Rep. : Repeatability
Contml
Table 2 - Mix proportions
1 -2 -3 6 - 7 - 8 9-10 12-13 15 16-17 18-19 - 4 -5 -11 -14 -21 -20
Rep. Sens. Sens. Sens.
0.50 0.43 0.43 0.43 0.43 0.50 0.43 0.47
390 450 450 450 450 390 450 450
195 194 194 194 194 195 194 211
971 971 971 971 971 971 971 920
794 794 794 794 794 794 794 745
0 0.50 0.30 0.55 0.60 0.50 0.50 0.50
1.0 1.21 1.17 1.17 1.17 1.17 1.67 1,17 1.40 1.40 1.40 2.49 1.40 1.76 1.76 1.76 1.3 1.62
Sens. : Sensitivity
Table 3 - Results of repeatability tests
Mix W/C
1 2 3 0.43 0.5% 4 5
AWA (%)
Average Standard deviation
Coefficient of variation (%) Value
SP* Slump S. flow WSHcR D (mm) (mm) (%)
210 335 3.7 11.1 220 335 3.8 16.0
1.21 210 315 3.7 14.5 215 335 3.3 15.1
210 325 3.5 12.7
Av. 215 330 3.6 13.9 s 4 8 0.18 1.8 v 1.9 2.4 5.0 12.7 r 11 22 0.50 5.0
WSHMc.1 WSHMc.1 / (%) WSHcRD
3.0 4.2
3.9 4.6
3.6
3.9 0.5 12.8
r = 2.8 s (the repeatability value r defines the level below which the absolute difference between two single test results is found with a confidence level of 95% certainty and obtained under repeatability conditions [11] * : l/lOOkg of cement WSHcR D : Loss of mass by washout after 3 drops using CRD C61 test (%) WSHMc_ 1 : Loss of mass by washout using "MC-1" apparatus (%)
loss mass of the sample after 3 drops for the CRD C61 test and after 4 minutes for the MC-1 test (Table 3), (Mixes 1-5).
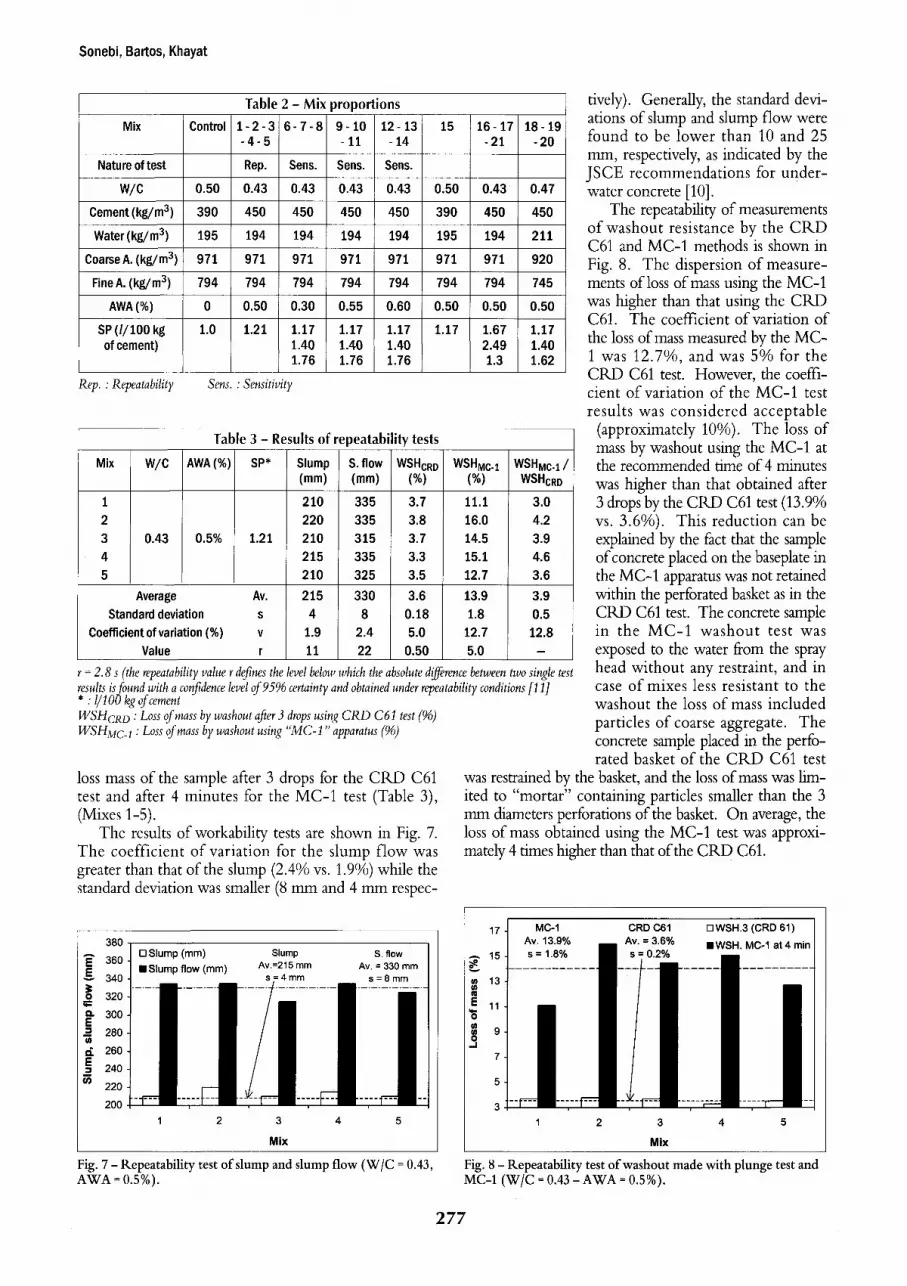
The results of workability tests are shown in Fig. 7. The coefficient of variation for the slump flow was greater than that of the slump (2.4% vs. 1.9%) while the standard deviation was smaller (8 mm and 4 mm respec-
tively). Generally, the standard devi- ations of slump and slump flow were found to be lower than 10 and 25 mm, respectively, as indicated by the JSCE recommendations for under- water concrete [10].
The repeatability of measurements of washout resistance by the CRD C61 and MC-1 methods is shown in Fig. 8. The dispersion of measure- ments of loss of mass using the MC-1 was higher than that using the CRD C61. The coefficient of variation of the loss of mass measured by the MC- 1 was 12.7%, and was 5% for the CRD C61 test. However, the coeffi- cient of variation of the MC-1 test results was considered acceptable
(approximately- 10%). The loss of mass by washout using the MC-1 at the recommended time of 4 minutes was higher than that obtained after 3 drops by the CRD C61 test (13.9% vs. 3.6%). This reduction can be explained by the fact that the sample of concrete placed on the baseplate in the MC-1 apparatus was not retained within the perforated basket as in the CRD C61 test. The concrete sample in the MC-1 washout test was exposed to the water from the spray head without any restraint, and in case of mixes less resistant to the washout the loss of mass included particles of coarse aggregate. The concrete sample placed in the perfo- rated basket of the CRD C61 test
was restrained by the basket, and the loss of mass was lim- ited to "mortar" containing particles smaller than the 3 mm diameters perforations of the basket. On average, the loss of mass obtained using the MC-1 test was approxi- mately 4 times higher than that of the CRD C61.
, ' jQ~
A
E g o
Q,
E - l
= D.
E
1 2 3 4 5
Mix
Fig. 7 - Repeatability test of slump and slump flow (W/C = 0.43,
A W A = 0 .5%) .
1 7
A 1 5
"6 11
~ 9 3
7
5
3
1 2 3 4 5
Mix
Fig. 8 - Repeatability test o f washout made with plunge test and M C - 1 ( W / C = 0.43 - A W A = 0 .5%) .
2 7 7
Materials and Structures/Mat~riaux et Constructions, Vol. 32, May 1999
Table 4 - Results of sensitivity tests
Mix W/C AWA(%) SP* Slump S. flow WSHcR D (mm) (mm) (%)
6 0.30 1.17 195 320 7.1 7 0.43 0.30 1.40 220 350 7.6 8 0.30 1.76 235 410 8.0
9 0.55 1.17 180 295 3.0 10 0.43 0.55 1.40 210 340 4.0 11 0.55 1.76 250 360 4.4
12 0.60 1.17 160 275 2.3 13 0.43 0.60 1.40 200 320 3.2 14 0.60 1.76 220 340 3.9
WSHcR D : Loss of mass by washout after 3 drops using CRD C6I test (%) WSHMc t :Loss of mass by washout using MC-I (%) * : I/1-O0-~g of cement
3.2 Sensitivity
The objective of the sensitMty investigation was to study the effect of small variations in dosage of the AWA and the SP on the workability and washout resistance. The water/cement ratio was constant at 0.43. The dosages of AWA were 0.30%, 0.55% and 0.60% by mass of cement. The dosage of the SP were 1.17 1, 1.40 1 and 1.76 1 per 100 kg of cement (Table 4). Workability of the mix was assessed by the slump and the slump flow tests, and the washout was assessed by the MC-1 and CRD C61 tests.
Details of the compositions of mixes used in the eval- uation of the sensitivity (Mixes 6-14) are given in Table 2. The results of the workability and washout tests are given in Table 4.
WSHMc.1 WSHMc-1 / (%) WSHcRD
40.0 5.6 50.6 6.7 57.0 7.1
11.9 4.0 23.8 6.0 31.5 7.16
12.6 5.4 19.9 6.0 24.4 6.3
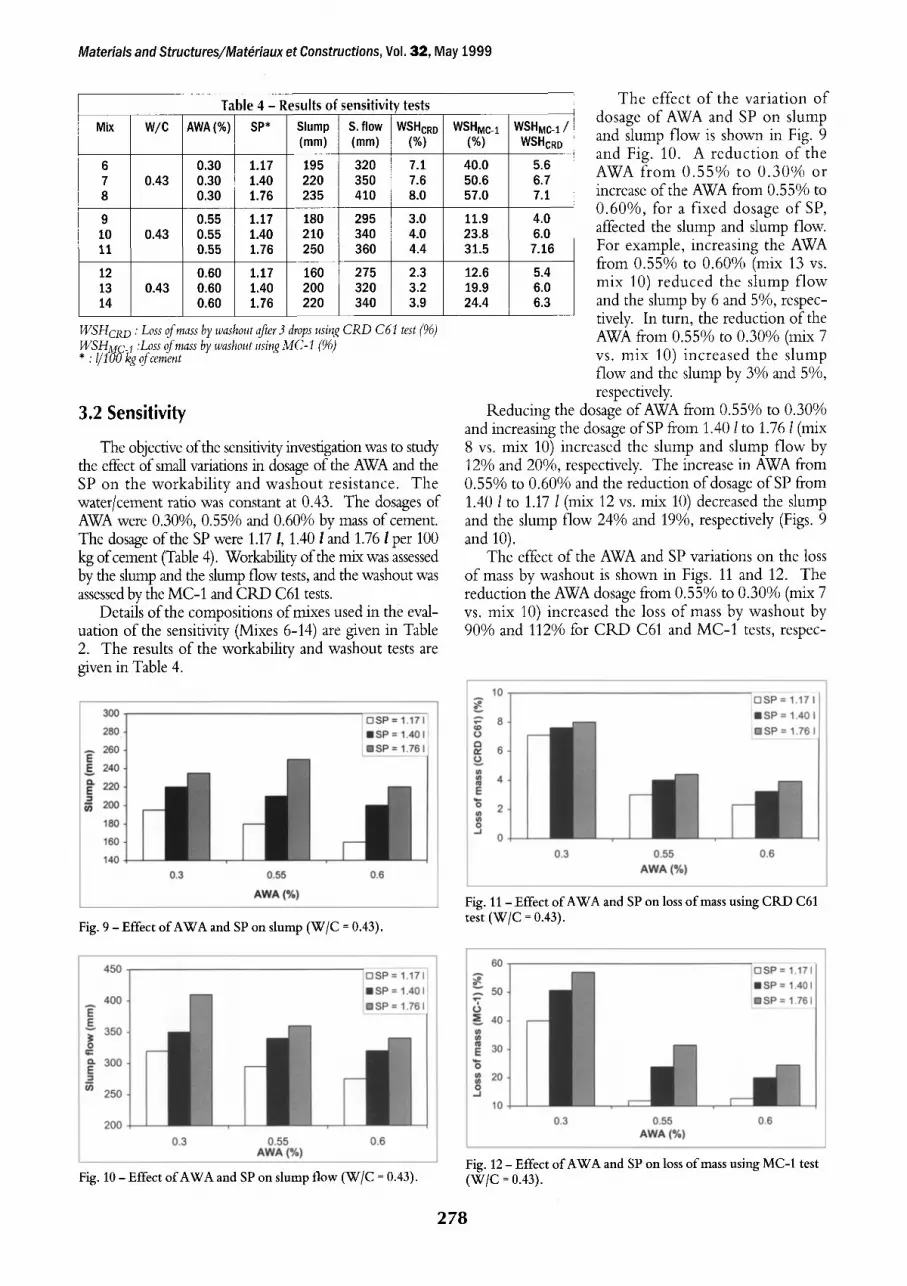
The effect of the variation of dosage of AWA and SP on slump and slump flow is shown in Fig. 9 and Fig. 10. A reduction of the AWA from 0.55% to 0.30% or increase of the AWA from 0.55% to 0.60%, for a fixed dosage of SP, affected the slump and slump flow. For example, increasing the AWA from 0.55% to 0.60% (mix 13 vs. mix 10) reduced the slump flow and the slump by 6 and 5%, respec- tively. In turn, the reduction of the AWA from 0.55% to 0.30% (mix 7 vs. mix 10) increased the slump flow and the slump by 3% and 5%, respectively.
Reducing the dosage of AWA from 0.55% to 0.30% and increasing the dosage of SP from 1.40 l to 1.76 l (mix 8 vs. mix 10) increased the slump and slump flow by 12% and 20%, respectively. The increase in AWA from 0.55% to 0.60% and the reduction of dosage of SP from 1.40 1 to 1.17 1 (mix 12 vs. mix 10) decreased the slump and the slump flow 24% and 19%, respectively (Figs. 9 and 10).
The effect of the AWA and SP variations on the loss of mass by washout is shown in Figs. 11 and 12. The reduction the AWA dosage from 0.55% to 0.30% (mix 7 vs. mix 10) increased the loss of mass by washout by 90% and 112% for CRD C61 and MC-1 tests, respec-
Fig. 9 - Effect o f A W A and SP on slump ( W / C = 0.43).
Fig. 11 - Effect o f A W A and SP on loss o f mass using C R D C61 test ( W / C = 0.43).
Fig. 10 - Effect o f A W A and SP on slump f low ( W / C = 0.43). Fig. 12 - Effect o f A W A and SP on loss o f mass using MC-1 test ( W / C = 0.43).
278
Sonebi, Bartos, Khayat
Table 5 - Results of effect of AWA and type of washout test
Mix W/C AWA(%) SP(1) Slump S.flow WSHcR D (mm) (mm) (%)
Control 0.50 0.0 1.0 160 265 16.3
15 0.50* 0.5 1.17 230 380 7.5
18 0.47 0.5 1.17 240 435 6.2 19 1.40 255 490 10.2 20 1.62 265 540 11.6
22 0.43 0.0 1.17 225 380 35.7
16 0.43 0.5 1.67 245 425 10.0 17 2.49 255 445 11.0
21 0.43 0.5 1.30 220 335 5.5 215 5.2 (2)
10.9 (3)
* : 390 kg/m 3 of cement (1) : 1/100 kg of cement (2) : Loss of mass by washout using C R D C61 basket and big tube (3) : Loss of mass by washout using a big basket and big tube
WSHMc.t (%)
WSHMc-1 / WSHcRD
52.2 3.3
46.6 6.2
37.4 6.0 51.5 5.0 73.2 6.3
56.2 1.6
44.3 4.43 56.5 5.14
36.4 6.6
tively. However, the increase of the dosage of the SP and keeping the dosage of AWA to 0.30% (mix 8 vs. mix 10), the loss of mass by washout was increased by 100% for CRD C61 and 140% for the MC-1 tests. This sharp increase of the loss of mass by washout was less affected by the increase in dosage of the SP compared to the reduction of AWA dosage.
The increase of AWA dosage and the reduction in the dosage of SP (mix 12 vs. mix 10), caused the same reduc-
tion of the loss of mass by washout, of 43% and 47% for the CRD C61 and MC-1 tests, respectively. Otherwise, in case of a simultaneous increase of AWA and SP (mix 14 vs. mix 10), the loss of mass by washout remained generally the same when both CRD C61 and the MC-1 tests were used. The results were 4% vs. 3.9% and 23.8% vs. 24.4%, respec- tively. These mixes also showed the same slump and slump flow results (210 mm and 200 mm, and 340 mm, respectively).
The results indicated the com- pensation between the opposing effects of AWA and SP. The AWA appeared to increase viscosity and reduce washout , while the SP enhanced the workability. For a
constant dosage of the AWA, the increase in the dosage of SP from 1.40 I to 1.76 1 increased the workability as well as the loss of mass by washout; however, the reduc- tion in the SP alone caused a decrease in values of these properties. In the case of the AWA content of 0.55%, the comparison between mixes 11 and 10, the slump flow and the loss of mass by washout were increased (by 6% for slump flow, 10% and 32% for CP,,D C61 and MC-1 tests, respectively).
400
E" 35O g 3OO
n E --= 250 r o:
150
SP = 1.21 I
O Slump (ram)
�9 S. flow (ram)
0 0.30% 0.50% 0.55% 0.60%
AWA (%)
Fig. 13 - Effect o f A W A o n workabi l i ty ( W / C = 0.43 - SP = 1.17 l).
60 ] Slump = 160 mm H Plunge test (%)
g 50 / l I Slump = 195 mm ==MC-1 at4 rain I
3O =~ 2o / I I Slump= Slump= Slump= I
10
0 0 0.30 0.50 0.5 0.60
AWA (%)
Fig. 14 - Ef fec t o f A W A on loss of mass by washout ( W / C = 0.43 - SP = 1.17 l).
3.3 Effect of AWA dosage on workability and loss of mass by washout
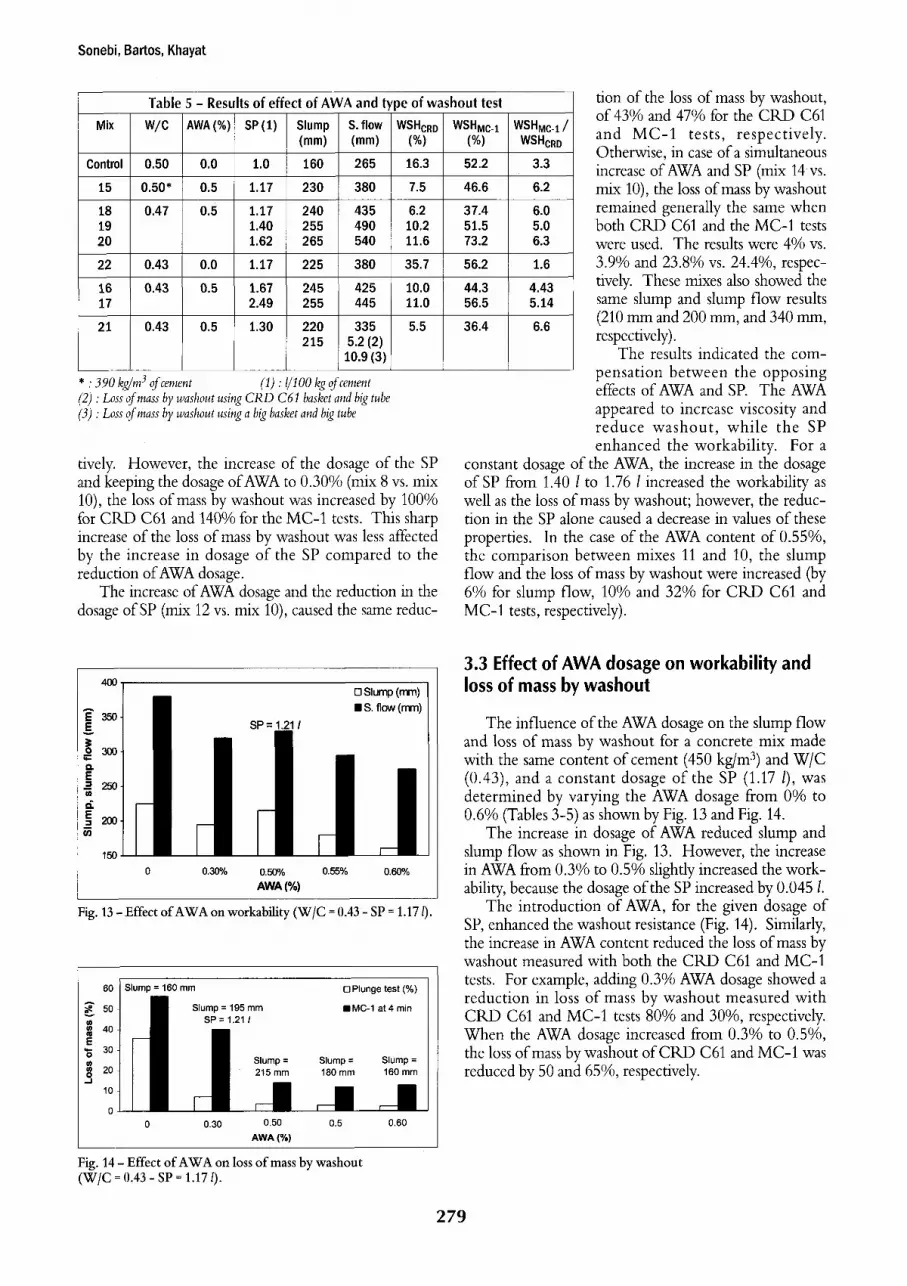
The influence of the AWA dosage on the slump flow and loss of mass by washout for a concrete mix made with the same content of cement (450 kg/m 3) and W/C (0.43), and a constant dosage of the SP (1.17 1), was determined by varying the AWA dosage from 0% to 0.6% (Tables 3-5) as shown by Fig. 13 and Fig. 14.
The increase in dosage of AWA reduced slump and slump flow as shown in Fig. 13. However, the increase in AWA from 0.3% to 0.5% slightly increased the work- ability, because the dosage of the SP increased by 0.045 I.
The introduction of AWA, for the given dosage of SP, enhanced the washout resistance (Fig. 14). Similarly, the increase in AWA content reduced the loss of mass by washout measured with both the CRD C61 and MC-1 tests. For example, adding 0.3% AWA dosage showed a reduction in loss of mass by washout measured with CRD C61 and MC-1 tests 80% and 30%, respectively. When the AWA dosage increased from 0.3% to 0.5%, the loss of mass by washout of CRD C61 and MC-1 was reduced by 50 and 65%, respectively.
279
Materials and Structures/Mat6riaux et Constructions, Vol. 32, May 1999
g == =" "6 == o,
;5
~0
~5
~0
5
0
5
0 CRD C61
200 mm tube
CRD C61
Big basket
450 mm tube 450 turn MC-1
Fig . 15 - Comparison of loss of mass measured by four washout tests ( W / C = 0 .43 - A W A = 0 . 5 % - S P = 1.3 1).
3.4 Comparison of washout measured by different plunge tests and the spray test apparatus
The loss of mass by washout was measured using a ref- erence concrete mix made with 450 kg/m 3 of cement and W/C of 0.43, and 0.5% of AWA and 1.30 1 of SP (mix 21). The losses of mass by washout measured using the CRD C61 basket and the big basket and tube were compared to the loss of mass by washout obtained with the MC-1 test. The results are shown in Table 5 and in Fig. 15.
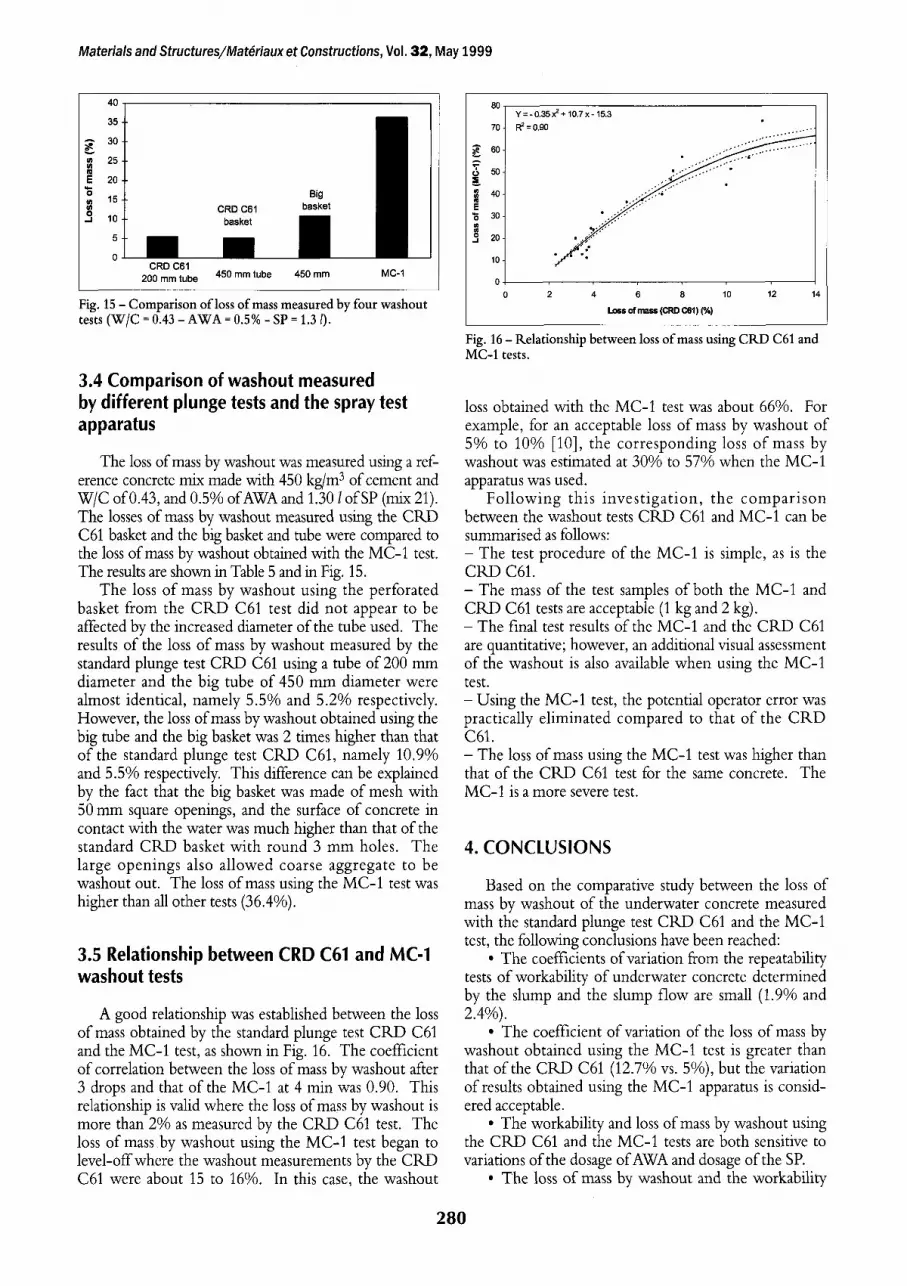
The loss of mass by washout using the perforated basket from the C1KD C61 test did not appear to be affected by the increased diameter of the tube used. The results of the loss of mass by washout measured by the standard plunge test CRD C61 using a tube of 200 mm diameter and the big tube of 450 mm diameter were almost identical, namely 5.5% and 5.2% respectively. However, the loss of mass by washout obtained using the big tube and the big basket was 2 times higher than that of the standard plunge test CRD C61, namely 10.9% and 5.5% respectively. This difference can be explained by the fact that the big basket was made of mesh with 50 mm square openings, and the surface of concrete in contact with the water was much higher than that of the standard CRD basket with round 3 mm holes. The large openings also allowed coarse aggregate to be washout out. The loss of mass using the MC-1 test was higher than all other tests (36.4%).
3.5 Relationship between CRD C61 and MC-1 washout tests
A good relationship was established between the loss of mass obtained by the standard plunge test CRD C61 and the MC-1 test, as shown in Fig. 16. The coefficient of correlation between the loss of mass by washout after 3 drops and that of the MC-1 at 4 min was 0.90. This relationship is valid where the loss of mass by washout is more than 2% as measured by the CRD C61 test. The loss of mass by washout using the MC-1 test began to level-offwhere the washout measurements by the CRD C61 were about 15 to 16%. In this case, the washout
8 0 , Y = - 0.35x2 + 10.7 x - 15.3
70-1 ~ = 0.90 o4'~ iiiii!iiii!!!!!!!!!iii 4O4
30 q
20 q
10q
OI 0 2 4 6 8 10 12 14
Loss of mass (CP.D CSl) (%)
Fig . 16 - R e l a t i o n s h i p b e t w e e n loss of mass using C R D C 6 1 and M C - 1 tes ts .
loss obtained with the MC-1 test was about 66%. For example, for an acceptable loss of mass by washout of 5% to 10% [10], the corresponding loss of mass by washout was estimated at 30% to 57% when the MC-1 apparatus was used.
Following this investigation, the comparison between the washout tests CRD C61 and MC-1 can be summarised as follows: - The test procedure of the MC-1 is simple, as is the CRD C61. - The mass of the test samples of both the MC-1 and CRD C61 tests are acceptable (1 kg and 2 kg). - The final test results of the MC-1 and the CRD C61 are quantitative; however, an additional visual assessment of the washout is also available when using the MC-1 test. - Using the MC-1 test, the potential operator error was practically eliminated compared to that of the CRD C61. - The loss of mass using the MC-1 test was higher than that of the CRD C61 test for the same concrete. The MC-1 is a more severe test.
4. CONCLUSIONS
Based on the comparative study between the loss of mass by washout of the underwater concrete measured with the standard plunge test CRD C61 and the MC-1 test, the following conclusions have been reached:
�9 The coefficients of variation from the repeatability tests of workability of underwater concrete determined by the slump and the slump flow are small (1.9% and 2.4%).
�9 The coefficient of variation of the loss of mass by washout obtained using the MC-1 test is greater than that of the CRD C61 (12.7% vs. 5%), but the variation of results obtained using the MC-1 apparatus is consid- ered acceptable.
�9 The workability and loss of mass by washout using the CRD C61 and the MC-1 tests are both sensitive to variations of the dosage of AWA and dosage of the SP.
�9 The loss of mass by washout and the workability
2 8 0
Sonebi, Bartos, Khayat
are influenced by the concentrations of the AWA and the dosage of SP. This result is in line with results of previous research [10].
�9 The loss of mass by washout using the CRD C61 appeared not to be affected by the diameter of the tube (200 vs. 450 mm). The loss of mass increased when a big basket with 50 mm square wire mesh and a big tube of 450 mm diameter were used.
�9 The relationship between the loss of mass by washout obtained with CRD C61 and MC-1 tests appeared to be of a polynomial type (1K 2 of 0.90).
�9 The MC-1 test proved to be more severe than the C1KD C61, and the washout test results were always higher�9
SYMBOLS
W/C : Water/cement ratio SP : Superplasticizer (I per 100 kg of cement) AWA : Anti-washout admixture (% of mass of cement) Av. �9 (~)
n - - 2 v(x-x0 s" Standard deviation s = ~i--~ n - 1
v Coefficient of variation s �9 V - - - - ' Z
X ~ ' Mean result x i �9 Individual result n" Number of result WSHca D �9 Loss of mass by washout after 3 drops using CRD C61 test (%) WSHMc_ 1 �9 Loss of mass by washout using MC-1 test at 4 min (%)
REFERENCES
[1] CRD C61, 'Test Method for Determining the Resistance of Freshly-Mixed Concrete to Washing out in Water', US Army Experiment Station, Handbook for Concrete, Vicksburg, Mississippi, Dec. 1989.
[2] Ceza, M., 'Fresh non-dispersive underwater concrete : Properties and tests', Ph. D Thesis, University of Paisley, United Kingdom, Sept. 1996.
[3] Ceza, M. and Bartos, P.J.M., 'Development a apparatus for test- ing the washout resistance of underwater concrete mixtures', ACI Concrete in 'Marine Environment', Proceedings Third CANMET/ACI International Conference, SP-163, (V.M. Malhotra, Canada, 1996) 111-126.
[4] Davies, B. A., 'Laboratory methods of testing concrete for place- ment underwater', Proceeding, Marine concrete 86- International Conference on Concrete in 'the Marine Environment', London, Sept. 1986 (Concrete Society, London, 1986) 279-286.
[5] Sogo, S. and Haga, T., 'Underwater Concrete Containing Segregation Controlling Polymers', Proceeding 5th International Congress on Polymers in 'Concrete', Brighton, England, Sept. 1987, 22-24.
[6] Japan Society of Civil Engineers, JSCE, 'Recommendations for design and construction in antiwashout underwater concrete', Concrete library of JSCE (67) (May 1991) 89 p.
[7] Annett, M. F., 'Underwater concreting using admixtures', C o n c r e t e 21 (9) (1987).
[8] BS 12, 'Specification for Portland Cement', British Standards Institute, London, (1983).
[9] BS 1881: Part 102, 'Method for Determination of Slump', British Standards Institute, London, (1983).
[10] Khayat, K. H., Sonebi, M., Yahia, A. and Skaggs, C. B., 'Statistical models to predict flowability, washout resistance and strength of underwater concrete', in 'Production Methods and Workability of Concrete', Glasgow, June 1996 (E & FN Spon, Scotland, 1996) 463-481.
[11] ISO 5725, 'Accuracy (trueness and precision) of measurement methods and results', (1990).
ACKNOWLEDGEMENTS
The Advanced Concre te and Masonry Centre (Scotland) and the Fund of Formation of Research in Quebec (Canada) are gratefully acknowledged for their support�9
IIIl~lii~
281