effects of washout loss on bond behavior of steel embedded in underwater concrete
TRANSCRIPT
ACI Structural Journal/May-June 2013 1
Title no. 110-S41
ACI STRUCTURAL JOURNAL TECHNICAL PAPER
ACI Structural Journal, V. 110, No. 3, May-June 2013.MS No. S-2011-219 received July 12, 2011, and reviewed under Institute
publication policies. Copyright © 2013, American Concrete Institute. All rights reserved, including the making of copies unless permission is obtained from the copyright proprietors. Pertinent discussion including author’s closure, if any, will be published in the March-April 2014 ACI Structural Journal if the discussion is received by November 1, 2013.
Effect of Washout Loss on Bond Behavior of Steel Embedded in Underwater Concreteby Joseph J. Assaad and Camille A. Issa
Limited studies have been undertaken to investigate the bond prop-erties of reinforcing steel bars embedded in underwater concrete (UWC). Approximately 60 pullout tests were carried out to eval-uate the effect of washout loss (W) on residual compressive and bond strengths. Washout was determined using the CRD C61 test and by simulation using a newly developed air-pressurized tube. Reference mixtures sampled in dry conditions were also tested.
Test results showed that bond between steel and UWC is affected by a combination of parameters that complement those documented in the literature for concrete cast and consolidated above water. These include the level of W, degree of segregation, hydrostatic water head (H), and interfacial concrete-water velocity. The bond-stress-versus-slip behavior of UWC is remarkably different from the one obtained using reference mixtures. Initially, the linear response is less stiff due to a coupled effect related to lower strength and increase in the relative coarse aggregate concentration. The slip at ultimate bond strength was found to decrease for UWC mixtures exhibiting higher levels of W.
Keywords: bond properties; segregation; underwater concrete; washout loss.
INTRODUCTIONThe construction or repair of reinforced concrete structures
under water requires understanding of the bond behavior between reinforcing bars and concrete to achieve adequate transfer of stresses. Underwater concrete (UWC) develops lower in-place performance than concrete cast and consoli-dated above water due to washout loss (W) and aggregate segregation, which arise from a combination of factors, such as turbulence of water, interfacial concrete-water velocity Ivelocity, hydrostatic water pressure, exceeding the specified water-cementitious material ratio (w/cm), and improper placement and consolidation.
The bond of steel reinforcement to concrete cast above water has been studied extensively over the last decades and a huge amount of experimental and analytical data have been published in the literature.1-3 For deformed bars, ACI 408R-031 reported that force transfer from the reinforcement to surrounding concrete occurs by chemical adhesion between both materials, frictional forces arising from the roughness of the interface, and mechanical bearing of the steel ribs against the concrete surface. Numerous parameters were found to affect the behavior of such bond, including bar properties (that is, yielding strength, cover, size, position in the cast element, geometry, epoxy coating, and others) and concrete properties (that is, compressive strength, density, presence of mineral admixtures, work-ability, method of consolidation, and others). The devel-oped length or spliced length for proper transfer of stresses can be calculated using currently available equations speci-fied in various building codes.4,5
Limited studies have been carried out to evaluate the bond behavior between reinforcing steel and UWC. Also, no
design provisions or descriptive equations have been made available to estimate the effect of W and aggregate segrega-tion on the corresponding development and splice lengths. McLeish6 suggested that the minimum length of lapped joints in tension for UWC works can be determined using ordinary design equations specified in ACI 318-084 or BS 8110.5 For example, for deformed bars or wires in tension, the development length is inversely proportional to the square root of concrete compressive strength, multiplied by additional factors to account for special considerations due to top bars, epoxy-coated bars, reinforcement size, light-weight concrete, and contribution of confining reinforce-ment (ACI 318-08, Eq. (12-1)4). ACI 546.2R-107 on UWC repair reported that the reduced cross section of reinforcing steel can be strengthened with the addition of new reinforcing bars, provided that the original reinforcement is exposed beyond the corroded section at a distance equal to the required design lap-splice length.
Theoretically speaking, bond and transfer of stresses between steel and UWC cannot be the same as those expe-rienced in concrete cast and consolidated above water. This is due to the fact that performance of materials and appli-cation procedures that perform well in dry conditions are often inadequate for underwater applications.7 For instance, the pullout strength of anchors embedded in polyester resin under submerged conditions was found to be as much as 50% lower than the strength of similar anchors installed under dry conditions.8 Also, in underwater reinforced concrete works, the current knowledge for bond behavior and direct use of existing equations for development length becomes unwar-ranted, as it is difficult to establish a realistic estimation of the contribution of concrete strength to the bond against steel bars. Sonebi and Khayat9 found that self-consolidated UWC developed in-place compressive strength greater than 70% of control samples when Ivelocity is less than 0.4 m/s (1.3 ft/s). Such strength ranged between 50 and 65% when Ivelocity increased to 0.65 m/s (2.13 ft/s). The authors9 concluded that the in-place compressive strength determined on 100 mm (3.93 in.) diameter cores is highly dependent on mixture composition and casting conditions, whereby relatively low values are obtained near the casting position due to the initial freefall of concrete in water and turbulence caused by the placement process. The strength was found to be slightly higher downstream from the placement point and then decreased near the end of the cast element due to progressive
2 ACI Structural Journal/May-June 2013
Joseph J. Assaad is a part-time Professor at Lebanese American University, Byblos, Lebanon, and an R&D Manager at Holderchem Building Chemicals S.A.L., Baabda, Lebanon. He received his PhD from the University of Sherbrooke, Sherbrooke, QC, Canada. His research interests include concrete materials and properties, repair systems, durability, formwork pressure, and rheological behavior of cementitious-based materials modified with chemical and mineral admixtures.
Camille A. Issa is a Professor of civil engineering at Lebanese American University. He received his PhD in civil engineering from Virginia Tech, Blacksburg, VA, in 1985. His research interests include structural rehabilitation and strengthening using carbon fiber-reinforced polymer and epoxy and reinforced concrete structural design.
reduction in the consolidation effort away from the casting point and increase in water erosion and segregation.9
CONTEXT AND SCOPE OF RESEARCH PROGRAMThis paper is part of a comprehensive research project
undertaken to evaluate the effect of W, segregation, Ivelocity, and depth of casting on bond behavior of reinforcing steel bars embedded in UWC. Three series of mixtures propor-tioned to exhibit compressive strength in dry conditions of 30, 45, and 60 MPa (4.3, 6.5, and 8.7 ksi) were tested. W of investigated UWC mixtures was evaluated using the CRD C61-89A10 test method and by simulation. The CRD C61-89A10 test was adopted by the U.S. Army Corps of Engineers and thought to simulate concrete freefall from a pump delivery hose through 1 to 2 m (3.3 to 6.6 ft) of water. However, only limited information concerning the behavior of the concrete-water interface during real placements can be deduced from the CRD C61 test, particularly when the concrete is subjected to various Ivelocity rates and/or high hydrostatic pressure resulting from deep placements.11 The air-pressurized tube was developed to simulate deep place-ments down to 140 m (460 ft) below the water surface level at various Ivelocity rates, which may vary from 0.1 to 2.5 m/s (0.33 to 8.2 ft/s).11 Low Ivelocity rates may simulate placements in stagnant water, where the concrete is slowly discharged to reduce turbulence and W. Conversely, high Ivelocity rates may simulate casting in flowing water particularly encountered in tidal zones as well as high stresses arising at the pipe’s bottom end during concrete pumping in deep water.
Scattered data and lack of correlation exist in the literature between W of UWC and its hardened properties due to the fact that the samples used to assess strength were different than those used for washout determination. For example, the common approach to evaluate compressive strength of UWC consists of dropping concrete into molds placed in water tanks. This approach does not simulate practical conditions and does not accurately estimate the degree of W that the fresh UWC sample has undergone during the drop-ping process in water.12,13 Also, it is not accurate to correlate W to compressive strength determined on cores extracted from existing underwater structures, given the direct effect of the casting method on W.6,9 Therefore, special care was placed throughout this project to determine the residual compressive and bond strengths using the same concrete samples that were used for W measurement. Such samples can better reflect actual UWC properties characterized by lower content of cementitious phase and higher w/cm than the specified value due to W and water infiltration inside the specimen. Also, the resulting relative increase in coarse aggregate concentration in the obtained sample may reflect the segregation phenomenon that takes place upon concrete casting under water and self-consolidation. It is to be noted that the direct pullout bond method was selected in this
project, given that it requires the least amounts of material, as will be described in a later section of the paper.
RESEARCH SIGNIFICANCEThe performance of underwater reinforced concrete struc-
tures depends on adequate bond strength between concrete and reinforcing steel. This paper presents useful information to contractors and engineers regarding the residual compressive and bond strengths of UWC with respect to mixture compo-sition, hydrostatic water pressure, and Ivelocity. Correlations with respect to W determined using the CRD C61-89A10 test and a newly developed tube for simulation of deep place-ments are established.
EXPERIMENTAL PROGRAMMaterials
Portland cement and silica fume conforming to ASTM C150/C150M, Type I, and ASTM C1240, respec-tively, were used in this study. The surface area of the cement (Blaine) and silica fume (using the BET Method) were 340 and 20,120 m2/kg (166 and 9815 ft2/lb), respec-tively; and their specific gravities were 3.1 and 2.22, respec-tively. A polycarboxylate-based high-range water-reducing admixture (HRWRA) and liquid cellulosic-based anti-washout admixture (AWA) with specific gravities of 1.1 and 1.12, respectively, and solid contents of 40% and 30%, respectively, were incorporated in all mixtures. A sodium-gluconate-based set-retarding agent was also used to reduce slump loss during testing.
Continuously graded crushed limestone aggregate with a nominal maximum particle size of 20 mm (0.78 in.) and well-graded siliceous sand were employed. Their grada-tions were within ASTM C33/C33M recommendations. The coarse aggregate and sand had fineness moduli of 6.4 and 2.5, respectively. Their bulk specific gravities were 2.72 and 2.65 and their absorptions were 0.6% and 1.1%, respectively.
Deformed steel bars were used to evaluate bond behavior and pullout strength of reinforcement embedded in UWC. The steel bars complied with ASTM A615/A615M No. 13 (No. 4) with a nominal diameter of 12.7 mm (0.5 in.). The Young’s modulus and yield strength were equal to 203 GPa (29,435 ksi) and 420 MPa (60.9 ksi), respectively.
Mixture proportioningAs summarized in Table 1, three series of UWC mixtures
proportioned to achieve different compressive strengths in dry condition (fc!(dry)) of 30 ± 3, 45 ± 4, and 60 ± 5 MPa (4.3 ± 0.4, 6.5 ± 0.6, and 8.7 ± 0.7 ksi) were tested; the corresponding cement content increased from 350 to 400 and 450 kg/m3 (588 to 672 and 756 lb/yd3), respectively, and the w/cm decreased from 0.56 to 0.49 and 0.4, respectively. In each series, five different combinations of admixtures commonly used for proportioning flowable to highly flowable UWC for repair or new construction were used. The AWA was added at either 0.5% or 0.85% of cement weight, while the HRWRA was adjusted to secure a slump of 220 mm (8.7 in.) or a slump flow of 450 mm (17.7 in.), respectively. The silica fume was added at either 6% or 10% of cement weight and the HRWRA was adjusted, as described previously. Also, a reference UWC mixture with a slump of 220 mm (8.7 in.) made without AWA or silica fume was tested. Addi-tional discussion regarding the mixture composition and optimization of W of UWC can be seen in other publica-tions.11,14-16 The sand-to-total-aggregate ratio was fixed at
ACI Structural Journal/May-June 2013 3
0.46 for all tested concrete. The set retarder was added at a relatively high dosage of 0.7% of cement weight to mini-mize slump or slump-flow loss during testing.
Specimen preparation and experimental testingAll mixtures were prepared in an open-pan mixer with a
capacity of 50 L (13 gal.). The mixing sequence consisted of homogenizing the sand and cementitious materials for 1 minute before introducing half of the mixing water along with the HRWRA. After 1 minute of mixing, the AWA diluted in the remaining part of the water was introduced and the concrete was mixed for 2 minutes. The ambient tempera-ture during mixing and sampling was fixed at 21°C ± 3°C (70°F ± 38°F).
Following the end of mixing, the workability, air content, and washout mass loss were evaluated. The slump, slump flow, and air content were determined as per ASTM C143/C143M, ASTM C1611/C1611M, and ASTM C231/C231M, respectively. Values of air content were found to be equal to 2.5% ± 0.5% for all tested mixtures. The filling ability of flowable mixtures with a slump flow of 450 mm (17.7 in.) was evaluated using the L-box test11 and was found to vary from 38 to 54%.
W determination—As previously mentioned, W of UWC was determined using two different methods. The first complies with the CRD C61 test and consists of subjecting a fresh concrete sample placed in a perforated basket to free fall in a 1.7 m (5.6 ft) high column of water.10 After 15 seconds at the bottom of the test tube, the sample is retrieved at a constant speed of 0.5 m/s (1.6 ft/s) and measured to deter-mine washout mass loss. Cumulative Ws after three drops (W3) in water are reported. Approximately 2 kg (4.4 lb) are normally used when testing W as per the CRD C61 test; however, this quantity was increased to approximately 3 kg (6.6 lb) in this testing program to secure enough material for subsequent testing of hardened UWC properties.
The second method for determining W is by simulation using a pressurized steel column with a height of 1200 mm (47.2 in.) and a diameter of 200 mm (7.8 in.).11 The testing procedure consists of filling the column with water and dropping approximately 3 kg (6.6 lb) of the fresh concrete sample to the bottom placed in a perforated basket similar to that used in the CRD C61 test method. The top cover is then tightly closed and an overhead air pressure is introduced at a fixed rate to simulate different water heads (Hs). Air pres-sure is monitored using two dial gauges of different ranges (0 to 6 bars [0 to 87 psi] or 0 to 14 bars [0 to 203 psi]) connected to an air compressor, thus enabling the simulation of increased heads of water reaching 140 m (460 ft) in height. The rate of increase in overhead pressure can be
controlled by adjusting the amount of air introduced in the tube by unit of time, thus simulating various Ivelocity rates. For example, to simulate W resulting from an H of 60 m (197 ft) at an Ivelocity of 0.5 m/s (1.6 ft/s), the pressure is gradually increased from 0 to 6 bars (0 to 87 psi) (corresponding to the desired simulated head of 60 m [197 ft]) over a period of 120 seconds (corresponding to the specified rate of 0.5 m/s [1.6 ft/s]). After opening the air valves to release the pres-sure, the basket containing the concrete sample is retrieved at a constant rate of 0.5 m/s (1.6 ft/s) and W is noted along with the corresponding applied H. As will be discussed later, the air-pressurized tube allows the determination of a certain threshold H, beyond which significant deterioration of the UWC specimen can occur.
Determination of unit weight and residual compressive and bond strengths—The procedure used to determine hardened properties of UWC, using the same concrete samples that were used for W measurement, is presented in Reference 14 and summarized as follows.
Immediately after measuring W3 (using the CRD C61) or W (using the pressurized tube), the fresh concrete sample was moved to a clean container and covered by a wet burlap. Subsequently, another fresh sample of approximately 3 kg (6.6 lb) was taken from the same batch, subjected to similar W testing, and then stored in the same container again. This process was repeated four times to obtain a total mass of approximately 10 kg (22 lb) (taking into consideration the material lost due to washout), which was then rigorously mixed for use in strength determination. It is important to note that the time needed to complete the four cycles of washout testing did not exceed 20 to 25 minutes, whereby slump or slump-flow loss thresholds were limited to less than 25 or 40 mm (1 or 1.6 in.), respectively. In case higher workability loss was encountered (particularly for the 220 mm [8.7 in.] slump mixture containing 0.5% AWA), a new batch was mixed and used for testing. It is to be noted that the variations in W obtained between the first and last cycle of testing using either the CRD C61 test or the pressurized tube were found to be less than 1.4% or 3.7%, respectively.
The so-obtained UWC samples were filled in 100 x 200 mm (3.94 x 7.88 in.) steel cylinders to determine the corresponding residual compressive strength. The method for compacting the concrete in the cylinder, demolding after 24 hours, curing in water, capping, and testing at 28 days complied with ASTM C39/C39M. Also, the strength of reference mixtures sampled in dry conditions (that is, without immer-sion in water) was determined. Prior to crushing at 28 days, the corresponding unit weight " was calculated by dividing the weight of the concrete sample by volume. It is impor-tant to note that some air voids were visually noticed on the
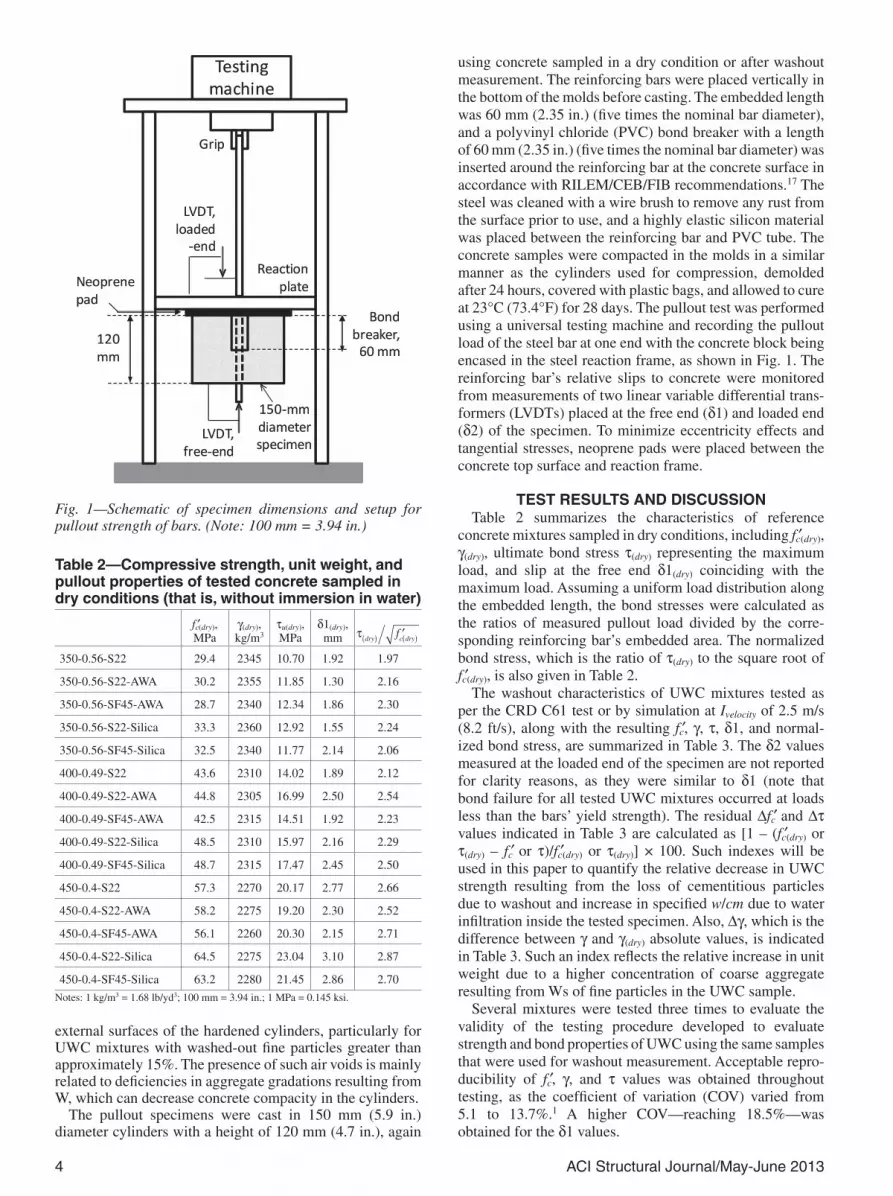
Table 1—Mixture composition of tested UWC
fc!(dry) = 30 ± 3 MPa fc!(dry) = 45 ± 4 MPa fc!(dry) = 60 ± 5 MPa
Cement content is 350 kg/m3 and w/cm = 0.56
Cement content is 400 kg/m3 and w/cm = 0.49
Cement content is 450 kg/m3 and w/cm = 0.40
Mixture No. 1 HRWRA adjusted to yield slump of 220 mm
Mixture No. 2 AWA = 0.5% of cement weight; HRWRA adjusted to yield slump of 220 mm
Mixture No. 3 AWA = 0.85% of cement weight; HRWRA adjusted to yield slump flow of 450 mm
Mixture No. 4 Silica fume = 6% of cement weight; HRWRA adjusted to yield slump of 220 mm
Mixture No. 5 Silica fume = 10% of cement weight; HRWRA adjusted to yield slump flow of 450 mmNotes: 1 kg/m3 = 1.68 lb/yd3; 100 mm = 3.94 in.; 1 MPa = 0.145 ksi.
4 ACI Structural Journal/May-June 2013
external surfaces of the hardened cylinders, particularly for UWC mixtures with washed-out fine particles greater than approximately 15%. The presence of such air voids is mainly related to deficiencies in aggregate gradations resulting from W, which can decrease concrete compacity in the cylinders.
The pullout specimens were cast in 150 mm (5.9 in.) diameter cylinders with a height of 120 mm (4.7 in.), again
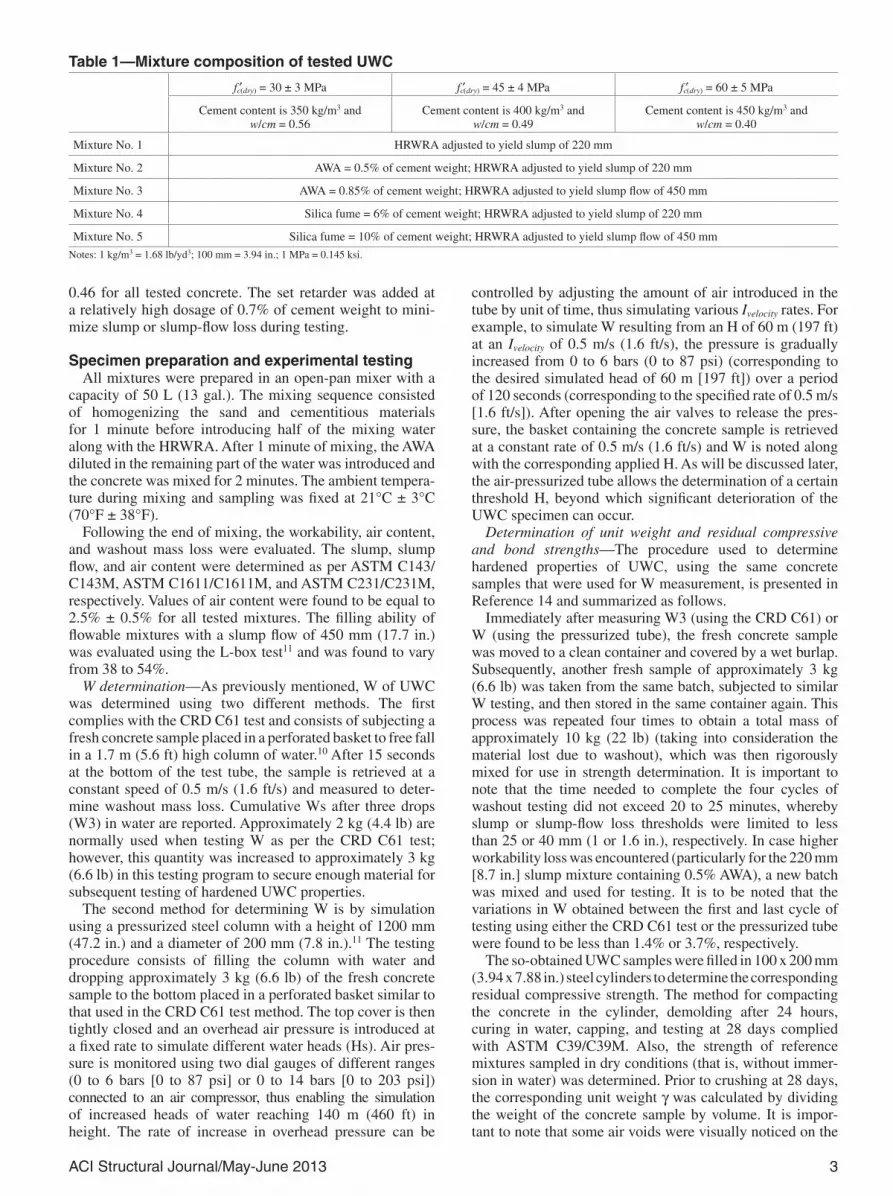
using concrete sampled in a dry condition or after washout measurement. The reinforcing bars were placed vertically in the bottom of the molds before casting. The embedded length was 60 mm (2.35 in.) (five times the nominal bar diameter), and a polyvinyl chloride (PVC) bond breaker with a length of 60 mm (2.35 in.) (five times the nominal bar diameter) was inserted around the reinforcing bar at the concrete surface in accordance with RILEM/CEB/FIB recommendations.17 The steel was cleaned with a wire brush to remove any rust from the surface prior to use, and a highly elastic silicon material was placed between the reinforcing bar and PVC tube. The concrete samples were compacted in the molds in a similar manner as the cylinders used for compression, demolded after 24 hours, covered with plastic bags, and allowed to cure at 23°C (73.4°F) for 28 days. The pullout test was performed using a universal testing machine and recording the pullout load of the steel bar at one end with the concrete block being encased in the steel reaction frame, as shown in Fig. 1. The reinforcing bar’s relative slips to concrete were monitored from measurements of two linear variable differential trans-formers (LVDTs) placed at the free end (#1) and loaded end (#2) of the specimen. To minimize eccentricity effects and tangential stresses, neoprene pads were placed between the concrete top surface and reaction frame.
TEST RESULTS AND DISCUSSIONTable 2 summarizes the characteristics of reference
concrete mixtures sampled in dry conditions, including fc!(dry), "(dry), ultimate bond stress $(dry) representing the maximum load, and slip at the free end #1(dry) coinciding with the maximum load. Assuming a uniform load distribution along the embedded length, the bond stresses were calculated as the ratios of measured pullout load divided by the corre-sponding reinforcing bar’s embedded area. The normalized bond stress, which is the ratio of $(dry) to the square root of fc!(dry), is also given in Table 2.
The washout characteristics of UWC mixtures tested as per the CRD C61 test or by simulation at Ivelocity of 2.5 m/s (8.2 ft/s), along with the resulting fc!, ", $, #1, and normal-ized bond stress, are summarized in Table 3. The #2 values measured at the loaded end of the specimen are not reported for clarity reasons, as they were similar to #1 (note that bond failure for all tested UWC mixtures occurred at loads less than the bars’ yield strength). The residual %fc! and %$ values indicated in Table 3 are calculated as [1 – (fc!(dry) or $(dry) – fc! or $)/fc!(dry) or $(dry)] ! 100. Such indexes will be used in this paper to quantify the relative decrease in UWC strength resulting from the loss of cementitious particles due to washout and increase in specified w/cm due to water infiltration inside the tested specimen. Also, %", which is the difference between " and "(dry) absolute values, is indicated in Table 3. Such an index reflects the relative increase in unit weight due to a higher concentration of coarse aggregate resulting from Ws of fine particles in the UWC sample.
Several mixtures were tested three times to evaluate the validity of the testing procedure developed to evaluate strength and bond properties of UWC using the same samples that were used for washout measurement. Acceptable repro-ducibility of fc!, ", and $ values was obtained throughout testing, as the coefficient of variation (COV) varied from 5.1 to 13.7%.1 A higher COV—reaching 18.5%—was obtained for the #1 values.
Table 2—Compressive strength, unit weight, and pullout properties of tested concrete sampled in dry conditions (that is, without immersion in water)
fc!(dry), MPa
"(dry), kg/m3
$u(dry), MPa
#1(dry), mm ! dry c dryf( ) ( )"
350-0.56-S22 29.4 2345 10.70 1.92 1.97
350-0.56-S22-AWA 30.2 2355 11.85 1.30 2.16
350-0.56-SF45-AWA 28.7 2340 12.34 1.86 2.30
350-0.56-S22-Silica 33.3 2360 12.92 1.55 2.24
350-0.56-SF45-Silica 32.5 2340 11.77 2.14 2.06
400-0.49-S22 43.6 2310 14.02 1.89 2.12
400-0.49-S22-AWA 44.8 2305 16.99 2.50 2.54
400-0.49-SF45-AWA 42.5 2315 14.51 1.92 2.23
400-0.49-S22-Silica 48.5 2310 15.97 2.16 2.29
400-0.49-SF45-Silica 48.7 2315 17.47 2.45 2.50
450-0.4-S22 57.3 2270 20.17 2.77 2.66
450-0.4-S22-AWA 58.2 2275 19.20 2.30 2.52
450-0.4-SF45-AWA 56.1 2260 20.30 2.15 2.71
450-0.4-S22-Silica 64.5 2275 23.04 3.10 2.87
450-0.4-SF45-Silica 63.2 2280 21.45 2.86 2.70Notes: 1 kg/m3 = 1.68 lb/yd3; 100 mm = 3.94 in.; 1 MPa = 0.145 ksi.
Fig. 1—Schematic of specimen dimensions and setup for pullout strength of bars. (Note: 100 mm = 3.94 in.)
ACI Structural Journal/May-June 2013 5
Phase 1—W versus properties of tested UWC mixtures
Effect of mixture composition on WWashout determined using CRD C61 test—Generally
speaking, W determined using the CRD C61 test method is directly affected by the mixture composition (Table 3). For example, lower W3 values are obtained for UWC prepared with combinations of higher cement content and lower w/cm. The addition of an increased concentration of either AWA or silica fume also resulted in lower W3 values for a given level of consistency. This can be attributed to the mode of function of such additives, which binds part of the mixing water, increases cohesiveness, and leads to lower washout upon contact of concrete with surrounding water.16 The increase in the level of consistency (that is, from a slump of
220 mm [8.7 in.] to slump flow of 450 mm [17.7 in.]) led to higher washout. Additional discussion regarding the effect of mixture composition on W3 variations can be found in References 11 and 14 through 16.
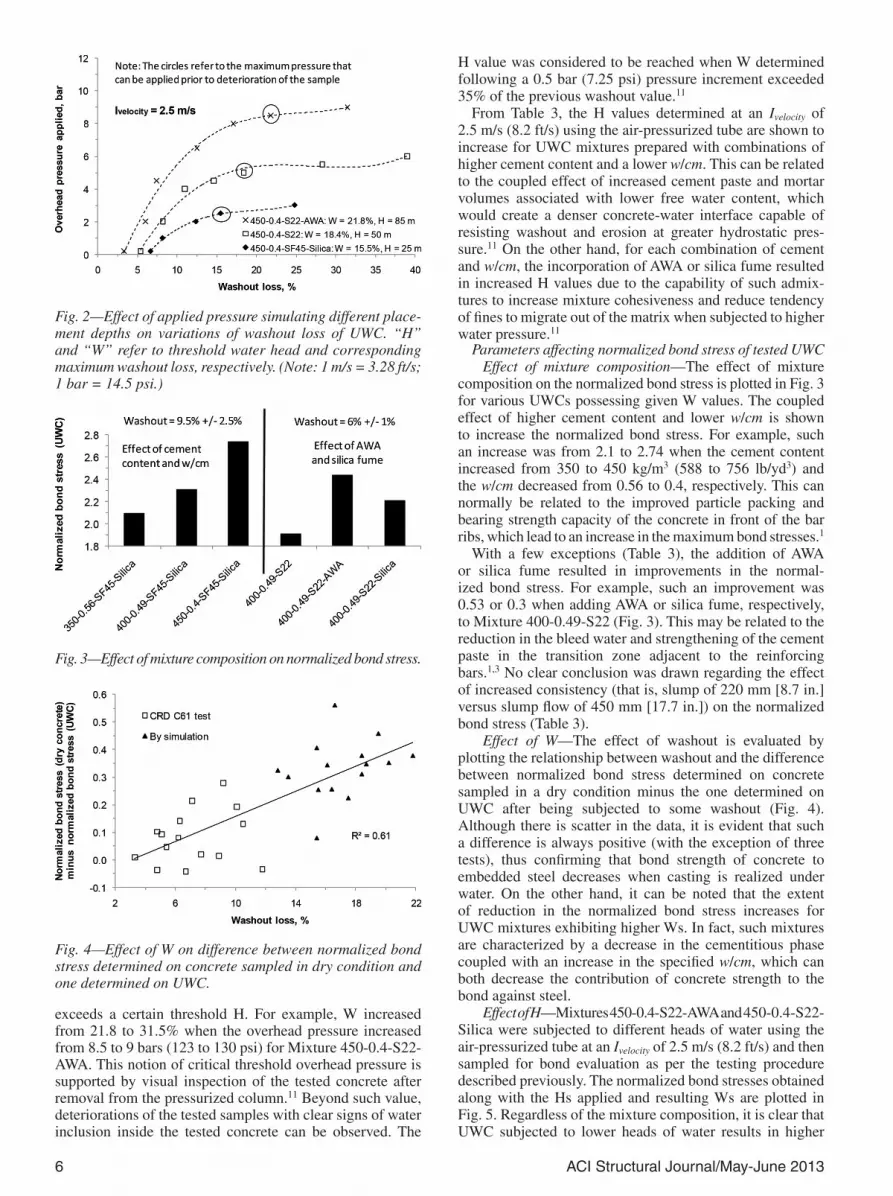
Washout determined by simulation—A typical example of the variation of placement depths, simulated by varying the overhead pressure in the pressurized tube, on W is plotted in Fig. 2 for UWC mixtures made with 450 kg/m3 (756 lb/yd3) cement. A new concrete sample was used for each simulation test realized at an Ivelocity of 2.5 m/s (8.2 ft/s). The gradual increase in air pressure over the submerged unhardened specimen led to a greater degree of W, thus indicating that washout is directly dependent on water depth at the casting point. For any given mixture, the increase in washout with H is shown to increase sharply when the applied pressure
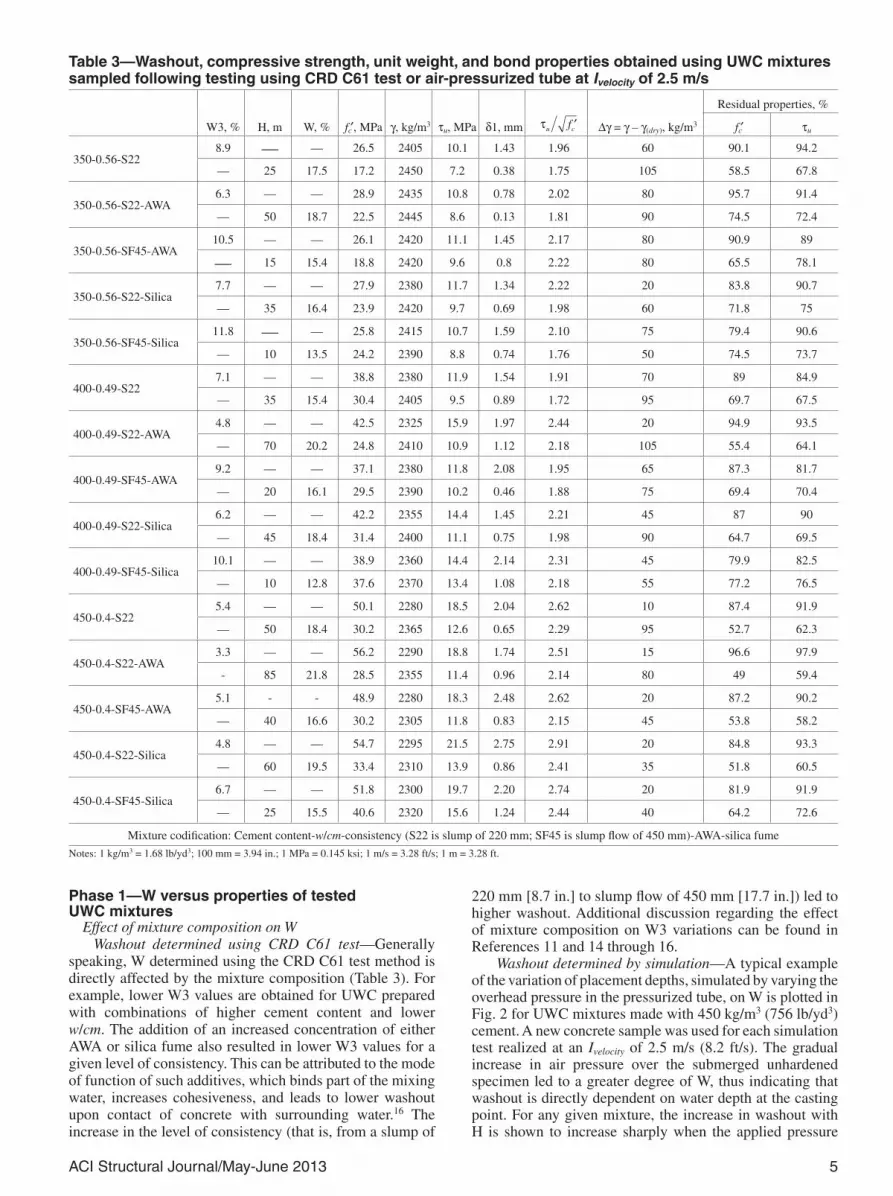
Table 3—Washout, compressive strength, unit weight, and bond properties obtained using UWC mixtures sampled following testing using CRD C61 test or air-pressurized tube at Ivelocity of 2.5 m/s
W3, % H, m W, % fc!, MPa ", kg/m3 $u, MPa #1, mm !u cf " %" = " – "(dry), kg/m3
Residual properties, %
fc! $u
350-0.56-S228.9 — — 26.5 2405 10.1 1.43 1.96 60 90.1 94.2
— 25 17.5 17.2 2450 7.2 0.38 1.75 105 58.5 67.8
350-0.56-S22-AWA6.3 — — 28.9 2435 10.8 0.78 2.02 80 95.7 91.4
— 50 18.7 22.5 2445 8.6 0.13 1.81 90 74.5 72.4
350-0.56-SF45-AWA10.5 — — 26.1 2420 11.1 1.45 2.17 80 90.9 89
— 15 15.4 18.8 2420 9.6 0.8 2.22 80 65.5 78.1
350-0.56-S22-Silica7.7 — — 27.9 2380 11.7 1.34 2.22 20 83.8 90.7
— 35 16.4 23.9 2420 9.7 0.69 1.98 60 71.8 75
350-0.56-SF45-Silica11.8 — — 25.8 2415 10.7 1.59 2.10 75 79.4 90.6
— 10 13.5 24.2 2390 8.8 0.74 1.76 50 74.5 73.7
400-0.49-S227.1 — — 38.8 2380 11.9 1.54 1.91 70 89 84.9
— 35 15.4 30.4 2405 9.5 0.89 1.72 95 69.7 67.5
400-0.49-S22-AWA4.8 — — 42.5 2325 15.9 1.97 2.44 20 94.9 93.5
— 70 20.2 24.8 2410 10.9 1.12 2.18 105 55.4 64.1
400-0.49-SF45-AWA9.2 — — 37.1 2380 11.8 2.08 1.95 65 87.3 81.7
— 20 16.1 29.5 2390 10.2 0.46 1.88 75 69.4 70.4
400-0.49-S22-Silica6.2 — — 42.2 2355 14.4 1.45 2.21 45 87 90
— 45 18.4 31.4 2400 11.1 0.75 1.98 90 64.7 69.5
400-0.49-SF45-Silica10.1 — — 38.9 2360 14.4 2.14 2.31 45 79.9 82.5
— 10 12.8 37.6 2370 13.4 1.08 2.18 55 77.2 76.5
450-0.4-S225.4 — — 50.1 2280 18.5 2.04 2.62 10 87.4 91.9
— 50 18.4 30.2 2365 12.6 0.65 2.29 95 52.7 62.3
450-0.4-S22-AWA3.3 — — 56.2 2290 18.8 1.74 2.51 15 96.6 97.9
- 85 21.8 28.5 2355 11.4 0.96 2.14 80 49 59.4
450-0.4-SF45-AWA5.1 - - 48.9 2280 18.3 2.48 2.62 20 87.2 90.2
— 40 16.6 30.2 2305 11.8 0.83 2.15 45 53.8 58.2
450-0.4-S22-Silica4.8 — — 54.7 2295 21.5 2.75 2.91 20 84.8 93.3
— 60 19.5 33.4 2310 13.9 0.86 2.41 35 51.8 60.5
450-0.4-SF45-Silica6.7 — — 51.8 2300 19.7 2.20 2.74 20 81.9 91.9
— 25 15.5 40.6 2320 15.6 1.24 2.44 40 64.2 72.6
Mixture codification: Cement content-w/cm-consistency (S22 is slump of 220 mm; SF45 is slump flow of 450 mm)-AWA-silica fumeNotes: 1 kg/m3 = 1.68 lb/yd3; 100 mm = 3.94 in.; 1 MPa = 0.145 ksi; 1 m/s = 3.28 ft/s; 1 m = 3.28 ft.
6 ACI Structural Journal/May-June 2013
exceeds a certain threshold H. For example, W increased from 21.8 to 31.5% when the overhead pressure increased from 8.5 to 9 bars (123 to 130 psi) for Mixture 450-0.4-S22-AWA. This notion of critical threshold overhead pressure is supported by visual inspection of the tested concrete after removal from the pressurized column.11 Beyond such value, deteriorations of the tested samples with clear signs of water inclusion inside the tested concrete can be observed. The
H value was considered to be reached when W determined following a 0.5 bar (7.25 psi) pressure increment exceeded 35% of the previous washout value.11
From Table 3, the H values determined at an Ivelocity of 2.5 m/s (8.2 ft/s) using the air-pressurized tube are shown to increase for UWC mixtures prepared with combinations of higher cement content and a lower w/cm. This can be related to the coupled effect of increased cement paste and mortar volumes associated with lower free water content, which would create a denser concrete-water interface capable of resisting washout and erosion at greater hydrostatic pres-sure.11 On the other hand, for each combination of cement and w/cm, the incorporation of AWA or silica fume resulted in increased H values due to the capability of such admix-tures to increase mixture cohesiveness and reduce tendency of fines to migrate out of the matrix when subjected to higher water pressure.11
Parameters affecting normalized bond stress of tested UWCEffect of mixture composition—The effect of mixture
composition on the normalized bond stress is plotted in Fig. 3 for various UWCs possessing given W values. The coupled effect of higher cement content and lower w/cm is shown to increase the normalized bond stress. For example, such an increase was from 2.1 to 2.74 when the cement content increased from 350 to 450 kg/m3 (588 to 756 lb/yd3) and the w/cm decreased from 0.56 to 0.4, respectively. This can normally be related to the improved particle packing and bearing strength capacity of the concrete in front of the bar ribs, which lead to an increase in the maximum bond stresses.1
With a few exceptions (Table 3), the addition of AWA or silica fume resulted in improvements in the normal-ized bond stress. For example, such an improvement was 0.53 or 0.3 when adding AWA or silica fume, respectively, to Mixture 400-0.49-S22 (Fig. 3). This may be related to the reduction in the bleed water and strengthening of the cement paste in the transition zone adjacent to the reinforcing bars.1,3 No clear conclusion was drawn regarding the effect of increased consistency (that is, slump of 220 mm [8.7 in.] versus slump flow of 450 mm [17.7 in.]) on the normalized bond stress (Table 3).
Effect of W—The effect of washout is evaluated by plotting the relationship between washout and the difference between normalized bond stress determined on concrete sampled in a dry condition minus the one determined on UWC after being subjected to some washout (Fig. 4). Although there is scatter in the data, it is evident that such a difference is always positive (with the exception of three tests), thus confirming that bond strength of concrete to embedded steel decreases when casting is realized under water. On the other hand, it can be noted that the extent of reduction in the normalized bond stress increases for UWC mixtures exhibiting higher Ws. In fact, such mixtures are characterized by a decrease in the cementitious phase coupled with an increase in the specified w/cm, which can both decrease the contribution of concrete strength to the bond against steel.
Effect of H—Mixtures 450-0.4-S22-AWA and 450-0.4-S22-Silica were subjected to different heads of water using the air-pressurized tube at an Ivelocity of 2.5 m/s (8.2 ft/s) and then sampled for bond evaluation as per the testing procedure described previously. The normalized bond stresses obtained along with the Hs applied and resulting Ws are plotted in Fig. 5. Regardless of the mixture composition, it is clear that UWC subjected to lower heads of water results in higher
Fig. 2—Effect of applied pressure simulating different place-ment depths on variations of washout loss of UWC. “H” and “W” refer to threshold water head and corresponding maximum washout loss, respectively. (Note: 1 m/s = 3.28 ft/s; 1 bar = 14.5 psi.)
Fig. 3—Effect of mixture composition on normalized bond stress.
Fig. 4—Effect of W on difference between normalized bond stress determined on concrete sampled in dry condition and one determined on UWC.

ACI Structural Journal/May-June 2013 7
normalized bond stress. For example, such stress increased from 2.41 to 2.85 for Mixture 450-0.4-S22-Silica when H decreased from 60 to 30 m (196.8 to 98.4 ft), respectively. This can indirectly be attributed to the decrease in W (that is, from 19.5% to 10.6%, respectively), which decreases the risks of water inclusion inside the UWC and migration of fines out of the matrix. Practically, this indicates that bond strength of steel embedded in UWC is directly dependent on water depth at the casting point for a given Ivelocity.
Effect of Ivelocity—The normalized bond stress determined on three UWC mixtures tested at an Ivelocity of 2.5 or 0.5 m/s (8.2 to 1.6 ft/s) is plotted in Fig. 6. The H applied on the tested specimen using the air-pressurized tube along with the resulting measured W are also reported. The results show that reducing the outflow velocity at which the UWC comes into contact with water leads to a remarkable increase in the normalized bond stress. For example, the stress increased from 1.81 to 2.16 for Mixture 350-0.56-S22-AWA when the Ivelocity decreased from 2.5 to 0.5 m/s (8.2 to 1.6 ft/s), respectively. Concrete cast at a relatively low Ivelocity rate possesses enough time to undergo structural buildup, leading to a decrease in slump consistency and an improvement in washout resistance,11 thus resulting in a higher contribution of concrete strength to the bond properties. In other words, this indicates that reducing turbulence and interfacial concrete-water velocity is crucial to limit W and increase bond strength of embedded steel.
Inadequacy of using fc!(dry) to evaluate bond between steel and UWC—Typical variations of the normalized bond stress of tested UWC with compressive strength determined either in a dry condition or after washout for mixtures made with 450 kg/m3 (756 lb/yd3) cement and 0.4 w/cm are plotted in Fig. 7. For a fixed fc!(dry) of 60 ± 5 MPa (8.7 ± 0.7 ksi), significant variations in the normalized bond stress ranging from approximately 2 to 3 are obtained. This indicates that fc!(dry) cannot be used as an index to reflect the contribution of UWC strength to the bond against steel. In other words, the use of fc!(dry) in current design equations to evaluate development and splice lengths is inadequate whenever concrete casting is to take place under water. Conversely, the normalized bond stress and fc! values determined on concrete subjected to washout are shown to normally increase within each other (that is, for a stress ranging from 2 to 3, the corre-sponding fc! varied from 28 to 56 MPa [4.06 to 8.12 ksi]).
Effect of W on UWC propertiesPrediction of UWC residual strengths through washout
testing—The effect of W determined using the CRD C61
test or by simulation at Ivelocity of 2.5 m/s (8.2 ft/s) on the variations of UWC residual strengths and unit weight is plotted in Fig. 8. Three categories depending on the level of W can be distinguished as follows:• W greater than 15%: UWC samples possessing such
levels of washout are characterized by a relative increase in coarse aggregate concentration resulting from the loss of cementitious paste and fine sand particles, thus
Fig. 5—Effect of H on normalized bond stress for Ivelocity of 2.5 m/s. (Note: 1 m/s = 3.28 ft/s; 1 m = 3.28 ft.)
Fig. 6—Effect of Ivelocity on normalized bond stress. (Note: 1 m/s = 3.28 ft/s; 1 m = 3.28 ft.)
Fig. 7—Variations of normalized bond stress for UWC mixtures with respect to compressive strength determined either in dry condition or after W. (Note: 1 MPa = 0.145 ksi.)
Fig. 8—Effect of W on residual bond and compressive strengths and difference in unit weights. (Note: 1 kg/m3 = 1.68 lb/yd3.)
8 ACI Structural Journal/May-June 2013
leading to a %" greater than approximately 95 kg/m3 (160 lb/yd3). A dramatic drop in the residual strength is noticed due to the coupled effects of cementitious loss and an increase in specified w/cm. The corresponding %fc! and %$ values ranged from 50% to 75% and 55% to 75%, respectively.
• W varying from 7.5 to 15%: The corresponding %" ranged from 70 to 95 kg/m3 (117 to 160 lb/yd3), whereas
the %fc! and %$ values both varied from approximately 65 to 90%.
• W less than 7.5%: Obviously, this category of mixtures is characterized by an improved concrete-water inter-face capable of resisting loss of fines and water inclu-sion inside the specimen, thus leading to %fc! and %$ values greater than approximately 80% with a %" less than 70 kg/m3 (117 lb/yd3).Effect of intrinsic W (W3) on threshold H and normalized
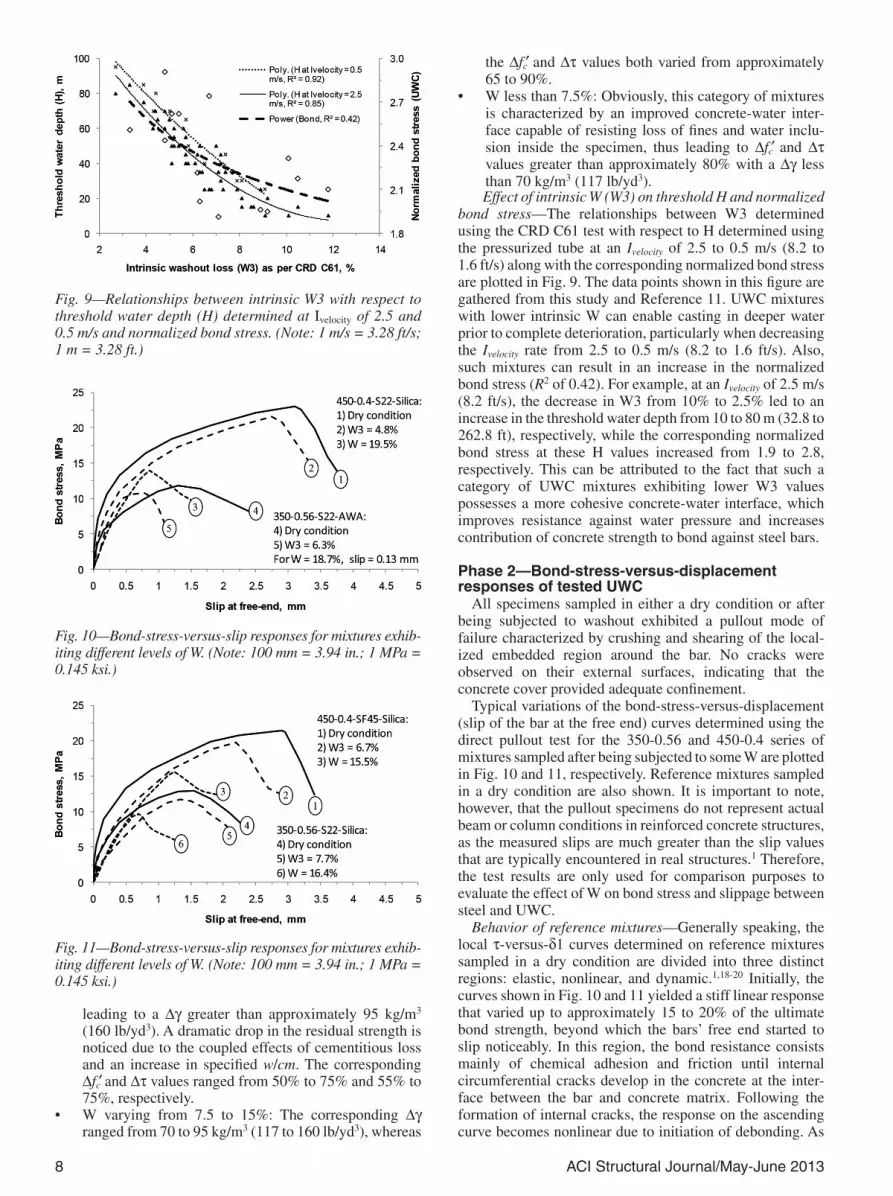
bond stress—The relationships between W3 determined using the CRD C61 test with respect to H determined using the pressurized tube at an Ivelocity of 2.5 to 0.5 m/s (8.2 to 1.6 ft/s) along with the corresponding normalized bond stress are plotted in Fig. 9. The data points shown in this figure are gathered from this study and Reference 11. UWC mixtures with lower intrinsic W can enable casting in deeper water prior to complete deterioration, particularly when decreasing the Ivelocity rate from 2.5 to 0.5 m/s (8.2 to 1.6 ft/s). Also, such mixtures can result in an increase in the normalized bond stress (R2 of 0.42). For example, at an Ivelocity of 2.5 m/s (8.2 ft/s), the decrease in W3 from 10% to 2.5% led to an increase in the threshold water depth from 10 to 80 m (32.8 to 262.8 ft), respectively, while the corresponding normalized bond stress at these H values increased from 1.9 to 2.8, respectively. This can be attributed to the fact that such a category of UWC mixtures exhibiting lower W3 values possesses a more cohesive concrete-water interface, which improves resistance against water pressure and increases contribution of concrete strength to bond against steel bars.
Phase 2—Bond-stress-versus-displacement responses of tested UWC
All specimens sampled in either a dry condition or after being subjected to washout exhibited a pullout mode of failure characterized by crushing and shearing of the local-ized embedded region around the bar. No cracks were observed on their external surfaces, indicating that the concrete cover provided adequate confinement.
Typical variations of the bond-stress-versus-displacement (slip of the bar at the free end) curves determined using the direct pullout test for the 350-0.56 and 450-0.4 series of mixtures sampled after being subjected to some W are plotted in Fig. 10 and 11, respectively. Reference mixtures sampled in a dry condition are also shown. It is important to note, however, that the pullout specimens do not represent actual beam or column conditions in reinforced concrete structures, as the measured slips are much greater than the slip values that are typically encountered in real structures.1 Therefore, the test results are only used for comparison purposes to evaluate the effect of W on bond stress and slippage between steel and UWC.
Behavior of reference mixtures—Generally speaking, the local $-versus-#1 curves determined on reference mixtures sampled in a dry condition are divided into three distinct regions: elastic, nonlinear, and dynamic.1,18-20 Initially, the curves shown in Fig. 10 and 11 yielded a stiff linear response that varied up to approximately 15 to 20% of the ultimate bond strength, beyond which the bars’ free end started to slip noticeably. In this region, the bond resistance consists mainly of chemical adhesion and friction until internal circumferential cracks develop in the concrete at the inter-face between the bar and concrete matrix. Following the formation of internal cracks, the response on the ascending curve becomes nonlinear due to initiation of debonding. As
Fig. 9—Relationships between intrinsic W3 with respect to threshold water depth (H) determined at Ivelocity of 2.5 and 0.5 m/s and normalized bond stress. (Note: 1 m/s = 3.28 ft/s; 1 m = 3.28 ft.)
Fig. 10—Bond-stress-versus-slip responses for mixtures exhib-iting different levels of W. (Note: 100 mm = 3.94 in.; 1 MPa = 0.145 ksi.)
Fig. 11—Bond-stress-versus-slip responses for mixtures exhib-iting different levels of W. (Note: 100 mm = 3.94 in.; 1 MPa = 0.145 ksi.)
ACI Structural Journal/May-June 2013 9
the debonding propagates along the embedded length, the stiffness of the ascending curves gradually softens until it reaches a maximum bond stress value. The ultimate bond strength is directly dependent on the contribution of concrete strength and quality of the interfacial transition zone between the paste and embedded steel.18,19 For example, the bond strength increased from 11.8 to 12.9 and 21.45 MPa (1.71 to 1.87 and 3.11 ksi) for Mixtures 350-0.56-S22-AWA, 350-0.56-S22-Silica, and 450-0.4-SF45-Silica, respectively (with fc!(dry) equal to 30.2, 33.3, and 63.2 MPa [4.38, 4.83, and 9.17 ksi], respectively). The debonding still continues in the post-peak region until the entire length is totally debonded, causing the steel bars to slide out dynamically. Concrete possessing higher compressive strength yielded generally more sharp decay in the $-versus-#1 curves as compared to lower-strength concrete (Fig. 10 and 11).
Behavior of UWC—Regardless of the composition, all mixtures subjected to a certain degree of W exhib-ited different $-versus-#1 behaviors than those described previously for concrete sampled in a dry condition. In the elastic region, the bars’ free end started to slip at rela-tively lower bond stress, thus attenuating the stiffness of UWC linear responses. For example, at the very small #1 of 0.05 mm (2 ! 10–3 in.), the bond stress decreased from approximately 5 to 3.5 and 1.3 MPa (0.73 to 0.51 and 0.19 ksi) for Mixture 450-0.4-S22-Silica having nil or a W of 4.8% and 19.5%, respectively (Fig. 10). In a direct pullout test, where the bar is placed in tension, the bond behavior is affected by the surrounding concrete that is placed in compression. Therefore, as discussed previously, UWC mixtures sampled after being subjected to washout are char-acterized by lower fc!, which decreases bond resistance and leads to internal cracking at lower bond stress. Furthermore, the attenuation of the UWC linear stiffness responses may be related to a more pronounced compression strain-softening phenomenon due to the relative increase in coarse aggregate concentration and air voids within the concrete samples. This is particularly the case for UWC mixtures with washed-out fine particles greater than approximately 15%, where some air voids were visually noticed on the external surfaces of the hardened concrete. Such a phenomenon is known to occur in the pre-peak portion of the stress-strain curve when air voids and microcracks coalesce to form a damaged zone around the aggregate particles, thus weakening the concrete load-carrying capacity.21
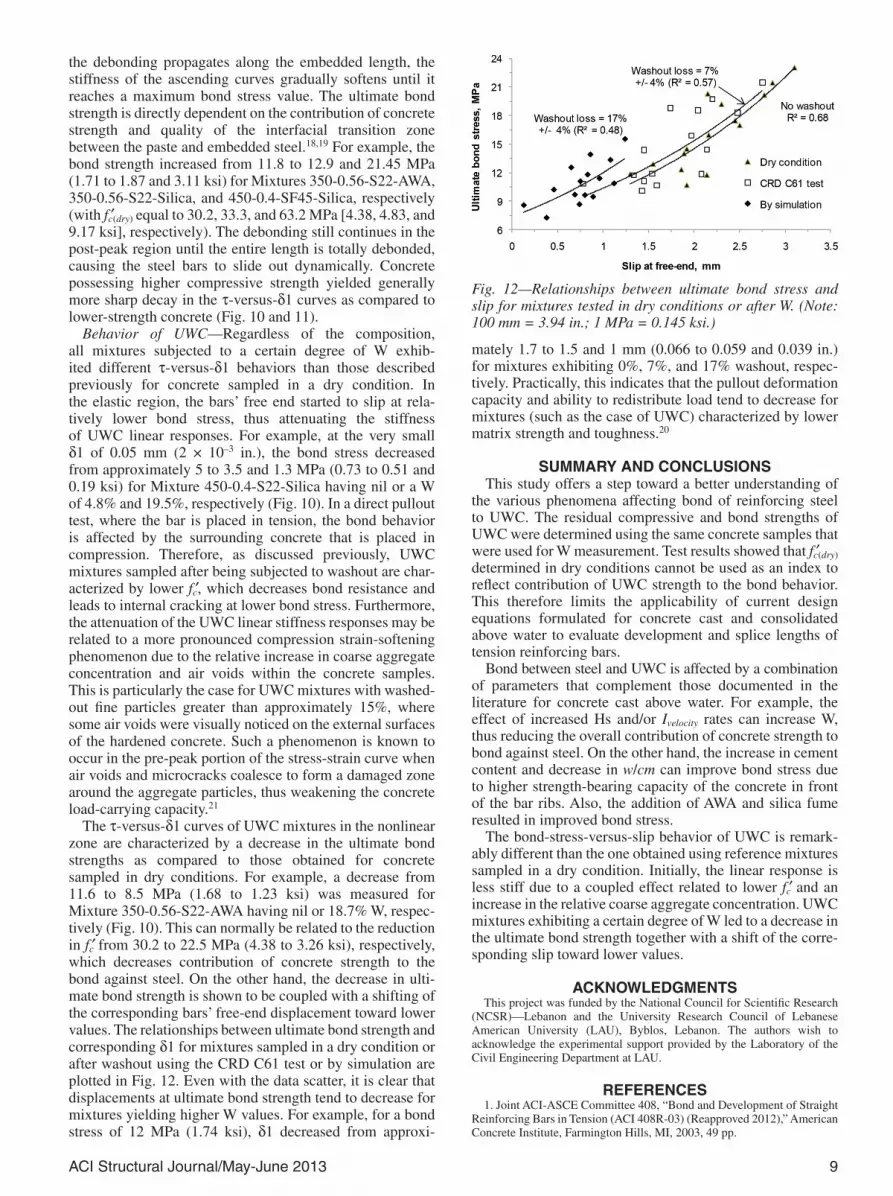
The $-versus-#1 curves of UWC mixtures in the nonlinear zone are characterized by a decrease in the ultimate bond strengths as compared to those obtained for concrete sampled in dry conditions. For example, a decrease from 11.6 to 8.5 MPa (1.68 to 1.23 ksi) was measured for Mixture 350-0.56-S22-AWA having nil or 18.7% W, respec-tively (Fig. 10). This can normally be related to the reduction in fc! from 30.2 to 22.5 MPa (4.38 to 3.26 ksi), respectively, which decreases contribution of concrete strength to the bond against steel. On the other hand, the decrease in ulti-mate bond strength is shown to be coupled with a shifting of the corresponding bars’ free-end displacement toward lower values. The relationships between ultimate bond strength and corresponding #1 for mixtures sampled in a dry condition or after washout using the CRD C61 test or by simulation are plotted in Fig. 12. Even with the data scatter, it is clear that displacements at ultimate bond strength tend to decrease for mixtures yielding higher W values. For example, for a bond stress of 12 MPa (1.74 ksi), #1 decreased from approxi-
Fig. 12—Relationships between ultimate bond stress and slip for mixtures tested in dry conditions or after W. (Note: 100 mm = 3.94 in.; 1 MPa = 0.145 ksi.)
mately 1.7 to 1.5 and 1 mm (0.066 to 0.059 and 0.039 in.) for mixtures exhibiting 0%, 7%, and 17% washout, respec-tively. Practically, this indicates that the pullout deformation capacity and ability to redistribute load tend to decrease for mixtures (such as the case of UWC) characterized by lower matrix strength and toughness.20
SUMMARY AND CONCLUSIONSThis study offers a step toward a better understanding of
the various phenomena affecting bond of reinforcing steel to UWC. The residual compressive and bond strengths of UWC were determined using the same concrete samples that were used for W measurement. Test results showed that fc!(dry) determined in dry conditions cannot be used as an index to reflect contribution of UWC strength to the bond behavior. This therefore limits the applicability of current design equations formulated for concrete cast and consolidated above water to evaluate development and splice lengths of tension reinforcing bars.
Bond between steel and UWC is affected by a combination of parameters that complement those documented in the literature for concrete cast above water. For example, the effect of increased Hs and/or Ivelocity rates can increase W, thus reducing the overall contribution of concrete strength to bond against steel. On the other hand, the increase in cement content and decrease in w/cm can improve bond stress due to higher strength-bearing capacity of the concrete in front of the bar ribs. Also, the addition of AWA and silica fume resulted in improved bond stress.
The bond-stress-versus-slip behavior of UWC is remark-ably different than the one obtained using reference mixtures sampled in a dry condition. Initially, the linear response is less stiff due to a coupled effect related to lower fc! and an increase in the relative coarse aggregate concentration. UWC mixtures exhibiting a certain degree of W led to a decrease in the ultimate bond strength together with a shift of the corre-sponding slip toward lower values.
ACKNOWLEDGMENTSThis project was funded by the National Council for Scientific Research
(NCSR)—Lebanon and the University Research Council of Lebanese American University (LAU), Byblos, Lebanon. The authors wish to acknowledge the experimental support provided by the Laboratory of the Civil Engineering Department at LAU.
REFERENCES1. Joint ACI-ASCE Committee 408, “Bond and Development of Straight
Reinforcing Bars in Tension (ACI 408R-03) (Reapproved 2012),” American Concrete Institute, Farmington Hills, MI, 2003, 49 pp.
10 ACI Structural Journal/May-June 2013
2. Harajli, M. H., “Development/Splice Strength of Reinforcing Bars Embedded in Plain and Fiber Reinforced Concrete,” ACI Structural Journal, V. 91, No. 5, Sept.-Oct. 1994, pp. 511-520.
3. Valcuende, M., and Parra, C., “Bond Behaviour of Reinforcement in Self-Compacting Concrete,” Construction & Building Materials, V. 23, 2009, pp. 162-170.
4. ACI Committee 318, “Building Code Requirements for Structural Concrete (ACI 318-08) and Commentary,” American Concrete Institute, Farmington Hills, MI, 2008, 473 pp.
5. BS 8110, “Structural Use of Concrete, Part 1: Code for Practice for Design and Construction,” British Standards Institution, London, UK, 2004, 173 pp.
6. McLeish, A., ed., Underwater Concreting and Repairing, Taylor & Francis, London, UK, 1994, 160 pp.
7. ACI Committee 546, “Guide to Underwater Repair of Concrete (ACI 546.2R-10),” American Concrete Institute, Farmington Hills, MI, 2010, 32 pp.
8. Best, J. F., and McDonald, J. E., “Evaluation of Polyester Resin, Epoxy, and Cement Grouts for Embedding Reinforcing Steel Bars in Hard-ened Concrete,” Technical Report REMR-CS-23, U.S. Army Corps of Engi-neers, 1990, 25 pp.
9. Sonebi, M., and Khayat, K. H., “Effect of Water Velocity on the Performance of Underwater Self-Consolidating Concrete,” ACI Materials Journal, V. 96, No. 5, Sept.-Oct. 1999, pp. 519-528.
10. CRD C61-89A, “Test Method for Determining the Resistance of Freshly-Mixed Concrete to Washing Out in Water,” Handbook for Cement and Concrete, U.S. Army Waterways Experiment Station, Vicksburg, MS, 1989, 3 pp.
11. Assaad, J. J.; Daou, Y.; and Khayat, K. H., “Simulation of Water Pres-sure on Washout of Underwater Concrete Repair,” ACI Materials Journal, V. 106, No. 6, Nov.-Dec. 2009, pp. 529-536.
12. Perry, S. H., and Holmyard, J. M., “Scaling of Underwater Concrete Repair Materials,” Technical Report OTH 89-298, Imperial College of Science and Technology, London, UK, 1992, 62 pp.
13. Moon, H. Y., and Shin, K. J., “Evaluation on Steel Bar Corrosion Embedded in Antiwashout Underwater Concrete Containing Mineral Admixtures,” Cement and Concrete Research, V. 36, 2006, pp. 521-529.
14. Assaad, J. J.; Daou, Y.; and Salman, H., “Correlating Washout to Strength Loss of Underwater Concrete,” Institute of Civil Engineers, V. 164, No. CM3, 2011, pp. 153-162.
15. Assaad, J. J.; Daou, Y.; and Harb, J., “Use of CEM Approach to Develop and Optimize High-Performance Underwater Concrete,” Journal of Materials in Civil Engineering, ASCE, V. 23, No. 7, 2011, 9 pp.
16. Khayat, K. H., and Assaad, J. J., “Relationship between Washout Resistance and Rheological Properties of High-Performance Under-water Concrete,” ACI Materials Journal, V. 100, No. 3, May-June 2003, pp. 185-193.
17. RILEM/CEB/FIB, “Bond Test for Reinforcing Steel: 2, Pullout Test,” Materials and Structures, V. 3, No. 5, 1970, pp. 175-178.
18. Sueki, S.; Soranakom, C.; Mobasher, B.; and Peled, A., “Pullout-Slip Response of Fabrics Embedded in a Cement Paste Matrix,” Journal of Materials in Civil Engineering, ASCE, V. 19, No. 9, 2007, pp. 718-727.
19. Haskett, M.; Oehlers, D. J.; and Ali, M., “Local and Global Bond Characteristics of Steel Reinforcing Bars,” Engineering Structures, V. 30, 2008, pp. 376-383.
20. Watson, A. K., and LaFave, J. M., “Effect of Increased Tensile Strength and Toughness on Reinforcing-Bar Bond Behavior,” Cement and Concrete Composites, V. 16, 1994, pp. 129-141.
21. Uebayasi, K.; Fujikake, K.; and Ohno, T., “Strain Softening Behav-iors of Concrete Materials under Compressive Rapid Loading,” Trans-actions of the 15th International Conference on Structural Mechanics, SMiRT-15, Seoul, South Korea, 1999, pp. 15-20.