single-vesicle architecture of synaptobrevin2 in astrocytes
TRANSCRIPT

ARTICLE
Received 13 Dec 2013 | Accepted 1 Apr 2014 | Published 7 May 2014
Single-vesicle architecture of synaptobrevin2in astrocytesPriyanka Singh1, Jernej Jorgacevski1,2, Marko Kreft1,2,3, Vladimir Grubisic4, Randy F. Stout Jr4,5,
Maja Potokar1,2, Vladimir Parpura4,6 & Robert Zorec1,2
Exocytic transmitter release is regulated by the SNARE complex, which contains a vesicular
protein, synaptobrevin2 (Sb2). However, Sb2 vesicular arrangement is unclear. Here we
use super-resolution fluorescence microscopy to study the prevalence and distribution of
endogenous and exogenous Sb2 in single vesicles of astrocytes, the most abundant glial cells
in the brain. We tag Sb2 protein at C- and N termini with a pair of fluorophores, which allows
us to determine the Sb2 length and geometry. To estimate total number of Sb2 proteins per
vesicle and the quantity necessary for the formation of fusion pores, we treat cells with
ATP to stimulate Ca2þ -dependent exocytosis, increase intracellular alkalinity to enhance
the fluorescence presentation of yellow-shifted pHluorin (YpH), appended to the vesicle
lumen domain of Sb2, and perform photobleaching of YpH fluorophores. Fluorescence
intensity analysis reveals that the total number of endogenous Sb2 units or molecules per
vesicle is r25.
DOI: 10.1038/ncomms4780
1 Laboratory of Neuroendocrinology—Molecular Cell Physiology, Institute of Pathophysiology, Faculty of Medicine, University of Ljubljana, 1000 Ljubljana,Slovenia. 2 Celica Biomedical Center, 1000 Ljubljana, Slovenia. 3 Department of Biology, Biotechnical Faculty, University of Ljubljana, 1000 Ljubljana, Slovenia.4 Department of Neurobiology, Center for Glial Biology in Medicine, University of Alabama, Birmingham, Alabama 35294, USA. 5 The Dominick P. PurpuraDepartment of Neuroscience, Albert Einstein College of Medicine, Bronx, New York 10461, USA. 6 Department of Biotechnology, University of Rijeka, 51000Rijeka, Croatia. Correspondence and requests for materials should be addressed to V.P. (email: [email protected]) or to R.Z. (email: [email protected]).
NATURE COMMUNICATIONS | 5:3780 | DOI: 10.1038/ncomms4780 | www.nature.com/naturecommunications 1
& 2014 Macmillan Publishers Limited. All rights reserved.

Astrocytes provide metabolic support to neurons, activelytune synaptic activity and influence the microcirculationof the brain1. A key process mediating astrocyte
communication with neighbouring cells is regulated exocytosis.This multi-stage, spatially and temporally highly organizedprocess consists of many steps leading to merger betweensecretory organelles and the plasma membrane. Astrocyticsecretory organelles may contain gliotransmitters (peptides,amino acids and/or nucleotides), membrane transporters,channels and/or other signalling molecules2,3. Distinct secretoryorganelle types4–6 can be engaged in regulated exocytosis7 andthey are differentially regulated. Vesicular exocytosis is mediatedby Sb2 (ref. 8), also referred to as VAMP2, while lysosomalexocytosis is thought to be governed by VAMP7 (ref. 9). Thus, tounderstand the nature of the exocytotic process and its role inastrocyte communication, one needs to understand secretoryorganelle architecture at the highest possible spatial resolution inliving cells. Individual vesicles can be studied by labelling proteinsthat allow the vesicular fusion process. Therefore, one can markSb2, which is typically present on the vesicle membrane inastrocytes10,11.
Our knowledge regarding the architecture of biologicalorganelles and their function at the cellular and subcellular levelin living cells arises mainly from studies using microscopictechniques, such as confocal laser scanning microscopy(CLSM)12,13. However, the resolution limit of CLSM, dictatedby diffraction14, impedes the ability to study single-cell organellessmaller than the limit of transverse and axial resolution(B200 nm and B500 nm, respectively). This limit can beovercome by super-resolution microscope techniques15, whichinclude structured illumination microscopy (SIM) with improved
transverse resolution to B100 nm16, thus allowing punctiformobject measurements at the nanoscale level. Furthermore, asexploited in the present work, SIM can also report on inter-fluorophore distances at a fraction of its resolution limit.
To study how Sb2 is structurally integrated and distributed insingle vesicles, we examined the arrangement of this vesiclemembrane protein in fixed and living cultured astrocytes. As adimensional calibration, we measured the length between twofluorescent tags placed at two ends of a Sb2 protein at the single-vesicle level. Analysis of the intensity of fluorescent tags,reporting on the number of molecules, revealed a multimodaldistribution with equally interspaced peaks. We conclude thatthere are r25 molecules of endogenous Sb2 per vesicle inastrocytes.
ResultsArrangement of Sb2 on a single vesicle. To describe the struc-tural integration of Sb2 proteins in a single vesicle at the nan-ometer scale, we designed a genetically modified protein chimera,yellow synaptopHluorin (YSpH) with yellow-shifted supereclipticpHluorin (YpH; a derivative of pHluorin17, a modified enhancedgreen fluorescent protein (EGFP)) targeted to the vesicle lumen(labelled as A in Fig. 1a), by attaching it to the C terminus of Sb2via an 8-amino-acid (aa) linker (Supplementary Fig. 1a). TheN-terminus of the same protein was marked with an anti-Sb2antibody (recognizing aa 1–18 of rat Sb2), which was tagged withsecondary antibodies conjugated with Atto 594, a rhodaminederivative dye, that has excitation and emission wavelengthsspectrally compatible with YpH (labelled as B in Fig. 1a). Byconsidering the length of the Sb2 protein to be 46 nm in its
Atto
Merge Mask
YpH
86 %
YpH Atto
Merge Mask
45 %
Vesicle membrane
A
Sb2 Antibody
10 nm
B
Figure 1 | Vesicle-associated membrane protein Sb2 fluorescently labelled at the luminal and cytoplasmic sides of the vesicle membrane. (a) The
diagram represents an astrocytic vesicle (left) in which a version of Sb2 is expressed, with a fluorescent protein in the vesicle lumen (fluorophore A,
that is, YpH) and with an immunolabelled cytoplasmic domain (fluorophore B, that is, Atto 594). The boxed diagram on right shows the architecture of Sb2
across the vesicle membrane, drawn to scale by considering the length of Sb218,19. b and c are images from CLSM and SIM, respectively. To stain
Sb2 in vesicle lumen, astrocytes were transfected with a plasmid encoding YSpH (green). To stain the N-terminal part of Sb2 located on the cytosolic side
of the vesicle membrane, primary antibody against Sb2 and a secondary antibody conjugated to Atto 594 (Atto; red) were used. Merge panels show
overlay of YSpH and Atto signals arising from the vesicle lumen and the cytoplasm. Mask panels show only the colocalized pixels between YpH and Atto.
Bar, 10 mm. Note the smaller amount of colocalization (percent, shown for representative single astrocytes) in the SIM image than in the CLSM image.
ARTICLE NATURE COMMUNICATIONS | DOI: 10.1038/ncomms4780
2 NATURE COMMUNICATIONS | 5:3780 | DOI: 10.1038/ncomms4780 | www.nature.com/naturecommunications
& 2014 Macmillan Publishers Limited. All rights reserved.

elongated or uncoiled form18–21 and the average length of an IgGantibody molecule (between 11.5 nm and 14 nm for two differentconfigurations)22, we predicted a structural arrangement asshown in Fig. 1a. As controls, we made additional geneticallyencoded Sb2 constructs. To avoid the use of antibodies, we fusedYSpH with red fluorescent protein (mCherry) on the cytoplasmicvesicle side (that is, N-terminus) of Sb2 (mCherry-YSpH)(Supplementary Fig. 2). In this construct, inter-fluorophore(centre-centre) distance of B54 nm is predicted, where oneconsiders an average aa residue size of 0.4 nm (ref. 20) (thus, forthe full length of 116 aa of Sb2 along with 8 aa of the linker, thereis total of 124 aa� 0.4 nm¼ 49.6 nm) and EGFP size of 4.7 nm23
along with an assumption of a similar size for mCherry. It shouldbe noted that for YSpH construct decorated with the primaryantibody against Sb2 and Atto-labelled secondary antibody, theYpH-Atto inter-fluorophore distance is predicted to be B75–80 nm (assuming a linear arrangement of two antibody moleculesin shorter and longer configurations, respectively, as well as anegligible size of Atto in comparison with EGFP). We alsoprepared another chimeric protein (YSpH-7aa-mCherry)(Supplementary Fig. 2) that had mCherry attached, via a 7-aaresidue linker (B2.8 nm), to C terminus of YpH, with a predictedinter-fluorophore distance up to B7.5 nm.
We transfected astrocytes with a plasmid encoding YSpH(shown in green on images, YpH) and subsequently exposedthese cells to immunocytochemical labelling with primaryantibodies against Sb2 followed by fluorescently tagged secondaryantibodies (Atto 594; shown in red in Fig. 1a). Antibody binds toexogenously expressed Sb2, that is, YpH, as well as its endogenousnonfluorescent form. As shown in Fig. 1, we determined thedegree of colocalization (%) between YpH and antibody-conjugated Atto, which significantly differed (Po0.001; Student’st-test) when obtained by CLSM (83±2%, n¼ 20 cells) and SIM(40±4%, n¼ 9 cells). The reduced colocalization in SIM imagesis consistent with the idea that YpH and Atto fluorophores,associated with imaged structures or vesicles, are present in closeproximity, not overlapping completely24. To verify this notion, wefurther studied individual fluorescent puncta, representing singlevesicles. Chemical fixation (see Methods) of the cells enhancedYpH signal due to pH equilibration between vesicles and theextracellular medium.
Pairs of YpH and Atto SIM signals exhibit different patterns(Fig. 2a–d). After eliminating YpH and Atto signals that were4200 nm apart from each other (15–20% of the puncta), fourpattern categories, in descending preponderance, were observed:(a) partial overlapping YpH and Atto signals (Fig. 2a); (b) partialoverlapping YpH and Atto signals, as in pattern (a), but theaverage Atto signal exhibited higher intensity than the YpH signal(Fig. 2b); (c) overlapping YpH and Atto signals (Fig. 2c); and(d) Atto enveloped YpH signal, which in cross-sectional fluore-scence profiles may appear as a YpH signal sandwiched betweentwo Atto signals (Fig. 2d). The proportions of these patterns wereas follows: for (a) 44±2%; (b) 34±2%; (c) 15±3%; and (d)7±1% (n¼ 349 vesicles, 3 cells) (Fig. 2e). All arrangements werefurther studied by plotting normalized intensity line profiles foreach of these arrangements (Fig. 2, mid column), which wereused to measure the distance between peaks of Gaussian curves,fitted to the intensity of YpH and Atto signals. The frequencydistribution plot for the distance, measured in each pair of YpHand Atto fluorophores, yielded a mean value of 65±2 nm(n¼ 541, 5 cells) (Fig. 2f). The measured distance, whencompared with predicted values (75–80 nm), could represent anunderestimate if the orientation of Sb2 and associated antibodiesare not parallel to the focal plane and/or if their configurationsare not so ‘linear’ as indicated in Fig. 1a (that is, antibodiesassume angles and Sb2 coils).
To further verify that this measurement of inter-fluorophoredistance is associated with the distance between C- andN termini of Sb2 across the vesicle membrane, we transfectedastrocytes to express mCherry-YSpH, an additional Sb2 construct(Supplementary Fig. 2), having red fluorescent protein (mCherry)appended to the N terminus (located at the vesicular cytosolicside) of YSpH; YpH at the C terminus is located in the vesicularlumen. The results revealed a mean inter-fluorophore (mCherry-YpH) distance of 57±1 nm (n¼ 403 vesicles, 7 cells; Fig. 3d),which is in good agreement with the predicted inter-fluorophoredistance (54 nm) in this Sb2 chimera, but significantly different(P¼ 0.004; analysis of variance (ANOVA) from YpH-Attomeasurements in Fig. 2f. This difference can likely be attributedto the length of attached antibodies when studying YpH-Attopairs. It cannot be ruled out that the mCherry-YpH measure-ments may represent the distance between fluorophores of twodifferent Sb2 molecules located on adjacent vesicles, although thisscenario is unlikely. As an additional cross-check measure,we expressed a chimeric protein with mCherry appendedvia a 7-aa linker to C terminus of YpH (YSpH-7aa-mCherry)(Supplementary Fig. 2) and recorded an inter-fluorophoredistance of 0±5 nm (n¼ 338 vesicles, 6 cells; Fig. 3h), ameasurement that is consistent with the predicted value (7.5 nm).
Diameter measurements of pHluorin-laden vesicles. We nextassessed vesicular diameter using an approach involving fillingthe vesicle lumen in live astrocytes using LysoTracker Red DND-99, which stains acidic organelles within a cell25. The specificity ofmonitoring secretory vesicles was obtained by transfectingastrocytes to express YSpH and hence label Sb2-positivevesicles, before their exposure to LysoTracker. Subsequently, weanalysed only dually, YSpH and LysoTracker, labelled puncta orvesicles (Fig. 4a,b) by obtaining Gaussian curves of the intensityprofiles along a line section through the equatorial plane of suchvesicles (Fig. 4c). The YSpH Gaussian curves of individual punctawere narrower and eccentrically positioned when compared withthose of matching individual LysoTracker puncta, indicating thatYSpH is non-uniformly distributed and does not completelydisclose vesicular lumen (Fig. 4c). Nonetheless, by measuring thefull width at half maximum intensity (FWHM) of the Gaussiancurve of red LysoTracker fluorescence (Fig. 4c,d), we determinedthe apparent diameter of astrocytic vesicles of 305±3 nm(n¼ 129 vesicles, 9 cells). It should be noted that this estimateof the vesicle diameter, which is in reasonable agreement with thepreviously obtained measurements or Sb2-laden vesicles in liveastrocytes26, is based on only a fraction of LysoTracker-positivevesicles in which YpH signal is significant, due to either arelatively high copy number of YSpH molecules and/or arelatively more alkaline vesicle lumen. In addition, LysoTracker-based measurement may overestimate vesicular diameter, as is thecase when measuring the diameter of standard fluorescent beads(nominally 200 nm in diameter with measured FWHM ofB255 nm, Supplementary Fig. 3c). Nonetheless, the Sb2-ladenvesicles that we have interrogated in live astrocytes have anapparent size of B300 nm in diameter.
The number of exogenous Sb2 molecules on single vesicles. Tolearn about the putative number of Sb2 molecules per vesicle orfluorescent punctum, we initially made a comparative analysis ofthe intensities of fluorophores that were used to label Sb2 and ofthose obtained from standard, dye-loaded spherical latex parti-cles, that is, green fluorescent beads (Supplementary Fig. 3). Closeinspection of the frequency histograms of fluorescence intensitiesof beads (Supplementary Fig. 3d) and fluorophore-taggedSb2 (YpH, Supplementary Fig. 3e; Atto, Supplementary Fig. 3f)
NATURE COMMUNICATIONS | DOI: 10.1038/ncomms4780 ARTICLE
NATURE COMMUNICATIONS | 5:3780 | DOI: 10.1038/ncomms4780 | www.nature.com/naturecommunications 3
& 2014 Macmillan Publishers Limited. All rights reserved.

revealed that the distribution of bead and YpH intensity valuesexhibit single-mode distributions (Supplementary Fig. 3d,e,respectively), albeit YpH, unlike bead fluorescence, is skewedfrom normality (D’Agostino test Po0.01 and P40.05, respec-tively). Of note, each distribution here contains signals frommany puncta (for comparison with individual YSpH punctum seeFig. 4b). It should be noted that the YpH labelling only discloses asubset of vesicles containing exogenous Sb2, that is, YSpH.
However, when all (endogenous and exogenous) Sb2 moleculesare labelled using antibodies, there are apparent multiple modesin the Atto intensities frequency histogram (SupplementaryFig. 3f). Although this optical fluorescence intensity methoddoes not distinguish single molecules from other unitary orquantal intensities (a finite fluorescence ‘packet’), these results areconsistent with the notion that Sb2 is non-uniformly distributedand that likely there is on average more than one unit or molecule
%
A B C D
Abs
olut
e in
tens
ity (
a.u.
)A
bsol
ute
inte
nsity
(a.
u.)
****
****
*
*
Distance (μm)
8,000
4,000
40,000
20,000
18,000
9,000
20,000
10,0006,500
13,000
Green Red7,000
3,500
35,00015,000
7,500 17,500
Rel
ativ
e in
tens
ity
0 00 50
Distance, d (nm)
100 150 200
Cou
nts
per
Bin
80
10
Configurations
20
30
40
50
00
1
1
00
1
1
00
1
1
00
1
1
d
Rel
ativ
e in
tens
ity
Figure 2 | Patterns of two Sb2-associated fluorophores reveal nonuniform vesicular distribution of Sb2. (a–d) Each panel contains (left to right) a SIM
image, a graph and a drawing. SIM images (left column) show different patterns of Atto (red) and YpH (green) fluorophores tagging Sb2. Graphs
(middle column) show normalized/relative fluorescence intensity profiles (red and green fluorescence along the section, that is, line, in corresponding SIM
image). The right ordinates of the intensity profiles show absolute intensity (a.u., arbitrary unit) of green and red fluorescent puncta. Schematics in the right
column show possible arrangements of two fluorophores in a single vesicle. The arrow and vertical dash-line are drawn to visualize the top view of
the fluorophore pair (c). The order of images (a–d) is according to abundance (shown in %) of the pattern observed in astrocytes as summarized in graph
(e). The error bars represent s.e.m. We analyzed three astrocytes in which a total of 349 vesicles were examined. *Po0.02 and **Po0.001 (ANOVA). As
indicated in line profile in a, distance (proximity) between the green and red fluorophores, d, can be determined as the distance between the peaks. The
frequency distribution plot of inter-fluorophore distance measured for all YpH-Atto pairs is shown in f. The mean value for the distance between YpH and
Atto is 65±2 nm (mean±s.e.m.), which is calculated by fitting a Gaussian curve (f) on a frequency distribution plot of the form Counts/bin¼{A/[s(O2p)]}� exp{� [x� m)2/2s2]} (Equation 1) where x¼distance (nm), total count A¼ (4,295±503); s¼ 28.6; m¼ (65±2) nm. The squared
correlation coefficient R2¼0.90, n¼ 541 vesicles, 5 cells; difference from zero was statistically significant (Po0.001; ANOVA).
ARTICLE NATURE COMMUNICATIONS | DOI: 10.1038/ncomms4780
4 NATURE COMMUNICATIONS | 5:3780 | DOI: 10.1038/ncomms4780 | www.nature.com/naturecommunications
& 2014 Macmillan Publishers Limited. All rights reserved.

of Sb2 present on the surface of a single vesicle, which weinvestigated further below. Of course, a fluorescent bead containsmore than one molecule of dye, but as the dye loading is uniformthroughout the bead as per its amorphous polymer backbone, thebead population fluorescence intensity distribution shows anappearance of a single ‘packet’. In YSpH-expressing astrocytesthat were immunolabelled by an anti-Sb2 antibody conjugatedwith Atto dye, we did not observe a correlation between thefluorescence intensity and the area of the Atto fluorescent puncta(R2¼ 0.05, P¼ 0.28).
In an attempt to determine the approximate number of Sb2molecules laden in each vesicle and used in the process ofvesicular fusion, using CLSM, we have monitored vesicle YSpHfluorescence in live astrocytes that were stimulated by ATP
(0.1 mM). By activating purinergic receptors, ATP increasescytosolic Ca2þ and promotes the merger between the vesicle andthe plasma membrane, leading to the formation of a fusionpore12,26–28. On fusion pore formation, alkalinization of thevesicle lumen is expected, as vesicular protons exit into theextracellular medium. This would be reflected by an increase inYSpH fluorescence emission. Alternatively, the vesicular lumencan be chemically alkalinized, so that, even when the fusion poreis closed, YSpH signal increases (Supplementary Fig. 1c,d). Fullalkalinization of vesicles can be accomplished by the applicationof NH4Cl29,30. Hence, to assess the extent to which ATPstimulation (with the main conduit for protons to exit thevesicle lumen via Ca2þ -dependent fusion pore opening) elicitedvesicle alkalinization, we subsequently added NH4Cl (45 mM) to
mCherry YpH Merge
mCherry YpH Merge
Cou
nts
per
bin
Cou
nts
per
bin
Distance (μm)
Distance (μm)R
elat
ive
inte
nsity
Rel
ativ
e in
tens
ity
Distance (μm)
Distance (μm)
00
1
00.0 0.1 0.2 0.3
30
60
90
1
0 00.0 0.1 0.2 0.3
100
200
0
1
1
Figure 3 | SIM measurements of the distance between fluorescent proteins appended to Sb2 termini. a and e are the SIM images showing astrocytes
transfected with mCherry-YSpH and YSpH-7aa-mCherry plasmids, respectively. Bar, 10mm. Merge panels show the overlay of the fluorescence of
mCherry (red) and YpH (green) signals. b and f are close-up images of the mCherry and YpH pairs obtained from the images (Merge, arrow) in a and e,
respectively. The inset drawings indicate the orientation of YpH and mCherry decorating Sb2. c and g show relative fluorescence intensity profiles
along the lines drawn in b and f. The histograms d and h show frequency distribution plots of the distances between the two fluorophores. (d) In case of
mCherry-YSpH, the mean value of the distance (peak-to-peak, as in Fig. 2a) between YpH (intravesicular) and mCherry (cytoplasmic) is 57±1 nm
(mean±s.e.m.) (R2¼0.98, n¼403 vesicles, 7 cells; significantly different than zero, Po0.001; ANOVA). To measure the peak-to-peak distance,
we fitted Gaussian curves using Equation 1. (h) In the case of YSpH-7aa-mCherry, the mean distance between two fluorophores juxta-positioned
(spacing provided by a 7-aa linker) in the vesicular lumen is negligible (0±5 nm; n¼ 338 vesicles, 6 cells).
NATURE COMMUNICATIONS | DOI: 10.1038/ncomms4780 ARTICLE
NATURE COMMUNICATIONS | 5:3780 | DOI: 10.1038/ncomms4780 | www.nature.com/naturecommunications 5
& 2014 Macmillan Publishers Limited. All rights reserved.

the bath to increase vesicle lumen pH independent of the fusionpore formation (Fig. 5a). It should be noted that inherent to ourexperimental design, here we could only interrogate those vesiclesthat undergo kiss and run with stable pore formation of varyingduration (see below), but not the full fusions, where the vesiclecollapses into the plasma membrane.
The individual vesicles of astrocytes subjected to the aboveexperimental paradigm show three types of responses (Fig. 5b):(i) ATP stimulation failed to increase YSpH fluorescence, whereasthe ensuing application of NH4Cl increased YSpH fluorescence(to reveal the presence of chimeric Sb2), which was the mostabundant pattern occurring in B60% of cases (261 of 430vesicles; 9 cells) and likely representing failure of fusion poreopening (Fig. 5b, left); (ii) ATP caused a persistent increase inYSpH fluorescence intensity, which was further increased by thesubsequent addition of NH4Cl, a response occurring in B35%(n¼ 149 vesicles; 9 cells) of cases (Fig. 5a and b, middle)and (iii) ATP evoked a transient increase in YSpH fluorescenceintensity, which returned to resting levels before the increase inYSpH fluorescence intensity was elicited by NH4Cl, an outcomeoccurring in B5% (n¼ 20 vesicles; 9 cells) of all cases (Fig. 5b,right). The latter two ATP-productive types of responses (ii andiii) likely represent cases where ATP stimulation was associatedwith a fusion pore opening, which was either persistently open,throughout the time-course of our approach, in the former case(ii), or opened only transiently in the latter case (iii). Such fusionpore changes have been described in astrocytes26 and in other celltypes31,32.
Next, we used the change in YSpH intensity measurementsfrom individual vesicles obtained in the above describedexperiments to generate YSpH intensity distributions at resting(no vesicular fusions)/background condition, as well as during thesequential stimulation with ATP and NH4Cl. Our aim was todefine the putative number of YSpH (that is, exogenous Sb2)molecules in fusion pore forming single vesicles. We firstobtained the distribution of the noise (basal level of YSpH)intensity changes, which expectedly yielded an average fluores-cence change near zero (Fig. 5c, left). We then obtaineddistributions of YSpH intensity changes during productive ATPstimulation (Fig. 5c, middle) and subsequent chemical alkaliniza-tion of vesicles with NH4Cl (Fig. 5c, right). All distributions werefitted with Gaussian curves using Equation 1 (with x¼DF; seefitting parameters in Table 1) to obtain multimodal values for allthe distributions (Fig. 5d). As one would expect, the first modecorresponds to background YSpH intensity changes (Fig. 5d,open bars), while the second mode represents the quantum ofYSpH intensity change due to the stimulation, with subsequentmodes being integer multiples. Surprisingly, ATP stimulation
generated only one mode, that of the single quantum (Fig. 5c,middle and Figure 5d, dark grey), while NH4Cl, beside the singlequantum, also generated integer multiples (Fig. 5c, right andFig. 5d, light grey). This implicates a differential accessibility ofvesicular lumen to de-protonation of YpH fluorophore duringphysiological ATP stimulation, as opposed to enforced chemicalalkalinization by NH4Cl (see Discussion). Nonetheless, thesemodal peaks of YSpH fluorescence are distributed as multiples offundamental quantal unit, likely representing the number ofYSpH molecules within individual vesicles, as revealed by a linearrelationship between the apparent number of YSpH moleculesand change in YSpH intensity (Fig. 5e). Our results indicate thatthere are maximum of five units or molecules of YSpH, that is,exogenous Sb2, in an astrocytic vesicle. However, only one YSpHmolecule appeared necessary for fusion pore formation as perATP stimulation data.
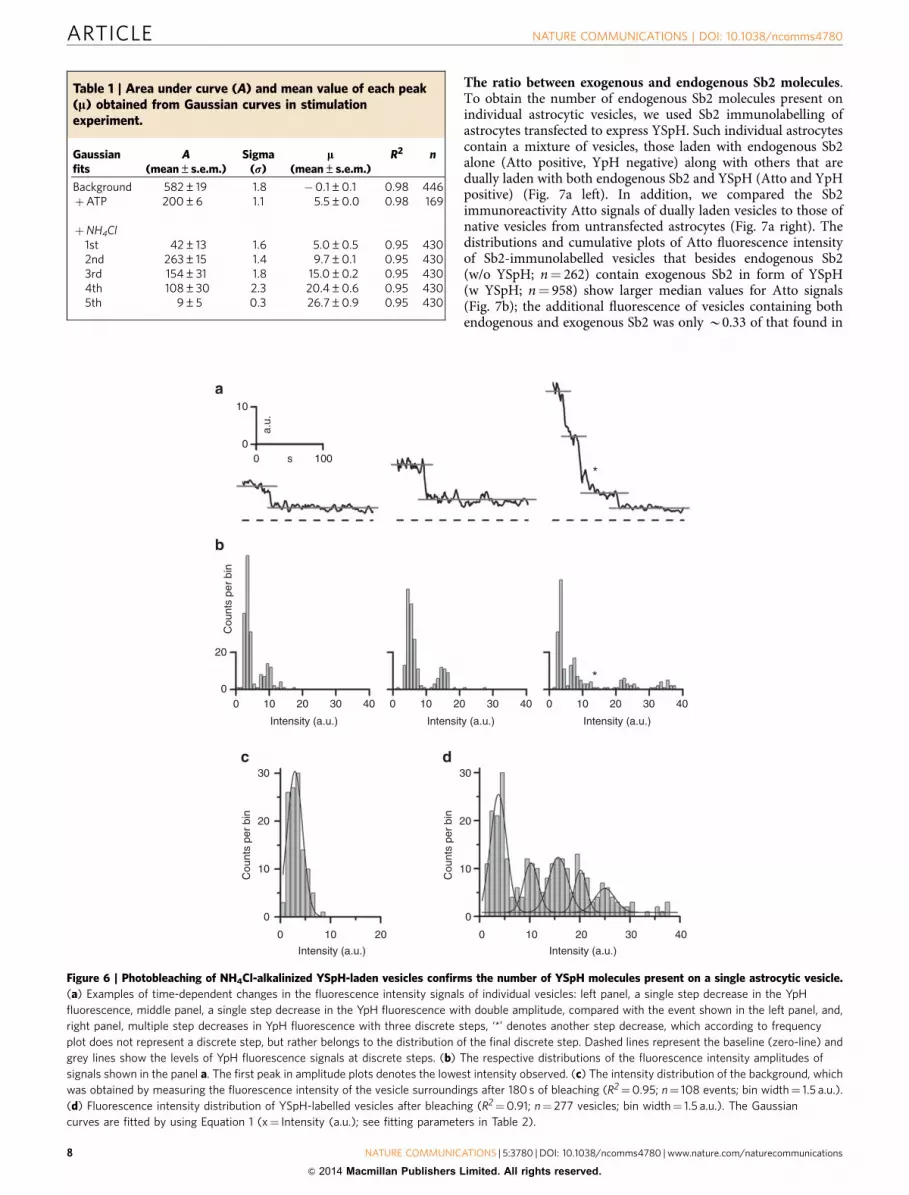
Photobleaching of YpH authenticates the number of exogen-ous Sb2 molecules. We performed photobleaching experimentsto cross-check the above determined number of YSpH moleculesin a single vesicle. As above, we transfected the astrocytes toexpress YSpH and stimulated them with NH4Cl solution. TheCLSM imaging was accomplished using regular (as above) laserpower and detector gain settings. The bleaching of YpH fluor-ophores was done by increasing the laser power by the factor of2–3. We observed two types of YpH fluorescence decay: (a)apparent exponential and (b) stepwise decays occurring in B30%and B70%, respectively, out of total analyzed events (n¼ 277).
We selected the stepwise events to analyse the number of YSpHmolecules. We observed different step decreases in YSpHfluorescence intensity originating from individual vesicles.Figure 6a displays three representative examples of such events:(i) a small step decrease in YpH fluorescence, (ii) a step decreaseby the factor of two, compared with the former event and (iii) anevent with three discrete step decreases in YpH fluorescence(Fig. 6a). By plotting the frequency distribution of the above typeof events (Fig. 6b), we observed distinct modes of YSpHfluorescence intensity. The background intensity in this set ofexperiments was measured in near vicinity of vesicles (n¼ 108events). The distribution of the background fluorescence could befitted by a Gaussian curve (Equation 1, where x¼ Intensity (a.u.);R2¼ 0.95, see fitting parameters in Table 2) and yieldeddistribution with the mean value of 2.9±0.1 a.u (mean±s.e.m.,Fig. 6c). Similarly, we obtained the distribution of the YSpHintensity changes due to photobleaching of NH4Cl alkalinizedvesicles, which showed multi-modality (Fig. 6d; R2¼ 0.91, seefitting parameters in Table 2). As one would expect, the first
300 nm
Cou
nts
per
bin
1
Rel
ativ
e in
tens
ity
Distance (μm)
00
Diameter (nm)
0 200 400 600
10
0
20
0.4 0.8
Figure 4 | Measurement of vesicle diameter in live astrocytes by SIM. (a) Diagram of an astrocytic vesicle loaded with LysoTracker DND-99 (red),
expressing YSpH (green) and (b) the corresponding SIM image in a live astrocyte. Bar, 300 nm. (c) Fluorescence intensity profile of LysoTracker
and YpH in the vesicle lumen along the line drawn in b. The dashed line indicates how the apparent diameter of a vesicle was determined, by measuring the
FWHM of Gaussian curve of the red fluorophore. Note the intersection with Gaussian curve drawn on normalized intensity of the red fluorophore, marked
with arrows. (d) The frequency distribution plot for apparent vesicle diameter, as defined in c. The mean value (mean±s.e.m.) of the
apparent vesicle diameter is 305±3 nm (n¼ 129 vesicles, 9 cells), measured by fitting a Gaussian curve of the form described in Equation 1 (R2¼0.94;
significantly different from zero, Po0.001; ANOVA).
ARTICLE NATURE COMMUNICATIONS | DOI: 10.1038/ncomms4780
6 NATURE COMMUNICATIONS | 5:3780 | DOI: 10.1038/ncomms4780 | www.nature.com/naturecommunications
& 2014 Macmillan Publishers Limited. All rights reserved.

mode corresponds to background YSpH intensity changes, whilethe remaining four equidistant modes, report on the discreteintensities (that is, quanta), corresponding to the number ofYSpH molecules in a single vesicle of live astrocytes (Fig. 6d;compared with Fig. 5d). This number of YSpH moleculesobtained from photobleaching experiments validates the quanti-fication obtained using the YSpH increase in fluorescencedue to ATP and NH4Cl stimulation (Fig. 5e). We furtheranalyzed exponential decays of the bleaching events of YSpH.
The average time constant (t) is B30 s (n¼ 14 vesicles), whichmeans that on average it takes 30 s to bleach 63% of thetotal number of Sb2 molecules present on a vesicle, that is, threeYSpH molecules bleach out of total five in 30 s. Therefore,it is likely (more than 10% probability) that two YSpH willbleach simultaneously, especially following the start of thebleaching procedure. In agreement, the percentage of events withthe double amplitude (Fig. 6a, middle) of the total bleachingevents was 16.6%.
00 50
ATP NH4Cl
100 150 200
10
20
30
00 50
ATP NH4Cl
100 150 200
10
20
30
00 50
ATP NH4Cl
100 150 200
10
20
40
30
0
50
0 10 20 30
100
150
0
50
100
150
0
50
100
150
Inte
nsity
(a.
u.)
ATP stimulationBefore stimulation NH4Cl stimulation
ΔF (a.u.)
0 10 20 30 0 21 3 4 5
ΔF (a.u.)
ΔF (
a.u.
)
Time (s) Time (s) Time (s)
Cou
nts
per
bin
Cou
nts
per
bin
Apparent # of YSpH
0 10 20 30
ΔF (a.u.)
0 10 20 30
ΔF (a.u.)
0
50
100
150
0
10
20
30
Figure 5 | Stimulation of YSpH-labelled vesicles by ATP and NH4Cl reveals the number of YSpH molecules present on a single astrocytic vesicle.
(a) Time series frames of a representative YSpH-positive vesicle (circle) recorded by CLSM before and after successive stimulations with ATP and NH4Cl.
Bar, 1mm. (b) Examples of time-dependent changes in the fluorescence intensity of individual vesicles: left panel, ATP failed to evoke an increase in
fluorescence intensity, however, NH4Cl elicited an increase; middle panel, application of ATP elicited a sustained increase in fluorescence intensity that was
augmented by NH4Cl; and right panel, ATP elicited a transient increase in fluorescence intensity, which was followed with NH4Cl-elicited increase.
Horizontal grey bars indicate the timing of ATP/NH4Cl applications. (c) Amplitude distributions of the change in YSpH fluorescence intensity (DF) recorded
in nine astrocytes before and after stimulations (bin width¼ 1.5 a.u.). Left panel, the change in YSpH intensity plot represents a background, which was
obtained by monitoring changes in YSpH intensity before and after addition (at 30 s for 10 s) of ATP (bottom horizontal line) in recordings where ATP failed
to elicit a significant increase in YSpH. Middle panel, after ATP, and, right panel, subsequent NH4Cl applications, the intensity distribution incrementally
shifts to the right as vesicles alkalinize due to the pore formation (ATP) and subsequent chemical alkalinization (NH4Cl), respectively. (d) Combined plot of
the change in YSpH intensity distributions for all vesicles (n¼ 1,045) from nine astrocytes: background (white) and after stimulation with ATP (dark grey)
and NH4Cl (light grey). The Gaussian curves are fitted by keeping the s.d. as determined in the background shown in left panel and using Equation 1 (where
x¼DF (a.u.), for fitting parameters see Table 1). (e) The peaks of the Gaussian fits of different modes of intensities (obtained in d) are plotted as a function
of modes, that is, number of YSpH packets; the relationship can be described using a liner regression in the form: DF (a.u.)¼ (4.95±0.04)� apparent # of
YSpHþ (�0.02±0.05), where # is the number or multiples of YSpH molecules (R2¼0.997; significantly different from zero, Po0.001; ANOVA).
NATURE COMMUNICATIONS | DOI: 10.1038/ncomms4780 ARTICLE
NATURE COMMUNICATIONS | 5:3780 | DOI: 10.1038/ncomms4780 | www.nature.com/naturecommunications 7
& 2014 Macmillan Publishers Limited. All rights reserved.
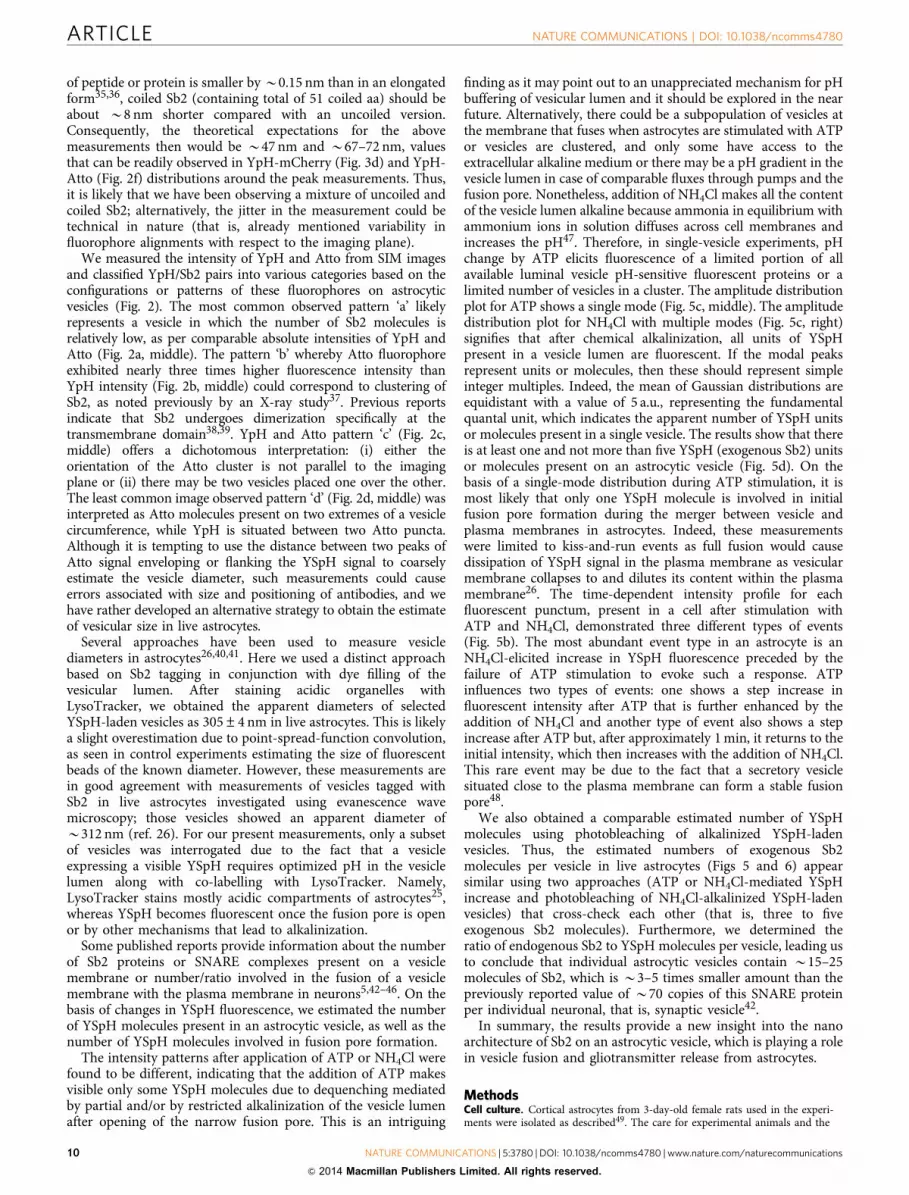
The ratio between exogenous and endogenous Sb2 molecules.To obtain the number of endogenous Sb2 molecules present onindividual astrocytic vesicles, we used Sb2 immunolabelling ofastrocytes transfected to express YSpH. Such individual astrocytescontain a mixture of vesicles, those laden with endogenous Sb2alone (Atto positive, YpH negative) along with others that aredually laden with both endogenous Sb2 and YSpH (Atto and YpHpositive) (Fig. 7a left). In addition, we compared the Sb2immunoreactivity Atto signals of dually laden vesicles to those ofnative vesicles from untransfected astrocytes (Fig. 7a right). Thedistributions and cumulative plots of Atto fluorescence intensityof Sb2-immunolabelled vesicles that besides endogenous Sb2(w/o YSpH; n¼ 262) contain exogenous Sb2 in form of YSpH(w YSpH; n¼ 958) show larger median values for Atto signals(Fig. 7b); the additional fluorescence of vesicles containing bothendogenous and exogenous Sb2 was only B0.33 of that found in
Table 1 | Area under curve (A) and mean value of each peak(l) obtained from Gaussian curves in stimulationexperiment.
Gaussianfits
A(mean±s.e.m.)
Sigma(r)
l(mean±s.e.m.)
R2 n
Background 582±19 1.8 �0.1±0.1 0.98 446þATP 200±6 1.1 5.5±0.0 0.98 169
þNH4Cl1st 42±13 1.6 5.0±0.5 0.95 4302nd 263±15 1.4 9.7±0.1 0.95 4303rd 154±31 1.8 15.0±0.2 0.95 4304th 108±30 2.3 20.4±0.6 0.95 4305th 9±5 0.3 26.7±0.9 0.95 430
a
b
c d
a.u.
0
10
0 100s
Cou
nts
per
bin
20
00 10 20 30 40 0 10 20 30 40 0 10 20 30 40
Intensity (a.u.) Intensity (a.u.)Intensity (a.u.)
*
*
Cou
nts
per
bin
0
10
20
30
Intensity (a.u.)
0 10 20
Cou
nts
per
bin
0
10
20
30
Intensity (a.u.)
0 10 20 30 40
Figure 6 | Photobleaching of NH4Cl-alkalinized YSpH-laden vesicles confirms the number of YSpH molecules present on a single astrocytic vesicle.
(a) Examples of time-dependent changes in the fluorescence intensity signals of individual vesicles: left panel, a single step decrease in the YpH
fluorescence, middle panel, a single step decrease in the YpH fluorescence with double amplitude, compared with the event shown in the left panel, and,
right panel, multiple step decreases in YpH fluorescence with three discrete steps, ‘*’ denotes another step decrease, which according to frequency
plot does not represent a discrete step, but rather belongs to the distribution of the final discrete step. Dashed lines represent the baseline (zero-line) and
grey lines show the levels of YpH fluorescence signals at discrete steps. (b) The respective distributions of the fluorescence intensity amplitudes of
signals shown in the panel a. The first peak in amplitude plots denotes the lowest intensity observed. (c) The intensity distribution of the background, which
was obtained by measuring the fluorescence intensity of the vesicle surroundings after 180 s of bleaching (R2¼0.95; n¼ 108 events; bin width¼ 1.5 a.u.).
(d) Fluorescence intensity distribution of YSpH-labelled vesicles after bleaching (R2¼0.91; n¼ 277 vesicles; bin width¼ 1.5 a.u.). The Gaussian
curves are fitted by using Equation 1 (x¼ Intensity (a.u.); see fitting parameters in Table 2).
ARTICLE NATURE COMMUNICATIONS | DOI: 10.1038/ncomms4780
8 NATURE COMMUNICATIONS | 5:3780 | DOI: 10.1038/ncomms4780 | www.nature.com/naturecommunications
& 2014 Macmillan Publishers Limited. All rights reserved.

vesicles containing only endogenous Sb2, indicating that for everyone molecule/quantum of YSpH there are B3 molecules ofendogenous Sb2. A similar ratio was obtained when comparingSb2 immunoreactivity/Atto signals from individual vesicles(n¼ 419) of untransfected astrocytes with those from duallyladen vesicles (n¼ 499) of YSpH-expressing astrocytes (Fig. 7c);the additional Atto fluorescence of vesicles containing both
endogenous and exogenous Sb2 was B0.22 of that foundin endogenous Sb2-only vesicles, which translates to B5 endo-genous Sb2 molecules for every YSpH molecule.
DiscussionWe have developed a new approach to label Sb2 with twodifferent fluorescent tags and used super-resolution microscopyto visualize them in a living cell. To determine compartmenta-lization of proteins in vesicles of astrocytes33, we measured thelength of Sb2 on a single vesicle in live cells in vitro. The lengthsof Sb2 marked with YpH in the vesicle lumen and with afluorescent protein (mCherry) or a dye conjugated withantibodies against Sb2 (Atto) present on the cytoplasmic sitewere 57 and 65 nm, respectively. These measurements are inaccordance with theoretical values of B54 nm and B75–80 nm,respectively, given for the length of uncoiled Sb2, pHluorin,mCherry and antibodies18,19,21. However, unstructured Sb2 coilsin the presence of syntaxin1 and/or the binary acceptorsyntaxin1-SNAP25 complex21,34, an expected scenario in thecellular millieu, as in our experiments. As coiled Sb2 has threea-helices (I: 36–54 aa, II: 77–88 aa and III: 93–115 aa)19 andthe distance between two adjacent aa residues in the helical form
Table 2 | Area under curve (A) and mean value of each peak(l) obtained from Gaussian curves in bleaching experiment.
Gaussianfits
A(mean±s.e.m.)
Sigma(r)
l(mean±s.e.m.)
R2 n
Background 116±6 1.5 2.9±0.1 0.95 108
Steps1st 99±9 1.5 3.8±0.1 0.91 2772nd 38±10 1.3 10.2±0.3 0.91 2773rd 55±16 1.8 15.7±0.4 0.91 2774th 26±12 1.0 20.1±0.4 0.91 2775th 25±13 1.9 25.0±0.8 0.91 277
0 2 4 6 0 2 4 6
0 2 4 6
0 2 4 60 2 4 60 2 4 6
Cou
nts
per
bin
Cum
ulat
ive
coun
ts/v
esic
leC
umul
ativ
eco
unts
/ves
icle
Cou
nts
bin
Int.x104 (a.u.) Int.x104 (a.u.) Int.x104 (a.u.)
w YSpH w/o YSpH
0
0
10
0
0
20
20
30
20
40
40
50
120
160
40
40
6060
80
80
1.0
0.8
0.6
0.4
0.2
0
1.0
0.8
0.6
0.4
0.2
0
w YSpHw/o YSpH
w YSpHw/o YSpH
Figure 7 | Quantification of the ratio between the number of YSpH and endogenous Sb2 molecules in astrocytic vesicles. (a) Left fluorescent
micrograph shows vesicles in cells transfected by YSpH and labelled by the Atto red dye (note that not all vesicles are labelled by both fluorophores),
whereas the right panel shows vesicles in astrocytes labelled by the Atto dye only. Bar, 10mm. (b,c) We obtained the distributions of Atto fluorescence
intensity of Sb2 immunolabelled vesicles containing only endogenous Sb2 (w/o YSpH) and those that additionally contain exogenous Sb2 in form
of YSpH (w YSpH). (b) Measurements were performed on vesicles within astrocytes expressing YSpH; some vesicles contained both endogenous Sb2 and
YSpH (b, left) (n¼958), while others were devoid of YSpH, expressing only endogenous Sb2 (b, right) (n¼ 262). (d) The normalized cumulative
counts of the Atto intensity in b show significantly different distributions (D¼0.134, Po0.001, Kolmogorov–Smirnov test). The vertical dotted lines drawn
indicate the median value of 18,772 a.u. (with YSpH) and 14,115 a.u. (without YSpH) for Atto signals; horizontal dotted line indicates 50% of the total vesicle
population. The difference between these two median values (4,657 a.u.) likely denotes the quantum fluorescence of exogenous Sb2, that is, YSpH,
which was B1/3 of that found in vesicles containing only endogenous Sb2. (c) Similar distribution as in b, only that we measured Atto fluorescence
intensities of Sb2 immunolabelled vesicles in YSpH-expressing (c, left) (n¼499) and in non-transfected astrocytes (c, right) (n¼419), respectively.
(e) The normalized cumulative counts of the Atto intensity in c show significantly different distributions (D¼0.184, Po0.001, Kolmogorov–Smirnov test);
the median values at 16,316 a.u. and 13,382 a.u. for Atto signals of w and w/o YSpH vesicles and the difference between these two median values
(2,934 a.u.) suggests that exogenous Sb2 molecules represent B1/5 of the number of endogenous Sb2 molecules; dotted lines as in d.
NATURE COMMUNICATIONS | DOI: 10.1038/ncomms4780 ARTICLE
NATURE COMMUNICATIONS | 5:3780 | DOI: 10.1038/ncomms4780 | www.nature.com/naturecommunications 9
& 2014 Macmillan Publishers Limited. All rights reserved.
of peptide or protein is smaller by B0.15 nm than in an elongatedform35,36, coiled Sb2 (containing total of 51 coiled aa) should beabout B8 nm shorter compared with an uncoiled version.Consequently, the theoretical expectations for the abovemeasurements then would be B47 nm and B67–72 nm, valuesthat can be readily observed in YpH-mCherry (Fig. 3d) and YpH-Atto (Fig. 2f) distributions around the peak measurements. Thus,it is likely that we have been observing a mixture of uncoiled andcoiled Sb2; alternatively, the jitter in the measurement could betechnical in nature (that is, already mentioned variability influorophore alignments with respect to the imaging plane).
We measured the intensity of YpH and Atto from SIM imagesand classified YpH/Sb2 pairs into various categories based on theconfigurations or patterns of these fluorophores on astrocyticvesicles (Fig. 2). The most common observed pattern ‘a’ likelyrepresents a vesicle in which the number of Sb2 molecules isrelatively low, as per comparable absolute intensities of YpH andAtto (Fig. 2a, middle). The pattern ‘b’ whereby Atto fluorophoreexhibited nearly three times higher fluorescence intensity thanYpH intensity (Fig. 2b, middle) could correspond to clustering ofSb2, as noted previously by an X-ray study37. Previous reportsindicate that Sb2 undergoes dimerization specifically at thetransmembrane domain38,39. YpH and Atto pattern ‘c’ (Fig. 2c,middle) offers a dichotomous interpretation: (i) either theorientation of the Atto cluster is not parallel to the imagingplane or (ii) there may be two vesicles placed one over the other.The least common image observed pattern ‘d’ (Fig. 2d, middle) wasinterpreted as Atto molecules present on two extremes of a vesiclecircumference, while YpH is situated between two Atto puncta.Although it is tempting to use the distance between two peaks ofAtto signal enveloping or flanking the YSpH signal to coarselyestimate the vesicle diameter, such measurements could causeerrors associated with size and positioning of antibodies, and wehave rather developed an alternative strategy to obtain the estimateof vesicular size in live astrocytes.
Several approaches have been used to measure vesiclediameters in astrocytes26,40,41. Here we used a distinct approachbased on Sb2 tagging in conjunction with dye filling of thevesicular lumen. After staining acidic organelles withLysoTracker, we obtained the apparent diameters of selectedYSpH-laden vesicles as 305±4 nm in live astrocytes. This is likelya slight overestimation due to point-spread-function convolution,as seen in control experiments estimating the size of fluorescentbeads of the known diameter. However, these measurements arein good agreement with measurements of vesicles tagged withSb2 in live astrocytes investigated using evanescence wavemicroscopy; those vesicles showed an apparent diameter ofB312 nm (ref. 26). For our present measurements, only a subsetof vesicles was interrogated due to the fact that a vesicleexpressing a visible YSpH requires optimized pH in the vesiclelumen along with co-labelling with LysoTracker. Namely,LysoTracker stains mostly acidic compartments of astrocytes25,whereas YSpH becomes fluorescent once the fusion pore is openor by other mechanisms that lead to alkalinization.
Some published reports provide information about the numberof Sb2 proteins or SNARE complexes present on a vesiclemembrane or number/ratio involved in the fusion of a vesiclemembrane with the plasma membrane in neurons5,42–46. On thebasis of changes in YSpH fluorescence, we estimated the numberof YSpH molecules present in an astrocytic vesicle, as well as thenumber of YSpH molecules involved in fusion pore formation.
The intensity patterns after application of ATP or NH4Cl werefound to be different, indicating that the addition of ATP makesvisible only some YSpH molecules due to dequenching mediatedby partial and/or by restricted alkalinization of the vesicle lumenafter opening of the narrow fusion pore. This is an intriguing
finding as it may point out to an unappreciated mechanism for pHbuffering of vesicular lumen and it should be explored in the nearfuture. Alternatively, there could be a subpopulation of vesicles atthe membrane that fuses when astrocytes are stimulated with ATPor vesicles are clustered, and only some have access to theextracellular alkaline medium or there may be a pH gradient in thevesicle lumen in case of comparable fluxes through pumps and thefusion pore. Nonetheless, addition of NH4Cl makes all the contentof the vesicle lumen alkaline because ammonia in equilibrium withammonium ions in solution diffuses across cell membranes andincreases the pH47. Therefore, in single-vesicle experiments, pHchange by ATP elicits fluorescence of a limited portion of allavailable luminal vesicle pH-sensitive fluorescent proteins or alimited number of vesicles in a cluster. The amplitude distributionplot for ATP shows a single mode (Fig. 5c, middle). The amplitudedistribution plot for NH4Cl with multiple modes (Fig. 5c, right)signifies that after chemical alkalinization, all units of YSpHpresent in a vesicle lumen are fluorescent. If the modal peaksrepresent units or molecules, then these should represent simpleinteger multiples. Indeed, the mean of Gaussian distributions areequidistant with a value of 5 a.u., representing the fundamentalquantal unit, which indicates the apparent number of YSpH unitsor molecules present in a single vesicle. The results show that thereis at least one and not more than five YSpH (exogenous Sb2) unitsor molecules present on an astrocytic vesicle (Fig. 5d). On thebasis of a single-mode distribution during ATP stimulation, it ismost likely that only one YSpH molecule is involved in initialfusion pore formation during the merger between vesicle andplasma membranes in astrocytes. Indeed, these measurementswere limited to kiss-and-run events as full fusion would causedissipation of YSpH signal in the plasma membrane as vesicularmembrane collapses to and dilutes its content within the plasmamembrane26. The time-dependent intensity profile for eachfluorescent punctum, present in a cell after stimulation withATP and NH4Cl, demonstrated three different types of events(Fig. 5b). The most abundant event type in an astrocyte is anNH4Cl-elicited increase in YSpH fluorescence preceded by thefailure of ATP stimulation to evoke such a response. ATPinfluences two types of events: one shows a step increase influorescent intensity after ATP that is further enhanced by theaddition of NH4Cl and another type of event also shows a stepincrease after ATP but, after approximately 1 min, it returns to theinitial intensity, which then increases with the addition of NH4Cl.This rare event may be due to the fact that a secretory vesiclesituated close to the plasma membrane can form a stable fusionpore48.
We also obtained a comparable estimated number of YSpHmolecules using photobleaching of alkalinized YSpH-ladenvesicles. Thus, the estimated numbers of exogenous Sb2molecules per vesicle in live astrocytes (Figs 5 and 6) appearsimilar using two approaches (ATP or NH4Cl-mediated YSpHincrease and photobleaching of NH4Cl-alkalinized YSpH-ladenvesicles) that cross-check each other (that is, three to fiveexogenous Sb2 molecules). Furthermore, we determined theratio of endogenous Sb2 to YSpH molecules per vesicle, leading usto conclude that individual astrocytic vesicles contain B15–25molecules of Sb2, which is B3–5 times smaller amount than thepreviously reported value of B70 copies of this SNARE proteinper individual neuronal, that is, synaptic vesicle42.
In summary, the results provide a new insight into the nanoarchitecture of Sb2 on an astrocytic vesicle, which is playing a rolein vesicle fusion and gliotransmitter release from astrocytes.
MethodsCell culture. Cortical astrocytes from 3-day-old female rats used in the experi-ments were isolated as described49. The care for experimental animals and the
ARTICLE NATURE COMMUNICATIONS | DOI: 10.1038/ncomms4780
10 NATURE COMMUNICATIONS | 5:3780 | DOI: 10.1038/ncomms4780 | www.nature.com/naturecommunications
& 2014 Macmillan Publishers Limited. All rights reserved.

euthanization of animals were carried out in strict accordance with the followingethical codes and directives: The International Guiding Principles for BiomedicalResearch Involving Animals developed by the Council for InternationalOrganizations of Medical Sciences and the Directive on Conditions for Issue ofLicense for Animal Experiments for Scientific Research Purposes (Official Gazetteof the Republic of Slovenia 40/85, 22/87, 43/07). The protocol for the euthanizationof the animals used in our study was approved by the Veterinary Administration ofthe Ministry for Agriculture and the Environment of the Republic of Slovenia(permit No: 34401-29/2009/2), issued on 22.4.2009; procedures were also in strictaccordance with the National Institutes of Health Guide for Care and Use ofLaboratory Animals and were approved by the University of Alabama,Birmingham Institutional Animal Care and Use Committee.
Astrocytes were plated on poly-L-lysine-coated coverslips and cultured withDulbecco’s modified Eagle medium (DMEM, high glucose content: 4,500 mg l� 1)supplemented with 10% fetal bovine serum (FBS), 1 mM sodium pyruvate, 2 mML-glutamine and 25 mg ml� 1 penicillin-streptomycin antibiotics in 95% air and 5%CO2 atmosphere at 37 �C. Unless stated otherwise, all chemicals were obtainedfrom Merck (Darmstadt, Germany) and Sigma (Diesenhofen, Germany). Forexperiments in Supplementary Fig. 1, cultured purified primary rat astrocytes wereobtained from visual cortices of 1- to 2-day-old Sprague–Dawley rats8.
Plasmid construction. Green superecliptic synaptopHluorin (GSpH), a fluor-escent Sb2 derivative, is a fusion protein chimera consisting of mouse Sb2 andmodified EGFP, pHluorin, fused to Sb2 C terminus inside the vesicle lumen. Onthe basis of known amino acids contributing to chromophore pockets of EGFPversus EYFP50,51, we introduced mutations to GSpH to generate its yellow-shiftedemission variant. This YSpH was constructed by polymerase chain reaction (PCR)mutagenesis using the original GSpH plasmid generously provided by Dr James E.Rothman (Yale University, New Haven, CT)17,52. Four primers were utilizedcontaining mutations as well as 15-bp overlapping sequences for use with theInFusion 2 system (Clontech Laboratories, Mountainview, CA). PCR for bothvector and insert fragments (listed below) was performed on a GSpH templateintroducing the desired mutations, and the resulting fragments were rejoined withInFusion 2 enzyme and buffers according to the manufacturer’s instructions. Theresulting plasmid (PYSpH) was sequenced and expressed in rat primary astrocyteculture using cytomegalovirus immediate early promoter contained in plasmid(Supplementary Fig. 1 for details).
Vector primersFwd 50-TACCAGACAACCATTACCTGTTTTACACTTCTACTC-30
Rev 50-AGCATTGCAGACCATAGCCGAAAGTAG-30
Insert primersFwd 50-ATGGTCTGCAATGCTTTGCCAGATAC-30
Rev 50-AGTGTAAAACAGGTAATGGTTGTCTG-30
Using the InFusion 2 subcloning system, we made two additional plasmids, oneencoding YSpH additionally tagged by the red fluorescent protein mCherry on thecytoplasmic vesicle site (PmCherry-YSpH) and the other (PYSpH-7aa-mCherry)encoding the chimeric protein YSpH-7aa-mCherry in which mCherry wasappended to the C terminus of YSpH via a 7-aa linker (see Supplementary Fig. 2 forplasmid maps). PCR for the vectors was performed on the YSpH template, whilethe PCR for the mCherry insert fragments was performed on the pcDNA3.1/VChR1-mCherry plasmid, kindly provided by Dr Karl Deisseroth (StanfordUniversity, Stanford, CA)4. The DNA sequence (50-tcaggtctacgatctagagct-30) of thepolypeptide linker (SGLRSRA), as we previously used5, was introduced by primeroverhangs. Plasmid constructs were checked by restriction enzyme digestion andsequencing before expression in primary astrocyte culture. Primers used insubcloning are listed below.
mCherry-YSpH Vector Primers:Fwd 50-TGTACAAGTCGGCTACCGCTGCCACCGTC-30
Rev 50-CTTGCTCACCATGGTGGCACGCGTGAATTC-30
mCherry-YSpH Insert Primers:Fwd 50-ACCATGGTGAGCAAGGGCGAGGAG-30
Rev 50-TAGCCGACTTGTACAGCTCGTCCATG-30
YSpH-7aa-mCherry Vector Primers:Fwd 50-TAATCTAGAGTCGACCCGGGCGGCCGCTTCCCTTTAG-30
Rev 50-AGATCGTAGACCTGAACCGGTTTTGTATAGTTCATCCATGCCATG-30
YSpH-7aa-mCherry Insert Primers:Fwd 50-TCAGGTCTACGATCTAGAGCTGTGAGCAAGGGCGAG-30
Rev 50-GTCGACTCTAGATTACTTGTACAGCTCGTCCATG-30 .
Plasmid DNA transfection. Astrocytes were transfected with 1–2 mg of pDNA6,7
using FuGENE 6 transfecting reagent (Roche, Mannheim, Germany) and theculture medium as above (without FBS). UltroserG (3%; Life Technologies) wasadded after an incubation period of 3 h at 37 �C, and the cells were then incubatedovernight. The transfected astrocytes were examined or immunolabelled after atleast 24 h incubation. In a subset of experiments (Supplementary Fig. 1), astrocyteswere transfected with plasmids using TransIT 293 transfection reagent (Mirus Bio,Madison, WI)8.
Immunocytochemistry. The transfected astrocytes were washed with phosphate-buffered saline (PBS), fixed in 4% formaldehyde (Thermo Scientific, USA) in PBSfor 15 min and incubated in 0.1% Triton X-100 for 10 min at room temperature.Nonspecific background staining was reduced by blocking buffer containing 3%bovine serum albumin (BSA) and 10% goat serum in PBS (37 �C, 1 h). We usedmouse polyclonal primary antibody raised against a synthetic peptide corre-sponding to amino acids 1–18 of Sb2 (1:500; Abcam, Cat. No. ab3347). Astrocyteswere incubated with an anti-Sb2 antibody diluted in 3% BSA in PBS for 2 h at 37 �Cor overnight at 4 �C. The cells were then stained with secondary antibodies againstmouse IgG conjugated to Atto 594 (1:100; Sigma Aldrich) at 37 �C for 45 min. Thecells were again rinsed four times with PBS and mounted on glass slides usingSlowFade Gold antifade reagent (Invitrogen, Eugene, OR).
Optical imaging. CLSM: Cells were examined with an inverted Zeiss LSM 510META microscope (Germany) with a 63� /1.4 Oil DIC objective, He/Ne andargon lasers. YSpH was excited by a 488 nm line. The light emitted was collectedthrough a band-pass filter (505–530 nm). SIM: The detailed architecture of astro-cytic vesicles was examined using a Zeiss ELYRA PS.1 super-resolution microscope(Germany) equipped with five different grating frequencies for SIM for optimalmatching of the illumination pattern to the laser wavelength and objective lens.The cells were scanned using a Plan-Apochromat 63� /1.4 Oil DIC M27 objectiveand HBO X-Cite 120 lamp. Cells were illuminated with laser lines (561 and488 nm). Sixteen-bit images were acquired with an EMCCD camera (Andor iXon885) with variable exposure. The diameter of standard beads used in the intensityanalysis was 200 nm (Zeiss, Germany). Additional details for the imaging used in asubset of Supplementary Fig. 1 can be found in Supplementary Methods.
Single-vesicle pHluorin experiments. Astrocytes expressing YSpH were scannedusing an LSM 510 META microscope. The cells were kept in 200 ml of extracellularsolution for live imaging, consisting of (in mM) 130 NaCl, 5 KCl, 2 CaCl2, 1 MgCl2,10 D-glucose, 10 N-2-hydroxyethylpiperazine-N0-2-ethanesulphonic acid (HEPES),pH 7.2 and B300 mOsm kg� 1. To increase the free concentration of calcium ions([Ca2þ ]i) in the cytoplasm, astrocytes were stimulated with 0.1 mM ATP. Extra-cellular solution containing 45 mM NH4Cl was used for the vesicle alkalinization.A time-lapse imaging series of 200 frames (1 frame s� 1) was acquired. Duringacquisition, we applied ATP and NH4Cl at 30 s and 120 s, respectively, and leftuntil the end of experiments. In photobleaching experiments, a time-lapse imagingseries of 300 frames (1 frame s� 1) was acquired. During acquisition, we appliedNH4Cl at 10 s and increased the laser power by factor of 2–3 after 50 s and both leftuntil the end of experiments.
To stain the vesicle lumen for measurement of vesicle diameter, transfectedastrocytes were incubated with 100 nM LysoTracker Red DND-99 (MolecularProbes) at 37 �C for 5 min.
Image and data analysis. To quantitatively analyse large collections of images, wedeveloped a custom tool ColocAna (Celica, Slovenia) using Matlab (Mathworks,Natick, MA). The colocalization of Atto and YpH was analyzed, as reported (Kreftet al.,33), by using ColocAna software that counts red, green and colocalized pixels.The colocalization was calculated for all pixels above the threshold, which was set at20% of maximum green and red fluorescence intensity and was expressed as thepercentage of colocalized green pixels. The distance between two fluorophores ismeasured using a ZEN lite software (Carl Zeiss) by drawing a line profile on twodifferent fluorophores in each of Atto-YpH and mCherry-YpH pairs. To measurethe diameter of astrocytic vesicles, we calculated the average values of FWHM of theline profile drawn for a LysoTracker-stained vesicle53; for better precision, we drewcrosshair line profiles in the x and y directions of the 2D plane of each punctum.Levenberg-Marquadt X2 minimization for nonlinear least-square fitting wasperformed in OriginLab Pro. 8 software to fit the Gaussian curve on the histograms.The intensity analysis for the pHluorin experiments was done with ImageJ 1.35jsoftware (National Institutes of Health, USA) by selecting square regions of interest(1.33� 1.33mm2) overlaid on each fluorescent punctum, and thereby meanintensities were estimated using the intensity versus time monitor plugin.
Statistical analysis. The values for the Gaussian fit are given as mean±s.e.m.Statistical significance of the data was analyzed in the SigmaPlot version 11 soft-ware. P-values o0.05 were considered to be statistically significant.
References1. Nedergaard, M., Ransom, B. & Goldman, S. A. New roles for astrocytes:
redefining the functional architecture of the brain. Trends Neurosci. 26,523–530 (2003).
2. Parpura, V. & Zorec, R. Gliotransmission: exocytotic release from astrocytes.Brain Res. Rev. 63, 83–92 (2010).
3. Halassa, M. M., Fellin, T. & Haydon, P. G. The tripartite synapse: roles forgliotransmission in health and disease. Trends Mol. Med. 13, 54–63 (2007).
4. Wienisch, M. & Klingauf, J. Vesicular proteins exocytosed and subsequentlyretrieved by compensatory endocytosis are nonidentical. Nat. Neurosci. 9,1019–1027 (2006).
NATURE COMMUNICATIONS | DOI: 10.1038/ncomms4780 ARTICLE
NATURE COMMUNICATIONS | 5:3780 | DOI: 10.1038/ncomms4780 | www.nature.com/naturecommunications 11
& 2014 Macmillan Publishers Limited. All rights reserved.

5. Hua, Y. et al. A readily retrievable pool of synaptic vesicles. Nat. Neurosci. 14,833–839 (2011).
6. Jordan, R., Lemke, E. A. & Klingauf, J. Visualization of synaptic vesiclemovement in intact synaptic boutons using fluorescence fluctuationspectroscopy. Biophys. J. 89, 2091–2102 (2005).
7. Gucek, A., Vardjan, N. & Zorec, R. Exocytosis in astrocytes: transmitter releaseand membrane signal regulation. Neurochem. Res. 37, 2351–2363 (2012).
8. Montana, V., Ni, Y., Sunjara, V., Hua, X. & Parpura, V. Vesicular glutamatetransporter-dependent glutamate release from astrocytes. J. Neurosci. 24,2633–2642 (2004).
9. Verderio, C. et al. TI-VAMP/VAMP7 is the SNARE of secretory lysosomescontributing to ATP secretion from astrocytes. Biol. Cell 104, 213–228 (2012).
10. Jeftinija, S. D., Jeftinija, K. V., Stefanovic, G. & Liu, F. Neuroligand-evokedcalcium-dependent release of excitatory amino acids from cultured astrocytes.J. Neurochem. 66, 676–684 (1996).
11. Parpura, V., Fang, Y., Basarsky, T., Jahn, R. & Haydon, P. G. Expression ofsynaptobrevin II, cellubrevin and syntaxin but not SNAP-25 in culturedastrocytes. FEBS Lett. 377, 489–492 (1995).
12. Stenovec, M. et al. Ca2þ -dependent mobility of vesicles capturing anti-VGLUT1 antibodies. Exp. Cell. Res. 313, 3809–3818 (2007).
13. Pangrsic, T. et al. Exocytotic release of ATP from cultured astrocytes. J. Biol.Chem. 282, 28749–28758 (2007).
14. Abbe, E. Beitragezurtheorie des mikroskops und der mikroskopischen-wahrnehmung. Archiv. fur mikroskopische Anatomie 9, 413–418 (1873).
15. Huang, B., Bates, M. & Zhuang, X. Super-resolution fluorescence microscopy.Annu. Rev. Biochem. 78, 993–1016 (2009).
16. Gustafsson, M. G. Surpassing the lateral resolution limit by a factor of twousing structured illumination microscopy. J. Microsc. 198, 82–87 (2000).
17. Miesenbock, G., De Angelis, D. A. & Rothman, J. E. Visualizing secretion andsynaptic transmission with pH-sensitive green fluorescent proteins. Nature 394,192–195 (1998).
18. Rizzo, M. A., Davidson, M. W. & Piston, D. W. Fluorescent protein trackingand detection: applications using fluorescent proteins in living cells. Cold SpringHarb. Protoc. doi:10.1101/pdb.top64 (2009).
19. Ellena, J. F. et al. Dynamic structure of lipid-bound synaptobrevin suggests anucleation-propagation mechanism for trans-SNARE complex formation. Proc.Natl Acad. Sci. USA 106, 20306–20311 (2009).
20. Ainavarapu, S. R. et al. Contour length and refolding rate of a small proteincontrolled by engineered disulfide bonds. Biophys. J. 92, 225–233 (2007).
21. Sutton, R. B., Fasshauer, D., Jahn, R. & Brunger, A. T. Crystal structure of aSNARE complex involved in synaptic exocytosis at 2.4 A resolution. Nature395, 347–353 (1998).
22. Labrijn, A. F. et al. Access of antibody molecules to the conserved coreceptorbinding site on glycoprotein gp120 is sterically restricted on primary humanimmunodeficiency virus type 1. J. Virol. 77, 10557–10565 (2003).
23. Squire, A., Verveer, P. J., Rocks, O. & Bastiaens, P. I. Red-edge anisotropymicroscopy enables dynamic imaging of homo-FRET between greenfluorescent proteins in cells. J. Struct. Biol. 147, 62–69 (2004).
24. Shroff, H. et al. Dual-color superresolution imaging of genetically expressedprobes within individual adhesion complexes. Proc. Natl Acad. Sci. USA 104,20308–20313 (2007).
25. Potokar, M. et al. Intermediate filaments attenuate stimulation-dependentmobility of endosomes/lysosomes in astrocytes. Glia 58, 1208–1219 (2010).
26. Malarkey, E. B. & Parpura, V. Temporal characteristics of vesicular fusion inastrocytes: examination of synaptobrevin 2-laden vesicles at single vesicleresolution. J. Physiol. 589, 4271–4300 (2011).
27. Neary, J. T., van Breemen, C., Forster, E., Norenberg, L. O. B. & Norenberg, M.D. ATP stimulates calcium influx in primary astrocyte cultures. Biochem.Biophys. Res. Commun. 157, 1410–1416 (1988).
28. Jeremic, A., Jeftinija, K., Stevanovic, J., Glavaski, A. & Jeftinija, S. ATPstimulates calcium-dependent glutamate release from cultured astrocytes.J. Neurochem. 77, 664–675 (2001).
29. Antonenko, Y. N., Pohl, P. & Denisov, G. A. Permeation of ammonia acrossbilayer lipid membranes studied by ammonium ion selective microelectrodes.Biophys. J. 72, 2187–2195 (1997).
30. Sankaranarayanan, S. & Ryan, T. A. Real-time measurements of vesicle-SNARErecycling in synapses of the central nervous system. Nat. Cell Biol. 2, 197–204(2000).
31. Vardjan, N., Stenovec, M., Jorgacevski, J., Kreft, M. & Zorec, R. Elementaryproperties of spontaneous fusion of peptidergic vesicles: fusion pore gating.J. Physiol. 585, 655–661 (2007).
32. Vardjan, N., Jorgacevski, J. & Zorec, R. Fusion pores, SNAREs, and exocytosis.Neuroscientist 19, 160–174 (2013).
33. Kreft, M., Milisav, I., Potokar, M. & Zorec, R. Automated high through-putcolocalization analysis of multichannel confocal images. Comput. Meth.Program Biomed. 74, 63–67 (2004).
34. Hazzard, J., Sudhof, T. C. & Rizo, J. NMR analysis of the structure of synapto-brevin and of its interaction with syntaxin. J. Biomol. NMR 14, 203–207 (1999).
35. Lehninger, A. L. Biochemistry: the Molecular Basis of Cell Structure andFunction (Worth Publishers, 1975).
36. Stryer, L. Biochemistry (W.H. Freeman, 1995).37. Castorph, S. et al. Structure parameters of synaptic vesicles quantified by small-
angle X-ray scattering. Biophys. J. 98, 1200–1208 (2010).38. Laage, R. & Langosch, D. Dimerization of the synaptic vesicle protein synapto-
brevin (vesicle-associated membrane protein) II depends on specific residueswithin the transmembrane segment. Eur. J. Biochem. 249, 540–546 (1997).
39. Fleming, K. G. & Engelman, D. M. Computation and mutagenesis suggest aright-handed structure for the synaptobrevin transmembrane dimer. Proteins45, 313–317 (2001).
40. Potokar, M., Stenovec, M., Kreft, M., Kreft, M. E. & Zorec, R. Stimulationinhibits the mobility of recycling peptidergic vesicles in astrocytes. Glia 56,135–144 (2008).
41. Bergami, M. et al. Uptake and recycling of pro-BDNF for transmitter-inducedsecretion by cortical astrocytes. J. Cell Biol. 183, 213–221 (2008).
42. Takamori, S. et al. Molecular anatomy of a trafficking organelle. Cell 127,831–846 (2006).
43. van den Bogaart, G. et al. One SNARE complex is sufficient for membranefusion. Nat. Struct. Mol. Biol. 17, 358–364 (2010).
44. Karatekin, E. et al. A fast, single-vesicle fusion assay mimics physiologicalSNARE requirements. Proc. Natl Acad. Sci. USA 107, 3517–3521 (2010).
45. Domanska, M. K., Kiessling, V., Stein, A., Fasshauer, D. & Tamm, L. K. Singlevesicle millisecond fusion kinetics reveals number of SNARE complexesoptimal for fast SNARE-mediated membrane fusion. J. Biol. Chem. 284,32158–32166 (2009).
46. Mohrmann, R., de Wit, H., Verhage, M., Neher, E. & Sorensen, J. B. Fast vesiclefusion in living cells requires at least three SNARE complexes. Science 330,502–505 (2010).
47. Roos, A. & Boron, W. F. Intracellular pH. Physiol. Rev. 61, 296–434 (1981).48. Jorgacevski, J. et al. Munc18-1 tuning of vesicle merger and fusion pore
properties. J. Neurosci. 31, 9055–9066 (2011).49. Schwartz, J. P. & Wilson, D. J. Preparation and characterization of type 1
astrocytes cultured from adult rat cortex, cerebellum, and striatum. Glia 5,75–80 (1992).
50. Miyawaki, A. et al. Fluorescent indicators for Ca2þ based on green fluorescentproteins and calmodulin. Nature 388, 882–887 (1997).
51. Nagai, T. et al. A variant of yellow fluorescent protein with fast andefficient maturation for cell-biological applications. Nat. Biotechnol. 20, 87–90(2002).
52. Sankaranarayanan, S., De Angelis, D., Rothman, J. E. & Ryan, T. A. The use ofpHluorins for optical measurements of presynaptic activity. Biophys. J. 79,2199–2208 (2000).
53. Balaji, J. & Ryan, T. A. Single-vesicle imaging reveals that synaptic vesicleexocytosis and endocytosis are coupled by a single stochastic mode. Proc. NatlAcad. Sci. USA 104, 20576–20581 (2007).
AcknowledgementsWe thank the financial support from EduGlia-ITN Network (EU, FP7), and grants(# P3-310, J3-4051, J3-4146) from Slovenian Research Agency (ARRS), National ScienceFoundation (CBET 0943343), and National Institutes of Health (The Eunice KennedyShriver National Institute of Child Health and Human Development award HD078678)is acknowledged. We also thank UAB High Resolution Imaging Facility and the CarlZeiss Reference Center for Confocal Micorscopy Ljubljana for the use of Zeiss LSM 510and 710 confocal microscopes and the Elyra PS1 Carl Zeiss super-resolution platform.The Heflin Center Genomics Core at UAB provided sequencing for the DNA plasmidsused in this work. We kindly thank Dr Matjaz Stenovec, Dr Helena Haque Chowdhury,Dr Bostjan Rituper and Dr Nina Vardjan for their help. We thank Dr Erwin Neher andDr Bertil Hille for comments on an earlier version of the manuscript.
Author contributionsR.Z., M.K., J.J. and M.P. designed the study. P.S. performed experiments and dataanalysis. V.G, R.S. and V.P. contributed plasmids and experiments/analysis/associatedwrite-ups for Supplementary Fig. 1. P.S., M.K., J.J., V.P. and R.Z. wrote the paper.All authors participated in the scientific discussions and manuscript preparation.
Additional informationSupplementary Information accompanies this paper at http://www.nature.com/naturecommunications
Competing financial interests: The authors declare no competing financial interests.
Reprints and permission information is available online at http://npg.nature.com/reprintsandpermissions/
How to cite this article: Singh, P. et al. Single-vesicle architecture of synaptobrevin2 inastrocytes. Nat. Commun. 5:3780 doi: 10.1038/ncomms4780 (2014).
ARTICLE NATURE COMMUNICATIONS | DOI: 10.1038/ncomms4780
12 NATURE COMMUNICATIONS | 5:3780 | DOI: 10.1038/ncomms4780 | www.nature.com/naturecommunications
& 2014 Macmillan Publishers Limited. All rights reserved.