roles of sar and ec in gully erosion development (a case study of kohgiloye va boyerahmad province,...
TRANSCRIPT

1
Roles of SAR and EC in Gully Erosion Development (A Case Study of Kohgiloye va Boyerahmad Province, Iran)
ABDAL SHAHRIVAR1, CHRISTOPHER TEH BOON SUNG2, SHAMSUDDIN JUSOP2,
ANUAR ABDUL RAHIM2, MAJID SOUFI3 1-Center for Agriculture and Natural Resources, Department of Water and Soil, Yasuj, Iran
2 - Faculty of Agriculture, University Putra Malaysia, 43400 UPM, Serdang, Selangor, Malaysia 3-Center for Agriculture and Natural Resources, Department of Soil Conservation and Watershed Management,
Shiraz, Iran
*Corresponding author: Email: [email protected]
Received: 13 October 2011 Accepted: 31 January 2012
ABSTRACT Gully erosion is a serious problem of land degradation in pasture land of Sothern Iran. To study the causes of gully erosion initiation, the Abgendi Watershed with the highest amount of gully erosion was selected as a semi-arid area in Iran. In this area, 35 gullies were randomly chosen and the influences of SAR and EC, as the indexes of alkalinity and salinity on gully erosion, were investigated. The role of sodium in calculating SAR, and the effective role of sodium to soil dispersing, It can increase the susceptibility of soil to water erosion. Moreover, concentration of soluble salts (are measured by electrical conductivity), such as sodium cations are attached to each soil clay particle in the arid and semi-arid areas. To accomplish this study, soil sampling from head-cut and gully walls in two depths of 0-30 cm (top layer) and 30cm to the bottom of gully (sub-layer) was carried out. One main objective of the present study was to determine the effects of these two chemical factors on gully erosion development. Based on gullies volume (as a dependent variable), the gullies were classified into four groups and were compared in terms of EC and SAR. The results indicated that the gullies with volume of more than 200 m3 (big gully group), in comparison to the gullies with volume less than 50 m3 (very small gully group), have greater EC and SAR. The amounts of EC and SAR of big gully group were significantly higher than very small gully group. Moreover, for the purpose of further analysis, the gullies were classified and compared in terms of EC and SAR. The results indicated that there is a significant difference between gullies volume groups in terms of EC and SAR as well. The gullies with EC > 8 dS/m and SAR > 8, compared to the gullies with EC < 4 dS/m and SAR < 4, have significantly greater volume and length. Keywords: Gully erosion, Sodium absorption ratio (SAR), Electrical conductivity (EC), Semi-arid area, Kohgiloye va Boyerahmad Province
INTRODUCTION
Gully erosion can potentially cause
severe soil degradation. Gully is considered
to be one of the most important soil erosion processes (Seeger and Ries, 1996). At one time, it was thought that gullies developed as enlarged rills but studies of the gullies
Journal of Research in Agricultural Science Vol. 8, No. 1 (2012), Pages: 1- 12
ORIGINAL RESEARCH
ABDAL SHAHRIVAR ET AL. / JRAS, Vol. 8, No. 1 (2012) 1-12
2
revealed that their initiation is more complex process (Morgan, 1996). It is one form of accelerated soil erosion and the occurrence of gullies often indicates an extreme form of land degradation warranting special attention (Yitbarek, 2007). Gully erosion usually represents a permanent loss of soil where agricultural production proceeds without appropriate protective measure and re-cultivation (Zachar, 1982). This type of erosion is one of the most damaging erosion, which studies about it has started in the world since the 1930 and in Iran since the 1990s (Servati et al., 2008). During the past twenty years, many researchers paid attention to the process of rill and sheet erosion while some researchers have showed that rill and sheet erosion on the plot is not an ideal indicator of the total amount of soil erosion (Fan et al., 2008). In past decades, priority of research has been given to address agricultural issues at the plot scale and thus to rill and inter-rill erosion (Valentin et al., 2005). Nowadays, gully erosion is a major process of land degradation in arid and semi-arid of the world. Researchers have shown that the causes of gully erosion initiation vary according to different climates. They show that this type of water erosion can be created differently in different climates (Ahmadi, 2007). Gullies not only occur in marl (clay + lime) and mountainous or hilly regions but also more globally in soils subjected to loess (European belt, Chinese Loess Plateau, North America) and sandy soils (Sahelian zone, north-east Thailand) or in soils prone to piping and tunneling such as dispersive soils (Valentin et al., 2005). Soil properties, rainfall and runoff intensity, wind action, geological, hydro-geochemical and geotechnical characteristics, and anthropogenic activities are factors generating soil and gully erosion processes (Egboka and Orajaka, 1987). Valentin et al. (2005) found that gully erosion results not only from surface flow
but also from sub-surface flow. The erodibility of soils is one of the most important properties that depends on some soil physical and chemical properties. The inherent susceptibility of soils to detachment and transport by various erosive agents is a function of the physical and chemical properties of soil (Dondofema et al., 2008). The physico-chemical properties of the two monitored badland sites by Piccarreta et al. (2006) show an important tendency to geochemical autostabilisation on the top of the slope. Many researchers have shown that gully erosion as an important soil degradation process, affected by soil chemical characteristics.
Servati (2008) investigated the effects of soil characteristics on gully erosion and resulted that some soil characteristics such as soil depth, SAR, EC, Na, and TDS have high effects on gully erosion development. Rahnoma and Riginejad (2010) compared the soil chemical properties of the area without gully erosion as control to the gully area, and concluded that the amount of EC and SAR of gully area were significantly higher than the control. Kemper and Koch (1966) have demonstrated that with an increase in the soluble salts of soil such as Na, the negative impact of clay on aggregate stability will increase and thus, erodibility of soil will increase as well. Mahangara (2010) indicated that the soils are highly dispersive promoting piping and gulling owing to the high sodium content. Moreover, Bell and Maud (1994) suggested that the threshold for soil dispersion is SAR value higher than 2 in a case study in Africa. When the SAR rises above 12-15, serious physical soil problems arise and plants have difficulty absorbing water (Munshower, 1994). Some researcher have indicated that there is a significant negative correlation between the amount of EC and soil dispersion ratio, because in this condition if the increasing of the EC is not due to the sodium ions, presence of the
ABDAL SHAHRIVAR ET AL. / JRAS, Vol. 8, No. 1 (2012) 1-12
3
multi valent cations can reduce the double layer thickness, and thus the clays is coagulated (Barzegar et al., 1997).
Investigation the soil erosion in Iran have shown that over 600000 hectares of farmland were eroded by water erosion and that about 500000 hectares of these areas are under the effect the gully erosion (Garshasebi, 2010). Soufi (2002) showed that the important damages due to gully erosion in Iran can include disconnection of rural roads and bridge breakage, recession of water table, immigration of rural people and movement of the location of villages. Wasson et al. (2002) showed that about 80% of the sediment in the reservoir can come from gully and channel erosion.
The objective of this study was to determine the role of EC and SAR as the soil chemical important properties on gully erosion development in the area to identify the susceptible regions and counsel the appropriate combat this erosion.
MATERIALS AND METHODS
The study area (Abgendi sub-catchment) is a dry area where is located southwestern Iran. The geographical location, climatic conditions and dry winds blowing in south and southwestern Iran have caused these areas of the country to have dry and semi dry conditions to an extent that the rate of rainfall in these regions is between 50 to 350 mm per year. Therefore, these regions have potential to soil erosion, as the average soil erosion in Iran is more than 30 ton per hectare per year (i.e, 6.5 times more than the limit of soil erosion) (UNDP, 1999).
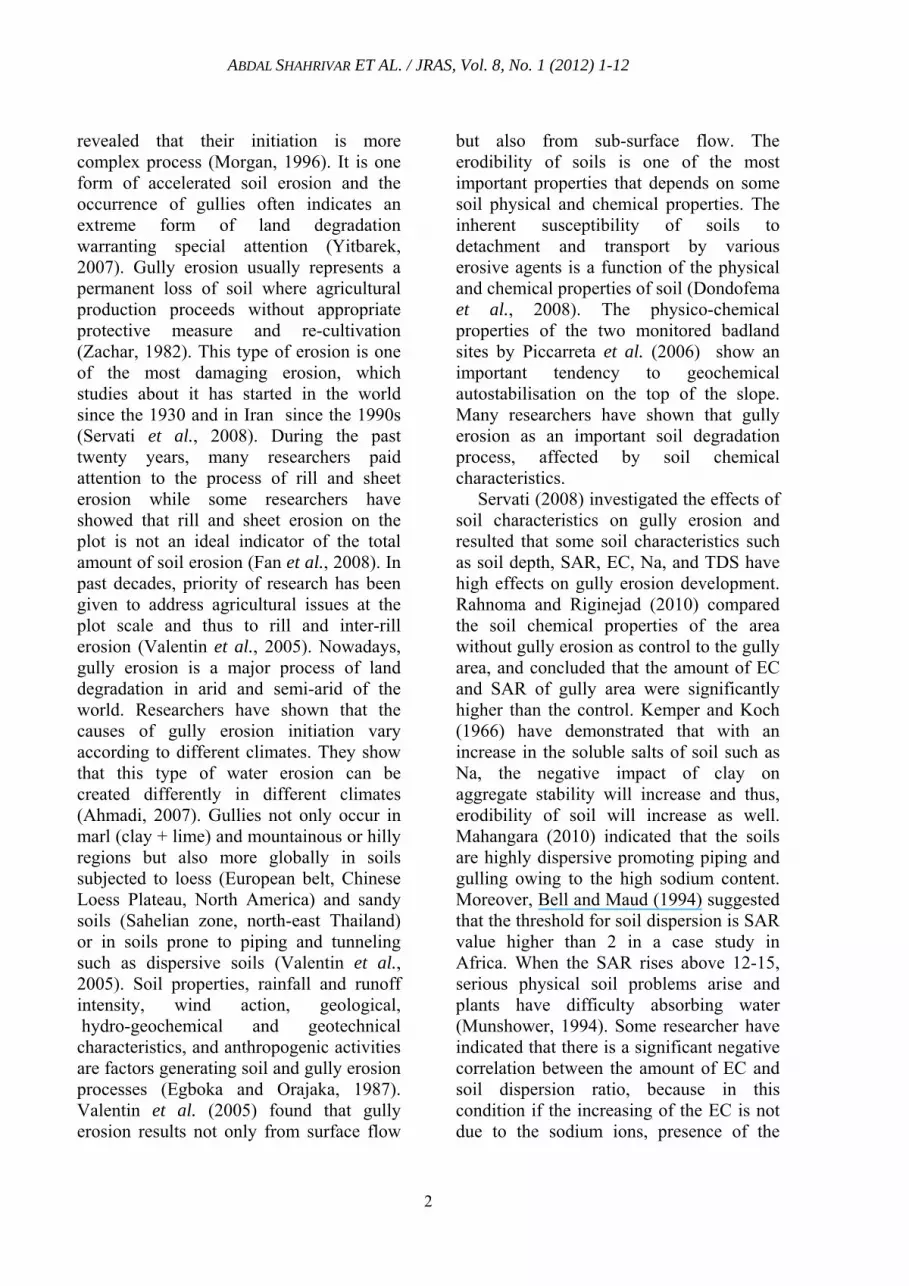
Abgendi sub-catchment was selected which has the largest number of gully erosion in Kohgiloye Boyerahmad (KB) province. This area is one of the sub catchment of Khirabad River with an area of 21000 ha in the south of (KB) province (Fig. 1). This region located in 45°, 23’, 03’’
to 47°, 56́, 08’’ longitude and 30°, 13’, 05’’to 33°, 52 ́, 07’’ latitude.
Figure 1. Location of study area Abgendi Watershed, Iran
ABDAL SHAHRIVAR ET AL. / JRAS, Vol. 8, No. 1 (2012) 1-12
4
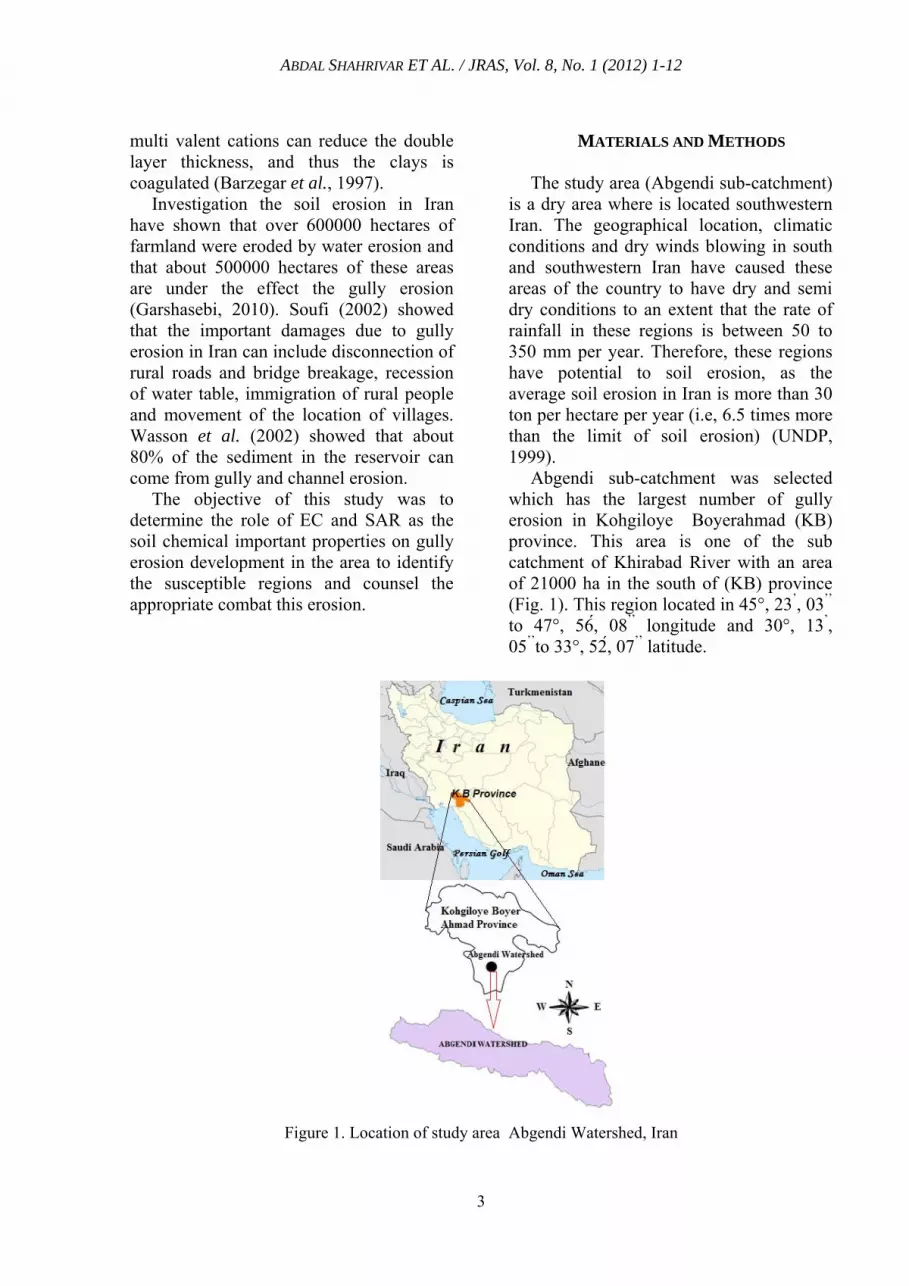
Average rainfall is 380 mm year-1, maximum rainfall in 24 hours is 9.87 mm, average annual evaporation is 2934 mm, and the average altitude is more than 450 meters above sea level. The area is hilly with dominant slope 10–20%. The land uses of the area are consist of poor range (vegetation cover < 25%), good range (vegetation cover > 50%) and dry farming with areas 11970, 5460 and 3570 hectares respectively (fig. 2). About 90% of the gullies occur in poor range land use. By revisiting the field and gullies scattering map all the gullies were coded and 35 gullies were chosen randomly.
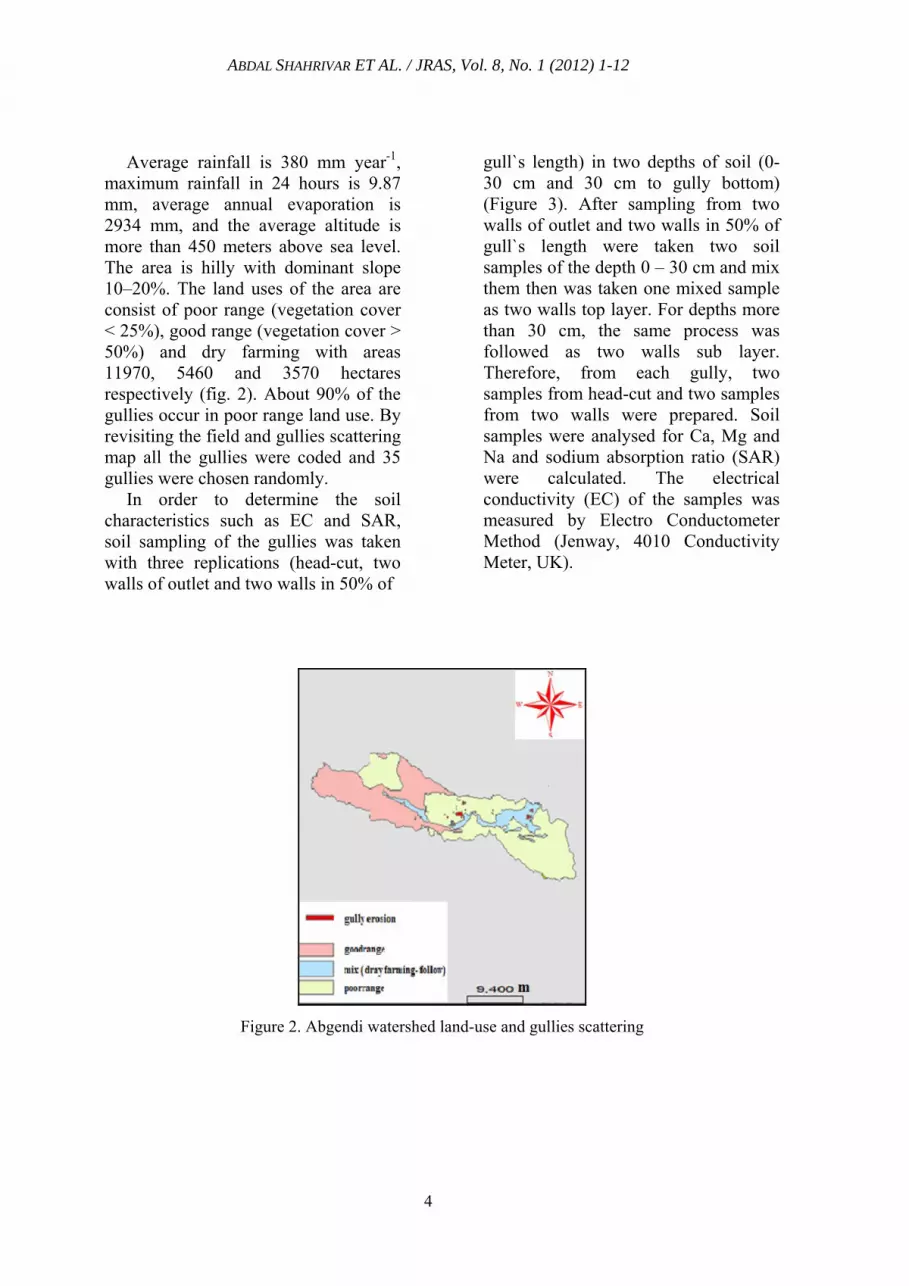
In order to determine the soil characteristics such as EC and SAR, soil sampling of the gullies was taken with three replications (head-cut, two walls of outlet and two walls in 50% of
gull`s length) in two depths of soil (0-30 cm and 30 cm to gully bottom) (Figure 3). After sampling from two walls of outlet and two walls in 50% of gull`s length were taken two soil samples of the depth 0 – 30 cm and mix them then was taken one mixed sample as two walls top layer. For depths more than 30 cm, the same process was followed as two walls sub layer. Therefore, from each gully, two samples from head-cut and two samples from two walls were prepared. Soil samples were analysed for Ca, Mg and Na and sodium absorption ratio (SAR) were calculated. The electrical conductivity (EC) of the samples was measured by Electro Conductometer Method (Jenway, 4010 Conductivity Meter, UK).
Figure 2. Abgendi watershed land-use and gullies scattering
ABDAL SHAHRIVAR ET AL. / JRAS, Vol. 8, No. 1 (2012) 1-12
5
Head-cut
Soil sampling > 30 cm
Soil sampling 0 – 30 cm
outlet
Head-cut
Figure 3. Gully erosion and soil sampling
location
Classification of gullies based on EC and SAR
Both EC and SAR are commonly used to classify salt-affected soils. Waskom et al. (2006) classified all soils in 3 groups as Table 1. Table 1.Classification of soils based on EC and
SAR values EC (dS/m) PH SAR Saline > 4 < 8.5 < 13 Sodic < 4 > 8.5 ≥13 Saline-sodic
> 4 < 8.5 ≥13
In this classification, EC=4.0 dS/m and
SAR ≥ 13 have been used as the threshold of EC and SAR to define saline, sodic and saline – sodic soils. There are some different definitions to define sodicity. Because all soils behave differently, and there is no exact definition of sodicity (Sumner, 1993). Moreover, U.S salinity laboratory has criteria to classify the soil as saline, alkali and saline-alkali. Abrol et al. (1988) classified the soils based on only EC values, as the classes were non saline, slightly saline, moderately saline, strongly saline, and very strongly saline with EC equal 0-2, 2-4, 4-8, 8-16 and > 16 dSm-1, respectively. Christos et al. (2010)
classified soil desertification risk for the degradation process salinization risk based on EC values in 4 groups such as EC > 8 dS/m (very high risk), EC = 4 – 8 dS/m (high), EC = 2 – 4 dS/m (moderate) and EC < 2 dS/m ( low).
In this research, taking into account the classification of the salt affected soil, and the range of determined data, the gullies were classified based on EC or SAR values in the top and the sub-layers of gully head-cut and two walls. The comparison of the groups was carried out separately in terms of gully volume and length. In this classification, the gullies were categorized into two groups, first classification was based on EC > 4 and EC < 4, and second classification was based on EC > 8 and EC < 8, which each pair were compared separately. To compare the mean values of the SAR and EC in the two groups, an independent sample t-test was run.
Classification of the gullies based on EC-SAR
Classification of the gullies based on
EC-SAR was carried out to compare the classes in terms of gully volume and length, as two important indexes of gully erosion. In this classification, both EC and SAR were considered. The gully top and sub-layers were investigated without considering the head-cut and the two walls of the gully. The mean value of EC in the top layers of head-cut and two walls as EC of gully top layer, and the mean value of EC in the sub layers of head-cut and two walls as EC of gully sub layer were calculated and statistically analysed. To calculate the SAR for gully top and sub-layer, the same calculations were used. Then, the gullies were classified based on each factor in the both top and sub-layer separately. In this classification, the gullies were categorized into 3 groups including the gullies content SAR < 8 and EC < 4 values in their top and sub-layers as Group
ABDAL SHAHRIVAR ET AL. / JRAS, Vol. 8, No. 1 (2012) 1-12
6
I, gullies with EC 4 - 8 and SAR 4 – 8 in their top or sub-layers as Group II, and gullies with EC more than 8 and SAR more than 13 in their top or sub-layers as Group III. To compare these three groups in terms of gully volume and gull length one-way analysis of variance was run (Table 2). Table 2. Gullies classification based on EC-SAR Group I Group II Group III EC < 4 4 – 8 > 8 SAR < 8 4 - 8 > 13
In addition to this classification, the gullies with EC > 8 were compared to the gullies with EC <8, and the gullies with SAR > 8 to the gullies with SAR < 8 as
well in terms of gully volume and length by running an independent sample t-test.
RESULTS
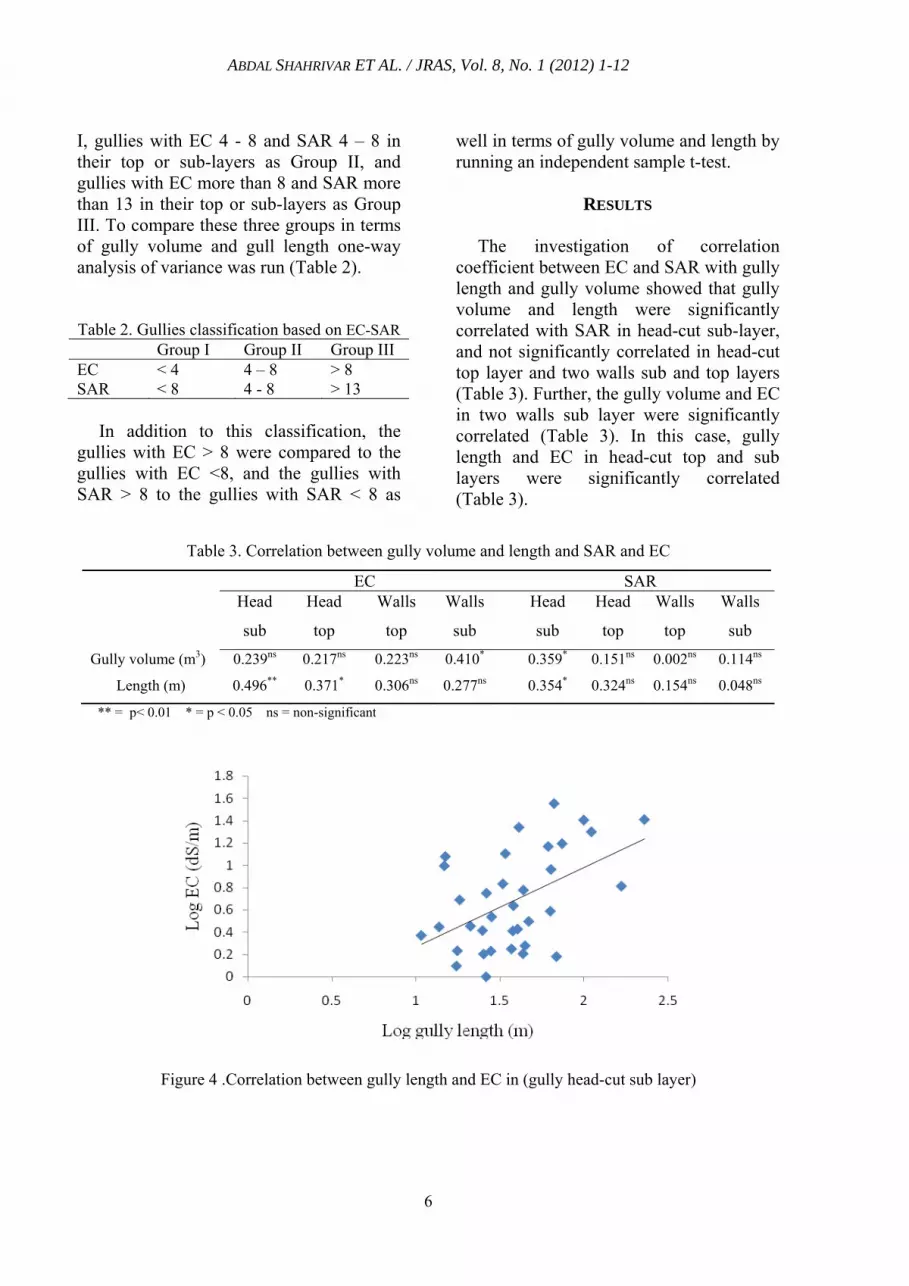
The investigation of correlation
coefficient between EC and SAR with gully length and gully volume showed that gully volume and length were significantly correlated with SAR in head-cut sub-layer, and not significantly correlated in head-cut top layer and two walls sub and top layers (Table 3). Further, the gully volume and EC in two walls sub layer were significantly correlated (Table 3). In this case, gully length and EC in head-cut top and sub layers were significantly correlated (Table 3).
Table 3. Correlation between gully volume and length and SAR and EC
EC SAR Head
sub
Head
top
Walls
top
Walls
sub
Head
sub
Head
top
Walls
top
Walls
sub
Gully volume (m3) 0.239ns 0.217ns 0.223ns 0.410* 0.359* 0.151ns 0.002ns 0.114ns
Length (m) 0.496** 0.371* 0.306ns 0.277ns 0.354* 0.324ns 0.154ns 0.048ns
** = p< 0.01 * = p < 0.05 ns = non-significant
Figure 4 .Correlation between gully length and EC in (gully head-cut sub layer)

ABDAL SHAHRIVAR ET AL. / JRAS, Vol. 8, No. 1 (2012) 1-12
7
Moreover, the average EC of gully head-cut and two walls in sub-layers (as EC in gully sub-layer) with gully volume and length, and average EC of gully top layer with gully length correlated significantly (Table 4). While the correlation between the gully volume and the average EC of gully top layer was not significantly. Meanwhile, the correlations between gully volume and length and EC and SAR were positive.
Table 4. Correlation between gully volume,
length, and the average EC of gully sub and top layers
Gully sub layer Gully top layer
Gully volume/ m3 0.472** 0.250ns
Gully Length / m
0.541** 0.392*
** = p< 0.01 * = p < 0.05 ns = non-significant
Comparison of the EC groups (in head-cut top and sub layers) in terms of gully volume and length
The results of the comparison of the EC groups (EC > 4 dS/m and EC < 4dS/m ) in gully head-cut top layer indicated that gully volume and length of the groups are not significantly different, gully length, (t (33) = -1.42, p = 0.17), and gully volume, (t (33) = -0.98, p = 0.34). The mean values of the gully volume with EC > 4 and EC < 4 were 135.9 m3 and 89.7 m3, respectively. Moreover, the comparison of the EC groups (EC > 4 and EC < 4 ) in the sub-layer of gully head-cut showed that these two groups were significantly different in term of gully length (t (33) = -2.3, p = 0.026), and were not significantly different in term of gully volume, (t (33) = -1.4, p = 0.167), as the values of gully length with EC > 4 dS/m and EC < 4 dS/m were 67.1 and 33.2 m, respectively. In addition, the gullies with EC > 8 dS/m and EC < 8 dS/m in their top
layer were compared, and the results show that these two groups had significant difference in term of gully length (t (33) = -2.3, p = 0.027), and had not significant difference in term of gully volume(t (33) = -1.4, p = 0.171).The mean values of gully length in EC > 8 and EC < 8 were 103.04 m and 44.65 m, respectively. Furthermore, the results of the comparison of the gullies with EC < 8 and EC > 8 (in their head-cut sub layers)showed that the groups were significantly different in term of gully length (t (33) = -2.3, p = 0.029), and were not significantly different in term of gully volume (t (33) = -1.4, p = 0.17).Mean values of the length in the gullies with EC > 8 and EC < 8 were 73.9 m and 38.5 m, respectively. The results also showed that the gully volume and length in the gullies with EC > 4 and EC <4, and EC >8 and EC < 8 in their top and sub-layers of the walls are not significantly different.
Comparison of the SAR groups (in the top and sub layers of gully head-cut) in terms of gully volume and length
Comparison of the SAR groups (SAR >
8 and SAR < 8) in gully head-cut top layer indicated that the groups were significantly different in term of gully length (t (33) = -2.3, p = 0.027), and were not significantly different in term of gully volume (t (33) = -1.4, p = 0.171). Mean value of the gullies length with SAR >8 and SAR <8 were 103.04 m and 44.65 m, respectively. Moreover, the gully groups with SAR >8 and SAR <8 in their head-cut sub-layers were not significantly different in terms of gully volume and length.
ABDAL SHAHRIVAR ET AL. / JRAS, Vol. 8, No. 1 (2012) 1-12
8
Comparison of the EC and SAR classes (in the top and sub-layers)in terms of gully volume and length
In this investigation, the gullies were
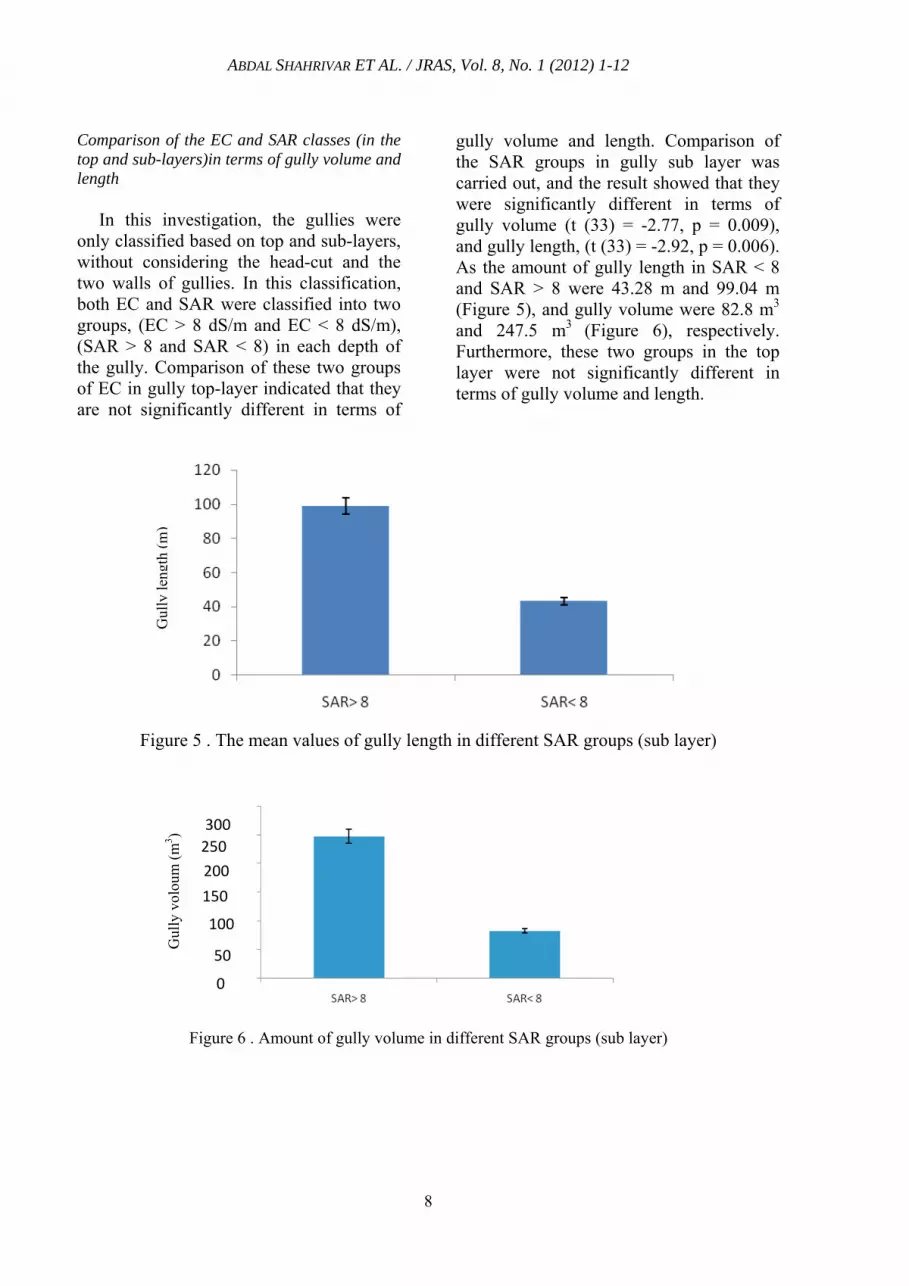
only classified based on top and sub-layers, without considering the head-cut and the two walls of gullies. In this classification, both EC and SAR were classified into two groups, (EC > 8 dS/m and EC < 8 dS/m), (SAR > 8 and SAR < 8) in each depth of the gully. Comparison of these two groups of EC in gully top-layer indicated that they are not significantly different in terms of
gully volume and length. Comparison of the SAR groups in gully sub layer was carried out, and the result showed that they were significantly different in terms of gully volume (t (33) = -2.77, p = 0.009), and gully length, (t (33) = -2.92, p = 0.006). As the amount of gully length in SAR < 8 and SAR > 8 were 43.28 m and 99.04 m (Figure 5), and gully volume were 82.8 m3 and 247.5 m3 (Figure 6), respectively. Furthermore, these two groups in the top layer were not significantly different in terms of gully volume and length.
Figure 5 . The mean values of gully length in different SAR groups (sub layer)
Figure 6 . Amount of gully volume in different SAR groups (sub layer)
Gul
ly le
ngth
(m
) G
ully
vol
oum
(m
3 ) 300
250
200
150
100
50
0

ABDAL SHAHRIVAR ET AL. / JRAS, Vol. 8, No. 1 (2012) 1-12
9
Comparison of the EC-SAR in terms of gully volume and length
Classification of the gullies based on
EC-SAR was carried out to compare the classes in terms of gully volume and length as two important indexes of gully erosion. In this study, the gully top and sub-layers were investigated without considering the head-cut and the two walls of gully. In this classification, the gullies were categorized into 3 groups including the gullies content SAR < 8 and EC < 4 values in their top and sub-layers as Group I, gullies with EC 4 -8 and SAR 4 – 8 in their top or sub-layers as Group II, and the gullies with EC > 8 and SAR > 13 in their top or sub-layers as Group III. To compare the mean values of gully volume and gully length in EC-SAR groups, One-Way Analysis of Variance was run. The results indicated that gully volume have significant differences (F= 3.69, sig = 0.036) between the groups, as the amounts of gully volume in Groups 1, 2 and 3 were 60.49, 148.3 and 169.3, respectively (Table 5, Figure 7). In addition to gully volume, there were also significant differences between the groups in terms of gully length (F= 5.47, sig = 0.006). The amounts of gully length in Groups 1, 2 and 3 were 31.85, 65.39 and 80.76, respectively (Table 5, Fig 8). The results were also tested by S.N.K test (Table 5). According to this test, there is a significant difference between Groups 1 and 3, while there were no significant differences between Group 2 and other groups. Meanwhile, the results of Duncan and Tukey tests were the same S.N.K test.
Table 5. Mean value of gully volume and
length in EC-SAR groups
EC – SAR groups
Gully volume
Gully length
I 60.5 a 31.8 a
II 148.3 a 65.4 ab
III 169.3 a 80.8 b
Figure 7 .Amount of gully volume in EC- SAR groups
Figure 8 . The mean values of gully length in EC- SAR groups
DISCUSSION Correlation between EC and gully
volume and length shows that sub layer of gully has the highest influence on gully volume and length as two indexes of gully erosion development. In the other words, sub layer of the soil in the region has the most susceptible to gully erosion. This correlation indicates that with increasing EC and SAR in the head-cut sub layer, gully erosion intensity will increase. In this case, Servati et al. (2008) and Rienks et al. (2000) indicated that there is a significant positive correlation between gully erosion development and EC and SAR. Furthermore, Ghodosi (2006) introduced the EC as an important factor to gully erosion initiation. Likewise, Ramezanpour (2008) indicated that amount of EC and SAR in different types of erosion (sheet, rill, gully and bad-land) are significantly different. As the EC values increases from
Gul
ly le
ngth
(m
) EC-SAR groups
EC-SAR groups
Gul
ly v
olou
m (
m3 )

ABDAL SHAHRIVAR ET AL. / JRAS, Vol. 8, No. 1 (2012) 1-12
10
sheet to bad-land. Rahnoma and Riginejad (2010) have also compared an area with sever gully erosion to the area without gully erosion as control in terms of EC and SAR, and resulted that amount of EC and SAR in control soil in comparison to the area with sever gully erosion were significantly more. As the mentioned above the soils have EC > 8 and SAR >13 have the most susceptible to gully erosion, because they are both saline and alkaline. Kemper & Koch (1966) have demonstrated that with an increase in the soluble salts of soil such as Na, the negative impact of clay on aggregate stability will increase and thus, erodibility of soil will increase as well. In this case Mahangara (2010) indicated that the soils are highly dispersive promoting piping and gulling owing to the high sodium content. Moreover, Bell and Maud (1994) suggested that the threshold for soil dispersion is SAR value higher than 2 in a case study in Africa. When the SAR rises above 12-15, serious physical soil problems arise and plants have difficulty absorbing water (Munshower, 1994). Some researcher have indicated that there is a significant negative correlation between the amount of EC and soil dispersion ratio (Zij, 2010), because in this condition, if the increasing of the EC is not due to the sodium ions, presence of the multi valent cations can reduce the double layer thickness, and thus the clays is coagulated (Barzegar, 1997). The soils with EC > 4 dS/m and SAR ≥ 13 are classified as the sodic soils that have poor drainage (Waskom et al., 2006) that can be susceptible to soil erosion.
CONCLUSION
It can be concluded that gully erosion development can be affected by the EC and SAR two causes of in these regions. However it should be considered other factors such as soil physical and topographical properties. This agree with other recent studies Ramezanpour (2008), Servati et al. (2008) and Rienks et al. (2000). The role of sodium in calculating SAR, and the effective role of sodium to soil dispersing, it can increase the susceptibility of soil to water erosion. Miller (2008) showed that Exchangeable Sodium Percentage (ESP) of 6% or greater have sodic soils and could be at higher risk of erosion (there is a liner correlation between ESP and SAR). Moreover, concentration of soluble salts (are measured by electrical conductivity), such as sodium cations are attached to each soil clay particle in the arid and semi-arid areas. Critical EC and SAR were EC > 8 and SAR > 13 that the soil have the same EC and SAR values it can have the most susceptible to gully erosion.
It can be also concluded that the interaction of these two factors rises the soil sensitivity to gully erosion. Moreover, these properties not only can increase the susceptibility of soil to erosion, but can limit the vegetation growth on the soil as well. Therefore, if the soils with high susceptibility to erosion do not have sufficient the vegetation cover, in that soil can occur accelerated soil erosion. Therefore, by soil sampling and determining the EC and SAR in a semi-arid area, it is possible to identify an area with high or low susceptibility to gully erosion development to carry out any preventive program.

ABDAL SHAHRIVAR ET AL. / JRAS, Vol. 8, No. 1 (2012) 1-12
11
REFERENCES
Abrol I.P., J.S.P. Yadav, F.I. Massoud. 1988. Salt-affected soils and their management. FAO Soils Bulletin, Soil resources, Management and Conservation Service, FAO Land and Water Development Division, 39:131.
Ahmadi H. 2007. Applied Geomorphology (water erosion), Tehran University.(in Persian) Barzegar A.R., P. N. Nelson, J. M. Oades, P. Rengasamy. 1997. Organic matter sodicity and clay type
influence on soil aggregation. Soil Science, 61:1131-1137. Bell F.G., R.R. Maud. 1994. Dispersive soils: a review from a South African perspective. Quarterly
Journal of Engineering Geology and Hydrogeology, 27:195-210. Christos A., C.K. Karavitis, K. Orestis, A. Kounalaki, V. Fasoul. 2010. Definition of desertification rick
by using simple indicators, Scientific reports, Agricultural University of Athens, Greece. Dondofema F., A. Murwira, A. Mhizha. 2008. Identifying Gullies and determining their relationships
with environmental factors using GIS in the Zhulube meso-catchment. Water and Sustainable Development for Improved Livelihoods, Johannesburg, South Africa.
Egboka B.C.E., I.P. Orajaka. 1987. Soil and gully erosion models for effective control programmes. Geoforum, 18:333-341.
Fan J., T. Bingwei, Y. Dong. 2008. Cause analysis of gully erosion in Yuanmou basin of Jinshajiang valley. Wuhan University Journal of Natural Sciences, 13:343-349.
Garshasebi P. 2010. Soil erosion in Iran, Hamshahri Newspaper, Tehran Municipality, 1735 - b393. pp. 5.
Ghodosi J. 2006. The effects of soil physico-chemical characteristics on gully erosion initiation. 3rd Erosion and Sediment National Conference Soil Conservation and Watershed Management, Tehran. pp. 282-289.
Kemper W.D., E.J. Koch. 1966. Aggregate stability of soils from western USA and Canada. USDA Technical Bulletin No.1355. US Government Printing Office, Washington, DC.
Mhangara P. 2010. Land use/cover change modelling and land degradation assessment in the Keiskamma catchment using remote sensing and GIS, Faculty of Science, Nelson Mandela Metropolitan University. pp. 187.
Miller W.B. 2008. Practical Guide to Soil Erosion: A Guide to Preventing, Assessing and Treating Soil Erosion on Your Farm Border Rivers-Gwydir Catchment Management Authority.
Morgan R.P.C. 1996. Soil erosion and conservation. Silsoe College, Cranfield University. Munshower F.F. 1994. Practical handbook of disturbed land revegetation Lewis, Boca Raton [etc.]. Piccarreta M., H. Faulkner, M. Bentivenga, D. Capolongo. 2006. The influence of physico-chemical
material properties on erosion processes in the badlands of Basilicata, Southern Italy. Geomorphology, 81:235-251.
Rahnoma J.K., F. Riginejad. 2010. Soil chemecal characteristics role on gully erosion initiation and development in Dashtyari Resion of Chabohar, Iran. Applied Geology, (Azad University of Zahedan): 9-16. (in Persian).
Ramezanpour H.S. 2008. Study of relationship between different type of erosion and soil properties of marls in Southern Guilan Province, Iran. .
Rienks S.M., G.A Botha, J.C. Hughes. 2000. Some physical and chemical properties of sediments exposed in a gully (donga) in northern KwaZulu-Natal, South Africa and their relationship to the erodibility of the colluvial layers. Catena, 39:11-31.
Seeger K.M.M., I. Marzolff, J.B. Ries. 1997. Identification of gully-development processes in semi-arid NE-Spain. Zeitschrift für Geomorphologie, 53 (2009)4. - ISSN 0372-8854 - p. 417 - 431.
Servati M.R., J.Ghoddosi, M. Dadkhah. 2008. Factor effecting initiation and advancement of gully erosion in loesses. Pejouhesh & Sazandegi: 20-33. (in Persian).
Soufi M. 2002. Characteristics and causes of gully erosion in Iran. 12th ISCO Conference, Beijing, China.
Sumner M. 1993. Sodic soils - New perspectives. Soil Research, 31:683-750. UNDP. 1999. Human development report of the Islamic republic of Iran. Chapter 8. pp. 113.

ABDAL SHAHRIVAR ET AL. / JRAS, Vol. 8, No. 1 (2012) 1-12
12
Valentin C., J. Poesen, Y. Li. 2005. Gully erosion: Impacts, factors and control. Catena, 63:132-153. Waskom R.M., T.A. Bauder, J.G. Davis, G.E. Cardon. 2006. Diagnosing saline and sodic soil problems.
Colorado State University Cooperative Extension Wasson RJ., N. Juyal, M. Jaiswal, M. McCulloch, M. Sarin, V. Jain, P. Srivastava, A. Singhvi. 2002.
Sourcing sediment using multiple tracers in the catchment of Lake Argyle, Northwestern Australia. Environmental Management, 29(5): 624–646.
Yitbarek T. 2007. Economic valuation of gully rehabilitation; A case study at Farta Woreda, in South Gondar, Ethiopia, Environmental Science, Addis Ababa University, Addis Ababa. pp. 96.
Zachar D. 1982. Soil Erosion. Elsevier Soil Scient. Publ. Co., Amsterdam. Zij G.M.V. 2010. An investigation of the soil properties controlling gully erosion in a Sub-Catchment I
Maphutseng, Lesotho. Soil science department, Stellenbosch University. pp.129. .