geotechnical assessment for gully erosion control and
TRANSCRIPT

Middle-East Journal of Scientific Research 27 (8): 644-654, 2019ISSN 1990-9233© IDOSI Publications, 2019DOI: 10.5829/idosi.mejsr.2019.644.654
Corresponding Author: Dr. H.O. Nwankwoala, Department of Geology, University of Port Harcourt, Nigeria.
644
Geotechnical Assessment for Gully Erosion Control andManagement in Agulu-Nanka, Southeastern Nigeria
H.O. Nwankwoala and T. Igbokwe1 2
Department of Geology, University of Port Harcourt, Nigeria1
Institute of Natural Resources, Environment and Sustainable Development (INRES), 2
University of Port Harcourt, Nigeria
Abstract: This study is aimed at providing geotechnical parameters and data of the soils, identify problems andfeatures making the area susceptible to gully erosion and proffering sustainable solutions to problems of gullyerosion in the affected areas of AguluNanka, Anambra State, Southeastern Nigeria.Standard methods were usedin the geotechnical assessment. The result of the study revealed the following: topography of the land showsa high sloppiness which makes it highly susceptible to erosion, predominantly that of weak clay and loosesandy clays, natural moisture content ranges from 1.71% –12.53% - this is because the soilshave low retentivecapacity, hence cannot hold much water. Compaction test shows the maximum dry density (MMD) and theoptimum moisture content (OMC) of the soil to be very low; plasticity index ranges from 0–33.283; compactedbulk density between 1.55- 1.76 kg/m ; the specific gravity ranges 1.68 – 2.06, with permeability ranging between3
1.32 × 10 and 1.63 × 10 cm/sec. This indicates that the area is highly prone to gully erosion which has proven3 3
to be detrimental to both agricultural activities and community development programs. The result also showsthat there have been some anthropogenic activities increasing the susceptibility of the area to erosion.Resultsobtained revealed that the soils in the study area are cohensionless, not compact and non-plastic, hence themenace of gully erosion. A highly exaggerated emphasis and predominance on engineering control measuresinvolving construction of check-dams, bulldozing of earth materials, backfilling with soils and compacting, orconstruction of drainage or cut-off flood channels do not seem to be successful in checking gully incipient andextension or expansion in Nankaand its environs. This study will helpin the implementation of betterenvironmental policies that are geared towards effective harnessing and beneficial use of the environment foragricultural and community development use.
Key words: Gully erosion Soils Permeability Geotechnics Agulu-Nanka
INTRODUCTION the economic, cultural and environmental impacts of local
The removal of top soil has caused several of fact, preventing the formation of a gully is much easierenvironmental degradations, which in turns makes life than controlling it once it has formed. If incipient gulliesdifficult in terms of agricultural participation because are not stabilized, they become longer, larger and deeperof loss of soil nutrient from the top soil as well as [1]. Under certain climatic and geological conditions,reduction of the surface area for agricultural activities, vertical gully banks can easily become as high as 20-30transportation, housing and desertification. The fact meters or more. This type of gully can engulf hillsidethat erosion is a natural occurrence is not in doubt, but farming areas, grass lands and even forest lands. In mosthuman activities have aided the rate at which erosion cases, it is not possible to stabilize those gullies becauseoccurs globally. of the huge landslides which occur on vertical (20-30m)
Traditional owners, cattle glaziers and other local gully banks after heavy rains and alternate freezing andresidents in the catchment are usually concerned about thawing [2].
gully erosion and downstream sedimentation. As a matter
Middle-East J. Sci. Res., 27 (8): 644-654, 2019
645
Gullies greatly interfere with normal farming this unresolved problem of gully erosion and theoperations such as cultivation, mustering stock, general application of inadequate measures to tackling theaccess and water supply. They present many problems to problem that poses the major problem in his study.landholders as they are a continuing source of soil loss. Akunobi [11]; Chikweluand Ogbuagu [12]; Obi andSediment transported from gullies may be deposited in Okekeogbu [13] conducted several studies on gullydams leading to a reduction in capacity and often has erosion menace in many parts of southeastern Nigeria.additional detrimental effect on other man-made drainage The purpose of this study was to investigate:infrastructure such as the blocking of pipes and culverts. Geotechnical analysis and geographic information systemSediment mobilized in drinking water catchments by (GIS) application for sustainable catchment managementerosion can reduce water quality for downstream users. and gully erosion control in AguluNanka, Anambra State.Water quality is affected by the increased turbidity and Specifically, the study will seeks to: (i) providethe nutrients adsorbed on the sediments can pollute the geotechnical parameters and data (permeability, liquidity,water potentially leading to algal blooms. In-stream plasticity, consistency, moisture content and compaction)habitat for aquatic plants and animals may also be of the soils available in the area (ii) Identify problems anddegraded by the smothering of the river bed with silt and features making the area susceptible to gully erosion, (iii)sand. Sediment covers vegetation and inhibits growth. Proffering sustainable solutions to problems of gully
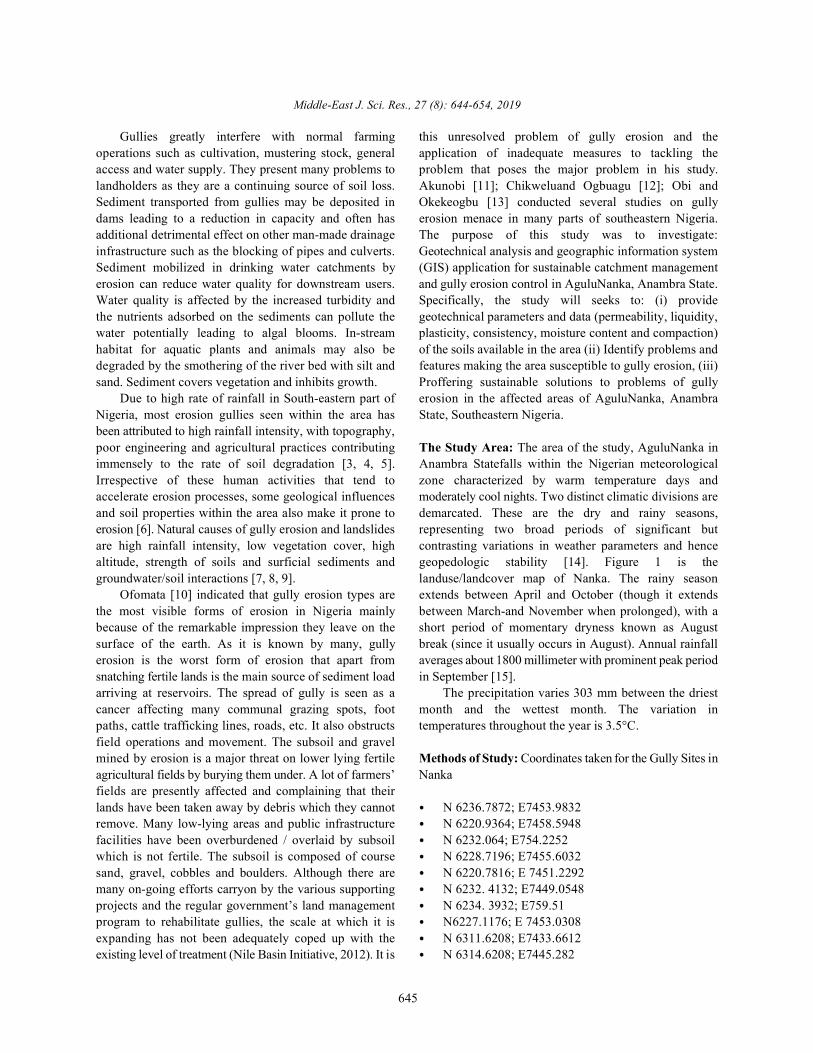
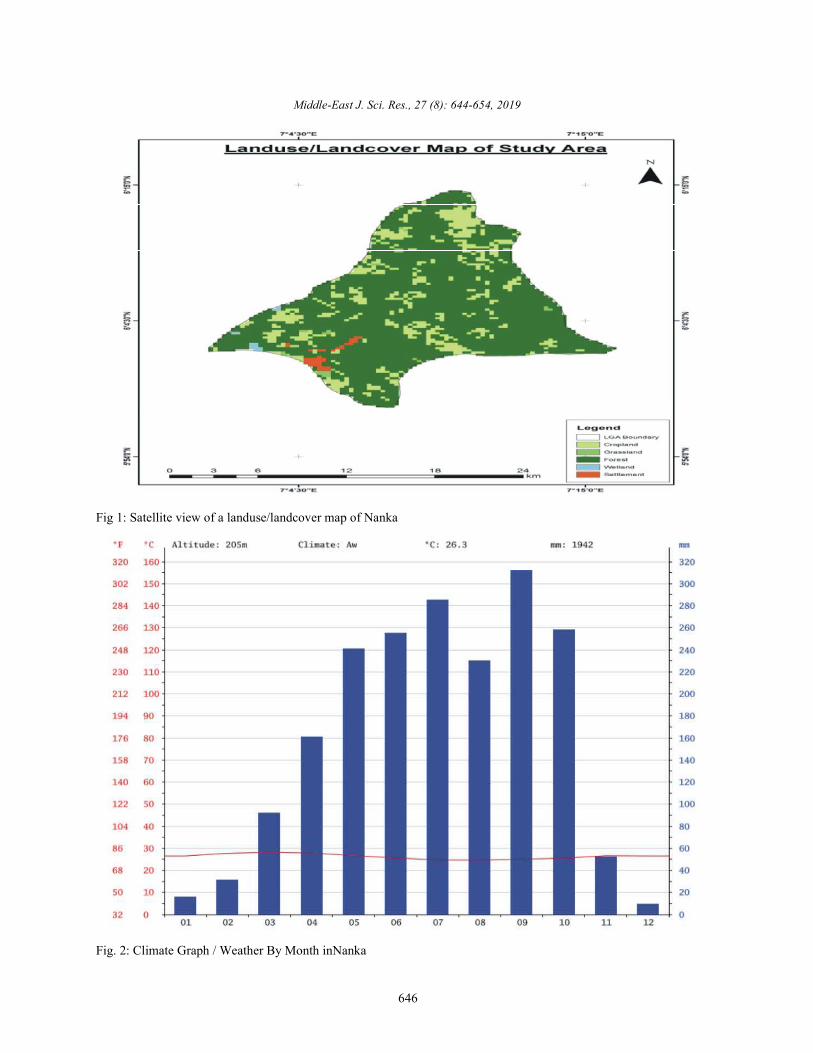
Due to high rate of rainfall in South-eastern part of erosion in the affected areas of AguluNanka, AnambraNigeria, most erosion gullies seen within the area has State, Southeastern Nigeria.been attributed to high rainfall intensity, with topography,poor engineering and agricultural practices contributing The Study Area: The area of the study, AguluNanka inimmensely to the rate of soil degradation [3, 4, 5]. Anambra Statefalls within the Nigerian meteorologicalIrrespective of these human activities that tend to zone characterized by warm temperature days andaccelerate erosion processes, some geological influences moderately cool nights. Two distinct climatic divisions areand soil properties within the area also make it prone to demarcated. These are the dry and rainy seasons,erosion [6]. Natural causes of gully erosion and landslides representing two broad periods of significant butare high rainfall intensity, low vegetation cover, high contrasting variations in weather parameters and hencealtitude, strength of soils and surficial sediments and geopedologic stability [14]. Figure 1 is thegroundwater/soil interactions [7, 8, 9]. landuse/landcover map of Nanka. The rainy season
Ofomata [10] indicated that gully erosion types are extends between April and October (though it extendsthe most visible forms of erosion in Nigeria mainly between March-and November when prolonged), with abecause of the remarkable impression they leave on the short period of momentary dryness known as Augustsurface of the earth. As it is known by many, gully break (since it usually occurs in August). Annual rainfallerosion is the worst form of erosion that apart from averages about 1800 millimeter with prominent peak periodsnatching fertile lands is the main source of sediment load in September [15].arriving at reservoirs. The spread of gully is seen as a The precipitation varies 303 mm between the driestcancer affecting many communal grazing spots, foot month and the wettest month. The variation inpaths, cattle trafficking lines, roads, etc. It also obstructs temperatures throughout the year is 3.5°C.field operations and movement. The subsoil and gravelmined by erosion is a major threat on lower lying fertile Methods of Study: Coordinates taken for the Gully Sites inagricultural fields by burying them under. A lot of farmers’ Nankafields are presently affected and complaining that theirlands have been taken away by debris which they cannot N 6236.7872; E7453.9832remove. Many low-lying areas and public infrastructure N 6220.9364; E7458.5948facilities have been overburdened / overlaid by subsoil N 6232.064; E754.2252which is not fertile. The subsoil is composed of course N 6228.7196; E7455.6032sand, gravel, cobbles and boulders. Although there are N 6220.7816; E 7451.2292many on-going efforts carryon by the various supporting N 6232. 4132; E7449.0548projects and the regular government’s land management N 6234. 3932; E759.51program to rehabilitate gullies, the scale at which it is N6227.1176; E 7453.0308expanding has not been adequately coped up with the N 6311.6208; E7433.6612existing level of treatment (Nile Basin Initiative, 2012). It is N 6314.6208; E7445.282
Middle-East J. Sci. Res., 27 (8): 644-654, 2019
646
Fig 1: Satellite view of a landuse/landcover map of Nanka
Fig. 2: Climate Graph / Weather By Month inNanka

Middle-East J. Sci. Res., 27 (8): 644-654, 2019
647
January February March April May June July August September October November DecemberAvg. Temperature (°C) 26.5 27.7 28.1 27.8 26.7 25.6 24.7 24.6 25 25.5 26.6 26.5Min. Temperature (°C) 21.5 22.5 23.4 23.2 22.3 21.6 21.3 21.7 21.2 21.3 22 21.3Max. Temperature (°C) 31.6 32.9 32.9 32.5 31.1 29.6 28.2 27.6 28.9 29.8 31.3 31.8Avg. Temperature (°F) 79.7 81.9 82.6 82.0 80.1 78.1 76.5 76.3 77.0 77.9 79.9 79.7Min. Temperature (°F) 70.7 72.5 74.1 73.8 72.1 70.9 70.3 71.1 70.2 70.3 71.6 70.3Max. Temperature (°F) 88.9 91.2 91.2 90.5 88.0 85.3 82.8 81.7 84.0 85.6 88.3 89.2Precipitation / Rainfall (mm) 16 31 92 161 241 255 285 230 312 258 52 9
Fig. 3: Weather by Month/Weather Averages in Nanka
Fig. 4: Average Temperature of Nanka
Gully Characteristics: q = discharge per unit time;
Gully Width = Range is between 0.13m-397.20m to the direction of flow;Gully length = Range is between 10m- 4, 369.20m i = hydraulic gradient;Gully Height = Range is between 2m-52.96 m k = Darcy’s coefficient of permeabilityNo. of gullies sited = 12 gullies (some wereconcentrated) If a soil sample of length L and cross-sectional area
Soil Parameters hydraulic gradient i will be equal to [(h – h )/L] and wePermeability Test: The soil permeability is a very have:important factor to study the behavior of soil in its naturalcondition with respect to water flow. The constant head q = k. [(h – h )/L] A (2)method is particularly suitable for relatively coarsegrained soil such as sands and gravel. where hydraulic gradient is unity, k is equal to V. Thus,
V= q/A = Ki. (1) defined as the average velocity of flow that will occur
where: hydraulic gradient. Dimensions are same as of velocity,V = velocity of flow or average discharge velocity cm/sec.
A = total cross-sectional area of soil mass, perpendicular
A, is subjected to differential head of water h – h , the1 2
1 2
1 2
the coefficient of permeability, or simply permeability is
through the total cross-sectional area of soil under unit
Middle-East J. Sci. Res., 27 (8): 644-654, 2019
648
Fig. 5: Hydraulic gradient determination
Determination of Moisture Content: The moisture Determination of Consistency or Liquidity Index of Soilcontent of a soil sample is defined as the mass of water in (LI): The liquidity index (LI) is used for scaling the naturalthe sample expressed as a percentage of the dry mass, water content of a soil sample to the limits. It can beusually heating at 1050C, i.e. calculated as a ratio of difference between natural water
Moisture content, w = W D M M x 100 (%) (3)
where, MW = mass of water MD = dry mass of sample (4)
Sample Requirements where W is the natural water contentSample Mass: The mass required for the test depends onthe grading of the soil, such as: Determination of Plasticity of the Soil: The Plastic Limit
Fine-grained soils, not less than 30 grams portion of a soil on a flat, non-porous surface. TheMedium-grained soils, not less than 300 grams procedure is defined in ASTM Standard D 4318. If the soilCoarse-grained soils, not less than 3 kg is at moisture content, where its behavior is plastic, this
Soils group (i) Fine-grained soils: Soils containing diameter. The sample can then be remolded and the testnot more than 10% retained on a 2 mm test sieve(ii) repeated. As the moisture content falls due toMedium-grained soils: Soils containing more than 10% evaporation, the thread will begin to break apart at largerretained on a 2 mm test sieve but not more than 10% diameters. The plastic limit is defined as the moistureretained on a 20 mm test sieve ( iii) Coarse-grained soils: content where the thread breaks apart at a diameter ofSoils containing more than 10% retained on a 20 mm test 3.2 mm (about 1/8 inch). A soil is considered non-plasticsieve but not more than 10% retained on a 37.5 mm test if a thread cannot be rolled out down to 3.2 mm at anysieve. moisture possible.
Accuracy of Weighing: The accuracy of weighing Determination of Consistency of the Soilrequired for test sample is as follows; (a) Fine-grained Determination of Wet-Soil Consistency: Testing is donesoils: within 0.01 g. (b) Medium-grained soils: within 0.1 g. when the soil is saturated with water, as, for example,c) Coarse-grained soils: within 1g. immediately after a good rainfall. First, determine
Safety Aspects: other objects. Then, determine plasticity, that is, the
Heat-resistant gloves and / or suitable tongs should continuously under the influence of a constant pressurebe used to avoid personal injury and possible and to retain the impressed shape when the pressure isdamage to samples. removed.
content, plastic limit and liquid limit:
LI=(W-PL)/(LL-PL)
(PL) is determined by rolling out a thread of the fine
thread will retain its shape down to a very narrow
stickiness, that is, the ability of soil materials to adhere to
ability of soil materials to change shape, but not volume,
Middle-East J. Sci. Res., 27 (8): 644-654, 2019
649
RESULTS AND DISCUSSION
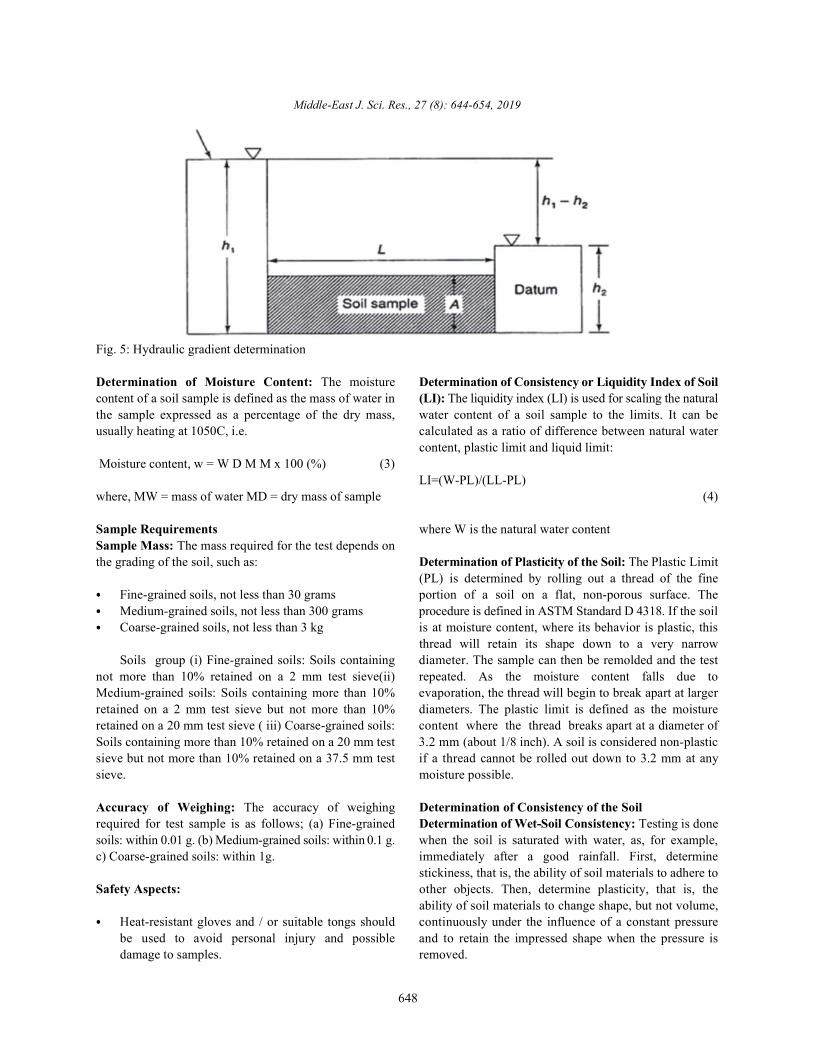
Results of Geotechnical AnalysisSoil Compaction Test: Soil compaction was carried out with the aim of determining the moisture density relationshipsof soils.
Fig. 6: Map of Study Area Showing Soil Distribution in the State (Source:ASTER Image (DEM) - Advanced SpaceborneThermal Emission and Reflection Radiometer) (2019)
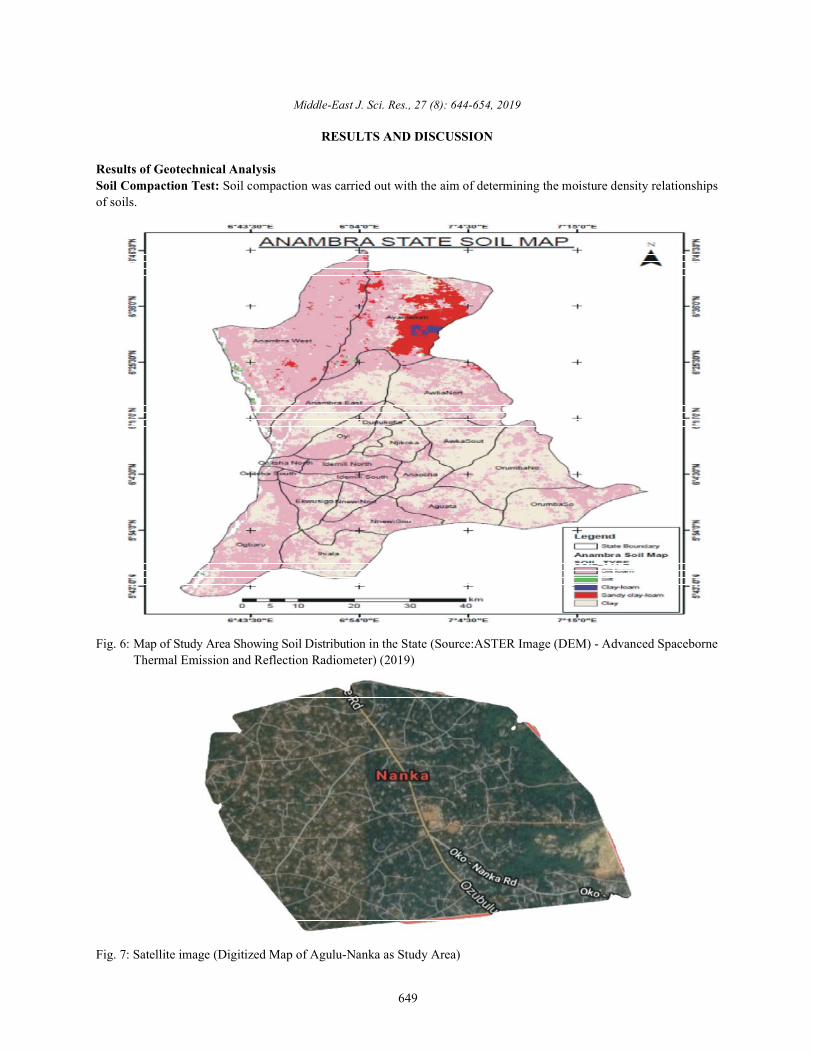
Fig. 7: Satellite image (Digitized Map of Agulu-Nanka as Study Area)

Middle-East J. Sci. Res., 27 (8): 644-654, 2019
650
Fig. 8: Map of Study Area Showing Soil Distribution
Fig. 9: Measuring of Gully Size
Fig. 10: Map of Gully Sites within Study Area
Middle-East J. Sci. Res., 27 (8): 644-654, 2019
651
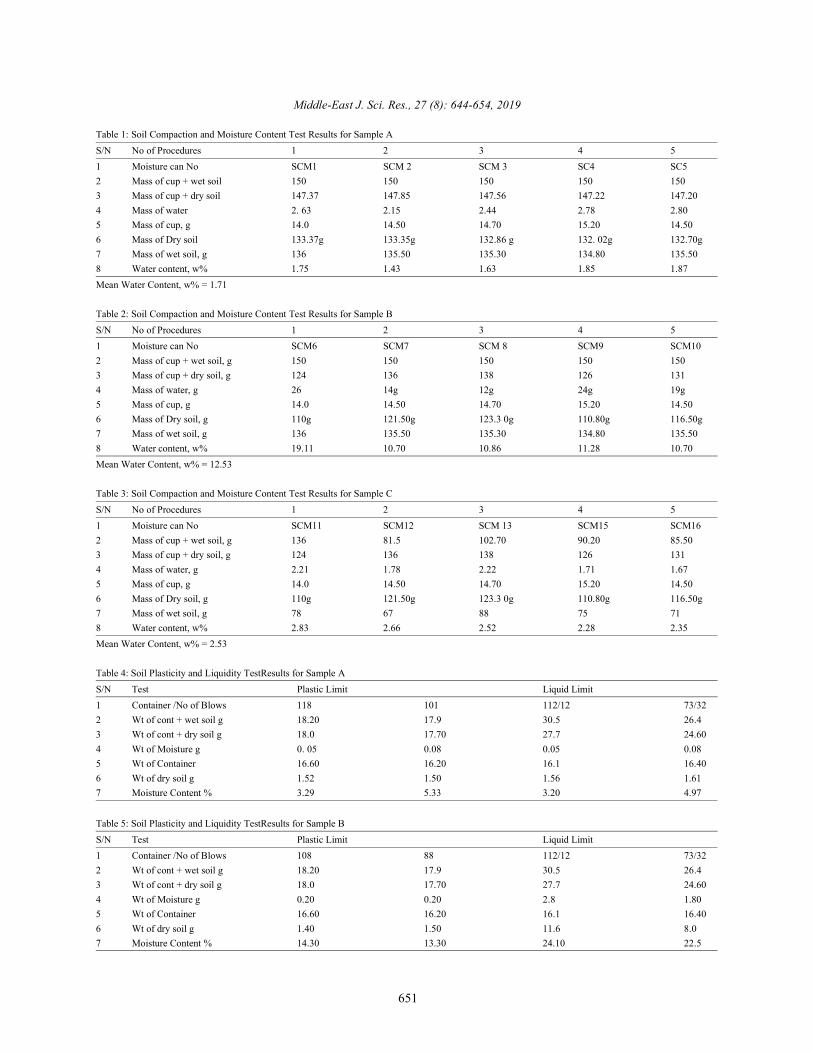
Table 1: Soil Compaction and Moisture Content Test Results for Sample AS/N No of Procedures 1 2 3 4 51 Moisture can No SCM1 SCM 2 SCM 3 SC4 SC52 Mass of cup + wet soil 150 150 150 150 1503 Mass of cup + dry soil 147.37 147.85 147.56 147.22 147.204 Mass of water 2. 63 2.15 2.44 2.78 2.805 Mass of cup, g 14.0 14.50 14.70 15.20 14.506 Mass of Dry soil 133.37g 133.35g 132.86 g 132. 02g 132.70g7 Mass of wet soil, g 136 135.50 135.30 134.80 135.508 Water content, w% 1.75 1.43 1.63 1.85 1.87Mean Water Content, w% = 1.71
Table 2: Soil Compaction and Moisture Content Test Results for Sample BS/N No of Procedures 1 2 3 4 51 Moisture can No SCM6 SCM7 SCM 8 SCM9 SCM102 Mass of cup + wet soil, g 150 150 150 150 1503 Mass of cup + dry soil, g 124 136 138 126 1314 Mass of water, g 26 14g 12g 24g 19g5 Mass of cup, g 14.0 14.50 14.70 15.20 14.506 Mass of Dry soil, g 110g 121.50g 123.3 0g 110.80g 116.50g7 Mass of wet soil, g 136 135.50 135.30 134.80 135.508 Water content, w% 19.11 10.70 10.86 11.28 10.70Mean Water Content, w% = 12.53
Table 3: Soil Compaction and Moisture Content Test Results for Sample CS/N No of Procedures 1 2 3 4 51 Moisture can No SCM11 SCM12 SCM 13 SCM15 SCM162 Mass of cup + wet soil, g 136 81.5 102.70 90.20 85.503 Mass of cup + dry soil, g 124 136 138 126 1314 Mass of water, g 2.21 1.78 2.22 1.71 1.675 Mass of cup, g 14.0 14.50 14.70 15.20 14.506 Mass of Dry soil, g 110g 121.50g 123.3 0g 110.80g 116.50g7 Mass of wet soil, g 78 67 88 75 718 Water content, w% 2.83 2.66 2.52 2.28 2.35Mean Water Content, w% = 2.53
Table 4: Soil Plasticity and Liquidity TestResults for Sample AS/N Test Plastic Limit Liquid Limit1 Container /No of Blows 118 101 112/12 73/322 Wt of cont + wet soil g 18.20 17.9 30.5 26.43 Wt of cont + dry soil g 18.0 17.70 27.7 24.604 Wt of Moisture g 0. 05 0.08 0.05 0.085 Wt of Container 16.60 16.20 16.1 16.406 Wt of dry soil g 1.52 1.50 1.56 1.617 Moisture Content % 3.29 5.33 3.20 4.97
Table 5: Soil Plasticity and Liquidity TestResults for Sample BS/N Test Plastic Limit Liquid Limit1 Container /No of Blows 108 88 112/12 73/322 Wt of cont + wet soil g 18.20 17.9 30.5 26.43 Wt of cont + dry soil g 18.0 17.70 27.7 24.604 Wt of Moisture g 0.20 0.20 2.8 1.805 Wt of Container 16.60 16.20 16.1 16.406 Wt of dry soil g 1.40 1.50 11.6 8.07 Moisture Content % 14.30 13.30 24.10 22.5

Middle-East J. Sci. Res., 27 (8): 644-654, 2019
652
Table 6: Soil Plasticity and Liquidity Test Results for Sample CS/N Test Plastic Limit Liquid Limit1 Container /No of Blows 112 99 102/12 54/242 Wt of cont + wet soil g 18.20 17.9 30.5 26.43 Wt of cont + dry soil g 18.0 17.70 27.7 24.604 Wt of Moisture g 0.20 0.20 2.8 1.805 Wt of Container 16.60 16.20 16.1 16.406 Wt of dry soil g 1.40 1.50 11.6 8.07 Moisture Content % 14.30 13.30 24.10 22.5
Summary of Findings and Discussions: activities increasing the susceptibility of the area to
The topography of the land shows a high sloppiness Unfortunately, the majority of gullies in Nanka arewhich makes it highly susceptible to erosion. very large, the widths ranged between 0.13m-397.20m, theThe type of soil found in the study area is gully height ranged between 2m-52.96m , while the lengthspredominantly that of weak clay and loose sandy ranged between 10m- 4, 369.20mand this has contributedclays. to loss of large expanse of useful lands which has becomeThe index test results for the natural moisture content unsuitable for settlement and cultivation in Nanka andranges from 1.71% –12.53 %; other parts of Southeastern Nigeria. There have beenThe plasticity index ranges from 0–33.283. numerous attempts to curb gully erosion in these regions;The compacted bulk density is between 1.55-1.76 especially through large-scale engineering projects,kg/m ; the specific gravity ranges from 1.68-2.06. however, little has been discussed about the real causes3
The permeability is l between 1.32 × 10 and 1.63 × of this menace (geotechnical and geologically) and ways3
10 cm/sec. The result shows that the area is highly to prevent their onset or the use of community-based low3
prone to gully erosion which has proven to be technology approaches to mitigate their development.detrimental to both agricultural activities and The features responsible for gully erosion incommunity development programs. Nankadepend on several factors like: highamount of landThe result also shows that there have been some exposed, the high sloppiness of the land, the nature of theanthropogenic activities increasing the susceptibility soil, poor method of land management, the intensity andof the area to erosion. duration of rainfall [18, 19, 20, 21]. The findings of the
Discussion of Findings: The findings revealed that stressed that soil erosion has damaging effects on landthetopography of the land shows a high sloppiness which and agricultural production. Akpata and Atanu [23];makesNanka highly susceptible to erosion. The types of Salako et al. [24] also added that the increasinglysoil found is predominantly clayey and sandy clay which deforestation which affects environmental conditionswere found not to be strongly compacted. The index test results from low level of education among the people inresults for the natural moisture content ranges from the area, this generally causes human activities2.30% - 15.20 %; the mean plasticity index range is low. contributing to soil erosion.The compacted bulk density is also low between 1.55- 1.76 The results of the moisture content presented inkg/m ; the specific gravity ranges from 1.68 - 2.06. For the Tables 1, 2 and 3 indicates that the soil samples show3
performance test; the compaction result shows that relatively low moisture content value ranging from 1.71 tothe average moisture content (OMC) ranges from 12.53 %, this is because the soil have low retentive1.71 -12.53 %. The permeability is between 1.32 × 10 & capacity and hence cannot hold much water. Compaction3
1.63 × 10 cm/sec which is not good enough to hold off test shows the maximum dry density (MMD) and the3
erosion in the area. The results show that gully erosion optimum moisture content (OMC) of the soil to be verycaused terrible damages to both agricultural activities low. One of the major reasons for carrying out compactionand Community Development Programmes in the area. test on soil is to increase the soil strength and to preventIn collaboration with the findings of the study, Ama, et al. seepage of water through the soil. Hence both soil water[17] revealed that gully erosion is partly enhanced by the content and the bulk density (dry density) affect soillow shear strength and plasticity index soils. The result strength, which will increase when the soil is compactedalso shows that there have been some anthropogenic to a higher density and when the soil loose water, it dries
erosion like excavation and deforestation.
study is also in line with the findings of Hudson [22], who
Middle-East J. Sci. Res., 27 (8): 644-654, 2019
653
and hardens. The geographic and geotechnical data Educate the people on the dangers of uncontrolledanalysis shows that Nanka and its environs have human activities causing or contributing to erosionrelatively weak clays and sandy clays. Though and flooding in the area.compaction test indicates the maximum dry density to Effective intervention and collaboration betweenwhich the soil may be compacted by a given force and it local and State government to tackle erosion in theindicates when the soil is either drier or wetter than its area.optimum moisture content while compacting will be more Government need to map out the entire area anddifficult. prepare gully erosion hazard/risk maps to guide
CONCLUSION anti-erosion structures.
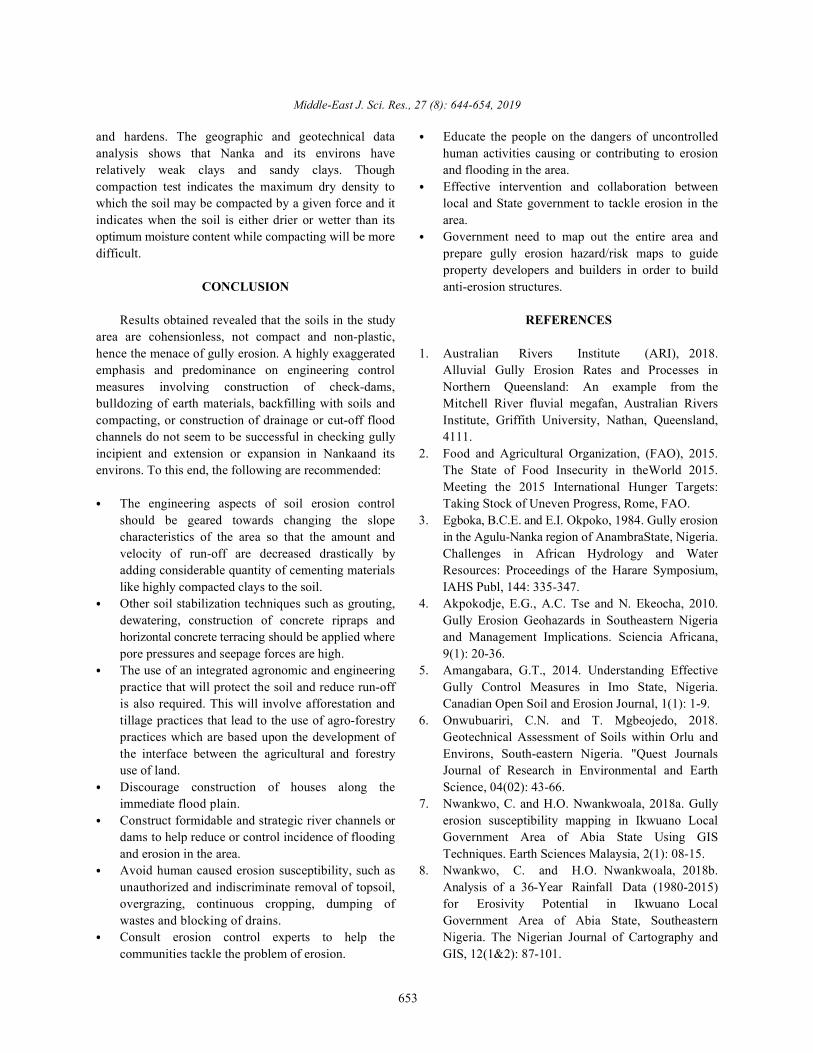
Results obtained revealed that the soils in the study REFERENCESarea are cohensionless, not compact and non-plastic,hence the menace of gully erosion. A highly exaggerated 1. Australian Rivers Institute (ARI), 2018.emphasis and predominance on engineering control Alluvial Gully Erosion Rates and Processes inmeasures involving construction of check-dams, Northern Queensland: An example from thebulldozing of earth materials, backfilling with soils and Mitchell River fluvial megafan, Australian Riverscompacting, or construction of drainage or cut-off flood Institute, Griffith University, Nathan, Queensland,channels do not seem to be successful in checking gully 4111.incipient and extension or expansion in Nankaand its 2. Food and Agricultural Organization, (FAO), 2015.environs. To this end, the following are recommended: The State of Food Insecurity in theWorld 2015.
The engineering aspects of soil erosion control Taking Stock of Uneven Progress, Rome, FAO.should be geared towards changing the slope 3. Egboka, B.C.E. and E.I. Okpoko, 1984. Gully erosioncharacteristics of the area so that the amount and in the Agulu-Nanka region of AnambraState, Nigeria.velocity of run-off are decreased drastically by Challenges in African Hydrology and Wateradding considerable quantity of cementing materials Resources: Proceedings of the Harare Symposium,like highly compacted clays to the soil. IAHS Publ, 144: 335-347.Other soil stabilization techniques such as grouting, 4. Akpokodje, E.G., A.C. Tse and N. Ekeocha, 2010.dewatering, construction of concrete ripraps and Gully Erosion Geohazards in Southeastern Nigeriahorizontal concrete terracing should be applied where and Management Implications. Sciencia Africana,pore pressures and seepage forces are high. 9(1): 20-36.The use of an integrated agronomic and engineering 5. Amangabara, G.T., 2014. Understanding Effectivepractice that will protect the soil and reduce run-off Gully Control Measures in Imo State, Nigeria.is also required. This will involve afforestation and Canadian Open Soil and Erosion Journal, 1(1): 1-9. tillage practices that lead to the use of agro-forestry 6. Onwubuariri, C.N. and T. Mgbeojedo, 2018.practices which are based upon the development of Geotechnical Assessment of Soils within Orlu andthe interface between the agricultural and forestry Environs, South-eastern Nigeria. "Quest Journalsuse of land. Journal of Research in Environmental and EarthDiscourage construction of houses along the Science, 04(02): 43-66.immediate flood plain. 7. Nwankwo, C. and H.O. Nwankwoala, 2018a. GullyConstruct formidable and strategic river channels or erosion susceptibility mapping in Ikwuano Localdams to help reduce or control incidence of flooding Government Area of Abia State Using GISand erosion in the area. Techniques. Earth Sciences Malaysia, 2(1): 08-15. Avoid human caused erosion susceptibility, such as 8. Nwankwo, C. and H.O. Nwankwoala, 2018b.unauthorized and indiscriminate removal of topsoil, Analysis of a 36-Year Rainfall Data (1980-2015)overgrazing, continuous cropping, dumping of for Erosivity Potential in Ikwuano Localwastes and blocking of drains. Government Area of Abia State, SoutheasternConsult erosion control experts to help the Nigeria. The Nigerian Journal of Cartography andcommunities tackle the problem of erosion. GIS, 12(1&2): 87-101.
property developers and builders in order to build
Meeting the 2015 International Hunger Targets:

Middle-East J. Sci. Res., 27 (8): 644-654, 2019
654
9. Egboka, B.C.E., E.O. Akudo and H.O. Nwankwoala, 17. Amah, E.A., E.A. Esu and E.O. Kanu, 2008.2019. Gully Erosion and Landslides in Southeastern Hydrogeological and Geotechnical Investigations ofNigeria: Causes, Consequences and Control Gully Erosion Sites in Calabar Area, SoutheasternMeasures. Glob J. Eng. Sci., 2(4): 2019. Nigeria. Global Journal of Pure and Applied Sciences,GJES.MS.ID.000541. DOI: 10.33552/GJES.2019.02. 14(4): 423-432.000541 18. Igwe, C.A., 1994. The Applicability of SLEMSA and
10. Ofomata, G.E.K., 2015. Soil erosion: Nigeria in maps, USLE erosion models on soils of SoutheasternEastern States. Benin City :Ethiope Publishing Nigeria, PhD Thesis University of Nigeria Nsukka.House. 19. Igwe, C.A., 2014. Land Use and Soil Conservation
11. Akudinobi, B.E.B., 1999. Gully Erosion Menace in Strategies for Potentially highly Erodible Soils ofNigeria: The Geotechnical and Anthropogenic Central Eastern Nigeria. Land DegradationImplications. Nigerian Journal of Science, Development, 10(2): 425-434.33(1): 121-132. 20. Igwe, C.A., F.O.R. Akamigbo and J.S.C. Mbagwu,
12. Chikwelu, E.E. and F.U. Ogbuagu, 2014. Geotechnical 2015. The Use of some Soil Aggregate indices toinvestigation of soil around Mbaukwu gully erosion assess potential soil loss in soils of Southeasternsites, south-eastern part of Nigeria. Journal of Nigeria. Journal of International Agrophysics,Applied Geology and Geophysics, 2(4): 6-17. 9(1): 95-100.
13. Obi, N.I. and C.J. Okekeogbu, 2017. Erosion Problems 21. Igwe, C.A., F.O.R. Akamigbo and J.S.C. Mbagwu,and their Impacts in Anambra State of Nigeria: (A 2016. Chemical and Mineralogical Properties of SoilsCase of Nanka Community). International Journal of in Southeastern Nigeria in relation to aggregateEnvironment and Pollution Research, 5(1): 24-37. stability. Journal of Geoderma, 9(2): 111-123.
14. Obi, M.E. and O.E. Ngwu, 2008. Characterization of 22. Hudson, N.W., 1973. Soil Conservation. New York:the Rainfall Regime for the Prediction of Surface Cornell University Press.Runoff and Soil Loss in Southeastern Nigeria. Journal 23. Akpata, D. and F.H. Atanu, 1990. A Threatenedof Contributions to Tropical Agriculture and Environment: A study of the impact of soil erosion.Veterinary Medicine, 26(1): 39-46. Teacher Education Journal, 1(3): 20-25.
15. Obi, M.E. and F.K. Salako, 2015. Rainfall Parameters 24. Salako, F.K., M.E. Obi and R. Lal, 2017. Comparativeinfluencing Erosivity in Southeastern Nigeria. Journal Assessment of Several Rainfall Erosivity Indices inof Catena, 2(4): 275-287. Southern Nigeria. Soil Technology, 4(1): 93-97.
16. ASTER, 2018. Remote Sensing Data Resources.Advanced Space borne Thermal Emission andReflection Radiometer (ASTER). Remote Sens.Environ., 68: 65-82.