gully erosion susceptibility mapping: the role of gis-based bivariate statistical models and their...
TRANSCRIPT

ORIGINAL PAPER
Gully erosion susceptibility mapping: the role of GIS-based bivariate statistical models and their comparison
Omid Rahmati1 • Ali Haghizadeh1 • Hamid Reza Pourghasemi2 •
Farhad Noormohamadi1
Received: 26 December 2014 / Accepted: 8 February 2016 / Published online: 22 February 2016� Springer Science+Business Media Dordrecht 2016
Abstract Gully erosion is a key issue in natural resource management that often has
severe environmental, economic, and social consequences. The objective of the present
study is to assess the capability of weights-of-evidence (WofE) and frequency ratio (FR)
models for spatial prediction of gully erosion susceptibility and characterizing suscepti-
bility conditions at Chavar region, Ilam province, Iran. At first, a gully erosion inventory
map is prepared, using multiple field surveys. In total, of the 63 gullies which have been
identified, 44 (70 %) cases are randomly algorithm selected to build gully susceptibility
models, while the remaining 19 (30 %) cases are used to validate the models. The
effectiveness of gully erosion susceptibility assessment via GIS-based models depends on
appropriate selection of the conditioning factors which play an important role in gully
erosion. Learning vector quantization (LVQ), one of the supervised neural network
methods, is employed in order to estimate variable importance. In this research, the
selected conditioning factors are: lithology, land use, distance from river, soil texture, slope
degree, slope aspect, plan curvature, topographic wetness index, drainage density, and
altitude. Finally, validation of the gully dataset which has not been utilized during the
spatial modeling process is applied to validate the gully susceptibility maps. The receiver
operating characteristic curves for each gully susceptibility map (i.e., produced by WofE
& Omid [email protected]
Hamid Reza [email protected]
Farhad [email protected]
1 Department of Watershed Management Engineering, College of Agriculture, Lorestan University,Khorramabad, Iran
2 Department of Natural Resources and Environmental Engineering, College of Agriculture, ShirazUniversity, Shiraz, Iran
123
Nat Hazards (2016) 82:1231–1258DOI 10.1007/s11069-016-2239-7
and FR) are drawn, and the areas under the curves (AUC) are calculated. The results show
that the gully erosion susceptibility map produced by the frequency ratio model
(AUC = 78.11 %) functions well in prediction compared with the WofE model
(AUC = 70.07 %). Furthermore, LVQ results reveal that distance from river, drainage
density, and land use are the most effective factors.
Keywords Gully erosion assessment � Bivariate statistical models � GIS � Learning vectorquantization � Iran
1 Introduction
Gully erosion is a major problem for natural resource management, leading to land
degradation and economic losses worldwide. This phenomenon causes different types of
damage to roads, natural resources, and agriculture (Burkard and Kostaschuk 1997; Nyssen
et al. 2002; Valentin et al. 2005; Choi et al. 2008; Takken et al. 2008; Akgun and Turk
2011; Chaplot 2013; Zakerinejad and Maerker 2015), which is considered as one of the
principal agents of geo-environmental degradation in Western Iran. Large parts of Ilam
province are affected by gully erosion (Noormohammadi et al. 2013, 2014). The gully
erosion and degradation processes are related to population growth and such interrelated
effects as expanding agricultural lands, overgrazing, and deforestation. Due to the semiarid
climate, intense precipitation events, and deforestation processes, gully erosion is con-
sidered an important source of land degradation in Ilam.
Geo-environmental factors controlling critical conditions for gully erosion occurrence
and development are primarily associated with topography, lithology, rainfall, soil, and
land use (Bryan and Jones 2000; Poesen et al. 2003; Martınez-Casasnovas et al. 2004;
Capra et al. 2009; Gomez Gutierrez et al. 2009b; Cui et al. 2012; El Maaoui et al. 2012).
Kirkby and Bracken (2009) stated that surface runoff is one of the principal factors con-
tributing to the occurrence of gully erosion. The velocity and volume of concentrated
surface flow are also controlled by land use and topographic attributes (e.g., contributing
drainage area, slope steepness, and slope curvature) (Vandekerckhove et al. 2000; Valentin
et al. 2005; Zucca et al. 2006; Dondofema 2007; Samani et al. 2009; Capra et al. 2009;
Svoray and Markovitch 2009; Conoscenti et al. 2013).
Several models have been developed for assessing the gully erosion rate (USDA-SCS
1992; Poesen et al. 2003). Among these are the following physically based models:
Chemicals, Runoff, and Erosion from Agricultural Management Systems (CREAMS;
Knisel 1980), Water Erosion Prediction Project (WEPP; Flanagan and Nearing 1995),
Ephemeral Gully Erosion Mode (EGEM; Merkel et al. 1988; Woodward 1999), and the
method developed by Sidorchuk (1999). However, the above-mentioned models do not
predict spatial distribution of gullies which is an essential tool for evaluating the impact of
environmental changes on the occurrence of gullies and planning the erosion-control
practices (Conoscenti et al. 2013). Additionally, the spatial distribution of soil erosion,
especially gully erosion, is an important factor in watershed management (Popp et al. 2000;
Sidorchuk et al. 2003; Kumar and Nair 2006). There are also models that allow an
investigator to produce gully erosion susceptibility map (GESM) or assess the spatial
probability of gully occurrence by defining statistical relationships between geo-environ-
mental conditioning factors and the spatial distribution of gullies (Table 1).
1232 Nat Hazards (2016) 82:1231–1258
123
The main objectives of this study are as follows: (1) variable contribution analysis via
learning vector quantization (LVQ) algorithm, (2) analyzing the geo-environmental con-
ditions which determine the occurrence of gully erosion, and (3) assessing the capability of
frequency ratio (FR) and weights-of-evidence (WofE) models to predict gully erosion
susceptibility. In order to achieve these goals, the original research was carried out in
Chavar region, Ilam province, Iran, as an area prone to gully erosion. The frequency ratio
and weights-of-evidence models were selected as the bivariate statistical analysis for
gauging gully erosion susceptibility because of the following reasons: (1) The mentioned
models can work with different types of independent variables such as binary categorical,
ordinal, or continuous and (2) only few studies have tested bivariate statistical analysis for
calculating gully erosion susceptibility (Dube et al. 2014). Producing the GESM will be
useful to decision makers and engineers in land-use management to identify prone areas for
future plans (e.g., road development and urbanization).
Table 1 Methods adopted in the several studies on the spatial distribution of gullies
Article Method
Martınez-Casasnovas et al. (2004) Logistic regression
Chaplot et al. (2005a, b) Linear regression
Meyer and Martınez-Casasnovas (1999) Logistic regression
Luca et al. (2011) Logistic regression; information value
Akgun and Turk (2011) Logistic regression
Conoscenti et al. (2014) Logistic regression
Conforti et al. (2010) Information value
Conoscenti et al. (2008) Conditional analysis
Conoscenti et al. (2013) Conditional analysis
Magliulo (2010, 2012) Conditional analysis
Martınez-Casasnovas (2003) Spatial information technology
Perroy et al. (2010) Airborne and ground-based LiDAR
Bou Kheir et al. (2007) CART
Geissen et al. (2007) CART
Marker et al. (2011) CART
Gomez Gutierrez et al. (2009b) CART; MARS
Hughes et al. (2001) Gully density
Gomez Gutierrez et al. (2009a) MARS
Dube et al. (2014) Weight of evidence
Kuhnert et al. (2010) Random forests
Svoray et al. (2012) Analytical hierarchy process; data mining techniques
Zakerinejad and Marker (2014) Maximum entropy modeling
Zakerinejad and Maerker (2015) Stream power index; USPED
Castillo et al. (2014) Normalized topographic method
Gomez-Gutierrez et al. (2015) MARS
CART classification and regression trees, MARS multivariate adaptive regression splines, USPED unitstream power-based erosion deposition
Nat Hazards (2016) 82:1231–1258 1233
123

2 Study area
The study area is located in the northern part of Ilam province, Iran, between latitudes of
33�210–33�470N and longitudes of 46�090–46�580E (Fig. 1). It covers an area of about
2,595 km2, and its altitude ranges from 423 to 2795 m above sea level, with an average of
1285 m. The study area is considered to have a semiarid climate with a mean annual
rainfall of 450 mm (WRCI 2013). It receives approximately 85 % of its annual rainfall
from December to April. In winter, the temperature ranges from -3 to 10.5 �C, while in
summer it varies from 25 to 39 �C. The major rivers in the study area are Chavar and
Seimare. Peak stream flows are experienced between February and June (WRCI 2013).
From a geological viewpoint, the study area is located in Zagros structural zone of Iran.
Zagros is identified as a region of polyphase deformation, fracture systems, and the latest
reflection of the collision of Arabia and Eurasia (Alavi 1994). The central part of the study
area is mostly covered by the massive limestone (Kazhdum formation). The vegetation
distributed above 2500 m is mainly chestnut forests or shrub grasslands. Three main soil
types occur within the study area, namely inceptisols, entisols, and vertisols. In this region,
the main erosive processes that affect the landscape are related to overland flow (diffuse
and/or linear) and gully formation that cause severe damages (Noormohammadi et al.
2013). The study area was selected because it is susceptible to gully erosion and land
degradation due to human activities (such as extension of agriculture and deforestation,
development of roads, and water transport project) and specific environmental and
socioeconomic settings (Noormohammadi et al. 2014). In the case of socioeconomic set-
ting, the people in this region earn a living by producing commodities through dry farming
and irrigated agriculture.
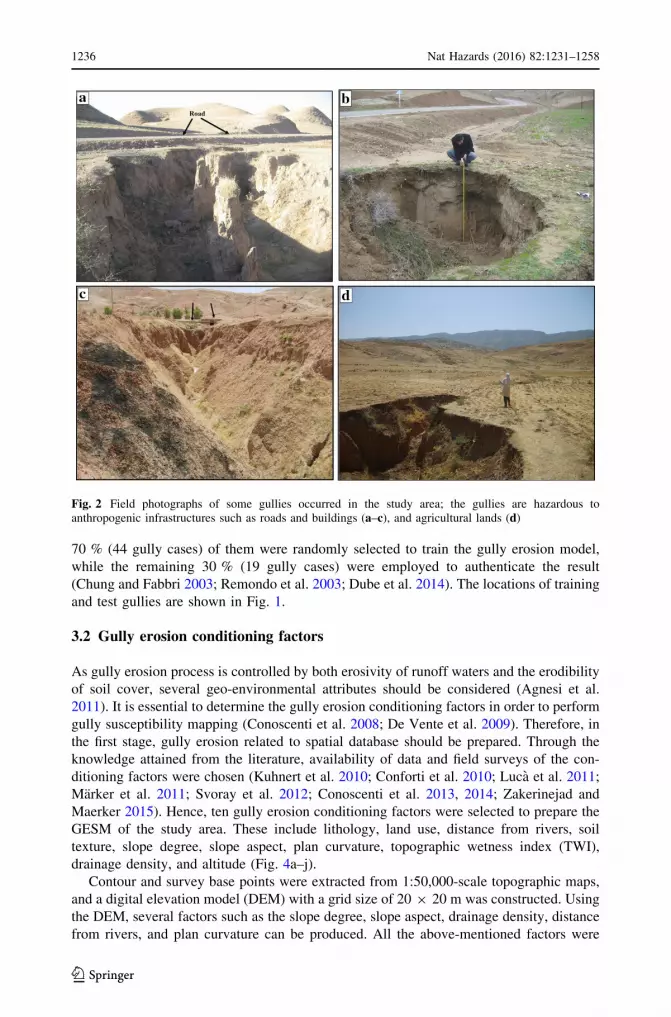
Four photographs of the recent gullies identified in the study area are shown in Fig. 2.
From the standpoint of people’s livelihood strategies, animal husbandry and agriculture
production are the main incomes in this area. From the viewpoint of natural resource
management, soil erosion is a major problem, especially in sub-humid, semiarid, and low-
and mid-latitude areas (Lal 2001) such as Chavar region in Iran.
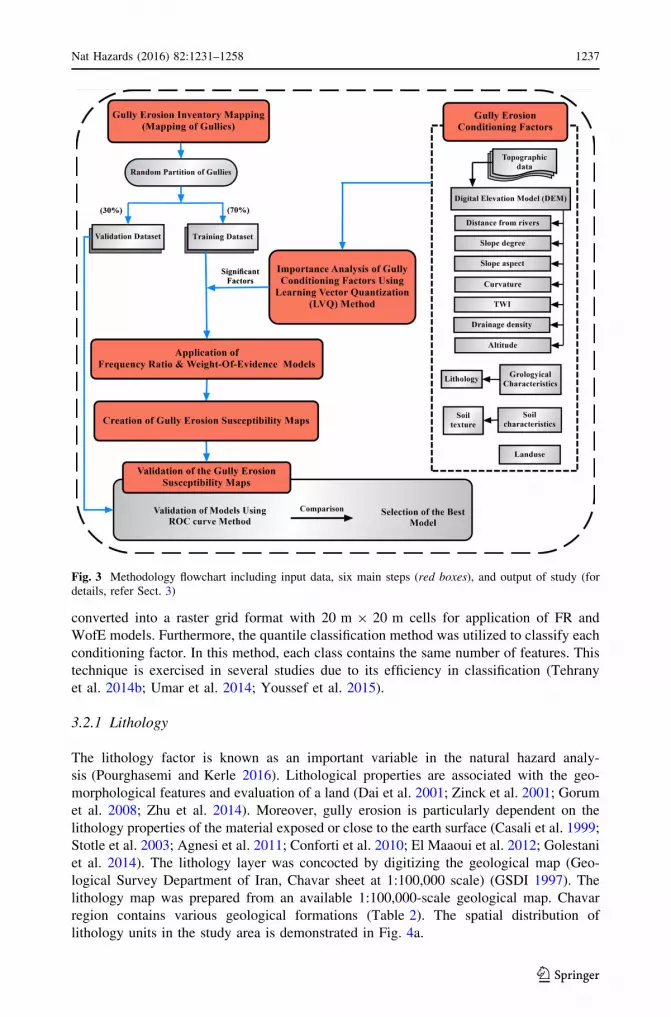
3 Methodology
The methodological approach applied in the current study is a statistical bivariate analysis,
as illustrated in Fig. 3. It consists of six main steps:
1. Gully erosion inventory mapping
2. Preparing of maps of gully erosion conditioning factors
3. Importance analysis of gully conditioning factors
4. Application of frequency ratio and weights-of-evidence models
5. Creation of gully erosion susceptibility maps
6. Validation of the gully erosion susceptibility maps.
These steps are explained and expanded in the following sections.
3.1 Gully erosion inventory mapping
In the present study, gully erosion inventory map is a collection of gully occurrences which
took place in the period of 2012–2014. To prepare a detailed and reliable gully inventory
1234 Nat Hazards (2016) 82:1231–1258
123
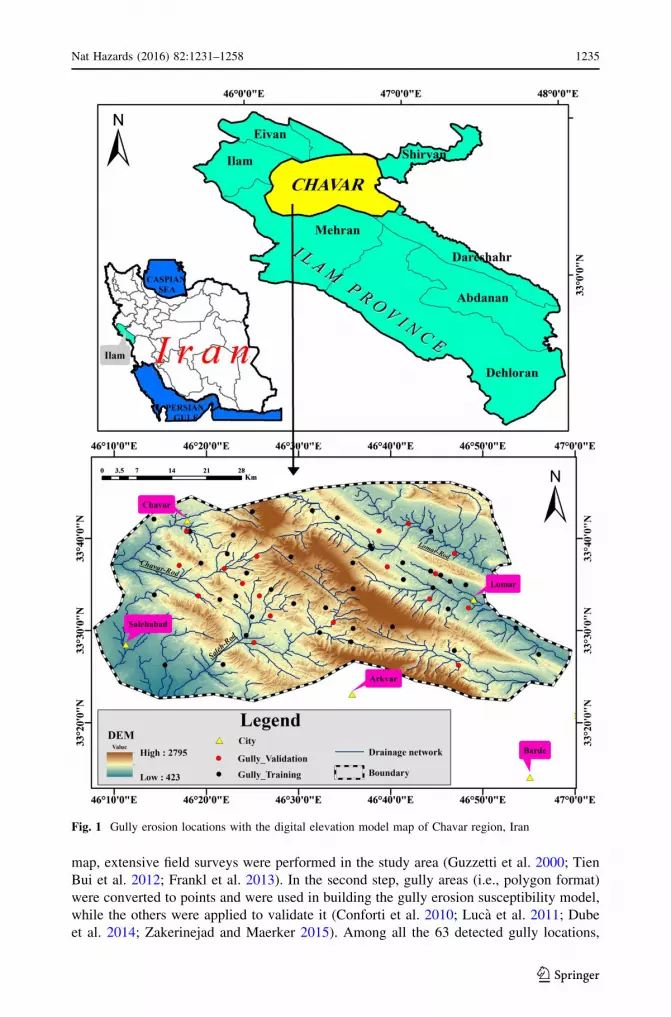
map, extensive field surveys were performed in the study area (Guzzetti et al. 2000; Tien
Bui et al. 2012; Frankl et al. 2013). In the second step, gully areas (i.e., polygon format)
were converted to points and were used in building the gully erosion susceptibility model,
while the others were applied to validate it (Conforti et al. 2010; Luca et al. 2011; Dube
et al. 2014; Zakerinejad and Maerker 2015). Among all the 63 detected gully locations,
Fig. 1 Gully erosion locations with the digital elevation model map of Chavar region, Iran
Nat Hazards (2016) 82:1231–1258 1235
123
70 % (44 gully cases) of them were randomly selected to train the gully erosion model,
while the remaining 30 % (19 gully cases) were employed to authenticate the result
(Chung and Fabbri 2003; Remondo et al. 2003; Dube et al. 2014). The locations of training
and test gullies are shown in Fig. 1.
3.2 Gully erosion conditioning factors
As gully erosion process is controlled by both erosivity of runoff waters and the erodibility
of soil cover, several geo-environmental attributes should be considered (Agnesi et al.
2011). It is essential to determine the gully erosion conditioning factors in order to perform
gully susceptibility mapping (Conoscenti et al. 2008; De Vente et al. 2009). Therefore, in
the first stage, gully erosion related to spatial database should be prepared. Through the
knowledge attained from the literature, availability of data and field surveys of the con-
ditioning factors were chosen (Kuhnert et al. 2010; Conforti et al. 2010; Luca et al. 2011;
Marker et al. 2011; Svoray et al. 2012; Conoscenti et al. 2013, 2014; Zakerinejad and
Maerker 2015). Hence, ten gully erosion conditioning factors were selected to prepare the
GESM of the study area. These include lithology, land use, distance from rivers, soil
texture, slope degree, slope aspect, plan curvature, topographic wetness index (TWI),
drainage density, and altitude (Fig. 4a–j).
Contour and survey base points were extracted from 1:50,000-scale topographic maps,
and a digital elevation model (DEM) with a grid size of 20 9 20 m was constructed. Using
the DEM, several factors such as the slope degree, slope aspect, drainage density, distance
from rivers, and plan curvature can be produced. All the above-mentioned factors were
Fig. 2 Field photographs of some gullies occurred in the study area; the gullies are hazardous toanthropogenic infrastructures such as roads and buildings (a–c), and agricultural lands (d)
1236 Nat Hazards (2016) 82:1231–1258
123
converted into a raster grid format with 20 m 9 20 m cells for application of FR and
WofE models. Furthermore, the quantile classification method was utilized to classify each
conditioning factor. In this method, each class contains the same number of features. This
technique is exercised in several studies due to its efficiency in classification (Tehrany
et al. 2014b; Umar et al. 2014; Youssef et al. 2015).
3.2.1 Lithology
The lithology factor is known as an important variable in the natural hazard analy-
sis (Pourghasemi and Kerle 2016). Lithological properties are associated with the geo-
morphological features and evaluation of a land (Dai et al. 2001; Zinck et al. 2001; Gorum
et al. 2008; Zhu et al. 2014). Moreover, gully erosion is particularly dependent on the
lithology properties of the material exposed or close to the earth surface (Casali et al. 1999;
Stotle et al. 2003; Agnesi et al. 2011; Conforti et al. 2010; El Maaoui et al. 2012; Golestani
et al. 2014). The lithology layer was concocted by digitizing the geological map (Geo-
logical Survey Department of Iran, Chavar sheet at 1:100,000 scale) (GSDI 1997). The
lithology map was prepared from an available 1:100,000-scale geological map. Chavar
region contains various geological formations (Table 2). The spatial distribution of
lithology units in the study area is demonstrated in Fig. 4a.
Fig. 3 Methodology flowchart including input data, six main steps (red boxes), and output of study (fordetails, refer Sect. 3)
Nat Hazards (2016) 82:1231–1258 1237
123

Fig. 4 Gully conditioning factors: a lithology (see Table 2 for legend of lithology map), b land use,c distance from rivers, d soil texture, e slope degree, f slope aspect, g plan curvature, h TWI, i drainagedensity, and j altitude
1238 Nat Hazards (2016) 82:1231–1258
123

Fig. 4 continued
Table 2 Lithology of the study area
Code Lithology Formation Geological age
Ekn Tine-bedded argillaceous limestone with calcareous shale Kandavan Eocene
EMas-sb Undifferentiated limestone Shahbazan Eocene
Kbgp Bangestan Group: mainly limestone and shale Surgah Cretaceous
KEpd-gu
Massive fossiliferous limestone Kazhdumi Cretaceous
KPeam Siltstone, sandstone locally with conglomerate and shellylimestone
Amiran Cretaceous–Paleocene
Mgs Anhydrite, salt, red marl, locally with argillaceous limestone Gachsaran Miocene
MuPlaj Sandstone (brown to gray), red marl, siltstone Aghajari Miocene
OMas Jointed limestone with intercalation of shale Asmari Miocene
Pd Cross-bedded, quartzitic sandstone Dorud Permian
Plbk Conglomerate locally with sandstone Bakhtyari Pliocene
Qft1 High-level pediment fan and valley terrace deposits – Quaternary
Nat Hazards (2016) 82:1231–1258 1239
123

3.2.2 Land use
Land-use management has a significant influence on the geomorphological slope stability
and gully occurrence (Anabalagan 1992; Zucca et al. 2006; Agnesi et al. 2011; Conoscenti
et al. 2013, 2014; Zakerinejad and Maerker 2015). Generally barren lands and sparsely
vegetated areas are more susceptible to erosion than forests where vegetation cover
strongly reduces the erosive action of surface runoff (Dai et al. 2001; Cevik and Topal
2003; Gomez Gutierrez et al. 2009a). In other words, a negative correlation exists among
erosion rate and vegetation density (Snelder and Bryan 1995; Hughes et al. 2001; Chaplot
et al. 2005b). The land-use map was obtained from Iranian Department of Water Resource
Management (IDWRM 2012). Main land-use types having been identified in the study area
were agriculture, range, forest, and urban classes (Fig. 4b). In particular, more than 81 %
of the study area presents an agricultural land-use type in which the large part of the gullies
(90.9 %) is included. Consequently, range land, forest, and urban areas are covered by
12.98, 4.35, and 0.79 % of the study area, respectively.
3.2.3 Distance from rivers
In most cases, gullies are linked to the drainage/stream network, facilitating the evacuation
of the material eroded from upland areas (Conoscenti et al. 2014). In order to explore the
influence of drainage network, the factor of distance from rivers was considered (Choi
et al. 2008; Conoscenti et al. 2014; Dube et al. 2014; Zakerinejad and Maerker 2015).
Hence, the distance calculation operation in ArcGIS 10.2 was exercised to derive the
distance from rivers and classify it into four categories based on quantile classification
scheme (Fig. 4c).
3.2.4 Soil texture
The physical properties of the surface soil play an important role in soil infiltration, runoff
rate, soil resistance to erosion, and gully occurrence (Bryan and Jones 2000; Bou Kheir
et al. 2007, 2008; Geissen et al. 2007; Magliulo 2012; Torri et al. 2012; Deng et al. 2015).
Above all, soil texture influences hypodermic/subsurface flow and piping occurrence
(tunnel erosion), which can lead to forming gullies when the roofs of pipes collapse (Bull
and Kirkby 1997; Bryan and Jones 2000; Valentin et al. 2005; Pulice et al. 2012).
Therefore, soil texture was selected to evaluate gully erosion susceptibility (Wells et al.
2009; Agnesi et al. 2011; Conoscenti et al. 2013). A soil texture map was digitized from
soil characteristics map obtained from Iranian Department of Agriculture. Six soil texture
types were in the study areas, namely loam, clay, clay loam, sandy, sandy clay, and sandy
clay loam (Fig. 4d).
3.2.5 Slope degree
The gentle slope areas are highly potential areas for surface flow accumulation and con-
sequent exposure to gully initiation (Dramis and Gentili 1977; Valentin et al. 2005; Agnesi
et al. 2011; Rahmati et al. 2015b; Ghorbani Nejad et al. 2016). In the case of gully erosion,
gullies in the catchment are mainly located on gentle slopes as confirmed by other
researches (Flugel et al. 2003; Chaplot et al. 2005a; Kakembo et al. 2009; Le Roux and
1240 Nat Hazards (2016) 82:1231–1258
123

Sumner 2012). In the current study, the slope degree was derived from the DEM and was
divided into five classes (Fig. 4e).
3.2.6 Slope aspect
Slope aspect is also considered a crucial factor in natural hazard analysis and susceptibility
mapping (Maharaj 1993; Baeza and Corominas 2001; Pourghasemi et al. 2013b; Umar
et al. 2014). The slope aspect can indirectly influence erosion processes because it controls
duration of sunlight exposition, evapotranspiration, moisture retention, vegetation cover
type, and vegetation distribution on slopes (Dai et al. 2001; Sidle and Ochiai 2006; Agnesi
et al. 2011; Wang et al. 2011; Jaafari et al. 2014). Moreover, it can indirectly express
(proxy role) the influence of the structural setting (Conoscenti et al. 2013). The slope
aspect map was constructed automatically in ArcGIS 10.2 software, using the DEM with a
grid cell size of 20 9 20 m, and is classified into nine categories (Fig. 4f).
3.2.7 Plan curvature
The useful geomorphological information and terrain morphology description can be
determined through the analysis of plan curvature (Davoodi Moghaddam et al. 2013;
Chaplot 2013; Tehrany et al. 2014b). Generally, the impact of plan curvature on gully
erosion occurrence is the divergence or convergence of water during downslope flow
(Agnesi et al. 2011; Conforti et al. 2010; Conoscenti et al. 2013; Gomez-Gutierrez et al.
2015). Therefore, plan curvature layer has been selected with respect to its effect on gullies
triggering and development. By means of ArcGIS 10.2 software, the plan curvature map
was prepared. This layer was classified into three classes of convex (positive curvature),
flat (zero curvature), and concave (negative curvature) (Fig. 4g).
3.2.8 Topographic wetness index
The topographic wetness index (TWI) is a water-related and secondary topographic factor
within the runoff model which is commonly applied to quantify topographic control in
hydrological processes (Rahmati et al. 2016). It is clarified by the following equation
(Moore et al. 1991):
TWI ¼ lnS
tan a
� �ð1Þ
where S is the cumulative upslope area draining through a point (per unit contour length)
and a is the slope gradient (in degrees) (Moore et al. 1991). The tendency of gravitational
forces to move toward water down slope (in terms of tana) and the tendency of water to
accumulate at any point in the catchment (in terms of S) are considered by the TWI factor.
As stated by Gomez-Gutierrez et al. (2015), TWI is recognized as an important factor in
evaluating gully erosion proneness. Gullying occurs as the flow velocity exceeds the soil
shear stress, which is mostly a function of S parameter and is related to energy level of
surface runoff (Vandaele et al. 1996; Chaplot 2013). The erosive power of runoff in terms
of flow velocity, potential discharge, and transport capacity was modeled by means of TWI
(Agnesi et al. 2011; Chaplot 2013; Conoscenti et al. 2014; Tehrany et al. 2015; Tah-
massebipoor et al. 2016), which was derived from the DEM. A morpho-dynamic inter-
pretation of topographic attributes (e.g., TWI, altitude, and slope angle) is given in detail
Nat Hazards (2016) 82:1231–1258 1241
123
by Wilson and Gallant (2000). In the present study, TWI map is divided into four groups,
using quantile classification method (Tehrany et al. 2014a) (Fig. 4h).
3.2.9 Drainage density
According to Tehrany et al. (2014b), a high drainage density causes larger surface runoff
ratio. The drainage pattern of an area is affected by several factors such as the nature and
structure of the geological formation, soil characteristics, vegetation cover condition,
infiltration rate, and slope degree (Manap et al. 2014; Pourtaghi and Pourghasemi 2014). In
order to produce drainage density map of study area, Line Density tool in ArcGIS 10.2 was
applied and its values have been organized in four classes (Fig. 4i).
3.2.10 Altitude
The topographic attributes (such as altitude and slope angle) mainly control gully erosion
process and, thus, determine the spatial distribution of gullies (Conoscenti et al. 2014;
Hongchun et al. 2014; Gomez-Gutierrez et al. 2015). In addition, altitude plays important
roles in vegetation cover type and precipitation properties. Hence, altitude map of the study
area was obtained from the DEM, and five classes (\925, 925–1,138, 1,138–1,359,
1,359–1,613, and[1,613 m) were constructed (Fig. 4j).
3.3 Importance analysis of gully conditioning factors
The learning vector quantization (LVQ) algorithm is one of the supervised neural network
methods first presented by Kohonen (1995). It applies a ‘‘winner-take-all’’ learning
approach (Pham and Oztemel 1994). Indeed, the Euclidean distance has been considered as
a basic rule of competition. The distance (Di) between the training vector X and the
reference vector Zi of neuron i is given by:
Di ¼ Zi � X ¼ffiffiffiffiffiffiffiffiffiffiffiffiffiffiffiffiffiffiffiffiffiffiffiffiffiffiffiffiX
Zij � Xj
� �2qð2Þ
where Xi and Zi are jth elements of X and Zi, respectively. The learning equation for
updating the Zi and consequently importance analysis of variables is given as follows. If
the neuron is in the wrong category (WC):
Zi t þ 1ð Þ ¼ Zi tð Þ � k tð Þhi tð Þ X tð Þ � Zi tð Þð Þ ð3Þ
and if the neuron is in the wrong category, then
Zi t þ 1ð Þ ¼ Zi tð Þ þ k tð Þhi tð Þ X tð Þ � Zi tð Þð Þ ð4Þ
where
hi tð Þ ¼1; if the ith neuron is a winner;0; otherwise;
�ð5Þ
denotes the degree of excitation of the neurons. k(t) is the learning rate at the time t. The
details of the LVQ algorithm can be found in Ahalt et al. (1990) and Kohonen et al. (1996).
This algorithm has been successfully applied in many different fields such as landslide
susceptibility zonation (Pavel et al. 2008; Borgogno Mondino et al. 2009; Pavel et al. 2011),
mineral potential mapping (Tayebi and Tangestani 2015), rock type classification of
1242 Nat Hazards (2016) 82:1231–1258
123
limestone (Patel and Chatterjee 2016), vegetation classification (Filippi and Jensen 2006),
and environmental sciences (Erbek et al. 2004; Zhang and Xie 2012; Williams et al. 2014).
Recently, Naghibi et al. (2016) have utilized the LVQ algorithm to quantify variables
importance (VI) and uncertainty analysis of groundwater modeling. In the current research,
the relative contribution of the independent variables to gully occurrence (i.e., dependent
variable) was evaluated via LVQ algorithm—which can be performed in R statistical
package.
3.4 Application of bivariate models
3.4.1 Frequency ratio model
Among several bivariate statistical approaches for gully susceptibility mapping, the fre-
quency ratio (FR) model has been employed in the current study (Poudyal et al. 2010;
Pradhan 2010). A simple geospatial assessment tool for identifying the probabilistic
relationship between dependent and independent factors can be explained, using the FR
model (Bonham-Carter 1994; Tehrany et al. 2013). In this study, the selected conditioning
factors (e.g., lithology, land use, distance from river, soil texture, slope degree, slope
aspect, plan curvature, topographic wetness index (TWI), drainage density, and altitude)
and gullies location are independent and dependent variables, respectively.
The FR can be described as the ratio of the area where gullies occurred in the total study
area (Conforti et al. 2010). In this model, for each conditioning factor, the density of the
gullies of the training set in each class was calculated, using the following equation
(Bonham-Carter 1994):
FR ¼ A=B
C=D; ð6Þ
where A is the number of pixels with gully erosion for each conditioning factor, B is the
number of total gully occurrences in study area, C is the number of pixels in the class area
of the factor and D is the number of total pixels in the study area. By operating the FR
model, the spatial relationships between gully locations and each factor’s contributing
gully erosion occurrence were derived. Then, the frequency ratio magnitude of each class
is computed through analysis of the relationship between gully location and the attributing
factors. In a given pixel, the gully erosion susceptibility index (GESI) can be obtained by
summation of pixel values according to Eq. (7):
GESI ¼XR¼n
R¼1
FR; ð7Þ
where GESI and FR are gully susceptibility index and the final weight for the FR model,
respectively.
3.4.2 Weights-of-evidence model
The weights-of-evidence (WofE) model is based on a statistical Bayesian bivariate
approach and has been used for landslide susceptibility mapping (Mohammady et al. 2012;
Pourghasemi et al. 2013b, c) and flood susceptibility mapping (Tehrany et al. 2014b). A
Nat Hazards (2016) 82:1231–1258 1243
123
detailed description of the mathematical equation of WofE model is explained by Bonham-
Carter (1991, 1994).
The WofE is one of the bivariate approaches which uses the log-linear form of the
Bayesian probability method to determine the relative importance of effective factors by
statistical means (Lee et al. 2012; Ozdemir and Altural 2013; Rahmati et al. 2015a). By
overlaying gully locations with each factor, the statistical relationship between them can be
identified and assessed as to whether and how significant the effective variable is
responsible for the occurrence of past gullies erosion. The WofE model is based on the
calculation of positive (W?) and negative (W-) weights. This model computes the weight
for each gully conditioning factor (A) on the basis of the presence or absence of the gully
locations (B) within the study area (Bonham-Carter 1994) as follows:
Wþi ¼ ln
P BjAf gP Bj�Af g ð8Þ
W�i ¼ ln
P �BjAf gP �Bj�Af g ; ð9Þ
where P is the probability and ln is the natural log function. B and �B indicate the presence
and absence of the gully conditioning factors, respectively. A is the presence of gully, and�A is the absence of a gully. A positive weight (W?) explains the fact that the conditioning
factor is present at the gully locations and its value is an indication of the positive cor-
relation between the presence of the gully conditioning factor and the gullies (Bonham-
Carter 1991; Mohammady et al. 2012). Similarly, a negative weight (W-) designates the
absence of the gully conditioning factor and reflects the level of negative correlation
(Regmi et al. 2013). In gully susceptibility mapping, the weight contrast (C) measures and
specifies the spatial association between the effective factors and gully erosion occur-
rences. C is negative for a negative spatial relationship and positive for a positive rela-
tionship (Pourghasemi et al. 2013b). The standard deviation S(C) of W is determined by
Eq. 10:
S Cð Þ ¼ffiffiffiffiffiffiffiffiffiffiffiffiffiffiffiffiffiffiffiffiffiffiffiffiffiffiffiffiffiffiffiffiffiffiffiffiffiS2 Wþð Þ þ S2 W�ð Þ
p; ð10Þ
where S2(W?) is the variance of the W? and S2(W-) is the variance of the W-. The
variances of the weights can be determined as follows (Bonham-Carter 1994):
S2 Wþð Þ ¼ 1
N B \ Af g þ1
B \ �Að11Þ
S2 W�ð Þ ¼ 1�B \ Af g þ
1
�B \ �Af g ð12Þ
The studentized contrast (GFinal) is a measure of confidence and is calculated, using the
following equation:
GFinal ¼C
S Cð Þ
� �; ð13Þ
where C shows the overall spatial association between a conditioning factor and gully
erosion occurrence (Bonham-Carter 1994). After applying the WofE model, the weights of
1244 Nat Hazards (2016) 82:1231–1258
123

the factors (GFinal) were summed to give and map a gully erosion susceptibility map
(GESM) based on the following equation:
GESI ¼XR¼n
R¼1
GFinal; ð14Þ
where GESI represents gully erosion susceptibility index.
4 Results and discussion
4.1 Relative importance analysis of gully conditioning factors
The results from LVQ technique are shown in Fig. 5. They indicated that distance from
river (VI = 66.4 %), drainage density (VI = 65.9 %), and land use (VI = 63.4 %) are the
most important conditioning factors, followed by slope degree (VI = 58.2 %), altitude
(VI = 57.2 %), soil (VI = approximately 56 %), plan curvature (VI = 55.4 %), TWI
(VI = 53.64 %), and lithology (VI = almost 49.5 %). Thus, all these layers were chosen
as input variables to generate the GESMs, because they make an important contribution to
gully erosion occurrence—based on the LVQ analysis—in the study area.
4.2 Application of frequency ratio model
To prepare gully susceptibility map and estimate the level of spatial correlation between
gully locations and conditioning factors, the FR model was applied. Figure 5 shows the
frequency ratio (FR) value that was computed for each class of the conditioning factors.
There is a low correlation, provided that the FR value is less than 1; and a higher corre-
lation exists if the FR value is larger than 1 (Oh and Lee 2010). In general, a comparatively
high value of FR reveals a higher probability of gully occurrence, while a low value of FR
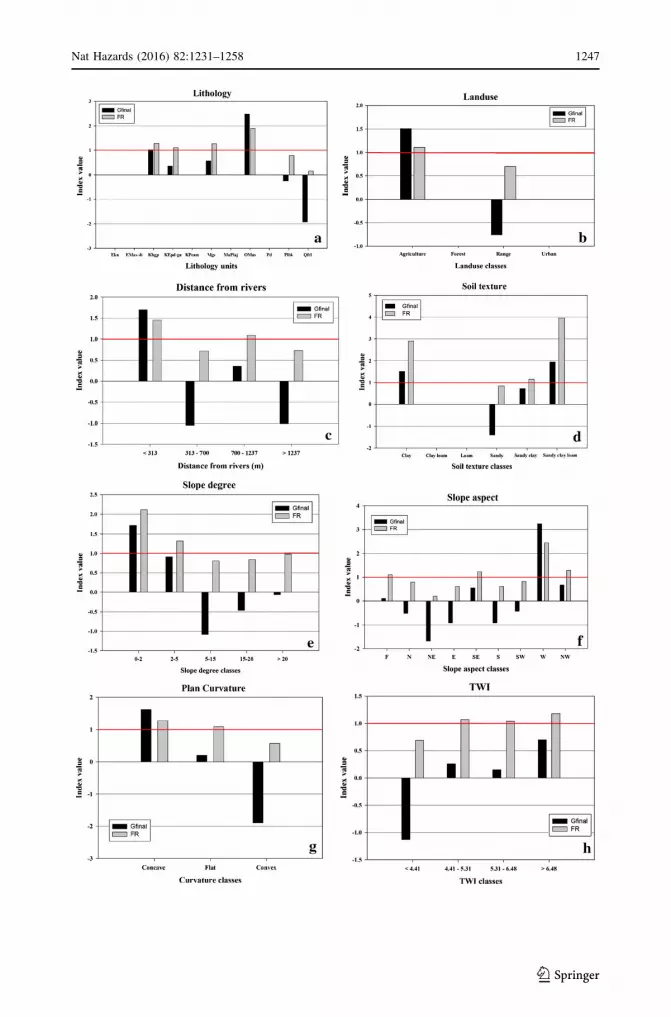
indicates a lower probability of gully susceptibility. Lithology had an important impact on
the erodibility of the study area. As shown in Fig. 5a, shale class of the Asmari formation
(OMas) has the highest value of FR (1.89) followed by limestone, shale class of the
Fig. 5 Variables importanceanalysis using LVQ method(distance f. r.: distance fromriver; drainage d.: drainagedensity; plan c.: plan curvature)
Nat Hazards (2016) 82:1231–1258 1245
123

Kazhdomi formation (Kbgp) (1.28), and gray marl class (Mgs) (1.26); thus, these classes
are the most influential ones in gully erosion occurrence. In the case of land-use type, it can
be seen that the agriculture class has FR value of 1.10, reflecting that the gully suscepti-
bility in this land-use type is high (Fig. 5b). In the case of distance from rivers, the results
denoted that as the distance from rivers increases, the gully erosion occurrence generally
decreases. In this case, the highest FR value (1.44) was obtained for\313 m (Fig. 5c).
However, analysis of the frequency ratio results reveals that the FR is\1 for distance from
rivers more than 1,237 m, representing a low probability of gully occurrence within this
class. In the soil texture factor, the highest values were recognized for sandy clay loam
(3.96), clay (2.88), and sandy clay (1.15) classes, while the remaining categories of soil
texture type have FR values less than 1 (Fig. 5d). The analysis of FR for the relationship
between gully occurrence and slope degree points out that slope degree class 0�–2� has thehighest value of FR (2.11) followed by 2�–5� class (1.32) (Fig. 5e). The FR value is less
than 1 for slope degree classes of 5�–15�, 15�–20�, and[20�, indicating a low probability
of gully occurrence within these slope ranges. These findings are similar to those of
Conoscenti et al. (2014), stating that slope degree is a major factor which controls the
overland flow concentration and the location and development of gullies. In the case of
slope aspect, the FR value is more than 1 for western, northwest, southeast, and flat faces,
showing a higher probability of gully occurrence compared to other slope aspect classes
(Fig. 5f). Assessment of plan curvature confirmed that the concave (FR value of 1.27) class
is most susceptible to gullies, followed by flat areas (FR value of 1.05) (Fig. 5g). Referring
to Fig. 5h, ratios greater than 1 were recognized in the TWI range of 4.41–5.31, 5.31–6.48,
and [6.48. This result points to significant relationships between gully occurrence and
TWI (in relation to runoff volume) that is in line with the findings of Dube et al. (2014).
Investigation of drainage density disclosed that 0.17–0.38 and[0.63 km/km2 classes have
FR value[1 (Fig. 5i). This can be explained by the fact that at high drainage density, there
is higher runoff water, and thus, the highest chances are present for gully occurrence.
Similarly, drainage density of less than 0.17 km/km2 has a lower value of FR (0.45). The
analysis of FR for the relationship between gully density and altitude showed that the
altitudes between 925 and 1138 m (FR value of 1.36) and 1138–1359 m (FR value of 1.02)
had a high correlation with gully occurrence (Fig. 5j). Finally, based on Eq. 3, the GESM
produced by the FR model is demonstrated in Fig. 6a. The GESM was classified for each
model according to the four classification methods, namely quantile, natural breaks, equal
interval, and geometrical interval (Fig. 7), into four different gully susceptibility zones,
including low, medium, high, and very high. By comparing the results of each classifi-
cation method and the distribution of training and validation gullies on the high and very
high gully susceptibility zones, it was found that the quantile classification method gave
the most accurate distribution. This agrees with the findings by Youssef et al. (2015) in that
quantile method is a good classifier in susceptibility mapping.
cFig. 6 The weights calculated of gully conditioning factors by FR and WofE models: a lithology, b landuse, c distance from river, d soil texture, e slope degree, f slope aspect, g plan curvature, h TWI, i drainagedensity, and j altitude. In the case of FR model, the value of 1 (red horizontal line) shows an averagecorrelation between gullies and conditioning factors. The FR values are zero, negative, and positive, ofwhich FR\ 1 reflects a lower correlation and FR[ 1 reflects a high correlation. In the case of WofE model,the GFinal value reflects the overall spatial association between the gully conditioning factors and the gullies.A positive GFinal shows a positive spatial correlation and vice versa for a negative GFinal value
1246 Nat Hazards (2016) 82:1231–1258
123
Nat Hazards (2016) 82:1231–1258 1247
123

4.3 Application of weights-of-evidence model
As it has been explained in the previous section, all parameters of WofE model are
computed for each gully conditioning factor. Figure 5 represents weights (GFinal values)
and the relationship between the gully occurrence and classes of each conditioning factor.
The GFinal is negative for a negative spatial association and positive for a positive spatial
association. A GFinal equal to zero illustrates that the considered class of conditioning
factors is not significant for the analysis (Corsini et al. 2009; Regmi et al. 2010). In the case
of the correlation between gully occurrence and lithology, the highest GFinal values were
?2.48 and ?1.02 for OMas and Kbgp classes, respectively (Fig. 5a). These lithology units
displayed the highest susceptibility to gully. Among the different land-use types, the
agriculture category had the highest GFinal value (?1.50), indicating maximum gully
susceptibility (Fig. 5b). Additionally, rangeland class acquired the weight of -0.76,
showing the negative influence on gully occurrence as the vegetated areas can decrease the
surface runoff and, therefore, reduce the gully erosion. This result is in accord with the
study by Zheng (2006), confirming that forested areas experience less erosion in the form
of gullies in comparison with bare and agriculture areas. In the case of distance from the
rivers, the class less than 313 m had the highest weight (GFinal = ?1.69), demonstrating
high gully erosion susceptibility in this range of distance from the rivers (Fig. 5c). The
findings are in agreement with those of Dube et al. (2014) and Conoscenti et al. (2014),
stating that low distances have a positive association (GFinal[ 0) and that it is easier for a
gully to develop on the bank of a river than on areas far from the river. The analysis of
WofE model for the relationship between gully locations and soil texture indicated that
both sandy clay loam (GFinal = ?1.95) and clay (GFinal = ?1.50) categories had positive
influences on gully erosion occurrence (Fig. 5d). In the case of slope degree, the 0�–2� and2�–5� classes have GFinal of ?1.71 and ?0.91, respectively (Fig. 5e). This means that the
gully erosion probability is higher in these classes. In contrast, slope degrees larger than
20� have the minimum value of GFinal (-0.05). The relationship between the gully loca-
tions and the slope aspect can be described as follows: It is significant that high GFinal
values were observed for southeast and flat areas (Fig. 5f), indicating a high probability of
gully erosion occurrence. This was mainly due to greater vegetation cover density in the
north-facing area compared with the south-facing area (Wang et al. 2011). Morphology of
the topography can be described, using the curvature values. In the case of curvature, the
Fig. 6 continued
1248 Nat Hazards (2016) 82:1231–1258
123
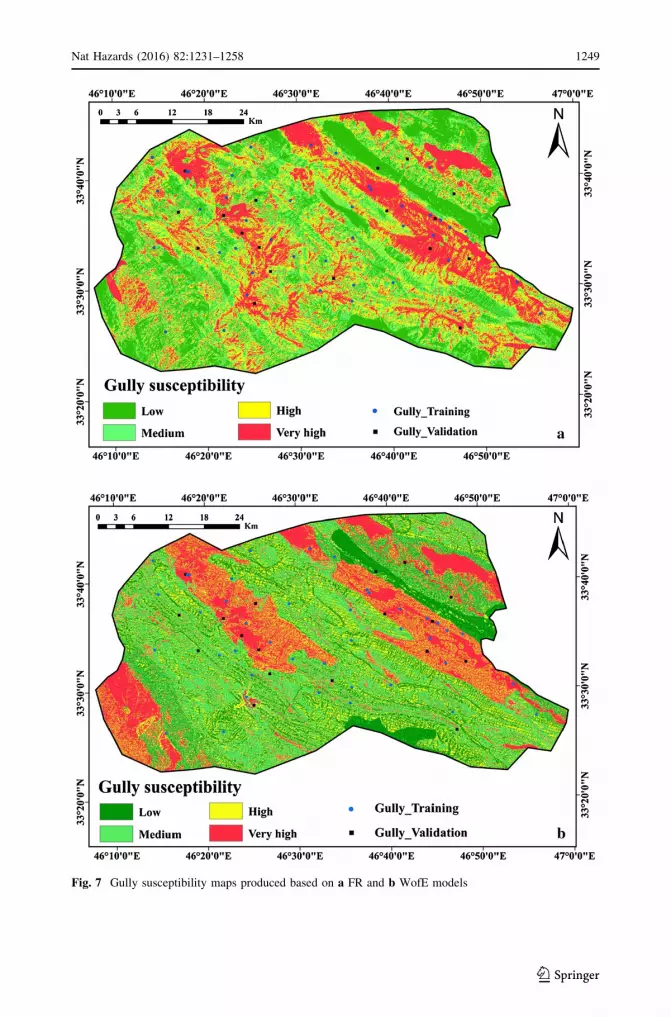
Fig. 7 Gully susceptibility maps produced based on a FR and b WofE models
Nat Hazards (2016) 82:1231–1258 1249
123

analysis of WofE model indicates that concave class has the highest value of GFinal
(?1.62), followed by flat curvature class (?0.20) (Fig. 5g). This result agrees with the
findings by Conforti et al. (2010) in the Turbolo stream catchment, Italy. Their results
proved that gully erosion processes commonly occur on concave slopes. Referring to
Fig. 5h, TWI larger than 6.48 (GFinal = ?0.7) has a high correlation with gully occurrence.
Moreover, GFinal values generally increase by increasing TWI classes. The drainage
density of 0.63–1.37 km/km2 has the largest GFinal value (?2.13), pointing to the fact that
the attributes of this class has the strongest relationship with gully susceptibility (Fig. 5i).
In the case of altitude, the highest weight (GFinal = ?1.18) was for the class of
925–1138 m, which has a positive effect on gully erosion occurrence (Fig. 5j). These
results are in line with those of De Oliveira (1990) and Meyer and Martınez-Casasnovas
(1999) in that gully distribution is mainly controlled by topographic factors (such as
altitude and slope angle). Finally, based on Eq. 10, the GESM produced by using the WofE
model is shown in Fig. 6b. According to the quantile classification scheme, the GESM
Fig. 8 Relationship between susceptibility classes (high ? very high) and the percent frequency of gullies(a) training and (b) validating gully numbers of different classification methods for FR and WofE models
1250 Nat Hazards (2016) 82:1231–1258
123

values were divided into four gully susceptible zones: low, medium, high, and very high
classes (Youssef et al. 2015).
4.4 Map validation and comparison
To determine the accuracy of the different gully erosion susceptibility models applied in
this study, the receiver operating characteristics (ROC) curve was employed (Mohammady
et al. 2012; Pourghasemi et al. 2013c; Devkota et al. 2013; Rahmati et al. 2014). ROC
curve analysis is a common technique for evaluating the accuracy of a diagnostic test
(Williams et al. 1999; Zare et al. 2013; Razandi et al. 2015). The area under the curve
(AUC) of the produced ROC describes the quality of a predicting system by showing the
ability of the system to model the occurrence or non-occurrence of predefined ‘‘events’’
(Tien Bui et al. 2012; Naghibi et al. 2014). In the ROC curve analysis, the ideal model
represents an AUC = 1.0, while an AUC value close to 0.5 shows inaccuracy in the
prediction model (Fawcett 2006). According to Yesilnacar (2005), the quantitative–qual-
itative relationship between AUC value and prediction accuracy can be classified as fol-
lows: 0.5–0.6, poor; 0.6–0.7, average; 0.7–0.8, good; 0.8–0.9, very good; and 0.9–1,
excellent. ROC curve assessment results (Fig. 8a, b) indicated that in the gully erosion
susceptibility maps produced via FR and WofE, the AUCs were 0.7811 and 0.7007.
Therefore, it is observed that the gully susceptibility map produced by FR model exhibited
better performance than the WofE model in the study area (Fig. 9).
5 Conclusion
Due to hazardous characteristics of gullies erosion, several researchers and natural
resources managers throughout the world have focused on assessing gully erosion sus-
ceptibility hazards and determining their spatial pattern for a given area. In the current
study, two statistical models, frequency ratio and weights-of-evidence models, were
employed for gully susceptibility mapping, and their performances were compared. At
first, a gully erosion inventory map was constructed through multiple field investigations.
Fig. 9 ROC curve for the gully susceptibility maps produced by (a) FR and (b) WofE models
Nat Hazards (2016) 82:1231–1258 1251
123
Of the sum total of 63 gully locations identified in the study area, 44 cases were utilized for
models training and the remaining 19 for validation purposes. In the next stage, the gully
conditioning factors such as lithology, land use, distance from rivers, soil texture, slope
degree, slope aspect, plan curvature, topographic witness index, drainage density, and
altitude were prepared. After a relative contribution assessment of each predictor variable
to the models (i.e., using LVQ algorithm), the gully erosion susceptibility modeling was
applied to Chavar region, Iran, via the FR and WofE techniques. Finally, for testing the
accuracy of the mentioned models, the ROC curve was organized. The analysis confirms
that the FR model (AUC = 78.11 %) shows a better accuracy than the WofE
(AUC = 70.07 %) model. Consequently, the performance of the gully erosion suscepti-
bility map constructed by FR model is obviously greater than that of the map produced by
WofE model. According to LVQ results, the most effective factors in the prediction of
gully erosion susceptibility were discovered to be distance from river, drainage density,
and land-use factors, although other selected factors had reasonably acceptable importance.
In summary, the findings of the present research proved that GIS-based FR and WofE
models could be successfully applied to the gully susceptibility mapping, particularly in
developing and low-income countries. In fact, the above-mentioned models require data
usually available for large areas (such as regional-scale resolution) or achievable without
high cost- and time-consuming methods; accordingly, these models are capable of being
easily reproduced and employed in other regions with the aim of gully erosion suscepti-
bility mapping. Hence, the information provided by these gully susceptibility maps can
help planners and natural resources managers reduce losses caused by focusing on ‘‘hot
spot’’ areas of gully erosion.
References
Agnesi V, Angileri S, Cappadonia C, Conoscenti C, Rotigliano E (2011) Multi-parametric GIS analysis toassess gully erosion susceptibility: a test in southern Sicily, Italy. Landf Anal 7:15–20
Ahalt SC, Krishnamurthy AK, Chen P, Melton DE (1990) Competitive learning algorithms for vectorquantization. Neural Netw 3(3):277–290
Akgun A, Turk N (2011) Mapping erosion susceptibility by a multivariate statistical method: a case studyfrom the Ayvalık region, NW Turkey. Comput Geosci 37:1515–1524
Alavi M (1994) Tectonics of the Zagros orogenic belt of Iran: new data and interpretations. Tectonophysics229:211–238
Anabalagan R (1992) Landslide hazard evaluation and zonation mapping in mountainous terrain. Eng Geol32:269–277
Baeza C, Corominas J (2001) Assessment of shallow landslide susceptibility by means of multivariatestatistical techniques. Earth Surf Process Landf 26:1251–1263
Bonham-Carter GF (1991) Integration of geoscientific data using GIS. In: Goodchild MF, Rhind DW,Maguire DJ (eds) Geographic information systems: principle and applications. Longdom, London,pp 171–184
Bonham-Carter GF (1994) Geographic information systems for geoscientists: modeling with GIS. In:Bonham-Carter F (ed) Computer methods in the geosciences. Pergamon, Oxford
Bryan RB, Jones JAA (2000) The significance of soil piping processes, inventory and prospect. Geomor-phology 20:209–218
Bull LJ, Kirkby MJ (1997) Gully processes and modelling. Prog Phys Geogr 21:354–374Burkard MB, Kostaschuk RA (1997) Patterns and controls of gully growth along the shoreline of Lake
Huron. Earth Surf Process Landf 22:901–911Capra A, Di Stefano C, Ferro V, Scicolone B (2009) Similarity between morphological characteristics of
rills and ephemeral gullies in Sicily, Italy. Hydrol Process 3341:3334–3341Casali J, Lopez JJ, Giraldez JV (1999) Ephemeral gully erosion in Southern Navarra (Spain). Catena
36:65–84
1252 Nat Hazards (2016) 82:1231–1258
123

Castillo C, Taguas EV, Zarco-Tejada P, James MR, Gomez JA (2014) The normalized topographic method:an automated procedure for gully mapping using GIS. Earth Surf Proc Land 39(15):2002–2015
Cevik E, Topal T (2003) GIS-based landslide susceptibility mapping for a problematic segment of thenatural gas pipeline, Hendek (Turkey). Environ Geol 44:949–962
Chaplot V (2013) Impact of terrain attributes, parent material and soil types on gully erosion. Geomor-phology 186:1–11
Chaplot V, Coadou le Brozec E, Silvera N, Valentin C (2005a) Spatial and temporal assessment of linearerosion in catchments under sloping lands of northern Laos. Catena 63:167–184
Chaplot V, Giboire G, Marchand P, Valentin C (2005b) Dynamic modelling for linear erosion initiation anddevelopment under climate and land-use changes in Northern Laos. Catena 63:318–328
Choi Y, Park H, Sunwoo C (2008) Flood and gully erosion problems at the Pasir open pit coal mine,Indonesia: a case study of the hydrology using GIS. Bull Eng Geol Environ 67:251–258
Chung CF, Fabbri AG (2003) Validation of spatial prediction models for landslide hazard mapping. NatHazards 30:451–472
Conforti M, Aucelli PPC, Robustelli G, Scarciglia F (2010) Geomorphology and GIS analysis for mappinggully erosion susceptibility in the Turbolo stream catchment (Northern Calabria, Italy). Nat Hazards56:881–898
Conoscenti C, Di Maggio C, Rotigliano E (2008) Soil erosion susceptibility assessment and validation usinga geostatistical multivariate approach: a test in Southern Sicily. Nat Hazard 46:287–305
Conoscenti C, Agnesi V, Angileri S, Cappadonia C, Rotigliano E, Marker M (2013) A GIS-based approachfor gully erosion susceptibility modelling: a test in Sicily, Italy. Environ Earth Sci 70(3):1179–1195
Conoscenti C, Angileri S, Cappadonia C, Rotigliano E, Agnesi V, Marker M (2014) Gully erosion sus-ceptibility assessment by means of GIS-based logistic regression: a case of Sicily (Italy). Geomor-phology 204(1):399–411
Corsini A, Cervi F, Ronchetti F (2009) Weight of evidence and artificial neural networks for potentialgroundwater spring mapping: an application to the Mt. Modino area (Northern Apennines, Italy).Geomorphology 111:79–87
Cui P, Lin Y, Chen C (2012) Destruction of vegetation due to geo-hazards and its environmental impacts inthe Wenchuan earthquake areas. Ecol Eng 44:61–69
Dai FC, Lee CF, Li J, Xu ZW (2001) Assessment of landslide susceptibility on the natural terrain of LantauIsland, Hong Kong. Environ Geol 40:381–391
De Oliveira MAT (1990) Slope geometry and gully erosion development: Bananal, Sao Paulo, Brazil.Z Geomorphol 34(4):423–434
De Vente J, Poesen J, Govers G, Boix-Fayos C (2009) The implications of data selection for regionalerosion and sediment yield modelling. Earth Surf Process Landf 34:1994–2007
Deng Q, Qin F, Zhang B, Wang H, Luo M, Shu C, Liu H, Liu G (2015) Characterizing the morphology ofgully cross-sections based on PCA: a case of Yuanmou Dry-Hot Valley. Geomorphology 228:703–713
Devkota KC, Regmi AD, Pourghasemi HR, Yoshida K, Pradhan B, Ryu IC, Dhital MR, Althuwaynee OF(2013) Landslide susceptibility mapping using certainty factor, index of entropy and logistic regressionmodels in GIS and their comparison at Mugling-Narayanghat road section in Nepal Himalaya. NatHazards 65:135–165
Dondofema F (2007) Relationship between gully characteristics and environmental factors in the Zhulumemeso-catchment: implications for water resources management. MSc Thesis, Civil EngineeringDepartment, University of Zimbabwe, Harare, Zimbabwe
Dramis F, Gentili B (1977) Contributo allo studio delle acclivita dei versanti nell’Appennino Umbro,Marchigiano. Stud Geol Camerti 3:153–164
Dube F, Nhapi I, Murwira A, Gumindoga W, Goldin J, Mashauri DA (2014) Potential of weight of evidencemodelling for gully erosion hazard assessment in Mbire District—Zimbabwe. Phys Chem Earth67:145–152
El Maaoui MA, Sfar Felfoul M, Boussema MR, Snane MH (2012) Sediment yield from irregularly shapedgullies located on the Fortuna lithologic formation in semi-arid area of Tunisia. Catena 93:97–104
Erbek FS, Ozkan C, Taberner M (2004) Comparison of maximum likelihood classification method withsupervised artificial neural network algorithms for land use activities. Int J Remote Sens 25(9):1733–1748
Fawcett T (2006) An introduction to ROC analysis. Pattern Recogn Lett 27(8):861–874Filippi AM, Jensen JR (2006) Fuzzy learning vector quantization for hyperspectral coastal vegetation
classification. Remote Sens Environ 100:512–530Flanagan DC, Nearing MA (1995) USDA-water erosion prediction project: hillslope profile and watershed
model documentation. NSERL Report #10.USDA-ARS National Soil Erosion Research Laboratory,West Lafayette, Indiana
Nat Hazards (2016) 82:1231–1258 1253
123

Flugel WA, Marker M, Moretti S, Rodolfi G, Sidorchuk A (2003) Integrating geographical informationsystems, remote sensing, ground truthing and modelling approaches for regional erosion classificationof semi-arid catchments in South Africa. Hydrol Process 17:929–942
Frankl A, Zwertvaegher A, Poesen J, Nyssen J (2013) Transferring Google Earth observations to GIS-software: example from gully erosion study. Int J Digit Earth 6(2):196–201
Geissen V, Kampichler C, Lopez-de Llergo-Juarez JJ, Galindo-Acantara A (2007) Superficial and subter-ranean soil erosion in Tabasco, tropical Mexico: development of a decision tree modeling approach.Geoderma 139:277–287
Geological Survey Department of Iran (GSDI) (1997) http://www.gsi.ir/Main/Lang_en/index.htmlGolestani G, Issazadeh L, Serajamani R (2014) Lithology effects on gully erosion in Ghoori chay Watershed
using RS & GIS. Int J Biosci 4(2):71–76Ghorbani Nejad S, Falah F, Daneshfar M, Haghizadeh A, Rahmati O (2016) Delineation of groundwater
potential zones using remote sensing and GIS-based data-driven models. Geocarto Int. doi:10.1080/10106049.2015.1132481
Gomez GA, Schnabel S, Felicısimo AM (2009a) Modelling the occurrence of gullies in rangelands ofsouthwest Spain. Earth Surf Process Landf 34:1894–1902
Gutierrez A G, Schnabel S, Lavado Contador F (2009b) Using and comparing two nonparametric methods(CART and MARS) to model the potential distribution of gullies. Ecol Model 220:3630–3637
Gorum T, Gonencgil B, Gokceoglu C, Nefeslioglu HA (2008) Implementation of reconstructed geomor-phologic units in landslide susceptibility mapping: the Melen Gorge (NW Turkey). Nat Hazards46(3):323–351
Guzzetti F, Cardinali M, Reichenbach P, Carrara A (2000) Comparing landslide maps: a case study in theupper Tiber River Basin, central Italy. Environ Manag 25:247–263
Gomez-Gutierrez A, Conoscenti C, Angileri SE, Rotigliano E, Schnabel S (2015) Using topographicalattributes to evaluate gully erosion proneness (susceptibility) in two mediterranean basins: advantagesand limitations. Nat Hazards. doi:10.1007/s11069-015-1703-0
Hongchun ZHU, Guoan T, Kejian Q, Haiying L (2014) Extraction and analysis of gully head of loessplateau in china based on digital elevation model. Chin Geogra Sci. doi:10.1007/s11769-014-0663-8
Hughes AO, Prosser IP, Stevenson J, Scott A, Lu H, Gallant J, Moran CJ (2001) Gully erosion mapping forthe national land and water resources audit. CSIRO Land and Water Technical report
Iranian Department of Water Resource Management (IDWRM) (2012) Report of natural resourcesmanagement
Jaafari A, Najafi A, Pourghasemi HR, Rezaeian J, Sattarian A (2014) GIS-based frequency ratio and indexof entropy models for landslide susceptibility assessment in the Caspian forest, northern Iran. Int JEnviron Sci Technol. doi:10.1007/s13762-013-0464-0
Kakembo V, Xanga WW, Rowntree K (2009) Topographic thresholds in gully development on the hill-slopes of communal areas in Ngqushwa Local Municipality, Eastern Cape, South Africa. Geomor-phology 110(3–4):188–194
Kheir RB, Wilson J, Deng Y (2007) Use of terrain variables for mapping gully erosion susceptibility inLebanon. Earth Surf Process Landf 32:1770–1782
Kheir RB, Chorowicz J, Abdallah C, Dhont D (2008) Soil and bedrock distribution estimated from gullyform and frequency: a GIS-based decision-tree model for Lebanon. Geomorphology 93:482–492
Kirkby MJ, Bracken LJ (2009) Gully processes and gully dynamics. Earth Surf Process Landf34(14):1841–1851
Knisel WG (1980) CREAMS: a field scale model for chemicals, runoff and erosion from agriculturalmanagement systems. US Department of Agriculture. Conserv Res Rep 26:474–485
Kohonen T (1995) Learning vector quantization; self-organizing maps. Springer, Berlin, pp 175–189Kohonen T, Hynninen J, Kangas J, Laaksonen J, Torkkola K (1996) Learning vector quantization. Technical
Report A30. Helsinki University of Technology, Laboratory of Computer and Information Science,Espoo
Kuhnert PM, Henderson AK, Bartley R, Herr A (2010) Incorporating uncertainty in gully erosion calcu-lations using the random forests modelling approach. Environmetrics 21:493–509
Kumar BM, Nair PKR (2006) Tropical homegardens: a time-tested example of sustainable agroforestry.Springer Science, Dordrecht, 380 p
Lal R (2001) Soil degradation by erosion. Land Degrad Dev 12:519–539Le Roux JJ, Sumner PD (2012) Factors controlling gully development: comparing continuous and dis-
continuous gullies. Land Degrad Dev 23(5):440–449Lee S, Kim YS, Oh HJ (2012) Application of a weights-of-evidence method and GIS to regional ground-
water productivity potential mapping. J Environ Manag 96:91–105
1254 Nat Hazards (2016) 82:1231–1258
123
Luca F, Conforti M, Robustelli G (2011) Comparison of GIS-based gullying susceptibility mapping usingbivariate and multivariate statistics: Northern Calabria, South Italy. Geomorphology 134:297–308
Magliulo P (2010) Soil erosion susceptibility maps of the Janare Torrent Basin (Southern Italy).J Maps 6:435–447
Magliulo P (2012) Assessing the susceptibility to water-induced soil erosion using a geomorphological,bivariate statistics-based approach. Environ Earth Sci 67:1801–1820
Maharaj R (1993) Landslide processes and landslide susceptibility analysis from an upland watershed: acase study from St Andrew, Jamaica, West Indies. Eng Geol 34:53–79
Manap MA, Nampak H, Pradhan B, Lee S, Sulaiman WNA, Ramli MF (2014) Application of probabilistic-based frequency ratio model in groundwater potential mapping using remote sensing data and GIS.Arab J Geosci 7(2):711–724
Marker M, Pelacani S, Schroder B (2011) A functional entity approach to predict soil erosion processes in asmall Plio-Pleistocene Mediterranean catchment in Northern Chianti, Italy. Geomorphology125:530–540
Martınez-Casasnovas JA (2003) A spatial information technology approach for the mapping and quantifi-cation of gully erosion. Catena 50:293–308
Martınez-Casasnovas JA, Ramos MC, Poesen J (2004) Assessment of sidewall erosion in large gullies usingmulti-temporal DEMs and logistic regression analysis. Geomorphology 58:305–321
Merkel WH, Woodward DE, Clarke CD (1988) Ephemeral gully erosion model (EGEM). Agricultural,Forest, and Rangeland Hydrology, 07–88. American Society of Agricultural Engineers Publication,pp 315–323
Meyer A, Martınez-Casasnovas JA (1999) Prediction of existing gully erosion in vineyard parcels of the NESpain: a logistic modelling approach. Soil Tillage Res 50:319–331
Moghaddam DD, Rezaei M, Pourghasemi HR, Pourtaghie ZS, Pradhan B (2013) Groundwater springpotential mapping using bivariate statistical model and GIS in the Taleghan Watershed, Iran. Arab JGeosci. doi:10.1007/s12517-013-1161-5
Mohammady M, Pourghasemi HR, Pradhan B (2012) Landslide susceptibility mapping at Golestan Pro-vince, Iran: a comparison between frequency ratio, Dempster-Shafer, and weights-of-evidence models.J Asian Earth Sci 61:221–236
Mondino EB, Giardino M, Perotti L (2009) A neural network method for analysis of hyperspectral imagerywith application to the Cassas landslide (Susa Valley, NW-Italy). Geomorphology 110:20–27
Moore ID, Grayson RB, Ladson AR (1991) Digital terrain modeling: a review of hydrological, geomor-phological and biological applications. Hydrol Process 5:3–30
Naghibi SA, Pourghasemi HR, Pourtaghi ZS, Rezaei A (2014) Groundwater qanat potential mapping usingfrequency ratio and Shannon’s entropy models in the Moghan watershed, Iran. Earth Sci Inform.doi:10.1007/s12145-014-0145-7
Naghibi SA, Pourghasemi HR, Dixon B (2016) GIS-based groundwater potential mapping using boostedregression tree, classification and regression tree, and random forest machine learning models in Iran.Environ Monit Assess. doi:10.1007/s10661-015-5049-6
Noormohammadi F, Fatollahi T, Mirzaei J, Soleimani K, Habibnejhad Roshan M, Kavian A (2013) Esti-mation of stormwise sediment yield of gully erosion using important rainfall components in differentland uses of Zagros sorest, Iran. Iran J Rangel Sci 3(4). www.rangeland.ir
Noormohammadi F, Soufi M, Sadeghi SH, Mirrezaie S, Kazemi V, Karimzadeh H, Ekhtesasi M, SheklabadiM, Azimzadeh H (2014) Storm-Wise Sediment Production of Gully Erosion in the West of Iran. Iran JEcopersia 2(2):539–556
Nyssen J, Poesen J, Moeyersons J, Luyten E, Veyret-Picot M, Deckers J, Haile M, Govers G (2002) Impactof road building on gully erosion risk: a case study from the Northern Ethiopian Highlands. Earth SurfProcess Landf 27:1267–1283
Oh HJ, Lee S (2010) Assessment of ground subsidence using GIS and the weights of evidence model. EngGeol 115:36–48
Ozdemir A, Altural T (2013) A comparative study of frequency ratio, weights of evidence and logisticregression methods for landslide susceptibility mapping: Sultan Mountains, SW Turkey. J Asian EarthSci 64(5):180–197
Patel AK, Chatterjee S (2016) Computer vision-based limestone rock-type classification using probabilisticneural network. Geosci Front 7:53–60
Pavel M, Fannin RJ, Nelson JD (2008) Replication of a terrain stability mapping using an artificial neuralnetwork. Geomorphology 97(3–4):356–373
Pavel M, Nelson JD, Fannin RJ (2011) An analysis of landslide susceptibility zonation using a subjectivegeomorphic mapping and existing landslides. Comput Geosci 37(4):554–566
Nat Hazards (2016) 82:1231–1258 1255
123

Perroy RL, Bookhagen B, Asner GP, Chadwick OA (2010) Comparison of gully erosion estimates usingairborne and ground-based LiDAR on Santa Cruz Island, California. Geomorphology 118:288–300
Pham DT, Oztemel E (1994) Control chart pattern recognition using learning vector quantization networks.Int J Prod Res 32:721–729
Poesen J, Nachetergaele J, Verstraeten J, Valentin C (2003) Gully erosion and environmental change:importance and research needs. Catena 50(2–4):91–133
Popp JH, Hyatt DE, Hoag D (2000) Modeling environmental condition with indices: a case study ofsustainability and soil resources. Ecol Model 130(1–3):131–143
Poudyal CP, Chang C, Oh HJ, Lee S (2010) Landslide susceptibility maps comparing frequency ratio andartificial neural networks: a case study from the Nepal Himalaya. Environ Earth Sci 61:1049–1064
Pourghasemi HR, Kerle N (2016) Random forests and evidential belief function-based landslide suscepti-bility assessment in Western Mazandaran Province, Iran. Environ Earth Sci. doi:10.1007/s12665-015-4950-1
Pourghasemi HR, Moradi HR, Fatemi Aghda SM (2013a) Landslide susceptibility mapping by binarylogistic regression, analytical hierarchy process, and statistical index models and assessment of theirperformances. Nat Hazards 69:749–779
Pourghasemi HR, Pradhan B, Gokceoglu C, Deylami Moezzi K (2013b) A comparative assessment ofprediction capabilities of Dempster-Shafer and Weights-of-evidence models in landslide susceptibilitymapping using GIS. Geomat Nat Hazards Risk 4(2):93–118
Pourghasemi HR, Pradhan B, Gokceoglu C, Mohammadi M, Moradi HR (2013c) Application of weights-of-evidence and certainty factor models and their comparison in landslide susceptibility mapping at Harazwatershed, Iran. Arab J Geosci 6:2351–2365
Pourtaghi ZS, Pourghasemi HR (2014) GIS-based groundwater spring potential assessment and mapping inthe Birjand Township, southern Khorasan Province, Iran. Hydrogeol J 22:643–662
Pradhan B (2010) Landslide susceptibility mapping of a catchment area using frequency ratio, fuzzy logicand multivariate logistic regression approaches. J Indian Soc Remote Sens 38(2):301–320
Pulice I, Cappadonia C, Conoscenti CSFRG, De Rose R, Rotigliano E, Agnesi V (2012) Geomorphological,chemical and physical study of ‘‘calanchi’’ landforms in NW Sicily (Southern Italy). Geomorphology153–154:219–231
Rahmati O, Nazari Samani A, Mahdavi M, Pourghasemi HR, Zeinivand H (2014) Groundwater potentialmapping at Kurdistan region of Iran using analytic hierarchy process and GIS. Arab J Geosci. doi:10.1007/s12517-014-1668-4
Rahmati O, Pourghasemi HR, Zeinivand H (2015a) Flood susceptibility mapping using frequency ratio andweights-of-evidence models in the Golastan Province, Iran. Geocarto Int. doi:10.1080/10106049.2015.1041559
Rahmati O, Zeinivand H, Besharat M (2015b) Flood hazard zoning in Yasooj region, Iran, using GIS andmulti-criteria decision analysis. Geomat Nat Hazards Risk. doi:10.1080/19475705.2015.1045043
Rahmati O, Pourghasemi HR, Melesse A (2016) Application of GIS-based data driven random forest andmaximum entropy models for groundwater potential mapping: a case study at Mehran Region, Iran.Catena 137:360–372
Razandi Y, Pourghasemi HR, Samani Neisani N, Rahmati O (2015) Application of analytical hierarchyprocess, frequency ratio, and certainty factor models for groundwater potential mapping using GIS.Earth Sci Inform. doi:10.1007/s12145-015-0220-8
Regmi NR, Giardino JR, Vitek JD (2010) Modeling susceptibility to landslides using the weight of evidenceapproach: Western Colorado, USA. Geomorphology 115:172–187
Regmi AD, Devkota KC, Yoshida K, Pradhan B, Pourghasemi HR, Kumamoto T, Akgun A (2013)Application of frequency ratio, statistical index, and weights-of-evidence models and their comparisonin landslide susceptibility mapping in Central Nepal Himalaya. Arab J Geosci. doi:10.1007/s12517-012-0807-z
Remondo J, Gonzalez A, Teran J, Cendrero A, Fabbri A, Chung C (2003) Validation of landslide sus-ceptibility maps; examples and applications from a case study in Northern Spain. Nat Hazards30:437–449
Samani AN, Ahmadi H, Jafari M, Boggs G, Ghoddousi J, Malekian A (2009) Geomorphic thresholdconditions for gully erosion in Southwestern Iran (Boushehr–Samal watershed). J Asian Earth Sci35:180–189
Sidle RC, Ochiai H (2006) Landslides: processes, prediction, and landuse, water res monograph, vol 18.American Geophysical Union, Washington, DC, p 312
Sidorchuk A (1999) Dynamic and static models of gully erosion. Catena 37:401–414Sidorchuk A, Marker M, Moretti S, Rodolfi G (2003) Gully erosion modelling and landscape response in the
Mbuluzi River catchment of Swaziland. Catena 50:507–525
1256 Nat Hazards (2016) 82:1231–1258
123
Snelder DJ, Bryan RB (1995) The use of rainfall simulation tests to assess the influence of vegetationdensity on soil loss on degraded rangelands in the Baringo District, Kenya. Catena 25(1–4):105–116
Stotle J, Liu B, Ritsema CJ, Van HGM, Den Elsen R, Hessel R (2003) Modeling water flow and sedimentprocesses in a small gully system on the Loess Plateau in China. Catena 54:117–130
Svoray T, Markovitch H (2009) Catchment scale analysis of the effect of topography, tillage direction andunpaved roads on ephemeral gully incision. Earth Surf Process Landf 34:1970–1984
Svoray T, Michailov E, Cohen A, Rokah L, Sturm A (2012) Predicting gully initiation: comparing datamining techniques, analytical hierarchy processes and the topographic threshold. Earth Surf ProcessLandf 37:607–619
Tahmassebipoor N, Rahmati O, Noormohamadi F, Lee S (2016) Spatial analysis of groundwater potentialusing weights-of-evidence and evidential belief function models and remote sensing. Arab J Geosci.doi:10.1007/s12517-015-2166-z
Takken I, Croke J, Lane P (2008) Thresholds for channel initiation at road drain outlets. Catena 75:257–267Tayebi MH, Tangestani MH (2015) Sub pixel mapping of alteration minerals using SOM neural network
model and hyperion data. Earth Sci Inform 8(2):279–291Tehrany MS, Pradhan B, Jebur MN (2013) Spatial prediction of flood susceptible areas using rule based
decision tree (DT) and a novel ensemble bivariate and multivariate statistical models in GIS. J Hydrol504:69–79
Tehrany MS, Lee MJ, Pradhan B, Jebur MN, Lee S (2014a) Flood susceptibility mapping using integratedbivariate and multivariate statistical models. Environ Earth Sci. doi:10.1007/s12665-014-3289-3
Tehrany MS, Pradhan B, Jebur MN (2014b) Flood susceptibility mapping using a novel ensemble weights-of-evidence and support vector machine models in GIS. J Hydrol 512:332–343
Tehrany MS, Pradhan B, Mansor S, Ahmad N (2015) Flood susceptibility assessment using GIS-basedsupport vector machine model with different kernel types. Catena 125:91–101
Tien Bui D, Pradhan B, Lofman O, Revhaug I, Dick OB (2012) Spatial prediction of landslide hazards inVietnam: a comparative assessment of the efficacy of evidential belief functions and fuzzy logicmodels. Catena 96:28–40
Torri D, Borselli L, Gariano SL, Greco R, Iaquinta P, Iovine G, Poesen J, Terranova OG (2012) Identifyinggullies in the Mediterranean environment by coupling a complex threshold model and a GIS. RendOnline Soc Geol Ital 21:441–443
Umar Z, Pradhan B, Ahmad A, Jebur MN, Tehrany MS (2014) Earthquake induced landslide susceptibilitymapping using an integrated ensemble frequency ratio and logistic regression models in WestSumatera Province, Indonesia. Catena 118:124–135
USDA-SCS (1992) Ephemeral gully erosion model. EGEM, Version 2.0 DOS user manual. WashingtonValentin C, Poesen J, Yong L (2005) Gully erosion: impacts, factors and control. Catena 63:132–153Vandaele K, Poesen J, Govers G, van Wesemael B (1996) Geomorphic threshold conditions for ephemeral
gully incision. Geomorphology 16:161–173Vandekerckhove L, Poesen J, OostwoudWijdenes D, Gyssels G, Beuselinck L, De Luna E (2000) Char-
acteristics and controlling factors of bank gullies in two semi-arid Mediterranean environments.Geomorphology 33:37–58
Wang L, Wei S, Horton R, Shao M (2011) Effects of vegetation and slope aspect on water budget in the hilland gully region of the Loess Plateau of China. Catena 87(1):90–100
Water Resources Company of Ilam (WRCI) (2013) Precipitation and temperature reports. http://www.ilam-rw.ir/index.aspx?siteid=1&fkeyid=&siteid=1&pageid=183. Accessed 11 Aug 2013
Wells RR, Bennett SJ, Alonso CV (2009) Effect of soil texture, tailwater height, and pore-water pressure onthe morphodynamics of migrating headcuts in upland concentrated flows. Earth Surf Process Landf34:1867–1877
Williams CJ, Lee SS, Fisher RA, Dickerman LH (1999) A comparison of statistical methods for prenatalscreening for Down syndrome. Appl Stoch Model D A 15:89–101
Williams RN, de Souza Jr PA, Jones EM (2014) Analysing coastal ocean model outputs using competitive-learning pattern recognition techniques. Environ Modell Softw 57:165–176
Wilson JP, Gallant JC (2000) Terrain analysis: principles and applications. Wiley & Sons Inc., ChichesterWoodward DE (1999) Method to predict cropland ephemeral gully erosion. Catena 37:393–399Yesilnacar EK (2005) The application of computational intelligence to landslide susceptibility mapping in
Turkey. Ph.D Thesis Department of Geomatics the University of Melbourne, p 423Youssef AM, Pourghasemi HR, El-Haddad BA, Dhahry BK (2015) Landslide susceptibility maps using
different probabilistic and bivariate statistical models and comparison of their performance at WadiItwad Basin, Asir Region, Saudi Arabia. Bull Eng Geol Environ. doi:10.1007/s10064-015-0734-9
Zakerinejad R,MaerkerM (2015) An integrated assessment of soil erosion dynamics with special emphasis ongully erosion in the Mazayjan basin, southwestern Iran. Nat Hazards. doi:10.1007/s11069-015-1700-3
Nat Hazards (2016) 82:1231–1258 1257
123
Zakerinejad R, Marker M (2014) Prediction of Gully erosion susceptibilities using detailed terrain analysisand maximum entropy modeling: a case study in the Mazayejan Plain, Southwest Iran. Geogr Fis DinQuat 37(1):67–76
Zare M, Pourghasemi HR, Vafakhah M, Pradhan B (2013) Landslide susceptibility mapping at VazWatershed (Iran) using an artificial neural network model: a comparison between multilayer perceptron(MLP) and radial basic function (RBF) algorithms. Arab J Geosci 6:2873–2888
Zhang C, Xie Z (2012) Combining object-based texture measures with a neural network for vegetationmapping in the Everglades from hyperspectral imagery. Remote Sens Environ 124:310–320
Zheng F (2006) Effect of vegetation changes on soil erosion on the Loess Plateau. Pedosphere16(4):420–427
Zhu A, Wang R, Qiao J, Qin C, Chen Y, Liu J, Du F, Lin Y, Zhu T (2014) An expert knowledge-basedapproach to landslide susceptibility mapping using GIS and fuzzy logic. Geomorphology. doi:10.1016/j.geomorph.2014.02.003
Zinck JA, Lopezb J, Metternichtc GI, Shresthaa DP, Vazquez-Selemd L (2001) Mapping and modellingmass movements and gullies in mountainous areas using remote sensing and GIS techniques. Int J ApplEarth Obs 3(1):43–53
Zucca C, Canu A, Della Peruta R (2006) Effects of land use and landscape on spatial distribution andmorphological features of gullies in an agropastoral area in Sardinia (Italy). Catena 68:87–95
1258 Nat Hazards (2016) 82:1231–1258
123