the gully a scientific review of its environment and ecosystem
TRANSCRIPT
Fisheries Pêches~ and Oceans et Océan s
Canadian Stock Assessment Secretariat Secrétariat canadien pour l'évaluation des stocksResearch Document 98/83 Document de recherche 98/83
Not to be cited withoutpermission of the authors '
Ne pas citer sansautorisation des auteurs '
The Gully :A Scientific Review of its Environment and Ecosyste m
W. Glen Harrison' and Derek G. Fenton2 (Editors )
Fisheries and Oceans Canada'Ocean Sciences Division
ZOceans Act Coordination OfficeBedford Institute of Oceanography
Box 1006, Dartmouth, NS B2Y 4A2
' This series documents the scientific basis forthe evaluation of fisheries resources in Canada .As such, it addresses the issues of the day inthe time frames required and the documents itcontains are not intended as definitivestatements on the subjects addressed butrather as progress reports on ongoinginvestigations .
Research documents are produced in theofficial language in which they are provided tothe Secretariat .
' La présente série documente les basesscientifiques des évaluations des ressourceshalieutiques du Canada . Elle traite desproblèmes courants selon les échéanciersdictés. Les documents qu'elle contient nedoivent pas être considérés comme desénoncés définitifs sur les sujets traités, maisplutôt comme des rapports d'étape sur lesétudes en cours .
Les documents de recherche sont publiés dansla langue officielle utilisée dans le manuscritenvoyé au secrétariat .
ISSN 1480-4883Ottawa, 1998
Canad'
Abstract
The Gully, a large submarine canyon east of Sable Island on the eastern Scotian Shelf, isa feature which has been described as a unique ecological site and valued component ofAtlantic Canadian coastal waters . Its suspected uniqueness and biological significancehas attracted the attention of a wide range of government agencies, researchers, oceanresource industries and conservationists . The Department of Fisheries and Oceans (DFO)has as one of its mandates the identification of sensitive marine areas and thedevelopment of a strategy for their conservation ; the Gully is one such area which DFOhas been asked to evaluate . As a first step in developing a Conservation Strategy for theGully, DFO coordinated a thorough scientific review of the region to establish the state ofknowledge of its environment and ecosystem and to place that information in the contextof the greater Scotian Shelf system. Thirty-two scientific experts from DFO, otherfederal natural resources departments, universities and other NGOs contributed to theGully Science Review which describes what is presently known about the regionsgeology, oceanography, benthos, fish, seabirds and mammals . In addition tosummarizing what is known about the region's environment and ecosystem, the reviewalso identifies information gaps and outlines future research needs .
Résumé
Le Gully, un important canyon sous-marin de l'Île de Sable, dans la partie est du plateaunéo-écossais, est une entité qui a été décrite comme un site écologique unique et unélément important des eaux côtières du Canada atlantique . Les caractères uniques etl'importance biologique qu'on lui attribue ont attiré l'attention d'une large gammed'organismes gouvernementaux, de chercheurs, d'industries océaniques et deconservationistes . Le Ministère des Pêches et des Océans (MPO) a notamment pourmandat d'identifier les zones marines vulnérables et d'élaborer une stratégie pour leurconservation. Le Gully est l'une de ces zones pour lesquelles il a été demandé au MPOde procéder à une évaluation. À titre de première étape de l'élaboration d'une stratégie deconservation pour le Gully, le MPO a coordonné un examen scientifique détaillée de larégion afin de définir l'état des connaissances en ce qui a trait à l'environnement et àl'écosystème de cette zone et de les situer dans le contexte du système global du plateaunéo-écossais. Au total, 32 scientifiques du MPO, d'autres ministères fédéraux desressources naturelles, d'universités et d'ONG ont participé à l'examen scientifique quicerne nos connaissances actuelles de la géologie, de l'océanographie, du benthos, despoissons, des oiseaux de mer et des mammifères de cette région . En plus de résumer lesconnaissances sur l'environnement et l'écosystème, l'examen précise les lacunes enmatière d'information et résume les besoins en recherche .
TABLE OF CONTENTS
SUMMARY . . . . . . . . . . . . . . . . . . . . . . . . . . . . . . . . . . . . . . . . . . . . . . . . . . . . . .. . . . . .. ........ .. .. . . .. .. . . .. .. .. ...... .... ...... .... .. . . .. .. . . . ii
Acknowledgements . . . . . . . . . . . . . . . . . . . . . . . . . . . . . . . . . . . . . . . . . . . . . . .. .. .. ...... .. .. . . .-. .. . . .. .. .. ............ ...... .. .. . . .. .. . . . x
1 .0 Geographical Setting and Conservation Efforts .... .. .. .. .. .. . . .. .. .. ...... ...... ...... .. .. . . .. .. . . . 1
2.0 The Science Review . . . . . . . . . . . . . . . . . . . . . . . . . . . . . . . . . . . . . . . . . .. .. ...... .. .. .. .. .. . . .. .. .. .... ...... ...... .. .. .. .. .. .. . . . 6
3.0 Surficial, Bedrock Geology, and Morphology .. ...... .... .. .. .. . . .. .. .. .... ...... .. .... .... .. .. .. .. . . . 8
4.0 Hydrography . . . . . . . . . . . . . . . . . . . . . . . . . . . . . . . . . . . . . . . . . . . . . . . . . . . .. .. .... .. .... .. .. .. .. .. .. .. .... ...... ...... .. .. .. .. .. .. .15
5.0 Acoustic Ambient Noise . . . . . . . . . . . . . . . . . . . . . . . . . . . . . . . . . . .. .. .. .... .... .. .. .. .. .. .. .. .... ...... .. .... ...... .. .. . . . 19
6.0 Oceanography . . . . . . . . . . . . . . . . . . . . . . . . . . . . . . . . . . . . . . . . . . . . . . . . . .. .. .... .. .... .. .. .. .. .. .. ...... ...... .. .... .... .. . . .. .. . 20
6.1 Physical Oceanography . . . . . . . . . . . . . . . . . . . . . . . . . . . . .. .. .... ........ .. .. .. .. .. ...... ...... .. .. .. .... .. .. .. .. . 20
6.2 Chemical Oceanography . . . . . . . . . . . . . . . . . . . . . . . . . . .. .. .... ...... .. .... .. .. ........ ...... .. .. .. .. ...... .. .. . 58
6.3 Biological Oceanography - Plankton . . . . . . . .. .. .... ........ .... .. .... .. .... .. .. .. .. .... ...... .. .. .. . 71
6.4 Submarine Canyons : Deposition Centres for Detrital Organi c
Matter? . . . . . . . . . . . . . . . . . . . . . . . . . . . . . . . . . . . . . . . . . . . . . . . . . . . . . . . . .. .. .... ........ .... .. .. .. .. .... ...... ........ .. .. . . . . . 105
6.5 Benthos . . . . . . . . . . . . . . . . . . . . . . . . . . . . . . . . . . . . . . . . . . . . . . . . . . . . . . . .. .. .... ...... .. .. .. .. .. .. .. .... .. .......... .. .. .. . . . . .107
6.5.1 The Sedimentary Interface Fauna . . . . .. .. .. ...... .. .. .. .. .. .. .. .... .. ...... .... .. .. . . . . . . . 107
6.5.2 Deep Sea Corals . . . . . . . . . . . . . . . . . . . . . . . . . . . . . . . . .. .. .... ........ .. .. .. .. .. .. .... .. .... .. .. .. .. .. . . . . . . .113
7.0 Fish and Fisheries . . . . . . . . . . . . . . . . . . . . . . . . . . . . . . . . . . . . . . . . . . . . . . .. .... .. .... .. .... .. .. .. .. ...... ...... .. .. .. .. . . . . . . . 121
7.1 Finfish and Selected Invertebrates . . . . . . . . . . . . .. .. .......... .... .. .. .. .. ...... ...... .... .. .. . . . . . . .121
7.2 Invertebrate Fisheries . . . . . . . . . . . . . . . . . . . . . . . . . . . . . . . .. .. .... ........ .... .. .. .. .. ............ ...... .. .. . . . . . 171
8.0 Pelagic Seabirds . . . . . . . . . . . . . . . . . . . . . . . . . . . . . . . . . . . . . . . . . . . . . . . .. . . .. .. ........ .... .. .. .. .. ...... .... .. .... .. .. . . . . . . .180
9.0 Marine Mammals . . . . . . . . . . . . . . . . . . . . . . . . . . . . . . . . . . . . . . . . . . . . . . .. . . .. .. ...... ...... .. .. .. .... .. ...... ...... .. .. . . . . .186
10.0 Ecosystem Classification . . . . . . . . . . . . . . . . . . . . . . . . . . . . . . . . . . . . . . . .... .... .... .. .. .. .. .... .. ...... .... . . .. . . . . . . . 222
10.1 A System Planning Approach to Marine Classification an d
Boundary Considerations . . . . . . . . . . . . . . . . . . . . . . . . . . . . .. .... .. .. .. .. .. .. .. .. .. .. .. ...... .. .. . . . . . . . . . . . 222
10.2 Submarine Landscapes . . . . . . . . . . . . . . . . . . . . . . . . . . . . . . . . . . . .. .... .. .... .. .. ...... .. .. .... .. ...... .. .. . . . . . 237
11.0 Knowledge Gaps, Recommendations and Future Researc h
Requirements . . . . . . . . . . . . . . . . . . . . . . . . . . . . . . . . . . . . . . . . . . . . . . . . . . . .. . . . . .. .. .. ............ .. .. .. .. .. .. .. .. .. .. ...... .. . 248
12.0 The Gully Ecosystem - An Integrated View . . . . . . . .. .. .. ...... ........ .. .. .. .. .. .. .... ........ .. . 252
13.0 Appendices . . . . . . . . . . . . . . . . . . . . . . . . . . . . . . . . . . . . . . . . . . . . . . . . . . . . . . . . . . . . .. . . .. .. .. .... .. .... .. .. .. . . .. .. .. . . .. .... .. .. .. . 255
13.1 Fish and Fisheries : Mackerel . . . . . . . . . . . . . . . . . . . . . .. .. .. .. .. .. .. .. .. .... .. .. .. . . .. .. .. .. .. .. .... . . . . . 255
13.2 Fish and Fisheries : Large Pelagics Fisheries . . .. .. .. .... ...... .. .. .. . . .. .. . . .. .. .. .... .. .. . 258
i
SUMMARY
Background
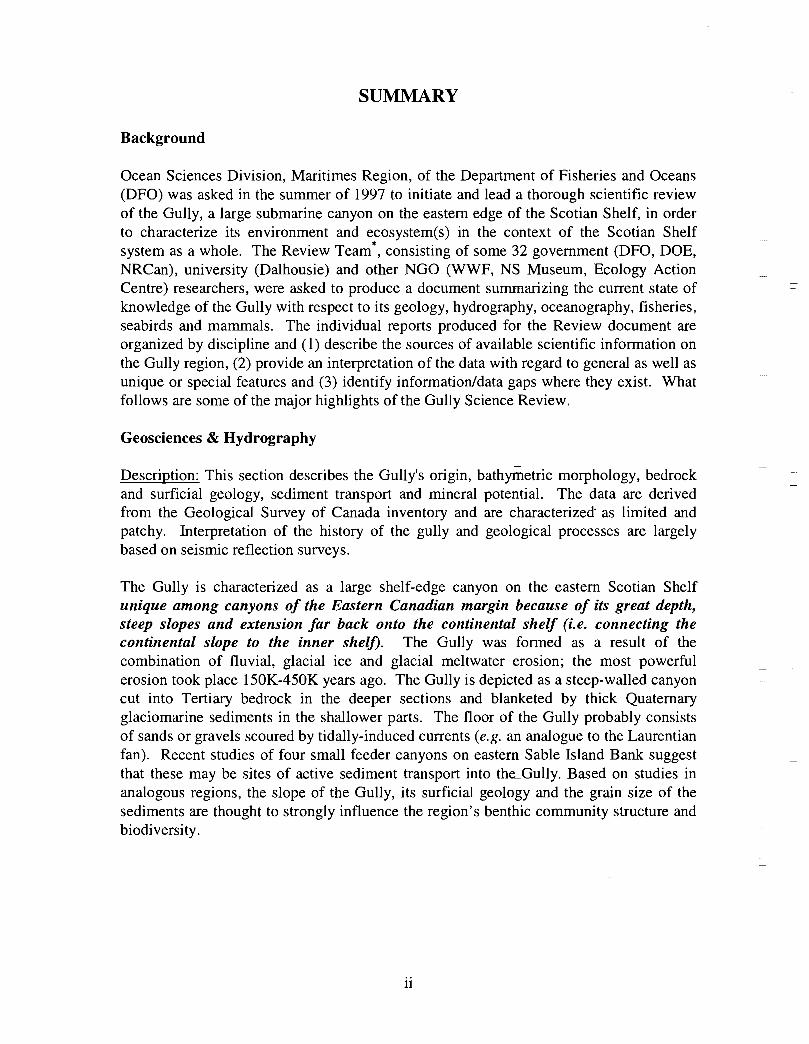
Ocean Sciences Division, Maritimes Region, of the Department of Fisheries and Oceans(DFO) was asked in the summer of 1997 to initiate and lead a thorough scientific reviewof the Gully, a large submarine canyon on the eastern edge of the Scotian Shelf, in orderto characterize its environment and ecosystem(s) in the context of the Scotian Shelfsystem as a whole . The Review Team*, consisting of some 32 government (DFO, DOE,NRCan), university (Dalhousie) and other NGO (WWF, NS Museum, Ecology ActionCentre) researchers, were asked to produce a document summarizing the current state ofknowledge of the Gully with respect to its geology, hydrography, oceanography, fisheries,seabirds and mammals . The individual reports produced for the Review document areorganized by discipline and (1) describe the sources of available scientific information onthe Gully region, (2) provide an interpretation of the data with regard to general as well asunique or special features and (3) identify information/data gaps where they exist . Whatfollows are some of the major highlights of the Gully Science Review .
Geosciences & Hydrograph y
Description : This section describes the Gully's origin, bathymetric morphology, bedrockand surficial geology, sediment transport and mineral potential . The data are derivedfrom the Geological Survey of Canada inventory and are characterized as limited andpatchy. Interpretation of the history of the gully and geological processes are largelybased on seismic reflection surveys .
The Gully is characterized as a large shelf-edge canyon on the eastern Scotian Shelfunique among canyons of the Eastern Canadian margin because of its great depth,steep slopes and extension far back onto the continental shelf (i.e . connecting thecontinental slope to the inner shelf) . The Gully was formed as a result of thecombination of fluvial, glacial ice and glacial meltwater erosion ; the most powerfulerosion took place 150K-450K years ago . The Gully is depicted as a steep-walled canyoncut into Tertiary bedrock in the deeper sections and blanketed by thick Quaternaryglaciomarine sediments in the shallower parts . The floor of the Gully probably consistsof sands or gravels scoured by tidally-induced currents (e .g. an analogue to the Laurentianfan) . Recent studies of four small feeder canyons on eastern Sable Island Bank suggestthat these may be sites of active sediment transport into the Gully . Based on studies inanalogous regions, the slope of the Gully, its surficial geology and the grain size of thesediments are thought to strongly influence the region's benthic community structure andbiodiversity .
ii
Information Gaps :
• The geology of the Gully is based on older datasets and consequently less well knownthan adjacent regions (e.g. Grand Banks) where newer data gathering techniques havebeen used .
• There is little information on the geology of the deeper (>600m) areas of the Gully ;<1% of that area has been surveyed .
Physical & Chemical Oceanography
Description : A detailed analysis of existing data on circulation, current variability andexchange, tides and low-frequency variability of hydrographic and chemical properties inthe Gully and surrounding regions are derived largely from the DFO-BIOhydrography/nutrient database, from direct current measurements, or from finite elementdiagnostic and prognostic models . Patterns of circulation in the Gully suggest that it mayplay an important role in (1) the localized retention of material, and (2) in the larger scaletransport of material onto and off of the shelf.
An analysis of the existing data on the physical oceanography of the Gully has indicated
that it may feature a weak counterclockwise circulation that could contribute to the
retention of particles within it . However, similar patterns are found elsewhere on the
Scotian Shelf, e.g. the clockwise gyre around Browns Bank, the Western Bank gyre, the
retention areas over Emerald and Western Banks . Low-frequency current variability in
the Gully is comparable to that observed in nearby regions and for the Scotian Shelf as a
whole . Barotropic tides behave regularly. There is some evidence in Batfish surveys and
in the temperature variability from fixed sensors that internal tides and internal wave
activity at the mouth the Gully may be enhanced . This could lead to g-reater vertical
mixing in the Gully with implications for nutrient exchange (i .e . greater supply to surface
waters) and consequently for primary productivity (i .e . increased localized productivity) .
However, a comparison of the long-term mean profiles of density indicates very little
difference among those from the Gully and from four surrounding areas . This may
indicate that either the internal wave activity seen in the Gully surveys extends into the
adjacent areas, or that enhanced mixing, driven by internal wave breaking and dissipation,
is highly localized within the Gully . Thus, the broad averaging of monthly density
profiles may have hidden localized mixing hot spots .
There are no data on chemical contaminants within the Gully . However, extrapolation ofdata from adjacent areas suggest that elevated concentrations of any of the commoncontaminants would not be anticipated in the water, sediments, or biota of the Gully .There are adequate measurements of nutrient and oxygen concentrations in the Gully tocalculate monthly mean concentrations for these variables . The general picture ofmonthly nutrient distributions averaged over the entire Gully is very similar to analogousdescriptions for adjacent areas . However, there are not enough data for an assessment ofnutrient variability on smaller time or space scales . For example, there is no indication inthe dataset of localized, elevated surface nutrient levels resulting from enhanced mixing
iii
in the Gully as some of the physical oceanographic data suggest . Mixing may be nogreater in the Gully than in the adjacent regions of the shelf, orzt may be occurring onsmall time and space scales that were missed with the limited data coverage, or surfacenutrients may be rapidly removed by biological uptake . Low frequency processes (causedprimarily by meteorological forcing) contribute to the onshore-offshore exchange of heatand salt through the Gully . Calculations based on current meter data and source waternutrient concentrations indicate that nutrient transport through the Gully could make asignificant contribution to the eastern Scotian Shelf during summer ; in winter, transportfrom the Gulf of St . Lawrence dominates .
Information Gaps :
• There has not been a systematic array of current meter moorings or surface drifterreleases in the Gully . Consequently, circulation models of the Gully are based onrelatively few observational data and are therefore subject to relatively largeuncertainties ; oceanographic data are lacking, in particular, for the deeper areas of theGully .
• Data on chemical contaminants (in water, sediments and organisms) in the Gullyregion are lacking .
• Knowledge of high frequency mixing processes occurring on small spatial scales andtheir importance for nutrient flux and productivity in the Gully is lacking .
Biological Oceanography - Plankton
Description : Analysis of phytoplankton, zooplankton and ichthyoplankton data fromhistorical Scotian Shelf Ichthyoplankton Program (SSIP) surveys (1978-82), more recentresearch on the Scotian Shelf, acoustics backscatter and satellite ocean colour data aredescribed .
The seasonal cycle of phytoplankton in the Gully region follows the pattern seen shelf-wide and observed in north temperate coastal waters in general ; low biomass levels areobserved during winter (due to light-limitation of growth) and summer (due to nutrient-limitation of growth) and biomass maxima occur in spring and fall (optimal light-nutrientconditions) . Analysis of the available data does not support the suggestion that the Gullyis a uniquely productive feature on the Scotian Shelf. Limited observational data do,however, suggest that high frequency events may result in localized enhancement ofphytoplankton abundance in the Gully, a feature that is missed with the conventionalcoarse-scale sampling carried out in the past .
The zooplankton seasonal cycle in the Gully, likewise, is similar to that of the ScotianShelf in general . The available data analyzed to date do not support the idea thatmesozooplankton are especially abundant in the Gully compared with other deep waterareas of the Scotian Shelf. Because it is an area of deep water, however, it does harbouroverwintering populations of C. finmarchicus at depths of >200 in and krill, which spendthe daylight hours at depths of >200 in and the night-time hours in the near surface
iv
layers. In the case of the macroplankton (krill), it is unclear whether concentrations in theGully are generally higher than those in other Basins on the Scotian Shelf or along theShelf break. It cannot be determined from the existing data whether the Gully is an areaof intrusion of the very abundant off-shore population of C. finmarchicus on to the Shelfin spring, as is the case further to the south and west in the area of the Halifax section . Ifit is, then it may provide an important source of copepods for Sable Island and WesternBanks in spring. Overall, plankton dynamics in the Gully exhibit features which arecharacteristic of both shelf basin and shelf break habitats .
Information Gaps :
• Existing data are neither spatially nor temporally resolved sufficiently to assess theimportance of some of the mesoscale (i .e . spring and fall "blooms") and small scaleprocesses that determine the region's plankton distribution and productivity .
• The trophic links between locally produced plankton and the benthos, fish andmammals of the Gully have not been established .
Benthos
Description : The sedimentary interface fauna (benthos) of the Scotian Shelf is poorlyknown and existing studies have been directed to specific regions or aspects of thebenthic community rather than to broad surveys . There is no general information on thedistribution of benthic organisms or benthic community structure for the Gully region .Based on a recent video survey in the region and research done in other submarinecanyons on the North Atlantic continental margin, however, a general picture of thecomposition, structure and vertical zonation of benthic communities in the Gully regioncan be hypothesized. Clear from studies in analogous regions is the observation that thediversity of species and their abundance is generally significantly greater in submarinecanyons than adjacent continental slope waters and that this can be related directly tothe richness and variety of habitats found in regions characterized by strong horizontalgradients in bathymetry (steep slopes) and surficial geology .
An analysis has also been made of the distribution and diversity of deep sea horny andstony corals along the Scotian Shelf and within the Gully, based on data gathered frominterviews with fisherman and scientists together with the study of museum collectionsand review of the scientific literature . From the coral survey it would appear that half ofthe 20 species of deep sea corals reported from Nova Scotia waters occur in the area ofthe Gully and the adjacent continental slope . This is a typical assemblage of species andno "rare" species occur . The corals are recognized as an important part of the benthicbiota of the Gully .
v
Information Gaps :
• Quantitative information (distribution, abundance, community composition andstructure, biology and ecology) is lacking on all components of the benthiccommunity in the Gully and adjacent shelf and slope regions .
• Information on the fate of pelagic production and its role in supporting the Gully'sbenthic communities, i .e . benthic/pelagic coupling, is lacking .
• Information necessary to establish the relationship between habitat(bathymetry/surficial geology) and benthic community structure and biodiversity islacking .
Fish and Fisheries
Description : A description of finfish and invertebrates on the Scotian Shelf is given,largely based on DFO trawl survey data from 1970-1993 . Analyses compare thedistribution and abundance of groundfish, pelagics and invertebrates in the Gully andsurrounding Eastern Scotian Shelf and slope regions .
SSIP samples were examined to determine the importance of the Gully as a spawningarea for marine fish. Twelve species of fish eggs and nearly thirty species of larvae wereencountered in the Gully. Of these, silver hake was the most abundant, followed bypollock, American Plaice and cod (eggs) or sandlance, windowpane flounder and cod(larvae) . Given the abundance of silver hake eggs and larvae in the region, it isreasonable to conclude that the Gully was an important spawning area for this species atthe time these samples were collected (1978-82) . The shelf-wide significance of theGully as a spawning site for this and other species in more recent years, however, is notknown since sample analyses were confined to only a few localized stations and werecarried out more than a decade ago .
Based on these analyses, it is concluded that the Gully and adjacent waters are areas ofrelatively high demersal finfish diversity relative to the eastern Scotian Shelf as awhole . There is no evidence for any endemic demersal species of fish, however, giventhe low sampling rate and the potentially low efficiency of the trawl in areas of rapidchanges in bathymetry such as occur in the area, this does not rule out the possibility thatsuch species occur .
The slope area of the Gully, as is the case for the Scotian Slope in general, is an area offaunal boundaries. The upper reaches of the slope (less than 360 m) represent the lowerboundaries of distribution for the shelf dwelling species and the upper limits for thosespecies which are truly slope dwellers . The slope itself down to depths of about 900 inhas it's own ichthyofauna . Beyond these depths the demersal fish fauna changes again torepresent that of the lower slope and abyssal rise . It is difficult to draw conclusions aboutthe uniqueness of the fish occurring in the slope waters of the Gully given the relativepaucity of like data from other areas suitable for comparison .
vi
The Gully area does not appear to be important for shelf dwelling pelagic speciesalthough these do occur there as migrants . The pelagic species occurring over the shelfslope and abyssal plain adjacent to the Gully are numerous (>200) . Given the broadgeographic distributions of many of these species, it is unlikely that any are unique to theGully .
The Gully is an area of high density for redfish, squid, cod, witch flounder, white hake,
and longfin hake, relative to the remainder of the eastern Scotian Shelf . The top nine
species of demersal fish occurring in the Gully can be split into those whose dynamics are
relatively similar to those demonstrated by that species elsewhere on the eastern Scotian
Shelf (redfish, squid and witch flounder) and those whose dynamics show different
patterns in the Gully relative to the eastern shelf (American Plaice, haddock, cod, silverhake, white hake and pollock) . The underlying causes of the different dynamics in these
areas has not been investigated .
Although at present the fisheries on the Eastern Scotian Shelf are severely restricted
relative to the recent past, the Gully continues to be an actively fished area . Longline
effort directed at Atlantic halibut and White hake is presently the most common . In the
past there has also been significant trawler effort in both the Gully and the adjacent slope
waters .
Squid is the only active commercial fishery for invertebrates in the Gully trough (>200 m)but there are several other fisheries in the surrounding area (clams, scallops, snow crab,shrimp) . There is potential for future expansion of existing fisheries to the Gully (e .g .snow crab, shrimp) as well as some new benthic fisheries (e .g. stone crab) . There are nodata that suggest the Gully is of special significance to the populations of any benthicinvertebrate species, but data on shelfwide distribution of most species is currently notavailable .
Information Gaps :
• Contemporary data, particularly on ichthyoplankton distribution, is lacking .• Information on the seasonal distribution of finfish in lacking, particularly outside the
summer survey periods .
• Complete distributional data on red crab, stone crab, lobster, other crustaceans arelacking; a possible source of information is the groundfish survey database, butinvertebrate species records are not complete .
• Information on the extent of movement between the Gully and the rest of the ScotianShelf (most finfish and invertebrate species) is lacking .
• Information on the recruitment links between the Gully and the rest of the ScotianShelf (most finfish and invertebrate species) is lacking .
• Information on interactions with other species is lacking .
vii
Seabirds
Description : A description is given of the species making up the western Atlantic pelagicavifauna, derived principally from the PIROP database of CWS which is comprised of 25years of observational data from ships and more recent studies .
The high variability of seabird distributional data make it difficult, with the dataavailable, to detect small, local anomalies of distribution. Highest concentrations ofpelagic birds are found along the shelf edge and in the turbulence and mixing zoneswhere currents round major headlands : East Point in P.E .I . and Cape North in the CabotStrait, for instance . High seabird numbers also occur predictably in the areas of mixingbetween Sable Island and the mainland generated by the Sable Island gyre .
The PIROP database unfortunately contains few observations made in the area of theGully, but the few data that are available do not show any unusual enhancement ofseabird numbers in the area. Researchers recently conducted a series of summertimeseabird surveys in the Gully region and noted that when compared with the rest of theScotian Shelf some species appeared less abundant, and others : Greater Shearwaters andpetrels for instance, appeared to be slightly more abundant . However, the data availablefor comparison were taken from the PIROP database gathered more than a decadepreviously and interannual variations in the numbers of these southern migrants may wellaccount for the small differences observed . Furthermore the comparison was with datafor the shelf as a whole rather than the adjacent shelf edge, and pelagic seabirds aregenerally more abundant near the shelf edge .
Based on the poor spatial/temporal resolution of available data on pelagic seabirddistributions off eastern Canada, there is not enough evidence to assess whethersubmarine canyons per se have any major effect on seabird distributions .
Information Gaps :
• There is a general lack of information on seabird distributions : (1) in the Gully region,particularly in the winter season and (2) contemporaneous with observations along theadjacent shelf edge .
• Information on the functional links between seabirds and marine mammaldistributions/aggregations and other components of the marine foodweb in the Gullyis lacking .
Marine Mammals
Description : A detailed account is given of existing information on the two principalorders of marine mammals (and the only two on the Scotian Shelf) ; whales/dolphins(cetaceans) and seals (pinnipeds) . Included are descriptions of the area, data sources anda summaries for each species of habitat preference, temporal use of area, approximatenumbers and significance of the Gully to the animals .
viii
Available evidence strongly suggests that the Gully/Sable Island area is the mostimportant habitat for both cetaceans and pinnipeds on the Scotian Shelf. The longestand most productive pinniped research programme anywhere in the world occurs in thisarea, as well as the only long-term study of a beaked whale species. The area is notablefor (1) high diversity of cetaceans (8-13 common species), (2) a high density of cetaceansin the Gully canyon . Densities of most species of Cetacea are considerably higher in theGully than on other parts of the eastern Scotian Shelf, and large whale density is higher inthe Gully than elsewhere along the edge of the Scotian Shelf (including the entrance ofthe Fundian Channel), and (3) a high density of grey seals breeding on Sable Island .
In addition, the Gully/Sable area is of particular significance (within a Canadian context)for (1) Grey seals, (2) Harbour seals, (3) Northern bottlenose whales, (4) Sperm whales,(5) Striped dolphins, (6) Atlantic white-sided dolphins and (7) Short-beaked commondolphins .
The most significant marine mammal habitat within the area for pinnipeds is Sable Islandand surrounding waters and for cetaceans is the deep canyon and northern basin of theGully (>200m in depth) .
Information Gaps :
• Data on at-sea distribution of pinnipeds are lacking .• Data on cetacean distribution in the Gully outside the summer months are lacking .
• Information on how cetaceans use the Gully area is lacking .
• Data on the acoustic ambient noise within the Gully and its influence on the behaviorof local marine mammal populations are lacking .
Ecosystem Classification Methods
Two ecosystem classification approaches are described . One approach is based on anobjective hierarchical system of identifying enduring and recurrent oceanographic andphysiographic features of the marine environment . The structure of this classificationsystem consists of six levels leading to the delineation of marine representative units(MRUs). The second approach employs similar principles by defining submarinelandscape elements using biophysical properties . This latter approach has been applied tothe Scotian Shelf and is described in the recently revised edition of, The Natural Historyof Nova Scotia ; the former approach is currently being tested on the Scotian Shelf .
Ecological classification is a "top-down" approach, providing a systematic and efficientmeans of characterizing ecosystems over a broad range of spatio-temporal scales . Thisapproach is currently being used to describe the Gully in the context of the greater ScotianShelf system .
ix
General Conclusion s
The Science Review has assessed the state of knowledge of the environment andecosystems of the Gully region . With the exception of cetacean studies, the Gully has notbeen a region of directed research. Consequently, the available information and level ofunderstanding of processes that characterize the Gully vary considerably . Aside fromspecific absence of data on certain components of the Gully environment (e .g. acousticambient noise, benthos), much of the available data lacks spatial/temporal resolution fordelineating features distinctive to the Gully . Moreover, much of the biological datacollection dates back a decade or longer and might not accurately represent presentconditions . These deficiencies, however, are not confined to the Gully but refleçt thegeneral availability (or lack) of data and level of understanding we have for ourcontinental shelf ecosystems. Despite these shortcomings, sufficient information exists todefine the major processes and linkages which characterize the Gully and other submarinecanyons .
Acknowledgements
The editors and DFO wish to thank the review team and in particular those members fromoutside the Department for the time and effort they put into their reports and the meetingsand discussions associated with the development of this document . We also wish tothank the many additional observers from the petroleum and fishing industries,environmental consulting companies, universities and conservation groups who attendedour meetings, contributed to the discussion, and provided valuable suggestions . Finally,we wish to express special thanks to Drs . Peter Auster, Stephen Brown and FrankAlmeida who served as external examiners for our Regional Advisory Process (RAP) andprovided valuable suggestions for the improvement of our Review .
* The Gully Science Review Team : C. Amos, (GSC), D. Bowen (DFO), R . Branton (DFO), H . Breeze(Ecology Action Centre), D . Davis (NS Museum), G . Fader (GSC), P . Fanning (DFO), D . Fenton (DFO),K. Frank (DFO), S . Gowans (Dal Univ), R . Halliday (DFO), C. Hannah (DFO), G. Harding (DFO), G .Harrison (DFO), E . Head (DFO), S . Hooker (Dal Univ), T . Lock (CWS), J . Loder (DFO), I . Milewski(WWF), F . Page (DFO), B . Petrie (DFO), D. Piper (GSC, G . Rockwell (DFO), J . Shore (DFO), W. Stobo(DFO), H. Stone (DFO), D . Themelis (DFO), J . Tremblay (DFO), H . Whitehead (Dal Univ), D. Wildish,(DFO), P . Yeats (DFO), K . Zwanenburg (DFO) .
x
1.0 Geographical Setting and Conservation Efforts
Derek FentonFisheries and Oceans CanadaOceans Act Coordination OfficeBedford Institute of OceanographyDartmouth, N S
1.0.1 Geographical Setting
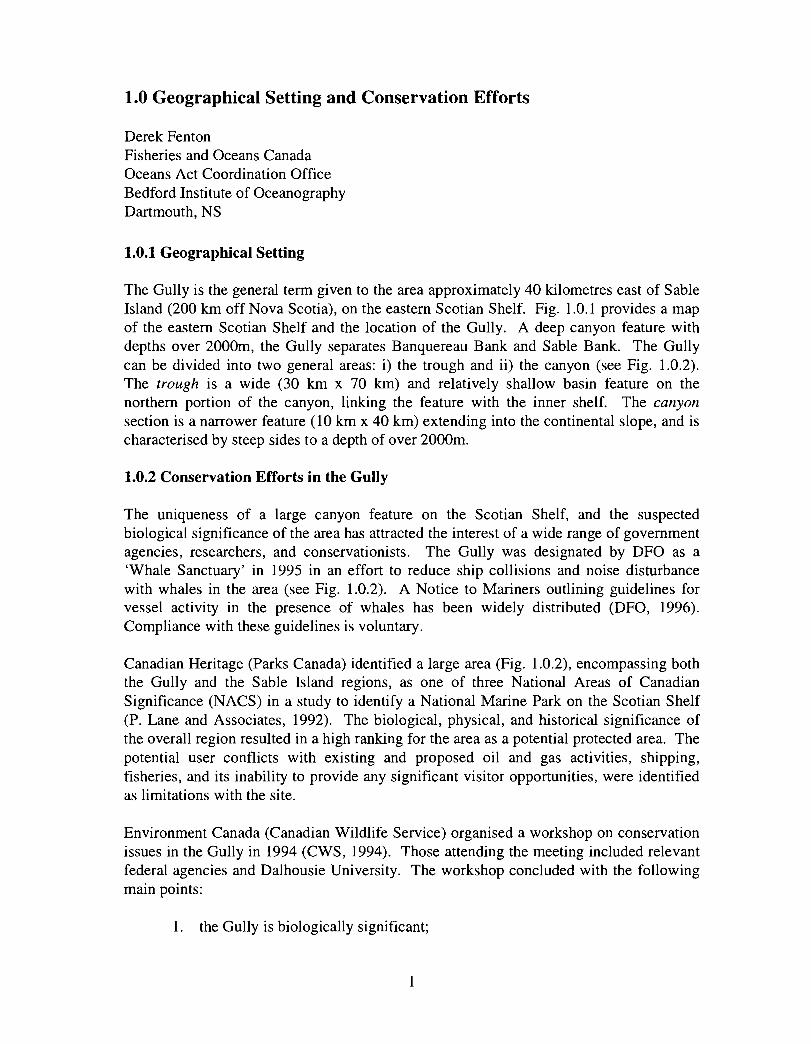
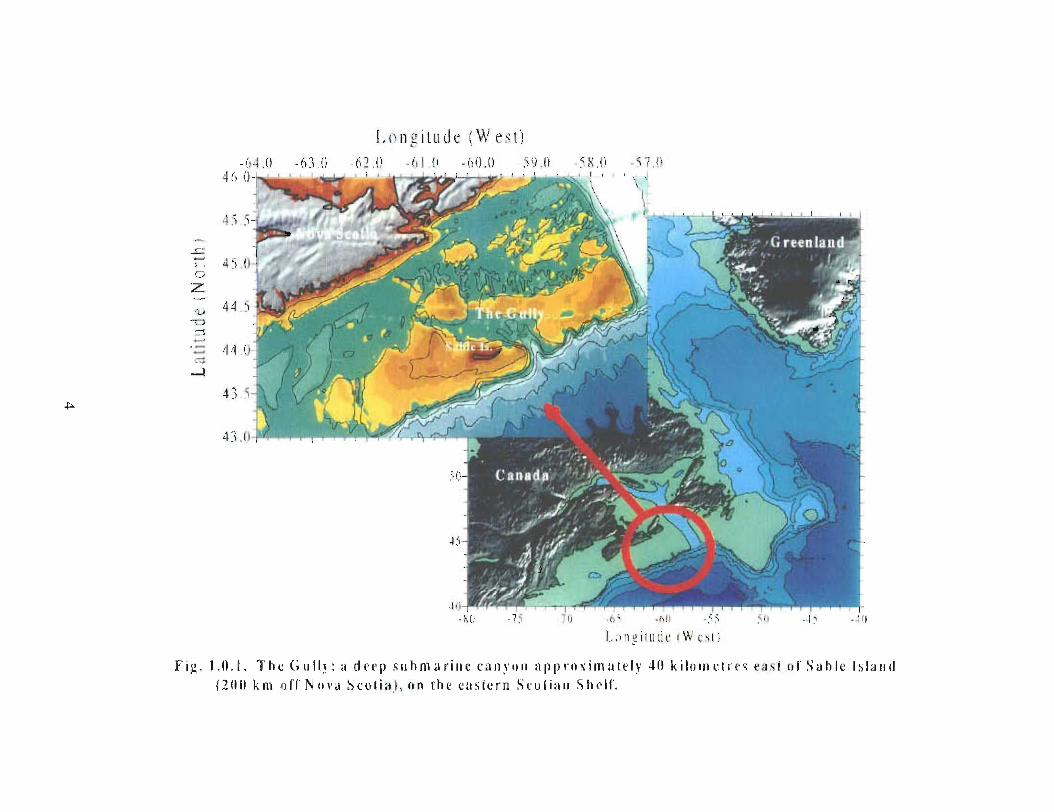
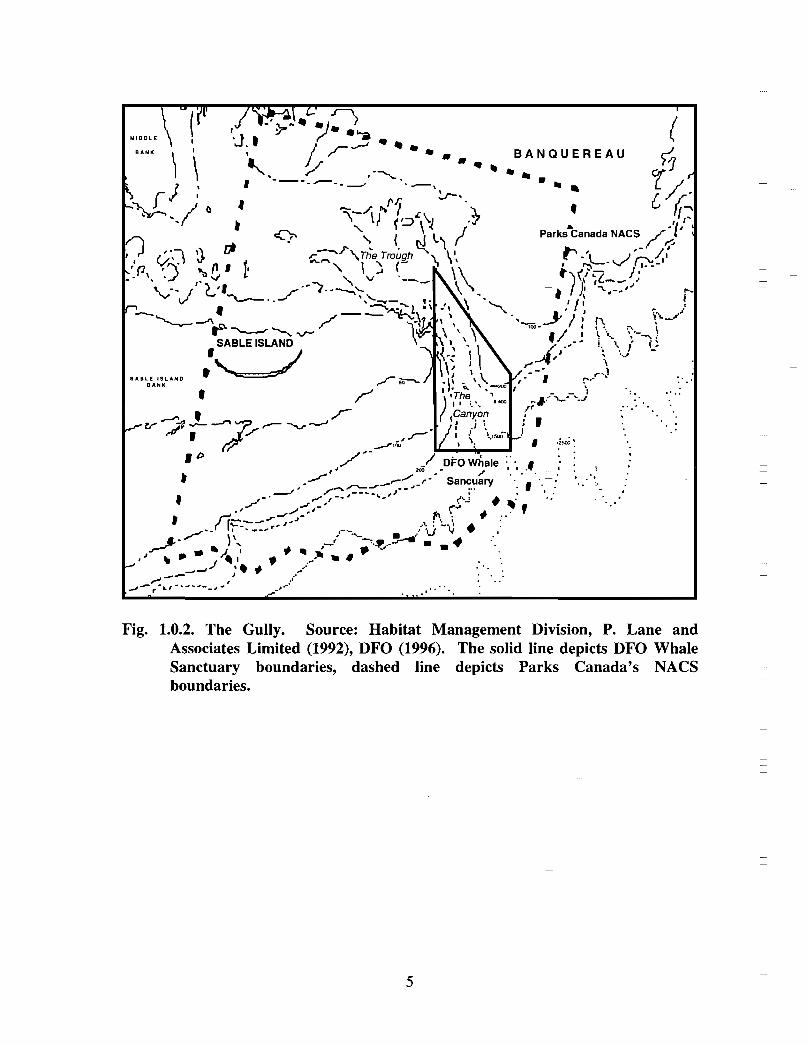
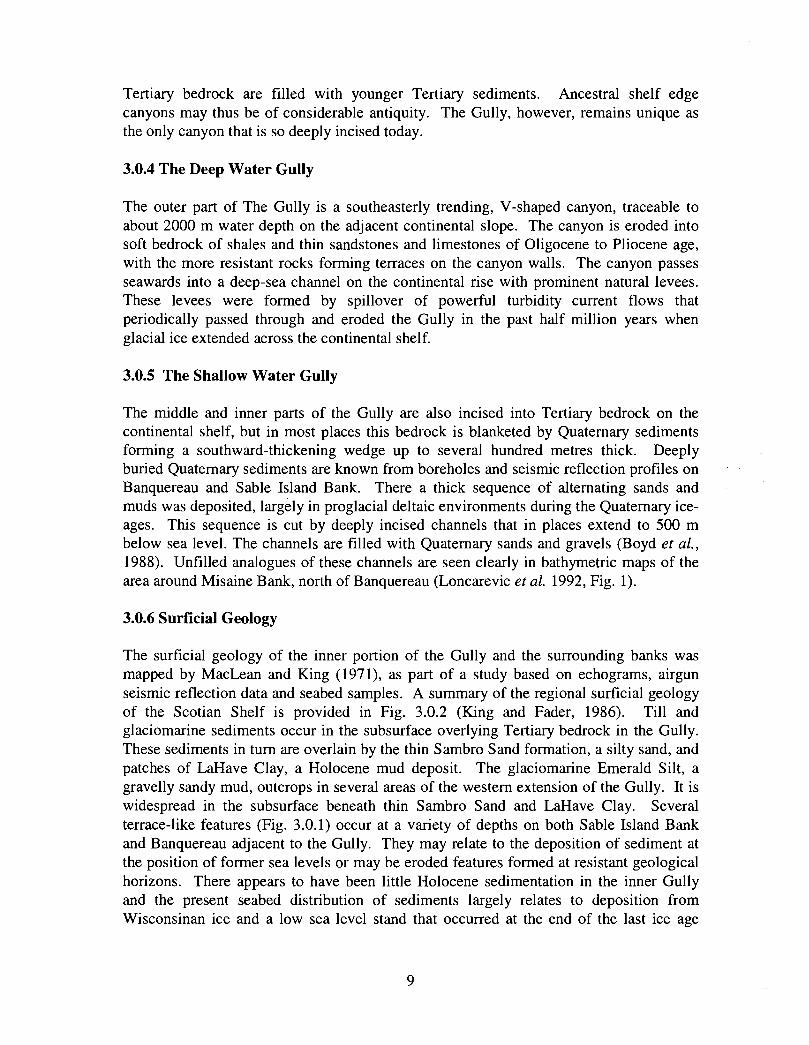
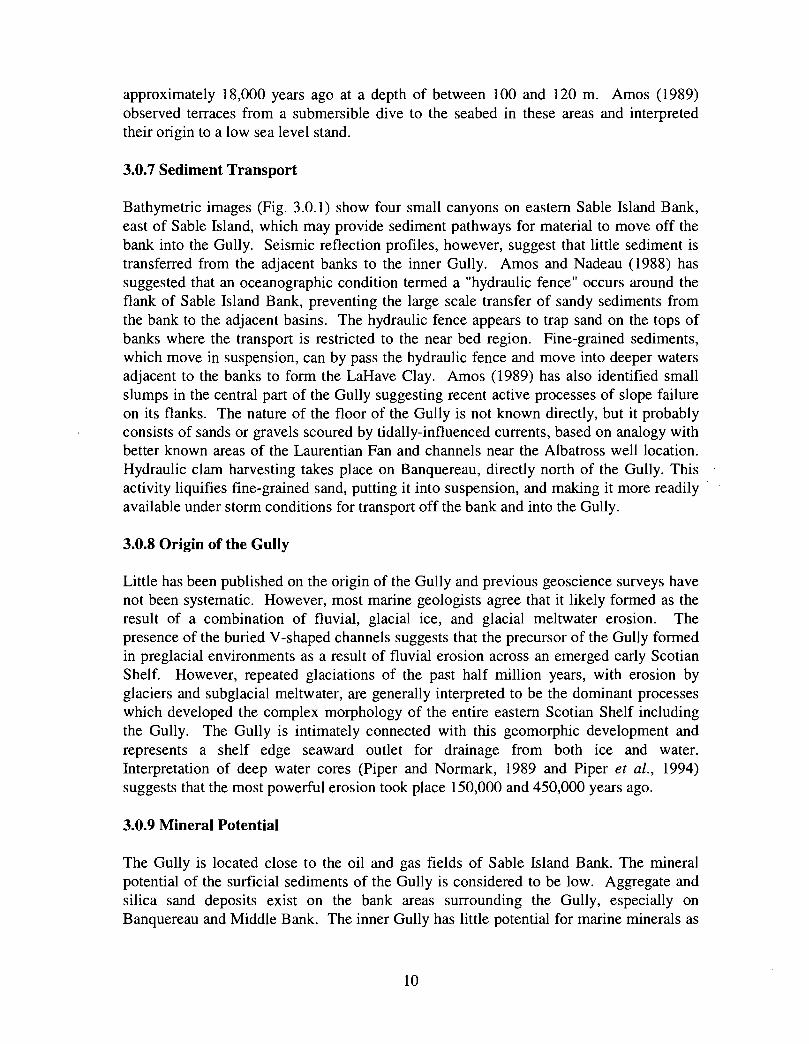
The Gully is the general term given to the area approximately 40 kilometres east of SableIsland (200 km off Nova Scotia), on the eastern Scotian Shelf . Fig. 1 .0.1 provides a mapof the eastern Scotian Shelf and the location of the Gully. A deep canyon feature withdepths over 2000m, the Gully separates Banquereau Bank and Sable Bank . The Gullycan be divided into two general areas: i) the trough and ii) the canyon (see Fig . 1 .0 .2) .The trough is a wide (30 km x 70 km) and relatively shallow basin feature on thenorthern portion of the canyon, linking the feature with the inner shelf. The canyonsection is a narrower feature (10 km x 40 km) extending into the continental slope, and ischaracterised by steep sides to a depth of over 2000m .
1.0.2 Conservation Efforts in the Gull y
The uniqueness of a large canyon feature on the Scotian Shelf, and the suspected
biological significance of the area has attracted the interest of a wide range of government
agencies, researchers, and conservationists . The Gully was designated by DFO as a
`Whale Sanctuary' in 1995 in an effort to reduce ship collisions and noise disturbance
with whales in the area (see Fig . 1 .0.2). A Notice to Mariners outlining guidelines for
vessel activity in the presence of whales has been widely distributed (DFO, 1996) .Compliance with these guidelines is voluntary .
Canadian Heritage (Parks Canada) identified a large area (Fig . 1 .0.2), encompassing boththe Gully and the Sable Island regions, as one of three National Areas of CanadianSignificance (NACS) in a study to identify a National Marine Park on the Scotian Shelf(P. Lane and Associates, 1992). The biological, physical, and historical significance ofthe overall region resulted in a high ranking for the area as a potential protected area . Thepotential user conflicts with existing and proposed oil and gas activities, shipping,fisheries, and its inability to provide any significant visitor opportunities, were identifiedas limitations with the site .
Environment Canada (Canadian Wildlife Service) organised a workshop on conservationissues in the Gully in 1994 (CWS, 1994) . Those attending the meeting included relevantfederal agencies and Dalhousie University . The workshop concluded with the followingmain points :
1 . the Gully is biologically significant ;
1
2 . current conservation strategies are inadequate to protect the significantbiological resources ; and ,
3. there is a need for an overall conservation strategy for the area .
A Discussion Paper outlining the main issues to be addressed in the development of aconservation strategy for the area resulted (CWS, 1995) .
The Sable Offshore Energy Project (SOEP) is located to the west of the Gully (Fig . 1 .0 .2) .The Gully was identified as a`unique ecological site' and `valued ecosystem component'in the SOEP Environmental Impact Statement (SOEP, 1996) . The SOEP Joint ReviewPanel Report identified a number of concerns regarding the potential impacts of theproject and future developments on the Gully area (SOEP Joint Review Panel, 1997) .The Panel recommends that prior to regulatory approval, SOEP submit its Code ofPractice outlining protection measures in the Gully as part of their final EnvironmentalProtection Plan (Recommendation 11) . As well, the Panel recommends that SOEP beginor contribute to research activities in the Gully that will provide the baseline data forEnvironmental Effects Monitoring programs (Recommendation 9) . In turn, this data willassist in determining the impact of the project and further resource developments on theGully .
The World Wildlife Fund (WWF) has identified the Gully as a potential site fo'r aprotected area as pa rt of their Endangered Spaces Campaign (WWF, 1997) . The WWFrecently produced a repo rt which details the biophysical characteristics and some of therelated m anagement issues for the area (Shackell et. al ., 1996) .
1 .0.3 Developing a Conservation Strategy for the Gully
Building upon the efforts of the Canadian Wildlife Service, a Gully ConservationStrategy will be developed and co-ordinated by DFO. The objective of the ConservationStrategy is to :
identify and address conservation and management issues of the Gully
in an open and transparent planning process.
The Conservation Strategy will provide a opportunity to review the CWS DiscussionPaper, update its conclusions and recommendations, and build consensus with a broadstakeholder community on the future conservation actions . The development of theConservation Strategy will coincide the efforts of other groups and studies and will totake into consideration these findings .
The Conservation Strategy is divided into three distinct, but interconnected phases (seeflow-chart below) . A staged approach will be taken with the goal of developing aninformation base and building consensus with stakeholders prior to moving onto furtherphases .
2
Phase II
IdentifyConservation
Objectives andOptions
July 97 - June 98 Summer 98
Phase III
Develop Strategyand Implementation
Fal198
The first phase is composed of the Gully Science Review to provide the most currentknowledge on the biological and physical processes in the Gully . The Review willprovide an initial indication of the key resources and related conservation issues of thearea. The second phase involves developing the conservation principles and objectivesfor the Gully. Once identified, the range of management measures and options requiredto meet these objectives can be explored . The third phase involves developing andassembling the Conservation Strategy document . Once the Conservation Strategy isfinalised an implementation team will be assembled to fulfil its objectives .
1 .0.4 References and Additional Readin g
Canadian Wildlife Service . 1994 . Notes from the Workshop - Evaluation of the NaturalValues of "The Gully" and Sable Island Offshore Areas . Bedford Institute ofOceanography, November 2, 1994 .
Canadian Wildlife Service . 1995 . Towards a Conservation Strategy for the Gully nearSable Island : Discussion Paper. June, 1995 . Canadian Wildlife Service, Sackville,N.B .
Department of Fisheries and Oceans . 1996 . Notice to Mariners Annual Edition 1996.Supply and Services, Ottawa.
P. Lane and Associates Limited . 1992 . A Study to Identify Marine Natural Areas of
Canadian Significance in the Scotian Shelf Marine Region . Project E-363 . Report
submitted to Canadian Parks Service, Environment Canada, May 1992 . Ottawa .
Sable Offshore Energy Project . 1996 . Environmental Impact Statement - Volume 3 .
Shackell, N ., Simard, P ., and Butler, M . 1996. Potential Protected Area in the GullyRegion, Scotian Shelf. Report to World Wildlife Fund of Canada . June, 1996 .
SOEP Joint Review Panel . 1997 . Joint Review Panel Report - Sable Gas Projects .
World Wildlife Fund, 1997 . Endangered Spaces Program Annual Report 1996-1997 .Toronto .
3
Longitude (W C-~t )li -(11 ( ) - 6 il .(~ 5 L)II -iti 0
I - L . 1 a 1 . . 1 1
hU '? 7f1 -f,, hIi -ii ill -I> • 10
k 0 111_° l1 d C I W C4I 1
F i g . 1 .t1 .1 . 'I'hc G uflw : a deep suhma r in e c a n 4un a pprrrxgm a tely 40 kilunirtr c .w c as t oll' Sable Island
1 2111i km t1fl' Nova Scu ti a l, o n the t.utiE e rn tir o Eian tihelt' .
mg,ri -~ ~
, ..
J . ` ~.~ q ~1l
'\ /•
of •• .
~
/ ' ~'/ • ~ ~~. . ~~,`_~, ~J "~~~ . ♦
SABLE ISLANDI
SABLE ISLANDBANK
r
1t_~ ~~•.~ -~1~l ~ ~ ~•,.
~i . . . .re ~'•~~ ~~ .
i •• .
J DFO Whale • •, /
Sancua ry-. ~- - /.
~ . . 1 • ;_ ._.,,__ ~ , •t!
,'~ ~ ~ ~ ~~ ~ ~ ~ ~-•sI r``*~--'--+ ■ •' ~ .
rLl _J ~~ ~~^_ .._ , .' . . . •
: ' . .r-~ - ---~ - ~
Fig. 1 .0.2. The Gully. Source: Habitat Management Division, P. Lane andAssociates Limited (1992), DFO (1996) . The solid line depicts DFO WhaleSanctuary boundaries, dashed line depicts Parks Canada's NACSboundaries .
/`/• =✓'` .
1~~1~ f~~``1 •~
1% 1 j
rr~f~The` ro{gh
BANGIUEREA Uto
• r
tV1 !
ni.•`_1~~
,• ,.
5
2.0 The Science Review
W. Glen Harrison
Fisheries and Oceans CanadaOcean Sciences Divisio nBedford Institute of OceanographyDartmouth, NS
2.0.1 Background
In May 1997, DFO Headquarters requested that Maritimes Region initiate a coordinatedreview of the Gully that would build upon the 1994 CWS sponsored Workshop andDiscussion Paper, "Towards a Conservation Strategy for the Gully near Sable Island,N.S ." (see Section 1 .0). This review was to constitute a summary of the state of ourknowledge of the Gully region which would be subjected to the Regional AdvisoryProcess (RAP) and developed into a DFO Research Document . Ocean Science Division,DFO was asked to lead this review, drawing on local expertise to provide a broad andcomprehensive scientific review of the region . A number of meetings were held in Junefrom which a list of subject areas and designated experts were chosen to carry out thereview (Table 2 .01) . The strategy chosen was to recruit a team composed of governmentand NGO experts since is was recognized that DFO did not have the capability to carryout such a broad review in-house .
Table 2.0.1. Gully Science Review Team Leaders .
Discipline Team Member AffiliationCoordination G. Harrsion DFO-OSD -Conservation Strategy D. Fenton DFO-OACOGeosciences G. Fader NRCan-GSCHydrography G. Rockwell DFO-CHSPhysical Oceanography B . Petrie DFO-OSDChemical Oceanography P. Yeats DFO-MES DBiological Oceanography E. Head DFO-OSD
G. Harding DFO-MES DBenthos D. Wildish DFO-MESD
H. Breeze Ecology Action CentreFish and Fisheries K. Zwanenburg DFO-MFD
J. Tremblay DFO-IFDSeabirds T. Lock DOE-CWSMarine Mammals H. Whitehead Dalhousie UniversityEcosystem Classification I . Milewski WWF
D. Davis NS MuseumOSD (Ocean Sciences Division), OACO (Oceans Act Coordinating Office), GSC {Geological Survey ofCanada), CHS (Canadian Hydrographic Service), MESD (Marine Environmental Sciences Division), MFD(Marine Fish Division), IFD (Invertebrate Fisheries Division), CWS (Canadian Wildlife Service), WWF(World Wildlife Fund) .
6
The first meeting of the Review Team was held in July to define the scope of the review
and to develop a timetable for its completion . An outline of the proposed Gully Science
Review was presented shortly afterwards at a DFO-organized meeting of stakeholders
(e.g. fisheries, petroleum industry representatives, environmental groups) where an
invitation was given for broader participation in the review . Two subsequent meetings
were held (September and October) to assess the status of the review components, to
evaluate and discuss findings and to provide instructions for the written reports and the
RAP. Final reports of all components of the review were received by early December and
evaluated by external reviewers, team members and stakeholders during the 2-day RAP
meetings held in February . On the basis of comments tabled during the RAP, the Gully
Science Review was revised and published as a DFO Canadian Stock Assessment
Secretariat Research Document. The entire process from initial planning to final
document publication took nearly a year to complete .
2.0.2 Principles of the Gully Science Review
The basis for a sound conservation strategy starts with an assessment of what we knowabout the ecosystem and environment of the region of interest (Section 1 .0). The GullyScience Review was produced to :
provide a description of the environment and ecosystem(s) of the Gullyand surrounding area and to frame this information in the context ofthe greater Scotian Shelf system.
To address this objective, the Gully Review Team was asked to base its analysis on thefollowing principles:
• The review will be coordinated by DFO but will include other Federal departmentsand experts from outside government (NGOs), using the available regional expertise .
• The review will be as comprehensive as possible (within the timeframe allocated),including an up-to-date bibliography .
• The review will incorporate unpublished research data to the extent possible .
• The review will identify knowledge gaps .
• Where no information exists, the review will draw on information from analogous(but better described) regions .
7
3.0 Surficial, Bedrock Geology, and Morphology
Gordon B . J . Fader, David J . W. Piper and Carl L . AmosGeological Survey of Canada (Atlantic)Bedford Institute of OceanographyDartmouth, NS
3.0.1 Introduction
The Gully is a large shelf edge canyon on the eastern Scotian Shelf, separating SableIsland Bank from Banquereau . It is unique among canyons of the Eastern Canadianmargin because of its great depth, steep slopes and extension far back on the continentalshelf. From a physiographic perspective, the Gully can be divided into three regions : 1)a deep water southeastern part of the canyon incised into the continental slope toapproximately 2000 in water depth; 2) a zone between Sable Island Bank and Banquereauwith depths ranging between 300 in and 1600 m ; and 3) a north and northwestern zonethat extends for over 100 km to Middle Bank .
3.0.2 Bathymetric Morpholog y
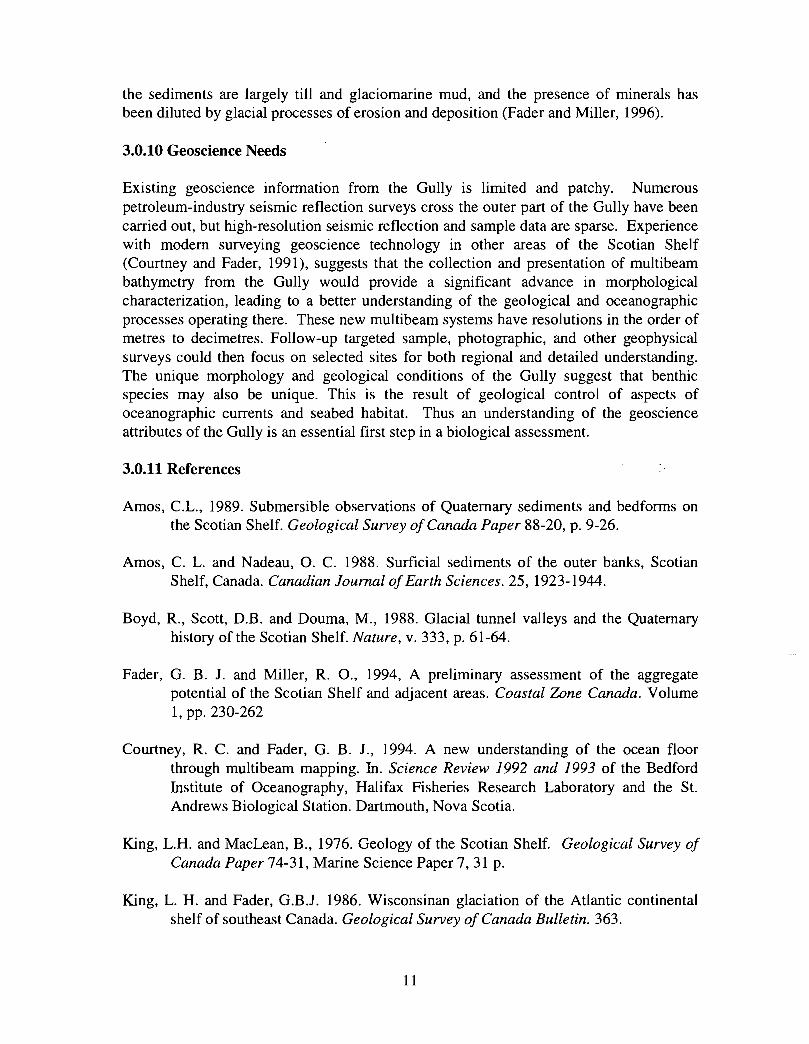
An artificially shaded and depth colour-coded digital terrain model (Loncarevic et al .1992, Fig. 5) provides the most grâphic rendering of the bathymetry of the area . It isbased on digital bathymetric data collected by the Canadian Hydrographic Service . Thedata covers areas of the Gully to approximately 800 m water depth and the imageillustrates the morphologic relationship with the surrounding banks and connections tothe north and west . The horizontal resolution of this image is approximately 400 in . LisaSankeralli of the University of Alberta is presently studying the origin of the morphologyof the eastern Scotian Shelf, including the Gully area, as part of an M .Sc . thesis, and hasreprocessed the bathymetric data (Fig . 3 .0.1) for higher resolution (200 m) .
3.0.3 Bedrock Geology
The regional bedrock geology of the area was first mapped by King and MacLean (1976) .The Scotian Shelf Volume of the East Coast Basin Atlas Series of the Geological Surveyof Canada contains a series of maps on the bedrock, surficial sediments, sedimenttransport, seabed and subsurface features, geotechnical sediment properties andcontinental slope sediments . The Gully and the outer edge of the continental shelf areunderlain by Tertiary mudstones and sandstones . Within the inner part of the Gully, localsalt domes rise through the sedimentary column, bringing Cretaceous sediments to theseabed in association with the diapirism (King and Maclean, 1976) . Regional airgunseismic reflection profiles have been collected in the Gully and depict a steep-walledcanyon cut into bedrock in the deeper sections and thick surficial materials in theshallower parts. Other V-shaped channels occur buried near the Gully and may be part ofan earlier subaerial development that has shifted with time . At various places near theedge of the Scotian Shelf, including the Gully region, buried channels cut into olde r
8
Tertiary bedrock are filled with younger Tertiary sediments . Ancestral shelf edgecanyons may thus be of considerable antiquity . The Gully, however, remains unique asthe only canyon that is so deeply incised today .
3.0.4 The Deep Water Gull y
The outer part of The Gully is a southeasterly trending, V-shaped canyon, traceable toabout 2000 m water depth on the adjacent continental slope . The canyon is eroded intosoft bedrock of shales and thin sandstones and limestones of Oligocene to Pliocene age,with the more resistant rocks forming terraces on the canyon walls . The canyon passesseawards into a deep-sea channel on the continental rise with prominent natural levees .These levees were formed by spillover of powerful turbidity current flows thatperiodically passed through and eroded the Gully in the past half million years whenglacial ice extended across the continental shelf .
3.0.5 The Shallow Water Gull y
The middle and inner parts of the Gully are also incised into Tertiary bedrock on thecontinental shelf, but in most places this bedrock is blanketed by Quaternary sedimentsforming a southward-thickening wedge up to several hundred metres thick . Deeplyburied Quaternary sediments are known from boreholes and seismic reflection profiles onBanquereau and Sable Island Bank . There a thick sequence of alternating sands andmuds was deposited, largely in proglacial deltaic environments during the Quaternary ice-ages. This sequence is cut by deeply incised channels that in places extend to 500 mbelow sea level . The channels are filled with Quaternary sands and gravels (Boyd et al.,1988). Unfilled analogues of these channels are seen clearly in bathymetric maps of thearea around Misaine Bank, north of Banquereau (Loncarevic et al. 1992, Fig . 1) .
3 .0.6 Surficial Geology
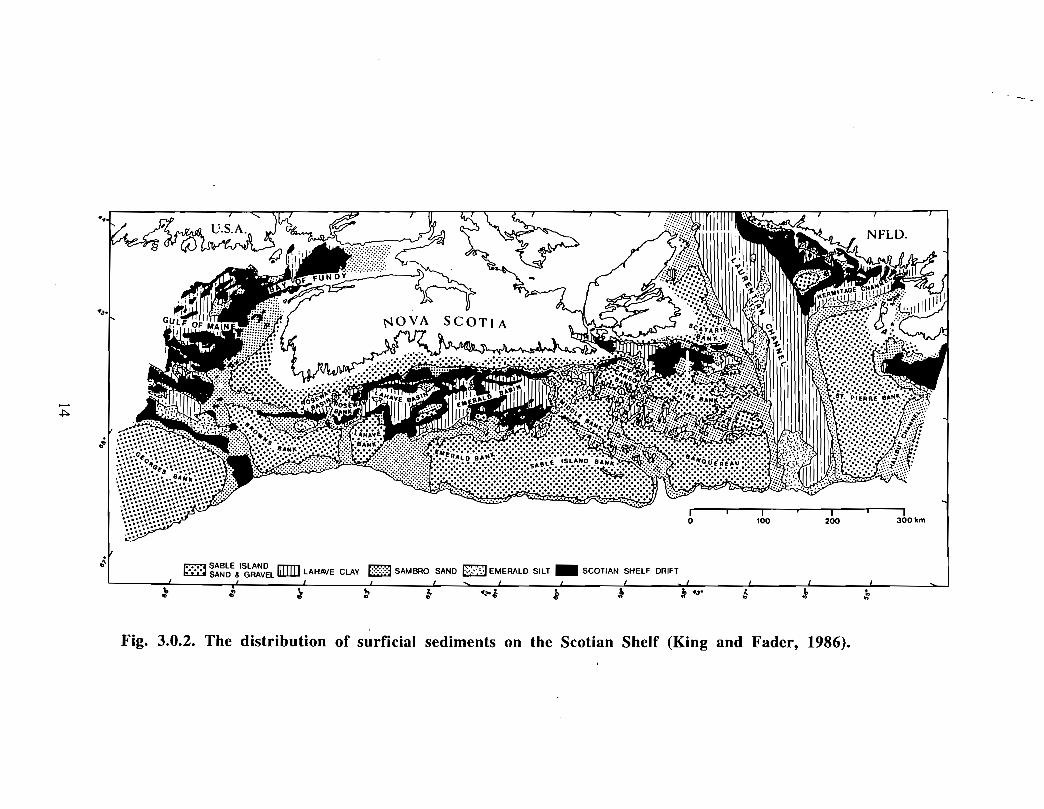
The surficial geology of the inner portion of the Gully and the surrounding banks wasmapped by MacLean and King (1971), as part of a study based on echograms, airgunseismic reflection data and seabed samples . A summary of the regional surficial geologyof the Scotian Shelf is provided in Fig. 3.0.2 (King and Fader, 1986). Till andglaciomarine sediments occur in the subsurface overlying Tertiary bedrock in the Gully .These sediments in turn are overlain by the thin Sambro Sand formation, a silty sand, andpatches of LaHave Clay, a Holocene mud deposit. The glaciomarine Emerald Silt, agravelly sandy mud, outcrops in several areas of the western extension of the Gully . It iswidespread in the subsurface beneath thin Sambro Sand and LaHave Clay . Severalterrace-like features (Fig . 3 .0.1) occur at a variety of depths on both Sable Island Bankand Banquereau adjacent to the Gully . They may relate to the deposition of sediment atthe position of former sea levels or may be eroded features formed at resistant geologicalhorizons . There appears to have been little Holocene sedimentation in the inner Gullyand the present seabed distribution of sediments largely relates to deposition fromWisconsinan ice and a low sea level stand that occurred at the end of the last ice age
9
approximately 18,000 years ago at a depth of between 100 and 120 in . Amos (1989)observed terraces from a submersible dive to the seabed in these areas and interpretedtheir origin to a low sea level stand .
3.0.7 Sediment Transport
Bathymetric images (Fig . 3 .0.1) show four small canyons on eastern Sable Island Bank,east of Sable Island, which may provide sediment pathways for material to move off thebank into the Gully. Seismic reflection profiles, however, suggest that little sediment istransferred from the adjacent banks to the inner Gully . Amos and Nadeau (1988) hassuggested that an oceanographic condition termed a "hydraulic fence" occurs around theflank of Sable Island Bank, preventing the large scale transfer of sandy sediments fromthe bank to the adjacent basins . The hydraulic fence appears to trap sand on the tops ofbanks where the transport is restricted to the near bed region . Fine-grained sediments,which move in suspension, can by pass the hydraulic fence and move into deeper watersadjacent to the banks to form the LaHave Clay . Amos (1989) has also identified smallslumps in the central part of the Gully suggesting recent active processes of slope failureon its flanks. The nature of the floor of the Gully is not known directly, but it probablyconsists of sands or gravels scoured by tidally-influenced currents, based on analogy withbetter known areas of the Laurentian Fan and channels near the Albatross well location .Hydraulic clam harvesting takes place on Banquereau, directly north of the Gully . Thisactivity liquifies fine-grained sand, putting it into suspension, and making it more readilyavailable under storm conditions for transport off the bank and into the Gully .
3.0.8 Origin of the Gully
Little has been published on the origin of the Gully and previous geoscience surveys havenot been systematic . However, most marine geologists agree that it likely formed as theresult of a combination of fluvial, glacial ice, and glacial meltwater erosion . Thepresence of the buried V-shaped channels suggests that the precursor of the Gully formedin preglacial environments as a result of fluvial erosion across an emerged early ScotianShelf. However, repeated glaciations of the past half million years, with erosion byglaciers and subglacial meltwater, are generally interpreted to be the dominant processeswhich developed the complex morphology of the entire eastern Scotian Shelf includingthe Gully . The Gully is intimately connected with this geomorphic development andrepresents a shelf edge seaward outlet for drainage from both ice and water .Interpretation of deep water cores (Piper and Normark, 1989 and Piper et al ., 1994)suggests that the most powerful erosion took place 150,000 and 450,000 years ago .
3.0.9 Mineral Potential
The Gully is located close to the oil and gas fields of Sable Island Bank . The mineralpotential of the surficial sediments of the Gully is considered to be low . Aggregate andsilica sand deposits exist on the bank areas surrounding the Gully, especially onBanquereau and Middle Bank. The inner Gully has little potential for marine minerals a s
10
the sediments are largely till and glaciomarine mud, and the presence of minerals hasbeen diluted by glacial processes of erosion and deposition (Fader and Miller, 1996) .
3.0.10 Geoscience Needs
Existing geoscience information from the Gully is limited and patchy . Numerouspetroleum-industry seismic reflection surveys cross the outer part of the Gully have beencarried out, but high-resolution seismic reflection and sample data are sparse . Experiencewith modern surveying geoscience technology in other areas of the Scotian Shelf(Courtney and Fader, 1991), suggests that the collection and presentation of multibeambathymetry from the Gully would provide a significant advance in morphologicalcharacterization, leading to a better understanding of the geological and oceanographicprocesses operating there. These new multibeam systems have resolutions in the order ofmetres to decimetres . Follow-up targeted sample, photographic, and other geophysicalsurveys could then focus on selected sites for both regional and detailed understanding .The unique morphology and geological conditions of the Gully suggest that benthicspecies may also be unique . This is the result of geological control of aspects ofoceanographic currents and seabed habitat . Thus an understanding of the geoscienceattributes of the Gully is an essential first step in a biological assessment .
3 .0.11 References
Amos, C .L., 1989. Submersible observations of Quaternary sediments and bedforms onthe Scotian Shelf. Geological Survey of Canada Paper 88-20, p . 9-26 .
Amos, C. L. and Nadeau, O . C. 1988 . Surficial sediments of the outer banks, ScotianShelf, Canada . Canadian Journal of Earth Sciences . 25, 1923-1944 .
Boyd, R., Scott, D .B. and Douma, M., 1988. Glacial tunnel valleys and the Quaternaryhistory of the Scotian Shelf. Nature, v . 333, p. 61-64 .
Fader, G. B . J. and Miller, R. 0., 1994, A preliminary assessment of the aggregatepotential of the Scotian Shelf and adjacent areas . Coastal Zone Canada . Volume1, pp. 230-262
Courtney, R . C. and Fader, G. B. J ., 1994. A new understanding of the ocean floorthrough multibeam mapping . In . Science Review 1992 and 1993 of the BedfordInstitute of Oceanography, Halifax Fisheries Research Laboratory and the St.Andrews Biological Station . Dartmouth, Nova Scotia .
King, L .H. and MacLean, B., 1976. Geology of the Scotian Shelf. Geological Survey ofCanada Paper 74-31, Marine Science Paper 7, 31 p .
King, L . H. and Fader, G .B .J. 1986 . Wisconsinan glaciation of the Atlantic continentalshelf of southeast Canada . Geological Survey of Canada Bulletin . 363 .
11
King, L . H. and MacLean, B . 1976, Geology of the Scotian Shelf; Canadian HydrographicService, Marine Sciences Paper 7, 31p.
Loncarevic, B .D., Piper, D.J .W. and Fader, G.B ., 1992 . Application of high-qualitybathymetry to geological interpretation of the Scotian Shelf . Geoscience Canada .v. 19, p . 5-12 .
Maclean, B . and King, L .H. 1971 . Surficial geology of the Banquereau and Misaine maparea. Geological Survey of Canada Paper 71-52, 19p .
Piper, D.J.W. and Normark, W.R, 1989 . Late Cenozoic sea-level changes and the onset ofglaciation : impact on continental slope progradation off eastern Canada . Marineand Petroleum Geology . 6, p. 336-348 .
Piper, D.J.W., Mudie, P.J., Aksu, A.E. and Skene, K .I. 1994. A 1 Ma record of sedimentflux south of the Grand Banks used to infer the development of glaciation insoutheastern Canada . Quaternary Science Reviews . 13, p . 23-37 .
12
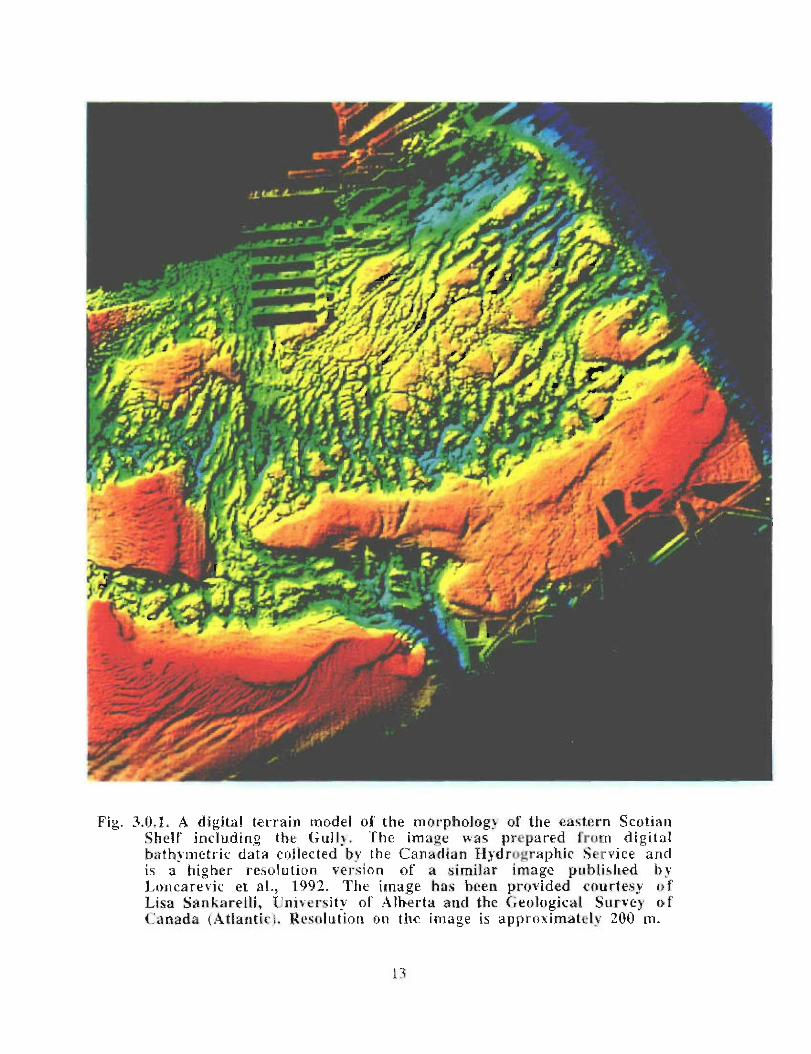
Fig . 3.0 .1 . A digital terrain model of the morphology of the eastern ScotianShelf including the tTullti . The image was prepared from digitalbath%nietric data collected by the Canadian Hydrographic Service andis a higher resolution version of a similar image pulilished byl,uncarevic et al.,, 1 992 . The image has been prov°ided courtesy ofLisa Sdnkarelli, Unke.rsity of Alberta and the Ceological 4urvey of'Canada (Atlantic) . Resolution on the iniage is approxirnatel}' 200 ni .
13
é ey
Fig. 3.0.2. The distribution of surficial sediments on the Scotian Shelf (King and Fader, 1986) .
4.0 Hydrography
Gary Rockwel lFisheries and Oceans CanadaCanadian Hydrographic ServiceBedford Institute of OceanographyDartmouth, N S
4.0.1 Introduction
The bathymetric data available for the Gully area is best described as limited . It isadequate to provide basic information for the safety of Navigation but lacks the detailrequired for scientific study .
The Canadian Hydrographic Service (CHS) maintains a database of bathymetricinformation for Canadian waters. Existing bathymetry for The Gully consists of singleline profiles collected over many years . This data was obtained using a variety ofpositioning and sounding systems and the reliability of the data is dependent on thesesystems . The line spacing is approximately 800 metres on the shallower inner portion ofThe Gully and two (2) to four (4) kilometers in other areas .
4.0.2 Geographical Boundarie s
The geographic extent of The Gully is open to discussion . The area now known as "TheGully" officially received its name in 1969 . Names are approved by the AdvisoryCommittee for Under Sea and Marine Features, Canadian Permanent Committee onGeographical Names . A feature is a part of the ocean floor that has measurable relief oris delimited by relief; its bathymetric character, extent and position must be accuratelyestablished . We must be aware, however, that most oceanic toponyms are not rigorous interms of spatial boundaries .
The current edition of the Nova Scotia (Atlantic Coast) and Bay of Fundy SailingDirections contains the most definitive information available . On page 39, it states :"Banquereau is separated from the Sable Island Bank by `The Gully' which is seven 7miles wide at its narrowest part and over 500 fathoms (914m) deep at its southern mostextremity between Banquereau Bank and Sable Island Bank" . The Gully is the largest ofthe canyon features identified along the Scotian Shelf (Table 4 .0 .1) .
4.0.3 CHS chart coverage in the Gully regio n
• Chart 4098, Sable Island, at a scale of 1 :100k, shows the western portion of the Gully .
• Several small scale "offshore charts" (see below) .
15
• Chart 4045 at a scale of 1 :400k. This chart has a good portrayal of The Gully,highlighting the 200 metre contour .
• The area is also portrayed on the bathymetric map 801-A at a scale of 1 :1,000,000 . Seethe Atlantic Chart Catalogue, available from CHS, for specific information on chartsof the Scotian Shelf.
Canadian Hydrographic Service Field Sheets are the source documents used to constructCHS charts . An index showing the locations of CHS field sheets follows (Fig . 4.0.1) .The accompanying table (Table 4 .0.2) gives details concerning scale, date of survey, linespacing, positioning systems and geographic extent. This data is available (at nominalcost) by contacting the CHS Hydrographic Data Centre (HDC) at The Bedford Institute ofOceanography (BIO) . HDC can also conduct customized data searches .
4.0.4 Summary
The amount of bathymetric data available for The Gully is not adequate to properly studyits biological and physical characteristics . This data represents a sampling of less that 1%of the total bottom area . It is now possible, using multibeam sounding systems, toachieve 100% bottom coverage . At this time (April, 1998), CHS does not have a multi-beam system capable of data collection in depths greater than 1000 metres .
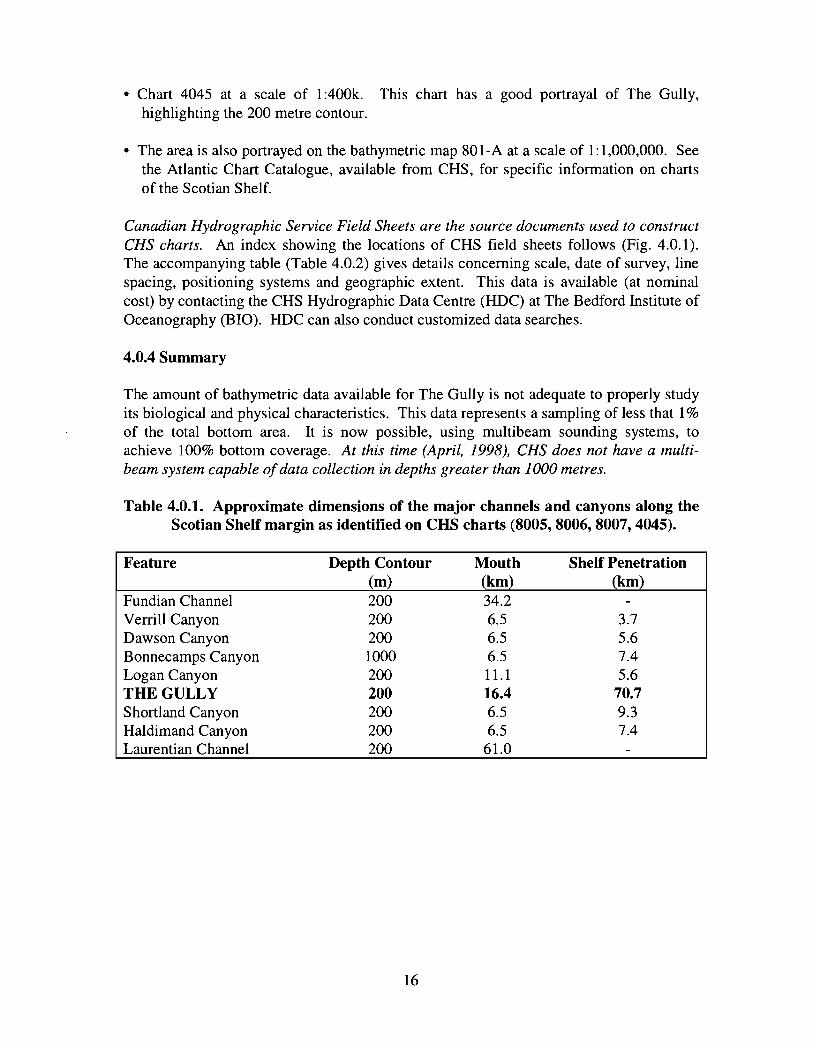
Table 4.0.1. Approximate dimensions of the major channels and canyons along theScotian Shelf margin as identified on CHS charts (8005, 8006, 8007, 4045) .
Feature Depth Contour Mouth Shelf Penetration(m) (km) (km)
Fundian Channel 200 34.2 -Verrill Canyon 200 6.5 3.7Dawson Canyon 200 6.5 5.6Bonnecamps Canyon 1000 6.5 7.4Logan Canyon 200 11.1 5.6THE GULLY 200 16.4 70.7Shortland Canyon 200 6.5 9.3Haldimand Canyon 200 6.5 7.4Laurentian Channel 200 61.0 -
16
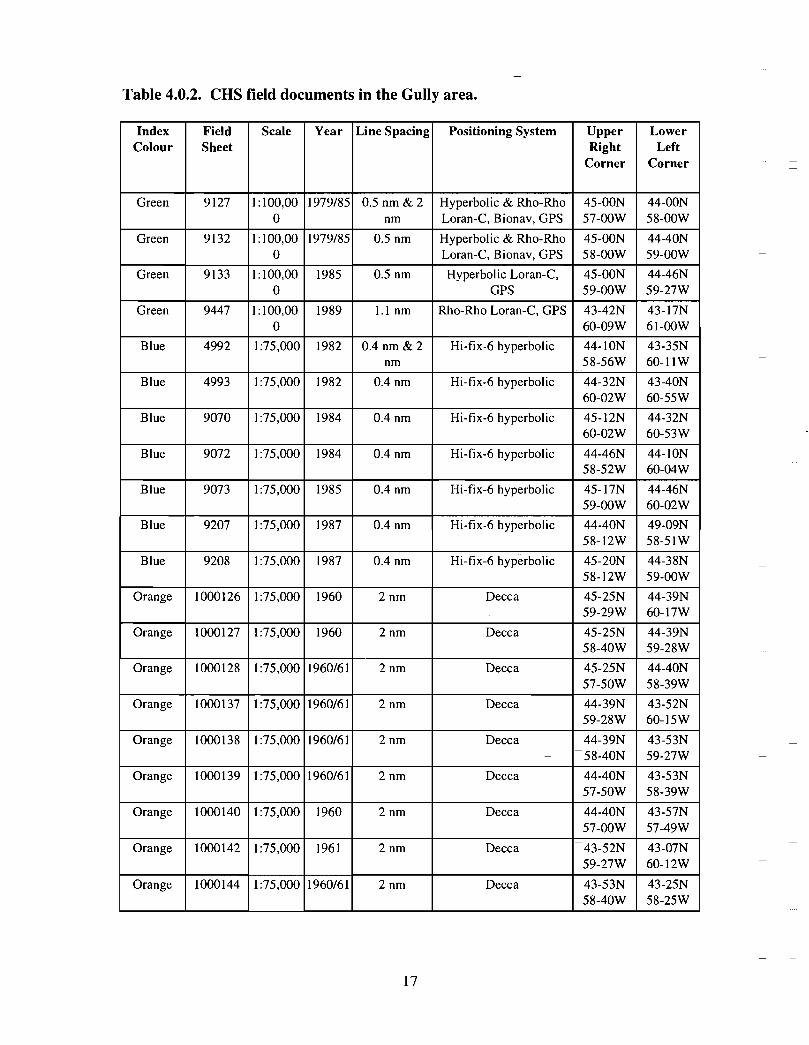
Table 4.0.2. CHS field documents in the Gully area .
Index Field Scale Year Line Spacing Positioning System Upper LowerColour Sheet Right Left
Corner Corner
Green 9127 1 :100,00 1979/85 0.5 nm & 2 Hyperbolic & Rho-Rho 45-OON 44-OON0 nm Loran-C, Bionav, GPS 57-OOW 58-OOW
Green 9132 1 :100,00 1979/85 0 .5 nm Hyperbolic & Rho-Rho 45-OON 44-40N0 Loran-C, Bionav, GPS 58-OOW 59-OOW
Green 9133 1 :100,00 1985 0 .5 nm Hyperbolic Loran-C, 45-OON 44-46N0 GPS 59-OOW 59-27W
Green 9447 1 :100,00 1989 1 .1 nm Rho-Rho Loran-C, GPS 43-42N 43-17N0 60-09W 61-OOW
Blue 4992 1 :75,000 1982 0 .4 nm & 2 Hi-fix-6 hyperbolic 44-ION 43-35Nnm -58-56W 60-11 W
Blue 4993 1 :75,000 1982 0 .4 nm Hi-fix-6 hyperbolic 44-32N 43-40N60-02W 60-55W
Blue 9070 1 :75,000 1984 0 .4 nm Hi-fix-6 hyperbolic 45-12N 44-32N
60-02W 60-53W
Blue 9072 1 :75,000 1984 0 .4 nm Hi-fix-6 hyperbolic 44-46N 44-1 ON58-52W 60-04W
Blue 9073 1 :75,000 1985 0 .4 nm Hi-fix-6 hyperbolic 45-17N 44-46N59-OOW 60-02W
Blue 9207 1 :75,000 1987 0 .4 nm Hi-fix-6 hyperbolic 44-40N 49-09N58-12W 58-51 W
Blue 9208 1 :75,000 1987 0 .4 nm Hi-fix-6 hyperbolic 45-20N 44-38N58-12W 59-OOW
Orange 1000126 1 :75,000 1960 2 nm Decca 45-25N 44-39N59-29W 60-17W
Orange 1000127 1 :75,000 1960 2 nm Decca 45-25N 44-39N58-40W 59-28W
Orange 1000128 1 :75,000 1960/61 2 nm Decca 45-25N 44-40N57-50W 58-39W
Orange 1000137 1 :75,000 1960/61 2 nm Decca 44-39N 43-52N59-28W 60-15W
Orange 1000138 1 :75,000 1960/61 2 nm Decca 44-39N 43-53N58-40N 59-27W
Orange 1000139 1 :75,000 1960/61 2 nm Decca 44-40N 43-53N57-50W 58-39W
Orange 1000140 1 :75,000 1960 2 nm Decca 44-40N 43-57N57-OOW 57-49W
Orange 1000142 1 :75,000 1961 2 nm Decca 43-52N 43-07N59-27W 60-12W
Orange 1000144 1 :75,000 1960/61 2 nm Decca 43-53N 43-25N58-40W 58-25W
17
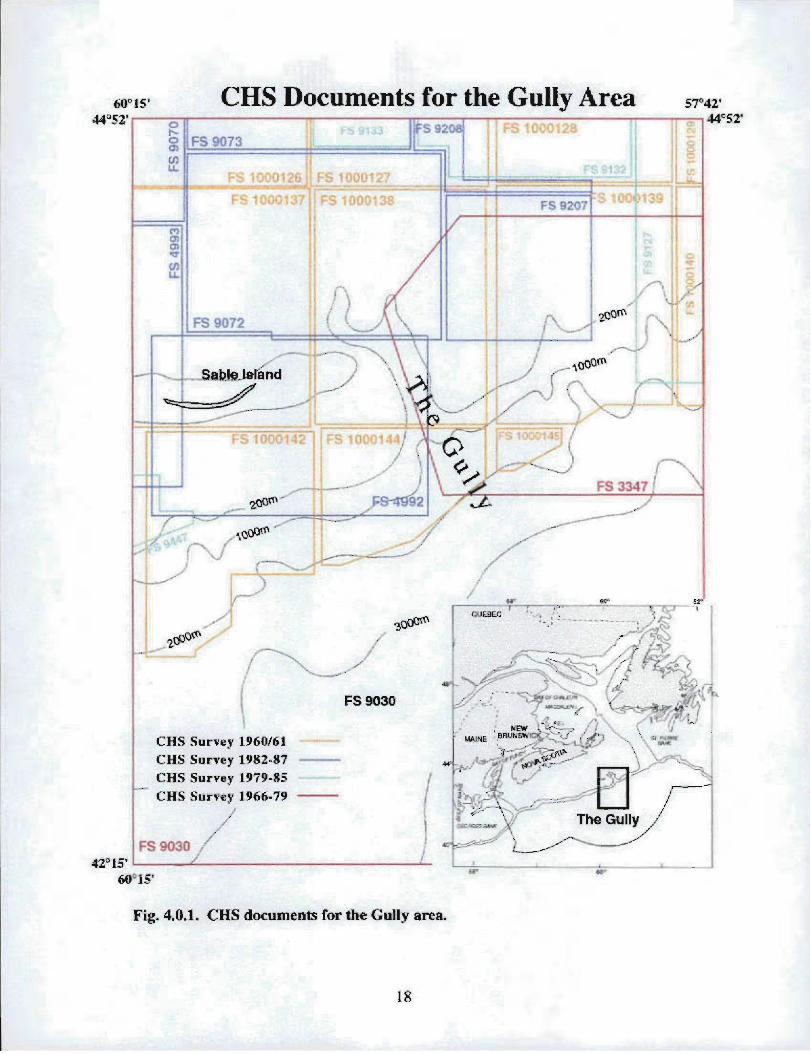
fi0°15 '-44j52' ,
CHS Documents for the Gully Area
I FS 9073
Sable Islan d
,,,~,tlp4mX~,^-'~.
! ~_1
FS 9030
CHS Survey 1 96 0I61
C HS , Survey 19$ 2 - 87 -C:HS Survey 197 9 -85
C :H S. Survey 1466-79 -
..- ;
17 1The Gully ;
IFS 9030 42'1F
(10 c' s ,
Fig. 4,0.1, CHS documents for the Gully area .
57"4t'44'52 '
65à0' E7,p . .---.~°r•^-. ~7-~
;UEHEC 7777. - - .
~L
`_ I arf r y a ..~w .~.,~a~ NI ,.
~_~~~ ~rs
s .~.
>
d8°
1 9
5.0 Acoustic Ambient Noise
5.0.1 Background
The Gully Scientific Review team did not include expertise in underwater acoustics . Thereview team recognized, however, that information on sources and levels of ambientnoise in the region is important (see Section 9.0). Moreover, the SOEP Joint ReviewPanel recently recommended (Recommendation #9) that an acoustics monitoring programbe implemented in the Sable Island-Gully region as part of the proposed EnvironmentalEffects Monitoring Program of the Sable Offshore Energy Project .
We have been in contact with scientists from Defense Research Establishment Atlantic(DREA), Department of National Defence, involved in ocean acoustics research in ourregion, to determine what information currently exists on ambient noise in and around theGully. Drs. I. Fraser and D. Chapman were involved in trial studies in the early 90s withone station in the Gully and, according to Dr . Fraser, that station was exceptionally quiet,particularly in the deeper reaches. He also related that the passage of a=trawler during thestudy generated a great deal of noise and concluded that noise levels in the Gully can beas high as anywhere on the Shelf but also quieter than any-other place that DREA hasmeasured in the open ocean (at depths sufficient to cut off sound transmission from longdistances). Dr. Chapman indicated that the raw data for these experiments are probablyavailable but have not been reduced to a reportable form . He also indicated that a morerecent study has been completed; a one-year cycle of ambient noise spectra at 4 easternshallow water sites, two of which were on the Scotian Shelf, although none were in theGully per se . According to Dr. Chapman, these data could provide a reference frame forfuture measurements in the Gully . The data were gathered in snapshots once per month,and are typical, although severely undersampled in time . The results of -this study arereported in a DREA contractor report . In addition, a brief summary of the work appearedin the proceedings of the recent Oceans '97 conference (Hazen and Deshamais, 1997) .Dr. Chapman also mentioned that there is another published study of ambient noise levels(based on DREA historical data) for Canadian North Atlantic coastal waters whichsummarizes data from 14 cruises carried out between 1972 and 1985 (Zakarauskas et al .1990) . The precise locations of stations, however, were not specified in the paper, onlygeographical averages were given .
5.0.2 References
Hazen, M. G. and F. Desharnais . 1997. The Eastern Canadian Shallow Water AmbientNoise Experiment . Oceans `97.
Zakarauskas, P ., D.M .F. Chapman and P.R. Staal. 1990. Underwater acoustic ambientnoise levels on the eastern Canadian continental shelf . J. Acoust. Soc. Am. 87 :2064-2071 .
19
6.0 Oceanograph y
6.1 Physical Oceanography
Brian Petrie, Jennifer Shore, Charles Hannah and John LoderFisheries and Oceans CanadaOcean Sciences Divisio nBedford Institute of OceanographyDartmouth, N S
6.1.1 Circulation
Observed Currents
The low-frequency water circulation in the Gully region is considered, examining themonthly current maps created from all of the archived data held at Bedford Institute ofOceanography. The majority of these records were collected as a component of theoffshore petrochemical exploration activity . Mean current vectors have been constructedfrom the data regardless of their depth or duration . In the monthly mean current mapsthat follow, the average duration of a record is 19 .4 days with a standard deviation of 10days. The minimum depth is 2 in, the maximum is 1500 in, the mean 43 m, and thestandard deviation is 78 in .
In the northeast portion of the region, currents are generally to the southwest throughoutthe year with amplitudes of up to 0 .15 m/s (Fig. 6 .1 .1 a,b) . An exception to this pattern isthe east to east-southeast flow seen at the 50 fathom isobath on the eastern flank of theGully from January to May . At the mouth of the Gully the current appears to be generallytowards the southwest from February to August . The instruments there were at depths of15, 22, 23, 33 and 74 in. The current records from within the Gully show a generallycounterclockwise circulation pattern with current speeds generally below 0 .1 m/s (seeMay, June and July in particular) . Currents around Sable Island are quite complicated,especially off the eastern tip where the direction of flow changes markedly in a shortdistance (see March for example). South of Sable Island, the flow is towards thesouthwest just as it was northeast of the Gully .
The overall picture that emerges for the area is generally a southwestward flow with somecounterclockwise circulation along the flanks of the Gully . At the mouth of the Gullythere is only a weak inflow indicated by the available data . This inflow is not consistentwith the stronger circulation observed within the Gully. However, since the datacoverage is sparse, it is possible that, at the mouth of the Gully, a region of strongerinflow was missed .
20
Modelled Currents
There has been considerable effort in the Coastal Ocean Science section of BedfordInstitute of Oceanography (BIO) in the development and application of finite elementmodels (FEM) to circulation problems on the Scotian Shelf. A computational mesh forthe eastern half of the Scotian Shelf demonstrates the spatial capabilities of these models,namely, high resolution in areas of rapidly changing depth and of particular concern (Fig .6.1 .2) . High vertical resolution is also achieved .
Han et al. (1997) have used the measured density structure and the observed wind in adiagnostic FEM model .of the baroclinic circulation on the Scotian Shelf for three periods :the long-term mean January-February (winter), April-May (spring), and July-August(summer) (Fig. 6.1 .3a,b,c) . A diagnostic calculation is strictly constrained by the densitystructure that is fixed in time, and by the external forcing . Han et a!. give a full accountof the details of their model . They present the near-surface (average from 5 to 25 m)currents for three seasons . Winter near-surface flows over the Gully are generally to thesouthwest at about 0.1 m/s; in spring the currents show a greater tendency to form a broadscale (over the Gully and the area east of Sable Island) counterclockwise circulation witha typical current speed of about 0 .05 m/s; in summer, the counterclockwise flow isconfined more tightly to the Gully with characteristic velocities of about 0 .1 m/s. Aninteresting feature crops up in the wintertime bottom circulation in the Gully, namely, aclockwise flow with a representative amplitude of 0 .05 m/s .
The gyre-like surface circulation has currents on the outer edge, some 15 km from itscentre , of about 0 .1 m/s. In geostrophic equi librium, there will be a surface slope ofapproximately 0.008 m1I5 km (sea level will be lowered at the centre of the gyre)assuming a line ar increase of current from the centre of the gyre (zero cu rrent) to theedge . Internal mass adjustment will cause the current to decrease to zero at some depth .This will give rise to doming of the isopycnals in a sense opposite to the sea surface (i .e .,the isopycnals will be shallower at the centre of the gyre) . The magnitude of this effectcan be estimated roughly as (plap)AS, where p is an average water column density, Ap
represents the vertical density difference (between 0 and 100 m for this example), and ASis the sea level difference across the gyre . Taking typical density differences for winterand summer, we estimate that the pycnocline would be elevated by 8 and 2 m,respectively, at the centre of the gyre.
Ongoing modelling efforts at BIO have extended the diagnostic calculations of Han et at(1997) to prognostic computations (J . Shore, J . Loder, C. Hannah, pers . comm.). Thenewer model runs begin with a specified density distribution and external forcing that aremaintained until an equilibrium has been established. The rigidly specified density fieldis then allowed to relax and to evolve away from the initial distribution according to thegoverning equations. These extended model runs generally do not change the results ofHan et at in a major way for the Gully region (see Fig . 6 .1 .4, spring 30 in currents) . Thedetailed density and current distribution for spring across and along the Gully are shownin Fig. 6.1 .5a-c . The density structure indicates that there is significant doming of the
21
isopycnals across the Gully. The currents are asymmetrically distributed across the Gullyimplying that all of the inflow does not return as part of a gyre . The density slopes andthe currents are generally weaker in the along-Gully section .
The model can be used to track the paths particles could take either at fixed depths or
when allowed to respond to the vertical as well as the horizontal velocities (Fig . 6 .1 .6a-e) .
Particles, whose initial positions are shown in Fig . 6.1 .6, are subject to the model's
currents . Their positions are displayed every 5 days at 30 m (Fig . 6 .1 .6b, c) . Particles in
the western end of the Gully tend to move south of Middle Bank, towards the coast and
are carried southwestward . Some particles, caught in the offshore directed flow move
around Sable Island Bank and along the outer shelf . Particles whose starting positions lay
near the tip of the 200 m isobath in the Gully show the greatest retention . About 11 of the
122 particles used in the calculation remain in the Gully after 40 days . The results are
quite similar for the particles that can respond to vertical movement though they seem to
experience greater dispersion . After 40 days there are only 4 particles remaining in the
Gully .
A line of particles placed across the Scotian Shelf including the Gully shows the largerscale character of the currents in the region (Fig . 6 .1 .7). Currents near the coast and at theshelf break flow in the same direction for long distances approximately parallel to thebathymetry. The clockwise flow around Middle Bank and the counterclockwisecirculation over the Gully indicates the influence of smaller scale topographic features .
Currents from these modelling studies have been compared to in situ current meter data .The statistic used is the sum of the squares of the vector differences between themodelled and observed currents, divided by the sum of the squares of the observedcurrents . A value of zero indicates perfect agreement ; a value of 1 indicates that the sumof the velocities squared of the difference flow is the same as the sum for the observedflow. For spring, the values of this ratio for Western Bank and Browns Bank were 1 .53and 0.40. Both of these values, but particularly the one for Western Bank which islocated just west of Sable Island, indicate that we should be cautious about over-interpreting the drifter tracks of Fig. 6 .1 .6 and 6.1 .7 .
Other modelling studies recently have shed some light upon the circulation on the easternScotian Shelf. Cong et al . (1996) modelled the 30 m circulation for an area of the ScotianShelf defined by a line running offshore from Louisbourg at the coast, cutting BanquereauBank just east of the Gully, then westward along the shelf break roughly at the 200 inisobath, and finally moving shoreward between Baccaro and Browns Banks to CapeSable (Fig. 6.1 .8a). The model is forced by a time-varying but spatially-uniformwindstress (based on Sable Island observations) and inflows through the open boundaries .Sea-level is fixed at zero along the shelf break open boundary where outward propagatinggravity waves are allowed to leave the model grid ; sea level is linear along thenortheastern open boundary and is inferred from Halifax observations at the coast and iszero at the outer boundary . The mean model currents are calculated from the long-termaverage winter density data and are used as the background flow for all runs . In
22
summary, the circulation consists of a background flow calculated from the winterdensity field and held fixed, the time varying currents forced by the windstress, and theflow component resulting from the sea level variations at the northeastern open boundary .
The background winter density-forced circulation at 30 in of Cong et al . (1996) showsonshelf flow throughout the Gully . However, Sheng and Thompson (1996) have shownthat when reasonable long-term contributions of wind and sea level are added, the totalcirculation features a general counterclockwise surface flow in the region, as is indicatedby the current observations . However, the surface flow west of the Gully and south ofSable Island is strongly offshore in their model ; moreover, while the modelled flow to thenortheast of the Gully is southwestward at the shelf break like the observed currents, themodelled currents on western Banquereau Bank do not indicate the southwestwardtendency shown by the observations . Thus, the modelled and observed flows have areasof agreement and disagreement .
Cong et al. (1996) seeded their model domain uniformly with particles at the beginning ofeach March and April for the period 1956 to 1993 (see Fig. 6.1 .8 for an example of theirmodel results) . They then calculated_the distribution of particles until the end of eachmonth and computed retention indices over the model region . The retention index is theratio of the number of original particles remaining in the specified area at time t, dividedby the total number of particles initially in the area under consideration . The Gully wasone of the regions that showed marked retention of particles . Cong et al. gave indices forthe 15th and 30th of March and April after starting from a uniform distribution ofparticles on March 1 and April 1 . The average (1956-1993) maximum values of theretention indices for the Gully were 0 .36 (March 15), 0 .17 (March 30), 0.40 (April 15),and 0.26 (April 30) . These correspond to approximate e-folding times of 16 and 19 daysfor March and April respectively . The maximum of the retention index is generallylocated just north of the 200 in isobath in the inner part of the Gully .
There are a couple of caveats to bear in mind with the Cong et al . simulations . First, thebaroclinic density-forced circulation is fixed in time . This is necessary because of thelack of sufficient observations to model this component of the circulation from year toyear; however, this assumption is certainly not true . Secondly, the outer, open boundaryof the model is at the outer edge of the Gully. This is also a concern in numericalmodelling - usually it is better to have an open boundary far from an area of interest .However, the Cong et al . (1996) results do provide some useful insights into themovement of particles in the Gully region .
6 .1.2 Low-Frequency Current Variability and Exchange
We have calculated the standard deviation of currents from all of the observed flowsshown in Figure 6 .1 .1 a,b . This represents 489 monthly values, with an average depth of43 in, a standard deviation of 78 in, and a depth range of 2 to 1500 in . The variabilityrepresents all of the fluctuations that occur at periods longer than about 1 day, i .e ., thesemidiurnal and diurnal tides, and inertial oscillations are not included. There is a
23
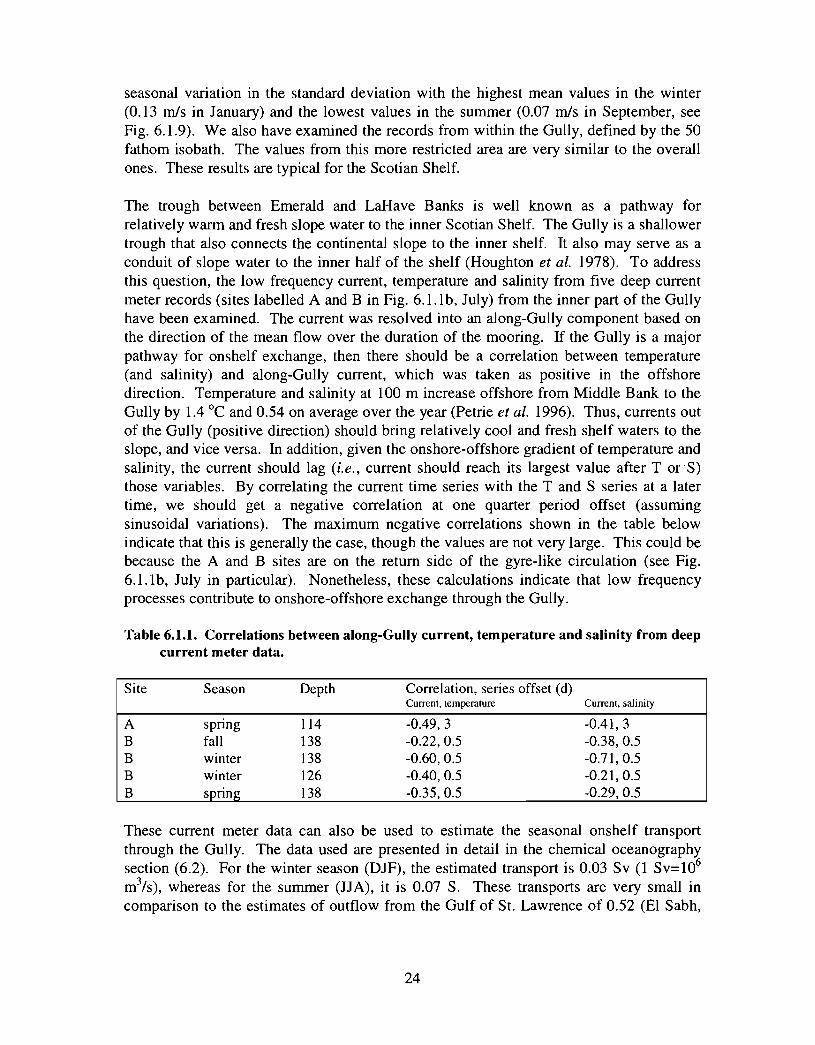
seasonal variation in the standard deviation with the highest mean values in the winter(0.13 m/s in January) and the lowest values in the summer (0.07 m/s in September, seeFig. 6 .1 .9). We also have examined the records from within the Gully, defined by the 50fathom isobath. The values from this more restricted area are very similar to the overallones. These results are typical for the Scotian Shelf .
The trough between Emerald and LaHave Banks is well known as a pathway for
relatively warm and fresh slope water to the inner Scotian Shelf . The Gully is a shallower
trough that also connects the continental slope to the inner shelf. It also may serve as a
conduit of slope water to the inner half of the shelf (Houghton et al. 1978). To address
this question, the low frequency current, temperature and salinity from five deep current
meter records (sites labelled A and B in Fig . 6 .1 .1 b, July) from the inner part of the Gully
have been examined . The current was resolved into an along-Gully component based on
the direction of the mean flow over the duration of the mooring . If the Gully is a major
pathway for onshelf exchange, then there should be a correlation between temperature
(and salinity) and along-Gully current, which was taken as positive in the offshoredirection. Temperature and salinity at 100 in increase offshore from Middle Bank to the
Gully by 1 .4 °C and 0 .54 on average over the year (Petrie et al. 1996). Thus, currents out
of the Gully (positive direction) should bring relatively cool and fresh shelf waters to the
slope, and vice versa . In addition, given the onshore-offshore gradient of temperature and
salinity, the current should lag (i.e., current should reach its largest value after T or S)
those variables . By correlating the current time series with the T and S series at a later
time, we should get a negative correlation at one quarter period offset (assuming
sinusoidal variations) . The maximum negative correlations shown in the table below
indicate that this is generally the case, though the values are not very large . This could be
because the A and B sites are on the return side of the gyre-like circulation (see Fig .
6.1 .1b, July in particular) . Nonetheless, these calculations indicate that low frequency
processes contribute to onshore-offshore exchange through the Gully .
Table 6 .1 .1. Correlations between along-Gully current, temperature and salinity from deepcurrent meter data .
Site Season Depth Correlation, series offset (d )Current, temperature Current, salinity
A spring 114 -0.49, 3 -0.41, 3B fall 138 -0.22, 0.5 -0.38, 0 .5B winter 138 -0.60, 0.5 -0.71, 0 .5B winter 126 -0.40, 0.5 -0.21, 0 .5B spring 138 -0.35, 0.5 -0.29, 0 . 5
These current meter data can also be used to estimate the seasonal onshelf transportthrough the Gully . The data used are presented in detail in the chemical oceanographysection (6 .2) . For the winter season (DJF), the estimated transport is 0 .03 Sv (1 Sv=106m3/s), whereas for the summer (JJA), it is 0 .07 S. These transports are very small incomparison to the estimates of outflow from the Gulf of St. Lawrence of 0.52 (El Sabh ,
24
1977) to 1 .0 Sv (Han et al.. 1998) for winter and 0 .41 to 0.8 5v for summer. The outflowfrom the Gulf is the major source of water for the eastern Scotian Shelf.
6.1.3 Barotropic lide s
The principal semidiumal and diumal tidal species have been modelled by de Margerieand Lank (1986). A concise summary of the 3 principal tidal constituents and theresidual current generated by the M2 tide, the largest constituent overall, are presented inFig. 6 .1 .10 and 6. 1 .11 . The ellipses represent the path a particle of water would take if itexperienced the currents at the grid points indicated (Fig . 6.I .10) . It is evident that thetidal currents are strongest where the depths are the least, i .e., in the vicinity of SableIsland. Weaker tidal flows occur in the adjacent deeper area of the Gully with theweakest flows found in the adjacent deep ocean . The non-linear M2 residual flows aregenerally weak throughout the entire area (Fig . 6.1 .11). The straight lines of Fig. 6. 1 .11indicate the excursion that a water parcel would take if it experienced the mean flow inthe local area for one day. The strongest M2 residual flow, 0.042 m/s, occurs just to thenorthwest of Sable Island .
6.1 .4 Infernal Wave s
The outer portion and flanks of the Gully to app roximately the 200 m isobath wereindicated by de M argerie and Lank ( 1986) as regions where internal tide generation wasfavoured. There is some evidence that this is indeed true. Sandstrom and Elliott (1989)reported the results of extensive Batfish hyd rographic surveys of the Gully. A section runon the eastern flank of the mouth of the Gully between the 100 and 200 m isobaths showslarge amplitude internal waves (Fig. 6.1 .12) . The nature of these oscillations - very steepwaveforms - indicates that they may be non-linear; that is, they are a group of cnoidalwaves generated as the internai tide evolves . Quite often they are called solitary waves orsolitons, though in this picture they are certainly not alone . In addition to temperature ,salini ty and density, the echo-sounder record is also shown Fig. 6.1 .12. There we restrong reflectors (Sandstrom et al. (1989) indicate that this is likely turbulence) at about
25 m that are associated with the density oscillations ; moreover, in the shallower region,the reflectors appear to be broken up as if enhanced mixing was generated by the passingwavetrain . This may be evidence of strong vert ical mixing in the region and thus cooldaffect the overall productivity (Sandstrom and Elliott , 1984; Sandstrom and Oakey,1995). This section is perhaps the best example in the Sandstrom-Elliott report .However, ve ry few sites on the Scotian Shelf have received such intensive surveying .Thus, we do not have the database to compa re the internal wave activity in the Gully tothat elsewhere . However, de Margerie and Lank (1986) indicate that the re are other areasof the Scotian Shelf and the Grand Banks that show as much potential for internal tide
generation as the Gully . In this respect, the Gully is not a unique region .
From these surveys we cannot say that the activity exhibited in the Gully is average orsignificantly different from average for the Scotian Shelf . Of the approximately 225sections displayed by Sandstrom and Elliott, about 40 showed marked internal wav e
25
activity. Note though, that some of these sections were very short and were obviouslytracking back over the same wave repeatedly in order to determine its history and fate .
Sandstrom and Elliott placed two current meter moorings each with 2 instruments (at 15and 67 m) on the eastern flank at the mouth of the Gully . They recorded temperature aswell as currents . The shallower and deeper instruments had the first and fourth highesttemperature variances for the 15 and 9 records respectively collected in the same monthfrom the area defined by Fig . 6 .1 .1 . This indicates that the outer Gully may be a region ofenhanced internal wave activity, and thus perhaps of mixing as well .
6 .1.5 Monthly Mean Temperature, Salinity and Density
Monthly mean temperature and salinity statistics from Petrie et al. (1996) are shown inFig. 6 .1 .13 and 6 .1 .14 for the Gully . The temperature and salinity fields evolve much likethe other regions on the Scotian Shelf . Maximum temperatures at the surface occur in thelate summer (Fig . 6 .1 .13) . The heat is mixed downward with increasing storm activity inthe fall ; winter cooling follows . Salinity is strongly influenced by the outflow from theGulf of St . Lawrence which contributes to the surface minimum in October . The mean,standard deviations and extreme temperatures and salinities, shown in Fig . 6.1 .14,emphasize the dominance of the annual cycle at shallow depths . Density reflects theannual variability in the temperature and salinity fields (Fig . 6 .1 .15) .
The question of enhanced mixing in the Gully that was raised above can be addressedthrough an examination of the density profiles in adjacent areas . This comparison isshown in Fig . 6.1 .16 for the Gully and the 4 areas surrounding it as defined by Petrie etal. (1996). For this comparison, we have selected only the months (March, July, Augustand November) that have enough data to give reasonable estimates of the mean densityprofiles . It is evident from these plots that there is not a marked difference among the 5regions, except for the deeper portion of the Middle Bank profiles . This could be becauseMiddle Bank is the region closest to the coast and is thus subject to a greater influence ofnearshore waters . Hence, it does not appear that there is enhanced mixing in the Gullyregion .
Mean seasonal bottom salinity distributions show the tendency for saltier and thusgenerally warmer waters to move onto the shelf via the Gully . The winter distribution ofsalinity shows this pattern quite distinctly (Fig . 6 .1 .17) . Similar intrusions are evident forthe other seasons as well .
6.1.6 Interannual Variability of Temperature and Sa linity
The waters of the Scotian Shelf have shown significant interannual and longer-termvariability of temperature and salinity (Petrie and Drinkwater, 1993). The variability atthe eastern end of the shelf was less than that in the central or western region . Theinterannual variability found in the Gully at the 0 and 50 m depths resembles the temporalchanges Petrie and Drinkwater (1993) found for the Sydney Bight region (Fig . 6.1 .18) .
26
This indicates the strong influence of Gulf of St . Lawrence outflow. At greater depths,the long-term changes of temperature and salinity in the Gully are similar to (but withsmaller amplitudes) those seen at Emerald Bank and Basin, and in the slope area to thewest (see Fig. 6 .1 .18 and Petrie and Drinkwater, 1993) .
6.1.7 Ice
The ice charts for the 30 year period from 1964-1993 prepared by the AtmosphericEnvironment Service have been digitized and analyzed at Bedford Institute ofOceanography (Roger Pettipas, pers . comm.). For this analysis, the ice boundary wasdefined as the locations where ice covered at least 10% of the ocean surface area . In thetable below, we present the mean year day number of first and last appearance of ice,number of years when ice was present at some time, and average duration of ice for five0.5° latitude by 1° longitude squares that cover the Gully . Ice cover greater than 10% inany part of a 0 .5° by 1° polygon counted as an occasion when ice was present . Thestatistics indicate that ice is present in the Gully region for less than 30% of the years andthat when present, its duration is quite short .
Table 6.1.2. Ice Statistics for the Gully for the 30 year period 1964-1993 .
Latitude (°N) Longitude (°W) Day of I51 Day of Last Number of Years Average DurationAppearance Appearance with Ice of Ice (days )
44-44.5 60-61 58 67 8 <1044-44.5 59-60 52 66 6 <1044-44.5 58-59 65 77 5 <1043.5-44 58-59 79 82 2 <1043.5-44 59-60 - - 0 0
6.1.8 Studies of Similar Topographic Features
There have been a number of studies of North American Atlantic coast canyons that couldlend some insight into the physical oceanography of the Gully . The common feature eachof these canyons has with the Gully, in addition to their morphology, is that the meanflow on the adjacent shelf and slope is in the same sense, i.e ., from right to left as youface the canyon from the deep ocean . This external mean flow will play a major role inthe determination of the circulation within the canyon .
Hotchkiss and Wunsch (1982) conducted a 15 week obse rvation program in HudsonCanyon. Hydrographic propert ies, pressure and current were measured from 5 moo ringswith 10 current meters and 14 temperature-pressure recorders . Hudson Canyon is asteeply sloped feature cutting 30 km into the continental shelf off New York Bight . It isabout 13 km wide at the mouth and 3 .5 km wide at the head. In these respects, it issimilar to the steep outer area of the Gully which intrudes 40 km into the shelf(approximate distance between the 2000 m and 200 in isobaths) and is about 14 km wideat the mouth . The major morphological difference between Hudson C anyon (and theother canyons discussed below) and the Gully is that, in the case of the latter, the 100 m
27
isobath defines a shallower, broad channel-like feature that penetrates deeply onto theshelf and could be considered as part of the overall feature . In fact, the channel definedby the 100 in isobath connects the slope region to the inner Scotian Shelf . HudsonCanyon is confined to the outer shelf . The main result reported by Hotchkiss andWunsch (1982) was the apparent amplification of the horizontal kinetic energy in theinternal wave band near bottom within the canyon and towards the head of the canyon .However, the evidence was not compelling . We do not have a comparable dataset andcannot confirm if the same is true for the Gully . However, in Fig. 6.1 .19, we havecombined all of the data available to show the distribution of variance along the axis ofthe Gully, including the inner portion defined by the 50 fathom isobath . The plotindicates that the variance is largest at the mouth of the Gully and decreases shoreward .As pointed out earlier, we have reasons to suspect enhanced internal wave energy there .
Hunkins (1988) maintained 12 moorings in and adjacent to Baltimore Canyon for up to18 months . The Canyon, defined by the 100 m and 700 in isobath is about 3 km wide atthe head, 8 km wide at the shelf break, and is about 13 km long . Thus it is smaller thanthe Gully. The current pattern within Baltimore Canyon was quite complex making itdifficult to determine a well-defined circulation . On the other hand, a number ofinteresting results emerged : a maximum peak current of 1 .06 m/s was observed near-bottom at 275 m(this mooring had instruments at 50, 230 and 275 m) ; near-bottomamplification of the semidiurnal tidal flows occurred consistently throughout the mooringperiod . Mean currents shallower than 100 in did not appear to be affected by the canyon .Deeper instruments in the canyon were generally at 2 levels, 50 and 6 m above thebottom. These were strongly affected by the local topography ; however, a well-definedcirculation pattern did not emerge.
Perhaps the most intensive study of the circulation in an east coast canyon was conducted
at Lydonia Canyon, off the southern flank of Georges Bank (Noble and Butman 1989) .
This feature cuts into the shelf by about 20 km and is about 5 km wide at the mouth . An
array of fourteen moorings, three bottom tripod systems and one bottom pressure mooring
was deployed for six months . Noble and Butman concluded that mean currents in the
Canyon were weaker than those over the adjacent shelf and slope . In addition, the
amplitude of subtidal flows was 2 to 6 times higher on the shelf and slope than in the
Canyon (see Fig . 6.1 .20) . An analysis was carried out to determine the circulation
patterns within the Canyon . The primary mode of circulation captured only 25% of the
along-canyon current variability . This indicates, as was the case for Baltimore Canyon,
that the circulation is quite complicated .
6.1.9 Summary
The review of the physical oceanography of the Gully has indicated that it may feature aweak, counterclockwise circulation that could contribute to the retention of particleswithin it . However, similar patterns are found elsewhere on the Scotian Shelf, forexample, the clockwise gyre around Browns Bank, the Western Bank gyre, the retentionareas over Emerald and Western Banks (Cong et al . 1996). Low-frequency current
28
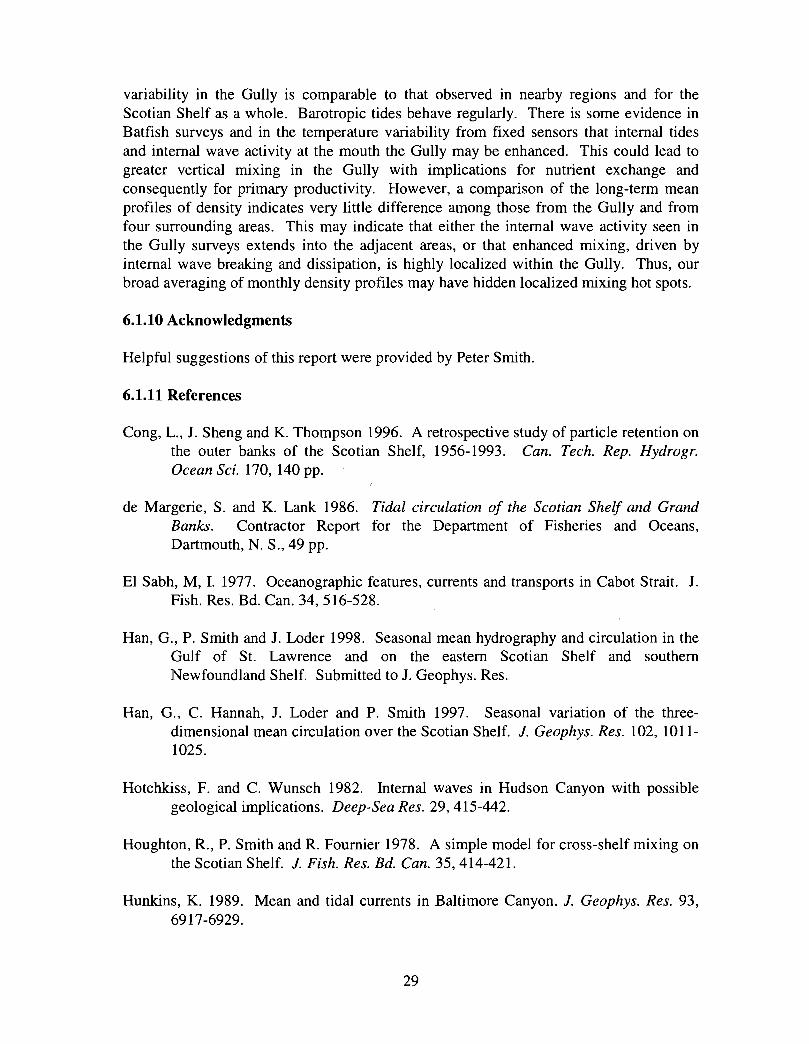
variability in the Gully is comparable to that observed in nearby regions and for theScotian Shelf as a whole . Barotropic tides behave regularly . There is some evidence inBatfish surveys and in the temperature variability from fixed sensors that internal tidesand internal wave activity at the mouth the Gully may be enhanced. This could lead togreater vertical mixing in the Gully with implications for nutrient exchange andconsequently for primary productivity . However, a comparison of the long-term meanprofiles of density indicates very little difference among those from the Gully and fromfour surrounding areas . This may indicate that either the internal wave activity seen inthe Gully surveys extends into the adjacent areas, or that enhanced mixing, driven byinternal wave breaking and dissipation, is highly localized within the Gully . Thus, ourbroad averaging of monthly density profiles may have hidden localized mixing hot spots .
6.1.10 Acknowledgments
Helpful suggestions of this report were provided by Peter Smith .
6 .1 .11 References
Cong, L ., J . Sheng and K . Thompson 1996 . A retrospective study of particle retention onthe outer banks of the Scotian Shelf, 1956-1993 . Can. Tech. Rep. Hydrogr.Ocean Sci. 170, 140 pp .
de Margerie, S. and K. Lank 1986. Tidal circulation of the Scotian Shelf and GrandBanks. Contractor Report for the Department of Fisheries and Oceans,Dartmouth, N . S., 49 pp .
El Sabh, M, I. 1977. Oceanographic features, currents and transports in Cabot Strait . J .Fish. Res . Bd . Can. 34, 516-528.
Han, G., P. Smith and J . Loder 1998. Seasonal mean hydrography and circulation in theGulf of St. Lawrence and on the eastern Scotian Shelf and southernNewfoundland Shelf . Submitted to J. Geophys . Res .
Han, G., C. Hannah, J . Loder and P . Smith 1997. Seasonal variation of the three-dimensional mean circulation over the Scotian Shelf. J. Geophys. Res. 102, 1011-1025 .
Hotchkiss, F. and C. Wunsch 1982. Internal waves in Hudson Canyon with possiblegeological implications . Deep-Sea Res. 29, 415-442.
Houghton, R., P. Smith and R . Fournier 1978. A simple model for cross-shelf mixing onthe Scotian Shelf. J. Fish. Res. Bd. Can . 35, 414-421 .
Hunkins, K. 1989 . Mean and tidal currents in Baltimore Canyon . J. Geophys . Res. 93,6917-6929 .
29
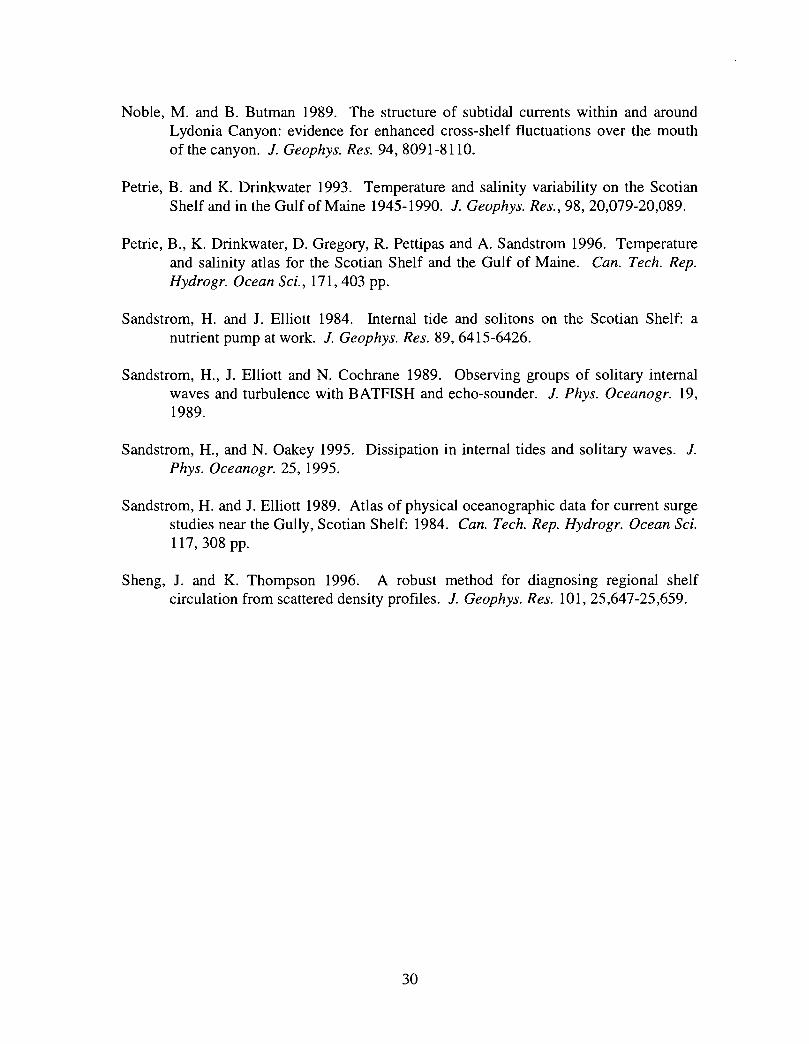
Noble, M . and B . Butman 1989 . The structure of subtidal currents within and aroundLydonia Canyon : evidence for enhanced cross-shelf fluctuations over the mouthof the canyon . J. Geophys. Res . 94, 8091-8110 .
Petrie, B . and K. Drinkwater 1993. Temperature and salinity variability on the ScotianShelf and in the Gulf of Maine 1945-1990 . J. Geophys. Res., 98, 20,079-20,089 .
Petrie, B., K. Drinkwater, D. Gregory, R . Pettipas and A . Sandstrom 1996. Temperatureand salinity atlas for the Scotian Shelf and the Gulf of Maine . Can. Tech. Rep .Hydrogr. Ocean Sci ., 171, 403 pp .
Sandstrom, H . and J . Elliott 1984. Internal tide and solitons on the Scoti an Shelf: anutrient pump at work . J. Geophys . Res. 89, 6415-6426 .
Sandstrom, H ., J. Elliott and N. Cochrane 1989 . Observing groups of solitary internalwaves and turbulence with BATFISH and echo-sounder . J. Phys. Oceanogr. 19,1989 .
Sandstrom, H., and N. Oakey 1995. Dissipation in internal tides and solitary waves . J.Phys. Oceanogr. 25, 1995 .
Sandstrom, H . and J . Elliott 1989. Atlas of physical oceanographic data for current surgestudies near the Gully, Scotian Shelf: 1984 . Can. Tech. Rep. Hydrogr. Ocean Sci .117, 308 pp .
Sheng, J . and K. Thompson 1996. A robust method for diagnosing regional shelfcirculation from scattered density profiles . J. Geophys. Res . 101, 25,647-25,659 .
30
January Mean Currents
44.
2 44. 19
= MA
43 3
43 .+
;T-
uA +
43 .5 i i
-f03 -f0.0
44 .5
NA {
44.3 il
f
M3
M.19
MA
419
43.7
IJA
IJS
f03 -f0. 0
M3
NA
M~
-4 ' o.1mr. l
hIslJaed 7
HM1üm ~,.
-373
Longitude
March Mean Currents
-S93
Longitud e
May Mean Currents
ws t ~ .. 71.
S .ik 1~6nd
oA +
o3i-f03
G . q
1 1 ~40.0 493 -5f.0
jP
A
L
February Mean Currents
us +
44.19
â MA
47.0
__q pS-H
-!&O -4S
44.
2 v N.1
~ 1J3 ~3L0 403
Tb.
f0.0
S .bl.
-573
Longitud e
April Mean Currents
-sr. rrYa
0 .1m.
0. 1m4
I
-SSA
s0.0 -5f5 -5f.0
Longitude
June Mean Currents
-i os +-
Sl0 ~05
MS
MA
44.3
4.4.2
M. 1
L 44.0
i0.0 -595 .59. 0
Longitude Longitude
Fig. 6.1.1 . Mean current vectors from the Bedford Institute oceanographicdata archive for the Gully region. All vectors are plotted regardlessof depth or duration (a) January-June, (b) July-December .
M.
Th.
G.ly
-SS.O
31
July Mean Currents August Mean Currents
as
~
S.6k
f0.0 .59.5 49-0 -SU -510
Longitude
f03 -400 -593 -59.0 -513 -53.0 i03
Longitude
~JS 4-
-i05
September Mean Currents October Mean Currents
Sa6k
Z - ~
71 e
•~•O1
. ~
-f0.0 -593 40.0
7L.
TGO,
i C
-593 -$9A dLS -51L0
Longitude Longitude
wd
wA
wJ
44.2
y 44.19
G wA
433
O,
.7 .,
4A
November Mean Currents
S.6k
~>
as a
403 f0.0
~~ L.tr~s
♦
43.5
a .v0.1mh
• :J-f
43 .5
-9.5 -SILO i03
w3
6 .61e1d.
d0A
43s4-
.595 .59.0 -5i5 -51.0 -f03
Longitude
Fig. 6.1.1. (Continued )
7è.• Gm7
i9
December Mean Currents
OI
Tb.Cetly
-595 -59.0
Longitude
A
-5i0
32
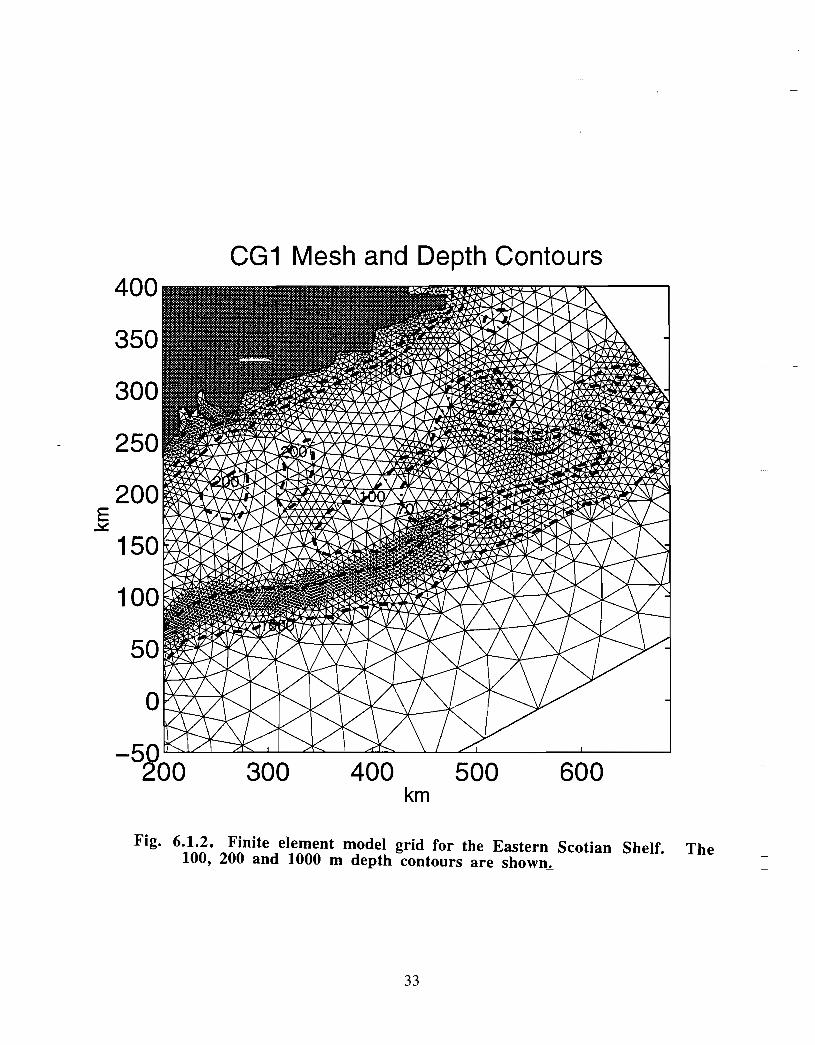
CG1 Mesh and Depth Contours400
350
300
250
200~
150
100
50
0
-50200 300 400 500
km600
Fig. 6 .1 .2. Finite element model grid for the Eastern Scotian Shelf. The100, 200 and 1000 m depth contours are shown . -
33
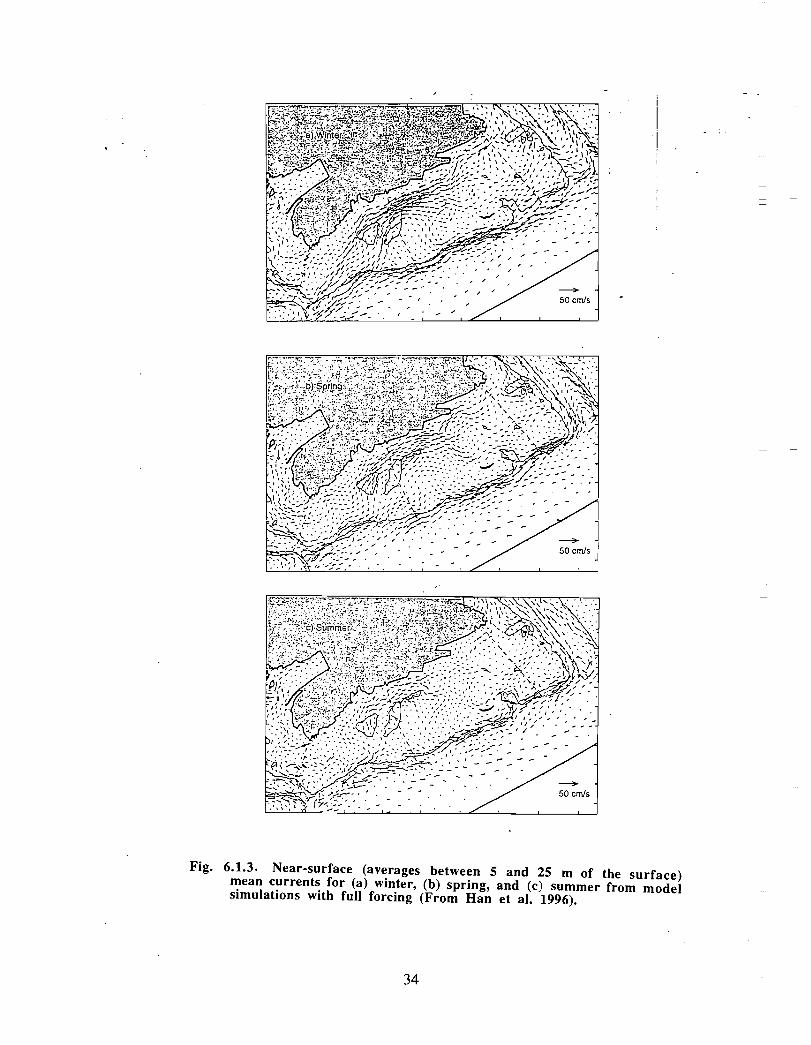
Fig. 6 .1.3. Near-surface (averages between 5 and 25 m of the surface)mean currents for (a) winter, (b) spring, and (c) summer from modelsimulations with full forcing (From Han et al . 1996) .
34
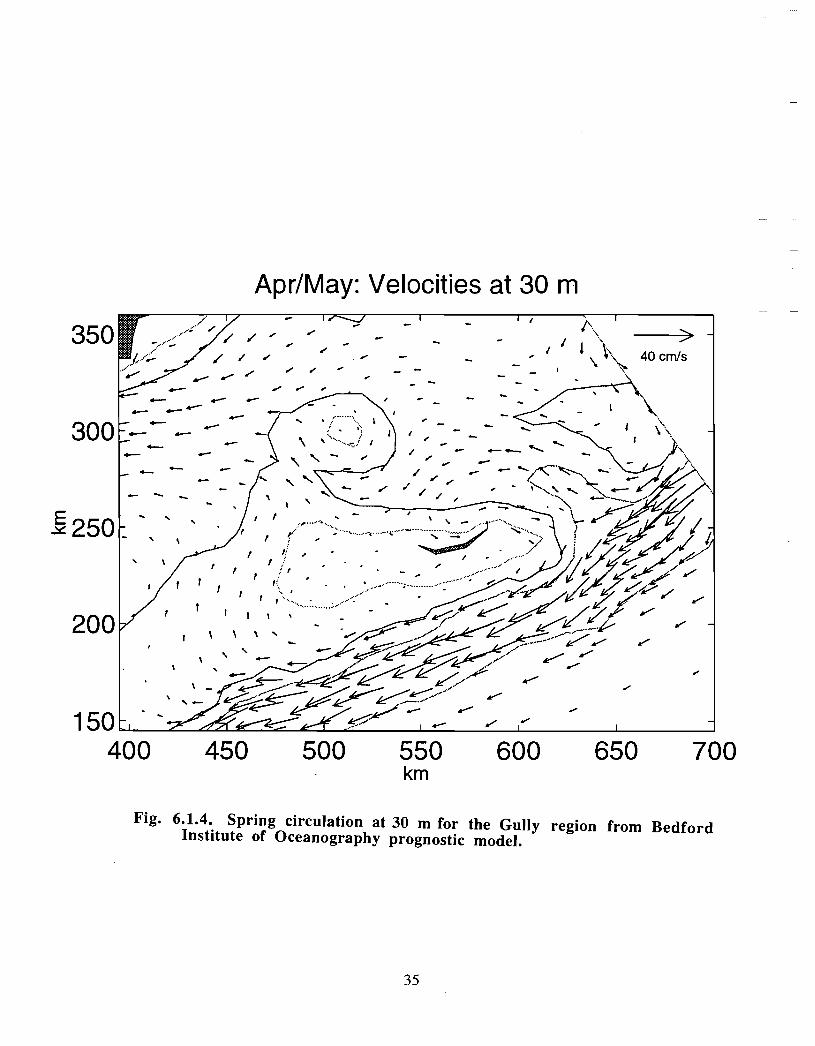
Apr/May: Velocities at 30 rn
Fig. 6.1.4. Spring circulation at 30 m for the Gully region from BedfordInstitute of Oceanography prognostic model .
35
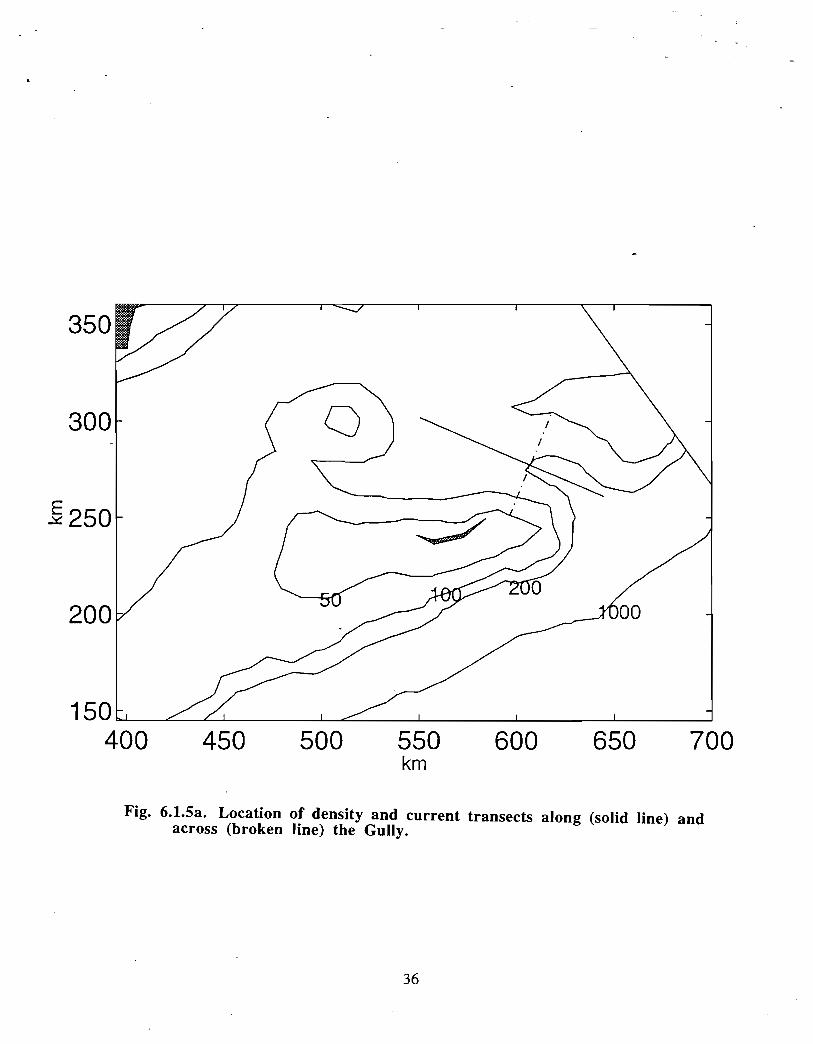
Fig. 6.1.5a . Location of density and current transects along (solid line) andacross (broken line) the Gully.
36
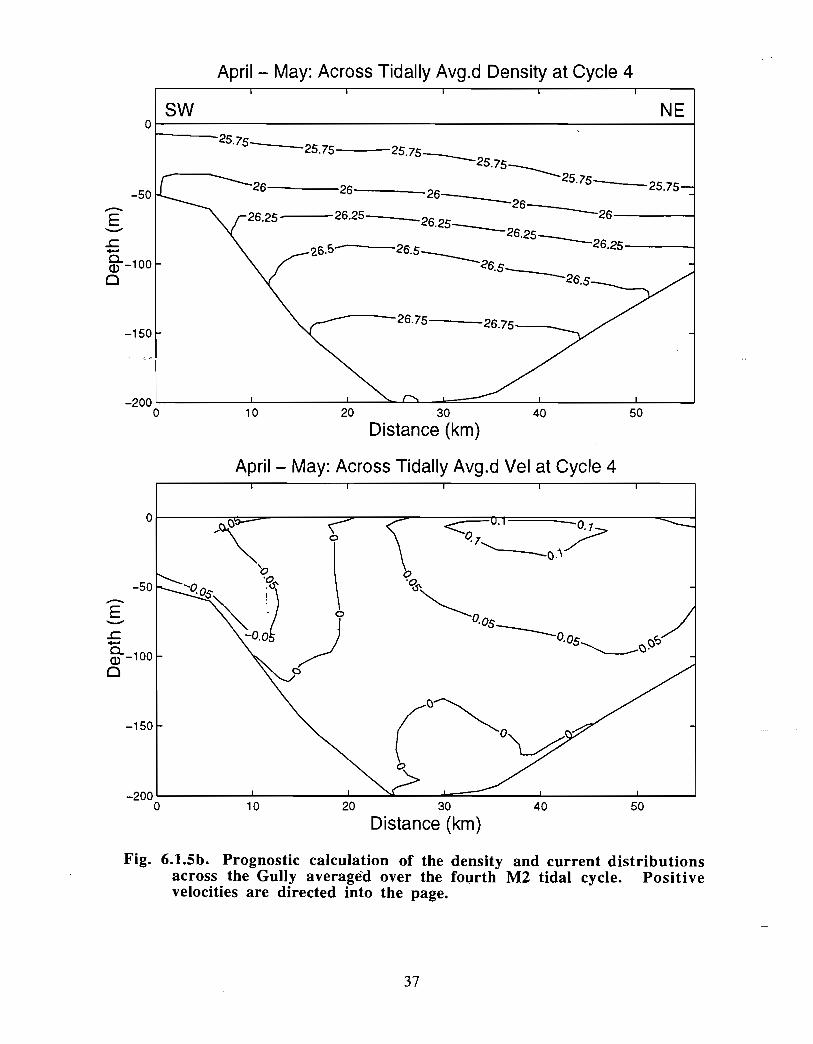
April - May: Across Tidally Avg .d Density at Cycle 4
SW NE
E
-50
0
-150
-200 L0
-25 .75
26
26.25
25.75 25.75
26.5
-26-
26.25
26
26.25
26. 5
- 26.75
10 20 30 40 50
Distance (km )
April - May: Across Tidally Avg .d Vel at Cycle 4
1 0-200 L
o 20 30 40 50
25.75 -~
Distance (km )
Fig. 6.1 .5b . Prognostic calculation of the density and current distributionsacross the Gully averagèd over the fourth M2 tidal cycle . Positivevelocities are directed into the page .
25.75
26.5
26
26.25
25.75
26.5
26
26.25
26.75
37
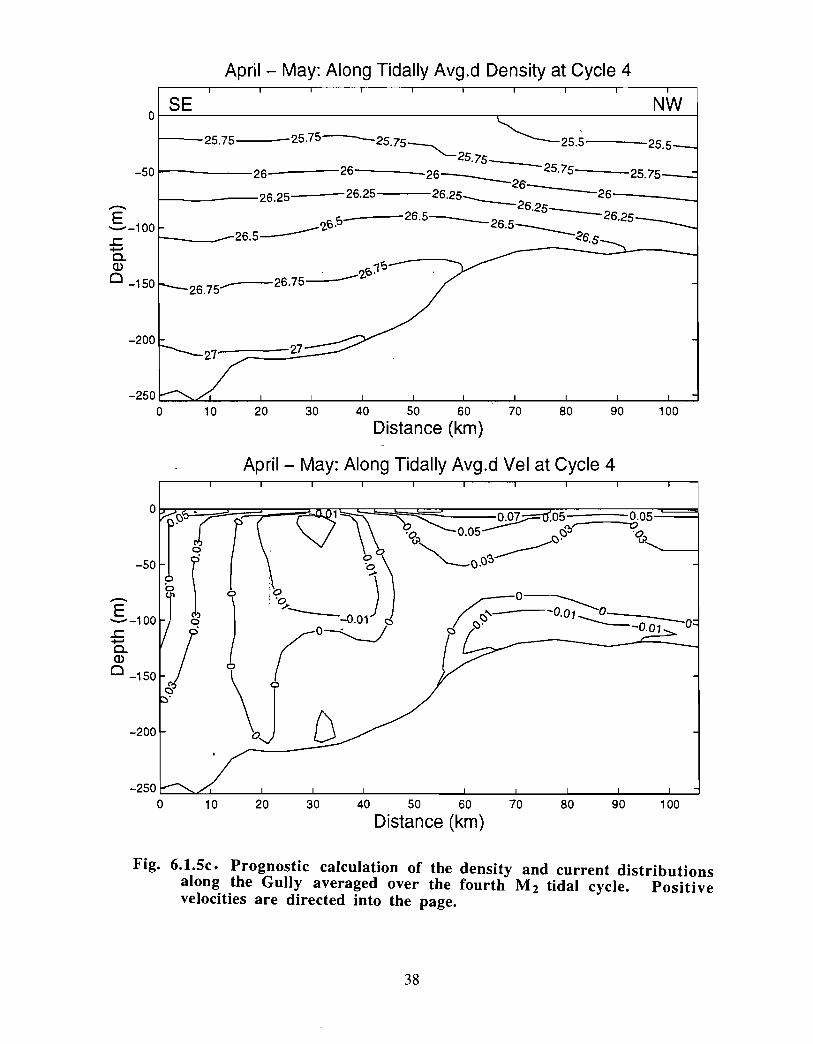
April - May: Along Tidally Avg .d Density at Cycle 4
-50
-200
o
--- 26.5
NW
25.75-25.75-----25.75 -~'-- 25.5---25.5
75--'26----26-~26~ 25.75 25.75-26-
~26.25--~26.25 26.25~ 26-- - _
5-- -26.5-t 26.25--'26.25--,
26.75
27
-250 1 1 1 1 1 1 1 1 1 -I
0 10 20 30 40 50 60 70 80 90 100
Distance (km)
April - May: Along Tidally Avg .d Vel at Cycle 4
-50
SE
26.7 5
F---27
0-CD0 -150
-200
-250
7
0 10
1 0.07 .05-•p 0.05 O`'~
~\-a 1
--0.010---:,~
1 1 1 1 1 1 1 120 30 40 50 60 70 80 90
Distance (km)
0;
71
100
Fig. 6.1.5c . Prognostic calculation of the density and current distributionsalong the Gully averaged over the fourth M2 tidal cycle. Positivevelocities are directed into the page.
38
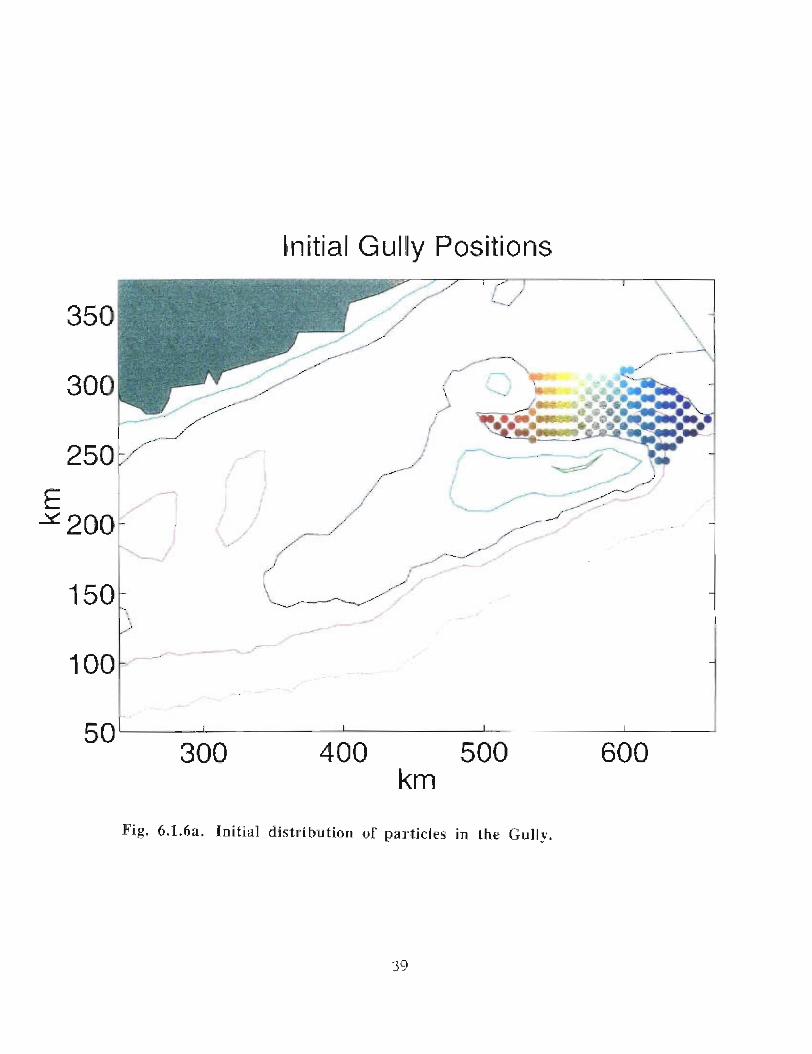
Initial Gully Position s
100
11,
3 00 400 500 600km
Fi g . 6.1 .6a . Initial distribution of particl e s in the [ïully .
~ C1
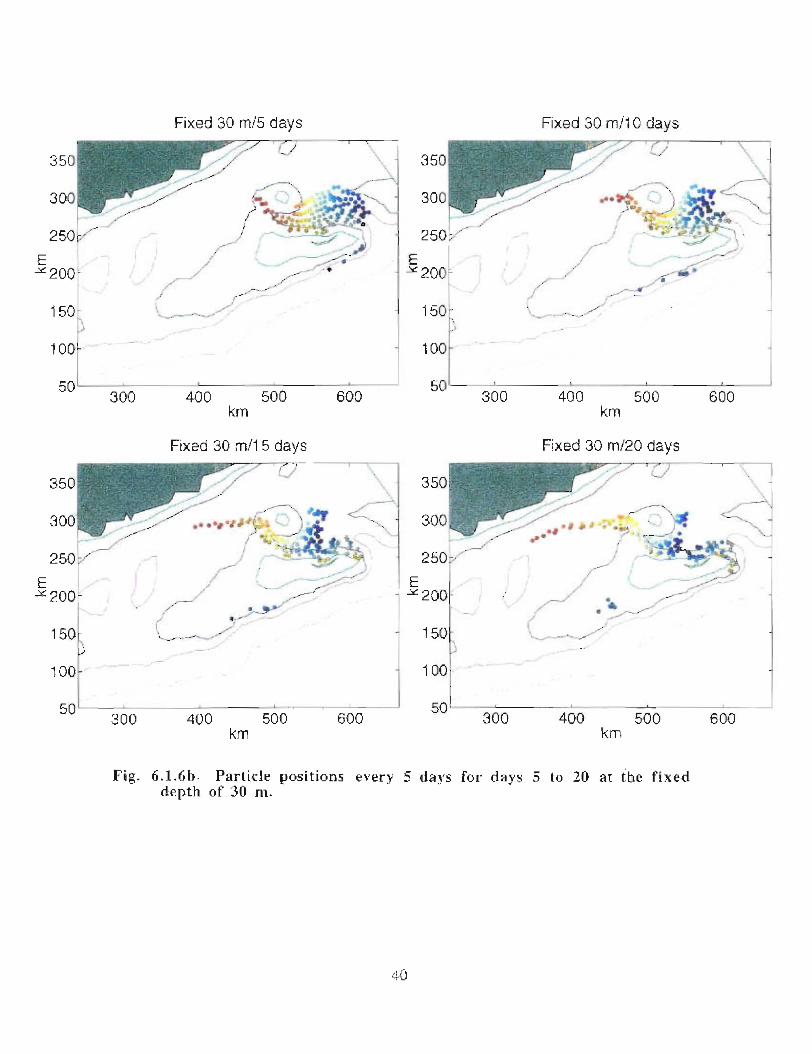
5 0
50
0 00
Fixed 30 m/5 days
400 500km
Fixed 30 mf"15 days
600
300 400 500 600km
100
50
50
Fixed 30 m110 days
300 400 500 600km
300
Fixed 30 m,,'20 days
400 500km
60 0
Fig . 6 .1 .6h . Particle positions every 5 days for days 5 to 2 4 at the fixeddepth of 30 m .
40
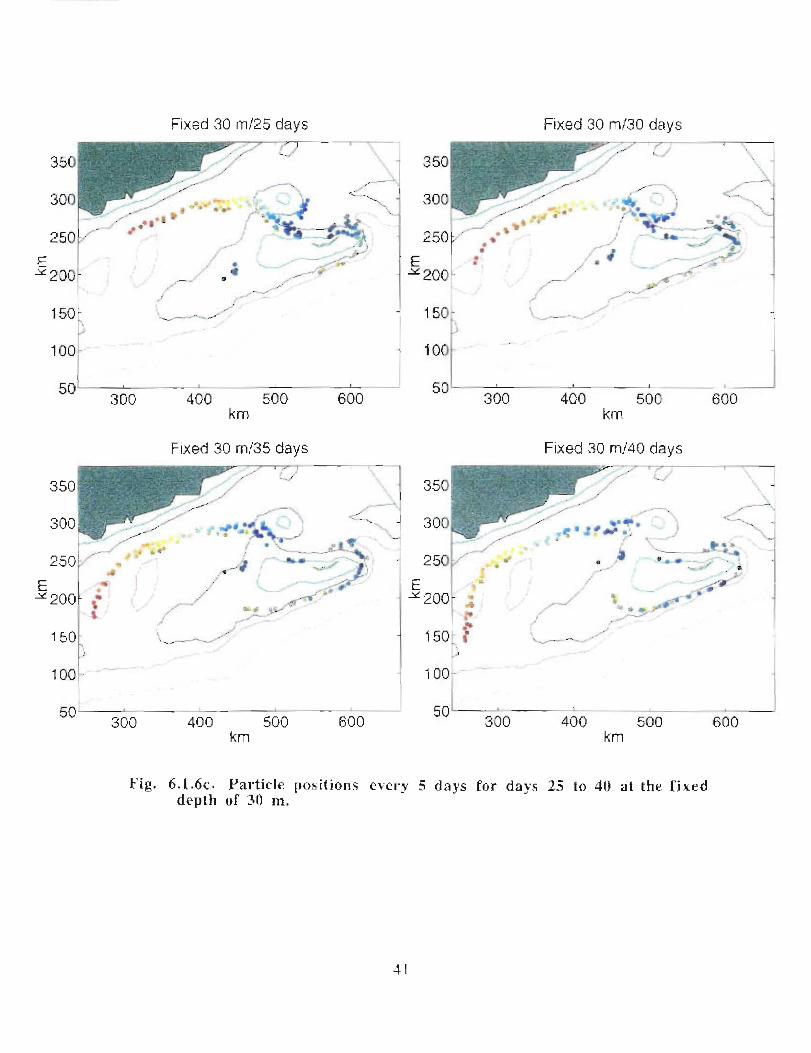
150-
10 0
50
; 100
300 400 500 600km
1-7
30050`
Fixed 30 m125 days
Fixed 30 m,,'35 days
400 500km
600
5 0
50
Fixed 30 m/30 days
3 00 400 500 600k m
Fixed 30 m/40 days
300 400 500km
Fig, 6 .1 .6c . Ptirticle positio ns e4ery ti days for days 25 to 40 at the fixeddepth of 30 m .
41
600
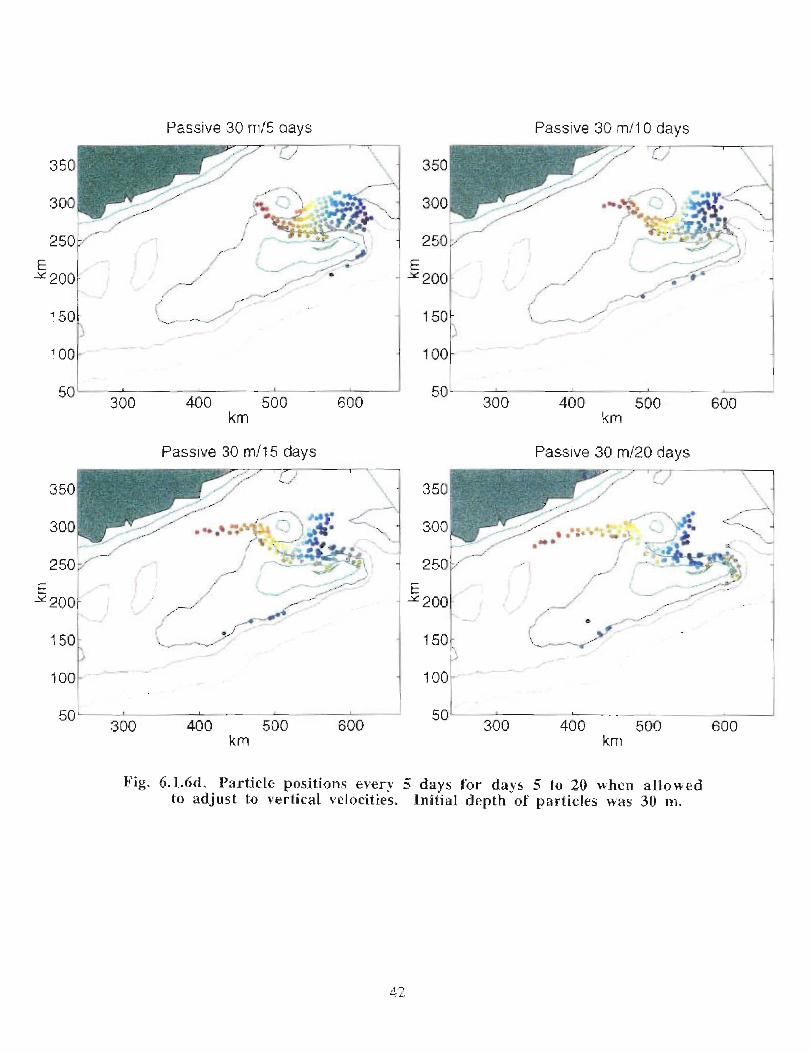
Passive 30 m~15 day s
100
50~-
1: 00
5030a0
300 400 500 60 0km
Passive 30 m/1 5 days
400 500 600km
Passive 30 m/10 days
100
50-300 400 500
k m
Passive 30 rn!20 day s
3OÙ 400 500k m
Fig. 6.1 .6d . Particle positions every 5 days for days 5 to 20 w h e n allo w ed
t o adjust to vertical velotities . Initial d epth of particles was 3 0 m .
44
600
600
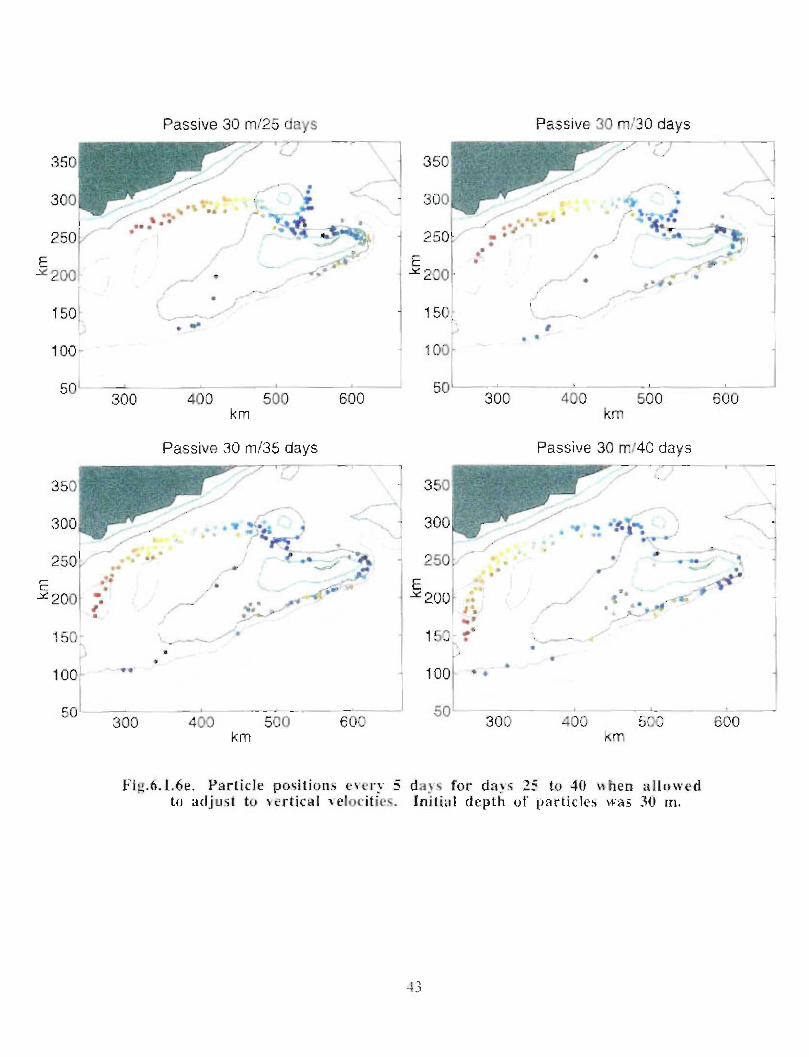
35 0
300
25 0
E" 200
150
100 .-
.50 i
100 100
50 50300 400 500 i 600km
Passive 30 m~025 days
300 400 500 600km
Passive 30 m'35 days
Passive 30 ml /30 days
300 400 500 600km
Passive 30 m140 day s
300 400 50© 600k m
F i g .f, .t .fie . Narticlc positions every 5 days for davs 25 to 40 irhen allot,ed
to atljiitit to vertical velocities . Initia l depth of particles as 31) m .
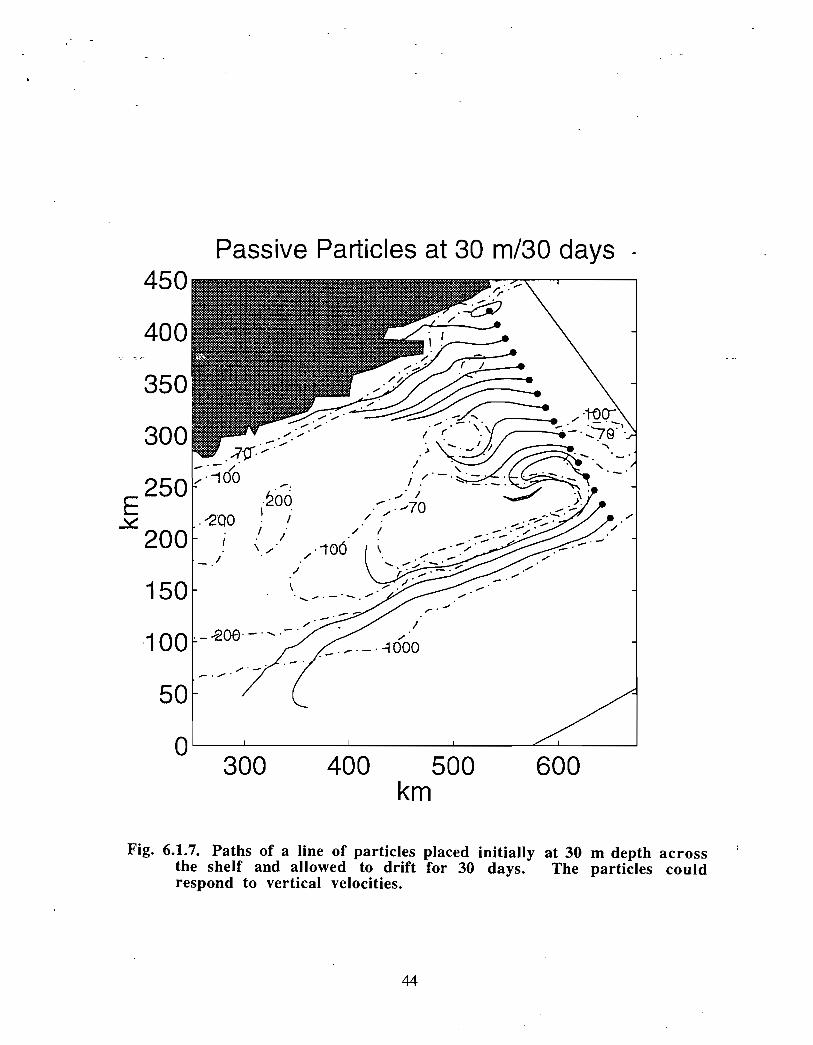
Passive Particles at 30 m/30 days450
400
350
300
EV250
200
150
. 100
50
0300 400 500
km600
Fig. 6.1.7. Paths of a line of particles placed initially at 30 m depth acrossthe shelf and allowed to drift for 30 days . The particles couldrespond to vertical velocities .
44
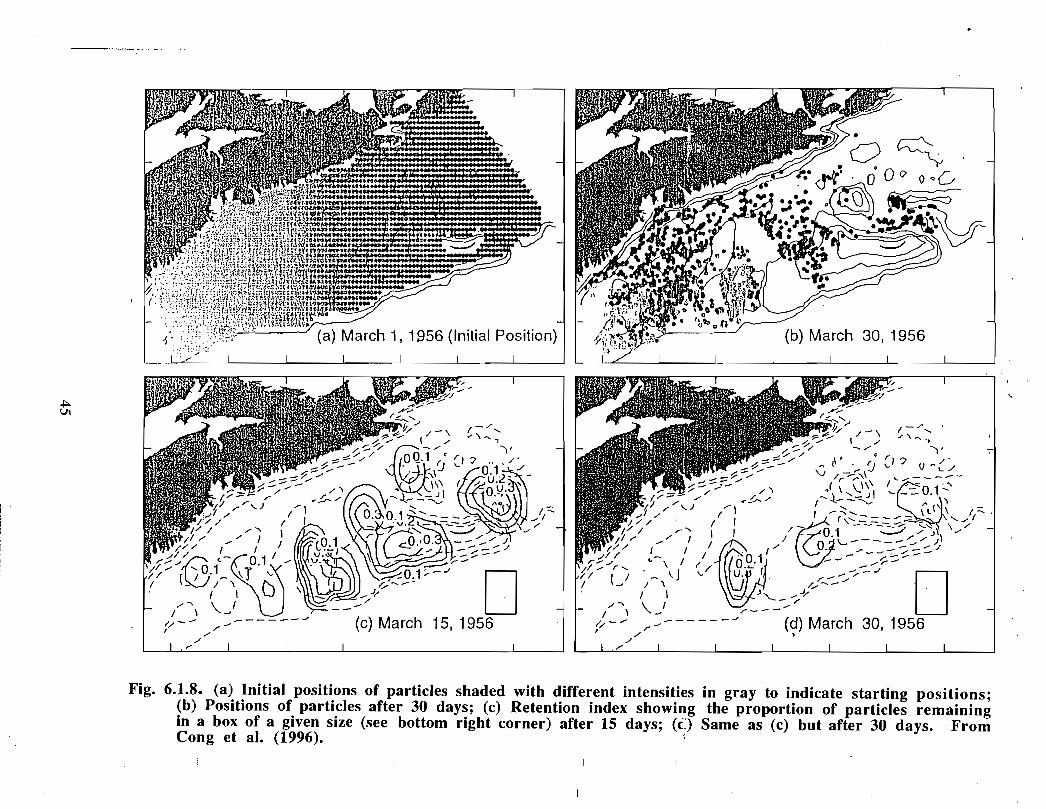
Fig. 6.1.8. (a) Initial positions of particles shaded with different intensities in gray to indicate starting positions ;(b) Positions of particles after 30 days ; (c) Retention index showing the proportion of particles remainingin a box of a given size (see bottom right corner) after 15 days ; (â') Same as (c) but after 30 days . FromCong et al . (1996) .
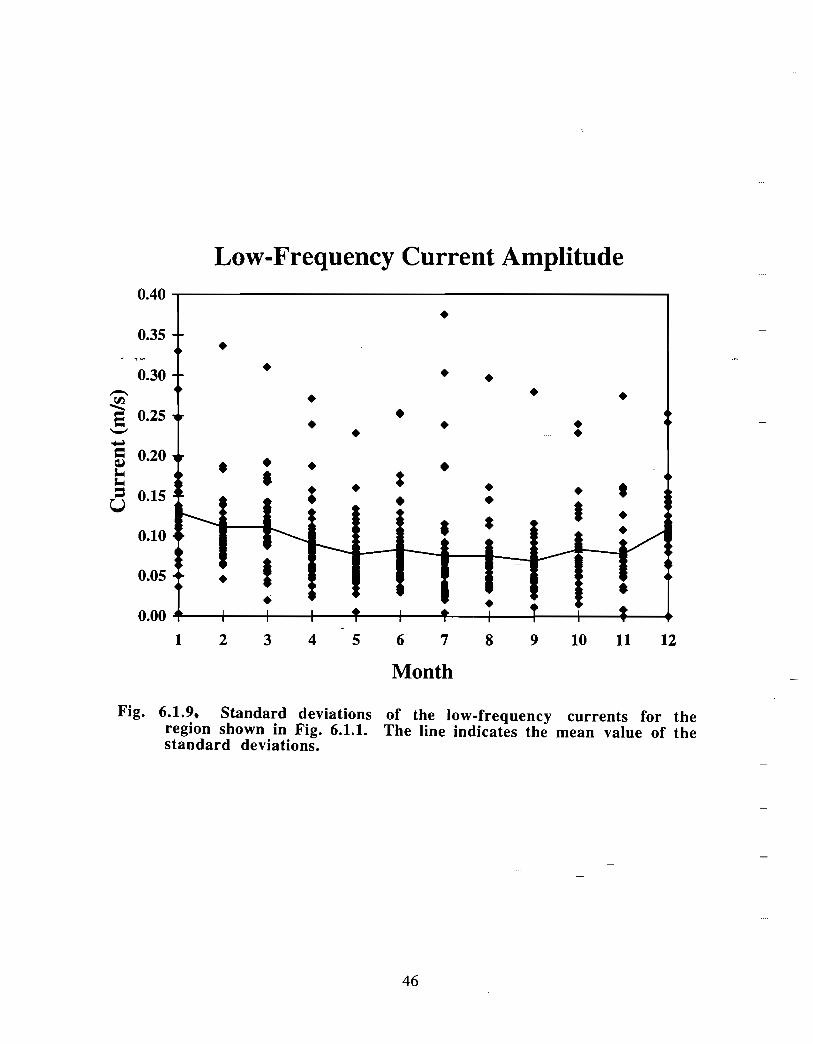
Low-Frequency Current Amplitude0.40
0.35
0.10
0.05
0.00
I
~ i • ~ • i T i~~
1 2 3 4 5 6 7 8 9 10 11 12
Month
Fig. 6.1 .9. Standard deviations of the low-frequency currents for theregion shown in Fig. 6.1.1 . The line indicates the mean value of thestandard deviations .
46
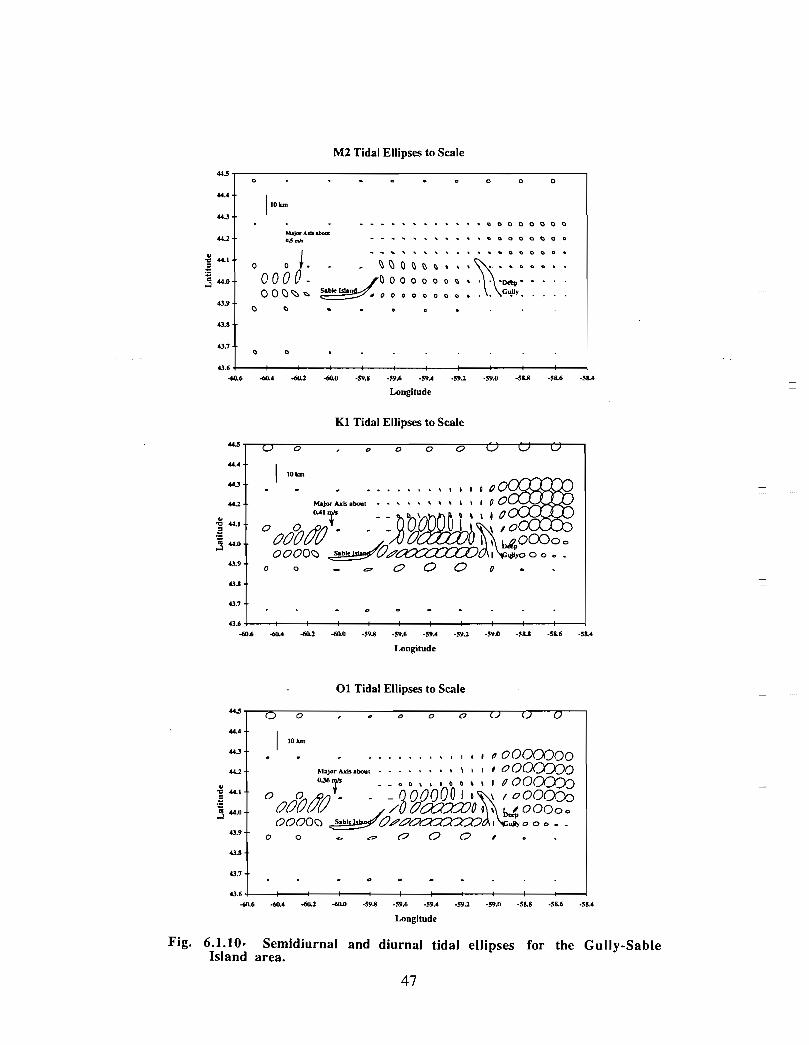
M2 Tidal Ellipses to Scale
44 .5
44A +
44 .3 +
44.2 +
'Ç 44.1 ?~
; 41.0
43.9 +
43.8 +
43.7+
1 10 k.
6LprAh .6an6s .
0 0 / . _ ~ O O O O O 0~••
O V O L' - O O O O O 0 0 O
0 0 () ~s O51bk B1,
/ O 0 0 0 0 0 0 0 •
O C ~ . e o •
o O
0 0 0 0 0 0 0 0
e o 0 0 0 0 0 0
•• o 0 0 0 0 •
43.6-60.6 -60.4 -60.2 -60.0 -59.8 -59.6 49A -593 -59.0 -568 -50.6 -58.4
Longitud e
Kl Tidal Ellipses to Scal e
44.4
44344"'
. . . . . . .,,,~IIOO O/~O/W~~
.f,/
0r-~0nmjo. ,lxts .eouc - - - , , • • • ~ ~ O l/ ,.ii.~Q
0.36m/,100%% n o00(D'.,yJ
44.2+ h,,,
~ M.1}
3 4~ .0tII
43 .9
43.5
43.7
I 101®
. . . . . . . . . . ~ 1 1 0 00~ Axis one„~ . _ . .
0A1 ~
°ô0~0 ~ ~b\ 6 b i ~O oooo oOOOOO S.b OO 4YY0 O O -
0 O - o O O O 0
43.6
40.6 -60.4 fi0.2 -60.0 -59.8 -59.6 -59A -59.2 -59.0 -185 -38.6 -5E .4
Longitude
443
44.4
443
44.z
41 .1
4C .0
43.9
43.8
43.7
01 Tidal Ellipses to Scal e
O , o O O
1 10km
°000</O -~ 00000 1 i oOO~yJ/D O o ~ O OO o 0
oooc~o S b Oo~5,
~ o o o . _o o ..
43.6 1 • I ---F I I I I I 1 I
-60 .6 -60.4 -60.2 -60.0 -599 - 19.6 -39.4 -59.2 -59.0 -56.8 -38.6 -38.4
Longitud e
Fig. 6.1.10 . Semidiurnal and diurnal tidal ellipses for the Gully-SableIsland area .
47
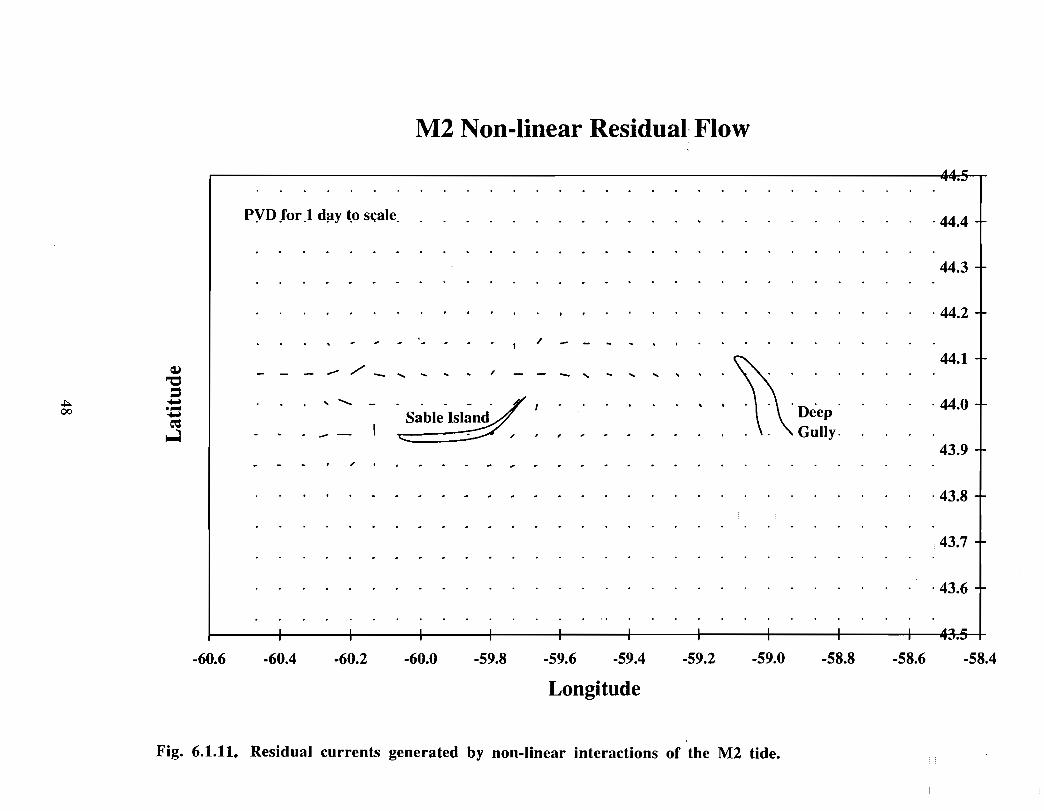
M2 Non-linear Residual• Flow
PVD for .1 doy to sçale .
- ~ ~ - - - -Sable Island
I
.
DeepGully .
•44.4
44.3
•44.2
44.1
•44.0
43.9
•43.8
43.7. . . . . . . . . . . . . . . . . . . . . .
. . . . . . . . . . . . . . . . . . . . . . . . . . . .43.6
-60.6 -60.4 -60.2 -60.0 -59.8 -59.6 -59.4 -59.2 -59.0 -58.8 -58.6 -58.4
Longitude
~ ~ . . . •
Fig. 6.1.11. Residual currents generated by non-linear interactions of the M2 tide .
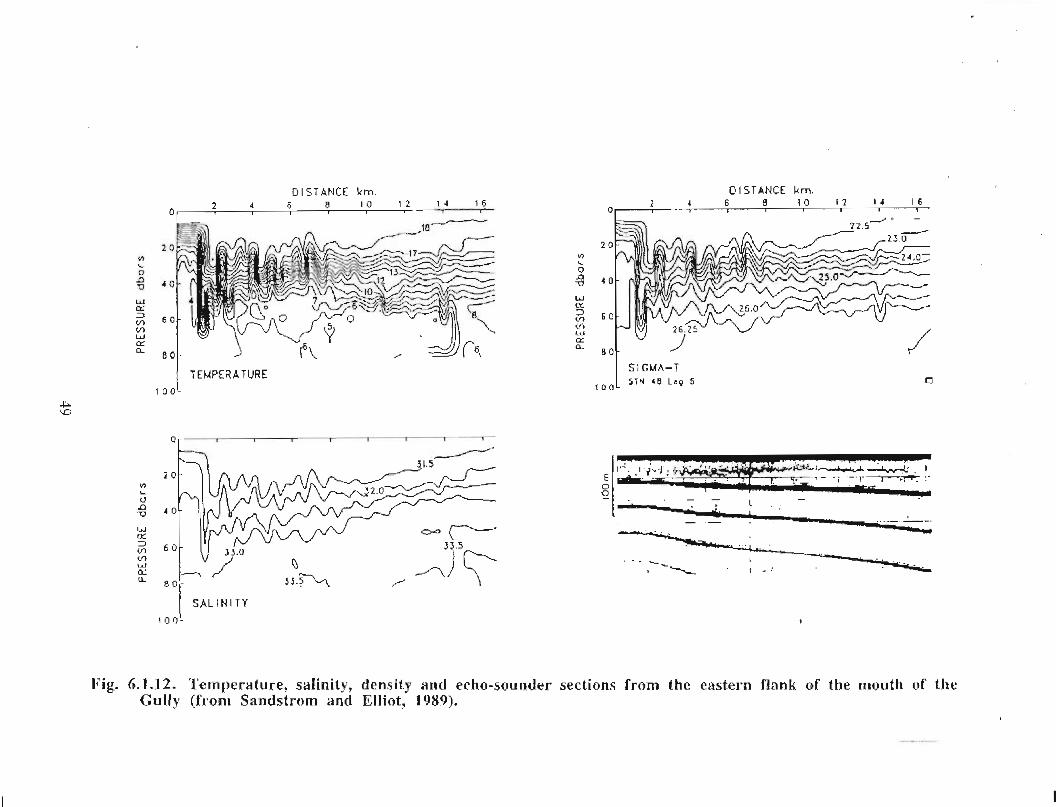
D ISTANCE km .
0
2 0
4 0
60
2 4 6 9 t d
SaLfMITY
l0~3-
14 160
2 0
4 0
wCr.u 60VI
B O
IO O
E
O6
2O I STdNC E krn.6 9 10 17
7 1
Fig. 6 .1 .12 . Temperature, salinity, density and erho-5e,under sections from the easteI•il flank of' the nt4 .► ulh of' lhe{.ully (froan Sandstrom and Elliot, 1 489 ),
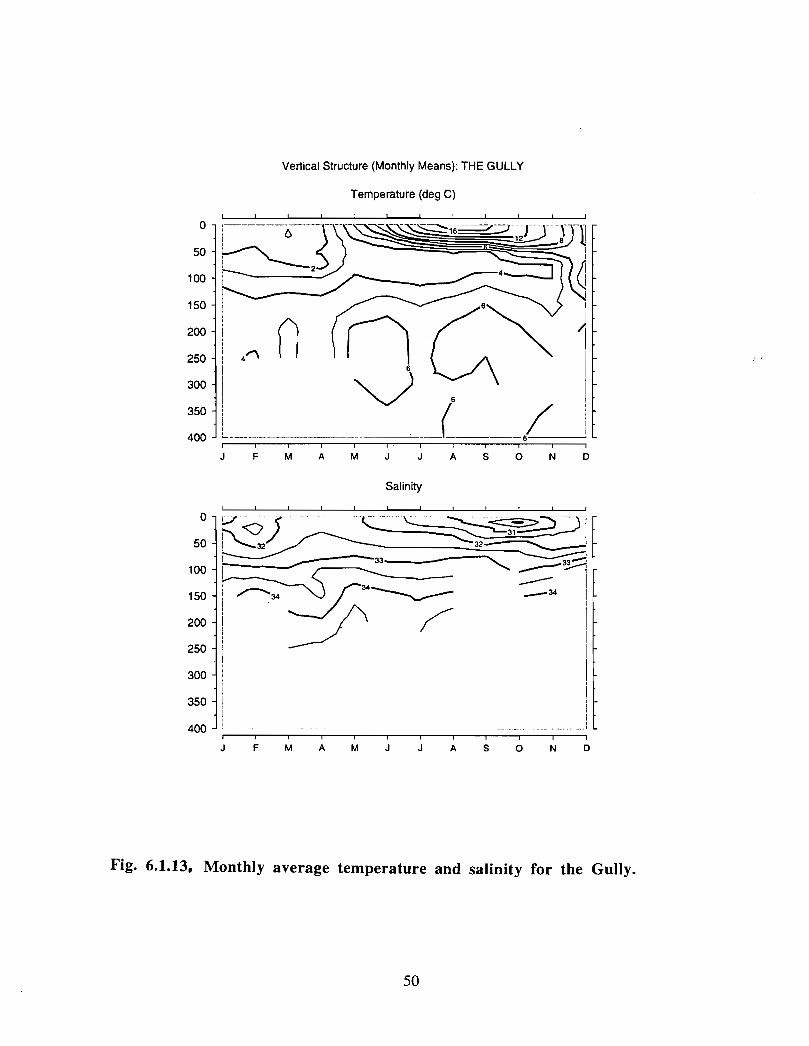
Ve rtical Structure ( Monthly Means) : THE GULL Y
Temperature (deg C)
Salinity
J F M A M J J S O N D
Fig. 6.1 .13. Monthly average temperature and salinity for the Gully.
50
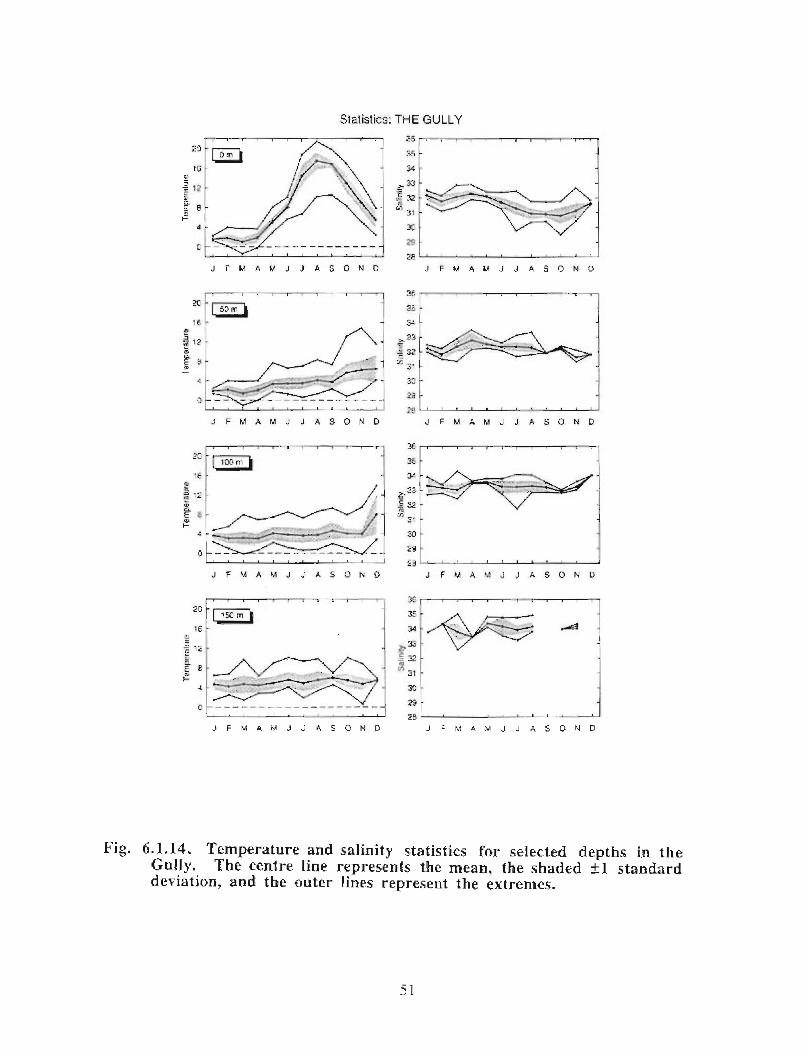
Statéstics : THE GULLYa535
J F M A M J J A S C N D
ie°s
~
F M A M_ J A S 0 N D
J F M A L1 J J A 5 D N
SC -
3C
2~
22
J F V A M J J A S O N =
3 r
25 -
29
2e
C_ P P A A M J J A S O N O
~- '1141,-------------------------------°°---- ---- _29 -2 4
J F M A M J J A S 0 N D Jr M A 3A J J C>A
~
Fig. 6.1 .14 . Temperature and salinity statistics for selected depths in theGuily . The centre line represents the mean, the shaded ±1 standarddeviation, and the outer lines represent the extremes .

5tatistics THE GULLY
J F M P. M . J A S C N D
20J F M F M J J A 5 D N 6
,; F M A M J J A S O N D
28
27 ^ _o
2b ^
J F M A U ., J A S C h ❑
Fig . 6 .1 .15 . Sigma-t statistics for selected depths in the Gully . The centreline represents the mean, the shaded ±1 standard deviation, and theouter lines represent the extremes .
52
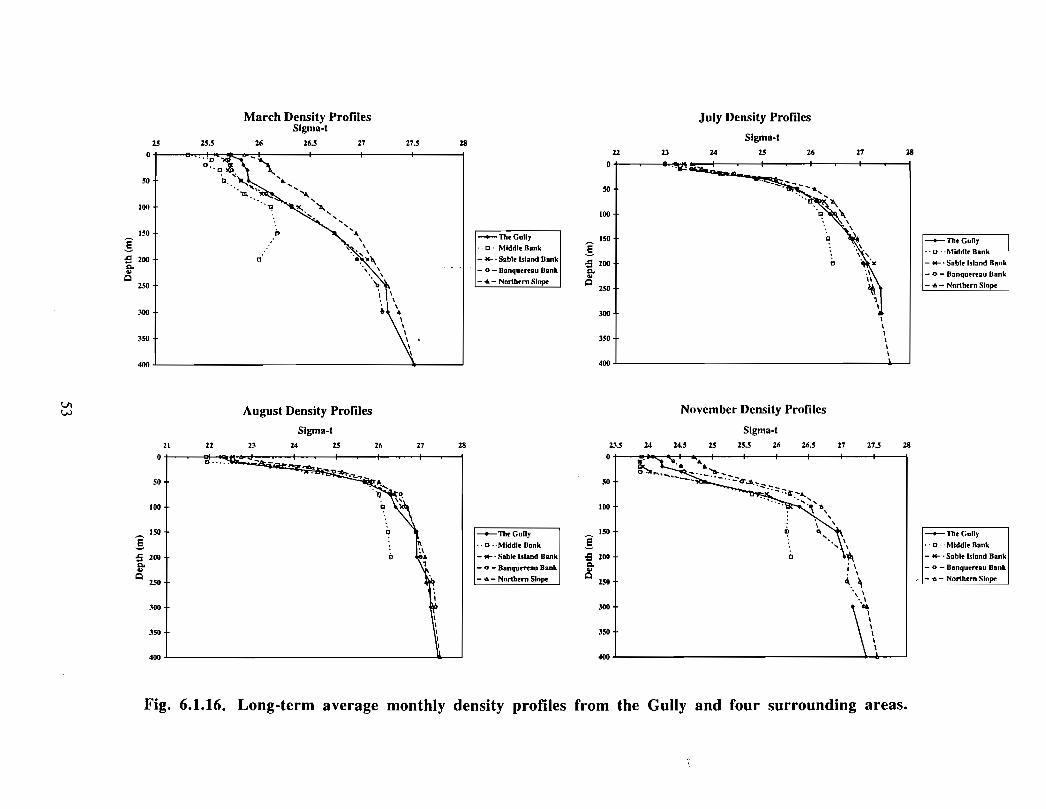
March Density ProfilesSigma-t
25 25.5 26 26.5 27 273 28
0 -ton.
• o
E
August Density Profiles
Sigma-t21 22 23 24 25 26
50 +
100 +
300 +
350 +
400
27 28
-t-The Gully
• • o Middle Bank
- *- - Sable Island Bank
- o - Banquereau Bank
- a - Nnrlhern Slope
~ The GuBy
• • o • -Mkldle Bank
- +- • Sable Island Bank
- o - Banqoerean Bank
- a - Nnrtbern Sinpe
July Density Profiles
Sigma-t22 23 24 25 26 27 28
01-
50 +
100 +
ISO {
Ê Il~ 200 t a
VG
250
300 +
350 +
400
•• \
November Density Profiles
Sigma- t23s 24 24 .5 25 25J 26 263 27 27 .5 28
$5~ .. • •_~.,_
• . . .~ ._ .100 +
300 +
350 +
400
~The Gua y
- • o - - Middle Bank
- M- • Sable Island Bank
- o - Banquereau Bank
-a - Northern Slope
~ The Gully
• - o - -Middle Bank
- ~ • Sable Island Bank
- o - Benquere-u Bank
- a - Northern Slope
Fig. 6.1.16 . Long-term average monthly density profiles from the Gully and four surrounding areas .
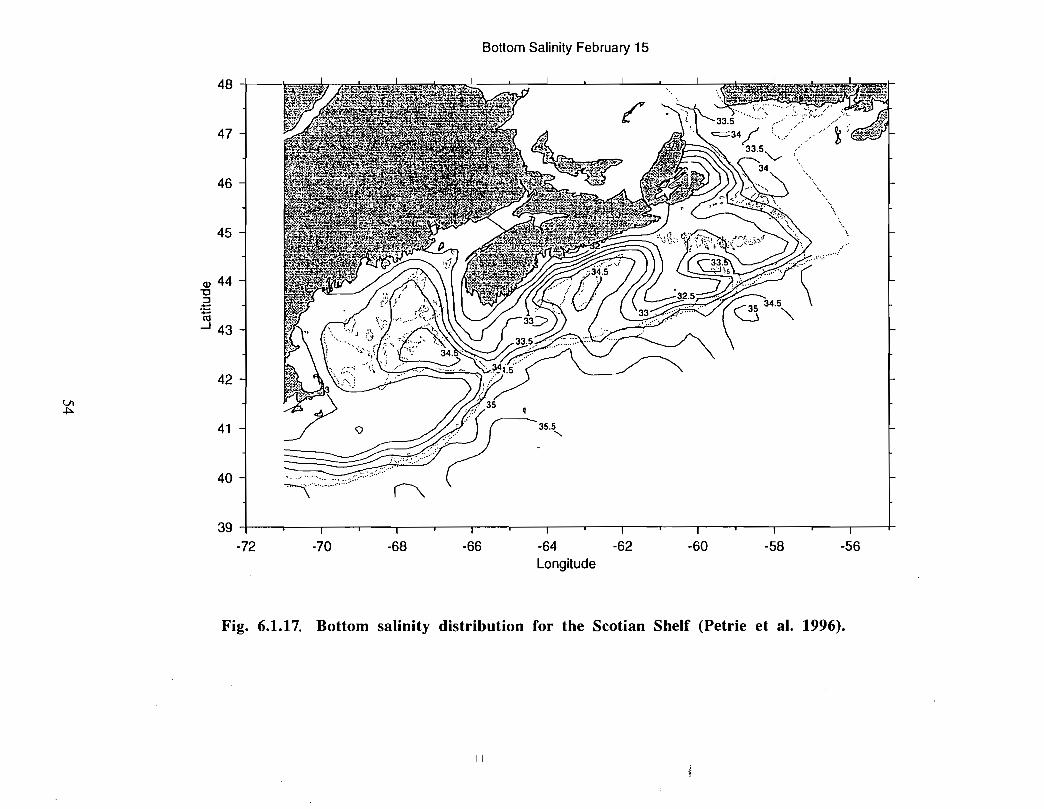
Bottom Salinity February 1 5
-72 -70 -68 -66 -64 -62 -60 -58 -56Longitude
Fig. 6.1 .17. Bottom salinity distribution for the Scotian Shelf (Petrie et al . 1996) .
ii
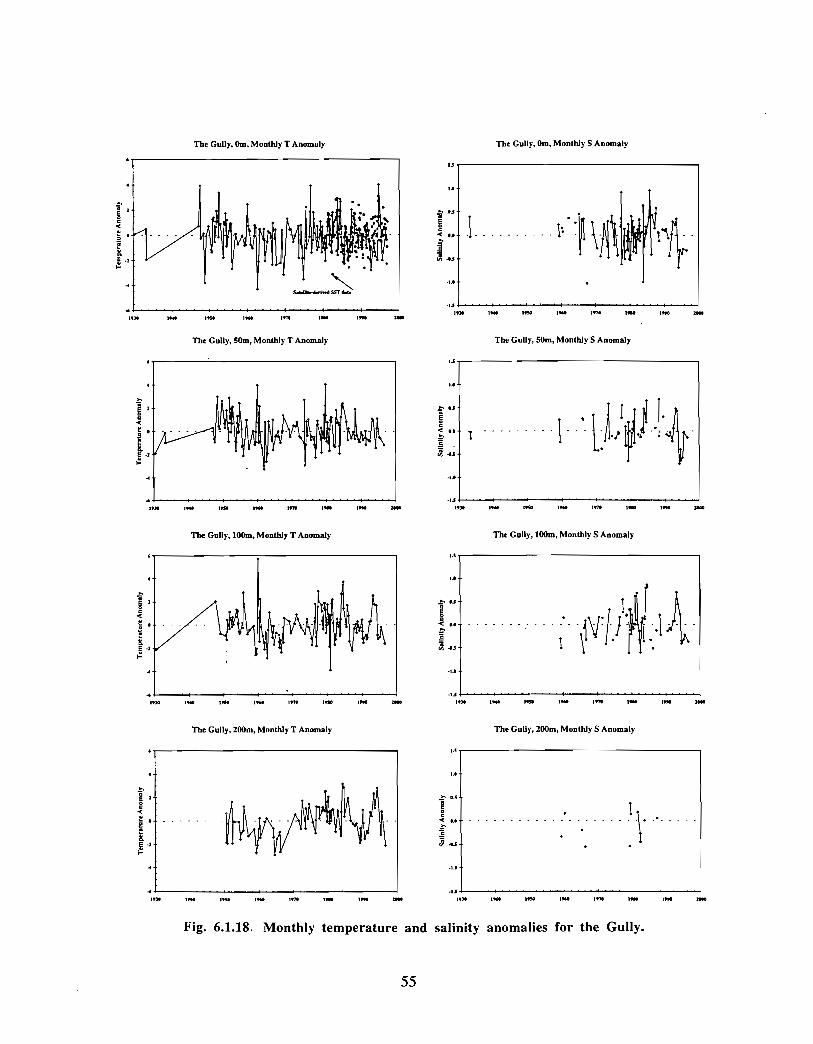
The Gully, Om, Monthly T Anomaly The Gully, Om, Monthly S Anomaly
1 .5
E .I . . . . . . . . . . 1~~ ~
-IJIM IfSG Iw 1~11 lw 1.1111] 1
.+
1 3
The Gully, 50m, Monthly T Anomaly
-li
If]I Iw IISC Iw Irn IMO IfM
The Gu1ly,100m, Monthly T Anomaly
1 .3
l+ +
,In Iw IfA Iw I.H Iw Ina 3.01
The Gully, 200m, Monthly T Anomaly The Gully, 200m, Monthly S Anomaly
Is
J
The Gully, 50m, Monthly S Anomaly
1+ }
I 3
_~ . . z---- .-----157 _r/1 +3
The Gully, 100m, Monthly S Anomaly
_ Is
~ . I< .+------- ----------- ~ •
.I +J3
♦
Ifi Iw IfSA iw I~l. Iw Ill. l.M
-ISIrJ1 Iw 1.50 Iw 1.1C Iw Iw IC!
Fig. 6.1 .18. Monthly temperature and salinity anomalies for the Gully.
55
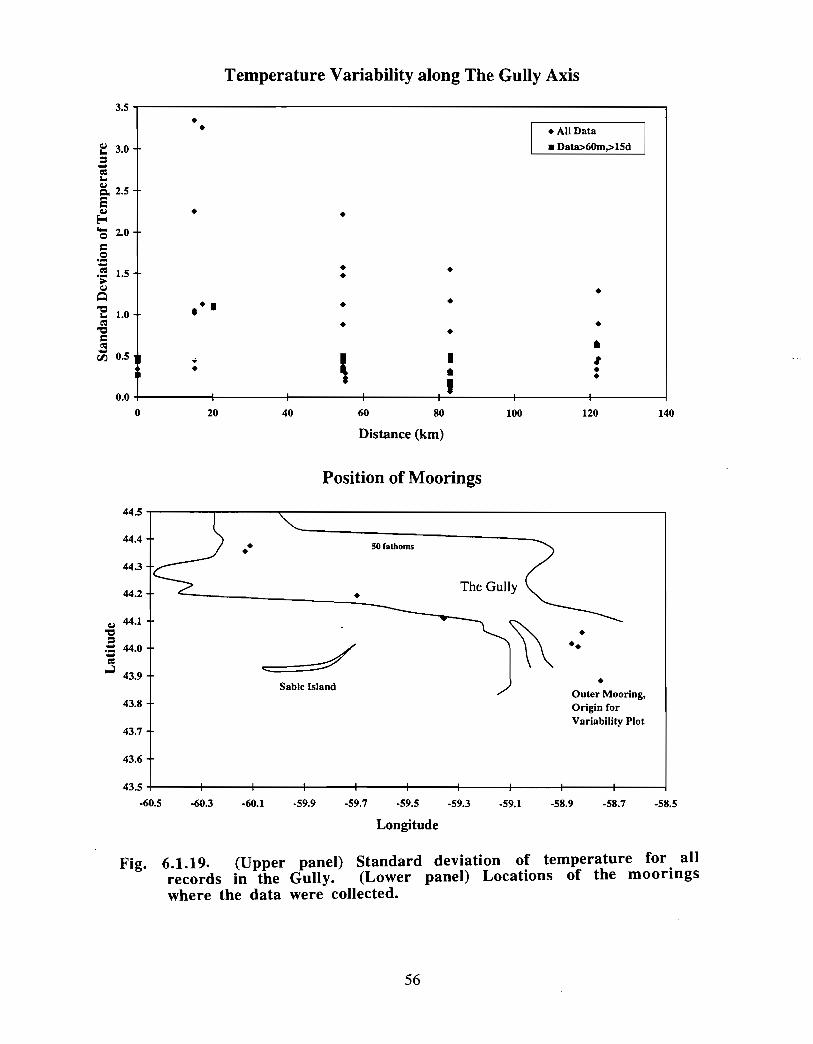
Temperature Variability along The Gully Axis
3.5
2.5 +CD.
2.0 +
1 .5 +
1 .0+
•
♦
♦
•
•
•
♦
♦ All Data
■ Data>60m,>15d
0 .5
0 .0
0 20 40 60 80
Distance (km )
44 .5
44 .4
44 .3
44 .2
43 .8 --
43 .7--
43 .5
•
43.6--
Sable Island
100 120
The Gully
-60.5 -60.3 -60.1 -59.9 -59.7 -59.5 -59.3 -59. 1
Longitude
•
Outer Moo ri ng,Origin forVariability Plot
14 0
-58.9 -58.7 -58. 5
Fig. 6 .1 .19. (Upper panel) Standard deviation of temperature for allrecords in the Gully . (Lower panel) Locations of the mooringswhere the data were collected.
Position of Moorings
50 fathoms
56
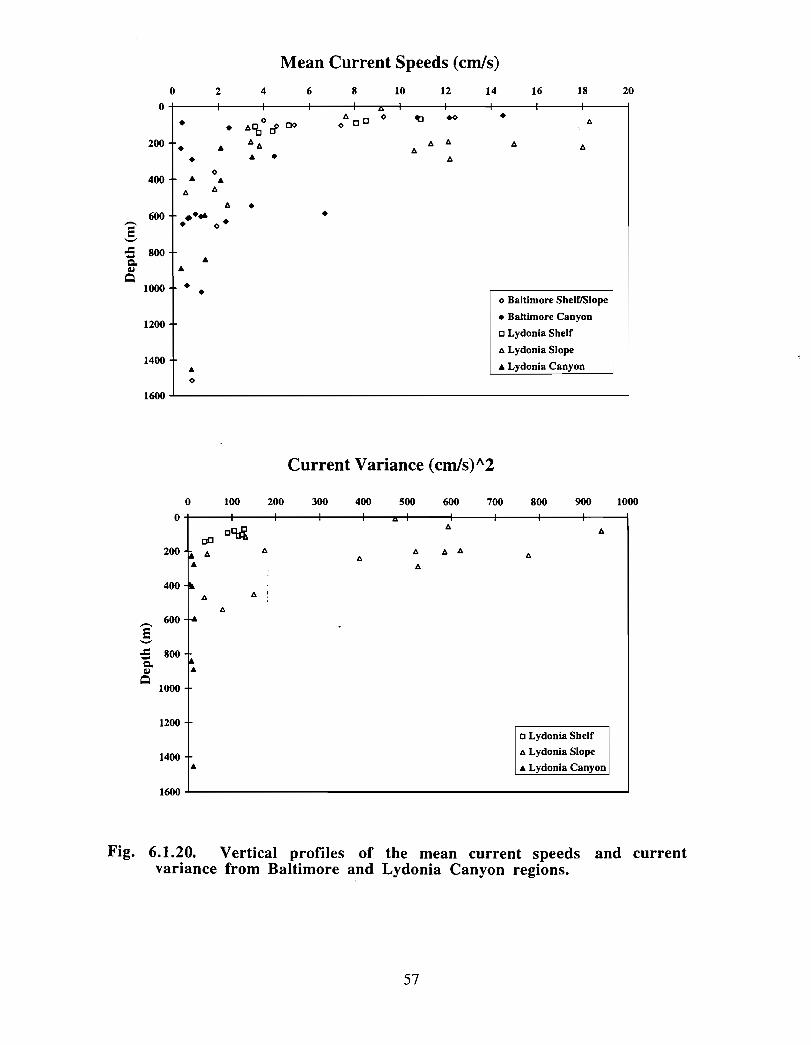
Mean Current Speeds (cm/s)
0
0 2 4 6 8 10 12 14 16 18 20
200 ♦
I
•
400 A o•A A
600 } ♦*M "I• o
800 +
1600-1
A
o Baltimore Shelf/Slope
• Baltimore Canyon
o Lydonia Shelf
n Lydonia Slope
• Lydonia Canyo n
♦
Current Variance (cm/s)A2
.~ .~
600 -N
1200 +
0 100 200 300 400 500 600 700 800 900
0
C03200 e n
-~----a~~- , -O pO 1:1 0 13 *O •
a
400 Ak
1400I •
1600
a
1000
A
n Lydonia Shelf
n Lydonia Slope
• Lydonia Canyon
Fig. 6 .1 .20. Vertical profiles of the mean current speeds and currentvariance from Baltimore and Lydonia Canyon regions .
57
6.2 Chemical Oceanography
Phil Yeats' and Brian Petrie 2Fisheries and Oceans Canad a'Marine Environmental Sciences Division2Ocean Sciences DivisionBedford Institute of OceanographyDartmouth, NS
6.2.1 Contaminants
No measurements of chemical contaminant concentrations in the Gully, either water orsediments, are available . If a broader geographic area that includes adjacent parts ofSable Island Bank, Middle Bank and Banquereau is considered, some limitedmeasurements of contaminants are encountered, including some measurements ofcontaminants in biota . Some of these data were collected on BIO cruises and other fieldsurveys, and some by the companies involved in the Sable Bank offshore energydevelopments. This latter body of data has recently been reviewed in the Sable OffshoreEnergy Project Environmental Impact Statement . Some of the BIO cruise results havebeen published (e.g . Keizer et al., 1978; Dalziel, 1992; Yeats, 1993; and Addison andStobo, 1993) . Additional data are stored in the BIO node of the National ContaminantsInformation System, a national DFO contaminants database, and in the AGC `open file'system. Analytes that have been considered in one or more of these studies include heavymetals, PCBs, and PAHs in water, sediments and/or biota . As would probably have beenexpected for an offshore area such as the Gully, no particularly elevated levels of any ofthese contaminants were encountered in any of these studies .
The main routes for contaminant transport to the Gully would be long range atmospherictransport and water transport in surface currents flowing out of the Gulf of St . Lawrenceand across the shelf. The importance of the St . Lawrence discharge on the Gully isindicated in the assessment of monthly mean salinity statistics (Section 6 .1). Someindication of the transport of heavy metals out of the Gulf of St . Lawrence in this surfacewater discharge is available (Yeats, 1993) . No information of organic contaminantdischarges from the Gulf is available . The importance of long range atmospherictransport of several organic contaminants and mercury has been identified in studies byDOE of wildlife in the Kejimkujik area of southwestern Nova Scotia. DOE data onconcentrations of organic contaminants in wet precipitation in Atlantic Canada have beensummarized by Brun et. al (1991). A potential new source for contaminant transport tothe Gully is the Sable Offshore Energy Project . Contaminants could be transported insolution or as particulates, and the magnitudes of the discharges could be quite large . Thework that has been done to date on the zones of impacts of drilling muds discharged fromoffshore developments and the current regimes in the SOEP area as part of the SOEP EIS,however, suggest that this potential source is unlikely to impact the Gully . Developmentof drilling sites closer to the Gully may present a far greater risk .
58
6.2.2 Nutrients
By far the largest chemical oceanographic data sets for the Gully area exist for nutrientsand oxygen. An extensive database of nutrient and oxygen data for eastern Canadianmarine waters is maintained by the Marine Chemistry Section at BIO . This database hasbeen used to develop the following picture of the nutrient distributions in the Gully area .
For this analysis, data were extracted from the nutrient and oxygen data from a polygonthat encompasses the Gully plus some of the shelf areas immediately adjacent to theGully, and from polygons for the shelf areas to the west (eastern Sable Island Bank),north (Middle Bank), and east (Banquereau) . These areas plus the locations of stationswith nutrient or oxygen data are shown in Fig . 6 .2 .1 .
A nitrate vs . depth profile for all the data from stations in the Gully polygon is shown inFig. 6 .2 .2. This representation gives a picture integrated over both space and time of thenitrate distribution . The two features that are most evident from this figure are thegeneral picture of nutrient concentrations increasing with depth and the large range innitrate concentrations that are seen in the surface mixed layer . The general profile showsan increase from non-detectable or very low levels at the surface to approximately 15 µMat 200 m depth - a level that is comparable to those generally found in intermediate depthslope waters off the Scotian Shelf. The variability in the surface layer reflects theseasonal cycle of nutrient concentrations decreasing from high concentrations in thewinter to low concentrations in the spring and through the summer into the early part ofthe fall . The seasonal cycle for nitrate in the surface mixed layer is shown in Fig . 6.2 .3 .Similar pictures, both the vertical profiles and the seasonal cycles, are seen for phosphateand silicate .
This general picture of the nitrate (or phosphate) distribution in the Gully, averaged as itis over time and space, is indistinguishable from similar pictures developed for SableIsland Bank, Middle Bank or Banquereau . A comparison of the seasonal cycle of nitratein the surface layer for the four regions is shown in Fig . 6 .2 .4 .-This figure shows theaverage monthly surface layer concentrations in each region . It is clear from this figurethat there are no substantive differences in the seasonal concentrations in any of theseregions. For the deeper waters a comparison of the nitrate profile for all Gully stationswith soundings greater than 100 m with those from similar depth stations from the SableIsland Bank and Banquereau shelf edge (Fig . 6.2.5) shows that the profiles areindistinguishable . The picture for silicate is slightly different with the seasonal surfacelayer distributions (Fig . 6.2 .6) showing higher concentrations in winter in the MiddleBank region. The source of this signal is probably the discharge from the Gulf of St .Lawrence . Otherwise, the silicate distributions are also substantively similar in all fourregions .
A major problem with the previous description is that results from all the stations arecombined. Only for the seasonal cycle in the surface layer are there enough data toinvestigate any trends . There are insufficient data to investigate long-term trends such a s
59
the decadal scale trends in oxygen seen in Emerald Basin (Petrie et al., 1994). Importantfeatures associated with specific locations such as inflows on the eastern flank of theGully associated with a counterclockwise circulation as suggested by some of the resultssummarized in Section 6 .1 may also be lost in the general picture . Offshore to inshoregradients or cross-Gully gradients may be important components of our understanding ofnutrient supply to the Gully, but there are insufficient data to investigate these gradients .One cruise in our database does have three stations lined up more or less along the mainaxis of the Gully and this line (approximately 50 km long) does show significantincreases in nitrate and silicate concentrations at 100 in depth from offshore to inshore .Salinity decreases slightly along this line . There are no cross-gully transects in thenutrient database that could be investigated for evidence of doming of nutrient profileslike those seen for chlorophyll a in the Gully (see Section 6 .3.1) or for nutrients elsewhere(e.g. Shea and Broenkow, 1982) .
Sources of nutrients to the Gully will include the three general sources identified abovein the section on contaminants . The Gulf of St . Lawrence outflow will be an importantsource, particularly in the winter as the nutrient discharge from the Gulf in winter is quitelarge (Yeats, 1988) . Atmospheric inputs for nutrients are generally considered to be fairlyminor but SOEP may be a significant source because produced waters usually containvery high ammonia concentrations . The most important source of nutrients, however,will be the input from offshore . The main source of these offshore waters :that mix ontothe shelf will be intermediate depth slope waters, either Warm Slope Water or LabradorSlope Water (Petrie and Drinkwater, 1993) . Nutrient concentrations in Warm SlopeWater are high (nitrate approximately 22 µM and silicate, 15 µM), while those in theLabrador Slope Water are less well defined based on the currently available data, butsomewhat lower than those in the Warm Slope Water . In either case these intermediatedepth slope waters will be a major contributor of nutrients to the shelf break regionincluding the Gully .
6.2.3 Nutrient Fluxes through the Gully
The contributions of low frequency processes to the onshore-offshore exchange of heatand salt through the Gully are described in Chapter 6 .1 . Moreover, Houghton et al .(1978) stated that there was evidence in their data of enhanced cross-shelf exchangethrough the Gully and the Scotian Gulf. They did not present quantitative evidence forthe former but did show detailed calculations of the heat, salt and nitrate fluxes for thelatter. Their nitrate fluxes were based on current meter data from a mooring located at the250 in isobath on the shelfbreak south of the Scotian Gulf from December 1975 to April1976 (Smith 1978) and water bottle observations of dissolved oxygen and nitrate . Thecurrent meters measured current speed and direction, temperature and salinity .Regressions between water bottle temperature and salinity with dissolved oxygen (fordepths >_ 50 m) were used to convert the temperature and salinity fluxes from the currentmeters to a dissolved oxygen flux ; then, a regression between dissolved oxygen andnitrate was used to transform the oxygen flux to a nitrate flux. The nitrate flux calculatedby Houghton et al. represents the contribution to the shelf for low frequency motions wit h
60
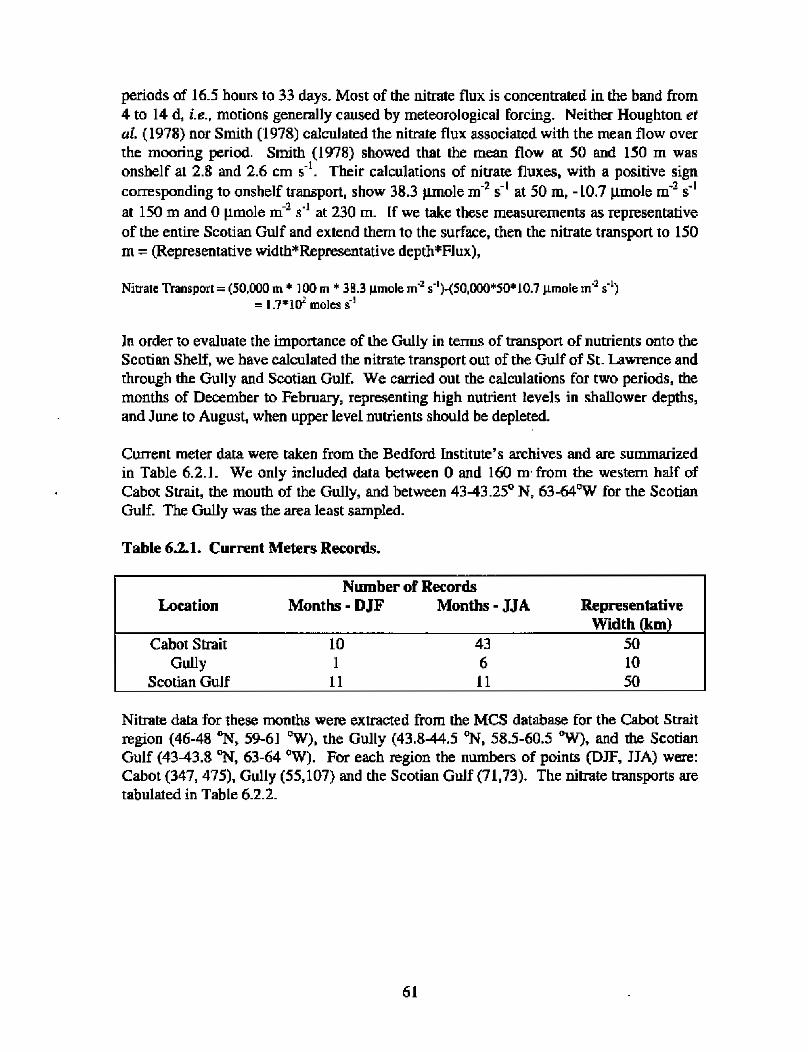
periods of 16.5 hours to 33 days . Most of the nitrate flux is concentrated in the band from4 to 14 d, i.e., motions generally caused by meteorological forcing . Neither Houghton eta1. (1978) nor Smith (1978) calculated the nitrate flux associated with the mean flow overthe mooring period . Smith (1978) showed that the mean flow at 50 and 150 m wasonshelf at 2.8 and 2 .6 cm s" 1 . Their calculations of nitrate fluxes, with a positive signcorresponding to onshel£ transport, show 38 .3 µmole m-2 s1 at 50 m, -10.7 µmole m'- s"
at 150 m and 0 µmole m'- s " at 230 m. If we take these measurements as representativeof the entire Scotian Gulf and extend them to the surface, then the nitrate transport to 150m = (Representative width*Representative depth#Flux) ,
Nitrate Transport = (50,000 m* 100m * 38 .3 µmole m Z s")-(50,000*50* 10.7 µmoEe m 2 s")=I .7*10`moles s 3
In order to evaluate the importance of the Gully in terms of transport of nutrients onto theScotian Shelf, we have calculated the nitrate transport out of the Gulf of St . Lawrence andthrough the Gully and Scotian Gulf. We carried out the calculations for two periods, themonths of December to February, representing high nutrient levels in shallower depths,and June to August, when upper level nutrients should be depleted .
Current meter data were taken from the Bedford Institute's archives and are summarizedin Table 6.2.1 . We only included data between 0 and 160 m• from the western half ofCabot Strait, the mouth of the Gully, and between 43-43 .25° N, 63-64°W for the ScotianGulf. The Gully was the area least sampled .
Table 6.2.1. Current Meters Records .
Number of RecordsLocation Months - D1F Months - JJA Representative
Width (km)Cabot Strait 10 43 50Gully 1 6 10
Scotian Gulf 11 11 50
Nitrate data for these months were extracted from the MCS database for the Cabot Straitregion (46-48 "1\T, 59-61 °W), the Gully (43 .8-44.5 °N, 58 .5-60.5 °W), and the ScotianGulf (43-43 .8 °N, 63-64 °W). For each region the numbers of points (DJF, JJA) were:Cabot (347, 475), Gully (55,107) and the Scotian Gulf (71,73) . The nitrate transports aretabulated in Table 6.2.2 .
61
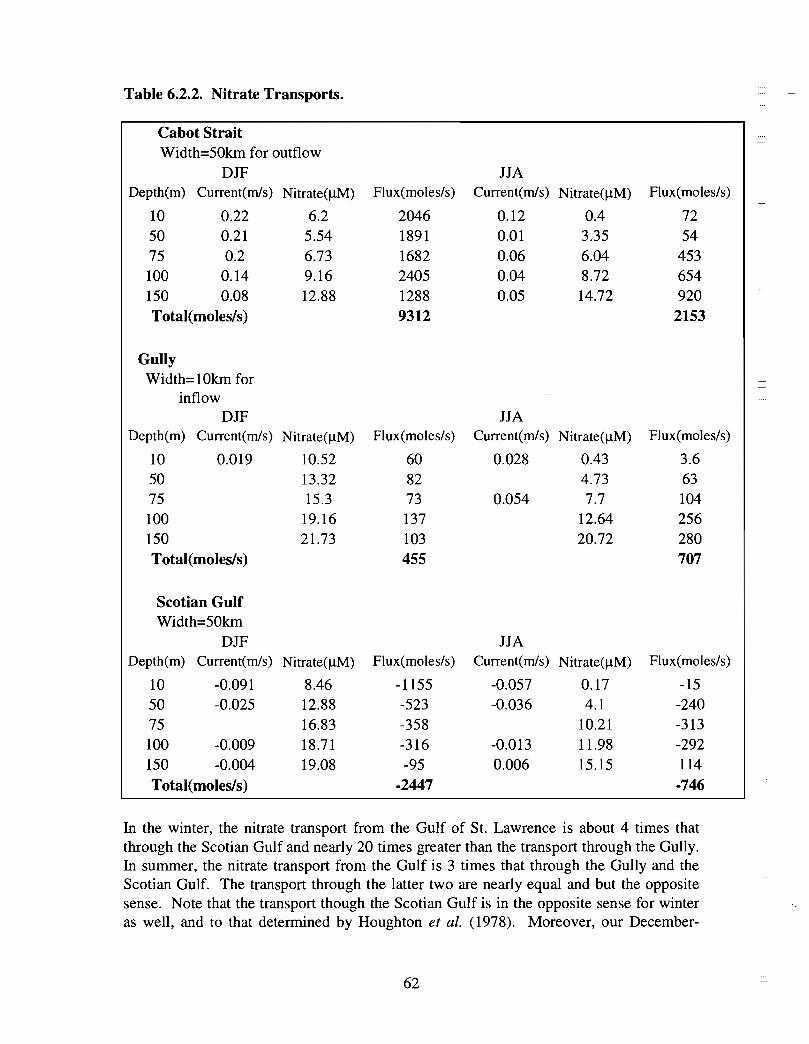
Table 6.2.2. Nitrate Transports .
Cabot StraitWidth=50km for outflow
DJF JJA
Depth(m) Current(m/s) Nitrate(µM) Flux(moles/s) Current(m/s) Nitrate(µM) Flux(moles/s)
10 0.22 6.2 2046 0.12 0.4 72
50 0.21 5.54 1891 0.01 3.35 54
75 0.2 6.73 1682 0.06 6.04 453
100 0.14 9.16 2405 0.04 8.72 654
150 0.08 12.88 1288 0.05 14.72 920
Total(moles/s) 9312 2153
GullyWidth= I Okm for
inflow
DJF JJA
Depth(m) Current(m/s) Nitrate(µM) Flux(moles/s) Current(m/s) Nitrate(µM) Flux(moles/s )
10 0.019 10.52 60 0.028 0.43 3.650 13.32 82 4.73 6375 15.3 73 0.054 7.7 104100 19.16 137 12.64 256150 21.73 103 20.72 280Total(moles/s) 455 707
Scotian GulfWidth=50km
DJF JJADepth(m) Current(m/s) Nitrate(µM) Flux(moles/s) Current(m/s) Nitrate(µM) Flux(moles/s)
10 -0.091 8.46 -1155 -0.057 0.17 -1550 -0.025 12.88 -523 -0.036 4.1 -240
75 16.83 -358 10.21 -313100 -0.009 18.71 -316 -0.013 11.98 -292150 -0.004 19.08 -95 0.006 15.15 114Total(moles/s) -2447 -746
In the winter, the nitrate transport from the Gulf of St . Lawrence is about 4 times thatthrough the Scotian Gulf and nearly 20 times greater than the transport through the Gully.In summer, the nitrate transport from the Gulf is 3 times that through the Gully and theScotian Gulf. The transport through the latter two are nearly equal and but the oppositesense. Note that the transport though the Scotian Gulf is in the opposite sense for winteras well, and to that determined by Houghton et al. (1978). Moreover, our December-
62
February transport exceeds their December-April transport by a factor of nearly 15. Thedifferences in their analysis compared to this one are that they used current data for onlyone period and from farther off the shelf, and they calculated the nutrient fluxes forperiods of about 1 to 30 days, whereas, our calculation estimates seasonal fluxes . Oneearlier estimate of nitrate transport through Cabot Strait based on geostrophic calculationsof the currents and BIO nutrient data collected in the 1970s (Yeats, 1988) gave an annualaverage of 5* 103 moles/s .
Our calculations are based on current meter data that were not collected at the same time
as the nutrient data, assumptions about the horizontal scale that the current meter datarepresent (e.g., half the width of the Gully at its narrowest point defined by the 100 in
isobath), very few current meter observations with poor vertical resolution (particularly
true for the Gully, where one winter current observation was taken as representative of
the entire depth to 150 m), and in some cases few nutrient measurements from the regions
(again particularly true for the Gully, where most of the data comes from the adjacent
bank areas). With these weaknesses in mind, the overall indication is that the nitrate
transport through the Gully could make a significant contribution to the eastern Scotian
Shelf during the summer . In winter, the transport from the Gulf of St. Lawrence
dominates .
6 .2.4 Summary
There are no data on contaminant concentrations within the Gully . Extrapolation of datafrom adjacent areas would suggest that elevated concentrations of any of the commoncontaminants would not be anticipated in the water, sediments or biota of the Gully .Contaminant survey(s) to establish baseline levels would be worthwhile .
There are adequate measurements of nutrient and oxygen concentrations in the Gully tocalculate monthly mean concentrations for these parameters. The general picture ofnutrient distributions in the Gully averaged as it is over monthly time scales and Gully-wide space scales is very similar to analagous descriptions for adjacent areas . Estimatesof nutrient transport through the Gully onto the Scotian Shelf based on these seasonallyaveraged descriptions of the distributions indicate that transport through the Gully canmake a significant contribution to the nutrient pool on the eastern Scotian Shelf. Thereare inadequate data for an investigation of nutrient variability on smaller time or spacescales . There is no indication in the available dataset of elevated nutrient levels that mayhave resulted from enhanced mixing or upwelling in the Gully . Mixing may be no greaterin the Gully than on the adjacent regions of the shelf, it may be occurring on small timeand space scales that were missed with the limited data coverage, or nutrients may berapidly removed by biological uptake . A combined physical, chemical and biologicalstudy would be required to investigate these possibilities .
63
6.2.5 References
Addison, R .F., and W.T. Stobo 1993 . Organochlorine residue concentrations and burdensin grey seal (Halichoerus grypus) blubber during the first year of life . J. Zoolog .Soc. London 230: 443-450 .
Brun, G.L., G.D . Howell and H .J. O'Neill 1991 . Spatial and temporal patterns of organiccontaminants in wet precipitation in Atlantic Canada . Environ. Sci. Technol. 25 :1249-1261 .
Dalziel, J .A . 1992. Reactive mercury on the Scotian Shelf and in the adjacent NorthwestAtlantic Ocean. Mar. Chem. 37 : 171-178 .
Houghton, R., P. Smith and R . Fournier 1978. A simple model for cross-shelf mixing onthe Scotian Shelf. J. Fish. Res. Bd. Can . 35 : 414-421 .
Keizer, P .D., J . Dale and D.C . Gordon, Jr . 1978. Hydrocarbons in surficial sedimentsfrom the Scotian Shelf. Geochim. Cosmochim. Acta 42 : 165-172 .
Petrie, B ., and K. Drinkwater 1993 . Temperature and salinity variability on the ScotianShelf and in the Gulf of Maine 1945-1990 . J. Geophys. Res . 98, 20079-20089 .
Pet rie, B., K. Drinkwater and P. Yeats 1994. Ocean climate variations for the Canadianeast coas t: a simple model with an update for 1993 . DFO Atlantic FisheriesResearch Document 94/17, 28 pp .
Shea, R.E., and W.W. Broenkow 1982. The role of internal tides in the nutrientenrichment of Monteray Bay, Califo rnia . Estuar. Coast. Shelf Sci. 15 : 57-66.
Smith, P.C. 1978. Low-frequency fluxes of momentum, heat, salt and nutrients at theedge of the Scotian Shelf . J. Geophys. Res. 83: 4079-4096 .
Yeats, P .A . 1998. Nutrients. In Chemical Oceanography in the Gulf of St . Lawrence(P.M. Strain, ed .), Canad. Bullet. Fish. Aquat. Sci. 220: 29-48.
Yeats, P.A. 1993 . Input of metals to the North Atlantic from two large Canadianestuaries . Mar. Chem. 43 : 201-209 .
64
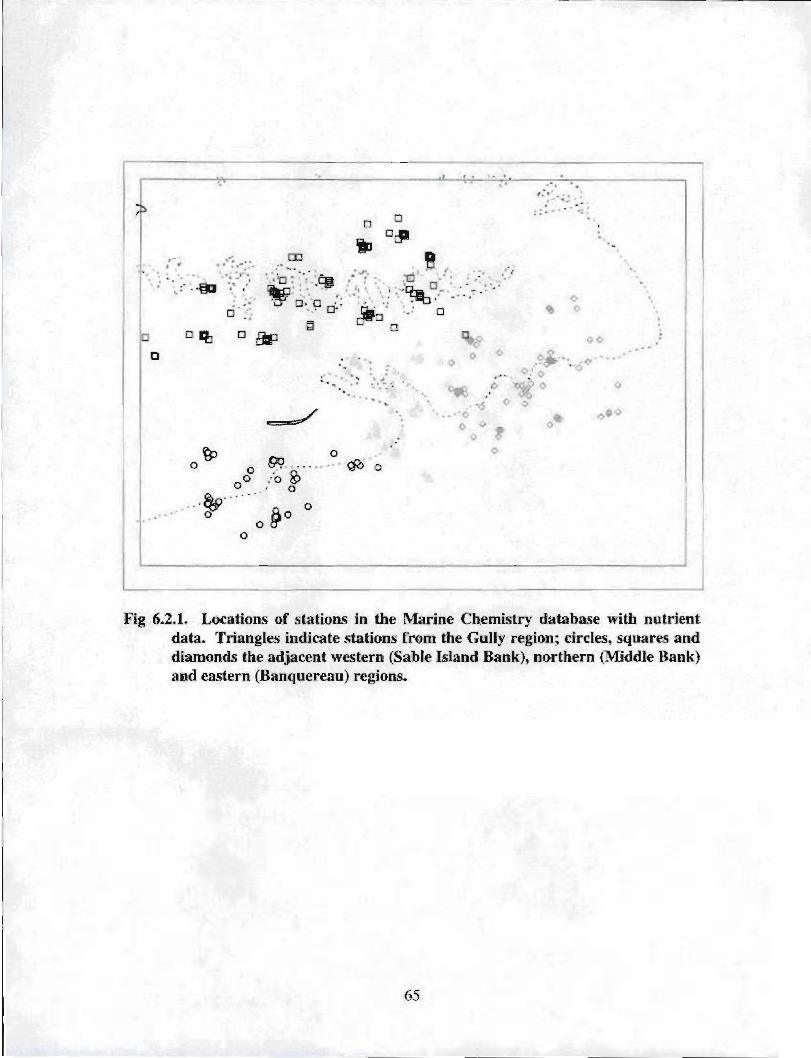
ID P? - . . . •
0 o
00 "4
O
O
*" ü4 tï
Fig 6.2 .1. Locations of stations in the Marine Chemistry database with nutrientdata. Triangles indicate stations from the Gully region; circles, squares and
diaTnond.s the adjacent western (Sable Island Bank), northern (Middle Bank)
and eastern (Banquereau) reg ions .
65
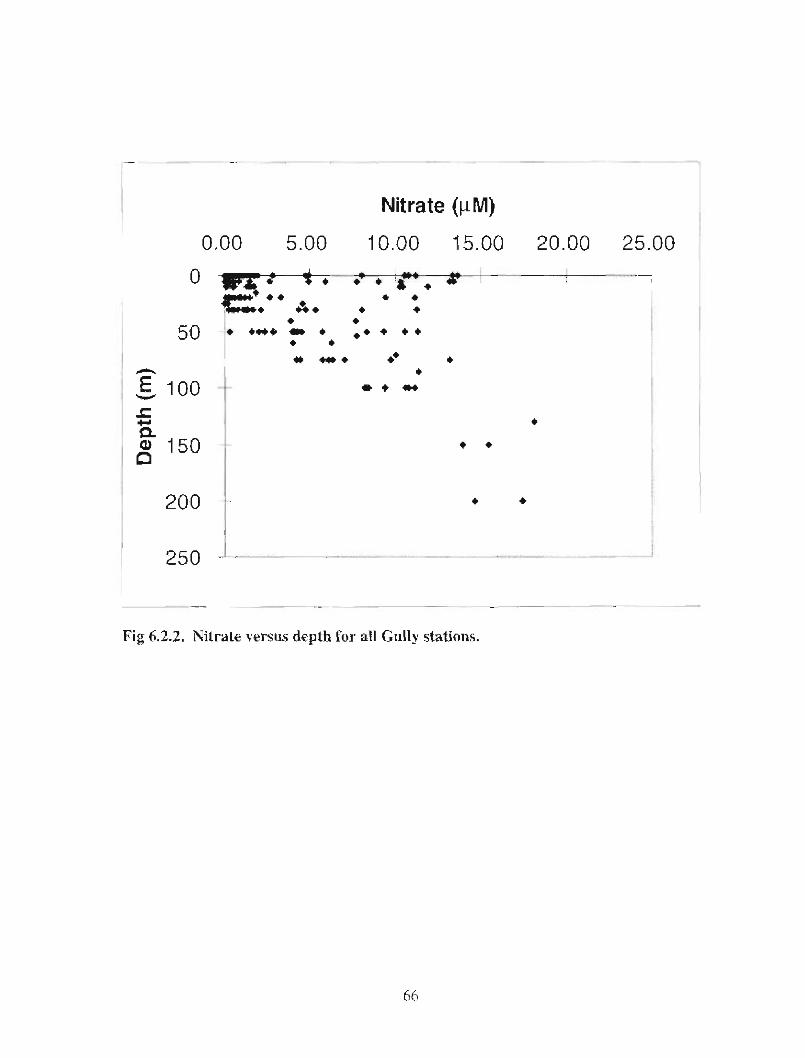
Nitrate (µ M)
0.00 5 .00 10 .00 15.00 20 .00 25 .0 0
0
5V
.-.
E 100
200
250
Fig 6.2.2. Nitrate versus depth for all Gullv stations .
~~ . ., . ,i• ,.ts ar► , #, , t *
~ .
,
66
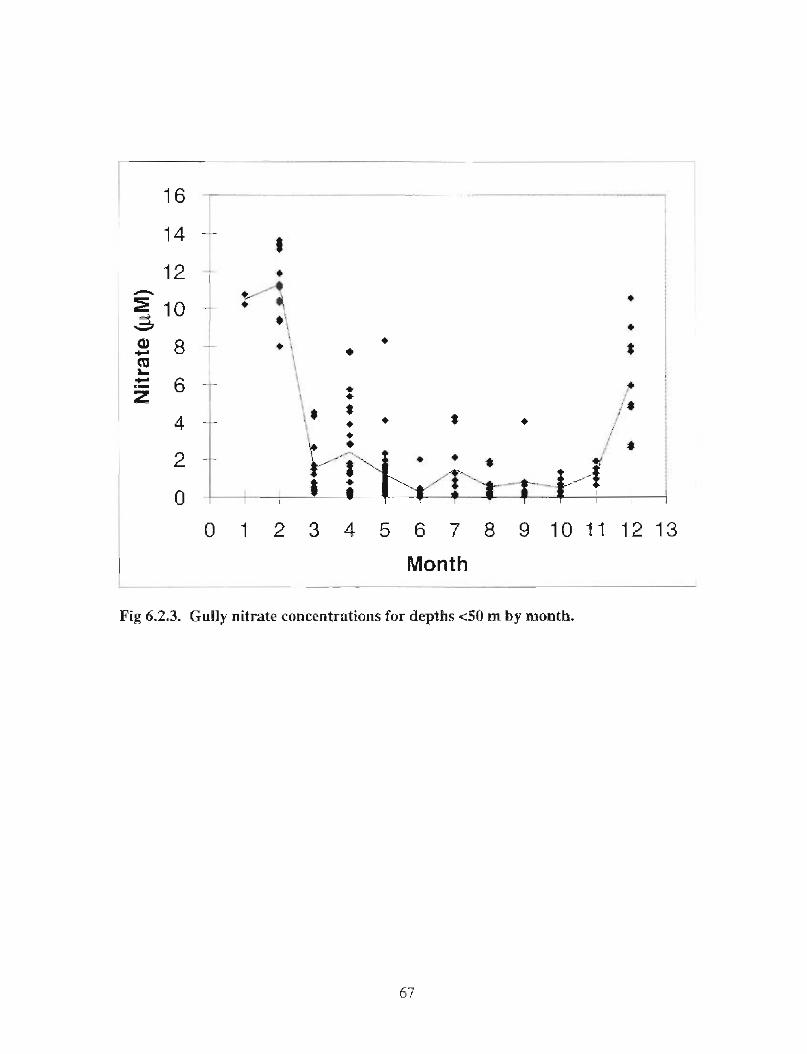
4
0
#
*.
2
0 1 2 3 4 5 6 7 8 9 10 11 12 1 3
Mont h
Fig 6.2 .3. Gully nitrate concentrations for depths <30 m by month.
67
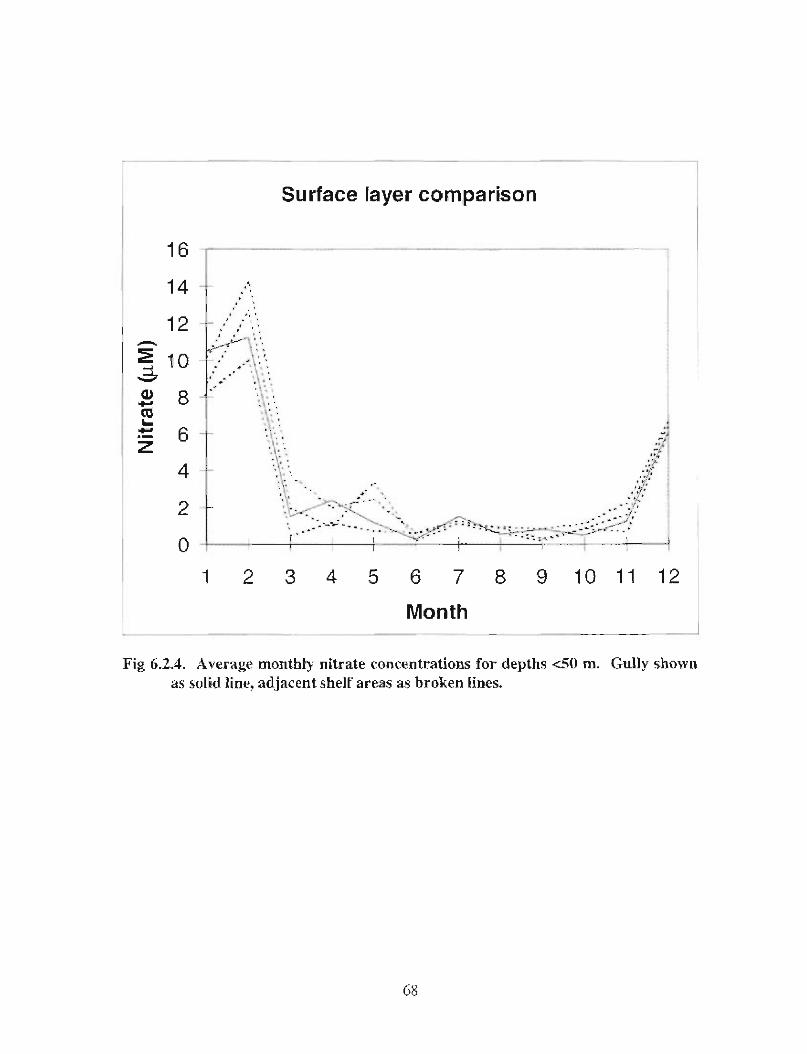
Surface layer compariso n
4
2
0
1 2 3 4 5 6 7
Month
Fil ; 6 .2 .4 . Average monthly nitrate concentrations for depths <50 sn . Gully shownas solid line . ad jacent shelf' areas as broken lines .
68
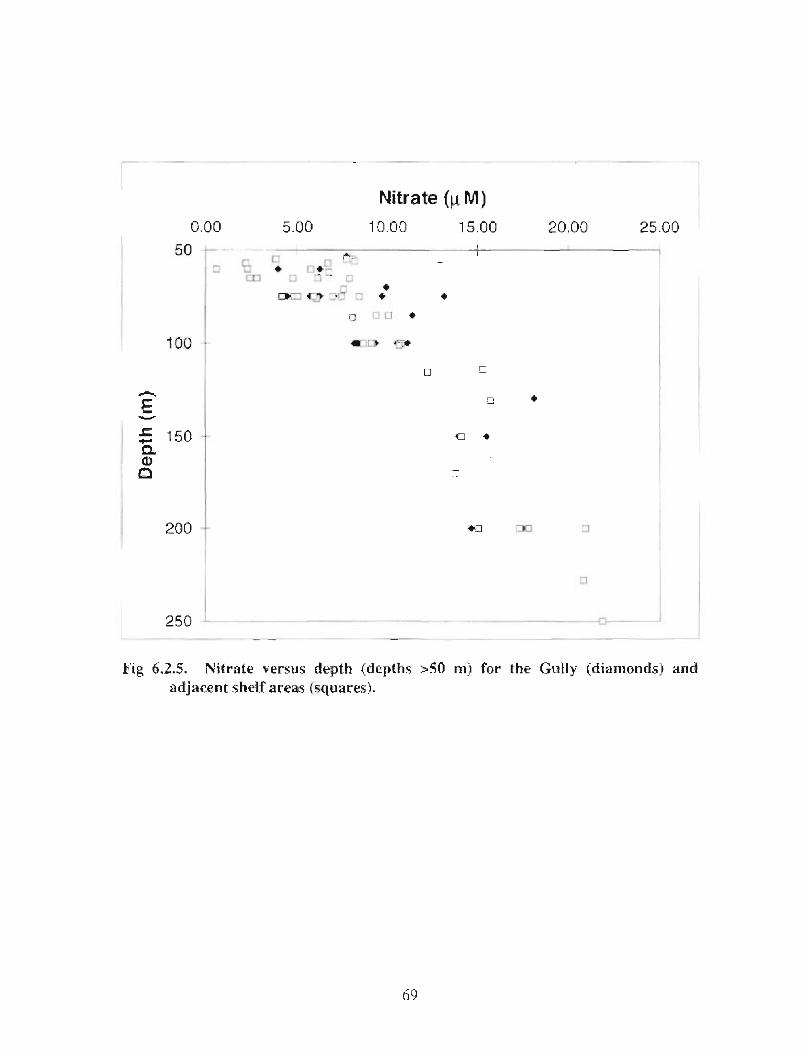
N i trate (p M )
0.00 5.00 10 .00 15.00 20.00 25 ..00
50:_ ~ • ❑ }-~ : ❑
❑r~ ~ s•~:; ~ • •
•
100 - a ► 4~_•
200
❑
Fig 6.2.5. Nitrate versu s depth (depths > 5 () rn) for the Gully (di amnnds) and
adjacent shelf ar ea s {squares ) .
❑
69
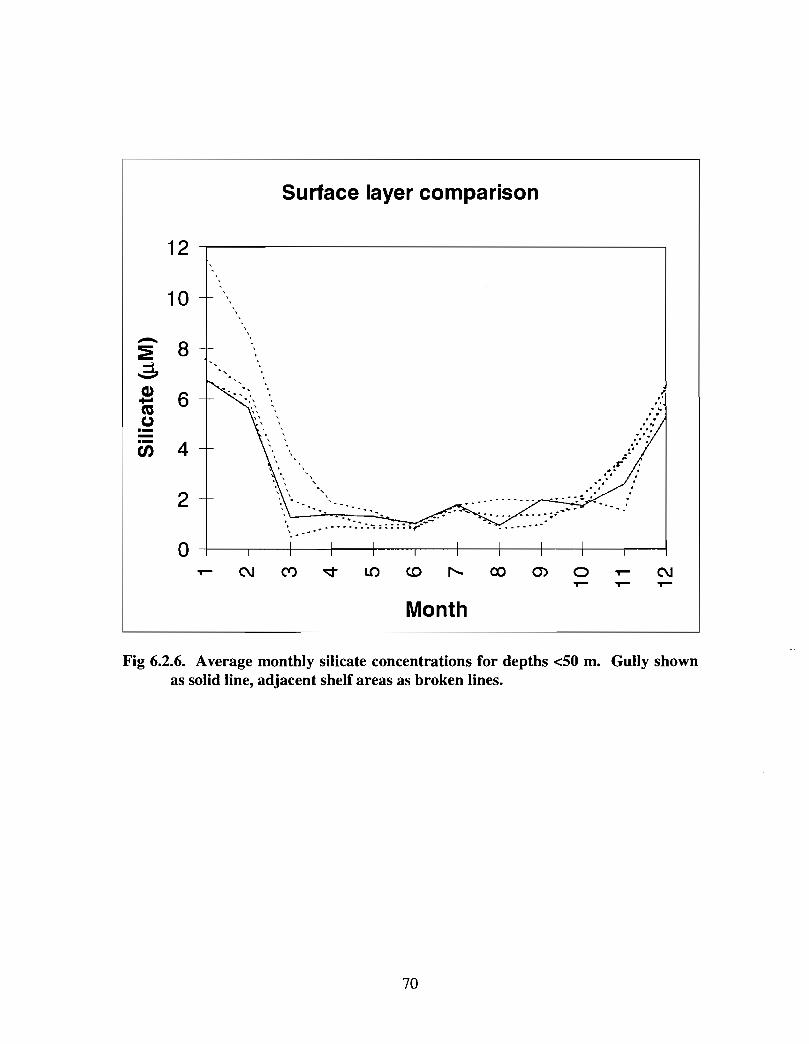
Fig 6.2.6. Average monthly silicate concentrations for depths <50 m . Gully shownas solid line, adjacent shelf areas as broken lines.
70
6.3 Biological Oceanography - Plankto n
Erica J . H. Head and W. Glen HarrisonFisheries and Oceans CanadaOcean Sciences Divisio nBedford Institute of OceanographyDartmouth, N S
6.3.1 Distribution and Seasonal Cycles of Phytoplankton
6.3.1 .1 Sources of data
Five sources of data will be used in the analysis of distribution and seasonal cycles ofphytoplankton. These are: (1) surface chlorophyll determinations made during theScotian Shelf Icthyoplankton Program (SSIP), 1978-1982 (O'Boyle et al., 1984), (2)surface chlorophyll maps derived from colour satellite images of the Coastal Zone ColorScanner (CZCS) which collected data from 1978-1986 (Feldman et al. 1989), (3) depthprofiles of chlorophyll concentrations collected either in July 1993 during a trainingcruise run out of Wood's Hole by the Sea Education Association (Robinson et al ., 1993 ;Chief Scientist, R . Bohrer) or (4) during missions of the CSGS Hudson (July 1995, June1996, April and October-November 1997) and CSGS Parizeau (November 1996) (Head,unpubl. data) and (5) estimates of chlorophyll concentration derived from Secchi depthobservations made in July 1993 and 1994 (Simard, 1995) .
Winter condition s
During winter, the water column over the Scotian Shelf mixes from top to bottom due tostorm activity, supplying nutrients (e.g. nitrate) to the near-surface layers . At this time,seasonal near surface light levels are relatively low, limiting the rate at whichphytoplankton can grow (photosynthesize) . In addition, the deep mixing means thatindividual cells will spend much of their time at depths at which their metabolicrequirements exceed their photosynthetic capacity, resulting in slow growth . Thus, in thewinter SSIP data (February, Fig . 6 .3 .1), surface chlorophyll concentrations were generallylow . For a few stations (including one in the Gully) chlorophyll levels were higher, butthe significance of this feature cannot be ascertained from the limited data available. Nousable winter data was available from the CZCS ocean colour satellite .
Spring condition s
During spring, the surface layer warms up as vertical mixing decreases . Solar radiationalso increases and the combination of water column stability, increased light intensity andhigh near-surface nutrient concentrations leads to the development of a "spring bloom" .On the Scotian Shelf the bloom progresses temporally from west to east, and from theshelf break to the inshore . Based on the SSIP data (1979, 1981) the spring bloom wasapparent over on the shelf west of Halifax in April and persisted on the eastern shelf into
71
May (Fig . 6.3 .1) . By contrast, in April in 1997 (Fig . 6 .3 .2), concentrations of chlorophyll(surface and column-intergrated) were comparable in the western and eastern areas of theshelf and low levels were seen only over Emerald Basin and at stations further offshoreon the Halifax Section. During April 1997, although phytoplankton concentrations(surface and integrated) were high in the Gully, they were not markedly higher than atstations on the eastern Scotian Shelf or in the Laurentian Channel . Surface and integratedchlorophyll concentrations were generally well-correlated over the shelf (Fig. 6.3.3)although distributional patterns differed along the Gully section ; surface concentrationswere highest offshore while integrated concentrations were highest at the inner-moststation . At the inner-most station, surface chlorophyll concentration was relatively lowand the subsurface chlorophyll layer was thicker (i) than at the two outer Gully stations,(ii) than at the four farthest offshore stations of the Louisbourg Line (Fig . 6 .3.4), and (iii)than at most other stations of the survey (data not shown) . Surface chlorophylldistributions in spring derived from CZCS satellite imagery (composites of -25individual images for 1979 and -25 images for 1980) showed that high phytoplanktonconcentrations extended well beyond the shelf edge but highest concentrations wereobserved inshore; there was no evidence of enhanced surface chlorophyll concentrationsin the vicinity of the Gully (Figs . 6 .3.5 and 6.3 .6) .
Summer condition s
During summer, phytoplankton commonly exhaust surface nutrients (see Section 6 .2) andtheir growth and biomass accumulation shifts to subsurface depths where optimalconditions of light intensity and nutrients persist (Cullen, 1982) . Summer phytoplanktongrowth and biomass accumulation will continue in surface waters, however, in regionswhere nutrient supply is maintained . In the June SSIP data, the relatively high surfacechlorophyll levels in the mid- and western regions of the shelf were likely a consequenceof the vertical mixing of deep nutrient-rich water from upwelling along the coast or at theshelf break and tidal mixing over Brown's Bank and into the Gulf of Maine (Fig . 6 .3 .1) .During a CSGS Hudson voyage in June 1996, surface chlorophyll concentrations werelow everywhere, but integrated chlorophyll concentrations were higher on and aroundBanquereau Bank which was likely the result of the upwelling of slope water at theBank's offshore margin (Fig . 6.3.7). Surface and integrated chlorophyll concentrationswere not well correlated (Fig. 6.3 .3); phytoplankton were generally concentrated in sharpsubsurface peaks at depths of 30-40 in . Over Banquereau Bank and at its offshore marginthe chlorophyll maximum depth was still at 30-40 in, but concentations were much higherthan elsewhere. In the August SSIP data, surface chlorophyll concentrations wereuniformly low (Fig. 6 .3 .1), although at this time of year they may not be representative ofthe total concentration of phytoplankton in the water column because of the subsurfaceaccumulation of biomass . CZCS satellite composites for summer 1979 (based on -22individual images) and 1980 (based on -24 individual images) showed thatphytoplankton biomass was extremely low seaward of the shelf break with lowconcentrations on the central shelf and higher concentrations to the west and east .Surface concentrations were higher on the eastern shelf than during spring . No
72
enhancement of phytoplankton biomass w as apparent for the Gully region compared tothe rest of the shelf (Figs . 6 .3 .5 & 6 .3 .6) .
It has been proposed that deep nutrient-rich slope water is mixed to the near surfacelayers in the Gully which results in an enhancement of productivity there (Houghton etal., 1978; Simard, 1995) . It is expected that summer would be the season for which theeffects of such a process would be most beneficial and most obvious . The observationsof chlorophyll concentration in the SSIP data and satellite images show no enhancementof phytoplankton biomass in the surface layers of the Gully, but observations within thewater column do suggest some effects . Researchers on the July 1993 cruise of the SeaEducation Association ran a transect between Sable Island Bank and Banquereau Bank,near the mouth of the Gully . They observed a "doming" of the isotherms and isopycnalsover the deepest region of the section . This is consistent with circulation modelssuggesting a cyclonic (counter-clockwise) gyre centred near the mouth of the Gully whichbrings deep water, if not to the surface, then to the near surface layers (see Section 6 .1) .Their observations of chlorophyll profiles also showed increased levels over the deepwater of the Gully compared with values over the Banks, but only at depths of 20-40 mand then only to concentrations of - 1 mg 1- I (Fig. 6 .3 .8). Simard (1995) ran transects nearthe mouth of the Gully, across it and along its axis, during the same period (July 1993)and in July of the following year on which he determined Secchi depths (an index ofwater transparency) . The shallowest Secchi readings and thus maximum concentration oflight absorbing material (i.e. phytoplankton) were over the deep water near the entrance tothe Gully. From his maximum attenuation coefficients in both years (ca . 0.14-0.16), achlorophyll concentration of -1-2 mg 1" 1 can be derived (Sathyendranath and Platt, 1988)which is consistent with that found in the Sea Education Association study in 1993 .Although these observations suggest that there was vertical transport of nutrient-richwater towards the surface in this region of the Gully, this is not the only area of theScotian Shelf where such processes can occur. For example, elevated chlorophyllconcentrations of a similar magnitude were seen at 30-40 m at the shelf break on theHalifax Section in July 1995 (Head, unpubl . data) and, as discussed above, moresignificant enhancements of phytoplankton growth due to vertical mixing processes wereseen in several areas in June during the SSIP survey (Fig . 6 .3 .1) .
Fall conditions
Increasing turbulence in the water column during fall caused by intensifying seasonalwinds results in water column mixing deep enough to bring nutrients to the surface, butnot so deep as to mix the phytoplankton to depths where they cannot photosynthesizeefficiently . The consequence of this is a "fall bloom" of phytoplankton which is oftencomparable to or larger in magnitude than that which occurs in the spring . In the SSIPdata, increases in surface chlorophyll concentrations were seen over the Western Shelf inSeptember and over most of the Shelf in November (Fig . 6.3.1). The CZCS coloursatellite composites (1979 from - 16 individual images, 1980 from -20 individual images)also showed clearly a shelf-wide fall bloom (1979) or one confined to the eastern shelf(1980) (Figs . 6 .3.5 & 6 .3 .6) . The surface chlorophyll concentrations in the Gully were no
73
higher than concentrations elsewhere, however, based on SSIP and satellite data . Incontrast to the data from 70s and 80s, there were low surface concentrations ofchlorophyll in the falls of 1996 and 1997, suggesting that the fall blooms in these yearswere not important or missed (Fig . 6.3.9). Surface chlorophyll levels did appear to bereasonably representative of integrated concentrations in the fall of 1996 (Fig . 6 .3.9), butthe correlation was not in fact significant (Fig . 6.3.3) . In the fall of 1997, at a station inthe Gully, surface and integrated chlorophyll concentrations were similar to those seenelsewhere on the Scotian Shelf (Fig . 6 .3 .9) .
63.2 Annual cycles of zooplankton biomass and abundance on the Scotian Shelf andin the Gully region .
6.3.2.1 Sources of data
Four sources of data will be used in the discussion concerning zooplankton . These are:(1) zooplankton abundance and biomass estimates (>333 µm) between 0 and the bottom(or 200 m), which were collected during the SSIP survey throughout the year between1978-1982 (O'Boyle et at, 1984); (2) zooplankton abundance and biomass estimates
(>233 }tm) made during missions of the CSGS Hudson in April, 1995, June 1996 andApril, 1997 (Head, unpubl . data); (3) zooplankton abundance estimates using theBIONESS net sampling system in fall, 1989 (Sameoto, unpubl . data); and, (4)observations of macropiankton (i .e. krill) and small fish using acoustic backscattering inAugust, 1984 and April, 1997 (Cohrane, unpubl . data) .
Definition of remis
Note that in this report the term zooplankton will be applied to animals > 200 µm in size .
There are zooplanktonic organisms < 200 µm on the Scotian Shelf, the so-calledmicrozooplankton, a group which includes unicellular protozoa, (e.g. heterotrophicdinoflagellates, ciliates) and the young life stages of some metazoans (e .g. invertebratelarvae, copepod nauplii) . Elsewhere these are known to be very abundant at times, butinformiation relating to their distribution and biomass on the Scotian Shelf is very limited,and for the Gully region it is non-existent, so that useful discussion is not possible .
Amongst the zooplankton 200-2000 µm in size, the so-called mesozooplankton, the mostimportant in terms of biomass and abundance are the copepods, which are shrimp-likecrustaceans which generally make up ca . 80 % of the total biomass . Although ca. 10-20copepod species occur on the Scotian Shelf either year-round or during particular seasons,the most important in terms of biomass is Calanus finmarchicus . This species has as partof it life-history a requirement to overwinter at depths of >200 m, which make itparticularly interesting in a discussion of the role of the Gully in the Scotian Shelfecosystem, as will be seen below.
Anothergroup of zooplankton, which also have particular significance for the Gully, arethe euphausiids, or krill . These shrimp-like animals range in size between < 1 cm and 2
74
or 3 cms, depending on their age and species, and are generally referred to asmacrozooplankton. They generally exhibit strong diurnal migration behaviour, spendingthe day at depths of > 200 in, and coming to the surface to feed on phytoplankton atnight . They may also feed carnivorously on copepods, probably in the deep water duringwinter, and they also exhibit strong net avoidance behaviour, which means that withoutspecial precautions being taken, they will generally be underestimated in net hauls,although they are sufficiently large to be "seen" using acoustic backscattering at highfrequencies .
6.3 .2 .2 Biomass of zooplankton on the Scotian Shelf at depths < 200 m
Winter conditions
The zooplankton net tows from the SSIP survey gave estimates of total of zooplanktonbiomass on the Scotian Shelf which were relatively low in the February, with levels beinga little higher at stations in the east than at stations in the west (Fig . 6 .3 .10). The stationsin or around the Gully did not show especially high values in February .
Spring conditions
The overall biomass levels of zooplankton as determined in the SSIP survey increased
greatly between February and April (Fig . 6.3.10). This increase was largely due to the
ascent of overwintering C. finmarchicus and its subsequent reproduction and growth in
the near-surface layers . C. finmarchicus appearing on the shelf in April can derive from
one of several overwintering populations. Firstly, there are populations which overwinter
in the shelf basins, such as Emerald Basin. These start to ascend to the near surface
layers in March and for Emerald Basin the ascent is complete by April (Herman, pers .
comm.). Secondly, there is a population which overwinters in the Gulf of St . Lawrence.
This population can "seed" the eastern Scotian Shelf, where its levels are higher in May
than in April, and it may ascend to the near-surface layers later (e.g. April-May) than the
Emerald Basin population . This population is carried to the Scotian Shelf in the outflow
from Cabot Strait, and which runs south-east along the eastern shore of Cape Breton and
then splits to form (i) the Nova Scotia Current, which flows south-west along the
coastline until Halifax, and then diffuses out to the south-west over Emerald Basin and
the western Scotian Shelf; and (ii) a second branch which flows along the western
boundary of the Laurentian Channel and then turns at its mouth to flow south-west along
the shelf break. There is a third population which overwinters in the deep water off the
shelf break, which contributes to high concentrations of C. finmarchicus which are seen
at the shelf break in April and May. According to Planque et al. (1997) C. finmarchicus
overwintering in the deep water south of Newfoundland start to ascend to the surface
layers in January . Given that the generation time for the species is ca . 2 months, the
population occurring along the Scotian Shelf break in April and May probably includes
individuals from both the previous and this year's generations . High concentrations of C.
finmarchicus have been observed at the shelf break on Halifax Section on several
occasions : April 1995 and 1997 (Fig . 6 .3 .11) and May 1996 (Head, unpubl . data) . These
75
animals can be advected on to the shelf in this region, so as to contribute to the biomassseen over Emerald Bank and at stations on the western Scotian Shelf .
Levels of biomass of C. finmarchicus at the shelf break off Banquereau Bank (easternScotian Shelf) in April 1995 were much higher than those seen in April 1997 (Fig .6 .3 .11). By contrast, however, the biomass of another copepod species, Calanushyperboreus, was somewhat higher in April 1997 compared with April 1995 (Fig .6 .3 .12) . C. hyperboreus has a life history similar to that of C. finmarchicus, but itsoverwintering period generally begins and ends earlier in the season and it may take 2 or3 years to reach maturity, whereas C. finmarchicus generally produces 1 or 2 generationsper year on or around the Scotian Shelf. C. hyperboreus is abundant in the Gulf of St .Lawrence, where it can overwinter, and in the cold surface waters of the onshore branchof the Labrador Current, which flows south and west through the deep channels of theSouth Newfoundland Shelf. Thus, off Banquereau Bank in 1997, compared with 1995,the zooplankton species composition suggests there may have been an increasedcontribution of water either from the Gulf of St . Lawrence via the Laurentian Channel, orfrom the inshore branch of the Labrador Current via the Newfoundland Shelf and thecurrent at the shelf break . It appears that the second route is the most likely one, firstlybecause one copepod species (Temora) which was abundant in samples collected inwestern Cabot Strait (i.e. the Gulf outflow) in April 1997 was largely absent fromsamples collected at the shelf break (L . Harris, pers. comm.), and secondly, becausehydrographic characteristics of water off St Pierre Bank (upstream, in the shelf breakcurrent) showed a significantly greater input of Newfoundland Shelf water in 1997compared with 1995 (data not shown) .
In the Gully in April 1997, C. finmarchicus biomass levels were higher than those atstations to the north and east, and C. hyperboreus biomass levels were lower (excludingthe shallow station on Banquereau Bank) (Figs . 6.3.11 & 6 .3 .12) . Calanus spp. in thesurface layers of the Gully in April may derive from one or more sources : the populationof the eastern Scotian Shelf, via advection in the near surface layers ; the shelf breakpopulation, via intrusion of shelf break waters at depth ; or a population whichoverwinters in the Gully itself . C. finmarchicus do accumulate the deep waters of theGully in fall (see below), and it appears that the physical processes occurring there wouldenable them to remain there during winter, but the importance of the input from othersources cannot be assessed at this time. In terms of total zooplankton biomass, in theSSIP data (Fig. 6 .3 .10) and in April 1997 (Fig . 6 .3 .13), levels were not generally higher inthe Gully than at the other nearby stations .
Summer condition s
C. finmarchicus dominated the biomass of zooplankton on the Scotian Shelf in June inthe SSIP data (Fig . 6.3 .10) . By August most C. finmarchicus had left the near-surfacelayers and retreated to their overwintering depths, and although they remained among themost abundant copepods in the SSIP net tows, other smaller species which werebecoming more abundant (e.g. Centropages) probably outnumbered them in the wate r
76
column. This suggestion is made because a relatively large mesh net (333 mm) was usedin the SSIP surveys, which would have lead to serious underestimation of the abundancesof the smaller copepod species . Levels of zooplankton biomass were not especially highin the Gully in summer compared with levels at other stations .
Fall conditions
Zooplankton biomass levels remained high in September and November in the SSIP data(Fig. 6 .3.10) . At this time of year water temperatures, phytoplankton concentrations andprimary productivity rates are high, leading to high growth rates amongst thezooplankton. The most important species at this time of year are relatively small in size(e.g. Centropages, Pseudocalanus, Nannocalanus etc.), and thus undersampled in theSSIP surveys, and species diversity is relatively high . C. finmarchicus in the surfacelayers at this time of year probably represent members of the second generation .Zooplankton biomass levels in the Gully in the fall at depths of < 200 in were no higherthan those at other nearby stations .
6 .3.2.3 Biomass of zooplankton in BIONESS tows to depths of >200 m
As has been discussed above, C. finmarchicus accumulate in deep water to overwinter inthe fall . The Gully is one deep water area in which they accumulate and, for comparison,Emerald Basin is another. During a voyage on the CSGS Parizeau in October 1989zooplankton tows were made in both the Gully and Emerald Basin, over series ofstratified depths using the BIONESS sampling system. C. finmarchicus were moreabundant at the deep stations in the Gully and were most concentrated at depths of 200-400 m (Fig . 6 .3.14) . Areal abundances at the deep stations in the Gully were ca . 6 timeslower than those found in Emerald Basin, where the animals were also most concentratedat depths of >200 m(Fig . 6.3 .15) . That there are differences in the abundances ofoverwintering copepods in each location is not surprising, since their sources aredifferent : C. finmarchicus overwintering in Emerald Basin probably derive from the Gulfof St. Lawrence, via the Nova Scotia Current, and from the nearby banks (Emerald andWestern Banks) ; C. finmarchicus overwintering in the Gully may derive from the shelfbreak population or from the eastern Scotian Shelf. In addition, however, numbers of C.finmarchicus overwintering in Emerald Basin have varied between a high of > 300,000M-2 (1986) and a low of < 35,000 M-2 (1996) between 1984 and 1996 (Sameoto, unpubl .data), which may be related to variations in productivity and circulation patterns . Itseems likely that variations may also occur in the number of C. finmarchicusoverwintering in the Gully, but annual variations in the two areas are not be expected tobe closely linked . Thus, while the abundance of C. finmarchicus in Emerald Basin in1989 was in the middle of the 12 year observed range, the same might not have been truefor the population in the Gully .
Abundances of euphausiids (krill) were also determined in the BIONESS net haulscarried out in October 1989. The bulk of the population of C. finmarchicus in Octoberhad retreated to overwinter at depths of >200 m at both the Gully and Emerald Basi n
77
stations (Figs . 6.3 .14 & 6.3 .15), but krill at this time were apparently still performing
their diel migrations, so that their vertical distribution was related to both time of day and
water depth (Figs 6 .3 .16 & 6 .3 .17) . Areal abundances of krill at stations within the Gully
were very variable, but they were generally higher (up to 30 times higher) in the Gully
than at the one station sampled in Emerald Basin (cf. Figs. 6 .3 .16 & 6 .3 .17). It is knownthat abundances of krill within Emerald Basin, which are determined quite regularly, vary
considerably from year-to-year (Sameoto, pers . comm.) and the same is probably true for
the Gully, although there is no reason to expect abundances in the two locations to co-
vary. Thus, it cannot be ascertained from this one set of measurements whether krill
abundances are generally higher in the Gully than in Emerald Basin .
6 .3.3 Observations of macroplankton (krill and small fish) densities using highfrequency acoustic backscattring
During the CSGS Hudson voyage in April 1997, observations of macroplankton densitieswere made using a hull-mounted 200 kHz acoustic system. The backscattering signalstrength is proportional to the biomass of target organisms, which at this frequencyincludes animals of 2 .5 cm and greater . The first track starts outside Halifax Harbour at alittle before dusk and continues overnight into Emerald Basin . During this periodeuphausiids would have been either moving into, or occupying, the near surface layers(Fig. 6.3 .18) . The integrated acoustic backscattering signal in the 30-200 m depth rangeincreased as the ship moved offshore, and remained high at stations in Emerald Basinuntil 1 or 2 h after dawn (A-F) . Thereafter the signal decreased and remained low (F-J),presumably because the primary target organisms (krill) spend the daylight hours atdepths of >200 in . As the ship started to move out of the Basin, a couple of hours beforedusk (K-L, Fig. 6.3 .18 & 6 .3.19), the signal strength increased and then decreased as theship moved into shallow water after dark (L-M) . The "spikiness" in the signal betweenM and R was probably due to bad weather conditions, but it appears that there werehigher concentrations of organisms in the deeper areas : N-O, on the outer flank ofEmerald Bank; Q-R and S-T, at the shelf break (Fig . 6.3 .19). After dawn the signalremained low, presumably because of vertical migration of the target organisms to depthsof >200 m .
The acoustic record of ship's approach to the entrance to the Gully starts where the depth
was about the 3000 m(Fig. 6 .3 .20, A) . Between points A and D the water depth was over
2000 in. The integrated backscattering signal increased between points B and D, just
before dusk . Thereafter, it decreased rapidly (C-D) and then slowly increased (D-F), until
the ship reached the shelf break, where there was an abrupt increase in signal strength (ca .
point G). As the ship crossed the edge of Sable Island Bank (G-H) the signal strength
decreased dramatically, but it increased equally dramatically in the deep water across the
entrance to the Gully (H-I) . After dawn, as the ship proceeded up the Gully's axis, the
signal strength remained low while the ship was over deep water (J-L) . At the most
northerly occupied stations where the bottom depth was ca . 200-300 m(Fig . 6 .3 .20, L-M;
Fig. 6.3 .21, M-O) the signal strength increased, even though it was still daytime. This
may be because some (or all) of the target organisms were not migrating to depths of
78
>200 m in this area, because of the restricted depth (cf . Tows 3 & 4, Fig. 6.3.16) .Thereafter, when the ship passed over shallow water (O-Q) the signal was low, butsurprisingly, since it was after dusk, it did not increase much over the deep water (Q-R) .Over Banquereau Bank the signal strength decreased (R-S) and at the shelf break (T)there was a sharp peak . The signal strength remained high until the ship moved intowater deeper than 2000 m (T-V) . After dawn the signal strength was low, with a smallpeak between points Z and AA as the ship was over water ca . 1000 m in depth .
The magnitude of the backscattering signal is proportional to biomass, but any organismslarger than 2.5 cm can contribute. On this voyage, a second acoustic system whichmeasured backscattering at 12 kHz was used . The targets for this frequency are animals
with air bladders, i .e . fish. By comparing the backscattering at the two frequencies, therelative contributions of euphausiids and small fish to the 200 kHz backscattering can beassessed. From these comparisons it was concluded that for area .s at the shelf break andin the entrance of the Gully some part of the signal was due to small fish. WithinEmerald Basin and the Gully, however, the signal was derived from krill alone . Thus, onthe basis of the acoustic estimates it appears that concentrations of krill in some areas ofthe Gully were higher than those in Emerald Basin . During this voyage, net tows weremade using a configuration of the BIONESS system especially designed to collect krill
(i.e. flashing lights to prevent net avoidance) in Emerald Basin and the Gully, but thesamples have not yet been analysed .
6.3.4 Summary
Phytoplankton
The phytoplankton data analyzed to date do not suggest that the Gully is a dictinctlyproductive feature on the Scotian Shelf . A statistical comparison (t-tests) of biomasslevels in the proximity of the Gully with those in the surrounding Shelf waters shows no
significant differences; if anything, biomass levels over the Gully are generally lower
(Table 6.3.1). It should be pointed out, however, that the data summarized in thisdocument provide information largely on the biomass at the sea surface and may notreliably assess the total phytoplankton biomass and productivity of the region per se. Tothe extent that a significant component of the biomass and growth of phytoplanktonoccurs below the sea surface, the data presented here and conclusions drawn from itshould be considered incomplete . In order to more accurately characterize phytoplanktonbiomass and primary productivity in the Gully region, further study is needed .
79
Table 6.3.1. Surface chlorophyll concentrations (µg l") from SSIP cruises: Mean (±S.D.). The Gully-Core i.s represented by the three SSIP standard stationslocat.ed in the central part of the Gully as defined by the 200m contour, theGully is represented by the Core stations plus 7 additional stations on theadjoining eastern and western SSIP lines, and the Eastern Shelf isrepresented by all SSIP stations east of 62W Longitude .
Season Year Shelf E. Shelf Gully Gully-Core
Winter 80 0.43(0.24) 0.57(0.17) 0.77(0.35) 1 .17(0.00)
81 0.30(0.19) 0.28(0.22) 0.29(0.13) 0.23(0.11 )Spring 79 2.76(5.17) 3 .87(6.10) 2.67(4.93) 0.31(0.11)
80 0.40(0.37) 0.42(0.36) 0.66(0.54) 0.90(0.93)81 4.06(2.41) 4.14(2.26) 5.29( 1 .50) 4.93(0.82)
Summer 78 0.41(0.38) 0.42(0.27) 0.35(0.09) 0.41(0.09)79 0.56(0.85) 0.42(0.17) 0.29(0.05) 0.33(0.01)80 1.47(2.75) 0.95(1 .21) 0.58(0.94) 0.24(0.16)81 0.26(0.11) 0.26(0.13) 0.20(0.03) 0.21(0.03)
Fall 79 1.00(0.68) 0.80(0.41) 0.76(0.29) 0.59(0.09)80 2.32(2.41) 1 .96(1 .87) 2.08(1 .57) 2.48(1 .89)81 0.90(0.95) 0.84(0.40) 0.74(0.39) 0.54(0.01. )
Zooplankton
The zooplankton data analyzed to date do not suppo rt the idea that mesozooplankton areespecially abundant in the Gully compared with other areas of the Scotian Shelf.Statistical tests (t-tests) using the SSIP data show that abundances of C. furmarchicus andC. dryperboreus and total plankton volume are no higher in the Gully-Core or Gullyregions than average abundances on either the Eastern Scotian Shelf, or the entire Shelf,during any of the months for which zooplankton were collected in the Gully-Co re region(Table 6.3 .2) . The same is true for the re lative abundances of two smaller copepodspecies (Centropages, P.seudocalanus spp.) and indeed, concentrations of Cenrropageswere actually lower (i.e . zero) in the Gully region than average values over the entireScotian Shelf in May and June (Table 6 .3.2) . Because the Gully is an area of deep water,however, it harbours overwintering populations of C. finmarchicus at depth.s of >200 inand krill, which spend the daylight hours at depths of > 200 m and the night-time hoursin the near surface layers . In the case of the macroplankton (krill) it is unclear whetherconcentrations in the Gully are generally higher than those in other Basins on the ScotianShelf. Equally, from existing data it cannot be dctermined whether the Gully is an area of
intrusion of the very abundant off-shore population of C. finmarchicus on to the Shelf inspring, as is the case further to the south and west in the area of the Halifax section. If itis, then it may provide an important source of copepods for Sable Island and WesternBanks in spring . In order to answer these important questions more study is needed.
80

Table 6.3.2. Abundances of large (Calanus finmarchicus, Calanus hyperboreus) andrelative abundances of small (Centropages sp., Pseudocalanus sp.) copepodspecies (#s x 1000 M-2 ) and plankton volume (ml m"2) from SSIP cruises .Region designations as in Table 6.3.1.
Calanusfinmarchicus Calanus hyperboreus
MONTH Shelf E. Gully Gully- MONTH Shelf E. Gully Gully-Shelf Core Shelf Core
MAY MAYMean 43.04 63.61 150.39 126.61 Mean 5.80 8.98 9.19 16.19Std . Dev. 67.55 74.98 132.18 74.33 Std. Dev. 8.10 8.63 7.25 7.40No . of stns. 138 88 8 3 No. of stns. 138 88 8 3JUNE JUNEMean 45.61 34.38 68.09 74.65 Mean 2.37 3.69 3 .47 6.07Std . Dev. 41.44 29.21 28.77 21 .61 Std. Dev. 5.67 7.24 2.70 2.95No. of stns. 153 85 7 2 No. of stns. 153 85 7 2AUGUST AUGUSTMean 12.12 10.03 13.74 50.98 Mean 0.27 0.46 0.01 0.00Std . Dev. 14.38 11 .46 19.01 Std. Dev. 1.20 1 .55 0.02
No . of stns. 38 22 5 1 No. of stns. 38 22 5 1SEPT. SEPT.Mean 12.09 16.97 21 .91 7.99 Mean 0.70 1 .11 0.00 0.00Std . Dev. 13.89 16.01 13.92 Std. Dev. 2.09 2.63 0.00
No . of stns. 88 51 2 1 No. of stns. 88 51 2 1NOV. NOV.Mean 11 .50 16.95 16.59 35.08 Mean 0.93 1.43 1 .52 4.48Std . Dev. 12.61 13.92 15.17 9.39 Std. Dev. 1.99 2 .26 2.43 2.14No . of stns. 117 65 6 2 No. of stns. 117 65 6 2
Total plankton volume
MONTH Shelf E. Gully Gully- MONTH Shelf E. Gully Gully-Shelf Core Shelf Core
MAY SEPT.Mean 88.96 87.88 189.53 198.09 Mean 37.41 43 .81 101.97 30.58Std . Dev. 87.51 77.22 158.04 129.31 Std. Dev. 37.36 44.25 71 .3 8No. of stns. 138 88 8 3 No. of stns. 88 51 2 1JUNE NOV.Mean 78.10 76.71 85.18 75.83 Mean 38.22 46.66 68.70 64.47Std . Dev. 51.62 55.80 83.45 5.42 Std. Dev. 31.86 36.44 66.28 20.68No. of stns. 153 85 7 2 No. of stns. 117 65 6 2AUGUST
Mean 32.16 39.56 61 .75 100.61Std . Dev. 30.76 35.77 57 .5 0No . of stns. 38 22 5 1
81
Table 6.3.2. (cont'd)
Centropages sp .
MAY
0.00 0.00 Mean 8.19 11 .57 15.11 22.550.00 0.00 Std. Dev. 12.44 12.15 10.79 9.738 3 No. of stns. 138 88 8 3
JUNE0.00 0.00 Mean 6.10 6.03 11 .76 9.000.00 0.00 Std. Dev. 7.38 7.83 16.32 0.717 2 No. of stns. 153 85 7 2
AUGUST
5.24 18.78 Mean 2.83 2.39 3.83 6.986.97 Std. Dev. 6.90 2.64 3.94
5 1 No. of stns. 38 22 5 1SEPTEMBER
MONTH Shelf E. Gully Gully- MONTH Shelf E. Gully Gully-Shelf Core Shelf Core
MAYMean 0.04 0.05Std . Dev. 0.28 0.34No . of stns. 138 88JUN EMean 0.36 0.06Std . Dev. 1.11 0.22No . of stns. 153 85AUGUSTMean 11 .69 14.51Std . Dev. 12.97 13.88No . of stns. 38 22SEPTEMBERMean 39.46 54.35 118.52Std . Dev. 92.34 119.18 88.35No . of stns. 88 51 2NOVEMBERMean 14.52 15.00Std . Dev. 18.00 21 .59No. of stns. 117 65
Pseudocalanus sp .
30.17 Mean 4.79 2.63 1 .64 0.98Std . Dev. 10.45 3.98 0.6 7
1 No. of stns. 88 51 2 1NOVEMBE R
17.14 29.08 Mean 4.66 4.64 5.27 8.6118 .71 26.74 Std. Dev. 4.69 5.24 4.18 4.646 2 No. of stns. 117 65 6 2
It should be noted that if all SSIP stations had been sampled on each cruise, there would
have been : 3 stations in the Gully-Core; 9 in the Gully region (3 within the Gully-Core
and 3 on adjacent lines) ; 110 on the Eastern Scotian Shelf; and ca. 189 over the entire
survey grid .
6 .3.5 General comment s
Overall, the present data suggest that the Gully has some features which are characteristicof a Shelf Basin and some which are characteristic of the Shelf Break, which when puttogether make it a somewhat unique area of the Scotian Shelf . It does not appear to be anarea of particularly high primary production, although its depth makes it an overwinteringarea for copepods and an area where krill congregate . The existing knowledge base isquite limited, however, and in order to gain a better understanding of the productivity ofthe region and its role in the ecology of the Scotian Shelf, a directed seasonal samplingprogramme would be needed .
6.3.6 References
Cullen, J .J. (1982) The deep chlorophyll maximum : comparing vertical profiles ofchlorophyll a . Can. J. Fish. Aq. Sci. 39 : 791-803
82
Feldman, G., N . Kuring, C . Ng, W. Esaias, C .R. McClain, J . Elrod, N., Maynard, D .Endres, R. Evans, J . Brown, S. Walsh, M. Carle, Podesta, G. (1989) Ocean colour .Availability of the global data set . Eos. Trans . Am. Geophys. Union. 70: 634-635
Houghton, R .W., Smith, P .C., Fournier, R.O. (1978) A simple model for cross-shelfmixing on the Scotian Shelf. J. Fish. Res. Board. Can . 35: 414-42 1
O'Boyle, R .N., Sinclair, M., Conover, R .J., Mann, K.H., Kohler, A .C . (1984) Temporaland spatial distribution of ichthyoplankton communities of the Scotian Shelf inrelation to biological, hydrological and physiographic features . Rapp. P.-V. Réun.Cons. Int. Explor. Mer. 183: 27-40
Planque, B ., Hays, G.C., Ibanez, F., Gamble, J .C. (1997) Large scale spatial variations inthe seasonal abundance of Calanusfinmarchicus . Deep-Sea Res. 44: 315-326
Robinson, B, Graber, Bauder, J ., Davison, C ., Hibben, W., Senecker, B . (1993)Movements of water masses and circulation in the Gully, a submarine canyon onthe Scotian Shelf. Cruise Report W-128A, Sea Grant As ., Woods Hole, Mass .
Sathyendranath, S ., Platt, T . (1988) The spectral irradiance field at the surface and in theinterior of the ocean : a model for applications in oceanography and remotesensing . J. Geophys. Res . 93 : 9270-9280
Simard, P. (1995) A survey of the physical and biological oceanographic features of"The Gully" in relation to the distribution of nothern bottlenose whales(Hyperoodon ampullatus) . Dept. of Biology Hon . Thesis, Dalhousie Univ .
83
Suiface Chlorophyll Abundance
WINTER SUMMER
49 CD
44 :i 0
4200-6600 -6400
February
-62 D0 -6 3 O D -58CIC
0 .0-0.2 • 1 -2
- 0.2-0.8 • 2-10
~ 0.8 -1 1* 10-20
460C
SPRING
-6500 -6400 -8200 -6000 -5600
FAL L
46 0 r
440--
May
-6-70 :-ô~800
4200l--"-6000 -6400
420C
-6200
September
-60G0 -58Co
-6500 -6400 -E220 -6i00 -580--
Fig . 6 .3 .1, Surface chloruphrll concentrations (µg 1-1} on the Scotian Shelf'for cruises during the SSIP surveti between 1978-19 8 1 .
S4
SURFACE CHLOROPHYLL CONCENTRATIONS - APRIL 1997
• =©02ug1-1
i? = 4.2 ug l- 1
8 5 ugl- 1
n
6600 6400 6200 600D 5800 560 0
INTEGRATED CHLOROPHYLL CONCENTRATI O NS - APRIL 199 7
4700
• a4300
w•
4200i~i
r6600 6400 6200 6000 5600 56DD
, = 2 mg m-2
0 = 25 D rng ni- 2
0 = 5f]O mg rrb-2
Fig. 6.;.~ . Surface f uQ I' ll and integraied Img m ' -} chlorophyllconcentrations on the Scotian Shelf in April 1997.
85
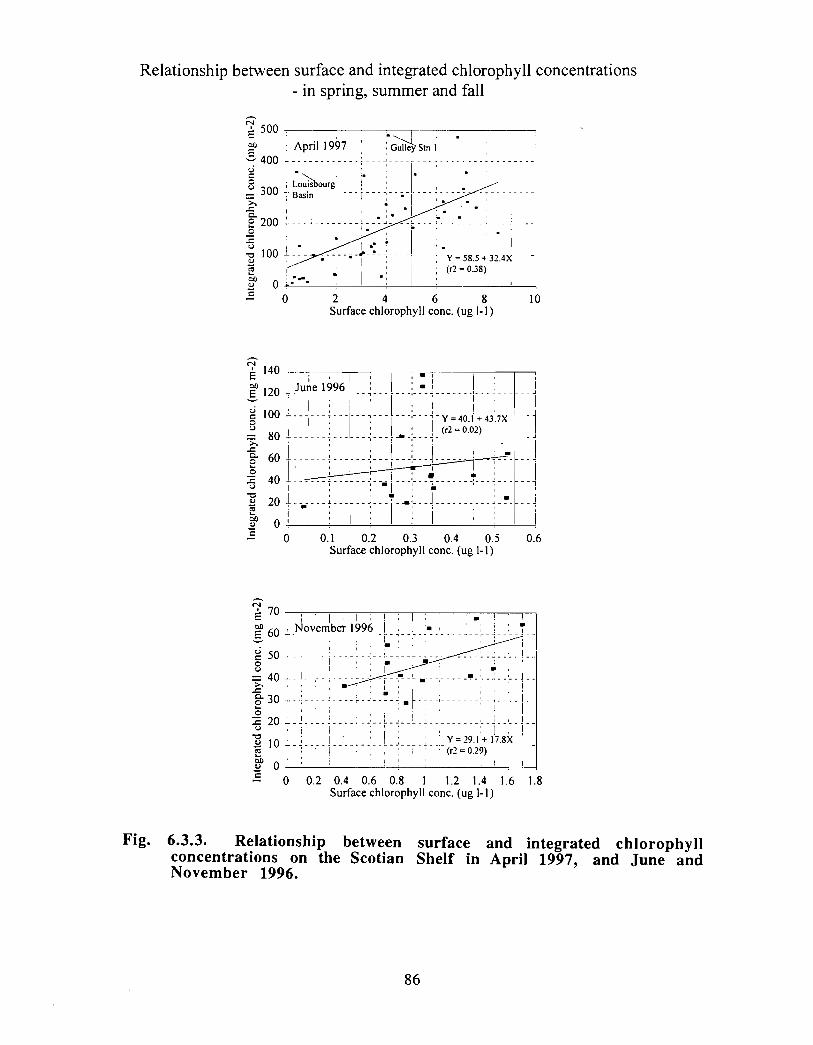
Relationship between surface and integrated chlorophyll concentrations- in spring, summer and fal l
0 200 ------------ - - --
0 300 Louisbourg • f --' Basi n
r4 500April 1997 Gulle Stn I
400 ------------- _ ----- ----------------
r-
-0 100 ___
~ o •.- ~v
o
ô
U~~
- 80T
60
--- ------ -------~---~
0 2 4 6 8 10Surface chlorophyll conc . (ug 1-1 )
June 1996
o (
140
E 120
c 100
-----------4U ! - ---I-- --- .
201
0J
a-------------0 0.1 0.2 0.3 0.4 0. 5
Surface chlorophyll conc . (ug 1-l)0 .6
~ 70
60 •- November 1996 (r2 = 0
.29 )o~n 0
~ 0 0.2 0.4 0.6 0.8 1 1 .2 1 .4 1 .6 1 .8Surface chlorophyll conc . (ug 1-1 )
7- 10 --i-
. I ~ i Y=29.l '+17 .8 X
30 ----- --------
ô50 ;j- ---
Fig. 6.3 .3. Relationship between surface and integrated chlorophyllconcentrations on the Scotian Shelf in April 1997, and June andNovember 1996 .
. IY=58.5+32 .4X(r2 = 0.38)
--
Y=40 .Î+43 .7X -~(r2 = 0 .02 )
I -----~----
86
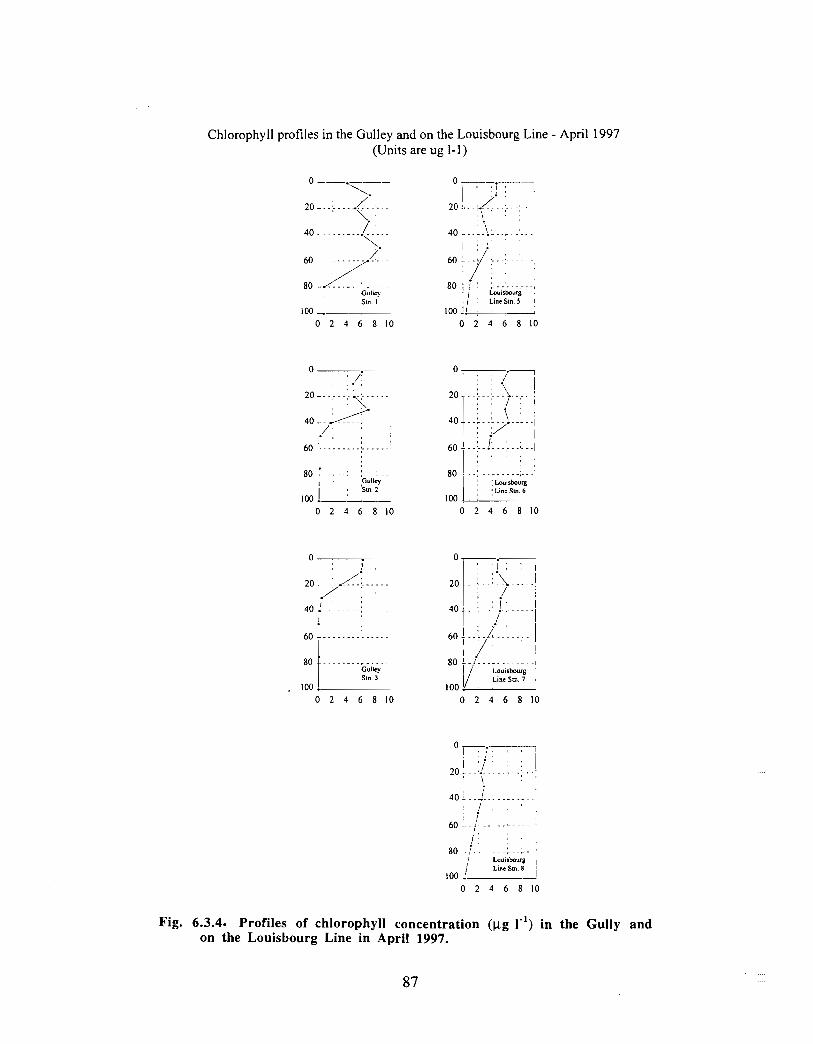
Chlorophyll profiles in the Gulley and on the Louisbourg Line - April 1997(Units are ug 1-1 )
8 0
80
GulIey
Stn. I
100 - .T
0 2 4 6 8 1 0
0
80 -----Gunry
IOO Sm2
I
0 2 4 6 8 10
0
--------GullryStn. 3
100 :
0 2 4 6 8 10
80 ------- --Ir Lauisbourg
1 Line Sin. S i
100 ~. .
0 2 4 6 8 10
2 0
4 0
60
----~----- i
I '--- .--- I
80 -- --rLouisem,rgL'ne Sm . 6
100
0 2 4 6 8 10
201-
40 .
L 60
80! t_------ ----~ Lauisbourg
1 00Linc Sm . 7
.
0 2 4 6 8 10
80 ----------T! Louinbourg
Il Linc Stn . 8
100 :
0 2 4 6 8 1 0
Fig. 6.3 .4. Profiles of chlorophyll concentration (µg l 'l) in the Gully andon the Louisbourg Line in April 1997 .
87
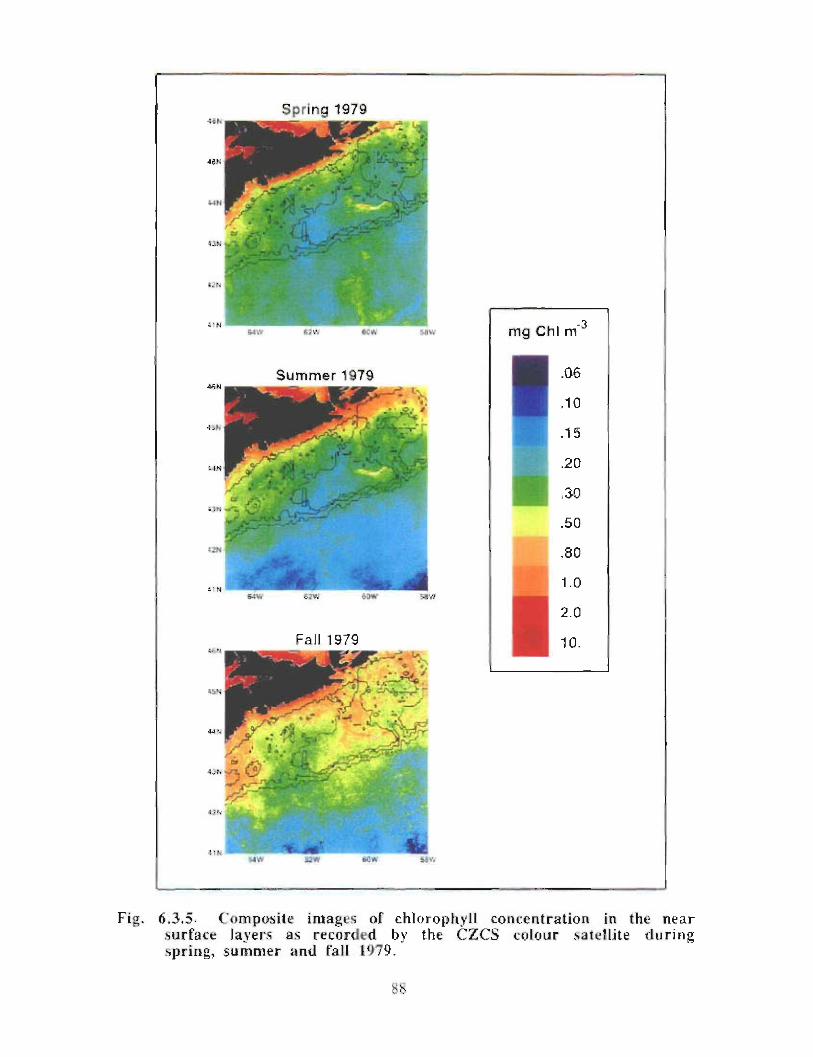
45N
n
~~_.~
mg Ch i.7'N
54 %
Summer 1979
I
.06
.1 0
.1 5
.20
.30
.50
»2 N
- I N64W ,aw
M
Fall 1979
f .
a3h _ 4ÿ% • ••~~ •e:~
?~7~1 ~~['` ~
42r.
10 .
Fig . 6 .3 . 5 . C omposite i mages of chlorophyll concentration in th e nearsurface la yers as recorded by the CZCS colour satellite durin gspring, 5nnn mer and fall 1979 .
1 .0
2 .0
4k
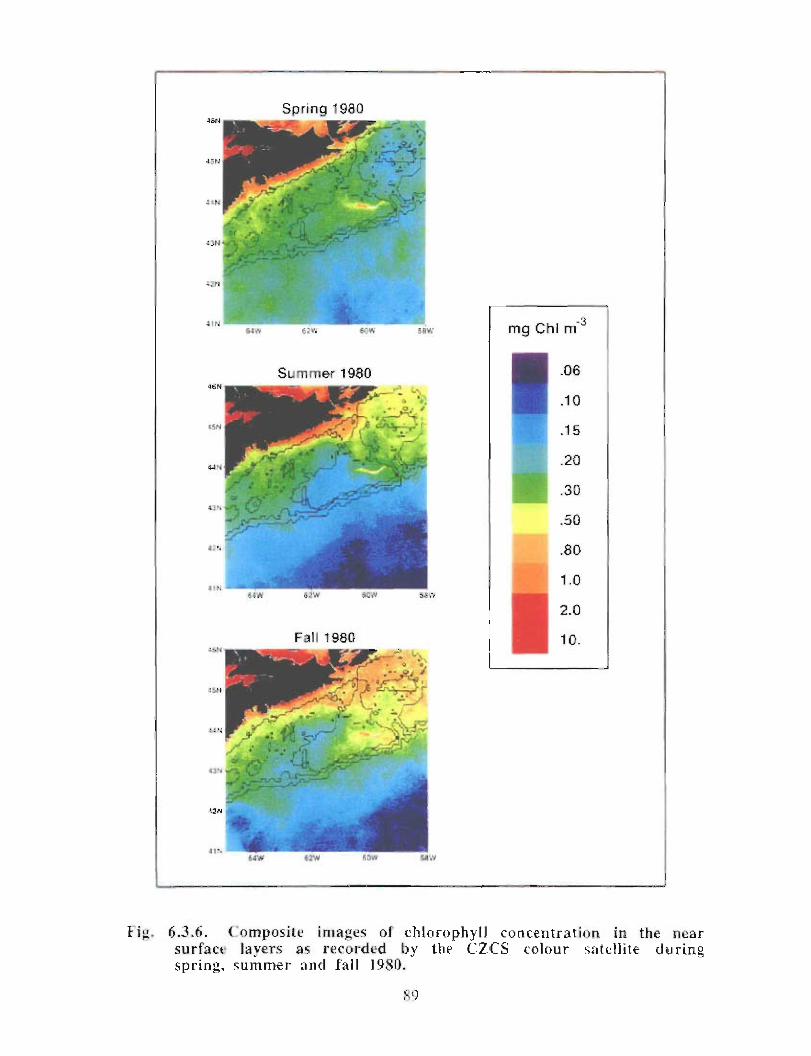
Spring 198 0
d_N
• ~ m~• } .'
rrr ; ~.•' ~ ~ r
,~ ~ r •Zi ,LJSr-- ~
yr
Sumrner 198 0
) ig . 6 .3.6 . Composite images of chlorophy ll concentration in the nearsurface layers as recorded by the CZCS colour satellite duringsprin g , tiummer and fall 1 9 811 .
S9
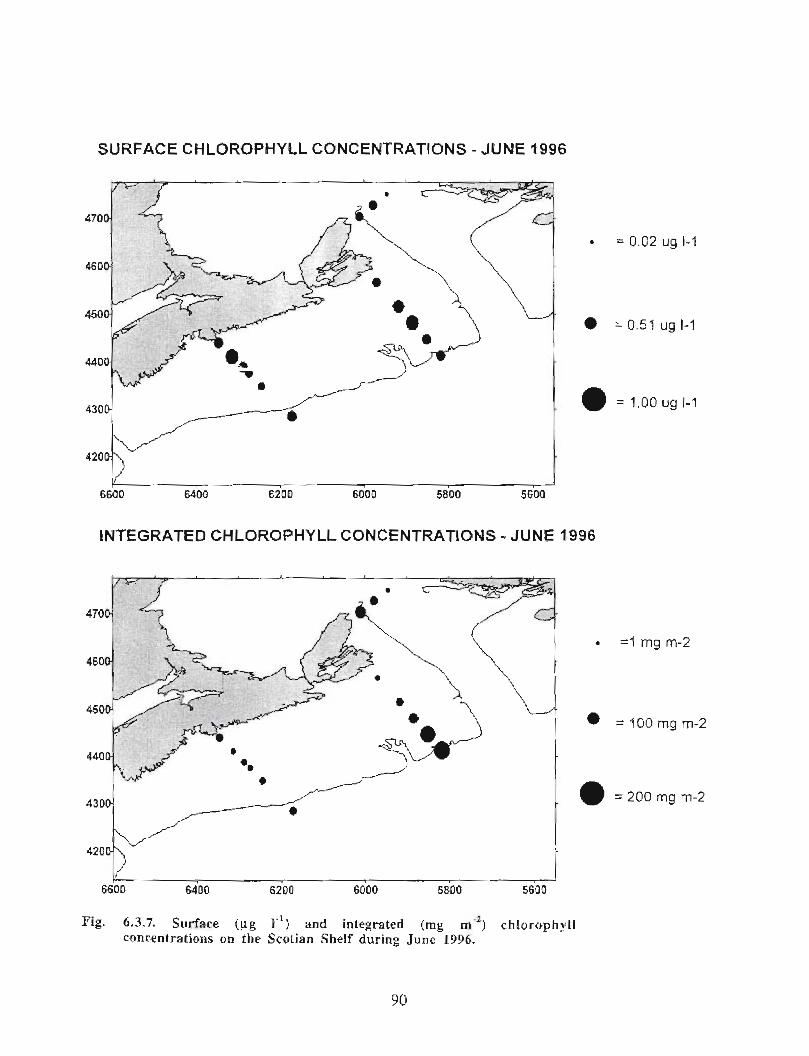
SURFACE CHLOROPHYLL CONCENTRATIONS - JUNE 1996
420
I /
6600 6400 6200 6000 ~saa 5600
INTEGRATED CHLOROPHYLL CONCENTRATIONS r JUNE 1996
Fig , 6.3.7. Surfac e (ug T1) and integrated (mg m°) ctaloraph v II
concentrations an th e Scotian Shetf during Tune 1946 .
90
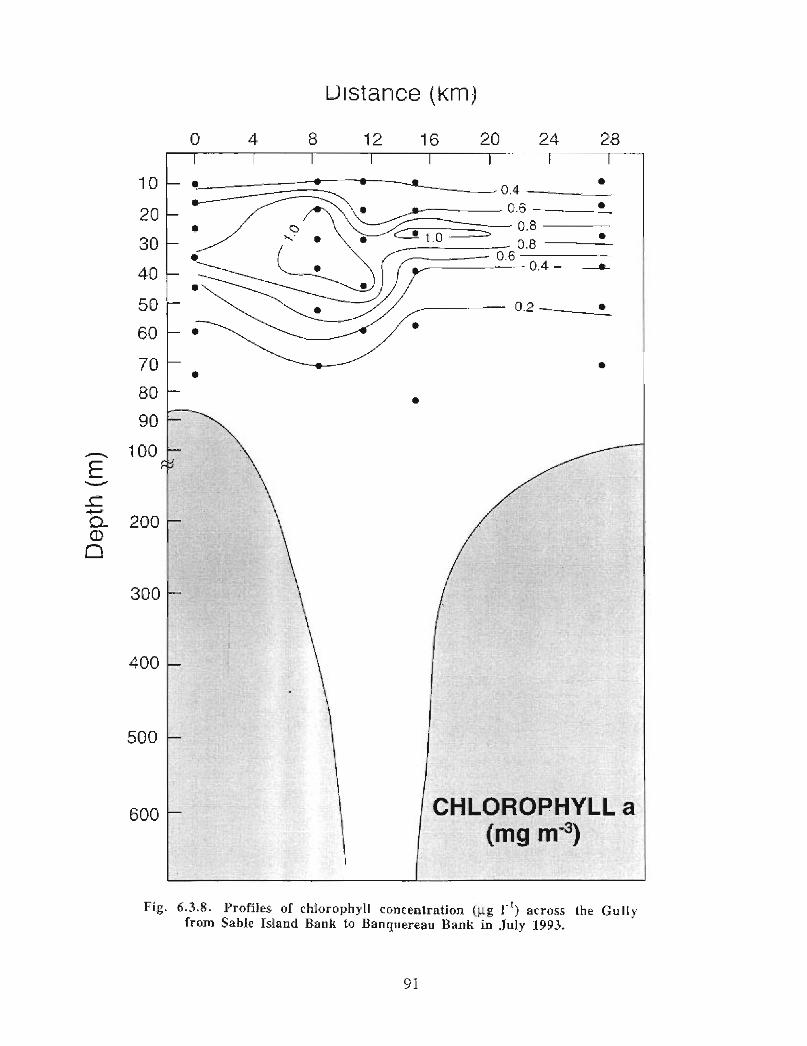
uistance (Km )
0 4 8 12 1 6 20 24 28
30 0
400
500
600
I
19
1
CHLOROPHYLL a(m9 M'3)
Fig . 6 .3 .8 . Profiles of chlorophyll concentration (.µg 1- 1) arross the Gullyfrom Sable Island Bank to Banquereau Bank in July 1993 ,
.
9 1
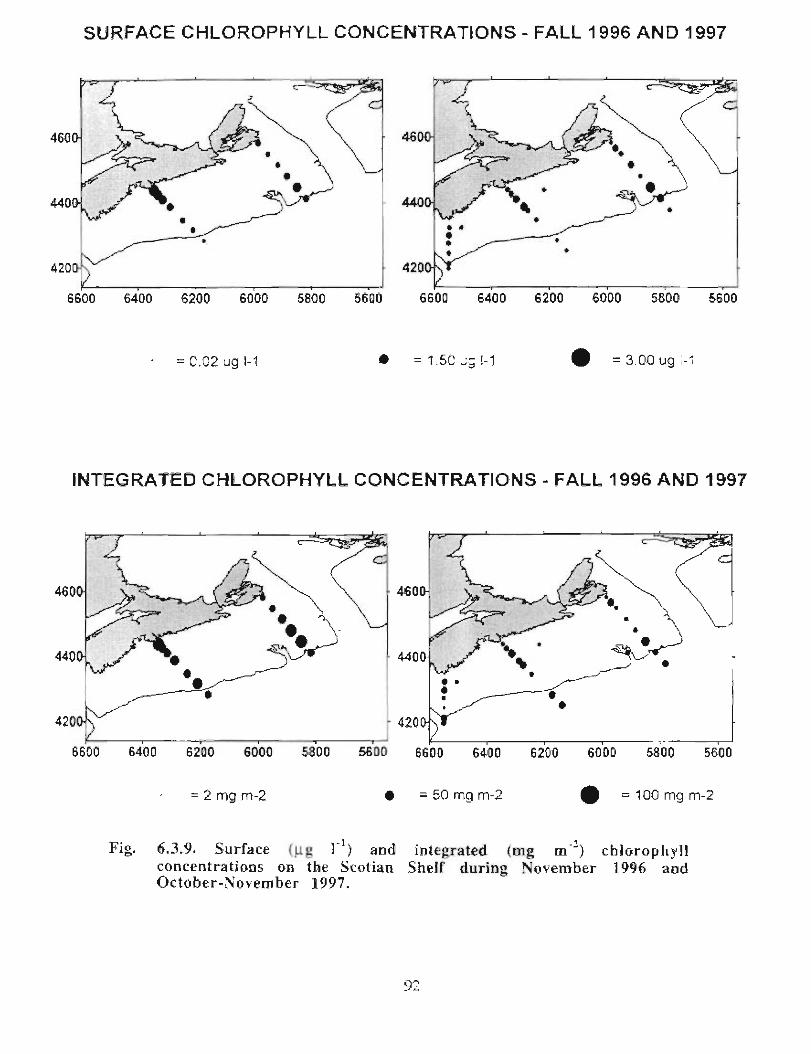
SURFACE CHLOROPHYLL CONCENTRATIONS - FALL 1996 AND 199 7
460
440
420
6600 6400 6200 6000
INTEGRATED CHLOROPHYLL CONCENTRATIONS - FALL 1996 AND 1997
460
440
4200-N 420
6600 6400
= 0.02 ug 1 -1
I r .--6200 6000 5800 5600 6600
=2mgm-2
5800 5600 6600 6400 6200 6000
• = 1 .50 :: ; !-1 0 = 3.00 ug 1- 1
6400
• =50mgm-2
620 0 6000
5800
5800
5600
5£0 0
0 =100mgm-2
Fig. 6 .3.4. Surface fug I" 1 and integrated (mg m ' -) chlorophyllconcentrations on the Scotian Shelf during November 1996 andOctober-tiovemher 1997 .
9?
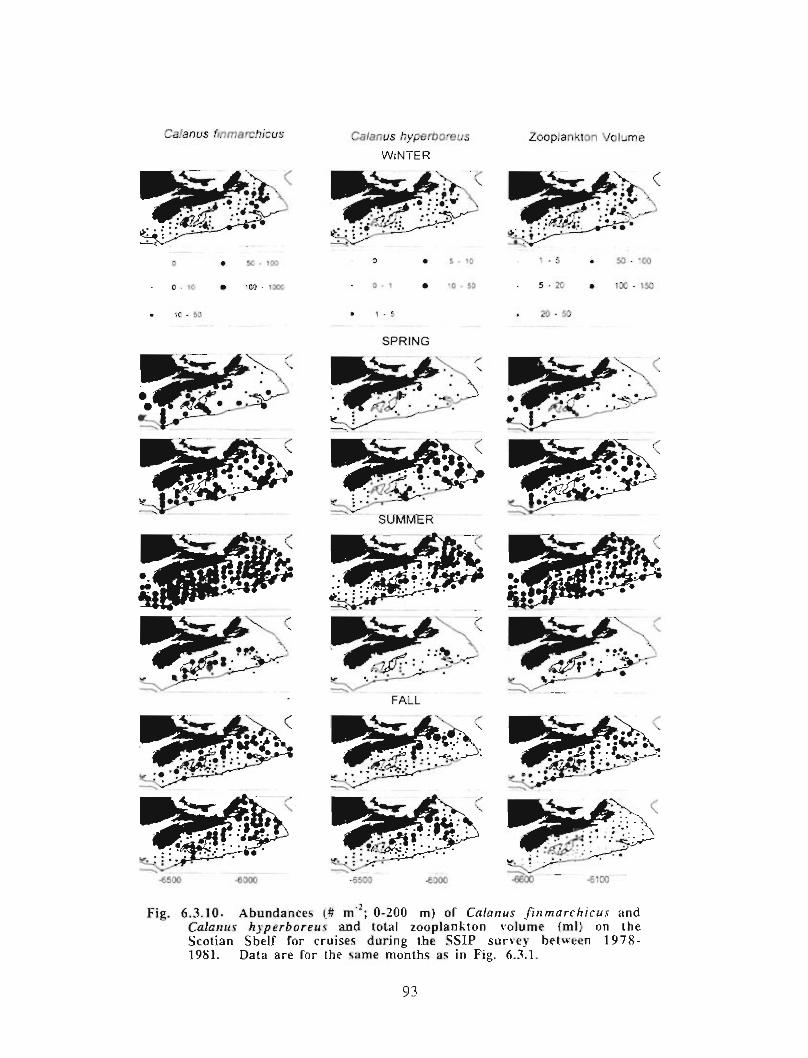
Calanus finmarchicus
!r!! • •~ :~•r- ~
s: ~ `~~k. •
o • Sc, - 100
o - +c • - c0 - 1 D0C
tC - 5]
Calanus hyperooreus
WINTER
~: ~~• ,.•-~,. : :' . .• ,s--~ -••-
~ • S - ,o
• o- . • -o - so
• i- 5
SPRIN G
SUMME R
FAL L
~~.:' ' , •~
_~ • •
-5500
Zoop!ankton Volum e
w- .• 9 .~~ . ~.,{ .•y, .
--~
-ÛÔOG -a 1CC
Fig. 6 .3.10 . Abundances I# m-' ; 0-200 ml o f Calanus finmarchicus andCalanus hvperboreus and total zooplankton volume (ml > on theScotian Shelf for cruises during the SSIP survey betHeen 19 7 8-1981 . Data are for the same months as in Fig. 6 .3 .1 .
93
1 -5 • 50-•00
5-Z= • ,x-15o
20 - 50
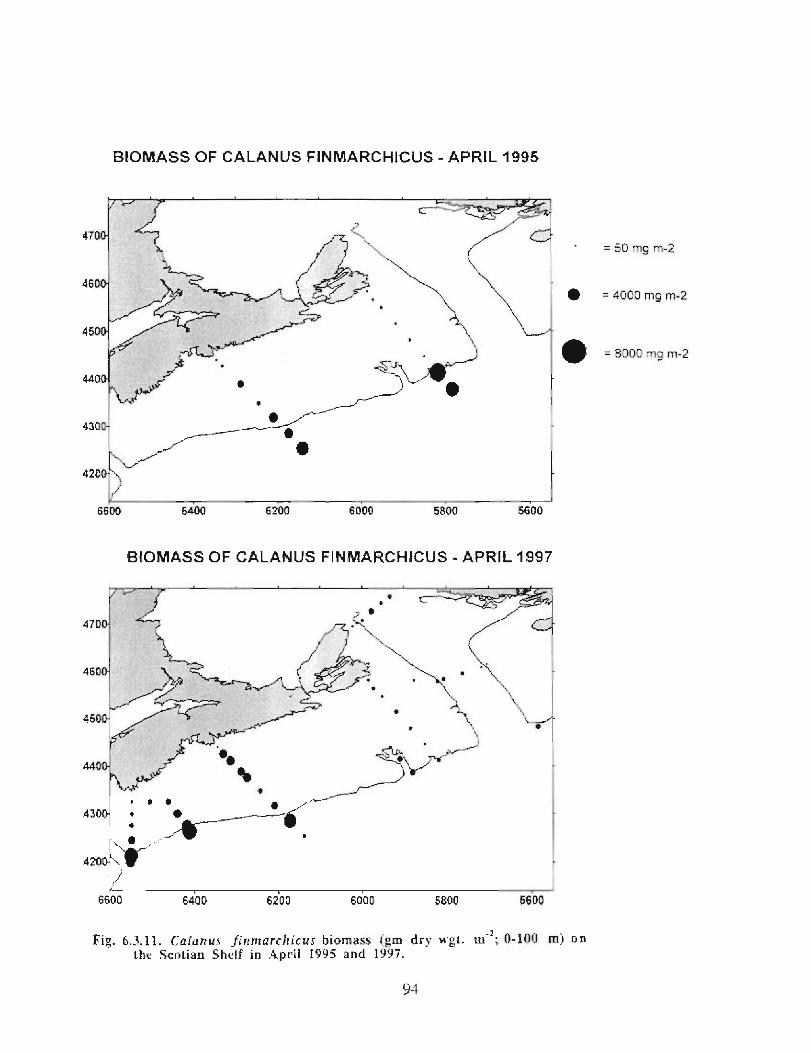
BIOMASS OF CALANUS FINMARCHICIJS - APRIL 1995
47 0o-F =50mgm- 2
= 4000 mg m- 2
6600 6400 6200 6000 5800 5600
4401)-
430- 0
420
BIOMASS OF CALANUS FIN MARCHiCUS - APRIL 199 7
6600 6400
1%
0
6200 6000 5800 5600
Fig. 63.11 . Calarz u s finmarchicus biomass igm dry w,gt . sn ''" ; ()- 100 m) onthe Scotian Shelf in April 149-5 and 1997 .
= 8000 mg m-2
94
BIO MASS OF CALANUS ITYPERBOREUS - APRIL 1995
= 50 mg m-2
0 = 4000 mg m- 2
= 8000 mg m- 2
~6600 64p0 6200 6000 5800 560 0
BIOMASS OF CALANUS ITYPERB©REUS - APRIL 199 7
Fig. 6,3.12 . Calanu s h, vprrh r+r e üs hioma5ti (-,m dry ",gt. m` 2 ; 0-100 m) on
the Scfliian Shelf in April 1995 and 1997 .
q ï
TOTAL ZOOPLANKTON BIOMASS - AP R IL 1995
= 50 mg m- 2
= 9000 mg m-2
=180a0mgm-2
a300-
6600 5dD0 62a0 6000 5BU0
TOTAL ZOOPLANKTON BIOMASS - APRIL 1997
6600
ai
6400 6200 G000
560G
6800 5600
Fig . 6.3 .13 . Total zooplankton biomass +gm dry wgt . m-` . 0-140 ml on theScotian SheIf in April 1995 and 1997 .
96
Abundance of Calanus finmarchicus in the Gully in October 1 989
444 0
442 0
44 : û
a?8 0
4360- 6
.
-597T3 -5960 -5950 -5940 -5930 -5920 -5910 -5900 -5090 -5850
Tow 12030h960m
-s0a ■ -0 25 50 750
Tow 2 Tow 3 Tow 42245h 0915h 11 00h2 75^n 275m 300m
iow5 Tow61745h 1630h8(lOm 240m
f
5G 75C 50 10 0 1500 25 50 750 50 120 140 e 25 5C 7 5
#/ rn3
Fig. 6-1 .14. Vertical distributions of Calanus fiTlmcrFelllcus at stations inthe (;ully in October 1989 .
Tow #!m21 151202 18843 65844 10905 161836 2984
97
Abundance of Calanus finmarchicus in Emerald Basin in October 198 9
4450 q ..,rop
4400
q
•
435 0
43006350 6300 6250 6200
Tow 18: 2345h275m
500 1000
#/m3
1500
tow #lm21a 10610 5
Fig. 6.3 .15 . Vertical distribution of Calanus finmarchicus at a stat ion. inEmerald Basin in October 1989 .
9S
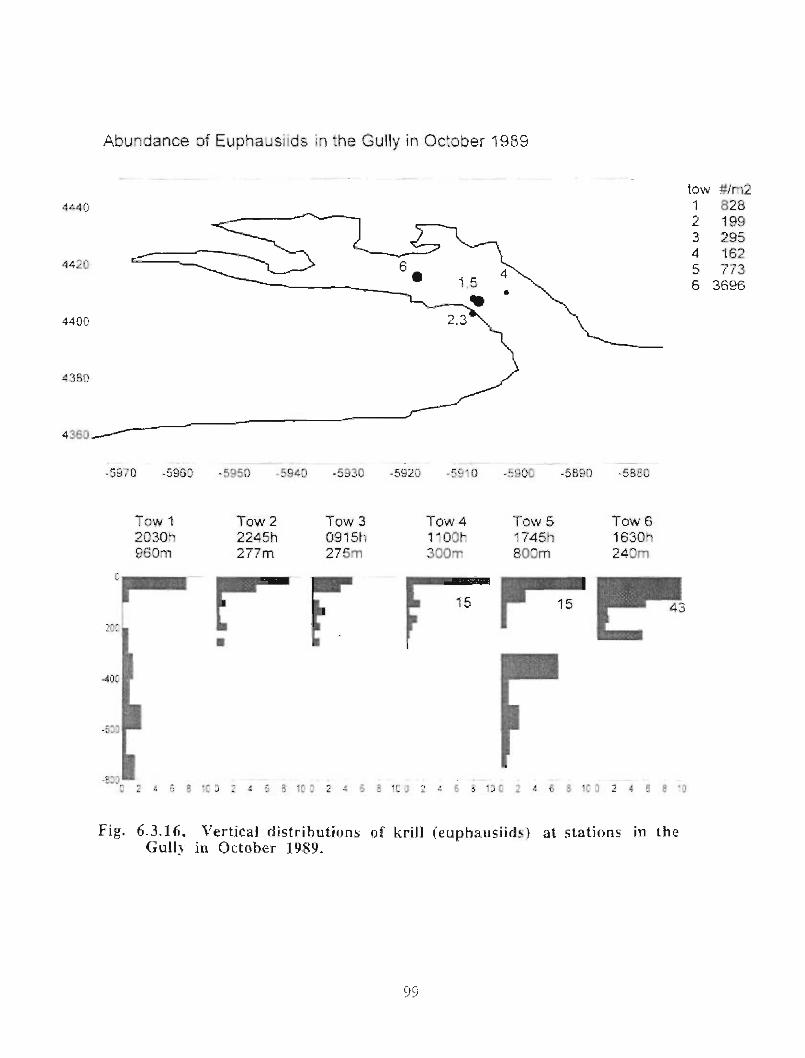
Abundance of Euphausiids in the Gully in October 19 89
444 C
44.ZC
440C
4380
-5370 -5960 , -5a50 -5 940 -5930 -592D - 5910 -ÿ900 -5890 -5850
TQVV 1 Tow 2 Tow 3 Tow 4 Tflw 5 Taw 62030h 2245h 0915h 1100h 1745h 1 630h960rro 277m 2 75°n 300-r Boom 24 :lm
7 r15 15
4 5 9 1C 7 2 4 5 3 1C C 2-~ 8 1C '7 2
r4 6 6 1 C 3 _ 4 6 3 1 C3 2 4 E F' ~
Fig. 6 .3 .16 . S'ertical distributions of krill ( cuphausiids ) at stations in thetÿullv in October 1989 .
tow #/m21 8282 1993 2954 1625 7 (36 .369fi
9 1)
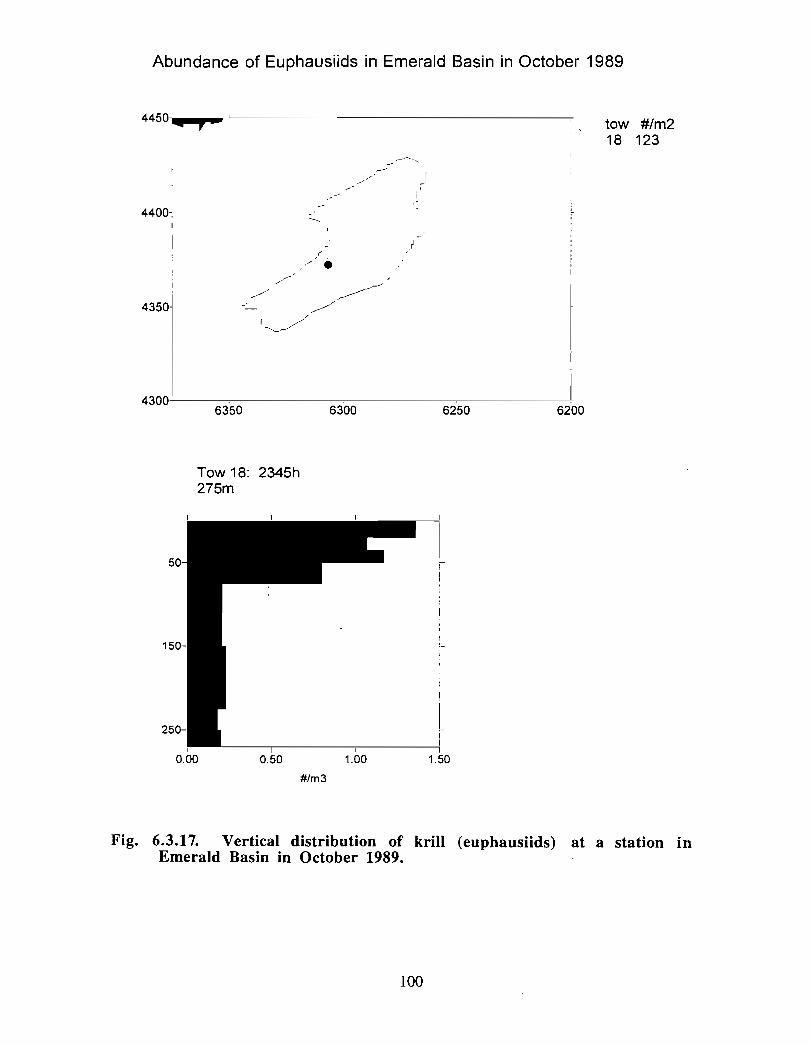
Abundance of Euphausiids in Emerald Basin in October 198 9
4450iq ■rW
4400,
I
/435W
43006350 6300 6250 6200
Tow 18 : 2345h275m
0.00 0 .50
#/m3
1 .00 1 .50
tow #/m218 123
Fig. 6.3.17. Vertical distribution of krill (euphausiids) at a station inEmerald Basin in October 1989.
100
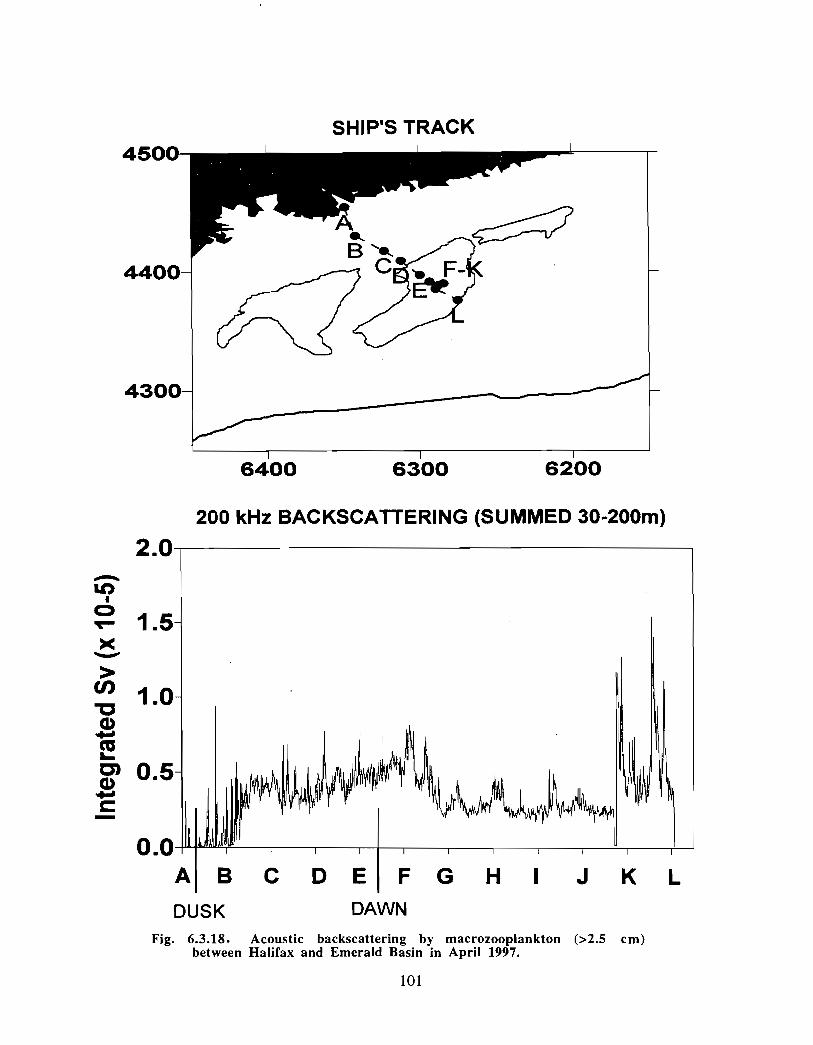
SHIP'S TRAC K
2.0
200 kHz BACKSCATTERING (SUMMED 30-200m )
>Cn 1 .0
6400 6300 6200
-a ~a~logo
ti
0 .0 1,1111W, u i
A B C D E F G H I J K L
DUSK DAWN
Fig. 6.3.18 . Acoustic backscattering by macrozooplankton (>2.5 cm)between Halifax and Emerald Basin in April 1997 .
101
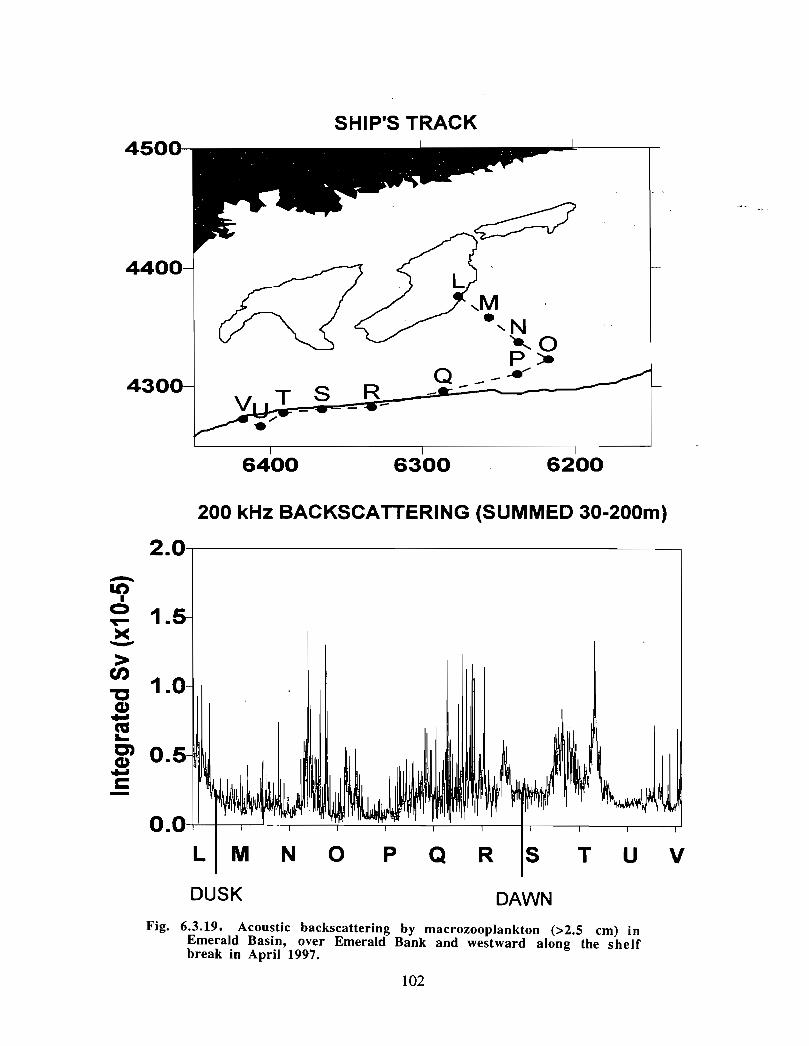
SHIP'S TRAC K
6400 6300 6200
200 kHz BACKSCATTERING (SUMMED 30-200m )
2 .0
UI)~°r» 1 .5x
Coam~ 0 .5c
0.04
S T U V
DUSK DAWNFig. 6 .3.19. Acoustic backscattering by macrozooplankton ( >2.5 cm) in
Emerald Basin, over Emerald Bank and westward along the shelfbreak in April 1997 .
102
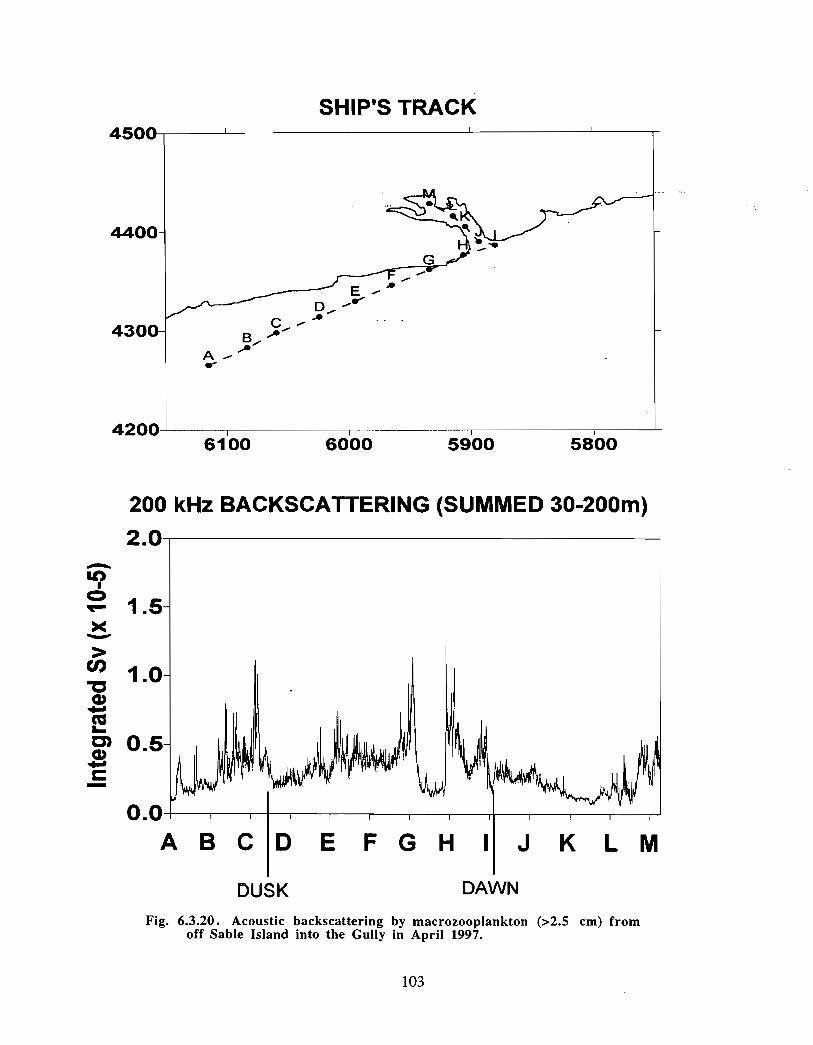
SHIP'S TRAC K
6100 6000 5900 5800
2.0
200 kHz BACKSCATTERING (SUMMED 30-200m)
J K L M
DUSK DAWN
Fig. 6.3 .20 . Acoustic backscattering by macrozooplankton (>2 .5 cm) fromoff Sable Island into the Gully in April 1997 .
103
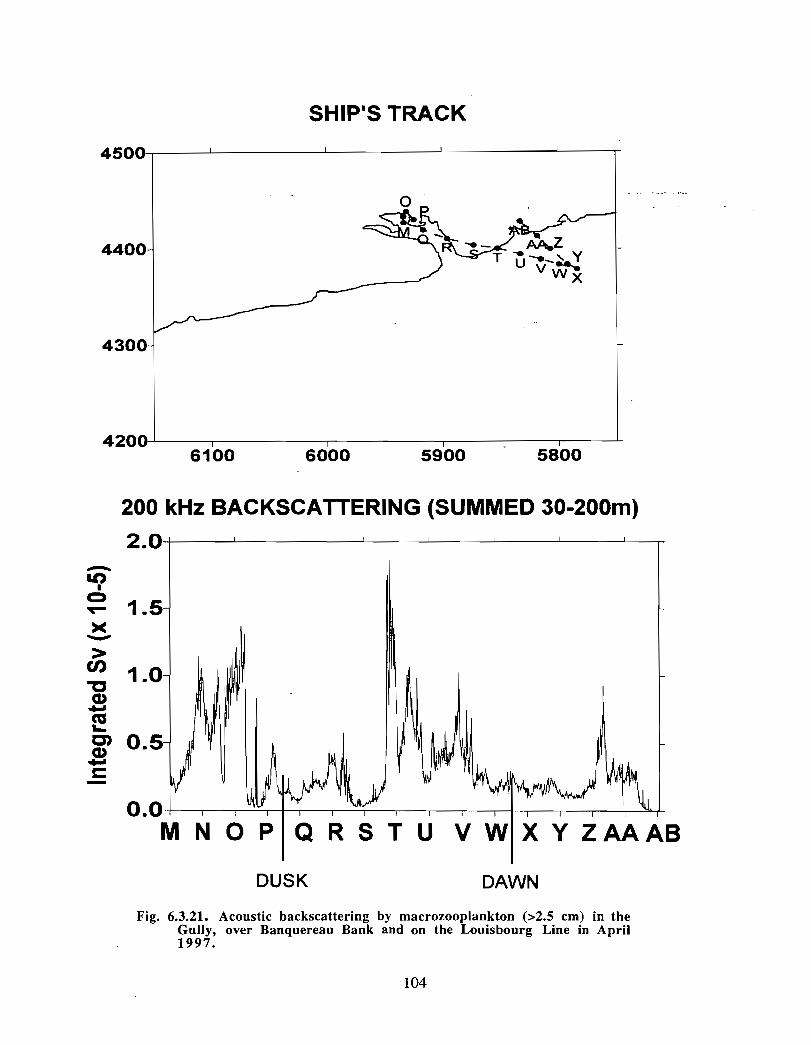
SHIP'S TRAC K
4200 I I
1 .5~
200 kHz BACKSCATTERING (SUMMED 30-200m)
2.0-i I I I I I 1 - 1
1 .0~
0 .5~
6100 6000 5900 5800
1
0 • 0 ' ~`"M N O P Q R S T U V W X Y ZAAAB
DUSK DAWN
Fig. 6.3.21 . Acoustic backscattering by macrozooplankton (>2 .5 cm) in theGully, over Banquereau Bank and on the Louisbourg Line in April1997 .
104
6.4 Submarine Canyons : Deposition Centres for Detrital OrganicMatter?
Gareth C . HardingFisheries and Oceans CanadaMarine Environmental Sciences DivisionBedford Institute of OceanographyDartmouth, NS
6.4.1 Background
Temperate continental shelves in general support higher primary production andconsequently larger standing stocks of particulate organic matter than nearby oceanicenvironments. This is due in part to the close proximity of the sea floor to the euphoticzone which enables recycling of nutrients originating from benthic metabolism once thesummer thermal structure of the water column is broken down by storms in the fall .
It has been known for some time that the sediments along the continental slope areenriched in organic material compared to that found on the shelves and in deeper waters(Walsh et al. 1981). Furthermore, it has recently been determind that the sedimentationalong the continental margin is an order of magnitude greater than that measured in thedeep sea at a comparable depths (Walsh et al. 1991). These findings were thebackground to two large scale studies of shelf exchange processes (SEEP I & SEEP lI) toevaluate cross shelf transport and decomposition of organic matter in the Mid AtlanticBight off New England (Walsh et al. 1988 ; Biscaye et al . 1994). These studies confirmedearlier findings that deposition of organics was highest in slope waters, centered at about1000m depth, and was coincident with regions of minimum current speeds . Differencesin deposition rates of up to 4x were observed between locations studied along the MidAtlantic Bight . The export of particulates from the shelf was highly seasonal and stronlydependent on storm events . However, this seasonality was less evident at the 1000mdeposition center which suggested intermediate settling and smoothing of off-shelffluxes, possibly in continental slope canyons . The bulk of the material reaching the1000m deposition center is refractory (Bacon et al. 1994 ; Anderson et al. 1994) whichmeans that the highest biomass of benthic organisms supported by this energy source, anddemersal fish feeding on these benthic organisms, should occur above this depth.Bacterialogical studies indicate that organic matter remineralization in bottom sedimentsand the overlying water column over the slope are approximately 3X that measured overthe shelf (Kemp, 1994) . This work suggests a greater supply of organic matter reachingthe slope environment than revealed by the surface particle trap data, indicating theimportance of a near-bottom down slope movement of organics. Kemp (1994) estimatesthat 7 to 15% of the primary production over the shelf in the Middle Atlantic Bightreaches the slope along or in close proximity to the bottom .
105
6.4.2 Implications
The implications for the Gully and other submarine canyons are obvious and may providepart of the answer to the attraction of many species of whales and other marine organismsto these regions . The physiographic and circulation characteristics of submarine canyonssuggest they are sites-of enhanced detrital organic matter deposition . This .material_will inturn support an abundant and diverse benthic community-which constitutes an importantfood source for fish and marine mammals .
6.4.3 References
Anderson R.F., G.T. Rowe, P. Kemp, S . Trumbore & P .E. Biscaye 1994. Carbon budgetfor the mid-slope depocenter of the-Middle Atlantic Bight . Deep-Sea Res. II 41 :669-703 .
Bacon, M.P., R.A. Belastock, M.H. Bothner . 1994. 210Pb balance and implications forparticle transport on the continental shelf, U .S . Middle Atlantic Bight . Deep-SeaRes. 1141 : 511-535 .
Biscaye, P.E., C .N. Flagg & P.G. Falkowsky . 1994. The shelf edge exchange processesexperiment, SEEP-II : an introduction to hypotheses, results and conclusions .Deep-Sea Res. 1141 : 231-252 .
Kemp, P.F. 1994. Microbial carbon utilization on the continental shelf and slope duringthe SEEP-II experiment . Deep-Sea Res. 1I 41 : 563-581 .
Walsh, J .J., P.E. Biscaye & G .T. Csanady . 1988. The 1983-1984 Shelf Edge ExchangeProcesses (SEEP)-1 experiment : hypotheses and highlights . Cont. Shelf Res . 8 :435-456 .
Walsh J .J., D.A. Dieterle & J .R. Pribble . 1991 . Organic debris on the continentalmargins : a simulation analysis of source and fate . Deep-Sea Res. 38 : 805-828 .
Walsh J .J ., G.T . Rowe, R.L. Iverson & C.P. McRoy . 1981 . Biological export of shelfcarbon: a neglected sink of the global CO2 cycle . Nature 291 : 196-201 .
106
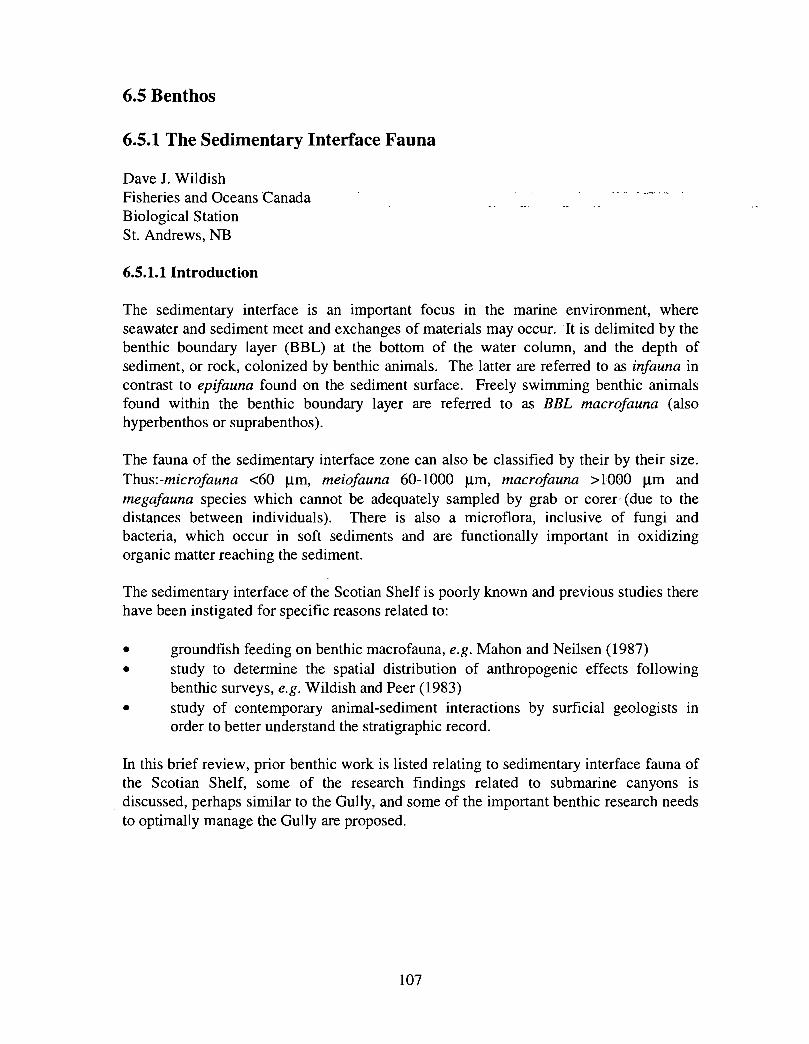
6.5 Benthos
6.5.1 The Sedimentary Interface Fauna
Dave J . WildishFisheries and Oceans "CanadaBiological StationSt. Andrews, NB
6.5.1 .1 Introduction
The sedimentary interface is an important focus in the marine environment, whereseawater and sediment meet and exchanges of materials may occur . It is delimited by thebenthic boundary layer (BBL) at the bottom of the water column, and the depth ofsediment, or rock, colonized by benthic animals . The latter are referred to as infauna incontrast to epifauna found on the sediment surface . Freely swimming benthic animalsfound within the benthic boundary layer are referred to as BBL macrofauna (alsohyperbenthos or suprabenthos) .
The fauna of the sedimentary interface zone can also be classified by their by their size .Thus :-microfauna <60 µm, meiofauna 60-1000 µm, macrofauna >1000 µm andmegafauna species which cannot be adequately sampled by grab or corer, (due to thedistances between individuals) . There is also a microflora, inclusive of fungi andbacteria, which occur in soft sediments and are functionally important in oxidizingorganic matter reaching the sediment.
The sedimentary interface of the Scotian Shelf is poorly known and previous studies therehave been instigated for specific reasons related to :
• groundfish feeding on benthic macrofauna, e.g. Mahon and Neilsen (1987)• study to determine the spatial distribution of anthropogenic effects following
benthic surveys, e.g. Wildish and Peer (1983 )• study of contemporary animal-sediment interactions by surficial geologists in
order to better understand the stratigraphic record.
In this brief review, prior benthic work is listed relating to sedimentary interface fauna ofthe Scotian Shelf, some of the research findings related to submarine canyons isdiscussed, perhaps similar to the Gully, and some of the important benthic research needsto optimally manage the Gully are proposed.
107
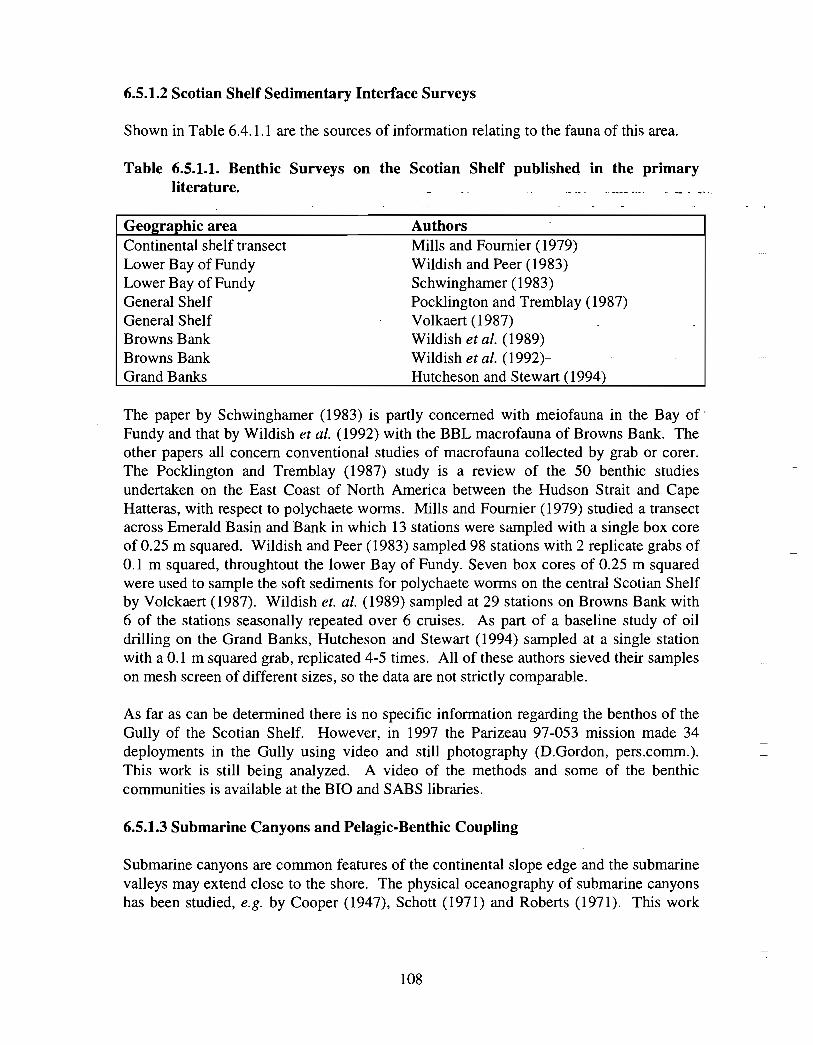
6.5 .1.2 Scotian Shelf Sedimentary Interface Survey s
Shown in Table 6 .4 .1 .1 are the sources of information relating to the fauna of this area .
Table 6.5 .1 .1. Benthic Surveys on the Scotian Shelf published in the primaryliterature. ~_ . ._ . _ _ .
Geographic areaContinental shelf transectLower Bay of FundyLower Bay of FundyGeneral ShelfGeneral ShelfBrowns BankBrowns BankGrand Banks
AuthorsMills and Fournier (1979)Wildish and Peer (1983)Schwinghamer (1983)Pocklington and Tremblay (1987)Volkaert (1987)Wildish et al. (1989)Wildish et al. (1992)-Hutcheson and Stewart (1994 )
The paper by Schwinghamer (1983) is partly concerned with meiofauna in the Bay ofFundy and that by Wildish et al. (1992) with the BBL macrofauna of Browns Bank . Theother papers all concern conventional studies of macrofauna collected by grab or corer .The Pocklington and Tremblay (1987) study is a review of the 50 benthic studiesundertaken on the East Coast of North America between the Hudson Strait and CapeHatteras, with respect to polychaete worms . Mills and Fournier (1979) studied a transectacross Emerald Basin and Bank in which 13 stations were sampled with a single box coreof 0 .25 in squared . Wildish and Peer (1983) sampled 98 stations with 2 replicate grabs of0.1 in squared, throughtout the lower Bay of Fundy. Seven box cores-of 0 .25 in squaredwere used to sample the soft sediments for polychaete worms on the central Scotian Shelfby Volckaert (1987) . Wildish et. al. (1989) sampled at 29 stations on Browns Bank with6 of the stations seasonally repeated over 6 cruises. As part of a baseline study of oildrilling on the Grand Banks, Hutcheson and Stewart (1994) sampled at a single stationwith a 0 .1 in squared grab, replicated 4-5 times . All of these authors sieved their sampleson mesh screen of different sizes, so the data are not strictly comparable .
As far as can be determined there is no specific information regarding the benthos of theGully of the Scotian Shelf. However, in 1997 the Parizeau 97-053 mission made 34deployments in the Gully using video and still photography (D.Gordon, pers .comm.) .This work is still being analyzed. A video of the methods and some of the benthiccommunities is available at the BIO and SABS libraries .
6 .5 .1.3 Submarine Canyons and Pelagic-Benthic Couplin g
Submarine canyons are common features of the continental slope edge and the submarinevalleys may extend close to the shore . The physical oceanography of submarine canyonshas been studied, e.g. by Cooper (1947), Schott (1971) and Roberts (1971) . This work
108
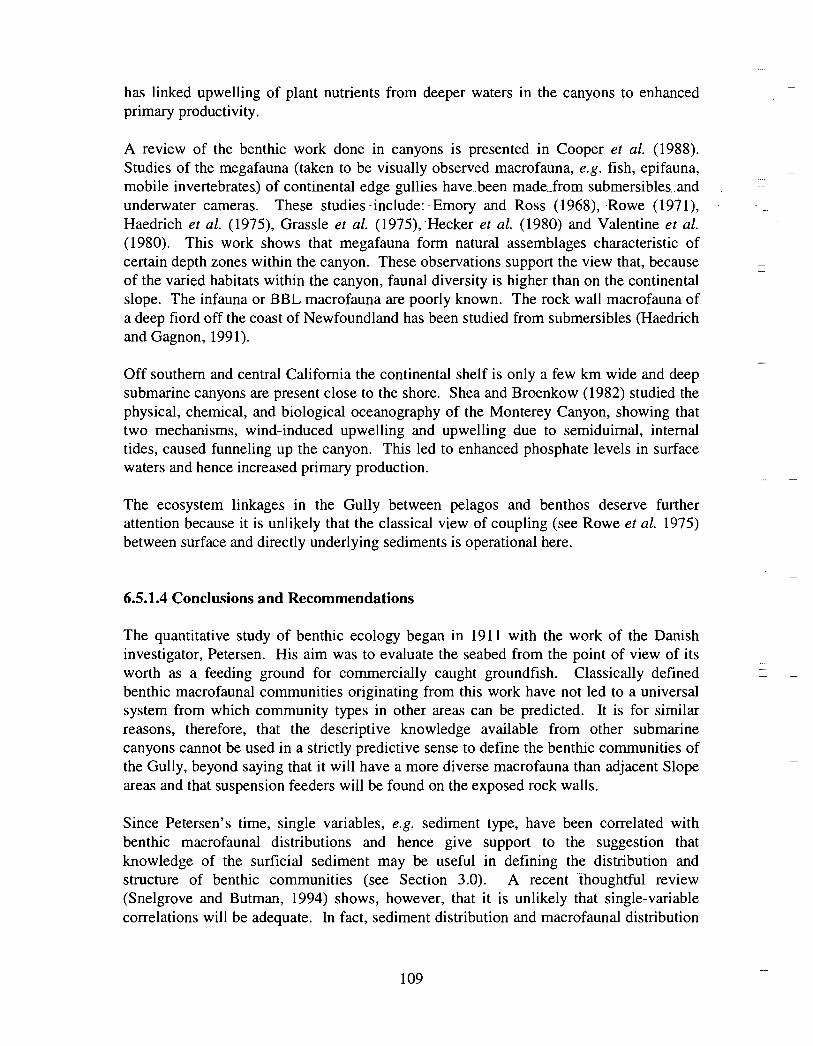
has linked upwelling of plant nutrients from deeper waters in the canyons to enhancedprimary productivity .
A review of the benthic work done in c anyons is presented in Cooper et al. (1988) .Studies of the megafauna (taken to be visually obse rved macrofauna, e .g. fish, epifauna,mobile invertebrates) of continental edge gullies have .been made_from submersibles. . andunderwater cameras . These studies - include : - Emory and Ross ( 1968), Rowe (1971),Haedrich et al. (1975), Grassle et al. (1975), - Hecker et al. (1980) and Valentine et al .(1980) . This work shows that megafauna form natural assemblages characteristic ofcertain depth zones within the c anyon . These obse rvations support the view that, becauseof the varied habitats within the c anyon, faunal diversity is higher than on the continentalslope. The infauna or BBL macrofauna are poorly known . The rock wall macrofauna ofa deep fiord off the coast of Newfoundland has been studied from submersibles (Haedrichand Gagnon, 1991) .
Off southern and central California the continental shelf is only a few km wide and deepsubmarine canyons are present close to the shore . Shea and Broenkow (1982) studied thephysical, chemical, and biological oceanography of the Monterey Canyon, showing thattwo mechanisms, wind-induced upwelling and upwelling due to semiduirnal, internaltides, caused funneling up the canyon. This led to enhanced phosphate levels in surfacewaters and hence increased primary production .
The ecosystem linkages in the Gully between pelagos and benthos deserve furtherattention because it is unlikely that the classical view of coupling (see Rowe et al. 1975)between surface and directly underlying sediments is operational here .
6 .5 .1 .4 Conclusions and Recommendations
The quantitative study of benthic ecology began in 1911 with the work of the Danishinvestigator, Petersen . His aim was to evaluate the seabed from the point of view of itsworth as a feeding ground for commercially caught groundfish . Classically definedbenthic macrofaunal communities originating from this work have not led to a universalsystem from which community types in other areas can be predicted . It is for similarreasons, therefore, that the descriptive knowledge available from other submarinecanyons cannot be used in a strictly predictive sense to define the benthic communities ofthe Gully, beyond saying that it will have a more diverse macrofauna than adjacent Slopeareas and that suspension feeders will be found on the exposed rock walls .
Since Petersen's time, single variables, e .g. sediment type, have been correlated withbenthic macrofaunal distributions and hence give support to the suggestion thatknowledge of the surficial sediment may be useful in defining the distribution andstructure of benthic communities (see Section 3 .0). A recent thoughtful review(Snelgrove and Butman, 1994) shows, however, that it is unlikely that single-variablecorrelations will be adequate. In fact, sediment distribution and macrofaunal distribution
109
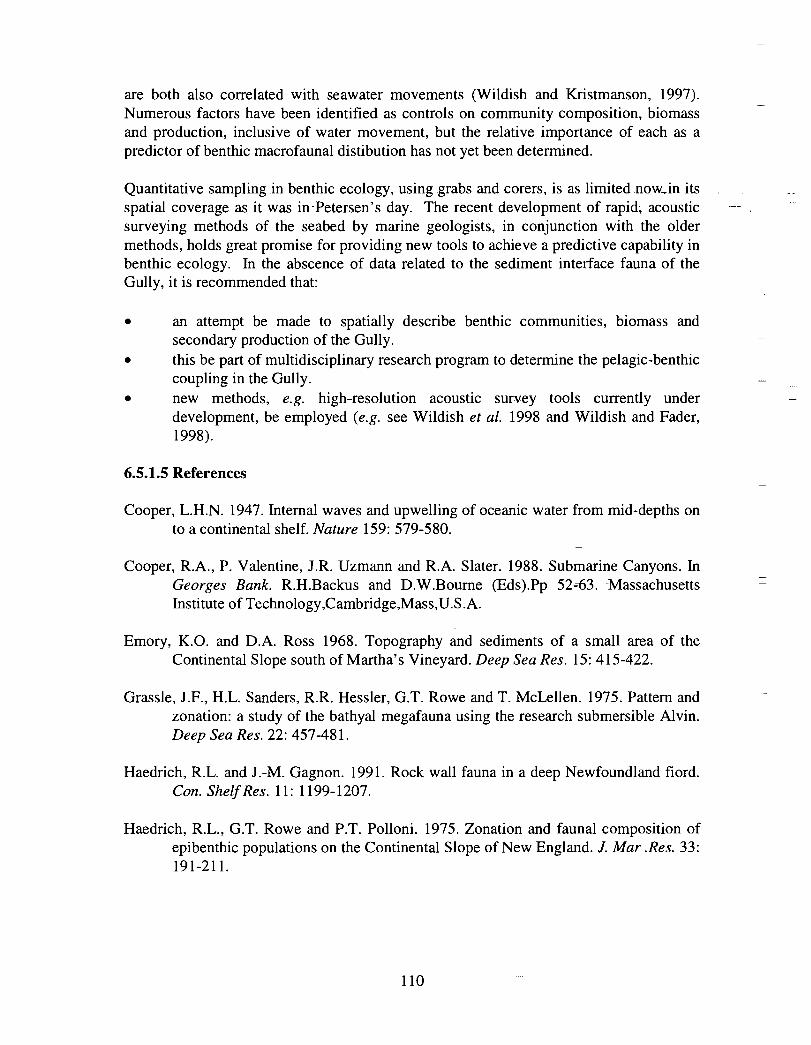
are both also correlated with seawater movements (Wildish and Kristmanson, 1997) .Numerous factors have been identified as controls on community composition, biomassand production, inclusive of water movement, but the relative importance of each as apredictor of benthic macrofaunal distibution has not yet been determined .
Quantitative sampling in benthic ecology, using grabs and corers, is as limited .now.in itsspatial coverage as it was in-Petersen's day . The recent development of rapid, acousticsurveying methods of the seabed by marine geologists, in conjunction with the oldermethods, holds great promise for providing new tools to achieve a predictive capability inbenthic ecology . In the abscence of data related to the sediment interface fauna of theGully, it is recommended that :
• an attempt be made to spatially describe benthic communities, biomass andsecondary production of the Gully .
• this be part of multidisciplinary research program to determine the pelagic-benthiccoupling in the Gully .
• new methods, e.g. high-resolution acoustic survey tools currently underdevelopment, be employed (e.g . see Wildish et al. 1998 and Wildish and Fader,1998) .
6 .5.1.5 References
Cooper, L.H.N. 1947. Internal waves and upwelling of oceanic water from mid-depths onto a continental shelf. Nature 159 : 579-580 .
Cooper, R.A., P. Valentine, J .R. Uzmann and R .A. Slater. 1988 . Submarine Canyons . InGeorges Bank. R.H.Backus and D .W.Bourne (Eds) .Pp 52-63 . -MassachusettsInstitute of Technology,Cambridge,Mass,U .S.A .
Emory, K.O. and D.A. Ross 1968. Topography and sediments of a small area of theContinental Slope south of Martha's Vineyard . Deep Sea Res . 15: 415-422 .
Grassle, J .F., H.L. Sanders, R .R. Hessler, G.T. Rowe and T . McLellen . 1975 . Pattern andzonation: a study of the bathyal megafauna using the research submersible Alvin .Deep Sea Res . 22 : 457-481 .
Haedrich, R .L. and J.-M. Gagnon. 1991 . Rock wall fauna in a deep Newfoundl and fiord .Con. ShelfRes . 11 : 1199-1207 .
Haedrich, R.L., G.T . Rowe and P.T. Polloni . 1975 . Zonation and faunal composition ofepibenthic populations on the Continental Slope of New Engl and . J. Mar . Res. 33:191-211 .
110
Hecker, B ., G. Blechschmidt and P . Gibson. 1980. Epifaunal zonation and communitystructure in three mid-and north Atlantic canyons . U.S . Dept .Interior,Washington .139pp + Appendices .
Hutcheson, M .S . and P.L. Stewart. 1994. A possible relict population of Mesodesmadeauratum (Turton) : Bivalvia .(Mesodesmatitidae) from the South-east . Shoal,Grand Banks of Newfoundland . Can. J. Fish.-Aquat . Sci. 51 :11624-168 . -
Mahon, R. and J.D. Neilson . 1987 . Diet changes in Scotian Shelf haddock during thepelagic and demersal phases of the first year of life . Mar. Ecol. Prog. Ser. 37 :123-130 .
Mills, E.L. and R.O. Fournier. 1979. Fish production and marine ecosystems of theScotian Shelf, Eastern Canada. Mar. Biol. 54 : 101-108 .
Pocklington, P. and M.J . Tremblay . 1987 . Faunal zones in the northwestern Atlanticbased on polychaete distribution . Can. J. Zool. 65 : 391-402 .
Roberts, J. 1975. Internal Gravity Waves in the Ocean . Marcel Dekker, New York,274pp .
Rowe, G.T. 1971 . Obse rvations on bottom currents and epibenthic populations inHatteras Submarine Canyon . Deep Sea Res. 18 :569-58 1 .
Rowe, G.T., C .H. Clifford, K .L. Smith and P.C. Hamilton . 1975. Benthic nutrientregeneration and its coupling to primary productivity in coastal waters . Nature255: 215-217 .
Schott, F . 1971 . On horizontal coherence and internal wave propagation in the North Sea .Deep Sea Res. 18 : 291-307.
Schwinghamer, P . 1983 . Generating ecological hypotheses from biomass spectra usingcausal analysis : a benthic example . Mar Ecol. Prog. Ser. 13: 151-166 .
Schwinghamer, P., J .Y.P. Guigne and W.G. Siu. 1996. Quantifying the impact of trawlingon benthic habitat structure using high resolution acoustics and chaos theory . Can.J. Fish. Aquat. Sci . 53 : 288-296 .
Shea, R.E. and W.W. Broenkow . 1982. The role of inte rnal tides in the nutrientenrichment of Monterey Bay, California . Est. Coast. Shelf Sci. 15 : 57-66 .
Snelgrove, P.V.R. and C.A . Butman . 1994 . Animal-sediment relationships revisited :causeversus effect . Ocean .Mar.Biol .Annu.Rev.32:111-177 .
1l1
Valentine, P.C., J.R. Uzmann and R .A . Cooper. 1980 . Geology and biology ofOceanographer Canyon . Mar. Geol . 38 : 283-312 .
Volckaert, F . 1987 . Spatial patterns of soft-bottom Polychaeta off Nova Scotia, Canada .Mar. Biol. 93 : 627-640
Wildish, D.J. and D. Peer. 1983: Tidal - current speed and production of benthicmacrofauna in the lower Bay of Fundy . Can. J. Fish. Aquat. Sci. 40 (Suppl .1) :309-321 .
Wildish, D.J., A.J. Wilson and B. Frost . 1989. Benthic macrofaunal production ofBrowns Bank, Northwest Atlantic . Can. J. Fish. Aquat. Sci. 46 : 584-590 .
Wildish, D .J., A.J. Wilson and B . Frost . 1992. Benthic boundary layer macrofauna ofBrowns Bank, Northwest Atlantic as potential prey of juvenile benthic fish . Can.J .Fish. Aquat. Sci . 49: 91-98 .
Wildish,D .J. and D.D.Kristmanson . 1997 . Benthic Suspension Feeders and Flow.Cambidge University Press, New York . 409p.
Wildish, D .J ., G.B .J . Fader P . Lawton and A .J. MacDonald . 1998 . The acoustic detectionand characteristics of sublittoral bivalve reefs in the Bay of Fundy . Con. Shelf Res .(In press) .
Wildish, D.J. and G.B.J. Fader . 1998. Pelagic-benthic coupling in the Bay of Fundy .Hydrobiologia (In press) .
112
6.5.2 Deep Sea Corals
Heather Breeze' and Derek S . Davis2'Ecology Action Centre, Halifax, NS2Nova Scotia Museum of Natural History, Halifax, NS
6.5.2.1 Introduction
A recent study of the distribution and status of deep sea corals of Nova Scotia (Breeze,1997) has demonstrated the diversity of horny corals (Gorgonacea) and stony corals(Scleractinia) that occur in Nova Scotia waters . The study was based on interviews withfishermen and scientists, the study of museum collections, and -a review of the scientificliterature which included published works by Cairns (1981), Deichmann (1936), Heckeret al (1989), Opresko (1980) and Zibrowius (1980) . The corals found in the study areaare generally typical of the continental slope of eastern North America . Some largespecies are well known to fishermen (as "trees") and are also reported in the scientificliterature . Other, smaller, species are not especially noted by fisherman and are rarelyreported in the literature . Ten species from the Order Gorgonacea are reported from theScotian Shelf and Slope of which nine species have been confirmed for the Gully area . Inaddition, ten species from the Order Scleractinia are likely to occur but only three areconfirmed from the Gully area .
The deep sea corals have been identified as a significant feature of the benthic fauna ofthe area, but relatively little is known about them or indeed many other communities ofthe benthos .
6 .5 .2 .2 Distribution
Deep sea corals have a limited geographic and bathymetric distribution . With somevariations the corals generally occur on the continental slope, in submarine canyons, andin gullies between fishing banks. Many have circum-North Atlantic distributions andmay range north into the arctic or south into tropical waters . Most Nova Scotian coralsare not found in depths less than 200 in, which roughly coincides with the shelf break .They extend at least to a depth of 2000 in and perhaps beyond . Many species occur attheir most shallow depth at the northern end of their range . Distribution correspondsclosely with the zone of high productivity associated with the shelf break off Nova Scotia .In the Natural History of Nova Scotia landscape classification (Davis and Browne, 1997),this zone is included in District 940 and Units 922 and 932 (see section 10 .2). Verticalzonation of species on canyon walls has been discussed by Hecker et. al (1980) .
6 .5 .2 .3 Bottom Communitie s
Most corals require a hard substrate for attachment and are thus generally found onbedrock and gravel bottoms . The large species best known to fishermen are hard bottomspecies and include Paragorgia arborea and Primnoa resedaeformis . Species that are
113
anchored in mud (e.g., Radicipes gracilis and Acanella arbuscula) have branchingcalcareous holdfasts for anchoring themselves . The colony generally begins attached to asmall stone or shell as the planktonic planula larval stage requires a hard smooth substrateon which to settle . This is also true for the stony coral, Lophelia pertusa which settles ona small stone but later forms large colonies (bioherms) . Dense growths of coral coloniesform physical structures that provide suitable habitat for many epibenthic _invertebxates .and fish in what -might otherwise be- a relatively featureless bottom (Mortensen et. al1995). Unlike the shallow water corals of the tropics, the deep water species areahermatypic in that they do not function in symbiotic association with zooxanthellae .They feed on suspended organic particles or zooplankton .
6.5 .2.4 Coral species of The Gully
Species with a North Atlantic distribution have been known to science since the middleof the eighteenth century from collections made in the eastern North Atlantic . Ourknowledge of the species from the western North Atlantic only dates from the end of thenineteenth century (Whiteaves, 1901) . Since the initial descriptions of species, very littlenew information has been published . The important Canyon Assessment Study (Heckeret. al, 1980) is a focal point of renewed interest in these fascinating animals .
The following species are either known from or expected to occur in the area of theGully. The information is summarized from Breeze (1997) . The known distribution offive species are shown in Fig. 6.5 .2 .1 . Specific occurrences of seven additional speciesare given in the text . The "area" of the Gully used here is that shown in Figure 6.5 .2 .1with the exception of two deep water stations, 800m and 1700 m, located at the south endof the Halifax Line (Sambro Bank-Western Bank) regularly sampled by Bedford Institutecruises in the 1960's and 1970's . The records come specifically from Dawson Cruise 78-006. Other records, included in Fig . 6.5 .2.1 were obtained by DFO Cruise Needler 734(1997). Several specimens from these cruises are in the collection of Nova ScotiaMuseum of Natural History .
6 .5 .2 .4.1 Order Gorgonace a
Family Paragor ig idae
Paragorgia arborea (Linnaeus, 1758) . A large and well known species that occurs in theNorth Atlantic and North Pacific as well as in the Southern Hemisphere . In the westernNorth Atlantic it is found off Greenland and in parts of the southern Grand Banks, NovaScotia and south to canyons off George's Bank from about 200 to 900 m depth .(Deichmann, 1936) . This species is recorded from the Gully and areas of the ContinentalSlope to the east and west . These large "trees" are known to grow to a height of 2 .5 m andlarger specimens have been reported . Records from near the Gully are shown in Fig.6.5 .2 .1 .
114
Family Anthothelidae
Anthothela grandiflora (Sars, 1856). Several specimens of this small, bush-like, speciescollected from near Sable Island Bank and Banquereau (Haldimand Canyon) at depths of320 to 640 m are in the collection of the Smithsonian Institution . Several specimens werealso collected in the area of Haldimand Canyon, between 250 and 3 .00 m, by .DEO CruiseN734. This is a common North Atlantic species . -
Family Acanthogor iidae
Acanthogorgia armata (Verrill, 1878) . A delicate, bush-like form 10-20 cm high foundoff Haldimand Canyon in 250-300 m depth (collected on Cruise N.734) . This species isnormally attached to hard rock and boulder bottom. The Type Specimen was collected"off Nova Scotia" at about 600 m depth (Deichmann, 1936) .
Family Chrysogorgiidae
Radicipes gracilis (Verrill, 1884) . This is a single-stemmed, whip-like form about -80 cmlong found on mud bottoms in deep water . It is considered to be rather abundant in deepwater off eastern North America (Deichmann, 1936) . There is one Nova Scotia record ofseveral specimens taken in an Agassiz Trawl at a depth of 1700 m(Dawson 78-006 Stn .9) . The station is at 42°44 .1' N. 61° 37 .9' W, off Western Bank .
Family Isididae
Acanella arbuscula (Johnson, 1862). A small (10-15 cm) bushy species obtained nearHaldimand Canyon (collected on Cruise N . 734 ) . The collection of the SmithsonianInstitution has specimens collected from near Sable Island Bank and Banquereau atbetween 274 and 686 m depth. This species settles on small stones and roots itself intothe bottom mud as it grows . A common species from Greenland to New England in 400to 2900 m. Also in the eastern Atlantic as far south as Madeira . (Deichmann, 1936) .
Family Keratoisidae
Keratoisis ornata (Verrill, 1878) . This common and distinct coral is sparsely branched,robust and grows to 1 m in height. It is found attached to rock or gravel bottoms in 400 to600 m The species is known to occur from George's Bank to the Stone Fence . Manyspecimens were collected in the area of Haldimand Canyon by DFO Cruise N .734. TheType Locality is given as "Nova Scotia" (Deichmann, 1936) . Records are shown in Fig .6 .5 .2 .1 .
Family Paramuriceidae
Paramuricea grandis (Verrill, 1883). A sparsely branched, fan-like colony reaching aheight of 50 cm It is found in the Northwest Atlantic from the Grand Banks to canyon s
115
off New England at 200 to 950 m depth on rock or boulder bottoms (Opresko, 1980) . Itoccurs on the Continental Slope both east and west of The Gully at 450 to 640 m depth .Records are shown in Fig . 6.5 .2 .1 . Little is known about the status of P. grandis, as fewspecimens have been recorded in the literature . This species may warrant specialprotection as it is believed to have a limited range .
Paramuricea placomus (Linnaeus, 1758) . This species is smaller and has less numerousbranches than P.grandis. Specimens were collected in 1997 (Cruise N. 734) from the areaof Haldimand Canyon in about 300 m It is known from the coast of northeastern NorthAmerica and Europe, including the Mediterranean (Deichmann, 1936) . Records areshown in Fig. 6 .5 .2 .1 .
Family Primnoidae
Primnoa resedaeformis (Gunnerus, 1763). This is a very conspicuous form well knownto fishermen and reported from the Gully from 1880 . Dr. David Honeyman showedspecimens of this species and Paragorgia arborea to members of the Nova ScotianInstitute of Science at their meeting on March 15, 1880 . They were collected by Halifaxfishermen "north of Sable Island" . Colonies grow to about 1 m in height, are calcifiedand very robust . They are usually attached to boulders from about 100 to 500 m deep(Deichmann, 1936). This species occurs in the northern North Atlantic and North Pacific .In the western North Atlantic it is found from Greenland south to the canyons off NewEngland. Records from near The Gully are shown in Fig . 6 .5 .2 .1 .
6.5 .2 .4.2 Order Scleractinia
Family Caryophylliidae
Lophelia pertusa (Linnaeus, 1758) . This is a massive much-branched stony coral that
occurs in large colonies (bioherms) on areas of flat bottom . Bioherms may have heights
of more than 2 in and cover an area in excess of 1,500 in (Wilson, 1979) . Depth range is
reported as 50 to 300 m but also down to 1000 in in the south of the range . The species
occurs throughout the North Atlantic and also in the southern hemisphere . In the western
North Atlantic it is known from Nova Scotia south to Brazil (Cairns, 1981). The dead
specimens found in the Gully and off Sable Island probably represent the northern limit of
its range in the western North Atlantic . No living specimens have been reported from the
area of the Gully .
Family Flabellidae
Flabellum alabastrum (Moseley, 1873) . A solitary coral about 6 .0 cm in maximumdiameter found on small stones on mud bottoms at depth of 357 to 1977 m . It is commonon the Continental Slope from Georgia to the Gulf of Maine and north to Davis Strait . Italso occurs in the eastern North Atlantic (Cairns, 1981) . There is one record of a deadspecimen from the south end of the Halifax Line, south of Western Bank in 800 in. The
116
specimen was taken with a box core sample (Dawson 78-006, Stn .6). Specimens of thisspecies have been saved by fisheries biologists on research cruises and fishermen havereported "mushroom" corals, which could be this species, off the southern points ofEmerald Bank .
Javania cailetti (Duchassaing and Michelotti, 1864) . A .specimen of this species,
collected near the Stone Fence (48:28 N 57.13 W) at a depth of 549 m, is in the-collection
of the Smithsonian Institution . The species is known from the continental slope as far
south as Georgia and also from the eastern North Atlantic, South Atlantic, Indian, and
Pacific Oceans .
6 .5.2.5 Concluding Remarks
From this general survey it would appear that half of the 20 species of deep sea coralsreported from Nova Scotia waters occur in the area of the Gully and the adjacentContinental Slope . This is a typical assemblage of species and no "rare" species occur .Although some species have been known to occur here since the late 1800's (Whiteaves,1901) very little work has been done on the biology and ecology of these animals . Theyhave been recognized as an important part of the biota of the Gully (Breeze, 1997) .
Some effort should be made to carry out more research, especially on the status of stonycorals such as Lophelia pertusa and Flabellum alabastrum . More species of stony corals,particularly Desmophyllum cristagalli and two other species of Flabellum, were expected .The former species is known from canyons on the continental slope off New England(Hecker et al. 1980) and has also been retrieved as fossils from Orphan Knoll, offNewfoundland (Smith et al, 1997) . Where species such as Acanthogorgia armata andKeratoisis ornata are noted as having Nova Scotia as the Type Locality it is important tomake strong efforts to conserve examples of the genetic stock .
The occurrence of corals at about 350 to 500 in depth close to Sable Island provides anexceptional opportunity for study of these poorly known animals through collection ofspecimens, data, and video footage and other images . Future studies might focus on theunique habitat of the coral beds in our waters and their sensitivity to environmentalchange and physical damage, the taxonomy of local coral species and their abundance,and the associations of animals they support .
6.5.2.6 Acknowledgment s
The authors would like to thank the fishermen and scientists who generously gave theirtime and provided information for this study. The coral project was funded, in part, by aRare Species Research Grant from the Nova Scotia Museum . The map (Fig. 6 .5 .2.1) wasprepared by Dr . Vladimir Kostylev .
117

6.5 .2 .7 References
Breeze, H. 1997 (Ms) . Distribution and Status of Deepwater Corals of Nova Scotia .Marine Issues Committee . Special Publication No . 1 . Ecology Action Centre,Halifax . pp 61 .
Cairns, S.D. 1981 . Marine Flora and Fauna of the Northeastern United States.Scleractinia . NOAA Technical Report NMFS Circular 438 . US Dept. ofCommerce, Washington. pp 13 .
Cimberg, R.L., T. Gerrodette and K. Muzik. 1981 . Habitat requirements and expecteddistribution of Alaska coral. Final Repo rt , Research unit No . 601 . U.S . Office ofMarine Pollution Assessment, Alaskan Office . pp 54 and appendices .
Davis D .S . and S . Browne (Eds.) 1997 ( in press) . Natural History of Nova Scotia.Nimbus Publishing and Nova Scotia Museum, Halifax .
Deichmann, E . 1936. The Alcyonaria of the Western Part of the Atlantic Ocean . Memoirsof the Museum of Comparative Zoology at Harvard College . Vol. LIII, XLIX,Cambridge. pp.5-317.
Hecker, B., G . Blechsmidt and P. Gibson 1980. Epifaunal Zonation and CommunityStructure in three Mid- and North Atlantic Canyons. Lamont-Doherty GeologicalObservatory, New York. pp 349 .
Mortensen, P .B ., M. Hovland, T. Brattegard and R. Farestveit, 1995. Deep waterBioherms of the Scleractinian Coral Lophelia pertusa (L.) at 64°N on theNorwegian Shelf: Structure and associated megafauna. Sarsia 80:145-158 .Bergen.
Opresko, D.M. (1980) . Taxonomic Description of Some Deep-Sea Octocorals of the Midand North Atlantic . In Hecker B., G. Blechschmidt and P . Gibson . Final Report--Canyon Assesment Study in the Mid- and North Atlantic areas of the U .S. outercontinental shelf, Appendix B . U.S .Dept. of Interior, Bureau of LandManagement, Washington, D .C. Contract No . BLM A 551-CT8-49 .
Shackell, N., P. Simard and M. Butler. 1996. (Ms) Potential Protected Area in The GullyRegion, Scotian Shelf. Repo rt to the World Wildlife Fund of C anada, Toronto . pp37 .
Smith, J . E., M. J. Risk, H. P. Schwarcz and T . A. McConnaughey. 1997. Rapid climatechange in the North Atlantic during the Younger Dryas recorded by deep-seacorals . Nature . 386: 818-820 .
118
Whiteaves, J .F. 1901 . Catalogue of the Marine Invertebrata of Eastern Canada .Geological Survey of Canada, Ottawa . pp 271 .
Wilson, J.B . 1979. 'Patch"development of the deep-water coral Lophelia pertusa (L.) onRockall Bank . J. Mar. biol. Ass . U.K. 59:165-177
Zibrowius, H. 1980. Les Scleractinares de la Mediterranée et de L'Atlantique Nord-Oriental . Memoires de L'Institute Oceanographique . Fondation, Albert 1er,Prince de Monaco, No . 11 . texte . pp 125-130 .
119
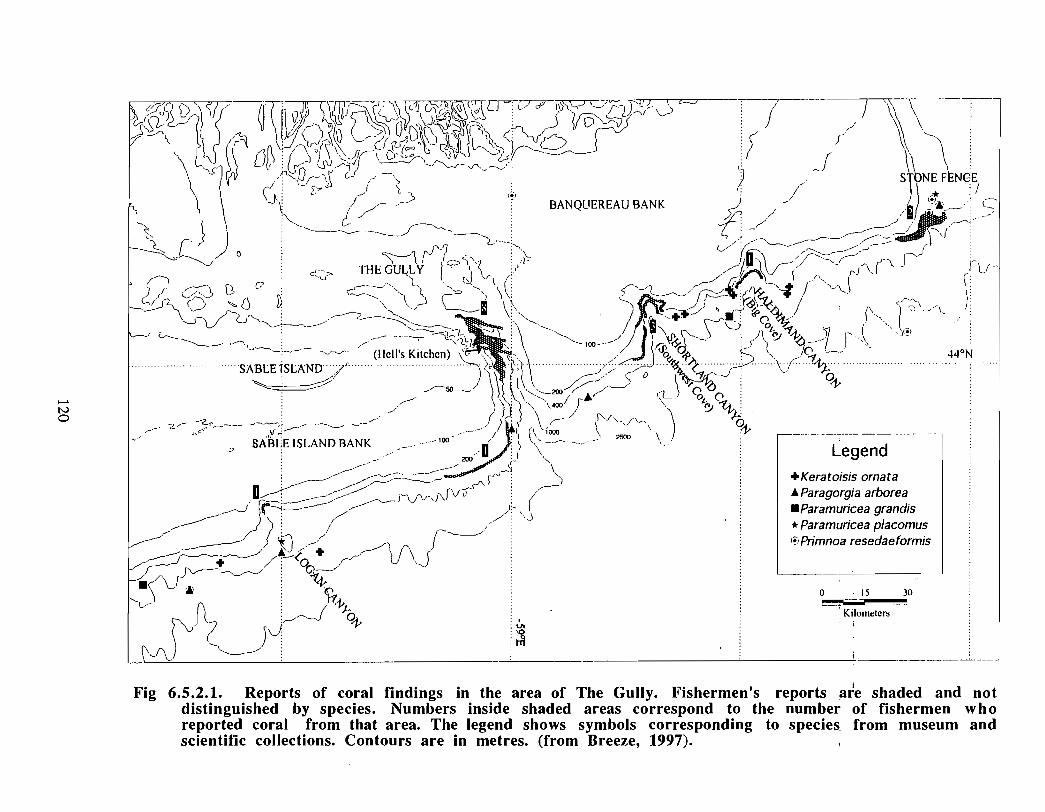
. . . . . . . . . . . . --- --SABLE SLAND . . . .~y . . . . . . . . . . . . . .
-I- ---
■/~~~ ~~/cb-
ry,~
f ~o1,
Legend
+Keratoisis omata♦ Paragorgia arborea■ Paramuricea grandis* Paramuricea placomusC-~,Primnoa resedaeformis
Fig 6.5.2 .1. Reports of coral findings in the area of The Gully . Fishermen's reports ;are shaded and notdistinguished by species . Numbers inside shaded areas correspond to the number of fishermen whoreported coral from that area . The legend shows symbols corresponding to species, from museum andscientific collections . Contours are in metres . (from Breeze, 1997) . 1
7.0 Fish and Fisherie s
7.1 Finfish and Selected Invertebrates
Kees C. Zwanenburg (Editor)Fisheries and Oceans CanadaMarine Fish DivisionBedford Institute of OceanographyDartmouth, NS
7.1.1 Introduction
The purpose of this document is to describe and analyze the scientific observations onfish and fisheries occurring in the Gully and adjacent waters, and to contrast and comparethese analyses to those for the eastern Scotian Shelf as a whole . The data will bepresented in two major sections, the first describing the distribution, diversity andabundance of finfish and some selected invertebrate species occurring in these areas andthe second describing the nature of the fisheries which occur in the area .
For purposes of this presentation we adopted the following definition of the Gully andsurrounding areas. The Gully proper is considered to be defined by the 200 fathomcontour of summer survey groundfish stratum 452 (Fig . 7 .1 .1) . = The Gully trough is thearea of mixed depths defined by depth stratum 457 just to the north and west of the Gullyproper, and the Gully slope is defined as the continental slope immediately adjacent to theGully and extending to a depth of 5000 m . G. Fader indicated the presence of an old riverbed which extends from the Gully proper down the slope and onto the upper reaches ofthe abyssal plain, this features should probably be considered a part of the Gully as awhole. The above features are considered to comprise the Gully and adjacent waters . Inthe body of the paper this area will be referred to simply as the Gully .
There are a number of recent documents which summarize, to some degree, the state ofscientific knowledge of this area. The first and most comprehensive was commissionedby the World Wildlife Fund of Canada (Shackell et al., 1996). This document presents apreamble outlining the form and benefits of a biophysical description of the area based ona survey of the published literature . In terms of the description of the ichthyofauna of thearea these authors present a sketch of the recently published results (Simon and Comeau,1994; Strong and Hanke, 1995) . A more detailed description based on both the literatureand more recent (unpublished) data was in order and to some extent prompted the presentdocument . The second was prepared by D . Fenton (Oceans Act Coordination Office,DFO) termed "The Gully" Overview of Biophysical Characteristics and Resource Use .This author also reports on the results of Simon and Comeau (1994), Strong and Hanke(1995), and refers to some of the preliminary results of East Coast of North AmericaStrategic Assessment project (published as Brown et al., 1996) .
121
7.1.2 Finfish
Descriptions of the finfish of the Scotian Shelf based mainly on the results of DFO trawlsurvey data include (Scott, 1976; Scott et al ., 1982 ; Mahon et al ., 1984 ; Mahon andSmith, 1989 ; Mahon, 1985 ; Brown et al ., 1-996 ; :and-Mahon et al ., -1997 MS),althoughnone of these focus on a description of the Gully itself . Strong and Hanke (1995)examine the trawl survey stratum 452 which encompasses the 100 to 200 fathom (180 to360m) isobaths within the Gully area . The latter authors also looked at seasonaldistribution of finfish in the stratum . Their results indicate the presence of some 45species (below) over the period 1970 - 1993 with about one third of these species presentall year . Information on the species composition of surrounding strata are also presentedfor this time period. Strata of particular interest because they represent the shallowerbanks which are likely ecologically connected with the Gully and approaches are 448(Western Banquereau), 455 and 456 (Western Sable Island), and 458 (Middle Bank) .Given the complicated bathymetry of the system of channels leading into the Gully proper(Fig . 7 .1 .1) we also examined the species composition of the mixed depth stratum 457 .
Species Occurring in the 100 - 200 Fathom isobaths of the Gully (1970 - 1993, fromStrong and Hanke 1995) in order of the frequency of occurrence over the time period.Note the unidentied Stomiatioid (38) and unidentifiedfish (42) in-the table.
1 . Redfish2 . A. Plaice3 . White Hake4 . Witch Fl .5 . Thorny Skate6 . Cod7 . Silver Hake8 . Longfin Hake9 . A. Halibut
10 . Winter Skate11 . Haddock12 . Marlins . Gren .13 . Smooth Skate14 . Monkfis h15 . Pollock16 . Sir Wolffish17 . Turbo t18 . Frb Rocklin
19 . Yellowtail Fl .20 . Ar. Hr Sculpin21 . N. Hagfish22. Cusk23. Herrin g24. A. Argentine25 . Wrymouth26. Lhrn Sculpin27. Red Hake
28 . Ocean Pout29 . N. Sand Lance30 . Capeli n31 . Lanternfish32 . Rck Grenadier33 . Offshore Hake34 . Spiny Dogfish35 . Sea Raven36 . Little Skate
37 . Mackerel38 . Unid Stomatio .39 . Rosefis h40. Arctic Eelpout41 . Mailed Sculpin42. Unid Fis h43 . Shortt . Eelpout44 . Ogrefis h45 . Rghnose Gren .
Strong and Hanke report that stratum 452 was also an area of relatively high speciesdiversity during the period 1986-1993, the final two of six time periods . It must howeverbe noted that this refers to stratum 452 only .
7 .1.3 Ichthyoplankton
K. Frank and F . Page
Marine Fish Division
Data from the Scotian Shelf Ichthyoplankton Program (SSIP) was examined to determinethe importance of the Gully as a spawning area for marine fishes . SSIP was a fixedstation survey with reasonably good seasonal coverage that was conducted from 1978-1982 . Ten stations were identified as representative of the Gully area and data fromoblique bongo hauls were extracted for the analysis (Fig . 7 .1 .2). One should bear in mindthat conclusions drawn from historical data may not provide an accurate representation of
122
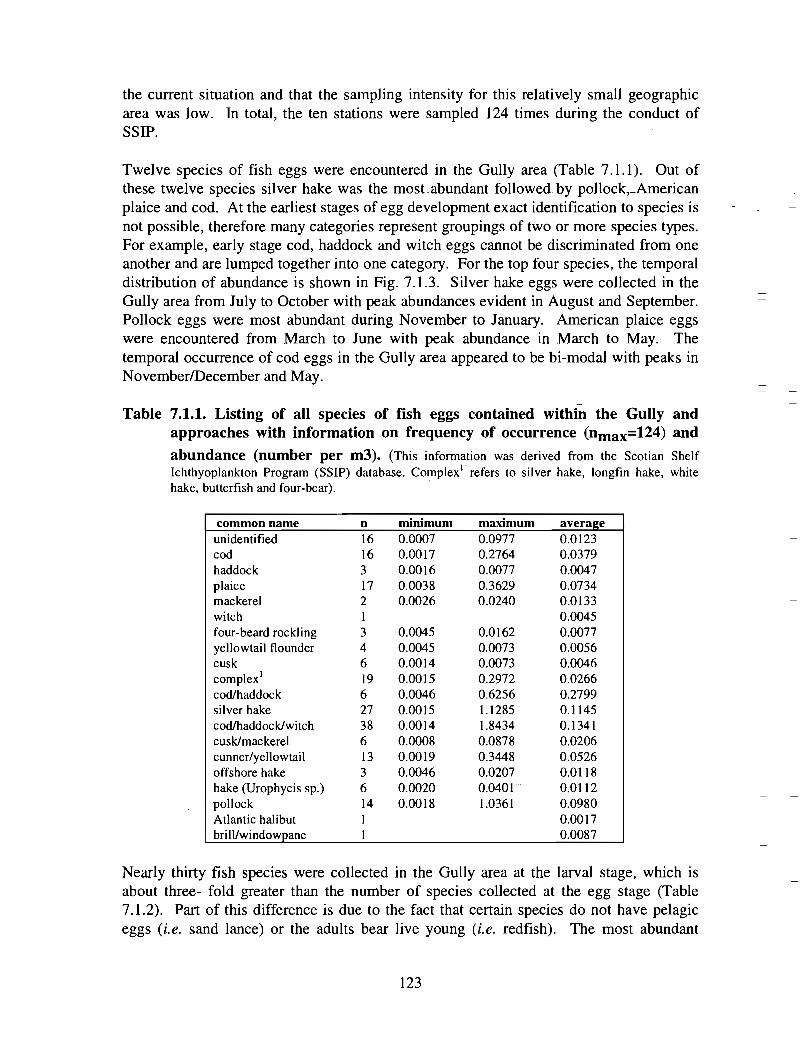
the current situation and that the sampling intensity for this relatively small geographicarea was low. In total, the ten stations were sampled 124 times during the conduct ofSSIP.
Twelve species of fish eggs were encountered in the Gully area (Table 7 .1 .1). Out of
these twelve species silver hake was the most_abundant followed . by pollock,_American
plaice and cod . At the earliest stages of egg development exact identification to species is
not possible, therefore many categories represent groupings of two or more species types .
For example, early stage cod, haddock and witch eggs cannot be discriminated from one
another and are lumped together into one category . For the top four species, the temporal
distribution of abundance is shown in Fig . 7 .1 .3. Silver hake eggs were collected in the
Gully area from July to October with peak abundances evident in August and September .
Pollock eggs were most abundant during November to January . American plaice eggs
were encountered from March to June with peak abundance in March to May . The
temporal occurrence of cod eggs in the Gully area appeared to be bi-modal with peaks in
November/December and May.
Table 7.1.1. Listing of all species of fish eggs contained within the Gully andapproaches with information on frequency of occurrence (nmax=124) and
abundance (number per m3). (This information was derived from the Scotian ShelfIchthyoplankton Program (SSIP) database. Complex' refers to silver hake, longfin hake, whitehake, butterfish and four-bear) .
common name n minimum maydmum average
unidentified 16 0.0007 0.0977 0.0123cod 16 0.0017 0.2764 0.0379haddock 3 0.0016 0.0077 0.0047plaice 17 0.0038 0.3629 0.0734mackerel 2 0.0026 0.0240 0.0133witch 1 0.0045four-beard rockling 3 0.0045 0.0162 0.0077yellowtail flounder 4 0.0045 0.0073 0.0056cusk 6 0.0014 0.0073 0.0046complex' 19 0.0015 0.2972 0.0266cod/haddock 6 0.0046 0.6256 0.2799silver hake 27 0.0015 1 .1285 0.1145cod/haddock/witch 38 0.0014 1 .8434 0.1341cusk/mackerel 6 0.0008 0.0878 0.0206cunner/yellowtail 13 0.0019 0.3448 0.0526offshore hake 3 0.0046 0.0207 0.0118hake (Urophycis sp.) 6 0.0020 0.0401 0.0112pollock 14 0.0018 1 .0361 0.0980Atlantic halibut 1 0.0017brill/windowpane 1 0.008 7
Nearly thirty fish species were collected in the Gully area at the larval stage, which isabout three- fold greater than the number of species collected at the egg stage (Table7.1 .2). Part of this difference is due to the fact that certain species do not have pelagiceggs (i.e. sand lance) or the adults bear live young (i.e . redfish). The most abundan t
123
species at the larval stage was silver hake . Given that this species was also mostabundant in the area at the egg stage, it is probably reasonable to conclude that silver hakespawn in the area defined as the Gully . The second most abundant species collected atthe larval stage was sand lance followed by cod, windowpane flounder, redfish, witchflounder and American plaice . The temporal pattern of occurrence for four out of five ofthe most abundant species in shown in Fig . 7 .1 .4 .. . Peak abundances of silver hake .lar.rvae.occurred in August to October, offset by about one month from the peak abundance oftheir eggs . Sand lance larvae were collected from January to June with a peak evident inApril . Cod larvae were abundant in two time periods, November/December andMay/June reflecting the temporal pattern of distribution at the egg stage . Redfish larvaewere encountered from March to August with a peak in abundance in April . It should benoted that pollock and American plaice, species that were relatively abundant in the Gullyarea during the egg stage, were encountered infrequently in the survey area during thelarval stage .
Table 7.1.2 . Listing of all larval fish species contained within the Gully andapproaches with information on frequency of occurrence (nmax= 124) and
abundance (number per m3). (This information was derived from the Scotian ShelfIchthyoplankton Program (SSIP) database . )
common name n minimum maximum averag e
Bothus sp . I 0 .0015
cod 9 0.0030 0.2172 0.0390
silver hake 29 0.0009 1.4539 0.3423pollock 1 0 .0054
redfish 23 0.0018 0.2825 0.0305
Americanplaice 3 0.0188 0.0225 0.0197
witch flounder 12 0.0049 0.0936 0.0242
yellowtail flounder 10 0.0017 0.0546 0.0144
Gulf Stream flounder 1 0 .0026
wolffish I 0.0033
herri ng I 0 .0030
mackerel 4 0.0019 0.0054 0.0031
unidentified 16 0.0020 0.1047 0.0143
four-beard rockling 5 0.0019 0.0169 0.0071
windowpane flounder 4 0.0131 0.0565 0.0312
latemfish species 10 0.0017 0.0856 0.0143glacier latemfish 23 0.0008 0.0722 0.0145
homed latemfish 1 0 .0007
spo tted latemfish 1 0 .0018
hake (Urophysis sp.) 14 0.0020 0.0642 0.0158protomyctomphum 1 0 .0021
Bathylagus compsus 1 0 .0016
longho rn sculpin 2 0.0035 0.0054 0.0044
sculpin (Triglops sp.) 1 0.0030sculpin(Cottidae) 1 0.0145monkfish 3 0.0034 0.0178 0.0085
sandlance 30 0.0016 1.6499 0.1074
wrymouth 1 0.0025
coral dragonet 1 0 .0007
Argyropelecus 1 0.0017
barracudina 1 0 .0022cardinalfish 1 0 .0007
un i .d. gobies 1 0 .000 7
124
7.1.4 Pelagic Fish
W. Stobo and H. StoneMarine Fish Division
The distribution . and abundance of these species is not . well estimated_ b.y_ .gr.o.un,dfishtrawls which are the primary sampling tool used by DFO since the late 1940's . Althoughpelagic species are encountered and caught by - the trawl, their overall catchability isconsidered to be low. The data are usually interpreted to indicate presence or absence ofspecies or to give very general trends in abundance over long time periods . There hasalso been work carried out in the past which made use of commercial catch data toestimate the distribution and abundance of at least the commercially exploited pelagicspecies .
Small Pelagiçs
Kulka and Stobo (1981) report on the results of an exploratory survey for mackerel(Scomber scombrus) using both bottom trawl and midwater trawls (see Appendices) .They found no mackerel in the Gully during the winter months . The results indicated thatjuvenile mackerel do stay on the shelf during the winter but that adults migrate south .During the summer these adults migrate from the south into the Gulf of St . Lawrence .The Gully is not considered an important area for mackerel feeding or spawning .
Large Pelagics
Heath Stone provided an overview of the Canadian large pelagics fisheries on the Scotian
Shelf in relation to the Gully area (See Appendices) . He states that a longline fisheries
for swordfish does occur in the Gully and adjacent areas . Based on catch rate information
the Gully does not appear to be an area of high swordfish abundance . He also reports that
tuna by-catches from the swordfish fishery are low in the Gully area relative to other
areas .
7.1.5 Deepwater Species I - Mesopelagics (Data provided by R. Halliday and D. Themelis )
The data on these species, which complete their life histories within the top 1000 m of thewater column, were extracted from the meso-pelagic data base compiled by RalphHalliday and Daphne Themelis . Sampling for these species was by IGYPT and Tuckertrawls and ranged over bottom depths of 1000 - 4000 m at various points along the slopeof the Scotian Slope (Fig . 7.1 .5). The findings indicate the occurrence of more than 200species of mesopelagic fish in the area . The Gully slope is bathed primarily by LabradorSlope water whereas further west warm slope water from the Gulf Stream is a morecommon occurrence. Many of the 200 species of mesopelagic fishes are southern indistribution, with quite a large number being expatriates from tropical waters . Themesopelagic ichthyofauna of the Labrador Slope water is composed mainly of Sub-arctic-Temperate species . Given this, only a small fraction of the 200 species of mesopelagi c
125
fishes (Table 7 .1 .3) is of common occurrence off the Gully, and none are endemic(Halliday et al., 1995) .
Table 7 .1.3 . Mesopelagic Species Composition Off the Scotian Shelf and SouthernGrand Banks collected by IGYPT and Tucker trawls during themesopelagic surveys conducted 1984 - 1989 (Data .provided by-R- G .-Halliday andD. Themelis) -
Family Number of Species
Myctophidae 68Gonostomatidae 8
Chauliodontidae 2Stemotychthidae IIStomiidae 3Serrivomeridae 2
Photichtydae 5Nemichthyidae 3Squalidae 1Derichtyidae 2
Eupharyngidae 1Bathylagidae 7Astronesthidae 10Melanostomiidae 29Malacosteidae 6
Idiacanthidae 1Scopel archidae 3Paralepidae 13Evermanellidae 3
OmosudidaeGadidae
Melanonidae 1
Trachipteridae
Regalecidae 1
Stylephoridae
Diretmidae
Anoplogaste ridae 1Melamphaeidae 11Rondeletiidae
Zeniontidae
Zeidae 1
Gmmmicolepidae I
Caproidae I
liparidae
Apogonidae 2
Perchichthyidae 3Bnunüdae ICaristüda eChiasmodontidae 2
Scombrolabracidae IGempylidae 5T richiuridae 2S tromateidae 7
Total 227
Rank (Numerical Abundance)
1-5,7-9,12,15-17,19,21,25
6,1 0
13
14
18
20
22,24
23
>25
>25
>25
These results show clearly that myctophids (lanternfish) dominate the mesopelagicichthyofauna of this area. This large family also contains the largest number of species(68) making up about 30% of the 227 species encountered .
7.1.6 Deepwater Species II - Epipelagic and Bathypelagic Species (Data provided by R .Halliday and D. Themelis )
Species composition and a general idea of relative abundance of the epipelagic (lifehistory completed in the upper 100 meters of the water column over oceanic depths),bathypelagic (life history completed deeper than 1000 m but not on the bottom) an d
126
neritic (those species which generally reside on the shallower waters of the shelves), arepresented below (Table 7 .1 .4) . These data were also gathered during the IGYPT andTucker trawl su rveys reported for the mesopelagic species above, and give only a generalimpression of the composition of the ichthyofauna at these depths in these regions .
Table 7.1.4. Epipelagic, .bathypelagic, and neritic species caught during the IGYPT,
and Tucker Trawl - mesopelagic trawl surveys conducted adjacent to theScotian Shelf and Southern Grand Banks 1984 - 1989 . ** The indicated speciesoccur only in the mesopelagic data set, while those which are not marked occur both in themesopelagic data set and the summer survey results conducted in waters < 360 m.
Species
Acanthurus spAhHa egmontisAhliesaurus berryiAlbula vulpes
Aldrovandia phalacraAlepocephalus spAleposaurus feroxAnguilla rostrata
Antennarius spAnthias spAriosoma balearicurnAriosoma spBeryx Dedecadactylus
Beryx splendensBothus spBregmaceros spCallionymid spCallionymus agassizi
Caranx hipposCaranx s pCarapid spChaetodon spCitharhicthys arctifronsCongrid sp
Cookeolus boopsCryptopsaras couesiCryptopsaras spDanaphryne nigrifilis
Decapterus spDibranchus atlanticusEchiodon dawsoni
Ectreposebastes imusEdriolychnus schmidtiEineria edentulaEngrauGs eurystoleEpinephelus spEtmopterus princeps
Etremeus teresEtropus microstomusFacciolella sp .
Fistularia tabacariaGadus morhuaGlossanodon spGlyptocephalus cynoglossus
Gonioplectms spGymnothorax spHalosaurid sp .HeGcolenus dactylopterus
Hildebrandia spHimantolophus spHippocampus erectus
Histrio histrioHolocanthus spHoltbyrnia anomalaHoplunnis sp .
Labrid spInemonema batbatulaLasiognathus beebei
Unique•r Frequency
' 14r 7
' 4
r 5
Total Species Unique'r Frequency Total
r
■
r 2
" 6
• 17
' 3
• Ilr
* 16r 2
r 2
48
r 50
2
5 r3
r 8
• 6
8
• 134r
" 55
'
• 2
3
' 6r 2
r 5
■
" 3r 7
4
r
' 5r 5
2r 8
2r I
" 4r 1
2
0 '5
" 5r 2
• 13
• 3r 5
" 5
41 Linophryne brevibarbis " 121 Linophryne coronata • 15 Unophryne macrodon
r 1 Linophrynesp ' I
I Linophrynid sp r 2 32 Lophodolus acanthognathus 2 27 Lopholatilus chamaeleonticeps • 141 Macrorhamphosus scolopax r I3 Macrourid sp 10 1222 Melanocetus johnsoni " 5 51 Melanocetus murrayi * 2 249 Melanostigma atlanticaum 1 52 Monolene sessilicauda 1
2 Morid sp 6 9121 Mugil cephalus I83 Mugil curema ' I
3 Muraenid sp. " 1
5 Myrophis punctatus " 3 8Naucrates ductor 1
5 Nettastoma sp• 11 Nezumia bairdi 3 3
7 Normichthys operosus r 13 24
11 Notacanthid sp. 1 I723 Oneirodes sp " I
Oneirodid sp ' 4 680 Ophichthus cruentifer r 5 8
Paraxenomystax sp 18 27
Peprilus triacanthus 5 82 Percoid sp 49 2523 Petromyzon marinus ' 3 36 Photostylus pycnopterus • 2 23 Phycis chesteri 29 63
5 Polymmixia lowei 5 6Priacanthus arenatus r 6 12
3 Roulenia maderensis" 14 Rypticus sp ' 2 2
4 Scombresox saurus 7 1045 Scopelosaurus argenteus II Scopelosaurus lepidus + 33 535 Scopelosaurus mauli 1 2
5 Scopelosaurus smithii + 5 11
2 Scorpaenid sp 4 5
10 Searsia koefoedi ' 4 4
3 Sebastes mentella I I
I Sebastes sp 18 69
4 Selar boops r 1
Selar crurrenophtalmusr 42 Selene vomer 9 1 4
2 Serranid sp • 2 3
5 Serranus sp " 1
6 Sphoeroides maculatus 3 3
2 Stephanolepis hispidus + 15 19
26 Svetovidoviasp r 19 59
3 Symphurus sp 2 2
6 Symphysanodon sp r 2 3
5 Synodontid sp r 5 1037 Taractes asper ■
Tamctes sp r I I
127
Species Unique" Frequency Total Species Unique" Frequency TotalTaractichthys longipinnis ' 2 2 Uroconger sp 1 5
Tetragonurus adanticus ' 3 3 Urophycis sp 1 2Trachinocephalus myops " 6 8 Urophyicstenuis 6 10Trichopsetta sp 3 4 Xenodermichthyscopei I 1
These data show that some 75 species of epipelagic and neritic fauna occur in the ScotianSlope and adjacent abyssal plain fauna . They also indicate a relatively low degree ofoverlap between the neritic fauna (shallow species as characterized by the 'results of thesummer trawl surveys) and the bathypelagic and epipelagic fauna . Of 125 speciesencountered only 25 occur in both data sets . The data indicate that these fauna aredominated numerically by conger eels . It is likely that this fauna is composed of amixture of resident species, migrants and vagrants from more southerly or oceanicpopulations . The spatial and temporal resolution of these data do not allow us to drawconclusions about whether or not particular species are restricted to the Gully .
7 .1.7 Demersal Fish
K. Zwanenburg and R . BrantonMarine Fish Divisio n
7.1 .7 .1 Scotian Slop e
Species composition for the lower reaches of the slopes of the Gully (below) 300 m ispresently not well defined . Some previous publications of the species composition ofthese deep waters include : Marckle and Musick (1974), Marckle et al. (1988), and Pohleet al. (1992) .
A series of redfish directed trawl surveys were carried out annually from 1982 to 1987and extended to depths of 500 fm (900 m) . The observations made along the shelf edgebetween 58 and 60 W were used to characterize the slope ichthyofauna for the shelf slopeportions of the Gully . Preliminary analyses indicate the presence of 63 species of fishcaught by the bottom trawl in depths ranging from 100 to 900 meters (Table 7 .1 .5). Thenumerically most abundant at depths less than 180m was Winter Skate, while at depthsgreater than 180m redfish was most numerous .
Table 7.1.5. Species composition by depth zone as estiamted by bottom trawl surveys
of the Scotian Slope between 58 and 60W. Species are shown as the percentage ofthe total numbers of fish caught in that depth zone (each column sums to 100%) .
Species Depth Zone
<180m 180-360m 360-540m 540-720m 720-900 mAMERICAN LOBSTER 0.012 0.054 0.000 0.000 0.000
AMERICAN PLAICE 3.092 0.836 0.065 0.023 0.239AMERICAN STRAPTAIL GRENADIER 0.000 0.000 0.003 0.000 0.000APRISTURUS LAURUSSONI 0.000 0.000 0.006 0.000 0.000
ARCTIC EELPOUT 0.000 0.000 0.003 0.000 0.000
ARGENTINE(ATLANTIC) 0.004 0.109 0.145 0.051 0.000BACKFIN TAPIRFISH 0.000 0.000 0.027 0.000 0.000
128
Species Depth Zone
<180m 180-360m 360-540m 540-720m 720-900 mBARNDOORSKATE
BLACK DOGFISH
BLUE ANTIMORA/HAKEBOA DRAGONFISH
COD(ATLANTIC)
CUS KDEEPSEA CAT SHARK
EELPOUTS(NS)
FRECKLED SKATE
GRAY'S CUTTHROAT EELHADDOCK
HALIBUT(ATLANTIC)
HERRING(ATLANTIC)JENSEN'S SKATE
KNIFENOSE CHIMERA
LANTERNFISH (NS)LITTLE SKATE
LONGFIN HAKE
LONGHORN SCULPIN
LONGNOSE CHIMERALONGNOSE GRENADIER
LUMPFISH
MACKEREL(ATLANTIC)MARLIN-SPIKE GRENADIER
MONKFISH,GOOSEFIS H,A NGLERNORTHERN HAGFISH
NORTHERNSTONE
NORTHERN WOLFFISHOCEAN POUT(COMMON)
OFF-SHORE HAKE
PANDALUSSP .POLLOC K
REDFISH UNSEPARATEDROCK GRENADIER(ROUNDNOSE)
ROUGHHEAD GRENADIER
ROUGHNOSE GRENADIER
ROUND SKATESEA RAVEN
SHORT-FIN SQUIDSHORTSPINE TAPIRFISH
SILVER HAK ESMOOTH SKATE
SNOW CRAB (QUEEN)
SNUBNOSE SLIME EEL
SPIDER CRAB (NS)SPIDER/(QUEEN,SNOW)UN I D
SPINY DOGFISHSPINY EEL
SPINY EELS (NS)
SPINY SPIDER CRAB
SPINYTAIL SKATESPOTTED WOLFFISH
SQUID (NS)
SQUIRREL OR RED HAKE
STRIPED ATLANTIC WOLFFISHTHORNY SKATETRUNKFISH
TURBOT,GREENLAND HALIBUT
WHITE HAK EWINTER SKATE
WITCH FLOUNDER
WRYMOUTHYELLOWTAIL FLOUNDER
0.0000.0000.0000.000
18.9990.0000.0000.0000.0000.000
12.3290.9590.5000.0000.0000.0000.0040.0730.0380.0000.0000.3690.0800.0000.2010.0080.0110.0290 .0000 .0080 .000
18 .51 31 .8750 .0000 .0000 .0000 .0000 .0510 .0000 .0006 .2530 .3530 .0080 .0000 .0000 .0080 .0710 .0000 .0000 .0130 .0000 .0400 .0220 .0051 .4054 .1240 .0000 .0212 .42 6
27 .0250 .9030 .0170 .153
129
0.0000.0000.0000.0006 .3100.2420.0000.0040.0040.0005 .362
1 .4980.2210.0000.0000.0000.0070.7150.0070.0000.0000.0000 .0000 .0351 .1880 .0140 .0520 .0320 .0040 .0510 .000
17 .58436.842
0 .0000 .0000 .0000 .0000 .0000 .0150 .0008 .4400 .1600 .0270 .0000 .0100 .0350 .1510 .0000 .0040 .0690 .0000 .0460 .1020 .0360 .5721 .7050 .0000 .021
12 .3162 .1122 .9740 .0000 .036
0 .0630 .1740 .0000 .0000 .3600 .2330 .0000 .0000 .0000 .0000 .0900 .3570 .0000 .0000 .0000 .0020 .0001 .1380 .0000 .0000 .0000 .0000 .0000 .0440 .9340 .0040 .0250 .0330.0000.5700.0000.102
93 .4050.0120.0050.0100.0040.0000.0030.0000.2190.0030.0000.0030.0140.0040.0130.0630.0000.0030.0000.0500 .0000.0130 .0870 .2090 .0160 .1771 .0600.1370 .1070 .0030 .003
0.0001 .8710.0590.0000 .0000 .0000:0000 .0320 .0000 .0590 .0000 .2370 .0000 .0280 .0630 .0000 .0001 .7540 .0000 .0780 .0280 .0000 .0000 .2380 .1180 .0000 .0540 .7030 .0000 .8540 .0320 .00 0
88 .3380 .0280 .0280 .0000 .0000 .0000 .0000 .0280 .0610 .0000 .0000 .0000 .0000 .0320 .0000 .1230 .0000 .000
1 .2760 .0280 .0000 .0000 .0000 .1580 .0002 .266
1 .0550.0000.2970.0000.000
0 .0009 .9880 .2460 .1230 .0000 .0000 .1230 .0000 .0000 .0000 .000
13 .2120 .0000 .0000 .0000 .0000 .0001 .1760 .0000 .2330 .0000 .0000 .0000 .7260 .0000 .0000 .0000 .0000 .0000 .3490 .0000 .00 0
67 .6180 .1162 .2100 .0000 .0000 .0000 .0000 .0000 .0000 .0000 .0000 .0000.0000.0000 .0000.1310 .0000 .0000.0000.0000.1100.0000.3490.0000.0002 .5830.3490.0000.1160.0000.000
An analysis of species abundance by depth zone of the slope waters in and adjacent to theGully, showed that the continental slope represents distributional boundaries for a largenumber of the demersal species . Over the range of depth sampled (100 - 900 m) somespecies are 1) shallow water inhabitants in that their abundance is highest in the shallowsdepths, some are 2) upper slope dwellers with numbers declining abruptly with depth,some are 3) true slope dwellers with the highest numbers at the mid range depths anddeclining abundance in either deeper or shallower waters, and some 4) deepwater specieswhose increasing abundance at the lower limits of the survey indicates that they may bemost abundant at depths beyond 900 m(Fig . 7.1 .6). The table below groups species intothese categories and shows their relative abundance within each of the depth zonesexamined. For each species we list the total numbers caught in the depth zone by thesurveys .
Shallow Water Species (Decreasing abund ance beyond 180 m)
LT180 LT360 LT540 LT 720 LT90 0
AMERICAN PLAICE 778.24 242.93 23.93 0.92 2.00COD(ATLANTIC) 4781 .17 1833.4 133.34 0.00 0.00HADDOCK 3102.76 1558.1 33.52 0.00 0.00LONGHORN SCULPIN 9.48 2 .12 0.00 0.00 0.00LUMPFISH 92.96 0.00 0.00 0.00 0.00MACKEREL(ATLANTIC) 20.20 0.00 0.00 0.00 0.00SEA RAVEN 12.93 0.00 0.00 0.00 0.00SMOOTH SKATE 88.79 46.37 0.97 0.00 0.00STRIPED ATLANTIC 353 .55 166.29 32 .39 0.00 2.92WOLFFISHTHORNY SKATE 1037 .75 495 .45 77 .44 6.25 0.00WINTER SKATE 6801 .12 613.79 50.85 0.00 0.00YELLOWTAIL FLOUNDER 38 .45 10.51 1 .09 0.00 0.00
This group contains 12 species and most of the presently commercially exploited speciesThe results indicate that the summer surveys used to monitor their abundance, and whichfish only to 360 in, sample the largest portion of their depth ranges . These survey resultsdo however indicated that some of these species do occur in small numbers to depths ofup to 720 m .
Upper Slope (Decreasing abundance beyond 360 m)
LT180 LT360 LT540 LT 720 LT900
FRECKLED SKATE 0.00 1.03 0.00 0.00 0.00LITTLE SKATE 0.97 2.12 0.00 0.00 0.00
MONKFISH,GOOSEFIS 50.53 345 .07 346.12 4.67 0.00H,ANGLERNORTHERN HAGFISH 2 .09 3.95 1.59 0.00 0.00OCEAN 0.00 1.03 0.00 0.00 0.00
POUT(COMMON)POLLOCK 4659.01 5109.73 37.75 0.00 0.00SHORT-FIN SQUID 0.00 4.25 1.09 0.00 0.00
130
LT180SILVER HAKE 1573.69SPINY DOGFISH 17.94SPINY EELS (NS) 0.00SQUIRREL OR RED 1 .17HAKEWHITE HAKE 610.43WITCH FLOUNDER 227 .17WRYMOUTH 4.18
LT360 LT540 LT 720 LT9002452.44 81 .04 2.42 0.0043 .79 4.67 0.00 0.00
1 .03 0.00 0.00 0.0010.50 5.00 0.00 0.00
3578.83 393.00 41 .59 2.92864.27 39.60 11 .73 0.970.00 0.97 0.00 0.00
This group contains 14 species of which are half are presently commercially exploited .The results show that significant numbers of monkfish, white hake, and witch flounderoccur beyond the limits of our regular summer groundfish surveys .
Slope (most abundant >360 <900)
AMERICAN STRAPTAILGRENADIERAPRISTURUS LAURUSSONIARCTIC EELPOUTARGENTINE(ATLANTIC)BACKFIN TAPIRFISHBARNDOORSKATECUSKEELPOUTS(NS)GRAY'S CUTTHROAT EELHALIBUT(ATLANTIC)JENSEN'S SKATEKNIFENOSE CHIMERALANTERNFISH (NS)LONGFIN HAKELONGNOSE GRENADIERMARLIN-SPIKE GRENADIERNORTHERN WOLFFISHOFF-SHORE HAKEREDFISH UNSEPARATEDROCK GRENADIER(ROUNDNOSE)ROUGHNOSE GRENADIERROUND SKATESHORTSPINE TAPIRFISHSNUBNOSE SL IME EELSPINY EELSP INYTAIL SKATESPOTTED WOLFFISHTRUNKFISHTURBOT,GREENLANDHALIBUT
LT180 LT360 LT540 LT 720 LT9000.00 0.00 1 .09 0.00 0.00
0.00 0.00 2.33 0.00 0.000.00 0.00 1 .09 0.00 0.000.92 31 .65 53.70 2.01 0.000.00 0.00 9.99 0.00 0.000.00 0.00 23.33 0.00 0.000.00 70.40 86.34 0.00 0.000.00 1 .03 0.00 1 .25 0.000.00 0.00 0.00 2.34 0.00241 .27 435.29 132 .43 9.36 110.420.00 0.00 0.00 1 .09 0.000.00 0.00 0.00 2.50 0.000.00 0.00 0.80 0.00 0.0018 .34 207.88 421 .79 69.16 9.830.00 0.00 0.00 1 .09 0.000.00 10.09 16 .34 9.38 6 .077 .37 9.26 12 .27 27 .73 0.001.93 14.82 211 .32 33 .67 2.92471 .81 10705.77 34622 .05 3483 .81 565.130.00 0.00 4 .37 1 .09 0.97
0.00 0.00 3 .67 0.00 0.000.00 0.00 1 .59 0.00 0.000.00 0.00 0.00 1 .09 0.000.00 0.00 1 .17 0.00 0.000.00 0.00 23 .25 4.84 1 .090.00 0.00 0.00 50.31 0.0010 .07 13.38 18 .57 1 .09 0.000.00 0.00 5 .83 0.00 0.005 .25 6.18 65 .56 89.36 21 .5 9
We found 29 species which were at their highest abundance over this range of depths .The overall most abundant was redfish (Sebastes sp) with significant numbers occurrin g
131
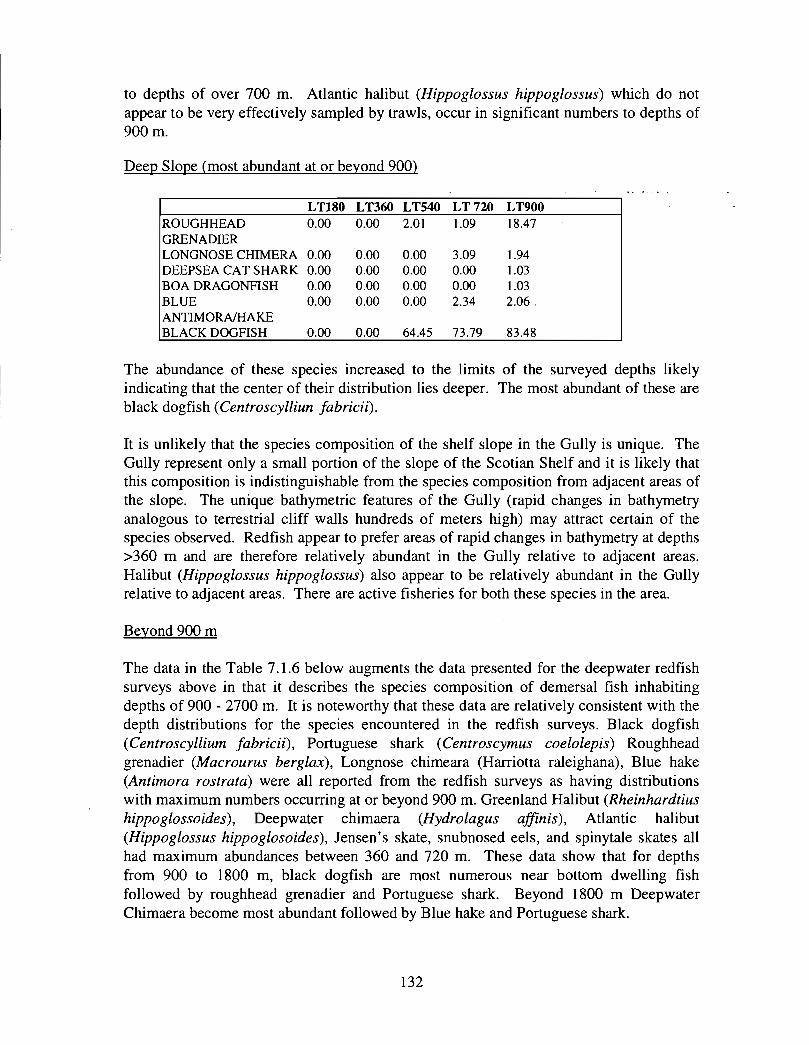
to depths of over 700 m . Atlantic halibut (Hippoglossus hippoglossus) which do notappear to be very effectively sampled by trawls, occur in significant numbers to depths of900 in .
Deep Slope (most abundant at or beyond 900 )
LT180 LT360 LT540 LT 720 LT900
ROUGHHEAD 0.00 0.00 2.01 1 .09 18.47GRENADIERLONGNOSE CHIMERA 0.00 0.00 0.00 3.09 1 .94DEEPSEA CAT SHARK 0 .00 0.00 0.00 0.00 1 .03BOA DRAGONFISH 0 .00 0.00 0.00 0.00 1 .03BLUE 0.00 0.00 0.00 2.34 2.06 .ANTIMORA/HAKEBLACK DOGFISH 0.00 0.00 64.45 73.79 83.4 8
The abundance of these species increased to the limits of the surveyed depths likelyindicating that the center of their distribution lies deeper . The most abundant of these areblack dogfish (Centroscylliun fabricii) .
It is unlikely that the species composition of the shelf slope in the Gully is unique . TheGully represent only a small portion of the slope of the Scotian Shelf and it is likely thatthis composition is indistinguishable from the species composition from adjacent areas ofthe slope. The unique bathymetric features of the Gully (rapid changes in bathymetryanalogous to terrestrial cliff walls hundreds of meters high) may attract certain of thespecies observed. Redfish appear to prefer areas of rapid changes in bathymetry at depths>360 in and are therefore relatively abundant in the Gully relative to adjacent areas .Halibut (Hippoglossus hippoglossus) also appear to be relatively abundant in the Gullyrelative to adjacent areas . There are active fisheries for both these species in the area.
Beyond 900 m
The data in the Table 7 .1 .6 below augments the data presented for the deepwater redfishsurveys above in that it describes the species composition of demersal fish inhabitingdepths of 900 - 2700 in. It is noteworthy that these data are relatively consistent with thedepth distributions for the species encountered in the redfish surveys . Black dogfish(Centroscyllium fabricii), Portuguese shark (Centroscymus coelolepis) Roughheadgrenadier (Macrourus berglax), Longnose chimeara (Harriotta raleighana), Blue hake(Antimora rostrata) were all reported from the redfish surveys as having distributionswith maximum numbers occurring at or beyond 900 m . Greenland Halibut (Rheinhardtiushippoglossoides), Deepwater chimaera (Hydrolagus affinis), Atlantic halibut(Hippoglossus hippoglosoides), Jensen's skate, snubnosed eels, and spinytale skates allhad maximum abundances between 360 and 720 m . These data show that for depthsfrom 900 to 1800 in, black dogfish are most numerous near bottom dwelling fishfollowed by roughhead grenadier and Portuguese shark . Beyond 1800 in DeepwaterChimaera become most abundant followed by Blue hake and Portuguese shark .
132
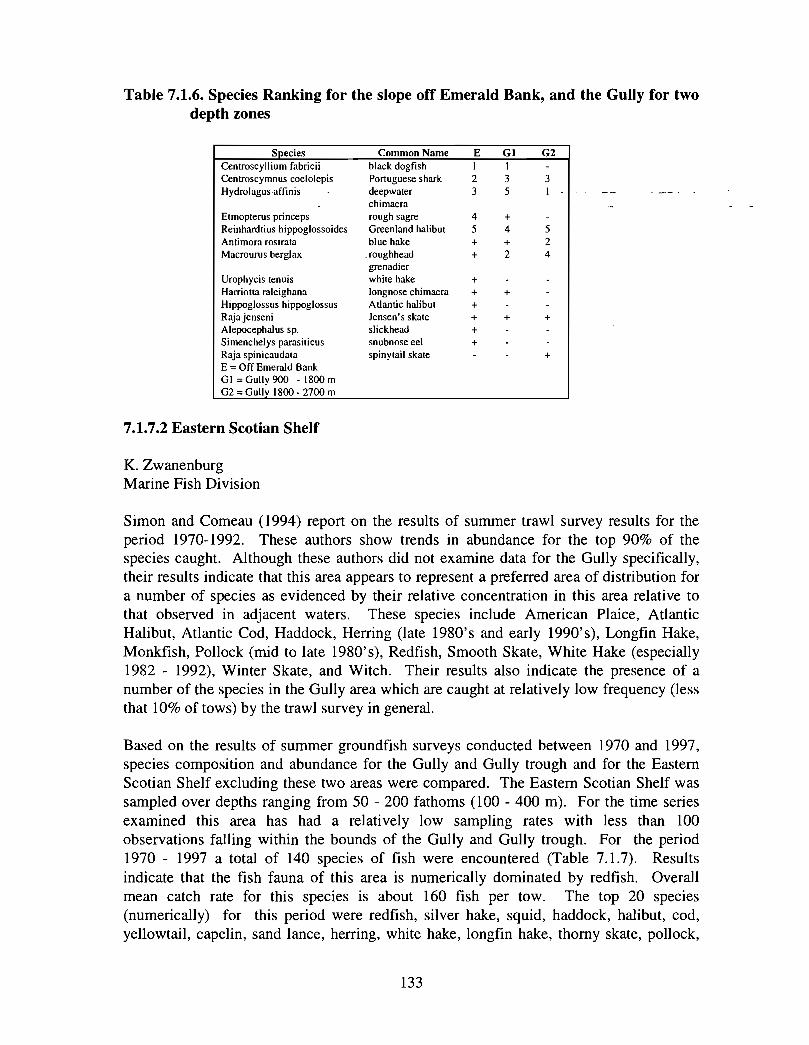
Table 7.1.6. Species Ranking for the slope off Emerald Bank, and the Gully for twodepth zones
Specie s
Centroscyllium fabriciiCentroscymnus coelolepis
Hydrolagus affinis
Etmopterus princepsReinhardtius hippoglossoides
Antimora rostrataMacrourus berglax
Urophycis tenuisHarriotta raleighana
Hippoglossus hippoglossusRaja jenseni
Alepocephalus sp .Simenchelys parasiticusRaja spinicaudat a
E = Off Emerald BankG 1= Gu11y 900 - 1800 mG2 = GuII ri1 800 - 2700 m
7.1 .7.2 Eastern Scotian Shelf
K. ZwanenburgMarine Fish Division
Common Name E G1 G2
black dogfish I I
Portuguese shark 2 3 3deepwater 3 5 1
chimaer arough sagre 4 + -
Greenland halibut 5 4 5
blue hake + + 2.roughhead + 2 4grenadier
white hake + -longnose chimaera + +Atlantic halibut + -
Jensen's skate + + +slickhead + - -snubnose eel + - -spinytail skate - - +
Simon and Comeau (1994) report on the results of summer trawl survey results for theperiod 1970-1992 . These authors show trends in abundance for the top 90% of thespecies caught . Although these authors did not examine data for the Gully specifically,their results indicate that this area appears to represent a preferred area of distribution fora number of species as evidenced by their relative concentration in this area relative tothat observed in adjacent waters . These species include American Plaice, AtlanticHalibut, Atlantic Cod, Haddock, Herring (late 1980's and early 1990's), Longfin Hake,Monkfish, Pollock (mid to late 1980's), Redfish, Smooth Skate, White Hake (especially1982 - 1992), Winter Skate, and Witch . Their results also indicate the presence of anumber of the species in the Gully area which are caught at relatively low frequency (lessthat 10% of tows) by the trawl survey in general .
Based on the results of summer groundfish surveys conducted between 1970 and 1997,species composition and abundance for the Gully and Gully trough and for the EasternScotian Shelf excluding these two areas were compared . The Eastern Scotian Shelf wassampled over depths ranging from 50 - 200 fathoms (100 - 400 m) . For the time seriesexamined this area has had a relatively low sampling rates with less than 100observations falling within the bounds of the Gully and Gully trough . For the period1970 - 1997 a total of 140 species of fish were encountered (Table 7 .1 .7). Resultsindicate that the fish fauna of this area is numerically dominated by redfish . Overallmean catch rate for this species is about 160 fish per tow. The top 20 species(numerically) for this period were redfish, silver hake, squid, haddock, halibut, cod,yellowtail, capelin, sand lance, herring, white hake, longfin hake, thorny skate, pollock ,
133
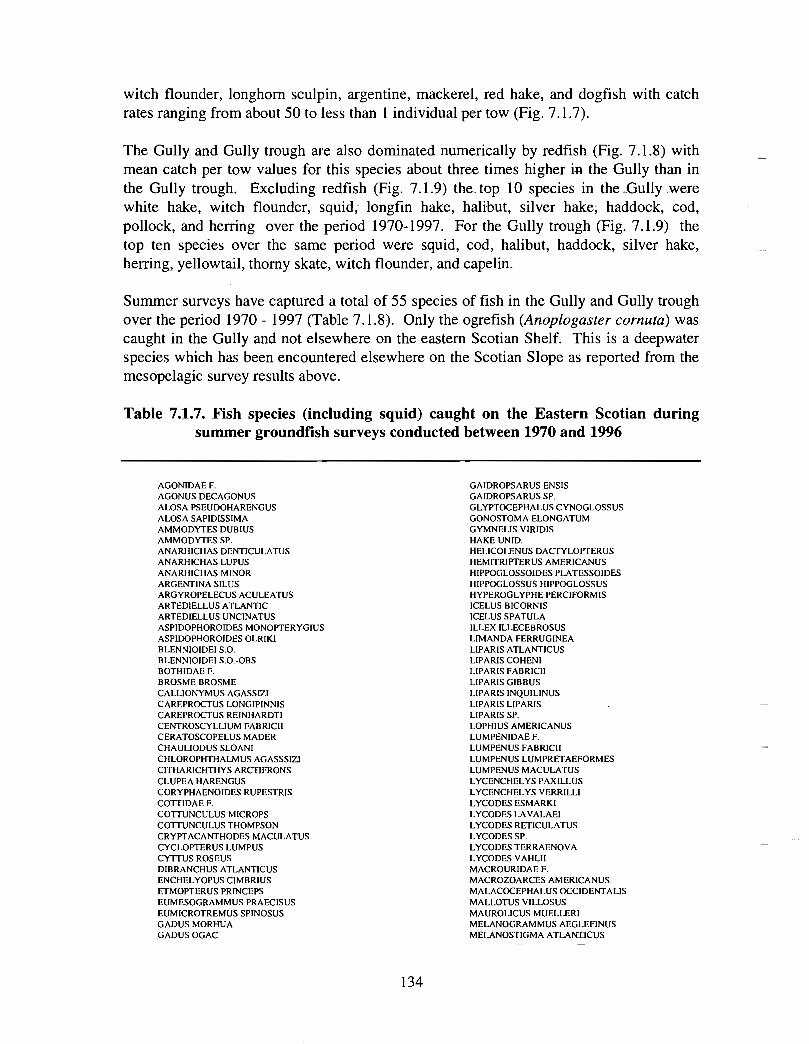
witch flounder, longhorn sculpin, argentine, mackerel, red hake, and dogfish with catchrates ranging from about 50 to less than 1 individual per tow (Fig. 7 .1 .7) .
The Gully and Gully trough are also dominated numerically by redfish (Fig . 7 .1 .8) withmean catch per tow values for this species about three times higher in the Gully than inthe Gully trough. Excluding redfish (Fig . 7.1 .9) the -top 10 species in the _Gully werewhite hake, witch flounder, squid; longfin hake, halibut, silver hake ; haddock, cod,pollock, and herring over the period 1970-1997 . For the Gully trough (Fig . 7.1 .9) thetop ten species over the same period were squid, cod, halibut, haddock, silver hake,herring, yellowtail, thorny skate, witch flounder, and capelin .
Summer surveys have captured a total of 55 species of fish in the Gully and Gully troughover the period 1970 - 1997 (Table 7 .1 .8) . Only the ogrefish (Anoplogaster cornuta) wascaught in the Gully and not elsewhere on the eastern Scotian Shelf . This is a deepwaterspecies which has been encountered elsewhere on the Scotian Slope as reported from themesopelagic survey results above .
Table 7.1.7. Fish species (including squid) caught on the Eastern Scotian duringsummer groundfish surveys conducted between 1970 and 1996
AGONID AE F .
AGONUSDECAGONUSALOSA PSEUDOHARENGUSALOSA SAPIDISSIMA
AMMODYTES DUBIUSAMMODYTES SP .ANARHICHAS DENTICULATUSANARHICHAS LUPUSANARHICHAS MINOR
ARGENTINA SILUSARGYROPELECUS ACULEATUSARTEDIELLUS ATLANTICARTEDIELLUS UNCINATUSASPIDOPHOROIDES MONOPTERYGIUS
ASPIDOPHOROIDES OLRIKIBLENNIOIDEI S .O.BLENNIOIDEI S .O.-OBSBOTHIDAE F .
BROSME BROSMECALLIONYMUS AGASSIZICAREPROCTUS LONGIPINNISCAREPROCTUS REINHARDTICENTROSCYLLIUM FABRICII
CERATOSCOPELUS MADERCHAULIODUS SLOANICHLOROPHTHALMUS AGASSSIZ[
CITHARICHTHYS ARCTIFRONSCLUPEA HARENGUSCORYPHAENOIDES RUPESTRIS
COTTIDAE F.
COTTUNCULUS MICROPSCOTTUNCULUSTHOMPSON
CRYPTACANTHODES MACULATU S
CYCLOPTERUS LUMPUSCYTTUS ROSEUSDIBRANCHUS ATLANTICUSENCHELYOPUS CIMBRIUS
ETMOPTERUS PRINCEPSEUMESOGRAMMUS PRAECISUSEUMICROTREMUS SPINOSUS
GADUS MORHUAGADUS OGAC
GAIDROPSARUS ENSISGAIDROPSARUS SP .
GLYPTOCEPHALUS CYNOGLOSSUSGONOSTOMA ELONGATUMGYMNELIS VIRIDISHAKE UNID.
HELICOLENUS DACTYLOPTERUSHEMITRIPTERUS AMERICANUSHIPPOGLOSSOIDES PLATESSOIDESHIPPOGLOSSUS HIPPOGLOSSUSHYPEROGLYPHE PERCIFORMIS
ICELUS BICORNI SICELUS SPATULAILLEX ILLECEBROSUSLIMANDA FERRUGINEA
LIPARIS ATLANTICUSLIPARIS COHENILIPARIS FABRICIILIPARIS GIBBUSLIPARIS INQUILINUS
LIPARIS LIPARISLIPARIS SP .LOPHIUS AMERICANUSLUMPENIDAE F.LUMPENUS FABRICI I
LUMPENUS LUMPRETAEFORMESLUMPENUS MACULATUS
LYCENCHELYS PAXILLUSLYCENCHELYS VERRILLILYCODES ESMARK ILYCODES LAVALAEI
LYCODES RETICULATUSLYCODES SP .LYCODES TERRAENOVALYCODES VAHUIMACROURIDAE F .MACROZOARCES AMERICANU SMALACOCEPHALUS OCCIDENTALIS
MALLOTUS VILLOSUSMAUROLICUS MUELLERIMELANOGRAMMUS AEGLEFINUSMELANOSTIGMA ATLAIIT_ICU S
134
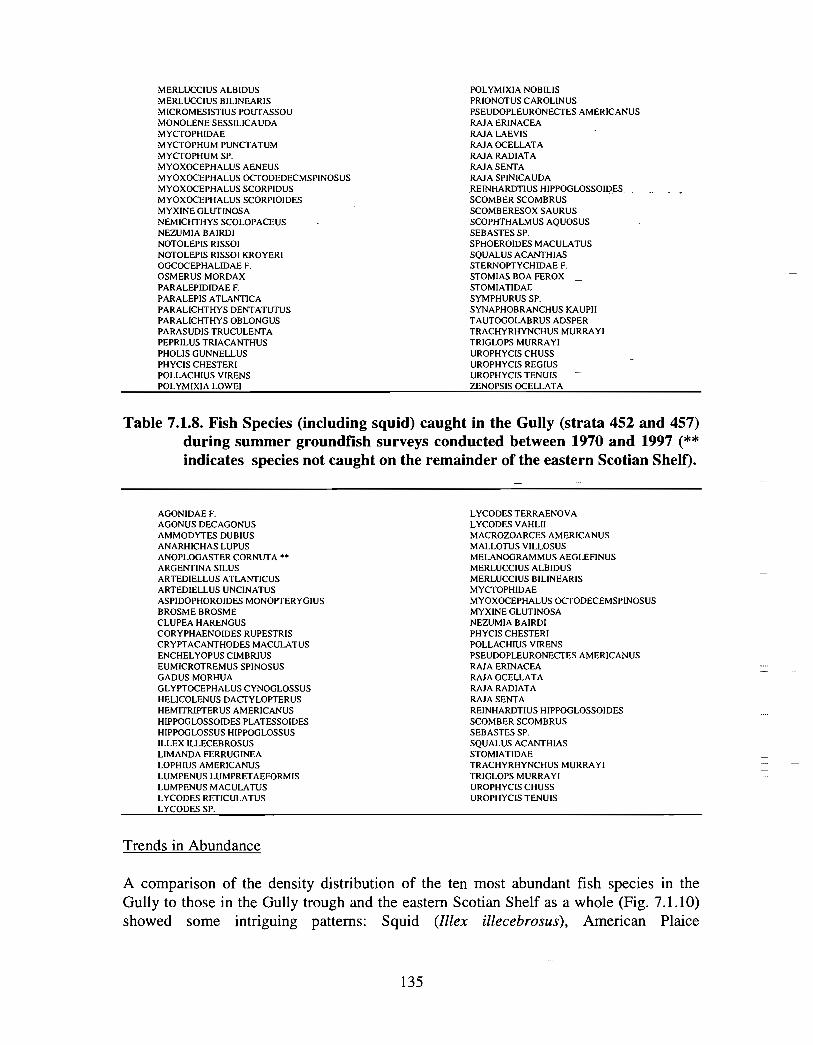
MERLUCCIUS ALBIDUSMERLUCCIUS BILINEARIS
MICROMESISTIUS POUTASSOUMONOLENE SESSILICAUDAMYCTOPHIDA E
MYCTOPHUM PUNCTATUMMYCTOPHUM SP.MYOXOCEPHALUS AENEUSMYOXOCEPHALUS OCTODEDECMSPINOSUS
MYOXOCEPHALUS SCORPIDUSMYOXOCEPHALUS SCORPIOIDESMYXINE GLUTINOSA
NEMICHTHYS SCOLOPACEUSNEZUMIA BAIRDINOTOLEPIS RISSOINOTOLEPIS RISSOI KROYERIOGCOCEPHALIDAE F.
OSMERUS MORDAXPARALEPIDIDAE F .PARALEPIS ATLANTICAPARALICHTHYS DENTATUTUS
PARALICHTHYS OBLONGUSPARASUDIS TRUCULENTAPEPRILUS TRIACANTHUS
PHOLIS GUNNELLU SPHYCIS CHESTERI
POLLACHIUS VIRENSPOLYMIXIA LOWEI
POLYMIXIA NOBILISPRIONOTUS CAROLINUSPSEUDOPLEURONECTES AMERICANUS
RAJA ERINACE ARAJA LAEVISRAJA OCELLATARAJA RADIATA
RAJA SENTARAJA SPINICAUD AREINHARDTIUS HIPPOGLOSSOIDES_
SCOMBERSCOMBRUSSCOMBERESOX SAURUSSCOPHTHALMUS AQUOSUSSEBASTES SP.
SPHOEROIDES MACULATUSSQUALUS ACANTHIASSTERNOPTYCHIDAE F .STOMIAS BOA FEROXSTOMIATIDAE
SYMPHURUSSP.SYNAPHOBRANCHUS KAUPIITAUTOGOLABRUSADSPERTRACHYRHYNCHUSMURRAYI
TRIGLOPS MURRAYIUROPHYCIS CHUSSUROPHYCIS REGIUSUROPHYCIS TENUI S
ZENOPSIS OCELLATA
Table 7.1.8. Fish Species (including squid) caught in the Gully (strata 452 and 457)during summer groundfish surveys conducted between 1970 and 1997 (**indicates species not caught on the remainder of the eastern Scotian Shelf) .
AGONIDAE F .AGONUSDECAGONUSAMMODYTES DUBIUSANARHICHAS LUPUSANOPLOGASTER CORNUTA **
ARGENTINA SILUSARTEDIELLUS ATLANTICUSARTEDIELLUS UNCINATUSASPIDOPHOROIDES MONOPTERYGIUS
BROSME BROSMECLUPEA HARENGUSCORYPHAENOIDES RUPESTRISCRYPTACANTHODES MACULATUSENCHELYOPUS CIMBRIUS
EUMICROTREMUS SPINOSUSGADUS MORHU AGLYPTOCEPHALUS CYNOGLOSSUSHELICOLENUS DACTYLOPTERUS
HEMITRIPTERUS AMERICANUSHIPPOGLOSSO ID ES PLATESSOIDESHIPPOGLOSSUSHIPPOGLOSSUS
ILLEX a,LECEBROSU SLIMANDA FERRUGINEA
LOPHIUS AMERICANUSLUMPENUS LUMPRETAEFORMISLUMPENUS MACULATUS
LYCODES RETICULATUSLYCODES SP.
LYCODESTERRAENOVALYCODES VAHLII
MACROZOARCES AMERICANUSMALLOTUS VILLOSUSMELANOGRAMMUS AEGLEFINUSMERLUCCIUS ALBIDUSMERLUCCIUS BILINEARIS
MYCTOPHIDAEMYOXOCEPHALUS OCTODECEMSPINOSUSMYXINE GLUTINOSANEZUMIA BAIRDI
PHYCIS CHESTERIPOLLACHIUS VIRENSPSEUDOPLEURONECTES AMERICANUSRAJA ERINACEA
RAJA OCELLATARAJA RADIATARAJA SENT AREINHARDTIUS HIPPOGLOSSOIDES
SCOMBERSCOMBRUS
SEBASTESSP .
SQUALUS ACANTHIASSTOMIATIDAE
TRACHYRHYNCHUS MURRAYITRIGLOPS MURRAYIUROPHYCIS CHUSSUROPHYCIS TENUIS
Trends in Abundanc e
A comparison of the density distribution of the ten most abundant fish species in theGully to those in the Gully trough and the eastern Scotian Shelf as a whole (Fig . 7 .1 .10)showed some intriguing patterns : Squid (Illex illecebrosus), American Plaic e
135
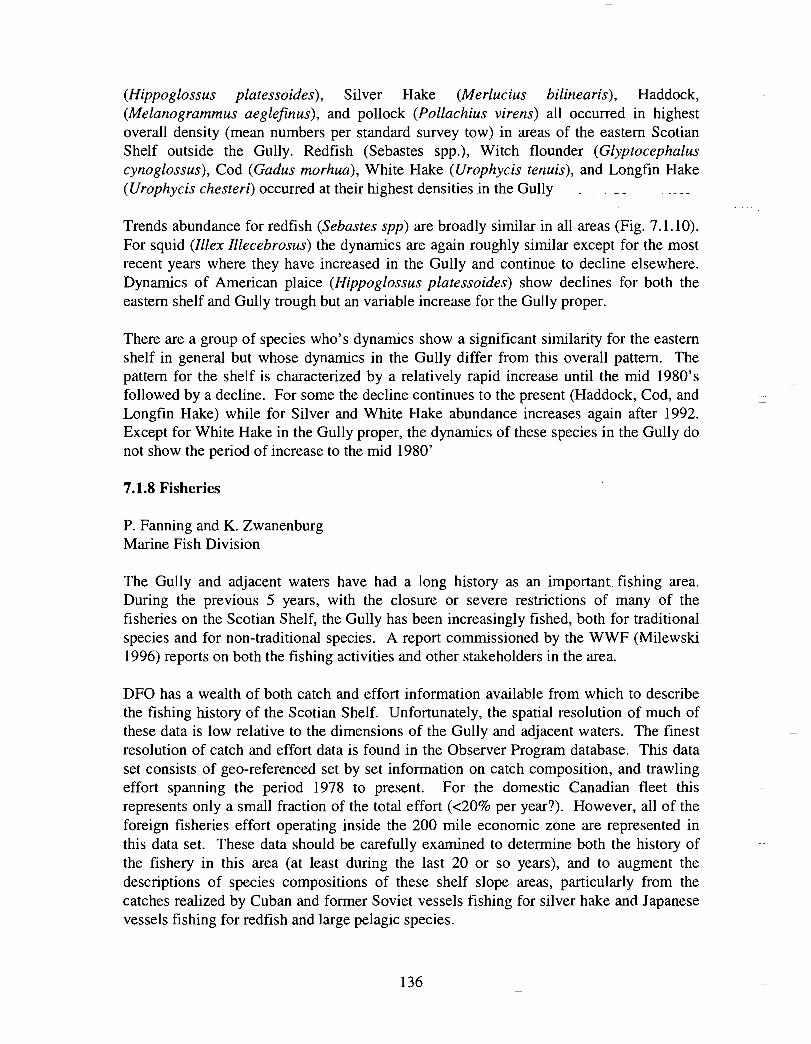
(Hippoglossus platessoides), Silver Hake (Merlucius bilinearis), Haddock,(Melanogrammus aeglefinus), and pollock (Pollachius virens) all occurred in highestoverall density (mean numbers per standard survey tow) in areas of the eastern ScotianShelf outside the Gully . Redfish (Sebastes spp .), Witch flounder (Glyptocephaluscynoglossus), Cod (Gadus morhua), White Hake (Urophycis tenuis), and Longfin Hake(Urophycis chesteri) occurred at their highest densities in the Gully
Trends abundance for redfish (Sebastes spp) are broadly similar in all areas (Fig . 7 .1 .10) .For squid (Illex Illecebrosus) the dynamics are again roughly similar except for the mostrecent years where they have increased in the Gully and continue to decline elsewhere .Dynamics of American plaice (Hippoglossus platessoides) show declines for both theeastern shelf and Gully trough but an variable increase for the Gully proper .
There are a group of species who's dynamics show a significant similarity for the easternshelf in general but whose dynamics in the Gully differ from this overall pattern . Thepattern for the shelf is characterized by a relatively rapid increase until the mid 1980'sfollowed by a decline. For some the decline continues to the present (Haddock, Cod, andLongfin Hake) while for Silver and White Hake abundance increases again after 1992 .Except for White Hake in the Gully proper, the dynamics of these species in the Gully donot show the period of increase to the mid 1980 '
7.1.8 Fisheries
P. Fanning and K . Zwanenburg
Marine Fish Division
The Gully and adjacent waters have had a long history as an important fishing area .During the previous 5 years, with the closure or severe restrictions of many of thefisheries on the Scotian Shelf, the Gully has been increasingly fished, both for traditionalspecies and for non-traditional species . A report commissioned by the WWF (Milewski1996) reports on both the fishing activities and other stakeholders in the area .
DFO has a wealth of both catch and effort information available from which to describethe fishing history of the Scotian Shelf . Unfortunately, the spatial resolution of much ofthese data is low relative to the dimensions of the Gully and adjacent waters . The finestresolution of catch and effort data is found in the Observer Program database . This dataset consists of geo-referenced set by set information on catch composition, and trawlingeffort spanning the period 1978 to present . For the domestic Canadian fleet thisrepresents only a small fraction of the total effort (<20% per year?) . However, all of theforeign fisheries effort operating inside the 200 mile economic zone are represented inthis data set . These data should be carefully examined to determine both the history ofthe fishery in this area (at least during the last 20 or so years), and to augment thedescriptions of species compositions of these shelf slope areas, particularly from thecatches realized by Cuban and former Soviet vessels fishing for silver hake and Japanesevessels fishing for redfish and large pelagic species .
136

The difficulties associated with trawling in much of the area both-in the steep sidedcanyons of the Gully and the adjacent deep waters (> 300m seaward, and stratum 457landward) have likely contributed to the relatively low sampling rate for the area .However, this area has been important to the fishing industry (both mobile gear and fixedgear) over an extended period . The detailed catch and effort information .gather.ed by. themembers of the Fishermen and Scientists Research Society would be an additional sourceof information, however we must appreciate the potential sensitivities associated withthese data if they are to be used in what could be viewed by members of the industry, asan argument to restrict fishing activities in the area .
We examined the general catch and effort data collected by DFO for the past three years(1995 - 1997) to get an indication of present fishing effort in the Gully and adjacentwaters . The resolution of these recent data is by geo-referenced location of each set .Prior to 1992, the highest level of resolution was to unit area . Since the Gully is bisectedby the boundaries of two NAFO unit areas, it is difficult to use these earlier data to gainan understanding of fishing effort in the area . There is a complicating factor to theseanalyses in that the major fisheries in this area have been essentially closed since 1993with the declaration of a moratorium on the Eastern Scotian Shelf cod stock .
Fig. 7.1 .11 shows that since 1995 the bulk of trawler effort has moved progressivelyeastward in the past three years . It is likely that this trawler effort was mainly directed atredfish, especially the effort along the edge of the continental shelf and along the slopesof the deep holes on the shelf proper . In 1995 we observe that there were several hundredsets in the mouth of the Gully and the waters immediately adjacent and to the east .
Shrimp trawls (Fig . 7 .1 .12) were active on the eastern Scotian Shelf during the period1995 - 1997, but concentrated their efforts in the mixed depth areas to the north and eastof the Gully . Only a very few sets were made in the Gully trough in the past two years .Effort by Danish Seiners (Fig . 7 .1 .13) has been more or less restricted to the shallowestportion of Banquereau Bank and none has been expended in the Gully .
Longline effort (Fig. 7 .1 .14) represents by far the most significant portion of all thefishing effort in the area . This effort is focused to a large extent on Atlantic halibut(Hippoglossus hippoglossus) and White hake (Urophycis tenuis) . Over the past threeyears this effort has amounted to hundreds of sets annually .
These preliminary analyses indicate that the Gully presently represents an area ofsignificant longline effort but that trawler effort is presently low. Indication fromindustry representatives are that the Gully has in the past been an area of significanttrawler activity and that the current lack of activity is due to the moratorium in effect .
137
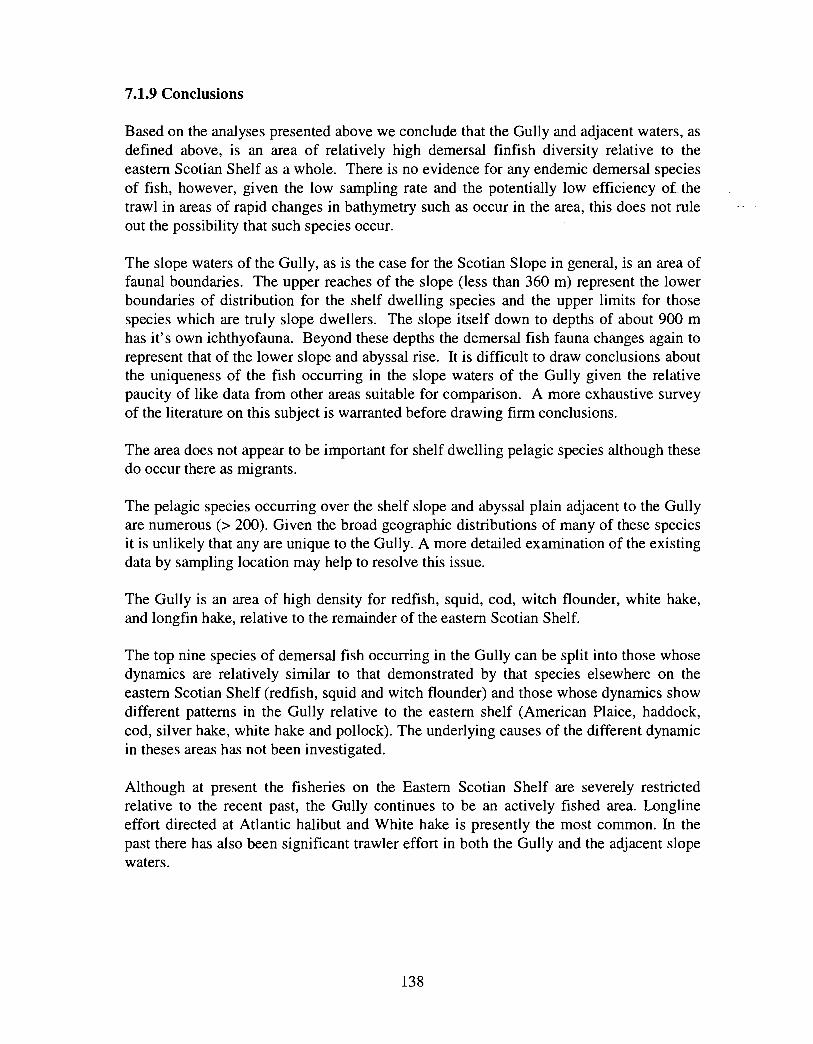
7.1.9 Conclusions
Based on the analyses presented above we conclude that the Gully and adjacent waters, asdefined above, is an area of relatively high demersal finfish diversity relative to theeastern Scotian Shelf as a whole . There is no evidence for any endemic demersal speciesof fish, however, given the. low sampling rate and the potentially low efficiency oLthetrawl in areas of rapid changes-in bathymetry such as occur in the area, this does not ruleout the possibility that such species occur.
The slope waters of the Gully, as is the case for the Scotian Slope in general, is an area offaunal boundaries . The upper reaches of the slope (less than 360 m) represent the lowerboundaries of distribution for the shelf dwelling species and the upper limits for thosespecies which are truly slope dwellers . The slope itself down to depths of about 900 mhas it's own ichthyofauna. Beyond these depths the demersal fish fauna changes again torepresent that of the lower slope and abyssal rise . It is difficult to draw conclusions aboutthe uniqueness of the fish occurring in the slope waters of the Gully given the relativepaucity of like data from other areas suitable for comparison . A more exhaustive surveyof the literature on this subject is warranted before drawing firm conclusions .
The area does not appear to be important for shelf dwelling pelagic species although thesedo occur there as migrants .
The pelagic species occurring over the shelf slope and abyssal plain adjacent to the Gullyare numerous (> 200) . Given the broad geographic distributions of many of these speciesit is unlikely that any are unique to the Gully . A more detailed examination of the existingdata by sampling location may help to resolve this issue .
The Gully is an area of high density for redfish, squid, cod, witch flounder, white hake,and longfin hake, relative to the remainder of the eastern Scotian Shelf .
The top nine species of demersal fish occurring in the Gully can be split into those whosedynamics are relatively similar to that demonstrated by that species elsewhere on theeastern Scotian Shelf (redfish, squid and witch flounder) and those whose dynamics showdifferent patterns in the Gully relative to the eastern shelf (American Plaice, haddock,cod, silver hake, white hake and pollock). The underlying causes of the different dynamicin theses areas has not been investigated .
Although at present the fisheries on the Eastern Scotian Shelf are severely restrictedrelative to the recent past, the Gully continues to be an actively fished area . Longlineeffort directed at Atlantic halibut and White hake is presently the most common . In thepast there has also been significant trawler effort in both the Gully and the adjacent slopewaters .
138
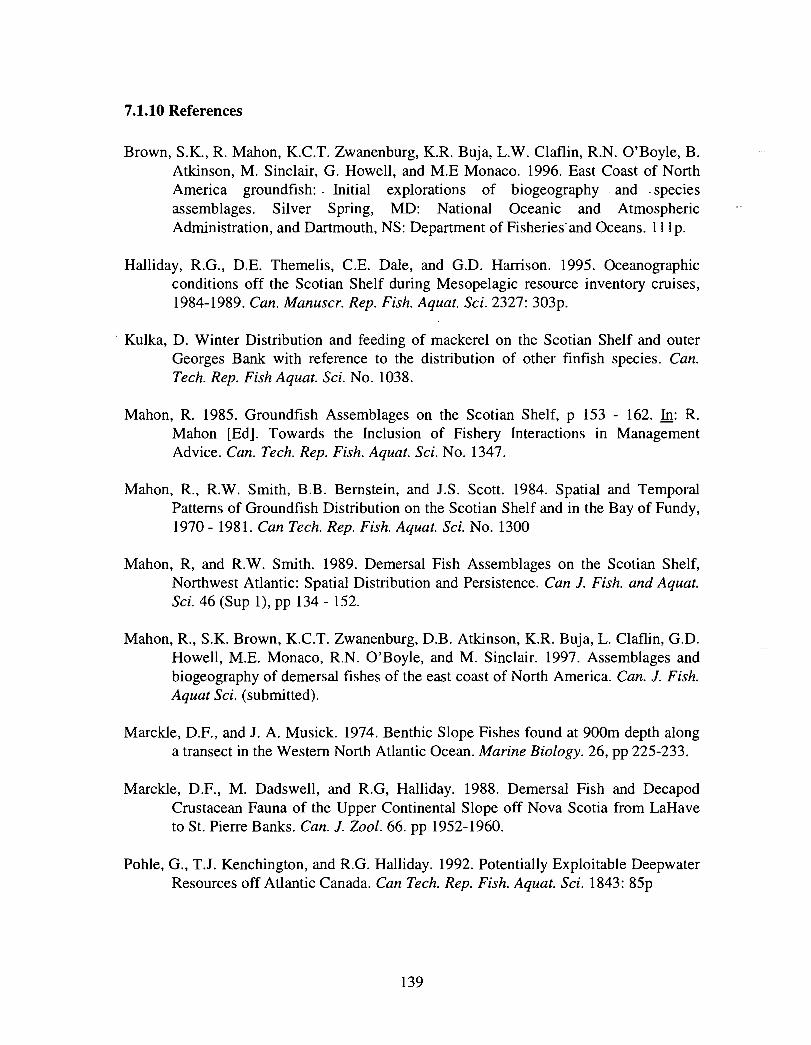
7.1.10 References
Brown, S.K., R. Mahon, K .C.T. Zwanenburg, K.R. Buja, L .W. Claflin, R.N . O'Boyle, B .Atkinson, M . Sinclair, G . Howell, and M .E Monaco . 1996. East Coast of NorthAmerica groundfish: - Initial explorations of biogeography and . speciesassemblages . Silver Spring, MD: National Oceanic and - AtmosphericAdministration, and Dartmouth, NS : Department of Fisheries and Oceans . I l lp .
Halliday, R.G., D.E. Themelis, C .E. Dale, and G.D. Harrison. 1995. Oceanographicconditions off the Scotian Shelf during Mesopelagic resource inventory cruises,1984-1989 . Can. Manuscr. Rep. Fish. Aquat. Sci . 2327: 303p .
Kulka, D. Winter Distribution and feeding of mackerel on the Scotian Shelf and outerGeorges Bank with reference to the distribution of other finfish species . Can .Tech. Rep. Fish Aquat. Sci. No. 1038.
Mahon, R. 1985. Groundfish Assemblages on the Scotian Shelf, p 153 - 162. In : R.Mahon [Ed] . Towards the Inclusion of Fishery Interactions in ManagementAdvice . Can. Tech. Rep. Fish. Aquat. Sci . No. 1347 .
Mahon, R., R.W. Smith, B.B. Bernstein, and J .S. Scott . 1984. Spatial and TemporalPatterns of Groundfish Distribution on the Scotian Shelf and in the Bay of Fundy,1970 - 1981 . Can Tech. Rep. Fish. Aquat. Sci. No. 1300
Mahon, R, and R .W. Smith. 1989. Demersal Fish Assemblages on the Scotian Shelf,Northwest Atlantic : Spatial Distribution and Persistence . Can J. Fish. and Aquat.Sci. 46 (Sup 1), pp 134 - 152 .
Mahon, R., S .K. Brown, K.C.T . Zwanenburg, D.B . Atkinson, K.R. Buja, L. Claflin, G .D .Howell, M.E . Monaco, R .N. O'Boyle, and M. Sinclair . 1997 . Assemblages andbiogeography of demersal fishes of the east coast of North America . Can. J. Fish.Aquat Sci . (submitted) .
Marckle, D.F., and J . A. Musick. 1974. Benthic Slope Fishes found at 900m depth alonga transect in the Western North Atlantic Ocean . Marine Biology . 26, pp 225-233 .
Marckle, D.F., M . Dadswell, and R.G, Halliday . 1988. Demersal Fish and DecapodCrustacean Fauna of the Upper Continental Slope off Nova Scotia from LaHaveto St . Pierre Banks . Can. J. Zool . 66 . pp 1952-1960 .
Pohle, G ., T.J . Kenchington, and R.G. Halliday. 1992. Potentially Exploitable DeepwaterResources off Atlantic Canada . Can Tech. Rep. Fish. Aquat. Sci . 1843: 85p
139
Shackell, N ., Simard, P ., and Butler, M . 1996. Potential Protected Area in the GullyRegion, Scotian Shelf. Report to World Wildlife Fund of Canada . June, 1996 .
Simon, J .E., and P.A. Comeau. 1994. Summer Distribution and Abundance Trends ofSpecies Caught on the Scotian Shelf from 1970 - 1992, by the Research VesselGroundfish Survey . Can Tech. Rep. of Fish. and Aquat. Sci. 1953 : x + 145p .
Strong, M., and A. Hanke . 1995. Diversity of Finfish Species in the Scotia Fundy Region .Can Tech Rep. of Fish. and Aquat. Sci . 2017: vii + 106p .
Scott, J .S . 1976. Summer Distribution of Groundfish on the Scotian Shelf, 1970 - 74.Fish. Res. Board Can. Tech. Rep . No. 635 .
Scott . J .S ., J .-J. Maguire, P. Koeller, and M. Sinclair. 1982. Groundfish Distribution and
Abundance on the Scotian Shelf and Southern Gulf of St . Lawrence. ICES Contr.
No. 16. Symposium on the Biological Productivity on Continental Shelves in the
Temperate Zone of the North Atlantic . (mimeo) .
140
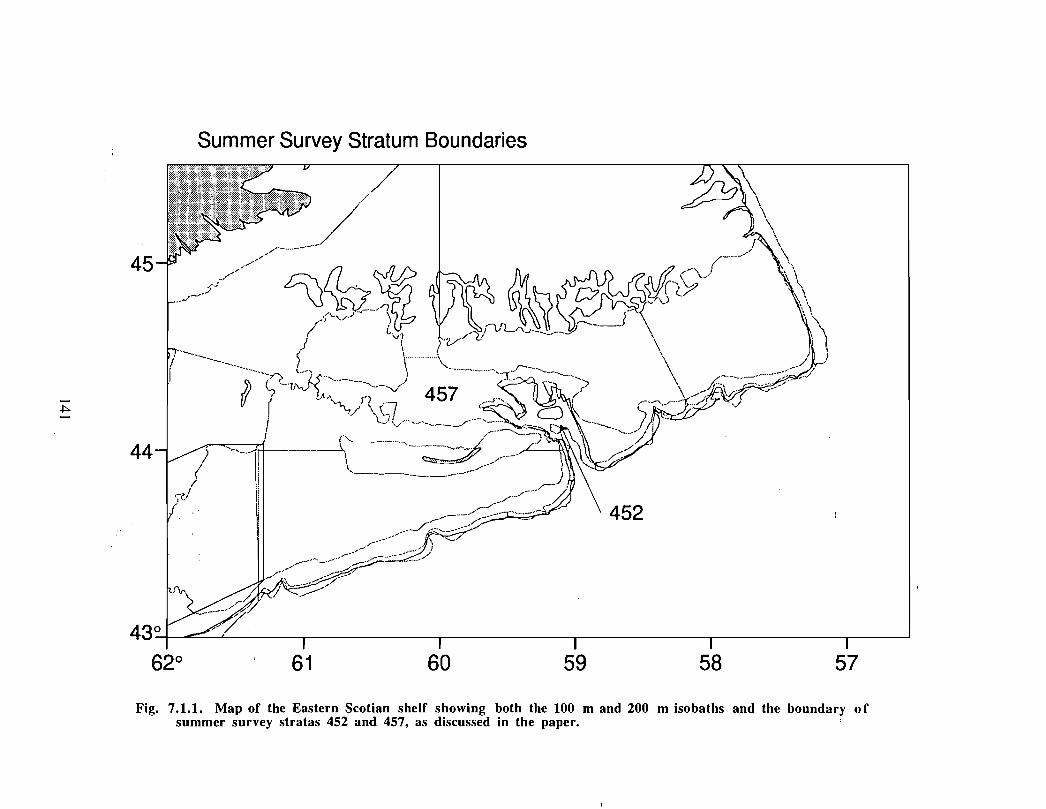
Summer Survey Stratum Boundaries
--1- 161 60 59 58 57
Fig. 7.1 .1 . Map of the Eastern Scotian shelf showing both the 100 m and 200 m isobaths and the boundary ofsummer survey stratas 452 and 457, as discussed in the paper .
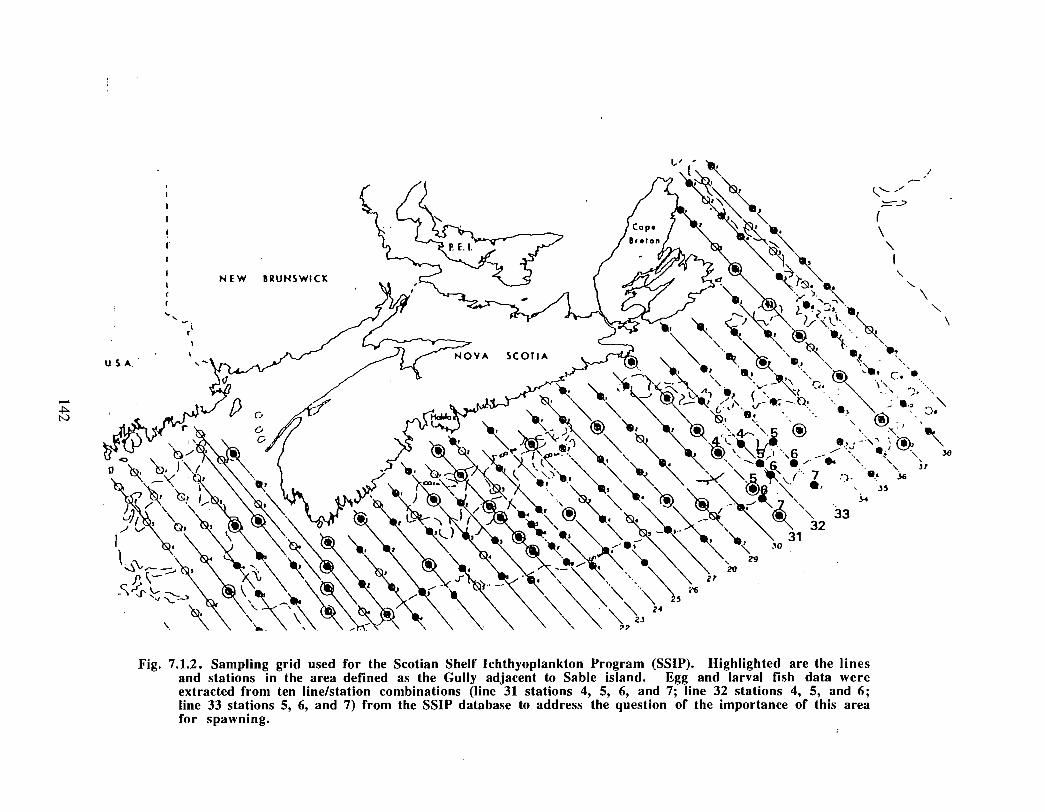
Fig. 7.1 .2. Sampling grid used for the Scotian Shelf Ichthyoplankton Program (SSIP) . Highlighted are the linesand stations in the area defined as the Gully adjacent to Sable island . Egg and larval fish data wereextracted from ten line/station combinations (line 31 stations 4, 5, 6, and 7 ; line 32 stations 4, 5, and 6 ;line 33 stations 5, 6, and 7) from the SSIP database to address the question of the importance of this areafor spawning .

Silver hake eggs I
1 .2
1
02
01
Pollock eggs
1 .2
02
OO
2 3 4 5 6 7month
8 9 1 2
é2 3 4 5 6 7 8 9 10 Il 12
mont h
American plaice eggs
0.4
o
0.3
6 7mont h
Cod egg s
0.3
2 3 4 5 8 9 10 11 1 2
2 3 4 5 6 7 8 9 10 11 12
month
Fig. 7 .1 .3. Temporal pattern of abundance of the most abundant fish eggtypes encountered in the Gully area.
143
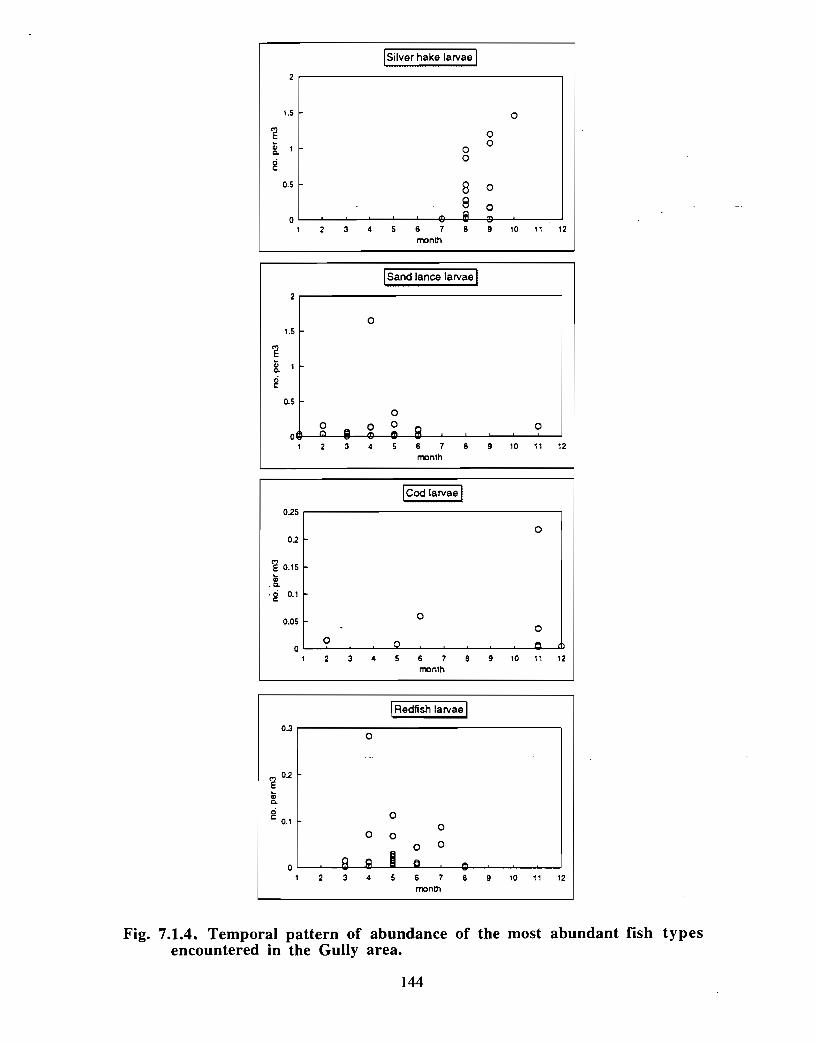
Silver hake larvae
1 .5
o
2
2
Sand lance Iarvae
1 . 5
o
2
3 4 5 6 7
month
6, A, ® 0. 23 4 6 7
month2
Cod Ia rv a e
0.05
0
0.2 5
0 .2
O
5
o
8
8
0
0
10
O
o
1 2
1 2
1 2 3 4 5 6 7 8 9 10 11 12month
Redfish larvae
0 .3
0
O
2
O
O O
3 4 5
O
O
6 7
month
08 9 10 1 2
Fig. 7.1.4. Temporal pattern of abundance of the most abundant fish typesencountered in the Gully area .
144
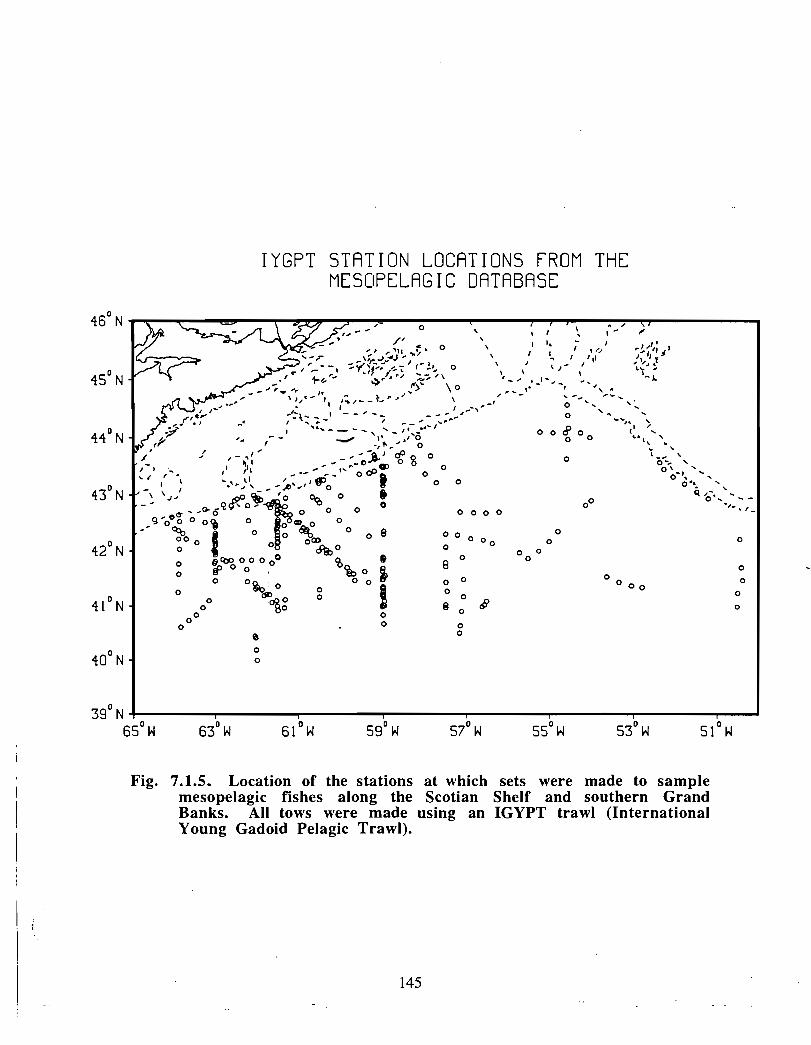
IYGPT STATION LOCATIONS FROM THEMESOPELAGIC DATABAS E
Fig. 7.1.5 . Location of the stations at which sets were made to samplemesopelagic fishes along the Scotian Shelf and southern GrandBanks. All tows were made using an IGYPT trawl (InternationalYoung Gadoid Pelagic Trawl) .
145
Depth Distruibution of Species along the Shelf Edge ( 58 - 60 W, to 1000 m )~-....~.~ . _
~.p. ..~.~.,,,~_ .. ._ .~._ . _
_ .. .~. . ...m~„.~.. . .. .~. . . ._ . _
11.._...a.. ., .,,,,w...~ ..._.~ .. .. ._ .-
~
I
11
ro. P~• n.~q ..Y p-. F .n+Y,~. . . .~. ._ . . .~.....w.~.-
,.. ....~. ., . .,,~._ .....,.._._ .~~.~.~~. ..~~•_,____/
.,. .,.,~.a...-r. :r,~ .,.._ . _
~.a. .. ., .~.,.,
1 :
i
..~ . ~ . ., . .~. ..~.~ . ...._ .-
~..., . .,~..~..... .,~ . ..._ ._
~
I
,~~ .....~_~ . _
_.. ....~ . .},.,.~..._.~._ . __~ .
.. .. ._ ., . .~:... .. . ..~.. ..._ . _
_.~. .,. .,.,b,.~ . .._.~..,` . _
Fig. 7.1.6. Depth distribution of species caught by -redfish directed surveys conducted along the Scotian Shelfbetween 58 and 60W. The data plotted are the total numbers caught by depth zone, the line for each plot i sthe distance weighted least square line. ,
Depth Distruibution of Species along the Shelf Edge ( 58 - 60 W, to 1000 m),..~ .p.. ., .~, ~ ~ .. ~ ~ ....' .,~ . ~ . . ~ ..r .~.._~..~.~.w o .A~.~ .. . . .- ~.~..~,~ .w . ~....~~.-
~., .. . .~,,,, ....--.....w.~ . w
....~ .~.~,.~~... . .~.~.-
w._
~~ .._ . .V-1✓ 4+_•w
I 11
,~... .,. .,,w~._. . .w~_4.. .-
w. _
P+. . .Y. .w'!V
~.p .rw+.....1._Y_•w
I
.~ . .,~ .,.,~..~~ . .~. .~ . w
•f 1 RnH
Y-w /. n .IMF~
fo_++4-I.r M._ • w
rr (J+r .t. n✓.~!
Fig. 7.1.6. (Continued)
Depth Distruibution of Species along the Shelf Edge ( 58 - 60 W, to 1000 m )..rw N. . n.n.tp +...w P.w n.Iwx rre+~~~~•- r~ ..~w+.....- ~•w~ ~•- .. . _ _ ro
.w ~..►~ .-
am
ru. %~~e~., ...+ ..~ . ..
..-..~,a., n• ~ .,,.--»w.~.r+..~ • ..
a+ .n .rvwre+...- ~..r~+ .. .~a. .~ • . .
•..ww~n.nny,•a..~+.v.+~ .. w • ..
.. . ....a..n .~„a.~.. .. . ...~. ~.r . . ._ . ..
I
qw. n• rw~a!re..-+ti~+w r . . .
w~wro ..n.rr w
... ...w.,n.n. .,.a..-~. ..~ .-~~.•-• .
..n. p» . n. ...•+u.•n.~... .. .++ ~. . +..~ . ..
~a ...- . .~w r..~ . ..
-.. a-. n . .,.,,,•a:~ ... ..~ . ...~ • ..
'l l
Fig. 7 .1 .6. (Continued)
I
Depth Distruibution of Species along the Shelf Edge ( 58 - 60 W, to 1000 m ). . ~ ..~.~ ~.~., .,.~..~ ._..~ .. ...~~„ .....~ ~ . ~,„..- .--.. .~_ ._.-
~..~. ., . .~,.~. ._-...~.. ._ . _
~ ~... ., .R., ,. _. ..~. .~ . _
~ . ..N,,.~-~~.~ .. .-
~. .̂ ...:w.~ . _
. ...,~. . .,. ,~
... ...~ . .. . .~,~..~. .. . ..~ .. ..~ .-
. . . ._ .,..~. . .~ . _
~ . .. .~,~
,i!
..~.- ...~,_.-
._.R .,~.'..,,.~-. ..~ ..~ . _
...~. ., . .N,.,.~.~..~ .~ . _
Fig. 7 .1 .6. (Continued)
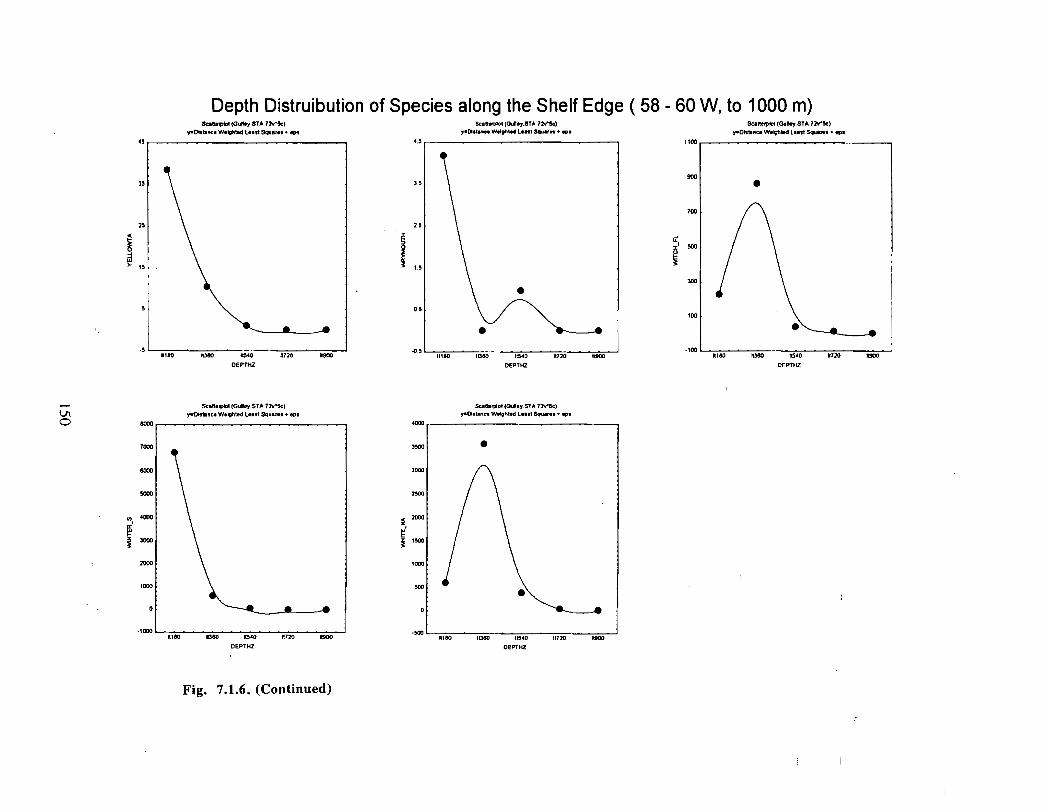
I
Depth Distruibution of Species along the Shelf Edge ( 58 - 60 W, to 1000 m )
4 5
3 5
1!
s
-s
MD
7000
K I M
eieo
Sme.TW (GuBry .BTA 7Ir'5c) Sc .tlrplal (Overy .RTA 7N5e) Sjr.1piM IGaeeY3TA 7NSc1y .OMhncA W.ebO L .M 9Q-• eM l'Dl.bnn MNphW L.M 9W-. . . M . Y'Dbhna VW IpAW Lnft Spuwm • W .
R54 o
OEPTHZ
4720
Sc.t1 .ryM (GuMy .STA 7h-~)
y -Obunu W.IpliteA Lnri BQU.m • ro.
neo wo
DEPTMZ
1172p
4 .3
7 .5
x e
1 .5
0 .5
-0. e
0
tooo
.y wmeo
IW0
DEPTHZ
U720
~: .m~Wa (GW tl .47A 7N6q
y.Dl . We . WNpnbE Ln.( bau ... - P .
oeo (nw
DEPTNZ11720
em wu
DEPTHZ
1720
Fig. 7 .1 .6 . (Continued)
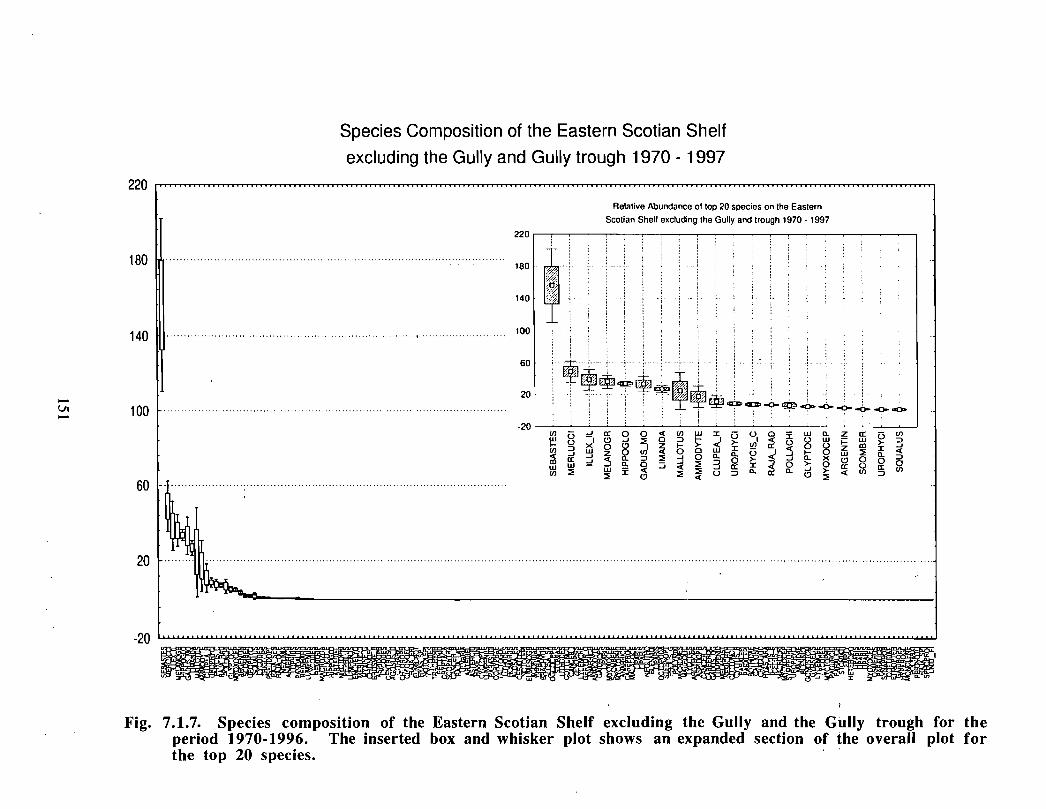
Species Composition of the Eastern Scotian Shelf
excluding the Gully and Gully trough 1970 - 199 7
220
Relative Abundance of top 20 species on the Eastern
Scotian Shell excluding the Gully and trough 1970 • 199 7
18 0
140
100
60
20
-20
. . . . . . . . .. . . . . . . . . . . . . . . . . . . . . . . . . . . . . . . . . . . . . . . . . . . . . . . . . . .. . . . . . . . . . . . . . .
.. . . . . . . . . . . . . . . . . . .
22 0
18 0
14 0
100
6 0
2 0
-20xU
â
wUO~IL5--J0
aw
O
Ô
~
zFzw0Q
CcW
O
8
~YId
QD
Fig. 7.1.7. Species composition of the Eastern Scotian Shelf excluding the Gully and the Gully trough for theperiod 1970-1996 . The inserted box and whisker plot shows an expanded section of the overall plot forthe top 20 species .
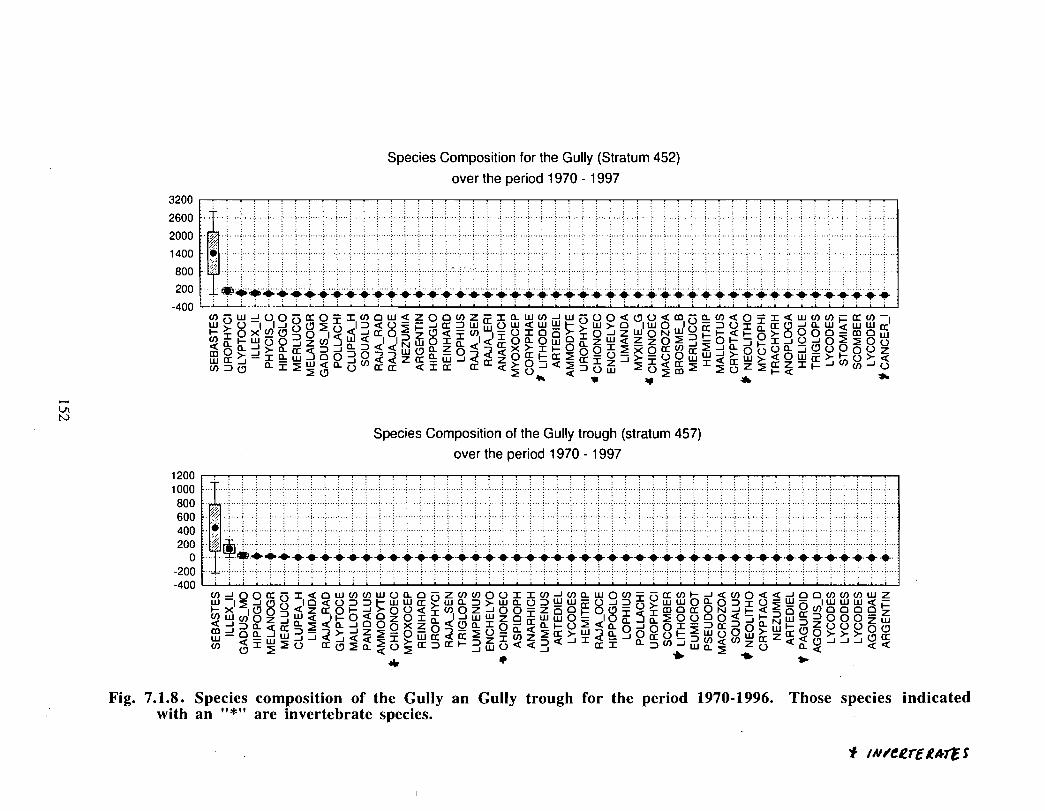
Species Composition for the Gully (Stratum 452)
over the period 1970 - 19973200
2600
2000
1400
800
200
-400
i . . . . ; . . . . . . . :. . . . . : . . ..~ .. . . :. .. . . ; . . . . : . . . ..i . ._, . . .~ . . . .< . . .. _.~ . . . .:. . . . .; . . . .; . . . . ; . . .. ; . . . < . . . .~ .. . . :. . . . . ; . . .. : . . . . .; . . . .i . . .. ; . . . . ; . .. . . . ; . . . . ;. . . . .; . . . . : .. . . .s . . . . ;. . . . :. . . . .~ .. .
: : . . : . . : . . . : .. : . : : : :. . : .: . . : . . : . : . . . . : . . : . : : . : . : . . : . : . : . : . . ~ . . .: . .. : . : . : . . . : . . : . . : : : . , . . .: . . . : . . . : . . . . : .. : . . : . . :. . . .: . . . : . . . . .: . . . . . . . . ... . . . .~qW3 . . . . . : .. : . :_ . . : . .: -~~~~ .}~..:tt.•:::t+tt -W; -9-t:::..t.:.t...t.t.cn V w =~ U O Vgr O== U o w a z O o U z Fr x a w cn - w V U O a ü U Q Co V a cn a O
= -J Ô (D2~8 wlVlô J°z~lg ~°I~ ô=~~al=ôâô W Ô=°zwâ z_°zô~~~~O ►Q-~°
M Q J J= w ô Ô ~° â â z¢ â w~~~ Z p a}[ ~~~~g U~~gÛ Ô w W Q} w~cn~(ry a=> ~~aU~cc Cr a=cl cr °C¢~~M aQ~Ûw 2Û~m›=gÛZ î
.1% y Y4 4b
Species Composition of the Gully trough (stratum 457)
over the period 1970 - 1997
12001 000800600400200
0-200-400
. . . . . . . .
.. . . . . . . . . . . . .. . . ., : : : . . ./ . : :; . ., . . . .,. . . . ;. . .. .. . . . . . . . . .. . . . . . . . .. . ; . . . ., . . . .<. . . . . ; . . .. ;. . . . .; . .. . ; . . . . ; .. .. . ; . . . . :. . . . ;. . . . . ; .. . . ;. . . . .; .,. . .
:. . . . .. . . . . . . . . .. . . .. . . . . . .. . .. . . .. . ` . . : . . . . : .. . . .: . .. .: . . . . :. . . . .: .. . . : . . . . .i . . . . : . . . .<. . .. . :. • . . , . .~(~j : . .. . .: . . . . :. . . . : . . . . .: . .. . : . . . . : . .. . : . . . . : . .. . . . . . . . .. . . . : . .. . : . . . . :. _: . . . . ; . .
?~♦~~+f~t++~tttftt~ ~ t1~t+tt++tttt~t+t+tt~+t+ltt+1• ♦
HXI~(,J70 UUQzU)~a~~~~
(a -1 LU oa w
c ~ I ~ 2 Û J/)
pw U) U) wUa0 V z U) cAOU~UOF J~ww~wa~>- w
âa~.~^- ~0=â .,~!Lw
~
JQQ2°LL0UC~OC~ V=~C7~dQU~oC~cCh Jw U
+é ~
w a Û 0~ry ~=w
(r U)w Ô â
Ô~OIOâgâiÔÛ ô
JW=
QaO -J °0 1: 5- ::1-j Oa: U ► - :D woC2 a :5 Ui wâ
Q (/)OQQ - O 0 U)O =) SU-w- IwOa J :) wW Z) Oa: ::) OwH ~ZQ~ Z Z Q Q~ J2 U aQ QQ~ 'b-
Fig. 7.1 .8 . Species composition of the Gully an Gully trough for the period 1970-1996 . Those species indicatedwith an "*" are invertebrate species .
~ Ô ~
f iNsoeQrERarES
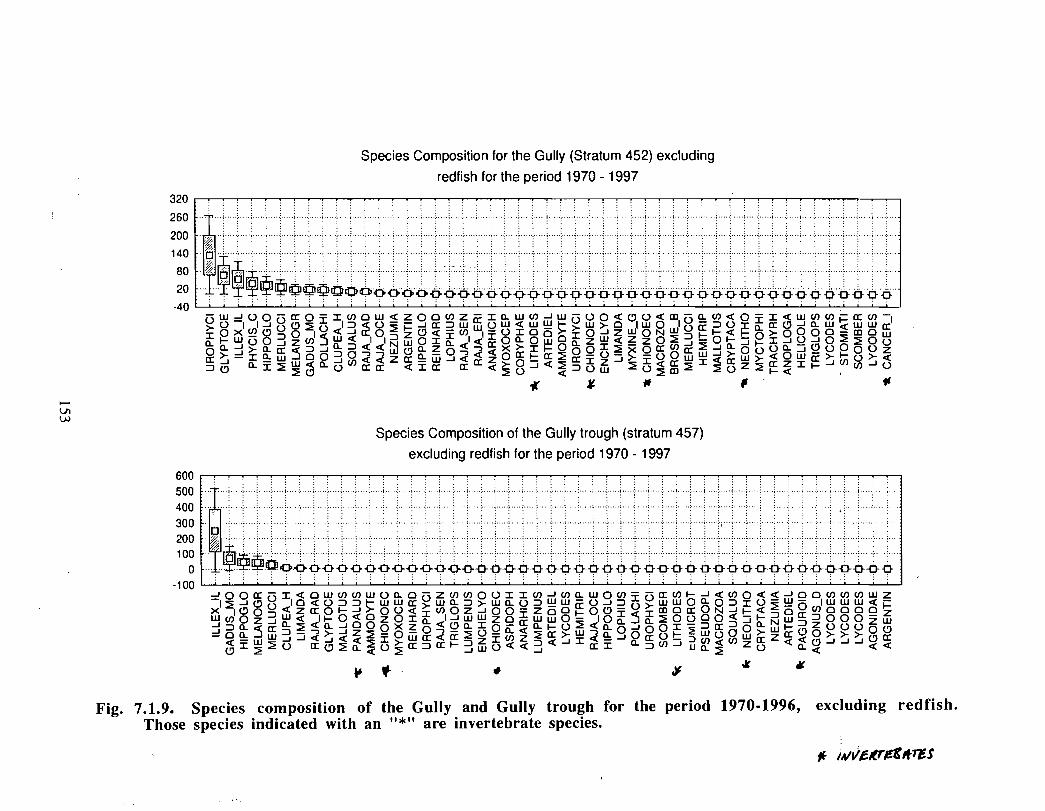
Species Composition for the Gully (Stratum 452) excluding
redfish for the period 1970 - 199 7
320
260
200
140
80
20
-40
. . . . . . . . . . . .i . .. . . ; . . . . < . . . . . . . . . ;. . . . . . . . . .: . . . . . . . .: . . .. : . . . ; . . .. .; . . . . . . . . .. . .<. . . . . . .. .. . . . . . . . .> . . . .L . . . .; . . . .< . . . .. ; . . . .< . . .. .i . . . . .> .. . .6 . . . .> . .. . . . .i . . . .s . . . .i . . . .<. . . . .i .. . . . :. . . . .t . . . .; . .
. . . .. .. . . . . . .: . . . . :. . . . . : :. . . .CI . . : . . .. . : . . . . : . . . . .: . . . . : . . . . .s . . .. . . . . . :
.,/ T . .. . .~`7 • :~. , . .,_ ... ~ . . . .. .. . . . . . . . . . . . . ... .. . . . . .. . .. . . . . .. . .. . . . . . . :. . . .! . . . .: . . . . . .. . .: . .: : :. . . . .: .. . . : . . . . .: . . . . :. . . .. : . . . . .:. . . .. : . . . . .: . . ..t . . . . .: . . . . : . . . . . : .. . . , . . . .: . . . . .: . . . . :. .. . . : . . . . :. .. . . : . . . . ; .. . . . : . . . ..~ . . . . : . .. . .: . . . . ; . . . . .: .. . . ;. . . . . : . . . . ;. . . .. . . . ... . . .L ~-D4
W}UJUpÛ ric 0 Û 1: (nI=o WOXCnS QJ O
O}J_}°" cgolô~ôQ 1 Q WZ) O CL S > W
2 à a U (0 Q~ z49
oU)z Fr Sawc/)Jw VUOQ(7UQm VCL V)Q0==Q Jâ W~w W I
Q=<0 wl = U= o p~= O ~ z ►LI O~ W I~~_ ►- Q~ p~ O O O o a m o w
Z CL QI a Q OX }~ H O p p=~ z Ô~ ui Q>
~} p Û IL ~ C? OU O2O pU Z
cc J~~ < O O J Q~~ U W J 2 U Q m~ Z: < cc Z~~ Z 2~ J(n ~ J Ug U Q F-Q
~ 9 it 0 ,
Species Composition of the Gully trough (stratum 457)
excluding redfish for the period 1970 - 1997
600500
400
300
200100
0
-100
~ . .. ..; . . . .~ . . .., . . . .~ . . . . .: . .. . : . . . . .. . . . .
?OHZ
Oa
U L
QI
. . . . . . . .. . . . . . . . .. . . . . . . . . . . .. . . . .. . . . : . .... ,., . > . . . . . . . . . . .. . : . . . . . . . :.. . . . ... . . . . . . . . . .. . . . . . . . . . .. . . . .. .. . . . :. . . . : . . . < . .: .:. . : . . . . . . : . . . . :. . . . : . .. . .: . . . . . .. : . . . .: . . . . . .. . .. . . . . . . . .. . . . . . .. . . . . . . . . . . . .. . . . . . .. . . . . . .. . .. . .. . . . . . . ., . : . . . . : .
: . . . ..: . . . : . . . . .: . .. . : . . . . .: . . . . :. . . . .: . . ..s. . . . .i . . .i. :. . . <. . . . .: .. . . .:. . . . . :. . . . .: . .. . : . . . .: . . . . : . . .. .: . . . . : . .. . . : . :. . . . . : . . . .<. . . . .i . . ..< . . . . : .. . .~ . . . . : . .. . : . . .. : . . . . : . . . .[ . : . . . . : . . . . .: .. . . : . . . . .: . . . . : . : . . . . < . . .. .:: : : : : s ,
. . . .: :: : : : : :
: :: . . . .. . . .
... . . . . . .. . . . . . . . . .: . . .. .. . . . . . . . . . .. .. . . . . . . . .. . . . . . . . . ... . . . . : . .. .-. . . . ., .. . ., .. _.. . . . .. . . .. . . . . . .. . . . . . . . .. .. . . . . .. . .. . . . . . . . .. . . . . . . . . .. . . . . . .. . . _ . . . . . . .. . . .. . . . . . .. : : :. . . . . . . . . .. . . . . . .: .. . . : . . . .: . . . . : . . .. . : . . . . : . . .. . : . . . . ' :~ . P à>0
: ~~ ~~~~~~~~~ -a-G~~~ ~~~~~~~~ ~~~~ 1
JI~~mU I~Uc ~~~IOZJââJ o d_ 3
CrJ
2 ~ 2 U
ow (n (n W UdoV Z U) cn 0 (J 2=v)a Ô~ ~~ W w m} w a o} w a U
Il:If-OQOOUQâ v) OZJO 0o
1w<r CI_ JoO~~ZOâc7â=pâQd
} Z g - OW-
7~ â Q Û ~ a[ ~ i r ~? w Û â ¢~ ~
JW
W
~0O
Q J
awOcn=V ccQ U J D U} w
~0'ogô° ~=~ a Jâm O
Q S D U
0
(nOQ QJooU) (/)tnw Z
J =
~ J0 0WU z
U w- I w w w Q-Q~ p O U o 0 0 0~~wm~OOO -:D Z W
Û Z Q Q(,j J J J
Q
07c~ Q
%K W
Fig. 7.1 .9. Species composition of the Gully and Gully trough for the period 1970-1996, excluding redfish .Those species indicated with an "*" are invertebrate species .
. . . . .; . .S . . 1 . . . . . . . . . . . .i . . . i . . . . . . i. . . . . . .; . ; . . .. ;. . . . .1 . . .. .. . . .q . .. . ;. . . . ., . . . . .i . . . ., . . . .: . . . , . . . . .: .. ., . . .: . . . ., . . : . ., . : . . .) . . ., . . . . . . .p . .. ., . . . . : . I . . . : . . . ,
0 /A/i!uroU>eS
Trends in abundance of Sebastes sp and Illex illicebrosusTnMS 1n Spedes AbuManp In 1M Ou6y (Sbtl 452)
Ip IAe 9erb0 1970 • 1997
1969 1972 1975 1980 1994 1969 1992 1996
Y1er
ScMlerplol (STI573CI.STA 51r'29c)
rpaWRr We IpIN .A L .tll SquvH • pf
1966 1972 1976 1990 1961 1986 1992 1996
NEWVAR
0
0
Sc66mp41 ( STS7 ALLSTA S1rY&)
y-Dkta-o WeIpM.A L.ol Spuuw • qq
1976 1960 1954 1966 tYYt 1996 2900
YEAR
Sranwylo1 (ST57 /1LLSTA61r'29c)
y-Oht-W .4~t~0 Lem Spmn . M
1966 1972 1976 1969 1961 1966 1992 1996
YEAR
Y000
Scatterpla (ESSNO6L .STA 16t.J26c)
f'Okt- WM9h1e0 Uaft Sprsef . "
SuMrpa (ESSNOOLSTA 16.v'26C)
p-o1.Wtu WUyvw l.uw 8 1 ws. .n
Fig. 7.1.10 . Trends in abundance of the 20 most abundant species in the Gully relative to the trends in thesespecies for the Gully trough and the Eastern Scotian Shelf excluding these areas . The data plotted are thestratified mean numbers caught per standard research tow for the year indicated. The line through thepoints is the distanced weighted least square estimated line .
Trends in abundance of Hippo,qlossus platessoides ar.d Merlucius bilinearisScaOerpbl (ST152SCI .STA 51v'28e) Saatterplal(ST57ALL .STA 51v'28e)
y-Dletenee Welphted Least Squares • eps y-Dlatence Welphted Least Squares + epa
. ~ .1978 . 150
,. . .. . . . •
1980 1984 1988 1992 1998 2000
NEWVAR
ScaOerplot (ST+52SCISTA 51v'29c)
y- Distance Welphted Least Squares • eps
1980 1984 1988 1992 1998 2000
NEWVAR
OJ
Statterplol(ESSNOGL .STA 164v'29c)
y-Distance Weighted Leael Squares • eqa
1 51979 1980 1984 1988 1992 1996 2000 1988 1972 1979 1980 1984 198B 1992 1998 200 0
YEAR
Scetterpd (STS7JU.LSTA 51 v29c)
y-Ohtance Weighted Least Squares • eps
1978 1990 1984 1988 1992 1996 2000
YEAR
Statterpbt (ESSNO(3LSTA 18 W 28c)
y-Distance WelpMed Leael Squares • ep s
14 0
120
100
80
80
40
20
0
.p
1968 1972 1978 1980 1984
YEAR
1988 1992 1998 2000
Fig. 7.1 .10 . ( Continued)
Abundance of Melanogrammus aeglefinnus and Glyptocepahalus cynoqlossusScaOerplol (STIS2SCLSTA 51v'28C(
T-DMlerce WeqMeA Least Squares - airs
90
so
7 0
80
20
10
0
-101988 1972 1976 1980 1984 1988 1992 1996 2000
NEWVAR
ScaO.iplol(ST452SCI .STA Slv'20t)
y-Distance Welphled Leaa1 Squares • ep a
180
140
120
100
w 80
60
40
20
0
1909 1972 1976 1980 1994 1988 1992 1990 2000
NEWVAR
ScaOerpbt (ST57J1LL.STA 51v28c) Statlerpld (ESSNOpL.STA 164v'28[)
y-Olalance WeIOMed Least Squares + eps y-0lstana WelghteA Least Squares • epa
90
80
70
60
2 0
10
0
-1 01968 1972 1976 1980 1984 1988 1992 1996 2000
YEAR
Scaaerybl (ST57JLLL.STA 51v'28c)r-Distance Weighted Least Squares • epe
1 1
1 2
10
2
0
1968 1972 1976 1980 1984 1988 1992
YEAR
1999 2000
90
Scatterplol (ESSNOGLSTA 16Iv28c)
Y-Olslance Weighted Least Squares • ep s
1 4
1 2
10
1968
4
1972 1976 1980 1984 1989 1992 1996 2000
YEAR
Fig . 7.1 .10 . ( Continued)
Trends in abundance of Gadus morhua and Urophycis tenuis
r0 0
900
100
0
1968 1972
ScetterplW (ST452SCI.STA 51v'2Ec)
y-Dletance Weighted Least Squares + epa
Scatterpbt (STI52SC1.STA 51v'29c)
y-Distance Welphted toast Squares • epe
1976 1980 1991 1998
NEWVAR
1992 1996 2000
Scatterpbl (ST57_ALLSTA 51v'20e)y-Dlslance Weighted Least Squeres' epe
Sealter ) bt (ST57_ALLSTA 51v'29e)
y-Dhtance Weighted Leest Squares • epe
1968 1972 1976 1980 199 4 1988 1992 1996 2000
YEAR
Scetlerpbl (ESSNOOLSTA 1 6 Iv129e)y-Oletance Weighted Least Squares • epa
Scatterplot (ESSNOGLSTA 161v'29c)
y-Distance Weighted Least Squares • eps
YEAR
Fig. 7.1 .10. (Continued)
Trends in Abundance of Urophycis chesteri and Pollachius virensScarterpbt (STI52SCI .STAS1v'28c) Scaderpbt (ESSNOOL.STA 18 4v'28c1
y-Olstence Weighted Leaa1 Squares • epe y-Dletance Welphled Lea>tl Squares • ep e
Statterpd (STI52SCI .STA 51v'28c)
y-Olalance Weighted Least Squares • eps
1980 1984 1988 1992 1996 2000
NEWVAR
thapAycN droaterf not encounterd In this are a
Scatterpbl (ST57_ALI. .STA 51v'28e)
y-Uhtanoe Weighted Least Squares . epa
45
Scatterpbt (ESSNt7(3L .STA 184v28c)
y-Dlatarxe Weighted Least Squares • epe
1980 1984 1988 1992 1996 2000
YEAR
35
25
sUt
15
5
. 51988 1972 1978 1980 1984 1988 1992 1996 2000
YEA R
Fig. 7 .1 .10. (Continued)
1995 Stern trawler Effort (No . of sets in log records )
600 59 58 57
Fig. 7.1.11. Stern trawler effort distribution shown as the total number ofsets recorded by 10 min square for the years 1995-1997 .
159
1996 Stern trawler Effort (No . of sets in log records)
600
Fig . 7.1 .11 . (Continued)
59 58 57
160
1997 Stern trawler Effort (No . of sets in log records )
Fig. 7.1.11 . (Continued)
161
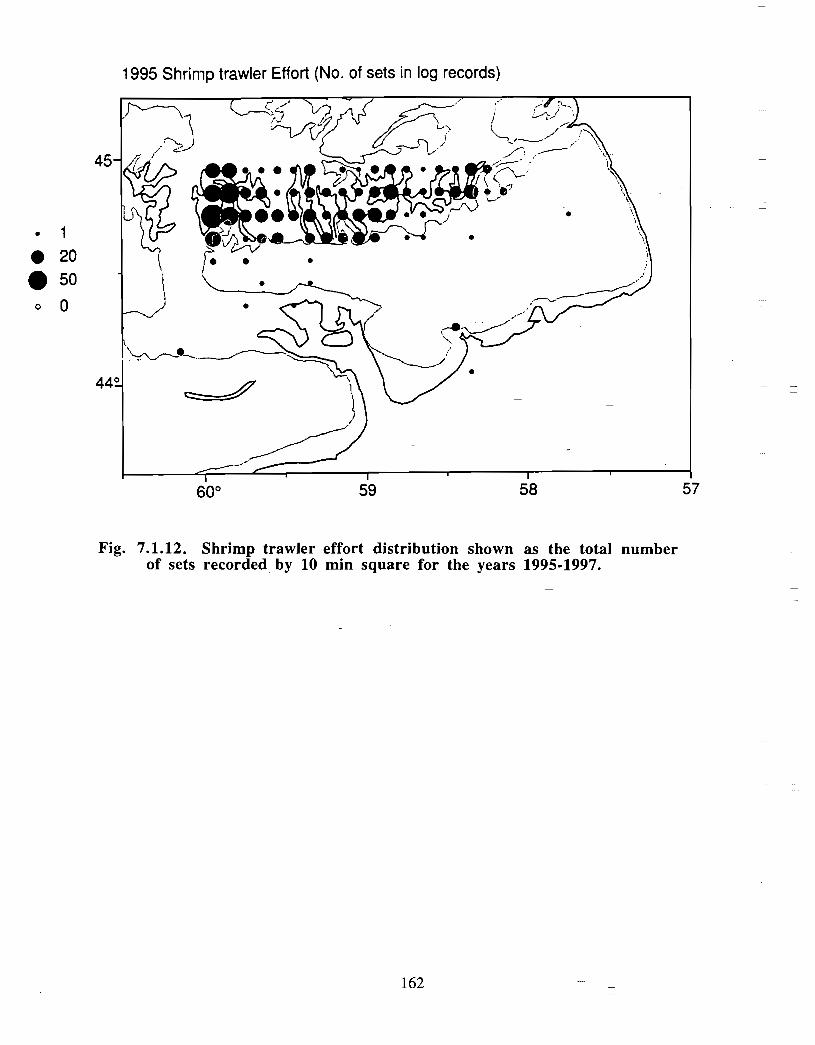
1995 Shrimp trawler Effort (No . of sets in log records )
45-I
442~
600
Fig. 7 .1 .12 . Shrimp trawler effort distribution shown as the total numberof sets recorded by 10 min square for the years 1995-1997.
57
162
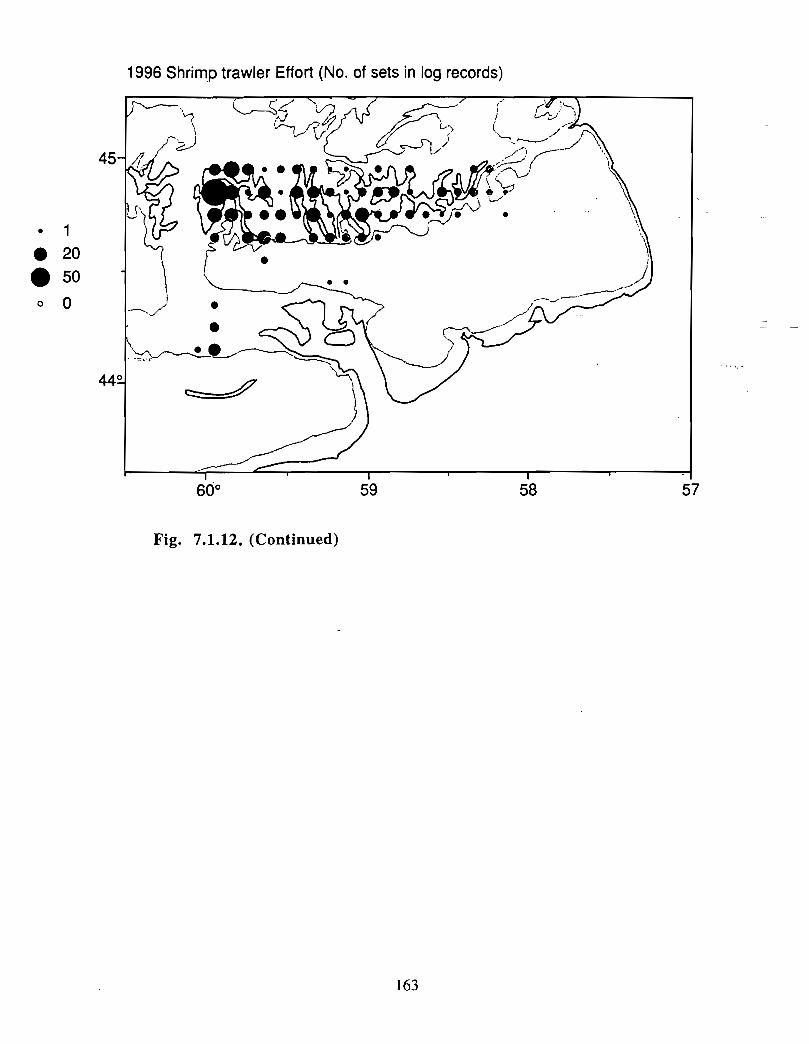
1996 Shrimp trawler Effort (No . of sets in log records )
60° 59 58
Fig. 7.1.12 . (Continued)
57
163
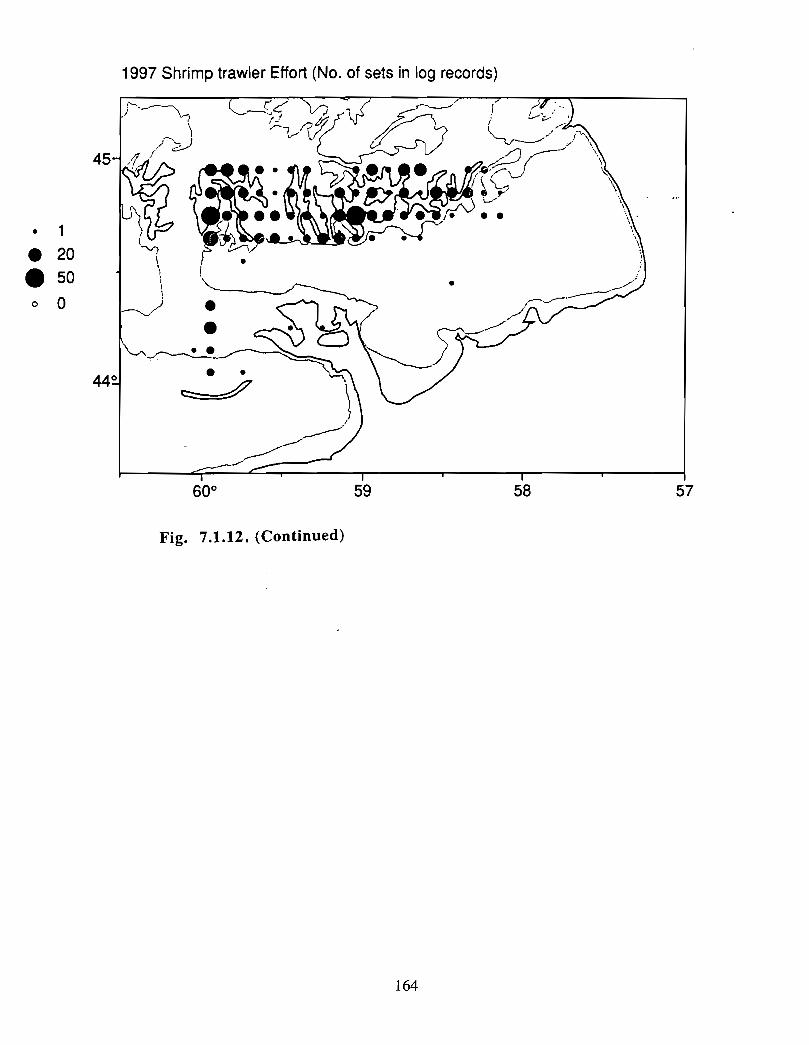
1997 Shrimp trawler Effort ( No . of sets in log records)
600
Fig. 7 .1 .12 . (Continued)
59 58 57
164
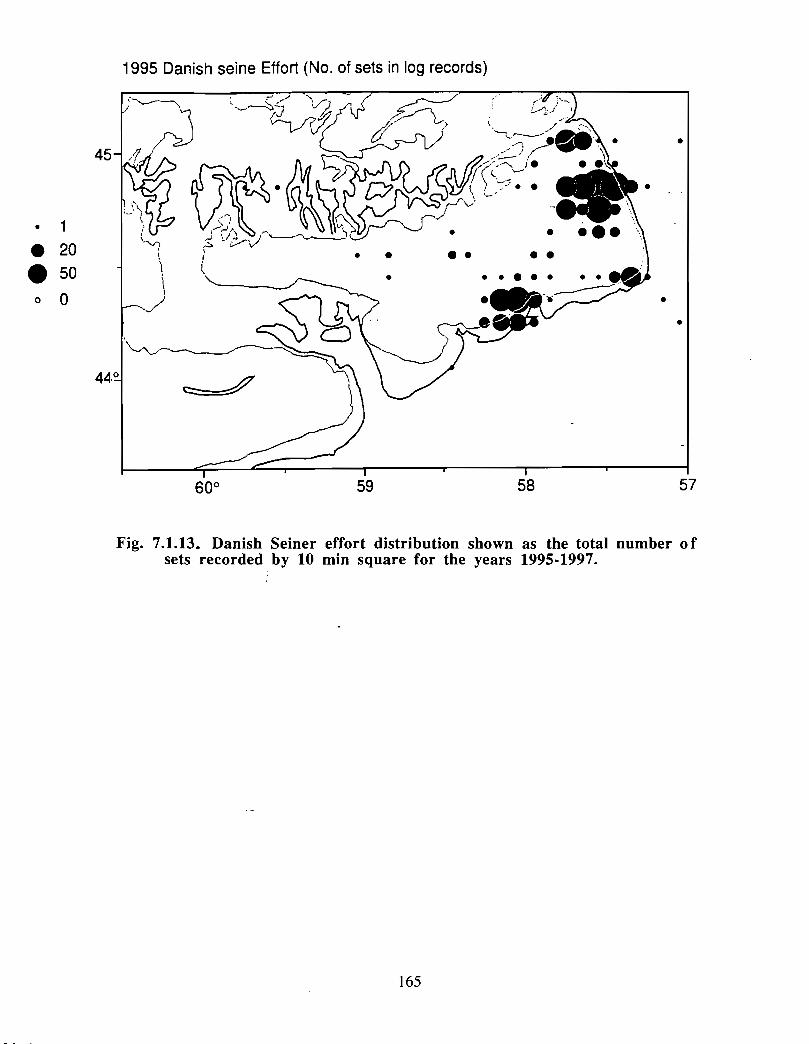
1995 Danish seine Effort (No. of sets in log records )
Fig. 7.1 .13. Danish Seiner effort distribution shown as the total number ofsets recorded by 10 min square for the years 1995-1997.
165
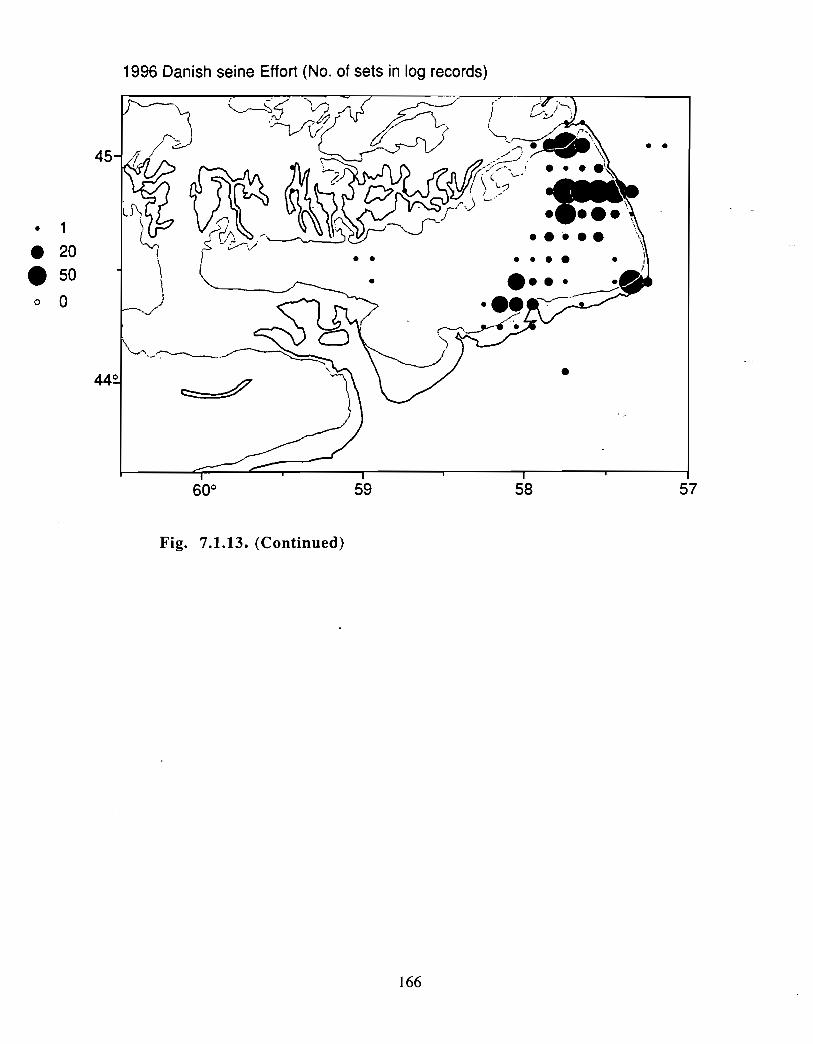
1996 Danish seine Effort (No. of sets in log records)
600
Fig. 7.1 .13 . (Continued)
59 58 57
166
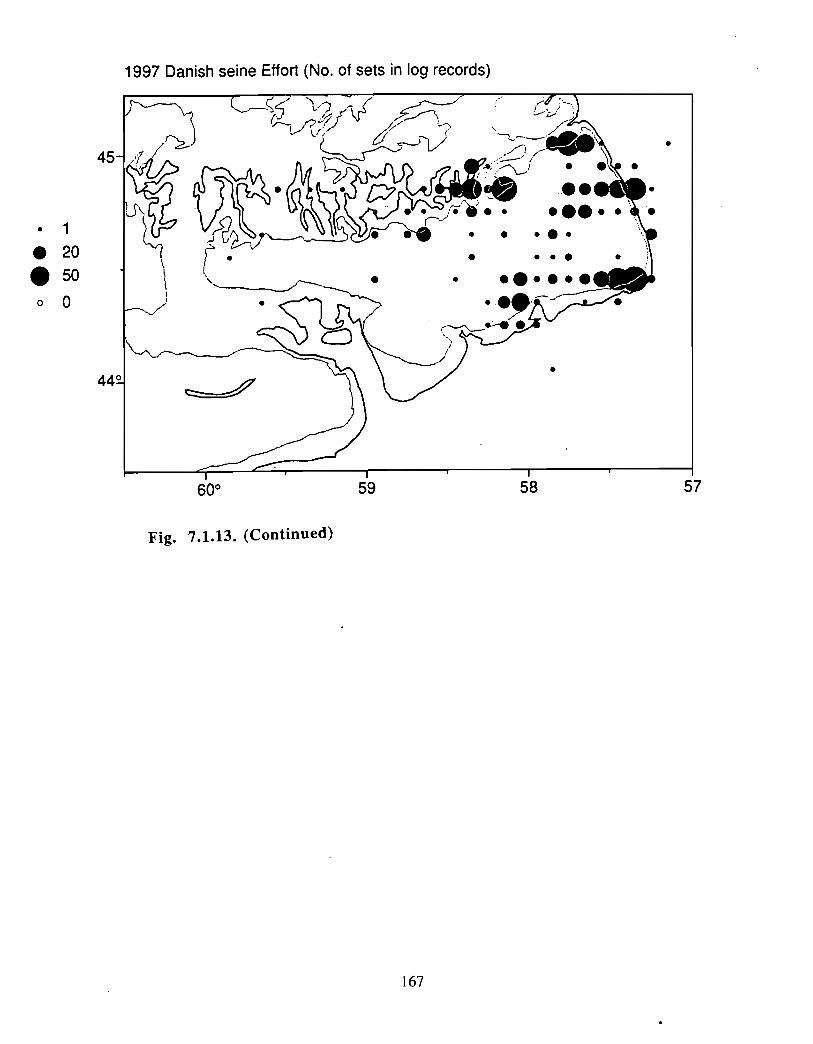
1997 Danish seine Effort (No . of sets in log records )
60° 59
Fig. 7.1 .13. (Continued)
167
58 57
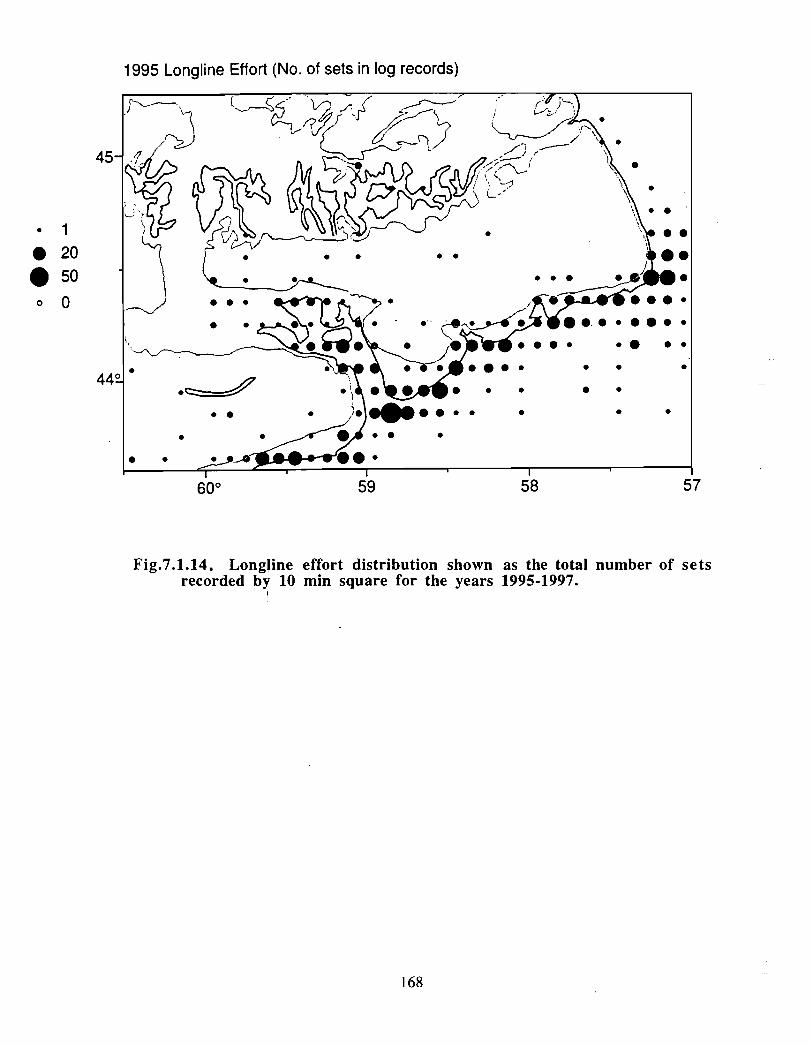
1995 Longline Effort (No. of sets in log records )
600 59 58 57
Fig .7 .1 .14 . Longline effort distribution shown as the total number of setsrecorded by 10 min square for the years 1995-1997 .
168
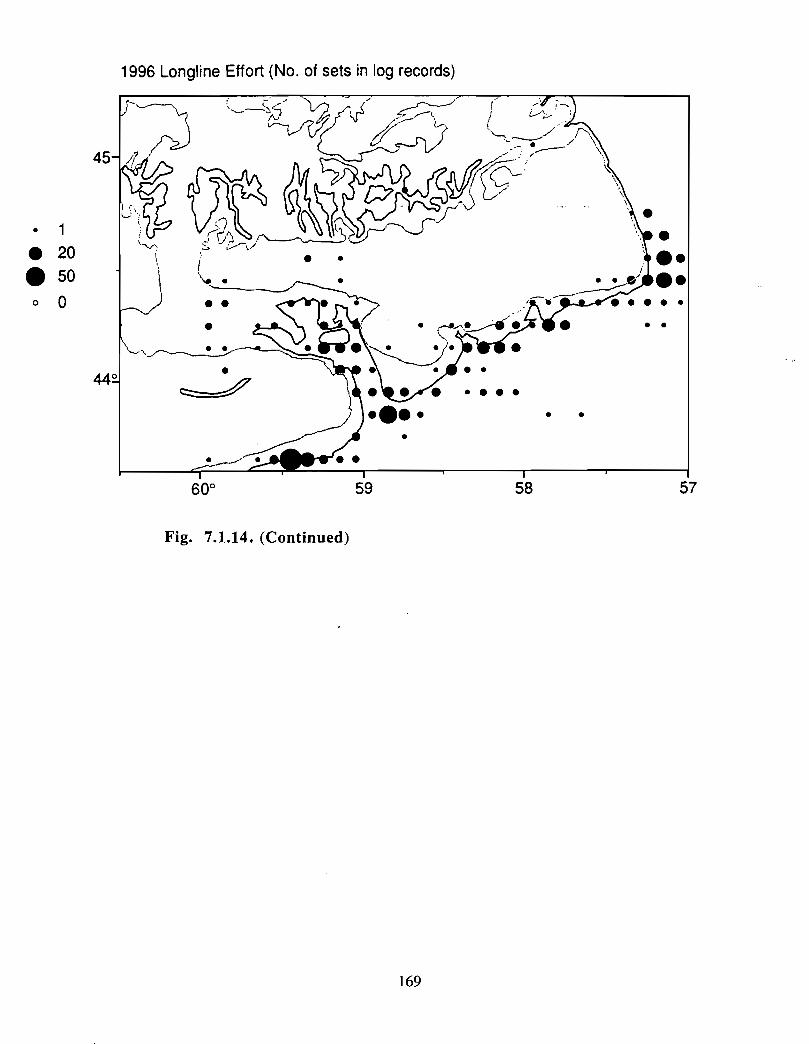
1996 Longline Effort (No . of sets in log records )
~--J~~~r • •
60° 59 58
Fig. 7.1.14. ( Continued)
57
169
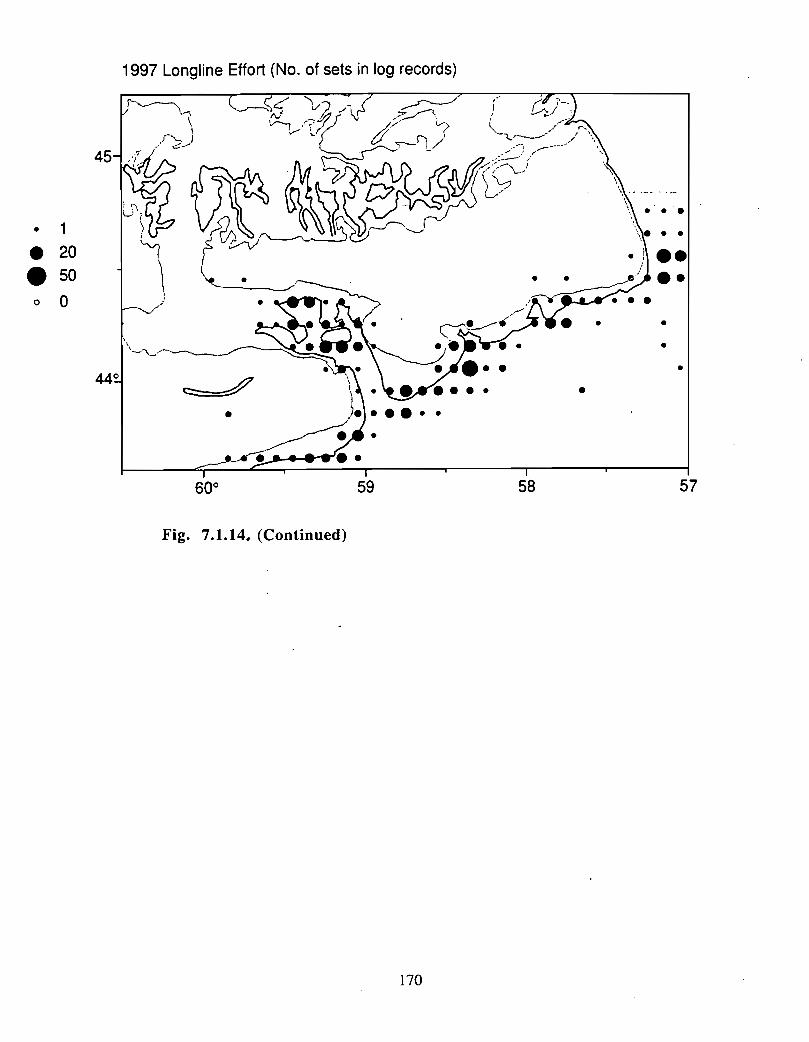
1997 Longline Effort (No . of sets in log records )
600
Fig. 7.1.14. (Continued)
--- ~59 58 57
170
7.2 Invertebrate Fisherie s
M. John TremblayFisheries and Oceans CanadaInvertebrate Fisheries DivisionBedford Institute of OceanographyDartmouth, NS
7.2.1 Introduction
Discussion papers prepared for the Canadian Wildlife Service, the World Wildlife Fundand Habitat Management Division have dealt with commercially fished invertebrates tosome extent, but have not been comprehensive. The - report for Habitat ManagementDivision lists the following species as significantly fished within the trough portion of theGully (most since 1993) : scallops, shrimp, stone crab, propeller and surf clam . The sizesof the fisheries are not given, and most of these fisheries are unlikely to occur within thetrough which is >200 m in depth . Finfish diversity and taxa are identified fromgroundfish surveys, but not invertebrates . The WWF report (Shackell et al. 1996)suggests future fishery development could include resumption of a clam fishery, scallopfishery, and trap fisheries for lobsters and crabs within the Gully area but few details aregiven.
There are few active fisheries for invertebrates within the Gully (demarcated by 200 mcontour) itself, but there is some potential for expansion of existing fisheries to this area,and for fisheries for new species. In addition there are some well developed fisheries onthe adjacent Banks . Discussed below are (i) existing invertebrate fisheries relevant to theGully area (ii) potential invertebrate fisheries, and (iii) some information gaps andpossible sources of information .
7.2.2. Existing Invertebrate Fisheries
Table 7.2.1 provides a summary, with some estimates of catches in the Gully are a
Scallops (Placopecten magellanicus) - On the eastern Scotian Shelf, scallop beds arepresent on Sable Island Bank, and on Western, Middle and Banquereau Banks (Black etal. 1993) at depths <125 m . Most of the catch comes from Western Bank, more than 100km from the Gully (Fig. 7.2 .1) . More information on scallop distribution closer to theGully may be available from 1997 exploratory survey of the eastern Scotian Shelf fundedby industry .
Arctic Surfclam , Northern Propellerclam and Ocean Quahog - These bivalves are foundon sand or mud bottoms, usually in depths <100 m . Arctic Surfclam (Mactromerispolynyma) has been an important offshore fishery since about 1987 (Roddick 1996) . Thecatch has been on Banquereau Bank, mainly east of Shortland Canyon . Propellerclam(Cyrtodaria siliqua) and ocean quahog (Arctica islandica) are permitted as a bycatch .
171
Although generally not landed (Duggan 1996a, b), there is interest in developing marketsfor this species .
Snow Crab (Chionoecetes opilio) - Snow crab are fished commercially in deep areas(generally >120 m) on the eastern Scotian Shelf, where seasonal bottom temperatures are
< 3°C (Tremblay. 1997). The fishery has extended . out as - far as the. Gully,-but, thedistance from port makes this area of secondary importance . Snow crab have beencaptured in groundfish trawls near the Gully, and on Sable Island Bank ; they were rarelycaptured west of 61 degrees longitude (Fig . 7 .2 .2) .
Shrimp (Pandalus borealis) - Like snow crab, most of the shrimp fishing on the easternScotian Shelf occurs in deep holes (Canso, Misaine and Louisbourg) shoreward of theGully, at depths >180 m . The bottom type is fine mud (La Have Clay) (Koeller 1996) .Groundfish surveys indicate a fishable biomass of shrimp in the Gully and there isanecdotal evidence that shrimp are larger there .
Lobster (Homarus americanus) - There is no offshore fishery for lobster on the easternScotian Shelf. There is a fishery to the west, but existing participants have not extendedtheir effort to the east (where catch rates are lower) (Fig . 7 .2 .3). Groundfish trawl surveysin the 1980s and exploratory fishing with traps indicates low concentrations of lobsters inthe Gully area (Fig . 7.2 .4) . Some fishers believe there is a recruitment link betweenoffshore lobster on the eastern Scotian Shelf and nearshore lobsters off eastern NovaScotia, but there is no evidence to substantiate this . It is unlikely that any Gully lobsterswould migrate inshore to the Chedabucto Bay area given the low bottom temperaturesand rough terrain in the intervening area .
Red Crab (Chaceon guinAuedens) - are fished mainly in depths of 300-900 m attemperatures of 5-8 °C (Duggan and Lawton 1997) . The current fishery (5 vessels) fishes
west of 61° longitude (Western Bank) (Fig. 7.2.5). Exploratory fishing suggests catchrates decrease to the east . Fishing with different gear types south of Emerald Bankcaptured over 400 crab, while in the Gully only 2 crab were taken (Halliday and Cooper1991) .
Squid (Illex illecebrosus) - have been highly abundant on the Scotian Shelf but not inrecent years . In 1979 73,000 metric tonnes (mt) of squid were caught on the ScotianShelf (Rowell et al. 1985). Catches declined in the 1980's and the fishery is nowprimarily a bycatch of the silver hake fishery . Squid prefer warmer waters (>6 .0) and aredistributed on the outer shelf and slope, in Emerald and La Have Basins and in the Gully .Concentrations were observed in the Gully between July and September of 1980- 1981but not in 1982-83 (Rowell et al . 1985). More recent data should be available fromgroundfish surveys .
172
7.2.3 Developing or Potential Fisheries
Stone Crab (Lithodes maia) - have been found at temperatures of 1-5_°C and depths of65-800 in (Squires 1990, Dooley and Johnson 1994, Woll 1996) . This crab has beentaken sporadically in other trap fisheries (snow crab, jonah crab) and as a bycatch infinfish operations . Exploratory trap fishing to date has generally yielded catch rates toolow for commercial exploitation but trap design modifications could result in increases .The Gully area appears to have a relatively high concentration of stone crab, given theresults of exploratory trap fishing (Perry and Smith 1969), and groundfish surveys. Arelated species (porcupine crab, Neolithodes grimaldi) is restricted to deeper waters,generally >300 m(Pohle et al. 1992) .
Other Crustace ans - Several deep-water species are listed as having commercial potentialby DFO ( 1991) and Pohle et al. ( 1992). In addition to stone crab, several deep watershrimp species are mentioned, as are two cephalopod species . Data on these species onthe slope of the Scotian Shelf is vi rtually non-existent .
7.2.4 Information Gaps
• Complete distribution data on red crab, stone crab, lobster, "other crustaceans "- the groundfish survey database has been accessed for some species but recordsfor most invertebrates are not complete .
• Extent of movement between Gully and the rest of the Scotian Shelf (mostspecies) .
• Recruitment links between Gully and the rest of the Scotian Shelf (all species) .
• Interactions between invertebrates and other species .
7.2.5 Summary
• Existing commercial fisheries (clams, scallops, snow crab, shrimp) occur adjacentto the Gully trough (>200 m) .
• In the future there is potential for expansion of existing fisheries to the Gully (e .g.snow crab, shrimp) as well as some new benthic fisheries (e.g. stone crab) .
• There are no data that suggest the Gully is of special significance to thepopulations of any benthic invertebrate species that have commercial potential,but data on shelfwide distribution of most species is currently not available, andany recruitment links between the Gully and the rest of the Scotian Shelf areunknown .
173
7.2.6 References
Black, G.A.P., R.K. Mohn, G. Robert, and M.J. Tremblay. 1993. Atlas of the biology anddistribution of the sea scallop Placopecten magellanicus and Iceland scallopChlamys islandica in the Northwest Atlantic . Can. Tech. Rep. Fish. Aquat. Sci.1915 : 40 p .
Dooley, T. and B. Johnson . 1994. Explorato ry fishing for northern stone crab on the southcoast of Newfoundland 1993 . Report for Dept. of Fisheries, Government ofNewfoundl and and Labrador .
Duggan, D .R. and P. Lawton 1997 . Review of the Canadian exploratory offshore fisheryfor red crab, Chaceon quinquedéns . DFO Atlantic Fish. Res. Doc . 96/138 .
Duggan , R.E. 1996a. Scotian Shelf No rthern Propeller Clam . DFO Stock Status Report96/129 .
Duggan, R .E. 1996b. Scotian Shelf Ocean Quahog . DRAFT.
Halliday, R. and C. Cooper . 1991 . Exploration of deepwater redwater resources off theScotian Shelf. Project Summary, Atlantic Fisheries Development No. 32, Dec .1991 .
Koeller, P . 1996. Aspects of the biology of northern shrimp Pandalus borealis on theScotian Shelf. DFO Atlantic Fish . Res. Doc. 96/9 .
Lawton, P. and D.R. Duggan. 1997. Scotian Shelf Red Crab. DFO Stock Status ReportC3-11 .
Perry, L.A., and H. Smith 1969. Nova Scotia deep sea crab explorations, 1968 . NovaScotia . Department of Fishe ries, Resource Development Division .
Pezzack, D . 1997 . LFA 41 Offshore Lobster . DFO Stock Status Report C3-14 .
Pohle, G., T.J . Kenchington and R .G. Halliday. 1992. Potentially exploitable deepwaterresources off Atlantic Canada. Can. Tech. Rept. Fish. Aquat. Sci . 1843: 85 p .
Robert, G . 1997. Eastern Scotian Shelf Scallop . DFO Stock Status Report C3-19 .
Robert, G . and M .A.E. Butler . 1996 . Scallop stock status for 1995 - Eastern Scotian Shelfand German Bank . DFO Atlantic Fish . Res. Doc . 96/132 .
Roddick, D. 1996. The Arctic surfclam fishery on Banquereau Bank. DFO Atlantic Fish.Res. Doc . 96/36
174
Rowell, T .W., J.H. Young, J .C . Poulard and J .P. Robin. 1985. Changes in distributionand biological characteristics of Illex illecebrosus on the Scotian Shelf 1980-83 .NAFO Sci. Counc . Stud. 9:11-26 .
Shackell, N ., Simard, P ., and Butler, M. 1996. Potential Protected Area in the GullyRegion, Scotian Shelf. Report to World Wildlife Fund of Canada . June, 1996 . _ .
Squires, H.J. 1990. Decapod crustacea of the Atlantic coast of Canada Can. Bull . Fish .Aquat. Sci . 221 : 532 p .
Tremblay, M.J. 1997 . Snow crab (Chionoecetes opilio) distribution and abundancetrends on the Scotian Shelf. J. Northw. Atl. Fish. Sci . 21 :7-22 .
Woll, A . 1996. Exploratory fishery for the no rthern stone crab (Lithodes maja) off thesoutheast coast of Greenland . ICES C.M. 1996/K: 19 .
175
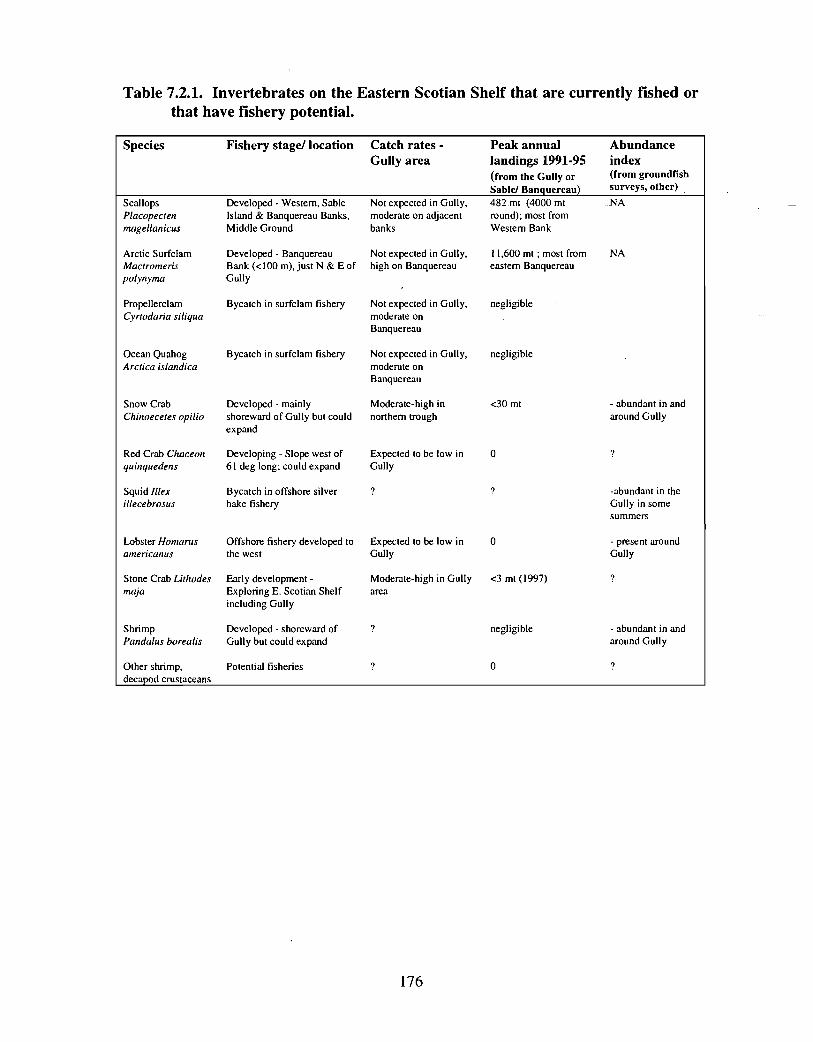
Table 7.2.1 . Invertebrates on the Eastern Scotian Shelf that are currently fished orthat have fishery potential.
Species Fishery stage/ location Catch rates - Peak annual Abundanc eGully area landings 1991-95
(from the Gully or
Sable/ Banquereau)
Not expected in Gully, negligiblemoderate o nBanquereau
Scallops Developed - Western, Sable Not expected in Gully, 482 .mt (4000 mt NAPlacopecten Island & Banquereau Banks, moderate on adjacent round) ; most from
magellanicus Middle Ground banks Western Bank
Arctic Surfclarn Developed - Banquereau Not expected in Gully, 11,600 mt ; most from NAMactromeris Bank (<100 m), just N & E of high on B anquereau eastern B anque rea upolynyma Gull y
Propellerclam Bycatch in surfclam fisheryCyrtodaria siliqua
Ocean Quahog Bycatch in sutfclam fisheryArctica islandica
Snow Crab Developed - mainlyChinoecetes opilio shoreward of Gully but coul d
expand
Red Crab Chaceon Developing - Slope west of
quinquedens 61 deg long ; could expan d
Squid Illex Bycatch in offshore silver
illecebrosus hake fishery
Lobster Homarus Offshore fishery developed toamericanus the west
Stone Crab Lithodes Early development -
maja Exploring E . Scotian Shelfincluding Gull y
Shrimp Developed - shoreward ofPandalus borealis Gully but could expan d
Other shrimp, Potential fisheries
decapod crustace an s
Not expected in Gully, negligiblemoderate o nBan que re a u
Moderate-high in <30 mt
index(from groundfishsurveys, other)
- abundant in andnorthern trough around Gully
Expected to be low in 0Gull y
Expected to be low in 0Gull y
Moderate-high in Gully <3 mt (1997)
are a
? negligible
? 0
?
-abundan t in theGully in somesummers
- pre sent aroundGully
?
- abundant in andaround Gull y
9
176
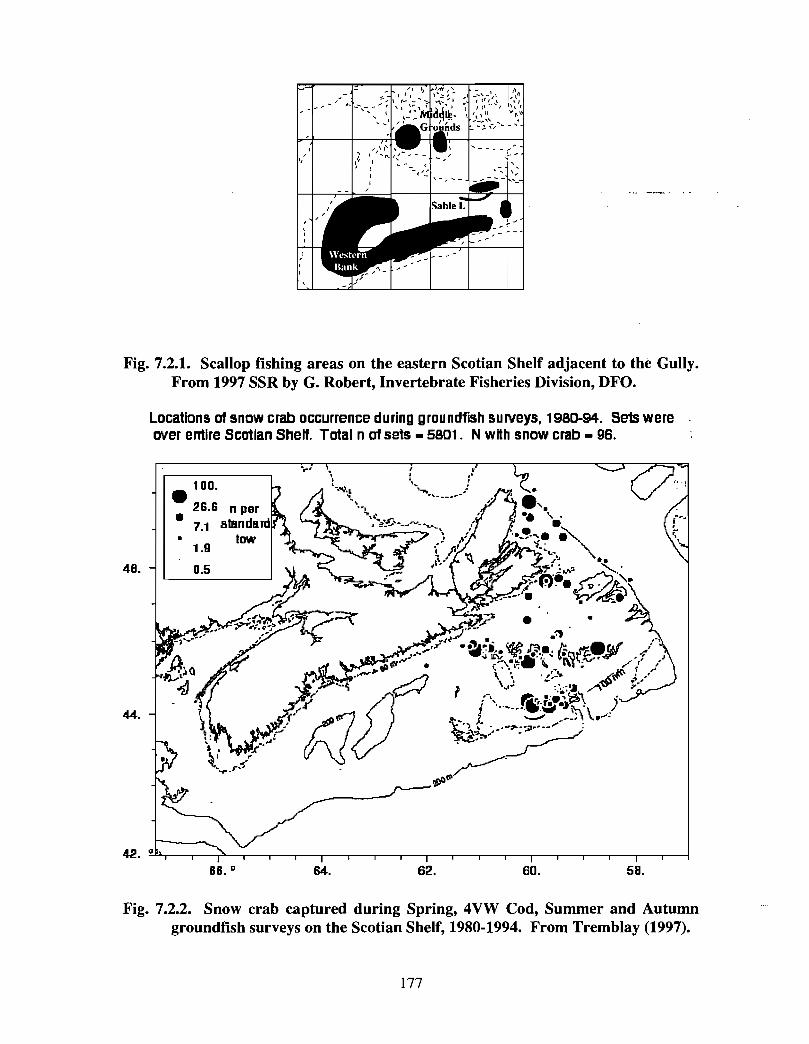
-G ,nds
' '--- -~ - -
~
Sable I .
__-
-- "- -
Fig. 7.2.1 . Scallop fishing areas on the eastern Scotian Shelf adjacent to the Gully.From 1997 SSR by G . Robert, Invertebrate Fisheries Division, DFO.
Locations of snow crab occurrence during groundfish surveys, 198D-94 . Sets wereover entire Scotian Shelf. Total n of sets - 5801 . N with snow crab - 96 .
Fig. 7.2.2 . Snow crab captured during Spring, 4VW Cod, Summer and Autumngroundfish surveys on the Scotian Shelf, 1980-1994 . From Tremblay (1997) .
177
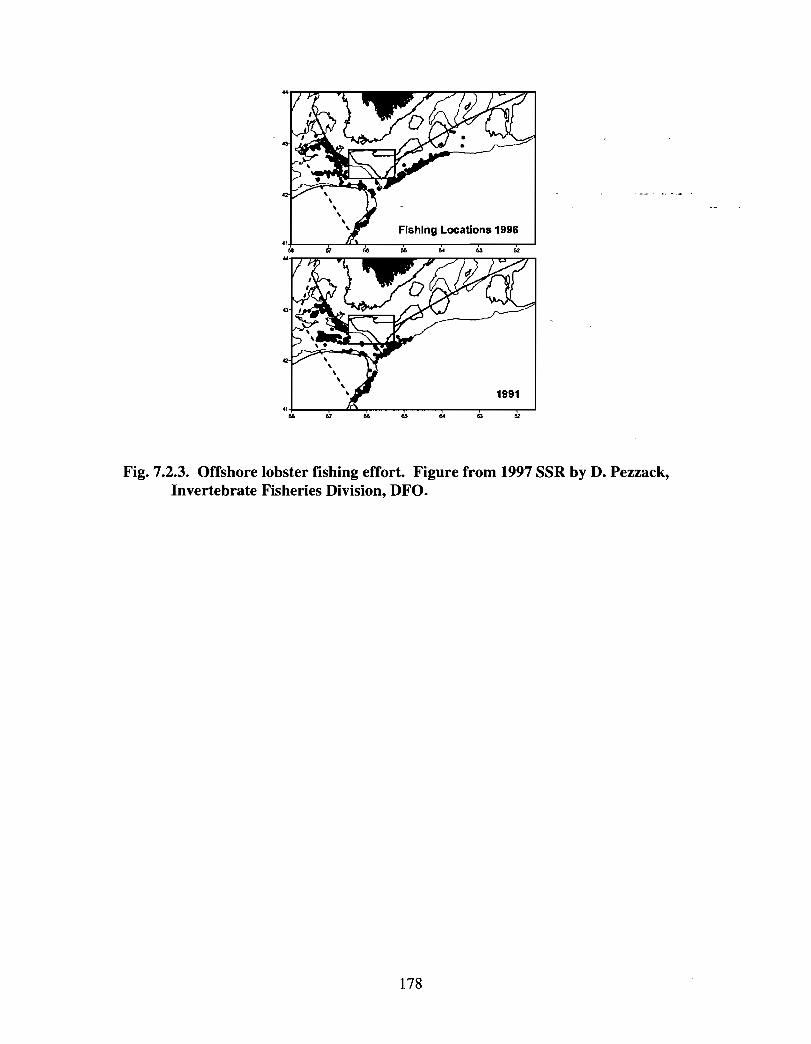
Fig. 7.2.3. Offshore lobster fishing effort . Figure from 1997 SSR by D. Pezzack,Invertebrate Fisheries Division, DFO .
178
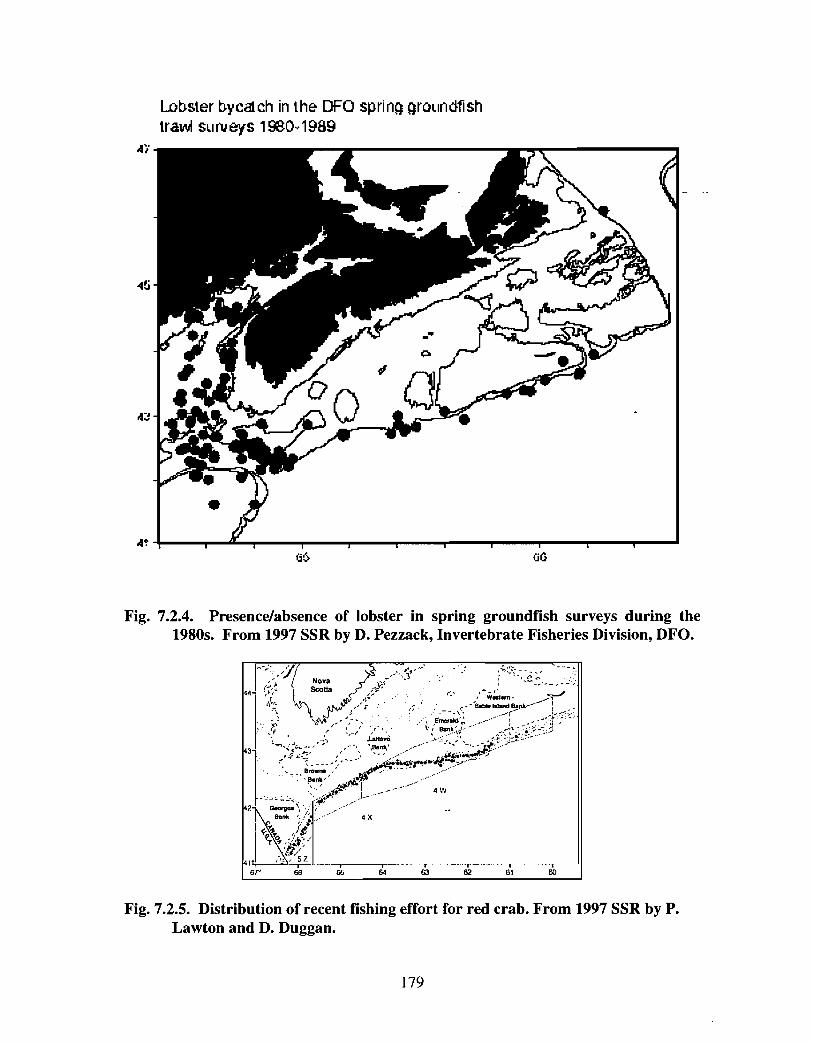
Lobster bycat ch in the DFO spring grom dfishirawl su rv eys 19M1989
Ai
45
A zj
At
Fig. 7.2.4. Presence/absence of lobster in spring groundfish surveys during the1980s. From 1997 SSR by D. Pezzack, Invertebrate Fisheries Division, DFO .
~- -
Nova
ÿ~ ô 9COt18
~ ~~ ~^ ~
~ ~
~ Wetem •
;i•~. ~~r ~ ~ .-é .a.i.t,nde.M- 1
• i' ' ~~ ~ ~ "~ •` ~, eenR,iJ- .c ~, :_i ~
~+. . . '~ION"
~~~ / ~~ ~~ 4 W. .~-Z
I
~ %
G-
.\ _.
I1 Sç3' ~ ~,
1 5~_ i Z
87° 68 6b 4 fïi 62 81 60
Fig. 7 .2 .5. Distribution of recent fishing effort for red crab . From 1997 SSR by P.Lawton and D. Duggan .
179
8.0 Pelagic Seabirds
A. R. LockCanadian Wildlife ServiceEnvironment Canada (Atlantic Region)Dartmouth, NS
8.0.1 The Scotian Shelf
The continental shelf to the east of Nova Scotia is about 200 km wide, with severalshallow areas less than 200 in deep . These banks, which have supported highlyproductive fisheries, are separated from the coast by trough of deeper water . Sable Islandlies at the edge of one of the largest of these banks, and the Gully is a deep submarinetrough penetrating the edge of the bank some 30 km to the east of Sable Island . The edgeof the continental shelf is influenced by the warm, north-easterly flow of the Gulf Streamand the south-westerly flow of the Nova Scotia current mixing with residual Labradorcurrent waters. The inshore area of the shelf is dominated by the cool, south-westerlyNova Scotia Current, which flows out of the Gulf of St . Lawrence and down to the Bay ofFundy and Gulf of Maine . A large, anti-clockwise gyre, roughly centered on Sable Islandforms as a result of interactions of these shelf currents (Fig . 8 .0 .1) .
8.0.2 Marine Birds
Marine birds can be broadly categorised into coastal birds (gulls, terns, cormorants,waterfowl), and pelagic birds, those which remain at sea all year, coming ashore only tobreed. Coastal birds, living in a mechanically complex environment generally havehigher rates of mortality than pelagic birds which live for most of the year in a simplerand less dangerous environment . To compensate for this higher mortality coastal birdstend to have larger clutches and earlier ages of first breeding. Pelagic birds usually havesingle-egg clutches, delayed maturity and low adult mortality rates .
Seabirds have not been dealt with seriously by oceanographers until very recently . Thecorrelation of seabirds with schools of fish, upwellings and distinct water bodies was partof the traditional knowledge of navigators and fishermen, but a rigorous synthesis ofornithology and oceanography has been made only in the last half century (Brown, 1980and Batty, 1989). It is a fair generalisation that seabirds are where they are for very goodreasons, usually concerned with food abundance . Recognition of that fact allows us toinfer a great deal about the structure of the ocean otherwise only detectable byoceanographic instruments . -
The community of marine pelagic birds on the Scotian Shelf contains very few species
and this community does not breed locally ; at all times of year the majority of birds
present in the offshore are Arctic or southern hemisphere breeders . Interestingly, the
pattern of distribution of the summer and winter avian communities is similar even
though totally different species are involved . The winter avifauna consists of auks ,
180
fulmars and kittiwakes while in summer shearwaters and storm-petrels and immaturegannets predominate . The species making up the western Atlantic marine avifauna areidentified below .
Tubenoses are relatives of the albatrosses, and five species are common on the ScotianShelf Northern Fulmars (Fulmarus glacialis) are Arctic-breeding .birds about the_size of aHerring Gull . In the last few decades fulmars have increased throughout the Atlantic andextended their breeding range southwards to Labrador and insular Newfoundland . Theyare widespread at temperate latitudes in winter, retreating northward in spring asshearwaters move in. Greater and Sooty Shearwaters (Puffinus gravis an d P. griseus)breed in the southern hemisphere, then migrate to moult in the northern hemisphere'ssummer. In early May, large numbers reach the Scotian Shelf on a clockwise circuit ofthe Atlantic Ocean . It is likely that most of the world- population of Greater Shearwaters(5-10 million) pass over the Scotian Shelf to "winter" in the North Atlantic . Storm-Petrels are, starling-sized birds which pick small fish and zooplankton from the oceansurface . Leach's Storm-Petrels (Oceanodroma leucorhoa) breed in burrows on coastalislands from southern Labrador to Maine . Wilson's Storm-Petrels (Oceanites oceanicus)breed in the South Atlantic, arriving here at the same time as the shearwaters, andremaining until late summer .
Northern Gannets (Sula bassanus) are relatives of pelicans which catch fish near thesurface by plunge diving . In eastern North America they breed at only six sites, three ineastern Newfoundland and three in the Gulf of St . Lawrence, and on the Scotian Shelfthey are abundant only during migration .
Auks are compact, fast-flying birds which capture small fish by pursuit diving . Fivespecies are common in North Atlantic pelagic waters. Two species of murres inhabitshelf waters in winter : Arctic-breeding Thick-billed Murres (Uria lomvia), and CommonMurres (U. aalge) which breed as far south as the Bay of Fundy. In summer they are tobe found close to their colonies ; in winter they are dispersed, with Atlantic Puffins(Fratercula arctica) and Razorbills (Alca torda) over the continental shelf off easternCanada. Dovekies (Alle alle) are robin-sized auks that breed in Greenland and theEuropean High Arctic . In summertime they are found on their breeding range, but inwinter they are widely dispersed over the North Atlantic .
Gulls are not usually pelagic in habit, but Black-legged Kittiwakes (Rissa tridactyla) arepelagic gulls which breed mainly in the Arctic, though they have extended their breedingrange south of Newfoundland to Nova Scotia around 1970, and began breeding in the Bayof Fundy in 1992 . This species is a notable scavenger at fishing fleets and is increasing innumbers on both sides of the Atlantic .
8 .0.3 Pelagic Distributions
Data on pelagic seabird distributions are derived from the Programme Intégré deRecherches sur les Oiseaux Pélagiques (PIROP) database maintained by the Canadia n
181
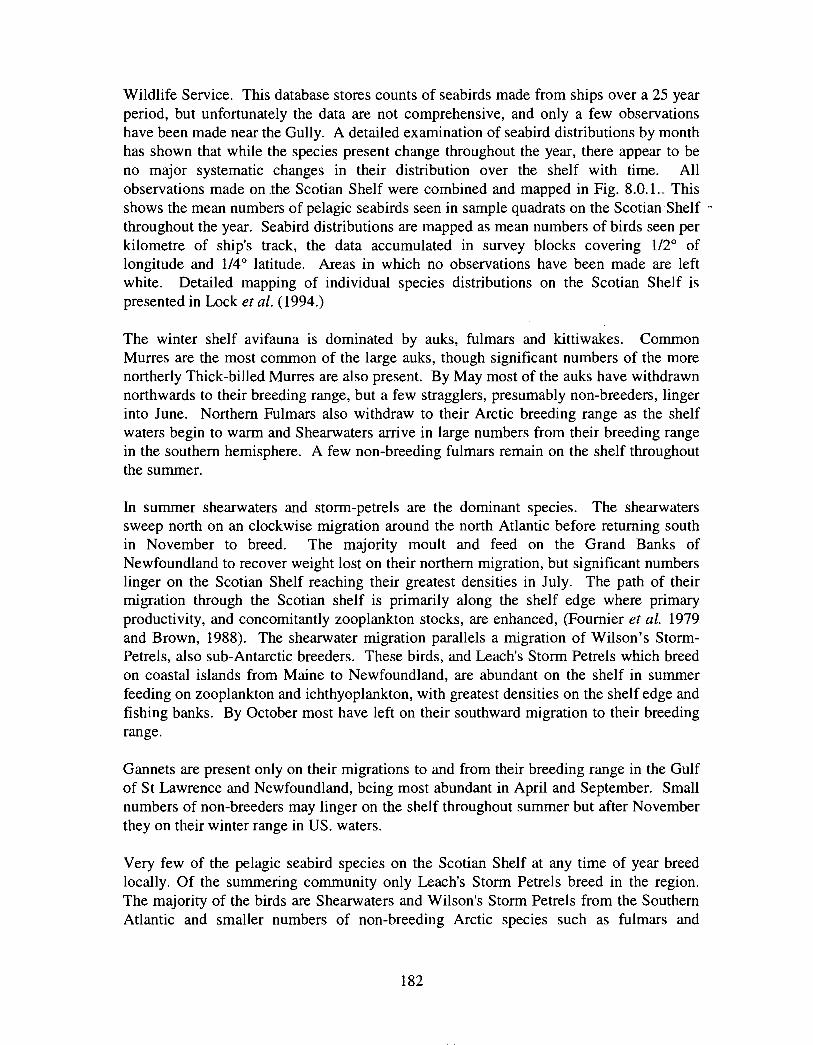
Wildlife Service. This database stores counts of seabirds made from ships over a 25 yearperiod, but unfortunately the data are not comprehensive, and only a few observationshave been made near the Gully . A detailed examination of seabird distributions by monthhas shown that while the species present change throughout the year, there appear to beno major systematic changes in their distribution over the shelf with time . Allobservations made on .the Scotian Shelf were combined and mapped in Fig . 8 .0 .1 ._ Thisshows the mean numbers of pelagic seabirds seen in sample quadrats on the Scotian Shelfthroughout the year . Seabird distributions are mapped as mean numbers of birds seen perkilometre of ship's track, the data accumulated in survey blocks covering 1/2° oflongitude and 1/4° latitude . Areas in which no observations have been made are leftwhite. Detailed mapping of individual species distributions on the Scotian Shelf ispresented in Lock et al . (1994 . )
The winter shelf avifauna is dominated by auks, fulmars and kittiwakes . CommonMurres are the most common of the large auks, though significant numbers of the morenortherly Thick-billed Murres are also present . By May most of the auks have withdrawnnorthwards to their breeding range, but a few stragglers, presumably non-breeders, lingerinto June. Northern Fulmars also withdraw to their Arctic breeding range as the shelfwaters begin to warm and Shearwaters arrive in large numbers from their breeding rangein the southern hemisphere . A few non-breeding fulmars remain on the shelf throughoutthe summer .
In summer shearwaters and storm-petrels are the dominant species . The shearwaterssweep north on an clockwise migration around the north Atlantic before returning southin November to breed. The majority moult and feed on the Grand Banks ofNewfoundland to recover weight lost on their northern migration, but significant numberslinger on the Scotian Shelf reaching their greatest densities in July. The path of theirmigration through the Scotian shelf is primarily along the shelf edge where primaryproductivity, and concomitantly zooplankton stocks, are enhanced, (Fournier et al. 1979and Brown, 1988) . The shearwater migration parallels a migration of Wilson's Storm-Petrels, also sub-Antarctic breeders . These birds, and Leach's Storm Petrels which breedon coastal islands from Maine to Newfoundland, are abundant on the shelf in summerfeeding on zooplankton and ichthyoplankton, with greatest densities on the shelf edge andfishing banks. By October most have left on their southward migration to their breedingrange .
Gannets are present only on their migrations to and from their breeding range in the Gulfof St Lawrence and Newfoundl and, being most abund ant in April and September. Smallnumbers of non-breeders may linger on the shelf throughout summer but after Novemberthey on their winter range in US. waters .
Very few of the pelagic seabird species on the Scotian Shelf at any time of year breedlocally. Of the summering community only Leach's Storm Petrels breed in the region .The majority of the birds are Shearwaters and Wilson's Storm Petrels from the SouthernAtlantic and smaller numbers of non-breeding Arctic species such as fulmars an d
182
kittiwakes . The wintering pelagic community is made up of primarily Arctic-breedingspecies. The coastal seabird community, in contrast, is made up primarily of locallybreeding species in winter and summer .
8.0.4 Conclusion s
The high variability of seabird distributional data make it difficult, with the--data -available, to detect small, local anomalies of distribution. Highest concentrations ofpelagic birds are found along the shelf edge and in the turbulence and mixing as currentsround major headlands : East Point in P .E.I. and Cape North in Cabot Strait for instance.High seabird numbers also occur predictably in the area of mixing between Sable Islandand the mainland generated by the Sable Island gyre .
The PIROP database unfortunately contains few observations made in the area of theGully, but the few data that are available do not show any unusual enhancement ofseabird numbers in the area . Weatherbee (1997) conducted a series of summertimeseabird surveys at the Gully and noted that when compared with the rest of the ScotianShelf some species appeared less abundant, and others : Greater Shearwaters and petrelsfor instance, appeared to be slightly more abundant . However the data available forcomparison were PIROP data gathered more than a decade previously and inter-yearvariations in the numbers of these southern migrants may well account for the smalldifferences observed . Furthermore his comparison was with data for the shelf as a wholerather than the adjacent shelf edge, and pelagic seabirds are generally more abundant nearthe shelf edge .
Yeats (Section 6 .2) mapped nutrients, nitrate and phosphate, and found the Gullyindistinguishable from the rest of the near-by continental shelf . Head and Harrison(Section 6 .3) examined phytoplankton and zooplankton distributions in the region and didnot detect any anomaly in the area around the Gully . The distributions of tuna andswordfish are determined, to some extent by the presence of small fish and invertebrateswhich are also the food of pelagic seabirds . Stone (Appendix 13 .2) found no increase inabundance of tuna and Swordfish at the Gully .
The Gully does not appear based on the limited data available to cause upwelling or localenhancement of productivity greater than that which occurs elsewhere at the shelf edge,nor is there evidence, based on a wider view of pelagic seabird distributions off easternCanada, that submarine canyons have any major effect on seabird distributions at thesurface . Because of the poor spatial/temporal resolution of available data on pelagicseabird distributions off eastern Canada, there is not enough evidence to assess whethersubmarine canyons per se have any major effect on seabird distributions at the surface .To document small differences between seabird abundance at the Gully and elsewhere onthe shelf, a series of contemporaneous observations at the Gully and over adjacent shelfareas at all seasons would be required .
183
8.0.5 References
Batty, L. 1989 . Birds as monitors of ma rine environments . Biologist. 36:151-154 .
Brown, R.G.B. 1980. Seabirds as Marine Animals . In . Behaviour of Marine Animals. J .Burger, B .L. Olla, and H.W. Winn (eds .) . Vol . 4. Plenum Publishing, New .York,pp. 1-39 .
Brown, R .G.B . ' 1988. Zooplankton patchiness and seabird dis tributions . In . ACTA XIXCongressus Internationalis Orn ithologici (H. Ouellet ed .) National Museum ofNatural Sciences : Ottawa, pp . 1001-1016.
Fournier, R.O., M . van Det, J .S . Wilson and N.B . Hargraves, 1979. Influence of theShelf-Break Front off Nova Scotia on Phytoplankton Standing Stock in Winter . J.Fish. Res. Board Can . 36, pp. 1228-1237.
Lock, A. R., R. G. B . Brown and S . H. Gerriets, 1994 . Gazetteer of Marine Birds inAtlantic Canada . Canadian Wildlife Service, Atlantic Region . 137 pp.
Weatherbee, R.A. 1997 . The Distribution and Abundance of Pelagic Birds in 'the Gully' .B .Sc. Thesis, Dalhousie University 59pp .
184
SeabirdsÏkrn
(3~ )R 8 .0 to 1C2 . 14.0 l0 7.9 (38)2 .01c 3 .9 (3110 .0 tc 1 .9 (45 )
Fig. $ .0 .1. Mean annual abundance of pelagic seabirds on the ScotianShelf. The 200m isobath and major rurrenls are also identified .
1 S7
9.0 Marine Mammals
Hal Whitehead', W. Don Bowen2, Sascha K . Hooker' and Shannon Gowans''Department of Biology, Dalhousie University, Halifax, N S2 Marine Fish Division, Bedford Institute of Oceanography, Dartmouth, N S
9.0.1 Introduction
The two principal orders of marine mammals, and the only two found on the Scotian Shelf,are the whales and dolphins, order Cetacea, and the seals, order Pinnipedia . The waters inand near the Gully and Sable Island have been identified as significant for marine mammalsseveral times in the scientific literature. For instance, Sergeant et al. (1970) noted that "thewaters around Sable Island evidently have the most diverse cetacean fauna of the region[eastern Canada] ." Amirault (1995) summarized more recent findings : "The diversity anddensity of marine mammals occurring in the area indicate that it is one of the most importanthabitats on the east coast of Canada, and possibly of global significance ."
Two of the most established eastern Canadian field studies of marine mammals occur in theSable Island/Gully region : the research on grey (Halichoerus grypus) and harbour (Phocavitulina) seals on Sable Island by D . Bowen and colleagues (e.g. Bowen et al., 1992a,b;Iverson et al. 1993 ; Boness et al., 1994); and the studies of northern bottlenose whales(Hyperoodon ampullatus) and other cetaceans in the Gully canyon by H . Whitehead andcolleagues (e.g. Gowans and Whitehead 1995 and Whitehead et al., 1992, 1997a) (Fig .9 .0 .1). Thus there is comparatively good information on marine mammal species in thisarea. However the data base contains significant temporal and geographical biases and gaps .There is also a lack of good comparable data for other areas of the Scotian Shelf, in particularits edge .
In this report, we first define our study area, indicate our data sources, outline their strengthsand limitations, and then give a short report on each species known (or suspected) to occurin the study area including : habitat preferences, temporal use of the area, approximatenumbers, and the significance of the Gully for the species . We then use this information tosuggest some boundaries for conservation area(s), and summarize the importance of thestudy area for this group of animals .
9 .0.2 Data Sources and Method s
For this summary, we adopt the following study area : 43° 30'- 44'30'N and 58'20'- 60° 10'W (Fig . 9 .0 .1). This includes the deep canyon of the Gully, the basin in the northern part ofthe Gully, the shallow waters around Sable Island, and slope waters to the southeast .
Data on the two orders of marine mammals were collected very differently, emphasizedistinct areas of biology, and are strongly biased towards different parts of the study area .Pinniped studies, carried out on Sable Island, emphasize population biology, reproduction,and breeding behaviour . There is comparatively little information on at-sea distribution andfeeding behaviour, although recent satellite tagging studies are beginning to fill these gaps .
186
In contrast, our knowledge of the population and reproductive biology of cetaceans in thearea is weak to non-existent. However, there is useful quantitative information on at-seadistribution, but this was collected principally in the vicinity of the Gully canyon, and duringthe summer months .
9.0.2.1 Pinniped studies
Although five species of seals are known to occur in the study area, only the harbour seal andgrey seal are common to abundant . For this reason, virtually all of the seal research has beenconducted on these two species. Most of this research has been carried out on Sable Islandduring the breeding (May-June for harbour seals, December-January for grey seals) andsummer moulting seasons for both species, although spring and fall research has also beenconducted over the past decade . Grey seal and harbour seal population research began onSable Island in the early 1960's and early 1970's, respectively, and continues annually . Dietswere estimated from analysis of stomach contents in the 1970s and 1980s, and examinationof fecal samples since 1990. The foraging behaviour of different age and sex classes ofharbour seals has been studied periodically during the breeding season since 1989 using acombination of stable isotopes, time-depth recorders and VHF telemetry. Between 1992 and1997, both time-depth recorders and satellite tags have been used to study the spatial andseasonal characteristics of at-sea foraging in adult male and female grey seals . Annualreproductive performance and survivorship have been studied since the mid 1970's in over2000 individually branded grey seals ranging in age from 4 to 32 years .
9 .0.2.2 Cetacean studies
Most of our information on cetaceans in the study area comes from studies of northernbottlenose whales and sperm whales (Physeter macrocephalus) by H . Whitehead andcolleagues. Each summer (June-August) between 1988-1997 (except 1991 and 1992)researchers spent periods of between 2-66 days in the region of the Gully canyon observingcetaceans aboard lOm (1988-1990) or 12m (1993-1997) auxiliary sailing vessels (Table9 .0.1). Except in 1988 and 1989 when sperm whales received considerable attention, thefocus of these studies was on northern bottlenose whales . However, sightings of all othercetaceans were recorded in a systematic manner and environmental data (including position,depth and sea temperature) were collected regularly (every hour for position, every 3 hoursfor other variables) .
Hooker et al. (submitted m/s) have compiled the sightings data from 1988-1996 into aGeographic Information System data base, along with regular environmental and positionrecords, for the geographic area bounded by 43° 38' - 44° 17' N and 58° 44' - 59° 31' W (Fig .9 .0.1), where there was a reasonable amount of effort . This data base contains 1885 hoursof daylight effort in this study area . The sightings and effort data permit the construction ofeffort-corrected images of the geographic distribution of each species, along with analysesof how abundance varies with environmental variables (such as date, sea temperature anddepth) . The displays and analyses of Hooker et al. form the bulk of our presentation aboutcetaceans .
187
Table 9.0 .1 . Trip dates of cetacean fieldwork in the Gully .
Daylight hoursYear TripDates spent in Gully
1988 July 8- 21, July 25 - Aug 6 213
1989 July 16 - 30, Aug 1- 15 . 215
1990 June 14 - 28, July 2- 18, July 25 - Aug 12 399
1993 July 10 - 23 153
1994 July 31 - Aug 18 170
1995 Aug 20 - Sept 2 80
1996 June 7- 25, July 4- 21, July 27 - Aug 12, Aug 19 - Sept 2 66 7
Taken from Hooker et al. are the following summaries of the data :
a) Summary of effort (Table 9 .0.1) ;
b) Sightings of different cetacean species by year with mean group sizes (Table9.0.2) ;
Table 9 .0.2. Cetacean species sighted in the Gully by yea r
Species No. of sightt8 fl s `89 `90 `93 `94 195 196 group sizemean (± SD)
blue whale 8 - - - -
fin whale 32 6 4 6 5
sei whale 3 - - - -
minke whale 8 4 - - 1
humpback whale 38 2 15 1 2
sperm whale 92 65 5 1 1
northern bottlenose wha1677 11 58 180 70
long-finned pilot whale 54 9 9 7 2
striped dolphin 29 - 5 3 10
Atlantic white-sided dolphN 11 15 53 17
short-beaked common doloWn 7 25 11 18
bott len ose dolphin 7 - - 2 1
3 5 1.38 (± 0 .52)
1 - 10 1.31 (t 0 .78)
- - 3 1 (t 0)
- - 3 1.25 (t 0 .46)
12 - 6 1.47 (t 1 .13)
3 1 16 1.09 (f 0 .32)
39 12 207 3.29 (t 2 .21)
8 8 11 11.44 (t 13 .41)
7 3 1 13.42 (f 2 .49)
7 - 45 8.80 (± 8 .39)
21 - 22 15.60 (t 25 .94)
- 1 3 11.29 (f 13 .28 )
TOTALS 1100 115 136 264 127 98 28 332
c) Mean water depth, sea floor slope, sea-surface temperature, and calendar monthfor sightings of cetace an species as well as for regularly-collected environmentaldata (effort) (Table 9 .0.3) ;
d) Distribution of cetacean sightings with depth and calendar month as sightingsper hour of effort (Hooker et al. found that, of those environmental parameters thatwere considered, these two variables explained almost all the dependence o f
188
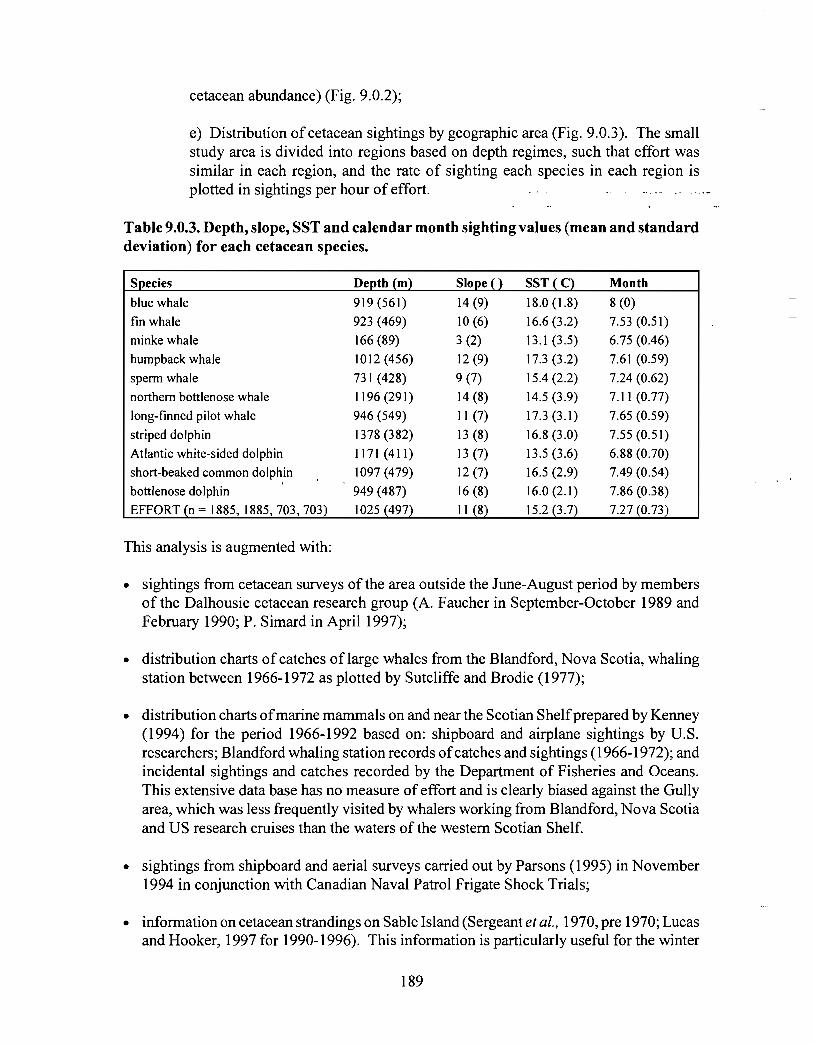
cetacean abundance) (Fig. 9.0.2) ;
e) Distribution of cetacean sightings by geographic area (Fig . 9 .0 .3). The smallstudy area is divided into regions based on depth regimes, such that effort wassimilar in each region, and the rate of sighting each species in each region isplotted in sightings per hour of effort .
Table 9.0.3 . Depth, slope, SST and calendar month sighting values (mean and standarddeviation) for each cetacean species .
Species Depth (m) Slope O SST (C) Month
blue whale 919 (561) 14 (9) 18.0 ( 1 .8) 8(0)fin whale 923 (469) 10 (6) 16.6 (3 .2) 7.53 (0 .51)
minke whale 166 (89) 3 (2) 13.1 (3 .5) 6.75 (0 .46)
humpback whale 1012 (456) 12 (9) 17.3 (3 .2) 7.61 (0 .59)
sperm whale 731 (428) 9(7) 15.4 (2 .2) 7.24 (0 .62)
no rthern bottlenose whale 1196 (291) 14 (8) 14.5 (3 .9) 7.11 (0 .77)
long-finned pilot whale 946 (549) 11 (7) 17 .3 (3 .1) 7.65 (0 .59)
striped dolphin 1378 (382) 13 (8) 16.8 (3 .0) 7.55 (0 .51)
Atlantic white-sided dolphin 1171 (411) 13 (7) 13.5 (3 .6) 6.88 (0 .70)
sho rt-beaked common dolphin 1097 (479) 12 (7) 16.5 (2 .9) 7.49 (0 .54)
bo tt lenose dolphin 949 (487) 16 (8) 16.0 (2.1) 7.86 (0 .38)
EFFORT (n = 1885, 1885, 703, 703) 1025 (497) 11 (8) 15 .2 (3 .7) 7.27 (0 .73 )
This analysis is augmented with :
• sightings from cetacean surveys of the area outside the June-August period by membersof the Dalhousie cetacean research group (A . Faucher in September-October 1989 andFebruary 1990 ; P. Simard in April 1997) ;
• distribution charts of catches of large whales from the Blandford, Nova Scotia, whalingstation between 1966-1972 as plo tted by Sutcliffe and Brodie (1977) ;
• distribution charts of marine mammals on and near the Scotian Shelf prepared by Kenney(1994) for the period 1966-1992 based on : shipboard and airplane sightings by U .S.researchers ; Blandford whaling station records of catches and sightings (1966-1972) ; andincidental sightings and catches recorded by the Department of Fisheries and Oceans .This extensive data base has no measure of effort and is clearly biased against the Gullyarea, which was less frequently visited by whalers working from Blandford, Nova Scotiaand US research cruises than the waters of the western Scotian Shelf .
• sightings from shipboard and aerial surveys carried out by Parsons (1995) in November1994 in conjunction with Canadian Naval Patrol Frigate Shock Trials ;
• information on cetacean strandings on Sable Island (Sergean t et al., 1970, pre 1970; Lucasand Hooker, 1997 for 1990-1996) . This information is particularly useful for the winte r
189
months (especially January and February) when pinniped scientists and other researchersidentified and recorded cetacean strandings on Sable Island, but when ship sighting datafrom the study area are very scarce .
• from these data sources, we have a good picture of cetacean distribution and abundancein the deep canyon of the Gully during the summer months, but data become much moresparse and inferential as we move away from the deep canyon and the summer-season .
9.0.3 Species Accounts : Cetaceans
In this section we give separate accounts for each species found in the study area . We firstbriefly describe the species and its usual habitat . We then provide information on itstemporal and spatial use of the study area, the approximate numbers that might be found inthe study area at any time, the likely identity of the population to which the Gully animalsbelong, the status of the population, and the significance of the study area for members ofthis population .
9.0.3.1 Blue whale (Balaenoptera musculus)
The blue whale, the largest animal on Earth, reaches to 30m, although North Atlantic animalstend to be smaller . Blue whales feed by engulfing large schools of zooplankton, especiallyeuphausiids (krill) .
Use of Gully are : A few blue whales are consistently found in and near the deep canyon ofthe Gully in mid and late August, but not earlier in the summer (Beck 1996 ; Hooker et al.Submitted m/s ; Fig . 9.0.2b) . A stranding on Sable Island in February 1958 suggests thatthese animals may use the Gully at other times of year (Sergeant et al., 1970), and Kenney(1994) and Parsons (1995) data show that blues were sighted on the western and centralScotian Shelf quite often between May-November . No more than four members of this veryconspicuous species have been seen at any time in the Gully . Therefore, we suspect thatmaximum numbers in the study area at any time are of the order of ten .
Stock identity and status: Stock relationships of blue whales in the western North Atlanticare unclear. One photographically identified animal from the Gully had been previously seenin the Gulf of St . Lawrence (R . Sears pers . comm.), and there are matches between the Gulfof St. Lawrence and Gulf of Maine (Sears et al., 1990) . Northwest Atlantic blues probablynumber a few hundred (Reeves and Brown, 1994) and are classified as "Vulnerable" by theCommittee on the Status on Endangered Wildlife in Canada (COSEWIC) .
Significance of study area: The consistency with which blue whales are sighted in and nearthe deep canyon suggests that the area has some importance to them, perhaps especially inlate summer . Although numbers in the study area are generally small, this is the only knownarea on the Scotian Shelf where blues are consistently found .
190
9.0 .3 .2 Fin whale (Balaenoptera physalus)
The fin whale, second largest of all whales, reaches to 24m in the northern hemisphere . Bulkfeeders, fin whales take schooling fish, zooplankton and squid .
Use of Gully are : Fin whales are sighted quite consistently in the Gully in July and August(Fig. 9.0.2b). Within Hooker et al.'s study area, there was no statistically significan tpreference for any depth regime. Kenney (1994) shows sightings and catches in the Gullyregion during all months from May to August, as part of a widespread distribution on theScotian Shelf throughout most of the year . Parsons ( 1995) saw fin whales near the shelfbreak southwest of Sable Island in November 1994 . Fin whales generally seem to prefer thedeeper waters of the Scoti an Shelf (Kenney, 1994) . Acoustic monito ring by US Navyhydrophone systems indicates that fin whales are the most common baleen whale species inthe deep waters off the Shelf, and that they are present in these waters from late August,through the winter, until late sp ring when vocal activity stops (Clark, 1994). Sightings ofthis species in the study area have never been ve ry numerous at any time, so we think itunlikely that there are ever many more than a few tens of an imals in the study area.
Stock identity and status : The Inte rnational Whaling Commission is unsure whether the finwhales found off Labrador/Newfoundland and on the Scotian Shelf are a single stock orseparate stocks ; together they probably number at le ast a few thous and animals (InternationalWhaling Commission, 1992) . The general se asonal migrations of fin whales in the weste rnNorth Atlantic (Mitchell, 1974) may me an that a substantial number of animals pass throughthe Gully area in any year. None of the identification photographs taken in the Gully matchany of the 800 animals catalogued from the Gulf of St Lawrence and the Gulf of Maine(Beck, 1996) . Fin whales are classified as "Vulnerable" by COSEWIC .
Significance of study area : Although fin whales are quite widespread on the Scotian Shelf
(Kenney, 1994), the Gully seems to be a particular (although not very emphatic) area of
concentration .
9 .0 .3.3 Sei whale (Balaenoptera borealis)
The sei whale, a slim baleen whale which principally feeds by skimming copepods and otherzooplankton, reaches about 18m in the northern hemisphere . Sei whales are quite difficultto identify definitively (Leatherwood and Reeves, 1983) and so sightings of this species arelikely to be under-represented in many data bases .
Use of Gully area : Definitive identifications of sei whales are rare in Hooker et al.'s database (Table 9 .0 .2), no sei whales are shown within our study area in Kenney's plots(although the species was commonly sighted and caught on the western Scotian Shelf), andno sei whales are reported as having stranded on Sable Island (Lucas and Hooker, 1997 ;Sergeant et al., 1970). Although our study area would seem to be crossed by Mitchell's(1974) assumed seasonal migration of seis along the Scotian Shelf, there is no evidence thatthey linger long within it .
191
Stock identity and status: Mitchell and Chapm an (1977) suggest that the sei whalesmigrating along the Scoti an Shelf form a distinct stock numbe ring in the low thous ands. Thestatus of sei whales has not been considered by COSEWIC .
Significance of study area : The study area appears to have little importance to sei whales .
9.0.3.4 Minke whales (Balaenoptera acutorostrata )
Minke whales, the smallest of the balaenopterids (about 9m), are often seen alone and havea wide distribution which sometimes includes waters very close to shore . They feed onschools of fish and plankton, and are not conspicuous .
Use of Gully area : There have been a few sightings of minke whales in the study area (Table9.0 .2; Kenney, 1994; Parsons, 1995), but generally in shallow water (Figs . 9 .0 .2a and 9.0.3) .Their migrations are unknown, although it is likely that some animals remain on or near theScotian Shelf in winter while others migrate to warmer waters (e .g. Reeves and Brown,1994). It is probable that a maximum of a few tens of animals are in the study area at anytime.
Stock identity and status : The Inte rnational Whaling Commission assumes an "easternCanadian stock" (Donovan, 1991) whose numbers have never been assessed but probablyare in the thousands (e.g. Reeves and Brown, 1994) . The status of minke whales has notbeen considered by COSEWIC .
Significance of study area : The study area seems to have no more significance to minkewhales than many other parts of the Scotian Shelf. In fact, this is the only species of Cetaceasighted at a significantly higher rate outside Hooker et al.'s study area compared with insideit (see Table 9.0 .4) .
9 .0 .3 .5 Humpback whale (Megaptera novaeangliae)
The 14m humpback whale is the world's best known baleen whale . Like the fin whale, thehumpback feeds on euphausiids, fish and squid . It is distinctive for its stocky body, longwhite (in the N. Atlantic) flippers, pronounced seasonal migrations, bubble-net feedingtechniques, and the songs sung by males on the wintering grounds (e.g. Winn and Reichly,1985) .
Use of Gully area: Humpback whales are regularly sighted in the Gully during the summermonths (Table 9.0 .2) . Kenney (1994) also shows sightings of humpbacks in or near the studyarea in May and September, and Parsons (1995) observed 7 animals in the Gully inNovember 1994. In Hooker et al.'s data set, they show no particular depth preference (Fig .9 .0.2a), but their abundance increases through the summer months (Fig . 9 .0.2b) . As mosthumpbacks migrate to warm waters in winter (Winn and Reichly, 1985), numbers are likelyreduced between November and May . Like fin whales, sightings of this species have neverbeen very numerous at any time, so we think it unlikely that there would ever be more thana few tens of animals in the study area at a time .
192
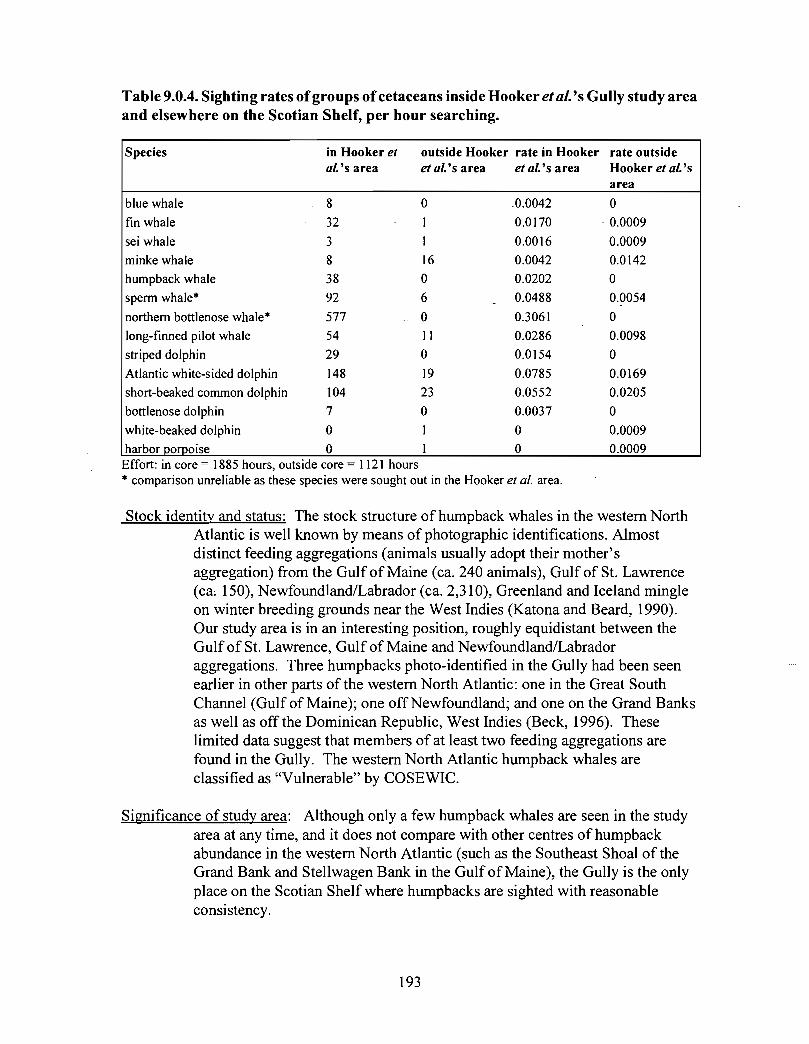
Table 9.0.4 . Sighting rates ofgroups of cetaceans inside Hooker et al.'s Gully study areaand elsewhere on the Scotian Shelf, per hour searching.
Species in Hooker et outside Hooker rate in Hooker rate outside
Ws area et Ws area et Ws area Hooker et Wsarea
blue whale 8 0 .0.0042 0
fin whale 32 1 0.0170 0.0009
sei whale 3 1 0.0016 0.0009
minke whale 8 16 0.0042 0.0142
humpback whale 38 0 0.0202 0
sperm whale* 92 6 0.0488 0.0054
northern bottlenose whale* 577 0 0.3061 0
long-finned pilot whale 54 11 0.0286 0.0098
striped dolphin 29 0 0.0154 0
Atlantic white-sided dolphin 148 19 0.0785 0.0169
short-beaked common dolphin 104 23 0.0552 0.0205
bottlenose dolphin 7 0 0.0037 0
white-beaked dolphin 0 1 0 0.0009
harbor porpoise 0 1 0 0.000 9Effort : in core = 1885 hours, outside core = 1121 hour s* comparison unreliable as these species were sought out in the Hooker et al. area .
Stock identitv and status : The stock structure of humpback whales in the western NorthAtlantic is well known by means of photographic identifications . Almostdistinct feeding aggregations (animals usually adopt their mother'saggregation) from the Gulf of Maine (ca . 240 animals), Gulf of St . Lawrence(ca: 150), Newfoundland/Labrador (ca . 2,310), Greenland and Iceland mingleon winter breeding grounds near the West Indies (Katona and Beard, 1990) .Our study area is in an interesting position, roughly equidistant between theGulf of St . Lawrence, Gulf of Maine and Newfoundland/Labradoraggregations . Three humpbacks photo-identified in the Gully had been seenearlier in other parts of the western North Atlantic : one in the Great SouthChannel (Gulf of Maine) ; one off Newfoundland ; and one on the Grand Banksas well as off the Dominican Republic, West Indies (Beck, 1996) . Theselimited data suggest that members of at least two feeding aggregations arefound in the Gully . The western North Atlantic humpback whales areclassified as "Vulnerable" by COSEWIC .
Significance of study area: Although only a few humpback whales are seen in the study
area at any time, and it does not compare with other centres of humpback
abundance in the western North Atlantic (such as the Southeast Shoal of the
Grand Bank and Stellwagen Bank in the Gulf of Maine), the Gully is the only
place on the Scotian Shelf where humpbacks are sighted with reasonable
consistency .
193
9.0 .3.6 Sperm whale (Physeter macrocephalus )
The sperm whale, the largest of the toothed whales, is generally an animal of deep waterswhere it feeds on mesopelagic and benthic squids and fishes . The two sexeshave quite different distributions : females (about 10-11m long) and young areusually restricted to waters warmer than about 15 ° C and latitudes less thanabout 40' , whereas the much larger males (up to about 18m) are found intemperate and polar waters, with larger, and older, males generally reachingwaters furthest from the equator (Rice, 1989) .
Use of Gully are : Male sperm whales are an important feature of the biota of the Gully .Although sperms can be found in any water deeper than 200m, there is aparticular concentration in the basin at the northern end of the Gully wherewater depths are between 200-400m (Fig . 9 .0 .3 ; Whitehead et al., 1992) .Sperm whales can be consistently found there during the summer months, andprobably during much or all of the rest of the year (as there have beenstrandings on Sable Island in October, January and February and sightings inthe Gully in November (Parsons, 1995 ; Reeves and Whitehead, 1997 ;Sergeant et al., 1970; R.W. Baird pers . comm.). In these northern Gullywaters their distinctive clicks can be heard much of the time through ahydrophone (Whitehead et al., 1992). Individual males have beenphotographed in the Gully over periods of several years (J . Christal,unpublished) indicating long-term fidelity or regular return to the area . TheseGully sperms are mostly maturing males of about 12.5-15 .5m, althoughgroups of females have been observed to enter the Gully briefly on twooccasions (Reeves and Whitehead, 1997 ; Whitehead et al ., 1992). From therate at which Whitehead et al . (1992) re-identified individual males, wesuggest that the population size in the study area at any time might number ofthe order of 10-30 animals .
Stock identity and status: The sperm whales in the North Atlantic are assumed by theInternational Whaling Commission to form a single stock (Donovan, 1991),partly on the basis of a male which was tagged on the Scotian Shelf andcaught off Spain (Mitchell, 1975). There is no credible estimate of the size ofthis population, but it probably numbers at least in the thousands (see Reevesand Whitehead, 1997) . Sperm whales are not considered at risk byCOSEWIC .
Significance of study area : Eastern Canadian waters rarely contain female sperm whales,but they seem to be important feeding grounds for males (Reeves andWhitehead, 1997) . The northern portion of the Gully is one of two areas notedfor sperm whale abundance off eastern Canada, the other being the entrance ofthe Hudson Strait (Reeves and Whitehead, 1997) . The Gully may be the mostimportant habitat for sperm whales on the Scotian Shelf, and it may containlong-term residents .
194
9.0.3.7 Northern bottlenose whale (Hyperoodon ampullatus )
The northern bottlenose whale, a 7-9m member of the beaked whale family, is only foundin the northern North Atlantic, and is the animal most identified with theGully. These are deep-diving animals which mostly eat squid (Mead, 1989) .
Use of Gully area : Northern bottlenose whales are consistently present in those waters ofthe Gully canyon deeper than about 500m (Whitehead et al., 1997b ; Figs9 .0.2a and 9 .0 .3) . Females are present throughout the year : they have beensighted in every survey of the Gully of which we are aware (in which therewere good sighting conditions for more than a few hours), in the months ofFebruary, May, June, July, August, October and November . The females areaccompanied by young animals which are thought to be born during thesummer months (Whitehead et al., 1997a). The same individuals have beenidentified in the Gully in both summer and winter (Whitehead et al., 1997a) .Mature males are rare in early summer, but are commonly sighted in August .Animals enter and leave the Gully at an unknown rate, but very approximatelyhalf the population of approximately 230 animals is in the Gully at any time(Whitehead et al., 1997b). Time-depth recorders attached to northernbottlenose whales in the Gully indicate that they are consistently diving tobeneath 1000 in, near or to the bottom of the canyon (S .K. Hooker and R .W.Baird, unpublished data) . These are the deepest known modal dives of anymammal .
Stock identity and status : There are indications (smaller size, apparently differentbreeding seasonality, and lack of subst antial migration) that the northe rnbo tt lenose whales found in the Gully are pa rtially or wholly distinct fromthose off northern Labrador, the nearest other population concentration(Whitehead et al., 1997a) . As there are sightings in other deep waters off theScotian Shelf (Kenney, 1994 ; Parsons, 1995 ; Whitehead et al., 1997b), it isthought that the Gully bottlenose whales may spend the part of the year whenthey are not in the c anyon south of the Scotian Shelf. The population ofnorthern bo tt lenose whales that uses the Gully is classified as "Vulnerable" byCOSEWIC .
Significance of study area: The Gully canyon is likely to be very important for thispopulation, as it contains about half the population at any time . The study ofthese animals in the Gully is the only long-term research on living beakedwhales of any species anywhere in the world (there are two recently initiatedstudies of Mesoplodon densirostris off the Bahamas and Ziphius cavirostrisoff Greece). Therefore most of what will be discovered in the next five yearsabout some aspects of the biology of beaked whales (especially socialorganization) will likely come from the Gully .
195
9.0 .3.8 Beaked whales of the genus Mesoplodon
The 13 or so beaked whales ofthe genus 1Ylesoplodon are the least known of marinemammals . They are deep-diving, elusive, small (4-6m) whales which are hardto sight and identify at sea.
Use of Gully area : Mesoplodon have been sighted several times in the deep waters of theGully. Sowerby's beaked whale (Mesoplodon bidens) has been identifiedpositively, and Blainville's beaked whale (Mesoplodon densirostris)tentatively . There has also been a single stranding of Sowerby's beaked whaleon Sable Island (preliminary identification by I .A. McLaren) . The difficultiesin sighting and identifying these animals mean that information is very sketchyand estimates of numbers impossible .
Stock identity and status: Nothing is known about the stock identity or status of thesean imals, although there has been a substantial by-catch of Mesoplodon in theUS east-coast pelagic drift-net fishery, p rincipally in and near shelf-edgecanyons to the southwest of the Gully (Read, 1994 and 1996) . Sowerby'sbeaked whale is considered "Vulnerable" by COSE1h1[C .
5icnificance of study area: Canyons are thought to be important habitat for Mesoplodon(e.g. Read, 1996) but the significance of the Gully for these animals isunknown .
9.0.3.9 Long-finned pilot whale (Globicephnla melas)
The long-finned pilot whale is a moderate-sized (5-6m) highly social and vocalodontocete which principally feeds on squid. Pilot whales are common overthe Scotian Shelf, and especially along its edge (Kenney, 1994).
Use of Gully area: Pilot whales are common in the study area in all summer months,although densities rise during August (Gowans and Whitehead, 1995) .Sightings plotted by Kenney (1994) show a distribution along the edge of theshelf during springrime, and there have been strandings on Sable Island inJanuary and February (Sergeant et al., 1970) as well as sightings off the shelfin November (Patsons, 199 5), suggesting that pilot whales are in the studyarea through much of the year . During the summer months they show noparticular depth preference within Hooker et aL 's study area (Figs 9.0.2a and
9.0 .3). Pilot whales often occur in large schools of tens of animals, so that,given the density of schools throughout the study area, it would not besurprising if there were, on occasion, more than one thousand animals in thearea.
Stock identit • and status : Stock distinctions among western North Atlantic [one -6nnedpilot whales are unclear, as are population sizes, although Hay (1982)estimated 13,000 for the waters off Newfoundland and Labrador . Although
196
the pilot whales in the Newfoundland area are likely to be still substantiallydepleted following a very intense drive fishery from 1947-1971 (Nelson andLien, 1996) long-finned pilot whales are not considered at risk by COSEWIC .
Significance of study area : The waters in our study often contain many long-finned pilotwhales, but densities are probably not much higher than in other outer watersof the Scotian Shelf (Table 9 .0 .4) .
9 .0 .3.10 Striped dolphin (Stenella coeruleoalba )
Striped dolphins are small (2 .5m), social and lively dolphins which are found intemperate and tropical waters around the world. They eat squid and fish .
Use of Gully area: Striped dolphins are common in the study area in late summer whenwater temperatures reach above about 15 ° C (Fig. 9 .0 .2b) . Within the studyarea, their habitat is the deeper waters in the southern part of the Gully canyon,and south of the shelf break (Fig . 9 .0 .3). Strandings in autumn and earlywinter on Sable Island (Baird et al., 1993a) suggest that they may stay in thearea after the water has cooled . Given the quite large schools sometimes seen,it is probable that numbers in the study area may sometimes exceed 1,000 .
Stock identity and status : In the western North Atlantic, stock distinctions and populationsizes are unknown for this species . It is not considered at risk by COSEWIC .
Significance of study area: The great majority of Canadian striped dolphin sightings havebeen made in the Gully (Baird et al., 1993a; Kenney, 1994). The study areaseems to be the most significant habitat for this species in Canadian waters .
9 .0 .3.11 Short-beaked common dolphin (Delphinus delphis )
The common dolphin is a very cosmopolitan species of tropical and temperate waters .Like the striped dolphin, these animals are small (2m) and gregarious, eatingschooling fish and squid .
Use of Gully area : Short-beaked common dolphins are very abundant in the southern halfof the study area in the later part of the summer (Figs 9 .0.3 and 9.0.2b) . Theywere frequently observed both on and off the Scotian Shelf during theNovember shipboard surveys reported by Parsons (1995) . They have largegroup sizes (Table 9 .0.2). Atlantic white-sided dolphins, the only smallcetacean species with a higher sighting rate, live in much smaller groups .Therefore, in July and August common dolphins are probably the mostabundant cetacean species in the study area, with numbers likely to be wellinto the thousands .
Stock identity and status: Stock distinctions and sizes in the western North Atlantic areunknown for this species. It is classified as not at risk by COSEWIC .
197
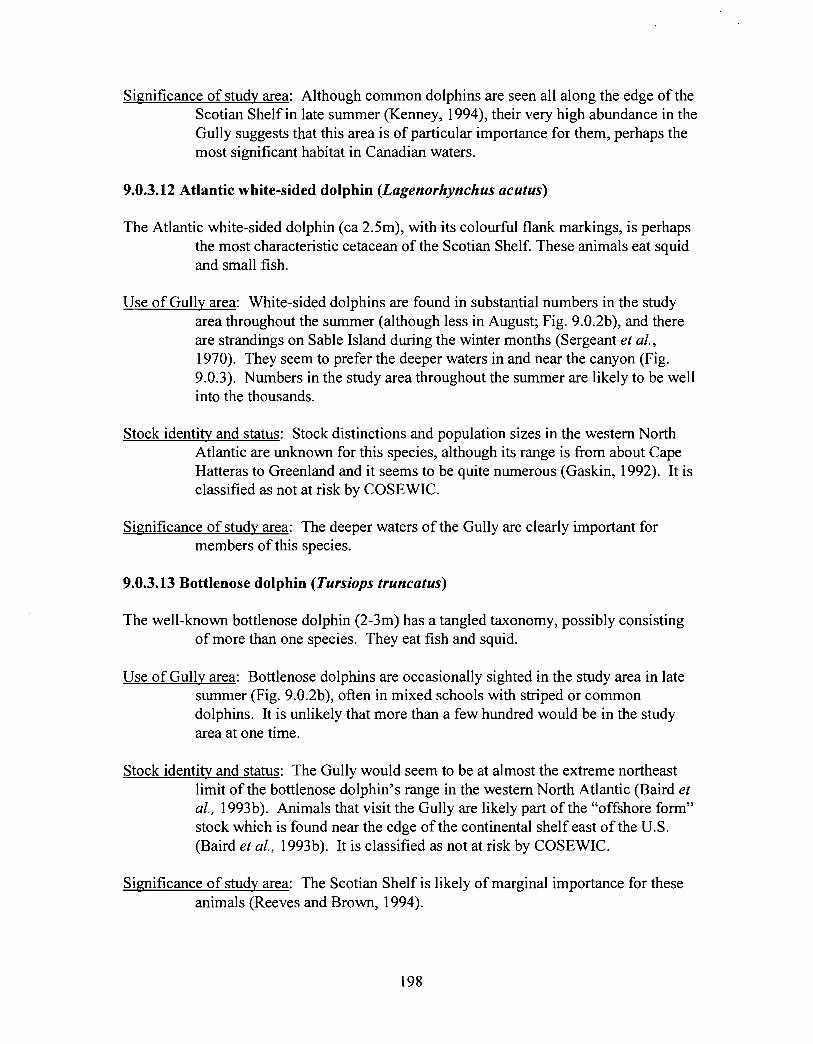
Significance of study area : Although common dolphins are seen all along the edge of theScotian Shelf in late summer (Kenney, 1994), their very high abundance in theGully suggests that this area is of particular importance for them, perhaps themost significant habitat in Canadian waters .
9 .0.3.12 Atlantic white-sided dolphin (Lagenorhynchus acutus)
The Atlantic white-sided dolphin (ca 2 .5m), with its colourful flank markings, is perhapsthe most characteristic cetacean of the Scotian Shelf . These animals eat squidand small fish .
Use of Gully area : White-sided dolphins are found in substantial numbers in the studyarea throughout the summer (although less in August ; Fig. 9 .0.2b), and thereare strandings on Sable Island during the winter months (Sergeant et al.,1970). They seem to prefer the deeper waters in and near the canyon (Fig .9.0 .3). Numbers in the study area throughout the summer are likely to be wellinto the thousands .
Stock identity and status : Stock distinctions and population sizes in the weste rn NorthAtlantic are unknown for this species, although its range is from about CapeHatteras to Greenland and it seems to be quite numerous (Gaskin, 1992) . It isclassified as not at risk by COSEWIC .
Significance of study area : The deeper waters of the Gully are clearly important formembers of this species .
9.0 .3 .13 Bottlenose dolphin (Tursiops truncatus )
The well-known bottlenose dolphin (2-3m) has a tangled taxonomy, possibly consistingof more than one species . They eat fish and squid .
Use of Gully are : Bottlenose dolphins are occasionally sighted in the study area in latesummer (Fig . 9 .0 .2b), often in mixed schools with striped or commondolphins. It is unlikely that more than a few hundred would be in the studyarea at one time .
Stock identit_y and status: The Gully would seem to be at almost the extreme northeastlimit of the bottlenose dolphin's range in the western North Atlantic (Baird etal., 1993b) . Animals that visit the Gully are likely part of the "offshore form"stock which is found near the edge of the continental shelf east of the U .S.(Baird et al., 1993b) . It is classified as not at risk by COSEWIC .
Significance of study area: The Scotian Shelf is likely of marginal importance for theseanimals (Reeves and Brown, 1994) .
198
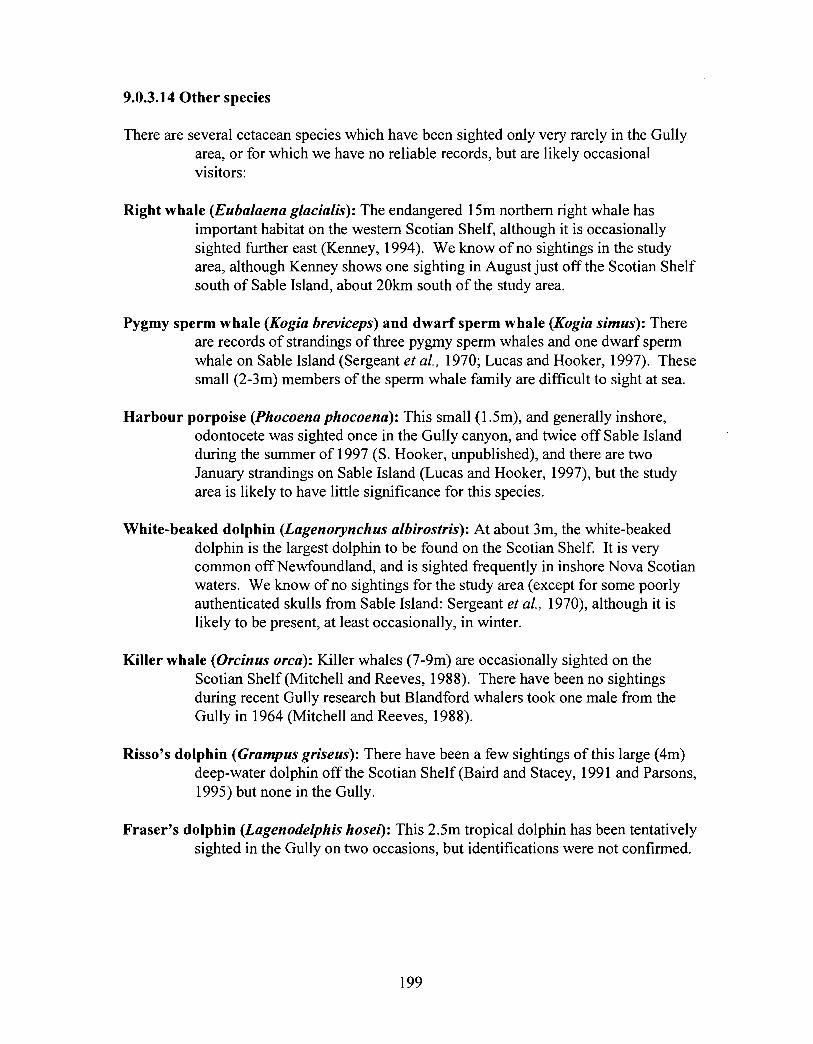
9.0 .3.14 Other species
There are several cetacean species which have been sighted only very rarely in the Gully
area, or for which we have no reliable records, but are likely occasional
visitors :
Right whale (Eubalaena glacialis) : The endangered 15m northern right whale hasimportant habitat on the western Scotian Shelf, although it is occasionallysighted further east (Kenney, 1994) . We know of no sightings in the studyarea, although Kenney shows one sighting in August just off the Scotian Shelfsouth of Sable Island, about 20km south of the study area .
Pygmy sperm whale (Kogia breviceps) and dwarf sperm whale (Kogia simus) : Thereare records of strandings of three pygmy sperm whales and one dwarf spermwhale on Sable Island (Sergeant et al., 1970; Lucas and Hooker, 1997) . Thesesmall (2-3m) members of the sperm whale family are difficult to sight at sea .
Harbour porpoise (Phocoena phocoena) : This small (1 .5m), and generally inshore,odontocete was sighted once in the Gully canyon, and twice off Sable Islandduring the summer of 1997 (S . Hooker, unpublished), and there are twoJanuary strandings on Sable Island (Lucas and Hooker, 1997), but the studyarea is likely to have little significance for this species .
White-beaked dolphin (Lagenorynchus albirostris) : At about 3m, the white-beakeddolphin is the largest dolphin to be found on the Scotian Shelf. It is verycommon off Newfoundland, and is sighted frequently in inshore Nova Scotianwaters . We know of no sightings for the study area (except for some poorlyauthenticated skulls from Sable Island : Sergeant et al., 1970), although it islikely to be present, at least occasionally, in winter .
Killer whale (Orcinus orca) : Killer whales (7-9m) are occasionally sighted on theScotian Shelf (Mitchell and Reeves, 1988) . There have been no sightingsduring recent Gully research but Blandford whalers took one male from theGully in 1964 (Mitchell and Reeves, 1988) .
Risso's dolphin (Grampus griseus) : There have been a few sightings of this large (4m)deep-water dolphin off the Scotian Shelf (Baird and Stacey, 1991 and Parsons,1995) but none in the Gully .
Fraser's dolphin (Lagenodelphis hosei) : This 2 .5m tropical dolphin has been tentativelysighted in the Gully on two occasions, but identifications were not confirmed .
199
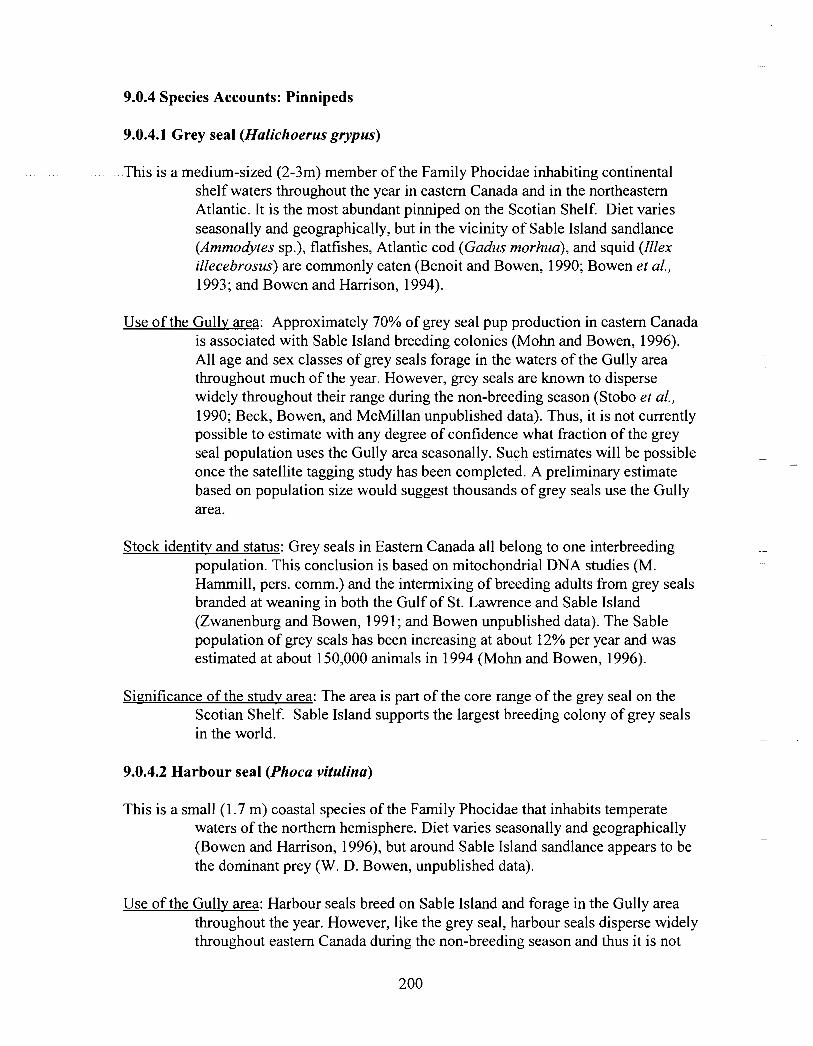
9.0.4 Species Accounts : Pinniped s
9.0.4 .1 Grey seal (Halichoerus grypus)
This is a medium-sized (2-3m) member of the Family Phocidae inhabiting continentalshelf waters throughout the year in eastern Canada and in the northeasternAtlantic . It is the most abundant pinniped on the Scotian Shelf . Diet variesseasonally and geographically, but in the vicinity of Sable Island sandlance(Ammodytes sp.), flatfishes, Atlantic cod (Gadus morhua), and squid (111exillecebrosus) are commonly eaten (Benoit and Bowen, 1990 ; Bowen et al.,1993 ; and Bowen and Harrison, 1994) .
Use of the Gully area : Approximately 70% of grey seal pup production in eastern Canadais associated with Sable Island breeding colonies (Mohn and Bowen, 1996) .
All age and sex classes of grey seals forage in the waters of the Gully areathroughout much of the year . However, grey seals are known to dispersewidely throughout their range during the non-breeding season (Stobo et al.,
1990; Beck, Bowen, and McMillan unpublished data) . Thus, it is not currentlypossible to estimate with any degree of confidence what fraction of the greyseal population uses the Gully area seasonally . Such estimates will be possible
once the satellite tagging study h as been completed . A preliminary estimate
based on population size would suggest thousands of grey seals use the Gully
area .
Stock identity and status: Grey seals in Eastern Canada all belong to one interbreeding
population. This conclusion is based on mitochondrial DNA studies (M .
Hammill, pers . comm.) and the intermixing of breeding adults from grey seals
branded at weaning in both the Gulf of St . Lawrence and Sable Island
(Zwanenburg and Bowen, 1991 ; and Bowen unpublished data) . The Sable
population of grey seals has been increasing at about 12% per year and was
estimated at about 150,000 animals in 1994 (Mohn and Bowen, 1996) .
Significance of the study area : The area is part of the core range of the grey seal on theScotian Shelf. Sable Island supports the largest breeding colony of grey sealsin the world .
9 .0 .4 .2 Harbour seal (Phoca vitulina)
This is a small (1 .7 m) coastal species of the Family Phocidae that inhabits temperatewaters of the northern hemisphere . Diet varies seasonally and geographically(Bowen and Harrison, 1996), but around Sable Island sandlance appears to bethe dominant prey (W . D . Bowen, unpublished data) .
Use of the Gully area: Harbour seals breed on Sable Island and forage in the Gully areathroughout the year . However, like the grey seal, harbour seals disperse widelythroughout eastern Canada during the non-breeding season and thus it is no t
200
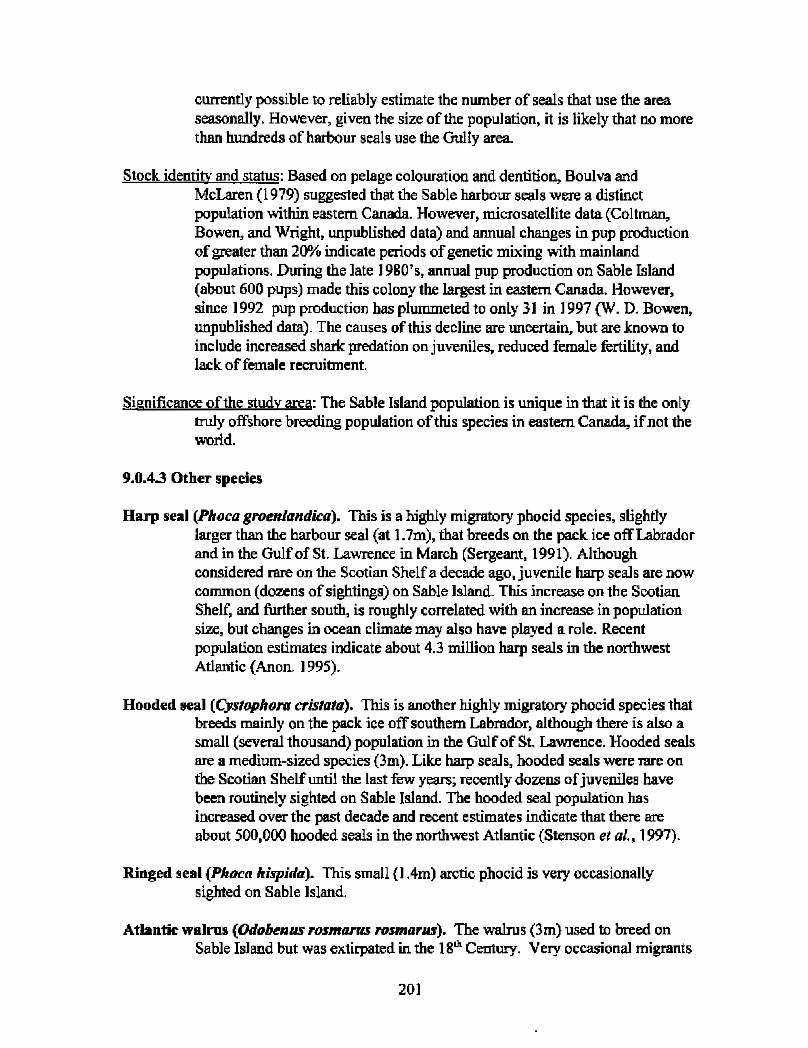
currently possible to reliably estimate the number of seals that use the areaseasonally . However, given the size of the population, it is likely that no morethan hundreds of harbour seals use the Gully area.
Stock identity andstatus : Based on pelage colouration and dentition, Boulva andMcLaren (1979) suggested that the Sable harbour seals were a distinctpopulation within eastern Canada . However, microsatellite data (Coltman,Bowen, and Wright, unpublished data) and annual changes in pup productionof greater than 20% indicate periods of genetic mixing with mainlandpopulations. During the late 1980's, annual pup production on Sable Island(about 600 pups) made this colony the largest in eastern Canada . However,since 1992 pup production has plummeted to only 31 in 1997 (W . D. Bowen,unpublished data) . The causes of this decline are uncertain, but are known toinclude increased shark predation on juveniles, reduced female fertility, andlack of female recruitment .
Si2nificance of the study area: The Sable Island population is unique in that it is the onlytruly offshore breeding population of this species in eastern Canada, if not thewrorld.
9.0.43 Other species
Harp seal (Phoca groeRlandfca) . This is a highly migratory phocid species, slightlylarger than the harbour seal (at 1 .7m), that breeds on the pack ice off Labradorand in the Gulf of St . Lawzence in March (Sergeant, 1991) . Althoughconsidered rare on the Scotian Shelf a decade ago, juvenile harp seals are nowcommon (dozens of sightings) on Sable Island . This increase on the ScotianShelf, and further south, is roughly correlated with an increase in populationsize, but changes in ocean climate may also have played a role . Recentpopulation estimates indicate about 4 .3 million harp seals in the northwestAtlantic ( .Anon. 1995) .
Hooded seal (Cystophora cristata). This is another highly migratory phocid species thatbreeds mainly on the pack ice off southern Labrador, although there is also asmall (several thousand) population in the Gulf of St . Lawrence. Hooded sealsare a medium-sized species (3m) . Like harp seals, hooded seals were rare onthe Scotian Shelf until the last few years; recently dozens of juveniles havebeen routinely sighted on Sable Island . The hooded seal population hasincreased over the past decade and recent estimates indicate that there areabout 500,000 hooded seals in the northwest Atlantic (Stenson et al., 1997) .
Ringed seal (Phoca hispida). This small (1 .4m) arctic phocid is very occasionallysighted on Sable Island .
Atlantic walrus (Odobenas rasmarus rosmarus) . The walrus (3m) used to breed onSable Island but was extirpated in the 18' Century . Very occasional migrant s
201
from arctic populations are seen off Nova Scotia (Katona er at, 1983), but weknow of no reports from the study area .
9.0.5 Significance of the Gully for Marine Mammals
9.0.5.1 Diversity
In the study area there are :
• 8 frequently sighted cetacean species (those with 25 or more sightings inHooker et al.'s data base; fin, humpback, sperm, northern bottlenose, and pilotwhales, and striped, Atlantic white-sided and short-beaked common dolphins) ;
• 5 cetacean species which are sighted quite often, but which have problems ofidentification (Sowerby's beaked whale, sei whale), a restricted temporalpresence (bottlenose dolphins, blue whales) or a distribution distinct from thenorthern bottlenose whale, which determined much of the distribution of effort(the minke whale) ;
• 7 cetacean species which are known to be, or are very likely to be, rare visitors(right whale, harbour porpoise, killer whale, white-beaked dolphin, Risso'sdolphin, pygmy sperm whale, dwarf sperm whale) ;
. 2 cetacean species whose presence is suspected but which have not beenpositively identified (Blainville's beaked whale, Fraser's dolphin) ;
• 2 abundant or common breeding pinniped species (grey and harbour seals) ;
• 2 fairly commonly sighted migratory pinniped species (harp and hooded seals) ;
• I rarely observed migrant pinniped (the ringed seal) .
It is impossible to compare diversity in the study area with other regions in a rigorousmanner, but the Gully seems to have a higher cetacean diversity than other areas, evenmuch larger ones, in the northwest Atlantic (using definitions of"common" of scientistsin different regions) :
• Gul[y area: 8-13 common species (depending on how many of category B areincluded)
• Scotian Shelf(excluding Hooker et al.'s study area) : 5 species sighted morethan once during 1,121 daylight hours of transit to and from the Gully (Table9.0 .4)
• Gulf of Maine: 6"common" species (Katona er al., 1983)
202
• Bay of Fundy: 6 "common" species (Gaskin, 1983)
• Shelf-edge (91-2000m) region from Cape Hatteras to George's Bank(62,100km): 12 "common" species (Hain er at, 1985)
• Netivfoundland-Labrador (inshore and offshore waters) : 9"commonly sighted"species (Lien et al., 1985)
Pinniped diversity (with 2 breeding species, 2 regularly sighted migrants, and one raremigrant) is no different to that of other pa rts of the eastern Scotian Shelf, and similar toother eastern Canadian waters.
9.0.5.2 Density
The study area contains the world's largest breeding colony ofgrey seals, and a largeproportion of the Canadian population of this species . In the study of Whitehead et al.(1993) sperm whales were heard much more frequently (per monitoring session) in thenorthern part of the Gully than elsewhere on the Scotian Shelf. The sighting rates ofcetaceans in Hooker eral.'s study area are compared to those on other parts of the easternScotian Shelf in Table 9 .0 .4. Data for species which were the objects of study in theGully but not outside (sperm and northern bottlenose whales) cannot be comparedlegitimately in this way . Differences between sighting rates inside and outside Hooker etal .'s study area were significant (P<0.05) for all the other species with sufficient data tomake a likelihood ratio G-test valid (fin whale, humpback whale, minke whale, pilotwhale, striped dolphin, white-sided dolphin, and common dolphin) . All of these species,except the minke whale, were sighted more frequently inside Hooker et at .'s study areathan elsewhere on the Scotian Shelf. There may be a bias towards the Gully because ofgenerally better sighting conditions, although this is unlikely to be large (probably lessthan a factor of 1 .5) . Even with these provisos considered, it is clear from Table 9 .0 .4,that the density of most species of cetaceans in the Gully area is substantially higher thanon other parts of the Shelf.
RTe were able to make a quantitative comparison of the density of large whales in theGully with that on other parts of the edge of the Scotian Shelf using the data of theBlandford whalers summarized by Sutcliffe and Brodie (1977) . We divided the shelfedge region up into contiguous areas each roughly the size of the Hooker et at study area(as shown in Fig. 9.0.4). For each area we calculated the distance to the whaling stationat Blandford, and the number of whales killed . These are plotted against one another inFig. 9 .0 .5 . As noted by Mitchell (1974), the whalers concentrated their attentions on seaareas within about 150 nautical miles from the whaling station, and the catch of whales(logged) falls roughly linearly with the log of the distance from Blandford (Fig . 9.0 .5 ; thepower relationship has exponent -2 .31). The catch of whales in the Gully isapproximately twice what would be expected from this relationship (Fig . 9 .0.5), andsignificantly higher than in the other shelf edge areas, accounting for distance fromBlandford (Analysis of Covariance, one-tailed P=0 .045) . Thus large whales seem to havebeen more available to the Blandford whalers in the Gully than in other similar-size d
203
areas along the edge of the Scotian Shelf (including the entrance of the Fundian Channel) .It can be seen, in Fig . 9 .0 .6, that catches in the overall Gully region are concentratedwithin the deep canyon and northern basin of the Gully, mostly over depths greater than200m and that the high abundance of whales in the Gully area indicated in Fig . 9 .0.5 isnot an artifact of where the boundary lines (indicated in Fig . 9 .0.4) were drawn.
Other measures of the high density of cetaceans in the Gully area include :
• the almost 100% record of sighting northern bottlenose whales in the deepcanyon on any survey of a few hours or more in good sighting conditions ;
• the high rate (50-100% of listening stations depending on area) at which spermwhales are heard through hydrophones in the northern part of the Gully(Whitehead et al., 1992);
• the high sighting rates of Atlantic white-sided and short-beaked commondolphins (Gowans and Whitehead, 1995) .
9 .0 .5.3 Significance for particular species
The significance of the study area for different marine mammal populations can betentatively classified as follows :
Species with populations which breed in the study area, and seem very dependent onhabitat within it :
• Grey sea l• Harbor seal• Northern bottlenose whale
Species for which the Gully is the most important habitat so far identified on the ScotianShelf and one of the most significant areas in Canadian waters :
• Sperm whale• Short-beaked common dolphin• Striped dolphin
Species for which the Gully is important habitat on the Scotian Shelf :
• Fin whale• Humpback whale• Atlantic white-sided dolphin
Common species for which the study area does not seem to contain particularly importanthabitat :
204
• Pilot whale• Minke whale• Harp seal• Hood seal
Unknown significance of study area :
• Beaked whales of genus Mesoplodon
9.0.6 Implications of marine mammal presence for other parts of the Gully biot a
The distribution of marine mammals correlates very well with that of their important
resources. The large number of pinnipeds in the study area is directly related to the
presence of suitable breeding areas on Sable Island . Similarly, the presence of cetaceans
implies an important resource which is almost certainly food. In most cases we know
little about the diets of the cetaceans that use the Gully . However a few species are
sufficiently stenophagous that their presence in the Gully allows inferences about the
increased availability of certain organisms . For instance, that blue whales are found in
the Gully in August implies that there are concentrated schools of euphasiids in the area
at that time . The consistent presence of northern bottlenose whales in the deep waters of
the Gully throughout the year is particularly interesting as it suggests a substantial
biomass of the deep-water squid Gonatusfabricius, which seems to be their predominant
prey in the region (S . Hooker et al ., unpublished data) . Overall, the large numbers of
cetaceans of many trophic habits found in the Gully indicates enhanced biomass of many
types .
9 .0.7 Cetaceans in canyons, large and smal l
Kenney and Winn (1987) tested the hypothesis that canyons are good cetacean habitatusing data from the 'CETAP' surveys of the edge of the US east coast continental shelf .They found, contrary to expectation, that cetacean biomass was significantly less in areascontaining canyons than adjacent parts of the shelf. Kenney and Winn (1987) cautionthat the biological significance of their result may be relatively minor, as there was nosignificant difference between canyons and non-canyon areas for any species (exceptStenella spp. which were more abundant in canyon areas), and no significant differencesfor any separate season . However, their findings seem in conflict with our result thatlarge cetaceans were about twice as available to Nova Scotian whalers in the Gully thanalong other parts of the edge of the continental shelf, as well as suggestions that othersubmarine canyons and their environs support increased numbers of cetaceans : KaikouraCanyon, New Zealand (Donoghue, 1996) ; Trincomalee Canyon, Sri Lanka (Alling, 1986and Gordon, 1991) ; and Monterey Canyon, California (Advanced Research ProjectsAgency, 1994) .
We suspect that some of this apparent contradiction may be due to the different sizes ofcanyons . Therefore we compared dimensions of the canyons used by Kenney and Winn(1987) as well as the Gully, and Kaikoura, Trincomalee and Monterey canyons, a s
205
defined by the 200 in and 1000 in contours (Table 9 .0.5) .
The Gully is the largest of the measured canyons in three of the four measureddimensions, and is particularly prominent when defined by the length of the 200 inindentation, which, at 70 .7 km, is over twice that for any of the other canyons . Its breadthis only rivaled by Trincomalee canyon . Although longest according to the 1000 incontour, it is closely rivaled by Hudson canyon . The Gully's width when defined by the1000 in contour, is not unusual among these canyons .
The Monterey, Trincomalee and Kaikoura Canyons do not appear obviously different indimension from those measured by Kenney and Winn . However unlike the US east coastcanyons and the Gully, these are adjacent to land, and so in very different physicalsettings. Thus it is probably unwise to extrapolate results from the US east coast canyonsto the Gully, because of its much greater size, and to Kaikoura, Trincomalee andMonterey canyons because of their proximity to shore . Both size and distance from shorewill affect physical oceanography, and thus potentially the resources available tocetaceans .
9 .0.8 Biological Boundarie s
In considering boundaries our goal was to suggest parts of the study area that seemedmost important for pinnipeds and for cetaceans, and whose degradation would have themost severe consequences . Two such areas stand out :
Sable Island and adjacent waters : The island and its surrounding waters are vital habitatfor the two species of breeding pinniped .
The Gully canyon and northern basin: All cetacean species for which the study area isprime breeding habitat (northern bottlenose whale), or the most important habitat so faridentified on the Scotian Shelf (sperm whale, short-beaked common dolphin, stripeddolphin) have primarily deep water distributions . In the case of sperm whales, watersgreater than about 200m deep seem to be important . All cetacean species that have beenseen in Hooker et al.'s study area, including those without clear depth preferences, aresighted in these deep waters . The catches of large cetaceans in the study area were alsoconcentrated in the deeper waters of the canyon and the northern basin (Fig . 9.0.6) .
Therefore, if the goal is to protect vital cetacean habitat, we suggest the followingboundaries (Fig . 9 .0 .1) :
• A core area of those waters deeper than 200m with latitudes greater than 43040' N and longitudes between 58° 30'N - 59° 30' W ;
• A buffer zone around this core area to protect it from threats which act at longranges (such as noise, chemical pollutants) . The width of the buffer zonewould depend on the range of the threats .
206
We recognize that boundaries must consider other aspects of the natural system as well ashuman activities, and it may be more practical to have straight boundaries .
Table 9.0.5. Dimensions of submarine canyons used in the analysis of Kenney andWinn (1987), together with Monterey, Kaikoura, Trincomalee canyons andthe Gully. Dimensions (in km) are approximate landward indentations of200 m and 1000 m contours from general shelf-edge trend ("length", as inKenney and Winn), and breadth of canyon, as defined by the 200 m or 1000m contour, half way into the indentation ("breadth") . Measurements weremade from nautical charts by S. Dufault.
200 m contour 1000 m contour
Canyon Length Breadth Length Breadth
Norfolk, US 15.2 2.9 6.9 1.3
Washington, US 8.8 4.5 10.2 2.6
Baltimore, US 13.7 4.2 10.5 1.7
Wilmington, US 12.2 8.5 10.7 2.2
Hudson, US 31.2 5.0 25.2 6.0
Veatch, US 8.7 5.3 6.8 2.3
Hydrographer, US 17.0 2.4 11.2 2.8
Welker, US 9.2 7.0 8.4 2.3
Oceanographer, US 21.8 4.2 18.3 2.8
Gilbert, US 11.2 6.0 13.0 3.3
Lydonia, US 18.0 4.0 10.0 3.1
Powell, US 8.7 5.2 6.8 2.0
Corsair, US 12.3 3.3 5.8 4.4
Monterey, US 24.8 8.1 16.9 3.0
Trincomalee, Sri Lanka 13.5 3.0 4.5 4.5
Kaikoura, New Zealand 13.0 15.0 15.8 3.5
The Gully, Canada 70.7 16.4 28.4 2.4
9.0.9 Data Deficiencie s
Our review of the marine mammals of the Gully area is hampered by deficiencies, o f
207
which we think the following are most significant :
Lack of data on at-sea distribution of pinnipeds : Although recent studies on adult greyseals have begun to address this deficiency, there is a nearly complete lack of informationon the at-sea distribution of harbour seals . Such studies could be important inunderstanding the causes of the dramatic population decline in this species .
Lack of data on cetacean distribution outside the summer months : Aerial surveys wouldbe a good way to get such information . Parsons (1995) showed how valuable a shortaerial survey of the Gully with experienced observers can be . Records collected byexperienced and interested fishermen could also help fill this gap .
Lack of information on how cetace ans use the Gul ly area: For instance, which speciesbreed there? For most species we do not know how individuals use the Gully . Are thehumpback whales observed in the Gully passing through or resident for much of theirsummer feeding season? Do they return in subsequent years? Additional photo-identifications should help address these issues .
9.0.10 Acknowledgments
We thank Robert Kenney for sending us data, and Susan Dufault who checked themanuscript .
9.0.11 Summary
• Available evidence strongly suggests that the Gully/Sable Island area is the mostimportant habitat for both cetaceans and pinnipeds on the Scotian Shelf .
• The area contains one of the longest and most productive pinniped researchprogrammes anywhere in the world, as well as the only long-term study of any beakedwhale species .
• The area is notable for :=> a high diversity of cetaceans (8-13 common species)
a high density of cetaceans in the Gully canyon. Densities of most species ofCetacea are considerably higher in the Gully than on other parts of the easternScotian Shelf, and large whale density is higher in the Gully than elsewherealong the edge of the Scotian Shelf (including the entrance of the FundianChannel) .
=> a high density of grey seals breeding on Sable Island=> particular significance (within a Canadian context) for :
Grey seal sHarbour seal sNorthern bottlenose whalesSperm whalesStriped dolphins
208
Atlantic white-sided dolphinsShort-beaked common dolphins
• The most significant marine mammal habitat within the area is :=> for pinnipeds: Sable Island and surrounding water so for cetaceans : the deep canyon and northern basin of the Gully (>200m in
depth)
9.0.12 References
Advanced Research Projects Agency. 1994. Draft Environmental ImpactStatement/Environmental Impact Report for the California Acoustic Thermometryof Ocean Climate Project.
Ailing, A. 1986. Records of odontocetes in the northern Indian Ocean (1981-82) and offthe coast of Sri Lanka (1982-84) . J. Bomba}+Nat . Hist. Soc. 83 :376-394.
Amirault, D.L. 1995. Towards a conservation strategy for the Gully, near Sable Island,Nova Scotia. Discussion Paper, Canadian Wildlife Service, Atlantic Region, P .O.Box 1590, Sackville, New Brunswick EOA 3C0 . 8pp .
Anon 1995 . Report on the status of harp seals in the northwest Atlantic . Department ofFisheries and Oceans, Canada Stock Status .Report 9517 .
Baird, R.W., and S tacey, P .J . 1991 . Status of Risso's dolphin, Grmrtpus griseus, inCanada . Can. Field ,Yat. 105 : 233-242 .
Baird, R.W., Stacey, P .J., and Whitehead, H . 1993a. Status of the striped dolphin,Stenella coeruleoalba in Canada . Can. Field Nrrr. 107 : 455-465 .
Baird, R.W., Walters, E.L., and Stacey, P .J. 1993b. Status of the bott lenose dolphin,Tursiops truncatus, in Canada . Can. Field Not . 107: 466-480 .
Beck, C.A. 1996. The distribution, habitat partitioning and movements of baleen whalesin the Gully, a submarine canyon on the Scotian Shelf. Honours BSC Thesis,Dalhousie University, Halifax, Nova Scotia .
Benoit, D., and Bowen, W.D. 1990. Summer diet of grey seals (Halicheorus grypus) atAnticosti Island, Gulf of St . Lawrence, Canada . Pages 227-242. Bowen, W. D.,ed. Population biology of sealworm (Psuedoterranova decipiens) in relation to itsintermediate and seal hosts . Can. Bull. J. Fish. Aquat Sci.
Boness, D . J ., Bowen, W.D., and Oftedal, O.T. 1994 . Evidence of a mate rnal foragingcycle resemb ling that of otariid seals in a small phocid, the harbor seal . Behav.Eco1. Sociobiol. 34:95-104.
209
Boulva, J., and McLaren, 1.A. 1979. Biology of the harbour seal, Phoca vindina, ineastern Canada. Bull. Fish. Res. Bd., Can. 200:1-24 .
Bowen, W. D., and Harrison, G . 1994. Offshore diet of grey seals Halicoeres gryphusnear Sable Island, Canada . Mar. Ecol. Prag. Ser. 112 :1-1 1 .
Bowen, W. D., and Harrison, G .D. 1996. Comparison of harbor seal diets in two habitatsin Atlantic Canada . Can. J. Zool. 74:125-135 .
Bowen. W. D., Lawson, J .W ., and Beck. B. 1993. Seasonal and geographic variation inthe species composition and size of prey consumed by g rey seals (Halicoeresgrvphus) on the Scotian shelf. Can. d. Fish. Aquat. Sci. 50 :1768-1778.
Bowen,lV. D., Oftedal, O.T., and Boness, D .J. . 1992a Mass and energy transfer duringlacta tion in a small phocid, the harbor seal (Phoca vihdina) . Physiol . Zool .65 :844-866 .
Bowen, W. D., Stobo, W.T., and Smith, S .J . 1992b. Mass changes of grey seal(Halicoeres gryphus) pups on Sable Island : differential maternal investmentreconsidered . J. Zool., Land 227:607-622 .
Clark, C .W. 1994. Note on acoustic activity of whales near the Scotian Shelf. Appendix 5of "Marine mammals and the Canadian Patrol Frigate Shock trials : a literaturereview and recommendations for mitigating the impacts ." by R.R Reeves andM.W. Brown. Prepared for National Defence Headquarters, Ottawa. pp 104-105.
Donoghue, M. 1996. The New Zealand experience--one country's response to cetaceanconserva tion. In The conservation of whales and dolphins: science and practice,ed. M. P. Simmonds, and J. Hutchinson . Chichester, U.K.: Wiley.
Donovan, G.P. 1991 . A review of IWC stock boundaries. Rep. int. Whal . Conwtn(special issue) 13 : 39-68.
Gaskin, D.E. 1983. The marine mammal contmunity . In . Marine and coastal systems ofthe Quoddy region, Now Brunswick Edited by M.L.H. Thomas . Canadian SpecialPublication of Fisheries and Aquatic Sciences 64 . Department of Fisheries andOceans, Ottawa . pp. 245-268 .
Gaskin, D .E. 1992. Status of the Atlantic white-sided dolphin, Lagenorhynchus acutus,in Canada. Can.Field Nat. 106: 64-72 .
Gordon, J . C. D. 1991 . The World Wildlife Fund's Indian Ocean Sperm Whale Project : anexample of cetacean research within the Indian Ocean Sanctuary . In Cetaceansand cetacean research in the Indian Ocean Sanctuary, ed. S . Leatherwood, and G .P. Donovan. Nairobi, Kenya: UNEP Technical Report Number 3 .
210
Gowans, S., and Whitehead, H . 1995 . Distribution and habitat partitioning by smallodontocetes in the Gully, a submarine canyon on the Scotian Shelf. Can. J. Zool.73 : 1599-1608 .
Hain, J.H.W., Hyman, M .A.M., Kenney, R.D., and Winn, H.E. 1985 . The role ofcetaceans in the shelf-edge region of the northeastern United States . Mar. Fish.Rev. 47: 13-17.
Hay, K. 1982. Aerial line-transect estimates of abundance of humpback, fin, and long-finned pilot whales in the Newfoundland-Labrador area . Rep. Int Whal. Commn32: 475-486 .
Hooker, S .K., Whitehead, H ., and Gowans, S . Submitted m/s . Spatial, temporal andenvironmental correlates of cetacean distribution in a submarine canyon--implications for the design of a marine protected area. Conserv. Biol.
International Whaling Commission 1992 . Report of the Comprehensive AssessmentSpecial Meeting on North Atlantic Fin Whales, Reykjavik, 25 February - 1 March1991 . Rep. Int. Whal. Commn 42 : 595-644.
Iverson, S . J ., Bowen, W .D., Boness, D .J., and Oftedal, O .T. 1993 . The effect ofmaternal size and milk output on pup growth in grey seals (Halicoeres gryphus) .Physiol. Zool. 66:61-88 .
Katona, S .K., and Beard, J .A . 1990 . Population size, migrations and feeding aggregationsof the humpback whale (Megaptera novaeangliae) in the western North AtlanticOcean . Rep. Int. Whal. Comm (special issue) 12: 295-305 .
Katona, S .K., Rough, V ., and Richardson, D.T. 1983 . A field guide to the whales,porpoises and seals of the Gulf of Maine and eastern Canada. 3rd ed . CharlesSc ribner's, New York .
Kenney, R.D. 1994. Distribution charts of marine mammals on the Scotian Shelf, 1966through 1992. Appendix 2 of "Marine mammals and the Canadian Patrol FrigateShock trials : a literature review and recommendations for mitigating the impacts ."by R.R Reeves and M.W. Brown. Prepared for National Defence Headquarters,Ottawa. pp 44-89 .
Kenney, R . D., and H. E . Winn. 1987 . Cetacean biomass densities near submarinecanyons compared to adjacent shelf/slope areas . Cont . ShelfRes. 7:107-114.
Leatherwood, S., and Reeves, R.R. 1983 . The Sierra Club handbook of whales anddolphins . Sierra Club Books, San Francisco .
Lien, J ., Fawcett, L., and Staniforth, S . 1985 . Wet and fat: whales and seals ofNewfoundland and Labrador. Breakwater, St John's, Newfoundland .
211
Lucas, Z.N., and Hooker, S .K. 1997 . Cetacean strandings on Sable Island, Nova Scotia .International Whaling Commission, Scientific Committee Document SC/49/0 6 .
Mead, J .G. 1989 . Bottlenose whales Hyperoodon ampullatus (Forster, 1770) andHyperoodon planifrons Flower, 1882. In. Handbook of Marine Mammals. Vol. 4 .Edited by S .H. Ridgway and R. Harrison. Academic Press, London. pp. 321-348 .
Mitchell, E. 1974. Present status of northwest Atlantic fin and other whale stocks . In . TheWhale Problem . Edited by W.E . Schevill . Harvard University Press, Cambridge,Massachusetts . pp. 108-169 .
Mitchell, E. 1975 . Report of the Scientific Committee, Annex U . Preliminary report onNova Scotian fishery for sperm whales (Physeter catodon) . Rep. Int. Whal.Commn 25 : 226-235 .
Mitchell, E., and Chapman, D .G. 1977 . Preliminary assessment of stocks of northwestAtlantic sei whales (Balaenoptera borealis) . Rep. Int. Whal. Commn (specialissue) 1 : 117-120 .
Mitchell, E., and Reeves, R .R. 1988. Records of killer whales in the western NorthAtlantic, with emphasis on eastern Canadian waters . Rit Fisk. 11 : 170-183 .
Mohn, R., and Bowen, W.D. 1996. Grey seal predation on the easte rn Scotian Shelf:modelling the impact on Atlantic cod . Can. J. Fish . Aquat. Sci. 53 :2722-2738.
Nelson, D., and Lien, J . 1996 . The status of the long-finned pilot whale, Globicephalamelas, in Canada. Can. Field Nat. 110: 511-524 .
Parsons, J . 1995 . Marine Mammal Monitoring Program--Canadian Patrol Frigate ShockTrials, November 8-21, 1994 . Final report to Department of National Defence,Ottawa by John Parsons & Associates, Dartmouth, Nova Scotia .
Read, A.J. 1994 . Interactions between cetaceans and gillnet and trap fishe ries in theNorthwest Atlantic . Rep. Int . Whal. Commn (special issue) 15 : 133-147 .
Read, A .J. 1996 . Incidental catches of small cetaceans . In . The conservation of whalesand dolphins : science and practice . Edited by M.P. Simmonds and J . Hutchinson .Wiley, Chichester, U .K. pp. 89-128 .
Reeves, R.R., and Brown, M.W. 1994 . Marine mammals and the Canadian Patrol FrigateShock trials : a literature review and recommendations for mitigating the impacts .Prepared for National Defence Headquarters, Ottawa. 105 pp .
Reeves, R.R., and Whitehead, H . 1997 . Status of the sperm whale (Physetermacrocephalus) in Canada . Can . Field Nat. 111 : 293-307 .
212
Rice, D.W. 1989. Sperm whale. Physeter macrocephalus Linnaeus, 1758. In . Handbookof marine mammals . Vol. 4. Edited by S.H . Ridgway and R. Harrison. AcademicPress, London. pp. 177-233 .
Sears, R., Williamson, J.M ., Wenzel, F.W., Bérubé, M., Gendron, D., and Jones.. P. 1990 .Photographic identification of the blue whale (Balaenoptera musculus) in the Gulfof St . Lawrence, Canada. Rep. /nt. W'hal. Commn (special issue) 12 : 335-342 .
Sergeant, D .E. 1991 . Harp seals, man, and ice . Can . Spec. Publ. Fish. Aquat. Sci .114:153p.
Sergeant, D .E., Mansfield, A.W., and Beck, B. 1970. Inshore records of Cetacea foreastern Canada 1949-68 . J. Fish. Res. Board Can. 27 : 1903-1915 .
Stenson, G .B., Myers, R.A., Ni, I ., and Warren,lA'.G. 1997. Pup production andpopulation growth of hooded seals (Cystophora cristata) near Newfoundland,Canada. Can. J. Fish. Aquat. Sci. 54 (Suppl .1):209-216.
Stobo, W.T., Beck,B., and Horne,J .K. 1990. Seasonal movements of grey seals(Halicoeres gryphus) in the No rthwest Atlantic . Edited by Bowen, W . D.,Population biology of sealworm (Psuedoterranova decipiens) in re lation to itsintermediate and seal hosts. Can. Bull. J. Fish. Aquat . Sci. pp. 199-213 .
Sutcliffe,W.H., and Brodie, P.F. 1977. Whale distributions in Nova Scotia waters.Fisheries and Marine Servfce Technical Report . No. 722 .
Whitehead, H ., Brennan, S ., and Grover, D. 1992. Distribution and behaviour of malesperm whales on the Scotian Shelf, Canada . Can. J. Zool. 70: 912-918 .
Whitehead, H ., Gowans, S., Faucher, A., and McCarrey, S . 1997a. Population of northernbottlenose whales in the Gully, Nova Scotia . Mar. Mammal Sci. 13 : 173-185 .
Whitehead, H., Faucher, A., Gowans, S., and McCarrey, S . 1997b. Status of the northernbottlenose whale, Hyperoodon ampullatus, in the Gully, Nova Scotia. Can. FieldNat. 111 : 287-292 .
Winn, H.E., and Reichly, N.E. 1985. Humpback whale Megaptera novaeangliae(Borowski 1781) . In . Handbook of marine mammals. Vol. 3 . Edited by S.H .Ridgway and R. Harrison. Academic Press, London. pp. 241-273 .
Z%vanenburg, K .C.T., and Bowen.. W.D. 1990. Population trends of the grey seal(Halicoeres gryphus) in eastern Canada. Pages 185-197. Bowen, W. D., ed .Population biology of sealworm (Psuedo(erranova decipiens) in relation to itsintermediate and seal hosts. Can. Bull. J. Fish. Aquat. Sci.
213
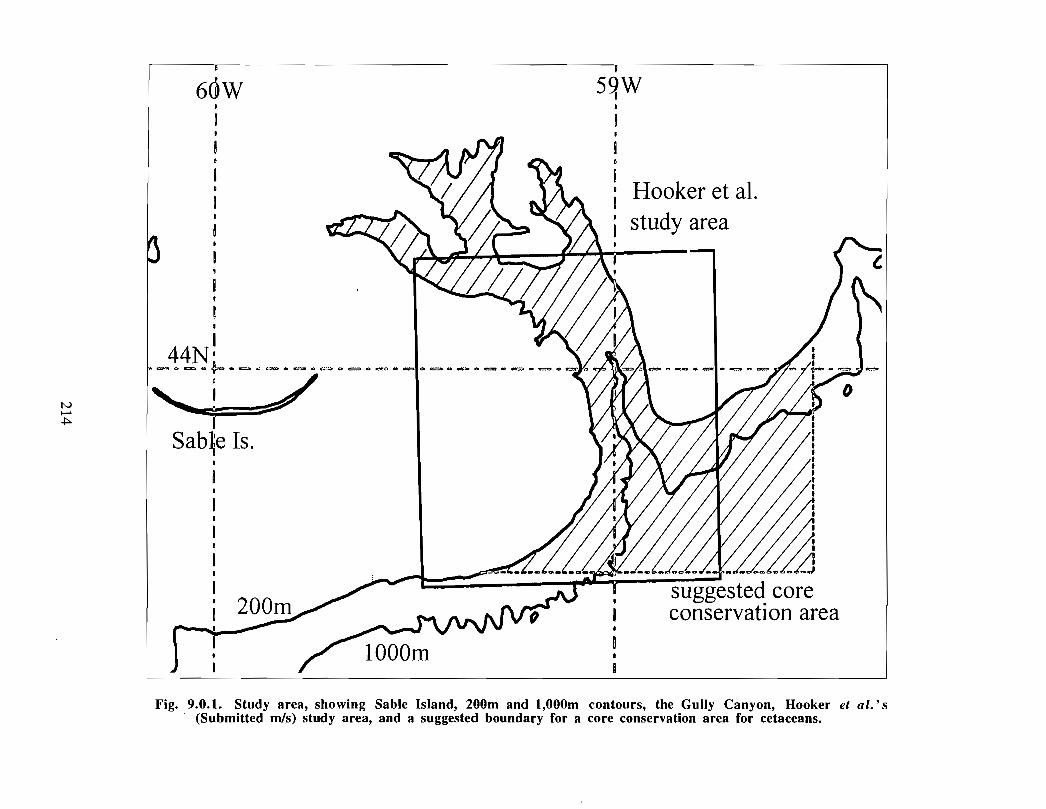
Fig. 9.0.1 . Study area, showing Sable Island, 200m and 1,000m contours, the Gully Canyon, Hooker et al.'s(Submitted m/s) study area, and a suggested boundary for a core conservation area for cetaceans .
Baleen Whale s
~x hurr~pbac k
O .b T
î"4otkaed Whale s
Dolphins
-+-- striped
~- A. white-side d
-A s-b eonnnon
x - bottlenose
VlN kri
OMr4
C~
ÔQU-,
r--
c~(~7
~
aG~
kr)~
a~t~
W
c
C
.~i
NCDtr,w
0LnNN
Depth range
Fig . 9 .0 .2 . Sighting rates of cetacean species (in sightings of groups perhour of effort) in Hooker et af.'s study area with water depth (Fig .9 .0.2a) and calendar month (Fig . 9 .0 .2b .) .
215
0.03
0.025
0.02
0.015b
0.01
0.005
0
0.5 T
0.4
~ 0.3
•ô 0 . 2
0 . 1
0 .160.140. 1 2- -
.- ,0.1 -0.080.06
ô 0.04V 0.02
0
6
Fig . 9 .0 .2. (Continued)
7
Month
216
Baleen Whales
-i- blue
--M- fin
---& minke
-x humpback
Toothed Whales
~ sperm
~ n. bottlenose
-,& -1-f pilot
Dolphins
~- striped
-~- A. white-sided
* s-b connnon
* bottlenose
8
blue whale (n = 8)
minke whale (n = 8 )
sperm whale (n = 92)
fin whale (n = 32 )
humpback whale (n = 38)
northe rn bottlenose whale (n = 577 )
Fig. 9.0 .3 . Maps of distributions of cetacean species in Hooker et al . studyarea using regions defined by depth (0-200m, 200-1,000m,>1,000m), and north-south and east-west boundaries in the centre ofthe Gully canyon. For each species, shading ranges from black forthe region of highest sightings per hour of effort to white for regionswithout sightings of the species .
217
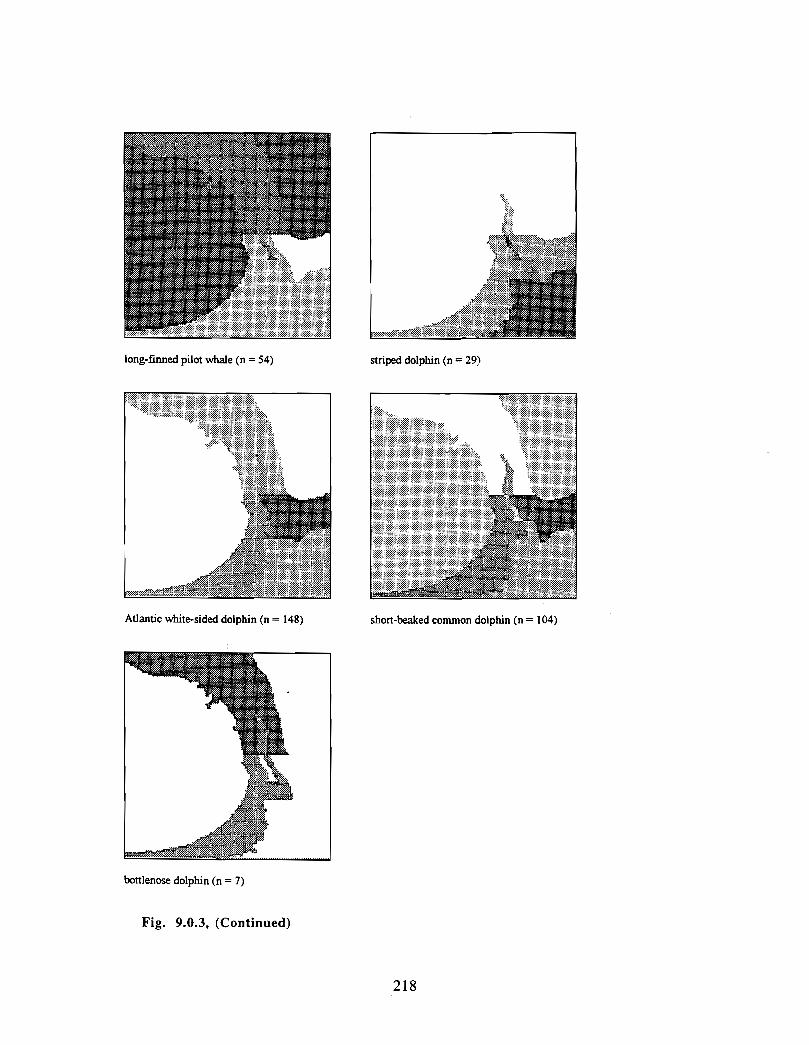
long-finned pilot whale (n = 54)
Atlantic white-sided dolphin (n = 148 )
bottlenose dolphin (n = 7 )
Fig. 9.0.3, (Continued)
striped dolphin (n = 29)
short-beaked common dolphin (n = 104 )
218
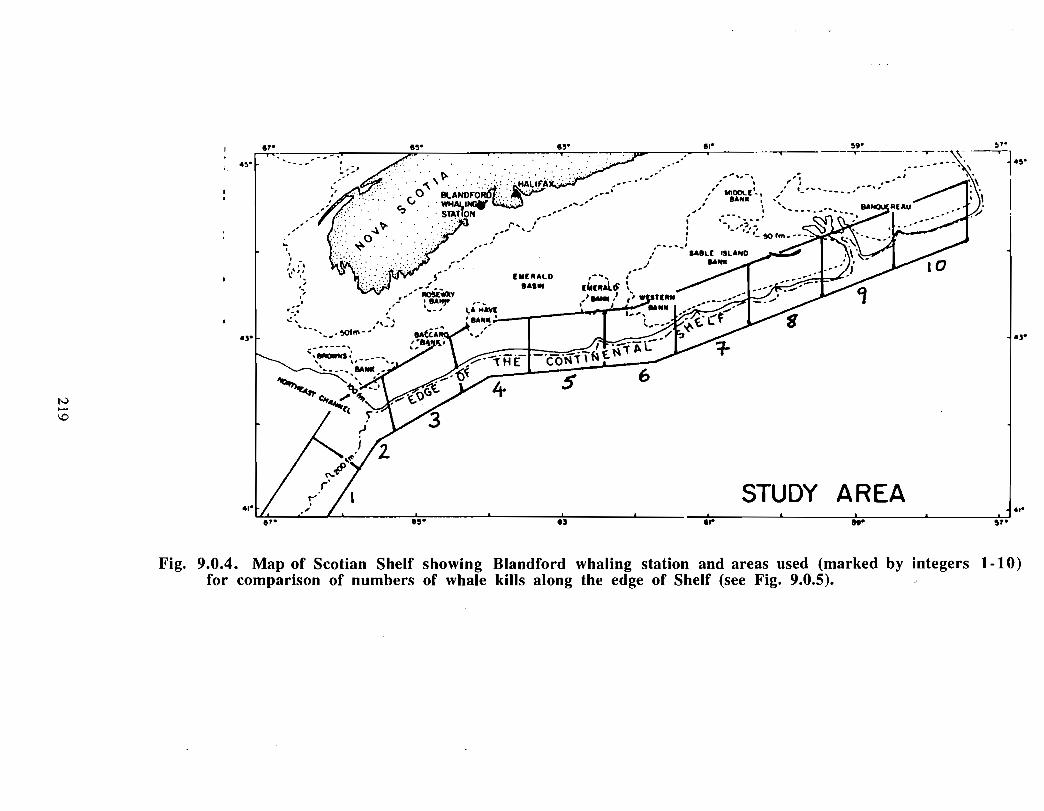
,, .
43.
5t•
. 1
Fig. 9.0.4 . Map of Scotian Shelf showing Blandford whaling station and areas used (marked by integers 1-10)for comparison of numbers of whale kills along the edge of Shelf (see Fig . 9.0.5).
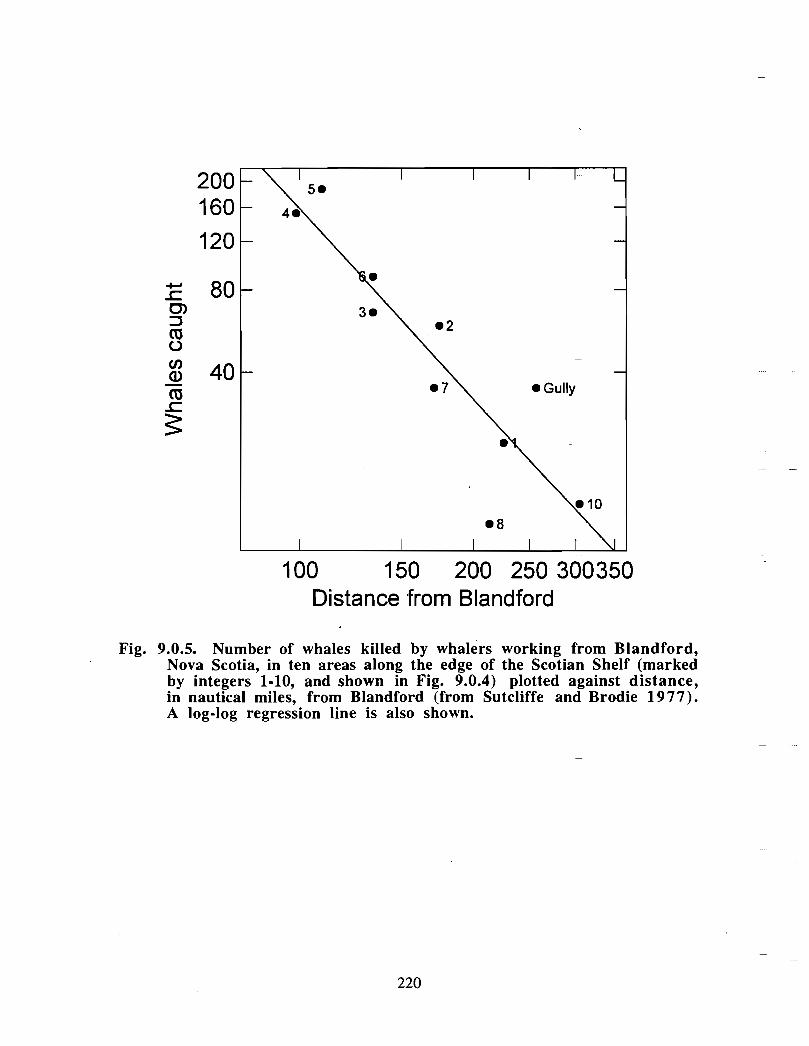
200160
120
80
40
100 150 200 250 300350Distance from Blandford
Fig. 9.0.5. Number of whales killed by whalers working from Blandford,Nova Scotia, in ten areas along the edge of the Scotian Shelf (markedby integers 1-10, and shown in Fig . 9.0.4) plotted against distance,in nautical miles, from Blandford (from Sutcliffe and Brodie 1977) .A log-log regression line is also shown .
220
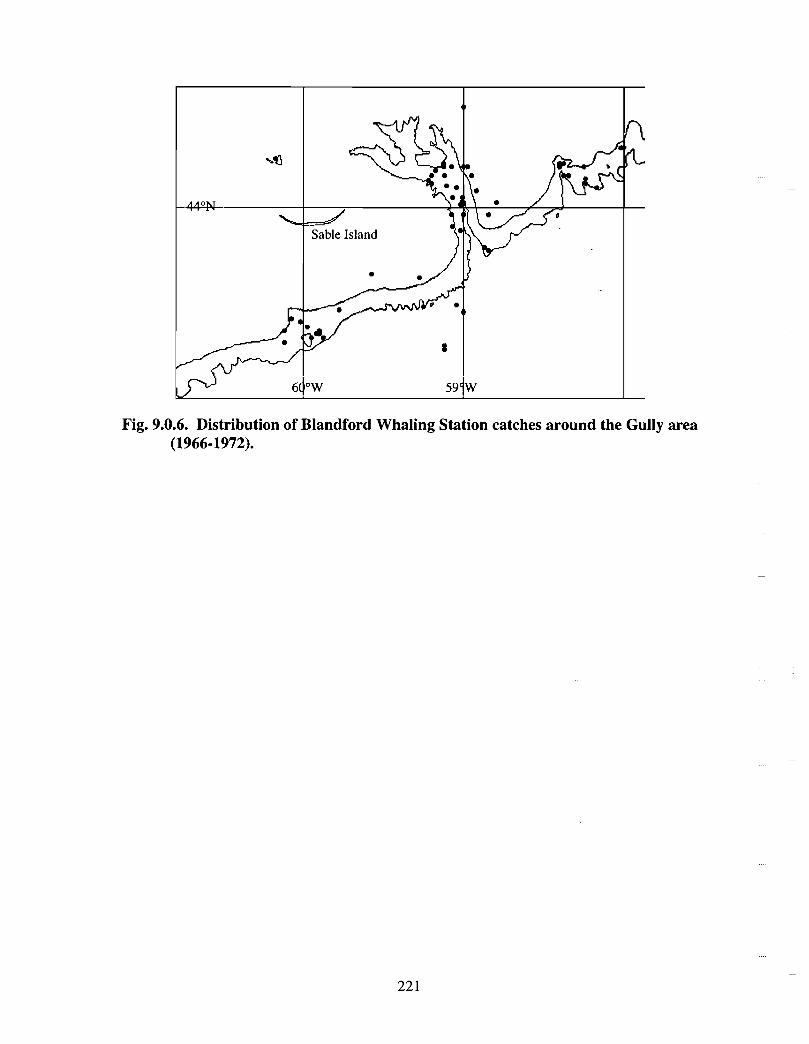
..
r ..
440bi• •'
..
Sable Island
. ~
_
6¢°W 591W
Fig. 9.0.6. Distribution of Blandford Whaling Station catches around the Gully area(1966-1972) .
221
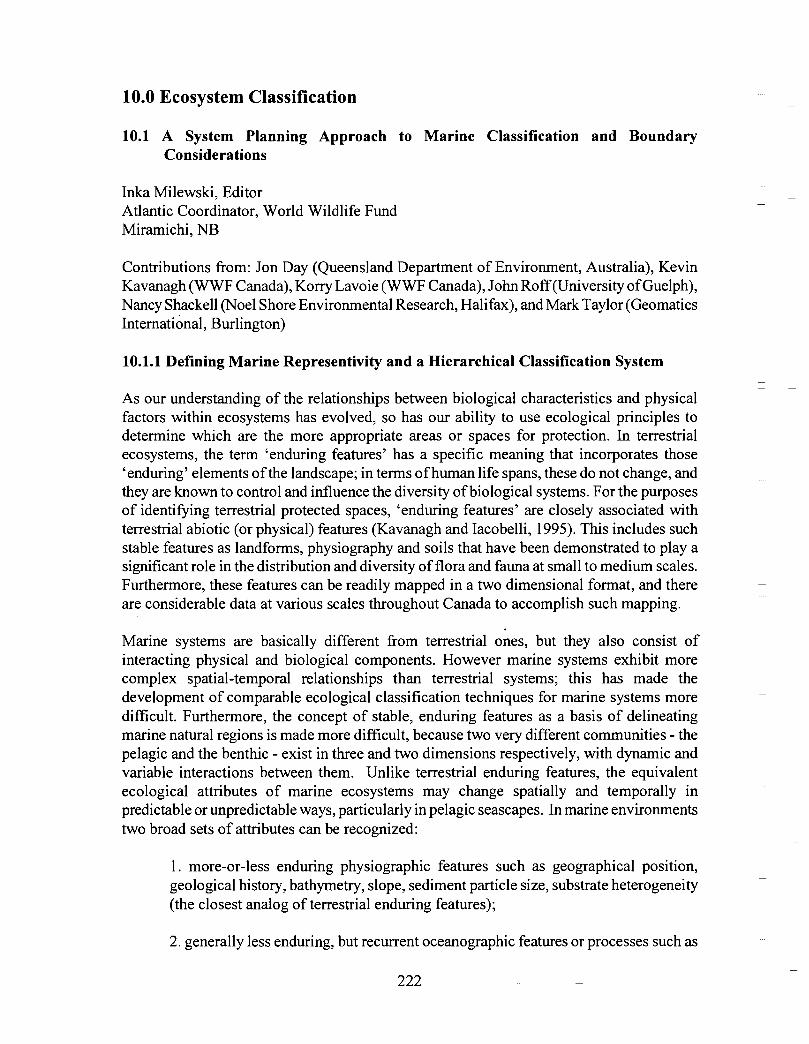
10.0 Ecosystem Classificatio n
10.1 A System Planning Approach to Marine Classification and BoundaryConsiderations
Inka Milewski, Edito rAtlantic Coordinator, World Wildlife FundMiramichi, NB
Contributions from: Jon Day (Queensland Department of Environment, Australia), KevinKavanagh (WWF Canada), Korry Lavoie (WWF Canada), John Roff (University of Guelph),Nancy Shackell (Noel Shore Environmental Research, Halifax), and Mark Taylor (GeomaticsInternational, Burlington)
10.1 .1 Defining Marine Representivity and a Hierarchical Classification Syste m
As our understanding of the relationships between biological characteristics and physicalfactors within ecosystems has evolved, so has our ability to use ecological principles todetermine which are the more appropriate areas or spaces for protection . In terrestrialecosystems, the term `enduring features' has a specific meaning that incorporates those`enduring' elements of the landscape; in terms of human life spans, these do not change, andthey are known to control and influence the diversity of biological systems . For the purposesof identifying terrestrial protected spaces, `enduring features' are closely associated withterrestrial abiotic (or physical) features (Kavanagh and lacobelli, 1995) . This includes suchstable features as landforms, physiography and soils that have been demonstrated to play asignificant role in the distribution and diversity of flora and fauna at small to medium scales .Furthermore, these features can be readily mapped in a two dimensional format, and thereare considerable data at various scales throughout Canada to accomplish such mapping .
Marine systems are basically different from terrestrial ones, but they also consist ofinteracting physical and biological components . However marine systems exhibit morecomplex spatial-temporal relationships than terrestrial systems ; this has made thedevelopment of comparable ecological classification techniques for marine systems moredifficult . Furthermore, the concept of stable, enduring features as a basis of delineatingmarine natural regions is made more difficult, because two very different communities - thepelagic and the benthic - exist in three and two dimensions respectively, with dynamic andvariable interactions between them. Unlike terrestrial enduring features, the equivalentecological attributes of marine ecosystems may change spatially and temporally inpredictable or unpredictable ways, particularly in pelagic seascapes . In marine environmentstwo broad sets of attributes can be recognized :
1 . more-or-less enduring physiographic features such as geographical position,geological history, bathymetry, slope, sediment part icle size, substrate heterogeneity(the closest analog of terrestrial endu ring features) ;
2 . generally less enduring, but recurrent oceanographic features or processes such as
222
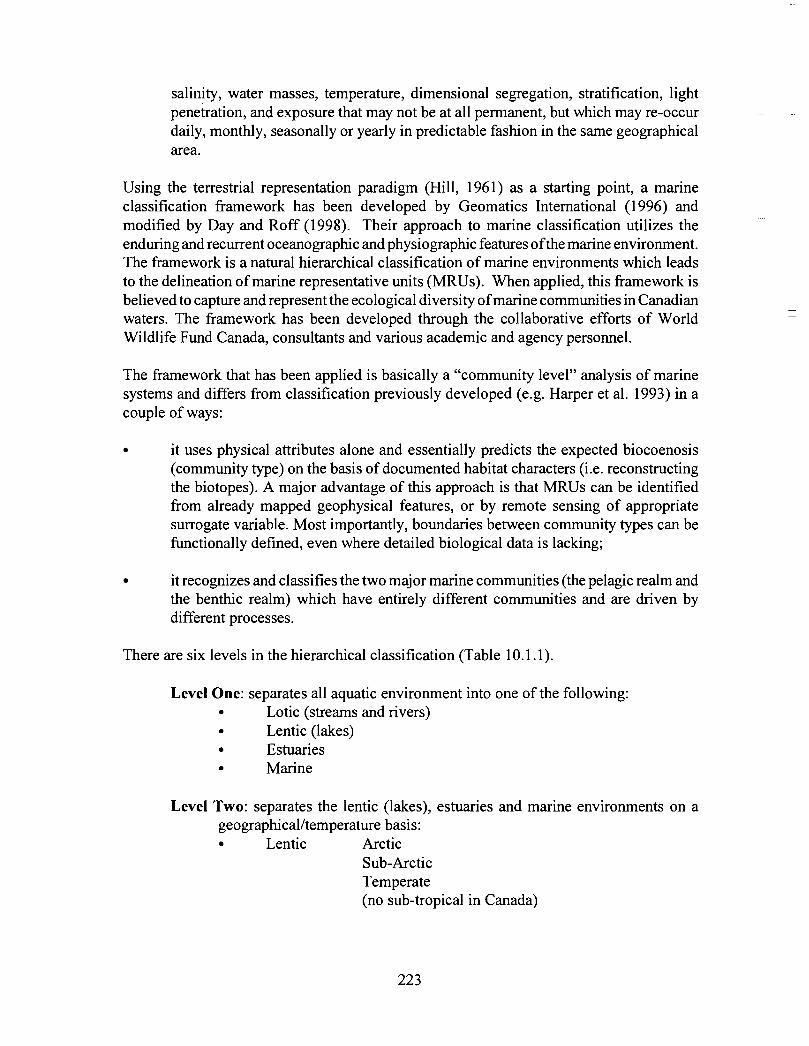
salinity, water masses, temperature, dimensional segregation, stratification, lightpenetration, and exposure that may not be at all permanent, but which may re-occurdaily, monthly, seasonally or yearly in predictable fashion in the same geographicalarea .
Using the terrestrial representation paradigm (Hill, 1961) as a starting point, a marineclassification framework has been developed by Geomatics International (1996) andmodified by Day and Roff (1998). Their approach to marine classification utilizes theenduring and recurrent oceanographic and physiographic features of the marine environment .The framework is a natural hierarchical classification of marine environments which leadsto the delineation of marine representative units (MRUs) . When applied, this framework isbelieved to capture and represent the ecological diversity of marine communities in Canadianwaters . The framework has been developed through the collaborative efforts of WorldWildlife Fund Canada, consultants and various academic and agency personnel .
The framework that has been applied is basically a "community level" analysis of marinesystems and differs from classification previously developed (e .g. Harper et al . 1993) in acouple of ways :
• it uses physical attributes alone and essentially predicts the expected biocoenosis(community type) on the basis of documented habitat characters (i .e . reconstructingthe biotopes) . A major advantage of this approach is that MRUs can be identifiedfrom already mapped geophysical features, or by remote sensing of appropriatesurrogate variable . Most importantly, boundaries between community types can befunctionally defined, even where detailed biological data is lacking ;
• it recognizes and classifies the two major marine communities (the pelagic realm andthe benthic realm) which have entirely different communities and are driven bydifferent processes .
There are six levels in the hierarchical classification (Table 10 .1 .1) .
Level One: separates all aquatic environment into one of the following :• Lotic (streams and rivers)• Lentic (lakes)• Estuaries• Marine
Level Two : separates the lentic ( lakes), estuaries and marine environments on ageographical/temperature basis :• Lentic Arctic
Sub-ArcticTemperate(no sub-tropical in Canada)
223
Estuaries Arctic ( seasonal ice)Sub-Arctic (Atlantic)Temperate (Atlantic)Temperate (Pacific)(No tropical in Canada)
Marine Arctic (permanent ices)Arctic (Atlantic)Sub-Arctic (Atlantic)Temperate (Atlantic)Sub-tropical (Atlantic)Temperate (Pacific )
Level Three: is a dimensional segregation that separates all relevant communitiesin Levels One and Two in Pelagic and Benthic realms .
Level Four (Benthic) : is a vertical division that distinguishes between depth classeson the substrate .
Light condition is particularly relevant to benthic communities and is used todelineate the sub-littoral euphotic zone (<50 m) . Between 50-200 m is the dysphoticzone where light is still present, but is too low in intensity to support plant growth ;below this again, the great majority of the oceans' depths lie within the aphoticzone, where no light penetrates . Rather more arbitrarily, the benthos is also dividedinto the bathyal zones (200m to 2000m) and abyssal/hadal zones (>2000 m) .
Level Four (Pelagic) : is a vertical division which distinguishes between depthclasses within the water column .
Within the water column, depth, pressure, light penetration and turbidity are allinter-correlated. Moving from the shoreline onto the Continental Shelf and thenoffshore beyond the Continental Slope, water column depth increases, lightpenetrates further (because of grater water clarity and lower turbidity), andpressure increases with depth. Water column depth itself therefore acts as asuitable discriminant of communi ty type, also accountingfor the correlatedfactorsof light penetration and pressure .
Level Five (Pelagic) : distinguishes whether water is stratified, non-stratified (well-mixed), or frontal (also referred to as "transititional") .
The vertical stratification of a water column separates its communities bothspatially and temporally. Stratified and non-stratifred waters will differ both in theirannual productivity regimes and in their annual community structures . Thus, manybanks and coastal regions of high tidal amplitude will remain unstratified and may
retain or accumulate populations of important pelagic species (e .g. larval fish,
lobsters, etc .)
224
Level Five (Benthic) : segregation is based on substrate type
Thesubstratewithinspecifrc deposition anderosional regintes tends to be relativetvconstant and is a major factor influencing the biota associated with the bottom.
There is a relation between sediments and wvNer motion and the latter may besignificant both as an erosional force as well as one which brings food andnutrients to the zone . There are obviousdiffference between rocky, sandy muimuddyshores though in deep waters the distinctions are reduced and only muds and sandsare distinguished. Fine sands, sills and clays are found in the deeper regions.
Level Six (Benthic) : distinguishes between degree of exposure for the intertidal andimmediate sub-tidal areas ; or the degree of slope in water >50 m .
Stable marine slopes for sediment accumulation are much lower angles thanterrestrial slopes for similar grain sizes. Mass movements ofmaterials have beenknown to occur at angles as low as 1°.
Marine biological ecosystems include extremely disparate communities within the same=area' as defined using two-dimensional mapping . It is therefore difficult to identityboundaries in marine systems because they are so dynamic (e.g., Tremblay and Roff, 1983),particularly when using traditional mapping techniques . Nevertheless, it is still appropriateto examine marine ecological characteristics and to define representative and distinctivecommunities in terms of their relationships to enduring physical factors or recurrentprocesses. While such a classification will not account for large scale or unpredictabledisturbances, like hurricanes, communities generally re-establish themselves in due courseand due composition based on the enduring physiographic and recurrent oceanographicfactors .
This proposed hierarchical classification framework is theoretical . However, it is currentlybeing tested on a region of the Atlantic coast known as the Scotian Shelf as part of acollaboration between World Wildlife Fund Canada, consultants, and various academic andgovernment agency personnel . The results of applying this framework to the Scotian Shelfwill be the selection and delineation of marine natural regions and MRUs within the studyarea. As a feature of the Scotian Shelf, the Gully will be part of this evaluation .
10.1.2 Boundaries Refined by Ecological Principles
Once enduring features are mapped, the boundaries of a proposed representative ordistinctive protected area need to be evaluated using ecological criteria that will support thelong-term viability of the protected area. Such long-term protection of biodiversity requi resthat important ecological processes are maintained. As a result, protected areas systemsplanning should reflect the scales at which these ecological processes occur . Protected areasmust be judged to be in the right place, of the right size, and the right configuration to helpprotect biodiversity over the long-term .
According to Noss (1995), "simply re presenting the enduring featu res of the vegetation ofa natural region in a reserve network will not guarantee that all species native to the region
225
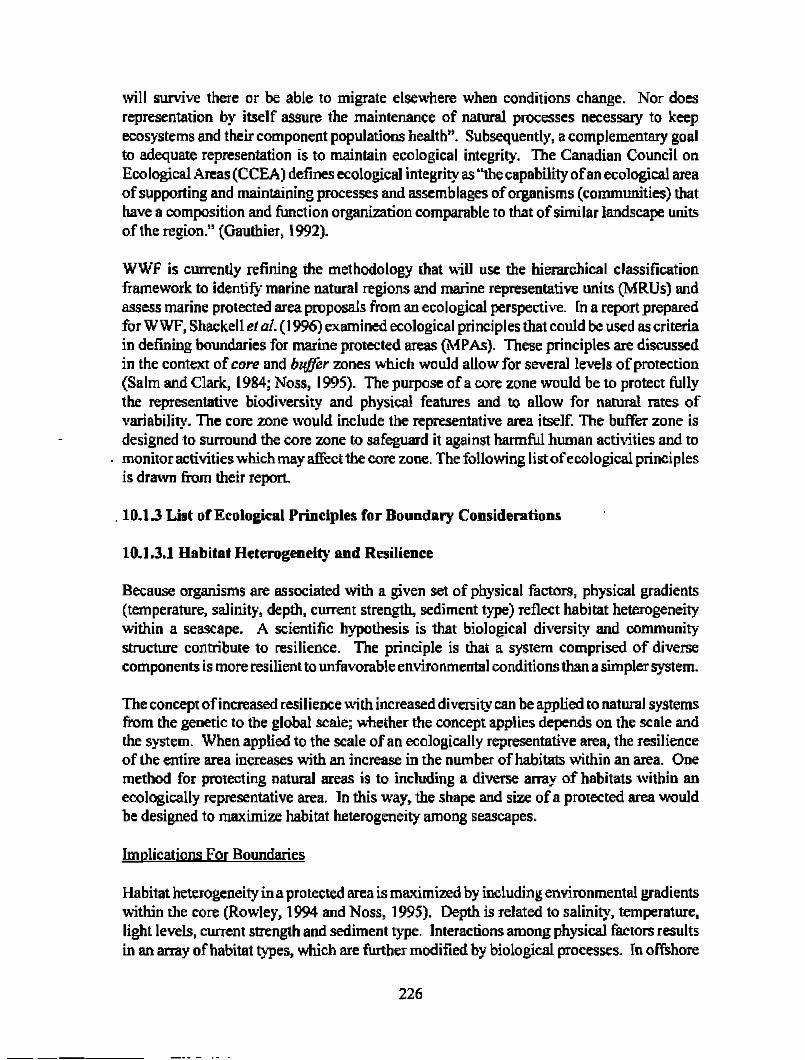
will survive there or be able to migrate elsewhere when conditions change . Nor doesrepresentation by itself assure the maintenance of natural processes necessary to keepecosystems and their component populations health" . Subsequently, a complementary goalto adequate representation is to maintain ecological integrity . The Canadian Council onEcological Areas (CCEA) defines ecological integrity as "the capability of an ecological areaof supporting and maintaining processes and assemblages of organisms (communities) thathave a composition and function organization comparable to that of similar landscape unitsof the re¢ion ." (Gauthier, 1992) .
WWF is currently refining the methodology that will use the hierarchical classificationframework to identify marine natural regions and marine representative units (MRUs) andassess marine protected area proposals from an ecological perspective . In a report preparedfor W WF, Shackell el al. (1996) examined ecological principles thatcould be used as criteriain defining boundaries for marine protected areas (\4PAs) . These principles are discussedin the context of core and buffer zones which would allow for several levels of protection(Salin and Clark, 1984; Noss, 1995). The purpose of a core zone would be to protect fullythe representative biodiversity and physical features and to allow for natural rates ofvariability . The core zone would include the representative area itself. The buffer zone isdesigned to surround the core zone to safeguard it against harmful human activities and tomonitor activities which may affect the core zone . The following list of ecological principlesis drawn from their report.
. 10 .1 .3 List of Ecological P rinciples for Boundary Consideration s
10.1 .3.1 Habitat Heterogeneity and Resilience
Because organisms are associated with a given set of physical factors, physical gradients(temperature, salinity, depth, current strength, sediment type) reflect habitat heterogeneitywithin a seascape. A scientific hypothesis is that biological diversity and communitystructure contribute to resilience. The principle is that a system comprised of diversecomponents is more resilient to unfavorable environmental conditionsthan a simpler system .
The concept ofincreased resilience with increased diversity can be applied to natural systemsfrom the genetic to the global scale ; whether the concept applies depends on the scale andthe system. When applied to the scale of an ecologically representative area, the resilienceof the entire area increases with an increase in the number of habitats within an area . Onemethod for protecting natural areas is to including a diverse array of habitats within anecologically representative area . In this way, the shape and size of a protected area wouldbe designed to maximize habitat heterogeneity among seascapes .
Implications For Boundaries
Habitat heterogeneity in aprotected area is maximized by including environmental gradientswithin the core (Rowley, 1994 and Noss, 1995) . Depth is related to salinity, temperature,light levels, current strength and sediment type . Interactions among physical factors resultsin an array of habitat types, which are further modified by biological processes . In offshore
226
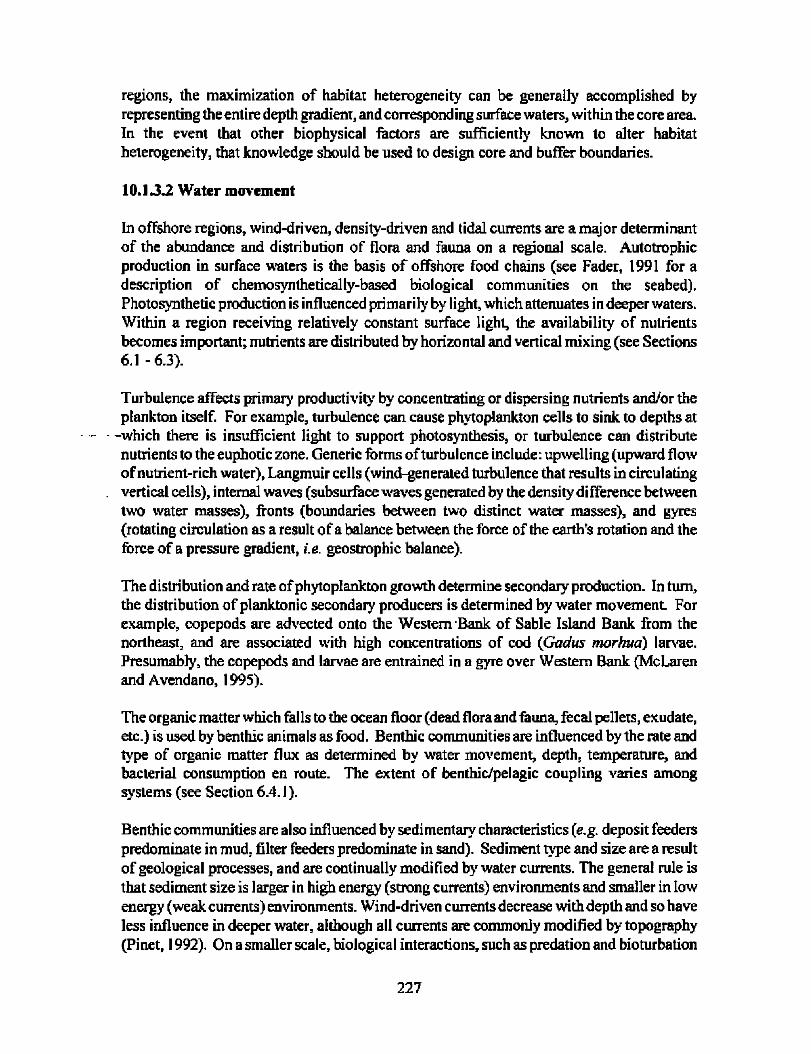
regions, the maximization of habitat heterogeneity can be generally accomplished byrepresenting the entire depth gradient, and corresponding surface waters, within the core area .In the event that other biophysical factors are sufficiently known to alter habitatheterogeneity, that knowledge should be used to design core and buffer boundaries .
10.1 .3.2 Water movement
In offshore regions, wind-driven, density-driven and tidal currents are a major determinantof the abundance and distribution of flora and fauna on a re gional scale . Autotrophicproduction in surface waters is the basis of offshore food chains (see Fader, 1991 for adescription of chemosynthetically-based biological communities on the seabed) .Photosynthetic production is influenced primarily by light, which attenuates in deeper waters .Within a region receiving relatively constant surface light, the availability of nutrientsbecomes important; nutrients are distributed by horizontal and vertical mixing (see Sections6.1 - 6 .3).
Turbulence affects primary productivity by concentrating or dispersing nut rients and/or theplankton itself. For example, turbulence c an cause phytoplankton cells to sink to depths at
-which there is insufficient light to support photosynthesis, or turbulence can distributenutrients to the euphotic zone . Generic forms ofturbulence include : upwelling (upward flowof nutrient-rich water), Langmuir cells (wind-generated turbulence that results in circulatingvertical cells), internal waves (subsurfacewaves generated by the density difference betweentwo water masses), fronts (boundaries between two distinct water masses), and gyres(rotating circulation as a result of a balance between the force of the earth's rotation and theforce of a pressure gradient, i .e . geostrophic balance).
The distribution and rate of phytoplankton growth determine secondary production . In turn,the distribution of planktonic secondary producers is determined by water movement . Forexample, copepods are advected onto the Western -Bank of Sable Island Bank from thenortheast, and are associated with high concentrations of cod (Gadus morhua) larvae.Presumably, the copepods and larvae are entrained in a gyre over Western Bank (McLarenand Avendano, 1995) .
The organic matter which falls to the ocean floor (dead flora and fauna, fecal pellets, exudate,etc.) is used by benthic animals as food . Benthic communities are influenced by the rate andtype of organic matter flux as determined by water movement, depth, temperature, andbacterial consumption en route . The extent of benthiclpelagic coupling varies amongsystems (see Section 6 .4 .1).
Benthic communities are also influenced by sedimentary characteristics (e .g. deposit feederspredominate in mud, filter feeders predominate in sand) . Sediment type and size are a resultof geological processes, and are continually modified by water currents . The general rule isthat sediment size is larger in high energy (strong currents) environments and smaller in lowenergy (weak currents) environments . Wind-driven currents decrease with depth and so haveless influence in deeper water, although all currents are commonly modified by topography(Pinet,1992) . On a smaller scale, biological interactions, such as predation and bioturbatio n
227
(Posey, 1990) and behavior (Langston et al. in press) can regulate the composi tion of benthiccommunities .
Implications for Boundaries
Water movement and depth influence the extent of benthic-pelagic coupling, and levels ofproductivity . Physical mechanisms of turbulence and consequent productivity anddistribution vary on spatio-temporal scales . Both the benthic and pelagic ecosystems shouldbe included in the core area .
10.1 .3.3 Spatialffemporal Environmental Variability
Temperature, salinity, and therefore density vary on spatio-temporal scales (see Section 6 .1) .Such variability can result in spatial shifts in the distribution of marine species .
Implications for Boundaries
The core and buffer zones of the Gvlly should be sufficiently large to accommodate variationin physical factors .
10.1 .3.4 Life History Strategy of Marine Species
Many of the abundant marine species are highly fecund but larval survival is low and highlyvariable . This life history pattern is common because the marine environment is variable .Organisms optimize the chances of survival by spawning a large number of eggs over timeand space to counteract environmental variability. That is, if organisms are highly fecund,there is a higher probability that at least some of those eggs will experience a favorableenvironment and survive to reproduce .
Implications for Boundaries . See 10 .1 .3 .5 below.
10.1 .3.5 Migratory Behaviour and Larval Dispersa l
Many of the larger species migrate long distances either seasonally or during different lifehistory stages . Both large and small species can have pelagic larvae which disperse widely(see Section 7.1).
Implications for Boundarie s
Protection of widely-ranging populations may be achieved through establishing a networkof ecologically representative areas within a region, and through the use ofhigh conservationstandards outside of protected areas .
10.1.3.6 Variable Food Webs
Marine species distributed throughout the water column are linked through the food web .
228
Primary producers (phytoplankton and chemoautotrophs) are food principally forzooplankton and bottom-dwelling invertebrates, which in turn are food for others(crustaceans, fish, seabirds, mammals) .
It is important in considering the boundaries to recognize that the strength of various linkagesamong groups in the food web is not fully understood . For example, researchers have onlyrecently discovered that bacteria can play a far greater role in production and nutrientregeneration than had been previously thought (Fuhrman, 1992) . Our incomplete knowledgeof marine systems re-enforces the need to define physical measures that will act as asurrogate for the biological measures we do not completely understand .
Implications for Boundaries
If some areas are relatively free from human activities we can partially compensate for ourlack of knowledge of ecological processes, such as energy transfer in food webs . Asufficiently large protected area should be designed to ensure that food webs are maintained .
10 .1 .3.7 State of Knowledge and Uncertaint y
Marine ecosystems are large-scale . The method of protecting ecosystem integrity is difficultto apply on a practical basis because of natural variability, the large scale of variousecological processes, and our general lack of understanding of marine systems . In temperatemarine regions, it is improbable that we could delineate boundaries that would enclose a"self-sustaining" ecosystem .
Implications for Boundaries
In the absence of empirical evidence, the use of oceanographic principles and theory,combined with a precautionary approach, is appropriate for designing boundaries .
10.1 .4 Conclusion
The gaps in our knowledge about marine species, habitats, and processes and the growingconservation imperative for the marine environment " . . . dictates a need to balance fine-scale,detailed information gathering exercises with coarse-scale planning that can operate inshorter time frames while still delivering protection to a significant proportion of Canada'snative biodiversity" (Kavanagh and lacobelli, 1995) . A system planning approach, similarto the terrestrial approach, can assist in striking this balance by : 1) providing a frameworkthat will help identify the most appropriate scale within which planning can operate ; and 2)once the appropriate scale is identified, help to identify the ecological criteria that can beused to define the landscape or seascape units that will serve to delineate boundaries .
10.1 .5 Reference s
Day J. and J .C . Roff. 1998. Planning for Representative Marine Protected Areas : AFramework for Canada's Oceans and the Great Lakes. Prepared for World Wildlife
229
Fund Canada, Toronto . in review .
Fader, G.B.J. 1991 . Gas-related sedimentary features from the eastern Canadian continentalshelf. Continental Shelf Research . 11 :1123-1153 .
Fuhrman ., J . 1992 . Bacterioplankton roles in cycling of organ ic matter : The microbial foodweb. pp. 361-407 In. P.G. Falkowski and A.D. Woodhead (eds .) Vol 43 . PrimaryProductivity and Biogeochemical Cycles . Plenum Press . NY. 550 pp.
Gauthier, D., ed. 1992. Canadian Council of Ecological Areas Framework for Developinga Nation-wide System of Protected Areas - Part 1 : A Strategy. Canadian Council ofEcological Areas Systems Framework Task Force. Ottawa, Canada.
Geomatics International Inc. 1996. National Framework and Methodology for theDetermination of Marine Representation and Ecological Integrity . Report preparedfor World Wildlife Fund Canada . 45 pp .
Harper, J .R., J . Christian, W .E. Cross, R. Frith, G. Searing, and D . Thompson. 1993. AClassification of the Marine Regions of Canada : Final Report to EnvironmentCanada, Coastal & Oceans Resources Inc ., Sidney, British Columbia . April 1993, 7 7
pp •
Hills,G.A. 1961 . The ecological basis of land use planning . Res. Rept. 46, Ont . Dept. ofLands and Forests, Toronto . 210 pp .
Kavanagh, K. and T. lacobelli . 1995 . A Protected Area Gap Analysis Methodology :Planning for the Conservation of Biodiversity . World Wildlife Fund. Toronto .Canada. 68 pp .
Langton, R .W., P.J. Auster, and D.C. Schneider. (in press) A spatial and temporalperspective on research and management of groundfish in the Northwest Atlantic .Reviews in Fisheries Science 0 :00-00 .
McLaren, I .A. and P. Avendano. 1995 . Prey field and diet of larval cod on Western Bank,Scotian Shelf. Canadian Journal of Fisheries and Aquatic Sciences . 52 :448-463 .
Noss, R.F. 1995 . Maintaining Ecological Integrity in Representative Reserve Networks . AWorld Wildlife Fund Canada/World Wildlife Fund-United States Discussion Paper .Toronto, Canada. 77 pp .
Pinet, P.R. 1992 . Oceanography, An Introduction to the Planet Oceanus . West Publishing
Company. St Paul, MN. 572 pp .
Posey, M .H. 1990. Functional approaches to soft-substrate communities : How useful arethey? Reviews in Aquatic Science . 2 : 343-356 .
Raffaelli D.G., A.G. Hildrew and P .S . Giller . 1992a. Scale, pattern and processes in aquaticsystems : Concluding remarks . In . Aquatic Ecology: Scale, pattern and process .
230
Raffaelli, D.G., Hildrew, A.G. and Giller, P .S. (eds). 1992b . The 3 ,0 Symposium of theBritish Ecological Society with the American Society of Limnology andOceanography. University College, Cork 1992 . Blackwell Scientific .
Rowley, R.J. 1994. Marine reserves in fisheries management .Aguatic Conservation ., Marineand Freshwater Ecosystems. 4: 233-254 .
Salm, R.V. and J.R. Clark. (Eds.) 1984 . Marine and Coastal Protected Area: A guide forPlanners an Managers . Proceedings of Workshops on ManagingCoastal and MarineProrectedAreas. WorldCongress on NationalParks, Bali, Indonesia. October 1982 .International Union for ConservationotNature and Natural Resources . State PrintingCo. Columbia, South Carolina. 302 pp.
Shackell, N., P. Simard, and M . Butler. 1996. Potential Protected Areas in the Gully Re gion,Scotian Shelf. Contract Report to R7A7F (Canada) .
Tremblay, M .J. and J .C. Roff. 1983 . Community gradients in the Scotian Shelfzooplankton .
Can. J . Fish. Aqua. Sci. 40:598-611 .
231
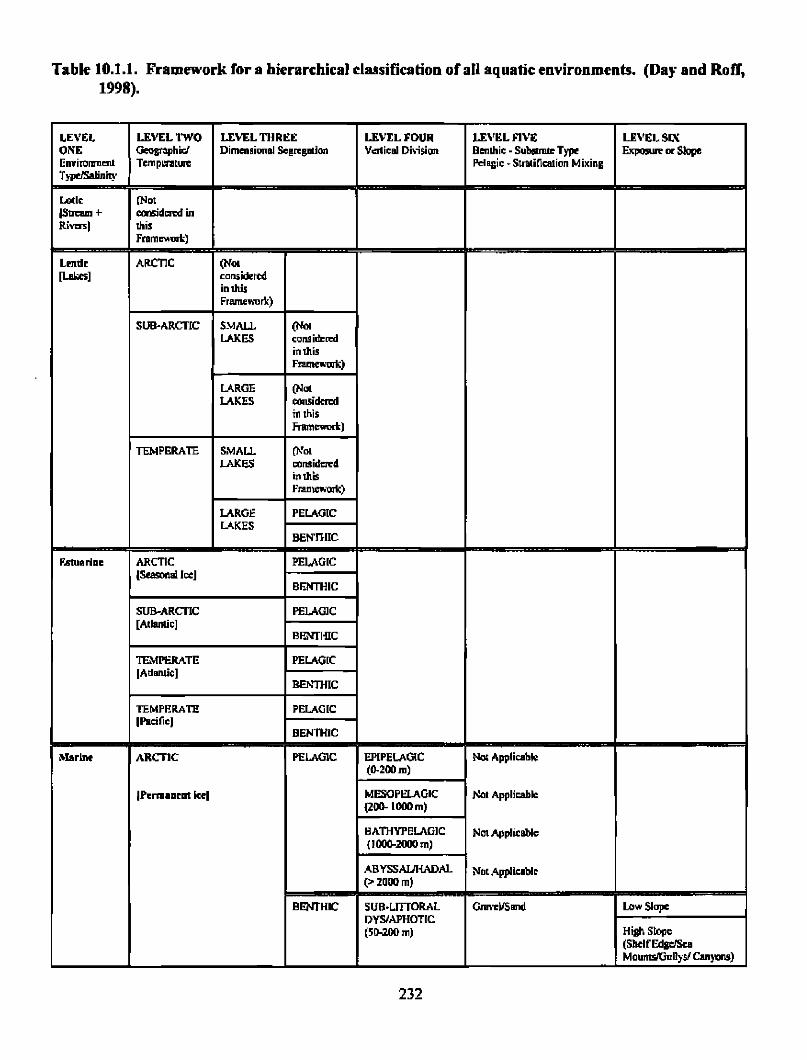
Table 10 .1 .1 . Framework for a hiera rchical classification of all aquatic environments . (Day and Roff,1998) .
LEVEI, LEVEL7IVO LEb•ELTIIREE LEVEL FOUR 1-EVELFIVE LEVEI-SL\ONE Geogtnphid Dimensiond Seeagmion Verlicd Dhision Benthic - Substmm Type Exposure or SlopeEnvironmem TemptYature Pclegic - StratiCicarionMixin g7ypelSalinin•
latte (No tIStrerm = eatmdoed inRkveli) thi s
Fmmmmarl- )
Lentie ARCTIC (Na
[Lakes] considercdin thisFramewvrk)
SUB-ARCffC SMALL (NdLAKES considered
in thisFmneworlt)
LARGE (NotLAKES oonsidered
in thisFrmneuvrt )
TEMPERATE SMALL (NotLAKES considered
in thi sFranuw•ork)
LARGE PELAGICLAKES
BEMfHiC
Pstunrlne ARCTIC PELAGIC[Seasatallce]
BF.NTHIC
SUB-ARCTIC PELAGI C[AtWdic]
BENFI•EC
TEMPERATE PELAGIC[ Adantic]
]3En7HIC
TEMPERATE PELAGICIPacificl
BENTHiC
Marine ARCTIC PELAGIC EPIPELAGiC Not Applicabl e(0-200 m )
IPermanrnt icel MI•SGPELAGIC Not Applicable(200- 1000 m )
BATHYPELAGIC Not Applicabl e(1000-2000m)
ABYSSAUHADAL2000 m)
NatApplicablr
0000BENTHIC 5UB-LITfORAL GmveUSmrd Low Slope
UYSIAPHOTIC(50-200 m) High Slope
(Shelf EdgdSe aMaumslGullya/ Can 3 +ons)
232
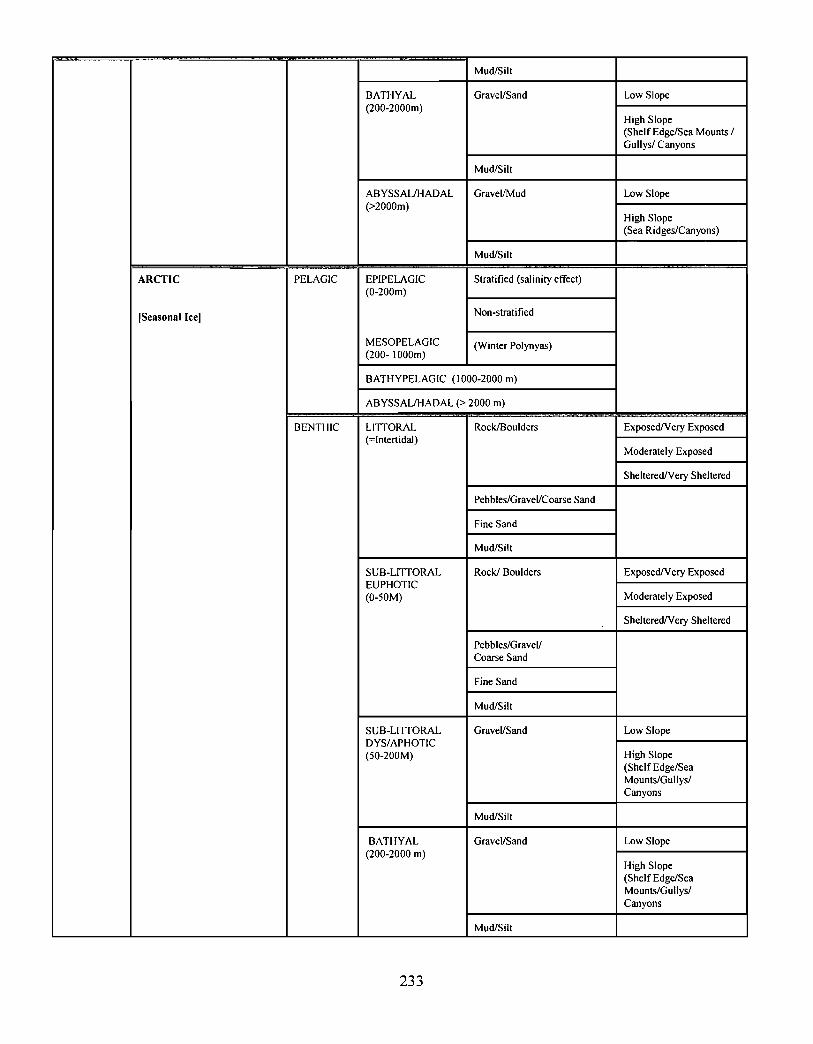
Mud/Sil t
BATHYAL Gravel/Sand Low Slop e(200-2000m)
High Slop e(Shelf Edge/Sea Mounts /Gullys/ Canyons
Mud/Sil t
ABYSSALJHADAL Gravel/Mud Low Slop e(>2000m)
High Slop e(Sea Ridges/Canyons )
Mud/Sil t
ARCTIC PELAGIC EPIPELAGIC(0-200m)
Stratified (salinity effect)
[ Seasonal Ice] Non-stratified
MESOPELAGI C(200- 1000m)
(Winter Polynyas)
BATHYPELAGIC (1000-2000 m )
ABYSSALJHADAL (> 2000 m )
BENTHIC LITTORAL Rock/Boulders Exposed/Very Exposed
(=Intertidal)Moderately Exposed
Sheltered/Very Sheltered
Pebbles/Gravel/Coarse Sand
Fine San d
Mud/Sil t
SUB-LITTORAL Rock/ Boulders Exposed/Very ExposedEUPHOTI C(0-50M) Moderately Exposed
Sheltered/Very Sheltered
Pebbles/Gravel/Coarse San d
Fine San d
Mud/Sil t
SUB-LITTORAL Gravel/Sand Low Slop eDYS/APHOTI C
(50-200M) High Slop e(Shelf Edge/SeaMounts/Gullys/Canyon s
Mud/Sil t
BATHYAL Gravel/Sand Low Slope(200-2000 m)
High Slop e(Shelf Edge/SeaMounts/Gullys/Canyon s
Mud/Sil t
233
ABYSSAL/HADAL I Not Applicable(>2000m)
SUB-ARCTI C
lAtlantic]
PELAGIC
BENTHIC
EPIPELAGIC(0-200m)
MESOPELAGIC(200-1000m )
BATHYPELAGIC(1000-2000 m)
Stratified (T & S effects)
Frontal
Non-stratified(T& S effects)
ABYSSALJHADAL(>2000 m)
LITTORAL(=Intert idal)
Rock/Boulders Exposed/Very Expose d
Moderately Expose d
Sheltered/Very Sheltere d
Pebbles/Gravel/Coarse Sand
Fine Mu d
Mud/Silt
SUB-LITTORALEUPHOTIC
(0-50M)
Rock/Boulders Exposed/Very Expose d
Moderately Expose d
ShelteredNery Sheltere d
Pebbles/Gravel/Coarse Sand
Fine Sand
Mud/Silt
SUB-LITTORALDYS/APHOTIC
(50-200M)
Gravel/San d
Mud/Silt
BATHYAL(200-2000 m)
Gravel/Sand
Low Slope
High Slope(ShelfEdge/SeaMounts/Gullys/Canyons )
Low Slope
High Slope(Shelf Edge/SeaMounts/Gullys/Canyons )
Mud/Silt
TEMPERATE
[Atlantic]
PELAGIC
ABYSSAL/HADAL(>2000 m)
EPIPELAGIC
(0-200 m)
MESOPELAGIC(200-1000 m)
Not applicabl e
S trati fied ("S" > 1 .5 )
Frontal ("S" = 1-2 )
Non-stratified ("S" < 1 .5 )
234
BATHYPELAGIC(1000-2000 m)
BENTHIC
ABYSSAL/HADAL(>2000 m)
LITTORAL(= Inte rt idal)
Rock/Boulders ExposedNery Expose d
Moderately Expose d
Sheltered/ModeratelySheltered
SUB-LITTORALEUPHOTIC
(0-50 m)
Pebbles/Gravel/ Coarse San d
Fine San d
Mud/Sil t
Rock/Boulders ExposedNery Expose d
Moderately Expose d
Sheltered/ModeratelySheltered
SUB-LITTORALDYS/APHOTIC(50-200 m)
BATHYAL(200-2000 m)
Pebbles/Gravel/ Coarse San d
Fine San d
Mud/Sil t
Gravel/Sand
Mud/Sil t
Gravel/Sand
Low Slope
High Slope(Shelf Edge/SeaMou nts/G ul lys/Canyon s
Low Slope
High Slope(Shelf Edge/Se a
M o u n ts/G u I l ys/C an yo n s
SUB-TROPICAL
[Atlanticl
PELAGI C
BENTHIC
ABYSSAL/HADAL
(>2000m)
EPIPELAGIC(0-200 m)
MESOPELAGIC(200-1000 m )
BATHYPELAGIC
(1000-2000 m )
ABYSSAL/HADAL
(>2000 m)
BATHYAL(200-2000 m)
Mud/Sil t
Not Applicable
Not Applicable -Always stratifie d
Not Applicable
Not Applicable
Not Applicabl e
Gravel/Sand Low Slope
High Slope(Shelf Edge/ SeaMounts/Gullys /Canyon s
Mud/Sil t
235
TEMPERATE
[ Transitional]
1 Pacific]
PELAGI C
BENTHIC
ABYSSAL/HADAL(>2000m)
EPIPELAGIC(0-200 m )
MESOPELAGIC(200-1000 m )
BATHYAL(200-2000 m)
Not Applicable
Stratified ("S" > 1 .5 )
Frontal ("S" = 1-2)
Non-stratified ("S" < 1 .5 )
ABYSSALJHADAL(>2000m )
LITTORAL(= Intert idal)
Rock/Boulders Exposed/Very Expose d
Moderately Expose d
Sheltered/ Very Sheltered
SUB-LITTORALEUPHOTIC(0-50 m)
Pebbles/Gravel/Coarse Sand
Fine Sand
Mud/Silt
Rock/Boulders Exposed/Very Exposed
Moderately Exposed
Sheltered/ Very Sheltered
SUB-LITTORALDYS/APHOTIC
(50-200 m)
BATHYAL(200-2000 m)
Pebbles/GraveUCoarse San d
Fine San d
Mud/Sil t
Gravel/San d
Mud/Sil t
GraveVSand
Low Slope
High Slope(Shelf Edge/SeaMounts/Gullys/Canyons
Low Slope
High Slope(Shelf Edge/SeaMounts/Gullys/Canyon s
ABYSSAL/HADAL(>2000m)
Mud/Sil t
Not Applicabl e
236
10.2 Submarine Landscapes
Derek S . Davis, Research AssociateNova Scotia Museum of Natural HistoryHalifax, NS
10.2.1 Introduction
The identification of landscape elements using biophysical parameters is a useful tool forstudying landscape processes within a defined geographic area . Landscape elements ofthe Nova Scotia land area, including the coast, have been described in the Natural Historyof Nova Scotia (Simmons et al. 1984 ). The second edition of this publication providesdescriptions of landscape elements that occur in the sea (Table 10 .2 .1). These elementshave been identified using a method similar to that used to identify terrestrial landscapesbut also including the physical characteristics of the sea bottom and overlying water(Davis and Browne, 1997 and Davis et al . 1994). The submarine landscapes identified bythis method are similar to those being proposed as part of a national marine classificationsystem (Geomatics International Inc ., 1997; see also Section 10 .1) .
Table. 10.2.1. Natural History of Nova Scotia - Hierarchic Syste m
Ecological Ecoregion Ecodistrict Ecosection Ecosite EcoelementLandsurvey - (Landform)
Equivalent I I
Natural Region District Unit Sub-Unit Habitat Vegetation Plant andHistory (Geographic) Association Animal
SpeciesInventory
Based BasedUpon Upon
Physical BiologicalDescription Descriptio n
The marine Region 900 is the area around Nova Scotia covered by seawater and extendsfrom the shoreline to the Provincial and National boundaries and to the limits of thedeclared fisheries and mineral resource management areas . The Region is divided intofour Districts of which two (930 and 940) have relevance to a greater management areafor the Gully as proposed by Shackell et al . (1996). District 930 (Outer Shelf ) is dividedinto two Units ; 931 (Outer Shelf Banks) and 932 (Saddles, Shelf Edge, SubmarineCanyons and Channels) . Unit 931 has two Sub-Units; 931e (Sable Island Bank) and 931f(Banquereau) as separate geographic elements of the same landscape Unit . District 940 isthe area of the Scotian Slope which begins at 200 m depth and extends onto theContinental Rise at depths of between 4000 and 5000 m. The locations of theselandscapes are shown in Fig . 10.2 .1 .
237
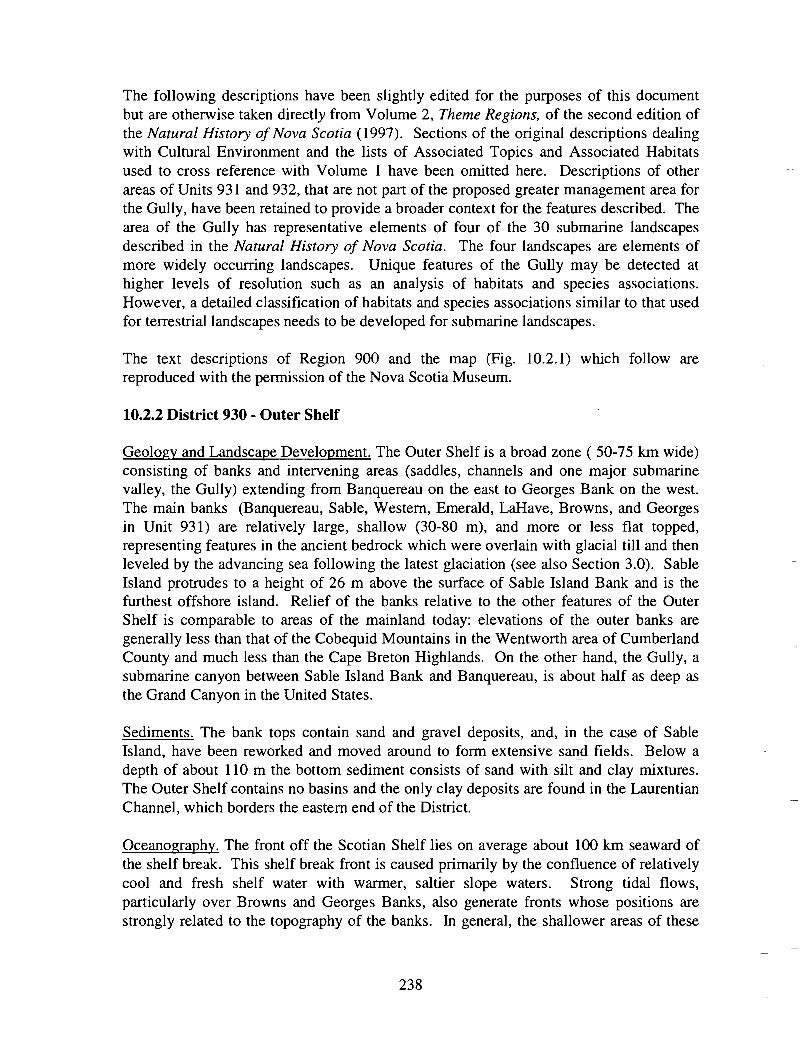
The following descriptions have been slightly edited for the purposes of this documentbut are otherwise taken directly from Volume 2, Theme Regions, of the second edition ofthe Natural History of Nova Scotia (1997). Sections of the original descriptions dealingwith Cultural Environment and the lists of Associated Topics and Associated Habitatsused to cross reference with Volume 1 have been omitted here . Descriptions of otherareas of Units 931 and 932, that are not part of the proposed greater management area forthe Gully, have been retained to provide a broader context for the features described . Thearea of the Gully has representative elements of four of the 30 submarine landscapesdescribed in the Natural History of Nova Scotia . The four landscapes are elements ofmore widely occurring landscapes . Unique features of the Gully may be detected athigher levels of resolution such as an analysis of habitats and species associations.However, a detailed classification of habitats and species associations similar to that usedfor terrestrial landscapes needs to be developed for submarine landscapes .
The text descriptions of Region 900 and the map (Fig . 10.2.1) which follow arereproduced with the permission of the Nova Scotia Museum .
10.2.2 District 930 - Outer Shel f
Geology and Landscape Development . The Outer Shelf is a broad zone ( 50-75 km wide)consisting of banks and intervening areas (saddles, channels and one major submarinevalley, the Gully) extending from Banquereau on the east to Georges Bank on the west .The main banks (Banquereau, Sable, Western, Emerald, LaHave, Browns, and Georgesin Unit 931) are relatively large, shallow (30-80 m), and more or less flat topped,representing features in the ancient bedrock which were overlain with glacial till and thenleveled by the advancing sea following the latest glaciation (see also Section 3 .0). SableIsland protrudes to a height of 26 m above the surface of Sable Island Bank and is thefurthest offshore island . Relief of the banks relative to the other features of the OuterShelf is comparable to areas of the mainland today : elevations of the ôuter banks aregenerally less than that of the Cobequid Mountains in the Wentworth area of CumberlandCounty and much less than the Cape Breton Highlands. On the other hand, the Gully, asubmarine canyon between Sable Island Bank and Banquereau, is about half as deep asthe Grand Canyon in the United States .
Sediments . The bank tops contain sand and gravel deposits, and, in the case of SableIsland, have been reworked and moved around to form extensive sand fields . Below adepth of about 110 in the bottom sediment consists of sand with silt and clay mixtures .The Outer Shelf contains no basins and the only clay deposits are found in the LaurentianChannel, which borders the eastern end of the District .
Oceanography . The front off the Scotian Shelf lies on average about 100 km seaward ofthe shelf break. This shelf break front is caused primarily by the confluence of relativelycool and fresh shelf water with warmer, saltier slope waters . Strong tidal flows,particularly over Browns and Georges Banks, also generate fronts whose positions arestrongly related to the topography of the banks . In general, the shallower areas of thes e
238
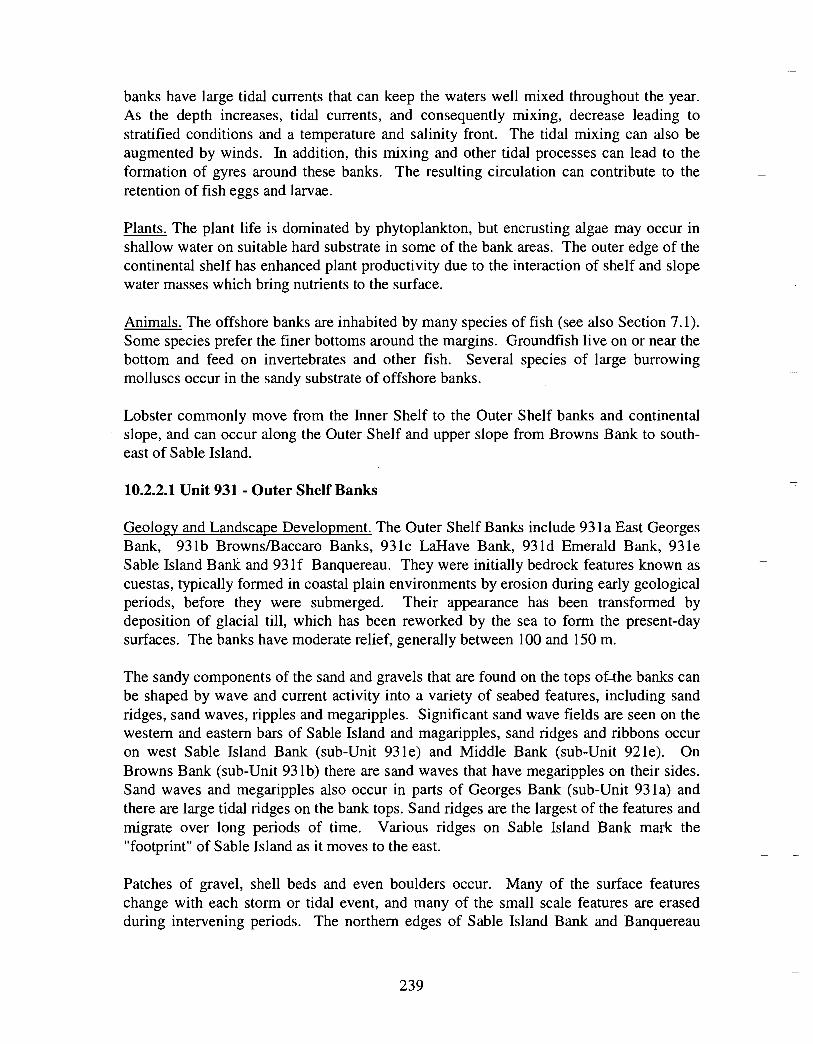
banks have large tidal currents that can keep the waters well mixed throughout the year .As the depth increases, tidal currents, and consequently mixing, decrease leading tostratified conditions and a temperature and salinity front . The tidal mixing can also beaugmented by winds . In addition, this mixing and other tidal processes can lead to theformation of gyres around these banks . The resulting circulation can contribute to theretention of fish eggs and larvae .
Plants . The plant life is dominated by phytoplankton, but encrusting algae may occur inshallow water on suitable hard substrate in some of the bank areas. The outer edge of thecontinental shelf has enhanced plant productivity due to the interaction of shelf and slopewater masses which bring nutrients to the surface. -
Animals . The offshore banks are inhabited by many species of fish (see also Section 7 .1) .Some species prefer the finer bottoms around the margins . Groundfish live on or near thebottom and feed on invertebrates and other fish. Several species of large burrowingmolluscs occur in the sandy substrate of offshore banks .
Lobster commonly move from the Inner Shelf to the Outer Shelf banks and continentalslope, and can occur along the Outer Shelf and upper slope from Browns Bank to south-east of Sable Island .
10.2 .2.1 Unit 931 - Outer Shelf Bank s
Geology and Landscape Development . The Outer Shelf Banks include 931a East GeorgesBank, 931b Browns/Baccaro Banks, 931c LaHave Bank, 931d Emerald Bank, 931eSable Island Bank and 931f Banquereau . They were initially bedrock features known ascuestas, typically formed in coastal plain environments by erosion during early geologicalperiods, before they were submerged. Their appearance has been transformed bydeposition of glacial till, which has been reworked by the sea to form the present-daysurfaces. The banks have moderate relief, generally between 100 and 150 in .
The sandy components of the s and and gravels that are found on the tops of-the banks canbe shaped by wave and current activity into a variety of seabed features, including sandridges, sand waves, ripples and megaripples . Significan t sand wave fields are seen on thewestern and eastern bars of Sable Island and magaripples, s and ridges and ribbons occuron west Sable Isl and Bank (sub-Unit 931e) and Middle B ank (sub-Unit 921e) . OnBrowns Bank (sub-Unit 931b) there are s and waves that have megaripples on their sides .Sand waves and megaripples also occur in parts of Georges Bank (sub-Unit 931a) andthere are large tidal ridges on the bank tops . S and ridges are the largest of the features andmigrate over long pe riods of time . Various ridges on Sable Island B ank mark the"footprint" of Sable Isl and as it moves to the east.
Patches of gravel, shell beds and even boulders occur. Many of the surface featureschange with each storm or tidal event, and many of the small scale features are erasedduring intervening periods. The northern edges of Sable Island Bank and Banquerea u
239
(sub-Unit 931f) have numerous steep-sided hanging valleys formed by glacial meltwaterthat ran over their edges. These hanging valleys extend onto the bank under the cover ofsurface sediments and are called tunnel valleys . Sediments moving off the edge of theshelf in these areas contribute material to the Gully, a major submarine canyon and aprobable remnant of an early drainage system . Similar movements of sediments on theouter edges of the Outer Shelf Banks, particularly during low sea level stand, have led tothe formation of distinct submarine canyons .
Sediments . The surfaces of the Outer Shelf Banks shallower than about 110 m consistchiefly of sands and gravels in various combinations in a layer generally less than 15 in inthickness . In some areas (such as the top of sub-Unit 931d Emerald Bank), gravelpredominates, while Sable Island Bank is predominantly covered in sand . Where gravelis found, it can form a protective pavement of rounded stones embedded in the bottom .The sand tends to be hard, smooth and flat with a variety of surface bedforms aspreviously mentioned . Both types of bottom are classified as Sable Island Sand andGravel. The margins of Outer Shelf Banks below 110 m have sediments that areprincipally sand, and that contain small amounts of clay, silt and (frequently) gravel . Thesurface may be flat and smooth to undulating and hummocky . Called Sambro Sand, thesedeposits cover the saddles adjacent to the Outer Shelf Banks in many cases .
Oceanography . The currents over the outer shelf banks are mainly caused by theinteraction of the southwestward mean flow originating from the Gulf of St . Lawrenceand the Newfoundland shelf-slope area with local topographic features, by tidal currents,and by wind-forced flows. The mean flow-topography interaction contributes to the gyre-like circulation in the Gully region and over Western Bank . Tidally generated currentsare major features of the circulation around Browns and Georges Banks. From time totime, wind-forced flows dominate the circulation over all of the banks, particularly duringwinter storms. Tides and wind driven currents also contribute to vertical mixing over thebanks . Tidal currents are strong enough to maintain well-mixed areas over Georges andBrowns Banks year round .
Plants . The biomass and seasonal pattern of phytoplankton and productivity of the watersover the shelf edges is similar to those of the adjacent banks and saddles, with theexception of the outer edges. Here phytoplankton productivity is greater as a result of theinteraction of shelf and slope water that occurs in the area .
Animals . More phytoplankton production reaches the seabed on the banks than inadjoining areas. Consequently benthic animal populations, including groundfish whichfeed near the bottom, are more significant on the offshore banks than in adjoining areas .
Cod stocks from Banquereau and Sable Island Bank migrate during the summer to theouter coast of Nova Scotia and northern Cape Breton Island . Some of the fish also go tothe Gulf of St . Lawrence . Southern Scotian Shelf cod overwinter in deeper water aroundLaHave and Browns Banks . Some move from deeper water to the shallower areas of thebanks in summer . On Georges Bank, Atlantic Cod occur principally on the eastern part .
240
Notable concentrations of Atlantic Halibut occur along the edges of Georges Bank, Sable
Island Bank and Banquereau . Witch Flounder have localized areas of high abundance in
the deep holes of Banquereau . Sand and gravel bottom typical of the banks is suitable
for haddock spawning . They aggregate around the offshore banks at the beginning of the
year and move onto the banks to spawn as the water temperature rises. Pollock (Boston
Bluefish) spawn on the northeast part of Georges Bank and Browns Bank . They also
spawn at several other locations on the Scotian Shelf and at Jeffries Ledge in the Gulf of
Maine, and migrate as juveniles to inshore areas . Eggs and larvae of cod, haddock,
pollock and Silver Hake are abundant on Western and Sable Island Banks . Those of cod
and pollock are there during midwinter and early spring , and those of Silver Hake during
midsummer .
Sea Scallop occur on Georges and Browns Banks particularly where the bottom consistsof firm gravel, shells and rock . Two other large bivalve mollusc species, Ocean Quahog(Arctica islandica) and Stimpson's Surf Clam (Mactromeris polynyma), are foundtypically on most of the offshore banks but they are only locally abundant . The OceanQuahog is the main species on Georges Bank and concentrations have also been found onWestern and Sable Island Banks . Stimpson's Surf Clam is found mainly on Banquereau .
Sandy areas which make up much of Sable Island Bank provide habitat for benthicorganisms such as the sand dollar, Echinarachnius parma, and the amphipods Uniciolairrorata and Leptocheirus pinguis . Sand dollars are extremely abundant in somelocations . Parts of the banks having coarse substrate (gravel) are expected to havepopulations of Horse Mussel (Modiolus modiolus), b ri ttlestars (Ophiopholis aculeata),Sea Scallops, lobster and Toad Crab (Hyas coarctatus) .
10.2.2.2 Unit 932 - Saddles, Shelf Edge, Submarine Canyons and Channel s
Geology and Landscape Development . The banks of the Outer Shelf are bordered byintervening deep-water areas which include saddles and channels, submarine canyons andthe continental slope. Saddles generally have gentle relief and are shallower than about200 in, while channels are deep, broad lowland features occurring at a similar depth to thebasins of the Middle Shelf. Saddles are found between Sable Island/Western Bank andEmerald Bank, and between Emerald Bank and LaHave Bank. Northeast Channelseparates Browns and Georges Banks and Laurentian Channel separates Banquereau andthe eastern Scotian Shelf from the banks off the coast of Newfoundland .
Submarine canyons occur along the outer edges of the Outer Shelf and extend down thecontinental slope . These are narrow, deep and steep-sided features and include the Gully,and Verrill, Dawson, Bonnecamps, Logan, Shortland, and Haldimand Canyons . TheGully is a submarine canyon that approaches Colorado's Grand Canyon in depth,extending from 100 in to more than a kilometer between Sable Island Bank andBanquereau Bank (the Cape Breton Highlands by comparison are roughly 500m high) .The Gully probably originated as a drainage channel and later developed into a canyon .
241
The river and submarine canyon at the mouth of the Hudson River on the United StatesEast Coast is an analogous feature .
Northeast Channel joins the Outer Shelf between Browns and Georges Banks with thebasins of the Gulf of Maine at depths between 200 and 300 m . Megaripples occur on thenorthern and eastern flanks of Northeast Channel at depths of 100-150 m, and sandwaves on the bottom of Northeastern Channel at depths of 230-260 m are evidentlycaused by tidal currents . These are some of the deepest recorded sand waves on thecontinental shelf, caused by the strong tidal currents in the Bay of Fundy-Gulf of Maine .
Laurentian Channel is the most impressive of these features, arising as a former rivervalley deepened by glacial ice and having a sill (a shallower portion near the outer edge) .The Channel extends 700 km from the junction of the Saguenay and the St . LawrenceRivers in Quebec to the edge of the continental shelf between Nova Scotia andNewfoundland, and was cut 300 m below the rest of the shelf by the advancing ice .Down the slope from the Channel the Laurentian Fan occurs, a delta-like featurecontaining sediments from the ancestral St . Lawrence River and from recent sedimentflow activity .
At the edge of the shelf, the bottom plunges downward to the continental slope . The shelfedge is marked by the occurrence of submarine canyons and glacial features whichdemonstrate the furthest extent of the ice sheets .
Sediments . Saddles between Outer Shelf Banks (Unit 931), parts of Northeast Channeland the Gully generally have a cover of sand containing clay, silt and frequently gravel(Sambro Sand, see above) . The outer and inner ends of Northeast Channel, in addition,have a cover of glacial till, consisting of mixtures of significant amounts of silt and clayin addition to sand, gravel and boulders . The glacial till is classed as Scotian Shelf Drift .
In the Laurentian Channel the bottom consists of glacial sediments, mainly clay, with siltexposed in some places . Flows of sediment down the slope from the Channel can leavecoarse deposits .
Oceanography. Saddles occur at depths less than 200m, and form an entrance to thebasins of the Middle Shelf (District 920) for subsurface water masses, typically thewarmer, deeper Slope Water from the shelf edge . Georges Bank with depths greater than200m is profoundly influenced by tides and serves as a pathway for water exchangesbetween the Gulf of Maine and the slope region . The deep Laurentian Channel permitsincursions of deep water of Atlantic origin into the Gulf of St . Lawrence .
Plants . Productivity of the waters, biomass of phytoplankton and seasonal patterns insaddles and canyons are similar to that of the adjacent shelves . The outer margin of thecontinental shelf, however, has greater plant productivity due to the interaction of shelfand slope water masses in a "frontal zone" whose position changes from year to year .
242
The elevated productivity is used by, and is believed to enhance, populations of fish andother organisms in the area .
The edge of the Outer Shelf is exposed periodically to water masses derived from theGulf Stream which flows to the south . Occasionally masses of the seaweed Sargassumcan be found floating in the area .
Animals . Witch Flounder are associated with deep holes and channels between thecoastal banks, along the deep edges of the banks where water temperatures are suitable,and in gullies where bottom is usually clay, muddy sand or mud . This species haslocalized areas of high abundance along the edge of the Laurentian Channel, betweenSable Island and Banquereau and in deep holes of Banquereau . Notable concentrationsof Atlantic Halibut occur along the edges of Georges, Sable Island and BanquereauBanks. Various flatfish species occur in areas fringing the banks . Owing to the warmerwater there, the outer margin of the shelf is a principal area of concentration of SilverHake which move onto the Scotian Shelf as temperatures warm in summer. The mainknown overwintering area for Atlantic Mackerel is the continental shelf south and south-west of Georges Bank .
Short-finned Squid are usually most common along the outer edge of the Scotian Shelf inJune, usually between Emerald and LaHave Banks and in some years along the entireedge of the Shelf. They spread over the shelf later in the summer and still later migratesouth-west down the North American east coast . The young are brought back into thearea by the Gulf Stream . Juveniles live in the Gulf Stream frontal zone and Slope Wateroff the edge of the continental shelf until they reach about 10 cm in length .
Deep-sea Red Crab (Geryon quinquedens) are abundant along the shelf edge from theFundian Channel to Sable Island at depths of 180-550 in . Significant quantities of lobsteroccur at the shelf edge from Browns Bank to Sable Island Bank .
One of the two best-known areas of concen tration of the Northern Bottlenose Whale is inthe Gully (see also Section 9 .0) .
Seabird concentrations are greater in the shelf edge region owing to the elevatedproductivity there (see also Section 8 .0) . Wintering Dovekies are most common over theedges of the Scotian Shelf. On Georges Bank, Wilson's Storm Petrels are most commonover the shelf-break .
10.2.3 District 940 - Scotian Slop e
The Scotian Slope District is a very large area extending from the outer limit of District930 (at approximately 200 m deep) to the political and resource management boundariesat depths of 4,000 to 5,000 m. This is a fully oceanic environment .
243
Geology and Landscape Development . The District includes the continental slope andrise, but as the boundary between them is not distinct no attempt has been made toseparate them as Units . The slope is indented by canyons and channels, including theGully and the Laurentian Channel, both of which originate in District 930 .
The area is underlain by thick post-Atlantic Rift sediments which have been accumulatingcontinuously in the Scotian Basin since the Mesozoic. The Jurassic and Cretaceous rocksare mildly folded and faulted along the continental margin . Both the Shelbourne sub-Basin in the southwest and Sable sub-Basin in the northeast have extensive salt deposits .Late Tertiary and Quaternary deposits are horizontally bedded and some outcrop incanyons and scarp features on the continental slope . The area is subject to high seismicactivity with main stress in a southwest/northeast direction with the earthquakes up tomagnitude 6 . The Newfoundland earthquake of 1929 registered 7 .2 on the Richter Scale .
Sediments . Recent sediments accumulating on the continental shelf are slumped along theshelf break and travel down the slope, often in the canyons, as turbidity currents . Thickaccumulations of these slumped sediments are found on the slope between 200 in and2,000 m depth. This talus material includes sand (Sable Island Sand and Gravel), marinesilty clay (LaHave Clay), glaciomarine silty clay (Emerald Clay) and Diamicton/Till . Thesurfaces of these deposits are marked with pockmarks, palaeoiceberg scour marks andsand ridges (Laurentian Fan ) . From the base of the slope towards the deep water there isa gradation of surficial sediments ; discontinuous, stratified mud series, muds alternatingwith silt and sand and finally a sand sheet of Later Pleistocene or Holocene age. Thesedeposits are cut by erosion channels of the same age . The deep water sediments arecovered with a thin layer of pelagic or hemipelagic sediment which include fine mineralparticles and the shells and spicules of marine organisms, e .g. Radiolaria .
Oceanography. This District is generally oceanic in character though on average a surfacewedge of shelf water approximately 50 m deep extends 100 km seaward of the shelfbreak. Two main types of slope water underlie the shelf water . Labrador Slope Water isrelatively cool and fresh, and Warm Slope Water, derived from a mixture of shelf watersand offshore waters associated with the Gulf Stream, is warmer and more saline . Anumber of processes contribute to the mixing of shelf and slope waters ; however, one ofthe most effective mechanisms is caused by the entrainment of shelf water by GulfStream rings and meanders. Wind-induced upwelling and the generation of internal tidesand waves at the shelf break contribute to the vertical mixing and transport of nutrients inthe region .
Plants . Phytoplankton in the surface water is responsible for the primary productivity thatoccurs in the District . However, this is only significant in the area of the shelf break asthe level of nutrients available diminished rapidly towards the deep water . Some floatingpatches of Sargassum weed occur which are of relatively little ecological significancealthough they support a distinct community of animals and may, rarely, reach the NovaScotia coast .
244
Animals . The deep water and oceanic conditions of District 940 support communities ofspecies of animals not normally encountered in continental shelf waters . The twoHabitats of the Offshore, Open Water Ocean and Benthic Ocean, will be treatedseparately .
Open water ocean species of pelagic animals depend upon the primary productivity of thesurface waters. Phytoplankton is grazed by herbivorous zooplankton ; copepods,cladocerans, euphausiids and a wide range of larval forms . There are many carnivorousspecies including crustaceans, medusae and the larvae and juveniles of fish . The nektonor free-swimming animals range in scale from jellyfish to whales, but the predominantforms are crustaceans, cephalopods and fish . In the deep water these animals are groupedinto vertically zoned communities; epipelagic (top), mesopelagic (middle) andbathypelagic (bottom) .
The epipelagic community includes surface swimming molluscs (Janthina an dArgonauta), coelenterates (Valella and Physalia) and fish ( Swordfish and Flyingfish) . Anumber of species of invertebrates and fish are associated with Sargassum weed andGoosebarnacles (Lepas) are associated with floating objects . The mesopelagiccommunity is characterised by a diurnal vertical migration ; rising to the surface at nightand descending to the depths at day . This migration of several hundred metres allows thedeep water species to take advantage of surface productivity . The mesopelagiccommunity is composed of crustaceans (shrimps and amphipods), cephalopods (squidand pelagic octopus) and fish, particularly the distinctive Lanterniish, Viperfish andHatchetfish) . These species are all predatory carnivores, often darkly coloured and mayhave reflective plates and photophores (light-producing organs) . Lanternfish are found ata depth of 700 to 1200 m during the day but rise to within 100 m of the surface to feed atnight . The bathypelagic community lives in close association with the bottom andincludes economically important types such as grenadier that occur down to 2,500 mdepth. Many of the species that occur in the bathypelagic zone, such as the Giant Squidwhich appears on a thirty-year cycle, are poorly known .
The benthic ocean habitat includes those communities that live in or on the ocean bottom .In District 940 this is an environment without light . The generally soft sediments supportan infauna of worms; Pogonophora and Polychaeta, coelenterates ; seapens, gorgonian(Radicipes) and solitary corals (Flabellum), a wide variety of scaphopod, pelecypod andgastropod molluscs and echinoderms. The crinoid (sea lily), Rhizocrinus lofotensis, hasbeen found on the slope at a depth of 1700 m . Epifauna includes any animal that roamsaround the sea bottom or attaches itself to a solid object. Old ice-rafted boulders arecolonised by sponges, coelenterates, bryozoa and brachiopods while crustaceans,seaspiders and brittlestarfish are vagrants . Rock bottoms provide habitat for a distinctcommunity of gorgonian corals, including Paragorgia, Primnoa and Keratoisis. Avariety of bottom feeding fish occurs including the Atlantic Batfish, Monkfish, anglerfishand Chimaera. Blue Hake, Antimora rostrata, occur between 1300 and 2500 m depth .
245
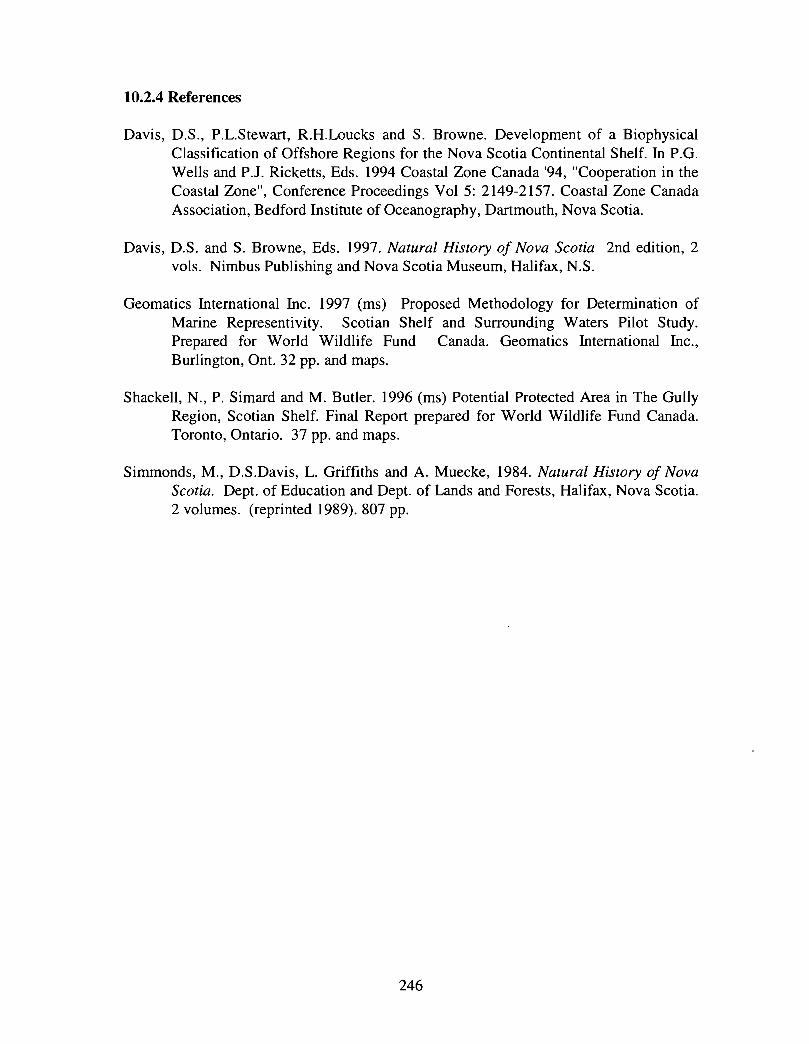
10.2.4 References
Davis, D.S ., P.L.Stewart , R.H.Loucks and S . Browne. Development of a BiophysicalClassification of Offshore Regions for the Nova Scotia Continental Shelf. In P.G .Wells and P.J . Ricketts, Eds . 1994 Coastal Zone C anada '94, "Cooperation in theCoastal Zone", Conference Proceedings Vol 5 : 2149-2157. Coastal Zone CanadaAssociation, Bedford Institute of Oceanography, Da rtmouth, Nova Scotia .
Davis, D.S . and S . Browne, Eds . 1997. Natural History of Nova Scotia 2nd edition, 2vols . Nimbus Publishing and Nova Scotia Museum, Halifax, N .S .
Geomatics International Inc . 1997 (ms) Proposed Methodology for Determination ofMarine Representivity . Scotian Shelf and Surrounding Waters Pilot Study .Prepared for World Wildlife Fund Canada . Geomatics International Inc .,Burlington, Ont . 32 pp . and maps .
Shackell, N ., P. Simard and M . Butler . 1996 (ms) Potential Protected Area in The GullyRegion, Scotian Shelf. Final Report prepared for World Wildlife Fund Canada.Toronto, Ontario . 37 pp. and maps .
Simmonds, M., D.S .Davis, L. Griffiths and A . Muecke, 1984 . Natural History of NovaScotia . Dept. of Education and Dept . of Lands and Forests, Halifax, Nova Scotia .2 volumes . (reprinted 1989) . 807 pp .
246
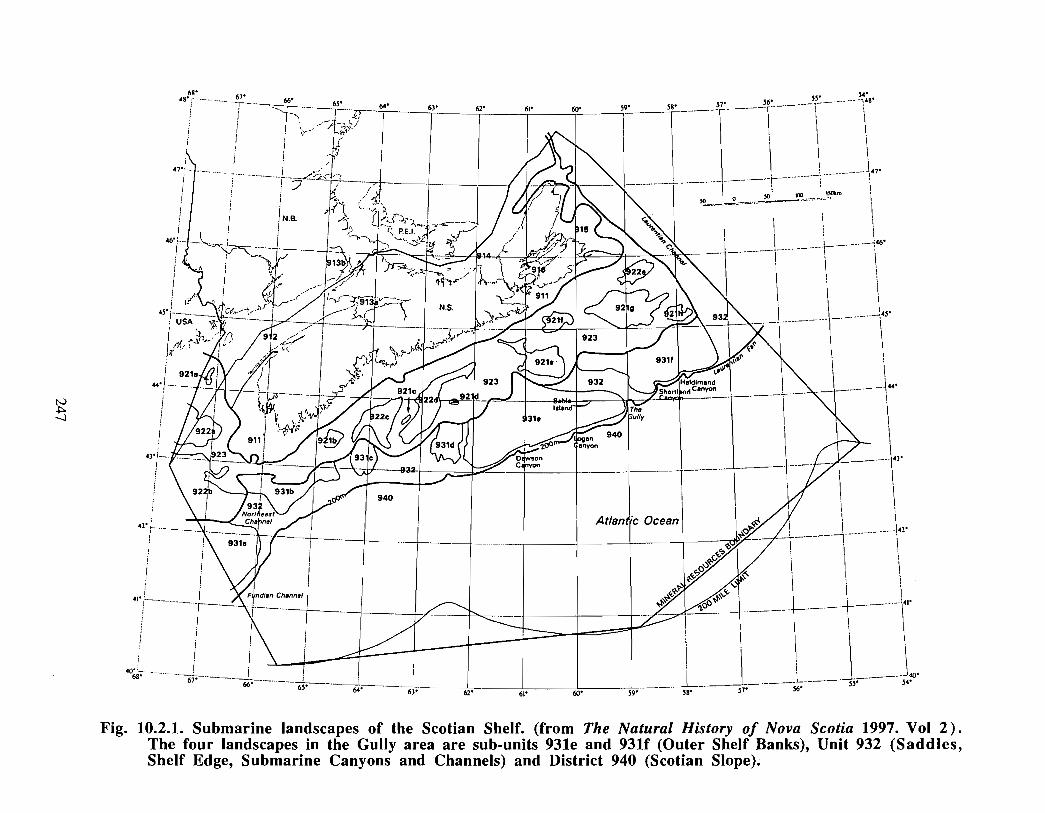
Fig. 10.2.1 . Submarine landscapes of the Scotian Shelf . (from The Natural History of Nova Scotia 1997. Vol 2) .The four landscapes in the Gully area are sub-units 931e and 931f (Outer Shelf Banks), Unit 932 (Saddles,Shelf Edge, Submarine Canyons and Channels) and District 940 (Scotian Slope) .
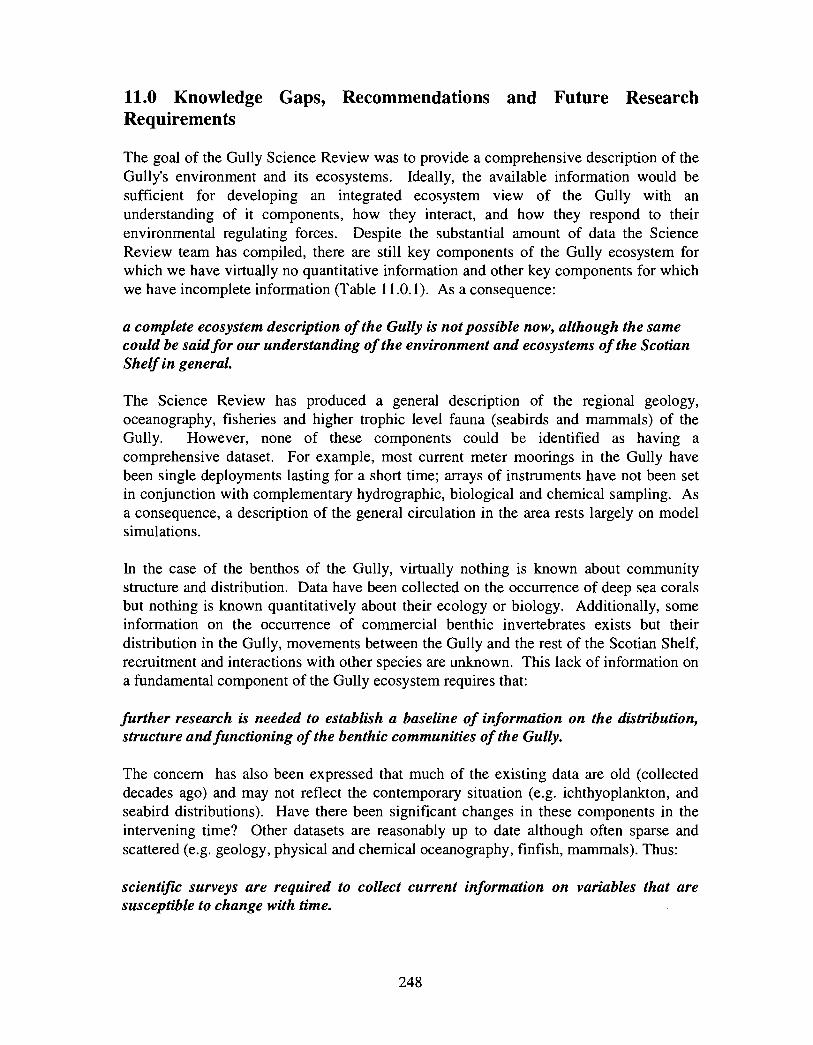
11.0 Knowledge Gaps, Recommendations and Future ResearchRequirements
The goal of the Gully Science Review was to provide a comprehensive description of theGully's environment and its ecosystems . Ideally, the available information would besufficient for developing an integrated ecosystem view of the Gully with anunderstanding of it components, how they interact, and how they respond to theirenvironmental regulating forces . Despite the substantial amount of data the ScienceReview team has compiled, there are still key components of the Gully ecosystem forwhich we have virtually no quantitative information and other key components for whichwe have incomplete information (Table 11 .0.1). As a consequence :
a complete ecosystem description of the Gully is not possible now, although the samecould be said for our understanding of the environment and ecosystems of the ScotianShelf in general.
The Science Review has produced a general description of the regional geology,oceanography, fisheries and higher trophic level fauna (seabirds and mammals) of theGully. However, none of these components could be identified as having acomprehensive dataset . For example, most current meter moorings in the Gully havebeen single deployments lasting for a short time ; arrays of instruments have not been setin conjunction with complementary hydrographic, biological and chemical sampling . Asa consequence, a description of the general circulation in the area rests largely on modelsimulations .
In the case of the benthos of the Gully, virtually nothing is known about communitystructure and distribution . Data have been collected on the occurrence of deep sea coralsbut nothing is known quantitatively about their ecology or biology. Additionally, someinformation on the occurrence of commercial benthic invertebrates exists but theirdistribution in the Gully, movements between the Gully and the rest of the Scotian Shelf,recruitment and interactions with other species are unknown . This lack of information ona fundamental component of the Gully ecosystem requires that :
further research is needed to establish a baseline of information on the distribution,structure and functioning of the benthic communities of the Gully.
The concern has also been expressed that much of the existing data are old (collecteddecades ago) and may not reflect the contempora ry situation (e.g. ichthyoplankton, andseabird distributions) . Have there been significant changes in these components in theintervening time? Other datasets are reasonably up to date although often sparse andscattered (e .g . geology, physical and chemical oceanography, finfish, mammals). Thus :
scientific surveys are required to collect current information on variables that aresusceptible to change with time.
248
Another recurring concern is that the spatial and temporal resolution of the available dataare inadequate to address unambiguously questions relating to : (1) the uniqueness of theGully as compared to the rest of the Scotian Shelf and slope, (2) the processes occurringwithin the Gully that influence productivity of the region and (3) the issue of definingoperational "boundaries" for the Gully . Notably, descriptions of the physical, chemicaland biological oceanography from limited small-scale studies showed that oceanographicconditions conducive to enhanced nutrient supply and productivity might exist in theGully but were not discernible from conventional coarse-scale sampling . A similarargument was made in evaluating the distribution of pelagic seabirds in the vicinity of theGully. Clearly, data with a spatial resolution considerably less than the 10s of km thatdefine the bathymetric "boundaries" of the Gully (e .g. the 200m contour) and temporalresolution shorter than seasonal or monthly means would be required to address thedynamics that characterize the Gully on the small scale. At present, the only data withadequate spatial resolution are the multibeam bathymetry for geological andhydrographical studies, acoustics and towed instrumentation (including video) foroceanography and fish, and airborne surveillance for seabirds and mammals . These dataare limited to small areas of the Gully or are simply unavailable, however . It is evident,therefore, that :
the more widespread use of technology that permits rapid, high spatial resolutionsampling will be required to adequately address questions relating to thecharacteristics of the Gully with regard to its ecologically dynamic features and will berequired to delineate Gully boundaries based on biological as well as physicalproperties.
Filling information gaps will be a necessary but not sufficient condition to develop anintegrated ecosystem description of the Gully . Fundamental questions remain about thefunctional linkages between ocean physics-chemistry and productivity of the plankton,the benthos (i .e . benthic-pelagic coupling) and the aggregation of seabirds and marinemammals in the region. No single research organization, including DFO, has thecapabilities to carry out a complete system study . It is essential, therefore, that :
the various government and NGO researchers and stakeholders should commitresources for more focused, coordinated and comprehensive research in the Gullyregion in order to develop a better understanding of the processes that account for itsabundant and diverse biota. Scientific information collection will also benefit fromand should be supplemented by the working knowledge of resource users, i.e.traditional ecological knowledge.
The Science Review team acknowledged that information gaps will exist even if allrecommendations are implemented . Therefore :
in cases where crucial scientific information is lacking, the "precautionary principle"as stated in the Oceans Act must be applied .
249
The Gully Science Review team was given the task of assembling information on ageographically small area of the Scotian Shelf but without being given strict guidelines onthe nature and scope of the review . This can be described as a "bottom-up" approach fordeveloping an understanding of a region's environment and ecology . That is to say, theprimary focus is on the description of a specific region with its relationship tosurrounding regions being secondary . The Gully Science Review has taken almost a yearto complete and has involved the commitment of considerable time from numerousexperts from within and outside the government . Two reports at the end of the ScienceReview propose that a "top-down" approach based on a systems classification schememay be a more logical and efficient starting point . Here, the specific region of interest isplaced in the context of the surrounding regions right at the onset . The science of systemplanning is, in fact, a mature one, developed decades ago and successfully applied as atool for classifying terrestrial ecosystems . It is currently being adapted to marineecosystems . It is the consensus of the Gully Science Review team in judging the meritsof "bottom-up" versus "top-down" approaches that consideration of the time andresources that went into the Gully Science Review, the prospect for others in the future,and considering that much of the ground work has already been laid in systemsclassification of the Scotian Shelf :
a systems approach to ecosystem classification should be implemented by DFO as aframework for meeting future departmental requirements for science information forour regional waters .
Systems classification is not considered a substitute for the site-based, focused researchrequired to address region-specific questions but will provide the background informationnecessary for more efficient use of research personnel and resources and for placing thescientific understanding gained in the broader system context .
250
Table 11.0.1. Current status of information on the environment and ecosystem of theGully.
Component Information Data* Gaps
Good Useful Poor Analog
Geology x X x Limited to shallow zone (<600 m) ;Little multibeam data .
Hydrography x X Coverage <1% of the bottom area .
Ambient Noise X x Not addressed in Gully ScienceReview .
Oceanography
Physical x X Limited to shallow zone; Sparce datafor circ . model calibration .
Chemical X No contaminants data; Poor small-scalespatial/temporal coverage .
Biological X Lack of contemporary data ; Poorsmall-scale spatial/temporal coverage .
Benthos x X ? No quantitative data .
Fish
Finfish X X x Poor small-scale spatial/temporalcoverage .
Invertebrates X X x Lack of data on distribution,movements, recruitment .
Seabirds X Poor small-scale spatial/tempora lcoverage .
Mammals x X Lack of data on at-sea distribution ofpinnipeds ; Lack of data on cetaceandistribution outside summer .
*Additional data available but not analyzed
251
12.0 The Gully Ecosystem - An Integrated View
Ihspite gaps in our knowledge of a number of important environmental and ecologicalelements of the Gully (Section 11 .0), enough is presently known from this and analogousregions to describe the key processes and interactions which define submarine canyonecosystems in general and the Gully in particular (Fig . 12.0.1).
The Science Review revealed that the Gully is the largest of the submarine canyons whichcut into the eastern continental margin of North America . It is equally distinctive for itspenetration well onto the continental shelf and for its depth (>2000 m) and extremelysteep walls. Collectively, these physiographic features have important implications forlocal circulation, onshelf nutrient fluxes, sediment dynamics, and the distribution andstructure of biological communities .
On the basis of scientific observations in the Gully, modelling results and more extensivestudies in analogous regions, it is clear that circulation in submarine canyons is stronglyinfluenced by the local topography and mean flows along the adjacent continental shelfand slope. Evidence suggests that the Gully may act at times as a significant conduit formaterial transport onto and off of the shelf and may be an area of significant materialretention, thus influencing local deposition. Its steep slopes make it an area whereinternal wave activity may be enhanced, leading to stronger local mixing, nutrienttransport to surface waters and to increased local primary production . Patterns ofcirculation and flow strengths also contribute to the distribution and nature of surficialsediments ; circulation and sediment type, in tum, influence the distribution . abundanceand community structure of the benthos .
Locally enhanced primary production can provide energy for zooplankton in the watercolumn and/or for benthic filter-feeders when transported to depth as phyto-detritus. Thezooplankton are in turn an important food source for larval fini"ish and invertebrateswhich are consumed by adult pelagic finfish, seabirds and marine mammals . The benthiccommunities are an additional food source for marine mammals and for demersal finfish .The diversity of feeding types of cetaceans found in the Gully suggests that the foodsources which support their activity are likewise diverse .
Besides providing a localized food source, submarine canyons may also provide refugefor a variety of organisms from plankton to mammals . These and the deep basins that arefound on the Scotian Shelf, for example, are known to harbour large populations of over-wintering meso and macrozooplankton, e .g. krill . The steep and complex bathymetry ofsubmarine canyons also provides for high substrate (habitat) diversity which is associatedwith high biodiversity. The Science Review has documented, for example, that the Gullyis a region of strong dentersal ichthyiofaunal boundaries and that their diversity is highcompared to the eastern Scotian Shelf as a whole . High benthic species diversity hasbeen noteworthy in studies of other canyon features along the North Atlantic coast .
252
It is not unreasonable, therefore to conclude that the aggregation of fish, seabirds andmammals within or in proximity of submarine canyons can be explained by : (1) anenhanced supply of food mediated by processes which favor localized production and itsretention there and (2) a diversity of habitats, providing both substrate and shelter tosupport a complex array of biotic communities within a geographically confined region .The extent to which the Gully conforms to this generic view of submarine canyonecosystems can only partially be evaluated at present ; more (multidisciplinary) research inthe region will be required to fill the critical knowledge gaps and quantify the keyprocesses and interactions .
253
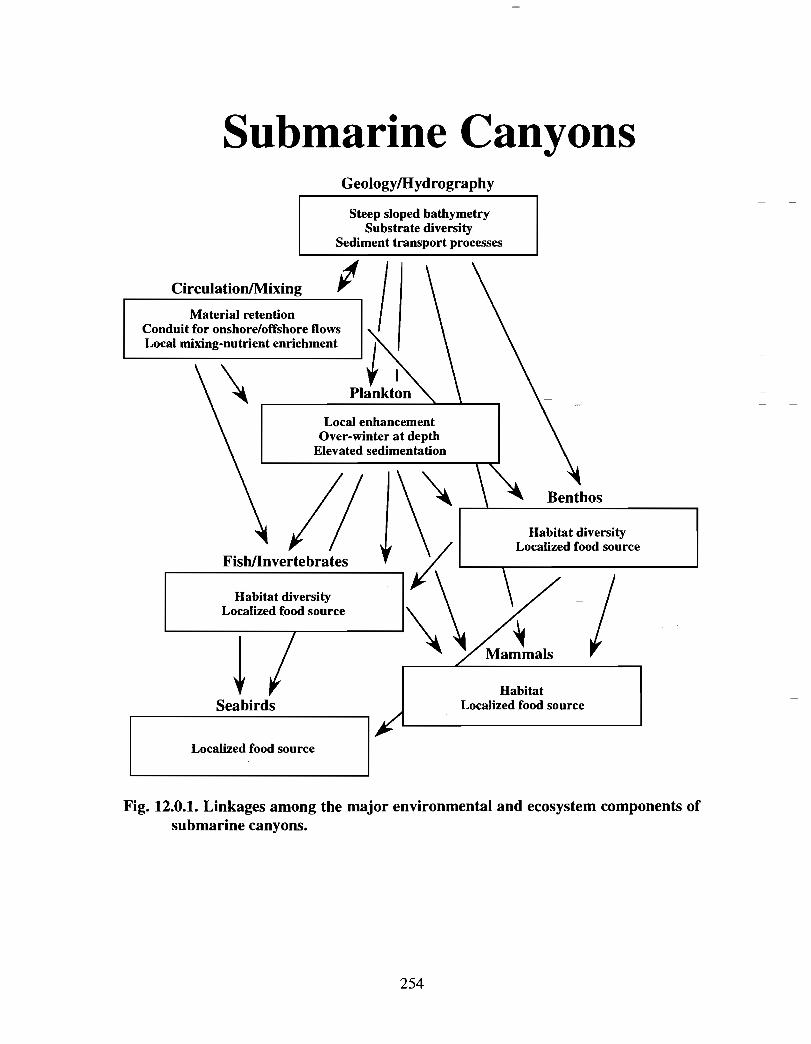
Submarine Canyons
Circulation/Mixin g
Material retentionConduit for onshore/offshore flowLocal mixing-nutrient enrichme n
Fish/I
Habitat diversityLocalized food
Seabirds
Localized food source
HabitatLocalized food source
Fig. 12.0.1. Linkages among the major environmental and ecosystem components ofsubmarine canyons.
Geology/Hydrography
Steep sloped bathymetrySubstrate diversity
Sediment transport processes
Local enhancementOver-winter at depth
Elevated sedimentation
\\'x Benthos
Habitat diversityLocalized food source
nvertebrates
source
\Mammals
254
APPENDICES
Appendix 13.1 Fish and Fisheries: Mackerel
W.T. StoboFisheries and Oceans CanadaMarine Fish DivisionBedford Institute of OceanographyDartmouth, NS
13.1.1 Background
The Marine Fish Division (MFD) group which met related to the Gully Science Reviewrequested that I comment on the distribution of mackerel on the Scotian Shelf from thesurvey work that I participated in some years ago . The work referred to is Kulka andStobo (1981) .
That work (November-December, 1976) was conducted before MFD has initiated thespring surveys . Our hypothesis was that juvenile mackerel may stay on the Scotian Shelfover winter rather than migrating south to Subarea 5 with the adults ; the results supportthat hypothesis . The objective was to determine if mackerel remained on the ScotianShelf over the winter in large numbers, and if so, was the distribution contiguous from theScotian Shelf to the western portion of Georges Bank where the main winter fisheryoccurred. We used both a mid-water and bottom trawl ; the vessel cruised a pre-determined tract and made a set, with the appropriate gear, whenever the sonar indicatedtrawlable numbers of fish . The cruise tract covered out to the edge of the Scotian Shelfand most of the deeper basins, the northeastern part of Georges, restricted the vessel tothe near edge area of western Georges, and then expanded again bank-wide off Cape Cod(Fig. 13 .1 .1). The western extension inshore was due to the location of the wintermackerel fishery off Cape Cod and our desire to ensure that the vessel could catchmackerel with both gear types .
The survey therefore was not systematic, but rather exploratory . It did cover the area ofthe Gully, but that was essentially the most eastward point and it did not extend ontoBanquereau Bank to any extent. We actually had only one set in the Gully, but nomackerel were found there. In fact, we found relatively few species in the study area eastof Sable Island; the most abundant species was yellowtail, with American plaice andwitch flounder the next two most abundant species .
Mackerel were found around Sable Island and across the Scotian Shelf, but mainly agegroups 0 and 1 . The data suggest that the overwintering mackerel are distributed in theoffshore areas of the shelf; we also examined previous specialized winter cruises(between 1958-76) and observed similar results . The mean bottom depth for the ScotianShelf mackerel catches was 118 in, considerably shallower than that in the Gully . Mostof the mackerel were either caught in the bottom trawl or when the mid-water trawl was
255
towed close to the bottom, suggesting a near bottom existence during winter .Examination of the summer RV survey results for the 1958-76 period suggested a moremid-shelf distribution, but again no obvious concentrations were observed near the Gully .
From that work I would conclude that the Gully is not an important aspect of mackerelpopulation dynamics ; nor would one expect another result . Mackerel spawn off CapeCod in early spring and in the Gulf of St . Lawrence in mid-summer; there has been nodocumentation of mackerel spawning in the offshore areas of the Scotian Shelf . Themigration of adults north appears to be along the mid- and inner areas of the Scotian Shelffrom observations of trap catches and recreational fishery activity . Although thereappears to be an annual run of mackerel going past Sable during mid-summer (W . Stobo,pers . comm.), there is no documented fishery in the area. The return migration in fall iseven less well understood. The limited winter work suggests that there are relatively fewadult mackerel on the Scotian Shelf during winter and that juveniles are probablyscattered across the outer shelf .
13.1.2 References
Kulka, D.W. and W.T. Stobo. 1981 . Winter distribution and feeding of mackerel on theScotian Shelf and outer Georges Bank with reference to the winter distribution ofother finfish species . Can. Tech. Rep. Fish. Aquat. Sci . No. 1038 .
256
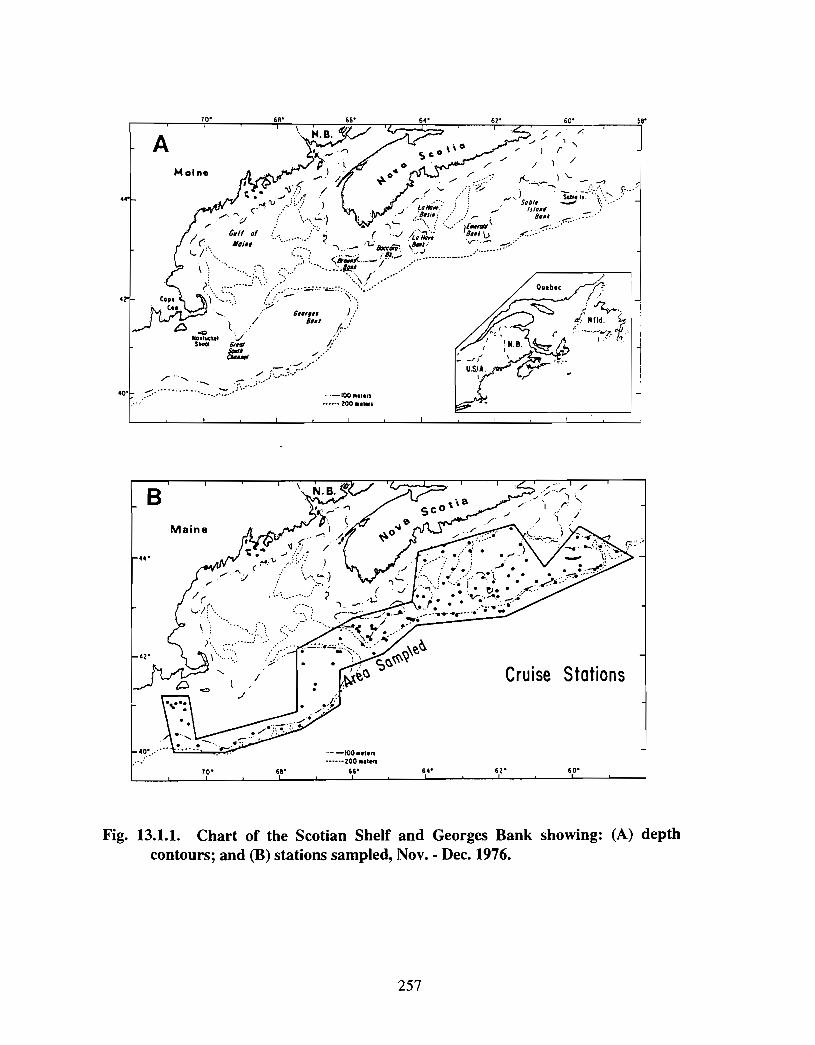
70' 66' 66'
_ 100 e.1m•---` 200 . .Itl{
61' 62' 60' 58'
Fig. 13.1.1. Chart of the Scotian Shelf and Georges Bank showing: (A) depth
contours; and (B) stations sampled, Nov. - Dec . 1976.
257
Appendix 13.2 Fish and Fisheries : Large Pelagic Fisheries
Heath StoneFisheries and Oceans CanadaBiological StationSt. Andrews, NB
13.2.1 Introduction and Method s
This document reviews the current geographic and seasonal distribution of large pelagicsfisheries (swordfish, bluefin tuna, other tunas) within the Canadian Fishing Zone. Theseanalyses are intended to provide background information for a Science Review of theGully area on the Scotian Shelf, which is being considered for "Marine Protected Area"status . Most of the data used for this analyses originates from commercial log recordsprovided by swordfish longline (1994-1996) and bluefin tuna (1988-96) fishermen .Although the harpoon fishery for swordfish accounts for up to 12% of the annuallandings, information on catch location is insufficient for an analysis of swordfishdistribution .
Detailed set information (i .e . latitude and longitude) for swordfish longline from logmonitoring data is only available back to 1994, however, the number of observationssince that time are considered adequate for determining the extent of this fishery . Plots oflongline fishing effort are based on individual set locations while plots of nominal catchper unit effort (CPUE) are based on aggregated data (number or weight of fish per tripdivided by total number of hooks per trip) . The proportion of swordfishing trips, sets andcatch in a rectangle approximating the Gully area (latitude : 43° 30'-44 ° 10' ; longitude: 58° 40'-59 ° 20') was calculated and compared with annual totals for 1994 through 1996 .Plots of catch location for bluefin tuna were based on positions reported by commercialfishermen in the bluefin log records .
Additional information on swordfish distribution was available from the CanadianInternational Observer Program database (1980-96) and from research surveys (1980,1990-93) conducted by Science Branch . Distribution plots from this series show setlocations and number of swordfish sampled .
13.2.2 Results and Discussion
Swordfish Lon lg ine - The Canadian swordfish longline fishery operates from GeorgesBank to the western edge of the Grand Banks when swordfish migrate into Canadianwaters during summer and fall . Pelagic longline gear is used to capture swordfish atnight when they feed in surface waters . The gear is set early in the evening and hauledback the following morning . Typically, a trip consists of 8-14 sets of the gear with up to1500 hooks/set, covering a distance of up to 60 km . Fishing effort generally progressesfrom west to east and back again along the edge of the continental shelf, followin g
258
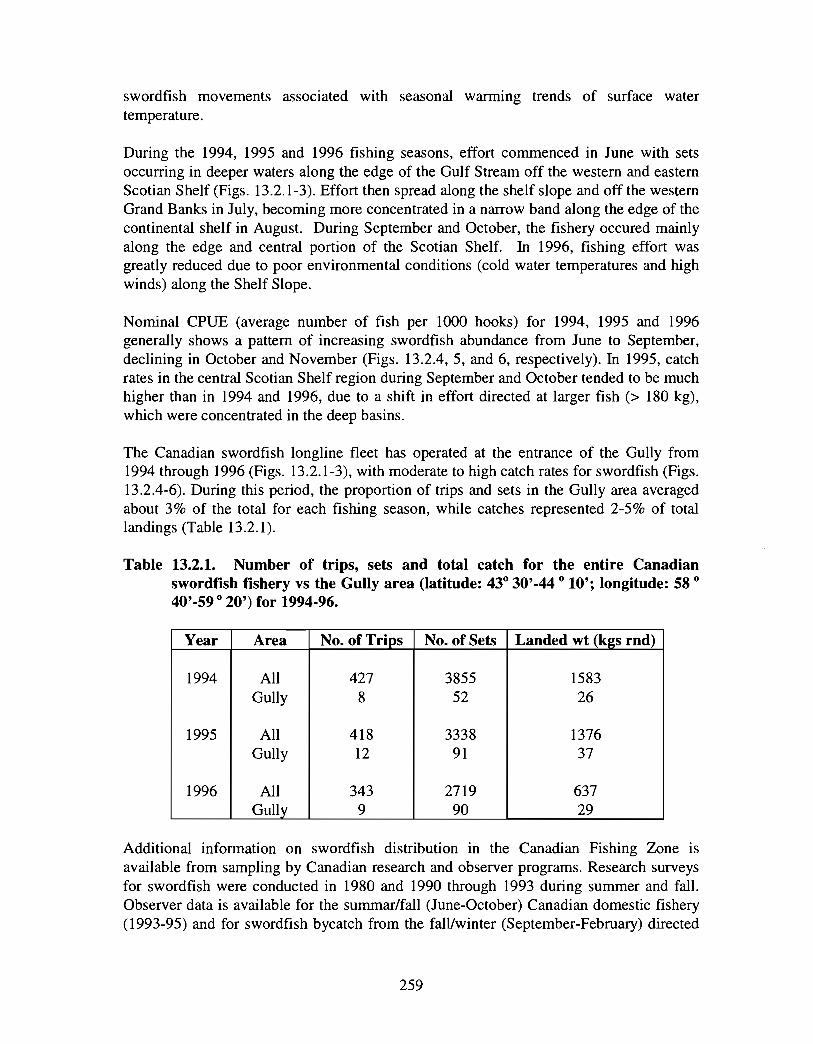
swordfish movements associated with seasonal warming trends of surface watertemperature .
During the 1994, 1995 and 1996 fishing seasons, effort commenced in June with setsoccurring in deeper waters along the edge of the Gulf Stream off the western and easternScotian Shelf (Figs . 13 .2 .1-3) . Effort then spread along the shelf slope and off the westernGrand Banks in July, becoming more concentrated in a narrow band along the edge of thecontinental shelf in August . During September and October, the fishery occured mainlyalong the edge and central portion of the Scotian Shelf. In 1996, fishing effort wasgreatly reduced due to poor environmental conditions (cold water temperatures and highwinds) along the Shelf Slope .
Nominal CPUE (average number of fish per 1000 hooks) for 1994, 1995 and 1996generally shows a pattern of increasing swordfish abundance from June to September,declining in October and November (Figs . 13.2.4, 5, and 6, respectively) . In 1995, catchrates in the central Scotian Shelf region during September and October tended to be muchhigher than in 1994 and 1996, due to a shift in effort directed at larger fish (> 180 kg),which were concentrated in the deep basins .
The Canadian swordfish longline fleet has operated at the entrance of the Gully from1994 through 1996 (Figs . 13 .2.1-3), with moderate to high catch rates for swordfish (Figs .13 .2 .4-6) . During this period, the proportion of trips and sets in the Gully area averagedabout 3% of the total for each fishing season, while catches represented 2-5% of totallandings (Table 13 .2.1) .
Table 13.2.1. Number of trips, sets and total catch for the entire Canadianswordfish fishery vs the Gully area (latitude: 43° 30'-44 ° 10' ; longitude: 58 °40'-59 ° 20') for 1994-96.
Year Area No. of Trips No. of Sets Landed wt (kgs rnd)
1994 All 427 3855 1583Gully 8 52 26
1995 All 418 3338 1376Gully 12 91 37
1996 All 343 2719 637
Gully 9 90 29
Additional information on swordfish distribution in the Canadian Fishing Zone isavailable from sampling by Canadian research and observer programs . Research surveysfor swordfish were conducted in 1980 and 1990 through 1993 during summer and fall .Observer data is available for the summar/fall (June-October) Canadian domestic fishery(1993-95) and for swordfish bycatch from the fall/winter (September-February) directe d
259
Japanese tuna longline fishery (1980-1996) . Set locations and relative number ofswordfish sampled per set from Canadian research and observer program collections (Fig .13 .2.7) and Canadian observer sampling on Japanese longline vessels (Fig . 13.2.8)indicate that catches in the Gully area did occur, but were of the same order of magnitudeas in other areas along the Shelf slope .
The distribution and relative abundance of swordfish in the Canadian Fishing Zone isgreatly influenced by oceanographic conditions and can vary considerably both seasonallyand geograhically from one year to the next (Fig . 13.2.9). Therefore, it is difficult todistinguish between areas of localized high swordfish abundance attributed tooceanographic features or a preference for a specific physical habitat (i.e. like the Gully) .Individual swordfish probably have a relatively short residence period in any, particulararea during their search for food on the Shelf and Shelf Slope . Tagging results haveshown movements from west to east along the Shelf slope during the fishing season .Swordfish can feed on a wide variety of prey found throughout the water column (i .e .groundfish, pelagics, deepwater fish and invertebrates) . While the Gully may offer agreater variety of prey items than other areas on the Scotian Shelf and Slope (due tohigher levels of productivity), it is unlikely that the relative abundance of swordfish ishigher in this area compared with other regions in Canadian waters (see Fig . 13 .2 .9) .
Albacore, Bi geye and Yellowfin Tuna Bycatch from Swordfish Lon lg ine - Since 1993,there has been increase in the number of swordfish longline trips directed for other tunas(albacore, bigeye and yellowfin), which is attributed in part to declining quotas forswordfish. These trips occur mainly during June and July when water temperatures arequite variable and the relative abundance of swordfish tends to be low . Fishermen usecircle hooks (which have better retention for tunas) in combination with conventional J-hooks on their longline gear, and a squid/mackerel bait mixture to attract these fish .
From 1994 through 1996, nominal catch rates (kgs round per 1000 hooks) were highestduring June and July for albacore (Figs . 13.2.10-12) and yellowfin (Figs. 13 .2.13-15), andfrom June through September for bigeye (Figs . 13 .2 .16-18). During these months, allthree species were captured primarily along the western edge of the Scotian Shelf slope,and in deeper waters along the edge of the Gulf Stream . Overall, the relative abundanceof all three species tends to be quite low in the vicinity of the Gully (and eastern ScotianShelf) where their occurrence appears to be incidental .
Bluefin Tuna Fishery - The Canadian bluefin tuna fishery currently operates in severalgeographic areas off the Atlantic coast from July to November when bluefin migrate intoCanadian waters. Since the late 1980's, the main commercial fisheries have included :Hell Hole tended line, Bay of Fundy harpoon, St . Margarets Bay trap, Gulf of St .Lawrence tended line/rod and reel, Chedabucto Bay rod and reel, and Grand Bankstended line/rod and reel . Recently, a tended line/rod and reel fishery has developed offHalifax, Nova Scotia .
260
Bluefin tuna capture locations within these geographic areas (fisheries) have been highlyvariable during the time series for which data on fishing location is available (1988-96,Figs . 13 .2 .17-19) . Most notable in recent years is : a) the expansion of catches from theHell Hole to adjacent areas on Georges Bank, Browns Bank and the Scotian Shelf, b) thedevelopment of an electric harpoon fishery in the Bay of Fundy in 1991 and a tendedline/rod and reel fishery off Halifax in 1995, c) an expanding rod and reel fishery inChedabucto Bay (beginning in 1990), d) a general decline followed by a recent increasein catches from the Grand Banks region off Newfoundland and e), a concentration ofcatches from the Gulf of St . Lawrence to the southern part of this region with highercatches in recent years .
Based on these spatial distributions, it is apparent that bluefin tuna form distinctaggregations in Canadian waters which can vary from one year to the next . However, nomajor concentrations are found offshore in the vicinity of the Gully or on the easternScotian Shelf. Although bluefin may be captured in this region on swordfish longlinegear, the Canadian fleet is not allowed to land them so there is no information availablefrom their log records .
13.2.3 Conclusion s
It is apparent from this analysis of commercial log record data that the swordfish longlinefishery currently operates within and adjacent to the Gully area on the Scotian Shelf. Interms of large pelagics species composition and relative abundance, there is no indicationthat this area is of greater or lesser importance as foraging habitat for swordfish than therest of the Scotian Shelf, and it does not appear to be an area commonly occupied by anyof the other tuna species (albacore, bigeye, yellowfin) . Since there is no directed fisheryfor bluefin in this area or anywhere offshore on the eastern Scotian Shelf, it is not clear ifthey commonly occur in the Gully or not .
261
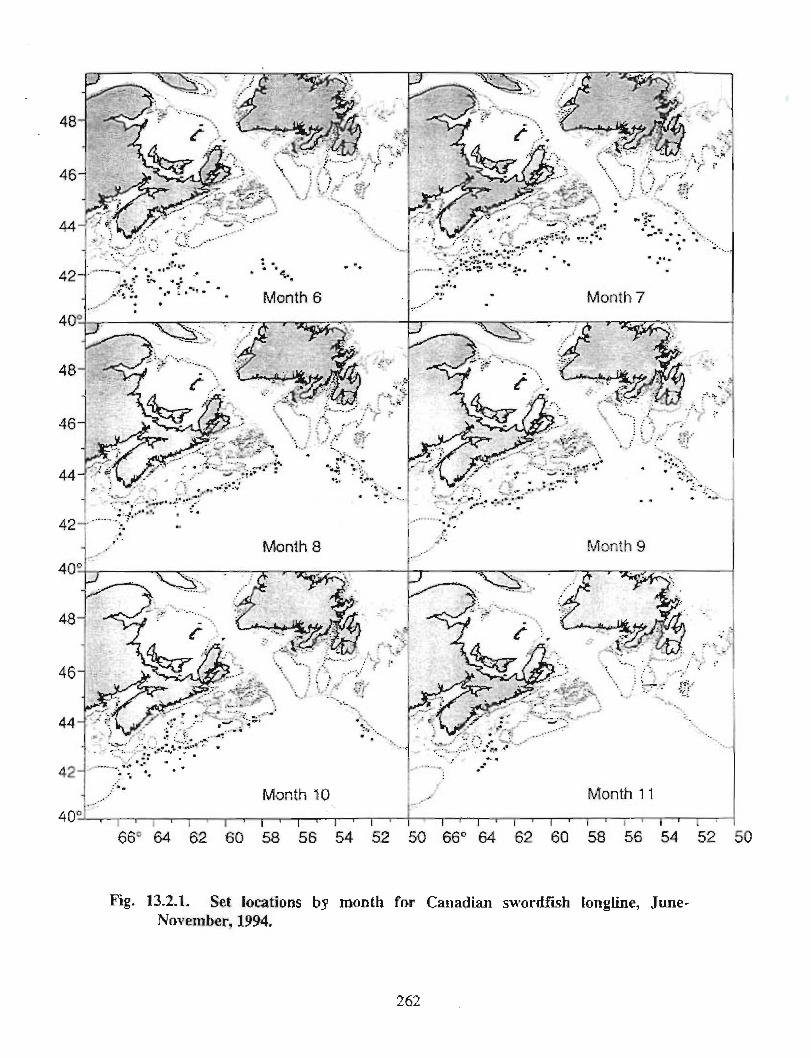
1 ' I I' 1 d
56~ 64 62 60 58 56 54 52 50 66° 64 62 60 58 56 54 52 50
Fig. 13.2.1. Set locations by month for Canadian swordfish longline, ,June-Novernber, 1994 .
ifi?
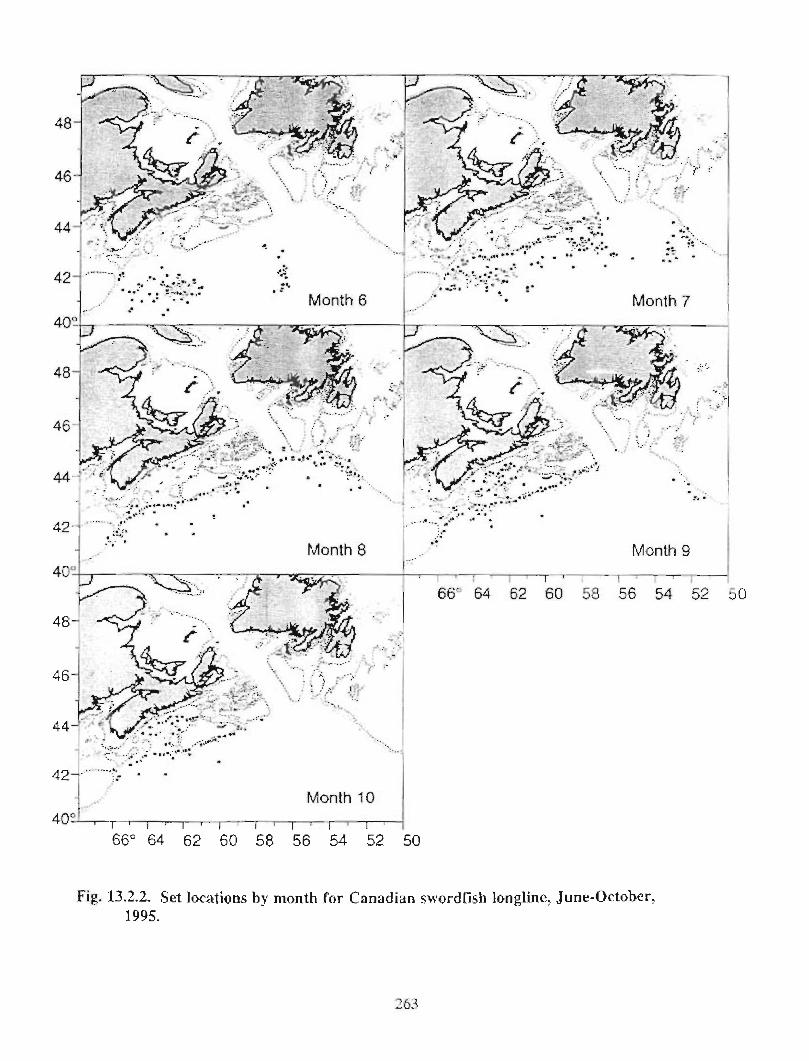
42-i
40'J
Ptironth 1 0
66° 64 62 60 58 56 54 52 50
Fig . 13.2 .2. Set locati ons by month for Canadian swordfish 1 ongline, June-Octoher,
1995 .
,,~,
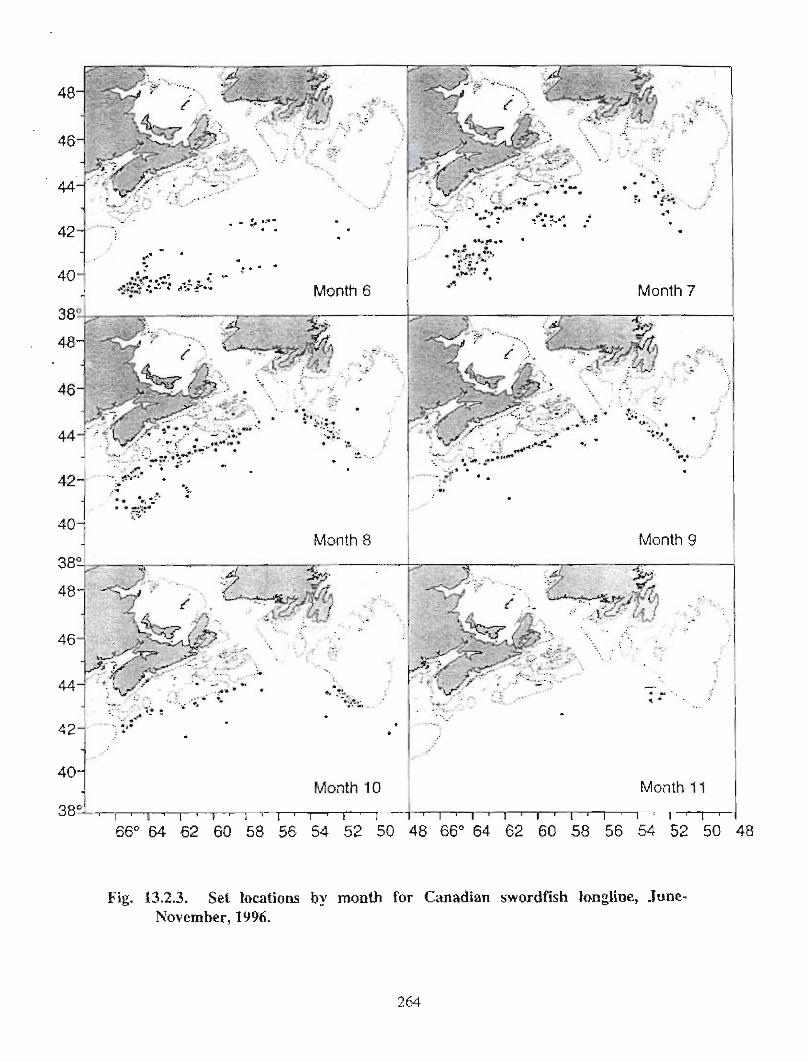
401 Nionth 10 I Month 1 1
38°66° 64 62 60 58 56 54 52 50 48 66° 64 62 60 58 56 54 52 50 4 8
Fig. 13.2.3. Set Socations by`• month for Canadian swordfish lor~~;line, June-
November, 1 996.
i64
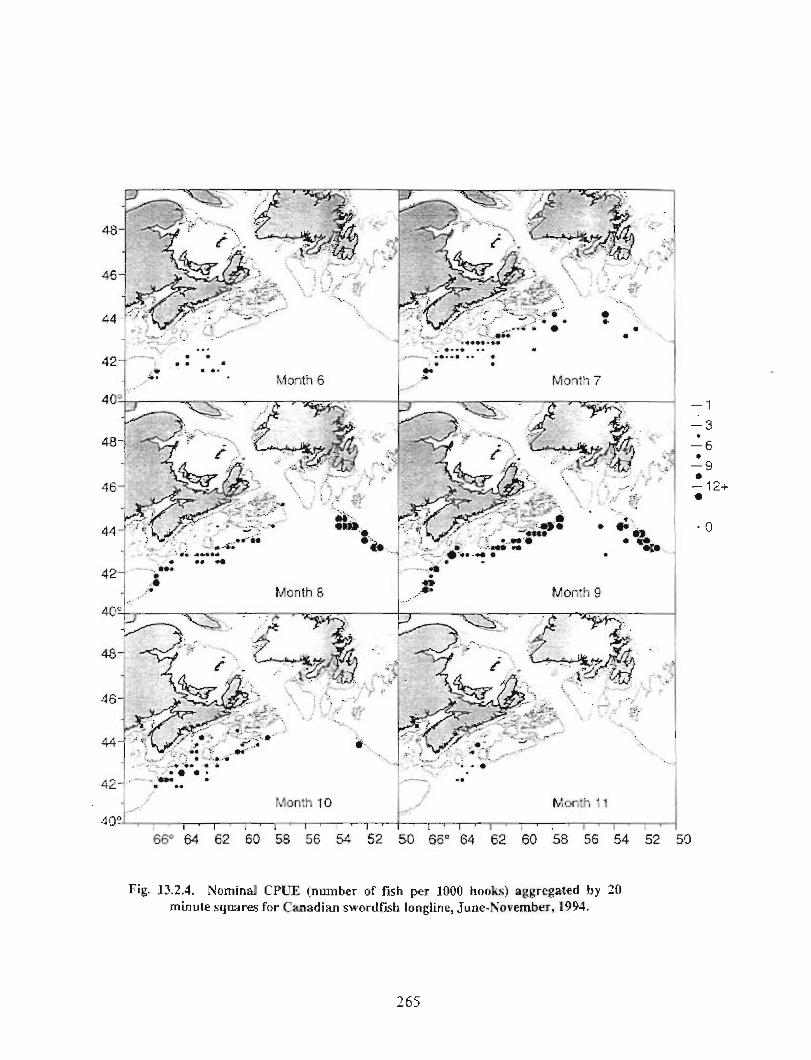
Fil ; . 13 .2 .4 . Nominal CPUE ( numb er of fish per 1000 hooks) aggregated by 20
minute squares for Canadian swordfish Iont;Iine . June-November, 1944 .
2 65
66° 64 62 60 58 56 54 52 50
Fig. 13 .2 .5 . Nominal CPUE pnumber of fish per 1000 hooksf aggregated by 2 0
minute squares for Canadian swc,rdfish longlineti June•[}ctober, 1 9 9 5 .
266
- 0
40
38°
Month 10 Month I 1
66° 64 62 60 58 5 6 54 52 50 48 66° 64 62 60 5 8 56 54 5 2 50 48
Fig. 13 .2 .6. Nominal CPUE (.number of fish per 10()0 hoolcs) aggregated by 20
minute squares for Canadian swordfish longline, June-November, 1996 .
267
11 'il; . 13.2 .7. Set locations and relative number uf sworclTish sample ►f per set from Canacli .an research and observer program
sample collections, 1980-1996 .
38 '6A"
Î
66 64 62 6© 5Rr-
56 52 50 48 46
Fig. 13 .2.8 . Set locations and relative number of' swordf!~*.h sampled per set on Japane5e longline vemsels fram Canadian
observer prcigrani 4aneplinl ;, 1 980 - 1 996.
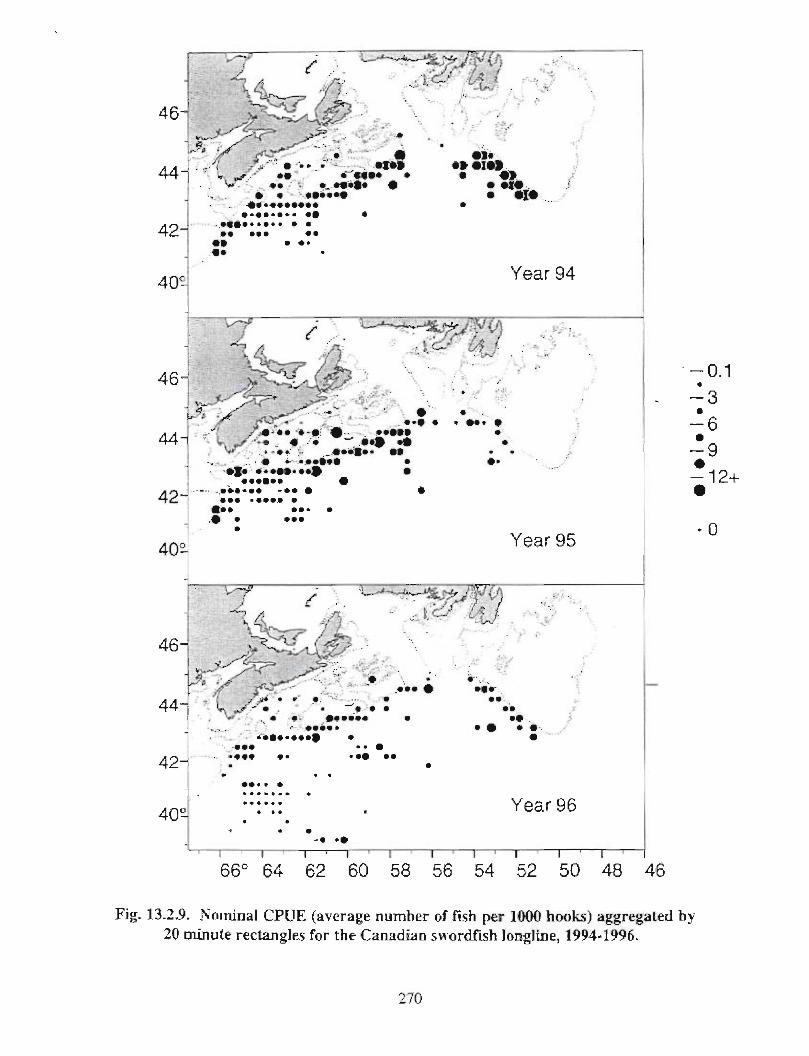
~5 ~ ,.~' ~ . r " ~ • ~lf
44ff" _ • ,* : _ _ llio go . ~1OS
+
.• 6-4669 ~ • i~s. , 0_ .•ü. 0 ig:. ! * `*~sr.i • ~~~
• 406 . *000000 •
•a ..•i . • ~i •
.i~. . .i . . • •
42~
. . i. . 40"60 as
•o i 9-
ii. •
Year 94
40 o
46~
• . . .s• .. •* .! • .* .. .
119!• **• i~ • i.~
• . .0•. s
>,,-l .?-~. -: s
.:~,• _ 4 -01- 'o~ r ./r•
# i •.9 si. _.••~t. . •*
• • • ..E~• ••** • . .i!• .a~ •
-~r .• t~h, ~~ .
•
It
Year 9 5
44 r~;; 1. .
'- y ~s ..-i a Ji i
I. - . i } . gi . .i• .
990-
1 . . :i~+•*!** •
..! • • 11P
i'
• .-
••
••l 'O• :
42 a" !. . .• .•i
. • •
•.•• •
402~ . . ..
~. •.
Yaar 96
66' 64 62 60 58 56 54 52 50 48 46
Fig. 1.3 .2.9 . Nominal CPUE ( average number of tïsh per 1000 books) aggregated bk20 minute rectangles for the Canadian swordfi3h longline . 1994 -199 6 .
.
• •.• ••
~
• •
270
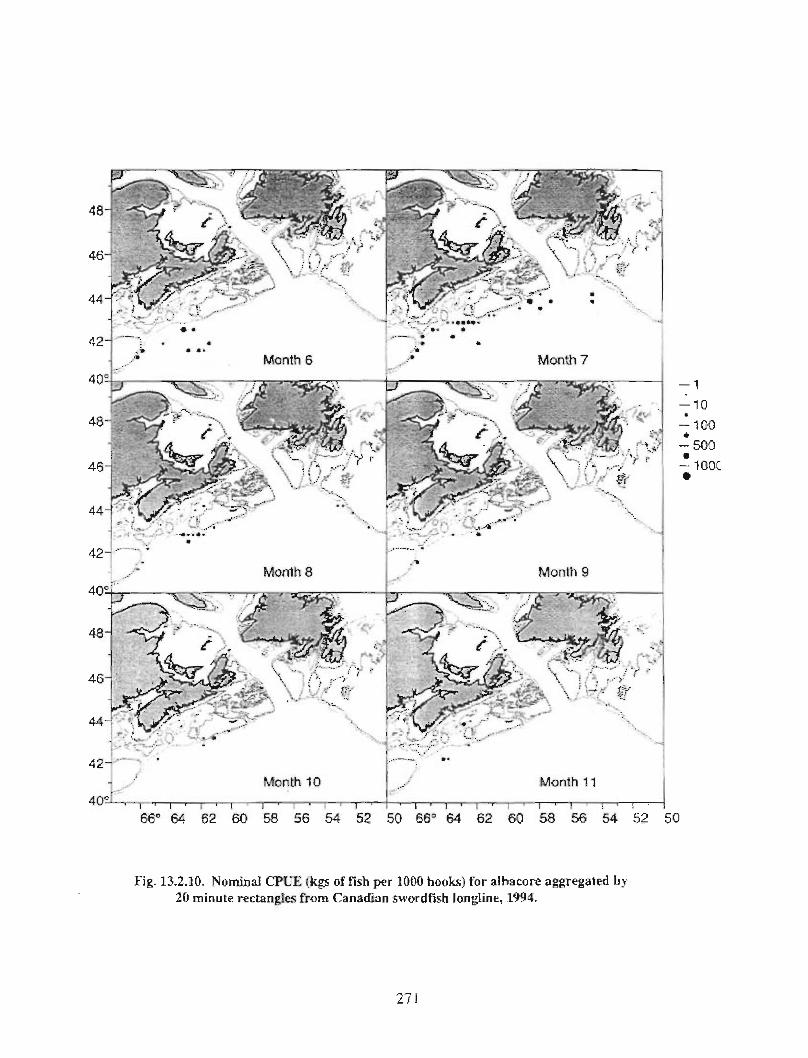
- 500
~ 104c•
66° 64 62 60 58 56 54 52 50 66° 64 62 60 58 56 54 52 5 0
Fig. 13.2 .]0 . Nominal CPUE (1 :gs of fish per 1 000 hco-oks) for albacore aggregated by
20 minute rectangles from Canadian swordlish Iongline, 1394 .
?71
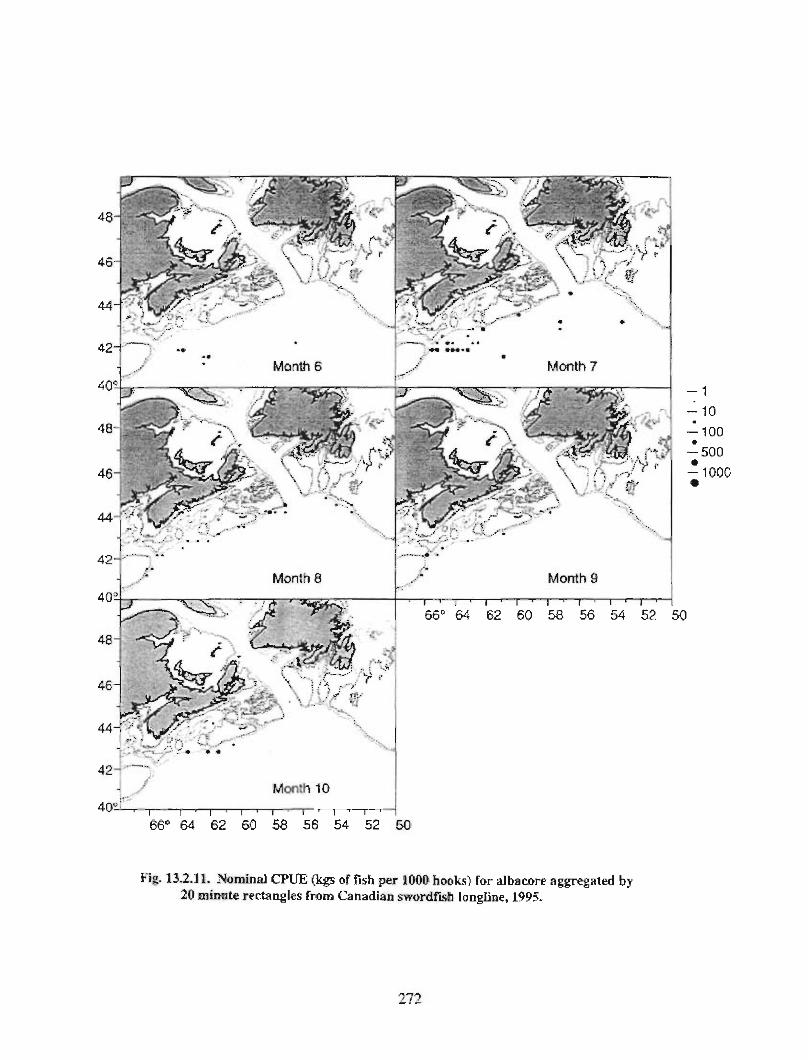
4o'~2
Month 1 0
66° 64 62 60 58 56 54 52 50
Fig . 13 .2 .11 . Nominal CPUE ikgs of fish per 1000 hooks) for albacore aggregated by20 minute rectangles from. Canadian svvordfish, longline, 1995 .
?î ')
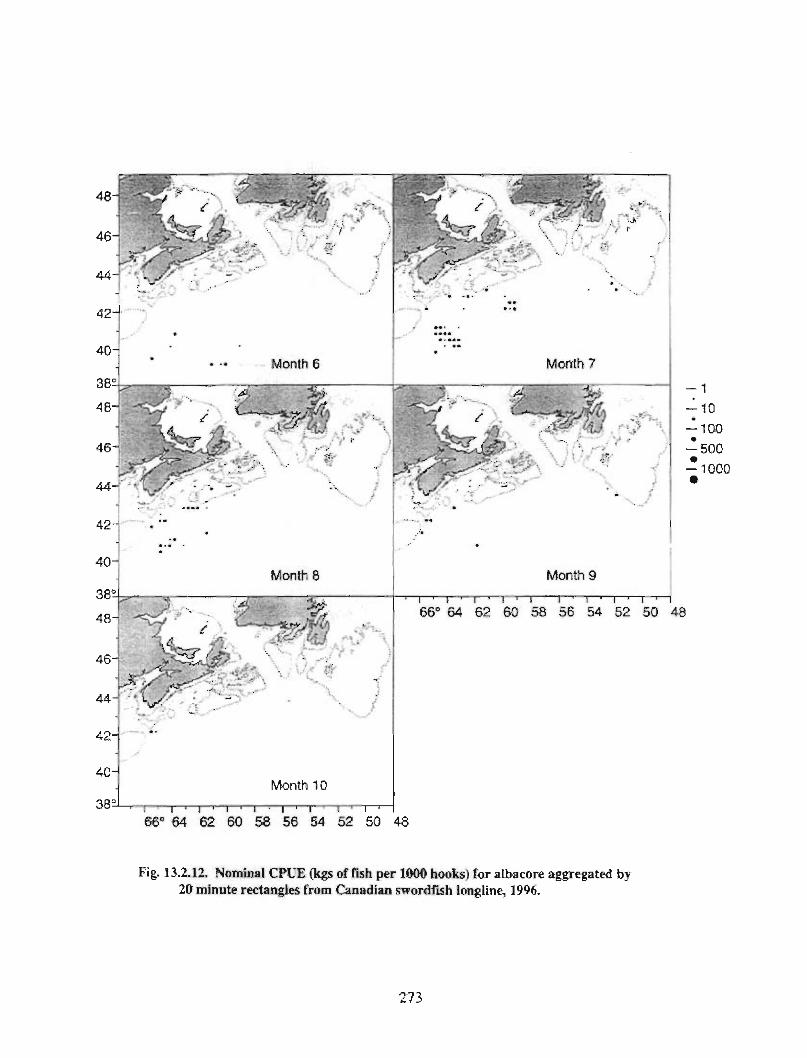
40-
38°-
48-~.,
Month 8
~ :,n' • . .~i:c.' ~~: x
46~~.-•~ ~ :~`' . . . .
. <v
42-
4d-
38 2
Manth 1 0
66° 64 62 60 58 56 54 52 5 0 48
T
Month 9
66° 64 62 60 58 56 54 52 50 48
Fig. 13.2 .12 . Nominal CPUE ikgs of fish per 1000 hooksM for albacore aggregated by20 minute rectangles from Canadian swordfish longline, 1996 .
?73
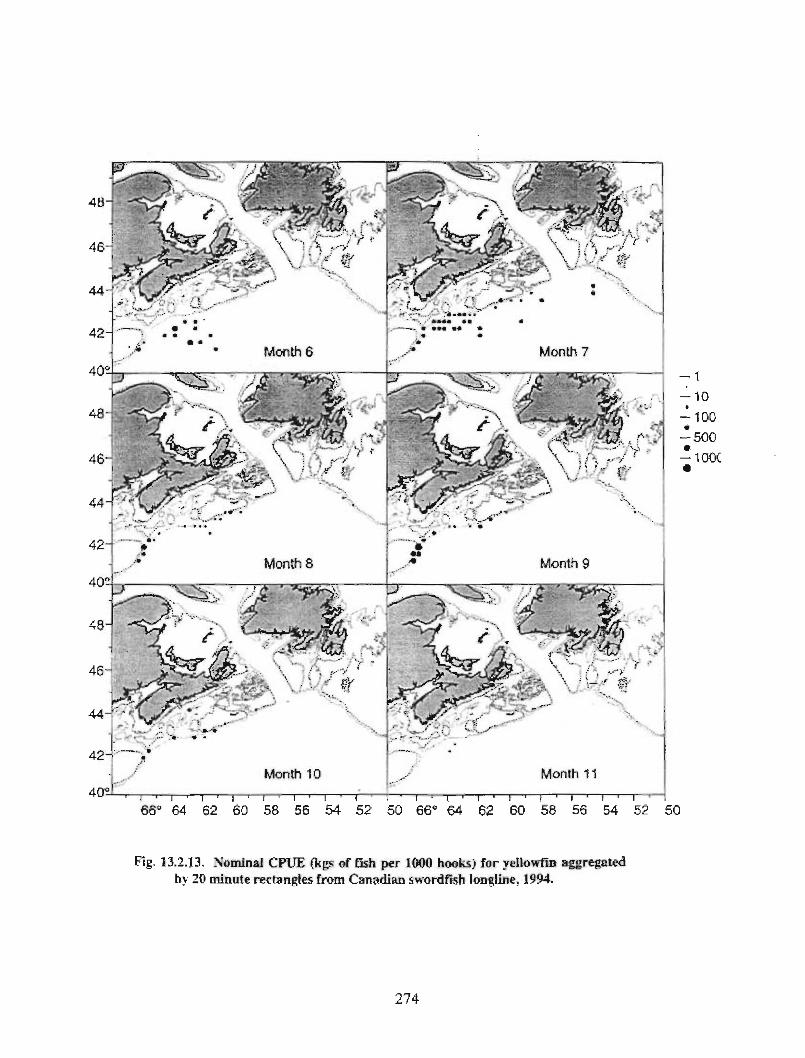
Month 10 Month l i I4û°
66° 64 62 60 58 56 54 52 50 66° 64 62 60 58 56 54 52 50
Fig . 13.2 .13 . tiominal CPUE r"kgs of fish per 1000 hooks} for iellowfin aggregated
by 20 minute rectangles from Canadian swordfish longline , 1994.
274
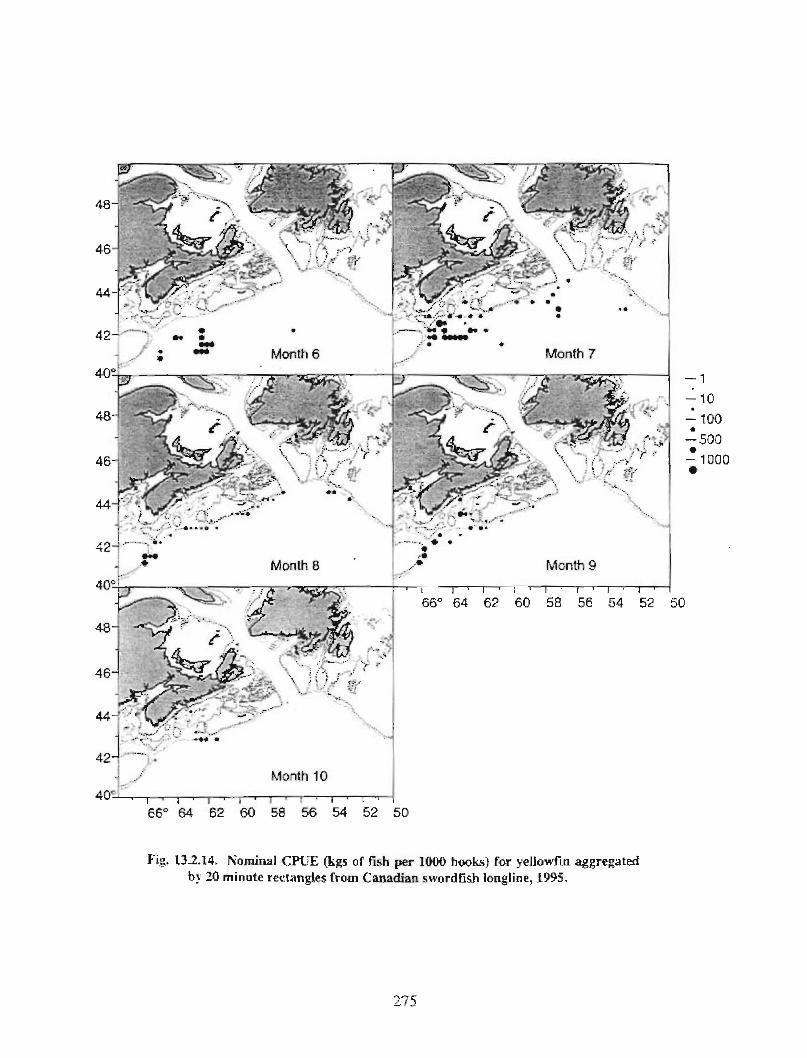
-1
-10.
-i000
- 500
- 1000i
66° 64 62 60 58 56 54 52 50
Month 1 0
66° 64 62 60 58 56 54 52 5 0
Fig. 13 .2.14 . Nominal CPUE ( kgs of fish per 1000 hooks) for yellowiin ag g r egated
by 20 minute rectangles from Canadian suordfish longline . 1995 .
?75
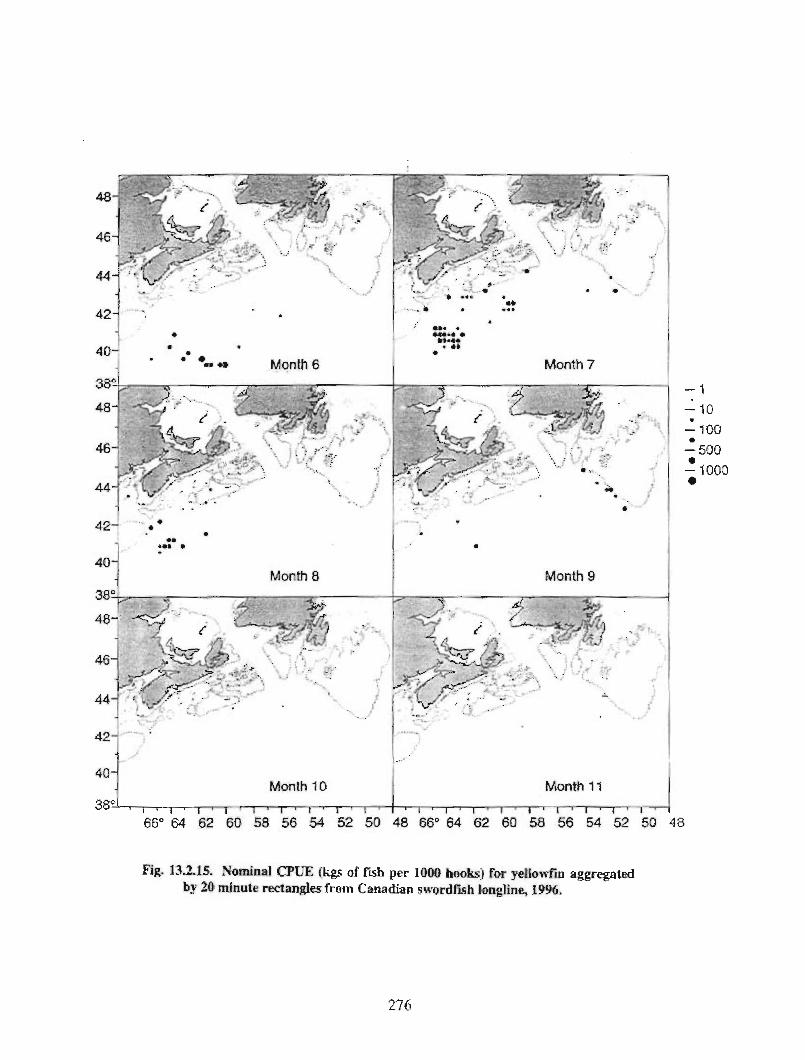
4c]- • o' ' :. .* Month 6
Month 1 04Q J
38°
Month 7
Month 1 1
66° 64 62 60 58 56 54 52 50 48 66° 64 62 60 5 8 56 54 52 50 48
Fig . 13 . 21 .15 . Nominal CPUE (kgs of fish per 1 000 hooks) for yellowfin aggregated
by 20, minute rectangles from Canadian s wordfish tongline, 1 "6 .
2 76
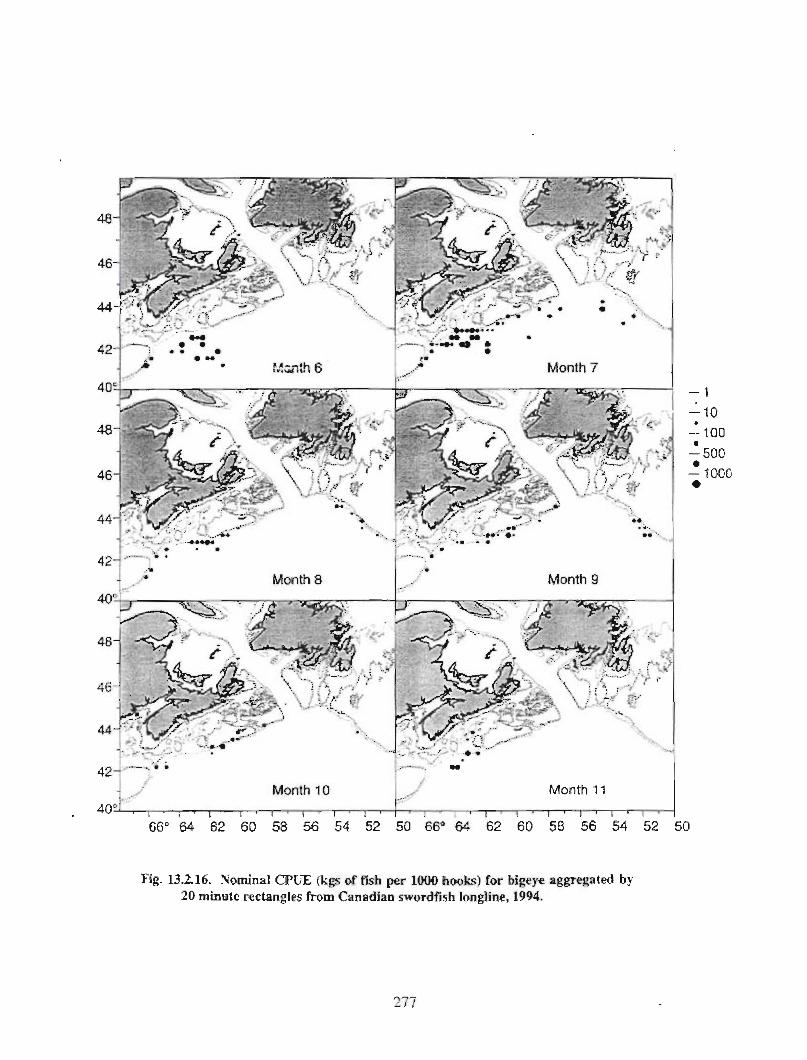
Month 10 Month 1 1
66° 64 62 60 58 56 54 52 50 66° 64 62 60 58 56 54 52 50
Fig . 13 .2.16. Nominal CPL:E (kgs of fish per 1000 hooks) for bigeye aggregated by
20 minute rectangles from Canadian swordfish longline . 1994 .
yi 7
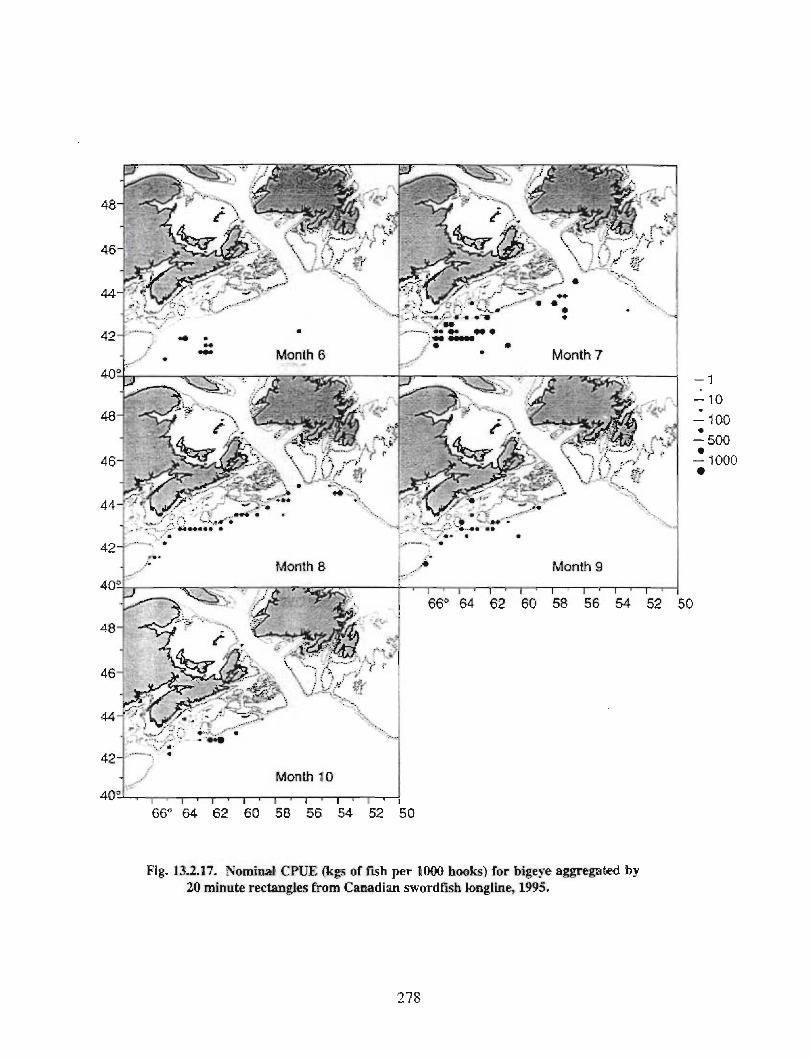
6£° 64 62 60 58 56 54 52 50
Fig . 13.2 .17. Nominal CPUE (kgs of fish per 1000 hooks) for hige ye aggregated by20 minute rectangles from Canadian swordfish longline, 1995 .
2 7 ,
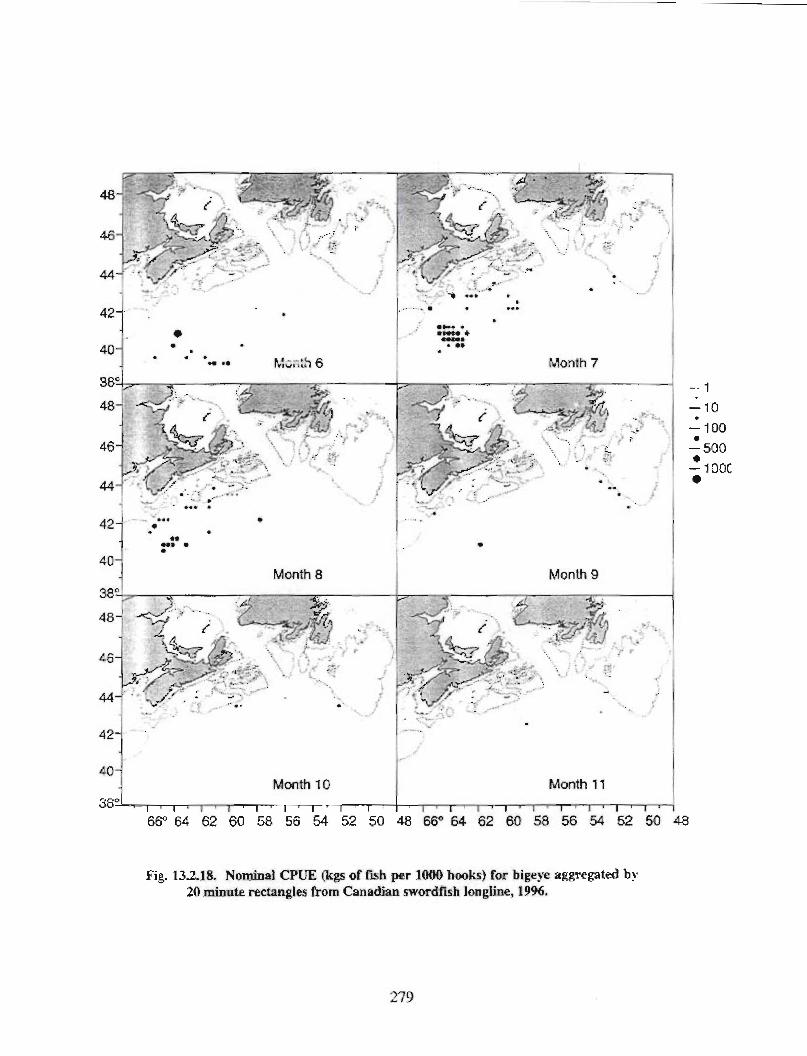
42-jJJ
J40-
40-
8`
11
Month 10
Month 7
Month 1 1
166° 64 62 60 58 56 54 52 50 48 66° 64 62 60 58 56 54 52 50 4 8
Fig . 13.2.18 . Nominal CPUE (kgs of xsh per 1000 hooks) for bigeye aggregated by
24 minute rectangles from Canadian swordfish longline, 1996 .
279
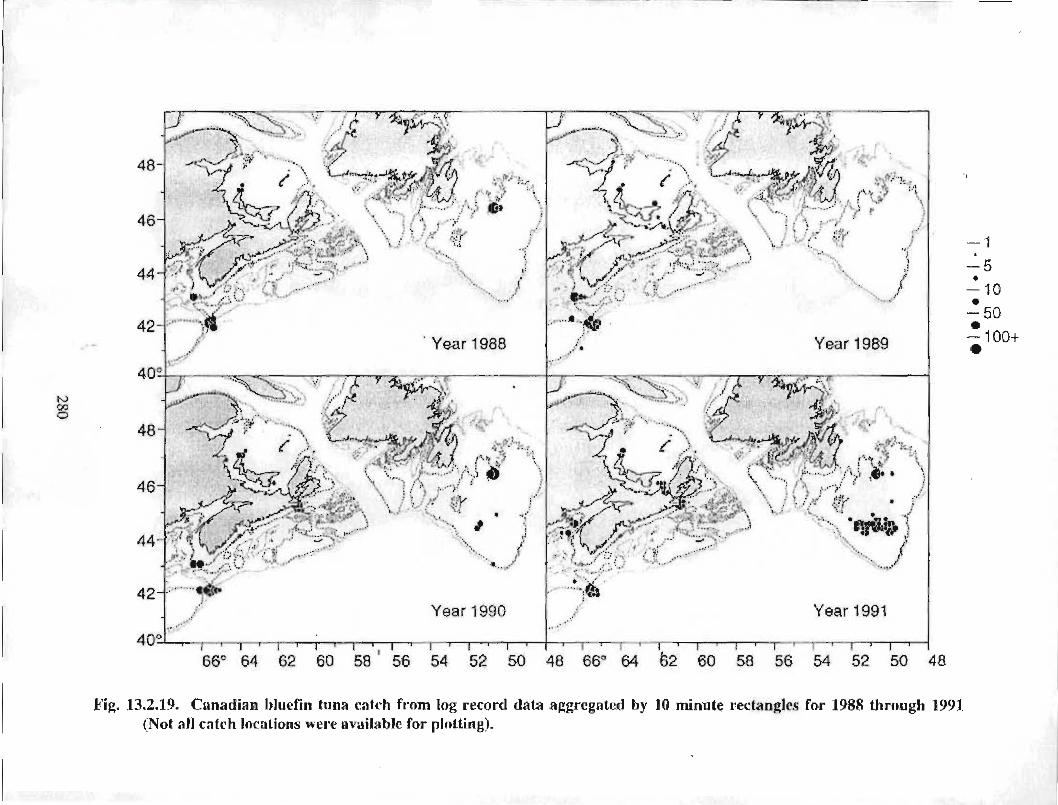
•
66° 64 62 60 58 1 56 54 52 5 0 48 66' 64 t2 60 58 56 54 52 50 48
Fig. 13.2.19. Canadian Ulue fi n tuna catch from log record data aggregated by 1[] minuie rectangles for 1 988 through 1991
(Not all catch locations were available for plotting) .
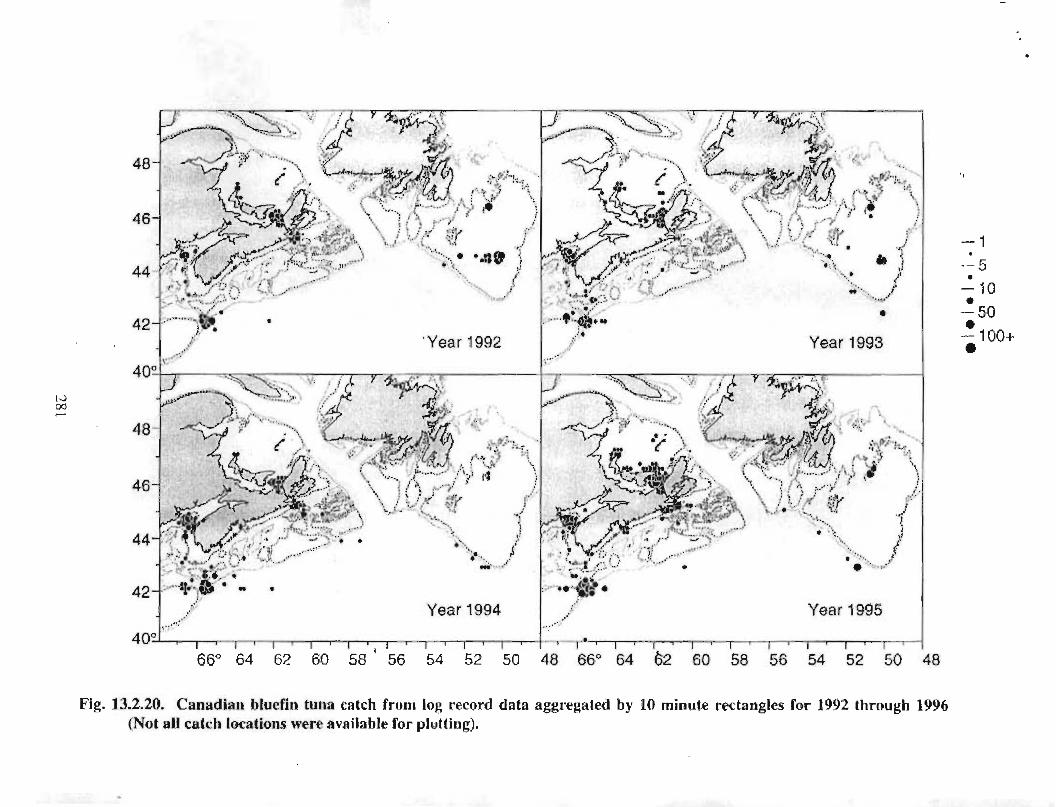
,
65° 64 62 60 58 ' 56 54 52 50 48 660 64 62 60 58 56 54 52 50 48
-100-Hs
Fig. 13.2.20. Canadian bluefin tuna catch from log record data aggregated by 10 minute rectangles for 1992 Ihrough 1 996
(Not all catch locations were available for plotting) .
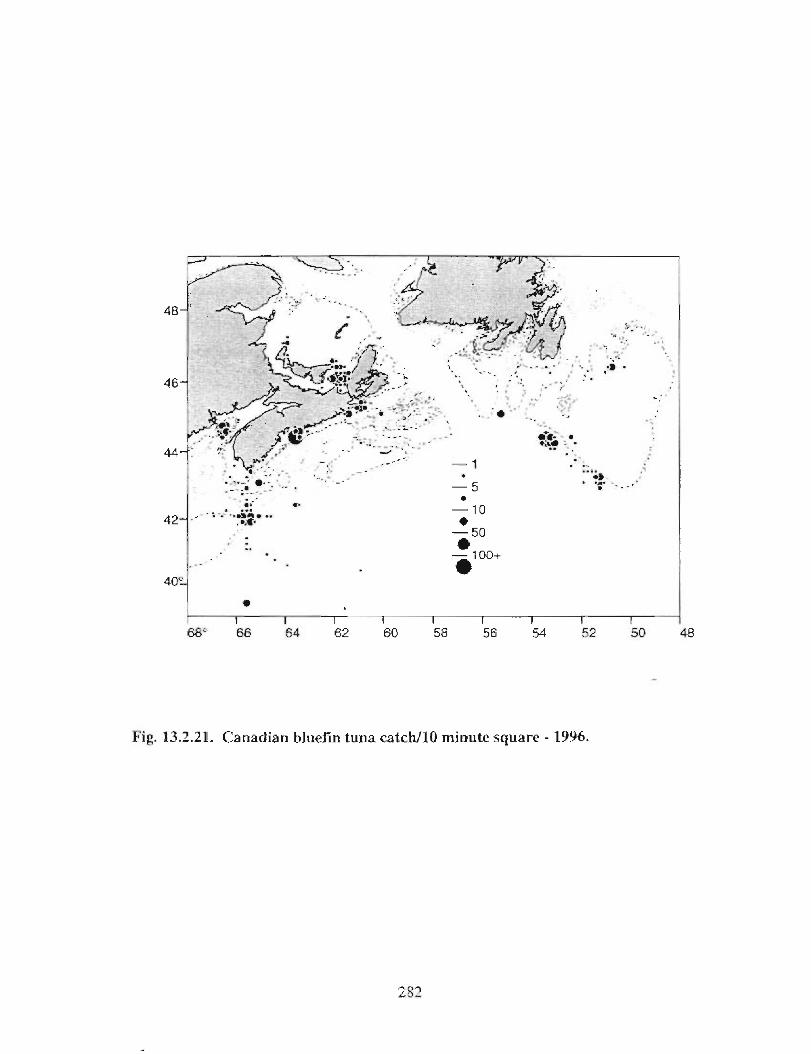
68 ° 66 64 62 60 58 56 54 52 -50
Fig. 13 .2 . 21 1 . Canadian bluefin tuna catch/10 minute square - 1996,
48
~8'