appendix e geotechnical interpretive report
TRANSCRIPT

Appendix E
Geotechnical Interpretive Report


Contract 440PN: Peka Peka to Otaki Expressway
Geotechnical Interpretative Report Draft – September 2011

NZ Transport AgencyPeka Peka to Otaki Expressway - Geotechnical Interpretative Report
September 2011 – draft i 5 C 1814.61 PP2O_Geotechnical Interpretatiive Report_draft1
This report has been prepared for the benefit of the NZ Transport Agency (NZTA). No liability is accepted by
this company or any employee or sub-consultant of this company with respect to its use by any other person.
This disclaimer shall apply notwithstanding that the report may be made available to other persons for an
application for permission or approval or to fulfil a legal requirement.
Authorship : This report has been produced for the NZ Transport Agency by:
Opus International Consultants Limited Wellington Office Level 9, Majestic Centre 100 Willis Street, PO Box 12-003 Wellington, New Zealand Telephone: +64 4 471 7000 Facsimile: +64 4 471 1397
Date: 14 September 2011
Report No.: GER 2011/07
Quality Assurance Statement
Project Manager: Tony Coulman
Prepared by: Janet Duxfield
Reviewed by: P Brabhaharan
Approved for issue by: Tony Coulman
Revision Schedule
Rev. No
Date Description Prepared by Reviewed by Approved by
NZ Transport AgencyPeka Peka to Otaki Expressway - Geotechnical Interpretative Report
September 2011 – draft ii 5 C 1814.61 PP2O_Geotechnical Interpretatiive Report_draft1
NZ Transport Agency
Contents
Summary ............................................................................................................................................................ v
1. Introduction ............................................................................................................................................. 1
2. Location of Route ..................................................................................................................................... 2
3. Geological Setting .................................................................................................................................... 3
3.1 Stratigraphy .............................................................................................................................. 3
3.2 Geomorphology ........................................................................................................................ 4
3.3 Engineering Geology Map .......................................................................................................... 4
3.4 Active Faults .............................................................................................................................. 5
4. Earthquake Hazards ................................................................................................................................. 7
4.1 General ..................................................................................................................................... 7
4.2 Ground Shaking ........................................................................................................................ 7
4.3 Fault Rupture ............................................................................................................................ 8
4.4 Earthquake Induced Slope Failure .............................................................................................. 8
4.5 Liquefaction Hazard .................................................................................................................. 8
5. Ground and Groundwater Conditions ..................................................................................................... 10
5.1 Ground Conditions .................................................................................................................. 10
5.2 Groundwater Conditions ......................................................................................................... 13
6. Material Properties ................................................................................................................................. 15
6.1 General ................................................................................................................................... 15
6.2 Representative Material Strengths ........................................................................................... 15
6.3 Compaction Characteristics of Potential Fill ............................................................................. 16
6.4 California Bearing Ratio ........................................................................................................... 16
6.5 Bulking Factor & Shrinkage Factors ......................................................................................... 17
7. Road Form of the Proposed Expressway ................................................................................................. 19

NZ Transport AgencyPeka Peka to Otaki Expressway - Geotechnical Interpretative Report
September 2011 – draft iii 5 C 1814.61 PP2O_Geotechnical Interpretatiive Report_draft1
8. Active Fault Crossing .............................................................................................................................. 20
9. Cut Slopes .............................................................................................................................................. 21
9.1 Cut Slope Angles and Configuration ........................................................................................ 21
9.2 Precedent Behaviours of Slope ................................................................................................. 22
9.3 Stability Analysis ..................................................................................................................... 22
9.4 Drainage ................................................................................................................................. 23
9.5 Re-vegetation and Erosion Control .......................................................................................... 24
10. Embankments ........................................................................................................................................ 25
10.1 Distribution and Configuration ................................................................................................ 25
10.2 Embankment Fill Materials ...................................................................................................... 25
10.3 Embankment Foundations ....................................................................................................... 27
10.4 Embankment Stability .............................................................................................................. 29
10.5 Drainage ................................................................................................................................. 30
10.6 Landscaping and Vegetation ................................................................................................... 31
11. Pavements .............................................................................................................................................. 32
11.1 Design Subgrade Parameters ................................................................................................... 32
11.2 Construction of Pavement Subgrade ........................................................................................ 33
11.3 Drainage ................................................................................................................................. 34
11.4 Existing Road Pavement .......................................................................................................... 35
12. Bridges ................................................................................................................................................... 36
12.1 Proposed Bridges .................................................................................................................... 36
12.2 Ground Conditions at the Bridge Sites ..................................................................................... 36
12.3 Types of Abutments and Foundations ..................................................................................... 38
12.4 Design Considerations ............................................................................................................ 38
12.5 Liquefaction Potential .............................................................................................................. 39
13. Culverts .................................................................................................................................................. 40
14. Ground Improvement ............................................................................................................................. 41
14.1 Ground Improvement Solutions ............................................................................................... 41
14.2 Undercutting ........................................................................................................................... 42
14.3 Complete Excavation and Replacement ................................................................................... 42
14.4 Partial Excavation and Preloading ............................................................................................ 42
14.5 Other Ground Improvement Methods ...................................................................................... 43
14.6 Instrumentation & Monitoring ................................................................................................. 43
14.7 Reuse of Excavated Peat .......................................................................................................... 45
15. Further Geotechnical Investigations ........................................................................................................ 47

NZ Transport AgencyPeka Peka to Otaki Expressway - Geotechnical Interpretative Report
September 2011 – draft iv 5 C 1814.61 PP2O_Geotechnical Interpretatiive Report_draft1
16. Recommendations .................................................................................................................................. 48
17. References ............................................................................................................................................. 50
List of Figures Figure 1: Location of Site Investigations
Figure 2: Engineering Geological Map
Figure 3: Fault Avoidance Zones
List of Appendices
Appendix A: Geotechnical Advice Papers
Appendix B: Preferred Proposal of Road Design
Appendix C: Potential Undercut Areas

NZ Transport AgencyPeka Peka to Otaki Expressway - Geotechnical Interpretative Report
September 2011 – draft v 5 C 1814.61 PP2O_Geotechnical Interpretatiive Report_draft1
Summary
A geotechnical assessment has been carried out to provide engineering interpretation of the ground conditions for the proposed Peka Peka to Otaki Expressway route and to provide geotechnical recommendations for the design and construction of earthworks, cuttings, fill embankments, bridges, pavements, culverts, and ground improvement.
The proposed expressway will be constructed in an area underlain by predominantly older terrace alluvium, recent alluvium, sand dunes, and inter-dunal swamp deposits. The Northern Ohariu Fault, with a recurrence interval of 1,000 to 3,000 years, is likely to cross the alignment, and its location would need to be confirmed. The expressway should be constructed so that it crosses the fault on an earth embankment, so that in the event of an earthquake associated with rupture along this fault, access can be quickly reinstated.
It will be constructed in an area of high seismicity, and the deep alluvium deposits means that it is characterised as site class D in accordance with NZS 1170.5. The bridges structures would need to be designed for an earthquake with a recurrence interval of 1 in 2,500 years (peak ground acceleration of 0.81g) and other free standing structures and earthworks to an earthquake with a recurrence interval of 1 in 1,500 years (peak ground acceleration of 0.67g).
There is a variable liquefaction hazard along the route. The alignment and form of construction proposed is such that only minor damage is expected from liquefaction. Localised ground improvement is expected to be required at some structure locations.
Cuttings up to 20 m high in the sand dunes should be formed at a slope of about 20° to 25°, and cuttings up to 8 m high in the terrace gravels shall be formed at maximum slope angle of 40°. Given the shortage of cut materials for forming the embankments, it would be prudent to form flatter cut slopes or cuttings set back from the highway to obtain more cut materials, where land space is available. Sub-horizontal drainage holes supplemented by sub-soil drains at the toe should be incorporated to draw down the water levels, and erosion protection measures (erosion protection matting and revegetation) to protect the surface from rilling, particularly in the erodible dune sand.
The predominant materials (dune sand and terrace gravels) from the cuttings are likely to be suitable for the embankment construction with side slopes of about 25°. The embankments in the low lying swamp (inter-dunal areas) underlain by peat and silt/clay will require ground improvement. We recommend that where possible the peat deposits up to 3 m should be removed and replaced with engineered fill. Locally where the peat is thicker (up to 4.5 m ) it may be economical to only undercut the upper 3 m depth, and carry out preloading to reduce post-
NZ Transport AgencyPeka Peka to Otaki Expressway - Geotechnical Interpretative Report
September 2011 – draft vi 5 C 1814.61 PP2O_Geotechnical Interpretatiive Report_draft1
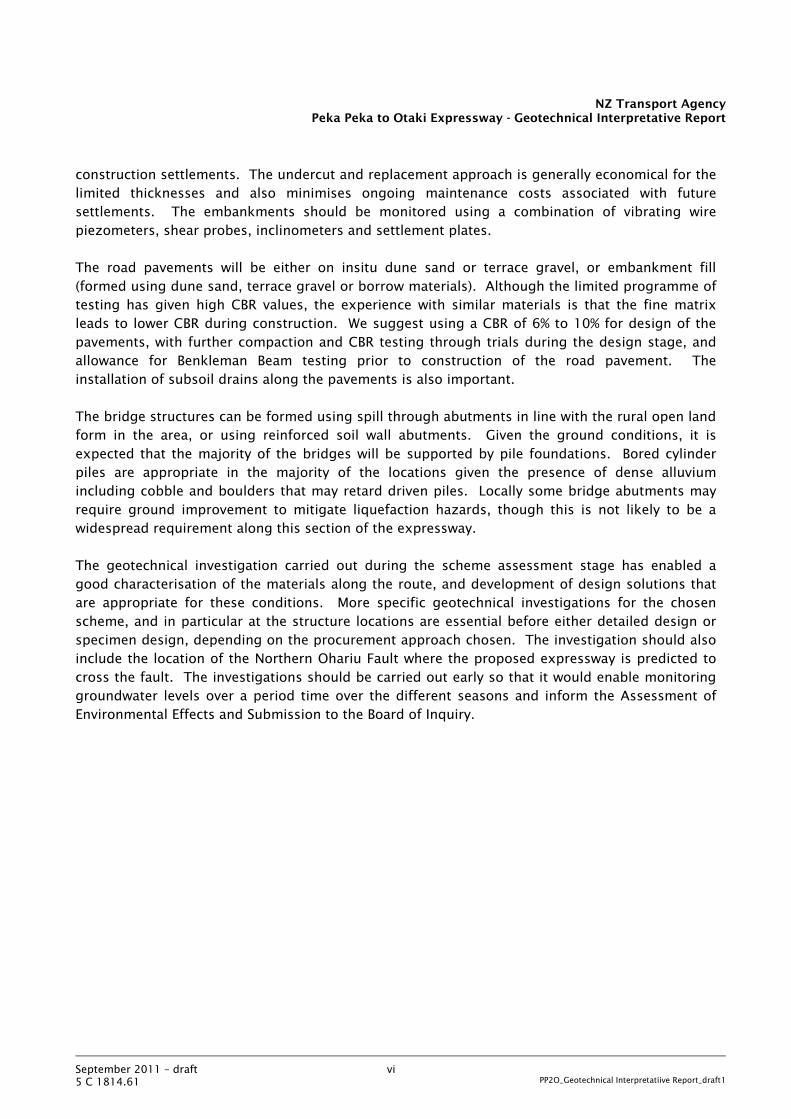
construction settlements. The undercut and replacement approach is generally economical for the limited thicknesses and also minimises ongoing maintenance costs associated with future settlements. The embankments should be monitored using a combination of vibrating wire piezometers, shear probes, inclinometers and settlement plates.
The road pavements will be either on insitu dune sand or terrace gravel, or embankment fill (formed using dune sand, terrace gravel or borrow materials). Although the limited programme of testing has given high CBR values, the experience with similar materials is that the fine matrix leads to lower CBR during construction. We suggest using a CBR of 6% to 10% for design of the pavements, with further compaction and CBR testing through trials during the design stage, and allowance for Benkleman Beam testing prior to construction of the road pavement. The installation of subsoil drains along the pavements is also important.
The bridge structures can be formed using spill through abutments in line with the rural open land form in the area, or using reinforced soil wall abutments. Given the ground conditions, it is expected that the majority of the bridges will be supported by pile foundations. Bored cylinder piles are appropriate in the majority of the locations given the presence of dense alluvium including cobble and boulders that may retard driven piles. Locally some bridge abutments may require ground improvement to mitigate liquefaction hazards, though this is not likely to be a widespread requirement along this section of the expressway.
The geotechnical investigation carried out during the scheme assessment stage has enabled a good characterisation of the materials along the route, and development of design solutions that are appropriate for these conditions. More specific geotechnical investigations for the chosen scheme, and in particular at the structure locations are essential before either detailed design or specimen design, depending on the procurement approach chosen. The investigation should also include the location of the Northern Ohariu Fault where the proposed expressway is predicted to cross the fault. The investigations should be carried out early so that it would enable monitoring groundwater levels over a period time over the different seasons and inform the Assessment of Environmental Effects and Submission to the Board of Inquiry.

NZ Transport AgencyPeka Peka to Otaki Expressway - Geotechnical Interpretative Report
September 2011 – draft 1 Opus Report No GER 2011 / 07 5 C 1814.61 PP2O_Geotechnical Interpretatiive Report_draft1
1. Introduction
The Peka Peka to Otaki Expressway is an approximately 13 km long new route, which runs from Peka Peka Road, north of Waikanae, to Taylors Road, north of Otaki. The Expressway forms one segment of the proposed road improvements along the Wellington Northern Corridor Roads of National Significance (RoNS).
The New Zealand Transport Agency (NZTA) has commissioned Opus International Consultants (Opus) to carry out the Secondary Investigation and Scheme Assessment Report Addendum (SARA) phase for the Peka Peka to Otaki Expressway for the NZTA Board approved corridor under Contract 440PN. As part of the SARA package, Opus carried out a review of literature available, interpretation of aerial photographs, field engineering geological mapping, scoping and direction of site investigations by other parties, provision of geotechnical advice as part of the development of the alignment options and design concepts, and geotechnical assessment for the route.
Site investigations comprising 15 boreholes, 34 trial pits, 26 Static Cone Penetration Tests, and laboratory testing were carried out between January and April 2011, and the results are presented in the Geotechnical Factual Report (AECOM, 2011). The locations of the investigations are shown on Figure 1.
This geotechnical (interpretative) report provides engineering interpretation of the ground conditions for the proposed Expressway route based on the results of site investigations and laboratory testing completed and provides recommendations for earthworks and a range of structures, from a geotechnical perspective. This will provide a basis for consideration of individual structures as the project is further developed.
During the site investigation stage and early geotechnical assessment stage, Opus has issued a number of Geotechnical Advice Papers for the development of road alignments and for cost estimation. Some of the information and recommendations provided in the Geotechnical Advice Papers are superseded by this report. The Geotechnical Advice Papers are included in Appendix A.

NZ Transport AgencyPeka Peka to Otaki Expressway - Geotechnical Interpretative Report
September 2011 – draft 2 Opus Report No GER 2011 / 07 5 C 1814.61 PP2O_Geotechnical Interpretatiive Report_draft1
2. Location of Route
The Peka Peka to Otaki Expressway area is located along the Kapiti Coast, approximately 40 km north of Wellington (see Illustration 1). The route stretches for 13 km from Peka Peka Road in the south to Taylors Road in the north. The route passes through the Te Horo and Otaki townships. It crosses the NIMT railway line and a number of main watercourses including the Otaki River, Waitohu Stream, and Mangaone Stream.
The NZMS 260 Map Grid Reference for the route is R26 860 386 at the Peka Peka Road intersection, S25 912 461 at the Otaki River crossing and S25 930 488 at the Taylors Road intersection.
Illustration 1: Location of Peka Peka to Otaki Expressway

NZ Transport AgencyPeka Peka to Otaki Expressway - Geotechnical Interpretative Report
September 2011 – draft 3 Opus Report No GER 2011 / 07 5 C 1814.61 PP2O_Geotechnical Interpretatiive Report_draft1
3. Geological Setting
3.1 Stratigraphy
The 1:250,000 QMap series Geological Map for Wellington area (IGNS, 2000a) indicates the area to be underlain predominantly by:
Aeolian dunes (Q1d) of Quarternary age to the south of Mary Crest, and north of Otaki
Poorly to moderately sorted gravel with minor sand to silt underlying aggradational and degradational terraces (Q2a) of Quaternary age from Mary Crest to Otaki River
Well sorted floodplain gravels (Q1a) of Holocene along the Otaki floodplain to the north of Otaki River, and along the Waitohu Stream flood plain
Localised aeolian dunes (Q1d) are present to the north of Otaki township, see Illustration 2.
Illustration 2: Geology of the area indicated on QMap (after IGNS, 2000a)
The Route
aeolian dunes
terraces
floodplain deposits
Mary Crest
NZ Transport AgencyPeka Peka to Otaki Expressway - Geotechnical Interpretative Report
September 2011 – draft 4 Opus Report No GER 2011 / 07 5 C 1814.61 PP2O_Geotechnical Interpretatiive Report_draft1
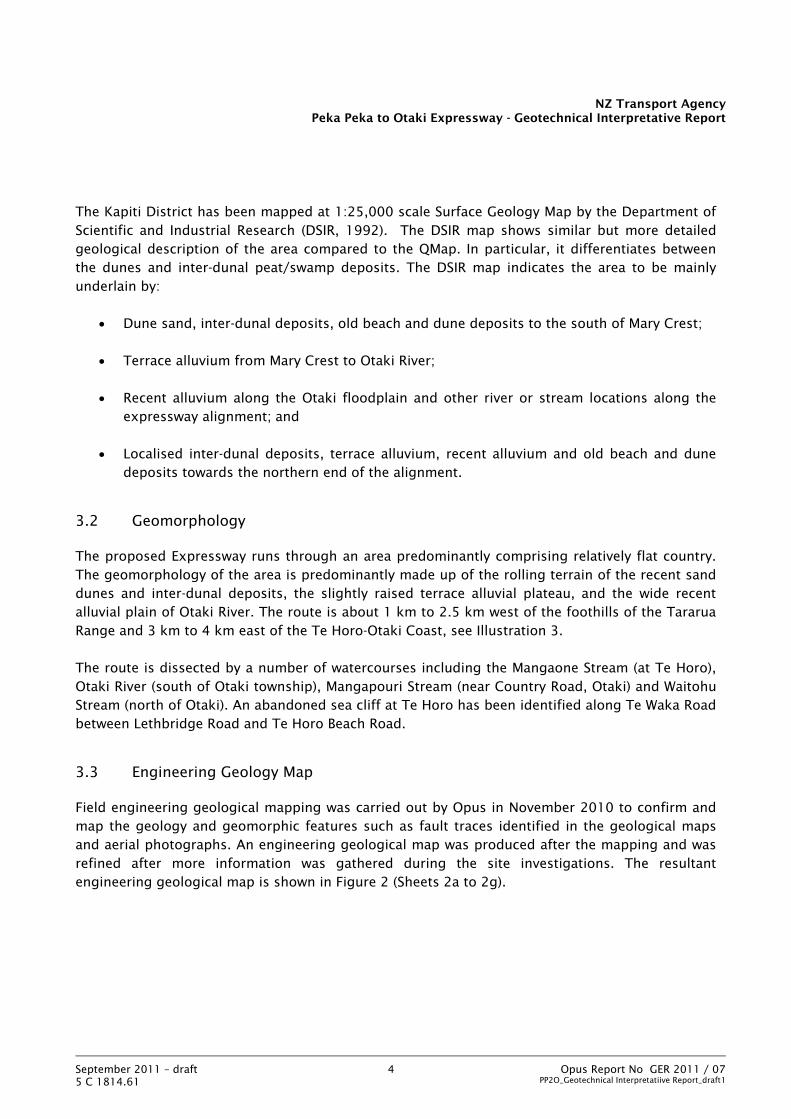
The Kapiti District has been mapped at 1:25,000 scale Surface Geology Map by the Department of Scientific and Industrial Research (DSIR, 1992). The DSIR map shows similar but more detailed geological description of the area compared to the QMap. In particular, it differentiates between the dunes and inter-dunal peat/swamp deposits. The DSIR map indicates the area to be mainly underlain by:
Dune sand, inter-dunal deposits, old beach and dune deposits to the south of Mary Crest;
Terrace alluvium from Mary Crest to Otaki River;
Recent alluvium along the Otaki floodplain and other river or stream locations along the expressway alignment; and
Localised inter-dunal deposits, terrace alluvium, recent alluvium and old beach and dune deposits towards the northern end of the alignment.
3.2 Geomorphology
The proposed Expressway runs through an area predominantly comprising relatively flat country. The geomorphology of the area is predominantly made up of the rolling terrain of the recent sand dunes and inter-dunal deposits, the slightly raised terrace alluvial plateau, and the wide recent alluvial plain of Otaki River. The route is about 1 km to 2.5 km west of the foothills of the Tararua Range and 3 km to 4 km east of the Te Horo-Otaki Coast, see Illustration 3.
The route is dissected by a number of watercourses including the Mangaone Stream (at Te Horo), Otaki River (south of Otaki township), Mangapouri Stream (near Country Road, Otaki) and Waitohu Stream (north of Otaki). An abandoned sea cliff at Te Horo has been identified along Te Waka Road between Lethbridge Road and Te Horo Beach Road.
3.3 Engineering Geology Map
Field engineering geological mapping was carried out by Opus in November 2010 to confirm and map the geology and geomorphic features such as fault traces identified in the geological maps and aerial photographs. An engineering geological map was produced after the mapping and was refined after more information was gathered during the site investigations. The resultant engineering geological map is shown in Figure 2 (Sheets 2a to 2g).

NZ Transport AgencyPeka Peka to Otaki Expressway - Geotechnical Interpretative Report
September 2011 – draft 5 Opus Report No GER 2011 / 07 5 C 1814.61 PP2O_Geotechnical Interpretatiive Report_draft1
Illustration 3: Oblique aerial photograph showing topography of the area (after Google Earth)
3.4 Active Faults
The proposed Expressway is located in the Wellington Region, an area of high seismicity in New Zealand. There are a number of major active faults in the area, which are summarised in Table 1.
Table 1: Active Faults in the Area
Fault Magnitude Recurrence
Interval (years) Distance from
site (km) Direction
Northern Ohariu Fault 7.2 – 7.5 1,000 – 3,000 0.1 East
Ohariu Fault 7.1 – 7.5 2,200 1 Southeast
Gibbs Fault ? 3,500 – 5,000 5 Southeast
Southeast Reikorangi Fault ? 5,000 – 10,000 8 Southeast
Otaki Forks Fault 7.3 – 7.6 4,000 – 9,000 12 East
Pukerua Bay Fault 7.6 2,000 – 3,500 25 Southwest
Wellington Fault 7.6 610 – 1,100 27 East
Source: Heron et al. (1998); IGNS (2000 & 2003), Litchfield et al. (2004, 2006, 2010); Little et al. (2009, 2010); Palmer & Van Dissen (2002); Stirling et al. (2002); Van Dissen & Berryman (1996) & GNS NZ Active Faults Database (http://maps.gns.cri.nz/website/af/viewer.htm).
Proposed Expressway
Otaki River

NZ Transport AgencyPeka Peka to Otaki Expressway - Geotechnical Interpretative Report
September 2011 – draft 6 Opus Report No GER 2011 / 07 5 C 1814.61 PP2O_Geotechnical Interpretatiive Report_draft1
The Northern Ohariu Fault and Ohariu Fault are the two active faults closest to the site. Location of the two faults and the respective fault avoidance zones are shown on Figure 3.
The proposed Expressway is shown to be 100 m away from the Northern Ohariu Fault at Te Horo. The southern section of the expressway alignment is indicated to be within the Fault Avoidance Zone of the Northern Ohariu Fault (GNS, 2003). The proposed route may actually cross the Northern Ohariu Fault because an extension of the fault may be present under the alluvium deposits and therefore uncovered and unmapped. The Northern Ohariu Fault has a characteristic magnitude of 7.2 to 7.5 with a recurrence interval of approximately 1000 to 3000 years (Palmer & Van Dissen, 2002).
The Ohariu Fault is indicated to be about 1 km away from the alignment to the southeast of Peka Peka Road (GNS, 2003). This fault is capable of rupturing in a magnitude 7.1 to 7.5 earthquake with an average return period of 2200 years (Heron et al., 1998; Litchfield et al., 2004, 2006, 2010). The Ohariu Fault is likely to cross the expressway outside the extent of the Peka Peka to North Otaki section, which is covered in this report.
NZ Transport AgencyPeka Peka to Otaki Expressway - Geotechnical Interpretative Report
September 2011 – draft 7 Opus Report No GER 2011 / 07 5 C 1814.61 PP2O_Geotechnical Interpretatiive Report_draft1
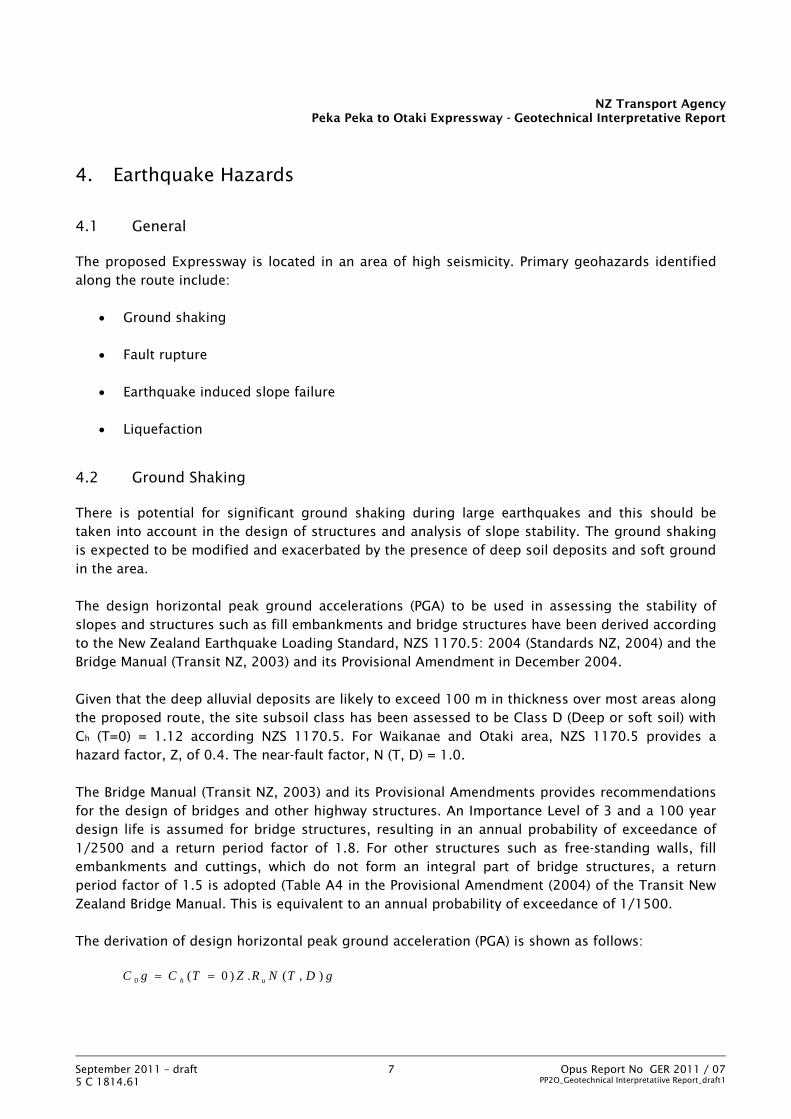
4. Earthquake Hazards
4.1 General
The proposed Expressway is located in an area of high seismicity. Primary geohazards identified along the route include:
Ground shaking
Fault rupture
Earthquake induced slope failure
Liquefaction
4.2 Ground Shaking
There is potential for significant ground shaking during large earthquakes and this should be taken into account in the design of structures and analysis of slope stability. The ground shaking is expected to be modified and exacerbated by the presence of deep soil deposits and soft ground in the area.
The design horizontal peak ground accelerations (PGA) to be used in assessing the stability of slopes and structures such as fill embankments and bridge structures have been derived according to the New Zealand Earthquake Loading Standard, NZS 1170.5: 2004 (Standards NZ, 2004) and the Bridge Manual (Transit NZ, 2003) and its Provisional Amendment in December 2004.
Given that the deep alluvial deposits are likely to exceed 100 m in thickness over most areas along the proposed route, the site subsoil class has been assessed to be Class D (Deep or soft soil) with Ch (T=0) = 1.12 according NZS 1170.5. For Waikanae and Otaki area, NZS 1170.5 provides a hazard factor, Z, of 0.4. The near-fault factor, N (T, D) = 1.0.
The Bridge Manual (Transit NZ, 2003) and its Provisional Amendments provides recommendations for the design of bridges and other highway structures. An Importance Level of 3 and a 100 year design life is assumed for bridge structures, resulting in an annual probability of exceedance of 1/2500 and a return period factor of 1.8. For other structures such as free-standing walls, fill embankments and cuttings, which do not form an integral part of bridge structures, a return period factor of 1.5 is adopted (Table A4 in the Provisional Amendment (2004) of the Transit New Zealand Bridge Manual. This is equivalent to an annual probability of exceedance of 1/1500.
The derivation of design horizontal peak ground acceleration (PGA) is shown as follows:
gDTNRZTCgC uh ),(.)0(0

NZ Transport AgencyPeka Peka to Otaki Expressway - Geotechnical Interpretative Report
September 2011 – draft 8 Opus Report No GER 2011 / 07 5 C 1814.61 PP2O_Geotechnical Interpretatiive Report_draft1
Where : Co = design ground acceleration coefficient
g = acceleration due to gravity Ch (T=0) = 1.12 = spectral shape factor at period T = 0 (subsoil Class D) Z = 0.4 = hazard factor (Waikanae and Otaki) Ru = 1.8 (bridge structure) and 1.5 (other free-standing structures) = return period factor N (T, D) = 1.0 = near-fault factor The assessed design PGA for analyses and design is presented in Table 2.
Table 2: Design Peak Ground Acceleration
Structure Return Period
Factor Annual Probability of
Exceedance Design PGA
Bridge structures 1.8 1/2500 0.81g
Free standing structures (e.g. retaining walls, fill embankments and cuttings) 1.5 1/1500 0.67g
4.3 Fault Rupture
Rupture along active fault traces, due to local earthquakes, could lead to significant damage or deformation of structures built over or adjacent to the faults.
A rupture of the Ohariu Fault could result in between 3 m and 5 m of right-lateral displacement at the ground surface, with less and more varied vertical displacement. It is also expected that an individual surface rupture along the Northern Ohariu Fault could generate 3 m to 4 m of right-lateral displacement at the ground surface, with a lesser and variable amount of vertical displacement.
4.4 Earthquake Induced Slope Failure
The Regional Slope Failure Hazard Map (Wellington Regional Council, 1995) indicates a generally low susceptibility to earthquake induced slope failure along the proposed route, apart from the southern end of the route where a moderate-to-high susceptibility is indicated in the beach and dune deposits.
4.5 Liquefaction Hazard
Liquefaction as a consequence of earthquakes could lead to subsidence and lateral spreading, which could affect any surface development.

NZ Transport AgencyPeka Peka to Otaki Expressway - Geotechnical Interpretative Report
September 2011 – draft 9 Opus Report No GER 2011 / 07 5 C 1814.61 PP2O_Geotechnical Interpretatiive Report_draft1
According to the Regional Liquefaction Hazard Map (Wellington Regional Council, 1993), majority of the proposed Expressway is situated in areas which are not susceptible to liquefaction. In areas to the north of Otaki River, variable potential for liquefaction from low to high may be present associated with the recent alluvium.
The hazard map indicates a variable potential for liquefaction in the area north of Addington Road, and may vary from low to high depending on local ground conditions. There is very low or no potential for liquefaction between Addington Road and Gear Road. A moderate potential for liquefaction is indicated in the areas underlain by sand dunes and inter-dunal deposits, south of Gear Road. Results of the site investigations show that there are localised sand and silt layers within the site that could potentially liquefy.

NZ Transport AgencyPeka Peka to Otaki Expressway - Geotechnical Interpretative Report
September 2011 – draft 10 Opus Report No GER 2011 / 07 5 C 1814.61 PP2O_Geotechnical Interpretatiive Report_draft1
5. Ground and Groundwater Conditions
5.1 Ground Conditions
The site is predominantly underlain by surficial deposits, as described in the sections that follow.
5.1.1 Alluvial floodplain deposits (recent alluvium as indicated in (DSIR, 1992))
Alluvial floodplain deposits are found in the Otaki River floodplain and along other watercourses including the Mangaone Stream the Waitohu Stream. The floodplain alluvium comprises well sorted sub-angular to rounded gravel and cobbles with some boulders in a sand and/or silt matrix. The gravel and cobbles are generally loose to medium dense (SPT N values generally less than 10 to 25) near surface and become dense to very dense (SPT N values from 30 to 50+) with depth. (Large SPT N values are sometimes due to large clasts of gravel, cobble or boulders being encountered in the alluvium). The clasts are predominantly formed from Greywacke sandstone. Interbedded layers of dense to very dense sand and firm to stiff silt and clay are commonly found within the gravels and cobbles.
Typical alluvial floodplain deposits are shown in Illustration 3.
Illustration 3: Alluvial floodplain deposits at Waitohu Stream
NZ Transport AgencyPeka Peka to Otaki Expressway - Geotechnical Interpretative Report
September 2011 – draft 11 Opus Report No GER 2011 / 07 5 C 1814.61 PP2O_Geotechnical Interpretatiive Report_draft1
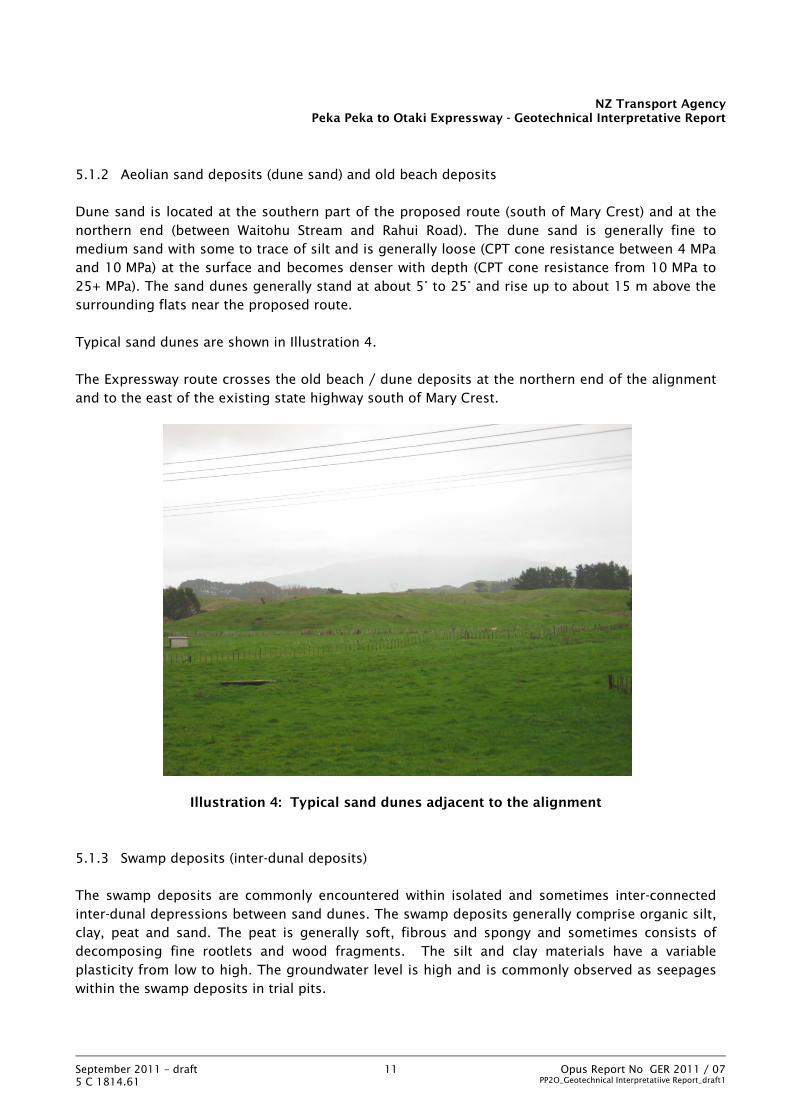
5.1.2 Aeolian sand deposits (dune sand) and old beach deposits
Dune sand is located at the southern part of the proposed route (south of Mary Crest) and at the northern end (between Waitohu Stream and Rahui Road). The dune sand is generally fine to medium sand with some to trace of silt and is generally loose (CPT cone resistance between 4 MPa and 10 MPa) at the surface and becomes denser with depth (CPT cone resistance from 10 MPa to 25+ MPa). The sand dunes generally stand at about 5° to 25° and rise up to about 15 m above the surrounding flats near the proposed route.
Typical sand dunes are shown in Illustration 4.
The Expressway route crosses the old beach / dune deposits at the northern end of the alignment and to the east of the existing state highway south of Mary Crest.
Illustration 4: Typical sand dunes adjacent to the alignment
5.1.3 Swamp deposits (inter-dunal deposits)
The swamp deposits are commonly encountered within isolated and sometimes inter-connected inter-dunal depressions between sand dunes. The swamp deposits generally comprise organic silt, clay, peat and sand. The peat is generally soft, fibrous and spongy and sometimes consists of decomposing fine rootlets and wood fragments. The silt and clay materials have a variable plasticity from low to high. The groundwater level is high and is commonly observed as seepages within the swamp deposits in trial pits.

NZ Transport AgencyPeka Peka to Otaki Expressway - Geotechnical Interpretative Report
September 2011 – draft 12 Opus Report No GER 2011 / 07 5 C 1814.61 PP2O_Geotechnical Interpretatiive Report_draft1
Typical swamp deposits are shown in Illustration 5.
Illustration 5: Swamp deposits in between sand dunes
The location and indicative thickness of swamp deposits along the proposed route are shown in Table 3.
Table 3: Inter-dunal Deposits along the Proposed Route
Location Approx. Station Indicative Thickness of Swamp
Deposits
North of Country Road 1450 – 1700 m Up to 3 m
Mary Crest Interdunes 9350 – 9750 m 1 m to 3 m
South of Mary Crest 10500 – 11550 m 3 m to 4.5 m
South of Mary Crest 11550 – 12200 m 1 m to 2 m
NZ Transport AgencyPeka Peka to Otaki Expressway - Geotechnical Interpretative Report
September 2011 – draft 13 Opus Report No GER 2011 / 07 5 C 1814.61 PP2O_Geotechnical Interpretatiive Report_draft1
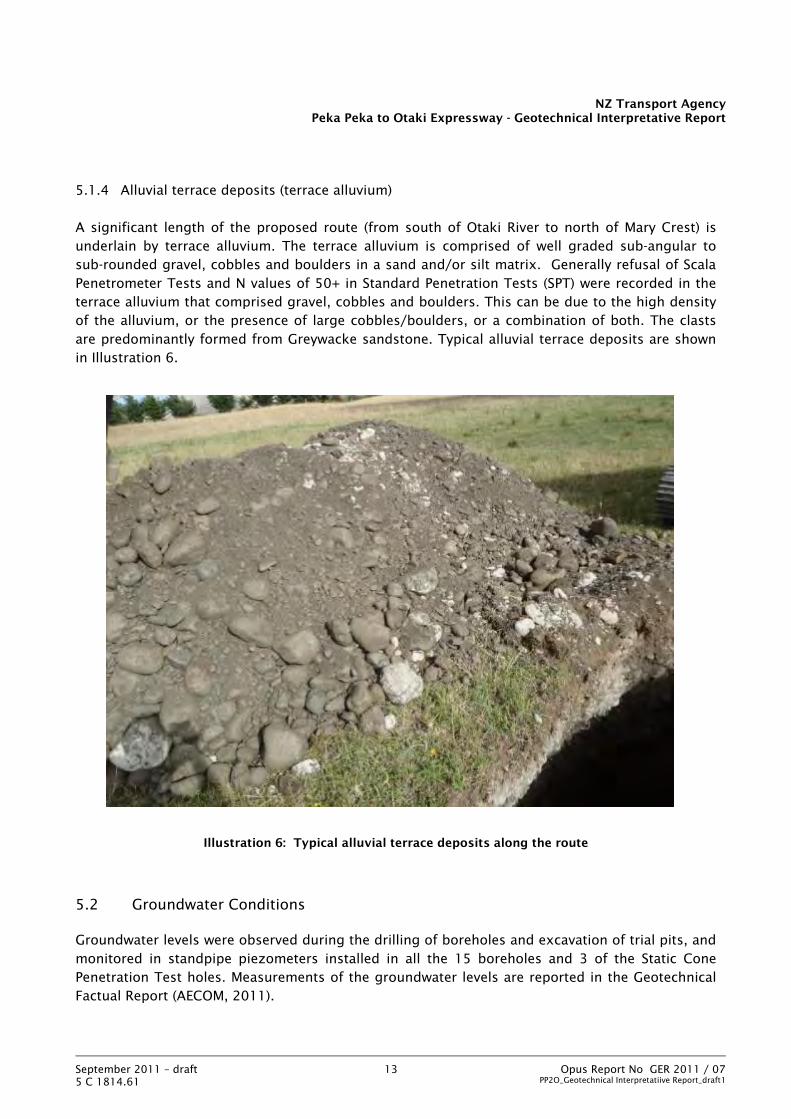
5.1.4 Alluvial terrace deposits (terrace alluvium)
A significant length of the proposed route (from south of Otaki River to north of Mary Crest) is underlain by terrace alluvium. The terrace alluvium is comprised of well graded sub-angular to sub-rounded gravel, cobbles and boulders in a sand and/or silt matrix. Generally refusal of Scala Penetrometer Tests and N values of 50+ in Standard Penetration Tests (SPT) were recorded in the terrace alluvium that comprised gravel, cobbles and boulders. This can be due to the high density of the alluvium, or the presence of large cobbles/boulders, or a combination of both. The clasts are predominantly formed from Greywacke sandstone. Typical alluvial terrace deposits are shown in Illustration 6.
Illustration 6: Typical alluvial terrace deposits along the route
5.2 Groundwater Conditions
Groundwater levels were observed during the drilling of boreholes and excavation of trial pits, and monitored in standpipe piezometers installed in all the 15 boreholes and 3 of the Static Cone Penetration Test holes. Measurements of the groundwater levels are reported in the Geotechnical Factual Report (AECOM, 2011).
NZ Transport AgencyPeka Peka to Otaki Expressway - Geotechnical Interpretative Report
September 2011 – draft 14 Opus Report No GER 2011 / 07 5 C 1814.61 PP2O_Geotechnical Interpretatiive Report_draft1
Groundwater seepage was commonly observed at 1 to 2 m depths within layers of inter-dunal swamp deposits during excavation of trial pits in the dry summer conditions. Groundwater level was also measured at shallow depths of 0 to 2 m in piezometers installed in the borehole drilled in the inter-dunal areas. Some low-lying inter-dunal areas are commonly water-logged with standing water during the wet winter periods.
Groundwater levels in the sand dune areas are generally dictated by the groundwater conditions at the inter-dunal depressions; thus the sand dunes are generally dry with groundwater levels similar to that in the adjacent inter-dunal areas.
The groundwater levels within the alluvial floodplain deposits are generally determined by the level of the adjacent watercourses such as rivers and streams, and are typically at 3 m to 5 m depth.
Groundwater levels were found to be about 10 m below surface in the alluvial terrace deposits.

NZ Transport AgencyPeka Peka to Otaki Expressway - Geotechnical Interpretative Report
September 2011 – draft 15 Opus Report No GER 2011 / 07 5 C 1814.61 PP2O_Geotechnical Interpretatiive Report_draft1
6. Material Properties
6.1 General
The engineering properties of the soils have been assessed based on the:
Engineering geological description of site soils;
Results of in-situ testing including Standard Penetration Tests in boreholes, Static Cone Penetration Tests, Scala Penetrometer Tests and shear vane tests in trial pits; and
Results of laboratory testing including water contents, Atterberg limits, particle size distribution, compaction, CBR, triaxial test, consolidation test, and organic contents; and
Our knowledge of the properties of similar soils in the region, including extensive geotechnical investigations carried out by Opus between MacKays and Peka Peka for the former Western Link Road project.
6.2 Representative Material Strengths
The representative material strength properties of the soils are summarised in Table 4.
Table 4: Representative Material Strength Parameters
Soil Type Density (kN/m3)
Cohesion (kN/m2)
Friction Angle (°)
Undrained shear strength
(kN/m2)
Dune Sand and Beach Sand 15 - 18 0 - 3 25 – 37 -
Alluvium (Gravel/Cobbles/Boulders) 18 - 22 0 - 3 30 – 45 -
Alluvium (Sand) 18 - 21 0 30 – 40 -
Alluvium (Silt/Clay) 16 - 18 - - 50 - 250
Swamp Deposits (Peat) 10 - 12 2 - 5 40 – 50 -
Swamp Deposits (Silt/Clay) 14 - - 10 - 25
NZ Transport AgencyPeka Peka to Otaki Expressway - Geotechnical Interpretative Report
September 2011 – draft 16 Opus Report No GER 2011 / 07 5 C 1814.61 PP2O_Geotechnical Interpretatiive Report_draft1
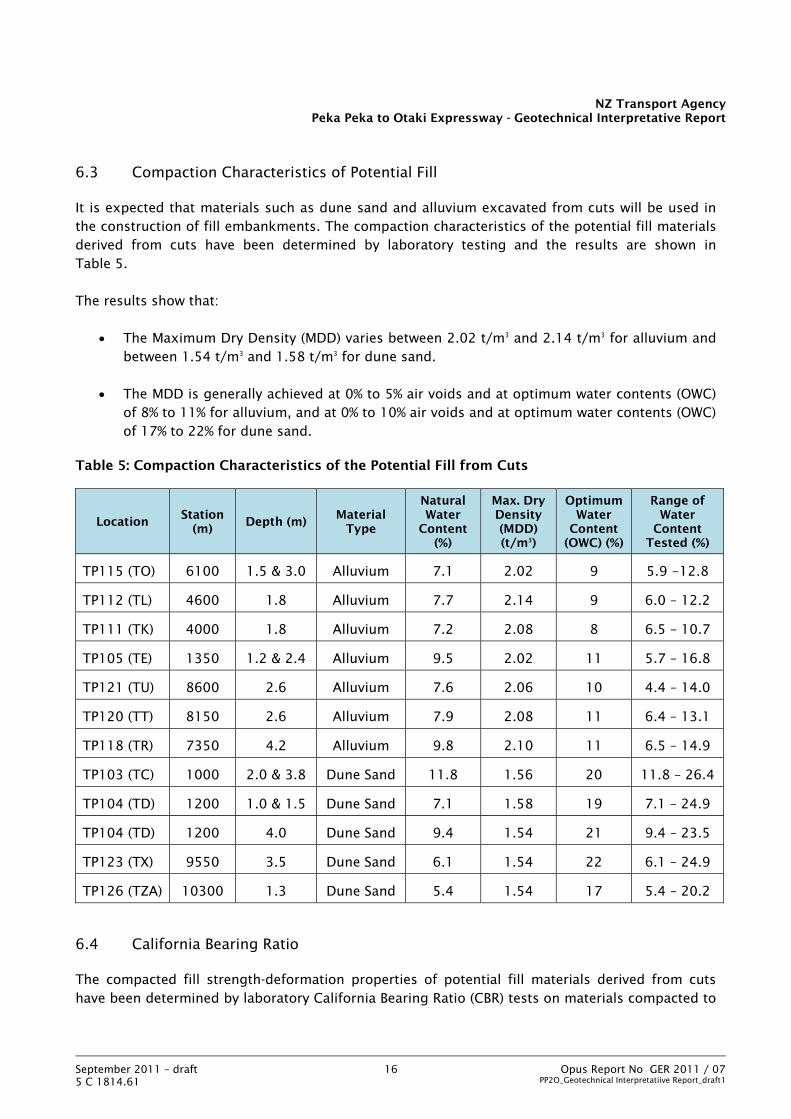
6.3 Compaction Characteristics of Potential Fill
It is expected that materials such as dune sand and alluvium excavated from cuts will be used in the construction of fill embankments. The compaction characteristics of the potential fill materials derived from cuts have been determined by laboratory testing and the results are shown in Table 5.
The results show that:
The Maximum Dry Density (MDD) varies between 2.02 t/m3 and 2.14 t/m3 for alluvium and between 1.54 t/m3 and 1.58 t/m3 for dune sand.
The MDD is generally achieved at 0% to 5% air voids and at optimum water contents (OWC) of 8% to 11% for alluvium, and at 0% to 10% air voids and at optimum water contents (OWC) of 17% to 22% for dune sand.
Table 5: Compaction Characteristics of the Potential Fill from Cuts
Location Station
(m) Depth (m)
Material Type
Natural Water
Content (%)
Max. Dry Density (MDD) (t/m3)
Optimum Water
Content (OWC) (%)
Range of Water
Content Tested (%)
TP115 (TO) 6100 1.5 & 3.0 Alluvium 7.1 2.02 9 5.9 -12.8
TP112 (TL) 4600 1.8 Alluvium 7.7 2.14 9 6.0 – 12.2
TP111 (TK) 4000 1.8 Alluvium 7.2 2.08 8 6.5 – 10.7
TP105 (TE) 1350 1.2 & 2.4 Alluvium 9.5 2.02 11 5.7 – 16.8
TP121 (TU) 8600 2.6 Alluvium 7.6 2.06 10 4.4 – 14.0
TP120 (TT) 8150 2.6 Alluvium 7.9 2.08 11 6.4 – 13.1
TP118 (TR) 7350 4.2 Alluvium 9.8 2.10 11 6.5 – 14.9
TP103 (TC) 1000 2.0 & 3.8 Dune Sand 11.8 1.56 20 11.8 – 26.4
TP104 (TD) 1200 1.0 & 1.5 Dune Sand 7.1 1.58 19 7.1 – 24.9
TP104 (TD) 1200 4.0 Dune Sand 9.4 1.54 21 9.4 – 23.5
TP123 (TX) 9550 3.5 Dune Sand 6.1 1.54 22 6.1 – 24.9
TP126 (TZA) 10300 1.3 Dune Sand 5.4 1.54 17 5.4 – 20.2
6.4 California Bearing Ratio
The compacted fill strength-deformation properties of potential fill materials derived from cuts have been determined by laboratory California Bearing Ratio (CBR) tests on materials compacted to
NZ Transport AgencyPeka Peka to Otaki Expressway - Geotechnical Interpretative Report
September 2011 – draft 17 Opus Report No GER 2011 / 07 5 C 1814.61 PP2O_Geotechnical Interpretatiive Report_draft1
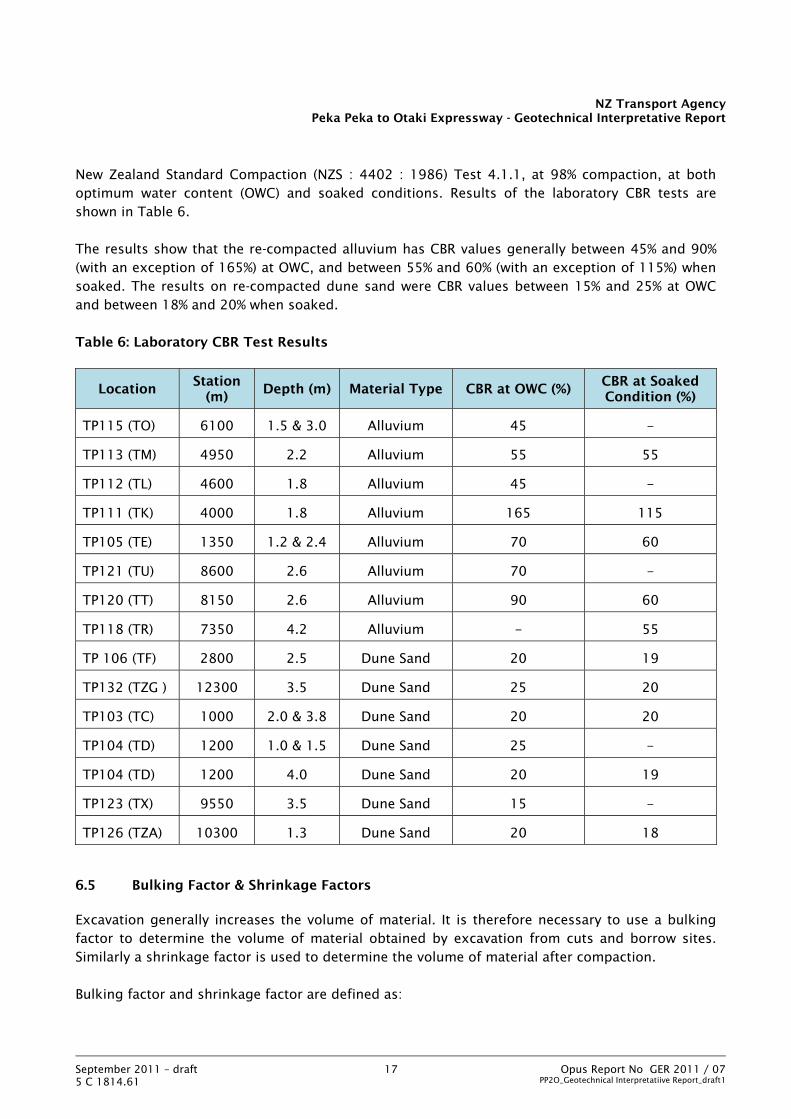
New Zealand Standard Compaction (NZS : 4402 : 1986) Test 4.1.1, at 98% compaction, at both optimum water content (OWC) and soaked conditions. Results of the laboratory CBR tests are shown in Table 6.
The results show that the re-compacted alluvium has CBR values generally between 45% and 90% (with an exception of 165%) at OWC, and between 55% and 60% (with an exception of 115%) when soaked. The results on re-compacted dune sand were CBR values between 15% and 25% at OWC and between 18% and 20% when soaked.
Table 6: Laboratory CBR Test Results
Location Station
(m) Depth (m) Material Type CBR at OWC (%)
CBR at Soaked Condition (%)
TP115 (TO) 6100 1.5 & 3.0 Alluvium 45 -
TP113 (TM) 4950 2.2 Alluvium 55 55
TP112 (TL) 4600 1.8 Alluvium 45 -
TP111 (TK) 4000 1.8 Alluvium 165 115
TP105 (TE) 1350 1.2 & 2.4 Alluvium 70 60
TP121 (TU) 8600 2.6 Alluvium 70 -
TP120 (TT) 8150 2.6 Alluvium 90 60
TP118 (TR) 7350 4.2 Alluvium - 55
TP 106 (TF) 2800 2.5 Dune Sand 20 19
TP132 (TZG ) 12300 3.5 Dune Sand 25 20
TP103 (TC) 1000 2.0 & 3.8 Dune Sand 20 20
TP104 (TD) 1200 1.0 & 1.5 Dune Sand 25 -
TP104 (TD) 1200 4.0 Dune Sand 20 19
TP123 (TX) 9550 3.5 Dune Sand 15 -
TP126 (TZA) 10300 1.3 Dune Sand 20 18
6.5 Bulking Factor & Shrinkage Factors
Excavation generally increases the volume of material. It is therefore necessary to use a bulking factor to determine the volume of material obtained by excavation from cuts and borrow sites. Similarly a shrinkage factor is used to determine the volume of material after compaction.
Bulking factor and shrinkage factor are defined as:

NZ Transport AgencyPeka Peka to Otaki Expressway - Geotechnical Interpretative Report
September 2011 – draft 18 Opus Report No GER 2011 / 07 5 C 1814.61 PP2O_Geotechnical Interpretatiive Report_draft1
Bulking Factor = Volume after Excavation / Volume before Excavation
Shrinkage Factor = Volume after Compaction / Volume before Excavation
In the absence of site-specific soil test results, the following indicative bulking factors and shrinkage factors, as shown in Table 7, may be used in estimating the transport haulage capacity and balance of cut and fill.
Table 7: Recommended Bulking Factors
Material Bulking Factor (Bank to Loose)
Shrinkage Factor (Bank to Compacted)
Dune Sand 1.0 – 1.1 0.85 - 0.9
Alluvium 1.1 – 1.15 0.9 – 0.95

NZ Transport AgencyPeka Peka to Otaki Expressway - Geotechnical Interpretative Report
September 2011 – draft 19 Opus Report No GER 2011 / 07 5 C 1814.61 PP2O_Geotechnical Interpretatiive Report_draft1
7. Road Form of the Proposed Expressway
The proposed Expressway runs from Taylors Road on the northern side of Otaki through to the northern end of the proposed Peka Peka interchange in parallel with the existing SH1. The proposed route runs through rolling terrain comprising raised sand dunes and inter-dunal depressions, alluvial flood plains, raised terrace alluvium. It crosses two main watercourses, which are the Otaki River and Waitohu Stream. A few road crossings will be required to provide linkage between the proposed Expressway and the existing arterial roads including the current SH1.
Based on the road alignment design as shown in Appendix B, the proposed Expressway will require the following forms of road construction:
Cuttings of up to 20 m high in sand dunes and up to 8 m high in terrace alluvium
Embankments of up to 8 m high over inter-dunal deposits, river alluvium and terrace alluvium (the higher sections of embankments are generally at the approaches to bridges and grade separated interchanges)
Bridges: several bridges will be required across roads (generally local roads over the expressways), railways (both local roads and expressways over railway), and main watercourses, including the Otaki River and Waitohu Stream
Roundabouts, which have been proposed at the interchange to the south of Otaki River
Culverts, where the proposed route dissects small water courses
A possible underpass/subway for an east-west link at Waerenga Road (the underpass is currently under consideration).

NZ Transport AgencyPeka Peka to Otaki Expressway - Geotechnical Interpretative Report
September 2011 – draft 20 Opus Report No GER 2011 / 07 5 C 1814.61 PP2O_Geotechnical Interpretatiive Report_draft1
8. Active Fault Crossing
The present road form shows that the Te Horo Overbridge is about 100 m away from the Northern Ohariu Fault trace. The proposed route may actually cross the fault because an extension of the fault may be present under the alluvium deposits and therefore uncovered and unmapped.
We recommend site investigations such as fault trenching and boreholes to be carried out early well before specimen or detailed design to investigate the extension of the Northern Ohariu Fault. This can provide information for assessing the risk due to fault rupture to any bridge structures which are within proximity of the fault. This may preferably require slight changes to the location of the bridge or at least incorporation of measures to limit damage.
It would be important to ensure that the expressway crosses the Northern Ohariu Fault on an earthworks embankment, rather than a (bridge) structure. This will ensure that in the event of an earthquake with surface ground rupture along this fault, access can be quickly restored through forming an earthworks ramp where required. If the expressway crosses the fault on a structure, then it will take a long time for reconstruction of the bridge which may collapse due to a movement of 3 m to 5 m along the fault.

NZ Transport AgencyPeka Peka to Otaki Expressway - Geotechnical Interpretative Report
September 2011 – draft 21 Opus Report No GER 2011 / 07 5 C 1814.61 PP2O_Geotechnical Interpretatiive Report_draft1
9. Cut Slopes
9.1 Cut Slope Angles and Configuration
High cuttings up to 20 m high will be formed in three main areas (see Appendix B for the actual location of cuttings):
South of Waitohu Stream
South of Otaki River
North of Te Hapua Road
Based on the materials in which the cuttings will be formed, and their performance under static conditions and during earthquake events, the following slope configurations, as shown in Table 8, are recommended for road design. Since there is a demand for fill materials for the construction of embankments to form the proposed Expressway, it is recommended to form the cuttings at flatter slope angles where there is sufficient space in order to generate more fill materials.
Table 8: Recommendations on Cut Slope Configurations
Major Cut Location
Station (m) Ground
Characteristics
Max. Height
(m)
Slope Angle
Benches
South of Waitohu Stream
1070 – 1460 Partly dune sand, partly terrace alluvium
20 22°
(2.5H : 1V) or less
3 m wide benches at 10 m maximum height intervals
South of Otaki River 3870 – 5300
Terrace alluvium (gravels, cobbles and boulders)
8 40°
(1.2H : 1V) or less
Not necessary
North of TeHapua Road
10100 – 10500 Dune sand 12 22°
(2.5H : 1V) or less
Not necessary
Benches
Benches will be required in cuttings higher than 10 m to minimise rilling and gully erosion from surface run-off and rock fall from boulders and cobble in the terrace alluvium. Benches may also be incorporated into cuttings to provide for walking, cycling and bridleway tracks. At these locations, benches of 3 m to 5 m width are proposed.
The benches should have an outward cross-fall to shed water rather than allowing the accumulation of water on the benches and hence destabilisation of the slope or causing localised
NZ Transport AgencyPeka Peka to Otaki Expressway - Geotechnical Interpretative Report
September 2011 – draft 22 Opus Report No GER 2011 / 07 5 C 1814.61 PP2O_Geotechnical Interpretatiive Report_draft1
erosion of the slope. Longitudinally, horizontal benches should be provided to avoid flow along benches leading to infiltration and erosion.
Rounding
It is proposed that the top of the cuttings and edges of benches be rounded in the vertical plane and the ends of the cuttings be rounded horizontally in plan to ensure the stability of near surface loose soils and also to provide a natural appearance which blends into the natural landscape.
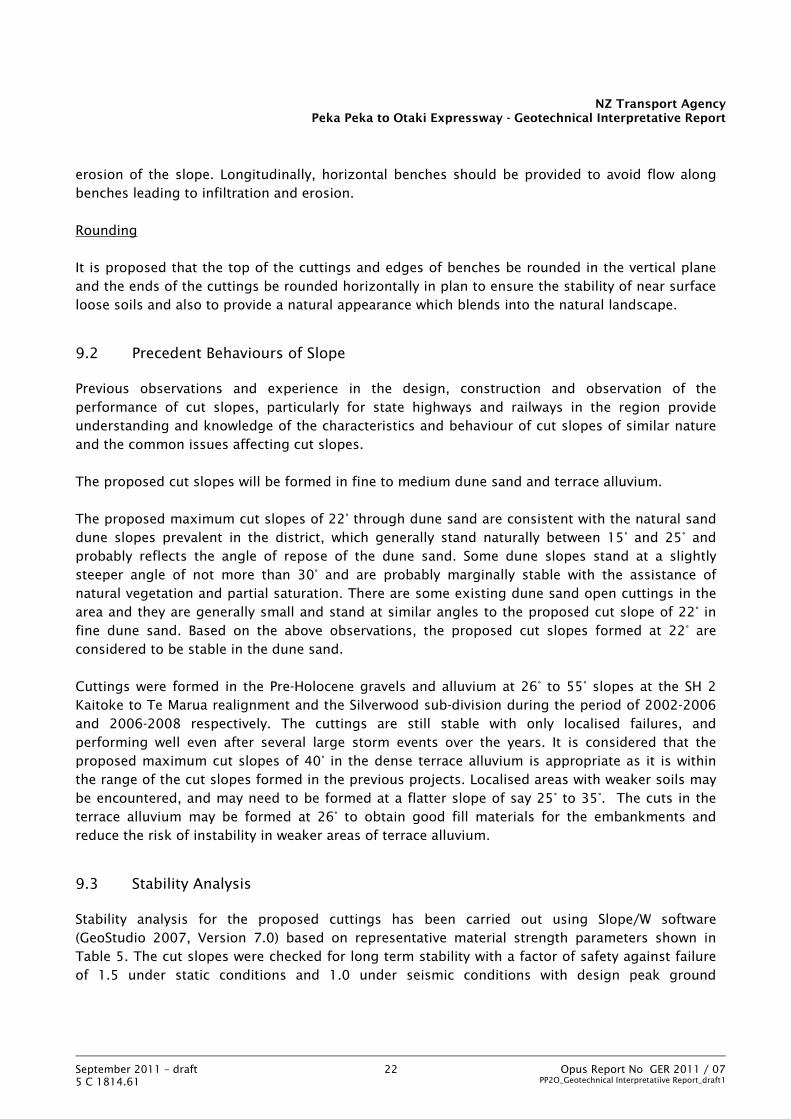
9.2 Precedent Behaviours of Slope
Previous observations and experience in the design, construction and observation of the performance of cut slopes, particularly for state highways and railways in the region provide understanding and knowledge of the characteristics and behaviour of cut slopes of similar nature and the common issues affecting cut slopes.
The proposed cut slopes will be formed in fine to medium dune sand and terrace alluvium.
The proposed maximum cut slopes of 22° through dune sand are consistent with the natural sand dune slopes prevalent in the district, which generally stand naturally between 15° and 25° and probably reflects the angle of repose of the dune sand. Some dune slopes stand at a slightly steeper angle of not more than 30° and are probably marginally stable with the assistance of natural vegetation and partial saturation. There are some existing dune sand open cuttings in the area and they are generally small and stand at similar angles to the proposed cut slope of 22° in fine dune sand. Based on the above observations, the proposed cut slopes formed at 22° are considered to be stable in the dune sand.
Cuttings were formed in the Pre-Holocene gravels and alluvium at 26° to 55° slopes at the SH 2 Kaitoke to Te Marua realignment and the Silverwood sub-division during the period of 2002-2006 and 2006-2008 respectively. The cuttings are still stable with only localised failures, and performing well even after several large storm events over the years. It is considered that the proposed maximum cut slopes of 40° in the dense terrace alluvium is appropriate as it is within the range of the cut slopes formed in the previous projects. Localised areas with weaker soils may be encountered, and may need to be formed at a flatter slope of say 25° to 35°. The cuts in the terrace alluvium may be formed at 26° to obtain good fill materials for the embankments and reduce the risk of instability in weaker areas of terrace alluvium.
9.3 Stability Analysis
Stability analysis for the proposed cuttings has been carried out using Slope/W software (GeoStudio 2007, Version 7.0) based on representative material strength parameters shown in Table 5. The cut slopes were checked for long term stability with a factor of safety against failure of 1.5 under static conditions and 1.0 under seismic conditions with design peak ground

NZ Transport AgencyPeka Peka to Otaki Expressway - Geotechnical Interpretative Report
September 2011 – draft 23 Opus Report No GER 2011 / 07 5 C 1814.61 PP2O_Geotechnical Interpretatiive Report_draft1
acceleration as shown in Table 3. Earthquake induced slope displacements were limited to no more than 250 mm as assessed using Newmark’s method (Ambraseys & Srbulov, 1995).
The analysis indicates that cut slopes of up to 22° (1V : 2.5H) in dune sand and up to 40° (1V : 1.25H) in alluvium are appropriate. A typical cut slope stability analysis is shown in Illustration 7.
Illustration 7: Typical Stability Analysis of Cut Slopes
9.4 Drainage
To ensure the stability of the cuttings and reduce erosion, adequate drainage measures shall be allowed for in the cuttings.
Where the existing groundwater table is high, it is important to install sub-horizontal drainage holes in the lower part of the cuttings to maintain low groundwater levels for slope stability and to minimise the risk in storm events. Discharge from the drainage holes should be managed, such as by installing detachable flexible HDPE pipes, to prevent erosion of the cut slopes from the outflow.
Sub-soil drains should be installed between the toe of the cut batters and the pavement to keep the slope free of water seepages and to keep the water level well below the pavement subgrade. Sub-soil drains should be at a depth of at least 1.5 m at the toe of the cuttings and comprise geotextile wrapped free draining aggregates with a slotted sub-soil pipe.
Dune Sand
Sand / Silt / Clay Matrix
Dune Sand
1.531
Proposed Rd Level
22 deg. cut slope
FOS increment by 0.1
Distance
0 5 10 15 20 25 30 35 40 45 50 55 60 65 70 75 80 85 90 95 100 105 110
Ele
vatio
n
15
20
25
30
35
40
45
50
55
NZ Transport AgencyPeka Peka to Otaki Expressway - Geotechnical Interpretative Report
September 2011 – draft 24 Opus Report No GER 2011 / 07 5 C 1814.61 PP2O_Geotechnical Interpretatiive Report_draft1
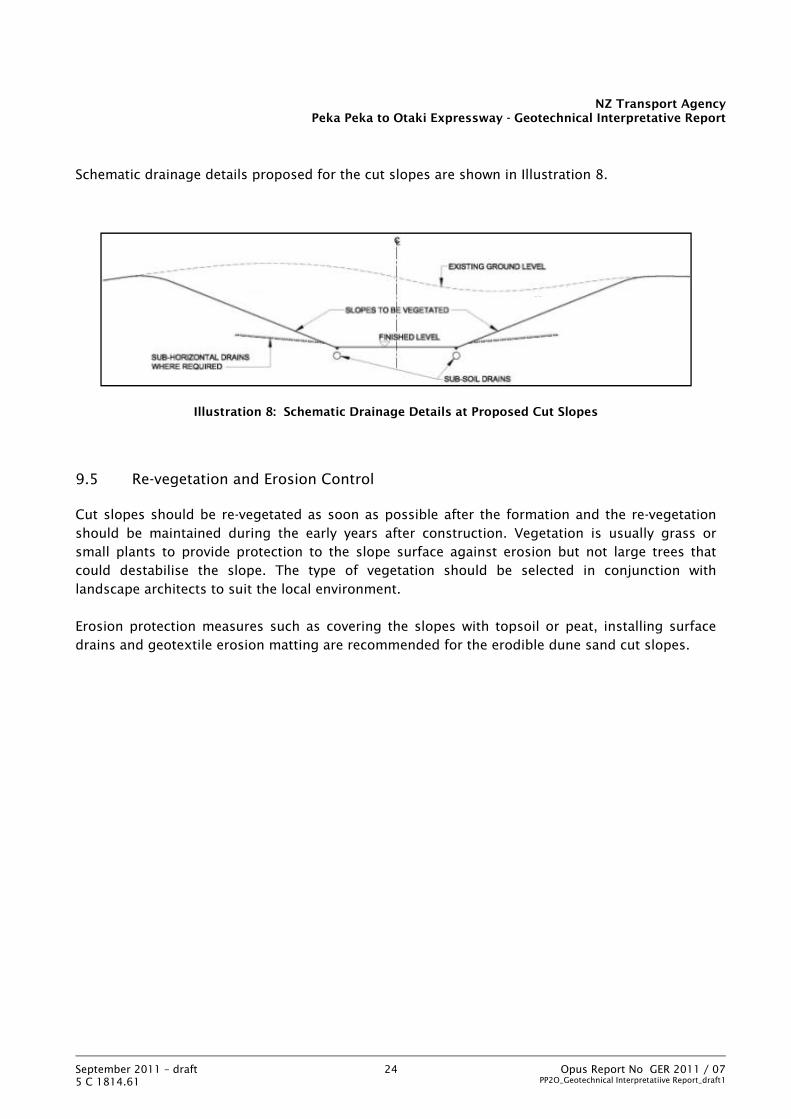
Schematic drainage details proposed for the cut slopes are shown in Illustration 8.
Illustration 8: Schematic Drainage Details at Proposed Cut Slopes
9.5 Re-vegetation and Erosion Control
Cut slopes should be re-vegetated as soon as possible after the formation and the re-vegetation should be maintained during the early years after construction. Vegetation is usually grass or small plants to provide protection to the slope surface against erosion but not large trees that could destabilise the slope. The type of vegetation should be selected in conjunction with landscape architects to suit the local environment.
Erosion protection measures such as covering the slopes with topsoil or peat, installing surface drains and geotextile erosion matting are recommended for the erodible dune sand cut slopes.

NZ Transport AgencyPeka Peka to Otaki Expressway - Geotechnical Interpretative Report
September 2011 – draft 25 Opus Report No GER 2011 / 07 5 C 1814.61 PP2O_Geotechnical Interpretatiive Report_draft1
10. Embankments
10.1 Distribution and Configuration
Fill embankments of up to 8 m high will be formed mainly over alluvium and inter-dunal deposits, see Appendix B: Preferred Proposal of Road Design and Figure 2: Engineering Geological Map.
The fill embankments are recommended to be formed at a maximum angle of 26° (2H : 1V). Steeper reinforced soil slopes may be considered using geogrid reinforcement if there is a constraint of space or for other reasons. The recommended maximum fill slope angle is provided based on our experience in the design and construction of embankments and observation of the performance of embankments, particularly for state highways and railways in the region. Examples of the relevant projects involving embankment slopes include the SH2 Kaitoke to Te Marua realignment, MacKays Crossing, and MacKays to Waikanae railway double tracking.
Given the generally low height of the embankments, an intermediate berm is not required. However, where space is available, a gentler shoulder fill, possibly with an intermediate berm, may be formed using a mix of sand and peat. This will facilitate the use of peat rather than removing it off-site.
10.2 Embankment Fill Materials
9.2.1 Sources of Fill
The current road geometric design model shows that the volume of embankment fill required is higher than the amount of materials obtained from the cuttings. In order to lessen the difference between cut and fill volumes, it is recommended that the cuts through dune sand or terrace alluvium be formed at flatter slopes and/or offset from the Expressway where space is available. This will be a more economical way of generating fill within the corridor than sourcing fill off-site.
Another option to generate fill materials is to excavate ponds within the designation. This has been commonly practised in some of the sub-division developments in the Kapiti area. Ponds are to be excavated through materials such as peat and sand, of which sand is used for fill materials and the excavated peat can be placed back in the ponds. Any further consideration of this option would require liaison with the landscape planners, and resource consents would likely need to be obtained.
Potential borrow sites at the eastern foothills and potential quarry sites at Otaki and Waikanae can
potentially provide suitable quality fill materials for construction. Our design team has been discussing with
the MacKays to Peka Peka Alliance Team about sourcing fill materials off‐site and will formulate a more
detailed borrow fill strategy when relevant information is gathered.

NZ Transport AgencyPeka Peka to Otaki Expressway - Geotechnical Interpretative Report
September 2011 – draft 26 Opus Report No GER 2011 / 07 5 C 1814.61 PP2O_Geotechnical Interpretatiive Report_draft1
9.2.2 Requirements of Fill
The results of the site investigations show that the materials (dune sand and alluvium) from the cuttings should be suitable for embankment fill. In general, the embankment fills materials, whether sourced within or off-site, should satisfy the following requirements:
Avoid particles larger than 150 mm in size.
The fill material shall be free from organic or otherwise deleterious materials (timber, metal, bricks, paper etc).
The material shall be free of shale or other soft materials, and particles prone to degradation.
The in-situ moisture content preferably close to the optimum water content (OWC).
The topsoil, residual soil and other overburden deposits from cuttings may be moisture sensitive and may be unsuitable for use as embankment fill particularly if wet and unable to be dried. This should be confirmed on site during construction. Where the topsoil, residual soil or other overburden deposits are found to be suitable, they should be used for bulk fill embankments of up to 5 m high. No unsuitable materials should be placed within the embankment, and any unsuitable materials should be disposed elsewhere or placed as a shoulder fill outside the recommended structural fill slope.
The following are recommended for the fill for placement and compaction:
Benching to key in and properly compact the fill material into the existing ground.
In order to achieve the maximum compaction, the fill should be placed with less than 250 mm bulk fill thickness per lift.
Standard compaction tests should be carried out on the borrow fill materials.
The in situ density shall not be less than 98% of the maximum dry density (MDD) for that material as determined by NZ Standard Compaction Test 4.1.1 of NZS 4402:1986 for each set of tests being the average of five separate field measurements. No separate field density measurement shall be less than 95%.
Preliminary field compaction trials are recommended to establish appropriate field compaction criteria and methods. This is especially important if the OWC is found to be difficult to achieve on site.

NZ Transport AgencyPeka Peka to Otaki Expressway - Geotechnical Interpretative Report
September 2011 – draft 27 Opus Report No GER 2011 / 07 5 C 1814.61 PP2O_Geotechnical Interpretatiive Report_draft1
10.3 Embankment Foundations
The embankments should be founded on competent ground. Any loose, soft, organic or otherwise unsuitable materials shall be removed and the foundations confirmed by a qualified geotechnical engineer or engineering geologist prior to placement of the new fill.
Embankments in terrace alluvium areas
In the terrace alluvium areas, topsoil and/or weak materials of 0.2 m to 0.3 m thickness are generally present over dense to very dense gravel, cobbles and boulders. The groundwater table was observed to be about 5 m or more lower than the embankment foundation level at the alluvium areas.
Based on the interpreted ground conditions, undercut of 0.2 m to 0.3 m of topsoil or weak materials should be allowed where embankments are founded on the terrace alluvium.
Embankments in floodplain alluvium areas
Floodplain alluvium generally consists of a top layer of weak materials such as loose to medium dense sand/gravel and soft to firm silt/clay. The thickness of this top weak layer varies and generally ranges from 0.3 m to up to 4 m. Groundwater table is generally dependent on the nearby watercourse levels in the floodplain alluvium areas.
Undercut of generally up to 0.3 m of weak alluvial materials should be allowed for where embankment is founded on floodplain alluvium. Undercut of 1 m to 3 m and special measures may be required at some locations where there are concerns of slope instability and substantial settlement of the embankment due to the presence of weak foundation materials of considerable thickness. In particular, soft alluvial silt of 4 m thickness was encountered at BH 111 (Station 10,000 m approximately) to the south of Mary Crest. We recommend 3 m undercut and preloading to be carried out at this area. A flatter slope (say 2.5H: 1V), geogrid reinforcements and possibly a low berm / fill buttress at the toe of the embankment may be considered to improve slope stability and reduce earthquake-induced displacements.
Recommended amount of undercut and potential ground improvement measures are shown in Appendix C.
Embankments in inter-dunal deposit areas
Some of the fill embankments are located in the low lying inter-dunal areas underlain by soft and compressible peat, silt and clay of about 0.5 m and 4.5 m thickness over dense to very dense sand (see Appendix C and Table 9 for locations of embankments in inter-dunal areas). The groundwater table is generally close to the ground surface in the inter-dunal areas.

NZ Transport AgencyPeka Peka to Otaki Expressway - Geotechnical Interpretative Report
September 2011 – draft 28 Opus Report No GER 2011 / 07 5 C 1814.61 PP2O_Geotechnical Interpretatiive Report_draft1
Consideration has been given to develop solutions for the embankments underlain by soft and compressible inter-dunal deposits, which could cause substantial settlement and failure of the embankments if not treated properly.
Table 9: Embankments in Inter-dunal Areas
Location Approximate Station
Embankment Height
Indicative Thickness of Inter-dunal
Deposits
Preparation of Embankment Foundation
North of Country Road
1450 – 1700 m Up to 3 m Up to 3 m
Option 1: Complete removal of soft deposits.
Option 2: Preloading of soft materials and formation of shoulder buttresses or pressure berms.
Mary Crest Inter-dunes
9350 – 9750 m Up to 8 m 1 m to 3 m
Complete removal of 1 m to 3 m thick soft deposits and replacement with competent fill.
South of Mary Crest
10500 – 11550 m* Up to 5 m
Up to 3 m to 4.5 m
Option 1: Complete removal of soft deposits.
Option 2: Removal of soft deposits up to 3 m depth and replacement with competent fill. Preloading the remaining soft materials.
Option 3: Preloading of soft materials and formation of shoulder buttresses or pressure berms.
South of Mary Crest
11550 – 12200 m Up to 1 m 1 m to 2 m
Complete removal of 1 m to 2 m thick soft deposits and replacement with competent fill
Note: * Localised inter-dunal deposits exist in between dune sand and alluvial deposits, refer to Figure 2 for exact locations of inter-dunal deposits.

NZ Transport AgencyPeka Peka to Otaki Expressway - Geotechnical Interpretative Report
September 2011 – draft 29 Opus Report No GER 2011 / 07 5 C 1814.61 PP2O_Geotechnical Interpretatiive Report_draft1
The following factors have been taken into account when considering the amount of undercut and other ground improvement measures for fill embankments in inter-dunal areas:
Cost effectiveness – this relates to the cost involving undercutting and replacement of competent fill and other ground improvement measures such as preloading and soil mixing;
Embankment stability and permanent earthquake-induced displacements of the fill embankments;
Settlement of the fill embankment due to consolidation and decomposition of organic peat materials.
The distribution and thickness of inter-dunal deposits below fill embankments and the recommended method of preparing the embankment foundation are summarised in Table 9.
Comparison and discussion of each type of ground improvement measures such as excavation of inter-dunal deposits, preloading, and monitoring instrumentation is covered in Section 13.
10.4 Embankment Stability
Fill embankment stability is largely dependent on the following factors:
Height of the embankment
Side slope of embankment
Strength of compacted embankment fill materials
Strength of founding material on which the fill is placed
The fill slopes have been checked for long term stability with a design factor of safety against failure of 1.5 under static conditions and 1.0 under seismic conditions with design peak ground acceleration as shown in Table 3. Earthquake induced slope displacements have been checked to be less than 300 mm as assessed by the Newmark’s method (Ambraseys & Srbulov, 1995). Detailed analysis of the stability and permanent earthquake-induced displacement of high embankments should be carried out once the road form design is confirmed at locations where soft alluvial or inter-dunal deposits are of considerable thickness.
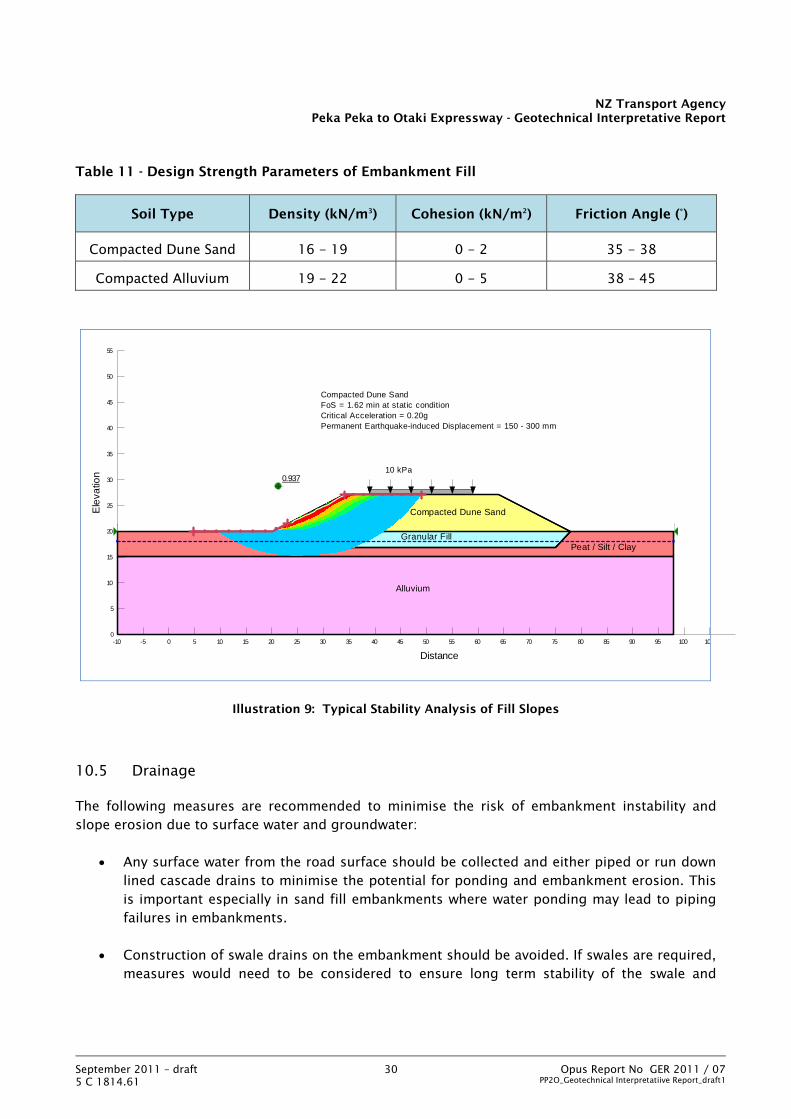
The design strength parameters of the embankment fill are shown in Table 11.
The analysis indicates that fill slopes of 26° (2H:1V) are appropriate. A typical fill slope stability analysis is shown in Illustration 9.
NZ Transport AgencyPeka Peka to Otaki Expressway - Geotechnical Interpretative Report
September 2011 – draft 30 Opus Report No GER 2011 / 07 5 C 1814.61 PP2O_Geotechnical Interpretatiive Report_draft1
Table 11 - Design Strength Parameters of Embankment Fill
Soil Type Density (kN/m3) Cohesion (kN/m2) Friction Angle (°)
Compacted Dune Sand 16 - 19 0 - 2 35 - 38
Compacted Alluvium 19 - 22 0 - 5 38 – 45
Illustration 9: Typical Stability Analysis of Fill Slopes
10.5 Drainage
The following measures are recommended to minimise the risk of embankment instability and slope erosion due to surface water and groundwater:
Any surface water from the road surface should be collected and either piped or run down lined cascade drains to minimise the potential for ponding and embankment erosion. This is important especially in sand fill embankments where water ponding may lead to piping failures in embankments.
Construction of swale drains on the embankment should be avoided. If swales are required, measures would need to be considered to ensure long term stability of the swale and
0.93710 kPa
Compacted Dune SandFoS = 1.62 min at static conditionCritical Acceleration = 0.20gPermanent Earthquake-induced Displacement = 150 - 300 mm
Compacted Dune Sand
Granular FillPeat / Silt / Clay
Alluvium
Distance
-10 -5 0 5 10 15 20 25 30 35 40 45 50 55 60 65 70 75 80 85 90 95 100 105
Ele
vatio
n
0
5
10
15
20
25
30
35
40
45
50
55

NZ Transport AgencyPeka Peka to Otaki Expressway - Geotechnical Interpretative Report
September 2011 – draft 31 Opus Report No GER 2011 / 07 5 C 1814.61 PP2O_Geotechnical Interpretatiive Report_draft1
embankment. It would be prudent to construct the swales outside the toe of the embankments.
Drainage blankets wrapped in geotextile with outlet sub-soil drains should be provided below the fill embankment. This is especially important for embankment in inter-dunal areas where soft compressible deposits are present.
Subsoil drains should be installed at the interface between new fill and existing slopes where there are seepages or potential for seepages in wet winter conditions.
Consider provision of toe protection where embankments are constructed in a gully or valley with a stream.
10.6 Landscaping and Vegetation
The fill embankment slopes shall be vegetated during or as soon as possible after construction and well maintained during the life of the embankment. Due to the erosion-prone nature of dune sand, embankments formed by dune sand may need to be protected by geotextile or geo-membrane until the vegetation is established.
Peat excavated from the low lying areas can be used to providing an organic layer to help vegetation. Grass or small plants would provide protection to the slope surface against erosion but not large trees, which could destabilise the slope. The type of vegetation should be selected in conjunction with the geotechnical engineer and the landscape architect to suit the local environment.

NZ Transport AgencyPeka Peka to Otaki Expressway - Geotechnical Interpretative Report
September 2011 – draft 32 Opus Report No GER 2011 / 07 5 C 1814.61 PP2O_Geotechnical Interpretatiive Report_draft1
11. Pavements
11.1 Design Subgrade Parameters
11.1.1 Design CBR on fill embankments
The design subgrade parameters for pavements on embankment fill were derived from laboratory California Bearing Ratio (CBR) tests carried out on the on-site materials, which comprises dune sand and alluvium, compacted to the New Zealand Standard Compaction (NZS: 4402: 1986: Test 4.1.1), i.e. 98% compaction, at both optimum water content and soaked conditions. The laboratory CBR test results are shown in Table 6.
The results show that re-compacted alluvium has CBR values generally between 45% and 90% at OWC and between 55% and 60% when soaked; re-compacted dune sand has CBR values between 15% and 25% at OWC and between 18% and 20% when soaked. However, due to limited tests carried out for soaked samples, soaked CBR values are likely to be less than the values indicated by the test results.
Our experience is that the high CBR values often do not materialise on site due to the presence of weaker matrix. It is recommended that CBR tests be carried out on the weaker matrix to check lower bound CBR values. We propose a CBR value of 8% to 10% for the pavement design on fill materials compacted to 98% using standard compaction. It is expected that a proportion of fill materials will be imported from off-site and therefore the imported fill should meet the minimum requirement of CBR value of 10%.
Embankment foundations should be properly prepared to ensure Scala Penetrometer Test results of 5 blows/100 mm or greater within 1.2 m depth from the subgrade level in order to fulfil the 10% CBR design requirement; otherwise alternative pavement designs would need to be considered. We also recommend Benkleman Beam tests be carried out during construction to confirm pavement subgrade.
11.1.2 Design CBR in cut areas
Majority of the road pavements will be constructed on compacted fill embankments; except at the cuttings through terrace alluvium and dune sand (see Appendix B and Table 9 for locations of cuttings). Geotechnical investigation results at the proposed cut areas were studied to determine the design CBR of subgrade material at the proposed formation level.
Terrace alluvium
The field testing results in the cut areas comprising terrace alluvium are as follows:
Scala Penetrometer blow count greater than 9 blows per 100 mm penetration within gravel, cobbles and boulders in silty sand matrix
NZ Transport AgencyPeka Peka to Otaki Expressway - Geotechnical Interpretative Report
September 2011 – draft 33 Opus Report No GER 2011 / 07 5 C 1814.61 PP2O_Geotechnical Interpretatiive Report_draft1
Standard Penetration Tests ‘N’ value greater than 50 blows
However, these high values are likely to be influenced by the presence of large gravel and cobble particles, whereas pavement behaviours will be influenced also by the matrix. Our experience is that the high CBR values often do not materialise on site due to the presence of weaker matrix. Based on the above field test results, the terrace alluvium is likely to be dense to very dense with CBR of greater than 6% to 10%. It is therefore proposed that a CBR of 6% to 10% be adopted for pavement design in cut areas comprising terrace alluvium. We recommend Benkleman Beam tests be carried out during construction to confirm pavement subgrade.
Dune sand
In general, the dune sand in the proposed cut area has the following strength properties:
CPT cone resistance (qc) between 4 MPa to 25 MPa
Scala Penetrometer blow counts between 6 and 14 blows per 100 mm
Based on the above field test results, the dune sand within cuttings is generally medium dense to very dense with CBR of 10% minimum.
At Station 1100 m to 1250 m, a sand/silt/clay matrix layer of about 0.5 m to 1.5 m thickness was encountered by CPT 102 & CPT 103. This layer has CPT cone resistance (qc) of 1 MPa to 4 MPa and is likely to be very loose to loose with CBR of 0% to 5%. This sand/silt/clay matrix layer would likely be encountered within 2 m depth from the subgrade level at some locations.
It is proposed that a CBR of 10% be adopted for pavement design in cut areas comprising dune sand, provided that any weak sand/silt/clay layers within 1.2 m below the subgrade level would be removed and replaced with well compacted fill. We recommend Benkleman Beam tests be carried out during construction to confirm pavement subgrade.
11.2 Construction of Pavement Subgrade
10.2.1 Undercut
It is recommended that weak materials should be undercut before construction of the pavement. This will ensure consistent subgrade strength and thus consistent pavement thickness can be used for significant sections of the alignment. Undercutting should be carried out at the following areas:
At the interface between cut and fill, where weak materials such as topsoil would be encountered in the cut platform
In the areas where the proposed subgrade level is at or near the existing ground level where surface material is unsuitable or weak.

NZ Transport AgencyPeka Peka to Otaki Expressway - Geotechnical Interpretative Report
September 2011 – draft 34 Opus Report No GER 2011 / 07 5 C 1814.61 PP2O_Geotechnical Interpretatiive Report_draft1
The amount of undercut should generally be up to 0.3 m thickness to remove the weak deposits within the 1 m influence depth of pavement.
10.2.2 Soil replacement and/or geogrid
As discussed in Section 10.1.2, a very loose to loose sand/silt/clay matrix layer of about 0.5 m to 1 m thickness underlying dune sand would likely be encountered within 2 m depth from the subgrade level at Station 1100 m to 1250 m. This weak layer should be removed and replaced with compacted fill. If the amount of unsuitable materials is found to be substantial, an alternative of strengthening using HDPE geogrid can be considered.
10.2.3 Construction practice
The following construction practice is recommended:
Field CBR tests / Benkleman Beam tests should be carried out on compacted fill during construction to demonstrate the achievementof the proposed design CBR.
In the cut areas in dune sand, Scala Penetrometer Tests should be carried out to at least 2 m depth below subgrade level before construction of pavement to confirm the design subgrade strength. Scala Penetrometer blow counts of 5 blows or greater per 100 mm penetration should be achieved in order to verify the proposed design CBR of 10%. This is especially important in the cuttings through dune sand as a layer of very loose to loose sand/silt/clay matrix of strength less than CBR 10% is present below the dune sand layer and could likely be within 2 m below the proposed subgrade level at some locations.
The conditions of subgrade should be inspected by a geotechnical engineer in terrace alluvium cuttings and Benkleman Beam tests should be carried out to confirm pavement subgrade during construction.
If the ground conditions or subgrade strength are found to be different from the design assumptions, the pavement design would need to be re-visited and revised, if necessary. One option would be to incorporate a sub-grade improvement layer with good quality imported granular materials.
Sub-soil drains should be installed below the subgrade level to maintain low groundwater levels during and after storm events.
11.3 Drainage
Groundwater table is generally 5 m or more lower than the pavement foundation level in the cuttings through terrace alluvium deposits. Groundwater table close to ground surface should be expected in low-cutting areas through dune sand adjacent to the inter-dunal depressions. Where
NZ Transport AgencyPeka Peka to Otaki Expressway - Geotechnical Interpretative Report
September 2011 – draft 35 Opus Report No GER 2011 / 07 5 C 1814.61 PP2O_Geotechnical Interpretatiive Report_draft1
the sand dune is further away from the inter-dunal depressions, the groundwater table should be much lower and could be as low as 10 m below the subgrade level.
We recommend installation of sub-soil drains below pavements to drain and conduit water infiltration from surface runoff. In areas where the existing groundwater table is close to the pavement subgrade level, deeper sub-soil drains would be required to lower the groundwater level and to protect the subgrade from water saturation.
11.4 Existing Road Pavement
Near the intersections of the proposed Expressway / roads and the existing roads, pavement trial pits and Benkelman Beam tests should be carried out in the existing pavement to determine the conditions (including layering and strength) of the pavement.
Depending on the pavement design and proposed levels at the new intersections, certain changes may need to be made to the existing pavements. The changes may include overlying the existing pavement or reconstruction of the pavement.
NZ Transport AgencyPeka Peka to Otaki Expressway - Geotechnical Interpretative Report
September 2011 – draft 36 Opus Report No GER 2011 / 07 5 C 1814.61 PP2O_Geotechnical Interpretatiive Report_draft1
12. Bridges
12.1 Proposed Bridges
According to the road form design shown in Appendix B, the following new bridges are proposed, from north to south:
Waitohu Stream bridge
Otaki northbound on-ramp bridge across the existing railway corridor
Otaki ramp bridge across the existing railway corridor and the proposed Expressway
Overbridge across the existing rail corridor and the proposed expressway at Rahui Road
Otaki River bridge
Overbridge across the proposed Expressway at Otaki Gorge Road
Overbridge across the existing rail corridor at Otaki Gorge Road
Overbridge across the existing SH1, rail corridor and the proposed Expressway at Te Horo
Mary Crest Underpass across the proposed Expressway
12.2 Ground Conditions at the Bridge Sites
Based on the results of the site investigations, the geological units and the ground conditions at each of the bridge sites have been assessed and are summarised in Table 12.
It should be noted that geotechnical investigations have not been carried out at every bridge site, and therefore the ground conditions have been estimated based on the geology and the investigations to characterise the different geological units encountered along the proposed expressway route.
Further geotechnical investigations are recommended to be carried out early, before the commencement of specimen or detailed design of the structures along the expressway route.

NZ Transport AgencyPeka Peka to Otaki Expressway - Geotechnical Interpretative Report
September 2011 – draft 37 Opus Report No GER 2011 / 07 5 C 1814.61 PP2O_Geotechnical Interpretatiive Report_draft1
Table 12: Ground Conditions at Bridge Sites
Bridge Location Geological Unit Comments on Ground Conditions
Waitohu Stream Bridge
Recent (floodplain) alluvium
Mainly silty gravel and cobbles with interbeded sand and clay layers.
Medium dense at the top 1 m to 2 m; becoming denser with depth.
Otaki Northbound On-ramp Bridge Dune sand No investigations carried out nearby.
Otaki Ramp Bridge
Inter-dunal deposits / terrace alluvium at the eastern side
Dune sand at the western side
Soft to firm organic silt encountered at 0 m to 1.5 m depth at the eastern end; overlying silty gravel / cobble and sand.
Rahui Road Overbridge
Recent (floodplain) alluvium
Dense to very dense gravel with interbedded sand and silty clay layers.
Otaki River Bridge Recent (floodplain) alluvium
Silt and medium dense to dense sandy gravel and cobbles at 0 m to 2 m depth; gravel and cobbles becoming denser at depth.
Interbedded sand/silt/clay layers.
Otaki Gorge Road Expressway Overbridge
Terrace alluvium Very dense gravel and cobbles in a sandy matrix.
Otaki Gorge Road Railway Overbridge Terrace alluvium No investigations carried out nearby.
Te Horo Overbridge Terrace alluvium Organic gravelly silt at 0 m to 1 m depth; overlying very dense gravel and cobbles.
Mary Crest Underpass(*)
Terrace alluvium Dune sand / inter-dunal
deposits / alluvium at the western abutment
Terrace alluvium is likely to be very dense gravel and cobbles (not investigated).
Western abutment - layers of gravel and cobbles, sand, silt and clay
Firm to stiff silt / clay and medium dense gravel layers from 0 m to 5 m depth.
(*) The alignment in Mary Crest is being re-considered and would potentially lead to changes to the location
and geotechnical issues at the Mary Crest Underpass.

NZ Transport AgencyPeka Peka to Otaki Expressway - Geotechnical Interpretative Report
September 2011 – draft 38 Opus Report No GER 2011 / 07 5 C 1814.61 PP2O_Geotechnical Interpretatiive Report_draft1
12.3 Types of Abutments and Foundations
Given the ground conditions at the bridge sites, large diameter bored pile foundations and reinforced soil wall (RSW) abutment walls are generally considered to be appropriate for most of the proposed bridges. Spill-through abutments are also recommended where space is sufficient.
Large diameter bored piles are considered to be appropriate because:
It is a simple form of foundation which would not require complex pile caps close to the live road and railway environment and is easy to construct even in a river environment;
They are robust against lateral displacement during an earthquake event.
High end bearing capacity can easily be achieved in very dense gravel and cobbles;
The required depth to provide lateral capacity can be achieved even in dense ground;
Bored piles can be advanced through very dense gravel and cobbles, on the other hand, the gravel, cobbles and boulders would possibly retard the penetration of driven piles.
In addition, driven piles are also considered suitable in a dune sand environment which generally permits easy penetration and provides sufficient strength.
Shallow foundations such as spread footings have the fundamental advantages of simplicity and low cost. Nevertheless the tolerance against vertical and lateral displacements of bridges supported on spread-footing would need to be checked if this type of foundations is considered.
Shallow foundations may be considered in terrace alluvium which is not prone to liquefaction or earthquake deformation. The use of shallow foundations should however be avoided where soil scour is a design consideration such as for river-crossing bridges.
12.4 Design Considerations
The following design issues should be taken into consideration in the design of bridge foundations and abutments:
Any weak or liquefiable materials should be removed and replaced by compacted fill materials before construction of the bridge abutments. In general, the amount of undercut at the bridge abutments along the alignments is about 1 m to 2 m and can be more in certain locations such as the western abutment of Mary Crest Underpass;
The type of foundations should be carefully chosen and the design of foundations should be appropriately carried out to ensure adequate load capacity and tolerance against both lateral and vertical displacements; and in some cases the allowance for scour effects;
NZ Transport AgencyPeka Peka to Otaki Expressway - Geotechnical Interpretative Report
September 2011 – draft 39 Opus Report No GER 2011 / 07 5 C 1814.61 PP2O_Geotechnical Interpretatiive Report_draft1
Allowance of additional pile length should be made in the design due to the presence of intermediate weak lenses of silt/clay/sand layers, especially in an alluvial environment;
The design of pile foundations in river channels should allow for the depth of general and local scour which could be a significant depth in the large rivers such as the Otaki River;
The effects of negative skin friction due to liquefaction should be considered in the design of pier foundation where liquefiable materials may be present in the top few metres of the site soils;
Piles/columns constructed through reinforced soil wall abutments or approach fill should be sleeved to minimise the effects of earthquake-induced displacement of the reinforced soil wall or approach fill to the piles and the bridge structure.
12.5 Liquefaction Potential
Liquefaction of saturated soils such as loose sand, gravel and silt could cause differential settlement of the abutments, instability of the abutment walls, lateral spreading of the abutment slopes, negative skin friction on the abutment and pier piles, and ultimately may affect the bridge structures.
Based on the ground conditions at the bridge sites as shown in Table 12, liquefaction at the bridge abutments would likely be prevented by removing the top 1 m to 2 m of loose or soft soils before construction of the abutments. The groundwater level at the Mary Crest Underpass was found to be at about 8 m below ground level, therefore we consider that liquefaction is unlikely to occur although firm silt / clay and medium dense gravels were encountered from to 5 m depth.
If detailed investigations identify liquefaction, ground improvement such as stone columns can be constructed to minimise adverse effects on bridge abutments.
While there could be a potential for liquefaction of some loose layers near the bridge piers, given the flat topography at the pier locations, lateral spreading is unlikely to occur and the localised liquefaction and consequent subsidence is unlikely to be critical for the structure. The induced negative skin friction on the pier piles due to liquefaction would need to be considered in the design of the bridge structure. However, the negative skin friction is not expected to have a significant effect on the structure if large diameter bored piles are founded in dense gravels.

NZ Transport AgencyPeka Peka to Otaki Expressway - Geotechnical Interpretative Report
September 2011 – draft 40 Opus Report No GER 2011 / 07 5 C 1814.61 PP2O_Geotechnical Interpretatiive Report_draft1
13. Culverts
The proposed alignment will traverse across a number of waterways in the form of bridges and embankments. Where the waterways are crossed by embankments, culverts are to be constructed below embankments to enable water flow.
Culverts should be founded on ground with adequate bearing capacity to avoid bearing failures and differential settlements along the structure. Any saturated loose sand, gravel or silt underneath the culvert should be removed to prevent damage from liquefaction.
The additional loading due to the weight of embankment fill and vehicular loading should be allowed for in the design of culvert structures. The approach embankments adjacent to the culverts would need to be engineered to provide smooth transition and minimise differential settlements.
Where there is potential for settlement at culvert locations, the gradient and camber of the culverts should be carefully chosen to accommodate potential differential settlements.
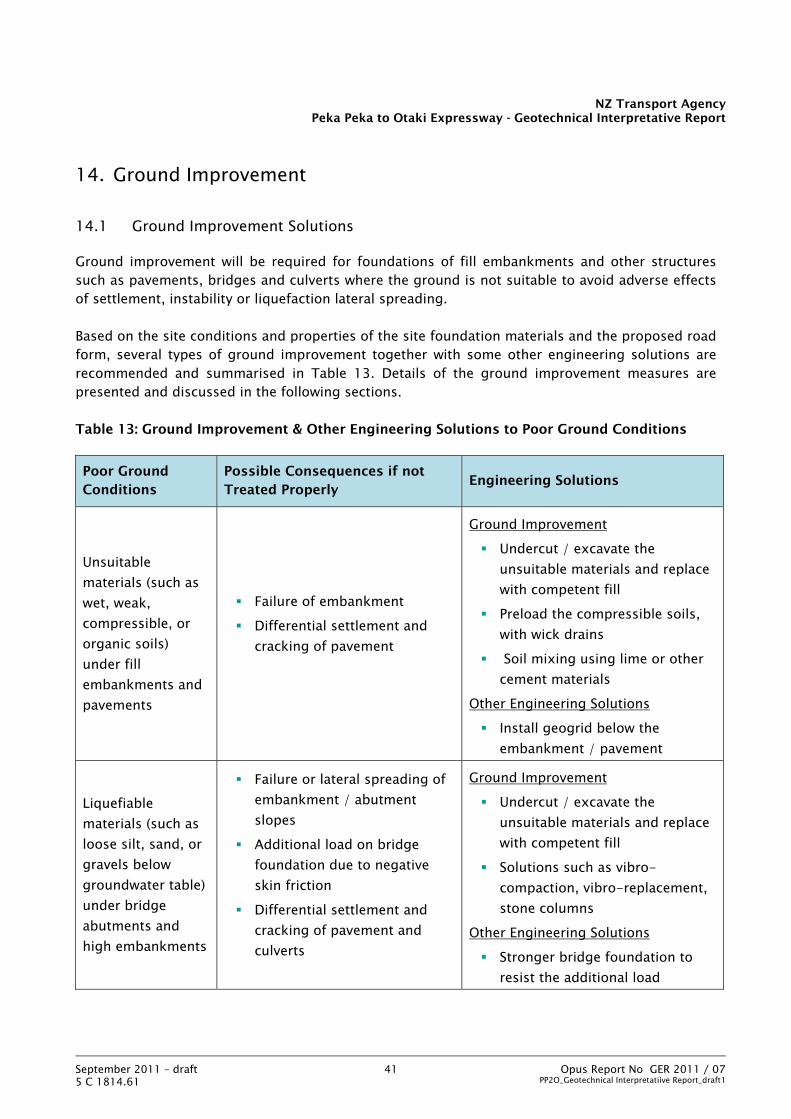
NZ Transport AgencyPeka Peka to Otaki Expressway - Geotechnical Interpretative Report
September 2011 – draft 41 Opus Report No GER 2011 / 07 5 C 1814.61 PP2O_Geotechnical Interpretatiive Report_draft1
14. Ground Improvement
14.1 Ground Improvement Solutions
Ground improvement will be required for foundations of fill embankments and other structures such as pavements, bridges and culverts where the ground is not suitable to avoid adverse effects of settlement, instability or liquefaction lateral spreading.
Based on the site conditions and properties of the site foundation materials and the proposed road form, several types of ground improvement together with some other engineering solutions are recommended and summarised in Table 13. Details of the ground improvement measures are presented and discussed in the following sections.
Table 13: Ground Improvement & Other Engineering Solutions to Poor Ground Conditions
Poor Ground Conditions
Possible Consequences if not Treated Properly
Engineering Solutions
Unsuitable materials (such as wet, weak, compressible, or organic soils) under fill embankments and pavements
Failure of embankment Differential settlement and
cracking of pavement
Ground Improvement Undercut / excavate the
unsuitable materials and replace with competent fill
Preload the compressible soils, with wick drains
Soil mixing using lime or other cement materials
Other Engineering Solutions Install geogrid below the
embankment / pavement
Liquefiable materials (such as loose silt, sand, or gravels below groundwater table) under bridge abutments and high embankments
Failure or lateral spreading of embankment / abutment slopes
Additional load on bridge foundation due to negative skin friction
Differential settlement and cracking of pavement and culverts
Ground Improvement Undercut / excavate the
unsuitable materials and replace with competent fill
Solutions such as vibro-compaction, vibro-replacement, stone columns
Other Engineering Solutions Stronger bridge foundation to
resist the additional load

NZ Transport AgencyPeka Peka to Otaki Expressway - Geotechnical Interpretative Report
September 2011 – draft 42 Opus Report No GER 2011 / 07 5 C 1814.61 PP2O_Geotechnical Interpretatiive Report_draft1
14.2 Undercutting
Undercut of weak and compressible soils should be allowed for preparing the foundations below fill embankments, bridge abutments, culvert and pavement. The thickness of undercut will generally be up to 0.3 m and can be more at the floodplain alluvium close to the water courses.
14.3 Complete Excavation and Replacement
Some of the fill embankments and bridge abutments are founded on weak, compressible, or liquefiable alluvial or inter-dunal deposits comprising peat, soft silt and clay of considerable thickness (generally up to 3 m but can be locally up to 5 m).
Complete excavation of the unsuitable materials and replacing them with competent fill would eliminate the risk of liquefaction and can avoid long term issues such as ongoing settlement of embankments due to consolidation of compressible materials and decomposition of organic peat. Settlements usually cause road deformation and result in poor road quality and high road maintenance costs. Therefore complete removal of the unsuitable materials would reduce long term maintenance costs. However, the cost of excavation would increase with depth. It would usually become difficult for depths greater than 3 m, where careful control of groundwater and lateral support is likely to be required.
14.4 Partial Excavation and Preloading
13.4.1 General Another approach other than complete excavation is to excavate and remove part of the unsuitable materials and preload the remaining compressible soils. Preloading can accelerate the process of consolidation and reduce the amount of post-construction settlement to an acceptable level. Additional drainage such as wick drains would help accelerate the settlement during the preload period. This approach can be cost effective especially for cases where deep excavation is required; however the remaining peat and compressible materials will cause on-going settlements as discussed in Section 13.3. A balance of initial cost, maintenance cost and accepted level of road performance would need to be considered carefully to determine the depth of undercut and preloading.
In some situations, the presence of remaining peat or weak materials will increase the risk of embankment slope instability. Solutions such as berms/fill buttresses at the embankment toes or flattening the fill slopes can minimise the risk of instability. Compaction of fill over compressible materials can be difficult and therefore the methodology of fill compaction would need to be considered carefully.
13.4.2 Preloading Based on the thickness of compressible materials and the proposed road form, it is estimated that preloading would be required for a period of about 6 to 9 months. Typical preloading with
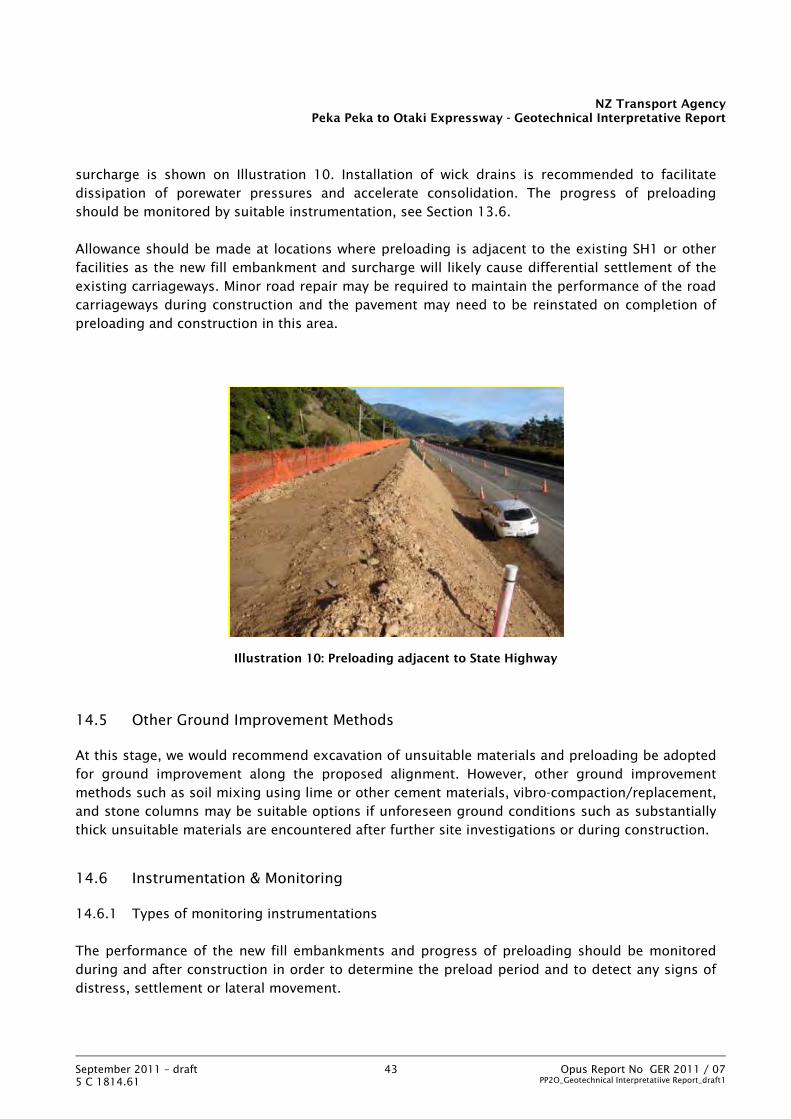
NZ Transport AgencyPeka Peka to Otaki Expressway - Geotechnical Interpretative Report
September 2011 – draft 43 Opus Report No GER 2011 / 07 5 C 1814.61 PP2O_Geotechnical Interpretatiive Report_draft1
surcharge is shown on Illustration 10. Installation of wick drains is recommended to facilitate dissipation of porewater pressures and accelerate consolidation. The progress of preloading should be monitored by suitable instrumentation, see Section 13.6.
Allowance should be made at locations where preloading is adjacent to the existing SH1 or other facilities as the new fill embankment and surcharge will likely cause differential settlement of the existing carriageways. Minor road repair may be required to maintain the performance of the road carriageways during construction and the pavement may need to be reinstated on completion of preloading and construction in this area.
Illustration 10: Preloading adjacent to State Highway
14.5 Other Ground Improvement Methods
At this stage, we would recommend excavation of unsuitable materials and preloading be adopted for ground improvement along the proposed alignment. However, other ground improvement methods such as soil mixing using lime or other cement materials, vibro-compaction/replacement, and stone columns may be suitable options if unforeseen ground conditions such as substantially thick unsuitable materials are encountered after further site investigations or during construction.
14.6 Instrumentation & Monitoring
14.6.1 Types of monitoring instrumentations
The performance of the new fill embankments and progress of preloading should be monitored during and after construction in order to determine the preload period and to detect any signs of distress, settlement or lateral movement.

NZ Transport AgencyPeka Peka to Otaki Expressway - Geotechnical Interpretative Report
September 2011 – draft 44 Opus Report No GER 2011 / 07 5 C 1814.61 PP2O_Geotechnical Interpretatiive Report_draft1
DEEP SETTLEMENT PLATE
Monitoring instrumentation listed in Table 14 shall be installed at the locations of new fill embankments and the preload areas. Monitoring shall be carried out on a regular basis during and for a period after construction.
Table 14: Instrumentation and Monitoring
Instrumentation Type of Monitoring
Settlement stations Total settlement
Deep settlement plates Foundation settlement
Piezometers (vibrating wire type) Porewater pressures
Shear probes Detection of embankment deformation
Inclinometers Measurement of embankment deformation
Settlement stations will be used to gauge the total settlement of fill and the foundation soils. Deep settlement plates and vibrating wire piezometers are required to monitor the settlement and porewater pressures of the foundation soils during preloading. These will be used in determining the duration of the surcharge. Shear probes and inclinometers will be used to monitor lateral movement of the large embankment which may be caused by lateral deformation of the compressible materials or potential instability of the embankment.
Settlement stations and deep settlement plates should be installed at intervals along the preload area and the shear probes should be installed at locations of the high embankments and thick compressible soils.
Illustration 11 shows typical details of instrumentation at the preload areas.
Illustration 11: Typical Details of Instrumentation at Preload Areas

NZ Transport AgencyPeka Peka to Otaki Expressway - Geotechnical Interpretative Report
September 2011 – draft 45 Opus Report No GER 2011 / 07 5 C 1814.61 PP2O_Geotechnical Interpretatiive Report_draft1
13.7.2 Requirements of monitoring
Monitoring should consist of the following works:
Precise levelling and coordinates of settlement stations, shear probes, inclinometers.
Sounding of shear probes with the specified gauge rods.
Inclinometers to measure deformation of embankments and walls.
Measurement of groundwater levels in standpipe piezometers and groundwater pressures in vibrating wire piezometers.
After installation of the monitoring stations, a baseline survey of each station should be carried out prior to the commencement of construction in that location.
13.7.3 Frequency of Monitoring
Following commencement of construction, monitoring at the following intervals is recommended:
Twice per 1 m lift of fill during construction, and not less than twice a week
Twice a week for the first two weeks following completion of the embankment/preload fill construction
Weekly thereafter for three months
Monthly during the remaining contract period
The results and frequency of monitoring should be reviewed by a geotechnical engineer during the period of monitoring. If the monitoring survey indicates potential distress then appropriate corrective actions should be taken.
14.7 Reuse of Excavated Peat
The excavated peat can be used as non-structural fill such as to form noise bunds or gently-sloping shoulders over fill embankments where settlement is not an issue. Trial vegetation on peat material may be carried out during construction to determine the effectiveness of the peat to facilitate grassing.
It is proposed that the peat material be spread out and drained to reduce the moisture content after excavation. Once the moisture content is reduced (the level of moisture content reduction for the purpose of construction should be determined at site), the peat can be placed in shoulders and

NZ Transport AgencyPeka Peka to Otaki Expressway - Geotechnical Interpretative Report
September 2011 – draft 46 Opus Report No GER 2011 / 07 5 C 1814.61 PP2O_Geotechnical Interpretatiive Report_draft1
bunds or spread on slopes. Consideration may be given to mixing peat with sand to improve material performance.
As mentioned in Section 10.2, excavation of ponds can be a viable approach in generating fill materials. If this is adopted, peat can also be dumped to the pond after excavation and thus save the cost of disposing peat off-site.

NZ Transport AgencyPeka Peka to Otaki Expressway - Geotechnical Interpretative Report
September 2011 – draft 47 Opus Report No GER 2011 / 07 5 C 1814.61 PP2O_Geotechnical Interpretatiive Report_draft1
15. Further Geotechnical Investigations
The previous geotechnical investigations were carried out to characterise the ground conditions along the proposed Expressway with focus on the main road crossings.
We recommend further geotechnical investigations to be carried out prior to specimen or detailed design in order to provide a better understating of:
Fault location e.g. Northern Ohariu Fault
Ground conditions where geology is complex e.g. where dune sand, inter-dunal deposits and recent alluvium intersect
Ground conditions at the actual bridge and crossing locations.
Compaction characteristics of the dune sand, through a field trial.
CBR characteristics of field compacted fill and subgrade materials.
The investigations should be carried out early so that it would enable monitoring groundwater levels over a period time over the different seasons and inform the Assessment of Environmental Effects and Submission to the Board of Inquiry.

NZ Transport AgencyPeka Peka to Otaki Expressway - Geotechnical Interpretative Report
September 2011 – draft 48 Opus Report No GER 2011 / 07 5 C 1814.61 PP2O_Geotechnical Interpretatiive Report_draft1
16. Recommendations
A geotechnical assessment has been carried out to provide engineering interpretation of the ground conditions for the proposed Peka Peka to Otaki Expressway route, and we make the following recommendations for the design and construction of earthworks, cuttings, fill embankments, bridges, pavements, culverts, and ground improvement:
1. The Northern Ohariu Fault, with a recurrence interval of 1,000 to 3,000 years, is likely to cross the alignment, and its location would need to be confirmed by investigations comprising fault trenching, seismic refraction surveys and / or boreholes.
2. The expressway should be constructed so that it crosses the fault on an earth embankment, so that in the event of an earthquake associated with rupture along this fault, access can be quickly reinstated.
3. The project should be designed for the high seismicity of the area, with site class D, with bridge structures designed for an earthquake with a recurrence interval of 1 in 2,500 years (peak ground acceleration of 0.81g) and other free standing structures and earthworks to an earthquake with a recurrence interval of 1 in 1,500 years (peak ground acceleration of 0.67g).
4. The liquefaction hazard along the route should be confirmed through geotechnical investigations, and localised ground improvement provided to manage the risk at some structure locations, where founded to be necessary.
5. Cuttings up to 20 m high in the sand dunes should be formed at a slope of about 20° to 25°, and cuttings up to 8 m high in the terrace gravels shall be formed at maximum slope angle of 40°. The high cuttings should have 3 m wide benches at 10 m height intervals, and the top of the cuttings should be rounded in a vertical plane. The ends of the cuttings should be rounded in a horizontal plane to avoid local slope failures and blend into the surrounding land form.
6. Given the shortage of cut materials for forming the embankments, consideration should be given to form flatter cut slopes or cuttings set back from the highway to obtain more cut materials, where land space is available. Sub-horizontal drainage holes supplemented by sub-soil drains at the toe should be incorporated to draw down the water levels, and erosion protection measures (erosion protection matting and revegetation) to protect the surface from rilling, particularly in the erodible dune sand.
7. The embankment construction should have side slopes of about 25°, given the predominant materials (dune sand and terrace gravels) from the cuttings.
8. The foundations of embankments in the low lying swamp (inter-dunal areas) underlain by peat and silt/clay should be improved using ground improvement. We recommend that where possible the peat deposits up to 3 m should be removed and replaced with

NZ Transport AgencyPeka Peka to Otaki Expressway - Geotechnical Interpretative Report
September 2011 – draft 49 Opus Report No GER 2011 / 07 5 C 1814.61 PP2O_Geotechnical Interpretatiive Report_draft1
engineered fill. Locally where the peat is thicker (up to 4.5 m ) it may be economical to only undercut the upper 3 m depth, and carry out preloading to reduce post-construction settlements.
9. The embankments should be monitored using a combination of vibrating wire piezometers, shear probes, inclinometers and settlement plates.
10. Initial pavement design should use a CBR of 6% to 10%, with further compaction and CBR testing through trials carried out during the design stage, and allowance for Benkleman Beam testing prior to construction of the road pavement.
11. Subsoil drains should be formed along the pavements.
12. The bridge structures can be formed using spill through abutments in line with the rural open land form in the area, or using reinforced soil wall abutments.
13. Given the ground conditions, pile foundations should be used to support the majority of the bridges. Bored cylinder piles are appropriate in the majority of the locations given the presence of dense alluvium including cobble and boulders that may retard driven piles.
14. Ground improvement should be used to mitigate liquefaction hazards, where this is locally founded to be an issue from the geotechnical investigations.
15. Geotechnical investigations should be carried out for the chosen scheme, and in particular at the structure locations before either detailed design or specimen design, depending on the procurement approach chosen. The investigation should also include the location of the Northern Ohariu Fault where the proposed expressway is predicted to cross the fault.
16. The investigations should be carried out early so that it would enable monitoring groundwater levels over a period time over the different seasons and inform the Assessment of Environmental Effects and Submission to the Board of Inquiry.

NZ Transport AgencyPeka Peka to Otaki Expressway - Geotechnical Interpretative Report
September 2011 – draft 50 Opus Report No GER 2011 / 07 5 C 1814.61 PP2O_Geotechnical Interpretatiive Report_draft1
17. References
AECOM (2011). PN 441: Peka Peka to Otaki, SH1 Upgrade. Geotechnical Factual Report. Final. June 2011.
Ambraseys N., Srbulov M. (1995) "Earthquake-induced displacements of slopes", Soil Mech. & Earthq. Eng.,
vol.14, pp.59-72.
Department of Scientific and Industrial Research (1992). Geology of the Kapiti Coast (Pukerua Bay to Otaki),
Wellington. Regional National Disaster Reduction Plan. Seismic Hazard. Part 4 of 1991/1992 study.
Department of Scientific and Industrial Research, Wellington.
Heron, D.W., Van Dissen, R.J. (1998). Late Quaternary movement on the Ohariu Fault, Tongue Point to
MacKays Crossing, North Island, New Zealand. New Zealand Journal of Geology & Geophysics 41: 419-439
Institute of Geological & Nuclear Sciences (2003). Earthquake Fault Trace Survey of the Kapiti Coast District. Report 2003/77. August 2003. Prepared by R. Van Dissen & D. Heron for Kapiti Coast District Council.
Institute of Geological and Nuclear Sciences (2000a). Geology of the Wellington area, scale 1:250,000.
Institute of Geological and Nuclear Sciences 1:250 000 geological map 10. Lower Hutt, New Zealand.
Compiled by Begg, J.G., and Johnston, M.R.
Institute of Geology and Nuclear Sciences (2000b). Probabilistic Seismic Hazard Assessment of New Zealand:
New Active Fault Data, Seismicity Data, Attenuation Relationships and Methods. Prepared by Stirling, M.,
McVerry, G., Berryman, K., McGinty, P., Villamor, P., Van Dissen, R., Dowrick, D., Cousins, J., Sutherland, R.
Client Report 2000 / 53. May 2000.
Litchfield, N. Van Dissen, R.J., Langridge, R., Heron, D.W., Prentice, C. (2004). Timing of the most recent
surface rupture event on the Ohariu Fault near Paraparaumu, New Zealand. New Zealand Journal of Geology
and Geophysics 47: 123-127.
Litchfield, N., Van Dissen, R.J., Heron, D.W., Rhoades, D. (2006). Constraints on the timing of the three most
recent surface rupture events and recurrence interval for the Ohariu Fault: trenching results from MacKays
Crossing, Wellington, New Zealand. New Zealand Journal of Geology and Geophysics 49: 57-61.
Litchfield, N.; Van Dissen, R.J.; Hemphill-Haley, M.; Townsend, D.; Heron, D.W. (2010). Post c. 300 year
rupture of the Ohariu Fault in Ohariu Valley, New Zealand. New Zealand Journal of Geology and Geophysics
53: 43-56.
Little, T.A.; Van Dissen, R.J.; Rieser, U.; Smith, E.G.C.; Langridge, R.M. (2010). Coseismic strike slip at a point
during the last four earthquakes on the Wellington Fault near Wellington, New Zealand. Journal of Geophysical
Research. Solid Earth, 115: B05403, doi:10.1029/2009JB006589.
Little, T.A.; Van Dissen, R.J.; Schermer, E.; Carne, R. (2009). Late Holocene surface ruptures on the southern
Wairarapa fault, New Zealand : link between earthquakes and the uplifting of beach ridges on a rocky coast.
Lithosphere 1(1): 4-28; doi:10.1130/L7.1

NZ Transport AgencyPeka Peka to Otaki Expressway - Geotechnical Interpretative Report
September 2011 – draft 51 Opus Report No GER 2011 / 07 5 C 1814.61 PP2O_Geotechnical Interpretatiive Report_draft1
Palmer, A.; Van Dissen, R.J. (2002). Northern Ohariu Fault: Earthquake hazard assessment of a newly
discovered active strike slip fault in Horowhenua. EQC Research Foundation Project 97/263. Institute of
Geological & Nuclear Sciences Ltd, Lower Hutt.
Standards New Zealand (2004). NZS 1170.5 Structural Design Actions Part 5 - Earthquake actions — New
Zealand. Wellington, New Zealand.
Stirling MW, McVerry GH, and Berryman, KH. (2002), A New Seismic Hazard Model for New Zealand. Bulletin of
the Seismological Society of America Vol 92, No 5, pp1878 – 1903
Transit New Zealand (2003). Bridge Manual. Second Edition and Amendments 1 to 4 and Draft Amendment
June/December 2005.
Van Dissen, R.J. and Berryman, K.R. (1996). Surface rupture earthquakes over the last ~1000 years in the
Wellington region, New Zealand, and implications for ground shaking hazard. Journal of geophysical research.
Solid earth, 101(B3): 5999-6019
Wellington Regional Council (1993). Seismic Hazard Map Series : Liquefaction hazard, Map Sheet 1 Wellington
(1st edition) 1:50,000 with notes. November 1993.
Wellington Regional Council (1995). Seismic Hazard Map Series: Slope Failure Hazard Maps: 4-Kapiti.
Compiled from Works Consultancy Services Reports by Kingsbury, P.A. and Hastie W.J.

NZ Transport AgencyPeka Peka to Otaki Expressway - Geotechnical Interpretative Report
September 2011 – draft 52 Opus Report No GER 2011 / 075 C 1814.61 PP2O_Geotechnical Interpretatiive Report_draft1
Figures
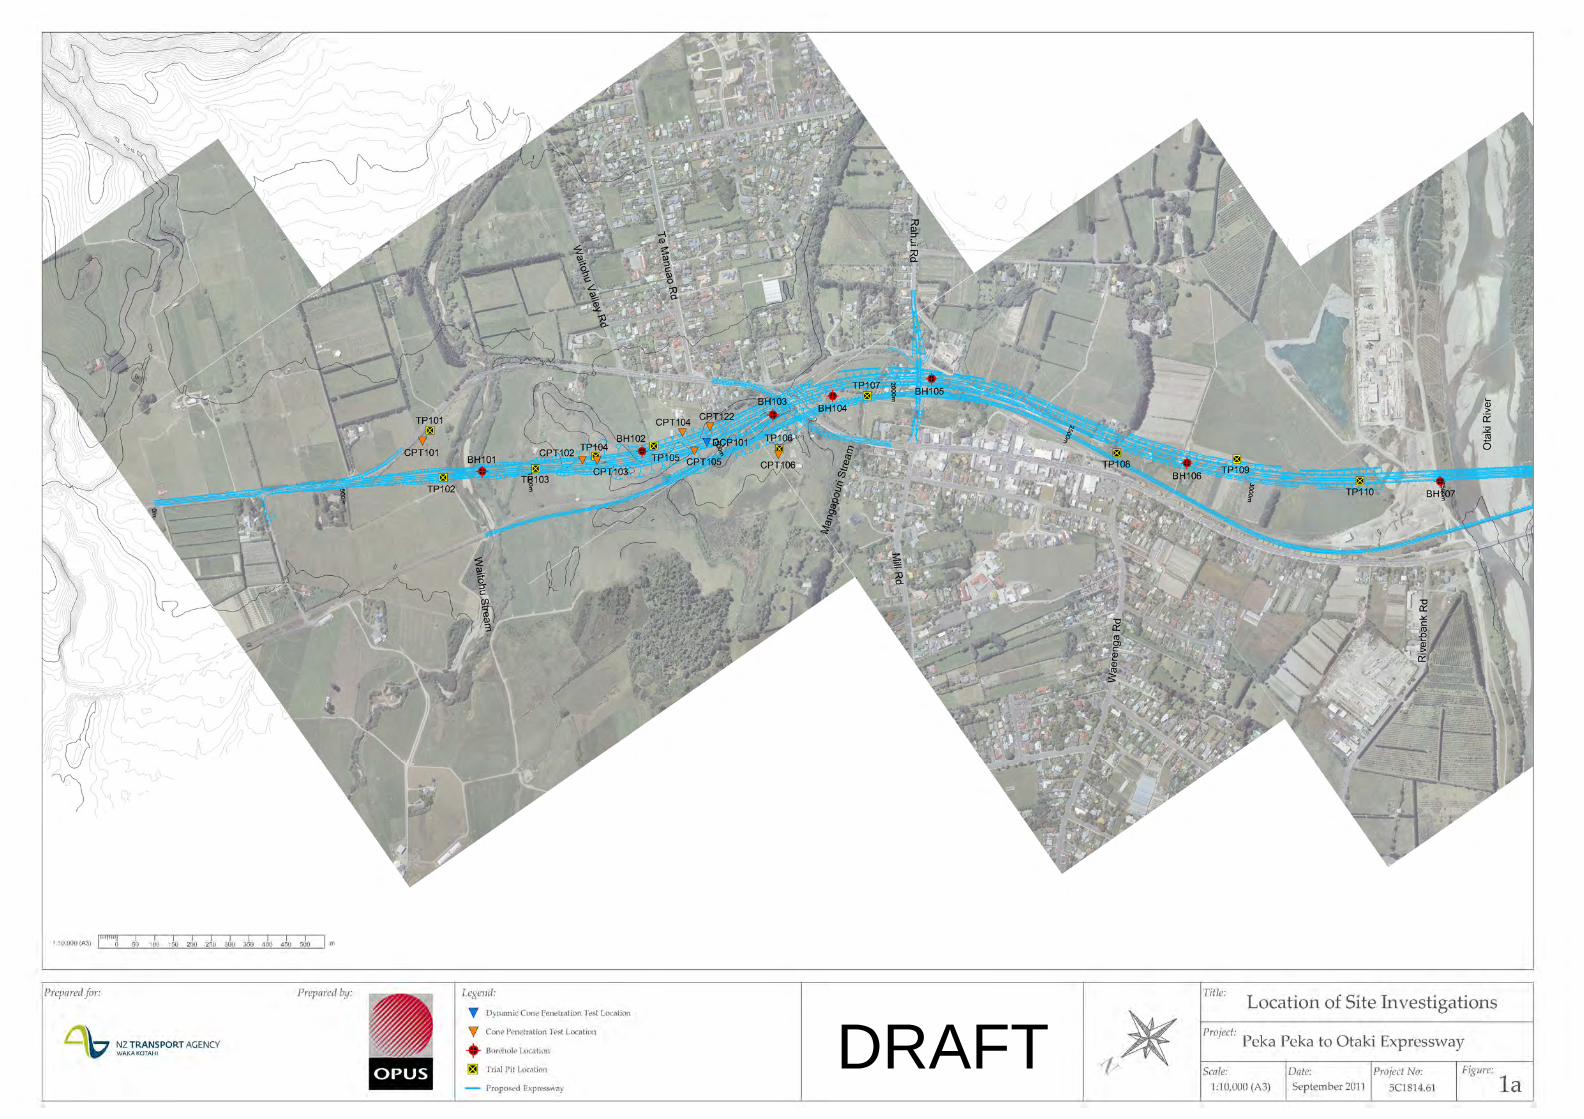
DRAFT

DRAFT
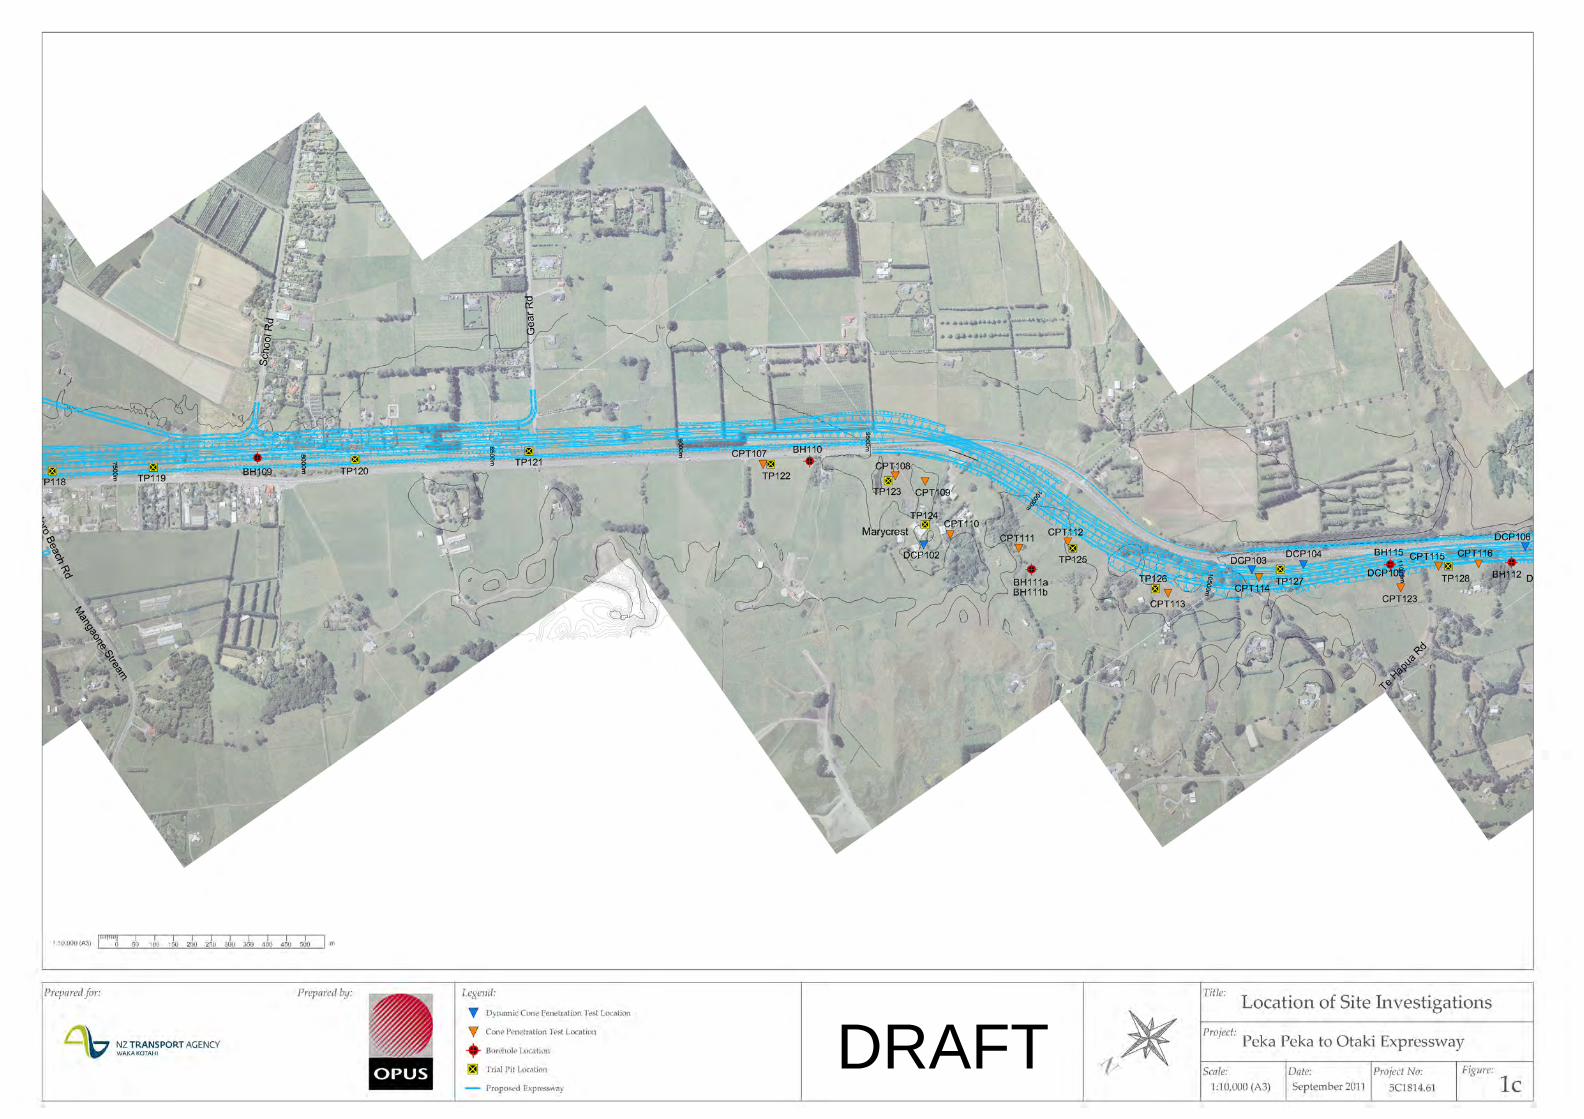
DRAFT
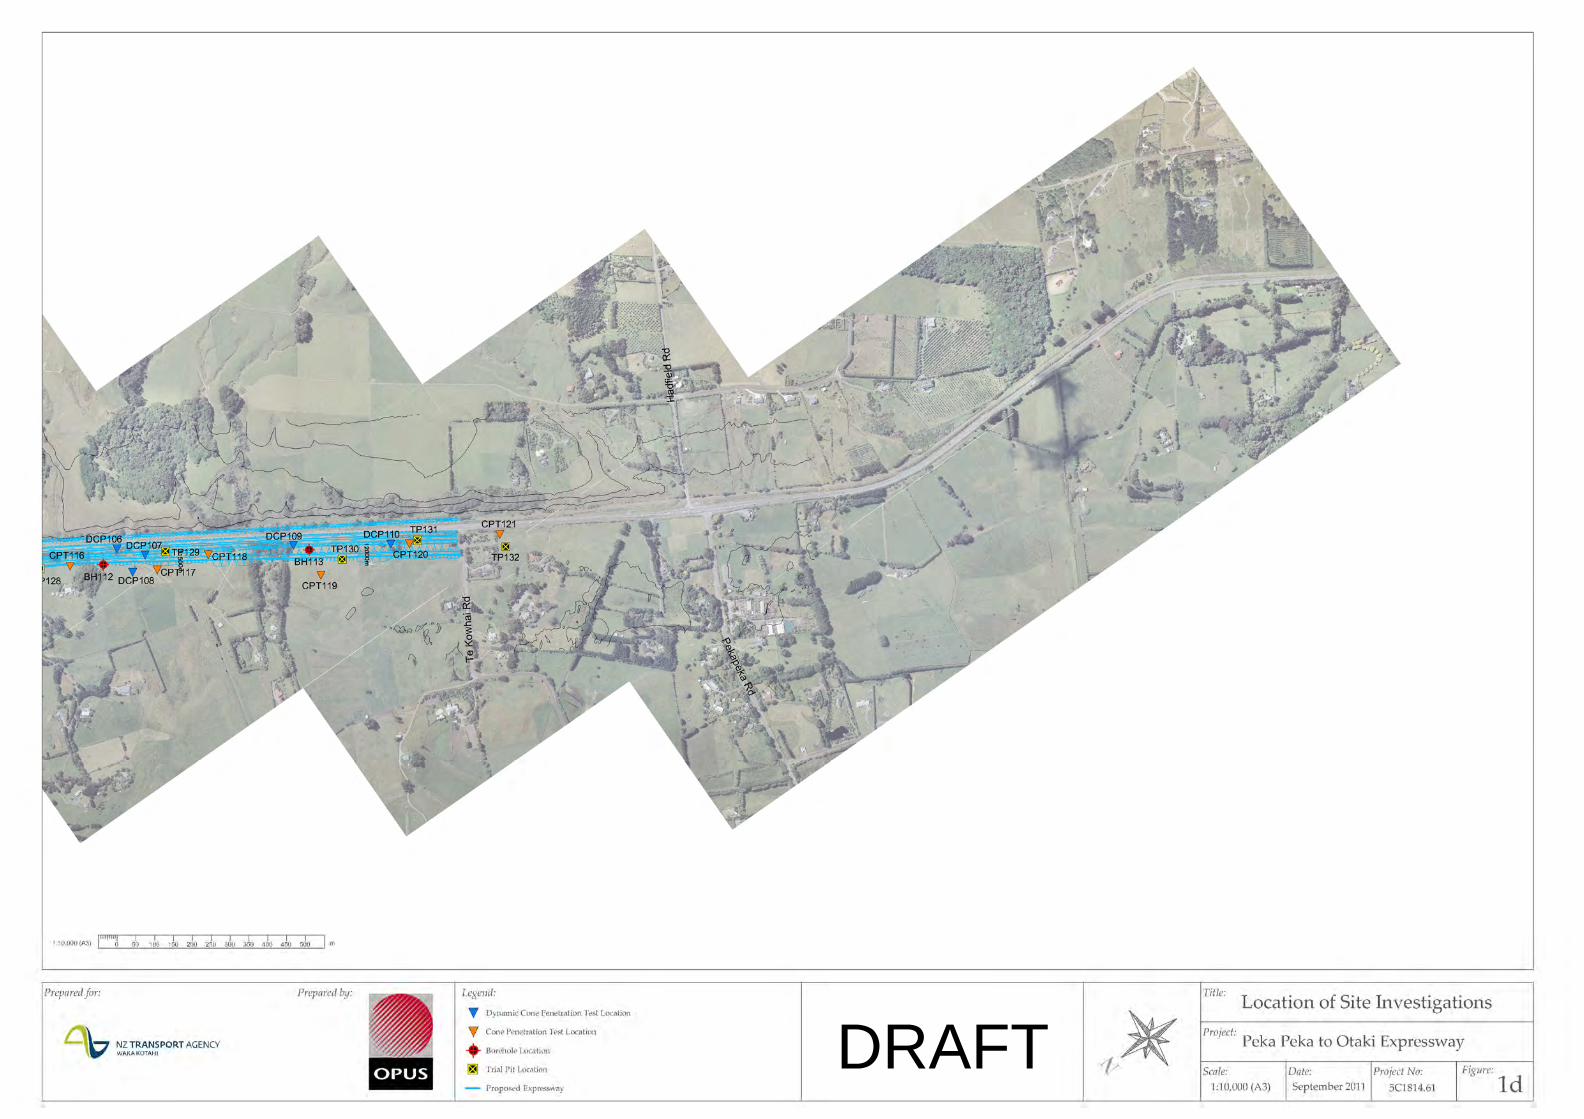
DRAFT
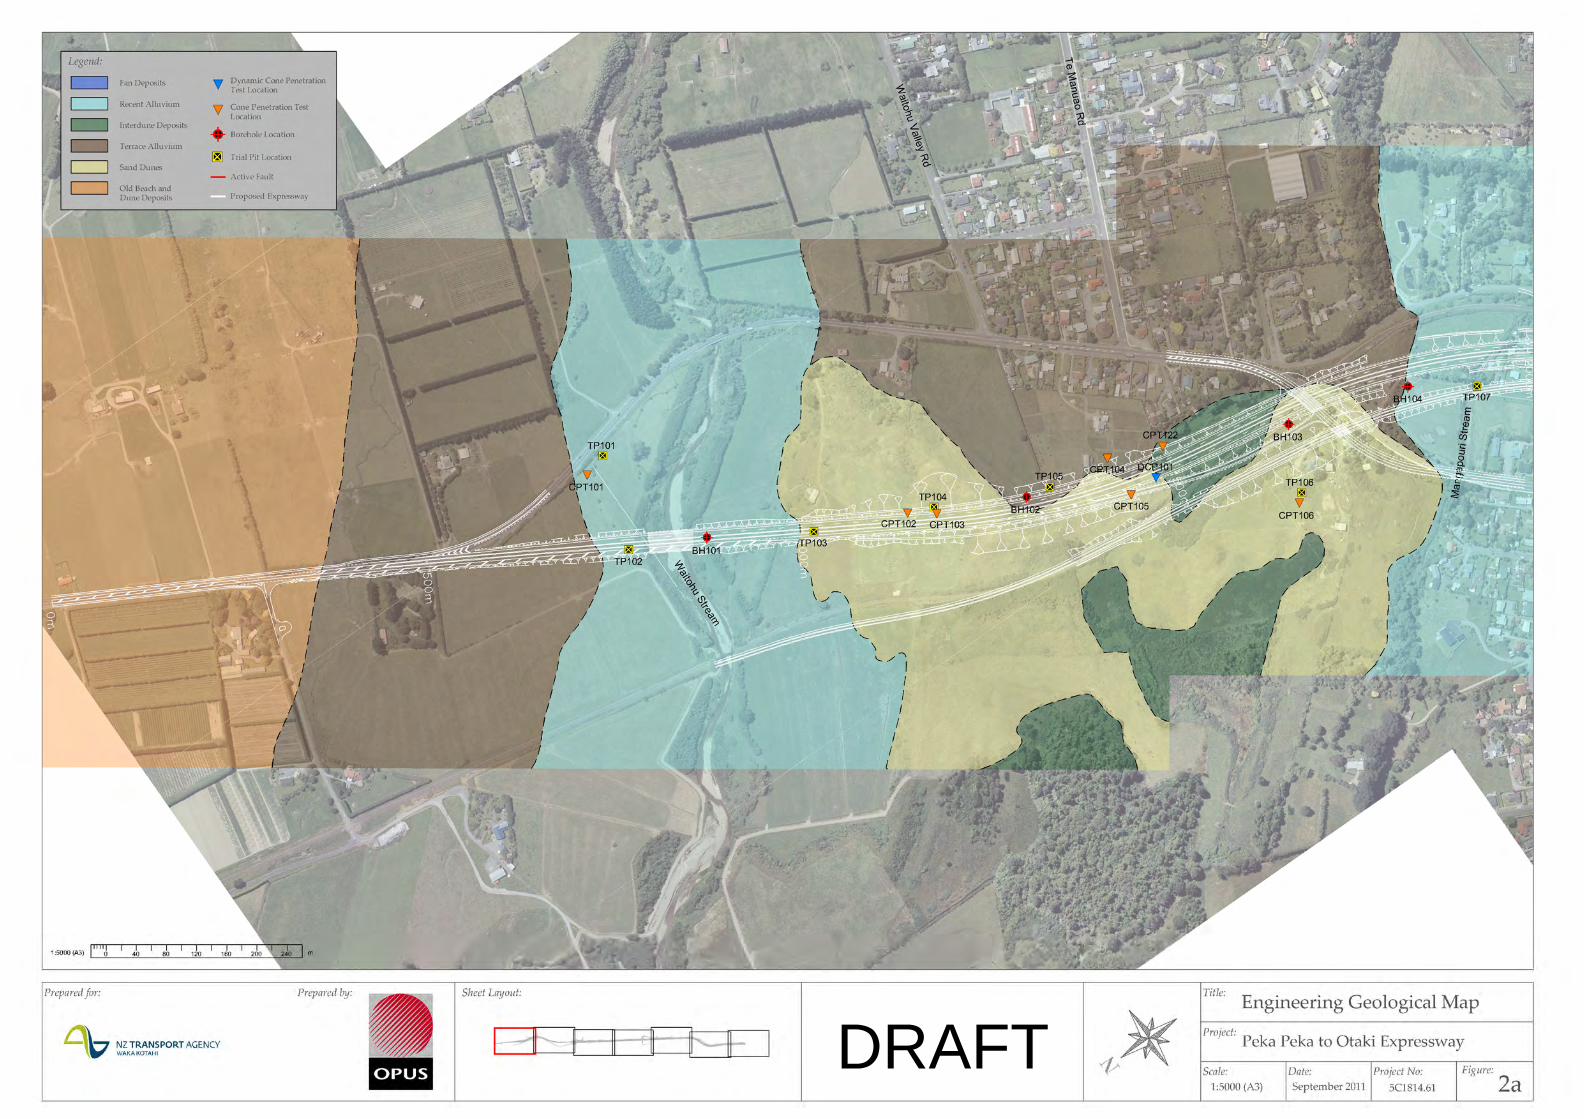
DRAFT

DRAFT
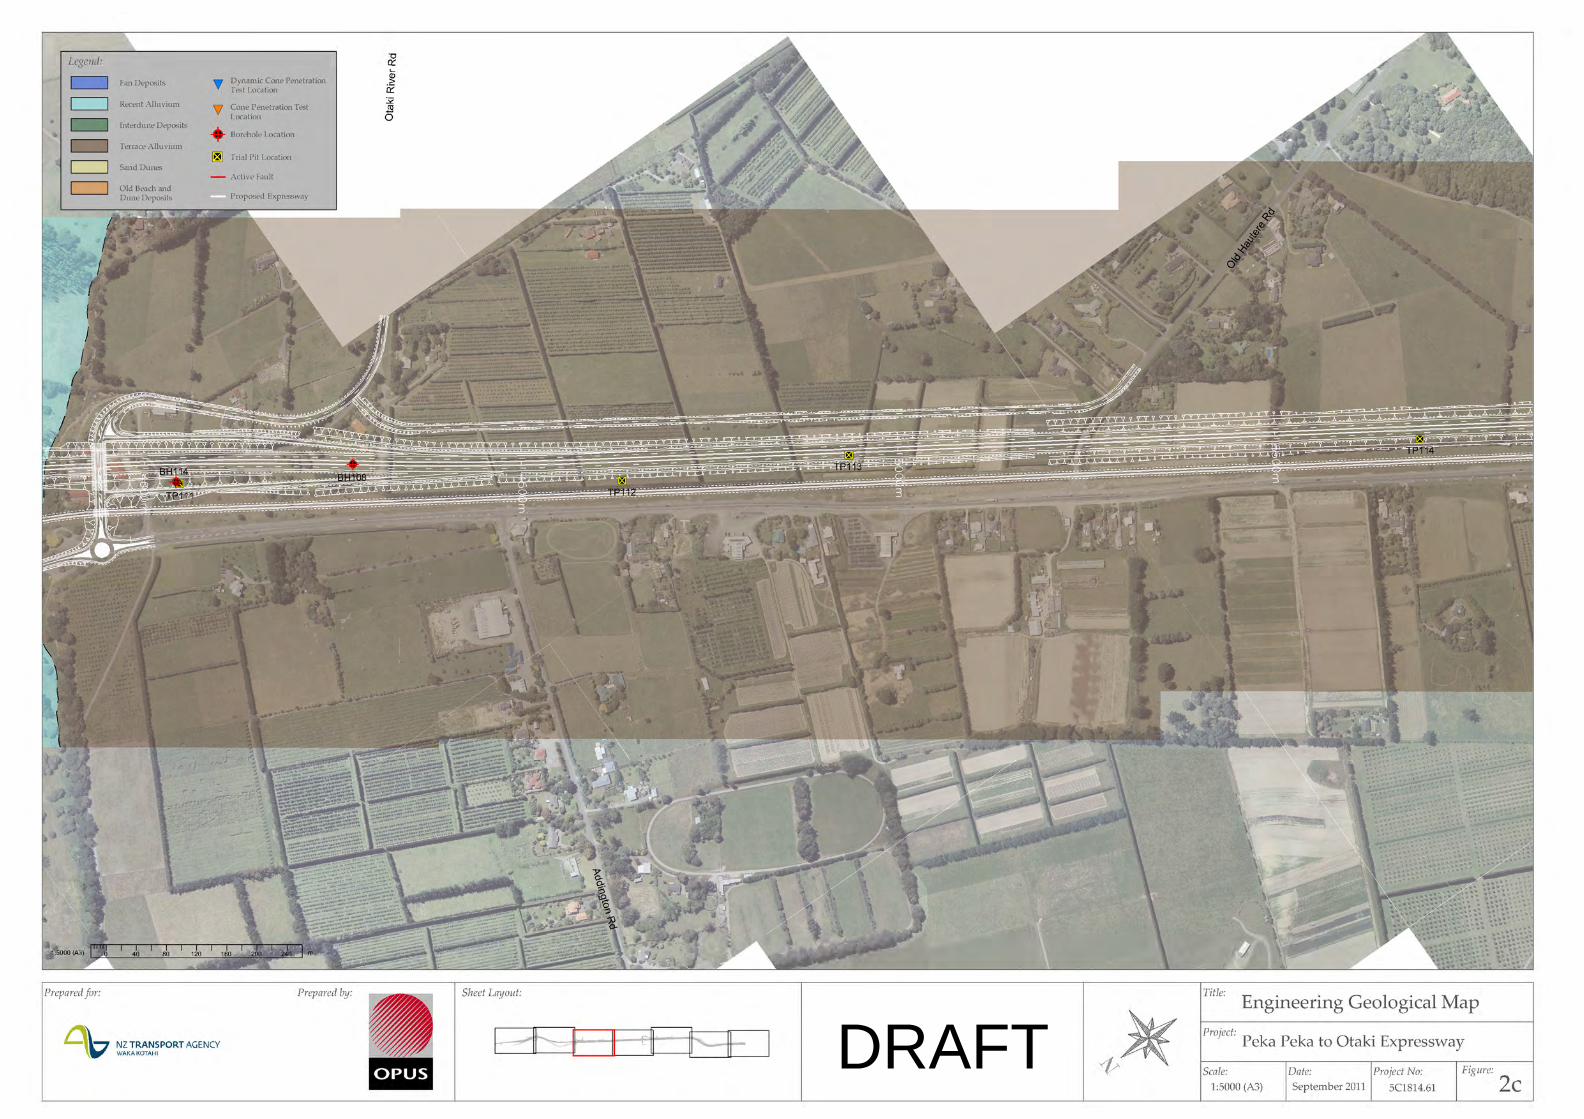
DRAFT

DRAFT

DRAFT
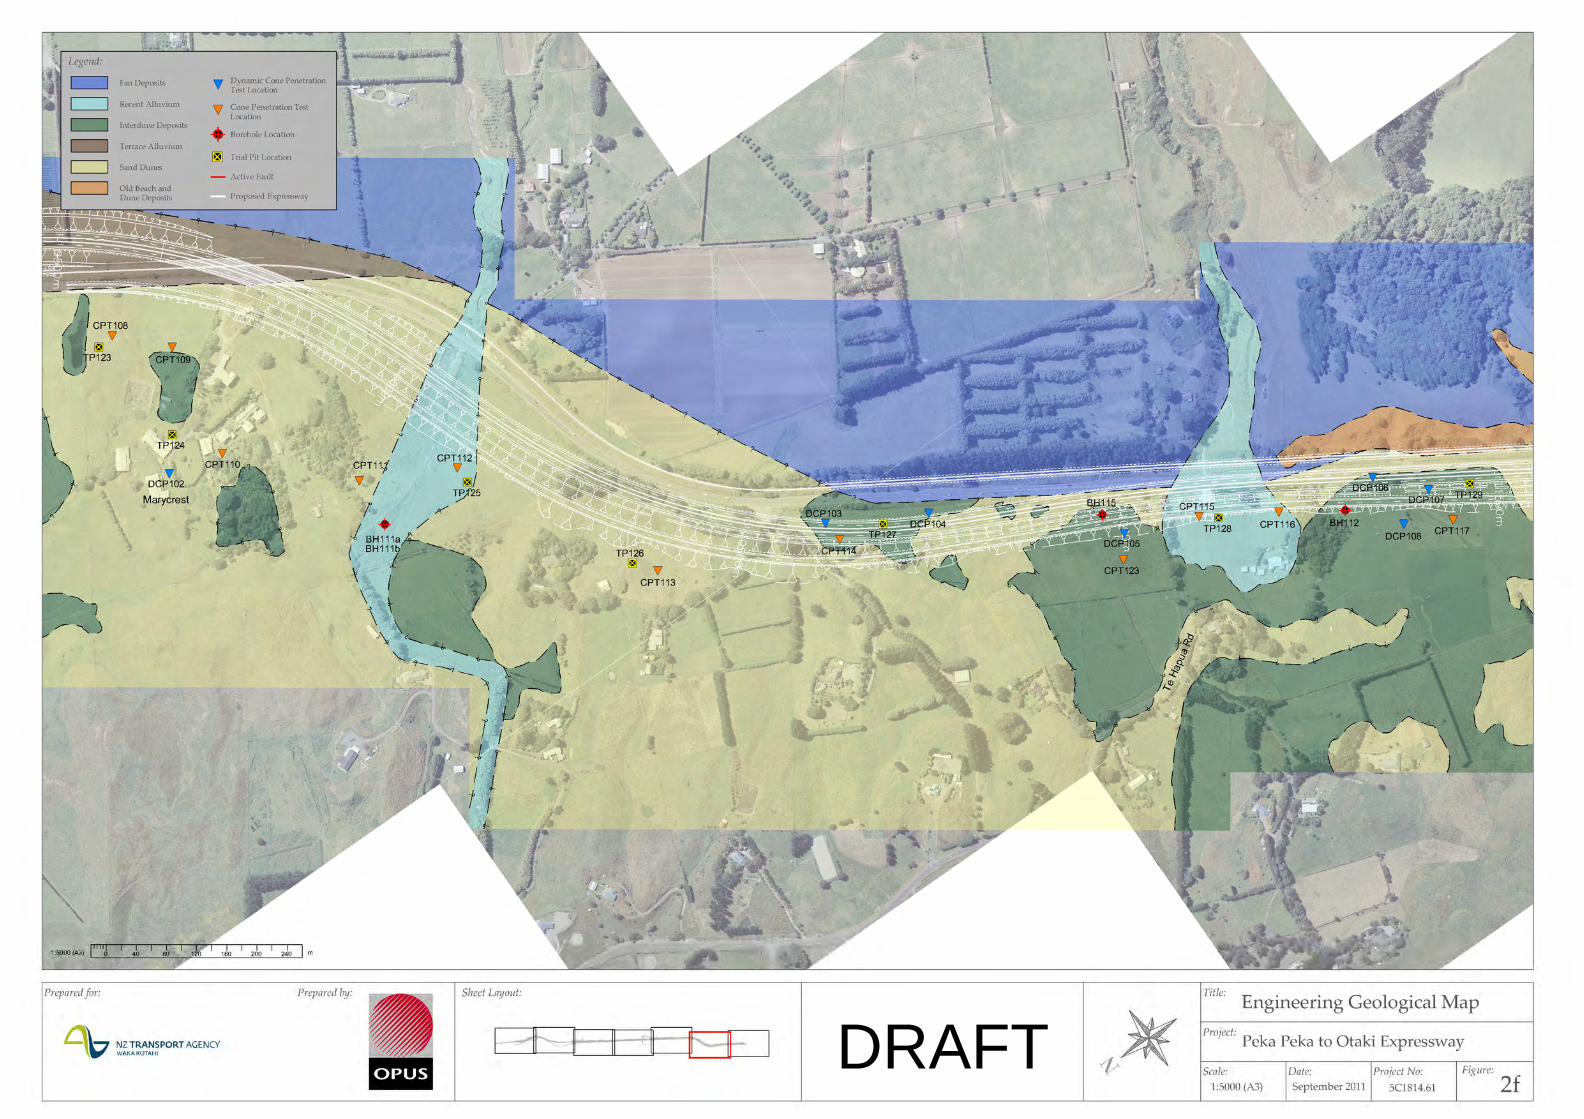
DRAFT
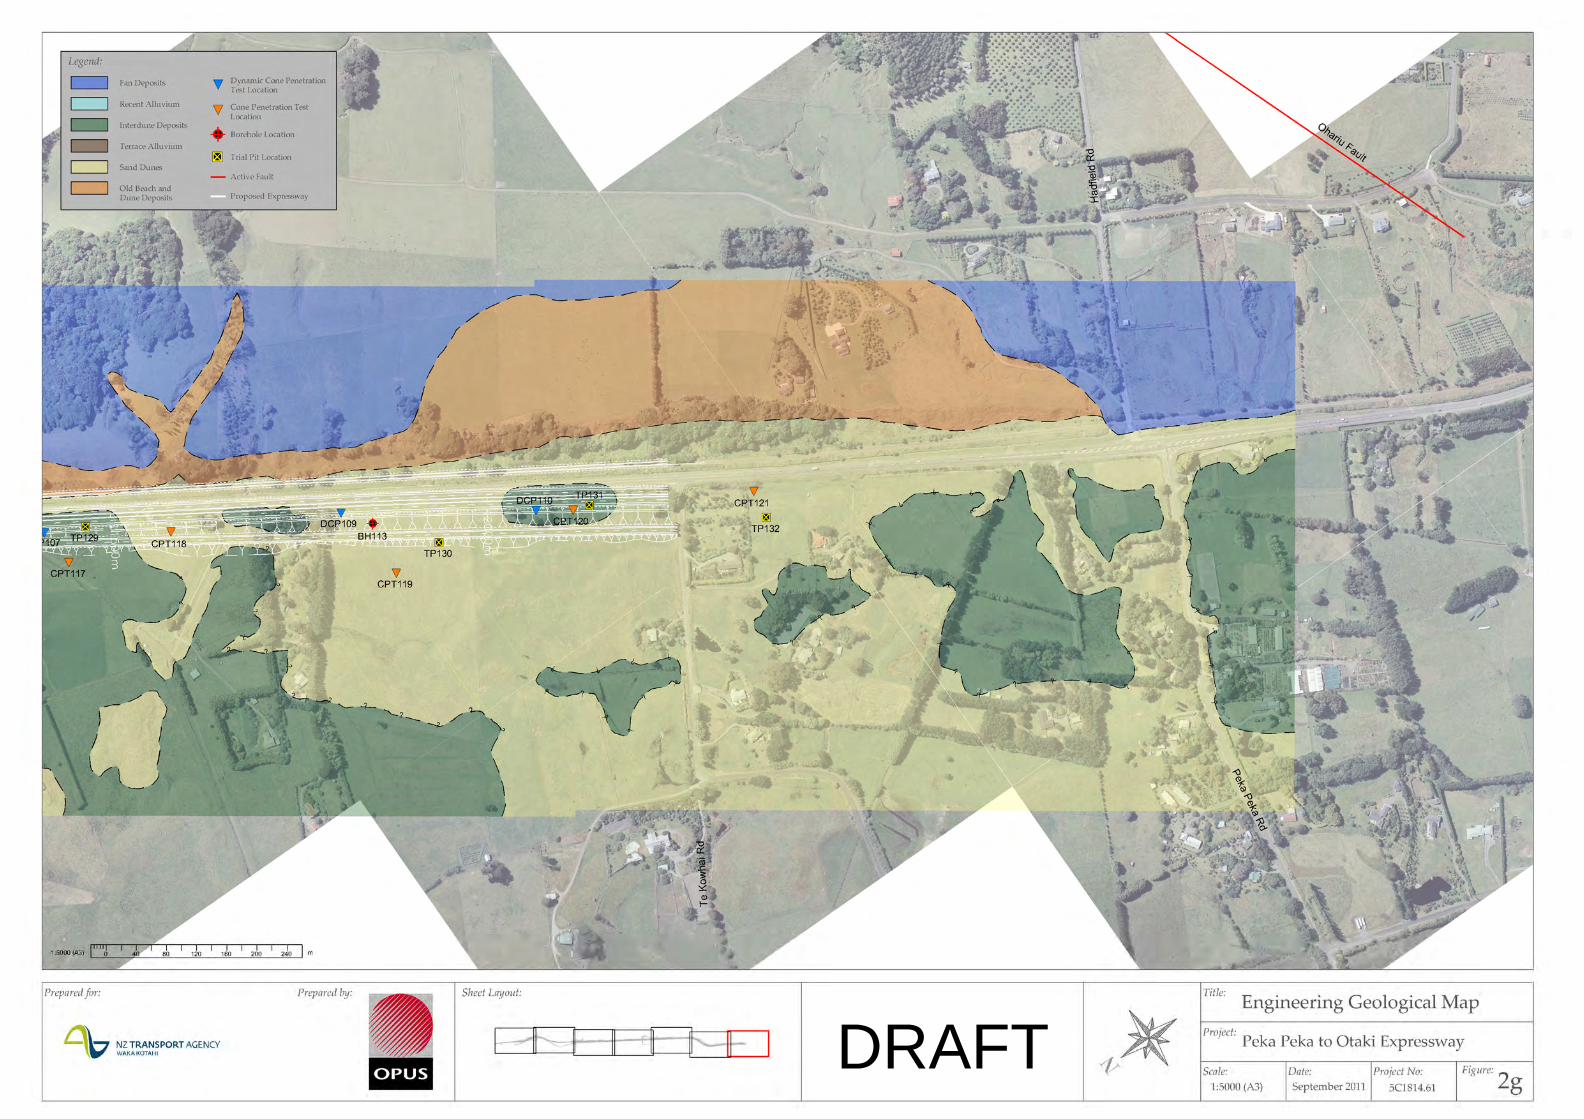
DRAFT

DRAFT

NZ Transport AgencyPeka Peka to Otaki Expressway - Geotechnical Interpretative Report
September 2011 – draft 53 Opus Report No GER 2011 / 075 C 1814.61 PP2O_Geotechnical Interpretatiive Report_draft1
Appendices

NZ Transport AgencyPeka Peka to Otaki Expressway - Geotechnical Interpretative Report
September 2011 – draft 54 Opus Report No GER 2011 / 075 C 1814.61 PP2O_Geotechnical Interpretatiive Report_draft1
Appendix A
Geotechnical Advice Papers

Opus International Consultants Limited Level 9, Majestic Centre Telephone: +64 4 471 7000 Wellington Office 100 Willis Street, PO Box 12-003 Facsimile: +64 4 471 1397 Wellington, New Zealand Website: www.opus.co.nz
p:\projects\5-c1814.00 peka peka to north otaki 440pn\500 technical\592 geotechnics\deliverables\reports\geotechnical interpretative report\appendix a - geotechnical advice papers\pp2o_paper ga1_cut slope assessment_issue 1_25 mar_11.doc
PP2O Peka Peka to Otaki Expressway Geotechnical Paper GA1 Issue 1
GGEEOOTTEECCHHNNIICCAALL PPAAPPEERR Contract PP2O Peka Peka to Otaki Expressway
Reference Date GA1 Issue 1 25 March 2011 File: 5C1814.00
Title
PRELIMINARY ASSESSMENT OF CUT SLOPES
Purpose To provide initial geotechnical engineering advice on cut slopes to enable the SARA team to develop a more refined road model.
Introduction The initial advice provided in this paper is based on:
Findings of the Stage 1 geotechnical investigations including desk study and engineering geological mapping carried out by Opus.
Findings of the Stage 2 geotechnical investigations including boreholes, trial pits, and Cone Penetration Tests carried out to date.
Our knowledge of the design, construction and performance of cut slopes of similar geology, based on highway cuttings undertaken in the Wellington Region in the past 20 years.
Cut Slopes
Cuttings will be required to form the proposed road at three main areas:
1. South of Waitohu Stream (Station 1070 – 1460 m) 2. South of Otaki River (Station 3870 – 5300 m) 3. North of TeHapua Road (Station 10100 – 10500 m)
The cuts will be formed in sand dunes and terrace alluvium, which comprises mainly gravels with cobbles and boulders. Cuttings are up to a maximum height of approximately 18 m. Table 1 summarise the locations, ground characteristics and heights of the three main cutting areas.

Page - 2
Table 1: Cut Slope Locations, Ground Characteristics and Heights
Major Cut Location Station Ground Characteristics
Max. Height of Cutting
South of Waitohu Stream Station 1070 – 1460 m
Dune sand 18 m
South of Otaki River Station 3870 – 5300 m
Terrace alluvium (gravels with cobbles and boulders)
8 m
North of TeHapua Road Station 10100 – 10500 m
Dune sand 12 m
According to the results of the site investigations to date, the dune sand generally comprise loose to dense fine sand. The terrace alluvium are mostly gravel with cobbles and boulders in a silty sand matrix. The clasts are generally well graded with boulders up to 40 cm, of sub-angular to sub-rounded greywacke. The gravel is generally overlain by a layer of stiff silt to silty sand of up to 0.5 m thickness. Design Considerations Key factors that influence the design of cut slopes are:
ground conditions
height of cuttings
groundwater conditions
slope above cuttings (insignificant in this site) The design of cut slopes need to take into consideration:
stability under normal conditions
stability under storm events
earthquake stability
soil erosion These issues would influence route security, maintenance costs and safety, and would need to be balanced against the capital cost of construction and environmental effects. Recommendations Preliminary cut slope configurations as shown in Table 2 are recommended for use in the preliminary road design. Table 2: Recommendations on Cut Slope Configurations
Ground Characteristics
Location Cut Slope Configurations
Indicative Slope Angles
Benches
Dune sand Station 1070 – 1460 m & Station 10100 – 10500 m
22° (1V : 2.5H) 3 m wide benches at 10 m height intervals
Terrace alluvium (gravels, cobbles and boulders)
Station 3870 – 5300 m
40° (1V : 1.2H) Not necessary. Cutting is less than 10 m high.

Page - 3
In addition, stabilisation measures such as sub-horizontal drainage holes and sub-soil drains should be installed to maintain low groundwater levels to improve slope stability, minimise the risk in storm events, and to keep the water level below the pavement subgrade. Provisional erosion protection measures such as surface drains and geotextile erosion matting are recommended for the erodible dune sand cut facings. The cut slope recommendations will be refined as the geotechnical investigations and assessment progress, based on the additional information made as part of the project.
Prepared by: Janet Duxfield 16 March 2011 Reviewed by: P Brabhaharan 25 March 2011

Opus International Consultants Limited Level 9, Majestic Centre Telephone: +64 4 471 7000 Wellington Office 100 Willis Street, PO Box 12-003 Facsimile: +64 4 471 1397 Wellington, New Zealand Website: www.opus.co.nz
p:\projects\5-c1814.00 peka peka to north otaki 440pn\500 technical\592 geotechnics\deliverables\reports\geotechnical interpretative report\appendix a - geotechnical advice papers\pp2o_paper ga2_ground improvement_issue 1_21 mar_11.doc
PP2O Peka Peka to Otaki Expressway Geotechnical Paper GA2 Issue 1
GGEEOOTTEECCHHNNIICCAALL PPAAPPEERR Contract PP2O Peka Peka to Otaki Expressway
Reference Date GA2 Issue 1 29 March 2011 File: 5C1814.00
Title
GROUND IMPROVEMENT
Purpose To provide initial geotechnical engineering advice on ground improvement and the amount of undercut under new embankments and pavements.
Introduction The initial advice provided in this paper is based on:
Findings of the Stage 1 geotechnical investigations including desk study and engineering geological mapping carried out by Opus.
Findings of the Stage 2 geotechnical investigations including boreholes, trial pits, and Cone Penetration Tests carried out to date.
Our knowledge of the engineering properties and performance of interdunal deposits and design and construction of ground improvements in the Kapati Area and the wider Wellington Region.
Ground Improvement
Ground improvement may include:
Undercut of weak, compressible, or organic soils and replacement with compacted fill;
Excavation and preloading of compressible soils, where there are significant thicknesses of soft compressible layers (generally greater than 3 m) which cannot be completely removed in a practical and economical manner;
Stone columns and wick drains to mitigate the risk of earthquake
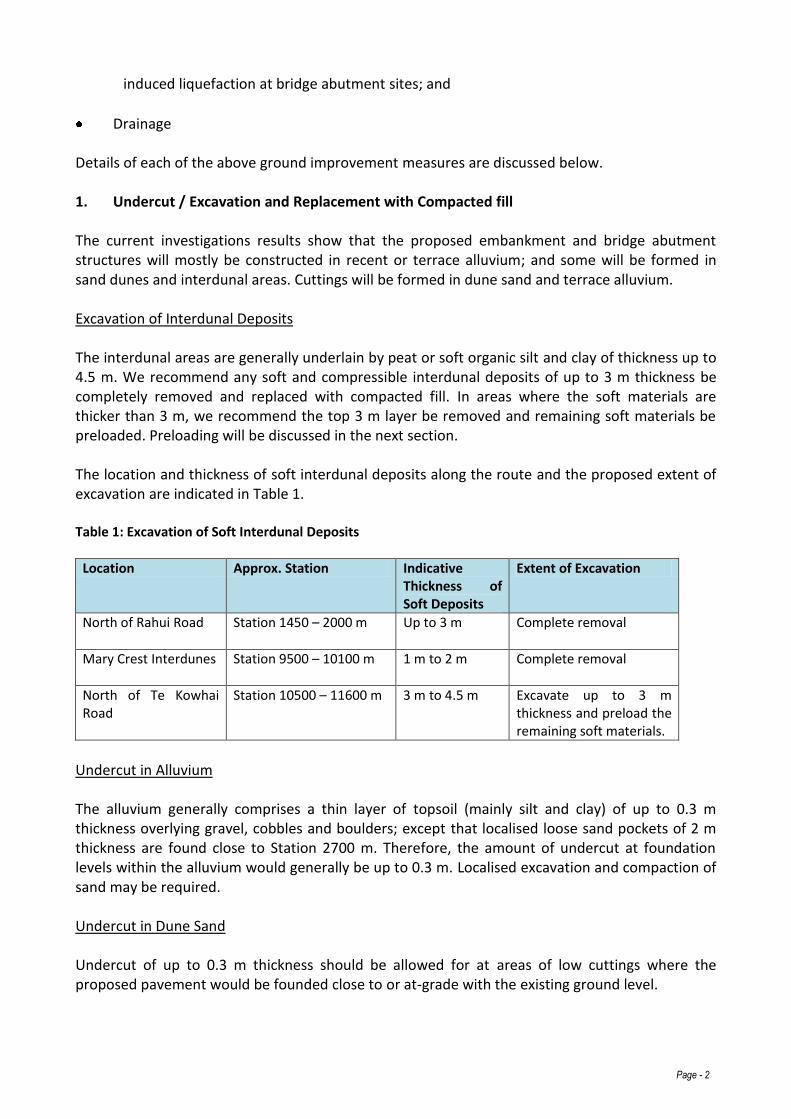
Page - 2
induced liquefaction at bridge abutment sites; and
Drainage
Details of each of the above ground improvement measures are discussed below. 1. Undercut / Excavation and Replacement with Compacted fill The current investigations results show that the proposed embankment and bridge abutment structures will mostly be constructed in recent or terrace alluvium; and some will be formed in sand dunes and interdunal areas. Cuttings will be formed in dune sand and terrace alluvium. Excavation of Interdunal Deposits The interdunal areas are generally underlain by peat or soft organic silt and clay of thickness up to 4.5 m. We recommend any soft and compressible interdunal deposits of up to 3 m thickness be completely removed and replaced with compacted fill. In areas where the soft materials are thicker than 3 m, we recommend the top 3 m layer be removed and remaining soft materials be preloaded. Preloading will be discussed in the next section. The location and thickness of soft interdunal deposits along the route and the proposed extent of excavation are indicated in Table 1. Table 1: Excavation of Soft Interdunal Deposits
Location Approx. Station Indicative Thickness of Soft Deposits
Extent of Excavation
North of Rahui Road Station 1450 – 2000 m
Up to 3 m Complete removal
Mary Crest Interdunes Station 9500 – 10100 m
1 m to 2 m Complete removal
North of Te Kowhai Road
Station 10500 – 11600 m
3 m to 4.5 m Excavate up to 3 m thickness and preload the remaining soft materials.
Undercut in Alluvium The alluvium generally comprises a thin layer of topsoil (mainly silt and clay) of up to 0.3 m thickness overlying gravel, cobbles and boulders; except that localised loose sand pockets of 2 m thickness are found close to Station 2700 m. Therefore, the amount of undercut at foundation levels within the alluvium would generally be up to 0.3 m. Localised excavation and compaction of sand may be required. Undercut in Dune Sand Undercut of up to 0.3 m thickness should be allowed for at areas of low cuttings where the proposed pavement would be founded close to or at-grade with the existing ground level.

Page - 3
2. Excavation and Preloading of Interdunal Deposits In areas where the thickness of soft compressible layers is significant (say beyond 3 m thick), excavation and removal of all the soft materials becomes non-practical. It is more appropriate to excavate the soft layers up to 3 m and preload the remaining soft materials to minimise post-construction ground settlement. (Refer to Table 1 for locations of soft compressible of thickness greater than 3 m.) Considering the thickness of soft materials and the height of the proposed embankment, the order of settlement would generally be around 300 – 500 mm. The period of preloading is estimated to be about 6 to 9 months. Since the remaining soft materials after excavation would likely be less than 2 m, wick drains would probably not be necessary. 3. Ground Improvement in Liquefiable Soils Additional ground improvement measures would be required where there is a potential for liquefaction which may affect the route security or affect the performance of structures such as bridge abutments. Measures such as installation of stone columns and wick drains have been commonly used to improve the strength and density of the liquefiable ground and to provide drainage in earthquake events. Liquefaction-prone soils include floodplain deposits such as loose silt, sand, and sandy gravel; or dense sand, below the groundwater level. 4. Drainage
Adequate drainage is important to avoid fill embankment instability. Sub-soil drains should be installed along the interface between the natural ground and the fill embankment. In addition, drains should be installed within the embankment fill formed using fine grained soils such as dune sand.
Recommendations A number of ground improvement methods have been recommended and the estimated amount of undercut along the route has been provided. The recommendations will be refined as the geotechnical investigations and assessment progress, based on the additional information made as part of the project.
Prepared by: Janet Duxfield 18 March 2011 Reviewed by: P Brabhaharan 29 March 2011

Opus International Consultants Limited Level 9, Majestic Centre Telephone: +64 4 471 7000 Wellington Office 100 Willis Street, PO Box 12-003 Facsimile: +64 4 471 1397 Wellington, New Zealand Website: www.opus.co.nz
p:\projects\5-c1814.00 peka peka to north otaki 440pn\500 technical\592 geotechnics\deliverables\reports\geotechnical interpretative report\appendix a - geotechnical advice papers\pp2o_paper ga3_otaki river bridge_issue 1_21_apr_11.doc
PP2O Peka Peka to Otaki Expressway Geotechnical Paper GA3 Issue 1
GGEEOOTTEECCHHNNIICCAALL PPAAPPEERR Contract PP2O Peka Peka to Otaki Expressway
Reference Date GA3 Issue 1 21 April 2011 File: 5C1814.61
Title
GEOTECHNICAL RECOMMENDATIONS FOR OTAKI RIVER BRIDGE
Purpose To provide ground conditions, soil properties, and liquefaction potential at Otaki River and to advise the form of bridge abutments and foundations based on the current site investigation results and geotechnical engineering requirements, for preliminary scheme design of the Otaki River Bridge as part of the Board Approved alignment option.
Introduction The initial advice provided in this paper is based on:
Findings of the Stage 1 geotechnical investigations including desk study and engineering geological mapping carried out by Opus.
Our knowledge of the site geology and material properties as Stage 2 geotechnical investigations progress with information available up to April 2011.
Geotechnical investigations and assessment carried out by Opus (2009) for the seismic performance assessment and retrofit of the SH1 Otaki River Bridge.
Our knowledge of the local geology and the design, construction, and performance of bridge structures, based on highway and bridge seismic retrofit projects (including seismic retrofit of the SH1 Otaki River Bridge) undertaken in the past 20 years.
Discussion Site Investigations
Site investigations carried out at or in the vicinity of the bridge site include:
Desk study and engineering geological mapping

Page - 2
1 borehole (BH7) at the northern abutment of the proposed Otaki River Bridge along the preferred alignment option
4 boreholes at the abutments and river bank of the SH1 Otaki River Bridge, including downhole shear wave velocity survey and laboratory testing, as part of the bridge seismic retrofit assessment.
Geology and Ground Conditions
The Geological Map for the Wellington Area (IGNS, 2000) indicates that the site is underlain by recent Holocene alluvial deposits comprising well sorted flood plain gravels with cobbles and boulders. The gravel, cobbles and boulders are predominantly derived from Greywacke sandstone. Based on the site investigation results, the site is mainly underlain by sandy gravel to gravel and cobbles. The gravel and cobbles are generally very dense; except that the materials are generally medium dense at the top 1 m to 2 m. Majority of the materials achieving SPT N-values greater than 50; however the SPT N-values are unreliable given the presence of large gravel, cobble and boulder particles. Layers of firm to stiff silt / clay and dense to very dense sand of about 1 m to 2 m thickness are present within the alluvium. There are some localised loose layers near the piers in the river channel, where no site investigations were carried out. Engineering Properties of Site Soils The indicative soil layers and inferred soil properties at the proposed northern abutment are presented in Table 1 based on the results of BHG. This can be used as a general pattern of soil distribution at the southern abutment as no boreholes were drilled there. However, given the river depositional environment, the extent and continuity of the layers in both longitudinal and transverse directions are likely to vary significantly; therefore the layering as shown in Table 1 is indicative only. Table 1: Indicative Soil Layers and Inferred Soil Properties at the Proposed Northern Abutment
Soil Unit Geotechnical Parameters
Medium dense GRAVEL and COBBLES
(Depth: 0 m to 2 m)
Bulk unit weight [kN/ m3] 18 to 20
Cohesion, c [kN/m2] 0
Friction Angle, (°) 30 to 34
k value for derivation of p-y curve [MN/m3]
20 to 30 (above water table)
10 to 20 (below water table)
Very dense GRAVEL and COBBLES
(Depth: 2 m to 14 m)
Bulk unit weight, [kN/ m3] 20 to 22
Cohesion, c [kN/m2] 0
Friction Angle, (°) 36 to 40
k value for derivation of p-y curve [MN/m3]
40 to 50 (below water table)
Firm to stiff silty CLAY Bulk unit weight [KN/m3] 18 to 21

Page - 3
Soil Unit Geotechnical Parameters
(Depth: 14 m to 16 m)
Undrained shear strength, su [kN/m2]
30 to 100
k value for derivation of p-y curve [MN/m3]
30 to 80 (cyclic load)
80 to 150 (static load)
Dense to very dense SAND
(Depth: 16 m to 18.5 m)
Bulk unit weight [KN/m3] 19 to 20
Cohesion, c [kN/m2] 0
Friction Angle, (°) 33 to 38
k value for derivation of p-y curve [MN/m3]
30 to 50 (below water table)
Stiff CLAY to silty CLAY with thin layers of dense clayey silty SAND
(Depth: 18.5 m to 20 m)
Bulk unit weight [KN/m3] 20 to 21
Undrained shear strength, su [kN/m2]
50 to 100
k value for derivation of p-y curve [MN/m3]
50 to 80 (cyclic load)
120 to 180 (static load)
Very dense GRAVEL and COBBLES
(Depth: 20 m to 35 m)
Bulk unit weight, [kN/ m3] 20 to 22
Cohesion, c [kN/m2] 0
Friction Angle, (°) 36 to 40
k value for derivation of p-y curve [MN/m3]
40 to 50 (below water table)
Note: Since no boreholes were drilled at the southern abutment, Table 1 can be used to provide an indicative soil layering at the southern abutment. However, significant variation of soil layering should be expected.
Liquefaction Based on the results of the liquefaction assessment of the site soils for the SH1 Otaki River bridge retrofit project (Opus, 2009), the dense gravel and cobbles beneath the abutments are very unlikely to liquefy under a large earthquake event. The medium dense gravel layer found in the current BHG between 0 m and 2 m depth could potentially liquefy in saturated state. Liquefaction of the medium dense soils at the abutments could cause lateral spreading of the abutment slopes, differential settlement of the abutments, and negative skin friction on the abutment piles. While there could be a potential for liquefaction of some loose layers near the piers, given the flat river channel, lateral spreading is unlikely to occur and the localised liquefaction and consequent subsidence is unlikely to be critical for the structure. The induced negative skin friction on the pier piles due to liquefaction would need to be considered in the design of the bridge structure. However, the negative skin friction is not expected to have a significant effect on the structure if large diameter bored piles are founded in very dense gravel and cobbles.

Page - 4
Recommendations Recommendations on Bridge Abutments
Given that the bridge will be constructed across a wide river channel, spill-through abutments are recommended.
We recommend that the medium dense gravel of about 2 m thickness beneath the abutments to be removed and replaced with compacted gravel before construction of the bridge abutments. This will eliminate the risk due to liquefaction on the abutments and the bridge structure.
Recommendations on Bridge Foundations
Large diameter bored piles are considered to be appropriate because: - High end bearing capacity can easily be achieved in very dense gravel and cobbles; - Bored piles can be advanced through very dense gravel and cobbles, on the other hand,
the gravel, cobbles and boulders would possibly retard the penetration of driven piles; - This is a simple form of foundation which would not require complex pile caps over a
number of smaller pile and is easy to construct in a river environment. - They are robust against lateral displacement during an earthquake event.
Due to the presence of silt/clay/sand layers of variable strengths, pilot boreholes are recommended to be drilled at the design pile founding levels to a minimum depth of 5 m to confirm the soil stratum underneath and the bearing capacity of the piles.
Allowance should be made in the pile length for the potential of longer piles due to the presence of silt/clay/sand layers.
The effects of negative skin friction due to liquefaction should be considered in the design of pier foundations.
References Institute of Geological & Nuclear Sciences (2000). Geology of the Wellington Area. 1:250,000 Geological Map 10. Compiled by Begg, J.G. and Johnston, M.R. Lower Hutt, New Zealand. 1 sheet + 64p. Opus International Consultants (2009). Otaki River Bridge Seismic Retrofit. Geotechnical and Scour Assessment Report. Report No 2009 / 13. June 2009. Wellington, New Zealand.
Prepared by: Janet Duxfield 8 April 2011 Reviewed by: P Brabhaharan 20 April 2011

NZ Transport AgencyPeka Peka to Otaki Expressway - Geotechnical Interpretative Report
September 2011 – draft 55 Opus Report No GER 2011 / 075 C 1814.61 PP2O_Geotechnical Interpretatiive Report_draft1
Appendix B
Preferred Proposal of Road Design

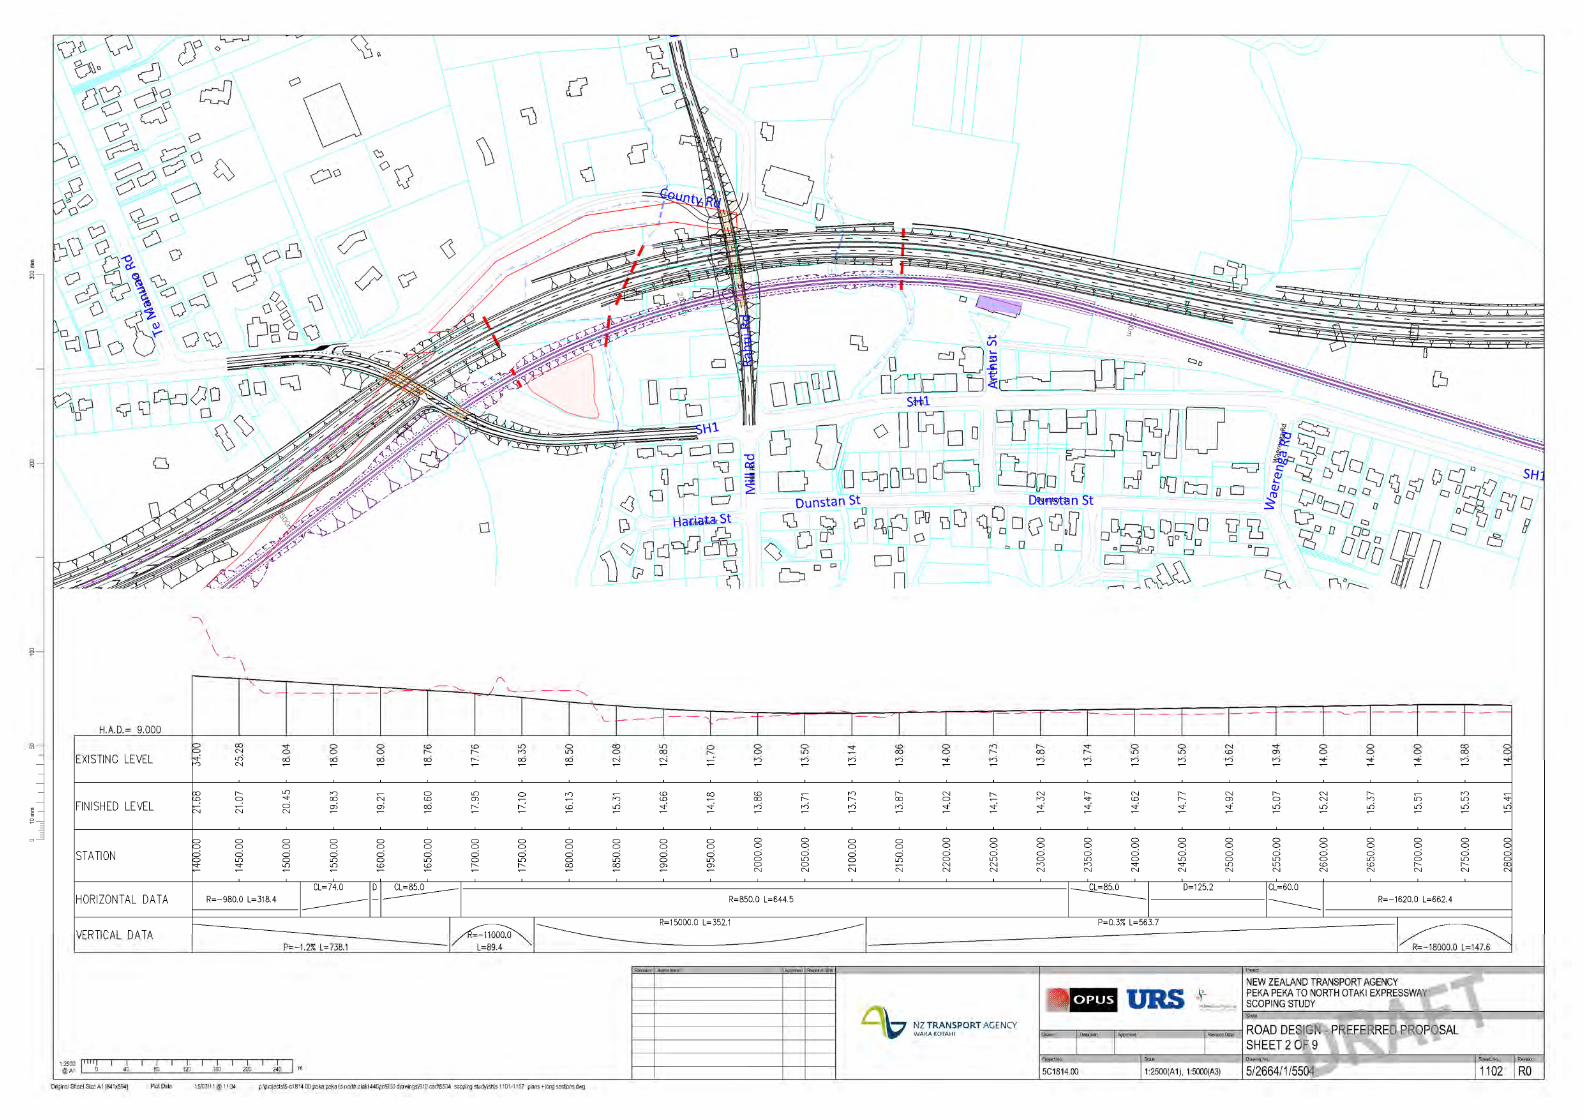


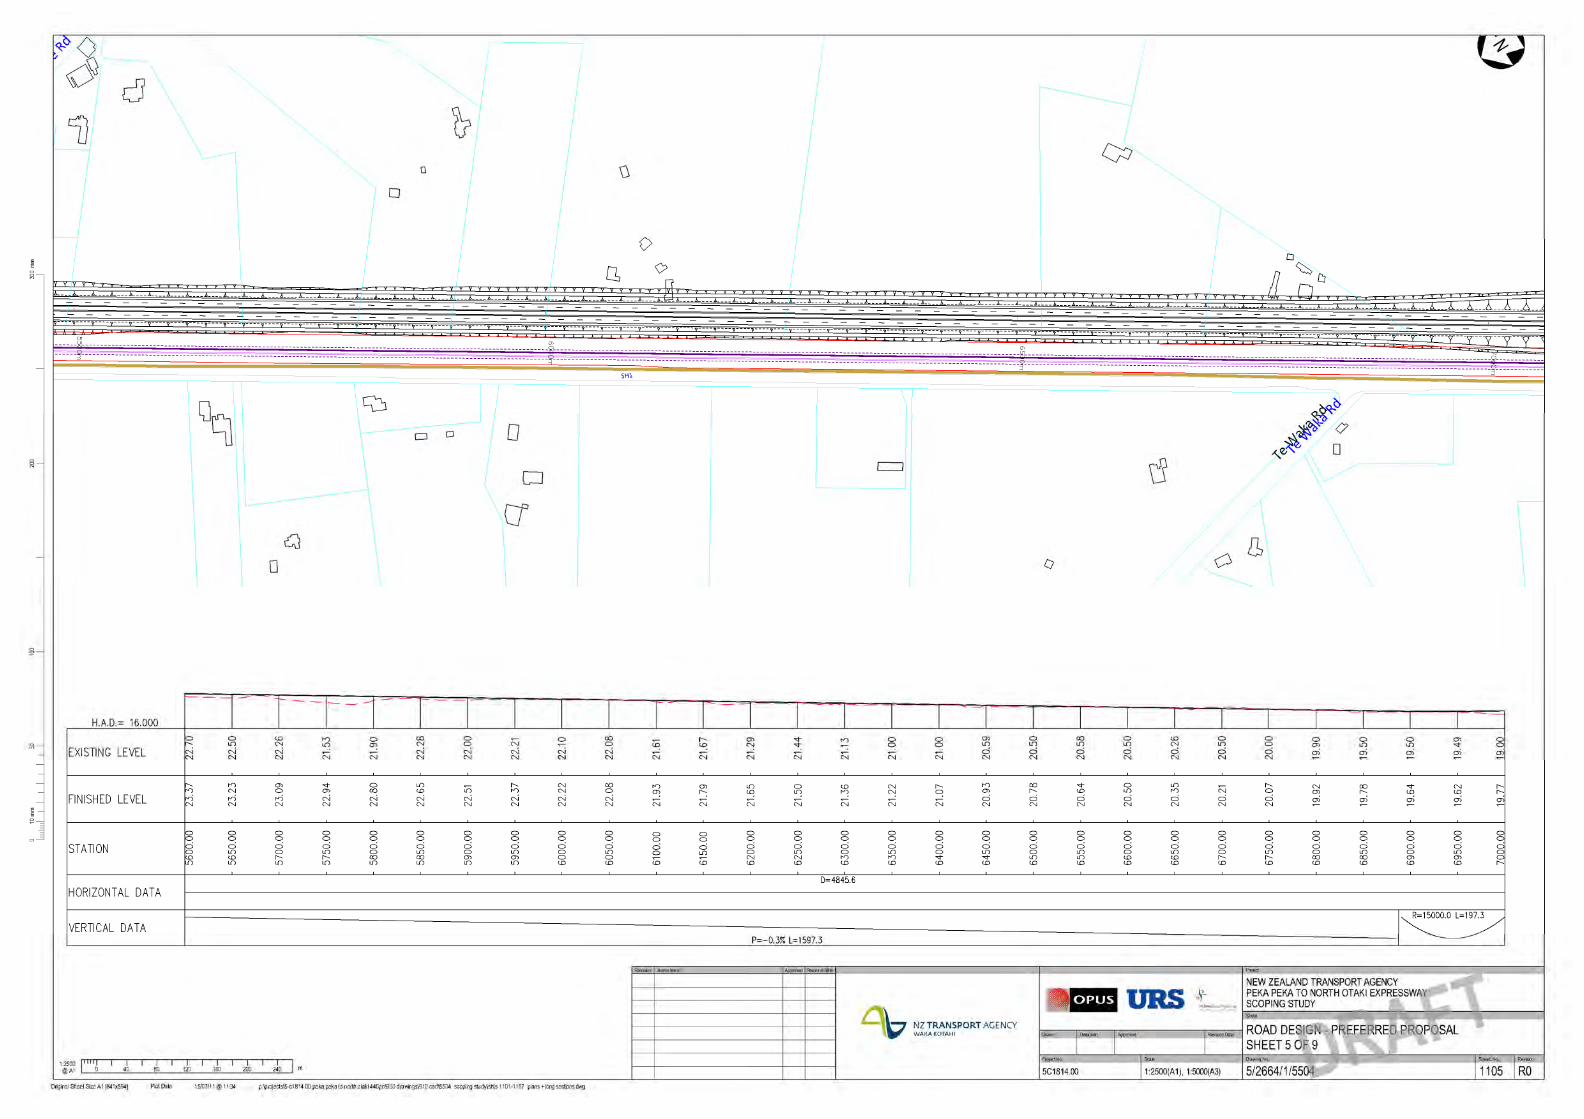


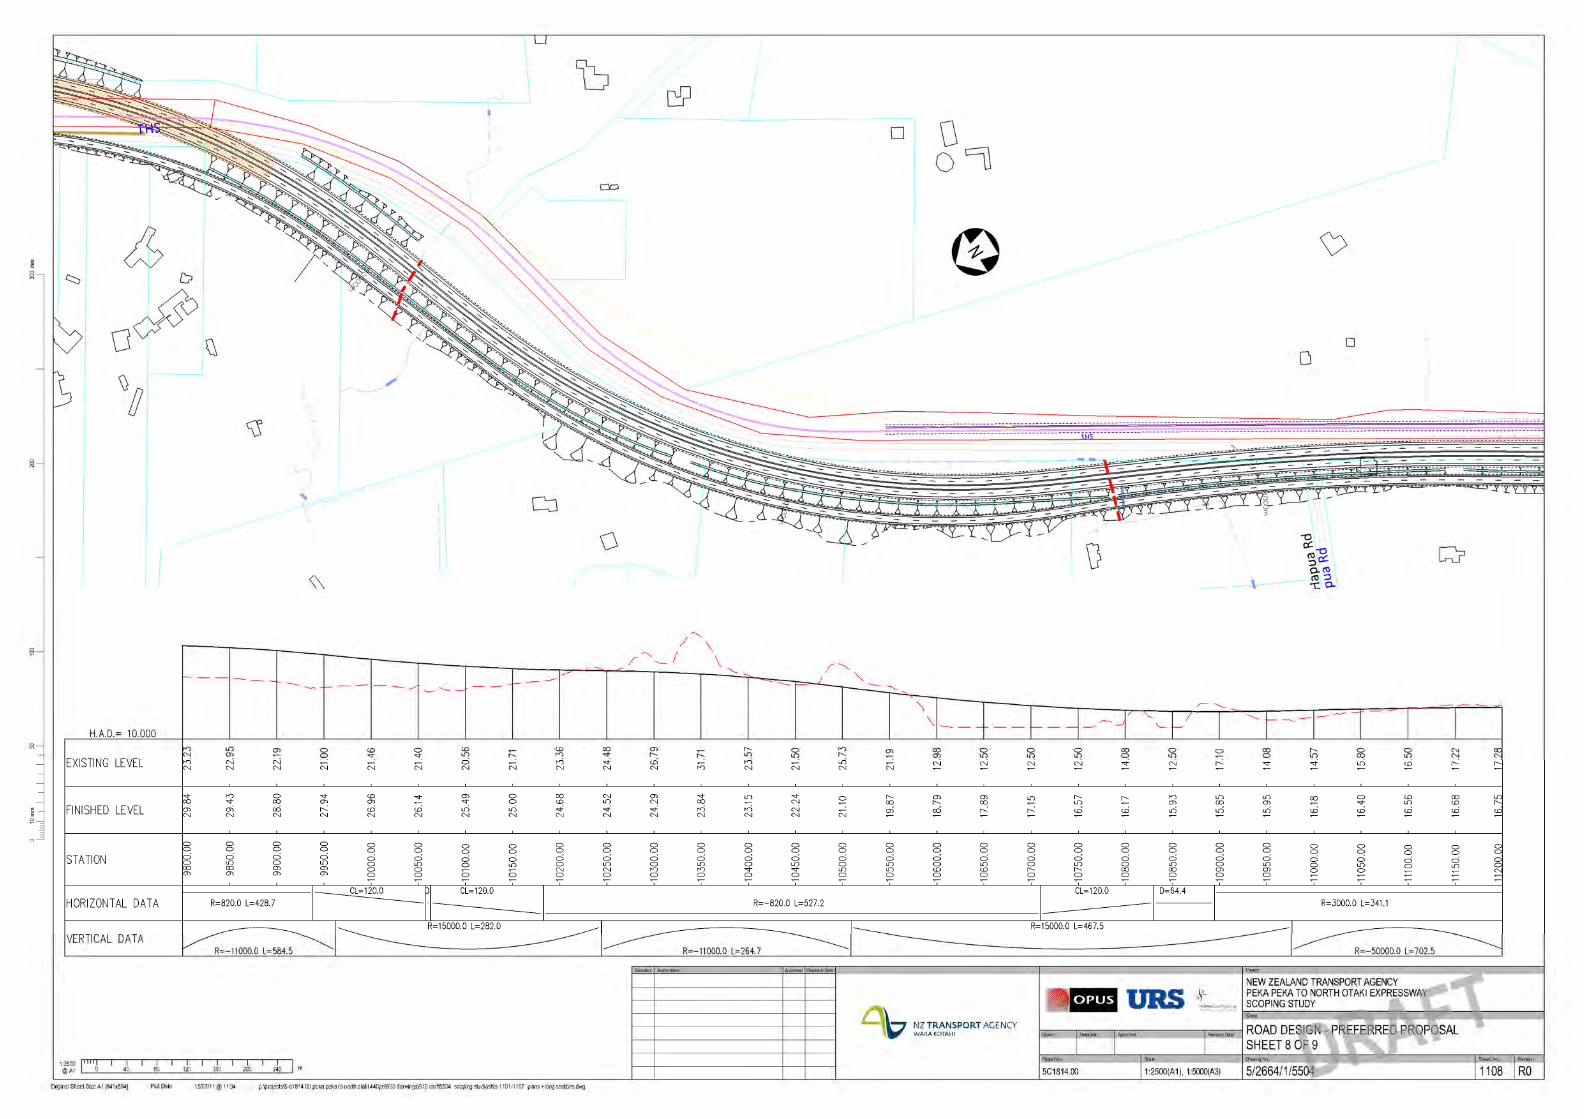


NZ Transport AgencyPeka Peka to Otaki Expressway - Geotechnical Interpretative Report
September 2011 – draft 56 Opus Report No GER 2011 / 075 C 1814.61 PP2O_Geotechnical Interpretatiive Report_draft1
Appendix C
Potential Undercut Areas

DRAFT

DRAFT

DRAFT

DRAFT