geotechnical exploration
TRANSCRIPT
- Expect Excellence -
Copyright © 2013 by ENGEO Incorporated. This document may not be reproduced in whole or in part by any means whatsoever, nor may it be quoted or excerpted without the express written consent of ENGEO Incorporated
GEOTECHNICAL EXPLORATION CANDLESTICK POINT CENTER
INFRASTRUCTURE IMPROVEMENTS SAN FRANCISCO, CALIFORNIA
Submitted to: Mr. B.H. Bronson Johnson
Lennar Urban One California Street, Suite 2700
San Francisco, CA 94111
Prepared by: ENGEO Incorporated
September 18, 2013
Project No:
8472.001.002
GEOTECHNICAL ENVIRONMENTAL
WATER RESOURCES CONSTRUCTION SERVICES
332 Pine Street, Suite 300 San Francisco, CA 94104 (415) 284-9900 Fax (888) 279-2698 www.engeo.com
Project No.
8472.001.002 September 18, 2013 Mr. B.H. Bronson Johnson Lennar Urban One California Street, Suite 2700 San Francisco, CA 94111 Subject: Candlestick Point Center (CP Center) Infrastructure Improvements San Francisco, California DESIGN GEOTECHNICAL REPORT Dear Mr. Johnson: We prepared this geotechnical report for the Infrastructure Improvement design at the Candlestick Point Center (CP Center) project in San Francisco, California as outlined in our agreement dated March 6, 2013. We characterized the subsurface conditions at the site to provide the enclosed geotechnical recommendations for design. Our experience and that of our profession clearly indicate that the risk of costly design, construction, and maintenance problems can be significantly lowered by retaining the design geotechnical engineering firm to review the project plans and specifications and provide geotechnical observation and testing services during construction. Please let us know when working drawings are nearing completion, and we will be glad to discuss these additional services with you. If you have any questions or comments regarding this report, please call and we will be glad to discuss them with you. Sincerely, ENGEO Incorporated Jeff Fippin, GE Leroy Chan, GE Daniel S. Haynosch, GE
Lennar Urban 8472.001.002 Candlestick Point Center September 18, 2013
TABLE OF CONTENTS
Letter of Transmittal
1.0 INTRODUCTION ......................................................................................... 1
1.1 PURPOSE AND SCOPE .......................................................................................1 1.2 PROJECT LOCATION ........................................................................................2 1.3 PROJECT DESCRIPTION ..................................................................................2 1.4 EXISTING GEOTECHNICAL DATA ................................................................2
FINDINGS ................................................................................................................ 3
1.5 GEOLOGY AND SEISMICITY ..........................................................................3 1.5.1 Geology ........................................................................................................3
1.5.1.1 Existing fill ......................................................................................3 1.5.1.2 Young Bay Mud ...............................................................................4 1.5.1.3 Alluvial Soil .....................................................................................4 1.5.1.4 Old Bay Mud....................................................................................4 1.5.1.5 Bedrock ............................................................................................4
1.5.2 Seismicity .....................................................................................................5 1.6 SURFACE CONDITIONS ....................................................................................6 1.7 FIELD EXPLORATION .......................................................................................7 1.8 SUBSURFACE CONDITIONS ............................................................................7 1.9 GROUNDWATER CONDITIONS ......................................................................8
2.0 CONCLUSIONS ............................................................................................ 8
2.1 SHALLOW ROCK EXCAVATION AND SUITABILITY ...............................9 2.2 SLOPE CONSTRUCTION .................................................................................10 2.3 EXISTING FILL ..................................................................................................10 2.4 SEISMIC HAZARDS ..........................................................................................11
2.4.1 Ground Rupture .........................................................................................11 2.4.2 Ground Shaking .........................................................................................11 2.4.3 Liquefaction ...............................................................................................11
2.4.3.1 Analyses of Clay-Like Material. .....................................................12 2.4.3.2 Analyses of Sand-Like Material ......................................................12 2.4.3.3 Summary of Liquefaction Analyses ...............................................13
2.4.4 Ground Lurching ........................................................................................14 2.4.5 Shoreline Stability ......................................................................................14
2.5 CONSOLIDATION SETTLEMENT OF YOUNG BAY MUD ......................14 2.6 CORROSIVITY CONSIDERATIONS .............................................................16 2.7 NATURALLY OCCURRING ASBESTOS .......................................................16
3.0 2010 AND 2013 CBC SEISMIC DESIGN PARAMETERS .................... 17
Lennar Urban 8472.001.002 Candlestick Point Center September 18, 2013
4.0 CONSTRUCTION MONITORING .......................................................... 17
5.0 EARTHWORK RECOMMENDATIONS ................................................ 18
5.1 GENERAL SITE CLEARING ...........................................................................18 5.2 OVER-OPTIMUM SOIL MOISTURE CONDITIONS ..................................19 5.3 ACCEPTABLE FILL ..........................................................................................19 5.4 FILL COMPACTION .........................................................................................19
5.4.1 Grading in Structural Areas .......................................................................19 5.4.2 Underground Utility Backfill .....................................................................20 5.4.3 Landscape Fill ............................................................................................20
6.0 FOUNDATION RECOMMENDATIONS ................................................. 21
7.0 EXTERIOR FLATWORK .......................................................................... 21
8.0 PAVEMENT DESIGN ................................................................................. 21
8.1 PAVEMENTS ......................................................................................................21 8.2 SUBGRADE COMPACTION ............................................................................22 8.3 AGGREGATE BASE COMPACTION (FLEXIBLE PAVEMENT
ALTERNATIVE) .................................................................................................22
9.0 LIMITATIONS AND UNIFORMITY OF CONDITIONS ...................... 23
FIGURES Figure 1 – Vicinity Map Figure 2 – Site Plan Figure 3 – Regional Geologic Map Figure 4 – Site Geologic Map Figure 5 – Seismic Hazard Zone Map Figure 6 – Regional Faulting and Seismicity Map Figure 7 – Proposed Grading with Historic Shoreline Figure 8 – Limits of Likely Surcharge and Removal Areas
APPENDIX A – Boring Logs – This Study APPENDIX B – Seismic Refraction Report (NorCal Geophysical) APPENDIX C – Previous Explorations (ENGEO) APPENDIX D – Previous Explorations (Other Consultants) APPENDIX E – Updated Liquefaction Analyses APPENDIX F – Bulk Asbestos Material Analysis (Forensic Analytical Laboratories)
Lennar Urban 8472.001.002 Candlestick Point Center September 18, 2013
- 1 -
1.0 INTRODUCTION 1.1 PURPOSE AND SCOPE We prepared this geotechnical report for design of the proposed infrastructure improvements at the CP Center site in San Francisco, California. This report addresses geotechnical aspects of the project related to mass grading, utilities, roadways, streetscape and related secondary improvements. It should be noted that separate, subsequent reports will be required for design of vertical improvements. Our approved scope of work included: Service Plan Development
Supplemental Subsurface Field Exploration
Soil Laboratory Testing
Data Analysis and Conclusions
Report Preparation For our use, we received: A grading plan by BKF titled “Candlestick Point, Jamestown Avenue and Arelious Walker,
Proposed Grading Plan,” dated March 26, 2013.
A plan by BKF titled “Grading and Storm Drain System Master Plan for the Candlestick Point Development,” dated August 16, 2013.
AutoCAD files showing additional grading information for the project.
The plans show grading for a pad as well as proposed elevations for perimeter roads surrounding the retail pad. The assessments and recommendations contained in this report are in general compliance with the San Francisco Building Code, the Seismic Hazards Mapping Act and CGS Special Publication 117A “Guidelines for Evaluating and Mitigating Seismic Hazards in California. This report was prepared for the exclusive use of our client and their consultants for design of this project. In the event that any changes are made in the character, design or layout of the development, we must be contacted to review the conclusions and recommendations contained in this report to determine whether modifications are necessary. This document may not be reproduced in whole or in part by any means whatsoever, nor may it be quoted or excerpted without our express written consent.
Lennar Urban 8472.001.002 Candlestick Point Center September 18, 2013
- 2 -
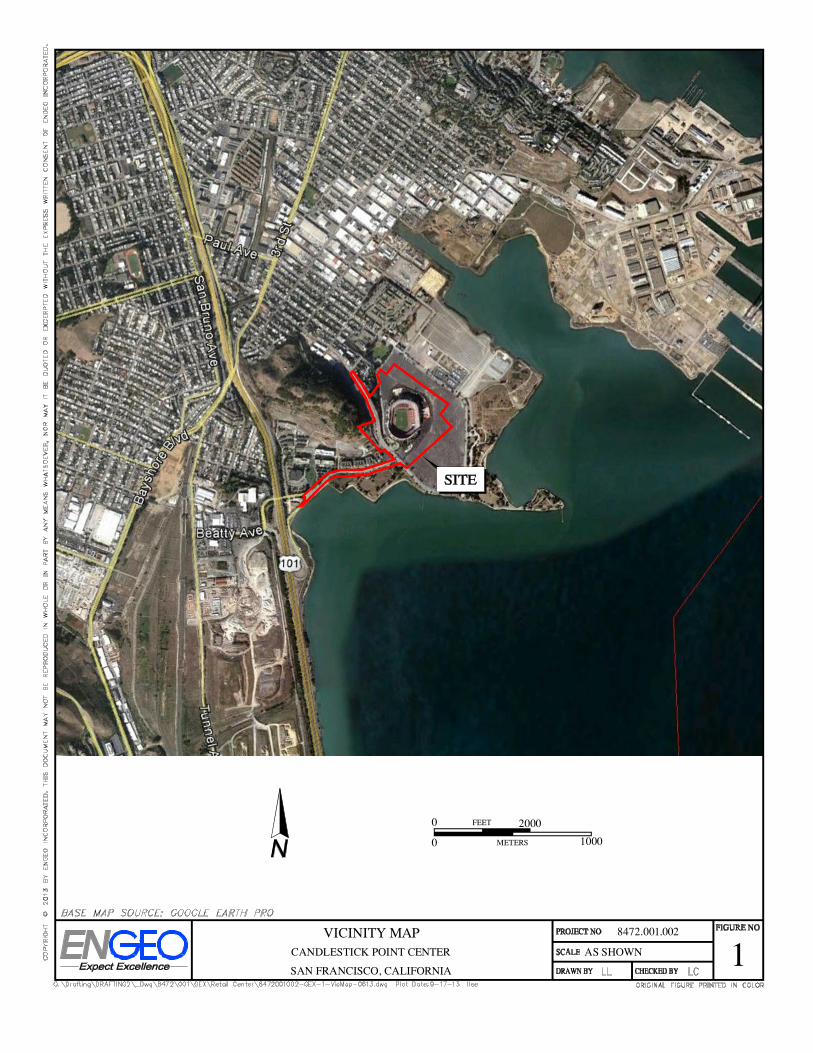
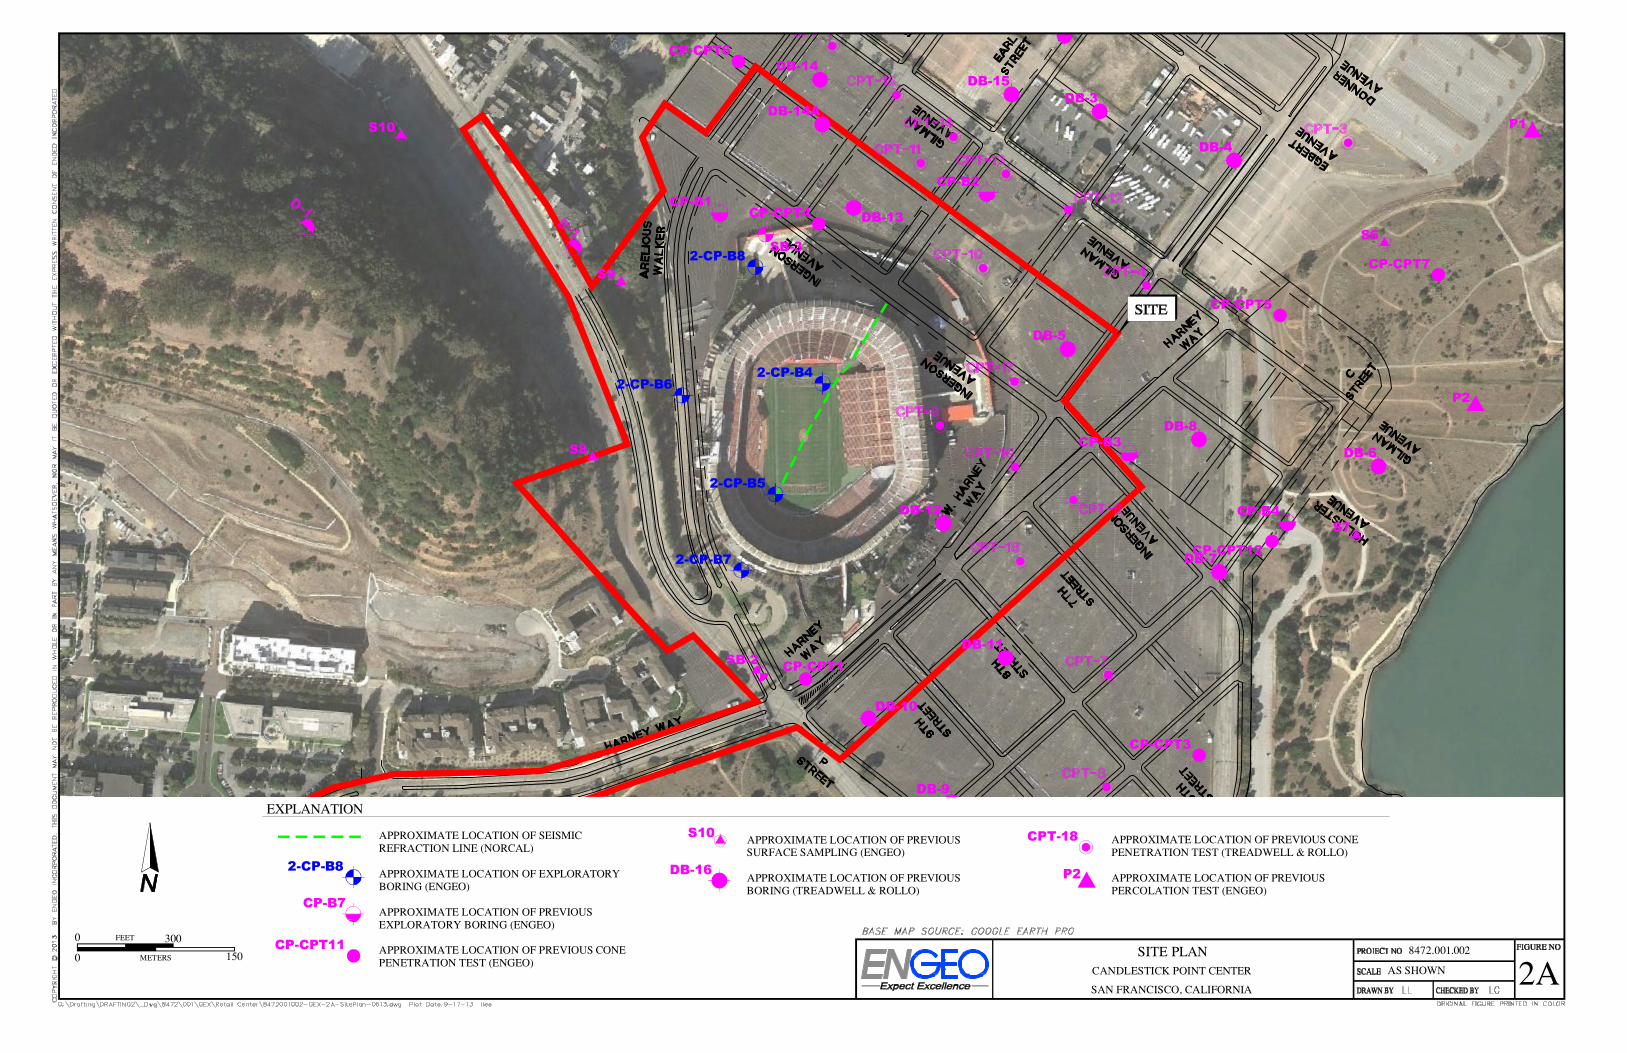
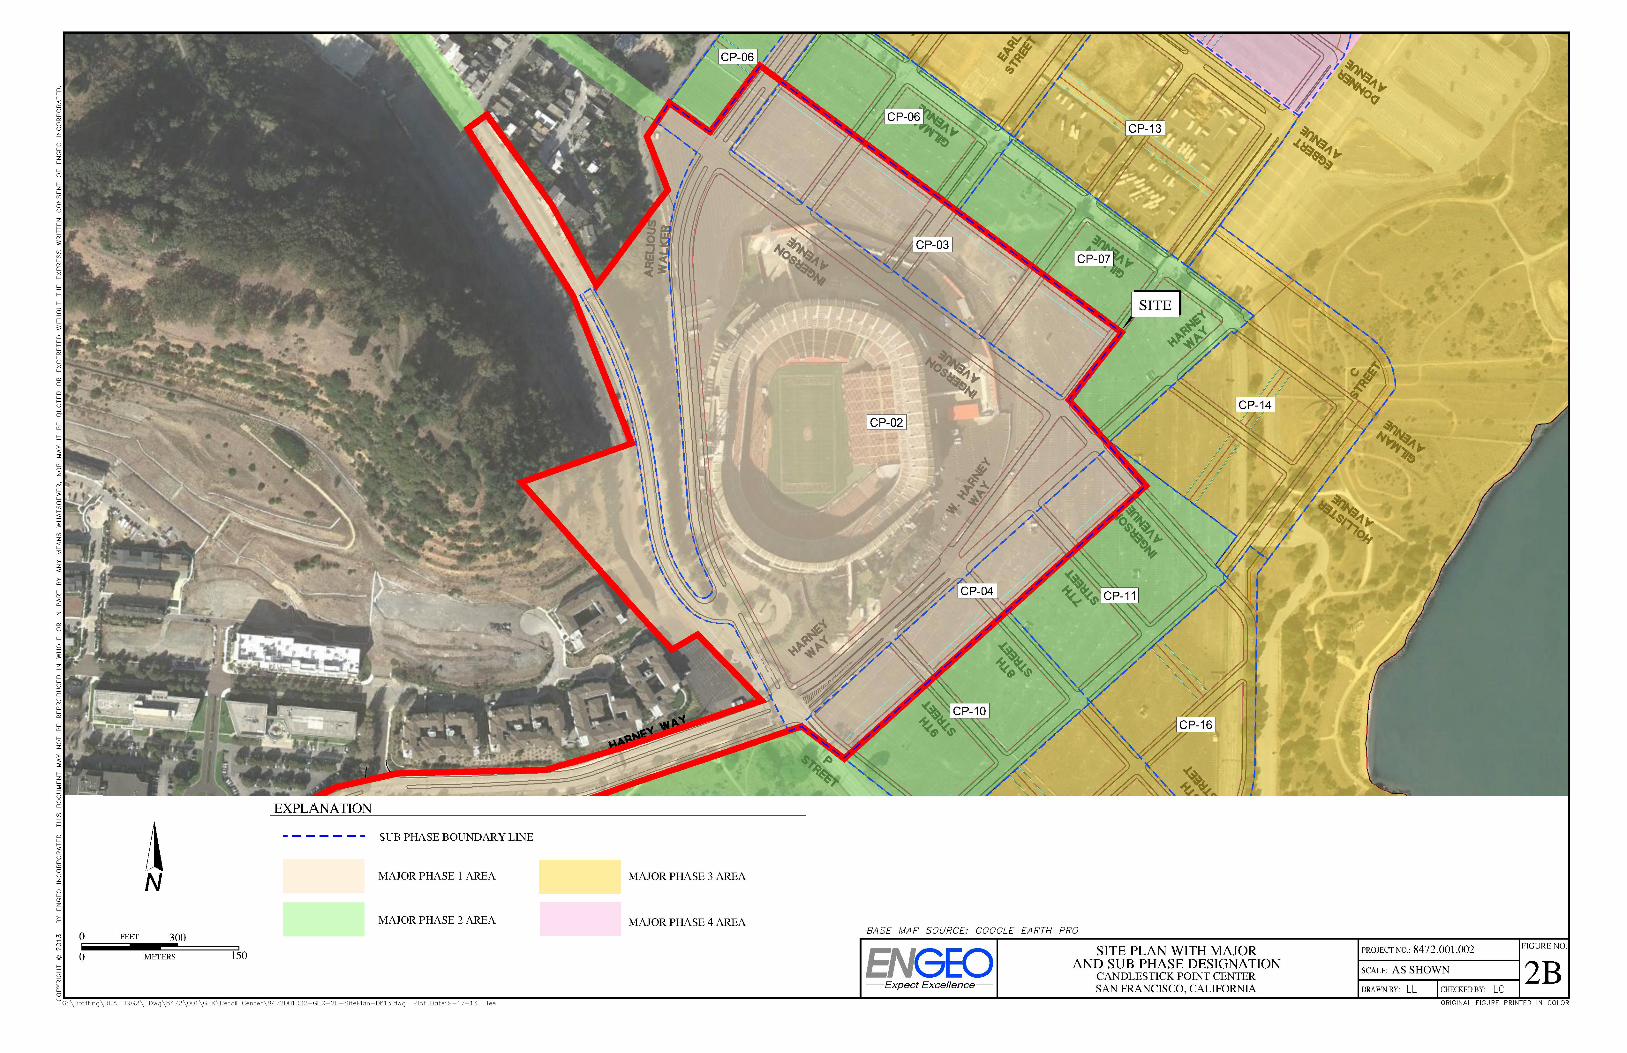
1.2 PROJECT LOCATION As shown in Figure 1, the site is located in the southeastern portion of the City of San Francisco in the Candlestick Point neighborhood. As shown in Figure 2, the project site covers the footprint of the existing football stadium and portions of the perimeter parking lot and access roads. The project is surrounded by Jamestown Road on the west, the extension of Harney Way on the southeast, and the extension of Ingerson Avenue on the northeast. 1.3 PROJECT DESCRIPTION At the current time, the development plans for the retail site are conceptual and include a superpad constructed at approximately project Elevation 110 feet (Datum = City of SF Datum plus 100 feet). The pad will be surrounded by extensions of existing Harney Way, Ingerson Avenue and Arelious Walker. Improvements are planned to realign the southern portion of Jamestown Avenue to intersect with the extension of Arelious Walker. The realignment of Jamestown Avenue will involve cuts of up to 12 feet with a retaining wall constructed on the western side of the roadway. The realigned portion of Jamestown Avenue will intersect with Arelious Walker near the existing turnaround at approximately Elevation 137 feet and slope upwards towards the north to tie in to the existing alignment at approximately Elevation 237 feet. A 2.5:1 (horizontal:vertical) slope will be constructed sloping down from the extension of Arelious Walker to the retail pad. This slope will be 40 feet tall at the highest point. The extension of Harney Way will intersect with Arelious Walker at approximately Elevation 120 feet and slope down to the intersection with Ingerson Avenue at approximately Elevation 110 feet. Slopes along Harney Way and Ingerson Avenue are shown as 3:1 or flatter. The majority of the grading will consist of cut. Fill up to 8 feet thick will be placed in the eastern corner of the retail pad near the intersection of Ingerson Avenue and Harney Way and in the northern corner of the retail pad near the intersection of Ingerson Avenue and Arelious Walker. On average, cuts will be on the order of 5 feet or less, however in the southern corner of the site, the grade will be lowered by as much as 37 feet near the existing Jamestown Avenue turnaround at the stadium. At the north side of the existing stadium, grade will be lowered as much as 25 feet. The proposed slope between Arelious Walker sloping down to the retail pad will be constructed by excavating in to the existing slope. 1.4 EXISTING GEOTECHNICAL DATA The site and vicinity have been investigated in the past. Subsurface explorations performed previously are shown on Figure 2. The reports associated with these previous explorations are: Treadwell and Rollo – A Geotechnical Investigation Report was prepared dated
March 3, 1998. The investigation included drilling 16 test borings, advancing 18 cone
Lennar Urban 8472.001.002 Candlestick Point Center September 18, 2013
- 3 -
penetration tests (CPT), and conducting five seismic refraction surveys between August 5 and September 16, 1997.
ENGEO 2011 – “Geotechnical Report, Hunters Point Shipyard Phase II Candlestick Point Redevelopment, San Francisco, California,” dated November 10, 2011. The subsurface exploration included seven borings, 12 CPTs, ten surface samples, and two percolation tests performed on Candlestick Point.
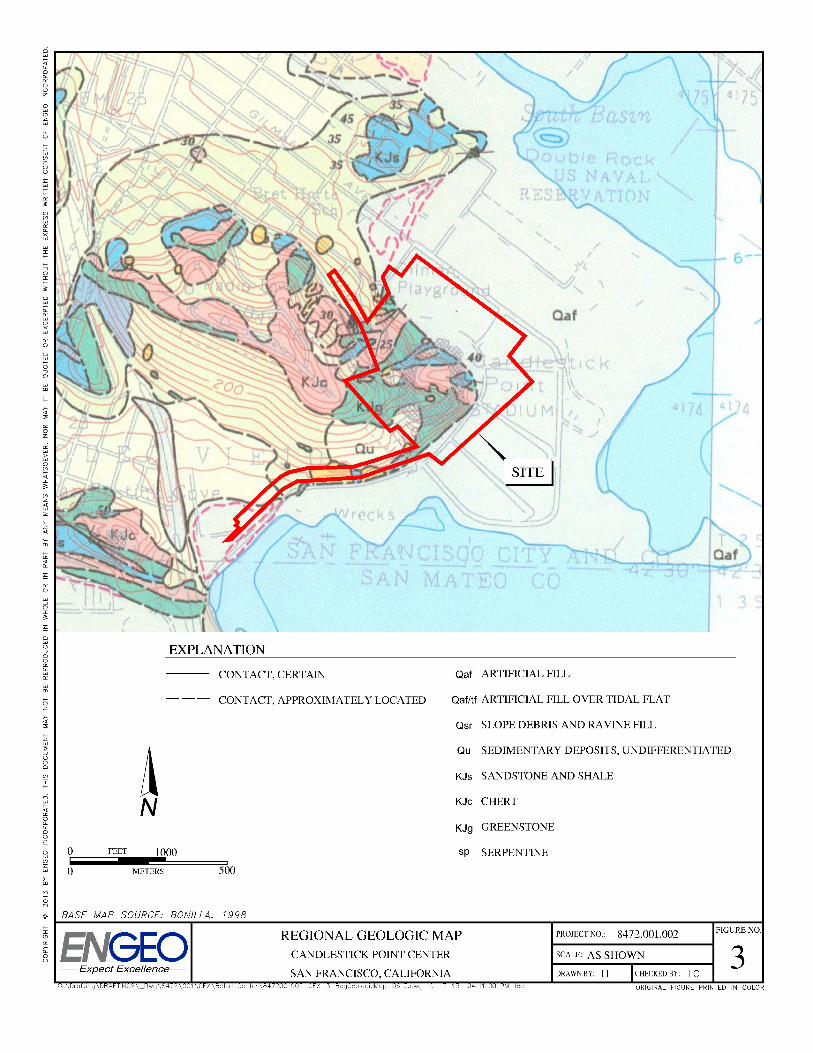
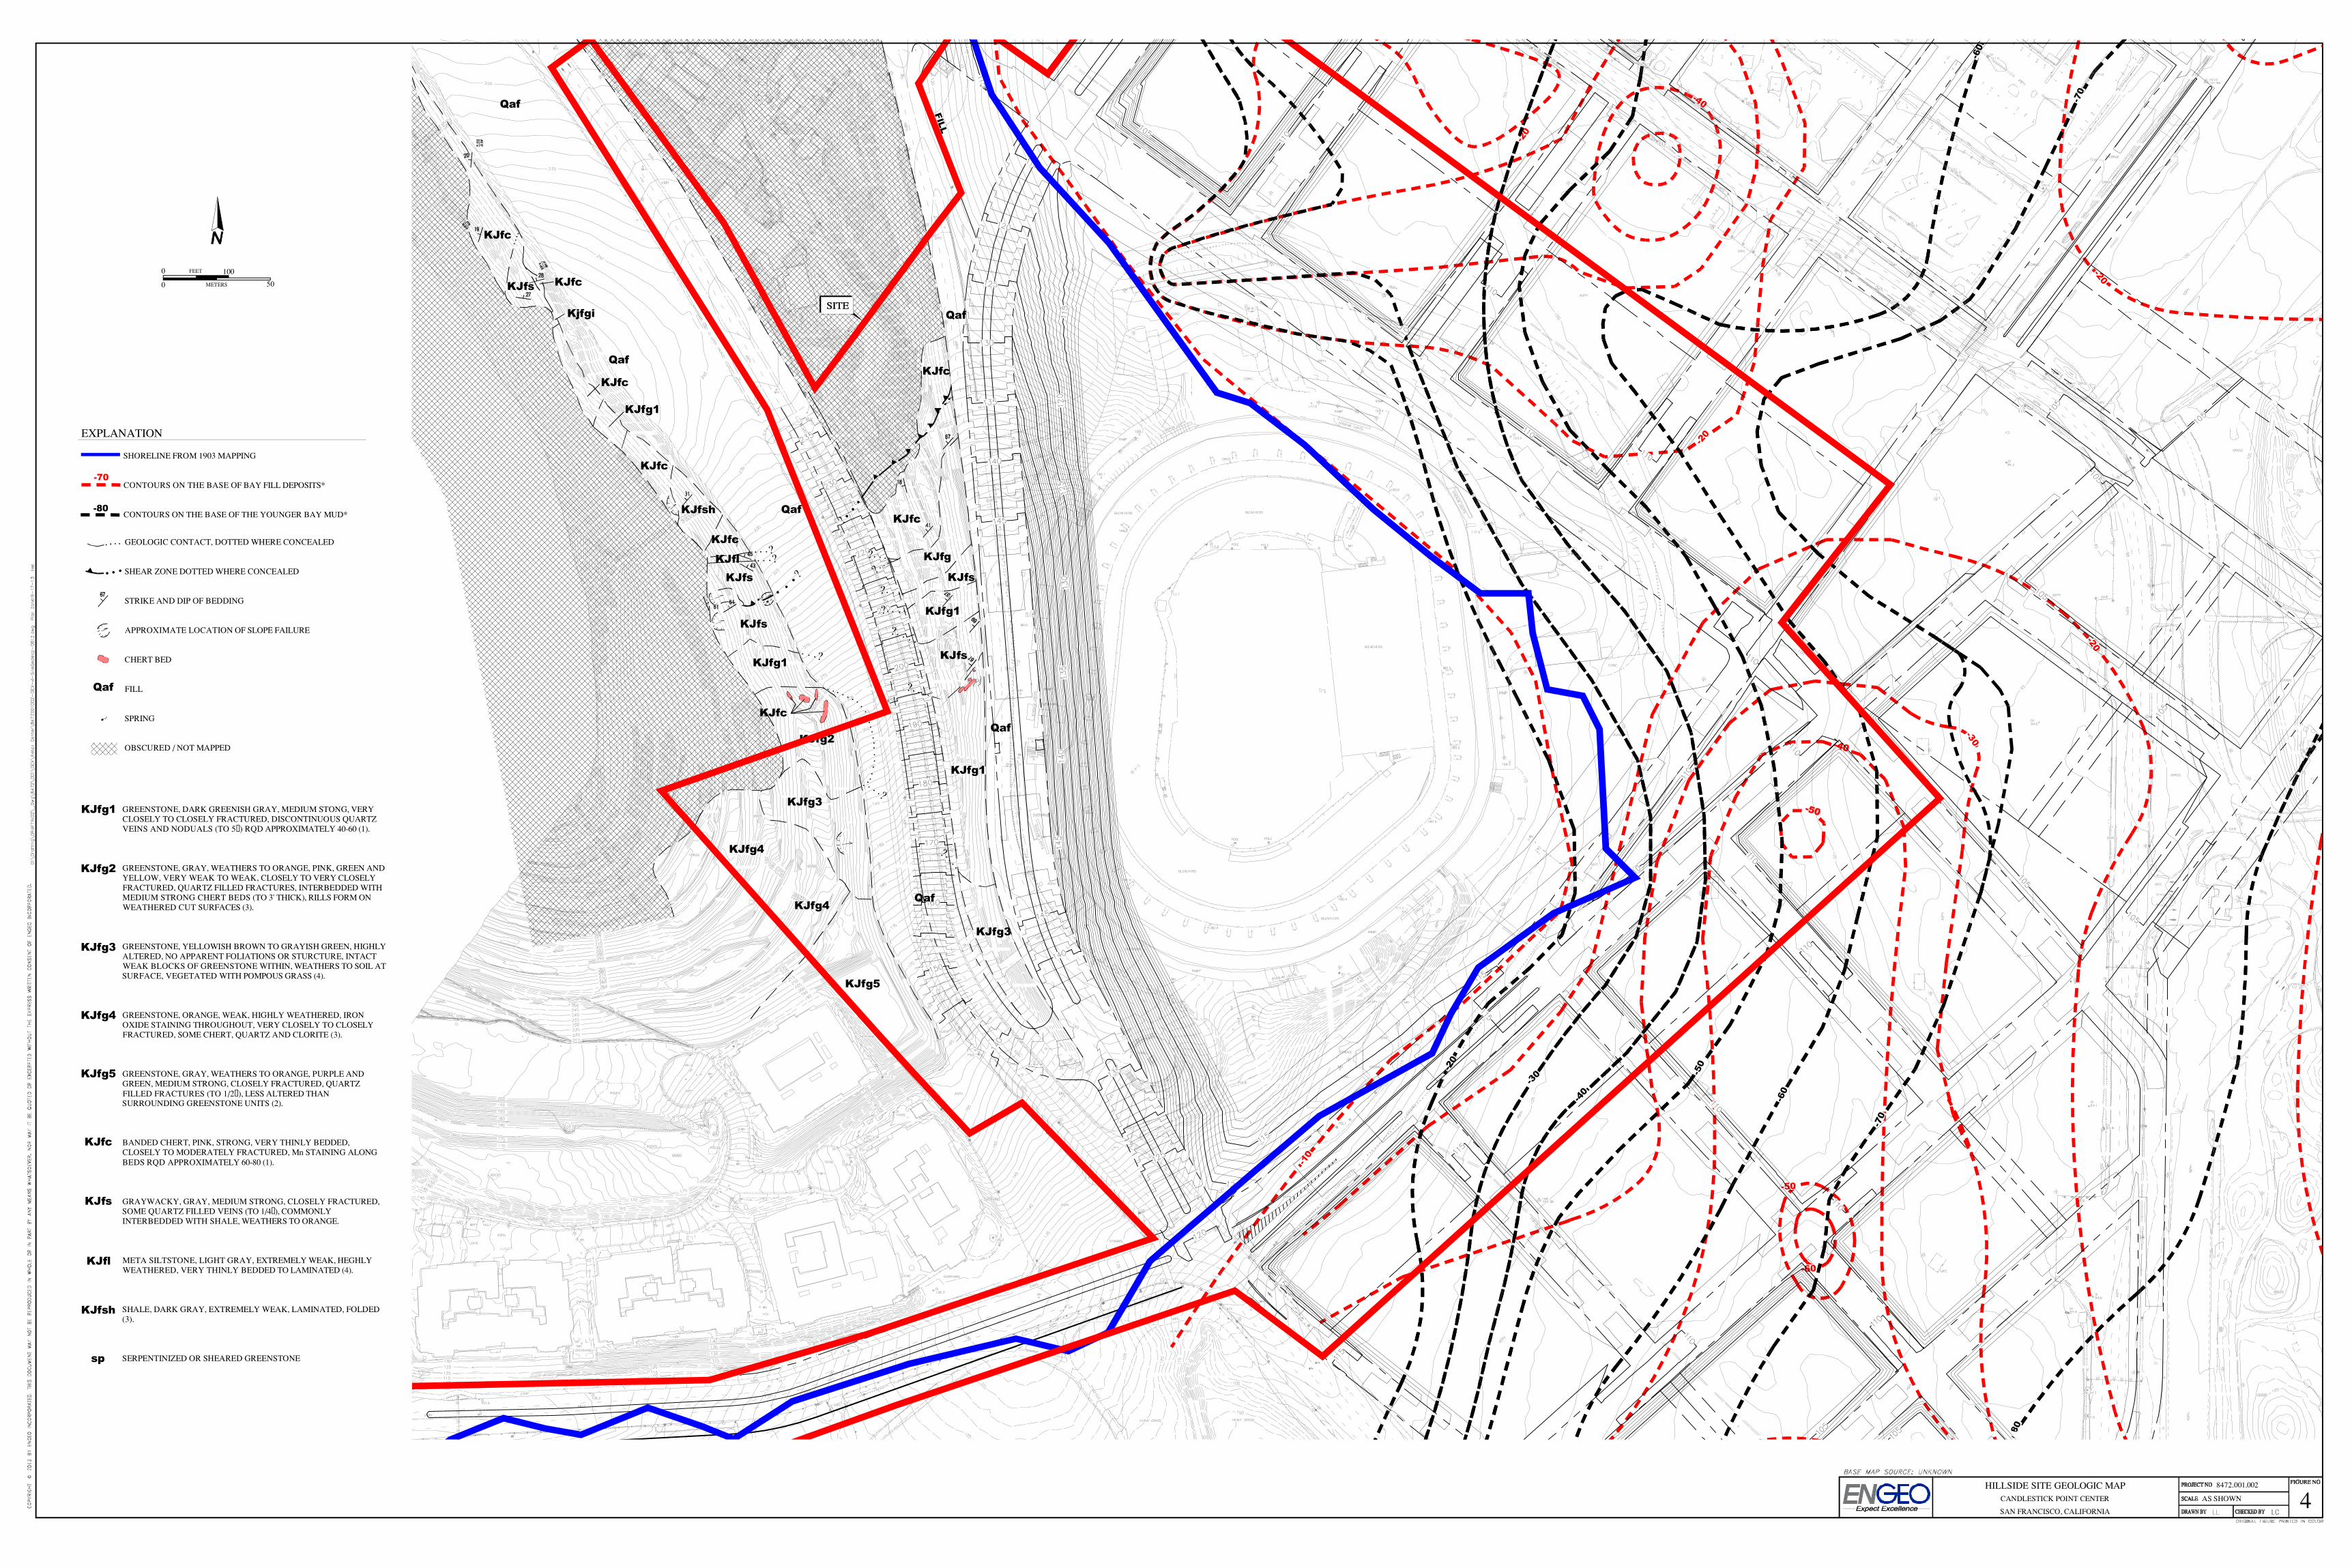
Several of the borings, CPTs and surface sampling were performed immediately adjacent to and within the project limits. FINDINGS 1.5 GEOLOGY AND SEISMICITY 1.5.1 Geology A published geologic map of the site and vicinity (Figure 3; Bonilla, 1971, 1998) indicates that the subject site is underlain primarily by Cretaceous and Jurassic Franciscan Complex rock with artificial fill at the north-eastern and eastern portions of the site. According to Bonilla (1998) Franciscan Complex rocks at the site generally comprise greenstone, chert and interbedded sandstone and shale. Bonilla maps Pleistocene undifferentiated sedimentary deposits at the southern portion of the site. Artificial fills mapped at the eastern portion of the site generally comprise clay, sand, silt, rock fragments, organic matter and man-made debris (Bonilla, 1998). We prepared a Site Geologic Map, Figure 4, based on geologic field mapping conducted by an ENGEO geologist in 2010. Mapping focused primarily on bedrock units exposed in road-cuts along Jamestown Avenue and Arelious Walker at the western portion of the site. The various geologic units shown on Figure 4 are described below. 1.5.1.1 Existing fill Areas of existing fill have been mapped where they are relatively wide spread in plain view and where the fill is more than about a foot or so in thickness. The most significant areas of artificial fill (Qaf) at the site are present along Jamestown Avenue, northeastern portion of the stadium, and existing parking lots in the eastern portion of the site in the vicinity of the proposed intersection of Ingerson Avenue and West Harney Way. With the exception of the northeastern portion, the existing stadium is located predominantly in an area of bedrock cut with relatively minor fills (generally less than 5 feet thick) with thicker fills to the northeast. The fill within the stadium and paved parking area generally consists of a mixture of soil and bedrock-derived material excavated from the adjacent ridge areas. Subsurface explorations and visual examination of exposures shows that the fills consist of sand, gravelly clay, silty and sandy clay and silty gravel. Based on our subsurface data and the review of the previous subsurface
Lennar Urban 8472.001.002 Candlestick Point Center September 18, 2013
- 4 -
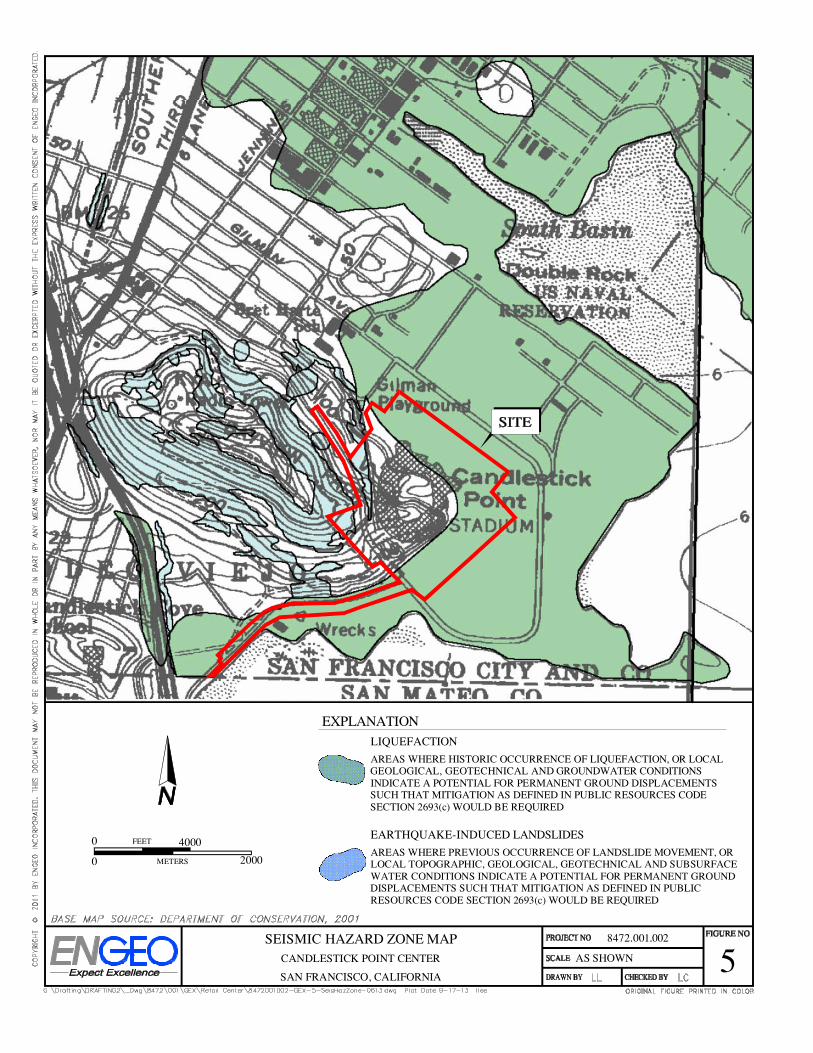
information provided, the coarse grained material varies in density from loose to medium dense, and fine grained materials are typically very stiff. As shown in Figure 5, the artificial fill to the north, east and south of the project limit is mapped in a Liquefaction Seismic Hazard Zone by the State of California Geologic Survey. The USGS map is intended to be used for baseline studies since it is based on correlation between liquefaction potential and geologic units applied across a region mapped with a scale 1:24,000 to 1:200,000. This map is acknowledged to be limited and detailed liquefaction potential evaluation with geotechnical borings and site-specific studies by a licensed professional are necessary. 1.5.1.2 Young Bay Mud The southeast portion of the study area, in the vicinity of proposed Ingerson Avenue and Harney Way is beyond the former shoreline as mapped in 1903 and shown in aerial photographs from 1938. This area of the site is underlain by compressible Young Bay Mud up to approximately 50 feet thick beneath the fill. The Young Bay Mud thickness generally increases away from the former shoreline. The Young Bay Mud is normally consolidated to slightly overconsolidated. Post-construction settlement as a result of consolidation of Young Bay Mud subjected to construction loading and new loads from fill or structures may have long-term detrimental effects on buildings and infrastructure within the project area. Further discussion of the effects of this soft/compressible soil and possible mitigation measures are provided in this report. 1.5.1.3 Alluvial Soil The Young Bay Mud is typically underlain by interbedded stiff clay, medium dense to dense sand, silty sand, and gravel layers. 1.5.1.4 Old Bay Mud Borings that penetrated through the alluvial soil encountered stiff to hard clay referred to locally as Old Bay Mud or Yerba Buena Mud. The Old Bay Mud is similar in material composition but is much stiffer and significantly less compressible compared to the Young Bay Mud. Occasionally, a layer of alluvium was encountered beneath the Old Bay Mud. 1.5.1.5 Bedrock The site is underlain by Jurassic- and Cretaceous-age Franciscan bedrock, including greenstone, chert, graywacke, and shale. Bedrock exposures can be found in the slopes above Jamestown Avenue and Arelious Walker. The borings encountered greenstone, graywacke, serpentinite, and shale. Areas where bedrock is currently exposed are shown on the Site Geologic Map, Figure 4. The weak to very strong bedrock varies from yellowish brown to dark gray in color. Bedrock structure is somewhat chaotic with bedding, fractures and foliations in various directions. The
Lennar Urban 8472.001.002 Candlestick Point Center September 18, 2013
- 5 -
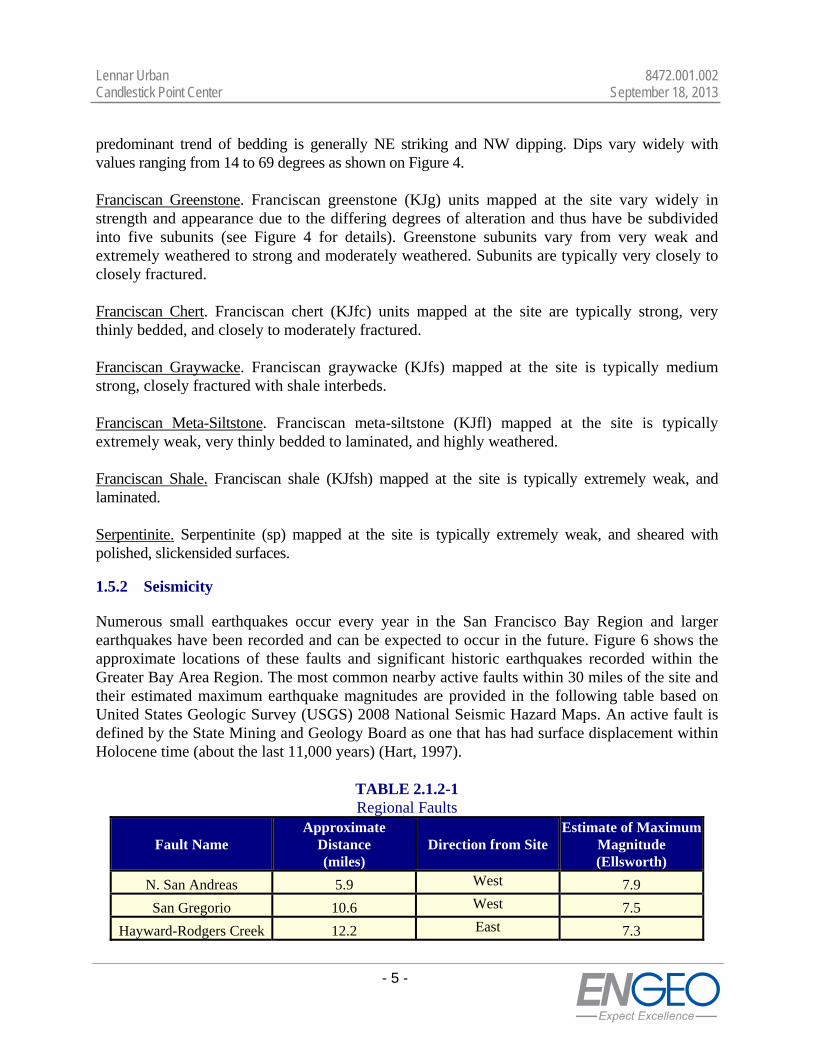
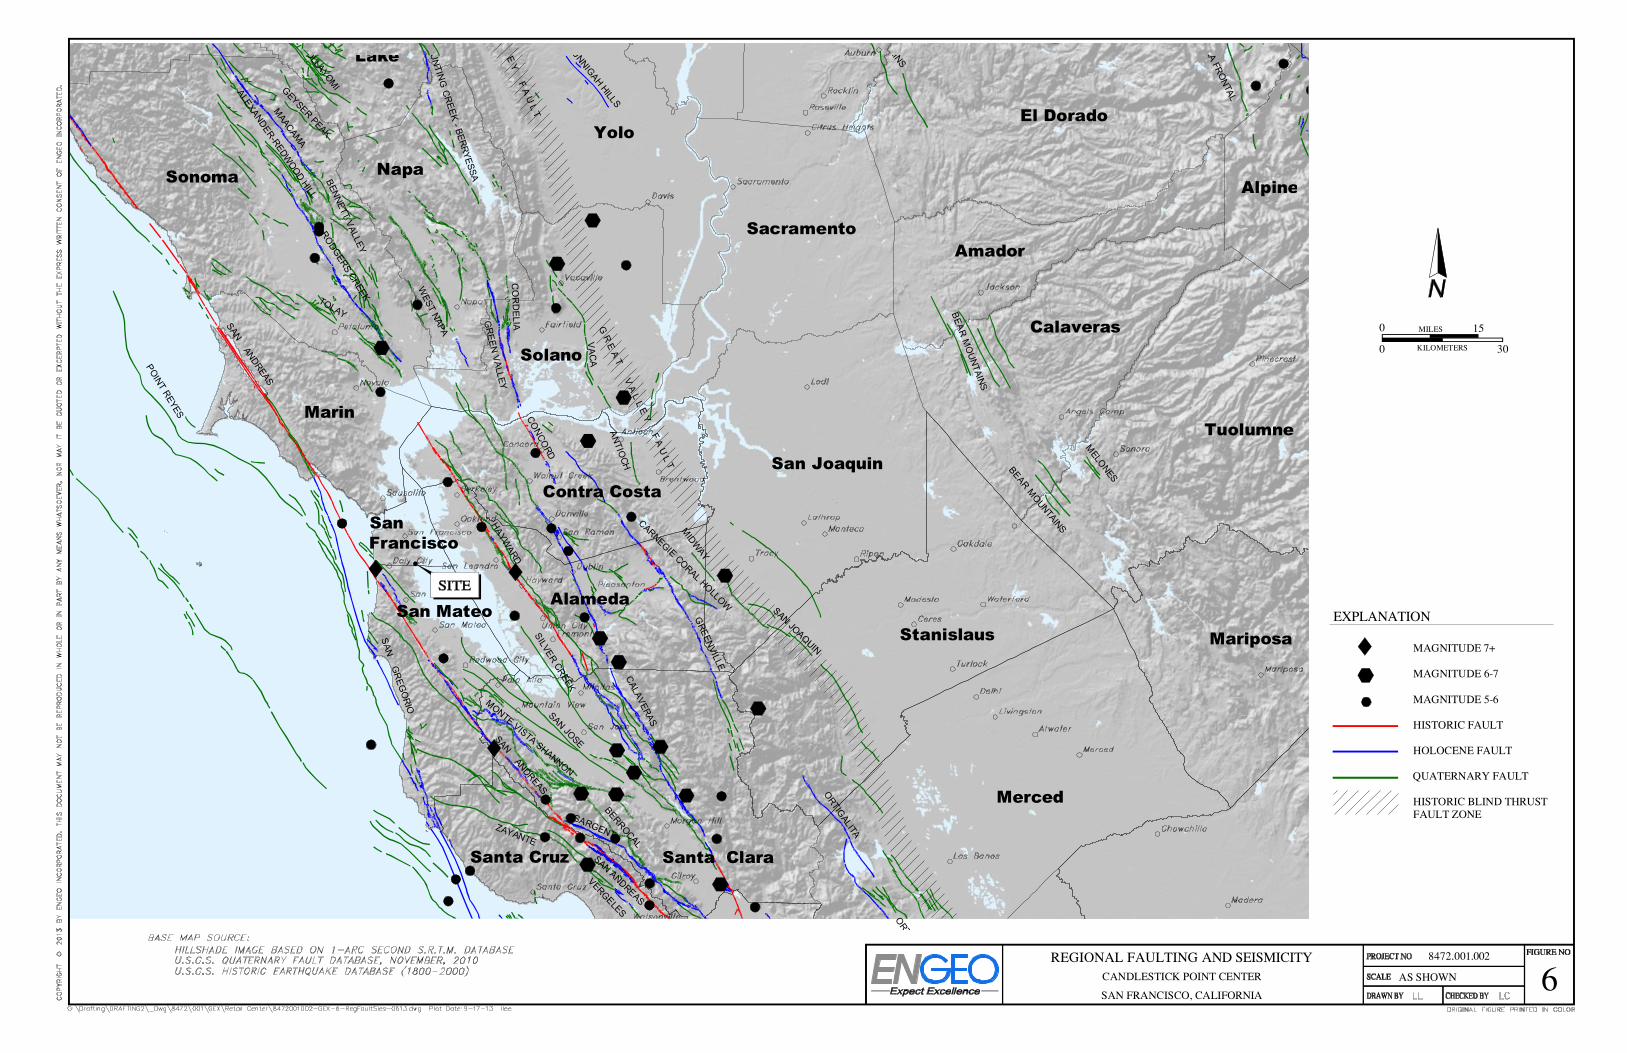
predominant trend of bedding is generally NE striking and NW dipping. Dips vary widely with values ranging from 14 to 69 degrees as shown on Figure 4. Franciscan Greenstone. Franciscan greenstone (KJg) units mapped at the site vary widely in strength and appearance due to the differing degrees of alteration and thus have be subdivided into five subunits (see Figure 4 for details). Greenstone subunits vary from very weak and extremely weathered to strong and moderately weathered. Subunits are typically very closely to closely fractured. Franciscan Chert. Franciscan chert (KJfc) units mapped at the site are typically strong, very thinly bedded, and closely to moderately fractured. Franciscan Graywacke. Franciscan graywacke (KJfs) mapped at the site is typically medium strong, closely fractured with shale interbeds. Franciscan Meta-Siltstone. Franciscan meta-siltstone (KJfl) mapped at the site is typically extremely weak, very thinly bedded to laminated, and highly weathered. Franciscan Shale. Franciscan shale (KJfsh) mapped at the site is typically extremely weak, and laminated. Serpentinite. Serpentinite (sp) mapped at the site is typically extremely weak, and sheared with polished, slickensided surfaces. 1.5.2 Seismicity Numerous small earthquakes occur every year in the San Francisco Bay Region and larger earthquakes have been recorded and can be expected to occur in the future. Figure 6 shows the approximate locations of these faults and significant historic earthquakes recorded within the Greater Bay Area Region. The most common nearby active faults within 30 miles of the site and their estimated maximum earthquake magnitudes are provided in the following table based on United States Geologic Survey (USGS) 2008 National Seismic Hazard Maps. An active fault is defined by the State Mining and Geology Board as one that has had surface displacement within Holocene time (about the last 11,000 years) (Hart, 1997).
TABLE 2.1.2-1 Regional Faults
Fault Name Approximate
Distance (miles)
Direction from Site
Estimate of MaximumMagnitude (Ellsworth)
N. San Andreas 5.9 West 7.9
San Gregorio 10.6 West 7.5
Hayward-Rodgers Creek 12.2 East 7.3
Lennar Urban 8472.001.002 Candlestick Point Center September 18, 2013
- 6 -
Fault Name Approximate
Distance (miles)
Direction from Site
Estimate of MaximumMagnitude (Ellsworth)
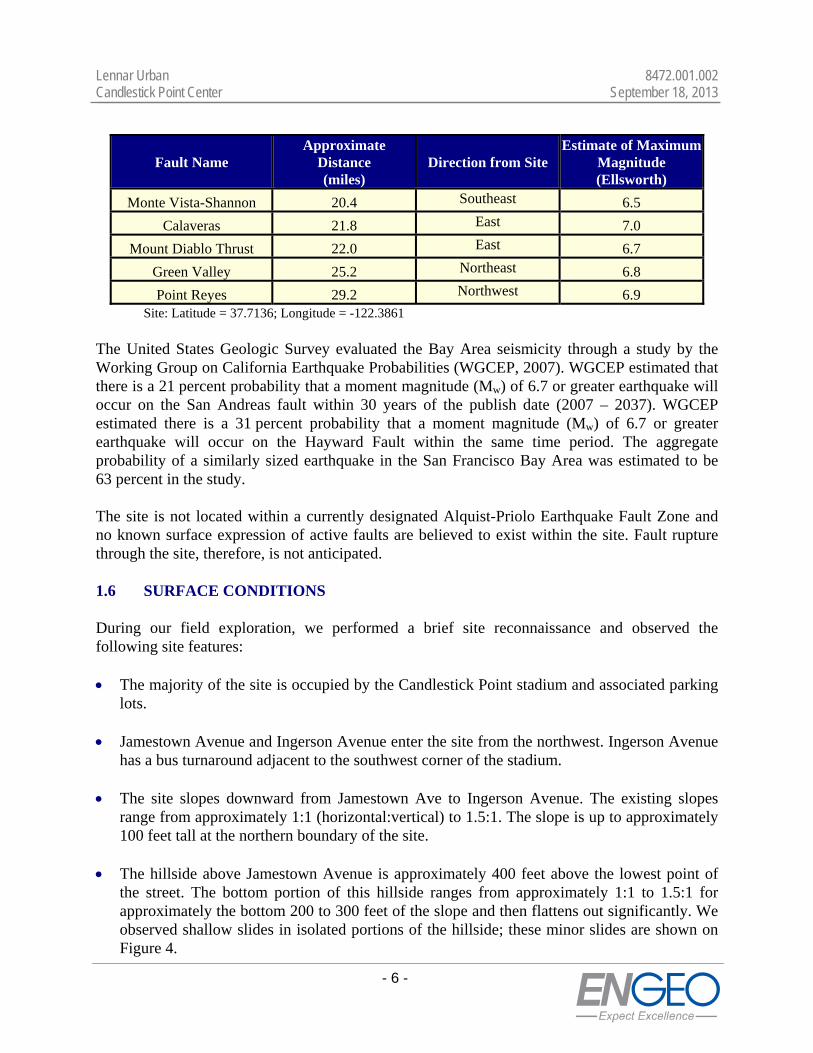
Monte Vista-Shannon 20.4 Southeast 6.5
Calaveras 21.8 East 7.0
Mount Diablo Thrust 22.0 East 6.7
Green Valley 25.2 Northeast 6.8
Point Reyes 29.2 Northwest 6.9 Site: Latitude = 37.7136; Longitude = -122.3861 The United States Geologic Survey evaluated the Bay Area seismicity through a study by the Working Group on California Earthquake Probabilities (WGCEP, 2007). WGCEP estimated that there is a 21 percent probability that a moment magnitude (Mw) of 6.7 or greater earthquake will occur on the San Andreas fault within 30 years of the publish date (2007 – 2037). WGCEP estimated there is a 31 percent probability that a moment magnitude (Mw) of 6.7 or greater earthquake will occur on the Hayward Fault within the same time period. The aggregate probability of a similarly sized earthquake in the San Francisco Bay Area was estimated to be 63 percent in the study. The site is not located within a currently designated Alquist-Priolo Earthquake Fault Zone and no known surface expression of active faults are believed to exist within the site. Fault rupture through the site, therefore, is not anticipated. 1.6 SURFACE CONDITIONS During our field exploration, we performed a brief site reconnaissance and observed the following site features: The majority of the site is occupied by the Candlestick Point stadium and associated parking
lots.
Jamestown Avenue and Ingerson Avenue enter the site from the northwest. Ingerson Avenue has a bus turnaround adjacent to the southwest corner of the stadium.
The site slopes downward from Jamestown Ave to Ingerson Avenue. The existing slopes range from approximately 1:1 (horizontal:vertical) to 1.5:1. The slope is up to approximately 100 feet tall at the northern boundary of the site.
The hillside above Jamestown Avenue is approximately 400 feet above the lowest point of the street. The bottom portion of this hillside ranges from approximately 1:1 to 1.5:1 for approximately the bottom 200 to 300 feet of the slope and then flattens out significantly. We observed shallow slides in isolated portions of the hillside; these minor slides are shown on Figure 4.
Lennar Urban 8472.001.002 Candlestick Point Center September 18, 2013
- 7 -
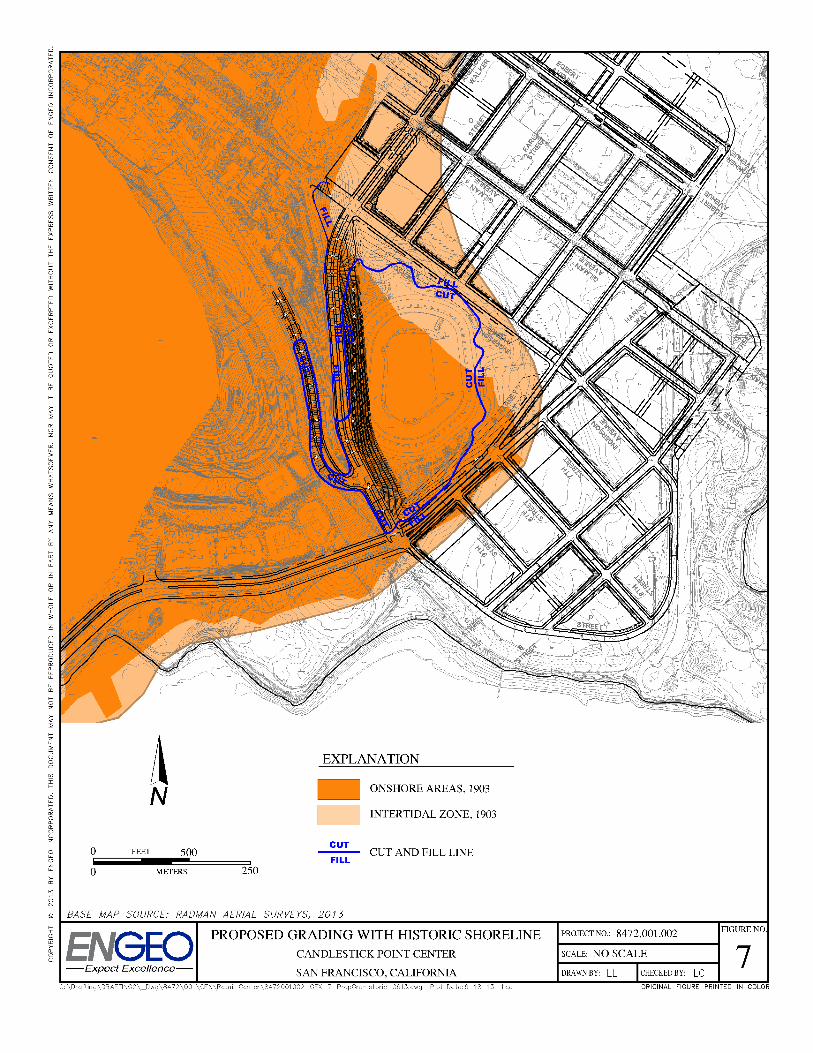
Please refer to the Site Plan, Figure 2, for more information on site features. 1.7 FIELD EXPLORATION We performed supplemental subsurface exploration within the stadium and within the perimeter outside of the stadium as part of this report. The exploration included a seismic refraction line, four borings and one rock core. The borings and rock core are labeled 2-CP-B4 through-B8; boring designations 2-CP-B1 through –B3 were reserved for the exploration work at the Alice Griffith Development that will be submitted under separate cover. The seismic refraction line was approximately 700 feet in length and was performed across the football stadium as shown on Figure 2. The borings were drilled using hollow stem auger and rotary-wash methods and ranged from approximately 10 to 16 feet in depth below existing ground surfaces. All of the borings terminated in bedrock. During drilling, samples were collected by driving either a 2.5-inch OD Standard Penetration Sampler or a 3-inch outside-diameter (O.D.) California-type split-spoon sampler fitted with 6-inch-long brass liners. The samplers were driven with a 140-pound automatic trip hammer falling a distance of 30 inches. The penetration of the sampler was field recorded as the number of blows needed to drive the sampler 18 inches in 6-inch increments. The boring log shows the number of blows required for the last one foot of penetration, and the blow counts have not been converted using any correction factors. Coring 2-CP-B6 was performed using HQ sampling methods. During coring, we recorded the rock quality designation (RQD) drilling rate, and recovery percent as well as logging the observed characteristics of the rock. The borings and rock core were logged in the field by an ENGEO representative. The field logs were then used to develop the report borelogs in Appendix A. The log depicts subsurface conditions encountered within the borings for the date of drilling; however, subsurface conditions may vary with time. The seismic refraction line was performed by a subconsultant; the subconsultant’s report is included in Appendix B. 1.8 SUBSURFACE CONDITIONS Based on information obtained to date, bedrock was encountered either at the surface of the site in areas of previous cuts or at a shallow depth (less than 5 feet) where fill overlie bedrock. Explorations previously performed near the northern and southern boundaries of the site encountered significantly thicker layers of fill, sedimentary deposits associated with the Bay, and deeper bedrock. As shown on Figure 7, the mapped shoreline from a 1903 shoreline map indicates that the historic shoreline falls inside the project boundaries. The thickness of Young Bay Mud is greatest near the intersection of Harney Way and Ingerson Avenue, where the previous borings encountered Young Bay Mud as thick as 50 feet. In some explorations outside of the historic shoreline, the explorations encountered thicker layers of fill with no Young Bay
Lennar Urban 8472.001.002 Candlestick Point Center September 18, 2013
- 8 -
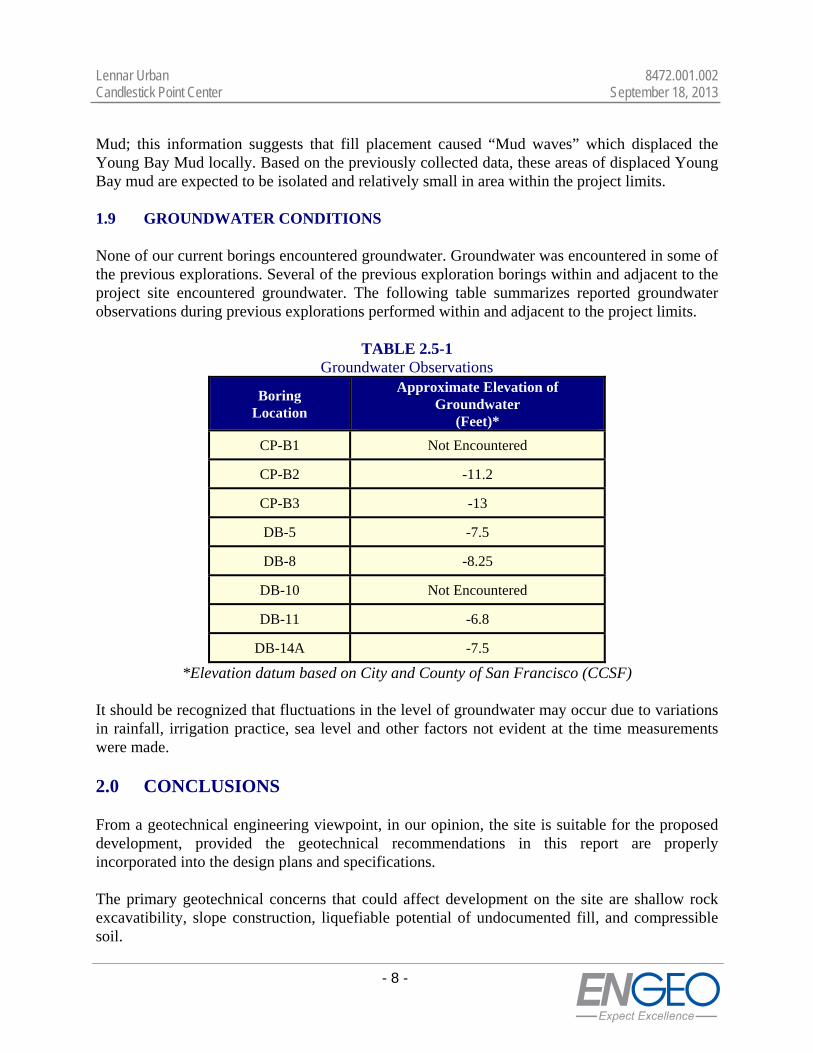
Mud; this information suggests that fill placement caused “Mud waves” which displaced the Young Bay Mud locally. Based on the previously collected data, these areas of displaced Young Bay mud are expected to be isolated and relatively small in area within the project limits. 1.9 GROUNDWATER CONDITIONS None of our current borings encountered groundwater. Groundwater was encountered in some of the previous explorations. Several of the previous exploration borings within and adjacent to the project site encountered groundwater. The following table summarizes reported groundwater observations during previous explorations performed within and adjacent to the project limits.
TABLE 2.5-1 Groundwater Observations
Boring Location
Approximate Elevation of Groundwater
(Feet)*
CP-B1 Not Encountered
CP-B2 -11.2
CP-B3 -13
DB-5 -7.5
DB-8 -8.25
DB-10 Not Encountered
DB-11 -6.8
DB-14A -7.5
*Elevation datum based on City and County of San Francisco (CCSF)
It should be recognized that fluctuations in the level of groundwater may occur due to variations in rainfall, irrigation practice, sea level and other factors not evident at the time measurements were made. 2.0 CONCLUSIONS From a geotechnical engineering viewpoint, in our opinion, the site is suitable for the proposed development, provided the geotechnical recommendations in this report are properly incorporated into the design plans and specifications. The primary geotechnical concerns that could affect development on the site are shallow rock excavatibility, slope construction, liquefiable potential of undocumented fill, and compressible soil.
Lennar Urban 8472.001.002 Candlestick Point Center September 18, 2013
- 9 -
2.1 SHALLOW ROCK EXCAVATION AND SUITABILITY The following is provided for informational purposes. A grading contractor should perform their own assessment of appropriate equipment during the bid process. As previously discussed, the majority of the proposed site is underlain by shallow Franciscan bedrock. Based on our seismic refraction testing, the shear wave velocity of the upper 10 feet of bedrock at the center of the site is approximately 8,000 feet per second (fps) or less. We anticipate that cuts to proposed grade in this area of the site can be accomplished with a D9 or larger bulldozer. However, localized massive hard rock should be expected, especially in the deeper cuts along Jamestown Avenue, which may be difficult or impractical to rip in-place. In this area and in cuts greater than 10 feet, the rock should be expected to be marginally rippable with large equipment such as a D11 bulldozer with a single tooth ripper shank, and non-rippable boulders and other resistant particles should be expected resulting in overexcavation and reconstruction of the cutslope. It is also possible that limited areas may require hydraulic hammers or controlled blasting to perform the excavation; the use of controlled blasting would be subject to the City and County of San Francisco approval. If blasting is considered to be a viable option, consideration needs to be given to dust control and vibration monitoring. Alternative methods of excavation in hard rock include expansion grouting, hydraulic loading, controlled foam injection, and specialized mechanical fracturing methods. If excavation of resistant rock result in oversize rock fragments beyond the size acceptable for engineered fill placement. It is likely that the oversize rock fragments will need to be processed with specialized equipment. Material that cannot be broken down to less than 12 inches in diameter may need to be removed from the site or selectively placed at the bottom of deeper fills on other portions of the project as approved by the Geotechnical Engineer; in general, the planned fill at this site is not deep enough to accept large diameter rocks; and in the areas where planned fill is thick enough to accept larger sized particles, the fill is within roadways and large particles placed in mass fill would likely cause issues with utility excavation. It may be beneficial for the grading contractors to perform test excavations near Jamestown Avenue prior to preparation of their bids to determine the most efficient means and methods of excavation. Similarly, we anticipate that it will be possible to trench most of the bedrock using large excavator-type equipment. Localized lenses of massive hard rock are expected that will require laborious trenching efforts and may necessitate the use of excavators equipped with single-tooth ripping hooks or hydraulic hammers. Trenching of localized hard rock is likely to result in over-break of trench walls and oversized trench spoils. Depending on the phasing of construction, it may be preferable to overexcavate bedrock in areas of proposed trenching during grading when more effective and powerful equipment is available. To assist in utility and foundation construction, we recommend that the upper 5 feet of the retail pad be excavated, processed and placed as engineered fill during site grading. Once building layouts have been determined, the depth of overexcavation may need to be modified so that the differential thickness of fill across a building pad is limited. For preliminary planning,
Lennar Urban 8472.001.002 Candlestick Point Center September 18, 2013
- 10 -
differential fill thickness no greater than 10 feet over a 100-foot horizontal distance should be considered. This differential fill thickness may be modified depending on location, building type, layout and grading. 2.2 SLOPE CONSTRUCTION In general, the planned cut and fill slope gradients are acceptable. If the grading plan is modified, cut slopes should be maintained at 2:1 or flatter and fill slopes should be 3:1 or flatter. Because of the chaotic nature of the bedrock at the site, it is anticipated that the planned 40 foot high slope below Arelious Walker will primarily encounter hard rock with localized areas of adverse rock conditions. It is our understanding that this is a temporary slope that will eventually be replaced with a parking structure retaining wall. While the existing slope below Jamestown Avenue in this area does not exhibit areas of adverse conditions, limited sloughing was mapped above Jamestown Avenue. The risk of rockfall in this formation is considered low, however, depending on the actual conditions encountered during grading and the duration of this temporary slope condition, it is possible that erosion and weathering may result in debris falling from the cut slope over time; some maintenance may be required to remove debris at the base of the slope. We recommend that a temporary ditch be installed at the base of the slope to capture runoff. 2.3 EXISTING FILL As previously mentioned, the majority of the site is underlain by non-engineered fill. The fill thickness is relatively thin (less than 5 feet) in the area of the existing stadium, however the fill is significantly thicker outside of the existing shoreline. Non-engineered fills can undergo excessive settlement, especially under new fills or building loads. As discussed earlier in this report, the borings encountered fill up to 40 feet thick near the planned intersection of Ingerson Avenue and Harney Way. Where feasible, particularly within the retail pad, we recommend complete removal of the undocumented fill to allow for consistent foundation types for buildings. If undocumented fill is encountered during site clearing, where feasible the existing fill should be removed to competent native soil, as discussed in Section 6.2. If deeper fills that extend to significant depths below groundwater are encountered, then alternative mitigation methods such as deep foundations for buildings and flexible utility connections may be necessary.
Lennar Urban 8472.001.002 Candlestick Point Center September 18, 2013
- 11 -
2.4 SEISMIC HAZARDS Potential seismic hazards resulting from a nearby moderate to major earthquake can generally be classified as primary and secondary. The primary effect is ground rupture, also called surface faulting. The common secondary seismic hazards include ground shaking, and ground lurching. The following sections present a discussion of these hazards as they apply to the site. Based on topographic and lithologic data, the risk of regional subsidence or uplift, soil liquefaction, lateral spreading, landslides, tsunamis, flooding or seiches is considered low to negligible at the site. 2.4.1 Ground Rupture Since there are no known active faults crossing the property and the site is not located within an Earthquake Fault Special Study Zone, it is our opinion that ground rupture is unlikely at the subject property. 2.4.2 Ground Shaking An earthquake of moderate to high magnitude generated within the San Francisco Bay region could cause considerable ground shaking at the site, similar to that which has occurred in the past. To mitigate the shaking effects, all structures should be designed using sound engineering judgment and the current California Building Code (CBC) requirements, as a minimum. Seismic design provisions of current building codes generally prescribe minimum lateral forces, applied statically to the structure, combined with the gravity forces of dead-and-live loads. The code-prescribed lateral forces are generally considered to be substantially smaller than the comparable forces that would be associated with a major earthquake. Therefore, structures should be able to: (1) resist minor earthquakes without damage, (2) resist moderate earthquakes without structural damage but with some nonstructural damage, and (3) resist major earthquakes without collapse but with some structural as well as nonstructural damage. Conformance to the current building code recommendations does not constitute any kind of guarantee that significant structural damage would not occur in the event of a maximum magnitude earthquake; however, it is reasonable to expect that a well-designed and well-constructed structure will not collapse or cause loss of life in a major earthquake (SEAOC, 1996). 2.4.3 Liquefaction We evaluated the susceptibility of the on-site fill material to liquefaction of sands, as well as the susceptibility of gravels and low plasticity fines to seismic loading based on methodology presented by, Bray and Sancio (2006), Idriss and Boulanger, 2004 and Seed et al, 2003 and others. The literature suggests that “transitional” material like silts and clays may be susceptible to seismic softening. As a result, we have divided our evaluation of liquefaction into soils exhibiting “sand-like” behavior and those exhibiting “clay-like” behavior. We have assessed the seismic susceptibility and deformation potential at the site based on material properties from laboratory testing and in-situ CPT data as discussed in the following sections. Our analyses of liquefaction potential were performed using a PGA of 0.61 and a Mw 7.9 earthquake; the PGA
Lennar Urban 8472.001.002 Candlestick Point Center September 18, 2013
- 12 -
value is based on the 2013 California Building Code and the earthquake magnitude is associated with an earthquake on the San Andreas Fault. 2.4.3.1 Analyses of Clay-Like Material. We have evaluated the susceptibility of fine-grained soil within the fill at the Candlestick Point site using the methods described in Bray and Sancio (2006) and criteria proposed by Idriss and Boulanger (2004). These methods evaluate the potential for cyclic softening based on the in-situ moisture content of the soil and properties determined during plasticity index testing. Based on this lab testing, the fine-grained soil that we sampled and tested within the fill at the Candlestick Point site is not expected to be susceptible to cyclic softening (a phenomenon similar to liquefaction where soil loses strength as a result of cyclic loading). 2.4.3.2 Analyses of Sand-Like Material Our empirically-based analyses of the subsurface data collected from CPTs and borings are described in the following sections. CPT Data We evaluated liquefaction resistance and related settlement based on the CPT data from our 2011 report previously referenced. The analysis was performed in accordance with procedures developed by Robertson (2009) using the computer software Cliq. The software employs methodology discussed by Youd et al, (2001) Moss et. al. (2006), and Robertson (2009) to assess the liquefaction of sandy materials as well as cyclic softening of clay. The software uses methodology by Zhang (2004) to estimate post-liquefaction displacement. To assess liquefaction hazard, we have calculated both the Factor of Safety and the Liquefaction Potential Index (LPI) for each CPT, as defined by Iwasaki (1982). LPI is a relative hazard index, calculated on a point-by-point basis using the factor of safety against liquefaction, as a function of depth. LPI has been correlated to observed damage in existing liquefaction case studies and is a more appropriate indicator of risk than factor of safety alone. The computed discrete factors of safety with depth, from which the LPI values for each CPT are derived, are summarized on the attached Cliq Output in Appendix E. Deformation of the ground surface is a common result of liquefaction. Vertical settlement may result from densification of the deposit or volumetric loss from venting to the ground surface. We calculated potential liquefaction induced settlement estimates from the CPT data using the program CLiq. The estimates of potential liquefaction-induced settlement are included in Appendix E. At the Candlestick Point site, our analyses indicate that potential volumetric settlement of the in-situ fill is highly variable. Based on the methodology described above, estimated settlement within the in-situ fill ranges from less than 1 inch to over 11 inches at the various explorations.
Lennar Urban 8472.001.002 Candlestick Point Center September 18, 2013
- 13 -
Analysis of two CPTs performed within the project limits (CP-CPT1 and CP-CPT4) indicate between 3 and 8 inches of potential liquefaction settlement assuming no mitigation, such as removal and replacement is performed. Boring Data We also performed an analysis of the potential liquefaction at the site based on our borings. We collected SPT blow counts and samples of the subsurface soil and used the laboratory test results and recorded blow counts to assess liquefaction using analytical methods published by Youd et al. (2001), Seed et al. (2003), and Idriss & Boulanger (2008). Recorded blow count resistances (N-value) were corrected for sampler and hammer type, overburden pressure, boring diameter, and fines content. As with the CPT data, we calculated potential settlement based on the results of our boring data using methods published by Ishihara and Yoshimine in 1992. The results of our liquefaction analyses performed on data from the borings are included in Appendix E In general, our borings encountered less potentially liquefiable soil than our CPTs though the estimated settlement is similar. Borings CP-B2 and CP-B3, both drilled near the perimeter of the site, indicate between 6 and 9 inches of potential liquefaction settlement. 2.4.3.3 Summary of Liquefaction Analyses In summary, based on our interpretation of the existing data and anticipated site variability, we estimate that the areas underlain by artificial fill during reclamation of the site may experience between 1 and 12 inches of seismically induced settlement in localized areas within the project site. This degree of settlement would be unsuitable for performance of shallow utilities, rigid pavements, surface drainage and buildings on shallow foundations constructed in areas underlain by the artificial fills. Gravity utilities may have issues with proper flow and providing design capacity. Utilities may also be subject to failure due to pipe breaks from differential settlement. Mitigation is possible using a variety of options. Due to the limited extent and depth of liquefiable soil, removal and replacement as engineered fill may be feasible in the areas of shallow existing fills. However, fill is expected to average approximately 25 feet in thickness and extend to as deep as 40 feet in limited areas. Due to shallow groundwater, and the depth to the bottom of the fill and adjacent existing utilities and structures, complete removal of all potentially liquefiable material in all improvement areas is likely infeasible. As an alternative to removal of liquefiable material, in-situ densification may be implemented to reduce the amount of liquefiable material, decrease settlement and reduce the chance of sand boiling. In-situ densification can be achieved by impact at the ground surface in order to densify the potentially liquefiable soil reducing the potential for liquefaction. These methods result in varying amounts of noise and vibration depending on the weight used and the frequency of the impact. A method such as rapid impact compaction (RIC) may be appropriate in some areas of planned improvements, whereas deep dynamic compaction may be a viable alternative over areas of fill greater than 15 feet in thickness.
Lennar Urban 8472.001.002 Candlestick Point Center September 18, 2013
- 14 -
Due to high variability of the fill, differential settlement over a typical building footprint may be on the order of half the total settlement; buildings planned in the deepest fills will likely need to be founded on deep foundations due to the potential liquefaction induced settlement. In areas of shallower fill, stiffened mat foundations may be feasible. Ground improvement by means of surface impact for buildings would likely damage infrastructure previously installed making this alternative for building construction likely infeasible for buildings. Due to the degree of anticipated settlement and difficulty in implementing the potential mitigation measures, it may be preferable to forego the above recommended liquefaction-specific mitigation measures within areas of planned improvements. If mitigation is not performed, the project should anticipate that improvements will need to be repaired after a major seismic event. 2.4.4 Ground Lurching Ground lurching is a result of the rolling motion imparted to the ground surface during energy released by an earthquake. Such rolling motion can cause ground cracks to form in weaker soils. The potential for the formation of these cracks is considered greater at contacts between deep alluvium and bedrock. Such an occurrence is possible at the site as in other locations in the Bay Area region, but based on the site location, it is our opinion that the offset is expected to be nominal. 2.4.5 Shoreline Stability Our previous report identified potential shoreline stability issues that could propogate as much as 150 feet from the shoreline. We do not anticipate that these lateral stability issues will impact the proposed development site, but will need to be addressed for adjacent projects. 2.5 CONSOLIDATION SETTLEMENT OF YOUNG BAY MUD Based on our review of published maps, and the existing information, northeast and southeast perimeters of the site are underlain by natural soft, highly compressible Young Bay Mud deposits. Young Bay Mud deposits are of particular concern since these deposits are highly compressible and may be susceptible to significant settlement when subjected to additional loading, either through the placement of additional fill and/or additional structural loads. In addition, these deposits have low strength characteristics and may be problematic for underground construction due to their instability in temporary cuts and slopes. In general, these materials are not considered suitable for reuse as engineered fill and will necessitate mitigation as discussed in following sections of this report. It should be noted that our current understanding of the project is that buildings will be pile supported where situated over thick fills and Young Bay Mud deposits, and therefore surcharging will be designed to accommodate only additional fill loads in improvement areas and not additional structural loads. It should also be noted that once the horizontal infrastructure is constructed that surcharging to accommodate additional building loads may no longer be an option to address
Lennar Urban 8472.001.002 Candlestick Point Center September 18, 2013
- 15 -
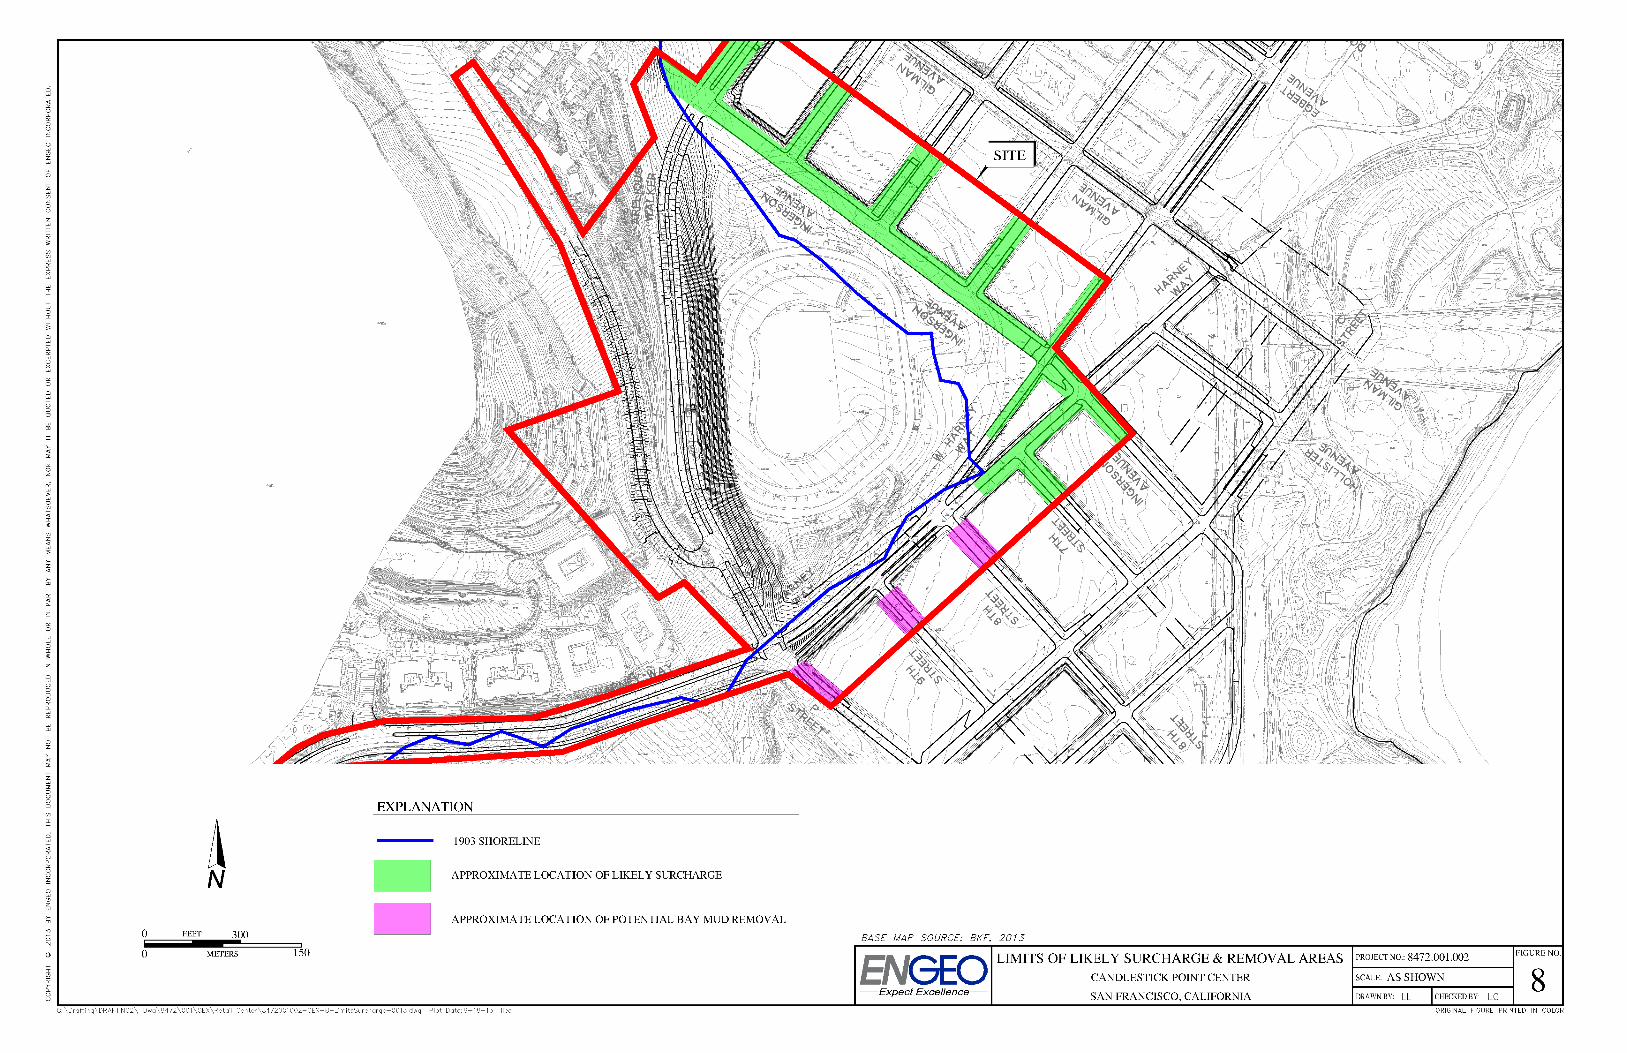
consolidation settlements due to the potential damage that may be caused to adjacent utilities and other improvements. The estimated Elevation of the bottom of the Young Bay Mud is shown on Figure 4. Also shown on Figure 4 is the currently proposed grading plan. Fill is planned along Harney Way and Ingerson Avenue; the current grading plan calls for the fill to range from approximately 5 to 10 feet in these areas. In general, the Young Bay Mud is approximately 10 to 15 feet in thickness with the thickness increasing dramatically near the intersection of Harney Way and Ingerson Avenue; Boring CP-B3 encountered approximately 50 feet of Young Bay Mud approximately 200 feet east of this intersection. Based on our existing information, we estimate Young Bay Mud is approximately 30 feet thick at this intersection. In general, consolidation settlement in limited areas due to new fill placement over existing Young Bay Mud is anticipated to be approximately 1 foot or less with approximately 70 percent of the settlement occurring in the first year after placement. However, near the intersection of Harney Way and Ingerson Avenue, consolidation settlement could be as great as 3 feet with less than 40 percent of the settlement occurring in the first year after placement. This amount of settlement would be unsuitable for performance of shallow utilities, rigid pavements, surface drainage and buildings on shallow foundations. Mitigation of the Young Bay Mud can be accomplished through removal, surcharging, use of lightweight fill or ground improvement. For portions of the site, where Young Bay Mud is less than 10 feet in thickness and existing fill is to be removed, it may be feasible to remove the Young Bay Mud. In other areas, surcharging appears to be a feasible solution. In the thickest areas of Young Bay Mud (the isolated areas with 20 feet or more of Young Bay Mud) wick drains may be necessary to reduce the required surcharge time to less than 1 year. A plan showing the limits where surcharge maybe considered for mitigation is provided in Figure 8. Once the construction phasing schedule is developed and grading plans finalized, we recommend developing a surcharge plan showing the amount of recommended fill for surcharge and areas and spacing for wick drains, if necessary. As an alternative to surcharge, the removal of existing fill and placement of lightweight fill (on the order of 30 pounds per square foot) would result in extremely limited settlement. Where 10 feet of fill is planned over Young Bay Mud, the weight of the new fill could be compensated by removing approximately the upper 2½ feet of existing fill and constructing to finish grade using lightweight fill. In building areas, a similar approach could be performed if the weight of the building is added in the calculation of thickness of lightweight fill. Even with proper surcharging, some amount of long term areal settlement from secondary compression of the Young Bay Mud should be anticipated. The magnitude of this residual settlement will be dependent on the amount of fill placed, thickness of Young Bay Mud, and time allowed for surcharging. In general, this secondary settlement will be approximately 10 percent of the primary settlement (between 1 and 4 inches). Foundations and structures may be designed by the Structural Engineer to accommodate some additional movement as a result of
Lennar Urban 8472.001.002 Candlestick Point Center September 18, 2013
- 16 -
this secondary compression settlement. It may be appropriate to increase surface grades to compensate for anticipated settlements. Similarly, it may be practical to increase design inverts for planned gravity utilities to accommodate potential settlements and maintain positive flow gradients. Future improvements on adjacent blocks and streets could result in loading of the foundation soil below the roads. This loading could result in settlement and damage to the improvements. We recommend that consideration be given to future improvements when designing the current project. It may be feasible to extend mitigation into adjacent future project areas so that future mitigation does not adversely affect the planned infrastructure. 2.6 CORROSIVITY CONSIDERATIONS An evaluation of possible corrosion impacts to study area improvements has not been conducted. We recommend that chemical tests be conducted on the subgrade soils of the final building pads prior to building and utility construction. The primary purpose of this testing will be to determine the concrete design parameters for foundation construction. The proximity to the Bay and corrosion considerations from the marine environment should be considered in the corrosion mitigation for the design of the project. 2.7 NATURALLY OCCURRING ASBESTOS Some ultramafic rock, such as serpentinite and potentially greenstone, contains the fibrous mineral chrysotile, which is considered an asbestos mineral. Based on supplemental laboratory testing performed as part of this exploration (Appendix F), no naturally occurring asbestos (NOA) was detected in soil collected from our current borings at the site. However, during our previous 2009 exploration (Appendix F), trace amounts of naturally occurring asbestos (NOA) were detected in soil and rock collected as surface samples at Candlestick Point. Two of three samples collected near Jamestown Road encountered chrysolite. Based on our research, the fill at Candlestick Point was predominantly derived from local bedrock and has the potential to contain NOA in varying amounts. Asbestos is considered hazardous when it becomes airborne. Additional testing from the current exploration is pending and the results will be issued as an addendum to this report when ready. It is our opinion that the project will be required to follow the rules and regulations outlined in the Asbestos Airborne Toxic Control Measure (ATCM) for Construction, Grading, Quarrying and Surface Mining Operations established by the Bay Area Air Quality Management District (District) under California Code of Regulations, Title 17, Section 93015. The purpose of this regulation is to reduce public exposure to NOA from construction and mining activities that emit dust, which may contain NOA. The ATCM requires regulated operations engaged in road construction and maintenance activities, construction and grading operations, and quarrying and surface mining operations in areas where NOA is likely to be found, to employ the best available dust mitigation measures in order to reduce and control dust emissions.
Lennar Urban 8472.001.002 Candlestick Point Center September 18, 2013
- 17 -
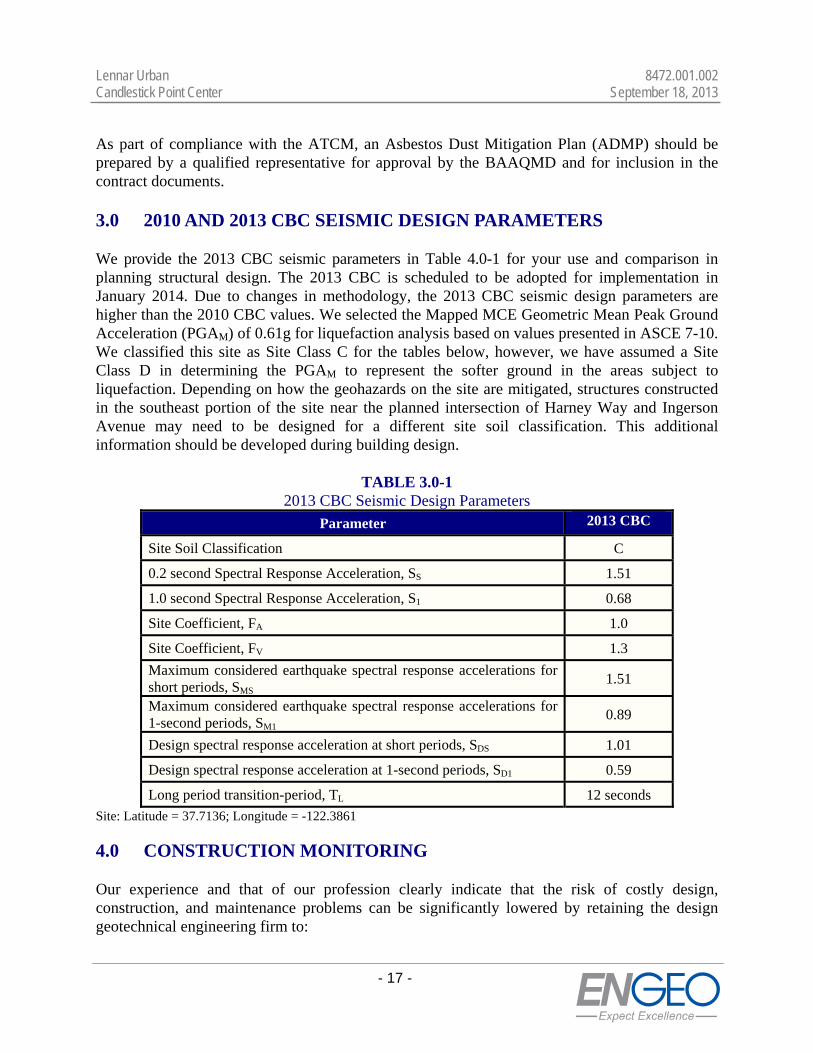
As part of compliance with the ATCM, an Asbestos Dust Mitigation Plan (ADMP) should be prepared by a qualified representative for approval by the BAAQMD and for inclusion in the contract documents. 3.0 2010 AND 2013 CBC SEISMIC DESIGN PARAMETERS We provide the 2013 CBC seismic parameters in Table 4.0-1 for your use and comparison in planning structural design. The 2013 CBC is scheduled to be adopted for implementation in January 2014. Due to changes in methodology, the 2013 CBC seismic design parameters are higher than the 2010 CBC values. We selected the Mapped MCE Geometric Mean Peak Ground Acceleration (PGAM) of 0.61g for liquefaction analysis based on values presented in ASCE 7-10. We classified this site as Site Class C for the tables below, however, we have assumed a Site Class D in determining the PGAM to represent the softer ground in the areas subject to liquefaction. Depending on how the geohazards on the site are mitigated, structures constructed in the southeast portion of the site near the planned intersection of Harney Way and Ingerson Avenue may need to be designed for a different site soil classification. This additional information should be developed during building design.
TABLE 3.0-1 2013 CBC Seismic Design Parameters
Parameter 2013 CBC
Site Soil Classification C
0.2 second Spectral Response Acceleration, SS 1.51
1.0 second Spectral Response Acceleration, S1 0.68
Site Coefficient, FA 1.0
Site Coefficient, FV 1.3
Maximum considered earthquake spectral response accelerations for short periods, SMS
1.51
Maximum considered earthquake spectral response accelerations for 1-second periods, SM1
0.89
Design spectral response acceleration at short periods, SDS 1.01
Design spectral response acceleration at 1-second periods, SD1 0.59
Long period transition-period, TL 12 seconds
Site: Latitude = 37.7136; Longitude = -122.3861
4.0 CONSTRUCTION MONITORING Our experience and that of our profession clearly indicate that the risk of costly design, construction, and maintenance problems can be significantly lowered by retaining the design geotechnical engineering firm to:
Lennar Urban 8472.001.002 Candlestick Point Center September 18, 2013
- 18 -
1. Review the final grading and foundation plans and specifications prior to construction to determine whether our recommendations have been implemented, and to provide additional or modified recommendations, if necessary. This also allows us to check if any changes have occurred in the nature, design or location of the proposed improvements and provides the opportunity to prepare a written response with updated recommendations.
2. Perform construction monitoring to check the validity of the assumptions we made to prepare
this report. All earthwork operations should be performed under the observation of our representative to check that the site is properly prepared, the selected fill materials are satisfactory, and that placement and compaction of the fills has been performed in accordance with our recommendations and the project specifications. Sufficient notification to us prior to earthwork is essential.
If we are not retained to perform the services described above, then we are not responsible for any party’s interpretation of our report (and subsequent addenda, letters, and verbal discussions). 5.0 EARTHWORK RECOMMENDATIONS The relative compaction and optimum moisture content of soil referred to in this report are based on the most recent ASTM D1557 test method. Compacted soil is not acceptable if it is unstable. It should exhibit only minimal flexing or pumping, as determined by an ENGEO representative. As used in this report, the term “moisture condition” refers to adjusting the moisture content of the soil by either drying if too wet or adding water if too dry. We define “structural areas” as any area sensitive to settlement of compacted soil. These areas include, but are not limited to building pads, sidewalks, and pavement areas. It is important that all construction activities be performed under the observation of the Geotechnical Engineer’s field representative, in accordance with the recommendations contained herein. 5.1 GENERAL SITE CLEARING The contractor should clear areas to be developed of all surface and subsurface deleterious materials including existing building foundations, slabs, buried utility and irrigation lines, pavements, debris, and designated trees, shrubs, and associated roots. The contractor should clean and backfill excavations extending below the planned finished site grades with suitable material compacted to the recommendations presented in this section. All backfill should be observed and tested by a representative of the Geotechnical Engineer. Foundations for the stadium will need to be completely removed and properly backfill. If deep foundations are present, the upper 10 feet of the foundation should be removed and the location surveyed for consideration in planning new building foundations.
Lennar Urban 8472.001.002 Candlestick Point Center September 18, 2013
- 19 -
Following clearing, strip the site to remove surface organic materials. Strip organics from the ground surface to a depth of at least 2 to 3 inches below the surface. Remove strippings from the site or, if considered suitable by the landscape architect and owner, use them in landscape fill. If undocumented fill is encountered during site clearing, all existing fill should be removed to competent native soil, as determined by a representative of the Geotechnical Engineer. 5.2 OVER-OPTIMUM SOIL MOISTURE CONDITIONS The contractor should anticipate encountering excessively over-optimum (wet) soil moisture conditions during winter or spring grading, or during or following periods of rain. As indicated above, groundwater was typically encountered at an Elevation between -6 and -11 feet; overly wet conditions should be anticipated for excavations that extend below these elevations. Wet soil can make proper compaction difficult or impossible. Wet soil conditions can be mitigated by: 1. Frequent spreading and mixing during warm dry weather; 2. Mixing with drier materials; 3. Mixing with a lime, lime-fly ash, or cement product; or 4. Stabilizing with aggregate, geotextile stabilization fabric, or both. Options 3 and 4 should be evaluated and approved by an ENGEO representative prior to implementation. 5.3 ACCEPTABLE FILL Onsite soil is suitable as fill material provided it is processed to remove concentrations of organic material, debris, and particles greater than 4 inches in maximum dimension. Imported fill materials should be approved by the Geotechnical Engineer, meet the above requirements and have a plasticity index less than 12. Allow ENGEO to sample and test proposed imported fill materials at least 72 hours prior to delivery to the site. 5.4 FILL COMPACTION 5.4.1 Grading in Structural Areas The contractor should perform subgrade compaction prior to fill placement, following cutting operations, and in areas left at grade as follows. 1. Scarify to a depth of at least 8 inches; 2. Moisture condition soil to at least 2 percentage points over the optimum moisture content;
and
Lennar Urban 8472.001.002 Candlestick Point Center September 18, 2013
- 20 -
3. Compact the soil to at least 90 percent relative compaction. Compact the upper 6-inches of finish pavement subgrade to at least 95 percent relative compaction prior to aggregate base placement.
After the subgrade has been compacted, the contractor should place and compact acceptable fill (defined in Section 6.3) as follows: 1. Spread fill in loose lifts that do not exceed 8 inches;
2. Moisture condition lifts to at least 2 percentage points over the optimum moisture content;
and 3. Compact fill to at least 90 percent relative compaction; compact the upper 6 inches of fill in
pavement areas to at least 95 percent relative compaction prior to aggregate base placement. The Contractor should compact the pavement Caltrans Class 2 Aggregate Base section to at least 95 percent relative compaction (ASTM D1557). The aggregate base should be moisture conditioned to or slightly above the optimum moisture content prior to compaction. 5.4.2 Underground Utility Backfill The contractor is responsible for conducting all trenching and shoring in accordance with CALOSHA requirements. Project consultants involved in utility design should specify pipe bedding materials. In structural areas, the contractor should place and compact trench backfill as follows: 1. Trench backfill should have a maximum particle size of 4 inches; 2. Moisture condition trench backfill to at least 2 percentage points above the optimum
moisture content. Moisture condition backfill outside the trench; 3. Place fill in loose lifts not exceeding 12 inches; and 4. Compact fill to at least 90 percent relative compaction. Jetting of backfill is not an acceptable means of compaction. 5.4.3 Landscape Fill In landscaping areas, the contractor should process, place and compact fill in accordance with Sections 6.4.1 and 6.4.2, except compact to at least 85 percent relative compaction.
Lennar Urban 8472.001.002 Candlestick Point Center September 18, 2013
- 21 -
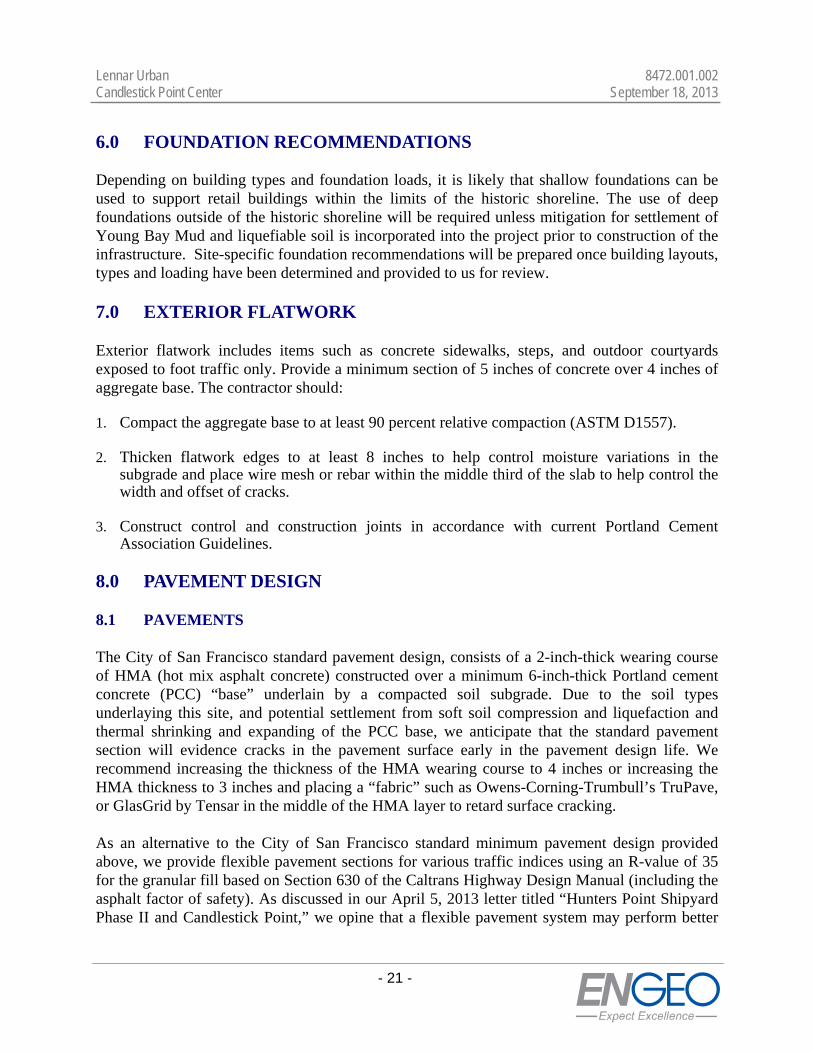
6.0 FOUNDATION RECOMMENDATIONS Depending on building types and foundation loads, it is likely that shallow foundations can be used to support retail buildings within the limits of the historic shoreline. The use of deep foundations outside of the historic shoreline will be required unless mitigation for settlement of Young Bay Mud and liquefiable soil is incorporated into the project prior to construction of the infrastructure. Site-specific foundation recommendations will be prepared once building layouts, types and loading have been determined and provided to us for review. 7.0 EXTERIOR FLATWORK Exterior flatwork includes items such as concrete sidewalks, steps, and outdoor courtyards exposed to foot traffic only. Provide a minimum section of 5 inches of concrete over 4 inches of aggregate base. The contractor should: 1. Compact the aggregate base to at least 90 percent relative compaction (ASTM D1557). 2. Thicken flatwork edges to at least 8 inches to help control moisture variations in the
subgrade and place wire mesh or rebar within the middle third of the slab to help control the width and offset of cracks.
3. Construct control and construction joints in accordance with current Portland Cement
Association Guidelines. 8.0 PAVEMENT DESIGN 8.1 PAVEMENTS The City of San Francisco standard pavement design, consists of a 2-inch-thick wearing course of HMA (hot mix asphalt concrete) constructed over a minimum 6-inch-thick Portland cement concrete (PCC) “base” underlain by a compacted soil subgrade. Due to the soil types underlaying this site, and potential settlement from soft soil compression and liquefaction and thermal shrinking and expanding of the PCC base, we anticipate that the standard pavement section will evidence cracks in the pavement surface early in the pavement design life. We recommend increasing the thickness of the HMA wearing course to 4 inches or increasing the HMA thickness to 3 inches and placing a “fabric” such as Owens-Corning-Trumbull’s TruPave, or GlasGrid by Tensar in the middle of the HMA layer to retard surface cracking. As an alternative to the City of San Francisco standard minimum pavement design provided above, we provide flexible pavement sections for various traffic indices using an R-value of 35 for the granular fill based on Section 630 of the Caltrans Highway Design Manual (including the asphalt factor of safety). As discussed in our April 5, 2013 letter titled “Hunters Point Shipyard Phase II and Candlestick Point,” we opine that a flexible pavement system may perform better
Lennar Urban 8472.001.002 Candlestick Point Center September 18, 2013
- 22 -
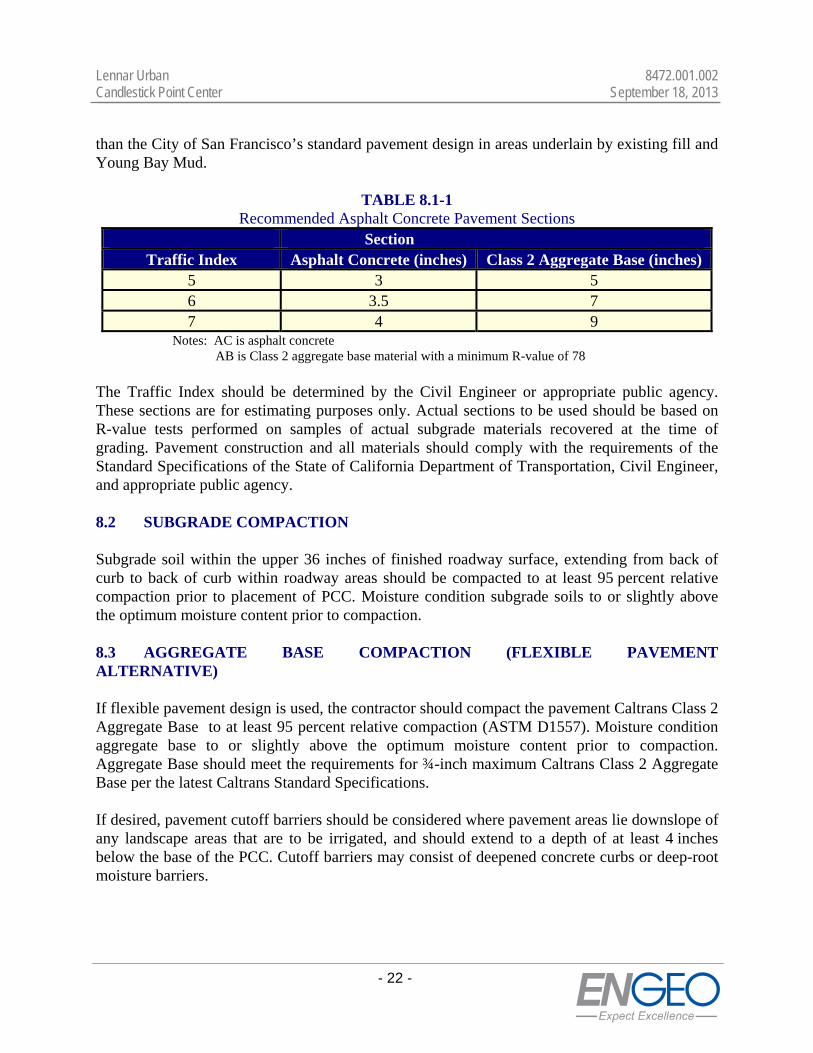
than the City of San Francisco’s standard pavement design in areas underlain by existing fill and Young Bay Mud.
TABLE 8.1-1 Recommended Asphalt Concrete Pavement Sections
Section Traffic Index Asphalt Concrete (inches) Class 2 Aggregate Base (inches)
5 3 5 6 3.5 7 7 4 9
Notes: AC is asphalt concrete AB is Class 2 aggregate base material with a minimum R-value of 78
The Traffic Index should be determined by the Civil Engineer or appropriate public agency. These sections are for estimating purposes only. Actual sections to be used should be based on R-value tests performed on samples of actual subgrade materials recovered at the time of grading. Pavement construction and all materials should comply with the requirements of the Standard Specifications of the State of California Department of Transportation, Civil Engineer, and appropriate public agency. 8.2 SUBGRADE COMPACTION Subgrade soil within the upper 36 inches of finished roadway surface, extending from back of curb to back of curb within roadway areas should be compacted to at least 95 percent relative compaction prior to placement of PCC. Moisture condition subgrade soils to or slightly above the optimum moisture content prior to compaction. 8.3 AGGREGATE BASE COMPACTION (FLEXIBLE PAVEMENT ALTERNATIVE) If flexible pavement design is used, the contractor should compact the pavement Caltrans Class 2 Aggregate Base to at least 95 percent relative compaction (ASTM D1557). Moisture condition aggregate base to or slightly above the optimum moisture content prior to compaction. Aggregate Base should meet the requirements for ¾-inch maximum Caltrans Class 2 Aggregate Base per the latest Caltrans Standard Specifications. If desired, pavement cutoff barriers should be considered where pavement areas lie downslope of any landscape areas that are to be irrigated, and should extend to a depth of at least 4 inches below the base of the PCC. Cutoff barriers may consist of deepened concrete curbs or deep-root moisture barriers.
Lennar Urban 8472.001.002 Candlestick Point Center September 18, 2013
- 23 -
9.0 LIMITATIONS AND UNIFORMITY OF CONDITIONS This report presents geotechnical recommendations for design of the improvements discussed in Section 1 for the CP Center project. If changes occur in the nature or design of the project, we should be allowed to review this report and provide additional recommendations, if any. It is the responsibility of the owner to transmit the information and recommendations of this report to the appropriate organizations or people involved in design of the project, including but not limited to developers, owners, buyers, architects, engineers, and designers. The conclusions and recommendations contained in this report are solely professional opinions and are valid for a period of no more than 2 years from the date of report issuance. We strived to perform our professional services in accordance with generally accepted geotechnical engineering principles and practices currently employed in the area; no warranty is expressed or implied. There are risks of earth movement and property damages inherent in building on or with earth materials. We are unable to eliminate all risks or provide insurance; therefore, we are unable to guarantee or warrant the results of our services. This report is based upon field and other conditions discovered at the time of report preparation. We developed this report with limited subsurface exploration data. We assumed that our subsurface exploration data is representative of the actual subsurface conditions across the site. Considering possible underground variability of soil, rock, stockpiled material, and groundwater, additional costs may be required to complete the project. We recommend that the owner establish a contingency fund to cover such costs. If unexpected conditions are encountered, notify us immediately to review these conditions and provide additional and/or modified recommendations, as necessary. Our services did not include excavation sloping or shoring, soil volume change factors, flood potential, or a geohazard exploration. In addition, our geotechnical exploration did not include work to determine the existence of possible hazardous materials. If any hazardous materials are encountered during construction, then notify the proper regulatory officials immediately. This document must not be subject to unauthorized reuse that is, reusing without our written authorization. Such authorization is essential because it requires us to evaluate the document’s applicability given new circumstances, not the least of which is passage of time. Actual field or other conditions will necessitate clarifications, adjustments, modifications or other changes to our documents. Therefore, we must be engaged to prepare the necessary clarifications, adjustments, modifications or other changes before construction activities commence or further activity proceeds. If our scope of services does not include on-site construction observation, or if other persons or entities are retained to provide such services, ENGEO cannot be held responsible for any or all claims arising from or resulting from the performance of such services by other persons or entities, and from any or all claims arising from or resulting from clarifications, adjustments, modifications, discrepancies or other changes necessary to reflect changed field or other conditions.
Lennar Urban 8472.001.002 Candlestick Point Center September 18, 2013
SELECTED REFERENCES Bonilla, M.G., 1998, Preliminary Geologic Map of the San Francisco South 7.5’ Quadrangle and
Part of the Hunters Point 7.5’ Quadrangle, San Francisco Bay Area, California: a Digital Database, U.S. Geological Survey, Open File Report OF-98-354.
California Department of Transportation, 2012, Highway Design Manual. California Geological Survey (CGS), 1997, Guidelines for Evaluating and Mitigating Seismic
Hazards in California, Special Publication 117, March. California Division of Mines and Geology, 2000, Seismic Hazard Zone Report and Map, City and
County of San Francisco, California, SHZR 043. California Geological Survey, 2003, Seismic Hazard Zone Report and Map, Hunters Point
Quadrangle, Alameda County, California, SHZR 082. ENGEO, 2009, Preliminary Geotechnical Report, Hunters Point Shipyard Phase II and
Candlestick Point, San Francisco, California, May 21, 2009, Project No. 7730.000.001. ENGEO, 2011, Geotechnical Report, Hunters Point Shipyard Phase II and Candlestick Point,
San Francisco, California, November 1, 2011, Project No. 8472.001.001. ENGEO, 2013, Recommended Flexible Pavement Areas, Hunters Point Shipyard Phase II and
Candlestick Point, San Francisco, California, April 5, 2013, Project No. 8472.001.001. Frankel, Arthur D. et al. Documentation for the 2002 Update of the National Seismic Hazard
Maps, Open-file Report 02-420. Goldman, H.B., 1969, Geologic and Engineering Aspects of San Francisco Bay Fill, California
Division of Mines and Geology Special Report 97. International Code Council, 2010 California Building Code. Ishihara, K., 1985, Stability of Natural Deposits During Earthquakes: Proceedings Eleventh
International Conference on Soil Mechanics and Foundation Engineering, San Francisco. Ishihara, K., 1985, Stability of Natural Deposits During Earthquakes: Proceedings of the
Eleventh International Conference on Soil Mechanics and Foundation Engineering. Nichols, D.R. and Wright, N.A., 1971, Preliminary map of historic margins of marshland, San
Francisco Bay, California: U.S. Geological Survey, Open-File Report OF-71-216, scale 1:24000.
SEAOC, 1996, Recommended Lateral Force Requirements and Tentative Commentary.
Lennar Urban 8472.001.002 Candlestick Point Center September 18, 2013
Treadwell & Rollo, Inc., 1998, Geotechnical Investigation, San Francisco 49ers Stadium and Candlestick Mills, San Francisco, California, March 3, 1998, Project No. 2149.02.
United States Geological Survey and the California Geological Survey, 2006; Quaternary fault and
fold database for the United States, accessed July 2011, from USGS web site: http//earthquakes.usgs.gov/regional/qfaults/.
Witter, R.C., Knudsen, K.L., Sowers, J.M., Wentworth, C.M., Koehler, R.D., Randolph, C.E.,
Brooks, S, K., and Gans, K.D., 2006, Maps of Quaternary deposits and liquefaction susceptibility in the central San Francisco Bay region, California: U.S. Geological Survey, Open-File Report OF-2006-1037, scale 1:200000.
Working Group on California Earthquake Probabilities, 2008, The Uniform California Earthquake
Rupture Forecast, Version 2 UCERF 2, USGS Open File Report 2007-1437.
FIGURES
Figure 1 - Vicinity Map Figure 2 - Site Plan Figure 3 - Regional Geologic Map (Bonilla, 1998) Figure 4 – Site Geologic Map Figure 5 – Seismic Hazard Zone Map Figure 6 - Regional Faulting and Seismicity Map Figure 7 – Proposed Grading with Historic Shoreline Figure 8 – Limits of Likely Surcharge Area
FIGURES
S10
DB-14
DB-14A
DB-13
DB-15DB-3
DB-4
DB-5
DB-12
DB-10
SB-3
S9
S8
S6
CP-CPT6
P1
CP-CPT7
CP-CPT5
DB-8
DB-11
DB-9
DB-7
DB-6
S7
P2
CP-CPT3
CP-CPT12
CP-B2
CP-B3
CP-B4
CP-B1CP-CPT4
CP-CPT1SB-2
S10
CP-CPT11
CP-B7
DB-16
CPT-18
P2
2-CP-B4
2-CP-B5
2-CP-B7
2-CP-B6
2-CP-B8
2-CP-B8
-50
-70
-60
-40
-30
-20
-80
-70
-60
-20
-40
-20
-30
-20
-20
-10
-50
-60
-20
-30
-40
-60
-50
-80
-70
-60
-70
KJfg1
KJfg1
KJfsKJfl
KJfc
KJfs
KJfc
KJfsh Qaf
KJfg4
KJfc
Qaf
Qaf
Qaf
QafKjfgi
KJfs
Qaf
KJfc
KJfc
KJfg
KJfg4
KJfg5
KJfg3
KJfg3
KJfg2
KJfc
KJfc
KJfs
KJfg1
KJfs
KJfg1
KJfc
-70
Qaf
KJfg1
KJfg2
KJfg3
KJfg4
KJfg5
KJfc
KJfs
KJfl
KJfsh
sp
-80
FILL
ORTIGALITA
GREENVILLE
SANG
REG
ORIO
SANANDREAS
HAYWARD
POINTREYES
SANANDREAS
CONCO
RD
GR
EENVALLEY
VA C
A
SANJOAQUIN
ORTIGALITA
TOLAY
RODGERS
CREEK
CO
RD
EL IA
MIDW
AY
SILVERCREEK
SANJOSE
MONTE VISTA SHANNON
BERROCAL
ZAYANTE
VERGELES
SARGENT
DUNNIGAHHILLS
MAACAMA
CALAVERAS
CARNEGIECORAL HOLLOW
WEST
NAPA
BENNETTVALLEY
HU
NTIN
GCR
EEK- BERRYESSA
ALEXANDER-REDWOOD
HILL
GEYSERPEAK
COLLAYOMI
ANTIOCH
BEARM
OUNTAINS
BEARMOUNTAINS
MELONES
BEARM
OUNTAINS
TAHOE
- SIERRAFRO
NTAL
GR
EA
TV
AL
LE
YF
AU
LT
GR
EA
TV
AL
LE
YF
AU
LT
Santa Cruz Santa Clara
Merced
San MateoMariposa
Alameda
Stanislaus
Contra CostaSan Joaquin
MarinTuolumne
CalaverasSolano
AmadorSacramento
NapaSonoma Alpine
YoloEl Dorado
Lake
SanFrancisco
SANANDREAS
APPENDIX A
Boring Logs (This Study)
APPENDIX
A
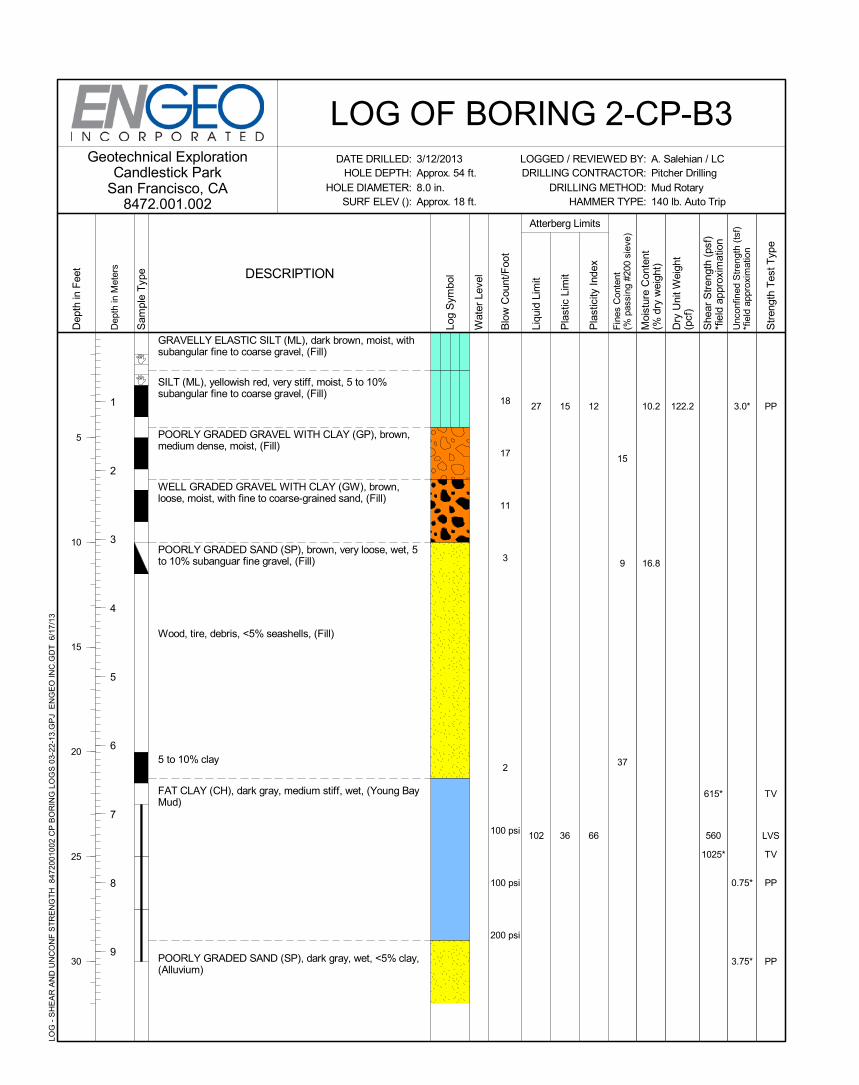
GRAVELLY ELASTIC SILT (ML), dark brown, moist, withsubangular fine to coarse gravel, (Fill)
SILT (ML), yellowish red, very stiff, moist, 5 to 10%subangular fine to coarse gravel, (Fill)
POORLY GRADED GRAVEL WITH CLAY (GP), brown,medium dense, moist, (Fill)
WELL GRADED GRAVEL WITH CLAY (GW), brown,loose, moist, with fine to coarse-grained sand, (Fill)
POORLY GRADED SAND (SP), brown, very loose, wet, 5to 10% subanguar fine gravel, (Fill)
Wood, tire, debris, <5% seashells, (Fill)
5 to 10% clay
FAT CLAY (CH), dark gray, medium stiff, wet, (Young BayMud)
POORLY GRADED SAND (SP), dark gray, wet, <5% clay,(Alluvium)
18
17
11
3
2
100 psi
100 psi
200 psi
27
102
15
36
12
66
15
9
37
10.2
16.8
122.2
615*
560
1025*
3.0*
0.75*
3.75*
PP
TV
LVS
TV
PP
PP
A. Salehian / LCPitcher DrillingMud Rotary140 lb. Auto Trip
Geotechnical ExplorationCandlestick Park
San Francisco, CA8472.001.002
DATE DRILLED:HOLE DEPTH:
HOLE DIAMETER:SURF ELEV ():
3/12/2013Approx. 54 ft.8.0 in.Approx. 18 ft.
Dep
th in
Met
ers
1
2
3
4
5
6
7
8
9
Dep
th in
Fee
t
5
10
15
20
25
30
Sam
ple
Typ
e
LOG OF BORING 2-CP-B3LOGGED / REVIEWED BY:DRILLING CONTRACTOR:
DRILLING METHOD:HAMMER TYPE:
DESCRIPTION
Wat
er L
evel
Blo
w C
ount
/Foo
t
Liqu
id L
imit
Pla
stic
Lim
it
Pla
stic
ity In
dex
Fin
es C
onte
nt(%
pas
sing
#20
0 si
eve)
Moi
stur
e C
onte
nt(%
dry
wei
ght)
Dry
Uni
t Wei
ght
(pcf
)
She
ar S
tren
gth
(psf
)*f
ield
app
roxi
mat
ion
Atterberg Limits
Unc
onfin
ed S
tren
gth
(tsf
)*f
ield
app
roxi
mat
ion
Str
engt
h T
est T
ype
Log
Sym
bol
LOG
- S
HE
AR
AN
D U
NC
ON
F S
TR
EN
GT
H 8
4720
010
02 C
P B
OR
ING
LO
GS
03-
22-1
3.G
PJ
EN
GE
O IN
C.G
DT
6/1
7/1
3
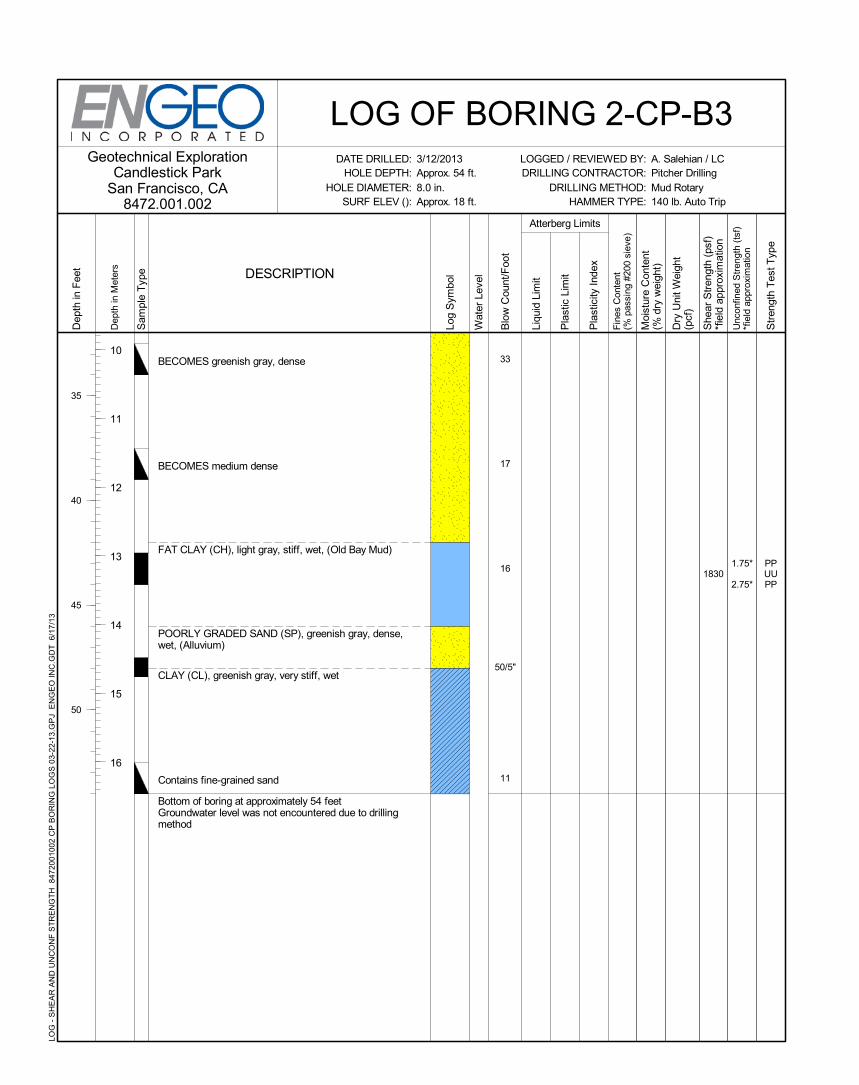
BECOMES greenish gray, dense
BECOMES medium dense
FAT CLAY (CH), light gray, stiff, wet, (Old Bay Mud)
POORLY GRADED SAND (SP), greenish gray, dense,wet, (Alluvium)
CLAY (CL), greenish gray, very stiff, wet
Contains fine-grained sand
Bottom of boring at approximately 54 feetGroundwater level was not encountered due to drillingmethod
33
17
16
50/5"
11
18301.75*
2.75*
PPUUPP
A. Salehian / LCPitcher DrillingMud Rotary140 lb. Auto Trip
Geotechnical ExplorationCandlestick Park
San Francisco, CA8472.001.002
DATE DRILLED:HOLE DEPTH:
HOLE DIAMETER:SURF ELEV ():
3/12/2013Approx. 54 ft.8.0 in.Approx. 18 ft.
Dep
th in
Met
ers
10
11
12
13
14
15
16
Dep
th in
Fee
t
35
40
45
50
Sam
ple
Typ
e
LOG OF BORING 2-CP-B3LOGGED / REVIEWED BY:DRILLING CONTRACTOR:
DRILLING METHOD:HAMMER TYPE:
DESCRIPTION
Wat
er L
evel
Blo
w C
ount
/Foo
t
Liqu
id L
imit
Pla
stic
Lim
it
Pla
stic
ity In
dex
Fin
es C
onte
nt(%
pas
sing
#20
0 si
eve)
Moi
stur
e C
onte
nt(%
dry
wei
ght)
Dry
Uni
t Wei
ght
(pcf
)
She
ar S
tren
gth
(psf
)*f
ield
app
roxi
mat
ion
Atterberg Limits
Unc
onfin
ed S
tren
gth
(tsf
)*f
ield
app
roxi
mat
ion
Str
engt
h T
est T
ype
Log
Sym
bol
LOG
- S
HE
AR
AN
D U
NC
ON
F S
TR
EN
GT
H 8
4720
010
02 C
P B
OR
ING
LO
GS
03-
22-1
3.G
PJ
EN
GE
O IN
C.G
DT
6/1
7/1
3
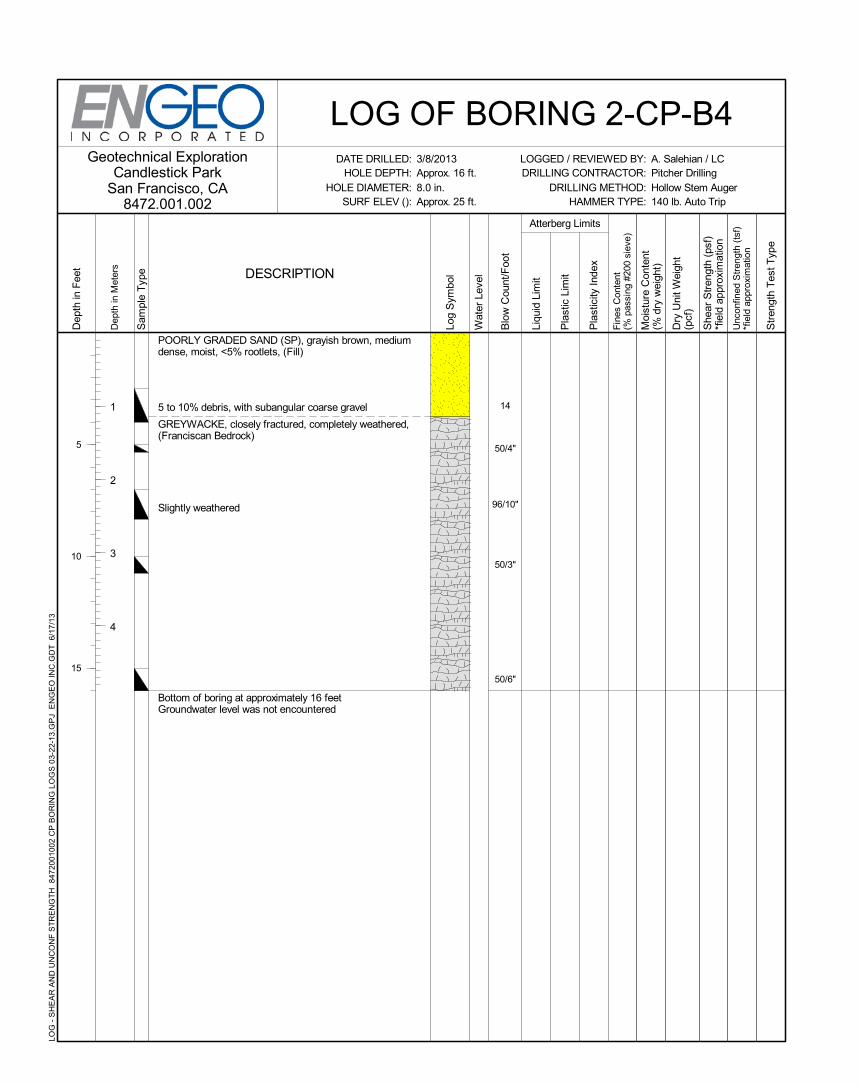
POORLY GRADED SAND (SP), grayish brown, mediumdense, moist, <5% rootlets, (Fill)
5 to 10% debris, with subangular coarse gravel
GREYWACKE, closely fractured, completely weathered,(Franciscan Bedrock)
Slightly weathered
Bottom of boring at approximately 16 feetGroundwater level was not encountered
14
50/4"
96/10"
50/3"
50/6"
A. Salehian / LCPitcher DrillingHollow Stem Auger140 lb. Auto Trip
Geotechnical ExplorationCandlestick Park
San Francisco, CA8472.001.002
DATE DRILLED:HOLE DEPTH:
HOLE DIAMETER:SURF ELEV ():
3/8/2013Approx. 16 ft.8.0 in.Approx. 25 ft.
Dep
th in
Met
ers
1
2
3
4
Dep
th in
Fee
t
5
10
15
Sam
ple
Typ
e
LOG OF BORING 2-CP-B4LOGGED / REVIEWED BY:DRILLING CONTRACTOR:
DRILLING METHOD:HAMMER TYPE:
DESCRIPTION
Wat
er L
evel
Blo
w C
ount
/Foo
t
Liqu
id L
imit
Pla
stic
Lim
it
Pla
stic
ity In
dex
Fin
es C
onte
nt(%
pas
sing
#20
0 si
eve)
Moi
stur
e C
onte
nt(%
dry
wei
ght)
Dry
Uni
t Wei
ght
(pcf
)
She
ar S
tren
gth
(psf
)*f
ield
app
roxi
mat
ion
Atterberg Limits
Unc
onfin
ed S
tren
gth
(tsf
)*f
ield
app
roxi
mat
ion
Str
engt
h T
est T
ype
Log
Sym
bol
LOG
- S
HE
AR
AN
D U
NC
ON
F S
TR
EN
GT
H 8
4720
010
02 C
P B
OR
ING
LO
GS
03-
22-1
3.G
PJ
EN
GE
O IN
C.G
DT
6/1
7/1
3
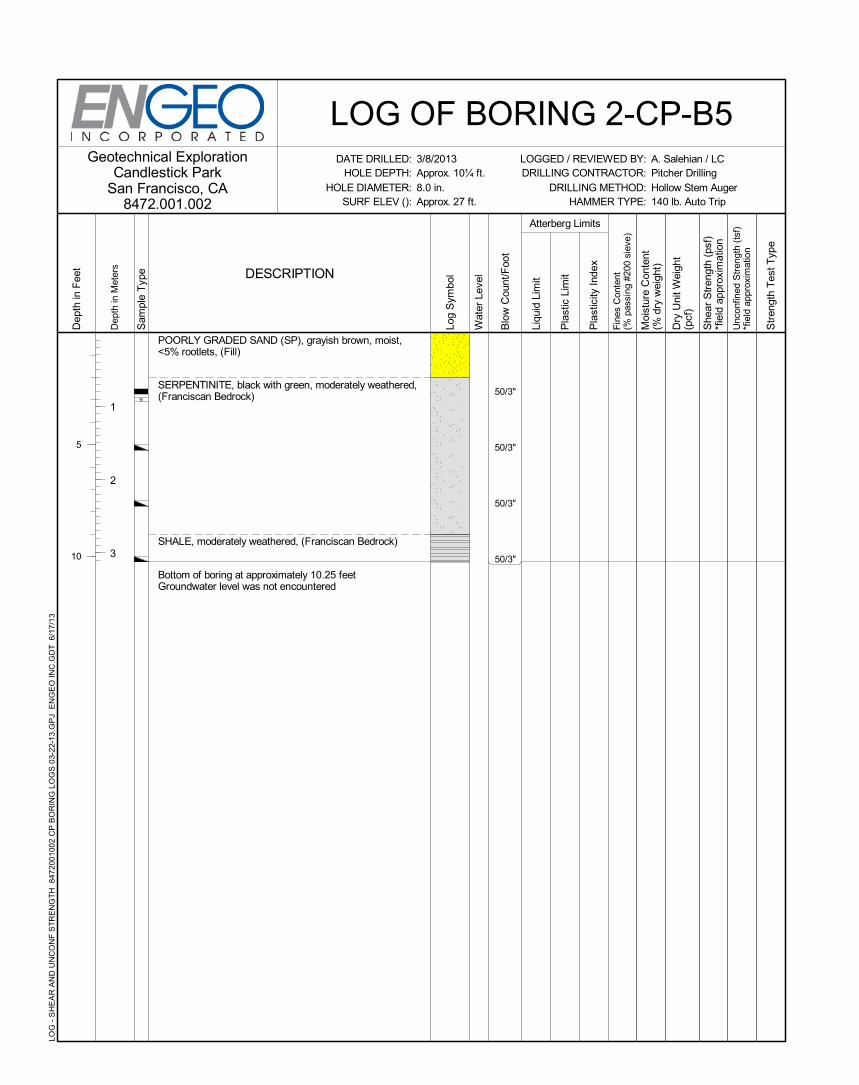
POORLY GRADED SAND (SP), grayish brown, moist,<5% rootlets, (Fill)
SERPENTINITE, black with green, moderately weathered,(Franciscan Bedrock)
SHALE, moderately weathered, (Franciscan Bedrock)
Bottom of boring at approximately 10.25 feetGroundwater level was not encountered
50/3"
50/3"
50/3"
50/3"
A. Salehian / LCPitcher DrillingHollow Stem Auger140 lb. Auto Trip
Geotechnical ExplorationCandlestick Park
San Francisco, CA8472.001.002
DATE DRILLED:HOLE DEPTH:
HOLE DIAMETER:SURF ELEV ():
3/8/2013Approx. 10¼ ft.8.0 in.Approx. 27 ft.
Dep
th in
Met
ers
1
2
3
Dep
th in
Fee
t
5
10
Sam
ple
Typ
e
LOG OF BORING 2-CP-B5LOGGED / REVIEWED BY:DRILLING CONTRACTOR:
DRILLING METHOD:HAMMER TYPE:
DESCRIPTION
Wat
er L
evel
Blo
w C
ount
/Foo
t
Liqu
id L
imit
Pla
stic
Lim
it
Pla
stic
ity In
dex
Fin
es C
onte
nt(%
pas
sing
#20
0 si
eve)
Moi
stur
e C
onte
nt(%
dry
wei
ght)
Dry
Uni
t Wei
ght
(pcf
)
She
ar S
tren
gth
(psf
)*f
ield
app
roxi
mat
ion
Atterberg Limits
Unc
onfin
ed S
tren
gth
(tsf
)*f
ield
app
roxi
mat
ion
Str
engt
h T
est T
ype
Log
Sym
bol
LOG
- S
HE
AR
AN
D U
NC
ON
F S
TR
EN
GT
H 8
4720
010
02 C
P B
OR
ING
LO
GS
03-
22-1
3.G
PJ
EN
GE
O IN
C.G
DT
6/1
7/1
3
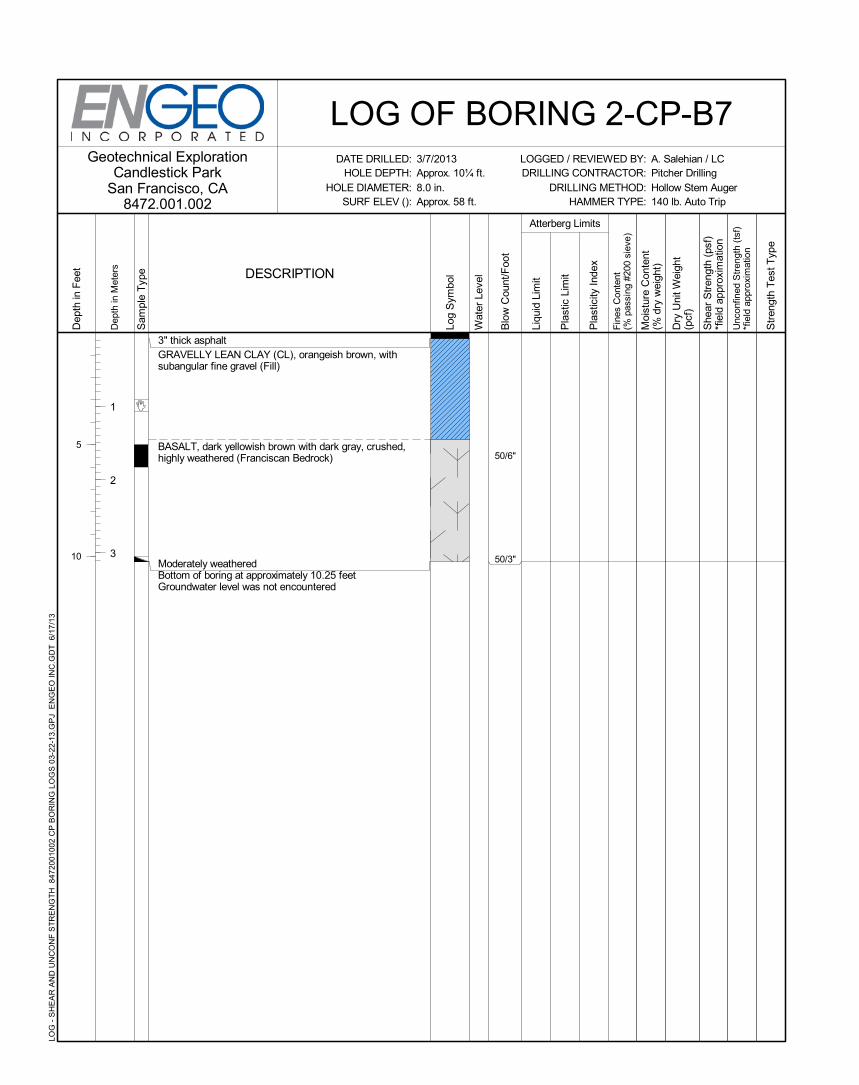
3" thick asphaltGRAVELLY LEAN CLAY (CL), orangeish brown, withsubangular fine gravel (Fill)
BASALT, dark yellowish brown with dark gray, crushed,highly weathered (Franciscan Bedrock)
Moderately weatheredBottom of boring at approximately 10.25 feetGroundwater level was not encountered
50/6"
50/3"
A. Salehian / LCPitcher DrillingHollow Stem Auger140 lb. Auto Trip
Geotechnical ExplorationCandlestick Park
San Francisco, CA8472.001.002
DATE DRILLED:HOLE DEPTH:
HOLE DIAMETER:SURF ELEV ():
3/7/2013Approx. 10¼ ft.8.0 in.Approx. 58 ft.
Dep
th in
Met
ers
1
2
3
Dep
th in
Fee
t
5
10
Sam
ple
Typ
e
LOG OF BORING 2-CP-B7LOGGED / REVIEWED BY:DRILLING CONTRACTOR:
DRILLING METHOD:HAMMER TYPE:
DESCRIPTION
Wat
er L
evel
Blo
w C
ount
/Foo
t
Liqu
id L
imit
Pla
stic
Lim
it
Pla
stic
ity In
dex
Fin
es C
onte
nt(%
pas
sing
#20
0 si
eve)
Moi
stur
e C
onte
nt(%
dry
wei
ght)
Dry
Uni
t Wei
ght
(pcf
)
She
ar S
tren
gth
(psf
)*f
ield
app
roxi
mat
ion
Atterberg Limits
Unc
onfin
ed S
tren
gth
(tsf
)*f
ield
app
roxi
mat
ion
Str
engt
h T
est T
ype
Log
Sym
bol
LOG
- S
HE
AR
AN
D U
NC
ON
F S
TR
EN
GT
H 8
4720
010
02 C
P B
OR
ING
LO
GS
03-
22-1
3.G
PJ
EN
GE
O IN
C.G
DT
6/1
7/1
3
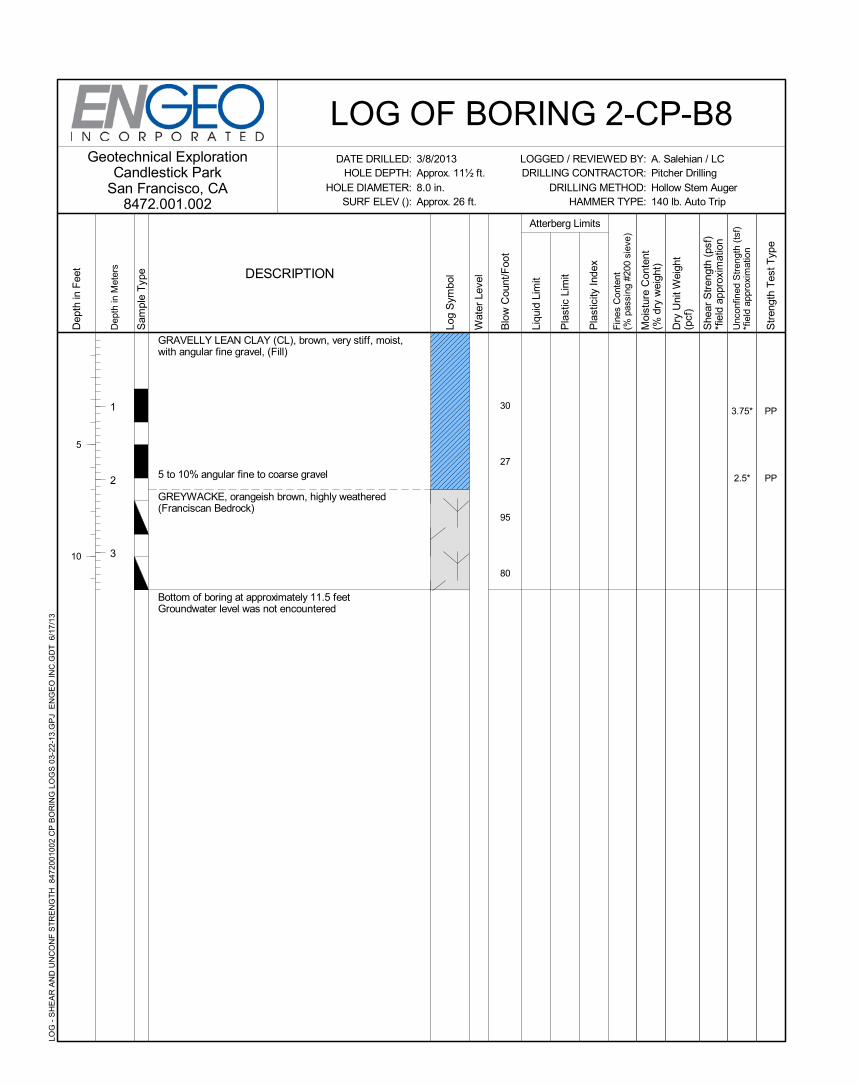
GRAVELLY LEAN CLAY (CL), brown, very stiff, moist,with angular fine gravel, (Fill)
5 to 10% angular fine to coarse gravel
GREYWACKE, orangeish brown, highly weathered(Franciscan Bedrock)
Bottom of boring at approximately 11.5 feetGroundwater level was not encountered
30
27
95
80
3.75*
2.5*
PP
PP
A. Salehian / LCPitcher DrillingHollow Stem Auger140 lb. Auto Trip
Geotechnical ExplorationCandlestick Park
San Francisco, CA8472.001.002
DATE DRILLED:HOLE DEPTH:
HOLE DIAMETER:SURF ELEV ():
3/8/2013Approx. 11½ ft.8.0 in.Approx. 26 ft.
Dep
th in
Met
ers
1
2
3
Dep
th in
Fee
t
5
10
Sam
ple
Typ
e
LOG OF BORING 2-CP-B8LOGGED / REVIEWED BY:DRILLING CONTRACTOR:
DRILLING METHOD:HAMMER TYPE:
DESCRIPTION
Wat
er L
evel
Blo
w C
ount
/Foo
t
Liqu
id L
imit
Pla
stic
Lim
it
Pla
stic
ity In
dex
Fin
es C
onte
nt(%
pas
sing
#20
0 si
eve)
Moi
stur
e C
onte
nt(%
dry
wei
ght)
Dry
Uni
t Wei
ght
(pcf
)
She
ar S
tren
gth
(psf
)*f
ield
app
roxi
mat
ion
Atterberg Limits
Unc
onfin
ed S
tren
gth
(tsf
)*f
ield
app
roxi
mat
ion
Str
engt
h T
est T
ype
Log
Sym
bol
LOG
- S
HE
AR
AN
D U
NC
ON
F S
TR
EN
GT
H 8
4720
010
02 C
P B
OR
ING
LO
GS
03-
22-1
3.G
PJ
EN
GE
O IN
C.G
DT
6/1
7/1
3

APPENDIX B
Seismic Refraction Report (NorCal Geophysical)
APPENDIX
B
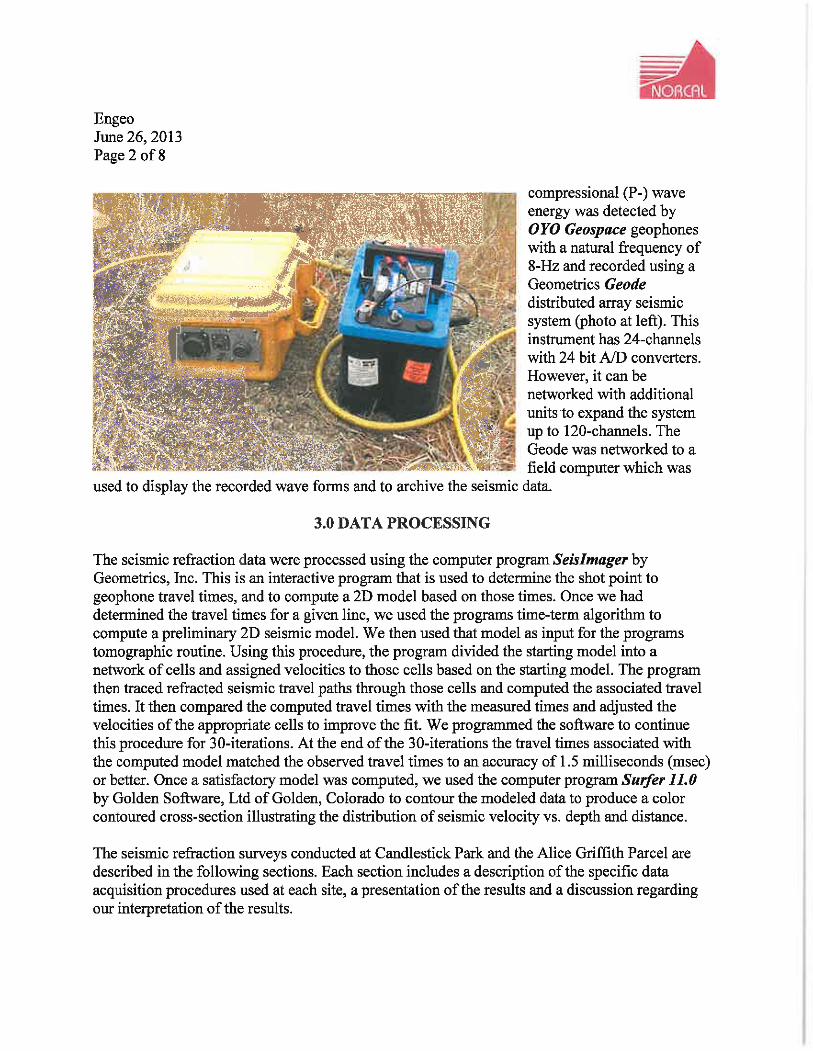
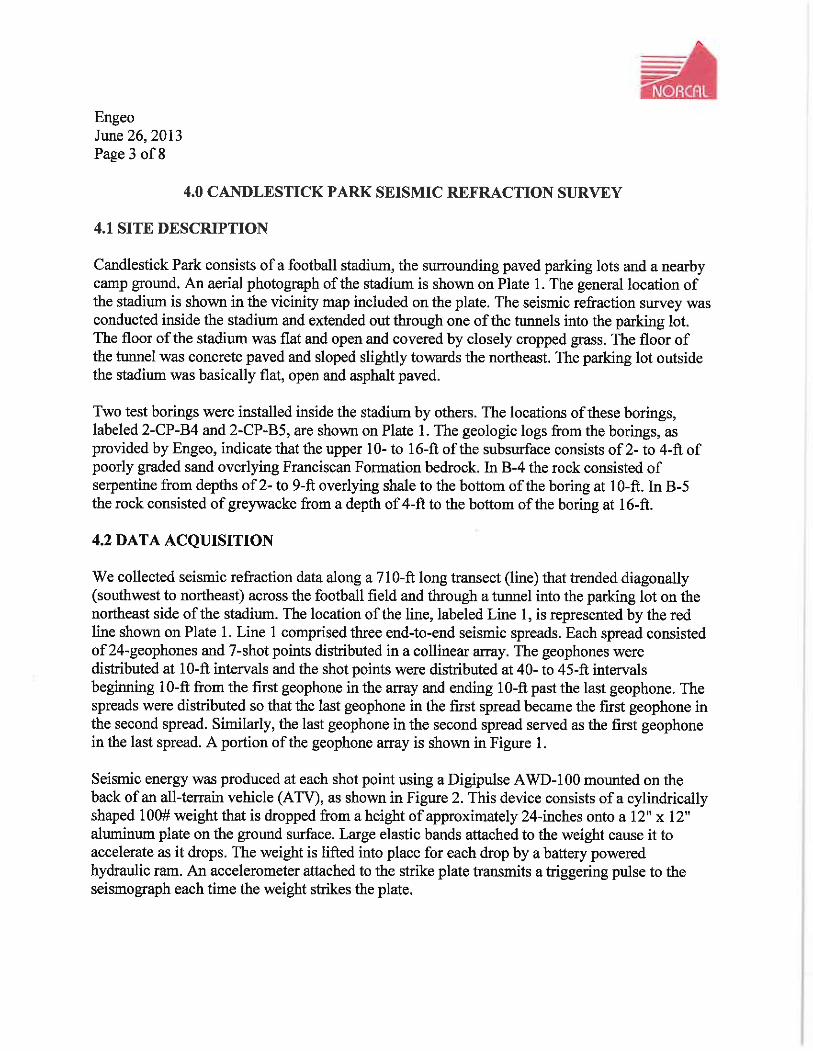
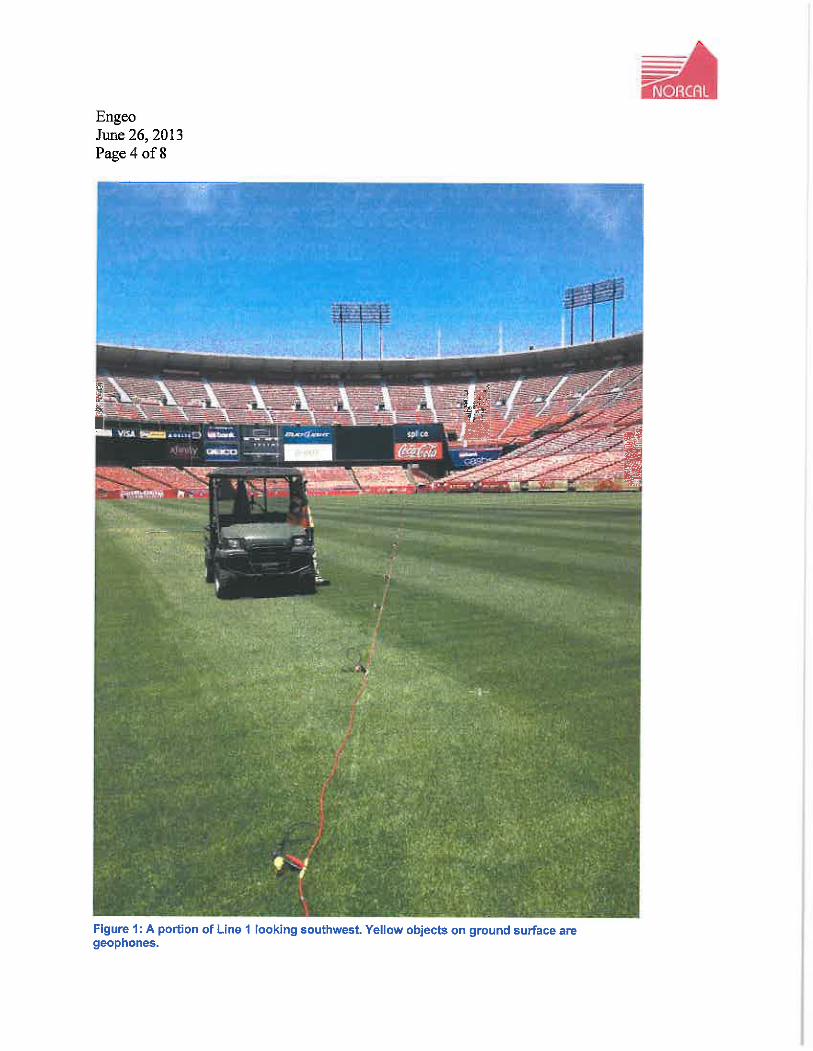
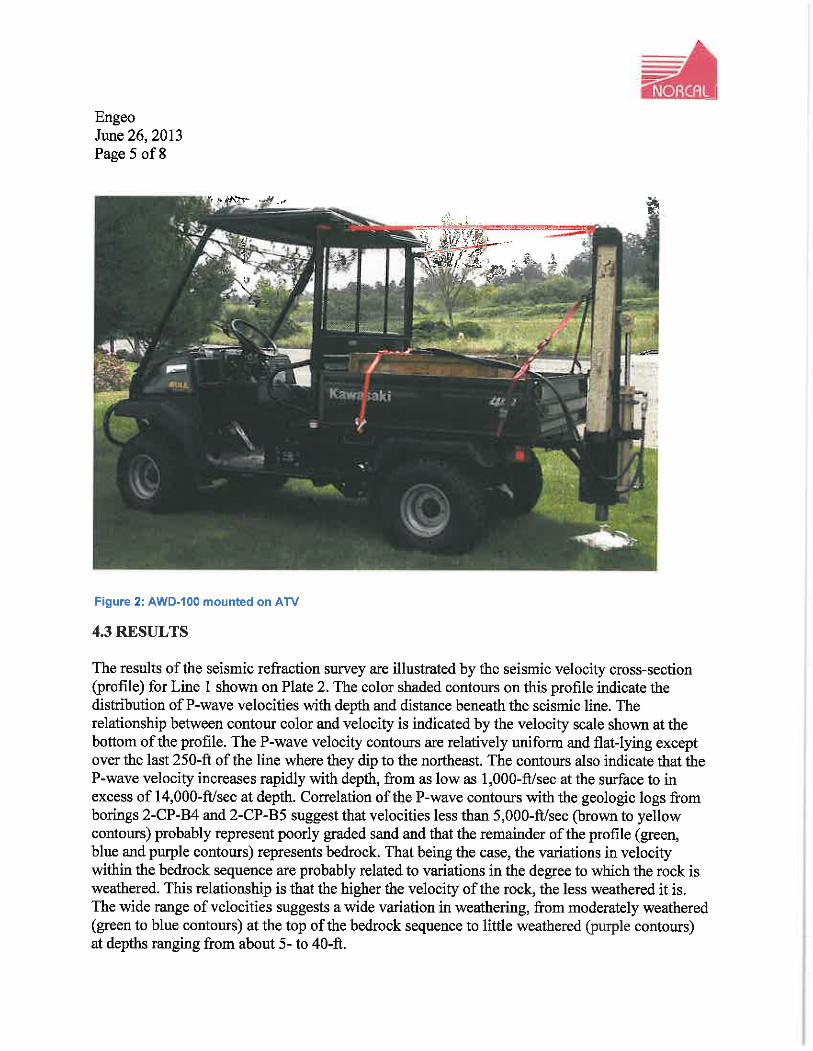
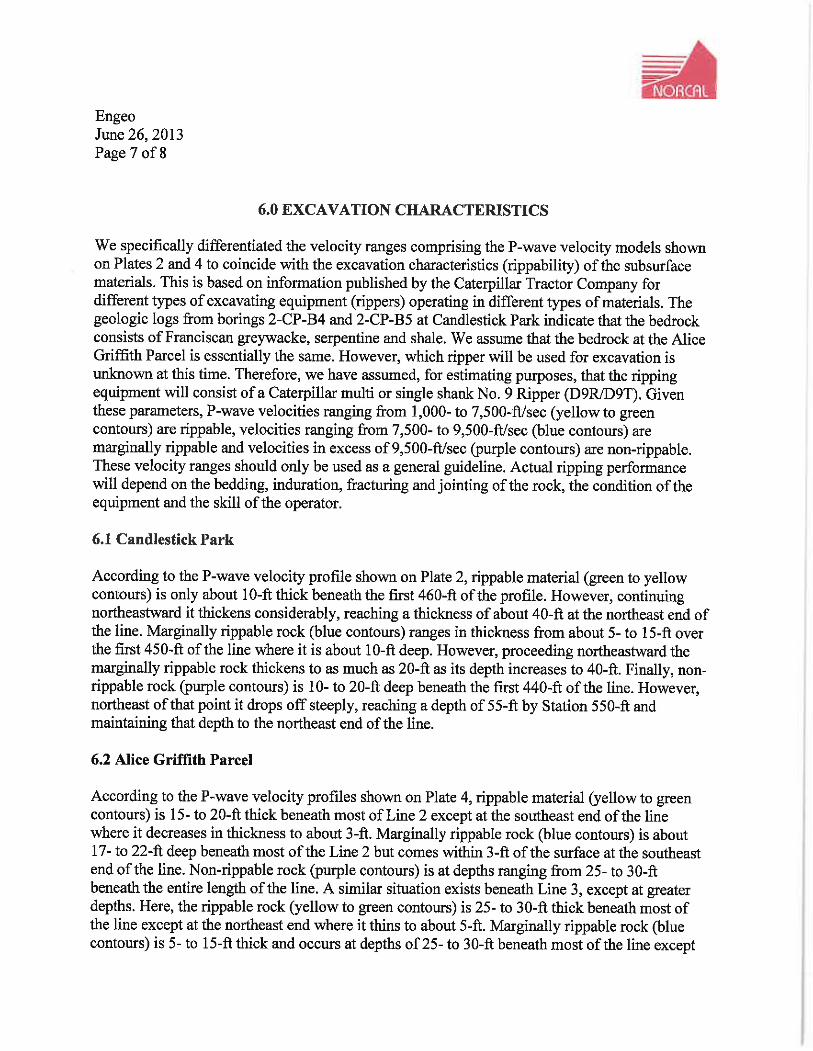
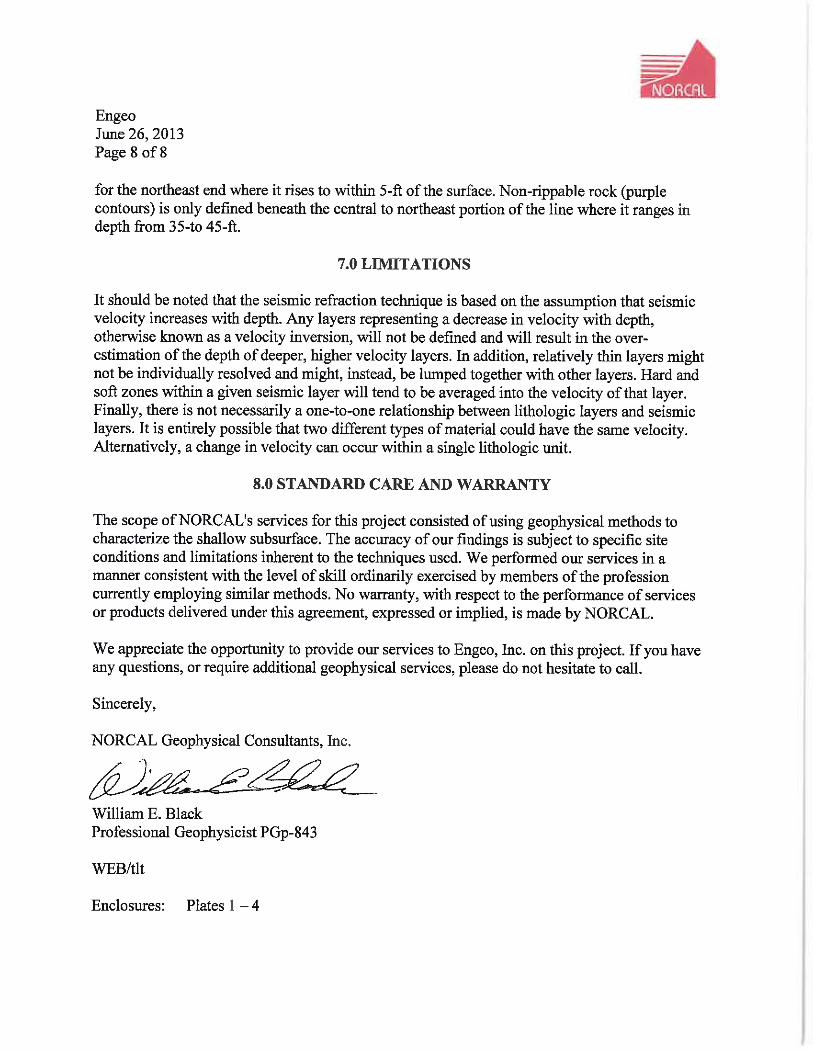
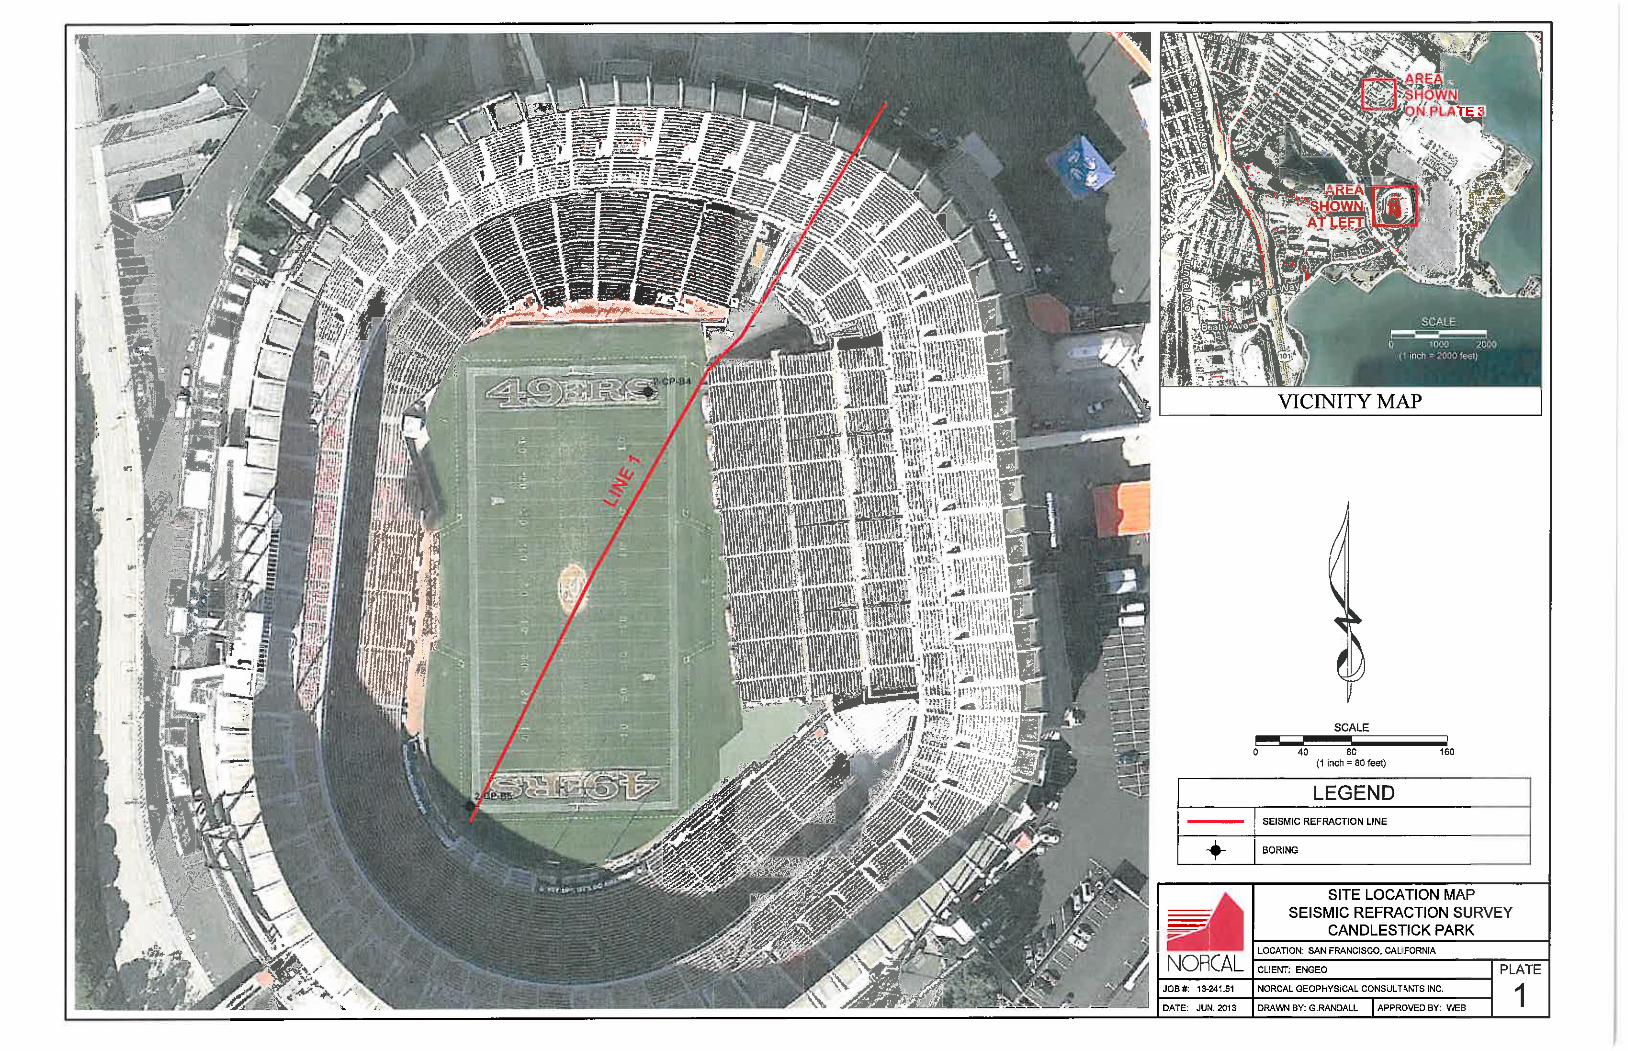
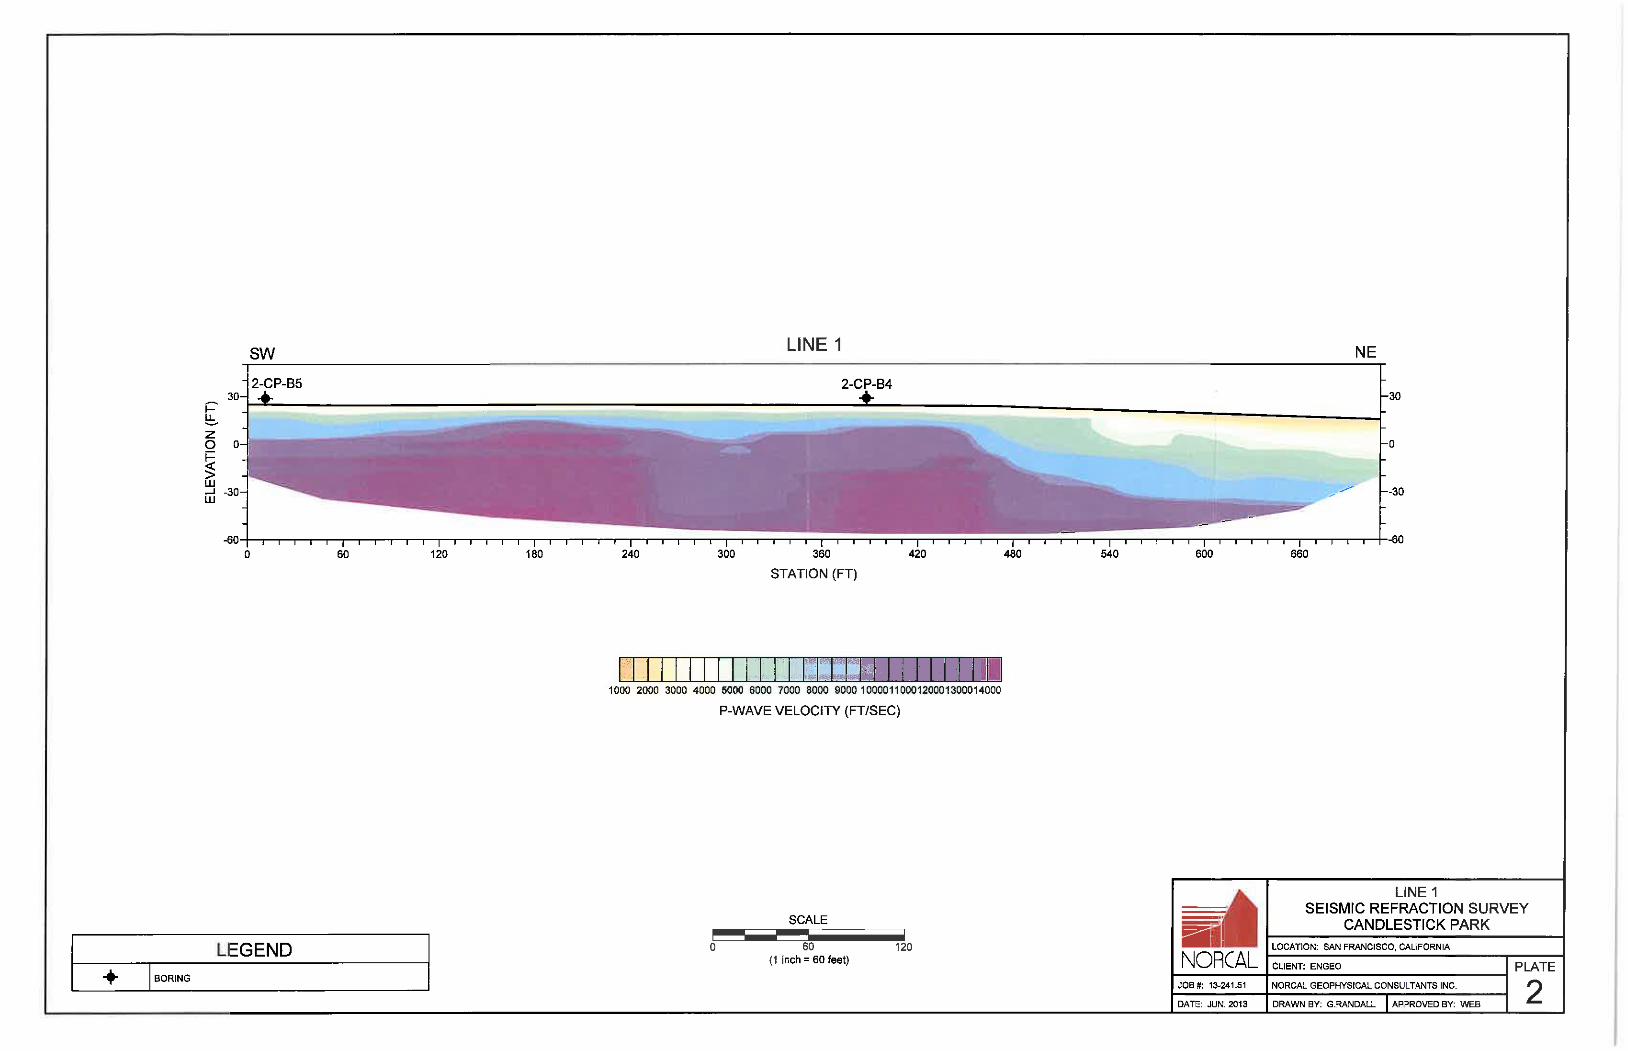
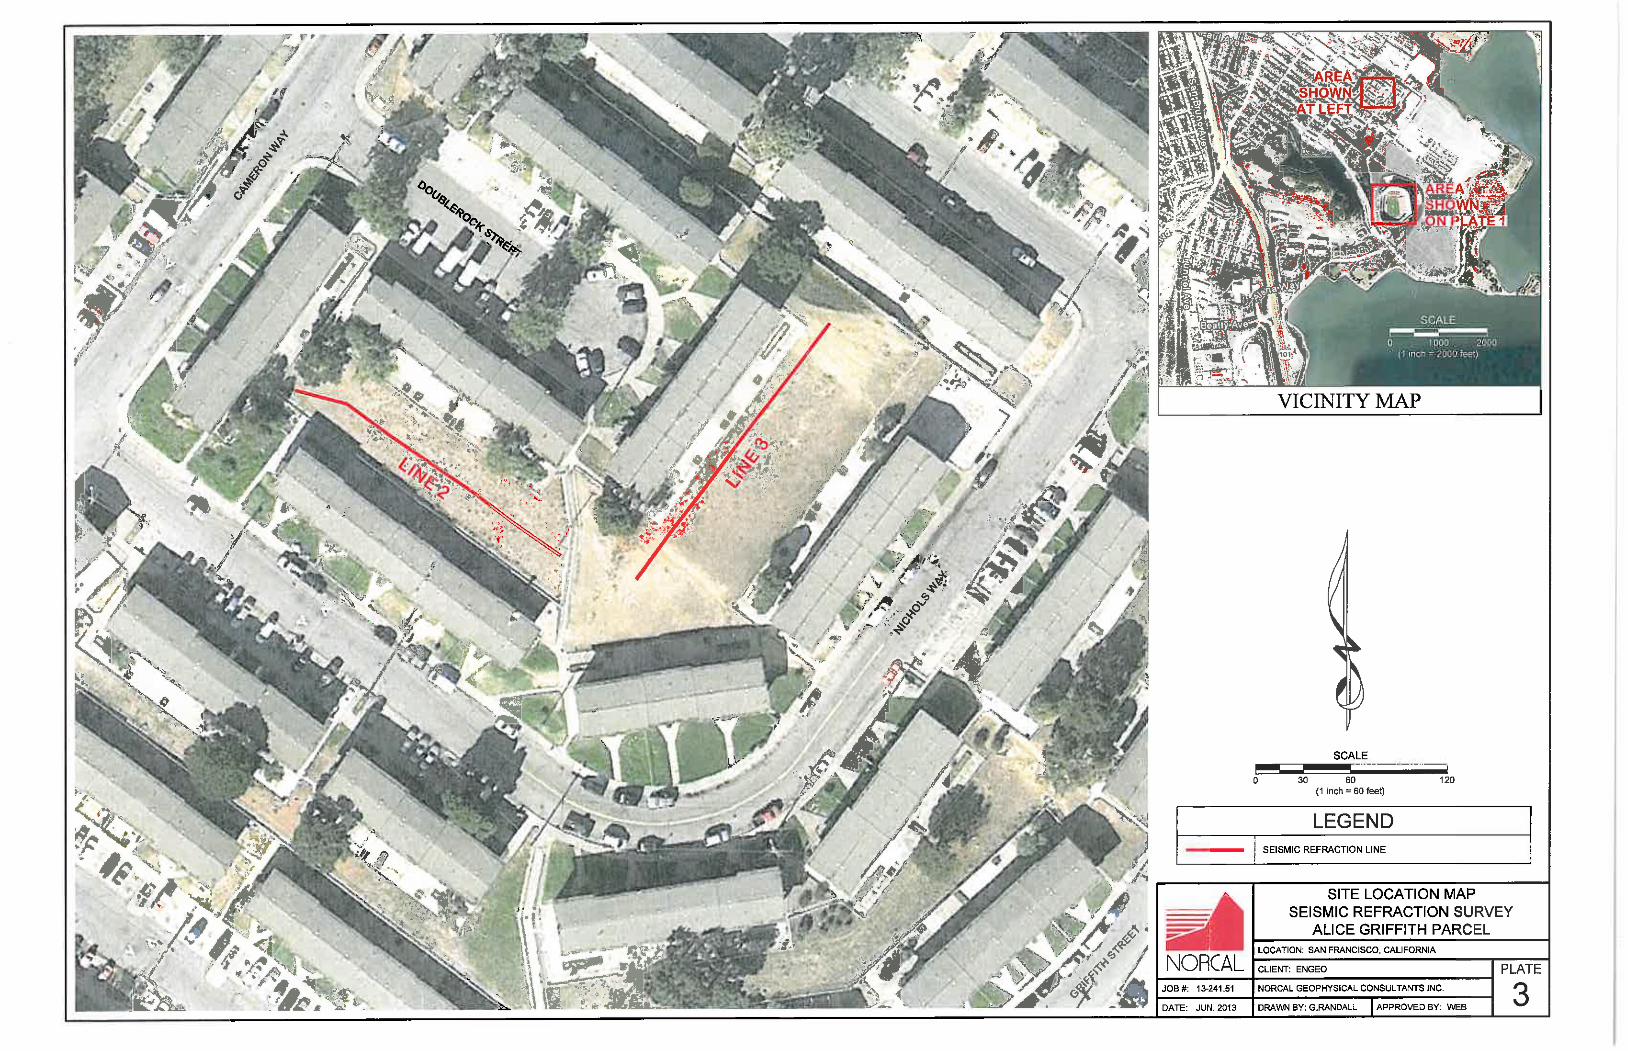
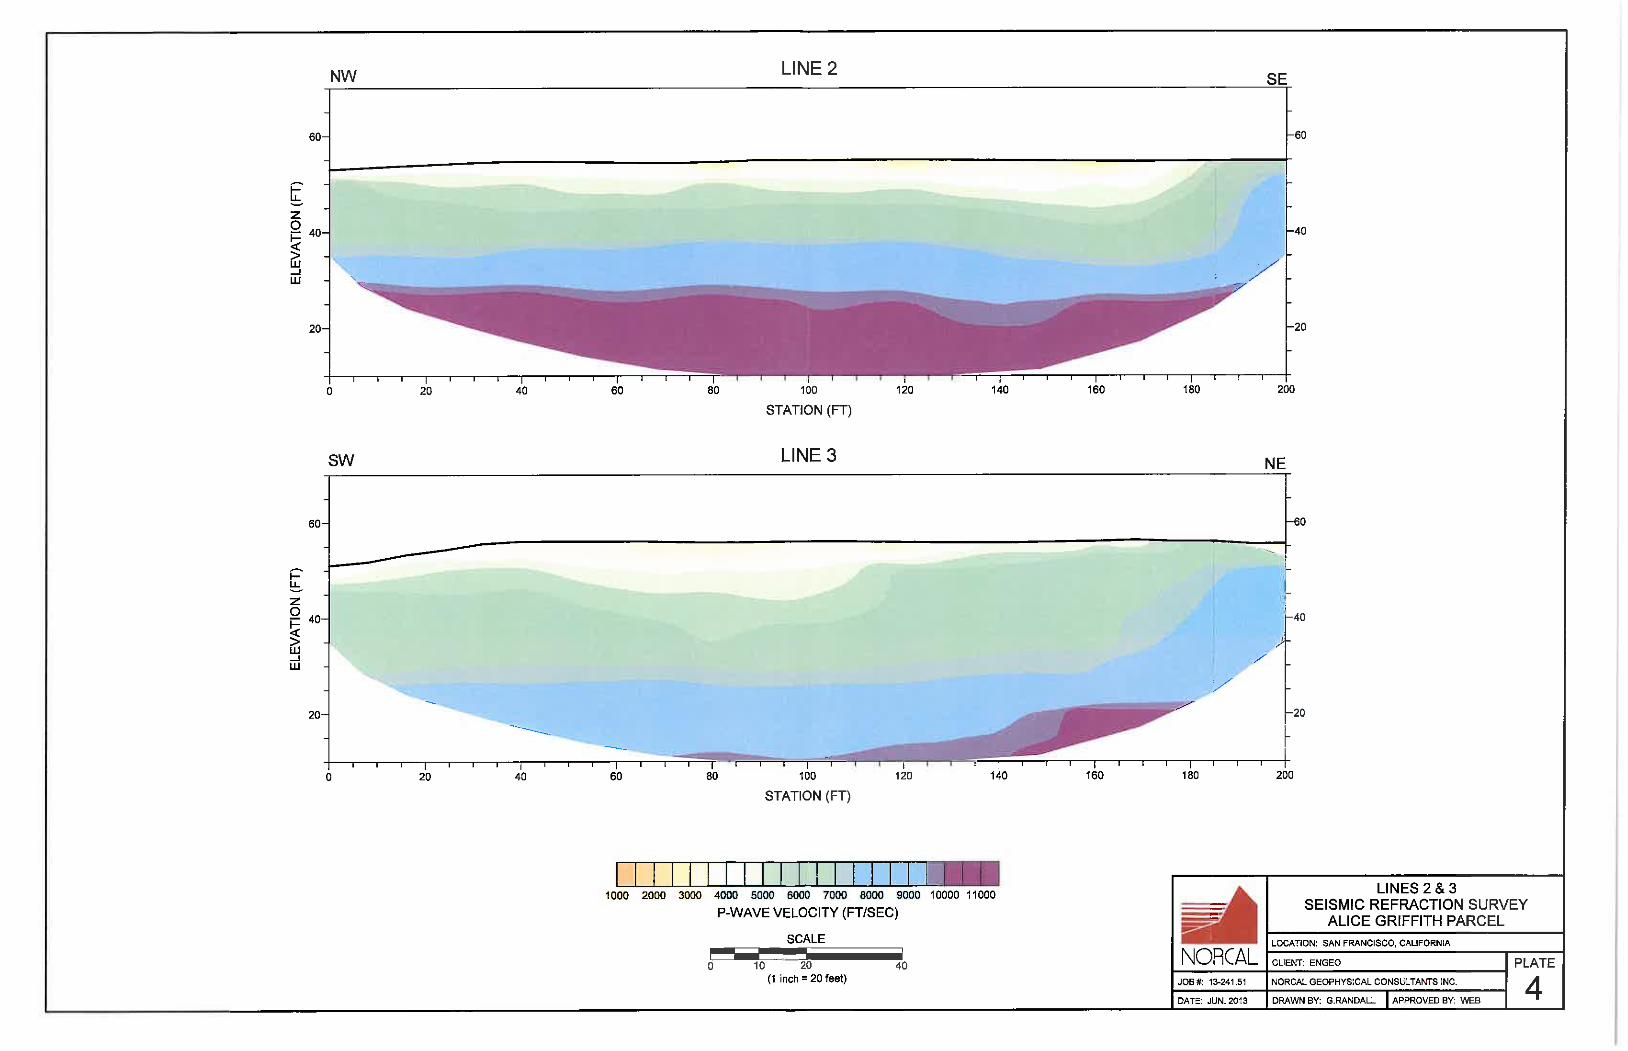
APPENDIX C
Previous Explorations (ENGEO)
APPENDIX
C
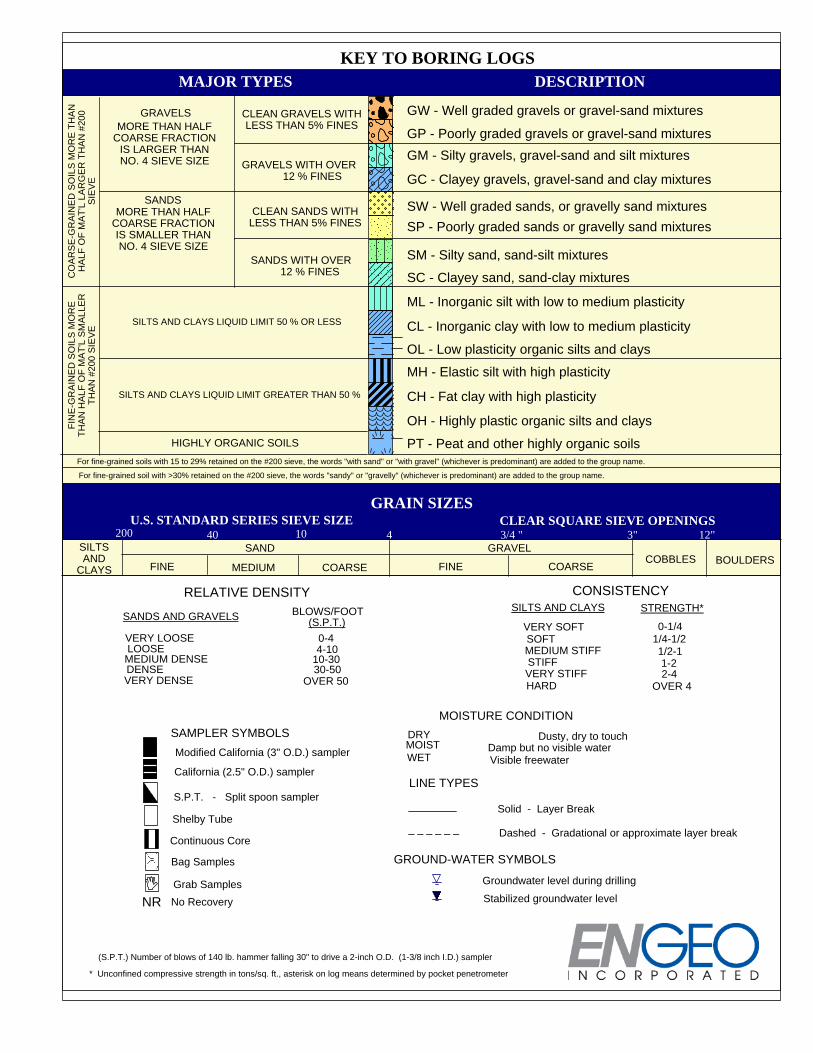
3/4 "41040
MORE THAN HALFCOARSE FRACTION
IS LARGER THANNO. 4 SIEVE SIZE
200
OH - Highly plastic organic silts and clays
For fine-grained soil with >30% retained on the #200 sieve, the words "sandy" or "gravelly" (whichever is predominant) are added to the group name.
For fine-grained soils with 15 to 29% retained on the #200 sieve, the words "with sand" or "with gravel" (whichever is predominant) are added to the group name.
FIN
E-G
RA
INE
D S
OIL
S M
OR
ET
HA
N H
ALF
OF
MA
T'L
SM
ALL
ER
TH
AN
#20
0 S
IEV
E
CO
AR
SE
-GR
AIN
ED
SO
ILS
MO
RE
TH
AN
HA
LF O
F M
AT
'L L
AR
GE
R T
HA
N #
200
SIE
VE
SILTS AND CLAYS LIQUID LIMIT 50 % OR LESS
U.S. STANDARD SERIES SIEVE SIZE
SILTS AND CLAYS LIQUID LIMIT GREATER THAN 50 %
PT - Peat and other highly organic soils
KEY TO BORING LOGS
CH - Fat clay with high plasticity
SC - Clayey sand, sand-clay mixtures
GP - Poorly graded gravels or gravel-sand mixtures
Grab Samples
Dusty, dry to touch
Solid - Layer Break
LINE TYPES
WET Visible freewater
MOIST Damp but no visible waterDRY
Groundwater level during drilling
MOISTURE CONDITION
* Unconfined compressive strength in tons/sq. ft., asterisk on log means determined by pocket penetrometer
(S.P.T.) Number of blows of 140 lb. hammer falling 30" to drive a 2-inch O.D. (1-3/8 inch I.D.) sampler
12"3"
No Recovery
Bag Samples
GRAIN SIZESCLEAR SQUARE SIEVE OPENINGS
MAJOR TYPES
NR
Continuous Core_ _ _ _ _ _
S.P.T. - Split spoon sampler
Dashed - Gradational or approximate layer break
Modified California (3" O.D.) sampler
GROUND-WATER SYMBOLS
California (2.5" O.D.) sampler
SAMPLER SYMBOLS
Stabilized groundwater level
Shelby Tube
SANDS WITH OVER 12 % FINES
GM - Silty gravels, gravel-sand and silt mixtures
HIGHLY ORGANIC SOILS
GRAVELS WITH OVER 12 % FINES
GRAVELS
DESCRIPTION
MH - Elastic silt with high plasticity
OL - Low plasticity organic silts and clays
GW - Well graded gravels or gravel-sand mixtures
CLEAN SANDS WITHLESS THAN 5% FINES
OVER 4
STRENGTH*
FINE
RELATIVE DENSITY CONSISTENCY
SANDSMORE THAN HALF
COARSE FRACTIONIS SMALLER THANNO. 4 SIEVE SIZE
CL - Inorganic clay with low to medium plasticity
ML - Inorganic silt with low to medium plasticity
SM - Silty sand, sand-silt mixtures
SP - Poorly graded sands or gravelly sand mixtures
SW - Well graded sands, or gravelly sand mixtures
GC - Clayey gravels, gravel-sand and clay mixtures
LOOSE
SILTSAND
CLAYS
VERY DENSE
0-4
BLOWS/FOOT SILTS AND CLAYS
SOFTVERY SOFT
STIFF
HARD2-41-2
1/4-1/20-1/4
CLEAN GRAVELS WITHLESS THAN 5% FINES
1/2-1
VERY STIFF
VERY LOOSE
DENSEMEDIUM DENSE
(S.P.T.)
GRAVELSAND
FINE COARSEBOULDERS
SANDS AND GRAVELS
4-10
OVER 5030-5010-30
MEDIUM STIFF
MEDIUM COARSECOBBLES
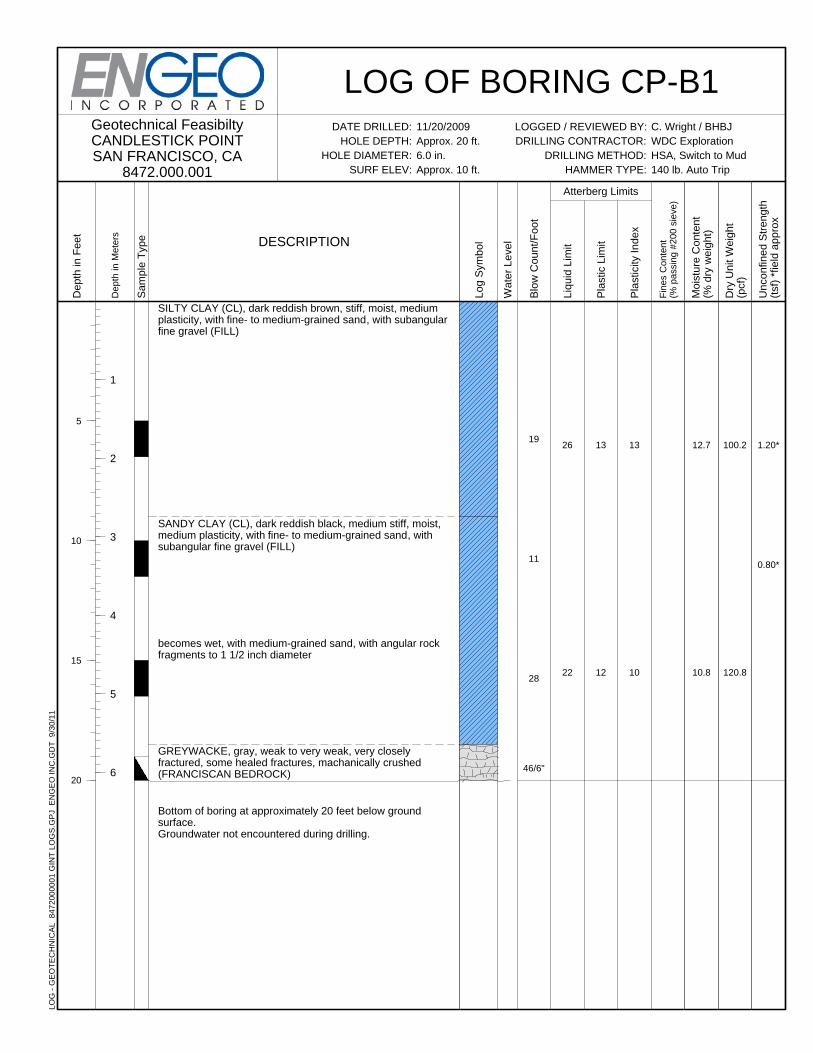
1.20*
0.80*
100.2
120.8
12.7
10.8
13
10
19
11
28
46/6"
13
12
26
22
SILTY CLAY (CL), dark reddish brown, stiff, moist, mediumplasticity, with fine- to medium-grained sand, with subangularfine gravel (FILL)
SANDY CLAY (CL), dark reddish black, medium stiff, moist,medium plasticity, with fine- to medium-grained sand, withsubangular fine gravel (FILL)
becomes wet, with medium-grained sand, with angular rockfragments to 1 1/2 inch diameter
GREYWACKE, gray, weak to very weak, very closelyfractured, some healed fractures, machanically crushed(FRANCISCAN BEDROCK)
Bottom of boring at approximately 20 feet below groundsurface.Groundwater not encountered during drilling.
Dep
th in
Met
ers
1
2
3
4
5
6
Dep
th in
Fee
t
5
10
15
20
Sam
ple
Typ
e
LOG OF BORING CP-B1LOGGED / REVIEWED BY:DRILLING CONTRACTOR:
DRILLING METHOD:HAMMER TYPE:
Unc
onfin
ed S
tren
gth
(tsf
) *f
ield
app
rox
Dry
Uni
t Wei
ght
(pcf
)
Moi
stur
e C
onte
nt(%
dry
wei
ght)
Pla
stic
ity In
dex
Blo
w C
ount
/Foo
t
Wat
er L
evel
Fin
es C
onte
nt(%
pas
sing
#20
0 si
eve)
Atterberg Limits
C. Wright / BHBJWDC ExplorationHSA, Switch to Mud140 lb. Auto Trip
Geotechnical FeasibiltyCANDLESTICK POINTSAN FRANCISCO, CA
8472.000.001
Pla
stic
Lim
it
Liqu
id L
imit
Log
Sym
bol
11/20/2009Approx. 20 ft.6.0 in.Approx. 10 ft.
DESCRIPTION
DATE DRILLED:HOLE DEPTH:
HOLE DIAMETER:SURF ELEV:
LO
G -
GE
OT
EC
HN
ICA
L
84
72
00
00
01
GIN
T L
OG
S.G
PJ
EN
GE
O I
NC
.GD
T
9/3
0/1
1
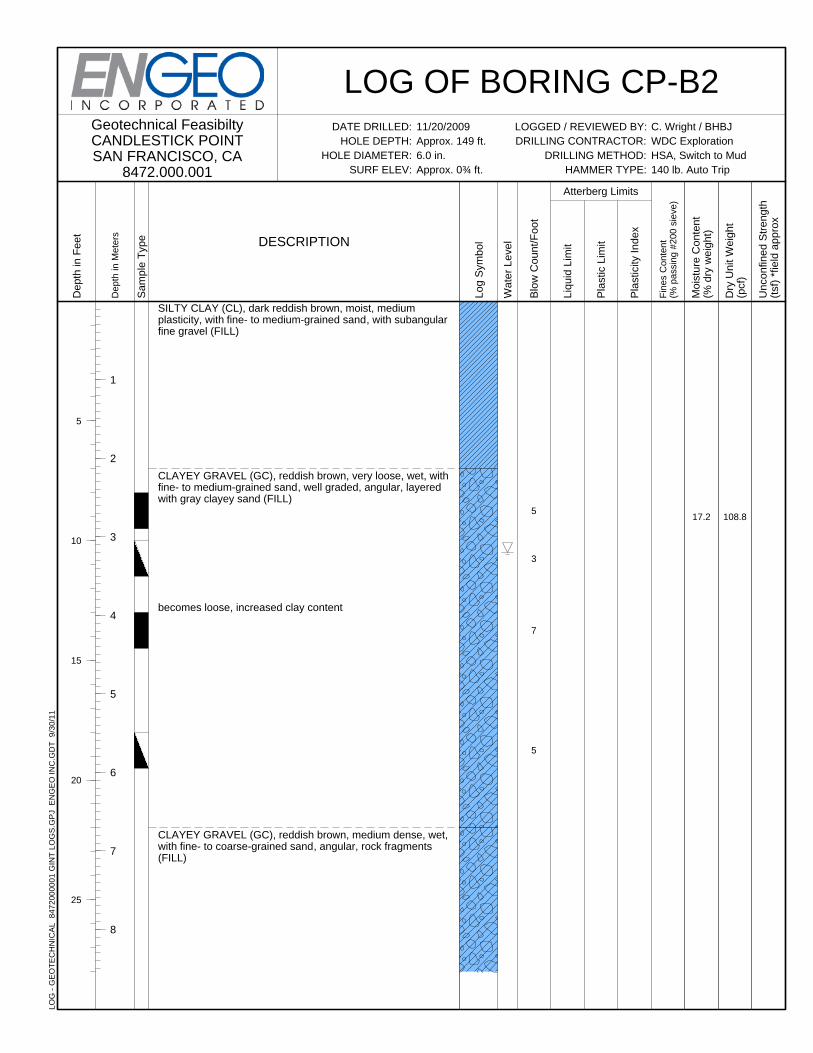
108.817.25
3
7
5
SILTY CLAY (CL), dark reddish brown, moist, mediumplasticity, with fine- to medium-grained sand, with subangularfine gravel (FILL)
CLAYEY GRAVEL (GC), reddish brown, very loose, wet, withfine- to medium-grained sand, well graded, angular, layeredwith gray clayey sand (FILL)
becomes loose, increased clay content
CLAYEY GRAVEL (GC), reddish brown, medium dense, wet,with fine- to coarse-grained sand, angular, rock fragments(FILL)
Dep
th in
Met
ers
1
2
3
4
5
6
7
8
Dep
th in
Fee
t
5
10
15
20
25
Sam
ple
Typ
e
LOG OF BORING CP-B2LOGGED / REVIEWED BY:DRILLING CONTRACTOR:
DRILLING METHOD:HAMMER TYPE:
Unc
onfin
ed S
tren
gth
(tsf
) *f
ield
app
rox
Dry
Uni
t Wei
ght
(pcf
)
Moi
stur
e C
onte
nt(%
dry
wei
ght)
Pla
stic
ity In
dex
Blo
w C
ount
/Foo
t
Wat
er L
evel
Fin
es C
onte
nt(%
pas
sing
#20
0 si
eve)
Atterberg Limits
C. Wright / BHBJWDC ExplorationHSA, Switch to Mud140 lb. Auto Trip
Geotechnical FeasibiltyCANDLESTICK POINTSAN FRANCISCO, CA
8472.000.001
Pla
stic
Lim
it
Liqu
id L
imit
Log
Sym
bol
11/20/2009Approx. 149 ft.6.0 in.Approx. 0¾ ft.
DESCRIPTION
DATE DRILLED:HOLE DEPTH:
HOLE DIAMETER:SURF ELEV:
LO
G -
GE
OT
EC
HN
ICA
L
84
72
00
00
01
GIN
T L
OG
S.G
PJ
EN
GE
O I
NC
.GD
T
9/3
0/1
1
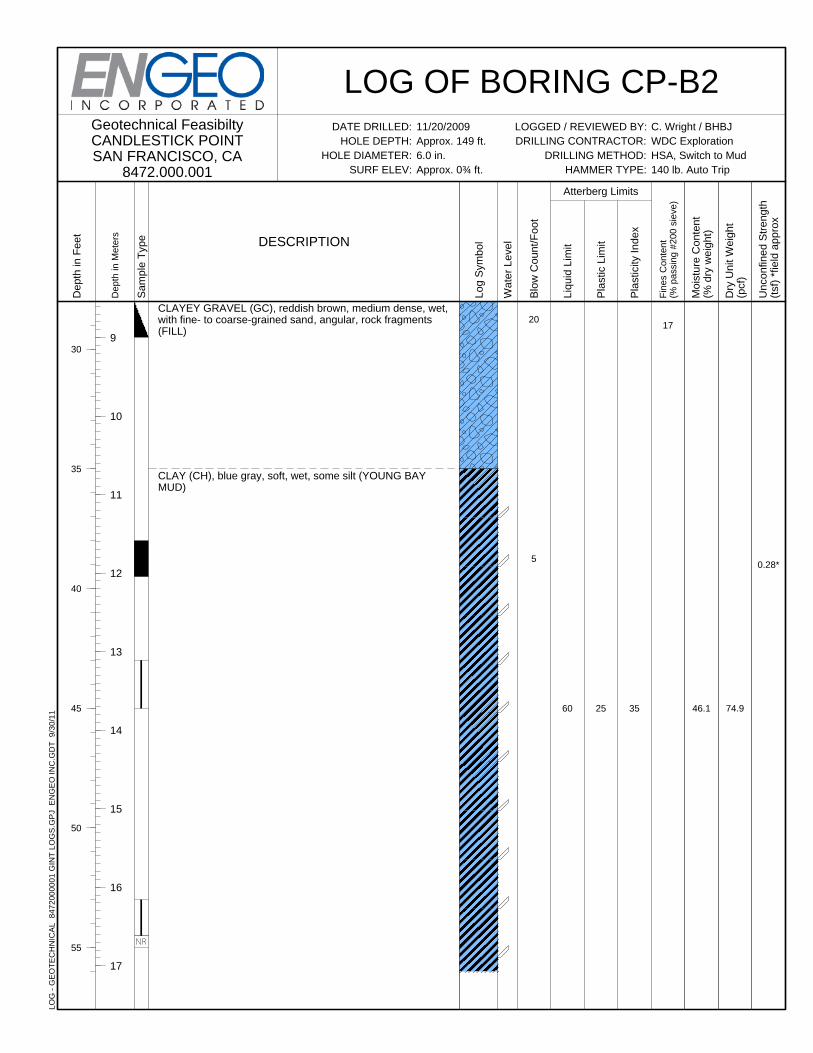
0.28*
74.946.135
20
5
17
2560
CLAYEY GRAVEL (GC), reddish brown, medium dense, wet,with fine- to coarse-grained sand, angular, rock fragments(FILL)
CLAY (CH), blue gray, soft, wet, some silt (YOUNG BAYMUD)
Dep
th in
Met
ers
9
10
11
12
13
14
15
16
17
Dep
th in
Fee
t
30
35
40
45
50
55
Sam
ple
Typ
e
LOG OF BORING CP-B2LOGGED / REVIEWED BY:DRILLING CONTRACTOR:
DRILLING METHOD:HAMMER TYPE:
Unc
onfin
ed S
tren
gth
(tsf
) *f
ield
app
rox
Dry
Uni
t Wei
ght
(pcf
)
Moi
stur
e C
onte
nt(%
dry
wei
ght)
Pla
stic
ity In
dex
Blo
w C
ount
/Foo
t
Wat
er L
evel
Fin
es C
onte
nt(%
pas
sing
#20
0 si
eve)
Atterberg Limits
C. Wright / BHBJWDC ExplorationHSA, Switch to Mud140 lb. Auto Trip
Geotechnical FeasibiltyCANDLESTICK POINTSAN FRANCISCO, CA
8472.000.001
Pla
stic
Lim
it
Liqu
id L
imit
Log
Sym
bol
11/20/2009Approx. 149 ft.6.0 in.Approx. 0¾ ft.
DESCRIPTION
DATE DRILLED:HOLE DEPTH:
HOLE DIAMETER:SURF ELEV:
LO
G -
GE
OT
EC
HN
ICA
L
84
72
00
00
01
GIN
T L
OG
S.G
PJ
EN
GE
O I
NC
.GD
T
9/3
0/1
1
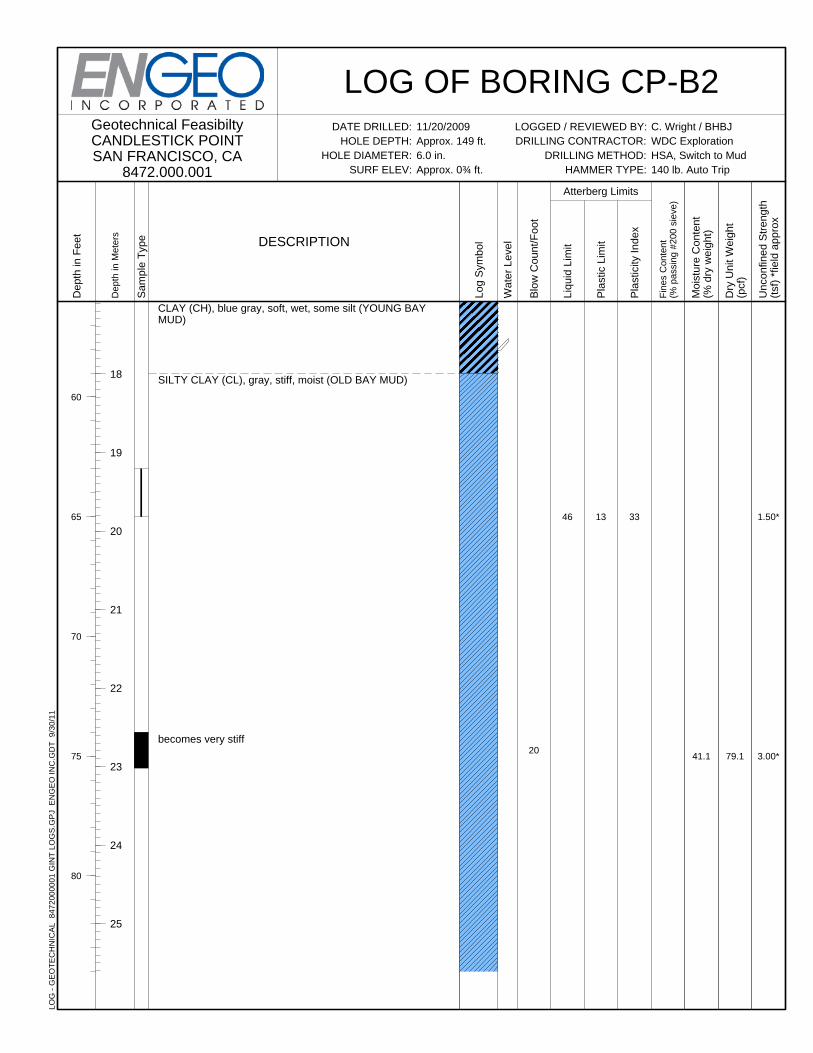
1.50*
3.00*79.141.1
33
20
1346
CLAY (CH), blue gray, soft, wet, some silt (YOUNG BAYMUD)
SILTY CLAY (CL), gray, stiff, moist (OLD BAY MUD)
becomes very stiff
Dep
th in
Met
ers
18
19
20
21
22
23
24
25
Dep
th in
Fee
t
60
65
70
75
80
Sam
ple
Typ
e
LOG OF BORING CP-B2LOGGED / REVIEWED BY:DRILLING CONTRACTOR:
DRILLING METHOD:HAMMER TYPE:
Unc
onfin
ed S
tren
gth
(tsf
) *f
ield
app
rox
Dry
Uni
t Wei
ght
(pcf
)
Moi
stur
e C
onte
nt(%
dry
wei
ght)
Pla
stic
ity In
dex
Blo
w C
ount
/Foo
t
Wat
er L
evel
Fin
es C
onte
nt(%
pas
sing
#20
0 si
eve)
Atterberg Limits
C. Wright / BHBJWDC ExplorationHSA, Switch to Mud140 lb. Auto Trip
Geotechnical FeasibiltyCANDLESTICK POINTSAN FRANCISCO, CA
8472.000.001
Pla
stic
Lim
it
Liqu
id L
imit
Log
Sym
bol
11/20/2009Approx. 149 ft.6.0 in.Approx. 0¾ ft.
DESCRIPTION
DATE DRILLED:HOLE DEPTH:
HOLE DIAMETER:SURF ELEV:
LO
G -
GE
OT
EC
HN
ICA
L
84
72
00
00
01
GIN
T L
OG
S.G
PJ
EN
GE
O I
NC
.GD
T
9/3
0/1
1
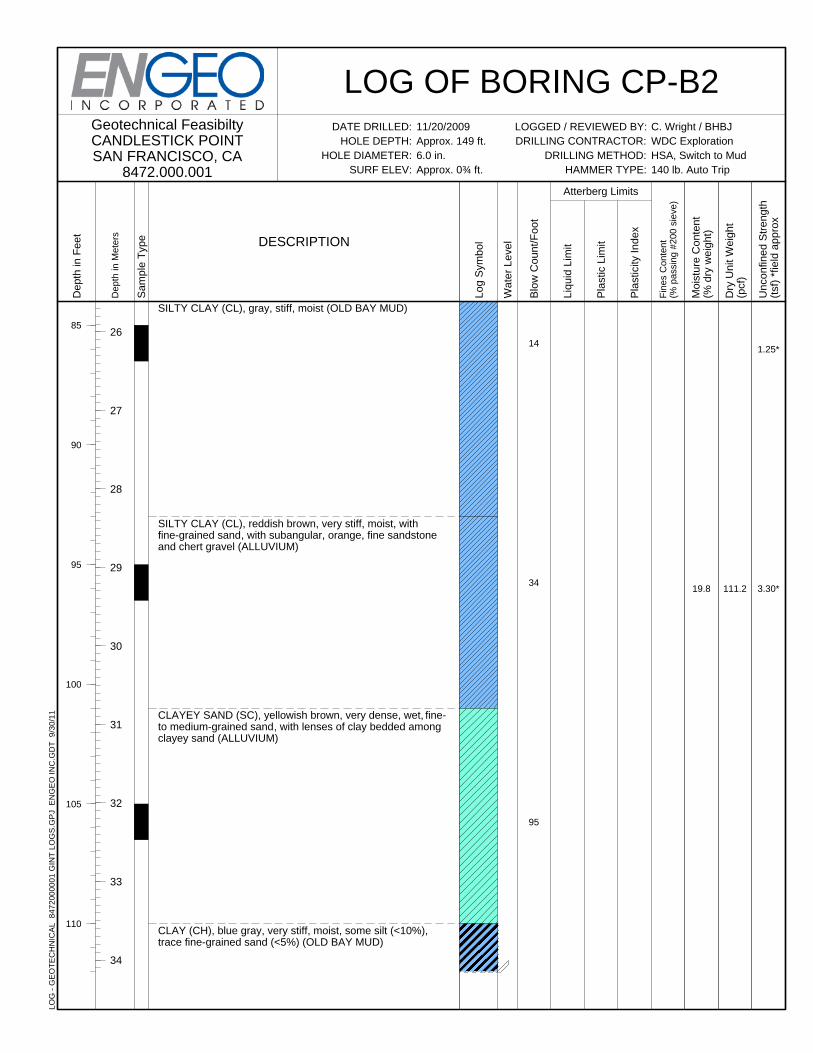
1.25*
3.30*111.219.8
14
34
95
SILTY CLAY (CL), gray, stiff, moist (OLD BAY MUD)
SILTY CLAY (CL), reddish brown, very stiff, moist, withfine-grained sand, with subangular, orange, fine sandstoneand chert gravel (ALLUVIUM)
CLAYEY SAND (SC), yellowish brown, very dense, wet, fine-to medium-grained sand, with lenses of clay bedded amongclayey sand (ALLUVIUM)
CLAY (CH), blue gray, very stiff, moist, some silt (<10%),trace fine-grained sand (<5%) (OLD BAY MUD)
Dep
th in
Met
ers
26
27
28
29
30
31
32
33
34
Dep
th in
Fee
t
85
90
95
100
105
110
Sam
ple
Typ
e
LOG OF BORING CP-B2LOGGED / REVIEWED BY:DRILLING CONTRACTOR:
DRILLING METHOD:HAMMER TYPE:
Unc
onfin
ed S
tren
gth
(tsf
) *f
ield
app
rox
Dry
Uni
t Wei
ght
(pcf
)
Moi
stur
e C
onte
nt(%
dry
wei
ght)
Pla
stic
ity In
dex
Blo
w C
ount
/Foo
t
Wat
er L
evel
Fin
es C
onte
nt(%
pas
sing
#20
0 si
eve)
Atterberg Limits
C. Wright / BHBJWDC ExplorationHSA, Switch to Mud140 lb. Auto Trip
Geotechnical FeasibiltyCANDLESTICK POINTSAN FRANCISCO, CA
8472.000.001
Pla
stic
Lim
it
Liqu
id L
imit
Log
Sym
bol
11/20/2009Approx. 149 ft.6.0 in.Approx. 0¾ ft.
DESCRIPTION
DATE DRILLED:HOLE DEPTH:
HOLE DIAMETER:SURF ELEV:
LO
G -
GE
OT
EC
HN
ICA
L
84
72
00
00
01
GIN
T L
OG
S.G
PJ
EN
GE
O I
NC
.GD
T
9/3
0/1
1
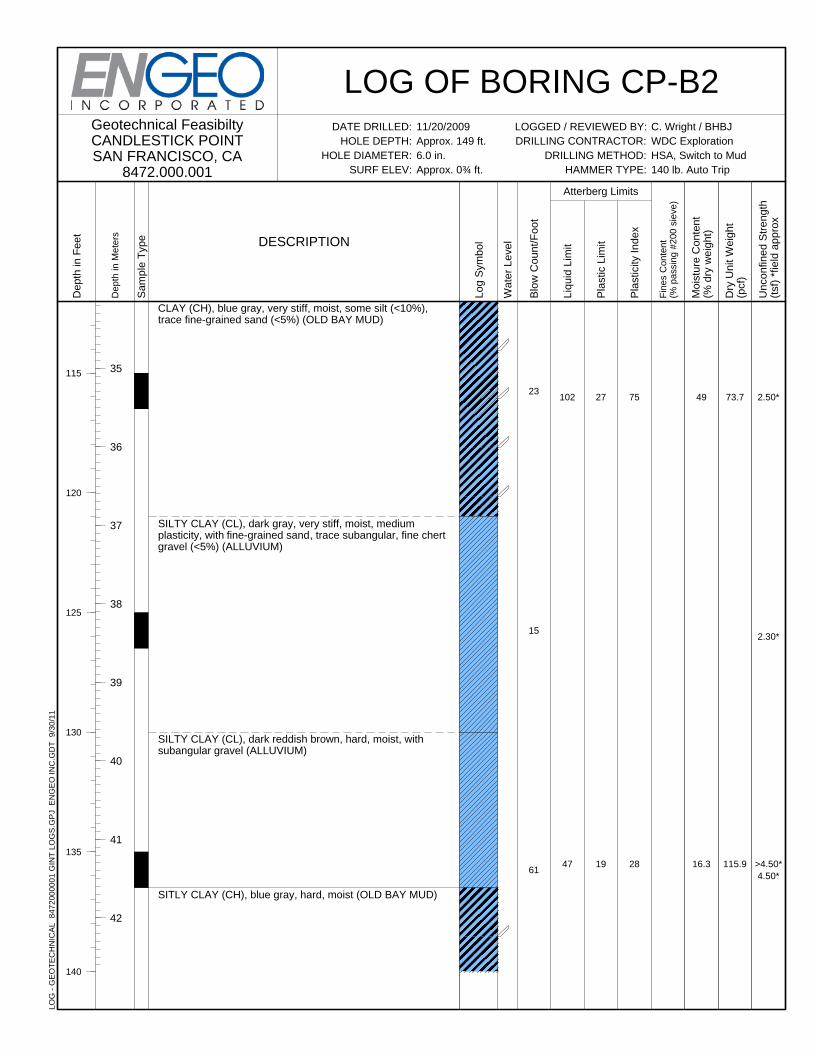
2.50*
2.30*
>4.50*4.50*
73.7
115.9
49
16.3
75
28
23
15
61
27
19
102
47
CLAY (CH), blue gray, very stiff, moist, some silt (<10%),trace fine-grained sand (<5%) (OLD BAY MUD)
SILTY CLAY (CL), dark gray, very stiff, moist, mediumplasticity, with fine-grained sand, trace subangular, fine chertgravel (<5%) (ALLUVIUM)
SILTY CLAY (CL), dark reddish brown, hard, moist, withsubangular gravel (ALLUVIUM)
SITLY CLAY (CH), blue gray, hard, moist (OLD BAY MUD)
Dep
th in
Met
ers
35
36
37
38
39
40
41
42
Dep
th in
Fee
t
115
120
125
130
135
140
Sam
ple
Typ
e
LOG OF BORING CP-B2LOGGED / REVIEWED BY:DRILLING CONTRACTOR:
DRILLING METHOD:HAMMER TYPE:
Unc
onfin
ed S
tren
gth
(tsf
) *f
ield
app
rox
Dry
Uni
t Wei
ght
(pcf
)
Moi
stur
e C
onte
nt(%
dry
wei
ght)
Pla
stic
ity In
dex
Blo
w C
ount
/Foo
t
Wat
er L
evel
Fin
es C
onte
nt(%
pas
sing
#20
0 si
eve)
Atterberg Limits
C. Wright / BHBJWDC ExplorationHSA, Switch to Mud140 lb. Auto Trip
Geotechnical FeasibiltyCANDLESTICK POINTSAN FRANCISCO, CA
8472.000.001
Pla
stic
Lim
it
Liqu
id L
imit
Log
Sym
bol
11/20/2009Approx. 149 ft.6.0 in.Approx. 0¾ ft.
DESCRIPTION
DATE DRILLED:HOLE DEPTH:
HOLE DIAMETER:SURF ELEV:
LO
G -
GE
OT
EC
HN
ICA
L
84
72
00
00
01
GIN
T L
OG
S.G
PJ
EN
GE
O I
NC
.GD
T
9/3
0/1
1
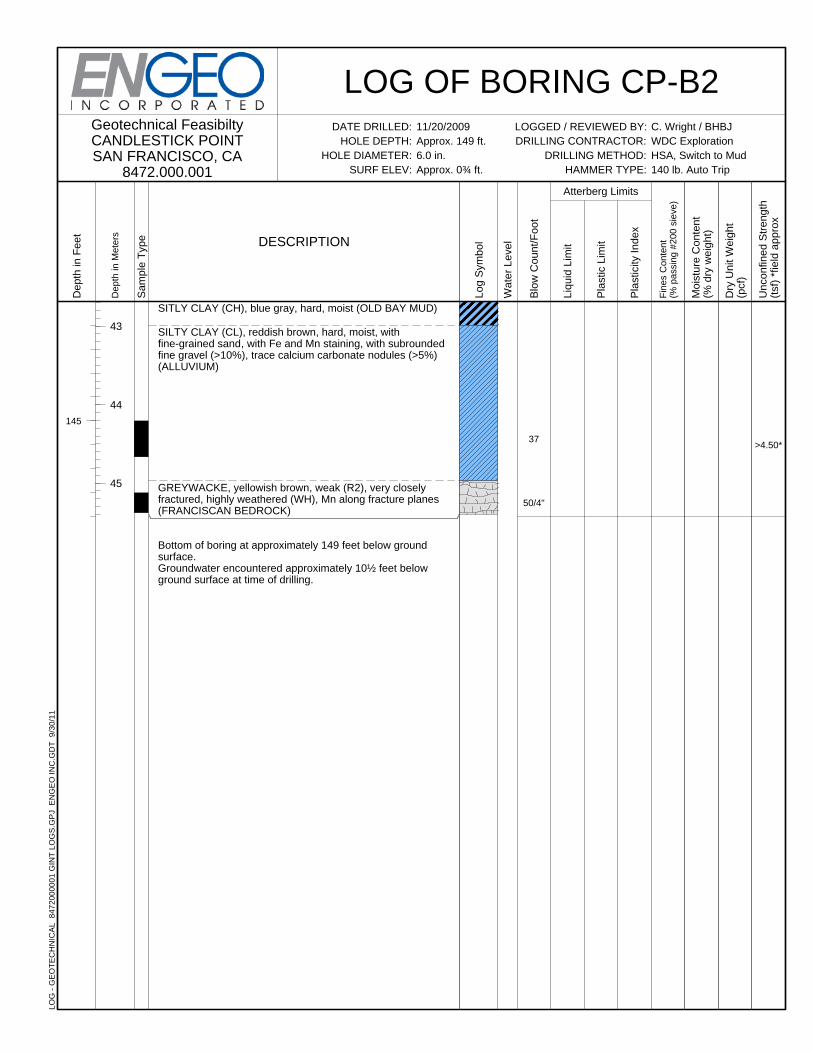
>4.50*37
50/4"
SITLY CLAY (CH), blue gray, hard, moist (OLD BAY MUD)
SILTY CLAY (CL), reddish brown, hard, moist, withfine-grained sand, with Fe and Mn staining, with subroundedfine gravel (>10%), trace calcium carbonate nodules (>5%)(ALLUVIUM)
GREYWACKE, yellowish brown, weak (R2), very closelyfractured, highly weathered (WH), Mn along fracture planes(FRANCISCAN BEDROCK)
Bottom of boring at approximately 149 feet below groundsurface.Groundwater encountered approximately 10½ feet belowground surface at time of drilling.
Dep
th in
Met
ers
43
44
45
Dep
th in
Fee
t
145
Sam
ple
Typ
e
LOG OF BORING CP-B2LOGGED / REVIEWED BY:DRILLING CONTRACTOR:
DRILLING METHOD:HAMMER TYPE:
Unc
onfin
ed S
tren
gth
(tsf
) *f
ield
app
rox
Dry
Uni
t Wei
ght
(pcf
)
Moi
stur
e C
onte
nt(%
dry
wei
ght)
Pla
stic
ity In
dex
Blo
w C
ount
/Foo
t
Wat
er L
evel
Fin
es C
onte
nt(%
pas
sing
#20
0 si
eve)
Atterberg Limits
C. Wright / BHBJWDC ExplorationHSA, Switch to Mud140 lb. Auto Trip
Geotechnical FeasibiltyCANDLESTICK POINTSAN FRANCISCO, CA
8472.000.001
Pla
stic
Lim
it
Liqu
id L
imit
Log
Sym
bol
11/20/2009Approx. 149 ft.6.0 in.Approx. 0¾ ft.
DESCRIPTION
DATE DRILLED:HOLE DEPTH:
HOLE DIAMETER:SURF ELEV:
LO
G -
GE
OT
EC
HN
ICA
L
84
72
00
00
01
GIN
T L
OG
S.G
PJ
EN
GE
O I
NC
.GD
T
9/3
0/1
1
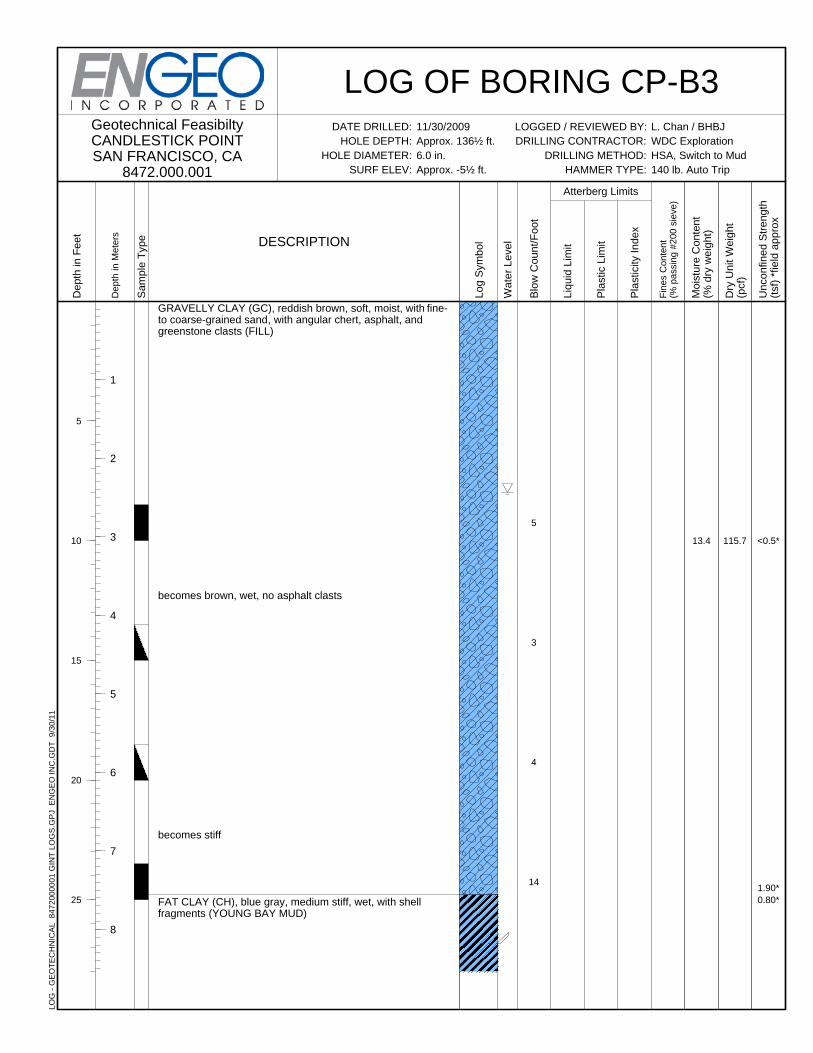
<0.5*
1.90*0.80*
115.713.4
5
3
4
14
GRAVELLY CLAY (GC), reddish brown, soft, moist, with fine-to coarse-grained sand, with angular chert, asphalt, andgreenstone clasts (FILL)
becomes brown, wet, no asphalt clasts
becomes stiff
FAT CLAY (CH), blue gray, medium stiff, wet, with shellfragments (YOUNG BAY MUD)
Dep
th in
Met
ers
1
2
3
4
5
6
7
8
Dep
th in
Fee
t
5
10
15
20
25
Sam
ple
Typ
e
LOG OF BORING CP-B3LOGGED / REVIEWED BY:DRILLING CONTRACTOR:
DRILLING METHOD:HAMMER TYPE:
Unc
onfin
ed S
tren
gth
(tsf
) *f
ield
app
rox
Dry
Uni
t Wei
ght
(pcf
)
Moi
stur
e C
onte
nt(%
dry
wei
ght)
Pla
stic
ity In
dex
Blo
w C
ount
/Foo
t
Wat
er L
evel
Fin
es C
onte
nt(%
pas
sing
#20
0 si
eve)
Atterberg Limits
L. Chan / BHBJWDC ExplorationHSA, Switch to Mud140 lb. Auto Trip
Geotechnical FeasibiltyCANDLESTICK POINTSAN FRANCISCO, CA
8472.000.001
Pla
stic
Lim
it
Liqu
id L
imit
Log
Sym
bol
11/30/2009Approx. 136½ ft.6.0 in.Approx. -5½ ft.
DESCRIPTION
DATE DRILLED:HOLE DEPTH:
HOLE DIAMETER:SURF ELEV:
LO
G -
GE
OT
EC
HN
ICA
L
84
72
00
00
01
GIN
T L
OG
S.G
PJ
EN
GE
O I
NC
.GD
T
9/3
0/1
1
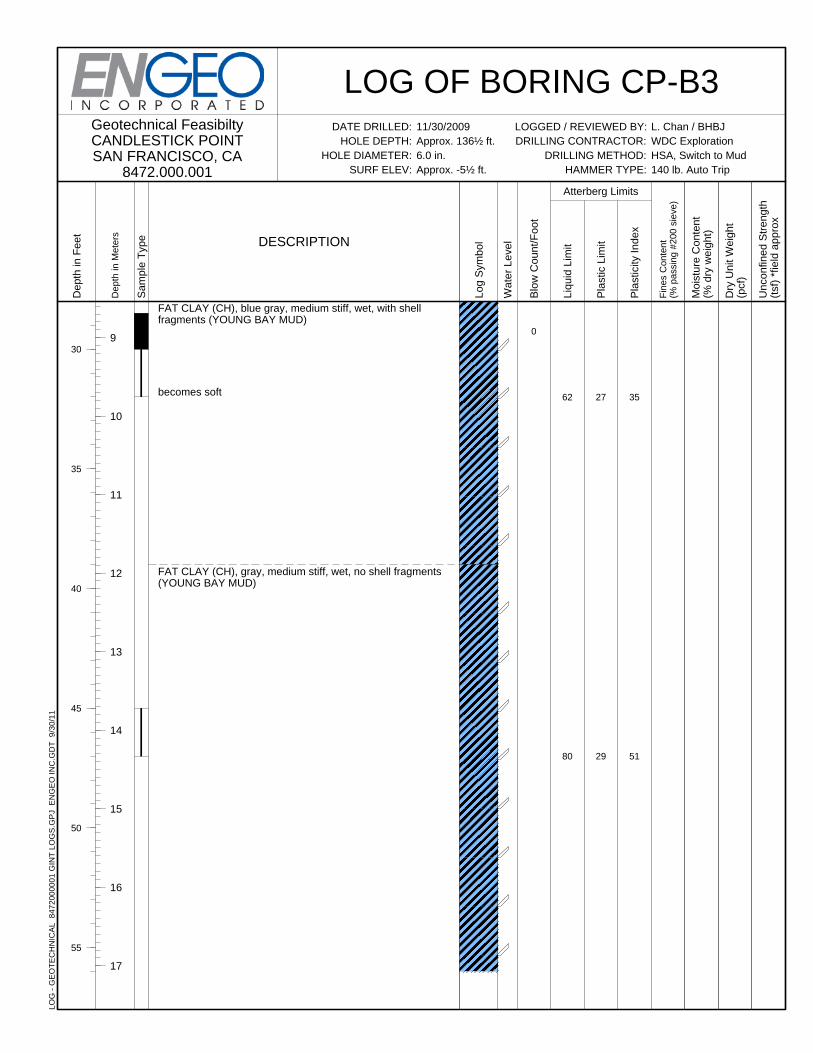
35
51
0
27
29
62
80
FAT CLAY (CH), blue gray, medium stiff, wet, with shellfragments (YOUNG BAY MUD)
becomes soft
FAT CLAY (CH), gray, medium stiff, wet, no shell fragments(YOUNG BAY MUD)
Dep
th in
Met
ers
9
10
11
12
13
14
15
16
17
Dep
th in
Fee
t
30
35
40
45
50
55
Sam
ple
Typ
e
LOG OF BORING CP-B3LOGGED / REVIEWED BY:DRILLING CONTRACTOR:
DRILLING METHOD:HAMMER TYPE:
Unc
onfin
ed S
tren
gth
(tsf
) *f
ield
app
rox
Dry
Uni
t Wei
ght
(pcf
)
Moi
stur
e C
onte
nt(%
dry
wei
ght)
Pla
stic
ity In
dex
Blo
w C
ount
/Foo
t
Wat
er L
evel
Fin
es C
onte
nt(%
pas
sing
#20
0 si
eve)
Atterberg Limits
L. Chan / BHBJWDC ExplorationHSA, Switch to Mud140 lb. Auto Trip
Geotechnical FeasibiltyCANDLESTICK POINTSAN FRANCISCO, CA
8472.000.001
Pla
stic
Lim
it
Liqu
id L
imit
Log
Sym
bol
11/30/2009Approx. 136½ ft.6.0 in.Approx. -5½ ft.
DESCRIPTION
DATE DRILLED:HOLE DEPTH:
HOLE DIAMETER:SURF ELEV:
LO
G -
GE
OT
EC
HN
ICA
L
84
72
00
00
01
GIN
T L
OG
S.G
PJ
EN
GE
O I
NC
.GD
T
9/3
0/1
1
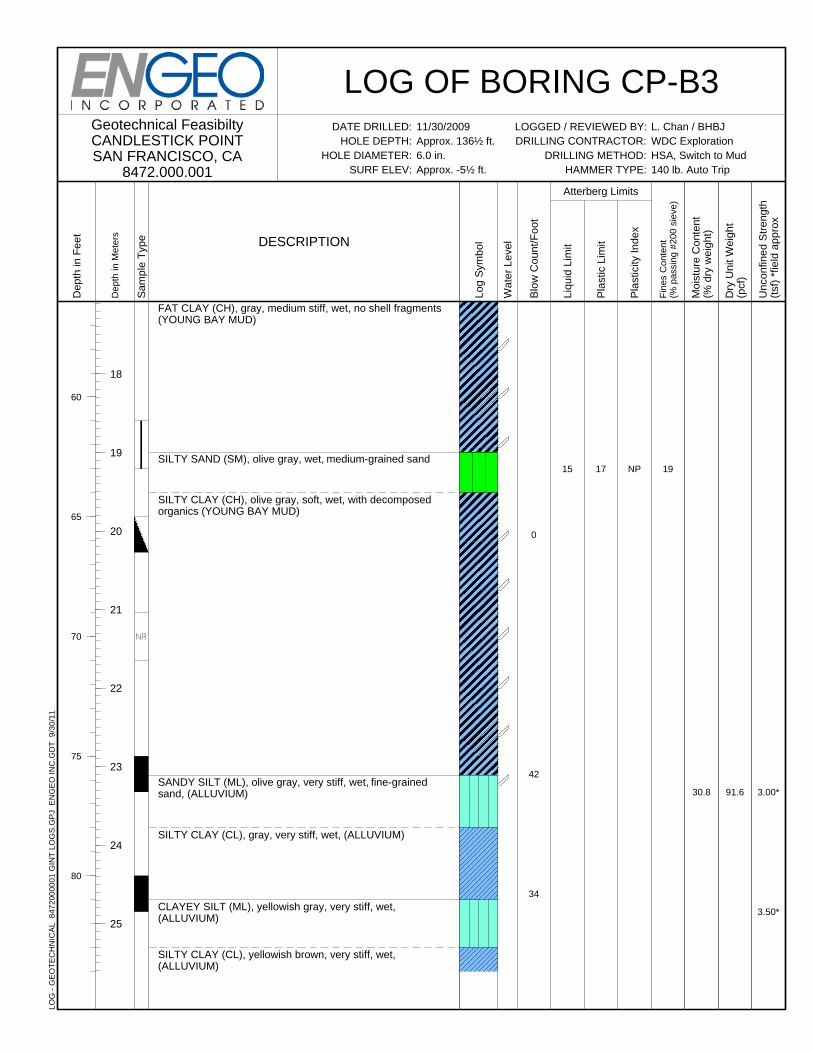
3.00*
3.50*
91.630.8
NP
0
42
34
191715
FAT CLAY (CH), gray, medium stiff, wet, no shell fragments(YOUNG BAY MUD)
SILTY SAND (SM), olive gray, wet, medium-grained sand
SILTY CLAY (CH), olive gray, soft, wet, with decomposedorganics (YOUNG BAY MUD)
SANDY SILT (ML), olive gray, very stiff, wet, fine-grainedsand, (ALLUVIUM)
SILTY CLAY (CL), gray, very stiff, wet, (ALLUVIUM)
CLAYEY SILT (ML), yellowish gray, very stiff, wet,(ALLUVIUM)
SILTY CLAY (CL), yellowish brown, very stiff, wet,(ALLUVIUM)
Dep
th in
Met
ers
18
19
20
21
22
23
24
25
Dep
th in
Fee
t
60
65
70
75
80
Sam
ple
Typ
e
LOG OF BORING CP-B3LOGGED / REVIEWED BY:DRILLING CONTRACTOR:
DRILLING METHOD:HAMMER TYPE:
Unc
onfin
ed S
tren
gth
(tsf
) *f
ield
app
rox
Dry
Uni
t Wei
ght
(pcf
)
Moi
stur
e C
onte
nt(%
dry
wei
ght)
Pla
stic
ity In
dex
Blo
w C
ount
/Foo
t
Wat
er L
evel
Fin
es C
onte
nt(%
pas
sing
#20
0 si
eve)
Atterberg Limits
L. Chan / BHBJWDC ExplorationHSA, Switch to Mud140 lb. Auto Trip
Geotechnical FeasibiltyCANDLESTICK POINTSAN FRANCISCO, CA
8472.000.001
Pla
stic
Lim
it
Liqu
id L
imit
Log
Sym
bol
11/30/2009Approx. 136½ ft.6.0 in.Approx. -5½ ft.
DESCRIPTION
DATE DRILLED:HOLE DEPTH:
HOLE DIAMETER:SURF ELEV:
LO
G -
GE
OT
EC
HN
ICA
L
84
72
00
00
01
GIN
T L
OG
S.G
PJ
EN
GE
O I
NC
.GD
T
9/3
0/1
1
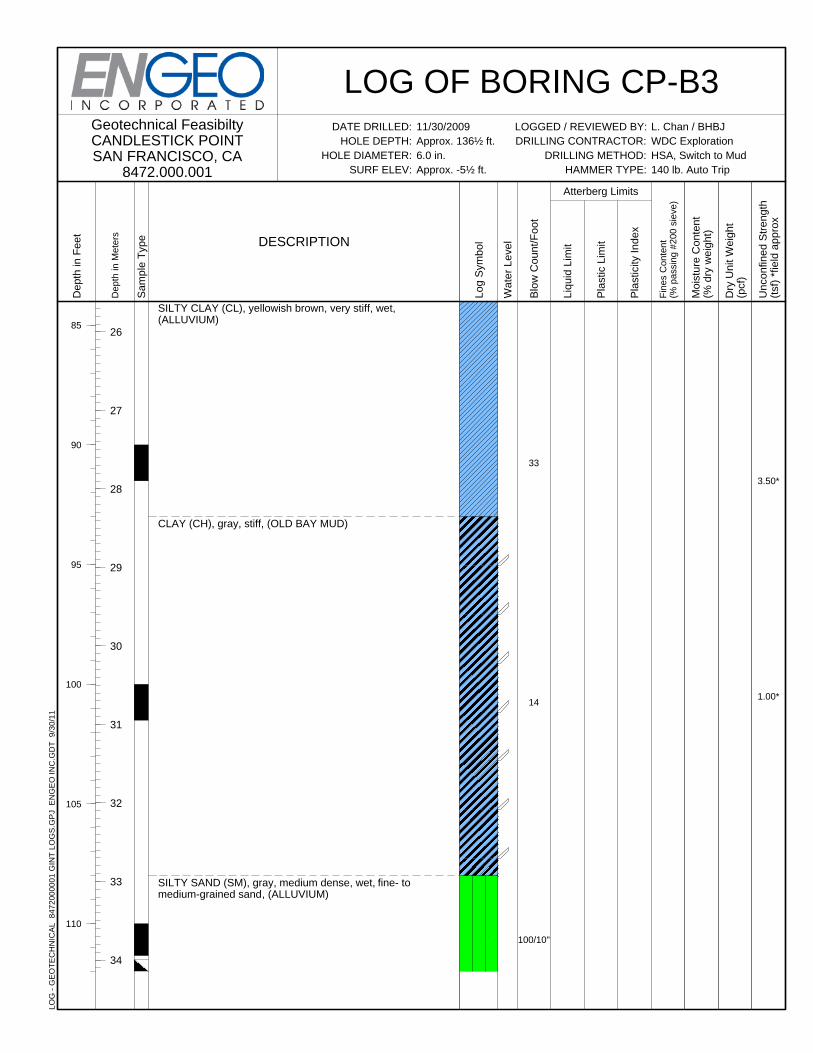
3.50*
1.00*
33
14
100/10"
SILTY CLAY (CL), yellowish brown, very stiff, wet,(ALLUVIUM)
CLAY (CH), gray, stiff, (OLD BAY MUD)
SILTY SAND (SM), gray, medium dense, wet, fine- tomedium-grained sand, (ALLUVIUM)
Dep
th in
Met
ers
26
27
28
29
30
31
32
33
34
Dep
th in
Fee
t
85
90
95
100
105
110
Sam
ple
Typ
e
LOG OF BORING CP-B3LOGGED / REVIEWED BY:DRILLING CONTRACTOR:
DRILLING METHOD:HAMMER TYPE:
Unc
onfin
ed S
tren
gth
(tsf
) *f
ield
app
rox
Dry
Uni
t Wei
ght
(pcf
)
Moi
stur
e C
onte
nt(%
dry
wei
ght)
Pla
stic
ity In
dex
Blo
w C
ount
/Foo
t
Wat
er L
evel
Fin
es C
onte
nt(%
pas
sing
#20
0 si
eve)
Atterberg Limits
L. Chan / BHBJWDC ExplorationHSA, Switch to Mud140 lb. Auto Trip
Geotechnical FeasibiltyCANDLESTICK POINTSAN FRANCISCO, CA
8472.000.001
Pla
stic
Lim
it
Liqu
id L
imit
Log
Sym
bol
11/30/2009Approx. 136½ ft.6.0 in.Approx. -5½ ft.
DESCRIPTION
DATE DRILLED:HOLE DEPTH:
HOLE DIAMETER:SURF ELEV:
LO
G -
GE
OT
EC
HN
ICA
L
84
72
00
00
01
GIN
T L
OG
S.G
PJ
EN
GE
O I
NC
.GD
T
9/3
0/1
1
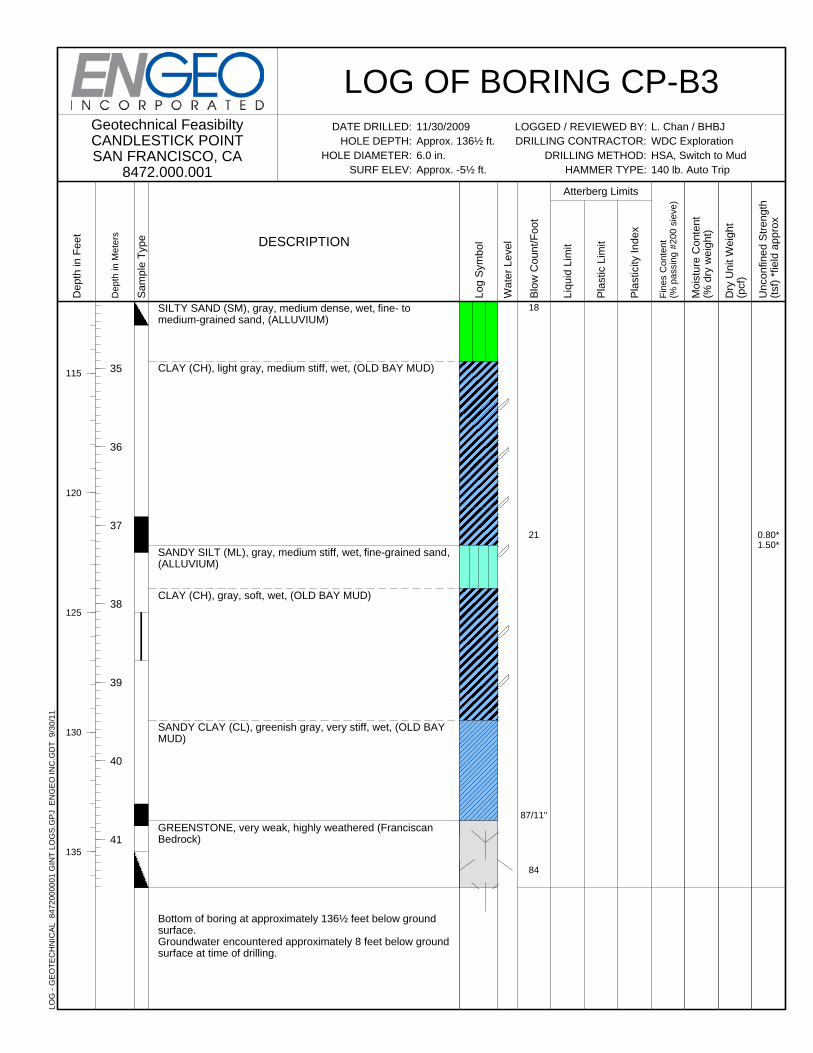
0.80*1.50*
18
21
87/11"
84
SILTY SAND (SM), gray, medium dense, wet, fine- tomedium-grained sand, (ALLUVIUM)
CLAY (CH), light gray, medium stiff, wet, (OLD BAY MUD)
SANDY SILT (ML), gray, medium stiff, wet, fine-grained sand,(ALLUVIUM)
CLAY (CH), gray, soft, wet, (OLD BAY MUD)
SANDY CLAY (CL), greenish gray, very stiff, wet, (OLD BAYMUD)
GREENSTONE, very weak, highly weathered (FranciscanBedrock)
Bottom of boring at approximately 136½ feet below groundsurface.Groundwater encountered approximately 8 feet below groundsurface at time of drilling.
Dep
th in
Met
ers
35
36
37
38
39
40
41
Dep
th in
Fee
t
115
120
125
130
135
Sam
ple
Typ
e
LOG OF BORING CP-B3LOGGED / REVIEWED BY:DRILLING CONTRACTOR:
DRILLING METHOD:HAMMER TYPE:
Unc
onfin
ed S
tren
gth
(tsf
) *f
ield
app
rox
Dry
Uni
t Wei
ght
(pcf
)
Moi
stur
e C
onte
nt(%
dry
wei
ght)
Pla
stic
ity In
dex
Blo
w C
ount
/Foo
t
Wat
er L
evel
Fin
es C
onte
nt(%
pas
sing
#20
0 si
eve)
Atterberg Limits
L. Chan / BHBJWDC ExplorationHSA, Switch to Mud140 lb. Auto Trip
Geotechnical FeasibiltyCANDLESTICK POINTSAN FRANCISCO, CA
8472.000.001
Pla
stic
Lim
it
Liqu
id L
imit
Log
Sym
bol
11/30/2009Approx. 136½ ft.6.0 in.Approx. -5½ ft.
DESCRIPTION
DATE DRILLED:HOLE DEPTH:
HOLE DIAMETER:SURF ELEV:
LO
G -
GE
OT
EC
HN
ICA
L
84
72
00
00
01
GIN
T L
OG
S.G
PJ
EN
GE
O I
NC
.GD
T
9/3
0/1
1
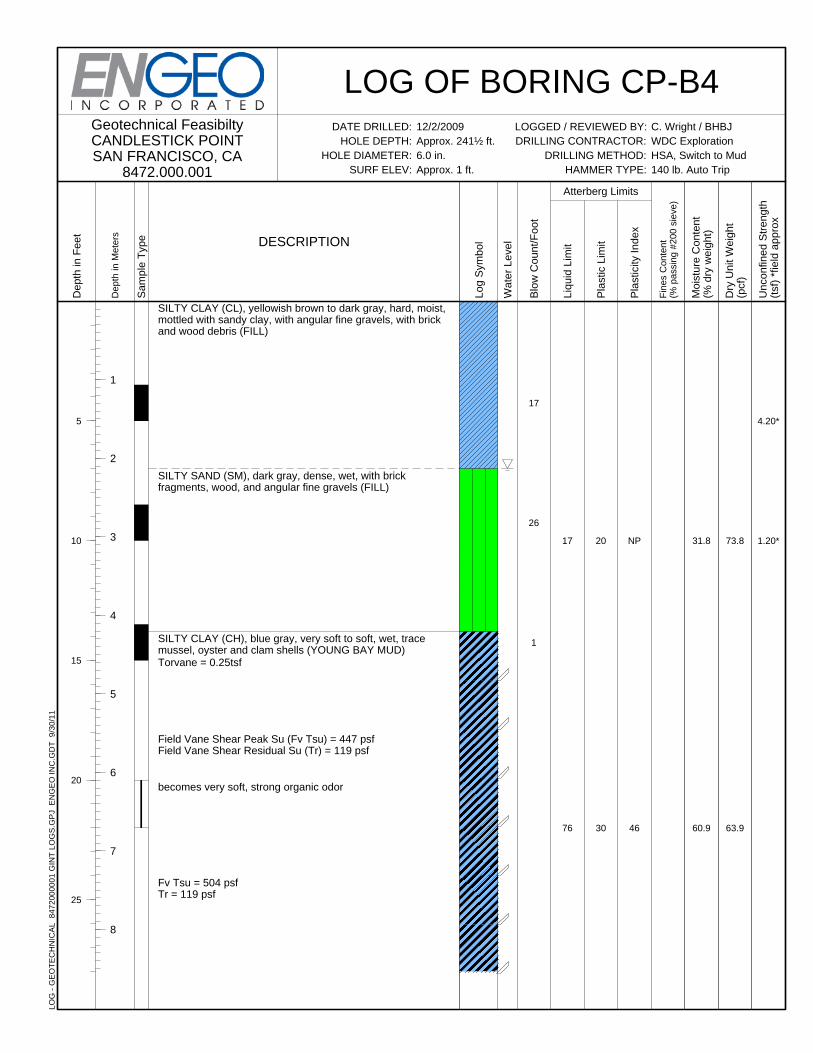
4.20*
1.20*73.8
63.9
31.8
60.9
NP
46
17
26
1
20
30
17
76
SILTY CLAY (CL), yellowish brown to dark gray, hard, moist,mottled with sandy clay, with angular fine gravels, with brickand wood debris (FILL)
SILTY SAND (SM), dark gray, dense, wet, with brickfragments, wood, and angular fine gravels (FILL)
SILTY CLAY (CH), blue gray, very soft to soft, wet, tracemussel, oyster and clam shells (YOUNG BAY MUD)Torvane = 0.25tsf
Field Vane Shear Peak Su (Fv Tsu) = 447 psfField Vane Shear Residual Su (Tr) = 119 psf
becomes very soft, strong organic odor
Fv Tsu = 504 psfTr = 119 psf
Dep
th in
Met
ers
1
2
3
4
5
6
7
8
Dep
th in
Fee
t
5
10
15
20
25
Sam
ple
Typ
e
LOG OF BORING CP-B4LOGGED / REVIEWED BY:DRILLING CONTRACTOR:
DRILLING METHOD:HAMMER TYPE:
Unc
onfin
ed S
tren
gth
(tsf
) *f
ield
app
rox
Dry
Uni
t Wei
ght
(pcf
)
Moi
stur
e C
onte
nt(%
dry
wei
ght)
Pla
stic
ity In
dex
Blo
w C
ount
/Foo
t
Wat
er L
evel
Fin
es C
onte
nt(%
pas
sing
#20
0 si
eve)
Atterberg Limits
C. Wright / BHBJWDC ExplorationHSA, Switch to Mud140 lb. Auto Trip
Geotechnical FeasibiltyCANDLESTICK POINTSAN FRANCISCO, CA
8472.000.001
Pla
stic
Lim
it
Liqu
id L
imit
Log
Sym
bol
12/2/2009Approx. 241½ ft.6.0 in.Approx. 1 ft.
DESCRIPTION
DATE DRILLED:HOLE DEPTH:
HOLE DIAMETER:SURF ELEV:
LO
G -
GE
OT
EC
HN
ICA
L
84
72
00
00
01
GIN
T L
OG
S.G
PJ
EN
GE
O I
NC
.GD
T
9/3
0/1
1
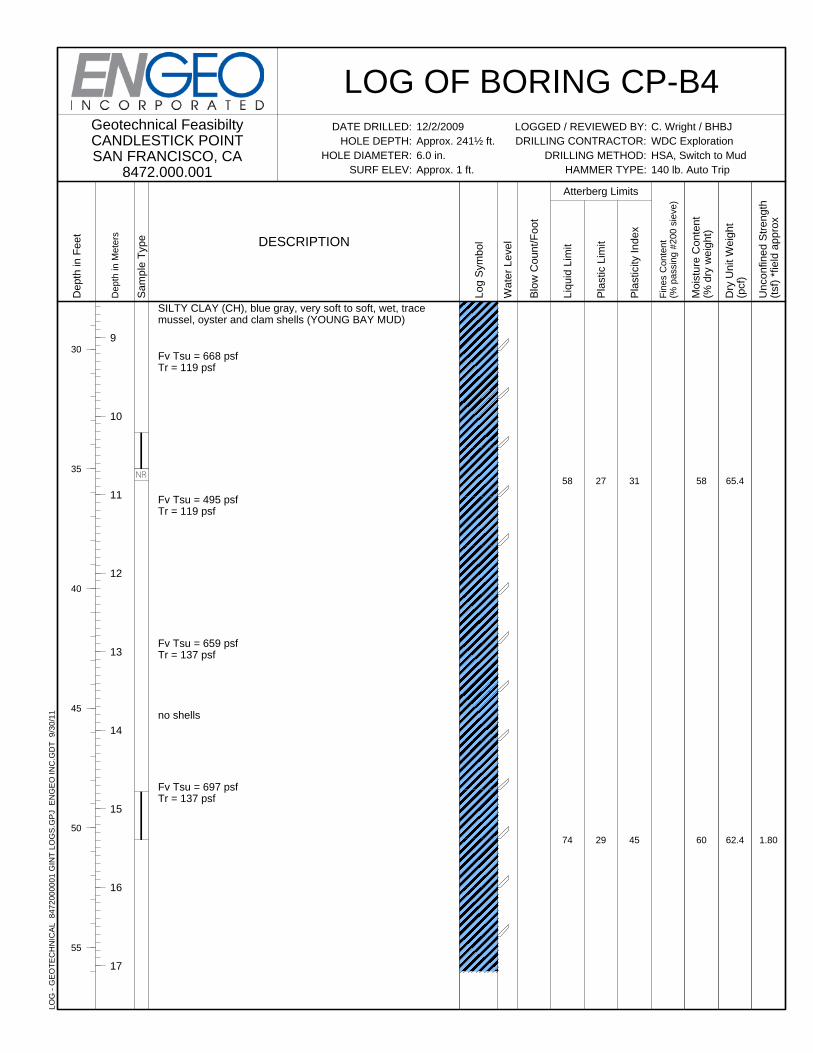
1.80
65.4
62.4
58
60
31
45
27
29
58
74
SILTY CLAY (CH), blue gray, very soft to soft, wet, tracemussel, oyster and clam shells (YOUNG BAY MUD)
Fv Tsu = 668 psfTr = 119 psf
Fv Tsu = 495 psfTr = 119 psf
Fv Tsu = 659 psfTr = 137 psf
no shells
Fv Tsu = 697 psfTr = 137 psf
Dep
th in
Met
ers
9
10
11
12
13
14
15
16
17
Dep
th in
Fee
t
30
35
40
45
50
55
Sam
ple
Typ
e
LOG OF BORING CP-B4LOGGED / REVIEWED BY:DRILLING CONTRACTOR:
DRILLING METHOD:HAMMER TYPE:
Unc
onfin
ed S
tren
gth
(tsf
) *f
ield
app
rox
Dry
Uni
t Wei
ght
(pcf
)
Moi
stur
e C
onte
nt(%
dry
wei
ght)
Pla
stic
ity In
dex
Blo
w C
ount
/Foo
t
Wat
er L
evel
Fin
es C
onte
nt(%
pas
sing
#20
0 si
eve)
Atterberg Limits
C. Wright / BHBJWDC ExplorationHSA, Switch to Mud140 lb. Auto Trip
Geotechnical FeasibiltyCANDLESTICK POINTSAN FRANCISCO, CA
8472.000.001
Pla
stic
Lim
it
Liqu
id L
imit
Log
Sym
bol
12/2/2009Approx. 241½ ft.6.0 in.Approx. 1 ft.
DESCRIPTION
DATE DRILLED:HOLE DEPTH:
HOLE DIAMETER:SURF ELEV:
LO
G -
GE
OT
EC
HN
ICA
L
84
72
00
00
01
GIN
T L
OG
S.G
PJ
EN
GE
O I
NC
.GD
T
9/3
0/1
1
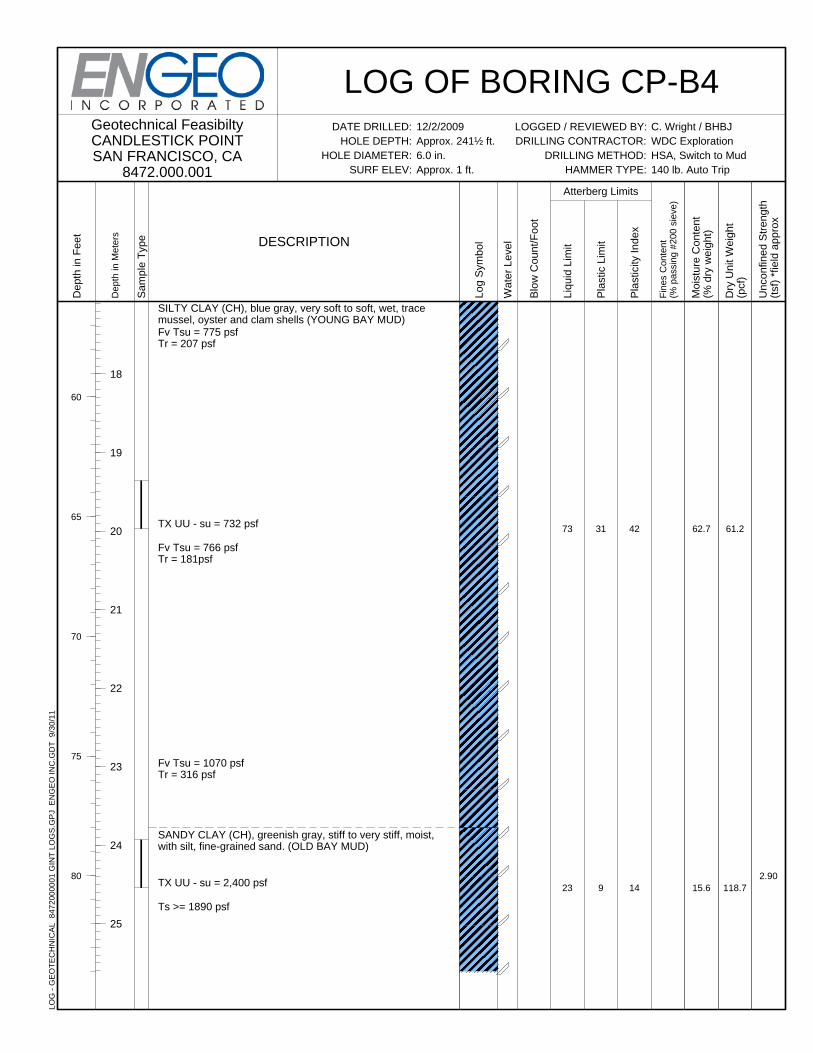
2.90
61.2
118.7
62.7
15.6
42
14
31
9
73
23
SILTY CLAY (CH), blue gray, very soft to soft, wet, tracemussel, oyster and clam shells (YOUNG BAY MUD)Fv Tsu = 775 psfTr = 207 psf
TX UU - su = 732 psf
Fv Tsu = 766 psfTr = 181psf
Fv Tsu = 1070 psfTr = 316 psf
SANDY CLAY (CH), greenish gray, stiff to very stiff, moist,with silt, fine-grained sand. (OLD BAY MUD)
TX UU - su = 2,400 psf
Ts >= 1890 psf
Dep
th in
Met
ers
18
19
20
21
22
23
24
25
Dep
th in
Fee
t
60
65
70
75
80
Sam
ple
Typ
e
LOG OF BORING CP-B4LOGGED / REVIEWED BY:DRILLING CONTRACTOR:
DRILLING METHOD:HAMMER TYPE:
Unc
onfin
ed S
tren
gth
(tsf
) *f
ield
app
rox
Dry
Uni
t Wei
ght
(pcf
)
Moi
stur
e C
onte
nt(%
dry
wei
ght)
Pla
stic
ity In
dex
Blo
w C
ount
/Foo
t
Wat
er L
evel
Fin
es C
onte
nt(%
pas
sing
#20
0 si
eve)
Atterberg Limits
C. Wright / BHBJWDC ExplorationHSA, Switch to Mud140 lb. Auto Trip
Geotechnical FeasibiltyCANDLESTICK POINTSAN FRANCISCO, CA
8472.000.001
Pla
stic
Lim
it
Liqu
id L
imit
Log
Sym
bol
12/2/2009Approx. 241½ ft.6.0 in.Approx. 1 ft.
DESCRIPTION
DATE DRILLED:HOLE DEPTH:
HOLE DIAMETER:SURF ELEV:
LO
G -
GE
OT
EC
HN
ICA
L
84
72
00
00
01
GIN
T L
OG
S.G
PJ
EN
GE
O I
NC
.GD
T
9/3
0/1
1
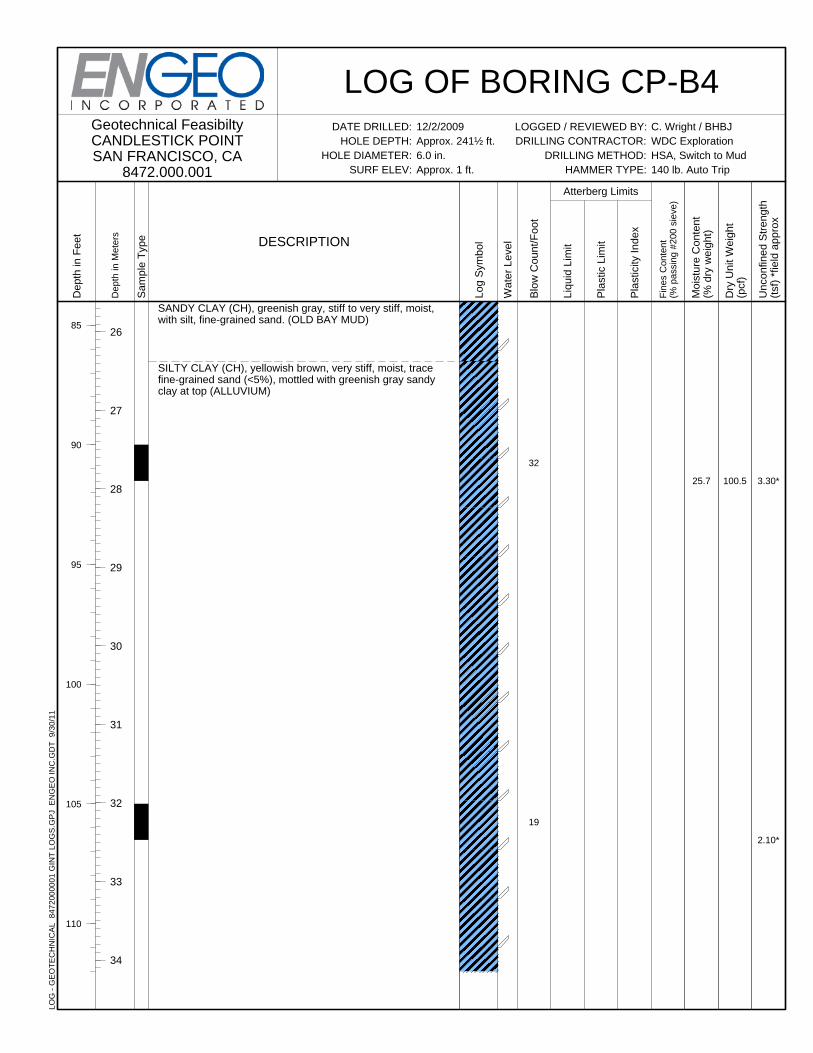
3.30*
2.10*
100.525.7
32
19
SANDY CLAY (CH), greenish gray, stiff to very stiff, moist,with silt, fine-grained sand. (OLD BAY MUD)
SILTY CLAY (CH), yellowish brown, very stiff, moist, tracefine-grained sand (<5%), mottled with greenish gray sandyclay at top (ALLUVIUM)
Dep
th in
Met
ers
26
27
28
29
30
31
32
33
34
Dep
th in
Fee
t
85
90
95
100
105
110
Sam
ple
Typ
e
LOG OF BORING CP-B4LOGGED / REVIEWED BY:DRILLING CONTRACTOR:
DRILLING METHOD:HAMMER TYPE:
Unc
onfin
ed S
tren
gth
(tsf
) *f
ield
app
rox
Dry
Uni
t Wei
ght
(pcf
)
Moi
stur
e C
onte
nt(%
dry
wei
ght)
Pla
stic
ity In
dex
Blo
w C
ount
/Foo
t
Wat
er L
evel
Fin
es C
onte
nt(%
pas
sing
#20
0 si
eve)
Atterberg Limits
C. Wright / BHBJWDC ExplorationHSA, Switch to Mud140 lb. Auto Trip
Geotechnical FeasibiltyCANDLESTICK POINTSAN FRANCISCO, CA
8472.000.001
Pla
stic
Lim
it
Liqu
id L
imit
Log
Sym
bol
12/2/2009Approx. 241½ ft.6.0 in.Approx. 1 ft.
DESCRIPTION
DATE DRILLED:HOLE DEPTH:
HOLE DIAMETER:SURF ELEV:
LO
G -
GE
OT
EC
HN
ICA
L
84
72
00
00
01
GIN
T L
OG
S.G
PJ
EN
GE
O I
NC
.GD
T
9/3
0/1
1
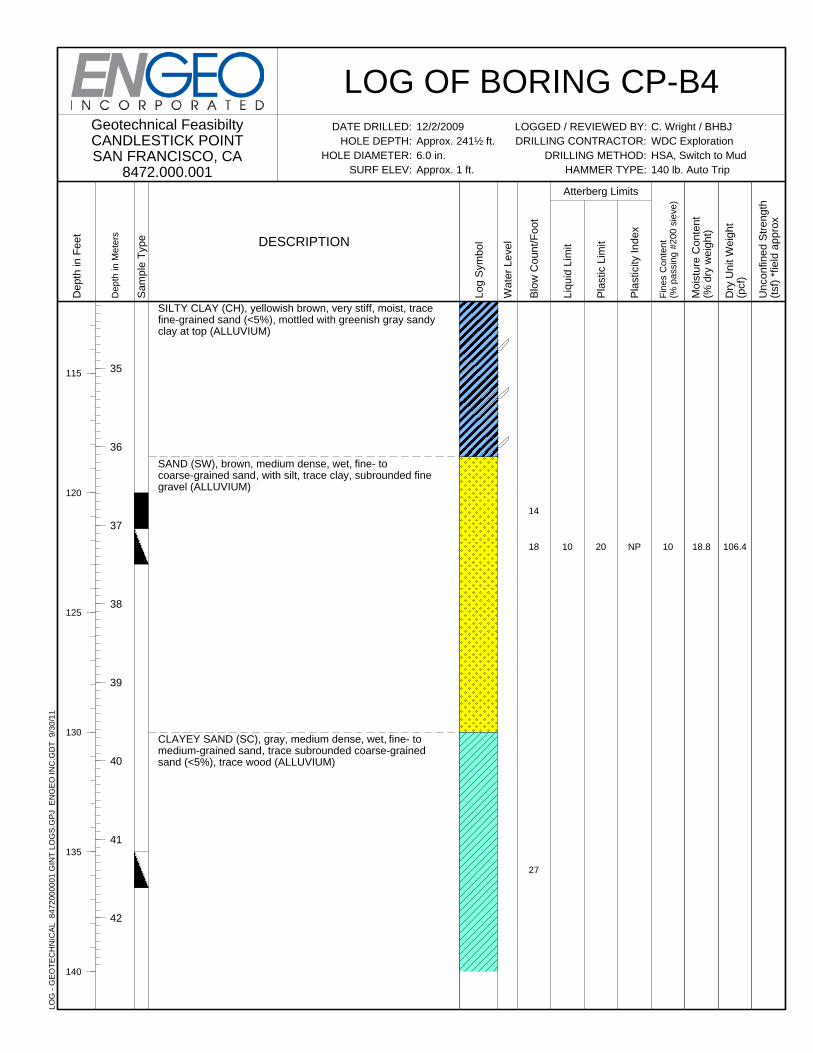
106.418.8NP
14
18
27
102010
SILTY CLAY (CH), yellowish brown, very stiff, moist, tracefine-grained sand (<5%), mottled with greenish gray sandyclay at top (ALLUVIUM)
SAND (SW), brown, medium dense, wet, fine- tocoarse-grained sand, with silt, trace clay, subrounded finegravel (ALLUVIUM)
CLAYEY SAND (SC), gray, medium dense, wet, fine- tomedium-grained sand, trace subrounded coarse-grainedsand (<5%), trace wood (ALLUVIUM)
Dep
th in
Met
ers
35
36
37
38
39
40
41
42
Dep
th in
Fee
t
115
120
125
130
135
140
Sam
ple
Typ
e
LOG OF BORING CP-B4LOGGED / REVIEWED BY:DRILLING CONTRACTOR:
DRILLING METHOD:HAMMER TYPE:
Unc
onfin
ed S
tren
gth
(tsf
) *f
ield
app
rox
Dry
Uni
t Wei
ght
(pcf
)
Moi
stur
e C
onte
nt(%
dry
wei
ght)
Pla
stic
ity In
dex
Blo
w C
ount
/Foo
t
Wat
er L
evel
Fin
es C
onte
nt(%
pas
sing
#20
0 si
eve)
Atterberg Limits
C. Wright / BHBJWDC ExplorationHSA, Switch to Mud140 lb. Auto Trip
Geotechnical FeasibiltyCANDLESTICK POINTSAN FRANCISCO, CA
8472.000.001
Pla
stic
Lim
it
Liqu
id L
imit
Log
Sym
bol
12/2/2009Approx. 241½ ft.6.0 in.Approx. 1 ft.
DESCRIPTION
DATE DRILLED:HOLE DEPTH:
HOLE DIAMETER:SURF ELEV:
LO
G -
GE
OT
EC
HN
ICA
L
84
72
00
00
01
GIN
T L
OG
S.G
PJ
EN
GE
O I
NC
.GD
T
9/3
0/1
1
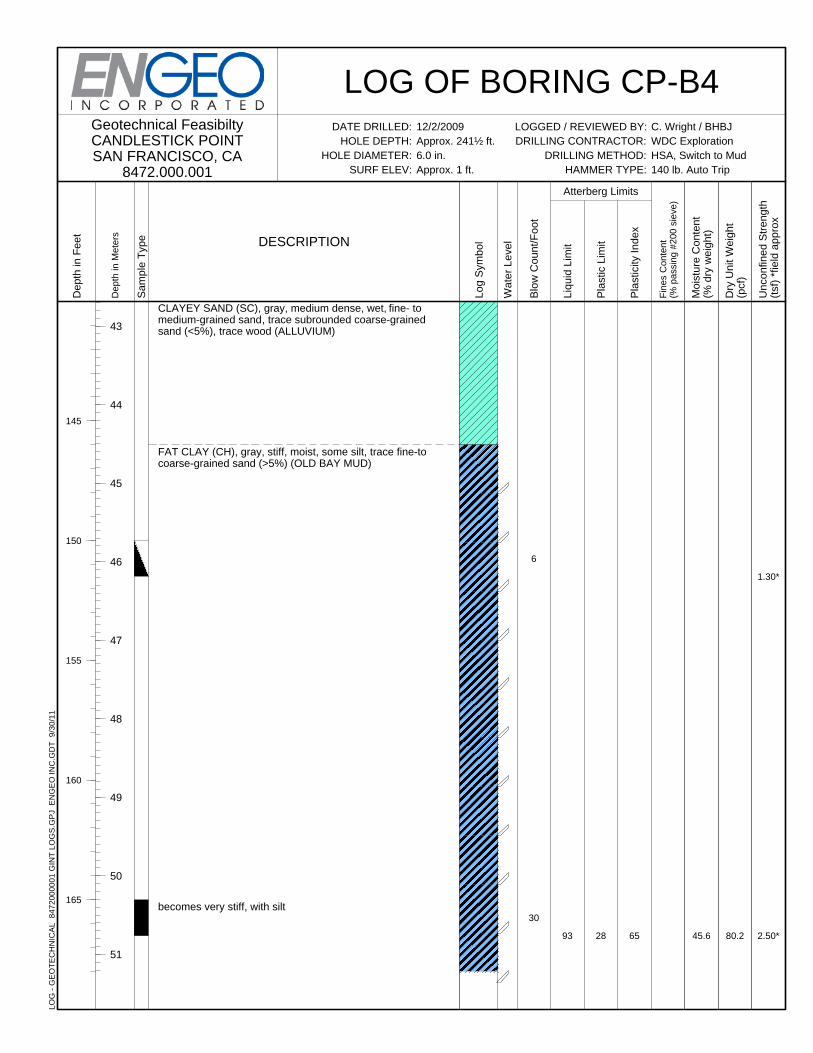
1.30*
2.50*80.245.665
6
30
2893
CLAYEY SAND (SC), gray, medium dense, wet, fine- tomedium-grained sand, trace subrounded coarse-grainedsand (<5%), trace wood (ALLUVIUM)
FAT CLAY (CH), gray, stiff, moist, some silt, trace fine-tocoarse-grained sand (>5%) (OLD BAY MUD)
becomes very stiff, with silt
Dep
th in
Met
ers
43
44
45
46
47
48
49
50
51
Dep
th in
Fee
t
145
150
155
160
165
Sam
ple
Typ
e
LOG OF BORING CP-B4LOGGED / REVIEWED BY:DRILLING CONTRACTOR:
DRILLING METHOD:HAMMER TYPE:
Unc
onfin
ed S
tren
gth
(tsf
) *f
ield
app
rox
Dry
Uni
t Wei
ght
(pcf
)
Moi
stur
e C
onte
nt(%
dry
wei
ght)
Pla
stic
ity In
dex
Blo
w C
ount
/Foo
t
Wat
er L
evel
Fin
es C
onte
nt(%
pas
sing
#20
0 si
eve)
Atterberg Limits
C. Wright / BHBJWDC ExplorationHSA, Switch to Mud140 lb. Auto Trip
Geotechnical FeasibiltyCANDLESTICK POINTSAN FRANCISCO, CA
8472.000.001
Pla
stic
Lim
it
Liqu
id L
imit
Log
Sym
bol
12/2/2009Approx. 241½ ft.6.0 in.Approx. 1 ft.
DESCRIPTION
DATE DRILLED:HOLE DEPTH:
HOLE DIAMETER:SURF ELEV:
LO
G -
GE
OT
EC
HN
ICA
L
84
72
00
00
01
GIN
T L
OG
S.G
PJ
EN
GE
O I
NC
.GD
T
9/3
0/1
1
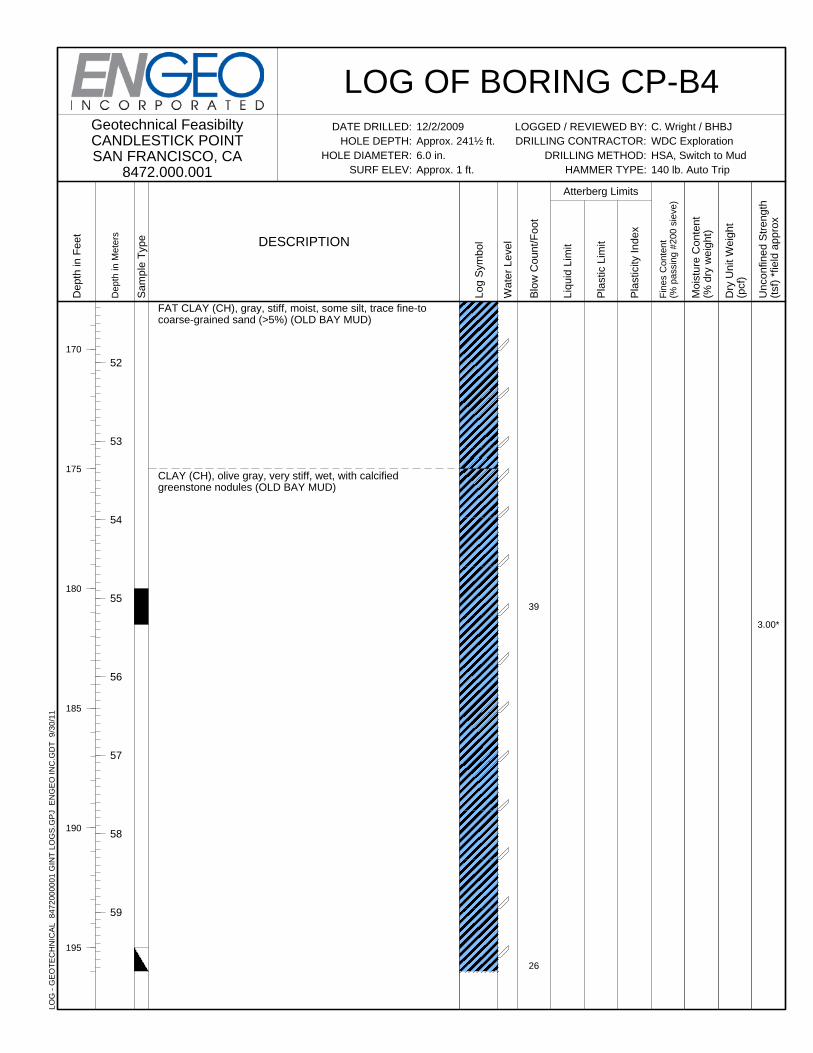
3.00*
39
26
FAT CLAY (CH), gray, stiff, moist, some silt, trace fine-tocoarse-grained sand (>5%) (OLD BAY MUD)
CLAY (CH), olive gray, very stiff, wet, with calcifiedgreenstone nodules (OLD BAY MUD)
Dep
th in
Met
ers
52
53
54
55
56
57
58
59
Dep
th in
Fee
t
170
175
180
185
190
195
Sam
ple
Typ
e
LOG OF BORING CP-B4LOGGED / REVIEWED BY:DRILLING CONTRACTOR:
DRILLING METHOD:HAMMER TYPE:
Unc
onfin
ed S
tren
gth
(tsf
) *f
ield
app
rox
Dry
Uni
t Wei
ght
(pcf
)
Moi
stur
e C
onte
nt(%
dry
wei
ght)
Pla
stic
ity In
dex
Blo
w C
ount
/Foo
t
Wat
er L
evel
Fin
es C
onte
nt(%
pas
sing
#20
0 si
eve)
Atterberg Limits
C. Wright / BHBJWDC ExplorationHSA, Switch to Mud140 lb. Auto Trip
Geotechnical FeasibiltyCANDLESTICK POINTSAN FRANCISCO, CA
8472.000.001
Pla
stic
Lim
it
Liqu
id L
imit
Log
Sym
bol
12/2/2009Approx. 241½ ft.6.0 in.Approx. 1 ft.
DESCRIPTION
DATE DRILLED:HOLE DEPTH:
HOLE DIAMETER:SURF ELEV:
LO
G -
GE
OT
EC
HN
ICA
L
84
72
00
00
01
GIN
T L
OG
S.G
PJ
EN
GE
O I
NC
.GD
T
9/3
0/1
1
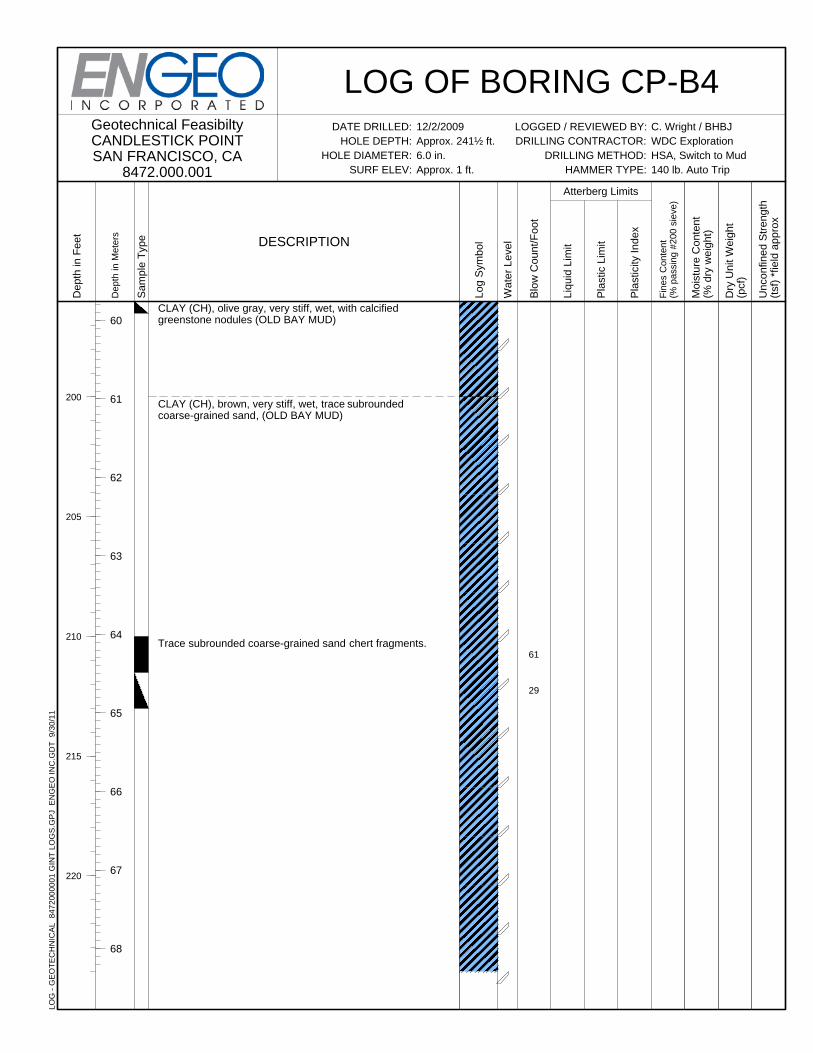
61
29
CLAY (CH), olive gray, very stiff, wet, with calcifiedgreenstone nodules (OLD BAY MUD)
CLAY (CH), brown, very stiff, wet, trace subroundedcoarse-grained sand, (OLD BAY MUD)
Trace subrounded coarse-grained sand chert fragments.
Dep
th in
Met
ers
60
61
62
63
64
65
66
67
68
Dep
th in
Fee
t
200
205
210
215
220
Sam
ple
Typ
e
LOG OF BORING CP-B4LOGGED / REVIEWED BY:DRILLING CONTRACTOR:
DRILLING METHOD:HAMMER TYPE:
Unc
onfin
ed S
tren
gth
(tsf
) *f
ield
app
rox
Dry
Uni
t Wei
ght
(pcf
)
Moi
stur
e C
onte
nt(%
dry
wei
ght)
Pla
stic
ity In
dex
Blo
w C
ount
/Foo
t
Wat
er L
evel
Fin
es C
onte
nt(%
pas
sing
#20
0 si
eve)
Atterberg Limits
C. Wright / BHBJWDC ExplorationHSA, Switch to Mud140 lb. Auto Trip
Geotechnical FeasibiltyCANDLESTICK POINTSAN FRANCISCO, CA
8472.000.001
Pla
stic
Lim
it
Liqu
id L
imit
Log
Sym
bol
12/2/2009Approx. 241½ ft.6.0 in.Approx. 1 ft.
DESCRIPTION
DATE DRILLED:HOLE DEPTH:
HOLE DIAMETER:SURF ELEV:
LO
G -
GE
OT
EC
HN
ICA
L
84
72
00
00
01
GIN
T L
OG
S.G
PJ
EN
GE
O I
NC
.GD
T
9/3
0/1
1
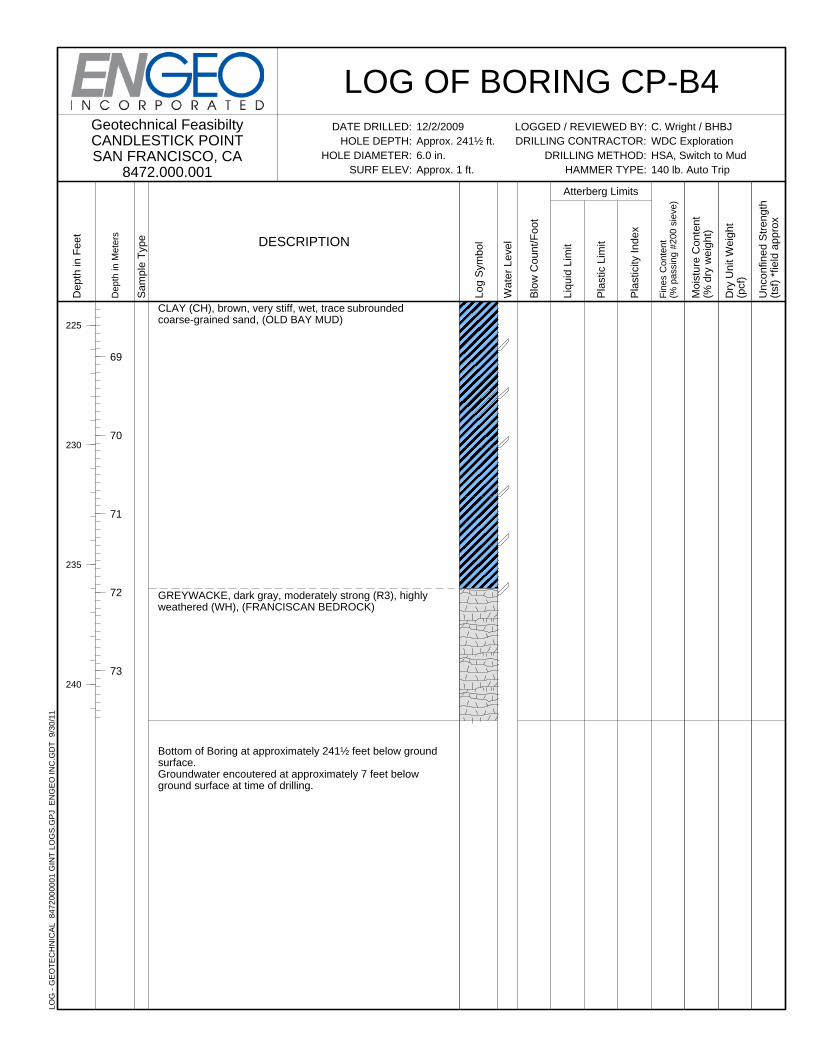
CLAY (CH), brown, very stiff, wet, trace subroundedcoarse-grained sand, (OLD BAY MUD)
GREYWACKE, dark gray, moderately strong (R3), highlyweathered (WH), (FRANCISCAN BEDROCK)
Bottom of Boring at approximately 241½ feet below groundsurface.Groundwater encoutered at approximately 7 feet belowground surface at time of drilling.
Dep
th in
Met
ers
69
70
71
72
73
Dep
th in
Fee
t
225
230
235
240
Sam
ple
Typ
e
LOG OF BORING CP-B4LOGGED / REVIEWED BY:DRILLING CONTRACTOR:
DRILLING METHOD:HAMMER TYPE:
Unc
onfin
ed S
tren
gth
(tsf
) *f
ield
app
rox
Dry
Uni
t Wei
ght
(pcf
)
Moi
stur
e C
onte
nt(%
dry
wei
ght)
Pla
stic
ity In
dex
Blo
w C
ount
/Foo
t
Wat
er L
evel
Fin
es C
onte
nt(%
pas
sing
#20
0 si
eve)
Atterberg Limits
C. Wright / BHBJWDC ExplorationHSA, Switch to Mud140 lb. Auto Trip
Geotechnical FeasibiltyCANDLESTICK POINTSAN FRANCISCO, CA
8472.000.001
Pla
stic
Lim
it
Liqu
id L
imit
Log
Sym
bol
12/2/2009Approx. 241½ ft.6.0 in.Approx. 1 ft.
DESCRIPTION
DATE DRILLED:HOLE DEPTH:
HOLE DIAMETER:SURF ELEV:
LO
G -
GE
OT
EC
HN
ICA
L
84
72
00
00
01
GIN
T L
OG
S.G
PJ
EN
GE
O I
NC
.GD
T
9/3
0/1
1
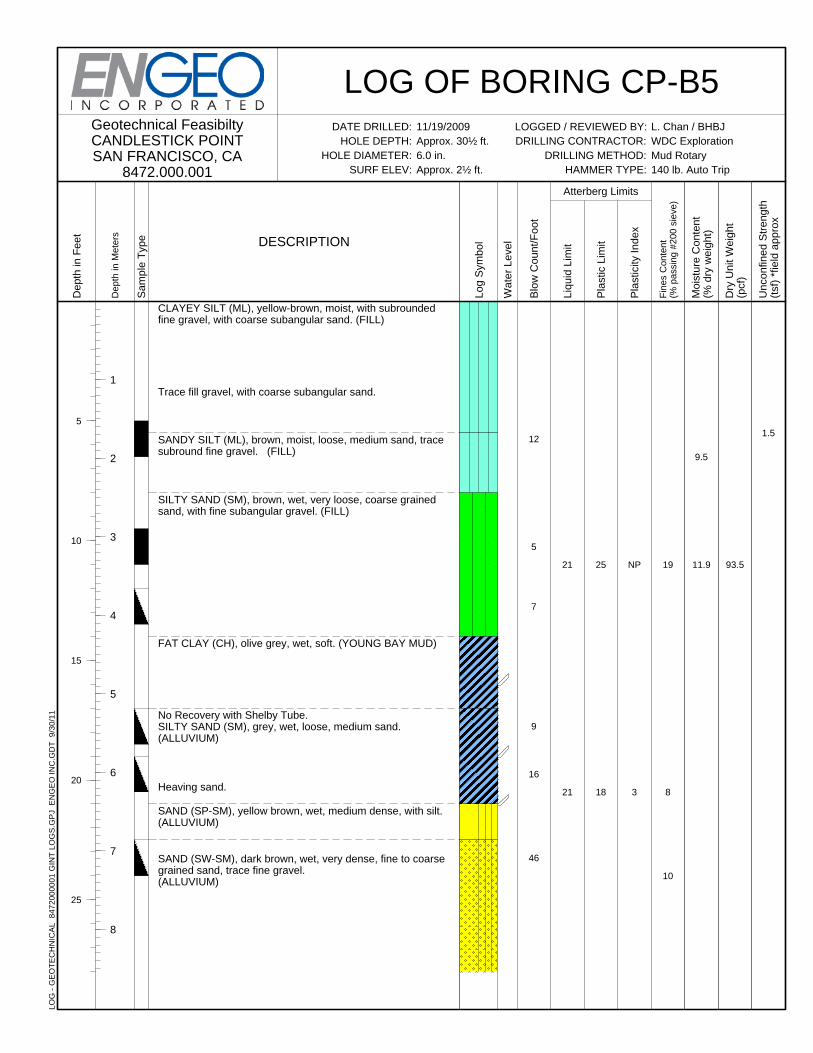
1.5
93.5
9.5
11.9NP
3
12
5
7
9
16
46
19
8
10
25
18
21
21
CLAYEY SILT (ML), yellow-brown, moist, with subroundedfine gravel, with coarse subangular sand. (FILL)
Trace fill gravel, with coarse subangular sand.
SANDY SILT (ML), brown, moist, loose, medium sand, tracesubround fine gravel. (FILL)
SILTY SAND (SM), brown, wet, very loose, coarse grainedsand, with fine subangular gravel. (FILL)
FAT CLAY (CH), olive grey, wet, soft. (YOUNG BAY MUD)
No Recovery with Shelby Tube.SILTY SAND (SM), grey, wet, loose, medium sand.(ALLUVIUM)
Heaving sand.
SAND (SP-SM), yellow brown, wet, medium dense, with silt.(ALLUVIUM)
SAND (SW-SM), dark brown, wet, very dense, fine to coarsegrained sand, trace fine gravel.(ALLUVIUM)
Dep
th in
Met
ers
1
2
3
4
5
6
7
8
Dep
th in
Fee
t
5
10
15
20
25
Sam
ple
Typ
e
LOG OF BORING CP-B5LOGGED / REVIEWED BY:DRILLING CONTRACTOR:
DRILLING METHOD:HAMMER TYPE:
Unc
onfin
ed S
tren
gth
(tsf
) *f
ield
app
rox
Dry
Uni
t Wei
ght
(pcf
)
Moi
stur
e C
onte
nt(%
dry
wei
ght)
Pla
stic
ity In
dex
Blo
w C
ount
/Foo
t
Wat
er L
evel
Fin
es C
onte
nt(%
pas
sing
#20
0 si
eve)
Atterberg Limits
L. Chan / BHBJWDC ExplorationMud Rotary140 lb. Auto Trip
Geotechnical FeasibiltyCANDLESTICK POINTSAN FRANCISCO, CA
8472.000.001
Pla
stic
Lim
it
Liqu
id L
imit
Log
Sym
bol
11/19/2009Approx. 30½ ft.6.0 in.Approx. 2½ ft.
DESCRIPTION
DATE DRILLED:HOLE DEPTH:
HOLE DIAMETER:SURF ELEV:
LO
G -
GE
OT
EC
HN
ICA
L
84
72
00
00
01
GIN
T L
OG
S.G
PJ
EN
GE
O I
NC
.GD
T
9/3
0/1
1
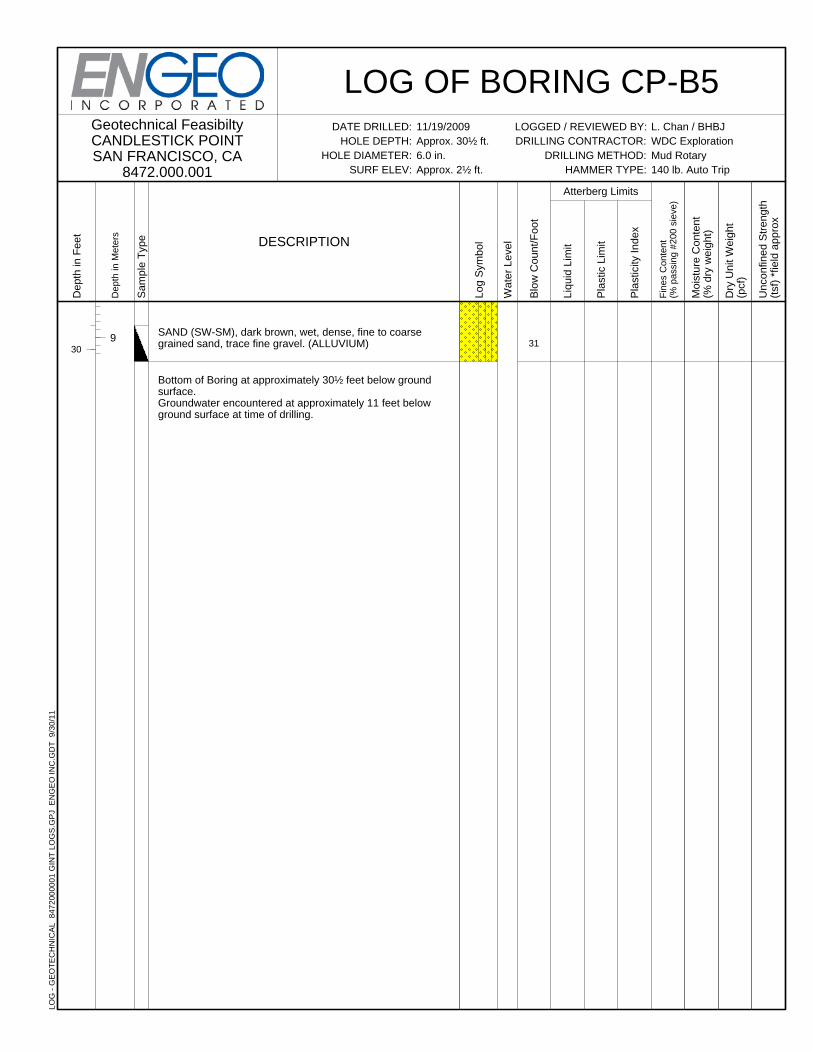
31SAND (SW-SM), dark brown, wet, dense, fine to coarsegrained sand, trace fine gravel. (ALLUVIUM)
Bottom of Boring at approximately 30½ feet below groundsurface.Groundwater encountered at approximately 11 feet belowground surface at time of drilling.
Dep
th in
Met
ers
9
Dep
th in
Fee
t
30
Sam
ple
Typ
e
LOG OF BORING CP-B5LOGGED / REVIEWED BY:DRILLING CONTRACTOR:
DRILLING METHOD:HAMMER TYPE:
Unc
onfin
ed S
tren
gth
(tsf
) *f
ield
app
rox
Dry
Uni
t Wei
ght
(pcf
)
Moi
stur
e C
onte
nt(%
dry
wei
ght)
Pla
stic
ity In
dex
Blo
w C
ount
/Foo
t
Wat
er L
evel
Fin
es C
onte
nt(%
pas
sing
#20
0 si
eve)
Atterberg Limits
L. Chan / BHBJWDC ExplorationMud Rotary140 lb. Auto Trip
Geotechnical FeasibiltyCANDLESTICK POINTSAN FRANCISCO, CA
8472.000.001
Pla
stic
Lim
it
Liqu
id L
imit
Log
Sym
bol
11/19/2009Approx. 30½ ft.6.0 in.Approx. 2½ ft.
DESCRIPTION
DATE DRILLED:HOLE DEPTH:
HOLE DIAMETER:SURF ELEV:
LO
G -
GE
OT
EC
HN
ICA
L
84
72
00
00
01
GIN
T L
OG
S.G
PJ
EN
GE
O I
NC
.GD
T
9/3
0/1
1
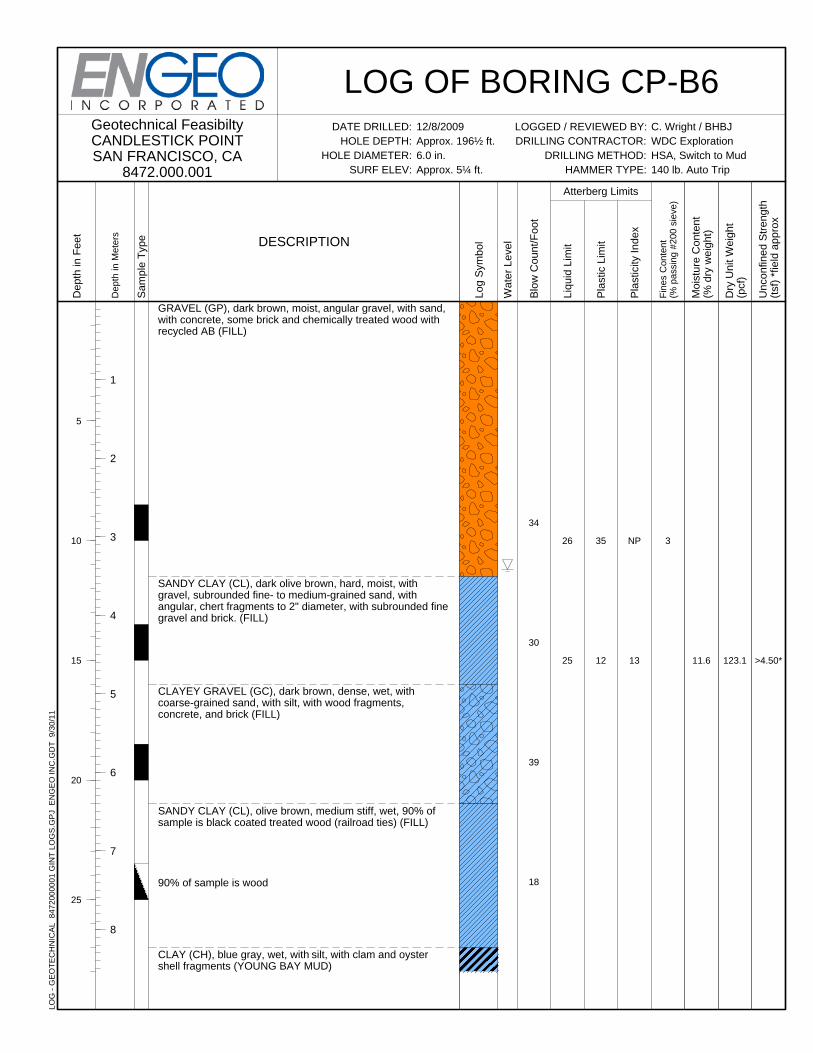
>4.50*123.111.6
NP
13
34
30
39
18
335
12
26
25
GRAVEL (GP), dark brown, moist, angular gravel, with sand,with concrete, some brick and chemically treated wood withrecycled AB (FILL)
SANDY CLAY (CL), dark olive brown, hard, moist, withgravel, subrounded fine- to medium-grained sand, withangular, chert fragments to 2" diameter, with subrounded finegravel and brick. (FILL)
CLAYEY GRAVEL (GC), dark brown, dense, wet, withcoarse-grained sand, with silt, with wood fragments,concrete, and brick (FILL)
SANDY CLAY (CL), olive brown, medium stiff, wet, 90% ofsample is black coated treated wood (railroad ties) (FILL)
90% of sample is wood
CLAY (CH), blue gray, wet, with silt, with clam and oystershell fragments (YOUNG BAY MUD)
Dep
th in
Met
ers
1
2
3
4
5
6
7
8
Dep
th in
Fee
t
5
10
15
20
25
Sam
ple
Typ
e
LOG OF BORING CP-B6LOGGED / REVIEWED BY:DRILLING CONTRACTOR:
DRILLING METHOD:HAMMER TYPE:
Unc
onfin
ed S
tren
gth
(tsf
) *f
ield
app
rox
Dry
Uni
t Wei
ght
(pcf
)
Moi
stur
e C
onte
nt(%
dry
wei
ght)
Pla
stic
ity In
dex
Blo
w C
ount
/Foo
t
Wat
er L
evel
Fin
es C
onte
nt(%
pas
sing
#20
0 si
eve)
Atterberg Limits
C. Wright / BHBJWDC ExplorationHSA, Switch to Mud140 lb. Auto Trip
Geotechnical FeasibiltyCANDLESTICK POINTSAN FRANCISCO, CA
8472.000.001
Pla
stic
Lim
it
Liqu
id L
imit
Log
Sym
bol
12/8/2009Approx. 196½ ft.6.0 in.Approx. 5¼ ft.
DESCRIPTION
DATE DRILLED:HOLE DEPTH:
HOLE DIAMETER:SURF ELEV:
LO
G -
GE
OT
EC
HN
ICA
L
84
72
00
00
01
GIN
T L
OG
S.G
PJ
EN
GE
O I
NC
.GD
T
9/3
0/1
1
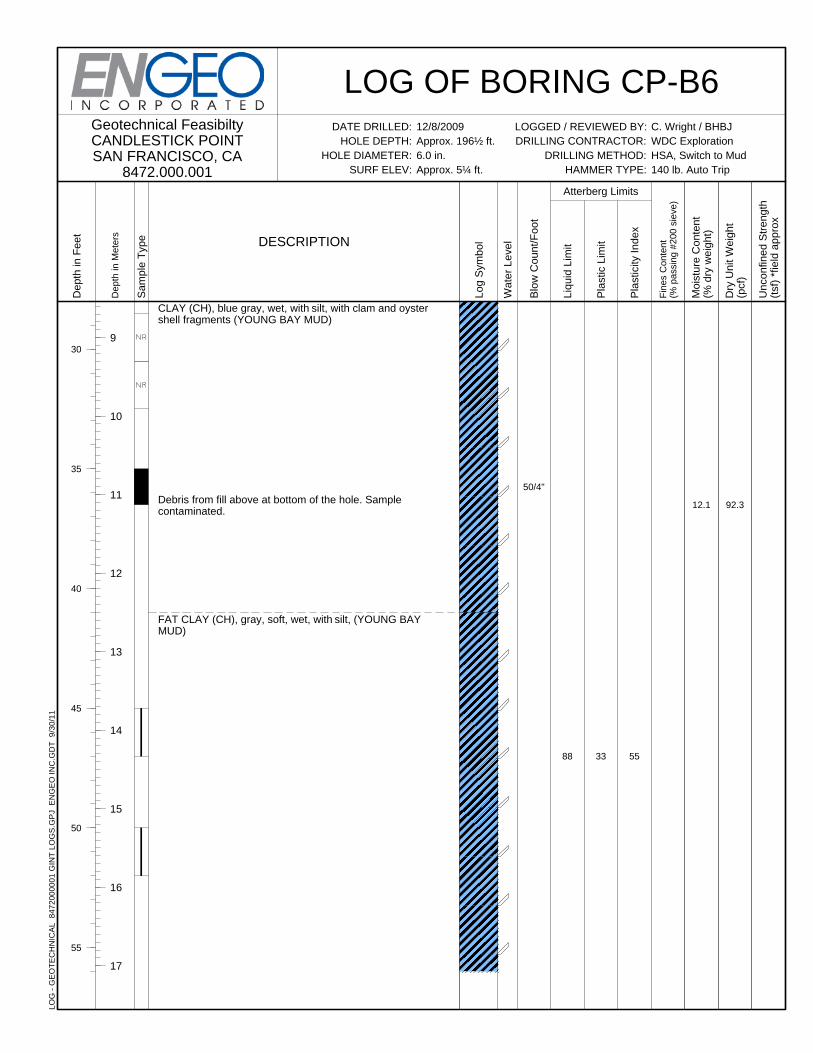
92.312.1
55
50/4"
3388
CLAY (CH), blue gray, wet, with silt, with clam and oystershell fragments (YOUNG BAY MUD)
Debris from fill above at bottom of the hole. Samplecontaminated.
FAT CLAY (CH), gray, soft, wet, with silt, (YOUNG BAYMUD)
Dep
th in
Met
ers
9
10
11
12
13
14
15
16
17
Dep
th in
Fee
t
30
35
40
45
50
55
Sam
ple
Typ
e
LOG OF BORING CP-B6LOGGED / REVIEWED BY:DRILLING CONTRACTOR:
DRILLING METHOD:HAMMER TYPE:
Unc
onfin
ed S
tren
gth
(tsf
) *f
ield
app
rox
Dry
Uni
t Wei
ght
(pcf
)
Moi
stur
e C
onte
nt(%
dry
wei
ght)
Pla
stic
ity In
dex
Blo
w C
ount
/Foo
t
Wat
er L
evel
Fin
es C
onte
nt(%
pas
sing
#20
0 si
eve)
Atterberg Limits
C. Wright / BHBJWDC ExplorationHSA, Switch to Mud140 lb. Auto Trip
Geotechnical FeasibiltyCANDLESTICK POINTSAN FRANCISCO, CA
8472.000.001
Pla
stic
Lim
it
Liqu
id L
imit
Log
Sym
bol
12/8/2009Approx. 196½ ft.6.0 in.Approx. 5¼ ft.
DESCRIPTION
DATE DRILLED:HOLE DEPTH:
HOLE DIAMETER:SURF ELEV:
LO
G -
GE
OT
EC
HN
ICA
L
84
72
00
00
01
GIN
T L
OG
S.G
PJ
EN
GE
O I
NC
.GD
T
9/3
0/1
1
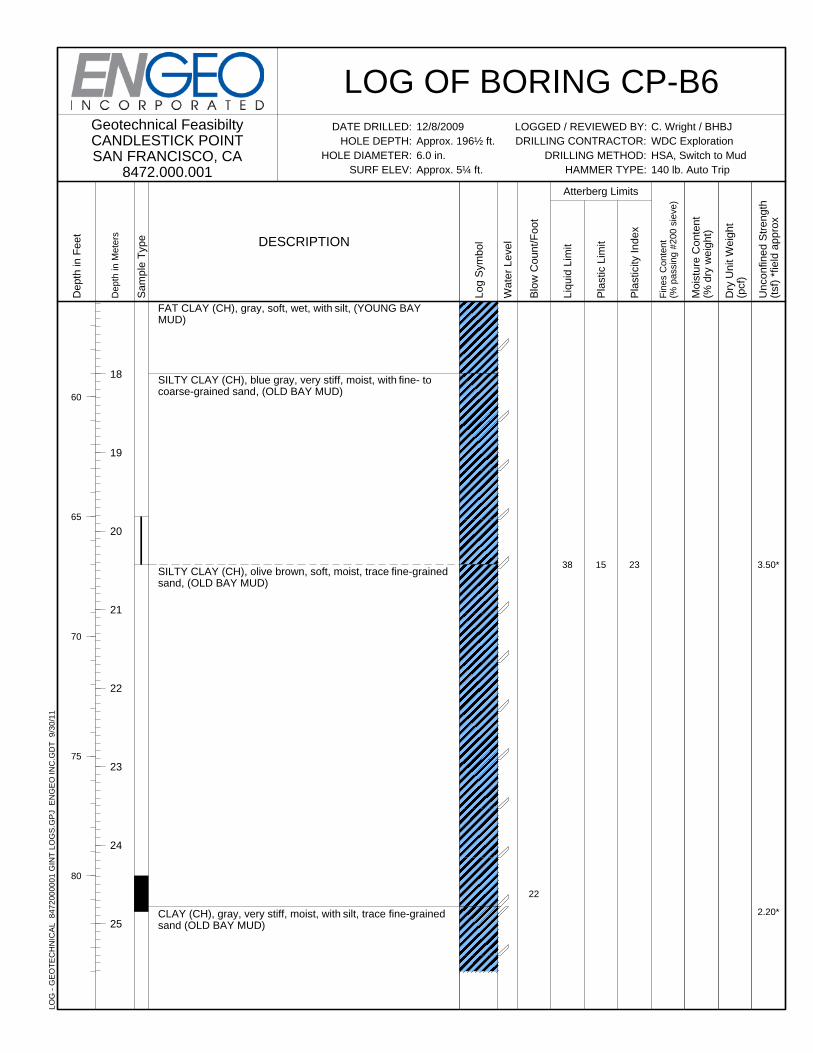
3.50*
2.20*
23
22
1538
FAT CLAY (CH), gray, soft, wet, with silt, (YOUNG BAYMUD)
SILTY CLAY (CH), blue gray, very stiff, moist, with fine- tocoarse-grained sand, (OLD BAY MUD)
SILTY CLAY (CH), olive brown, soft, moist, trace fine-grainedsand, (OLD BAY MUD)
CLAY (CH), gray, very stiff, moist, with silt, trace fine-grainedsand (OLD BAY MUD)
Dep
th in
Met
ers
18
19
20
21
22
23
24
25
Dep
th in
Fee
t
60
65
70
75
80
Sam
ple
Typ
e
LOG OF BORING CP-B6LOGGED / REVIEWED BY:DRILLING CONTRACTOR:
DRILLING METHOD:HAMMER TYPE:
Unc
onfin
ed S
tren
gth
(tsf
) *f
ield
app
rox
Dry
Uni
t Wei
ght
(pcf
)
Moi
stur
e C
onte
nt(%
dry
wei
ght)
Pla
stic
ity In
dex
Blo
w C
ount
/Foo
t
Wat
er L
evel
Fin
es C
onte
nt(%
pas
sing
#20
0 si
eve)
Atterberg Limits
C. Wright / BHBJWDC ExplorationHSA, Switch to Mud140 lb. Auto Trip
Geotechnical FeasibiltyCANDLESTICK POINTSAN FRANCISCO, CA
8472.000.001
Pla
stic
Lim
it
Liqu
id L
imit
Log
Sym
bol
12/8/2009Approx. 196½ ft.6.0 in.Approx. 5¼ ft.
DESCRIPTION
DATE DRILLED:HOLE DEPTH:
HOLE DIAMETER:SURF ELEV:
LO
G -
GE
OT
EC
HN
ICA
L
84
72
00
00
01
GIN
T L
OG
S.G
PJ
EN
GE
O I
NC
.GD
T
9/3
0/1
1
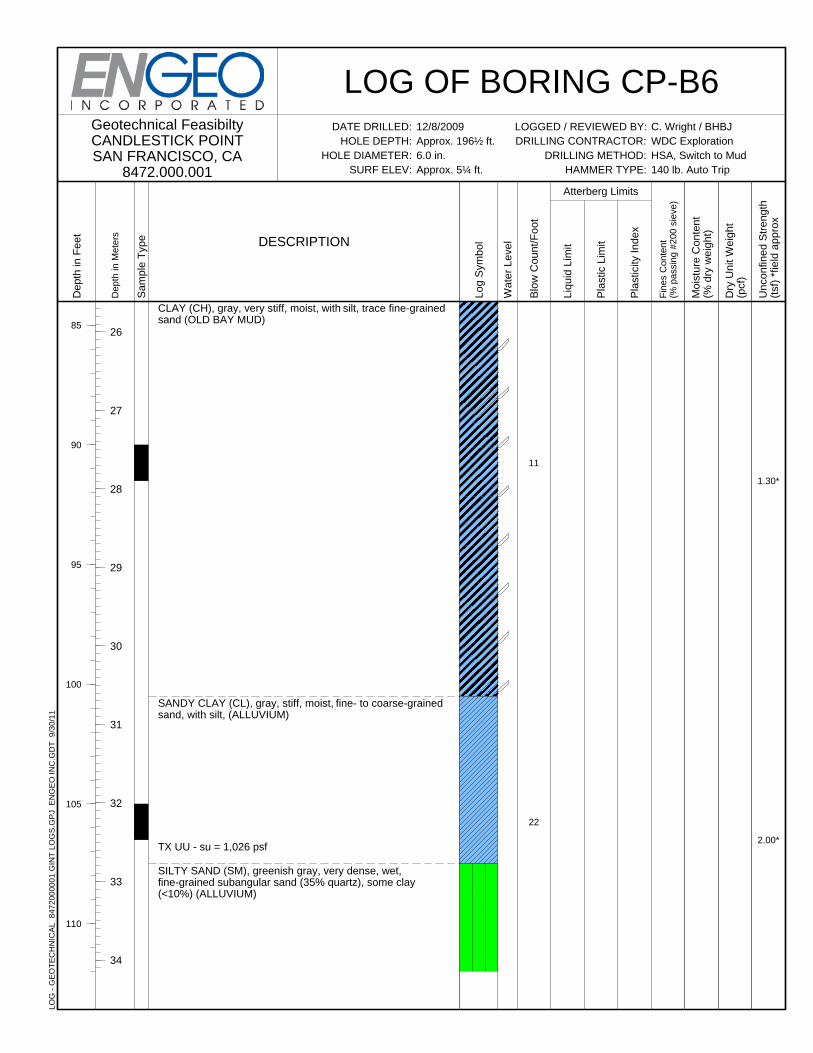
1.30*
2.00*
11
22
CLAY (CH), gray, very stiff, moist, with silt, trace fine-grainedsand (OLD BAY MUD)
SANDY CLAY (CL), gray, stiff, moist, fine- to coarse-grainedsand, with silt, (ALLUVIUM)
TX UU - su = 1,026 psf
SILTY SAND (SM), greenish gray, very dense, wet,fine-grained subangular sand (35% quartz), some clay(<10%) (ALLUVIUM)
Dep
th in
Met
ers
26
27
28
29
30
31
32
33
34
Dep
th in
Fee
t
85
90
95
100
105
110
Sam
ple
Typ
e
LOG OF BORING CP-B6LOGGED / REVIEWED BY:DRILLING CONTRACTOR:
DRILLING METHOD:HAMMER TYPE:
Unc
onfin
ed S
tren
gth
(tsf
) *f
ield
app
rox
Dry
Uni
t Wei
ght
(pcf
)
Moi
stur
e C
onte
nt(%
dry
wei
ght)
Pla
stic
ity In
dex
Blo
w C
ount
/Foo
t
Wat
er L
evel
Fin
es C
onte
nt(%
pas
sing
#20
0 si
eve)
Atterberg Limits
C. Wright / BHBJWDC ExplorationHSA, Switch to Mud140 lb. Auto Trip
Geotechnical FeasibiltyCANDLESTICK POINTSAN FRANCISCO, CA
8472.000.001
Pla
stic
Lim
it
Liqu
id L
imit
Log
Sym
bol
12/8/2009Approx. 196½ ft.6.0 in.Approx. 5¼ ft.
DESCRIPTION
DATE DRILLED:HOLE DEPTH:
HOLE DIAMETER:SURF ELEV:
LO
G -
GE
OT
EC
HN
ICA
L
84
72
00
00
01
GIN
T L
OG
S.G
PJ
EN
GE
O I
NC
.GD
T
9/3
0/1
1
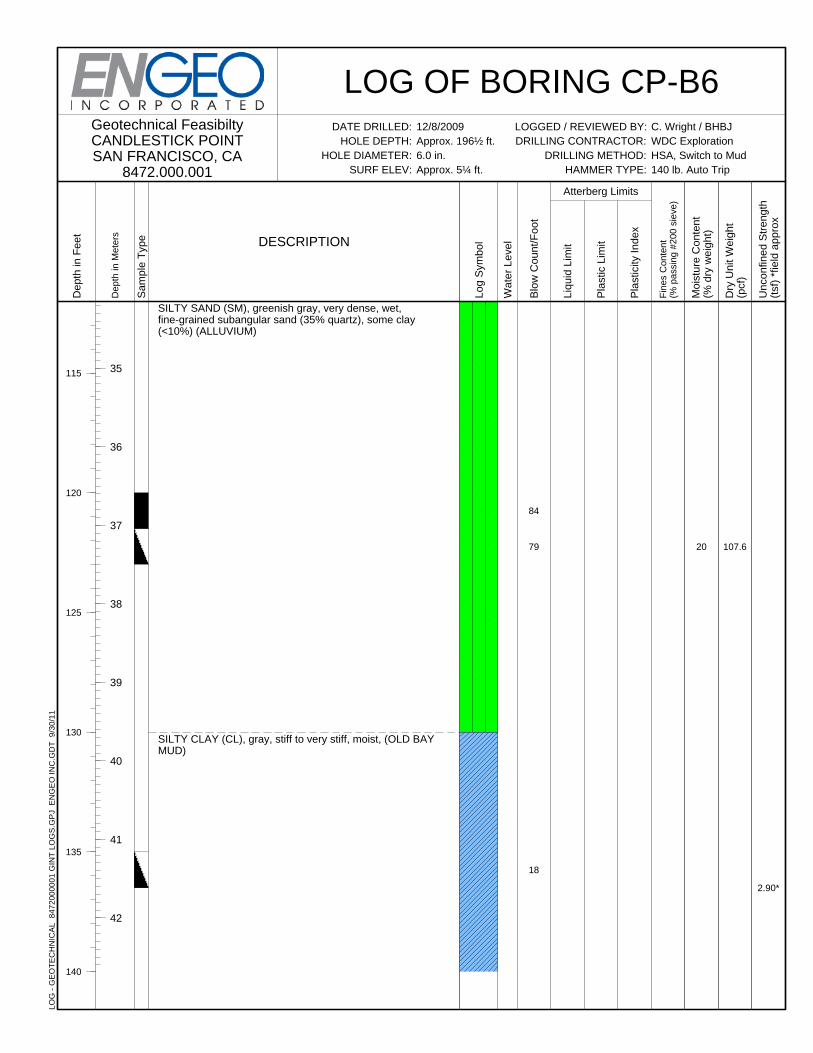
2.90*
107.620
84
79
18
SILTY SAND (SM), greenish gray, very dense, wet,fine-grained subangular sand (35% quartz), some clay(<10%) (ALLUVIUM)
SILTY CLAY (CL), gray, stiff to very stiff, moist, (OLD BAYMUD)
Dep
th in
Met
ers
35
36
37
38
39
40
41
42
Dep
th in
Fee
t
115
120
125
130
135
140
Sam
ple
Typ
e
LOG OF BORING CP-B6LOGGED / REVIEWED BY:DRILLING CONTRACTOR:
DRILLING METHOD:HAMMER TYPE:
Unc
onfin
ed S
tren
gth
(tsf
) *f
ield
app
rox
Dry
Uni
t Wei
ght
(pcf
)
Moi
stur
e C
onte
nt(%
dry
wei
ght)
Pla
stic
ity In
dex
Blo
w C
ount
/Foo
t
Wat
er L
evel
Fin
es C
onte
nt(%
pas
sing
#20
0 si
eve)
Atterberg Limits
C. Wright / BHBJWDC ExplorationHSA, Switch to Mud140 lb. Auto Trip
Geotechnical FeasibiltyCANDLESTICK POINTSAN FRANCISCO, CA
8472.000.001
Pla
stic
Lim
it
Liqu
id L
imit
Log
Sym
bol
12/8/2009Approx. 196½ ft.6.0 in.Approx. 5¼ ft.
DESCRIPTION
DATE DRILLED:HOLE DEPTH:
HOLE DIAMETER:SURF ELEV:
LO
G -
GE
OT
EC
HN
ICA
L
84
72
00
00
01
GIN
T L
OG
S.G
PJ
EN
GE
O I
NC
.GD
T
9/3
0/1
1
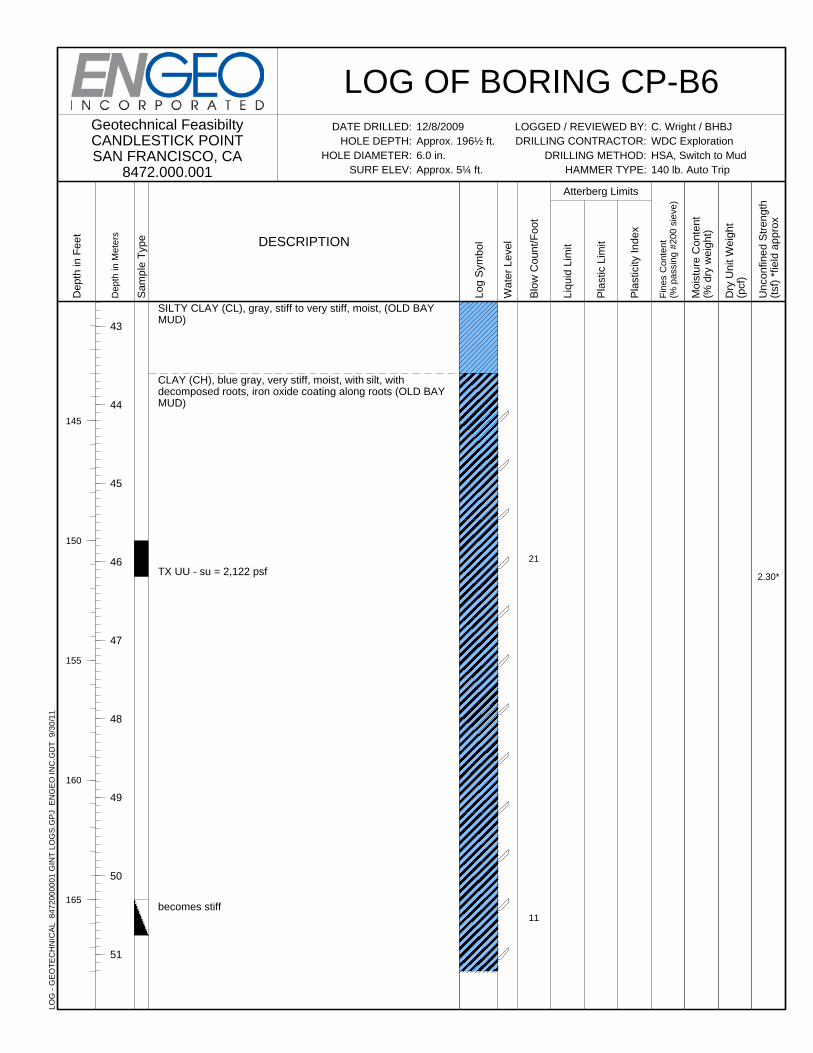
2.30*
21
11
SILTY CLAY (CL), gray, stiff to very stiff, moist, (OLD BAYMUD)
CLAY (CH), blue gray, very stiff, moist, with silt, withdecomposed roots, iron oxide coating along roots (OLD BAYMUD)
TX UU - su = 2,122 psf
becomes stiff
Dep
th in
Met
ers
43
44
45
46
47
48
49
50
51
Dep
th in
Fee
t
145
150
155
160
165
Sam
ple
Typ
e
LOG OF BORING CP-B6LOGGED / REVIEWED BY:DRILLING CONTRACTOR:
DRILLING METHOD:HAMMER TYPE:
Unc
onfin
ed S
tren
gth
(tsf
) *f
ield
app
rox
Dry
Uni
t Wei
ght
(pcf
)
Moi
stur
e C
onte
nt(%
dry
wei
ght)
Pla
stic
ity In
dex
Blo
w C
ount
/Foo
t
Wat
er L
evel
Fin
es C
onte
nt(%
pas
sing
#20
0 si
eve)
Atterberg Limits
C. Wright / BHBJWDC ExplorationHSA, Switch to Mud140 lb. Auto Trip
Geotechnical FeasibiltyCANDLESTICK POINTSAN FRANCISCO, CA
8472.000.001
Pla
stic
Lim
it
Liqu
id L
imit
Log
Sym
bol
12/8/2009Approx. 196½ ft.6.0 in.Approx. 5¼ ft.
DESCRIPTION
DATE DRILLED:HOLE DEPTH:
HOLE DIAMETER:SURF ELEV:
LO
G -
GE
OT
EC
HN
ICA
L
84
72
00
00
01
GIN
T L
OG
S.G
PJ
EN
GE
O I
NC
.GD
T
9/3
0/1
1
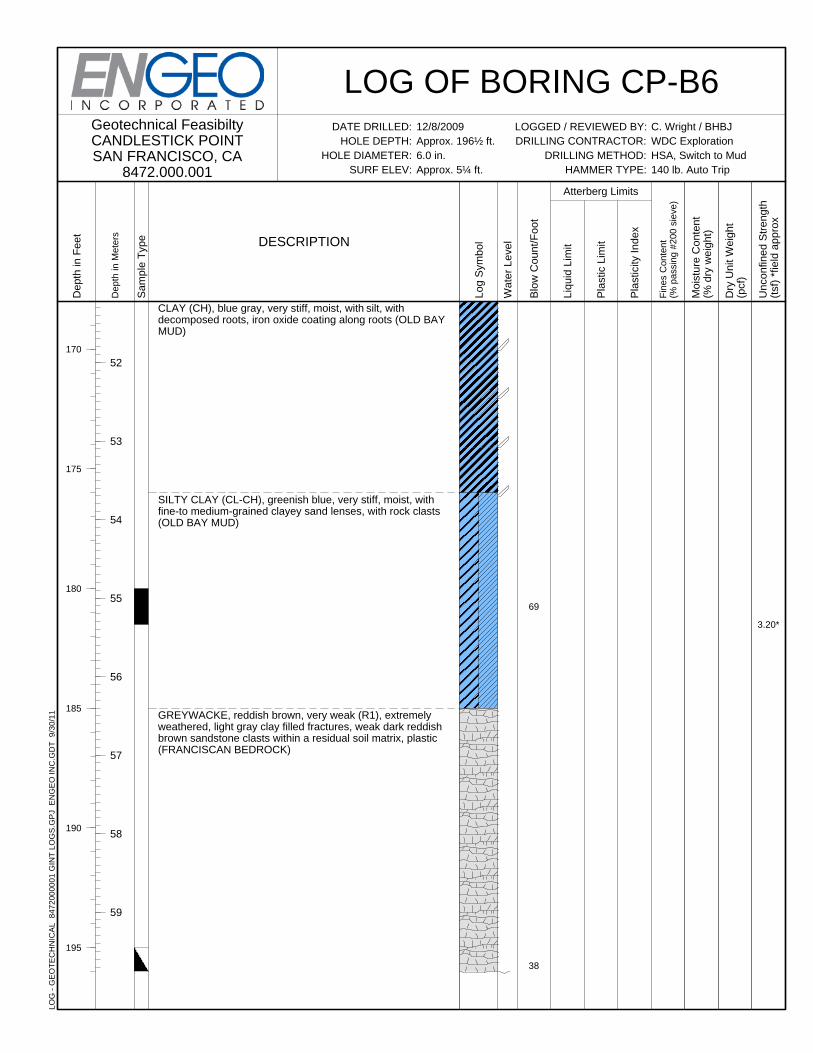
3.20*
69
38
CLAY (CH), blue gray, very stiff, moist, with silt, withdecomposed roots, iron oxide coating along roots (OLD BAYMUD)
SILTY CLAY (CL-CH), greenish blue, very stiff, moist, withfine-to medium-grained clayey sand lenses, with rock clasts(OLD BAY MUD)
GREYWACKE, reddish brown, very weak (R1), extremelyweathered, light gray clay filled fractures, weak dark reddishbrown sandstone clasts within a residual soil matrix, plastic(FRANCISCAN BEDROCK)
Dep
th in
Met
ers
52
53
54
55
56
57
58
59
Dep
th in
Fee
t
170
175
180
185
190
195
Sam
ple
Typ
e
LOG OF BORING CP-B6LOGGED / REVIEWED BY:DRILLING CONTRACTOR:
DRILLING METHOD:HAMMER TYPE:
Unc
onfin
ed S
tren
gth
(tsf
) *f
ield
app
rox
Dry
Uni
t Wei
ght
(pcf
)
Moi
stur
e C
onte
nt(%
dry
wei
ght)
Pla
stic
ity In
dex
Blo
w C
ount
/Foo
t
Wat
er L
evel
Fin
es C
onte
nt(%
pas
sing
#20
0 si
eve)
Atterberg Limits
C. Wright / BHBJWDC ExplorationHSA, Switch to Mud140 lb. Auto Trip
Geotechnical FeasibiltyCANDLESTICK POINTSAN FRANCISCO, CA
8472.000.001
Pla
stic
Lim
it
Liqu
id L
imit
Log
Sym
bol
12/8/2009Approx. 196½ ft.6.0 in.Approx. 5¼ ft.
DESCRIPTION
DATE DRILLED:HOLE DEPTH:
HOLE DIAMETER:SURF ELEV:
LO
G -
GE
OT
EC
HN
ICA
L
84
72
00
00
01
GIN
T L
OG
S.G
PJ
EN
GE
O I
NC
.GD
T
9/3
0/1
1
Bottom of boring at approximately 136½ feet below groundsurface.Groundwater encoutered at approximately 11 feet belowground surface at time of drilling.
Dep
th in
Met
ers
Dep
th in
Fee
t
Sam
ple
Typ
e
LOG OF BORING CP-B6LOGGED / REVIEWED BY:DRILLING CONTRACTOR:
DRILLING METHOD:HAMMER TYPE:
Unc
onfin
ed S
tren
gth
(tsf
) *f
ield
app
rox
Dry
Uni
t Wei
ght
(pcf
)
Moi
stur
e C
onte
nt(%
dry
wei
ght)
Pla
stic
ity In
dex
Blo
w C
ount
/Foo
t
Wat
er L
evel
Fin
es C
onte
nt(%
pas
sing
#20
0 si
eve)
Atterberg Limits
C. Wright / BHBJWDC ExplorationHSA, Switch to Mud140 lb. Auto Trip
Geotechnical FeasibiltyCANDLESTICK POINTSAN FRANCISCO, CA
8472.000.001
Pla
stic
Lim
it
Liqu
id L
imit
Log
Sym
bol
12/8/2009Approx. 196½ ft.6.0 in.Approx. 5¼ ft.
DESCRIPTION
DATE DRILLED:HOLE DEPTH:
HOLE DIAMETER:SURF ELEV:
LO
G -
GE
OT
EC
HN
ICA
L
84
72
00
00
01
GIN
T L
OG
S.G
PJ
EN
GE
O I
NC
.GD
T
9/3
0/1
1
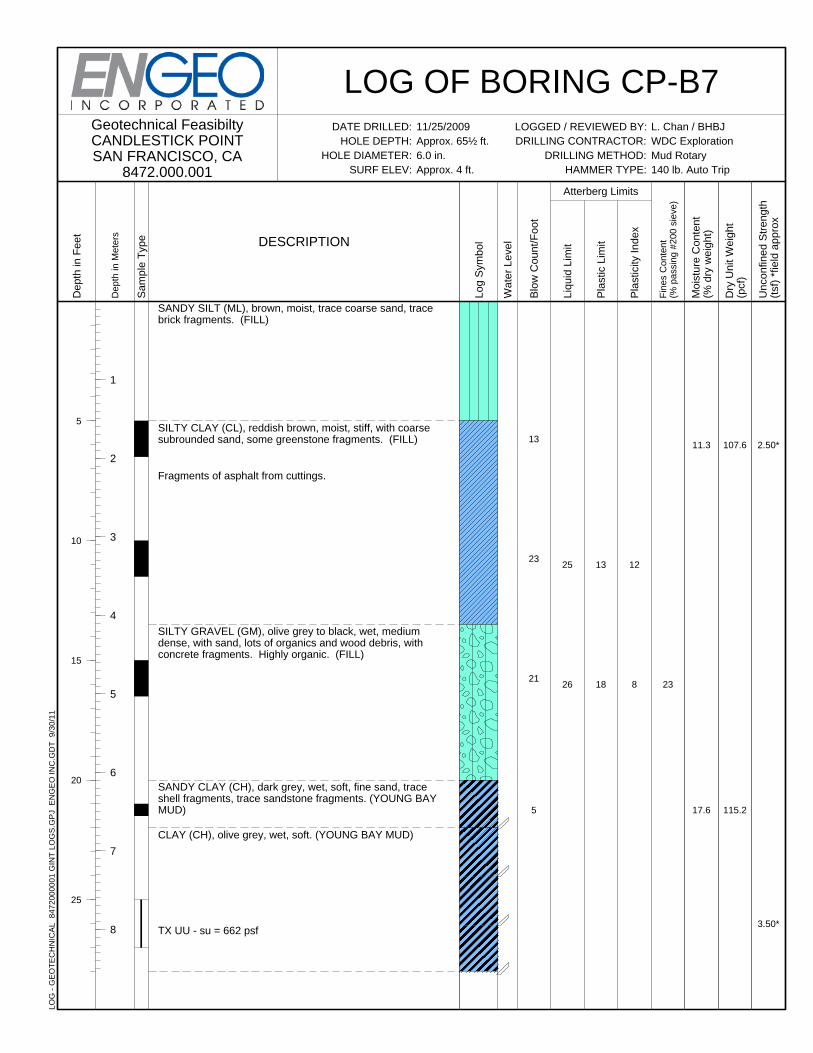
2.50*
3.50*
107.6
115.2
11.3
17.6
12
8
13
23
21
5
23
13
18
25
26
SANDY SILT (ML), brown, moist, trace coarse sand, tracebrick fragments. (FILL)
SILTY CLAY (CL), reddish brown, moist, stiff, with coarsesubrounded sand, some greenstone fragments. (FILL)
Fragments of asphalt from cuttings.
SILTY GRAVEL (GM), olive grey to black, wet, mediumdense, with sand, lots of organics and wood debris, withconcrete fragments. Highly organic. (FILL)
SANDY CLAY (CH), dark grey, wet, soft, fine sand, traceshell fragments, trace sandstone fragments. (YOUNG BAYMUD)
CLAY (CH), olive grey, wet, soft. (YOUNG BAY MUD)
TX UU - su = 662 psf
Dep
th in
Met
ers
1
2
3
4
5
6
7
8
Dep
th in
Fee
t
5
10
15
20
25
Sam
ple
Typ
e
LOG OF BORING CP-B7LOGGED / REVIEWED BY:DRILLING CONTRACTOR:
DRILLING METHOD:HAMMER TYPE:
Unc
onfin
ed S
tren
gth
(tsf
) *f
ield
app
rox
Dry
Uni
t Wei
ght
(pcf
)
Moi
stur
e C
onte
nt(%
dry
wei
ght)
Pla
stic
ity In
dex
Blo
w C
ount
/Foo
t
Wat
er L
evel
Fin
es C
onte
nt(%
pas
sing
#20
0 si
eve)
Atterberg Limits
L. Chan / BHBJWDC ExplorationMud Rotary140 lb. Auto Trip
Geotechnical FeasibiltyCANDLESTICK POINTSAN FRANCISCO, CA
8472.000.001
Pla
stic
Lim
it
Liqu
id L
imit
Log
Sym
bol
11/25/2009Approx. 65½ ft.6.0 in.Approx. 4 ft.
DESCRIPTION
DATE DRILLED:HOLE DEPTH:
HOLE DIAMETER:SURF ELEV:
LO
G -
GE
OT
EC
HN
ICA
L
84
72
00
00
01
GIN
T L
OG
S.G
PJ
EN
GE
O I
NC
.GD
T
9/3
0/1
1
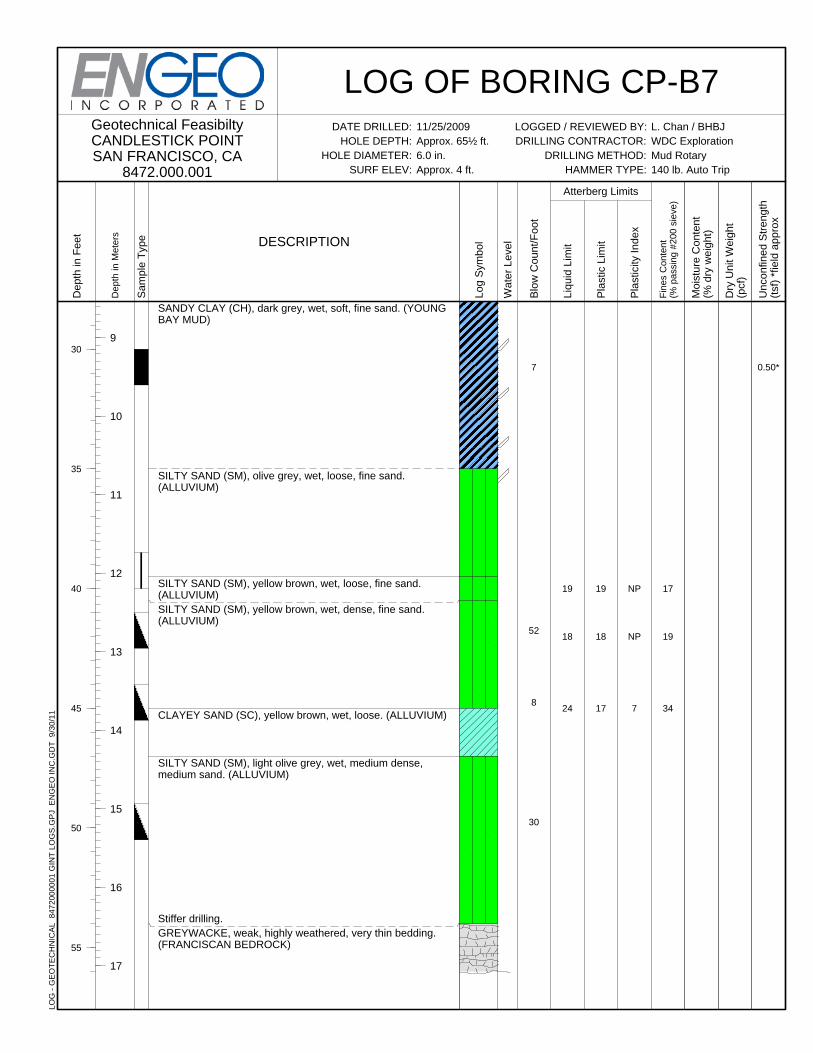
0.50*
NP
NP
7
7
52
8
30
17
19
34
19
18
17
19
18
24
SANDY CLAY (CH), dark grey, wet, soft, fine sand. (YOUNGBAY MUD)
SILTY SAND (SM), olive grey, wet, loose, fine sand.(ALLUVIUM)
SILTY SAND (SM), yellow brown, wet, loose, fine sand.(ALLUVIUM)SILTY SAND (SM), yellow brown, wet, dense, fine sand.(ALLUVIUM)
CLAYEY SAND (SC), yellow brown, wet, loose. (ALLUVIUM)
SILTY SAND (SM), light olive grey, wet, medium dense,medium sand. (ALLUVIUM)
Stiffer drilling.GREYWACKE, weak, highly weathered, very thin bedding.(FRANCISCAN BEDROCK)
Dep
th in
Met
ers
9
10
11
12
13
14
15
16
17
Dep
th in
Fee
t
30
35
40
45
50
55
Sam
ple
Typ
e
LOG OF BORING CP-B7LOGGED / REVIEWED BY:DRILLING CONTRACTOR:
DRILLING METHOD:HAMMER TYPE:
Unc
onfin
ed S
tren
gth
(tsf
) *f
ield
app
rox
Dry
Uni
t Wei
ght
(pcf
)
Moi
stur
e C
onte
nt(%
dry
wei
ght)
Pla
stic
ity In
dex
Blo
w C
ount
/Foo
t
Wat
er L
evel
Fin
es C
onte
nt(%
pas
sing
#20
0 si
eve)
Atterberg Limits
L. Chan / BHBJWDC ExplorationMud Rotary140 lb. Auto Trip
Geotechnical FeasibiltyCANDLESTICK POINTSAN FRANCISCO, CA
8472.000.001
Pla
stic
Lim
it
Liqu
id L
imit
Log
Sym
bol
11/25/2009Approx. 65½ ft.6.0 in.Approx. 4 ft.
DESCRIPTION
DATE DRILLED:HOLE DEPTH:
HOLE DIAMETER:SURF ELEV:
LO
G -
GE
OT
EC
HN
ICA
L
84
72
00
00
01
GIN
T L
OG
S.G
PJ
EN
GE
O I
NC
.GD
T
9/3
0/1
1
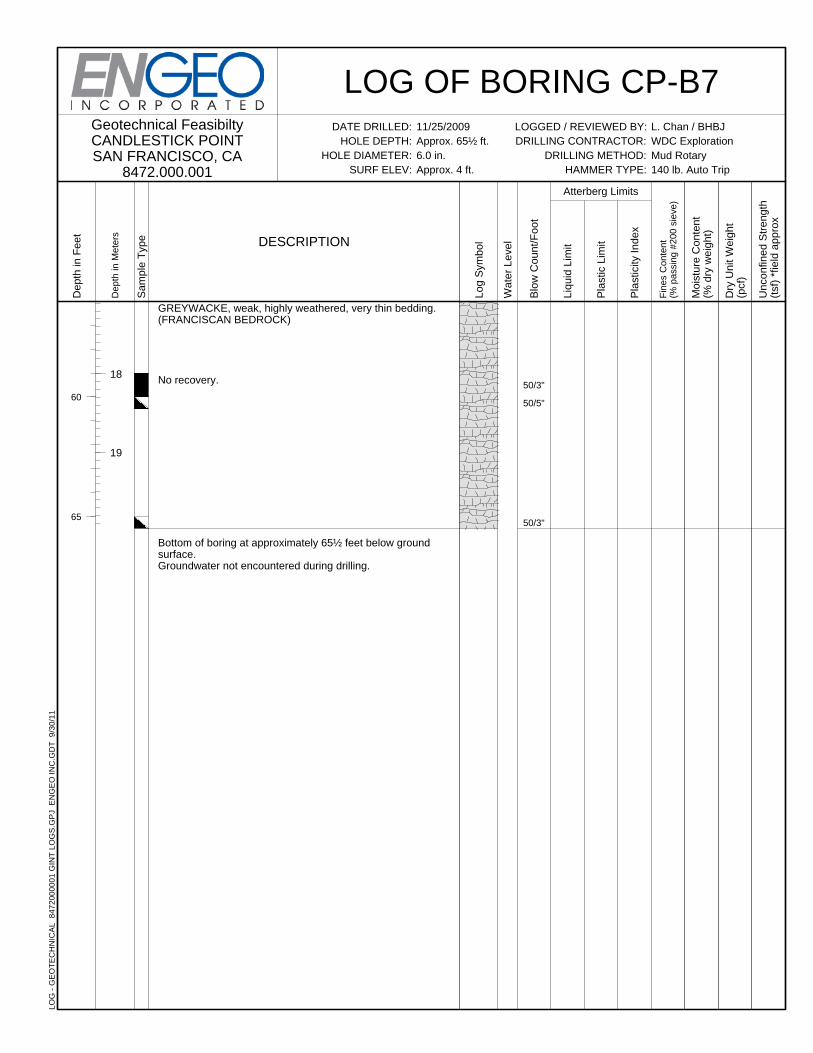
50/3"
50/5"
50/3"
GREYWACKE, weak, highly weathered, very thin bedding.(FRANCISCAN BEDROCK)
No recovery.
Bottom of boring at approximately 65½ feet below groundsurface.Groundwater not encountered during drilling.
Dep
th in
Met
ers
18
19
Dep
th in
Fee
t
60
65
Sam
ple
Typ
e
LOG OF BORING CP-B7LOGGED / REVIEWED BY:DRILLING CONTRACTOR:
DRILLING METHOD:HAMMER TYPE:
Unc
onfin
ed S
tren
gth
(tsf
) *f
ield
app
rox
Dry
Uni
t Wei
ght
(pcf
)
Moi
stur
e C
onte
nt(%
dry
wei
ght)
Pla
stic
ity In
dex
Blo
w C
ount
/Foo
t
Wat
er L
evel
Fin
es C
onte
nt(%
pas
sing
#20
0 si
eve)
Atterberg Limits
L. Chan / BHBJWDC ExplorationMud Rotary140 lb. Auto Trip
Geotechnical FeasibiltyCANDLESTICK POINTSAN FRANCISCO, CA
8472.000.001
Pla
stic
Lim
it
Liqu
id L
imit
Log
Sym
bol
11/25/2009Approx. 65½ ft.6.0 in.Approx. 4 ft.
DESCRIPTION
DATE DRILLED:HOLE DEPTH:
HOLE DIAMETER:SURF ELEV:
LO
G -
GE
OT
EC
HN
ICA
L
84
72
00
00
01
GIN
T L
OG
S.G
PJ
EN
GE
O I
NC
.GD
T
9/3
0/1
1
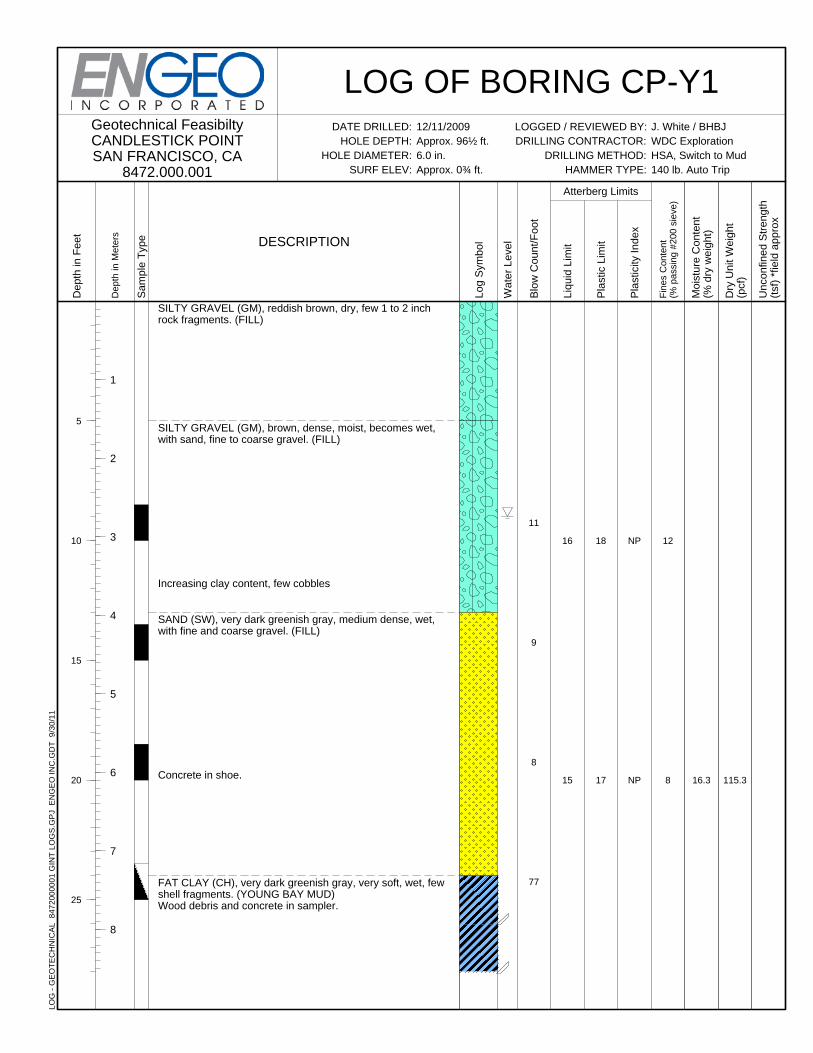
115.316.3
NP
NP
11
9
8
77
12
8
18
17
16
15
SILTY GRAVEL (GM), reddish brown, dry, few 1 to 2 inchrock fragments. (FILL)
SILTY GRAVEL (GM), brown, dense, moist, becomes wet,with sand, fine to coarse gravel. (FILL)
Increasing clay content, few cobbles
SAND (SW), very dark greenish gray, medium dense, wet,with fine and coarse gravel. (FILL)
Concrete in shoe.
FAT CLAY (CH), very dark greenish gray, very soft, wet, fewshell fragments. (YOUNG BAY MUD)Wood debris and concrete in sampler.
Dep
th in
Met
ers
1
2
3
4
5
6
7
8
Dep
th in
Fee
t
5
10
15
20
25
Sam
ple
Typ
e
LOG OF BORING CP-Y1LOGGED / REVIEWED BY:DRILLING CONTRACTOR:
DRILLING METHOD:HAMMER TYPE:
Unc
onfin
ed S
tren
gth
(tsf
) *f
ield
app
rox
Dry
Uni
t Wei
ght
(pcf
)
Moi
stur
e C
onte
nt(%
dry
wei
ght)
Pla
stic
ity In
dex
Blo
w C
ount
/Foo
t
Wat
er L
evel
Fin
es C
onte
nt(%
pas
sing
#20
0 si
eve)
Atterberg Limits
J. White / BHBJWDC ExplorationHSA, Switch to Mud140 lb. Auto Trip
Geotechnical FeasibiltyCANDLESTICK POINTSAN FRANCISCO, CA
8472.000.001
Pla
stic
Lim
it
Liqu
id L
imit
Log
Sym
bol
12/11/2009Approx. 96½ ft.6.0 in.Approx. 0¾ ft.
DESCRIPTION
DATE DRILLED:HOLE DEPTH:
HOLE DIAMETER:SURF ELEV:
LO
G -
GE
OT
EC
HN
ICA
L
84
72
00
00
01
GIN
T L
OG
S.G
PJ
EN
GE
O I
NC
.GD
T
9/3
0/1
1
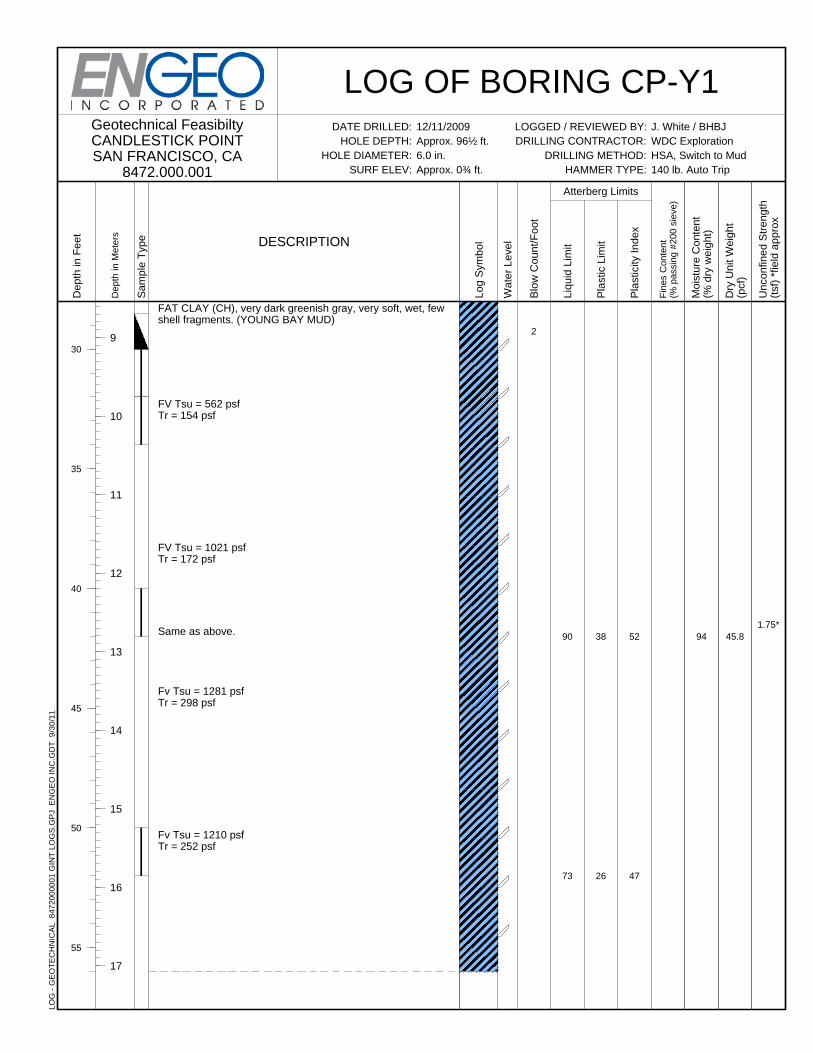
1.75*45.89452
47
2
38
26
90
73
FAT CLAY (CH), very dark greenish gray, very soft, wet, fewshell fragments. (YOUNG BAY MUD)
FV Tsu = 562 psfTr = 154 psf
FV Tsu = 1021 psfTr = 172 psf
Same as above.
Fv Tsu = 1281 psfTr = 298 psf
Fv Tsu = 1210 psfTr = 252 psf
Dep
th in
Met
ers
9
10
11
12
13
14
15
16
17
Dep
th in
Fee
t
30
35
40
45
50
55
Sam
ple
Typ
e
LOG OF BORING CP-Y1LOGGED / REVIEWED BY:DRILLING CONTRACTOR:
DRILLING METHOD:HAMMER TYPE:
Unc
onfin
ed S
tren
gth
(tsf
) *f
ield
app
rox
Dry
Uni
t Wei
ght
(pcf
)
Moi
stur
e C
onte
nt(%
dry
wei
ght)
Pla
stic
ity In
dex
Blo
w C
ount
/Foo
t
Wat
er L
evel
Fin
es C
onte
nt(%
pas
sing
#20
0 si
eve)
Atterberg Limits
J. White / BHBJWDC ExplorationHSA, Switch to Mud140 lb. Auto Trip
Geotechnical FeasibiltyCANDLESTICK POINTSAN FRANCISCO, CA
8472.000.001
Pla
stic
Lim
it
Liqu
id L
imit
Log
Sym
bol
12/11/2009Approx. 96½ ft.6.0 in.Approx. 0¾ ft.
DESCRIPTION
DATE DRILLED:HOLE DEPTH:
HOLE DIAMETER:SURF ELEV:
LO
G -
GE
OT
EC
HN
ICA
L
84
72
00
00
01
GIN
T L
OG
S.G
PJ
EN
GE
O I
NC
.GD
T
9/3
0/1
1
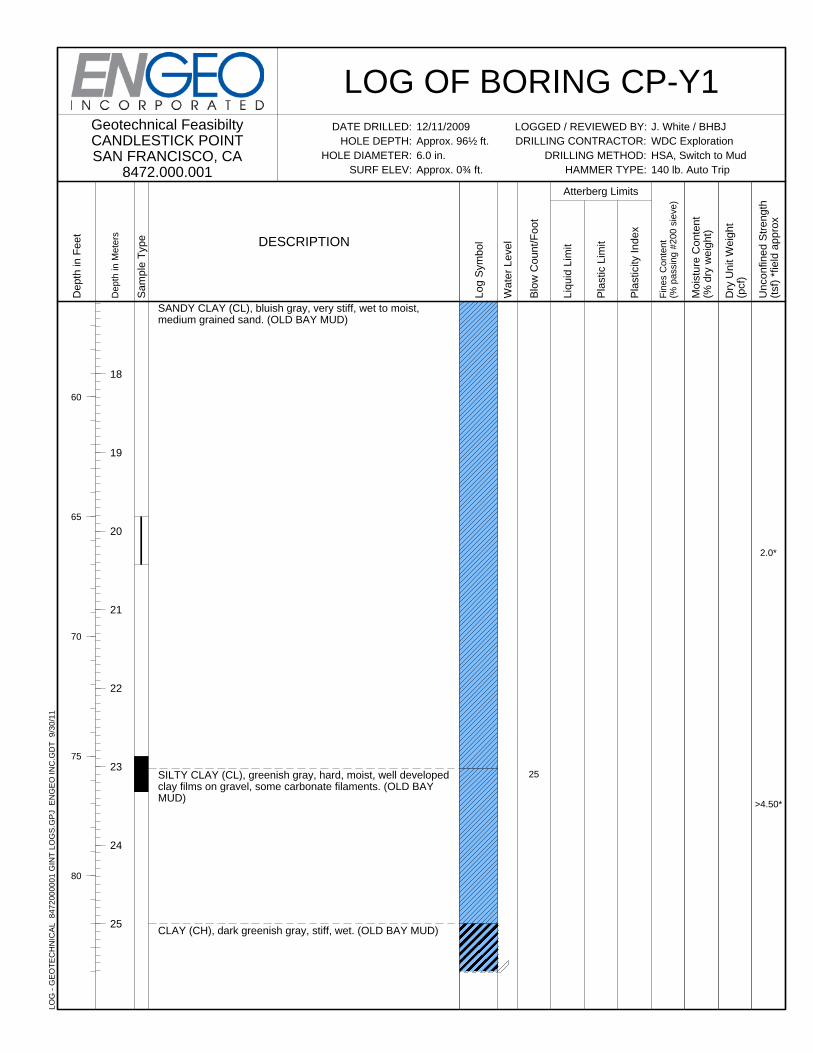
2.0*
>4.50*
25
SANDY CLAY (CL), bluish gray, very stiff, wet to moist,medium grained sand. (OLD BAY MUD)
SILTY CLAY (CL), greenish gray, hard, moist, well developedclay films on gravel, some carbonate filaments. (OLD BAYMUD)
CLAY (CH), dark greenish gray, stiff, wet. (OLD BAY MUD)
Dep
th in
Met
ers
18
19
20
21
22
23
24
25
Dep
th in
Fee
t
60
65
70
75
80
Sam
ple
Typ
e
LOG OF BORING CP-Y1LOGGED / REVIEWED BY:DRILLING CONTRACTOR:
DRILLING METHOD:HAMMER TYPE:
Unc
onfin
ed S
tren
gth
(tsf
) *f
ield
app
rox
Dry
Uni
t Wei
ght
(pcf
)
Moi
stur
e C
onte
nt(%
dry
wei
ght)
Pla
stic
ity In
dex
Blo
w C
ount
/Foo
t
Wat
er L
evel
Fin
es C
onte
nt(%
pas
sing
#20
0 si
eve)
Atterberg Limits
J. White / BHBJWDC ExplorationHSA, Switch to Mud140 lb. Auto Trip
Geotechnical FeasibiltyCANDLESTICK POINTSAN FRANCISCO, CA
8472.000.001
Pla
stic
Lim
it
Liqu
id L
imit
Log
Sym
bol
12/11/2009Approx. 96½ ft.6.0 in.Approx. 0¾ ft.
DESCRIPTION
DATE DRILLED:HOLE DEPTH:
HOLE DIAMETER:SURF ELEV:
LO
G -
GE
OT
EC
HN
ICA
L
84
72
00
00
01
GIN
T L
OG
S.G
PJ
EN
GE
O I
NC
.GD
T
9/3
0/1
1
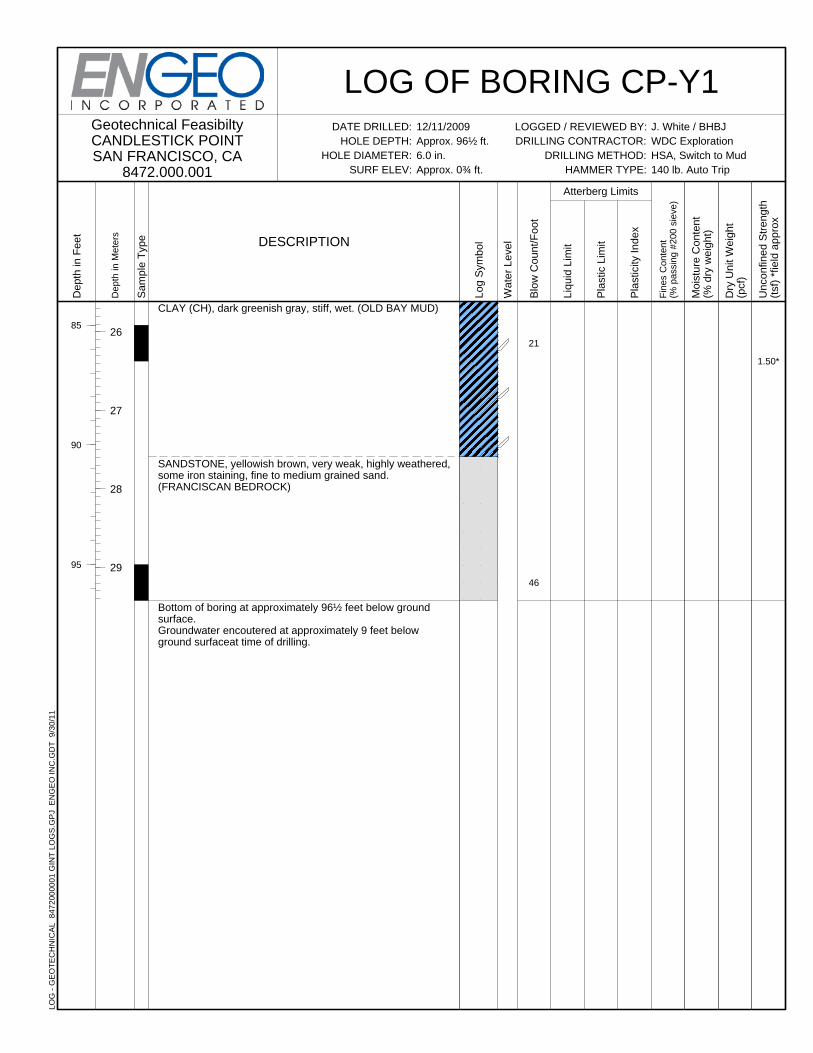
1.50*
21
46
CLAY (CH), dark greenish gray, stiff, wet. (OLD BAY MUD)
SANDSTONE, yellowish brown, very weak, highly weathered,some iron staining, fine to medium grained sand.(FRANCISCAN BEDROCK)
Bottom of boring at approximately 96½ feet below groundsurface.Groundwater encoutered at approximately 9 feet belowground surfaceat time of drilling.
Dep
th in
Met
ers
26
27
28
29
Dep
th in
Fee
t
85
90
95
Sam
ple
Typ
e
LOG OF BORING CP-Y1LOGGED / REVIEWED BY:DRILLING CONTRACTOR:
DRILLING METHOD:HAMMER TYPE:
Unc
onfin
ed S
tren
gth
(tsf
) *f
ield
app
rox
Dry
Uni
t Wei
ght
(pcf
)
Moi
stur
e C
onte
nt(%
dry
wei
ght)
Pla
stic
ity In
dex
Blo
w C
ount
/Foo
t
Wat
er L
evel
Fin
es C
onte
nt(%
pas
sing
#20
0 si
eve)
Atterberg Limits
J. White / BHBJWDC ExplorationHSA, Switch to Mud140 lb. Auto Trip
Geotechnical FeasibiltyCANDLESTICK POINTSAN FRANCISCO, CA
8472.000.001
Pla
stic
Lim
it
Liqu
id L
imit
Log
Sym
bol
12/11/2009Approx. 96½ ft.6.0 in.Approx. 0¾ ft.
DESCRIPTION
DATE DRILLED:HOLE DEPTH:
HOLE DIAMETER:SURF ELEV:
LO
G -
GE
OT
EC
HN
ICA
L
84
72
00
00
01
GIN
T L
OG
S.G
PJ
EN
GE
O I
NC
.GD
T
9/3
0/1
1
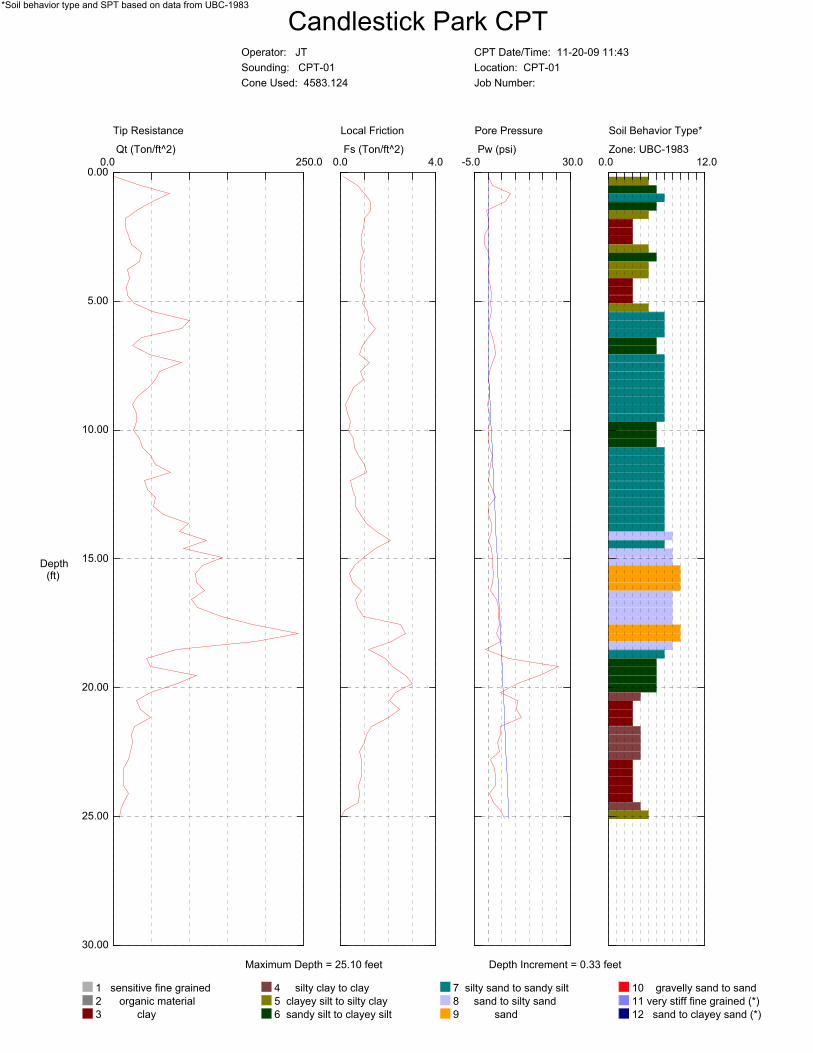
Candlestick Park CPTOperator: JT
Sounding: CPT-01
Cone Used: 4583.124
CPT Date/Time: 11-20-09 11:43
Location: CPT-01
Job Number:
Maximum Depth = 25.10 feet Depth Increment = 0.33 feet
*Soil behavior type and SPT based on data from UBC-1983
Tip Resistance
Qt (Ton/ft^2)
250.00.00.00
5.00
10.00
15.00
20.00
25.00
30.00
Depth(ft)
Local Friction
Fs (Ton/ft^2)
4.00.0
Pore Pressure
Pw (psi)
30.0-5.0
Soil Behavior Type*
Zone: UBC-1983
1 sensitive fine grained
2 organic material
3 clay
4 silty clay to clay
5 clayey silt to silty clay
6 sandy silt to clayey silt
7 silty sand to sandy silt
8 sand to silty sand
9 sand
10 gravelly sand to sand
11 very stiff fine grained (*)
12 sand to clayey sand (*)
12.00.0
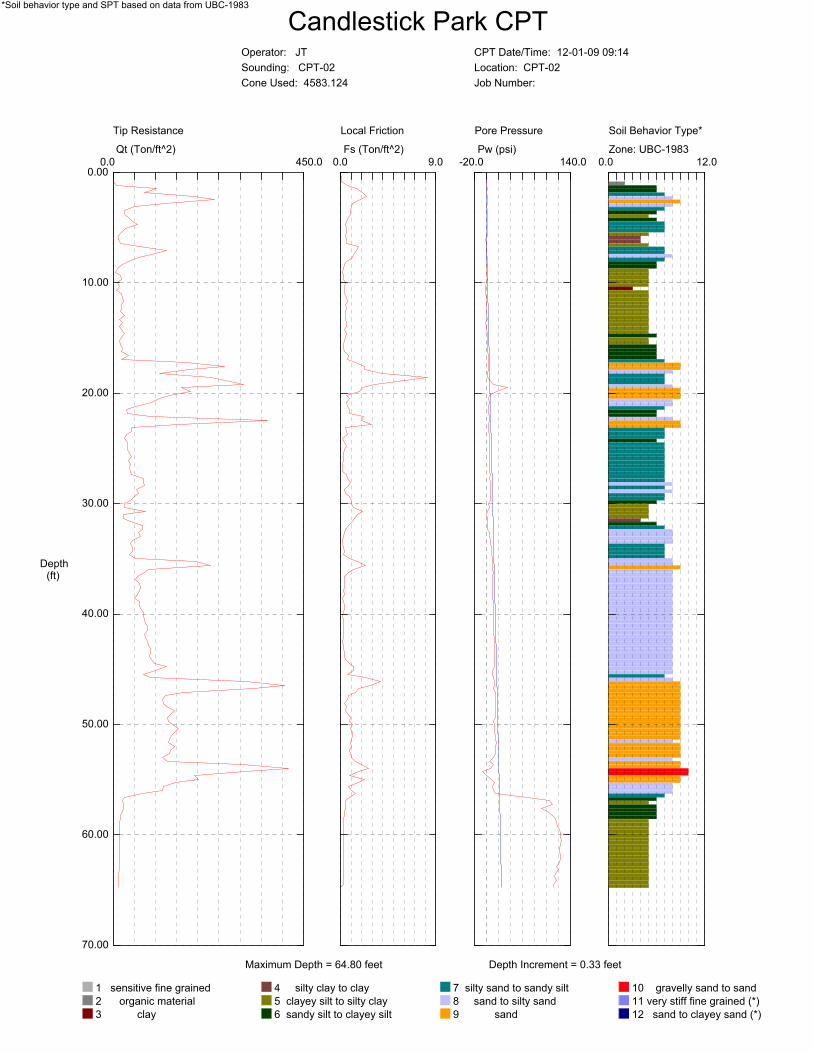
Candlestick Park CPTOperator: JT
Sounding: CPT-02
Cone Used: 4583.124
CPT Date/Time: 12-01-09 09:14
Location: CPT-02
Job Number:
Maximum Depth = 64.80 feet Depth Increment = 0.33 feet
*Soil behavior type and SPT based on data from UBC-1983
Tip Resistance
Qt (Ton/ft^2)
450.00.00.00
10.00
20.00
30.00
40.00
50.00
60.00
70.00
Depth(ft)
Local Friction
Fs (Ton/ft^2)
9.00.0
Pore Pressure
Pw (psi)
140.0-20.0
Soil Behavior Type*
Zone: UBC-1983
1 sensitive fine grained
2 organic material
3 clay
4 silty clay to clay
5 clayey silt to silty clay
6 sandy silt to clayey silt
7 silty sand to sandy silt
8 sand to silty sand
9 sand
10 gravelly sand to sand
11 very stiff fine grained (*)
12 sand to clayey sand (*)
12.00.0
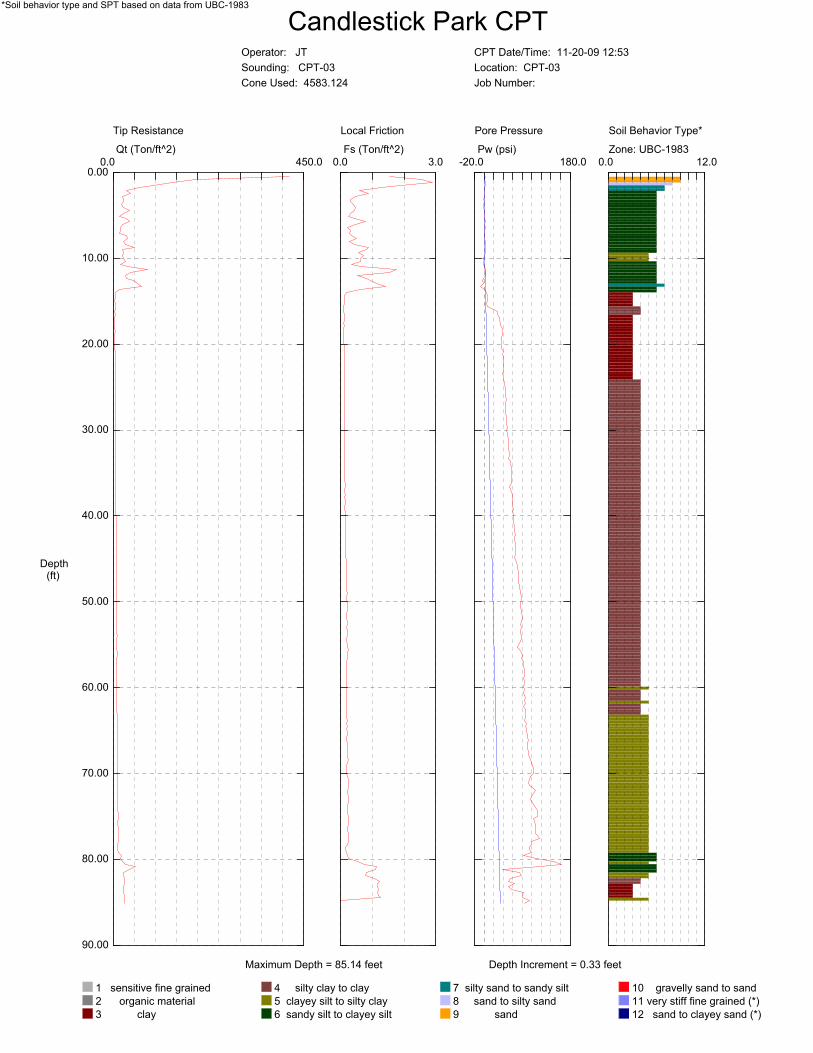
Candlestick Park CPTOperator: JT
Sounding: CPT-03
Cone Used: 4583.124
CPT Date/Time: 11-20-09 12:53
Location: CPT-03
Job Number:
Maximum Depth = 85.14 feet Depth Increment = 0.33 feet
*Soil behavior type and SPT based on data from UBC-1983
Tip Resistance
Qt (Ton/ft^2)
450.00.00.00
10.00
20.00
30.00
40.00
50.00
60.00
70.00
80.00
90.00
Depth(ft)
Local Friction
Fs (Ton/ft^2)
3.00.0
Pore Pressure
Pw (psi)
180.0-20.0
Soil Behavior Type*
Zone: UBC-1983
1 sensitive fine grained
2 organic material
3 clay
4 silty clay to clay
5 clayey silt to silty clay
6 sandy silt to clayey silt
7 silty sand to sandy silt
8 sand to silty sand
9 sand
10 gravelly sand to sand
11 very stiff fine grained (*)
12 sand to clayey sand (*)
12.00.0
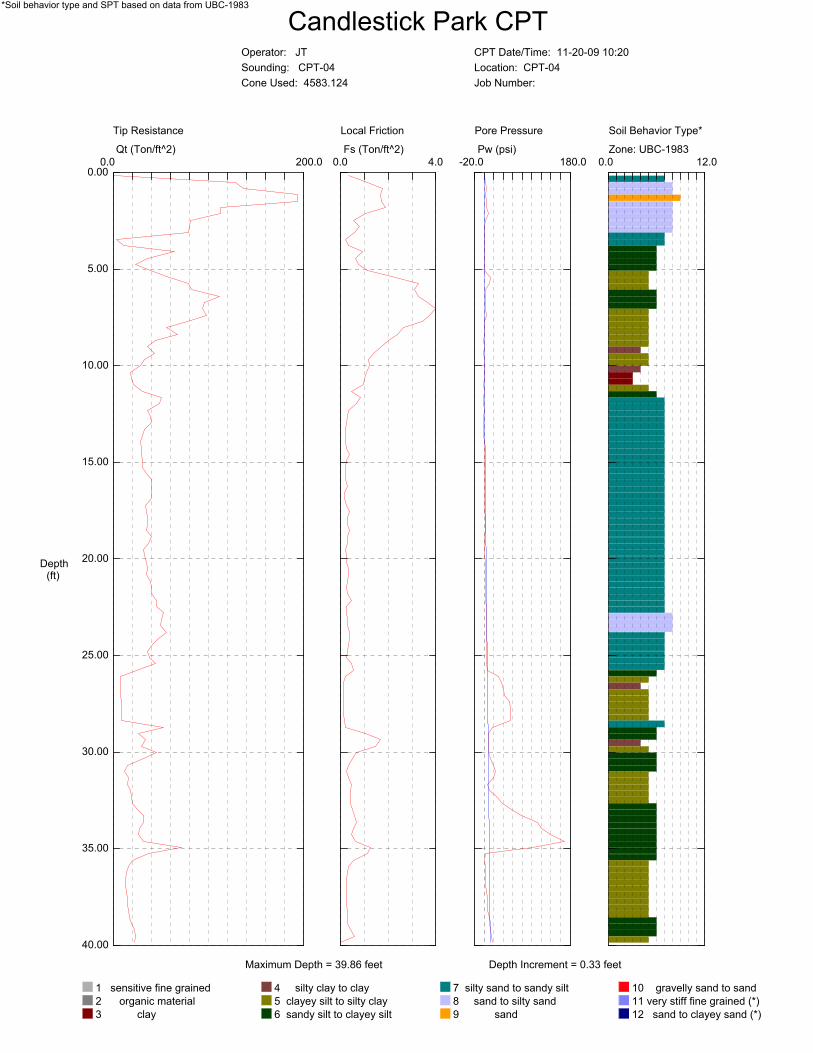
Candlestick Park CPTOperator: JT
Sounding: CPT-04
Cone Used: 4583.124
CPT Date/Time: 11-20-09 10:20
Location: CPT-04
Job Number:
Maximum Depth = 39.86 feet Depth Increment = 0.33 feet
*Soil behavior type and SPT based on data from UBC-1983
Tip Resistance
Qt (Ton/ft^2)
200.00.00.00
5.00
10.00
15.00
20.00
25.00
30.00
35.00
40.00
Depth(ft)
Local Friction
Fs (Ton/ft^2)
4.00.0
Pore Pressure
Pw (psi)
180.0-20.0
Soil Behavior Type*
Zone: UBC-1983
1 sensitive fine grained
2 organic material
3 clay
4 silty clay to clay
5 clayey silt to silty clay
6 sandy silt to clayey silt
7 silty sand to sandy silt
8 sand to silty sand
9 sand
10 gravelly sand to sand
11 very stiff fine grained (*)
12 sand to clayey sand (*)
12.00.0
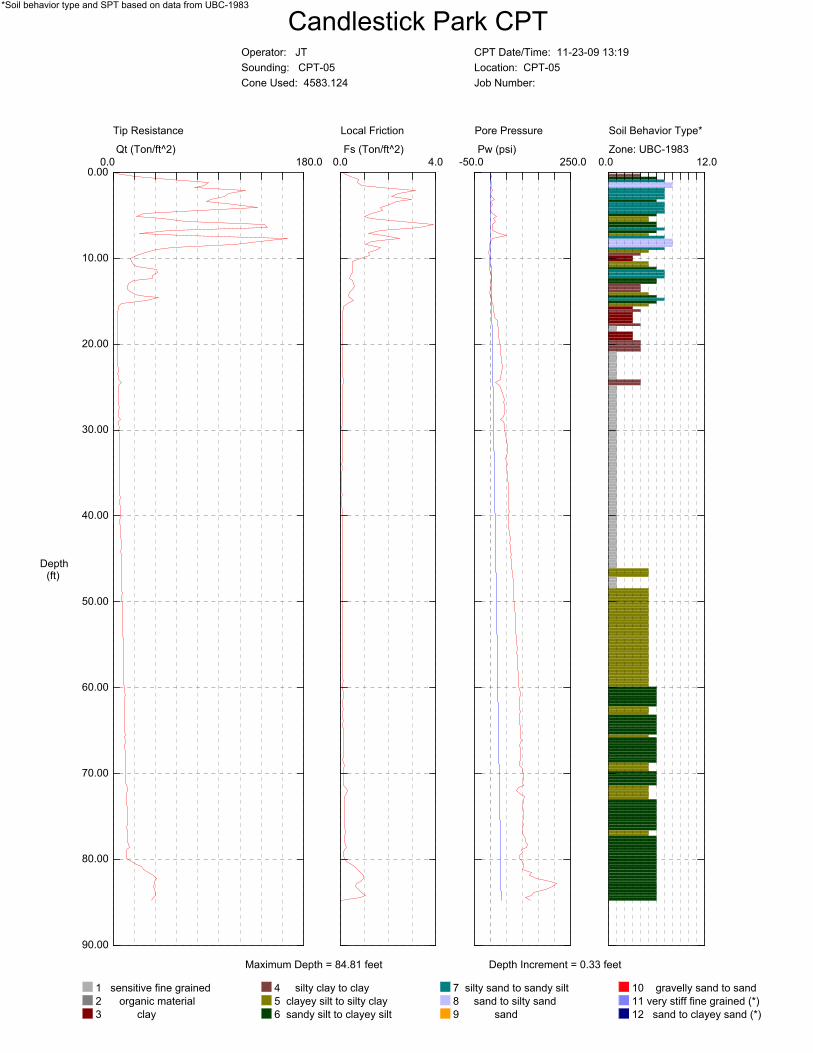
Candlestick Park CPTOperator: JT
Sounding: CPT-05
Cone Used: 4583.124
CPT Date/Time: 11-23-09 13:19
Location: CPT-05
Job Number:
Maximum Depth = 84.81 feet Depth Increment = 0.33 feet
*Soil behavior type and SPT based on data from UBC-1983
Tip Resistance
Qt (Ton/ft^2)
180.00.00.00
10.00
20.00
30.00
40.00
50.00
60.00
70.00
80.00
90.00
Depth(ft)
Local Friction
Fs (Ton/ft^2)
4.00.0
Pore Pressure
Pw (psi)
250.0-50.0
Soil Behavior Type*
Zone: UBC-1983
1 sensitive fine grained
2 organic material
3 clay
4 silty clay to clay
5 clayey silt to silty clay
6 sandy silt to clayey silt
7 silty sand to sandy silt
8 sand to silty sand
9 sand
10 gravelly sand to sand
11 very stiff fine grained (*)
12 sand to clayey sand (*)
12.00.0

Candlestick Park CPTOperator: JT
Sounding: CPT-06
Cone Used: 4583.124
CPT Date/Time: 11-20-09 08:55
Location: CPT-06
Job Number:
Maximum Depth = 11.65 feet Depth Increment = 0.33 feet
*Soil behavior type and SPT based on data from UBC-1983
Tip Resistance
Qt (Ton/ft^2)
500.00.00.00
2.00
4.00
6.00
8.00
10.00
12.00
Depth(ft)
Local Friction
Fs (Ton/ft^2)
6.00.0
Pore Pressure
Pw (psi)
12.0-4.0
Soil Behavior Type*
Zone: UBC-1983
1 sensitive fine grained
2 organic material
3 clay
4 silty clay to clay
5 clayey silt to silty clay
6 sandy silt to clayey silt
7 silty sand to sandy silt
8 sand to silty sand
9 sand
10 gravelly sand to sand
11 very stiff fine grained (*)
12 sand to clayey sand (*)
12.00.0
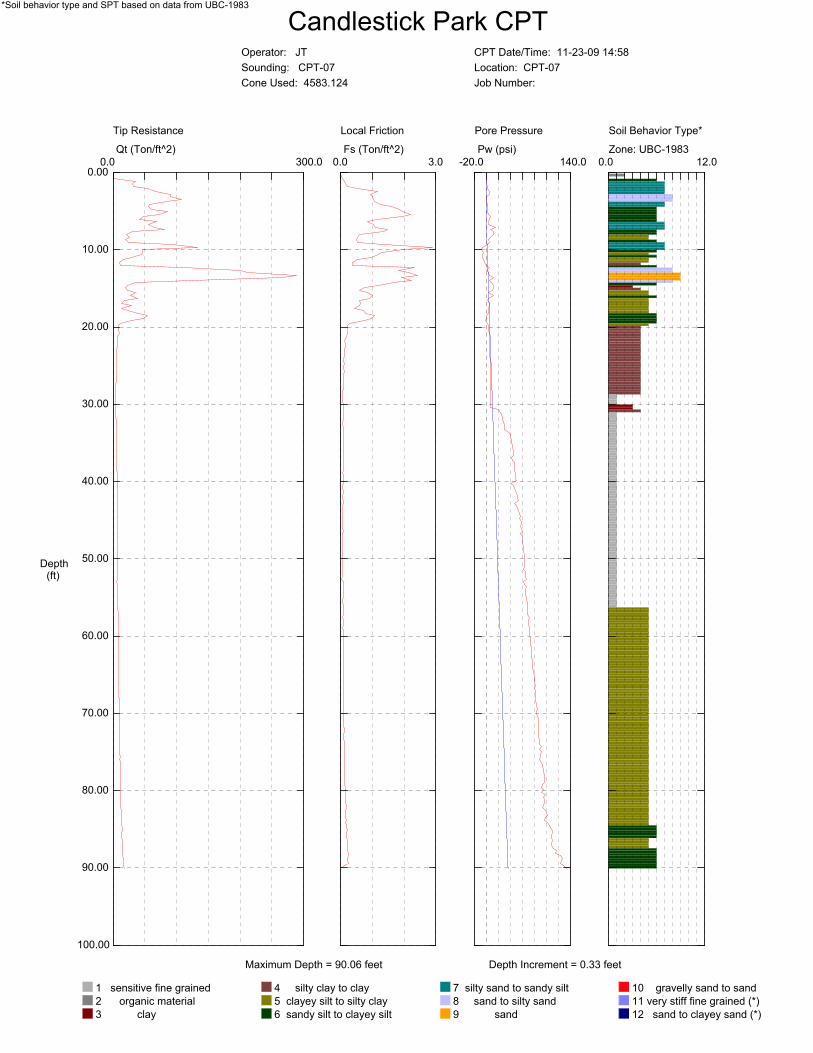
Candlestick Park CPTOperator: JT
Sounding: CPT-07
Cone Used: 4583.124
CPT Date/Time: 11-23-09 14:58
Location: CPT-07
Job Number:
Maximum Depth = 90.06 feet Depth Increment = 0.33 feet
*Soil behavior type and SPT based on data from UBC-1983
Tip Resistance
Qt (Ton/ft^2)
300.00.00.00
10.00
20.00
30.00
40.00
50.00
60.00
70.00
80.00
90.00
100.00
Depth(ft)
Local Friction
Fs (Ton/ft^2)
3.00.0
Pore Pressure
Pw (psi)
140.0-20.0
Soil Behavior Type*
Zone: UBC-1983
1 sensitive fine grained
2 organic material
3 clay
4 silty clay to clay
5 clayey silt to silty clay
6 sandy silt to clayey silt
7 silty sand to sandy silt
8 sand to silty sand
9 sand
10 gravelly sand to sand
11 very stiff fine grained (*)
12 sand to clayey sand (*)
12.00.0
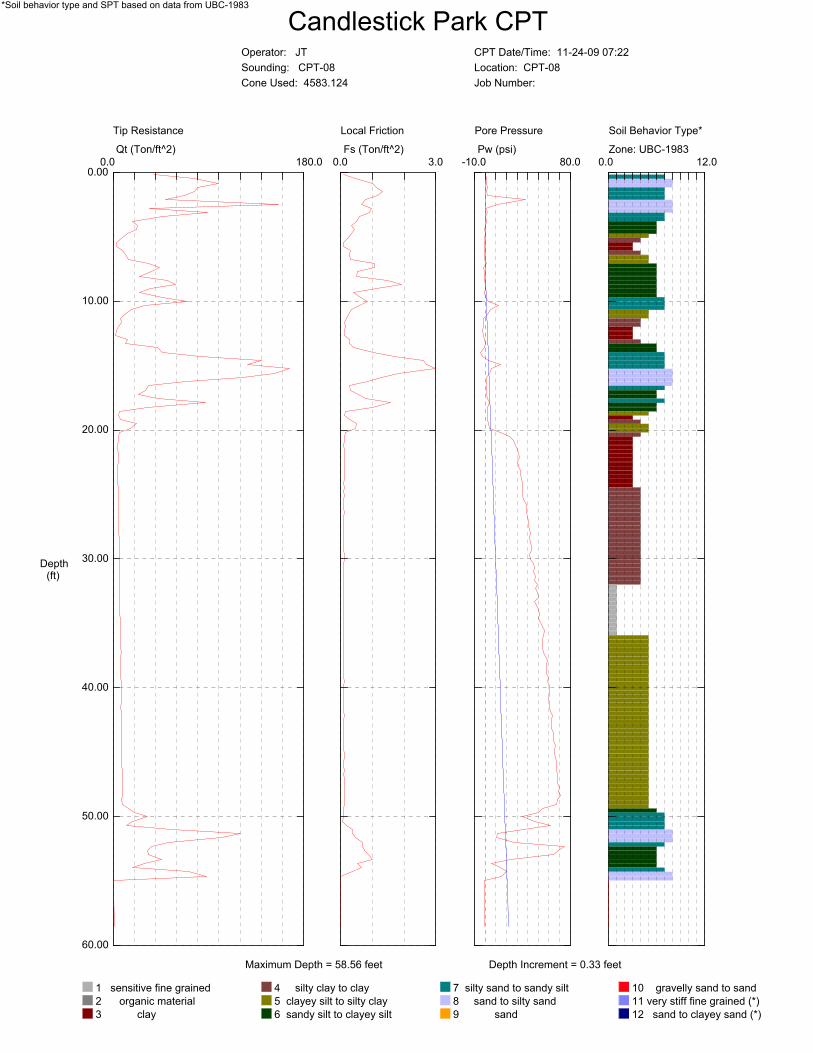
Candlestick Park CPTOperator: JT
Sounding: CPT-08
Cone Used: 4583.124
CPT Date/Time: 11-24-09 07:22
Location: CPT-08
Job Number:
Maximum Depth = 58.56 feet Depth Increment = 0.33 feet
*Soil behavior type and SPT based on data from UBC-1983
Tip Resistance
Qt (Ton/ft^2)
180.00.00.00
10.00
20.00
30.00
40.00
50.00
60.00
Depth(ft)
Local Friction
Fs (Ton/ft^2)
3.00.0
Pore Pressure
Pw (psi)
80.0-10.0
Soil Behavior Type*
Zone: UBC-1983
1 sensitive fine grained
2 organic material
3 clay
4 silty clay to clay
5 clayey silt to silty clay
6 sandy silt to clayey silt
7 silty sand to sandy silt
8 sand to silty sand
9 sand
10 gravelly sand to sand
11 very stiff fine grained (*)
12 sand to clayey sand (*)
12.00.0
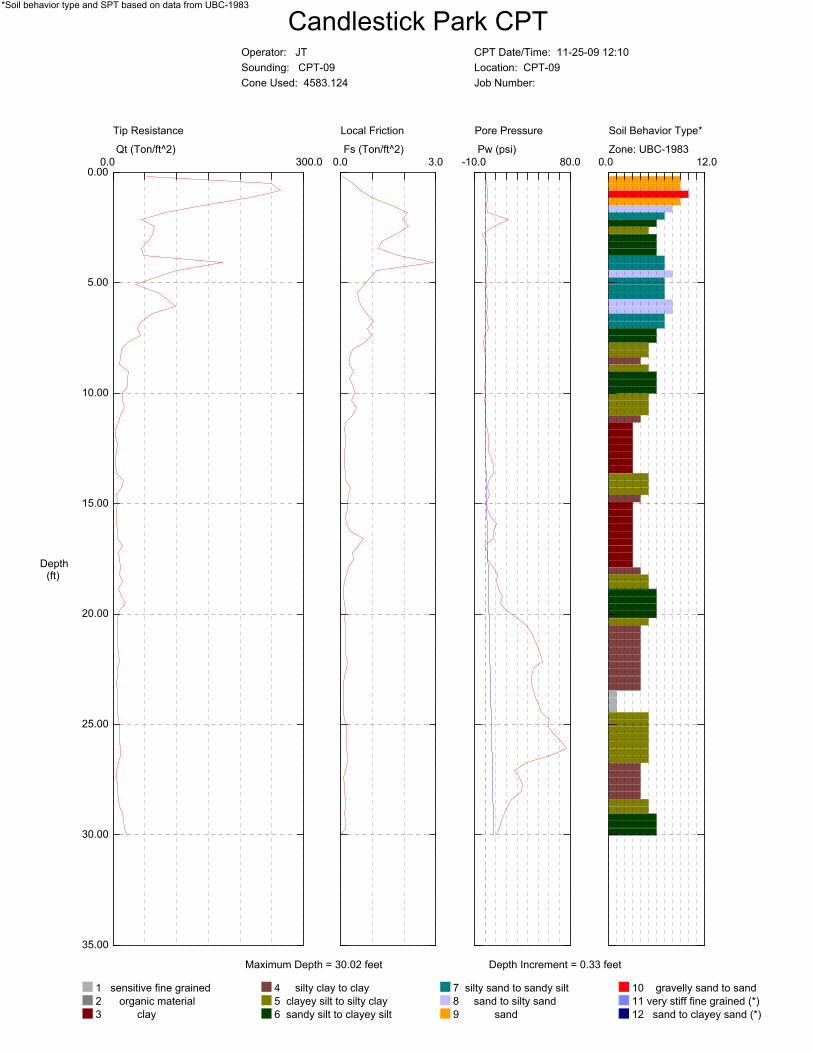
Candlestick Park CPTOperator: JT
Sounding: CPT-09
Cone Used: 4583.124
CPT Date/Time: 11-25-09 12:10
Location: CPT-09
Job Number:
Maximum Depth = 30.02 feet Depth Increment = 0.33 feet
*Soil behavior type and SPT based on data from UBC-1983
Tip Resistance
Qt (Ton/ft^2)
300.00.00.00
5.00
10.00
15.00
20.00
25.00
30.00
35.00
Depth(ft)
Local Friction
Fs (Ton/ft^2)
3.00.0
Pore Pressure
Pw (psi)
80.0-10.0
Soil Behavior Type*
Zone: UBC-1983
1 sensitive fine grained
2 organic material
3 clay
4 silty clay to clay
5 clayey silt to silty clay
6 sandy silt to clayey silt
7 silty sand to sandy silt
8 sand to silty sand
9 sand
10 gravelly sand to sand
11 very stiff fine grained (*)
12 sand to clayey sand (*)
12.00.0
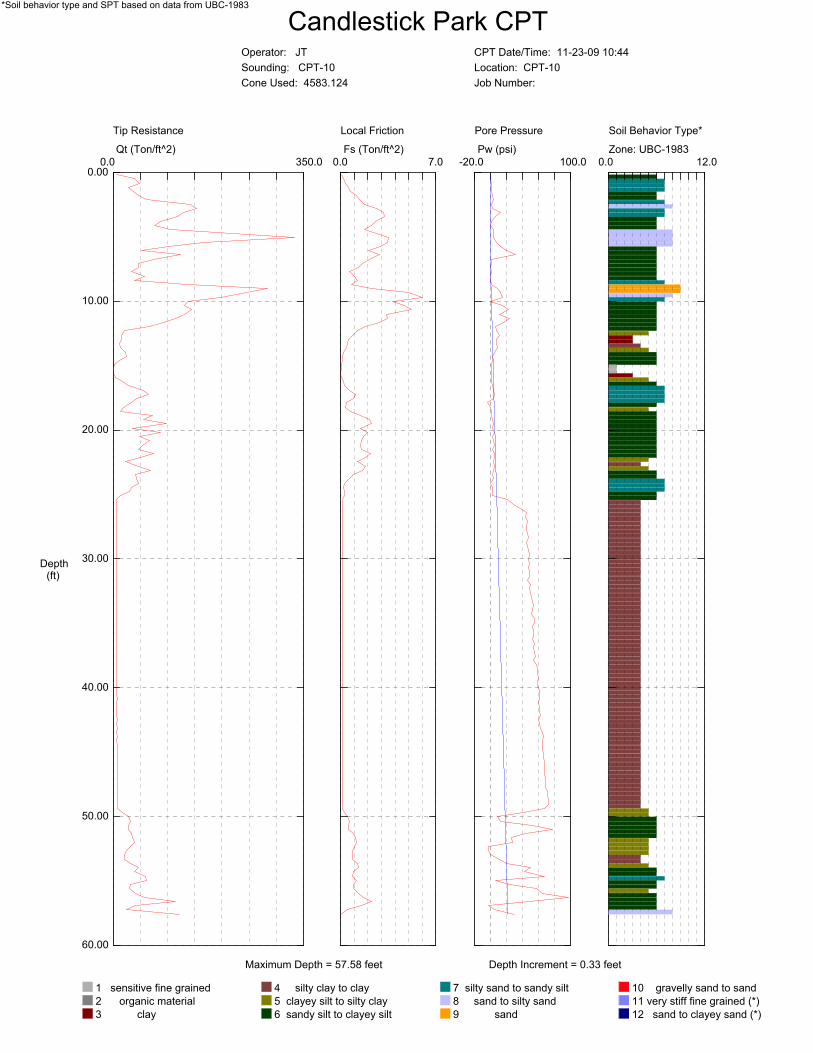
Candlestick Park CPTOperator: JT
Sounding: CPT-10
Cone Used: 4583.124
CPT Date/Time: 11-23-09 10:44
Location: CPT-10
Job Number:
Maximum Depth = 57.58 feet Depth Increment = 0.33 feet
*Soil behavior type and SPT based on data from UBC-1983
Tip Resistance
Qt (Ton/ft^2)
350.00.00.00
10.00
20.00
30.00
40.00
50.00
60.00
Depth(ft)
Local Friction
Fs (Ton/ft^2)
7.00.0
Pore Pressure
Pw (psi)
100.0-20.0
Soil Behavior Type*
Zone: UBC-1983
1 sensitive fine grained
2 organic material
3 clay
4 silty clay to clay
5 clayey silt to silty clay
6 sandy silt to clayey silt
7 silty sand to sandy silt
8 sand to silty sand
9 sand
10 gravelly sand to sand
11 very stiff fine grained (*)
12 sand to clayey sand (*)
12.00.0
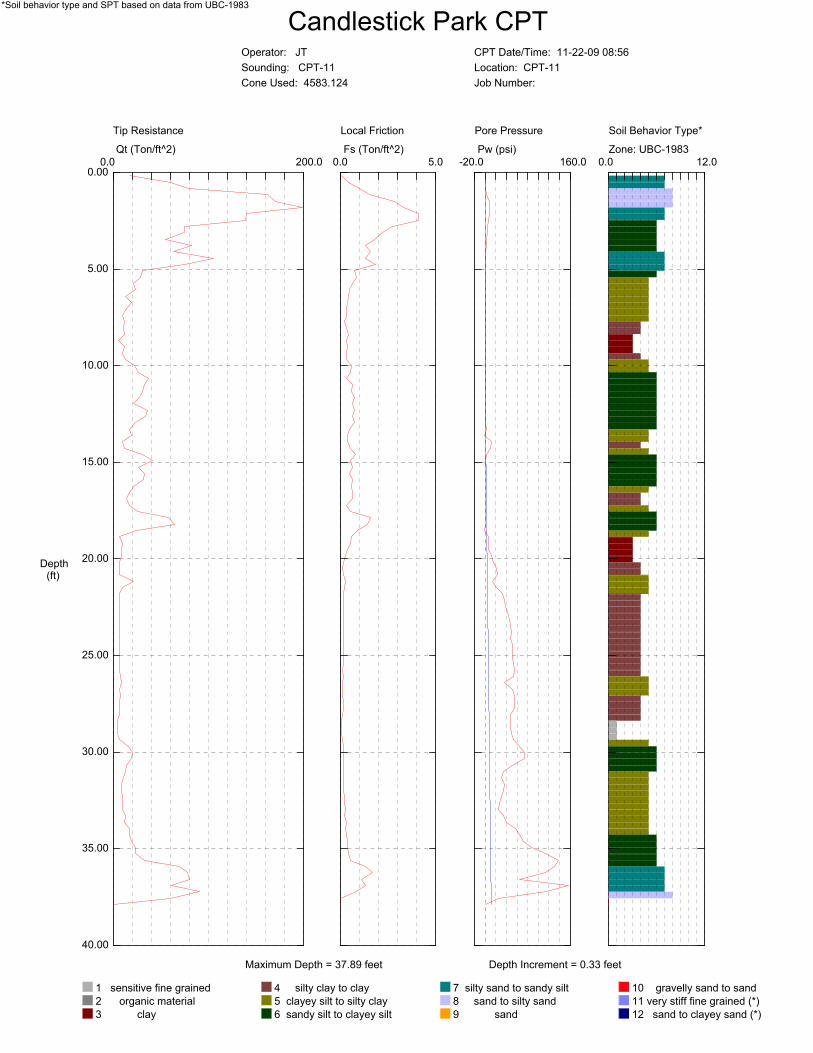
Candlestick Park CPTOperator: JT
Sounding: CPT-11
Cone Used: 4583.124
CPT Date/Time: 11-22-09 08:56
Location: CPT-11
Job Number:
Maximum Depth = 37.89 feet Depth Increment = 0.33 feet
*Soil behavior type and SPT based on data from UBC-1983
Tip Resistance
Qt (Ton/ft^2)
200.00.00.00
5.00
10.00
15.00
20.00
25.00
30.00
35.00
40.00
Depth(ft)
Local Friction
Fs (Ton/ft^2)
5.00.0
Pore Pressure
Pw (psi)
160.0-20.0
Soil Behavior Type*
Zone: UBC-1983
1 sensitive fine grained
2 organic material
3 clay
4 silty clay to clay
5 clayey silt to silty clay
6 sandy silt to clayey silt
7 silty sand to sandy silt
8 sand to silty sand
9 sand
10 gravelly sand to sand
11 very stiff fine grained (*)
12 sand to clayey sand (*)
12.00.0
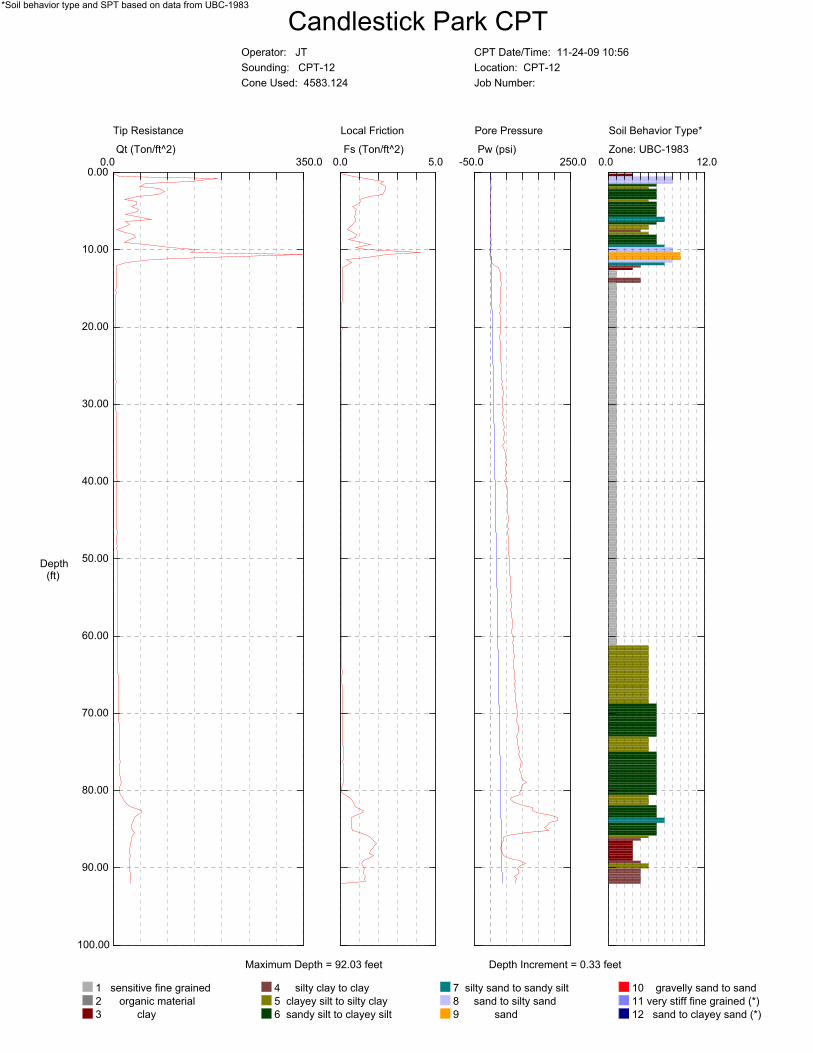
Candlestick Park CPTOperator: JT
Sounding: CPT-12
Cone Used: 4583.124
CPT Date/Time: 11-24-09 10:56
Location: CPT-12
Job Number:
Maximum Depth = 92.03 feet Depth Increment = 0.33 feet
*Soil behavior type and SPT based on data from UBC-1983
Tip Resistance
Qt (Ton/ft^2)
350.00.00.00
10.00
20.00
30.00
40.00
50.00
60.00
70.00
80.00
90.00
100.00
Depth(ft)
Local Friction
Fs (Ton/ft^2)
5.00.0
Pore Pressure
Pw (psi)
250.0-50.0
Soil Behavior Type*
Zone: UBC-1983
1 sensitive fine grained
2 organic material
3 clay
4 silty clay to clay
5 clayey silt to silty clay
6 sandy silt to clayey silt
7 silty sand to sandy silt
8 sand to silty sand
9 sand
10 gravelly sand to sand
11 very stiff fine grained (*)
12 sand to clayey sand (*)
12.00.0
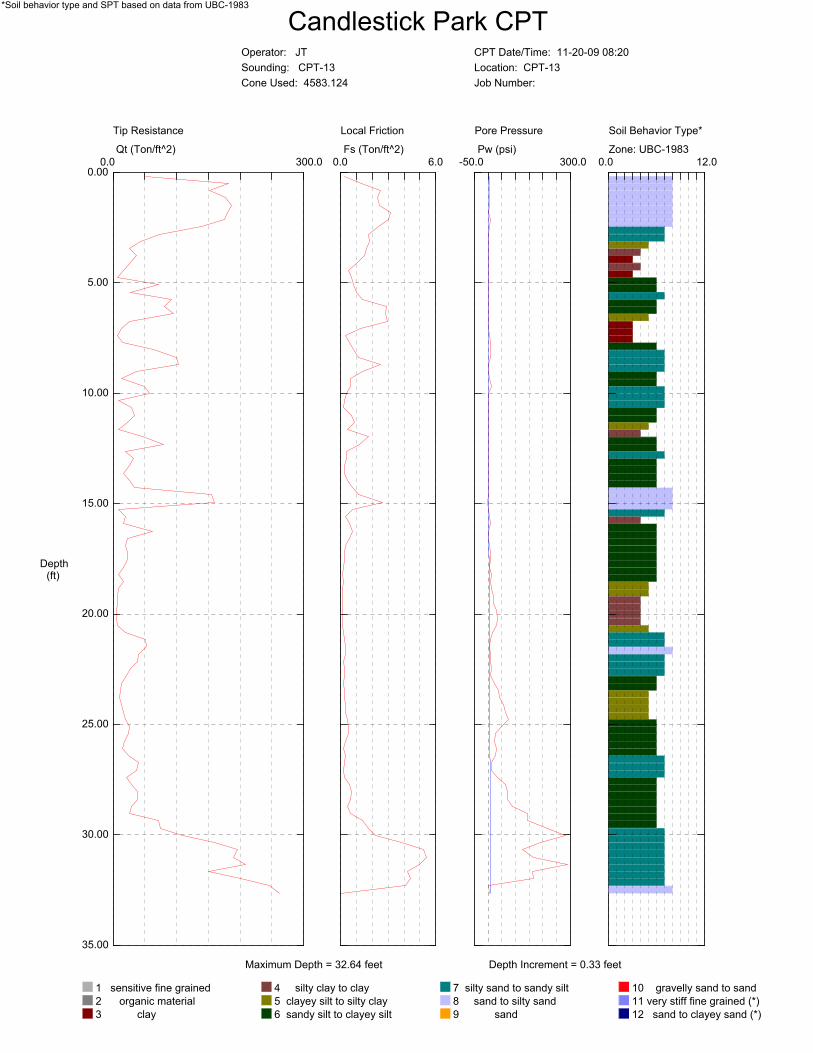
Candlestick Park CPTOperator: JT
Sounding: CPT-13
Cone Used: 4583.124
CPT Date/Time: 11-20-09 08:20
Location: CPT-13
Job Number:
Maximum Depth = 32.64 feet Depth Increment = 0.33 feet
*Soil behavior type and SPT based on data from UBC-1983
Tip Resistance
Qt (Ton/ft^2)
300.00.00.00
5.00
10.00
15.00
20.00
25.00
30.00
35.00
Depth(ft)
Local Friction
Fs (Ton/ft^2)
6.00.0
Pore Pressure
Pw (psi)
300.0-50.0
Soil Behavior Type*
Zone: UBC-1983
1 sensitive fine grained
2 organic material
3 clay
4 silty clay to clay
5 clayey silt to silty clay
6 sandy silt to clayey silt
7 silty sand to sandy silt
8 sand to silty sand
9 sand
10 gravelly sand to sand
11 very stiff fine grained (*)
12 sand to clayey sand (*)
12.00.0
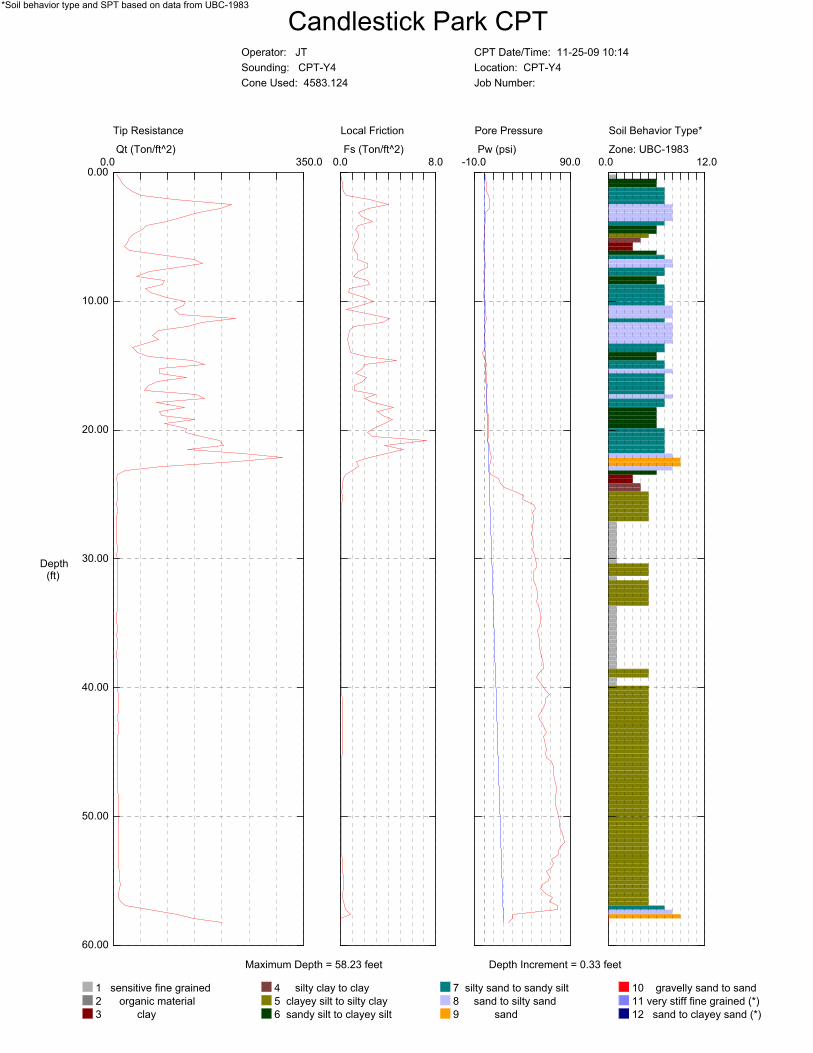
Candlestick Park CPTOperator: JT
Sounding: CPT-Y4
Cone Used: 4583.124
CPT Date/Time: 11-25-09 10:14
Location: CPT-Y4
Job Number:
Maximum Depth = 58.23 feet Depth Increment = 0.33 feet
*Soil behavior type and SPT based on data from UBC-1983
Tip Resistance
Qt (Ton/ft^2)
350.00.00.00
10.00
20.00
30.00
40.00
50.00
60.00
Depth(ft)
Local Friction
Fs (Ton/ft^2)
8.00.0
Pore Pressure
Pw (psi)
90.0-10.0
Soil Behavior Type*
Zone: UBC-1983
1 sensitive fine grained
2 organic material
3 clay
4 silty clay to clay
5 clayey silt to silty clay
6 sandy silt to clayey silt
7 silty sand to sandy silt
8 sand to silty sand
9 sand
10 gravelly sand to sand
11 very stiff fine grained (*)
12 sand to clayey sand (*)
12.00.0
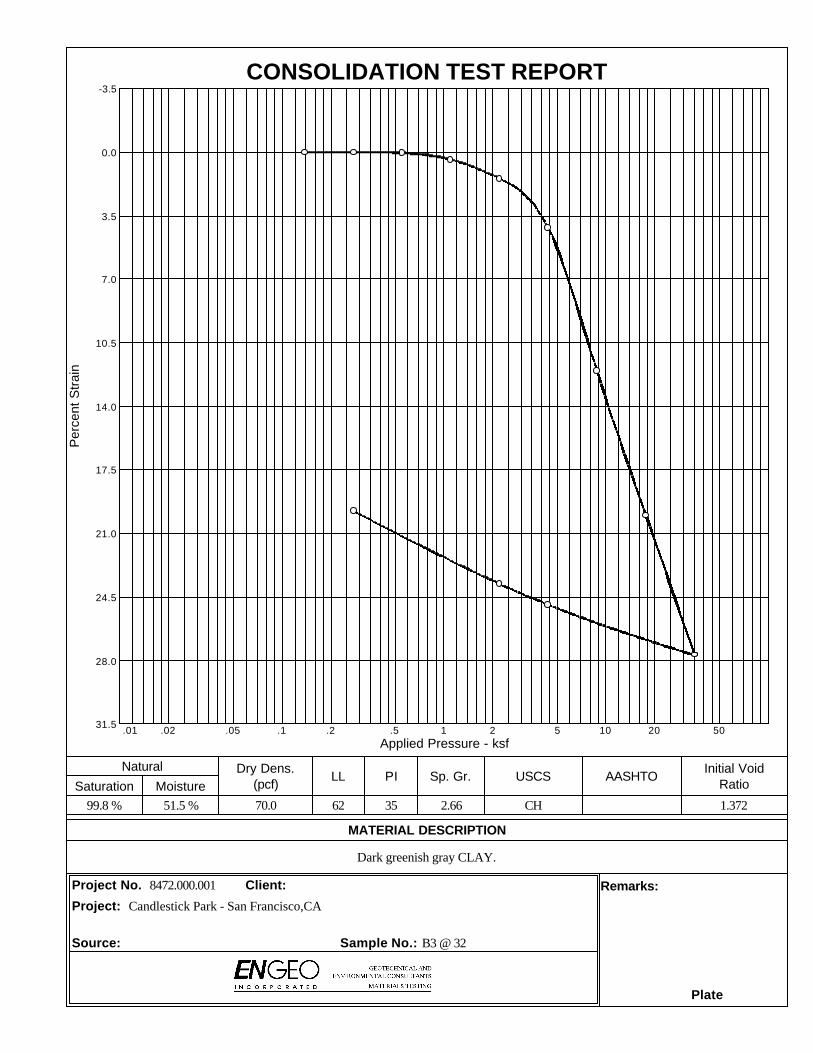
RatioMoistureSaturation
Initial VoidAASHTOUSCSSp. Gr.PILL
Dry Dens.Natural
Project:
Remarks:Client:Project No.
MATERIAL DESCRIPTION
CONSOLIDATION TEST REPORT
.01 .02 .05 .1 .2 .5 1 2 5 10 20 5031.5
28.0
24.5
21.0
17.5
14.0
10.5
7.0
3.5
0.0
-3.5
Pe
rce
nt
Str
ain
Applied Pressure - ksf
(pcf)
Candlestick Park - San Francisco,CA
8472.000.001
Dark greenish gray CLAY.
1.372CH2.66356270.051.5 %99.8 %
Plate
Source: Sample No.: B3 @ 32
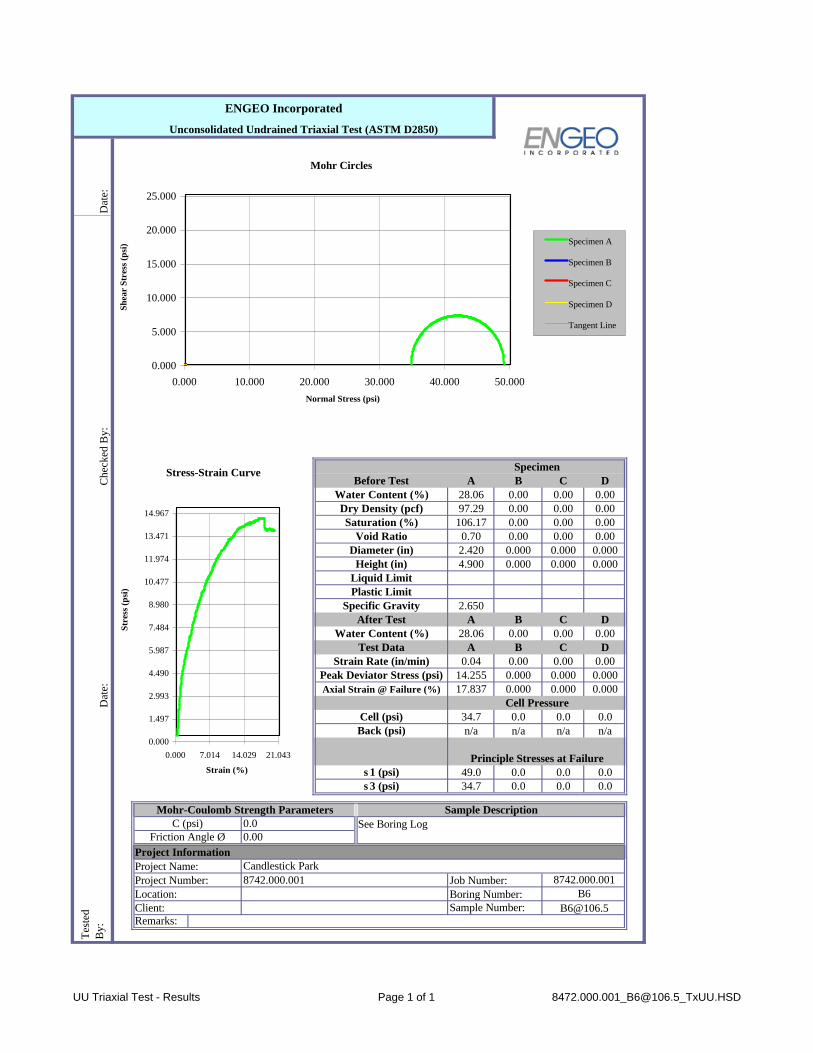
A B C D28.06 0.00 0.00 0.0097.29 0.00 0.00 0.00
106.17 0.00 0.00 0.000.70 0.00 0.00 0.002.420 0.000 0.000 0.0004.900 0.000 0.000 0.000
2.650A B C D
28.06 0.00 0.00 0.00A B C D
0.04 0.00 0.00 0.0014.255 0.000 0.000 0.00017.837 0.000 0.000 0.000
34.7 0.0 0.0 0.0n/a n/a n/a n/a
49.0 0.0 0.0 0.034.7 0.0 0.0 0.0
Project InformationProject Name:Project Number:Location:Client:Remarks:
Candlestick Park
Sample Number: [email protected]
Tes
ted
By:
8742.000.001Boring Number: B6 Job Number:8742.000.001
Back (psi)
Dat
e:
Friction Angle Ø
s 3 (psi)
C (psi) 0.00.00
Diameter (in)
Strain Rate (in/min)
See Boring Log
Height (in)
Che
cked
By:
Dat
e:ENGEO Incorporated
Unconsolidated Undrained Triaxial Test (ASTM D2850)
Void Ratio
SpecimenBefore Test
Water Content (%)Dry Density (pcf)Saturation (%)
s 1 (psi)
Water Content (%)
Mohr-Coulomb Strength Parameters Sample Description
Cell Pressure
Principle Stresses at Failure
Cell (psi)
Peak Deviator Stress (psi)Axial Strain @ Failure (%)
Liquid LimitPlastic Limit
Specific Gravity
Test Data
After Test
Mohr Circles
0.000
5.000
10.000
15.000
20.000
25.000
0.000 10.000 20.000 30.000 40.000 50.000Normal Stress (psi)
Shea
r St
ress
(psi
) Specimen A
Specimen B
Specimen C
Specimen D
Tangent Line
Stress-Strain Curve
0.000
1.497
2.993
4.490
5.987
7.484
8.980
10.477
11.974
13.471
14.967
0.000 7.014 14.029 21.043
Strain (%)
Stre
ss (p
si)
UU Triaxial Test - Results Page 1 of 1 [email protected]_TxUU.HSD
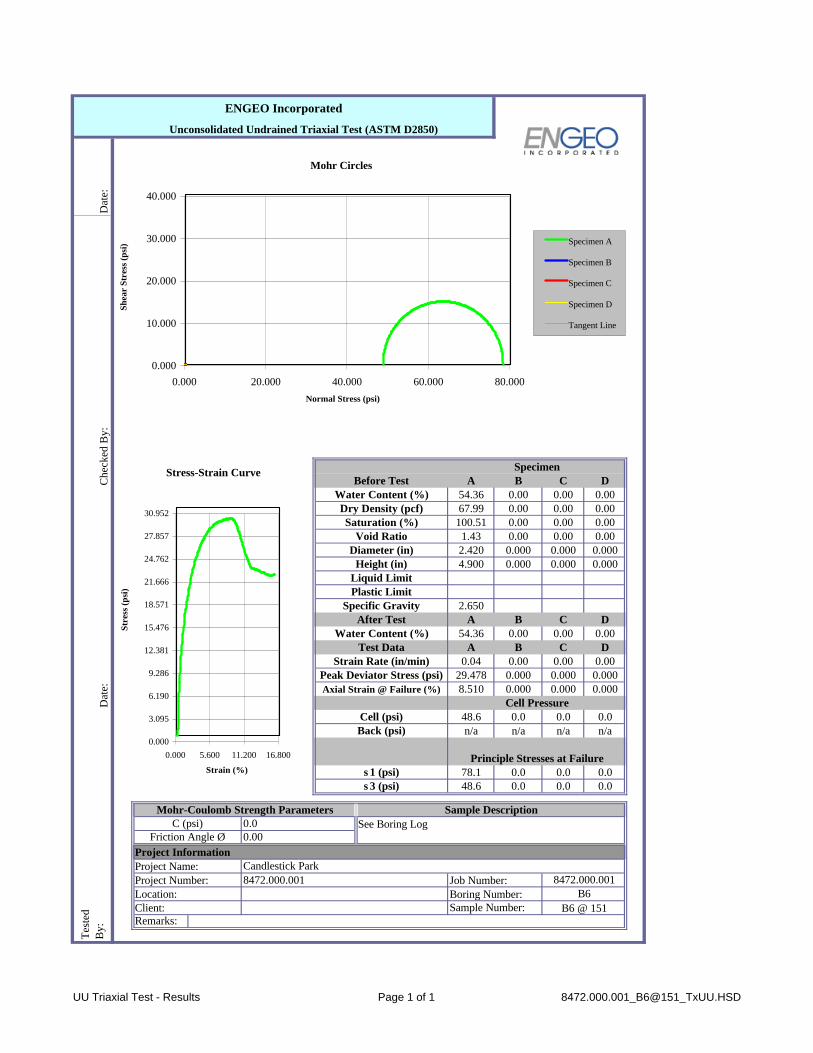
A B C D54.36 0.00 0.00 0.0067.99 0.00 0.00 0.00
100.51 0.00 0.00 0.001.43 0.00 0.00 0.002.420 0.000 0.000 0.0004.900 0.000 0.000 0.000
2.650A B C D
54.36 0.00 0.00 0.00A B C D
0.04 0.00 0.00 0.0029.478 0.000 0.000 0.0008.510 0.000 0.000 0.000
48.6 0.0 0.0 0.0n/a n/a n/a n/a
78.1 0.0 0.0 0.048.6 0.0 0.0 0.0
Project InformationProject Name:Project Number:Location:Client:Remarks:
Candlestick Park
Sample Number: B6 @ 151
Tes
ted
By:
8472.000.001Boring Number: B6 Job Number:8472.000.001
Back (psi)
Dat
e:
Friction Angle Ø
s 3 (psi)
C (psi) 0.00.00
Diameter (in)
Strain Rate (in/min)
See Boring Log
Height (in)
Che
cked
By:
Dat
e:ENGEO Incorporated
Unconsolidated Undrained Triaxial Test (ASTM D2850)
Void Ratio
SpecimenBefore Test
Water Content (%)Dry Density (pcf)Saturation (%)
s 1 (psi)
Water Content (%)
Mohr-Coulomb Strength Parameters Sample Description
Cell Pressure
Principle Stresses at Failure
Cell (psi)
Peak Deviator Stress (psi)Axial Strain @ Failure (%)
Liquid LimitPlastic Limit
Specific Gravity
Test Data
After Test
Mohr Circles
0.000
10.000
20.000
30.000
40.000
0.000 20.000 40.000 60.000 80.000Normal Stress (psi)
Shea
r St
ress
(psi
) Specimen A
Specimen B
Specimen C
Specimen D
Tangent Line
Stress-Strain Curve
0.000
3.095
6.190
9.286
12.381
15.476
18.571
21.666
24.762
27.857
30.952
0.000 5.600 11.200 16.800
Strain (%)
Stre
ss (p
si)
UU Triaxial Test - Results Page 1 of 1 8472.000.001_B6@151_TxUU.HSD
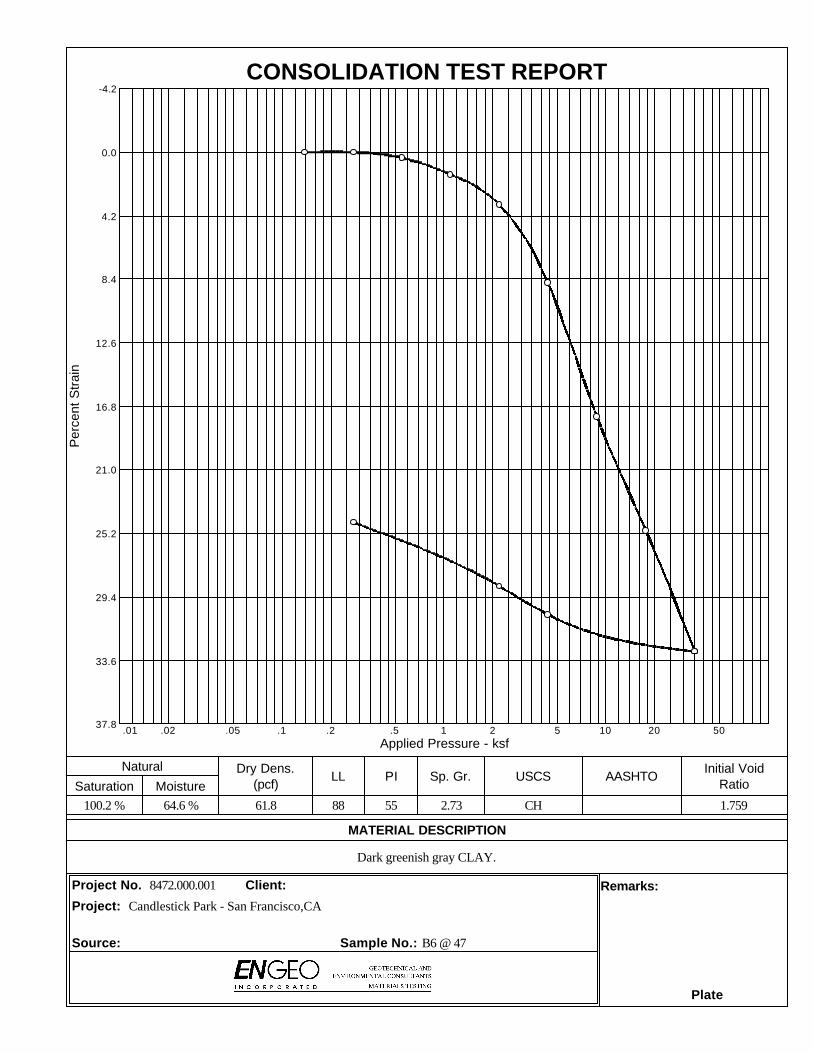
RatioMoistureSaturation
Initial VoidAASHTOUSCSSp. Gr.PILL
Dry Dens.Natural
Project:
Remarks:Client:Project No.
MATERIAL DESCRIPTION
CONSOLIDATION TEST REPORT
.01 .02 .05 .1 .2 .5 1 2 5 10 20 5037.8
33.6
29.4
25.2
21.0
16.8
12.6
8.4
4.2
0.0
-4.2
Pe
rce
nt
Str
ain
Applied Pressure - ksf
(pcf)
Candlestick Park - San Francisco,CA
8472.000.001
Dark greenish gray CLAY.
1.759CH2.73558861.864.6 %100.2 %
Plate
Source: Sample No.: B6 @ 47
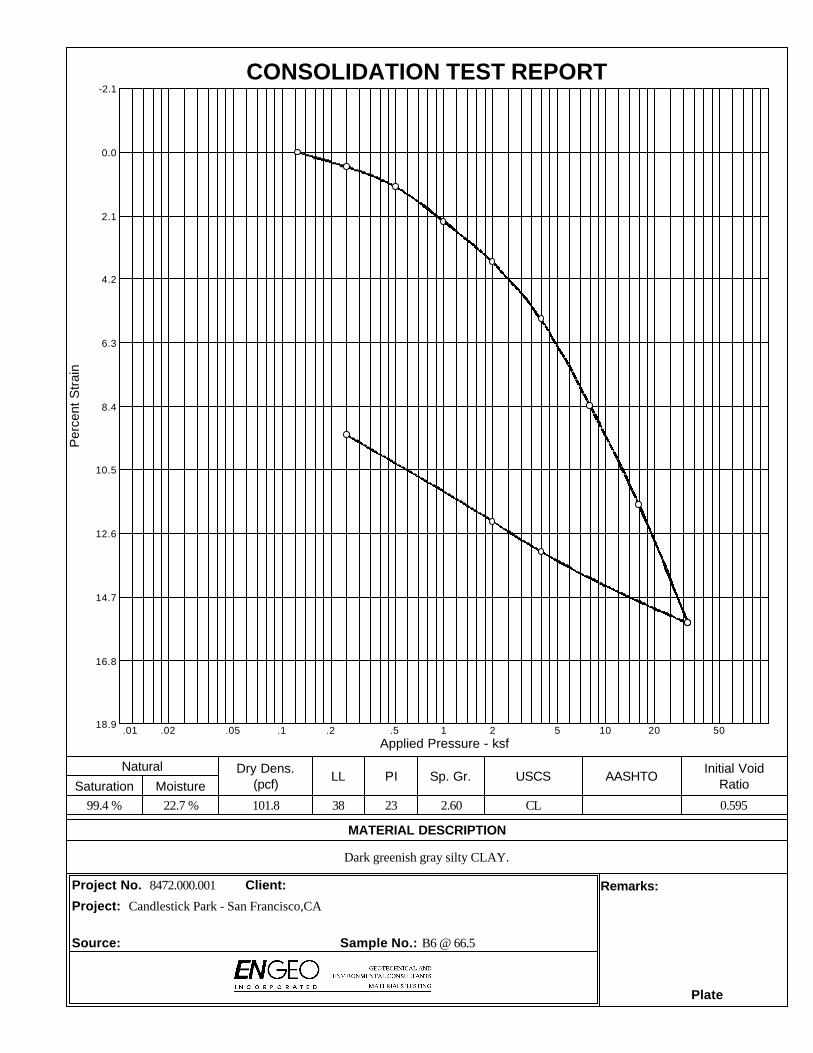
RatioMoistureSaturation
Initial VoidAASHTOUSCSSp. Gr.PILL
Dry Dens.Natural
Project:
Remarks:Client:Project No.
MATERIAL DESCRIPTION
CONSOLIDATION TEST REPORT
.01 .02 .05 .1 .2 .5 1 2 5 10 20 5018.9
16.8
14.7
12.6
10.5
8.4
6.3
4.2
2.1
0.0
-2.1
Pe
rce
nt
Str
ain
Applied Pressure - ksf
(pcf)
Candlestick Park - San Francisco,CA
8472.000.001
Dark greenish gray silty CLAY.
0.595CL2.602338101.822.7 %99.4 %
Plate
Source: Sample No.: B6 @ 66.5
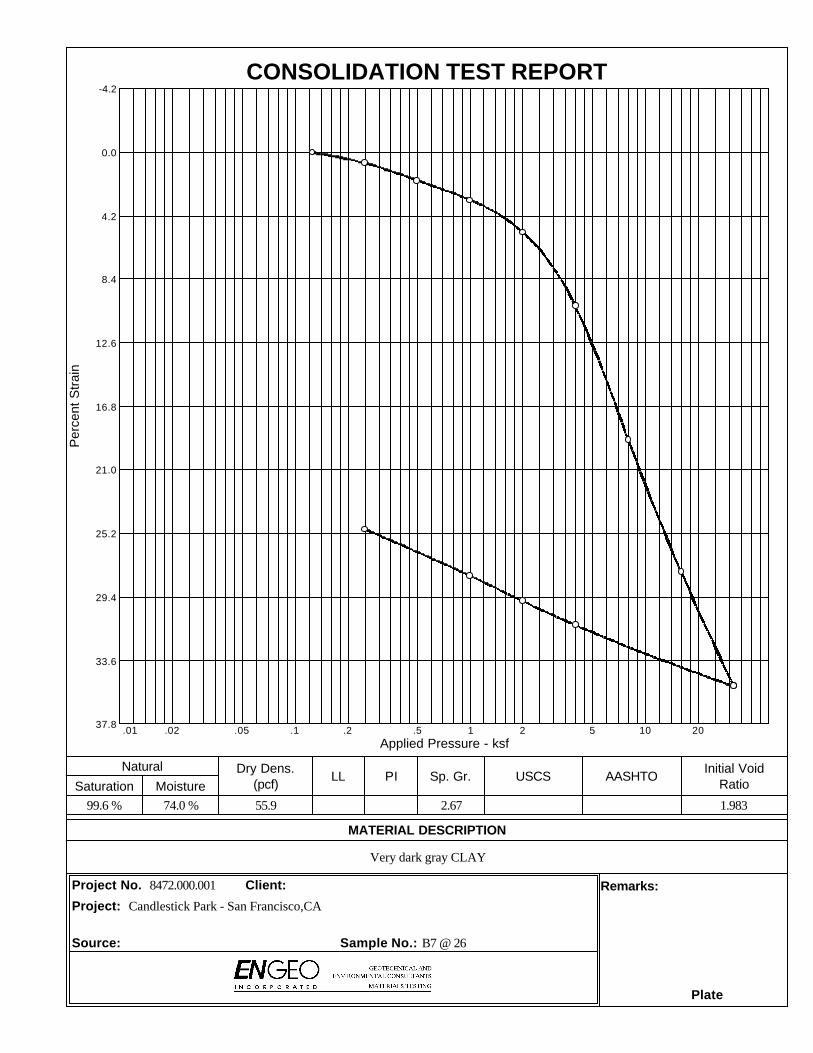
RatioMoistureSaturation
Initial VoidAASHTOUSCSSp. Gr.PILL
Dry Dens.Natural
Project:
Remarks:Client:Project No.
MATERIAL DESCRIPTION
CONSOLIDATION TEST REPORT
.01 .02 .05 .1 .2 .5 1 2 5 10 2037.8
33.6
29.4
25.2
21.0
16.8
12.6
8.4
4.2
0.0
-4.2
Pe
rce
nt
Str
ain
Applied Pressure - ksf
(pcf)
Candlestick Park - San Francisco,CA
8472.000.001
Very dark gray CLAY
1.9832.6755.974.0 %99.6 %
Plate
Source: Sample No.: B7 @ 26
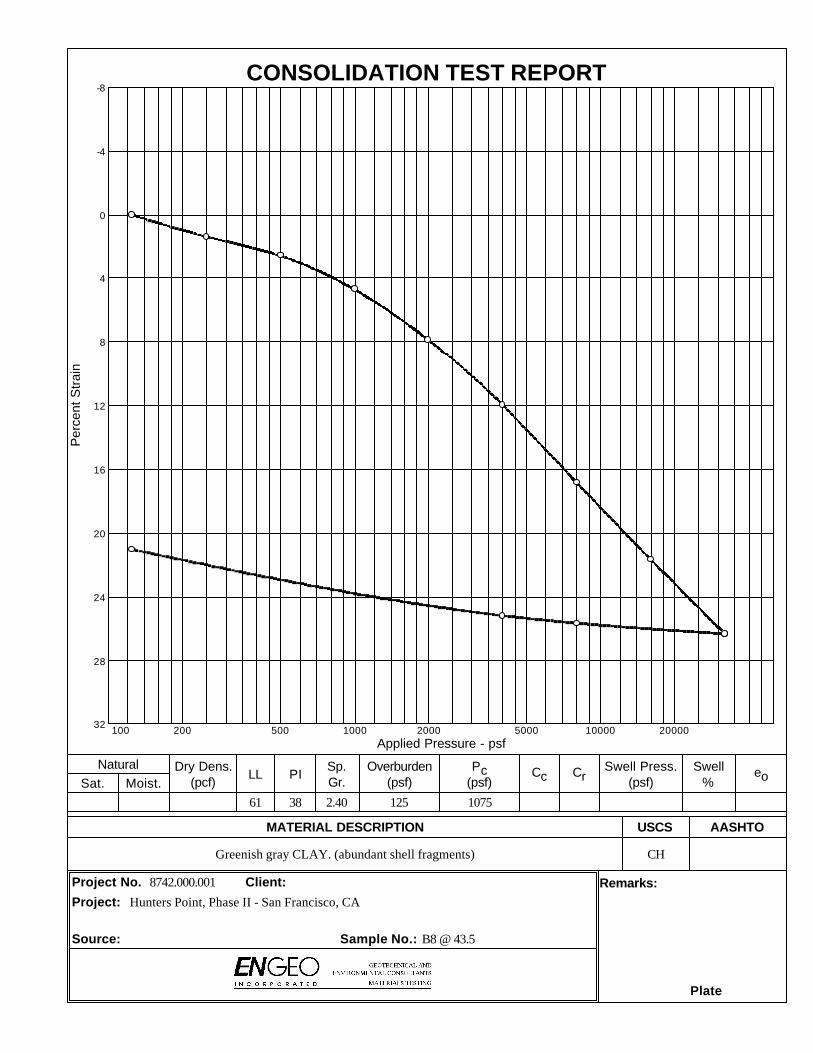
%Gr.Moist.Sat.eo
Swell Press.CcPcOverburdenSp.
PILLDry Dens.Natural
Project:Remarks:Client:Project No.
AASHTOUSCSMATERIAL DESCRIPTION
CONSOLIDATION TEST REPORT
100 200 500 1000 2000 5000 10000 2000032
28
24
20
16
12
8
4
0
-4
-8
Pe
rce
nt
Str
ain
Applied Pressure - psf
(psf)(psf)(psf)(pcf)
SwellCr
Hunters Point, Phase II - San Francisco, CA
8742.000.001
CHGreenish gray CLAY. (abundant shell fragments)
10751252.403861
Plate
Source: Sample No.: B8 @ 43.5
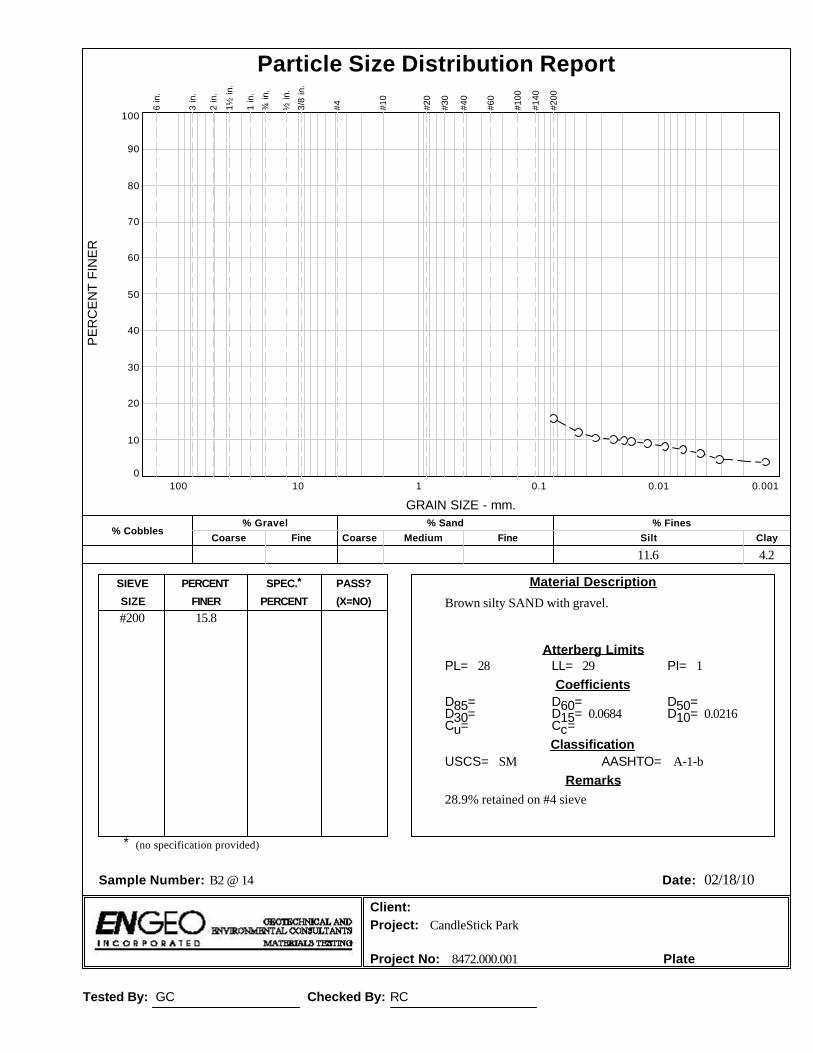
Tested By: GC Checked By: RC
02/18/10
(no specification provided)
PL= LL= PI=
D85= D60= D50=D30= D15= D10=Cu= Cc=
USCS= AASHTO=
*
Brown silty SAND with gravel.#200 15.8
28 29 1
0.0684 0.0216
SM A-1-b
28.9% retained on #4 sieve
CandleStick Park
8472.000.001
Material Description
Atterberg Limits
Coefficients
Classification
Remarks
Sample Number: B2 @ 14 Date:
Client:Project:
Project No: Plate
SIEVE PERCENT SPEC.* PASS?
SIZE FINER PERCENT (X=NO)
PE
RC
EN
T F
INE
R
0
10
20
30
40
50
60
70
80
90
100
GRAIN SIZE - mm.
0.0010.010.1110100
% CobblesCoarse
% GravelFine Coarse Medium
% SandFine Silt
% FinesClay
11.6 4.2
6 in.
3 in.
2 in.
1½
in.
1 in.
¾ in.
½ in.
3/8
in.
#4
#10
#20
#30
#40
#60
#100
#140
#200
Particle Size Distribution Report
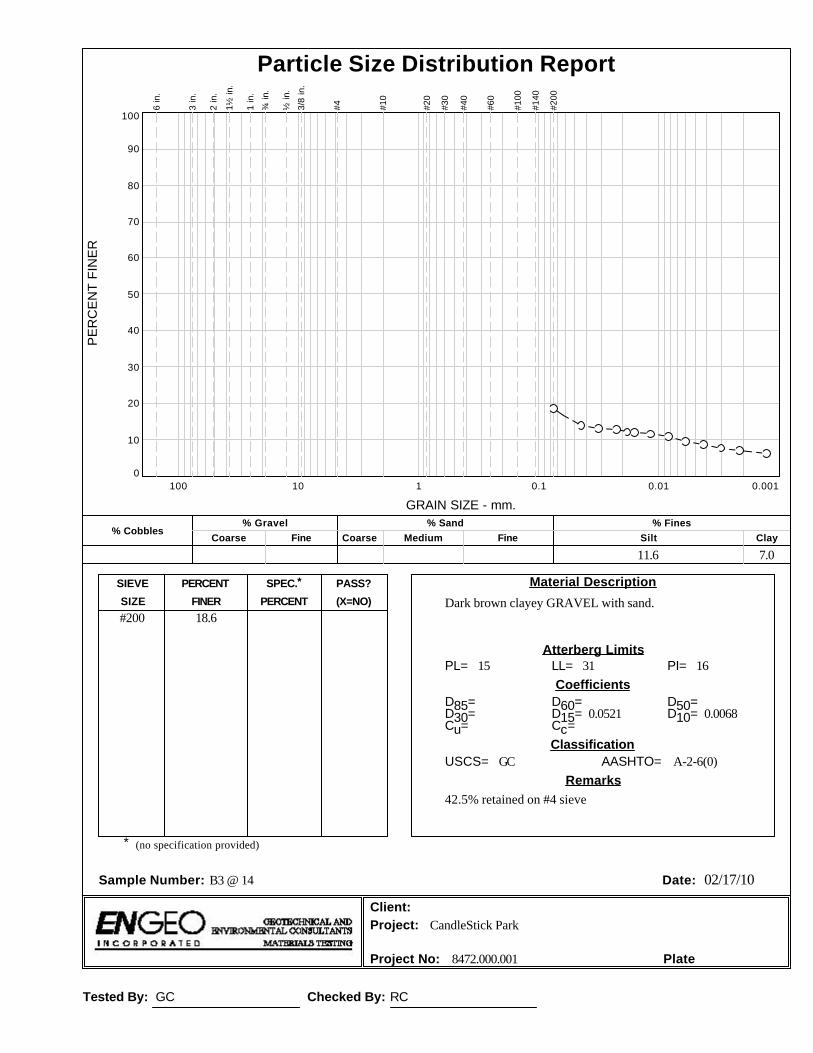
Tested By: GC Checked By: RC
02/17/10
(no specification provided)
PL= LL= PI=
D85= D60= D50=D30= D15= D10=Cu= Cc=
USCS= AASHTO=
*
Dark brown clayey GRAVEL with sand.#200 18.6
15 31 16
0.0521 0.0068
GC A-2-6(0)
42.5% retained on #4 sieve
CandleStick Park
8472.000.001
Material Description
Atterberg Limits
Coefficients
Classification
Remarks
Sample Number: B3 @ 14 Date:
Client:Project:
Project No: Plate
SIEVE PERCENT SPEC.* PASS?
SIZE FINER PERCENT (X=NO)
PE
RC
EN
T F
INE
R
0
10
20
30
40
50
60
70
80
90
100
GRAIN SIZE - mm.
0.0010.010.1110100
% CobblesCoarse
% GravelFine Coarse Medium
% SandFine Silt
% FinesClay
11.6 7.0
6 in.
3 in.
2 in.
1½
in.
1 in.
¾ in.
½ in.
3/8
in.
#4
#10
#20
#30
#40
#60
#100
#140
#200
Particle Size Distribution Report

01/05/10
(no specification provided)
PL= LL= PI=
D85= D60= D50=D30= D15= D10=Cu= Cc=
USCS= AASHTO=
*
Dark greenish gray silty SAND.#4#10#200
92.185.718.7
17 15 NP
1.8937 0.6029 0.41560.1833 0.0371 0.0062
97.95 9.05
SM A-2-4(0)
Candlestick Park - San Francisco,CA
8472.000.001
Material Description
Atterberg Limits
Coefficients
Classification
Remarks
Sample Number: B3 @ 62 Date:
Client:Project:
Project No: Plate
SIEVE PERCENT SPEC.* PASS?
SIZE FINER PERCENT (X=NO)
PE
RC
EN
T F
INE
R
0
10
20
30
40
50
60
70
80
90
100
GRAIN SIZE - mm.
0.0010.010.1110100
% CobblesCoarse
% GravelFine Coarse Medium
% SandFine Silt
% FinesClay
6.4 35.1 31.9 12.1 6.6
6 in.
3 in.
2 in.
1½
in.
1 in.
¾ in.
½ in.
3/8
in.
#4
#10
#20
#30
#40
#60
#100
#140
#200
Particle Size Distribution Report

01/04/10
(no specification provided)
PL= LL= PI=
D85= D60= D50=D30= D15= D10=Cu= Cc=
USCS= AASHTO=
*
Dark grayish brown SAND with silt.#10#200
89.310.0
20 10 NP
1.7689 0.8474 0.61830.3003 0.1370 0.0753
11.25 1.41
SW-SM A-1-b
Candlestick Park - San Francisco,CA
8472.000.001
Material Description
Atterberg Limits
Coefficients
Classification
Remarks
Sample Number: B4 @ 121.5 Date:
Client:Project:
Project No: Plate
SIEVE PERCENT SPEC.* PASS?
SIZE FINER PERCENT (X=NO)
PE
RC
EN
T F
INE
R
0
10
20
30
40
50
60
70
80
90
100
GRAIN SIZE - mm.
0.0010.010.1110100
% CobblesCoarse
% GravelFine Coarse Medium
% SandFine Silt
% FinesClay
50.3 29.0 7.2 2.8
6 in.
3 in.
2 in.
1½
in.
1 in.
¾ in.
½ in.
3/8
in.
#4
#10
#20
#30
#40
#60
#100
#140
#200
Particle Size Distribution Report

01/05/10
(no specification provided)
PL= LL= PI=
D85= D60= D50=D30= D15= D10=Cu= Cc=
USCS= AASHTO=
*
Dark yellowish brown silty SAND with gravel.#4#10#200
83.771.318.5
25 21 NP
1.0309 0.59580.1878 0.0489 0.0099
104.20 3.46
SM A-1-b
Candlestick Park - San Francisco,CA
8472.000.001
Material Description
Atterberg Limits
Coefficients
Classification
Remarks
Sample Number: B5 @ 11 Date:
Client:Project:
Project No: Plate
SIEVE PERCENT SPEC.* PASS?
SIZE FINER PERCENT (X=NO)
PE
RC
EN
T F
INE
R
0
10
20
30
40
50
60
70
80
90
100
GRAIN SIZE - mm.
0.0010.010.1110100
% CobblesCoarse
% GravelFine Coarse Medium
% SandFine Silt
% FinesClay
12.4 27.5 25.3 13.5 5.0
6 in.
3 in.
2 in.
1½
in.
1 in.
¾ in.
½ in.
3/8
in.
#4
#10
#20
#30
#40
#60
#100
#140
#200
Particle Size Distribution Report

01/05/10
(no specification provided)
PL= LL= PI=
D85= D60= D50=D30= D15= D10=Cu= Cc=
USCS= AASHTO=
*
Dark grayish brown silty SAND.#4#10#200
88.529.67.9
18 21 3
4.5374 3.2339 2.79882.0143 0.3701 0.1433
22.56 8.75
SP-SM A-1-a
Candlestick Park - San Francisco,CA
8472.000.001
Material Description
Atterberg Limits
Coefficients
Classification
Remarks
Sample Number: B5 @ 20 Date:
Client:Project:
Project No: Plate
SIEVE PERCENT SPEC.* PASS?
SIZE FINER PERCENT (X=NO)
PE
RC
EN
T F
INE
R
0
10
20
30
40
50
60
70
80
90
100
GRAIN SIZE - mm.
0.0010.010.1110100
% CobblesCoarse
% GravelFine Coarse Medium
% SandFine Silt
% FinesClay
58.9 13.7 8.0 5.4 2.5
6 in.
3 in.
2 in.
1½
in.
1 in.
¾ in.
½ in.
3/8
in.
#4
#10
#20
#30
#40
#60
#100
#140
#200
Particle Size Distribution Report
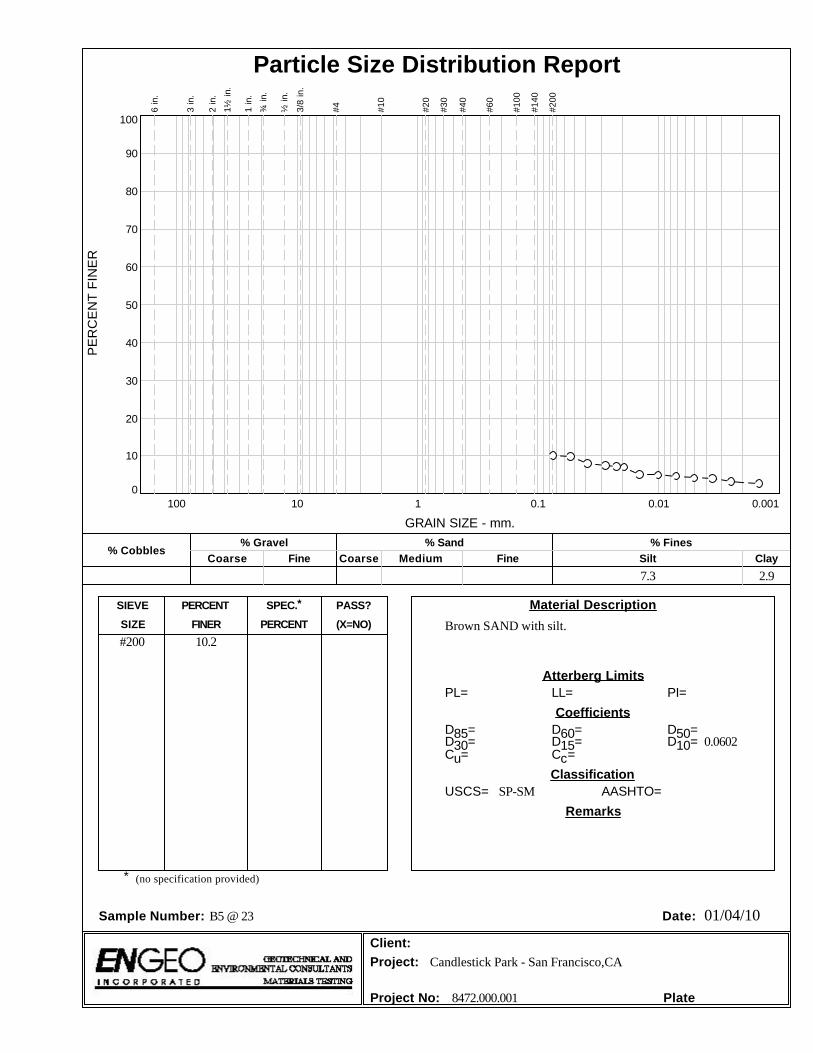
01/04/10
(no specification provided)
PL= LL= PI=
D85= D60= D50=D30= D15= D10=Cu= Cc=
USCS= AASHTO=
*
Brown SAND with silt.#200 10.2
0.0602
SP-SM
Candlestick Park - San Francisco,CA
8472.000.001
Material Description
Atterberg Limits
Coefficients
Classification
Remarks
Sample Number: B5 @ 23 Date:
Client:Project:
Project No: Plate
SIEVE PERCENT SPEC.* PASS?
SIZE FINER PERCENT (X=NO)
PE
RC
EN
T F
INE
R
0
10
20
30
40
50
60
70
80
90
100
GRAIN SIZE - mm.
0.0010.010.1110100
% CobblesCoarse
% GravelFine Coarse Medium
% SandFine Silt
% FinesClay
7.3 2.9
6 in.
3 in.
2 in.
1½
in.
1 in.
¾ in.
½ in.
3/8
in.
#4
#10
#20
#30
#40
#60
#100
#140
#200
Particle Size Distribution Report
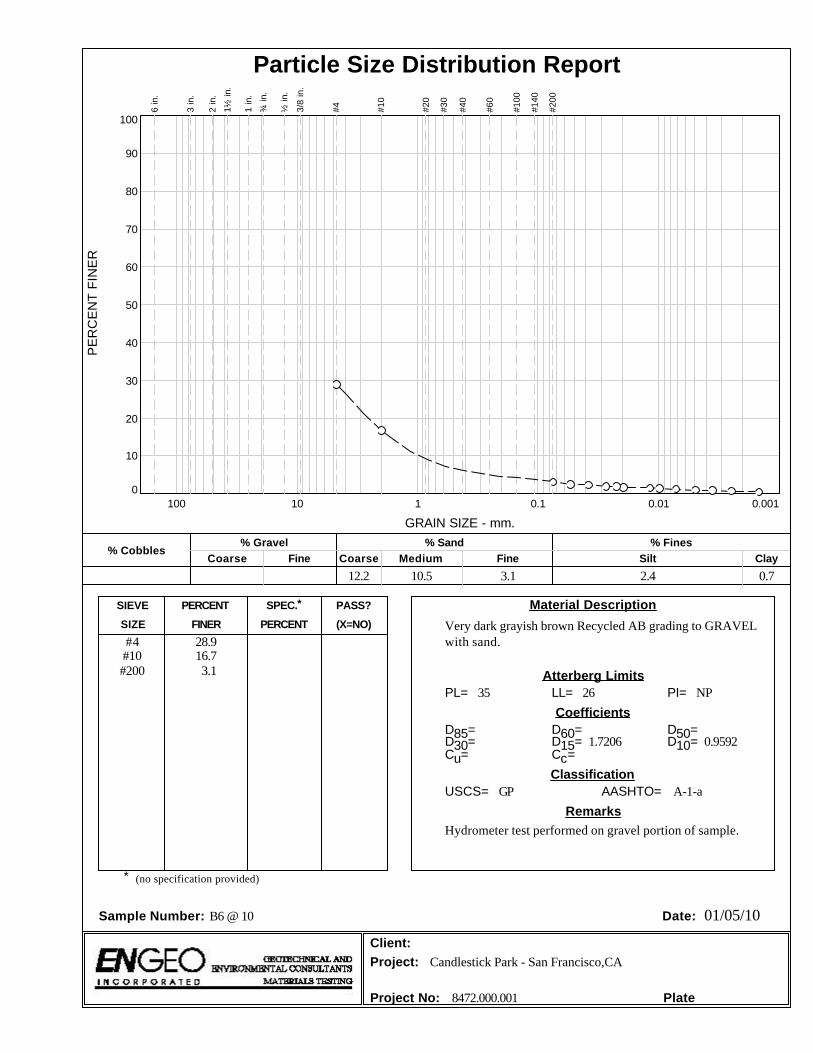
01/05/10
(no specification provided)
PL= LL= PI=
D85= D60= D50=D30= D15= D10=Cu= Cc=
USCS= AASHTO=
*
Very dark grayish brown Recycled AB grading to GRAVELwith sand.#4
#10#200
28.916.73.1
35 26 NP
1.7206 0.9592
GP A-1-a
Hydrometer test performed on gravel portion of sample.
Candlestick Park - San Francisco,CA
8472.000.001
Material Description
Atterberg Limits
Coefficients
Classification
Remarks
Sample Number: B6 @ 10 Date:
Client:Project:
Project No: Plate
SIEVE PERCENT SPEC.* PASS?
SIZE FINER PERCENT (X=NO)
PE
RC
EN
T F
INE
R
0
10
20
30
40
50
60
70
80
90
100
GRAIN SIZE - mm.
0.0010.010.1110100
% CobblesCoarse
% GravelFine Coarse Medium
% SandFine Silt
% FinesClay
12.2 10.5 3.1 2.4 0.7
6 in.
3 in.
2 in.
1½
in.
1 in.
¾ in.
½ in.
3/8
in.
#4
#10
#20
#30
#40
#60
#100
#140
#200
Particle Size Distribution Report
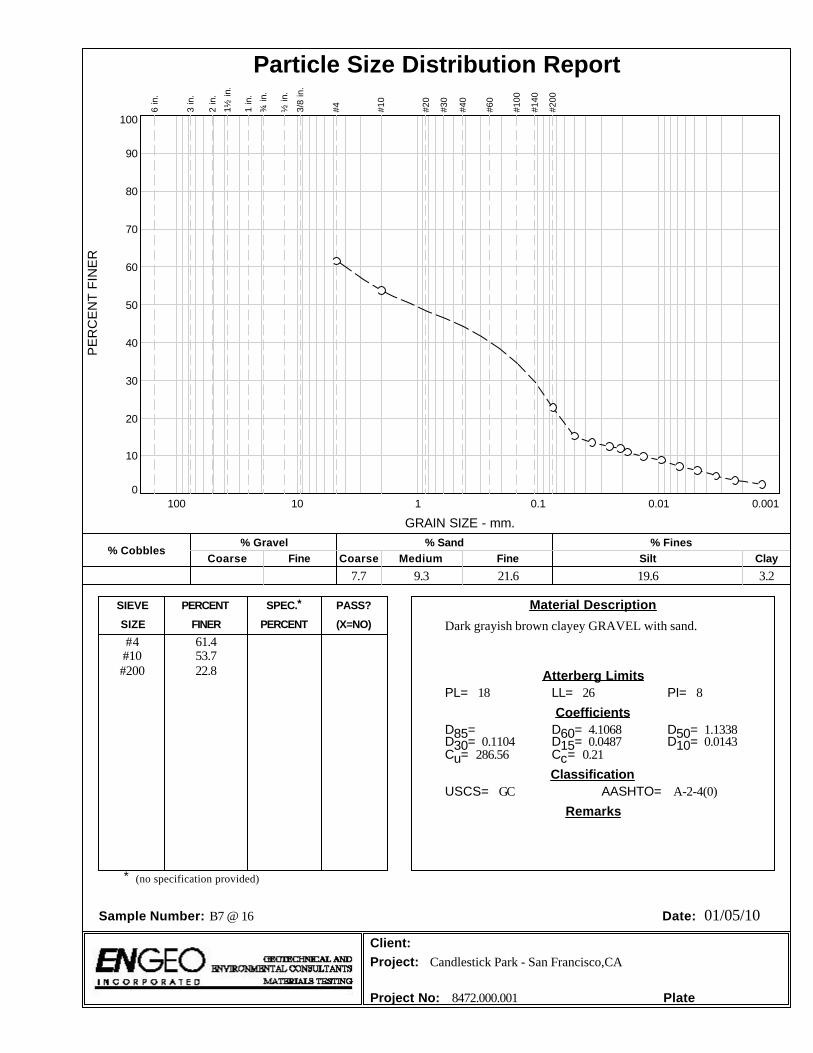
01/05/10
(no specification provided)
PL= LL= PI=
D85= D60= D50=D30= D15= D10=Cu= Cc=
USCS= AASHTO=
*
Dark grayish brown clayey GRAVEL with sand.#4#10#200
61.453.722.8
18 26 8
4.1068 1.13380.1104 0.0487 0.0143
286.56 0.21
GC A-2-4(0)
Candlestick Park - San Francisco,CA
8472.000.001
Material Description
Atterberg Limits
Coefficients
Classification
Remarks
Sample Number: B7 @ 16 Date:
Client:Project:
Project No: Plate
SIEVE PERCENT SPEC.* PASS?
SIZE FINER PERCENT (X=NO)
PE
RC
EN
T F
INE
R
0
10
20
30
40
50
60
70
80
90
100
GRAIN SIZE - mm.
0.0010.010.1110100
% CobblesCoarse
% GravelFine Coarse Medium
% SandFine Silt
% FinesClay
7.7 9.3 21.6 19.6 3.2
6 in.
3 in.
2 in.
1½
in.
1 in.
¾ in.
½ in.
3/8
in.
#4
#10
#20
#30
#40
#60
#100
#140
#200
Particle Size Distribution Report
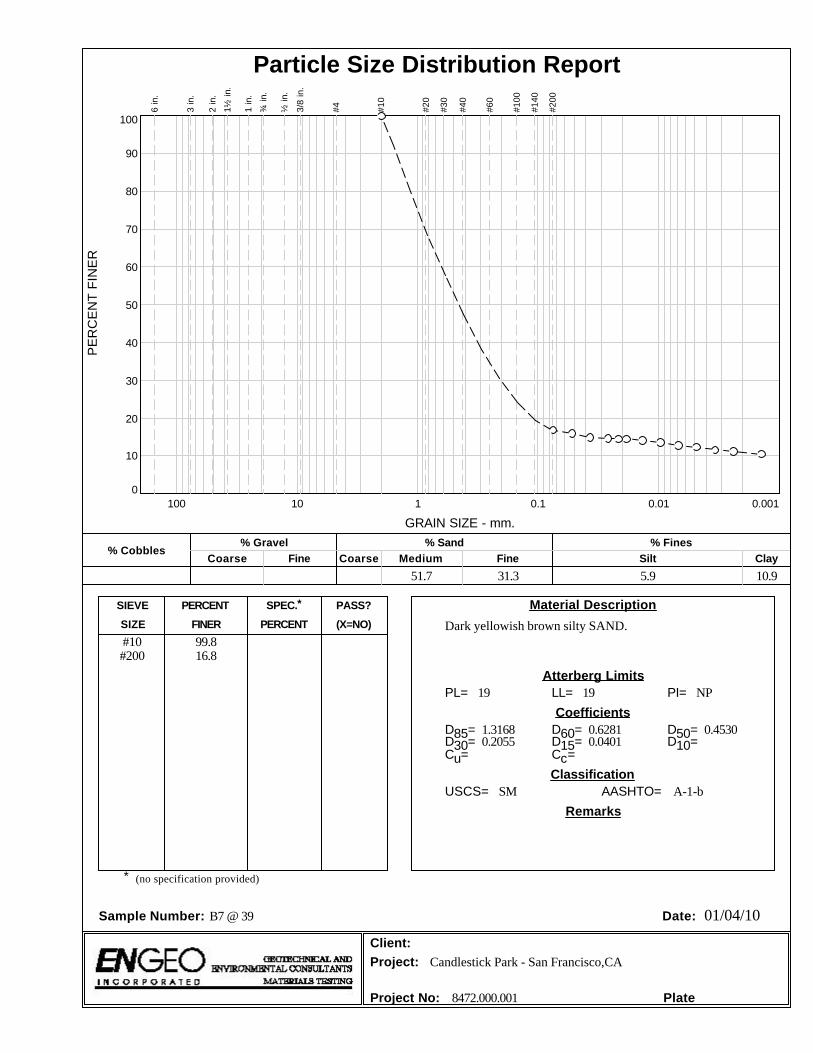
01/04/10
(no specification provided)
PL= LL= PI=
D85= D60= D50=D30= D15= D10=Cu= Cc=
USCS= AASHTO=
*
Dark yellowish brown silty SAND.#10#200
99.816.8
19 19 NP
1.3168 0.6281 0.45300.2055 0.0401
SM A-1-b
Candlestick Park - San Francisco,CA
8472.000.001
Material Description
Atterberg Limits
Coefficients
Classification
Remarks
Sample Number: B7 @ 39 Date:
Client:Project:
Project No: Plate
SIEVE PERCENT SPEC.* PASS?
SIZE FINER PERCENT (X=NO)
PE
RC
EN
T F
INE
R
0
10
20
30
40
50
60
70
80
90
100
GRAIN SIZE - mm.
0.0010.010.1110100
% CobblesCoarse
% GravelFine Coarse Medium
% SandFine Silt
% FinesClay
51.7 31.3 5.9 10.9
6 in.
3 in.
2 in.
1½
in.
1 in.
¾ in.
½ in.
3/8
in.
#4
#10
#20
#30
#40
#60
#100
#140
#200
Particle Size Distribution Report

01/04/10
(no specification provided)
PL= LL= PI=
D85= D60= D50=D30= D15= D10=Cu= Cc=
USCS= AASHTO=
*
Dark yellowish brown silty SAND.#200 18.8
18 18 NP
0.0208 0.0018
SM
Candlestick Park - San Francisco,CA
8472.000.001
Material Description
Atterberg Limits
Coefficients
Classification
Remarks
Sample Number: B7 @ 42 Date:
Client:Project:
Project No: Plate
SIEVE PERCENT SPEC.* PASS?
SIZE FINER PERCENT (X=NO)
PE
RC
EN
T F
INE
R
0
10
20
30
40
50
60
70
80
90
100
GRAIN SIZE - mm.
0.0010.010.1110100
% CobblesCoarse
% GravelFine Coarse Medium
% SandFine Silt
% FinesClay
8.7 10.1
6 in.
3 in.
2 in.
1½
in.
1 in.
¾ in.
½ in.
3/8
in.
#4
#10
#20
#30
#40
#60
#100
#140
#200
Particle Size Distribution Report
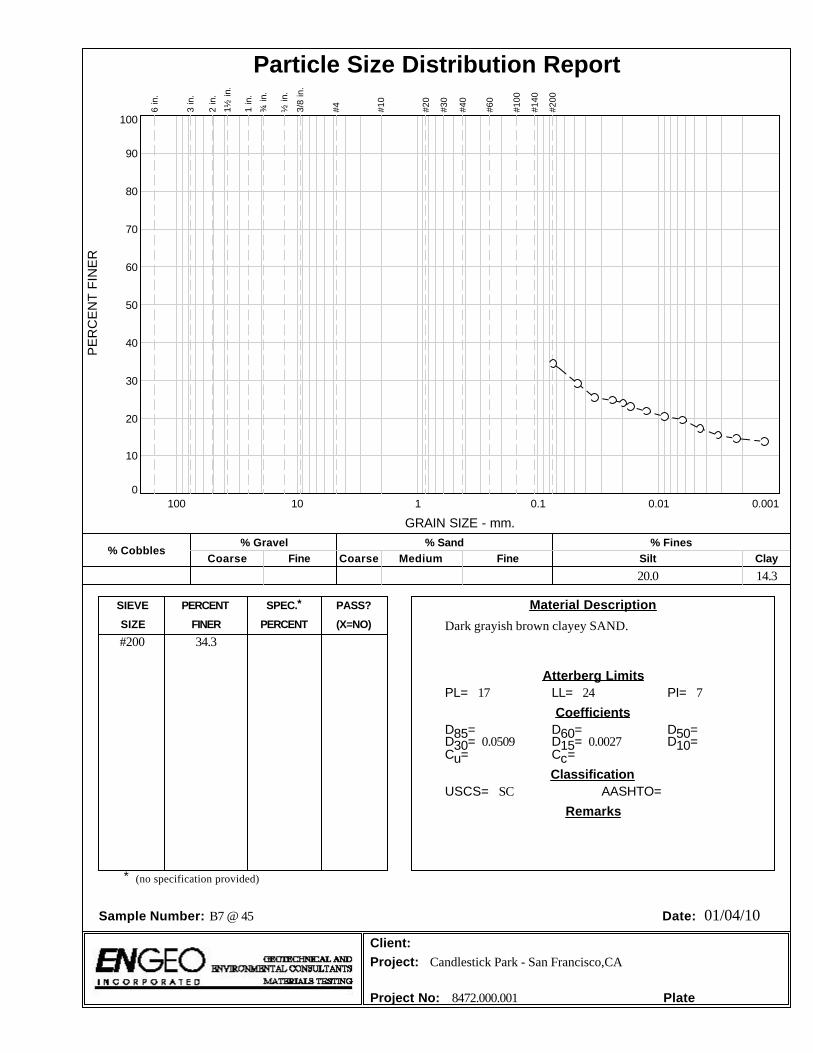
01/04/10
(no specification provided)
PL= LL= PI=
D85= D60= D50=D30= D15= D10=Cu= Cc=
USCS= AASHTO=
*
Dark grayish brown clayey SAND.#200 34.3
17 24 7
0.0509 0.0027
SC
Candlestick Park - San Francisco,CA
8472.000.001
Material Description
Atterberg Limits
Coefficients
Classification
Remarks
Sample Number: B7 @ 45 Date:
Client:Project:
Project No: Plate
SIEVE PERCENT SPEC.* PASS?
SIZE FINER PERCENT (X=NO)
PE
RC
EN
T F
INE
R
0
10
20
30
40
50
60
70
80
90
100
GRAIN SIZE - mm.
0.0010.010.1110100
% CobblesCoarse
% GravelFine Coarse Medium
% SandFine Silt
% FinesClay
20.0 14.3
6 in.
3 in.
2 in.
1½
in.
1 in.
¾ in.
½ in.
3/8
in.
#4
#10
#20
#30
#40
#60
#100
#140
#200
Particle Size Distribution Report
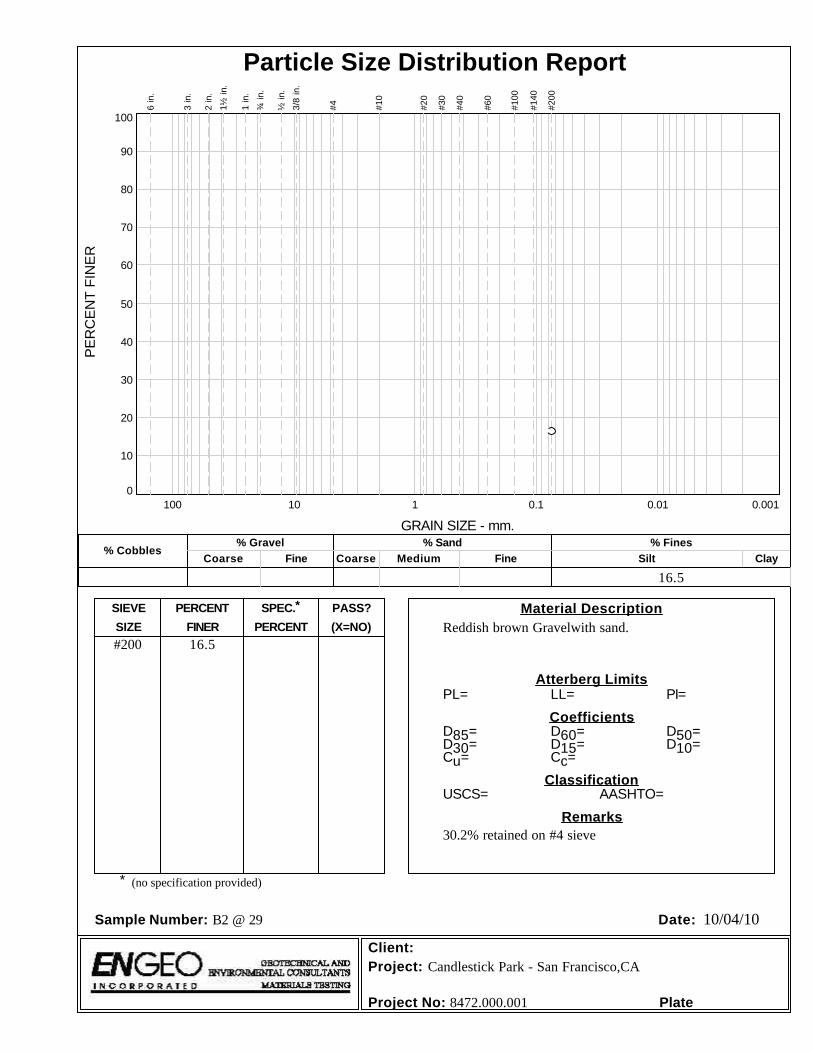
10/04/10
(no specification provided)
PL= LL= PI=
D85= D60= D50=D30= D15= D10=Cu= Cc=
USCS= AASHTO=
*
Reddish brown Gravelwith sand.#200 16.5
30.2% retained on #4 sieve
Candlestick Park - San Francisco,CA
8472.000.001
Material Description
Atterberg Limits
Coefficients
Classification
Remarks
Sample Number: B2 @ 29 Date:
Client:Project:
Project No: Plate
SIEVE PERCENT SPEC.* PASS?
SIZE FINER PERCENT (X=NO)
PE
RC
EN
T F
INE
R
0
10
20
30
40
50
60
70
80
90
100
GRAIN SIZE - mm.
0.0010.010.1110100
% CobblesCoarse
% GravelFine Coarse Medium
% SandFine Silt
% FinesClay
16.5
6 in.
3 in.
2 in.
1½
in.
1 in.
¾ in.
½ in.
3/8
in.
#4
#10
#20
#30
#40
#60
#100
#140
#200
Particle Size Distribution Report
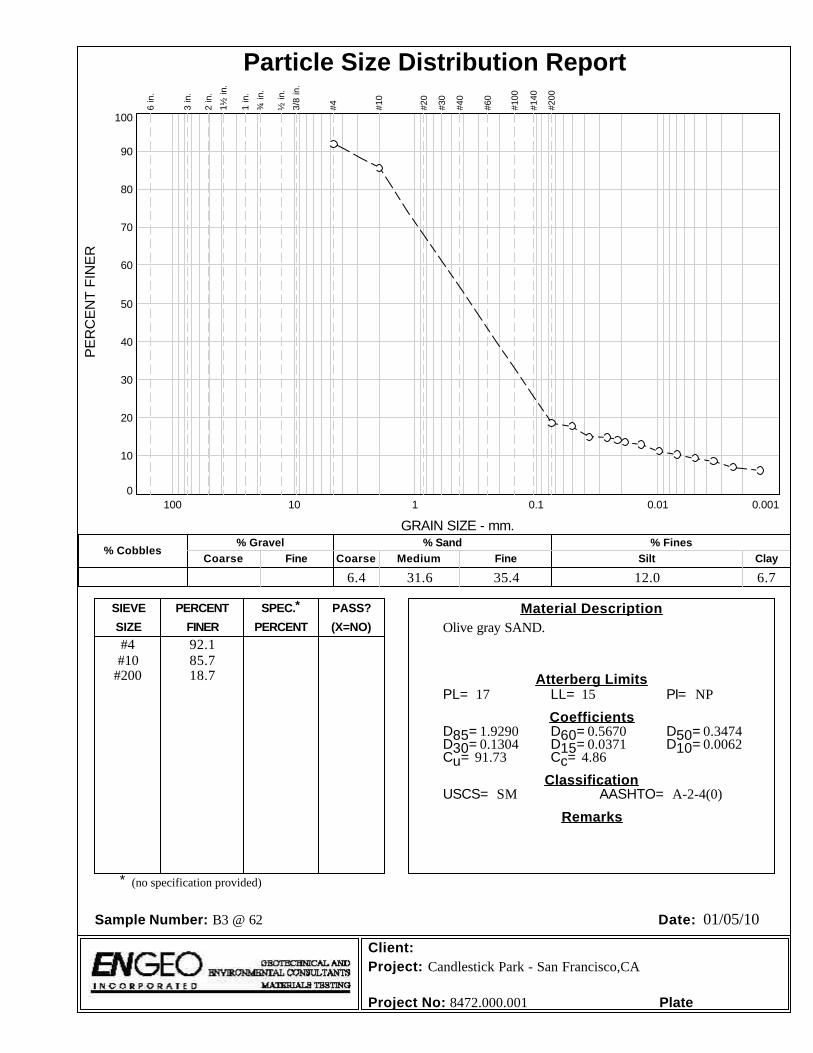
01/05/10
(no specification provided)
PL= LL= PI=
D85= D60= D50=D30= D15= D10=Cu= Cc=
USCS= AASHTO=
*
Olive gray SAND.#4#10
#200
92.185.718.7
17 15 NP
1.9290 0.5670 0.34740.1304 0.0371 0.0062
91.73 4.86
SM A-2-4(0)
Candlestick Park - San Francisco,CA
8472.000.001
Material Description
Atterberg Limits
Coefficients
Classification
Remarks
Sample Number: B3 @ 62 Date:
Client:Project:
Project No: Plate
SIEVE PERCENT SPEC.* PASS?
SIZE FINER PERCENT (X=NO)
PE
RC
EN
T F
INE
R
0
10
20
30
40
50
60
70
80
90
100
GRAIN SIZE - mm.
0.0010.010.1110100
% CobblesCoarse
% GravelFine Coarse Medium
% SandFine Silt
% FinesClay
6.4 31.6 35.4 12.0 6.7
6 in.
3 in.
2 in.
1½
in.
1 in.
¾ in.
½ in.
3/8
in.
#4
#10
#20
#30
#40
#60
#100
#140
#200
Particle Size Distribution Report
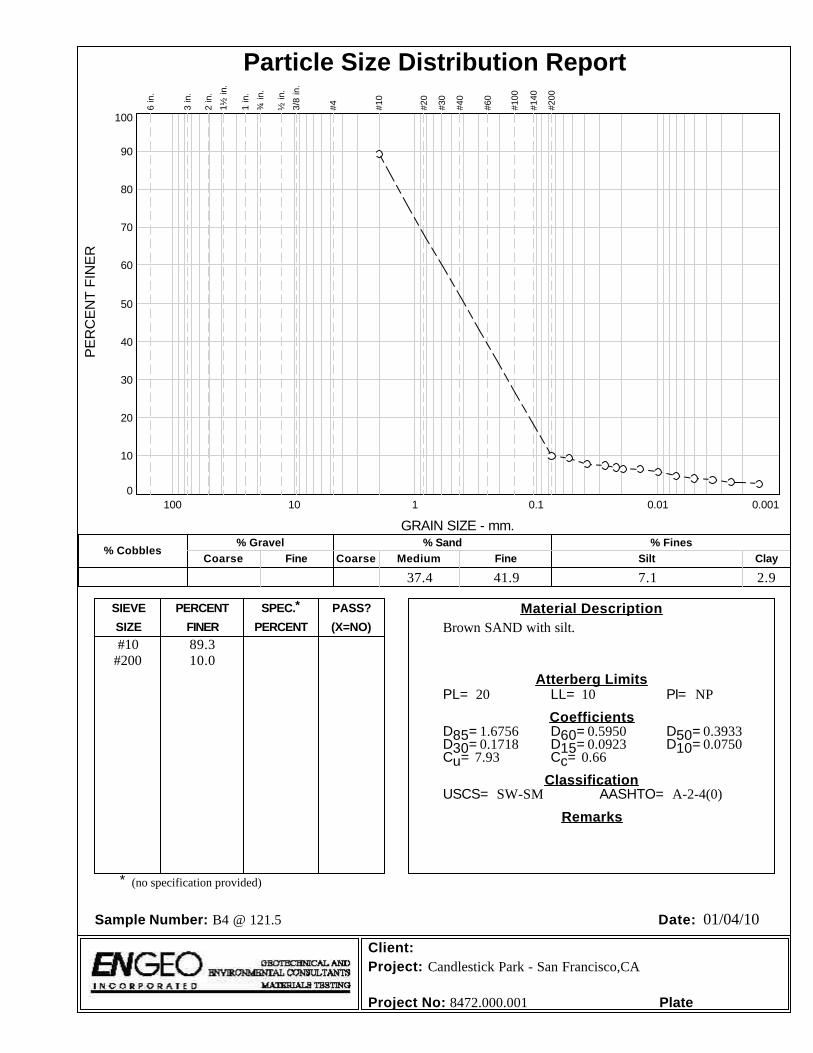
01/04/10
(no specification provided)
PL= LL= PI=
D85= D60= D50=D30= D15= D10=Cu= Cc=
USCS= AASHTO=
*
Brown SAND with silt.#10
#20089.310.0
20 10 NP
1.6756 0.5950 0.39330.1718 0.0923 0.0750
7.93 0.66
SW-SM A-2-4(0)
Candlestick Park - San Francisco,CA
8472.000.001
Material Description
Atterberg Limits
Coefficients
Classification
Remarks
Sample Number: B4 @ 121.5 Date:
Client:Project:
Project No: Plate
SIEVE PERCENT SPEC.* PASS?
SIZE FINER PERCENT (X=NO)
PE
RC
EN
T F
INE
R
0
10
20
30
40
50
60
70
80
90
100
GRAIN SIZE - mm.
0.0010.010.1110100
% CobblesCoarse
% GravelFine Coarse Medium
% SandFine Silt
% FinesClay
37.4 41.9 7.1 2.9
6 in.
3 in.
2 in.
1½
in.
1 in.
¾ in.
½ in.
3/8
in.
#4
#10
#20
#30
#40
#60
#100
#140
#200
Particle Size Distribution Report
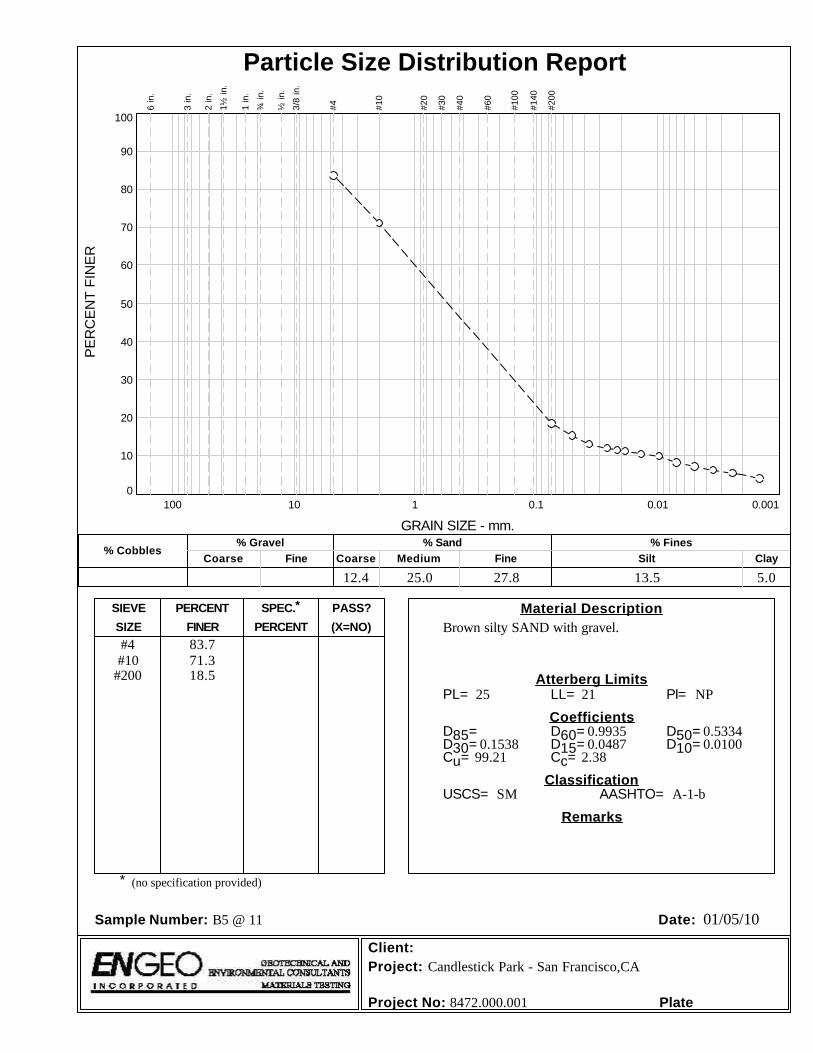
01/05/10
(no specification provided)
PL= LL= PI=
D85= D60= D50=D30= D15= D10=Cu= Cc=
USCS= AASHTO=
*
Brown silty SAND with gravel.#4#10
#200
83.771.318.5
25 21 NP
0.9935 0.53340.1538 0.0487 0.0100
99.21 2.38
SM A-1-b
Candlestick Park - San Francisco,CA
8472.000.001
Material Description
Atterberg Limits
Coefficients
Classification
Remarks
Sample Number: B5 @ 11 Date:
Client:Project:
Project No: Plate
SIEVE PERCENT SPEC.* PASS?
SIZE FINER PERCENT (X=NO)
PE
RC
EN
T F
INE
R
0
10
20
30
40
50
60
70
80
90
100
GRAIN SIZE - mm.
0.0010.010.1110100
% CobblesCoarse
% GravelFine Coarse Medium
% SandFine Silt
% FinesClay
12.4 25.0 27.8 13.5 5.0
6 in.
3 in.
2 in.
1½
in.
1 in.
¾ in.
½ in.
3/8
in.
#4
#10
#20
#30
#40
#60
#100
#140
#200
Particle Size Distribution Report

01/05/10
(no specification provided)
PL= LL= PI=
D85= D60= D50=D30= D15= D10=Cu= Cc=
USCS= AASHTO=
*
Dark grayish brown SAND.#4#10
#200
88.529.67.9
18 21 3
4.5147 3.1261 2.69872.0112 0.2190 0.1028
30.42 12.59
SP-SM A-1-a
Candlestick Park - San Francisco,CA
8472.000.001
Material Description
Atterberg Limits
Coefficients
Classification
Remarks
Sample Number: B5 @ 20 Date:
Client:Project:
Project No: Plate
SIEVE PERCENT SPEC.* PASS?
SIZE FINER PERCENT (X=NO)
PE
RC
EN
T F
INE
R
0
10
20
30
40
50
60
70
80
90
100
GRAIN SIZE - mm.
0.0010.010.1110100
% CobblesCoarse
% GravelFine Coarse Medium
% SandFine Silt
% FinesClay
58.9 10.2 11.5 5.4 2.5
6 in.
3 in.
2 in.
1½
in.
1 in.
¾ in.
½ in.
3/8
in.
#4
#10
#20
#30
#40
#60
#100
#140
#200
Particle Size Distribution Report
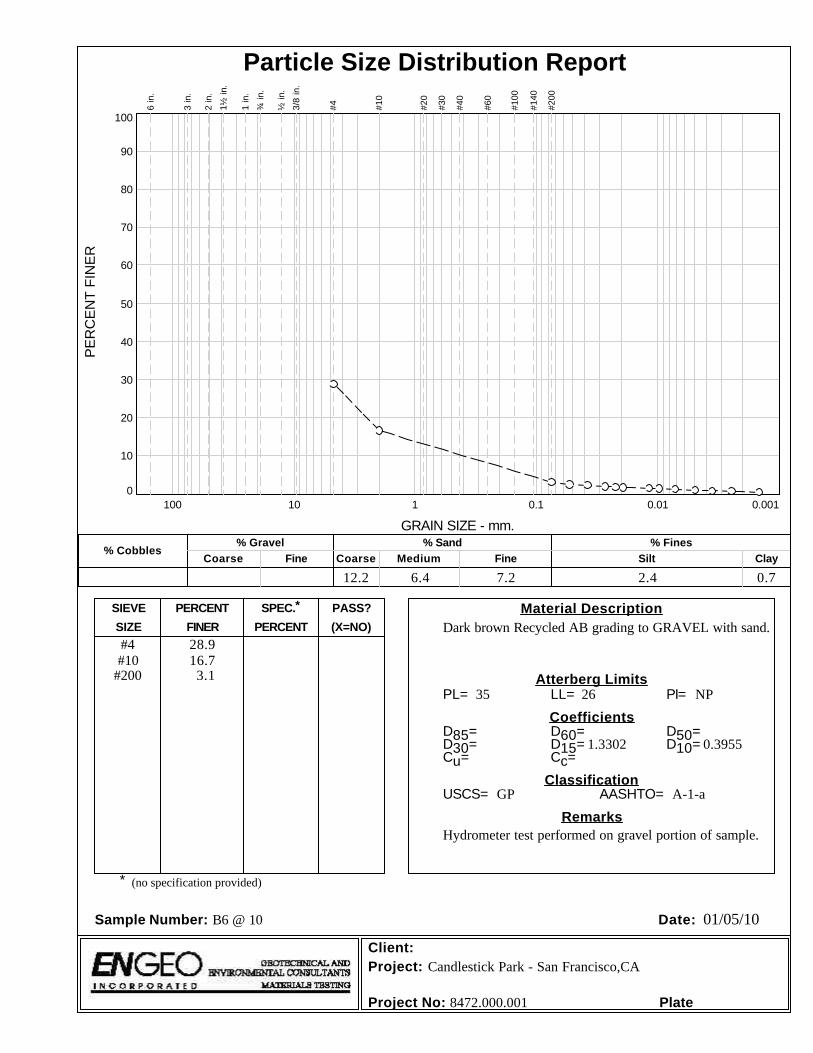
01/05/10
(no specification provided)
PL= LL= PI=
D85= D60= D50=D30= D15= D10=Cu= Cc=
USCS= AASHTO=
*
Dark brown Recycled AB grading to GRAVEL with sand.#4#10
#200
28.916.73.1
35 26 NP
1.3302 0.3955
GP A-1-a
Hydrometer test performed on gravel portion of sample.
Candlestick Park - San Francisco,CA
8472.000.001
Material Description
Atterberg Limits
Coefficients
Classification
Remarks
Sample Number: B6 @ 10 Date:
Client:Project:
Project No: Plate
SIEVE PERCENT SPEC.* PASS?
SIZE FINER PERCENT (X=NO)
PE
RC
EN
T F
INE
R
0
10
20
30
40
50
60
70
80
90
100
GRAIN SIZE - mm.
0.0010.010.1110100
% CobblesCoarse
% GravelFine Coarse Medium
% SandFine Silt
% FinesClay
12.2 6.4 7.2 2.4 0.7
6 in.
3 in.
2 in.
1½
in.
1 in.
¾ in.
½ in.
3/8
in.
#4
#10
#20
#30
#40
#60
#100
#140
#200
Particle Size Distribution Report
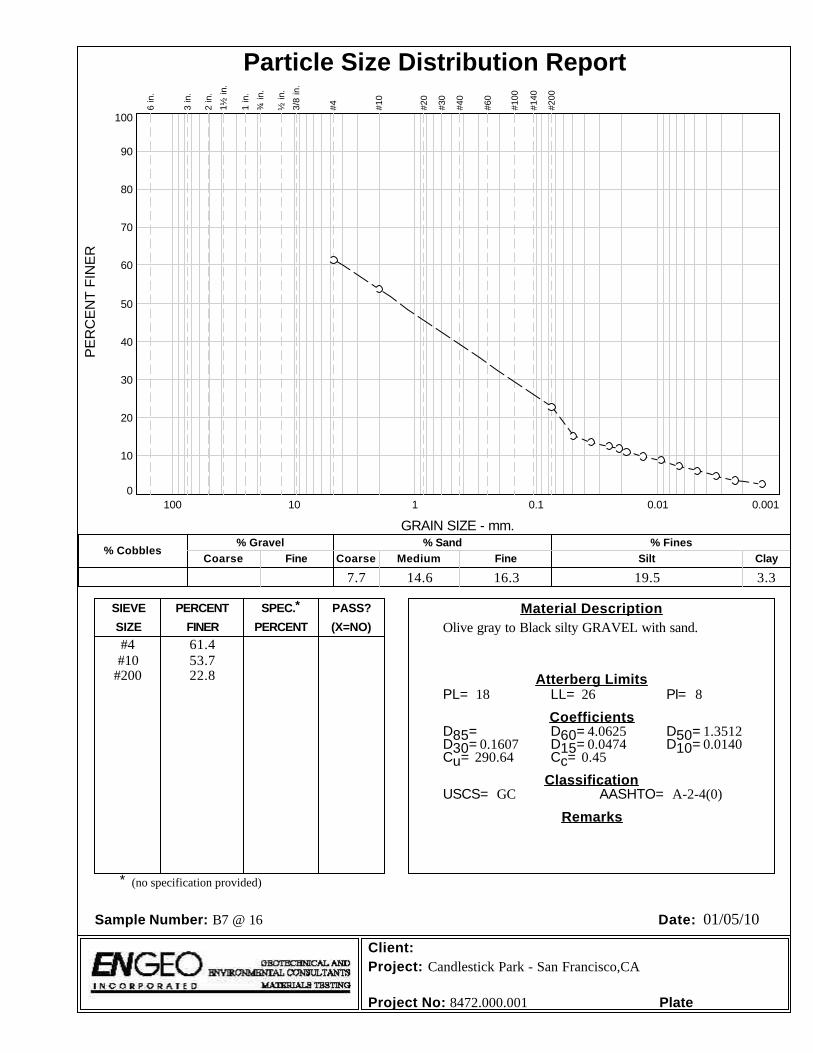
01/05/10
(no specification provided)
PL= LL= PI=
D85= D60= D50=D30= D15= D10=Cu= Cc=
USCS= AASHTO=
*
Olive gray to Black silty GRAVEL with sand.#4#10
#200
61.453.722.8
18 26 8
4.0625 1.35120.1607 0.0474 0.0140
290.64 0.45
GC A-2-4(0)
Candlestick Park - San Francisco,CA
8472.000.001
Material Description
Atterberg Limits
Coefficients
Classification
Remarks
Sample Number: B7 @ 16 Date:
Client:Project:
Project No: Plate
SIEVE PERCENT SPEC.* PASS?
SIZE FINER PERCENT (X=NO)
PE
RC
EN
T F
INE
R
0
10
20
30
40
50
60
70
80
90
100
GRAIN SIZE - mm.
0.0010.010.1110100
% CobblesCoarse
% GravelFine Coarse Medium
% SandFine Silt
% FinesClay
7.7 14.6 16.3 19.5 3.3
6 in.
3 in.
2 in.
1½
in.
1 in.
¾ in.
½ in.
3/8
in.
#4
#10
#20
#30
#40
#60
#100
#140
#200
Particle Size Distribution Report
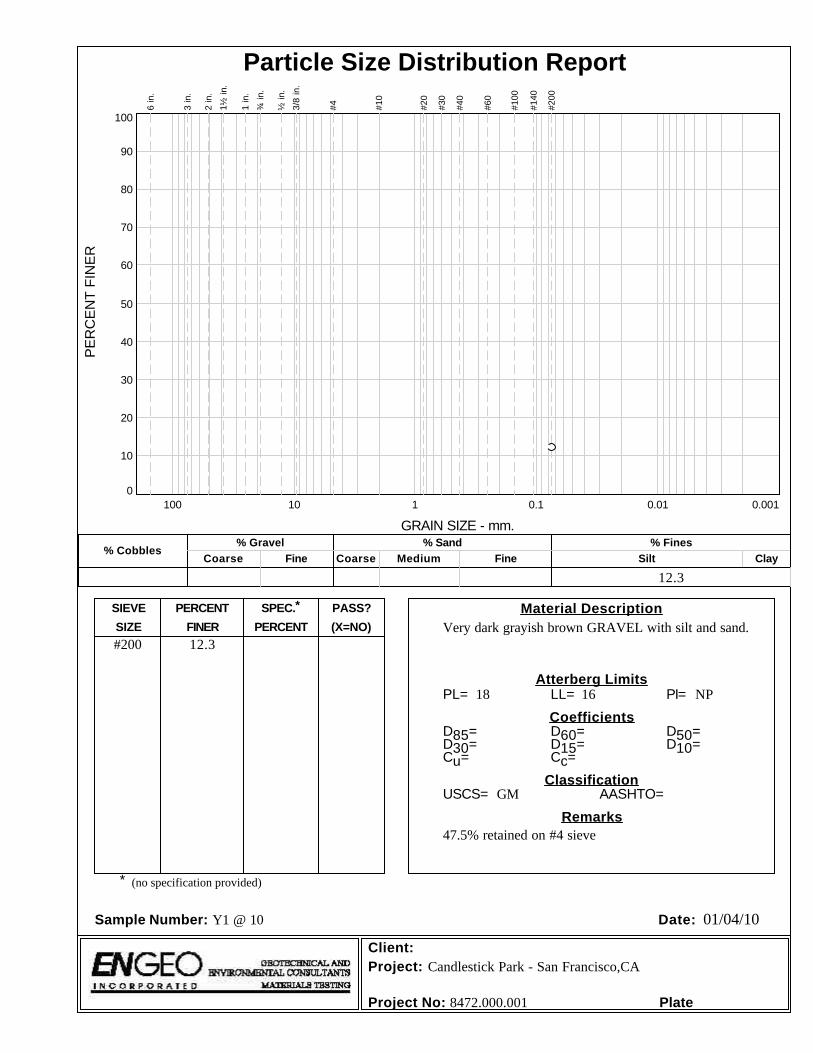
01/04/10
(no specification provided)
PL= LL= PI=
D85= D60= D50=D30= D15= D10=Cu= Cc=
USCS= AASHTO=
*
Very dark grayish brown GRAVEL with silt and sand.#200 12.3
18 16 NP
GM
47.5% retained on #4 sieve
Candlestick Park - San Francisco,CA
8472.000.001
Material Description
Atterberg Limits
Coefficients
Classification
Remarks
Sample Number: Y1 @ 10 Date:
Client:Project:
Project No: Plate
SIEVE PERCENT SPEC.* PASS?
SIZE FINER PERCENT (X=NO)
PE
RC
EN
T F
INE
R
0
10
20
30
40
50
60
70
80
90
100
GRAIN SIZE - mm.
0.0010.010.1110100
% CobblesCoarse
% GravelFine Coarse Medium
% SandFine Silt
% FinesClay
12.3
6 in.
3 in.
2 in.
1½
in.
1 in.
¾ in.
½ in.
3/8
in.
#4
#10
#20
#30
#40
#60
#100
#140
#200
Particle Size Distribution Report
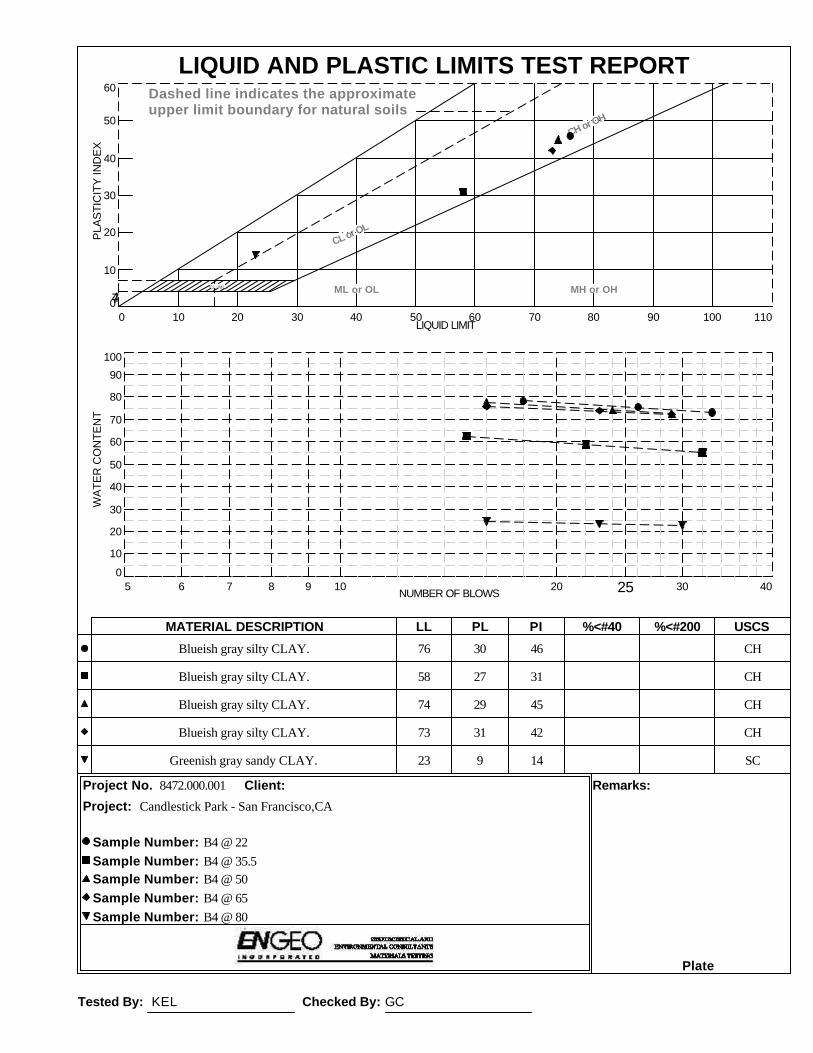
Tested By: KEL Checked By: GC
Blueish gray silty CLAY. 76 30 46 CH
Blueish gray silty CLAY. 58 27 31 CH
Blueish gray silty CLAY. 74 29 45 CH
Blueish gray silty CLAY. 73 31 42 CH
Greenish gray sandy CLAY. 23 9 14 SC
8472.000.001
MATERIAL DESCRIPTION LL PL PI %<#40 %<#200 USCS
Project No. Client: Remarks:
Project:
Plate
Sample Number: B4 @ 22Sample Number: B4 @ 35.5Sample Number: B4 @ 50Sample Number: B4 @ 65Sample Number: B4 @ 80
PLA
ST
ICIT
Y IN
DE
X
0
10
20
30
40
50
60
LIQUID LIMIT0 10 20 30 40 50 60 70 80 90 100 110
CL-ML
CL or OL
CH or OH
ML or OL MH or OH
Dashed line indicates the approximateupper limit boundary for natural soils
47
WA
TE
R C
ON
TE
NT
0
10
20
30
40
50
60
70
80
90
100
NUMBER OF BLOWS5 6 7 8 9 10 20 25 30 40
LIQUID AND PLASTIC LIMITS TEST REPORT
Candlestick Park - San Francisco,CA
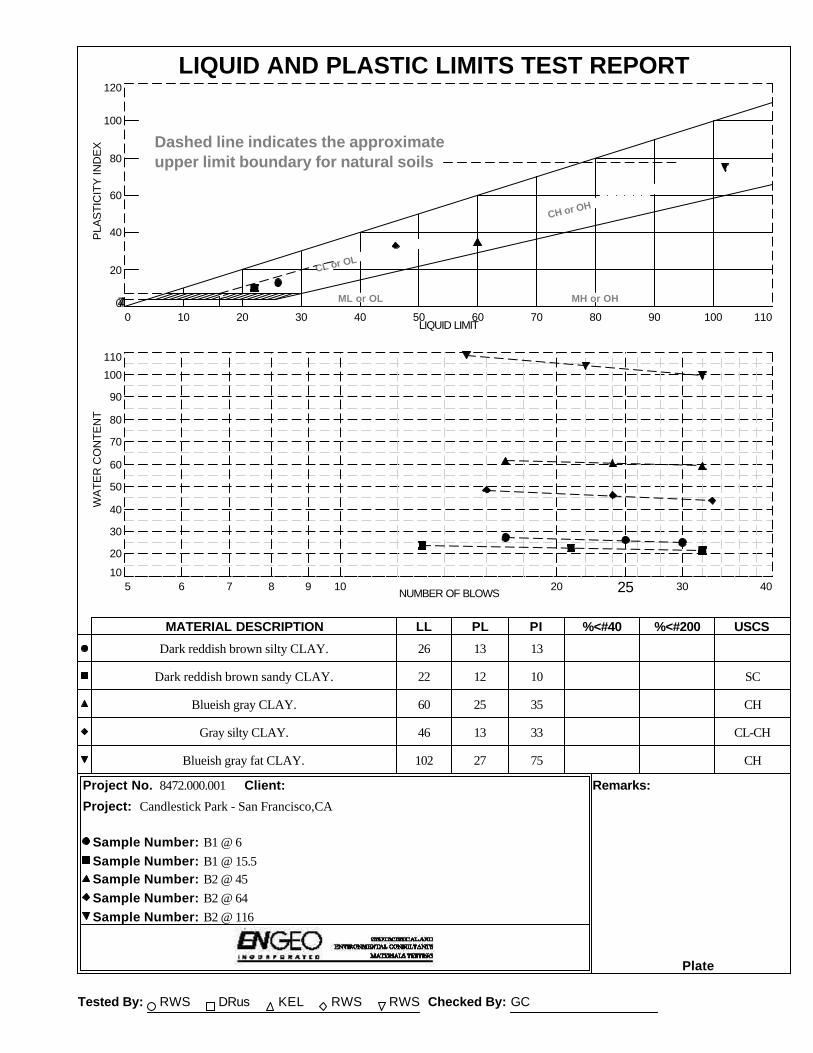
Tested By: RWS DRus KEL RWS RWS Checked By: GC
Dark reddish brown silty CLAY. 26 13 13
Dark reddish brown sandy CLAY. 22 12 10 SC
Blueish gray CLAY. 60 25 35 CH
Gray silty CLAY. 46 13 33 CL-CH
Blueish gray fat CLAY. 102 27 75 CH
8472.000.001
MATERIAL DESCRIPTION LL PL PI %<#40 %<#200 USCS
Project No. Client: Remarks:
Project:
Plate
Sample Number: B1 @ 6Sample Number: B1 @ 15.5Sample Number: B2 @ 45Sample Number: B2 @ 64Sample Number: B2 @ 116
PLA
ST
ICIT
Y IN
DE
X
0
20
40
60
80
100
120
LIQUID LIMIT0 10 20 30 40 50 60 70 80 90 100 110
CL-ML
CL or OL
CH or OH
ML or OL MH or OH
Dashed line indicates the approximateupper limit boundary for natural soils
47
WA
TE
R C
ON
TE
NT
10
20
30
40
50
60
70
80
90
100
110
NUMBER OF BLOWS5 6 7 8 9 10 20 25 30 40
LIQUID AND PLASTIC LIMITS TEST REPORT
Candlestick Park - San Francisco,CA
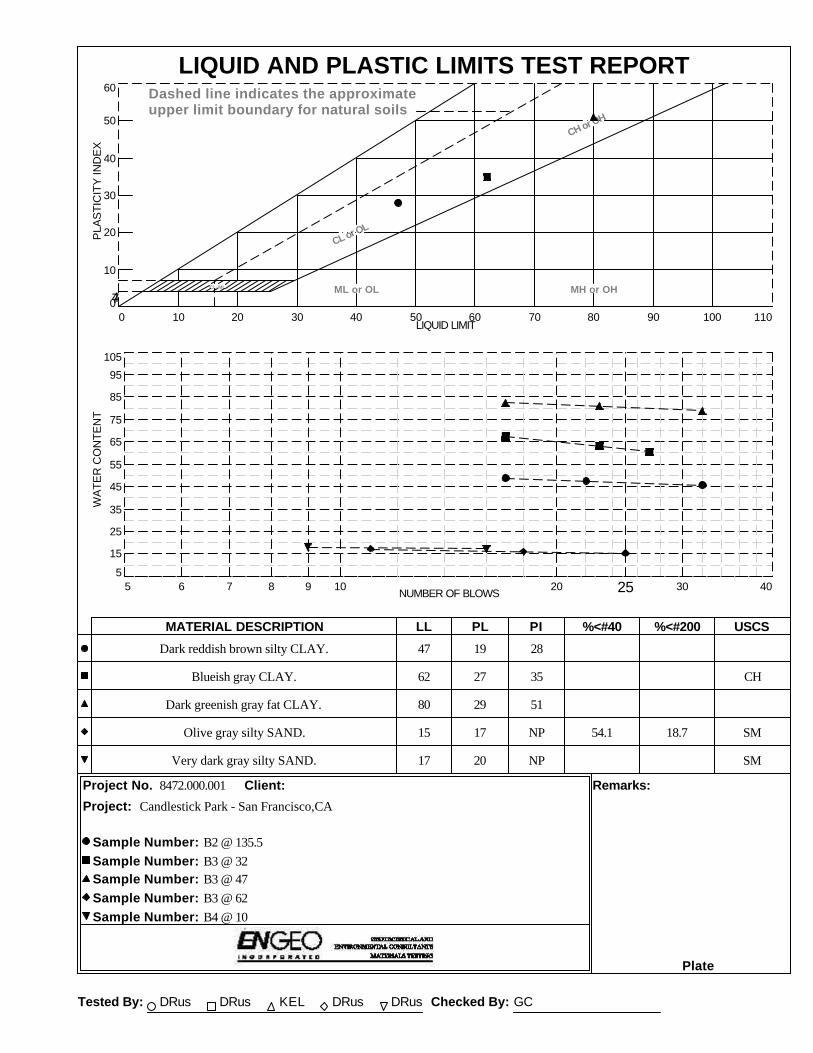
Tested By: DRus DRus KEL DRus DRus Checked By: GC
Dark reddish brown silty CLAY. 47 19 28
Blueish gray CLAY. 62 27 35 CH
Dark greenish gray fat CLAY. 80 29 51
Olive gray silty SAND. 15 17 NP 54.1 18.7 SM
Very dark gray silty SAND. 17 20 NP SM
8472.000.001
MATERIAL DESCRIPTION LL PL PI %<#40 %<#200 USCS
Project No. Client: Remarks:
Project:
Plate
Sample Number: B2 @ 135.5Sample Number: B3 @ 32Sample Number: B3 @ 47Sample Number: B3 @ 62Sample Number: B4 @ 10
PLA
ST
ICIT
Y IN
DE
X
0
10
20
30
40
50
60
LIQUID LIMIT0 10 20 30 40 50 60 70 80 90 100 110
CL-ML
CL or OL
CH or OH
ML or OL MH or OH
Dashed line indicates the approximateupper limit boundary for natural soils
47
WA
TE
R C
ON
TE
NT
5
15
25
35
45
55
65
75
85
95
105
NUMBER OF BLOWS5 6 7 8 9 10 20 25 30 40
LIQUID AND PLASTIC LIMITS TEST REPORT
Candlestick Park - San Francisco,CA
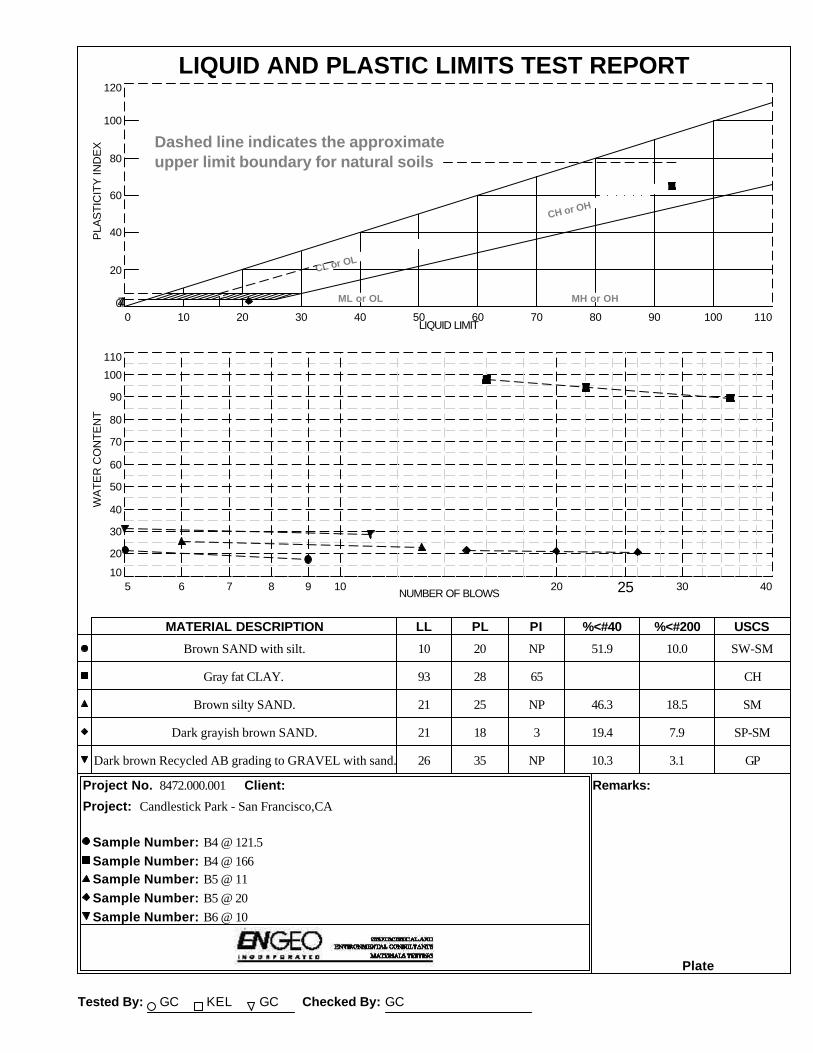
Tested By: GC KEL GC Checked By: GC
Brown SAND with silt. 10 20 NP 51.9 10.0 SW-SM
Gray fat CLAY. 93 28 65 CH
Brown silty SAND. 21 25 NP 46.3 18.5 SM
Dark grayish brown SAND. 21 18 3 19.4 7.9 SP-SM
Dark brown Recycled AB grading to GRAVEL with sand. 26 35 NP 10.3 3.1 GP
8472.000.001
MATERIAL DESCRIPTION LL PL PI %<#40 %<#200 USCS
Project No. Client: Remarks:
Project:
Plate
Sample Number: B4 @ 121.5Sample Number: B4 @ 166Sample Number: B5 @ 11Sample Number: B5 @ 20Sample Number: B6 @ 10
PLA
ST
ICIT
Y IN
DE
X
0
20
40
60
80
100
120
LIQUID LIMIT0 10 20 30 40 50 60 70 80 90 100 110
CL-ML
CL or OL
CH or OH
ML or OL MH or OH
Dashed line indicates the approximateupper limit boundary for natural soils
47
WA
TE
R C
ON
TE
NT
10
20
30
40
50
60
70
80
90
100
110
NUMBER OF BLOWS5 6 7 8 9 10 20 25 30 40
LIQUID AND PLASTIC LIMITS TEST REPORT
Candlestick Park - San Francisco,CA
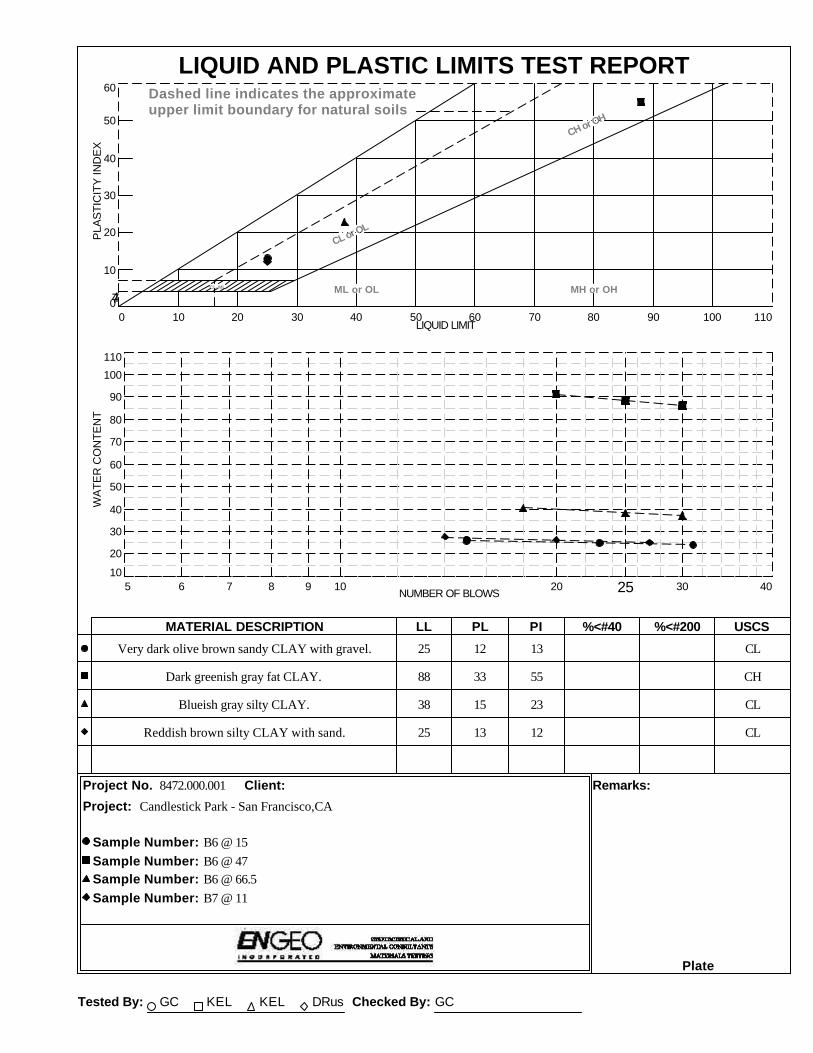
Tested By: GC KEL KEL DRus Checked By: GC
Very dark olive brown sandy CLAY with gravel. 25 12 13 CL
Dark greenish gray fat CLAY. 88 33 55 CH
Blueish gray silty CLAY. 38 15 23 CL
Reddish brown silty CLAY with sand. 25 13 12 CL
8472.000.001
MATERIAL DESCRIPTION LL PL PI %<#40 %<#200 USCS
Project No. Client: Remarks:
Project:
Plate
Sample Number: B6 @ 15Sample Number: B6 @ 47Sample Number: B6 @ 66.5Sample Number: B7 @ 11
PLA
ST
ICIT
Y IN
DE
X
0
10
20
30
40
50
60
LIQUID LIMIT0 10 20 30 40 50 60 70 80 90 100 110
CL-ML
CL or OL
CH or OH
ML or OL MH or OH
Dashed line indicates the approximateupper limit boundary for natural soils
47
WA
TE
R C
ON
TE
NT
10
20
30
40
50
60
70
80
90
100
110
NUMBER OF BLOWS5 6 7 8 9 10 20 25 30 40
LIQUID AND PLASTIC LIMITS TEST REPORT
Candlestick Park - San Francisco,CA
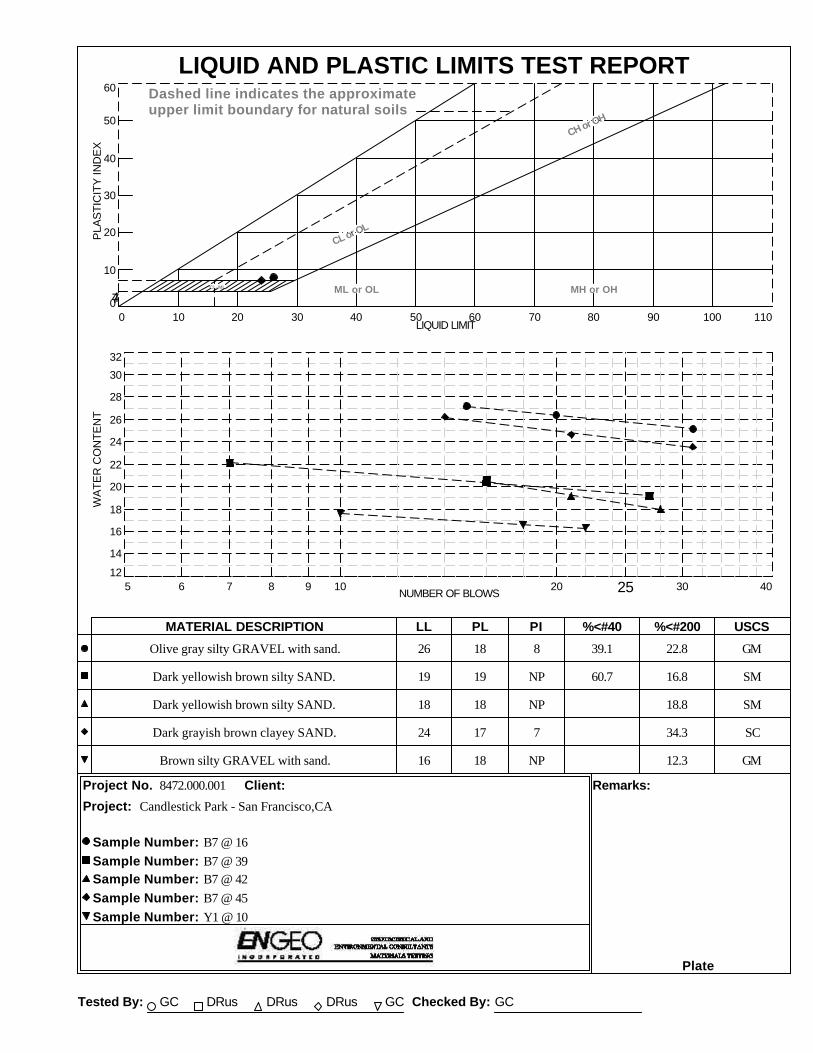
Tested By: GC DRus DRus DRus GC Checked By: GC
Olive gray silty GRAVEL with sand. 26 18 8 39.1 22.8 GM
Dark yellowish brown silty SAND. 19 19 NP 60.7 16.8 SM
Dark yellowish brown silty SAND. 18 18 NP 18.8 SM
Dark grayish brown clayey SAND. 24 17 7 34.3 SC
Brown silty GRAVEL with sand. 16 18 NP 12.3 GM
8472.000.001
MATERIAL DESCRIPTION LL PL PI %<#40 %<#200 USCS
Project No. Client: Remarks:
Project:
Plate
Sample Number: B7 @ 16Sample Number: B7 @ 39Sample Number: B7 @ 42Sample Number: B7 @ 45Sample Number: Y1 @ 10
PLA
ST
ICIT
Y IN
DE
X
0
10
20
30
40
50
60
LIQUID LIMIT0 10 20 30 40 50 60 70 80 90 100 110
CL-ML
CL or OL
CH or OH
ML or OL MH or OH
Dashed line indicates the approximateupper limit boundary for natural soils
47
WA
TE
R C
ON
TE
NT
12
14
16
18
20
22
24
26
28
30
32
NUMBER OF BLOWS5 6 7 8 9 10 20 25 30 40
LIQUID AND PLASTIC LIMITS TEST REPORT
Candlestick Park - San Francisco,CA
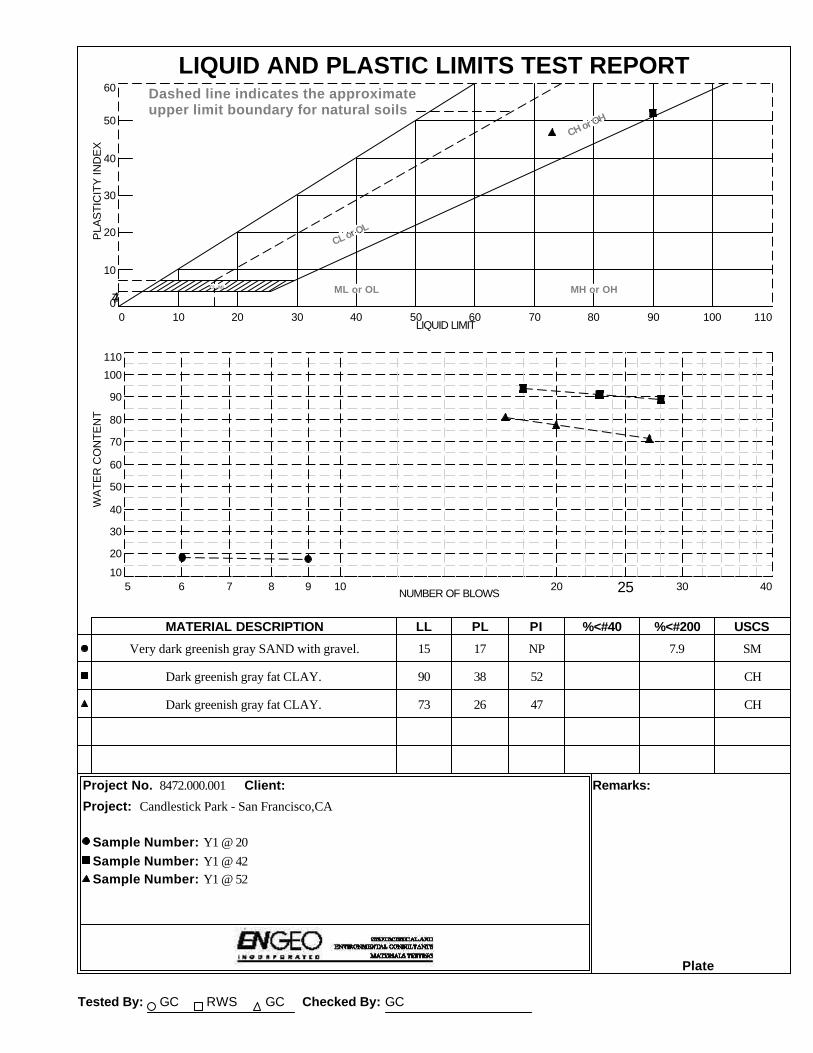
Tested By: GC RWS GC Checked By: GC
Very dark greenish gray SAND with gravel. 15 17 NP 7.9 SM
Dark greenish gray fat CLAY. 90 38 52 CH
Dark greenish gray fat CLAY. 73 26 47 CH
8472.000.001
MATERIAL DESCRIPTION LL PL PI %<#40 %<#200 USCS
Project No. Client: Remarks:
Project:
Plate
Sample Number: Y1 @ 20Sample Number: Y1 @ 42Sample Number: Y1 @ 52
PLA
ST
ICIT
Y IN
DE
X
0
10
20
30
40
50
60
LIQUID LIMIT0 10 20 30 40 50 60 70 80 90 100 110
CL-ML
CL or OL
CH or OH
ML or OL MH or OH
Dashed line indicates the approximateupper limit boundary for natural soils
47
WA
TE
R C
ON
TE
NT
10
20
30
40
50
60
70
80
90
100
110
NUMBER OF BLOWS5 6 7 8 9 10 20 25 30 40
LIQUID AND PLASTIC LIMITS TEST REPORT
Candlestick Park - San Francisco,CA
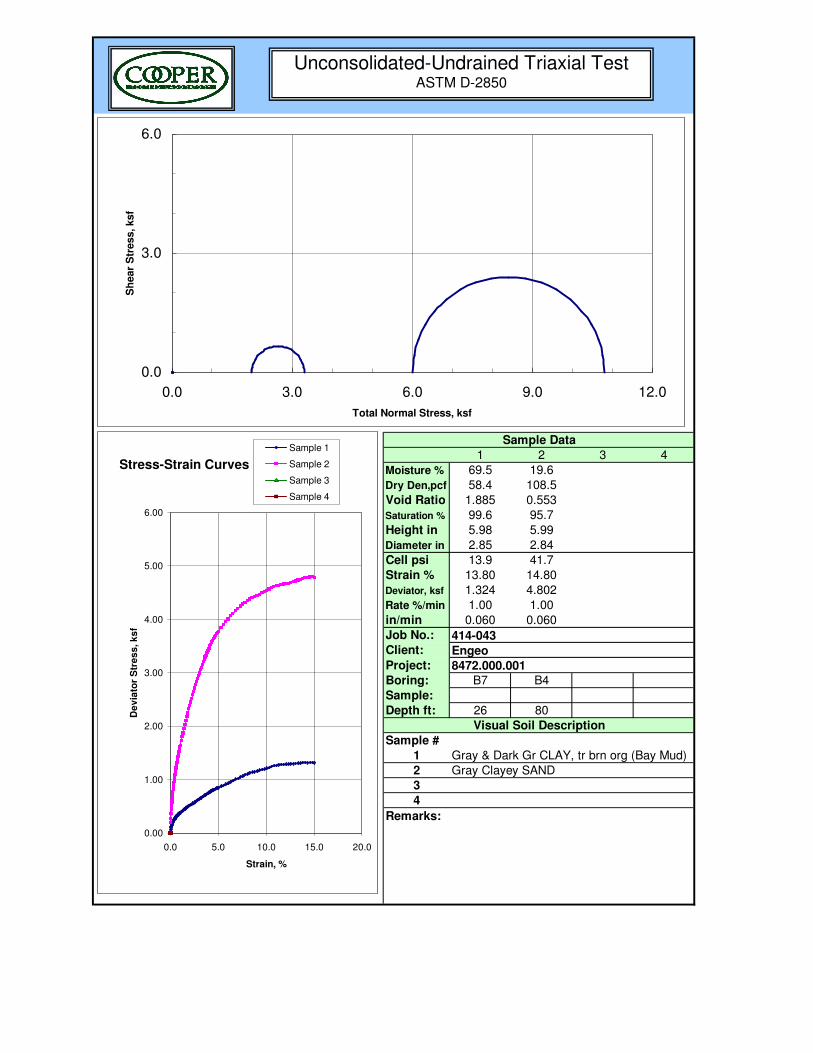
1 2 3 4
Moisture % 69.5 19.6
Dry Den,pcf 58.4 108.5
Void Ratio 1.885 0.553
Saturation % 99.6 95.7
Height in 5.98 5.99
Diameter in 2.85 2.84
Cell psi 13.9 41.7
Strain % 13.80 14.80
Deviator, ksf 1.324 4.802
Rate %/min 1.00 1.00
in/min 0.060 0.060
Job No.:
Client:
Project:
Boring: B7 B4
Sample:
Depth ft: 26 80
Sample #
1
2
3
4
Remarks:
Sample Data
Visual Soil Description
Gray & Dark Gr CLAY, tr brn org (Bay Mud)
Gray Clayey SAND
414-043
Engeo
8472.000.001
0.0
3.0
6.0
0.0 3.0 6.0 9.0 12.0
Total Normal Stress, ksf
Sh
ear
Str
ess, ksf
Stress-Strain Curves
0.00
1.00
2.00
3.00
4.00
5.00
6.00
0.0 5.0 10.0 15.0 20.0
Strain, %
De
via
tor
Str
es
s, k
sf
Sample 1
Sample 2
Sample 3
Sample 4
Unconsolidated-Undrained Triaxial TestASTM D-2850
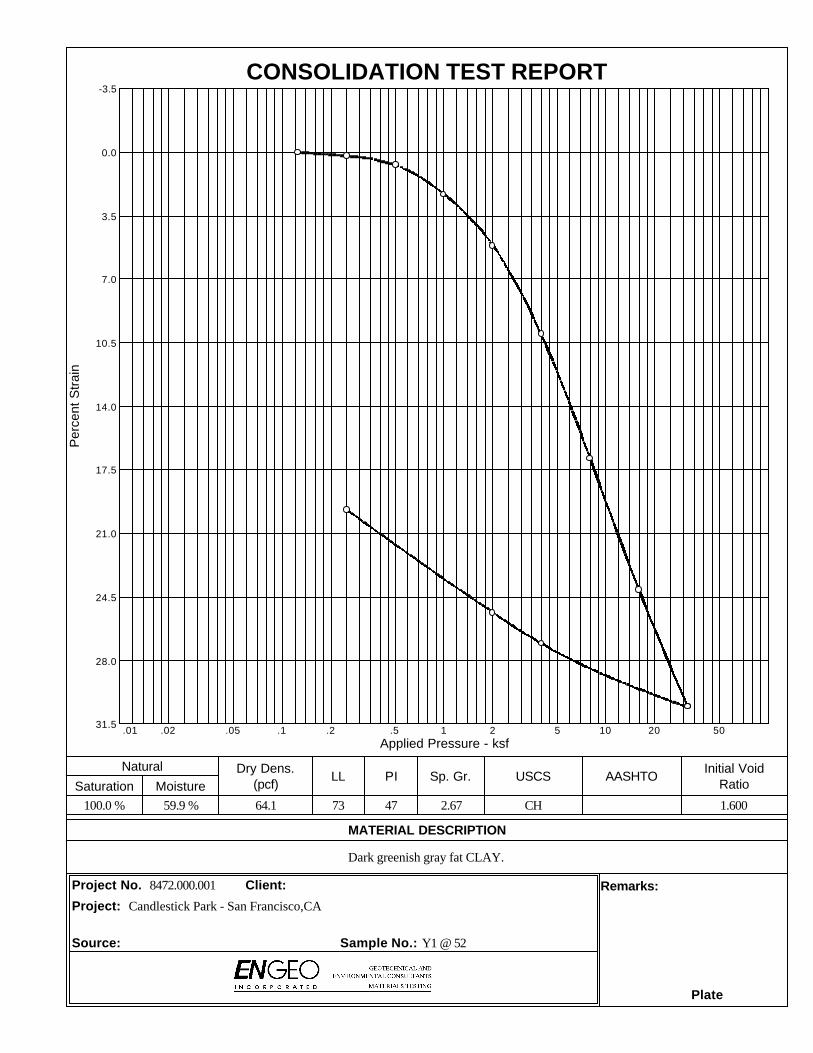
RatioMoistureSaturation
Initial VoidAASHTOUSCSSp. Gr.PILL
Dry Dens.Natural
Project:
Remarks:Client:Project No.
MATERIAL DESCRIPTION
CONSOLIDATION TEST REPORT
.01 .02 .05 .1 .2 .5 1 2 5 10 20 5031.5
28.0
24.5
21.0
17.5
14.0
10.5
7.0
3.5
0.0
-3.5
Pe
rce
nt
Str
ain
Applied Pressure - ksf
(pcf)
Candlestick Park - San Francisco,CA
8472.000.001
Dark greenish gray fat CLAY.
1.600CH2.67477364.159.9 %100.0 %
Plate
Source: Sample No.: Y1 @ 52
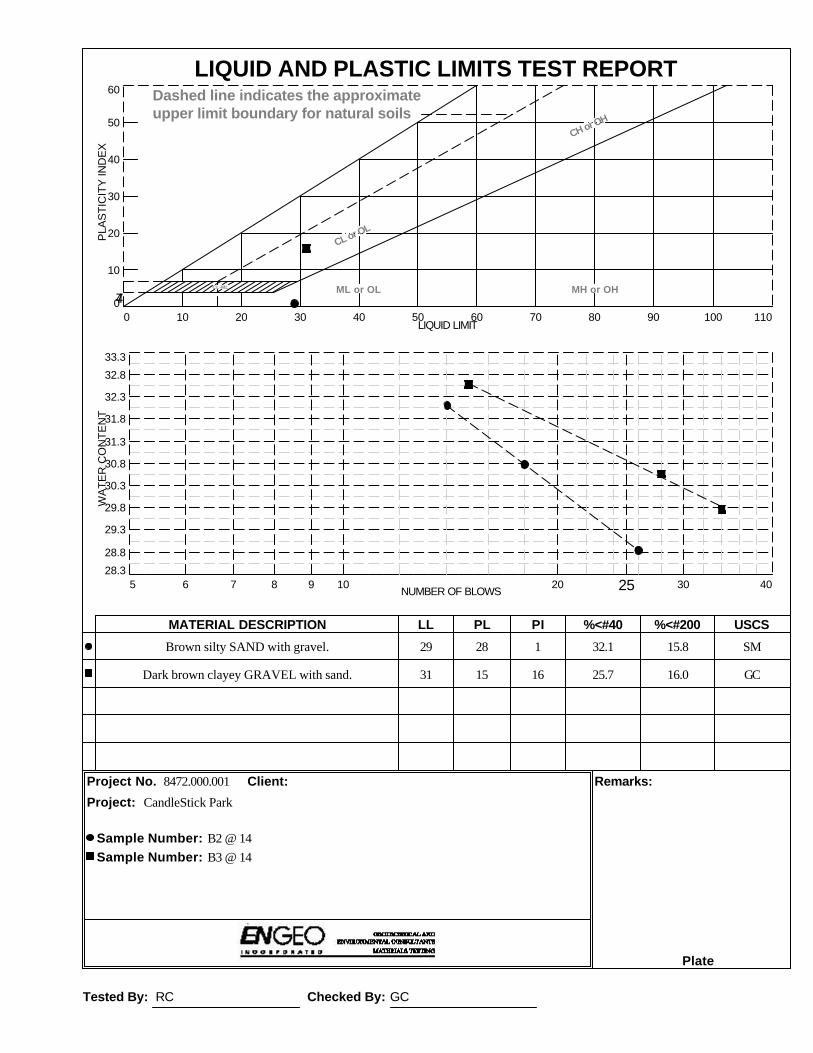
Tested By: RC Checked By: GC
Brown silty SAND with gravel. 29 28 1 32.1 15.8 SM
Dark brown clayey GRAVEL with sand. 31 15 16 25.7 16.0 GC
8472.000.001
MATERIAL DESCRIPTION LL PL PI %<#40 %<#200 USCS
Project No. Client: Remarks:
Project:
Plate
Sample Number: B2 @ 14Sample Number: B3 @ 14
PLA
ST
ICIT
Y IN
DE
X
0
10
20
30
40
50
60
LIQUID LIMIT0 10 20 30 40 50 60 70 80 90 100 110
CL-ML
CL or OL
CH or OH
ML or OL MH or OH
Dashed line indicates the approximateupper limit boundary for natural soils
47
WA
TE
R C
ON
TE
NT
28.3
28.8
29.3
29.8
30.3
30.8
31.3
31.8
32.3
32.8
33.3
NUMBER OF BLOWS5 6 7 8 9 10 20 25 30 40
LIQUID AND PLASTIC LIMITS TEST REPORT
CandleStick Park
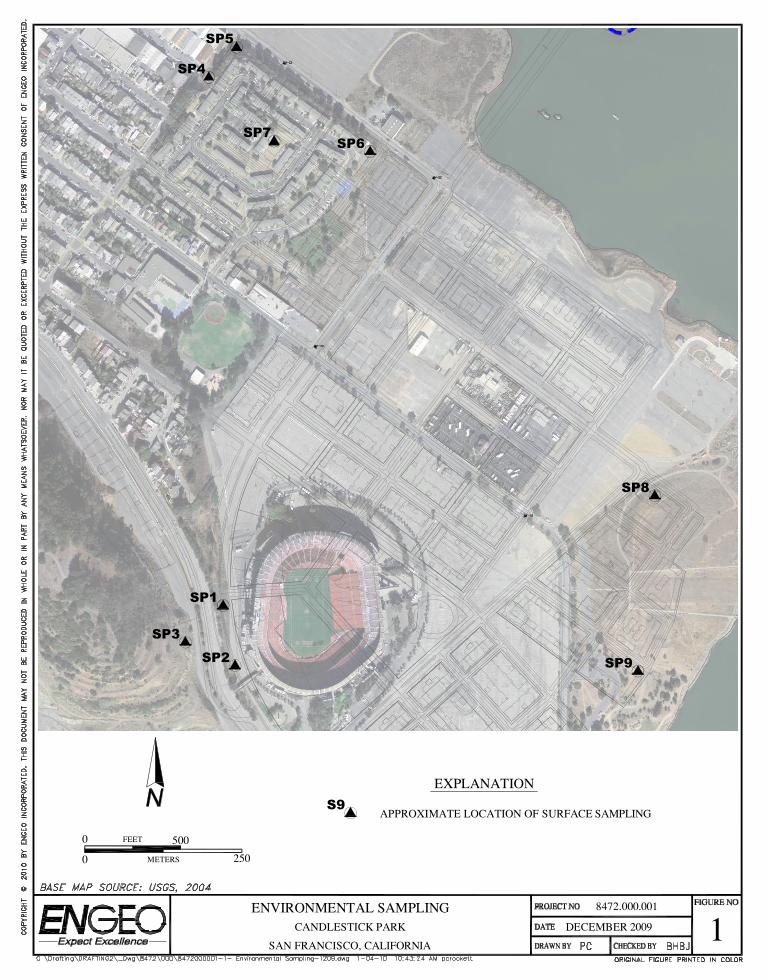
SP6
SP1
SP2
SP8
SP3
SP9
SP7
SP5
SP4
S9
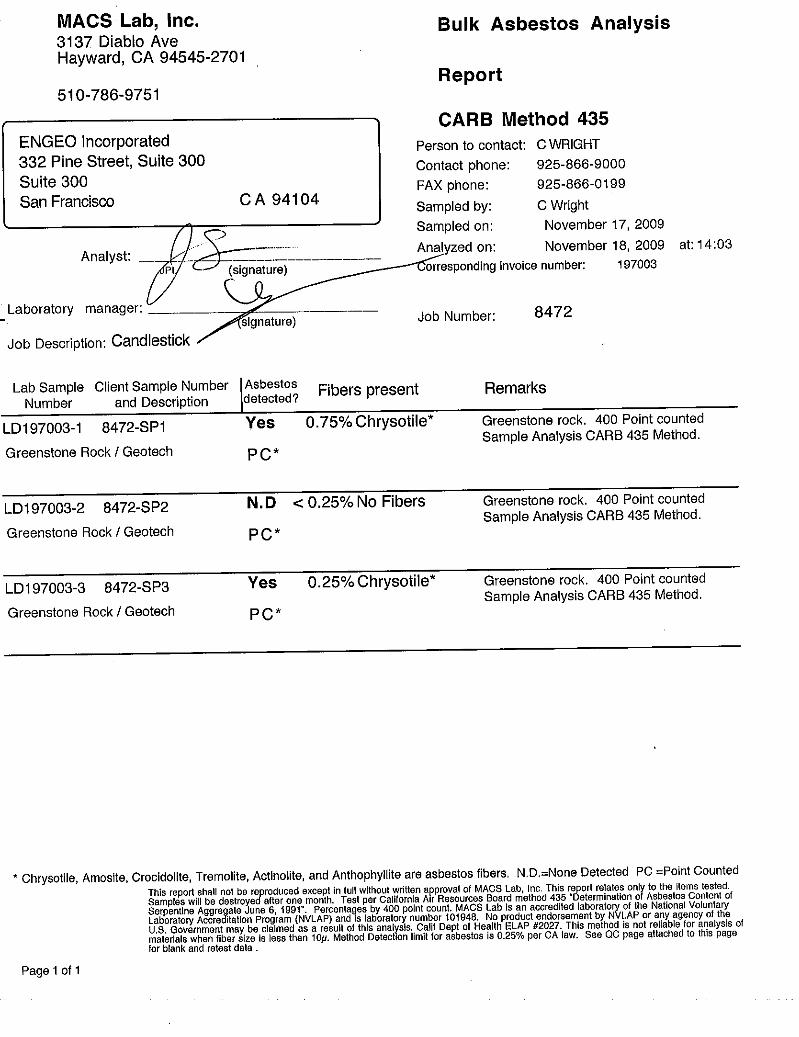
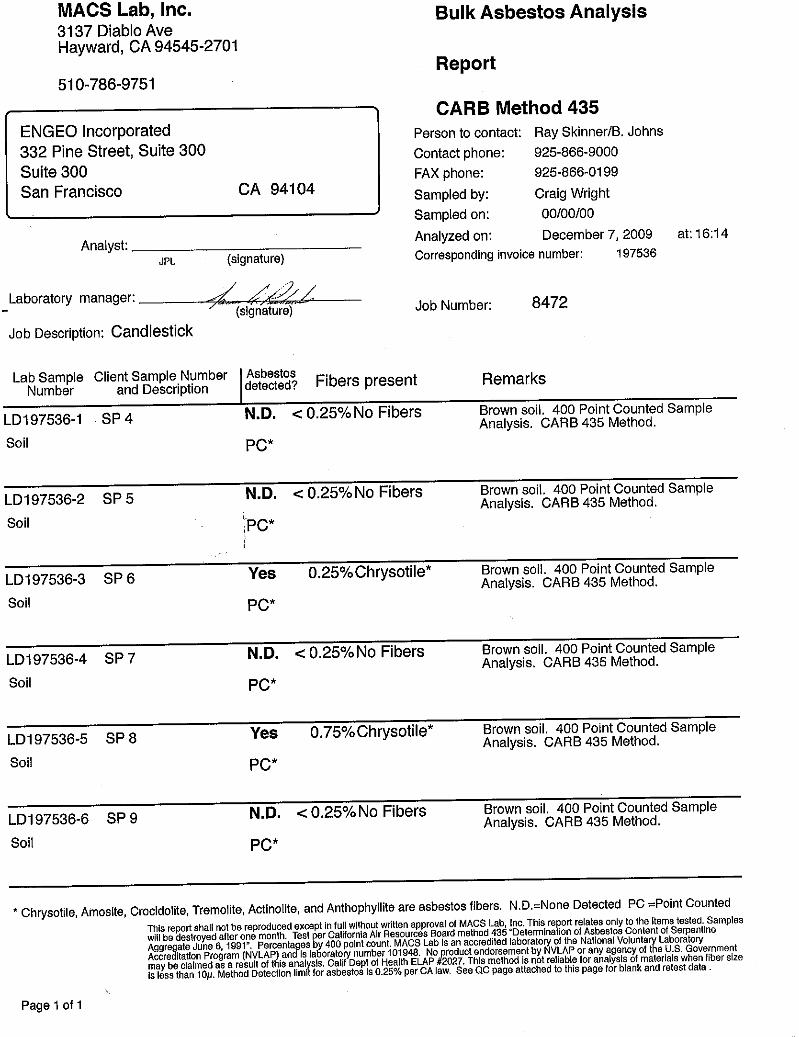
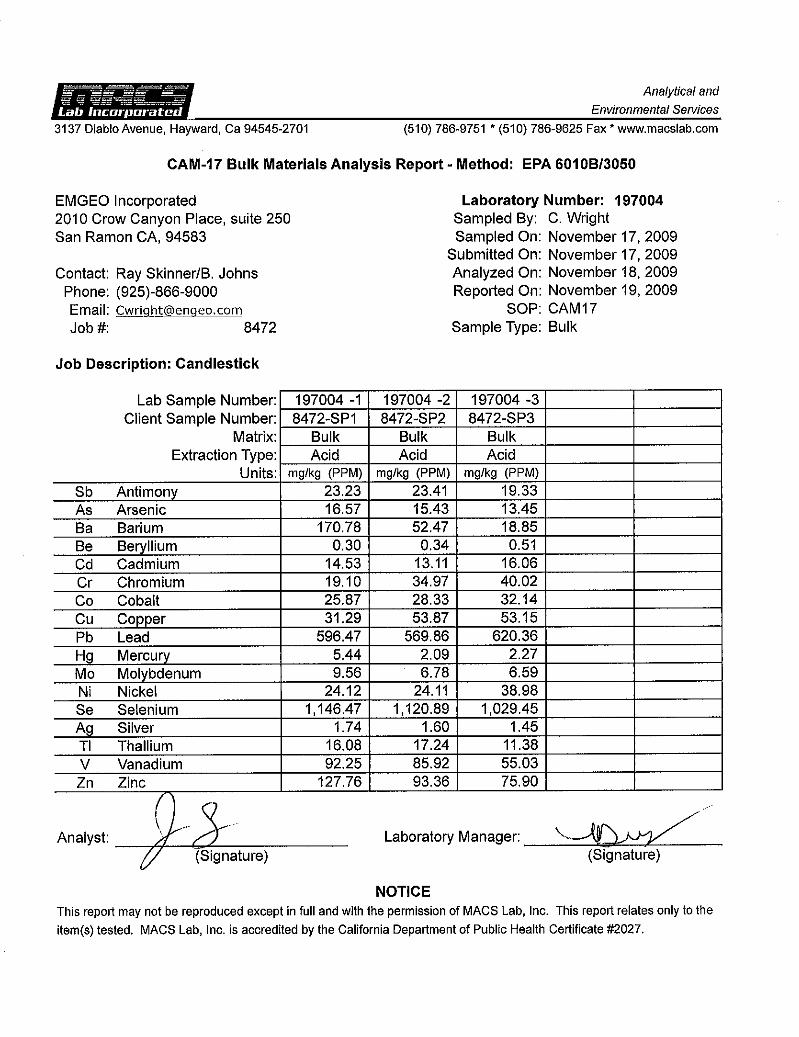
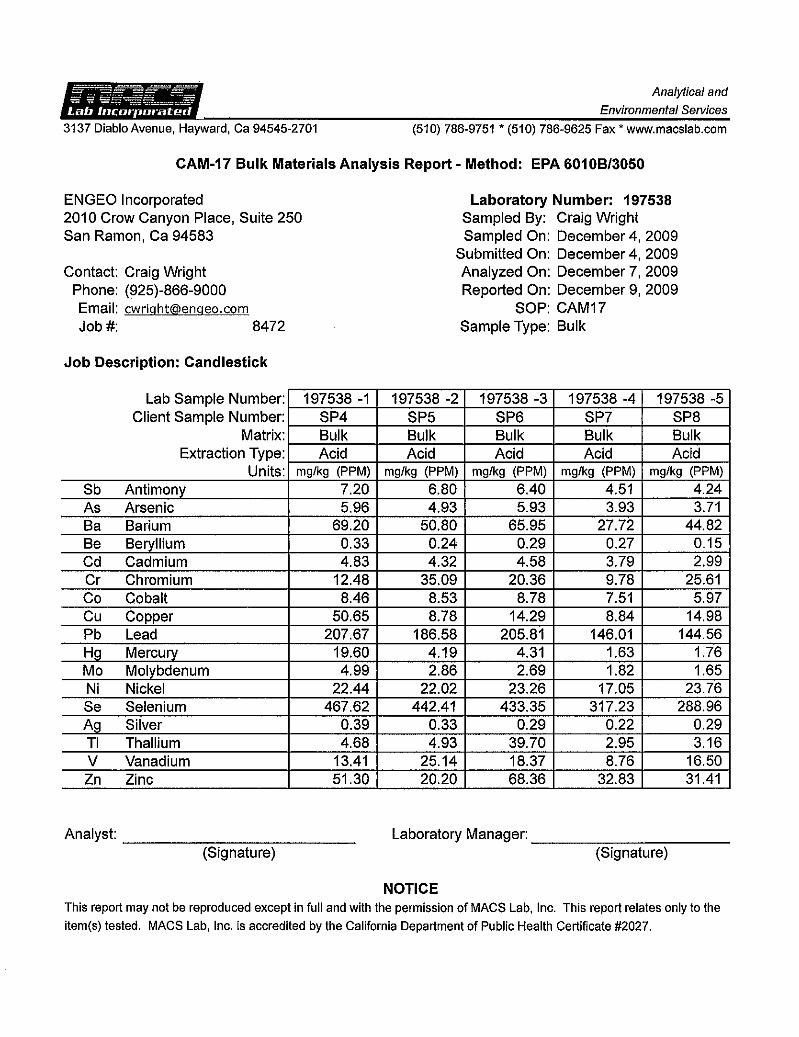
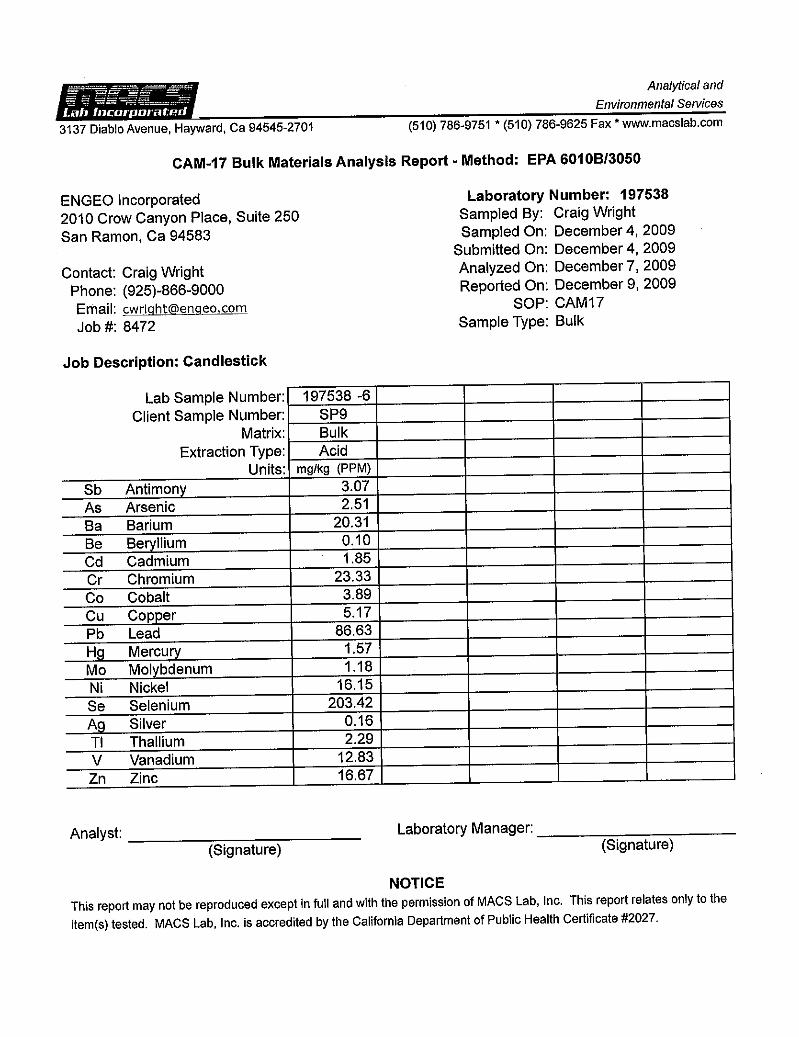
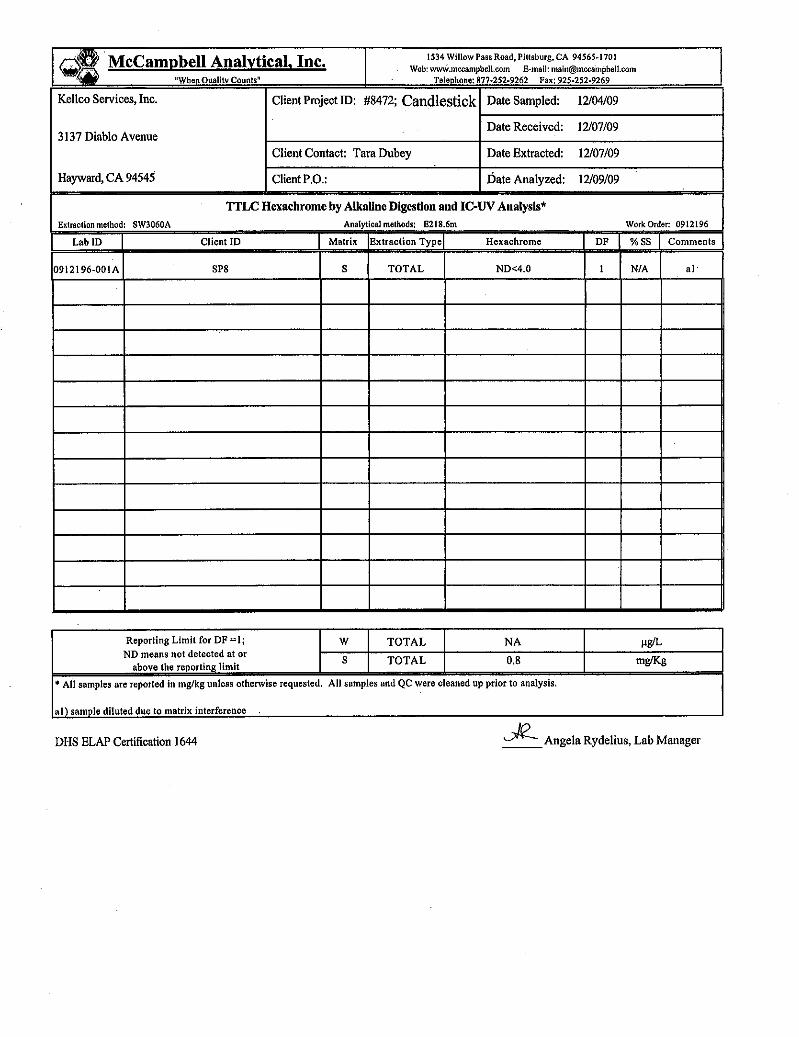
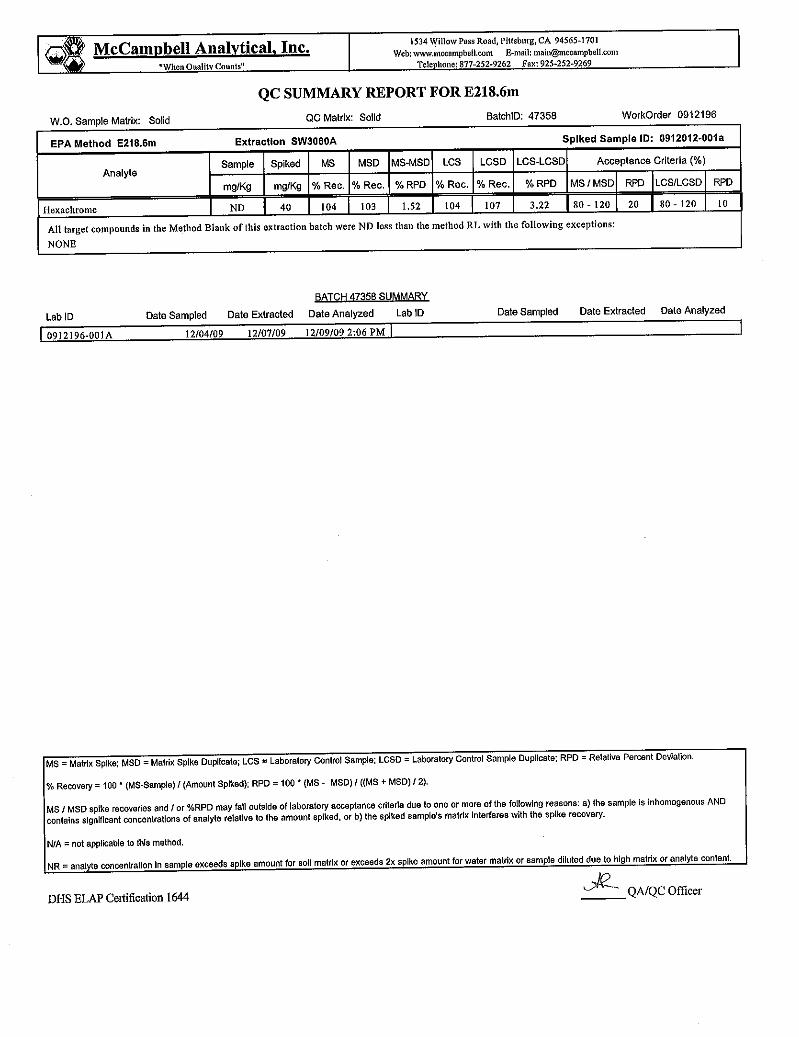
APPENDIX D
APPENDIX D – Previous Explorations (Other Consultants)
APPENDIX
D
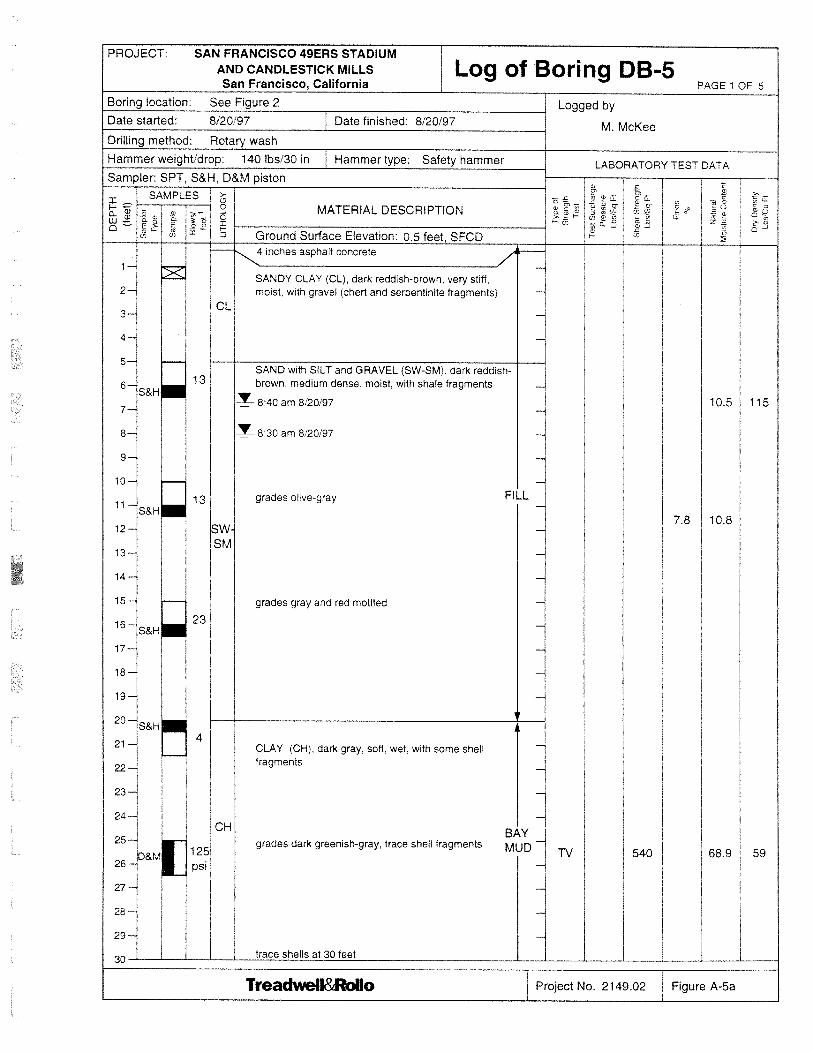
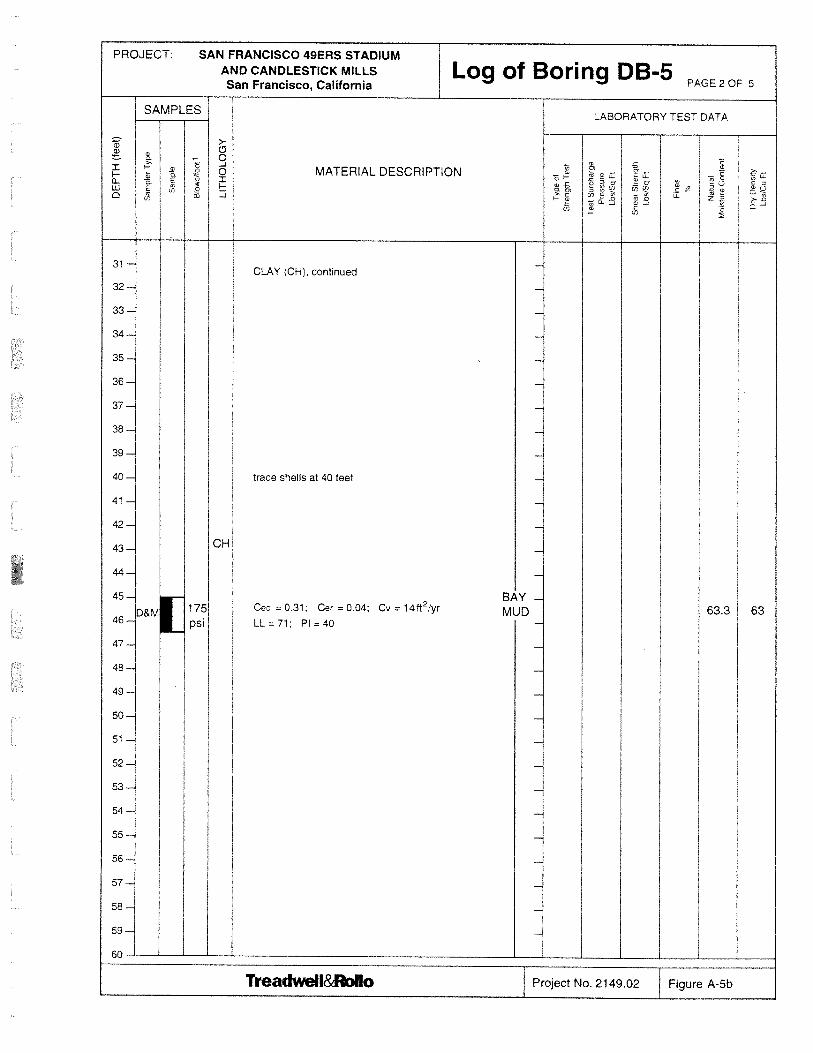
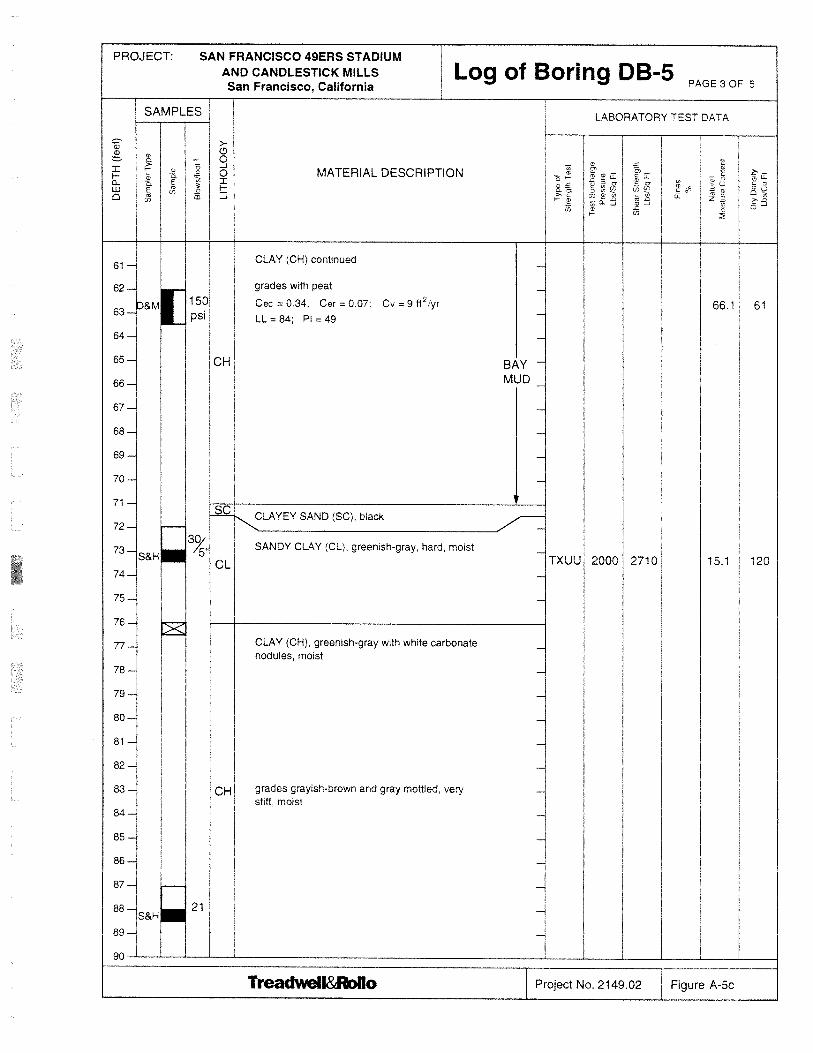
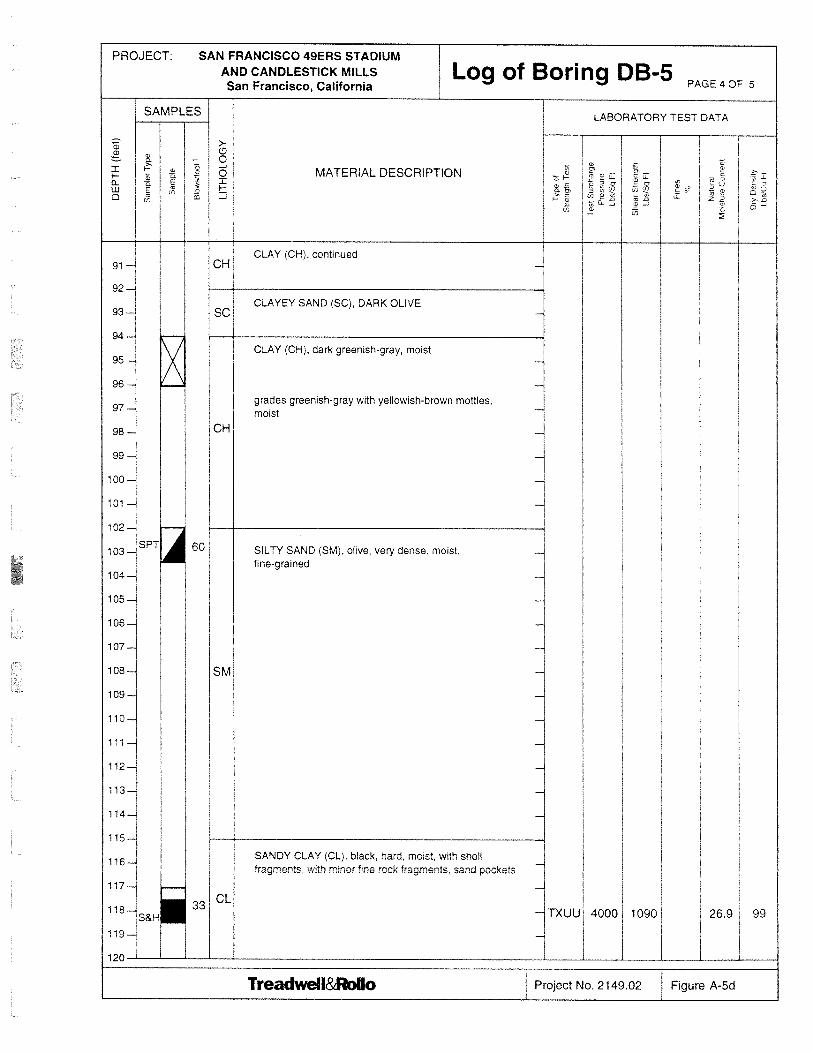

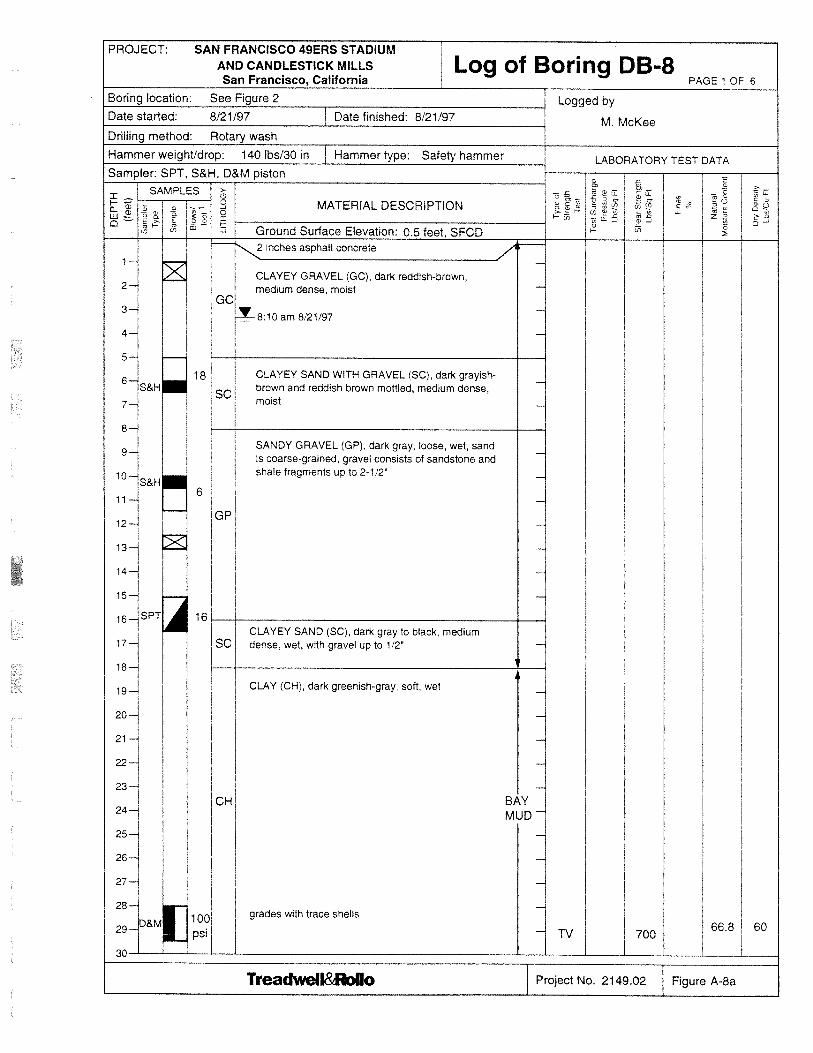
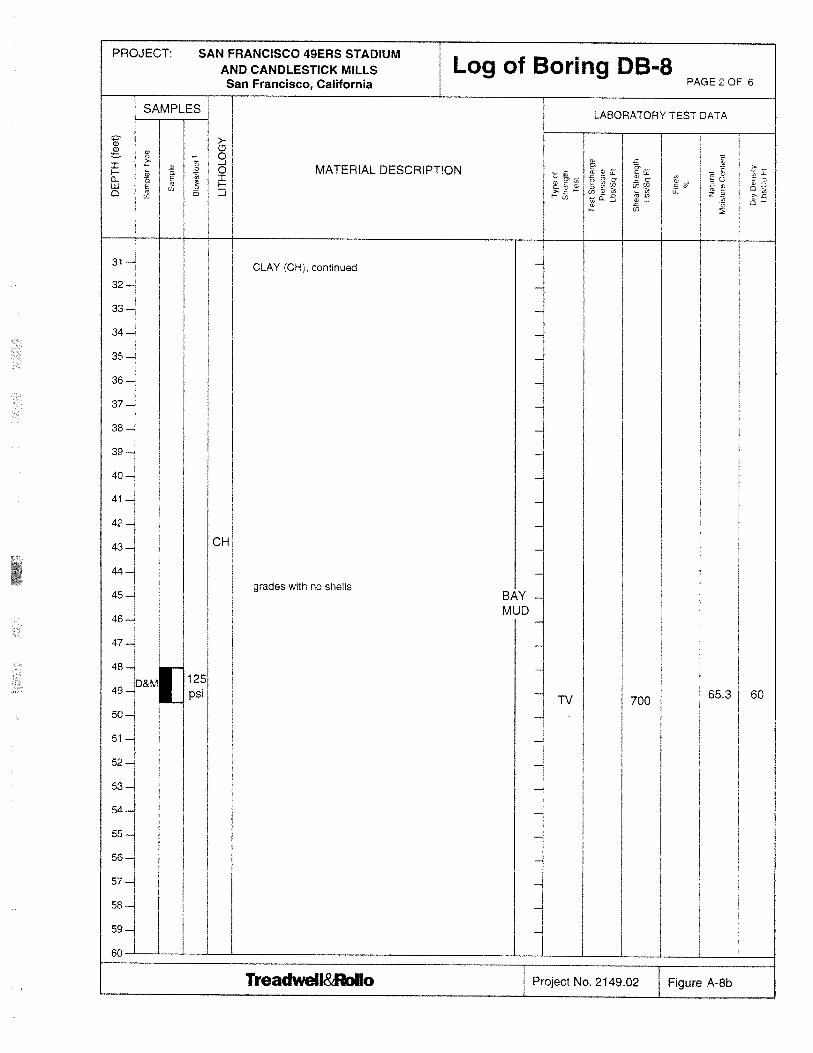
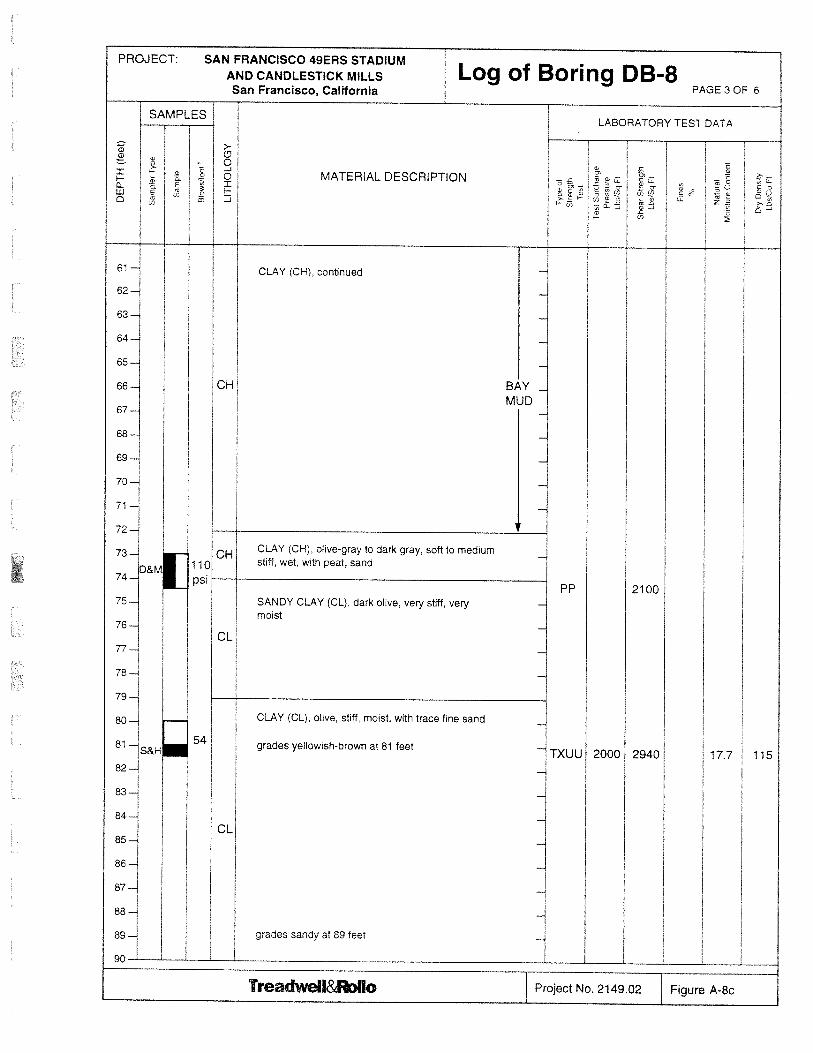
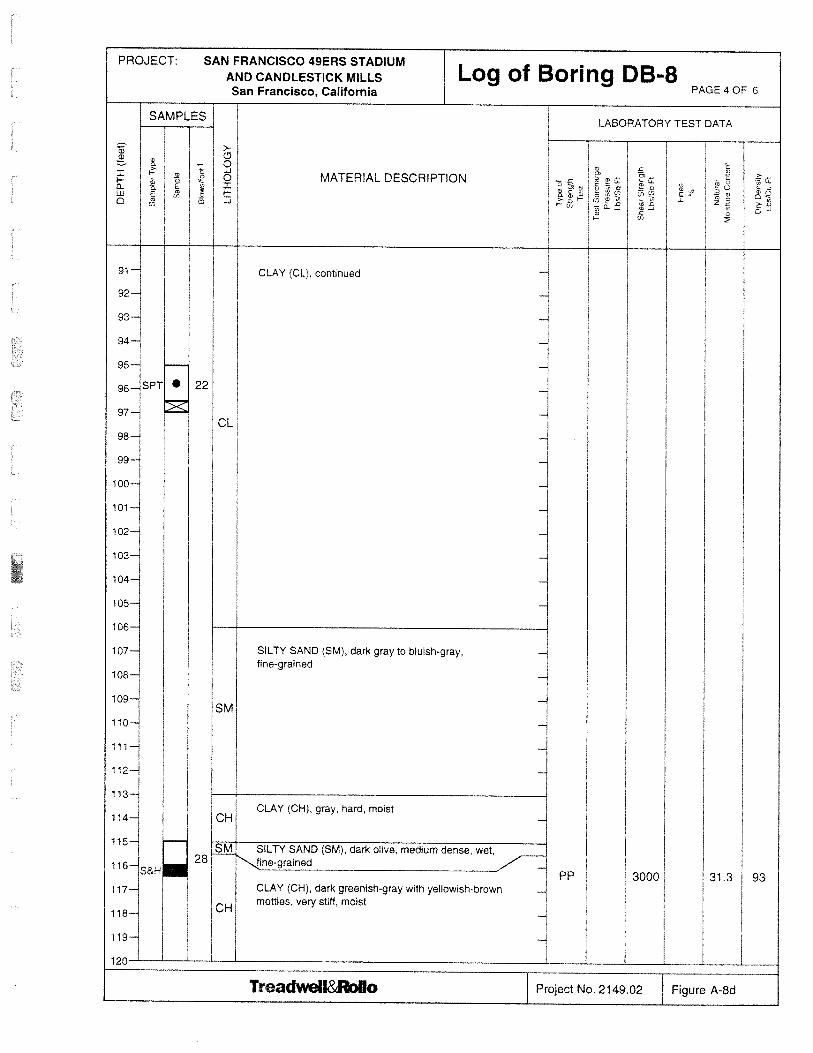
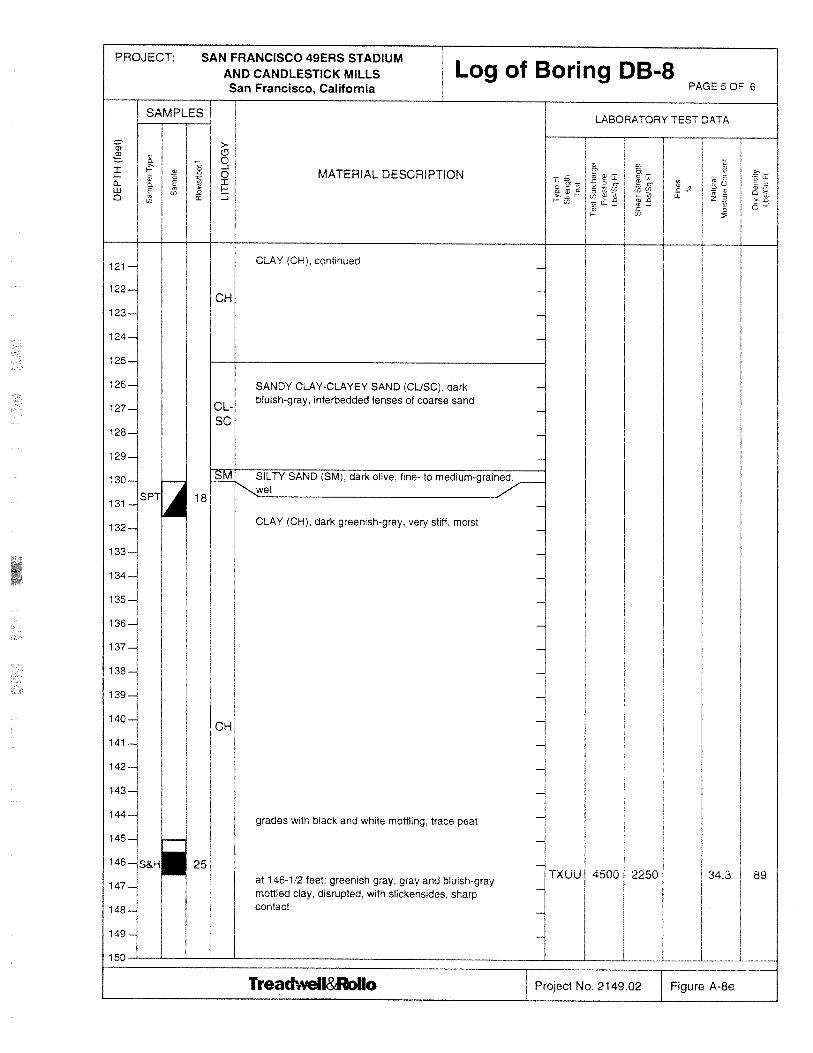
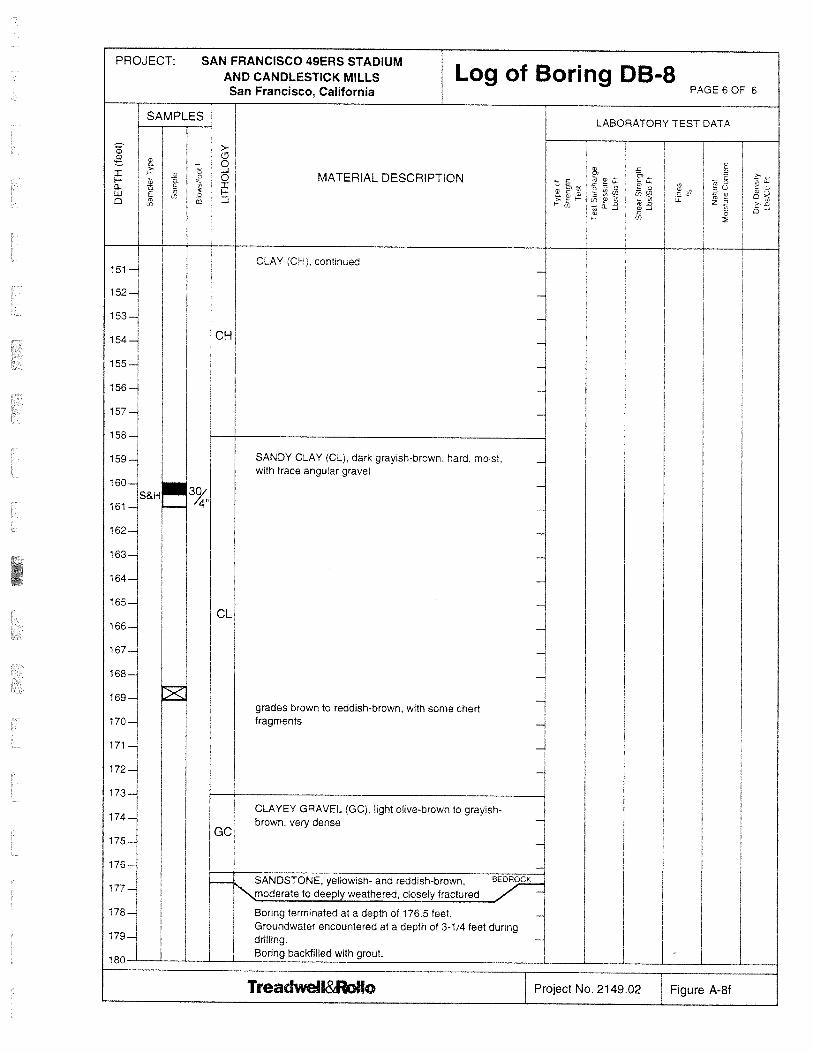
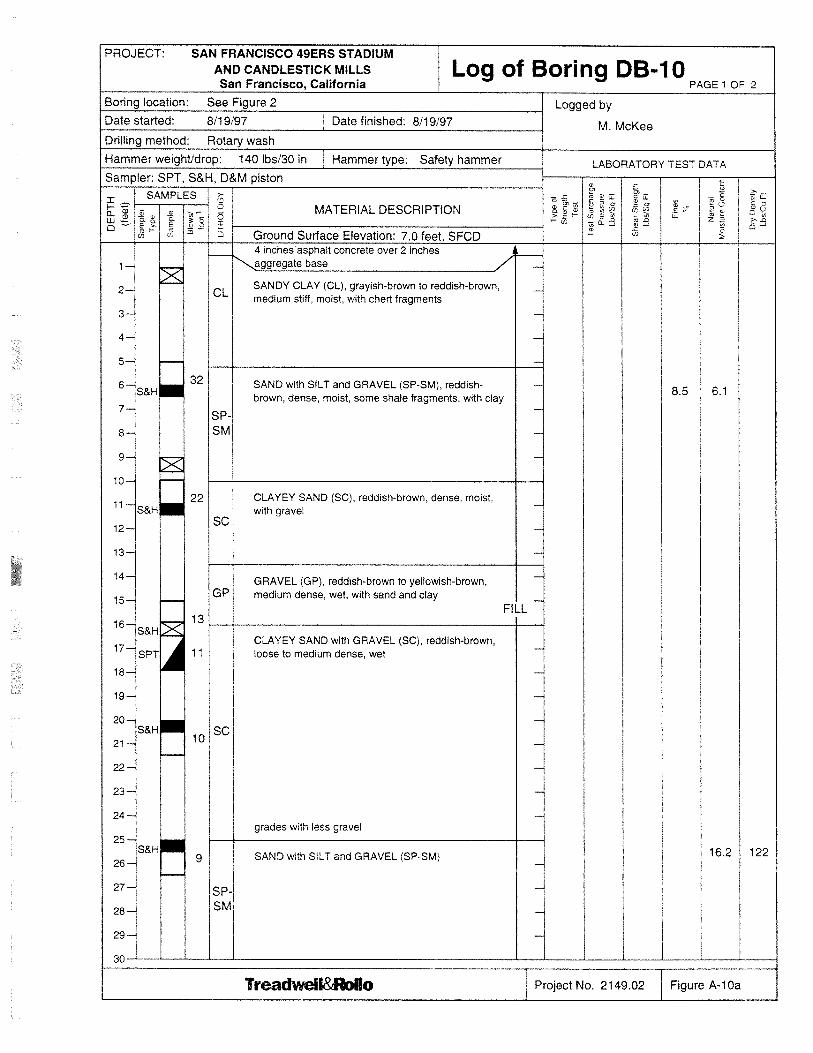
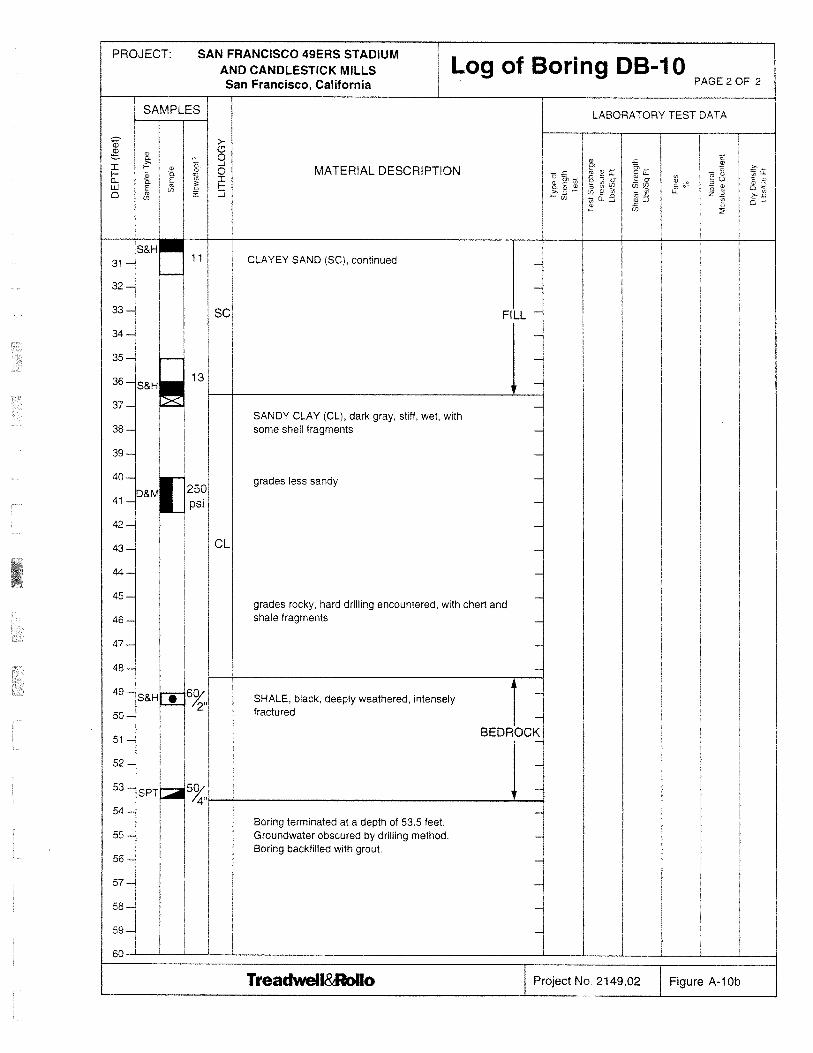
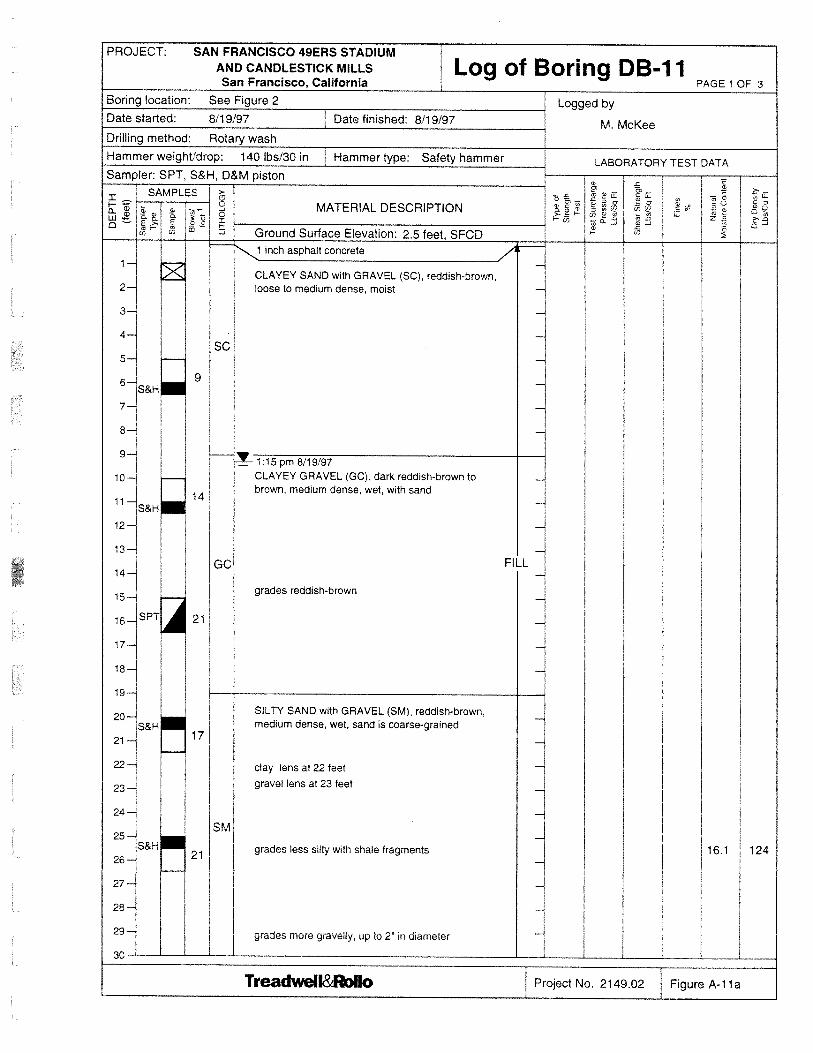
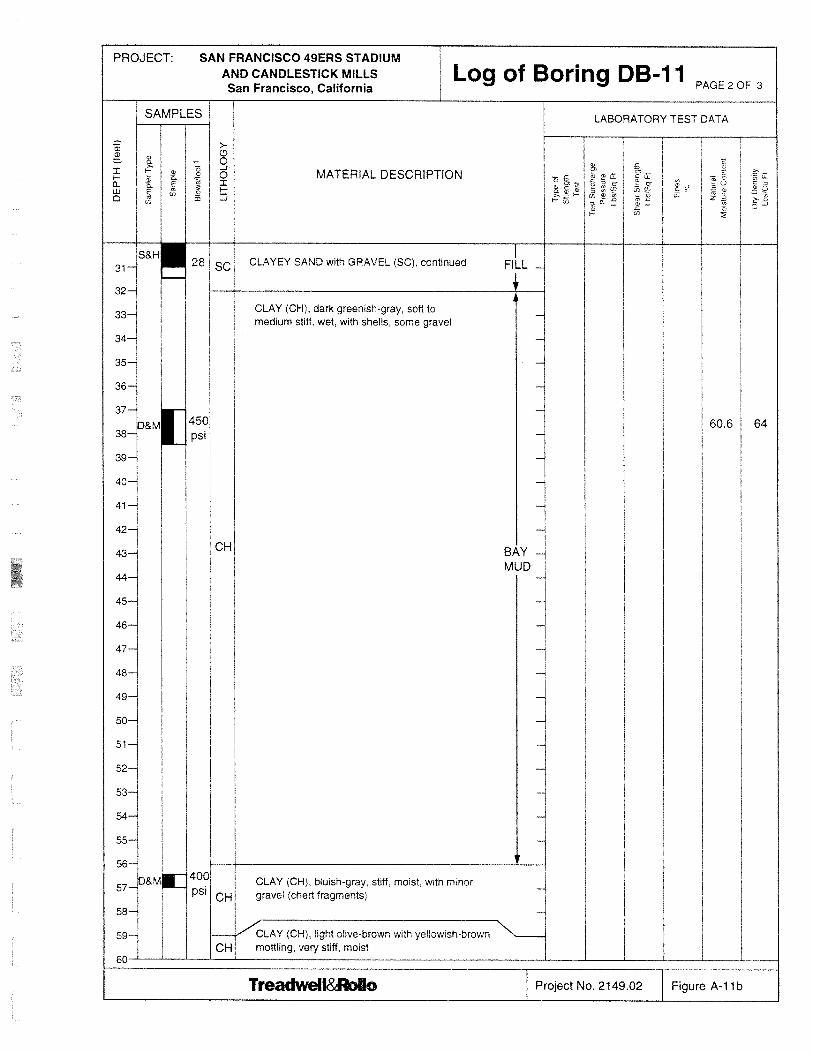
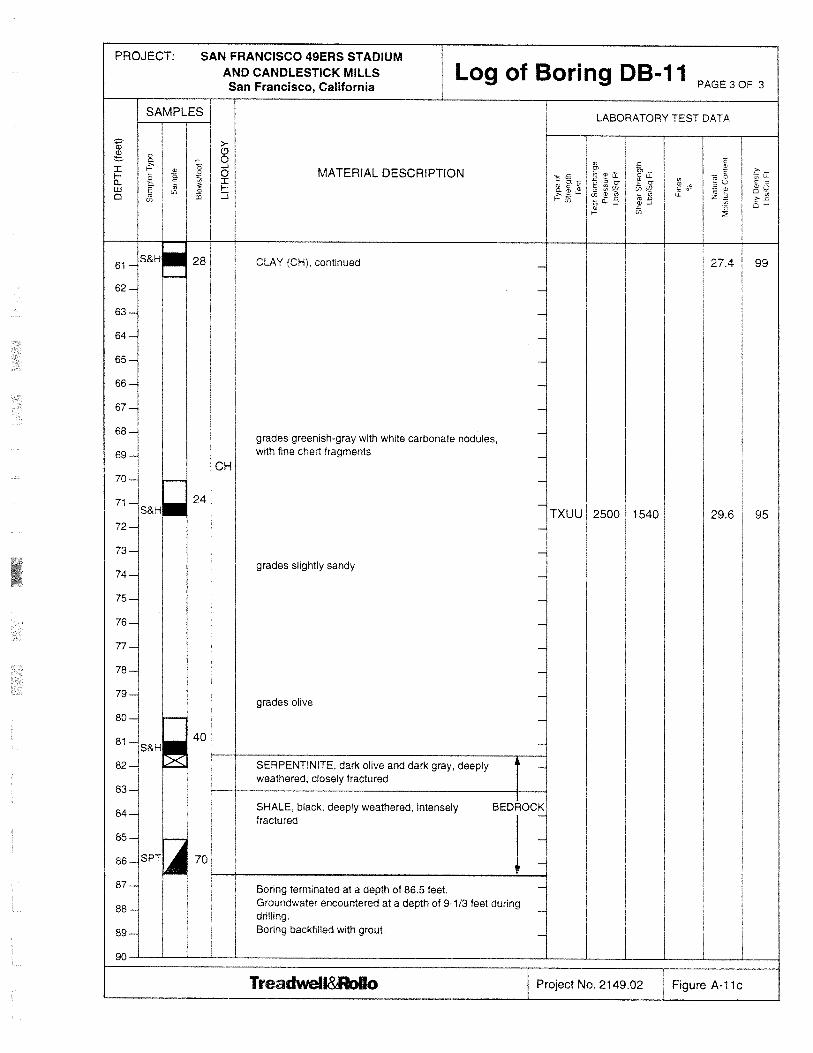
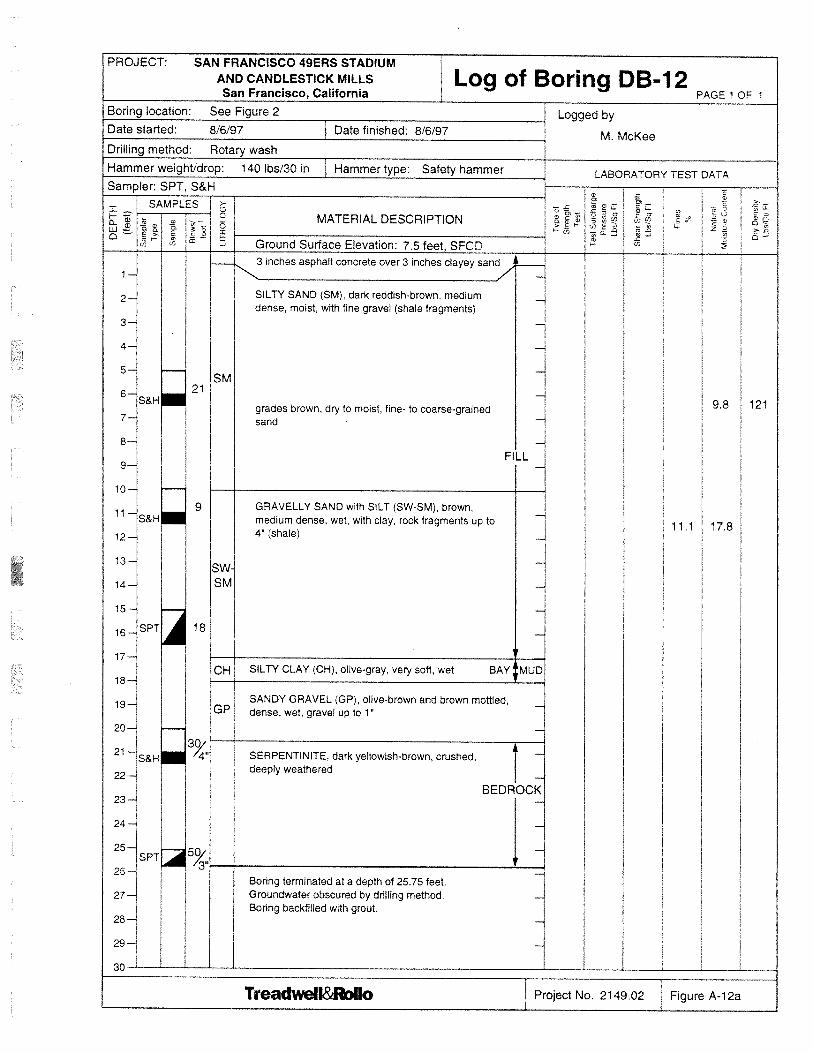
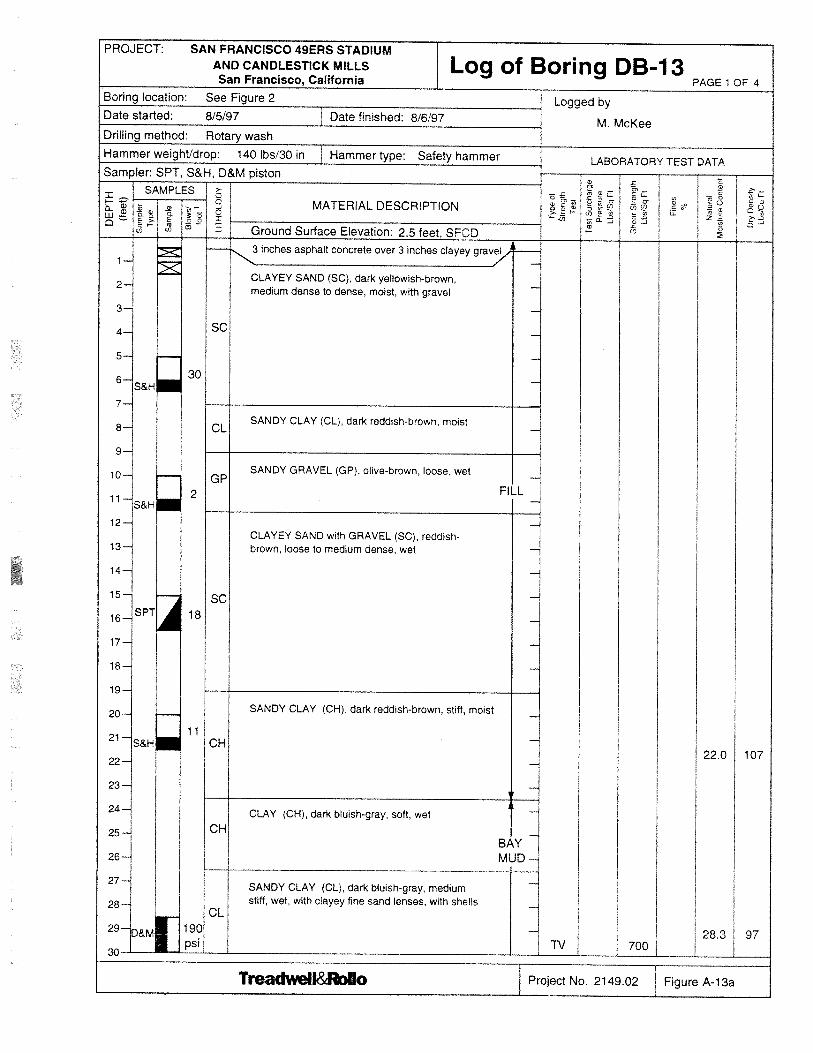
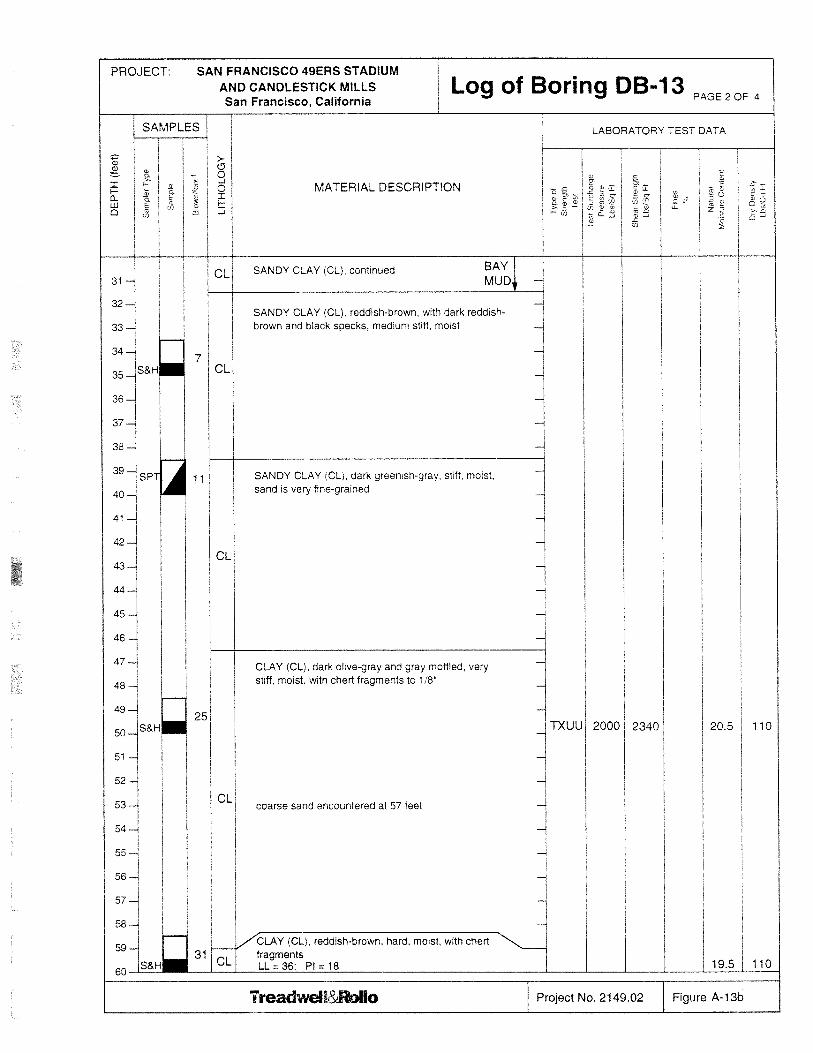
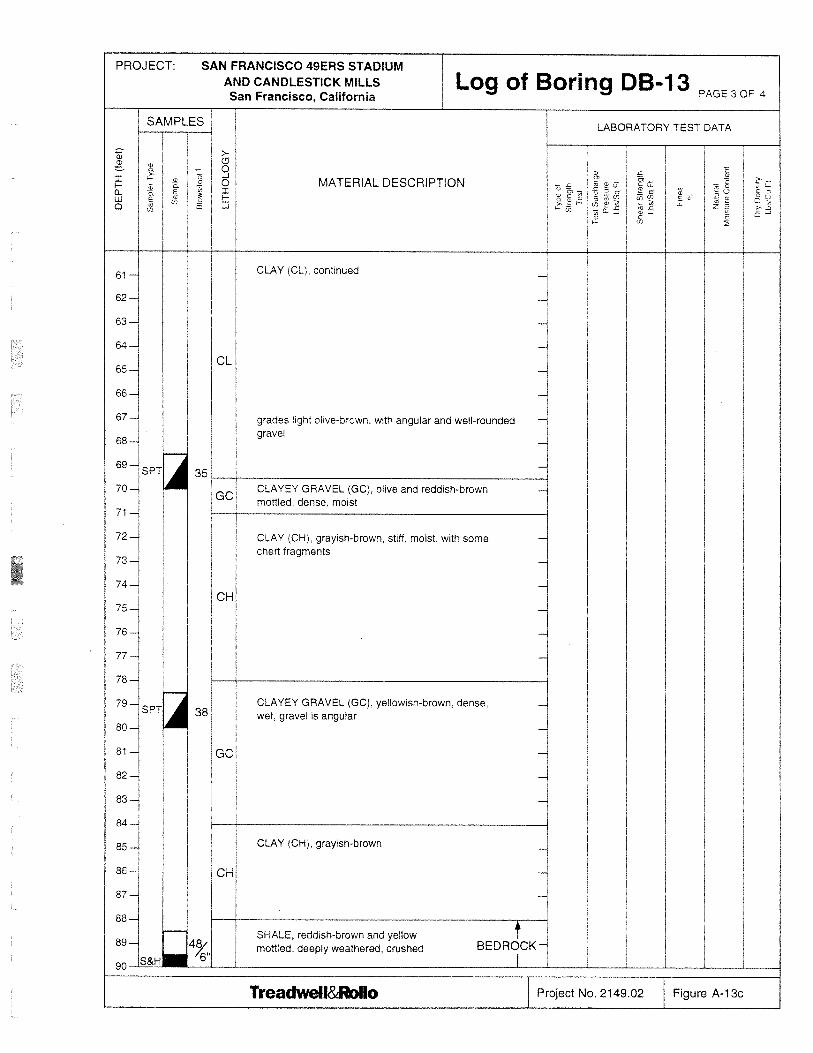
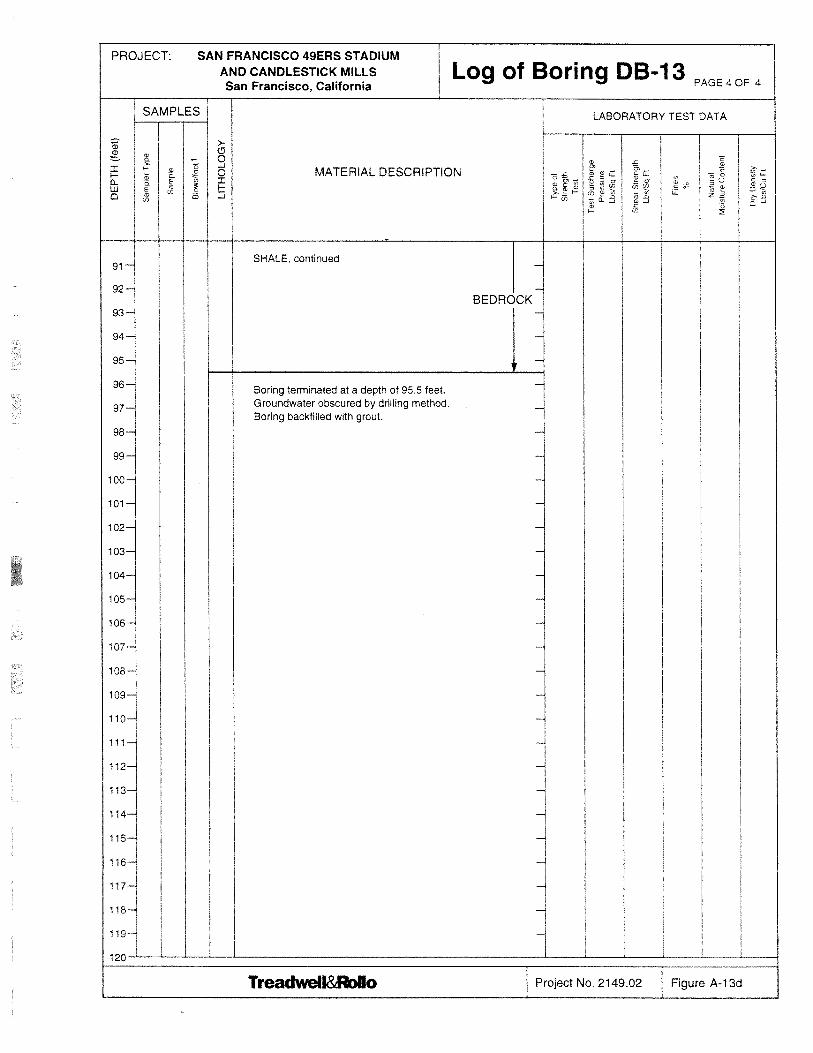
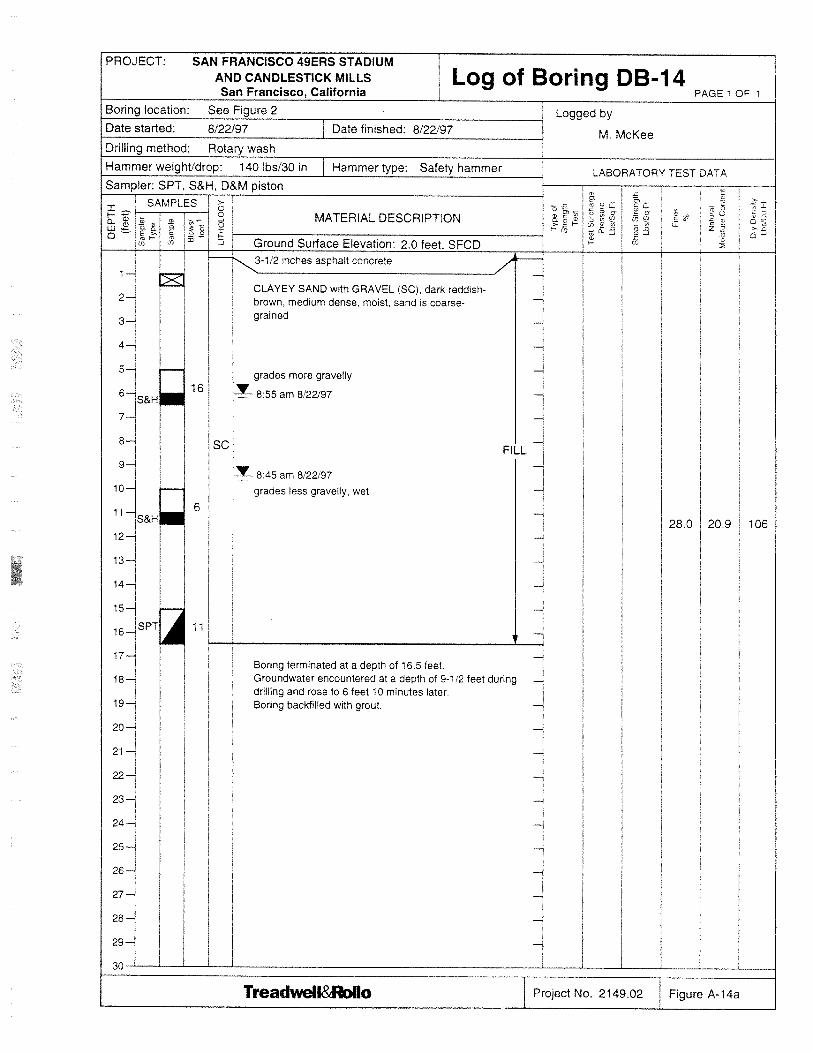
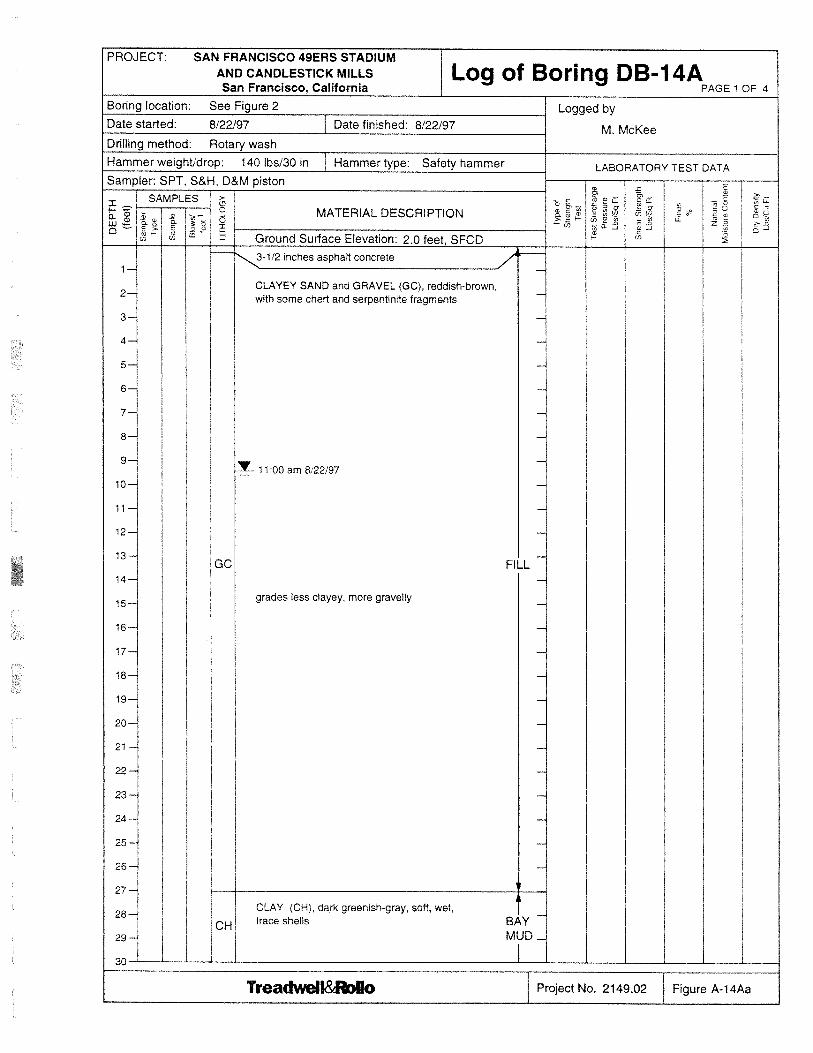
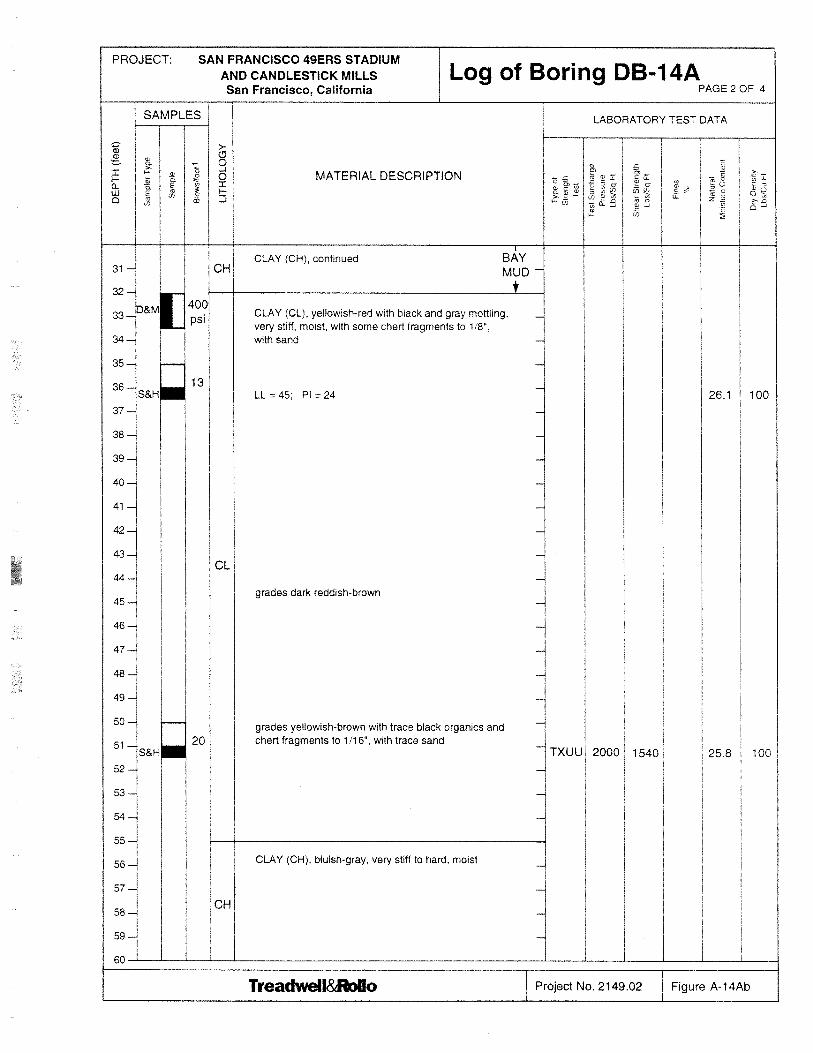
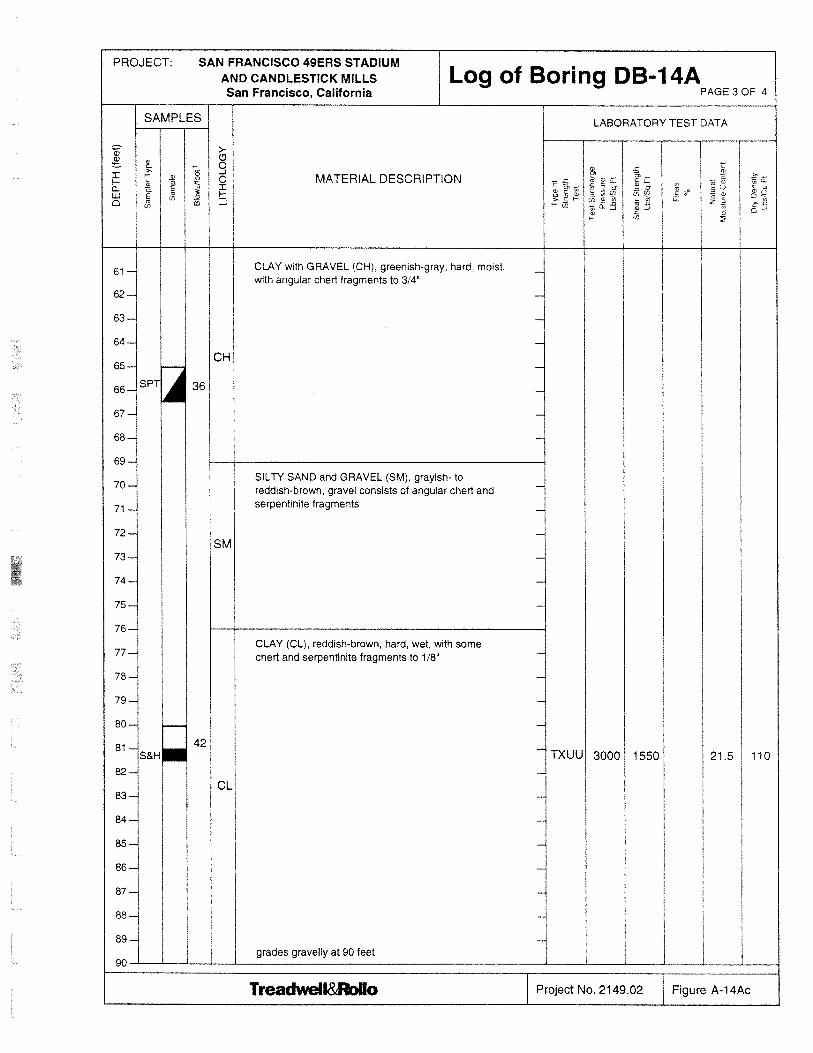
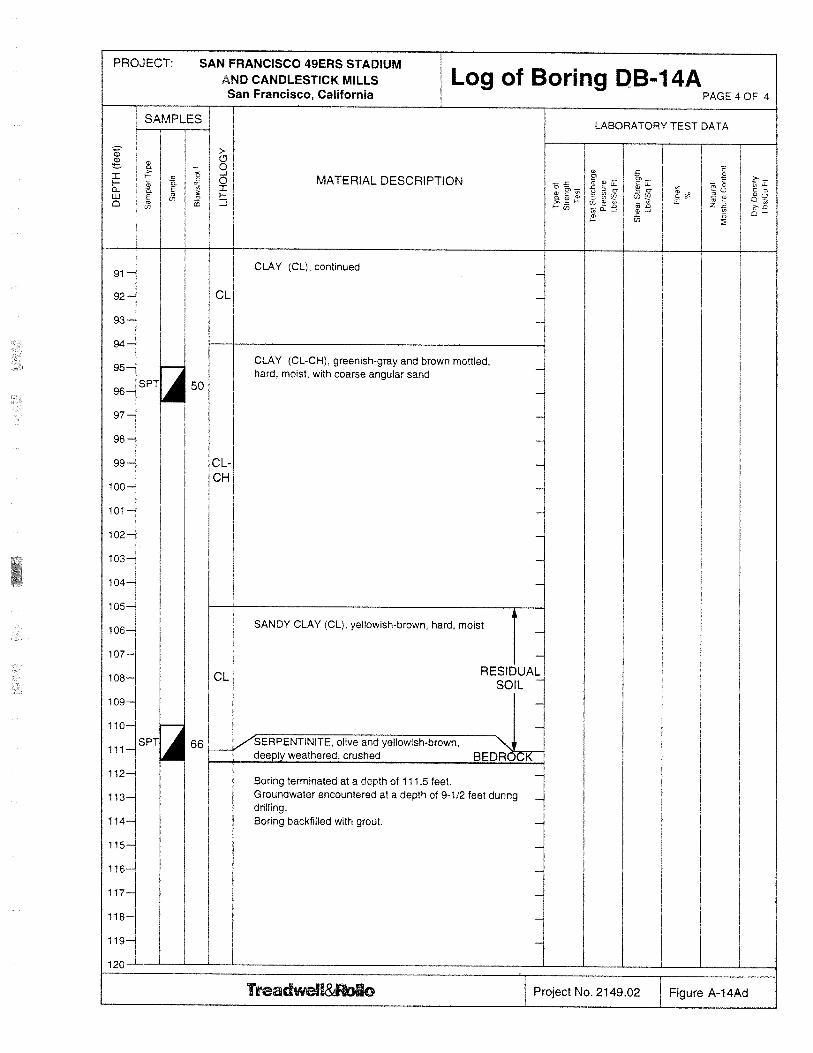
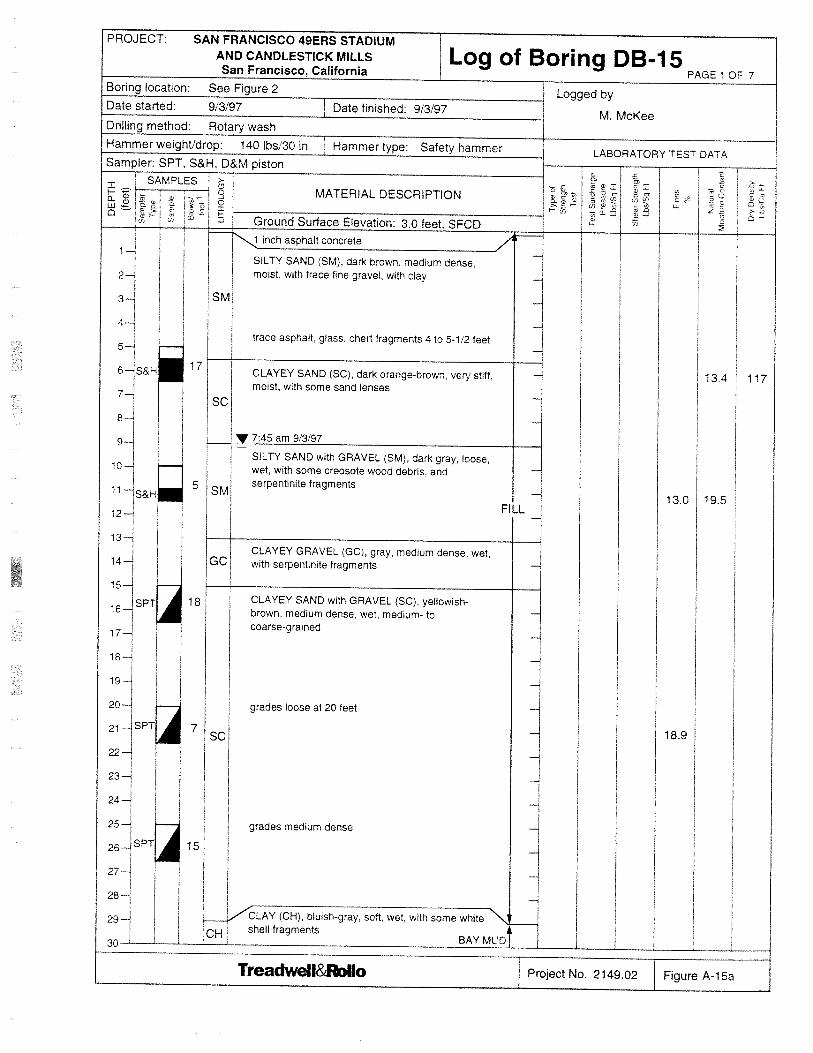
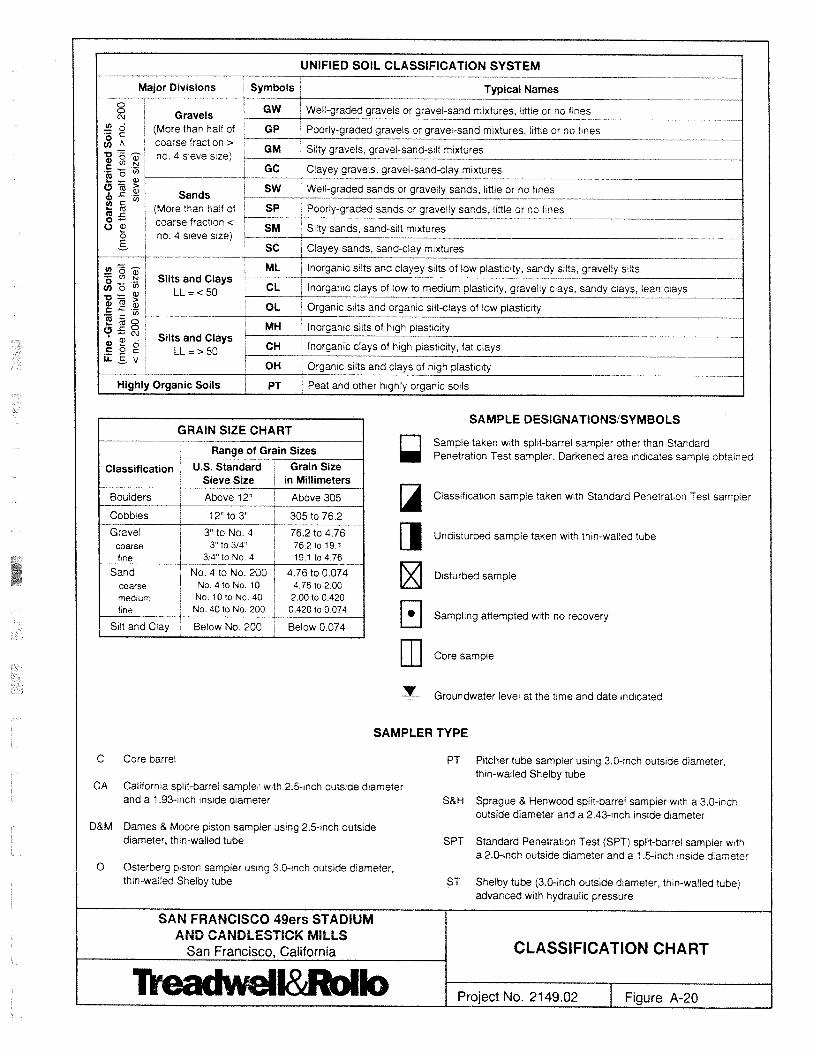
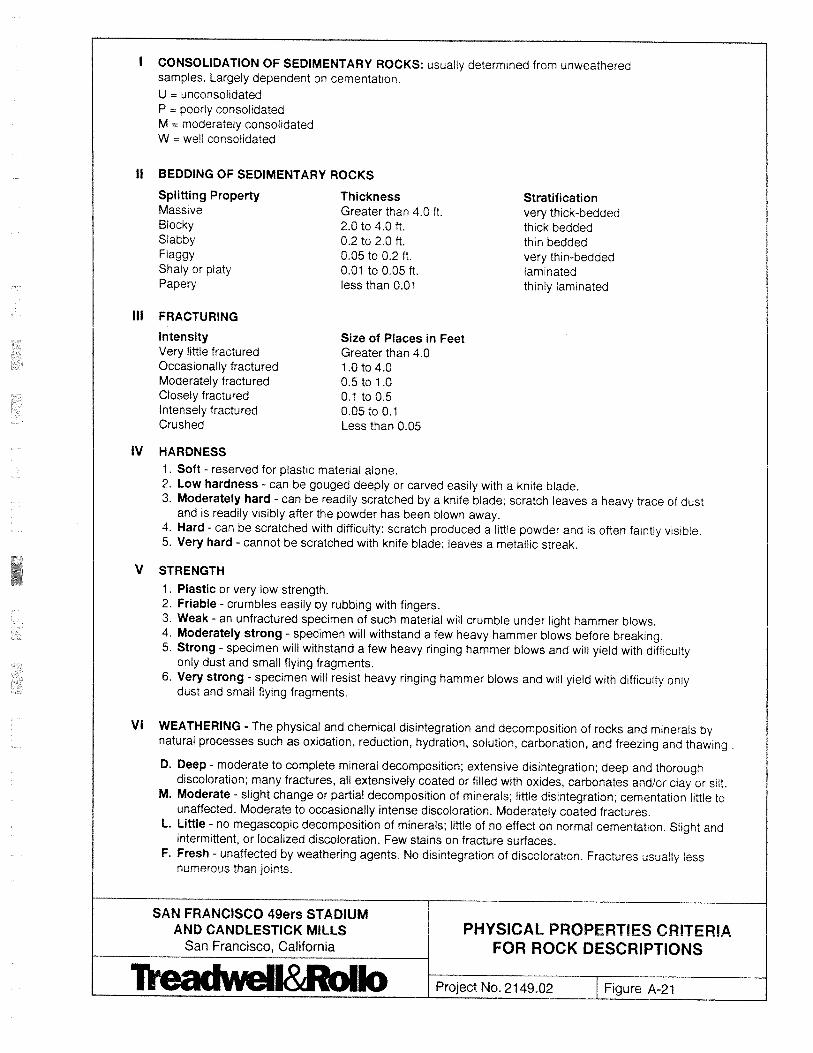
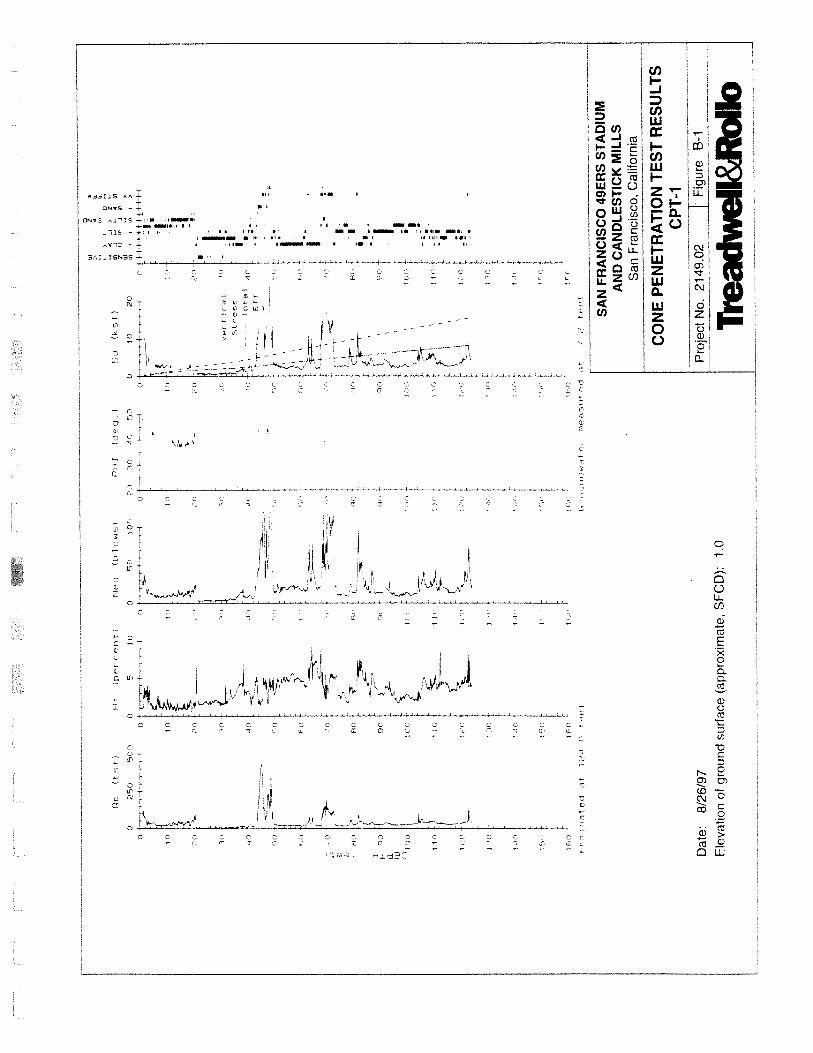
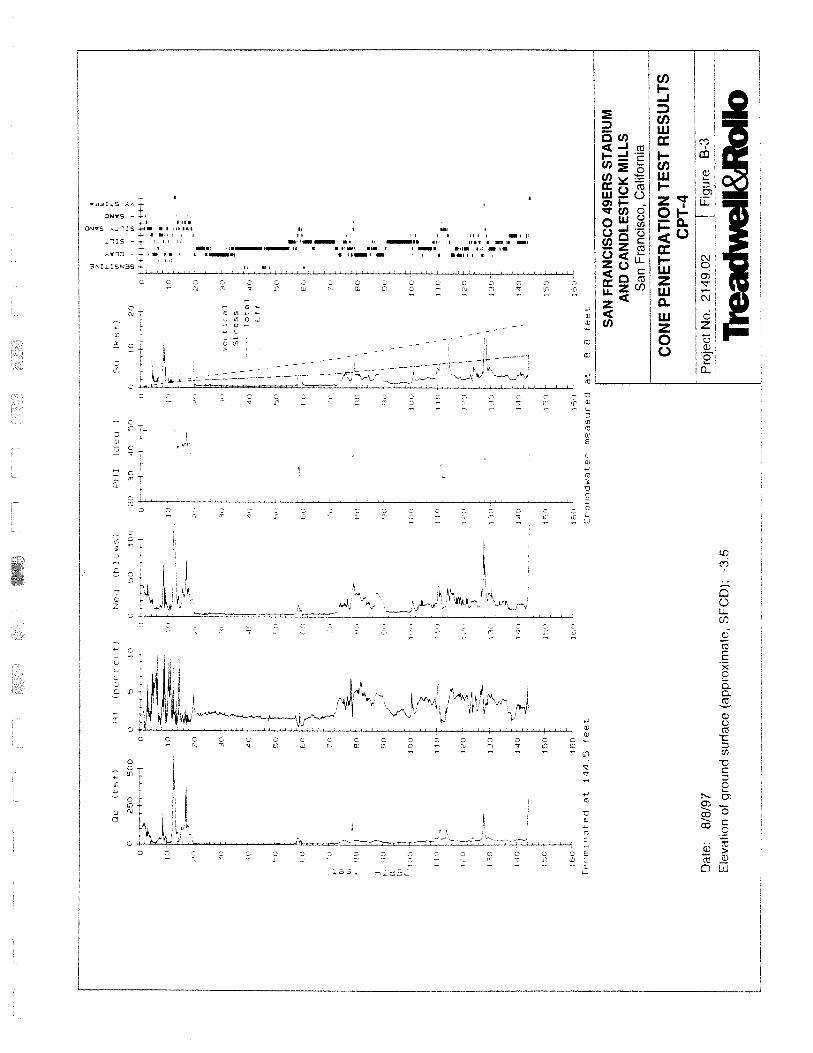
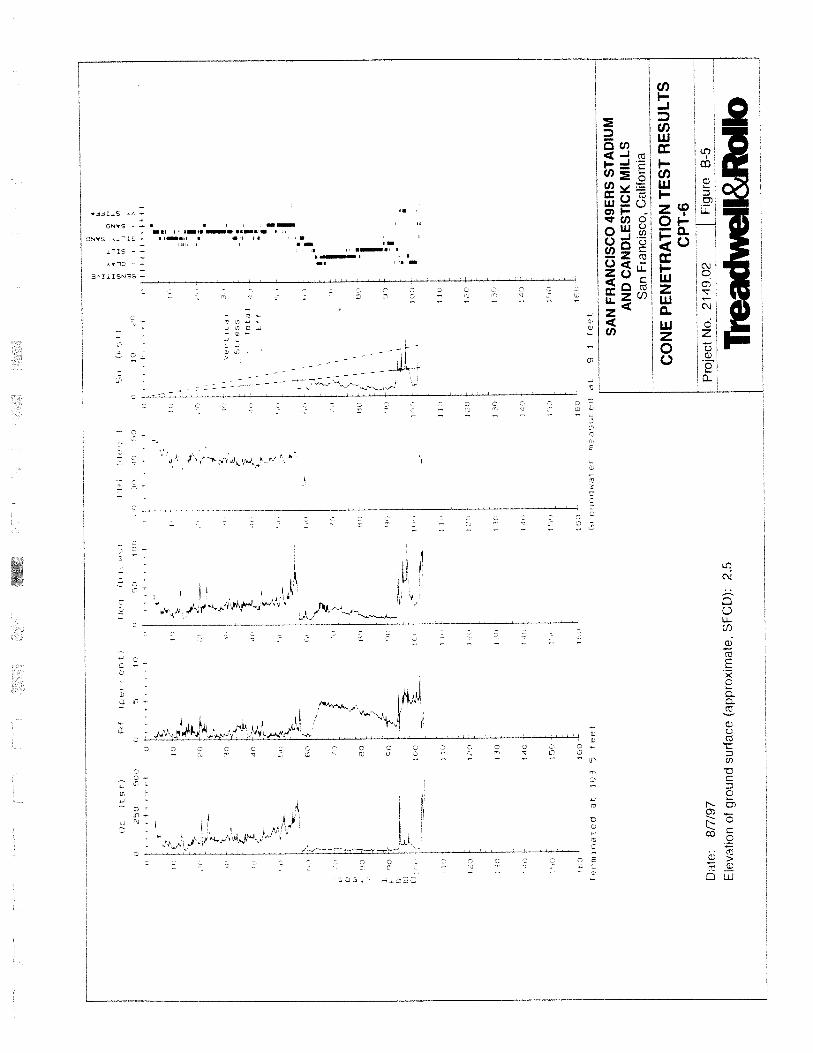
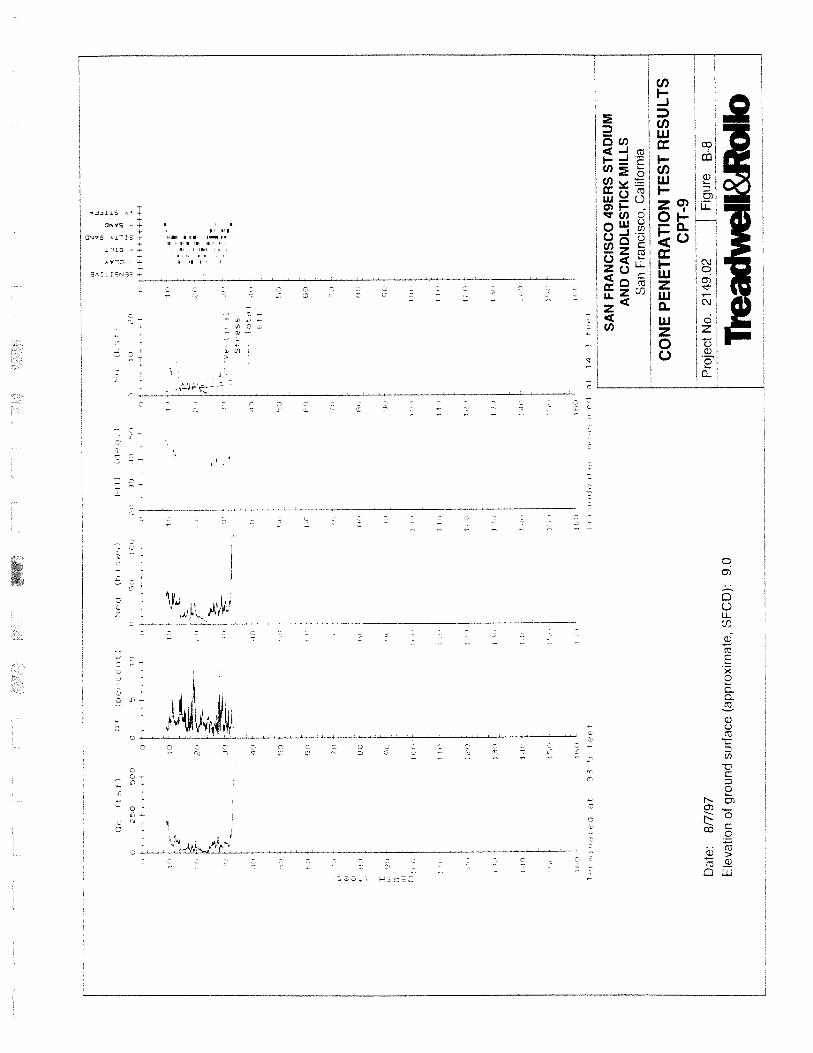
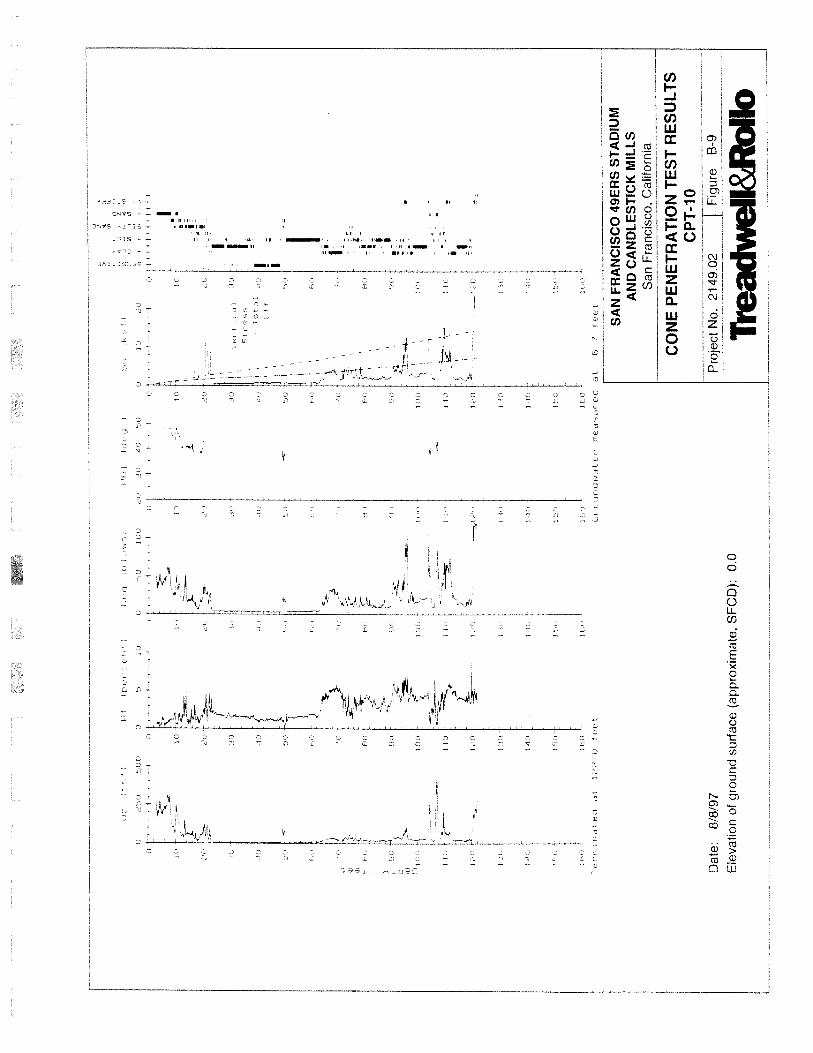

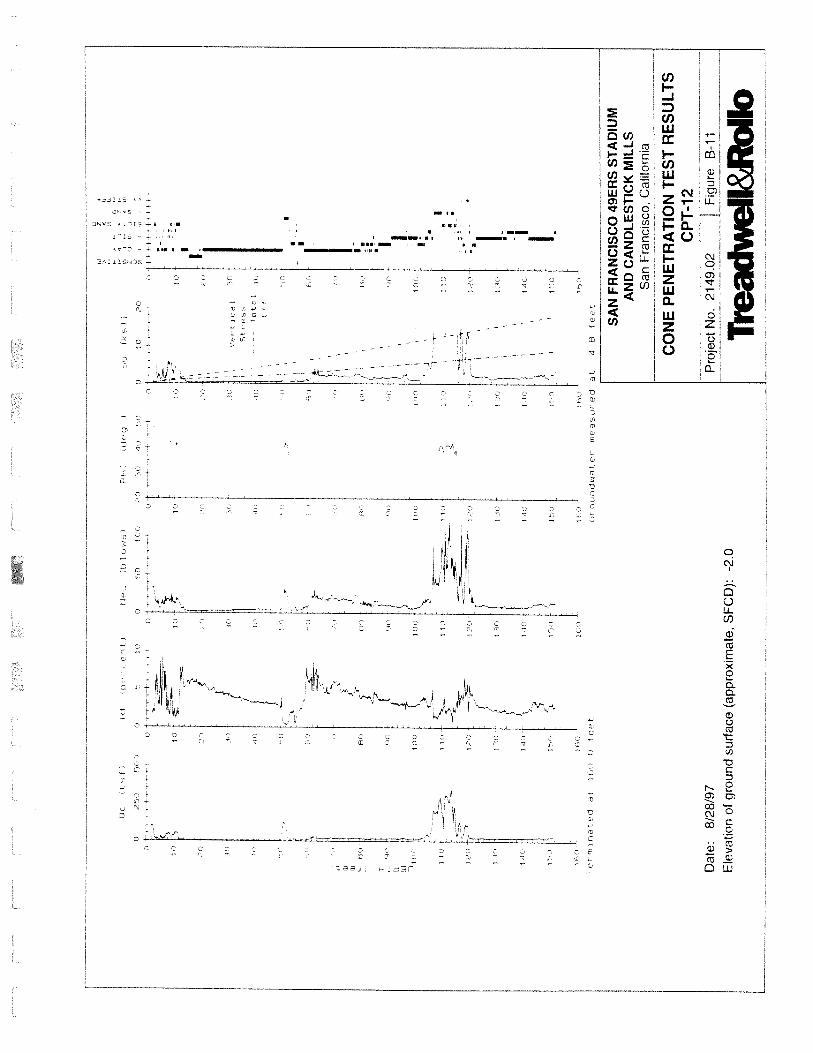
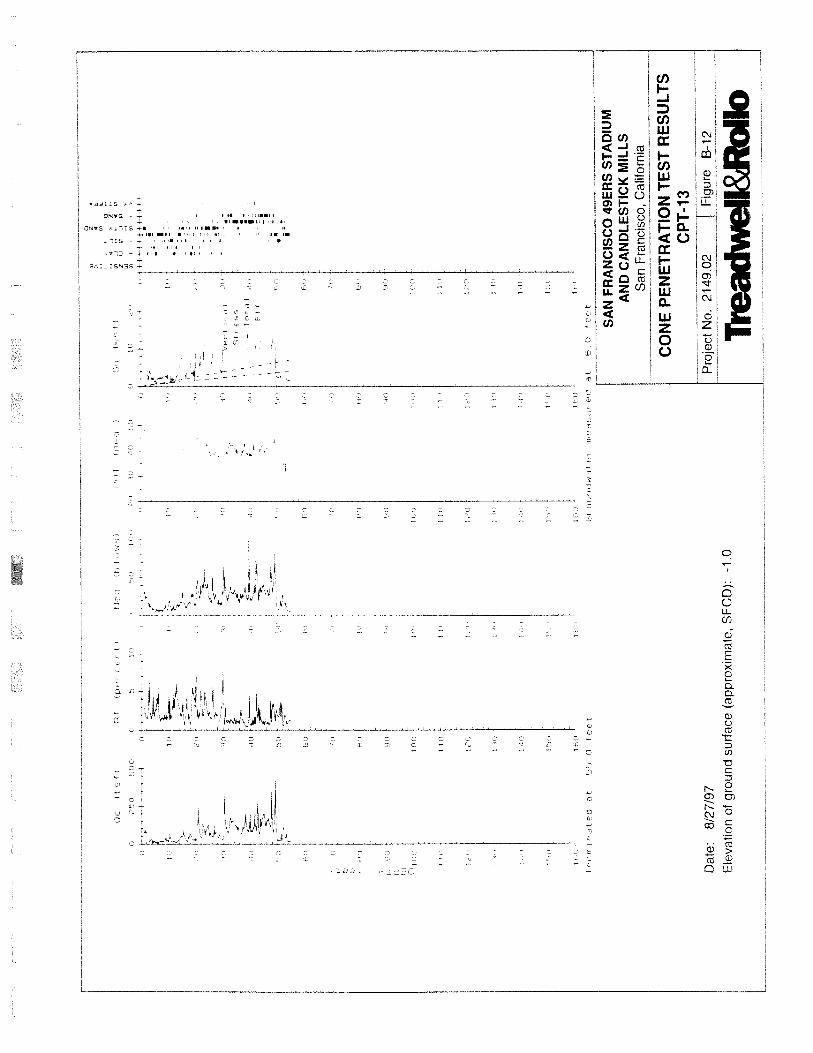
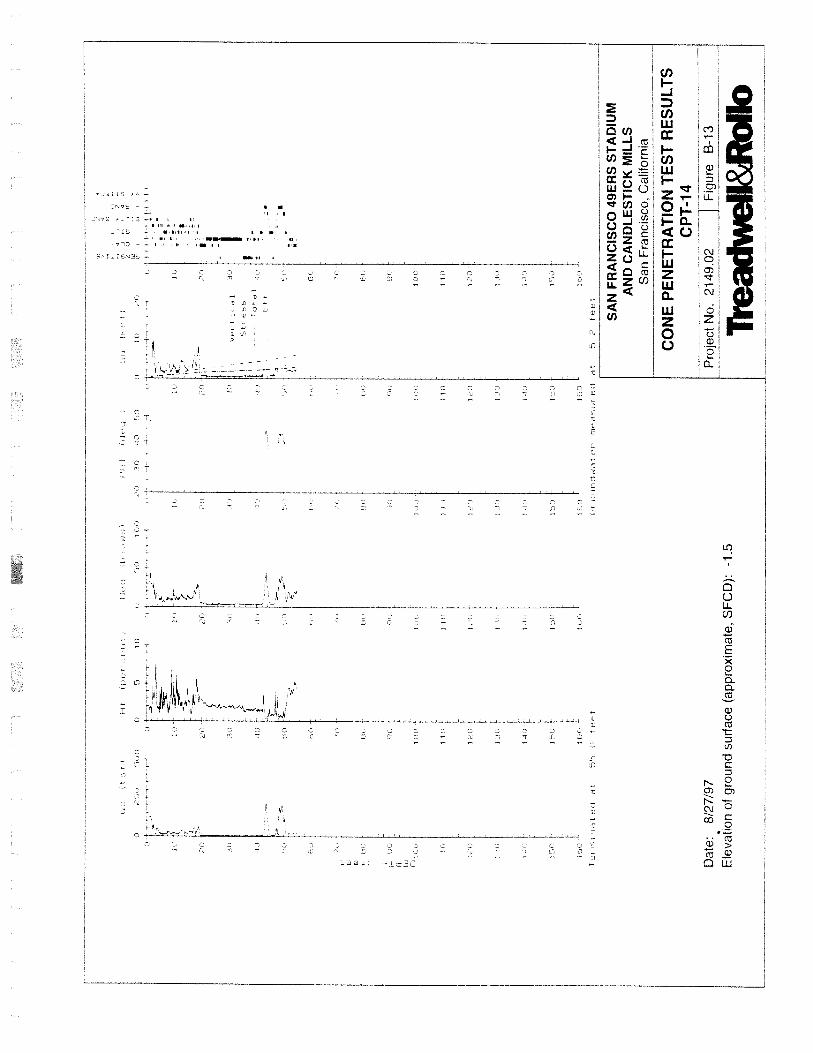
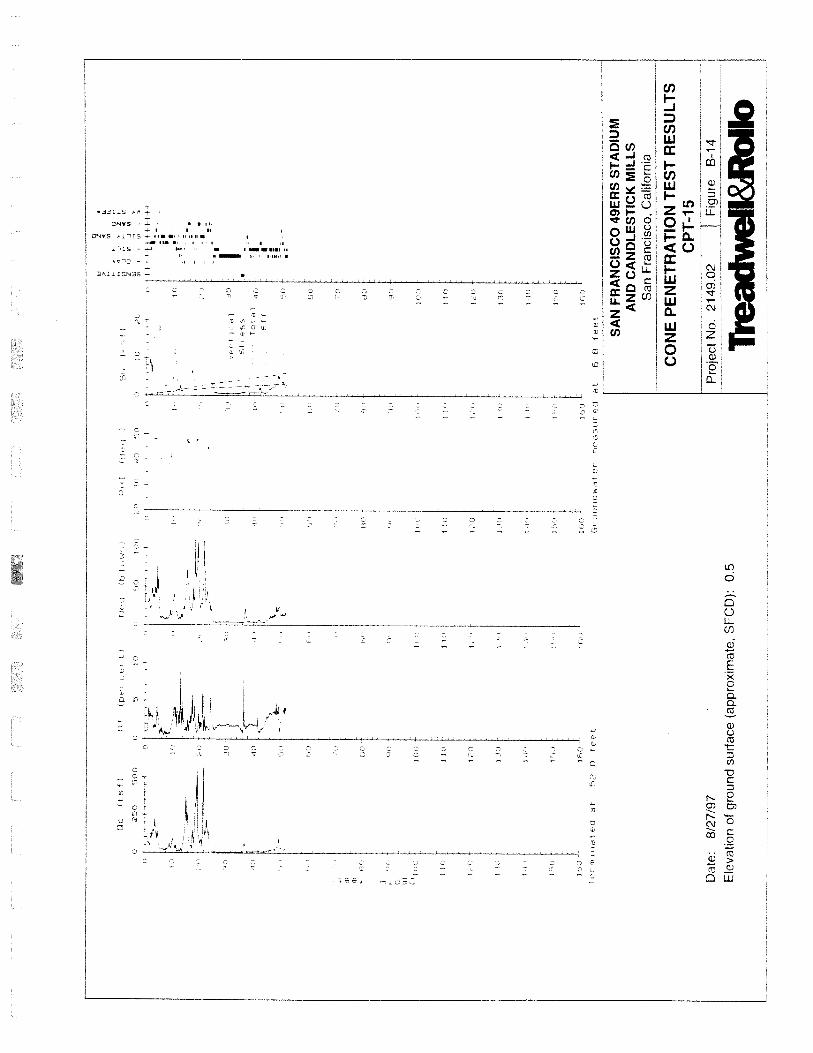
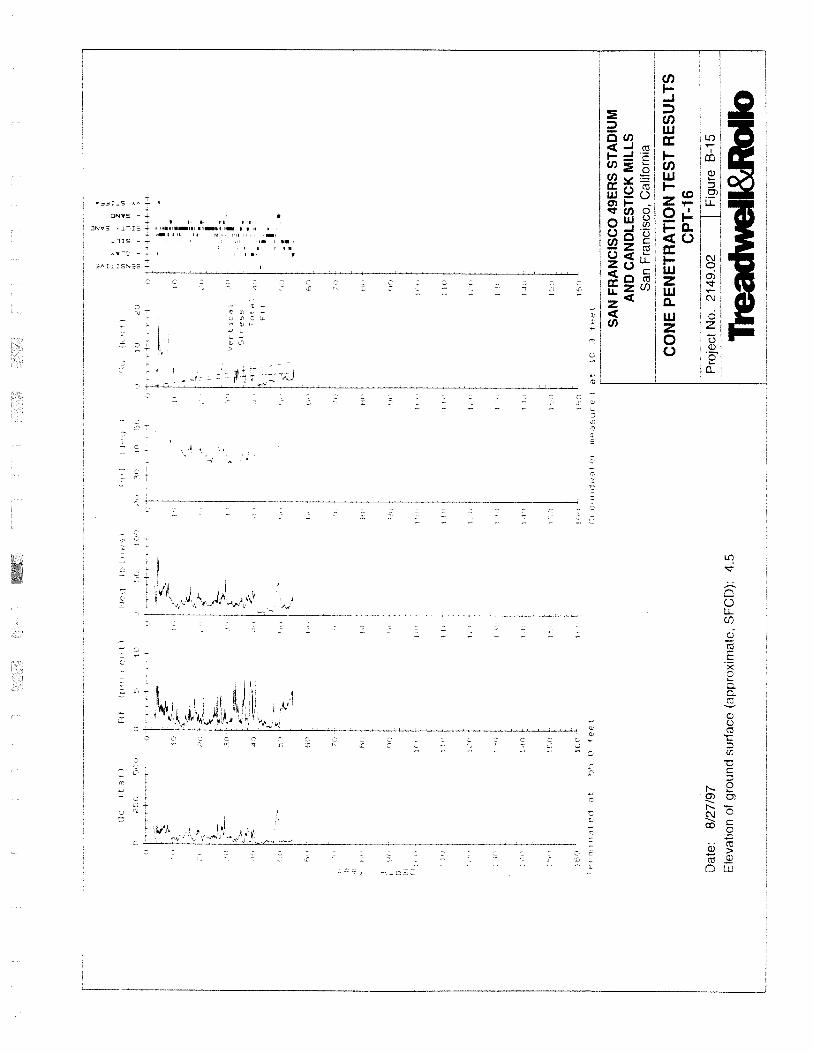
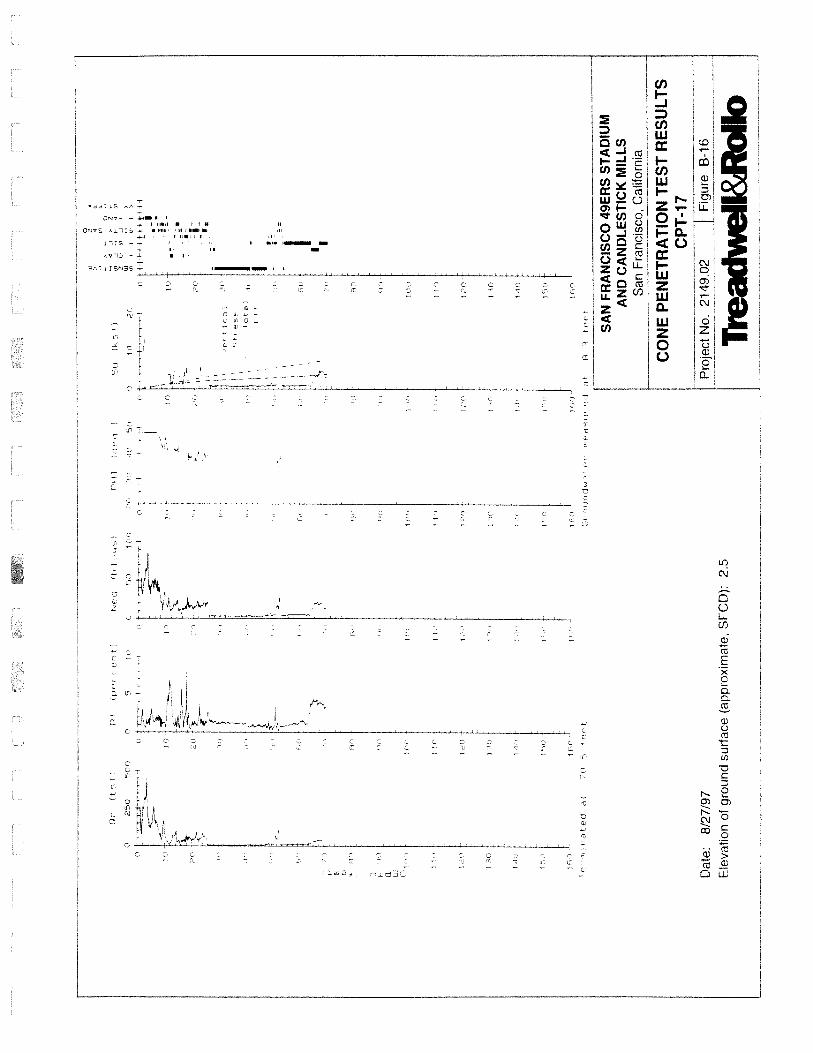
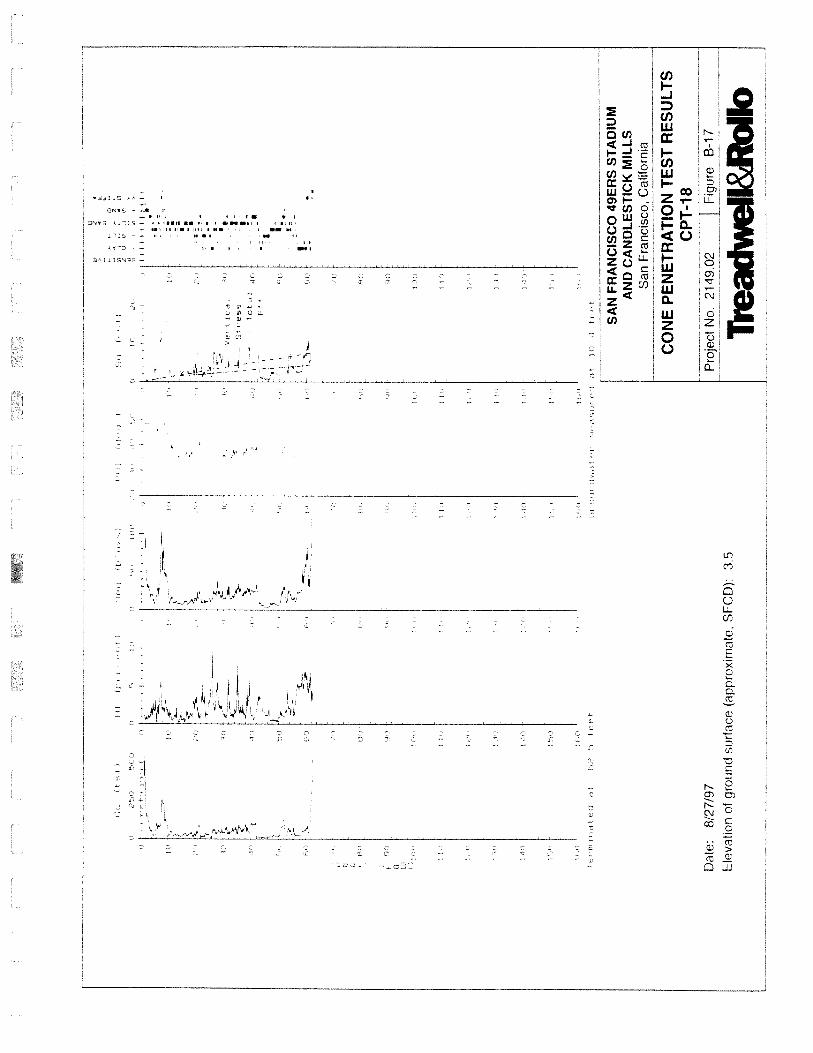
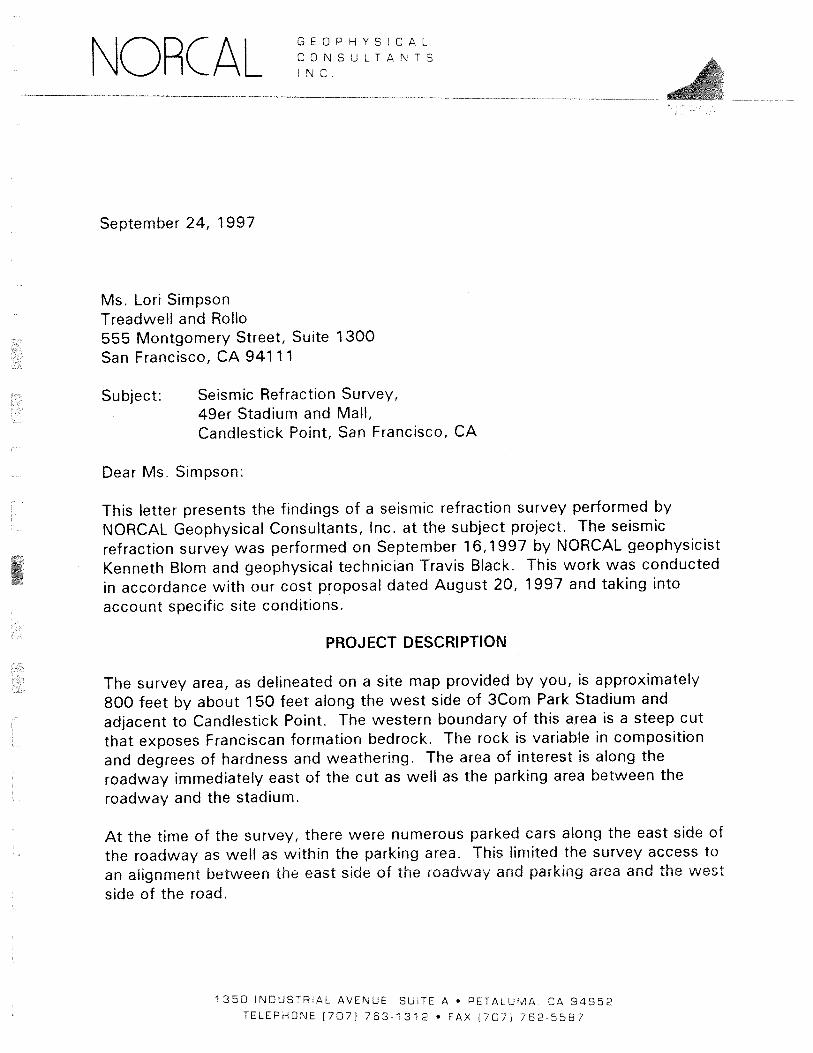
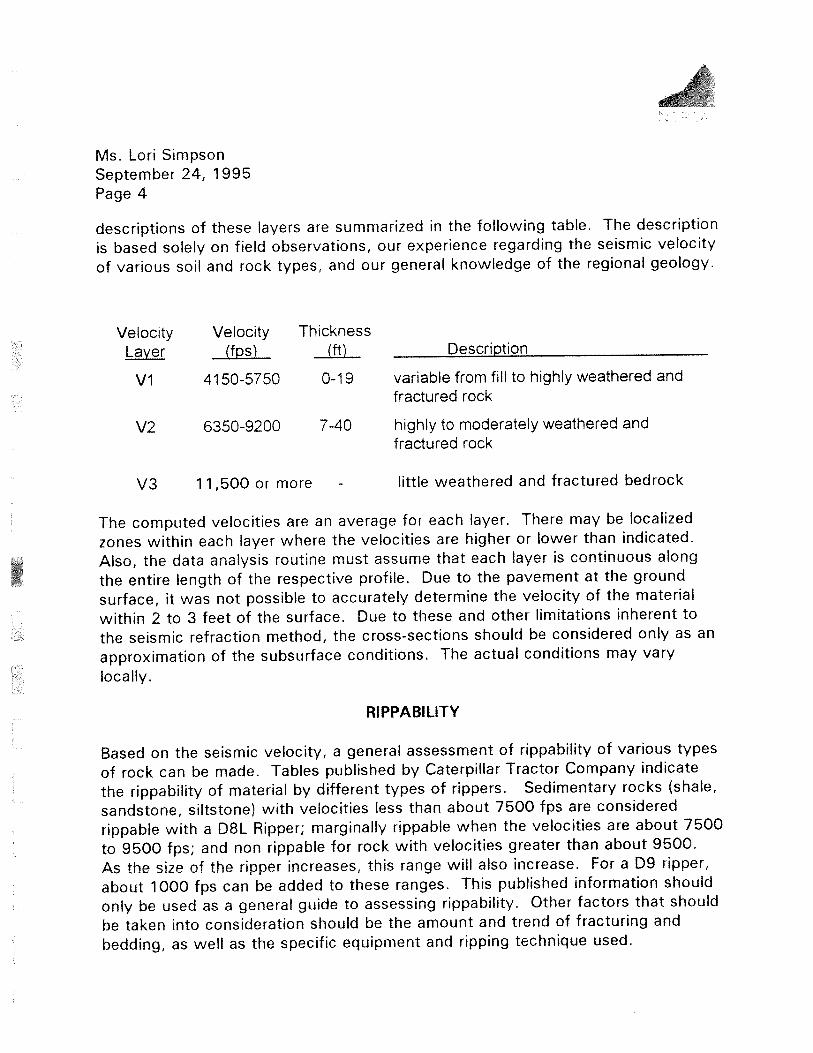
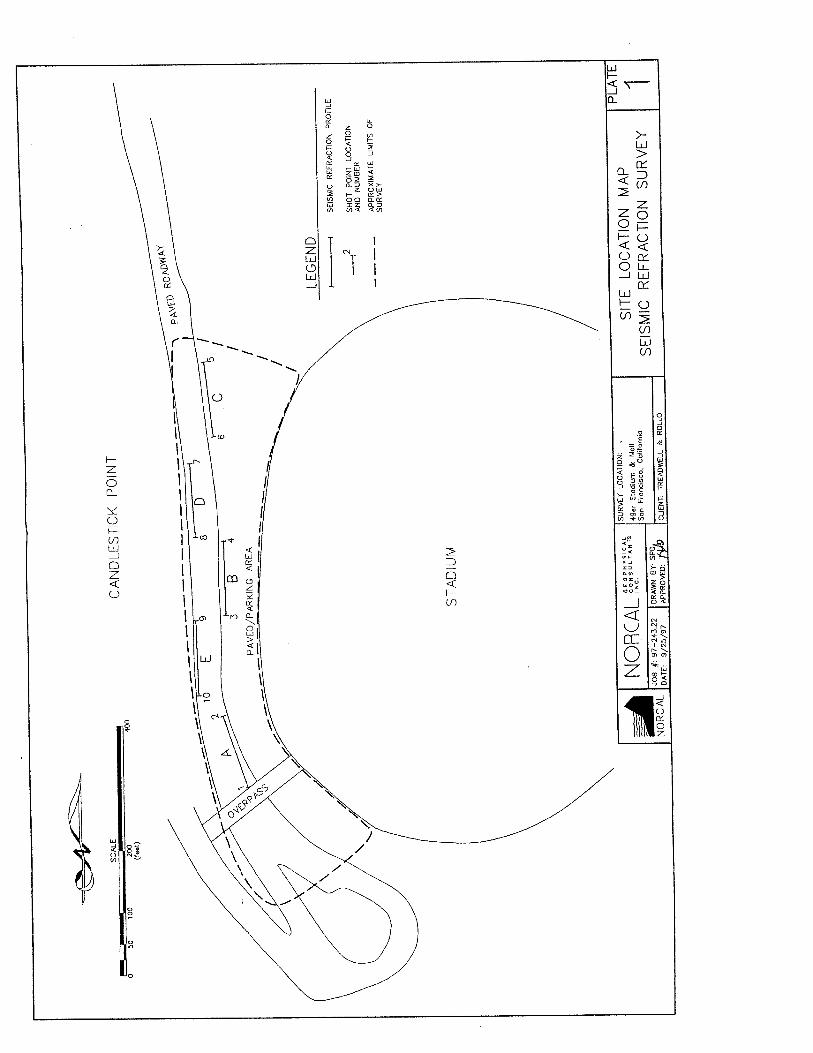
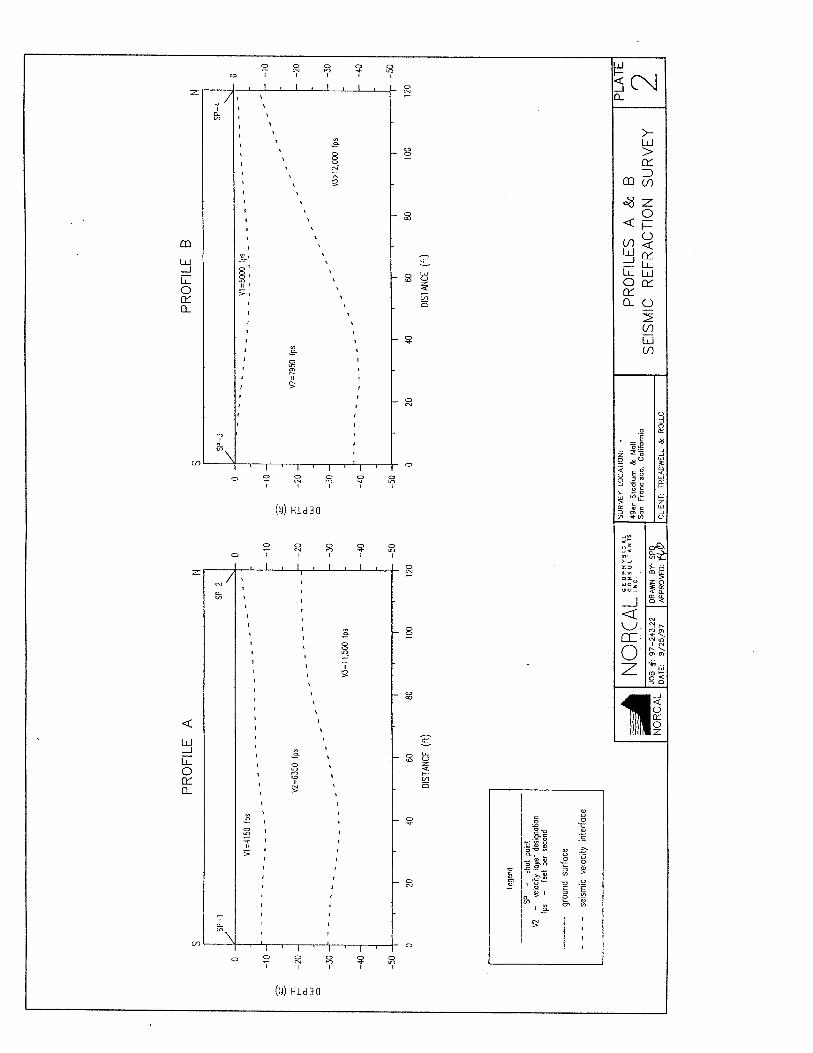
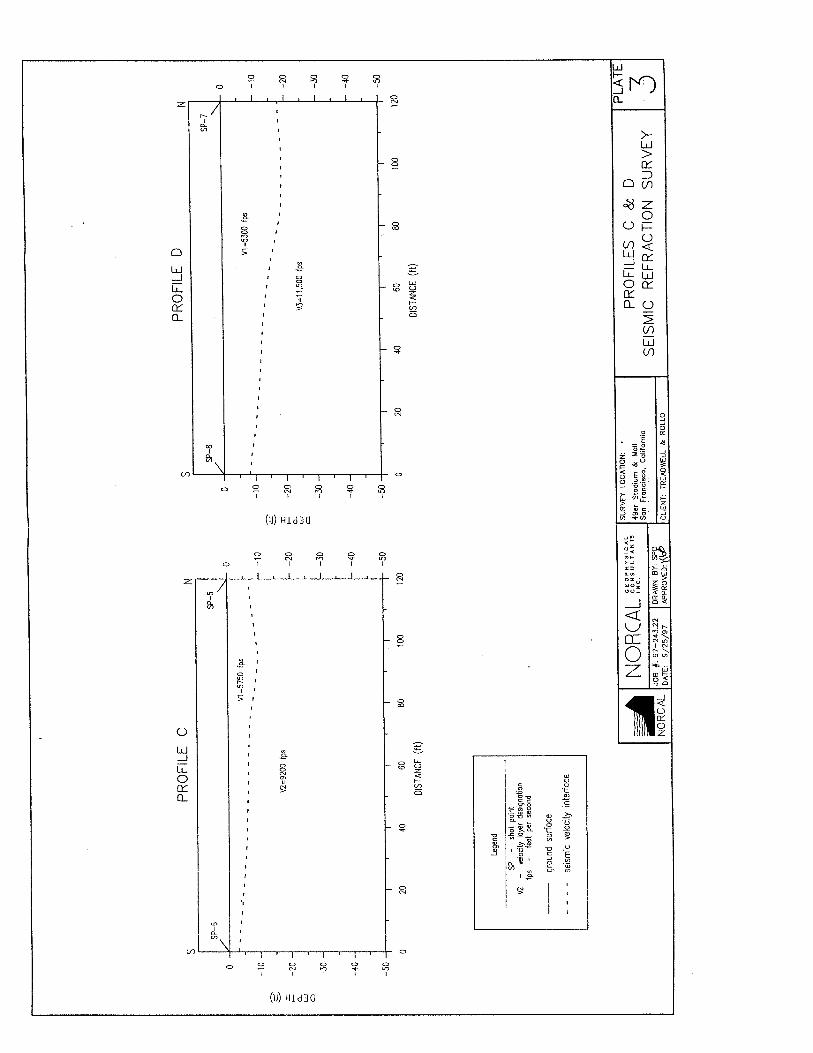
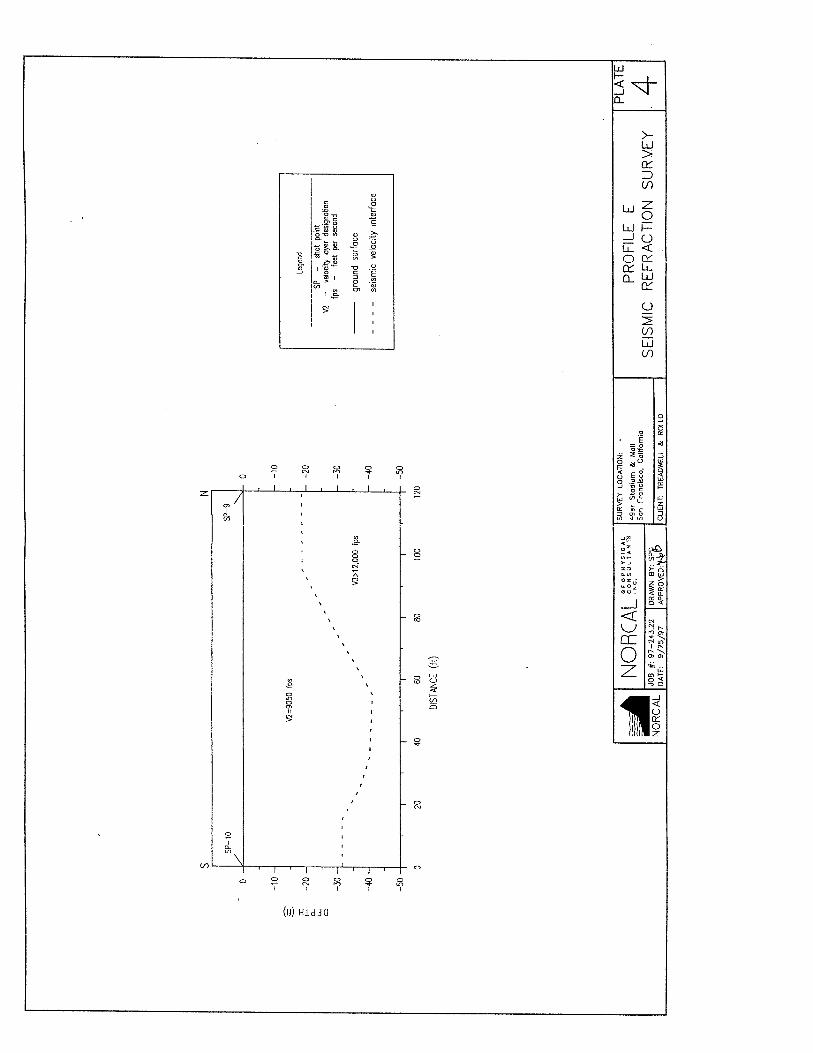
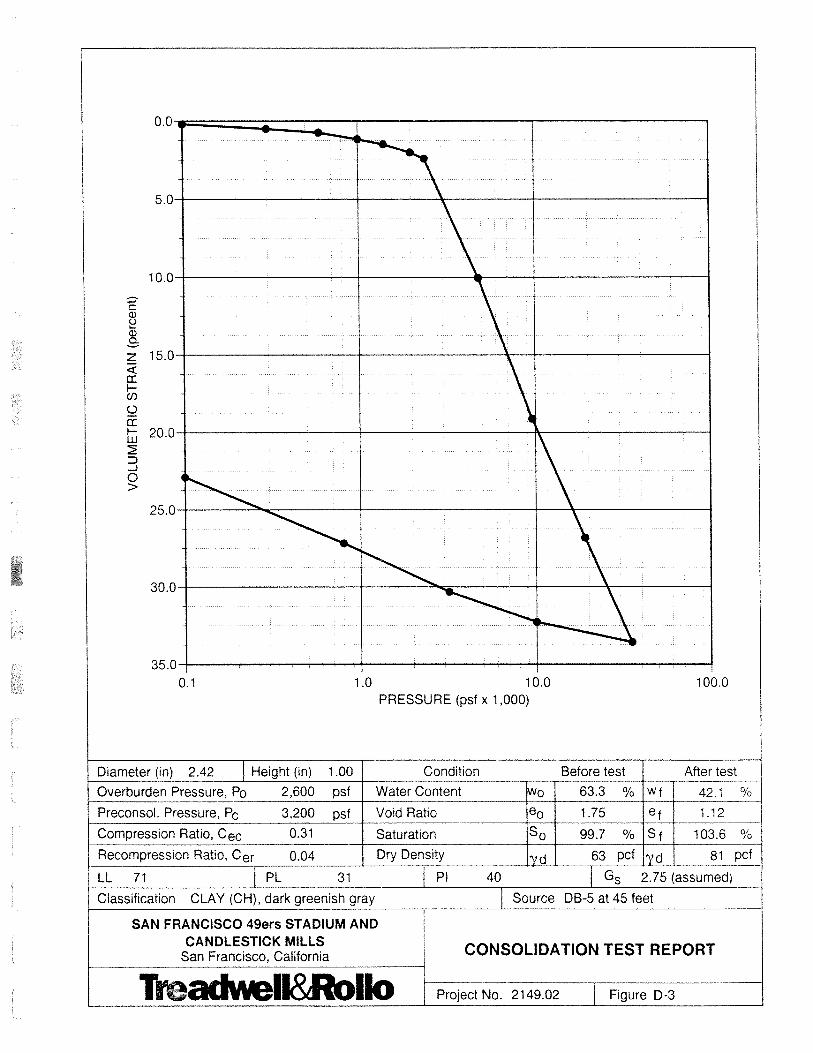
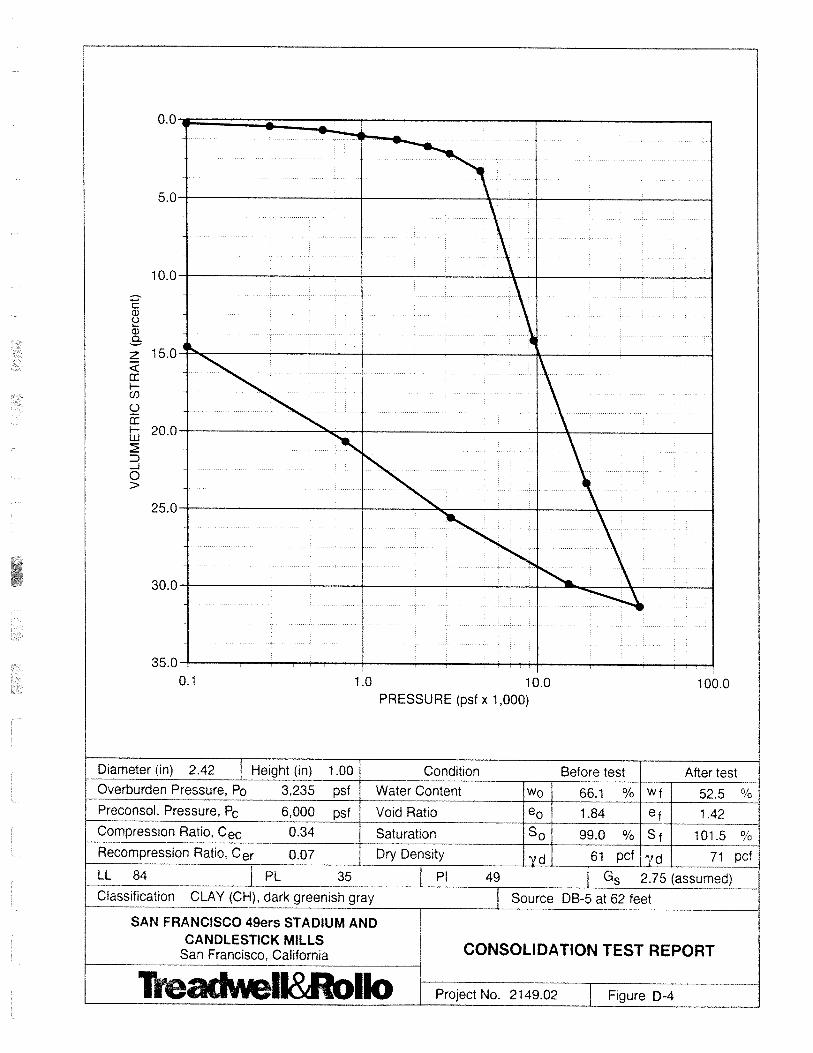
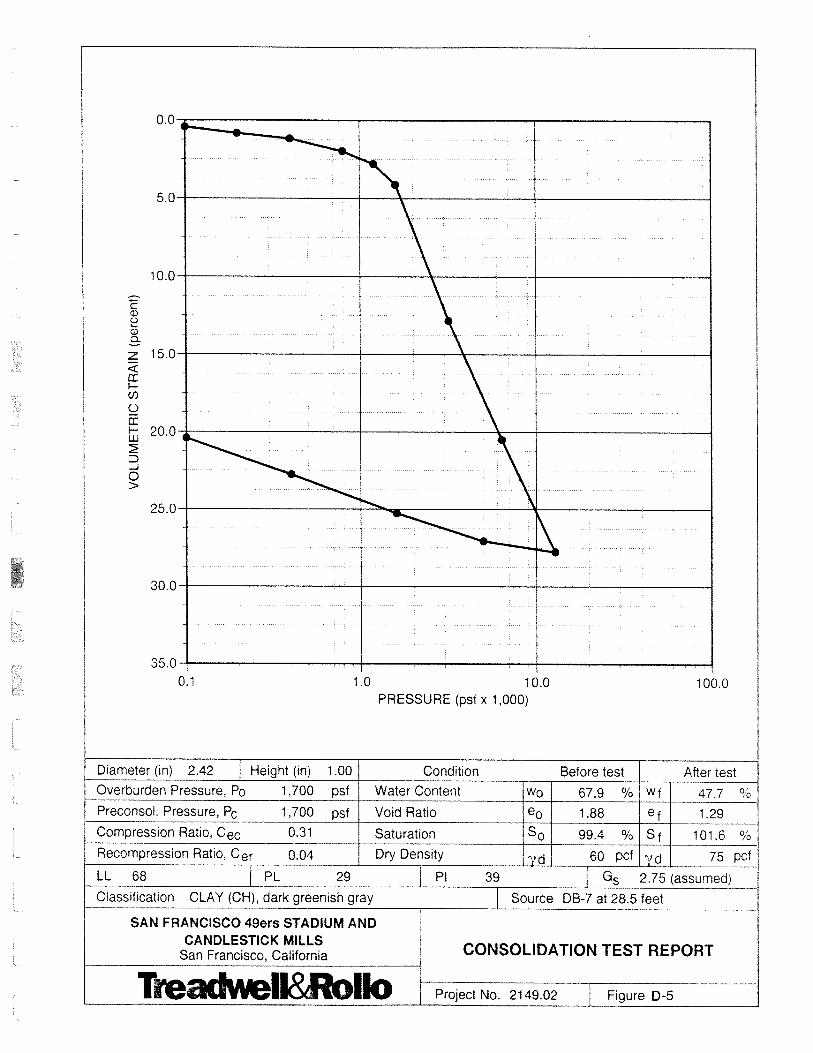
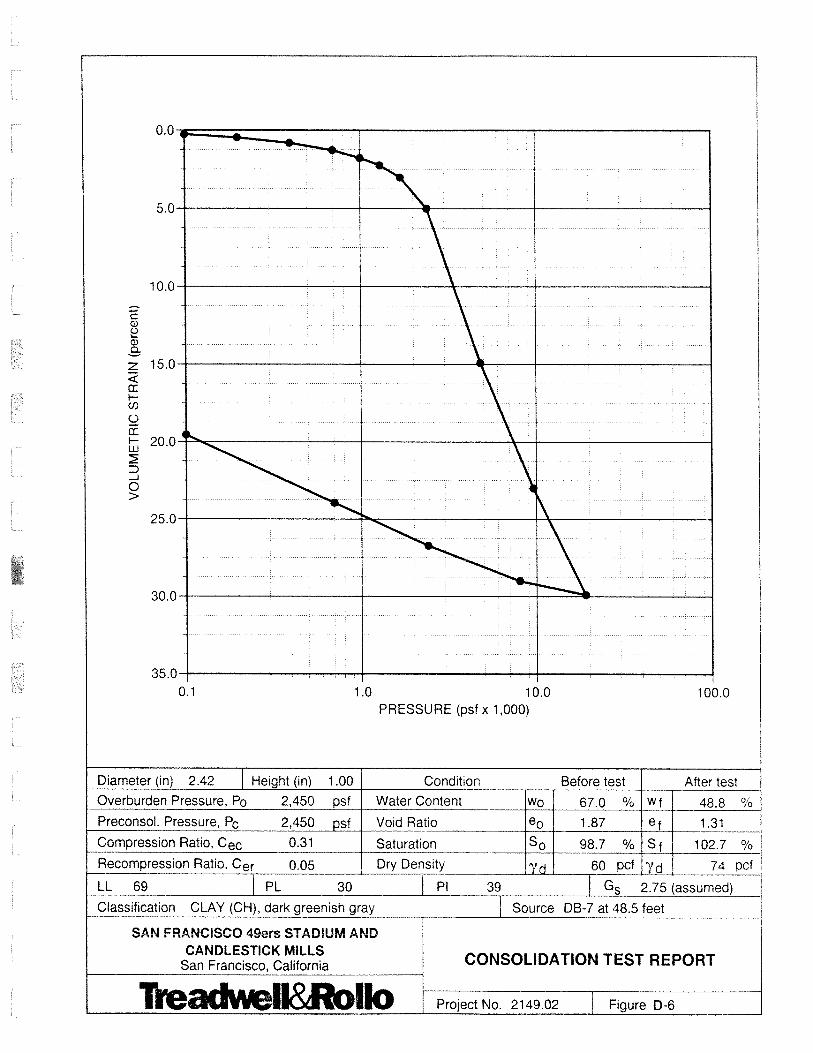
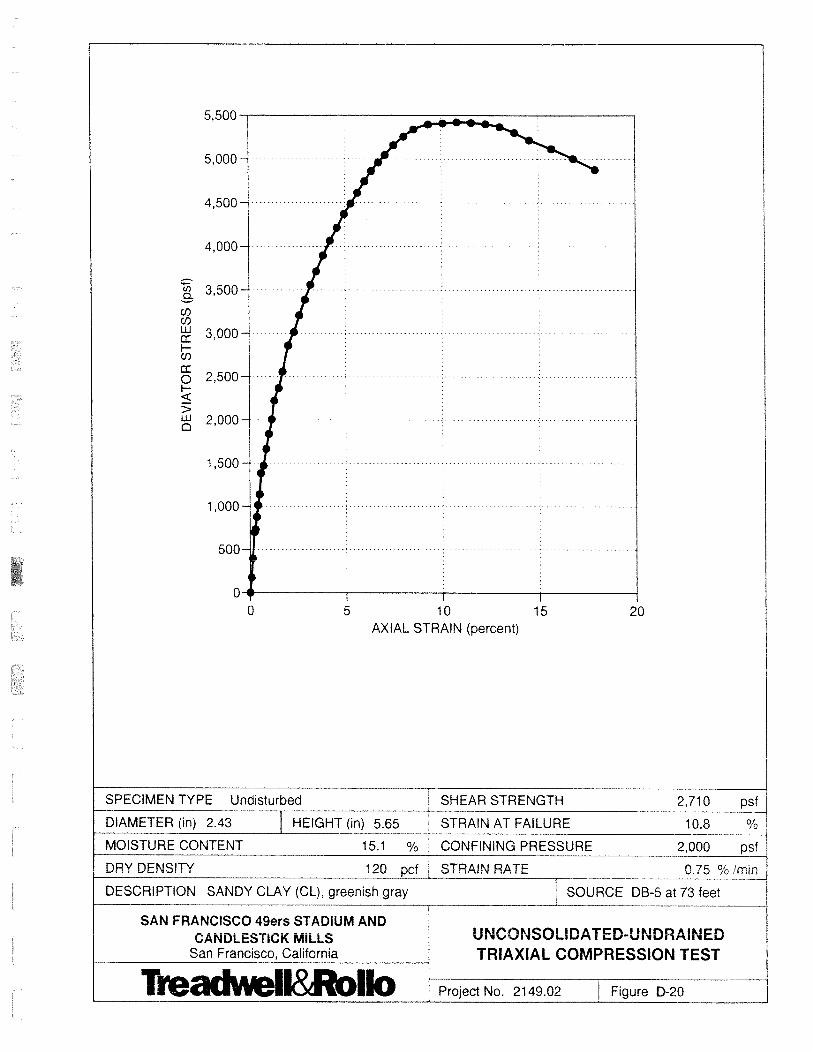
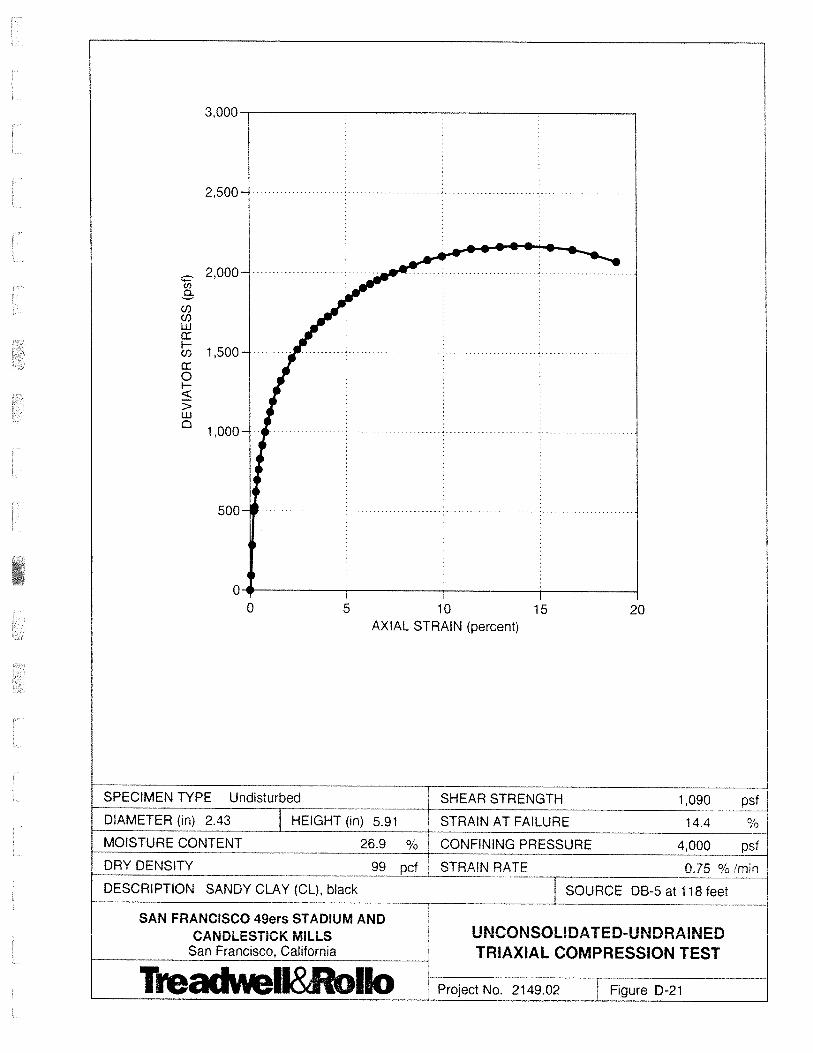
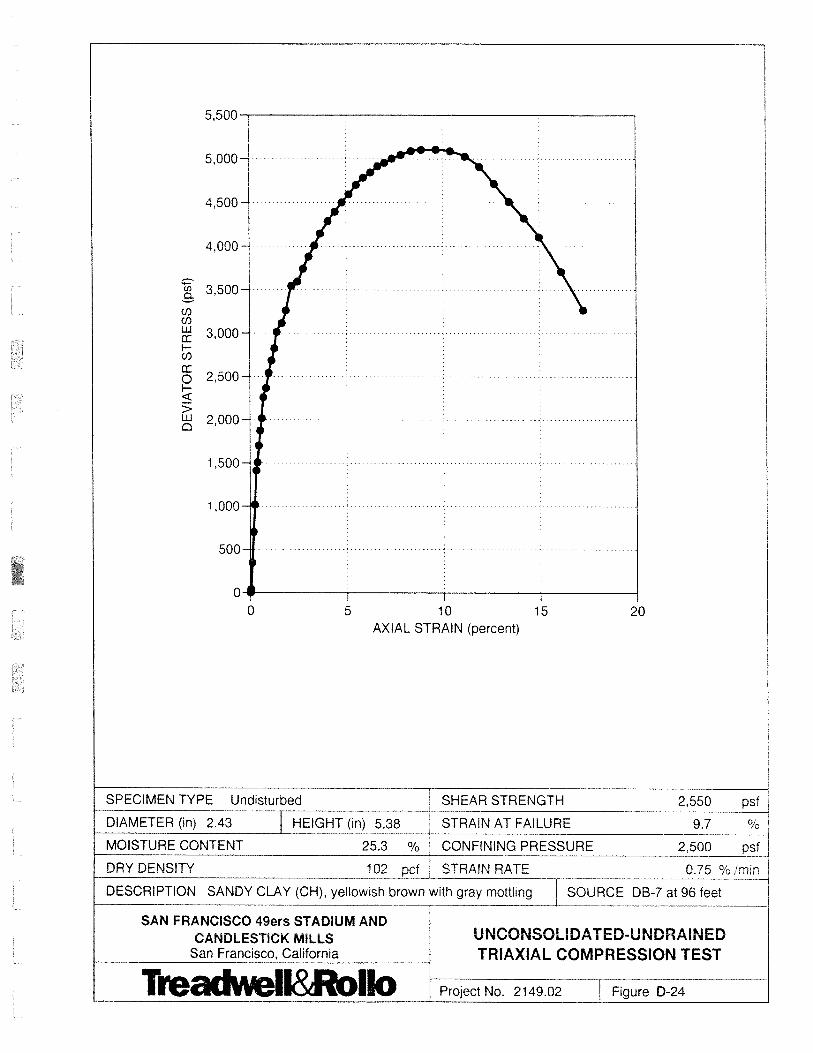
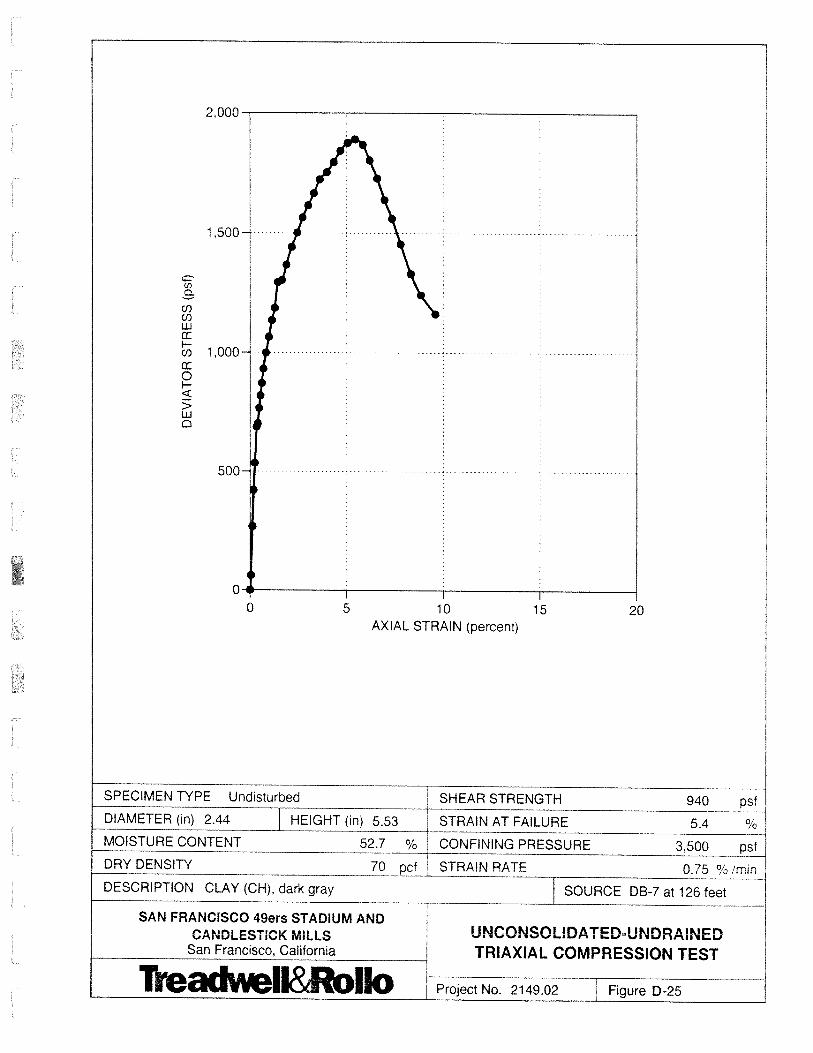
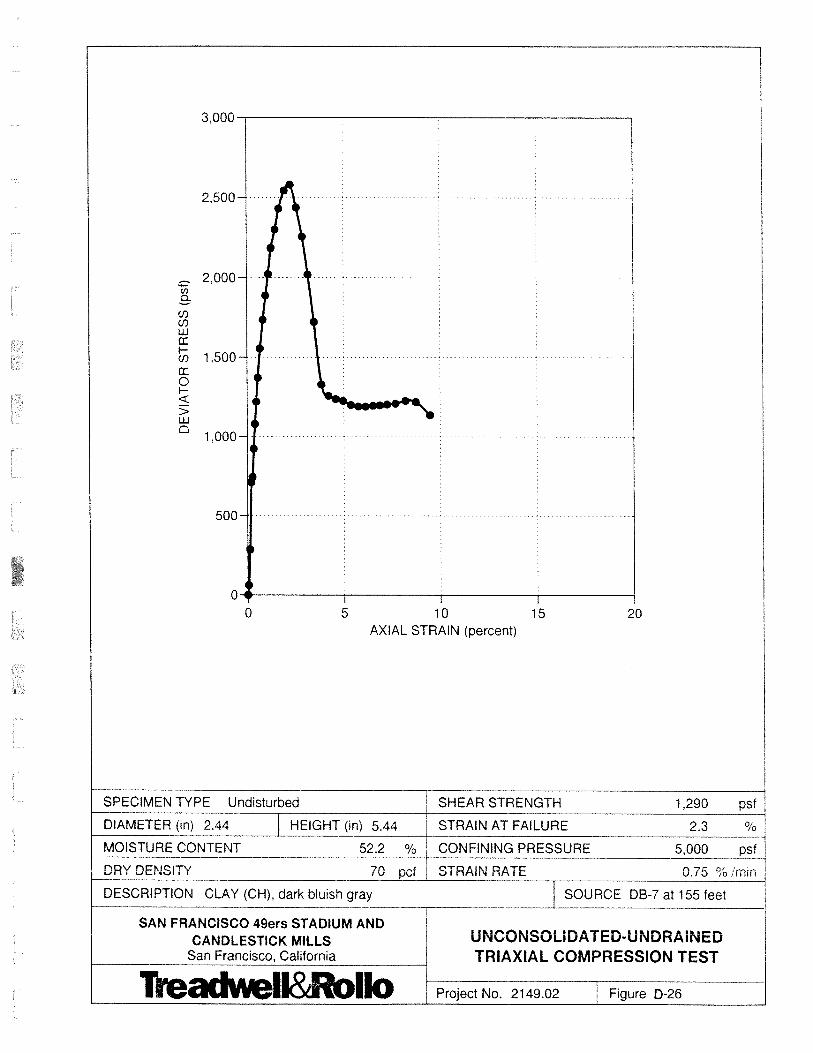
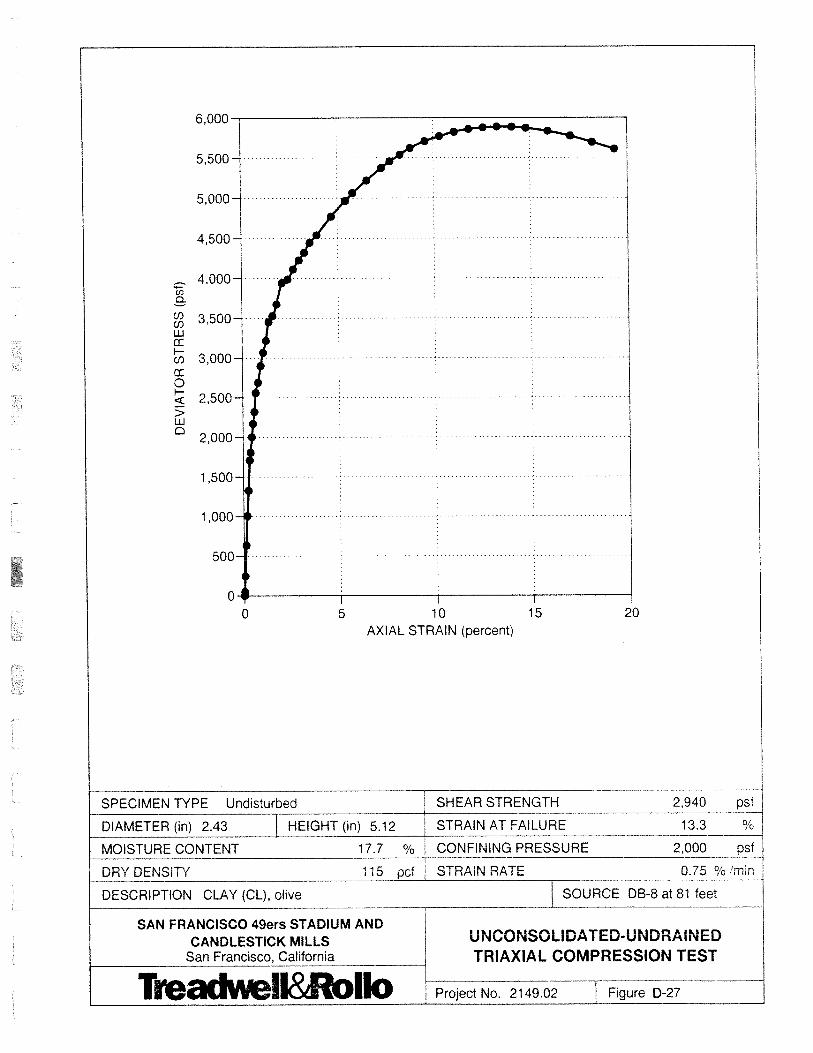
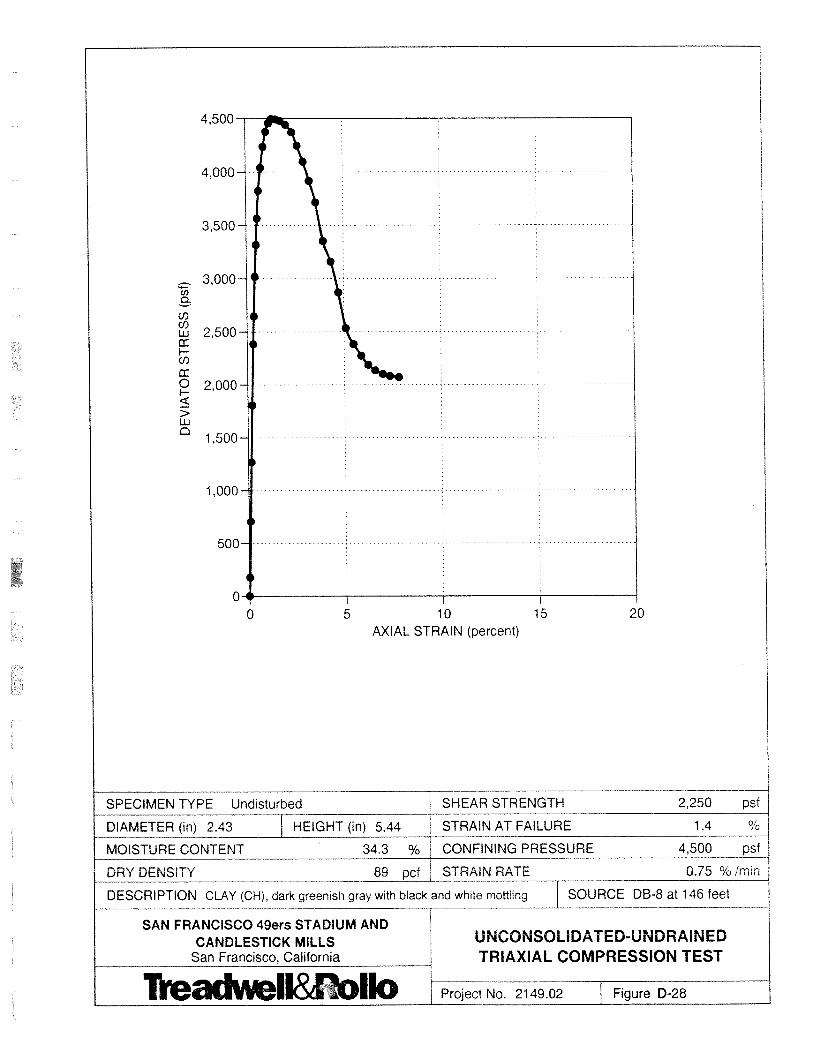
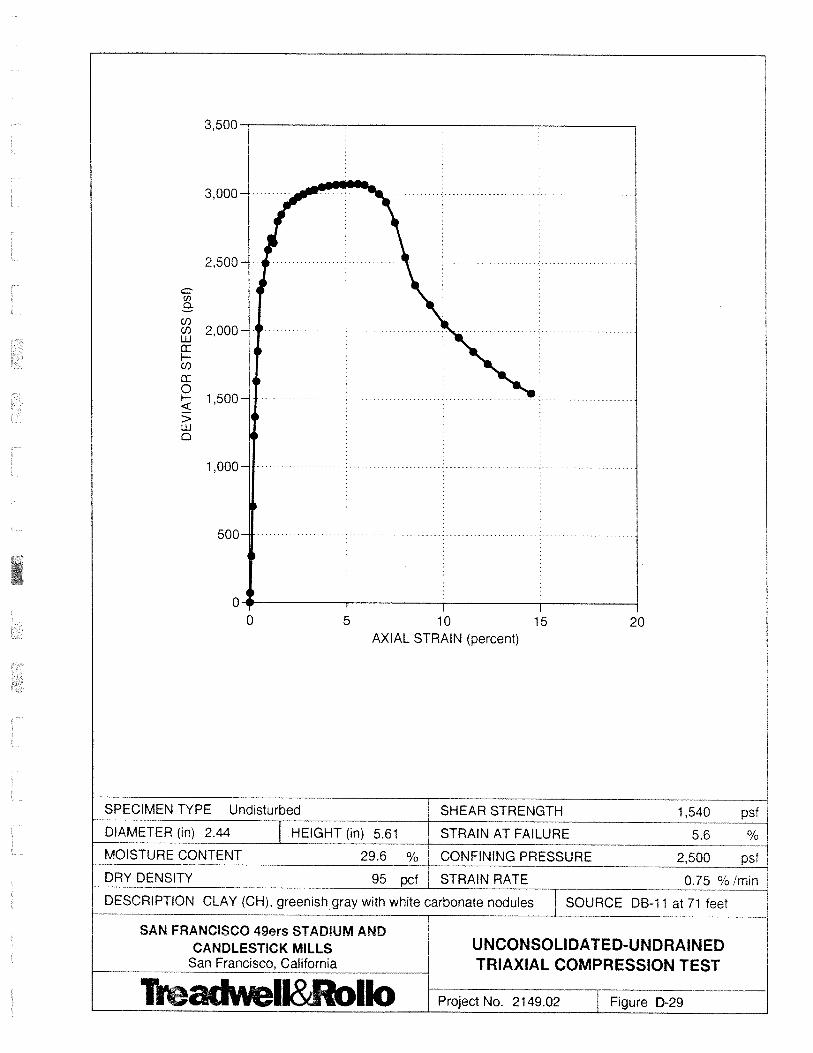
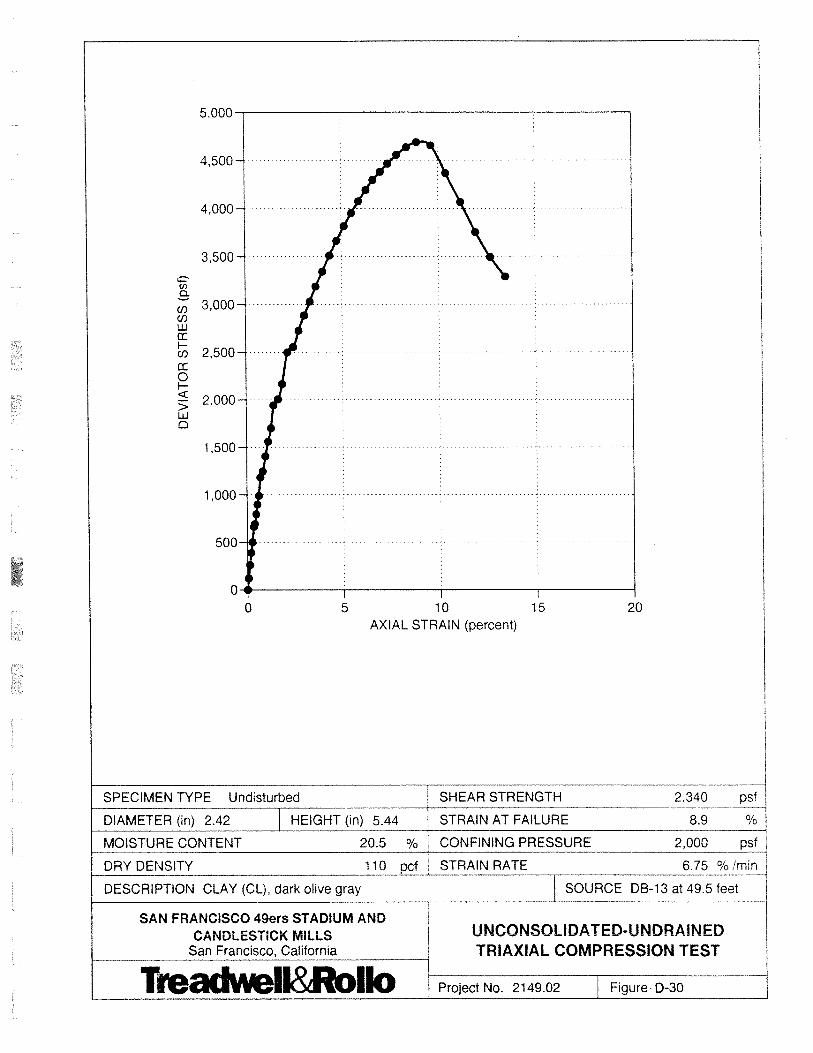
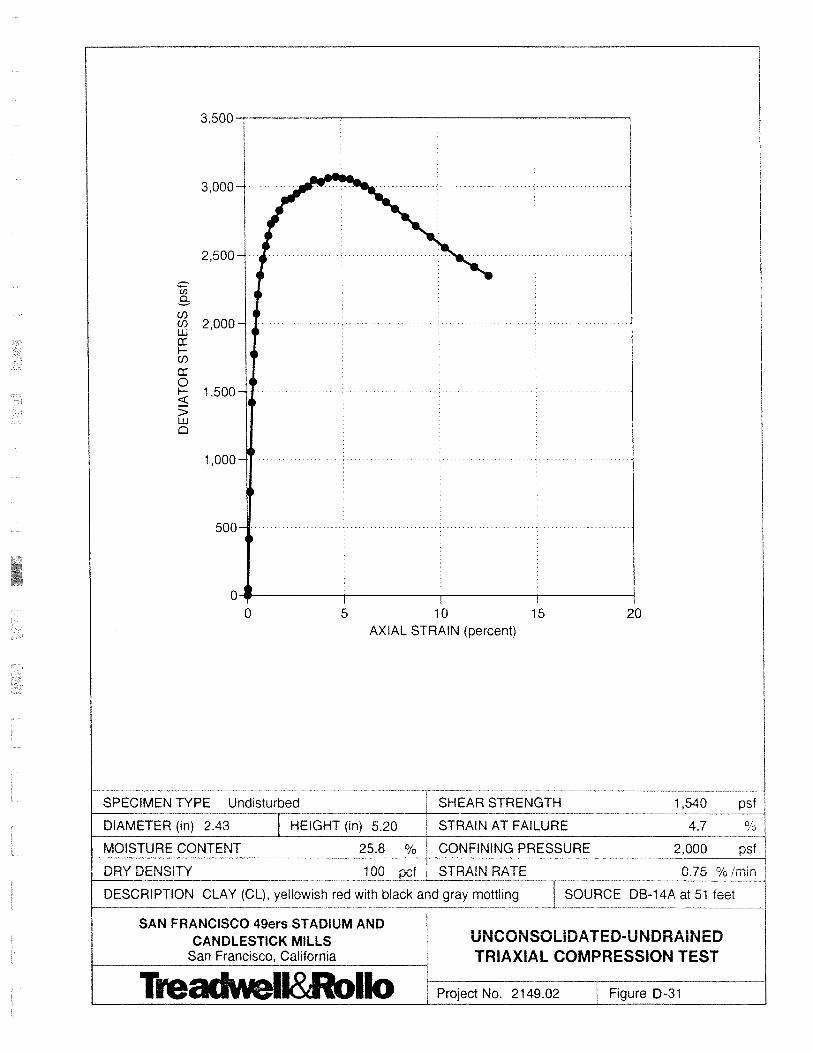
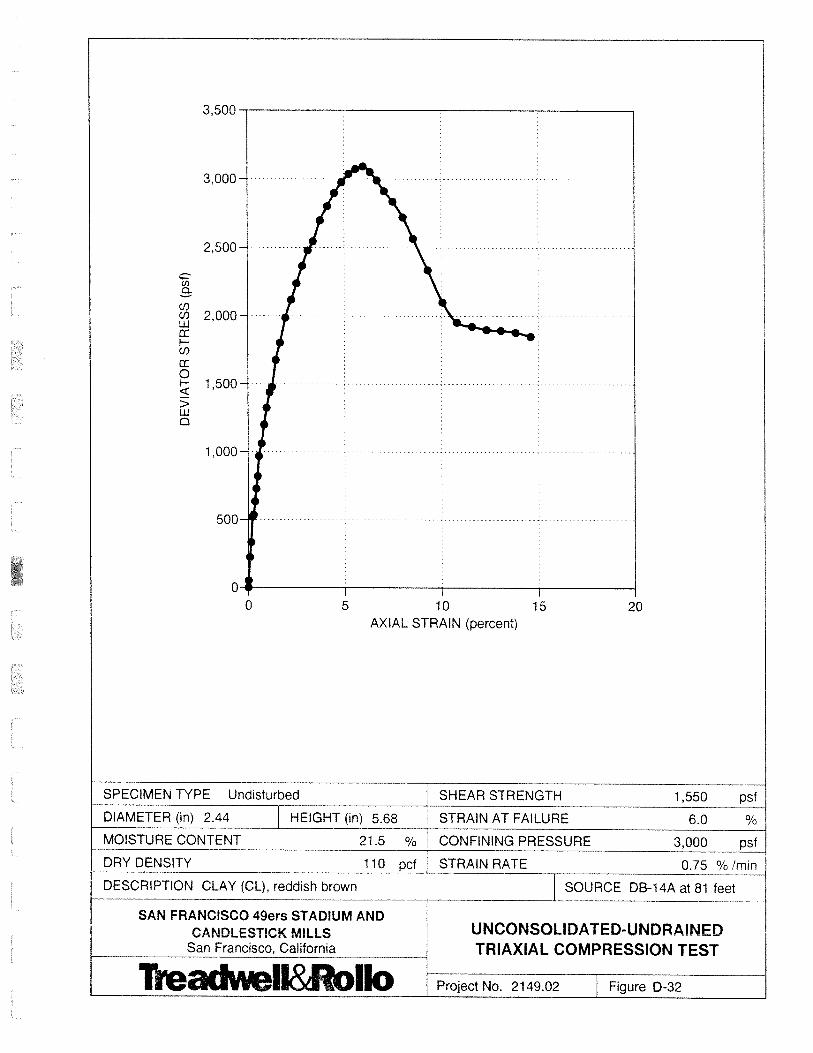
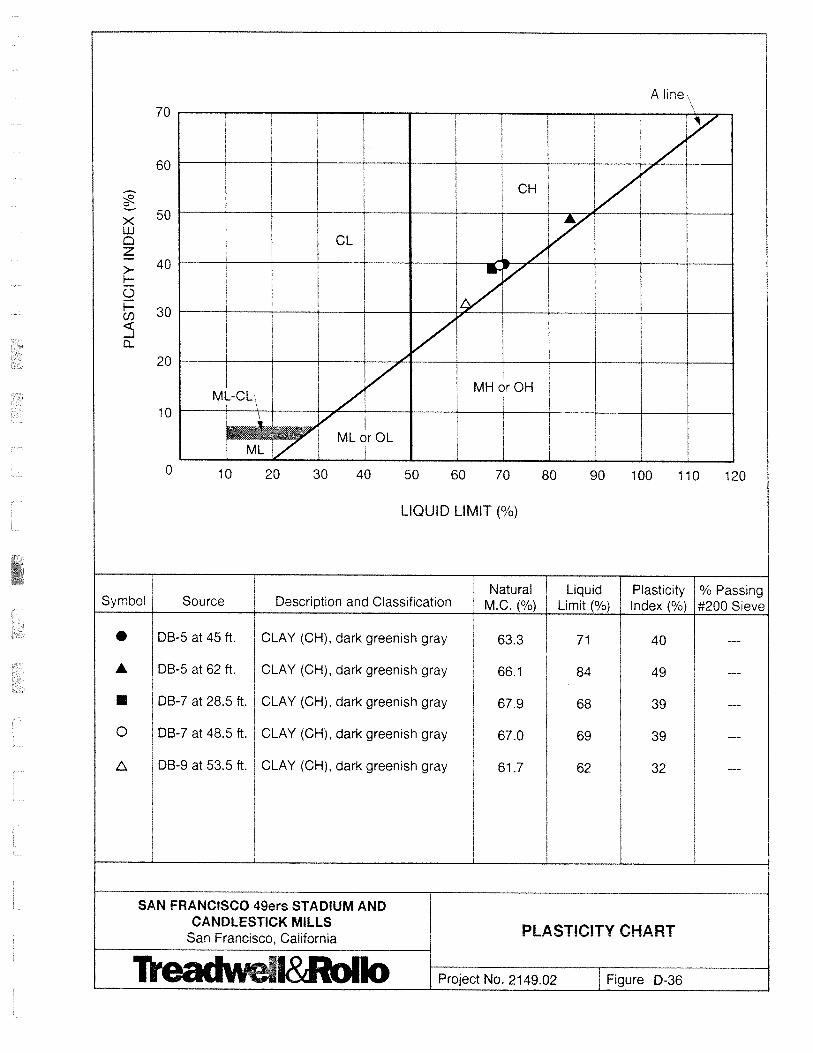
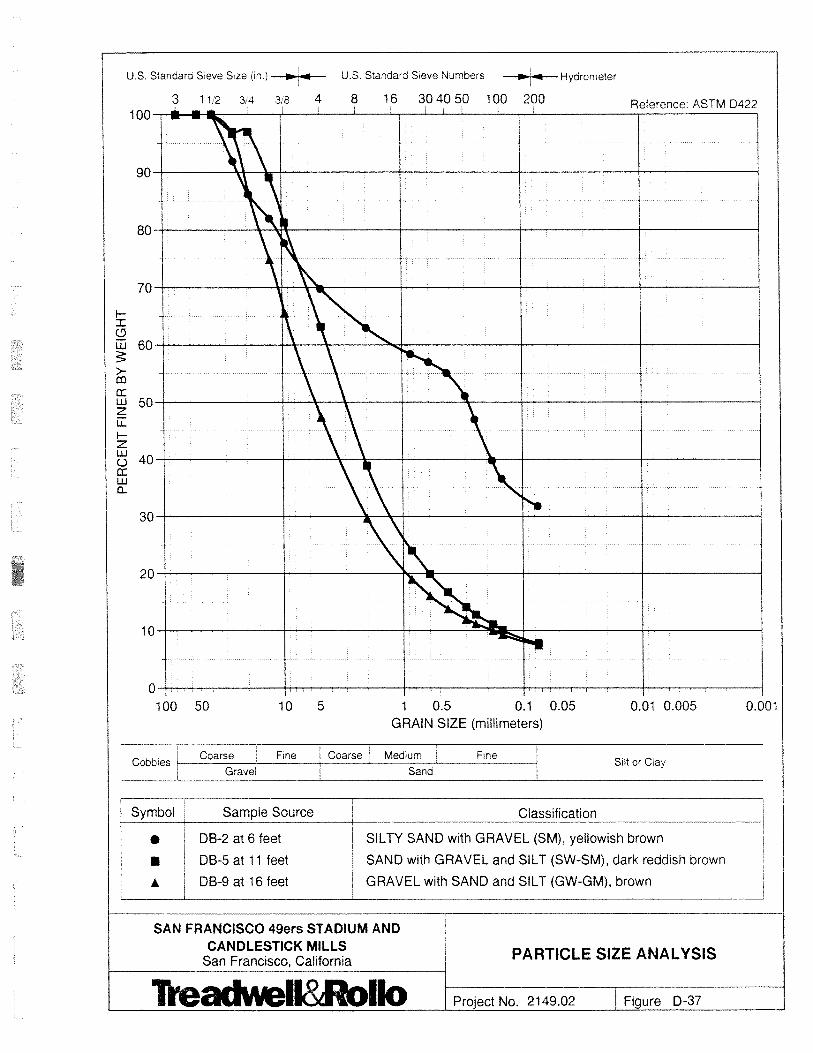
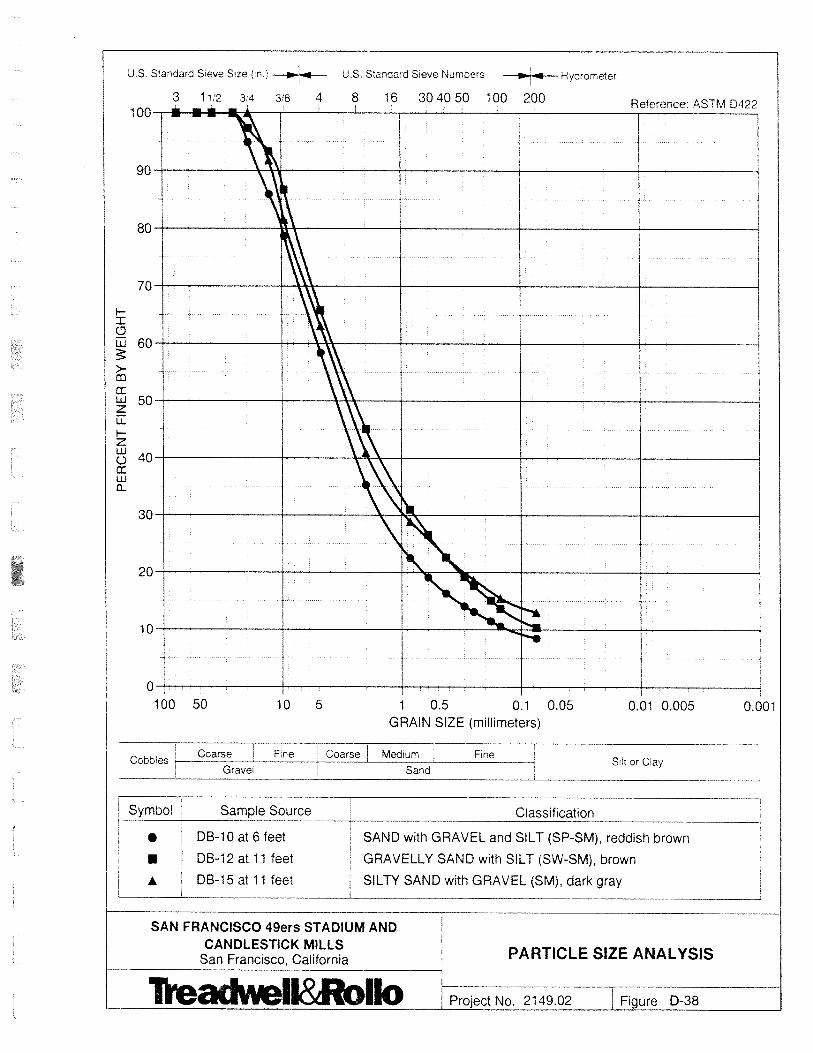
APPENDIX E
APPENDIX E – Updated Liquefaction Analyses
APPENDIX
E

L I Q U E F A C T I O N A N A L Y S I S R E P O R T
Input parameters and analysis dataAnalysis method:Fines correction method:Points to test:Earthquake magnitude Mw:Peak ground acceleration:
Robertson (2009)Robertson (2009)Based on Ic value7.900.61
G.W.T. (in-situ):G.W.T. (earthq.):Average results interval:Ic cut-off value:Unit weight calculation:
Project title : Candlestick Point Location : San Francisco, CA
ENGEO332 Pine St #300 San Francisco, CA 94104
CPT file : CPT-01
5.00 ft5.00 ft32.60Based on SBT
Use fill:Fill height:Fill weight:Trans. detect. applied:Kσ applied:
NoN/AN/AYesNo
Clay like behaviorapplied:Limit depth applied:Limit depth:
All soilsNoN/A
Cone resistance
qt (tsf)15010050
Dep
th (
ft)
25
24
23
22
21
20
19
18
17
16
15
14
13
12
11
10
9
8
7
6
5
4
3
2
1
Cone resistance SBTn Plot
Ic (Robertson 1990)4321
25
24
23
22
21
20
19
18
17
16
15
14
13
12
11
10
9
8
7
6
5
4
3
2
1
SBTn Plot CRR plot
CRR & CSR10.750.50.250
25
24
23
22
21
20
19
18
17
16
15
14
13
12
11
10
9
8
7
6
5
4
3
2
1
CRR plot
During earthq.
Qtn,cs200180160140120100806040200
Cyc
lic S
tres
s R
atio
* (C
SR*)
0.6
0.5
0.4
0.3
0.2
0.1
0
Liquefaction
No Liquefaction
Normalized friction ratio (%)0.1 1 10
Nor
mal
ized
CPT
pen
etra
tion
res
ista
nce
1
10
100
1,000
Friction Ratio
Rf (%)54321
25
24
23
22
21
20
19
18
17
16
15
14
13
12
11
10
9
8
7
6
5
4
3
2
1
Friction Ratio
Mw=71/2, sigma'=1 atm base curve Summary of liquefaction potential
FS Plot
Factor of safety21.510.50
25
24
23
22
21
20
19
18
17
16
1514
13
12
11
10
9
8
7
6
5
4
3
2
1
FS Plot
During earthq.
Zone A1: Cyclic liquefaction likely depending on size and duration of cyclic loadingZone A2: Cyclic liquefaction and strength loss likely depending on loading and groundgeometryZone B: Liquefaction and post-earthquake strength loss unlikely, check cyclic softeningZone C: Cyclic liquefaction and strength loss possible depending on soil plasticity,brittleness/sensitivity, strain to peak undrained strength and ground geometry
CLiq v.1.7.1.14 - CPT Liquefaction Assessment Software - Report created on: 9/17/2013, 7:03:09 PMProject file: G:\Active Projects\8472\8472001002 CP Retail Site\Updated Cliq Analysis.clq
1
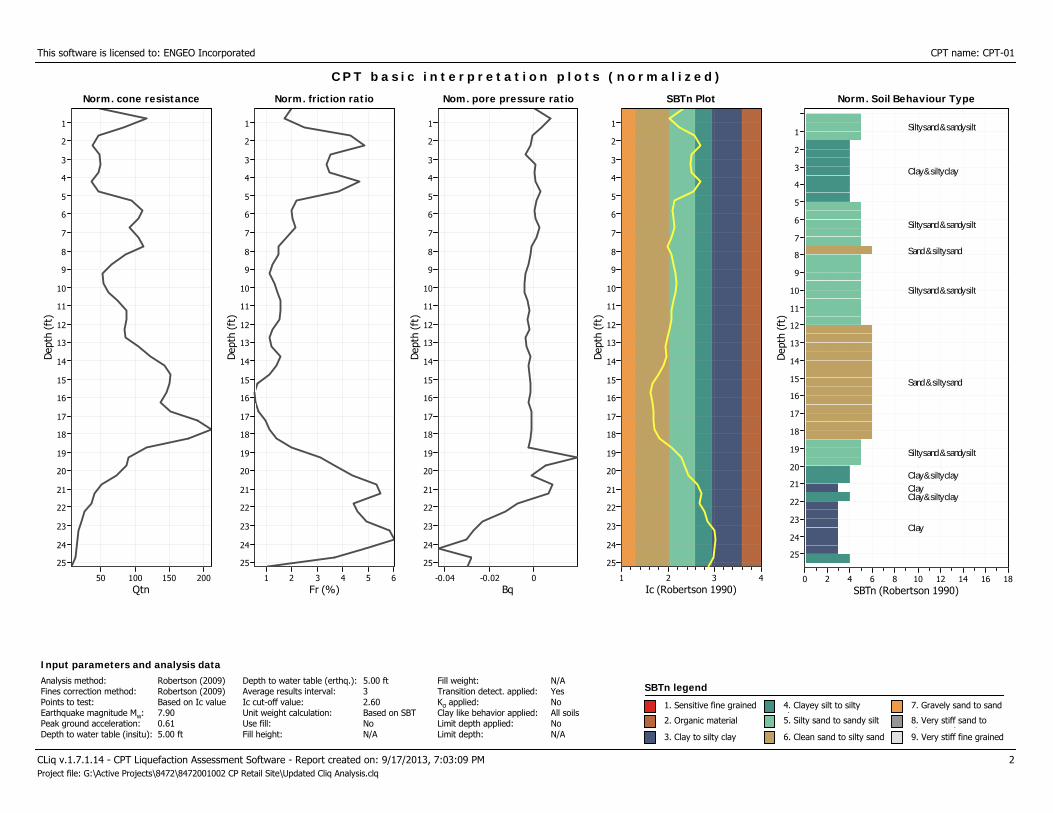
This software is licensed to: ENGEO Incorporated CPT name: CPT-01
Norm. cone resistance
Qtn20015010050
Dep
th (
ft)
25
24
23
22
21
20
19
18
17
16
15
14
13
12
11
10
9
8
7
6
5
4
3
2
1
Norm. cone resistance
C P T b a s i c i n t e r p r e t a t i o n p l o t s ( n o r m a l i z e d )
Norm. friction ratio
Fr (%)654321
Dep
th (
ft)
25
24
23
22
21
20
19
18
17
16
15
14
13
12
11
10
9
8
7
6
5
4
3
2
1
Norm. friction ratio Nom. pore pressure ratio
Bq0-0.02-0.04
Dep
th (
ft)
25
24
23
22
21
20
19
18
17
16
15
14
13
12
11
10
9
8
7
6
5
4
3
2
1
Nom. pore pressure ratio SBTn Plot
Ic (Robertson 1990)4321
Dep
th (
ft)
25
24
23
22
21
20
19
18
17
16
15
14
13
12
11
10
9
8
7
6
5
4
3
2
1
SBTn Plot Norm. Soil Behaviour Type
SBTn (Robertson 1990)181614121086420
Dep
th (
ft)
25
24
23
22
21
20
19
18
17
16
15
14
13
12
11
10
9
8
7
6
5
4
3
2
1
Norm. Soil Behaviour Type
Silty sand & sandy silt
Clay & silty clay
Silty sand & sandy silt
Sand & silty sand
Silty sand & sandy silt
Sand & silty sand
Silty sand & sandy silt
Clay & silty clay
ClayClay & silty clay
Clay
CLiq v.1.7.1.14 - CPT Liquefaction Assessment Software - Report created on: 9/17/2013, 7:03:09 PM 2Project file: G:\Active Projects\8472\8472001002 CP Retail Site\Updated Cliq Analysis.clq
SBTn legend
1. Sensitive fine grained
2. Organic material
3. Clay to silty clay
4. Clayey silt to siltyl5. Silty sand to sandy silt
6. Clean sand to silty sand
7. Gravely sand to sand
8. Very stiff sand tol d
9. Very stiff fine grained
Input parameters and analysis dataAnalysis method:Fines correction method:Points to test:Earthquake magnitude Mw:Peak ground acceleration:Depth to water table (insitu):
Robertson (2009)Robertson (2009)Based on Ic value7.900.615.00 ft
Depth to water table (erthq.):Average results interval:Ic cut-off value:Unit weight calculation:Use fill:Fill height:
5.00 ft32.60Based on SBTNoN/A
Fill weight:Transition detect. applied:Kσ applied:Clay like behavior applied:Limit depth applied:Limit depth:
N/AYesNoAll soilsNoN/A
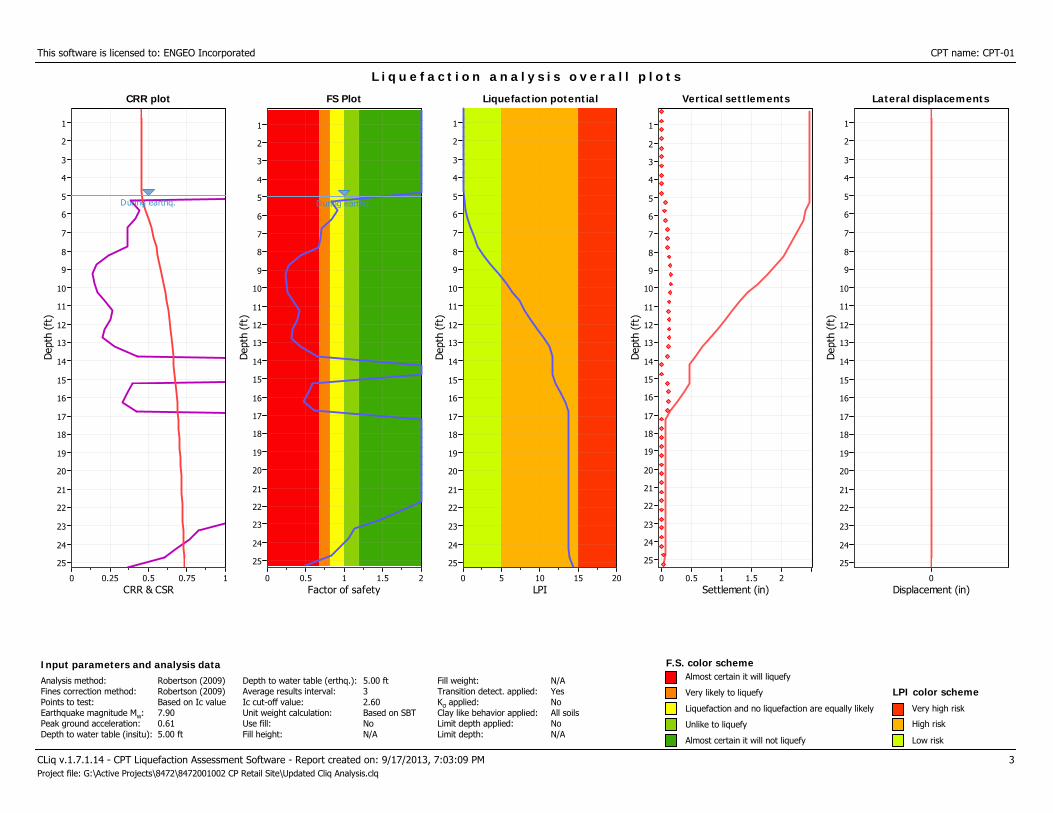
This software is licensed to: ENGEO Incorporated CPT name: CPT-01
CRR plot
CRR & CSR10.750.50.250
Dep
th (
ft)
25
24
23
22
21
20
19
18
17
16
15
14
13
12
11
10
9
8
7
6
5
4
3
2
1
CRR plot
During earthq.
L i q u e f a c t i o n a n a l y s i s o v e r a l l p l o t s
FS Plot
Factor of safety21.510.50
Dep
th (
ft)
25
24
23
22
21
20
19
18
17
16
15
14
13
12
11
10
9
8
7
6
5
4
3
2
1
FS Plot
During earthq.
Liquefaction potential
LPI20151050
Dep
th (
ft)
25
24
23
22
21
20
19
18
17
16
15
14
13
12
11
10
9
8
7
6
5
4
3
2
1
Liquefaction potential Vertical settlements
Settlement (in)21.510.50
Dep
th (
ft)
25
24
23
22
21
20
19
18
17
16
15
14
13
12
11
10
9
8
7
6
5
4
3
2
1
Vertical settlements Lateral displacements
Displacement (in)0
Dep
th (
ft)
25
24
23
22
21
20
19
18
17
16
15
14
13
12
11
10
9
8
7
6
5
4
3
2
1
Lateral displacements
CLiq v.1.7.1.14 - CPT Liquefaction Assessment Software - Report created on: 9/17/2013, 7:03:09 PM 3Project file: G:\Active Projects\8472\8472001002 CP Retail Site\Updated Cliq Analysis.clq
F.S. color scheme
Liquefaction and no liquefaction are equally likely
Unlike to liquefy
Almost certain it will not liquefy
LPI color schemeVery high risk
High risk
Low risk
Input parameters and analysis dataAnalysis method:Fines correction method:Points to test:Earthquake magnitude Mw:Peak ground acceleration:Depth to water table (insitu):
Robertson (2009)Robertson (2009)Based on Ic value7.900.615.00 ft
Depth to water table (erthq.):Average results interval:Ic cut-off value:Unit weight calculation:Use fill:Fill height:
5.00 ft32.60Based on SBTNoN/A
Fill weight:Transition detect. applied:Kσ applied:Clay like behavior applied:Limit depth applied:Limit depth:
N/AYesNoAll soilsNoN/A
Very likely to liquefy
Almost certain it will liquefy
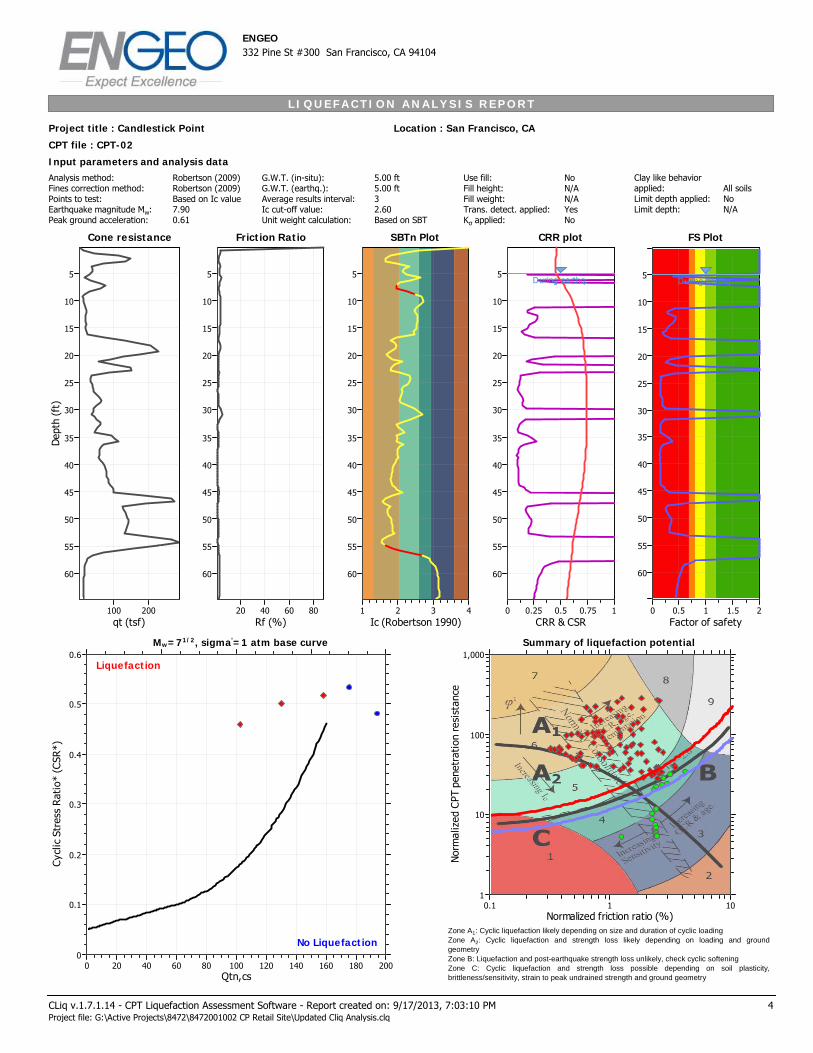
L I Q U E F A C T I O N A N A L Y S I S R E P O R T
Input parameters and analysis dataAnalysis method:Fines correction method:Points to test:Earthquake magnitude Mw:Peak ground acceleration:
Robertson (2009)Robertson (2009)Based on Ic value7.900.61
G.W.T. (in-situ):G.W.T. (earthq.):Average results interval:Ic cut-off value:Unit weight calculation:
Project title : Candlestick Point Location : San Francisco, CA
ENGEO332 Pine St #300 San Francisco, CA 94104
CPT file : CPT-02
5.00 ft5.00 ft32.60Based on SBT
Use fill:Fill height:Fill weight:Trans. detect. applied:Kσ applied:
NoN/AN/AYesNo
Clay like behaviorapplied:Limit depth applied:Limit depth:
All soilsNoN/A
Cone resistance
qt (tsf)200100
Dep
th (
ft)
60
55
50
45
40
35
30
25
20
15
10
5
Cone resistance SBTn Plot
Ic (Robertson 1990)4321
60
55
50
45
40
35
30
25
20
15
10
5
SBTn Plot CRR plot
CRR & CSR10.750.50.250
60
55
50
45
40
35
30
25
20
15
10
5
CRR plot
During earthq.
Qtn,cs200180160140120100806040200
Cyc
lic S
tres
s R
atio
* (C
SR*)
0.6
0.5
0.4
0.3
0.2
0.1
0
Liquefaction
No Liquefaction
Normalized friction ratio (%)0.1 1 10
Nor
mal
ized
CPT
pen
etra
tion
res
ista
nce
1
10
100
1,000
Friction Ratio
Rf (%)80604020
60
55
50
45
40
35
30
25
20
15
10
5
Friction Ratio
Mw=71/2, sigma'=1 atm base curve Summary of liquefaction potential
FS Plot
Factor of safety21.510.50
60
55
50
45
40
35
30
25
20
15
10
5
FS Plot
During earthq.
Zone A1: Cyclic liquefaction likely depending on size and duration of cyclic loadingZone A2: Cyclic liquefaction and strength loss likely depending on loading and groundgeometryZone B: Liquefaction and post-earthquake strength loss unlikely, check cyclic softeningZone C: Cyclic liquefaction and strength loss possible depending on soil plasticity,brittleness/sensitivity, strain to peak undrained strength and ground geometry
CLiq v.1.7.1.14 - CPT Liquefaction Assessment Software - Report created on: 9/17/2013, 7:03:10 PMProject file: G:\Active Projects\8472\8472001002 CP Retail Site\Updated Cliq Analysis.clq
4
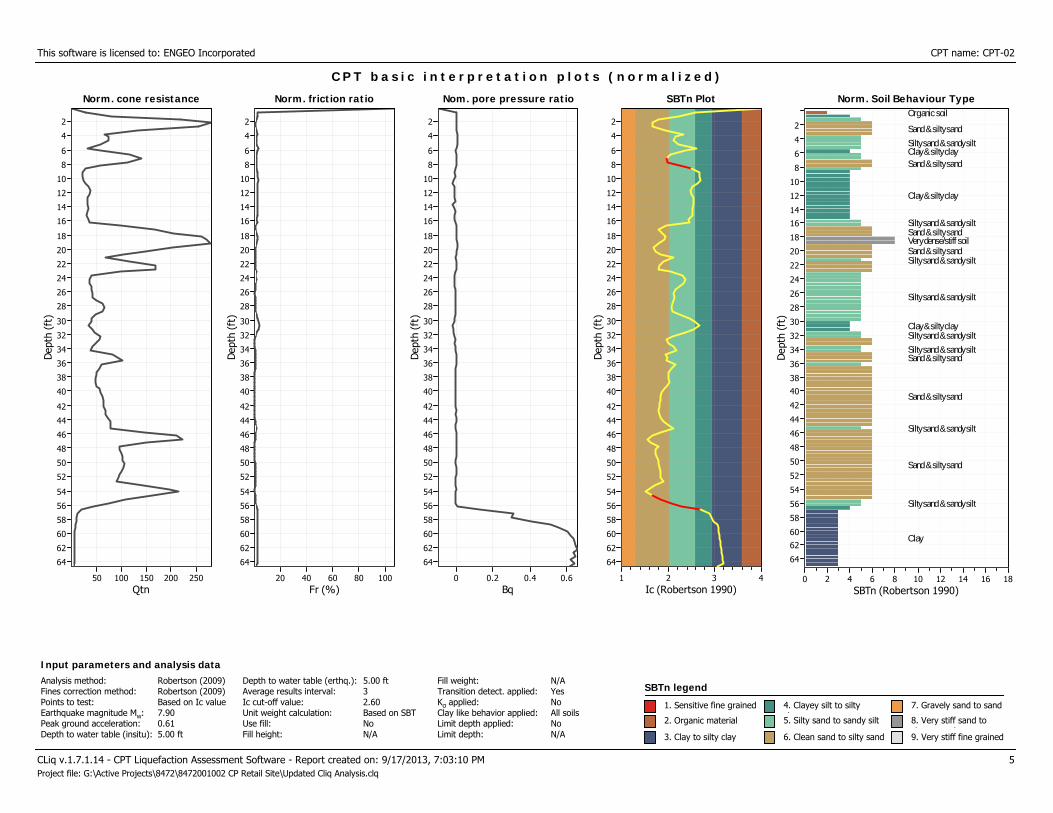
This software is licensed to: ENGEO Incorporated CPT name: CPT-02
Norm. cone resistance
Qtn25020015010050
Dep
th (
ft)
64
62
60
58
56
54
52
50
48
46
44
42
40
38
36
34
32
30
28
26
24
22
20
18
16
14
12
10
8
6
4
2
Norm. cone resistance
C P T b a s i c i n t e r p r e t a t i o n p l o t s ( n o r m a l i z e d )
Norm. friction ratio
Fr (%)10080604020
Dep
th (
ft)
64
62
60
58
56
54
52
50
48
46
44
42
40
38
36
34
32
30
28
26
24
22
20
18
16
14
12
10
8
6
4
2
Norm. friction ratio Nom. pore pressure ratio
Bq0.60.40.20
Dep
th (
ft)
64
62
60
58
56
54
52
50
48
46
44
42
40
38
36
34
32
30
28
26
24
22
20
18
16
14
12
10
8
6
4
2
Nom. pore pressure ratio SBTn Plot
Ic (Robertson 1990)4321
Dep
th (
ft)
64
62
60
58
56
54
52
50
48
46
44
42
40
38
36
34
32
30
28
26
24
22
20
18
16
14
12
10
8
6
4
2
SBTn Plot Norm. Soil Behaviour Type
SBTn (Robertson 1990)181614121086420
Dep
th (
ft)
64
6260
58
56
54
52
50
48
46
44
42
4038
36
34
32
30
28
26
24
22
20
18
1614
12
10
8
6
4
2
Norm. Soil Behaviour TypeOrganic soil
Sand & silty sand
Silty sand & sandy siltClay & silty claySand & silty sand
Clay & silty clay
Silty sand & sandy siltSand & silty sandVery dense/stiff soilSand & silty sandSilty sand & sandy silt
Silty sand & sandy silt
Clay & silty claySilty sand & sandy silt
Silty sand & sandy siltSand & silty sand
Sand & silty sand
Silty sand & sandy silt
Sand & silty sand
Silty sand & sandy silt
Clay
CLiq v.1.7.1.14 - CPT Liquefaction Assessment Software - Report created on: 9/17/2013, 7:03:10 PM 5Project file: G:\Active Projects\8472\8472001002 CP Retail Site\Updated Cliq Analysis.clq
SBTn legend
1. Sensitive fine grained
2. Organic material
3. Clay to silty clay
4. Clayey silt to siltyl5. Silty sand to sandy silt
6. Clean sand to silty sand
7. Gravely sand to sand
8. Very stiff sand tol d
9. Very stiff fine grained
Input parameters and analysis dataAnalysis method:Fines correction method:Points to test:Earthquake magnitude Mw:Peak ground acceleration:Depth to water table (insitu):
Robertson (2009)Robertson (2009)Based on Ic value7.900.615.00 ft
Depth to water table (erthq.):Average results interval:Ic cut-off value:Unit weight calculation:Use fill:Fill height:
5.00 ft32.60Based on SBTNoN/A
Fill weight:Transition detect. applied:Kσ applied:Clay like behavior applied:Limit depth applied:Limit depth:
N/AYesNoAll soilsNoN/A
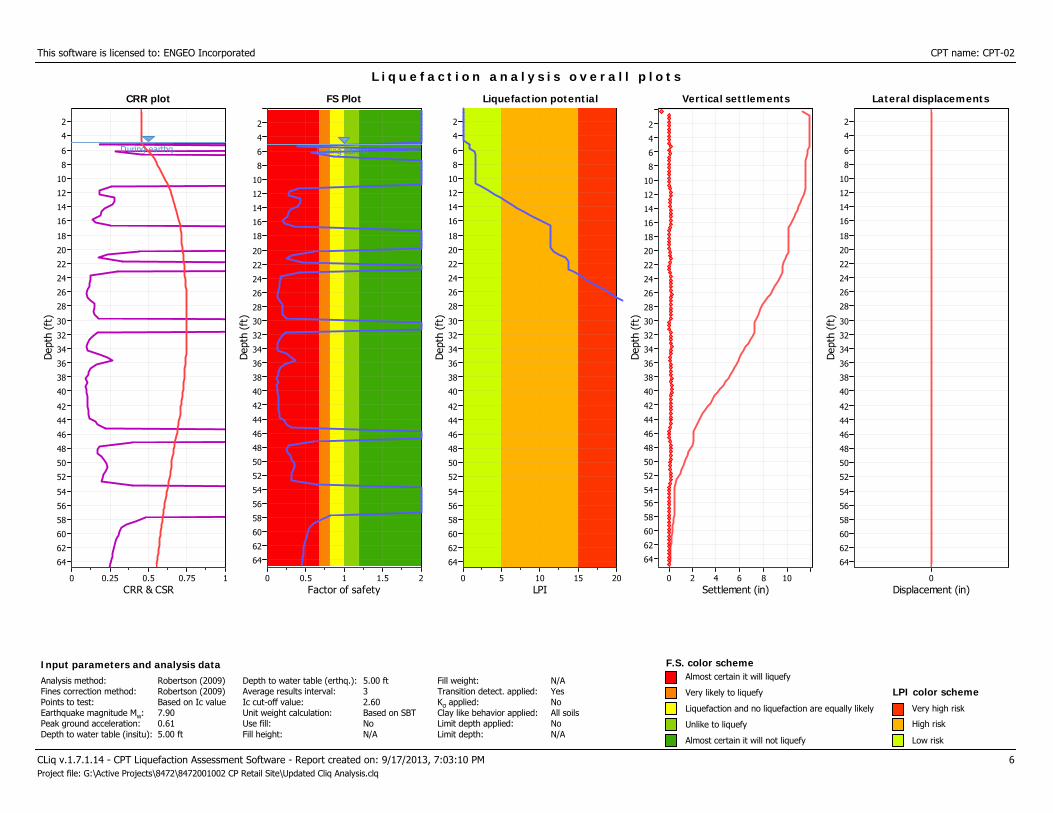
This software is licensed to: ENGEO Incorporated CPT name: CPT-02
CRR plot
CRR & CSR10.750.50.250
Dep
th (
ft)
64
62
60
58
56
54
52
50
48
46
44
42
40
38
36
34
32
30
28
26
24
22
20
18
16
14
12
10
8
6
4
2
CRR plot
During earthq.
L i q u e f a c t i o n a n a l y s i s o v e r a l l p l o t s
FS Plot
Factor of safety21.510.50
Dep
th (
ft)
64
62
60
58
56
54
52
50
48
46
44
42
40
38
36
34
32
30
28
26
24
22
20
18
16
14
12
10
8
6
4
2
FS Plot
During earthq.
Liquefaction potential
LPI20151050
Dep
th (
ft)
64
62
60
58
56
54
52
50
48
46
44
42
40
38
36
34
32
30
28
26
24
22
20
18
16
14
12
10
8
6
4
2
Liquefaction potential Vertical settlements
Settlement (in)1086420
Dep
th (
ft)
64
62
60
58
5654
52
50
48
46
44
42
40
38
36
34
32
30
28
26
24
22
20
18
16
14
12
10
8
6
4
2
Vertical settlements Lateral displacements
Displacement (in)0
Dep
th (
ft)
64
62
60
58
56
54
52
50
48
46
44
42
40
38
36
34
32
30
28
26
24
22
20
18
16
14
12
10
8
6
4
2
Lateral displacements
CLiq v.1.7.1.14 - CPT Liquefaction Assessment Software - Report created on: 9/17/2013, 7:03:10 PM 6Project file: G:\Active Projects\8472\8472001002 CP Retail Site\Updated Cliq Analysis.clq
F.S. color scheme
Liquefaction and no liquefaction are equally likely
Unlike to liquefy
Almost certain it will not liquefy
LPI color schemeVery high risk
High risk
Low risk
Input parameters and analysis dataAnalysis method:Fines correction method:Points to test:Earthquake magnitude Mw:Peak ground acceleration:Depth to water table (insitu):
Robertson (2009)Robertson (2009)Based on Ic value7.900.615.00 ft
Depth to water table (erthq.):Average results interval:Ic cut-off value:Unit weight calculation:Use fill:Fill height:
5.00 ft32.60Based on SBTNoN/A
Fill weight:Transition detect. applied:Kσ applied:Clay like behavior applied:Limit depth applied:Limit depth:
N/AYesNoAll soilsNoN/A
Very likely to liquefy
Almost certain it will liquefy
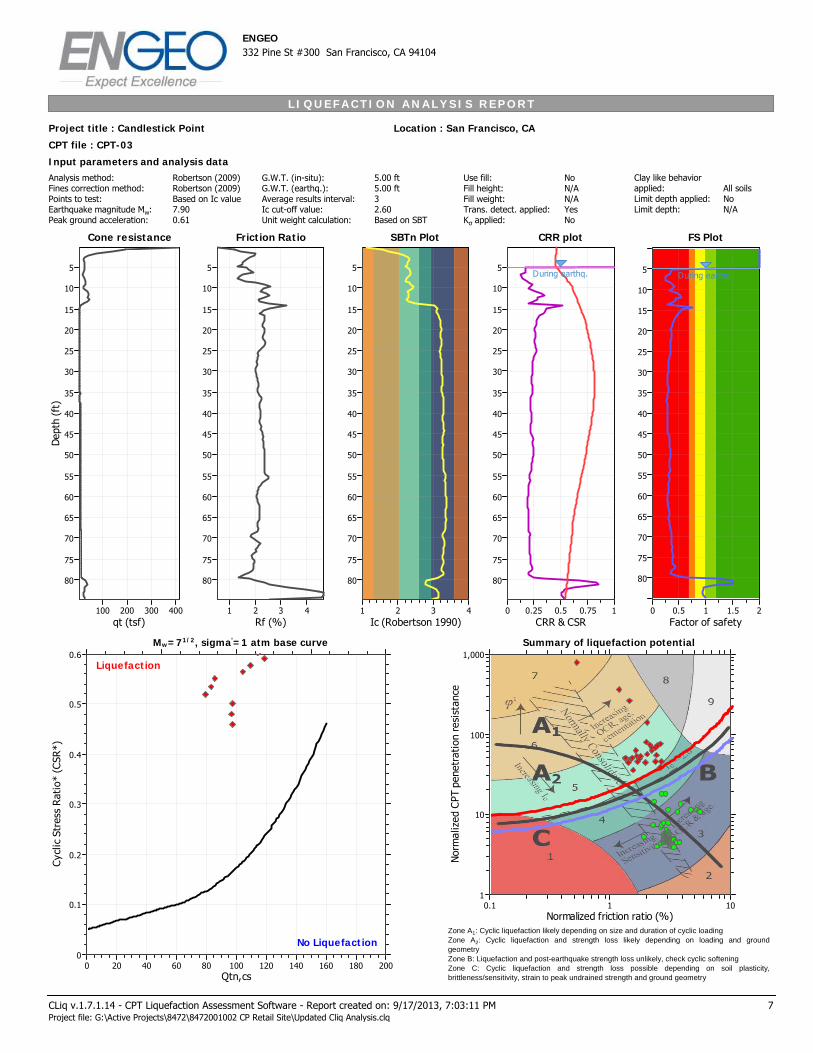
L I Q U E F A C T I O N A N A L Y S I S R E P O R T
Input parameters and analysis dataAnalysis method:Fines correction method:Points to test:Earthquake magnitude Mw:Peak ground acceleration:
Robertson (2009)Robertson (2009)Based on Ic value7.900.61
G.W.T. (in-situ):G.W.T. (earthq.):Average results interval:Ic cut-off value:Unit weight calculation:
Project title : Candlestick Point Location : San Francisco, CA
ENGEO332 Pine St #300 San Francisco, CA 94104
CPT file : CPT-03
5.00 ft5.00 ft32.60Based on SBT
Use fill:Fill height:Fill weight:Trans. detect. applied:Kσ applied:
NoN/AN/AYesNo
Clay like behaviorapplied:Limit depth applied:Limit depth:
All soilsNoN/A
Cone resistance
qt (tsf)400300200100
Dep
th (
ft)
80
75
70
65
60
55
50
45
40
35
30
25
20
15
10
5
Cone resistance SBTn Plot
Ic (Robertson 1990)4321
80
75
70
65
60
55
50
45
40
35
30
25
20
15
10
5
SBTn Plot CRR plot
CRR & CSR10.750.50.250
80
75
70
65
60
55
50
45
40
35
30
25
20
15
10
5
CRR plot
During earthq.
Qtn,cs200180160140120100806040200
Cyc
lic S
tres
s R
atio
* (C
SR*)
0.6
0.5
0.4
0.3
0.2
0.1
0
Liquefaction
No Liquefaction
Normalized friction ratio (%)0.1 1 10
Nor
mal
ized
CPT
pen
etra
tion
res
ista
nce
1
10
100
1,000
Friction Ratio
Rf (%)4321
80
75
70
65
60
55
50
45
40
35
30
25
20
15
10
5
Friction Ratio
Mw=71/2, sigma'=1 atm base curve Summary of liquefaction potential
FS Plot
Factor of safety21.510.50
80
75
70
65
60
55
50
45
40
35
30
25
20
15
10
5
FS Plot
During earthq.
Zone A1: Cyclic liquefaction likely depending on size and duration of cyclic loadingZone A2: Cyclic liquefaction and strength loss likely depending on loading and groundgeometryZone B: Liquefaction and post-earthquake strength loss unlikely, check cyclic softeningZone C: Cyclic liquefaction and strength loss possible depending on soil plasticity,brittleness/sensitivity, strain to peak undrained strength and ground geometry
CLiq v.1.7.1.14 - CPT Liquefaction Assessment Software - Report created on: 9/17/2013, 7:03:11 PMProject file: G:\Active Projects\8472\8472001002 CP Retail Site\Updated Cliq Analysis.clq
7
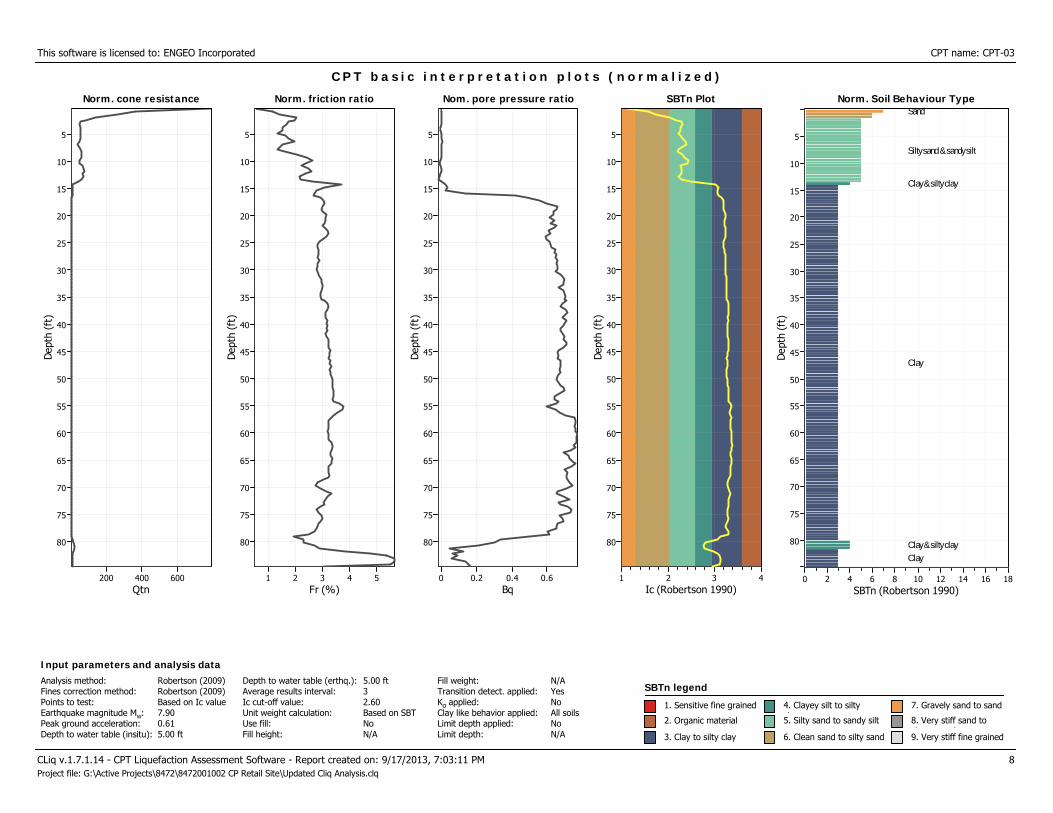
This software is licensed to: ENGEO Incorporated CPT name: CPT-03
Norm. cone resistance
Qtn600400200
Dep
th (
ft)
80
75
70
65
60
55
50
45
40
35
30
25
20
15
10
5
Norm. cone resistance
C P T b a s i c i n t e r p r e t a t i o n p l o t s ( n o r m a l i z e d )
Norm. friction ratio
Fr (%)54321
Dep
th (
ft)
80
75
70
65
60
55
50
45
40
35
30
25
20
15
10
5
Norm. friction ratio Nom. pore pressure ratio
Bq0.60.40.20
Dep
th (
ft)
80
75
70
65
60
55
50
45
40
35
30
25
20
15
10
5
Nom. pore pressure ratio SBTn Plot
Ic (Robertson 1990)4321
Dep
th (
ft)
80
75
70
65
60
55
50
45
40
35
30
25
20
15
10
5
SBTn Plot Norm. Soil Behaviour Type
SBTn (Robertson 1990)181614121086420
Dep
th (
ft)
80
75
70
65
60
55
50
45
40
35
30
25
20
15
10
5
Norm. Soil Behaviour TypeSand
Silty sand & sandy silt
Clay & silty clay
Clay
Clay & silty clay
Clay
CLiq v.1.7.1.14 - CPT Liquefaction Assessment Software - Report created on: 9/17/2013, 7:03:11 PM 8Project file: G:\Active Projects\8472\8472001002 CP Retail Site\Updated Cliq Analysis.clq
SBTn legend
1. Sensitive fine grained
2. Organic material
3. Clay to silty clay
4. Clayey silt to siltyl5. Silty sand to sandy silt
6. Clean sand to silty sand
7. Gravely sand to sand
8. Very stiff sand tol d
9. Very stiff fine grained
Input parameters and analysis dataAnalysis method:Fines correction method:Points to test:Earthquake magnitude Mw:Peak ground acceleration:Depth to water table (insitu):
Robertson (2009)Robertson (2009)Based on Ic value7.900.615.00 ft
Depth to water table (erthq.):Average results interval:Ic cut-off value:Unit weight calculation:Use fill:Fill height:
5.00 ft32.60Based on SBTNoN/A
Fill weight:Transition detect. applied:Kσ applied:Clay like behavior applied:Limit depth applied:Limit depth:
N/AYesNoAll soilsNoN/A

This software is licensed to: ENGEO Incorporated CPT name: CPT-03
CRR plot
CRR & CSR10.750.50.250
Dep
th (
ft)
80
75
70
65
60
55
50
45
40
35
30
25
20
15
10
5
CRR plot
During earthq.
L i q u e f a c t i o n a n a l y s i s o v e r a l l p l o t s
FS Plot
Factor of safety21.510.50
Dep
th (
ft)
80
75
70
65
60
55
50
45
40
35
30
25
20
15
10
5
FS Plot
During earthq.
Liquefaction potential
LPI20151050
Dep
th (
ft)
64
62
60
58
56
54
52
50
48
46
44
42
40
38
36
34
32
30
28
26
24
22
20
18
16
14
12
10
8
6
4
2
Liquefaction potential Vertical settlements
Settlement (in)6543210
Dep
th (
ft)
80
75
70
65
60
55
50
45
40
35
30
25
20
15
10
5
Vertical settlements Lateral displacements
Displacement (in)0
Dep
th (
ft)
80
75
70
65
60
55
50
45
40
35
30
25
20
15
10
5
Lateral displacements
CLiq v.1.7.1.14 - CPT Liquefaction Assessment Software - Report created on: 9/17/2013, 7:03:11 PM 9Project file: G:\Active Projects\8472\8472001002 CP Retail Site\Updated Cliq Analysis.clq
F.S. color scheme
Liquefaction and no liquefaction are equally likely
Unlike to liquefy
Almost certain it will not liquefy
LPI color schemeVery high risk
High risk
Low risk
Input parameters and analysis dataAnalysis method:Fines correction method:Points to test:Earthquake magnitude Mw:Peak ground acceleration:Depth to water table (insitu):
Robertson (2009)Robertson (2009)Based on Ic value7.900.615.00 ft
Depth to water table (erthq.):Average results interval:Ic cut-off value:Unit weight calculation:Use fill:Fill height:
5.00 ft32.60Based on SBTNoN/A
Fill weight:Transition detect. applied:Kσ applied:Clay like behavior applied:Limit depth applied:Limit depth:
N/AYesNoAll soilsNoN/A
Very likely to liquefy
Almost certain it will liquefy

L I Q U E F A C T I O N A N A L Y S I S R E P O R T
Input parameters and analysis dataAnalysis method:Fines correction method:Points to test:Earthquake magnitude Mw:Peak ground acceleration:
Robertson (2009)Robertson (2009)Based on Ic value7.900.61
G.W.T. (in-situ):G.W.T. (earthq.):Average results interval:Ic cut-off value:Unit weight calculation:
Project title : Candlestick Point Location : San Francisco, CA
ENGEO332 Pine St #300 San Francisco, CA 94104
CPT file : CPT-04
5.00 ft5.00 ft32.60Based on SBT
Use fill:Fill height:Fill weight:Trans. detect. applied:Kσ applied:
NoN/AN/AYesNo
Clay like behaviorapplied:Limit depth applied:Limit depth:
All soilsNoN/A
Cone resistance
qt (tsf)15010050
Dep
th (
ft)
40
38
36
34
32
30
28
26
24
22
20
18
16
14
12
10
8
6
4
2
Cone resistance SBTn Plot
Ic (Robertson 1990)4321
40
38
36
34
32
30
28
26
24
22
20
18
16
14
12
10
8
6
4
2
SBTn Plot CRR plot
CRR & CSR10.750.50.250
40
38
36
34
32
30
28
26
24
22
20
18
16
14
12
10
8
6
4
2
CRR plot
During earthq.
Qtn,cs200180160140120100806040200
Cyc
lic S
tres
s R
atio
* (C
SR*)
0.6
0.5
0.4
0.3
0.2
0.1
0
Liquefaction
No Liquefaction
Normalized friction ratio (%)0.1 1 10
Nor
mal
ized
CPT
pen
etra
tion
res
ista
nce
1
10
100
1,000
Friction Ratio
Rf (%)4321
40
38
36
34
32
30
28
26
24
22
20
18
16
14
12
10
8
6
4
2
Friction Ratio
Mw=71/2, sigma'=1 atm base curve Summary of liquefaction potential
FS Plot
Factor of safety21.510.50
40
38
36
34
32
30
28
26
24
22
20
18
16
14
12
10
8
6
4
2
FS Plot
During earthq.
Zone A1: Cyclic liquefaction likely depending on size and duration of cyclic loadingZone A2: Cyclic liquefaction and strength loss likely depending on loading and groundgeometryZone B: Liquefaction and post-earthquake strength loss unlikely, check cyclic softeningZone C: Cyclic liquefaction and strength loss possible depending on soil plasticity,brittleness/sensitivity, strain to peak undrained strength and ground geometry
CLiq v.1.7.1.14 - CPT Liquefaction Assessment Software - Report created on: 9/17/2013, 7:03:11 PMProject file: G:\Active Projects\8472\8472001002 CP Retail Site\Updated Cliq Analysis.clq
10
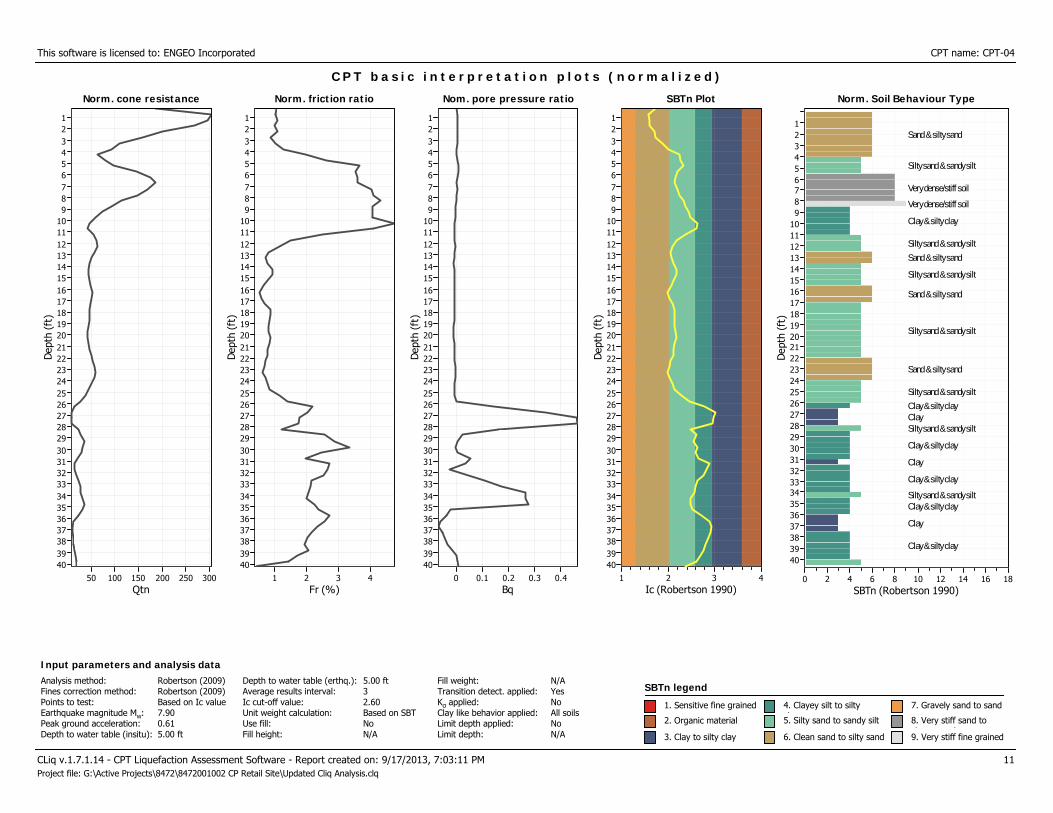
This software is licensed to: ENGEO Incorporated CPT name: CPT-04
Norm. cone resistance
Qtn30025020015010050
Dep
th (
ft)
40393837363534333231302928272625242322212019181716151413121110987654321
Norm. cone resistance
C P T b a s i c i n t e r p r e t a t i o n p l o t s ( n o r m a l i z e d )
Norm. friction ratio
Fr (%)4321
Dep
th (
ft)
40393837363534333231302928272625242322212019181716151413121110987654321
Norm. friction ratio Nom. pore pressure ratio
Bq0.40.30.20.10
Dep
th (
ft)
40393837363534333231302928272625242322212019181716151413121110987654321
Nom. pore pressure ratio SBTn Plot
Ic (Robertson 1990)4321
Dep
th (
ft)
40393837363534333231302928272625242322212019181716151413121110987654321
SBTn Plot Norm. Soil Behaviour Type
SBTn (Robertson 1990)181614121086420
Dep
th (
ft)
40393837363534333231302928272625242322212019181716151413121110987654321
Norm. Soil Behaviour Type
Sand & silty sand
Silty sand & sandy silt
Very dense/stiff soil
Very dense/stiff soil
Clay & silty clay
Silty sand & sandy silt
Sand & silty sand
Silty sand & sandy silt
Sand & silty sand
Silty sand & sandy silt
Sand & silty sand
Silty sand & sandy silt
Clay & silty clayClaySilty sand & sandy silt
Clay & silty clay
Clay
Clay & silty clay
Silty sand & sandy siltClay & silty clay
Clay
Clay & silty clay
CLiq v.1.7.1.14 - CPT Liquefaction Assessment Software - Report created on: 9/17/2013, 7:03:11 PM 11Project file: G:\Active Projects\8472\8472001002 CP Retail Site\Updated Cliq Analysis.clq
SBTn legend
1. Sensitive fine grained
2. Organic material
3. Clay to silty clay
4. Clayey silt to siltyl5. Silty sand to sandy silt
6. Clean sand to silty sand
7. Gravely sand to sand
8. Very stiff sand tol d
9. Very stiff fine grained
Input parameters and analysis dataAnalysis method:Fines correction method:Points to test:Earthquake magnitude Mw:Peak ground acceleration:Depth to water table (insitu):
Robertson (2009)Robertson (2009)Based on Ic value7.900.615.00 ft
Depth to water table (erthq.):Average results interval:Ic cut-off value:Unit weight calculation:Use fill:Fill height:
5.00 ft32.60Based on SBTNoN/A
Fill weight:Transition detect. applied:Kσ applied:Clay like behavior applied:Limit depth applied:Limit depth:
N/AYesNoAll soilsNoN/A
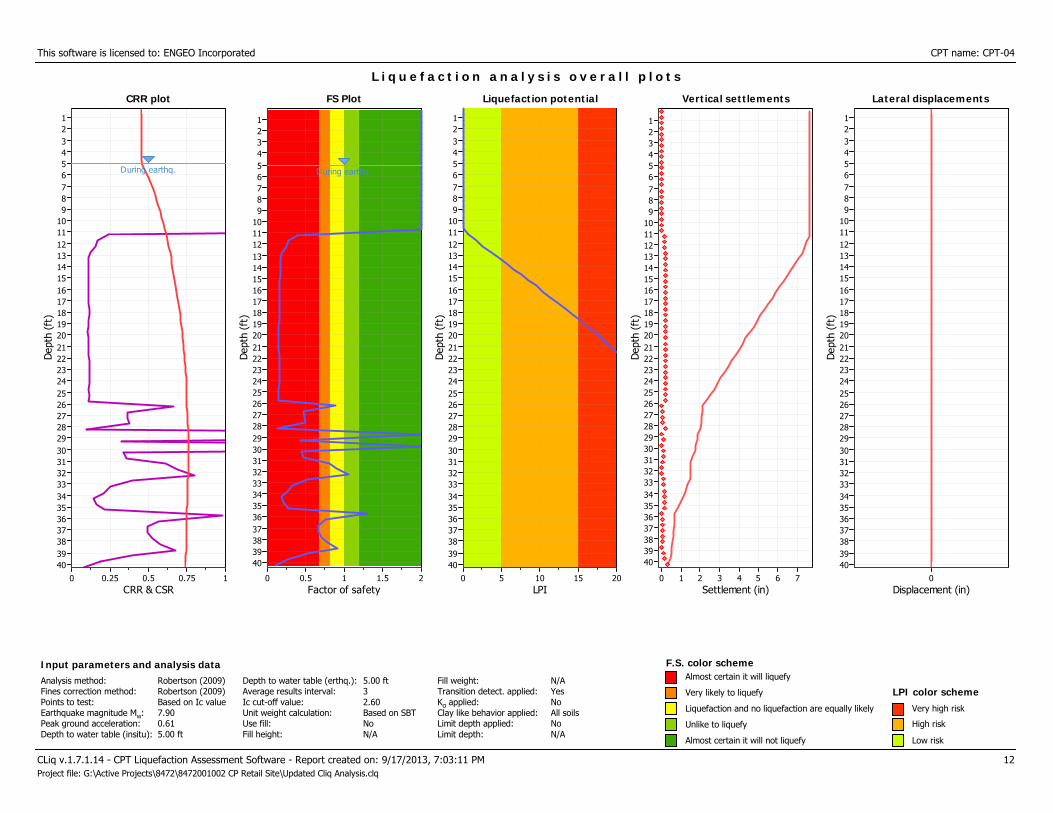
This software is licensed to: ENGEO Incorporated CPT name: CPT-04
CRR plot
CRR & CSR10.750.50.250
Dep
th (
ft)
40393837363534333231302928272625242322212019181716151413121110987654321
CRR plot
During earthq.
L i q u e f a c t i o n a n a l y s i s o v e r a l l p l o t s
FS Plot
Factor of safety21.510.50
Dep
th (
ft)
40393837363534333231302928272625242322212019181716151413121110987654321
FS Plot
During earthq.
Liquefaction potential
LPI20151050
Dep
th (
ft)
40393837363534333231302928272625242322212019181716151413121110987654321
Liquefaction potential Vertical settlements
Settlement (in)76543210
Dep
th (
ft)
40393837363534333231302928272625242322212019181716151413121110987654321
Vertical settlements Lateral displacements
Displacement (in)0
Dep
th (
ft)
40393837363534333231302928272625242322212019181716151413121110987654321
Lateral displacements
CLiq v.1.7.1.14 - CPT Liquefaction Assessment Software - Report created on: 9/17/2013, 7:03:11 PM 12Project file: G:\Active Projects\8472\8472001002 CP Retail Site\Updated Cliq Analysis.clq
F.S. color scheme
Liquefaction and no liquefaction are equally likely
Unlike to liquefy
Almost certain it will not liquefy
LPI color schemeVery high risk
High risk
Low risk
Input parameters and analysis dataAnalysis method:Fines correction method:Points to test:Earthquake magnitude Mw:Peak ground acceleration:Depth to water table (insitu):
Robertson (2009)Robertson (2009)Based on Ic value7.900.615.00 ft
Depth to water table (erthq.):Average results interval:Ic cut-off value:Unit weight calculation:Use fill:Fill height:
5.00 ft32.60Based on SBTNoN/A
Fill weight:Transition detect. applied:Kσ applied:Clay like behavior applied:Limit depth applied:Limit depth:
N/AYesNoAll soilsNoN/A
Very likely to liquefy
Almost certain it will liquefy
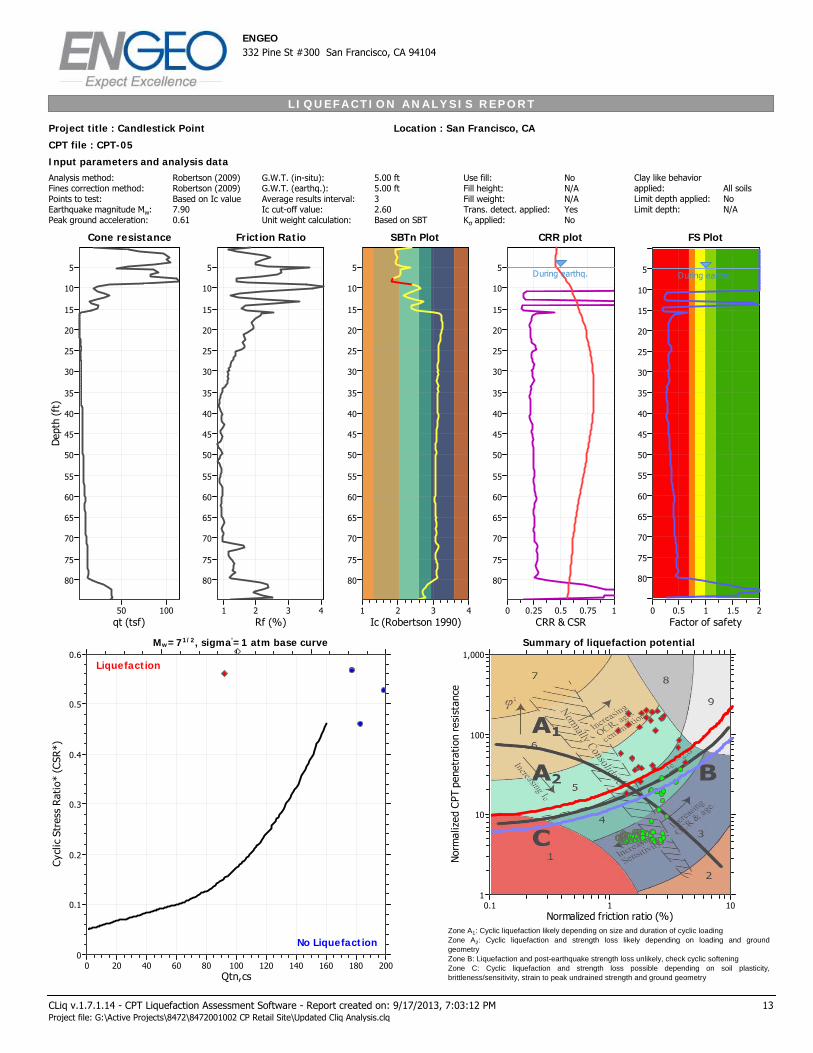
L I Q U E F A C T I O N A N A L Y S I S R E P O R T
Input parameters and analysis dataAnalysis method:Fines correction method:Points to test:Earthquake magnitude Mw:Peak ground acceleration:
Robertson (2009)Robertson (2009)Based on Ic value7.900.61
G.W.T. (in-situ):G.W.T. (earthq.):Average results interval:Ic cut-off value:Unit weight calculation:
Project title : Candlestick Point Location : San Francisco, CA
ENGEO332 Pine St #300 San Francisco, CA 94104
CPT file : CPT-05
5.00 ft5.00 ft32.60Based on SBT
Use fill:Fill height:Fill weight:Trans. detect. applied:Kσ applied:
NoN/AN/AYesNo
Clay like behaviorapplied:Limit depth applied:Limit depth:
All soilsNoN/A
Cone resistance
qt (tsf)10050
Dep
th (
ft)
80
75
70
65
60
55
50
45
40
35
30
25
20
15
10
5
Cone resistance SBTn Plot
Ic (Robertson 1990)4321
80
75
70
65
60
55
50
45
40
35
30
25
20
15
10
5
SBTn Plot CRR plot
CRR & CSR10.750.50.250
80
75
70
65
60
55
50
45
40
35
30
25
20
15
10
5
CRR plot
During earthq.
Qtn,cs200180160140120100806040200
Cyc
lic S
tres
s R
atio
* (C
SR*)
0.6
0.5
0.4
0.3
0.2
0.1
0
Liquefaction
No Liquefaction
Normalized friction ratio (%)0.1 1 10
Nor
mal
ized
CPT
pen
etra
tion
res
ista
nce
1
10
100
1,000
Friction Ratio
Rf (%)4321
80
75
70
65
60
55
50
45
40
35
30
25
20
15
10
5
Friction Ratio
Mw=71/2, sigma'=1 atm base curve Summary of liquefaction potential
FS Plot
Factor of safety21.510.50
80
75
70
65
60
55
50
45
40
35
30
25
20
15
10
5
FS Plot
During earthq.
Zone A1: Cyclic liquefaction likely depending on size and duration of cyclic loadingZone A2: Cyclic liquefaction and strength loss likely depending on loading and groundgeometryZone B: Liquefaction and post-earthquake strength loss unlikely, check cyclic softeningZone C: Cyclic liquefaction and strength loss possible depending on soil plasticity,brittleness/sensitivity, strain to peak undrained strength and ground geometry
CLiq v.1.7.1.14 - CPT Liquefaction Assessment Software - Report created on: 9/17/2013, 7:03:12 PMProject file: G:\Active Projects\8472\8472001002 CP Retail Site\Updated Cliq Analysis.clq
13
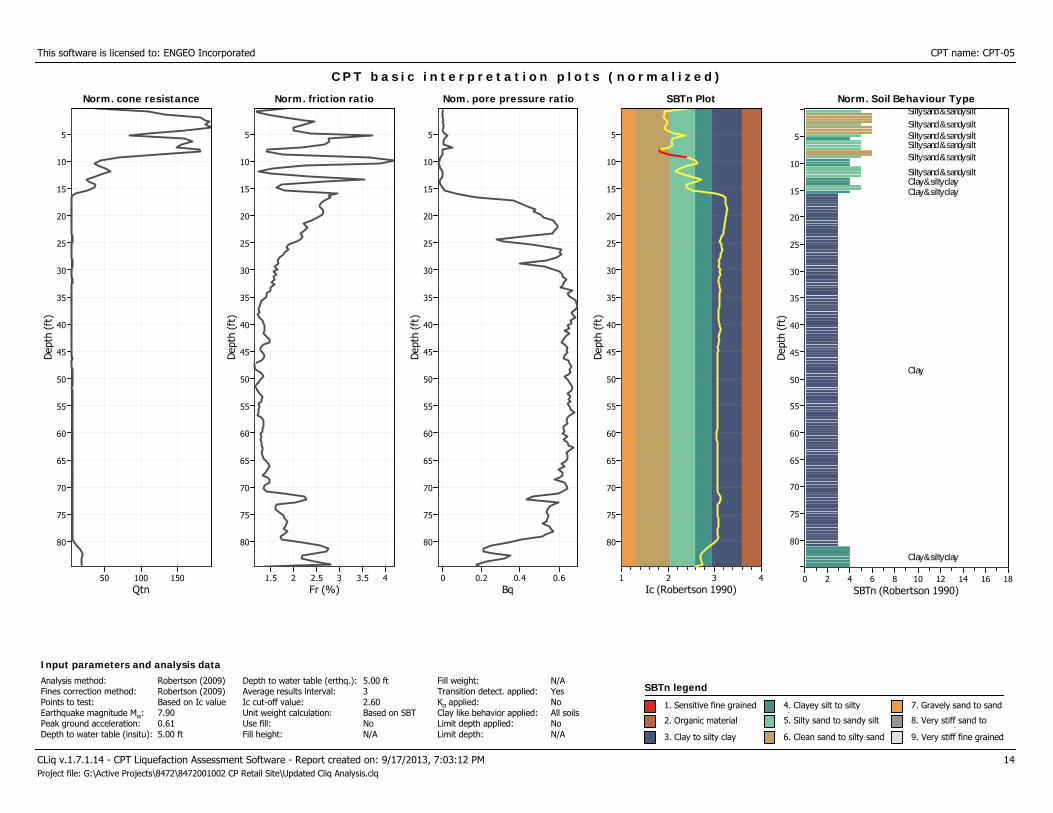
This software is licensed to: ENGEO Incorporated CPT name: CPT-05
Norm. cone resistance
Qtn15010050
Dep
th (
ft)
80
75
70
65
60
55
50
45
40
35
30
25
20
15
10
5
Norm. cone resistance
C P T b a s i c i n t e r p r e t a t i o n p l o t s ( n o r m a l i z e d )
Norm. friction ratio
Fr (%)43.532.521.5
Dep
th (
ft)
80
75
70
65
60
55
50
45
40
35
30
25
20
15
10
5
Norm. friction ratio Nom. pore pressure ratio
Bq0.60.40.20
Dep
th (
ft)
80
75
70
65
60
55
50
45
40
35
30
25
20
15
10
5
Nom. pore pressure ratio SBTn Plot
Ic (Robertson 1990)4321
Dep
th (
ft)
80
75
70
65
60
55
50
45
40
35
30
25
20
15
10
5
SBTn Plot Norm. Soil Behaviour Type
SBTn (Robertson 1990)181614121086420
Dep
th (
ft)
80
75
70
65
60
55
50
45
40
35
30
25
20
15
10
5
Norm. Soil Behaviour TypeSilty sand & sandy silt
Silty sand & sandy siltSilty sand & sandy siltSilty sand & sandy siltSilty sand & sandy silt
Silty sand & sandy siltClay & silty clayClay & silty clay
Clay
Clay & silty clay
CLiq v.1.7.1.14 - CPT Liquefaction Assessment Software - Report created on: 9/17/2013, 7:03:12 PM 14Project file: G:\Active Projects\8472\8472001002 CP Retail Site\Updated Cliq Analysis.clq
SBTn legend
1. Sensitive fine grained
2. Organic material
3. Clay to silty clay
4. Clayey silt to siltyl5. Silty sand to sandy silt
6. Clean sand to silty sand
7. Gravely sand to sand
8. Very stiff sand tol d
9. Very stiff fine grained
Input parameters and analysis dataAnalysis method:Fines correction method:Points to test:Earthquake magnitude Mw:Peak ground acceleration:Depth to water table (insitu):
Robertson (2009)Robertson (2009)Based on Ic value7.900.615.00 ft
Depth to water table (erthq.):Average results interval:Ic cut-off value:Unit weight calculation:Use fill:Fill height:
5.00 ft32.60Based on SBTNoN/A
Fill weight:Transition detect. applied:Kσ applied:Clay like behavior applied:Limit depth applied:Limit depth:
N/AYesNoAll soilsNoN/A
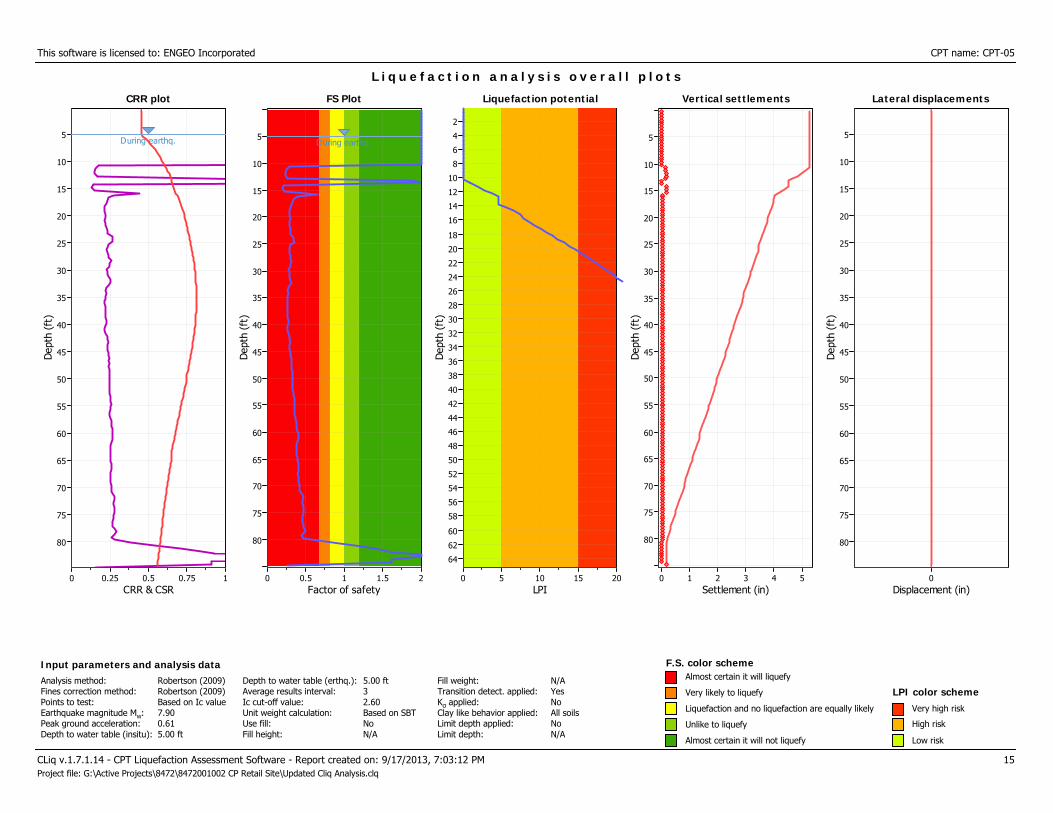
This software is licensed to: ENGEO Incorporated CPT name: CPT-05
CRR plot
CRR & CSR10.750.50.250
Dep
th (
ft)
80
75
70
65
60
55
50
45
40
35
30
25
20
15
10
5
CRR plot
During earthq.
L i q u e f a c t i o n a n a l y s i s o v e r a l l p l o t s
FS Plot
Factor of safety21.510.50
Dep
th (
ft)
80
75
70
65
60
55
50
45
40
35
30
25
20
15
10
5
FS Plot
During earthq.
Liquefaction potential
LPI20151050
Dep
th (
ft)
64
62
60
58
56
54
52
50
48
46
44
42
40
38
36
34
32
30
28
26
24
22
20
18
16
14
12
10
8
6
4
2
Liquefaction potential Vertical settlements
Settlement (in)543210
Dep
th (
ft)
80
75
70
65
60
55
50
45
40
35
30
25
20
15
10
5
Vertical settlements Lateral displacements
Displacement (in)0
Dep
th (
ft)
80
75
70
65
60
55
50
45
40
35
30
25
20
15
10
5
Lateral displacements
CLiq v.1.7.1.14 - CPT Liquefaction Assessment Software - Report created on: 9/17/2013, 7:03:12 PM 15Project file: G:\Active Projects\8472\8472001002 CP Retail Site\Updated Cliq Analysis.clq
F.S. color scheme
Liquefaction and no liquefaction are equally likely
Unlike to liquefy
Almost certain it will not liquefy
LPI color schemeVery high risk
High risk
Low risk
Input parameters and analysis dataAnalysis method:Fines correction method:Points to test:Earthquake magnitude Mw:Peak ground acceleration:Depth to water table (insitu):
Robertson (2009)Robertson (2009)Based on Ic value7.900.615.00 ft
Depth to water table (erthq.):Average results interval:Ic cut-off value:Unit weight calculation:Use fill:Fill height:
5.00 ft32.60Based on SBTNoN/A
Fill weight:Transition detect. applied:Kσ applied:Clay like behavior applied:Limit depth applied:Limit depth:
N/AYesNoAll soilsNoN/A
Very likely to liquefy
Almost certain it will liquefy
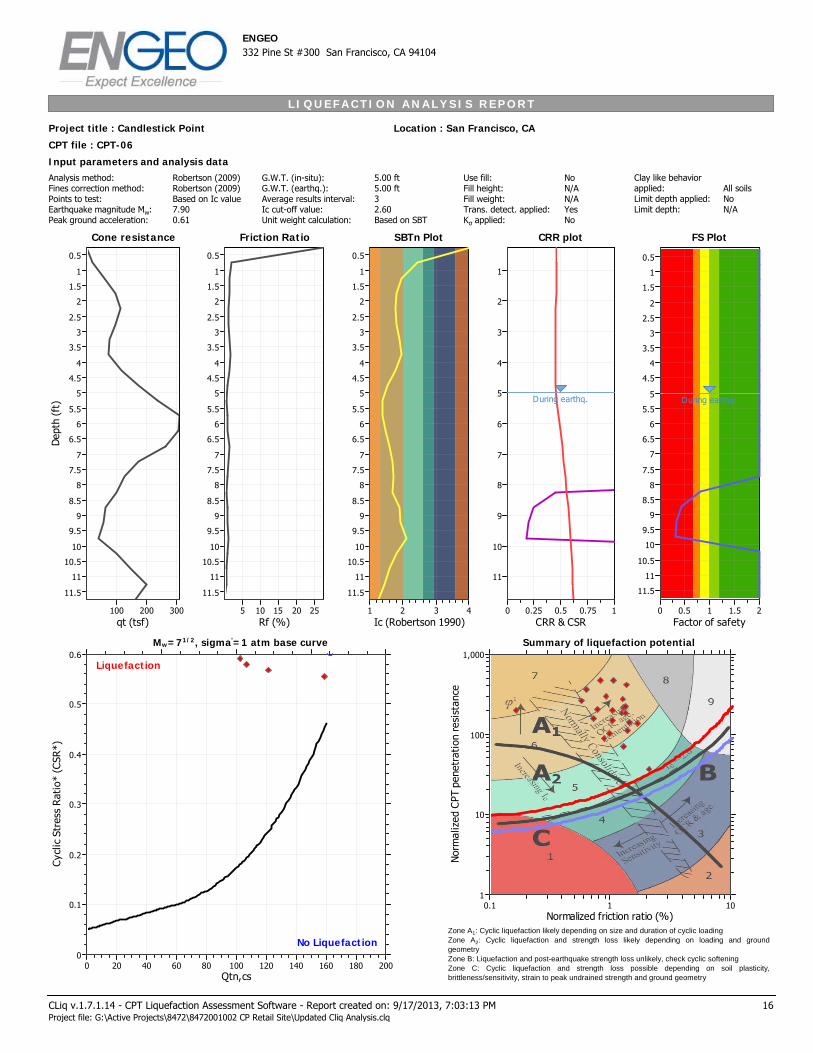
L I Q U E F A C T I O N A N A L Y S I S R E P O R T
Input parameters and analysis dataAnalysis method:Fines correction method:Points to test:Earthquake magnitude Mw:Peak ground acceleration:
Robertson (2009)Robertson (2009)Based on Ic value7.900.61
G.W.T. (in-situ):G.W.T. (earthq.):Average results interval:Ic cut-off value:Unit weight calculation:
Project title : Candlestick Point Location : San Francisco, CA
ENGEO332 Pine St #300 San Francisco, CA 94104
CPT file : CPT-06
5.00 ft5.00 ft32.60Based on SBT
Use fill:Fill height:Fill weight:Trans. detect. applied:Kσ applied:
NoN/AN/AYesNo
Clay like behaviorapplied:Limit depth applied:Limit depth:
All soilsNoN/A
Cone resistance
qt (tsf)300200100
Dep
th (
ft)
11.5
11
10.5
10
9.5
9
8.5
8
7.5
7
6.5
6
5.5
5
4.5
4
3.5
3
2.5
2
1.5
1
0.5
Cone resistance SBTn Plot
Ic (Robertson 1990)4321
11.5
11
10.5
10
9.5
9
8.5
8
7.5
7
6.5
6
5.5
5
4.5
4
3.5
3
2.5
2
1.5
1
0.5
SBTn Plot CRR plot
CRR & CSR10.750.50.250
11
10
9
8
7
6
5
4
3
2
1
CRR plot
During earthq.
Qtn,cs200180160140120100806040200
Cyc
lic S
tres
s R
atio
* (C
SR*)
0.6
0.5
0.4
0.3
0.2
0.1
0
Liquefaction
No Liquefaction
Normalized friction ratio (%)0.1 1 10
Nor
mal
ized
CPT
pen
etra
tion
res
ista
nce
1
10
100
1,000
Friction Ratio
Rf (%)252015105
11.5
11
10.5
10
9.5
9
8.5
8
7.5
7
6.5
6
5.5
5
4.5
4
3.5
3
2.5
2
1.5
1
0.5
Friction Ratio
Mw=71/2, sigma'=1 atm base curve Summary of liquefaction potential
FS Plot
Factor of safety21.510.50
11.5
11
10.5
10
9.5
9
8.5
8
7.5
7
6.5
6
5.5
5
4.5
4
3.5
3
2.5
2
1.5
1
0.5
FS Plot
During earthq.
Zone A1: Cyclic liquefaction likely depending on size and duration of cyclic loadingZone A2: Cyclic liquefaction and strength loss likely depending on loading and groundgeometryZone B: Liquefaction and post-earthquake strength loss unlikely, check cyclic softeningZone C: Cyclic liquefaction and strength loss possible depending on soil plasticity,brittleness/sensitivity, strain to peak undrained strength and ground geometry
CLiq v.1.7.1.14 - CPT Liquefaction Assessment Software - Report created on: 9/17/2013, 7:03:13 PMProject file: G:\Active Projects\8472\8472001002 CP Retail Site\Updated Cliq Analysis.clq
16
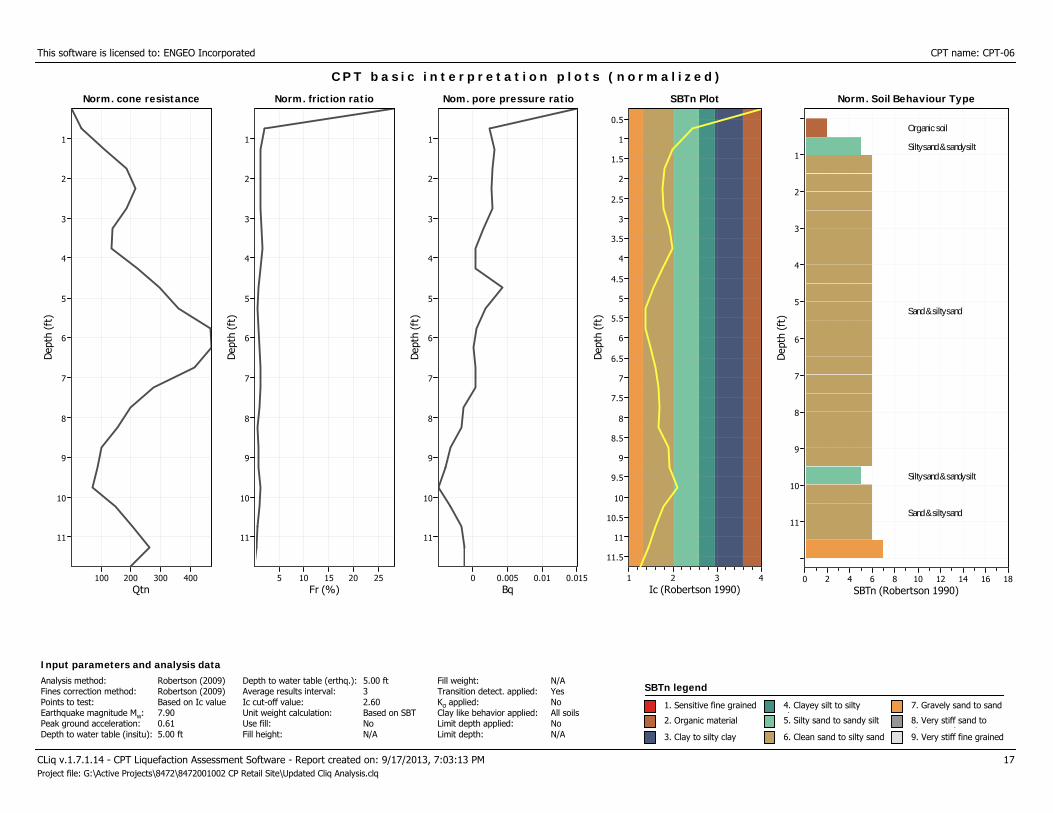
This software is licensed to: ENGEO Incorporated CPT name: CPT-06
Norm. cone resistance
Qtn400300200100
Dep
th (
ft)
11
10
9
8
7
6
5
4
3
2
1
Norm. cone resistance
C P T b a s i c i n t e r p r e t a t i o n p l o t s ( n o r m a l i z e d )
Norm. friction ratio
Fr (%)252015105
Dep
th (
ft)
11
10
9
8
7
6
5
4
3
2
1
Norm. friction ratio Nom. pore pressure ratio
Bq0.0150.010.0050
Dep
th (
ft)
11
10
9
8
7
6
5
4
3
2
1
Nom. pore pressure ratio SBTn Plot
Ic (Robertson 1990)4321
Dep
th (
ft)
11.5
11
10.5
10
9.5
9
8.5
8
7.5
7
6.5
6
5.5
5
4.5
4
3.5
3
2.5
2
1.5
1
0.5
SBTn Plot Norm. Soil Behaviour Type
SBTn (Robertson 1990)181614121086420
Dep
th (
ft)
11
10
9
8
7
6
5
4
3
2
1
Norm. Soil Behaviour Type
Organic soil
Silty sand & sandy silt
Sand & silty sand
Silty sand & sandy silt
Sand & silty sand
CLiq v.1.7.1.14 - CPT Liquefaction Assessment Software - Report created on: 9/17/2013, 7:03:13 PM 17Project file: G:\Active Projects\8472\8472001002 CP Retail Site\Updated Cliq Analysis.clq
SBTn legend
1. Sensitive fine grained
2. Organic material
3. Clay to silty clay
4. Clayey silt to siltyl5. Silty sand to sandy silt
6. Clean sand to silty sand
7. Gravely sand to sand
8. Very stiff sand tol d
9. Very stiff fine grained
Input parameters and analysis dataAnalysis method:Fines correction method:Points to test:Earthquake magnitude Mw:Peak ground acceleration:Depth to water table (insitu):
Robertson (2009)Robertson (2009)Based on Ic value7.900.615.00 ft
Depth to water table (erthq.):Average results interval:Ic cut-off value:Unit weight calculation:Use fill:Fill height:
5.00 ft32.60Based on SBTNoN/A
Fill weight:Transition detect. applied:Kσ applied:Clay like behavior applied:Limit depth applied:Limit depth:
N/AYesNoAll soilsNoN/A
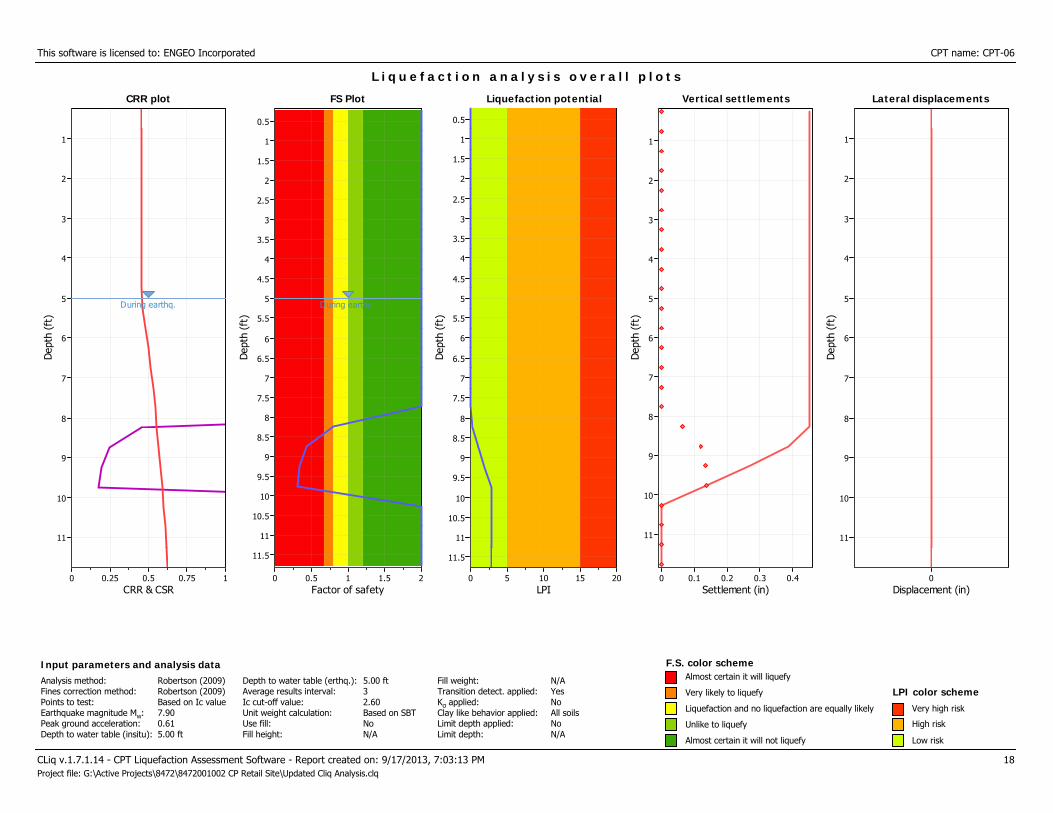
This software is licensed to: ENGEO Incorporated CPT name: CPT-06
CRR plot
CRR & CSR10.750.50.250
Dep
th (
ft)
11
10
9
8
7
6
5
4
3
2
1
CRR plot
During earthq.
L i q u e f a c t i o n a n a l y s i s o v e r a l l p l o t s
FS Plot
Factor of safety21.510.50
Dep
th (
ft)
11.5
11
10.5
10
9.5
9
8.5
8
7.5
7
6.5
6
5.5
5
4.5
4
3.5
3
2.5
2
1.5
1
0.5
FS Plot
During earthq.
Liquefaction potential
LPI20151050
Dep
th (
ft)
11.5
11
10.5
10
9.5
9
8.5
8
7.5
7
6.5
6
5.5
5
4.5
4
3.5
3
2.5
2
1.5
1
0.5
Liquefaction potential Vertical settlements
Settlement (in)0.40.30.20.10
Dep
th (
ft)
11
10
9
8
7
6
5
4
3
2
1
Vertical settlements Lateral displacements
Displacement (in)0
Dep
th (
ft)
11
10
9
8
7
6
5
4
3
2
1
Lateral displacements
CLiq v.1.7.1.14 - CPT Liquefaction Assessment Software - Report created on: 9/17/2013, 7:03:13 PM 18Project file: G:\Active Projects\8472\8472001002 CP Retail Site\Updated Cliq Analysis.clq
F.S. color scheme
Liquefaction and no liquefaction are equally likely
Unlike to liquefy
Almost certain it will not liquefy
LPI color schemeVery high risk
High risk
Low risk
Input parameters and analysis dataAnalysis method:Fines correction method:Points to test:Earthquake magnitude Mw:Peak ground acceleration:Depth to water table (insitu):
Robertson (2009)Robertson (2009)Based on Ic value7.900.615.00 ft
Depth to water table (erthq.):Average results interval:Ic cut-off value:Unit weight calculation:Use fill:Fill height:
5.00 ft32.60Based on SBTNoN/A
Fill weight:Transition detect. applied:Kσ applied:Clay like behavior applied:Limit depth applied:Limit depth:
N/AYesNoAll soilsNoN/A
Very likely to liquefy
Almost certain it will liquefy
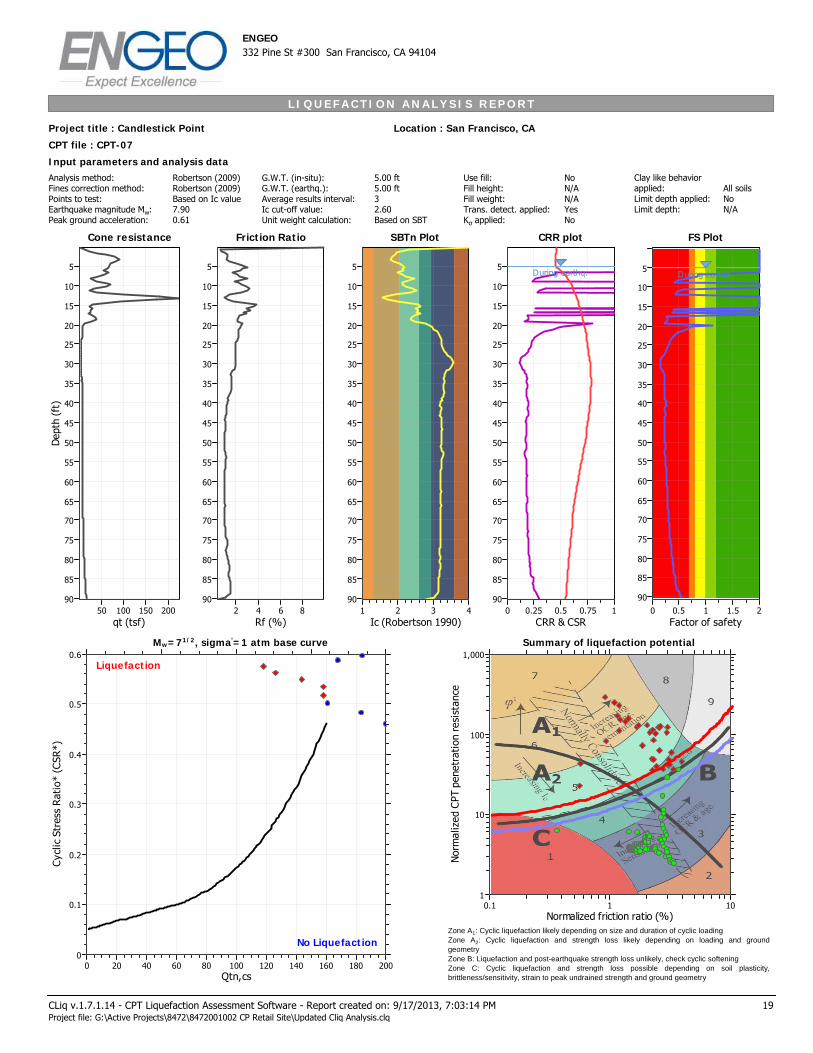
L I Q U E F A C T I O N A N A L Y S I S R E P O R T
Input parameters and analysis dataAnalysis method:Fines correction method:Points to test:Earthquake magnitude Mw:Peak ground acceleration:
Robertson (2009)Robertson (2009)Based on Ic value7.900.61
G.W.T. (in-situ):G.W.T. (earthq.):Average results interval:Ic cut-off value:Unit weight calculation:
Project title : Candlestick Point Location : San Francisco, CA
ENGEO332 Pine St #300 San Francisco, CA 94104
CPT file : CPT-07
5.00 ft5.00 ft32.60Based on SBT
Use fill:Fill height:Fill weight:Trans. detect. applied:Kσ applied:
NoN/AN/AYesNo
Clay like behaviorapplied:Limit depth applied:Limit depth:
All soilsNoN/A
Cone resistance
qt (tsf)20015010050
Dep
th (
ft)
90
85
80
75
70
65
60
55
50
45
40
35
30
25
20
15
10
5
Cone resistance SBTn Plot
Ic (Robertson 1990)4321
90
85
80
75
70
65
60
55
50
45
40
35
30
25
20
15
10
5
SBTn Plot CRR plot
CRR & CSR10.750.50.250
90
85
80
75
70
65
60
55
50
45
40
35
30
25
20
15
10
5
CRR plot
During earthq.
Qtn,cs200180160140120100806040200
Cyc
lic S
tres
s R
atio
* (C
SR*)
0.6
0.5
0.4
0.3
0.2
0.1
0
Liquefaction
No Liquefaction
Normalized friction ratio (%)0.1 1 10
Nor
mal
ized
CPT
pen
etra
tion
res
ista
nce
1
10
100
1,000
Friction Ratio
Rf (%)8642
90
85
80
75
70
65
60
55
50
45
40
35
30
25
20
15
10
5
Friction Ratio
Mw=71/2, sigma'=1 atm base curve Summary of liquefaction potential
FS Plot
Factor of safety21.510.50
90
85
80
75
70
65
60
55
50
45
40
35
30
25
20
15
10
5
FS Plot
During earthq.
Zone A1: Cyclic liquefaction likely depending on size and duration of cyclic loadingZone A2: Cyclic liquefaction and strength loss likely depending on loading and groundgeometryZone B: Liquefaction and post-earthquake strength loss unlikely, check cyclic softeningZone C: Cyclic liquefaction and strength loss possible depending on soil plasticity,brittleness/sensitivity, strain to peak undrained strength and ground geometry
CLiq v.1.7.1.14 - CPT Liquefaction Assessment Software - Report created on: 9/17/2013, 7:03:14 PMProject file: G:\Active Projects\8472\8472001002 CP Retail Site\Updated Cliq Analysis.clq
19
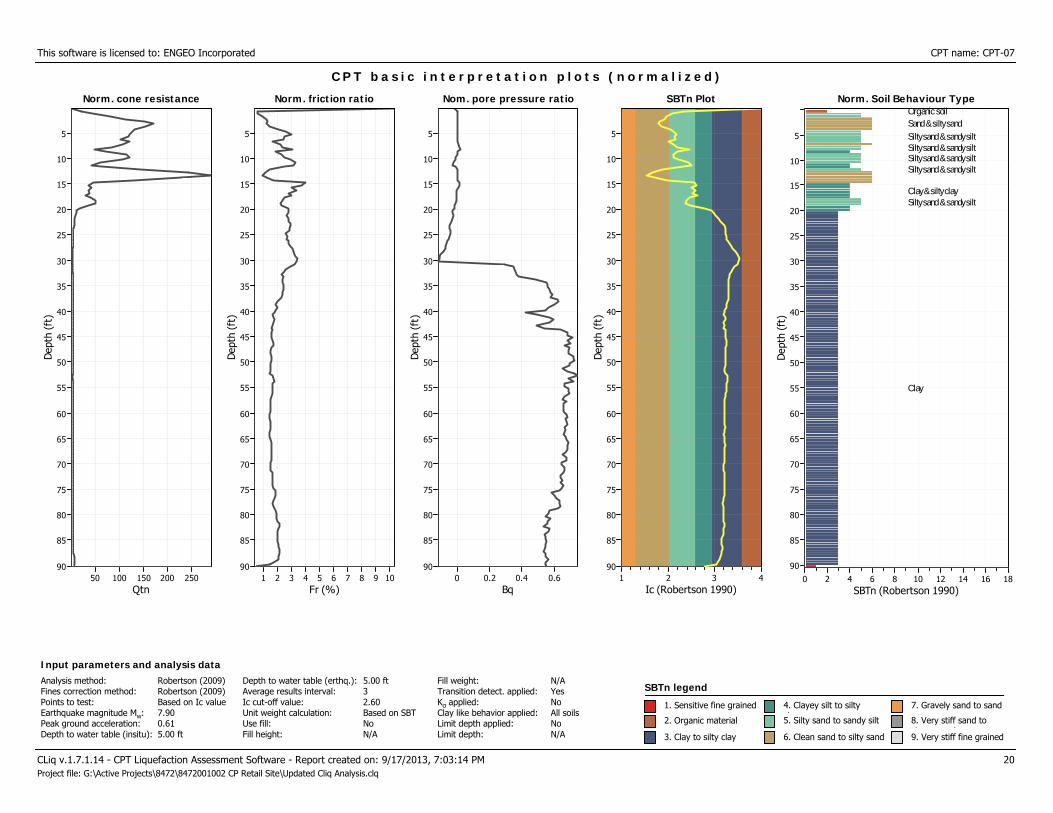
This software is licensed to: ENGEO Incorporated CPT name: CPT-07
Norm. cone resistance
Qtn25020015010050
Dep
th (
ft)
90
85
80
75
70
65
60
55
50
45
40
35
30
25
20
15
10
5
Norm. cone resistance
C P T b a s i c i n t e r p r e t a t i o n p l o t s ( n o r m a l i z e d )
Norm. friction ratio
Fr (%)10987654321
Dep
th (
ft)
90
85
80
75
70
65
60
55
50
45
40
35
30
25
20
15
10
5
Norm. friction ratio Nom. pore pressure ratio
Bq0.60.40.20
Dep
th (
ft)
90
85
80
75
70
65
60
55
50
45
40
35
30
25
20
15
10
5
Nom. pore pressure ratio SBTn Plot
Ic (Robertson 1990)4321
Dep
th (
ft)
90
85
80
75
70
65
60
55
50
45
40
35
30
25
20
15
10
5
SBTn Plot Norm. Soil Behaviour Type
SBTn (Robertson 1990)181614121086420
Dep
th (
ft)
90
85
80
75
70
65
60
55
50
45
40
35
30
25
20
15
10
5
Norm. Soil Behaviour TypeOrganic soilSand & silty sand
Silty sand & sandy siltSilty sand & sandy siltSilty sand & sandy siltSilty sand & sandy silt
Clay & silty claySilty sand & sandy silt
Clay
CLiq v.1.7.1.14 - CPT Liquefaction Assessment Software - Report created on: 9/17/2013, 7:03:14 PM 20Project file: G:\Active Projects\8472\8472001002 CP Retail Site\Updated Cliq Analysis.clq
SBTn legend
1. Sensitive fine grained
2. Organic material
3. Clay to silty clay
4. Clayey silt to siltyl5. Silty sand to sandy silt
6. Clean sand to silty sand
7. Gravely sand to sand
8. Very stiff sand tol d
9. Very stiff fine grained
Input parameters and analysis dataAnalysis method:Fines correction method:Points to test:Earthquake magnitude Mw:Peak ground acceleration:Depth to water table (insitu):
Robertson (2009)Robertson (2009)Based on Ic value7.900.615.00 ft
Depth to water table (erthq.):Average results interval:Ic cut-off value:Unit weight calculation:Use fill:Fill height:
5.00 ft32.60Based on SBTNoN/A
Fill weight:Transition detect. applied:Kσ applied:Clay like behavior applied:Limit depth applied:Limit depth:
N/AYesNoAll soilsNoN/A
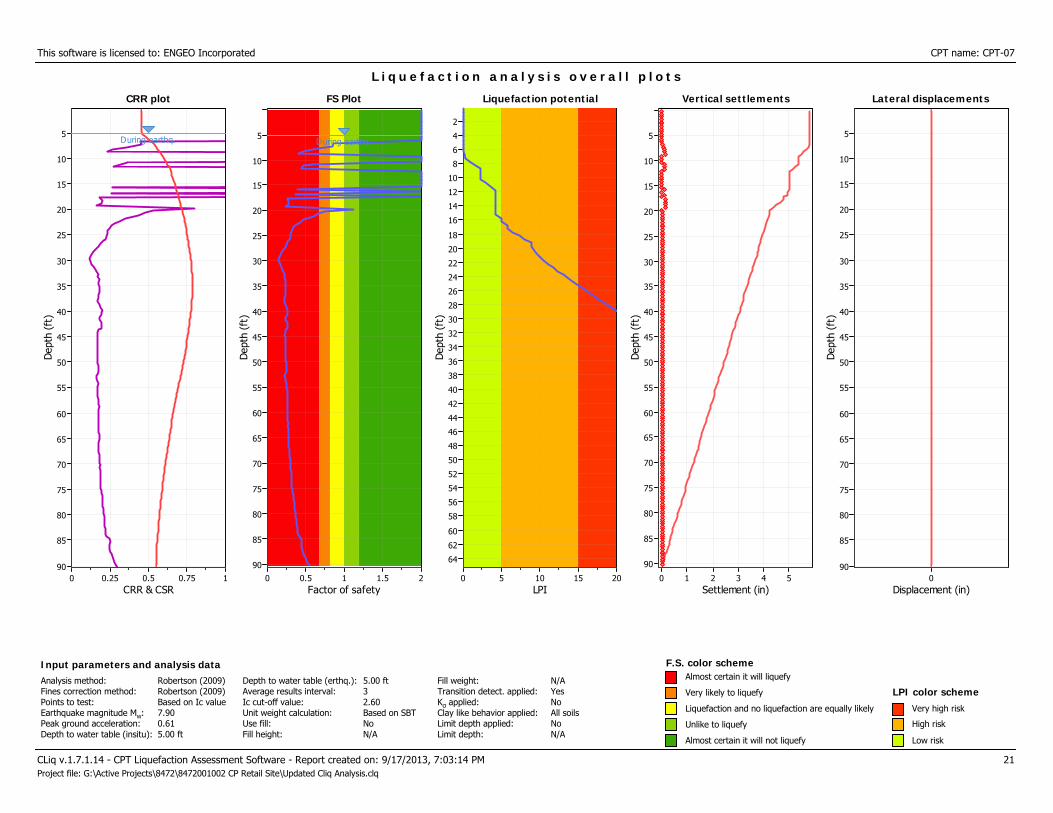
This software is licensed to: ENGEO Incorporated CPT name: CPT-07
CRR plot
CRR & CSR10.750.50.250
Dep
th (
ft)
90
85
80
75
70
65
60
55
50
45
40
35
30
25
20
15
10
5
CRR plot
During earthq.
L i q u e f a c t i o n a n a l y s i s o v e r a l l p l o t s
FS Plot
Factor of safety21.510.50
Dep
th (
ft)
90
85
80
75
70
65
60
55
50
45
40
35
30
25
20
15
10
5
FS Plot
During earthq.
Liquefaction potential
LPI20151050
Dep
th (
ft)
64
62
60
58
56
54
52
50
48
46
44
42
40
38
36
34
32
30
28
26
24
22
20
18
16
14
12
10
8
6
4
2
Liquefaction potential Vertical settlements
Settlement (in)543210
Dep
th (
ft)
90
85
80
75
70
65
60
55
50
45
40
35
30
25
20
15
10
5
Vertical settlements Lateral displacements
Displacement (in)0
Dep
th (
ft)
90
85
80
75
70
65
60
55
50
45
40
35
30
25
20
15
10
5
Lateral displacements
CLiq v.1.7.1.14 - CPT Liquefaction Assessment Software - Report created on: 9/17/2013, 7:03:14 PM 21Project file: G:\Active Projects\8472\8472001002 CP Retail Site\Updated Cliq Analysis.clq
F.S. color scheme
Liquefaction and no liquefaction are equally likely
Unlike to liquefy
Almost certain it will not liquefy
LPI color schemeVery high risk
High risk
Low risk
Input parameters and analysis dataAnalysis method:Fines correction method:Points to test:Earthquake magnitude Mw:Peak ground acceleration:Depth to water table (insitu):
Robertson (2009)Robertson (2009)Based on Ic value7.900.615.00 ft
Depth to water table (erthq.):Average results interval:Ic cut-off value:Unit weight calculation:Use fill:Fill height:
5.00 ft32.60Based on SBTNoN/A
Fill weight:Transition detect. applied:Kσ applied:Clay like behavior applied:Limit depth applied:Limit depth:
N/AYesNoAll soilsNoN/A
Very likely to liquefy
Almost certain it will liquefy
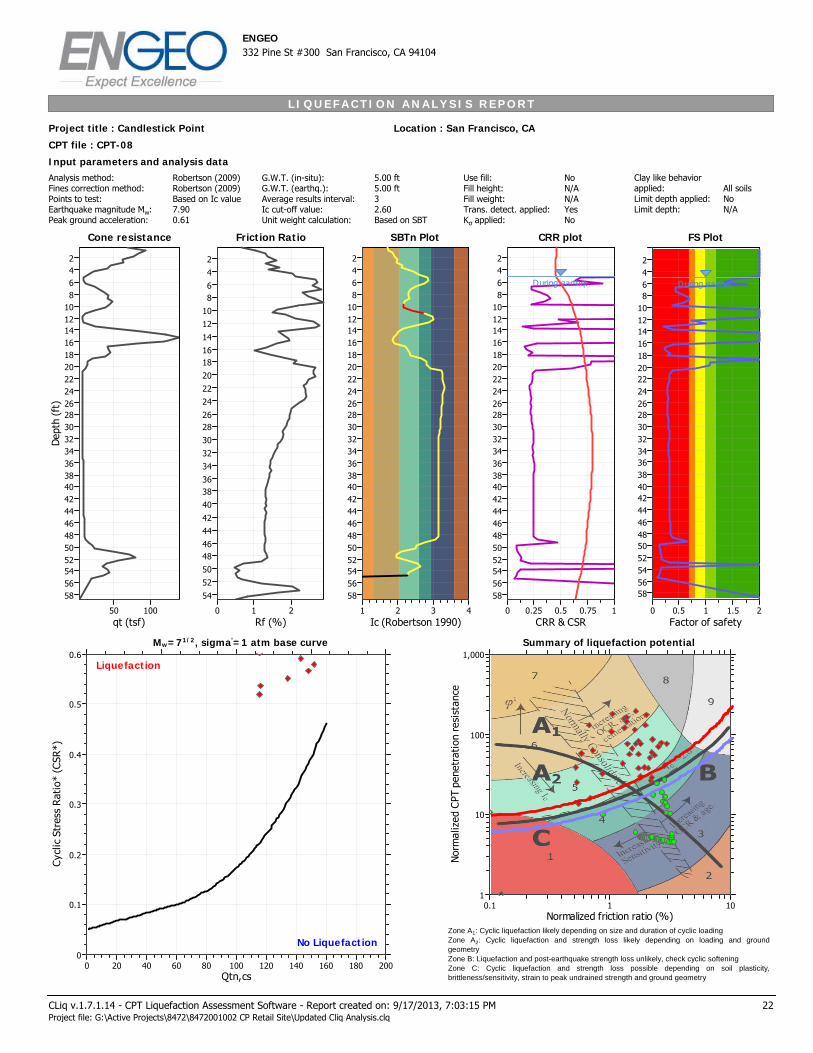
L I Q U E F A C T I O N A N A L Y S I S R E P O R T
Input parameters and analysis dataAnalysis method:Fines correction method:Points to test:Earthquake magnitude Mw:Peak ground acceleration:
Robertson (2009)Robertson (2009)Based on Ic value7.900.61
G.W.T. (in-situ):G.W.T. (earthq.):Average results interval:Ic cut-off value:Unit weight calculation:
Project title : Candlestick Point Location : San Francisco, CA
ENGEO332 Pine St #300 San Francisco, CA 94104
CPT file : CPT-08
5.00 ft5.00 ft32.60Based on SBT
Use fill:Fill height:Fill weight:Trans. detect. applied:Kσ applied:
NoN/AN/AYesNo
Clay like behaviorapplied:Limit depth applied:Limit depth:
All soilsNoN/A
Cone resistance
qt (tsf)10050
Dep
th (
ft)
585654525048464442403836343230282624222018161412108642
Cone resistance SBTn Plot
Ic (Robertson 1990)4321
585654525048464442403836343230282624222018161412108642
SBTn Plot CRR plot
CRR & CSR10.750.50.250
585654525048464442403836343230282624222018161412108642
CRR plot
During earthq.
Qtn,cs200180160140120100806040200
Cyc
lic S
tres
s R
atio
* (C
SR*)
0.6
0.5
0.4
0.3
0.2
0.1
0
Liquefaction
No Liquefaction
Normalized friction ratio (%)0.1 1 10
Nor
mal
ized
CPT
pen
etra
tion
res
ista
nce
1
10
100
1,000
Friction Ratio
Rf (%)210
54525048464442403836343230282624222018161412108642
Friction Ratio
Mw=71/2, sigma'=1 atm base curve Summary of liquefaction potential
FS Plot
Factor of safety21.510.50
585654525048464442403836343230282624222018161412108642
FS Plot
During earthq.
Zone A1: Cyclic liquefaction likely depending on size and duration of cyclic loadingZone A2: Cyclic liquefaction and strength loss likely depending on loading and groundgeometryZone B: Liquefaction and post-earthquake strength loss unlikely, check cyclic softeningZone C: Cyclic liquefaction and strength loss possible depending on soil plasticity,brittleness/sensitivity, strain to peak undrained strength and ground geometry
CLiq v.1.7.1.14 - CPT Liquefaction Assessment Software - Report created on: 9/17/2013, 7:03:15 PMProject file: G:\Active Projects\8472\8472001002 CP Retail Site\Updated Cliq Analysis.clq
22
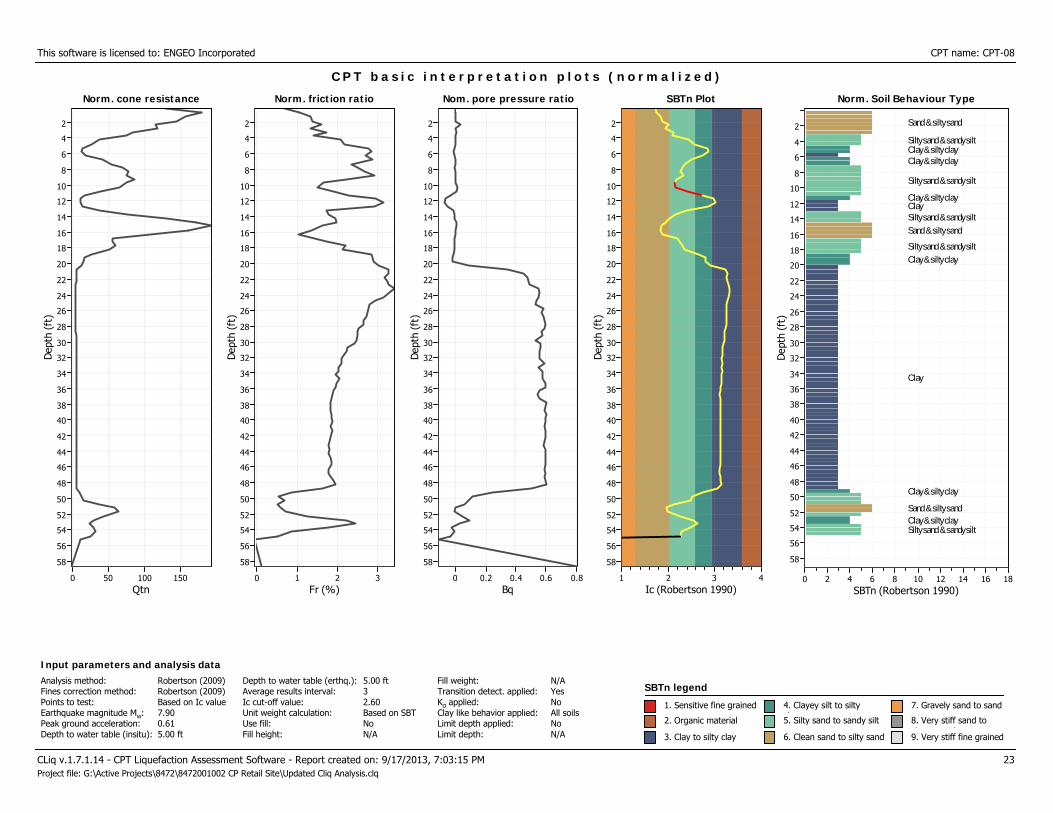
This software is licensed to: ENGEO Incorporated CPT name: CPT-08
Norm. cone resistance
Qtn150100500
Dep
th (
ft)
58
56
54
52
50
48
46
44
42
40
38
36
34
32
30
28
26
24
22
20
18
16
14
12
10
8
6
4
2
Norm. cone resistance
C P T b a s i c i n t e r p r e t a t i o n p l o t s ( n o r m a l i z e d )
Norm. friction ratio
Fr (%)3210
Dep
th (
ft)
58
56
54
52
50
48
46
44
42
40
38
36
34
32
30
28
26
24
22
20
18
16
14
12
10
8
6
4
2
Norm. friction ratio Nom. pore pressure ratio
Bq0.80.60.40.20
Dep
th (
ft)
58
56
54
52
50
48
46
44
42
40
38
36
34
32
30
28
26
24
22
20
18
16
14
12
10
8
6
4
2
Nom. pore pressure ratio SBTn Plot
Ic (Robertson 1990)4321
Dep
th (
ft)
58
56
54
52
50
48
46
44
42
40
38
36
34
32
30
28
26
24
22
20
18
16
14
12
10
8
6
4
2
SBTn Plot Norm. Soil Behaviour Type
SBTn (Robertson 1990)181614121086420
Dep
th (
ft)
58
56
54
52
50
48
46
44
42
40
38
36
34
32
30
28
26
24
22
20
18
16
14
12
10
8
6
4
2
Norm. Soil Behaviour Type
Sand & silty sand
Silty sand & sandy siltClay & silty clayClay & silty clay
Silty sand & sandy silt
Clay & silty clayClaySilty sand & sandy silt
Sand & silty sand
Silty sand & sandy silt
Clay & silty clay
Clay
Clay & silty clay
Sand & silty sandClay & silty claySilty sand & sandy silt
CLiq v.1.7.1.14 - CPT Liquefaction Assessment Software - Report created on: 9/17/2013, 7:03:15 PM 23Project file: G:\Active Projects\8472\8472001002 CP Retail Site\Updated Cliq Analysis.clq
SBTn legend
1. Sensitive fine grained
2. Organic material
3. Clay to silty clay
4. Clayey silt to siltyl5. Silty sand to sandy silt
6. Clean sand to silty sand
7. Gravely sand to sand
8. Very stiff sand tol d
9. Very stiff fine grained
Input parameters and analysis dataAnalysis method:Fines correction method:Points to test:Earthquake magnitude Mw:Peak ground acceleration:Depth to water table (insitu):
Robertson (2009)Robertson (2009)Based on Ic value7.900.615.00 ft
Depth to water table (erthq.):Average results interval:Ic cut-off value:Unit weight calculation:Use fill:Fill height:
5.00 ft32.60Based on SBTNoN/A
Fill weight:Transition detect. applied:Kσ applied:Clay like behavior applied:Limit depth applied:Limit depth:
N/AYesNoAll soilsNoN/A
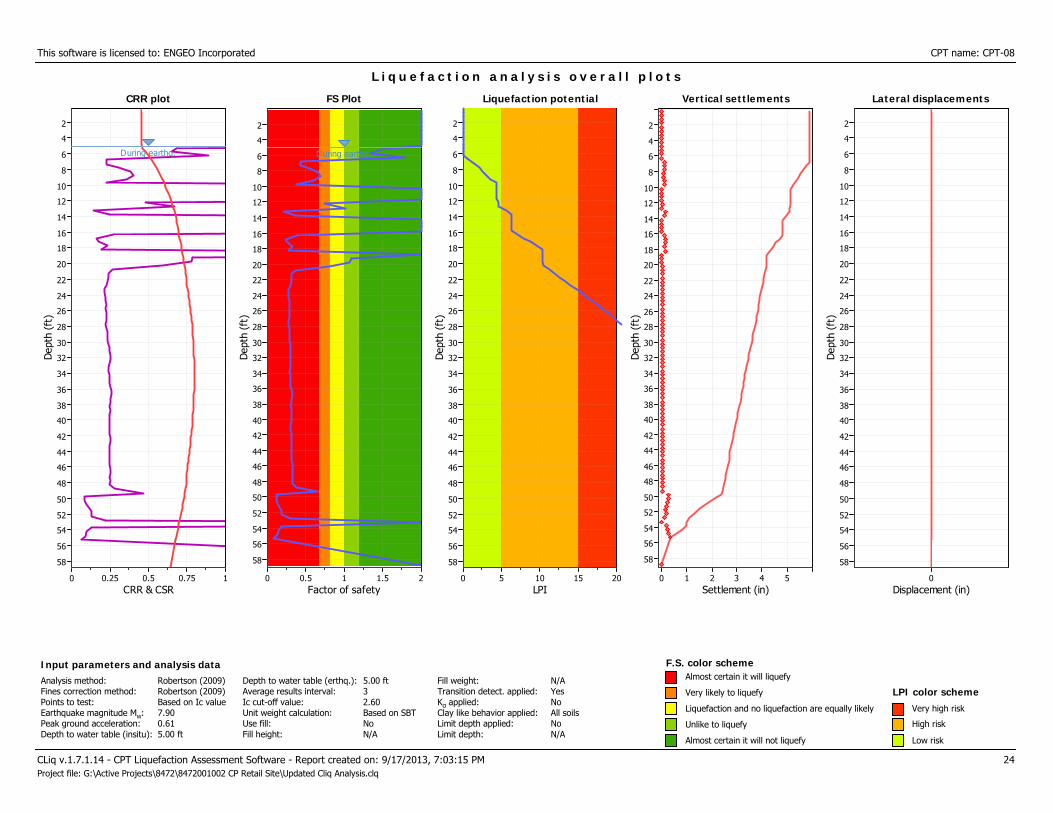
This software is licensed to: ENGEO Incorporated CPT name: CPT-08
CRR plot
CRR & CSR10.750.50.250
Dep
th (
ft)
58
56
54
52
50
48
46
44
42
40
38
36
34
32
30
28
26
24
22
20
18
16
14
12
10
8
6
4
2
CRR plot
During earthq.
L i q u e f a c t i o n a n a l y s i s o v e r a l l p l o t s
FS Plot
Factor of safety21.510.50
Dep
th (
ft)
58
56
54
52
50
48
46
44
42
40
38
36
34
32
30
28
26
24
22
20
18
16
14
12
10
8
6
4
2
FS Plot
During earthq.
Liquefaction potential
LPI20151050
Dep
th (
ft)
58
56
54
52
50
48
46
44
42
40
38
36
34
32
30
28
26
24
22
20
18
16
14
12
10
8
6
4
2
Liquefaction potential Vertical settlements
Settlement (in)543210
Dep
th (
ft)
58
56
54
52
50
48
46
44
42
40
38
36
34
32
30
28
26
24
22
20
18
16
14
12
10
8
6
4
2
Vertical settlements Lateral displacements
Displacement (in)0
Dep
th (
ft)
58
56
54
52
50
48
46
44
42
40
38
36
34
32
30
28
26
24
22
20
18
16
14
12
10
8
6
4
2
Lateral displacements
CLiq v.1.7.1.14 - CPT Liquefaction Assessment Software - Report created on: 9/17/2013, 7:03:15 PM 24Project file: G:\Active Projects\8472\8472001002 CP Retail Site\Updated Cliq Analysis.clq
F.S. color scheme
Liquefaction and no liquefaction are equally likely
Unlike to liquefy
Almost certain it will not liquefy
LPI color schemeVery high risk
High risk
Low risk
Input parameters and analysis dataAnalysis method:Fines correction method:Points to test:Earthquake magnitude Mw:Peak ground acceleration:Depth to water table (insitu):
Robertson (2009)Robertson (2009)Based on Ic value7.900.615.00 ft
Depth to water table (erthq.):Average results interval:Ic cut-off value:Unit weight calculation:Use fill:Fill height:
5.00 ft32.60Based on SBTNoN/A
Fill weight:Transition detect. applied:Kσ applied:Clay like behavior applied:Limit depth applied:Limit depth:
N/AYesNoAll soilsNoN/A
Very likely to liquefy
Almost certain it will liquefy
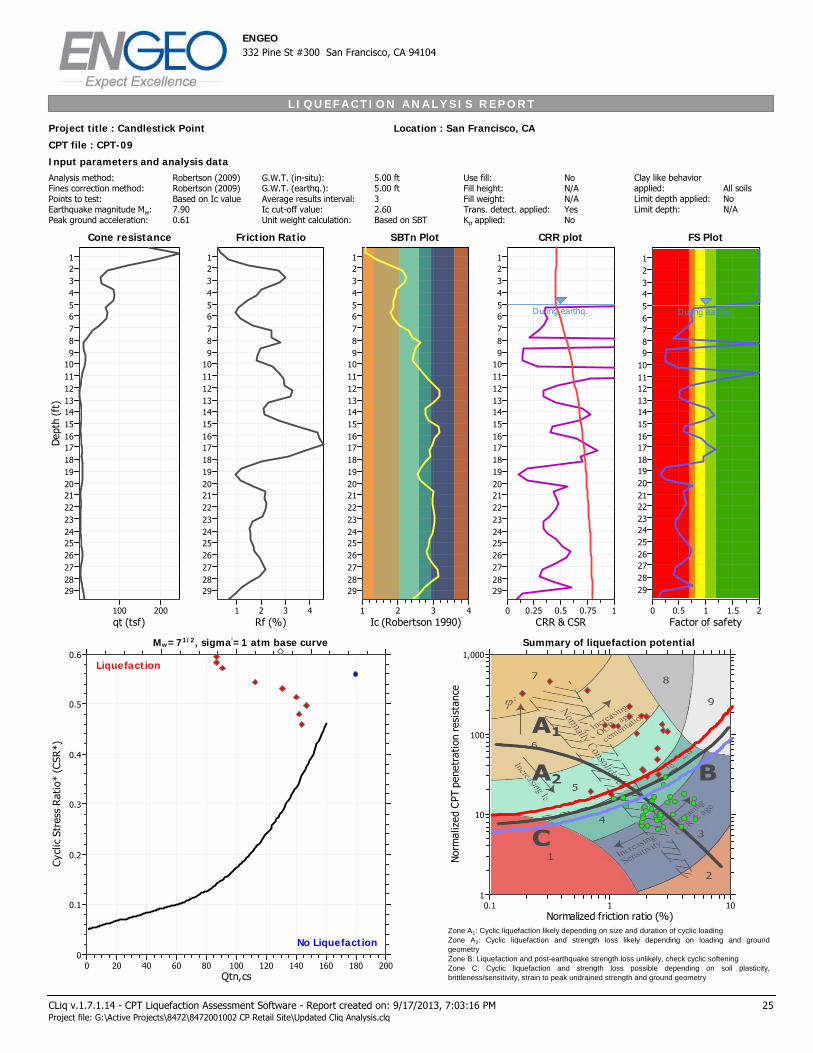
L I Q U E F A C T I O N A N A L Y S I S R E P O R T
Input parameters and analysis dataAnalysis method:Fines correction method:Points to test:Earthquake magnitude Mw:Peak ground acceleration:
Robertson (2009)Robertson (2009)Based on Ic value7.900.61
G.W.T. (in-situ):G.W.T. (earthq.):Average results interval:Ic cut-off value:Unit weight calculation:
Project title : Candlestick Point Location : San Francisco, CA
ENGEO332 Pine St #300 San Francisco, CA 94104
CPT file : CPT-09
5.00 ft5.00 ft32.60Based on SBT
Use fill:Fill height:Fill weight:Trans. detect. applied:Kσ applied:
NoN/AN/AYesNo
Clay like behaviorapplied:Limit depth applied:Limit depth:
All soilsNoN/A
Cone resistance
qt (tsf)200100
Dep
th (
ft)
2928272625242322212019181716151413121110987654321
Cone resistance SBTn Plot
Ic (Robertson 1990)4321
2928272625242322212019181716151413121110987654321
SBTn Plot CRR plot
CRR & CSR10.750.50.250
2928272625242322212019181716151413121110987654321
CRR plot
During earthq.
Qtn,cs200180160140120100806040200
Cyc
lic S
tres
s R
atio
* (C
SR*)
0.6
0.5
0.4
0.3
0.2
0.1
0
Liquefaction
No Liquefaction
Normalized friction ratio (%)0.1 1 10
Nor
mal
ized
CPT
pen
etra
tion
res
ista
nce
1
10
100
1,000
Friction Ratio
Rf (%)4321
2928272625242322212019181716151413121110987654321
Friction Ratio
Mw=71/2, sigma'=1 atm base curve Summary of liquefaction potential
FS Plot
Factor of safety21.510.50
2928272625242322212019181716151413121110987654321
FS Plot
During earthq.
Zone A1: Cyclic liquefaction likely depending on size and duration of cyclic loadingZone A2: Cyclic liquefaction and strength loss likely depending on loading and groundgeometryZone B: Liquefaction and post-earthquake strength loss unlikely, check cyclic softeningZone C: Cyclic liquefaction and strength loss possible depending on soil plasticity,brittleness/sensitivity, strain to peak undrained strength and ground geometry
CLiq v.1.7.1.14 - CPT Liquefaction Assessment Software - Report created on: 9/17/2013, 7:03:16 PMProject file: G:\Active Projects\8472\8472001002 CP Retail Site\Updated Cliq Analysis.clq
25
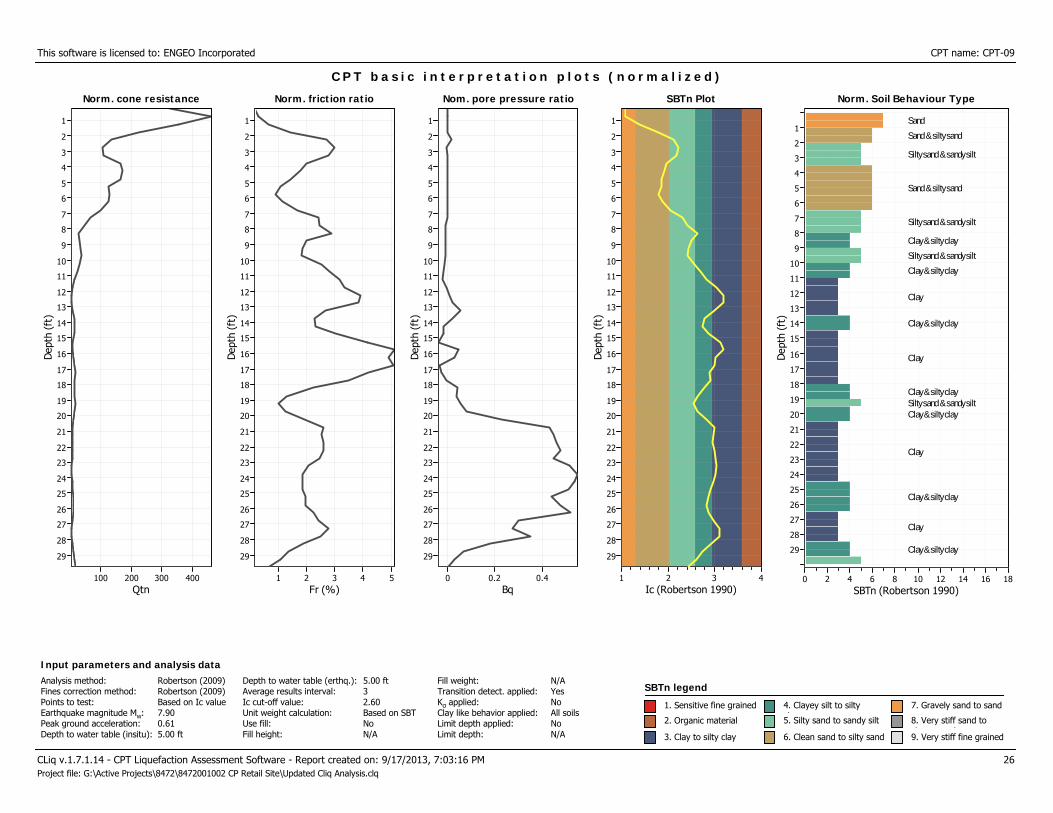
This software is licensed to: ENGEO Incorporated CPT name: CPT-09
Norm. cone resistance
Qtn400300200100
Dep
th (
ft)
29
28
27
26
25
24
23
22
21
20
19
18
17
16
15
14
13
12
11
10
9
8
7
6
5
4
3
2
1
Norm. cone resistance
C P T b a s i c i n t e r p r e t a t i o n p l o t s ( n o r m a l i z e d )
Norm. friction ratio
Fr (%)54321
Dep
th (
ft)
29
28
27
26
25
24
23
22
21
20
19
18
17
16
15
14
13
12
11
10
9
8
7
6
5
4
3
2
1
Norm. friction ratio Nom. pore pressure ratio
Bq0.40.20
Dep
th (
ft)
29
28
27
26
25
24
23
22
21
20
19
18
17
16
15
14
13
12
11
10
9
8
7
6
5
4
3
2
1
Nom. pore pressure ratio SBTn Plot
Ic (Robertson 1990)4321
Dep
th (
ft)
29
28
27
26
25
24
23
22
21
20
19
18
17
16
15
14
13
12
11
10
9
8
7
6
5
4
3
2
1
SBTn Plot Norm. Soil Behaviour Type
SBTn (Robertson 1990)181614121086420
Dep
th (
ft)
29
28
27
26
25
24
23
22
21
20
19
18
17
16
15
14
13
12
11
10
9
8
7
6
5
4
3
2
1
Norm. Soil Behaviour Type
Sand
Sand & silty sand
Silty sand & sandy silt
Sand & silty sand
Silty sand & sandy silt
Clay & silty clay
Silty sand & sandy silt
Clay & silty clay
Clay
Clay & silty clay
Clay
Clay & silty claySilty sand & sandy siltClay & silty clay
Clay
Clay & silty clay
Clay
Clay & silty clay
CLiq v.1.7.1.14 - CPT Liquefaction Assessment Software - Report created on: 9/17/2013, 7:03:16 PM 26Project file: G:\Active Projects\8472\8472001002 CP Retail Site\Updated Cliq Analysis.clq
SBTn legend
1. Sensitive fine grained
2. Organic material
3. Clay to silty clay
4. Clayey silt to siltyl5. Silty sand to sandy silt
6. Clean sand to silty sand
7. Gravely sand to sand
8. Very stiff sand tol d
9. Very stiff fine grained
Input parameters and analysis dataAnalysis method:Fines correction method:Points to test:Earthquake magnitude Mw:Peak ground acceleration:Depth to water table (insitu):
Robertson (2009)Robertson (2009)Based on Ic value7.900.615.00 ft
Depth to water table (erthq.):Average results interval:Ic cut-off value:Unit weight calculation:Use fill:Fill height:
5.00 ft32.60Based on SBTNoN/A
Fill weight:Transition detect. applied:Kσ applied:Clay like behavior applied:Limit depth applied:Limit depth:
N/AYesNoAll soilsNoN/A
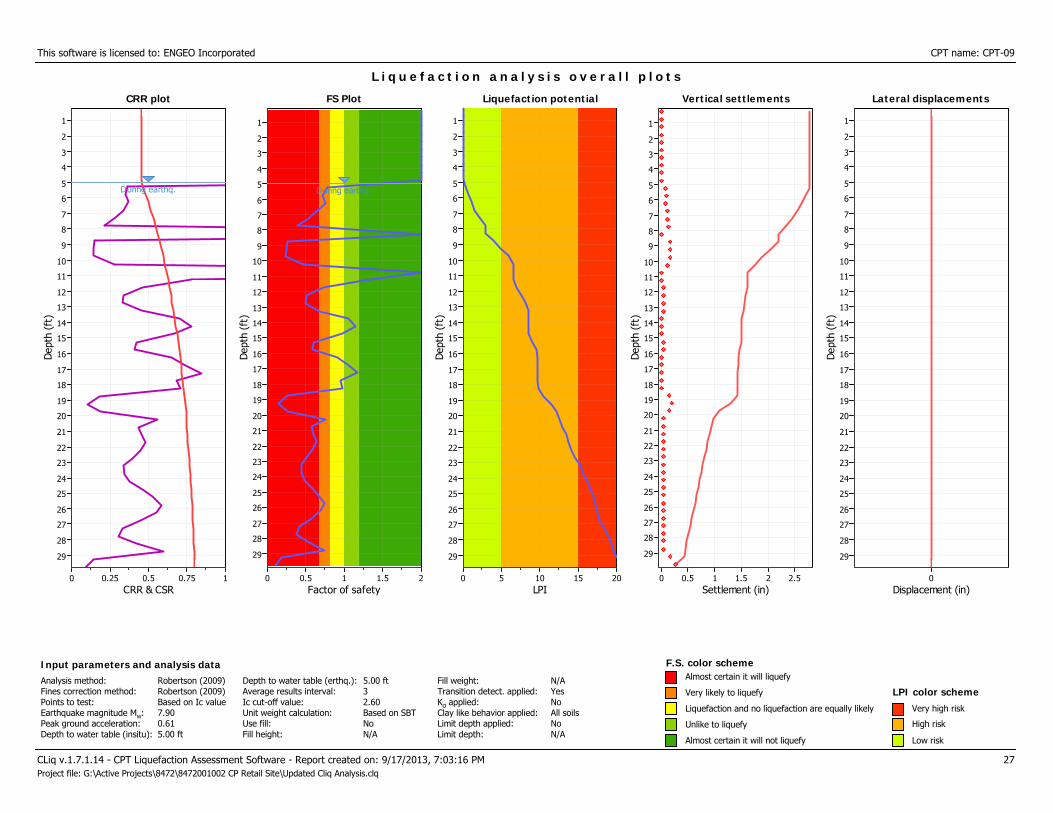
This software is licensed to: ENGEO Incorporated CPT name: CPT-09
CRR plot
CRR & CSR10.750.50.250
Dep
th (
ft)
29
28
27
26
25
24
23
22
21
20
19
18
17
16
15
14
13
12
11
10
9
8
7
6
5
4
3
2
1
CRR plot
During earthq.
L i q u e f a c t i o n a n a l y s i s o v e r a l l p l o t s
FS Plot
Factor of safety21.510.50
Dep
th (
ft)
29
28
27
26
25
24
23
22
21
20
19
18
17
16
15
14
13
12
11
10
9
8
7
6
5
4
3
2
1
FS Plot
During earthq.
Liquefaction potential
LPI20151050
Dep
th (
ft)
29
28
27
26
25
24
23
22
21
20
19
18
17
16
15
14
13
12
11
10
9
8
7
6
5
4
3
2
1
Liquefaction potential Vertical settlements
Settlement (in)2.521.510.50
Dep
th (
ft)
29
28
27
26
25
24
23
22
21
20
19
18
17
16
15
14
13
12
11
10
9
8
7
6
5
4
3
2
1
Vertical settlements Lateral displacements
Displacement (in)0
Dep
th (
ft)
29
28
27
26
25
24
23
22
21
20
19
18
17
16
15
14
13
12
11
10
9
8
7
6
5
4
3
2
1
Lateral displacements
CLiq v.1.7.1.14 - CPT Liquefaction Assessment Software - Report created on: 9/17/2013, 7:03:16 PM 27Project file: G:\Active Projects\8472\8472001002 CP Retail Site\Updated Cliq Analysis.clq
F.S. color scheme
Liquefaction and no liquefaction are equally likely
Unlike to liquefy
Almost certain it will not liquefy
LPI color schemeVery high risk
High risk
Low risk
Input parameters and analysis dataAnalysis method:Fines correction method:Points to test:Earthquake magnitude Mw:Peak ground acceleration:Depth to water table (insitu):
Robertson (2009)Robertson (2009)Based on Ic value7.900.615.00 ft
Depth to water table (erthq.):Average results interval:Ic cut-off value:Unit weight calculation:Use fill:Fill height:
5.00 ft32.60Based on SBTNoN/A
Fill weight:Transition detect. applied:Kσ applied:Clay like behavior applied:Limit depth applied:Limit depth:
N/AYesNoAll soilsNoN/A
Very likely to liquefy
Almost certain it will liquefy

L I Q U E F A C T I O N A N A L Y S I S R E P O R T
Input parameters and analysis dataAnalysis method:Fines correction method:Points to test:Earthquake magnitude Mw:Peak ground acceleration:
Robertson (2009)Robertson (2009)Based on Ic value7.900.61
G.W.T. (in-situ):G.W.T. (earthq.):Average results interval:Ic cut-off value:Unit weight calculation:
Project title : Candlestick Point Location : San Francisco, CA
ENGEO332 Pine St #300 San Francisco, CA 94104
CPT file : CPT-10
5.00 ft5.00 ft32.60Based on SBT
Use fill:Fill height:Fill weight:Trans. detect. applied:Kσ applied:
NoN/AN/AYesNo
Clay like behaviorapplied:Limit depth applied:Limit depth:
All soilsNoN/A
Cone resistance
qt (tsf)20015010050
Dep
th (
ft)
5654525048464442403836343230282624222018161412108642
Cone resistance SBTn Plot
Ic (Robertson 1990)4321
5654525048464442403836343230282624222018161412108642
SBTn Plot CRR plot
CRR & CSR10.750.50.250
5654525048464442403836343230282624222018161412108642
CRR plot
During earthq.
Qtn,cs200180160140120100806040200
Cyc
lic S
tres
s R
atio
* (C
SR*)
0.6
0.5
0.4
0.3
0.2
0.1
0
Liquefaction
No Liquefaction
Normalized friction ratio (%)0.1 1 10
Nor
mal
ized
CPT
pen
etra
tion
res
ista
nce
1
10
100
1,000
Friction Ratio
Rf (%)4321
5654525048464442403836343230282624222018161412108642
Friction Ratio
Mw=71/2, sigma'=1 atm base curve Summary of liquefaction potential
FS Plot
Factor of safety21.510.50
5654525048464442403836343230282624222018161412108642
FS Plot
During earthq.
Zone A1: Cyclic liquefaction likely depending on size and duration of cyclic loadingZone A2: Cyclic liquefaction and strength loss likely depending on loading and groundgeometryZone B: Liquefaction and post-earthquake strength loss unlikely, check cyclic softeningZone C: Cyclic liquefaction and strength loss possible depending on soil plasticity,brittleness/sensitivity, strain to peak undrained strength and ground geometry
CLiq v.1.7.1.14 - CPT Liquefaction Assessment Software - Report created on: 9/17/2013, 7:03:18 PMProject file: G:\Active Projects\8472\8472001002 CP Retail Site\Updated Cliq Analysis.clq
28
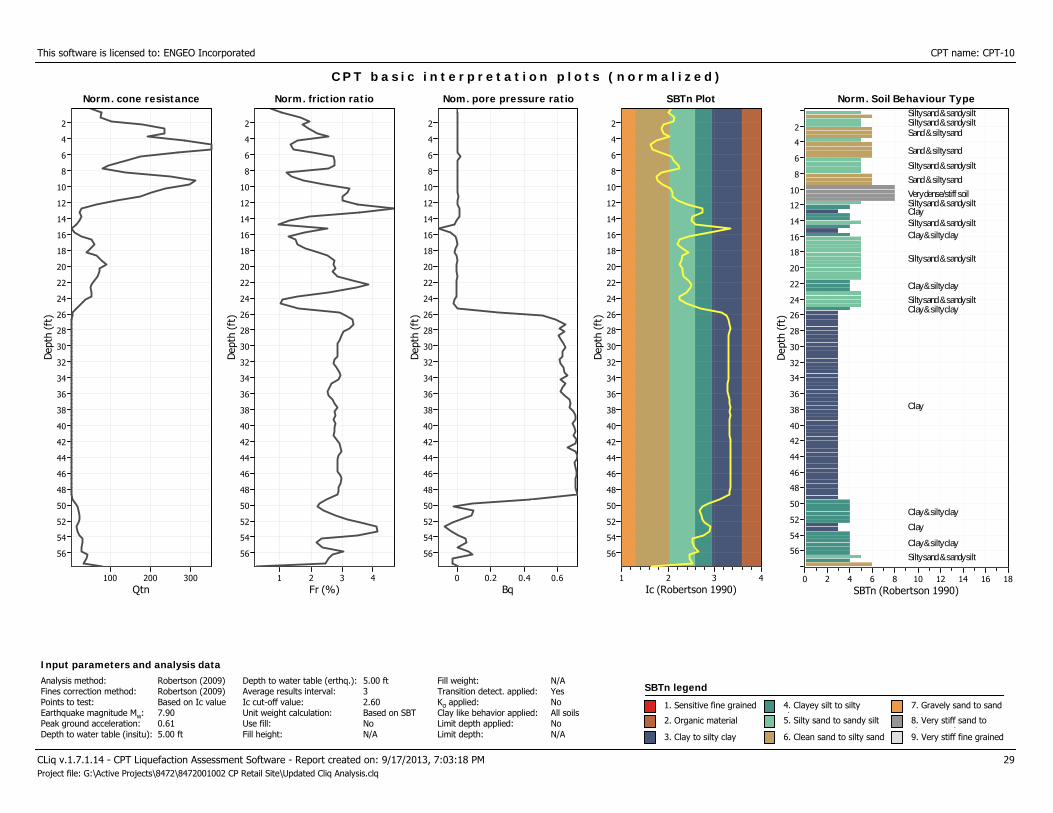
This software is licensed to: ENGEO Incorporated CPT name: CPT-10
Norm. cone resistance
Qtn300200100
Dep
th (
ft)
56
54
52
50
48
46
44
42
40
38
36
34
32
30
28
26
24
22
20
18
16
14
12
10
8
6
4
2
Norm. cone resistance
C P T b a s i c i n t e r p r e t a t i o n p l o t s ( n o r m a l i z e d )
Norm. friction ratio
Fr (%)4321
Dep
th (
ft)
56
54
52
50
48
46
44
42
40
38
36
34
32
30
28
26
24
22
20
18
16
14
12
10
8
6
4
2
Norm. friction ratio Nom. pore pressure ratio
Bq0.60.40.20
Dep
th (
ft)
56
54
52
50
48
46
44
42
40
38
36
34
32
30
28
26
24
22
20
18
16
14
12
10
8
6
4
2
Nom. pore pressure ratio SBTn Plot
Ic (Robertson 1990)4321
Dep
th (
ft)
56
54
52
50
48
46
44
42
40
38
36
34
32
30
28
26
24
22
20
18
16
14
12
10
8
6
4
2
SBTn Plot Norm. Soil Behaviour Type
SBTn (Robertson 1990)181614121086420
Dep
th (
ft)
56
54
52
50
48
46
44
42
40
38
36
34
32
30
28
26
24
22
20
18
16
14
12
10
8
6
4
2
Norm. Soil Behaviour TypeSilty sand & sandy siltSilty sand & sandy siltSand & silty sand
Sand & silty sand
Silty sand & sandy silt
Sand & silty sand
Very dense/stiff soilSilty sand & sandy siltClaySilty sand & sandy siltClay & silty clay
Silty sand & sandy silt
Clay & silty clay
Silty sand & sandy siltClay & silty clay
Clay
Clay & silty clay
Clay
Clay & silty clay
Silty sand & sandy silt
CLiq v.1.7.1.14 - CPT Liquefaction Assessment Software - Report created on: 9/17/2013, 7:03:18 PM 29Project file: G:\Active Projects\8472\8472001002 CP Retail Site\Updated Cliq Analysis.clq
SBTn legend
1. Sensitive fine grained
2. Organic material
3. Clay to silty clay
4. Clayey silt to siltyl5. Silty sand to sandy silt
6. Clean sand to silty sand
7. Gravely sand to sand
8. Very stiff sand tol d
9. Very stiff fine grained
Input parameters and analysis dataAnalysis method:Fines correction method:Points to test:Earthquake magnitude Mw:Peak ground acceleration:Depth to water table (insitu):
Robertson (2009)Robertson (2009)Based on Ic value7.900.615.00 ft
Depth to water table (erthq.):Average results interval:Ic cut-off value:Unit weight calculation:Use fill:Fill height:
5.00 ft32.60Based on SBTNoN/A
Fill weight:Transition detect. applied:Kσ applied:Clay like behavior applied:Limit depth applied:Limit depth:
N/AYesNoAll soilsNoN/A
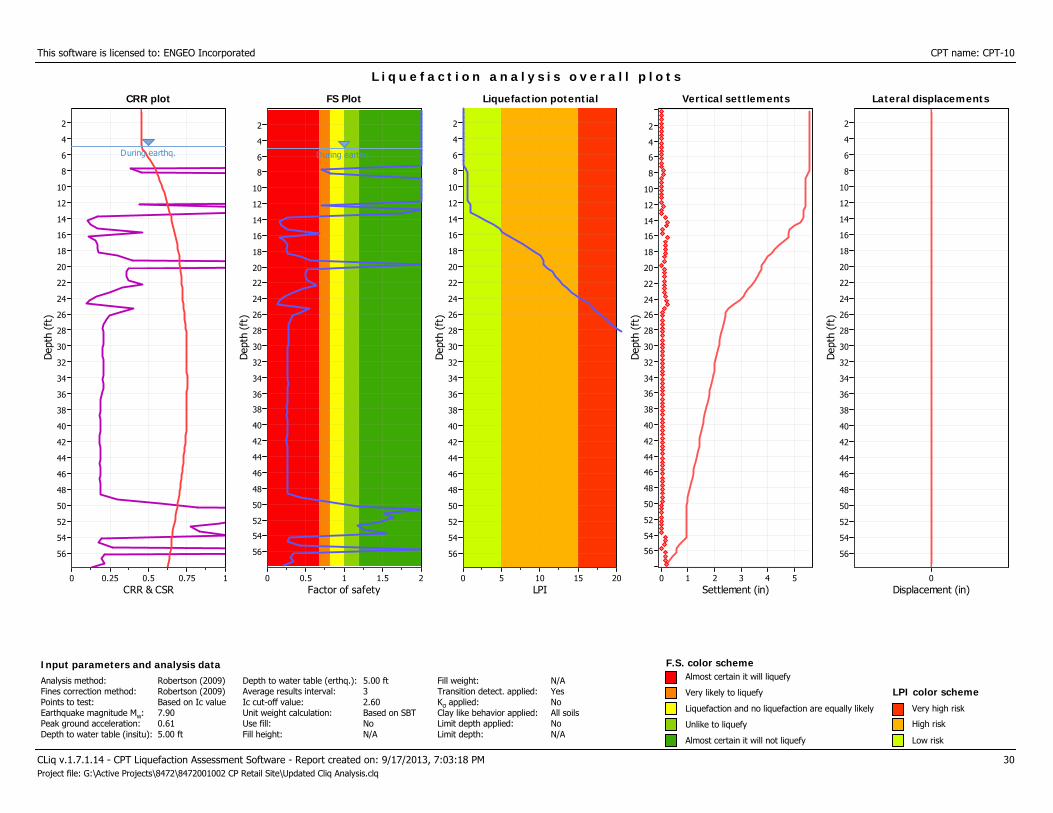
This software is licensed to: ENGEO Incorporated CPT name: CPT-10
CRR plot
CRR & CSR10.750.50.250
Dep
th (
ft)
56
54
52
50
48
46
44
42
40
38
36
34
32
30
28
26
24
22
20
18
16
14
12
10
8
6
4
2
CRR plot
During earthq.
L i q u e f a c t i o n a n a l y s i s o v e r a l l p l o t s
FS Plot
Factor of safety21.510.50
Dep
th (
ft)
56
54
52
50
48
46
44
42
40
38
36
34
32
30
28
26
24
22
20
18
16
14
12
10
8
6
4
2
FS Plot
During earthq.
Liquefaction potential
LPI20151050
Dep
th (
ft)
56
54
52
50
48
46
44
42
40
38
36
34
32
30
28
26
24
22
20
18
16
14
12
10
8
6
4
2
Liquefaction potential Vertical settlements
Settlement (in)543210
Dep
th (
ft)
56
54
52
50
48
46
44
42
40
38
36
34
32
30
28
26
24
22
20
18
16
14
12
10
8
6
4
2
Vertical settlements Lateral displacements
Displacement (in)0
Dep
th (
ft)
56
54
52
50
48
46
44
42
40
38
36
34
32
30
28
26
24
22
20
18
16
14
12
10
8
6
4
2
Lateral displacements
CLiq v.1.7.1.14 - CPT Liquefaction Assessment Software - Report created on: 9/17/2013, 7:03:18 PM 30Project file: G:\Active Projects\8472\8472001002 CP Retail Site\Updated Cliq Analysis.clq
F.S. color scheme
Liquefaction and no liquefaction are equally likely
Unlike to liquefy
Almost certain it will not liquefy
LPI color schemeVery high risk
High risk
Low risk
Input parameters and analysis dataAnalysis method:Fines correction method:Points to test:Earthquake magnitude Mw:Peak ground acceleration:Depth to water table (insitu):
Robertson (2009)Robertson (2009)Based on Ic value7.900.615.00 ft
Depth to water table (erthq.):Average results interval:Ic cut-off value:Unit weight calculation:Use fill:Fill height:
5.00 ft32.60Based on SBTNoN/A
Fill weight:Transition detect. applied:Kσ applied:Clay like behavior applied:Limit depth applied:Limit depth:
N/AYesNoAll soilsNoN/A
Very likely to liquefy
Almost certain it will liquefy
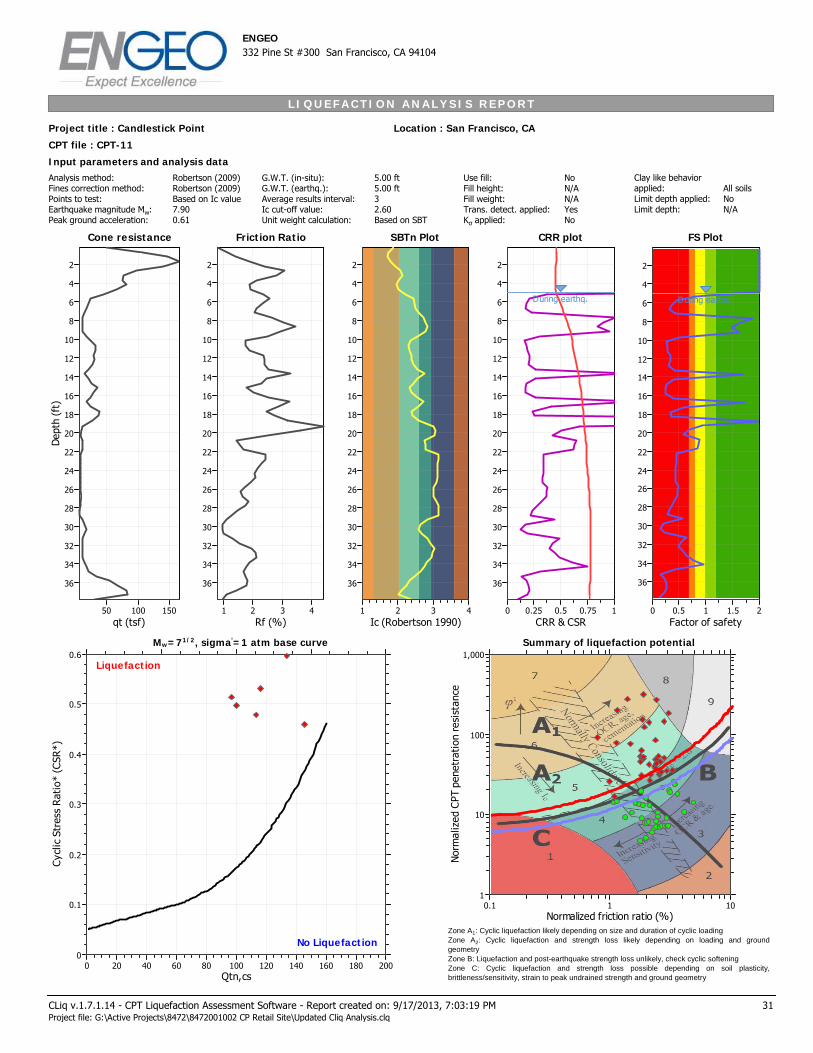
L I Q U E F A C T I O N A N A L Y S I S R E P O R T
Input parameters and analysis dataAnalysis method:Fines correction method:Points to test:Earthquake magnitude Mw:Peak ground acceleration:
Robertson (2009)Robertson (2009)Based on Ic value7.900.61
G.W.T. (in-situ):G.W.T. (earthq.):Average results interval:Ic cut-off value:Unit weight calculation:
Project title : Candlestick Point Location : San Francisco, CA
ENGEO332 Pine St #300 San Francisco, CA 94104
CPT file : CPT-11
5.00 ft5.00 ft32.60Based on SBT
Use fill:Fill height:Fill weight:Trans. detect. applied:Kσ applied:
NoN/AN/AYesNo
Clay like behaviorapplied:Limit depth applied:Limit depth:
All soilsNoN/A
Cone resistance
qt (tsf)15010050
Dep
th (
ft)
36
34
32
30
28
26
24
22
20
18
16
14
12
10
8
6
4
2
Cone resistance SBTn Plot
Ic (Robertson 1990)4321
36
34
32
30
28
26
24
22
20
18
16
14
12
10
8
6
4
2
SBTn Plot CRR plot
CRR & CSR10.750.50.250
36
34
32
30
28
26
24
22
20
18
16
14
12
10
8
6
4
2
CRR plot
During earthq.
Qtn,cs200180160140120100806040200
Cyc
lic S
tres
s R
atio
* (C
SR*)
0.6
0.5
0.4
0.3
0.2
0.1
0
Liquefaction
No Liquefaction
Normalized friction ratio (%)0.1 1 10
Nor
mal
ized
CPT
pen
etra
tion
res
ista
nce
1
10
100
1,000
Friction Ratio
Rf (%)4321
36
34
32
30
28
26
24
22
20
18
16
14
12
10
8
6
4
2
Friction Ratio
Mw=71/2, sigma'=1 atm base curve Summary of liquefaction potential
FS Plot
Factor of safety21.510.50
36
34
32
30
28
26
24
22
20
18
16
14
12
10
8
6
4
2
FS Plot
During earthq.
Zone A1: Cyclic liquefaction likely depending on size and duration of cyclic loadingZone A2: Cyclic liquefaction and strength loss likely depending on loading and groundgeometryZone B: Liquefaction and post-earthquake strength loss unlikely, check cyclic softeningZone C: Cyclic liquefaction and strength loss possible depending on soil plasticity,brittleness/sensitivity, strain to peak undrained strength and ground geometry
CLiq v.1.7.1.14 - CPT Liquefaction Assessment Software - Report created on: 9/17/2013, 7:03:19 PMProject file: G:\Active Projects\8472\8472001002 CP Retail Site\Updated Cliq Analysis.clq
31
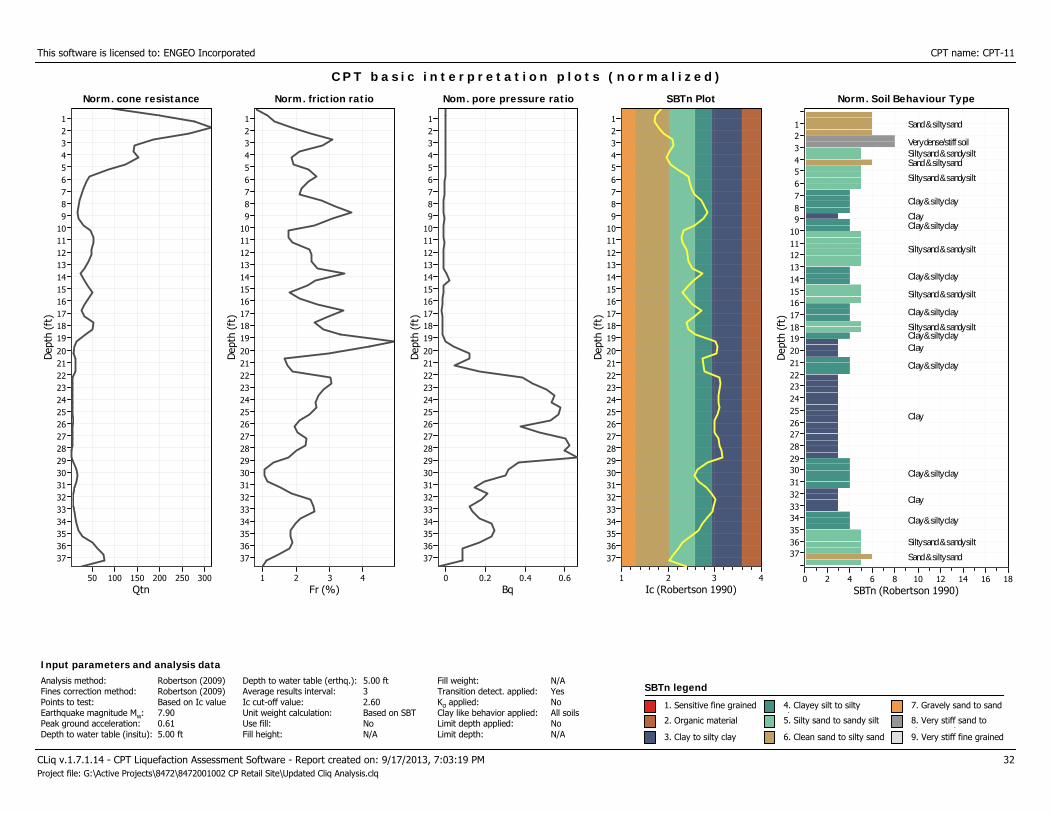
This software is licensed to: ENGEO Incorporated CPT name: CPT-11
Norm. cone resistance
Qtn30025020015010050
Dep
th (
ft)
37363534333231302928272625242322212019181716151413121110987654321
Norm. cone resistance
C P T b a s i c i n t e r p r e t a t i o n p l o t s ( n o r m a l i z e d )
Norm. friction ratio
Fr (%)4321
Dep
th (
ft)
37363534333231302928272625242322212019181716151413121110987654321
Norm. friction ratio Nom. pore pressure ratio
Bq0.60.40.20
Dep
th (
ft)
37363534333231302928272625242322212019181716151413121110987654321
Nom. pore pressure ratio SBTn Plot
Ic (Robertson 1990)4321
Dep
th (
ft)
37363534333231302928272625242322212019181716151413121110987654321
SBTn Plot Norm. Soil Behaviour Type
SBTn (Robertson 1990)181614121086420
Dep
th (
ft)
37363534333231302928272625242322212019181716151413121110987654321
Norm. Soil Behaviour Type
Sand & silty sand
Very dense/stiff soilSilty sand & sandy siltSand & silty sand
Silty sand & sandy silt
Clay & silty clay
ClayClay & silty clay
Silty sand & sandy silt
Clay & silty clay
Silty sand & sandy silt
Clay & silty clay
Silty sand & sandy siltClay & silty clayClay
Clay & silty clay
Clay
Clay & silty clay
Clay
Clay & silty clay
Silty sand & sandy silt
Sand & silty sand
CLiq v.1.7.1.14 - CPT Liquefaction Assessment Software - Report created on: 9/17/2013, 7:03:19 PM 32Project file: G:\Active Projects\8472\8472001002 CP Retail Site\Updated Cliq Analysis.clq
SBTn legend
1. Sensitive fine grained
2. Organic material
3. Clay to silty clay
4. Clayey silt to siltyl5. Silty sand to sandy silt
6. Clean sand to silty sand
7. Gravely sand to sand
8. Very stiff sand tol d
9. Very stiff fine grained
Input parameters and analysis dataAnalysis method:Fines correction method:Points to test:Earthquake magnitude Mw:Peak ground acceleration:Depth to water table (insitu):
Robertson (2009)Robertson (2009)Based on Ic value7.900.615.00 ft
Depth to water table (erthq.):Average results interval:Ic cut-off value:Unit weight calculation:Use fill:Fill height:
5.00 ft32.60Based on SBTNoN/A
Fill weight:Transition detect. applied:Kσ applied:Clay like behavior applied:Limit depth applied:Limit depth:
N/AYesNoAll soilsNoN/A
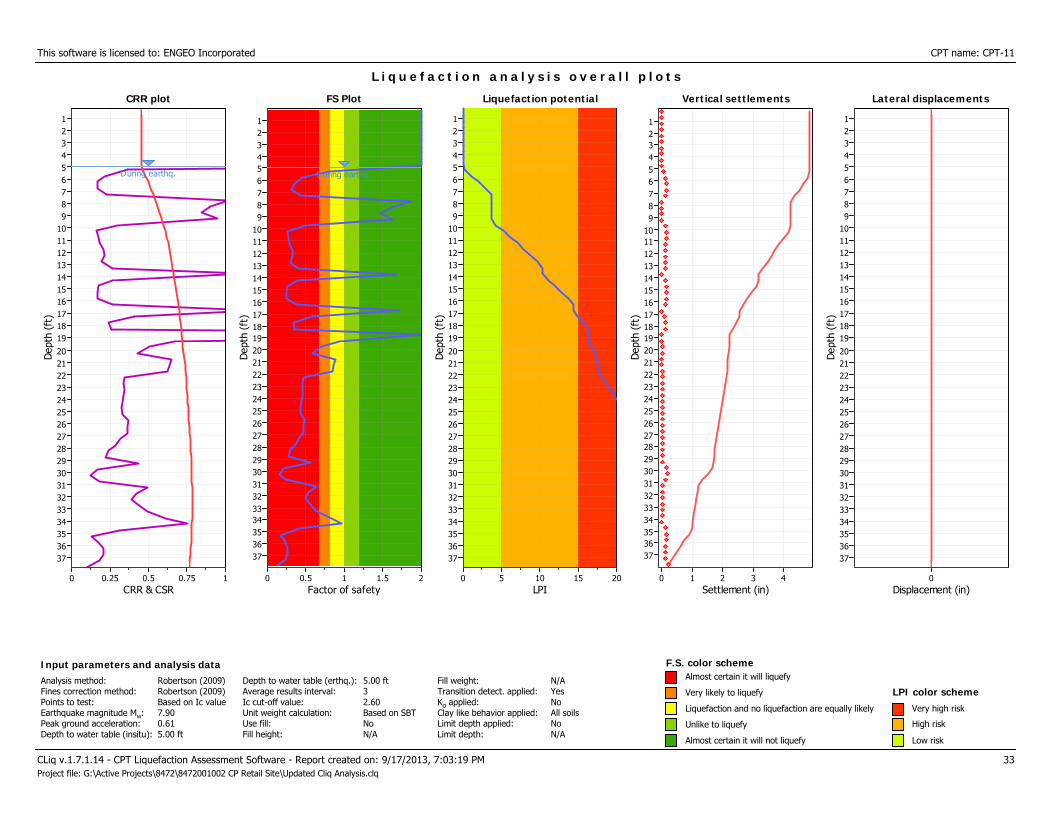
This software is licensed to: ENGEO Incorporated CPT name: CPT-11
CRR plot
CRR & CSR10.750.50.250
Dep
th (
ft)
37363534333231302928272625242322212019181716151413121110987654321
CRR plot
During earthq.
L i q u e f a c t i o n a n a l y s i s o v e r a l l p l o t s
FS Plot
Factor of safety21.510.50
Dep
th (
ft)
37363534333231302928272625242322212019181716151413121110987654321
FS Plot
During earthq.
Liquefaction potential
LPI20151050
Dep
th (
ft)
37363534333231302928272625242322212019181716151413121110987654321
Liquefaction potential Vertical settlements
Settlement (in)43210
Dep
th (
ft)
37363534333231302928272625242322212019181716151413121110987654321
Vertical settlements Lateral displacements
Displacement (in)0
Dep
th (
ft)
37363534333231302928272625242322212019181716151413121110987654321
Lateral displacements
CLiq v.1.7.1.14 - CPT Liquefaction Assessment Software - Report created on: 9/17/2013, 7:03:19 PM 33Project file: G:\Active Projects\8472\8472001002 CP Retail Site\Updated Cliq Analysis.clq
F.S. color scheme
Liquefaction and no liquefaction are equally likely
Unlike to liquefy
Almost certain it will not liquefy
LPI color schemeVery high risk
High risk
Low risk
Input parameters and analysis dataAnalysis method:Fines correction method:Points to test:Earthquake magnitude Mw:Peak ground acceleration:Depth to water table (insitu):
Robertson (2009)Robertson (2009)Based on Ic value7.900.615.00 ft
Depth to water table (erthq.):Average results interval:Ic cut-off value:Unit weight calculation:Use fill:Fill height:
5.00 ft32.60Based on SBTNoN/A
Fill weight:Transition detect. applied:Kσ applied:Clay like behavior applied:Limit depth applied:Limit depth:
N/AYesNoAll soilsNoN/A
Very likely to liquefy
Almost certain it will liquefy
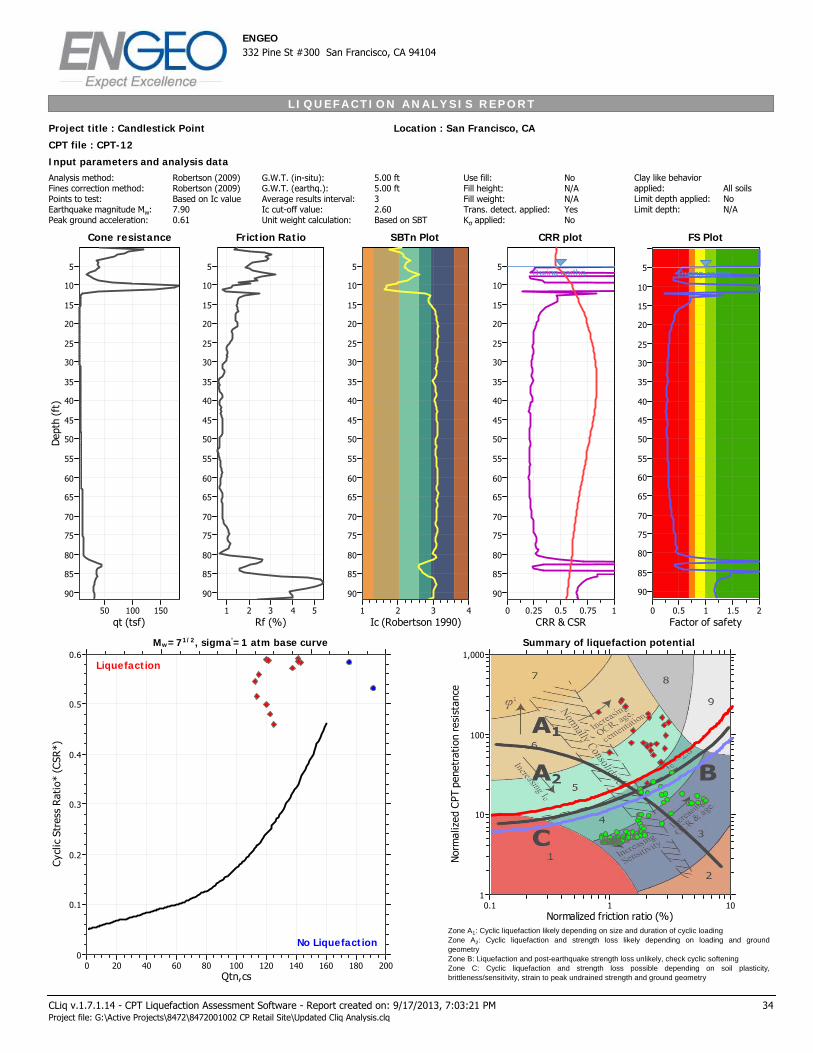
L I Q U E F A C T I O N A N A L Y S I S R E P O R T
Input parameters and analysis dataAnalysis method:Fines correction method:Points to test:Earthquake magnitude Mw:Peak ground acceleration:
Robertson (2009)Robertson (2009)Based on Ic value7.900.61
G.W.T. (in-situ):G.W.T. (earthq.):Average results interval:Ic cut-off value:Unit weight calculation:
Project title : Candlestick Point Location : San Francisco, CA
ENGEO332 Pine St #300 San Francisco, CA 94104
CPT file : CPT-12
5.00 ft5.00 ft32.60Based on SBT
Use fill:Fill height:Fill weight:Trans. detect. applied:Kσ applied:
NoN/AN/AYesNo
Clay like behaviorapplied:Limit depth applied:Limit depth:
All soilsNoN/A
Cone resistance
qt (tsf)15010050
Dep
th (
ft)
90
85
80
75
70
65
60
55
50
45
40
35
30
25
20
15
10
5
Cone resistance SBTn Plot
Ic (Robertson 1990)4321
90
85
80
75
70
65
60
55
50
45
40
35
30
25
20
15
10
5
SBTn Plot CRR plot
CRR & CSR10.750.50.250
90
85
80
75
70
65
60
55
50
45
40
35
30
25
20
15
10
5
CRR plot
During earthq.
Qtn,cs200180160140120100806040200
Cyc
lic S
tres
s R
atio
* (C
SR*)
0.6
0.5
0.4
0.3
0.2
0.1
0
Liquefaction
No Liquefaction
Normalized friction ratio (%)0.1 1 10
Nor
mal
ized
CPT
pen
etra
tion
res
ista
nce
1
10
100
1,000
Friction Ratio
Rf (%)54321
90
85
80
75
70
65
60
55
50
45
40
35
30
25
20
15
10
5
Friction Ratio
Mw=71/2, sigma'=1 atm base curve Summary of liquefaction potential
FS Plot
Factor of safety21.510.50
90
85
80
75
70
65
60
55
50
45
40
35
30
25
20
15
10
5
FS Plot
During earthq.
Zone A1: Cyclic liquefaction likely depending on size and duration of cyclic loadingZone A2: Cyclic liquefaction and strength loss likely depending on loading and groundgeometryZone B: Liquefaction and post-earthquake strength loss unlikely, check cyclic softeningZone C: Cyclic liquefaction and strength loss possible depending on soil plasticity,brittleness/sensitivity, strain to peak undrained strength and ground geometry
CLiq v.1.7.1.14 - CPT Liquefaction Assessment Software - Report created on: 9/17/2013, 7:03:21 PMProject file: G:\Active Projects\8472\8472001002 CP Retail Site\Updated Cliq Analysis.clq
34
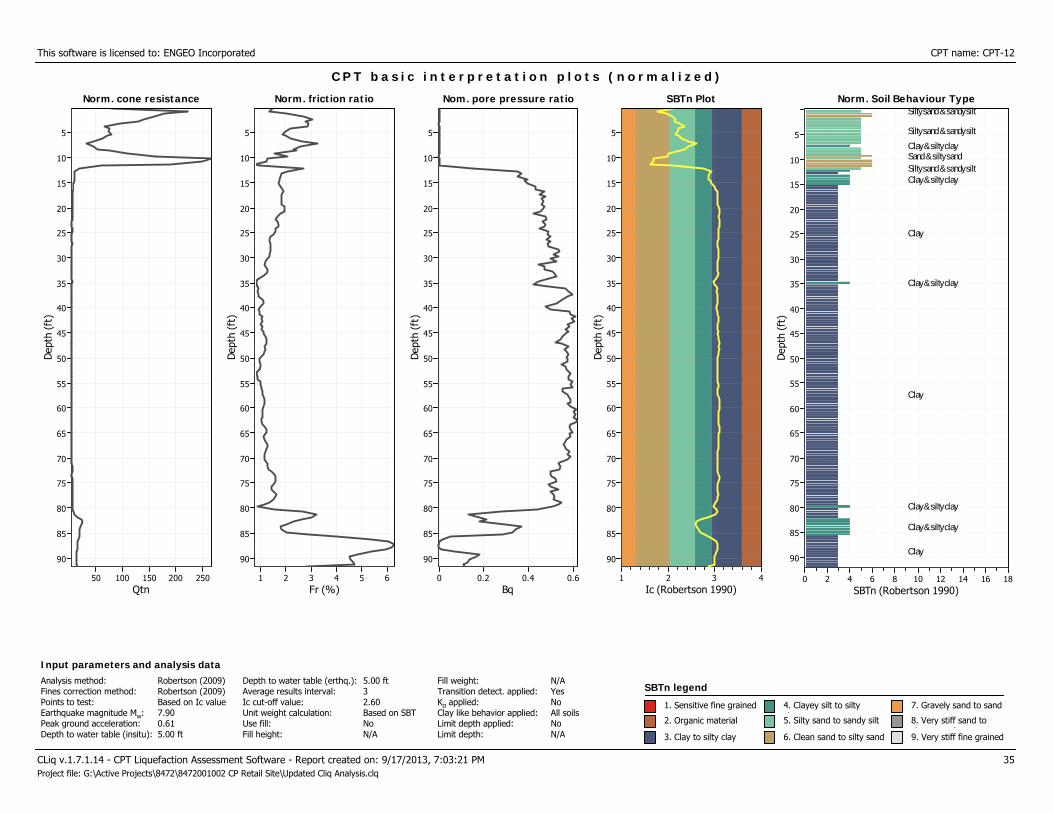
This software is licensed to: ENGEO Incorporated CPT name: CPT-12
Norm. cone resistance
Qtn25020015010050
Dep
th (
ft)
90
85
80
75
70
65
60
55
50
45
40
35
30
25
20
15
10
5
Norm. cone resistance
C P T b a s i c i n t e r p r e t a t i o n p l o t s ( n o r m a l i z e d )
Norm. friction ratio
Fr (%)654321
Dep
th (
ft)
90
85
80
75
70
65
60
55
50
45
40
35
30
25
20
15
10
5
Norm. friction ratio Nom. pore pressure ratio
Bq0.60.40.20
Dep
th (
ft)
90
85
80
75
70
65
60
55
50
45
40
35
30
25
20
15
10
5
Nom. pore pressure ratio SBTn Plot
Ic (Robertson 1990)4321
Dep
th (
ft)
90
85
80
75
70
65
60
55
50
45
40
35
30
25
20
15
10
5
SBTn Plot Norm. Soil Behaviour Type
SBTn (Robertson 1990)181614121086420
Dep
th (
ft)
90
85
80
75
70
65
60
55
50
45
40
35
30
25
20
15
10
5
Norm. Soil Behaviour TypeSilty sand & sandy silt
Silty sand & sandy silt
Clay & silty claySand & silty sandSilty sand & sandy siltClay & silty clay
Clay
Clay & silty clay
Clay
Clay & silty clay
Clay & silty clay
Clay
CLiq v.1.7.1.14 - CPT Liquefaction Assessment Software - Report created on: 9/17/2013, 7:03:21 PM 35Project file: G:\Active Projects\8472\8472001002 CP Retail Site\Updated Cliq Analysis.clq
SBTn legend
1. Sensitive fine grained
2. Organic material
3. Clay to silty clay
4. Clayey silt to siltyl5. Silty sand to sandy silt
6. Clean sand to silty sand
7. Gravely sand to sand
8. Very stiff sand tol d
9. Very stiff fine grained
Input parameters and analysis dataAnalysis method:Fines correction method:Points to test:Earthquake magnitude Mw:Peak ground acceleration:Depth to water table (insitu):
Robertson (2009)Robertson (2009)Based on Ic value7.900.615.00 ft
Depth to water table (erthq.):Average results interval:Ic cut-off value:Unit weight calculation:Use fill:Fill height:
5.00 ft32.60Based on SBTNoN/A
Fill weight:Transition detect. applied:Kσ applied:Clay like behavior applied:Limit depth applied:Limit depth:
N/AYesNoAll soilsNoN/A
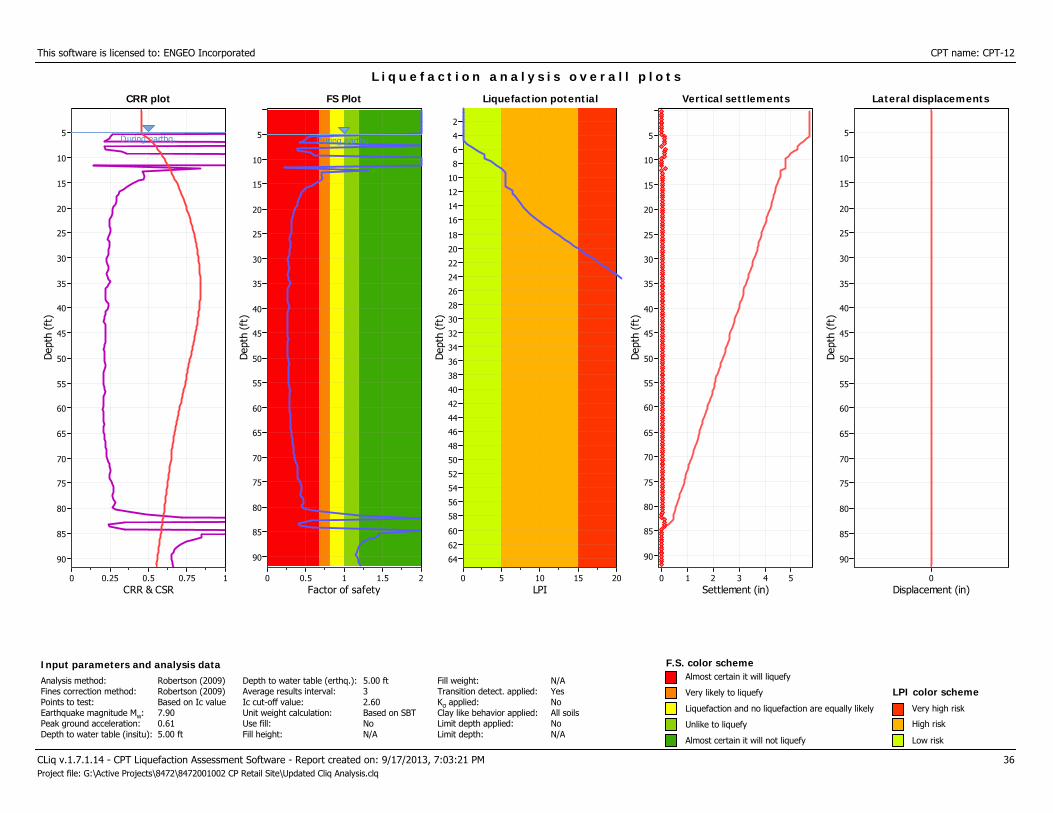
This software is licensed to: ENGEO Incorporated CPT name: CPT-12
CRR plot
CRR & CSR10.750.50.250
Dep
th (
ft)
90
85
80
75
70
65
60
55
50
45
40
35
30
25
20
15
10
5
CRR plot
During earthq.
L i q u e f a c t i o n a n a l y s i s o v e r a l l p l o t s
FS Plot
Factor of safety21.510.50
Dep
th (
ft)
90
85
80
75
70
65
60
55
50
45
40
35
30
25
20
15
10
5
FS Plot
During earthq.
Liquefaction potential
LPI20151050
Dep
th (
ft)
64
62
60
58
56
54
52
50
48
46
44
42
40
38
36
34
32
30
28
26
24
22
20
18
16
14
12
10
8
6
4
2
Liquefaction potential Vertical settlements
Settlement (in)543210
Dep
th (
ft)
90
85
80
75
70
65
60
55
50
45
40
35
30
25
20
15
10
5
Vertical settlements Lateral displacements
Displacement (in)0
Dep
th (
ft)
90
85
80
75
70
65
60
55
50
45
40
35
30
25
20
15
10
5
Lateral displacements
CLiq v.1.7.1.14 - CPT Liquefaction Assessment Software - Report created on: 9/17/2013, 7:03:21 PM 36Project file: G:\Active Projects\8472\8472001002 CP Retail Site\Updated Cliq Analysis.clq
F.S. color scheme
Liquefaction and no liquefaction are equally likely
Unlike to liquefy
Almost certain it will not liquefy
LPI color schemeVery high risk
High risk
Low risk
Input parameters and analysis dataAnalysis method:Fines correction method:Points to test:Earthquake magnitude Mw:Peak ground acceleration:Depth to water table (insitu):
Robertson (2009)Robertson (2009)Based on Ic value7.900.615.00 ft
Depth to water table (erthq.):Average results interval:Ic cut-off value:Unit weight calculation:Use fill:Fill height:
5.00 ft32.60Based on SBTNoN/A
Fill weight:Transition detect. applied:Kσ applied:Clay like behavior applied:Limit depth applied:Limit depth:
N/AYesNoAll soilsNoN/A
Very likely to liquefy
Almost certain it will liquefy
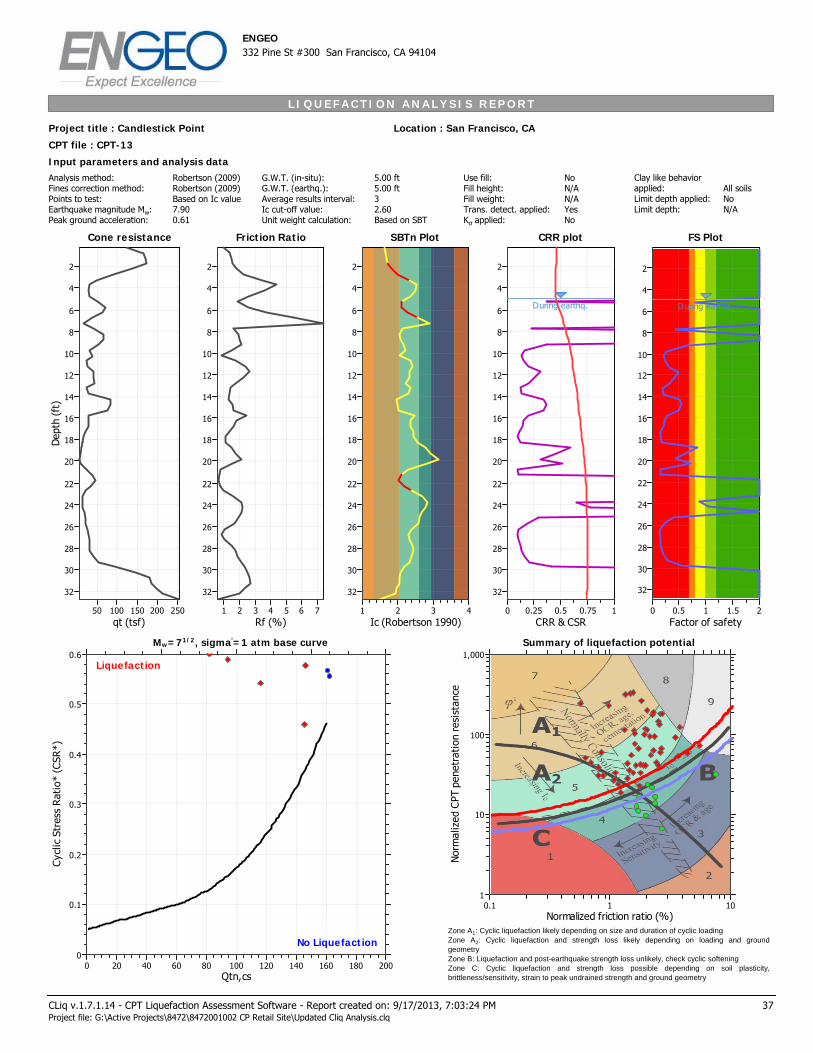
L I Q U E F A C T I O N A N A L Y S I S R E P O R T
Input parameters and analysis dataAnalysis method:Fines correction method:Points to test:Earthquake magnitude Mw:Peak ground acceleration:
Robertson (2009)Robertson (2009)Based on Ic value7.900.61
G.W.T. (in-situ):G.W.T. (earthq.):Average results interval:Ic cut-off value:Unit weight calculation:
Project title : Candlestick Point Location : San Francisco, CA
ENGEO332 Pine St #300 San Francisco, CA 94104
CPT file : CPT-13
5.00 ft5.00 ft32.60Based on SBT
Use fill:Fill height:Fill weight:Trans. detect. applied:Kσ applied:
NoN/AN/AYesNo
Clay like behaviorapplied:Limit depth applied:Limit depth:
All soilsNoN/A
Cone resistance
qt (tsf)25020015010050
Dep
th (
ft)
32
30
28
26
24
22
20
18
16
14
12
10
8
6
4
2
Cone resistance SBTn Plot
Ic (Robertson 1990)4321
32
30
28
26
24
22
20
18
16
14
12
10
8
6
4
2
SBTn Plot CRR plot
CRR & CSR10.750.50.250
32
30
28
26
24
22
20
18
16
14
12
10
8
6
4
2
CRR plot
During earthq.
Qtn,cs200180160140120100806040200
Cyc
lic S
tres
s R
atio
* (C
SR*)
0.6
0.5
0.4
0.3
0.2
0.1
0
Liquefaction
No Liquefaction
Normalized friction ratio (%)0.1 1 10
Nor
mal
ized
CPT
pen
etra
tion
res
ista
nce
1
10
100
1,000
Friction Ratio
Rf (%)7654321
32
30
28
26
24
22
20
18
16
14
12
10
8
6
4
2
Friction Ratio
Mw=71/2, sigma'=1 atm base curve Summary of liquefaction potential
FS Plot
Factor of safety21.510.50
32
30
28
26
24
22
20
18
16
14
12
10
8
6
4
2
FS Plot
During earthq.
Zone A1: Cyclic liquefaction likely depending on size and duration of cyclic loadingZone A2: Cyclic liquefaction and strength loss likely depending on loading and groundgeometryZone B: Liquefaction and post-earthquake strength loss unlikely, check cyclic softeningZone C: Cyclic liquefaction and strength loss possible depending on soil plasticity,brittleness/sensitivity, strain to peak undrained strength and ground geometry
CLiq v.1.7.1.14 - CPT Liquefaction Assessment Software - Report created on: 9/17/2013, 7:03:24 PMProject file: G:\Active Projects\8472\8472001002 CP Retail Site\Updated Cliq Analysis.clq
37
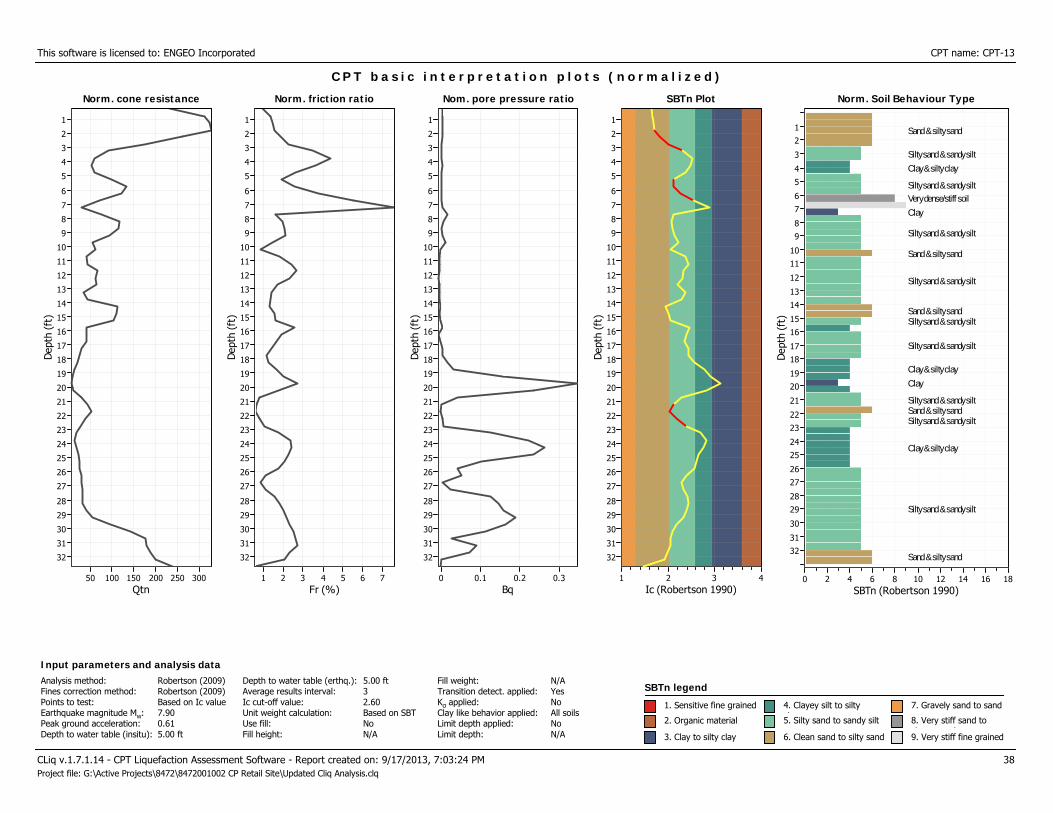
This software is licensed to: ENGEO Incorporated CPT name: CPT-13
Norm. cone resistance
Qtn30025020015010050
Dep
th (
ft)
32
31
30
29
28
27
26
25
24
23
22
21
20
19
18
17
16
15
14
13
12
11
10
9
8
7
6
5
4
3
2
1
Norm. cone resistance
C P T b a s i c i n t e r p r e t a t i o n p l o t s ( n o r m a l i z e d )
Norm. friction ratio
Fr (%)7654321
Dep
th (
ft)
32
31
30
29
28
27
26
25
24
23
22
21
20
19
18
17
16
15
14
13
12
11
10
9
8
7
6
5
4
3
2
1
Norm. friction ratio Nom. pore pressure ratio
Bq0.30.20.10
Dep
th (
ft)
32
31
30
29
28
27
26
25
24
23
22
21
20
19
18
17
16
15
14
13
12
11
10
9
8
7
6
5
4
3
2
1
Nom. pore pressure ratio SBTn Plot
Ic (Robertson 1990)4321
Dep
th (
ft)
32
31
30
29
28
27
26
25
24
23
22
21
20
19
18
17
16
15
14
13
12
11
10
9
8
7
6
5
4
3
2
1
SBTn Plot Norm. Soil Behaviour Type
SBTn (Robertson 1990)181614121086420
Dep
th (
ft)
3231
30
2928
2726
2524
2322
21
2019
1817
1615
1413
12
1110
98
76
54
3
21
Norm. Soil Behaviour Type
Sand & silty sand
Silty sand & sandy silt
Clay & silty clay
Silty sand & sandy silt
Very dense/stiff soil
Clay
Silty sand & sandy silt
Sand & silty sand
Silty sand & sandy silt
Sand & silty sandSilty sand & sandy silt
Silty sand & sandy silt
Clay & silty clay
Clay
Silty sand & sandy siltSand & silty sandSilty sand & sandy silt
Clay & silty clay
Silty sand & sandy silt
Sand & silty sand
CLiq v.1.7.1.14 - CPT Liquefaction Assessment Software - Report created on: 9/17/2013, 7:03:24 PM 38Project file: G:\Active Projects\8472\8472001002 CP Retail Site\Updated Cliq Analysis.clq
SBTn legend
1. Sensitive fine grained
2. Organic material
3. Clay to silty clay
4. Clayey silt to siltyl5. Silty sand to sandy silt
6. Clean sand to silty sand
7. Gravely sand to sand
8. Very stiff sand tol d
9. Very stiff fine grained
Input parameters and analysis dataAnalysis method:Fines correction method:Points to test:Earthquake magnitude Mw:Peak ground acceleration:Depth to water table (insitu):
Robertson (2009)Robertson (2009)Based on Ic value7.900.615.00 ft
Depth to water table (erthq.):Average results interval:Ic cut-off value:Unit weight calculation:Use fill:Fill height:
5.00 ft32.60Based on SBTNoN/A
Fill weight:Transition detect. applied:Kσ applied:Clay like behavior applied:Limit depth applied:Limit depth:
N/AYesNoAll soilsNoN/A
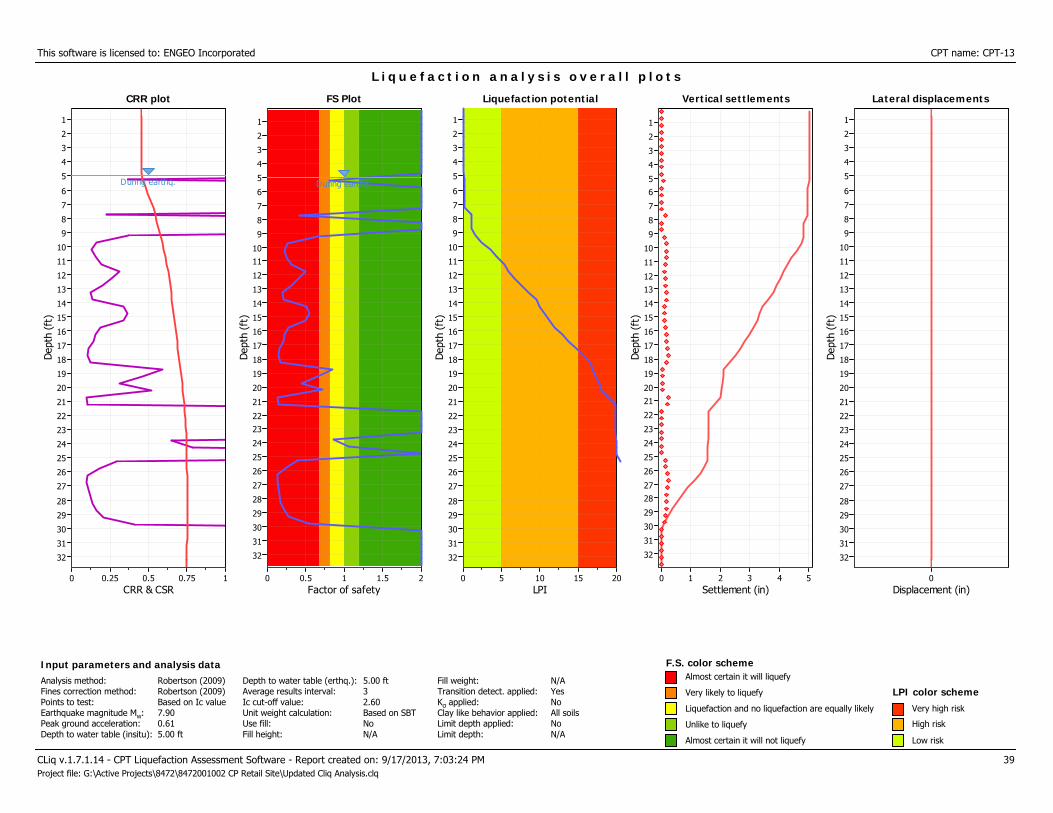
This software is licensed to: ENGEO Incorporated CPT name: CPT-13
CRR plot
CRR & CSR10.750.50.250
Dep
th (
ft)
32
31
30
29
28
27
26
25
24
23
22
21
20
19
18
17
16
15
14
13
12
11
10
9
8
7
6
5
4
3
2
1
CRR plot
During earthq.
L i q u e f a c t i o n a n a l y s i s o v e r a l l p l o t s
FS Plot
Factor of safety21.510.50
Dep
th (
ft)
32
31
30
29
28
27
26
25
24
2322
21
20
19
18
17
16
15
14
13
12
1110
9
8
7
6
5
4
3
2
1
FS Plot
During earthq.
Liquefaction potential
LPI20151050
Dep
th (
ft)
32
31
30
29
28
27
26
25
24
23
22
21
20
19
18
17
16
15
14
13
12
11
10
9
8
7
6
5
4
3
2
1
Liquefaction potential Vertical settlements
Settlement (in)543210
Dep
th (
ft)
32
31
30
29
2827
26
25
24
23
22
2120
19
18
17
16
15
14
1312
11
10
9
8
7
65
4
3
2
1
Vertical settlements Lateral displacements
Displacement (in)0
Dep
th (
ft)
32
31
30
29
28
27
26
25
24
23
22
21
20
19
18
17
16
15
14
13
12
11
10
9
8
7
6
5
4
3
2
1
Lateral displacements
CLiq v.1.7.1.14 - CPT Liquefaction Assessment Software - Report created on: 9/17/2013, 7:03:24 PM 39Project file: G:\Active Projects\8472\8472001002 CP Retail Site\Updated Cliq Analysis.clq
F.S. color scheme
Liquefaction and no liquefaction are equally likely
Unlike to liquefy
Almost certain it will not liquefy
LPI color schemeVery high risk
High risk
Low risk
Input parameters and analysis dataAnalysis method:Fines correction method:Points to test:Earthquake magnitude Mw:Peak ground acceleration:Depth to water table (insitu):
Robertson (2009)Robertson (2009)Based on Ic value7.900.615.00 ft
Depth to water table (erthq.):Average results interval:Ic cut-off value:Unit weight calculation:Use fill:Fill height:
5.00 ft32.60Based on SBTNoN/A
Fill weight:Transition detect. applied:Kσ applied:Clay like behavior applied:Limit depth applied:Limit depth:
N/AYesNoAll soilsNoN/A
Very likely to liquefy
Almost certain it will liquefy

L I Q U E F A C T I O N A N A L Y S I S R E P O R T
Input parameters and analysis dataAnalysis method:Fines correction method:Points to test:Earthquake magnitude Mw:Peak ground acceleration:
Robertson (2009)Robertson (2009)Based on Ic value7.900.61
G.W.T. (in-situ):G.W.T. (earthq.):Average results interval:Ic cut-off value:Unit weight calculation:
Project title : Candlestick Point Location : San Francisco, CA
ENGEO332 Pine St #300 San Francisco, CA 94104
CPT file : Y-4
5.00 ft5.00 ft32.60Based on SBT
Use fill:Fill height:Fill weight:Trans. detect. applied:Kσ applied:
NoN/AN/AYesNo
Clay like behaviorapplied:Limit depth applied:Limit depth:
All soilsNoN/A
Cone resistance
qt (tsf)20015010050
Dep
th (
ft)
585654525048464442403836343230282624222018161412108642
Cone resistance SBTn Plot
Ic (Robertson 1990)4321
585654525048464442403836343230282624222018161412108642
SBTn Plot CRR plot
CRR & CSR10.750.50.250
585654525048464442403836343230282624222018161412108642
CRR plot
During earthq.
Qtn,cs200180160140120100806040200
Cyc
lic S
tres
s R
atio
* (C
SR*)
0.6
0.5
0.4
0.3
0.2
0.1
0
Liquefaction
No Liquefaction
Normalized friction ratio (%)0.1 1 10
Nor
mal
ized
CPT
pen
etra
tion
res
ista
nce
1
10
100
1,000
Friction Ratio
Rf (%)4321
585654525048464442403836343230282624222018161412108642
Friction Ratio
Mw=71/2, sigma'=1 atm base curve Summary of liquefaction potential
FS Plot
Factor of safety21.510.50
585654525048464442403836343230282624222018161412108642
FS Plot
During earthq.
Zone A1: Cyclic liquefaction likely depending on size and duration of cyclic loadingZone A2: Cyclic liquefaction and strength loss likely depending on loading and groundgeometryZone B: Liquefaction and post-earthquake strength loss unlikely, check cyclic softeningZone C: Cyclic liquefaction and strength loss possible depending on soil plasticity,brittleness/sensitivity, strain to peak undrained strength and ground geometry
CLiq v.1.7.1.14 - CPT Liquefaction Assessment Software - Report created on: 9/17/2013, 7:03:25 PMProject file: G:\Active Projects\8472\8472001002 CP Retail Site\Updated Cliq Analysis.clq
40
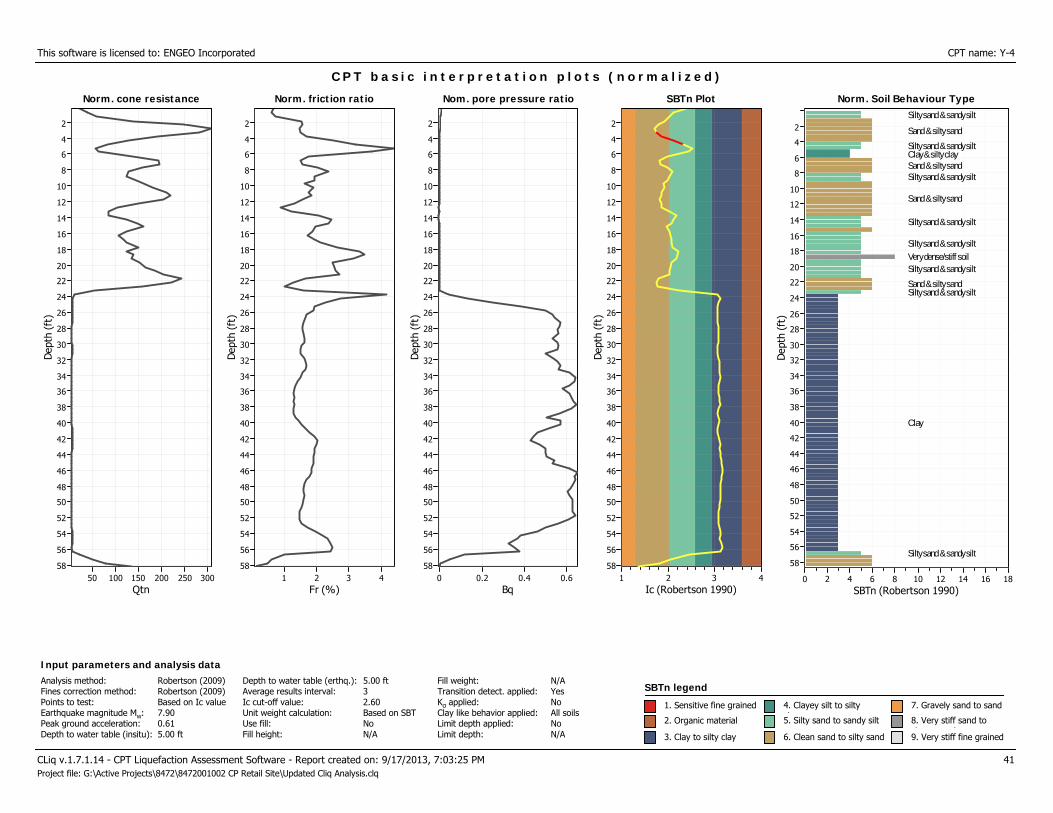
This software is licensed to: ENGEO Incorporated CPT name: Y-4
Norm. cone resistance
Qtn30025020015010050
Dep
th (
ft)
58
56
54
52
50
48
46
44
42
40
38
36
34
32
30
28
26
24
22
20
18
16
14
12
10
8
6
4
2
Norm. cone resistance
C P T b a s i c i n t e r p r e t a t i o n p l o t s ( n o r m a l i z e d )
Norm. friction ratio
Fr (%)4321
Dep
th (
ft)
58
56
54
52
50
48
46
44
42
40
38
36
34
32
30
28
26
24
22
20
18
16
14
12
10
8
6
4
2
Norm. friction ratio Nom. pore pressure ratio
Bq0.60.40.20
Dep
th (
ft)
58
56
54
52
50
48
46
44
42
40
38
36
34
32
30
28
26
24
22
20
18
16
14
12
10
8
6
4
2
Nom. pore pressure ratio SBTn Plot
Ic (Robertson 1990)4321
Dep
th (
ft)
58
56
54
52
50
48
46
44
42
40
38
36
34
32
30
28
26
24
22
20
18
16
14
12
10
8
6
4
2
SBTn Plot Norm. Soil Behaviour Type
SBTn (Robertson 1990)181614121086420
Dep
th (
ft)
58
56
54
52
50
48
46
44
42
40
38
36
34
32
30
28
26
24
22
20
18
16
14
12
10
8
6
4
2
Norm. Soil Behaviour TypeSilty sand & sandy silt
Sand & silty sand
Silty sand & sandy siltClay & silty claySand & silty sandSilty sand & sandy silt
Sand & silty sand
Silty sand & sandy silt
Silty sand & sandy silt
Very dense/stiff soilSilty sand & sandy silt
Sand & silty sandSilty sand & sandy silt
Clay
Silty sand & sandy silt
CLiq v.1.7.1.14 - CPT Liquefaction Assessment Software - Report created on: 9/17/2013, 7:03:25 PM 41Project file: G:\Active Projects\8472\8472001002 CP Retail Site\Updated Cliq Analysis.clq
SBTn legend
1. Sensitive fine grained
2. Organic material
3. Clay to silty clay
4. Clayey silt to siltyl5. Silty sand to sandy silt
6. Clean sand to silty sand
7. Gravely sand to sand
8. Very stiff sand tol d
9. Very stiff fine grained
Input parameters and analysis dataAnalysis method:Fines correction method:Points to test:Earthquake magnitude Mw:Peak ground acceleration:Depth to water table (insitu):
Robertson (2009)Robertson (2009)Based on Ic value7.900.615.00 ft
Depth to water table (erthq.):Average results interval:Ic cut-off value:Unit weight calculation:Use fill:Fill height:
5.00 ft32.60Based on SBTNoN/A
Fill weight:Transition detect. applied:Kσ applied:Clay like behavior applied:Limit depth applied:Limit depth:
N/AYesNoAll soilsNoN/A
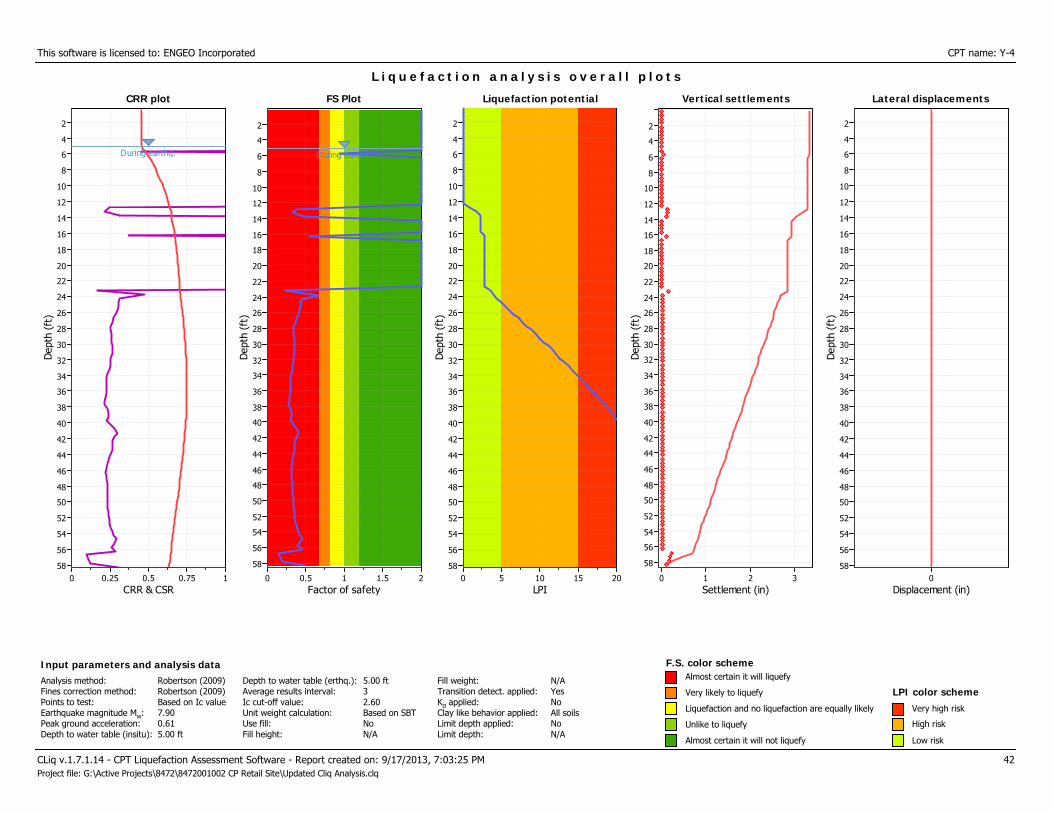
This software is licensed to: ENGEO Incorporated CPT name: Y-4
CRR plot
CRR & CSR10.750.50.250
Dep
th (
ft)
58
56
54
52
50
48
46
44
42
40
38
36
34
32
30
28
26
24
22
20
18
16
14
12
10
8
6
4
2
CRR plot
During earthq.
L i q u e f a c t i o n a n a l y s i s o v e r a l l p l o t s
FS Plot
Factor of safety21.510.50
Dep
th (
ft)
58
56
54
52
50
48
46
44
42
40
38
36
34
32
30
28
26
24
22
20
18
16
14
12
10
8
6
4
2
FS Plot
During earthq.
Liquefaction potential
LPI20151050
Dep
th (
ft)
58
56
54
52
50
48
46
44
42
40
38
36
34
32
30
28
26
24
22
20
18
16
14
12
10
8
6
4
2
Liquefaction potential Vertical settlements
Settlement (in)3210
Dep
th (
ft)
58
56
54
52
50
48
46
44
42
40
38
36
34
32
30
28
26
24
22
20
18
16
14
12
10
8
6
4
2
Vertical settlements Lateral displacements
Displacement (in)0
Dep
th (
ft)
58
56
54
52
50
48
46
44
42
40
38
36
34
32
30
28
26
24
22
20
18
16
14
12
10
8
6
4
2
Lateral displacements
CLiq v.1.7.1.14 - CPT Liquefaction Assessment Software - Report created on: 9/17/2013, 7:03:25 PM 42Project file: G:\Active Projects\8472\8472001002 CP Retail Site\Updated Cliq Analysis.clq
F.S. color scheme
Liquefaction and no liquefaction are equally likely
Unlike to liquefy
Almost certain it will not liquefy
LPI color schemeVery high risk
High risk
Low risk
Input parameters and analysis dataAnalysis method:Fines correction method:Points to test:Earthquake magnitude Mw:Peak ground acceleration:Depth to water table (insitu):
Robertson (2009)Robertson (2009)Based on Ic value7.900.615.00 ft
Depth to water table (erthq.):Average results interval:Ic cut-off value:Unit weight calculation:Use fill:Fill height:
5.00 ft32.60Based on SBTNoN/A
Fill weight:Transition detect. applied:Kσ applied:Clay like behavior applied:Limit depth applied:Limit depth:
N/AYesNoAll soilsNoN/A
Very likely to liquefy
Almost certain it will liquefy
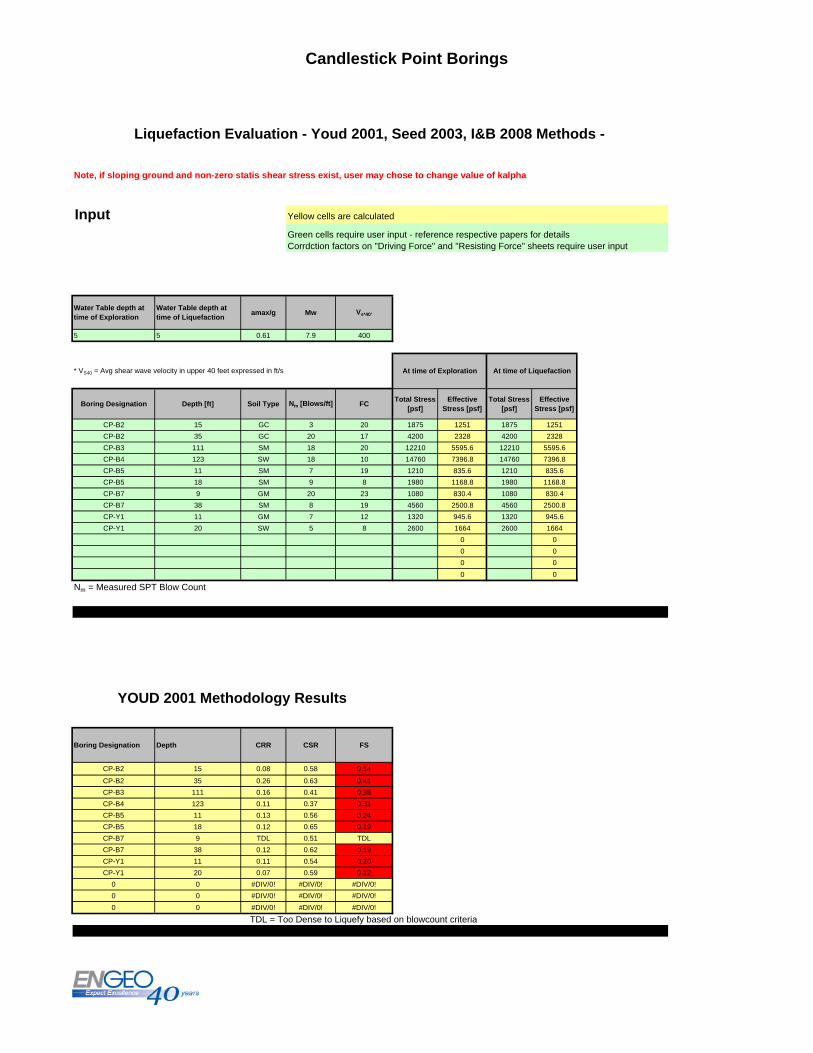
Candlestick Point Borings
Note, if sloping ground and non-zero statis shear stress exist, user may chose to change value of kalpha
Input
Water Table depth at time of Exploration
Water Table depth at time of Liquefaction
amax/g Mw Vs*40'
5 5 0.61 7.9 400
* VS40 = Avg shear wave velocity in upper 40 feet expressed in ft/s
Boring Designation Depth [ft] Soil Type Nm [Blows/ft] FCTotal Stress
[psf]Effective
Stress [psf]Total Stress
[psf]Effective
Stress [psf]
CP-B2 15 GC 3 20 1875 1251 1875 1251
CP-B2 35 GC 20 17 4200 2328 4200 2328
CP-B3 111 SM 18 20 12210 5595.6 12210 5595.6
CP-B4 123 SW 18 10 14760 7396.8 14760 7396.8
CP-B5 11 SM 7 19 1210 835.6 1210 835.6
CP-B5 18 SM 9 8 1980 1168.8 1980 1168.8
CP-B7 9 GM 20 23 1080 830.4 1080 830.4
CP-B7 38 SM 8 19 4560 2500.8 4560 2500.8
CP-Y1 11 GM 7 12 1320 945.6 1320 945.6
CP-Y1 20 SW 5 8 2600 1664 2600 1664
0 0
0 0
0 0
0 0
Nm = Measured SPT Blow Count
Boring Designation Depth CRR CSR FS
CP-B2 15 0.08 0.58 0.14
CP-B2 35 0.26 0.63 0.41
CP-B3 111 0.16 0.41 0.38
CP-B4 123 0.11 0.37 0.31
CP-B5 11 0.13 0.56 0.24
CP-B5 18 0.12 0.65 0.19
CP-B7 9 TDL 0.51 TDL
CP-B7 38 0.12 0.62 0.19
CP-Y1 11 0.11 0.54 0.20
CP-Y1 20 0.07 0.59 0.12
0 0 #DIV/0! #DIV/0! #DIV/0!
0 0 #DIV/0! #DIV/0! #DIV/0!
0 0 #DIV/0! #DIV/0! #DIV/0!
TDL = Too Dense to Liquefy based on blowcount criteria
Liquefaction Evaluation - Youd 2001, Seed 2003, I&B 2008 Methods -
At time of Exploration At time of Liquefaction
Green cells require user input - reference respective papers for detailsCorrdction factors on "Driving Force" and "Resisting Force" sheets require user input
Yellow cells are calculated
YOUD 2001 Methodology Results
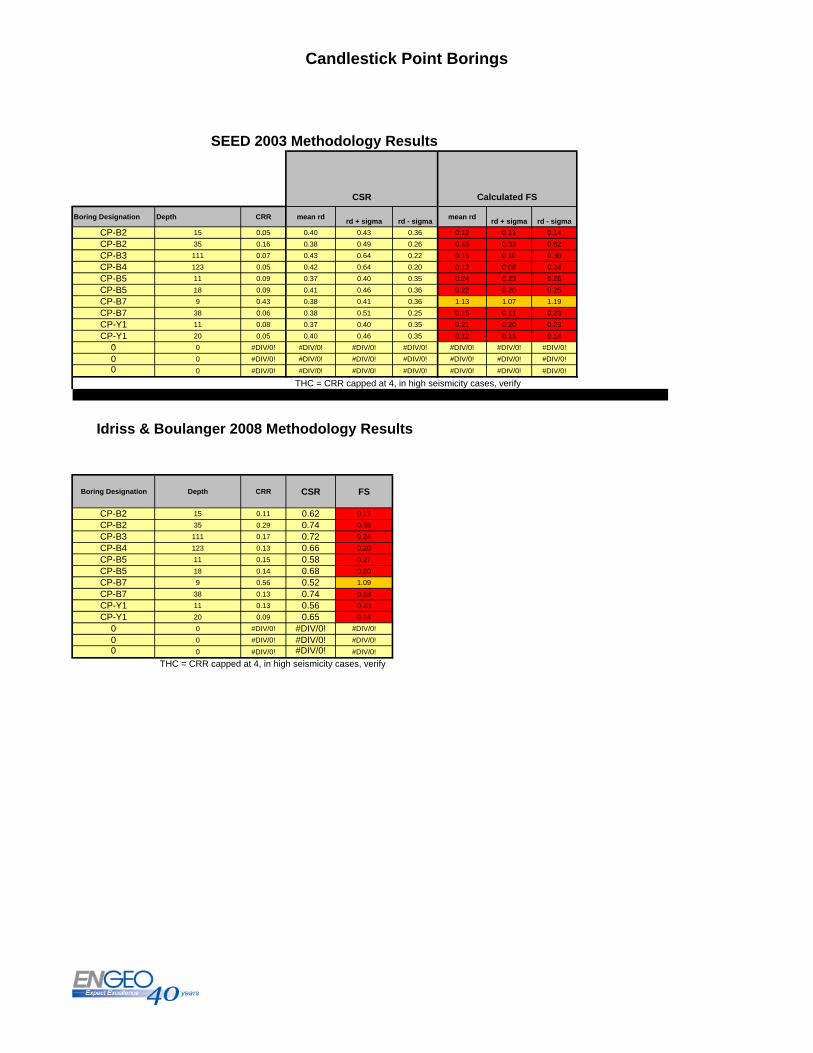
Candlestick Point Borings
Boring Designation Depth CRR mean rdrd + sigma rd - sigma
mean rdrd + sigma rd - sigma
CP-B2 15 0.05 0.40 0.43 0.36 0.12 0.11 0.14
CP-B2 35 0.16 0.38 0.49 0.26 0.43 0.33 0.62
CP-B3 111 0.07 0.43 0.64 0.22 0.15 0.10 0.30
CP-B4 123 0.05 0.42 0.64 0.20 0.12 0.08 0.24
CP-B5 11 0.09 0.37 0.40 0.35 0.24 0.23 0.26
CP-B5 18 0.09 0.41 0.46 0.36 0.22 0.20 0.25
CP-B7 9 0.43 0.38 0.41 0.36 1.13 1.07 1.19
CP-B7 38 0.06 0.38 0.51 0.25 0.15 0.11 0.23
CP-Y1 11 0.08 0.37 0.40 0.35 0.21 0.20 0.23
CP-Y1 20 0.05 0.40 0.46 0.35 0.12 0.11 0.14
0 0 #DIV/0! #DIV/0! #DIV/0! #DIV/0! #DIV/0! #DIV/0! #DIV/0!
0 0 #DIV/0! #DIV/0! #DIV/0! #DIV/0! #DIV/0! #DIV/0! #DIV/0!
0 0 #DIV/0! #DIV/0! #DIV/0! #DIV/0! #DIV/0! #DIV/0! #DIV/0!
Boring Designation Depth CRR CSR FS
CP-B2 15 0.11 0.62 0.17
CP-B2 35 0.29 0.74 0.39
CP-B3 111 0.17 0.72 0.24
CP-B4 123 0.13 0.66 0.20
CP-B5 11 0.15 0.58 0.27
CP-B5 18 0.14 0.68 0.20
CP-B7 9 0.56 0.52 1.09
CP-B7 38 0.13 0.74 0.18
CP-Y1 11 0.13 0.56 0.23
CP-Y1 20 0.09 0.65 0.14
0 0 #DIV/0! #DIV/0! #DIV/0!
0 0 #DIV/0! #DIV/0! #DIV/0!
0 0 #DIV/0! #DIV/0! #DIV/0!
SEED 2003 Methodology Results
Idriss & Boulanger 2008 Methodology Results
Calculated FSCSR
THC = CRR capped at 4, in high seismicity cases, verify
THC = CRR capped at 4, in high seismicity cases, verify
APPENDIX F
Bulk Asbestos Material Analysis (Forensic Analytical Laboratories)
APPENDIX
F
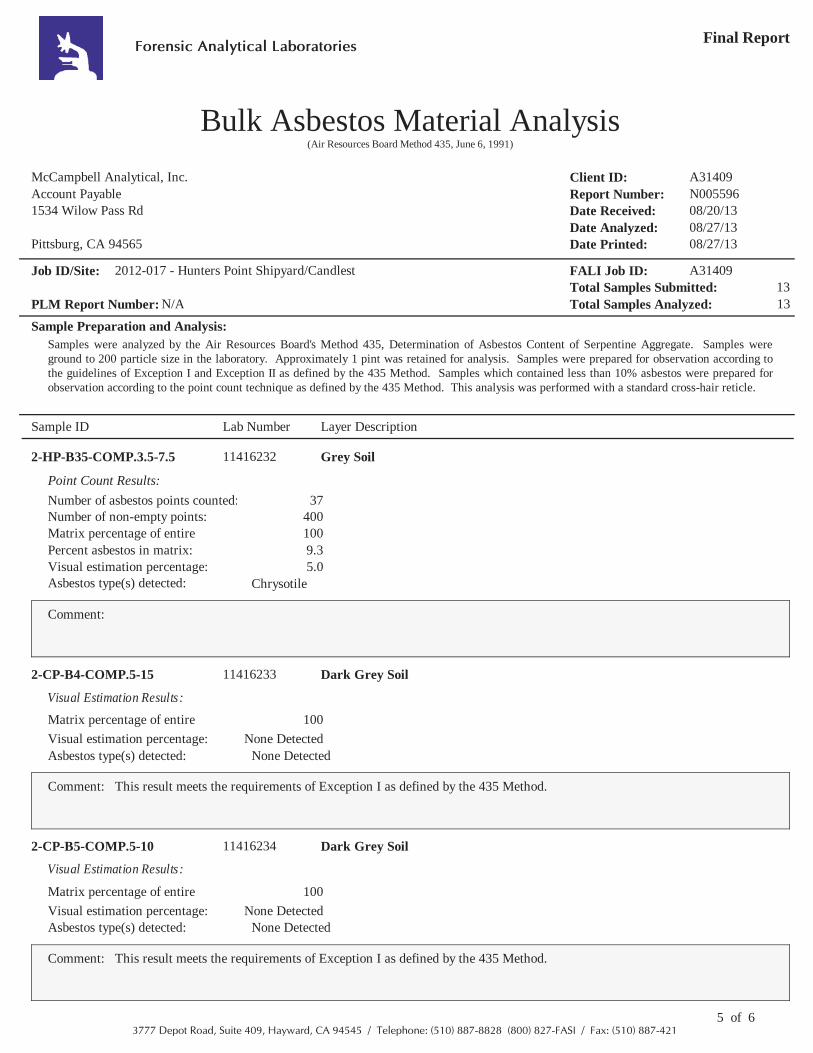
Final Report
McCampbell Analytical, Inc.
1534 Wilow Pass RdAccount Payable
Pittsburg, CA 94565
Client ID:Report Number:Date Received:
Date Printed:Date Analyzed:
N005596A31409
08/27/1308/27/13
Job ID/Site: FALI Job ID:2012-017 - Hunters Point Shipyard/Candlest A31409
(Air Resources Board Method 435, June 6, 1991)
Bulk Asbestos Material Analysis
Sample Preparation and Analysis:
08/20/13
Forensic Analytical Laboratories
Total Samples Submitted:Total Samples Analyzed:
1313PLM Report Number: N/A
Samples were analyzed by the Air Resources Board's Method 435, Determination of Asbestos Content of Serpentine Aggregate. Samples wereground to 200 particle size in the laboratory. Approximately 1 pint was retained for analysis. Samples were prepared for observation according tothe guidelines of Exception I and Exception II as defined by the 435 Method. Samples which contained less than 10% asbestos were prepared forobservation according to the point count technique as defined by the 435 Method. This analysis was performed with a standard cross-hair reticle.
Lab NumberSample ID Layer Description
2-HP-B35-COMP.3.5-7.5 11416232 Grey Soil
Asbestos type(s) detected: Chrysotile
9.3100
Number of asbestos points counted:Number of non-empty points: 400
37
Visual estimation percentage: 5.0
Point Count Results:
Percent asbestos in matrix:Matrix percentage of entiresample:
Comment:
2-CP-B4-COMP.5-15 11416233 Dark Grey Soil
Visual Estimation Results:
100
Visual estimation percentage: None DetectedAsbestos type(s) detected: None Detected
Matrix percentage of entiresample:
Comment: This result meets the requirements of Exception I as defined by the 435 Method.
2-CP-B5-COMP.5-10 11416234 Dark Grey Soil
Visual Estimation Results:
100
Visual estimation percentage: None DetectedAsbestos type(s) detected: None Detected
Matrix percentage of entiresample:
Comment: This result meets the requirements of Exception I as defined by the 435 Method.
5 of 63777 Depot Road, Suite 409, Hayward, CA 94545 / Telephone: (510) 887-8828 (800) 827-FASI / Fax: (510) 887-421
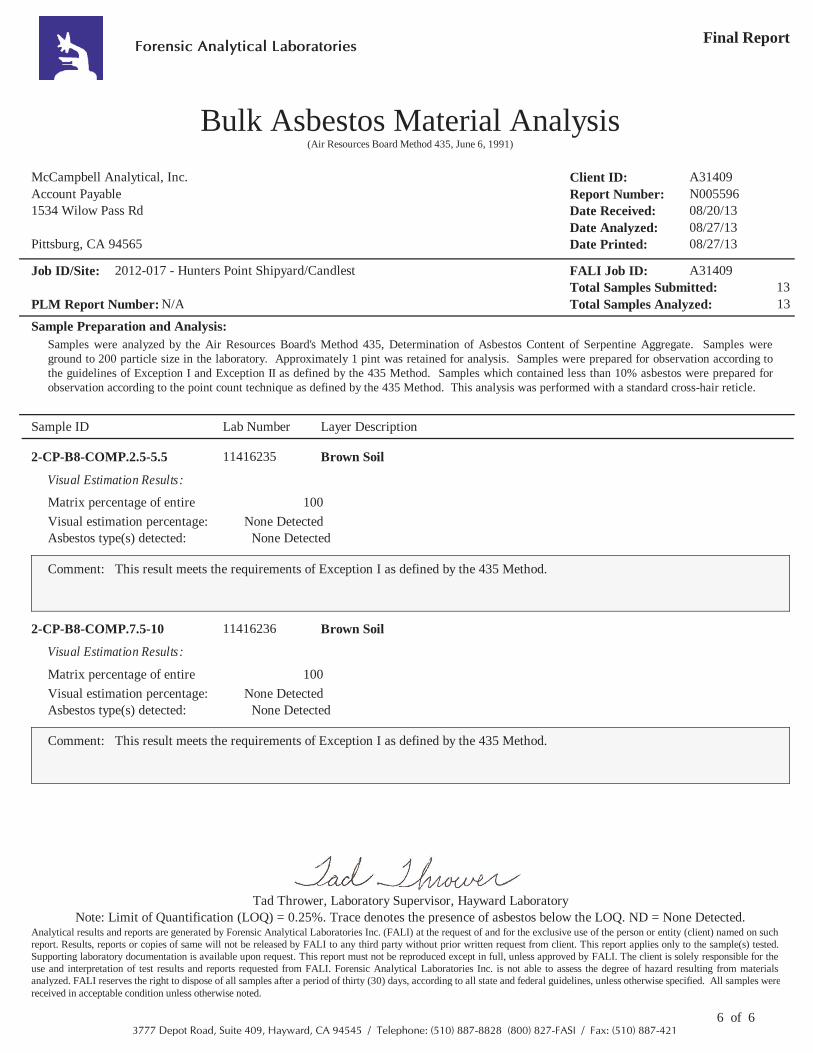
Final Report
McCampbell Analytical, Inc.
1534 Wilow Pass RdAccount Payable
Pittsburg, CA 94565
Client ID:Report Number:Date Received:
Date Printed:Date Analyzed:
N005596A31409
08/27/1308/27/13
Job ID/Site: FALI Job ID:2012-017 - Hunters Point Shipyard/Candlest A31409
(Air Resources Board Method 435, June 6, 1991)
Bulk Asbestos Material Analysis
Sample Preparation and Analysis:
08/20/13
Forensic Analytical Laboratories
Total Samples Submitted:Total Samples Analyzed:
1313PLM Report Number: N/A
Samples were analyzed by the Air Resources Board's Method 435, Determination of Asbestos Content of Serpentine Aggregate. Samples wereground to 200 particle size in the laboratory. Approximately 1 pint was retained for analysis. Samples were prepared for observation according tothe guidelines of Exception I and Exception II as defined by the 435 Method. Samples which contained less than 10% asbestos were prepared forobservation according to the point count technique as defined by the 435 Method. This analysis was performed with a standard cross-hair reticle.
Lab NumberSample ID Layer Description
2-CP-B8-COMP.2.5-5.5 11416235 Brown Soil
Visual Estimation Results:
100
Visual estimation percentage: None DetectedAsbestos type(s) detected: None Detected
Matrix percentage of entiresample:
Comment: This result meets the requirements of Exception I as defined by the 435 Method.
2-CP-B8-COMP.7.5-10 11416236 Brown Soil
Visual Estimation Results:
100
Visual estimation percentage: None DetectedAsbestos type(s) detected: None Detected
Matrix percentage of entiresample:
Comment: This result meets the requirements of Exception I as defined by the 435 Method.
Analytical results and reports are generated by Forensic Analytical Laboratories Inc. (FALI) at the request of and for the exclusive use of the person or entity (client) named on suchreport. Results, reports or copies of same will not be released by FALI to any third party without prior written request from client. This report applies only to the sample(s) tested.Supporting laboratory documentation is available upon request. This report must not be reproduced except in full, unless approved by FALI. The client is solely responsible for theuse and interpretation of test results and reports requested from FALI. Forensic Analytical Laboratories Inc. is not able to assess the degree of hazard resulting from materialsanalyzed. FALI reserves the right to dispose of all samples after a period of thirty (30) days, according to all state and federal guidelines, unless otherwise specified. All samples werereceived in acceptable condition unless otherwise noted.
Note: Limit of Quantification (LOQ) = 0.25%. Trace denotes the presence of asbestos below the LOQ. ND = None Detected.Tad Thrower, Laboratory Supervisor, Hayward Laboratory
6 of 63777 Depot Road, Suite 409, Hayward, CA 94545 / Telephone: (510) 887-8828 (800) 827-FASI / Fax: (510) 887-421