engineering geological and geotechnical appraisal of ... - core
TRANSCRIPT

American Scientific Research Journal for Engineering, Technology, and Sciences (ASRJETS) ISSN (Print) 2313-4410, ISSN (Online) 2313-4402
© Global Society of Scientific Research and Researchers
http://asrjetsjournal.org/
Engineering geological and geotechnical appraisal of
Northern Mekelle town, Tigray, Northern Ethiopia
Ephrem Getahun Gure a, Kifle Weldearegay (Dr.) b, Gebremedihin Birhane c
aDepartment of Geology, Arba Minch University, P.o.box 21, Arba Minch, Ethiopia
b,c Department of Earth Science, Mekelle University, P.o.box 231, Mekelle, Tigray, Ethiopia [email protected], [email protected]
Abstract
As population number grows, the demand of constructing buildings for residential, commercial, industrial, and
other purposes also increases. Mekelle town is presently rapidly and geometrically expanding towards all
directions, and several civil engineering structures such as single to multi-storey buildings, roads, bridges, etc.
are under construction. The main research aim is to characterize the engineering geological and geotechnical
properties of soils and rocks, and develop detailed multi-purpose engineering geological map at a detail scale.
Engineering geological and geotechnical characterization of soils and rocks are based on their index and
engineering properties, and their classification is according to the standard proposed by Unified Soil
Classification System (USCS) and International association of Engineering Geologists (IAEG (1981).
According to USCS; soils are classified into: fat clay type; inorganic silt, elastic silt and (silty of clayey fine
sand with slight plasticity) of silt soil types; lean sandy clay, inorganic silts, elastic sandy silt of sandy clay/ silt
type; and clayey/ silty sand soil types. According to IAEG (1981); soils are classified into: clay of intermediate
and high plasticity; silt of intermediate, high and very high plasticity; SAND clayey of intermediate plasticity,
SAND silt of high plasticity; and CLAYEY sand of intermediate, high plasticity and SILT sand of intermediate
plasticity). Classification of rock masses is based on their strength, degree of weathering and joint
characteristics; classified into three major engineering geological subunits: rocks with low mass strength, rocks
with medium mass strength and rocks with high mass strength.
Keywords: Classification; Geotechnical, Map; Mekelle town; Rock mass; Soil; Strength
1. Introduction
Mekelle is the capital city of Tigray National Regional State located in Northern Ethiopia. Its approximate
geographic location is 39o 28' Eastern Longitude and 13o 32' Northern latitude. It has an average altitude of 2000
meters above mean sea level.
23

American Scientific Research Journal for Engineering, Technology, and Sciences (ASRJETS) (2013) Volume 5, No 1, pp 23-56
The city is growing into different directions and has to adjust its planning strategies to accomplish the demands
of an abruptly growing population. The spatial effects of the surrounding mountain ridges and enclosing
landforms have special importance for reservation of specific areas and facilitate development of the city.
At present, significant concentration of engineering structures mainly multi-story buildings, roads, bridges are
under construction, especially they are concentrated in the north, northwest, and west directions of the city.
There is a need for systematic work of detailed engineering geological and geotechnical mapping for Mekelle
town and surrounding area.
Engineering geological mapping, plays a vital tool in most current civil engineering and mining works, has not
been given the attention it deserves in most countries lying within the tropics [1]. According to [1], the reasons
for this might be partially found in the unavailability of personnel and facilities in these countries and lack of
awareness of decision makers and planners. A major reason, however, is the absence of methods specifically
designed to cope with the special problems of the tropical regions.
Densely populated urban centers are often founded on steep slopes, or on poor soil conditions, and even in some
cases with high seismicity areas. Knowledge of the geological and geotechnical conditions of an urban area is
necessary to provide basic information of the ground condition to the local authorities, engineers and
contractors. This necessary information also constitutes the basic concept for the evaluation of both the
geological hazards, which are encountered in the area in question, and the dynamic response of the construction
in the case of seismic activity.
The current research work was conducted by considering the present expansion of the town towards the northern
and north western parts, the results of the research provides detailed engineering geological information that
help for planning, design and maintenance of engineering structures on these areas.
2. Objectives
The general objectives are to determine the nature and type of soils and rocks and their engineering properties.
To produce detail engineering geological map of the northern part of the Mekelle town at a detail scale.
Specifically rocks and soils of the area are characterised and classified according to the standard classification
schemes and provide adequate engineering geological and geotechnical information for different construction
industry in the area regarding the foundation and subsurface condition.
3. Description of the study area
3.1. Location
Mekelle town is the capital city and commercial center of the Tigray National Regional State, located about
783km north of Addis Ababa, capital city of Ethiopia. Geographically the town is located at 390 28' East
longitude and 130 32' North latitudes, situated in the extension of the central highlands of Ethiopia. The study
24

American Scientific Research Journal for Engineering, Technology, and Sciences (ASRJETS) (2013) Volume 5, No 1, pp 23-56
area is the northern part of Mekelle town. The altitude of northern Mekelle town is between 1940m and 2220m
above sea level. The area is enclosed within the limit of 1492000-1500000 North and 546000-556000 East and
covers about 50 km2.
Figure 1: Location map of the study area.
3.2. Topography and drainage
The northern part of Mekelle is situated at the foot of a steep cliff of the Endayesus escarpment on the east side
and steep bedded limestone cliff on the northern and northeastern side. The major part of the study area is gentle
to flat lying land. The altitude varies from 2220m at eastern to 1940m in the northwestern part of the study area
(lower reach of Illala river). Topographically, the northern part of Mekelle town has an overall tilt towards west
and northwest direction. As the city is within the Tekeze river basin, the Illala River flows from East to West, in
25

American Scientific Research Journal for Engineering, Technology, and Sciences (ASRJETS) (2013) Volume 5, No 1, pp 23-56
which many tributaries feed the river with substantial amount of water during rainy season. The stream is
seasonal where the peak discharge is attained during summer and is a tributary to river Giba. Giba river is not
far from the study area (about 3-4km far from the northwestern part of study area). Giba is also a relatively big
river that flows to the major river Tekeze.
19001920194019601980200020202040206020802100212021402160218022002220224022602280230023202340236023802400
0 2000 4000 6000 8000
Messebo escarpment
Illala river
Gentle to moderately steep slope lands
Steep to very steep lands (cliffs)
Flat
to ge
ntly
slopin
g lan
d
Figure 2: 3D-simulation of the topography, drainage, relief and landforms map of the study area from DEM
(30m resolutions). Scale bars: in meters for both horizontal and vertical bars.
1.3. Climate
The Ethiopian Mapping Agency (1981) [2] differentiated five traditional climatic zones in the National Atlas of
Ethiopia. According to this classification the study area is within “Weina Dega” or subtropical climatic zone
with altitude 1500-2300 m and mean annual temperature and evapotranspiration of 15-200C and 1100-1250 mm
respectively. The climate of Mekelle varies mainly according to elevation.
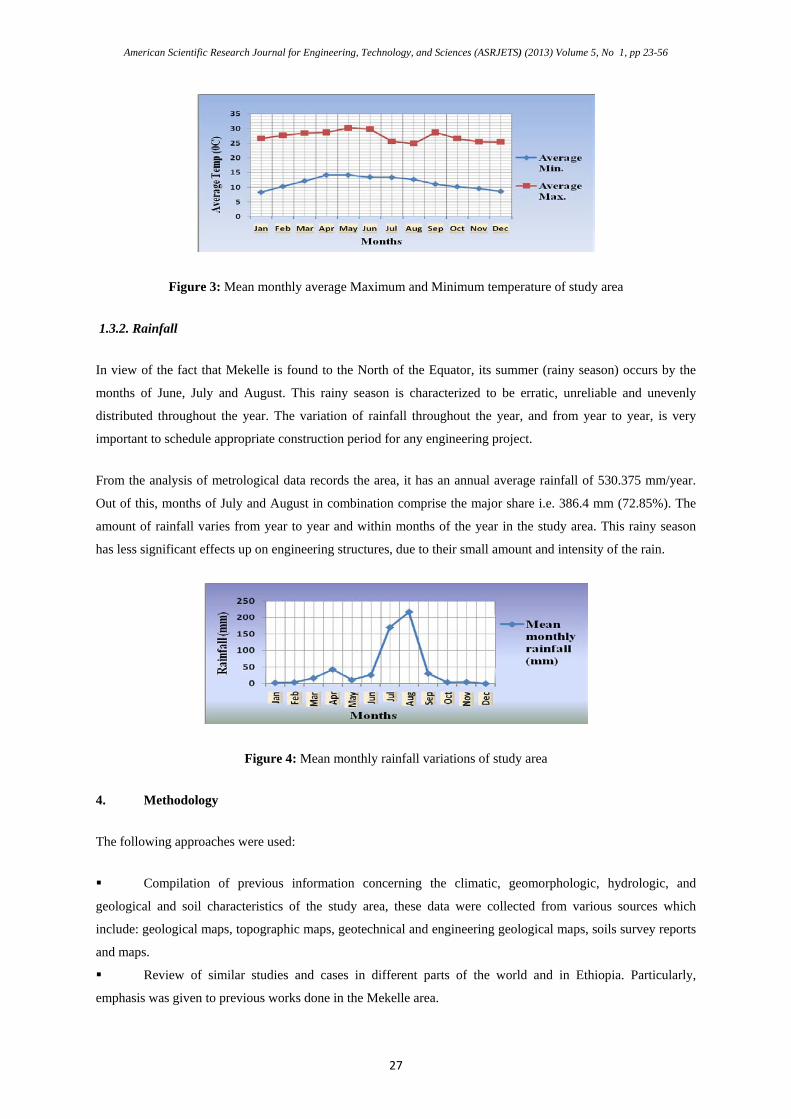
1.3.1. Temperature
Temperature determines the suitability of a site for settlement and development of various infrastructures. The
temperature records (Annex A) were analyzed to determine the average maximum and minimum temperature of
the area. According to this analysis, the area has an annual average maximum temperature of 27.350C and
annual average minimum temperature of 11.520C. There is monthly variation in temperature. May and June are
the hottest months with a monthly mean maximum temperature of 30.20C and 29.80C respectively, and monthly
mean minimum temperature of 14.20C and 13.50C. December and January are the coldest months with a mean
monthly maximum temperature of 25.40C and 26.60C and monthly mean minimum temperature of 8.60C and
8.30C respectively.
26
American Scientific Research Journal for Engineering, Technology, and Sciences (ASRJETS) (2013) Volume 5, No 1, pp 23-56
Figure 3: Mean monthly average Maximum and Minimum temperature of study area
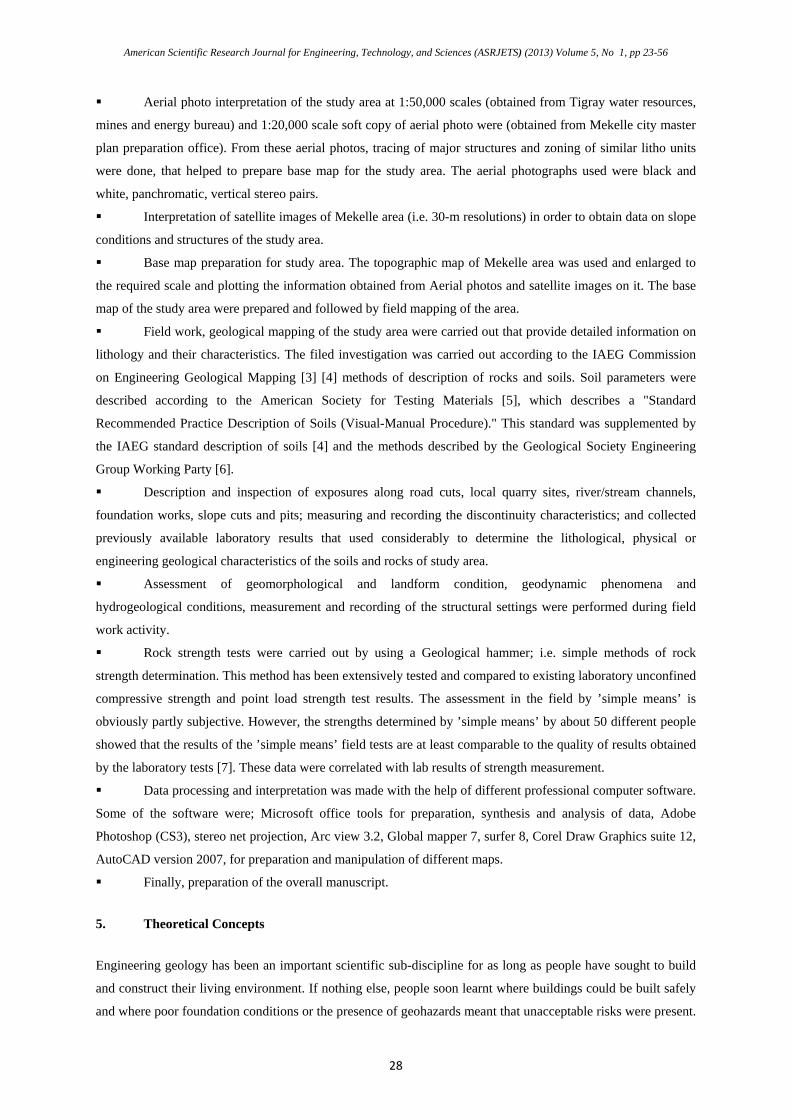
1.3.2. Rainfall
In view of the fact that Mekelle is found to the North of the Equator, its summer (rainy season) occurs by the
months of June, July and August. This rainy season is characterized to be erratic, unreliable and unevenly
distributed throughout the year. The variation of rainfall throughout the year, and from year to year, is very
important to schedule appropriate construction period for any engineering project.
From the analysis of metrological data records the area, it has an annual average rainfall of 530.375 mm/year.
Out of this, months of July and August in combination comprise the major share i.e. 386.4 mm (72.85%). The
amount of rainfall varies from year to year and within months of the year in the study area. This rainy season
has less significant effects up on engineering structures, due to their small amount and intensity of the rain.
Figure 4: Mean monthly rainfall variations of study area
4. Methodology
The following approaches were used:
Compilation of previous information concerning the climatic, geomorphologic, hydrologic, and
geological and soil characteristics of the study area, these data were collected from various sources which
include: geological maps, topographic maps, geotechnical and engineering geological maps, soils survey reports
and maps.
Review of similar studies and cases in different parts of the world and in Ethiopia. Particularly,
emphasis was given to previous works done in the Mekelle area.
27
American Scientific Research Journal for Engineering, Technology, and Sciences (ASRJETS) (2013) Volume 5, No 1, pp 23-56
Aerial photo interpretation of the study area at 1:50,000 scales (obtained from Tigray water resources,
mines and energy bureau) and 1:20,000 scale soft copy of aerial photo were (obtained from Mekelle city master
plan preparation office). From these aerial photos, tracing of major structures and zoning of similar litho units
were done, that helped to prepare base map for the study area. The aerial photographs used were black and
white, panchromatic, vertical stereo pairs.
Interpretation of satellite images of Mekelle area (i.e. 30-m resolutions) in order to obtain data on slope
conditions and structures of the study area.
Base map preparation for study area. The topographic map of Mekelle area was used and enlarged to
the required scale and plotting the information obtained from Aerial photos and satellite images on it. The base
map of the study area were prepared and followed by field mapping of the area.
Field work, geological mapping of the study area were carried out that provide detailed information on
lithology and their characteristics. The filed investigation was carried out according to the IAEG Commission
on Engineering Geological Mapping [3] [4] methods of description of rocks and soils. Soil parameters were
described according to the American Society for Testing Materials [5], which describes a "Standard
Recommended Practice Description of Soils (Visual-Manual Procedure)." This standard was supplemented by
the IAEG standard description of soils [4] and the methods described by the Geological Society Engineering
Group Working Party [6].
Description and inspection of exposures along road cuts, local quarry sites, river/stream channels,
foundation works, slope cuts and pits; measuring and recording the discontinuity characteristics; and collected
previously available laboratory results that used considerably to determine the lithological, physical or
engineering geological characteristics of the soils and rocks of study area.
Assessment of geomorphological and landform condition, geodynamic phenomena and
hydrogeological conditions, measurement and recording of the structural settings were performed during field
work activity.
Rock strength tests were carried out by using a Geological hammer; i.e. simple methods of rock
strength determination. This method has been extensively tested and compared to existing laboratory unconfined
compressive strength and point load strength test results. The assessment in the field by ’simple means’ is
obviously partly subjective. However, the strengths determined by ’simple means’ by about 50 different people
showed that the results of the ’simple means’ field tests are at least comparable to the quality of results obtained
by the laboratory tests [7]. These data were correlated with lab results of strength measurement.
Data processing and interpretation was made with the help of different professional computer software.
Some of the software were; Microsoft office tools for preparation, synthesis and analysis of data, Adobe
Photoshop (CS3), stereo net projection, Arc view 3.2, Global mapper 7, surfer 8, Corel Draw Graphics suite 12,
AutoCAD version 2007, for preparation and manipulation of different maps.
Finally, preparation of the overall manuscript.
5. Theoretical Concepts
Engineering geology has been an important scientific sub-discipline for as long as people have sought to build
and construct their living environment. If nothing else, people soon learnt where buildings could be built safely
and where poor foundation conditions or the presence of geohazards meant that unacceptable risks were present.
28

American Scientific Research Journal for Engineering, Technology, and Sciences (ASRJETS) (2013) Volume 5, No 1, pp 23-56
However, engineering geology came to greater prominence with the flowering of geology as a major science in
the early 19th century, a time which saw the founding of the Geological Society of London, in 1807 [8].
Engineering geological studies for the preparation of maps and plans have been carried out since the early years
of the 20th century, mainly in Europe. The purpose of these maps was to provide information about
characteristics of the natural environment for planning land use and engineering structures of all kinds. Rapid
urbanization due to population growth in developing countries requires infrastructure and housing development
over large areas. Problems resulting from unfavorable engineering geological conditions have confirmed that
engineering geological mapping is a fundamental prerequisite for planning [9]. Various authors have developed
concepts about engineering geological maps or mapping. According to [8], an engineering geological map is the
best way to depict the natural environment for engineering purposes. The purpose of engineering geological
maps is to show the distribution of specific geological phenomena and characteristics of rocks and soils
affecting engineering use of different terrains.
In Ethiopia, the preparation of engineering geological maps is not well known; perhaps the country demand and
requirement of the map for the development of engineering structures and planning purpose in the near future
became critical. From the report of [10], even the Geological mapping of the country is not fully addressed.
Consequently, in many towns of Ethiopia, very little is known about the soil and rock conditions or engineering
geology of the towns.
The boundaries of rock and soil units shown on engineering geological maps of various scales should delimit
rock and soil units, which are characterized by a certain degree of homogeneity in basic engineering geological
properties [11]. The term soil in the engineering geological sense, comprises all materials found in the surface
layer of the earth crust that are loose enough to be moved by spade, shovel or can be excavated without the use
of explosives or equipment for loosening [12]. The main problem in engineering geological mapping is the
selection of geological features of rocks and soils which are closely related to physical properties, such as
strength, deformability, durability and permeability, which are important in engineering geology. This is
because, at present, we lack regional data on the variability of engineering properties of rocks and soils. Neither
have suitable methods and techniques been developed for determining them in sufficient quantity, over large
areas, quantitatively, quickly and cheaply [11].
Many engineering activities, foundations for buildings, roads, bridges, etc., are in most cases limited within the
top few meters of the surface of the earth. Therefore, surficial material deposits are of prime importance in most
engineering geological and geotechnical investigations. A soil layer in an area is considered as a unit if its
thickness exceeds one meter [11]. If the soil thickness is less than one meter, the area is mapped as the
underlying bedrock. Accordingly, the thickness of one meter is chosen, because of surface morphology of the
underlying bedrock is usually recognizable if the overlying soil is less than one meter thick and not recognizable
when the soil thickness exceeds one meter; and the engineering geological importance of a soil cover if less than
one meter is limited. In this regards, the presentation of lithological and engineering geological units on
geological and engineering geological maps respectively are done based on the above principle of mapping of
soils and/ or underlying bedrocks.
29

American Scientific Research Journal for Engineering, Technology, and Sciences (ASRJETS) (2013) Volume 5, No 1, pp 23-56
A complete engineering geological rock mass description contains details of the rock material and the natural
discontinuities. Adequate descriptors, a uniform format, and standard terminology must be used for all
engineering geologic investigations to properly describe rock foundation condition. So, engineering geological
rock descriptions should include generalized lithologic and physical characteristics using qualitative and
quantitative descriptors. In this work the descriptive scheme proposed by [13] is adopted to systematically
characterize the rock material and rock mass properties. These involve: a) determination of the fundamental
rock name (lithological rock name), b) description of the properties of the rock material (color, texture, state of
weathering and strength) and c) description of additional properties necessary to describe the features of the
rock mass (structure, discontinuities and weathering profile). This method provides a descriptive rock name
from which engineering properties may readily be inferred than from a lithological rock name. Units should be
differentiated by their engineering properties and not necessarily by formal stratigraphic properties where
differences are significant. So far engineering geological studies, each particular stratigraphic unit may require
further subdivisions to identify engineering parameters.
A standard method is used for identifying and classifying soils into categories or groups that have distinct
engineering characteristics. This enables a common understanding of soil behavior just by knowing the
classification. Classification is usually the very first and most important step of activities to rock classification in
to certain system for rock engineering purposes. Rocks may be classified by origin or genesis, geological/
lithological classification, engineering classification of intact rocks on the basis of rock strength and/ or a
combination of these [14].
6. General geology of Mekelle area
Regional geological mapping of parts of northern Ethiopia by [16] are standard references for the geology of the
region. Northern Ethiopia is characterized by highly diversified and laterally extensive coverage of sedimentary
rocks of varying genesis. The Mesozoic sedimentary succession, unconformably overlying the Precambrian
basement, forms a nearly circular 8,000 km2 area around Mekelle [17] [18]. Detail mapping of Northern
Ethiopian provinces (Central and Western Tigray) was done by [15]. According to this work the history of the
sedimentary basin in Tigray (Mekelle Outlier) began in either the Ordovician or Carboniferous and probably
ended in lower Cretaceous before the eruption of the Trap Volcanics.
The general stratigraphies of the Mekelle outlier were summarized from bottom to top by [17], the stratigraphies
are mainly Paleozoic-Mesozoic (in age) sedimentary terrain of northern Ethiopia, these are Edaga-Arbi glacial
and Enticho sandstone, Adigrat sandstone, Antalo limestone, Agula shale, Amba Aradam formation, Mekelle
dolerite and flood basalts of Tertiary age.
7. Geological structures and Tectonics
Reference [16] investigated the structure and tectonics of the Mekelle area (central part of sheet ND37-11) and
he pointed out that faulting and tectonic movements control the structure of the area. Three main fault systems
exist in the area; two of them are limited to the Ethiopian plateau and one to the rifts of the Danakil depression.
30

American Scientific Research Journal for Engineering, Technology, and Sciences (ASRJETS) (2013) Volume 5, No 1, pp 23-56
The fault systems of the plateau are normal. The longest of these faults in the area is the Mekelle fault which
passes about 9 kilometers northeast of the town and forms a long escarpment which is about 65 kilometers in
length. Faulting brings the lower most formation of the Antalo group against its upper most formation, near the
town of Mekelle, which means a throw of about 400 meters [16].
Faults and lineaments are Late Cretaceous and early Tertiary structures developed in the area particularly in the
sedimentary succession of the Mekelle Outlier. These are pre-rift structures aligned obliquely to the NNW-SSE
directed marginal faults of the rift. At present the area is dissected by three sub-parallel faults forming four
major blocks. The Amba-Aradam block is the most southern block, bounded by the Fulcea fault from the south
and the Chelekot fault from the north. Next are the Mekelle, the Agulae-Wukro, and the Negash blocks bounded
by the Chelekot-Mekelle, Mekelle-Wukro, and Wukro-Senkata faults, respectively (Fig. 5).
The structure and Tectonics of the sedimentary rocks of Mekelle outlier and those found in the escarpment are
also studied by [15]. He identified two main fault systems by considering the third fault systems of [16] as a
lineament. The two fault system were the Mekelle outlier fault system that are concentrated along En-echelon
WNW running fault belts comprises of Wukro, Mekelle, Chelekwot and Fuicea-Mariam fault belts and the rift
valley fault system that comprises of the rift valley escarpment and the Danakil depression.
Figure 5: Regional Structural sketch of the Mekelle Area. Modified from [15] and [18], Scale bar is in meter
8. Lithologic Units
The study area is found in the center of Mekelle Outlier composed of a thick sedimentary sequence and intrusive
dykes and sills. The main lithologic units in the northern part of Mekelle town according to their age are bedded
limestone, limestone-marl-shale intercalations, dolerite and unconsolidated sediments. Description of each
lithologic unit is briefly presented below.
31

American Scientific Research Journal for Engineering, Technology, and Sciences (ASRJETS) (2013) Volume 5, No 1, pp 23-56
8.1. Bedded Limestone
This rock unit is found dominantly in the northern and southwestern part of the study area. Particularly in the
Messebo area, it forms a prominent cliff. The upper most part is yellowish to gray in color, with minor fossils,
fractured, and intercalated with variegated, calcareous shale and marl. Towards the foot of the cliff dark, dark-
brownish, massive with thin beds of fossiliferous and oolitic limestone, black shale and mudstone is observed.
At the central part of the study area north of Illala river the karastified limestone is observed, where, solution
voids and with some stalactite-stalagmite features. Previous exploration of boreholes drilled in the Messebo area
shows that a sulphide (pyrite) mineralization and stylolitic features, solution voids and karst features.
Generally, it is well bedded, black and yellowish in color, crystalline and slightly weathered. Traces of fossils
and shell fragments are observed in some hand specimens. Bed thickness is variable (50cm to more than 2m).
Thin layers of shale-mudstone and marl are found in this unit, i.e. alternating limestone and thin beds of shale
and marl.
Figure 6: Characteristics of bedded Limestone units: (A) crystalline bedded limestone, (B) travertine features
formed due to dissolution effects
8.2. Limestone-Marl-Shale intercalations
This intercalation unit covers large part of the study area. It shows cyclic nature of the interbeds and commonly
observed along gentle slopes, and it is less resistance to weathering as compared to the cliff forming bedded
limestone. It is stratified, fine grained, and variegated in color, and friable up on weathering. The limestone
layer is finely crystalline, black and in places light yellow in color containing some fossils (e.g. gastropods and
brachiopods), in places the massive and friable mudstone is also observed in this intercalation unit. It is stronger
than marl and shale layers; the bed thickness varies from 0.3 to 2m. The marl is mostly yellowish with few beds
of brown-yellow to black coquina and sandy limestone. The marl bed thickness varies from 1.5cm to 2m. Shale
layer in the unit is thinly bedded or laminated. It is variegated, light yellowish, greenish gray, dark in color,
friable, moderately to highly weathered. The thickness of this bed varies from 0.2 to 2m. In places swarms of
dolerite dykes and sills are observed. Weathering is more intensive in shale beds than limestone beds.
B
A
32

American Scientific Research Journal for Engineering, Technology, and Sciences (ASRJETS) (2013) Volume 5, No 1, pp 23-56
Figure 7: Limestone-Marl-shale intercalation
8.3. Dolerite
This Lithologic unit is mainly exposed at the southeastern part of the northern Mekelle town. It forms steep cliff,
in the northwestern and western part of the study area. The dolerites in these areas are exposed as aligned
intruded small stocks following the main fault lines and southern part of Illala River, near the center of the town.
It is dark green to light gray in color, fine to coarse grained, crystalline, formed as sills, dykes and small stokes,
intruded throughout the sedimentary sequence. The unit shows weathering surface of rounded or exfoliation. In
some places, sub-rounded fragments are observed with elongated feldspar minerals and fine secondary
inclusions. This rock unit is jointed vertically and horizontally. Swarms of dolerite are observed here and there
aligned mainly along faults forming dykes and in places forming sills parallel to the bedding plane of the
sedimentary sequences. It shows differential weathering surface from place to place that affects the quality of
the rock mass and in many localities remnant corestones are common especially in foundation excavations.
Figure 8: Dolerite rock units and its typical characteristics: (A&B) spheriodal weathering
8.4. Unconsolidated sediments
These sediments consist of alluvial deposits, residual soils and occasionally colluvial deposits. The alluvial
deposits range in grain-size from clay to sand with very minor boulders and have been transported to its present
location by water. It is widely observed along flatlands, streams and northern and northwest of the area, in
particular along Illala river. It is dark to gray in color, loose to stiff and in places stratified. The residual or
A B
33
American Scientific Research Journal for Engineering, Technology, and Sciences (ASRJETS) (2013) Volume 5, No 1, pp 23-56
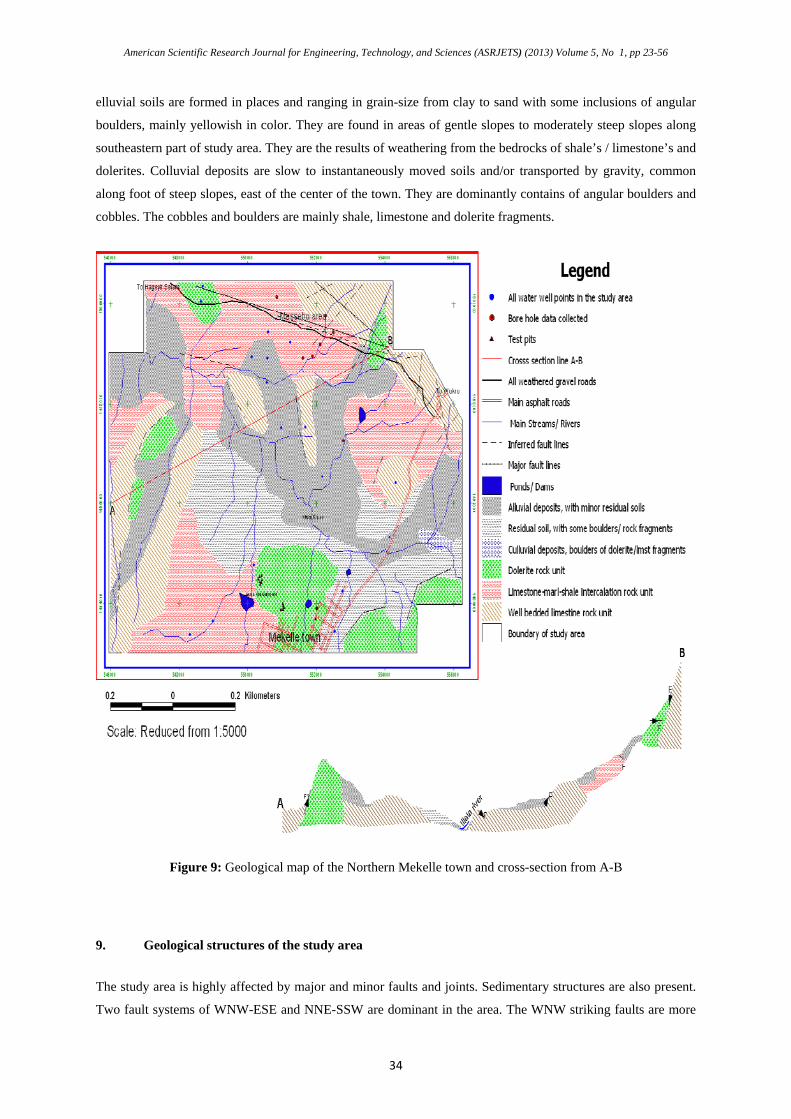
elluvial soils are formed in places and ranging in grain-size from clay to sand with some inclusions of angular
boulders, mainly yellowish in color. They are found in areas of gentle slopes to moderately steep slopes along
southeastern part of study area. They are the results of weathering from the bedrocks of shale’s / limestone’s and
dolerites. Colluvial deposits are slow to instantaneously moved soils and/or transported by gravity, common
along foot of steep slopes, east of the center of the town. They are dominantly contains of angular boulders and
cobbles. The cobbles and boulders are mainly shale, limestone and dolerite fragments.
Figure 9: Geological map of the Northern Mekelle town and cross-section from A-B
9. Geological structures of the study area
The study area is highly affected by major and minor faults and joints. Sedimentary structures are also present.
Two fault systems of WNW-ESE and NNE-SSW are dominant in the area. The WNW striking faults are more
34

American Scientific Research Journal for Engineering, Technology, and Sciences (ASRJETS) (2013) Volume 5, No 1, pp 23-56
dominant. The largest Mekelle normal fault is within this system, which is running several kilometers along its
strike with considerable vertical displacement and dips 800 to SWS, forming about 250m high cliff in the
Messebo area. minor folds observed in the study area might be formed by the up doming effect of the dolerite or
syn-depositional folding
The second fault system in the study area is the NNE-SSW and NE-SW striking faults. The vertical
displacement of these fault system is not prominent and difficult to measure due to absence of marker beds.
Faults of insignificant displacement and length are also common that might be initiated during the dolerite
intrusion and the alignment of the dolerite intruded small stocks indicate that, the presence of fault line.
Sedimentary structures of solution voids, karst features, horizontal and inclined bedding planes in the
sedimentary rock units are very common.
The third major structure which affects the strength or quality of rock mass is joint. Joints of various orientations
have been measured (Annex-E). The strikes of the joints are generally parallel to the faults in the area and
seldom perpendicular. Most of the joints are vertical and some are horizontal, parallel to bedding planes in
sedimentary rocks. Four major joint sets are observed. The NNE-SSW, NE-SW, NW-SE and WNW-ESE
striking joint sets are the dominant once. In the limestone, shale and marl beds, horizontal and vertical joints are
very common, while in the dolerite only vertical or columnar joints were dominantly observed.
The other geologic structure is bedding plane, which is considered as discontinuity in engineering geological
investigations and could facilitate landslide or slope instability. In large part of the town beds are horizontal, but
inclined beds are also observed resulted from dolerite intrusion and faulting.
Figure 10: Rose diagram of joints
10. Result and discussion
Geotechnical and Engineering Geological Characteristic and Classification of soils and rocks
35

American Scientific Research Journal for Engineering, Technology, and Sciences (ASRJETS) (2013) Volume 5, No 1, pp 23-56
10.1. General
The characteristics of soils and rocks of the study area were classified based on their related engineering
properties, and according to the standard classification systems of soils and rocks. As a result, multi-purpose
geotechnical and engineering geological map was prepared.
10.2. Geotechnical and engineering geological characterization of soils and rocks
Engineering soils, of various genetic types, for example alluvial, residual soils formed by the weathering of
rocks, occupy an important position in the sedimentary group. Among these types, the alluvial soils and residual
soils and very small area coverage of colluvial deposits are found in the study area.
Characterizing the geotechnical and engineering geological properties of soils were started by describing the
main lithological and/ or textural descriptions and discussion of geotechnical laboratory results of the study area.
10.2.1. Results and discussion of soils of the study area
I. Natural Moisture content (NMC)
Natural moisture content (NMC) of soils was determined. According to results (Table 1), the moisture content
of the soils of the study area shows that the clay soils have moisture content of 16.5-28.5%, silt soils have 22.8-
29.14%, sandy clay / silt have 11.42-20.53% and the clayey / silty sand soils have 13.5–14.9%. Accordingly,
clay and silt dominating soils of the area shows high capacity to absorb water that can swell and shrink during
varied climate conditions.
II. Grain-size Analysis
The results of grain size analyses of soil samples obtained were presented in Table 1. The range of the gravel,
sand, silt, and clay fraction is very wide and reflects the wide range of composition, weathering, fracturing, and
geologic history of the parent materials. From the result of the grain size analysis, soils of the study area were
categorized in to four classes of soil sizes. Ranges of gravel size varies from 0-14%, sand size soils varies from
6-55%, silt size soils ranges from 28-85%, and clay sized soils varies from 8-57%. Generally, % of fines soils
are dominant in the study area from the grain size analyzes obtained.
Table 1: Natural moisture content, grain size analysis, consistency limit, liquidity index and consistency index
values of laboratory result analysis of the study area.
Test pit/
Borehole
No
Dept
h (m)
NM
C in
(%)
Sieve analysis (%) Consistency
limit (%) Liquidit
y index
(LI)
Consisten
cy index
(CI)
Litholog
ic type Grav
el
san
d
sil
t
cla
y LL PL PI
36

American Scientific Research Journal for Engineering, Technology, and Sciences (ASRJETS) (2013) Volume 5, No 1, pp 23-56
SHBH2 1.9 16.5 0 20 36 44
59.
3
28.
6
30.
7
-0.394 1.394
Clay
soils
SHBH2 3.8 25.2 0 11 34 55
80.
8
40.
7
40.
1
-0.386 1.386
SHBH2 5.3 23.5 0 16 41 43
67.
1
36.
3
30.
8
-0.415 1.415
SHBH3 2.8 28.5 0 10 33 57
71.
6
32.
3
39.
3
-0.096 1.096
SHBH3 5.6 28.4 0 12 36 52
70.
7
36.
2
34.
5
-0.226 1.226
WCHP1 0.6-
1.5
24.7
6 0 26 43 31 50 16 34
0.2576 0.7424
WCHP2 1.5-
2.0
23.0
3 0 36 55 09 51 17 34
0.1774 0.8226
MPBH21
4
1.5 25.5 0 7 85 8 61
26.
6
34.
4
-0.032 1.032
Silt soils
MPBH21
5
1.5 26.5 0 6 85 9
64.
7
22.
7 42
0.0905 0.9095
SHBH1 2.2 25.5 0 13 47 40
61.
2
33.
3
27.
9
-0.279 1.279
SHBH1 2.8 22.8 0 10 52 38
61.
8
31.
4
30.
4
-0.283 1.283
WCHP4 1.0-
2.3
27.8
9 0 34 57 09 44 19 25
0.3556 0.6444
WCHP5 1.5-
2.4
29.1
4 0 28 56 16 71 40 31
-0.3503 1.3503
MPBH20
6
12 Nd 0 44 36 20 48
24.
6
23.
4
Nd Nd
Sandy
clay/silt
soils
MPBH21
6
12.2 Nd 0 55 28 17
45.
5
24.
2
21.
3
Nd Nd
MPBH21
6
17 Nd 0 30 46 24 50
27.
2
22.
8
Nd Nd
MCHP1 1.1-
2.0
11.4
2 0 23 49 28 48 24 24
-0.5242 1.5242
WCHP7 1.9 20.5
3 0 19 63 18 70 34 36
-0.3742 1.3742
MPBH21
3
5.8 14.9 14 19 29 38
40.
6
24.
3
16.
3
-0.5766 1.5766 Clayey
/silty
37
American Scientific Research Journal for Engineering, Technology, and Sciences (ASRJETS) (2013) Volume 5, No 1, pp 23-56
MPBH21
3
7.4 13.5 1 12 47 30 37
24.
1
12.
9
-0.8217 1.8217 sand
soils
MPBH21
8
13.8 Nd 0 15 45 40
52.
6 33
19.
6
Nd Nd
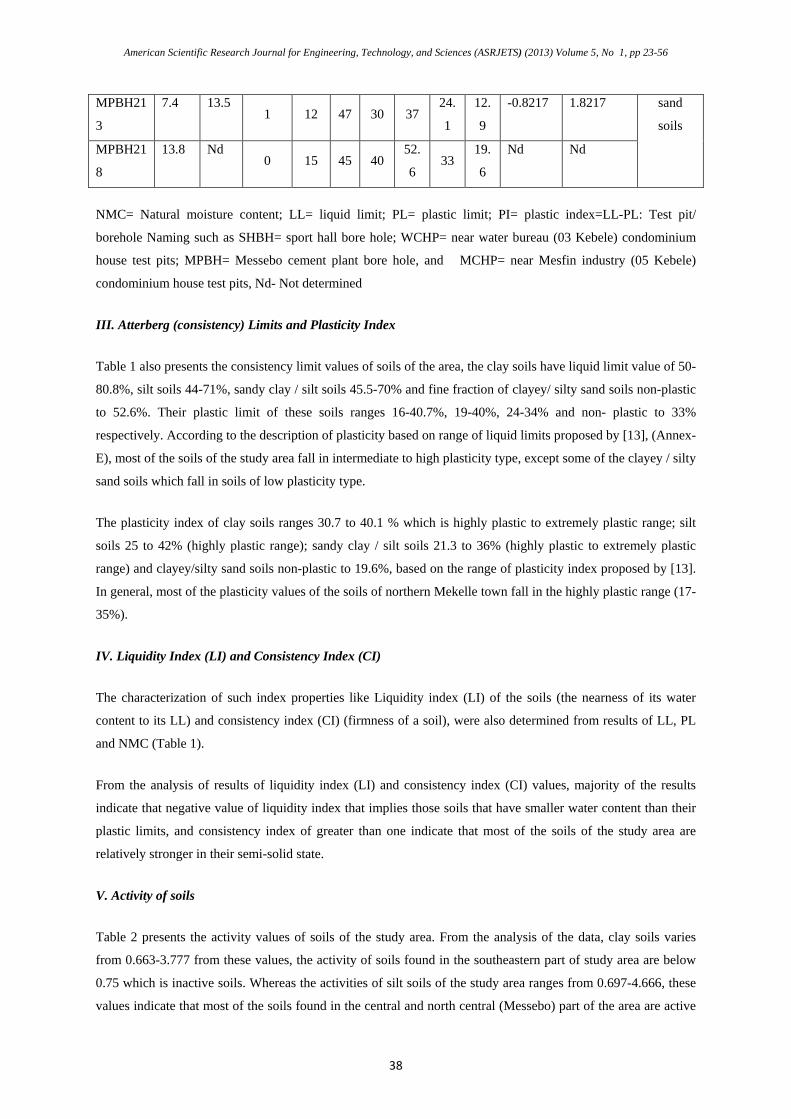
NMC= Natural moisture content; LL= liquid limit; PL= plastic limit; PI= plastic index=LL-PL: Test pit/
borehole Naming such as SHBH= sport hall bore hole; WCHP= near water bureau (03 Kebele) condominium
house test pits; MPBH= Messebo cement plant bore hole, and MCHP= near Mesfin industry (05 Kebele)
condominium house test pits, Nd- Not determined
III. Atterberg (consistency) Limits and Plasticity Index
Table 1 also presents the consistency limit values of soils of the area, the clay soils have liquid limit value of 50-
80.8%, silt soils 44-71%, sandy clay / silt soils 45.5-70% and fine fraction of clayey/ silty sand soils non-plastic
to 52.6%. Their plastic limit of these soils ranges 16-40.7%, 19-40%, 24-34% and non- plastic to 33%
respectively. According to the description of plasticity based on range of liquid limits proposed by [13], (Annex-
E), most of the soils of the study area fall in intermediate to high plasticity type, except some of the clayey / silty
sand soils which fall in soils of low plasticity type.
The plasticity index of clay soils ranges 30.7 to 40.1 % which is highly plastic to extremely plastic range; silt
soils 25 to 42% (highly plastic range); sandy clay / silt soils 21.3 to 36% (highly plastic to extremely plastic
range) and clayey/silty sand soils non-plastic to 19.6%, based on the range of plasticity index proposed by [13].
In general, most of the plasticity values of the soils of northern Mekelle town fall in the highly plastic range (17-
35%).
IV. Liquidity Index (LI) and Consistency Index (CI)
The characterization of such index properties like Liquidity index (LI) of the soils (the nearness of its water
content to its LL) and consistency index (CI) (firmness of a soil), were also determined from results of LL, PL
and NMC (Table 1).
From the analysis of results of liquidity index (LI) and consistency index (CI) values, majority of the results
indicate that negative value of liquidity index that implies those soils that have smaller water content than their
plastic limits, and consistency index of greater than one indicate that most of the soils of the study area are
relatively stronger in their semi-solid state.
V. Activity of soils
Table 2 presents the activity values of soils of the study area. From the analysis of the data, clay soils varies
from 0.663-3.777 from these values, the activity of soils found in the southeastern part of study area are below
0.75 which is inactive soils. Whereas the activities of silt soils of the study area ranges from 0.697-4.666, these
values indicate that most of the soils found in the central and north central (Messebo) part of the area are active
38

American Scientific Research Journal for Engineering, Technology, and Sciences (ASRJETS) (2013) Volume 5, No 1, pp 23-56
soils that have high water holding capacity and expansive nature. Sandy clay/ silt soils varies from 0.857-2.0,
their activity values fall in the range from normal to active soils and found mostly southern side of Messebo area
and near south eastern part of the study area. Clayey/ silty sand soils vary from 0.428-0.49, which indicates the
values of activity of soils are below 0.75 i.e. inactive soils. Results of the activity of soils of study area are
plotted on the activity chart.
Figure 11: plot of activities of soils of the study area on the activity chart.
VI. Free Swell
The free swell values of the soils of the study area are presented in table 2. From these results soils found in
Messebo area have 100% free swell value which is highly expansive soils and serious consideration should be
given to these area during construction of engineering structures, it can bring considerable damage to lightly
loaded structures basically depending up on the clay mineralogy and soil thickness. Generally the free swell
values of soils of the study area vary from 0 to 100%. Some of the soils in the study area were not determined
their free swell values.
Currently identification and classification of expansive soils are either on direct measurement of free swell value
or on correlation of simpler test results with swell potential measurements. Reference [19] classified clays
according to their activity values; this method is used to correlate the activity of soils of the study area with their
potential expansiveness. Predictions of swelling potential of soils of the study area were made roughly from the
analysis of the activities of the soils. Terms used to determine the potential expansiveness of soils of the study
area are Low for soils having activity value of less than 0.75, Medium for soils having activity value between
0.75 to 1.25 and High for soils having an activity value of greater than 1.25.
39

American Scientific Research Journal for Engineering, Technology, and Sciences (ASRJETS) (2013) Volume 5, No 1, pp 23-56
Table 5.2: Activity and Free swell potential of soils of the study area.
Test pit/
Borehole
No
Depth
(m)
NMC
in
(%)
Plasticity
Index
(PI)
(%) of
clay
fractions
Activity
of soils
Free
Swell
(%)
Potential
expansivene
ss of soils
Lithologic type
SHBH2 1.9 16.5 30.7 44 0.697 Nd Low
Clay soils
SHBH2 3.8 25.2 40.1 55 0.729 Nd Low
SHBH2 5.3 23.5 30.8 43 0.716 Nd Low
SHBH3 2.8 28.5 39.3 57 0.689 Nd Low
SHBH3 5.6 28.4 34.5 52 0.663 Nd Low
WCHP1 0.6-1.5 24.76 34 31 1.096 Nd Medium
WCHP2 1.5-2.0 23.03 34 09 3.777 Nd High
MPBH214 1.5 25.5 34.4 8 4.300 100 High
Silt soils
MPBH215 1.5 26.5 42 9 4.666 100 High
SHBH1 2.2 25.5 27.9 40 0.697 Nd Low
SHBH1 2.8 22.8 30.4 38 0.800 Nd Medium
WCHP4 1.0-2.3 27.89 25 09 2.777 Nd High
WCHP5 1.5-2.4 29.14 31 16 1.937 Nd High
MPBH206 12 Nd 23.4 20 1.170 50 Medium
Sandy clay/silt
soils
MPBH216 12.2 Nd 21.3 17 1.253 50 High
MPBH216 17 Nd 22.8 24 0.950 30 Medium
MCHP1 1.1-2.0 11.42 24 28 0.857 Nd Medium
WCHP7 1.9 20.53 36 18 2.000 Nd High
MPBH213 5.8 14.9 16.3 38 0.428 Nd Low Clayey /silty
sand soils MPBH213 7.4 13.5 12.9 30 0.430 Nd Low
MPBH218 13.8 Nd 19.6 40 0.490 60 Low
Nd: Not determined
VII. Chemical tests of soils
In the study area, the chemical tests of soils were determined from the laboratory results obtained from the
above mentioned sources. According to the results presented in Table 3, soil of the study area have pH value of
greater than 7 which is alkaline in composition and their value reaches maximum of pH 7.8, which indicates
most minerals of the soils are stable, whereas the concentration of chloride ranges from 0.0053-0.212 and sulfate
ranges from 0.032-0.2. However, alkali-silica reactions, external sulphate and chloride attack is often
manifested, by expansion or cracking of concretes, loss of cohesion and strength. Attention should be given for
engineering structures to be built in the area and proper soil chemical tests and hydrochemical analysis should
be done for further understanding of their effects to the foundation materials. And if their presence is proved
special cement need to be incorporated into a concrete mix to prevent their attacks.
40

American Scientific Research Journal for Engineering, Technology, and Sciences (ASRJETS) (2013) Volume 5, No 1, pp 23-56
Table 3: Chemical test result of soils of the study area
Item no Borehole No Depth (m) PH-value Chloride (%) Sulfate (%)
1 MPBH206 12 7.2 0.0142 0.064
2 MPBH213 1.5 7.6 0.0212 0.216
3 MPBH213 5.8 7.6 0.0142 0.032
4 MPBH213 7.4 7.4 0.0142 0.064
5 MPBH214 3.6 7.3 0.0053 0.080
6 MPBH214 9.0 7.4 0.0140 0.040
7 MPBH215 5.8 7.8 0.0106 0.330
8 MPBH216 3 7.3 0.0212 0.240
9 MPBH216 4.1 7.1 0.0106 0.312
10 MPBH216 11.3 7.5 0.0071 0.344
11 MPBH216 17 7.1 0.0106 0.048
12 MPBH217 5.4 7.8 0.0120 0.200
VIII. Shear Strength of Soils
The shear strength test values of soils of the study area were obtained from the laboratory results of the above
mentioned sources. Table 4, presents the shear strength parameters of soils of the study area. From the result of
the analysis, the shear strength parameters such as the normal stress values, shear stress values, cohesion and
internal friction angles of soils were determined. In addition, the unconfined compressive strength of these soils
was determined. The maximum applied normal stress values ranges from 1.5-3.0 kg/cm2 and their
corresponding shear stress varies from 1.39-2.62 kg/cm2. The plotted points of shear stress (τ) versus normal
stress (σn) establish a straight line (Mohr envelop), the value of shear stress at zero normal stress are the
cohesion of soils varies from 0-0.86 kg/cm2 for clay soils, 0.4-0.61 kg/cm2 for silt soils, 0.32-0.98 kg/cm2 for
sandy clay/ silt soils and 0.2-0.21 kg/cm2 for clayey/ silty sand soils. The value of shear resistance is obtained
from the angle between the normal stress and Mohr envelop, the internal friction angle of soils indicate that clay
soils vary from 23.22-300, silt soils 14-21.50, sandy clay/ silt soils vary from 13-27.180 and clayey/ silty soils of
the study area varies from 22.9-24.240.
The unconfined compressive strength is, under practical conditions, twice the cohesion (shear strength) of a clay
soil. The unconfined compression strength of soils of the study area were indicated in Table 4, according to the
UCS results of the soils, the clay soils ranges from 2.97 up to 4.5 kg/cm2, silt soil ranges 1.95-3.5 kg/cm2, sandy
clay/ silt soils ranges 0.88-45 kg/cm2 and clayey/ silty sand soils have 4.5 kg/cm2 and above.
Parameters of shear strengths: σ-normal stress value to shear plane, τ-shear strength values, c-cohesion value
and Φ (degree)-angle of internal friction values of soils. SHBH-Sport Hall Bore Holes, MPBH-Messebo cement
Plant Bore Hole, WCHP-near Water bureau Condominium House test Pits, ACHP-Ayder Condominium House
test Pits, and MCHP-near Mesfin industry Condominium House test Pits. Nd- Not determined.
41

American Scientific Research Journal for Engineering, Technology, and Sciences (ASRJETS) (2013) Volume 5, No 1, pp 23-56
Table 4: Shear strength parameter value of soils of the study area
Pit No Depth in
(m)
Material strength (kg/cm2) UCS in
Kg/cm2 Lithologic type
σ τ c Φ(degree)
SHBH1 2.8 3.0 2.1 0.6 27 3.61
Clay soils WCHP2 2.0 1.5 1.77 0.52 23.22 3.5
SHBH3 5.6 3.0 2.62 0.86 30.0 2.97
ACHP5 1.4 1.5 1.39 0 27.8 >4.5
MPBH214 1.5 3.0 1.40 0.43 18 2.91
Silt soils MPBH215 1.5 3.0 1.20 0.45 14 1.97
WCHP4 2.3 1.5 1.66 0.61 19.37 3.5
WCHP5 2.4 1.5 1.54 0.40 21.50 3.0
MCHP1 2.0 1.5 2.04 0.45 27.18 Nd
Sandy clay/ silt
soils
SHBH2 3.8 3.0 1.48 0.80 13.0 0.88
ACHP2 1.2 1.5 1.3 0.32 18.6 >4.5
MCHP3 1.4 1.5 1.39 0.39 18.66 Nd
MCHP4 1.0 1.5 2.11 0.98 20.43 Nd
ACHP7 1.4 1.5 1.34 0.38 17.6 >4.5
MCHP2 1.4 1.5 1.58 0.20 24.24 >4.5 Clayey/ silty sand
soils ACHP4 1.4 1.5 1.5 0.21 22.9 >4.5
10.2.2. Geotechnical and Engineering geological characterization of rocks
Description is the initial step in an engineering geological investigation of rock masses. The description should
also be uniform and consistent for easy understanding and to gain acceptance. In view of this, to characterize the
engineering properties of rocks of the study area, detail field description and determination of engineering
properties of rocks was conducted, the descriptions of rocks of the northern Mekelle town was carried out
according to the descriptive schemes proposed by [13]. Some engineering property determination tests were
conducted at the field. The simple means of determination of strength of rocks were done according to the
scheme proposed by working party report of Geological society of London, 1977 based on the modified scheme
of [20] cited in [21]. According to this method about 22 tests are done using geological hammer in the field and
more than 40 site investigation boreholes (Annex-G) obtained from previous works and were used to determine
the engineering properties of the rock masses of the study area. The engineering geological characteristics of
rocks of the study area were described basically according to the lithological units and characterizing with their
similar engineering geological subunits of the rocks. The engineering geological descriptions of the rocks of the
study area are discussed below.
42

American Scientific Research Journal for Engineering, Technology, and Sciences (ASRJETS) (2013) Volume 5, No 1, pp 23-56
10.2.2.1. Dolerite
In the study area, these rocks are widely exposed along the escarpments sides and some rocks are exposed due
to the structural setting and river/stream cuts and excavations for quarry sites, road and foundation work. These
exposures help to describe the rock mass characteristics. From engineering geological point of view, this rock
unit has variable properties such as fresh to slightly weathered strong dolerite having high mass strength,
moderately weathered moderately strong to strong dolerite having Medium mass strength and highly weathered
weak to moderately strong dolerite having Low mass strength.
I. Fresh to slightly weathered, strong dolerite (Rock with high mass strength): this engineering geological
subunit is found in the southeastern side of the study area forming a steep cliff. Due to the high strength, slight
effect of weathering and narrow to widely spaced joints are observed, the simple geological hammer strength
estimate value of this unit indicate that strong rock and unconfined compressive strength of 50-100MPa, which
is strong to very strong. Two sets of joints are dominant. WNW and NNE, in places columnar joints are
observed. The joint wall or surface is planar and smooth and have strong wall strength. The aperture of the joints
varies from tight to narrow.
II. Moderately weathered, moderately strong to strong dolerite (Rocks with medium mass strength): these
subunits are found in the southern, western and northwestern part of the study area and the rock unit has mass
strength ranges from medium to strong. It is moderately weathered medium to coarse grained rock mass, where
the strength determination from the estimation range of geological hammer test value indicates that from 13 to
45MPa that is moderately strong material. Two sets and random joints are dominant which are vertical and
medium to widely spaced. The joint surface for the systematic once, is planar and rough, and weak to
moderately strong wall strength .the separation or aperture is variable and ranges from very narrow to
moderately narrow, Clay and calcite are the common infill materials in some of joints, occasionally silica veins
are observed
III. Highly weathered, weak to moderately strong dolerite (Rock with low mass strength): this rock is
mainly found at the south central part, southeastern (foot of Endayesus ridge), western and northwestern part of
the study area. It is moderately to highly weathered dark greenish, fine to coarse grained dolerite rock unit. The
material strength estimated in the field indicates varies from 2 to 20MPa (weak rocks). Joints of WNW strike are
common. In places NNE strike joints are observed. The joints are in general vertical and the spacing varies from
4 to 20cm (very closely to closely spaced). Joint surfaces are planar and rough, low wall strength and very
narrow and moderately narrow aperture. Clay, calcite and silica are common infill materials in some joints.
5.2.2.2. Limestone-Marl-Shale intercalation
This rock mass unit covers large part in the study area. From engineering geological point of view, this rock
mass is characterized by moderately to highly weathered, weak to moderately strong to strong Limestone-Marl-
Shale intercalation rock mass (Rock with low mass strength).
43

American Scientific Research Journal for Engineering, Technology, and Sciences (ASRJETS) (2013) Volume 5, No 1, pp 23-56
Moderately to highly weathered, weak to moderately strong Limestone-Marl-Shale intercalation rock
mass (Rock with low mass strength): Even though the strength of each layer varies from weak (shale) to
strong (limestone), it is considered as weak engineering geological unit or rock with low mass strength, because
in most engineering designs it is the weak layer that governs the stability of the structures and design parameter
of the weakest layer is considered. It is variegated (gray, yellowish, dark brown, etc.) crystalline and moderately
to highly weathered, especially, the shale layer is highly weathered. The rock material strength is variable and
difficult to estimate the whole rock mass, i.e. from very weak for shale (1.5-5MPa) to medium to strong for
limestone. Generally three vertical joint sets and horizontal joint are observed in this intercalation unit. This
Joint surfaces or wall is generally planar and rough, and have variable wall strength, weak to strong, and tight to
moderately narrow aperture (0-3cm). The spacing of the systematic joint set is on average 0.5 to 1.5m. This
intercalation unit is horizontally to sub-horizontally bedded with bed thickness of 0.2 to 1.5m. In place the beds
are inclined in different direction due to the intrusion of dolerite.
5.2.2.3. Bedded Limestone
This rock unit is found mainly along the northern Messebo escarpment, forming a steep cliff, central and
southwestern part of the study area. From engineering geological point of view, the rock mass is characterized
by slightly weathered strong limestone (Rock with high mass strength) and moderately weathered moderately
strong to strong limestone (Rock with medium mass strength). Their descriptions are as follows.
I. Slightly weathered, strong limestone (Rock with high mass strength): This subunit is mainly observed in
the northeastern and southwestern part of the study area and forms a steep cliff. It is characterized by fresh to
slightly weathered, crystalline, light yellowish to black in color. The exposures of this subunit are outcropped
along the escarpment and streams. The rock material strength determined from geological hammer estimation
varies from 50-100MPa at the foot of the escarpment and greater than 100MPa at the midway part of the
escarpment. Three vertical joint set and horizontal joint parallel to bedding planes are the dominant once. The
joint surface or wall is planar and rough to smooth, and shows strong wall strength and the aperture varies from
tight (for horizontal joints) to 4cm (for vertical joints). The vertical joints are widely spaced (0.5 to 2.5m). This
limestone unit is bedded in most places horizontal and bed thickness reaches up to 1.2m.
II. Moderately weathered, moderately strong to strong limestone (Rock with medium mass strength): This
unit is mainly observed at Messebo area, western and southwestern part of the study area. It is characterized by
light to brownish yellow, moderately weathered limestone. The material strength of the rock mass varies from
12.5 to 50MPa which is a moderate strength of material. Horizontal and two vertical set of joints, the horizontal
joints are parallel to the bedding plane, shows that moderately strong to strong wall strength and the aperture
varies from narrow to widely spaced joints.
10.3. Geotechnical and Engineering Geological classification of soils and rocks
The main aim of soil and rock classification is to arrange or divide the soils and rocks into limited number of
groups such that the engineering materials in a particular group have similar behavior. A classification system is
44

American Scientific Research Journal for Engineering, Technology, and Sciences (ASRJETS) (2013) Volume 5, No 1, pp 23-56
also meant to provide a common language for the exchange of information and experience about various types
of soils and/or rocks. Soil and rock classification system leads the engineering geologist or geotechnical
engineer to estimate their engineering properties from tables and charts for preliminary design and planning.
In view of the above principle the soils and rocks of the study area are classified according to their physical and
engineering geological properties characterized. The classification system used for the soils and rocks of the
northern Mekelle town is described as follows.
10.3.1. Classification of soils
In this work, to classify the soils of the study area, the Unified soil classification system and classification
system proposed by [13] which is modified form of the unified soil classification (USC) and the British soil
classification for engineering purposes (BSCS) are used. The unified soil classification system, originally
proposed in united states, and most popular for use in all types of engineering problems involving soils, is
based on both gain size and plasticity properties of the soil and is applicable to any use (Annex-F).
Soil is defined and allocated to an appropriate group on the basis of grading and plasticity after excluding
boulders and cobbles (>300-mm and 300-75-mm respectively). Gravel particles are those passing a 75-mm (3-
in) sieve but retained on a 4.75-mm (No. 4) sieve. Sand particles pass a 4.75-mm sieve and are retained on a
0.075-mm (No. 200) sieve. Fines are soil particles that pass a 0.075-mm (No. 200) sieve; they are further
characterized as silt or clay, based on their plasticity. The soils are broadly classified into two categories, coarse-
grained, if more than 50% of the soil is retained on the 0.075 mm (No.200) sieve, fine-grained, if more than
50% of the soil passes the 0.075mm (No. 200) sieve. The coarse-grained soils are further subdivided based on
grain sizing, plasticity index and liquid limit. For fine grained soils exact type of the soils is determined by their
behavior from plasticity or casagrande chart.
Once a soil is determined to be fine grained by the grain-size curve, its classification into one of the six groups
is done by the results of Atterberg limits tests as plotted on the plasticity chart, with attention being given to the
organic content. Inorganic fine-grained soils with PI greater than 7 and above the `A' line are CL or CH,
depending on whether their liquid limits are below 50 percent or above 50 percent respectively. Similarly,
inorganic fine-grained soils with PI less than 4 or below the `A' line are ML or MH, depending on whether their
liquid limits are below or above 50 percent, respectively. Fine-grained soils which fall above the `A' line but
which have a plasticity index between 4 and 7 are classified ML-CL. In view these, the soils of the study area
are classified and plotted on the plasticity charts based on both USCS.
The classification system proposed by International association of Engineering Geologists commission on
engineering geological mapping [13] is also based on grading and plasticity of soils. Grading and plasticity are
divided into a number of clearly defined ranges. Each of which may be referred to by a descriptive name and
letter (Table 6). The descriptive plasticity ranges used to classify the soils of the study area proposed by [13] is
presented in Annex-F.
45

American Scientific Research Journal for Engineering, Technology, and Sciences (ASRJETS) (2013) Volume 5, No 1, pp 23-56
Table 5: Classification of soils of the study area based on Unified soil classification system
Test pit/
Borehole
No
Depth
(m)
Sieve analysis (%) Consistency
limit (%) USCS Lithologic
type Gravel sand silt clay LL PI S** Soil name
SHBH2 1.9 0 20 36 44 59.3 30.7 CH Fat clay
Clay soils
SHBH2 3.8 0 11 34 55 80.8 40.1 CH Fat clay
SHBH2 5.3 0 16 41 43 67.1 30.8 CH Fat clay
SHBH3 2.8 0 10 33 57 71.6 39.3 CH Fat clay
SHBH3 5.6 0 12 36 52 70.7 34.5 CH Fat clay
WCHP1 0.6-
1.5 0 26 43 31 50 34
MH Elastic silt
Silt soils
WCHP2 1.5-
2.0 0 36 55 09 51 34
MH Elastic silt
MPBH214 1.5 0 7 85 8 61 34.4 MH Elastic silt
MPBH215 1.5 0 6 85 9 64.7 42 MH Elastic silt
SHBH1 2.2 0 13 47 40 61.2 27.9 MH Elastic silt
SHBH1 2.8 0 10 52 38 61.8 30.4 MH Elastic silt
WCHP4 1.0-
2.3 0 34 57 09 44 25 ML
Silty of clayey fine
sand with slight
plasticity
WCHP5 1.5-
2.4 0 28 56 16 71 31
MH Elastic silt
MPBH206 12 0 44 36 20 48 23.4 CL Lean sandy clay
Sandy
clay/silt
soils
MPBH216 12.2 0 55 28 17 45.5 21.3 CL Lean sandy clay
MPBH216 17 0 30 46 24 50 22.8 MH Elastic sandy silt
MCHP1 1.1-
2.0 0 23 49 28 48 24
ML Sandy Silty, clayey
with slight plasticity
WCHP7 1.9 0 19 63 18 70 36 MH Elastic sandy silt
MPBH213 5.8 14 19 29 38 40.6 16.3 SC Clayey sand
Clayey
/silty sand
soils
MPBH213 7.4 1 12 47 30 37 12.9
SC-
SM
Clayey, silty sand
MPBH218 13.8 0 15 45 40 52.6 19.6
SC-
SM
Clayey, silty sand
S**= Symbol, LL= liquid limit; PI= plastic index: Test pit/ borehole Naming such as SHBH= sport hall bore
hole; WCHP= near water bureau (03 Kebele) condominium house test pits; MPBH= Messebo cement plant bore
hole, and MCHP= near mesfin industry (05 Kebele) condominium house test pits.
46

American Scientific Research Journal for Engineering, Technology, and Sciences (ASRJETS) (2013) Volume 5, No 1, pp 23-56
Figure 12: Plots of soils of the study area on casagrande plasticity chart based on USCS
Table 6: Classification of soils of the study area based on International Association of Engineering Geologists
commission on engineering geological mapping (IAEG (1981))
Test pit/
Borehole
No
Depth
(m)
Sieve analysis (%) Consistency
limit (%) IAEG (1981) Lithologic
type Gravel sand silt clay LL PI S** Soil name
SHBH2 1.9 0 20 36 44 59.3 30.7
CH CLAY of high
plasticity
Clay soils
SHBH2 3.8 0 11 34 55 80.8 40.1
CV CLAY of very high
plasticity
SHBH2 5.3 0 16 41 43 67.1 30.8
CH CLAY of high
plasticity
SHBH3 2.8 0 10 33 57 71.6 39.3
CV CLAY of very high
plasticity
SHBH3 5.6 0 12 36 52 70.7 34.5
CV CLAY of very high
plasticity
WCHP1 0.6-
1.5 0 26 43 31 50 34
MI SILT of high
plasticity
Silt soils WCHP2 1.5-
2.0 0 36 55 09 51 34
MH SILT of high
plasticity
MPBH214 1.5 0 7 85 8 61 34.4
MH SILT of high
plasticity
47

American Scientific Research Journal for Engineering, Technology, and Sciences (ASRJETS) (2013) Volume 5, No 1, pp 23-56
MPBH215 1.5 0 6 85 9 64.7 42
MH SILT of high
plasticity
SHBH1 2.2 0 13 47 40 61.2 27.9
MH SILT of high
plasticity
SHBH1 2.8 0 10 52 38 61.8 30.4
MH SILT of high
plasticity
WCHP4 1.0-
2.3 0 34 57 09 44 25 MI
SILT of
intermediate
plasticity
WCHP5 1.5-
2.4 0 28 56 16 71 31
MV SILT of very high
plasticity
MPBH206 12
0 44 36 20 48 23.4
SC
(SCI)
SAND clayey of
intermediate
plasticity Sandy
clay/silt
soils
MPBH216 12.2
0 55 28 17 45.5 21.3
SC
(SCI)
SAND clayey of
intermediate
plasticity
MPBH216 17 0 30 46 24 50 22.8
SM
(SMH)
SAND silty of high
plasticity
MCHP1 1.1-
2.0 0 23 49 28 48 24
MI SILT sand of
intermediate
plasticity
Clayey
/silty sand
soils
WCHP7 1.9 0 19 63 18 70 36
MV SILT sand of very
high plasticity
MPBH213 5.8
14 19 29 38 40.6 16.3
CI CLAYEY sand of
intermediate
plasticity
MPBH213 7.4
1 12 47 30 37 12.9
MI SILT sand of
intermediate
plasticity
MPBH218 13.8 0 15 45 40 52.6 19.6
CH CLAYEY sand of
high plasticity
S**= Symbol, LL= liquid limit; PI= plastic index: Test pit/ borehole Naming such as SHBH= sport hall bore
hole; WCHP= near water bureau (03 Kebele) condominium house test pits; MPBH= Messebo cement plant bore
hole, and MCHP= near mesfin industry (05 Kebele) condominium house test pits.
48

American Scientific Research Journal for Engineering, Technology, and Sciences (ASRJETS) (2013) Volume 5, No 1, pp 23-56
Figure 13: Classification of soils of the study area based on the IAEG (1981) on plasticity chart
10.3.2. Classification of rocks of the study area
Geotechnical classifications for intact rock and rock masses have been devised; many of the classifications have
been designed for specific engineering applications such as tunneling, open-pit mining and foundations.
Although some feel there is a need for an acceptable universal classification of rock for geotechnical purposes,
the difficulty in arriving at such a classification indeed, even the feasibility of trying to do so. And it has been
noted by several specialists in rock mechanics [22] [23] [24] [25] [26]. The presently available specialized
classification provide for the unique requirements for which each was devised. The more universal the intended
use of a classification, the greater the number of intact rock and rock mass properties that must be measured for
the classification to meet the intended purposes.
In a classification system empirical relations between rock mass properties and the behavior of the rock mass in
relation to a particular engineering application, are combined to give a method of designing engineering
structures in or on a rock mass. Rock mass classification has been applied successfully for some years in
tunneling and underground mining. Some rock mass classification systems [7] result in empirical strength
criteria for a rock mass.
In view of the above mentioned principles, systematic ways of classifying the rock masses of the study area are
reviewed. Simple approaches of classifying the rocks are the main options indeed. These are based on their
intact rock strength values and joint characteristics and the weathering degree of rocks. During field works, the
49

American Scientific Research Journal for Engineering, Technology, and Sciences (ASRJETS) (2013) Volume 5, No 1, pp 23-56
measurements of joint characteristics, in-situ strength determinations by simple means of intact rock strength
estimation by using geological hammer and descriptions of engineering geological properties of rocks are
carried out. Based on these data’s the rocks of the area are classified and delineated in the multi-purpose
engineering geological map.
10.3.2.1. Classification of rock mass based on strength values and joint characteristics
The rock mass classification of the study area is done based on the strength values determined from the simple
geological hammer test results and the joint characteristics determined from field observations. According to
this, the rock masses of the study area fall in to three major classes, such as rocks with low mass strength, rock
with medium mass strength and rocks with high mass strengths. Distributions of these engineering geological
units are represented in the multi-purpose engineering geological map prepared.
I. Rocks with low mass strength
This engineering geological unit is grouped for rocks that can be characterized by the intact rock strength value
mostly less than 20MPa. The limestone-marl-shale intercalation and moderate to highly weathered dolerite rock
units are found in this classification system. The low to moderately strong dolerite unit is mostly observed in the
southern part of Illala River and foot of the eastern escarpment and the intercalation of limestone-marl-shale
cover large part in the study area and mostly found in the northern, northeastern, western and southwestern part
of the study area. The weathering activity in this unit is moderately to highly active, played vital role in reducing
the strength of the rock mass unit. The characteristics of joint spacing is mainly ranges from 1-10cm, and these
joint characteristics influenced the rock mass strength to reduce in addition to the lithological properties, and
grouped the rocks under the low mass strength unit of rock masses of the engineering geological mapping.
II. Rock with medium mass strength
The rocks that can be classified to medium mass strength are characterized by the intact strength values ranging
from 13-50MpPa, where some exaggerated intact strength value up to 100Mpa is estimated because of the some
resistant boulders of the dolerite fragments and thick beds of the limestone in the rock masses. The main rock
units grouped in this engineering geological unit is moderately weathered dolerite and limestone units where 50-
60% of the rock mass is fabrics of the intact rocks (Annex-F). They are characterized by moderate weathering
(spheroidal characteristics in dolerite) and closely to medium spaced joints ranging 1-20cm where in places the
spacing ranges up to 0.5m. The distribution of these units is observed in the down side or foot of Messebo
escarpment, northwestern, western and southern part of study area and represented on the multi-purpose
engineering geological map of the area.
III. Rocks with high mass strength
In this unit, the thick well bedded limestone and fresh to slightly weathered dolerite rock units are the major
engineering geological subunits, they are characterized by their intact rock strength of mostly 50-100Mpa and
some sound rocks indicate their strength values are exceeding the 100Mpa and gives thin sound when blown by
50

American Scientific Research Journal for Engineering, Technology, and Sciences (ASRJETS) (2013) Volume 5, No 1, pp 23-56
the geological hammer. More than 60-80% of the rock masses are fragments of the intact rocks. whereas the
discontinuity characteristics in limestone rocks shows horizontally bedded and in the dolerite rocks stay as
crystalline but showing discontinuities and exfoliations of weathering effects on the rock mass. The weathering
activity in this unit is slight that has not yet brought reduction in the strength of the rock mass. Where typical
spheroidal weathering is observed in the dolerite and along the bedding and joints of limestone rocks weathering
activity is also observed. The joint characteristics are medium to widely spaced joints and spacing ranges from
10-60cm in the dolerite rock unit and tight to 50cm spacing is observed along the well bedded limestone unit.
The distribution of this engineering geological unit is along the southeastern escarpment elevated side and at the
Messebo escarpment cliff part of the study area and represented on the prepared multi-purpose engineering
geological map of the northern Mekelle town.
10.3.2.2. Variations of Unconfined compressive strength with rock types
Moreover, the variation of unconfined compressive strength with main lithologic unit is portrayed in Figure 14
below. The measurement of the UCS values obtained from Messebo cement plant site investigation report and
Gebremedhin Berhane (2002) (Annex-B) are used to evaluate the variation of engineering properties of the
lithologic units found in the area. The rocks of the area shows ranges of strength from very strong (225MPa)
obtained from bedded limestone unit to moderately strong (25MPa) of dolerite rock unit (Annex-F).
Figure 14: Variation of Unconfined Compressive Strength values with rock types of study area.
11. Preparation of Multi-purpose engineering geological map
Multi-purpose maps are produced to provide information on many aspects of engineering geology for a variety
of planning and engineering purposes. Most of these maps are comprehensive in content, depicting all the
principal components of the engineering geological environment, where on one map sheet areas classified as
51

American Scientific Research Journal for Engineering, Technology, and Sciences (ASRJETS) (2013) Volume 5, No 1, pp 23-56
units based on the uniformity of their engineering geological conditions are shown. As a result, the preparation
of multi-purpose engineering geological and geotechnical map of the northern part of Mekelle town is mainly
based on the detail field work mapping and results of engineering geological and geotechnical field and
laboratory tests. Basic components of the geological environment needed for the engineering geological
mapping was well assessed and discussed, and presented in addition to the engineering geological subunits on
the produced maps.
The multi-purpose engineering geological map is produced based on the principle of similar physical and
engineering geological properties of soils and rocks at their present state suggested by the international
association of engineering geologists [13] commission on engineering geological mapping beside the
description and classification schemes used. So, soils and rocks of the study area that have uniform physical and
engineering geological properties and their spatial distributions are described and delineated on the multi-
purpose engineering geological map. As a result, this map (Fig. 15) generally consists of the lithological and
engineering geological sub units with accompanying geomorphological, geodynamic phenomena and
hydrogeological conditions of the northern part of Mekelle town.
Figure 5.6: Multi-Purpose Engineering Geological Map and engineering geological cross section (A-B)
52

American Scientific Research Journal for Engineering, Technology, and Sciences (ASRJETS) (2013) Volume 5, No 1, pp 23-56
12. Conclusion and Recommendations
12.1. Conclusion
From this research work, the following points are concluded:
• In the study area, the dominant rock units are dolerite, limestone-marl-shale intercalation and bedded
limestone, and the major soil units mapped are the alluvial, residual and colluvial soil deposits.
• Two fault systems (WNW and NNE striking) are dominant in the study area and inferred faults are
trending in these two fault systems. The WNW-ESE trending faults are more dominant and the strike of the
main Mekelle fault line is within this trend. The major joint sets of the study area have similar orientation with
that of the two major fault systems, striking (NNE, NE, NW and WNW). Following the above dominant fault
system, the NW and NNE striking joints are dominant.
• Assessment of the geomorphological condition of the study area revealed that four major landform
units are common in the area: flat to gently sloping, gently sloping to rolling, sloping to moderately steep (hilly
land), and steeply to very steeply sloping (escarpment) landforms.
• Four types of lithological soils (i.e. clay, silt, sandy clay/ silt and clayey/ silty sand) are identified in the
study area. The evaluation of the laboratory result indicates that:
Clay soils are characterized by a moisture content of 16.5-28.5%, liquid limit of 50-80.8%, plasticity
index of 30.7 to 40.1 % (highly to extremely plastic), activity of 0.663 to 3.777 (inactive to active soils, i.e. low-
high potential expansiveness of the soil) and UCS of 2.97-4.5 Kg/cm2.
Silt soils are characterized by a moisture content of 22.8-29.14%, liquid limit of 44-71%, plasticity
index of 25 to 42% (highly to extremely plastic soils), activity of 0.4697-4.666 (inactive to active soils, i.e. low
to high potential expansiveness) and UCS of 245-392 Kg/cm2.
Sandy clay/ silt soils are characterized by a moisture content of 11.42-20.53%, liquid limit of 45.5-
70%, plasticity index of 21.3 to 36% (highly to extremely plastic), activity of 0.857 to 2.00 (normal to active
soils, i.e. medium to high potential expansiveness) and UCS of 0.88-4.5 Kg/cm2.
Clayey/ silty sand soils are characterized by a moisture content of 13.5-14.9%, liquid limit of 37-
52.6%, plasticity index of 12.9% to 19.6% (moderately to highly plastic), activity of 0.428 to 0.49 (inactive
soils, i.e. low potential expansiveness) and UCS of 4.5 Kg/cm2 and above.
The soils, as determined from chemical tests, are alkaline (pH>7). Sulphate concentration is found to
vary from 0.032% to 0.20%. Chloride concentration in these soils ranges from 0.0053% to 0.212%. These
values of sulphate and chloride concentration can bring deterioration of concretes when in contact with such
types of soils.
• Each lithological rock types are classified into their engineering geological subunits.
The dolerite rock unit is subdivided into: (a) fresh to slightly weathered, strong rock mass (rock with
high mass strength); with UCS value of 50-100MPa, (b) moderately weathered, moderately strong to strong rock
mass (rock with medium strength); with UCS value of 13-50MPa, and (c) highly weathered, weak to moderately
strong rock mass (rock with low mass strength); with UCS value of 2-20MPa.
53

American Scientific Research Journal for Engineering, Technology, and Sciences (ASRJETS) (2013) Volume 5, No 1, pp 23-56
The limestone-marl-shale intercalation unit is characterized by moderately to highly weathered, weak
to moderately strong rock mass (rock with low mass strength) and has UCS value of 1.5-5MPa.
The bedded limestone unit is subdivided into: (a) slightly weathered strong rock mass (rock with high
mass strength) with UCS value of 50-150MPa and moderately strong to strong rock mass (rock with medium
mass strength) moderately weathered, that has UCS value of 13-50MPa.
• The classification systems used for the soils of the study area are based on the Unified Soil
Classification System (USCS) and classification system proposed by [13].
According to the USCS: (a) the clay soils fall in CH (fat clays) type, (b) the silt soils fall in MH
(inorganic silt, elastic silts) and ML (silty of clayey fine sand with slight plasticity), (c) sandy clay/ silt soils fall
in CL (lean sandy clay), ML and MH (inorganic silts or fat clay with sand, lean sandy clay or very fine sands,
elastic sandy silt or silty/ or clayey fine sand), and (d) the clayey/ silty sand soils fall in SC (clayey sand) and
SC-SM (clayey sand or sandy clay mixtures, and silty, clayey sand soils) types.
According to IAEG (1981): (a) the clay soils fall in CV (clay of intermediate plasticity) and CH (clay
of high plasticity soils), (b) the silt soils fall in MI, MH and MV (silt of intermediate, high and very high
plasticity), (c) the sandy clay/silt soils fall in SC (SCI) (SAND clayey of intermediate plasticity) and SM (SMH)
(SAND silt of high plasticity) and (d) the clayey/ silty sand soils fall in to CI, CH (CLAYEY sand of
intermediate, high plasticity) and MI (SILT sand of intermediate plasticity).
• The rock masses of study area are classified based on the strength values and joint characteristics of the
lithological rock units. According to this, the rock mass of the study area are classified into three major
engineering geological subunits:
Rocks with low mass strength (rocks that has intact rock strength less than 20Mpa and joint spacing
ranges from 1-10cm).
Rocks with medium mass strength (rocks that has intact strength value ranges from 13-50Mpa and joint
spacing ranges from 1-20cm).
Rocks with high mass strength (rocks that has intact strength value ranges from 50-100Mpa and greater
than 100Mpa and joint spacing ranges of 10-60cm).
• Multi-purpose engineering geological map of the northern part of Mekelle town is prepared and it
provides information on the engineering geological and geotechnical characteristics of soils and rocks,
geomorphological, geodynamical and hydrogeological conditions of the study area.
12.2. Recommendation
Based on the geotechnical and engineering geological investigation of the study area, the following
recommendations are made.
• The engineering behaviors of soils and rocks of the study area are identified and presented on the
engineering geological map of study area. Areas dominated by soils with swelling and shrinking behaviors
require careful consideration during design and construction of engineering structures in these areas.
• In the north central part of study area karstic limestone features were identified, and collapse/ or
subsidence could be the main problem to be encountered. During site investigation for an engineering structure,
54

American Scientific Research Journal for Engineering, Technology, and Sciences (ASRJETS) (2013) Volume 5, No 1, pp 23-56
the lateral and vertical extent of the features (voids) should be investigated by using indirect geophysical
techniques and direct subsurface investigations methods such as trenches, drilling, etc.
• Attention should be given to the way of handling geotechnical and engineering geological laboratory
results collected and recorded in the data base format. This can be implemented by an authorized concerned
body that could set guidelines for soils and rocks laboratory analysis system and record all the results done so
far in and around Mekelle area. This could help the country’s efforts in geotechnical and engineering geological
activities in a better way.
• In order to provide easy, adequate and well organized geological, geotechnical and engineering
geological information of a particular site (for planners, engineers, designers and others that require it), it is
recommended to prepare a database for the engineering geological map of the Mekelle town, where the database
should demonstrate the attribute and spatial values of lithological, structural, geomorphological condition,
geodynamic processes, hydrogeological conditions, geotechnical and engineering geological characteristics and
classification of the soils and rocks of the Mekelle area.
• If there are quantitative geotechnical and engineering geological property descriptive records, there is
the possibility to prepare the 3-Dimentional engineering geological map of the Mekelle town. It is recommended
to undertake further research in order to prepare the 3-Dimentional engineering geological map of the town.
This could further benefit subsurface investigations for engineering structures built in the Mekelle town. It can
provide data on the lateral and vertical lithological, geotechnical and engineering geological information which
could be used for the design and construction of large-scale engineering works.
References
[1] S. Malomo, M. A. Olorunniwo, O. Ogunsanwo (1983). Engineering geological mapping in terrain of
tropical weathering. An example from Abuja, Nigeria. Eng. Geol., 19: 133-148
[2] EMA, (1981). Atlas of Ethiopia. Ethiopian Mapping Agency, Addis Ababa, Ethiopia.
[3] IAEG, (1981a). Recommended symbols for engineering geological mapping. Bull. Int. Assoc. Eng. Geol.,
24:227 234.
[4] IAEG, (1981b). Rock and soil description for engineering geological mapping. Bull. Int. Assoc. Eng. Geol.,
24: 235-274.
[5] ASTM, (1988). Annual Book of American Society for Testing Materials Standards, D-2488-69, Visual-
manual procedure of Soil and Rock, Building Stones and Geotextiles. Vol. 04.08, ASTM, Philadelphia, Del.
[6] Anon, (1990). Tropical residual soils. Q. J. Eng. Geol., 23: I 101.
[7] Hack H.R.G.K. (1996). Slope stability probability classification, SSPC. Publ. ITC, Enschede. The
Netherlands. ISBN 90 6164 125 X. 258 pp.
[8] Dearman, W.R. (1991). Engineering Geological Mapping. Butterworth-Heinemann Ltd, Oxford, 1-23 pp.
[9] Schalkwjk, A.V., Price, G.V., (1990). Engineering Geological Mapping for urban planning in developing
countries. 6th Int. Cong. of Int. Association of Engineering Geology, 257–264
[10] Geological survey of Ethiopia, (2006). Federal democratic republic of Ethiopia, Annual report, published
by technical publication team, Addis Ababa, Ethiopia, pp 1-52.
[11] Price, D. G. and Rengers, N. (1982). Engineering Geological mapping and Photo interpretation. M. Sc.
Lecturer Notes, ITC, Delft, the Netherlands.
55

American Scientific Research Journal for Engineering, Technology, and Sciences (ASRJETS) (2013) Volume 5, No 1, pp 23-56
[12] WinterKorn, H. F., Fang, D. and Hsai-Yang (1975). Foundation engineering Hand book, Litton Educational
Publishing, Inc., USA, 751 pp.
[13] IAEG (1981). Rock and Soil Description and Classification for Engineering Geological Mapping: Report
by IAEG commission on Engineering Geological Mapping, Bull. Int. Assoc. Eng. Geol., 24, pp 235-274.
[14] Jumikis, A. R. (1979). Rock mechanics: Series on rock and soil mechanics (V. 3). Trans Tech publications,
USA.
[15] Beyth, M. (1971). Geology of central and western Tigray. Unpub Report, EIGS, Addis Ababa.
[16] Levitte, D. (1970). The Geology of Mekelle (Report on the Geology of the central part of sheet ND 37-11).
Geological Survey of Ethiopia, Addis Ababa.
[17] Beyth, M. (1972). A contribution to the geology of central-western Tigray. Unpub. Report Bonn.
[18] Tesfamichael G., Florimond D. S., Miruts H., Solomon G., Kassa A., Kurkura K., Abdulwassie H., Nyssen
J., Bauer H., Moeyersons J., Deckers J., Mitiku H., Nurhussen T. (2010). Large-scale geological mapping
of Geba basin, northern Ethiopia. VLIR-Mekelle University IUC Program. Tigray Livelihood Paper No. 9.
PP 1-46.
[19] Skempton, A.W. (1953). The colloidal “Activity” of clays. Proceedings of the 3rd International Conference
of Soil Mechanics and Foundation Engineering. (1) 57-60.
[20] Piteau, D. R. (1970). ‘Geological factors significant to the stability of slopes cut in rock’, Proc. Symp.
Planning Open Pit Mines, Johannesburg. A.A. Balkema, Amsterdam, pp. 33-53.
[21] Clayton, C.R.I., Matthews, M.C., and Simons, N.E., (1992). Site investigation. 2nd Ed. Dept. Civil Eng.,
University of Surveying.
[22] Deere, D. U. and Miller, R. P., (1966). Engineering classification and index properties for intact rock; Tech.
Rep. No. AFWL-TR-65-116, Univ. of Illionois, Urbana, 299 pp.
[23] Voight, B., (1970). On the functional classification of rocks for engineering purposes: proc. Intl. Symp.
Rock mech., Madrid, Spain, pp. 131-135.
[24] Muller, L., (1974). Rock mass behavior-determination and application in engineering practice; advances in
rock mechanics: proc. 3rd cong. Intl. soc. Rock mech., Denver, colo., vol. 1, Pt. A, pp. 205-215.
[25] Goodman, R. E., (1976). Methods of geological engineering in discontinuities of rocks: west, St. Paul,
Minn., 472 pp.
[26] Bieniawski, Z. T., (1980). Rock classification: state of the art and prospects for standardization: Transp.
Res. Rec. 783, pp. 2-9.
56