introducing soil property evaluation in geotechnical
TRANSCRIPT

Paper ID #12085
Introducing Soil Property Evaluation in Geotechnical Engineering – SomeFood for Thought
Dr. Gregg L. Fiegel, California Polytechnic State University
Gregg L. Fiegel is a Professor in the Civil and Environmental Engineering Department at CaliforniaPolytechnic State University (Cal Poly), San Luis Obispo. He is a registered Professional Engineer inCalifornia, and he currently serves as the Interim Director of the University Honors Program. Dr. Fiegelreceived his B.S. degree in Civil Engineering from Cal Poly in 1990. He received his M.S. and Ph.D.degrees from the University of California, Davis in 1992 and 1995, respectively.
Mr. Nephi Derbidge, Cal Poly, San Luis Obispo, CA
After completing my undergraduate studies at Cal Poly, San Luis Obispo, I worked for a private geotech-nical consulting firm in California for over 15 years. My consulting career provided a broad range ofexperience on mostly public works projects. Over the last 10 years I have managed the geotechnicallaboratory which served more than 5 offices throughout the state for domestic and international projects.I have been teaching mostly geotechnical laboratory courses at Cal Poly for over 10 years. UtilizingCal Poly’s ’Learn by Doing’ mantra, I share my practical project experience with my students duringlaboratory activities.
c©American Society for Engineering Education, 2015
Page 26.1027.1

Introducing Soil Property Evaluation in Geotechnical Engineering – Some Food for Thought
Abstract A first course in geotechnical engineering usually includes a laboratory component where students touch, examine, and test different soils. The astute instructor provides samples and simple demonstrations to help illustrate new and important concepts related to soil behavior. In addition, instructors encourage students to develop a sense of proportion and perspective when considering geologic materials. How large are gravel, sand, silt, and clay particles? What is the consistency of soft clay or loose sand? Developing perspective can be challenging since many students have not yet worked with earth materials nor have they considered soils as important elements of construction. In these cases, analogies and comparisons with familiar everyday 'things' prove helpful in improving student learning, developing a sense of proportion, and generating interest in a new topic. In this paper, we present some food for thought when addressing soil property evaluation in geotechnical engineering instruction. Specifically, we summarize the results of a laboratory test program designed to assess the "engineering behavior" of different foods. Specific tests we performed and foods we examined include measured consistency of common grocery store items using the liquid limit device, torvane, pocket penetrometer, and triaxial test apparatus; frictional resistance of grain-like foods using direct shear test equipment; particle size and particle size distribution of various food items; particle shape of various soft and hard candies; and others. We present our test results with interesting graphics, photographs, and illustrations that are ready for use as props by other instructors. In addition, we reflect on lessons learned while testing food in the geotechnical laboratory. The food analogies presented in this paper can serve as a lighthearted yet engaging introduction to soil mechanics and soil property evaluation in a first course on geotechnical engineering. Introduction During a first course in soil mechanics and geotechnical engineering, instructors must emphasize the importance of soil property evaluation for classification and engineering purposes. Student learning outcomes typically address field and laboratory experiments commonly performed in practice. On every project a geotechnical engineer must use visual-manual and more prescribed tests to assess soil characteristics such as particle size distribution, particle shape, consistency, plasticity, strength, compressibility, compaction, and hydraulic conductivity. Students quickly learn that a geotechnical engineer serves as detective on the job, gathering important facts and information about the site soils before addressing the design problem. A first course in geotechnical engineering usually includes a laboratory component where students touch, examine, and test different soils. The astute instructor provides samples and simple demonstrations to help illustrate new and important concepts related to soil behavior. In addition, instructors encourage students to develop a sense of proportion and perspective when considering earth materials. How large are gravel, sand, silt, and clay particles? What is the consistency of soft clay or loose sand? Developing perspective can be challenging since many students have not yet considered soils as construction materials. In these cases, analogies and comparisons with familiar everyday 'things' prove helpful in improving student learning, developing a sense of proportion, and generating interest in a new topic.
Page 26.1027.2

Every student has at least some knowledge of food, though this knowledge will admittedly vary with the individual's palette. Instructors often use this fact to their advantage when demonstrating important concepts related to mechanics and materials. Have you ever witnessed the use of dry pasta to demonstrate an important concept in physics or engineering? Indeed, geotechnical engineering instructors often apply food analogies in classroom and textbook discussions. Butter, peanut butter, and cheese prove illustrative when describing the consistency of clayey soils at varying moisture contents. In this paper, we present some food for thought when addressing soil property evaluation in geotechnical engineering instruction. Specifically, we summarize the results of a laboratory test program designed to assess the "engineering behavior" of different foods. For example, as shown on Figure 1, part of our investigation focused on the consistency of different cheeses. We present our test results with interesting graphics, photographs, and illustrations ready for use as props by other instructors, in either the classroom or laboratory. The food analogies presented in this paper can serve as a lighthearted yet engaging introduction to soil mechanics and soil property evaluation in a first-class on geotechnical engineering. Student testing of soil samples and in-depth discussions of actual soil behavior would presumably follow such an introduction. Bon appetite.
Figure 1 - Food for Thought: Consistency Measurements for Different Cheeses (It's cranberry juice, of course. We work on a dry campus.)
Page 26.1027.3

Background Education literature includes many examples of instructors using food to illustrate fundamental concepts related to engineering and engineering mechanics. Pasta is commonly used for demonstrations in statics and strength of materials lessons1,2. Elementary school students have used crackers and peanut butter to build laminated arches as part of an outreach activity3. In addition, instructors recently used olive oil manufacturing and processing in the application of fundamental chemical engineering principles and unit operations4. Indeed, a search of the ASEE conference proceedings database returns multiple hits when using keywords such as marshmallow, cheese, brewing, and bubble gum. You probably have additional examples of your own. In geotechnical engineering, instructors have used items like pea soup, butter, cheese, and candy to describe the consistency of fine-grained soils at different moisture contents5. Instructors may illustrate fundamental concepts in soil mechanics by pointing out similarities (and differences) between common tests performed on powder or bulk solid foods. Geotechnical engineering students are often surprised to learn that material property evaluation is important in the food processing industry, particularly when dealing with the design of hoppers, bins, and silos. Familiar physical properties such as particle size distribution, density, porosity, compressibility, and strength may be important when addressing these designs and the behavior of foods such as cereals, grains, coffee, and salt6. To be sure, the engineering behavior of food is fundamentally different from soils in many cases. However, analogies can prove useful when introducing and explaining new concepts. The education literature includes numerous examples describing the use of analogies in teaching engineering and mechanics7. In addition, literature on student learning demonstrates that students learn best when they can make a connection to something they already know or have experienced8. Most would agree that students are familiar with food and can make a connection. Demonstrating tests on food in the classroom or laboratory, presenting the test results, and developing food-soil analogies allows an instructor to address multiple learning styles when teaching fundamental principles and concepts in geotechnical engineering9. In addition, addressing new course material in this manner is fun for the students and instructor. The use of demonstrations, models, and analogies (food or not) adds a level of intellectual excitement to any lesson, which many consider to be an essential element of exemplary teaching10. Based on our experiences, introducing soil property evaluation in this manner (humorous to us, at least) provides an excellent opportunity to engage students in the classroom. We share some of our food experiences in the remaining sections of the paper.
Page 26.1027.4
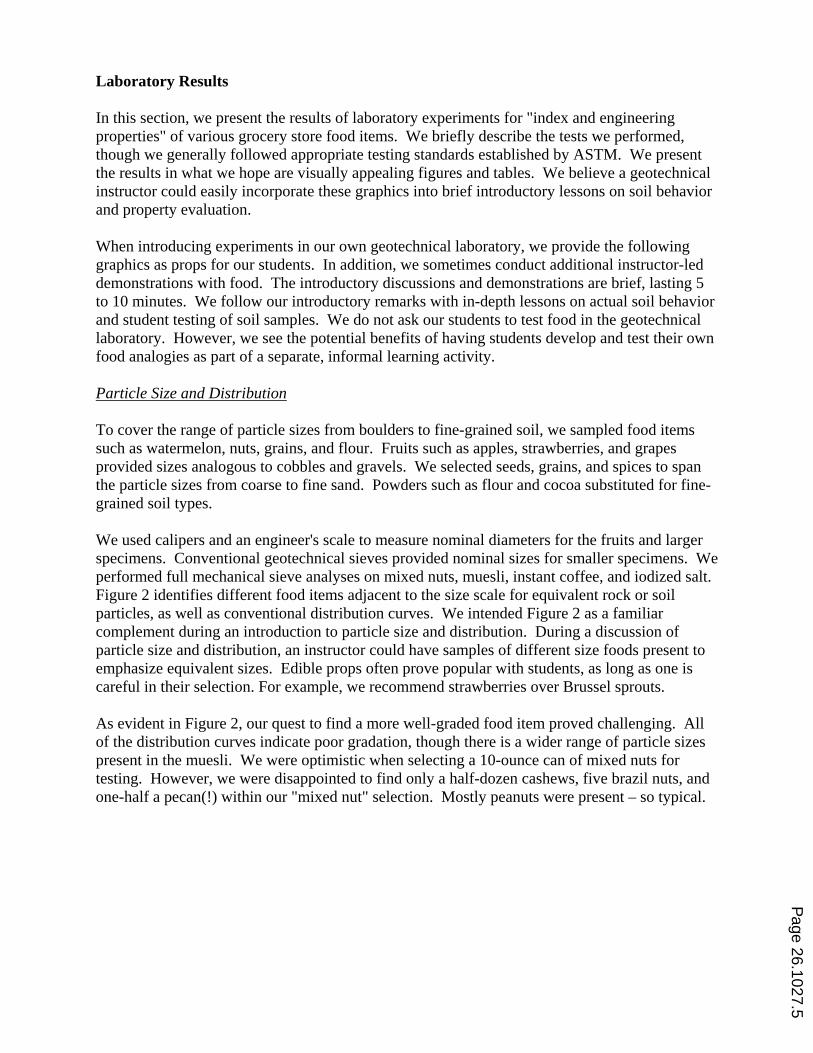
Laboratory Results In this section, we present the results of laboratory experiments for "index and engineering properties" of various grocery store food items. We briefly describe the tests we performed, though we generally followed appropriate testing standards established by ASTM. We present the results in what we hope are visually appealing figures and tables. We believe a geotechnical instructor could easily incorporate these graphics into brief introductory lessons on soil behavior and property evaluation. When introducing experiments in our own geotechnical laboratory, we provide the following graphics as props for our students. In addition, we sometimes conduct additional instructor-led demonstrations with food. The introductory discussions and demonstrations are brief, lasting 5 to 10 minutes. We follow our introductory remarks with in-depth lessons on actual soil behavior and student testing of soil samples. We do not ask our students to test food in the geotechnical laboratory. However, we see the potential benefits of having students develop and test their own food analogies as part of a separate, informal learning activity. Particle Size and Distribution To cover the range of particle sizes from boulders to fine-grained soil, we sampled food items such as watermelon, nuts, grains, and flour. Fruits such as apples, strawberries, and grapes provided sizes analogous to cobbles and gravels. We selected seeds, grains, and spices to span the particle sizes from coarse to fine sand. Powders such as flour and cocoa substituted for fine-grained soil types. We used calipers and an engineer's scale to measure nominal diameters for the fruits and larger specimens. Conventional geotechnical sieves provided nominal sizes for smaller specimens. We performed full mechanical sieve analyses on mixed nuts, muesli, instant coffee, and iodized salt. Figure 2 identifies different food items adjacent to the size scale for equivalent rock or soil particles, as well as conventional distribution curves. We intended Figure 2 as a familiar complement during an introduction to particle size and distribution. During a discussion of particle size and distribution, an instructor could have samples of different size foods present to emphasize equivalent sizes. Edible props often prove popular with students, as long as one is careful in their selection. For example, we recommend strawberries over Brussel sprouts. As evident in Figure 2, our quest to find a more well-graded food item proved challenging. All of the distribution curves indicate poor gradation, though there is a wider range of particle sizes present in the muesli. We were optimistic when selecting a 10-ounce can of mixed nuts for testing. However, we were disappointed to find only a half-dozen cashews, five brazil nuts, and one-half a pecan(!) within our "mixed nut" selection. Mostly peanuts were present – so typical.
Page 26.1027.5

Figure 2 - Particle Sizes and Distributions for Different Foods
Grain Diameter - mm
0.010.11101001000
Perc
ent P
assi
ng B
y M
ass
- %
0
20
40
60
80
100
Iodized Salt
Instant Coffee
Mixed Nuts
Muesli
Boulders Cobbles Gravels Sands Fines
Coarse Fine Medium Fine Coarse Silt and Clay
Cantaloupe
Watermelon Cocoa Powder
Granny Smith Apple
GranulatedGarlic White Rice
Cream ofWheat
KalamataOlive
SunflowerSeed
Curry PowderStrawberry
Page 26.1027.6

Table 1 includes a summary of our research regarding the particle sizes of different food items. We compare grocery store items directly with the various soil fractions (and identifiers). Included in the table are nominal (or effective) diameters for each of the selected food items.
Table 1 - Effective Particle Diameters for Different Foods
Shopping List Effective Diameter
(mm)
Size Range (mm)
Soil Fraction
Jack O'Lantern Pumpkin 334 >300 Boulders
Watermelon 290
75 to 300 Cobbles Honeydew Melon 191
Cantaloupe 135
Granny Smith Apple 86
Red Potato 71
19 to 75 Coarse Gravel Strawberry 49
Unshelled Walnut 26
Kalamata Olive 18.1
4.75 to 19 Fine Gravel
M&M Candy 13.4
Cheerios 12.4
Garbanzo Bean 8.1
Popcorn Kernel 5.3
Shelled Sunflower Seed 4.1 2.0 to 4.75
(#10 to #4 sieve) Coarse Sand Fennell Seed 3.1
Quinoa 2.4
White Rice 1.7 0.425 to 2.0
(#40 to #10 sieve) Medium Sand Instant Coffee 1.2
Cream of Wheat 0.5
Iodized Salt 0.4 0.075 to 0.425
(#200 to #40 sieve) Fine Sand Granulated Garlic 0.2
Curry Powder 0.1
Baking Flour <0.075 <0.075 Silt and Clay
Cocoa Powder <0.075
Page 26.1027.7

Consistency of Fine-Grained Materials Geotechnical engineers qualitatively characterize fine-grained soil consistency (firmness of subgrade) ranging from very soft to soft, through three levels of stiff, and finally to hard. Standard Penetration Test (SPT) results and undrained shear strength (su) ranges establish consistency descriptors (e.g. clay with a SPT value less than 2 and an undrained shear strength less than 12 kilo-Pascals would be characterized as "very soft"). Cheese, chocolate, butter, and hazelnut spread served as familiar grocery basket items when connecting edibles to fine-grained soil consistency. We performed multiple pocket penetrometer and hand torvane tests on refrigerated specimens to measure nominal ranges for undrained shear strength. Figure 3 shows these instruments with a stick of butter. Table 2 provides conventional soil consistency descriptions with ranges of SPT blow counts, undrained shear strengths, and manual field test descriptions. The far right columns of Table 2 present food equivalents and the measured strength results (e.g. developing a project site with "very soft" consistency is similar to building on a bed of hazelnut spread - tasty but providing limited support and extremely messy).
Figure 3 - Photograph of Torvane and Pocket Penetrometer Instruments and a Stick of Butter
Page 26.1027.8

Table 2 - Criteria for Consistency of Fine-Grained Soil with Food Analogs
Consistency SPT, N (bpf)
Undrained Shear Strength, su
kPa (psf) Manual Field Test
Food Analog
Estimate of su*
kPa (psf)
Very soft 0-2 < 12
(< 250)
Thumb penetrates easily; extrudes between fingers
when squeezed
Hazelnut Spread
2-5 (50-100)
Soft 2-4 12-24
(250-500)
Thumb will penetrate soil about 1 inch; molds with
light finger pressure
Stick of Butter
14-24 (300-500)
Medium Stiff
5-8 24-48
(500-1,000)
Thumb will penetrate about ¼-inch with moderate effort;
molds with strong finger pressure
Mozzarella Cheese
28-34 (600-700)
Stiff 9-15 48-96
(1,000-2,000)
Thumb indents easily and will penetrate ½-inch with
great effort
Sharp Cheddar Cheese
57-72 (1,200-1,500)
Very Stiff 16-30 96-192
(2,000-4,000)
Thumb will not indent soil, but thumbnail readily
indents it
Romano Cheese
115-139 (2,400-2,900)
Hard >30 > 192
(> 4,000)
Thumbnail will not indent soil or will indent it only
with difficulty
Baking Chocolate
> 192 (> 4,000)
*- Undrained shear strengths estimated for foods using the pocket penetrometer and torvane.
Page 26.1027.9

Undrained Shear Strength We investigated the undrained shear strength of refrigerated butter and soft and hard cheeses. Using a soil lathe and wire knife, we carved prismatic samples into testable cylinders with a length to diameter ratio of approximately two. The nominal diameter of a typical sample was approximately 40 millimeters (1.5 inches). Figure 4 illustrates a cheddar cheese specimen after carving and mounting in the triaxial testing cell. Obviously, we granted ourselves an exemption to the "no food in the dirt lab" policy. We tested samples in undrained shear with confining pressures ranging from 34 to 103 kilo-Pascals (kPa), or 720 to 2,160 pounds per square foot (psf). A computer-controlled load test apparatus monotonically applied axial compression load to the specimens until failure (applied force reached a maximum value and then reduced). A data acquisition system recorded applied load and axial deflection throughout the test. Figure 5 shows the applied axial stress versus axial strain for three butter specimens. A distinct peak axial stress occurred at axial strains of about four to five percent. Equivalent undrained shear strengths for these peaks range between 10 and 16 kPa, or 210 and 335 psf. This strength range is generally consistent with the values reported in Table 2.
Figure 4 - Photographs of UU Triaxial Testing on Cheese Samples
Page 26.1027.10

Axial Strain - %
0 4 8 12 16 20 24 28
App
lied
Axi
al S
tres
s - k
Pa
0
10
20
30
40
C
B
A
A: cell = 34 kPa
C: cell = 103 kPa
B: cell = 68 kPa
Sample # Unit Weight kN/m3 (pcf)
Confining Stress
kPa (psf)
Applied Axial Stress at Failure
kPa (psf)
Undrained Shear Strength kPa (psf)
A 8.80 (56) 34 (720) 20 (420) 10 (210)
B 8.96 (57) 68 (1,440) 29 (600) 15 (300)
C 8.96 (57) 103 (2,160) 32 (670) 16 (335)
Figure 5 - Results of UU Triaxial Tests Performed on Sticks of Butter
Page 26.1027.11

Figure 6 illustrates post-test failure surfaces observed for butter and Romano cheese specimens. We tested these specimens under a confining stress of 34 kPa. The defined failure planes observed in the edible specimens are consistent with soil specimens of similar consistency. Shear strength measurements from triaxial tests performed on butter and cheese are generally consistent with strength estimates reported in Table 2 (based on torvane and pocket penetrometer tests). We measured the ratio of undrained shear strength, Romano cheese to butter, to be approximately 8:1, based on triaxial shear testing. It is interesting to note the costs of the specimens conformed to a similar ratio. Needless to say, we performed only one strength test on Romano cheese.
(a) (b)
Figure 6 - Post-Failure Photographs of UU Triaxial Test Specimens, Diameter = 40 mm: (a) Butter; (b) Romano Cheese
Plasticity Characteristics The consistency of fine-grained soil changes from soft and almost liquid at elevated water contents to plastic, then ductile and brittle and lower water contents. Evaluation of the plasticity of fine-grained soils involves measuring the moisture content at two distinct changes in consistency; the liquid and plastic limit. The liquid limit is the moisture content at the consistency change from a plastic solid to liquid. A Casagrande liquid limit device (pictured on Figure 7) measures the consistency of soil for the liquid limit test. The test involves spreading a layer of soil within the brass cup, cutting a groove though the soil to expose the brass beneath, and turning the hand crank. As the hand crank is turned, the brass cup rises and falls on a resilient plastic base. Each turn (drop of the cup or blow) causes the material in either side of the
Page 26.1027.12

groove to come together and close the groove. If the groove closes over a distance of 12.7 mm (0.5 inches) with 25 blows, the soil is at its liquid limit.
Figure 7 - Liquid Limit Cup Test on Hazelnut Spread
We tested various spreads, peanut butter, cake icing, cream cheese, miso paste, and hummus with the goal of identifying the food item at the liquid limit consistency. Since temperature variations will affect the consistency for the food items, we tested all samples immediately after removing them from the refrigerator. Figure 8 provides the number of blows required to achieve the specified gap closure. Unfortunately, we were not successful identifying the food with the exact liquid limit consistency. However, we learned a soil's liquid limit will likely occur when the consistency of the soil is not as firm as cream cheese but is firmer than hummus. The search continues.
Page 26.1027.13

Figure 8 - Experimental Results with LL Cup for Different Foods Particle Angularity Particle angularity influences the engineering properties of coarse-grained soils. We selected candy and sweets to illustrate the definitions describing particle angularity, as shown by Figure 9. Jellybeans consist of rounded particles with smooth curves. Chocolate covered raisins are subrounded; they have plane sides with rounded edges. Candy hearts provide amusing messages and good examples of subangular particles. With sharp edges and plane sides, peanut brittle illustrates an angular particle.
Blows Required for Groove Closure Using LL Cup
0 10 20 30 40 50 60
Vegetable Oil Spread
Hazelnut Spread
Peanut Butter
Hummus
Soil at Liquid Limit
Cream Cheese
Miso Paste
Cake Icing 50+
50+
Page 26.1027.14

Rounded Subrounded
Subangular Angular
Figure 9 - Jelly Beans, Chocolate Covered Raisins, Candy Hearts, and Peanut Brittle to Describe Shapes of Coarse-Grained Soil Particles
Shear Strength of Coarse-Grained Materials We investigated the shear strength of dry white rice and iodized salt by measuring the angle of repose and performing direct shear tests. Figure 10 illustrates the angle of repose for rice. The direct shear specimens for rice and salt had nominal diameters equal to 60 mm (2.4 inches). We prepared the specimens in the shear box using three, lightly-tamped lifts of dry material. Computer controlled testing equipment applied normal and shearing forces. Applied normal stresses ranged from approximately 25 to 75 kPa (500 to 1,500 psf). Figures 11 and 12 provide failure envelopes and estimates of effective friction angles for the salt and rice samples, respectively. The measured effective friction angle for the salt sample is consistent with direct shear results for soil samples with similar particle size, shape, and angularity.
Page 26.1027.15

The relatively weak particle strength of the rice grains created interesting results when tested in direct shear. Although not presented, shear stress versus horizontal displacement plots showed an increase in shear stress, followed by a sudden decrease. The cycle repeated (increase, followed by sudden decrease) throughout the range of horizontal displacement. Internal stresses caused individual rice grains to fail suddenly; hence the sudden drop in applied shear stress. We could actually hear the grains snapping immediately prior to observing a sudden drop in shear stress. We also observed numerous fractured rice grains when removing the sample from the shear box. Weak grains created abrupt, localized, peaks and valleys in the shear stress versus horizontal displacement plots. Figure 12 shows the "average" absolute peak shear strength for each applied normal stress. Post-peak (or residual) shear strength data produced inconclusive results. For most granular soils, we assume the individual particles will not shear during testing, but will rotate and slide between one another. The results for rice show that unusual or difficult to interpret test results do not necessarily suggest an error, but may be indicative of a specific type of soil behavior (such as the fracture of individual soil particles, which can occur when testing calcareous sands at relatively high confining stresses). Rice’s pronounced elongated grains likely caused the significant difference between the angle of repose (25°) and the friction angle measured in the direct shear test (56°). Considering the size of the shear box (only 60 mm diameter), and the forced failure path of the direct shear test, we infer that stress concentrations along the box’s boundary contributed to the measured shear strength. For the case of direct shear testing on rice, results from the food item may actually offer insight when interpreting test results on soil with friable, elongated particles. Food for thought . . .
Figure 10 - Angle of Repose for Dry White Rice
Page 26.1027.16

Normal Stress - kPa
0 25 50 75 100 125
Shea
r Str
ess
- kPa
0
25
50
75
100
IODIZED SALT
Peak: ' = 45o, c' = 0 kPaResidual: ' = 38o, c' = 0 kPa
Normal Stress - kPa
0 25 50 75 100 125
Shea
r Str
ess
- kPa
0
25
50
75
100
125
DRY WHITE RICE
Peak: ' = 56o, c' = 0 kPaResidual: Inconclusive Results
Figure 11 - Direct Shear Test Results for Iodized Salt
Figure 12 - Direct Shear Test Results for Dry White Rice
Page 26.1027.17

Reflection In his 1977 address to graduating engineers at West Point, Ralph Peck, arguably one of this country's greatest geotechnical engineers, emphasized developing a good sense of proportion and the ability to consciously evaluate the size of things11. One could argue that knowing the magnitude of a typical column load is more important than the nominal diameter of garbanzo bean, but the goal is the same. "Familiarity with the size of things" is important. Would Dr. Peck approve of the work summarized in this paper? More food for thought. Reception to this investigation has been positive, though we have received strange looks from faculty colleagues, local practitioners, and janitorial staff. Presenting students with unconsolidated undrained triaxial test results for Romano cheese is certainly an attention grabber. Based on our experience, the graphics and tables presented in this paper serve as a lighthearted yet engaging introduction to soil behavior and material property evaluation. We plan to continue using these props in the future to help students develop a sense of proportion. Developing this sense of proportion and understanding the fundamentals of material property evaluation are essential for aspiring civil and geotechnical engineers. During future geotechnical laboratories, we plan to introduce a bonus laboratory activity where students design their own experiments while thinking of their own food analogies. Our goal is to continue to expand our database of food test results. We encourage other geotechnical instructors to do the same, and we look forward to the sharing of results. Who will find the food with liquid limit consistency? Acknowledgement The authors wish to thank their stomachs and long nights in the geotechnical engineering laboratory for inspiration and motivation in conducting this study and preparing this manuscript. The authors also thank the practicing geotechnical engineers and civil engineering educators who reviewed earlier versions of this manuscript and provided positive and constructive feedback. ---------------------------------- References 1. Klosky J.L. and Vander Schaaf, R. (2003). "Show Me the Money! Using Physical Models to Excite Student
Interest in Mechanics." Paper ID #2003-939 Proceedings, American Society for Engineering Education (ASEE) Annual Conference and Exposition.
2. Schmucker, D.G.(1998). "Models, Models, Models: The Use of Physical Models to Enhance the Structural Engineering Experience." Paper ID #1998-389, Proceedings, American Society for Engineering Education (ASEE) Annual Conference and Exposition.
3. Saliklis, E. (2008). "Arch Building for Kids. What did they learn? What did we learn?" Paper ID #2008-571, Proceedings, American Society for Engineering Education (ASEE) Annual Conference and Exposition.
Page 26.1027.18

4. Gifford, M.P, Cervo, E.G., Savelski, M.J., Farrell, S., Hesketh, R.P., and Slater, C.S. (2003). "Non-traditional Laboratory Experiments: Olive Oil Manufacturing and Testing – Part I: Freshman Engineering Experiments." Paper ID #2003-880, Proceedings, American Society for Engineering Education (ASEE) Annual Conference and Exposition.
5. Sowers, G.F. (1979). Introductory Soil Mechanics and Foundations: Geotechnical Engineering, 4th Edition, Macmillan, New York, NY.
6. Ibarz, A. and Barbosa-Canovas, G.V. (2014). Introduction to Food Process Engineering, CRC Press, Taylor & Francis Group, Boca Raton, Florida.
7. Durham, S., Hale, M., and Freyne, S. (2008). "Classroom Teaching Aids and Laboratory Experimentation to Engage Students in Materials Learning." Paper ID #2008-2564, Proceedings, American Society for Engineering Education (ASEE) Annual Conference and Exposition.
8. Davis, Barbara Gross (1993). Tools for Teaching, Jossey-Bass, San Francisco, California.
9. Felder, R.M. and Silverman, L.K. (1988). "Learning and Teaching Styles in Engineering Education." Engineering Education 78(7), 674-681.
10. Lohman, J. (1995). Mastering the Techniques of Teaching, 2nd Edition, Jossey-Bass, San Francisco, California.
11. Peck, R.B (1977). "Advice to a Young Engineer." Publication No. 167, Military Engineering, 69:450, 232-234.
Page 26.1027.19