introducing project quality management
TRANSCRIPT
8IntroducingProject QualityManagement
CertPrs8 / PMP Project Management Professional Study Guide / Phillips / 223062-2 / Chapter 8Blind Folio 8:317
D:\010Comp\CertPrs8\062-2\ch08.vpWednesday, December 03, 2003 12:41:06 PM
Color profile: Generic CMYK printer profileComposite Default screen
What is quality? Quality is the “totality of characteristics of an entity that bear onits ability to satisfy stated or implied needs.” Every project has an anticipatedlevel of quality for the project deliverables. Project quality management is the
process to ensure that the project fulfills its obligations to satisfy the project needs. As projectsvary, so too will the anticipated level of quality.
Picture this: it’s late on a hot summer night and you’re hungry. You pull up a gravelroad and see a diner with a neon “open” sign. The sign, you notice, really says “Ope”since the “n” is burned out. Inside the diner, stale smoke drifts around like fog. Grease,onions, and garlic seep into your clothes. You opt for a booth only to find the tablesmeared with catsup, a little gravy, and, guessing by the stickiness, a glob of maple syrup.
Now picture this: You step off the elevator on the 43rd floor. A maitre d’ welcomesyou and guides you to a table next to a window offering a sweeping view of the city.A piano player massages a song into the evening. The waiter snaps open a napkinand drapes it across your lap. Another waiter pours you a glass of cold, crisp water andpresents the menu. By the soft candlelight, everything looks, and feels, grand.
With these two contrasting scenarios, which one do you think will have betterquality? Or can they both have an acceptable level of quality? For the first scenario—the diner—you expect a certain level of quality when it comes to service, food, andatmosphere. With the second scenario—the fancy restaurant—you also have anexpected level of quality regarding service, food, and atmosphere. Both experiencesare measured by that expected level of quality.
In the diner, you might get one of the best bacon cheeseburger/milkshake combosyou can find late at night in the middle of nowhere. Just what you’d expect from thiskind of place. And the fancy downtown restaurant? A fancy meal cooked to perfection—also what you’d expect. The difference between the two restaurants is grade. Theexpected level of service, food, and atmosphere is the quality of the experience.
The Big Quality PictureBefore we hop into the three different facets of project quality management, let’sestablish a few “PMI-isms” on quality. Because quality means so many different thingsto so many different people, it’s important to confirm we’re working with a commonunderstanding of what quality is and what quality management hopes to accomplish—from PMI’s point of view.
318 Chapter 8: Introducing Project Quality Management
CertPrs8 / PMP Project Management Professional Study Guide / Phillips / 223062-2 / Chapter 8
D:\010Comp\CertPrs8\062-2\ch08.vpWednesday, December 03, 2003 12:41:06 PM
Color profile: Generic CMYK printer profileComposite Default screen
Accepting the Quality Management ApproachThe details and specifications set out by the customer determine what the expectedlevel of quality is. Project quality management, as far as your exam goes, is compatiblewith ISO 9000 and ISO 10000 quality standards and guidelines.
Project quality management also is concerned with the management of the projectand the product of the project. It’s easy to focus on the product (the thing or servicethe project creates), but project managers must also provide quality for the projectmanagement activities. Aspects of the downside of focusing too much on the productinclude:
■ Overworking the project team in order to complete the project. This mayresult in unacceptable work, decline in team morale, and the slow, steadydestruction of the project team’s willingness to work.
■ A hurry to complete the project work by speeding through quality inspections.This can result in unacceptable deliverables
Quality vs. GradeQuality and grade are not the same.
Quality is the sum of the characteristics ofa product that allow it to meet the demands orexpectations of the project. Grade, accordingto the PMBOK, “is a category or rank given toentities having the same functional use butdifferent technical characteristics.” For example,there are different grades of paint, different gradesof metal, and even different grades of travel.
Implementing Quality Project ManagementQuality management and project management have similar characteristics:
■ Customer satisfaction The project must satisfy the customer requirementsby delivering what it promised in order to satisfy the needs of the customer.The PMBOK puts it as “conformance to requirements” and “fitness for use.”
■ Prevention Quality is planned into a project, not inspected in. It is alwaysmore cost-effective to prevent mistakes than to correct them.
The Big Quality Picture 319
CertPrs8 / PMP Project Management Professional Study Guide / Phillips / 223062-2 / Chapter 8
Know that low quality isalways a problem, but low grade may notbe. Depending on the requirements of thecustomer, low grade may be completelyacceptable, but low quality never is.
D:\010Comp\CertPrs8\062-2\ch08.vpWednesday, December 03, 2003 12:41:06 PM
Color profile: Generic CMYK printer profileComposite Default screen
320 Chapter 8: Introducing Project Quality Management
CertPrs8 / PMP Project Management Professional Study Guide / Phillips / 223062-2 / Chapter 8
■ Management responsibility The project team must work towards the qualitygoal, but management must provide the needed resources to deliver on thequality promises.
■ Plan-do-check-act Deming, arguably the world’s leader in quality managementtheory thanks to his management methods implemented in Japan after WorldWar II, set the bar with his “plan-do-check-act” approach to qualitymanagement. This approach is similar to the project management processesevery project passes through.
■ Kaizen technology Kaizen is a quality management philosophy of applyingcontinuous small improvements to reduce costs and ensure consistency orproject performance.
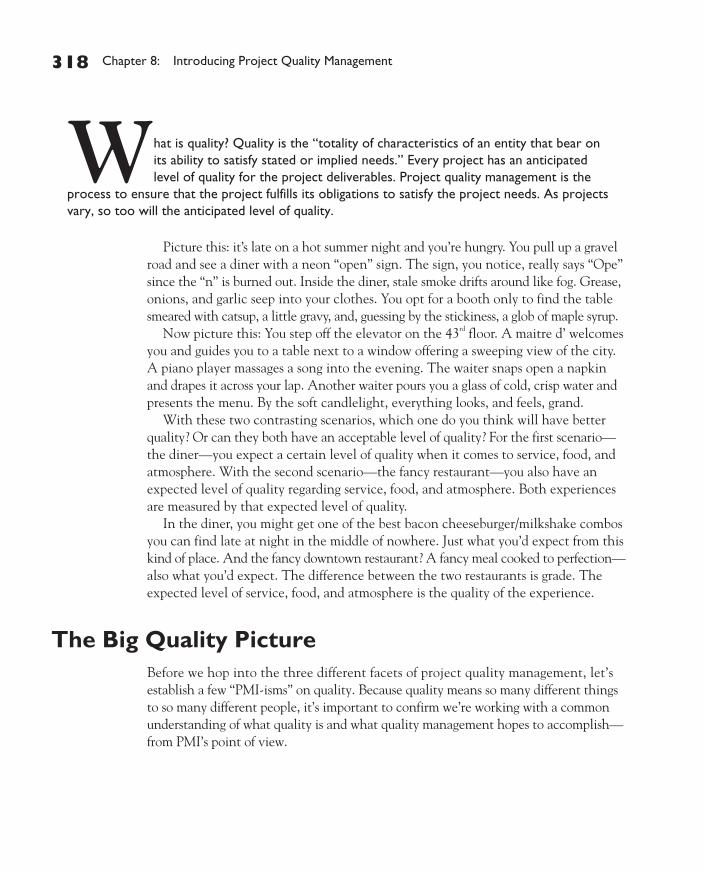
■ Marginal analysis Marginal analysis studies the cost of the incrementalimprovements to a process or product and compares it against the increasein revenue made from the improvements. For example, the price of the addedfeature may cost the company $7.50 per unit, but the amount of gained salesper year because of the improvement will meet or exceed the cost of theimprovement.
Preparing for QualityBefore a project manager can plan for quality, he must know what the qualityexpectations are. Specifically, what are the quality standards of the performingorganization and which quality standards are applicable to the project? As part of theplanning processes, the project manager and the project team must identify therequirements of planning, determine how the requirements may be met, and identifythe costs and time demands to meet the identified requirements.
One of the key principles of project quality management is that quality is plannedin, not inspected in. Planning for quality is more cost-effective than inspecting workresults and doing the work over, or correcting problems to adhere to quality demands.
The project manager must consider the cost of achieving the expected level of qualityin contrast to the cost of nonconformance. The cost of quality includes training, safetymeasures, and action to prevent poor quality. The cost of nonconformance can far
D:\010Comp\CertPrs8\062-2\ch08.vpWednesday, December 03, 2003 12:41:06 PM
Color profile: Generic CMYK printer profileComposite Default screen
Preparing for Quality 321
CertPrs8 / PMP Project Management Professional Study Guide / Phillips / 223062-2 / Chapter 8
outweigh the cost of quality: loss of customers, rework, lost time, lost materials, anddanger to workers.
Determining the Quality PolicyTop management should define the quality policy. The quality policy of the organizationmay follow a formal approach such as ISO 9000, Six Sigma, or Total Quality Management(TQM), or it may have its own direction and approach to satisfying the demand forquality.
The project team should adapt the quality policy of the organization to guide theproject implementation. This ensures the management of the project and thedeliverables of the project are in alignment with the performing organization’squality policy. In addition, the project manager should document how the projectwill fulfill the quality policy in both management and in the project deliverable.
But what if the performing organization doesn’t have a quality policy? Or what iftwo different entities are working together on a project and they use differing qualitypolicies? In these circumstances, the project management team should create thequality policy. The quality policy, in these instances, will accomplish the same goalsas a company’s quality policy: to define quality requirements and determine how toadhere to them.
Regardless of where the quality policy comes from—management or the projectteam—the project stakeholders must be aware of the quality policy. This is importantbecause the quality policy, and associated quality methodology, may require actionsthat could lengthen the project schedule. For example, quality audits, peer reviews,and other quality-centric activities. In addition to the required time to fulfill thequality requirements, there may be additional costs incurred.
Reviewing the Project Scope StatementJust as project quality management is focused on fulfilling the needs of the project, thescope statement is a key input to the quality planning process. Recall that the scopestatement defines what will and will not be delivered as part of the project, as well asobjectives regarding cost, schedule, and scope. The deliverables, and the expectationsof the customers, will help guide the quality planning session to ensure the customerrequirements in regard to quality are met.
Reviewing the Product DescriptionWhile the project scope will define the initial product description, the product descriptionmay have supporting detail that the project manager and project team will need to review.
D:\010Comp\CertPrs8\062-2\ch08.vpWednesday, December 03, 2003 12:41:07 PM
Color profile: Generic CMYK printer profileComposite Default screen
CertPrs8 / PMP Project Management Professional Study Guide / Phillips / 223062-2 / Chapter 8
Consider a project to create an apartment building. The requirements, specifications,and details of the building will need to be evaluated and reviewed since this informationwill, no doubt, affect the quality planning.
Reviewing the Standards and RegulationsThe standards and regulations of each industry will need to be reviewed to determinethat both the project plan and the plan for quality are acceptable. For example, a projectto wire a building for electricity will have certain regulations it must adhere to. Therelevance of the regulations must be planned into the project to conform tothe requirements.
Reviewing Other Process OutputsThe project manager will need more than just the scope statement and the productdescription to plan for quality. The outputs of other processes will need to be evaluatedfor quality considerations. For example, procurement, which we’ll discuss in Chapter 12,may have special needs for contractors. The organization purchases products and servicesfrom vendors. If the vendors’ level of quality is unacceptable, the project can suffer, getoff schedule, or result in failure.
Planning for QualityOnce the project manager has assembled the needed inputs, and evaluated the productdescription and project scope, he can get to work creating a plan on how to satisfy thequality demands. He’ll need to rely on the documentation created to date, his project team,and the project’s key stakeholder for much of the input. In addition, the project managerwill use several different techniques to plan on meeting quality.
As planning is an iterative process, so too is quality planning. As events happenwithin the project, the project manager should evaluate the events and then applycorrective actions. This is a common PMI theme: plan, implement, measure, react—and document! Throughout the project implementation, things will go awry, teammembers may complete less-than-acceptable work, stakeholders will demand changes,and so on; all of these variables must be evaluated for their impact on project quality.What good is a project if it’s “completed” on time, but the quality of the deliverableis unacceptable? Technically, if the product is unacceptable, the project is not finishedsince it failed to meet the project scope. Let’s look at some tools and techniques theproject manager will use to plan for quality.
322 Chapter 8: Introducing Project Quality Management
CertPrs8 / PMP Project Management Professional Study Guide / Phillips / 223062-2 / Chapter 8
D:\010Comp\CertPrs8\062-2\ch08.vpWednesday, December 03, 2003 12:41:07 PM
Color profile: Generic CMYK printer profileComposite Default screen
CertPrs8 / PMP Project Management Professional Study Guide / Phillips / 223062-2 / Chapter 8
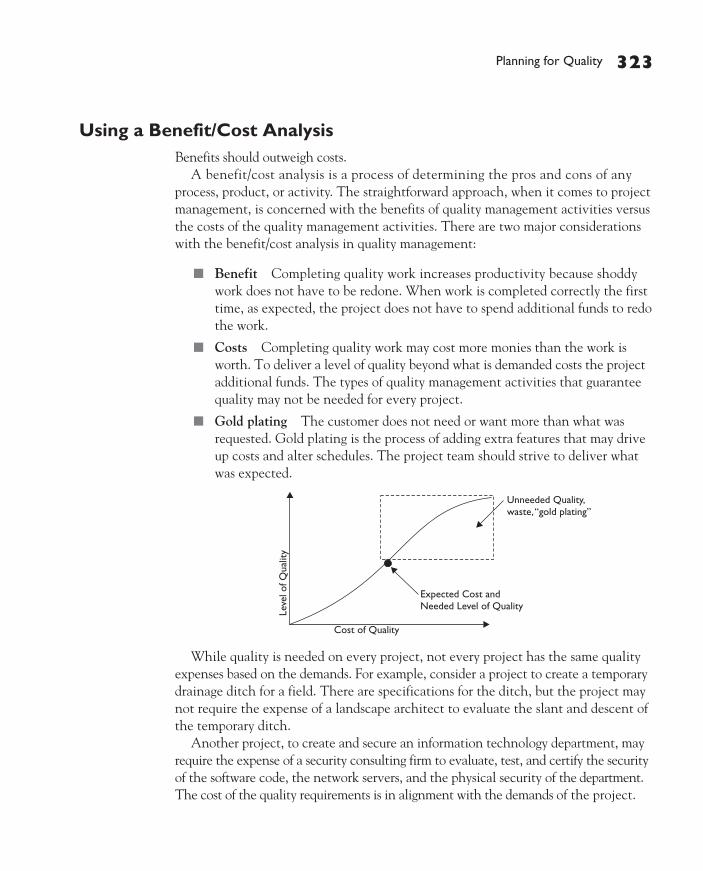
Using a Benefit/Cost AnalysisBenefits should outweigh costs.
A benefit/cost analysis is a process of determining the pros and cons of anyprocess, product, or activity. The straightforward approach, when it comes to projectmanagement, is concerned with the benefits of quality management activities versusthe costs of the quality management activities. There are two major considerationswith the benefit/cost analysis in quality management:
■ Benefit Completing quality work increases productivity because shoddywork does not have to be redone. When work is completed correctly the firsttime, as expected, the project does not have to spend additional funds to redothe work.
■ Costs Completing quality work may cost more monies than the work isworth. To deliver a level of quality beyond what is demanded costs the projectadditional funds. The types of quality management activities that guaranteequality may not be needed for every project.
■ Gold plating The customer does not need or want more than what wasrequested. Gold plating is the process of adding extra features that may driveup costs and alter schedules. The project team should strive to deliver whatwas expected.
While quality is needed on every project, not every project has the same qualityexpenses based on the demands. For example, consider a project to create a temporarydrainage ditch for a field. There are specifications for the ditch, but the project maynot require the expense of a landscape architect to evaluate the slant and descent ofthe temporary ditch.
Another project, to create and secure an information technology department, mayrequire the expense of a security consulting firm to evaluate, test, and certify the securityof the software code, the network servers, and the physical security of the department.The cost of the quality requirements is in alignment with the demands of the project.
Planning for Quality 323
CertPrs8 / PMP Project Management Professional Study Guide / Phillips / 223062-2 / Chapter 8
D:\010Comp\CertPrs8\062-2\ch08.vpWednesday, December 03, 2003 12:41:07 PM
Color profile: Generic CMYK printer profileComposite Default screen
324 Chapter 8: Introducing Project Quality Management
CertPrs8 / PMP Project Management Professional Study Guide / Phillips / 223062-2 / Chapter 8
Applying Benchmarking PracticesBenchmarking, when it comes to quality project management, is all about comparingthis project to another. Benchmarking is a technique to take what the project managerhas planned or experienced regarding quality and compare it to another project to seehow things measure up. The current project can be measured against any other project—not just projects within the performing organization or within the same industry.
The goal of benchmarking is to evaluate the differences between the two projectsand then to make corrective actions to the current project. For example, Project Amay have better quality performance than Project B. When the project managercompares the two projects, he’ll want to find out what the differences are between them.He’ll look for what’s missing in Project B, or what activities the folks in Project A aredoing that he’s not.
Benchmarking allows the project manager and the project team to see what’s possibleand then strive toward that goal. Benchmarking can also be used as a measurementagainst industry standards, competitors’ pricing, or competitors’ level of performance.
Benchmarking, if used improperly, can create some false goals and internalcompetition. If the projects that are being compared to each other are active,truth in reporting is mandatory; otherwise, the results of the benchmarkingwill be skewed. Ideally, benchmarking is compared against similar, completedprojects early in the quality planning, rather than late in the process.
Creating a Flow ChartTechnically, a flow chart is any diagram illustrating how components within a systemare related. An organizational flow chart shows the bottom crew of operations up tothe “little squirt” on top. A HVAC blueprint shows how the air flows through a buildingfrom the furnace to each room. Flow charts show the relation between components, aswell as help the project team determine where quality issues may be present and, oncedone, plan accordingly.
There are two types of flow charts you’ll need to be concerned with for this exam:
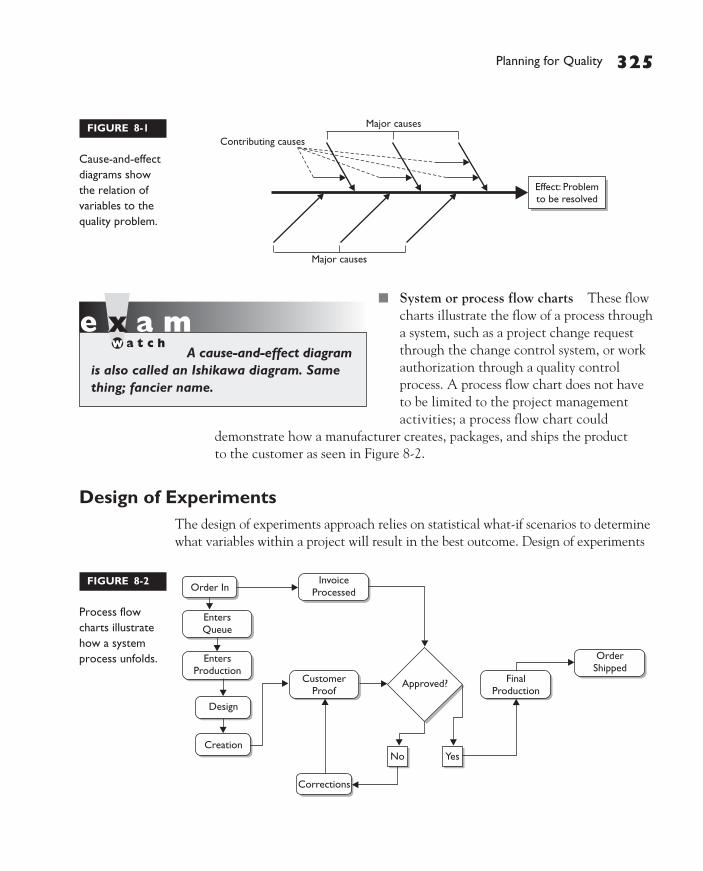
■ Cause-and-effect diagrams These diagrams show the relation between thevariables within a process and how those relations may contribute to inadequatequality. This diagram can help organize both the process and team opinions, aswell as generate discussion on finding a solution to ensure quality. Figure 8-1is an example of a cause-and-effect diagram. These diagrams are also knownas Ishikawa diagrams and fishbone diagrams.
CertPrs8 / PMP Project Management Professional Study Guide / Phillips / 223062-2 / Chapter 8
D:\010Comp\CertPrs8\062-2\ch08.vpWednesday, December 03, 2003 12:41:07 PM
Color profile: Generic CMYK printer profileComposite Default screen
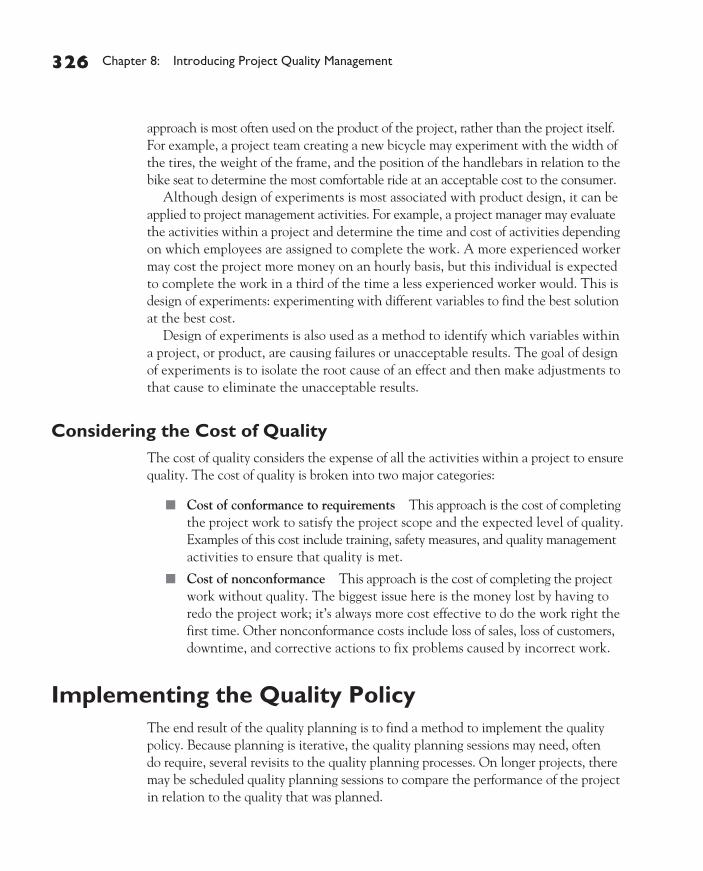
■ System or process flow charts These flowcharts illustrate the flow of a process througha system, such as a project change requestthrough the change control system, or workauthorization through a quality controlprocess. A process flow chart does not haveto be limited to the project managementactivities; a process flow chart could
demonstrate how a manufacturer creates, packages, and ships the productto the customer as seen in Figure 8-2.
Design of ExperimentsThe design of experiments approach relies on statistical what-if scenarios to determinewhat variables within a project will result in the best outcome. Design of experiments
Planning for Quality 325
CertPrs8 / PMP Project Management Professional Study Guide / Phillips / 223062-2 / Chapter 8
FIGURE 8-1
Cause-and-effectdiagrams showthe relation ofvariables to thequality problem.
FIGURE 8-2
Process flowcharts illustratehow a systemprocess unfolds.
A cause-and-effect diagramis also called an Ishikawa diagram. Samething; fancier name.
D:\010Comp\CertPrs8\062-2\ch08.vpWednesday, December 03, 2003 12:41:08 PM
Color profile: Generic CMYK printer profileComposite Default screen
326 Chapter 8: Introducing Project Quality Management
CertPrs8 / PMP Project Management Professional Study Guide / Phillips / 223062-2 / Chapter 8
approach is most often used on the product of the project, rather than the project itself.For example, a project team creating a new bicycle may experiment with the width ofthe tires, the weight of the frame, and the position of the handlebars in relation to thebike seat to determine the most comfortable ride at an acceptable cost to the consumer.
Although design of experiments is most associated with product design, it can beapplied to project management activities. For example, a project manager may evaluatethe activities within a project and determine the time and cost of activities dependingon which employees are assigned to complete the work. A more experienced workermay cost the project more money on an hourly basis, but this individual is expectedto complete the work in a third of the time a less experienced worker would. This isdesign of experiments: experimenting with different variables to find the best solutionat the best cost.
Design of experiments is also used as a method to identify which variables withina project, or product, are causing failures or unacceptable results. The goal of designof experiments is to isolate the root cause of an effect and then make adjustments tothat cause to eliminate the unacceptable results.
Considering the Cost of QualityThe cost of quality considers the expense of all the activities within a project to ensurequality. The cost of quality is broken into two major categories:
■ Cost of conformance to requirements This approach is the cost of completingthe project work to satisfy the project scope and the expected level of quality.Examples of this cost include training, safety measures, and quality managementactivities to ensure that quality is met.
■ Cost of nonconformance This approach is the cost of completing the projectwork without quality. The biggest issue here is the money lost by having toredo the project work; it’s always more cost effective to do the work right thefirst time. Other nonconformance costs include loss of sales, loss of customers,downtime, and corrective actions to fix problems caused by incorrect work.
Implementing the Quality PolicyThe end result of the quality planning is to find a method to implement the qualitypolicy. Because planning is iterative, the quality planning sessions may need, oftendo require, several revisits to the quality planning processes. On longer projects, theremay be scheduled quality planning sessions to compare the performance of the projectin relation to the quality that was planned.
D:\010Comp\CertPrs8\062-2\ch08.vpWednesday, December 03, 2003 12:41:08 PM
Color profile: Generic CMYK printer profileComposite Default screen
CertPrs8 / PMP Project Management Professional Study Guide / Phillips / 223062-2 / Chapter 8
Creating the Quality Management PlanOne of the major outputs of quality planning is the quality management plan. Thisdocument describes how the project manager and the project team will fulfill the qualitypolicy. In an ISO 9000 environment, the quality management plan is referred to as the“project quality system.”
The quality management plan addresses threethings about the project and the project work:
■ Quality control Work results are monitoredto see if they meet relevant quality standards.If the results do not meet the quality standards,the project manager applies root cause analysisto determine the cause of the poor performanceand then eliminates the cause. Quality controlis inspection orientated.
■ Quality assurance The overall performance is evaluated to ensure the projectmeets the relevant quality standards. Quality assurance maps to an organization’squality policy and is typically a managerial process. Quality assurance is generallyconsidered the work of applying the quality plan.
■ Quality improvement The project performance is measured and evaluated,and corrective actions are applied to improve the product and the project.The improvements can be large or small depending on the condition and thequality philosophy of the performing organization.
Identifying the Operational DefinitionsOperational definitions, also known as metrics, are the quantifiable terms and valuesto measure a process, activity, or work result. An example of an operational definitioncould be an expected value for the required torque to tighten a bolt on a piece ofequipment. By testing and measuring the torque, the operational definition would proveor disprove the quality of the product. Other examples can include hours of labor tocomplete a work package, required safety measures, cost per unit, and so on.
Operational definitions are clear, concise measurements. Designating that 95 percentof all customer service calls should be answered by a live person within 30 secondsis a metric. A statement that all calls should be answered in a timely manner is not.
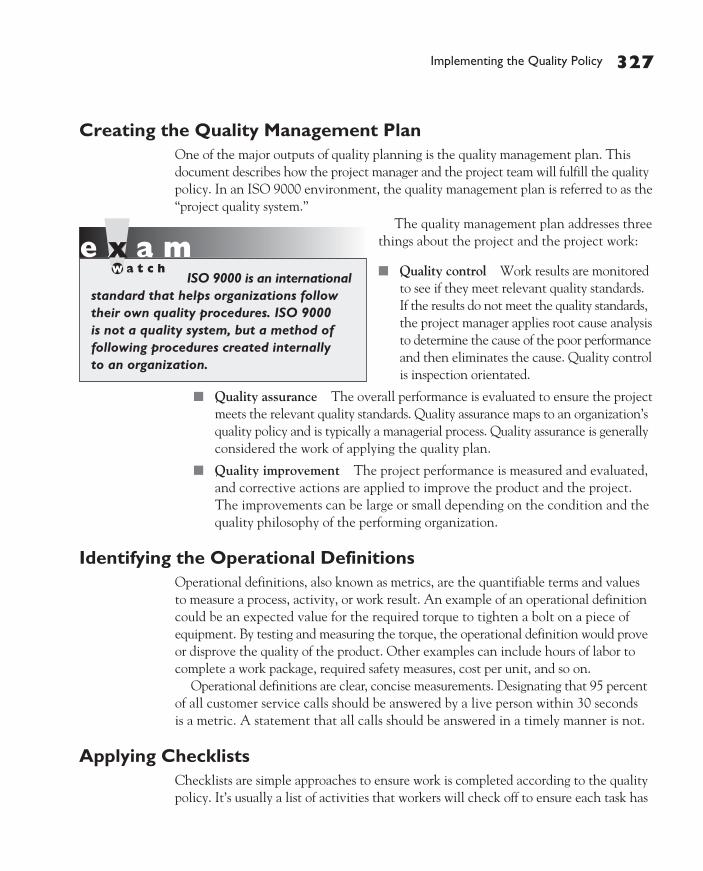
Applying ChecklistsChecklists are simple approaches to ensure work is completed according to the qualitypolicy. It’s usually a list of activities that workers will check off to ensure each task has
Implementing the Quality Policy 327
CertPrs8 / PMP Project Management Professional Study Guide / Phillips / 223062-2 / Chapter 8
ISO 9000 is an internationalstandard that helps organizations followtheir own quality procedures. ISO 9000is not a quality system, but a method offollowing procedures created internallyto an organization.
D:\010Comp\CertPrs8\062-2\ch08.vpWednesday, December 03, 2003 12:41:08 PM
Color profile: Generic CMYK printer profileComposite Default screen
328 Chapter 8: Introducing Project Quality Management
CertPrs8 / PMP Project Management Professional Study Guide / Phillips / 223062-2 / Chapter 8
been completed. Checklists can be quick instructions of what needs to be done to cleana piece of equipment, or questions that remind the employee to complete a task: “Didyou turn off the printer before opening the cover?”
Creating Quality AssuranceQuality assurance (QA) is the sum of the planning and the implementations of theplans the project manager, the project team, and management does to ensure the projectmeets the demands of quality. QA is not something that is done only at the end of theproject, but before and during the project.
In some organizations, the Quality Assurance department or another entity willcomplete the QA activities. QA is interested in finding the defects and then fixingthe problems. There are many different approaches to QA, depending on the qualitysystem the organization or project team has adapted. There are two types of QA:
■ Internal QA Assurance provided to management and the project team
■ External QA Assurance provide to the external customers of the project
Preparing for Quality AssuranceThere are three inputs the project manager and the project team will need to preparefor QA:
■ The quality management plan This plan defines how the project team willimplement and fulfill the quality policy of the performing organization.
■ Results of quality control measurements Quality control tests will providethese measurements. The values must be quantifiable so results may be measured,compared, and analyzed. In other words, “pretty close to on track” is notadequate; “95 percent pass rate” is more acceptable.
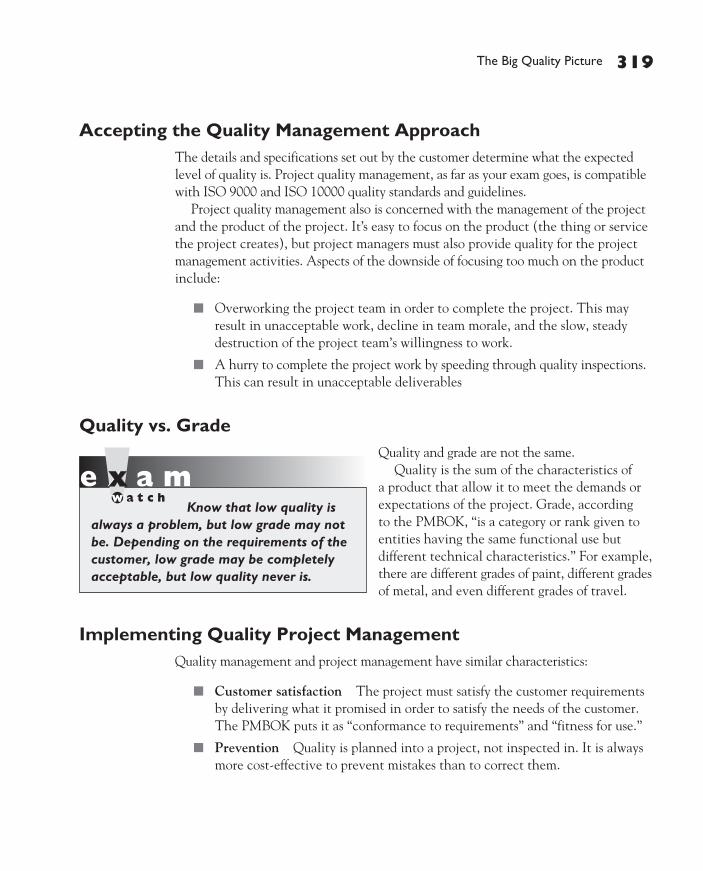
Safety Checklist
Confirm power is offOpen wall coverInspect wiringReplace connectors if needed
Yes No
Install new switchRestore powerTest powerAdd face plate
Completed byInitial
D:\010Comp\CertPrs8\062-2\ch08.vpWednesday, December 03, 2003 12:41:08 PM
Color profile: Generic CMYK printer profileComposite Default screen
Implementing Quality Control 329
CertPrs8 / PMP Project Management Professional Study Guide / Phillips / 223062-2 / Chapter 8
■ Operational definitions The metrics that define the project processes, theirattributes, and units of measure are needed for QA.
Applying Quality AssuranceThe QA department, management, or in some instances, even the project managercan complete the requirements for QA. QA can be accomplished using the same toolsused for project planning:
■ Benefit cost analysis
■ Benchmarking
■ Flowcharting
■ Design of experiments
■ Cost of quality
Completing a Quality AuditQuality audits are about learning. The idea of a quality audit is to identify the lessonslearned on the current project to determine how to make things better for this project—and other projects within the organization. The idea is that Susan the project managercan learn from the implementations of Bob the project manager and vice versa.
Quality audits are formal reviews of what’s been completed within a project, what’sworked, and what didn’t work. The end result of the audit is to improve performancefor the current project, other projects, or the entire organization.
Quality audits can be scheduled at key intervals within a project or—Surprise!—they can come without warning. The audit process can vary depending on who iscompleting the audit: internal auditors or hired, third-party experts.
Improving the ProjectThe lone output of QA? Quality improvement.
Quality improvement requires action to improve the project’s effectiveness. Theactions to improve the effectiveness may have to be routed through the changecontrol system, which means change requests, analysis of the costs and risks, andinvolvement from the Change Control Board.
Implementing Quality ControlQuality control (QC) requires the project manager, or other qualified party, tomonitor and measure project results to determine that the results are up to the
D:\010Comp\CertPrs8\062-2\ch08.vpWednesday, December 03, 2003 12:41:08 PM
Color profile: Generic CMYK printer profileComposite Default screen
330 Chapter 8: Introducing Project Quality Management
CertPrs8 / PMP Project Management Professional Study Guide / Phillips / 223062-2 / Chapter 8
demands of the quality standards. If the results are not satisfactory, root cause analysisfollows the quality control processes. Root cause analysis is needed so the projectmanager can determine the cause and apply corrective actions. On the whole, QCoccurs throughout the life of a project, not just at its end.
QC is also not only concerned with the product the project is creating, but withthe project management processes. QC measures performance, scheduling, and costvariances. The experience of the project should be of quality—not just the productthe project creates. Consider a project manager that demands the project team workextreme hours to meet an unrealistic deadline; team morale suffers and likely so doesthe project work the team is completing.
The project team should have the following skill sets to be competent at qualitycontrol:
■ Statistical quality control, such as sampling and probability
■ Inspection to keep errors away from the customer
■ Attribute sampling to measure conformance to quality on a per unit basis
■ Variable sampling to measure conformance to quality as a whole
■ Special causes to determine anomalies to quality
■ Random causes to determine expected variances of quality
■ Tolerance range to determine if the results are within, or without, an acceptablelevel of quality
■ Control limits to determine if the results are in, or out, of quality control
Preparing for Quality ControlQuality control relies on several inputs:
■ Work results The results of both the project processes and the productresults are needed to measure and compare to the quality standards. Theexpected results of the product and the project can be measured from theproject plan.
■ Quality management plan This plan defines how the project team willmeet the quality policy.
■ Operational definitions The operational definitions that define the metricsfor the project are needed so QC can measure and react to the results ofproject performance.
D:\010Comp\CertPrs8\062-2\ch08.vpWednesday, December 03, 2003 12:41:08 PM
Color profile: Generic CMYK printer profileComposite Default screen
■ Checklists If the project is using checklists to ensure project work is completed,a copy of the checklists will be needed as part of quality control. The checklistscan serve as an indicator of completed work—and expected results.
Inspecting ResultsAlthough quality is planned into a project, not inspected in, inspections are needed toprove the conformance to the requirements. An inspection can be done on the projectas a whole, a portion of the project work, the project deliverable, or even an individualactivity. Inspections are also known as:
■ Review
■ Product reviews
■ Audits
■ Walkthroughs
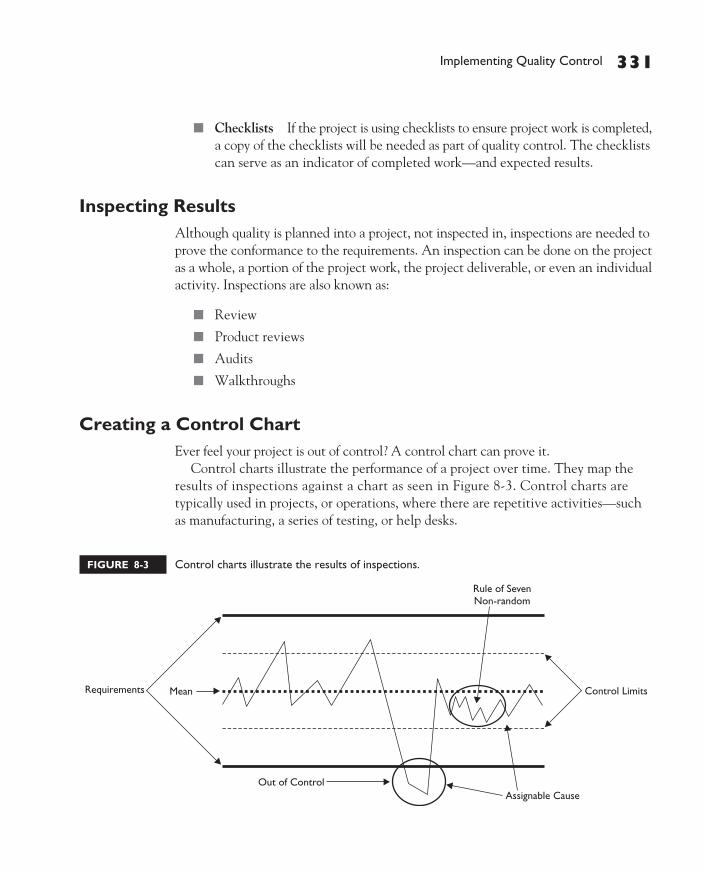
Creating a Control ChartEver feel your project is out of control? A control chart can prove it.
Control charts illustrate the performance of a project over time. They map theresults of inspections against a chart as seen in Figure 8-3. Control charts aretypically used in projects, or operations, where there are repetitive activities—suchas manufacturing, a series of testing, or help desks.
CertPrs8 / PMP Project Management Professional Study Guide / Phillips / 223062-2 / Chapter 8
Implementing Quality Control 331
CertPrs8 / PMP Project Management Professional Study Guide / Phillips / 223062-2 / Chapter 8
FIGURE 8-3 Control charts illustrate the results of inspections.
D:\010Comp\CertPrs8\062-2\ch08.vpWednesday, December 03, 2003 12:41:09 PM
Color profile: Generic CMYK printer profileComposite Default screen
332 Chapter 8: Introducing Project Quality Management
CertPrs8 / PMP Project Management Professional Study Guide / Phillips / 223062-2 / Chapter 8
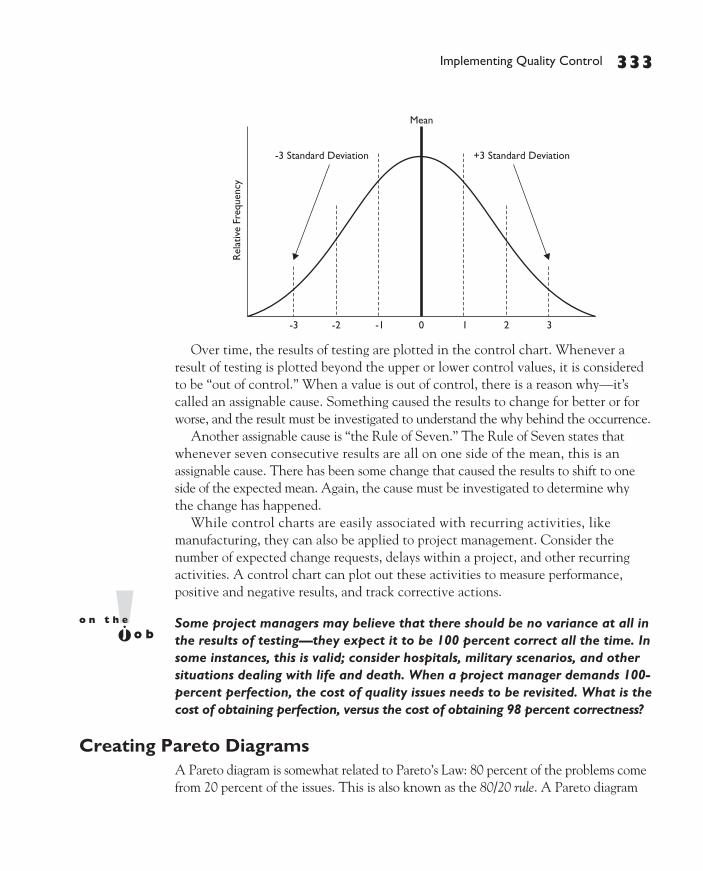
The outer limits of a control chart are set by the customer requirements. Within thecustomer requirements are the Upper Control Limits (UCL) and the Lower ControlLimits (LCL). The UCL is typically set at +3 or +6 sigma, while the LCL is set at –3 or–6 sigma. Sigma results show the degree of correctness. Table 8-1 shows the four sigmavalues representing normal distribution. You’ll need to know these for the PMP exam.
Value Percent Correct
+/– 1 sigma 68.26 percent
+/– 2 sigma 95.46 percent
+/– 3 sigma 99.73 percent
+/– 6 sigma 99.99 percent
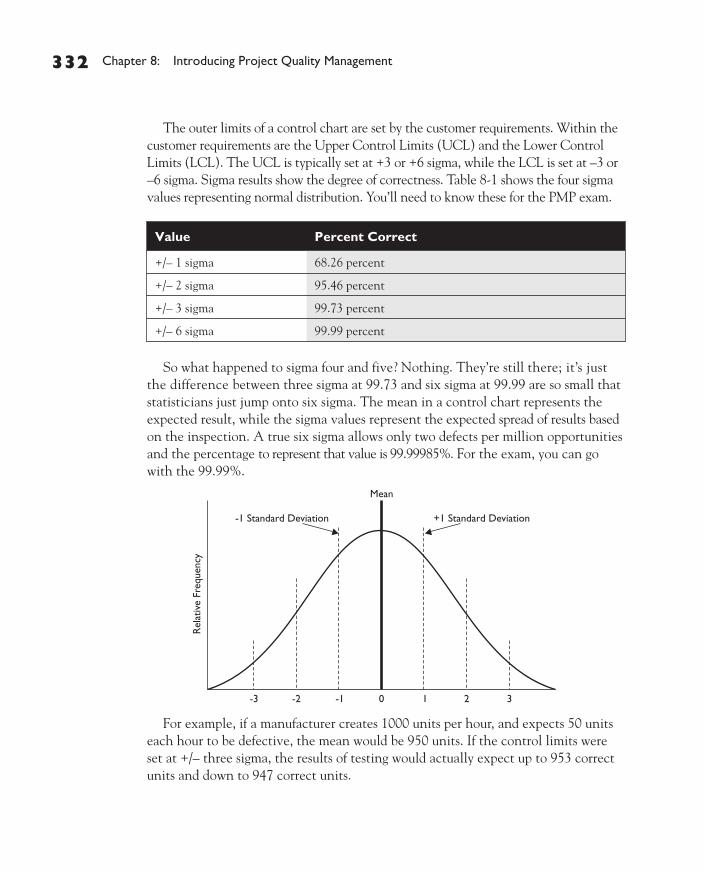
So what happened to sigma four and five? Nothing. They’re still there; it’s justthe difference between three sigma at 99.73 and six sigma at 99.99 are so small thatstatisticians just jump onto six sigma. The mean in a control chart represents theexpected result, while the sigma values represent the expected spread of results basedon the inspection. A true six sigma allows only two defects per million opportunitiesand the percentage to represent that value is 99.99985%. For the exam, you can gowith the 99.99%.
For example, if a manufacturer creates 1000 units per hour, and expects 50 unitseach hour to be defective, the mean would be 950 units. If the control limits wereset at +/– three sigma, the results of testing would actually expect up to 953 correctunits and down to 947 correct units.
D:\010Comp\CertPrs8\062-2\ch08.vpWednesday, December 03, 2003 12:41:09 PM
Color profile: Generic CMYK printer profileComposite Default screen
CertPrs8 / PMP Project Management Professional Study Guide / Phillips / 223062-2 / Chapter 8
Over time, the results of testing are plotted in the control chart. Whenever aresult of testing is plotted beyond the upper or lower control values, it is consideredto be “out of control.” When a value is out of control, there is a reason why—it’scalled an assignable cause. Something caused the results to change for better or forworse, and the result must be investigated to understand the why behind the occurrence.
Another assignable cause is “the Rule of Seven.” The Rule of Seven states thatwhenever seven consecutive results are all on one side of the mean, this is anassignable cause. There has been some change that caused the results to shift to oneside of the expected mean. Again, the cause must be investigated to determine whythe change has happened.
While control charts are easily associated with recurring activities, likemanufacturing, they can also be applied to project management. Consider thenumber of expected change requests, delays within a project, and other recurringactivities. A control chart can plot out these activities to measure performance,positive and negative results, and track corrective actions.
Some project managers may believe that there should be no variance at all inthe results of testing—they expect it to be 100 percent correct all the time. Insome instances, this is valid; consider hospitals, military scenarios, and othersituations dealing with life and death. When a project manager demands 100-percent perfection, the cost of quality issues needs to be revisited. What is thecost of obtaining perfection, versus the cost of obtaining 98 percent correctness?
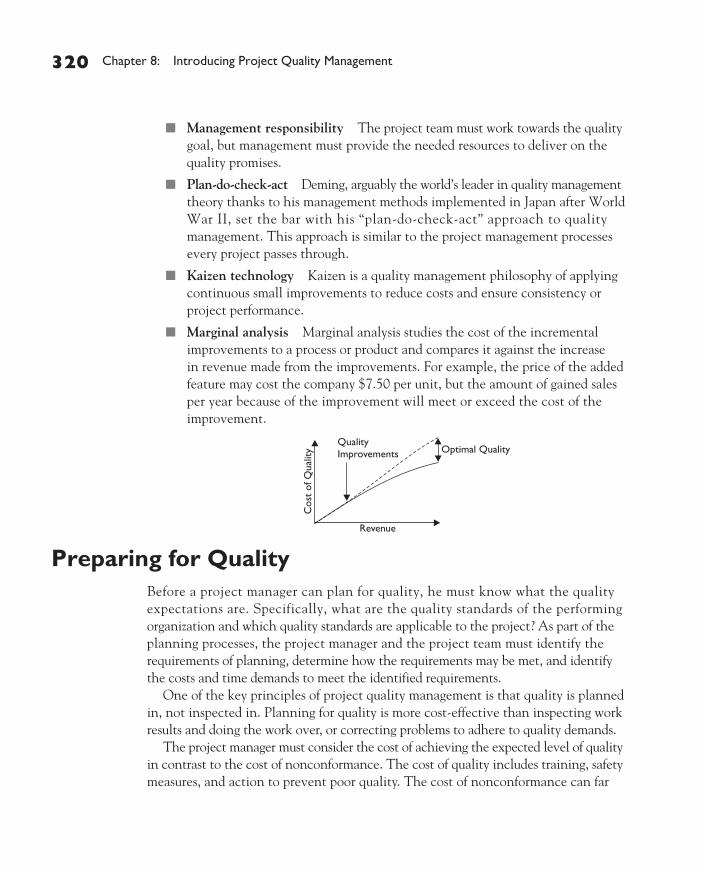
Creating Pareto DiagramsA Pareto diagram is somewhat related to Pareto’s Law: 80 percent of the problems comefrom 20 percent of the issues. This is also known as the 80/20 rule. A Pareto diagram
Implementing Quality Control 333
CertPrs8 / PMP Project Management Professional Study Guide / Phillips / 223062-2 / Chapter 8
D:\010Comp\CertPrs8\062-2\ch08.vpWednesday, December 03, 2003 12:41:09 PM
Color profile: Generic CMYK printer profileComposite Default screen
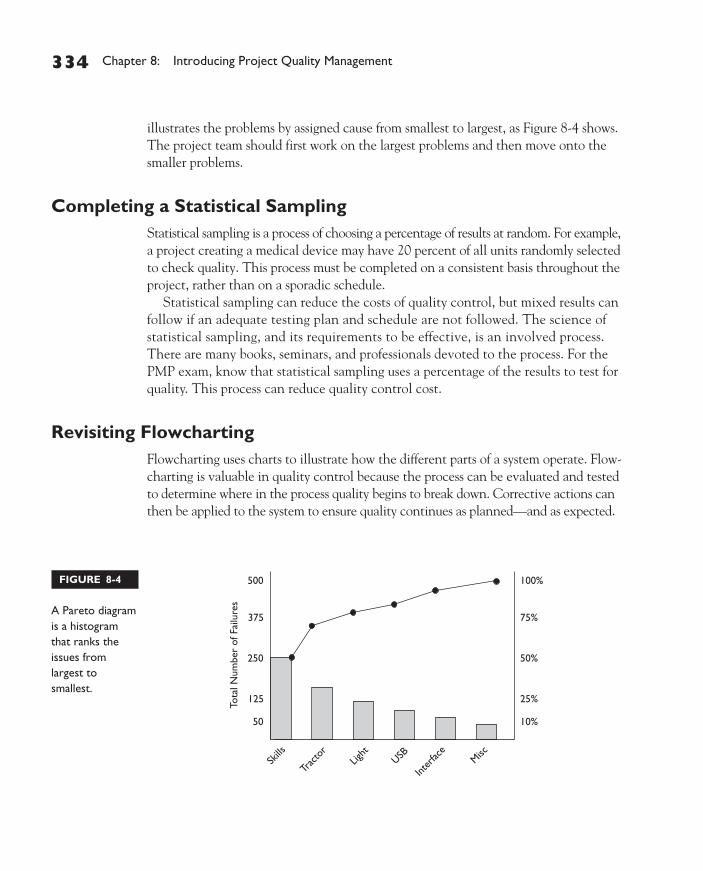
illustrates the problems by assigned cause from smallest to largest, as Figure 8-4 shows.The project team should first work on the largest problems and then move onto thesmaller problems.
Completing a Statistical SamplingStatistical sampling is a process of choosing a percentage of results at random. For example,a project creating a medical device may have 20 percent of all units randomly selectedto check quality. This process must be completed on a consistent basis throughout theproject, rather than on a sporadic schedule.
Statistical sampling can reduce the costs of quality control, but mixed results canfollow if an adequate testing plan and schedule are not followed. The science ofstatistical sampling, and its requirements to be effective, is an involved process.There are many books, seminars, and professionals devoted to the process. For thePMP exam, know that statistical sampling uses a percentage of the results to test forquality. This process can reduce quality control cost.
Revisiting FlowchartingFlowcharting uses charts to illustrate how the different parts of a system operate. Flow-charting is valuable in quality control because the process can be evaluated and testedto determine where in the process quality begins to break down. Corrective actions canthen be applied to the system to ensure quality continues as planned—and as expected.
334 Chapter 8: Introducing Project Quality Management
CertPrs8 / PMP Project Management Professional Study Guide / Phillips / 223062-2 / Chapter 8
500
375
250
125
50
100%
75%
50%
25%
10%
Skills
Trac
tor
Light
USB
Inter
face
Misc
Tota
l Num
ber
of F
ailu
res
FIGURE 8-4
A Pareto diagramis a histogramthat ranks theissues fromlargest tosmallest.
D:\010Comp\CertPrs8\062-2\ch08.vpWednesday, December 03, 2003 12:41:09 PM
Color profile: Generic CMYK printer profileComposite Default screen
CertPrs8 / PMP Project Management Professional Study Guide / Phillips / 223062-2 / Chapter 8
Applying Trend AnalysisTrend analysis is the science of taking past results to predict future performance. Sportsannouncers use trend analysis all the time: “The Cubs have never won in Saint Louis,on a Tuesday night, in the month of July, when the temperature at the top of the thirdinning is above 80 degrees.”
The results of trend analysis allow the project manager to apply corrective actionto intervene and prevent unacceptable outcomes. Trend analysis on a project requiresadequate records to predict results and set current expectations. Trend analysis canmonitor:
■ Technical performance Trend analysis can ask, “How many errors havebeen experienced by this point in the project schedule, and how manyadditional errors were encountered?”
■ Cost and schedule performance Trend analysis can ask, “How manyactivities were completed incorrectly, or came in late, or had significantcost variances?”
Results of Quality ControlQuality control should, first and foremost, result in quality improvement. The projectmanager and project team, based on the results of the tools and techniques to implementquality control, apply corrective actions to prevent unacceptable quality and improvethe overall quality of the project management processes.
The corrective actions the project manager and the project team want to incorporateinto the project may require change requests and management approval. The valueand importance of the change should be evident so the improvement to quality isapproved and folded into the project. In addition to quality improvement, there areother results of quality control:
■ Acceptance decisions Results of work are either accepted or rejected.Rejected items typically mean rework.
■ Rework Nonconformance to quality results in rework. Rework costs timeand money and contributes to projects being late, over budget, or both. It isalways more cost effective to do the work right the first time than to do itcorrect the second.
Results of Quality Control 335
CertPrs8 / PMP Project Management Professional Study Guide / Phillips / 223062-2 / Chapter 8
D:\010Comp\CertPrs8\062-2\ch08.vpWednesday, December 03, 2003 12:41:10 PM
Color profile: Generic CMYK printer profileComposite Default screen
CertPrs8 / PMP Project Management Professional Study Guide / Phillips / 223062-2 / Chapter 8
336 Chapter 8: Introducing Project Quality Management
CertPrs8 / PMP Project Management Professional Study Guide / Phillips / 223062-2 / Chapter 8
■ Completed checklists If the project is using checklists to confirm thecompletion of work, then the completed checklists should become part ofthe project records. Some project managers require the project team membercompleting the checklist to initial the checklists as whole and complete.
■ Process adjustments When results of inspections indicate quality is out ofcontrol then process adjustments may be needed to make immediate correctiveactions or planned preventive actions to ensure quality improves. Processadjustments, depending on the nature of the adjustment, may qualify for achange request and be funneled through the Change Control System as partof integration management.
CERTIFICATION SUMMARYWhat good is a project deliverable if it doesn’t work, is unacceptable, or faulty? Projectquality management ensures that the deliverables project teams create meet theexpectations of the stakeholders. For your PMP examination, quality means deliveringthe project at the exact level of the design specifications and the project scope. No more,no less.
Quality and grade are two different things. Grade is the ranking assigned todifferent components that have the same functional purpose. For example, sheetmetal may come in different grades based on what it is needed for. Another exampleis the grade of paper based on its thickness, ability to retain ink, and so on. Lowquality is always a problem; low grade may not be.
Quality planning happens before project work begins—but also as work is completed.Quality planning can confirm the preexistence of quality—or the need for qualityimprovements. Quality is planned into a project, not inspected in. However, qualitycontrol uses inspections to prove the existence of quality within a project deliverable.
The cost of quality is concerned with the monies invested in the project toascertain the expected level of quality. Examples of this cost include training, safetymeasures, and quality management activities. The cost of nonconformance centerson the monies lost by not completing the project work correctly the first time. Inaddition this fee includes the loss of sales, loss of customers, and downtime withinthe project.
Optimal quality is reached when the cost of the improvements equals theincremental costs to achieve quality. Marginal analysis is the study of when optimalquality is reached. The PMP candidate should know what marginal analysis is—and
D:\010Comp\CertPrs8\062-2\ch08.vpWednesday, December 03, 2003 12:41:10 PM
Color profile: Generic CMYK printer profileComposite Default screen
CertPrs8 / PMP Project Management Professional Study Guide / Phillips / 223062-2 / Chapter 8
why management is concerned with it. Ideally, the cost of quality earns is earned backbecause the deliverables of the project are better and more profitable than if thequality of deliverables was lacking.
Certification Summary 337
CertPrs8 / PMP Project Management Professional Study Guide / Phillips / 223062-2 / Chapter 8
Quality, in project management, has manydifferent meanings. For the PMP exam, youshould know four key facts:
■ Customer satisfaction is the conformanceof the requirements and fitness for use.
■ Quality is distinct from grade.
■ Quality is the project team doing whatwas promised at the start of the project.
■ Quality is concerned with preventionover inspection.
Don’t get flustered over the differencebetween QC and QA. QC focuses onmonitoring specific results of project work.QA focuses on monitoring overall performance.If it helps for the exam, think of QC beingproject-wide, and QA being organization-wide. Another aspect of QC is that the projectteam must be empowered to stop project workif quality is outside of the control limits set bythe quality management plan.
The quality management plan spans all areasof project quality—not just the product theproject is creating. The experience of the projectas led by the project manager should be ofquality as well. The relation between the project
deliverables and the project management qualityis directly related.
Another area of quality is scheduling.A project manager must examine resources,how they are allocated, and pay attentionto cost of quality for the assigned resources.One scheduling technique, just-in-time (JIT)scheduling demands higher quality. JIT doesnot order inventory, such as supplies andmaterials, until they are needed. This improvescash flow and reduces the cost of inventorynot in use. However, a lack of quality in theproject may cause defects. Because of the defects,the material in use is wasted and downtimeoccurs. Downtime occurs because there are noadditional materials on hand and the project iswaiting for new materials to arrive.
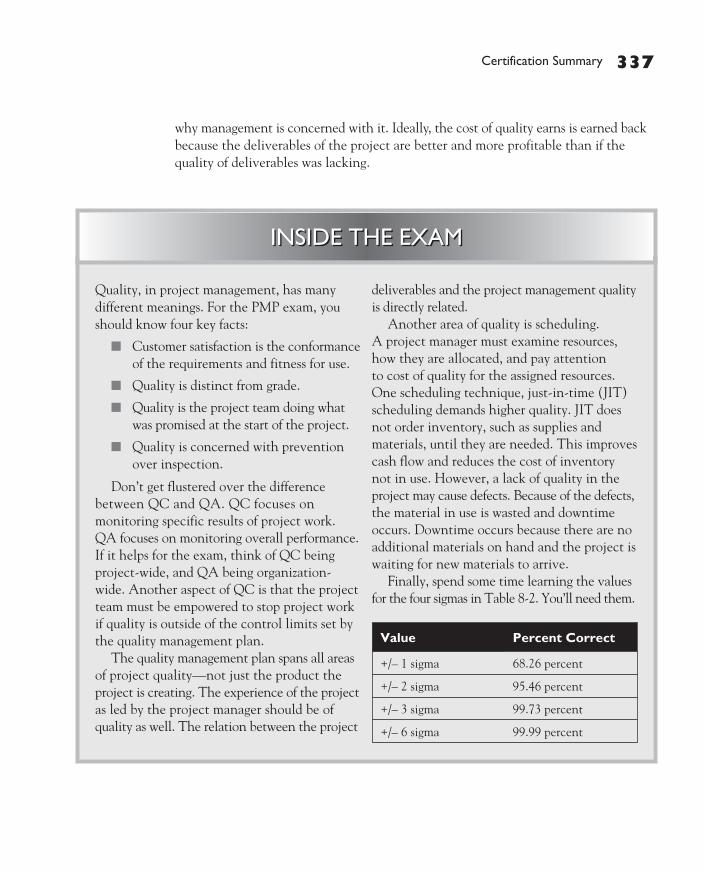
Finally, spend some time learning the valuesfor the four sigmas in Table 8-2. You’ll need them.
Value Percent Correct
+/– 1 sigma 68.26 percent
+/– 2 sigma 95.46 percent
+/– 3 sigma 99.73 percent
+/– 6 sigma 99.99 percent
INSIDE THE EXAMINSIDE THE EXAM
D:\010Comp\CertPrs8\062-2\ch08.vpWednesday, December 03, 2003 12:41:10 PM
Color profile: Generic CMYK printer profileComposite Default screen
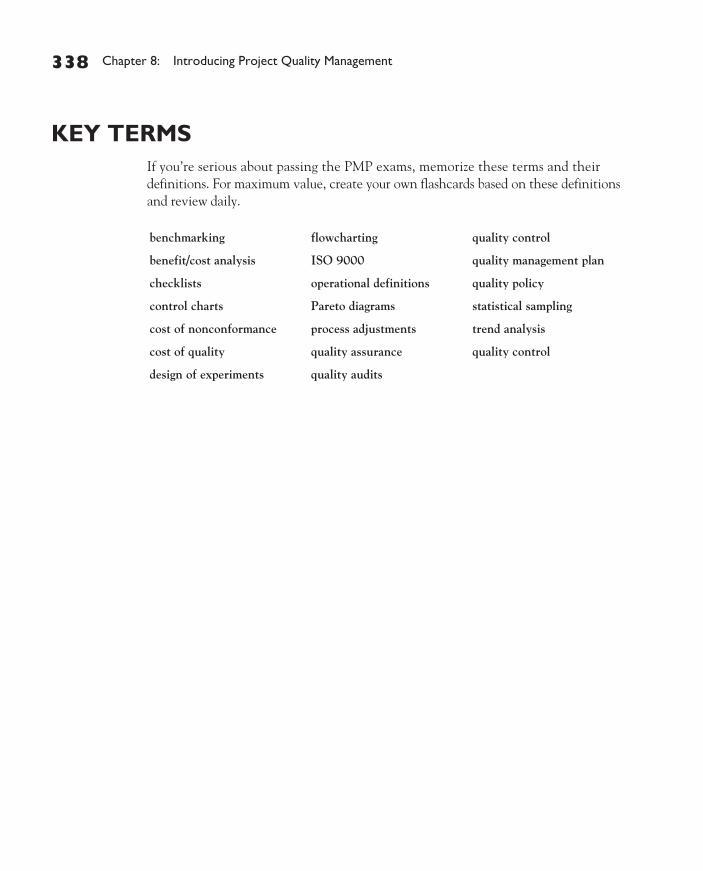
KEY TERMSIf you’re serious about passing the PMP exams, memorize these terms and theirdefinitions. For maximum value, create your own flashcards based on these definitionsand review daily.
benchmarking flowcharting quality control
benefit/cost analysis ISO 9000 quality management plan
checklists operational definitions quality policy
control charts Pareto diagrams statistical sampling
cost of nonconformance process adjustments trend analysis
cost of quality quality assurance quality control
design of experiments quality audits
338 Chapter 8: Introducing Project Quality Management
CertPrs8 / PMP Project Management Professional Study Guide / Phillips / 223062-2 / Chapter 8
D:\010Comp\CertPrs8\062-2\ch08.vpWednesday, December 03, 2003 12:41:10 PM
Color profile: Generic CMYK printer profileComposite Default screen
Two-Minute Drill 339
CertPrs8 / PMP Project Management Professional Study Guide / Phillips / 223062-2 / Chapter 8
✓TWO-MINUTE DRILLEnsuring Project Quality
❑ The project manager is responsible for the overall quality management of theproject and must set quality expectations based on the requirements of thecustomers and stakeholders.
❑ The project manager must integrate the quality control of the project withthe quality assurance program of the performing organization.
❑ Quality is planned into a project, not inspected in.
Enforcing Project Quality❑ The project team members (the people actually completing the project work)
have the power and responsibility of the quality of the deliverables.
❑ The project team, as guided by the project manager and the qualitymanagement plan, should be empowered to stop the project work whenpreset, quality thresholds are exceeded.
❑ Quality planning is an iterative process. As quality concerns creep into theproject the planning processes are revisted to ensure actions—preventive andcorrective actions—are taken to ensure quality.
Implementing Quality Control❑ Quality control monitors specific results within a project.
❑ Quality control is concerned that the results must satisfy relevant qualitystandards.
❑ Quality control can rely on root cause analysis used to eliminate unsatisfactoryresults.
❑ Quality control is completed through inspection.
Implementing Quality Assurance❑ Quality assurance monitors overall results.
❑ Quality assurance may use a QA program to set quality standards.
❑ Quality assurance represents the implementation of the quality plan.
Relying on Quality Management❑ Quality management is the process to ensure the project is completed with
no deviations from the requirements. There are several quality managementphilosophies:
D:\010Comp\CertPrs8\062-2\ch08.vpWednesday, December 03, 2003 12:41:11 PM
Color profile: Generic CMYK printer profileComposite Default screen
340 Chapter 8: Introducing Project Quality Management
CertPrs8 / PMP Project Management Professional Study Guide / Phillips / 223062-2 / Chapter 8
❑ Total Quality Management (TQM) The organization strives for constantimprovement for products and business practices.
❑ Kaizen The organization applies small changes to products and processes toimprove consistency, reduce costs, and provide overall quality improvements.
❑ Marginal analysis The cost of the quality is not greater than the increasedsales because of the level of quality implemented. Ideally, the revenue generatedbecause of the quality improvements far exceeds the cost of the quality.
Evaluating Quality Costs❑ The cost of quality is the amount of monies the performing organization must
spend to satisfy the quality standards. This can include training, safety measures,additional activities implemented to prevent nonconformance.
❑ The cost of nonconformance to quality is the monies or events attributed tonot satisfying the quality demands. These can include loss of business, downtime,wasted materials, rework, and cost and schedule variances.
❑ Optimal quality is reached when the cost of quality meets or exceeds theincremental cost to achieve quality.
Charting Quality Control❑ Fishbone diagram This is a cause-and-effect diagram that illustrates the
factors which may be contributing to quality issues or problems. It is alsoknown as an Ishikawa diagram.
❑ Flow charts Flow charts demonstrate how a system works from start tofinish, and illustrate how system components are integrated.
❑ Pareto diagrams These histograms are related to Pareto’s 80/20 rule, “80percent of the problems come from 20 percent of the issues.” The diagramcharts the problems, categories, and frequency. The project team should firstsolve the larger problems and then move onto smaller issues.
❑ Control Charts These charts plot out the results of inspections againsta mean to examine performance against expected results. Upper and lowercontrol limits are typically set to ± three or six sigma. Results that are beyondthe control limit value are considered out of control. Out of control resultshave an assignable cause that requires investigation to determine why theresult occurred. In addition, seven consecutive results on one side of themean indicate an assignable cause and is known as the “Rule of Seven.”
D:\010Comp\CertPrs8\062-2\ch08.vpWednesday, December 03, 2003 12:41:12 PM
Color profile: Generic CMYK printer profileComposite Default screen
SELF TEST1. Which of the following is responsible for the quality of the project deliverables?
A. Project championB. Project teamC. StakeholdersD. Customers
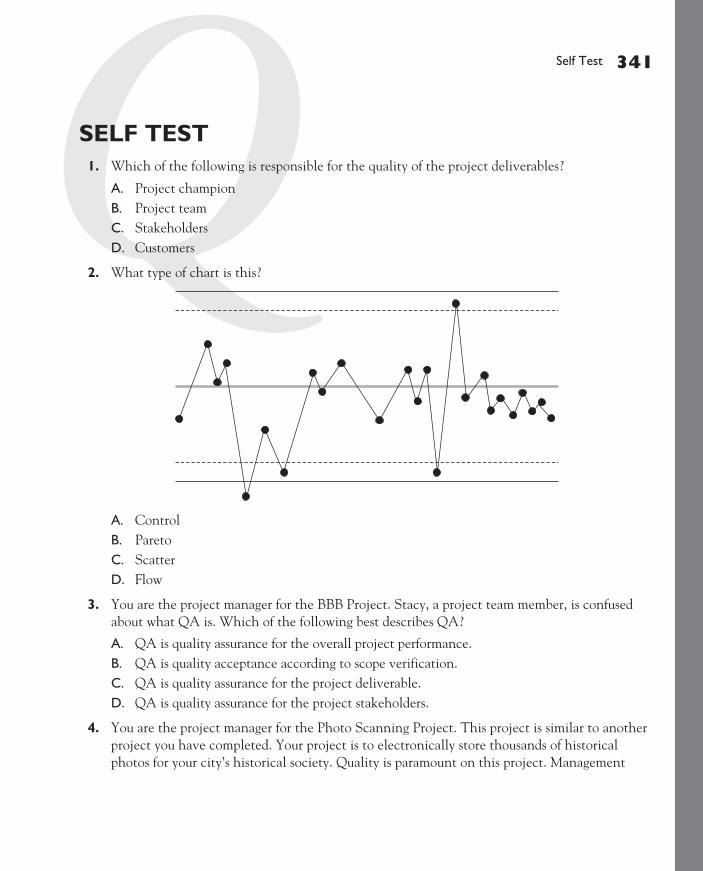
2. What type of chart is this?
A. ControlB. ParetoC. ScatterD. Flow
3. You are the project manager for the BBB Project. Stacy, a project team member, is confusedabout what QA is. Which of the following best describes QA?
A. QA is quality assurance for the overall project performance.B. QA is quality acceptance according to scope verification.C. QA is quality assurance for the project deliverable.D. QA is quality assurance for the project stakeholders.
4. You are the project manager for the Photo Scanning Project. This project is similar to anotherproject you have completed. Your project is to electronically store thousands of historicalphotos for your city’s historical society. Quality is paramount on this project. Management
Self Test 341
CertPrs8 / PMP Project Management Professional Study Guide / Phillips / 223062-2 / Chapter 8
D:\010Comp\CertPrs8\062-2\ch08.vpWednesday, December 03, 2003 12:41:12 PM
Color profile: Generic CMYK printer profileComposite Default screen
342 Chapter 8: Introducing Project Quality Management
CertPrs8 / PMP Project Management Professional Study Guide / Phillips / 223062-2 / Chapter 8
approaches you and asks why you have devoted so much of the project time for planning. Yourresponse is which of the following?
A. This is a first-time, first-use project, so more time is needed for planning.B. Planning for a project of this size, with this amount of quality, is mandatory.C. Quality is planned into a project, not inspected in.D. Quality audits are part of the planning time.
5. You are the project manager for the Floor Installation Project. Today, you plan to meet with yourproject team to ensure the project is completed with no deviations from the project requirements.This process is which of the following?
A. Quality planningB. Quality managementC. Quality controlD. Quality assurance
6. You are the project manager for the ASE Project. This project must map to industry standardsin order to be accepted by the customer. You and your team have studied the requirements andhave created a plan to implement the deliverables with the appropriate level of quality. Thisprocess is called which of the following?
A. Quality planningB. Quality managementC. Quality controlD. Quality assurance
7. Which of the following is an example of internal failure cost?
A. ReworkB. Quality auditsC. Random quality auditsD. Project team training
8. QC is typically a(n) ___________________________ process.
A. ManagementB. Project managerC. AuditD. Inspection
D:\010Comp\CertPrs8\062-2\ch08.vpWednesday, December 03, 2003 12:41:12 PM
Color profile: Generic CMYK printer profileComposite Default screen
Self Test 343
CertPrs8 / PMP Project Management Professional Study Guide / Phillips / 223062-2 / Chapter 8
9. QA is typically a(n) _________________________________ process.
A. ManagementB. Project managerC. AuditD. Inspection
10. You are the project manager for a large manufacturer of wood furniture. Your new project is theShop Table Project, which will be the creation and manufacturing of a new table for woodworkersto use in their wood shops. On this project you have elected to use JIT for scheduling. Whichof the following is an advantage to using JIT?
A. Requires materials to be readily available.B. Allows the project team to have control over the materials.C. Decreases the inventory investment.D. Allows for a broad range of deviation than other inventory solutions.
11. Your company has elected to use ISO 9000 standards. What is an attribute of ISO 9000?
A. It ensures your company follows its own quality procedures.B. It ensures that your company will follow the set phases in each project from initiation
to closure.C. It ensures that your company maps its processes to a proven process within the program.D. It ensures that QA and QC are integrated into the product or service your organization offers.
12. You are the project manager of the Halogen Installation Project. As this project gets underway,you receive notice from the program manager that the organization will be moving to Kaizentechnologies as part of its quality management program. What are Kaizen technologies?
A. Small improvements for small resultsB. Small improvements for all projectsC. Small process and product improvements that are carried out on a continuous basisD. Small process improvements that are made to shorten the project duration
13. A fishbone diagram is the same as a(n) ______________________ chart.
A. IshikawaB. ParetoC. FlowD. Control
D:\010Comp\CertPrs8\062-2\ch08.vpWednesday, December 03, 2003 12:41:12 PM
Color profile: Generic CMYK printer profileComposite Default screen
344 Chapter 8: Introducing Project Quality Management
CertPrs8 / PMP Project Management Professional Study Guide / Phillips / 223062-2 / Chapter 8
14. Management has asked you to define the correlation between quality and the project scope.Which of the following is the best answer?
A. The project scope will include metrics for quality.B. Quality metrics will be applied to the project scope.C. Quality is the process of completing the scope to meet stated or implied needs.D. Quality is the process of evaluating the project scope to ensure quality exists.
15. Which of the following is most true about quality?
A. It will cost more money to build quality into the project.B. It will cost less money to build quality into the project process.C. Quality is inspection driven.D. Quality is prevention driven.
16. _______________________________ is a business philosophy to find methods to continuouslyimprove products, services, and business practices.
A. TQMB. ASQC. QAD. QC
17. In quality management, which of the following is not an attribute of the cost of nonconformance?
A. Loss of customersB. DowntimeC. Safety measuresD. Rework
18. You are the project manager for the KOY Project. This project requires quality that maps tofederal guidelines. To ensure that you can meet these standards, you have elected to send theproject team through training specific to the federal guidelines your project must adhere to.The costs of these classes can be assigned to which of the following?
A. Cost of doing businessB. Cost of qualityC. Cost of adherenceD. Cost of nonconformance
19. You are the project manager for the KOY Project. This project requires quality that maps tofederal guidelines. During a quality audit, you discovered that a portion of the project work isfaulty and must be done again. The requirement to do the work is an example of which of thefollowing?
D:\010Comp\CertPrs8\062-2\ch08.vpWednesday, December 03, 2003 12:41:12 PM
Color profile: Generic CMYK printer profileComposite Default screen
Self Test 345
CertPrs8 / PMP Project Management Professional Study Guide / Phillips / 223062-2 / Chapter 8
A. Cost of qualityB. Cost of adherenceC. Cost of nonconformanceD. Cost of doing business
20. Optimal quality is reached at what point?
A. When the stakeholder accepts the project deliverable.B. When revenue from improvements equal the costs of conformance.C. When revenue from improvement equals the incremental costs to achieve the quality.D. When revenue from corrective actions equals the costs of the improvement.
21. You are the project manager of the JKL Project. The project is having some flaws in its production.Which analysis tool will allow you to determine the cause-and-effect of the production faults?
A. Flow chartB. Pareto diagramC. IshikawaD. Control chart
22. Linda is the project manager of a manufacturing project. She and her project team are usingdesign of experiments to look for ways to improve quality. Which of the following best describesthe method Linda and her team are using?
A. Design of experiments allows the project manager to move the relationship of activitiesto complete the project work with the best resources available.
B. Design of experiments allows the project manager to experiment with the project designto determine what variables are causing the flaws.
C. Design of experiments allows the project manager to experiment with variables to attemptto improve quality.
D. Design of experiments allows the project manager to experiment with the project designdocument to become more productive and provide higher quality.
23. You are the project manager of the Global Upgrade Project. Your project team consists of 75project team members around the world. Each project team will be upgrading a piece ofequipment in many different facilities. Which of the following could you implement to ensurethe project team members are completing all of the steps in the install procedure with quality?
A. ChecklistsB. WBSC. PNDD. The WBS dictionary
D:\010Comp\CertPrs8\062-2\ch08.vpWednesday, December 03, 2003 12:41:12 PM
Color profile: Generic CMYK printer profileComposite Default screen
346 Chapter 8: Introducing Project Quality Management
CertPrs8 / PMP Project Management Professional Study Guide / Phillips / 223062-2 / Chapter 8
24. Mark is the project manager of the PMH Project. Quality audits of the deliverables show thereare several problems. Management has asked Mark to create a chart showing the distribution ofproblems and their frequencies. Management wants which of the following?
A. Control chartB. Ishikawa chartC. Pareto diagramD. Flow chart
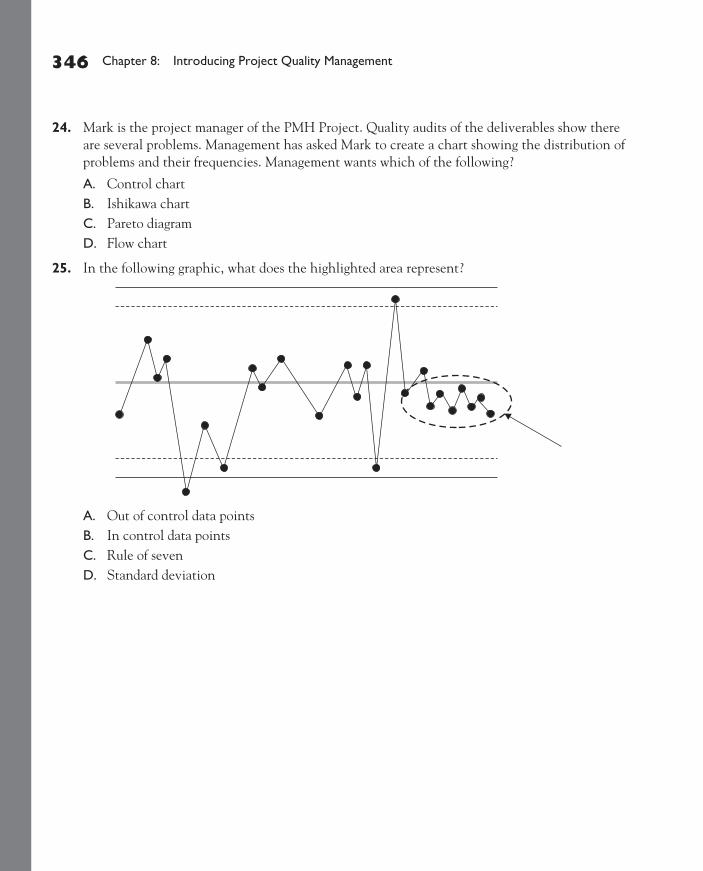
25. In the following graphic, what does the highlighted area represent?
A. Out of control data pointsB. In control data pointsC. Rule of sevenD. Standard deviation
D:\010Comp\CertPrs8\062-2\ch08.vpWednesday, December 03, 2003 12:41:13 PM
Color profile: Generic CMYK printer profileComposite Default screen
SELF TEST ANSWERS1. � B. The project team (the individuals completing the project work) is responsible for the
quality of the project deliverables.� A is incorrect; the project champion may review the work, but the responsibility to qualitydoes not lie with this individual. C and D are also incorrect choices; the customer and otherstakeholders are not responsible for the quality of the project.
2. � A. The chart shown is a control chart.� B is incorrect since a Pareto diagram maps categories of issues and their frequency.C is incorrect; a scatter chart compares common values across multiple categories. D, a flowchart, is incorrect also; flow charts illustrate how a process moves through a system and howthe components are interrelated.
3. � A. QA is concerned with overall project quality performance.� B, C, and D are incorrect because they do not correctly explain quality assurance.
4. � C. Of all the choices presented, this is the best answer. Quality is planned into the projectand the planning requires time.� A is incorrect because a project of this nature has been completed before. B is incorrectbecause there is not enough information provided to determine what the quality demands ofthe project are. D is incorrect because quality audits are not part of the planning processes.
5. � A. Quality planning should be completed prior to the work beginning—and thereafterbe revisited as needed.� B is incorrect as Quality management is not an applicable answer to the scenario;C and D are incorrect, because QA and QC are part of quality management.
6. � A. Quality planning is the process of creating a plan to meet the requirements of quality.� Choices B, C, and D are incorrect because they do not explain the process in the questionsscenario.
7. � A. Internal failure cost is attributed to failure that results in rework. It is an example of thecost of nonconformance to quality.� B and C are incorrect; quality audits are not a cost associated with nonconformance.D is incorrect because project team training is an example of the cost of conformance to quality.
8. � D. QC requires an inspection of the work results. While quality is planned into a project,inspections ensure it exists.� A is incorrect; QA is a managerial function. B is incorrect because another department,team member, or SME can complete QC. C is incorrect; an audit is too broad an answer forthis question. Audits can be financial, schedule, or quality driven.
Self Test Answers 347
CertPrs8 / PMP Project Management Professional Study Guide / Phillips / 223062-2 / Chapter 8
D:\010Comp\CertPrs8\062-2\ch08.vpWednesday, December 03, 2003 12:41:13 PM
Color profile: Generic CMYK printer profileComposite Default screen
9. � A. QA is typically a management process.� B is incorrect because another department, team member, or SME can complete QC.C is incorrect because an audit is too broad of an answer for this question. Audits can be financial,schedule, or quality driven. D is wrong because QA is typically not an inspection process.
10. � C. JIT, just-in-time scheduling, decreases the investment in inventory. However, mistakeswith the materials can cause downtime if no additional materials are on hand.� A is incorrect because materials are only available when they are needed. B is incorrect;the project team must use caution not to waste the materials. D is incorrect because JIT doesnot allow a broad range of deviation.
11. � A. ISO 9000 is not a quality management system, but a system to ensure an organizationfollows its own quality procedures.� B, C, and D are all incorrect. These choices do not correctly describe ISO 9000.
12. � C. Kaizen technologies are small changes to processes and products on a steady, continuousbasis to save costs and improve quality.� A is incorrect; while Kaizen does implement small process changes, it does not aim forsmall results. B and D are also incorrect. Kaizen does not have to be implemented in allprojects, though it often is. Kaizen is also not interested in necessarily reducing the projectduration.
13. � A. A fishbone diagram is the same as an Ishikawa diagram.� B, C, and D are incorrect; these charts and diagrams accomplish goals other than thecause-and-effect of the Ishikawa.
14. � C. Quality, in regard to the project scope, is about completing the work as promised.� A is incorrect; the project scope will have requirements for acceptance, but may not havemetrics for quality defined. B and D are also incorrect.
15. � D. Quality is prevention driven. Quality wants to complete the work correctly the firsttime to prevent poor results, loss of time, and loss of funds.� A and B are incorrect; there is no guarantee that a project will cost more or less dependingon the amount of expected quality. Incidentally, lack of quality will likely cost more than qualityplanning because of the cost of nonconformance. C is incorrect because quality is planned intoa project, not inspected in.
16. � A. TQM, Total Quality Management, is a business philosophy to find methods tocontinuously improve.� B, ASQ (American Society of Quality) is not a business philosophy. C and D are attributesof TQM, but are not correct answers for this question.
348 Chapter 8: Introducing Project Quality Management
CertPrs8 / PMP Project Management Professional Study Guide / Phillips / 223062-2 / Chapter 8
D:\010Comp\CertPrs8\062-2\ch08.vpWednesday, December 03, 2003 12:41:13 PM
Color profile: Generic CMYK printer profileComposite Default screen
17. � C. A safety measure is not an attribute of the cost of nonconformance, but rather a costof adhering to quality.� A, B, and D are incorrect choices; these are all attributes of the cost of nonconformance.
18. � B. Training to meet the quality expectations are attributed to the cost of quality.� A, C, and D are incorrect because these choices do not describe training as a cost of quality.
19. � C. When project work results are faulty and must be done over, it is attributed to the costof nonconformance to quality.� A, B, and D are all incorrect; these values do not describe faulty work or the cost ofnonconformance.
20. � C. Marginal analysis provides that optimal quality is reached when the cost of theimprovements equals the incremental costs to achieve the quality.� A, B, and D are incorrect. These answers do not describe marginal analysis.
21. � C. The key words “cause-and-effect” equate to the Ishikawa diagram.� A is incorrect; a flow chart will show how a process moves through the system, but notthe cause-and-effect of the problems involved. B is incorrect as well. A Pareto chart maps out thecauses and frequency of problems. D, a control chart, plots out the results of sampling, but doesnot show the cause-and-effect of problems.
22. � C. Of all the choices presented, C is the best. Design of experiments uses experiments and“what-if” scenarios to determine what variables are affecting quality.� A is incorrect because design of experiments, in regard to quality, is not interested in changingthe relationship of activities to complete project work. B and D are also incorrect because designof experiments will not be changing project design to determine where flaws exist or to becomemore productive.
23. � A. Checklists are simple but effective quality management tools that the project managercan use to ensure the project team is completing the required work.� B, C, and D are all incorrect. The WBS, PND, and WBS dictionary are not tools the projectteam can necessarily use to prove they’ve completed required work. Checklists are the bestapproach for this scenario.
24. � C. Management wants Mark to create a Pareto diagram. Recall that a Pareto diagram mapsout the causes of defects and illustrates their frequency.� A is incorrect because a control chart does not identify the problems, only the relation ofthe results to the expected mean. B is incorrect because a cause-and-effect diagram does notmap out the frequency of problems. D is also incorrect; flow charts show how a process movesthrough a system and how the components are related.
Self Test Answers 349
CertPrs8 / PMP Project Management Professional Study Guide / Phillips / 223062-2 / Chapter 8
D:\010Comp\CertPrs8\062-2\ch08.vpWednesday, December 03, 2003 12:41:13 PM
Color profile: Generic CMYK printer profileComposite Default screen
25. � C. The highlighted area shows seven consecutive sampling results all on one side of themean; this is known as the rule of seven and is an assignable cause.� A is incorrect; these values are in control. B is correct, but it does not fully answerthe question as choice C does. D is incorrect; standard deviation is a predicted measureof the variance from the expected mean of a sampling.
350 Chapter 8: Introducing Project Quality Management
CertPrs8 / PMP Project Management Professional Study Guide / Phillips / 223062-2 / Chapter 8
D:\010Comp\CertPrs8\062-2\ch08.vpWednesday, December 03, 2003 12:41:13 PM
Color profile: Generic CMYK printer profileComposite Default screen