an interdisciplinary project for air-quality characterisation in
TRANSCRIPT

LIFE ENV/P/000830
An interdisciplinary project for air-quality characterisation in the Sines region (Portugal)
Sines is one of the big industrial regions of this country suffering pressures not only from the normal demographic growth of the Portuguese littoral but also from industry and, tourism. Local authorities are naturally concerned with these factors – industries and the need for environmental sustainability – seeking for constant and efficient control and management of environmental indicators and particularly air quality.
In this context the Coordinating Commission for the Development of the Alentejo Region (CCDR–Alentejo), the Instituto Superior Técnico (IST, Environmental Group of the CMRP), the Lisbon University Foundation (FUL; Laboratory Museum of the Botanic Garden) and the Instituto Superior for Work and Business Sciences (ISCTE; OBSERVA), carried out a project for the design and implementation of an air-quality monitoring, control and management tool for the Sines region.
From the very beginning this project could count on the full support, including technical as well as financial participation, of the main businesses in the region, some of which holders of potential air-quality polluting industries – Petrogal, Borealis, CPPE, Transgás Atlântico e Administração do Porto de Sines. Apart from companies and universities this project was also financially supported by the Life–Environment programme of the European Commission (covering 50% of the costs).
Geostatistical and mathematical modelling, bio monitoring and social enquiries form the methodological framework on which an information system (GIS and data base) was built. This system – systematically fed with industrial emission data, air quality records from several monitoring stations and data from passive sampler campaigns – will inform managers and the general public, through the internet, about the current state of the region’s air quality.
The residents feel that air quality is one of the most severe environmental problems in their area, which should deserve more attention from national and local authorities. This motivated and set off the ISCTE team to elaborate a picture of the way the population feels about the environment of their region.
The FUL team used lichens, organisms sensitive to air quality, as bio-indicators (lichen biodiversity) for the most negatively affected areas. Subsequently, the same team used lichen bioaccumulation capacity to measure dioxin, PCB and heavy metal contamination in the whole region.
Simultaneously, the CCDR–Alentejo set up and implemented a field survey, using passive samplers – diffusion tubes – to assess levels of the main pollutant gases in the region. These led to the first images of regional spatial dispersion of contaminants, clearly related to air quality.
LIFE ENV/P/000830
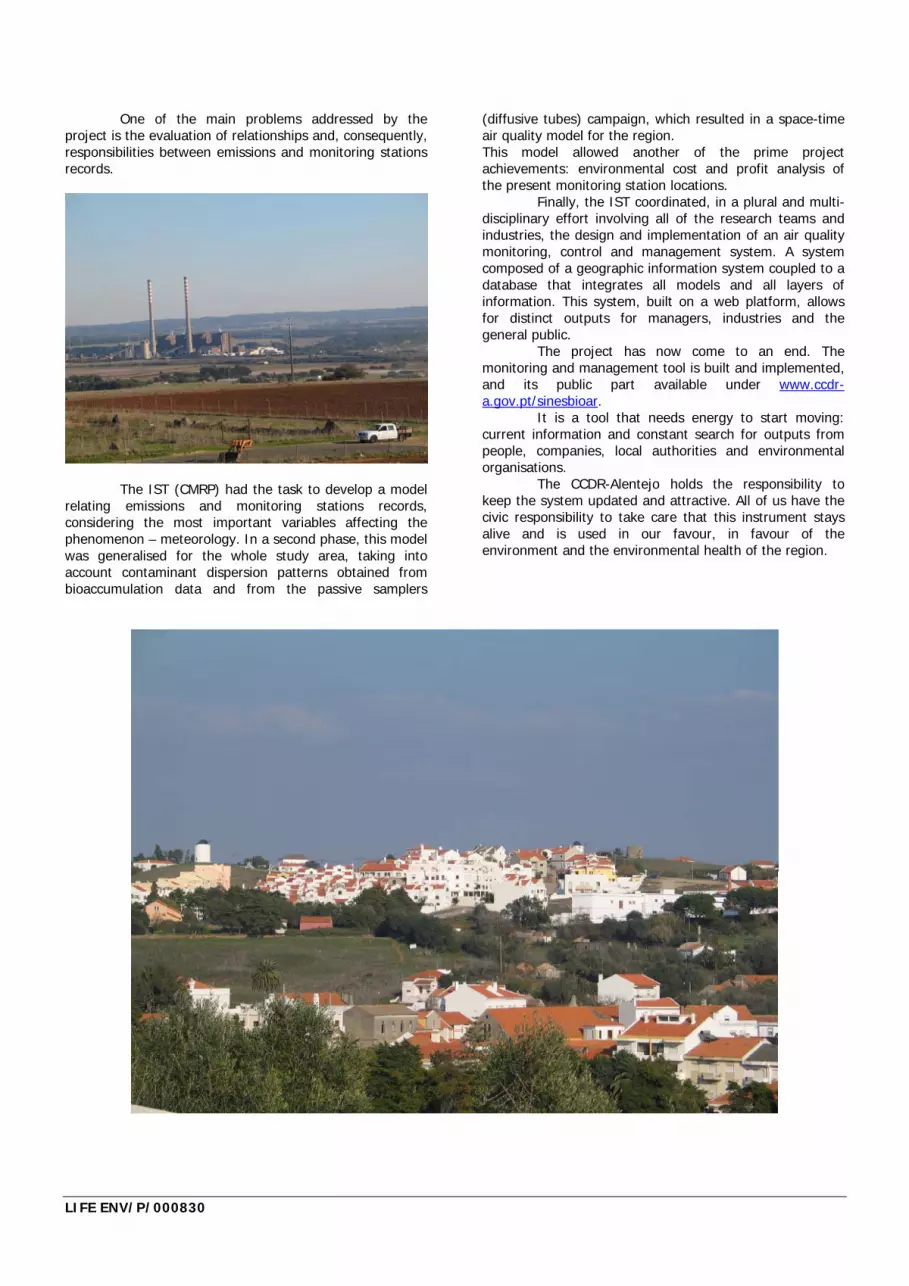
One of the main problems addressed by the project is the evaluation of relationships and, consequently, responsibilities between emissions and monitoring stations records.
The IST (CMRP) had the task to develop a model relating emissions and monitoring stations records, considering the most important variables affecting the phenomenon – meteorology. In a second phase, this model was generalised for the whole study area, taking into account contaminant dispersion patterns obtained from bioaccumulation data and from the passive samplers
(diffusive tubes) campaign, which resulted in a space-time air quality model for the region. This model allowed another of the prime project achievements: environmental cost and profit analysis of the present monitoring station locations.
Finally, the IST coordinated, in a plural and multi-disciplinary effort involving all of the research teams and industries, the design and implementation of an air quality monitoring, control and management system. A system composed of a geographic information system coupled to a database that integrates all models and all layers of information. This system, built on a web platform, allows for distinct outputs for managers, industries and the general public.
The project has now come to an end. The monitoring and management tool is built and implemented, and its public part available under www.ccdr-a.gov.pt/sinesbioar.
It is a tool that needs energy to start moving: current information and constant search for outputs from people, companies, local authorities and environmental organisations.
The CCDR-Alentejo holds the responsibility to keep the system updated and attractive. All of us have the civic responsibility to take care that this instrument stays alive and is used in our favour, in favour of the environment and the environmental health of the region.

LIFE ENV/P/000830
Tasks Monitoring air quality - Collection and analysis of historical data - Bioindication and biomonitoring using lichens - Laboratory analysis Modelling air quality - Temporal analysis - Spatial analysis of lichen biodiversity, bioaccumulation
and passive samplers (diffusive tubes) - Classification of multi-sources contribution - Simulation of extreme and critical scenarios Social Component e impacts - Development and application of a survey - Elaboration of an institutional and framework analysis of
the main social actors participating in the ecological communication at the local level namely: governmental (local and central level), industries and non-governmental organizations, dealing with environmental, nature conservation, sustainable development, and territory planning issues at the local level
- Case studies on recent past events and processes of social and political mobilization and protest on environmental issues, focusing in particular air quality issues and pollution caused by, or ascribed to, industries installed on the region
Risk analysis and environmental impact costs - Landuse map - Unitary costs map - Impact cost analysis of monitoring stations spatial
location Air quality control tool - Design and implementation of a geographical database - Software Implementation of air quality modelling Dissemination - Public presentations of the project - Press releases and short notes on media - Brochure of the project - Webpage - Technical workshops - Participation on international scientific meetings and
conferences
Impacts on Environmental Field The first and main result and impact of this project lays on the innovation of the organizational approach by integrating the different partners intervenient in the air quality problem of the region: the industries with emissions, interested in the management and control of the air quality of the region, given their economical and technological strengths for the reduction of their own emissions; the different regional public services and social entities interested in the achievement of the crucial balance, between local economy and environment, for the sustainable development of the region; the research centers of different universities interested on the implementation of new technologies for the solution of local problems such as the evaluation and management of the air quality. Innovative aspects The most relevant print of this project is precisely the innovative organizational component for the achievement of one goal, which is integrated in the new way of approaching global environmental problems: “Think global, act local”. In this approach, the project had the ability of coupling and organizing private companies, public entities and research centers for the local solution of a global problem: air quality and reduction of emissions. Another innovative aspect was the use of multidisciplinary methodologies implemented in air quality evaluation and management tools. The approach of this problem, which is transversal to economic, social and environmental components, was based on multidisciplinary methodologies: the use of liquens as bio-monitors, the survey of most relevant social problems, the geostatistical models of space-time dispersion of pollutants and the geographical information systems to integrate all information layers in useful tools for the evaluation and control of impacts.

LIFE ENV/P/000830
One o the main aims of Sinesbioar Project consisted identification of the most disturbed areas due to atmospheric pollution through using lichens as biomonitors. Biomonitoring consists on measuring environment features, in this case atmospheric pollution, by using living organisms. Lichens were the biomonitor chosen for developing this study. Lichens are able to accumulate several pollutants. In some cases this pollution is so high that becomes toxic for the lichen itself, causing its death. It was because of these two features: accumulating pollutants and dying from toxic pollution that a biomonitoring system was developed in the region of Sines. The application of this methodology was based on two different strategies: i) using lichen biodiversity as a measure of ecological and anthropogenic disturbance and ii) using the pollutants accumulated in lichens as a measure of these pollutants atmospheric deposition. Finally we were able to combine both the two previous levels of information in order to establish the areas of the Sines Region that were subjected to chronic atmospheric deposition. Lichen Biodiversity
On this approach we selected 73 sampling points equally
distributed all over the Region of Sines and at each sampling site the number of lichen species was recorded. We used a standard methodology for sampling lichens also largely used and recommended in European Union. The main objective of this part of the work was to determine the areas most probably affect by atmospheric pollution. This analysis was based on the fact that some lichen species disappear when subjected to atmospheric pollution. Therefore, areas with a low number of lichen species was considered to be affect by some kind of pollution or stress.
The data obtained in this part of the work was modelled by using geostatistic techniques and the output was a map of the spatial distribution of the areas showing different disturbances based on the number of foliose and fruticose lichen species. On this figure the red areas show the sites with lower number of lichen species and thus are the most affected areas. On the other hand areas in blue show the sites with higher number of lichen species and thus are the less affected by both natural and anthropogenic factors.

LIFE ENV/P/000830
Pollutants accumulation on lichens This approach was based on the chemical analysis of several pollutants on lichens. The lichens were collected from 130 sampling sites distributed all over the Region of Sines. The main objective was to identify which pollutants and what amount was being deposited on the study area. Each pollutant was modelled independently. However, in order to search for sources we performed a multivariate analysis to associated different pollutants with the same emission sources.
On the figures on the top it is plotted the spatial distribution of two different groups of pollutants. On the left we show the plot of the combined spatial distribution of ion, aluminium, nickel, chromium, titanium and manganese. On the plot on the right it is represented the map of the combined distribution of mercury, lead, zinc and copper. Areas in red show the
sites with greatest pollution deposition whereas areas in blue show sites with lower pollutants deposition.
Areas with Chronic Atmospheric Pollution This approach resulted in the combination of both the map showing the number of lichen species and the map representing the common source of pollutants in lichens. On the left map we are able to identify the orange and red areas with lower number of lichen species and thus disturbed and, simultaneously the areas with high concentration of pollutants jointly deposited (ion, aluminium, nickel, chromium, titanium and manganese).
On the map on the right the orange and red areas show the sites where lichen biodiversity was low and the concentration of some pollutants was high (mercury, lead, zinc and copper). These maps represent the areas that are more frequently subjected to atmospheric pollution deposition being considered as the areas with chronic atmospheric pollution. It is suggested that these areas should be monitored more frequently.

LIFE ENV/P/000830
Different emission sources’ contributions to Sines’ air quality One of the noblest components of this project was precisely the development of an instrument that allows air quality control and management. When the potential local sources of emission are identified, a basic part of any control and management action is necessarily the knowledge of the contribution of these sources for air quality. The focal objective of this project, regarding air quality control and management, consisted in developing and implementing a methodology that allowed classifying the contribution of different emission sources to the improvement or degradation of air quality.
The developed two steps methodological approach proposed for this project can be summarized as follows: i) A predictive model of the different emission sources’ contributions to the pollutant concentrations, captured at each monitoring station, divides the time series into two classes: pairs of highly correlated points and pairs of points with poor correlation; ii) Validation and generalization of this classification model for the entire area, generating a space-time model.
Temporal characterization between emissions and air quality data from monitoring stations The presented methodology is based on the use of artificial neural networks (ANN’s), in order to identify non-linear relations between meteorological parameters, emissions and air quality data measured at monitoring stations. Within the scope of this work, 3 objectives were pursued: i) identification of regional emission-reception patterns for some pollutants; ii) quantification of the individual contribution of local industrial units; iii) development of an instrument that allows, simultaneously, to evaluate temporal forecasts of air quality parameters and to simulate situations of extreme atmospheric pollution.
A two steps methodology was approached for this project. First, the time series of each data pair – industrial emission and monitoring station records – was filtered out, in order to obtain contiguous time periods with high correlation of that specific industrial emission with the equivalent monitoring-station measurements. For this purpose, an iterative optimisation process was developed, using the correlogram between industrial emissions standardized data and monitoring station time series as the objective function. After this classification of “historical” data, the process becomes automatic for any future pair of data (same industrial emission source and monitoring station) through the use of a probabilistic neural network (PNN).
In a second step, artificial neural networks (ANN’s) were applied in order to identify non-linear relations between the SO2 emitted by the industrial complexes, AQ parameters measured at the monitoring stations and meteorological information.
Sulphur dioxide emissions (mg/m3) from three industrial complexes – Petrogal, Borealis and CPPE – are periodically measured in a set of monitoring stations – Santiago do Cacém, Sonega, Monte Chãos, Monte Velho – and converted to daily averages for a period of 12 months (from 1/1/2002 to 31/12/2002). Meteorological data – wind speed and direction on an hourly basis, for the same period – was also collected and analysed.
The developed models establish reasonable results for both stages. Next figure shows an example of contiguous SO2 (µg m-3) Sonega and Borealis class 1 data points.
The models developed present high correlations between pollutant values emitted by the tree industrial units (Petrogal, Borealis and CPPE) and those values measured at the AQ monitoring stations (Monte Chãos, Monte Velho, Santiago do Cacém and Sonega). Models’ performance could be improved using longer AQ data series, and other types of meteorological data series.
Emissions – Monitoring stations: neural nets and the meteorological component The meteorological variables are usually one of the main concerns when doing an analysis of any dispersion of atmospheric contaminants model. After the first attempts of including meteorological variables into prediction models, we concluded that the available data of wind speed and direction wasn’t responsible for the dynamics of the different pollutant plumes. The main reason is that the meteorological data was often collected at an altitude and locations inadequate to capture emissions from the different industries’ chimneys. Thus, no ANN had been successful in the attempt to determine the influence of those meteorological parameters in the relation between the values emitted and measured in the monitoring stations. Wind characteristics measured in the monitoring stations were withdrawn, and only then the relations between emissions and receptions appeared in a clear way. It is essentially for that reason - inappropriate meteorological data for this project’s case study - that the classic deterministic contamination models would certainly not

LIFE ENV/P/000830
Geostatistical models for spatial contaminants dispersion Fundamental instruments in conduction of the project, the geostatistical models were the support for the following stages: selection of the bio-sampling and diffusive tubes’ spatial localization, characterization of the spatial dispersion of biodiversity and contaminants (bio accumulators and passive samplers), characterization of the space-time relation between the emissions and contaminants values in the area and analysis of costs of the monitoring stations localization’s impacts. Selection of sampling locations The selection of sampling locations was based on a preliminary biodiversity campaign that had begun in May of 2002. The preliminary results consisted on the number of foliose and fruticose lichen species that were present in 44 sampling places distributed throughout the study area. These preliminary results allowed the development of air quality spatial simulation models for all the region of Sines, in order to identify critical locations: areas with lesser number of species or areas of higher spatial uncertainty (variability). These spatial uncertainty images were the fundamental criteria used to decide the best location for bio accumulators and passive samplers (diffusing tubes). Diffusive tubes A monitoring campaign of ozone (O3), sulphur dioxide (SO2), nitrogen dioxide (NO2), benzene and toluene was carried through using passive samplers (Radiello). The bio monitoring sampling net was used again. The sampling period (31 of March till 10 of April of the year 2003) was characterized by dominant north/northwest winds with average speeds of 10-17 km/h. In general, the humidity levels had been high, reaching 80%-100%. Air temperature presented a typical spring deviation, with an average temperature of 15 ºC.
Maps of spatial dispersion for each one of the elements were produced. NO2, SO2, benzene and toluene’s concentrations present very high values in Sines relatively to the remaining area. The highest values of ozone occur, in a spot of great extension, in Serra de Grândola’s area.
Geostatistical model to characterize pollutants dispersion through time and space One of the characteristics of natural dynamic phenomenon monitoring systems with some structural complexity, as it is the case of contaminants dispersion in the atmosphere, is that it privileges the temporal observations in detriment
of the sampling in the space. A typical system of local air quality monitoring is constituted by a scarce number of monitoring stations that measure the pollutants in very short periods of time. That is the case of the area of Sines,
Complex phenomenon analysis with neural networks Artificial neural networks (ANN) are composed by a number of interconnected entities, similar in many ways to biological neurons – the artificial neurons. These artificial neurons may be associated in many different ways – the network architecture. The network is adjusted, based on a comparison of the output and the target, until the network output matches the target.
Artificial neural networks are non-linear mathematical structures capable of arbitrarily represent complex and non-linear processes that relate inputs and outputs of any system. ANN’s are frequently used in statistical analysis and data modelling, as alternative to the non-linear regression or to clusters analyses’ techniques. Generically, ANN’s are essentially used in pattern classification and function approximation.

LIFE ENV/P/000830
which has 3 active monitoring stations that measure NOx, SO2 and O3 in an hourly continuous regimen.
This was one of the important challenges embraced during this project: construction of a model that characterized the pollutants’ dispersion in time but that was also representative for the case study area, based the existing monitoring stations net and complemented by the spatial samplings of bio monitoring and diffusing tubes.
The model proposed can be summarized in two stages. First, artificial neural networks were used with the purpose of identifying the existent temporal relation between the different emission sources and the monitoring stations.
Subsequently, the temporal model was validated and generalized to all the area. Diffusive tubes measurements were used to determine a local trend of the SO2 concentration corresponding to the 11 days period, through ordinary kriging . Based on the diffusive tubes variograms (spatial pattern) and the monitoring stations AQ values, a set of simulated images of SO2 is obtained for the 11 days period, using direct sequential simulation with local means. Finaly, in order to validate the classification model for the entire area, the simulated images were averaged for each day, and the resulting most probable image was classified with a PNN, resulting in areas with high and low correlation with the different emissions. Validation of the PNN predictive model is necessary to evaluate the probability of other
areas around the monitoring stations to belong to either of the classes of correlation with the emissions or, in other words, to evaluate the probability that the pollutant concentration in non-sampled locations is caused by the industrial emissions.
The space-time dispersion model of the region’s contamination is thus characterized based on the existing monitoring stations net and in a set of periodic campaigns of passive samplers (diffusing tubes).
Analysis of the impacts’ costs of the spatial placement of monitoring stations When the number of air quality monitoring stations of one specific region is scarce and the objective is necessarily the local characterization of the atmospheric contamination, the space and time representation of the sampling net can be a concern. Any approach on the number and optimal spatial placing of monitoring stations must take in account a cost criteria: costs of sampling, costs of impacts, costs of bad classification, etc.
An analysis model of impacts costs in order to optimise the localization of the current net of the monitoring stations.
This model is based the simulated geostatistical maps of the contaminants dispersion for a set of days of a certain time period. For each point in space, possible candidate to the placement of a monitoring station, was calculated a cost function of the impact of the involving area. It depends on the difference of "observed" values in the potential station and each point of the area, on the land occupation type (with different costs) and on the spatial contaminants pattern.
The final result is a cost of impacts map for the observations regarding that time period. As soon as this analysis will be carried through for future periods of time
(other diffusing tubes campaigns), its conclusions, more consistent and representative, will be able to produce a decision on where to install the monitoring stations.

LIFE ENV/P/000830
Satellite imagery classification In order to evaluate air quality impacts and costs in a certain region, the type of land occupation should be well known. Remote sensing images and, more specifically, satellite images, might have an important role, allowing an efficient, expedite and low costs cartography of the land occupation. A Landsat satellite 7 ETM+ (August, 2002) was used in order to do the land occupation cartography. It was subjected to an assisted classification. For such a purpose, the identification and geographic localization of the areas occupied by each class of the study area was made. This classification was later on validated in situ. The map shows the image classified in 9 land occupation classes. This classification is implemented easily and has to be updated as required.
Sinesbioar – A monitoring and air quality management tool
Final visible goal and public expression of all the project, the air quality monitoring and management instrument,has as core a set of models that transform the information into knowledge, and knowledge into procedures.
The information block is composed by historical data of emissions and air quality, soundings to the populations results, procedures’ manuals, data measured with an average periodicity (biodiversity, bio accumulators, diffusive tubes and satellite images) and short term sampled data (emissions and air quality receptions).
This is the information that is treated by the set of geostatistical models of spatial inference, "data mining" models for data exploratory analysis, neural nets, space-time models of contaminants’ dispersion, analysis of satellite images and mathematical optimisation models.
The models’ results are basically reports, statistics, maps, charts, images, and consequent set of procedures for critical and extreme situations related to air quality.
All this set - information, models, knowledge and procedures - is articulated in a platform database and GIS in a Internet environment, with proper interfaces for the different users - companies, system managers and public in general.
An instrument available through the Internet A tool (gis.Net) composed by two websites and parsers software, drawn specifically to work with them, was produced in order to allow online access to Sinesbioar project’s results.
Within the first site, Sinesbioar’s Site, http://www.ccdr-a.gov.pt/sinesbioar, the available information to general public is published. There the applied methodologies, the numerous stages of the project, as well as the reports or associated publications may be consulted.
The Geographic Information System (GIS) is located in this site. It will be possible to the user to consult the existing geographic information regarding the Sines area. The GIS will publish the results of the Models developed to analyze the data uploaded by the companies.
The other component, Sinesbioar Manager, is compose by the Internet site and parsers created to manage the uploaded data. The software reads the files uploaded by the companies through the site, validates the data and keeps the values received in a database. The database will supply these values later on to the Models.
As a result, it was possible to develop a tool that allows keeping Sines’ air quality data in a single format and protected.

LIFE ENV/P/000830
To live with the Sines Industrial Pole
Outcome of a sociological study about pollution, environment and life quality in the municipalities of Sines and Santiago do Cacém The Sinesbioar Project was about a sociological approach which focused in the perspective of the population residing in the area, who was heard in a survey, and which took in account the view points of the different social agents in the area, from the non governmental organizations to the industries, passing by the central and local State representatives and other sectors with particular emphasis in the environment, health and administration that intervene and influence the relevant local context concerning the dynamic interaction between the environment and the other areas of the region’s social and economic life. As long as they are considered the main goals of the project’s sociological component, we can underline:
a. Checking the environmental risk associated to area’s industrial activity and to the associated pollution.
b. Producing models of analysis that can support the social monitoring of the industrial pollution in the Sines area as well as the public communication mechanisms.
In order to provide answers to these goals, tenths of interviews were carried out during the different stages of the Project which led to the construction of a survey that was then applied to a sample statistically representative of the population residing in the surrounding municipalities of the Sines’ industrial pole – Sines, Porto Covo, Cercal, Santo André and Santiago do Cacém. Metris, GFK, a company belonging to this branch of activity, was accountable for this application and for the sample calculation.
It is also known that, in spite of the legislation improvements on environmental pollution and the access to the information, as well as the companies‘ progressive awareness and social and environmental accountability, the history about the Sines industrial development was marked by notorious incidents, in some cases even accidents. These events went on leaving their traces and, still today, they reflect the people’s opinions and behaviours.
The social perception of the environmental risks and problems As foreword, it is important to refer that some variables like age and school attendance, usually the differential factors in similar studies, seem here to loose explanatory power in favour of variables like municipality ownership or professional connection with the industrial pole. The physical proximity of the industrial complex seems to exert a strong influence over the opinions related to the majority of the approached subjects, resulting in a more critical attitude and in a stronger risk perception from the inquired people who have a closer contact with the complex. On the other hand, the fact that there is, or there was, a professional link with the industrial pole seems to open room to a different form of rationalisation of his presence, which enables a better access to the information, factor of great importance in many of the variables analysed.
The results reached point out to a significant concern towards the daily contact with the industrial pole, namely the resulting consequences for the population health. However, the general appreciation of the inquired people on the life quality and the environmental quality in the municipalities they live in is all in all very positive.
Variables such as proximity and connection to the industrial pole appears as able to impose themselves in relation to the detention of higher levels of information which seems to soften, in some ways, the perception of these kind of risks. Besides, knowing to what extent the degree of environmental information showed by the people inquired is low (Graphic 1), it is easy to draw the conclusion that we face a very rich context which can lead to a sharp perception of the risks associated with the industrial production, independently of the objective conditions for the increase or decrease of the effective risk.
GRAPHIC 1. CONCERNING THE INDUSTRIAL POLLUTANT EMISSIONS
IN THE SINES AREA, HOW DO YOU FEEL…?
41%
24%
9% 2%1%23%
Not informed
Little informed
SomewhatinformedWell informed
Very well informed
DNK/DNA
In fact, the lack of knowledge concerning a set of procedures (legislative and management) already implemented or to be implemented, to which it should be added the one with true consequences which the daily contact with the industrial infrastructure can bring to the health and environment, seems to result, in large extent, from remarked deficits of action and information. Thus, when faced with the question about the follow up and monitoring of the industry’s environmental performances, most of the people inquired does not hesitate in considering as crucial the establishment of a structure aiming at that goal (Graphic 2).
It must be said that most of the general opinions thinks that industries are an essential partner in such a committee. Besides, they (these committees) are placed among the entities that can do more to prevent the negative impacts on the population’s health. These observations apparently point out for the industries’ accountability which are not only restricted to the quality of potential causes of environmental problems which reflect on the population’s health, but also include the detention

LIFE ENV/P/000830
of a good share in the capacity and possibility to solve them. GRAPHIC 2. OPINION ON THE NEED TO ESTABLISH A STEERING AND
MONITORING COMMITTEE ON ENVIRONMENT AT A LOCAL LEVEL
10%
54%
26%
5% 5%
Not needed at all
Does not seemnecessary, how ever itcan be usefulIt w ould be of greatutility
It is crucial
DNK/DNA
Even so, the image of the environmental performance transmitted by the answers of the people inquired shows the trend for a big cleavage between very critical and less critical attitudes, cleavage which fades in front of the near unanimity concerning the thematic of surveillance. Here, the most significant opinion is that the regulation and control systems are not fulfilling their role.
Environment and health: a relation of problematic causality The concern about the potential effects of the industrial pollution on the population’s health is apparently highly marked (Graphic 3). This emphasis is particularly relevant for those living in the municipalities nearer the industrial complex. A concern that seems to be even more directly linked to the air pollution: for instance, the diseases associated with the respiratory system and allergies are the more referred in this context (Graphic 4). On the other hand, on what concerns the most wanted information about the origin of the local environmental problems, it is relevant that the concern about the potential accumulation
of pollutants in food comes next to the one associated with the air, (Graphic 5). The need to have studies on the population’s health and the way the dispersion of environment pollutants takes place are still areas that point out the need, well stressed to the population in this survey, to have more and better information in terms of the environment-health interaction. GRAPHIC 3. WILL YOUR HEALTH AND THE HEALTH OF YOUR FAMILY
BE AFFECTED BY THE PRESENCE OF THE INDUSTRIES?
27%
7%
66%
YesNoDNK/DNA
In this context, we cannot be at all surprised that health appears to the population as the industrial pole’s main target respecting collateral effects (Graphic 6) or that the Ministry of Health is a continuous reference in the speeches of the interviewed and inquired, namely while a credible source of support and information, capacity and ability to intervene in the thematics that cause the main concerns. These results seem to indicate when a more preventive and broad action of health surveys, and follow up of the industrial infrastructure’s environmental performances, needs to lay on a good communication and interconnection basis with the local community in order to vanish doubts and ‘ghosts’ that seem, maybe in a right way, standout in the perception of the environmental risk at a local level. The underlying incertitude concerning the daily risks may worsen its perception if nothing is done to explain and context them
GRAPHIC 4. EXPECTED CONSEQUENCES FOR THE HEALTH AS THE OUTCOME OF THE INDUSTRIAL POLLUTION
1.7
1.8
2.3
3.2
6
18.3
23.3
33.3
50.3
0 10 20 30 40 50 60
Genetic changes
Stress
Liver problems
Reproductive problems
Digestion problems
Headaches/migraines
Cancer problems
Allergies
Diseases or respiratory problems
%

LIFE ENV/P/000830
GRAPHIC 5. ENVIRONMENTAL INFORMATION TO WHICH YOU WOULD LIKE TO HAVE ACCESS
7
12.2
17.8
21.8
24.3
49.7
66.5
0 10 20 30 40 50 60 70
Sea pollution
Water pollution
Pollution particles in the environment
Study on people's health
Quality of general purpose water
Pollutants concentration on food
Air pollution
%
GRAPHIC 6. HOW TO PREVENT THE INDUSTRIAL POLLUTION EFFECTS ON PEOPLE’S HEALTH
7,3
9,5
20,8
20,8
24,3
31,5
0 5 10 15 20 25 30 35
Awareness boards for continuous information on pollution
To close the industries that do not fulfill the legislation
Health control
Better focus on the companies' emissions
Improve the companies' pollution control systems
Better access to health care
%
Communication and information at a local level So, the results of this analysis seem to show a strong environmental information deficit as one of the incertitude and mistrust sources related with the environmental performance of the industrial complex. It is known that the better informed people tend to produce a vision, perhaps more demanding but also more in accordance with the context, of the problems. This allows them to increase their confidence in the way the system works and also to have a better understanding or acceptance of their gaps and limitations. On the contrary, those less informed seem to tend to build an image necessarily more negative where confidence has a more difficult progression.
Within this context, a good environmental information and a broad communication system appear as the key to a more democratic and socially healthy trustful relation among the populations, industries and regulation entities working in the area. This matter emerges as needing a deep and sustained intervention that might invert the huge information deficits seen in the population. So, the development of initiatives promoting a continuous, constructive, sharp and transparent information communication that is already becoming available appears as absolutely essential. The establishment of a follow up mechanism with a large participation of different local and regional players could undoubtedly be the answer to this
need which is clearly felt and broadly displayed by the population and by the different groups of interest.
Such an initiative should obviously be framed within a logic social responsibility, not only from the local industries, but also from the representatives of the local and central power and the different social sectors that compose the local collective texture. The assumption of a constructive and proactive attitude from each of the participants in a follow up, monitoring and environmental communication structure represents its success key. With this goal, it will be essential to collect and value the information available, search answers for the registered informative gaps and develop a communication plan aimed at different public.
Such a kind of mechanism, if it cannot avoid the presence and participation of representatives of the different local and regional players, even if only under the consultant and follow up scope, asks for, as its own pillar, a technical group that assures its operational functioning. The management philosophy of this follow up mechanism should inspire itself in the transparency and co-responsibility where all the relevant local agents in the economical life and in the running of the collective life have the right and duty to participate.