kenya secondary education quality improvement project (seqip)
TRANSCRIPT

TEACHERS SERVICE COMMISSION
KENYA SECONDARY EDUCATION QUALITY IMPROVEMENT PROJECT (SEQIP)
TITLE: CONSULTANCY FOR DEVELOPMENT AND IMPLEMENTATION OFA SCHOOL BASED TEACHER SUPPORT SYTEM (SBTSS) FORENGLISH SUBJECT
CONTRACT NO: TSC/SEQIP/EOI/001/2018/2019
PROCUREMENT METHOD:
QCBS
TERMS OF REFERENCE (ToRs)
1. BACKGROUND.
1.1 The Government of Kenya (GoK) through the Ministry of Education and the NationalTreasury has requested the World Bank for support to improve student learning in secondaryeducation and transition from primary to secondary education, in targeted areas1. This is inline with the aspirations of Kenya’s Vision 2030. The Vision’s Social Pillar singles out theeducation and training system as a vehicle to drive Kenya's efforts towards becoming anupper-middle income economy.
1.2 Kenya has made good progress in primary education completion and transition to secondaryeducation compared to many other Sub-Saharan African countries. Participation in EarlyChildhood Education (ECD) increased from a net enrollment rate (NER) of 62.2 percent in2012 to 74.9 percent in 2016, the primary school NER was 89 percent in 2016, and thetransition rate from primary to secondary was 81 percent-a remarkable improvement from 55
1 See Annex 2 for the list of the targeted areas. Page 1 of 40
percent in 2009. These achievements, among others, have been facilitated by the introductionof relevant policy frameworks such the Universal Free Primary Education (FPE) and FreeDay Secondary Education (FDSE).
1.3 In spite of these achievements, there is significant variation in school participation acrosscounties, especially at the secondary level. Secondary school NER in 2014 was below 15percent for the bottom 5 counties, while it was above 80 percent for the top 5 counties, out of47 counties. Importantly, gender disparity in school participation is concentrated in the mosteducationally disadvantaged counties.
1.4 Kenya has made investments in improving quality and learning outcomes at the primarylevel; nevertheless, achievement on basic skills appears low in relation to countries in otherregions. For example, 66 percent of Kenyan urban adults performed at level 1 or below outof a scale of 5 levels on the Skills toward Employability and Productivity (STEP) readingproficiency test in 2015, indicating very rudimentary skills which were lower than theirpeers’ in 6 of the other 7 low- and middle-income countries surveyed in South East Asia,Eastern Europe and Latin America.
1.5 At the secondary level, national assessment data indicate deficiencies and inequities inlearning outcomes. For example, the 2014 national Monitoring Learner Achievement (MLA)assessment at Form 2 found that, in mathematics, almost 90 percent of students did not haveminimum competency in algebra and geometry, and about 30 percent did not have minimumcompetency in measurement, numbers and statistics. The Form 2 MLA also revealedremarkable variation in student achievement between genders, between urban and rural areas,and across counties. For example, in algebra, geometry and trigonometry, the share ofstudents with minimum competency in urban areas was twice that in rural areas. Both supplyand demand-side factors contribute to inequalities in completion of primary education, andtransition to and completion of secondary education, as well as in student learning outcomes.
1.6 The proposed Kenya Secondary Education Quality Improvement Project (SEQIP) will seekto address the supply and demand-side factors particularly in the most educationally andeconomically disadvantaged areas, as well as the poorest and most vulnerable children.SEQIP will employ a hybrid structure as an initial step towards more Results BasedFinancing (RBF) of the education portfolio in Kenya. This RBF provides an opportunity for astrengthened dialogue through closer monitoring of Government performance againstselected Disbursement Linked Indicators (DLIs).
2. PROJECT DESCRIPTION
Page 2 of 40
i.7 . The Project Development Objective (PDO) is to improve student learning in secondaryeducation and transition from primary to secondary education in targeted areas. The PDOwill be measured through three key project performance indicators namely: (i) averagestudent test score in English subjects at Form 2 at public schools in targeted sub-counties;(ii) average student test score in English at Form 2 at public schools in targeted sub-counties; and (iii) transition from primary to secondary education in targeted sub-counties. Overall, implementation of the proposed project will be the responsibility of theMinistry of Education (MoE). Component 1 of the project, which is ‘Improving qualityof teaching in targeted areas will be implemented jointly by MOE and TSC. Thecommission will implement sub component 1:1 and 1:2.
i.8 The project has four components: (i) Improve quality of teaching and learning in targetedareas; (ii) Improving retention in upper primary and transition to secondary in targetedareas; (iii) System reform support; and (iv) Project management, coordination andcommunication.
i.9 Component 1, Improving quality of teaching in targeted areas includes three sub-components namely: (i) Subcomponent 1.1: Reducing teacher shortage; (ii)Subcomponent 1.2: Enhancing teacher professional development; and (iii) Subcomponent1.3: Provision of textbooks. These ToRs applies to Subcomponent 1.2, Enhancing teacherprofessional development.
3. OBJECTIVE OF THE ASSIGNMENT
The overall aim of this assignment is to enhance continuous Teacher Professional Development(TPD) for teachers of English subject. The consultancy will provide technical support to theTeachers Service Commission (TSC) to develop and implement the school based teacher supportsystem for the English subject in targeted sub-counties. The specific objectives of the assignmentare to: (i) Support TSC to establish a School Based Teacher Support System (SBTSS) aimed atproviding professional development training in subject matter as well as pedagogical contentknowledge to teachers of English in the targeted sub-counties. (ii) Support TSC in monitoringand evaluation of these activities including data collection, analysis and preparation of reports.This activity is based on results based financing modality. The institution will therefore berequired to support the TSC in collection and validation of the required data for the relevantDisbursement Linked Indicators (DLIs) and relevant indicators in the project’s results framework(see annex 1 of this ToRs). An independent firm will be recruited separately to review and verifyresults achieved under the SBTSS program for the English subject, and other DLIs under thisproject.
4. DURATION OF THE ASSIGNMENT AND WORK PLAN
The assignment will be undertaken over a six-year period between January 2018 and October2022 and will have a total duration of 12 months per year. The first phase of this assignmentwill commence in January 2018 or shortly thereafter and will involve design of SBTSS
Page 3 of 40
implementation plan and verification of TPAD data on teachers’ performance gaps inEnglish. A performance review of the selected institution will be conducted after each year.Remedial actions agreed upon must be executed within the agreed upon timelines, otherwisea contract termination will be considered. A payment schedule against major milestones willbe agreed upon during contract negotiations and before contract finalization.
5. SCOPE OF WORK AND DELIVERABLES
The main task of this assignment involves the formulation and support of the delivery of anelaborate program for SBTSS for the English subject for teachers in target Sub-Counties asstipulated below. A list of target Sub-Counties is included in Annex 2 of these ToRs.
A third-party institution (independent verifier), will be recruited to independently review,analyze and verify, on a sample basis, the project’s DLIs associated with this activity. Each DLIhas a specific achievement level and timeline linked to it (see annex 1 of these ToRs).
5.1 Task 1: Development of a School based Teacher Support System (SBTSS) to support peer learning using Information, Communication Technology for teachers of English
Under this task, the institution is expected to:
a) Formulate a detailed proposal, in the form of an inception report, for the proposedSBTSS program for discussion with TSC. The institution will only proceed with thistask once the overall proposal is agreed upon with TSC.
b) Prepare an elaborate program for the SBTSS program for teachers in target Sub-Counties. The program, as a minimum, MUST take EACH of the following aspects intoaccount:
i. Conduct skills and competency diagnostics to identify teachers’ training needs toimprove classroom practices in English subject in target Sub-Counties. Build ondata and reports from the Teacher Performance Appraisal and Development(TPAD) and on existing insights on implementing school based TPD in Kenyaand globally, and analysis of the general and school-specific KCPE2 and KCSE3
reports, to identify training needs and modalities of school-based support. Thisanalysis will be complemented with information collected during workshops withTSC CDs, SCDs, CSOs, Principals, Head teachers, senior masters/ teachers andteachers.
ii. Based on the identified needs above, develop teachers support materials,simplified teaching aids and other relevant instructional materials, and sample
2 Kenya Certificate of primary Education.
3 Kenya Certificate of Secondary Education Page 4 of 40
continuous student assessment tools. Existing and relevant teacher trainingmaterials, including digital ones, developed in Kenya by various partners couldbe assessed and adapted as necessary. An English subject matter expert panelwill be constituted by TSC to review and approve the proposed materials beforeproduction and utilization. Any materials produced must be adapted for specialneeds education. The support materials will include e-learning materials,adequate samples of formative assessment tools to guide learners’ progress,teachers’ guides with learning resources related to each lesson, and a range ofsuggested activities that teachers can use to guide learners’ practice. This will bewithin the established Curriculum.
iii. Identification of teacher support facilitators/trainers. In collaboration with TSC,develop ToRs for the Teacher support facilitators/trainers and determine thenumber of trainers required. TSC will recruit the facilitators/trainers based on aset criteria and performance standards. The facilitators will include teachers,CSOs and TSC Sub-county Directors. The institution will be expected to train thefacilitators using materials and assessment tools reviewed and approved bysubject matter panels. For target primary schools, TSC sub-county directors andcurriculum support officers will support the SBTSS as trainers. Where theworkload requires they will be complemented by additional resource persons.
iv. Develop and implement a program to promote peer learning and to support.Teachers’ pedagogic support, including assistance on inquiry-based learningapproaches for teaching English subject and integration of ICT in teaching andlearning, and using technology for peer learning. To encourage peer learning, theinstitution will support the facilitators/trainers to assist participating teachers inestablishing professional learning community/groups such as WhatsApp, googlegroups etc. Participating teachers will learn how to address and solve issuesthrough collaboration, how to share knowledge and experience among them, andhow to leverage this social group effectively to improve their lesson plans andpedagogical approaches. Facilitators will oversee and moderate the WhatsAppgroups to ensure relevance and effectiveness.
v. During the SBTSS initial phase, training will be provided for about 5,667primary school teachers and 1,700 secondary school teachers for English intargeted sub counties at INSET school based centres. Based on the evaluation ofthe first two years of implementation of SBTSS, the intervention will be scaledup to cover all primary and secondary teachers of English in the over 5,500primary schools and additional 1,500 secondary schools in the targeted sub-counties.
Page 5 of 40
5.2 Task 2: Development of a costed and implementation plan for the School based TeacherSupport System (SBTSS) in English
Under this task, the institution is expected to:
a) In collaboration with the TSC, develop a detailed and costed implementation plan forexecution of the SBTSS program considering each activity described under Task 1above. During the SBTSS’ initial phase, training will be provided for about 5,667primary school teachers and 1,700 secondary school English subject teachers in thetargeted sub-counties. This phase 1 training will be conducted in selected Sub-Counties (from the target Sub-County) before scaling up to all the targeted Sub-Counties. An independent evaluation will be conducted to inform the scaling upexercise.
b) For the institutions planning purposes, training will be conducted at the establishedCEMASTEA4 school-based INSET centers. Exceptions for the training Centers willbe considered as need arises and upon justification of the same. The duration of eachtraining event will vary depending on the skills and competencies identified based onthe training needs assessment. Each training event will be followed by a series ofcoaching and mentoring visits to the targeted schools by the facilitator/trainers. Thescope of the coaching and mentoring will be identified and outlined by eachfacilitator/trainer working together with the teachers participating in the respectivetraining event and these aspects will be reflected in the program and itsimplementation plan.
5.3 Task 3: Assessing the effectiveness of English training
Under this task, the institution is expected to:
a) Conduct pre- and post-assessments to assess gains in teachers’ proficiency incollaboration with TSC. The assessment tools and content will be developed incollaboration with KNEC5 and KICD6 to ensure validity and reliability (alignment toestablished curriculum and assessments), based on the methodology for testsdevelopment used by KNEC. The minimum knowledge indicators for the Englishsubject and levels (upper primary and secondary schools) will be established by theinstitutions subject matter panel. This will be reviewed and cleared by TSC.
5.4 Task 4: Collection of data, analyses and reporting
Under this task, the institution will be required to:
4 Centre for Mathematics, Science, and Technology Education in Africa
5 Kenya National Examinations Council
6 Kenya Institute of Curriculum Development Page 6 of 40
Support TSC to collect, analyze and prepare reports based on the project’s resultsindicators and DLIs relevant to the SBTSS training for the English subject (see Annex 1).The reporting formats will be agreed upon with the TSC.
Prepare relevant power point presentation for the SBTSS training for the English subject forpresentation to the National Project Steering Committee
5.5 Task 5: Monitoring and Reporting
Under this task, the institution is expected to:
a) Produce an inception report (proposal) detailing the understanding of this ToRs andproposed framework to approach this assignment.
b) Based on the four tasks above, prepare a detailed and costed implementation plan for theSBTSS training program for the English subject
c) Prepare monitoring reports as described under task 4 above.
d) Prepare monthly progress reports to inform TSC on the status of this assignment and forTSC to determine any remedial actions that may be required.
6. Key Deliverables
a) Implementation plan for the SBTSS training program: Should give details of the trainingprogram including timelines, cost, input and output of all the activities.
b) Training needs assessment
c) SBTSS material
d) Training of facilitators and teachers (be specific about target numbers)
e) Monitoring and evaluation reports for the SBTSS program: This should be done in theformat agreed upon with TSC.
f) Monthly progress reports: This should give TSC an update on the status of theassignment.
7. KEY TECHNICAL REQUIREMENTS
7.1 The consulting institution must have the experience of conducting similar assignments orexperience in developing and implementing school based teacher professional
Page 7 of 40
development. Evidence for this is required. The institution will put together a team withthe necessary skills to undertake this assignment.
7.2 The minimum mandatory criteria for short listing of the institutions is:
a) Have a minimum of five years of experience in conducting similar assignments orexperience in developing and implementing school based teacher professionaldevelopment. Attach relevant documentation as evidence.
b) Have minimum of five years’ professional experience in collecting and analyzingdata, documenting findings, and creating and presenting reports.
c) Provide evidence of a sound track record of successful implementation of similarassignments with relevant national and international organisations.
d) Financial capacity. Audited financial statements for the past 3 years.
7.3 Staff requirements /Team Composition
i. Team Leader who must be a holder of PhD in Education, Economics or SocialSciences with at least 5 years’ experience in educational surveys at the schoollevel
ii. Education specialists particularly in English/Literature subject, teachermanagement and development, and in development and evaluation ofinstructional materials.
iii. A Statistician who can also handle Monitoring and Reporting aspects
iv. A finance specialist conversant with results-based financing
v. A logistics coordinator
8. KEY DELIVERABLES AND TIMELINES
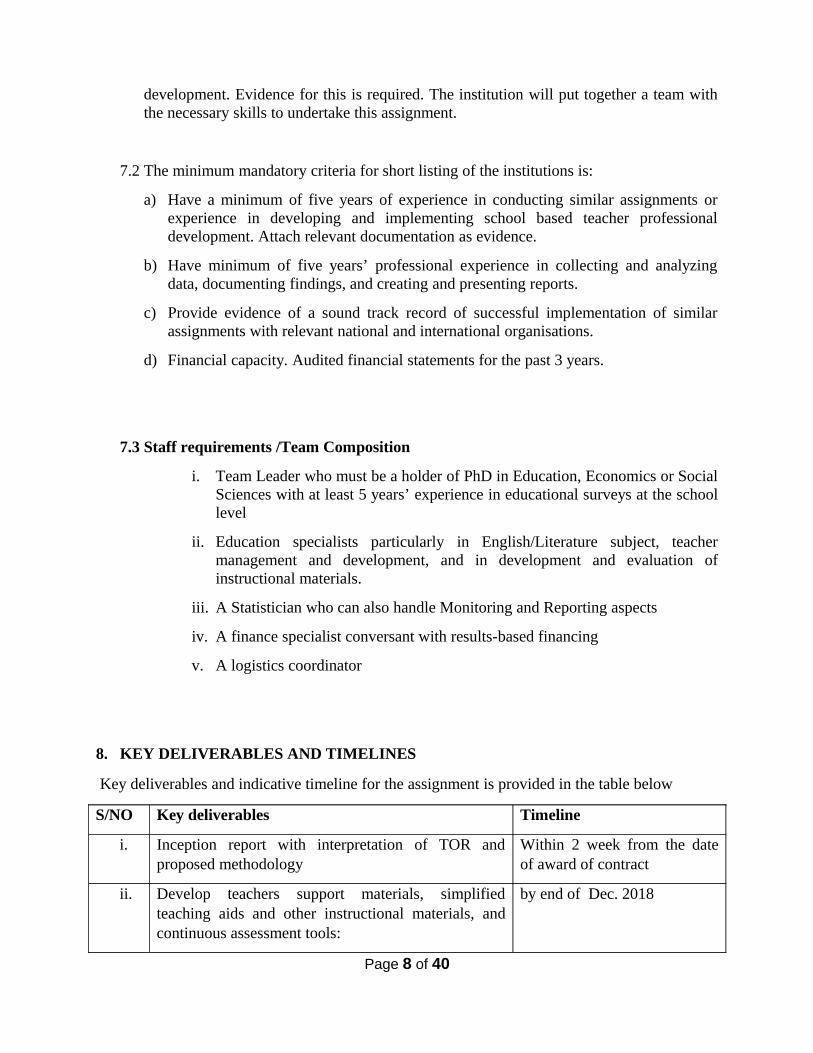
Key deliverables and indicative timeline for the assignment is provided in the table below
S/NO Key deliverables Timeline
i. Inception report with interpretation of TOR andproposed methodology
Within 2 week from the dateof award of contract
ii. Develop teachers support materials, simplifiedteaching aids and other instructional materials, andcontinuous assessment tools:
by end of Dec. 2018
Page 8 of 40
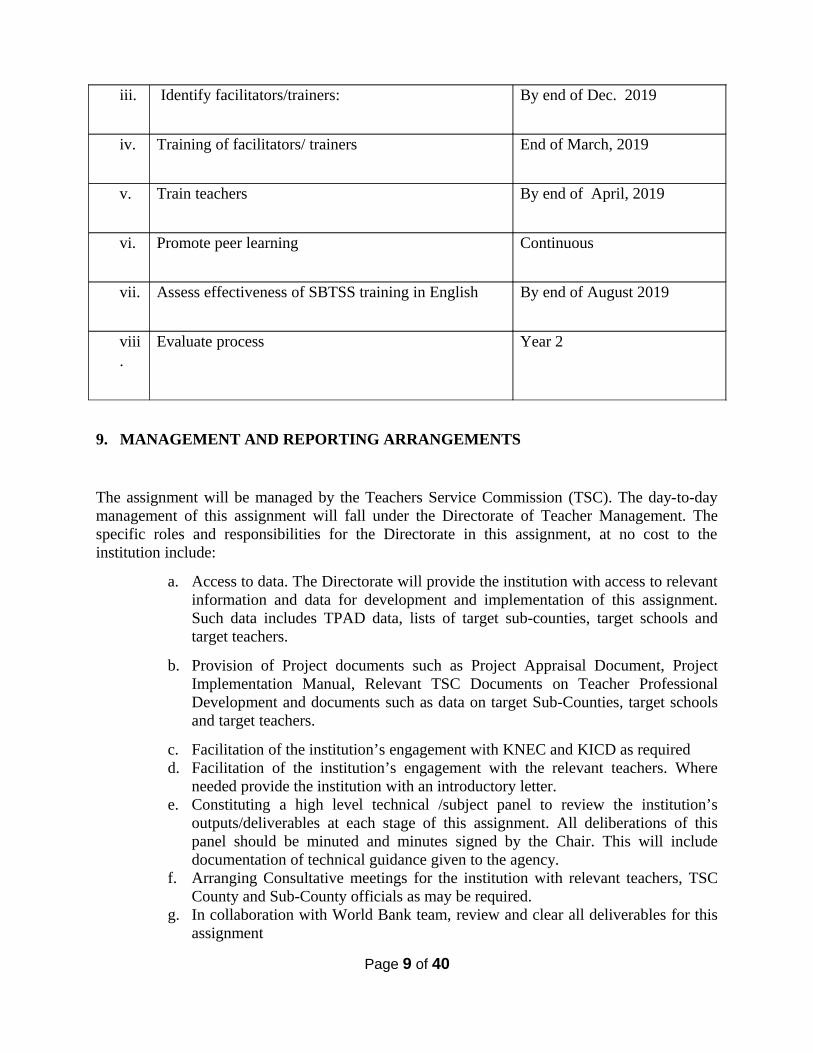
iii. Identify facilitators/trainers: By end of Dec. 2019
iv. Training of facilitators/ trainers End of March, 2019
v. Train teachers By end of April, 2019
vi. Promote peer learning Continuous
vii. Assess effectiveness of SBTSS training in English By end of August 2019
viii.
Evaluate process Year 2
9. MANAGEMENT AND REPORTING ARRANGEMENTS
The assignment will be managed by the Teachers Service Commission (TSC). The day-to-daymanagement of this assignment will fall under the Directorate of Teacher Management. Thespecific roles and responsibilities for the Directorate in this assignment, at no cost to theinstitution include:
a. Access to data. The Directorate will provide the institution with access to relevantinformation and data for development and implementation of this assignment.Such data includes TPAD data, lists of target sub-counties, target schools andtarget teachers.
b. Provision of Project documents such as Project Appraisal Document, ProjectImplementation Manual, Relevant TSC Documents on Teacher ProfessionalDevelopment and documents such as data on target Sub-Counties, target schoolsand target teachers.
c. Facilitation of the institution’s engagement with KNEC and KICD as requiredd. Facilitation of the institution’s engagement with the relevant teachers. Where
needed provide the institution with an introductory letter. e. Constituting a high level technical /subject panel to review the institution’s
outputs/deliverables at each stage of this assignment. All deliberations of thispanel should be minuted and minutes signed by the Chair. This will includedocumentation of technical guidance given to the agency.
f. Arranging Consultative meetings for the institution with relevant teachers, TSCCounty and Sub-County officials as may be required.
g. In collaboration with World Bank team, review and clear all deliverables for thisassignment
Page 9 of 40
The responsibility for final clearance of the proposals, proposed program for the SBTSS trainingfor the English subject, and the detailed and costed implementation plan for this program lieswith the TSC.
ANNEXES
a) DLI and DLRs table
b) Target Sub-counties
c) DLRs and DLRs Verification protocols
d) Results Framework
10. CONTACTS FOR THIS ASSIGNMENT:
The Secretary, Teachers Service Commission,Private Bag, NairobiAttn: Head of Supply Chain Management Postal Address: Teachers Service Commission, Private Bag, NairobiCode: 00100City: Nairobi, Kenya Zip code: +254 Tel: 020 289 2000Email: [email protected] and be deposited in the tender box located at on second floor, Podiumwing, TSC House, Kilimanjaro Road, on or before 31st October, 2018.
Page 10 of 40
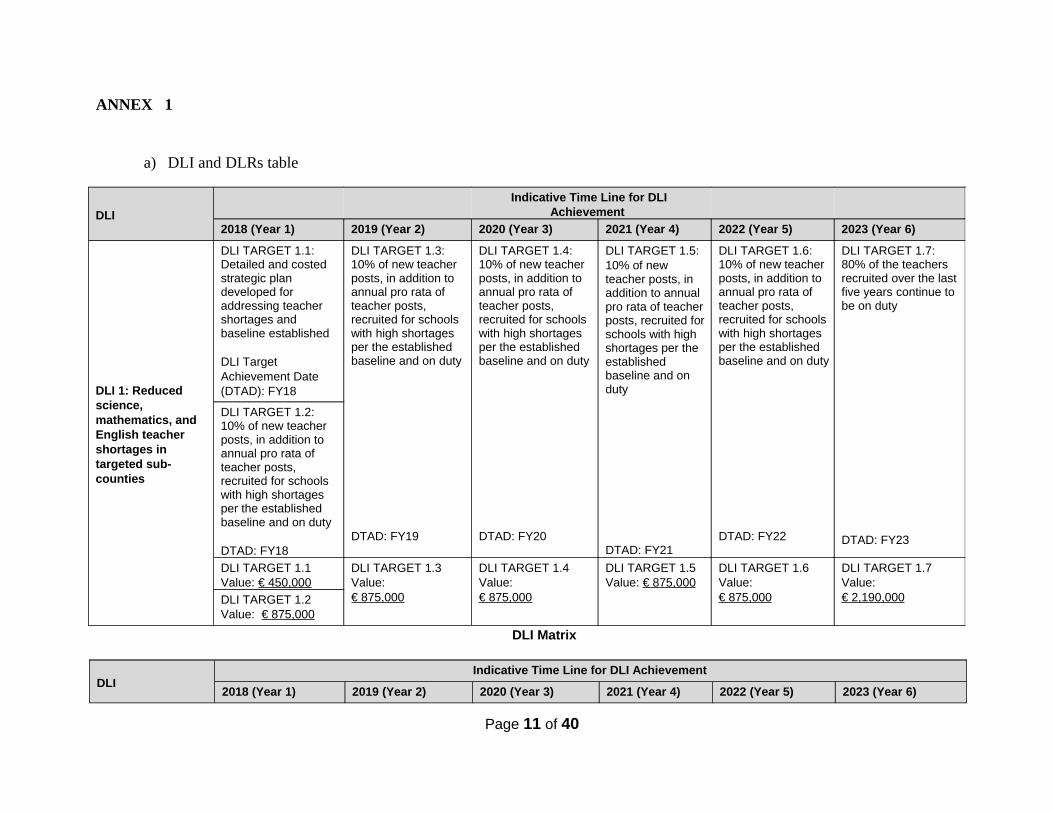
ANNEX 1
a) DLI and DLRs table
DLI Matrix
DLI Indicative Time Line for DLI Achievement
2018 (Year 1) 2019 (Year 2) 2020 (Year 3) 2021 (Year 4) 2022 (Year 5) 2023 (Year 6)
Page 11 of 40
DLI
Indicative Time Line for DLIAchievement
2018 (Year 1) 2019 (Year 2) 2020 (Year 3) 2021 (Year 4) 2022 (Year 5) 2023 (Year 6)
DLI 1: Reduced science, mathematics, and English teacher shortages in targeted sub-counties
DLI TARGET 1.1: Detailed and costed strategic plan developed for addressing teacher shortages and baseline established DLI Target Achievement Date (DTAD): FY18
DLI TARGET 1.3: 10% of new teacher posts, in addition to annual pro rata of teacher posts, recruited for schools with high shortages per the established baseline and on duty DTAD: FY19
DLI TARGET 1.4: 10% of new teacher posts, in addition to annual pro rata of teacher posts, recruited for schools with high shortages per the established baseline and on duty DTAD: FY20
DLI TARGET 1.5: 10% of new teacher posts, in addition to annual pro rata of teacherposts, recruited forschools with high shortages per the established baseline and on duty DTAD: FY21
DLI TARGET 1.6: 10% of new teacher posts, in addition to annual pro rata of teacher posts, recruited for schoolswith high shortages per the established baseline and on duty DTAD: FY22
DLI TARGET 1.7: 80% of the teachers recruited over the lastfive years continue to be on duty DTAD: FY23
DLI TARGET 1.2: 10% of new teacher posts, in addition to annual pro rata of teacher posts, recruited for schools with high shortages per the established baseline and on duty DTAD: FY18
DLI TARGET 1.1 Value: € 450,000
DLI TARGET 1.3 Value: € 875,000
DLI TARGET 1.4 Value: € 875,000
DLI TARGET 1.5 Value: € 875,000
DLI TARGET 1.6 Value: € 875,000
DLI TARGET 1.7 Value: € 2,190,000
DLI TARGET 1.2 Value: € 875,000
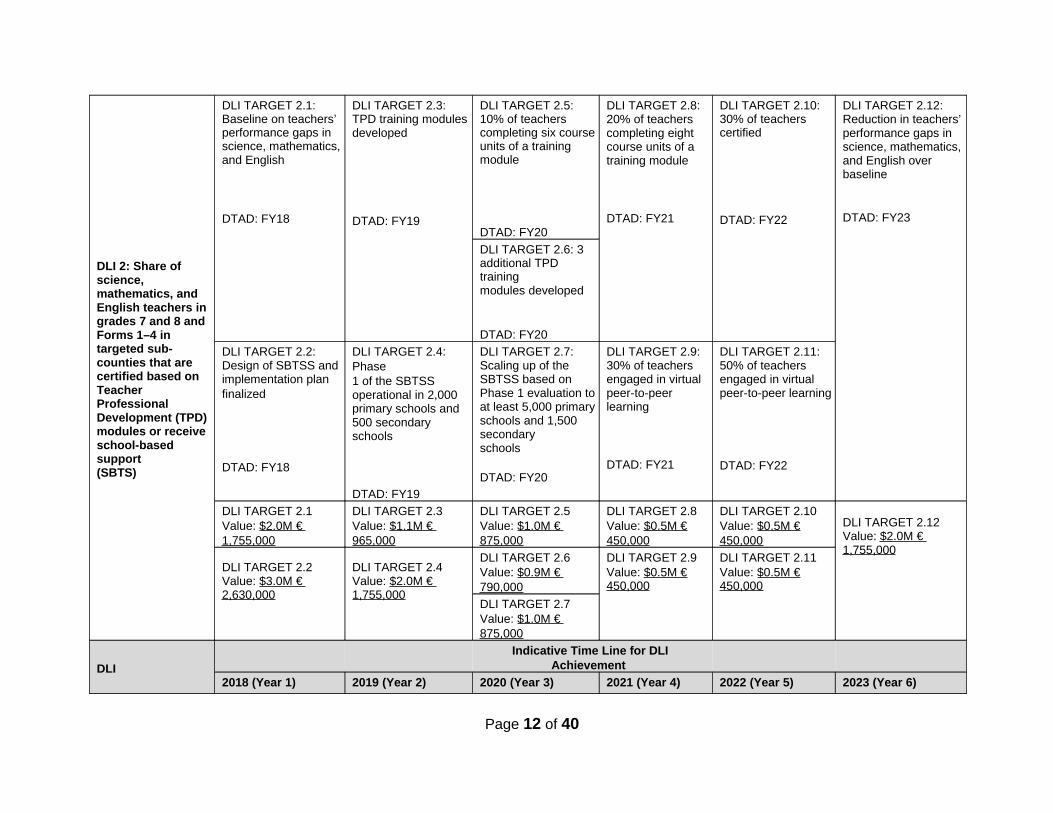
DLI 2: Share of science, mathematics, and English teachers in grades 7 and 8 and Forms 1–4 in targeted sub-counties that are certified based on Teacher Professional Development (TPD) modules or receive school-based support (SBTS)
DLI TARGET 2.1: Baseline on teachers’ performance gaps in science, mathematics,and English DTAD: FY18
DLI TARGET 2.3: TPD training modulesdeveloped DTAD: FY19
DLI TARGET 2.5: 10% of teachers completing six courseunits of a training module DTAD: FY20
DLI TARGET 2.8: 20% of teachers completing eight course units of a training module DTAD: FY21
DLI TARGET 2.10: 30% of teachers certified DTAD: FY22
DLI TARGET 2.12: Reduction in teachers’performance gaps in science, mathematics,and English over baseline DTAD: FY23
DLI TARGET 2.6: 3 additional TPD training modules developed DTAD: FY20
DLI TARGET 2.2: Design of SBTSS and implementation plan finalized DTAD: FY18
DLI TARGET 2.4: Phase 1 of the SBTSS operational in 2,000 primary schools and 500 secondary schools DTAD: FY19
DLI TARGET 2.7: Scaling up of the SBTSS based on Phase 1 evaluation toat least 5,000 primaryschools and 1,500 secondary schools DTAD: FY20
DLI TARGET 2.9: 30% of teachers engaged in virtual peer-to-peer learning DTAD: FY21
DLI TARGET 2.11: 50% of teachers engaged in virtual peer-to-peer learning DTAD: FY22
DLI TARGET 2.1 Value: $2.0M € 1,755,000
DLI TARGET 2.3 Value: $1.1M € 965,000
DLI TARGET 2.5 Value: $1.0M € 875,000
DLI TARGET 2.8 Value: $0.5M € 450,000
DLI TARGET 2.10 Value: $0.5M € 450,000
DLI TARGET 2.12 Value: $2.0M € 1,755,000
DLI TARGET 2.2 Value: $3.0M € 2,630,000
DLI TARGET 2.4 Value: $2.0M € 1,755,000
DLI TARGET 2.6 Value: $0.9M € 790,000
DLI TARGET 2.9 Value: $0.5M € 450,000
DLI TARGET 2.11 Value: $0.5M € 450,000
DLI TARGET 2.7 Value: $1.0M € 875,000
DLI
Indicative Time Line for DLIAchievement
2018 (Year 1) 2019 (Year 2) 2020 (Year 3) 2021 (Year 4) 2022 (Year 5) 2023 (Year 6)
Page 12 of 40
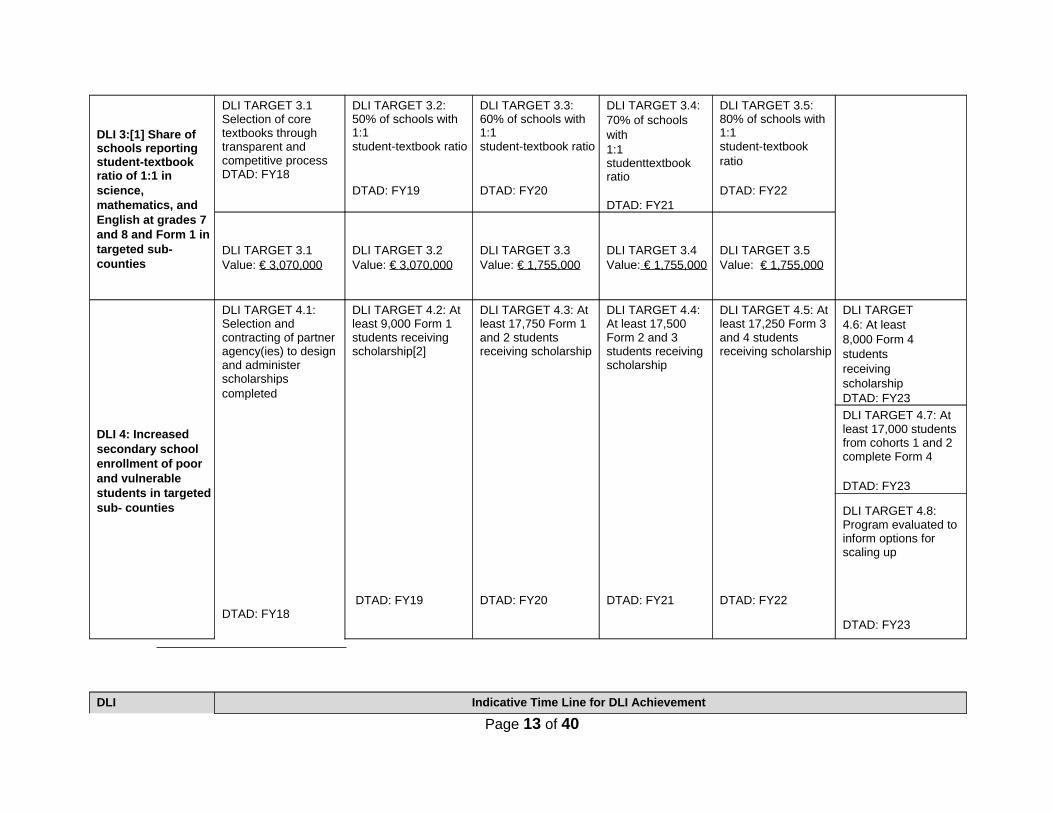
DLI 3:[1] Share of schools reporting student-textbook ratio of 1:1 in science, mathematics, and English at grades 7 and 8 and Form 1 intargeted sub-counties
DLI TARGET 3.1 Selection of core textbooks through transparent and competitive process DTAD: FY18
DLI TARGET 3.2: 50% of schools with 1:1 student-textbook ratio DTAD: FY19
DLI TARGET 3.3: 60% of schools with 1:1 student-textbook ratio DTAD: FY20
DLI TARGET 3.4: 70% of schools with 1:1 studenttextbook ratio DTAD: FY21
DLI TARGET 3.5: 80% of schools with 1:1 student-textbook ratio DTAD: FY22
DLI TARGET 3.1 Value: € 3,070,000
DLI TARGET 3.2 Value: € 3,070,000
DLI TARGET 3.3 Value: € 1,755,000
DLI TARGET 3.4 Value: € 1,755,000
DLI TARGET 3.5 Value: € 1,755,000
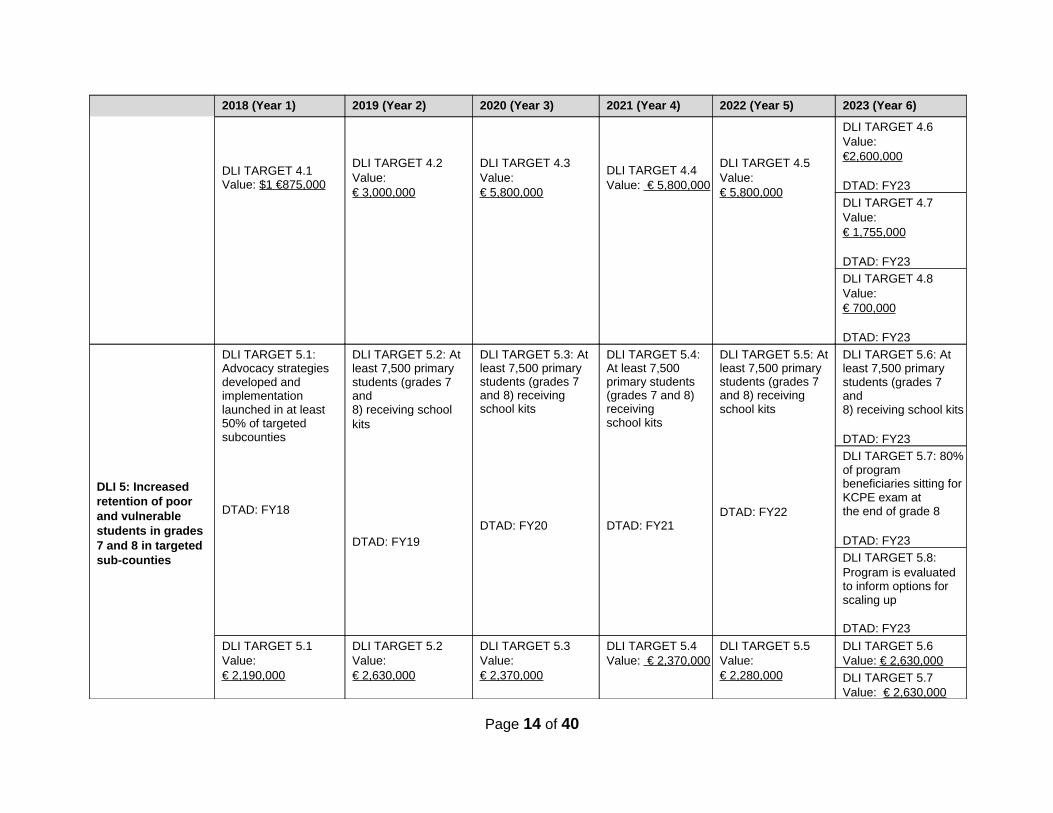
DLI 4: Increased secondary school enrollment of poor and vulnerable students in targetedsub- counties
DLI TARGET 4.1: Selection and contracting of partner agency(ies) to design and administer scholarships completed DTAD: FY18
DLI TARGET 4.2: At least 9,000 Form 1 students receiving scholarship[2] DTAD: FY19
DLI TARGET 4.3: At least 17,750 Form 1 and 2 students receiving scholarship DTAD: FY20
DLI TARGET 4.4: At least 17,500 Form 2 and 3 students receiving scholarship DTAD: FY21
DLI TARGET 4.5: At least 17,250 Form 3 and 4 students receiving scholarship DTAD: FY22
DLI TARGET 4.6: At least 8,000 Form 4 students receiving scholarship DTAD: FY23
DLI TARGET 4.7: At least 17,000 students from cohorts 1 and 2 complete Form 4 DTAD: FY23
DLI TARGET 4.8: Program evaluated to inform options for scaling up DTAD: FY23
DLI Indicative Time Line for DLI Achievement
Page 13 of 40
2018 (Year 1) 2019 (Year 2) 2020 (Year 3) 2021 (Year 4) 2022 (Year 5) 2023 (Year 6)
DLI TARGET 4.1 Value: $1 €875,000
DLI TARGET 4.2 Value: € 3,000,000
DLI TARGET 4.3 Value: € 5,800,000
DLI TARGET 4.4 Value: € 5,800,000
DLI TARGET 4.5 Value: € 5,800,000
DLI TARGET 4.6 Value: €2,600,000 DTAD: FY23
DLI TARGET 4.7 Value: € 1,755,000 DTAD: FY23
DLI TARGET 4.8 Value: € 700,000 DTAD: FY23
DLI 5: Increased retention of poor and vulnerable students in grades 7 and 8 in targeted sub-counties
DLI TARGET 5.1: Advocacy strategies developed and implementation launched in at least 50% of targeted subcounties DTAD: FY18
DLI TARGET 5.2: At least 7,500 primary students (grades 7 and 8) receiving school kits DTAD: FY19
DLI TARGET 5.3: At least 7,500 primary students (grades 7 and 8) receiving school kits DTAD: FY20
DLI TARGET 5.4: At least 7,500 primary students (grades 7 and 8) receiving school kits DTAD: FY21
DLI TARGET 5.5: Atleast 7,500 primary students (grades 7 and 8) receiving school kits DTAD: FY22
DLI TARGET 5.6: At least 7,500 primary students (grades 7 and 8) receiving school kits DTAD: FY23
DLI TARGET 5.7: 80%of program beneficiaries sitting for KCPE exam at the end of grade 8 DTAD: FY23
DLI TARGET 5.8: Program is evaluated to inform options for scaling up DTAD: FY23
DLI TARGET 5.1 Value: € 2,190,000
DLI TARGET 5.2 Value: € 2,630,000
DLI TARGET 5.3 Value: € 2,370,000
DLI TARGET 5.4 Value: € 2,370,000
DLI TARGET 5.5 Value: € 2,280,000
DLI TARGET 5.6 Value: € 2,630,000
DLI TARGET 5.7 Value: € 2,630,000
Page 14 of 40
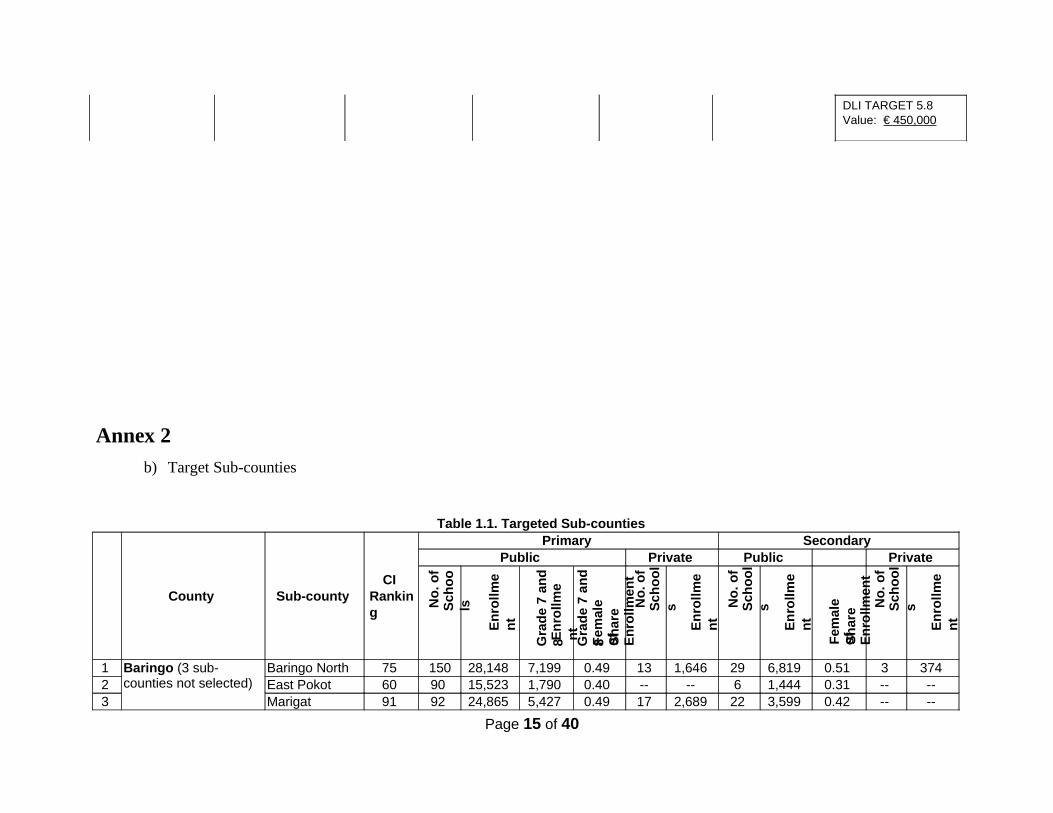
DLI TARGET 5.8 Value: € 450,000
Annex 2
b) Target Sub-counties
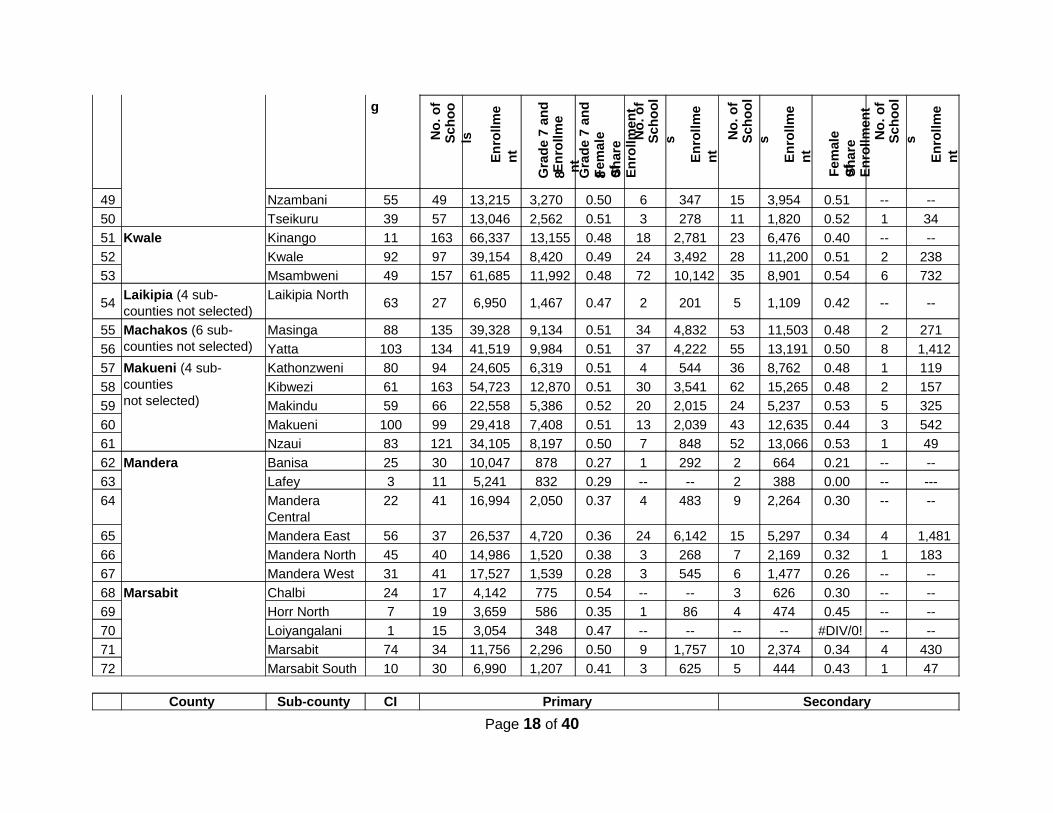
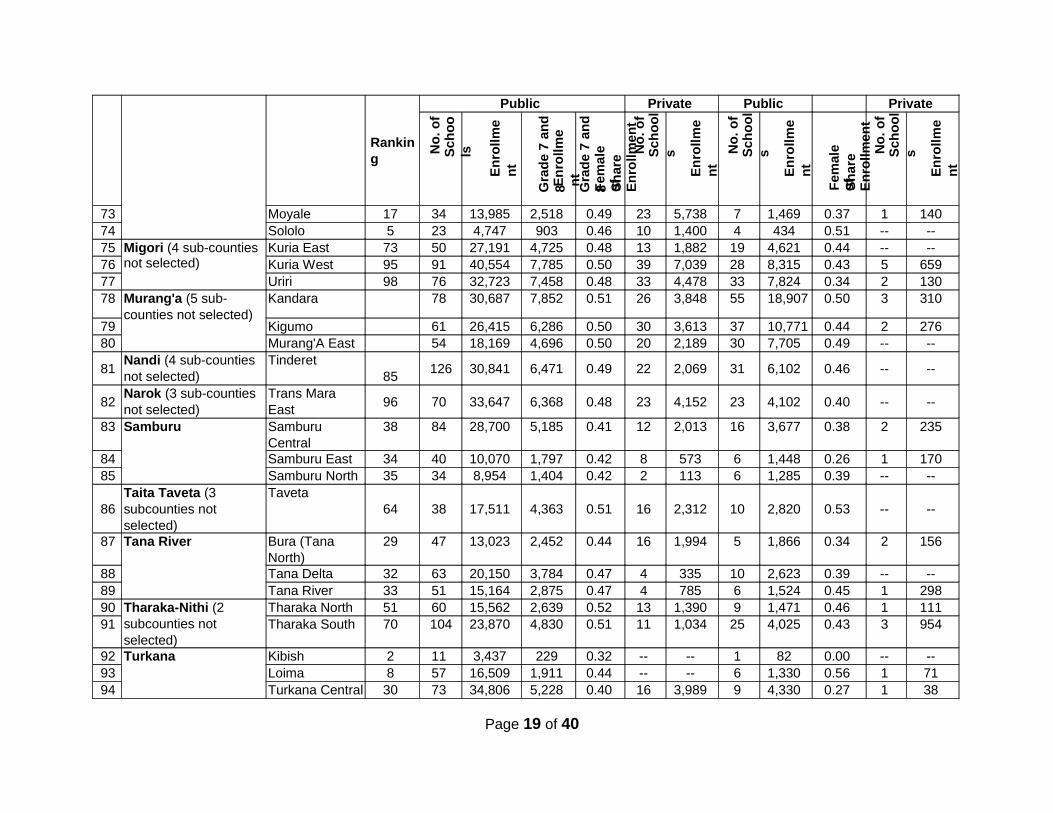
Table 1.1. Targeted Sub-counties
County Sub-county CI
Ranking
Primary Secondary Public Private Public Private
1 Baringo (3 sub-counties not selected)
Baringo North 75 150 28,148 7,199 0.49 13 1,646 29 6,819 0.51 3 374 2 East Pokot 60 90 15,523 1,790 0.40 -- -- 6 1,444 0.31 -- -- 3 Marigat 91 92 24,865 5,427 0.49 17 2,689 22 3,599 0.42 -- --
Page 15 of 40
No
. of
S
ch
oo
ls
En
roll
me
nt
Gra
de
7 a
nd
8 E
nro
llme
nt
Gra
de
7 a
nd
8
Fe
mal
e
Sh
are
o
f E
nro
llm
en
t
No
. of
Sc
ho
ol
s
En
roll
me
nt
No
. o
f S
ch
oo
ls
En
rollm
en
t
Fem
ale
S
har
e
of
En
rollm
en
t
No
. o
f S
ch
oo
ls
En
roll
me
nt
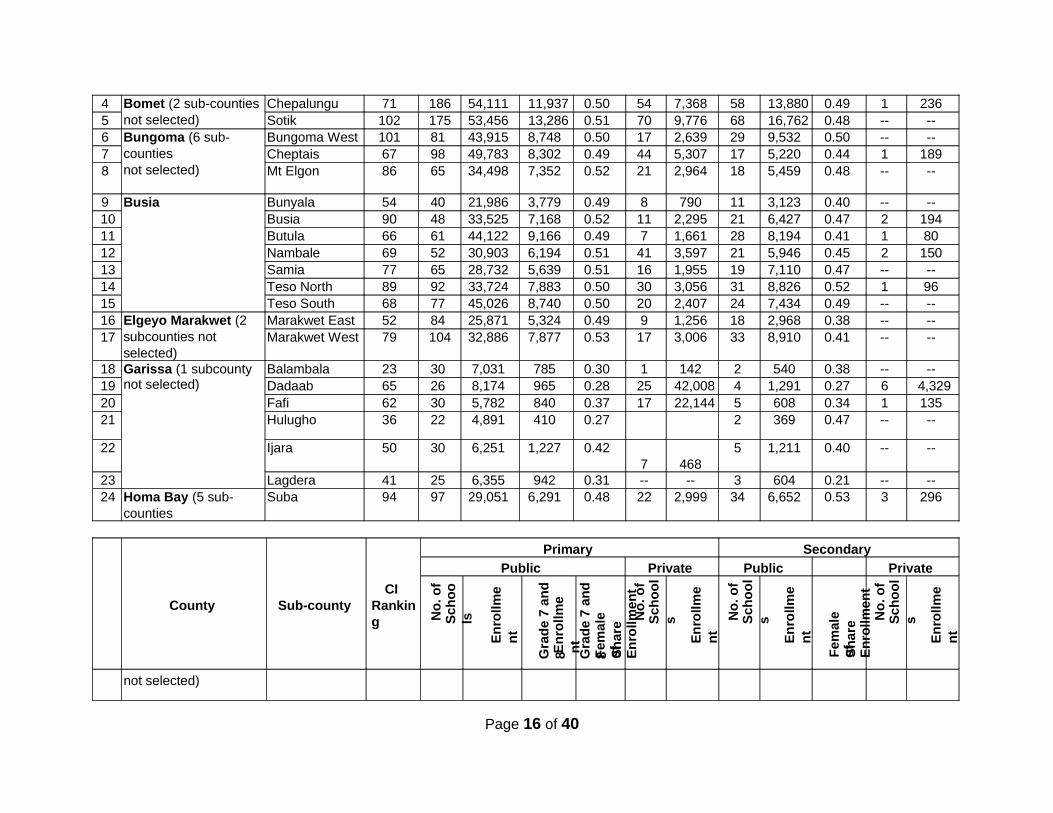
4 Bomet (2 sub-counties not selected)
Chepalungu 71 186 54,111 11,937 0.50 54 7,368 58 13,880 0.49 1 236 5 Sotik 102 175 53,456 13,286 0.51 70 9,776 68 16,762 0.48 -- -- 6 Bungoma (6 sub-
counties not selected)
Bungoma West 101 81 43,915 8,748 0.50 17 2,639 29 9,532 0.50 -- -- 7 Cheptais 67 98 49,783 8,302 0.49 44 5,307 17 5,220 0.44 1 189 8 Mt Elgon 86 65 34,498 7,352 0.52 21 2,964 18 5,459 0.48 -- --
9 Busia
Bunyala 54 40 21,986 3,779 0.49 8 790 11 3,123 0.40 -- -- 10 Busia 90 48 33,525 7,168 0.52 11 2,295 21 6,427 0.47 2 194 11 Butula 66 61 44,122 9,166 0.49 7 1,661 28 8,194 0.41 1 80 12 Nambale 69 52 30,903 6,194 0.51 41 3,597 21 5,946 0.45 2 150 13 Samia 77 65 28,732 5,639 0.51 16 1,955 19 7,110 0.47 -- -- 14 Teso North 89 92 33,724 7,883 0.50 30 3,056 31 8,826 0.52 1 96 15 Teso South 68 77 45,026 8,740 0.50 20 2,407 24 7,434 0.49 -- -- 16 Elgeyo Marakwet (2
subcounties not selected)
Marakwet East 52 84 25,871 5,324 0.49 9 1,256 18 2,968 0.38 -- -- 17 Marakwet West 79 104 32,886 7,877 0.53 17 3,006 33 8,910 0.41 -- --
18 Garissa (1 subcounty not selected)
Balambala 23 30 7,031 785 0.30 1 142 2 540 0.38 -- -- 19 Dadaab 65 26 8,174 965 0.28 25 42,008 4 1,291 0.27 6 4,329 20 Fafi 62 30 5,782 840 0.37 17 22,144 5 608 0.34 1 135 21 Hulugho 36 22 4,891 410 0.27 2 369 0.47 -- --
22 Ijara 50 30 6,251 1,227 0.42 7
468
5 1,211 0.40 -- --
23 Lagdera 41 25 6,355 942 0.31 -- -- 3 604 0.21 -- -- 24 Homa Bay (5 sub-
counties Suba 94 97 29,051 6,291 0.48 22 2,999 34 6,652 0.53 3 296
County Sub-county CI
Ranking
Primary Secondary
Public Private Public Private
not selected)
Page 16 of 40
No
. of
S
ch
oo
ls
En
roll
me
nt
Gra
de
7 a
nd
8
En
roll
me
nt
Gra
de
7 a
nd
8 F
ema
le
Sh
are
o
f E
nro
llme
nt
No
. o
f S
ch
oo
ls
En
rollm
en
t
No
. o
f S
ch
oo
ls
En
rollm
en
t
Fe
mal
e
Sh
are
o
f E
nro
llm
en
t
No
. of
Sc
ho
ol
s
En
roll
me
nt
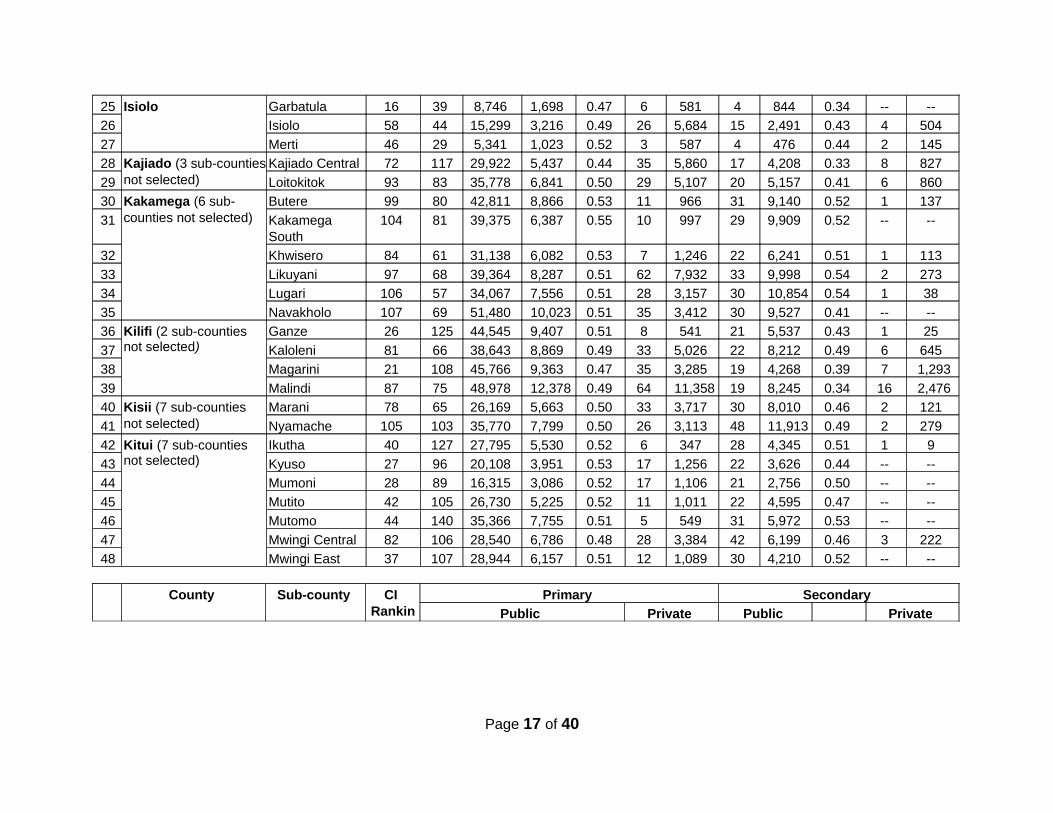
25 Isiolo
Garbatula 16 39 8,746 1,698 0.47 6 581 4 844 0.34 -- --
26 Isiolo 58 44 15,299 3,216 0.49 26 5,684 15 2,491 0.43 4 504
27 Merti 46 29 5,341 1,023 0.52 3 587 4 476 0.44 2 145
28 Kajiado (3 sub-countiesnot selected)
Kajiado Central 72 117 29,922 5,437 0.44 35 5,860 17 4,208 0.33 8 827
29 Loitokitok 93 83 35,778 6,841 0.50 29 5,107 20 5,157 0.41 6 860
30 Kakamega (6 sub-counties not selected)
Butere 99 80 42,811 8,866 0.53 11 966 31 9,140 0.52 1 137
31 Kakamega South
104 81 39,375 6,387 0.55 10 997 29 9,909 0.52 -- --
32 Khwisero 84 61 31,138 6,082 0.53 7 1,246 22 6,241 0.51 1 113
33 Likuyani 97 68 39,364 8,287 0.51 62 7,932 33 9,998 0.54 2 273
34 Lugari 106 57 34,067 7,556 0.51 28 3,157 30 10,854 0.54 1 38
35 Navakholo 107 69 51,480 10,023 0.51 35 3,412 30 9,527 0.41 -- --
36 Kilifi (2 sub-counties not selected)
Ganze 26 125 44,545 9,407 0.51 8 541 21 5,537 0.43 1 25
37 Kaloleni 81 66 38,643 8,869 0.49 33 5,026 22 8,212 0.49 6 645
38 Magarini 21 108 45,766 9,363 0.47 35 3,285 19 4,268 0.39 7 1,293
39 Malindi 87 75 48,978 12,378 0.49 64 11,358 19 8,245 0.34 16 2,476
40 Kisii (7 sub-counties not selected)
Marani 78 65 26,169 5,663 0.50 33 3,717 30 8,010 0.46 2 121
41 Nyamache 105 103 35,770 7,799 0.50 26 3,113 48 11,913 0.49 2 279
42 Kitui (7 sub-counties not selected)
Ikutha 40 127 27,795 5,530 0.52 6 347 28 4,345 0.51 1 9
43 Kyuso 27 96 20,108 3,951 0.53 17 1,256 22 3,626 0.44 -- --
44 Mumoni 28 89 16,315 3,086 0.52 17 1,106 21 2,756 0.50 -- --
45 Mutito 42 105 26,730 5,225 0.52 11 1,011 22 4,595 0.47 -- --
46 Mutomo 44 140 35,366 7,755 0.51 5 549 31 5,972 0.53 -- --
47 Mwingi Central 82 106 28,540 6,786 0.48 28 3,384 42 6,199 0.46 3 222
48 Mwingi East 37 107 28,944 6,157 0.51 12 1,089 30 4,210 0.52 -- --
County Sub-county CI Rankin
Primary Secondary
Public Private Public Private
Page 17 of 40
g
49 Nzambani 55 49 13,215 3,270 0.50 6 347 15 3,954 0.51 -- --
50 Tseikuru 39 57 13,046 2,562 0.51 3 278 11 1,820 0.52 1 34
51 Kwale
Kinango 11 163 66,337 13,155 0.48 18 2,781 23 6,476 0.40 -- --
52 Kwale 92 97 39,154 8,420 0.49 24 3,492 28 11,200 0.51 2 238
53 Msambweni 49 157 61,685 11,992 0.48 72 10,142 35 8,901 0.54 6 732
54 Laikipia (4 sub-counties not selected)
Laikipia North 63 27 6,950 1,467 0.47 2 201 5 1,109 0.42 -- --
55 Machakos (6 sub-counties not selected)
Masinga 88 135 39,328 9,134 0.51 34 4,832 53 11,503 0.48 2 271
56 Yatta 103 134 41,519 9,984 0.51 37 4,222 55 13,191 0.50 8 1,412
57 Makueni (4 sub-counties not selected)
Kathonzweni 80 94 24,605 6,319 0.51 4 544 36 8,762 0.48 1 119
58 Kibwezi 61 163 54,723 12,870 0.51 30 3,541 62 15,265 0.48 2 157
59 Makindu 59 66 22,558 5,386 0.52 20 2,015 24 5,237 0.53 5 325
60 Makueni 100 99 29,418 7,408 0.51 13 2,039 43 12,635 0.44 3 542
61 Nzaui 83 121 34,105 8,197 0.50 7 848 52 13,066 0.53 1 49
62 Mandera
Banisa 25 30 10,047 878 0.27 1 292 2 664 0.21 -- --
63 Lafey 3 11 5,241 832 0.29 -- -- 2 388 0.00 -- ---
64 Mandera Central
22 41 16,994 2,050 0.37 4 483 9 2,264 0.30 -- --
65 Mandera East 56 37 26,537 4,720 0.36 24 6,142 15 5,297 0.34 4 1,481
66 Mandera North 45 40 14,986 1,520 0.38 3 268 7 2,169 0.32 1 183
67 Mandera West 31 41 17,527 1,539 0.28 3 545 6 1,477 0.26 -- --
68 Marsabit
Chalbi 24 17 4,142 775 0.54 -- -- 3 626 0.30 -- --
69 Horr North 7 19 3,659 586 0.35 1 86 4 474 0.45 -- --
70 Loiyangalani 1 15 3,054 348 0.47 -- -- -- -- #DIV/0! -- --
71 Marsabit 74 34 11,756 2,296 0.50 9 1,757 10 2,374 0.34 4 430
72 Marsabit South 10 30 6,990 1,207 0.41 3 625 5 444 0.43 1 47
County Sub-county CI Primary Secondary
Page 18 of 40
No
. o
f
Sc
ho
ols
En
rollm
en
t
Gra
de
7 a
nd
8 E
nro
llme
nt
Gra
de
7 a
nd
8 F
ema
le
Sh
are
o
f E
nro
llme
nt
No
. o
f S
ch
oo
ls
En
roll
me
nt
No
. o
f S
ch
oo
ls
En
roll
me
nt
Fe
mal
e
Sh
are
o
f E
nro
llm
en
t
No
. o
f S
ch
oo
ls
En
roll
me
nt
Ranking
Public Private Public Private
73 Moyale 17 34 13,985 2,518 0.49 23 5,738 7 1,469 0.37 1 140 74 Sololo 5 23 4,747 903 0.46 10 1,400 4 434 0.51 -- -- 75 Migori (4 sub-counties
not selected)
Kuria East 73 50 27,191 4,725 0.48 13 1,882 19 4,621 0.44 -- -- 76 Kuria West 95 91 40,554 7,785 0.50 39 7,039 28 8,315 0.43 5 659 77 Uriri 98 76 32,723 7,458 0.48 33 4,478 33 7,824 0.34 2 130 78 Murang'a (5 sub-
counties not selected) Kandara 78 30,687 7,852 0.51 26 3,848 55 18,907 0.50 3 310
79 Kigumo 61 26,415 6,286 0.50 30 3,613 37 10,771 0.44 2 276 80 Murang'A East 54 18,169 4,696 0.50 20 2,189 30 7,705 0.49 -- --
81 Nandi (4 sub-counties not selected)
Tinderet 85
126 30,841 6,471 0.49 22 2,069 31 6,102 0.46 -- --
82 Narok (3 sub-counties not selected)
Trans Mara East
96 70 33,647 6,368 0.48 23 4,152 23 4,102 0.40 -- --
83 Samburu
Samburu Central
38 84 28,700 5,185 0.41 12 2,013 16 3,677 0.38 2 235
84 Samburu East 34 40 10,070 1,797 0.42 8 573 6 1,448 0.26 1 170 85 Samburu North 35 34 8,954 1,404 0.42 2 113 6 1,285 0.39 -- --
86 Taita Taveta (3 subcounties not selected)
Taveta 64 38 17,511 4,363 0.51 16 2,312 10 2,820 0.53 -- --
87 Tana River
Bura (Tana North)
29 47 13,023 2,452 0.44 16 1,994 5 1,866 0.34 2 156
88 Tana Delta 32 63 20,150 3,784 0.47 4 335 10 2,623 0.39 -- -- 89 Tana River 33 51 15,164 2,875 0.47 4 785 6 1,524 0.45 1 298 90 Tharaka-Nithi (2
subcounties not selected)
Tharaka North 51 60 15,562 2,639 0.52 13 1,390 9 1,471 0.46 1 111 91 Tharaka South 70 104 23,870 4,830 0.51 11 1,034 25 4,025 0.43 3 954
92 Turkana
Kibish 2 11 3,437 229 0.32 -- -- 1 82 0.00 -- -- 93 Loima 8 57 16,509 1,911 0.44 -- -- 6 1,330 0.56 1 71 94 Turkana Central 30 73 34,806 5,228 0.40 16 3,989 9 4,330 0.27 1 38
Page 19 of 40
No
. of
S
ch
oo
ls
En
roll
me
nt
Gra
de
7 a
nd
8 E
nro
llme
nt
Gra
de
7 a
nd
8 F
ema
le
Sh
are
o
f E
nro
llme
nt
No
. o
f S
ch
oo
ls
En
rollm
en
t
No
. o
f S
ch
oo
ls
En
rollm
en
t
Fe
mal
e
Sh
are
o
f E
nro
llm
en
t
No
. o
f S
ch
oo
ls
En
rollm
en
t
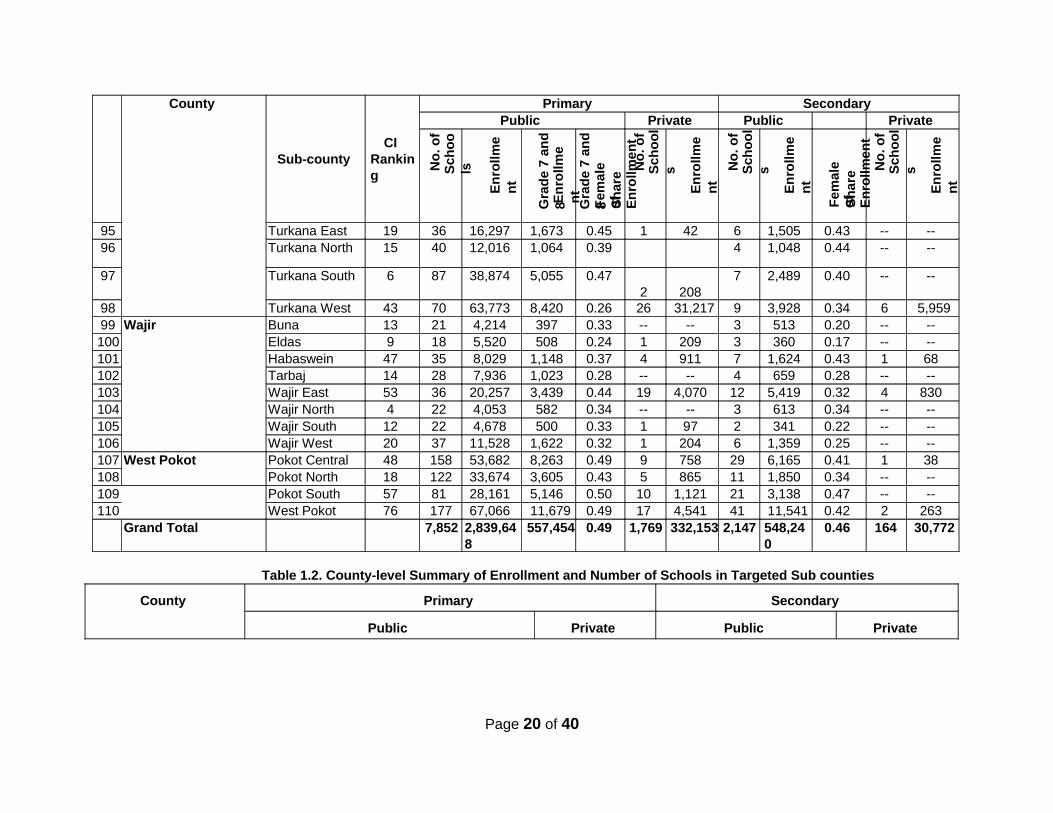
County
Sub-county CI
Ranking
Primary Secondary Public Private Public Private
95 Turkana East 19 36 16,297 1,673 0.45 1 42 6 1,505 0.43 -- -- 96 Turkana North 15 40 12,016 1,064 0.39 4 1,048 0.44 -- --
97 Turkana South 6 87 38,874 5,055 0.47 2
208
7 2,489 0.40 -- --
98 Turkana West 43 70 63,773 8,420 0.26 26 31,217 9 3,928 0.34 6 5,959 99 Wajir
Buna 13 21 4,214 397 0.33 -- -- 3 513 0.20 -- --
100 Eldas 9 18 5,520 508 0.24 1 209 3 360 0.17 -- -- 101 Habaswein 47 35 8,029 1,148 0.37 4 911 7 1,624 0.43 1 68 102 Tarbaj 14 28 7,936 1,023 0.28 -- -- 4 659 0.28 -- -- 103 Wajir East 53 36 20,257 3,439 0.44 19 4,070 12 5,419 0.32 4 830 104 Wajir North 4 22 4,053 582 0.34 -- -- 3 613 0.34 -- -- 105 Wajir South 12 22 4,678 500 0.33 1 97 2 341 0.22 -- -- 106 Wajir West 20 37 11,528 1,622 0.32 1 204 6 1,359 0.25 -- -- 107 West Pokot
Pokot Central 48 158 53,682 8,263 0.49 9 758 29 6,165 0.41 1 38
108 Pokot North 18 122 33,674 3,605 0.43 5 865 11 1,850 0.34 -- -- 109 Pokot South 57 81 28,161 5,146 0.50 10 1,121 21 3,138 0.47 -- -- 110 West Pokot 76 177 67,066 11,679 0.49 17 4,541 41 11,541 0.42 2 263
Grand Total 7,852 2,839,648
557,454 0.49 1,769 332,153 2,147 548,240
0.46 164 30,772
Table 1.2. County-level Summary of Enrollment and Number of Schools in Targeted Sub counties
County Primary Secondary
Public Private Public Private
Page 20 of 40
No
. of
S
ch
oo
ls
En
roll
me
nt
Gra
de
7 a
nd
8 E
nro
llme
nt
Gra
de
7 a
nd
8 F
ema
le
Sh
are
o
f E
nro
llme
nt
No
. o
f S
ch
oo
ls
En
rollm
en
t
No
. o
f S
ch
oo
ls
En
rollm
en
t
Fe
mal
e
Sh
are
o
f E
nro
llm
en
t
No
. o
f S
ch
oo
ls
En
rollm
en
t
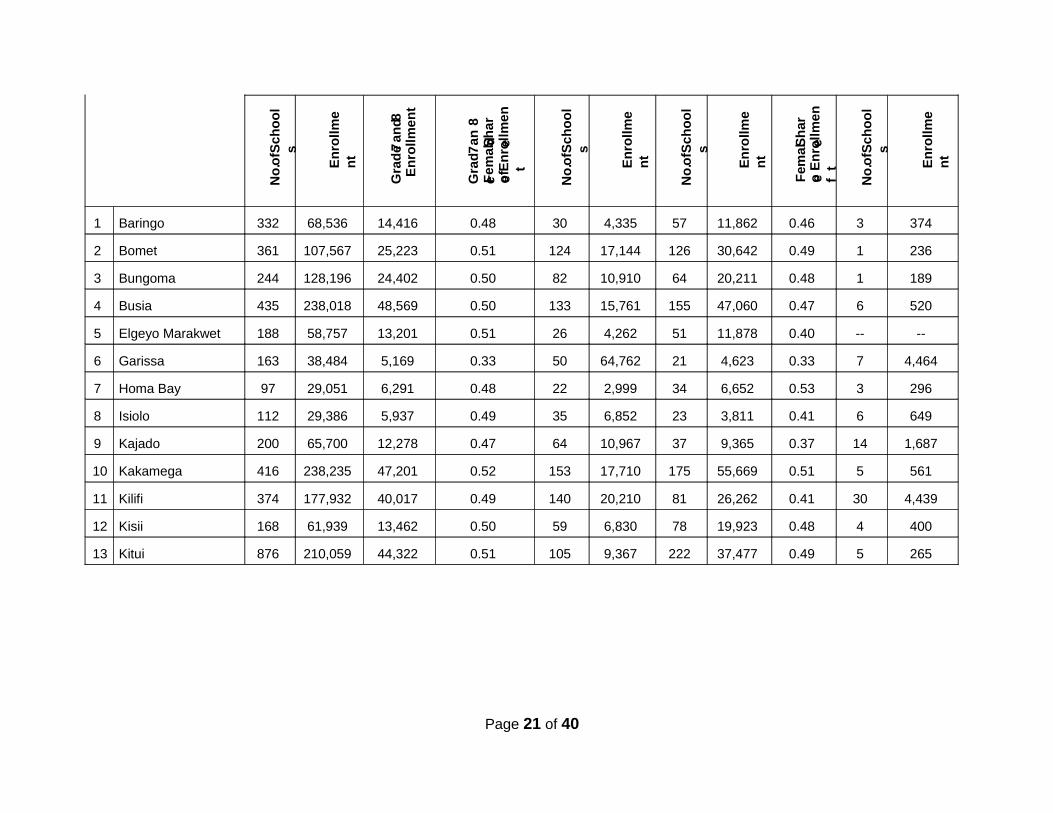
1 Baringo 332 68,536 14,416 0.48 30 4,335 57 11,862 0.46 3 374
2 Bomet 361 107,567 25,223 0.51 124 17,144 126 30,642 0.49 1 236
3 Bungoma 244 128,196 24,402 0.50 82 10,910 64 20,211 0.48 1 189
4 Busia 435 238,018 48,569 0.50 133 15,761 155 47,060 0.47 6 520
5 Elgeyo Marakwet 188 58,757 13,201 0.51 26 4,262 51 11,878 0.40 -- --
6 Garissa 163 38,484 5,169 0.33 50 64,762 21 4,623 0.33 7 4,464
7 Homa Bay 97 29,051 6,291 0.48 22 2,999 34 6,652 0.53 3 296
8 Isiolo 112 29,386 5,937 0.49 35 6,852 23 3,811 0.41 6 649
9 Kajado 200 65,700 12,278 0.47 64 10,967 37 9,365 0.37 14 1,687
10 Kakamega 416 238,235 47,201 0.52 153 17,710 175 55,669 0.51 5 561
11 Kilifi 374 177,932 40,017 0.49 140 20,210 81 26,262 0.41 30 4,439
12 Kisii 168 61,939 13,462 0.50 59 6,830 78 19,923 0.48 4 400
13 Kitui 876 210,059 44,322 0.51 105 9,367 222 37,477 0.49 5 265
Page 21 of 40
No
. of S
ch
oo
ls
En
roll
me
nt
Gra
de 7
an
d 8
En
roll
me
nt
Gra
de
7 a
nd
8
Fe
mal
e S
ha
re
o
f En
roll
me
nt
No
. of S
ch
oo
ls
En
roll
me
nt
No
. of S
ch
oo
ls
En
rollm
en
t
Fem
al
e S
har
e
o f E
nro
llm
en
t
No
. of S
ch
oo
ls
En
roll
me
nt
County
Primary Secondary
Public Private Public Private
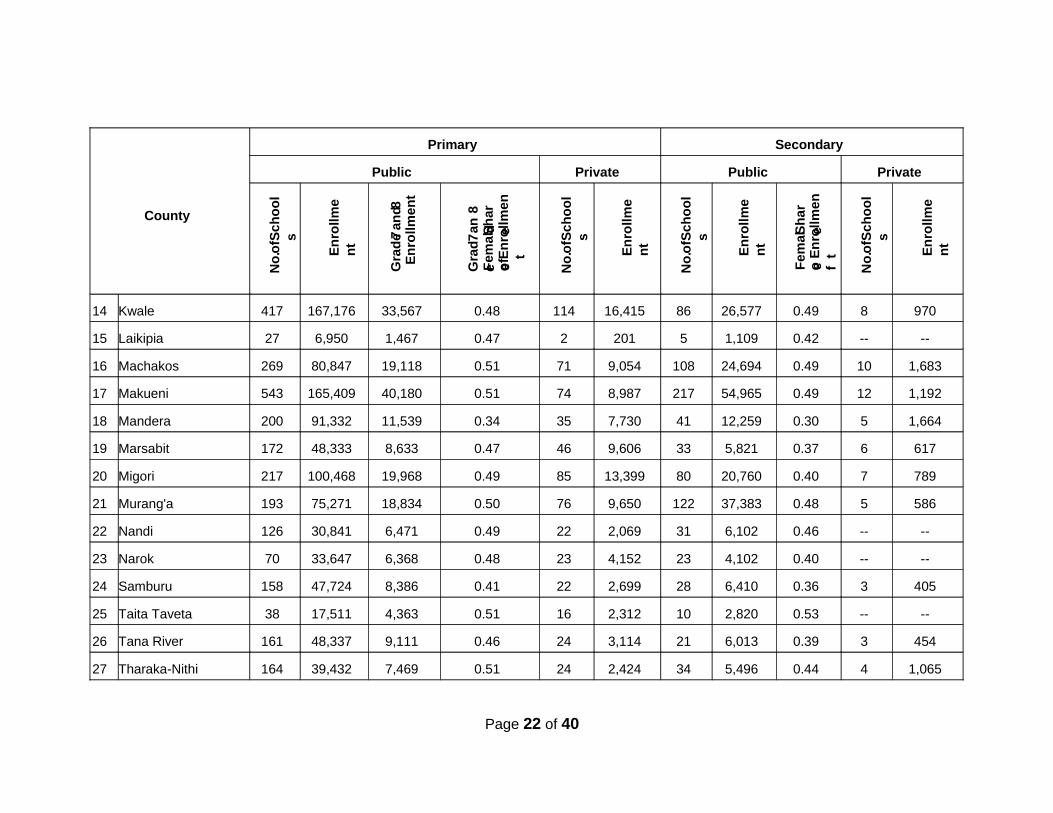
14 Kwale 417 167,176 33,567 0.48 114 16,415 86 26,577 0.49 8 970
15 Laikipia 27 6,950 1,467 0.47 2 201 5 1,109 0.42 -- --
16 Machakos 269 80,847 19,118 0.51 71 9,054 108 24,694 0.49 10 1,683
17 Makueni 543 165,409 40,180 0.51 74 8,987 217 54,965 0.49 12 1,192
18 Mandera 200 91,332 11,539 0.34 35 7,730 41 12,259 0.30 5 1,664
19 Marsabit 172 48,333 8,633 0.47 46 9,606 33 5,821 0.37 6 617
20 Migori 217 100,468 19,968 0.49 85 13,399 80 20,760 0.40 7 789
21 Murang'a 193 75,271 18,834 0.50 76 9,650 122 37,383 0.48 5 586
22 Nandi 126 30,841 6,471 0.49 22 2,069 31 6,102 0.46 -- --
23 Narok 70 33,647 6,368 0.48 23 4,152 23 4,102 0.40 -- --
24 Samburu 158 47,724 8,386 0.41 22 2,699 28 6,410 0.36 3 405
25 Taita Taveta 38 17,511 4,363 0.51 16 2,312 10 2,820 0.53 -- --
26 Tana River 161 48,337 9,111 0.46 24 3,114 21 6,013 0.39 3 454
27 Tharaka-Nithi 164 39,432 7,469 0.51 24 2,424 34 5,496 0.44 4 1,065
Page 22 of 40
No
. of S
ch
oo
ls
En
rollm
en
t
Gra
de 7
an
d 8
En
rollm
en
t
Gra
de
7 a
n d 8
F
ema
le
Sh
are
o
f En
rollm
en
t
No
. of S
ch
oo
ls
En
rollm
en
t
No
. of S
ch
oo
ls
En
roll
me
nt
Fe
mal
e S
ha
re
o f
En
rollm
en
t
No
. of S
ch
oo
ls
En
rollm
en
t
County
Primary Secondary
Public Private Public Private
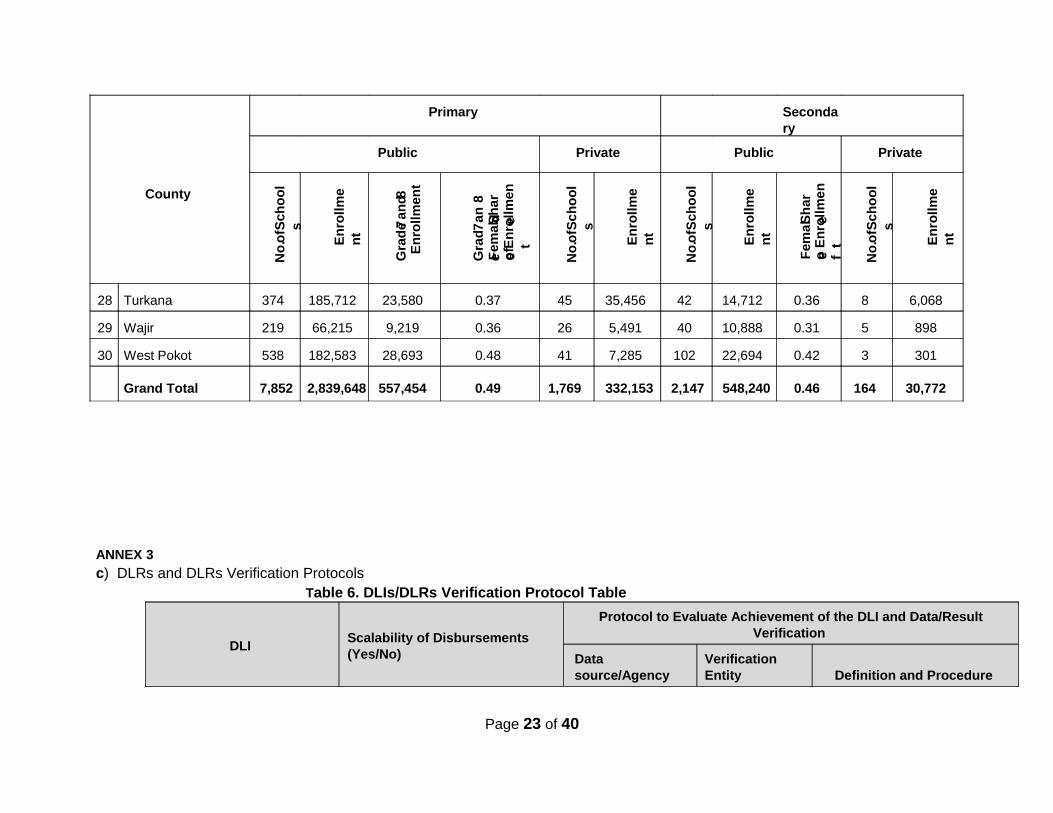
28 Turkana 374 185,712 23,580 0.37 45 35,456 42 14,712 0.36 8 6,068
29 Wajir 219 66,215 9,219 0.36 26 5,491 40 10,888 0.31 5 898
30 West Pokot 538 182,583 28,693 0.48 41 7,285 102 22,694 0.42 3 301
Grand Total 7,852 2,839,648 557,454 0.49 1,769 332,153 2,147 548,240 0.46 164 30,772
ANNEX 3
c) DLRs and DLRs Verification ProtocolsTable 6. DLIs/DLRs Verification Protocol Table
DLI Scalability of Disbursements (Yes/No)
Protocol to Evaluate Achievement of the DLI and Data/ResultVerification
Data source/Agency
Verification Entity Definition and Procedure
Page 23 of 40
No
. of S
ch
oo
ls
En
roll
me
nt
Gra
de 7
an
d 8
En
roll
me
nt
Gra
de
7 a
nd
8
Fe
mal
e S
ha
re
o
f En
roll
me
nt
No
. of S
ch
oo
ls
En
roll
me
nt
No
. of S
ch
oo
ls
En
roll
me
nt
Fem
al
e S
har
e
o f E
nro
llm
en
t
No
. of S
ch
oo
ls
En
roll
me
nt
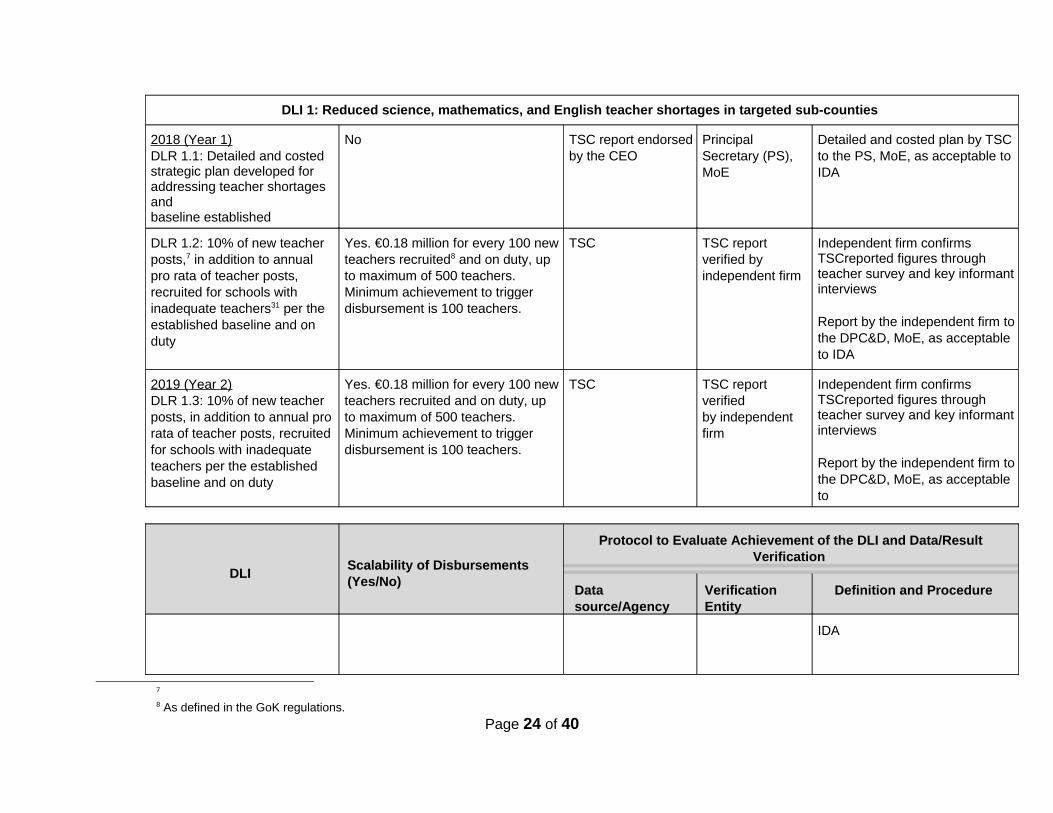
DLI 1: Reduced science, mathematics, and English teacher shortages in targeted sub-counties
2018 (Year 1) DLR 1.1: Detailed and costed strategic plan developed for addressing teacher shortages and baseline established
No TSC report endorsedby the CEO
Principal Secretary (PS), MoE
Detailed and costed plan by TSCto the PS, MoE, as acceptable to IDA
DLR 1.2: 10% of new teacher posts,7 in addition to annual pro rata of teacher posts, recruited for schools with inadequate teachers31 per the established baseline and on duty
Yes. €0.18 million for every 100 newteachers recruited8 and on duty, up to maximum of 500 teachers. Minimum achievement to trigger disbursement is 100 teachers.
TSC TSC report verified by independent firm
Independent firm confirms TSCreported figures through teacher survey and key informantinterviews Report by the independent firm tothe DPC&D, MoE, as acceptable to IDA
2019 (Year 2) DLR 1.3: 10% of new teacher posts, in addition to annual pro rata of teacher posts, recruited for schools with inadequate teachers per the established baseline and on duty
Yes. €0.18 million for every 100 newteachers recruited and on duty, up to maximum of 500 teachers. Minimum achievement to trigger disbursement is 100 teachers.
TSC TSC report verified by independent firm
Independent firm confirms TSCreported figures through teacher survey and key informantinterviews Report by the independent firm tothe DPC&D, MoE, as acceptable to
DLI Scalability of Disbursements (Yes/No)
Protocol to Evaluate Achievement of the DLI and Data/ResultVerification
Data source/Agency
Verification Entity
Definition and Procedure
IDA
7
8 As defined in the GoK regulations.
Page 24 of 40
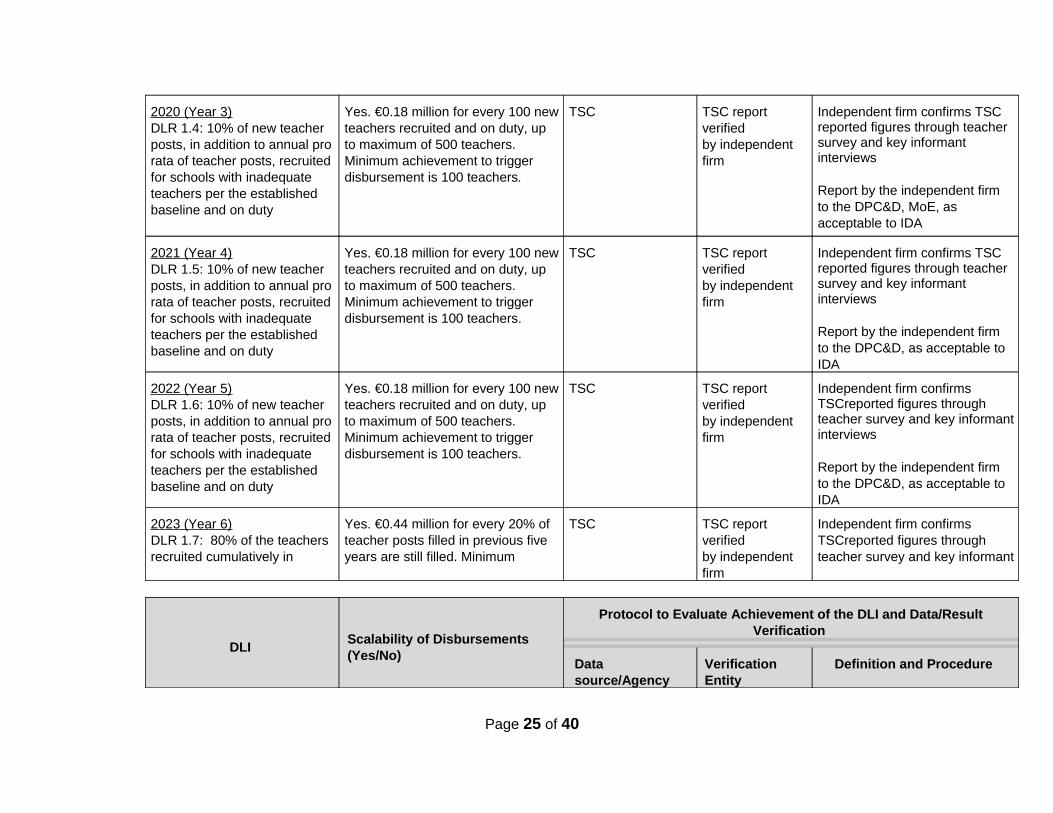
2020 (Year 3) DLR 1.4: 10% of new teacher posts, in addition to annual prorata of teacher posts, recruited for schools with inadequate teachers per the established baseline and on duty
Yes. €0.18 million for every 100 newteachers recruited and on duty, up to maximum of 500 teachers. Minimum achievement to trigger disbursement is 100 teachers.
TSC TSC report verified by independent firm
Independent firm confirms TSC reported figures through teacher survey and key informant interviews Report by the independent firm to the DPC&D, MoE, as acceptable to IDA
2021 (Year 4) DLR 1.5: 10% of new teacher posts, in addition to annual prorata of teacher posts, recruited for schools with inadequate teachers per the established baseline and on duty
Yes. €0.18 million for every 100 newteachers recruited and on duty, up to maximum of 500 teachers. Minimum achievement to trigger disbursement is 100 teachers.
TSC TSC report verified by independent firm
Independent firm confirms TSC reported figures through teacher survey and key informant interviews Report by the independent firm to the DPC&D, as acceptable to IDA
2022 (Year 5) DLR 1.6: 10% of new teacher posts, in addition to annual prorata of teacher posts, recruited for schools with inadequate teachers per the established baseline and on duty
Yes. €0.18 million for every 100 newteachers recruited and on duty, up to maximum of 500 teachers. Minimum achievement to trigger disbursement is 100 teachers.
TSC TSC report verified by independent firm
Independent firm confirms TSCreported figures through teacher survey and key informantinterviews Report by the independent firm to the DPC&D, as acceptable to IDA
2023 (Year 6) DLR 1.7: 80% of the teachers recruited cumulatively in
Yes. €0.44 million for every 20% of teacher posts filled in previous five years are still filled. Minimum
TSC TSC report verified by independent firm
Independent firm confirms TSCreported figures through teacher survey and key informant
DLI Scalability of Disbursements (Yes/No)
Protocol to Evaluate Achievement of the DLI and Data/ResultVerification
Data source/Agency
Verification Entity
Definition and Procedure
Page 25 of 40
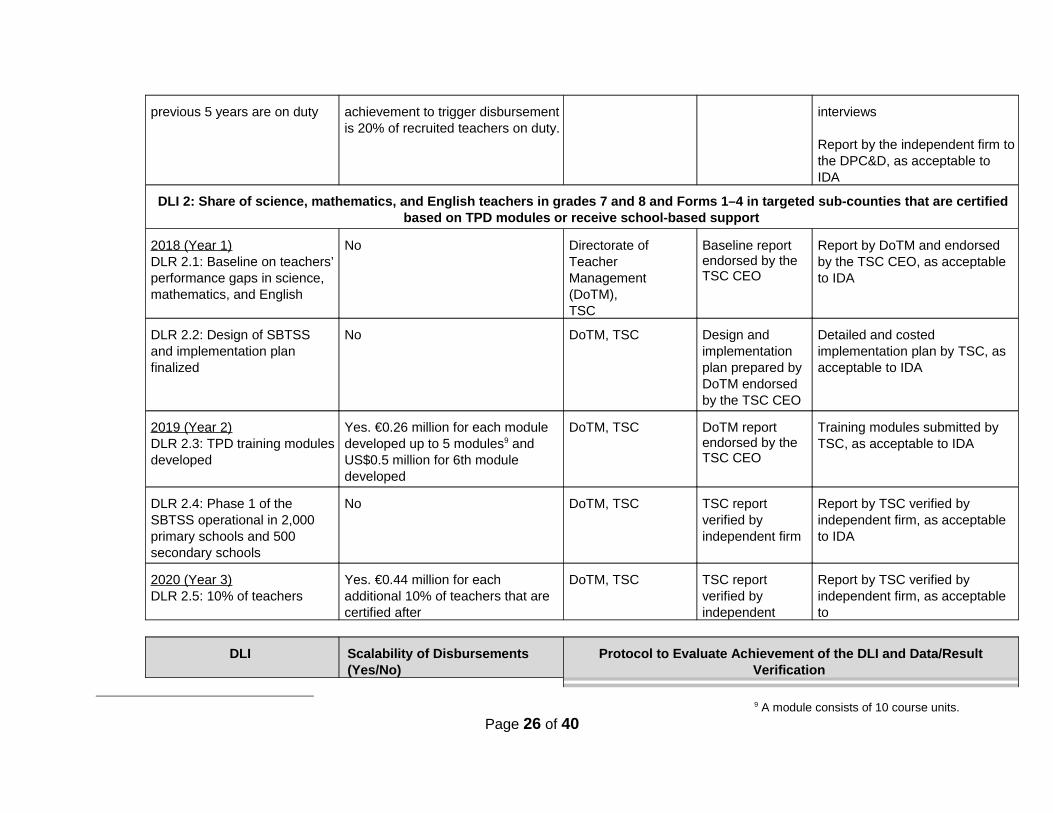
previous 5 years are on duty achievement to trigger disbursementis 20% of recruited teachers on duty.
interviews Report by the independent firm tothe DPC&D, as acceptable to IDA
DLI 2: Share of science, mathematics, and English teachers in grades 7 and 8 and Forms 1–4 in targeted sub-counties that are certifiedbased on TPD modules or receive school-based support
2018 (Year 1) DLR 2.1: Baseline on teachers’performance gaps in science, mathematics, and English
No Directorate of Teacher Management (DoTM), TSC
Baseline report endorsed by the TSC CEO
Report by DoTM and endorsed by the TSC CEO, as acceptable to IDA
DLR 2.2: Design of SBTSS and implementation plan finalized
No DoTM, TSC Design and implementation plan prepared by DoTM endorsed by the TSC CEO
Detailed and costed implementation plan by TSC, as acceptable to IDA
2019 (Year 2) DLR 2.3: TPD training modulesdeveloped
Yes. €0.26 million for each module developed up to 5 modules9 and US$0.5 million for 6th module developed
DoTM, TSC DoTM report endorsed by the TSC CEO
Training modules submitted by TSC, as acceptable to IDA
DLR 2.4: Phase 1 of the SBTSS operational in 2,000 primary schools and 500 secondary schools
No DoTM, TSC TSC report verified by independent firm
Report by TSC verified by independent firm, as acceptable to IDA
2020 (Year 3) DLR 2.5: 10% of teachers
Yes. €0.44 million for each additional 10% of teachers that are certified after
DoTM, TSC TSC report verified by independent
Report by TSC verified by independent firm, as acceptable to
DLI Scalability of Disbursements (Yes/No)
Protocol to Evaluate Achievement of the DLI and Data/ResultVerification
9 A module consists of 10 course units.
Page 26 of 40
Data source/Agency
Verification Entity
Definition and Procedure
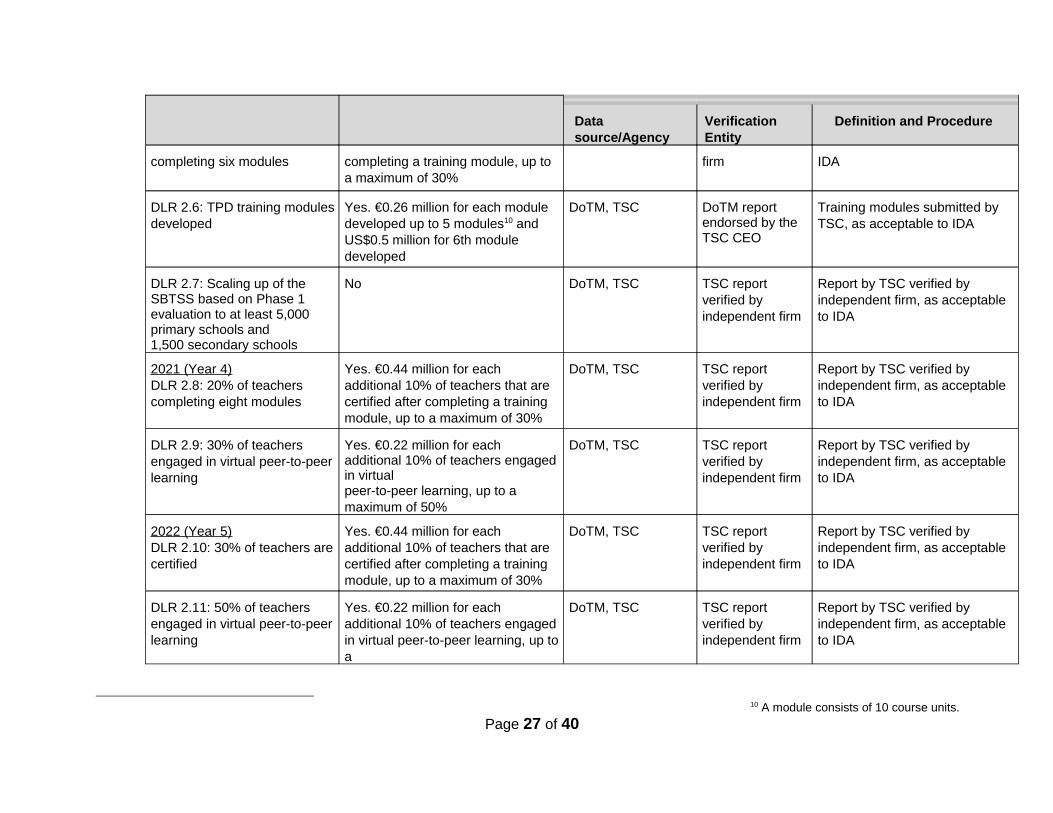
completing six modules completing a training module, up to a maximum of 30%
firm IDA
DLR 2.6: TPD training modulesdeveloped
Yes. €0.26 million for each module developed up to 5 modules10 and US$0.5 million for 6th module developed
DoTM, TSC DoTM report endorsed by the TSC CEO
Training modules submitted by TSC, as acceptable to IDA
DLR 2.7: Scaling up of the SBTSS based on Phase 1 evaluation to at least 5,000 primary schools and 1,500 secondary schools
No DoTM, TSC TSC report verified by independent firm
Report by TSC verified by independent firm, as acceptable to IDA
2021 (Year 4) DLR 2.8: 20% of teachers completing eight modules
Yes. €0.44 million for each additional 10% of teachers that are certified after completing a training module, up to a maximum of 30%
DoTM, TSC TSC report verified by independent firm
Report by TSC verified by independent firm, as acceptable to IDA
DLR 2.9: 30% of teachers engaged in virtual peer-to-peerlearning
Yes. €0.22 million for each additional 10% of teachers engaged in virtual peer-to-peer learning, up to a maximum of 50%
DoTM, TSC TSC report verified by independent firm
Report by TSC verified by independent firm, as acceptable to IDA
2022 (Year 5) DLR 2.10: 30% of teachers arecertified
Yes. €0.44 million for each additional 10% of teachers that are certified after completing a training module, up to a maximum of 30%
DoTM, TSC TSC report verified by independent firm
Report by TSC verified by independent firm, as acceptable to IDA
DLR 2.11: 50% of teachers engaged in virtual peer-to-peerlearning
Yes. €0.22 million for each additional 10% of teachers engaged in virtual peer-to-peer learning, up toa
DoTM, TSC TSC report verified by independent firm
Report by TSC verified by independent firm, as acceptable to IDA
10 A module consists of 10 course units.
Page 27 of 40
DLI Scalability of Disbursements (Yes/No)
Protocol to Evaluate Achievement of the DLI and Data/ResultVerification
Data source/Agency
Verification Entity
Definition and Procedure
maximum of 50%
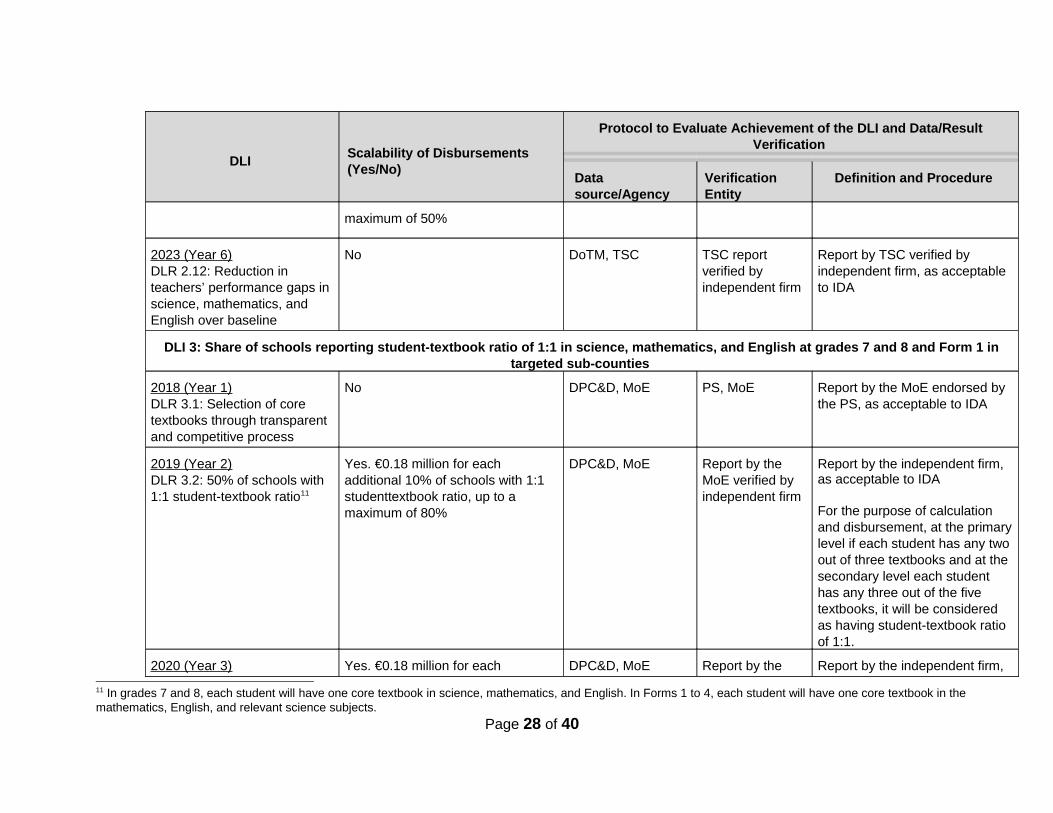
2023 (Year 6) DLR 2.12: Reduction in teachers’ performance gaps in science, mathematics, and English over baseline
No DoTM, TSC TSC report verified by independent firm
Report by TSC verified by independent firm, as acceptable to IDA
DLI 3: Share of schools reporting student-textbook ratio of 1:1 in science, mathematics, and English at grades 7 and 8 and Form 1 intargeted sub-counties
2018 (Year 1) DLR 3.1: Selection of core textbooks through transparent and competitive process
No DPC&D, MoE PS, MoE Report by the MoE endorsed by the PS, as acceptable to IDA
2019 (Year 2) DLR 3.2: 50% of schools with 1:1 student-textbook ratio11
Yes. €0.18 million for each additional 10% of schools with 1:1 studenttextbook ratio, up to a maximum of 80%
DPC&D, MoE Report by the MoE verified by independent firm
Report by the independent firm, as acceptable to IDA For the purpose of calculation and disbursement, at the primarylevel if each student has any two out of three textbooks and at the secondary level each student has any three out of the five textbooks, it will be considered as having student-textbook ratio of 1:1.
2020 (Year 3) Yes. €0.18 million for each DPC&D, MoE Report by the Report by the independent firm,
11 In grades 7 and 8, each student will have one core textbook in science, mathematics, and English. In Forms 1 to 4, each student will have one core textbook in themathematics, English, and relevant science subjects.
Page 28 of 40
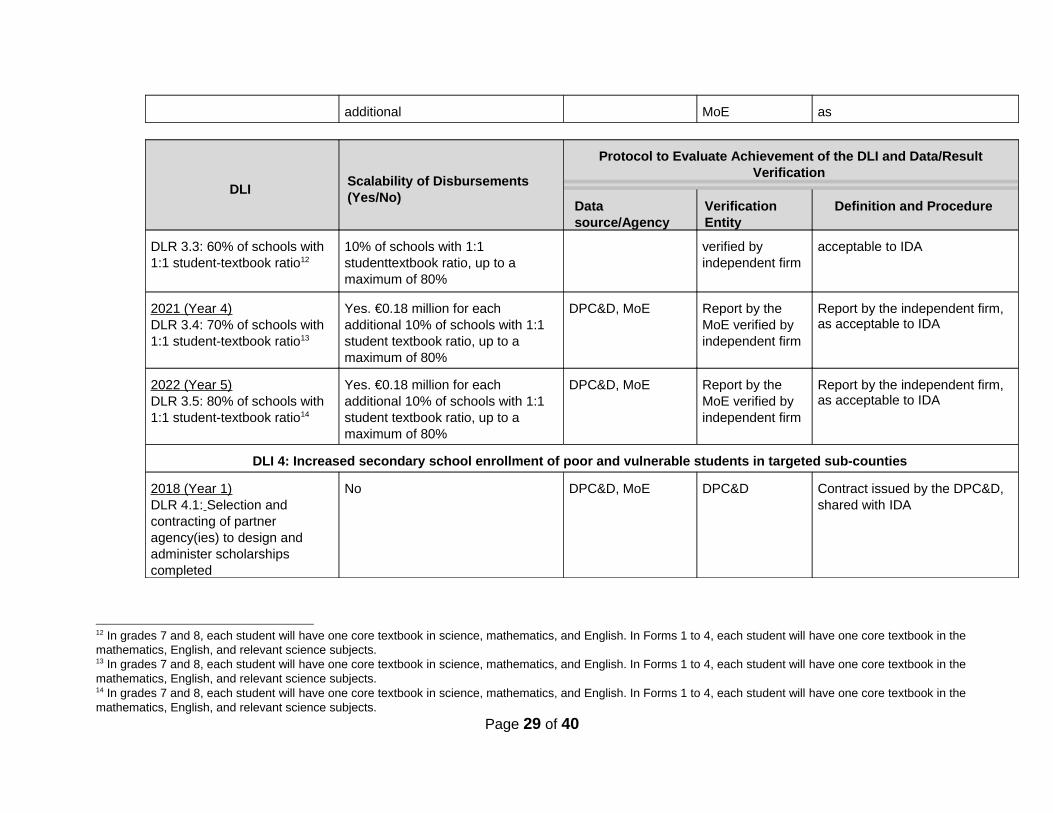
additional MoE as
DLI Scalability of Disbursements (Yes/No)
Protocol to Evaluate Achievement of the DLI and Data/ResultVerification
Data source/Agency
Verification Entity
Definition and Procedure
DLR 3.3: 60% of schools with 1:1 student-textbook ratio12
10% of schools with 1:1 studenttextbook ratio, up to a maximum of 80%
verified by independent firm
acceptable to IDA
2021 (Year 4) DLR 3.4: 70% of schools with 1:1 student-textbook ratio13
Yes. €0.18 million for each additional 10% of schools with 1:1 student textbook ratio, up to a maximum of 80%
DPC&D, MoE Report by the MoE verified by independent firm
Report by the independent firm, as acceptable to IDA
2022 (Year 5) DLR 3.5: 80% of schools with 1:1 student-textbook ratio14
Yes. €0.18 million for each additional 10% of schools with 1:1 student textbook ratio, up to a maximum of 80%
DPC&D, MoE Report by the MoE verified by independent firm
Report by the independent firm, as acceptable to IDA
DLI 4: Increased secondary school enrollment of poor and vulnerable students in targeted sub-counties
2018 (Year 1) DLR 4.1: Selection and contracting of partner agency(ies) to design and administer scholarships completed
No DPC&D, MoE DPC&D Contract issued by the DPC&D, shared with IDA
12 In grades 7 and 8, each student will have one core textbook in science, mathematics, and English. In Forms 1 to 4, each student will have one core textbook in themathematics, English, and relevant science subjects. 13 In grades 7 and 8, each student will have one core textbook in science, mathematics, and English. In Forms 1 to 4, each student will have one core textbook in themathematics, English, and relevant science subjects. 14 In grades 7 and 8, each student will have one core textbook in science, mathematics, and English. In Forms 1 to 4, each student will have one core textbook in themathematics, English, and relevant science subjects.
Page 29 of 40
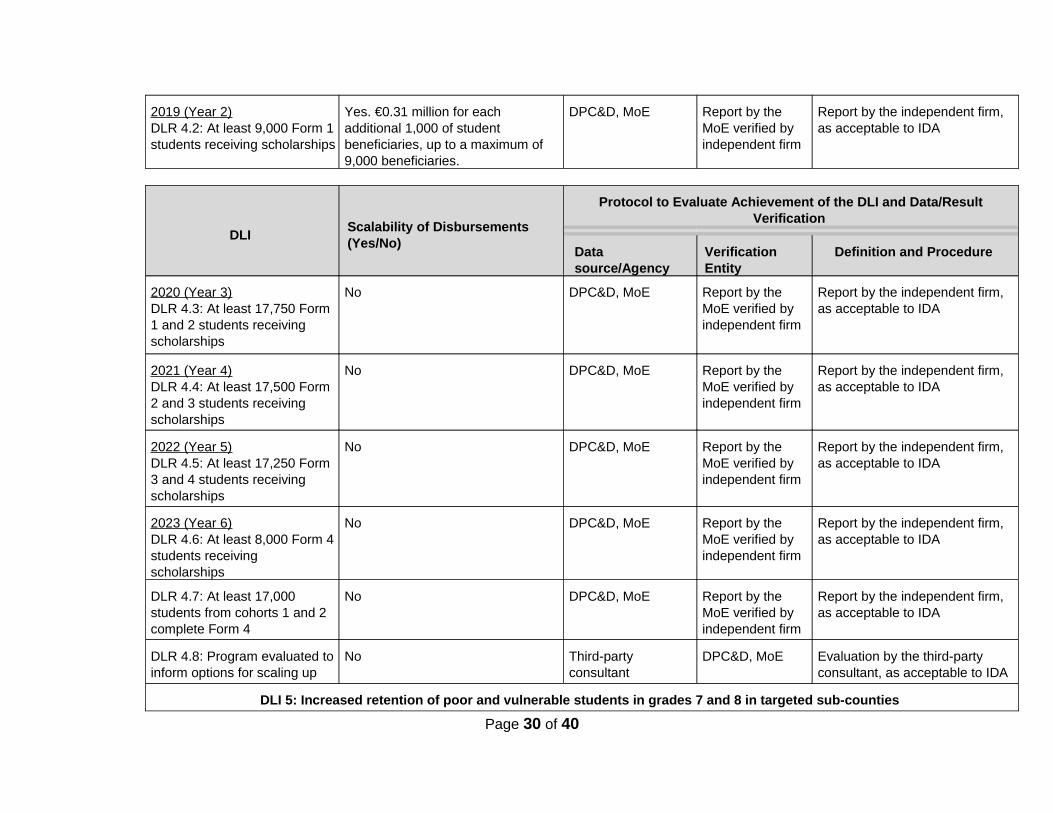
2019 (Year 2) DLR 4.2: At least 9,000 Form 1students receiving scholarships
Yes. €0.31 million for each additional 1,000 of student beneficiaries, up to a maximum of 9,000 beneficiaries.
DPC&D, MoE Report by the MoE verified by independent firm
Report by the independent firm, as acceptable to IDA
DLI Scalability of Disbursements (Yes/No)
Protocol to Evaluate Achievement of the DLI and Data/ResultVerification
Data source/Agency
Verification Entity
Definition and Procedure
2020 (Year 3) DLR 4.3: At least 17,750 Form 1 and 2 students receiving scholarships
No DPC&D, MoE Report by the MoE verified by independent firm
Report by the independent firm, as acceptable to IDA
2021 (Year 4) DLR 4.4: At least 17,500 Form 2 and 3 students receiving scholarships
No DPC&D, MoE Report by the MoE verified by independent firm
Report by the independent firm, as acceptable to IDA
2022 (Year 5) DLR 4.5: At least 17,250 Form 3 and 4 students receiving scholarships
No DPC&D, MoE Report by the MoE verified by independent firm
Report by the independent firm, as acceptable to IDA
2023 (Year 6) DLR 4.6: At least 8,000 Form 4students receiving scholarships
No DPC&D, MoE Report by the MoE verified by independent firm
Report by the independent firm, as acceptable to IDA
DLR 4.7: At least 17,000 students from cohorts 1 and 2 complete Form 4
No DPC&D, MoE Report by the MoE verified by independent firm
Report by the independent firm, as acceptable to IDA
DLR 4.8: Program evaluated toinform options for scaling up
No Third-party consultant
DPC&D, MoE Evaluation by the third-party consultant, as acceptable to IDA
DLI 5: Increased retention of poor and vulnerable students in grades 7 and 8 in targeted sub-counties
Page 30 of 40
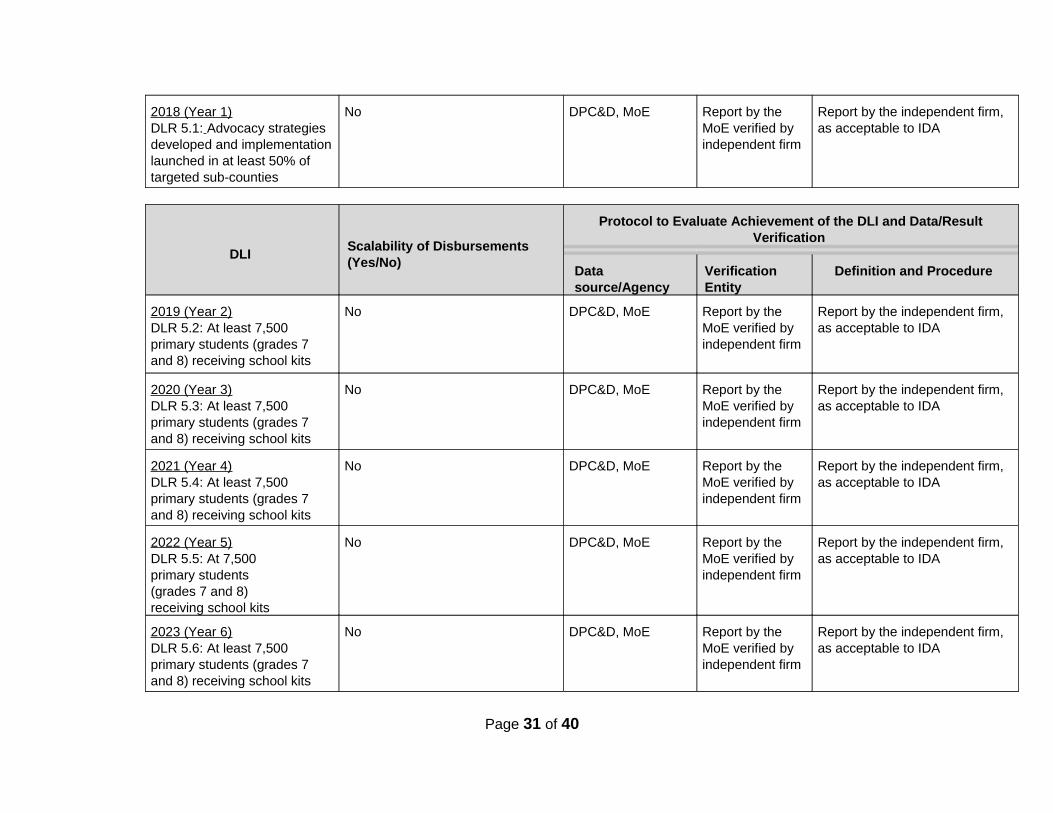
2018 (Year 1) DLR 5.1: Advocacy strategies developed and implementationlaunched in at least 50% of targeted sub-counties
No DPC&D, MoE Report by the MoE verified by independent firm
Report by the independent firm, as acceptable to IDA
DLI Scalability of Disbursements (Yes/No)
Protocol to Evaluate Achievement of the DLI and Data/ResultVerification
Data source/Agency
Verification Entity
Definition and Procedure
2019 (Year 2) DLR 5.2: At least 7,500 primary students (grades 7 and 8) receiving school kits
No DPC&D, MoE Report by the MoE verified by independent firm
Report by the independent firm, as acceptable to IDA
2020 (Year 3) DLR 5.3: At least 7,500 primary students (grades 7 and 8) receiving school kits
No DPC&D, MoE Report by the MoE verified by independent firm
Report by the independent firm, as acceptable to IDA
2021 (Year 4) DLR 5.4: At least 7,500 primary students (grades 7 and 8) receiving school kits
No DPC&D, MoE Report by the MoE verified by independent firm
Report by the independent firm, as acceptable to IDA
2022 (Year 5) DLR 5.5: At 7,500 primary students (grades 7 and 8) receiving school kits
No DPC&D, MoE Report by the MoE verified by independent firm
Report by the independent firm, as acceptable to IDA
2023 (Year 6) DLR 5.6: At least 7,500 primary students (grades 7 and 8) receiving school kits
No DPC&D, MoE Report by the MoE verified by independent firm
Report by the independent firm, as acceptable to IDA
Page 31 of 40
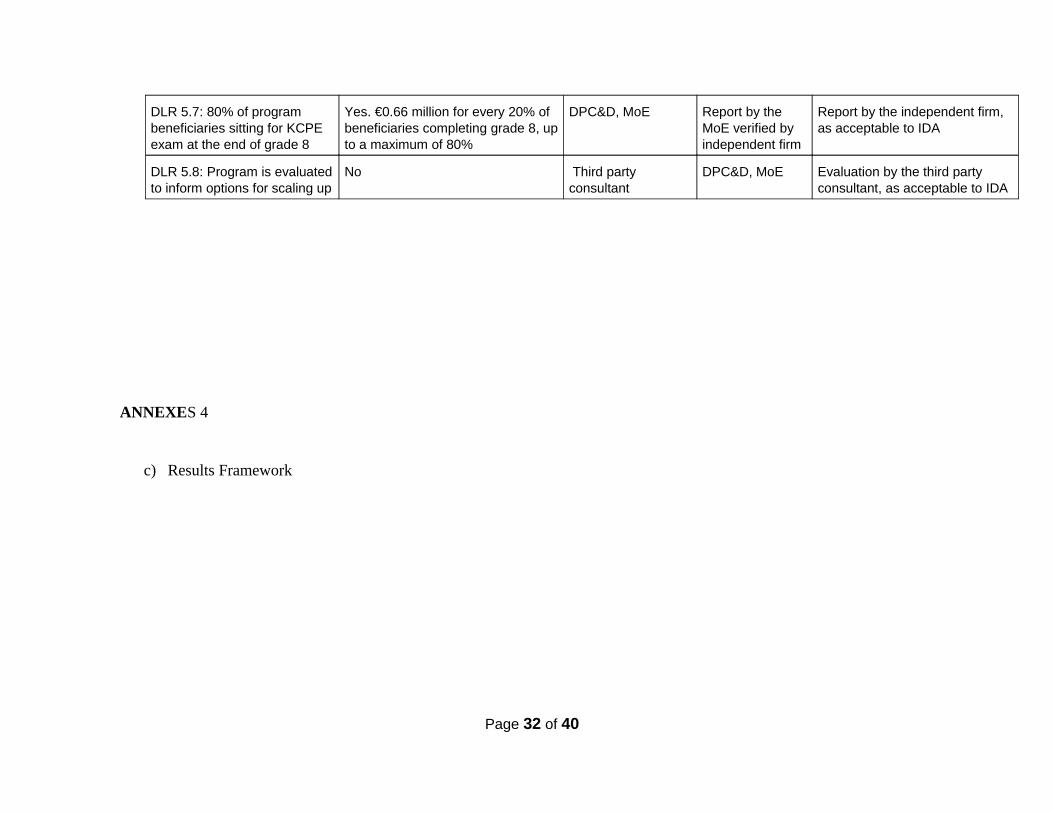
DLR 5.7: 80% of program beneficiaries sitting for KCPE exam at the end of grade 8
Yes. €0.66 million for every 20% of beneficiaries completing grade 8, upto a maximum of 80%
DPC&D, MoE Report by the MoE verified by independent firm
Report by the independent firm, as acceptable to IDA
DLR 5.8: Program is evaluatedto inform options for scaling up
No Third party consultant
DPC&D, MoE Evaluation by the third party consultant, as acceptable to IDA
ANNEXES 4
c) Results Framework
Page 32 of 40
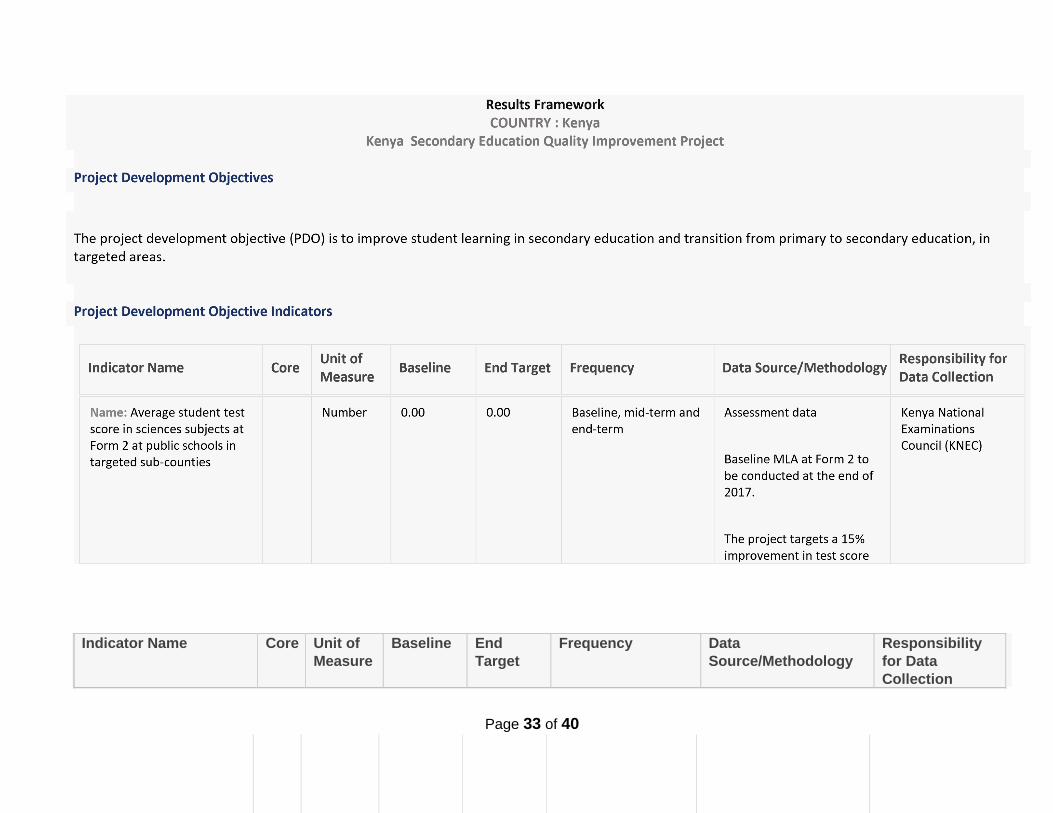
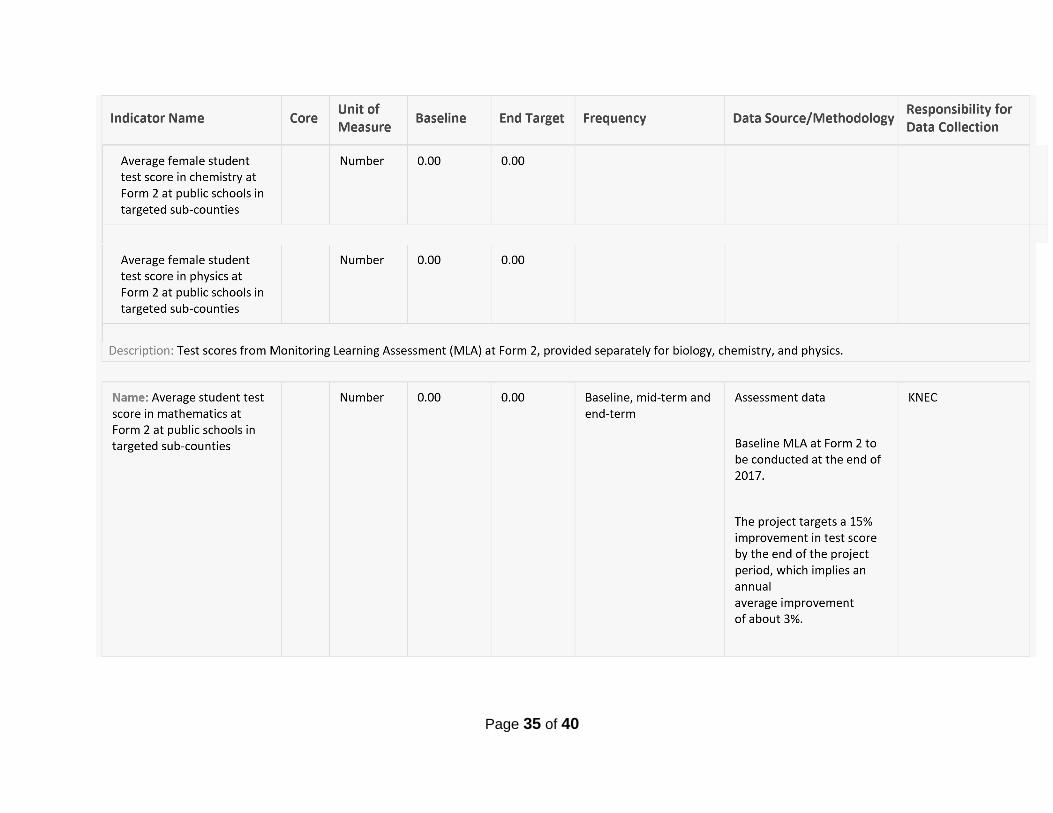
Indicator Name
Core Unit of Measure
Baseline End Target
Frequency Data Source/Methodology
Responsibility for Data Collection
Page 33 of 40
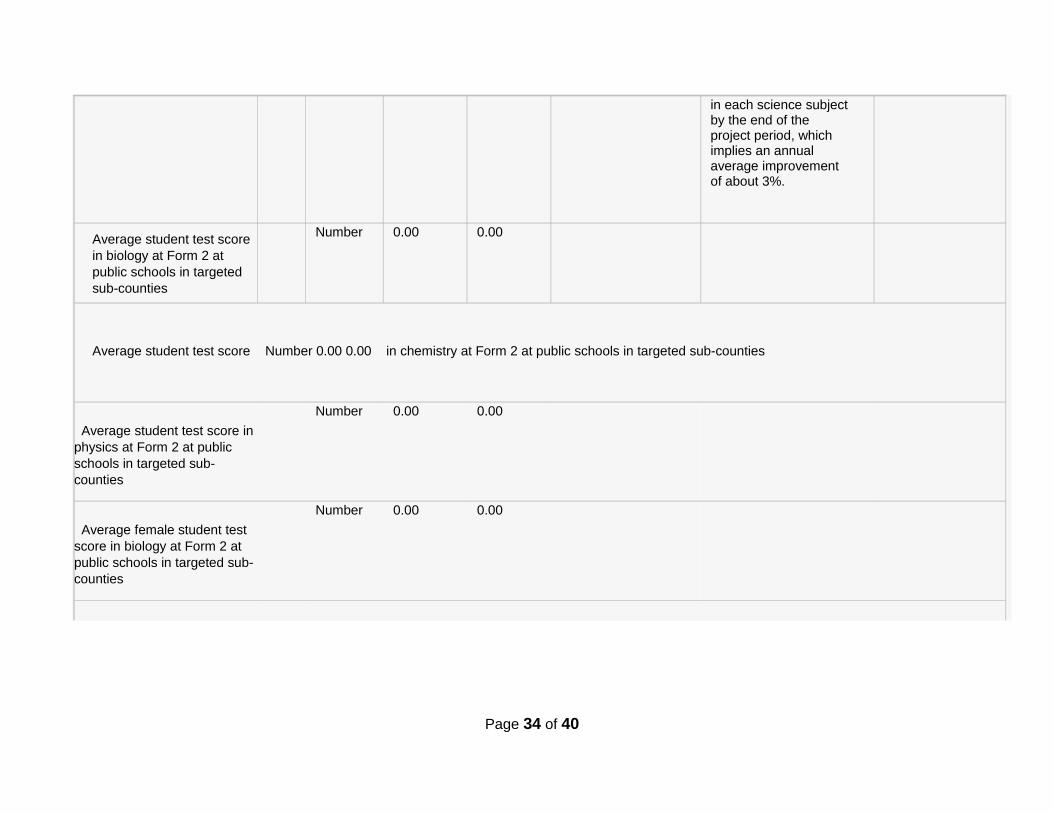
in each science subjectby the end of the project period, which implies an annual average improvement of about 3%.
Average student test scorein biology at Form 2 at public schools in targeted sub-counties
Number 0.00 0.00
Average student test score Number 0.00 0.00 in chemistry at Form 2 at public schools in targeted sub-counties
Average student test score inphysics at Form 2 at public schools in targeted sub-counties
Number 0.00 0.00
Average female student test score in biology at Form 2 at public schools in targeted sub-counties
Number 0.00 0.00
Page 34 of 40
Page 35 of 40
Page 36 of 40
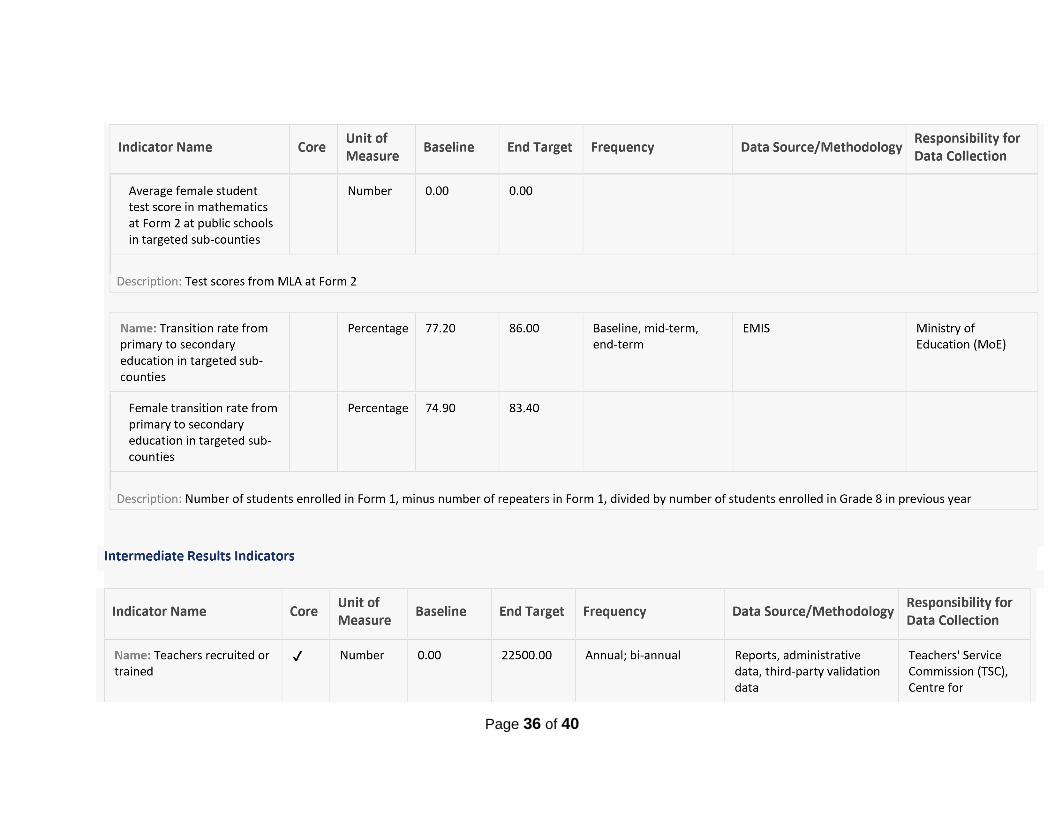
Indicator Name Core Unit of Measure
Baseline End Target Frequency Data Source/Methodology
Responsibility forData Collection
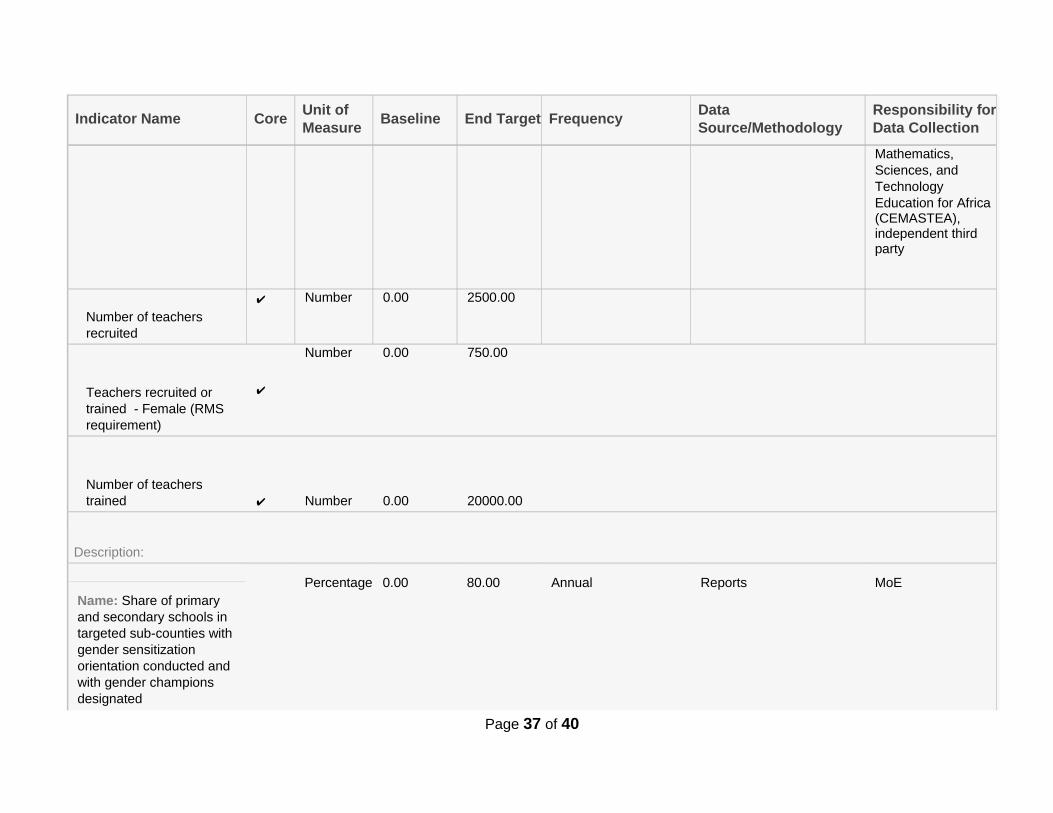
Mathematics, Sciences, and Technology Education for Africa (CEMASTEA), independent third party
Number of teachers recruited
✔ Number 0.00 2500.00
Teachers recruited or trained - Female (RMS requirement)
✔
Number 0.00 750.00
Number of teachers trained ✔ Number 0.00 20000.00
Description:
Name: Share of primary and secondary schools in targeted sub-counties with gender sensitization orientation conducted and with gender champions designated
Percentage 0.00 80.00 Annual
Reports
MoE
Page 37 of 40
Indicator Name Core Unit of Measure
Baseline End Target
Frequency Data Source/Methodology Responsibility for Data Collection
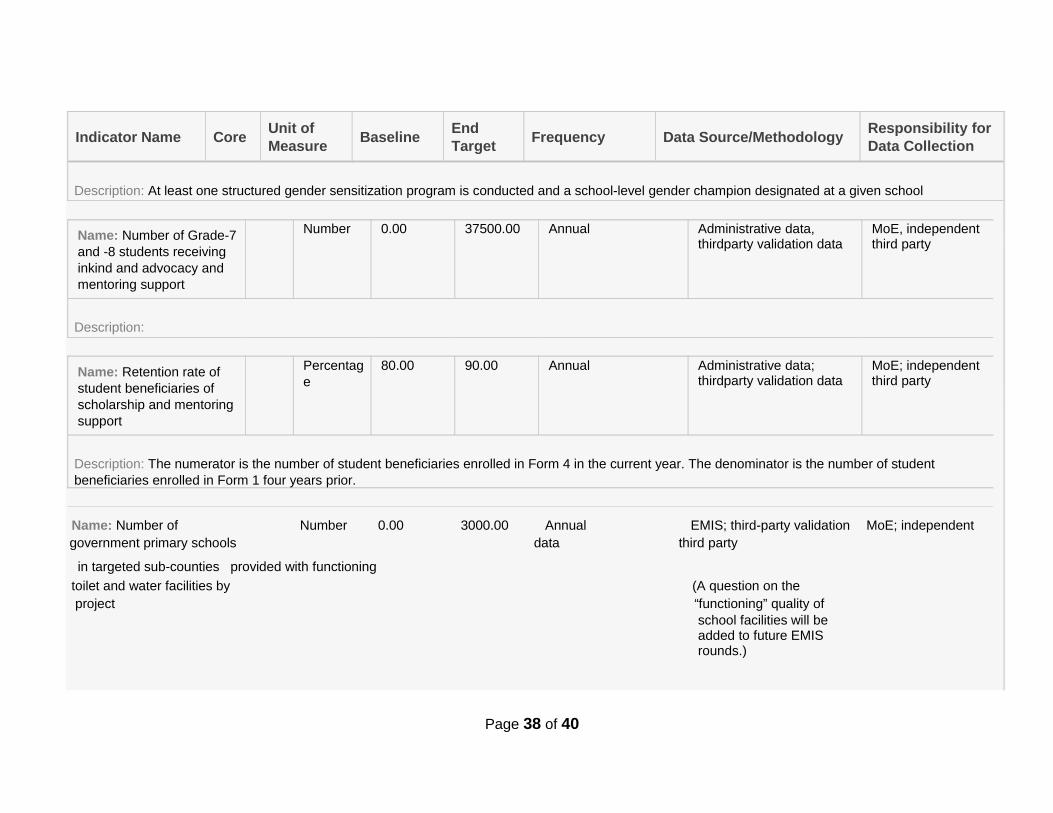
Description: At least one structured gender sensitization program is conducted and a school-level gender champion designated at a given school
Name: Number of Grade-7and -8 students receiving inkind and advocacy and mentoring support
Number 0.00 37500.00 Annual
Administrative data, thirdparty validation data
MoE, independent third party
Description:
Name: Retention rate of student beneficiaries of scholarship and mentoring support
Percentage
80.00 90.00 Annual
Administrative data; thirdparty validation data
MoE; independent third party
Description: The numerator is the number of student beneficiaries enrolled in Form 4 in the current year. The denominator is the number of student beneficiaries enrolled in Form 1 four years prior.
Name: Number of Number 0.00 3000.00 Annual EMIS; third-party validation MoE; independent government primary schools data third party
in targeted sub-counties provided with functioning
toilet and water facilities by (A question on the project “functioning” quality of
school facilities will be added to future EMIS rounds.)
Page 38 of 40
Indicator Name Core Unit of Measure
Baseline End Target
Frequency Data Source/Methodology Responsibility for Data Collection
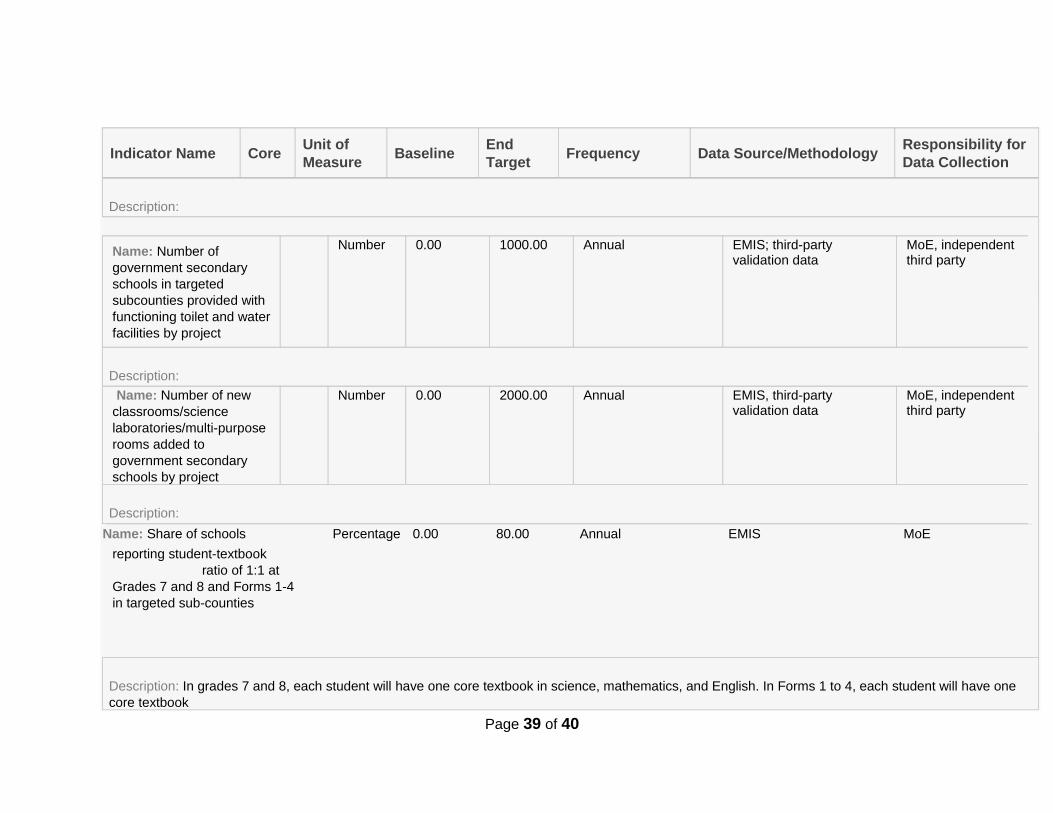
Description:
Name: Number of government secondary schools in targeted subcounties provided with functioning toilet and waterfacilities by project
Number 0.00 1000.00 Annual
EMIS; third-party validation data
MoE, independent third party
Description:
Name: Number of new classrooms/science laboratories/multi-purpose rooms added to government secondary schools by project
Number 0.00 2000.00 Annual
EMIS, third-party validation data
MoE, independent third party
Description:
Name: Share of schools Percentage 0.00 80.00 Annual EMIS MoE
reporting student-textbook ratio of 1:1 at
Grades 7 and 8 and Forms 1-4 in targeted sub-counties
Description: In grades 7 and 8, each student will have one core textbook in science, mathematics, and English. In Forms 1 to 4, each student will have one core textbook
Page 39 of 40
Indicator Name Core Unit of Measure
Baseline End Target
Frequency Data Source/Methodology
Responsibility for Data Collection
in the mathematics, English, and relevant science subjects.
Page 40 of 40