health care quality indicators project 2006 data collection
TRANSCRIPT
OECD Health Working Papers No. 29
Health Care QualityIndicators Project 2006 Data
Collection Update Report
Sandra Garcia Armesto,Maria Luisa Gil Lapetra,
Lihan Wei,Edward Kelley
https://dx.doi.org/10.1787/058047614770
DELSA/HEA/WD/HWP(2007)4
OECD HEALTH WORKING PAPERS
HEALTH CARE QUALITY INDICATORS PROJECT 2006 DATA COLLECTION UPDATE REPORT
Sandra Garcia Armesto, Maria Luisa Gil Lapetra, Lihan Wei, Edward Kelley and the Members of the HCQI Expert Group
29
Unclassified DELSA/HEA/WD/HWP(2007)4 Organisation de Coopération et de Développement Economiques Organisation for Economic Co-operation and Development 30-Oct-2007 ___________________________________________________________________________________________
English - Or. English DIRECTORATE FOR EMPLOYMENT, LABOUR AND SOCIAL AFFAIRS HEALTH COMMITTEE
Health Working Papers
OECD HEALTH WORKING PAPERS NO. 29 HEALTH CARE QUALITY INDICATORS PROJECT 2006 DATA COLLECTION UPDATE REPORT
Sandra Garcia Armesto, Maria Luisa Gil Lapetra, Lihan Wei, Edward Kelley and the Members of the HCQI Expert Group
This version has been amended to correct mis-statements in the Acknowledgments page.
JT03234872
Document complet disponible sur OLIS dans son format d'origine Complete document available on OLIS in its original format
DE
LSA
/HE
A/W
D/H
WP(2007)4
Unclassified
English - O
r. English
Cancels & replaces the same document of 11 October 2007
DELSA/HEA/WD/HWP(2007)4
2
DIRECTORATE FOR EMPLOYMENT, LABOUR AND SOCIAL AFFAIRS
OECD HEALTH WORKING PAPERS
This series is designed to make available to a wider readership health studies prepared for use within the OECD. Authorship is usually collective, but principal writers are named. The papers are generally available only in their original language � English or French � with a summary in the other. Comment on the series is welcome, and should be sent to the Directorate for Employment, Labour and Social Affairs, 2, rue André-Pascal, 75775 PARIS CEDEX 16, France.
The opinions expressed and arguments employed here are the responsibility of the author(s) and do not necessarily reflect those of the OECD
Applications for permission to reproduce or translate all or part of this material should be made to:
Head of Publications Service
OECD 2, rue André-Pascal
75775 Paris, CEDEX 16 France
Copyright OECD 2007
DELSA/HEA/WD/HWP(2007)4
3
ACKNOWLEDGEMENTS
1. The Health Care Quality Indicators Project was guided by an expert group made up of national experts nominated by countries participating in the project1. Financial support from the European Commission was in part used to support outreach to non-OECD European member states to encourage their participation in the collection of data. To date, three of these eight countries supplied data : Cyprus2, 3, Latvia and Malta.
2. The authors would like to acknowledge the input provided by Peter Scherer, Elizabeth Docteur, Jeremy Hurst, Niek Klazinga and Gaetan Lafortune.
3. The HCQI project was funded during 2006 partly by regular contributions from member countries of the OECD. Additional voluntary contributions to the project were made by the following member countries: Australia, Denmark, Ireland, Italy, Japan, Netherlands, New Zealand, Norway, and Spain. In addition, �in kind� support was provided by the United States through the secondment of Dr. Edward Kelley from the Agency for Healthcare Research and Quality (AHRQ) to the project throughout 2006. Support was also provided by the Commonwealth Fund during the first phase of the HCQI Project that made possible the appointment of Professor Arnie Epstein (Harvard University) as chairman of the project�s Expert Group during that period
4. The HCQI project was also supported during 2006 by a grant provided by the European Commission (DG SANCO).
1 The following OECD countries participate in the Group:
Australia, Austria, Belgium, Canada, Czech Republic,
Denmark, Finland, France, Germany, Greece,
Hungary, Iceland, Ireland, Italy, Japan,
Korea, Mexico, Netherlands, New Zealand, Norway,
Poland, Portugal, Slovak Republic, Spain, Sweden,
Switzerland, Turkey, United Kingdom, United States.
2 Footnote by Turkey: The information in this document with reference to « Cyprus » relates to the southern part of the Island. There is no single authority representing both Turkish and Greek Cypriot people on the Island. Turkey recognizes the Turkish Republic of Northern Cyprus (TRNC). Until a lasting and equitable solution is found within the context of United Nations, Turkey shall preserve its position concerning the �Cyprus issue�. 3 Footnote by all the European Union Member States of the OECD and the European Commission:
The Republic of Cyprus is recognized by all members of the United Nations with the exception of Turkey. The information in this document relates to the area under the effective control of the Government of the Republic of Cyprus.

DELSA/HEA/WD/HWP(2007)4
4
DELSA/HEA/WD/HWP(2007)4
5
SUMMARY
5. This report is an update to the OECD Health Working Paper No. 22, Health Care Quality Indicators Project: Initial Indicators Report that was based on data collected between 2003 and 2005 and released in 20064. That report presented the OECD�s initial work on developing a set of health care quality indicators that could be used to raise questions about differences in quality of care across countries. The 2006 report covered 21 �initial indicators� with data provided by 24 countries. It identified 17 of these indicators as being fit for international comparisons of which 4 were identified as needing further work5. Following the release of that report in March 2006, the OECD undertook a second round of data collection on the initial indicator set and also gathered data for the first time on new indicators in a questionnaire sent to participating HCQI countries. This paper reports on the results of that second round of data collection. Data is presented here on an augmented indicator set considered fit for the purpose of making international comparisons on quality of health care. The data is comprised of 19 indicators (17 initial indicators plus 2 new ones). The paper also presents the data provided on 7 other indicators that are not yet considered fit for international comparison. In this round of data collection, data were reported by 32 countries.
6. The Secretariat and collaborating HCQI country experts carried out several data comparability analyses on the new indicators for which data had been gathered. Certain comparability issues were discussed with the HCQI Project Expert Group at its meeting in Paris in October 2006. These issues included:
• The use of data which were not nationally representative
• Presentation of administrative versus survey data for cancer screening
• Harmonising data recall periods for cancer survival and screening
• The use of a truncated standard population for age adjustment
7. The results of the above analysis are presented in detail in this paper. However, an overall view of data comparability and possible improvement can be offered. It is clear from the analysis that significant progress has been made within the HCQI Project and by individual member countries in improving data comparability on the set of indicators from the HCQI Project since the first data collection in 2003. For example, on a range of survey indicators (such as cancer screening), countries have been able to alter national reporting standards to provide the OECD with comparable data. In the area of mortality rates for
4 Mattke S, Kelley E, Scherer P, Hurst J, Gil Lapetra M and the Members of the HCQI Expert Group (2006), �Health Care Quality Indicators Project: Initial Indicators Report�, OECD Health Working Paper No. 22, OECD, Paris, http://www.oecd.org/dataoecd/1/34/36262514.pdf. 5 The 21 indicators (those labelled �fit for international comparison� and �evaluated as not fit� in column 2 of Table 2, below) were described as �17� indicators in OECD Health Working Paper No. 22. That is because a group of three related indicators for �incidence of vaccine preventable diseases� and a group of three related indicators for �coverage for basic vaccination programme� were each listed as one indicator respectively. The six components of these two groups are now considered separately.
DELSA/HEA/WD/HWP(2007)4
6
acute myocardial infarction (AMI) and stroke, country estimates have become significantly more comparable since the first data collection. What is also clear is that both gaps in data and persistent data comparability issues remain within the indicator set. For example, there are a number of countries where nationally representative data for indicators such as cancer survival are not yet available. In other instances, countries have not been able to furnish the OECD with indicators that match the age or recall period (for survey data) specifications, making differences between countries difficult to interpret. However, member countries continue to be supportive of the Secretariat�s efforts to investigate these data comparability issues. With this support, the Secretariat plans to continue to improve the existing indicators while at the same time work on developing new indicators based on comparable data.
8. As noted above, this paper presents three groups of indicators:
a) All of the initial 17 indicators that were reported as being fit for international comparison in Health Working Paper No. 22, which were updated during the 2006 data collection. They are:
• Breast cancer five-year survival rate
• Mammography screening rate
• Cervical cancer five-year survival rate
• Cervical cancer screening rate
• Colorectal cancer five-year survival rate
• Incidence of vaccine preventable diseases (Pertussis, measles, and hepatitis B)
• Coverage for basic vaccination programme, age 2, (Pertussis, measles, and hepatitis B)
• Asthma mortality rate, ages 5-39
• In-hospital mortality rate within 30 days of hospital admission for acute myocardial infarction
• In-hospital mortality rate within 30 days of hospital admission for stroke
• Waiting times for surgery after hip fracture, over age 65
• Influenza vaccination, over age 65
• Smoking rate
b) Following discussions from the October 2006 meeting, two new indicators tested in the 2006 data collection round that, were judged by the HCQI Expert Group as mature enough to be added to the initial set:
• Retinal exams in diabetics � This indicator was included in the first HCQI questionnaires (in 2004 and 2005) but was not considered fit until the 2006 data collection round.
• Asthma admission rate � This indicator was collected for the first time through the 2006 questionnaire.
c) Seven indicators were not yet considered suitable for inclusion in the HCQI data set for international comparison but were recommended for additional sensitivity analysis to find ways to improve
DELSA/HEA/WD/HWP(2007)4
7
comparability. Among them, three indicators were collected in the 2003-2005 questionnaire have seen no substantial improvements for comparability and thus are still considered not yet suitable for international comparison. These are:
• Annual HbA1c testing for patients with diabetics
• Patients with diabetics with poor glucose control
• Major amputations in diabetics
9. Four other indicators were collected for the first time through the 2006 questionnaire:
• Post-operative hip fracture or fall
• Transfusion reaction
• Uncontrolled diabetes admission rate
• Hypertension admission rate
10. The first group of indicators listed above is presented with definitions and updated data. For the second and third groups of indicators, the report reviews detailed information on the scientific soundness, importance, availability of data and the international comparability of the data for each indicator.
11. The smoking rate remains in the indicator set. This indicator was initially adopted since it is the risk factor which countries attempt to affect as they institute efforts through the health care delivery system to change tobacco consumption. There has been much discussion on this indicator because of its dependence on certain factors outside the control of the health system. It is therefore considered a relatively less valid indicator of quality of health care than the other indicators considered �fit for international comparisons�. The Expert Group will examine other, more health care-related indicators of smoking cessation. At this point, however, these indicators are not available from a wide enough group of countries. Therefore, for the moment, the smoking rate continues to be retained among the 19 indicators in the 2006 HCQI indicator set.
DELSA/HEA/WD/HWP(2007)4
8
RESUMÉ
12. Le présent rapport est une version actualisée du Document de travail de l�OCDE sur la santé n 22 intitulé Health Care Quality Indicators Project : Initial Indicators Report, établi sur la base des données rassemblées en 2003/2005 et publié en 20066. Ce rapport présentait les travaux initiaux de l�OCDE concernant l�élaboration d�une série d�indicateurs sur la qualité des soins de santé qui pourraient être utilisés pour tenter d�expliquer les différences en matière de qualité de soins entre les pays. Le rapport 2006 portait sur 21 « indicateurs initiaux » pour lesquels 24 pays avaient communiqué des données ; il a été estimé que 17 de ces indicateurs se prêtaient à des comparaisons internationales et que quatre d�entre eux nécessitaient des travaux approfondis7. A la suite de la publication du rapport en mars 2006, l�OCDE a entamé un deuxième cycle de collecte de données relatives à la série initiale d�indicateurs et a entrepris de recueillir pour la première fois des données sur de nouveaux indicateurs par le biais d�un questionnaire adressé aux pays participants au projet HCQI. Le présent rapport fait état des résultats du deuxième cycle de collecte de données. Il contient des données sur la série élargie d�indicateurs considérés comme se prêtant à des comparaisons internationales, soit des données portant sur 19 indicateurs (17 indicateurs existants et 2 nouveaux). Il présente également les données fournies en ce qui concerne 7 autres indicateurs dont on estime qu�ils ne se prêtent pas encore à des comparaisons internationales. Les données communiquées émanent cette fois de 32 pays (des pays de l�UE qui ne sont pas membres de l�OCDE ont été invités à participer au projet8).
13. Dans le cadre de l�étude des nouveaux indicateurs au sujet desquels des données ont été réunies, le Secrétariat et les experts nationaux collaborant au projet HCQI ont mené plusieurs analyses touchant la comparabilité des données. Certaines questions de comparabilité ont été examinées avec le Groupe d�experts du Projet HCQI lors de la réunion de ce dernier à Paris en octobre 2006. Il s�agit des questions suivantes :
• L�utilisation de données non représentatives au plan national
• La présentation de données administratives par opposition à des données d�enquêtes en ce qui concerne le dépistage du cancer
6 Mattke S, Kelley E, Scherer P, Hurst J, Gil Lapetra M et les membres du Groupe d�experts du Projet HCQI. Health Care Quality Indicators Project: Initial Indicators Report. Document de travail sur la santé no. 22. (Paris, France: OCDE). 2006. http://www.oecd.org/dataoecd/1/34/36262514.pdf. 7 Les 21 indicateurs (voir la colonne 1 du tableau 2) étaient �en fait� présentés comme �17� indicateurs dans le Document de travail de l�OCDE sur la santé no. 22. En effet un groupe de trois indicateurs relatifs à l�« incidence des maladies pouvant être prévenues par la vaccination� et un groupe de trois indicateurs relatifs à la �couverture des programmes de vaccination de base� apparaissaient respectivement dans le document en tant qu�un seul indicateur. Les six indicateurs considérés dans ces deux groupes sont désormais distincts. 8 Un appui financier de la Commission européenne a été utilisé afin de favoriser l�ouverture vers des États européens non membres de l�OCDE et d�encourager leur participation au projet. A ce jour, trois des huit pays concernés prennent désormais part au projet.
DELSA/HEA/WD/HWP(2007)4
9
• L�harmonisation des périodes de référence des données relatives au taux de survie et au dépistage du cancer
• L�utilisation d�une population standard tronquée à des fins d�ajustement en fonction de l�âge
14. Les résultats des analyses susmentionnées sont présentés de façon détaillée dans le rapport. Cela étant, on peut d�ores donner une idée générale de la comparabilité des données et dire si celle-ci s�est améliorée. Il ressort clairement de l�analyse des questions de comparabilité des données existantes et des données nouvelles que d�importants progrès ont été réalisés dans le cadre du Projet HCQI ainsi que par certains pays membres en ce qui concerne la comparabilité des données afférentes à l�ensemble des indicateurs considérés dans le Projet HCQI depuis la première collecte effectuée en 2003. Par exemple, s�agissant d�un ensemble d�indicateurs reposant sur des enquêtes (tel que le dépistage du cancer), les pays ont été à même de modifier leurs normes nationales de notification afin de fournir à l�OCDE des données comparables. Pour ce qui est des taux de mortalité après un infarctus aigu du myocarde ou après un accident vasculaire cérébral, la comparabilité des estimations des pays s�est beaucoup améliorée depuis la première collecte de données. Il apparaît par ailleurs clairement que certains problèmes de comparabilité des données concernant la série d�indicateurs retenus dans le projet HCQI n�ont pu encore être résolus. Ainsi, dans un certain nombre d�entre eux, des données représentatives au plan national relatif à des indicateurs tels que le taux de survie au cancer ne sont pas encore disponibles. Dans d�autres cas, les pays n�ont pas été en mesure de communiquer à l�OCDE des données correspondant aux spécifications en matière d�âge ou de période de référence (pour les données d�enquêtes), d�où des difficultés pour interpréter les différences entre pays. Cela étant, les pays membres s�intéressent à la comparabilité des données et ont soutenu les efforts déployés par le Secrétariat pour étudier les questions s�y rapportant. Grâce à ce soutien, le Secrétariat envisage d�affiner les indicateurs existants tout en travaillant à l�élaboration de nouveaux indicateurs s�appuyant sur des données comparables.
15. Comme on l�a vu ci-dessus, trois groupes d�indicateurs sont présentés dans le rapport :
a) L�ensemble des 17 indicateurs initiaux considérés comme se prêtant à des comparaisons internationales dans le Document de travail sur la santé n° 22, mis à jour à l�occasion de la collecte de données de 2006. Il s�agit des indicateurs suivants :
• Taux de survie à cinq ans au cancer du sein
• Taux de dépistage par mammographie
• Taux de survie à cinq ans au cancer du col de l�utérus
• Taux de dépistage du cancer du col de l�utérus
• Taux de survie à cinq ans au cancer colorectal
• Incidence des maladies pouvant être prévenues par la vaccination (coqueluche, rougeole et hépatite B)
• Couverture des programmes de vaccination de base, à l�âge de deux ans, (coqueluche, rougeole et hépatite B)
• Taux de mortalité pour cause d�asthme entre 5 et 39 ans
• Taux de mortalité à 30 jours hors hôpital/à l�hôpital après un infarctus aigu du myocarde
• Taux de mortalité à 30 jours hors hôpital/à l�hôpital après un accident vasculaire cérébral
• Temps d�attente pour une opération après une fracture de la hanche, à 65 ans et plus
• Vaccination contre la grippe pour les adultes de plus de 65 ans
DELSA/HEA/WD/HWP(2007)4
10
• Taux de tabagisme
b) Deux nouveaux indicateurs, testés lors du cycle de collecte de données de 2006 et jugés par le Groupe d�experts du Projet HCQI, à la suite des débats qui se sont déroulés lors de la réunion d�octobre 2006, comme étant suffisamment élaborés pour être ajoutés à l�ensemble initial.
• Examen de la rétine chez les patients diabétiques � cet indicateur figurait dans les questionnaires initiaux du Projet HCQI (en 2004 et 2005) mais n�était pas considéré comme approprié jusqu�à présent.
• Taux d�hospitalisation des adultes pour cause d�asthme � des données relatives à cet indicateur ont été collectées pour la première fois dans le questionnaire de 2006.
c) Sept indicateurs envisagés dans le projet HCQI dont on estime qu�ils ne sont pas prêts à être inclus dans la série car ils ne se prêtent à des comparaisons internationales, mais pour lesquels il a été recommandé de procéder à des analyses de sensibilité supplémentaires afin de trouver des moyens d�améliorer la comparabilité des données. Des données ont été rassemblées sur trois d�entre eux pour les questionnaires de 2003 à 2005 mais, faute d�une amélioration sensible de leur comparabilité, on considère que ces indicateurs ne se prêtent toujours pas à des comparaisons internationales. Il s�agit des indicateurs suivants :
• Dosage de l�HbA1c chez les personnes diabétiques
• Contrôle insuffisant de la glycémie chez les personnes diabétiques
• Amputations majeures chez les personnes diabétiques
16. Quatre d�entre eux ont fait l�objet d�une collecte de données pour la première fois dans le cadre du questionnaire de 2006 :
• Fracture de la hanche ou chute post-opératoire
• Réaction à la transfusion
• Taux d�hospitalisation pour diabète non contrôlé
• Taux d�hospitalisation pour hypertension
17. Les indicateurs du premier groupe sont accompagnés de leur définition et de données actualisées. S�agissant des indicateurs des deuxième et troisième groupes, le rapport examine des informations détaillées concernant la validité scientifique, l�importance et la disponibilité des données ainsi que la comparabilité internationale de ces dernières pour chacun d�eux.
18. Le taux de tabagisme continue de figurer dans la série d�indicateurs du Projet HCQI considérée dans le présent rapport. Cet indicateur a été initialement retenu car il représente l�aspect essentiel sur lequel les pays s�efforcent d�influer lorsqu�ils s�attachent à modifier le comportement des fumeurs par le biais du système de soins de santé. Beaucoup de questions ont été soulevées au sujet de cet indicateur et du fait qu�il dépend de nombreux facteurs qui échappent au contrôle du système de santé. Il s�agit donc d�un indicateur relativement moins représentatif de la qualité des soins de santé. Le Groupe d�experts examinera d�autres indicateurs concernant l�arrêt du tabac qui sont davantage liés aux soins de santé. Cela étant, à ce stade, ces indicateurs ne sont pas disponibles dans un groupe suffisamment important de pays. Le taux de tabagisme continue donc de figurer au nombre des 19 indicateurs de la série retenue pour 2006 dans le cadre du projet HCQI.
DELSA/HEA/WD/HWP(2007)4
11
TABLE OF CONTENTS
ACKNOWLEDGEMENTS............................................................................................................................ 3 SUMMARY.................................................................................................................................................... 5 RESUMÉ ........................................................................................................................................................ 8 INTRODUCTION ........................................................................................................................................ 14
Health Care Quality Indicator Project: purpose and initial steps .............................................................. 14 General methods for the indicator set of the HCQI Project ...................................................................... 16
DATA COMPARABILITY ISSUES ........................................................................................................... 20 �INITIAL� (2003-2005) INDICATORS: 2006 SPECIFICATIONS AND DATA RESULTS ................... 24
Breast cancer five-year survival rate ..................................................................................................... 26 Breast cancer five-year survival rate, sources and methods .................................................................. 29 Mammography screening rate ............................................................................................................... 35 Mammography screening rate, sources and methods ............................................................................ 35 Cervical cancer five-year survival rate .................................................................................................. 36 Cervical cancer five-year survival rate, sources and methods............................................................... 39 Cervical cancer screening rate ............................................................................................................... 44 Cervical cancer screening rate, sources and method ............................................................................. 45 Colorectal cancer five-year survival rate ............................................................................................... 45 Colorectal cancer five-year survival rate, sources and methods............................................................ 48 Incidence of vaccine preventable diseases (Pertussis, measles, hepatitis B)......................................... 52 Incidence of vaccine preventable diseases (Pertussis, measles, hepatitis B), sources and methods...... 54 Coverage for basic vaccination programme, age 2, (Pertussis, measles, hepatitis B) ........................... 60 Coverage for basic vaccination programme, age 2, (Pertussis, measles, hepatitis B), sources and methods.................................................................................................................................................. 63 Asthma mortality rate, ages 5-39........................................................................................................... 69 Asthma mortality rate, ages 5-39, sources and methods........................................................................ 70 In-hospital mortality rate within 30 days of hospital admission for AMI ............................................. 73 In-hospital mortality rate within 30 days of hospital admission for AMI, sources and methods .......... 75 In-hospital mortality rate within 30 days of hospital admission for stroke ........................................... 79 In-hospital mortality rate within 30 days of hospital admission for stroke, sources and methods ........ 81 In-hospital waiting time for surgery after hip fracture, over age 65...................................................... 87 In-hospital waiting time for surgery after hip fracture, over age 65, sources and methods................... 88 Influenza vaccination, over age 65 ........................................................................................................ 90 Influenza vaccination, sources and methods.......................................................................................... 90 Smoking rate.......................................................................................................................................... 91 Smoking rate, sources and methods....................................................................................................... 91
DELSA/HEA/WD/HWP(2007)4
12
TWO NEW INDICATORS CONSIDERED FIT FOR INTERNATIONAL COMPARISONS: CLINICAL IMPORTANCE, SCIENTIFIC SOUNDNESS, SPECIFICATIONS AND DATA RESULTS................... 92
Retinal exam in diabetics....................................................................................................................... 94 Retinal exam in diabetics, sources and methods.................................................................................... 97 Asthma admission rate......................................................................................................................... 100 Asthma admission rate, sources and methods ..................................................................................... 102
INDICATORS NOT SELECTED FOR INCLUSION IN 2006 HCQI INDICATOR SET....................... 107 Annual HbA1c test for patients with diabetes ..................................................................................... 107 Annual HbA1c test for patients with diabetes, sources and methods.................................................. 110 HbA1c level indicating poor glucose control ...................................................................................... 112 HbA1c level indicating poor glucose control, sources and methods ................................................... 114 Major amputation in diabetics ............................................................................................................. 116 Major amputation in diabetics, sources and methods .......................................................................... 119 Post-operative hip fracture rate............................................................................................................ 126 Post-operative hip fracture rate, sources and methods ........................................................................ 128 Transfusion reaction rate ..................................................................................................................... 132 Transfusion reaction rate, sources and methods .................................................................................. 134 Uncontrolled diabetes admission rate.................................................................................................. 137 Uncontrolled diabetes admission rate, sources and methods............................................................... 139 Hypertension admission rate................................................................................................................ 144 Hypertension admission rate, sources and methods ............................................................................ 147
REFERENCES ........................................................................................................................................... 152 Tables
Table 1. Example of questionnaire response categories ..................................................................... 17 Table 2. Composition and evolution of the HCQI set of indicators.................................................... 19 Table 3. 2004 Admission based ischemic stroke case fatality in Sweden .......................................... 23 Table 4. Availability of data for �Initial� (2003-2005) Indicators presented in this section ............... 25 Table 5. Breast cancer five-year survival rate..................................................................................... 27 Table 6. Mammography screening rate............................................................................................... 35 Table 7. Cervical cancer five-year survival rate ................................................................................. 37 Table 8. Cervical cancer screening rate .............................................................................................. 44 Table 9. Colorectal cancer five-year survival rate .............................................................................. 46 Table 10. Incidence of vaccine preventable diseases (Pertussis, measles, hepatitis B) ........................ 52 Table 11. Coverage for basic vaccination programme, age 2, (Pertussis, measles, hepatitis B) .......... 61 Table 12. Asthma mortality rate, ages 5-39 .......................................................................................... 69 Table 13. In-hospital mortality rate within 30 days of hospital admission for AMI............................. 73 Table 14. In-hospital mortality rate within 30 days of hospital admission for stroke........................... 79 Table 15. In-hospital waiting time for surgery after hip fracture, over age 65 ..................................... 87 Table 16. Influenza vaccination, over age 65 ....................................................................................... 90 Table 17. Smoking rate ......................................................................................................................... 91 Table 18. Summary of data availability for two new indicators in the 2006 HCQI Project indicator set ..................................................................................... 93 Table 19. Retinal exam in diabetics ...................................................................................................... 96 Table 20. Asthma admission rate per 10 000 discharges, (primary care and prevention, ambulatory sensitive conditions) ........................................................................................ 101 Table 21. Annual HbA1c test for patients with diabetes .................................................................... 109
DELSA/HEA/WD/HWP(2007)4
13
Table 22. Annual HbA1c test for patients with diabetes, comparability issues.................................. 111 Table 23. HbA1c level indicating poor glucose control ..................................................................... 113 Table 24. HbA1c level indicating poor glucose control, comparability issues................................... 115 Table 25. Major amputation in diabetics, per 10 000 diabetics .......................................................... 118 Table 26. Major amputation in diabetics, comparability issues.......................................................... 125 Table 27. Post-operative hip fracture rate per 100 discharges ............................................................ 127 Table 28. Post-operative hip fracture rate, comparability issues ........................................................ 131 Table 29. Transfusion reaction rate per 100 000 discharges............................................................... 133 Table 30. Transfusion reaction rate, comparability issues.................................................................. 136 Table 31. Uncontrolled diabetes admission rate ................................................................................. 138 Table 32. Uncontrolled diabetes admission rate, comparability issues............................................... 143 Table 33. Hypertension admission rate per 100 000 discharges......................................................... 146 Table 34. Hypertension admission rate, comparability issues ............................................................ 151
Figures
Figure 1. Findings on differences between administrative and survey data for cancer screening ...... 21
DELSA/HEA/WD/HWP(2007)4
14
INTRODUCTION
Health Care Quality Indicator Project: purpose and initial steps
19. Quality of health care delivery is a topic of concern throughout the member countries of the OECD. Articles on shortcomings in care or on comparative differences in quality across countries have become more frequent in the popular press. Efforts to improve the measurement of quality of care through the development of quality indicators have become more present in the literature and in policy forums worldwide (IOM, 2001; Sawicki, 2005; Roland, 2004; AHRQ, 2005). Many of these efforts target specific disease areas in one particular country while others compare across countries, but target particular conditions (Ramirez, 2005). The quality indicator set reported on here is one of the few efforts9 which have attempted to examine quality of care across clinical conditions for more than one country.
20. The long-term objective of the Health Care Quality Indicator (HCQI) Project is to develop a set of indicators that can be used to raise questions on health care quality and that can be reliably reported across countries using comparable data. The indicators are intended to help raise questions for further investigations of differences in quality of care across countries. In light of its endeavour, the indicators of the HCQI Project are conceived as a �living set� in which indicators transit through different stages of maturity until they are considered fit for the purpose of international comparisons. These stages arrive from the joint effort between the participating countries and the Secretariat to improve the quality and the quantity of available data. At the core of the project rests the conviction that to enhance the international comparability of health care quality it is indispensable to have a thorough and methodical work plan for the refinement and standardisation of health care information along with the steady encouragement of information systems� development at the national level. Table 2 illustrates the process of broadening the set of indicators hitherto, showing the list of indicators involved in each data collection round and their assessed status in terms of fitness for use.
21. The OECD HCQI project began in 2001, building on two previous international initiatives to develop indicators of health care quality across countries. One of these, initiated by the Commonwealth Fund involved five countries (Australia, Canada, New Zealand, United Kingdom and United States). Another, initiated by the Nordic Council of Ministers, included another six countries (Denmark, Finland, Iceland, Norway, Sweden and Greenland). Initially a group of 19 countries (including ten of those listed under the two initiatives mentioned above) accepted the OECD�s invitation to join the HCQI project. A preliminary list of indicators was derived from the work of these two earlier initiatives. Based on expert judgement, the HCQI Country Expert group chose 21 indicators out of that list, considering them as scientifically sound and important. These indicators had also shown an acceptable degree of comparability
9 First Report and Recommendations of the Commonwealth Fund�s International Working Group on Quality Indicators a Report to Health Ministers of Australia, Canada, New Zealand, the United Kingdom, and the United States. June 2004. The Commonwealth Fund. (no. 752).
DELSA/HEA/WD/HWP(2007)4
15
across countries in the context of the previous exercises. Data collection for these 21 indicators was conducted across participating countries to prove its feasibility. Various checks were undertaken of the indicators� specifications across countries to establish their individual fitness for the purpose of international comparisons.
22. The indicator selection criteria applied in the process of creating the original and current indicator list are summarised here. For an indicator to be a useful tool for evidence-based policy decisions, two conditions should be met. First, it has to capture an important performance aspect. Second, it must be scientifically sound.
23. The importance of an indicator can be further broken down into three dimensions:
• Impact on health. What is the impact on health associated with this problem? Does the measure address areas in which there is a clear gap between the actual and potential levels of health? The impact on health is quantified where data is available for each indicator by using mortality and morbidity estimates from the World Health Organization for the �EURO A�10 group of countries, (Murray, 2001). This group of countries includes most of the countries participating in the OECD HCQI Project.
• Policy importance. Are policymakers and consumers concerned about this area? Although this dimension is difficult to quantify objectively, the cost associated with the condition covered by each indicator is used to indicate the economic importance related to each indicator. Where suitable evidence on costs exists, it is also presented for each indicator.
• Susceptibility to being influenced by the health care system. Can the health care system meaningfully address this aspect or problem? Does the health care system have an impact on the indicator independent of confounders like patient risk? Will changes in the indicator give information about success or failure of policy changes? This dimension is discussed based on a review of the relevant literature demonstrating that the health system can influence each indicator.
The scientific soundness of each indicator can also be broken down into three dimensions:
• Face validity. Does the measure make sense logically and clinically? The face validity of each indicator in this report is based on the basic clinical rationale for the indicator and on past usage of the indicator in national or other quality reporting activities.
• Content validity. Does the measure capture meaningful aspects of the quality of care? Content validity is assessed through a literature review of studies relevant to each indicator.
• Reliability. Does the measure provide stable results across various populations and circumstances? Reliability of each indicator is assessed through a literature review of studies assessing the stability of results across populations or circumstances.
24. The application of these criteria to the initial indicator set of the HCQI Project had been carried out as part of the two predecessor projects to the HCQI Project, mentioned above. For the Commonwealth Fund work, a rating system was used to rank each indicator based on the above criteria. Indicators which
10 WHO EURO A countries include Andorra, Austria, Belgium, Croatia, Czech Republic, Denmark, Finland, France, Germany, Greece, Iceland, Ireland, Israel, Italy, Luxembourg, Malta, Monaco, Netherlands, Norway, Portugal, San Marino, Slovenia, Spain, Sweden, Switzerland, and the United Kingdom.
DELSA/HEA/WD/HWP(2007)4
16
ranked highly on these criteria were retained in the measure set. This rating process was reviewed by the OECD Secretariat and then by the HCQI Expert Group as it began its work on selecting indicators.
25. The initial gathering of information and analysis was carried out from 2003 to 2005; new countries have continued to join the project, providing additional data for the analysis. The indicators collected during this period are listed in the first column of Table 2. Of the indicators, 17 of the 21 tested were considered fit for the purpose of international comparisons, but 4 of them (those related to diabetes care) were regarded as not yet ready, either due to their lack of availability across a sufficient number of countries (the experts agreed on a threshold of at least 10 countries able to provide data on the indicator) or some comparability issues not yet overcome. The data collected for the 21 indicators, together with the analysis of their fitness for international comparisons, were published as OECD Health Working Paper No. 22, Health Care Quality Indicators Project: Initial Indicators Report (Mattke et al., 2006).
26. The set of indicators resulting from the initial compilation effort was judged by the HCQI Expert Group as being too limited for comprehensive comparisons of the quality of health care across countries. Therefore the HCQI Expert Group instituted a process to identify important gaps in the areas of health care for which indicators had been developed, judging by the burden of disease being tackled, health care utilisation rates and costs. Country experts were asked to rate a set of health care condition areas in terms of importance. This rating process yielded 5 priority areas for the development of additional HCQI indicators11:
• Cardiac care
• Diabetes care
• Primary care and prevention
• Mental health
• Patient safety
27. Five international expert panels were commissioned to propose relevant and scientifically sound measures for each of these areas12. The result was a list of 86 indicators considered as valid and reliable to report on the quality of care in these priority areas.
General methods for the indicator set of the HCQI Project
28. Following the release of the five expert panel reports recommending the 86 indicators in the 5 priority areas, an availability survey was conducted across the participating countries to find out whether 10 or more countries would be able to collect the data for each indicator. The 86 indicators included a few already being collected in OECD Health Data as well as some being gathered as part of the initial indicator set at the time when the recommendations were issued.
11 For a detailed description of this decision making process please consult the monographic supplement published by International Journal for Quality in Health Care; September 2006 Volume 18 supplement I. 12 The five reports were published as OECD Health Technical Paper Nos. 14 - 18. The reports are downloadable from the HCQI web page www.oecd.org/health/hcqi. An overall picture of the process and a summary of the recommendations produced by the 5 panels can also be found in the monographic supplement published by the International Journal for Quality in Health Care, 2006, Vol.18 (suppl. 1).
DELSA/HEA/WD/HWP(2007)4
17
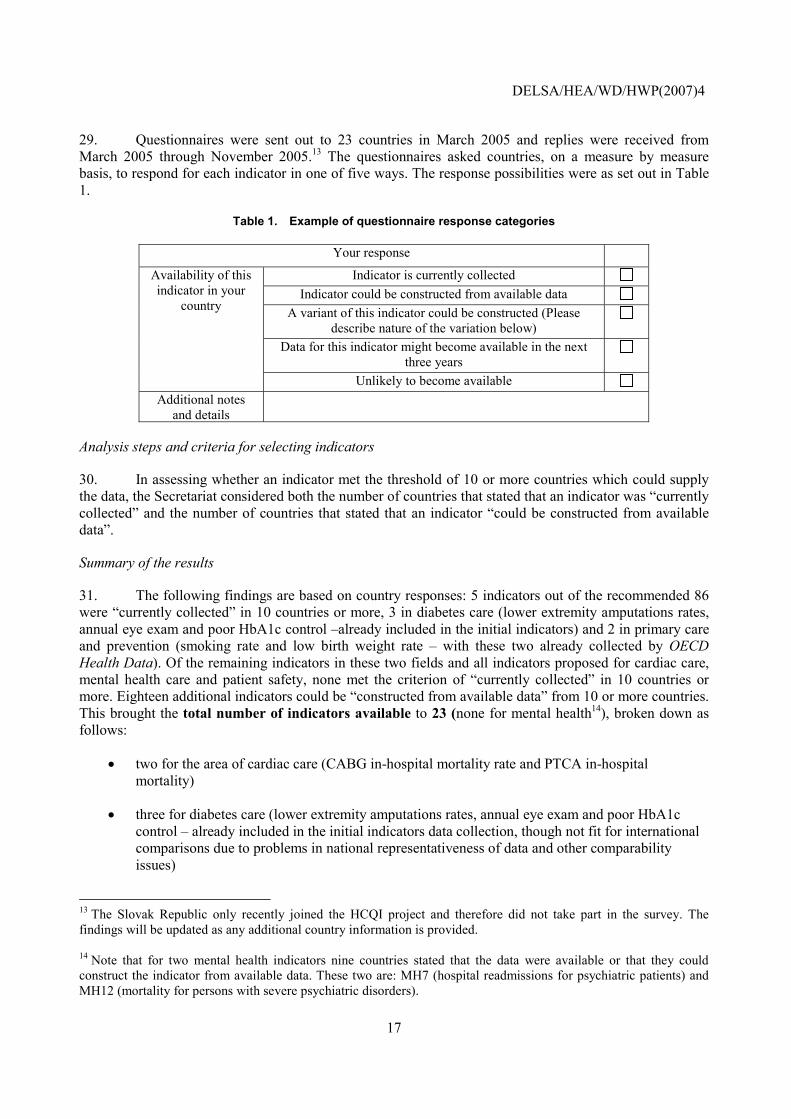
29. Questionnaires were sent out to 23 countries in March 2005 and replies were received from March 2005 through November 2005.13 The questionnaires asked countries, on a measure by measure basis, to respond for each indicator in one of five ways. The response possibilities were as set out in Table 1.
Table 1. Example of questionnaire response categories
Your response
Indicator is currently collected Indicator could be constructed from available data
A variant of this indicator could be constructed (Please describe nature of the variation below)
Data for this indicator might become available in the next three years
Availability of this indicator in your
country
Unlikely to become available Additional notes
and details
Analysis steps and criteria for selecting indicators
30. In assessing whether an indicator met the threshold of 10 or more countries which could supply the data, the Secretariat considered both the number of countries that stated that an indicator was �currently collected� and the number of countries that stated that an indicator �could be constructed from available data�.
Summary of the results
31. The following findings are based on country responses: 5 indicators out of the recommended 86 were �currently collected� in 10 countries or more, 3 in diabetes care (lower extremity amputations rates, annual eye exam and poor HbA1c control �already included in the initial indicators) and 2 in primary care and prevention (smoking rate and low birth weight rate � with these two already collected by OECD Health Data). Of the remaining indicators in these two fields and all indicators proposed for cardiac care, mental health care and patient safety, none met the criterion of �currently collected� in 10 countries or more. Eighteen additional indicators could be �constructed from available data� from 10 or more countries. This brought the total number of indicators available to 23 (none for mental health14), broken down as follows:
• two for the area of cardiac care (CABG in-hospital mortality rate and PTCA in-hospital mortality)
• three for diabetes care (lower extremity amputations rates, annual eye exam and poor HbA1c control � already included in the initial indicators data collection, though not fit for international comparisons due to problems in national representativeness of data and other comparability issues)
13 The Slovak Republic only recently joined the HCQI project and therefore did not take part in the survey. The findings will be updated as any additional country information is provided. 14 Note that for two mental health indicators nine countries stated that the data were available or that they could construct the indicator from available data. These two are: MH7 (hospital readmissions for psychiatric patients) and MH12 (mortality for persons with severe psychiatric disorders).
DELSA/HEA/WD/HWP(2007)4
18
• nine for patient safety (problems with childbirth, obstetric trauma-vaginal, obstetrics trauma-caesarean section, post-operative hip fracture, foreign body left in during procedure, birth trauma-injury to neonate, complications of anaesthesia, transfusion reaction and wrong blood type)
• nine for primary care and prevention (smoking rate, diabetes prevalence, low birth weight rate, obesity prevalence � already collected by OECD Health Data, abortion rates, prevalence of immunisable conditions, physical activity, gonorrhoea/Chlamydia rates and hospitalisation for ambulatory-care sensitive conditions)
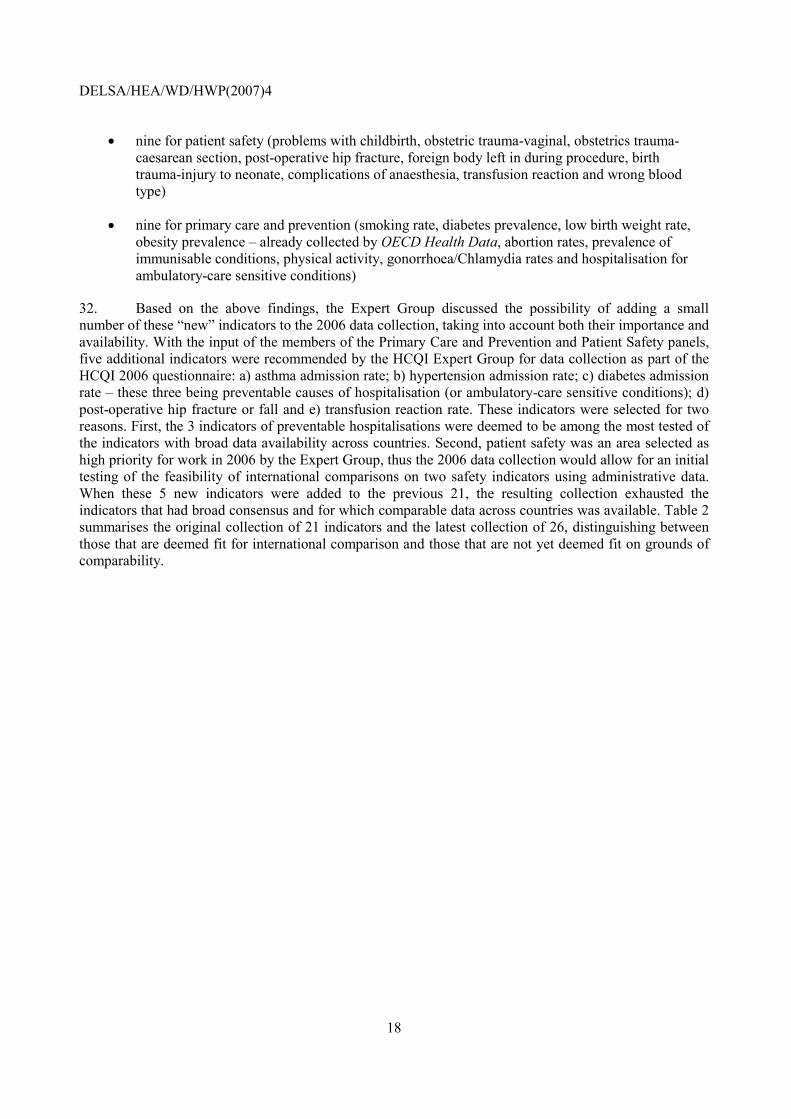
32. Based on the above findings, the Expert Group discussed the possibility of adding a small number of these �new� indicators to the 2006 data collection, taking into account both their importance and availability. With the input of the members of the Primary Care and Prevention and Patient Safety panels, five additional indicators were recommended by the HCQI Expert Group for data collection as part of the HCQI 2006 questionnaire: a) asthma admission rate; b) hypertension admission rate; c) diabetes admission rate � these three being preventable causes of hospitalisation (or ambulatory-care sensitive conditions); d) post-operative hip fracture or fall and e) transfusion reaction rate. These indicators were selected for two reasons. First, the 3 indicators of preventable hospitalisations were deemed to be among the most tested of the indicators with broad data availability across countries. Second, patient safety was an area selected as high priority for work in 2006 by the Expert Group, thus the 2006 data collection would allow for an initial testing of the feasibility of international comparisons on two safety indicators using administrative data. When these 5 new indicators were added to the previous 21, the resulting collection exhausted the indicators that had broad consensus and for which comparable data across countries was available. Table 2 summarises the original collection of 21 indicators and the latest collection of 26, distinguishing between those that are deemed fit for international comparison and those that are not yet deemed fit on grounds of comparability.
DELSA/HEA/WD/HWP(2007)4
19
Table 2. Composition and evolution of the HCQI set of indicators
Indicator 2003-2005 set of indicators as published in OECD HWP No. 22 2006 set of indicators
Breast cancer five-year survival rate fit for international comparison fit for international comparison Mammography screening rate fit for international comparison fit for international comparison Cervical cancer five-year survival rate fit for international comparison fit for international comparison Cervical cancer screening rate fit for international comparison fit for international comparison Colorectal cancer five-year survival rate fit for international comparison fit for international comparison Incidence of vaccine preventable diseases (Pertussis, measles, and hepatitis B) fit for international comparison fit for international comparison
Coverage for basic vaccination programme, age 2 (Pertussis, measles, and hepatitis B)
fit for international comparison fit for international comparison
Asthma mortality rate, ages 5-39 fit for international comparison fit for international comparison In-hospital mortality rate within 30 days of hospital admission for AMI fit for international comparison fit for international comparison
In-hospital mortality rate within 30 days of hospital admission for stroke fit for international comparison fit for international comparison
In-hospital waiting time for surgery after hip fracture, over age 65 fit for international comparison fit for international comparison
Influenza vaccination, over 65 fit for international comparison fit for international comparison Smoking rate fit for international comparison fit for international comparison Retinal exam in diabetics evaluated as not fit fit for international comparison Asthma admission rate not reviewed fit for international comparison Annual HbA1c test for diabetics evaluated as not fit evaluated as not fit HbA1c level indicating poor glucose control evaluated as not fit evaluated as not fit Major amputations in diabetics evaluated as not fit evaluated as not fit Post-operative hip fracture rate not reviewed evaluated as not fit Transfusion reaction rate not reviewed evaluated as not fit Uncontrolled diabetes admission rate not reviewed evaluated as not fit Hypertension admission rate not reviewed evaluated as not fit
33. The HCQI Expert Group has agreed to conduct developmental work in each of the priority areas, establishing specific expert subgroups for each of them sequentially. Based on the results of the data availability survey and on a review of the clinical and policy importance and scientific soundness ratings given to the indicators, the HCQI Expert Group at its 2005 meeting recommended that the initial focus areas would be patient safety and mental health. Both subgroups were formed in April 2006 and important progress in addressing methodological issues has been and continues to be made.
DELSA/HEA/WD/HWP(2007)4
20
DATA COMPARABILITY ISSUES
34. In OECD Health Working Paper No. 22 on the Initial Indicators for the HCQI Project, an extensive examination of a range of data comparability issues was reported. Data comparability issues persist in the current indicator set requiring further investigation. These issues were discussed at the recent HCQI Experts Meeting in October 2006. These issues include:
• the use of non-nationally representative data
• presentation of administrative versus survey data for cancer screening
• harmonising data recall periods for cancer survival and screening
• the use of a truncated standard population for age adjustment
35. The use of non-nationally representative data In Health Working Paper No. 22, the OECD Secretariat published data from countries that was not strictly nationally representative. This was an explicit recommendation of the HCQI Expert Group in 2004, when several countries stated that they were unable to provide nationally representative data for cancer survival. At the time, the HCQI Expert Group discussed this and recommended that non-nationally representative data should be included where countries provided a written statement that the data was broadly generalisable to the nation as a whole. The HCQI Expert Group reviewed this decision in October 16-17, 2006 and recommended that non-nationally representative data should be presented separately in the working paper, noting the reason why the data was presented in a separate note. It was hoped that this solution would avoid confusing comparisons between nationally representative and non-nationally representative data.
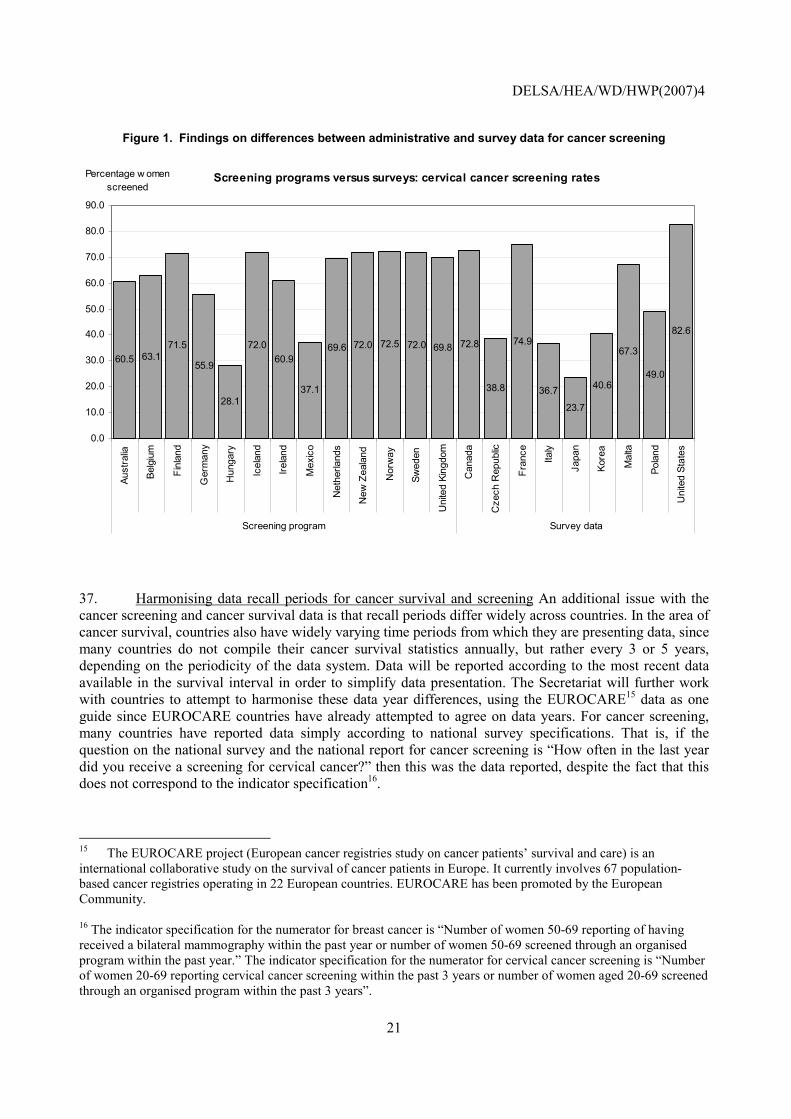
36. Presentation of administrative versus survey data for cancer screening In Health Working Paper No. 22, data were presented on cancer screening for breast and cervical cancer. In many cases, these data came from varying sources across countries, namely administrative and programmatic data or household surveys. In the analysis reported in Health Working Paper No. 22, there appeared to be a systematic difference between these two data sources, in that administrative records often provided lower estimates than survey data. The most recent round of data collection in 2006 shows that there no longer appears to be a systematic difference between these two data sources (see Figure 1 below.) However, the broader literature continues to report differences between administrative records and surveys.
DELSA/HEA/WD/HWP(2007)4
21
Figure 1. Findings on differences between administrative and survey data for cancer screening
Screening programs versus surveys: cervical cancer screening rates
60.5 63.171.5
55.9
28.1
72.060.9
37.1
69.6 72.0 72.5 72.0 69.8 72.8
38.8
74.9
36.7
23.7
40.6
67.3
49.0
82.6
0.0
10.0
20.0
30.0
40.0
50.0
60.0
70.0
80.0
90.0
Aust
ralia
Belg
ium
Finl
and
Ger
man
y
Hun
gary
Icel
and
Irela
nd
Mex
ico
Net
herla
nds
New
Zea
land
Nor
way
Swed
en
Uni
ted
King
dom
Can
ada
Cze
ch R
epub
lic
Fran
ce
Italy
Japa
n
Kore
a
Mal
ta
Pola
nd
Uni
ted
Stat
es
Screening program Survey data
Percentage w omen screened
37. Harmonising data recall periods for cancer survival and screening An additional issue with the cancer screening and cancer survival data is that recall periods differ widely across countries. In the area of cancer survival, countries also have widely varying time periods from which they are presenting data, since many countries do not compile their cancer survival statistics annually, but rather every 3 or 5 years, depending on the periodicity of the data system. Data will be reported according to the most recent data available in the survival interval in order to simplify data presentation. The Secretariat will further work with countries to attempt to harmonise these data year differences, using the EUROCARE15 data as one guide since EUROCARE countries have already attempted to agree on data years. For cancer screening, many countries have reported data simply according to national survey specifications. That is, if the question on the national survey and the national report for cancer screening is �How often in the last year did you receive a screening for cervical cancer?� then this was the data reported, despite the fact that this does not correspond to the indicator specification16.
15 The EUROCARE project (European cancer registries study on cancer patients� survival and care) is an international collaborative study on the survival of cancer patients in Europe. It currently involves 67 population-based cancer registries operating in 22 European countries. EUROCARE has been promoted by the European Community. 16 The indicator specification for the numerator for breast cancer is �Number of women 50-69 reporting of having received a bilateral mammography within the past year or number of women 50-69 screened through an organised program within the past year.� The indicator specification for the numerator for cervical cancer screening is �Number of women 20-69 reporting cervical cancer screening within the past 3 years or number of women aged 20-69 screened through an organised program within the past 3 years�.
DELSA/HEA/WD/HWP(2007)4
22
38. In October 2006, the HCQI Experts agreed that countries should try to harmonise these data over the next year so that the 2008 data collection would represent more comparable data. It was agreed, however, that the data should be presented as collected, with appropriate notes on differing recall and data years.
39. The use of a truncated standard population for age adjustment Age standardisation is necessary since a country�s age structure, depending on the nature of the disease and the structure of the population, can influence the international comparison of health system performance. For example, if Country A�s population is notably older as a whole than Country B�s population, we would expect there to be higher rates of chronic diseases and thus the population, as a whole, may appear �sicker.� This may cause apparent differences in performance for diseases whose incidence and prognosis depends on the age at diagnosis. Such apparent differences are not within the control of the health system, and adjustments for them should be made when comparing performance levels on quality indicators across countries. The same holds true for longitudinal comparisons within one country if the country�s age structure changes significantly over time.
40. To account for such differences in age structure, age adjustments are made based on standardised populations. The resulting age-adjusted rates reflect a country�s hypothetical performance on a standard population and should thus be viewed as relative indexes rather than actual measures. These adjustments can become extremely important when examining data over time and comparing performance across geographical areas. Many national reports on quality of care use some form of age adjustment to account for changes over time in the age structure of the population (CIHI, 2004).
41. An analysis of the impact of age standardisation was undertaken as part of OECD Health Working Paper No. 22. The findings indicated that there appeared to be virtually no difference in countries� relative rankings using either a 1980 or 2005 OECD standard population in calculating cancer survival rates. Secondly, there appeared to be only small differences in the ranking of countries between the use of a 1980 OECD standard population and the disease specific EUROCARE cancer population for relative survival rates. There was, however, some modest influence in the ranking of countries between the use of the 1980 OECD standard population and the EUROCARE cancer population in terms of observed survival. Relative survival rates are the ratio of the disease-specific mortality to overall mortality in a given population. The above findings, therefore, are not surprising as these relative survival rates control to some degree for differences in the age structure of the general population. Lastly, it appears that the use of a truncated version of the 1980 OECD standard population (at age 45+, thus shaping the age structure more closely to a disease specific population) provides estimates moderately different from those based on the EUROCARE cancer population, although the differences were more important for some types of cancers (cervical cancer) than for others. The recommendation at that point was to keep the 1980 OECD standard population as reference for standardisation in 2006 data collection and start exploring more specialised adjustment approaches for both relative and observed survival rates.
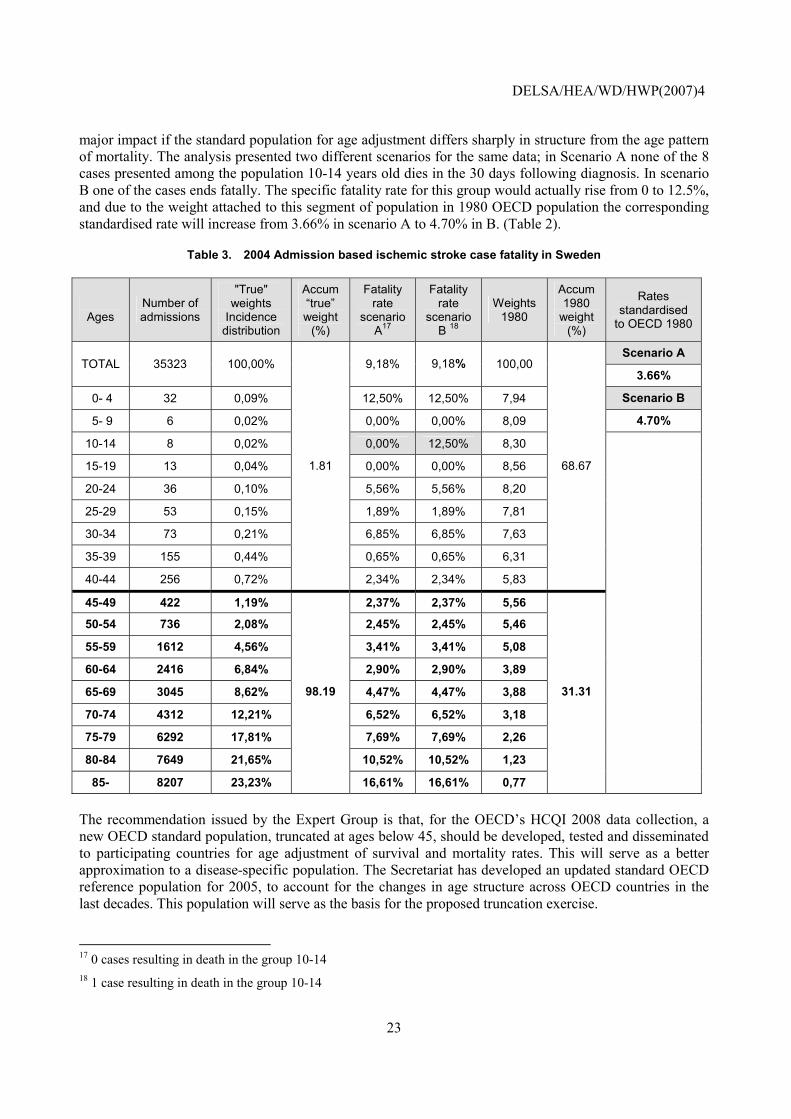
42. Working Paper No. 22 introduced also a recommendation to consider the need to apply age standardisation to the calculation of case fatality rates. So far, the Secretariat has suggested to countries to provide age standardised data or specific age groups rates for the two case fatality rate indicators, however, it has not been set as a requisite to accept data in any of the data collections hitherto due to the inability of several countries to provide data with this level of disaggregation. However the potential impact of this lack of age standardisation is not minor. In a presentation to the HCQI Experts� Group in October 2006, Dr. Max Köster, one of Sweden�s representatives in the Expert Group, presented findings from an analysis examining this issue for AMI and stroke survival rates. This analysis looked at Swedish data and compared different adjustments by age and discussed whether all ages should be included. He showed how 98% of the deaths for ischemic stroke occurred in age groups of 45+. However, in the 1980 OECD standard population that was used in the HCQI Initial Indicators Report, only 31% of the population is found in this age group. This means that variations in small numbers of deaths in the younger age groups can have a
DELSA/HEA/WD/HWP(2007)4
23
major impact if the standard population for age adjustment differs sharply in structure from the age pattern of mortality. The analysis presented two different scenarios for the same data; in Scenario A none of the 8 cases presented among the population 10-14 years old dies in the 30 days following diagnosis. In scenario B one of the cases ends fatally. The specific fatality rate for this group would actually rise from 0 to 12.5%, and due to the weight attached to this segment of population in 1980 OECD population the corresponding standardised rate will increase from 3.66% in scenario A to 4.70% in B. (Table 2).
Table 3. 2004 Admission based ischemic stroke case fatality in Sweden
Ages
Number of admissions
"True" weights
Incidence distribution
Accum �true� weight
(%)
Fatality rate
scenario A17
Fatality rate
scenario B 18
Weights 1980
Accum 1980
weight (%)
Rates standardised
to OECD 1980
Scenario A TOTAL 35323 100,00% 9,18% 9,18% 100,00
3.66%
0- 4 32 0,09% 12,50% 12,50% 7,94 Scenario B
5- 9 6 0,02% 0,00% 0,00% 8,09 4.70%
10-14 8 0,02% 0,00% 12,50% 8,30
15-19 13 0,04% 0,00% 0,00% 8,56
20-24 36 0,10% 5,56% 5,56% 8,20
25-29 53 0,15% 1,89% 1,89% 7,81
30-34 73 0,21% 6,85% 6,85% 7,63
35-39 155 0,44% 0,65% 0,65% 6,31
40-44 256 0,72%
1.81
2,34% 2,34% 5,83
68.67
45-49 422 1,19% 2,37% 2,37% 5,56
50-54 736 2,08% 2,45% 2,45% 5,46
55-59 1612 4,56% 3,41% 3,41% 5,08
60-64 2416 6,84% 2,90% 2,90% 3,89
65-69 3045 8,62% 4,47% 4,47% 3,88
70-74 4312 12,21% 6,52% 6,52% 3,18
75-79 6292 17,81% 7,69% 7,69% 2,26
80-84 7649 21,65% 10,52% 10,52% 1,23
85- 8207 23,23%
98.19
16,61% 16,61% 0,77
31.31
The recommendation issued by the Expert Group is that, for the OECD�s HCQI 2008 data collection, a new OECD standard population, truncated at ages below 45, should be developed, tested and disseminated to participating countries for age adjustment of survival and mortality rates. This will serve as a better approximation to a disease-specific population. The Secretariat has developed an updated standard OECD reference population for 2005, to account for the changes in age structure across OECD countries in the last decades. This population will serve as the basis for the proposed truncation exercise.
17 0 cases resulting in death in the group 10-14 18 1 case resulting in death in the group 10-14
DELSA/HEA/WD/HWP(2007)4
24
�INITIAL� (2003-2005) INDICATORS: 2006 SPECIFICATIONS AND DATA RESULTS
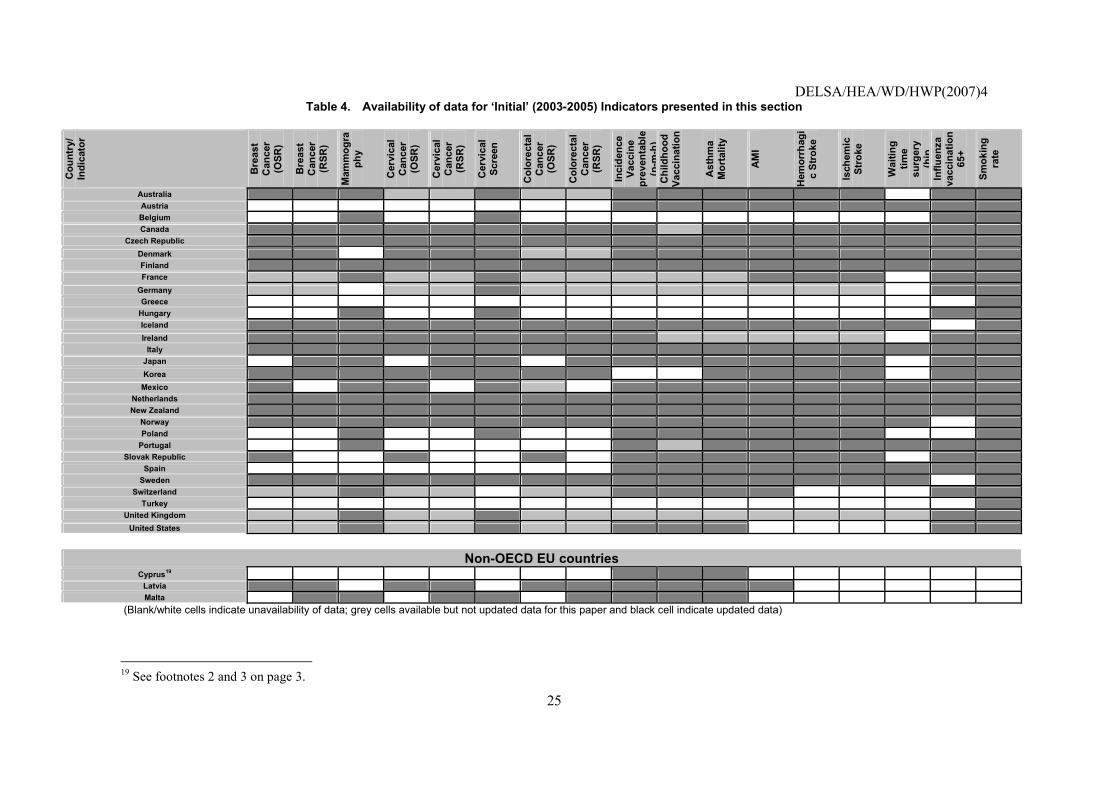
43. This section of the report presents data updated in 2006 for the 2003-2005 set of indicators. The indicators listed in this section are the �initial� HCQI indicators published in OECD Health Working Paper No. 22. They are listed in column 1 of Table 2 above. A full discussion of the scientific soundness and clinical importance of the indicators presented in this section is presented in OECD Health Working Paper No. 22 (http://www.oecd.org/dataoecd/1/34/36262514.pdf) and is not repeated here.
44. As mentioned earlier, it is clear that while the indicators listed in this section have met the HCQI criteria for being scientifically sound, clinically important and having comparable data across countries, this does not mean that they are free of data comparability issues. This paper reports fully on the data comparability for all indicators. The OECD Secretariat will continue to work with countries to improve the comparability of the indicators listed in this section.
45. The following table summarises the data availability for all the indicators presented in this section of the report.
DELSA/HEA/WD/HWP(2007)4
25
Table 4. Availability of data for �Initial� (2003-2005) Indicators presented in this section
Cou
ntry
/ In
dica
tor
Bre
ast
Can
cer
(OSR
)
Bre
ast
Can
cer
(RSR
)
Mam
mog
raph
y
Cer
vica
l C
ance
r (O
SR)
Cer
vica
l C
ance
r (R
SR)
Cer
vica
l Sc
reen
Col
orec
tal
Can
cer
(OSR
)
Col
orec
tal
Can
cer
(RSR
)
Inci
denc
e Va
ccin
e pr
even
tabl
e (p
-m-h
)C
hild
hood
Va
ccin
atio
n
Ast
hma
Mor
talit
y
AM
I
Hem
orrh
agi
c St
roke
Isch
emic
St
roke
Wai
ting
time
surg
ery
(hip
Influ
enza
va
ccin
atio
n 65
+
Smok
ing
rate
Australia Austria Belgium Canada
Czech Republic Denmark Finland France
Germany Greece
Hungary Iceland Ireland
Italy Japan Korea
Mexico Netherlands New Zealand
Norway Poland
Portugal Slovak Republic
Spain Sweden
Switzerland Turkey
United Kingdom United States
Non-OECD EU countries
Cyprus19 Latvia Malta
(Blank/white cells indicate unavailability of data; grey cells available but not updated data for this paper and black cell indicate updated data)
19 See footnotes 2 and 3 on page 3.
DELSA/HEA/WD/HWP(2007)4
26
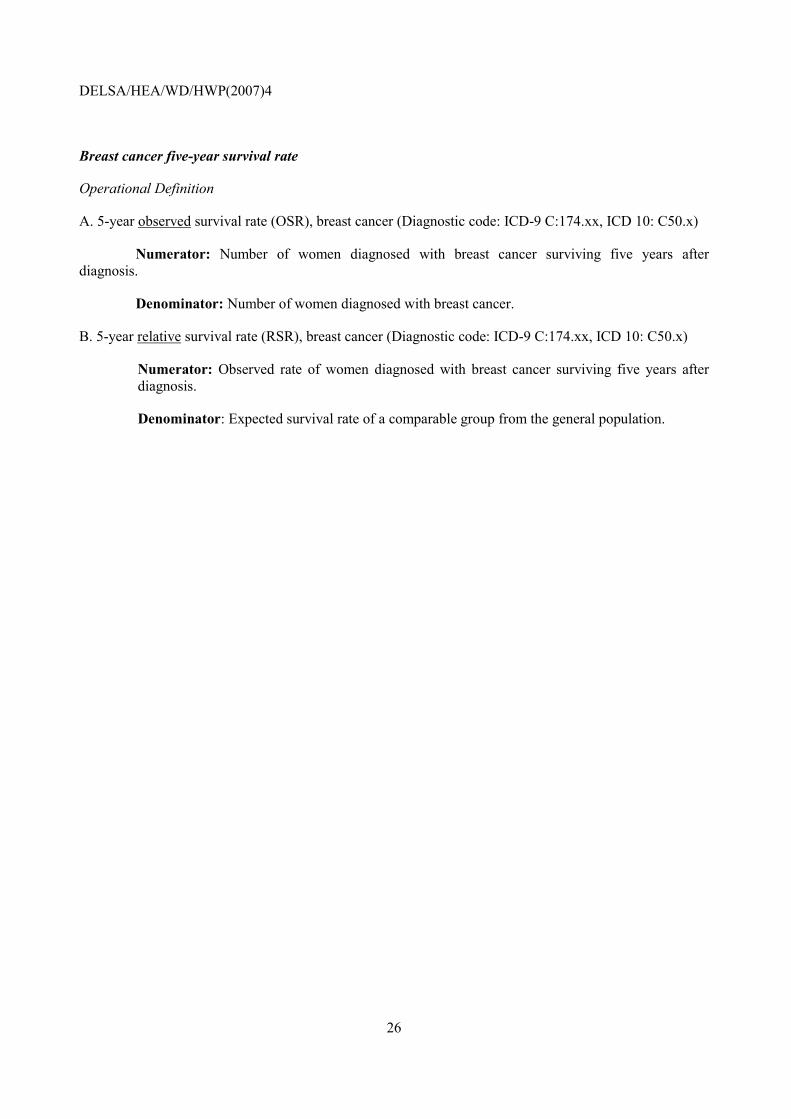
Breast cancer five-year survival rate
Operational Definition
A. 5-year observed survival rate (OSR), breast cancer (Diagnostic code: ICD-9 C:174.xx, ICD 10: C50.x)
Numerator: Number of women diagnosed with breast cancer surviving five years after diagnosis.
Denominator: Number of women diagnosed with breast cancer.
B. 5-year relative survival rate (RSR), breast cancer (Diagnostic code: ICD-9 C:174.xx, ICD 10: C50.x)
Numerator: Observed rate of women diagnosed with breast cancer surviving five years after diagnosis.
Denominator: Expected survival rate of a comparable group from the general population.
DELSA/HEA/WD/HWP(2007)4
27
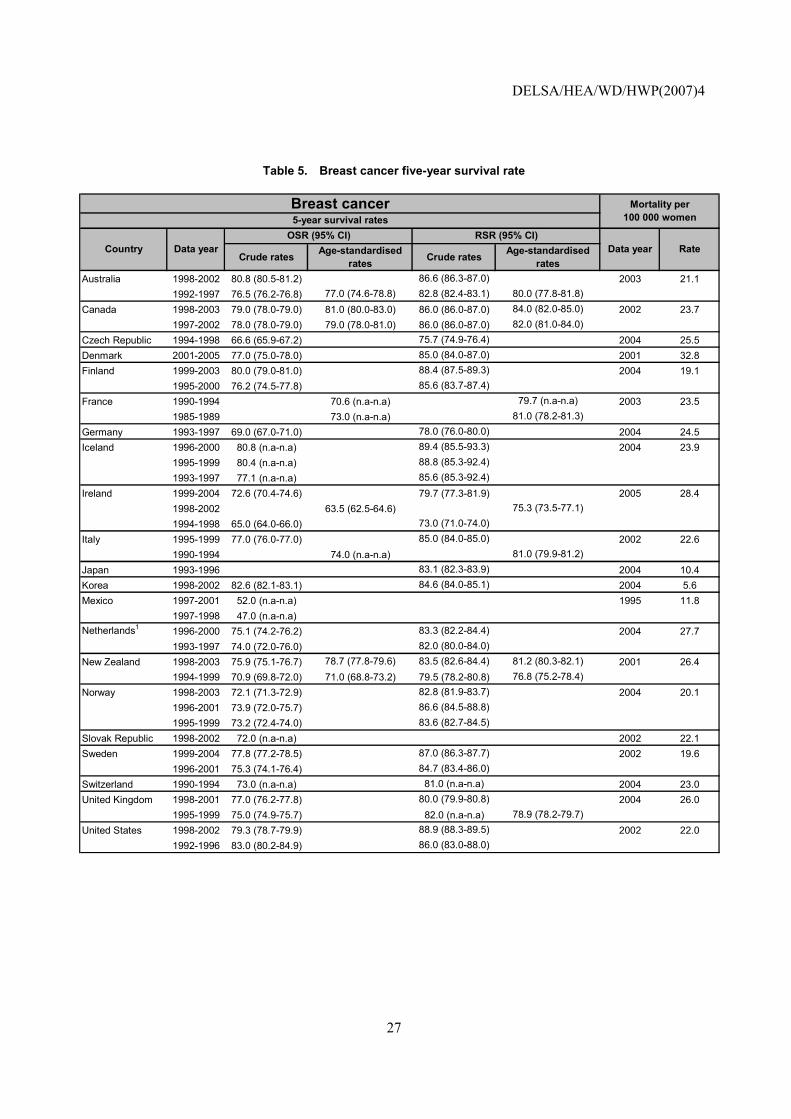
Table 5. Breast cancer five-year survival rate
Crude rates Age-standardised rates Crude rates Age-standardised
ratesAustralia 1998-2002 80.8 (80.5-81.2) 86.6 (86.3-87.0) 2003 21.1
1992-1997 76.5 (76.2-76.8) 77.0 (74.6-78.8) 82.8 (82.4-83.1) 80.0 (77.8-81.8)Canada 1998-2003 79.0 (78.0-79.0) 81.0 (80.0-83.0) 86.0 (86.0-87.0) 84.0 (82.0-85.0) 2002 23.7
1997-2002 78.0 (78.0-79.0) 79.0 (78.0-81.0) 86.0 (86.0-87.0) 82.0 (81.0-84.0)Czech Republic 1994-1998 66.6 (65.9-67.2) 75.7 (74.9-76.4) 2004 25.5Denmark 2001-2005 77.0 (75.0-78.0) 85.0 (84.0-87.0) 2001 32.8Finland 1999-2003 80.0 (79.0-81.0) 88.4 (87.5-89.3) 2004 19.1
1995-2000 76.2 (74.5-77.8) 85.6 (83.7-87.4)France 1990-1994 70.6 (n.a-n.a) 79.7 (n.a-n.a) 2003 23.5
1985-1989 73.0 (n.a-n.a) 81.0 (78.2-81.3)Germany 1993-1997 69.0 (67.0-71.0) 78.0 (76.0-80.0) 2004 24.5Iceland 1996-2000 80.8 (n.a-n.a) 89.4 (85.5-93.3) 2004 23.9
1995-1999 80.4 (n.a-n.a) 88.8 (85.3-92.4)1993-1997 77.1 (n.a-n.a) 85.6 (85.3-92.4)
Ireland 1999-2004 72.6 (70.4-74.6) 79.7 (77.3-81.9) 2005 28.41998-2002 63.5 (62.5-64.6) 75.3 (73.5-77.1)1994-1998 65.0 (64.0-66.0) 73.0 (71.0-74.0)
Italy 1995-1999 77.0 (76.0-77.0) 85.0 (84.0-85.0) 2002 22.61990-1994 74.0 (n.a-n.a) 81.0 (79.9-81.2)
Japan 1993-1996 83.1 (82.3-83.9) 2004 10.4Korea 1998-2002 82.6 (82.1-83.1) 84.6 (84.0-85.1) 2004 5.6Mexico 1997-2001 52.0 (n.a-n.a) 1995 11.8
1997-1998 47.0 (n.a-n.a)Netherlands1 1996-2000 75.1 (74.2-76.2) 83.3 (82.2-84.4) 2004 27.7
1993-1997 74.0 (72.0-76.0) 82.0 (80.0-84.0)New Zealand 1998-2003 75.9 (75.1-76.7) 78.7 (77.8-79.6) 83.5 (82.6-84.4) 81.2 (80.3-82.1) 2001 26.4
1994-1999 70.9 (69.8-72.0) 71.0 (68.8-73.2) 79.5 (78.2-80.8) 76.8 (75.2-78.4)Norway 1998-2003 72.1 (71.3-72.9) 82.8 (81.9-83.7) 2004 20.1
1996-2001 73.9 (72.0-75.7) 86.6 (84.5-88.8)1995-1999 73.2 (72.4-74.0) 83.6 (82.7-84.5)
Slovak Republic 1998-2002 72.0 (n.a-n.a) 2002 22.1Sweden 1999-2004 77.8 (77.2-78.5) 87.0 (86.3-87.7) 2002 19.6
1996-2001 75.3 (74.1-76.4) 84.7 (83.4-86.0)Switzerland 1990-1994 73.0 (n.a-n.a) 81.0 (n.a-n.a) 2004 23.0United Kingdom 1998-2001 77.0 (76.2-77.8) 80.0 (79.9-80.8) 2004 26.0
1995-1999 75.0 (74.9-75.7) 82.0 (n.a-n.a) 78.9 (78.2-79.7)United States 1998-2002 79.3 (78.7-79.9) 88.9 (88.3-89.5) 2002 22.0
1992-1996 83.0 (80.2-84.9) 86.0 (83.0-88.0)
Mortality per 100 000 women
Breast cancer5-year survival rates
Country Data yearOSR (95% CI) RSR (95% CI)
Data year Rate
DELSA/HEA/WD/HWP(2007)4
28
Crude rates Age-standardised rates Crude rates Age-standardised
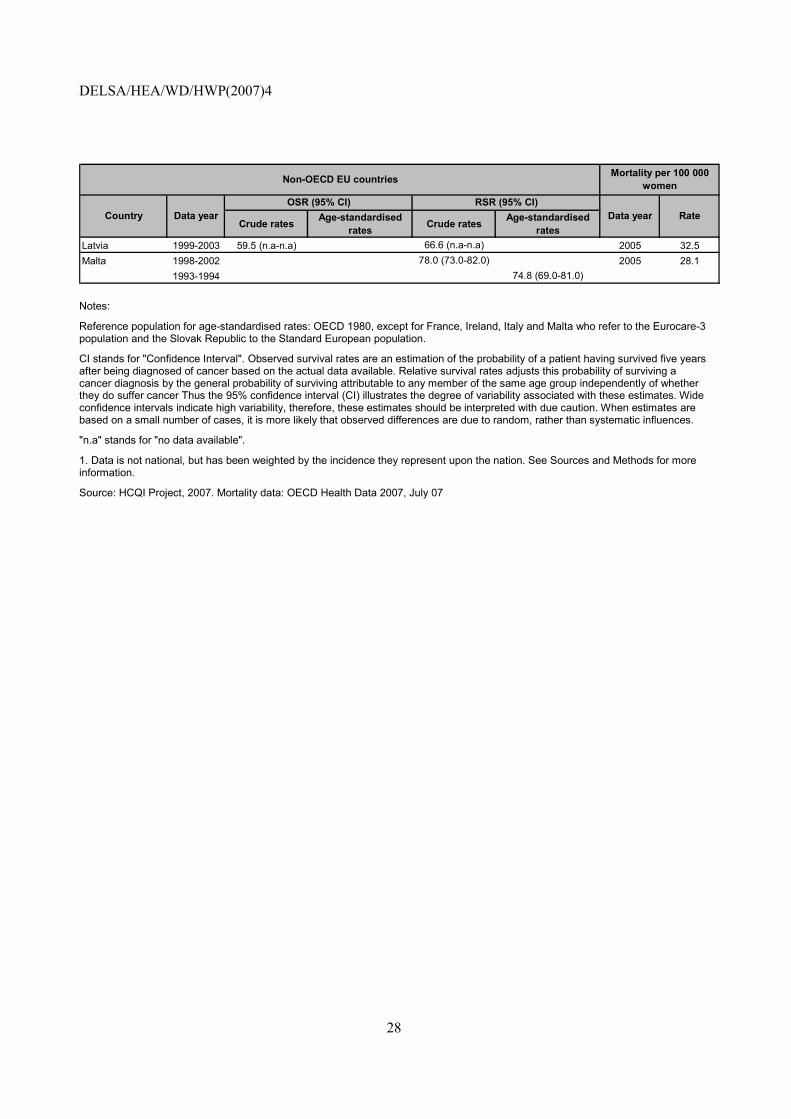
ratesLatvia 1999-2003 59.5 (n.a-n.a) 66.6 (n.a-n.a) 2005 32.5Malta 1998-2002 78.0 (73.0-82.0) 2005 28.1
1993-1994 74.8 (69.0-81.0)
Data year Rate
Non-OECD EU countries
Country Data yearOSR (95% CI) RSR (95% CI)
Mortality per 100 000 women
Notes:
Reference population for age-standardised rates: OECD 1980, except for France, Ireland, Italy and Malta who refer to the Eurocare-3 population and the Slovak Republic to the Standard European population.
CI stands for "Confidence Interval". Observed survival rates are an estimation of the probability of a patient having survived five years after being diagnosed of cancer based on the actual data available. Relative survival rates adjusts this probability of surviving a cancer diagnosis by the general probability of surviving attributable to any member of the same age group independently of whether they do suffer cancer Thus the 95% confidence interval (CI) illustrates the degree of variability associated with these estimates. Wide confidence intervals indicate high variability, therefore, these estimates should be interpreted with due caution. When estimates are based on a small number of cases, it is more likely that observed differences are due to random, rather than systematic influences.
"n.a" stands for "no data available".
1. Data is not national, but has been weighted by the incidence they represent upon the nation. See Sources and Methods for more information.
Source: HCQI Project, 2007. Mortality data: OECD Health Data 2007, July 07
DELSA/HEA/WD/HWP(2007)4
29
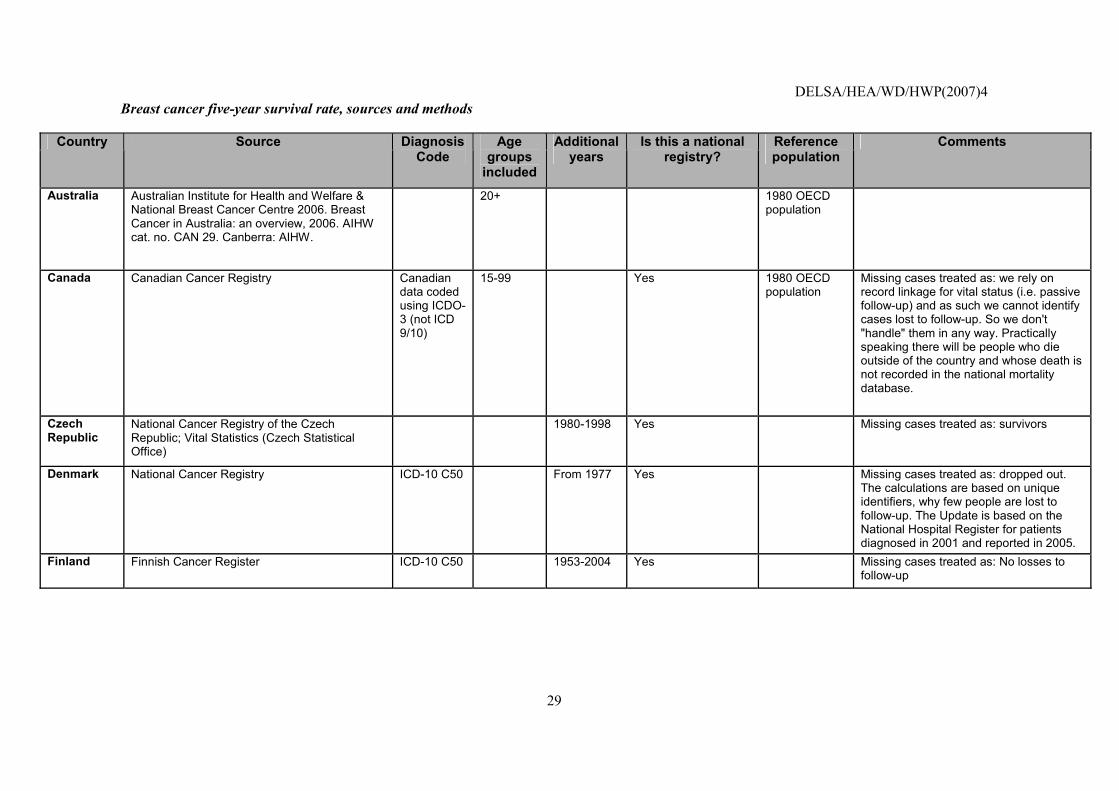
Breast cancer five-year survival rate, sources and methods
Country Source Diagnosis Code
Age groups
included
Additional years
Is this a national registry?
Reference population
Comments
Australia Australian Institute for Health and Welfare & National Breast Cancer Centre 2006. Breast Cancer in Australia: an overview, 2006. AIHW cat. no. CAN 29. Canberra: AIHW.
20+ 1980 OECD population
Canada Canadian Cancer Registry Canadian data coded using ICDO-3 (not ICD 9/10)
15-99 Yes 1980 OECD population
Missing cases treated as: we rely on record linkage for vital status (i.e. passive follow-up) and as such we cannot identify cases lost to follow-up. So we don't "handle" them in any way. Practically speaking there will be people who die outside of the country and whose death is not recorded in the national mortality database.
Czech Republic
National Cancer Registry of the Czech Republic; Vital Statistics (Czech Statistical Office)
1980-1998 Yes Missing cases treated as: survivors
Denmark National Cancer Registry ICD-10 C50 From 1977 Yes Missing cases treated as: dropped out. The calculations are based on unique identifiers, why few people are lost to follow-up. The Update is based on the National Hospital Register for patients diagnosed in 2001 and reported in 2005.
Finland Finnish Cancer Register ICD-10 C50 1953-2004 Yes Missing cases treated as: No losses to follow-up
DELSA/HEA/WD/HWP(2007)4
30
Country Source Diagnosis Code
Age groups
included
Additional years
Is this a national registry?
Reference population
Comments
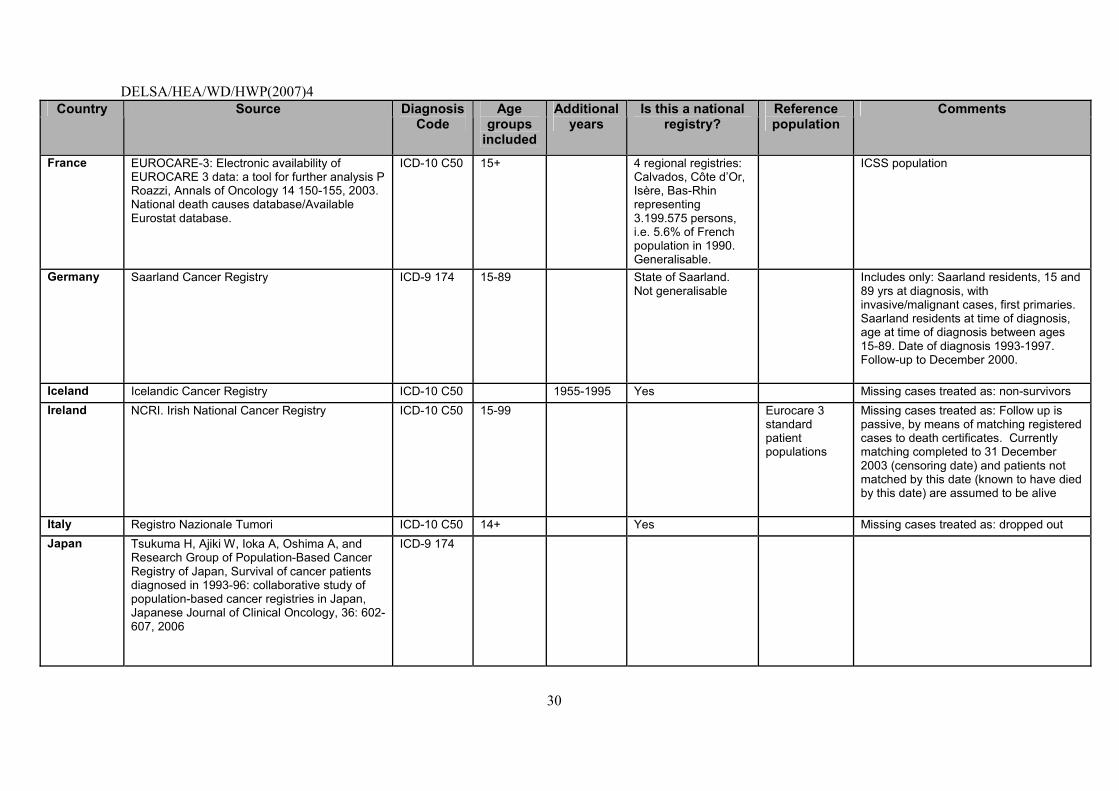
France EUROCARE-3: Electronic availability of EUROCARE 3 data: a tool for further analysis P Roazzi, Annals of Oncology 14 150-155, 2003. National death causes database/Available Eurostat database.
ICD-10 C50 15+ 4 regional registries: Calvados, Côte d�Or, Isère, Bas-Rhin representing 3.199.575 persons, i.e. 5.6% of French population in 1990. Generalisable.
ICSS population
Germany Saarland Cancer Registry ICD-9 174 15-89 State of Saarland. Not generalisable
Includes only: Saarland residents, 15 and 89 yrs at diagnosis, with invasive/malignant cases, first primaries. Saarland residents at time of diagnosis, age at time of diagnosis between ages 15-89. Date of diagnosis 1993-1997. Follow-up to December 2000.
Iceland Icelandic Cancer Registry ICD-10 C50 1955-1995 Yes Missing cases treated as: non-survivors Ireland NCRI. Irish National Cancer Registry ICD-10 C50 15-99 Eurocare 3
standard patient populations
Missing cases treated as: Follow up is passive, by means of matching registered cases to death certificates. Currently matching completed to 31 December 2003 (censoring date) and patients not matched by this date (known to have died by this date) are assumed to be alive
Italy Registro Nazionale Tumori ICD-10 C50 14+ Yes Missing cases treated as: dropped out Japan Tsukuma H, Ajiki W, Ioka A, Oshima A, and
Research Group of Population-Based Cancer Registry of Japan, Survival of cancer patients diagnosed in 1993-96: collaborative study of population-based cancer registries in Japan, Japanese Journal of Clinical Oncology, 36: 602-607, 2006
ICD-9 174
DELSA/HEA/WD/HWP(2007)4
31
Country Source Diagnosis Code
Age groups
included
Additional years
Is this a national registry?
Reference population
Comments
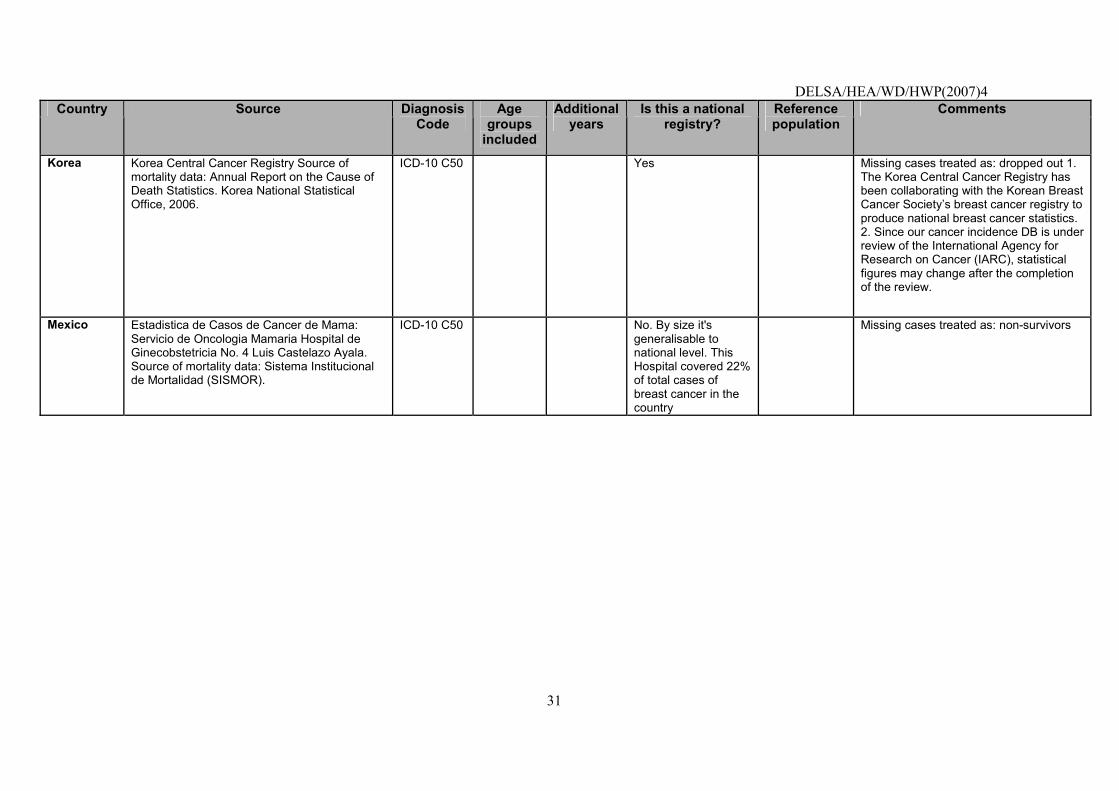
Korea Korea Central Cancer Registry Source of mortality data: Annual Report on the Cause of Death Statistics. Korea National Statistical Office, 2006.
ICD-10 C50 Yes Missing cases treated as: dropped out 1. The Korea Central Cancer Registry has been collaborating with the Korean Breast Cancer Society�s breast cancer registry to produce national breast cancer statistics. 2. Since our cancer incidence DB is under review of the International Agency for Research on Cancer (IARC), statistical figures may change after the completion of the review.
Mexico Estadistica de Casos de Cancer de Mama: Servicio de Oncologia Mamaria Hospital de Ginecobstetricia No. 4 Luis Castelazo Ayala. Source of mortality data: Sistema Institucional de Mortalidad (SISMOR).
ICD-10 C50 No. By size it's generalisable to national level. This Hospital covered 22% of total cases of breast cancer in the country
Missing cases treated as: non-survivors
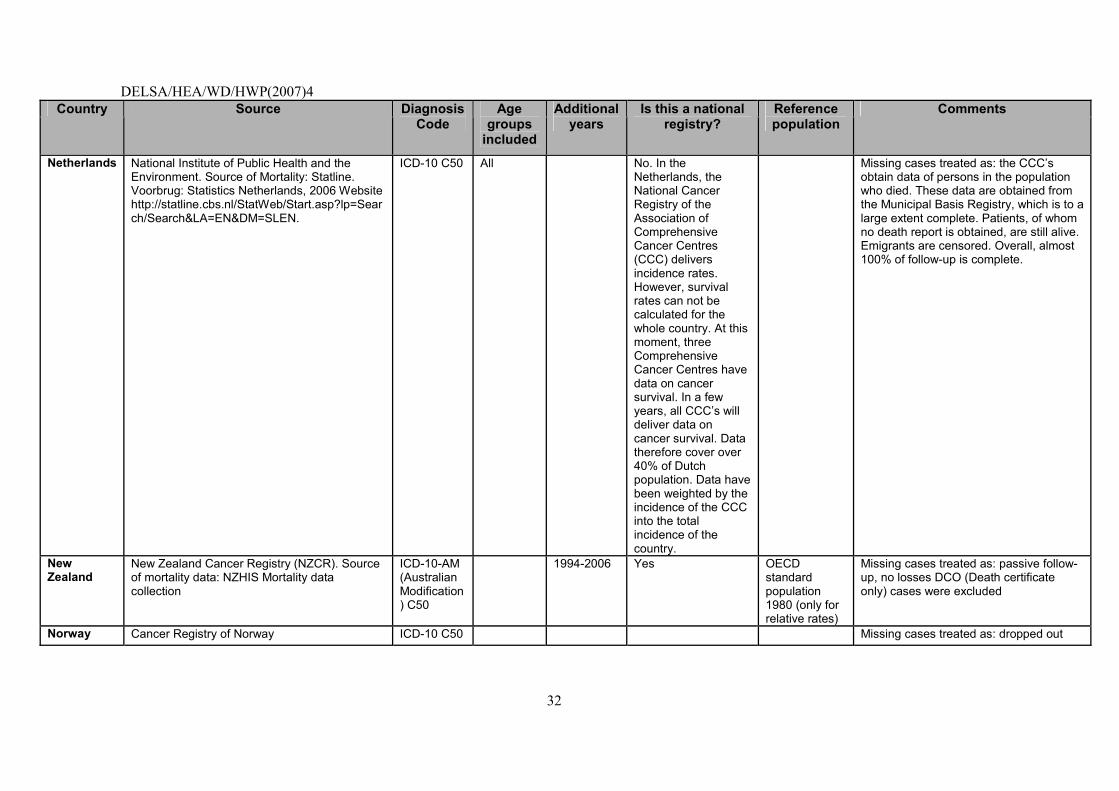
DELSA/HEA/WD/HWP(2007)4
32
Country Source Diagnosis Code
Age groups
included
Additional years
Is this a national registry?
Reference population
Comments
Netherlands National Institute of Public Health and the Environment. Source of Mortality: Statline. Voorbrug: Statistics Netherlands, 2006 Website http://statline.cbs.nl/StatWeb/Start.asp?lp=Search/Search&LA=EN&DM=SLEN.
ICD-10 C50 All No. In the Netherlands, the National Cancer Registry of the Association of Comprehensive Cancer Centres (CCC) delivers incidence rates. However, survival rates can not be calculated for the whole country. At this moment, three Comprehensive Cancer Centres have data on cancer survival. In a few years, all CCC�s will deliver data on cancer survival. Data therefore cover over 40% of Dutch population. Data have been weighted by the incidence of the CCC into the total incidence of the country.
Missing cases treated as: the CCC�s obtain data of persons in the population who died. These data are obtained from the Municipal Basis Registry, which is to a large extent complete. Patients, of whom no death report is obtained, are still alive. Emigrants are censored. Overall, almost 100% of follow-up is complete.
New Zealand
New Zealand Cancer Registry (NZCR). Source of mortality data: NZHIS Mortality data collection
ICD-10-AM (Australian Modification) C50
1994-2006 Yes OECD standard population 1980 (only for relative rates)
Missing cases treated as: passive follow-up, no losses DCO (Death certificate only) cases were excluded
Norway Cancer Registry of Norway ICD-10 C50 Missing cases treated as: dropped out
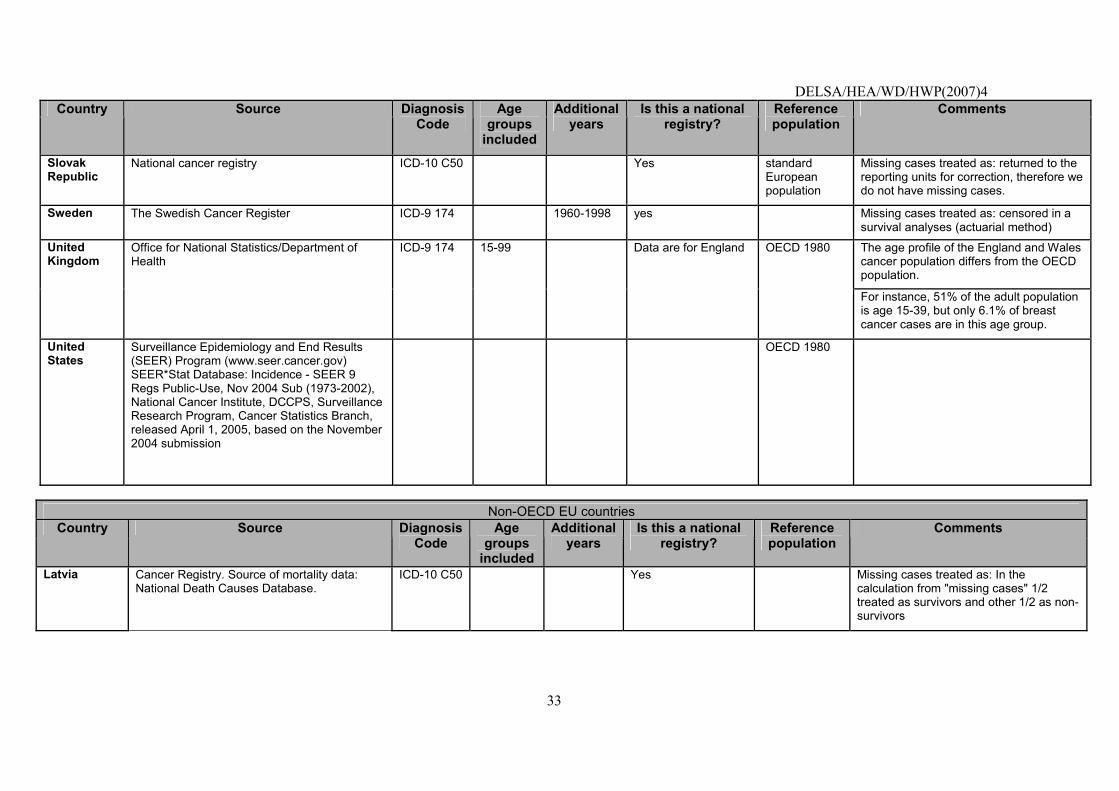
DELSA/HEA/WD/HWP(2007)4
33
Country Source Diagnosis Code
Age groups
included
Additional years
Is this a national registry?
Reference population
Comments
Slovak Republic
National cancer registry ICD-10 C50 Yes standard European population
Missing cases treated as: returned to the reporting units for correction, therefore we do not have missing cases.
Sweden The Swedish Cancer Register ICD-9 174 1960-1998 yes Missing cases treated as: censored in a survival analyses (actuarial method)
The age profile of the England and Wales cancer population differs from the OECD population.
United Kingdom
Office for National Statistics/Department of Health
ICD-9 174 15-99 Data are for England OECD 1980
For instance, 51% of the adult population is age 15-39, but only 6.1% of breast cancer cases are in this age group.
United States
Surveillance Epidemiology and End Results (SEER) Program (www.seer.cancer.gov) SEER*Stat Database: Incidence - SEER 9 Regs Public-Use, Nov 2004 Sub (1973-2002), National Cancer Institute, DCCPS, Surveillance Research Program, Cancer Statistics Branch, released April 1, 2005, based on the November 2004 submission
OECD 1980
Non-OECD EU countries
Country Source Diagnosis Code
Age groups
included
Additional years
Is this a national registry?
Reference population
Comments
Latvia Cancer Registry. Source of mortality data: National Death Causes Database.
ICD-10 C50 Yes Missing cases treated as: In the calculation from "missing cases" 1/2 treated as survivors and other 1/2 as non-survivors
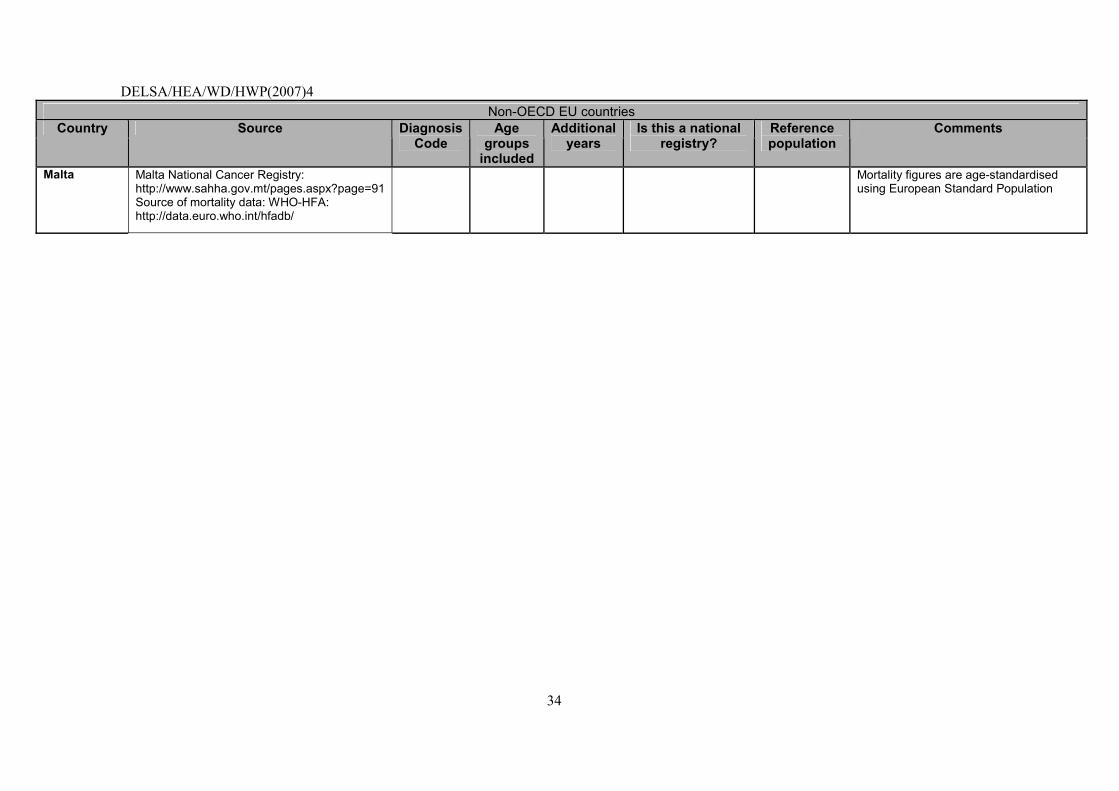
DELSA/HEA/WD/HWP(2007)4
34
Non-OECD EU countries Country Source Diagnosis
Code Age
groups included
Additional years
Is this a national registry?
Reference population
Comments
Malta Malta National Cancer Registry: http://www.sahha.gov.mt/pages.aspx?page=91 Source of mortality data: WHO-HFA: http://data.euro.who.int/hfadb/
Mortality figures are age-standardised using European Standard Population
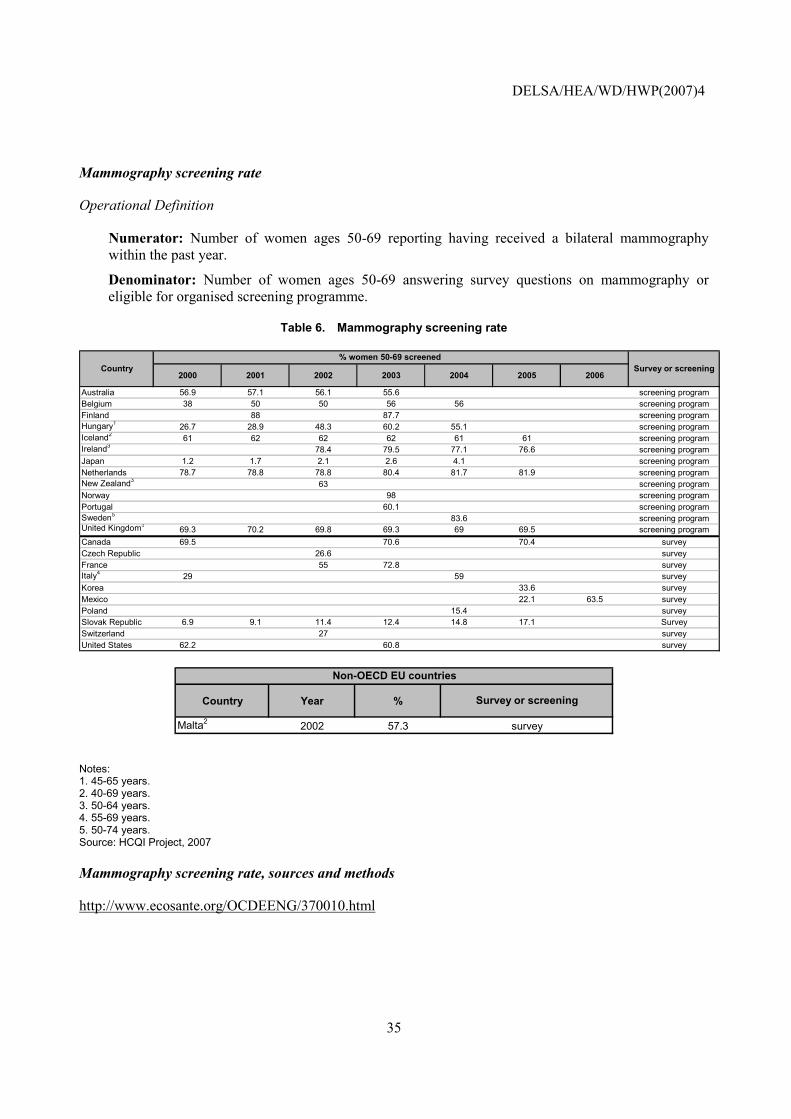
DELSA/HEA/WD/HWP(2007)4
35
Mammography screening rate
Operational Definition
Numerator: Number of women ages 50-69 reporting having received a bilateral mammography within the past year.
Denominator: Number of women ages 50-69 answering survey questions on mammography or eligible for organised screening programme.
Table 6. Mammography screening rate
2000 2001 2002 2003 2004 2005 2006
Australia 56.9 57.1 56.1 55.6 screening programBelgium 38 50 50 56 56 screening programFinland 88 87.7 screening programHungary1 26.7 28.9 48.3 60.2 55.1 screening programIceland2 61 62 62 62 61 61 screening programIreland3 78.4 79.5 77.1 76.6 screening programJapan 1.2 1.7 2.1 2.6 4.1 screening programNetherlands 78.7 78.8 78.8 80.4 81.7 81.9 screening programNew Zealand3 63 screening programNorway 98 screening programPortugal 60.1 screening programSweden5 83.6 screening programUnited Kingdom3
69.3 70.2 69.8 69.3 69 69.5 screening programCanada 69.5 70.6 70.4 surveyCzech Republic 26.6 surveyFrance 55 72.8 surveyItaly4 29 59 surveyKorea 33.6 surveyMexico 22.1 63.5 surveyPoland 15.4 surveySlovak Republic 6.9 9.1 11.4 12.4 14.8 17.1 SurveySwitzerland 27 surveyUnited States 62.2 60.8 survey
% women 50-69 screened Country Survey or screening
Country Year %
Malta2 2002 57.3
Survey or screening
survey
Non-OECD EU countries
Notes: 1. 45-65 years. 2. 40-69 years. 3. 50-64 years. 4. 55-69 years. 5. 50-74 years. Source: HCQI Project, 2007
Mammography screening rate, sources and methods
http://www.ecosante.org/OCDEENG/370010.html
DELSA/HEA/WD/HWP(2007)4
36
Cervical cancer five-year survival rate
Operational Definition
A. 5-year observed survival rate (OSR), cervical cancer (Diagnostic code: ICD-9 C:180.xx; ICD-10: C53.x)
Numerator: Number of women diagnosed with cervical cancer surviving five years after diagnosis.
Denominator: Number of women diagnosed with cervical cancer.
B. 5-year relative survival rate (RSR), cervical cancer (Diagnostic code: ICD-9 C:180.xx; ICD-10: C53.x)
Numerator: Observed rate of women diagnosed with cervical cancer surviving five years after diagnosis
Denominator: Expected survival rate of a comparable group from the general population
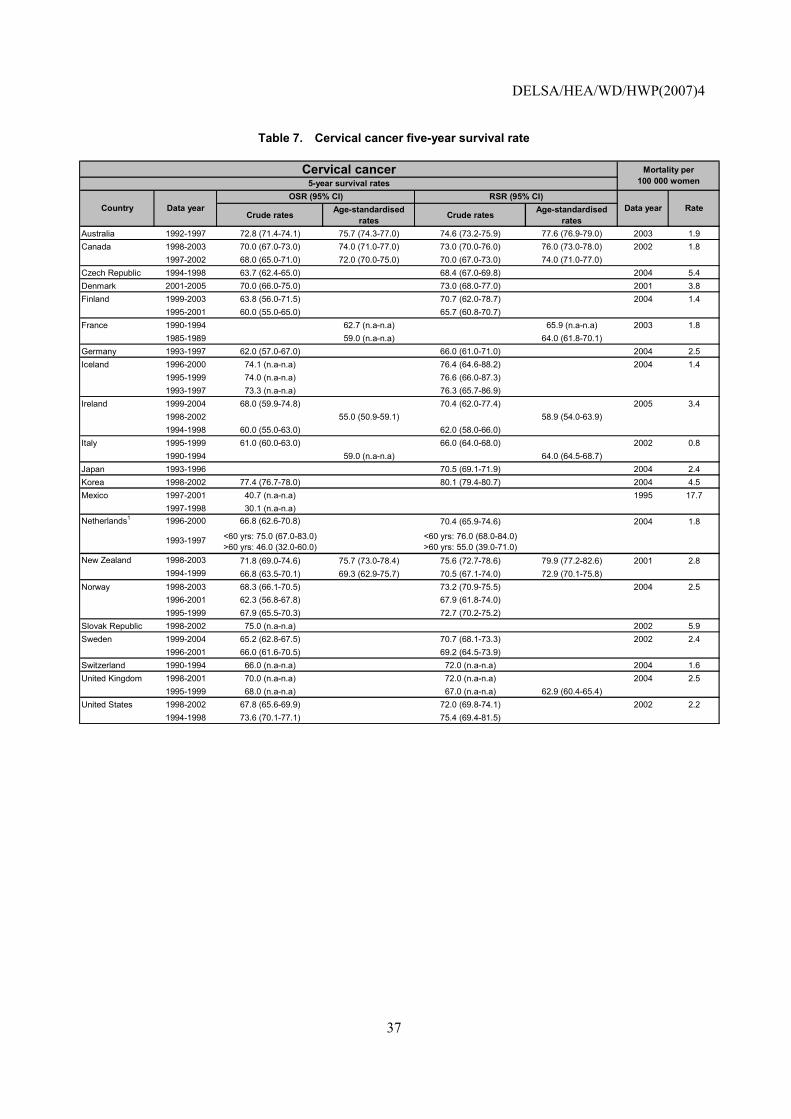
DELSA/HEA/WD/HWP(2007)4
37
Table 7. Cervical cancer five-year survival rate
Crude rates Age-standardised rates Crude rates Age-standardised
ratesAustralia 1992-1997 72.8 (71.4-74.1) 75.7 (74.3-77.0) 74.6 (73.2-75.9) 77.6 (76.9-79.0) 2003 1.9Canada 1998-2003 70.0 (67.0-73.0) 74.0 (71.0-77.0) 73.0 (70.0-76.0) 76.0 (73.0-78.0) 2002 1.8
1997-2002 68.0 (65.0-71.0) 72.0 (70.0-75.0) 70.0 (67.0-73.0) 74.0 (71.0-77.0)Czech Republic 1994-1998 63.7 (62.4-65.0) 68.4 (67.0-69.8) 2004 5.4Denmark 2001-2005 70.0 (66.0-75.0) 73.0 (68.0-77.0) 2001 3.8Finland 1999-2003 63.8 (56.0-71.5) 70.7 (62.0-78.7) 2004 1.4
1995-2001 60.0 (55.0-65.0) 65.7 (60.8-70.7)France 1990-1994 62.7 (n.a-n.a) 65.9 (n.a-n.a) 2003 1.8
1985-1989 59.0 (n.a-n.a) 64.0 (61.8-70.1)Germany 1993-1997 62.0 (57.0-67.0) 66.0 (61.0-71.0) 2004 2.5Iceland 1996-2000 74.1 (n.a-n.a) 76.4 (64.6-88.2) 2004 1.4
1995-1999 74.0 (n.a-n.a) 76.6 (66.0-87.3)1993-1997 73.3 (n.a-n.a) 76.3 (65.7-86.9)
Ireland 1999-2004 68.0 (59.9-74.8) 70.4 (62.0-77.4) 2005 3.41998-2002 55.0 (50.9-59.1) 58.9 (54.0-63.9)1994-1998 60.0 (55.0-63.0) 62.0 (58.0-66.0)
Italy 1995-1999 61.0 (60.0-63.0) 66.0 (64.0-68.0) 2002 0.81990-1994 59.0 (n.a-n.a) 64.0 (64.5-68.7)
Japan 1993-1996 70.5 (69.1-71.9) 2004 2.4Korea 1998-2002 77.4 (76.7-78.0) 80.1 (79.4-80.7) 2004 4.5Mexico 1997-2001 40.7 (n.a-n.a) 1995 17.7
1997-1998 30.1 (n.a-n.a)Netherlands1 1996-2000 66.8 (62.6-70.8) 70.4 (65.9-74.6) 2004 1.8
1993-1997 <60 yrs: 75.0 (67.0-83.0)>60 yrs: 46.0 (32.0-60.0)
<60 yrs: 76.0 (68.0-84.0)>60 yrs: 55.0 (39.0-71.0)
New Zealand 1998-2003 71.8 (69.0-74.6) 75.7 (73.0-78.4) 75.6 (72.7-78.6) 79.9 (77.2-82.6) 2001 2.81994-1999 66.8 (63.5-70.1) 69.3 (62.9-75.7) 70.5 (67.1-74.0) 72.9 (70.1-75.8)
Norway 1998-2003 68.3 (66.1-70.5) 73.2 (70.9-75.5) 2004 2.51996-2001 62.3 (56.8-67.8) 67.9 (61.8-74.0)1995-1999 67.9 (65.5-70.3) 72.7 (70.2-75.2)
Slovak Republic 1998-2002 75.0 (n.a-n.a) 2002 5.9Sweden 1999-2004 65.2 (62.8-67.5) 70.7 (68.1-73.3) 2002 2.4
1996-2001 66.0 (61.6-70.5) 69.2 (64.5-73.9)Switzerland 1990-1994 66.0 (n.a-n.a) 72.0 (n.a-n.a) 2004 1.6United Kingdom 1998-2001 70.0 (n.a-n.a) 72.0 (n.a-n.a) 2004 2.5
1995-1999 68.0 (n.a-n.a) 67.0 (n.a-n.a) 62.9 (60.4-65.4)United States 1998-2002 67.8 (65.6-69.9) 72.0 (69.8-74.1) 2002 2.2
1994-1998 73.6 (70.1-77.1) 75.4 (69.4-81.5)
Data year Rate
Mortality per 100 000 women
Cervical cancer5-year survival rates
Country Data yearOSR (95% CI) RSR (95% CI)
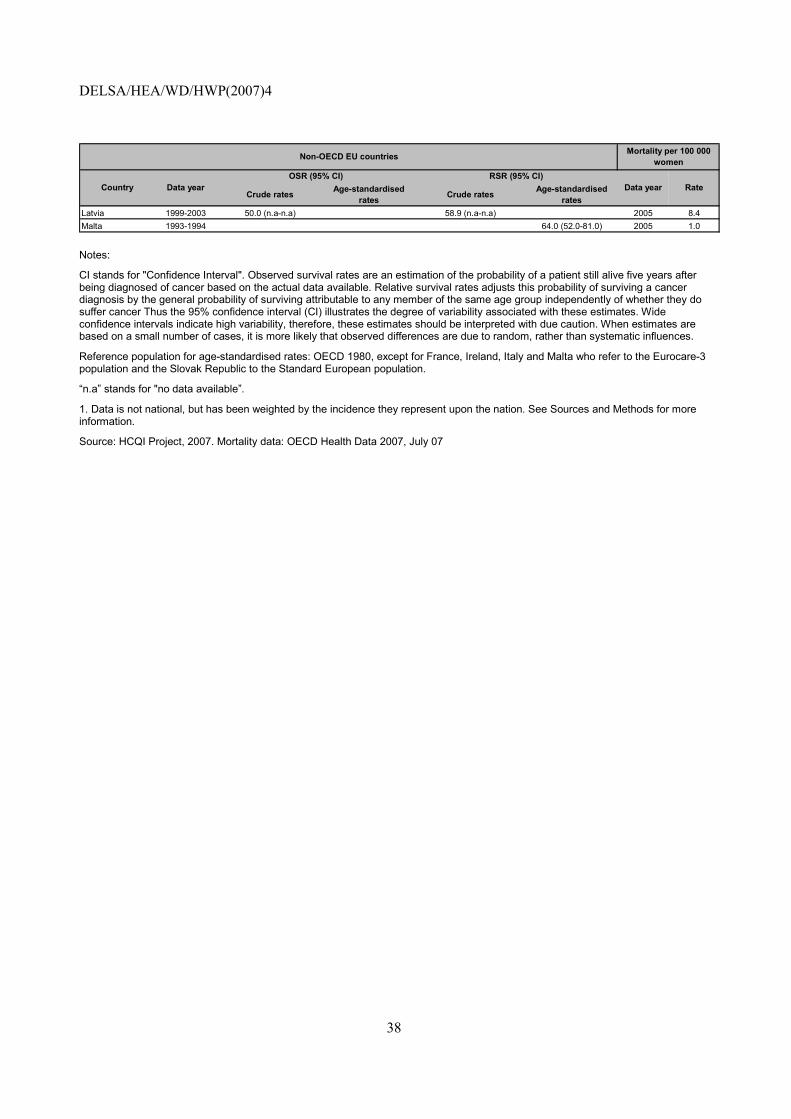
DELSA/HEA/WD/HWP(2007)4
38
Crude rates Age-standardised rates Crude rates Age-standardised
ratesLatvia 1999-2003 50.0 (n.a-n.a) 58.9 (n.a-n.a) 2005 8.4Malta 1993-1994 64.0 (52.0-81.0) 2005 1.0
Data year Rate
Non-OECD EU countries
Country Data yearOSR (95% CI) RSR (95% CI)
Mortality per 100 000 women
Notes:
CI stands for "Confidence Interval". Observed survival rates are an estimation of the probability of a patient still alive five years after being diagnosed of cancer based on the actual data available. Relative survival rates adjusts this probability of surviving a cancer diagnosis by the general probability of surviving attributable to any member of the same age group independently of whether they do suffer cancer Thus the 95% confidence interval (CI) illustrates the degree of variability associated with these estimates. Wide confidence intervals indicate high variability, therefore, these estimates should be interpreted with due caution. When estimates are based on a small number of cases, it is more likely that observed differences are due to random, rather than systematic influences.
Reference population for age-standardised rates: OECD 1980, except for France, Ireland, Italy and Malta who refer to the Eurocare-3 population and the Slovak Republic to the Standard European population.
�n.a� stands for "no data available�.
1. Data is not national, but has been weighted by the incidence they represent upon the nation. See Sources and Methods for more information.
Source: HCQI Project, 2007. Mortality data: OECD Health Data 2007, July 07
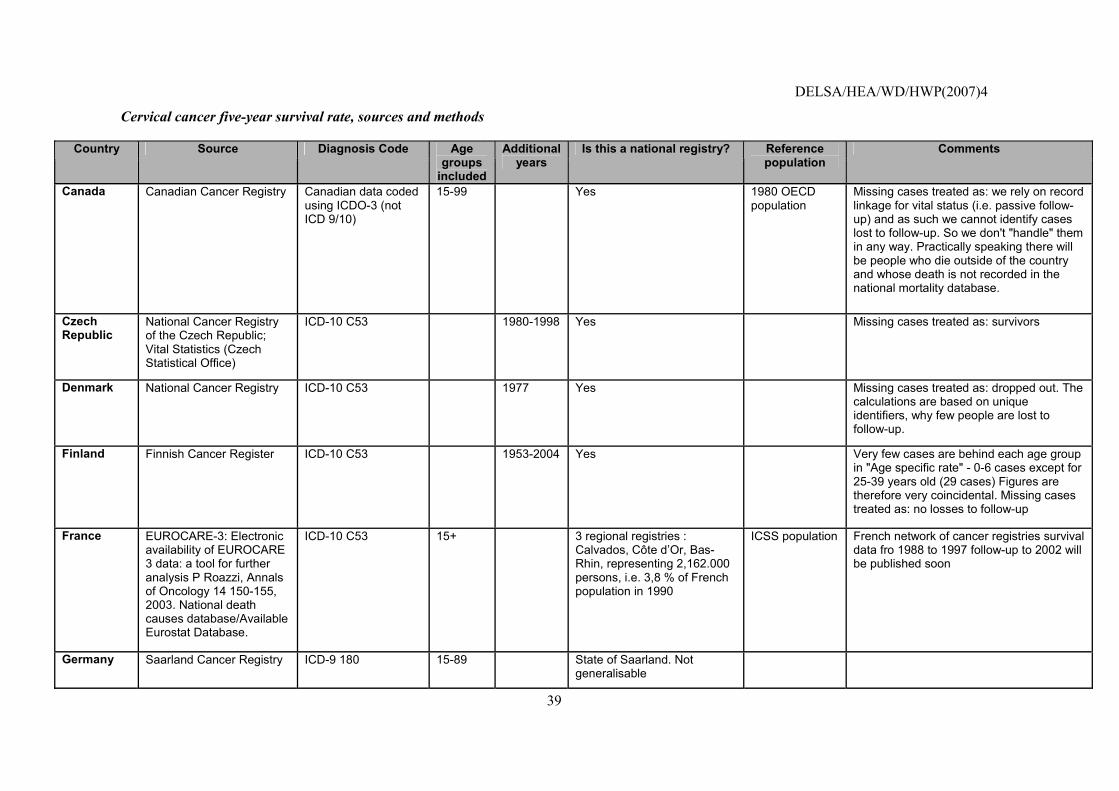
DELSA/HEA/WD/HWP(2007)4
39
Cervical cancer five-year survival rate, sources and methods
Country Source Diagnosis Code Age groups
included
Additional years
Is this a national registry? Reference population
Comments
Canada Canadian Cancer Registry Canadian data coded using ICDO-3 (not ICD 9/10)
15-99 Yes 1980 OECD population
Missing cases treated as: we rely on record linkage for vital status (i.e. passive follow-up) and as such we cannot identify cases lost to follow-up. So we don't "handle" them in any way. Practically speaking there will be people who die outside of the country and whose death is not recorded in the national mortality database.
Czech Republic
National Cancer Registry of the Czech Republic; Vital Statistics (Czech Statistical Office)
ICD-10 C53 1980-1998 Yes Missing cases treated as: survivors
Denmark National Cancer Registry ICD-10 C53 1977 Yes Missing cases treated as: dropped out. The calculations are based on unique identifiers, why few people are lost to follow-up.
Finland Finnish Cancer Register ICD-10 C53 1953-2004 Yes Very few cases are behind each age group in "Age specific rate" - 0-6 cases except for 25-39 years old (29 cases) Figures are therefore very coincidental. Missing cases treated as: no losses to follow-up
France EUROCARE-3: Electronic availability of EUROCARE 3 data: a tool for further analysis P Roazzi, Annals of Oncology 14 150-155, 2003. National death causes database/Available Eurostat Database.
ICD-10 C53 15+ 3 regional registries : Calvados, Côte d�Or, Bas-Rhin, representing 2,162.000 persons, i.e. 3,8 % of French population in 1990
ICSS population French network of cancer registries survival data fro 1988 to 1997 follow-up to 2002 will be published soon
Germany Saarland Cancer Registry ICD-9 180 15-89 State of Saarland. Not generalisable
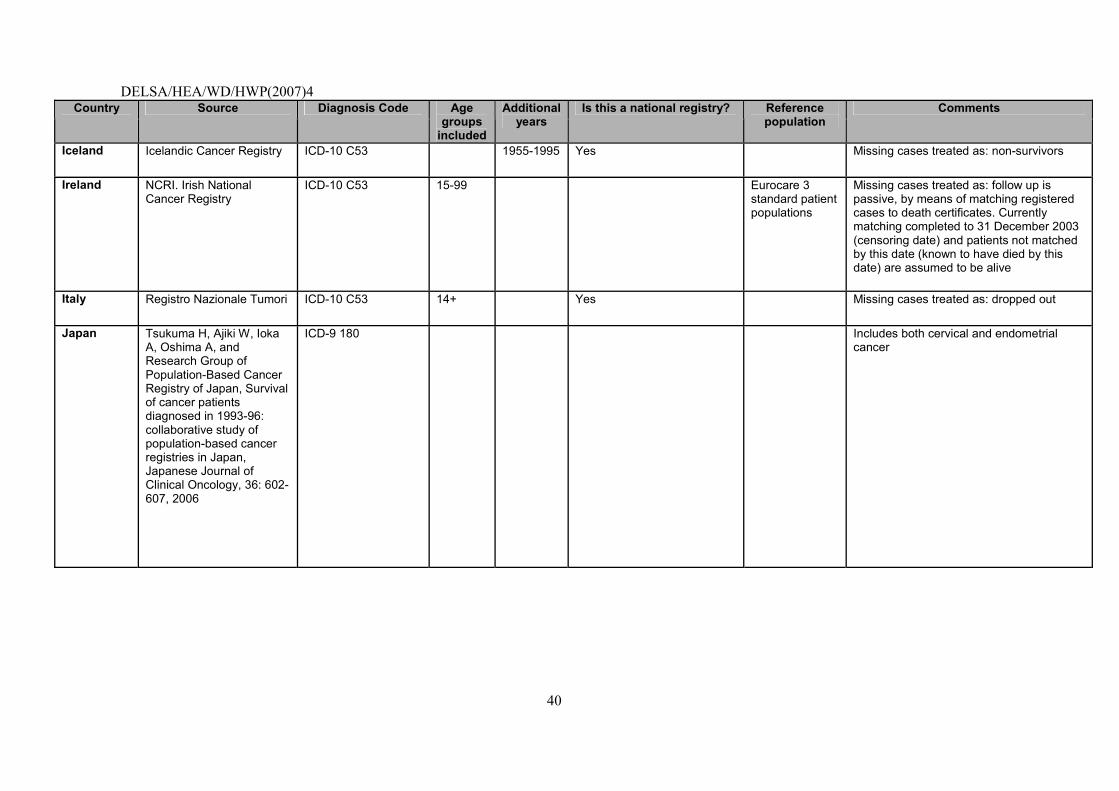
DELSA/HEA/WD/HWP(2007)4
40
Country Source Diagnosis Code Age groups
included
Additional years
Is this a national registry? Reference population
Comments
Iceland Icelandic Cancer Registry ICD-10 C53 1955-1995 Yes Missing cases treated as: non-survivors
Ireland NCRI. Irish National Cancer Registry
ICD-10 C53 15-99 Eurocare 3 standard patient populations
Missing cases treated as: follow up is passive, by means of matching registered cases to death certificates. Currently matching completed to 31 December 2003 (censoring date) and patients not matched by this date (known to have died by this date) are assumed to be alive
Italy Registro Nazionale Tumori ICD-10 C53 14+ Yes Missing cases treated as: dropped out
Japan Tsukuma H, Ajiki W, Ioka A, Oshima A, and Research Group of Population-Based Cancer Registry of Japan, Survival of cancer patients diagnosed in 1993-96: collaborative study of population-based cancer registries in Japan, Japanese Journal of Clinical Oncology, 36: 602-607, 2006
ICD-9 180 Includes both cervical and endometrial cancer
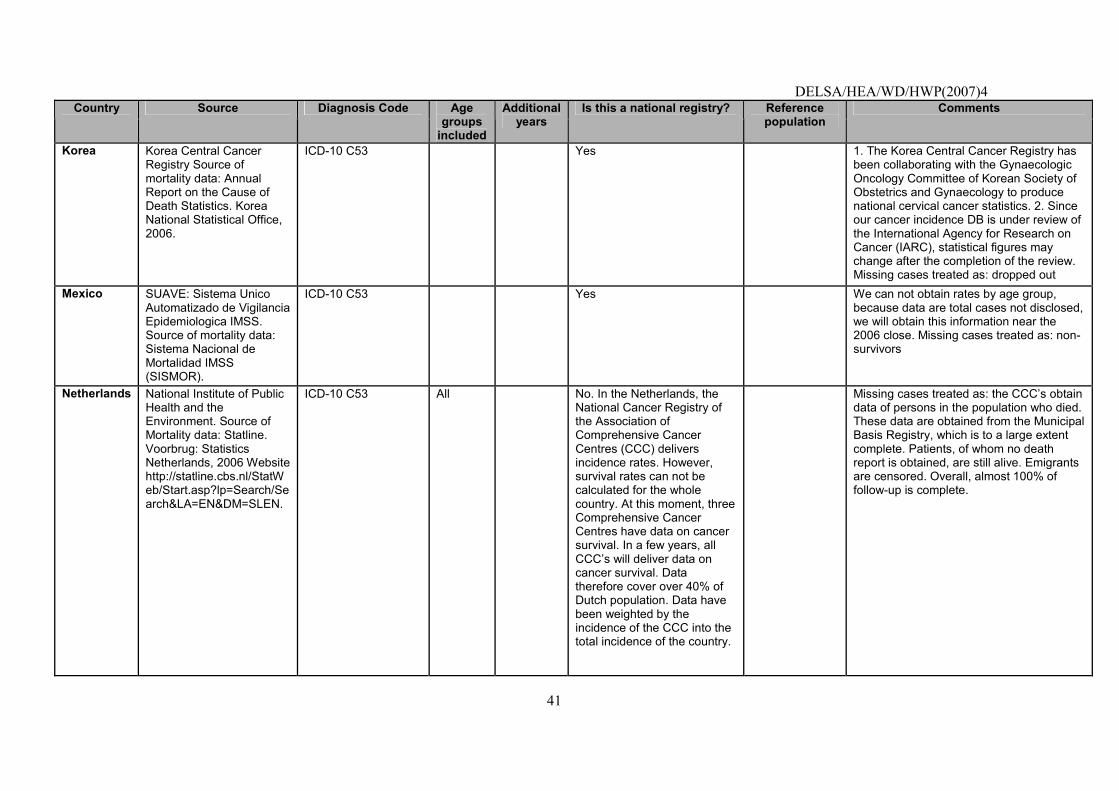
DELSA/HEA/WD/HWP(2007)4
41
Country Source Diagnosis Code Age groups
included
Additional years
Is this a national registry? Reference population
Comments
Korea Korea Central Cancer Registry Source of mortality data: Annual Report on the Cause of Death Statistics. Korea National Statistical Office, 2006.
ICD-10 C53 Yes 1. The Korea Central Cancer Registry has been collaborating with the Gynaecologic Oncology Committee of Korean Society of Obstetrics and Gynaecology to produce national cervical cancer statistics. 2. Since our cancer incidence DB is under review of the International Agency for Research on Cancer (IARC), statistical figures may change after the completion of the review. Missing cases treated as: dropped out
Mexico SUAVE: Sistema Unico Automatizado de Vigilancia Epidemiologica IMSS. Source of mortality data: Sistema Nacional de Mortalidad IMSS (SISMOR).
ICD-10 C53 Yes We can not obtain rates by age group, because data are total cases not disclosed, we will obtain this information near the 2006 close. Missing cases treated as: non-survivors
Netherlands National Institute of Public Health and the Environment. Source of Mortality data: Statline. Voorbrug: Statistics Netherlands, 2006 Website http://statline.cbs.nl/StatWeb/Start.asp?lp=Search/Search&LA=EN&DM=SLEN.
ICD-10 C53 All No. In the Netherlands, the National Cancer Registry of the Association of Comprehensive Cancer Centres (CCC) delivers incidence rates. However, survival rates can not be calculated for the whole country. At this moment, three Comprehensive Cancer Centres have data on cancer survival. In a few years, all CCC�s will deliver data on cancer survival. Data therefore cover over 40% of Dutch population. Data have been weighted by the incidence of the CCC into the total incidence of the country.
Missing cases treated as: the CCC�s obtain data of persons in the population who died. These data are obtained from the Municipal Basis Registry, which is to a large extent complete. Patients, of whom no death report is obtained, are still alive. Emigrants are censored. Overall, almost 100% of follow-up is complete.
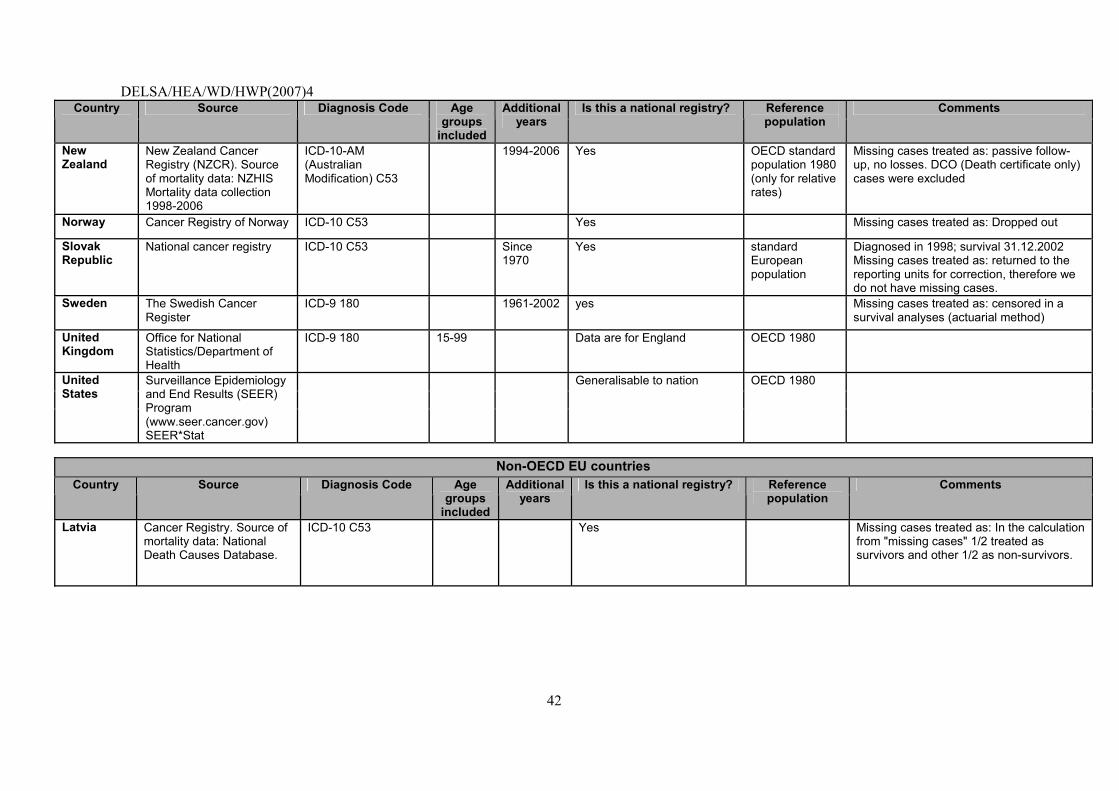
DELSA/HEA/WD/HWP(2007)4
42
Country Source Diagnosis Code Age groups
included
Additional years
Is this a national registry? Reference population
Comments
New Zealand
New Zealand Cancer Registry (NZCR). Source of mortality data: NZHIS Mortality data collection 1998-2006
ICD-10-AM (Australian Modification) C53
1994-2006 Yes OECD standard population 1980 (only for relative rates)
Missing cases treated as: passive follow-up, no losses. DCO (Death certificate only) cases were excluded
Norway Cancer Registry of Norway ICD-10 C53 Yes Missing cases treated as: Dropped out
Slovak Republic
National cancer registry ICD-10 C53 Since 1970
Yes standard European population
Diagnosed in 1998; survival 31.12.2002 Missing cases treated as: returned to the reporting units for correction, therefore we do not have missing cases.
Sweden The Swedish Cancer Register
ICD-9 180 1961-2002 yes Missing cases treated as: censored in a survival analyses (actuarial method)
United Kingdom
Office for National Statistics/Department of Health
ICD-9 180 15-99 Data are for England OECD 1980
United States
Surveillance Epidemiology and End Results (SEER) Program (www.seer.cancer.gov) SEER*Stat
Generalisable to nation OECD 1980
Non-OECD EU countries
Country Source Diagnosis Code Age groups
included
Additional years
Is this a national registry? Reference population
Comments
Latvia Cancer Registry. Source of mortality data: National Death Causes Database.
ICD-10 C53 Yes Missing cases treated as: In the calculation from "missing cases" 1/2 treated as survivors and other 1/2 as non-survivors.
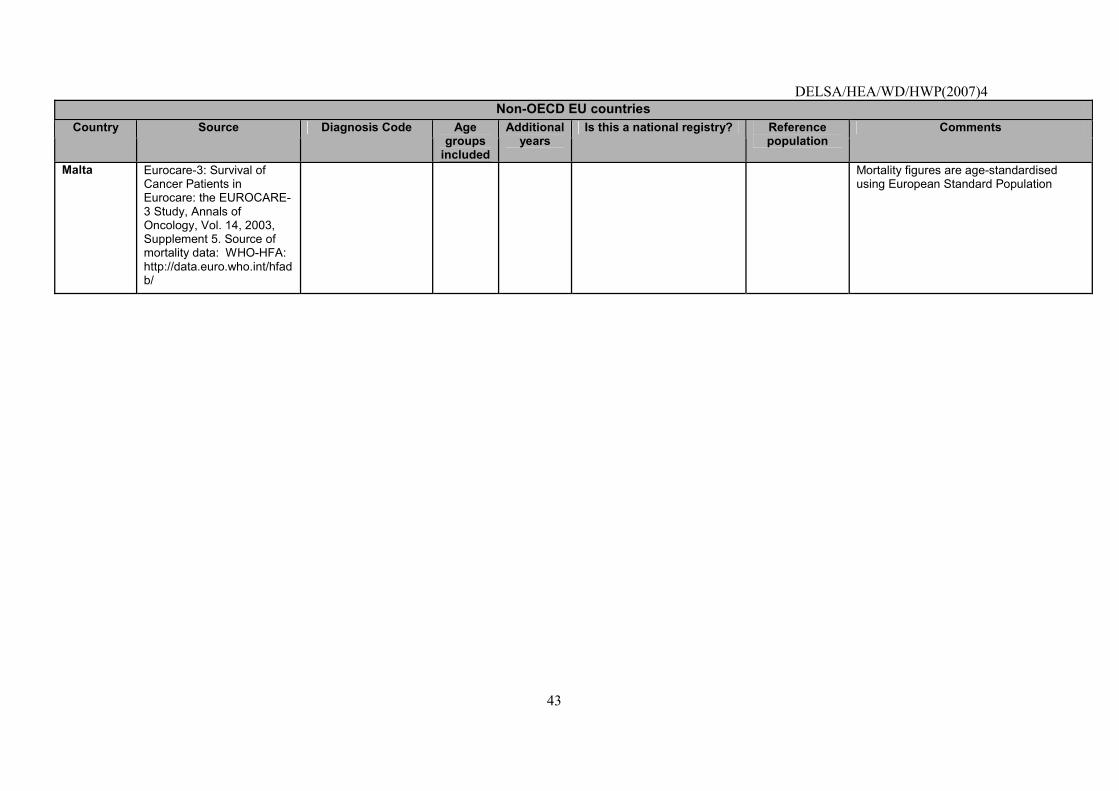
DELSA/HEA/WD/HWP(2007)4
43
Non-OECD EU countries Country Source Diagnosis Code Age
groups included
Additional years
Is this a national registry? Reference population
Comments
Malta Eurocare-3: Survival of Cancer Patients in Eurocare: the EUROCARE-3 Study, Annals of Oncology, Vol. 14, 2003, Supplement 5. Source of mortality data: WHO-HFA: http://data.euro.who.int/hfadb/
Mortality figures are age-standardised using European Standard Population
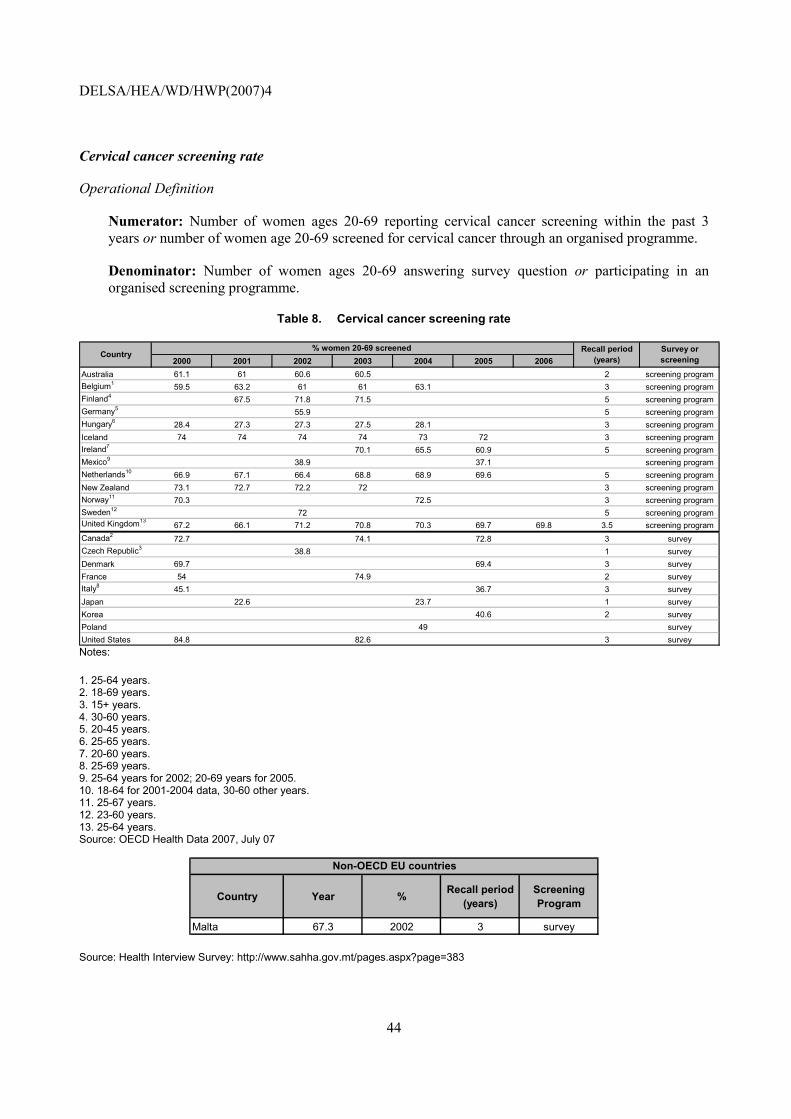
DELSA/HEA/WD/HWP(2007)4
44
Cervical cancer screening rate
Operational Definition
Numerator: Number of women ages 20-69 reporting cervical cancer screening within the past 3 years or number of women age 20-69 screened for cervical cancer through an organised programme.
Denominator: Number of women ages 20-69 answering survey question or participating in an organised screening programme.
Table 8. Cervical cancer screening rate
2000 2001 2002 2003 2004 2005 2006Australia 61.1 61 60.6 60.5 2 screening programBelgium1 59.5 63.2 61 61 63.1 3 screening programFinland4 67.5 71.8 71.5 5 screening programGermany5 55.9 5 screening programHungary6 28.4 27.3 27.3 27.5 28.1 3 screening programIceland 74 74 74 74 73 72 3 screening programIreland7 70.1 65.5 60.9 5 screening programMexico9 38.9 37.1 screening programNetherlands10 66.9 67.1 66.4 68.8 68.9 69.6 5 screening programNew Zealand 73.1 72.7 72.2 72 3 screening programNorway11 70.3 72.5 3 screening programSweden12 72 5 screening programUnited Kingdom13
67.2 66.1 71.2 70.8 70.3 69.7 69.8 3.5 screening programCanada2 72.7 74.1 72.8 3 surveyCzech Republic3 38.8 1 surveyDenmark 69.7 69.4 3 surveyFrance 54 74.9 2 surveyItaly8 45.1 36.7 3 surveyJapan 22.6 23.7 1 surveyKorea 40.6 2 surveyPoland 49 surveyUnited States 84.8 82.6 3 survey
% women 20-69 screened Country Recall period
(years)Survey or screening
Notes:
1. 25-64 years. 2. 18-69 years. 3. 15+ years. 4. 30-60 years. 5. 20-45 years. 6. 25-65 years. 7. 20-60 years. 8. 25-69 years. 9. 25-64 years for 2002; 20-69 years for 2005. 10. 18-64 for 2001-2004 data, 30-60 other years. 11. 25-67 years. 12. 23-60 years. 13. 25-64 years. Source: OECD Health Data 2007, July 07
Country Year % Recall period (years)
Screening Program
Malta 67.3 2002 3 survey
Non-OECD EU countries
Source: Health Interview Survey: http://www.sahha.gov.mt/pages.aspx?page=383
DELSA/HEA/WD/HWP(2007)4
45
Cervical cancer screening rate, sources and method
http://www.ecosante.org/OCDEENG/370020.html
Colorectal cancer five-year survival rate
Operational Definition
A. 5-year observed survival rate (OSR), colorectal cancer (Diagnostic code: ICD-9 C:153.xx, 154.xx; ICD-10: C18.xx, C19.xx, C20.xx)
Numerator: Number of people diagnosed with colorectal cancer surviving five years after diagnosis.
Denominator: Number of people diagnosed with colorectal cancer.
B. 5-year relative survival rate (RSR), colorectal cancer (Diagnostic code: ICD-9 C:153.xx, 154.xx; ICD-10: C18.xx, C19.xx, C20.xx)
Numerator: Observed rate of people diagnosed with colorectal cancer surviving five years after diagnosis.
Denominator: Expected survival rate of a comparable group from the general population.
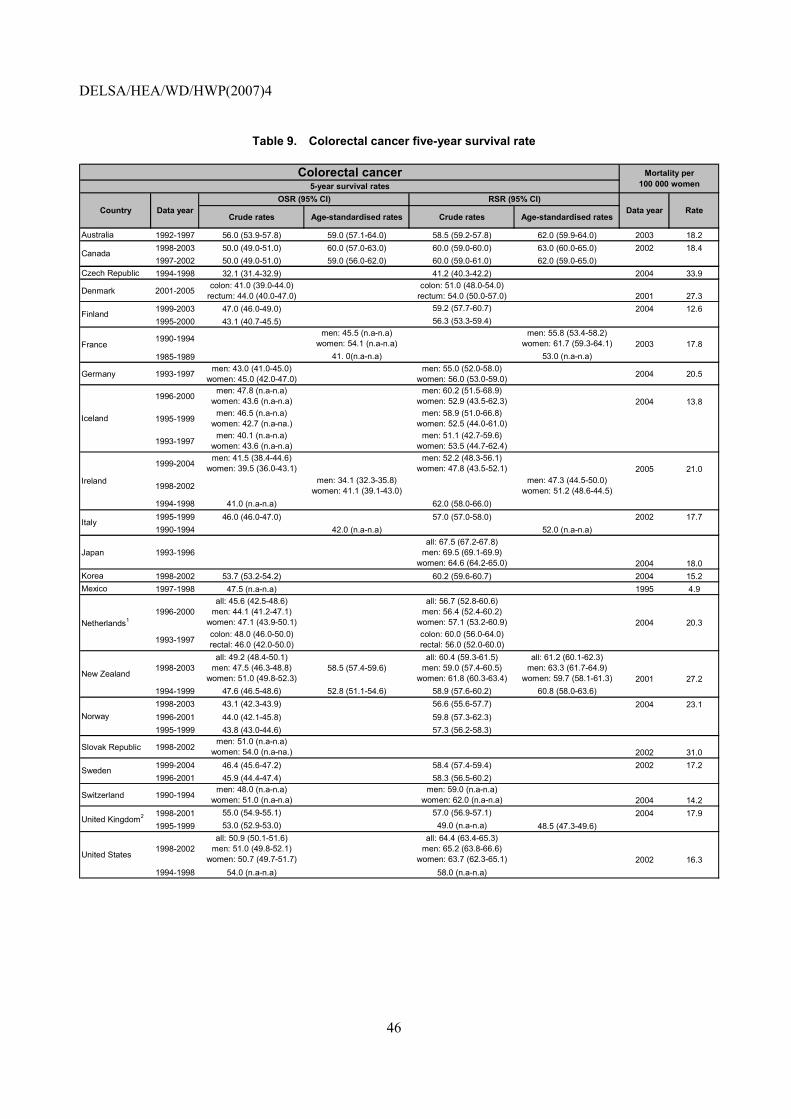
DELSA/HEA/WD/HWP(2007)4
46
Table 9. Colorectal cancer five-year survival rate
Crude rates Age-standardised rates Crude rates Age-standardised rates
Australia 1992-1997 56.0 (53.9-57.8) 59.0 (57.1-64.0) 58.5 (59.2-57.8) 62.0 (59.9-64.0) 2003 18.21998-2003 50.0 (49.0-51.0) 60.0 (57.0-63.0) 60.0 (59.0-60.0) 63.0 (60.0-65.0) 2002 18.41997-2002 50.0 (49.0-51.0) 59.0 (56.0-62.0) 60.0 (59.0-61.0) 62.0 (59.0-65.0)
Czech Republic 1994-1998 32.1 (31.4-32.9) 41.2 (40.3-42.2) 2004 33.9
Denmark 2001-2005 colon: 41.0 (39.0-44.0)rectum: 44.0 (40.0-47.0)
colon: 51.0 (48.0-54.0)rectum: 54.0 (50.0-57.0) 2001 27.3
1999-2003 47.0 (46.0-49.0) 59.2 (57.7-60.7) 2004 12.61995-2000 43.1 (40.7-45.5) 56.3 (53.3-59.4)
1990-1994men: 45.5 (n.a-n.a)
women: 54.1 (n.a-n.a)men: 55.8 (53.4-58.2)
women: 61.7 (59.3-64.1) 2003 17.81985-1989 41. 0(n.a-n.a) 53.0 (n.a-n.a)
Germany 1993-1997 men: 43.0 (41.0-45.0)women: 45.0 (42.0-47.0)
men: 55.0 (52.0-58.0)women: 56.0 (53.0-59.0) 2004 20.5
1996-2000men: 47.8 (n.a-n.a)
women: 43.6 (n.a-n.a)men: 60.2 (51.5-68.9)
women: 52.9 (43.5-62.3) 2004 13.8
1995-1999men: 46.5 (n.a-n.a)
women: 42.7 (n.a-na.)men: 58.9 (51.0-66.8)
women: 52.5 (44.0-61.0)
1993-1997men: 40.1 (n.a-n.a)
women: 43.6 (n.a-n.a)men: 51.1 (42.7-59.6)
women: 53.5 (44.7-62.4)
1999-2004men: 41.5 (38.4-44.6)
women: 39.5 (36.0-43.1)men: 52.2 (48.3-56.1)
women: 47.8 (43.5-52.1) 2005 21.0
1998-2002men: 34.1 (32.3-35.8)
women: 41.1 (39.1-43.0)men: 47.3 (44.5-50.0)
women: 51.2 (48.6-44.5)1994-1998 41.0 (n.a-n.a) 62.0 (58.0-66.0)1995-1999 46.0 (46.0-47.0) 57.0 (57.0-58.0) 2002 17.71990-1994 42.0 (n.a-n.a) 52.0 (n.a-n.a)
Japan 1993-1996all: 67.5 (67.2-67.8)
men: 69.5 (69.1-69.9)women: 64.6 (64.2-65.0) 2004 18.0
Korea 1998-2002 53.7 (53.2-54.2) 60.2 (59.6-60.7) 2004 15.2Mexico 1997-1998 47.5 (n.a-n.a) 1995 4.9
1996-2000all: 45.6 (42.5-48.6)
men: 44.1 (41.2-47.1)women: 47.1 (43.9-50.1)
all: 56.7 (52.8-60.6)men: 56.4 (52.4-60.2)
women: 57.1 (53.2-60.9) 2004 20.3
1993-1997colon: 48.0 (46.0-50.0)rectal: 46.0 (42.0-50.0)
colon: 60.0 (56.0-64.0)rectal: 56.0 (52.0-60.0)
1998-2003all: 49.2 (48.4-50.1)
men: 47.5 (46.3-48.8)women: 51.0 (49.8-52.3)
58.5 (57.4-59.6)all: 60.4 (59.3-61.5)
men: 59.0 (57.4-60.5)women: 61.8 (60.3-63.4)
all: 61.2 (60.1-62.3)men: 63.3 (61.7-64.9)
women: 59.7 (58.1-61.3) 2001 27.21994-1999 47.6 (46.5-48.6) 52.8 (51.1-54.6) 58.9 (57.6-60.2) 60.8 (58.0-63.6)1998-2003 43.1 (42.3-43.9) 56.6 (55.6-57.7) 2004 23.11996-2001 44.0 (42.1-45.8) 59.8 (57.3-62.3)1995-1999 43.8 (43.0-44.6) 57.3 (56.2-58.3)
Slovak Republic 1998-2002men: 51.0 (n.a-n.a)
women: 54.0 (n.a-na.) 2002 31.01999-2004 46.4 (45.6-47.2) 58.4 (57.4-59.4) 2002 17.21996-2001 45.9 (44.4-47.4) 58.3 (56.5-60.2)
Switzerland 1990-1994men: 48.0 (n.a-n.a)
women: 51.0 (n.a-n.a)men: 59.0 (n.a-n.a)
women: 62.0 (n.a-n.a) 2004 14.21998-2001 55.0 (54.9-55.1) 57.0 (56.9-57.1) 2004 17.91995-1999 53.0 (52.9-53.0) 49.0 (n.a-n.a) 48.5 (47.3-49.6)
1998-2002all: 50.9 (50.1-51.6)
men: 51.0 (49.8-52.1)women: 50.7 (49.7-51.7)
all: 64.4 (63.4-65.3)men: 65.2 (63.8-66.6)
women: 63.7 (62.3-65.1) 2002 16.31994-1998 54.0 (n.a-n.a) 58.0 (n.a-n.a)
RateCountry
Finland
France
Colorectal cancer5-year survival rates
Mortality per 100 000 women
Data yearOSR (95% CI)
Data year
Canada
RSR (95% CI)
Iceland
Ireland
Sweden
United Kingdom2
United States
Italy
Netherlands1
New Zealand
Norway
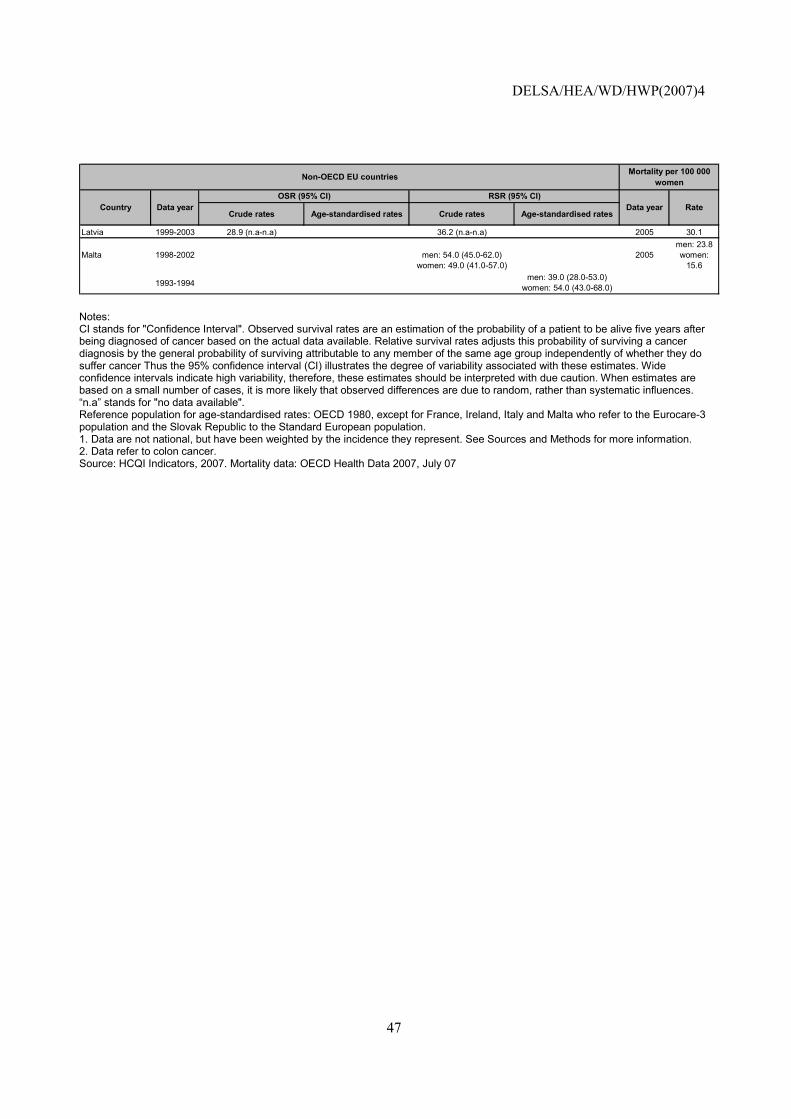
DELSA/HEA/WD/HWP(2007)4
47
Crude rates Age-standardised rates Crude rates Age-standardised rates
Latvia 1999-2003 28.9 (n.a-n.a) 36.2 (n.a-n.a) 2005 30.1
Malta 1998-2002 men: 54.0 (45.0-62.0)women: 49.0 (41.0-57.0)
2005men: 23.8women:
15.6
1993-1994men: 39.0 (28.0-53.0)
women: 54.0 (43.0-68.0)
Mortality per 100 000 womenNon-OECD EU countries
Country Data yearOSR (95% CI) RSR (95% CI)
Data year Rate
Notes: CI stands for "Confidence Interval". Observed survival rates are an estimation of the probability of a patient to be alive five years after being diagnosed of cancer based on the actual data available. Relative survival rates adjusts this probability of surviving a cancer diagnosis by the general probability of surviving attributable to any member of the same age group independently of whether they do suffer cancer Thus the 95% confidence interval (CI) illustrates the degree of variability associated with these estimates. Wide confidence intervals indicate high variability, therefore, these estimates should be interpreted with due caution. When estimates are based on a small number of cases, it is more likely that observed differences are due to random, rather than systematic influences. �n.a� stands for "no data available". Reference population for age-standardised rates: OECD 1980, except for France, Ireland, Italy and Malta who refer to the Eurocare-3 population and the Slovak Republic to the Standard European population. 1. Data are not national, but have been weighted by the incidence they represent. See Sources and Methods for more information. 2. Data refer to colon cancer. Source: HCQI Indicators, 2007. Mortality data: OECD Health Data 2007, July 07
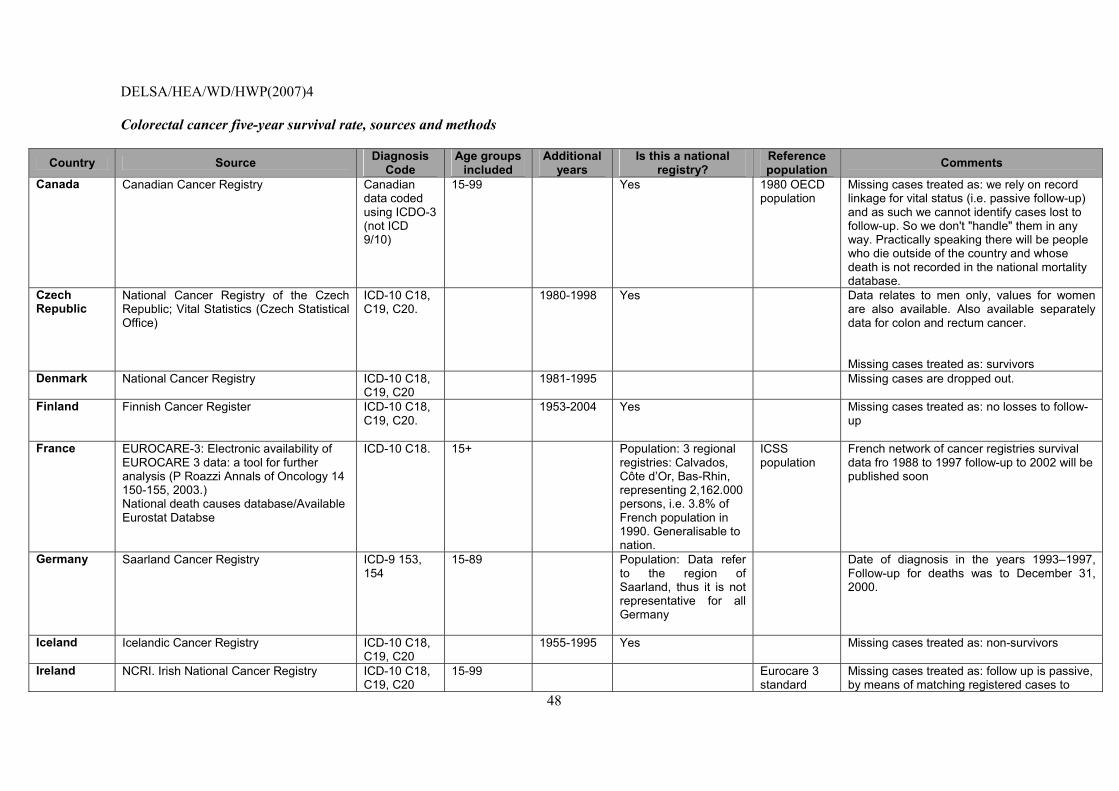
DELSA/HEA/WD/HWP(2007)4
48
Colorectal cancer five-year survival rate, sources and methods
Country Source Diagnosis Code
Age groups included
Additional years
Is this a national registry?
Reference population Comments
Canada Canadian Cancer Registry Canadian data coded using ICDO-3 (not ICD 9/10)
15-99 Yes 1980 OECD population
Missing cases treated as: we rely on record linkage for vital status (i.e. passive follow-up) and as such we cannot identify cases lost to follow-up. So we don't "handle" them in any way. Practically speaking there will be people who die outside of the country and whose death is not recorded in the national mortality database.
Czech Republic
National Cancer Registry of the Czech Republic; Vital Statistics (Czech Statistical Office)
ICD-10 C18, C19, C20.
1980-1998 Yes Data relates to men only, values for women are also available. Also available separately data for colon and rectum cancer. Missing cases treated as: survivors
Denmark National Cancer Registry ICD-10 C18, C19, C20
1981-1995 Missing cases are dropped out.
Finland Finnish Cancer Register ICD-10 C18, C19, C20.
1953-2004 Yes Missing cases treated as: no losses to follow-up
France EUROCARE-3: Electronic availability of EUROCARE 3 data: a tool for further analysis (P Roazzi Annals of Oncology 14 150-155, 2003.) National death causes database/Available Eurostat Databse
ICD-10 C18. 15+ Population: 3 regional registries: Calvados, Côte d�Or, Bas-Rhin, representing 2,162.000 persons, i.e. 3.8% of French population in 1990. Generalisable to nation.
ICSS population
French network of cancer registries survival data fro 1988 to 1997 follow-up to 2002 will be published soon
Germany Saarland Cancer Registry ICD-9 153, 154
15-89 Population: Data refer to the region of Saarland, thus it is not representative for all Germany
Date of diagnosis in the years 1993�1997, Follow-up for deaths was to December 31, 2000.
Iceland Icelandic Cancer Registry ICD-10 C18, C19, C20
1955-1995 Yes Missing cases treated as: non-survivors
Ireland NCRI. Irish National Cancer Registry
ICD-10 C18, C19, C20
15-99 Eurocare 3 standard
Missing cases treated as: follow up is passive, by means of matching registered cases to
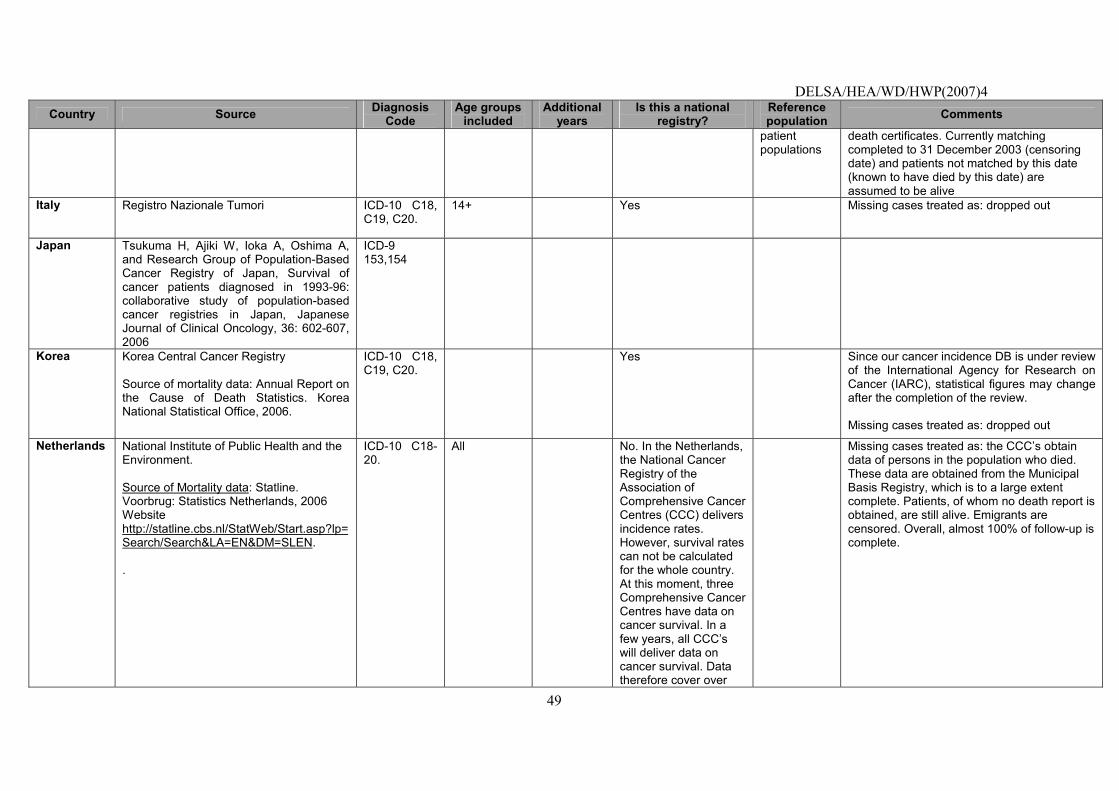
DELSA/HEA/WD/HWP(2007)4
49
Country Source Diagnosis Code
Age groups included
Additional years
Is this a national registry?
Reference population Comments
patient populations
death certificates. Currently matching completed to 31 December 2003 (censoring date) and patients not matched by this date (known to have died by this date) are assumed to be alive
Italy Registro Nazionale Tumori
ICD-10 C18, C19, C20.
14+ Yes Missing cases treated as: dropped out
Japan Tsukuma H, Ajiki W, Ioka A, Oshima A, and Research Group of Population-Based Cancer Registry of Japan, Survival of cancer patients diagnosed in 1993-96: collaborative study of population-based cancer registries in Japan, Japanese Journal of Clinical Oncology, 36: 602-607, 2006
ICD-9 153,154
Korea
Korea Central Cancer Registry Source of mortality data: Annual Report on the Cause of Death Statistics. Korea National Statistical Office, 2006.
ICD-10 C18, C19, C20.
Yes Since our cancer incidence DB is under review of the International Agency for Research on Cancer (IARC), statistical figures may change after the completion of the review. Missing cases treated as: dropped out
Netherlands
National Institute of Public Health and the Environment. Source of Mortality data: Statline. Voorbrug: Statistics Netherlands, 2006 Website http://statline.cbs.nl/StatWeb/Start.asp?lp=Search/Search&LA=EN&DM=SLEN. .
ICD-10 C18-20.
All No. In the Netherlands, the National Cancer Registry of the Association of Comprehensive Cancer Centres (CCC) delivers incidence rates. However, survival rates can not be calculated for the whole country. At this moment, three Comprehensive Cancer Centres have data on cancer survival. In a few years, all CCC�s will deliver data on cancer survival. Data therefore cover over
Missing cases treated as: the CCC�s obtain data of persons in the population who died. These data are obtained from the Municipal Basis Registry, which is to a large extent complete. Patients, of whom no death report is obtained, are still alive. Emigrants are censored. Overall, almost 100% of follow-up is complete.
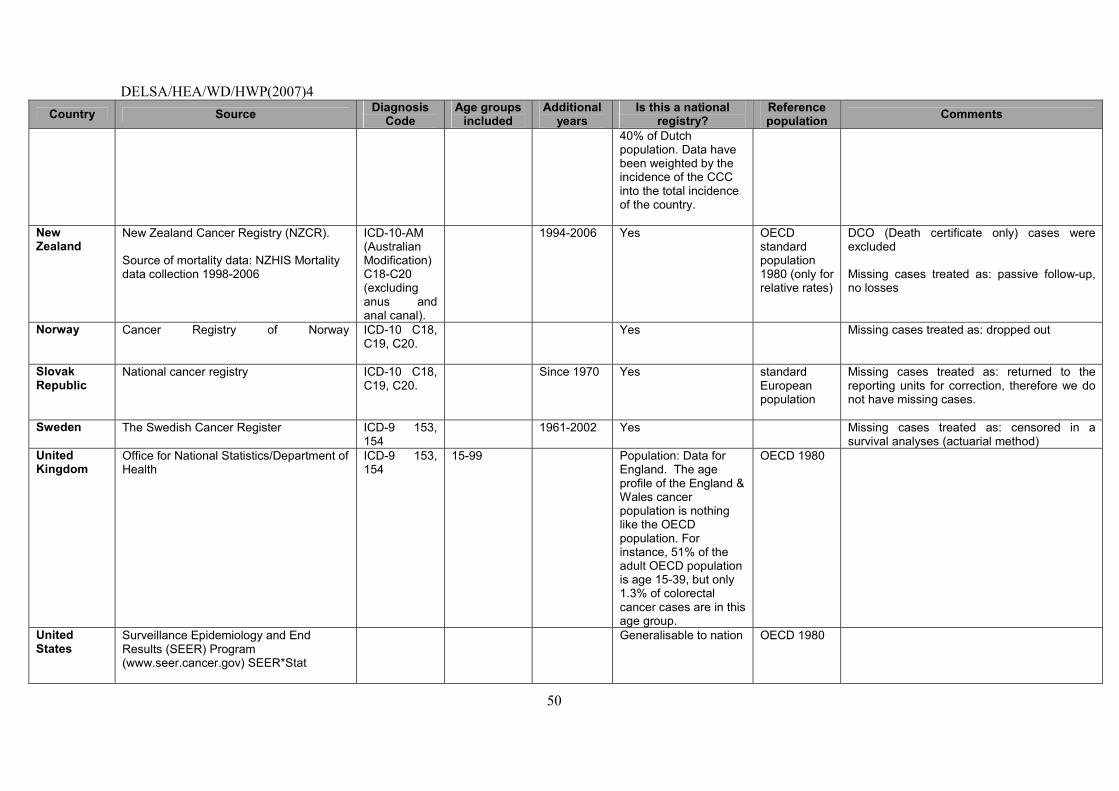
DELSA/HEA/WD/HWP(2007)4
50
Country Source Diagnosis Code
Age groups included
Additional years
Is this a national registry?
Reference population Comments
40% of Dutch population. Data have been weighted by the incidence of the CCC into the total incidence of the country.
New Zealand
New Zealand Cancer Registry (NZCR). Source of mortality data: NZHIS Mortality data collection 1998-2006
ICD-10-AM (Australian Modification) C18-C20 (excluding anus and anal canal).
1994-2006 Yes OECD standard population 1980 (only for relative rates)
DCO (Death certificate only) cases were excluded Missing cases treated as: passive follow-up, no losses
Norway
Cancer Registry of Norway
ICD-10 C18, C19, C20.
Yes Missing cases treated as: dropped out
Slovak Republic
National cancer registry ICD-10 C18, C19, C20.
Since 1970 Yes standard European population
Missing cases treated as: returned to the reporting units for correction, therefore we do not have missing cases.
Sweden
The Swedish Cancer Register ICD-9 153, 154
1961-2002 Yes Missing cases treated as: censored in a survival analyses (actuarial method)
United Kingdom
Office for National Statistics/Department of Health
ICD-9 153, 154
15-99 Population: Data for England. The age profile of the England & Wales cancer population is nothing like the OECD population. For instance, 51% of the adult OECD population is age 15-39, but only 1.3% of colorectal cancer cases are in this age group.
OECD 1980
United States
Surveillance Epidemiology and End Results (SEER) Program (www.seer.cancer.gov) SEER*Stat
Generalisable to nation OECD 1980
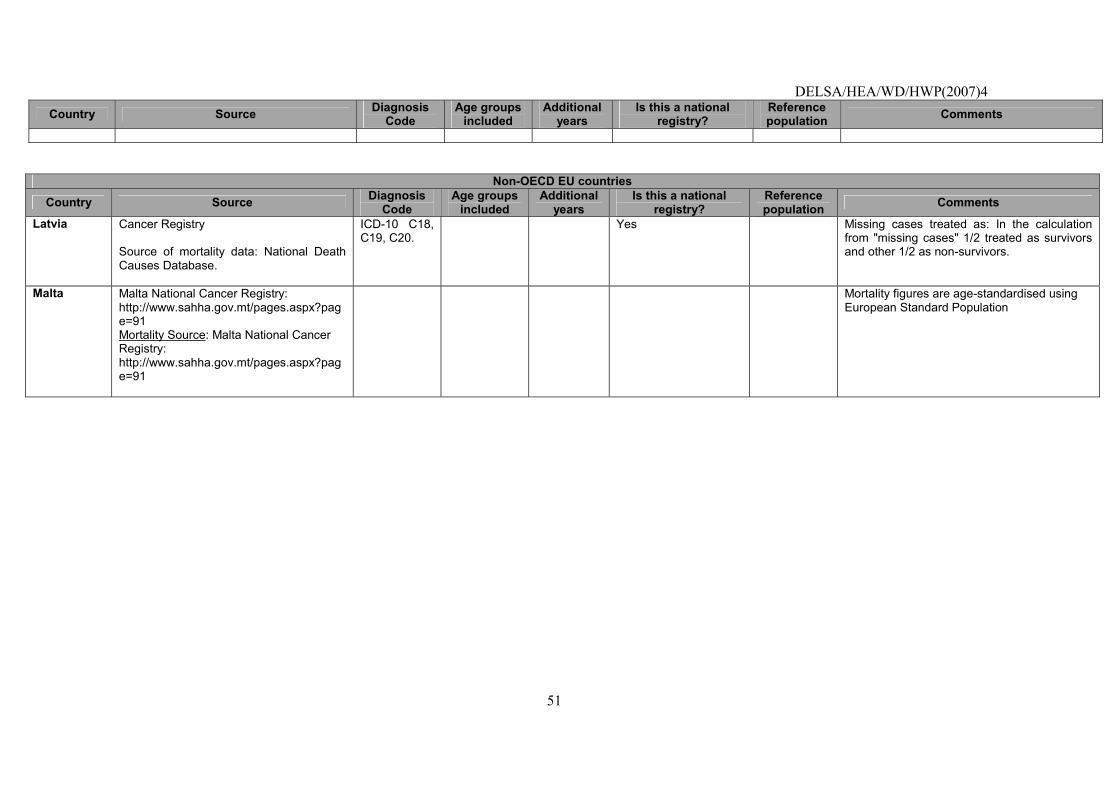
DELSA/HEA/WD/HWP(2007)4
51
Country Source Diagnosis Code
Age groups included
Additional years
Is this a national registry?
Reference population Comments
Non-OECD EU countries
Country Source Diagnosis Code
Age groups included
Additional years
Is this a national registry?
Reference population Comments
Latvia
Cancer Registry Source of mortality data: National Death Causes Database.
ICD-10 C18, C19, C20.
Yes Missing cases treated as: In the calculation from "missing cases" 1/2 treated as survivors and other 1/2 as non-survivors.
Malta
Malta National Cancer Registry: http://www.sahha.gov.mt/pages.aspx?page=91 Mortality Source: Malta National Cancer Registry: http://www.sahha.gov.mt/pages.aspx?page=91
Mortality figures are age-standardised using European Standard Population
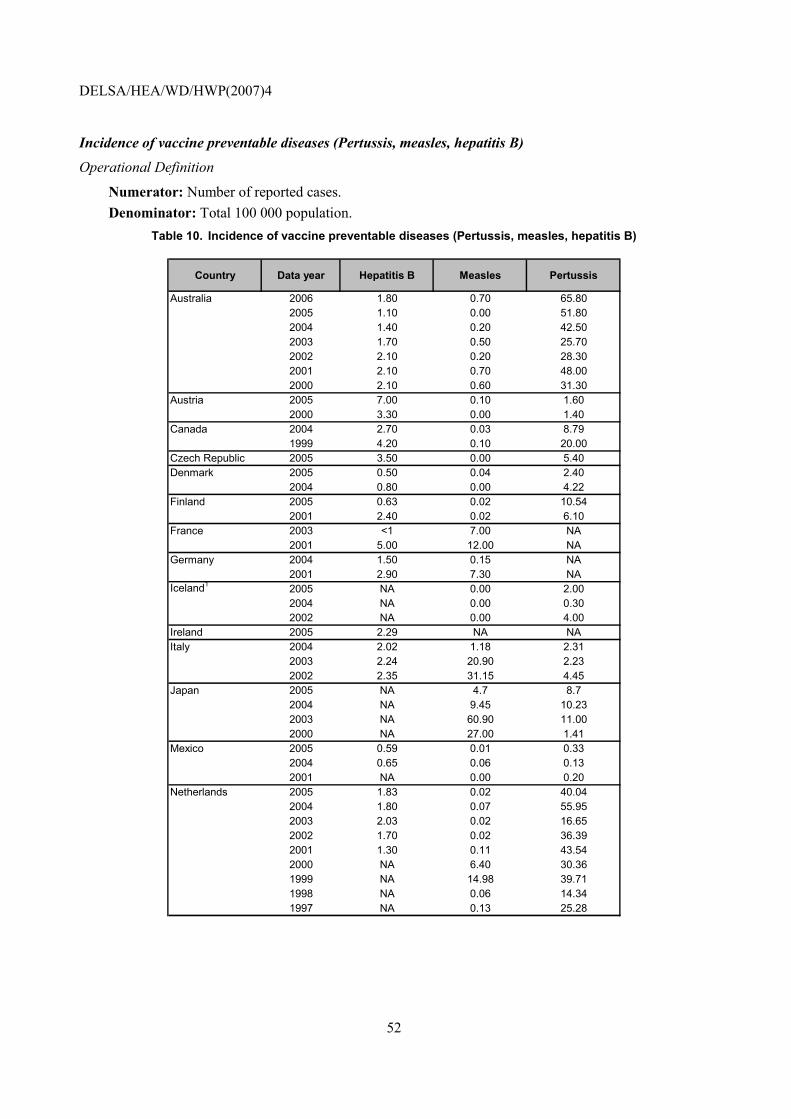
DELSA/HEA/WD/HWP(2007)4
52
Incidence of vaccine preventable diseases (Pertussis, measles, hepatitis B)
Operational Definition
Numerator: Number of reported cases. Denominator: Total 100 000 population.
Table 10. Incidence of vaccine preventable diseases (Pertussis, measles, hepatitis B)
Country Data year Hepatitis B Measles Pertussis
Australia 2006 1.80 0.70 65.802005 1.10 0.00 51.802004 1.40 0.20 42.502003 1.70 0.50 25.702002 2.10 0.20 28.302001 2.10 0.70 48.002000 2.10 0.60 31.30
Austria 2005 7.00 0.10 1.602000 3.30 0.00 1.40
Canada 2004 2.70 0.03 8.791999 4.20 0.10 20.00
Czech Republic 2005 3.50 0.00 5.40Denmark 2005 0.50 0.04 2.40
2004 0.80 0.00 4.22Finland 2005 0.63 0.02 10.54
2001 2.40 0.02 6.10France 2003 <1 7.00 NA
2001 5.00 12.00 NAGermany 2004 1.50 0.15 NA
2001 2.90 7.30 NAIceland1 2005 NA 0.00 2.00
2004 NA 0.00 0.302002 NA 0.00 4.00
Ireland 2005 2.29 NA NAItaly 2004 2.02 1.18 2.31
2003 2.24 20.90 2.232002 2.35 31.15 4.45
Japan 2005 NA 4.7 8.72004 NA 9.45 10.232003 NA 60.90 11.002000 NA 27.00 1.41
Mexico 2005 0.59 0.01 0.332004 0.65 0.06 0.132001 NA 0.00 0.20
Netherlands 2005 1.83 0.02 40.042004 1.80 0.07 55.952003 2.03 0.02 16.652002 1.70 0.02 36.392001 1.30 0.11 43.542000 NA 6.40 30.361999 NA 14.98 39.711998 NA 0.06 14.341997 NA 0.13 25.28
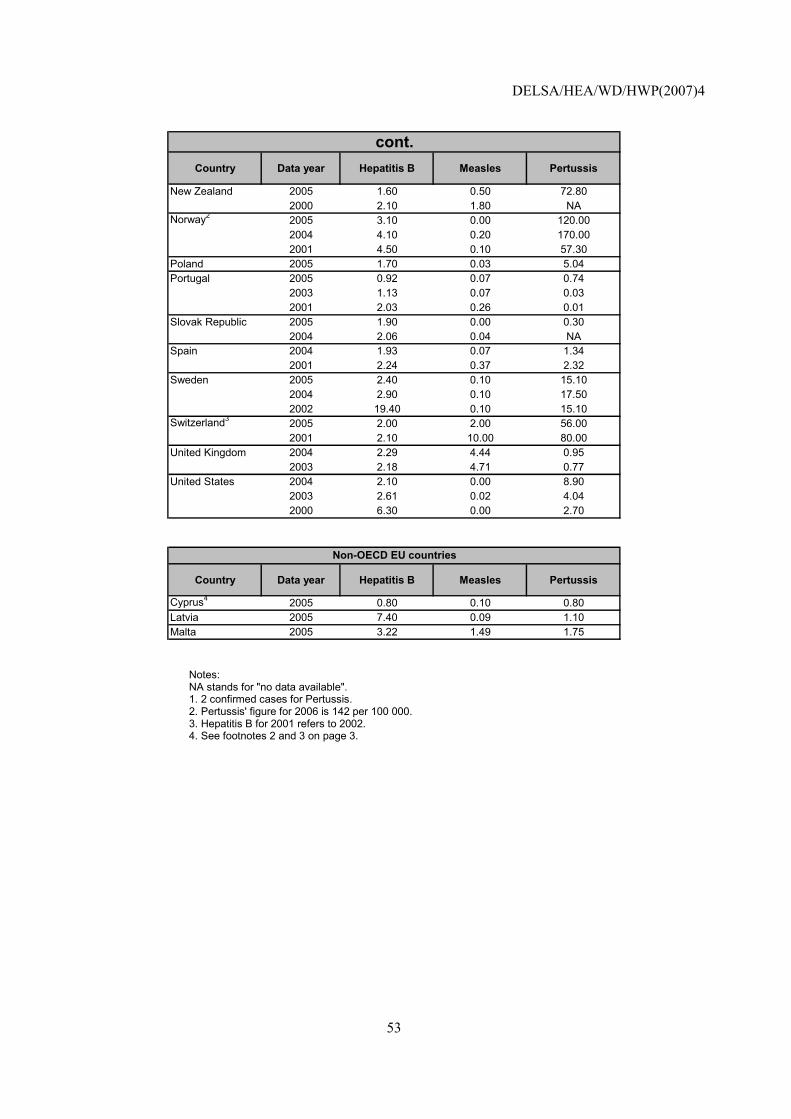
DELSA/HEA/WD/HWP(2007)4
53
Country Data year Hepatitis B Measles Pertussis
New Zealand 2005 1.60 0.50 72.802000 2.10 1.80 NA
Norway2 2005 3.10 0.00 120.002004 4.10 0.20 170.002001 4.50 0.10 57.30
Poland 2005 1.70 0.03 5.04Portugal 2005 0.92 0.07 0.74
2003 1.13 0.07 0.032001 2.03 0.26 0.01
Slovak Republic 2005 1.90 0.00 0.302004 2.06 0.04 NA
Spain 2004 1.93 0.07 1.342001 2.24 0.37 2.32
Sweden 2005 2.40 0.10 15.102004 2.90 0.10 17.502002 19.40 0.10 15.10
Switzerland3 2005 2.00 2.00 56.002001 2.10 10.00 80.00
United Kingdom 2004 2.29 4.44 0.952003 2.18 4.71 0.77
United States 2004 2.10 0.00 8.902003 2.61 0.02 4.042000 6.30 0.00 2.70
cont.
Country Data year Hepatitis B Measles Pertussis
Cyprus4 2005 0.80 0.10 0.80Latvia 2005 7.40 0.09 1.10Malta 2005 3.22 1.49 1.75
Non-OECD EU countries
Notes: NA stands for "no data available". 1. 2 confirmed cases for Pertussis. 2. Pertussis' figure for 2006 is 142 per 100 000. 3. Hepatitis B for 2001 refers to 2002. 4. See footnotes 2 and 3 on page 3.
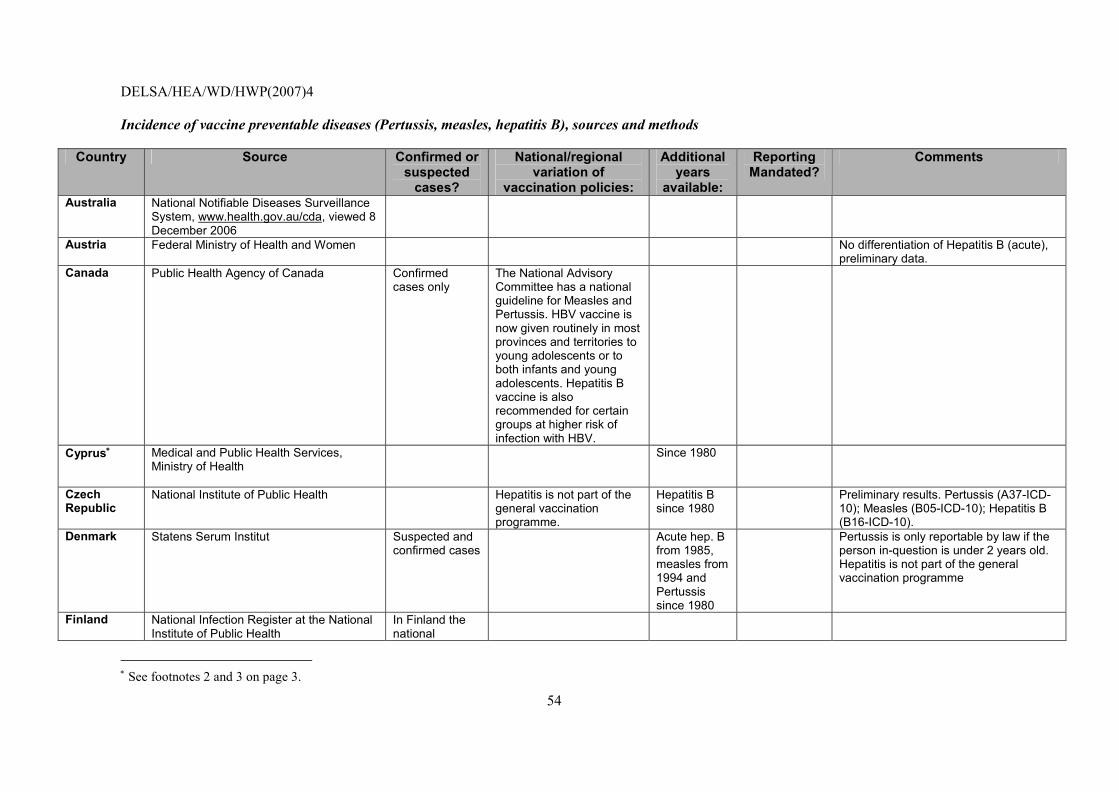
DELSA/HEA/WD/HWP(2007)4
54
Incidence of vaccine preventable diseases (Pertussis, measles, hepatitis B), sources and methods
Country Source Confirmed or suspected
cases?
National/regional variation of
vaccination policies:
Additional years
available:
Reporting Mandated?
Comments
Australia National Notifiable Diseases Surveillance System, www.health.gov.au/cda, viewed 8 December 2006
Austria Federal Ministry of Health and Women
No differentiation of Hepatitis B (acute), preliminary data.
Canada Public Health Agency of Canada
Confirmed cases only
The National Advisory Committee has a national guideline for Measles and Pertussis. HBV vaccine is now given routinely in most provinces and territories to young adolescents or to both infants and young adolescents. Hepatitis B vaccine is also recommended for certain groups at higher risk of infection with HBV.
Cyprus∗ Medical and Public Health Services, Ministry of Health
Since 1980
Czech Republic
National Institute of Public Health
Hepatitis is not part of the general vaccination programme.
Hepatitis B since 1980
Preliminary results. Pertussis (A37-ICD-10); Measles (B05-ICD-10); Hepatitis B (B16-ICD-10).
Denmark Statens Serum Institut Suspected and confirmed cases
Acute hep. B from 1985, measles from 1994 and Pertussis since 1980
Pertussis is only reportable by law if the person in-question is under 2 years old. Hepatitis is not part of the general vaccination programme
Finland National Infection Register at the National Institute of Public Health
In Finland the national
∗ See footnotes 2 and 3 on page 3.
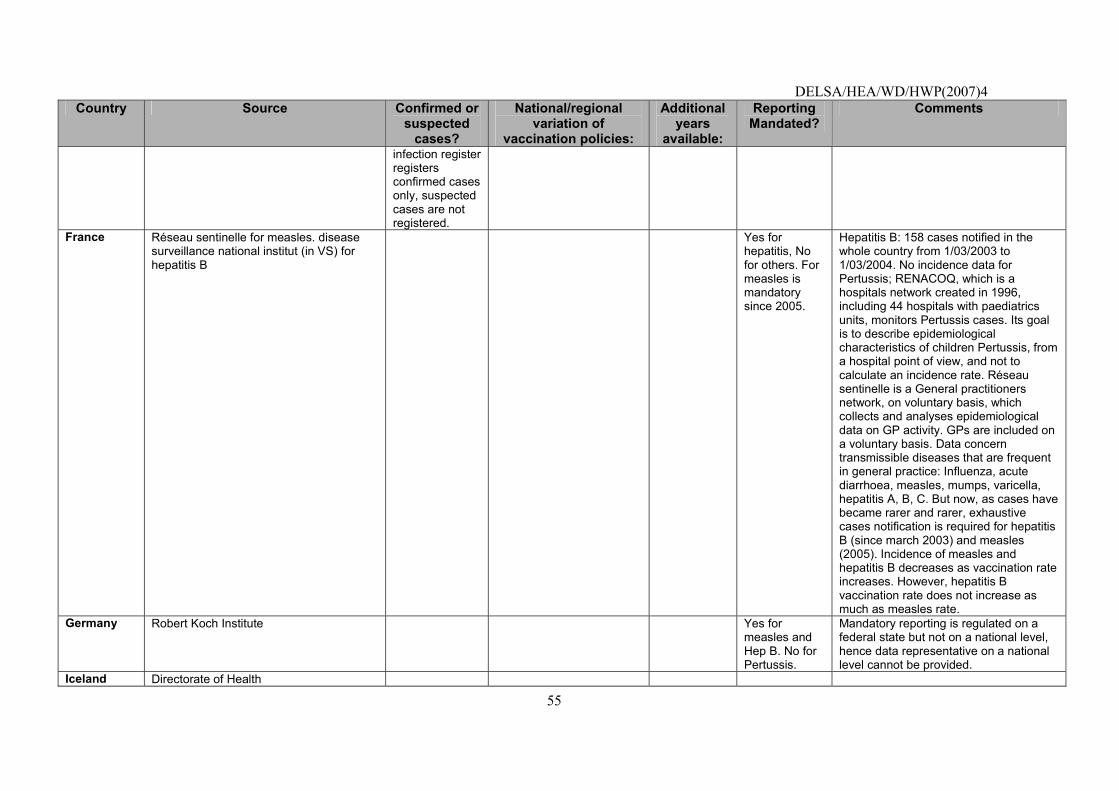
DELSA/HEA/WD/HWP(2007)4
55
Country Source Confirmed or suspected
cases?
National/regional variation of
vaccination policies:
Additional years
available:
Reporting Mandated?
Comments
infection register registers confirmed cases only, suspected cases are not registered.
France Réseau sentinelle for measles. disease surveillance national institut (in VS) for hepatitis B
Yes for hepatitis, No for others. For measles is mandatory since 2005.
Hepatitis B: 158 cases notified in the whole country from 1/03/2003 to 1/03/2004. No incidence data for Pertussis; RENACOQ, which is a hospitals network created in 1996, including 44 hospitals with paediatrics units, monitors Pertussis cases. Its goal is to describe epidemiological characteristics of children Pertussis, from a hospital point of view, and not to calculate an incidence rate. Réseau sentinelle is a General practitioners network, on voluntary basis, which collects and analyses epidemiological data on GP activity. GPs are included on a voluntary basis. Data concern transmissible diseases that are frequent in general practice: Influenza, acute diarrhoea, measles, mumps, varicella, hepatitis A, B, C. But now, as cases have became rarer and rarer, exhaustive cases notification is required for hepatitis B (since march 2003) and measles (2005). Incidence of measles and hepatitis B decreases as vaccination rate increases. However, hepatitis B vaccination rate does not increase as much as measles rate.
Germany Robert Koch Institute
Yes for measles and Hep B. No for Pertussis.
Mandatory reporting is regulated on a federal state but not on a national level, hence data representative on a national level cannot be provided.
Iceland Directorate of Health
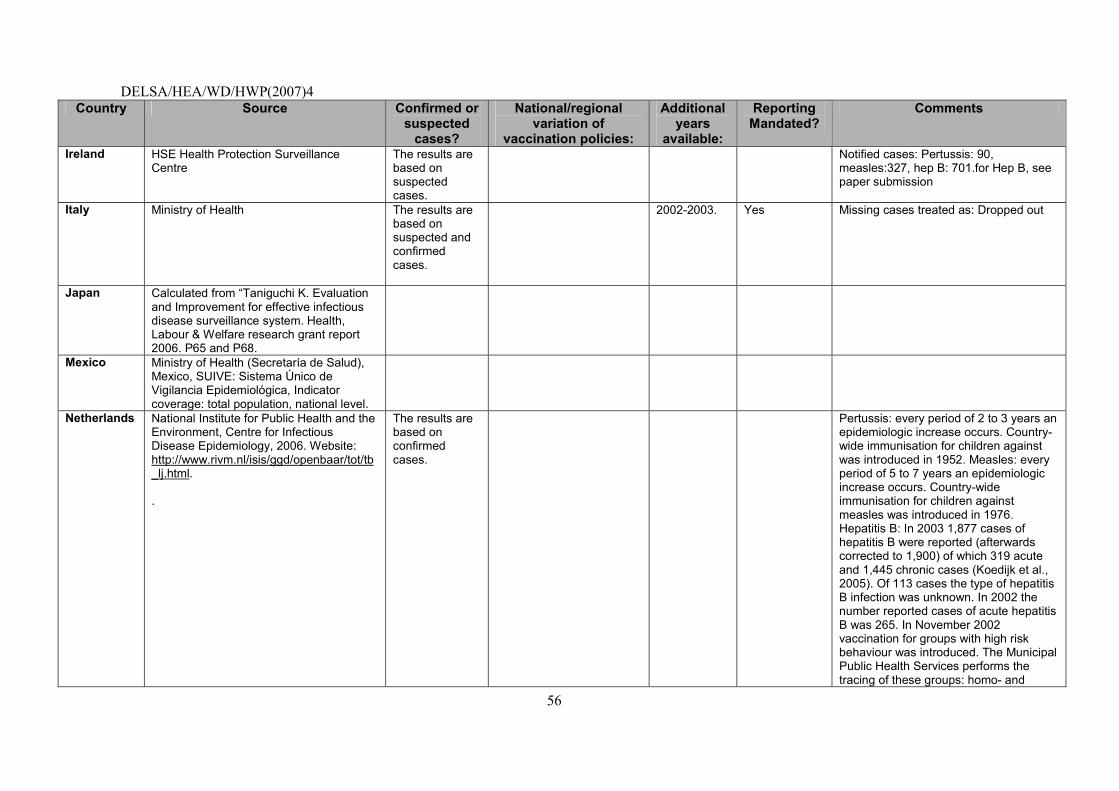
DELSA/HEA/WD/HWP(2007)4
56
Country Source Confirmed or suspected
cases?
National/regional variation of
vaccination policies:
Additional years
available:
Reporting Mandated?
Comments
Ireland HSE Health Protection Surveillance Centre
The results are based on suspected cases.
Notified cases: Pertussis: 90, measles:327, hep B: 701.for Hep B, see paper submission
Italy Ministry of Health
The results are based on suspected and confirmed cases.
2002-2003. Yes Missing cases treated as: Dropped out
Japan Calculated from �Taniguchi K. Evaluation and Improvement for effective infectious disease surveillance system. Health, Labour & Welfare research grant report 2006. P65 and P68.
Mexico
Ministry of Health (Secretaría de Salud), Mexico, SUIVE: Sistema Único de Vigilancia Epidemiológica, Indicator coverage: total population, national level.
Netherlands
National Institute for Public Health and the Environment, Centre for Infectious Disease Epidemiology, 2006. Website: http://www.rivm.nl/isis/ggd/openbaar/tot/tb_lj.html. .
The results are based on confirmed cases.
Pertussis: every period of 2 to 3 years an epidemiologic increase occurs. Country-wide immunisation for children against was introduced in 1952. Measles: every period of 5 to 7 years an epidemiologic increase occurs. Country-wide immunisation for children against measles was introduced in 1976. Hepatitis B: In 2003 1,877 cases of hepatitis B were reported (afterwards corrected to 1,900) of which 319 acute and 1,445 chronic cases (Koedijk et al., 2005). Of 113 cases the type of hepatitis B infection was unknown. In 2002 the number reported cases of acute hepatitis B was 265. In November 2002 vaccination for groups with high risk behaviour was introduced. The Municipal Public Health Services performs the tracing of these groups: homo- and
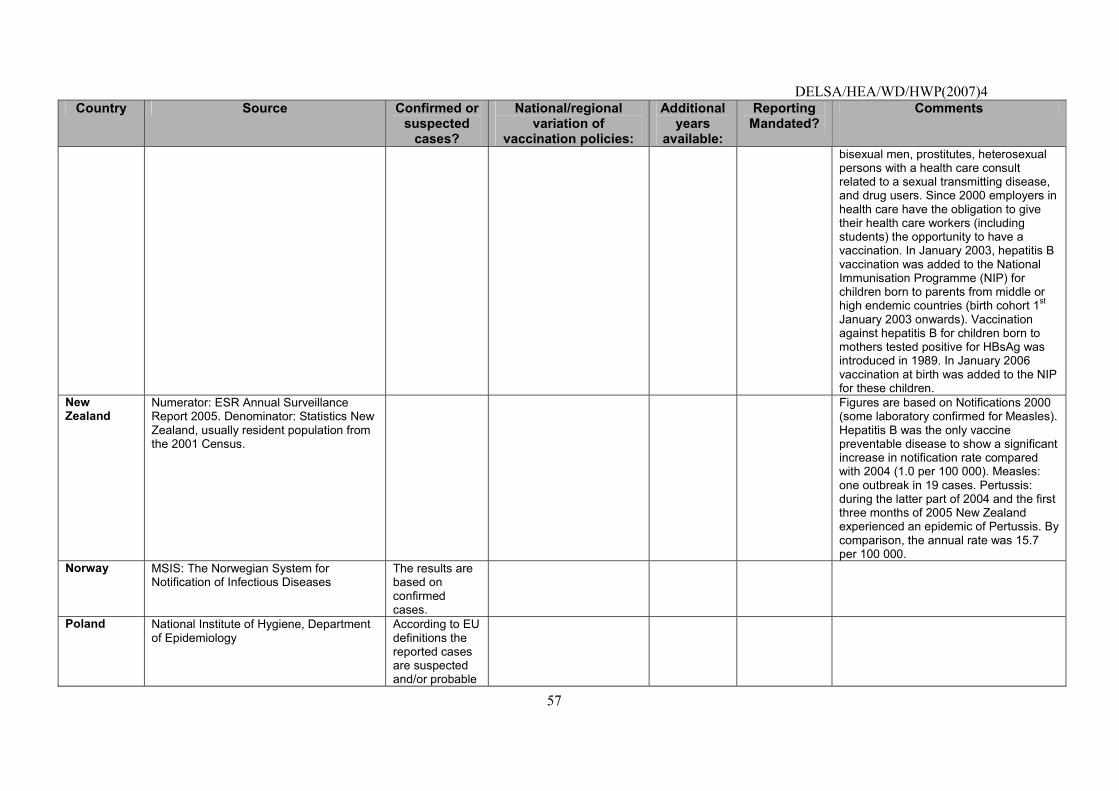
DELSA/HEA/WD/HWP(2007)4
57
Country Source Confirmed or suspected
cases?
National/regional variation of
vaccination policies:
Additional years
available:
Reporting Mandated?
Comments
bisexual men, prostitutes, heterosexual persons with a health care consult related to a sexual transmitting disease, and drug users. Since 2000 employers in health care have the obligation to give their health care workers (including students) the opportunity to have a vaccination. In January 2003, hepatitis B vaccination was added to the National Immunisation Programme (NIP) for children born to parents from middle or high endemic countries (birth cohort 1st January 2003 onwards). Vaccination against hepatitis B for children born to mothers tested positive for HBsAg was introduced in 1989. In January 2006 vaccination at birth was added to the NIP for these children.
New Zealand
Numerator: ESR Annual Surveillance Report 2005. Denominator: Statistics New Zealand, usually resident population from the 2001 Census.
Figures are based on Notifications 2000 (some laboratory confirmed for Measles). Hepatitis B was the only vaccine preventable disease to show a significant increase in notification rate compared with 2004 (1.0 per 100 000). Measles: one outbreak in 19 cases. Pertussis: during the latter part of 2004 and the first three months of 2005 New Zealand experienced an epidemic of Pertussis. By comparison, the annual rate was 15.7 per 100 000.
Norway
MSIS: The Norwegian System for Notification of Infectious Diseases
The results are based on confirmed cases.
Poland National Institute of Hygiene, Department of Epidemiology
According to EU definitions the reported cases are suspected and/or probable
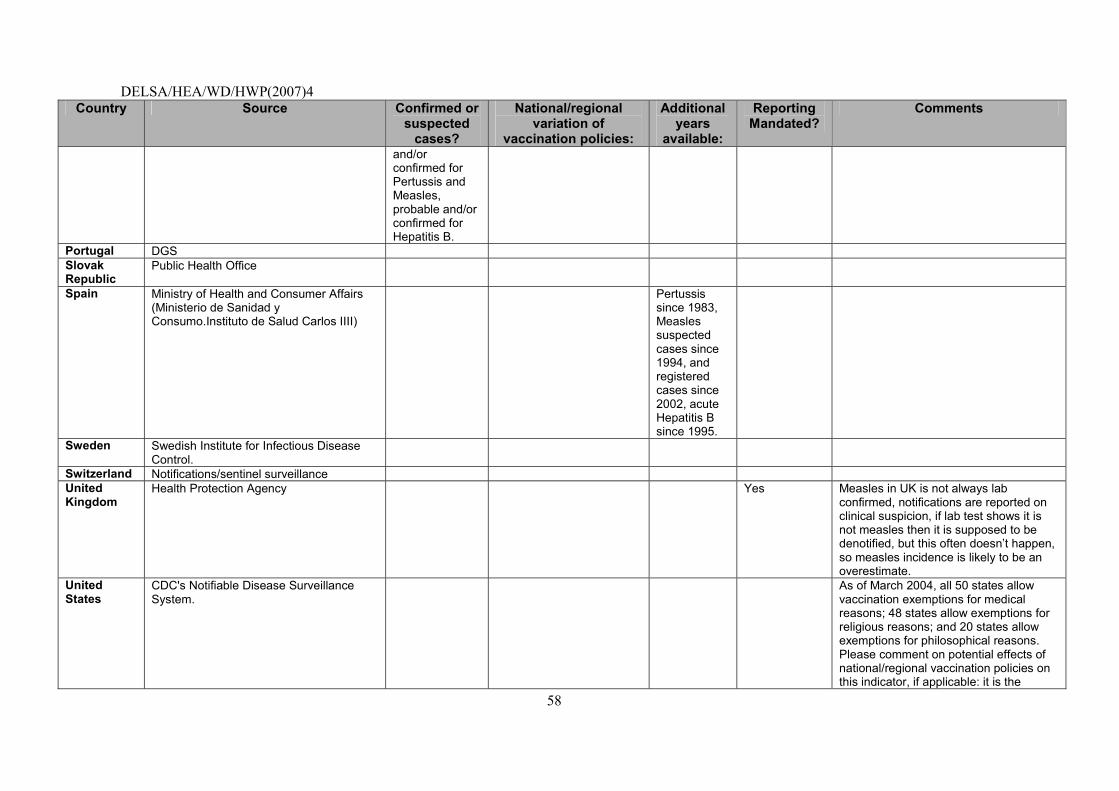
DELSA/HEA/WD/HWP(2007)4
58
Country Source Confirmed or suspected
cases?
National/regional variation of
vaccination policies:
Additional years
available:
Reporting Mandated?
Comments
and/or confirmed for Pertussis and Measles, probable and/or confirmed for Hepatitis B.
Portugal DGS Slovak Republic
Public Health Office
Spain Ministry of Health and Consumer Affairs (Ministerio de Sanidad y Consumo.Instituto de Salud Carlos IIII)
Pertussis since 1983, Measles suspected cases since 1994, and registered cases since 2002, acute Hepatitis B since 1995.
Sweden
Swedish Institute for Infectious Disease Control.
Switzerland Notifications/sentinel surveillance United Kingdom
Health Protection Agency
Yes Measles in UK is not always lab confirmed, notifications are reported on clinical suspicion, if lab test shows it is not measles then it is supposed to be denotified, but this often doesn�t happen, so measles incidence is likely to be an overestimate.
United States
CDC's Notifiable Disease Surveillance System.
As of March 2004, all 50 states allow vaccination exemptions for medical reasons; 48 states allow exemptions for religious reasons; and 20 states allow exemptions for philosophical reasons. Please comment on potential effects of national/regional vaccination policies on this indicator, if applicable: it is the
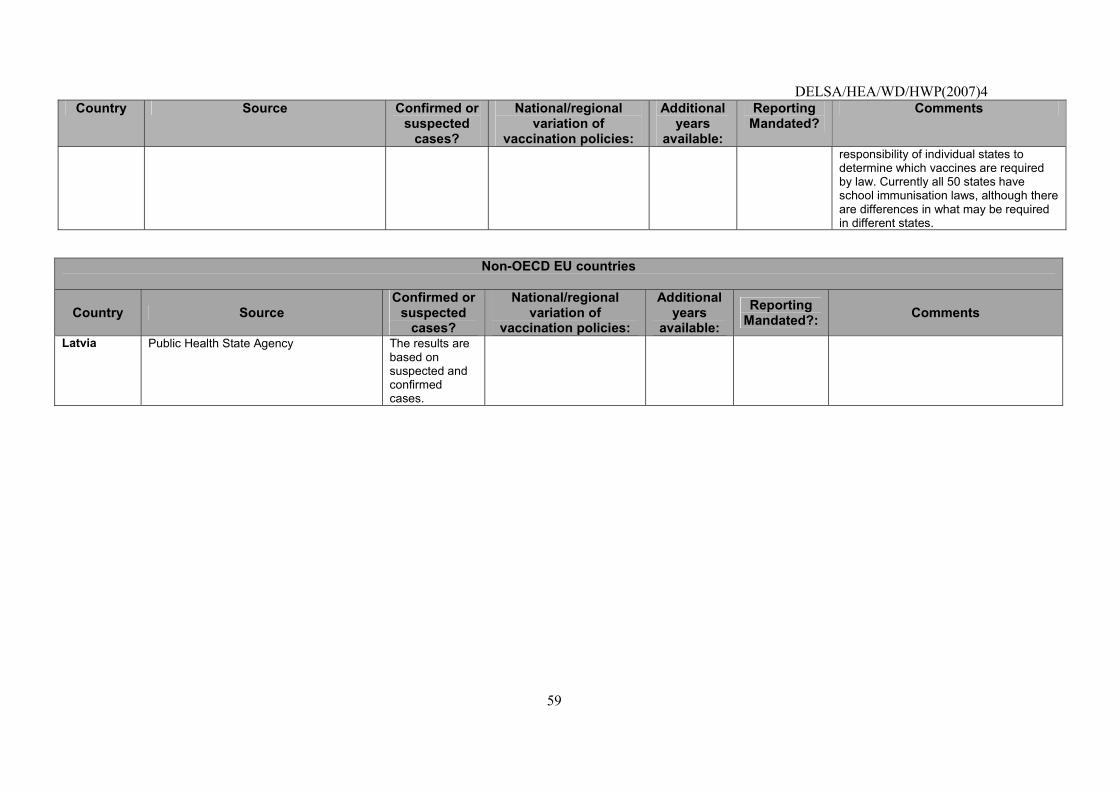
DELSA/HEA/WD/HWP(2007)4
59
Country Source Confirmed or suspected
cases?
National/regional variation of
vaccination policies:
Additional years
available:
Reporting Mandated?
Comments
responsibility of individual states to determine which vaccines are required by law. Currently all 50 states have school immunisation laws, although there are differences in what may be required in different states.
Non-OECD EU countries
Country Source Confirmed or
suspected cases?
National/regional variation of
vaccination policies:
Additional years
available: Reporting
Mandated?: Comments
Latvia
Public Health State Agency
The results are based on suspected and confirmed cases.

DELSA/HEA/WD/HWP(2007)4
60
Coverage for basic vaccination programme, age 2, (Pertussis, measles, hepatitis B)
Operational Definition
Numerator: Number of children who are fully immunised at age 2 for basic vaccination programme.
Denominator: Number of children age 2 years.
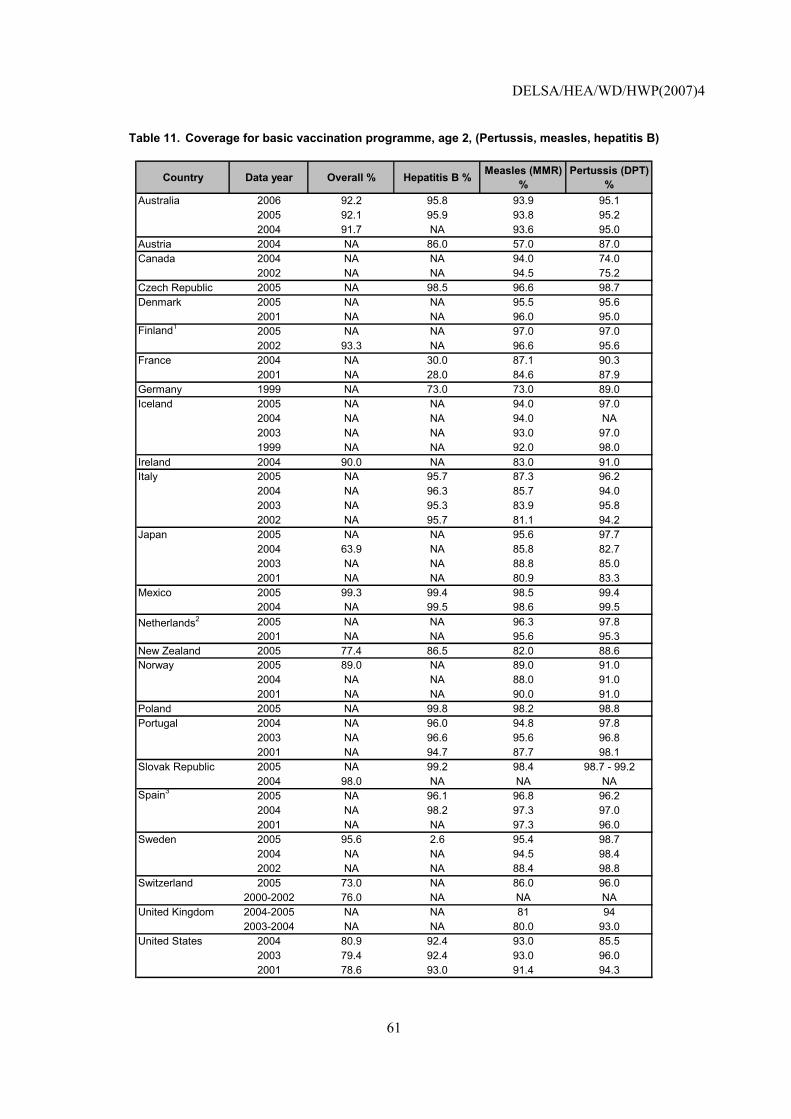
DELSA/HEA/WD/HWP(2007)4
61
Table 11. Coverage for basic vaccination programme, age 2, (Pertussis, measles, hepatitis B)
Country Data year Overall % Hepatitis B % Measles (MMR) %
Pertussis (DPT) %
Australia 2006 92.2 95.8 93.9 95.12005 92.1 95.9 93.8 95.22004 91.7 NA 93.6 95.0
Austria 2004 NA 86.0 57.0 87.0Canada 2004 NA NA 94.0 74.0
2002 NA NA 94.5 75.2Czech Republic 2005 NA 98.5 96.6 98.7Denmark 2005 NA NA 95.5 95.6
2001 NA NA 96.0 95.0Finland1 2005 NA NA 97.0 97.0
2002 93.3 NA 96.6 95.6France 2004 NA 30.0 87.1 90.3
2001 NA 28.0 84.6 87.9Germany 1999 NA 73.0 73.0 89.0Iceland 2005 NA NA 94.0 97.0
2004 NA NA 94.0 NA2003 NA NA 93.0 97.01999 NA NA 92.0 98.0
Ireland 2004 90.0 NA 83.0 91.0Italy 2005 NA 95.7 87.3 96.2
2004 NA 96.3 85.7 94.02003 NA 95.3 83.9 95.82002 NA 95.7 81.1 94.2
Japan 2005 NA NA 95.6 97.72004 63.9 NA 85.8 82.72003 NA NA 88.8 85.02001 NA NA 80.9 83.3
Mexico 2005 99.3 99.4 98.5 99.42004 NA 99.5 98.6 99.5
Netherlands2 2005 NA NA 96.3 97.82001 NA NA 95.6 95.3
New Zealand 2005 77.4 86.5 82.0 88.6Norway 2005 89.0 NA 89.0 91.0
2004 NA NA 88.0 91.02001 NA NA 90.0 91.0
Poland 2005 NA 99.8 98.2 98.8Portugal 2004 NA 96.0 94.8 97.8
2003 NA 96.6 95.6 96.82001 NA 94.7 87.7 98.1
Slovak Republic 2005 NA 99.2 98.4 98.7 - 99.22004 98.0 NA NA NA
Spain3 2005 NA 96.1 96.8 96.22004 NA 98.2 97.3 97.02001 NA NA 97.3 96.0
Sweden 2005 95.6 2.6 95.4 98.72004 NA NA 94.5 98.42002 NA NA 88.4 98.8
Switzerland 2005 73.0 NA 86.0 96.02000-2002 76.0 NA NA NA
United Kingdom 2004-2005 NA NA 81 942003-2004 NA NA 80.0 93.0
United States 2004 80.9 92.4 93.0 85.52003 79.4 92.4 93.0 96.02001 78.6 93.0 91.4 94.3
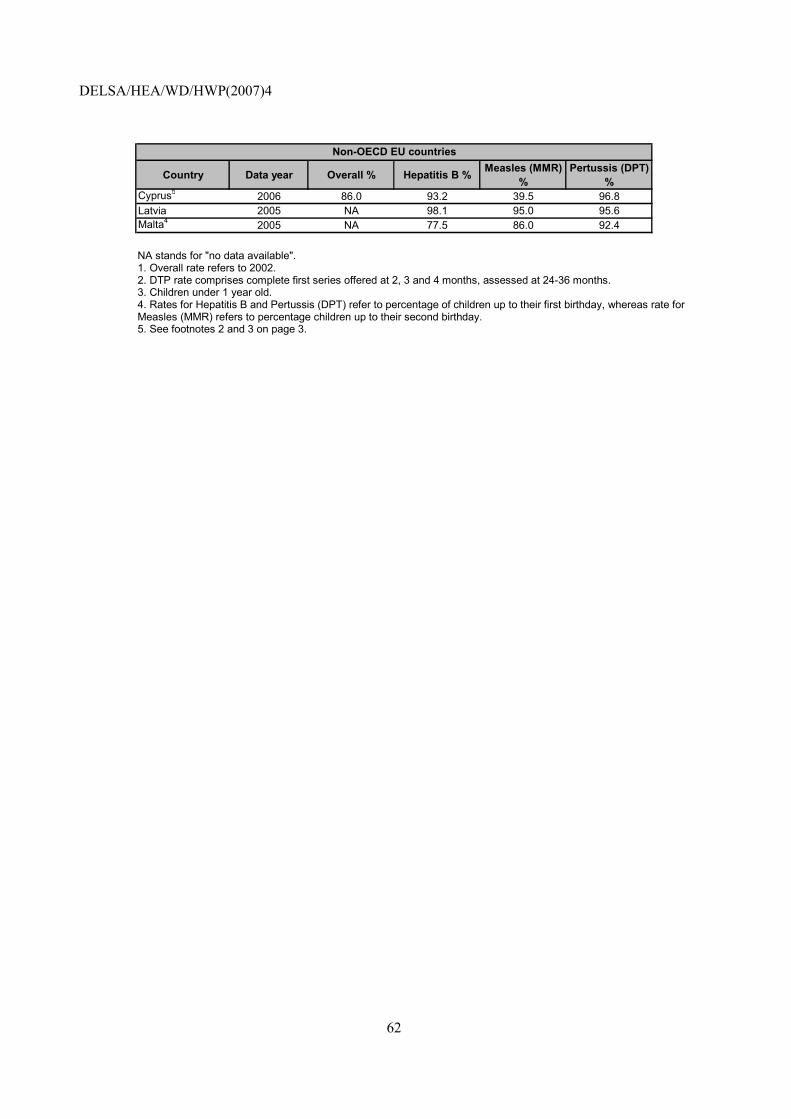
DELSA/HEA/WD/HWP(2007)4
62
Country Data year Overall % Hepatitis B % Measles (MMR) %
Pertussis (DPT) %
Cyprus5 2006 86.0 93.2 39.5 96.8Latvia 2005 NA 98.1 95.0 95.6Malta4 2005 NA 77.5 86.0 92.4
Non-OECD EU countries
NA stands for "no data available". 1. Overall rate refers to 2002. 2. DTP rate comprises complete first series offered at 2, 3 and 4 months, assessed at 24-36 months. 3. Children under 1 year old. 4. Rates for Hepatitis B and Pertussis (DPT) refer to percentage of children up to their first birthday, whereas rate for Measles (MMR) refers to percentage children up to their second birthday. 5. See footnotes 2 and 3 on page 3.
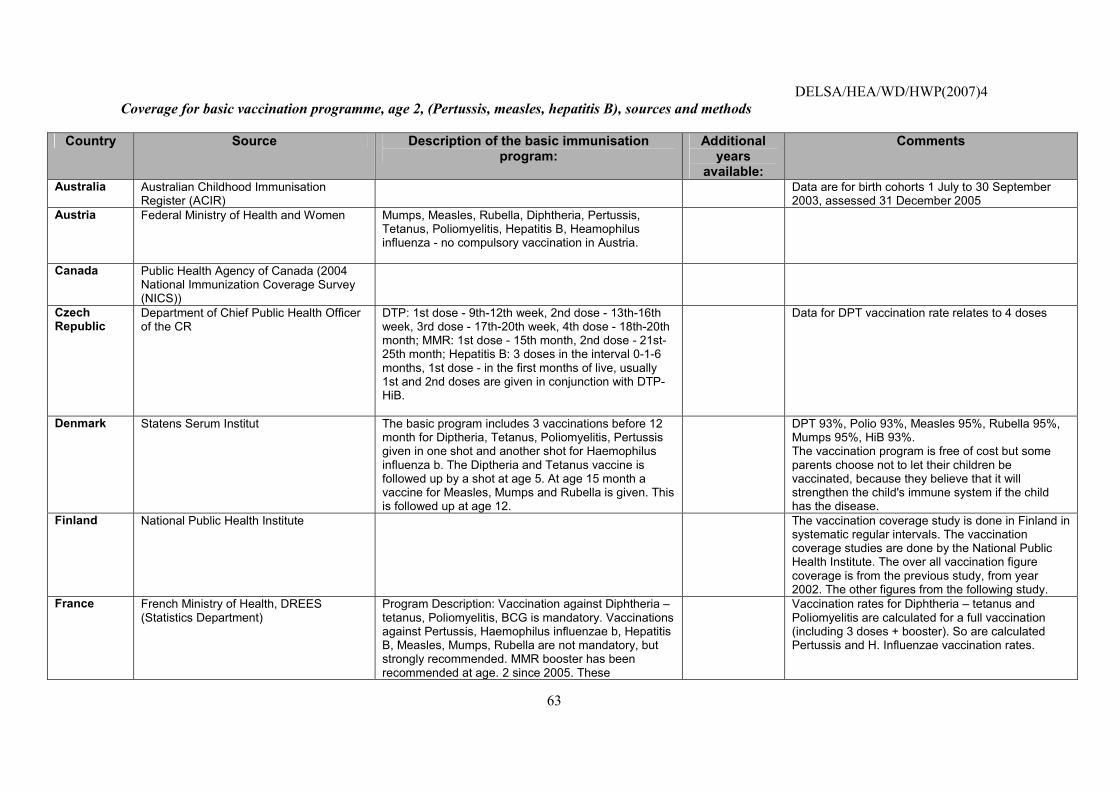
DELSA/HEA/WD/HWP(2007)4
63
Coverage for basic vaccination programme, age 2, (Pertussis, measles, hepatitis B), sources and methods
Country Source Description of the basic immunisation program:
Additional years
available:
Comments
Australia Australian Childhood Immunisation Register (ACIR)
Data are for birth cohorts 1 July to 30 September 2003, assessed 31 December 2005
Austria Federal Ministry of Health and Women Mumps, Measles, Rubella, Diphtheria, Pertussis, Tetanus, Poliomyelitis, Hepatitis B, Heamophilus influenza - no compulsory vaccination in Austria.
Canada Public Health Agency of Canada (2004 National Immunization Coverage Survey (NICS))
Czech Republic
Department of Chief Public Health Officer of the CR
DTP: 1st dose - 9th-12th week, 2nd dose - 13th-16th week, 3rd dose - 17th-20th week, 4th dose - 18th-20th month; MMR: 1st dose - 15th month, 2nd dose - 21st-25th month; Hepatitis B: 3 doses in the interval 0-1-6 months, 1st dose - in the first months of live, usually 1st and 2nd doses are given in conjunction with DTP-HiB.
Data for DPT vaccination rate relates to 4 doses
Denmark Statens Serum Institut
The basic program includes 3 vaccinations before 12 month for Diptheria, Tetanus, Poliomyelitis, Pertussis given in one shot and another shot for Haemophilus influenza b. The Diptheria and Tetanus vaccine is followed up by a shot at age 5. At age 15 month a vaccine for Measles, Mumps and Rubella is given. This is followed up at age 12.
DPT 93%, Polio 93%, Measles 95%, Rubella 95%, Mumps 95%, HiB 93%. The vaccination program is free of cost but some parents choose not to let their children be vaccinated, because they believe that it will strengthen the child's immune system if the child has the disease.
Finland National Public Health Institute
The vaccination coverage study is done in Finland in systematic regular intervals. The vaccination coverage studies are done by the National Public Health Institute. The over all vaccination figure coverage is from the previous study, from year 2002. The other figures from the following study.
France French Ministry of Health, DREES (Statistics Department)
Program Description: Vaccination against Diphtheria � tetanus, Poliomyelitis, BCG is mandatory. Vaccinations against Pertussis, Haemophilus influenzae b, Hepatitis B, Measles, Mumps, Rubella are not mandatory, but strongly recommended. MMR booster has been recommended at age. 2 since 2005. These
Vaccination rates for Diphtheria � tetanus and Poliomyelitis are calculated for a full vaccination (including 3 doses + booster). So are calculated Pertussis and H. Influenzae vaccination rates.
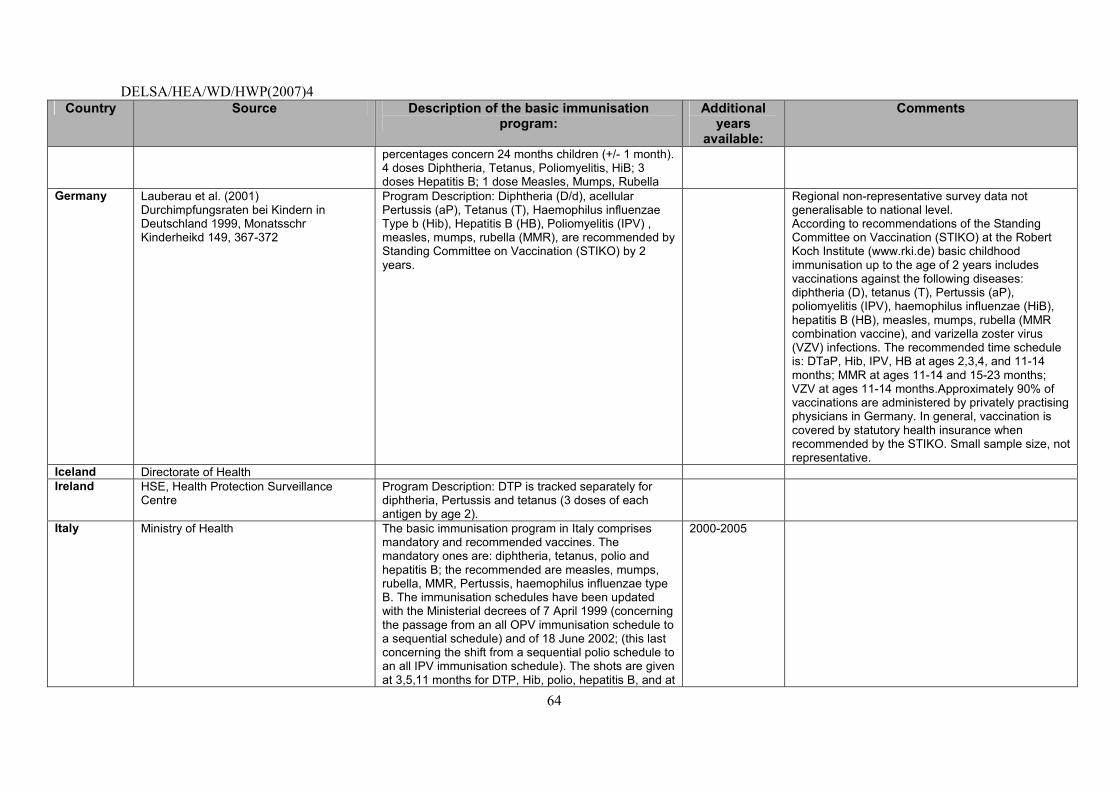
DELSA/HEA/WD/HWP(2007)4
64
Country Source Description of the basic immunisation program:
Additional years
available:
Comments
percentages concern 24 months children (+/- 1 month). 4 doses Diphtheria, Tetanus, Poliomyelitis, HiB; 3 doses Hepatitis B; 1 dose Measles, Mumps, Rubella
Germany Lauberau et al. (2001) Durchimpfungsraten bei Kindern in Deutschland 1999, Monatsschr Kinderheikd 149, 367-372
Program Description: Diphtheria (D/d), acellular Pertussis (aP), Tetanus (T), Haemophilus influenzae Type b (Hib), Hepatitis B (HB), Poliomyelitis (IPV) , measles, mumps, rubella (MMR), are recommended by Standing Committee on Vaccination (STIKO) by 2 years.
Regional non-representative survey data not generalisable to national level. According to recommendations of the Standing Committee on Vaccination (STIKO) at the Robert Koch Institute (www.rki.de) basic childhood immunisation up to the age of 2 years includes vaccinations against the following diseases: diphtheria (D), tetanus (T), Pertussis (aP), poliomyelitis (IPV), haemophilus influenzae (HiB), hepatitis B (HB), measles, mumps, rubella (MMR combination vaccine), and varizella zoster virus (VZV) infections. The recommended time schedule is: DTaP, Hib, IPV, HB at ages 2,3,4, and 11-14 months; MMR at ages 11-14 and 15-23 months; VZV at ages 11-14 months.Approximately 90% of vaccinations are administered by privately practising physicians in Germany. In general, vaccination is covered by statutory health insurance when recommended by the STIKO. Small sample size, not representative.
Iceland Directorate of Health Ireland HSE, Health Protection Surveillance
Centre
Program Description: DTP is tracked separately for diphtheria, Pertussis and tetanus (3 doses of each antigen by age 2).
Italy Ministry of Health The basic immunisation program in Italy comprises mandatory and recommended vaccines. The mandatory ones are: diphtheria, tetanus, polio and hepatitis B; the recommended are measles, mumps, rubella, MMR, Pertussis, haemophilus influenzae type B. The immunisation schedules have been updated with the Ministerial decrees of 7 April 1999 (concerning the passage from an all OPV immunisation schedule to a sequential schedule) and of 18 June 2002; (this last concerning the shift from a sequential polio schedule to an all IPV immunisation schedule). The shots are given at 3,5,11 months for DTP, Hib, polio, hepatitis B, and at
2000-2005
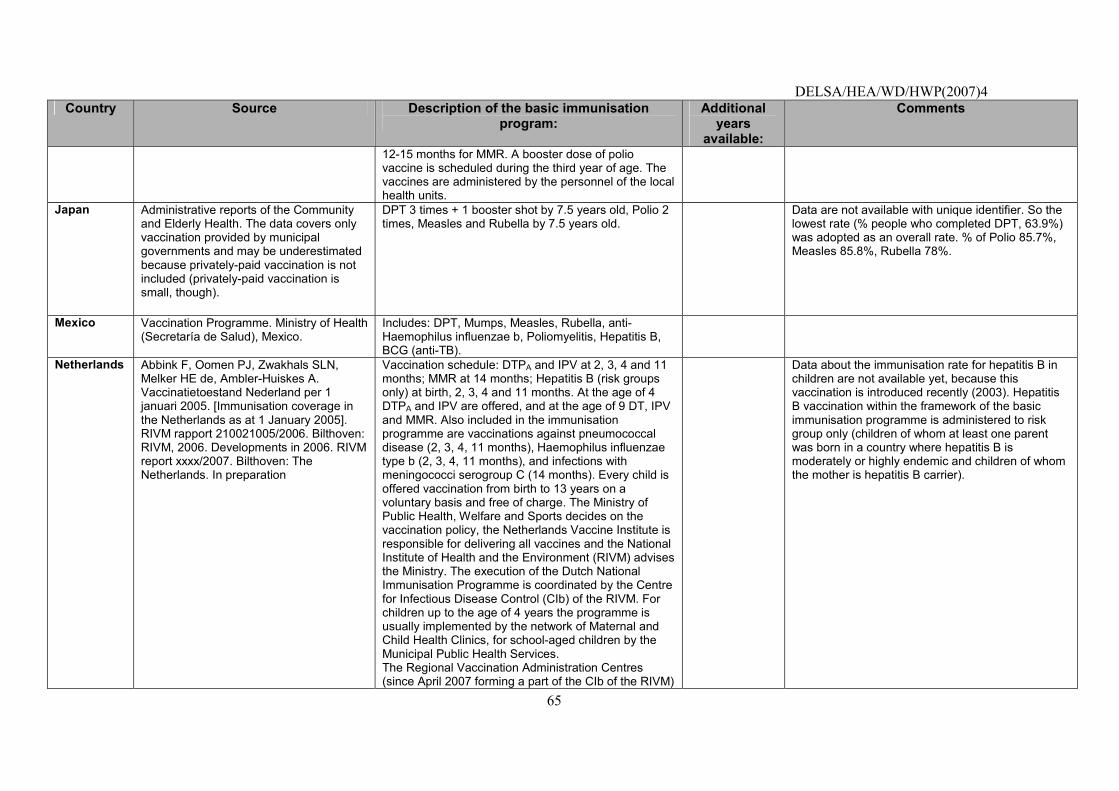
DELSA/HEA/WD/HWP(2007)4
65
Country Source Description of the basic immunisation program:
Additional years
available:
Comments
12-15 months for MMR. A booster dose of polio vaccine is scheduled during the third year of age. The vaccines are administered by the personnel of the local health units.
Japan Administrative reports of the Community and Elderly Health. The data covers only vaccination provided by municipal governments and may be underestimated because privately-paid vaccination is not included (privately-paid vaccination is small, though).
DPT 3 times + 1 booster shot by 7.5 years old, Polio 2 times, Measles and Rubella by 7.5 years old.
Data are not available with unique identifier. So the lowest rate (% people who completed DPT, 63.9%) was adopted as an overall rate. % of Polio 85.7%, Measles 85.8%, Rubella 78%.
Mexico
Vaccination Programme. Ministry of Health (Secretaría de Salud), Mexico.
Includes: DPT, Mumps, Measles, Rubella, anti-Haemophilus influenzae b, Poliomyelitis, Hepatitis B, BCG (anti-TB).
Netherlands
Abbink F, Oomen PJ, Zwakhals SLN, Melker HE de, Ambler-Huiskes A. Vaccinatietoestand Nederland per 1 januari 2005. [Immunisation coverage in the Netherlands as at 1 January 2005]. RIVM rapport 210021005/2006. Bilthoven: RIVM, 2006. Developments in 2006. RIVM report xxxx/2007. Bilthoven: The Netherlands. In preparation
Vaccination schedule: DTPA and IPV at 2, 3, 4 and 11 months; MMR at 14 months; Hepatitis B (risk groups only) at birth, 2, 3, 4 and 11 months. At the age of 4 DTPA and IPV are offered, and at the age of 9 DT, IPV and MMR. Also included in the immunisation programme are vaccinations against pneumococcal disease (2, 3, 4, 11 months), Haemophilus influenzae type b (2, 3, 4, 11 months), and infections with meningococci serogroup C (14 months). Every child is offered vaccination from birth to 13 years on a voluntary basis and free of charge. The Ministry of Public Health, Welfare and Sports decides on the vaccination policy, the Netherlands Vaccine Institute is responsible for delivering all vaccines and the National Institute of Health and the Environment (RIVM) advises the Ministry. The execution of the Dutch National Immunisation Programme is coordinated by the Centre for Infectious Disease Control (CIb) of the RIVM. For children up to the age of 4 years the programme is usually implemented by the network of Maternal and Child Health Clinics, for school-aged children by the Municipal Public Health Services. The Regional Vaccination Administration Centres (since April 2007 forming a part of the CIb of the RIVM)
Data about the immunisation rate for hepatitis B in children are not available yet, because this vaccination is introduced recently (2003). Hepatitis B vaccination within the framework of the basic immunisation programme is administered to risk group only (children of whom at least one parent was born in a country where hepatitis B is moderately or highly endemic and children of whom the mother is hepatitis B carrier).
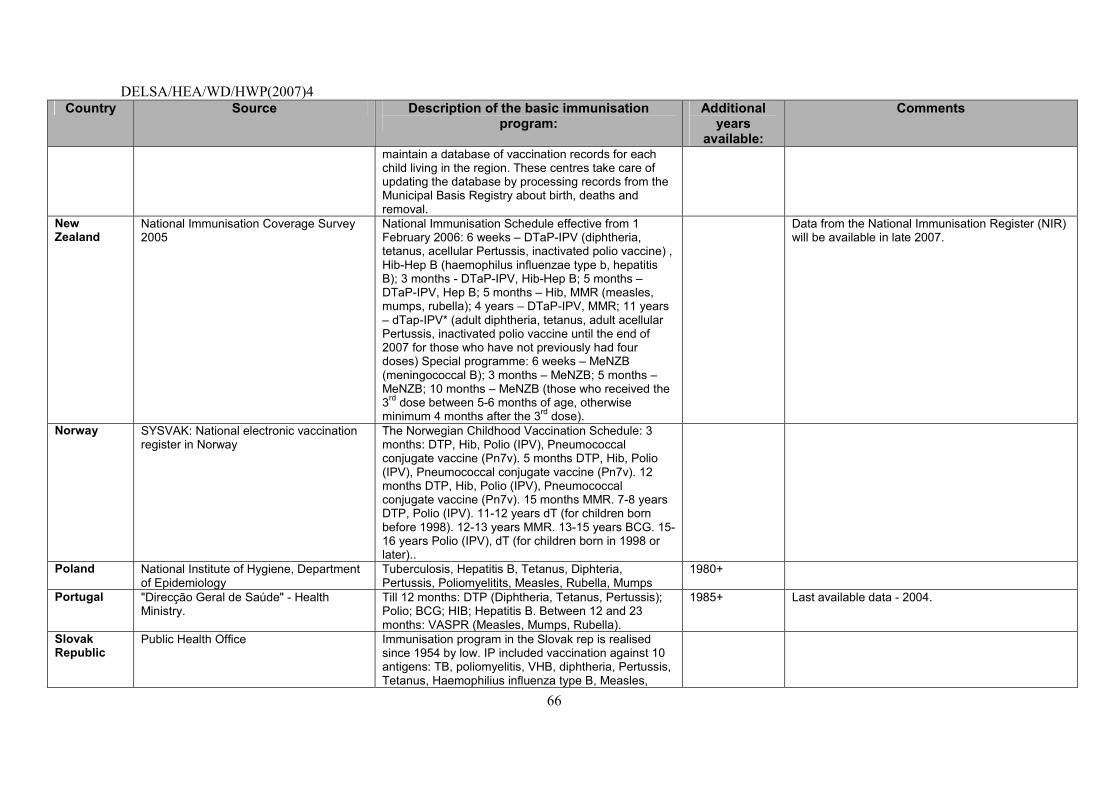
DELSA/HEA/WD/HWP(2007)4
66
Country Source Description of the basic immunisation program:
Additional years
available:
Comments
maintain a database of vaccination records for each child living in the region. These centres take care of updating the database by processing records from the Municipal Basis Registry about birth, deaths and removal.
New Zealand
National Immunisation Coverage Survey 2005
National Immunisation Schedule effective from 1 February 2006: 6 weeks � DTaP-IPV (diphtheria, tetanus, acellular Pertussis, inactivated polio vaccine) , Hib-Hep B (haemophilus influenzae type b, hepatitis B); 3 months - DTaP-IPV, Hib-Hep B; 5 months � DTaP-IPV, Hep B; 5 months � Hib, MMR (measles, mumps, rubella); 4 years � DTaP-IPV, MMR; 11 years � dTap-IPV* (adult diphtheria, tetanus, adult acellular Pertussis, inactivated polio vaccine until the end of 2007 for those who have not previously had four doses) Special programme: 6 weeks � MeNZB (meningococcal B); 3 months � MeNZB; 5 months � MeNZB; 10 months � MeNZB (those who received the 3rd dose between 5-6 months of age, otherwise minimum 4 months after the 3rd dose).
Data from the National Immunisation Register (NIR) will be available in late 2007.
Norway
SYSVAK: National electronic vaccination register in Norway
The Norwegian Childhood Vaccination Schedule: 3 months: DTP, Hib, Polio (IPV), Pneumococcal conjugate vaccine (Pn7v). 5 months DTP, Hib, Polio (IPV), Pneumococcal conjugate vaccine (Pn7v). 12 months DTP, Hib, Polio (IPV), Pneumococcal conjugate vaccine (Pn7v). 15 months MMR. 7-8 years DTP, Polio (IPV). 11-12 years dT (for children born before 1998). 12-13 years MMR. 13-15 years BCG. 15-16 years Polio (IPV), dT (for children born in 1998 or later)..
Poland National Institute of Hygiene, Department of Epidemiology
Tuberculosis, Hepatitis B, Tetanus, Diphteria, Pertussis, Poliomyelitits, Measles, Rubella, Mumps
1980+
Portugal "Direcção Geral de Saúde" - Health Ministry.
Till 12 months: DTP (Diphtheria, Tetanus, Pertussis); Polio; BCG; HIB; Hepatitis B. Between 12 and 23 months: VASPR (Measles, Mumps, Rubella).
1985+ Last available data - 2004.
Slovak Republic
Public Health Office Immunisation program in the Slovak rep is realised since 1954 by low. IP included vaccination against 10 antigens: TB, poliomyelitis, VHB, diphtheria, Pertussis, Tetanus, Haemophilius influenza type B, Measles,
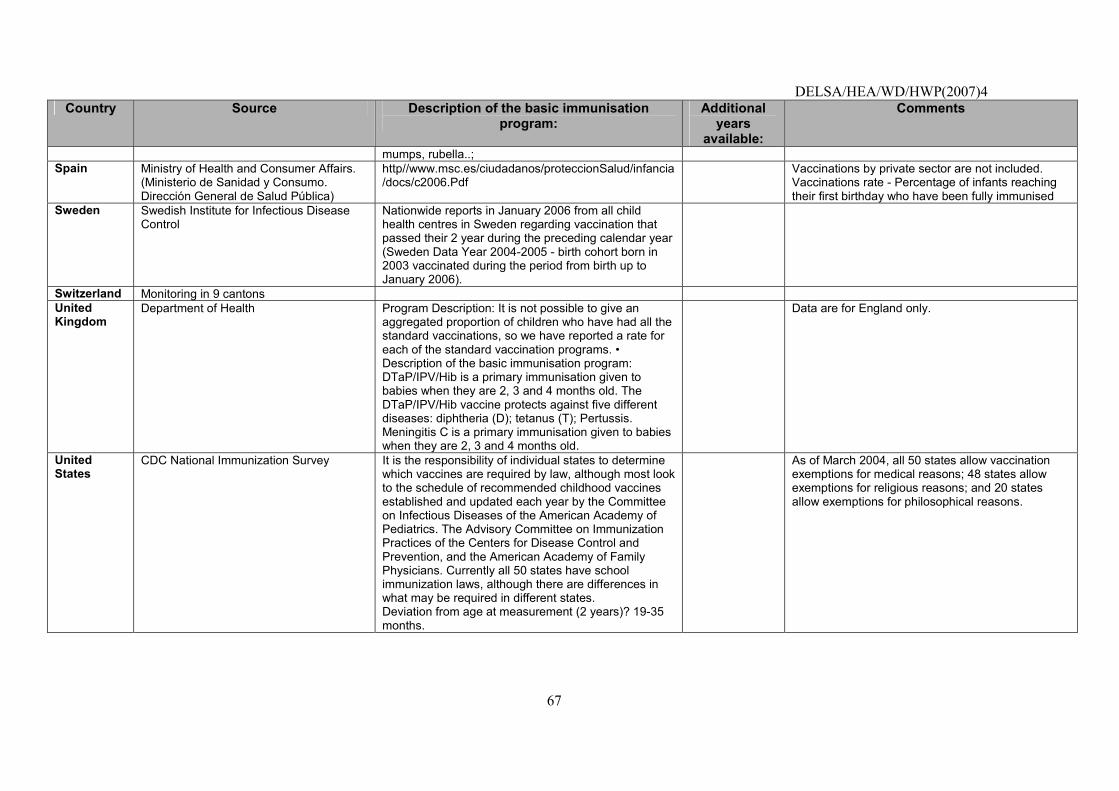
DELSA/HEA/WD/HWP(2007)4
67
Country Source Description of the basic immunisation program:
Additional years
available:
Comments
mumps, rubella..; Spain Ministry of Health and Consumer Affairs.
(Ministerio de Sanidad y Consumo. Dirección General de Salud Pública)
http//www.msc.es/ciudadanos/proteccionSalud/infancia/docs/c2006.Pdf
Vaccinations by private sector are not included. Vaccinations rate - Percentage of infants reaching their first birthday who have been fully immunised
Sweden
Swedish Institute for Infectious Disease Control
Nationwide reports in January 2006 from all child health centres in Sweden regarding vaccination that passed their 2 year during the preceding calendar year (Sweden Data Year 2004-2005 - birth cohort born in 2003 vaccinated during the period from birth up to January 2006).
Switzerland Monitoring in 9 cantons United Kingdom
Department of Health Program Description: It is not possible to give an aggregated proportion of children who have had all the standard vaccinations, so we have reported a rate for each of the standard vaccination programs. � Description of the basic immunisation program: DTaP/IPV/Hib is a primary immunisation given to babies when they are 2, 3 and 4 months old. The DTaP/IPV/Hib vaccine protects against five different diseases: diphtheria (D); tetanus (T); Pertussis. Meningitis C is a primary immunisation given to babies when they are 2, 3 and 4 months old.
Data are for England only.
United States
CDC National Immunization Survey It is the responsibility of individual states to determine which vaccines are required by law, although most look to the schedule of recommended childhood vaccines established and updated each year by the Committee on Infectious Diseases of the American Academy of Pediatrics. The Advisory Committee on Immunization Practices of the Centers for Disease Control and Prevention, and the American Academy of Family Physicians. Currently all 50 states have school immunization laws, although there are differences in what may be required in different states. Deviation from age at measurement (2 years)? 19-35 months.
As of March 2004, all 50 states allow vaccination exemptions for medical reasons; 48 states allow exemptions for religious reasons; and 20 states allow exemptions for philosophical reasons.
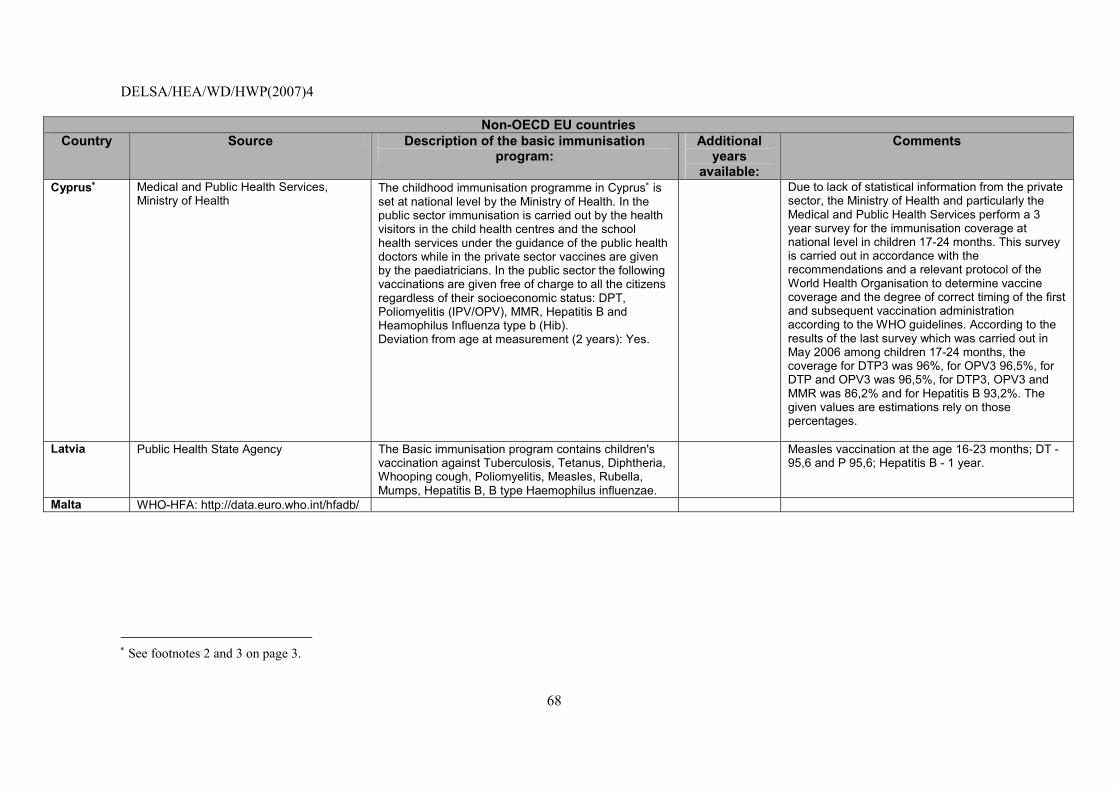
DELSA/HEA/WD/HWP(2007)4
68
Non-OECD EU countries
Country Source Description of the basic immunisation program:
Additional years
available:
Comments
Cyprus∗ Medical and Public Health Services, Ministry of Health
The childhood immunisation programme in Cyprus∗ is set at national level by the Ministry of Health. In the public sector immunisation is carried out by the health visitors in the child health centres and the school health services under the guidance of the public health doctors while in the private sector vaccines are given by the paediatricians. In the public sector the following vaccinations are given free of charge to all the citizens regardless of their socioeconomic status: DPT, Poliomyelitis (IPV/OPV), MMR, Hepatitis B and Heamophilus Influenza type b (Hib). Deviation from age at measurement (2 years): Yes.
Due to lack of statistical information from the private sector, the Ministry of Health and particularly the Medical and Public Health Services perform a 3 year survey for the immunisation coverage at national level in children 17-24 months. This survey is carried out in accordance with the recommendations and a relevant protocol of the World Health Organisation to determine vaccine coverage and the degree of correct timing of the first and subsequent vaccination administration according to the WHO guidelines. According to the results of the last survey which was carried out in May 2006 among children 17-24 months, the coverage for DTP3 was 96%, for OPV3 96,5%, for DTP and OPV3 was 96,5%, for DTP3, OPV3 and MMR was 86,2% and for Hepatitis B 93,2%. The given values are estimations rely on those percentages.
Latvia
Public Health State Agency
The Basic immunisation program contains children's vaccination against Tuberculosis, Tetanus, Diphtheria, Whooping cough, Poliomyelitis, Measles, Rubella, Mumps, Hepatitis B, B type Haemophilus influenzae.
Measles vaccination at the age 16-23 months; DT - 95,6 and P 95,6; Hepatitis B - 1 year.
Malta WHO-HFA: http://data.euro.who.int/hfadb/
∗ See footnotes 2 and 3 on page 3.
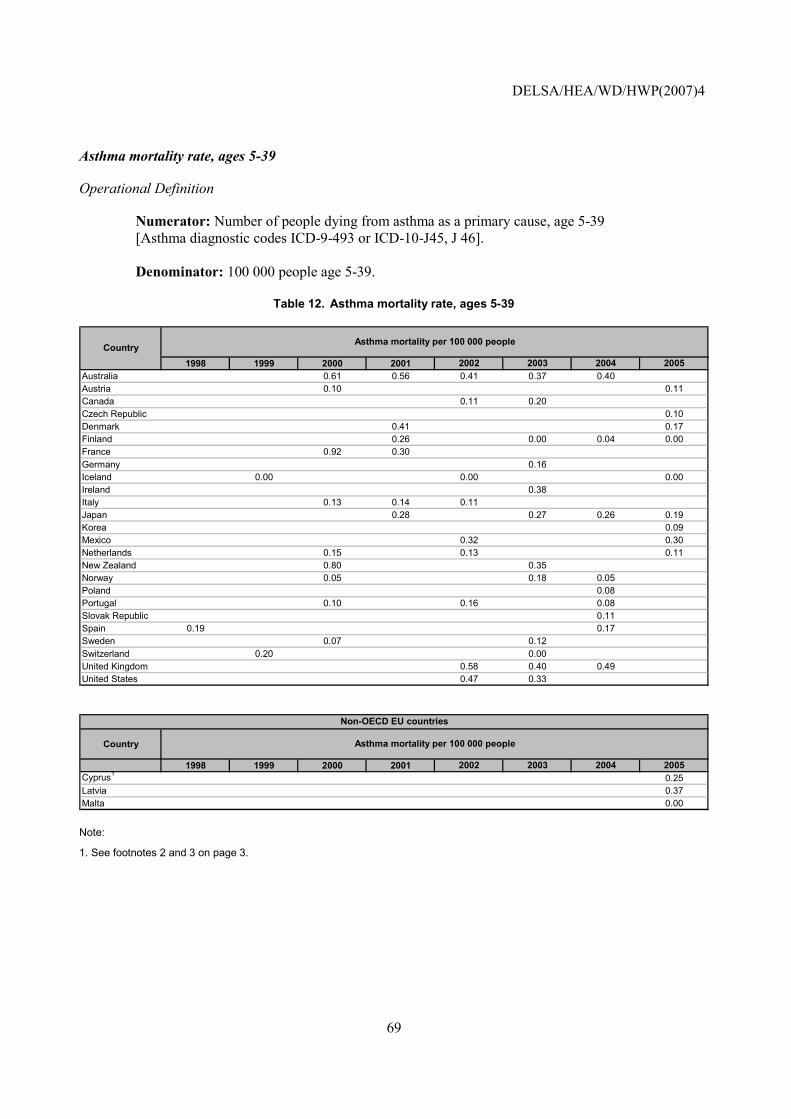
DELSA/HEA/WD/HWP(2007)4
69
Asthma mortality rate, ages 5-39
Operational Definition
Numerator: Number of people dying from asthma as a primary cause, age 5-39 [Asthma diagnostic codes ICD-9-493 or ICD-10-J45, J 46]. Denominator: 100 000 people age 5-39.
Table 12. Asthma mortality rate, ages 5-39
1998 1999 2000 2001 2002 2003 2004 2005Australia 0.61 0.56 0.41 0.37 0.40Austria 0.10 0.11Canada 0.11 0.20Czech Republic 0.10Denmark 0.41 0.17Finland 0.26 0.00 0.04 0.00France 0.92 0.30Germany 0.16Iceland 0.00 0.00 0.00Ireland 0.38Italy 0.13 0.14 0.11Japan 0.28 0.27 0.26 0.19Korea 0.09Mexico 0.32 0.30Netherlands 0.15 0.13 0.11New Zealand 0.80 0.35Norway 0.05 0.18 0.05Poland 0.08Portugal 0.10 0.16 0.08Slovak Republic 0.11Spain 0.19 0.17Sweden 0.07 0.12Switzerland 0.20 0.00United Kingdom 0.58 0.40 0.49United States 0.47 0.33
Asthma mortality per 100 000 peopleCountry
Country
1998 1999 2000 2001 2002 2003 2004 2005Cyprus1 0.25Latvia 0.37Malta 0.00
Asthma mortality per 100 000 people
Non-OECD EU countries
Note:
1. See footnotes 2 and 3 on page 3.
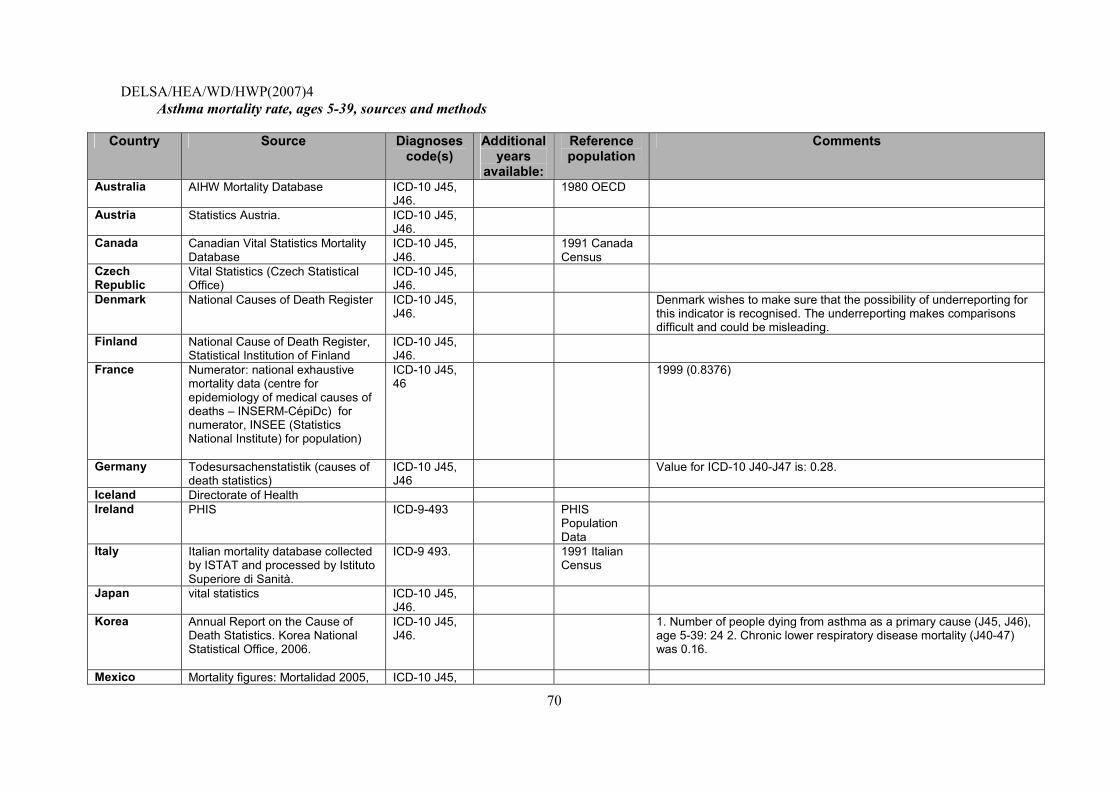
DELSA/HEA/WD/HWP(2007)4
70
Asthma mortality rate, ages 5-39, sources and methods
Country Source Diagnoses code(s)
Additional years
available:
Reference population
Comments
Australia AIHW Mortality Database
ICD-10 J45, J46.
1980 OECD
Austria Statistics Austria. ICD-10 J45, J46.
Canada Canadian Vital Statistics Mortality Database
ICD-10 J45, J46.
1991 Canada Census
Czech Republic
Vital Statistics (Czech Statistical Office)
ICD-10 J45, J46.
Denmark National Causes of Death Register ICD-10 J45, J46.
Denmark wishes to make sure that the possibility of underreporting for this indicator is recognised. The underreporting makes comparisons difficult and could be misleading.
Finland National Cause of Death Register, Statistical Institution of Finland
ICD-10 J45, J46.
France Numerator: national exhaustive mortality data (centre for epidemiology of medical causes of deaths � INSERM-CépiDc) for numerator, INSEE (Statistics National Institute) for population)
ICD-10 J45, 46
1999 (0.8376)
Germany Todesursachenstatistik (causes of death statistics)
ICD-10 J45, J46
Value for ICD-10 J40-J47 is: 0.28.
Iceland Directorate of Health Ireland PHIS ICD-9-493 PHIS
Population Data
Italy Italian mortality database collected by ISTAT and processed by Istituto Superiore di Sanità.
ICD-9 493. 1991 Italian Census
Japan vital statistics ICD-10 J45, J46.
Korea Annual Report on the Cause of Death Statistics. Korea National Statistical Office, 2006.
ICD-10 J45, J46.
1. Number of people dying from asthma as a primary cause (J45, J46), age 5-39: 24 2. Chronic lower respiratory disease mortality (J40-47) was 0.16.
Mexico Mortality figures: Mortalidad 2005, ICD-10 J45,
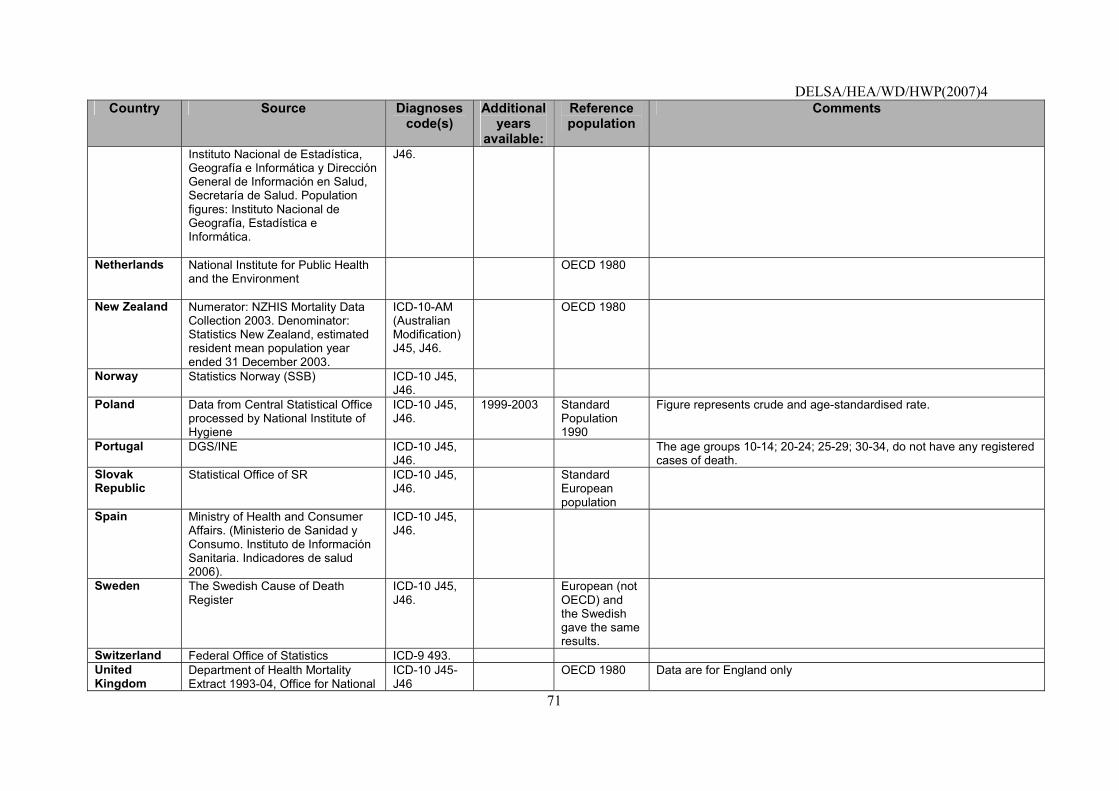
DELSA/HEA/WD/HWP(2007)4
71
Country Source Diagnoses code(s)
Additional years
available:
Reference population
Comments
Instituto Nacional de Estadística, Geografía e Informática y Dirección General de Información en Salud, Secretaría de Salud. Population figures: Instituto Nacional de Geografía, Estadística e Informática.
J46.
Netherlands
National Institute for Public Health and the Environment
OECD 1980
New Zealand
Numerator: NZHIS Mortality Data Collection 2003. Denominator: Statistics New Zealand, estimated resident mean population year ended 31 December 2003.
ICD-10-AM (Australian Modification) J45, J46.
OECD 1980
Norway
Statistics Norway (SSB) ICD-10 J45, J46.
Poland Data from Central Statistical Office processed by National Institute of Hygiene
ICD-10 J45, J46.
1999-2003 Standard Population 1990
Figure represents crude and age-standardised rate.
Portugal DGS/INE ICD-10 J45, J46.
The age groups 10-14; 20-24; 25-29; 30-34, do not have any registered cases of death.
Slovak Republic
Statistical Office of SR
ICD-10 J45, J46.
Standard European population
Spain Ministry of Health and Consumer Affairs. (Ministerio de Sanidad y Consumo. Instituto de Información Sanitaria. Indicadores de salud 2006).
ICD-10 J45, J46.
Sweden
The Swedish Cause of Death Register
ICD-10 J45, J46.
European (not OECD) and the Swedish gave the same results.
Switzerland Federal Office of Statistics ICD-9 493. United Kingdom
Department of Health Mortality Extract 1993-04, Office for National
ICD-10 J45-J46
OECD 1980 Data are for England only
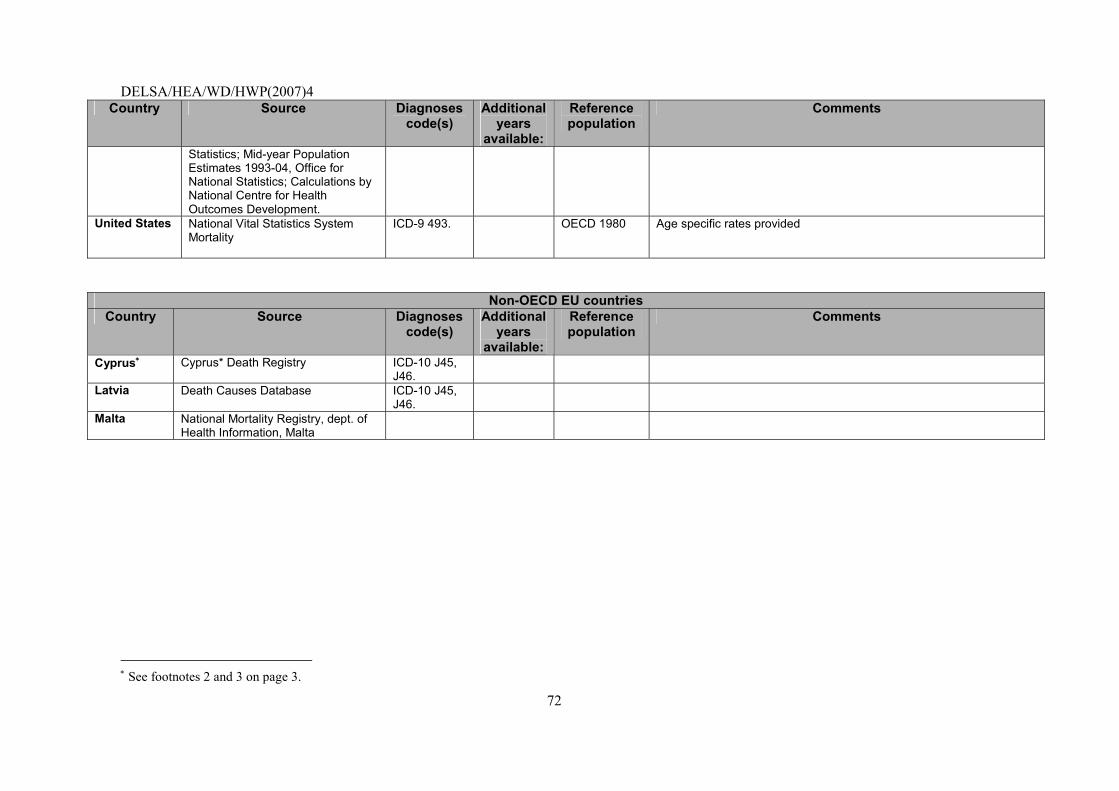
DELSA/HEA/WD/HWP(2007)4
72
Country Source Diagnoses code(s)
Additional years
available:
Reference population
Comments
Statistics; Mid-year Population Estimates 1993-04, Office for National Statistics; Calculations by National Centre for Health Outcomes Development.
United States
National Vital Statistics System Mortality
ICD-9 493. OECD 1980 Age specific rates provided
Non-OECD EU countries Country Source Diagnoses
code(s) Additional
years available:
Reference population
Comments
Cyprus∗ Cyprus* Death Registry ICD-10 J45, J46.
Latvia
Death Causes Database ICD-10 J45, J46.
Malta National Mortality Registry, dept. of Health Information, Malta
∗ See footnotes 2 and 3 on page 3.
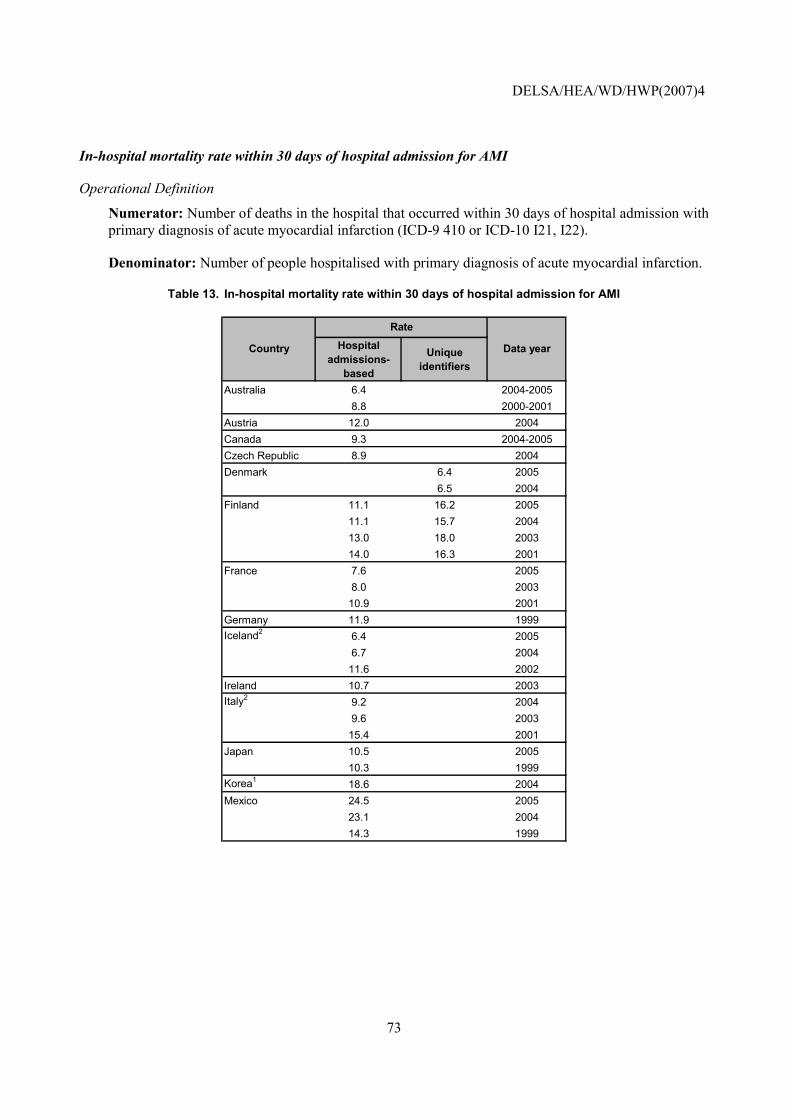
DELSA/HEA/WD/HWP(2007)4
73
In-hospital mortality rate within 30 days of hospital admission for AMI
Operational Definition
Numerator: Number of deaths in the hospital that occurred within 30 days of hospital admission with primary diagnosis of acute myocardial infarction (ICD-9 410 or ICD-10 I21, I22).
Denominator: Number of people hospitalised with primary diagnosis of acute myocardial infarction.
Table 13. In-hospital mortality rate within 30 days of hospital admission for AMI
Hospital admissions-
based
Unique identifiers
Australia 6.4 2004-20058.8 2000-2001
Austria 12.0 2004Canada 9.3 2004-2005Czech Republic 8.9 2004Denmark 6.4 2005
6.5 2004Finland 11.1 16.2 2005
11.1 15.7 200413.0 18.0 200314.0 16.3 2001
France 7.6 20058.0 2003
10.9 2001Germany 11.9 1999Iceland2 6.4 2005
6.7 200411.6 2002
Ireland 10.7 2003Italy2 9.2 2004
9.6 200315.4 2001
Japan 10.5 200510.3 1999
Korea1 18.6 2004Mexico 24.5 2005
23.1 200414.3 1999
Rate
Country Data year
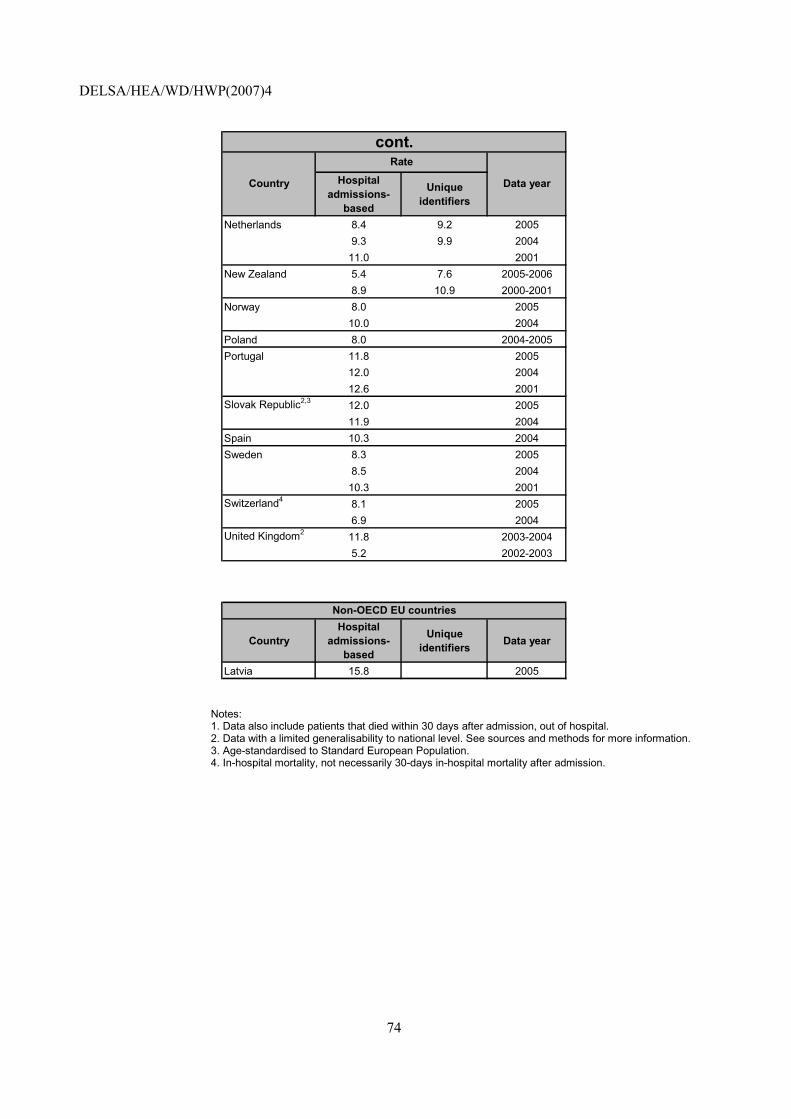
DELSA/HEA/WD/HWP(2007)4
74
Hospital admissions-
based
Unique identifiers
Netherlands 8.4 9.2 20059.3 9.9 2004
11.0 2001New Zealand 5.4 7.6 2005-2006
8.9 10.9 2000-2001Norway 8.0 2005
10.0 2004Poland 8.0 2004-2005Portugal 11.8 2005
12.0 200412.6 2001
Slovak Republic2,3 12.0 200511.9 2004
Spain 10.3 2004Sweden 8.3 2005
8.5 200410.3 2001
Switzerland4 8.1 20056.9 2004
United Kingdom2 11.8 2003-20045.2 2002-2003
cont.Rate
Country Data year
CountryHospital
admissions-based
Unique identifiers Data year
Latvia 15.8 2005
Non-OECD EU countries
Notes: 1. Data also include patients that died within 30 days after admission, out of hospital. 2. Data with a limited generalisability to national level. See sources and methods for more information. 3. Age-standardised to Standard European Population. 4. In-hospital mortality, not necessarily 30-days in-hospital mortality after admission.
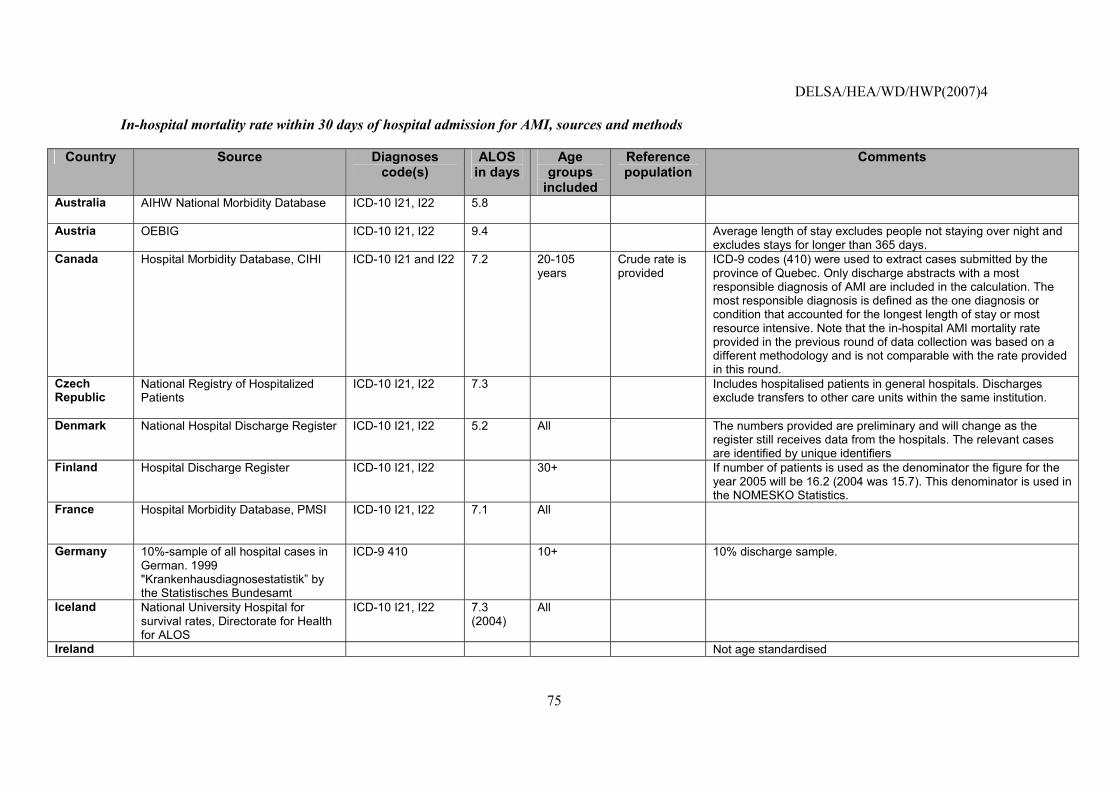
DELSA/HEA/WD/HWP(2007)4
75
In-hospital mortality rate within 30 days of hospital admission for AMI, sources and methods
Country Source Diagnoses code(s)
ALOS in days
Age groups
included
Reference population
Comments
Australia AIHW National Morbidity Database
ICD-10 I21, I22 5.8
Austria OEBIG ICD-10 I21, I22 9.4 Average length of stay excludes people not staying over night and excludes stays for longer than 365 days.
Canada Hospital Morbidity Database, CIHI ICD-10 I21 and I22 7.2 20-105 years
Crude rate is provided
ICD-9 codes (410) were used to extract cases submitted by the province of Quebec. Only discharge abstracts with a most responsible diagnosis of AMI are included in the calculation. The most responsible diagnosis is defined as the one diagnosis or condition that accounted for the longest length of stay or most resource intensive. Note that the in-hospital AMI mortality rate provided in the previous round of data collection was based on a different methodology and is not comparable with the rate provided in this round.
Czech Republic
National Registry of Hospitalized Patients
ICD-10 I21, I22 7.3 Includes hospitalised patients in general hospitals. Discharges exclude transfers to other care units within the same institution.
Denmark National Hospital Discharge Register ICD-10 I21, I22 5.2 All The numbers provided are preliminary and will change as the register still receives data from the hospitals. The relevant cases are identified by unique identifiers
Finland Hospital Discharge Register ICD-10 I21, I22 30+ If number of patients is used as the denominator the figure for the year 2005 will be 16.2 (2004 was 15.7). This denominator is used in the NOMESKO Statistics.
France Hospital Morbidity Database, PMSI
ICD-10 I21, I22 7.1 All
Germany 10%-sample of all hospital cases in German. 1999 "Krankenhausdiagnosestatistik� by the Statistisches Bundesamt
ICD-9 410 10+ 10% discharge sample.
Iceland National University Hospital for survival rates, Directorate for Health for ALOS
ICD-10 I21, I22 7.3 (2004)
All
Ireland Not age standardised
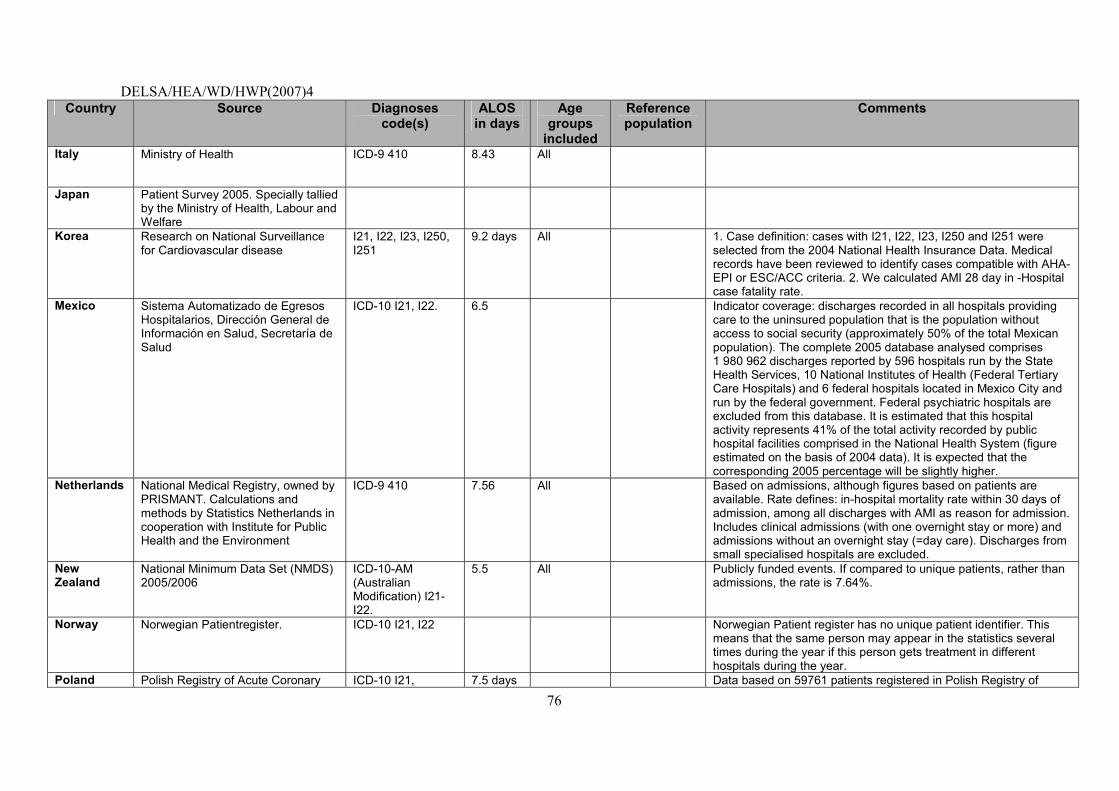
DELSA/HEA/WD/HWP(2007)4
76
Country Source Diagnoses code(s)
ALOS in days
Age groups
included
Reference population
Comments
Italy Ministry of Health
ICD-9 410 8.43 All
Japan Patient Survey 2005. Specially tallied by the Ministry of Health, Labour and Welfare
Korea Research on National Surveillance for Cardiovascular disease
I21, I22, I23, I250, I251
9.2 days All 1. Case definition: cases with I21, I22, I23, I250 and I251 were selected from the 2004 National Health Insurance Data. Medical records have been reviewed to identify cases compatible with AHA-EPI or ESC/ACC criteria. 2. We calculated AMI 28 day in -Hospital case fatality rate.
Mexico
Sistema Automatizado de Egresos Hospitalarios, Dirección General de Información en Salud, Secretaría de Salud
ICD-10 I21, I22. 6.5 Indicator coverage: discharges recorded in all hospitals providing care to the uninsured population that is the population without access to social security (approximately 50% of the total Mexican population). The complete 2005 database analysed comprises 1 980 962 discharges reported by 596 hospitals run by the State Health Services, 10 National Institutes of Health (Federal Tertiary Care Hospitals) and 6 federal hospitals located in Mexico City and run by the federal government. Federal psychiatric hospitals are excluded from this database. It is estimated that this hospital activity represents 41% of the total activity recorded by public hospital facilities comprised in the National Health System (figure estimated on the basis of 2004 data). It is expected that the corresponding 2005 percentage will be slightly higher.
Netherlands
National Medical Registry, owned by PRISMANT. Calculations and methods by Statistics Netherlands in cooperation with Institute for Public Health and the Environment
ICD-9 410 7.56 All Based on admissions, although figures based on patients are available. Rate defines: in-hospital mortality rate within 30 days of admission, among all discharges with AMI as reason for admission. Includes clinical admissions (with one overnight stay or more) and admissions without an overnight stay (=day care). Discharges from small specialised hospitals are excluded.
New Zealand
National Minimum Data Set (NMDS) 2005/2006
ICD-10-AM (Australian Modification) I21-I22.
5.5 All Publicly funded events. If compared to unique patients, rather than admissions, the rate is 7.64%.
Norway
Norwegian Patientregister. ICD-10 I21, I22 Norwegian Patient register has no unique patient identifier. This means that the same person may appear in the statistics several times during the year if this person gets treatment in different hospitals during the year.
Poland Polish Registry of Acute Coronary ICD-10 I21, 7.5 days Data based on 59761 patients registered in Polish Registry of
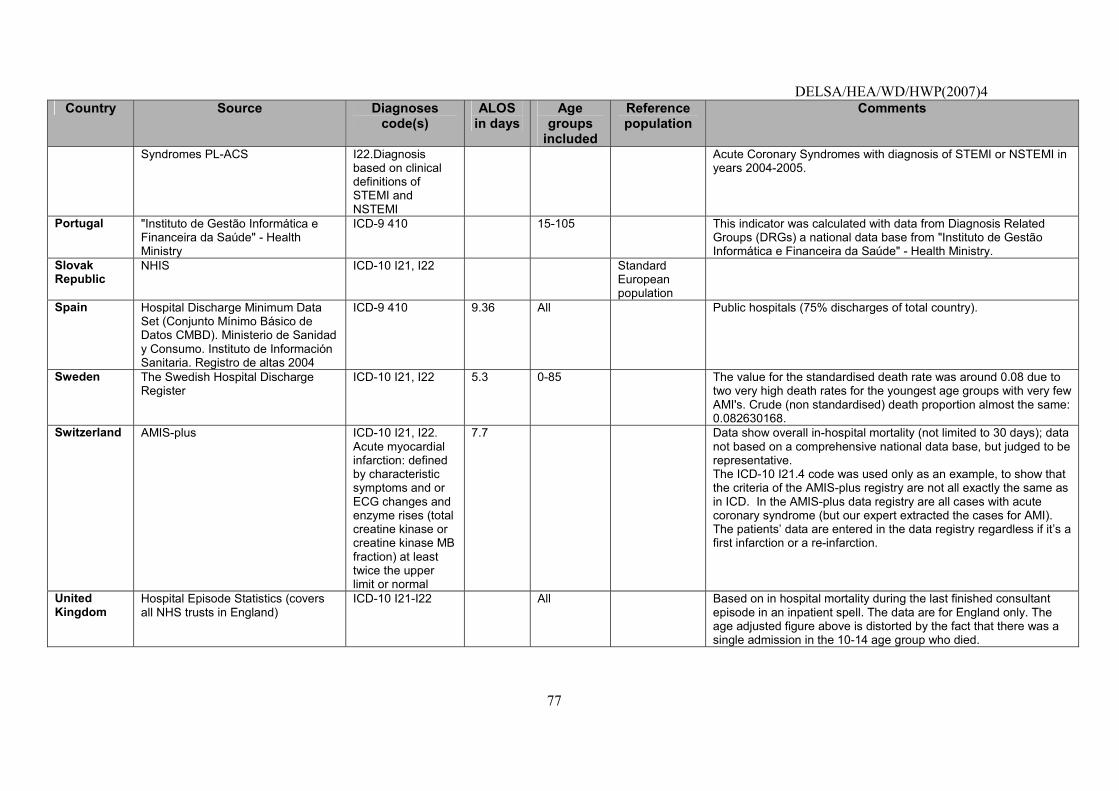
DELSA/HEA/WD/HWP(2007)4
77
Country Source Diagnoses code(s)
ALOS in days
Age groups
included
Reference population
Comments
Syndromes PL-ACS I22.Diagnosis based on clinical definitions of STEMI and NSTEMI
Acute Coronary Syndromes with diagnosis of STEMI or NSTEMI in years 2004-2005.
Portugal "Instituto de Gestão Informática e Financeira da Saúde" - Health Ministry
ICD-9 410 15-105 This indicator was calculated with data from Diagnosis Related Groups (DRGs) a national data base from "Instituto de Gestão Informática e Financeira da Saúde" - Health Ministry.
Slovak Republic
NHIS
ICD-10 I21, I22 Standard European population
Spain Hospital Discharge Minimum Data Set (Conjunto Mínimo Básico de Datos CMBD). Ministerio de Sanidad y Consumo. Instituto de Información Sanitaria. Registro de altas 2004
ICD-9 410 9.36 All Public hospitals (75% discharges of total country).
Sweden
The Swedish Hospital Discharge Register
ICD-10 I21, I22 5.3 0-85 The value for the standardised death rate was around 0.08 due to two very high death rates for the youngest age groups with very few AMI's. Crude (non standardised) death proportion almost the same: 0.082630168.
Switzerland AMIS-plus ICD-10 I21, I22. Acute myocardial infarction: defined by characteristic symptoms and or ECG changes and enzyme rises (total creatine kinase or creatine kinase MB fraction) at least twice the upper limit or normal
7.7 Data show overall in-hospital mortality (not limited to 30 days); data not based on a comprehensive national data base, but judged to be representative. The ICD-10 I21.4 code was used only as an example, to show that the criteria of the AMIS-plus registry are not all exactly the same as in ICD. In the AMIS-plus data registry are all cases with acute coronary syndrome (but our expert extracted the cases for AMI). The patients� data are entered in the data registry regardless if it�s a first infarction or a re-infarction.
United Kingdom
Hospital Episode Statistics (covers all NHS trusts in England)
ICD-10 I21-I22 All Based on in hospital mortality during the last finished consultant episode in an inpatient spell. The data are for England only. The age adjusted figure above is distorted by the fact that there was a single admission in the 10-14 age group who died.
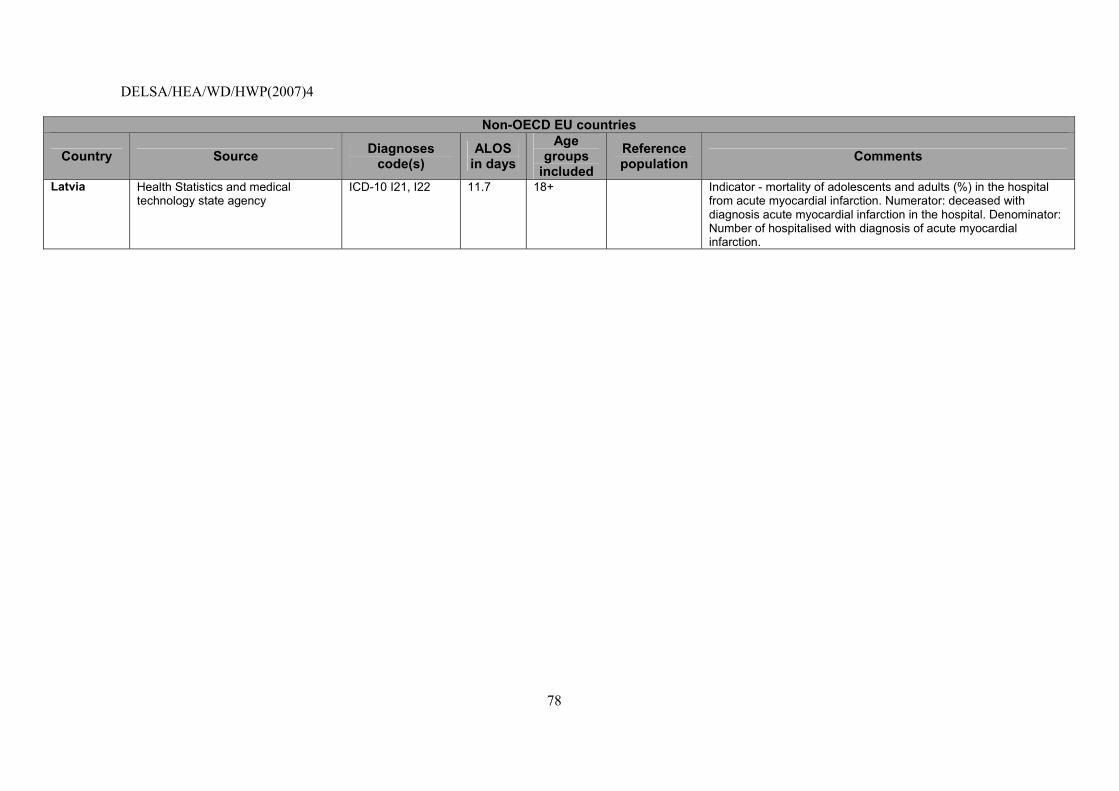
DELSA/HEA/WD/HWP(2007)4
78
Non-OECD EU countries
Country Source Diagnoses code(s)
ALOS in days
Age groups
included
Reference population Comments
Latvia
Health Statistics and medical technology state agency
ICD-10 I21, I22 11.7 18+ Indicator - mortality of adolescents and adults (%) in the hospital from acute myocardial infarction. Numerator: deceased with diagnosis acute myocardial infarction in the hospital. Denominator: Number of hospitalised with diagnosis of acute myocardial infarction.
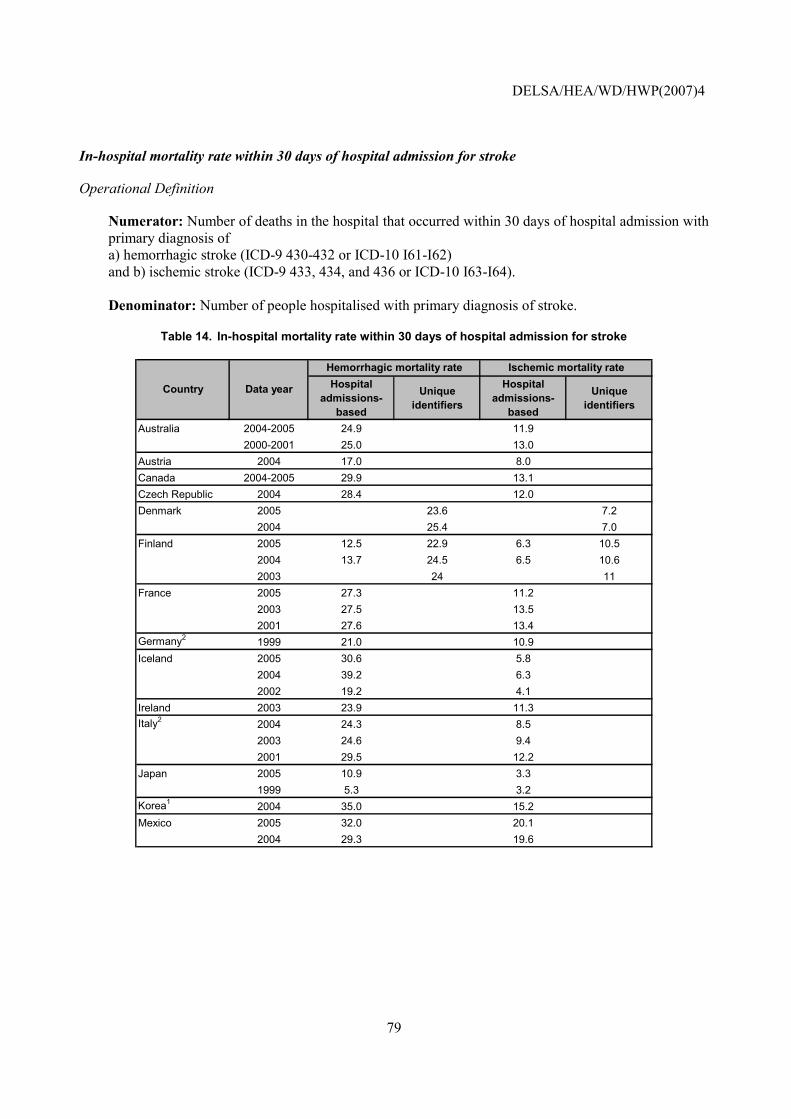
DELSA/HEA/WD/HWP(2007)4
79
In-hospital mortality rate within 30 days of hospital admission for stroke
Operational Definition
Numerator: Number of deaths in the hospital that occurred within 30 days of hospital admission with primary diagnosis of a) hemorrhagic stroke (ICD-9 430-432 or ICD-10 I61-I62) and b) ischemic stroke (ICD-9 433, 434, and 436 or ICD-10 I63-I64). Denominator: Number of people hospitalised with primary diagnosis of stroke.
Table 14. In-hospital mortality rate within 30 days of hospital admission for stroke
Hospital admissions-
based
Unique identifiers
Hospital admissions-
based
Unique identifiers
Australia 2004-2005 24.9 11.92000-2001 25.0 13.0
Austria 2004 17.0 8.0Canada 2004-2005 29.9 13.1Czech Republic 2004 28.4 12.0Denmark 2005 23.6 7.2
2004 25.4 7.0Finland 2005 12.5 22.9 6.3 10.5
2004 13.7 24.5 6.5 10.62003 24 11
France 2005 27.3 11.22003 27.5 13.52001 27.6 13.4
Germany2 1999 21.0 10.9Iceland 2005 30.6 5.8
2004 39.2 6.32002 19.2 4.1
Ireland 2003 23.9 11.3Italy2 2004 24.3 8.5
2003 24.6 9.42001 29.5 12.2
Japan 2005 10.9 3.31999 5.3 3.2
Korea1 2004 35.0 15.2Mexico 2005 32.0 20.1
2004 29.3 19.6
Hemorrhagic mortality rate Ischemic mortality rate
Country Data year
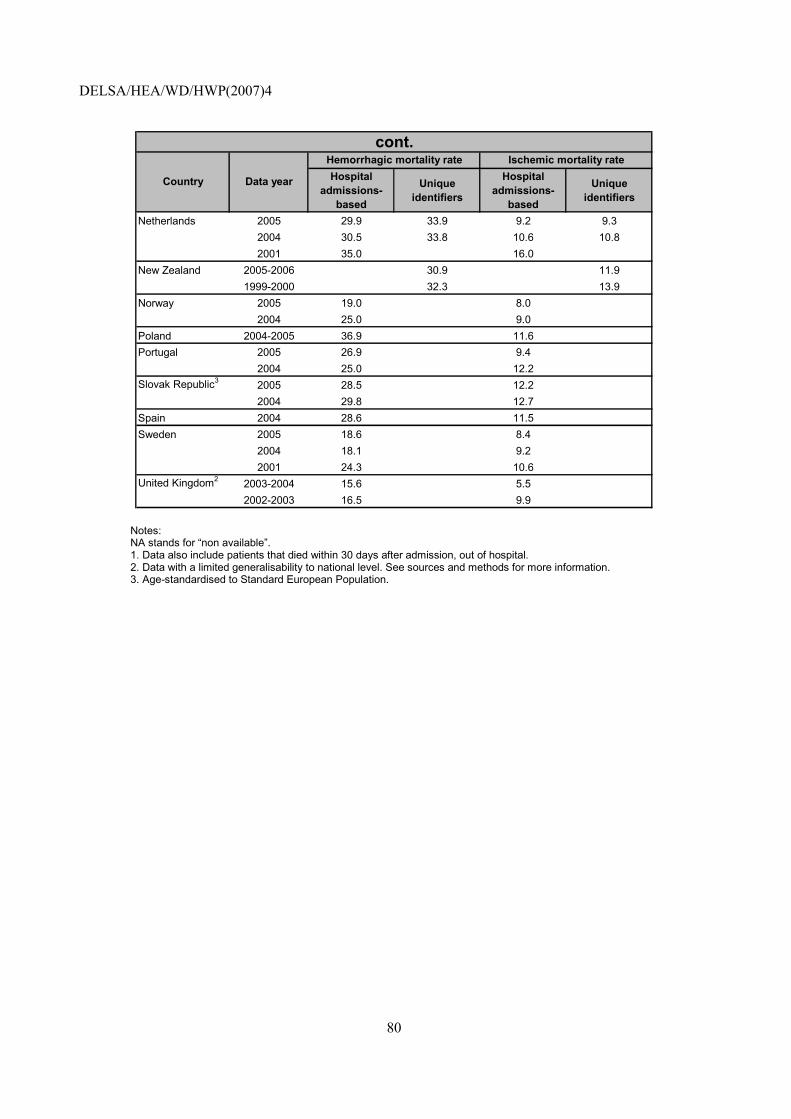
DELSA/HEA/WD/HWP(2007)4
80
Hospital admissions-
based
Unique identifiers
Hospital admissions-
based
Unique identifiers
Netherlands 2005 29.9 33.9 9.2 9.32004 30.5 33.8 10.6 10.82001 35.0 16.0
New Zealand 2005-2006 30.9 11.91999-2000 32.3 13.9
Norway 2005 19.0 8.02004 25.0 9.0
Poland 2004-2005 36.9 11.6Portugal 2005 26.9 9.4
2004 25.0 12.2Slovak Republic3 2005 28.5 12.2
2004 29.8 12.7Spain 2004 28.6 11.5Sweden 2005 18.6 8.4
2004 18.1 9.22001 24.3 10.6
United Kingdom2 2003-2004 15.6 5.52002-2003 16.5 9.9
Hemorrhagic mortality rate Ischemic mortality ratecont.
Country Data year
Notes: NA stands for �non available�. 1. Data also include patients that died within 30 days after admission, out of hospital. 2. Data with a limited generalisability to national level. See sources and methods for more information. 3. Age-standardised to Standard European Population.
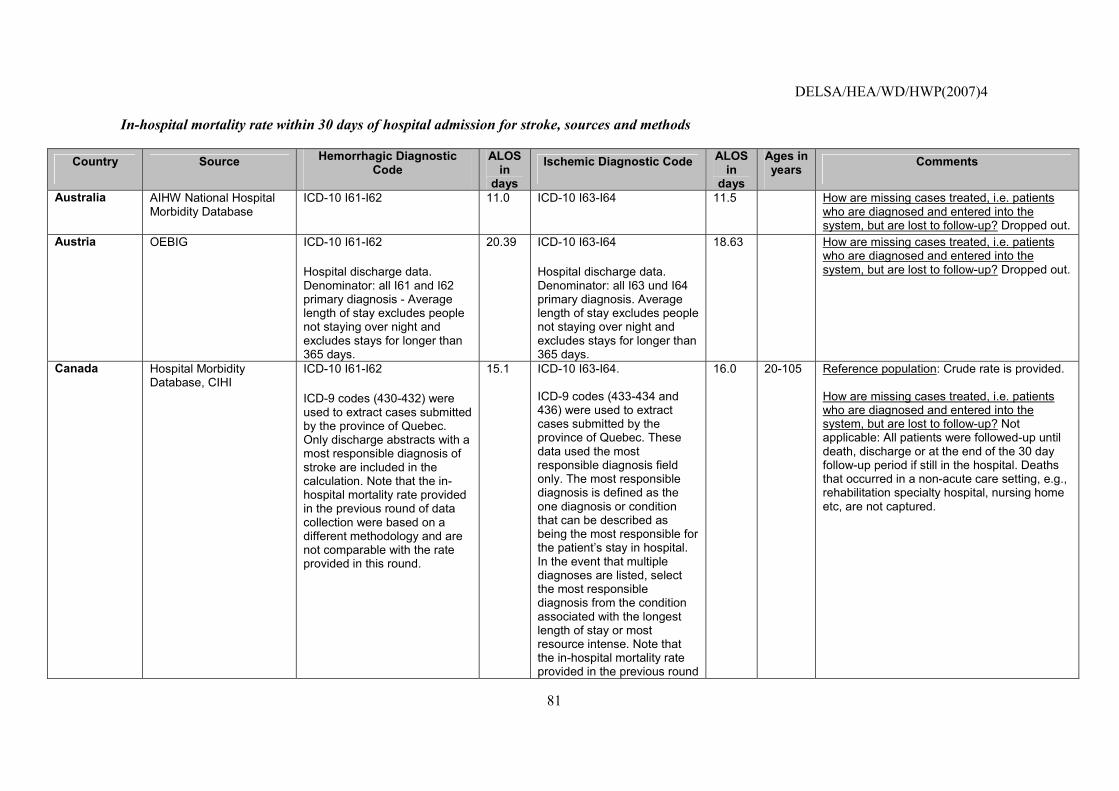
DELSA/HEA/WD/HWP(2007)4
81
In-hospital mortality rate within 30 days of hospital admission for stroke, sources and methods
Country Source Hemorrhagic Diagnostic Code
ALOS in
days
Ischemic Diagnostic Code ALOS in
days
Ages in years
Comments
Australia AIHW National Hospital Morbidity Database
ICD-10 I61-I62 11.0 ICD-10 I63-I64 11.5 How are missing cases treated, i.e. patients who are diagnosed and entered into the system, but are lost to follow-up? Dropped out.
Austria OEBIG ICD-10 I61-I62
Hospital discharge data. Denominator: all I61 and I62 primary diagnosis - Average length of stay excludes people not staying over night and excludes stays for longer than 365 days.
20.39 ICD-10 I63-I64
Hospital discharge data. Denominator: all I63 und I64 primary diagnosis. Average length of stay excludes people not staying over night and excludes stays for longer than 365 days.
18.63 How are missing cases treated, i.e. patients who are diagnosed and entered into the system, but are lost to follow-up? Dropped out.
Canada Hospital Morbidity Database, CIHI
ICD-10 I61-I62
ICD-9 codes (430-432) were used to extract cases submitted by the province of Quebec. Only discharge abstracts with a most responsible diagnosis of stroke are included in the calculation. Note that the in-hospital mortality rate provided in the previous round of data collection were based on a different methodology and are not comparable with the rate provided in this round.
15.1 ICD-10 I63-I64. ICD-9 codes (433-434 and 436) were used to extract cases submitted by the province of Quebec. These data used the most responsible diagnosis field only. The most responsible diagnosis is defined as the one diagnosis or condition that can be described as being the most responsible for the patient�s stay in hospital. In the event that multiple diagnoses are listed, select the most responsible diagnosis from the condition associated with the longest length of stay or most resource intense. Note that the in-hospital mortality rate provided in the previous round
16.0 20-105 Reference population: Crude rate is provided. How are missing cases treated, i.e. patients who are diagnosed and entered into the system, but are lost to follow-up? Not applicable: All patients were followed-up until death, discharge or at the end of the 30 day follow-up period if still in the hospital. Deaths that occurred in a non-acute care setting, e.g., rehabilitation specialty hospital, nursing home etc, are not captured.
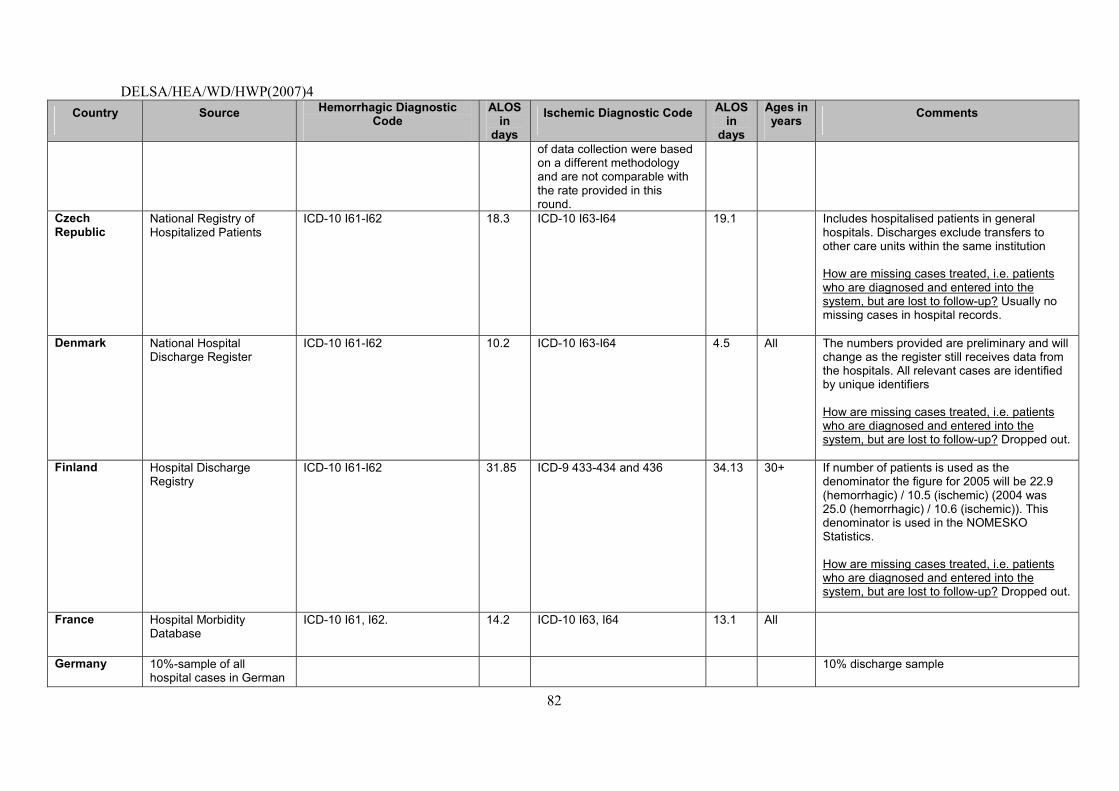
DELSA/HEA/WD/HWP(2007)4
82
Country Source Hemorrhagic Diagnostic Code
ALOS in
days
Ischemic Diagnostic Code ALOS in
days
Ages in years Comments
of data collection were based on a different methodology and are not comparable with the rate provided in this round.
Czech Republic
National Registry of Hospitalized Patients
ICD-10 I61-I62
18.3 ICD-10 I63-I64 19.1 Includes hospitalised patients in general hospitals. Discharges exclude transfers to other care units within the same institution How are missing cases treated, i.e. patients who are diagnosed and entered into the system, but are lost to follow-up? Usually no missing cases in hospital records.
Denmark National Hospital Discharge Register
ICD-10 I61-I62
10.2 ICD-10 I63-I64 4.5 All The numbers provided are preliminary and will change as the register still receives data from the hospitals. All relevant cases are identified by unique identifiers How are missing cases treated, i.e. patients who are diagnosed and entered into the system, but are lost to follow-up? Dropped out.
Finland Hospital Discharge Registry
ICD-10 I61-I62
31.85 ICD-9 433-434 and 436 34.13 30+ If number of patients is used as the denominator the figure for 2005 will be 22.9 (hemorrhagic) / 10.5 (ischemic) (2004 was 25.0 (hemorrhagic) / 10.6 (ischemic)). This denominator is used in the NOMESKO Statistics. How are missing cases treated, i.e. patients who are diagnosed and entered into the system, but are lost to follow-up? Dropped out.
France Hospital Morbidity Database
ICD-10 I61, I62. 14.2 ICD-10 I63, I64 13.1 All
Germany 10%-sample of all hospital cases in German
10% discharge sample
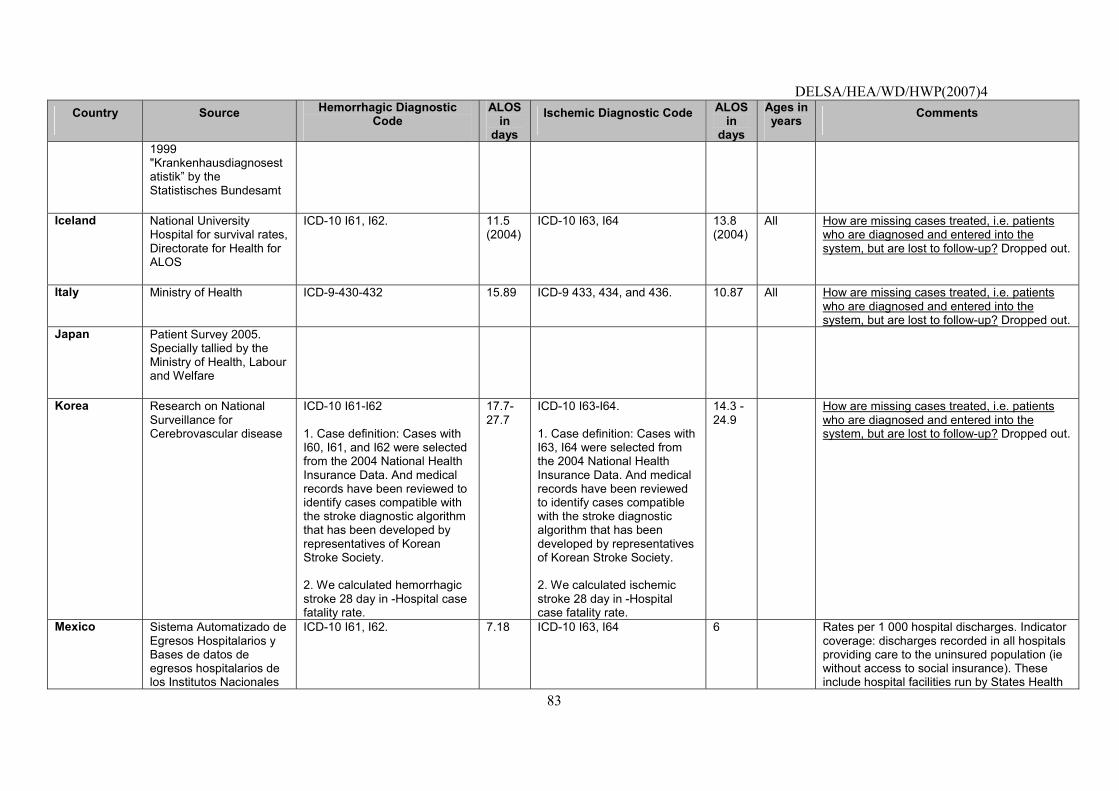
DELSA/HEA/WD/HWP(2007)4
83
Country Source Hemorrhagic Diagnostic Code
ALOS in
days
Ischemic Diagnostic Code ALOS in
days
Ages in years Comments
1999 "Krankenhausdiagnosestatistik� by the Statistisches Bundesamt
Iceland National University Hospital for survival rates, Directorate for Health for ALOS
ICD-10 I61, I62. 11.5 (2004)
ICD-10 I63, I64 13.8 (2004)
All How are missing cases treated, i.e. patients who are diagnosed and entered into the system, but are lost to follow-up? Dropped out.
Italy Ministry of Health ICD-9-430-432 15.89 ICD-9 433, 434, and 436. 10.87 All How are missing cases treated, i.e. patients who are diagnosed and entered into the system, but are lost to follow-up? Dropped out.
Japan Patient Survey 2005. Specially tallied by the Ministry of Health, Labour and Welfare
Korea Research on National Surveillance for Cerebrovascular disease
ICD-10 I61-I62 1. Case definition: Cases with I60, I61, and I62 were selected from the 2004 National Health Insurance Data. And medical records have been reviewed to identify cases compatible with the stroke diagnostic algorithm that has been developed by representatives of Korean Stroke Society. 2. We calculated hemorrhagic stroke 28 day in -Hospital case fatality rate.
17.7-27.7
ICD-10 I63-I64. 1. Case definition: Cases with I63, I64 were selected from the 2004 National Health Insurance Data. And medical records have been reviewed to identify cases compatible with the stroke diagnostic algorithm that has been developed by representatives of Korean Stroke Society. 2. We calculated ischemic stroke 28 day in -Hospital case fatality rate.
14.3 - 24.9
How are missing cases treated, i.e. patients who are diagnosed and entered into the system, but are lost to follow-up? Dropped out.
Mexico Sistema Automatizado de Egresos Hospitalarios y Bases de datos de egresos hospitalarios de los Institutos Nacionales
ICD-10 I61, I62. 7.18 ICD-10 I63, I64 6 Rates per 1 000 hospital discharges. Indicator coverage: discharges recorded in all hospitals providing care to the uninsured population (ie without access to social insurance). These include hospital facilities run by States Health
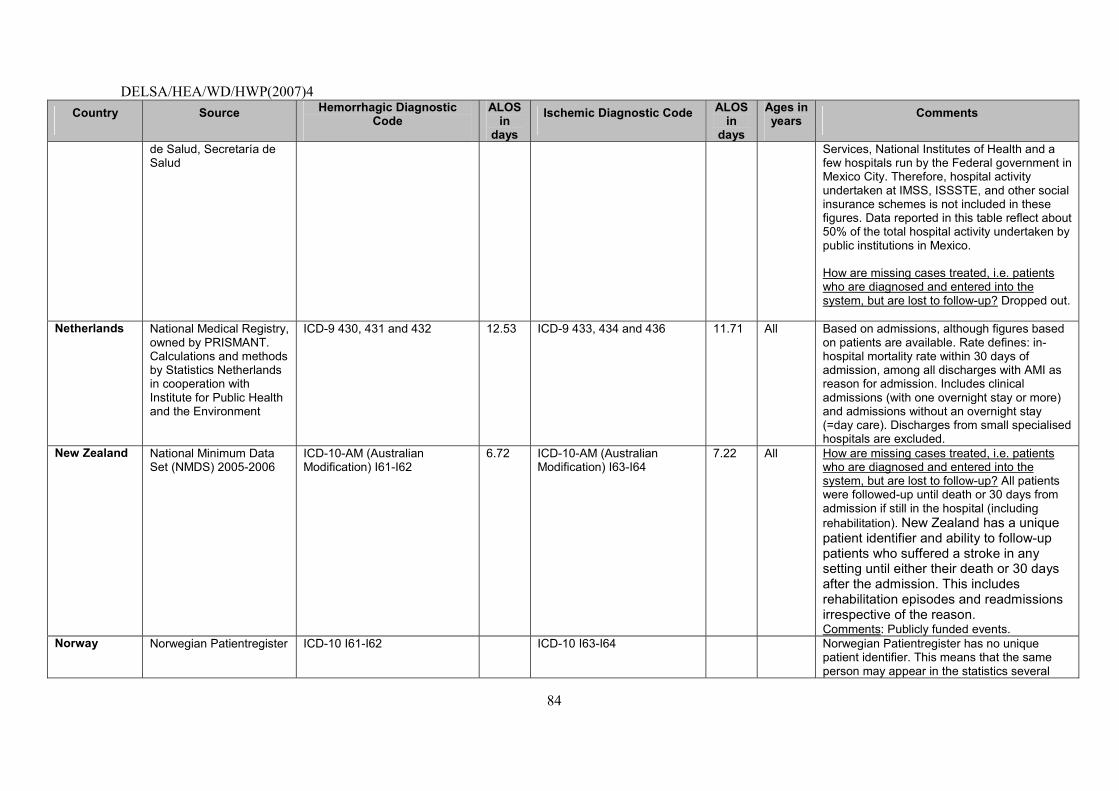
DELSA/HEA/WD/HWP(2007)4
84
Country Source Hemorrhagic Diagnostic Code
ALOS in
days
Ischemic Diagnostic Code ALOS in
days
Ages in years Comments
de Salud, Secretaría de Salud
Services, National Institutes of Health and a few hospitals run by the Federal government in Mexico City. Therefore, hospital activity undertaken at IMSS, ISSSTE, and other social insurance schemes is not included in these figures. Data reported in this table reflect about 50% of the total hospital activity undertaken by public institutions in Mexico. How are missing cases treated, i.e. patients who are diagnosed and entered into the system, but are lost to follow-up? Dropped out.
Netherlands National Medical Registry, owned by PRISMANT. Calculations and methods by Statistics Netherlands in cooperation with Institute for Public Health and the Environment
ICD-9 430, 431 and 432 12.53 ICD-9 433, 434 and 436 11.71 All Based on admissions, although figures based on patients are available. Rate defines: in-hospital mortality rate within 30 days of admission, among all discharges with AMI as reason for admission. Includes clinical admissions (with one overnight stay or more) and admissions without an overnight stay (=day care). Discharges from small specialised hospitals are excluded.
New Zealand National Minimum Data Set (NMDS) 2005-2006
ICD-10-AM (Australian Modification) I61-I62
6.72 ICD-10-AM (Australian Modification) I63-I64
7.22 All How are missing cases treated, i.e. patients who are diagnosed and entered into the system, but are lost to follow-up? All patients were followed-up until death or 30 days from admission if still in the hospital (including rehabilitation). New Zealand has a unique patient identifier and ability to follow-up patients who suffered a stroke in any setting until either their death or 30 days after the admission. This includes rehabilitation episodes and readmissions irrespective of the reason. Comments: Publicly funded events.
Norway Norwegian Patientregister ICD-10 I61-I62 ICD-10 I63-I64 Norwegian Patientregister has no unique patient identifier. This means that the same person may appear in the statistics several
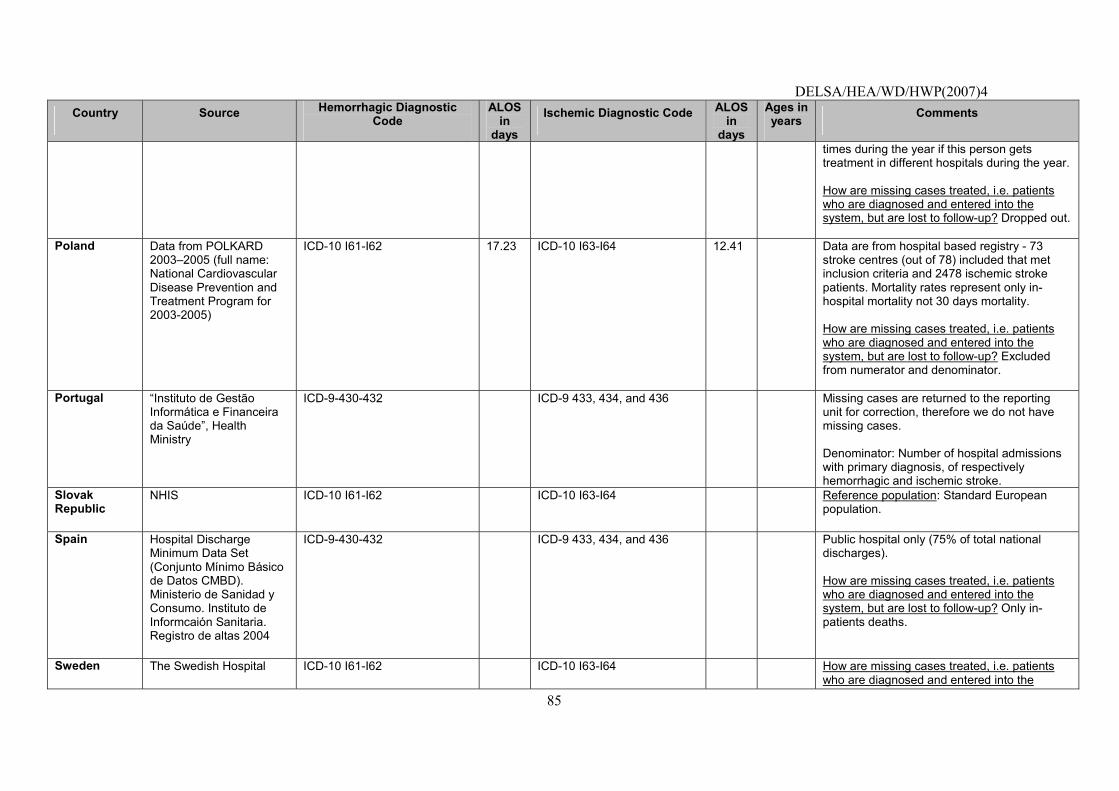
DELSA/HEA/WD/HWP(2007)4
85
Country Source Hemorrhagic Diagnostic Code
ALOS in
days
Ischemic Diagnostic Code ALOS in
days
Ages in years Comments
times during the year if this person gets treatment in different hospitals during the year. How are missing cases treated, i.e. patients who are diagnosed and entered into the system, but are lost to follow-up? Dropped out.
Poland Data from POLKARD 2003�2005 (full name: National Cardiovascular Disease Prevention and Treatment Program for 2003-2005)
ICD-10 I61-I62 17.23 ICD-10 I63-I64 12.41 Data are from hospital based registry - 73 stroke centres (out of 78) included that met inclusion criteria and 2478 ischemic stroke patients. Mortality rates represent only in-hospital mortality not 30 days mortality. How are missing cases treated, i.e. patients who are diagnosed and entered into the system, but are lost to follow-up? Excluded from numerator and denominator.
Portugal �Instituto de Gestão Informática e Financeira da Saúde�, Health Ministry
ICD-9-430-432 ICD-9 433, 434, and 436 Missing cases are returned to the reporting unit for correction, therefore we do not have missing cases. Denominator: Number of hospital admissions with primary diagnosis, of respectively hemorrhagic and ischemic stroke.
Slovak Republic
NHIS ICD-10 I61-I62 ICD-10 I63-I64 Reference population: Standard European population.
Spain Hospital Discharge Minimum Data Set (Conjunto Mínimo Básico de Datos CMBD). Ministerio de Sanidad y Consumo. Instituto de Informcaión Sanitaria. Registro de altas 2004
ICD-9-430-432 ICD-9 433, 434, and 436 Public hospital only (75% of total national discharges). How are missing cases treated, i.e. patients who are diagnosed and entered into the system, but are lost to follow-up? Only in-patients deaths.
Sweden The Swedish Hospital ICD-10 I61-I62 ICD-10 I63-I64 How are missing cases treated, i.e. patients who are diagnosed and entered into the
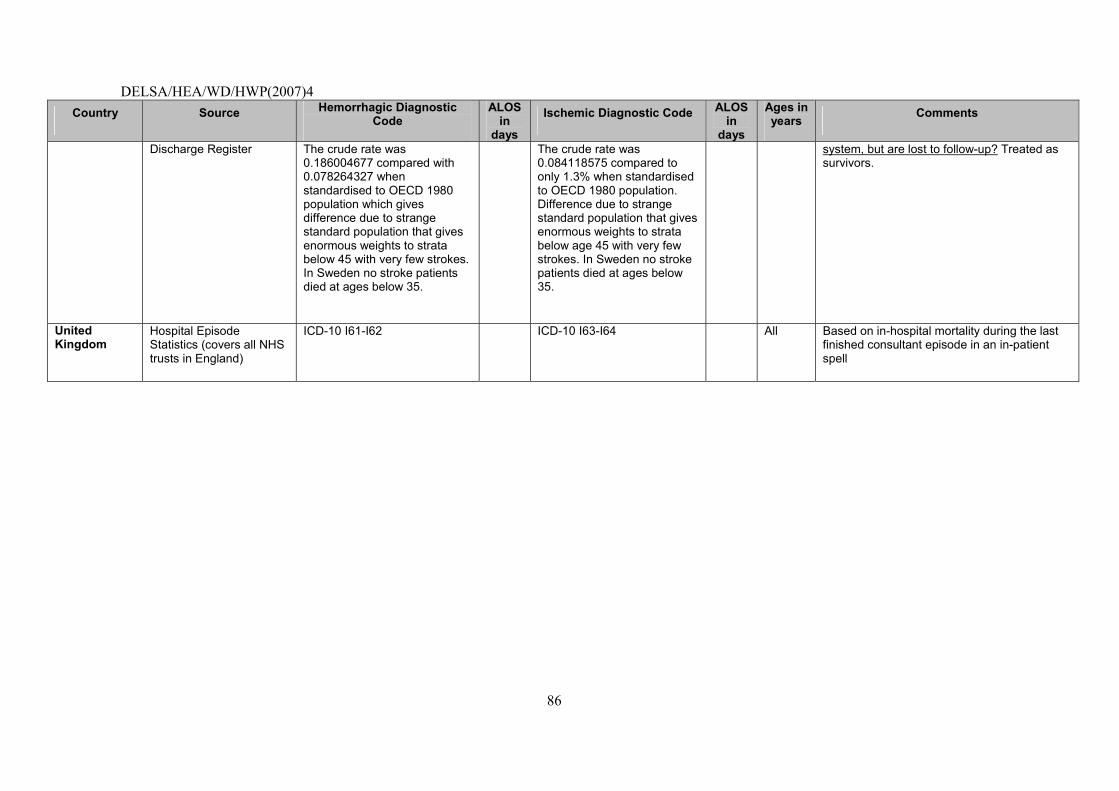
DELSA/HEA/WD/HWP(2007)4
86
Country Source Hemorrhagic Diagnostic Code
ALOS in
days
Ischemic Diagnostic Code ALOS in
days
Ages in years Comments
Discharge Register The crude rate was 0.186004677 compared with 0.078264327 when standardised to OECD 1980 population which gives difference due to strange standard population that gives enormous weights to strata below 45 with very few strokes. In Sweden no stroke patients died at ages below 35.
The crude rate was 0.084118575 compared to only 1.3% when standardised to OECD 1980 population. Difference due to strange standard population that gives enormous weights to strata below age 45 with very few strokes. In Sweden no stroke patients died at ages below 35.
system, but are lost to follow-up? Treated as survivors.
United Kingdom
Hospital Episode Statistics (covers all NHS trusts in England)
ICD-10 I61-I62 ICD-10 I63-I64 All Based on in-hospital mortality during the last finished consultant episode in an in-patient spell
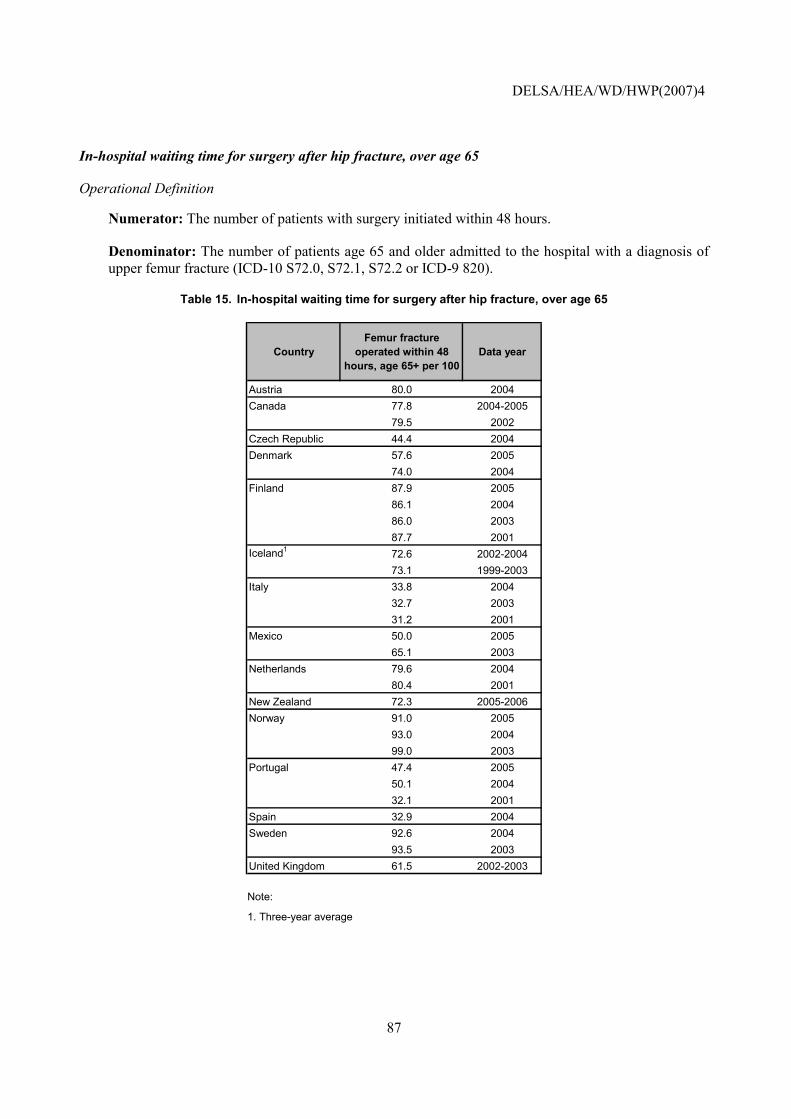
DELSA/HEA/WD/HWP(2007)4
87
In-hospital waiting time for surgery after hip fracture, over age 65
Operational Definition
Numerator: The number of patients with surgery initiated within 48 hours.
Denominator: The number of patients age 65 and older admitted to the hospital with a diagnosis of upper femur fracture (ICD-10 S72.0, S72.1, S72.2 or ICD-9 820).
Table 15. In-hospital waiting time for surgery after hip fracture, over age 65
CountryFemur fracture
operated within 48 hours, age 65+ per 100
Data year
Austria 80.0 2004Canada 77.8 2004-2005
79.5 2002Czech Republic 44.4 2004Denmark 57.6 2005
74.0 2004Finland 87.9 2005
86.1 200486.0 200387.7 2001
Iceland1 72.6 2002-200473.1 1999-2003
Italy 33.8 200432.7 200331.2 2001
Mexico 50.0 200565.1 2003
Netherlands 79.6 200480.4 2001
New Zealand 72.3 2005-2006Norway 91.0 2005
93.0 200499.0 2003
Portugal 47.4 200550.1 200432.1 2001
Spain 32.9 2004Sweden 92.6 2004
93.5 2003United Kingdom 61.5 2002-2003
Note:
1. Three-year average
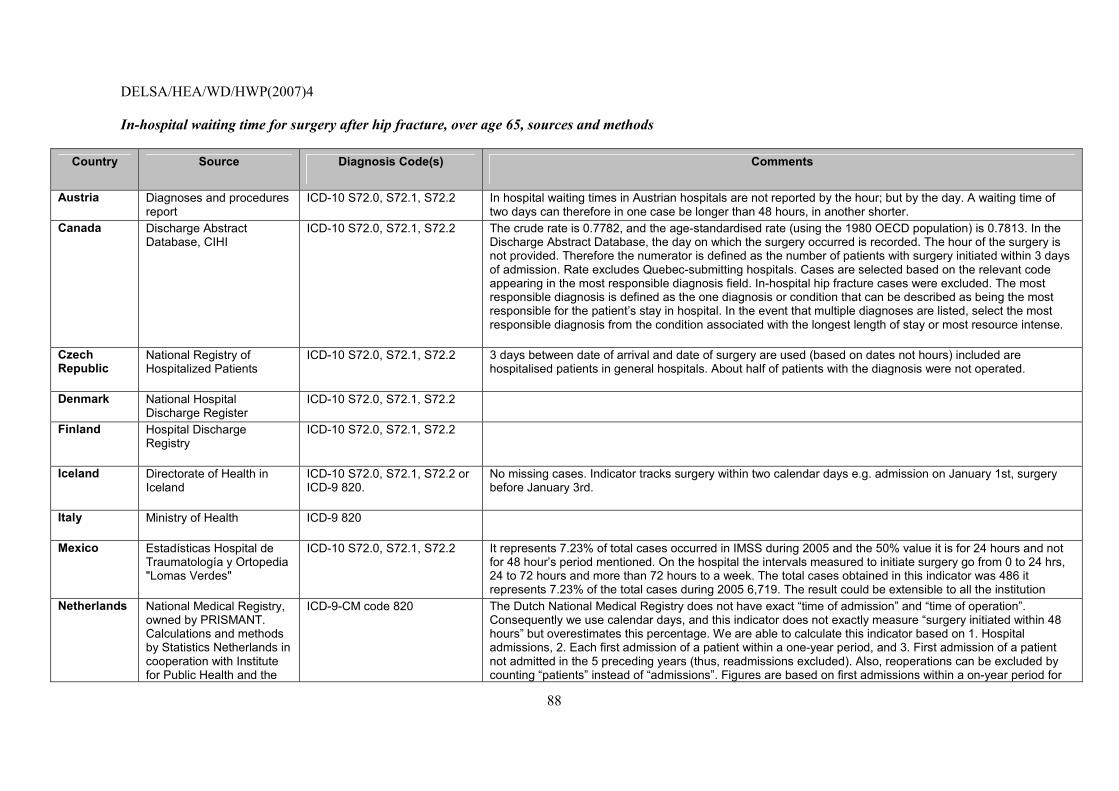
DELSA/HEA/WD/HWP(2007)4
88
In-hospital waiting time for surgery after hip fracture, over age 65, sources and methods
Country Source Diagnosis Code(s) Comments
Austria Diagnoses and procedures report
ICD-10 S72.0, S72.1, S72.2 In hospital waiting times in Austrian hospitals are not reported by the hour; but by the day. A waiting time of two days can therefore in one case be longer than 48 hours, in another shorter.
Canada Discharge Abstract Database, CIHI
ICD-10 S72.0, S72.1, S72.2 The crude rate is 0.7782, and the age-standardised rate (using the 1980 OECD population) is 0.7813. In the Discharge Abstract Database, the day on which the surgery occurred is recorded. The hour of the surgery is not provided. Therefore the numerator is defined as the number of patients with surgery initiated within 3 days of admission. Rate excludes Quebec-submitting hospitals. Cases are selected based on the relevant code appearing in the most responsible diagnosis field. In-hospital hip fracture cases were excluded. The most responsible diagnosis is defined as the one diagnosis or condition that can be described as being the most responsible for the patient�s stay in hospital. In the event that multiple diagnoses are listed, select the most responsible diagnosis from the condition associated with the longest length of stay or most resource intense.
Czech Republic
National Registry of Hospitalized Patients
ICD-10 S72.0, S72.1, S72.2 3 days between date of arrival and date of surgery are used (based on dates not hours) included are hospitalised patients in general hospitals. About half of patients with the diagnosis were not operated.
Denmark National Hospital Discharge Register
ICD-10 S72.0, S72.1, S72.2
Finland Hospital Discharge Registry
ICD-10 S72.0, S72.1, S72.2
Iceland Directorate of Health in Iceland
ICD-10 S72.0, S72.1, S72.2 or ICD-9 820.
No missing cases. Indicator tracks surgery within two calendar days e.g. admission on January 1st, surgery before January 3rd.
Italy Ministry of Health ICD-9 820
Mexico Estadísticas Hospital de Traumatología y Ortopedia "Lomas Verdes"
ICD-10 S72.0, S72.1, S72.2 It represents 7.23% of total cases occurred in IMSS during 2005 and the 50% value it is for 24 hours and not for 48 hour�s period mentioned. On the hospital the intervals measured to initiate surgery go from 0 to 24 hrs, 24 to 72 hours and more than 72 hours to a week. The total cases obtained in this indicator was 486 it represents 7.23% of the total cases during 2005 6,719. The result could be extensible to all the institution
Netherlands National Medical Registry, owned by PRISMANT. Calculations and methods by Statistics Netherlands in cooperation with Institute for Public Health and the
ICD-9-CM code 820 The Dutch National Medical Registry does not have exact �time of admission� and �time of operation�. Consequently we use calendar days, and this indicator does not exactly measure �surgery initiated within 48 hours� but overestimates this percentage. We are able to calculate this indicator based on 1. Hospital admissions, 2. Each first admission of a patient within a one-year period, and 3. First admission of a patient not admitted in the 5 preceding years (thus, readmissions excluded). Also, reoperations can be excluded by counting �patients� instead of �admissions�. Figures are based on first admissions within a on-year period for
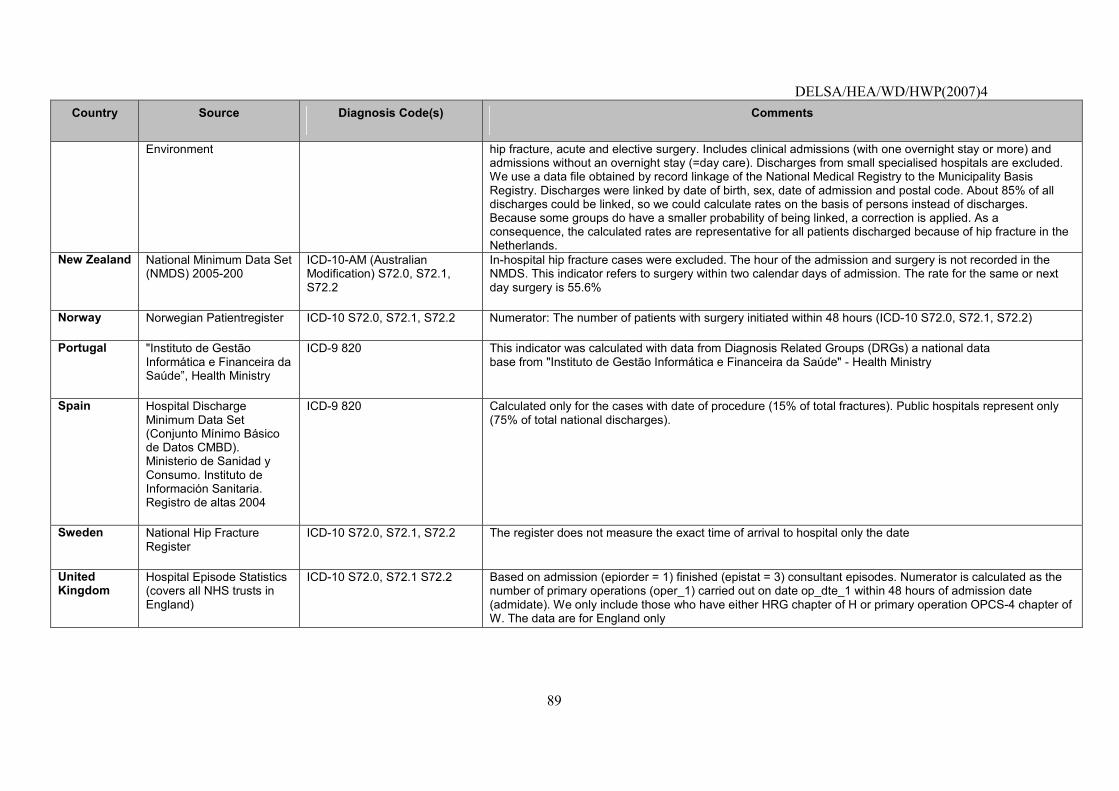
DELSA/HEA/WD/HWP(2007)4
89
Country Source Diagnosis Code(s) Comments
Environment hip fracture, acute and elective surgery. Includes clinical admissions (with one overnight stay or more) and admissions without an overnight stay (=day care). Discharges from small specialised hospitals are excluded. We use a data file obtained by record linkage of the National Medical Registry to the Municipality Basis Registry. Discharges were linked by date of birth, sex, date of admission and postal code. About 85% of all discharges could be linked, so we could calculate rates on the basis of persons instead of discharges. Because some groups do have a smaller probability of being linked, a correction is applied. As a consequence, the calculated rates are representative for all patients discharged because of hip fracture in the Netherlands.
New Zealand National Minimum Data Set (NMDS) 2005-200
ICD-10-AM (Australian Modification) S72.0, S72.1, S72.2
In-hospital hip fracture cases were excluded. The hour of the admission and surgery is not recorded in the NMDS. This indicator refers to surgery within two calendar days of admission. The rate for the same or next day surgery is 55.6%
Norway Norwegian Patientregister ICD-10 S72.0, S72.1, S72.2 Numerator: The number of patients with surgery initiated within 48 hours (ICD-10 S72.0, S72.1, S72.2)
Portugal "Instituto de Gestão Informática e Financeira da Saúde�, Health Ministry
ICD-9 820 This indicator was calculated with data from Diagnosis Related Groups (DRGs) a national data base from "Instituto de Gestão Informática e Financeira da Saúde" - Health Ministry
Spain Hospital Discharge Minimum Data Set (Conjunto Mínimo Básico de Datos CMBD). Ministerio de Sanidad y Consumo. Instituto de Información Sanitaria. Registro de altas 2004
ICD-9 820 Calculated only for the cases with date of procedure (15% of total fractures). Public hospitals represent only (75% of total national discharges).
Sweden National Hip Fracture Register
ICD-10 S72.0, S72.1, S72.2 The register does not measure the exact time of arrival to hospital only the date
United Kingdom
Hospital Episode Statistics (covers all NHS trusts in England)
ICD-10 S72.0, S72.1 S72.2 Based on admission (epiorder = 1) finished (epistat = 3) consultant episodes. Numerator is calculated as the number of primary operations (oper_1) carried out on date op_dte_1 within 48 hours of admission date (admidate). We only include those who have either HRG chapter of H or primary operation OPCS-4 chapter of W. The data are for England only
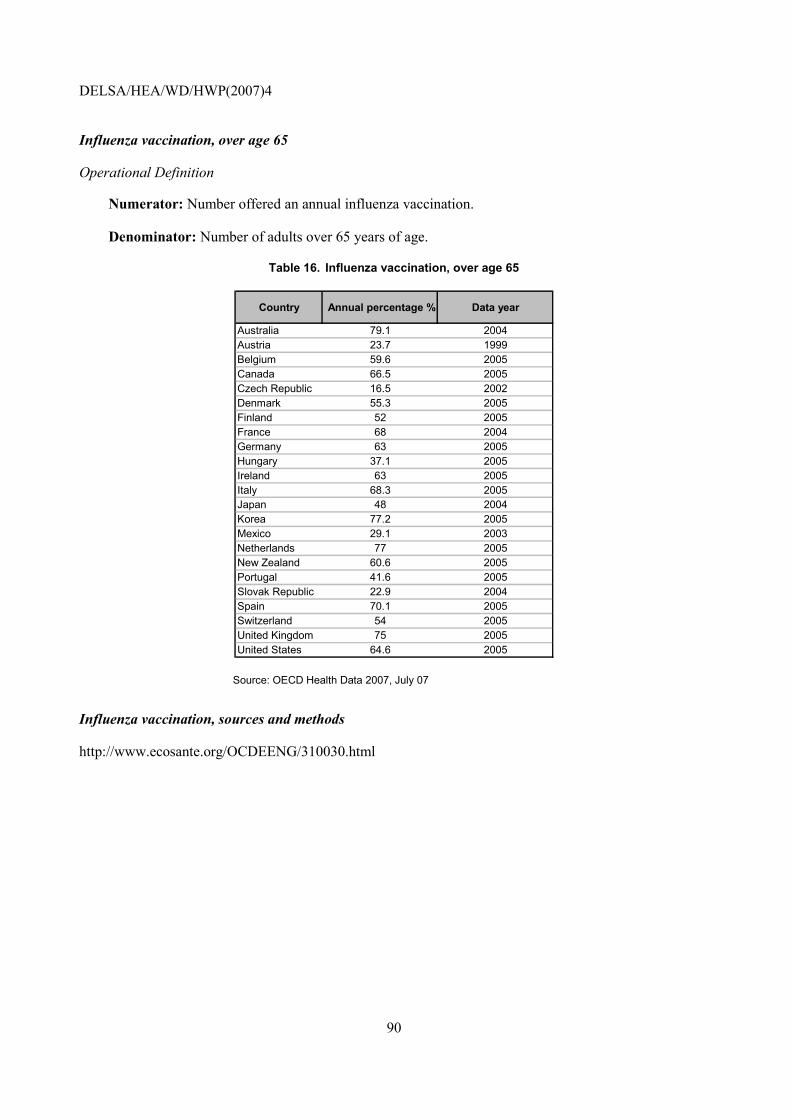
DELSA/HEA/WD/HWP(2007)4
90
Influenza vaccination, over age 65
Operational Definition
Numerator: Number offered an annual influenza vaccination.
Denominator: Number of adults over 65 years of age.
Table 16. Influenza vaccination, over age 65
Country Annual percentage % Data year
Australia 79.1 2004Austria 23.7 1999Belgium 59.6 2005Canada 66.5 2005Czech Republic 16.5 2002Denmark 55.3 2005Finland 52 2005France 68 2004Germany 63 2005Hungary 37.1 2005Ireland 63 2005Italy 68.3 2005Japan 48 2004Korea 77.2 2005Mexico 29.1 2003Netherlands 77 2005New Zealand 60.6 2005Portugal 41.6 2005Slovak Republic 22.9 2004Spain 70.1 2005Switzerland 54 2005United Kingdom 75 2005United States 64.6 2005
Source: OECD Health Data 2007, July 07
Influenza vaccination, sources and methods
http://www.ecosante.org/OCDEENG/310030.html
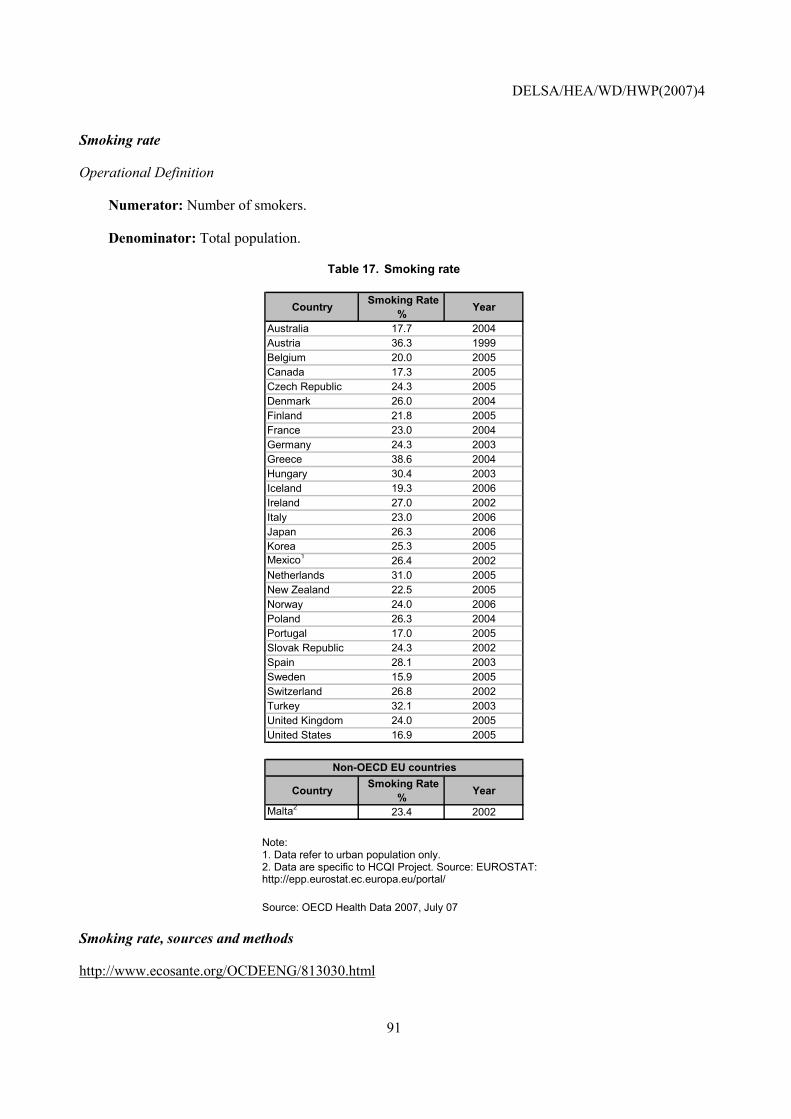
DELSA/HEA/WD/HWP(2007)4
91
Smoking rate
Operational Definition
Numerator: Number of smokers.
Denominator: Total population.
Table 17. Smoking rate
Country Smoking Rate % Year
Australia 17.7 2004Austria 36.3 1999Belgium 20.0 2005Canada 17.3 2005Czech Republic 24.3 2005Denmark 26.0 2004Finland 21.8 2005France 23.0 2004Germany 24.3 2003Greece 38.6 2004Hungary 30.4 2003Iceland 19.3 2006Ireland 27.0 2002Italy 23.0 2006Japan 26.3 2006Korea 25.3 2005Mexico1 26.4 2002Netherlands 31.0 2005New Zealand 22.5 2005Norway 24.0 2006Poland 26.3 2004Portugal 17.0 2005Slovak Republic 24.3 2002Spain 28.1 2003Sweden 15.9 2005Switzerland 26.8 2002Turkey 32.1 2003United Kingdom 24.0 2005United States 16.9 2005
Country Smoking Rate % Year
Malta2 23.4 2002
Non-OECD EU countries
Note: 1. Data refer to urban population only. 2. Data are specific to HCQI Project. Source: EUROSTAT: http://epp.eurostat.ec.europa.eu/portal/
Source: OECD Health Data 2007, July 07
Smoking rate, sources and methods
http://www.ecosante.org/OCDEENG/813030.html
DELSA/HEA/WD/HWP(2007)4
92
TWO NEW INDICATORS CONSIDERED FIT FOR INTERNATIONAL COMPARISONS: CLINICAL IMPORTANCE, SCIENTIFIC SOUNDNESS, SPECIFICATIONS AND DATA
RESULTS
46. This section presents information on two indicators that were reviewed by the HCQI Expert Group and found to be ready for publication in a working paper format. The decisions were guided by a review of the indicators according to criteria for scientific soundness, clinical and policy importance of the indicator and the comparability across countries of the indicator�s data sources.
47. Since these indicators are being published for the first time, a full account is given here of their description and definition, scientific soundness, importance and data comparability issues related to the indicator. Also presented are the national estimates and the sources and methods for each indicator.
48. The following table presents a summary of the data availability for the two indicators presented in this section.
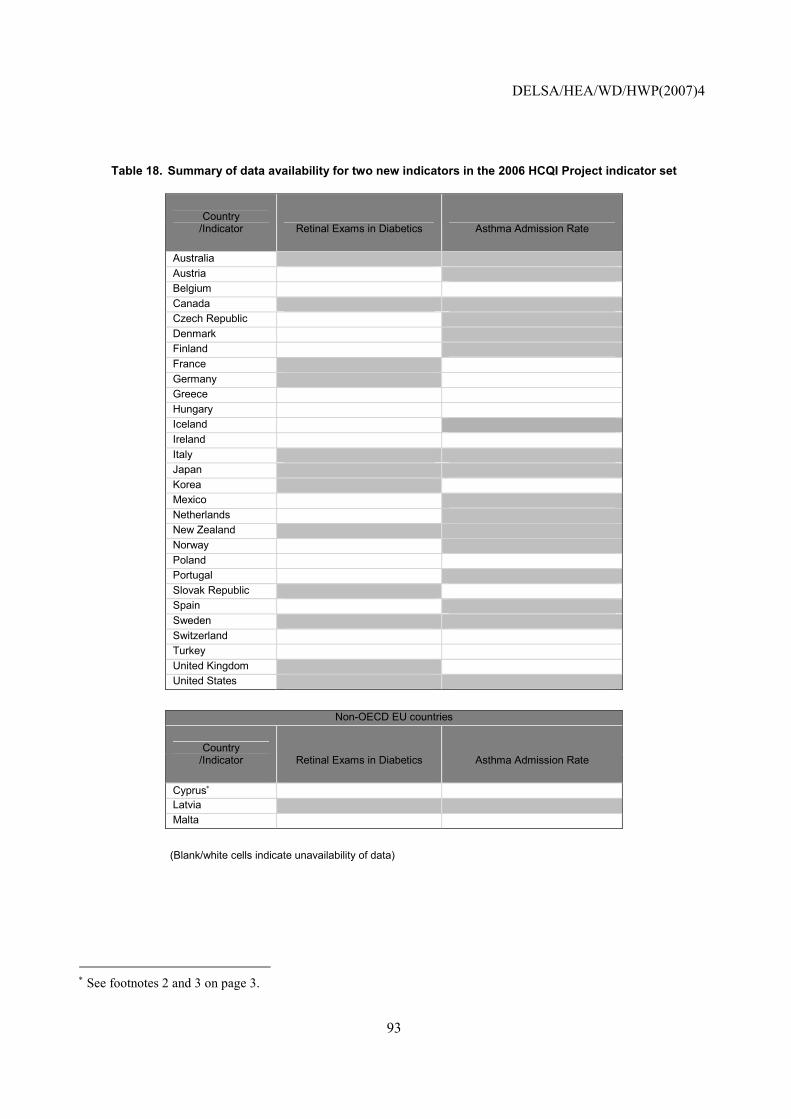
DELSA/HEA/WD/HWP(2007)4
93
Table 18. Summary of data availability for two new indicators in the 2006 HCQI Project indicator set
Country /Indicator Retinal Exams in Diabetics Asthma Admission Rate
Australia Austria Belgium Canada Czech Republic Denmark Finland France Germany Greece Hungary Iceland Ireland Italy Japan Korea Mexico Netherlands New Zealand Norway Poland Portugal Slovak Republic Spain Sweden Switzerland Turkey United Kingdom United States
Non-OECD EU countries
Country /Indicator Retinal Exams in Diabetics Asthma Admission Rate
Cyprus∗ Latvia Malta
(Blank/white cells indicate unavailability of data)
∗ See footnotes 2 and 3 on page 3.
DELSA/HEA/WD/HWP(2007)4
94
Retinal exam in diabetics
Operational Definition
Numerator: Number of diabetic patients who received a dilated eye exam or evaluation of retinal photography by an ophthalmologist or optometrist in a given year.
Denominator: Number of patients with diabetes (type I and type II) age 18-75 years.
49. Importance: Diabetes has become one of the most important public health challenges of the 21st century. Over 150 million adults are affected worldwide with the number expected to double in the next 25 years (King et al., 1998; Zimmet et al., 2001). For example in the US an estimated 15.7 million people suffers diabetes, including an estimated 5.4 million people not yet diagnosed. The prevalence of diabetes in the US is projected to increase from the present rate of 5.9% to 8.9% by 2025.20 This rise is fuelled largely by the rise in obesity. The epidemic of diabetes requires resources to be devoted to the management of diabetes and its complications. Diabetes is the leading cause of blindness in industrialised countries in people ages 20-74 (Ghafour et al., 1983) and the most common cause of end-stage renal disease in the United States, Europe, and Japan. Individuals with type II diabetes have a 2-4 times greater risk of cardiovascular disease compared with people who do not have diabetes (Haffner, 2000). Non-traumatic amputations are 15 times more frequent in diabetic patients than in the general population (Ollendorf et al., 1998). While recent medical advances have led to a reduction in mortality from cardiovascular disease in OECD countries, such a positive trend has not been documented for diabetic patients, suggesting that these advances may be less effective for diabetics (Gu et al., 1999). Diabetes mellitus was responsible for an estimated 21 deaths per 100,000 people in WHO Euro A countries in 2000. This represents 2% of all deaths.
50. Retinopathy poses a serious threat to vision. In the United States, diabetes is responsible for 8% of legal blindness, making it the leading cause of new cases of blindness in adults 20-74 years of age. 21 Each year, between 12,000 and 24,000 people lose their sight because of diabetes. Nearly all patients who have type I diabetes for about 20 years will have evidence of diabetic retinopathy. Up to 21% of people with type II diabetes have retinopathy when they are first diagnosed with diabetes, and most will eventually develop some degree of retinopathy.
51. Cost: In 2002, the cost of diabetes in the United States was an estimated USD 92 billion in
medical expenditures and USD 40 billion in lost productivity (ADA, 2003). According to projections by the International Diabetes Federation, countries will be spending 7-13% of their healthcare budgets on diabetes care by the year 2025 (IDF, 2003).
Scientific Soundness
52. Face validity: The prevalence of retinopathy is strongly related to the duration and control of diabetes, rendering adequate glycemic control the key measure to prevent retinopathy. But even in patients with manifest retinopathy, treatment modalities exist that can delay progression and eventual blindness.22
20 American Diabetes Association �Facts and Figures�, http://www.diabetes.org; NIDDK �Diabetes Overview�, http://www.niddk.nih.gov/health/diabetes/pubs/dmover/dmover.htm. 21 American Diabetes Association, http://www.diabetes.org/diabetes-statistics/eye-complications.jsp. Accessed, 28/07/04. 22 American Diabetes Association: Clinical Practice Recommendations 2002. Diabetic Retinopathy (Position Statement).2002;25(sup.1):90-93. Available at: http://care.diabetesjournals.org/cgi/content/full/25/suppl_1/s90.
DELSA/HEA/WD/HWP(2007)4
95
People with proliferate retinopathy can reduce their risk of blindness by 95% with timely treatment and appropriate follow-up care.23 Because a person can be unaware of having retinopathy and not realise it, a regular check-up with an eye care professional is essential for early detection and treatment. Additionally, there have been several cost-effectiveness analyses of screening for diabetic retinopathy. Even though modelling techniques and component costs have differed substantially, the result of all the analyses is the same: screening for diabetic retinopathy saves vision at a relatively low cost, and the cost is less than the disability payments provided to people who would go blind in the absence of a screening programme.24
53. Construct validity: A number of associations, such as the American Association of Clinical Endocrinologists/American College of Endocrinology, American Diabetes Association, and American Academy of Ophthalmology, offer clinical guidelines recommending that annual eye exams be performed for patients with diabetes. In addition, annual retinal exams are one of five diabetes management tests recommended by the US Alliance on Diabetes Quality Improvement (which includes the American Diabetes Association). They recommend that for the patient group 29 years or younger that the first examination be made within 3-5 years after diagnosis of diabetes once the patient is age 10 or older, with a minimum routine of yearly follow-up. For the patient group 30 years an older, it is recommended that the first examination be conducted at the time of diagnosis of diabetes and with yearly minimum routine follow-ups. Women with diabetes who are planning to become pregnant should have a comprehensive eye examination and be counselled on the risk of developing retinopathy, and also have a comprehensive eye examination in the 1st trimester with close follow up throughout pregnancy.
54. Reliability: Countries use national surveys to determine eye exam rates. These rates will be affected by national aspects of survey design such as the question used, sampling, and method of administering the survey. Survey questions are also sensitive to cultural differences in survey responses in different countries, potentially leading to recall bias.
Feasibility
55. Data availability: Retinal eye exam rates are available for ten countries (Table 19). Data are provided for the years 1999 to 2005. Some countries use slightly different age ranges. One country could only provide regional data. Another country provided data for retinal exams in the last two years. One country could only provide the rate of eye exams by diabetics. Countries obtained their data from population surveys, from patient records, or clinical surveys.
56. Comparability issues: The deviations in age and years are minor. Another minor problem is comparing a country using rate of �eye exams� in diabetics to the dilated eye exam. The different methods of collecting data represent major threats to comparability. There are two basic ways to obtain estimates for this indicator, population based surveys, and surveys at clinical sites or a review of patient records. Population based surveys rely on respondents to self-report their diabetes diagnosis and their most recent eye exam. Population based surveys are likely to capture diabetics who might not be regularly seeing a physician. However, there may be recall bias associated with these surveys�in that respondents may not accurately be able to remember their last exam. Data obtained from patient records are likely to be more accurate with respect to the frequency of tests, but exclude diabetics who do not seek regular medical care. For these reasons rates obtained from population based surveys should be compared with caution to rates obtained from clinical surveys or clinical records.
23 National Eye Institute, http://www.nei.nih.gov/health/diabetic/retinopathy.asp#15. Accessed, 28/07/04. 24 American Diabetes Association: Clinical Practice Recommendations 2002. Diabetic Retinopathy (Position Statement).2002; 25(sup.1):90-93. Available at: http://care.diabetesjournals.org/cgi/content/full/25/suppl_1/s90.
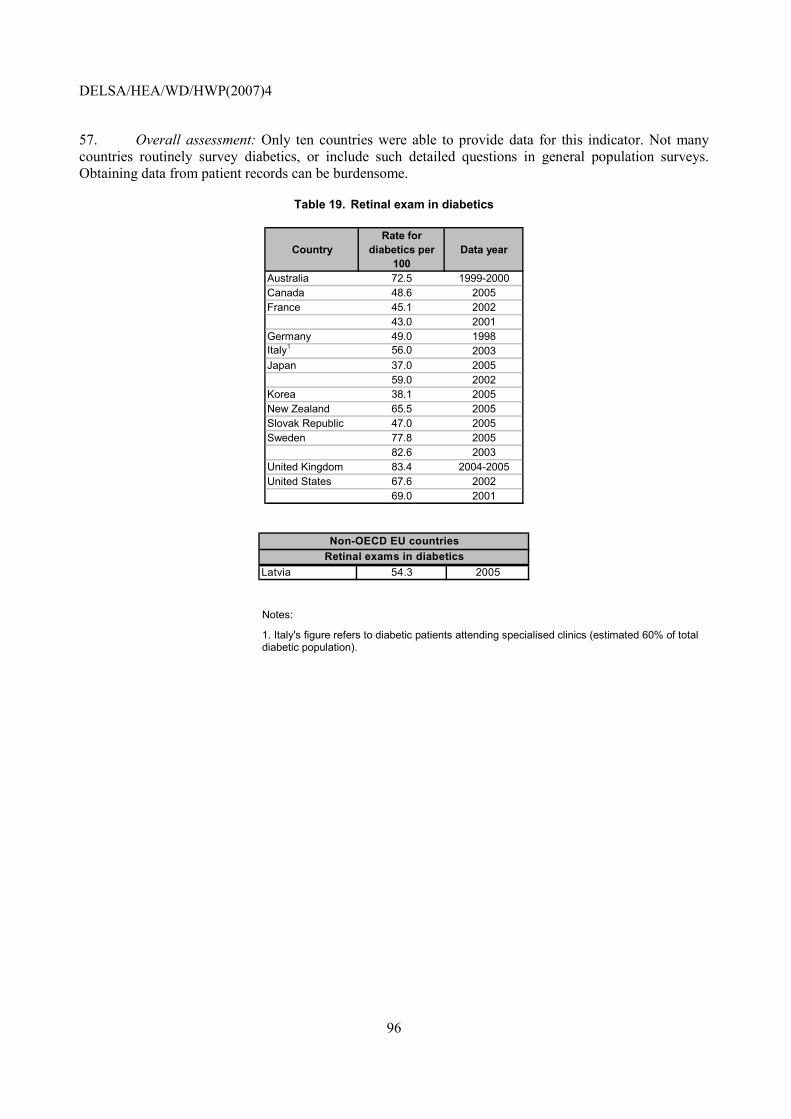
DELSA/HEA/WD/HWP(2007)4
96
57. Overall assessment: Only ten countries were able to provide data for this indicator. Not many countries routinely survey diabetics, or include such detailed questions in general population surveys. Obtaining data from patient records can be burdensome.
Table 19. Retinal exam in diabetics
CountryRate for
diabetics per 100
Data year
Australia 72.5 1999-2000Canada 48.6 2005France 45.1 2002
43.0 2001Germany 49.0 1998Italy1 56.0 2003Japan 37.0 2005
59.0 2002Korea 38.1 2005New Zealand 65.5 2005Slovak Republic 47.0 2005Sweden 77.8 2005
82.6 2003United Kingdom 83.4 2004-2005United States 67.6 2002
69.0 2001
Latvia 54.3 2005Retinal exams in diabeticsNon-OECD EU countries
Notes:
1. Italy's figure refers to diabetic patients attending specialised clinics (estimated 60% of total diabetic population).
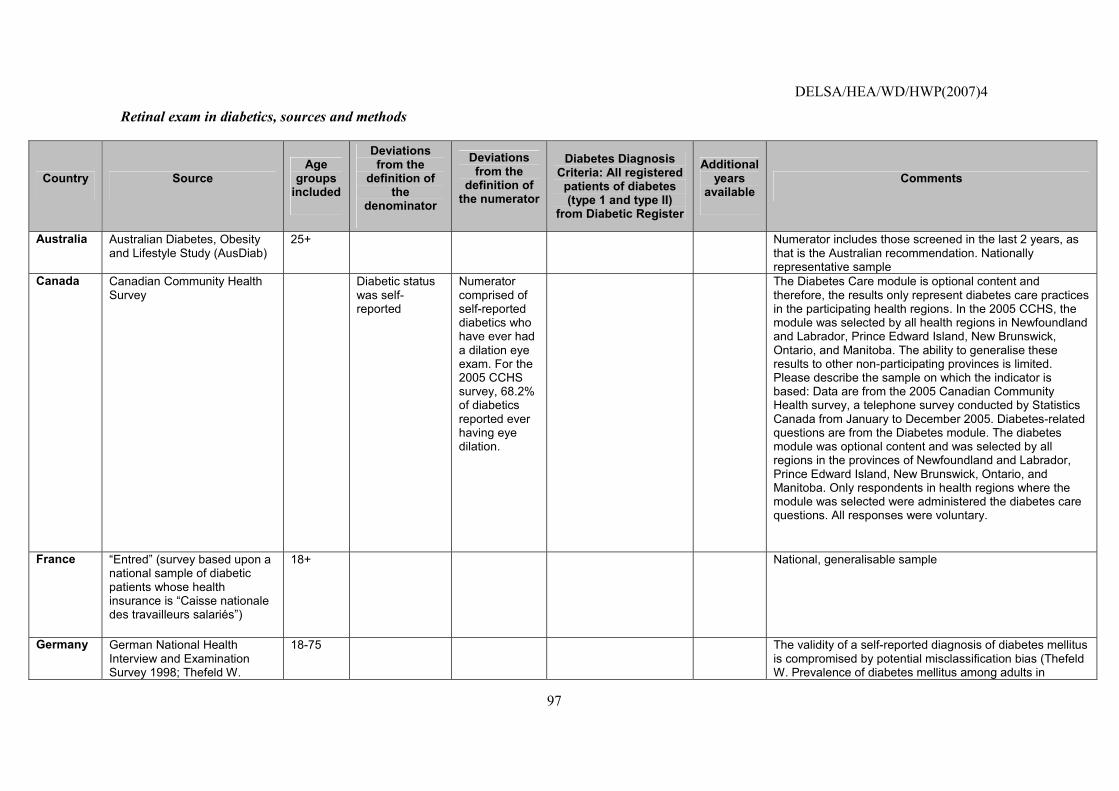
DELSA/HEA/WD/HWP(2007)4
97
Retinal exam in diabetics, sources and methods
Country Source Age
groups included
Deviations from the
definition of the
denominator
Deviations from the
definition of the numerator
Diabetes Diagnosis Criteria: All registered
patients of diabetes (type 1 and type II)
from Diabetic Register
Additional years
available Comments
Australia Australian Diabetes, Obesity and Lifestyle Study (AusDiab)
25+ Numerator includes those screened in the last 2 years, as that is the Australian recommendation. Nationally representative sample
Canada Canadian Community Health Survey
Diabetic status was self-reported
Numerator comprised of self-reported diabetics who have ever had a dilation eye exam. For the 2005 CCHS survey, 68.2% of diabetics reported ever having eye dilation.
The Diabetes Care module is optional content and therefore, the results only represent diabetes care practices in the participating health regions. In the 2005 CCHS, the module was selected by all health regions in Newfoundland and Labrador, Prince Edward Island, New Brunswick, Ontario, and Manitoba. The ability to generalise these results to other non-participating provinces is limited. Please describe the sample on which the indicator is based: Data are from the 2005 Canadian Community Health survey, a telephone survey conducted by Statistics Canada from January to December 2005. Diabetes-related questions are from the Diabetes module. The diabetes module was optional content and was selected by all regions in the provinces of Newfoundland and Labrador, Prince Edward Island, New Brunswick, Ontario, and Manitoba. Only respondents in health regions where the module was selected were administered the diabetes care questions. All responses were voluntary.
France �Entred� (survey based upon a national sample of diabetic patients whose health insurance is �Caisse nationale des travailleurs salariés�)
18+ National, generalisable sample
Germany German National Health Interview and Examination Survey 1998; Thefeld W.
18-75 The validity of a self-reported diagnosis of diabetes mellitus is compromised by potential misclassification bias (Thefeld W. Prevalence of diabetes mellitus among adults in
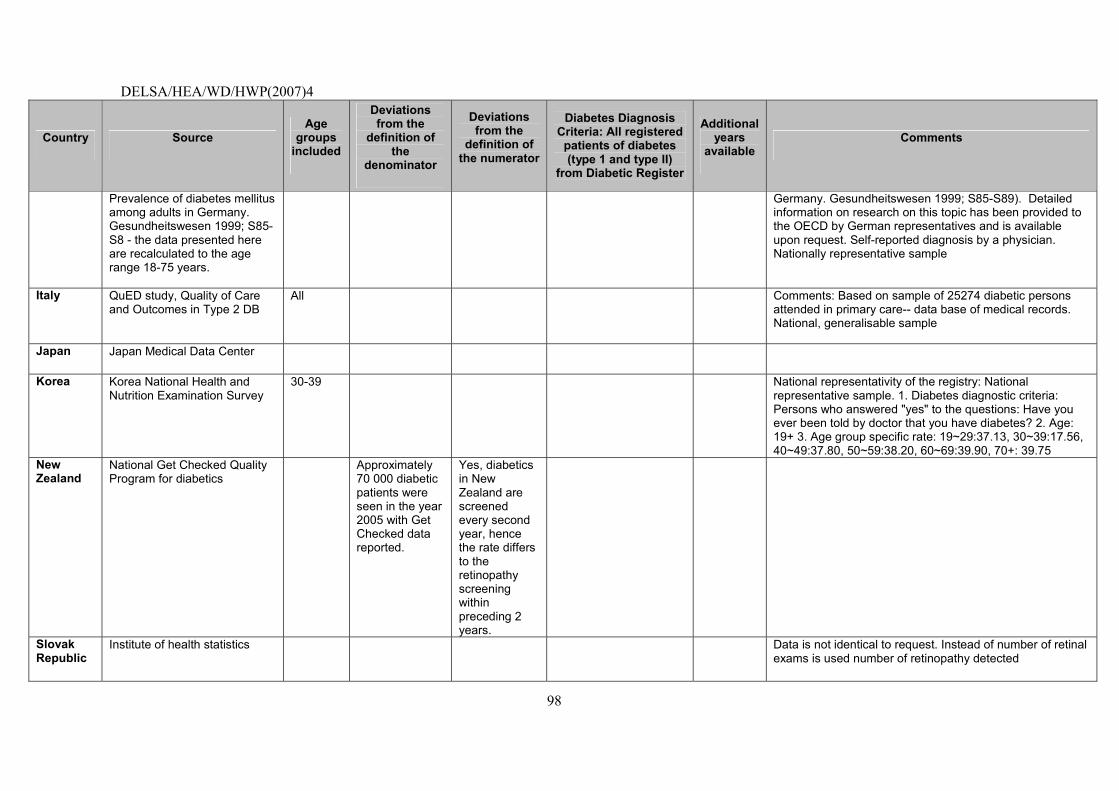
DELSA/HEA/WD/HWP(2007)4
98
Country Source Age
groups included
Deviations from the
definition of the
denominator
Deviations from the
definition of the numerator
Diabetes Diagnosis Criteria: All registered
patients of diabetes (type 1 and type II)
from Diabetic Register
Additional years
available Comments
Prevalence of diabetes mellitus among adults in Germany. Gesundheitswesen 1999; S85-S8 - the data presented here are recalculated to the age range 18-75 years.
Germany. Gesundheitswesen 1999; S85-S89). Detailed information on research on this topic has been provided to the OECD by German representatives and is available upon request. Self-reported diagnosis by a physician. Nationally representative sample
Italy QuED study, Quality of Care and Outcomes in Type 2 DB
All Comments: Based on sample of 25274 diabetic persons attended in primary care-- data base of medical records. National, generalisable sample
Japan Japan Medical Data Center
Korea Korea National Health and Nutrition Examination Survey
30-39 National representativity of the registry: National representative sample. 1. Diabetes diagnostic criteria: Persons who answered "yes" to the questions: Have you ever been told by doctor that you have diabetes? 2. Age: 19+ 3. Age group specific rate: 19~29:37.13, 30~39:17.56, 40~49:37.80, 50~59:38.20, 60~69:39.90, 70+: 39.75
New Zealand
National Get Checked Quality Program for diabetics
Approximately 70 000 diabetic patients were seen in the year 2005 with Get Checked data reported.
Yes, diabetics in New Zealand are screened every second year, hence the rate differs to the retinopathy screening within preceding 2 years.
Slovak Republic
Institute of health statistics Data is not identical to request. Instead of number of retinal exams is used number of retinopathy detected
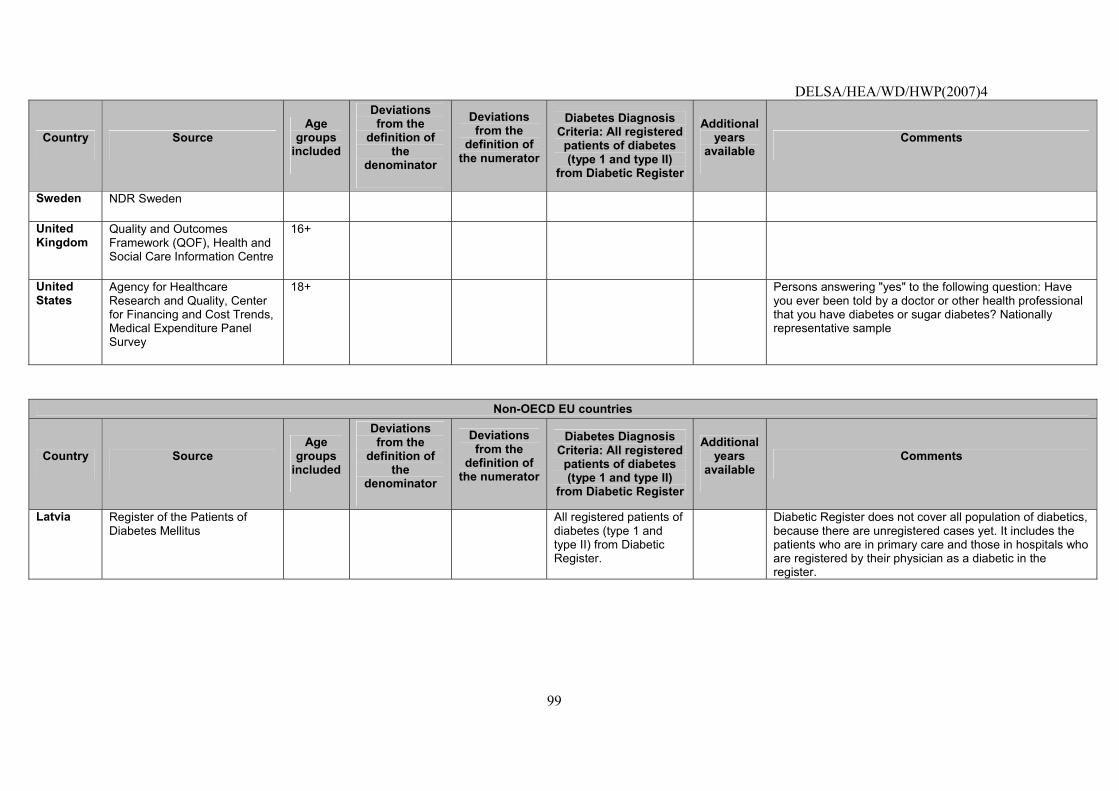
DELSA/HEA/WD/HWP(2007)4
99
Country Source Age
groups included
Deviations from the
definition of the
denominator
Deviations from the
definition of the numerator
Diabetes Diagnosis Criteria: All registered
patients of diabetes (type 1 and type II)
from Diabetic Register
Additional years
available Comments
Sweden NDR Sweden
United Kingdom
Quality and Outcomes Framework (QOF), Health and Social Care Information Centre
16+
United States
Agency for Healthcare Research and Quality, Center for Financing and Cost Trends, Medical Expenditure Panel Survey
18+ Persons answering "yes" to the following question: Have you ever been told by a doctor or other health professional that you have diabetes or sugar diabetes? Nationally representative sample
Non-OECD EU countries
Country Source Age
groups included
Deviations from the
definition of the
denominator
Deviations from the
definition of the numerator
Diabetes Diagnosis Criteria: All registered
patients of diabetes (type 1 and type II)
from Diabetic Register
Additional years
available Comments
Latvia Register of the Patients of Diabetes Mellitus
All registered patients of diabetes (type 1 and type II) from Diabetic Register.
Diabetic Register does not cover all population of diabetics, because there are unregistered cases yet. It includes the patients who are in primary care and those in hospitals who are registered by their physician as a diabetic in the register.
DELSA/HEA/WD/HWP(2007)4
100
Asthma admission rate
Operational Definition
Source: AHRQ Prevention Quality Indicators.
Numerator: All non-maternal discharges of age 18 years and older with ICD-9-CM principal diagnosis code of asthma.
Denominator: Total population.
58. Importance: Asthma is the most common chronic disease in childhood, with increasing prevalence in recent decades. Research suggests that asthma may in fact be a collection of different diseases with similar symptoms (Wenzel, 2006). Asthma is an inherently treatable disease through appropriate medical care. In 2002, the estimated annual cost of treating asthma in the United States was USD 14 billion, of which hospital care accounted for almost a third of direct costs (NHLBI, 2002). Estimates for the European Union suggest annual medical costs of EUR 17.7 billion and productivity losses of EUR 9.8 billion (ERS, 2003). The cost of asthma treatments accounts for close to 2% of annual expenditures for medical care in Japan (Tanihara and Kobayashi, 2004). Analysis from Korea has shown that hospitalisations for asthma were a significant health care cost however hospitalisations and trips to the emergency department were only a small fraction of the total health care cost of uncontrolled asthma (Park, 2006).
59. Clinical significance of process or outcome: Avoidable hospitalisations are those conditions that could have been avoided if proper ambulatory care had been received and can thus be seen as a measure of access to appropriate medical care. While not all admissions for ambulatory care sensitive conditions are avoidable, appropriate prior ambulatory care can prevent most cases of the onset of this type of illness or condition, control an acute episodic illness or condition, or manage a chronic disease or condition. Hence a disproportionately high rate is presumed to reflect problems in obtaining access to primary care (Weisman, 1992). Admission rates for asthma have been shown to be associated with lower socioeconomic status (AHRQ, 2006).
60. Identification of process/outcome as quality problem: The rate of Ambulatory Care Sensitive (ACS) hospitalisations is considered an index of access of a population to adequate primary care. Primary care should be able to effectively manage both adults and children with asthma. Treatment with anti-inflammatory agents, such as inhaled corticosteroids and leukotriene inhibitors, are largely able to prevent exacerbation and, when it occurs, systemic corticosteroids and bronchodilators should preclude any need for hospitalisation. While current protocols and guidelines provide clear guidance for the treatment of asthma, studies suggests that treatment often falls short of recommended care (Mattke et al., 2006b; Halterman, 2001; and AAFA, 2005). As a consequence of insufficient treatment, patients with asthma may need to be hospitalised. Admission rates for asthma and asthma mortality rates have been used to assess quality of care. For example, the UK National Health Service has designated asthma admission as a High Level Performance Indicator, and both paediatric and adult admission rates are part of the US National Healthcare Quality Report (AHRQ, 2006). Asthma mortality rates have been used as an indicator to assess the quality of care for health system comparison in the European Community, United Kingdom, Australia, and several other countries (Charlton et al., 1998; Holland et al., 1997; Manuel and Mao, 2002; AIHW; 2003).
61. Policy importance: Given the high cost of hospital care and the high prevalence of asthma, elevated ACS hospitalisation rates could point not only towards possibilities to improve quality but also to substantial cost savings, if better primary care were provided. In addition, the ACS hospitalisation rate appears sensitive to the presence or absence of economic barriers to access. It has been reported to be lower and/or less correlated with socioeconomic status in countries with national health insurance (Billings, 1996).
62. Susceptibility to being influenced by the health system: Appropriate prior ambulatory care could prevent the onset of an illness or condition; control an acute episodic illness or condition; or manage a chronic disease or condition (Anderson, 1996). According to the National Asthma Education Program, asthma is a
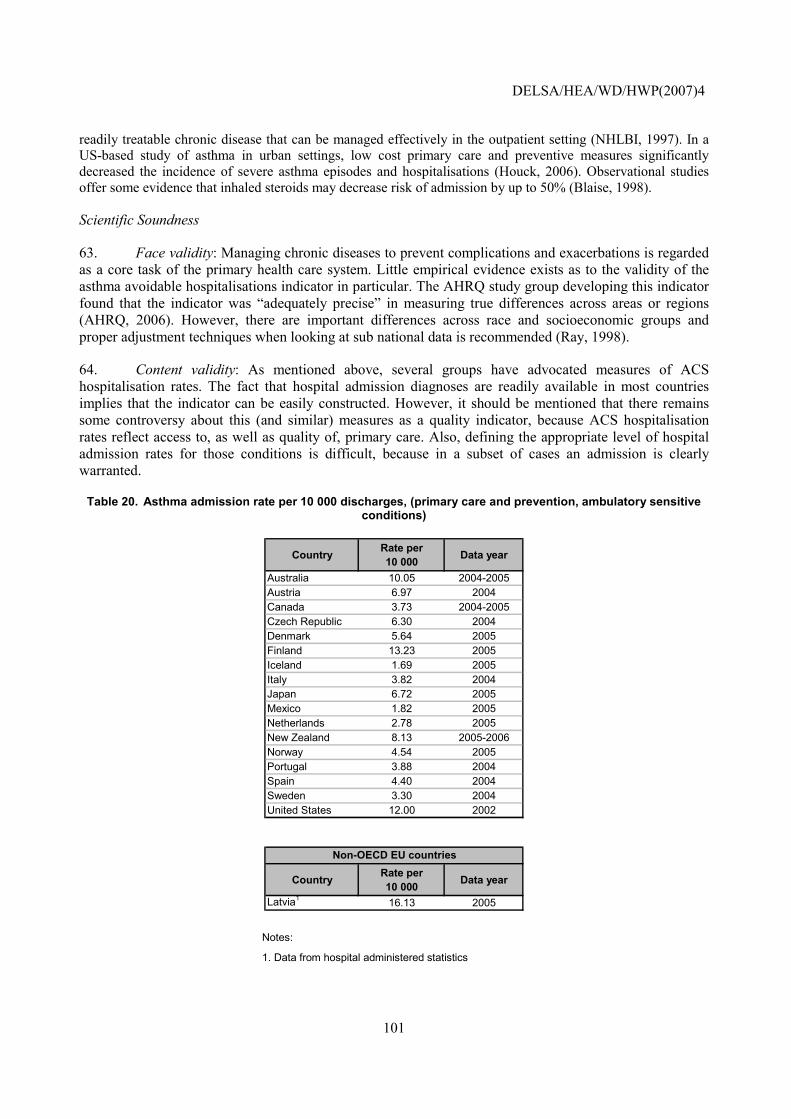
DELSA/HEA/WD/HWP(2007)4
101
readily treatable chronic disease that can be managed effectively in the outpatient setting (NHLBI, 1997). In a US-based study of asthma in urban settings, low cost primary care and preventive measures significantly decreased the incidence of severe asthma episodes and hospitalisations (Houck, 2006). Observational studies offer some evidence that inhaled steroids may decrease risk of admission by up to 50% (Blaise, 1998).
Scientific Soundness
63. Face validity: Managing chronic diseases to prevent complications and exacerbations is regarded as a core task of the primary health care system. Little empirical evidence exists as to the validity of the asthma avoidable hospitalisations indicator in particular. The AHRQ study group developing this indicator found that the indicator was �adequately precise� in measuring true differences across areas or regions (AHRQ, 2006). However, there are important differences across race and socioeconomic groups and proper adjustment techniques when looking at sub national data is recommended (Ray, 1998).
64. Content validity: As mentioned above, several groups have advocated measures of ACS hospitalisation rates. The fact that hospital admission diagnoses are readily available in most countries implies that the indicator can be easily constructed. However, it should be mentioned that there remains some controversy about this (and similar) measures as a quality indicator, because ACS hospitalisation rates reflect access to, as well as quality of, primary care. Also, defining the appropriate level of hospital admission rates for those conditions is difficult, because in a subset of cases an admission is clearly warranted.
Table 20. Asthma admission rate per 10 000 discharges, (primary care and prevention, ambulatory sensitive conditions)
Country Rate per 10 000 Data year
Australia 10.05 2004-2005Austria 6.97 2004Canada 3.73 2004-2005Czech Republic 6.30 2004Denmark 5.64 2005Finland 13.23 2005Iceland 1.69 2005Italy 3.82 2004Japan 6.72 2005Mexico 1.82 2005Netherlands 2.78 2005New Zealand 8.13 2005-2006Norway 4.54 2005Portugal 3.88 2004Spain 4.40 2004Sweden 3.30 2004United States 12.00 2002
Country Rate per 10 000 Data year
Latvia1 16.13 2005
Non-OECD EU countries
Notes:
1. Data from hospital administered statistics
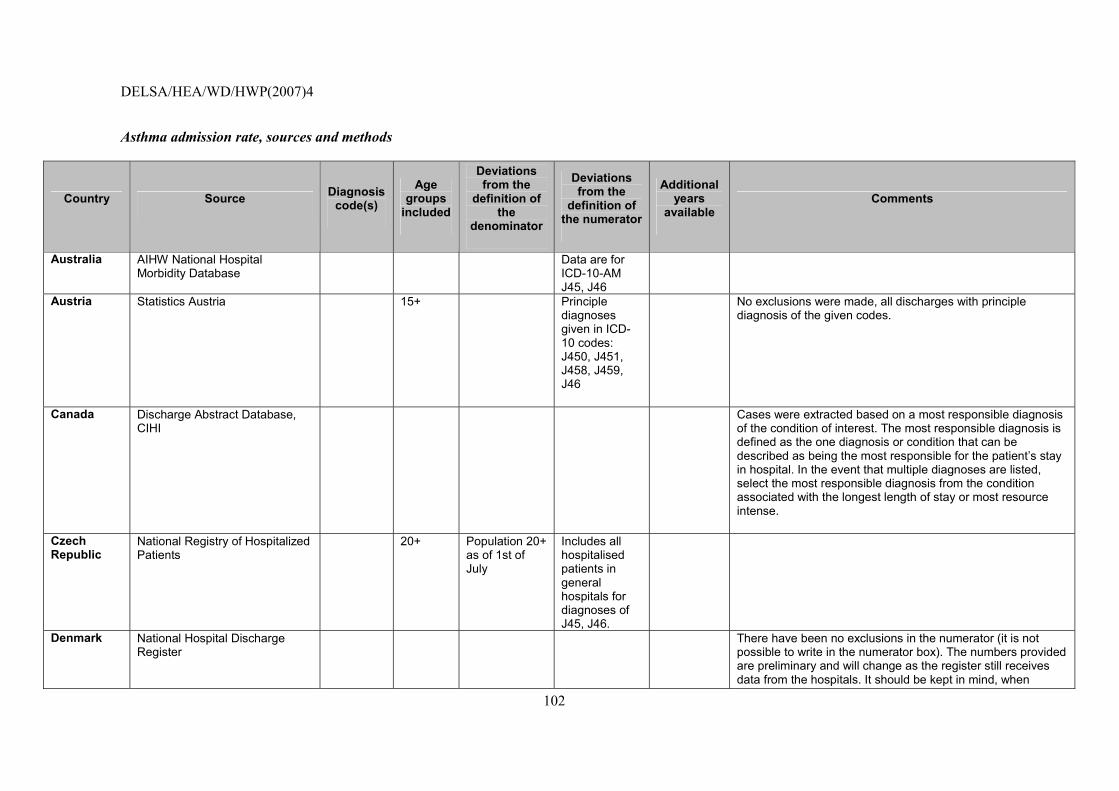
DELSA/HEA/WD/HWP(2007)4
102
Asthma admission rate, sources and methods
Country Source Diagnosis code(s)
Age groups
included
Deviations from the
definition of the
denominator
Deviations from the
definition of the numerator
Additional years
available Comments
Australia AIHW National Hospital Morbidity Database
Data are for ICD-10-AM J45, J46
Austria Statistics Austria
15+ Principle diagnoses given in ICD-10 codes: J450, J451, J458, J459, J46
No exclusions were made, all discharges with principle diagnosis of the given codes.
Canada Discharge Abstract Database, CIHI
Cases were extracted based on a most responsible diagnosis of the condition of interest. The most responsible diagnosis is defined as the one diagnosis or condition that can be described as being the most responsible for the patient�s stay in hospital. In the event that multiple diagnoses are listed, select the most responsible diagnosis from the condition associated with the longest length of stay or most resource intense.
Czech Republic
National Registry of Hospitalized Patients
20+ Population 20+ as of 1st of July
Includes all hospitalised patients in general hospitals for diagnoses of J45, J46.
Denmark National Hospital Discharge Register
There have been no exclusions in the numerator (it is not possible to write in the numerator box). The numbers provided are preliminary and will change as the register still receives data from the hospitals. It should be kept in mind, when
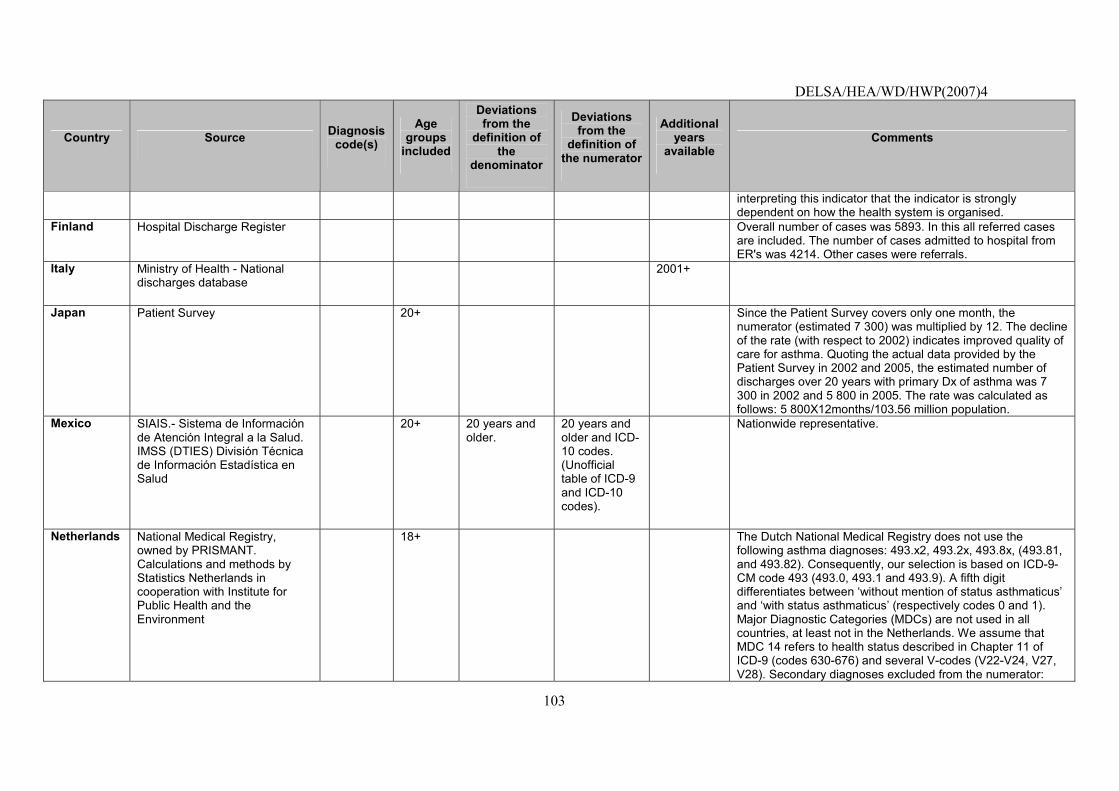
DELSA/HEA/WD/HWP(2007)4
103
Country Source Diagnosis code(s)
Age groups
included
Deviations from the
definition of the
denominator
Deviations from the
definition of the numerator
Additional years
available Comments
interpreting this indicator that the indicator is strongly dependent on how the health system is organised.
Finland Hospital Discharge Register Overall number of cases was 5893. In this all referred cases are included. The number of cases admitted to hospital from ER's was 4214. Other cases were referrals.
Italy Ministry of Health - National discharges database
2001+
Japan Patient Survey
20+ Since the Patient Survey covers only one month, the numerator (estimated 7 300) was multiplied by 12. The decline of the rate (with respect to 2002) indicates improved quality of care for asthma. Quoting the actual data provided by the Patient Survey in 2002 and 2005, the estimated number of discharges over 20 years with primary Dx of asthma was 7 300 in 2002 and 5 800 in 2005. The rate was calculated as follows: 5 800X12months/103.56 million population.
Mexico SIAIS.- Sistema de Información de Atención Integral a la Salud. IMSS (DTIES) División Técnica de Información Estadística en Salud
20+ 20 years and older.
20 years and older and ICD-10 codes. (Unofficial table of ICD-9 and ICD-10 codes).
Nationwide representative.
Netherlands National Medical Registry, owned by PRISMANT. Calculations and methods by Statistics Netherlands in cooperation with Institute for Public Health and the Environment
18+ The Dutch National Medical Registry does not use the following asthma diagnoses: 493.x2, 493.2x, 493.8x, (493.81, and 493.82). Consequently, our selection is based on ICD-9-CM code 493 (493.0, 493.1 and 493.9). A fifth digit differentiates between �without mention of status asthmaticus� and �with status asthmaticus� (respectively codes 0 and 1). Major Diagnostic Categories (MDCs) are not used in all countries, at least not in the Netherlands. We assume that MDC 14 refers to health status described in Chapter 11 of ICD-9 (codes 630-676) and several V-codes (V22-V24, V27, V28). Secondary diagnoses excluded from the numerator:
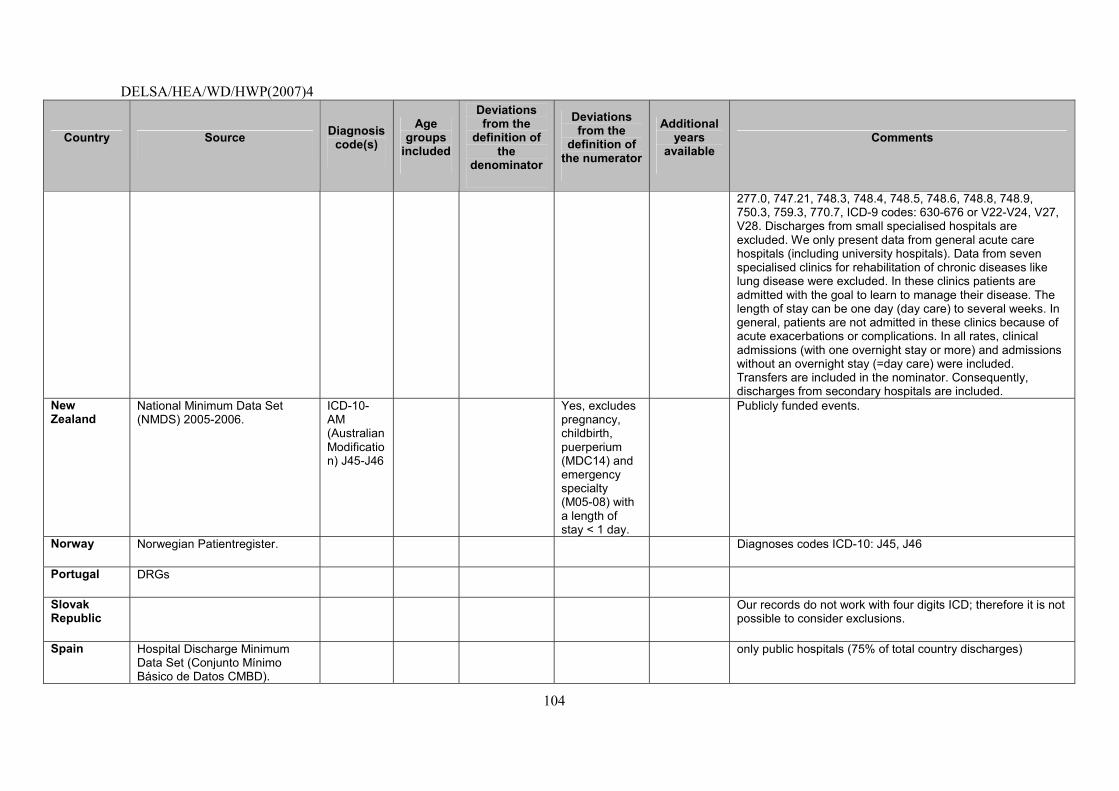
DELSA/HEA/WD/HWP(2007)4
104
Country Source Diagnosis code(s)
Age groups
included
Deviations from the
definition of the
denominator
Deviations from the
definition of the numerator
Additional years
available Comments
277.0, 747.21, 748.3, 748.4, 748.5, 748.6, 748.8, 748.9, 750.3, 759.3, 770.7, ICD-9 codes: 630-676 or V22-V24, V27, V28. Discharges from small specialised hospitals are excluded. We only present data from general acute care hospitals (including university hospitals). Data from seven specialised clinics for rehabilitation of chronic diseases like lung disease were excluded. In these clinics patients are admitted with the goal to learn to manage their disease. The length of stay can be one day (day care) to several weeks. In general, patients are not admitted in these clinics because of acute exacerbations or complications. In all rates, clinical admissions (with one overnight stay or more) and admissions without an overnight stay (=day care) were included. Transfers are included in the nominator. Consequently, discharges from secondary hospitals are included.
New Zealand
National Minimum Data Set (NMDS) 2005-2006.
ICD-10-AM (Australian Modification) J45-J46
Yes, excludes pregnancy, childbirth, puerperium (MDC14) and emergency specialty (M05-08) with a length of stay < 1 day.
Publicly funded events.
Norway Norwegian Patientregister. Diagnoses codes ICD-10: J45, J46
Portugal DRGs
Slovak Republic
Our records do not work with four digits ICD; therefore it is not possible to consider exclusions.
Spain Hospital Discharge Minimum Data Set (Conjunto Mínimo Básico de Datos CMBD).
only public hospitals (75% of total country discharges)
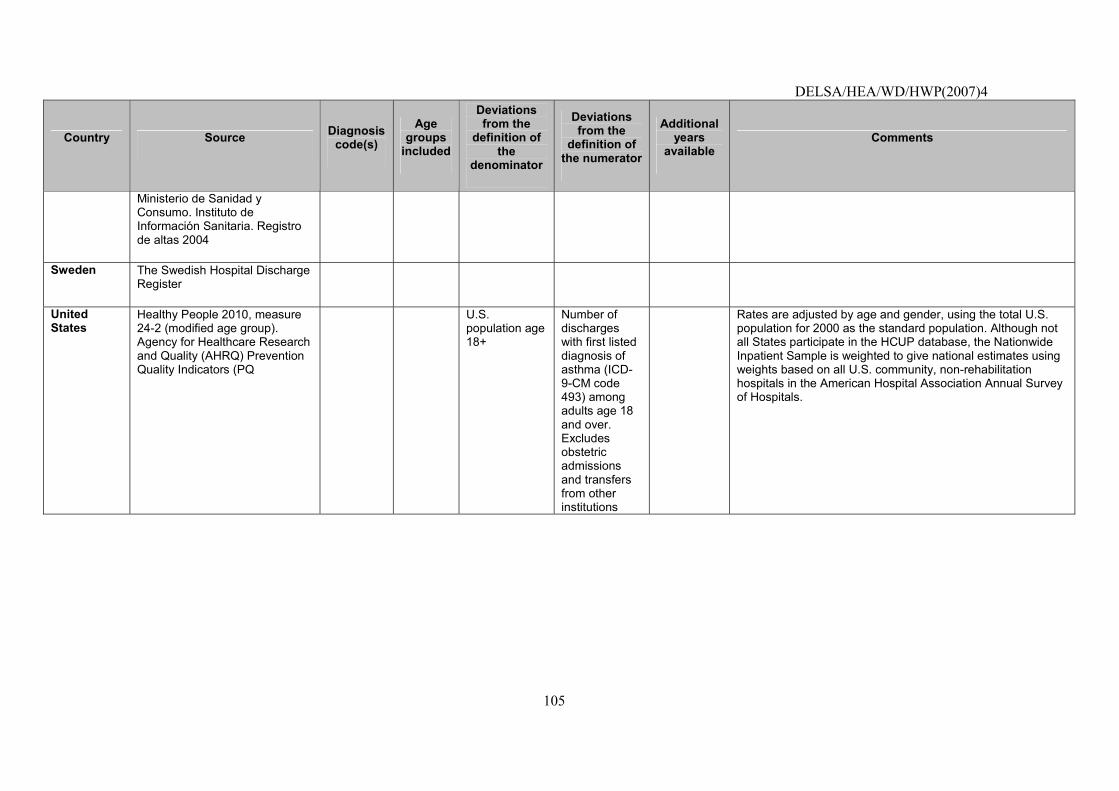
DELSA/HEA/WD/HWP(2007)4
105
Country Source Diagnosis code(s)
Age groups
included
Deviations from the
definition of the
denominator
Deviations from the
definition of the numerator
Additional years
available Comments
Ministerio de Sanidad y Consumo. Instituto de Información Sanitaria. Registro de altas 2004
Sweden The Swedish Hospital Discharge Register
United States
Healthy People 2010, measure 24-2 (modified age group). Agency for Healthcare Research and Quality (AHRQ) Prevention Quality Indicators (PQ
U.S. population age 18+
Number of discharges with first listed diagnosis of asthma (ICD-9-CM code 493) among adults age 18 and over. Excludes obstetric admissions and transfers from other institutions
Rates are adjusted by age and gender, using the total U.S. population for 2000 as the standard population. Although not all States participate in the HCUP database, the Nationwide Inpatient Sample is weighted to give national estimates using weights based on all U.S. community, non-rehabilitation hospitals in the American Hospital Association Annual Survey of Hospitals.
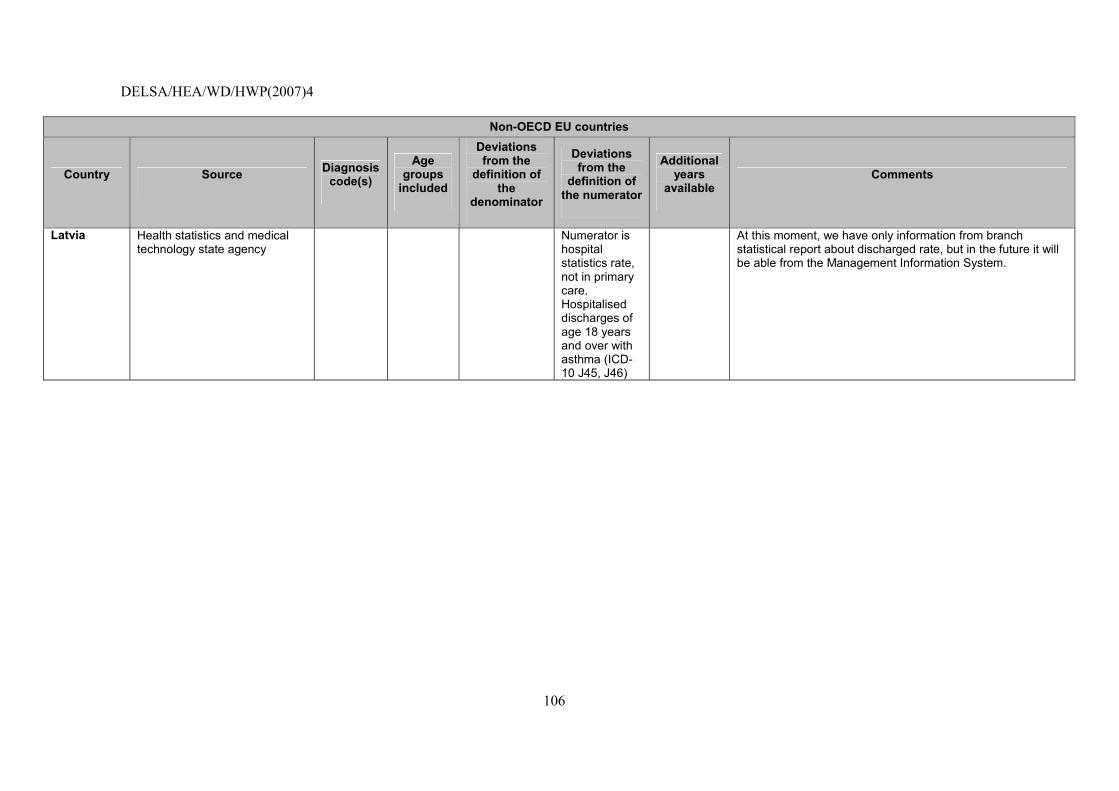
DELSA/HEA/WD/HWP(2007)4
106
Non-OECD EU countries
Country Source Diagnosis code(s)
Age groups
included
Deviations from the
definition of the
denominator
Deviations from the
definition of the numerator
Additional years
available Comments
Latvia Health statistics and medical technology state agency
Numerator is hospital statistics rate, not in primary care. Hospitalised discharges of age 18 years and over with asthma (ICD-10 J45, J46)
At this moment, we have only information from branch statistical report about discharged rate, but in the future it will be able from the Management Information System.
DELSA/HEA/WD/HWP(2007)4
107
INDICATORS NOT SELECTED FOR INCLUSION IN 2006 HCQI INDICATOR SET
65. This section presents information on the clinical importance, scientific soundness together with specifications and data results for the 7 indicators which are not yet considered suitable for international comparisons by the HCQI Expert Group and which are still under review. The criteria applied for this assessment of the indicators were either the lack of availability of the indicator across a sufficient number of countries or some major divergences in the methodology of calculation between countries hampering seriously the comparability of figures. The comparability problems underlying this judgement are presented and possible solutions suggested. The section offers information about the 4 indicators already tested in the previous data collection for which the availability and comparability problems have not yet been satisfactorily solved and 3 new indicators tested for the first time in 2006 data collection, for which the HCQI Expert Group recommended further work before inclusion in the HCQI indicators set.
Annual HbA1c test for patients with diabetes
NOTE that this indicator was already tested in (2003-2005) HCQI data collection and it is not yet considered suitable for international comparisons by the HCQI Expert Group. It is included in this paper to illustrate current data concerns with the indicator and possible future solutions
Operational Definition
Numerator: Number of patients with at least one test of HbA1c levels in the reporting year.
Denominator: People age 18-75 with diabetes mellitus type I or II, defined as: at least one physician visit with a diagnosis of diabetes or patient dispensed insulin and/or hypoglycaemic agent, excluding those with gestational diabetes and those not seen for continuing care.
Importance
66. Mortality: Diabetes mellitus was responsible for an estimated 21 deaths per 100 000 people in WHO Euro A countries in 2000. This represents 2.1% of all deaths.
67. Prevalence: Diabetes mellitus affected an estimated 3 of every 100 people living in WHO Euro A countries in 2000. Diabetes mellitus constitutes a major public health burden in the industrialised countries, affecting, for example in the US an estimated 15.7 million people, including an estimated 5.4 million people not yet diagnosed. In addition to being the seventh leading cause of death in the US (ADA, 2006), diabetes mellitus is also the leading cause of blindness in people ages 20-74, the leading cause of end-stage renal disease (ESRD), the most frequent cause of non-traumatic lower limb amputations, and a major risk factor for heart disease and stroke. The prevalence of diabetes in the US is projected to increase from the present rate of 5.9% to 8.9% by 2025 (ADA, 2006).
68. Cost: Endocrine diseases, of which diabetes is the most common, are the 12th attributable contributor to cost of illness in Canada (2.2% of direct and indirect costs). In the United States, the costs of diabetes totalled $132 billion in 2002, including about $92 billion in direct medical expenditures and about $40 billion in lost productivity and premature death (Hogan, 2003).
DELSA/HEA/WD/HWP(2007)4
108
Scientific Soundness
69. Face validity: There is now strong evidence that reducing blood glucose to normal levels can reduce the risk of complications associated with both type I and type II (ADA, 2001) diabetes. Severity of complications associated with chronic diabetes, lack of symptoms in initial stages of disease, and long period between the commencement of sustained hyperglycaemia and observable complications make this disease a prime candidate for aggressive, outpatient based, primary preventive care. Blood glucose testing using HbA1c is recommended as a quality indicator by the American Medical Association and is used by the US Veteran�s Administration. The American Diabetes Association and many other national scientific societies have issued guidelines for the management of diabetes that reflect the implications of this research (ADA, 2001). These guidelines have been disseminated widely, and adapted by many health care provider organisations to reflect local practice. Yet as in other areas of clinical practice, numerous studies have documented that the level of clinician adherence to diabetes practice guidelines� recommendations for routine monitoring and screening remains variable and often quite low (Streja, 1999; Lawler, 1997).
70. Content validity: Reviews of the evidence from clinical trials of diabetes management, including those conducted by the Cochrane Collaboration, the American Diabetes Association, the New Zealand Guidelines Group, and others, have all concluded that good glycemic control reduces the occurrence of retinopathy, nephropathy, and neuropathy, and improves functional status and well-being among people with type I and type II diabetes (Renders, 2002; Nathan; 2002).
71. Reliability: Data on the frequency of HbA1c testing is usually derived from studies using medical chart review or prospective data collection. International comparison of these studies is therefore affected by all differences in study design.
Feasibility
72. Data availability: HbA1c test rates are available for eight countries (Table 21). The HbA1c screening data supplied were for 2000-2005. Five countries provided data that slightly deviated from the requested OECD age range. Countries provided data based on samples from primary care clinics, and from patient surveys. Countries that reported from general surveys also reported a problem that many diabetics are not familiar with the term of HbAc1.
73. Comparability issues: Detailed documentation and assessment is provided in Table 22. There should be concern over comparing the results of patient surveys to a review of patient records. A major challenge for this indicator relates to fielding surveys that might be able to accurately collect information on HbAc1 testing. Because diabetics are not always familiar with the term HbAc1, self-reported data may not be reliable, resulting in one country not reporting their data. Data derived as part of research project may not be generalisable to a country, because care patterns and patient characteristics may be systematically different from the general population.
74. Overall assessment: Only eight countries could provide data on this indicator. It also appears that some of the data comes from research projects and may not be regularly collected. However, during the course of the project, data availability improved for this indicator and it may warrant examination in future HCQI efforts.
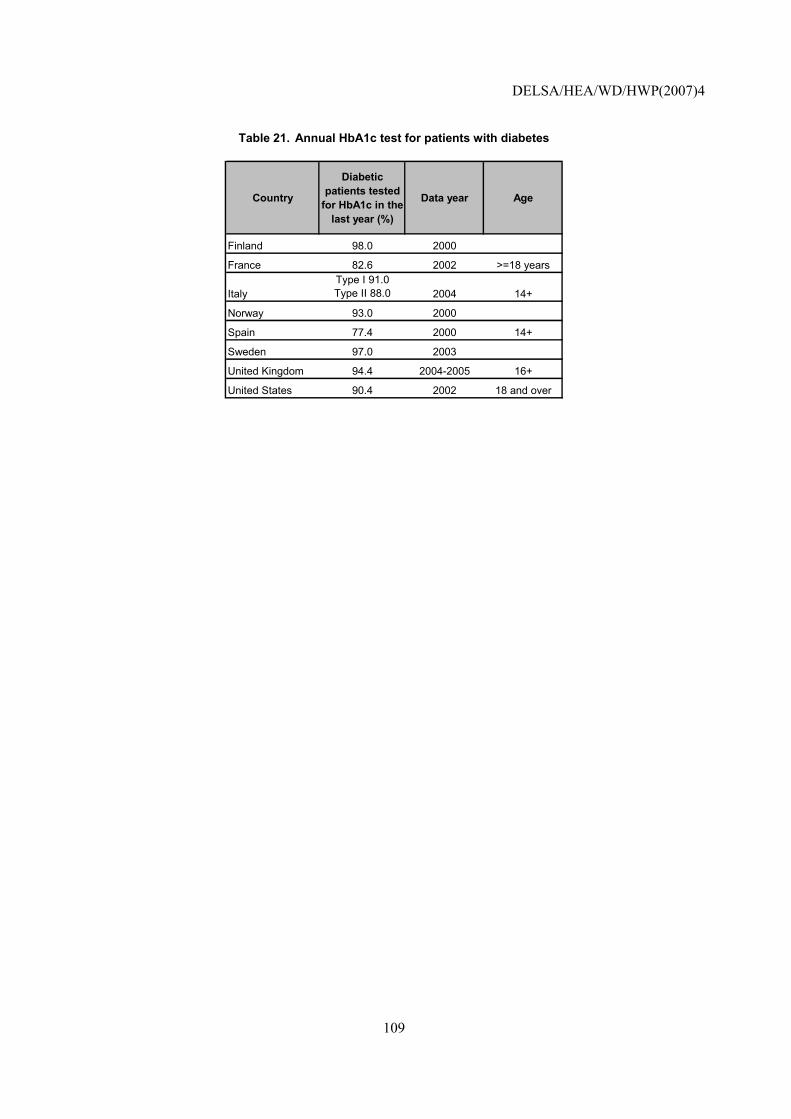
DELSA/HEA/WD/HWP(2007)4
109
Table 21. Annual HbA1c test for patients with diabetes
Country
Diabetic patients tested
for HbA1c in the last year (%)
Data year Age
Finland 98.0 2000
France 82.6 2002 >=18 years
ItalyType I 91.0 Type II 88.0 2004 14+
Norway 93.0 2000
Spain 77.4 2000 14+
Sweden 97.0 2003
United Kingdom 94.4 2004-2005 16+
United States 90.4 2002 18 and over
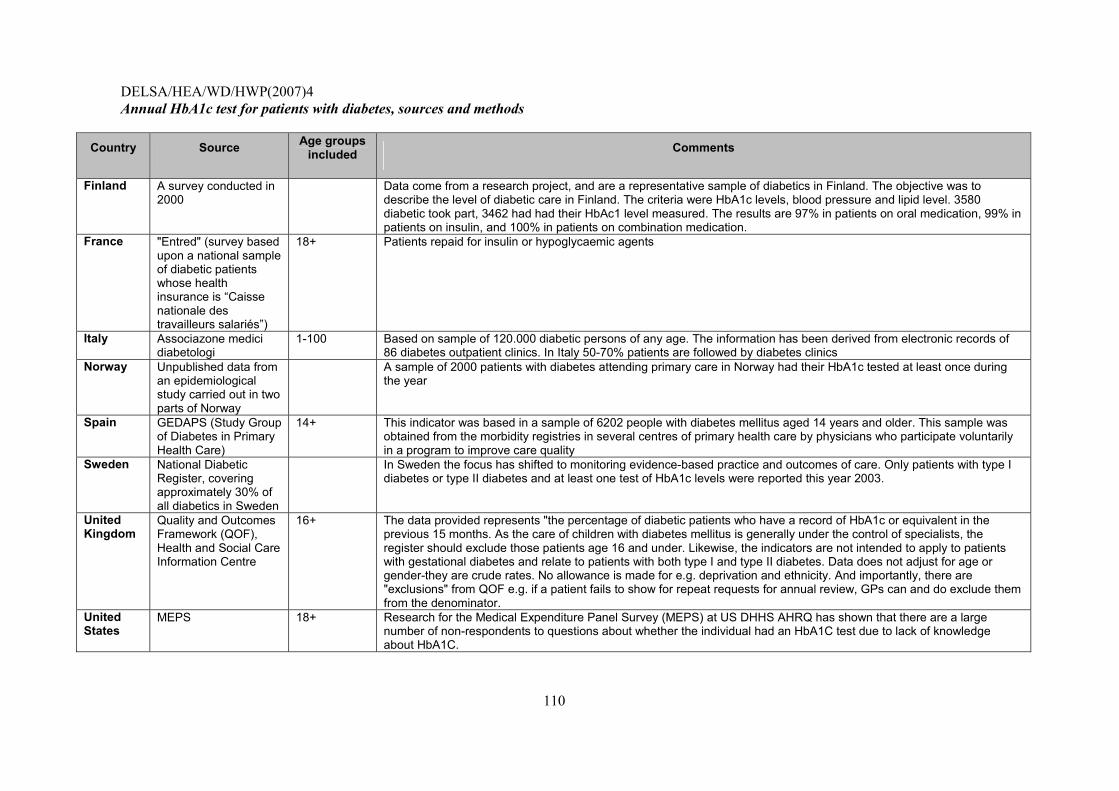
DELSA/HEA/WD/HWP(2007)4
110
Annual HbA1c test for patients with diabetes, sources and methods
Country Source Age groups included Comments
Finland A survey conducted in 2000
Data come from a research project, and are a representative sample of diabetics in Finland. The objective was to describe the level of diabetic care in Finland. The criteria were HbA1c levels, blood pressure and lipid level. 3580 diabetic took part, 3462 had had their HbAc1 level measured. The results are 97% in patients on oral medication, 99% in patients on insulin, and 100% in patients on combination medication.
France "Entred" (survey based upon a national sample of diabetic patients whose health insurance is �Caisse nationale des travailleurs salariés�)
18+ Patients repaid for insulin or hypoglycaemic agents
Italy Associazone medici diabetologi
1-100 Based on sample of 120.000 diabetic persons of any age. The information has been derived from electronic records of 86 diabetes outpatient clinics. In Italy 50-70% patients are followed by diabetes clinics
Norway Unpublished data from an epidemiological study carried out in two parts of Norway
A sample of 2000 patients with diabetes attending primary care in Norway had their HbA1c tested at least once during the year
Spain GEDAPS (Study Group of Diabetes in Primary Health Care)
14+ This indicator was based in a sample of 6202 people with diabetes mellitus aged 14 years and older. This sample was obtained from the morbidity registries in several centres of primary health care by physicians who participate voluntarily in a program to improve care quality
Sweden National Diabetic Register, covering approximately 30% of all diabetics in Sweden
In Sweden the focus has shifted to monitoring evidence-based practice and outcomes of care. Only patients with type I diabetes or type II diabetes and at least one test of HbA1c levels were reported this year 2003.
United Kingdom
Quality and Outcomes Framework (QOF), Health and Social Care Information Centre
16+ The data provided represents "the percentage of diabetic patients who have a record of HbA1c or equivalent in the previous 15 months. As the care of children with diabetes mellitus is generally under the control of specialists, the register should exclude those patients age 16 and under. Likewise, the indicators are not intended to apply to patients with gestational diabetes and relate to patients with both type I and type II diabetes. Data does not adjust for age or gender-they are crude rates. No allowance is made for e.g. deprivation and ethnicity. And importantly, there are "exclusions" from QOF e.g. if a patient fails to show for repeat requests for annual review, GPs can and do exclude them from the denominator.
United States
MEPS 18+ Research for the Medical Expenditure Panel Survey (MEPS) at US DHHS AHRQ has shown that there are a large number of non-respondents to questions about whether the individual had an HbA1C test due to lack of knowledge about HbA1C.
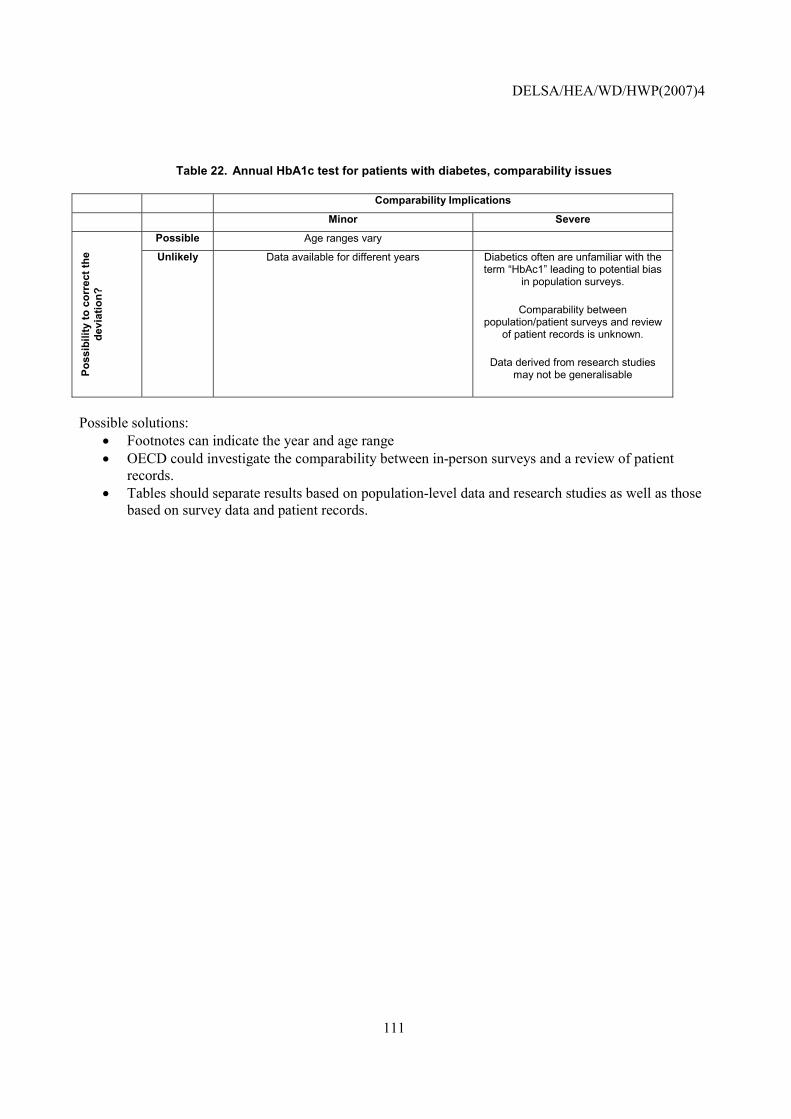
DELSA/HEA/WD/HWP(2007)4
111
Table 22. Annual HbA1c test for patients with diabetes, comparability issues
Comparability Implications
Minor Severe
Possible Age ranges vary
Poss
ibili
ty to
cor
rect
the
devi
atio
n?
Unlikely Data available for different years
Diabetics often are unfamiliar with the term �HbAc1� leading to potential bias
in population surveys.
Comparability between population/patient surveys and review
of patient records is unknown.
Data derived from research studies may not be generalisable
Possible solutions:
• Footnotes can indicate the year and age range • OECD could investigate the comparability between in-person surveys and a review of patient
records. • Tables should separate results based on population-level data and research studies as well as those
based on survey data and patient records.
DELSA/HEA/WD/HWP(2007)4
112
HbA1c level indicating poor glucose control
NOTE that this indicator was already tested in (2003-2005) HCQI data collection and it is not yet considered suitable for international comparisons by the HCQI Expert Group. It is included in this paper to illustrate current data concerns with the indicator and possible future solutions.
Operational Definition
Numerator: Number of patients with HbA1c level greater than 9.5% at the most recent test given in the reporting year.
Denominator: People age 18-75 with diabetes mellitus type I or II who had HbA1c levels tested within the reporting year (Diabetes defined as: at least one physician visit with a diagnosis of diabetes OR patient dispensed insulin and/or hypoglycaemic agent, excluding those with gestational diabetes).
Importance (for a more detailed discussed, please see above under HbA1c test rate)
75. Mortality: Diabetes mellitus was responsible for an estimated 21 deaths per 100 000 people in WHO Euro A countries in 2000. This represents 2.1% of all deaths.
76. Prevalence: Diabetes mellitus affected an estimated three of every 100 people living in WHO Euro A countries in 2000.
77. Cost: Endocrine diseases, of which diabetes is the most common, are the 12th highest contributor to cost of illness in Canada (2.2% of direct and indirect costs). In the United States, the costs of diabetes totalled $132 billion in 2002, including about $92 billion in direct medical expenditures and about $40 billion in lost productivity and premature death (Hogan, 2003).
Scientific Soundness
78. Face validity: HbA1c has been termed the memory of glucose control. Chronically elevated blood glucose levels, indicating poor glycemic control, lead to chemical alterations of the haemoglobin, the component of the red blood cells that transport oxygen. By measuring HbA1c-levels, clinicians gain insight into the glycemic control of a patient over the last couple of weeks. Thus, the test determines how well a patient�s diabetes has been managed with elevated values indicating uncontrolled diabetes.
79. Content validity: Reviews of the evidence from clinical trials of diabetes management, including those conducted by the Cochrane Collaboration, the American Diabetes Association, the New Zealand Guidelines Group, and others, have all concluded that good glycemic control reduces the occurrence of retinopathy, nephropathy, and neuropathy, and improves functional status and well-being among people with type I and type II diabetes (Renders, 2002; Nathan, 2003). Many diabetic patients have poor glycemic control (Renders, 2002). The threshold for this indicator, 9.5% (indicating very poor glycemic control), is based on a recommendation from a group of 15 experts in developing clinical diabetes indicators for the National Committee for Quality Assurance (NCQA, 2003). This threshold, however, will need to be updated periodically as numerous organisations, including the US National Quality Forum and the Alliance on Diabetes Quality Improvement (representing the American Medical Association, the American Diabetes Association and the Joint Commission on the Accreditation of Healthcare Organisations) have updated this threshold to a more stringent level.
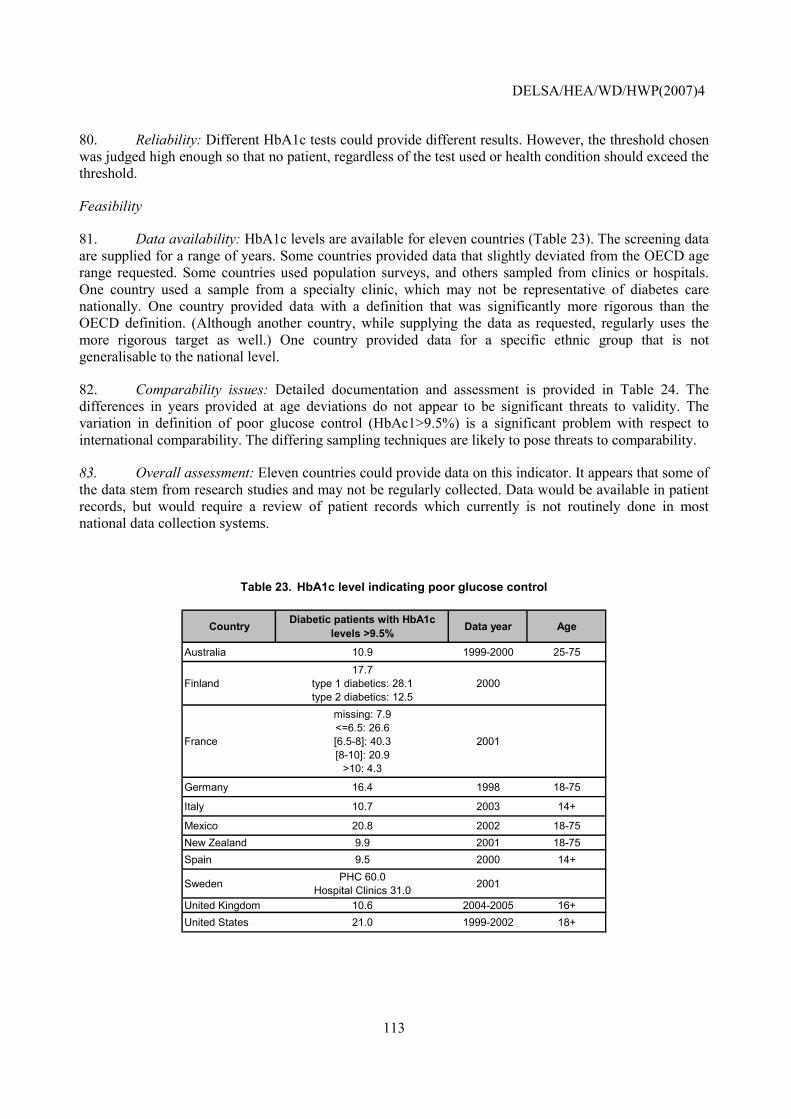
DELSA/HEA/WD/HWP(2007)4
113
80. Reliability: Different HbA1c tests could provide different results. However, the threshold chosen was judged high enough so that no patient, regardless of the test used or health condition should exceed the threshold.
Feasibility
81. Data availability: HbA1c levels are available for eleven countries (Table 23). The screening data are supplied for a range of years. Some countries provided data that slightly deviated from the OECD age range requested. Some countries used population surveys, and others sampled from clinics or hospitals. One country used a sample from a specialty clinic, which may not be representative of diabetes care nationally. One country provided data with a definition that was significantly more rigorous than the OECD definition. (Although another country, while supplying the data as requested, regularly uses the more rigorous target as well.) One country provided data for a specific ethnic group that is not generalisable to the national level.
82. Comparability issues: Detailed documentation and assessment is provided in Table 24. The differences in years provided at age deviations do not appear to be significant threats to validity. The variation in definition of poor glucose control (HbAc1>9.5%) is a significant problem with respect to international comparability. The differing sampling techniques are likely to pose threats to comparability.
83. Overall assessment: Eleven countries could provide data on this indicator. It appears that some of the data stem from research studies and may not be regularly collected. Data would be available in patient records, but would require a review of patient records which currently is not routinely done in most national data collection systems.
Table 23. HbA1c level indicating poor glucose control
Country Diabetic patients with HbA1c levels >9.5% Data year Age
Australia 10.9 1999-2000 25-75
Finland17.7
type 1 diabetics: 28.1 type 2 diabetics: 12.5
2000
France
missing: 7.9 <=6.5: 26.6 [6.5-8]: 40.3 [8-10]: 20.9
>10: 4.3
2001
Germany 16.4 1998 18-75
Italy 10.7 2003 14+
Mexico 20.8 2002 18-75New Zealand 9.9 2001 18-75Spain 9.5 2000 14+
Sweden PHC 60.0 Hospital Clinics 31.0 2001
United Kingdom 10.6 2004-2005 16+United States 21.0 1999-2002 18+
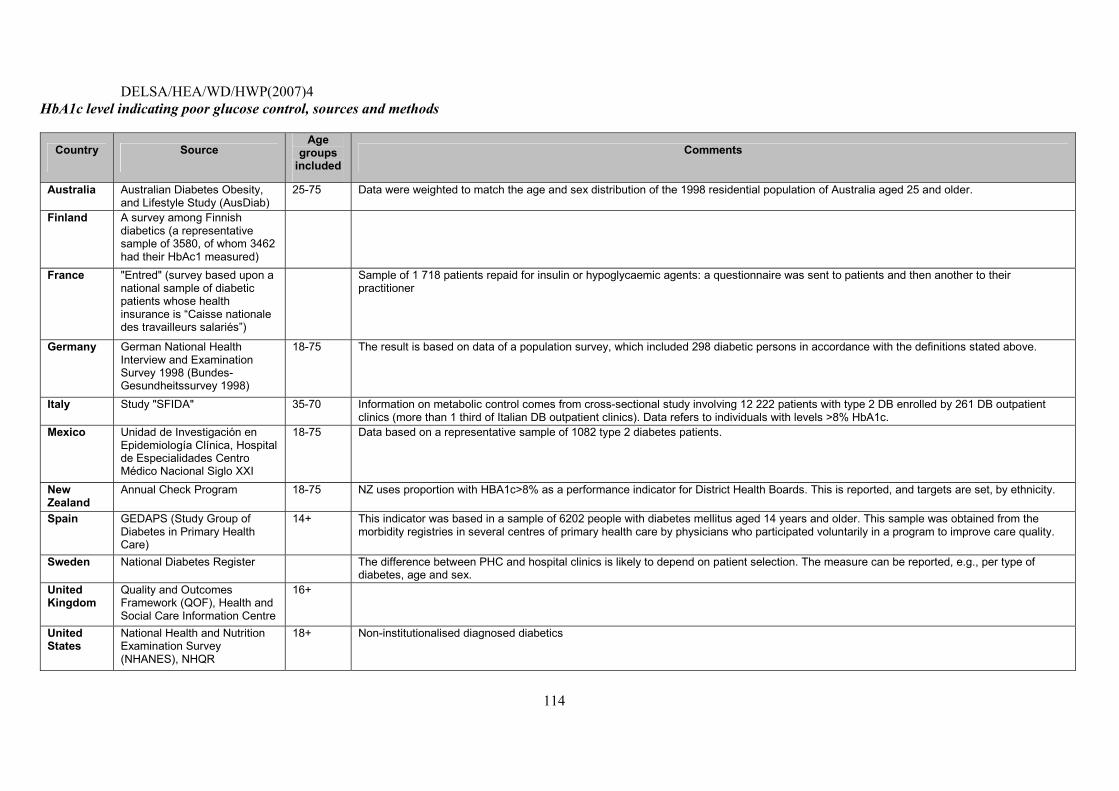
DELSA/HEA/WD/HWP(2007)4
114
HbA1c level indicating poor glucose control, sources and methods
Country Source Age
groups included
Comments
Australia Australian Diabetes Obesity, and Lifestyle Study (AusDiab)
25-75 Data were weighted to match the age and sex distribution of the 1998 residential population of Australia aged 25 and older.
Finland A survey among Finnish diabetics (a representative sample of 3580, of whom 3462 had their HbAc1 measured)
France "Entred" (survey based upon a national sample of diabetic patients whose health insurance is �Caisse nationale des travailleurs salariés�)
Sample of 1 718 patients repaid for insulin or hypoglycaemic agents: a questionnaire was sent to patients and then another to their practitioner
Germany German National Health Interview and Examination Survey 1998 (Bundes-Gesundheitssurvey 1998)
18-75 The result is based on data of a population survey, which included 298 diabetic persons in accordance with the definitions stated above.
Italy Study "SFIDA" 35-70 Information on metabolic control comes from cross-sectional study involving 12 222 patients with type 2 DB enrolled by 261 DB outpatient clinics (more than 1 third of Italian DB outpatient clinics). Data refers to individuals with levels >8% HbA1c.
Mexico Unidad de Investigación en Epidemiología Clínica, Hospital de Especialidades Centro Médico Nacional Siglo XXI
18-75 Data based on a representative sample of 1082 type 2 diabetes patients.
New Zealand
Annual Check Program 18-75 NZ uses proportion with HBA1c>8% as a performance indicator for District Health Boards. This is reported, and targets are set, by ethnicity.
Spain GEDAPS (Study Group of Diabetes in Primary Health Care)
14+ This indicator was based in a sample of 6202 people with diabetes mellitus aged 14 years and older. This sample was obtained from the morbidity registries in several centres of primary health care by physicians who participated voluntarily in a program to improve care quality.
Sweden National Diabetes Register The difference between PHC and hospital clinics is likely to depend on patient selection. The measure can be reported, e.g., per type of diabetes, age and sex.
United Kingdom
Quality and Outcomes Framework (QOF), Health and Social Care Information Centre
16+
United States
National Health and Nutrition Examination Survey (NHANES), NHQR
18+ Non-institutionalised diagnosed diabetics
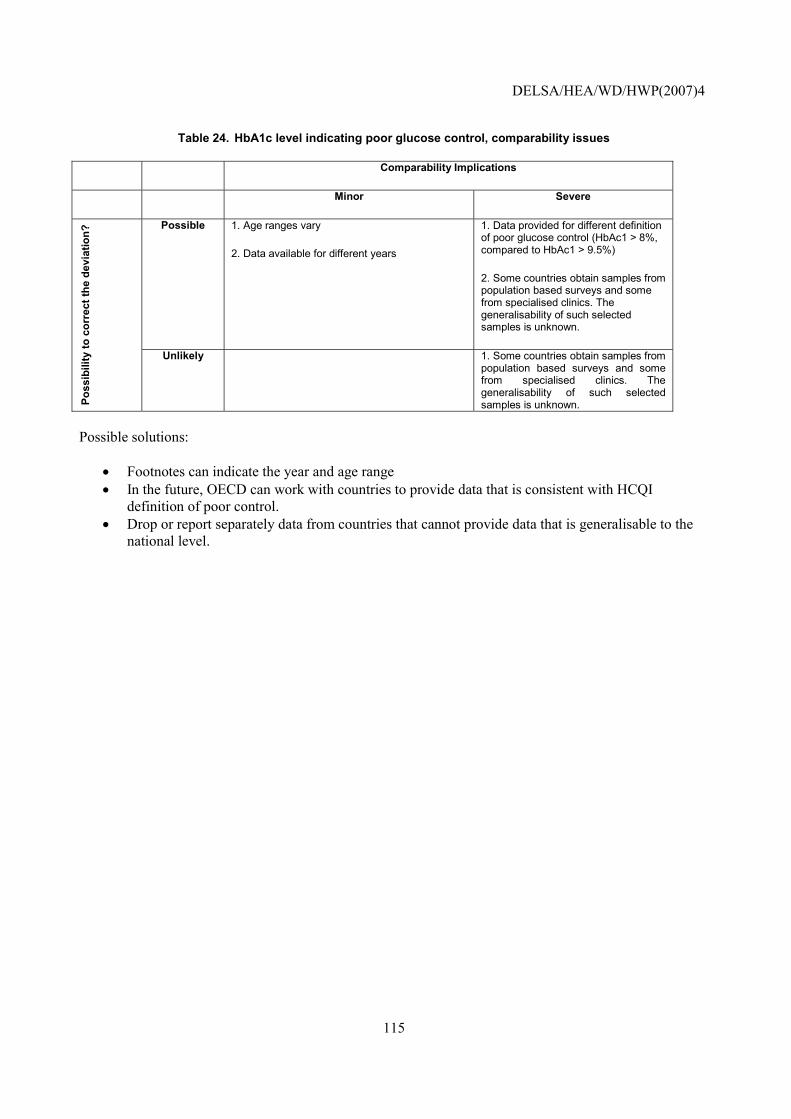
DELSA/HEA/WD/HWP(2007)4
115
Table 24. HbA1c level indicating poor glucose control, comparability issues
Comparability Implications
Minor Severe
Possible 1. Age ranges vary
2. Data available for different years
1. Data provided for different definition of poor glucose control (HbAc1 > 8%, compared to HbAc1 > 9.5%)
2. Some countries obtain samples from population based surveys and some from specialised clinics. The generalisability of such selected samples is unknown.
Poss
ibili
ty to
cor
rect
the
devi
atio
n?
Unlikely 1. Some countries obtain samples from population based surveys and some from specialised clinics. The generalisability of such selected samples is unknown.
Possible solutions:
• Footnotes can indicate the year and age range • In the future, OECD can work with countries to provide data that is consistent with HCQI
definition of poor control. • Drop or report separately data from countries that cannot provide data that is generalisable to the
national level.
DELSA/HEA/WD/HWP(2007)4
116
Major amputation in diabetics
NOTE that this indicator was already tested in (2003-2005) HCQI data collection and it is not yet considered suitable for international comparisons by the HCQI Expert Group. It is included in this paper to illustrate current data concerns with the indicator and possible future solutions.
Operational Definition
Numerator: Number of diabetic patients with major (above or below knee) amputations in a given year.
Denominator: Number of patients with diabetes (type I and type II) ages 18-75 years.
Importance25
84. Mortality: Diabetes mellitus was responsible for an estimated 21 deaths per 100,000 people in WHO Euro A countries in 2000. This represents 2% of all deaths.
85. Prevalence: Each year, more than 10,000 Americans with diabetes face decisions related to amputation. Two of the main complications of longstanding inadequate glycemic control (indicating poor diabetes management) are peripheral vascular disease, the chronic deprivation of blood supply of the legs due to arteriolosclerosis, and peripheral neuropathy, damage to the peripheral nervous system. The combination of those two complications put diabetics at greater risk for lower extremity lesions. Loss of sensation in the foot increases likelihood that minor trauma goes unnoticed, while inadequate blood supply results in impaired healing of the wound and greater risk of infection. Thus, osteomyelitis (severe infections of the bone) and gangrene (infection induced tissue necrosis) may result. For about 75% of the cases, a partial amputation of a foot may be enough to stop the foot ulcer from progressing, but for the remaining 25%, it will be necessary to remove the leg from below the knee (Mundell, 2004). Diabetics are also at higher risk of developing uninfected necroses of the lower extremities because of vascular complications. In the US, minority populations have had the highest rates of amputations and it is thought that socioeconomic status is a major factor leading to amputations. Thus, differences in level and distribution of wealth may be reflected in the measure together with differences in quality of care.
86. Cost: Amputations have a large impact on health, particularly on quality of life, and result in substantial follow-up cost in the form of rehabilitation, prostheses and disability.
Scientific Soundness
87. Face validity: Adequate glycemic control has been shown to reduce the risk and severity of neuropathy and vascular complications in diabetics (Renders, 2002). It is also widely believed that careful monitoring for an intensive treatment of minor lesions in the presence of neuropathic and arterial disease of the extremities can prevent amputations, but only a few randomised trials have been conducted to support this (Lavery, 2000).
88. Construct validity: The main challenge to the construct validity of this indicator is a certain disjoint of the underlying concept and the operationalisation. Precisely speaking the concept behind the indicator is that proper diabetes management should reduce the risk of severe tissue damage to lower extremities. However, the indicator measures amputation rates, a closely related but slightly different
25 For additional discussion on the importance of diabetes, please refer to the discussion above under the retinal exam indicator.
DELSA/HEA/WD/HWP(2007)4
117
concept that captures the typical consequence of severe tissue damage. One could also argue that, while severe tissue damage is unambiguously negative, the decision to amputate is not so that the indicator does not clearly indicate better or worse quality of care. However, many regard major amputation rates as reasonable proxy for severe tissue damage rates and thus a valid quality indicator.26 Because of the importance of this complication and plausibility of the concept behind the indicator, this measure has great potential. But it needs to be further studied before adopting it for international comparisons.
89. Reliability: As this indicator is derived from hospital discharge information, the ability to construct it reliably for international comparisons depends on the comparability of coding and reporting practices across countries. Amputation rates should be ascertainable in a reliable fashion in administrative data, as is done currently in the US by the Centers for Disease Control and Prevention (NCQA, 2003), because such major procedures usually influence hospital payments and are thus reliably reported. But it may be difficult to reliably identify the diabetic population, because diabetes may only be recorded as comorbid condition rather than the primary reason for admission and coding of such secondary diagnoses may vary across countries.
Feasibility
90. Data availability: Major amputations in diabetics� rates are available for 14 countries (Table 25). The data were reported for years ranging from 1994 to 2004. The OECD definition is for all ages, and five countries had deviations in the age range. All countries use hospital records for the numerator, but the method of estimating the denominator varied. Some countries used previous estimates or population surveys to obtain the denominators. Other countries used administrative data to obtain the denominator, which would not capture all diabetics but only the diabetics receiving hospital or other medical care, and the diagnostic codes to capture the diabetic population varied. One country indicated that hospital records may be incompletely coded, and may underestimate the amputations on diabetics. Countries used different procedure codes, and even some using the same coding system included different (more or less) procedures. Countries used varying inclusion criteria for the procedure, even accounting for differences in national coding systems. This is of serious concern to comparability.
91. Comparability issues: Detailed documentation and assessment is provided below. There are serious concerns about comparability, both from the estimation of the denominator, and because different procedures are being included, the HCQI project will have to ensure that countries are reporting the same type of amputations.
92. Overall assessment: Fourteen countries provided data on this indicator. While information for this indicator might exist in hospital records of other countries as well, it is unclear how many countries would be able to construct this indicator on a routine basis. Additionally, a significant amount of analytic work will have to be done in order to ensure that the data are internationally comparable. However, data comparability and availability for this indicator improved during the project and the indicator may warrant examination in the future as part of HCQI indicator updates.
26 The situation is clearly different for minor amputations (e.g., toes), where timely amputations can avoid progression of the disease.
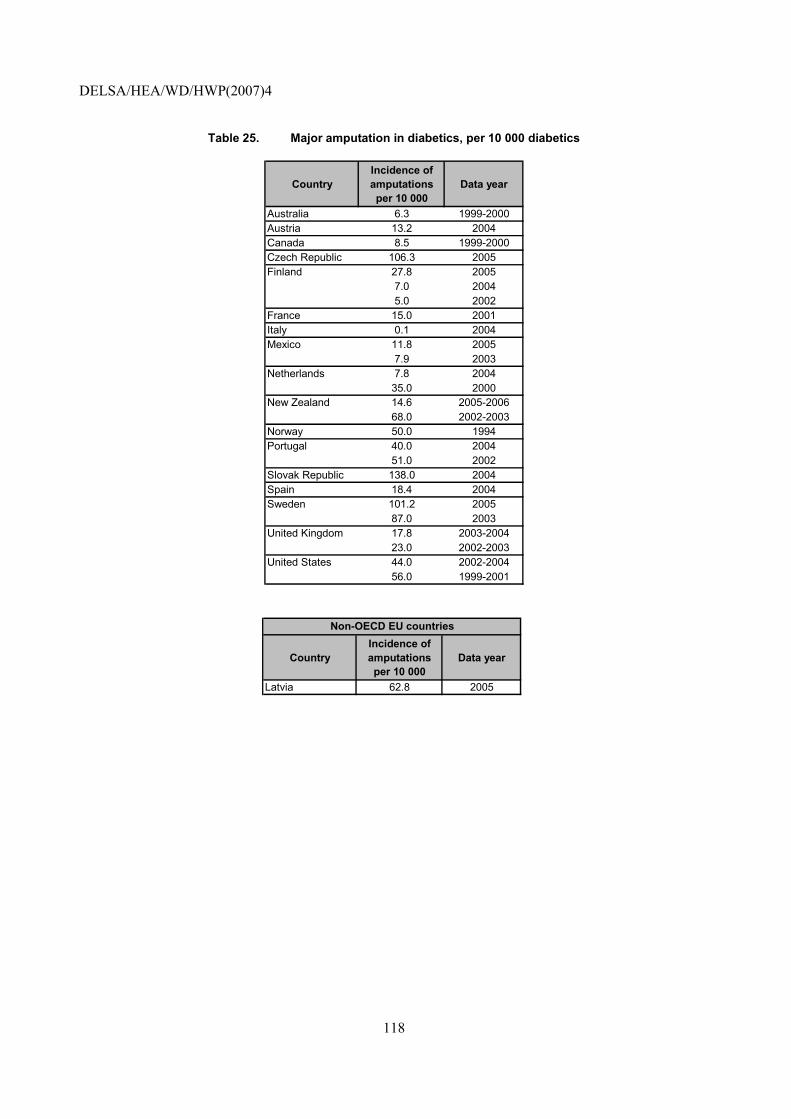
DELSA/HEA/WD/HWP(2007)4
118
Table 25. Major amputation in diabetics, per 10 000 diabetics
CountryIncidence of amputations per 10 000
Data year
Australia 6.3 1999-2000Austria 13.2 2004Canada 8.5 1999-2000Czech Republic 106.3 2005Finland 27.8 2005
7.0 20045.0 2002
France 15.0 2001Italy 0.1 2004Mexico 11.8 2005
7.9 2003Netherlands 7.8 2004
35.0 2000New Zealand 14.6 2005-2006
68.0 2002-2003Norway 50.0 1994Portugal 40.0 2004
51.0 2002Slovak Republic 138.0 2004Spain 18.4 2004Sweden 101.2 2005
87.0 2003United Kingdom 17.8 2003-2004
23.0 2002-2003United States 44.0 2002-2004
56.0 1999-2001
CountryIncidence of amputations per 10 000
Data year
Latvia 62.8 2005
Non-OECD EU countries
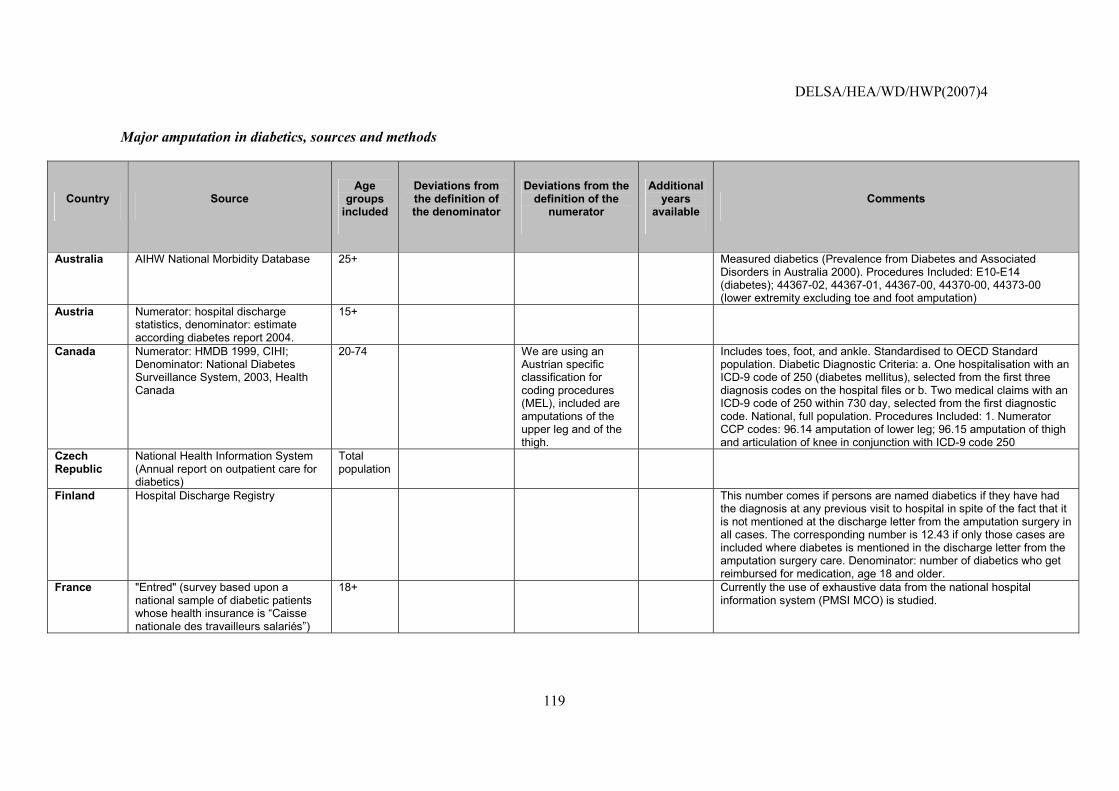
DELSA/HEA/WD/HWP(2007)4
119
Major amputation in diabetics, sources and methods
Country Source Age
groups included
Deviations from the definition of the denominator
Deviations from the definition of the
numerator
Additional years
available Comments
Australia AIHW National Morbidity Database
25+ Measured diabetics (Prevalence from Diabetes and Associated Disorders in Australia 2000). Procedures Included: E10-E14 (diabetes); 44367-02, 44367-01, 44367-00, 44370-00, 44373-00 (lower extremity excluding toe and foot amputation)
Austria Numerator: hospital discharge statistics, denominator: estimate according diabetes report 2004.
15+
Canada Numerator: HMDB 1999, CIHI; Denominator: National Diabetes Surveillance System, 2003, Health Canada
20-74 We are using an Austrian specific classification for coding procedures (MEL), included are amputations of the upper leg and of the thigh.
Includes toes, foot, and ankle. Standardised to OECD Standard population. Diabetic Diagnostic Criteria: a. One hospitalisation with an ICD-9 code of 250 (diabetes mellitus), selected from the first three diagnosis codes on the hospital files or b. Two medical claims with an ICD-9 code of 250 within 730 day, selected from the first diagnostic code. National, full population. Procedures Included: 1. Numerator CCP codes: 96.14 amputation of lower leg; 96.15 amputation of thigh and articulation of knee in conjunction with ICD-9 code 250
Czech Republic
National Health Information System (Annual report on outpatient care for diabetics)
Total population
Finland Hospital Discharge Registry This number comes if persons are named diabetics if they have had the diagnosis at any previous visit to hospital in spite of the fact that it is not mentioned at the discharge letter from the amputation surgery in all cases. The corresponding number is 12.43 if only those cases are included where diabetes is mentioned in the discharge letter from the amputation surgery care. Denominator: number of diabetics who get reimbursed for medication, age 18 and older.
France "Entred" (survey based upon a national sample of diabetic patients whose health insurance is �Caisse nationale des travailleurs salariés�)
18+ Currently the use of exhaustive data from the national hospital information system (PMSI MCO) is studied.
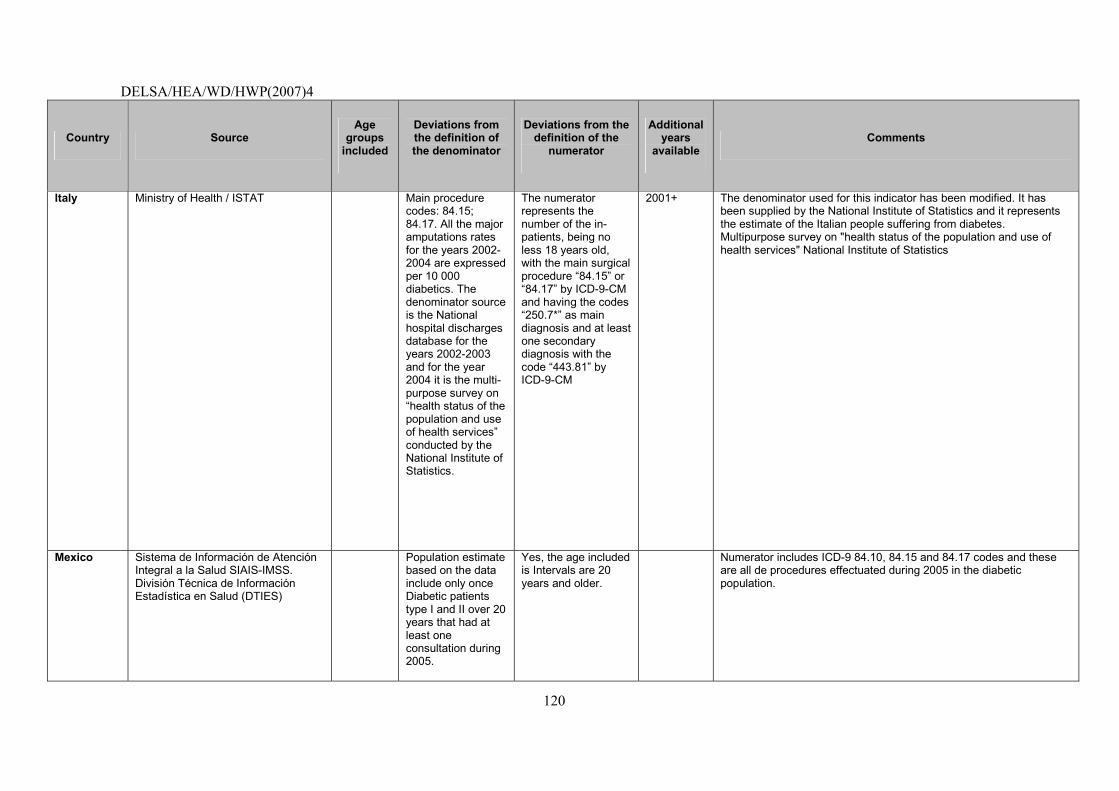
DELSA/HEA/WD/HWP(2007)4
120
Country Source Age
groups included
Deviations from the definition of the denominator
Deviations from the definition of the
numerator
Additional years
available Comments
Italy Ministry of Health / ISTAT Main procedure codes: 84.15; 84.17. All the major amputations rates for the years 2002-2004 are expressed per 10 000 diabetics. The denominator source is the National hospital discharges database for the years 2002-2003 and for the year 2004 it is the multi-purpose survey on �health status of the population and use of health services� conducted by the National Institute of Statistics.
The numerator represents the number of the in-patients, being no less 18 years old, with the main surgical procedure �84.15� or �84.17� by ICD-9-CM and having the codes �250.7*� as main diagnosis and at least one secondary diagnosis with the code �443.81� by ICD-9-CM
2001+ The denominator used for this indicator has been modified. It has been supplied by the National Institute of Statistics and it represents the estimate of the Italian people suffering from diabetes. Multipurpose survey on "health status of the population and use of health services" National Institute of Statistics
Mexico Sistema de Información de Atención Integral a la Salud SIAIS-IMSS. División Técnica de Información Estadística en Salud (DTIES)
Population estimate based on the data include only once Diabetic patients type I and II over 20 years that had at least one consultation during 2005.
Yes, the age included is Intervals are 20 years and older.
Numerator includes ICD-9 84.10, 84.15 and 84.17 codes and these are all de procedures effectuated during 2005 in the diabetic population.
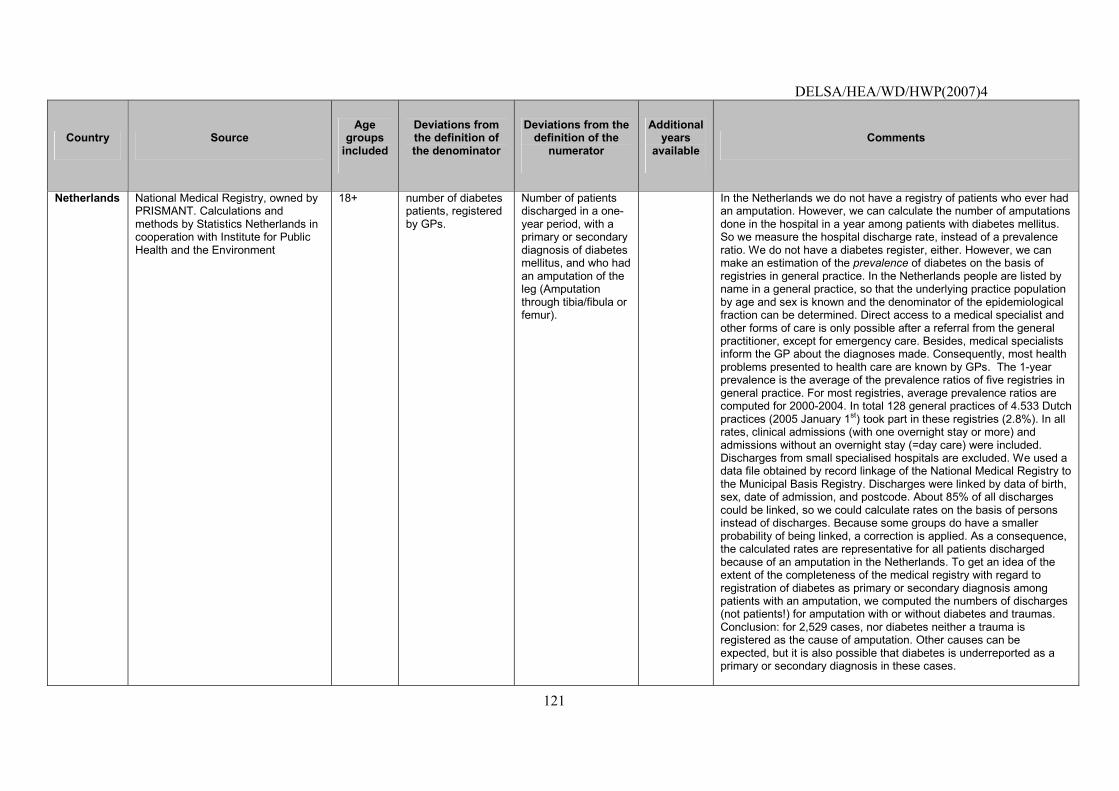
DELSA/HEA/WD/HWP(2007)4
121
Country Source Age
groups included
Deviations from the definition of the denominator
Deviations from the definition of the
numerator
Additional years
available Comments
Netherlands National Medical Registry, owned by PRISMANT. Calculations and methods by Statistics Netherlands in cooperation with Institute for Public Health and the Environment
18+ number of diabetes patients, registered by GPs.
Number of patients discharged in a one-year period, with a primary or secondary diagnosis of diabetes mellitus, and who had an amputation of the leg (Amputation through tibia/fibula or femur).
In the Netherlands we do not have a registry of patients who ever had an amputation. However, we can calculate the number of amputations done in the hospital in a year among patients with diabetes mellitus. So we measure the hospital discharge rate, instead of a prevalence ratio. We do not have a diabetes register, either. However, we can make an estimation of the prevalence of diabetes on the basis of registries in general practice. In the Netherlands people are listed by name in a general practice, so that the underlying practice population by age and sex is known and the denominator of the epidemiological fraction can be determined. Direct access to a medical specialist and other forms of care is only possible after a referral from the general practitioner, except for emergency care. Besides, medical specialists inform the GP about the diagnoses made. Consequently, most health problems presented to health care are known by GPs. The 1-year prevalence is the average of the prevalence ratios of five registries in general practice. For most registries, average prevalence ratios are computed for 2000-2004. In total 128 general practices of 4.533 Dutch practices (2005 January 1st) took part in these registries (2.8%). In all rates, clinical admissions (with one overnight stay or more) and admissions without an overnight stay (=day care) were included. Discharges from small specialised hospitals are excluded. We used a data file obtained by record linkage of the National Medical Registry to the Municipal Basis Registry. Discharges were linked by data of birth, sex, date of admission, and postcode. About 85% of all discharges could be linked, so we could calculate rates on the basis of persons instead of discharges. Because some groups do have a smaller probability of being linked, a correction is applied. As a consequence, the calculated rates are representative for all patients discharged because of an amputation in the Netherlands. To get an idea of the extent of the completeness of the medical registry with regard to registration of diabetes as primary or secondary diagnosis among patients with an amputation, we computed the numbers of discharges (not patients!) for amputation with or without diabetes and traumas. Conclusion: for 2,529 cases, nor diabetes neither a trauma is registered as the cause of amputation. Other causes can be expected, but it is also possible that diabetes is underreported as a primary or secondary diagnosis in these cases.
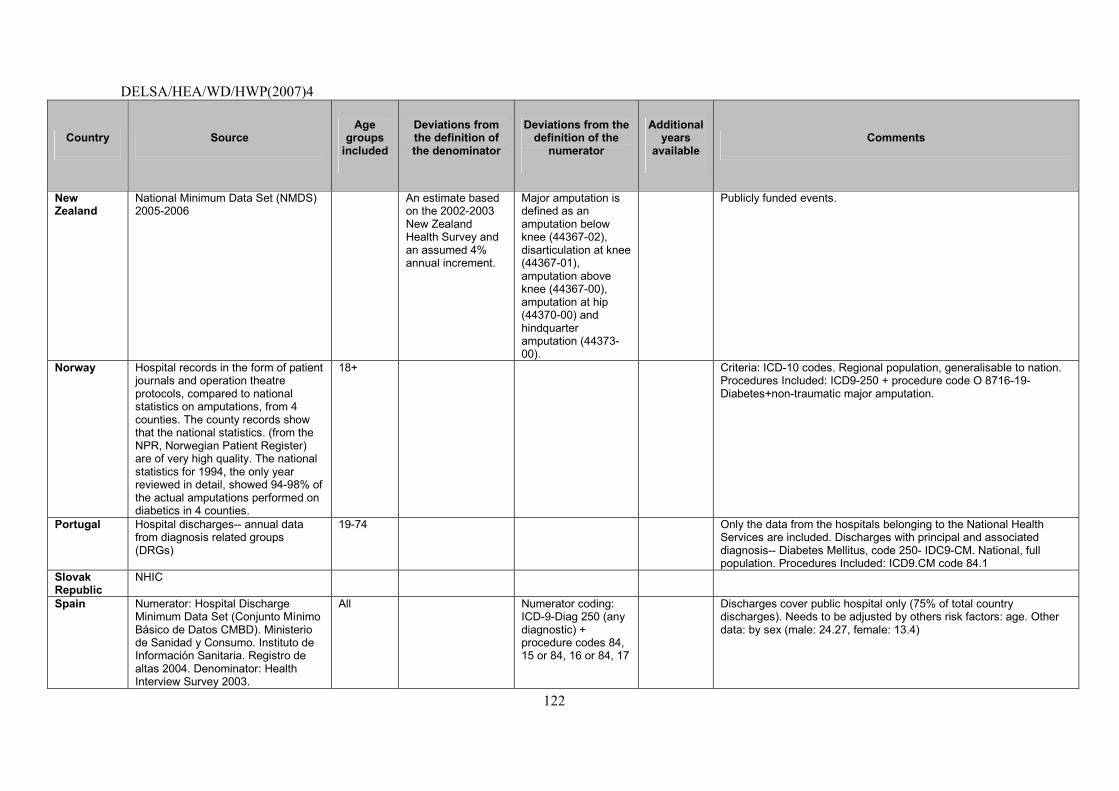
DELSA/HEA/WD/HWP(2007)4
122
Country Source Age
groups included
Deviations from the definition of the denominator
Deviations from the definition of the
numerator
Additional years
available Comments
New Zealand
National Minimum Data Set (NMDS) 2005-2006
An estimate based on the 2002-2003 New Zealand Health Survey and an assumed 4% annual increment.
Major amputation is defined as an amputation below knee (44367-02), disarticulation at knee (44367-01), amputation above knee (44367-00), amputation at hip (44370-00) and hindquarter amputation (44373-00).
Publicly funded events.
Norway Hospital records in the form of patient journals and operation theatre protocols, compared to national statistics on amputations, from 4 counties. The county records show that the national statistics. (from the NPR, Norwegian Patient Register) are of very high quality. The national statistics for 1994, the only year reviewed in detail, showed 94-98% of the actual amputations performed on diabetics in 4 counties.
18+ Criteria: ICD-10 codes. Regional population, generalisable to nation. Procedures Included: ICD9-250 + procedure code O 8716-19-Diabetes+non-traumatic major amputation.
Portugal Hospital discharges-- annual data from diagnosis related groups (DRGs)
19-74 Only the data from the hospitals belonging to the National Health Services are included. Discharges with principal and associated diagnosis-- Diabetes Mellitus, code 250- IDC9-CM. National, full population. Procedures Included: ICD9.CM code 84.1
Slovak Republic
NHIC
Spain Numerator: Hospital Discharge Minimum Data Set (Conjunto Mínimo Básico de Datos CMBD). Ministerio de Sanidad y Consumo. Instituto de Información Sanitaria. Registro de altas 2004. Denominator: Health Interview Survey 2003.
All Numerator coding: ICD-9-Diag 250 (any diagnostic) + procedure codes 84, 15 or 84, 16 or 84, 17
Discharges cover public hospital only (75% of total country discharges). Needs to be adjusted by others risk factors: age. Other data: by sex (male: 24.27, female: 13.4)
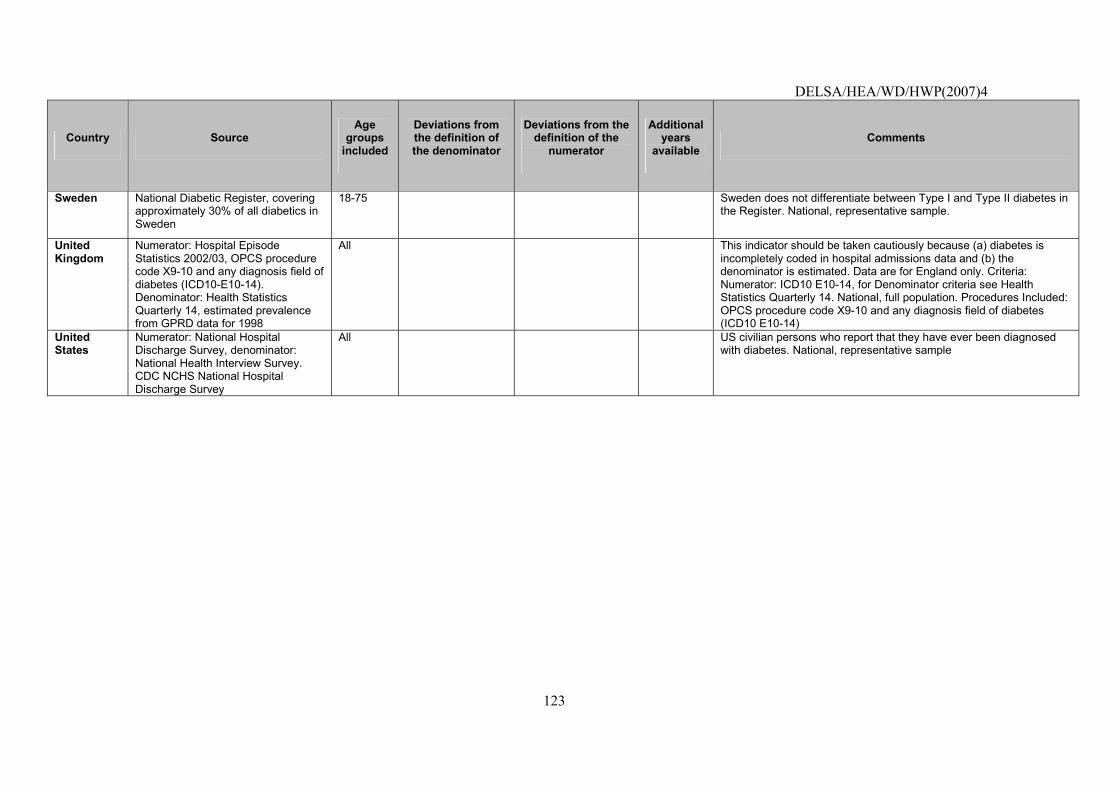
DELSA/HEA/WD/HWP(2007)4
123
Country Source Age
groups included
Deviations from the definition of the denominator
Deviations from the definition of the
numerator
Additional years
available Comments
Sweden National Diabetic Register, covering approximately 30% of all diabetics in Sweden
18-75 Sweden does not differentiate between Type I and Type II diabetes in the Register. National, representative sample.
United Kingdom
Numerator: Hospital Episode Statistics 2002/03, OPCS procedure code X9-10 and any diagnosis field of diabetes (ICD10-E10-14). Denominator: Health Statistics Quarterly 14, estimated prevalence from GPRD data for 1998
All This indicator should be taken cautiously because (a) diabetes is incompletely coded in hospital admissions data and (b) the denominator is estimated. Data are for England only. Criteria: Numerator: ICD10 E10-14, for Denominator criteria see Health Statistics Quarterly 14. National, full population. Procedures Included: OPCS procedure code X9-10 and any diagnosis field of diabetes (ICD10 E10-14)
United States
Numerator: National Hospital Discharge Survey, denominator: National Health Interview Survey. CDC NCHS National Hospital Discharge Survey
All US civilian persons who report that they have ever been diagnosed with diabetes. National, representative sample
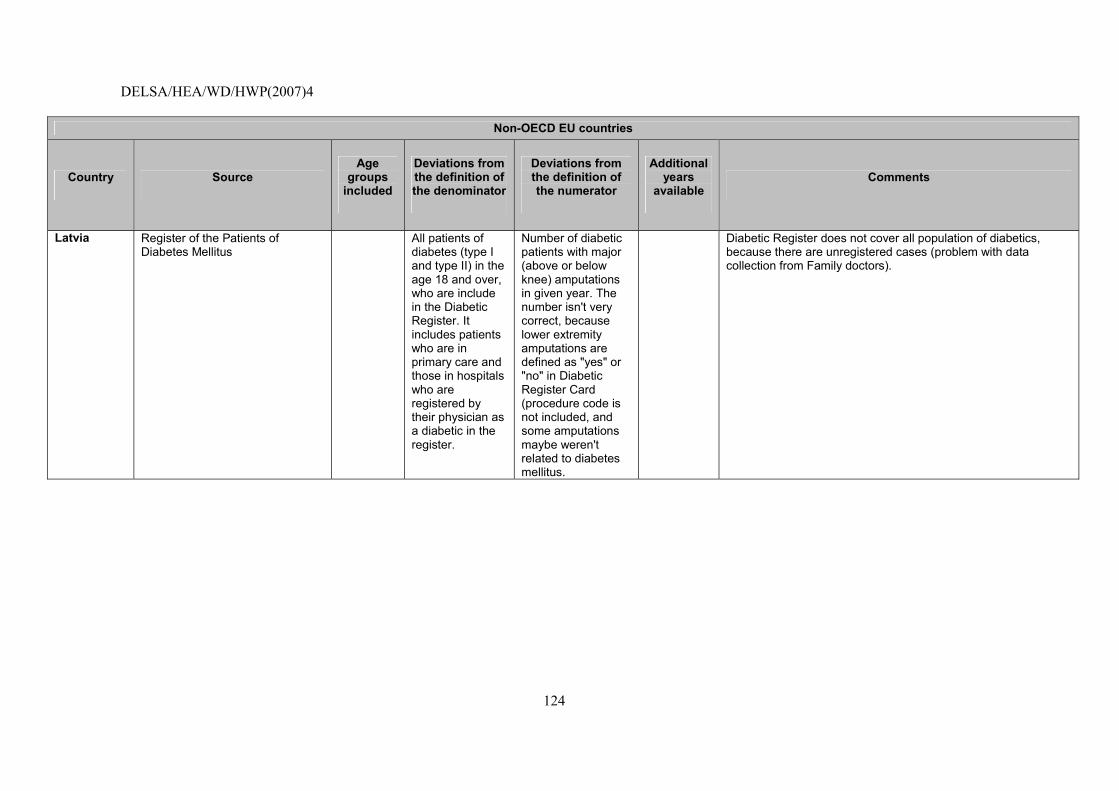
DELSA/HEA/WD/HWP(2007)4
124
Non-OECD EU countries
Country Source Age
groups included
Deviations from the definition of the denominator
Deviations from the definition of the numerator
Additional years
available Comments
Latvia Register of the Patients of Diabetes Mellitus
All patients of diabetes (type I and type II) in the age 18 and over, who are include in the Diabetic Register. It includes patients who are in primary care and those in hospitals who are registered by their physician as a diabetic in the register.
Number of diabetic patients with major (above or below knee) amputations in given year. The number isn't very correct, because lower extremity amputations are defined as "yes" or "no" in Diabetic Register Card (procedure code is not included, and some amputations maybe weren't related to diabetes mellitus.
Diabetic Register does not cover all population of diabetics, because there are unregistered cases (problem with data collection from Family doctors).
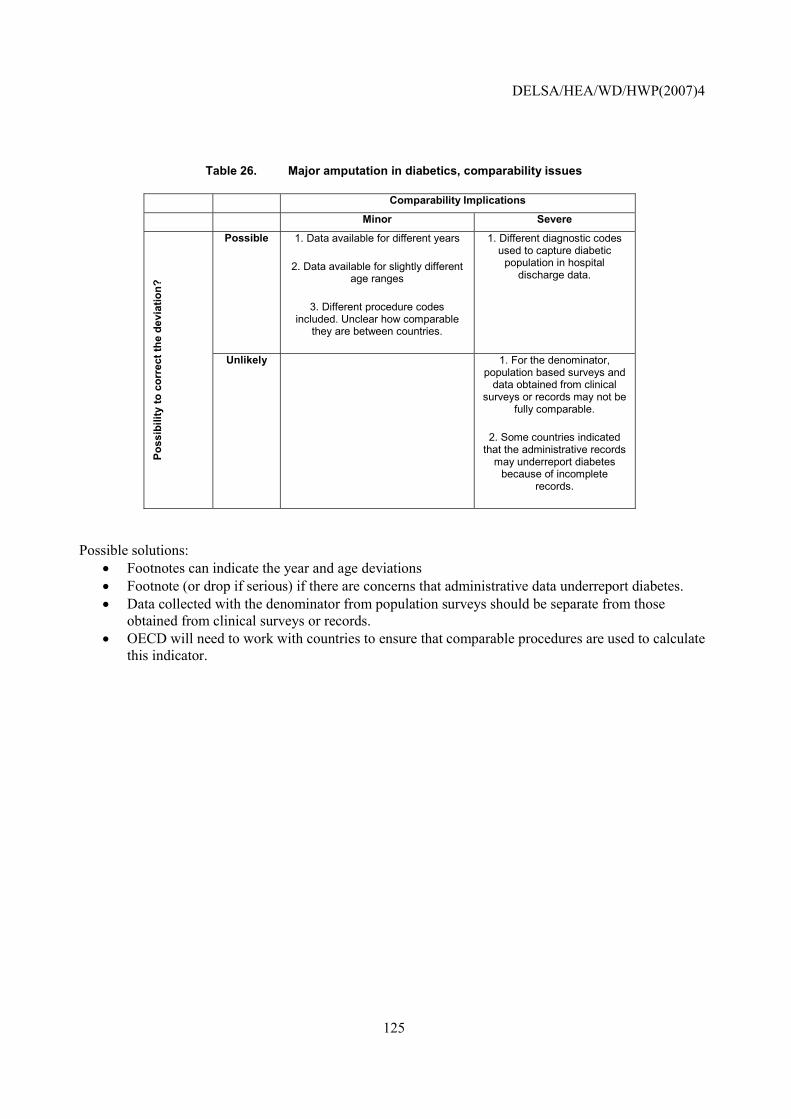
DELSA/HEA/WD/HWP(2007)4
125
Table 26. Major amputation in diabetics, comparability issues
Comparability Implications
Minor Severe
Possible 1. Data available for different years
2. Data available for slightly different age ranges
3. Different procedure codes included. Unclear how comparable
they are between countries.
1. Different diagnostic codes used to capture diabetic
population in hospital discharge data.
Poss
ibili
ty to
cor
rect
the
devi
atio
n?
Unlikely 1. For the denominator, population based surveys and
data obtained from clinical surveys or records may not be
fully comparable.
2. Some countries indicated that the administrative records
may underreport diabetes because of incomplete
records.
Possible solutions: • Footnotes can indicate the year and age deviations • Footnote (or drop if serious) if there are concerns that administrative data underreport diabetes. • Data collected with the denominator from population surveys should be separate from those
obtained from clinical surveys or records. • OECD will need to work with countries to ensure that comparable procedures are used to calculate
this indicator.
DELSA/HEA/WD/HWP(2007)4
126
Post-operative hip fracture rate
NOTE that this indicator was already tested in (2003-2005) HCQI data collection and it is not yet considered suitable for international comparisons by the HCQI Expert Group. It is included in this paper to illustrate current data concerns with the indicator and possible future solutions.
Operational Definition
Source: Agency for Healthcare Research and Quality Patient Safety Indicators (AHRQ PSIs).
Numerator: Patients experiencing an in-hospital hip fracture OR fall as defined by the CSP: secondary diagnosis only and excluding patients with trauma or metastatic cancer as any diagnosis; excluding patients with principal diagnosis of seizure, syncope, stroke, coma, cardiac arrest, or poisoning; excluding patients in MDC 8.
Denominator: Inpatients undergoing major surgery OR minor or miscellaneous surgery OR invasive cardiac procedures OR invasive radiologic procedures OR endoscopy OR medical patients OR all patients as defined by the CSP.
Importance
93. Clinical significance: Falls are a leading cause of adverse event in acute care hospitals. Up to 20% or 1 in 5 elderly people fall during recovery from illness (many patients are �at risk� because of problematic medication effect, rehabilitation, etc). Falls are associated with functional disability and injury, increased length of stay, and risk of nursing home placement from hospital. Patient falls are also a significant liability issue for hospital risk-management, because many falls and their damaging consequences are preventable. Falls may be caused by the persons� health status, response to medication or anaesthesia, external factors (wet floor, etc.) or other factors. Reducing risk of falls is an important quality of care issue for hospitals (Iezzoni, 1994).
94. The incidence of hip fracture is related with demographic factors (and others) such as: age, gender, racial difference, rural vs. urban, institutional vs. community dwelling and family history. Two thirds of all hip fractures occur among women. Hip fracture incidence rate from different countries within Europe appear to vary substantially with the highest incidences found in Northern Europe and the lowest in Mediterranean area. Highest rates are found in white populations and lower rates are found in Asian and developing countries. Rural population have lower incidence than urban population. Institutionalised elderly people also have higher rates.
95. Policy importance: Prevention of falls is an important factor in hospital management. It�s an important aspect for patients, hospital managers, and visitors. Failure to provide safe conditions in hospital, and a safe environment can lead to falls, which may result in injuries. These injuries may lead to complications and decrease in mobility. In other hand, falls may have impact in patient�s perception of safety and psychological well-being.
Scientific Soundness
96. Evidence supporting indicator validity: The review of this indicator by the AHRQ study group constructing the AHRQ PSIs found post-operative hip fracture generally performs well on several different dimensions, including reliability, bias, relatedness of indicators, and persistence over time (AHRQ, 2005).
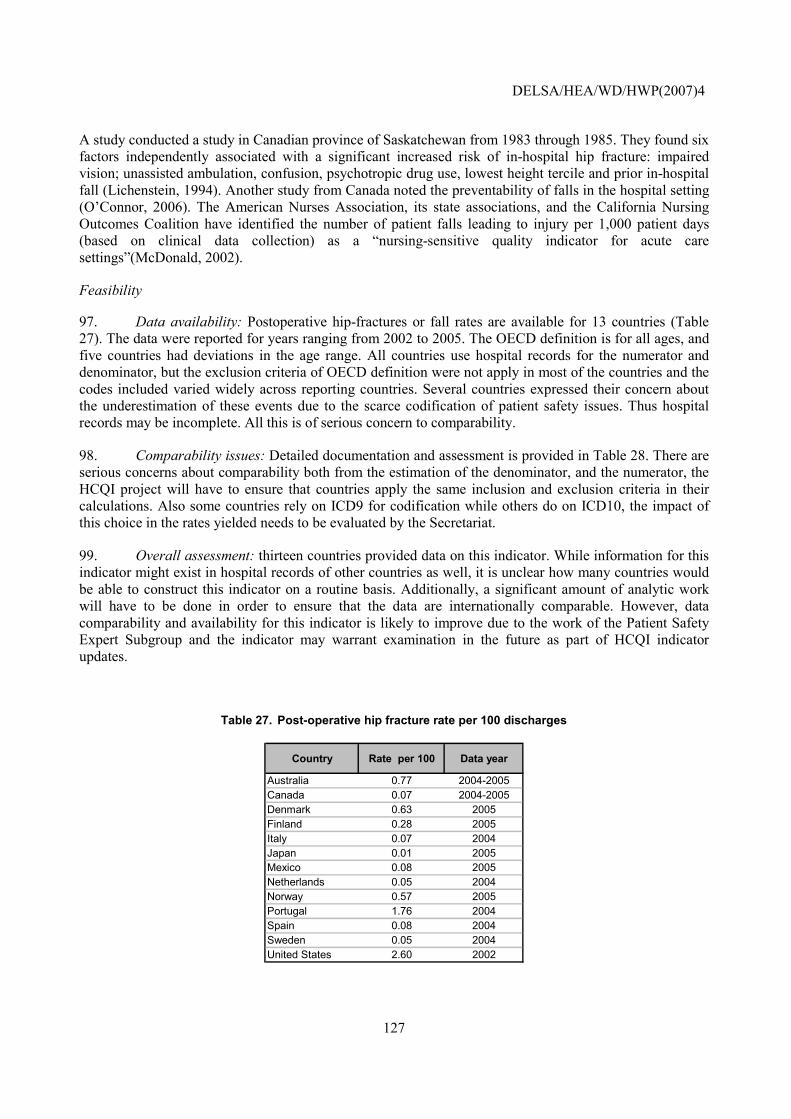
DELSA/HEA/WD/HWP(2007)4
127
A study conducted a study in Canadian province of Saskatchewan from 1983 through 1985. They found six factors independently associated with a significant increased risk of in-hospital hip fracture: impaired vision; unassisted ambulation, confusion, psychotropic drug use, lowest height tercile and prior in-hospital fall (Lichenstein, 1994). Another study from Canada noted the preventability of falls in the hospital setting (O�Connor, 2006). The American Nurses Association, its state associations, and the California Nursing Outcomes Coalition have identified the number of patient falls leading to injury per 1,000 patient days (based on clinical data collection) as a �nursing-sensitive quality indicator for acute care settings�(McDonald, 2002).
Feasibility
97. Data availability: Postoperative hip-fractures or fall rates are available for 13 countries (Table 27). The data were reported for years ranging from 2002 to 2005. The OECD definition is for all ages, and five countries had deviations in the age range. All countries use hospital records for the numerator and denominator, but the exclusion criteria of OECD definition were not apply in most of the countries and the codes included varied widely across reporting countries. Several countries expressed their concern about the underestimation of these events due to the scarce codification of patient safety issues. Thus hospital records may be incomplete. All this is of serious concern to comparability.
98. Comparability issues: Detailed documentation and assessment is provided in Table 28. There are serious concerns about comparability both from the estimation of the denominator, and the numerator, the HCQI project will have to ensure that countries apply the same inclusion and exclusion criteria in their calculations. Also some countries rely on ICD9 for codification while others do on ICD10, the impact of this choice in the rates yielded needs to be evaluated by the Secretariat.
99. Overall assessment: thirteen countries provided data on this indicator. While information for this indicator might exist in hospital records of other countries as well, it is unclear how many countries would be able to construct this indicator on a routine basis. Additionally, a significant amount of analytic work will have to be done in order to ensure that the data are internationally comparable. However, data comparability and availability for this indicator is likely to improve due to the work of the Patient Safety Expert Subgroup and the indicator may warrant examination in the future as part of HCQI indicator updates.
Table 27. Post-operative hip fracture rate per 100 discharges
Country Rate per 100 Data year
Australia 0.77 2004-2005Canada 0.07 2004-2005Denmark 0.63 2005Finland 0.28 2005Italy 0.07 2004Japan 0.01 2005Mexico 0.08 2005Netherlands 0.05 2004Norway 0.57 2005Portugal 1.76 2004Spain 0.08 2004Sweden 0.05 2004United States 2.60 2002
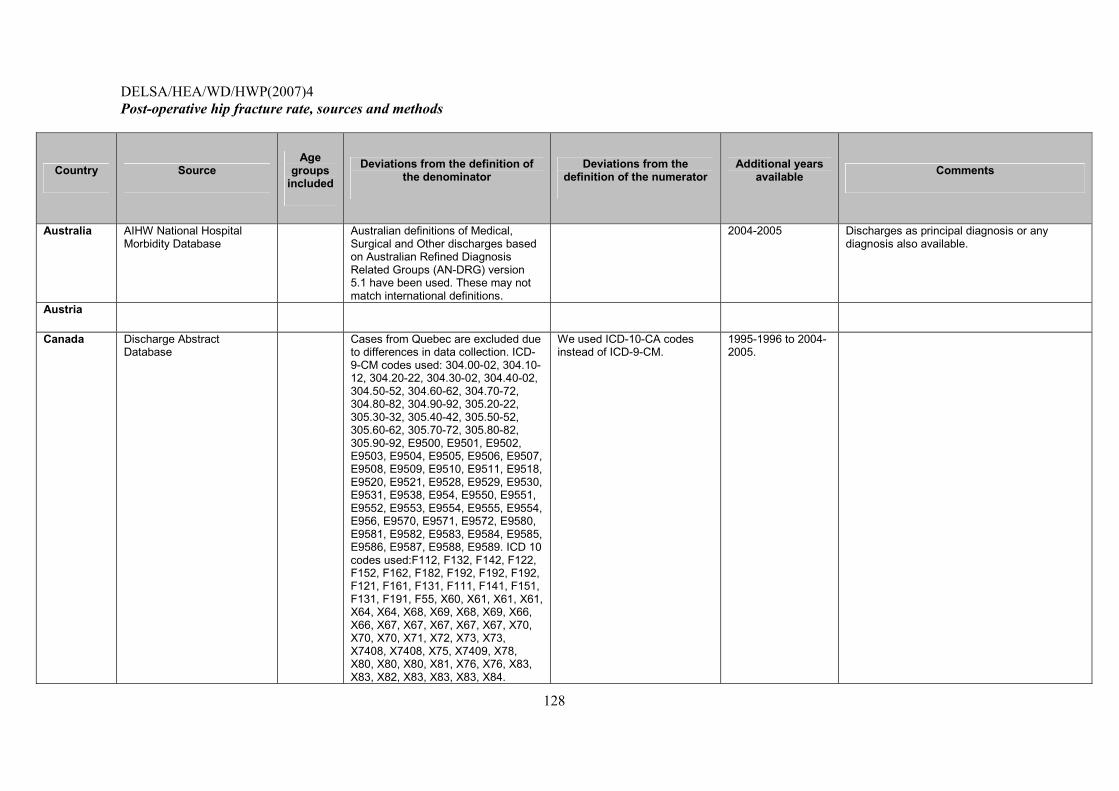
DELSA/HEA/WD/HWP(2007)4
128
Post-operative hip fracture rate, sources and methods
Country Source Age
groups included
Deviations from the definition of the denominator
Deviations from the definition of the numerator
Additional years available Comments
Australia AIHW National Hospital Morbidity Database
Australian definitions of Medical, Surgical and Other discharges based on Australian Refined Diagnosis Related Groups (AN-DRG) version 5.1 have been used. These may not match international definitions.
2004-2005 Discharges as principal diagnosis or any diagnosis also available.
Austria
Canada Discharge Abstract Database
Cases from Quebec are excluded due to differences in data collection. ICD-9-CM codes used: 304.00-02, 304.10-12, 304.20-22, 304.30-02, 304.40-02, 304.50-52, 304.60-62, 304.70-72, 304.80-82, 304.90-92, 305.20-22, 305.30-32, 305.40-42, 305.50-52, 305.60-62, 305.70-72, 305.80-82, 305.90-92, E9500, E9501, E9502, E9503, E9504, E9505, E9506, E9507, E9508, E9509, E9510, E9511, E9518, E9520, E9521, E9528, E9529, E9530, E9531, E9538, E954, E9550, E9551, E9552, E9553, E9554, E9555, E9554, E956, E9570, E9571, E9572, E9580, E9581, E9582, E9583, E9584, E9585, E9586, E9587, E9588, E9589. ICD 10 codes used:F112, F132, F142, F122, F152, F162, F182, F192, F192, F192, F121, F161, F131, F111, F141, F151, F131, F191, F55, X60, X61, X61, X61, X64, X64, X68, X69, X68, X69, X66, X66, X67, X67, X67, X67, X67, X70, X70, X70, X71, X72, X73, X73, X7408, X7408, X75, X7409, X78, X80, X80, X80, X81, X76, X76, X83, X83, X82, X83, X83, X83, X84.
We used ICD-10-CA codes instead of ICD-9-CM.
1995-1996 to 2004-2005.
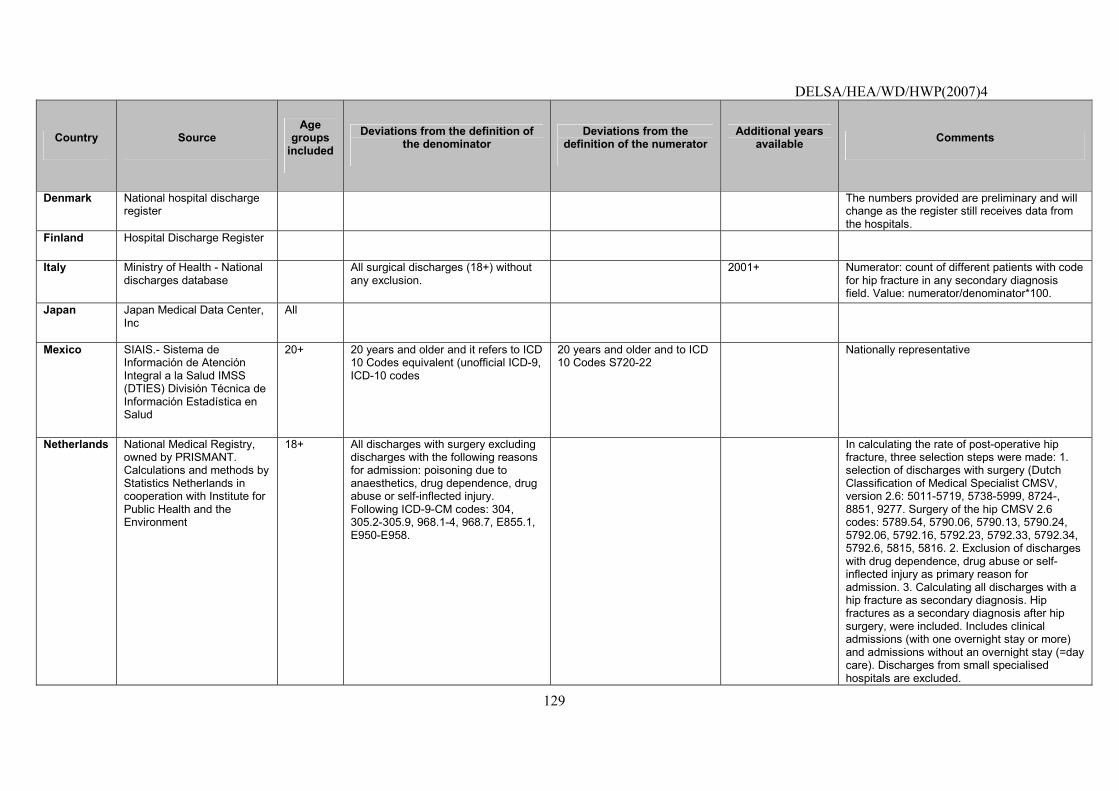
DELSA/HEA/WD/HWP(2007)4
129
Country Source Age
groups included
Deviations from the definition of the denominator
Deviations from the definition of the numerator
Additional years available Comments
Denmark National hospital discharge register
The numbers provided are preliminary and will change as the register still receives data from the hospitals.
Finland Hospital Discharge Register
Italy Ministry of Health - National discharges database
All surgical discharges (18+) without any exclusion.
2001+ Numerator: count of different patients with code for hip fracture in any secondary diagnosis field. Value: numerator/denominator*100.
Japan Japan Medical Data Center, Inc
All
Mexico SIAIS.- Sistema de Información de Atención Integral a la Salud IMSS (DTIES) División Técnica de Información Estadística en Salud
20+ 20 years and older and it refers to ICD 10 Codes equivalent (unofficial ICD-9, ICD-10 codes
20 years and older and to ICD 10 Codes S720-22
Nationally representative
Netherlands National Medical Registry, owned by PRISMANT. Calculations and methods by Statistics Netherlands in cooperation with Institute for Public Health and the Environment
18+ All discharges with surgery excluding discharges with the following reasons for admission: poisoning due to anaesthetics, drug dependence, drug abuse or self-inflected injury. Following ICD-9-CM codes: 304, 305.2-305.9, 968.1-4, 968.7, E855.1, E950-E958.
In calculating the rate of post-operative hip fracture, three selection steps were made: 1. selection of discharges with surgery (Dutch Classification of Medical Specialist CMSV, version 2.6: 5011-5719, 5738-5999, 8724-, 8851, 9277. Surgery of the hip CMSV 2.6 codes: 5789.54, 5790.06, 5790.13, 5790.24, 5792.06, 5792.16, 5792.23, 5792.33, 5792.34, 5792.6, 5815, 5816. 2. Exclusion of discharges with drug dependence, drug abuse or self-inflected injury as primary reason for admission. 3. Calculating all discharges with a hip fracture as secondary diagnosis. Hip fractures as a secondary diagnosis after hip surgery, were included. Includes clinical admissions (with one overnight stay or more) and admissions without an overnight stay (=day care). Discharges from small specialised hospitals are excluded.
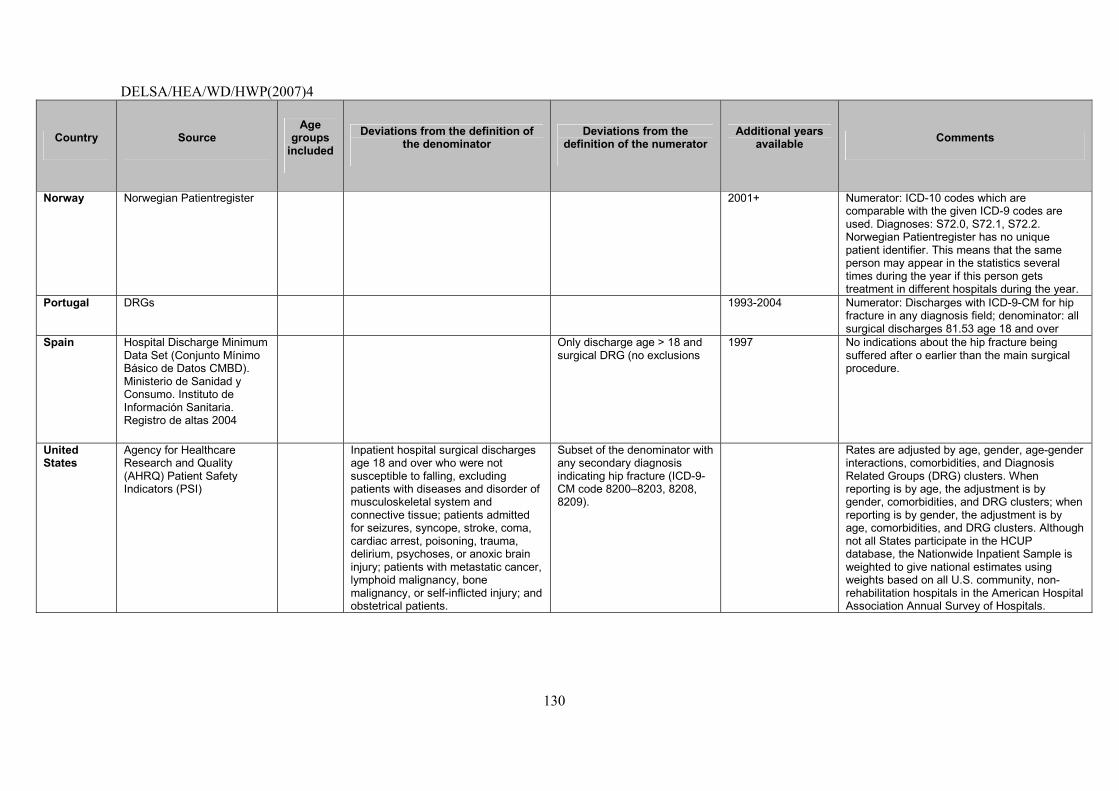
DELSA/HEA/WD/HWP(2007)4
130
Country Source Age
groups included
Deviations from the definition of the denominator
Deviations from the definition of the numerator
Additional years available Comments
Norway Norwegian Patientregister 2001+ Numerator: ICD-10 codes which are comparable with the given ICD-9 codes are used. Diagnoses: S72.0, S72.1, S72.2. Norwegian Patientregister has no unique patient identifier. This means that the same person may appear in the statistics several times during the year if this person gets treatment in different hospitals during the year.
Portugal DRGs 1993-2004 Numerator: Discharges with ICD-9-CM for hip fracture in any diagnosis field; denominator: all surgical discharges 81.53 age 18 and over
Spain Hospital Discharge Minimum Data Set (Conjunto Mínimo Básico de Datos CMBD). Ministerio de Sanidad y Consumo. Instituto de Información Sanitaria. Registro de altas 2004
Only discharge age > 18 and surgical DRG (no exclusions
1997 No indications about the hip fracture being suffered after o earlier than the main surgical procedure.
United States
Agency for Healthcare Research and Quality (AHRQ) Patient Safety Indicators (PSI)
Inpatient hospital surgical discharges age 18 and over who were not susceptible to falling, excluding patients with diseases and disorder of musculoskeletal system and connective tissue; patients admitted for seizures, syncope, stroke, coma, cardiac arrest, poisoning, trauma, delirium, psychoses, or anoxic brain injury; patients with metastatic cancer, lymphoid malignancy, bone malignancy, or self-inflicted injury; and obstetrical patients.
Subset of the denominator with any secondary diagnosis indicating hip fracture (ICD-9-CM code 8200�8203, 8208, 8209).
Rates are adjusted by age, gender, age-gender interactions, comorbidities, and Diagnosis Related Groups (DRG) clusters. When reporting is by age, the adjustment is by gender, comorbidities, and DRG clusters; when reporting is by gender, the adjustment is by age, comorbidities, and DRG clusters. Although not all States participate in the HCUP database, the Nationwide Inpatient Sample is weighted to give national estimates using weights based on all U.S. community, non-rehabilitation hospitals in the American Hospital Association Annual Survey of Hospitals.
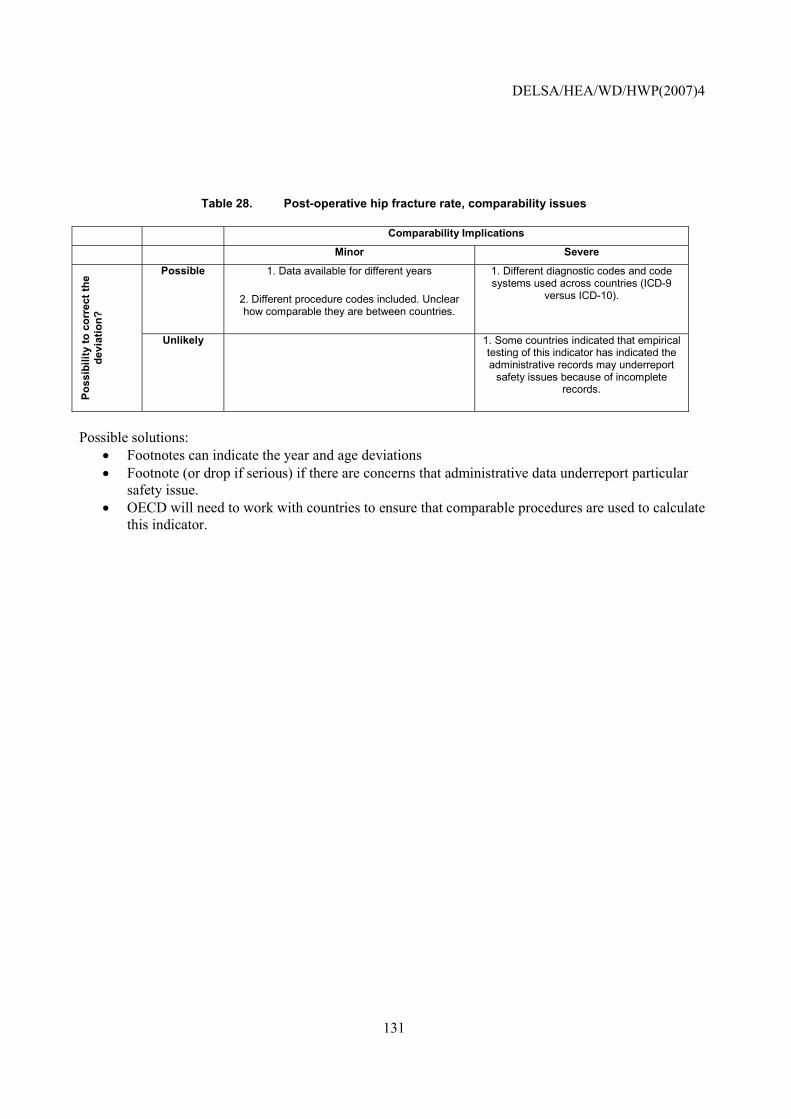
DELSA/HEA/WD/HWP(2007)4
131
Table 28. Post-operative hip fracture rate, comparability issues
Comparability Implications
Minor Severe
Possible 1. Data available for different years
2. Different procedure codes included. Unclear how comparable they are between countries.
1. Different diagnostic codes and code systems used across countries (ICD-9
versus ICD-10).
Poss
ibili
ty to
cor
rect
the
devi
atio
n?
Unlikely 1. Some countries indicated that empirical testing of this indicator has indicated the administrative records may underreport
safety issues because of incomplete records.
Possible solutions:
• Footnotes can indicate the year and age deviations • Footnote (or drop if serious) if there are concerns that administrative data underreport particular
safety issue. • OECD will need to work with countries to ensure that comparable procedures are used to calculate
this indicator.
DELSA/HEA/WD/HWP(2007)4
132
Transfusion reaction rate
NOTE that this indicator is new; it has been incorporated for the first time in the 2006 HCQI data collection. It is included in this paper to illustrate current data concerns with the indicator and possible future solutions.
Operational Definition
Source: AHRQ/CIHI Safety Indicators. Numerator: Discharges with ICD-9-CM codes for transfusion reaction in any secondary diagnosis field per 100 discharges. Denominator: All medical and surgical discharges, 18 years and older or MDC 14 (pregnancy, childbirth or puerperium).
Importance
100. Clinical significance: Transfusion of wrong blood type to the wrong person may have serious effects. The risk of adverse outcome from erroneous transfusion rivals or exceeds current estimates of the risk of acquiring infectious disease by transfusion (Linden, 2000). According the same authors the systems must be redesigned to allow minor fluctuations in human performance, especially in routine tasks. The use of systems designed to prevent specific errors may be helpful (such as convenient access to standard operating procedures instructions in work areas, a blood component lock system that will not allow the access of a component unless there is patient wristband and blood component match, etc.).
101. Recent studies on human error in medicine followed methods derived from the experience gained while analysing large-scale technological disasters (Eagle, 1992; Reason, 1990). They recognised that medical, like technological, accidents nearly always require the conjunction of two types of failures: active failures, mistakes happening while performing a task, and latent failures, or management system errors. The latter ones are more difficult to perceive, because they constitute silent failures residing in a system until human error allows the expression resulting in a major accident (Baele, 1994). According to the author the detection and the correction of the latter type failure, ideally before the occurrence of accidents, is more efficient in improving the overall quality of a system than any action aiming at only active failures. Clinician panellists from AHRQ consider that this indicator very likely reflects actual medical errors. As expected, this indicator proved to be very rare with less than 1 per 10 000 cases at risk.
102. Scientific Soundness
103. Evidence supporting indicator validity: This indicator was originally proposed by Iezzoni et al.(1992) as part of the Complications Screening Programme (CSP �sentinel events�), along with gas gangrene, CNS abscess, anoxic brain injury, accidental puncture or laceration, wound dehiscence, and foreign body left in (all of which were omitted from this indicator). It was also included as one component of a broader indicator (�adverse events and iatrogenic complications�) in AHRQ�s original HCUP Quality Indicators. It was proposed by Miller et al. (2001) in the original �AHRQ PSI Algorithms and Groupings,� although their definition also includes minor transfusion reactions (999.8), which were omitted from this indicator.
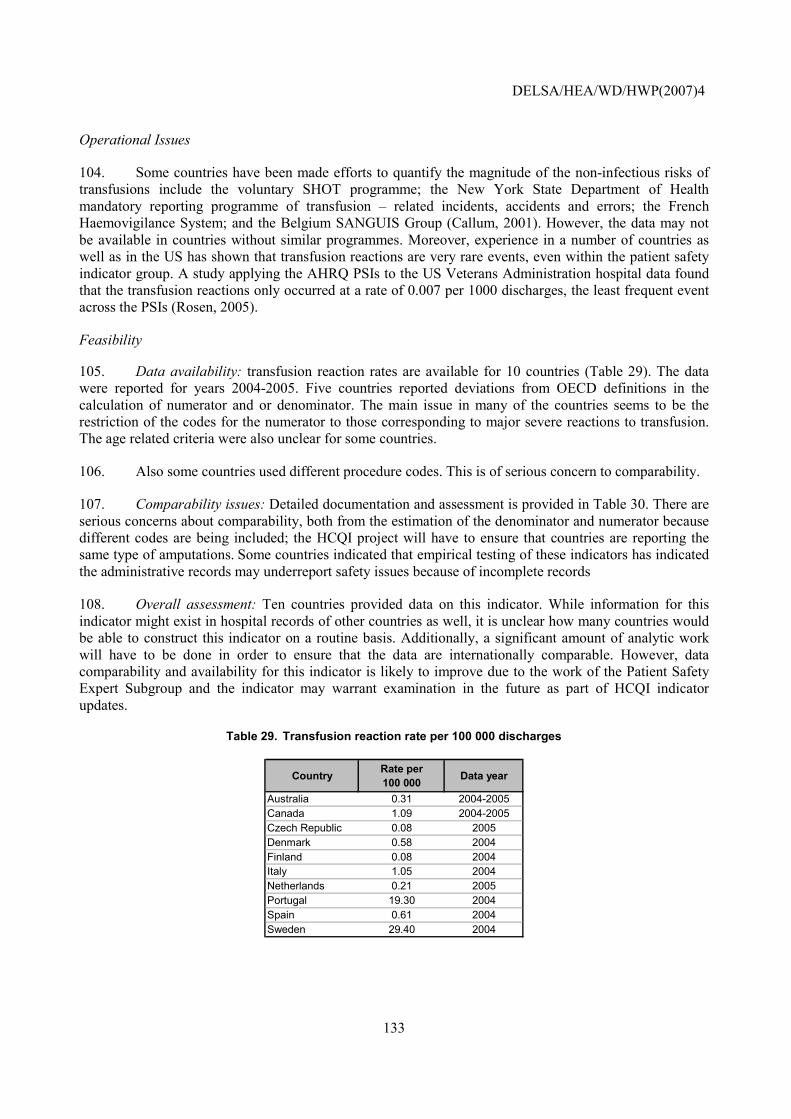
DELSA/HEA/WD/HWP(2007)4
133
Operational Issues
104. Some countries have been made efforts to quantify the magnitude of the non-infectious risks of transfusions include the voluntary SHOT programme; the New York State Department of Health mandatory reporting programme of transfusion � related incidents, accidents and errors; the French Haemovigilance System; and the Belgium SANGUIS Group (Callum, 2001). However, the data may not be available in countries without similar programmes. Moreover, experience in a number of countries as well as in the US has shown that transfusion reactions are very rare events, even within the patient safety indicator group. A study applying the AHRQ PSIs to the US Veterans Administration hospital data found that the transfusion reactions only occurred at a rate of 0.007 per 1000 discharges, the least frequent event across the PSIs (Rosen, 2005).
Feasibility
105. Data availability: transfusion reaction rates are available for 10 countries (Table 29). The data were reported for years 2004-2005. Five countries reported deviations from OECD definitions in the calculation of numerator and or denominator. The main issue in many of the countries seems to be the restriction of the codes for the numerator to those corresponding to major severe reactions to transfusion. The age related criteria were also unclear for some countries.
106. Also some countries used different procedure codes. This is of serious concern to comparability.
107. Comparability issues: Detailed documentation and assessment is provided in Table 30. There are serious concerns about comparability, both from the estimation of the denominator and numerator because different codes are being included; the HCQI project will have to ensure that countries are reporting the same type of amputations. Some countries indicated that empirical testing of these indicators has indicated the administrative records may underreport safety issues because of incomplete records
108. Overall assessment: Ten countries provided data on this indicator. While information for this indicator might exist in hospital records of other countries as well, it is unclear how many countries would be able to construct this indicator on a routine basis. Additionally, a significant amount of analytic work will have to be done in order to ensure that the data are internationally comparable. However, data comparability and availability for this indicator is likely to improve due to the work of the Patient Safety Expert Subgroup and the indicator may warrant examination in the future as part of HCQI indicator updates.
Table 29. Transfusion reaction rate per 100 000 discharges
Country Rate per 100 000 Data year
Australia 0.31 2004-2005Canada 1.09 2004-2005Czech Republic 0.08 2005Denmark 0.58 2004Finland 0.08 2004Italy 1.05 2004Netherlands 0.21 2005Portugal 19.30 2004Spain 0.61 2004Sweden 29.40 2004
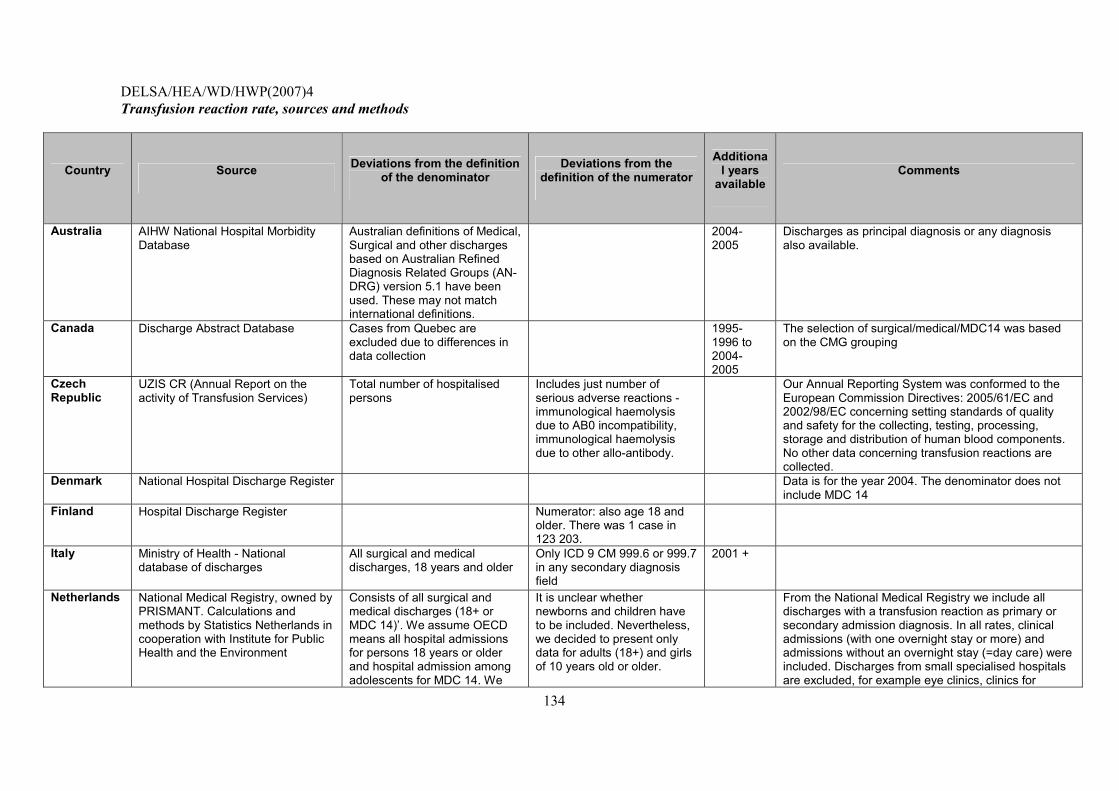
DELSA/HEA/WD/HWP(2007)4
134
Transfusion reaction rate, sources and methods
Country Source Deviations from the definition of the denominator
Deviations from the definition of the numerator
Additional years
available Comments
Australia AIHW National Hospital Morbidity Database
Australian definitions of Medical, Surgical and other discharges based on Australian Refined Diagnosis Related Groups (AN-DRG) version 5.1 have been used. These may not match international definitions.
2004-2005
Discharges as principal diagnosis or any diagnosis also available.
Canada Discharge Abstract Database Cases from Quebec are excluded due to differences in data collection
1995-1996 to 2004-2005
The selection of surgical/medical/MDC14 was based on the CMG grouping
Czech Republic
UZIS CR (Annual Report on the activity of Transfusion Services)
Total number of hospitalised persons
Includes just number of serious adverse reactions - immunological haemolysis due to AB0 incompatibility, immunological haemolysis due to other allo-antibody.
Our Annual Reporting System was conformed to the European Commission Directives: 2005/61/EC and 2002/98/EC concerning setting standards of quality and safety for the collecting, testing, processing, storage and distribution of human blood components. No other data concerning transfusion reactions are collected.
Denmark National Hospital Discharge Register Data is for the year 2004. The denominator does not include MDC 14
Finland Hospital Discharge Register Numerator: also age 18 and older. There was 1 case in 123 203.
Italy Ministry of Health - National database of discharges
All surgical and medical discharges, 18 years and older
Only ICD 9 CM 999.6 or 999.7 in any secondary diagnosis field
2001 +
Netherlands National Medical Registry, owned by PRISMANT. Calculations and methods by Statistics Netherlands in cooperation with Institute for Public Health and the Environment
Consists of all surgical and medical discharges (18+ or MDC 14)�. We assume OECD means all hospital admissions for persons 18 years or older and hospital admission among adolescents for MDC 14. We
It is unclear whether newborns and children have to be included. Nevertheless, we decided to present only data for adults (18+) and girls of 10 years old or older.
From the National Medical Registry we include all discharges with a transfusion reaction as primary or secondary admission diagnosis. In all rates, clinical admissions (with one overnight stay or more) and admissions without an overnight stay (=day care) were included. Discharges from small specialised hospitals are excluded, for example eye clinics, clinics for
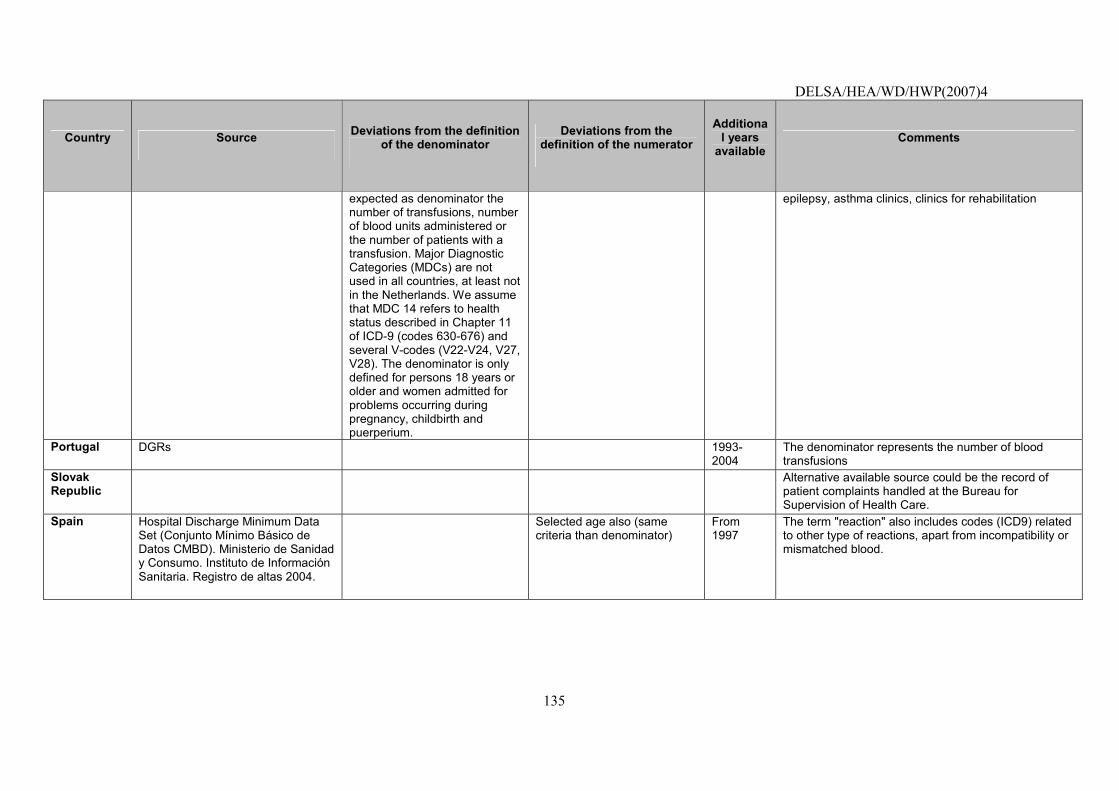
DELSA/HEA/WD/HWP(2007)4
135
Country Source Deviations from the definition of the denominator
Deviations from the definition of the numerator
Additional years
available Comments
expected as denominator the number of transfusions, number of blood units administered or the number of patients with a transfusion. Major Diagnostic Categories (MDCs) are not used in all countries, at least not in the Netherlands. We assume that MDC 14 refers to health status described in Chapter 11 of ICD-9 (codes 630-676) and several V-codes (V22-V24, V27, V28). The denominator is only defined for persons 18 years or older and women admitted for problems occurring during pregnancy, childbirth and puerperium.
epilepsy, asthma clinics, clinics for rehabilitation
Portugal DGRs 1993-2004
The denominator represents the number of blood transfusions
Slovak Republic
Alternative available source could be the record of patient complaints handled at the Bureau for Supervision of Health Care.
Spain Hospital Discharge Minimum Data Set (Conjunto Mínimo Básico de Datos CMBD). Ministerio de Sanidad y Consumo. Instituto de Información Sanitaria. Registro de altas 2004.
Selected age also (same criteria than denominator)
From 1997
The term "reaction" also includes codes (ICD9) related to other type of reactions, apart from incompatibility or mismatched blood.
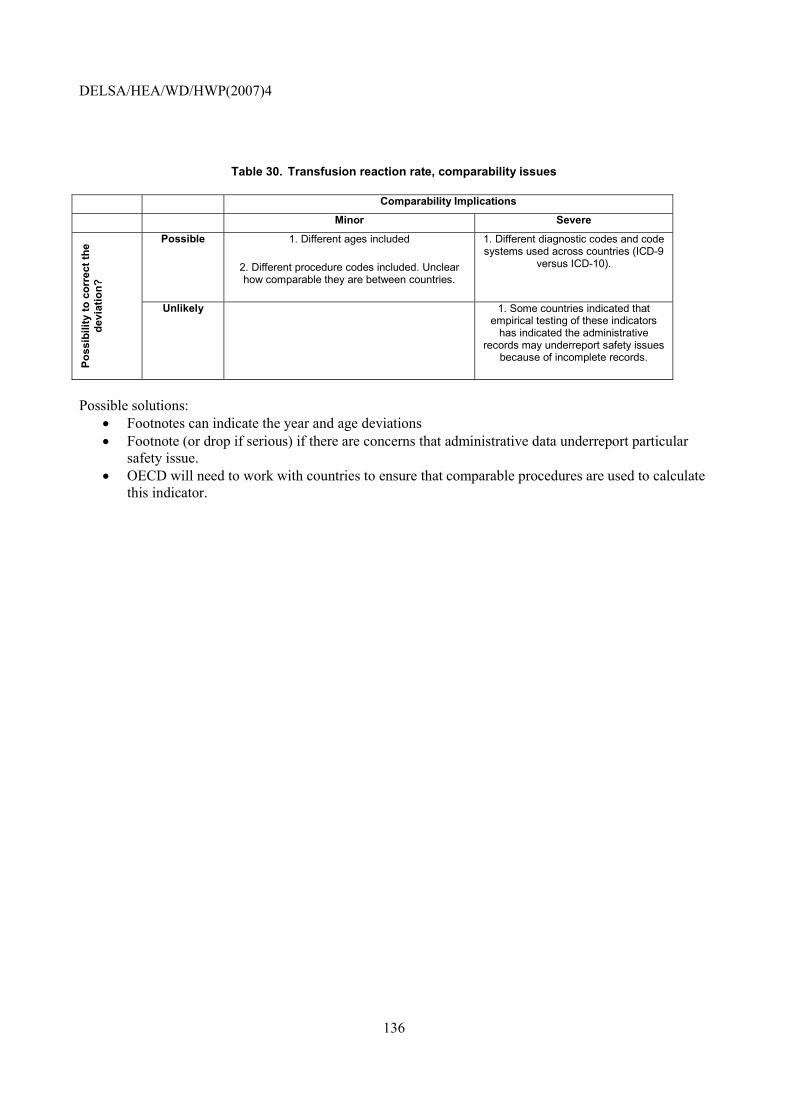
DELSA/HEA/WD/HWP(2007)4
136
Table 30. Transfusion reaction rate, comparability issues
Comparability Implications
Minor Severe
Possible 1. Different ages included
2. Different procedure codes included. Unclear how comparable they are between countries.
1. Different diagnostic codes and code systems used across countries (ICD-9
versus ICD-10).
Poss
ibili
ty to
cor
rect
the
devi
atio
n?
Unlikely 1. Some countries indicated that empirical testing of these indicators
has indicated the administrative records may underreport safety issues
because of incomplete records.
Possible solutions:
• Footnotes can indicate the year and age deviations • Footnote (or drop if serious) if there are concerns that administrative data underreport particular
safety issue. • OECD will need to work with countries to ensure that comparable procedures are used to calculate
this indicator.
DELSA/HEA/WD/HWP(2007)4
137
Uncontrolled diabetes admission rate
NOTE that this indicator is new and has been incorporated for the first time in 2006 HCQI data collection. It is included in this paper to illustrate current data concerns with the indicator and possible future solutions.
Operational Definition
Source: AHRQ Prevention Quality Indicators. Numerator: All non-maternal discharges of age 18 years and older with ICD-9-CM principal diagnosis code for uncontrolled diabetes, without mention of a short-term or long-term complication. Denominator: Total population.
Importance
109. Clinical significance of process or outcome: Avoidable hospitalisations are those conditions that could have been avoided if proper ambulatory care had been received and can thus be seen as a measure of access to appropriate medical care. While not all admissions for ambulatory care sensitive conditions are avoidable, it is assumed that appropriate prior ambulatory care could prevent the onset of this type of illness or condition, control an acute episodic illness or condition, or manage a chronic disease or condition. A disproportionately high rate is presumed to reflect problems in obtaining access to primary care (Weissman, 1992). In terms of avoiding uncontrolled diabetes admission rates, in the US, the Healthy People 2010 effort has set a national goal to reduce the rate of admissions for uncontrolled diabetes for persons 18-64 years of age from 7.2 per 10 000 to 5.4 per 10 000 population (HHS, 2000). Studies in the US have shown similar rates of admissions for uncontrolled diabetes for men and women and across racial and ethnic groups, unlike some other preventable hospitalisation indicators for diabetes care (Correa-de-Araujo, 2006).
110. Identification of process/outcome as quality problem: The rate of Ambulatory Care Sensitive (ACS) hospitalisations is considered an index of access of a population to adequate primary care. These are hospitalisations for selected diagnoses some of which might reasonably have been prevented if primary care had been received in time. ACS hospitalisations are elevated in low-income areas and in rural/frontier areas.
111. Policy importance: Given the high cost of hospital care and the high prevalence of the disease included in this indicator, elevated ACS hospitalisation rates could point not only towards possibilities to improve quality but also to substantial cost savings, if better primary care were provided. In addition, the ACS hospitalisation rate appears sensitive to the presence or absence of economic barriers to access. It has been reported to be lower and/or less correlated with socioeconomic status in countries with national health insurance (Billings, 1996).
112. Susceptibility to being influenced by the health system: Appropriate prior ambulatory care could prevent the onset of an illness or condition; control an acute episodic illness or condition; or manage a chronic disease or condition (Anderson, 1996).
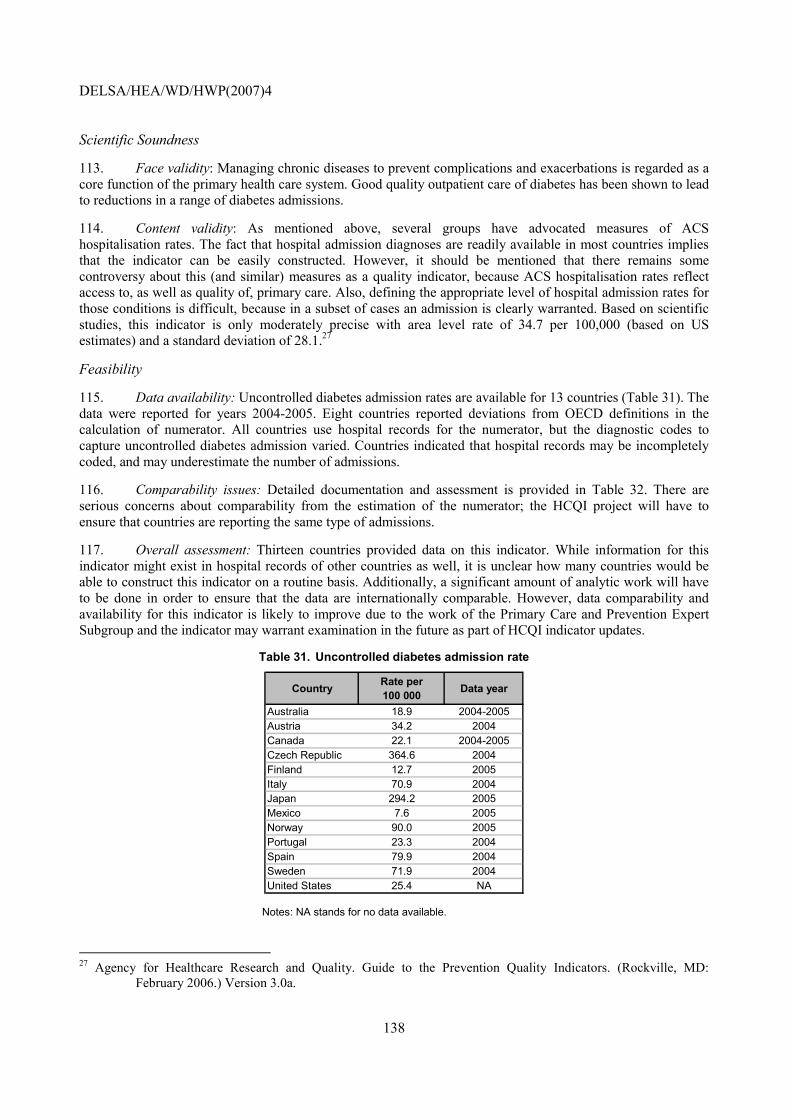
DELSA/HEA/WD/HWP(2007)4
138
Scientific Soundness
113. Face validity: Managing chronic diseases to prevent complications and exacerbations is regarded as a core function of the primary health care system. Good quality outpatient care of diabetes has been shown to lead to reductions in a range of diabetes admissions.
114. Content validity: As mentioned above, several groups have advocated measures of ACS hospitalisation rates. The fact that hospital admission diagnoses are readily available in most countries implies that the indicator can be easily constructed. However, it should be mentioned that there remains some controversy about this (and similar) measures as a quality indicator, because ACS hospitalisation rates reflect access to, as well as quality of, primary care. Also, defining the appropriate level of hospital admission rates for those conditions is difficult, because in a subset of cases an admission is clearly warranted. Based on scientific studies, this indicator is only moderately precise with area level rate of 34.7 per 100,000 (based on US estimates) and a standard deviation of 28.1.27
Feasibility
115. Data availability: Uncontrolled diabetes admission rates are available for 13 countries (Table 31). The data were reported for years 2004-2005. Eight countries reported deviations from OECD definitions in the calculation of numerator. All countries use hospital records for the numerator, but the diagnostic codes to capture uncontrolled diabetes admission varied. Countries indicated that hospital records may be incompletely coded, and may underestimate the number of admissions.
116. Comparability issues: Detailed documentation and assessment is provided in Table 32. There are serious concerns about comparability from the estimation of the numerator; the HCQI project will have to ensure that countries are reporting the same type of admissions.
117. Overall assessment: Thirteen countries provided data on this indicator. While information for this indicator might exist in hospital records of other countries as well, it is unclear how many countries would be able to construct this indicator on a routine basis. Additionally, a significant amount of analytic work will have to be done in order to ensure that the data are internationally comparable. However, data comparability and availability for this indicator is likely to improve due to the work of the Primary Care and Prevention Expert Subgroup and the indicator may warrant examination in the future as part of HCQI indicator updates.
Table 31. Uncontrolled diabetes admission rate
Country Rate per 100 000 Data year
Australia 18.9 2004-2005Austria 34.2 2004Canada 22.1 2004-2005Czech Republic 364.6 2004Finland 12.7 2005Italy 70.9 2004Japan 294.2 2005Mexico 7.6 2005Norway 90.0 2005Portugal 23.3 2004Spain 79.9 2004Sweden 71.9 2004United States 25.4 NA
Notes: NA stands for no data available.
27 Agency for Healthcare Research and Quality. Guide to the Prevention Quality Indicators. (Rockville, MD:
February 2006.) Version 3.0a.
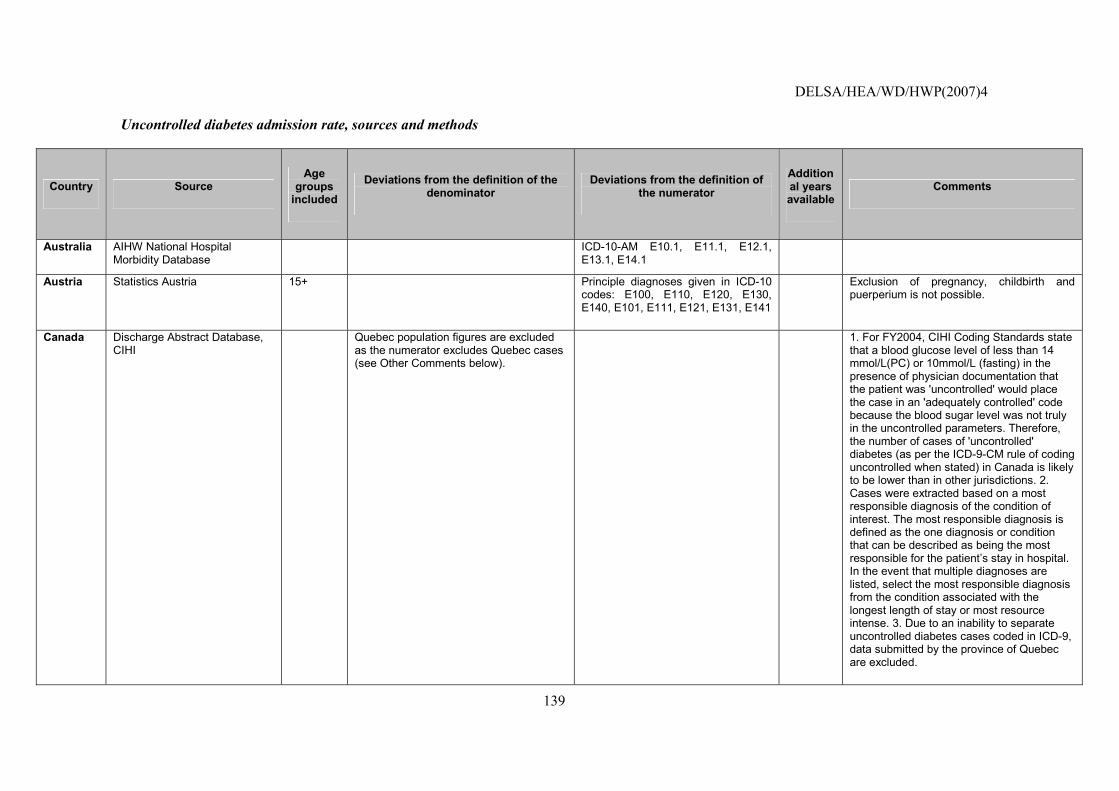
DELSA/HEA/WD/HWP(2007)4
139
Uncontrolled diabetes admission rate, sources and methods
Country Source Age
groups included
Deviations from the definition of the denominator
Deviations from the definition of the numerator
Additional years available
Comments
Australia AIHW National Hospital Morbidity Database
ICD-10-AM E10.1, E11.1, E12.1, E13.1, E14.1
Austria Statistics Austria 15+ Principle diagnoses given in ICD-10 codes: E100, E110, E120, E130, E140, E101, E111, E121, E131, E141
Exclusion of pregnancy, childbirth and puerperium is not possible.
Canada Discharge Abstract Database, CIHI
Quebec population figures are excluded as the numerator excludes Quebec cases (see Other Comments below).
1. For FY2004, CIHI Coding Standards state that a blood glucose level of less than 14 mmol/L(PC) or 10mmol/L (fasting) in the presence of physician documentation that the patient was 'uncontrolled' would place the case in an 'adequately controlled' code because the blood sugar level was not truly in the uncontrolled parameters. Therefore, the number of cases of 'uncontrolled' diabetes (as per the ICD-9-CM rule of coding uncontrolled when stated) in Canada is likely to be lower than in other jurisdictions. 2. Cases were extracted based on a most responsible diagnosis of the condition of interest. The most responsible diagnosis is defined as the one diagnosis or condition that can be described as being the most responsible for the patient�s stay in hospital. In the event that multiple diagnoses are listed, select the most responsible diagnosis from the condition associated with the longest length of stay or most resource intense. 3. Due to an inability to separate uncontrolled diabetes cases coded in ICD-9, data submitted by the province of Quebec are excluded.
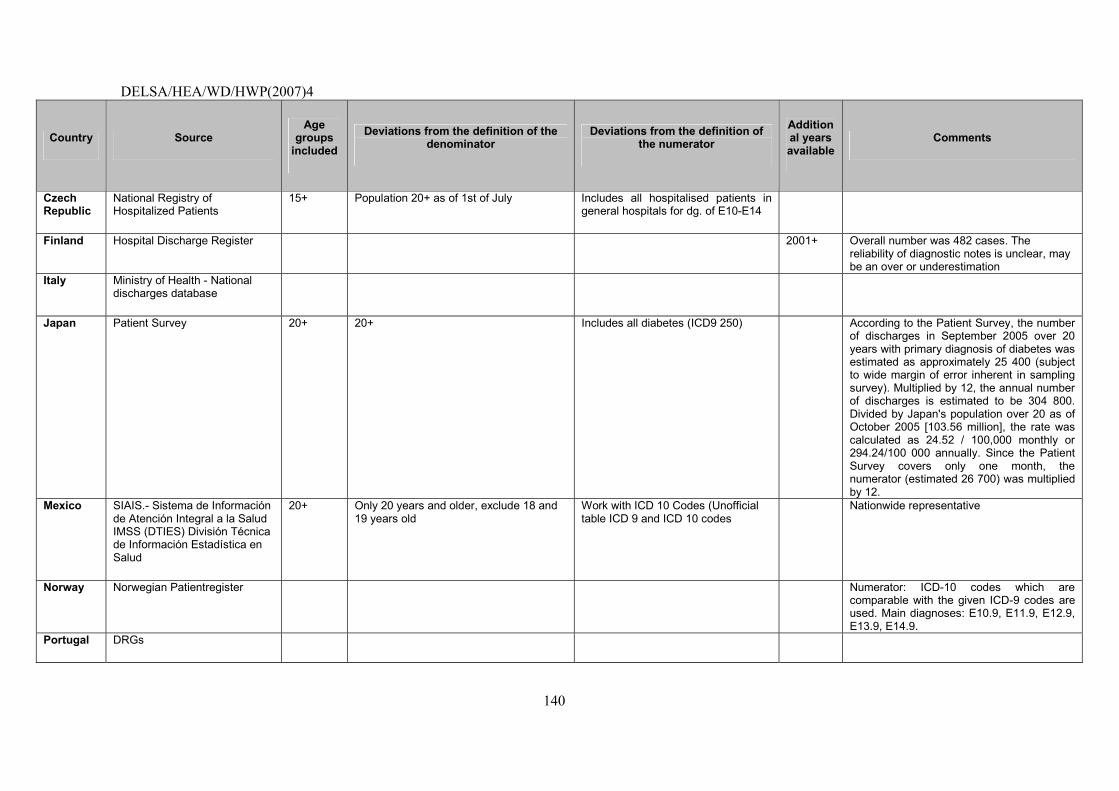
DELSA/HEA/WD/HWP(2007)4
140
Country Source Age
groups included
Deviations from the definition of the denominator
Deviations from the definition of the numerator
Additional years available
Comments
Czech Republic
National Registry of Hospitalized Patients
15+ Population 20+ as of 1st of July Includes all hospitalised patients in general hospitals for dg. of E10-E14
Finland Hospital Discharge Register 2001+ Overall number was 482 cases. The reliability of diagnostic notes is unclear, may be an over or underestimation
Italy Ministry of Health - National discharges database
Japan Patient Survey 20+ 20+ Includes all diabetes (ICD9 250) According to the Patient Survey, the number of discharges in September 2005 over 20 years with primary diagnosis of diabetes was estimated as approximately 25 400 (subject to wide margin of error inherent in sampling survey). Multiplied by 12, the annual number of discharges is estimated to be 304 800. Divided by Japan's population over 20 as of October 2005 [103.56 million], the rate was calculated as 24.52 / 100,000 monthly or 294.24/100 000 annually. Since the Patient Survey covers only one month, the numerator (estimated 26 700) was multiplied by 12.
Mexico SIAIS.- Sistema de Información de Atención Integral a la Salud IMSS (DTIES) División Técnica de Información Estadística en Salud
20+ Only 20 years and older, exclude 18 and 19 years old
Work with ICD 10 Codes (Unofficial table ICD 9 and ICD 10 codes
Nationwide representative
Norway Norwegian Patientregister Numerator: ICD-10 codes which are comparable with the given ICD-9 codes are used. Main diagnoses: E10.9, E11.9, E12.9, E13.9, E14.9.
Portugal DRGs
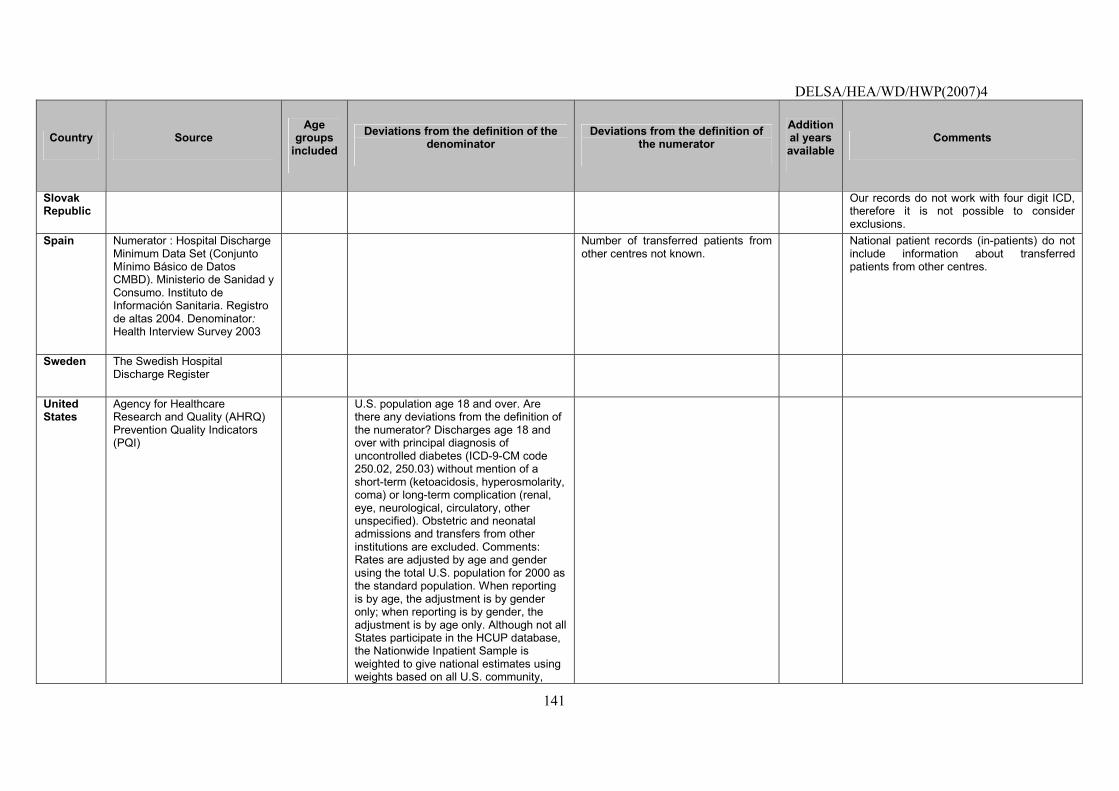
DELSA/HEA/WD/HWP(2007)4
141
Country Source Age
groups included
Deviations from the definition of the denominator
Deviations from the definition of the numerator
Additional years available
Comments
Slovak Republic
Our records do not work with four digit ICD, therefore it is not possible to consider exclusions.
Spain Numerator : Hospital Discharge Minimum Data Set (Conjunto Mínimo Básico de Datos CMBD). Ministerio de Sanidad y Consumo. Instituto de Información Sanitaria. Registro de altas 2004. Denominator: Health Interview Survey 2003
Number of transferred patients from other centres not known.
National patient records (in-patients) do not include information about transferred patients from other centres.
Sweden The Swedish Hospital Discharge Register
United States
Agency for Healthcare Research and Quality (AHRQ) Prevention Quality Indicators (PQI)
U.S. population age 18 and over. Are there any deviations from the definition of the numerator? Discharges age 18 and over with principal diagnosis of uncontrolled diabetes (ICD-9-CM code 250.02, 250.03) without mention of a short-term (ketoacidosis, hyperosmolarity, coma) or long-term complication (renal, eye, neurological, circulatory, other unspecified). Obstetric and neonatal admissions and transfers from other institutions are excluded. Comments: Rates are adjusted by age and gender using the total U.S. population for 2000 as the standard population. When reporting is by age, the adjustment is by gender only; when reporting is by gender, the adjustment is by age only. Although not all States participate in the HCUP database, the Nationwide Inpatient Sample is weighted to give national estimates using weights based on all U.S. community,
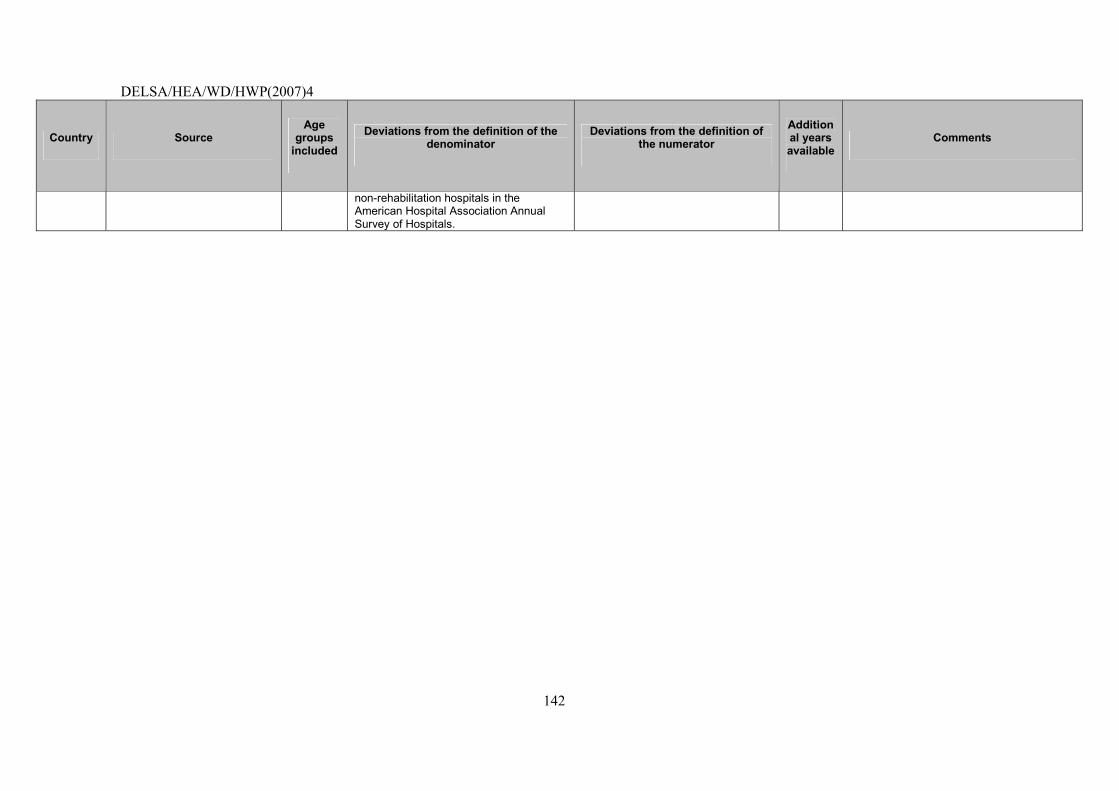
DELSA/HEA/WD/HWP(2007)4
142
Country Source Age
groups included
Deviations from the definition of the denominator
Deviations from the definition of the numerator
Additional years available
Comments
non-rehabilitation hospitals in the American Hospital Association Annual Survey of Hospitals.
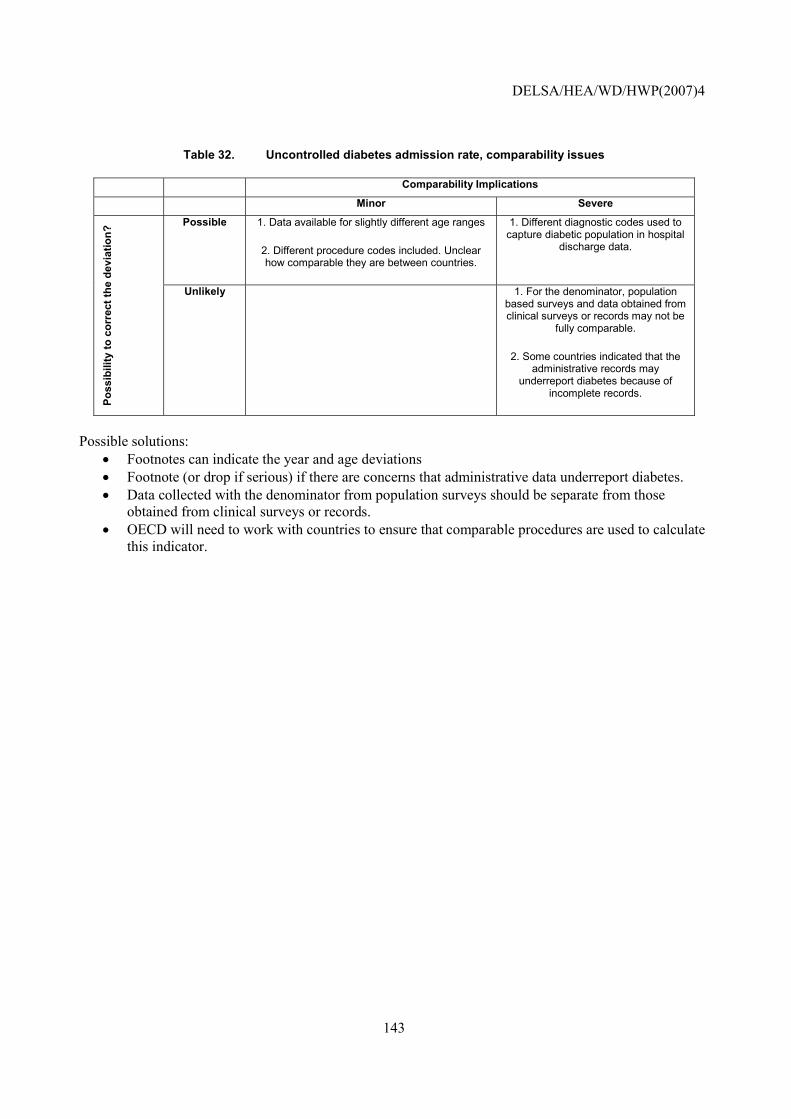
DELSA/HEA/WD/HWP(2007)4
143
Table 32. Uncontrolled diabetes admission rate, comparability issues
Comparability Implications
Minor Severe
Possible 1. Data available for slightly different age ranges
2. Different procedure codes included. Unclear how comparable they are between countries.
1. Different diagnostic codes used to capture diabetic population in hospital
discharge data.
Poss
ibili
ty to
cor
rect
the
devi
atio
n?
Unlikely 1. For the denominator, population based surveys and data obtained from clinical surveys or records may not be
fully comparable.
2. Some countries indicated that the administrative records may
underreport diabetes because of incomplete records.
Possible solutions:
• Footnotes can indicate the year and age deviations • Footnote (or drop if serious) if there are concerns that administrative data underreport diabetes. • Data collected with the denominator from population surveys should be separate from those
obtained from clinical surveys or records. • OECD will need to work with countries to ensure that comparable procedures are used to calculate
this indicator.
DELSA/HEA/WD/HWP(2007)4
144
Hypertension admission rate
NOTE that this indicator is new and has been incorporated for the first time in 2006 HCQI data collection. It is included in this paper to illustrate current data concerns with the indicator and possible future solutions.
Operational Definition
Source: AHRQ Prevention Quality Indicators. Numerator: All non-maternal discharges of age 18 years and older with ICD-9-CM principal diagnosis code for hypertension. (Excluding cases: transfer from other institution, MDC 14 (pregnancy, childbirth, and puerperium or with cardiac procedure codes in any field. Denominator: Total population.
Importance
118. Clinical significance of process or outcome: Avoidable hospitalisations are those conditions that could have been avoided if proper ambulatory care had been received and can thus be seen as a measure of access to appropriate medical care. While not all admissions for ambulatory care sensitive conditions are avoidable, it is assumed that appropriate prior ambulatory care could prevent the onset of this type of illness or condition, control an acute episodic illness or condition, or manage a chronic disease or condition. A disproportionately high rate is presumed to reflect problems in obtaining access to primary care (Weissman, 1992). While not all admissions for hypertension are inappropriate, it has been shown that good quality primary care can keep hypertensive patients out of the hospital. Moreover, while hypertension is relatively common, hospitalisations for hypertension are relatively rare. One study in the US found that hypertension accounted for only 0.5% of total admissions for ambulatory care sensitive conditions (Blustein, 1998).
119. Identification of process/outcome as quality problem: The rate of Ambulatory Care Sensitive (ACS) hospitalisations is considered an index of access of a population to adequate primary care. These are hospitalisations for selected diagnoses some of which might reasonably have been prevented if primary care had been received in time. ACS hospitalisations are elevated in low-income areas and in rural/frontier areas. A Italian study on the causes of uncontrolled hypertension concluded that, in addition to patient level factors, the doctor-patient relationship and a good quality of primary care were significant factors in avoiding adverse outcomes (Degli Esposti, 2004).
120. Policy importance: Given the high cost of hospital care and the high prevalence of the disease included in this indicator, elevated ACS hospitalisation rates could point not only towards possibilities to improve quality but also to substantial cost savings, if better primary care were provided. In addition, the ACS hospitalisation rate appears sensitive to the presence or absence of economic barriers to access. It has been reported to be lower and/or less correlated with socioeconomic status in countries with national health insurance (Billings, 1996).
121. Susceptibility to being influenced by the health system: Appropriate prior ambulatory care could prevent the onset of an illness or condition; control an acute episodic illness or condition; or manage a chronic disease or condition (Anderson, 1996).
DELSA/HEA/WD/HWP(2007)4
145
Scientific Soundness
122. Face validity: Managing chronic diseases to prevent complications and exacerbations is regarded as a core task of the primary health care system. Little empirical evidence exists as to the validity of the hypertension avoidable hospitalisations indicator in particular. However, studies have shown that there are significant differences across age and sex, and AHRQ recommends that this indicator be ultimately age and sex adjusted (AHRQ, 2006).
123. Content validity: As mentioned above, several groups have advocated measures of ACS hospitalisation rates. The fact that hospital admission diagnoses are readily available in most countries implies that the indicator can be easily constructed. However, it should be mentioned that there remains some controversy about this (and similar) measures as a quality indicator, because ACS hospitalisation rates reflect access to, as well as quality of, primary care. Also, defining the appropriate level of hospital admission rates for those conditions is difficult, because in a subset of cases an admission is clearly warranted.
Feasibility
124. Data availability: Uncontrolled diabetes admission rates are available for 15 countries (Table 33). The data were reported for years 2004-2005. Seven countries reported deviations from OECD definitions in the calculation of numerator. All countries use hospital records for the numerator, but the diagnostic codes to capture hypertension admission varied. One country indicated that hospital records may be incompletely coded, and may underestimate the number of admissions.
125. Comparability issues: Detailed documentation and assessment is provided in Table 34. There are serious concerns about comparability from the estimation of the numerator; the HCQI project will have to ensure that countries are reporting the same type of admissions. Another threat for the comparability comes from the variation of hypertension prevalence across countries. There should be explored the need for age-standardisation and the use of a truncated population as a proxy for disease specific population.
126. Overall assessment: Fifteen countries provided data on this indicator. While information for this indicator might exist in hospital records of other countries as well, it is unclear how many countries would be able to construct this indicator on a routine basis. Additionally, a significant amount of analytic work will have to be done in order to ensure that the data are internationally comparable. However, data comparability and availability for this indicator is likely to improve due to the work of the Primary Care and Prevention Expert Subgroup and the indicator may warrant examination in the future as part of HCQI indicator updates.
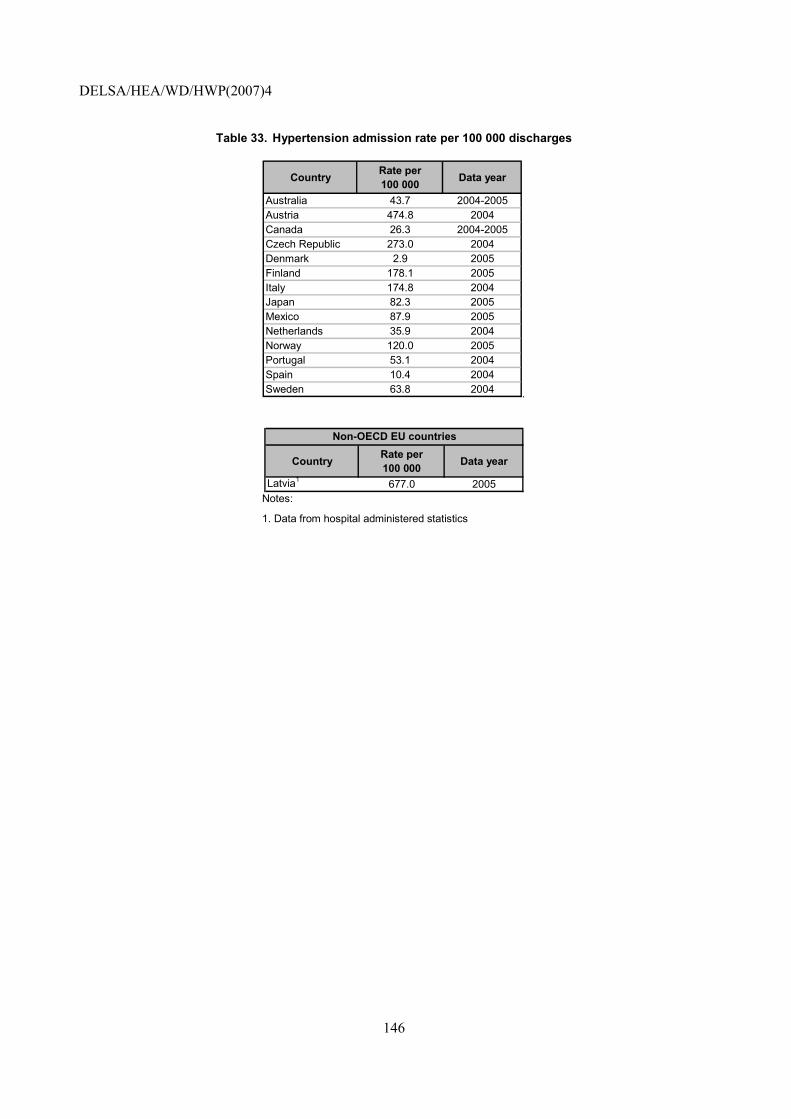
DELSA/HEA/WD/HWP(2007)4
146
Table 33. Hypertension admission rate per 100 000 discharges
Country Rate per 100 000 Data year
Australia 43.7 2004-2005Austria 474.8 2004Canada 26.3 2004-2005Czech Republic 273.0 2004Denmark 2.9 2005Finland 178.1 2005Italy 174.8 2004Japan 82.3 2005Mexico 87.9 2005Netherlands 35.9 2004Norway 120.0 2005Portugal 53.1 2004Spain 10.4 2004Sweden 63.8 2004 .
Country Rate per 100 000 Data year
Latvia1 677.0 2005
Non-OECD EU countries
Notes:
1. Data from hospital administered statistics
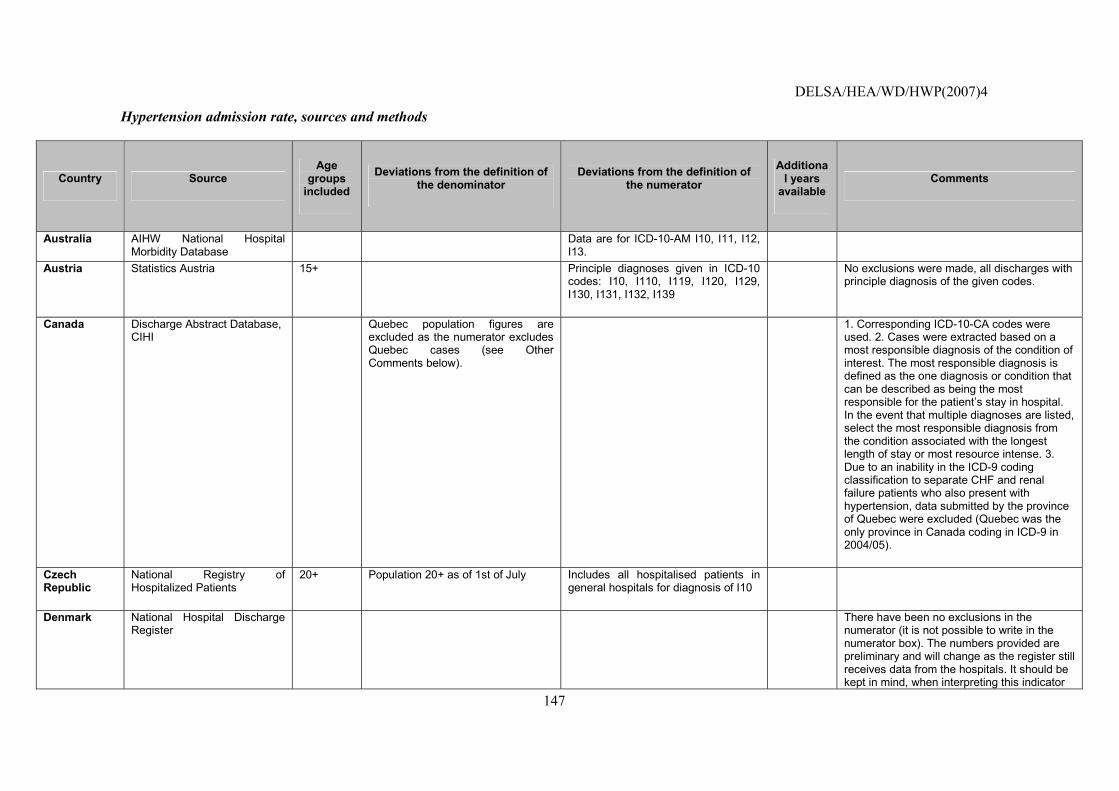
DELSA/HEA/WD/HWP(2007)4
147
Hypertension admission rate, sources and methods
Country Source Age
groups included
Deviations from the definition of the denominator
Deviations from the definition of the numerator
Additional years
available Comments
Australia AIHW National Hospital Morbidity Database
Data are for ICD-10-AM I10, I11, I12, I13.
Austria Statistics Austria 15+ Principle diagnoses given in ICD-10 codes: I10, I110, I119, I120, I129, I130, I131, I132, I139
No exclusions were made, all discharges with principle diagnosis of the given codes.
Canada Discharge Abstract Database, CIHI
Quebec population figures are excluded as the numerator excludes Quebec cases (see Other Comments below).
1. Corresponding ICD-10-CA codes were used. 2. Cases were extracted based on a most responsible diagnosis of the condition of interest. The most responsible diagnosis is defined as the one diagnosis or condition that can be described as being the most responsible for the patient�s stay in hospital. In the event that multiple diagnoses are listed, select the most responsible diagnosis from the condition associated with the longest length of stay or most resource intense. 3. Due to an inability in the ICD-9 coding classification to separate CHF and renal failure patients who also present with hypertension, data submitted by the province of Quebec were excluded (Quebec was the only province in Canada coding in ICD-9 in 2004/05).
Czech Republic
National Registry of Hospitalized Patients
20+ Population 20+ as of 1st of July Includes all hospitalised patients in general hospitals for diagnosis of I10
Denmark National Hospital Discharge Register
There have been no exclusions in the numerator (it is not possible to write in the numerator box). The numbers provided are preliminary and will change as the register still receives data from the hospitals. It should be kept in mind, when interpreting this indicator
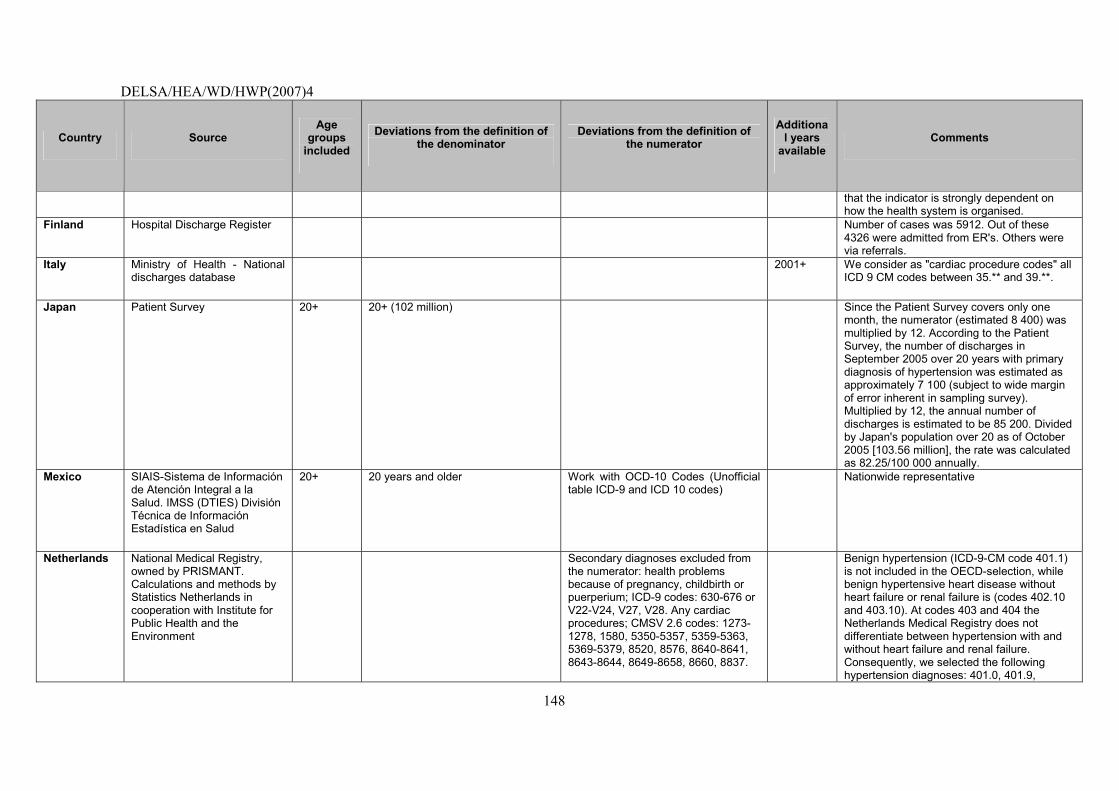
DELSA/HEA/WD/HWP(2007)4
148
Country Source Age
groups included
Deviations from the definition of the denominator
Deviations from the definition of the numerator
Additional years
available Comments
that the indicator is strongly dependent on how the health system is organised.
Finland Hospital Discharge Register Number of cases was 5912. Out of these 4326 were admitted from ER's. Others were via referrals.
Italy Ministry of Health - National discharges database
2001+ We consider as "cardiac procedure codes" all ICD 9 CM codes between 35.** and 39.**.
Japan Patient Survey 20+ 20+ (102 million) Since the Patient Survey covers only one month, the numerator (estimated 8 400) was multiplied by 12. According to the Patient Survey, the number of discharges in September 2005 over 20 years with primary diagnosis of hypertension was estimated as approximately 7 100 (subject to wide margin of error inherent in sampling survey). Multiplied by 12, the annual number of discharges is estimated to be 85 200. Divided by Japan's population over 20 as of October 2005 [103.56 million], the rate was calculated as 82.25/100 000 annually.
Mexico SIAIS-Sistema de Información de Atención Integral a la Salud. IMSS (DTIES) División Técnica de Información Estadística en Salud
20+ 20 years and older Work with OCD-10 Codes (Unofficial table ICD-9 and ICD 10 codes)
Nationwide representative
Netherlands National Medical Registry, owned by PRISMANT. Calculations and methods by Statistics Netherlands in cooperation with Institute for Public Health and the Environment
Secondary diagnoses excluded from the numerator: health problems because of pregnancy, childbirth or puerperium; ICD-9 codes: 630-676 or V22-V24, V27, V28. Any cardiac procedures; CMSV 2.6 codes: 1273-1278, 1580, 5350-5357, 5359-5363, 5369-5379, 8520, 8576, 8640-8641, 8643-8644, 8649-8658, 8660, 8837.
Benign hypertension (ICD-9-CM code 401.1) is not included in the OECD-selection, while benign hypertensive heart disease without heart failure or renal failure is (codes 402.10 and 403.10). At codes 403 and 404 the Netherlands Medical Registry does not differentiate between hypertension with and without heart failure and renal failure. Consequently, we selected the following hypertension diagnoses: 401.0, 401.9,
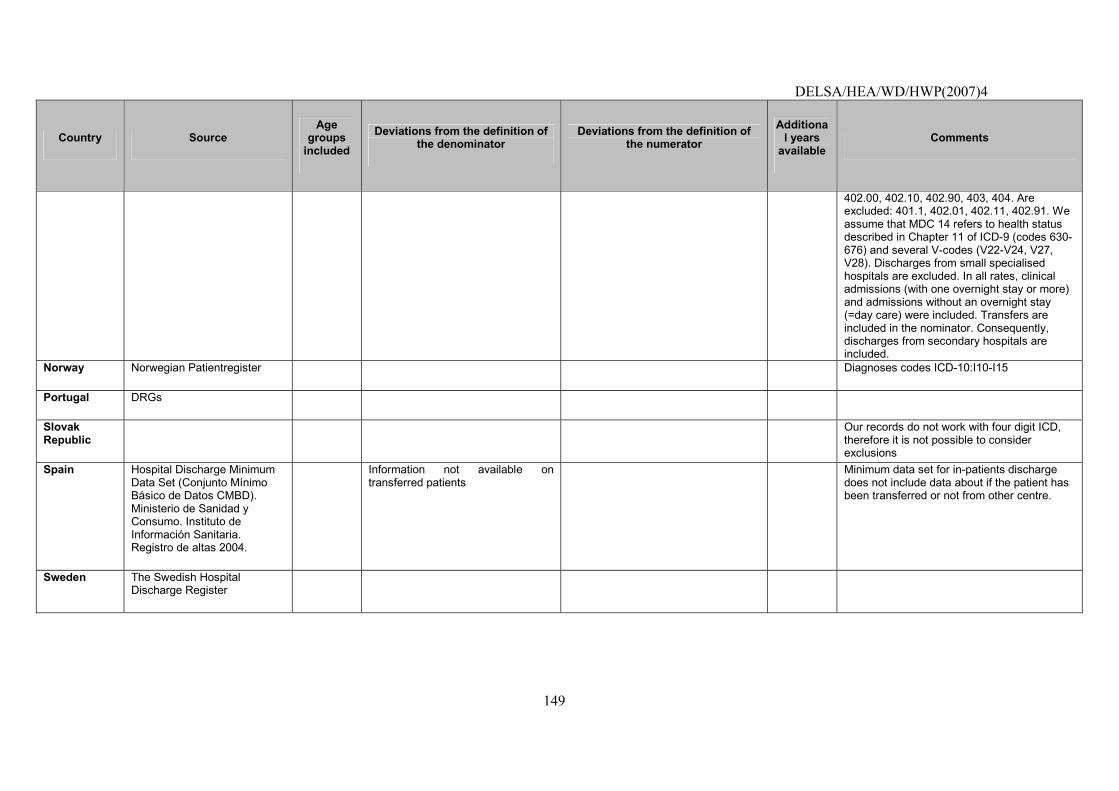
DELSA/HEA/WD/HWP(2007)4
149
Country Source Age
groups included
Deviations from the definition of the denominator
Deviations from the definition of the numerator
Additional years
available Comments
402.00, 402.10, 402.90, 403, 404. Are excluded: 401.1, 402.01, 402.11, 402.91. We assume that MDC 14 refers to health status described in Chapter 11 of ICD-9 (codes 630-676) and several V-codes (V22-V24, V27, V28). Discharges from small specialised hospitals are excluded. In all rates, clinical admissions (with one overnight stay or more) and admissions without an overnight stay (=day care) were included. Transfers are included in the nominator. Consequently, discharges from secondary hospitals are included.
Norway Norwegian Patientregister Diagnoses codes ICD-10:I10-I15
Portugal DRGs
Slovak Republic
Our records do not work with four digit ICD, therefore it is not possible to consider exclusions
Spain Hospital Discharge Minimum Data Set (Conjunto Mínimo Básico de Datos CMBD). Ministerio de Sanidad y Consumo. Instituto de Información Sanitaria. Registro de altas 2004.
Information not available on transferred patients
Minimum data set for in-patients discharge does not include data about if the patient has been transferred or not from other centre.
Sweden The Swedish Hospital Discharge Register
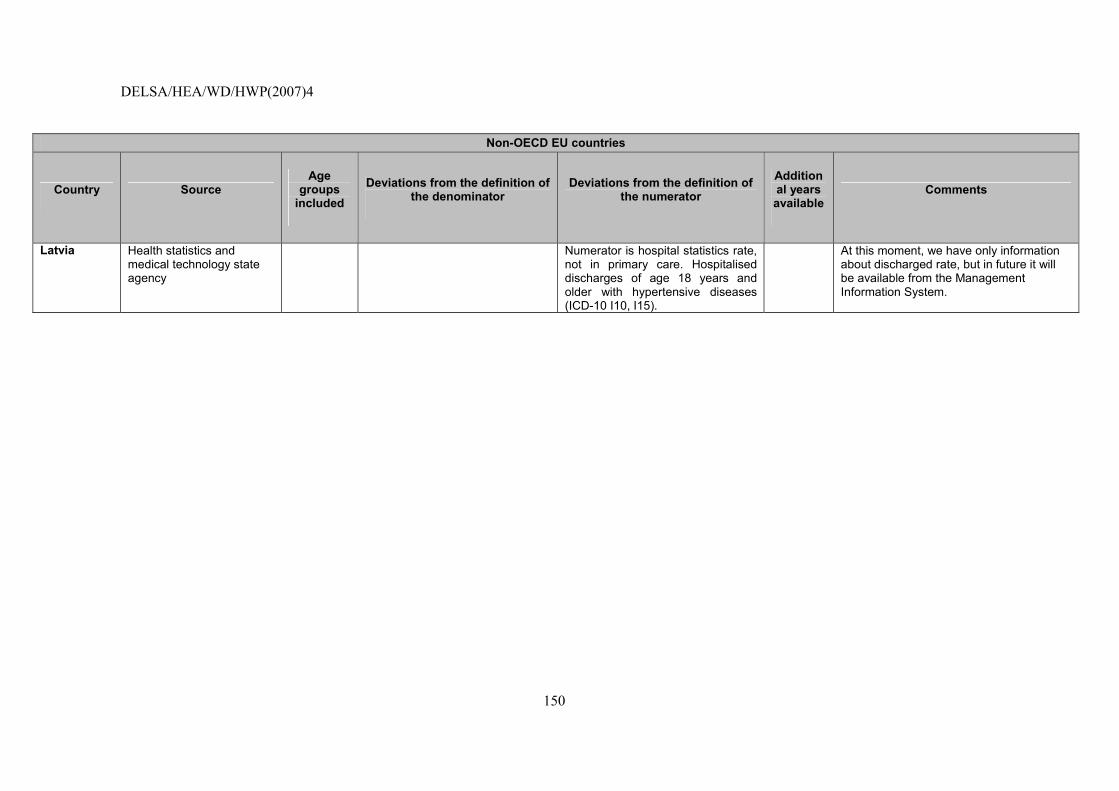
DELSA/HEA/WD/HWP(2007)4
150
Non-OECD EU countries
Country Source Age
groups included
Deviations from the definition of the denominator
Deviations from the definition of the numerator
Additional years available
Comments
Latvia Health statistics and medical technology state agency
Numerator is hospital statistics rate, not in primary care. Hospitalised discharges of age 18 years and older with hypertensive diseases (ICD-10 I10, I15).
At this moment, we have only information about discharged rate, but in future it will be available from the Management Information System.
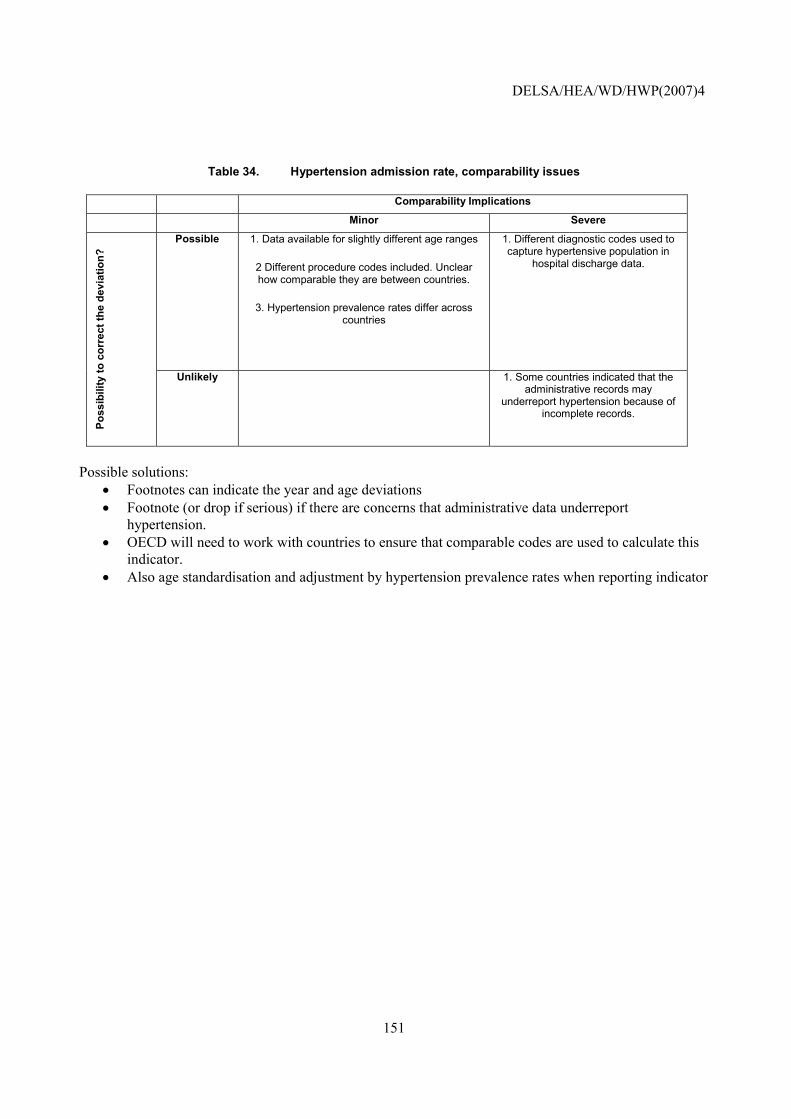
DELSA/HEA/WD/HWP(2007)4
151
Table 34. Hypertension admission rate, comparability issues
Comparability Implications
Minor Severe
Possible 1. Data available for slightly different age ranges
2 Different procedure codes included. Unclear how comparable they are between countries.
3. Hypertension prevalence rates differ across countries
1. Different diagnostic codes used to capture hypertensive population in
hospital discharge data.
Poss
ibili
ty to
cor
rect
the
devi
atio
n?
Unlikely 1. Some countries indicated that the administrative records may
underreport hypertension because of incomplete records.
Possible solutions:
• Footnotes can indicate the year and age deviations • Footnote (or drop if serious) if there are concerns that administrative data underreport
hypertension. • OECD will need to work with countries to ensure that comparable codes are used to calculate this
indicator. • Also age standardisation and adjustment by hypertension prevalence rates when reporting indicator
DELSA/HEA/WD/HWP(2007)4
152
REFERENCES
AAFA � Asthma and Allergy Foundation of America (2006), Asthma Facts and Figures, available at www.aafa.org (accessed on December 6, 2006).
Agency for Healthcare Research and Quality (2006), Guide to the Prevention Quality Indicators, AHRQ, Rockville.
American Diabetes Association (ADA) Position Statement: Implications of the United Kingdom Prospective Diabetes Study, Diabetes Care 24(1) supplement, ADA Clinical Practice Recommendations 2001, http://www.diabetes.org/clinicalrecommendations/Supplement101/S28.htm.
ADA (2003), �Economic Costs of Diabetes in the US in 2002�, Diabetes Care, Vol. 26, pp. 917-932.
ADA (2006), �Summary of revisions for the 2006 Clinical Practice Recommendations�, Diabetes Care, Vol. 29, Supplement, pg.1:S3.
Anderson, G.M. (1996), �Common conditions considered sensitive to ambulatory care� in Goel V, J.I. Williams, G.M. Anderson, P. Blackstein-Hirsch, C. Fooks, C.D. Naylor, (eds.), Patterns of Health Care in Ontario, 2nd Edition, Canadian Medical Association, Ottawa.
Baele, P.L., M. Bruyere, V. Deneys, V., E. Dupont, J. Flament, M. Lambermont, D. Latinne, L. Steensens, B. Van Camp and H. Waterloos, (1994), �Bedside transfusion errors: a prospective survey by the Belgium SAnGUIS group�, Vox sanguinis, Vol.66, pp.117-121.
Billings, J., G.M. Anderson, and L.S. Newman, (1996), �Recent Findings on Preventable Hospitalizations�, Health Affairs, Vol. 15, No. 3, pp.239-249.
Blais, L., P. Ernst, J.F. Boivin, and S. Suissa, (1998), �Inhaled corticosteroids and the prevention of readmission to hospital for asthma�, American Journal of Respiratory and Critical Care Medicine, Vol. 158, No. 1, pg. 126-132.
Blustein, J., K. Hanson and S. Shea, (1998), �Preventable hospitalizations and socioeconomic status�, Health Affairs (Millwood), Vol. 17, No. 2, pg. 177-189.
Callum, J.L., H.S. Kaplan, L.L. Merkley, P.H. Pinkerton, B. Rabin Fastman, R.A. Romans, A.S Coovadia and M.D. Reis, (2001), �Reporting of near-miss events for transfusion medicine: improving transfusion safety�, Transfusion, Vol.41, pp.1204-1211.
Canadian Institute for Health Information (2004), Comparable Health and Health System Performance Indicators for Canada, the Provinces and Territories, CIHI, Ottawa, (http://www.cihi.ca/cihiweb/dispPage.jsp?cw_page=prtwg_2006_e).
DELSA/HEA/WD/HWP(2007)4
153
Centers for Disease Control and Prevention, (2005), �National diabetes fact sheet: general information and national estimates on diabetes in the United States, 2005�, Atlanta, Department of Health and Human Services, Centers for Disease Control and Prevention.
Correa-de-Araujo R., K. McDermott and E. Moy, (2006), �Gender differences across racial and ethnic groups in the quality of care for diabetes�, Womens Health Issues, Vol. 16, No. 2, pg. 56-65.
Eagle, C.J., J.M. Davies and J. Reason, (1992), �Accident analysis of large scale technological disasters applied to an anaesthetic complication�, Canadian Journal of Anaesthesia, Vol.39, pp.118-122.
Ghafour, I.M., D. Allan and W.S. Foulds (1983), �Common Causes of Blindness and Visual Handicap in the West of Scotland�, British Journal of Ophthalmology, Vol. 67, No. 4, pp. 209-213.
Gu, K., C.C. Cowie and M.I. Harris (1999), �Diabetes and Decline in Heart Disease Mortality in US adults�, Journal of the American Medical Association (JAMA), Vol. 14, No. 281, pp. 1291-1297.
Haffner, S.M. (2000), �Coronary Heart Disease in Patients with Diabetes�, New England Journal of Medicine, Vol. 342, pp. 1040-1042.
Halterman, J.S., H.L. Yoos, K. Sidora, H. Kitzman and A. McMullen (2001), �Medication Use and Health Care Contacts among Symptomatic Children with Asthma�, Ambulatory Pediatrics, Vol. 1, No. 5, pp. 275-279.
Hogan, P., T. Dall and P. Nikolov, (2003), �Economic costs of diabetes in the US in 2002�, Diabetes Care, Vol. 26, No. 3, pg. 917-932.
Houck, P.W., F.R. Whitehouse (2006), �Asthma prevention in urbanites�, Journal of Asthma, Vol. 43, No. 8, pg. 573-578.
IDF � International Diabetes Federation (2003), International Diabetes Federation Diabetes Atlas 3rd Edition, D. Gan (ed.), International Diabetes Federation, Brussels.
Iezzoni, L.I., J. Daley, T. Heeren, S.M. Foley, E.S. Fisher, C. Duncan, J.S. Hughes and G.A. Coffman, (1994), �Identifying complications of care using administrative data�, Medical Care, Vol. 32, No. 7, pg. 700-715.
Iezzoni, L.I., S.M. Foley, T. Heeren, J. Daley, C.C. Duncan, E.S. Fisher and J. Hughes (1992), �A method for screening the quality of hospital care using administrative data: preliminary validation results�, QRB Quality Review Bulletin, Vol.18, pp.361-371.
Institute of Medicine (2001), Crossing the quality chasm: a new health system for the 21st century, Washington, DC: National Academies Press.
King, H., R.E. Aubert and W.H. Herman (1998), �Global Burden of Diabetes, 1995-2025: Prevalence, Numerical Estimates, and Projections�, Diabetes Care, Vol. 21, No. 9, pp. 1414-1431.
Lavery, L. and J.D. Gazewood, (2000), �Assessing the feet of patients with diabetes�, Journal of Family Practice, Vol. 49, No. 11 Suppl., pg. 9-16.
DELSA/HEA/WD/HWP(2007)4
154
Lawler, F.H. and N. Viviani, (1997), �Patient and Physician Perspectives Regarding Treatment of Diabetes: Compliance with Practice Guidelines�, Journal of Family Practice, Vol. 44, No. 4, pg. 369-373.
Lichtenstein, M.L., M.R. Griffin, J.E. Cornell, E. Malcolm and W.A. Ray, (1994), �Risk factors for hip fracture occurring in the hospital�, American Journal of Epidemiology, Vol. 140, No. 9, pg. 830-838.
Linden, J.V., K. Wagner, A.E. Voytovich, and J. Sheehan, (2000), �Transfusion errors in New York State: an analysis of 10 years� experience�, Transfusion, Vol. 40, pp.1207-1213.
Mattke S, E. Kelley, P. Scherer, J. Hurst , and M.Gil Lapetra and the Members of the HCQI Expert Group (2006). Health Care Quality Indicators Project: Initial Indicators Report. OECD Health Working Paper No. 22, OECD, Paris.
Mattke, S., F. Martorell, P. Sharma, L.K. Morse, N. Lurie and M. Lara (2006b), �Estimating the Impact of Improving Asthma Treatment. A Review and Synthesis of the Literature�, RAND Working Paper No. WR-448-MCAN.
McDonald, K., P. Romano, J. Geppert, S.M. Davies, B.W. Duncan, K.G. Shojania and A.Hansen (2002), Measures of Patient Safety Based on Hospital Administrative Data. The Patient Safety Indicators. Technical Review 5 (Prepared by the University of California San Francisco-Stanford Evidence-based Practice Center under Contract No. 290-97-0013). AHRQ Publication No. 02-0038 . Rockville, Agency for Healthcare Research and Quality.
Miller, M., A. Elixhauser, C. Zhan, and G. Meyer, (2001), �Patient Safety Indicators: Using administrative data to identify potential patient safety concerns�, Health Services Research, Vol. 36 No. 6 (Part II), pp.110-132.
Mundell, E.J., (2004), �Simple Test Predicts Diabetes Amputation Success� (2004), available at: http://www.wtoctv.com/global/story.asp?s=2113336&ClientType=printable, accessed August 3, 2004.
Murray, C.J.L., A.D. Lopez, C.D. Mathers, and C. Stein (2001), The Global Burden of Disease 2000 Project: Aims, Methods, and Data Sources. Global Programme on Evidence for Health Policy Discussion Paper No. 36, WHO, Geneva.
Nathan, D.M., (2002), �Initial management of glycemia in type 2 diabetes mellitus�, New England Journal of Medicine, Vol. 347, No. 17, pg. 1342-1349.
National Committee for Quality Assurance, �Diabetes Quality Improvement Project initial measure set (final version).� http://www.ncqa.org/dprp/dqip2.htm, accessed May 2003.
National Heart, Lung, and Blood Institute/National Asthma Education and Prevention Program. Expert Panel Report 2: Guidelines for the diagnosis and management of asthma, in National Institutes of Health publication No. 97-4051, Bethesda, MD.
National Institute of Diabetes and Digestive and Kidney Diseases, (2005), �National Diabetes Statistics fact sheet: general information and national estimates on diabetes in the United States, 2005�, Bethesda, U.S. Department of Health and Human Services, National Institute of Health.
O'Connor, P., J. Creager, S. Mooney, A.M. Laizner and J.A. Ritchie, (2006), �Taking aim at fall injury adverse events: best practices and organizational change�, Healthcare Quarterly, Vol. 9, pg. 43-49.
DELSA/HEA/WD/HWP(2007)4
155
Ollendorf, D.A., J.G. Kotsanos, W.J. Wishner, M. Friedman, T. Cooper, M. Bittoni and G. Oster (1998), �Potential Economic Benefits of Lower-extremity Amputation Prevention Strategies in Diabetes�, Diabetes Care, Vol. 21, No. 8, pp. 1240-1245.
Park, C.S., H.Y. Kang, I. Kwon, D.R. Kang and H.Y. Jung, (2006), �Cost-of-illness study of asthma in Korea: estimated from the Korea National Health insurance claims database�, Korean Journal of Preventive Medicine, Vol. 39, No. 5, pg. 397-403.
Ramirez, J.A. (2005), �Worldwide Perspective of the Quality of Care Provided to Hospitalized Patients with Community-Acquired Pneumonia: Results from the CAPO International Cohort Study�, Seminars in Respiratory and Critical Care Medicine, Vol. 26, No. 6, pg. 543-552.
Ray, N.F., M. Thamer, B. Fadillioglu and P.J. Gergan (1998), �Race, income, urbanicity, and asthma hospitalization in California: a small area analysis�, Chest, Vol. 113, No. 5, pg. 1277-1284.
Reason, J. (1990), Human Error, Cambridge University Press.
Renders, C.M., G.D. Valk, S. Griffin, E.H. Wagner, J.T.M. van Eijk and W.J.J. Assendelft, (2003), �Interventions to improve the management of diabetes mellitus in primary care, outpatient and community settings (Cochrane Review) in: The Cochrane Library, Issue 2, 2002. Oxford: Update Software; New Zealand Guidelines Group, Primary care guidelines for the management of core aspects of diabetes, http://www.nzgg.org.nz/library/gl_complete/diabetes/index.cfm#contents, accessed May 2003.
Roland, M. (2004), �Linking physicians' pay to the quality of care--a major experiment in the United Kingdom�, New England Journal of Medicine. Vol. 351, No. 14, pg. 1448-1454.
Rosen, A.K., P. Rivard, S. Zhao, S. Loveland, D. Tsilimingras, C.L. Christiansen, A. Elixhauser, P.S. Romano, (2005), �Evaluating the patient safety indicators: how well do they perform on Veterans Health Administration data?�, Medical Care, Vol. 43, No. 9, pg. 873-884.
Sawicki, P.T. (2005), �Quality of health care in Germany. A six-country comparison�, Medizinische Klinik, Vol. 100, No. 11, pg. 755-768.
Streja, D.A. and S.W. Rabkin, (1999), �Factors Associated with Implementation of Preventive Care Measures in Patients with Diabetes Mellitus�, Archives of Internal Medicine, Vol. 159, pg. 294-302.
U.S. Department of Health and Human Services, (2000), Healthy People 2010. 2nd ed. With Understanding and Improving Health and Objectives for Improving Health. 2 vols. Washington, DC, Government Printing Office.
US Department of Health and Human Services (2005), US National Healthcare Quality Report, 2004, Rockville, MD: Agency for Healthcare Research and Quality.
Weissman, J.S., C. Gatsonis, and A.M. Epstein, (1992), �Rates of avoidable hospitalization by insurance status in Massachusetts and Maryland� JAMA, Vol. 268, No. 17, pg. 2388-2394.
Wenzel, S.E. (2006), �Asthma: Defining of the Persistent Adult Phenotypes�, The Lancet, Vol. 368, No. 9537, pp. 804-813.
Zimmet, P., K.G. Alberti and J. Shaw (2001), �Global and Societal Implications of the Diabetes Epidemic�, Nature, Vol. 414, No. 6865, pp. 782-787.
DELSA/HEA/WD/HWP(2007)4
156
OECD HEALTH WORKING PAPERS
Papers in this series can be found on the OECD website: www.oecd.org/els/health/workingpapers
No. 28 PHARMACEUTICAL PRICING AND REIMBURSEMENT POLICIES IN SWEDEN (2007) Pierre Moïse and Elizabeth Docteur
No. 27 PHARMACEUTICAL PRICING AND REIMBURSEMENT POLICIES IN SWITZERLAND (2007) Valérie Paris and Elizabeth Docteur
No. 26 TRENDS IN SEVERE DISABILITY AMONG ELDERLY PEOPLE: ASSESSING THE EVIDENCE IN 12 OECD COUNTRIES AND THE FUTURE IMPLICATIONS (2007) Gaétan Lafortune, Gaëlle Balestat, and the Disability Study Expert Group Members
No. 25 PHARMACEUTICAL PRICING AND REIMBURSEMENT POLICIES IN MEXICO (2007) Pierre Moïse and Elizabeth Docteur
No. 24 PHARMACEUTICAL PRICING AND REIMBURSEMENT POLICIES IN CANADA (2006) Valérie Paris and Elizabeth Docteur
No. 23 HEALTH CARE QUALITY INDICATORS PROJECT, CONCEPTUAL FRAMEWORK PAPER (2006) Edward Kelley and Jeremy Hurst
No. 22 HEALTH CARE QUALITY INDICATORS PROJECT, INITIAL INDICATORS REPORT (2006) Soeren Mattke, Edward Kelley, Peter Scherer, Jeremy Hurst, Maria Luisa Gil Lapetra and the HCQI Expert Group Members
No. 21 THE SUPPLY OF PHYSICIANS IN OECD COUNTRIES (2006) Steven Simeons and Jeremy Hurst
No. 20 CONSUMER DIRECTION AND CHOICE IN LONG-TERM CARE FOR OLDER PERSONS, INCLUDING PAYMENTS FOR INFORMAL CARE: HOW CAN IT HELP IMPROVE CARE OUTCOMES, EMPLOYMENT AND FISCAL SUSTAINABILITY? (2005) Jens Lundsgaard
No. 19 TACKLING NURSE SHORTAGES IN OECD COUNTRIES (2004) Steven Simoens, Mike Villeneuve and Jeremy Hurst
No. 18 PRIVATE HEALTH INSURANCE IN THE NETHERLANDS. A CASE STUDY (2004) Nicole Tapay and Francesca Colombo
No. 17 SKILL-MIX AND POLICY CHANGE IN THE HEALTH WORKFORCE: NURSES IN ADVANCED ROLES (2004) James Buchan and Lynn Calman
No. 16 SHA-BASED NATIONAL HEALTH ACCOUNTS IN THIRTEEN OECD COUNTRIES: A COMPARATIVE ANALYSIS (2004) Eva Orosz and David Morgan
No. 15 PRIVATE HEALTH INSURANCE IN OECD COUNTRIES: THE BENEFITS AND COSTS FOR INDIVIDUALS AND HEALTH SYSTEMS (2004) Francesca Colombo and Nicole Tapay
No. 14 INCOME-RELATED INEQUALITY IN THE USE OF MEDICAL CARE IN 21 OECD COUNTRIES (2004) Eddy van Doorslaer, Cristina Masseria and the OECD Health Equity Research Group
No. 13 DEMENTIA CARE IN 9 OECD COUNTRIES: A COMPARATIVE ANALYSIS (2004) Pierre Moise, Michael Schwarzinger, Myung-Yong Um and the Dementia Experts� Group
No. 12 PRIVATE HEALTH INSURANCE IN FRANCE (2004) Thomas C. Buchmueller and Agnes Couffinhal
No. 11 THE SLOVAK HEALTH INSURANCE SYSTEM AND THE POTENTIAL ROLE FOR PRIVATE HEALTH INSURANCE: POLICY CHALLENGES (2004) Francesca Colombo and Nicole Tapay
No. 10 PRIVATE HEALTH INSURANCE IN IRELAND. A CASE STUDY (2004) Francesca Colombo and Nicole Tapay
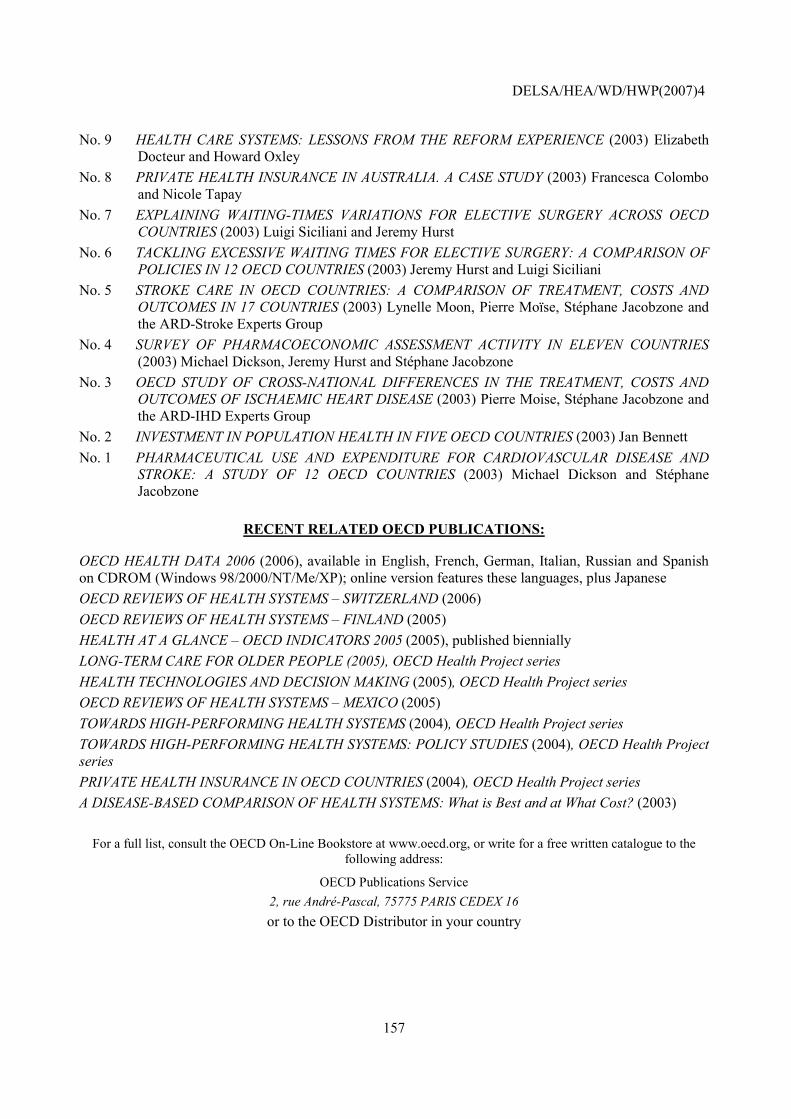
DELSA/HEA/WD/HWP(2007)4
157
No. 9 HEALTH CARE SYSTEMS: LESSONS FROM THE REFORM EXPERIENCE (2003) Elizabeth Docteur and Howard Oxley
No. 8 PRIVATE HEALTH INSURANCE IN AUSTRALIA. A CASE STUDY (2003) Francesca Colombo and Nicole Tapay
No. 7 EXPLAINING WAITING-TIMES VARIATIONS FOR ELECTIVE SURGERY ACROSS OECD COUNTRIES (2003) Luigi Siciliani and Jeremy Hurst
No. 6 TACKLING EXCESSIVE WAITING TIMES FOR ELECTIVE SURGERY: A COMPARISON OF POLICIES IN 12 OECD COUNTRIES (2003) Jeremy Hurst and Luigi Siciliani
No. 5 STROKE CARE IN OECD COUNTRIES: A COMPARISON OF TREATMENT, COSTS AND OUTCOMES IN 17 COUNTRIES (2003) Lynelle Moon, Pierre Moïse, Stéphane Jacobzone and the ARD-Stroke Experts Group
No. 4 SURVEY OF PHARMACOECONOMIC ASSESSMENT ACTIVITY IN ELEVEN COUNTRIES (2003) Michael Dickson, Jeremy Hurst and Stéphane Jacobzone
No. 3 OECD STUDY OF CROSS-NATIONAL DIFFERENCES IN THE TREATMENT, COSTS AND OUTCOMES OF ISCHAEMIC HEART DISEASE (2003) Pierre Moise, Stéphane Jacobzone and the ARD-IHD Experts Group
No. 2 INVESTMENT IN POPULATION HEALTH IN FIVE OECD COUNTRIES (2003) Jan Bennett No. 1 PHARMACEUTICAL USE AND EXPENDITURE FOR CARDIOVASCULAR DISEASE AND
STROKE: A STUDY OF 12 OECD COUNTRIES (2003) Michael Dickson and Stéphane Jacobzone
RECENT RELATED OECD PUBLICATIONS:
OECD HEALTH DATA 2006 (2006), available in English, French, German, Italian, Russian and Spanish on CDROM (Windows 98/2000/NT/Me/XP); online version features these languages, plus Japanese OECD REVIEWS OF HEALTH SYSTEMS � SWITZERLAND (2006) OECD REVIEWS OF HEALTH SYSTEMS � FINLAND (2005) HEALTH AT A GLANCE � OECD INDICATORS 2005 (2005), published biennially LONG-TERM CARE FOR OLDER PEOPLE (2005), OECD Health Project series HEALTH TECHNOLOGIES AND DECISION MAKING (2005), OECD Health Project series OECD REVIEWS OF HEALTH SYSTEMS � MEXICO (2005) TOWARDS HIGH-PERFORMING HEALTH SYSTEMS (2004), OECD Health Project series TOWARDS HIGH-PERFORMING HEALTH SYSTEMS: POLICY STUDIES (2004), OECD Health Project series PRIVATE HEALTH INSURANCE IN OECD COUNTRIES (2004), OECD Health Project series A DISEASE-BASED COMPARISON OF HEALTH SYSTEMS: What is Best and at What Cost? (2003)
For a full list, consult the OECD On-Line Bookstore at www.oecd.org, or write for a free written catalogue to the following address:
OECD Publications Service 2, rue André-Pascal, 75775 PARIS CEDEX 16 or to the OECD Distributor in your country