ambient monitoring quality assurance project plan - georgia
TRANSCRIPT
QUALITY ASSURANCE PROGRAM PLAN
Water Quality Modeling and Groundwater and Surface Monitoring
Georgia Department of Natural Resources
Environmental Protection Division
2018-22
Georgia Environmental Protection Division
Watershed Protection Branch
2 MLK, Jr., S.W., Suite 1152
Atlanta, Georgia 30334
WPMP-QAPP 3 rev 1
June 2018
USEPA Sections 106, 104, 604 and 319 Monitoring
GA DNR Grant #s BG – 96409617, C6-00499916, C6-00499917, C6-00499918, C6-00499919
I-95411508-0, and I-9511408-0.
Georgia Environmental Protection Division
QAPP for Water Quality Modeling and Ground Water and Surface Monitoring WPMP-QAPP 3 rev 1
June 2018
Page 2 of 132
A. PROJECT MANAGEMENT
A1. Title and Approval Sheet
QUALITY ASSURANCE PROGRAM PLAN
WATER QUALITY MODELING AND
GROUNDWATER AND SURFACE MONITORING
GEORGIA DEPARTMENT OF NATURAL RESOURCES
ENVIRONMENTAL PROTECTION DIVISION
2018-22
GAEPD Watershed Monitoring Manager: ______(Original Signed & Dated)___________
(Elizabeth Booth) (Date)
GAEPD Database/GIS Officer: _____ _(Original Signed & Dated)___________
(Joel Owen) (Date)
GAEPD Quality Assurance Officer: ______ (Original Signed & Dated)____________ (Susan Salter) (Date)
Georgia Environmental Protection Division
QAPP for Water Quality Modeling and Ground Water and Surface Monitoring WPMP-QAPP 3 rev 1
June 2018
Page 3 of 132
FORWARD:
This document is the Quality Assurance Program Plan (QAPP) for the Georgia Environmental Protection
Division (GAEPD) Surface Water Modeling and Monitoring Projects. This QAPP applies to the
collection and assessment of groundwater and surface water quality data by GAEPD for a five-year
period (2018-2022). Annual addendums to this QAPP shall be provided to U.S. Environmental
Protection Agency (USEPA), Region IV and other users for any programmatic changes affecting the
monitoring or modeling programs.
This five-year program QAPP shall be annually supplemented by project-specific water quality modeling
and sampling plans that provide detailed information regarding individual project sampling design.
QAPP Format:
This QAPP has been prepared following the USEPA’s requirements for Quality Assurance Project Plans
(EPA QA/R-5, March 2001 and USEPA’s Guidance for Quality Assurance Project Plans (EPA QA/G-5,
December 2002).
Document Availability:
The 2018-22 QAPP is available in electronic format (pdf, CD and GAEPD website:
https://epd.georgia.gov/watershed-protection-branch.
Electronic and paper copies of this QAPP are available upon request. Requests should be submitted to
Susan Ruff at 404-643-1507, [email protected], or by mail at 2 MLK, Jr., Drive, S.W., Suite 1152,
Atlanta, GA 30334.
Georgia Environmental Protection Division
QAPP for Water Quality Modeling and Ground Water and Surface Monitoring WPMP-QAPP 3 rev 1
June 2018
Page 4 of 132
A2. Table of Contents
A. PROJECT MANAGEMENT .....................................................................................................2 A1. TITLE AND APPROVAL SHEET ................................................................................................... 2
A2. Table of Contents .....................................................................................................................4
Appendix ................................................................................................................................... 6
Tables ........................................................................................................................................ 7
Figures ....................................................................................................................................... 7
Acronyms and Abbreviations .................................................................................................... 8
A3. DISTRIBUTION LIST ................................................................................................................ 10 A4. PROGRAM DESCRIPTION AND ORGANIZATION ........................................................................ 12
A5. PROBLEM DEFINITION/BACKGROUND .................................................................................... 16 A6. PROJECT/ TASK DESCRIPTION AND SCHEDULE ....................................................................... 17
A7. QUALITY OBJECTIVES AND CRITERIA FOR WATER QUALITY MODELING ............................... 28 A7.1 STATE THE PROBLEM ............................................................................................. 29
A7.2 IDENTIFY THE STUDY QUESTION .............................................................................. 29 A7.3 IDENTIFY INFORMATION NEEDS ............................................................................ 29 A7.4 SPECIFY THE CHARACTERISTICS THAT DEFINE THE POPULATION OF INTEREST ...... 29
A7.5 DEVELOP THE STRATEGY FOR INFORMATION SYNTHESIS ....................................... 30 A7.6 SPECIFY PERFORMANCE AND ACCEPTANCE CRITERIA ........................................... 31
A7.7 OPTIMIZE THE DESIGN FOR OBTAINING AND GENERATING ADEQUATE DATA OR
INFORMATION .................................................................................................................... 32 A8. SPECIAL TRAINING REQUIREMENTS/CERTIFICATION LISTED .................................................. 36
A9. QUALITY OBJECTIVES AND CRITERIA FOR WATER QUALITY MONITORING ............................ 34
A9.1. ACCURACY ............................................................................................................... 39 A9.2. PRECISION ................................................................................................................ 39 A9.3. REPRESENTATIVENESS ............................................................................................. 40
A9.4. COMPLETENESS ........................................................................................................ 40 A9.5. COMPARABILITY ...................................................................................................... 40
A9.6. DETECTION LIMITS ................................................................................................... 40 A9.7. HOLDING TIMES ....................................................................................................... 40
A9.8. SENSITIVITY ............................................................................................................. 40 A9.9. STANDARD PROTOCOLS ........................................................................................... 41 A9.10. PERFORMANCE AUDITING ...................................................................................... 41
A10. DOCUMENTS AND RECORDS ................................................................................................. 41 A10.1. FIELD RECORDS ..................................................................................................... 42 A10.2. LABORATORY RECORDS ......................................................................................... 43 A10.3. OFFICE RECORDS ................................................................................................... 43
A10.4. SAMPLING STATION REGISTRATION ....................................................................... 43 A10.5. DOCUMENTATION PROTOCOLS ............................................................................... 43 A10.6. DATA HANDLING RECORDS ................................................................................... 43 A10.7. DATA ARCHIVING AND RETRIEVAL ........................................................................ 44
B. DATA GENERATION AND ACQUISITION........................................................................45 B1. SAMPLING PROCESS DESIGN ................................................................................................... 45
B1.1. PURPOSE/BACKGROUND ........................................................................................... 45
Georgia Environmental Protection Division
QAPP for Water Quality Modeling and Ground Water and Surface Monitoring WPMP-QAPP 3 rev 1
June 2018
Page 5 of 132
B1.2. MONITORING DESIGN ............................................................................................... 46 B1.2.1. RIVER BASINS ........................................................................................... 46
B1.2.2. ECOREGIONS ............................................................................................. 46 B1.3. INDICATOR VARIABLES .............................................................................................. 47 B1.4. LONG-TERM DESIGN STRATEGY .............................................................................. 47 B1.5. SITE SELECTION CRITERIA ....................................................................................... 48 B1.6. CURRENT DESIGN APPROACH .................................................................................. 48
B1.7. DETAILED PROJECT-SPECIFIC SAMPLING PLANS ...................................................... 50 B2. SAMPLING METHODS ............................................................................................................... 50
B2.1. FIELD SAFETY .......................................................................................................... 52 B2.2. AVAILABLE FIELD EQUIPMENT................................................................................. 52
B2.3. BOTTLE TYPES, PRESERVATION TECHNIQUES AND HOLDING TIMES ........................ 54 B2.4. FIELD QUALITY CONTROL ....................................................................................... 55
B2.5. FIELD DOCUMENTATION .......................................................................................... 55 B2.6. DECONTAMINATION PROCEDURES ........................................................................... 55
B2.7. SYSTEM FAILURE AND CORRECTIVE ACTION ........................................................... 56 B2.7.1. SAMPLE COLLECTION/LABORATORY ANALYSES ....................................... 56
B3. SAMPLE HANDLING AND CUSTODY REQUIREMENTS .............................................................. 56
B3.1. SAMPLE PROCESSING ............................................................................................... 56 B3.2. SAMPLE CUSTODY PROCEDURE ................................................................................ 57
B4. ANALYTICAL METHODS ......................................................................................................... 58 B4.1. LABORATORY SOPS ................................................................................................. 58 B4.2. ANALYTICAL UNITS, METHODS, AND HOLDING TIMES ............................................ 58
B4.3. LAB DATA QUALIFIERS ............................................................................................ 58
B4.4. LABORATORY TURNAROUND TIME REQUIREMENTS ................................................. 59 B4.5. LABORATORY DATA REPORT ................................................................................... 59 B4.6. SAFETY AND HAZARDOUS MATERIAL DISPOSAL REQUIREMENTS ............................ 60
B4.7. METHOD VALIDATION .............................................................................................. 60 B4.8. CORRECTIVE ACTION PROCESS FOR ANALYTICAL SYSTEM FAILURE ...................... 60
B5. QUALITY CONTROL ................................................................................................................ 60 B5.1. MODELING QUALITY CONTROL ................................................................................ 60
B5.2. FIELD QUALITY CONTROL ........................................................................................ 61 B5.3. LAB QUALITY CONTROL .......................................................................................... 62
B6. INSTRUMENT/ EQUIPMENT TESTING, INSPECTION AND MAINTENANCE .................................. 62
B6.1. COMPUTER MAINTENANCE....................................................................................... 62 B6.2. PURPOSE/ BACKGROUND/MEASUREMENT TRACEABILITY ........................................ 62 B6.3. TESTING, INSPECTION, AND MAINTENANCE ............................................................. 64
B7. INSTRUMENT/ EQUIPMENT CALIBRATION ............................................................................... 64
B7.1. MODEL CALIBRATION .............................................................................................. 64 B7.2. FIELD INSTRUMENT CALIBRATION ........................................................................... 65
B8. INSPECTION OF SUPPLIES ........................................................................................................ 65 B9. NON-DIRECT MEASUREMENTS ............................................................................................... 67 B10. DATA MANAGEMENT ........................................................................................................... 68
B10.1. GAEPD DATABASES .............................................................................................. 68 B10.2. FIELD AND LAB DATA ENTRY ................................................................................ 69 B10.3. DATA AVAILABILITY .............................................................................................. 69
Georgia Environmental Protection Division
QAPP for Water Quality Modeling and Ground Water and Surface Monitoring WPMP-QAPP 3 rev 1
June 2018
Page 6 of 132
C. ASSESSMENT AND OVERSIGHT .......................................................................................70 C1. ASSESSMENTS AND RESPONSE ACTIONS ................................................................................. 70
C1.1 MODELING RESPONSE ACTIONS ................................................................................ 72 C1.2. ORGANIZATIONAL ASSESSMENTS ............................................................................. 73 C1.3. ASSESSMENT OF PROJECT ACTIVITIES ...................................................................... 73 C1.4. ASSESSMENT PERSONNEL ......................................................................................... 74
C2. REPORTS TO MANAGEMENT ................................................................................................... 74
C2.1. FREQUENCY, CONTENT AND DISTRIBUTION OF REPORTS ......................................... 74
D. DATA VALIDATION AND USABILITY .............................................................................76 D1. DATA REVIEW, VERIFICATION, AND VALIDATION .................................................................. 76
D1.1. GUIDANCE DOCUMENTS ........................................................................................... 76 D1.2. SAMPLE COLLECTION PROCEDURES ......................................................................... 77
D1.3. SAMPLE HANDLING .................................................................................................. 77 D1.4. ANALYTICAL PROCEDURES ...................................................................................... 77
D1.5. QUALITY CONTROL .................................................................................................. 77 D2. VALIDATION AND VERIFICATION METHODS ........................................................................... 77
D2.1. MODEL DATA VERIFICATION ................................................................................... 77
D2.2. CHEMICAL DATA VERIFICATION .............................................................................. 78 D2.3. PROCESS FOR VALIDATING AND VERIFYING DATA .................................................. 78
D2.4. BIOLOGICAL DATA VERIFICATION ........................................................................... 79 D2.5. PROCESS FOR RESOLVING ISSUES ............................................................................. 79 D2.6. LABORATORY ISSUES DOCUMENTATION .................................................................. 79
D3. RECONCILIATION WITH DATA QUALITY OBJECTIVES ............................................................. 80
D3.1. RECONCILIATION OF PROJECT RESULTS WITH DATA QUALITY OBJECTIVES ............ 80 D3.1.1. CHEMICAL AND BACTERIOLOGICAL DATA RECONCILIATION ................................ 80 D3.1.2. BIOLOGICAL DATA RECONCILIATION .................................................................... 80
D3.1.3. FIELD DATA RECONCILIATION .............................................................................. 80 D3.2. HOW DATA LIMITATION WILL BE REPORTED .......................................................... 80
D3.3. DATA REJECTION ..................................................................................................... 80
REFERENCES ..............................................................................................................................81
APPENDIX A ORGANIZATION CHART FOR WATER QUALITY MODELING .................83
APPENDIX B ORGANIZATION CHART FOR WATER QUALITY DATA COLLECTION
AND ASSESSMENT ....................................................................................................................87 APPENDIX C DATA QUALITY INDICATOR DEFINITIONS ..............................................889 APPENDIX D MONITORING STATIONS AND FACILITIES .................................................93
1. 2018 SURFACE WATER MONITORING STATIONS ....................................................... 934 2. COASTAL SHELLFISH MONITORING STATIONS .......................................................... 113 3. COASTAL BEACH MONITORING STATIONS ................................................................ 114 4. DNR STATE PARKS LAKE BEACH MONITORING STATIONS....................................... 115 5. 2018 GROUND WATER MONITORING WELLS ............................................................ 116 6. MERCURY IN FISH TREND MONITORING STATIONS .................................................... 123
Georgia Environmental Protection Division
QAPP for Water Quality Modeling and Ground Water and Surface Monitoring WPMP-QAPP 3 rev 1
June 2018
Page 7 of 132
7. MUNICIPAL/INDUSTRIAL WATER POLLUTION CONTROL FACILITIES FY2018
COMPLIANCE SAMPLING INSPECTION SCHEDULE LITIES AND INDUSTRIAL
(PRETREATMENT FACILITIES) .................................................................................... 124 APPENDIX E EXAMPLE FORMS ............................................................................................152
1. EXAMPLE SAMPLE LABEL ......................................................................................... 152 2. CHAIN OF CUSTODY RECORD - AMU ........................................................................ 152 3. CHAIN OF CUSTODY RECORD - FMU ........................................................................ 152
4. MONITORING AUDIT REPORT FORM .......................................................................... 152 APPENDIX F STANDARD OPERATING PROCEDURES AND QUALITY ASSURANCE
PLANS .........................................................................................................................................158 List of Tables
Table 1. Program Roles and Responsibilities Related to Water Quality Modeling, Monitoring,
and Data Use ................................................................................................................................. 14
Table 2. Project Decision Statement and Actions ......................................................................... 17
Table 3. Relative Errors and Statistical Targets for Hydrologic Calibration ................................ 31
Table 4. Typical Secondary Environmental Data to Be Collected ............................................... 32
Table 5. Personnel Training .......................................................................................................... 34
Table 6. Measurement Quality Objectives for Water Quality Monitoring ................................... 36
Table 7. Core and Supplemental Indicators .................................................................................. 47
Table 8. Field Sampling Performance Methods ........................................................................... 51
Table 9. Field Equipment Inventory and Disposables .................................................................. 52
Table 10. Bottle Type, Preservation Techniques and Holding Times for Samples ...................... 54
Table 11. Analytical Reporting Units and Methods ..................................................................... 59
Table 12. Field Sampling Quality Control Requirements for Water Quality Analytes (Nutrients,
Bacteria, Chlorophyll a, etc.) ........................................................................................................ 63
Table 13. Quality Control Requirements for Multi-Probe Instruments (D.O., pH, Conductivity,
Water Temperature, depth) ........................................................................................................... 63
Table 14. GAEPD Field Instrument Calibration and Maintenance .............................................. 66
Table 15. Consumable Inspections and Acceptance Criteria........................................................ 67
Table 16. Assessment Activities Personnel .................................................................................. 74
Table 17. Project Status Reports ................................................................................................... 75
Table 18. Data Verification Process ............................................................................................. 79
List of Figures
Figure 1. Major River Basins in Georgia ...................................................................................... 26 Figure 2. Quality Assurance Process ............................................................................................ 71
Georgia Environmental Protection Division
QAPP for Water Quality Modeling and Ground Water and Surface Monitoring WPMP-QAPP 3 rev 1
June 2018
Page 8 of 132
List of Acronyms
AMU Ambient Monitoring Unit
BMP Best Management Practice
BOD Biochemical Oxygen Demand
cfs Cubic feet per second
COC Chain of Custody
COD Chemical Oxygen Demand
CRD Coastal Resources Division
CWA Clean Water Act
CWW Columbus Water Works
DNR Department of Natural Resources
DO Dissolved Oxygen
DQO Data Quality Objectives
EFDC Environmental Fluid Dynamics Code
EPA U.S. Environmental Protection Agency
EPD-RIV-1 GAEPD one dimensional hydrodynamic water quality model
GAEMN Georgia Automated Environmental Monitoring Network
FMU Facilities Monitoring Unit
GA DOSAG GAEPD water quality model
GAEPD Georgia Environmental Protection Division
GA ESTUARY GAEPD water quality model
GAPDES Georgia Pollution Discharge Elimination System Permit Database
GAWP Georgia Association of Water Professionals
GIS Geographic Information System
GOMAS Georgia envirOnmental Monitoring and Assessment System Database
GPS Global Positioning System
GRWA Georgia Rural Water Association
GWWI Georgia Water & Wastewater Institute
HSPF Hydrologic Simulation Program FORTRAN
IBI Index of Biotic Integrity
ISU Intensive Surveys Unit
L Liter
LSPC Loading Simulation Program C++
LAS Land Application System
LIMS Laboratory Information Management Systems
MDL Method Detection Limit
mg milligram
MPN Most Probable Number
MQO Measurement Quality Objective
NCDC National Climatic Data Center
NPDES National Pollutant Discharge Elimination System
NPS Nonpoint Source
% R Percent Recovery
PET Potential evapotranspiration
PL Project Leader
PM Project Manager
PIDs Privately Owned & Institutional Developments
POTW Publicly Owned Treatment Works
QAP Quality Assurance Plan (Laboratory)
QAPP Quality Assurance Project Plan or Quality Assurance Program Plan
QA/QC Quality Assurance/Quality Control
QMP Quality Management Plan
RBP Rapid Bioassessment Protocol
RDC Regional Development Centers
RDL Reporting Detection Limit
Georgia Environmental Protection Division
QAPP for Water Quality Modeling and Ground Water and Surface Monitoring WPMP-QAPP 3 rev 1
June 2018
Page 9 of 132
RL Reporting Limit
RPD Relative Percent Difference
SOPs Standard Operating Procedures
SOW Scope of Work
SQAP Sampling Quality Assurance Plan
STATSGO State Soil Geographic Database
STORET STOrage and RETrieval Data System
TMDLs Total Maximum Daily Loads
USLE Universal Soil Loss Equation
USEPA United States Environmental Protection Agency
USGS United States Department of the Interior Geological Survey
WASP Water Quality Analysis and Simulation Program
WCS Watershed Characterization System
WLA Wasteload Allocation
WPB Watershed Protection Branch of the GAEPD
WPMP Watershed Planning & Monitoring Program
WQ Water Quality
WQS Water Quality Standard
WQX Water Quality Exchange
WRD Wildlife Resources Division of the Georgia Department of Natural Resources
WRDB Water Resources Database
Georgia Environmental Protection Division
QAPP for Water Quality Modeling and Ground Water and Surface Monitoring WPMP-QAPP 3 rev 1
June 2018
Page 10 of 132
A3. Distribution List
Copies of this document were distributed to the following individuals within the GAEPD. Additional
copies were distributed to non-GAEPD agencies and individuals upon request (including other state and
federal agencies, consultants, universities, etc.).
Mr. James A. Capp, Branch Chief, Watershed Protection Branch
Georgia DNR, Environmental Protection Division
2 MLK, Jr. Drive, S.W., Suite 1152, Atlanta, GA 30334
Phone: (404) 463-4911
Email Address: [email protected]
Phillip Mitchell, EPD Laboratory QA Manager
Georgia DNR, Environmental Protection Division
5804 Peachtree Corners East
Norcross, GA 30092-3403
Phone: (678) 248-7384
Email Address: [email protected]
Elizabeth Booth, Program Manager (Modeling and Monitoring Project Manager)
Watershed Protection Branch
Georgia DNR, Environmental Protection Division
2 MLK, Jr. Drive, S.W., Suite 1152, Atlanta, GA 30334
Phone: (404) 463-4929
Email Address: [email protected]
Josh Welte, Unit Manager (Water Quality Modeling Unit)
Watershed Protection Branch
Georgia DNR, Environmental Protection Division
2 MLK, Jr. Drive, S.W., Suite 1152, Atlanta, GA 30334
Phone: (404) 463-4948
Email Address: [email protected]
Tyler Parsons, Unit Manager (TMDL Modeling and Development Unit)
Watershed Protection Branch
Georgia DNR, Environmental Protection Division
2 MLK, Jr. Drive, S.W., Suite 1152, Atlanta, GA 30334
Phone: (404) 463-4924
Email Address: [email protected]
Susan Salter, Environmental Specialist (Monitoring & Assessment QA Officer)
Watershed Protection Branch
Georgia DNR, Environmental Protection Division
2 MLK, Jr. Drive, S.W., Suite 1152, Atlanta, GA 30334
Phone: (404) 463-4917
Email Address: [email protected]
Georgia Environmental Protection Division
QAPP for Water Quality Modeling and Ground Water and Surface Monitoring WPMP-QAPP 3 rev 1
June 2018
Page 11 of 132
Reid Jackson, Unit Manager (South Georgia Monitoring Unit)
Watershed Protection Branch
Georgia DNR, Environmental Protection Division
400 Commerce Center Dr., Brunswick, GA 31523
Phone: (912) 264-7284
Email Address: [email protected]
Jeremy Smith, Unit Manager (North Georgia Monitoring Unit)
Watershed Protection Branch
Georgia DNR, Environmental Protection Division
7 MLK, Jr. Drive, S.W., Suite 450, Atlanta, GA 30334
Phone: (404) 651-8454
Email Address: [email protected]
Mike Phipps, Unit Manager (Facilities Monitoring Unit)
Watershed Protection Branch
Georgia DNR, Environmental Protection Division
7 MLK, Jr. Drive, S.W., Suite 450, Atlanta, GA 30334
Phone: (404) 651-8461
Email Address: [email protected]
Joel Owen, Environmental Compliance Specialist (Monitoring Database/GIS Officer)
Ambient Monitoring Unit
Watershed Protection Branch
Georgia DNR, Environmental Protection Division
2 MLK, Jr. Drive, S.W., Suite 1152, Atlanta, GA 30334
Phone: 404-463-4915
Email Address: [email protected]
Veronica Craw, Unit Manager (319(h) Grants Administration)
Watershed Protection Branch
Georgia DNR, Environmental Protection Division
2 MLK, Jr. Drive, S.W., Suite 1462, Atlanta, GA 30334
Phone: (404) 651-8532
Email Address: [email protected]
A hard copy in paper format and in an electronic format on CD have been placed in the main file room in
the Watershed Protection Branch office located at 2 MLK, Jr. Drive, S.W., Suite 1152, Atlanta, GA
30334 and all documents to be posted on the GAEPD internet site: https://epd.georgia.gov/watershed-
protection-branch-technical-guidance.
Georgia Environmental Protection Division
QAPP for Water Quality Modeling and Ground Water and Surface Monitoring WPMP-QAPP 3 rev 1
June 2018
Page 12 of 132
A4. Program Description and Organization
The GAEPD Watershed Protection Branch (WPB) is responsible for implementing a number of programs
in accordance with Federal requirements under the Clean Water Act (CWA). Among these are:
Monitoring and Assessment of the State’s Waters
Water Quality Modeling to Determine Available Assimilative Capacity
Development of Wasteload Allocations (WLAs)
Development of Total Maximum Daily Loads (TMDLs)
Coordination of TMDL Implementation Plan Development and Administration
Wastewater NPDES and Land Application System (LAS) Permitting
Storm-Water NPDES Program
Water Withdrawal Permitting Program
Non-Point Source (NPS) Program
Grants Program Administration
Conducting water quality monitoring and modeling to support the determination of the State waterbodies’
Assimilative Capacities and the development of Wasteload Allocations (WLAs), Total Maximum Daily
Loads (TMDLs), and Water Quality Standards (WQS) for Georgia’s rivers, lakes, estuaries and wetlands
is essential to the work performed by the WPB. The Watershed Planning & Monitoring Program
(WPMP) within the WPB is taking the lead for the water quality modeling projects. Funding for the
water quality modeling work is generated through Sections 106, 104(b)(3), and 604(b) watershed
management and water quality modeling resources. The watershed, lake, and estuary modeling efforts
may be performed through a contract.
Monitoring, assessment, and data management performed as part of these programs meet the ten basic
elements of a State water-monitoring program outlined by the USEPA and the prerequisites of the CWA
Section 106.
1. Monitoring Program Strategy: A long term monitoring strategy that serves the
State’s water quality management needs and addresses all state ground water and
surface waters including rivers, streams, lakes, estuaries, and coastal waters.
2. Monitoring Objectives: Monitoring Objectives that are effective in generating data
that serves the water quality management decision needs.
3. Monitoring Design: A monitoring design developed to select sample sites that fulfill
the expectations of the monitoring objectives.
4. Core and Supplemental Water Quality Indicators: Core indicators selected to
evaluate the designated use of the water-body with supplemental indicators selected
according to site-specific decision criteria.
5. Quality Assurance: Quality Management Plans and Quality Assurance Project Plans
are developed and implemented to ensure the validity of monitoring and laboratory
activities.
6. Data Management: An electronic data system for storage and retrieval of water
quality data.
7. Data Analysis and Assessment: A methodology developed to analyze and assess all
available and existing data for all water-body types in the State with criteria adopted
under the State’s water quality standards.
8. Reporting: The State produces water quality reports and lists as required by federal
regulations.
Georgia Environmental Protection Division
QAPP for Water Quality Modeling and Ground Water and Surface Monitoring WPMP-QAPP 3 rev 1
June 2018
Page 13 of 132
9. Programmatic Evaluation: The State conducts periodic reviews of its water quality
monitoring program to determine how well the program serves its water quality
decisions needs for all state waters and makes adjustments to the program as needed.
10. General Support and Infrastructure Planning: Current and future resource needs are
evaluated for full implementation of the water quality monitoring program strategy.
The responsibility for groundwater and surface water quality monitoring and assessment is a primary
responsibility of the WPMP within the WPB. The WPMP coordinates the collection and delivery of
samples by field offices in outlying GAEPD District offices and through joint funding agreements and
contracts with the U.S. Geological Survey (USGS) and the Columbus Water Works (CWW). The Grants
Unit within the WPB coordinates additional data collection by outside entities through the administration
of 319(h) grants.
Funding for the water quality modeling and monitoring work performed for WPMP is through State and
Federal Sections 106 and 604(b) grants water quality resources. The WPMP is the principle data user
with the general public and other outside agencies as secondary users of the water quality data. Water
quality data obtained through the monitoring efforts of the project(s) are used in the development of the
305(b)/303(d) reporting and assessment of State waters, TMDL development, WLA development, water
quality modeling, basin planning activities, watershed assessment, TMDL Implementation Plan
development, stream restoration and non-point source controls, and NPDES permit compliance. After
being QA/QC’d, all monitoring data is input into GAEPD Georgia envirOnmental Monitoring and
Assessment System (GOMAS) database and then uploaded to STORET via WQX and made available to
the public. All data are provided to the USEPA, local agencies, universities, environmental groups, and
private citizens upon request. A public interface for GOMAS is currently under development.
The QAPP is available for public review at any time on the GAEPD website. Any individuals, groups or
agencies conducting Section 319(h) Grant-funded projects are advised by the GAEPD’s Section 319(h)
Grant Managers and the Water Quality Monitoring Unit Managers of GAEPD’s web site posting of the
State’s Rules and Regulations governing collection of water quality samples and submittal of data to the
GAEPD for consideration in the 305(b)/303(d) listing process. The web site includes links to the
GAEPD’s Quality Assurance Manual, Standard Operating Procedures (SOPs) for data collection, the
Guidance Document for Submittal of Data to the GAEPD, and the Secretary of State’s Laboratory
Analytical Accreditation requirements. In addition, when making a Section 319(h) Grant application, the
grantee is advised by GAEPD’s Section 319 Grant Manager of the availability of the GAEPD’s QAPP
and the procedures contained within. Any academic, public, or private organization or group generating
data for use in Georgia’s assessment of water quality is required to comply with the provisions of this
QAPP, sampling quality assurance plan requirements, and SOPs for water quality data collection.
The organizational aspects of the program provide the framework for conducting tasks. They can also
facilitate project performance and adherence to quality control (QC) procedures and quality assurance
(QA) requirements. Key project roles are filled by those persons responsible for ensuring the gathering of
valid data and the routine assessment of the data for precision and accuracy, as well as the data users and
the person(s) responsible for approving and accepting final products and deliverables. The program
organization chart for water quality modeling is presented in Appendix A, which includes relationships,
lines of communication among all participants and data users, and each of their responsibilities. The
organizational chart for water quality data collection, analysis, and assessment is included in Appendix B.
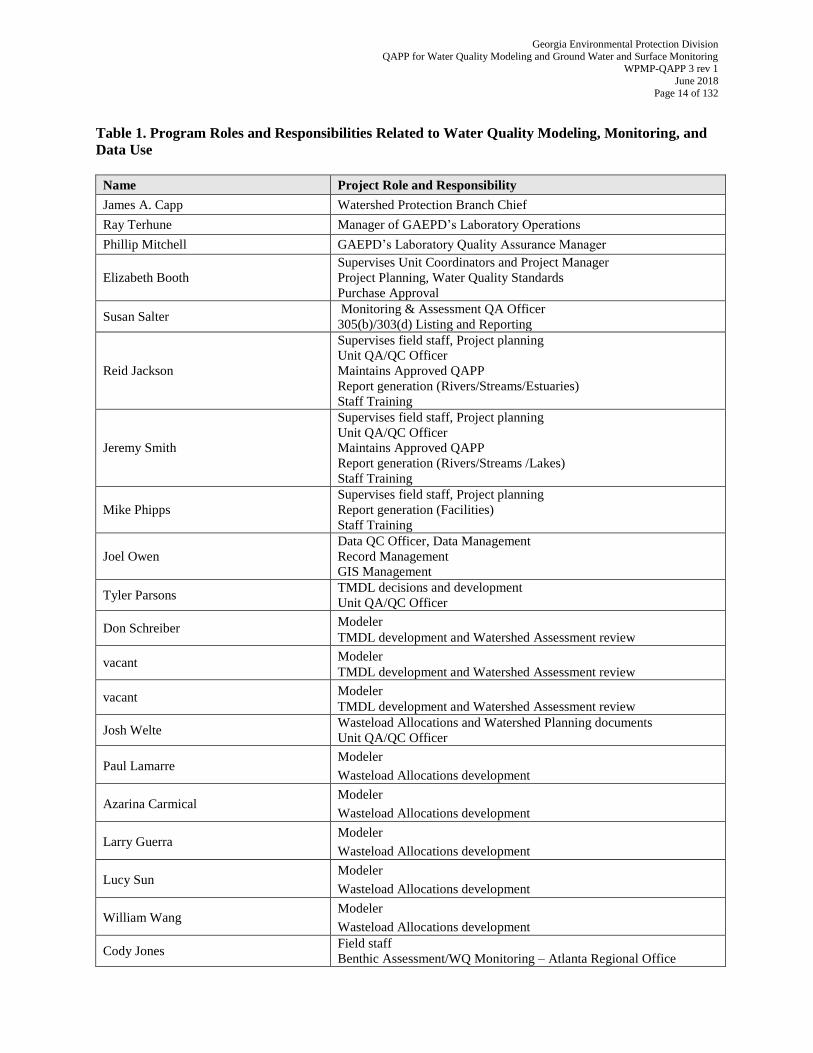
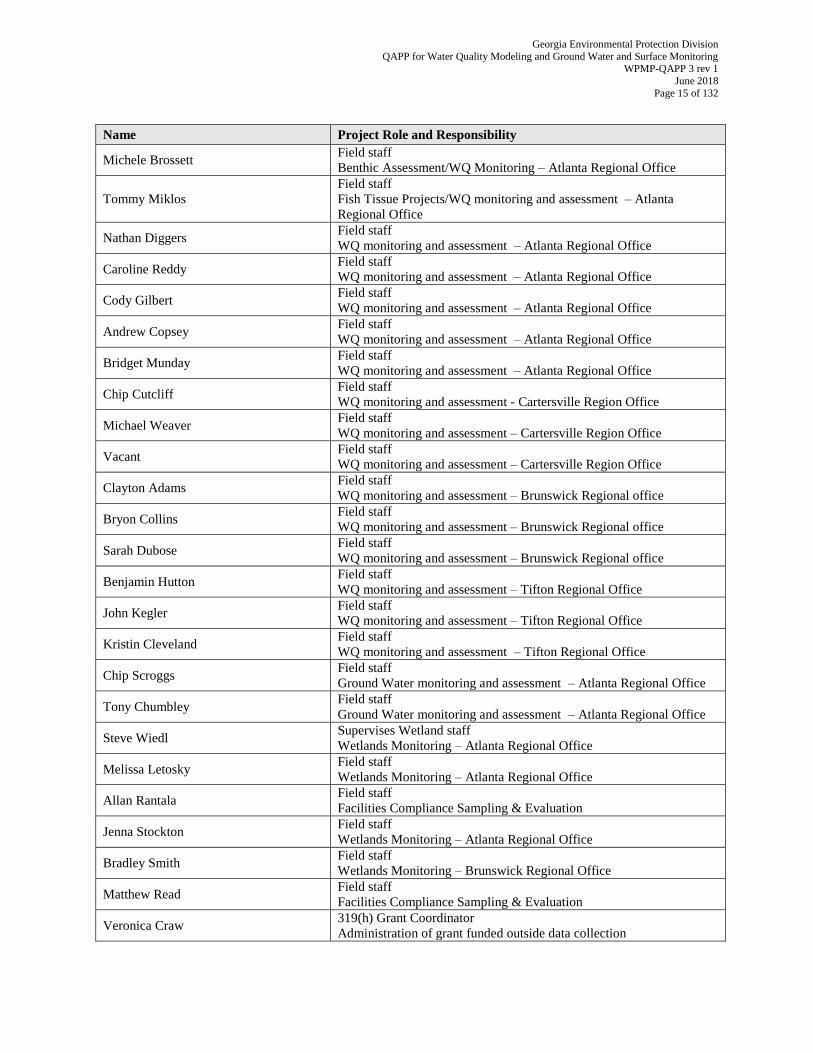
Table 1 below provides a more detailed description of the roles and responsibilities of staff involved in the
planning, participation, and reporting activities for water quality modeling and monitoring projects
initiated by the Georgia Department of Natural Resources (DNR).
Georgia Environmental Protection Division
QAPP for Water Quality Modeling and Ground Water and Surface Monitoring WPMP-QAPP 3 rev 1
June 2018
Page 14 of 132
Table 1. Program Roles and Responsibilities Related to Water Quality Modeling, Monitoring, and
Data Use
Name Project Role and Responsibility
James A. Capp Watershed Protection Branch Chief
Ray Terhune Manager of GAEPD’s Laboratory Operations
Phillip Mitchell GAEPD’s Laboratory Quality Assurance Manager
Elizabeth Booth
Supervises Unit Coordinators and Project Manager
Project Planning, Water Quality Standards
Purchase Approval
Susan Salter Monitoring & Assessment QA Officer
305(b)/303(d) Listing and Reporting
Reid Jackson
Supervises field staff, Project planning
Unit QA/QC Officer
Maintains Approved QAPP
Report generation (Rivers/Streams/Estuaries)
Staff Training
Jeremy Smith
Supervises field staff, Project planning
Unit QA/QC Officer
Maintains Approved QAPP
Report generation (Rivers/Streams /Lakes)
Staff Training
Mike Phipps
Supervises field staff, Project planning
Report generation (Facilities)
Staff Training
Joel Owen
Data QC Officer, Data Management
Record Management
GIS Management
Tyler Parsons TMDL decisions and development
Unit QA/QC Officer
Don Schreiber Modeler
TMDL development and Watershed Assessment review
vacant Modeler
TMDL development and Watershed Assessment review
vacant Modeler
TMDL development and Watershed Assessment review
Josh Welte Wasteload Allocations and Watershed Planning documents
Unit QA/QC Officer
Paul Lamarre Modeler
Wasteload Allocations development
Azarina Carmical Modeler
Wasteload Allocations development
Larry Guerra Modeler
Wasteload Allocations development
Lucy Sun Modeler
Wasteload Allocations development
William Wang Modeler
Wasteload Allocations development
Cody Jones Field staff
Benthic Assessment/WQ Monitoring – Atlanta Regional Office
Georgia Environmental Protection Division
QAPP for Water Quality Modeling and Ground Water and Surface Monitoring WPMP-QAPP 3 rev 1
June 2018
Page 15 of 132
Name Project Role and Responsibility
Michele Brossett Field staff
Benthic Assessment/WQ Monitoring – Atlanta Regional Office
Tommy Miklos
Field staff
Fish Tissue Projects/WQ monitoring and assessment – Atlanta
Regional Office
Nathan Diggers Field staff
WQ monitoring and assessment – Atlanta Regional Office
Caroline Reddy Field staff
WQ monitoring and assessment – Atlanta Regional Office
Cody Gilbert Field staff
WQ monitoring and assessment – Atlanta Regional Office
Andrew Copsey Field staff
WQ monitoring and assessment – Atlanta Regional Office
Bridget Munday Field staff
WQ monitoring and assessment – Atlanta Regional Office
Chip Cutcliff Field staff
WQ monitoring and assessment - Cartersville Region Office
Michael Weaver Field staff
WQ monitoring and assessment – Cartersville Region Office
Vacant Field staff
WQ monitoring and assessment – Cartersville Region Office
Clayton Adams Field staff
WQ monitoring and assessment – Brunswick Regional office
Bryon Collins Field staff
WQ monitoring and assessment – Brunswick Regional office
Sarah Dubose Field staff
WQ monitoring and assessment – Brunswick Regional office
Benjamin Hutton Field staff
WQ monitoring and assessment – Tifton Regional Office
John Kegler Field staff
WQ monitoring and assessment – Tifton Regional Office
Kristin Cleveland Field staff
WQ monitoring and assessment – Tifton Regional Office
Chip Scroggs Field staff
Ground Water monitoring and assessment – Atlanta Regional Office
Tony Chumbley Field staff
Ground Water monitoring and assessment – Atlanta Regional Office
Steve Wiedl Supervises Wetland staff
Wetlands Monitoring – Atlanta Regional Office
Melissa Letosky Field staff
Wetlands Monitoring – Atlanta Regional Office
Allan Rantala Field staff
Facilities Compliance Sampling & Evaluation
Jenna Stockton Field staff
Wetlands Monitoring – Atlanta Regional Office
Bradley Smith Field staff
Wetlands Monitoring – Brunswick Regional Office
Matthew Read Field staff
Facilities Compliance Sampling & Evaluation
Veronica Craw 319(h) Grant Coordinator
Administration of grant funded outside data collection
Georgia Environmental Protection Division
QAPP for Water Quality Modeling and Ground Water and Surface Monitoring WPMP-QAPP 3 rev 1
June 2018
Page 16 of 132
WPMP is responsible for developing the data quality objectives for final use of the data. This QAPP
provides general descriptions of the work to be performed to support the development of water quality
models, the standards to be met, and the procedures that are used to ensure that the modeling results are
scientifically valid and defensible and that uncertainty has been reduced to a known and practical
minimum. In addition, this QAPP addresses the use of data collected by GAEPD, USGS, and other
entities for various purposes. The water quality modeling work does not require the collection of primary
data. If it is determined during the data evaluation effort and after consultation with the GAEPD Project
Manager that the collection of primary data is required, that collection will be covered by this QAPP. The
GAEPD will be responsible for implementing quality assurance and quality control (QA/QC) procedures
for their field sampling and laboratory analytical activities according to established GAEPD protocols.
This QAPP describes the methods and procedures that will be used by the GAEPD and their contractors
to ensure the quality, accuracy, precision, and completeness of the data collected and analyzed and
describes the data quality objectives for the data’s final use. Any outside organization, that submits data
to GAEPD for assessment purposes, will be required to adhere to the conditions of this QAPP. Any
project-specific sampling project will be required to submit sampling plans to be approved by the
GAEPD.
A5. Problem Definition/Background
As part of funding agreements between the State and the USEPA, Georgia agrees to model and monitor
the waters of the state and report findings to the USEPA, as well as other customers and stakeholders, in
order to support the goals of the CWA. The CWA defines as its objective:
“…to restore and maintain the chemical, physical, and biological integrity of the Nation’s waters, and,
where attainable, to achieve a level of water quality that provides for the protection and propagation of
fish, shellfish, and wildlife, and for recreation in and on the water.”
The GAEPD is the water quality management agency designated to implement the provisions of the
CWA within the State of Georgia. The responsibilities of the GAEPD under the CWA are to improve and
protect water quality in the State. GAEPD and/or their contractor(s) are responsible for developing
analytical modeling tools for performing resource assessments of the assimilative capacity and TMDL of
selected water bodies. GAEPD and/or its contractor(s) develop computer modeling tools for watersheds,
streams and rivers, estuaries, and lakes. The results of this work are used by GAEPD in support of
regulatory and permitting activity and by regional water planning councils in the refinement of their
Water Development and Conservation Plans in support of the Georgia Comprehensive Statewide Water
Management Plan.
GAEPD’s water quality monitoring program is intended to provide a measure of progress toward meeting
the goals established in the CWA and Georgia’s Water Quality Control Act. This is achieved by
determining use-attainment status of surface waters in the State.
To accomplish this purpose, data are collected and assessed in order to:
Assess the condition of the State’s waters.
Identify areas potentially in violation of Georgia’s numerical or narrative water quality standards.
Identify causes and sources of water quality problems.
Document areas with potential human health threats from elevated bacteria levels.
Screen fish in selected water-bodies for fish tissue contaminants (metals, PCBs and organo-
chlorine pesticides) to provide for public health risk assessment.
Over the long term, collect water quality data to enable the determination of trends in parameter
concentrations and/or loads.
Georgia Environmental Protection Division
QAPP for Water Quality Modeling and Ground Water and Surface Monitoring WPMP-QAPP 3 rev 1
June 2018
Page 17 of 132
Gauge compliance with NPDES permit limits.
Document baseline conditions prior to a potential impact or as a reference stream for downstream
uses or other sites within the same eco-region and/or watershed.
Assess water quality improvements based on site remediation, implementation of Best
Management Practices, and other restoration strategies.
Identify proper water use classifications, including anti-degradation policy implementation.
Identify natural reference conditions on an eco-region basis for refinement of water quality
standards.
Water quality data collected is compared to criteria and standards set forth in Georgia’s Rules and
Regulations for Water Quality Control, Chapter 391-3-6-.03 and the Level IV eco-regional reference
conditions.
Table 2. Project Decision Statement and Actions
Decision Statement Actions To Be Taken
Assess the condition of the State’s waters
Compare monitoring results to Water Quality Rules and
Regulations, Chapter 391-3-6-.03, water quality criteria
and regional reference data to determine if waters are
supporting their designated uses. Publish biennial
305(b) report.
Identify problem areas with parameter values that
exceed Georgia’s numerical or narrative water quality
standards. Identify causes and sources of water quality
problems.
Include in the 303(d) List of Waters.
Document areas with potential human health threats
from elevated bacteria levels or fish tissue
contamination.
Notify public of water contact or fish consumption
advisory at water-bodies that pose a threat to human
health.
Monitor 303(d) listed waters Refine 303(d) List.
Monitor major and minor NPDES Permitted facility
discharges to State waters
Compare results to NPDES Permit effluent limitations.
Issue notice of violation if limits exceeded.
Prioritize TMDL development and collect appropriate
data. Develop TMDL by developing analytical modeling tools
Identify natural reference conditions on an eco-region
basis for refinement of water quality standards.
(Monitor Level IV eco-regional reference sites).
Data used to refine water quality criteria and eco-
regional water quality expectations.
Identify water-body use classifications.
Assign use classification to all monitored water-bodies
in the watershed group. Identify tier status for waters
where regulatory decisions are needed.
A6. Project/ Task Description and Schedule
Modeling
Major modeling activities include the assemblage of water quality databases, and the development and
calibration of watershed, riverine, and lake hydrodynamic and water quality models. Each activity has
inherent QC requirements and requires oversight by a trained staff person. The activities can be divided
into a number of tasks, each requiring management and QC oversight by qualified personnel. The
modeling subtasks 1 through 6 are addressed in this QAPP.
Georgia Environmental Protection Division
QAPP for Water Quality Modeling and Ground Water and Surface Monitoring WPMP-QAPP 3 rev 1
June 2018
Page 18 of 132
Task 1: Quality Assurance Project Plan
All modeling work is expected to adhere to a high standard of quality. This QAPP has been developed to
cover all modeling activities and also addresses both technical quality and practicable/operational quality.
The QAPP was prepared following EPA Guidance as appropriate.
Task 2: Data Compilation and Management
The models require historic data of various types for either model input or model calibration. The data
types described in this section are general in nature and are needed for most model applications. Other
model specific data requirements will be described later.
In general, GAEPD or their contractor shall identify sources, collect available data, and develop digital
databases and accompanying geographic information system (GIS) map coverages for the data categories
described in this and following tasks. Data should be collected for specified time period. All numerical
databases used for models are developed using the Water Resources Database (WRDB) software (or its
successor), which is available from GAEPD and can be found at the following website:
http://www.wrdb.com/. A description of the data categories follows:
Water Quality Data: GAEPD, USGS, NPDES permittees, and other entities
operating under an approved data management plan have monitored water quality for
a variety of water bodies at various locations in Georgia.
Flow Data: The USGS has monitored streamflow at a variety of locations. The flow
data may be used to derive flow statistics such as 7Q10.
Watershed Assessment Data: GAEPD has required some municipalities to perform
watershed assessments for the watersheds in their jurisdictions. These watershed
assessments include initial and long-term water quality monitoring programs.
Facility NPDES Monitoring Data: Municipal and industrial wastewater treatment
facilities with National Pollutant Discharge Elimination System (NPDES) permits
have monitoring data that includes effluent flow and quality. These data are often
recorded on a daily basis and summarized monthly. Note that in some cases, it will
be necessary to obtain information from facilities located in other states.
Water Withdrawal Data: Municipal and industrial facilities that operate water
withdrawals have data on their withdrawal rates. These data are often recorded on a
daily basis and summarized monthly. Note that in some cases, it will be necessary to
obtain information from facilities located in other states.
Heat Load Data: Heat load data for power plants and other facilities will have to be
compiled. These data will include both flow and temperature discharge data. These
data may not be available in NPDES compliance reports, so an alternative method
may have to be developed for estimating heat loads.
Meteorological Data: A number of organizations including the National Climatic
Data Center (NCDC) and UGA’s Georgia Automated Environmental Monitoring
Network (GAEMN) have meteorological data at a number of locations. Typical
meteorological data parameters include precipitation, air temperature, dew point
temperature, barometric pressure, solar radiation, relative humidity, and wind speed.
Georgia Environmental Protection Division
QAPP for Water Quality Modeling and Ground Water and Surface Monitoring WPMP-QAPP 3 rev 1
June 2018
Page 19 of 132
These data are collected in various time intervals including 15-minute, hourly, or
daily.
GAEPD and/or their contractor shall identify the available data, retrieve the data, and develop a database
containing these data using WRDB or other relevant database. Coordination with other states may be
necessary.
All of the data types described above have a location associated with them that can be used to create GIS
coverages. GAEPD and/or their contractor will develop and maintain GIS coverages for each data type
that includes the location and other descriptive information for the site using GIS software. The software
needs to be compatible with ArcGIS developed by Environmental Systems Research Institute (ESRI).
Task 3: Watershed Modeling
When necessary, as a part of the process of determining the assimilative capacity for rivers, lakes or
estuaries, GAEPD and/or their contractor shall develop watershed models. Watershed models will be
developed for the appropriate scale to answer model questions posed. The watershed models will be
designed to perform a continuous simulation for flow and water quality for a set time period (often ten
years). Watershed models can be developed using the Watershed Characterization System (WCS)
Sediment Tool that incorporates the Universal Soil Loss Equation (USLE), Hydrologic Simulation
Program Fortran (HSPF) that is available at the following website
http://www.aquaterra.com/resources/hspfsupport/index.php, or the Loading Simulation Program in C++
(LSPC).
For each of the watersheds, the existing annual sediment load can be estimated using the USLE. The
USLE predicts the average annual soil loss caused by sheet and rill erosion. Soil loss from sheet and rill
erosion is mainly due to detachment of soil particles during rainfall events. It is the major source of soil
loss from crop production and animal grazing areas, logging areas, mine sites, unpaved roads, and
construction sites. The equation used for estimating average annual soil erosion is:
A = RKLSCP
Where:
A = average annual soil loss, in tons/acre
R = rainfall erosivity index
K = soil erodibility factor
LS = topographic factor
L = slope length
S = slope
C = cropping factor
P = conservation practice factor
The Environmental Protection Agency (EPA) Regions 3 and 4 developed LSPC for preparing TMDLs. It
utilizes the hydrologic core program of HSPF with a custom interface of the Mining Data Analysis
System (MDAS) and modifications for non-mining applications such as nutrient and pathogen modeling.
Each watershed model will be divided into modeling sub-basins based on hydrologic criteria to be
represented as a series of hydraulically connected sub-watersheds in which the watershed model will
calculate surface water runoff and the advective transport of constituents using historic precipitation data.
Watershed models may also include water temperature modeling.
Georgia Environmental Protection Division
QAPP for Water Quality Modeling and Ground Water and Surface Monitoring WPMP-QAPP 3 rev 1
June 2018
Page 20 of 132
The following data and other modeling requirements maybe be required to perform the watershed model
simulations:
Meteorological Data: The USLE uses the R factor, or rainfall erosivity index, which
describes the kinetic energy generated by the frequency and intensity of the rainfall.
It is statistically calculated from the annual summation of rainfall energy in every
storm, which correlates to the raindrop size, times its maximum 30-minute intensity.
It varies geographically and is given by county. Hourly meteorological data from
weather stations within, or in close proximity to, the sub-watershed will be used in
HSPF or LSPC watershed models. Precipitation data for the watershed will be
gathered from several sources and the watershed will be subdivided into Thiessen
polygons with precipitation stations as centers, in order to select the station for the
watershed. The potential evapotranspiration will be calculated from the maximum
and minimum daily temperatures obtained from either NCDC or GAEMN stations.
The Hamon PET method will be used to calculate hourly potential evapotranspiration
using air temperature, a monthly variable coefficient, the number of hours of
sunshine (based on latitude), and absolute humidity (computed from air temperature).
Land Use/Land Cover: The USLE uses the C factor or cropping factor, which
represents the effect plants, soil cover, soil biomass, soil disturbing activities and
roads have on erosion and the C factor is based on the land cover and road type. The
USLE also uses the P factor or conservation practice factor represents the effects of
conservation practices on erosion. The conservation practices include BMPs such as
contour farming, strip cropping and terraces. The watershed models HSPF or LSPC
use land cover data as the basis for representing hydrology and nonpoint source
loading. GAEPD and/or their contractor shall obtain the most current digital map
coverages for land use/land cover for the watersheds to be modeled. In addition,
forecasted future land use coverages may be used for future planning. Land cover
categories for modeling will include open water, urban, barren or mining, cropland,
pasture, forest, grassland, and wetlands. Coverages of imperviousness may also be
utilized to develop the typical imperviousness percentages for each land use category.
The percent imperviousness of a given land category will be calculated as an area-
weighted average of land use classes encompassing the modeling land category.
Soils Data: Soils data for the watershed will be obtained from the State Soil
Geographic Database (STATSGO). There are four main hydrologic soil groups. The
different soil groups range from soils that have a low runoff potential to soils that
have a high runoff potential. The total area that each hydrologic soil group covers
within each sub-watershed will be determined. The hydrologic soil group that has
the highest percent of coverage within each sub-watershed will be used to represent
the sub-watershed. The USLE uses the K factor, or soil erodibility factor, represents
the susceptibility of soil to be eroded. This factor quantifies the cohesive or bonding
character of the soil and ability of the soil to resist detachment and transport during a
rainfall event. Soil type is also Infiltration is It is a function of the soil type, which is
provided by the STATSGO data.
Digital Elevation Model: Digital elevation model (DEM) data will be obtained for
the watersheds modeled and shall have a 10-meter grid resolution. These data will be
used to determine the channel and watershed slopes for use in the watershed model.
The USLE uses the LS factor, or topographic factor, which represents the effect of
Georgia Environmental Protection Division
QAPP for Water Quality Modeling and Ground Water and Surface Monitoring WPMP-QAPP 3 rev 1
June 2018
Page 21 of 132
slope length and slope steepness on erosion. Steeper slopes produce higher overland
flow velocities. Longer slopes accumulate more runoff from larger areas and also
result in higher overflow velocities. The slope length and slope is based on the grid
size and ground slope provided by DEM data.
Point Source Discharge Data: The watershed model should be designed to include
point source discharge data. The watershed models will include all point sources of
nutrients and organic material.
Water Withdrawal Data: The watershed model should be designed to include water
withdrawal data.
GA EPD will use the steady state model DOSAG to determine wasteload allocations (WLAs) for oxygen
demanding substances. The results of these models will be incorporated into the watershed models.
The watershed model will be calibrated to available daily flows and discrete instream water quality data
measured by GA EPD, USGS, local municipalities, counties, George Power, and the Corps of Engineers.
The watershed models will simulate the rainfall runoff process for both flow and water quality, and the
results of these models will be used as tributary inputs to the river, lake and/or estuary models.
Task 4: River Modeling
For simple river systems that can be modeled under steady state, GAEPD will develop and use GA
DOSAG models to determine WLAs for oxygen demanding substances. GA DOSAG is a steady-state,
one-dimensional, advection dispersion, mass transport, deterministic model based on the modified
Streeter-Phelps equation and can be downloaded from the following website:
http://epdsoftware.wileng.com/. The models will be developed for critical conditions in accordance with
standard practices. The critical conditions models will be run with the NPDES point sources at their full
permit loads.
When dealing with complex hydrodynamic systems, river modeling will be done using GAEPD’s EPD
RIV-1. Model development and calibration shall be done using the period that has the most complete
available data for model input and calibration. The period should span a minimum of two years.
Requirements of the river modeling also include:
River Cross Sections: The EPD RIV-1 hydrodynamic model requires river channel
cross sections as input for the open channel hydraulics calculations. The modeler
shall obtain available measured cross sections for the modeled river segments and
incorporate them into the model geometry. Where cross section data are not
available, cross sections may be developed using other means to be approved by the
program manager.
Watershed Inflows: River model input data for watershed contributions of flow and
water quality will be obtained from the watershed model results.
Meteorological Data: The EPD RIV-1 hydrodynamic model requires hourly
meteorological data from one or more monitoring stations in the vicinity of the river
to be used as model input.
Georgia Environmental Protection Division
QAPP for Water Quality Modeling and Ground Water and Surface Monitoring WPMP-QAPP 3 rev 1
June 2018
Page 22 of 132
USGS Streamflow Data: USGS streamflow data will be used where appropriate for
boundary flow input. Streamflow data may be used to estimate low-flow statistics,
such as 7Q10.
Water Quality Data: Available water quality data collected at the boundary will be
used as model input.
Facility Monitoring Data: Daily facility operating data for both wastewater
discharges and water withdrawals will be used in the model for the period modeled.
The river model will be calibrated with available USGS streamflow data and water quality data collected
at locations within the model reach and during the modeling period.
Task 5: Lake Modeling
Lake models shall consist of linked three-dimensional hydrodynamic and water quality models. The
lakes will be modeled in three-dimensions, which will allow GAEPD to calibrate the models to site-
specific data and to determine the effect of direct discharges into these systems without assuming laterally
averaged segments.
The Environmental Fluid Dynamics Code (EFDC) will be used to simulate the internal flows and water
temperature of the lake models. The model can be downloaded from the following website:
https://www.epa.gov/ceam/environment-fluid-dynamics-code-efdc-download-page. EFDC or the Water
Quality Analysis Simulation Program (WASP) will be used to simulate the fate and transport of water
quality constituents within the lake. WASP can be downloaded from the following website:
https://www.epa.gov/ceam/water-quality-analysis-simulation-program-wasp. Model development and
calibration will be done for a period that has the most complete data set, and should span a minimum of
two years.
Lake Hydrodynamic Modeling
EFDC is a general-purpose hydrodynamic model capable of simulating one, two, and three-dimensional
flow in surface water systems including rivers and lakes. The EFDC model for each lake will include:
A three-dimensional model grid having an appropriate resolution based on shoreline
and bathymetric data.
Boundary inflows provided by results from the HSPF or LSPC watershed model
Hourly meteorological data including barometric pressure, air temperature, relative
humidity, dew point, rainfall, evaporation, wind speed, solar radiation, and cloud
cover
Water temperature modeling
Estimated bottom elevations and shoreline boundaries define the EFDC model grid. Bathymetric
assumptions will be derived from available cross-sections from lake and estuary bathymetry. In addition,
any previously developed models for the lakes and estuaries will be examined to ensure consistency.
EFDC requires boundary conditions to simulate circulation and transportation. These conditions include
the water elevations at the downstream boundary, watershed inflows, and meteorological data. The
upstream boundaries will be the tributary flows and water quality results from the watershed models. The
lake levels recorded at the lake dam will be used to define the water surface elevation at the downstream
boundary.
Georgia Environmental Protection Division
QAPP for Water Quality Modeling and Ground Water and Surface Monitoring WPMP-QAPP 3 rev 1
June 2018
Page 23 of 132
The meteorological data that will be used include barometric pressure, air temperature, relative humidity,
dew point, rainfall, evaporation, wind speed, solar radiation, and cloud cover. These data are measured at
the NCDC or GAEMN stations.
Water temperature will be simulated in EFDC using solar radiation, atmospheric temperature, heat
transfer at the water surface, and the temperature of the hydraulic inputs. Lake Water Quality Modeling
WASP and EFDC are dynamic models designed to describe aquatic systems. Both EFDC and WASP
model time-varying processes of advection, dispersion, point and diffuse mass loading, and boundary
exchange and both models can be structured in one, two, or three dimensions. WASP contains a series of
independent kinetic process routines that can be employed. WASP will be used with its eutrophication
module (EUTRO) which models conventional water quality constituents and algal kinetics. The water
quality constituents and nutrient and algal kinetics in EUTRO are as follows:
Organic nitrogen
Ammonia
Nitrate-nitrite
Organic phosphorus
Orthophosphate
Chlorophyll a
Dissolved oxygen
Biochemical oxygen demand (BOD)
WASP is not a hydrodynamic model. The model uses the EFDC model results contained in the
hydrodynamic linkage file to provide the transport parameters required by the WASP water quality
model. Therefore, the WASP model segmentation must be compatible with the EFDC grid structure.
Both WASP and EFDC models simulate sediment oxygen demand, reaeration, full nutrient dynamics, and
algal kinetics. Boundary inflow and constituent concentrations of BOD, total nitrogen, and total
phosphorus will be imported from the calibrated HSPF or LSPC models. Since the watershed models
only predict total nitrogen and phosphorus loadings, these lumped constituents must be partitioned into
their component parts including organic phosphorus, ortho-phosphate, organic nitrogen, ammonia, and
nitrate-nitrite for use as input to the lake water quality model. The nitrogen and phosphorus loads will be
fractionated based on the results of measured water quality data.
If there are direct discharges to the lakes, daily discharge flows, 5-day BOD, ammonia, total phosphorus,
and dissolved oxygen concentrations for the NPDES permitted discharges will be obtained from
Operating Monitoring Reports (OMRs) and will be input into the model. If the lake has direct water
withdrawals, daily water withdrawal data will also be input into the model.
The model lake water quality model will be calibrated with existing water quality data including
chlorophyll a, nitrogen components, phosphorus components, dissolved oxygen profiles, and water
temperature profiles.
Task 6: Estuary Models
Estuary models will be used to assess pollutant loads to Georgia estuaries. The GA ESTUARY model is
a mid-tide, steady state model used to assess the assimilative capacity of Georgia’s estuaries for oxygen
demanding substances. The models will be developed for critical conditions in accordance with standard
practices and these critical conditions models will be run with the NPDES point sources at their full
permit loads. The GA ESTUARY models have been developed for those water bodies that currently have
permitted wastewater treatment plants that discharge into them.
Georgia Environmental Protection Division
QAPP for Water Quality Modeling and Ground Water and Surface Monitoring WPMP-QAPP 3 rev 1
June 2018
Page 24 of 132
For certain estuaries, LSPC watershed models are developed for the River Basin and EFDC, WASP or
Finite Volume Coastal Ocean Model (FVCOM) estuary models are used to evaluate the impacts of both
point sources and non-point sources, primarily from total oxygen demanding loadings.
Monitoring
The role of the monitoring program is to provide timely water quality data and periodic data analysis
reports to customers within the Georgia DNR and elsewhere, and to make these data and reports available
to other potential users (other federal, state and local governmental agencies, educational institutions,
consulting firms, and individuals). Data collected through this monitoring program are used for a variety
of purposes, but in broad terms, uses may be summarized as the determination of status and trends in
water quality Statewide within Georgia.
Specific objectives of the monitoring program are as follows:
1. Determine whether water quality at sampling sites exceeds water quality standards. This
objective is intended to address the 303(d) section of the CWA. Results are compared to
Georgia’s water quality standards.
2. Assess the status of water quality in Georgia. This objective is intended to address the 305(b)
section of the CWA.
3. Provide analytical water quality information that describes present conditions and changes
(trends). Long-term monitoring at fixed stations followed by periodic statistical analysis of
the data and interpretive reports of the results are one of the assessment and reporting
functions of the WPMP. These data are extremely valuable because they provide the most
efficient and sensitive means for the early detection of emerging water quality problems. The
data quality objectives are based primarily on the objective of early detection of deteriorating
water quality conditions within Georgia’s less impacted waters. These requirements are also
adequate for the detection of improving water quality conditions in degraded water bodies as
well as for meeting the other objectives stated here.
4. Provide timely and high-quality data for other users. Specific uses of data collected through
this program are as varied as the number of entities studying or managing water quality in
Georgia. Each use will have its own minimum data quality requirements, but our data quality
will be appropriate for most uses. Other uses of data include:
a. TMDL analyses – data are used to refine and verify TMDL models.
b. Developments of waste-load allocations – data are used to define maximum
discharge limits to waters of the state.
c. Supporting the wastewater discharge permitting system – data are used by permit
writers requiring water quality data to assess facility discharges.
d. Development of water quality standards – data are often the cornerstone for
technical analysis leading to revisions of the state’s water quality standards.
e. Cooperative projects with other governmental entities – data are used to support
various conservation/restoration projects.
To address the above objectives, GAEPD measures several conventional water quality constituents. Four
constituents can be readily compared to state standards: temperature, pH, dissolved oxygen, and bacteria
(fecal coliform, and Escherichia coli). GAEPD measures constituents susceptible to change due to
anthropogenic sources: conductivity, hardness, nutrients (total phosphorus, ortho-phosphate, total
nitrogen, nitrate-nitrite nitrogen, ammonia nitrogen, and TKN), total suspended solids, biochemical
oxygen demand, total organic carbon, and turbidity. In addition, GAEPD monitors lakes that have
Georgia Environmental Protection Division
QAPP for Water Quality Modeling and Ground Water and Surface Monitoring WPMP-QAPP 3 rev 1
June 2018
Page 25 of 132
numeric criteria for nutrients (Total P and Total N) and chlorophyll a. and monitors waterbodies for
metals to protect aquatic life and priority pollutants to protect human health.
Questions that can be posed by the objectives stated above are:
Are water quality standards violated at each monitoring station?
What is the quality of Georgia’s waters?
What are the current conditions and trends in water quality within Georgia?
Figure 1 is a map delineating the 14 major river basins in Georgia.
Coordination with other groups, such as USEPA, USGS, CWW, Regional Development Centers (RDCs),
consultants, volunteer monitoring associations, and others is typically done to enhance data collection and
minimize duplication of effort. For example, GAEPD may request and receive monitoring and/or
analytical assistance from USEPA for types of monitoring or analyses it is typically more suited for, such
as ambient toxicity testing, sediment, nutrient and/or periphyton. The GAEPD contracts for water quality
monitoring assistance with the USGS and CWW. Also, volunteer groups often target the same sampling
location and desired parameters. In these cases, the GAEPD may elect to rely on these efforts based on a
thorough review of the group’s Sampling Quality Assurance Plan, which is required for all outside
organizations intending to submit data for Georgia’s 305(b)/303(d) listing assessments. Also, GAEPD
will review their history of producing usable data and if they adhere to the QA/QC procedures detailed in
this QAPP.
Monitoring resources are prioritized as follows:
1. Statewide Monitoring: Each year, as many new stations as resources allow are
added to the annual station list to increase the percentage of assessed water-bodies.
Field measurements including DO, conductivity, pH, salinity, turbidity, and water
temperature are conducted at these sites. In addition, chemical samples are collected
monthly to determine potential pollutant sources and bacteriological samples are
collected 16 times to determine designated use support. Samples for heavy metals
are collected quarterly.
2. Long-Term Trend Station Monitoring: For water quality trend analyses,
established sites are monitored. Water samples for chemical analysis are collected
monthly at each of these stations and field measurements and bacteriological samples
are collected 16 times during the year.
3. NPDES Compliance Monitoring: GAEPD requires NPDES facilities to conduct
monitoring in accordance with their permits. These data are submitted to the State
for evaluation and determination of compliance with permit limitations. To ensure
that the self-monitoring program is effective, the State conducts facility inspections
and splits samples for comparison of laboratory results.
4. Fish Consumption Advisory: Fish tissue monitoring for fish advisories is planned
by a workgroup consisting of representatives from the WPMP and DNR’s Wildlife
Resources Division (WRD) and Coastal Resources Division (CRD). The workgroup
coordinates a monitoring strategy and selection of fish size and types for the annual
monitoring and assessment. The results are published annually in “Guidelines for
Eating Fish from Georgia Waters”.
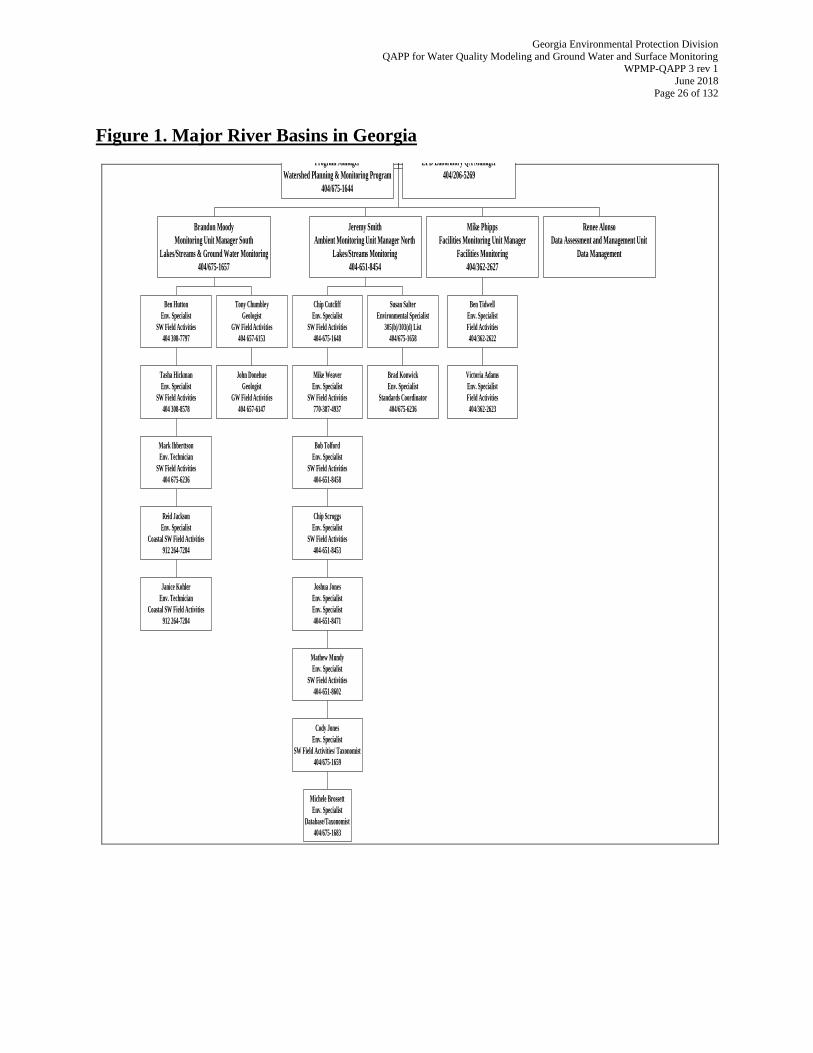
Georgia Environmental Protection Division
QAPP for Water Quality Modeling and Ground Water and Surface Monitoring WPMP-QAPP 3 rev 1
June 2018
Page 26 of 132
Figure 1. Major River Basins in Georgia
Organizational Chart for Water Quality Data Collection and Assessment
Elizabeth Booth
Program Manager
Watershed Planning & Monitoring Program
404/675-1644
Phillip Mitchell
EPD Laboratory QA Manager
404/206-5269
Janice Kohler
Env. Technician
Coastal SW Field Activities
912 264-7284
Reid Jackson
Env. Specialist
Coastal SW Field Activities
912 264-7284
Mark Ibberttson
Env. Technician
SW Field Activities
404 675-6236
Tasha Hickman
Env. Specialist
SW Field Activities
404 308-8578
Ben Hutton
Env. Specialist
SW Field Activities
404 308-7797
John Donehue
Geologist
GW Field Activities
404 657-6147
Tony Chumbley
Geologist
GW Field Activities
404 657-6153
Brandon Moody
Monitoring Unit Manager South
Lakes/Streams & Ground Water Monitoring
404/675-1657
Michele Brossett
Env. Specialist
Database/Taxonomist
404/675-1683
Cody Jones
Env. Specialist
SW Field Activities/ Taxonomist
404/675-1659
Mathew Mundy
Env. Specialist
SW Field Activities
404-651-8602
Joshua Jones
Env. Specialist
Env. Specialist
404-651-8471
Chip Scroggs
Env. Specialist
SW Field Activities
404-651-8453
Bob Tolford
Env. Specialist
SW Field Activities
404-651-8458
Mike Weaver
Env. Specialist
SW Field Activities
770-387-4937
Chip Cutcliff
Env. Specialist
SW Field Activities
404-675-1648
Brad Konwick
Env. Specialist
Standards Coordinator
404/675-6236
Susan Salter
Environmental Specialist
305(b)/303(d) List
404/675-1658
Jeremy Smith
Ambient Monitoring Unit Manager North
Lakes/Streams Monitoring
404-651-8454
Victoria Adams
Env. Specialist
Field Activities
404/362-2623
Ben Tidwell
Env. Specialist
Field Activities
404/362-2622
Mike Phipps
Facilities Monitoring Unit Manager
Facilities Monitoring
404/362-2627
Renee Alonso
Data Assessment and Management Unit
Data Management
Ga. Dept. of Natural Resources
Environmental Protection Division
Atlanta, GA.
Jud Turner, Director
Georgia Environmental Protection Division
QAPP for Water Quality Modeling and Ground Water and Surface Monitoring WPMP-QAPP 3 rev 1
June 2018
Page 27 of 132
5. Reservoir and Lakes Monitoring: Major lakes are those lakes within the State of Georgia
that are 500 acres or larger. They are divided into 2 categories: Standard lakes for which the
State has established specific water quality standards; and Basin lakes, which include all
public lakes in a specific basin group. Each year, standard lakes are sampled monthly, April
through October. Each year Basin group lakes are also sampled monthly, April through
October, as resources allow. Data collection includes depth profiles of the field
measurements and collection of water samples for laboratory analysis. An integrated photic
zone water sample is collected for laboratory analysis of selected water quality constituents
including nutrients and biochemical oxygen demand, and a sample is filtered on site for
chlorophyll a analysis. A surface grab sample is collected and analyzed for the presence of
fecal coliform bacteria and Escherichia coli.
6. Evaluation of Stream Mitigation: WPMP performs evaluations of stream mitigation
projects to document the success of the projects funded under USEPA 319(h) funding Grants.
7. Eco-region Benthic Monitoring: Following Georgia’s Benthic SOPs, macroinvertebrate
sites are sampled during the fall and winter index period (September-February). Periphyton
(benthic algae) in streams are sampled during the spring and summer index period (April-
October). Chemical samples, field parameters, and flow readings are taken along with the
benthic collections.
All stations are geo-referenced, with each station number assigned to a specific latitude and longitude.
Though there are a number of stations located on lakes and reservoirs, the majority of the monitoring
stations fall on rivers, streams, and estuarine waters. Most of the stations in the non-coastal regions are
located at bridge crossings or other public accesses and are accessible by land. Lakes, estuaries and other
large water-bodies are monitored by boat.
The monitoring programs focus primarily on chemical, physical, and bacterial pathogen characteristics of
the water column. The indicators are primarily selected from those parameters that currently have state
water-quality criteria and are cost-effective to analyze. Additional indicators may also be included that do
not have specific associated standards, but are useful in the interpretation of other measurements, used for
modeling, or in identifying long-term trends. A basic core suite of indicators is measured at all stations.
Additional indicators may be included depending on site-specific concerns such as use classification,
water-body types, discharge types, and historical or suspected issues. Additional field observations such
as weather conditions, water color, water clarity and water level are also recorded at all site visits.
The monitoring program has flexibility built into the sampling schedules to allow for inclement weather,
equipment availability, and balancing field staff responsibilities. The individual field staff, with the help
of the project team leader, determines their specific daily sampling schedule. However, sampling is
completed for each calendar month (i.e. sampling scheduled for January is completed by January 31st).
Each monitoring activity and the associated data are input into the GOMAS database. The data are used
in the production of the “Water Quality in Georgia” Report that summarizes all statewide water quality
findings and conclusions. Data collected are assessed and used to address the problems or water quality
related questions discussed earlier in this section.
Georgia Environmental Protection Division
QAPP for Water Quality Modeling and Ground Water and Surface Monitoring WPMP-QAPP 3 rev 1
June 2018
Page 28 of 132
A7. Quality Objectives and Criteria for Water Quality Modeling
Data quality objectives (DQOs) are qualitative and quantitative statements that clarify the intended use of
the data, define the type of data needed to support decision making, identify the conditions under which
the data should be collected, and specify tolerable limits on the probability of making a decision error due
to uncertainty in the data (if applicable). Data users develop DQOs to specify the data quality needed to
support specific decisions.
Data of known and documented quality are essential to the success of any water quality modeling study,
which in turn generates data for use in various evaluations and to make decisions. Model setup,
calibration, and validation for the projects under this QAPP will be accomplished using data available
from other studies. The QA process for this study consists of using appropriate data, data analysis
procedures, modeling methodology and technology, administrative procedures, and auditing. To a large
extent, the quality of a water quality modeling study to collect data to be used in the model is determined
by the expertise of the modeling and quality assessment teams. Project quality objectives and criteria for
measurement data will be addressed in the context of the two tasks discussed above: (1) evaluating the
quality of the data used, and (2) assessing the results of the model application.
Project Quality Objectives
The quality of an environmental monitoring program that develops data used in water quality models can
be evaluated in three steps: (1) establishing scientific assessment quality objectives, (2) evaluating
program design for whether the objectives can be met, and (3) establishing assessment and measurement
quality objectives that can be used to evaluate the appropriateness of the methods being used in the
program. The quality of a particular data set is some measure of the types and amount of error
associated with the data.
Sources of error or uncertainty in statistical inference are commonly grouped into two categories:
Sampling error: The difference between sample values and in situ “true” values form
unknown biases due to sampling design. Sampling error includes natural variability
(spatial heterogeneity and temporal variability in population abundance and distribution)
not specifically accounted for in a design (for design-based inference), as well as
variability associated with model parameters or incorrect model specification (for model-
based inference).
Measurement error: The difference between sample values and in situ “true” values
associated with the measurement process. Measurement error includes bias and
imprecision associated with sampling methodology; specification of the sampling unit;
sample handling, storage, preservation, and identification; and instrumentation.
Through the establishment and implementation of a TMDL, pollutant loadings from all sources are
estimated; links are established between pollutants, sources, and impacts on water quality; maximum
pollutant loads are allocated to each source; and appropriate control mechanisms are established or
modified so that water quality standards can be achieved (USEPA, 1999).
Sections A7.1 through A7.7 below describe DQOs and criteria for model inputs and outputs, written in
accordance with the seven steps described in U.S. EPA’s Guidance for the Data Quality Objectives
Process (EPA QA/G-4) (USEPA, 2000).
Georgia Environmental Protection Division
QAPP for Water Quality Modeling and Ground Water and Surface Monitoring WPMP-QAPP 3 rev 1
June 2018
Page 29 of 132
A7.1 State the Problem
The protection and restoration of Georgia’s waters is the goal of GAEPD activities. In order to
accomplish these goals, computer models are used as tools to determine available assimilative capacity
for a variety of pollutants. Modeled pollutants include oxygen demanding substances, sediment, and
excessive nutrients. Excessive nutrient levels may add to poor water quality in Georgia’s lakes and
estuaries. High nutrient levels in most small streams may prohibit normal aquatic life. Elevated levels of
these nutrients may be indicators of runoff and effluent waste streams from irrigation and animal
production and management operations. Because nitrogen is a limiting nutrient to algal production in
estuarine systems, limiting the nitrogen loads to receiving streams may be important to alleviating
eutrophication in downstream waters.
A7.2 Identify the Study Question
The objective of modeling projects can be to determine the allowable loads of pollutants concentrations
so that water quality standards are attained. Attainment of aquatic life uses is measured by comparing
criteria in the WQS for various pollutants to measurements taken from the water column to determine
attainment for specific pollutants. Furthermore, if assessments of the stream biota indicate impairment as
a result of WQS exceedances, the stream is considered in “non-attainment” of its designated use.
The models should be suitably flexible to allow adjustment to parameters relative to both quantity and
quality of existing resources, as well as the dynamic environmental and anthropogenic influences to flow
and water volumes and the overall water quality and character of the state’s waters to ensure attainment of
current and future designated uses. Furthermore, if, through assessment of these waters, a waterbody is
considered impaired, GAEPD will use the water quality monitoring data and models to develop TMDLs
to facilitate its recovery and to return the waterbody to attainment.
The load allocations will be used to develop nonpoint source reduction plans based on meeting relevant
sediment loads. In general, ambient sediment loads have incorporated a margin of safety such that
concentrations at or just less than these loads indicates a potential for unacceptable risks to aquatic life;
exceedances are anticipated to produce impairment. If the calculated nonpoint source limit for the
sediment load is exceeded, then the pollutant will continue to present a hazard.
Nutrients are a primary cause of impairment. For impairments associated with nutrients, intermediate
targets are identified to complement the biocriteria. Load reductions are estimated by comparing instream
summer concentrations to desired targets. The assumption underlying the assimilative capacity analysis is
that meeting the desired nutrient targets will result in meeting the biocriteria.
A7.3 Identify Information Needs
Flow measurements from gages, water quality monitoring data, watershed assessment data, NPDES
monitoring data, water withdrawal data, heat load data, meteorological data, land use and land cover data,
soils data, digital elevation model data, and any other recent relevant studies should be incorporated into
whatever model is chosen to determine load allocations. Supporting documentation related to GIS is
available to GAEPD at the Georgia GIS Clearinghouse website found at https://data.georgiaspatial.org.
A7.4 Specify the Characteristics that Define the Population of Interest
Water quality monitoring and modeling projects must support the goal of quantifying the amount of
sediment, nutrients, and oxygen demanding material that Georgia’s waters can assimilate while improving
Georgia Environmental Protection Division
QAPP for Water Quality Modeling and Ground Water and Surface Monitoring WPMP-QAPP 3 rev 1
June 2018
Page 30 of 132
biological target scores. In most cases, the statistical criteria for the designations/allocations are detailed
with the error discussion in Section A7.6.
Data sources will be compiled from available federal (e.g., EPA, USGS, NOAA) state (GAEPD) sources;
from municipal and industrial dischargers; watershed assessment investigations; and those collected by
researchers and published in peer-reviewed literature. Where no available data sources can be identified,
GAEPD will define methods most practical and applicable to address those needs on the basis of
estimates of potential error or imprecision associated with the alternative approach options.
A7.5 Develop the Strategy for Information Synthesis
GAEPD and/or their contractor will use a systematic planning process to develop LSPC, EFDC, WASP,
GA DOSAG, EPD RIV-1, GA ESTUARY, WCS, and other models for the assimilative capacity
analyses. This process takes into account the following elements:
The accuracy and precision needed for the models to predict a given quantity at the
application site of interest in order to satisfy regulatory objectives.
The appropriate criteria for making a determination of whether the models are
accurate and precise enough based on past general experience combined with site-
specific knowledge and completeness of the conceptual models.
How the appropriate criteria would be used to determine whether model outputs
achieve the needed quality.
Acceptance criteria that result from systematic planning address the following types of components for
modeling projects. Criteria used in selecting the appropriate model will be documented in the modeling
reports and typically include the following:
Technical criteria (concerning the requirements for the model’s simulation of the
physical system).
Regulatory criteria (concerning constraints imposed by regulations, such as water
quality standards).
User criteria (concerning operational or economic constraints imposed, such as
hardware/software compatibility).
The available models will be compared to enable the Project Manager to select the most appropriate
models for a particular study. Typically, a GAEPD-approved model exists that is appropriate for use in
the development project. In addition, existing model programming language may be converted into a
different programming language to enhance software compatibility. The models which may be used are
listed below:
Loading Simulation Program C++ (LSPC)
Environmental Fluid Dynamics Code (EFDC)
Water Quality Analysis and Simulation Program (WASP)
Finite Volume Coastal Ocean Model (FVCOM)
GA DOSAG
EPD RIV-1
GA ESTUARY
Watershed Characterization System (WCS)
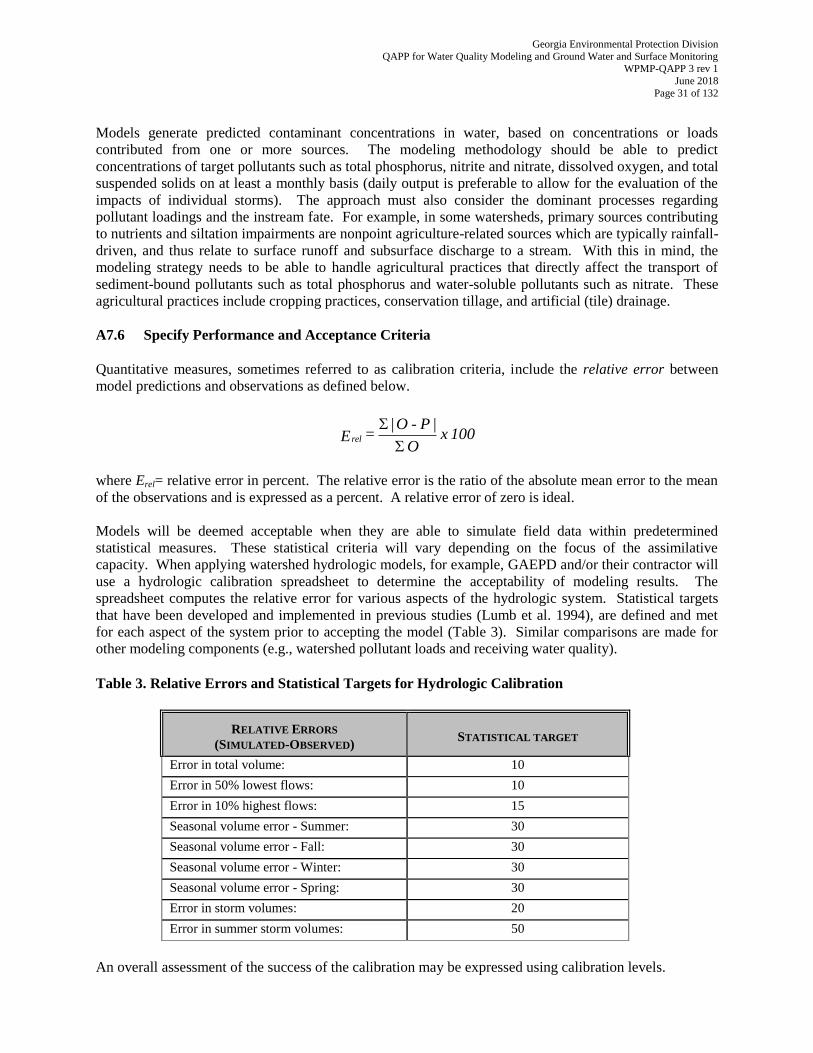
Georgia Environmental Protection Division
QAPP for Water Quality Modeling and Ground Water and Surface Monitoring WPMP-QAPP 3 rev 1
June 2018
Page 31 of 132
Models generate predicted contaminant concentrations in water, based on concentrations or loads
contributed from one or more sources. The modeling methodology should be able to predict
concentrations of target pollutants such as total phosphorus, nitrite and nitrate, dissolved oxygen, and total
suspended solids on at least a monthly basis (daily output is preferable to allow for the evaluation of the
impacts of individual storms). The approach must also consider the dominant processes regarding
pollutant loadings and the instream fate. For example, in some watersheds, primary sources contributing
to nutrients and siltation impairments are nonpoint agriculture-related sources which are typically rainfall-
driven, and thus relate to surface runoff and subsurface discharge to a stream. With this in mind, the
modeling strategy needs to be able to handle agricultural practices that directly affect the transport of
sediment-bound pollutants such as total phosphorus and water-soluble pollutants such as nitrate. These
agricultural practices include cropping practices, conservation tillage, and artificial (tile) drainage.
A7.6 Specify Performance and Acceptance Criteria
Quantitative measures, sometimes referred to as calibration criteria, include the relative error between
model predictions and observations as defined below.
where Erel= relative error in percent. The relative error is the ratio of the absolute mean error to the mean
of the observations and is expressed as a percent. A relative error of zero is ideal.
Models will be deemed acceptable when they are able to simulate field data within predetermined
statistical measures. These statistical criteria will vary depending on the focus of the assimilative
capacity. When applying watershed hydrologic models, for example, GAEPD and/or their contractor will
use a hydrologic calibration spreadsheet to determine the acceptability of modeling results. The
spreadsheet computes the relative error for various aspects of the hydrologic system. Statistical targets
that have been developed and implemented in previous studies (Lumb et al. 1994), are defined and met
for each aspect of the system prior to accepting the model (Table 3). Similar comparisons are made for
other modeling components (e.g., watershed pollutant loads and receiving water quality).
Table 3. Relative Errors and Statistical Targets for Hydrologic Calibration
RELATIVE ERRORS
(SIMULATED-OBSERVED)
STATISTICAL TARGET
Error in total volume: 10
Error in 50% lowest flows: 10
Error in 10% highest flows: 15
Seasonal volume error - Summer: 30
Seasonal volume error - Fall: 30
Seasonal volume error - Winter: 30
Seasonal volume error - Spring: 30
Error in storm volumes: 20
Error in summer storm volumes: 50
An overall assessment of the success of the calibration may be expressed using calibration levels.
100 x O
|P -O | = Erel
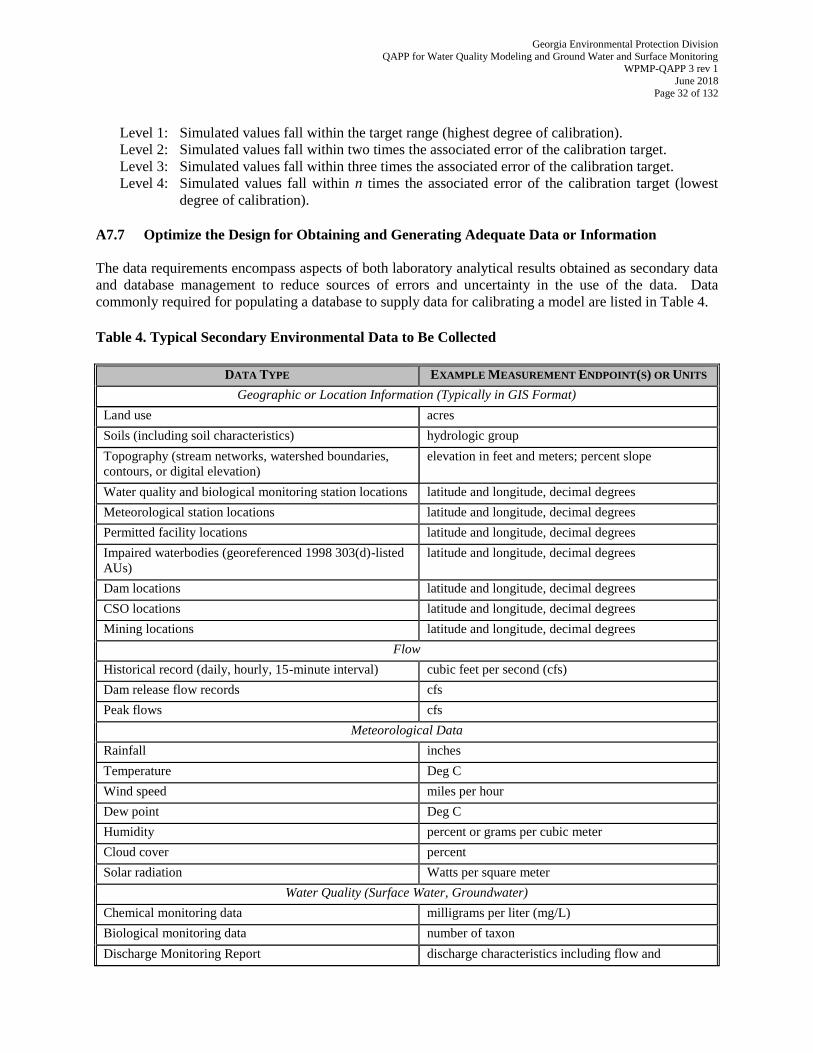
Georgia Environmental Protection Division
QAPP for Water Quality Modeling and Ground Water and Surface Monitoring WPMP-QAPP 3 rev 1
June 2018
Page 32 of 132
Level 1: Simulated values fall within the target range (highest degree of calibration).
Level 2: Simulated values fall within two times the associated error of the calibration target.
Level 3: Simulated values fall within three times the associated error of the calibration target.
Level 4: Simulated values fall within n times the associated error of the calibration target (lowest
degree of calibration).
A7.7 Optimize the Design for Obtaining and Generating Adequate Data or Information
The data requirements encompass aspects of both laboratory analytical results obtained as secondary data
and database management to reduce sources of errors and uncertainty in the use of the data. Data
commonly required for populating a database to supply data for calibrating a model are listed in Table 4.
Table 4. Typical Secondary Environmental Data to Be Collected
DATA TYPE EXAMPLE MEASUREMENT ENDPOINT(S) OR UNITS
Geographic or Location Information (Typically in GIS Format)
Land use acres
Soils (including soil characteristics) hydrologic group
Topography (stream networks, watershed boundaries,
contours, or digital elevation)
elevation in feet and meters; percent slope
Water quality and biological monitoring station locations latitude and longitude, decimal degrees
Meteorological station locations latitude and longitude, decimal degrees
Permitted facility locations latitude and longitude, decimal degrees
Impaired waterbodies (georeferenced 1998 303(d)-listed
AUs)
latitude and longitude, decimal degrees
Dam locations latitude and longitude, decimal degrees
CSO locations latitude and longitude, decimal degrees
Mining locations latitude and longitude, decimal degrees
Flow
Historical record (daily, hourly, 15-minute interval) cubic feet per second (cfs)
Dam release flow records cfs
Peak flows cfs
Meteorological Data
Rainfall inches
Temperature Deg C
Wind speed miles per hour
Dew point Deg C
Humidity percent or grams per cubic meter
Cloud cover percent
Solar radiation Watts per square meter
Water Quality (Surface Water, Groundwater)
Chemical monitoring data milligrams per liter (mg/L)
Biological monitoring data number of taxon
Discharge Monitoring Report discharge characteristics including flow and
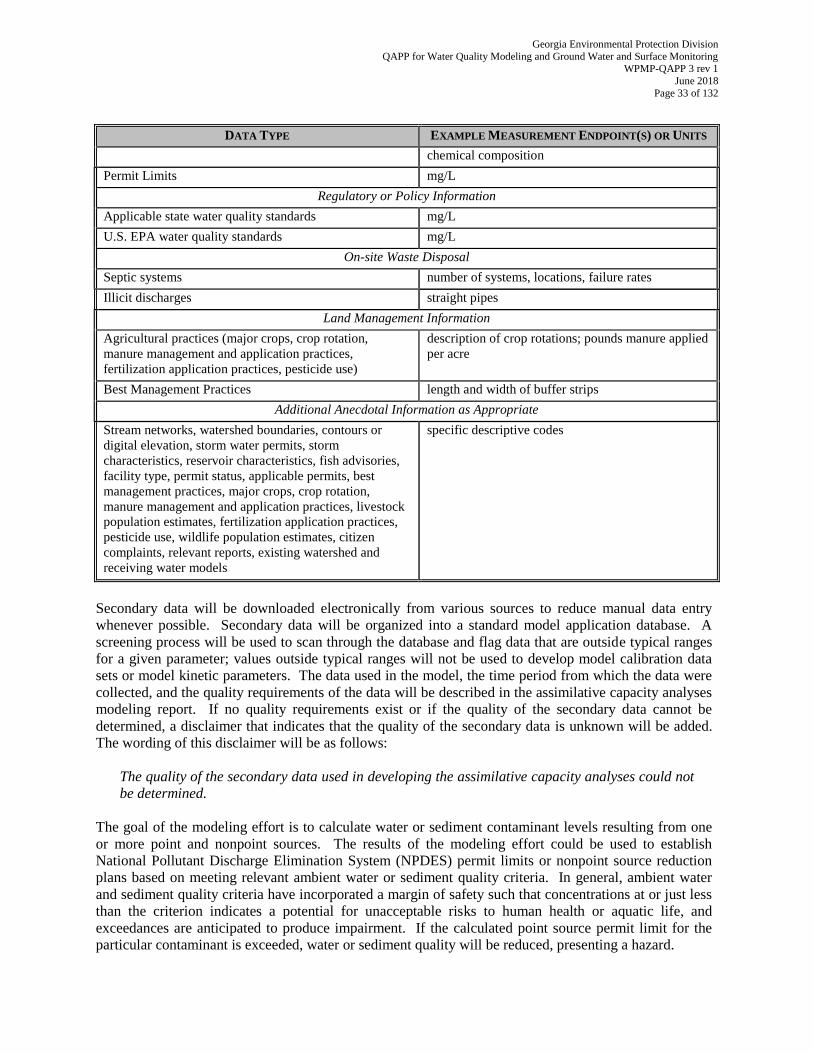
Georgia Environmental Protection Division
QAPP for Water Quality Modeling and Ground Water and Surface Monitoring WPMP-QAPP 3 rev 1
June 2018
Page 33 of 132
DATA TYPE EXAMPLE MEASUREMENT ENDPOINT(S) OR UNITS
chemical composition
Permit Limits mg/L
Regulatory or Policy Information
Applicable state water quality standards mg/L
U.S. EPA water quality standards mg/L
On-site Waste Disposal
Septic systems number of systems, locations, failure rates
Illicit discharges straight pipes
Land Management Information
Agricultural practices (major crops, crop rotation,
manure management and application practices,
fertilization application practices, pesticide use)
description of crop rotations; pounds manure applied
per acre
Best Management Practices length and width of buffer strips
Additional Anecdotal Information as Appropriate
Stream networks, watershed boundaries, contours or
digital elevation, storm water permits, storm
characteristics, reservoir characteristics, fish advisories,
facility type, permit status, applicable permits, best
management practices, major crops, crop rotation,
manure management and application practices, livestock
population estimates, fertilization application practices,
pesticide use, wildlife population estimates, citizen
complaints, relevant reports, existing watershed and
receiving water models
specific descriptive codes
Secondary data will be downloaded electronically from various sources to reduce manual data entry
whenever possible. Secondary data will be organized into a standard model application database. A
screening process will be used to scan through the database and flag data that are outside typical ranges
for a given parameter; values outside typical ranges will not be used to develop model calibration data
sets or model kinetic parameters. The data used in the model, the time period from which the data were
collected, and the quality requirements of the data will be described in the assimilative capacity analyses
modeling report. If no quality requirements exist or if the quality of the secondary data cannot be
determined, a disclaimer that indicates that the quality of the secondary data is unknown will be added.
The wording of this disclaimer will be as follows:
The quality of the secondary data used in developing the assimilative capacity analyses could not
be determined.
The goal of the modeling effort is to calculate water or sediment contaminant levels resulting from one
or more point and nonpoint sources. The results of the modeling effort could be used to establish
National Pollutant Discharge Elimination System (NPDES) permit limits or nonpoint source reduction
plans based on meeting relevant ambient water or sediment quality criteria. In general, ambient water
and sediment quality criteria have incorporated a margin of safety such that concentrations at or just less
than the criterion indicates a potential for unacceptable risks to human health or aquatic life, and
exceedances are anticipated to produce impairment. If the calculated point source permit limit for the
particular contaminant is exceeded, water or sediment quality will be reduced, presenting a hazard.
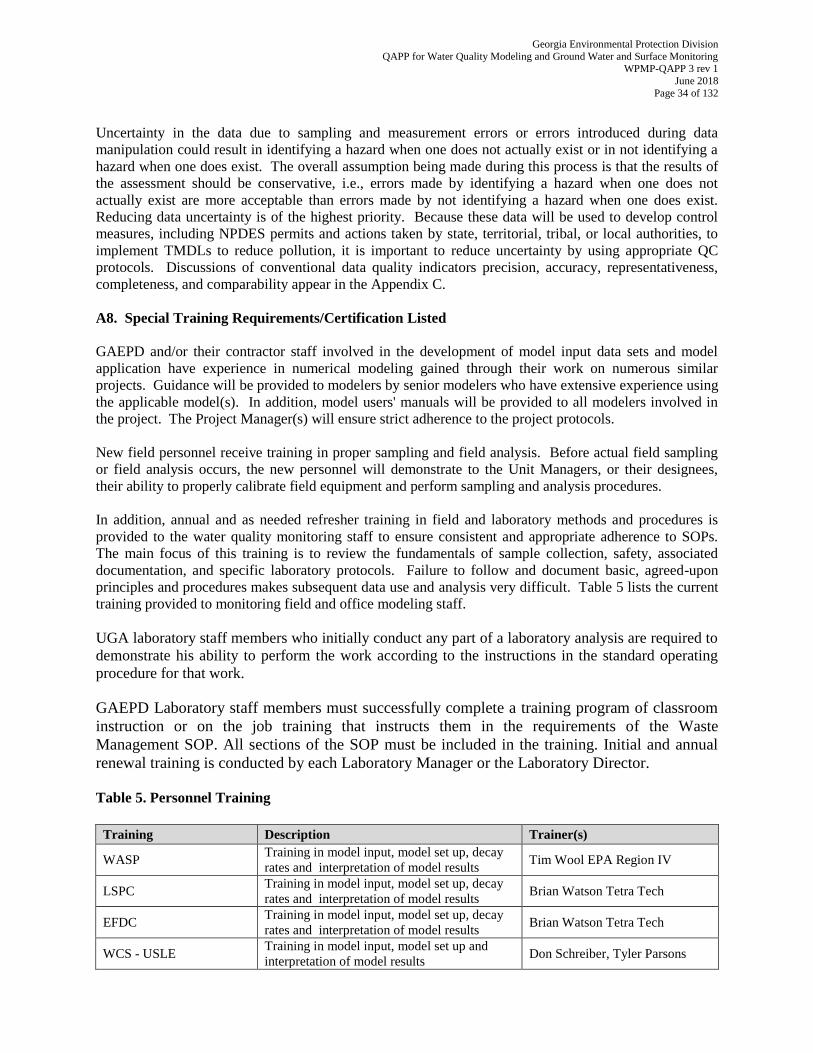
Georgia Environmental Protection Division
QAPP for Water Quality Modeling and Ground Water and Surface Monitoring WPMP-QAPP 3 rev 1
June 2018
Page 34 of 132
Uncertainty in the data due to sampling and measurement errors or errors introduced during data
manipulation could result in identifying a hazard when one does not actually exist or in not identifying a
hazard when one does exist. The overall assumption being made during this process is that the results of
the assessment should be conservative, i.e., errors made by identifying a hazard when one does not
actually exist are more acceptable than errors made by not identifying a hazard when one does exist.
Reducing data uncertainty is of the highest priority. Because these data will be used to develop control
measures, including NPDES permits and actions taken by state, territorial, tribal, or local authorities, to
implement TMDLs to reduce pollution, it is important to reduce uncertainty by using appropriate QC
protocols. Discussions of conventional data quality indicators precision, accuracy, representativeness,
completeness, and comparability appear in the Appendix C.
A8. Special Training Requirements/Certification Listed
GAEPD and/or their contractor staff involved in the development of model input data sets and model
application have experience in numerical modeling gained through their work on numerous similar
projects. Guidance will be provided to modelers by senior modelers who have extensive experience using
the applicable model(s). In addition, model users' manuals will be provided to all modelers involved in
the project. The Project Manager(s) will ensure strict adherence to the project protocols.
New field personnel receive training in proper sampling and field analysis. Before actual field sampling
or field analysis occurs, the new personnel will demonstrate to the Unit Managers, or their designees,
their ability to properly calibrate field equipment and perform sampling and analysis procedures.
In addition, annual and as needed refresher training in field and laboratory methods and procedures is
provided to the water quality monitoring staff to ensure consistent and appropriate adherence to SOPs.
The main focus of this training is to review the fundamentals of sample collection, safety, associated
documentation, and specific laboratory protocols. Failure to follow and document basic, agreed-upon
principles and procedures makes subsequent data use and analysis very difficult. Table 5 lists the current
training provided to monitoring field and office modeling staff.
UGA laboratory staff members who initially conduct any part of a laboratory analysis are required to
demonstrate his ability to perform the work according to the instructions in the standard operating
procedure for that work.
GAEPD Laboratory staff members must successfully complete a training program of classroom
instruction or on the job training that instructs them in the requirements of the Waste
Management SOP. All sections of the SOP must be included in the training. Initial and annual
renewal training is conducted by each Laboratory Manager or the Laboratory Director.
Table 5. Personnel Training
Training Description Trainer(s)
WASP Training in model input, model set up, decay
rates and interpretation of model results Tim Wool EPA Region IV
LSPC Training in model input, model set up, decay
rates and interpretation of model results Brian Watson Tetra Tech
EFDC Training in model input, model set up, decay
rates and interpretation of model results Brian Watson Tetra Tech
WCS - USLE Training in model input, model set up and
interpretation of model results Don Schreiber, Tyler Parsons
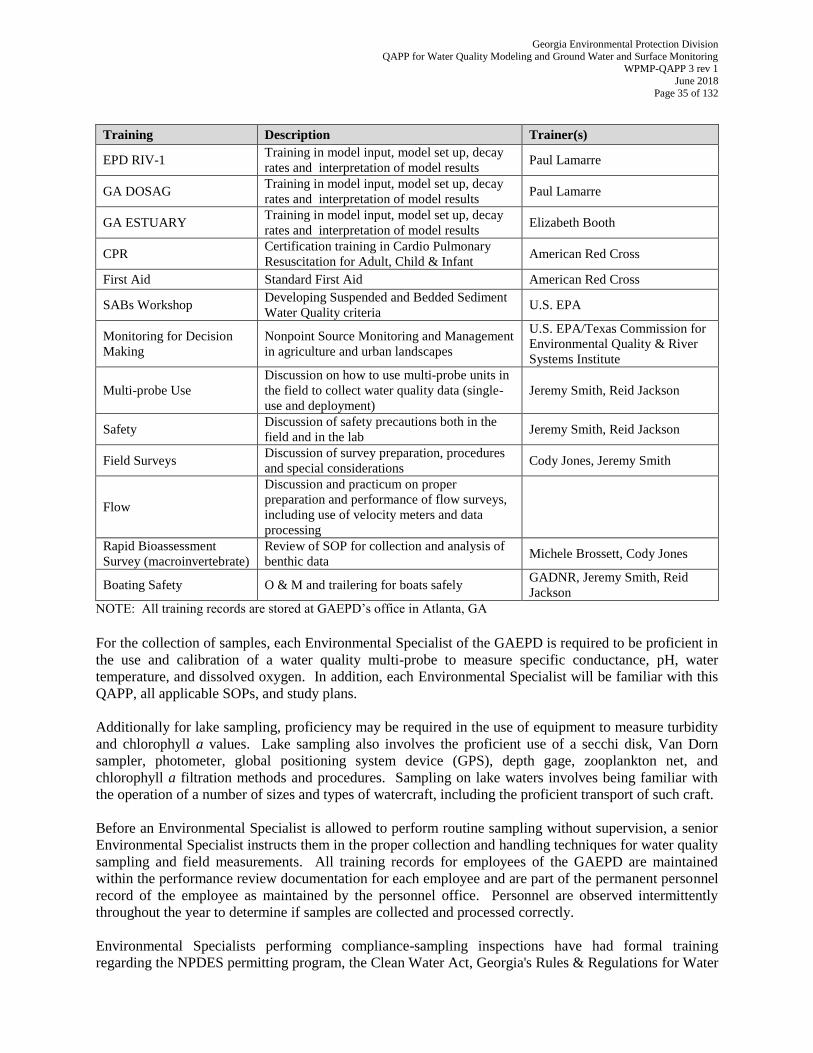
Georgia Environmental Protection Division
QAPP for Water Quality Modeling and Ground Water and Surface Monitoring WPMP-QAPP 3 rev 1
June 2018
Page 35 of 132
Training Description Trainer(s)
EPD RIV-1 Training in model input, model set up, decay
rates and interpretation of model results Paul Lamarre
GA DOSAG Training in model input, model set up, decay
rates and interpretation of model results Paul Lamarre
GA ESTUARY Training in model input, model set up, decay
rates and interpretation of model results Elizabeth Booth
CPR Certification training in Cardio Pulmonary
Resuscitation for Adult, Child & Infant American Red Cross
First Aid Standard First Aid American Red Cross
SABs Workshop Developing Suspended and Bedded Sediment
Water Quality criteria U.S. EPA
Monitoring for Decision
Making
Nonpoint Source Monitoring and Management
in agriculture and urban landscapes
U.S. EPA/Texas Commission for
Environmental Quality & River
Systems Institute
Multi-probe Use
Discussion on how to use multi-probe units in
the field to collect water quality data (single-
use and deployment)
Jeremy Smith, Reid Jackson
Safety Discussion of safety precautions both in the
field and in the lab Jeremy Smith, Reid Jackson
Field Surveys Discussion of survey preparation, procedures
and special considerations Cody Jones, Jeremy Smith
Flow
Discussion and practicum on proper
preparation and performance of flow surveys,
including use of velocity meters and data
processing
Rapid Bioassessment
Survey (macroinvertebrate)
Review of SOP for collection and analysis of
benthic data Michele Brossett, Cody Jones
Boating Safety O & M and trailering for boats safely GADNR, Jeremy Smith, Reid
Jackson
NOTE: All training records are stored at GAEPD’s office in Atlanta, GA
For the collection of samples, each Environmental Specialist of the GAEPD is required to be proficient in
the use and calibration of a water quality multi-probe to measure specific conductance, pH, water
temperature, and dissolved oxygen. In addition, each Environmental Specialist will be familiar with this
QAPP, all applicable SOPs, and study plans.
Additionally for lake sampling, proficiency may be required in the use of equipment to measure turbidity
and chlorophyll a values. Lake sampling also involves the proficient use of a secchi disk, Van Dorn
sampler, photometer, global positioning system device (GPS), depth gage, zooplankton net, and
chlorophyll a filtration methods and procedures. Sampling on lake waters involves being familiar with
the operation of a number of sizes and types of watercraft, including the proficient transport of such craft.
Before an Environmental Specialist is allowed to perform routine sampling without supervision, a senior
Environmental Specialist instructs them in the proper collection and handling techniques for water quality
sampling and field measurements. All training records for employees of the GAEPD are maintained
within the performance review documentation for each employee and are part of the permanent personnel
record of the employee as maintained by the personnel office. Personnel are observed intermittently
throughout the year to determine if samples are collected and processed correctly.
Environmental Specialists performing compliance-sampling inspections have had formal training
regarding the NPDES permitting program, the Clean Water Act, Georgia's Rules & Regulations for Water
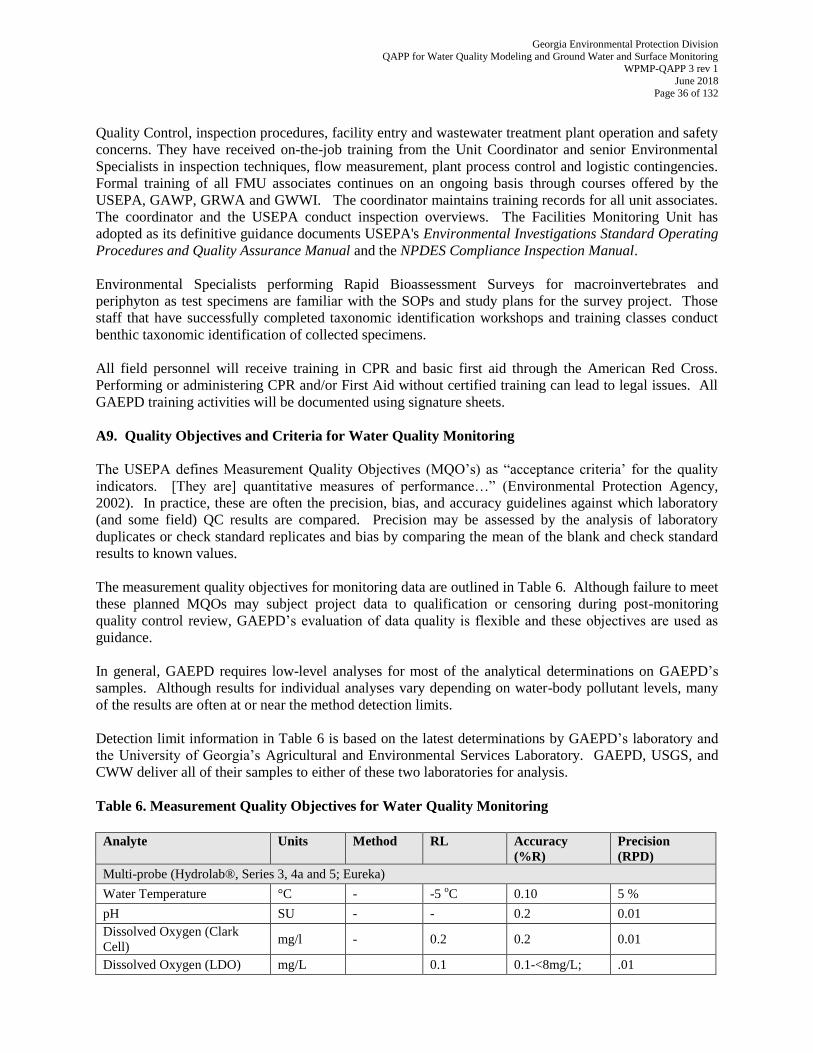
Georgia Environmental Protection Division
QAPP for Water Quality Modeling and Ground Water and Surface Monitoring WPMP-QAPP 3 rev 1
June 2018
Page 36 of 132
Quality Control, inspection procedures, facility entry and wastewater treatment plant operation and safety
concerns. They have received on-the-job training from the Unit Coordinator and senior Environmental
Specialists in inspection techniques, flow measurement, plant process control and logistic contingencies.
Formal training of all FMU associates continues on an ongoing basis through courses offered by the
USEPA, GAWP, GRWA and GWWI. The coordinator maintains training records for all unit associates.
The coordinator and the USEPA conduct inspection overviews. The Facilities Monitoring Unit has
adopted as its definitive guidance documents USEPA's Environmental Investigations Standard Operating
Procedures and Quality Assurance Manual and the NPDES Compliance Inspection Manual.
Environmental Specialists performing Rapid Bioassessment Surveys for macroinvertebrates and
periphyton as test specimens are familiar with the SOPs and study plans for the survey project. Those
staff that have successfully completed taxonomic identification workshops and training classes conduct
benthic taxonomic identification of collected specimens.
All field personnel will receive training in CPR and basic first aid through the American Red Cross.
Performing or administering CPR and/or First Aid without certified training can lead to legal issues. All
GAEPD training activities will be documented using signature sheets.
A9. Quality Objectives and Criteria for Water Quality Monitoring
The USEPA defines Measurement Quality Objectives (MQO’s) as “acceptance criteria’ for the quality
indicators. [They are] quantitative measures of performance…” (Environmental Protection Agency,
2002). In practice, these are often the precision, bias, and accuracy guidelines against which laboratory
(and some field) QC results are compared. Precision may be assessed by the analysis of laboratory
duplicates or check standard replicates and bias by comparing the mean of the blank and check standard
results to known values.
The measurement quality objectives for monitoring data are outlined in Table 6. Although failure to meet
these planned MQOs may subject project data to qualification or censoring during post-monitoring
quality control review, GAEPD’s evaluation of data quality is flexible and these objectives are used as
guidance.
In general, GAEPD requires low-level analyses for most of the analytical determinations on GAEPD’s
samples. Although results for individual analyses vary depending on water-body pollutant levels, many
of the results are often at or near the method detection limits.
Detection limit information in Table 6 is based on the latest determinations by GAEPD’s laboratory and
the University of Georgia’s Agricultural and Environmental Services Laboratory. GAEPD, USGS, and
CWW deliver all of their samples to either of these two laboratories for analysis.
Table 6. Measurement Quality Objectives for Water Quality Monitoring
Analyte Units Method RL Accuracy
(%R)
Precision
(RPD)
Multi-probe (Hydrolab®, Series 3, 4a and 5; Eureka)
Water Temperature °C - -5 oC 0.10 5 %
pH SU - - 0.2 0.01
Dissolved Oxygen (Clark
Cell) mg/l - 0.2 0.2 0.01
Dissolved Oxygen (LDO) mg/L 0.1 0.1-<8mg/L; .01
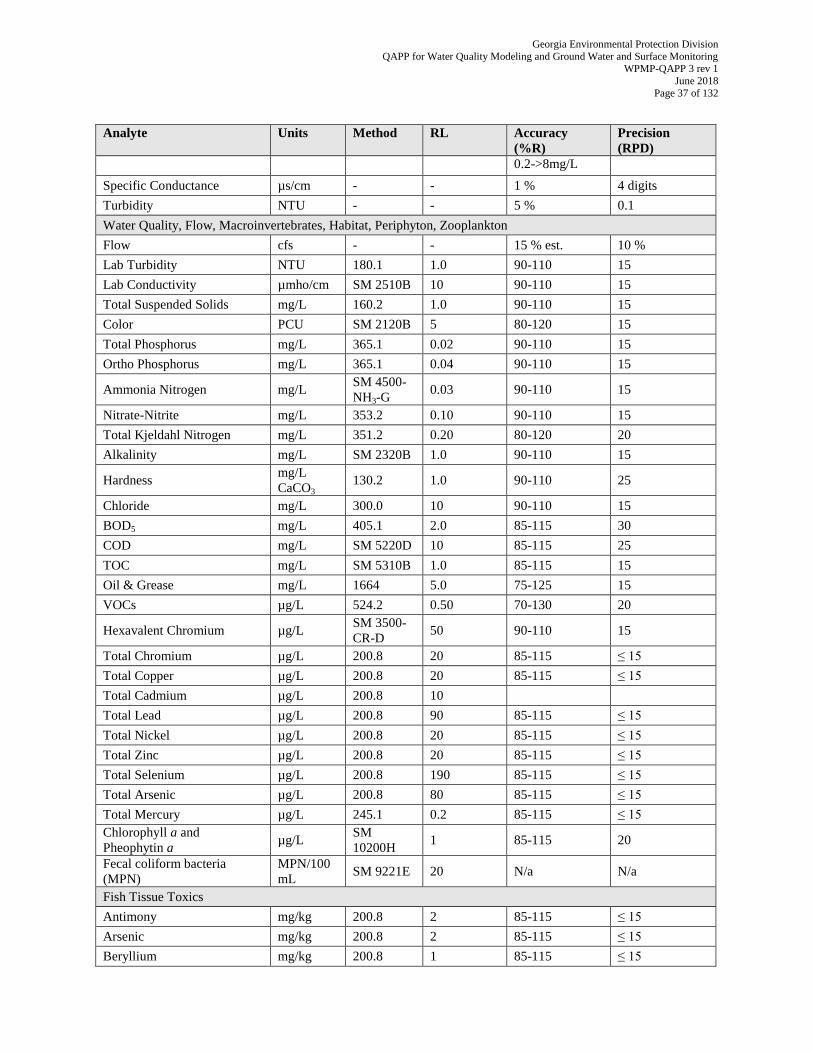
Georgia Environmental Protection Division
QAPP for Water Quality Modeling and Ground Water and Surface Monitoring WPMP-QAPP 3 rev 1
June 2018
Page 37 of 132
Analyte Units Method RL Accuracy
(%R)
Precision
(RPD)
0.2->8mg/L
Specific Conductance µs/cm - - 1 % 4 digits
Turbidity NTU - - 5 % 0.1
Water Quality, Flow, Macroinvertebrates, Habitat, Periphyton, Zooplankton
Flow cfs - - 15 % est. 10 %
Lab Turbidity NTU 180.1 1.0 90-110 15
Lab Conductivity µmho/cm SM 2510B 10 90-110 15
Total Suspended Solids mg/L 160.2 1.0 90-110 15
Color PCU SM 2120B 5 80-120 15
Total Phosphorus mg/L 365.1 0.02 90-110 15
Ortho Phosphorus mg/L 365.1 0.04 90-110 15
Ammonia Nitrogen mg/L SM 4500-
NH3-G 0.03 90-110 15
Nitrate-Nitrite mg/L 353.2 0.10 90-110 15
Total Kjeldahl Nitrogen mg/L 351.2 0.20 80-120 20
Alkalinity mg/L SM 2320B 1.0 90-110 15
Hardness mg/L
CaCO3 130.2 1.0 90-110 25
Chloride mg/L 300.0 10 90-110 15
BOD5 mg/L 405.1 2.0 85-115 30
COD mg/L SM 5220D 10 85-115 25
TOC mg/L SM 5310B 1.0 85-115 15
Oil & Grease mg/L 1664 5.0 75-125 15
VOCs µg/L 524.2 0.50 70-130 20
Hexavalent Chromium µg/L SM 3500-
CR-D 50 90-110 15
Total Chromium µg/L 200.8 20 85-115 ≤ 15
Total Copper µg/L 200.8 20 85-115 ≤ 15
Total Cadmium µg/L 200.8 10
Total Lead µg/L 200.8 90 85-115 ≤ 15
Total Nickel µg/L 200.8 20 85-115 ≤ 15
Total Zinc µg/L 200.8 20 85-115 ≤ 15
Total Selenium µg/L 200.8 190 85-115 ≤ 15
Total Arsenic µg/L 200.8 80 85-115 ≤ 15
Total Mercury µg/L 245.1 0.2 85-115 ≤ 15
Chlorophyll a and
Pheophytin a µg/L
SM
10200H 1 85-115 20
Fecal coliform bacteria
(MPN)
MPN/100
mL SM 9221E 20 N/a N/a
Fish Tissue Toxics
Antimony mg/kg 200.8 2 85-115 ≤ 15
Arsenic mg/kg 200.8 2 85-115 ≤ 15
Beryllium mg/kg 200.8 1 85-115 ≤ 15
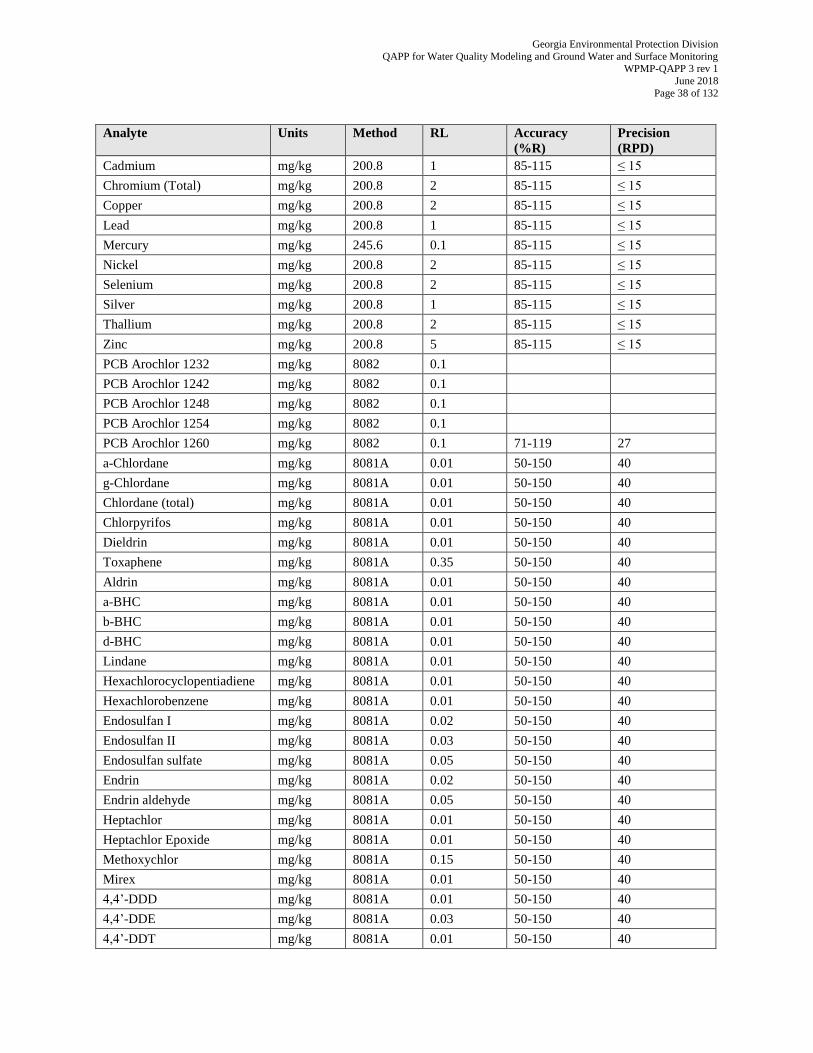
Georgia Environmental Protection Division
QAPP for Water Quality Modeling and Ground Water and Surface Monitoring WPMP-QAPP 3 rev 1
June 2018
Page 38 of 132
Analyte Units Method RL Accuracy
(%R)
Precision
(RPD)
Cadmium mg/kg 200.8 1 85-115 ≤ 15
Chromium (Total) mg/kg 200.8 2 85-115 ≤ 15
Copper mg/kg 200.8 2 85-115 ≤ 15
Lead mg/kg 200.8 1 85-115 ≤ 15
Mercury mg/kg 245.6 0.1 85-115 ≤ 15
Nickel mg/kg 200.8 2 85-115 ≤ 15
Selenium mg/kg 200.8 2 85-115 ≤ 15
Silver mg/kg 200.8 1 85-115 ≤ 15
Thallium mg/kg 200.8 2 85-115 ≤ 15
Zinc mg/kg 200.8 5 85-115 ≤ 15
PCB Arochlor 1232 mg/kg 8082 0.1
PCB Arochlor 1242 mg/kg 8082 0.1
PCB Arochlor 1248 mg/kg 8082 0.1
PCB Arochlor 1254 mg/kg 8082 0.1
PCB Arochlor 1260 mg/kg 8082 0.1 71-119 27
a-Chlordane mg/kg 8081A 0.01 50-150 40
g-Chlordane mg/kg 8081A 0.01 50-150 40
Chlordane (total) mg/kg 8081A 0.01 50-150 40
Chlorpyrifos mg/kg 8081A 0.01 50-150 40
Dieldrin mg/kg 8081A 0.01 50-150 40
Toxaphene mg/kg 8081A 0.35 50-150 40
Aldrin mg/kg 8081A 0.01 50-150 40
a-BHC mg/kg 8081A 0.01 50-150 40
b-BHC mg/kg 8081A 0.01 50-150 40
d-BHC mg/kg 8081A 0.01 50-150 40
Lindane mg/kg 8081A 0.01 50-150 40
Hexachlorocyclopentiadiene mg/kg 8081A 0.01 50-150 40
Hexachlorobenzene mg/kg 8081A 0.01 50-150 40
Endosulfan I mg/kg 8081A 0.02 50-150 40
Endosulfan II mg/kg 8081A 0.03 50-150 40
Endosulfan sulfate mg/kg 8081A 0.05 50-150 40
Endrin mg/kg 8081A 0.02 50-150 40
Endrin aldehyde mg/kg 8081A 0.05 50-150 40
Heptachlor mg/kg 8081A 0.01 50-150 40
Heptachlor Epoxide mg/kg 8081A 0.01 50-150 40
Methoxychlor mg/kg 8081A 0.15 50-150 40
Mirex mg/kg 8081A 0.01 50-150 40
4,4’-DDD mg/kg 8081A 0.01 50-150 40
4,4’-DDE mg/kg 8081A 0.03 50-150 40
4,4’-DDT mg/kg 8081A 0.01 50-150 40
Georgia Environmental Protection Division
QAPP for Water Quality Modeling and Ground Water and Surface Monitoring WPMP-QAPP 3 rev 1
June 2018
Page 39 of 132
The USEPA defines Data Quality Objectives (DQO’s) as “qualitative and quantitative statements that
clarify study objectives, define the appropriate type of data, and specify tolerable levels of potential
decision errors…” (Environmental Protection Agency, 2002). DQOs may be used to evaluate whether the
data are adequate to address the project’s objectives. Among GAEPD’s objectives, the ability to detect
changes in water quality (trends) is the cornerstone of our sampling design. A historical perspective,
which only long-term records can provide, is necessary in order to make informed decisions regarding
TMDL development, water quality assessments, or the effects of regulatory actions on water quality.
The DQOs for this program can be met by adhering to the procedures defined in this QAPP. Accuracy,
precision, completeness, representativeness, and comparability required to meet these objectives are
summarized below along with other data quality criteria, such as holding time, sensitivity and detection
limits.
A9.1. Accuracy
Accuracy is determined by how close a reported result is to a true or expected value.
Laboratory accuracy will be determined by following the policy and procedures provided in the
Laboratory’s Quality Assurance Plan and analyte-specific program SOPs. These generally employ
estimates of percent recoveries (% R) for known internal standards, matrix spike and performance
evaluation samples, and evaluation of blank contamination.
Depending on the analyte, specific accuracy objectives can be concentration-based (e.g. +/- 0.01% @
<0.05 mg/L and +/- 20% @ >0.05 mg/L), or can be defined in terms of percent recovery percentages (e.g.
80-120 % recovery of matrix spike/PE samples).
Accuracy for multi-probe measurements is tested prior to use using standards that bracket the
measurement range, and after use, checking against standards to determine if probes remained in
calibration at the end of the measurement period. A NIST-certified thermometer is used to periodically
check thermometer accuracy. The post-sampling checks of each unit ensure that the readings taken
during the survey(s) were within QC acceptance limits for each multi-probe analyte.
A9.2. Precision
Precision is a measure of the degree of agreement among repeated measurements and is determined
through sampling and analyses of replicate samples.
Laboratory precision of lab duplicates will be determined by following the policy and procedures
provided in the Laboratory’s Quality Assurance Plan (QAP) and the program’s individual SOPs. This
varies depending on the lab and analyte, but typically involves analysis of same-sample lab duplicates and
matrix spike duplicates.
Overall precision objectives using relative percent difference (RPD) of field duplicate samples vary
depending on the parameter and typically range from 10-25% RPD. GAEPD recognizes that precision
estimates based on small numbers can result in relatively high RPDs (due to small number effect).
Precision of the multi-probe measurements can be determined by taking duplicate (via a second
placement of the unit) readings at the same station location. This is sometimes performed for river and
lake surveys. Multi-probe precision objectives generally range from 5-10% RPD depending on the
parameter.
Georgia Environmental Protection Division
QAPP for Water Quality Modeling and Ground Water and Surface Monitoring WPMP-QAPP 3 rev 1
June 2018
Page 40 of 132
A9.3. Representativeness
Representativeness refers to the extent to which measurements actually represent the true environmental
condition. Sampling stations are always selected to ensure that the samples taken represent typical field
conditions at the time and location of sampling, and not anomalies due to uncommon effects. In many
cases, stations are chosen to evaluate site-specific impacts (i.e. “hot spots”) using the same attention to
ensuring representativeness.
A9.4. Completeness
Completeness refers to the amount of valid data collected using a measurement system. It is expressed as
a percentage of the number of valid measurements that should have been collected. For GAEPD’s
monitoring, the completeness criterion is typically 80-100%. This assumes that, at most, one event out of
five might be cancelled for some reason that could cause an incomplete data set with up to 20% of the
planned-on data not obtained.
A9.5. Comparability
Comparability refers to the extent to which the data from a study is comparable to other studies conducted
in the past or from other areas. For GAEPD’s monitoring, the use of standardized sampling, analytical
methods, units of reporting, and site selection procedures helps to ensure comparability of data. Review
of existing data and methods used to collect historical data have been reviewed and taken into account in
the sampling design. Efforts to enhance data comparability have been made where possible and
appropriate.
A9.6. Detection Limits
In general, the detection limits define the smallest amount of analyte that can be detected above signal
noise and within certain confidence levels. Typically, Method Detection Limits (MDL) are calculated in
the laboratory by analyzing a minimum of seven low-level standard solutions using a specific method.
Detection limits in the traditional sense do not apply to some measurements such as pH and temperature
that have essentially continuous scales. Multiplication factors are typically applied to MDL values by
labs to express Reporting Limits (RL or RDL), which define a level above which there is greater
confidence in reported values. Where low-level results are needed, the GAEPD often requests results
reported down to the MDL with or without lab qualification (rather than “<RDL”).
A9.7. Holding Times
Most analytes have standard holding times (maximum allowed time from collection to analysis) that have
been established to ensure analytical accuracy. For enforcement activities, bacteria sampling and
analyses for groundwater and surface waters adhere to the 6-hour delivery and 8-hour maximum holding
times, regardless of method. Due to constraints in shipping samples, all other bacterial samples collected
for watershed monitoring follow USEPA’s allowance of a 24-hour maximum holding time.
A9.8. Sensitivity
This is the ability of the method or instrument to discriminate between measurement responses. The
specifications for sensitivity are unique to each analytical instrument and are typically defined in
Laboratory QAP and SOPs.
Georgia Environmental Protection Division
QAPP for Water Quality Modeling and Ground Water and Surface Monitoring WPMP-QAPP 3 rev 1
June 2018
Page 41 of 132
A9.9. Standard Protocols
The use of approved field and lab SOPs by GAEPD and its agents provides some assurance that
programmatic data quality objectives shall be met consistently.
A9.10. Performance Auditing
Scheduled and unscheduled field audits are typically performed to evaluate implementation of field
methods, consistency with this QAPP and compliance with GAEPD’s SOPs for all projects. Field audits
attempt to evaluate at least one monitoring crew-member a minimum of one time over the annual
monitoring period.
Proficiency testing of laboratory analytical accuracy is performed with single or double blind lab QC
checks using purchased QC check samples. All audit results are compared to “true” values/results and
evaluated against acceptance limit criteria. Results are also provided to lab analysts and survey
coordinators.
A10. Documents and Records
Documentation of all modeling activities is necessary for the interpretation of study results. As directed
by the Program Manager, GAEPD and/or their contractor will prepare progress reports and other
deliverables, which will be distributed to project participants as indicated by the Program Manager. Data
and assumptions used to develop the assimilative capacity analyses models will be recorded and
documented in the assimilative capacity analyses modeling report.
The format of the raw data to be used for assimilative capacity model parameters, model input, model
calibration, and model output will be converted to the appropriate units, as necessary, for use in
assimilative capacity analyses development.
The Program Manager and Project Managers will maintain files, as appropriate, as repositories for
information and data used in models and for the preparation of any reports and documents during the
project. Electronic project files are maintained on network computers and are backed up periodically.
The Project Managers will supervise the use of materials in any administrative record. The following
information may be included in the hard copy or electronic project files:
Any reports and documents prepared.
Contract and project information.
Electronic copies of model input/output (for model calibration and allocation
scenarios).
Results of technical reviews, model tests, data quality assessments of output data, and
audits.
Documentation of response actions during the project to correct model development
or implementation problems.
Assessment reports for acquired data.
Statistical goodness-of-fit methods and other rationale used to decide which
statistical distributions should be used to characterize the uncertainty or variability of
model input parameters.
Communications (electronic mail, memoranda; internal notes; telephone conversation
records; letters; meeting minutes; and all written correspondence among the project
team personnel, subcontractors, suppliers, or others).
Georgia Environmental Protection Division
QAPP for Water Quality Modeling and Ground Water and Surface Monitoring WPMP-QAPP 3 rev 1
June 2018
Page 42 of 132
Maps, photographs, and drawings.
Studies, reports, documents, and newspaper articles pertaining to the project.
Spreadsheet data files: physical measurements, chemistry data, and microbiological
data.
The model application will include complete record keeping of each step of the modeling process. As
directed by the project managers, documentation may consist of reports and files addressing the following
items:
Assumptions
Parameter values and sources
Nature of grid, network design, or subwatershed delineation
Changes and verification of changes made in code
Actual input used
Output of model runs and interpretation
Calibration and validation of the model(s)
Formal reports are maintained at GAEPD’s Atlanta office.
The Ambient Monitoring Unit (AMU) Manger will be the lead Manager assigned to updating and
ensuring project personnel have the most current approved version of the QAPP and any applicable SOPs
and project-specific sampling plans. Each QAPP will be assigned a version update number with
publication date. Any modifications or updates containing significant changes to methodologies,
protocols or data processing and handling will be submitted to the USEPA for review and approval.
Distribution of updated plans will follow the distribution list contained within the QAPP.
Documents and records for the monitoring program and specifically for each station, which include lab
reports from the laboratories, field observations and field measurements, are kept on file for a minimum
of ten years for listing and/or reporting requirements.
A10.1. Field Records
Files for each monitoring location that is sampled during the course of a calendar year will be created for
the storage of information about the site. These files will contain all the visual observations and field
data. All the files are stored by GAEPD basin and further by a monitoring location number (MON LOC
ID). This number correlates with the number given to each major river basin.
Field books and field forms contain all original field notes and are kept on file for each station. The field
books and field forms contain information that describes station identification number, station name, date
and time of the sample collection, person(s) collecting the samples, type of samples collected, weather
conditions at the time of sampling, and field observation and measurements.
Upon completion of the sample collection for the day, the current day’s field notes are reviewed for
accuracy. If a discrepancy is discovered, immediate corrective action is taken. For the compliance
sampling inspections, all field notes are entered into the inspection field book. When results of analyses
for the samples are received from the lab, the Environmental Specialist prepares inspection reports for
transmittal to the corresponding compliance/enforcement personnel within the WPB responsible for each
facility inspected.
Georgia Environmental Protection Division
QAPP for Water Quality Modeling and Ground Water and Surface Monitoring WPMP-QAPP 3 rev 1
June 2018
Page 43 of 132
A10.2. Laboratory Records
Each sample is sent to the laboratory with a GAEPD laboratory source document. This form acts as a
chain-of-custody (COC) form and analytical services request form. The laboratory source document is
filled out for each station prior to delivery/shipment. While in the custody of the shipper, all sample
shipments are tracked by GAEPD personnel to ensure that the samples are handled properly and arrive
within the appropriate holding times.
The reports of the analyses of the samples are optimally produced within 30 days of receipt of the sample.
All analytical reports are maintained on file at the EPD lab.
A10.3. Office Records
Formal project folders containing field data, lab data, and ancillary information (including results of
calibration and QC checks, model input, and output files, etc.) are kept at the WPB’s Sloppy Floyd office
in Atlanta, Georgia. These records are maintained complete and orderly by the principle investigator. In
addition, any other records or documents applicable to the projects, such as project-specific sampling
plans, pre- and post- study meeting notes, audit reports, etc. will be placed as hard copies in the project
folder. Report format will include the scope of the project, personnel assignments for specific monitoring
and assessment tasks, equipment used with identification numbers, data assessment and any health or
safety issues. All records are physically housed in a dedicated file in the WPMP offices. Reports will be
maintained in an electronic file as well as in a hard copy paper format and will be available to the public
for review during business hours.
A10.4. Sampling Station Registration
Each sampling location (station) has a unique identification number and description. All sampling
locations are surveyed according to GAEPD’s protocols to determine if the site is suitable for monitoring.
A10.5. Documentation Protocols
GAEPD logbooks, forms, data sheets, lab notebooks, and chain-of-custody forms are formal records.
Records should be made in indelible black ink or extra fine point permanent marker. There should be no
omissions in the data. Striking a single line through the material to be corrected or deleted and initialed
and dated by the person making the change will make any corrections to original documentation or
records. The line shall not obscure the original material requiring a change. Groups of related errors on a
single page should have one line through the entries and should be initialed and dated with a short
comment supplied for the reason of data deletion.
A10.6. Data Handling Records
All records of data verification and validation become part of the permanent record of the station and are
included in the files of the GAEPD WPMP. Once the data is transmitted to the GAEPD, all records of the
use of the data for the listing and reporting process, computation of TMDLs, and other uses become part
of the files of the GAEPD and are stored following, at a minimum, the federal requirements for records
retention.
Georgia Environmental Protection Division
QAPP for Water Quality Modeling and Ground Water and Surface Monitoring WPMP-QAPP 3 rev 1
June 2018
Page 44 of 132
A10.7. Data Archiving and Retrieval
All of GAEPD’s water quality monitoring data is housed in GOMAS. The GAEPD archives original data
into perpetuity. Original field notes, and other paper documents original to the data collection activity
remain part of the permanent files of the GAEPD WPB Sloppy Floyd office in Atlanta, Georgia. Copies
of electronic water quality data is transferred to the National Archive STOrage and RETrieval System
(STORET). The data package is maintained according to the Federal requirement for records retention.
Georgia Environmental Protection Division
QAPP for Water Quality Modeling and Ground Water and Surface Monitoring WPMP-QAPP 3 rev 1
June 2018
Page 45 of 132
B. DATA GENERATION AND ACQUISITION
B1. Sampling Process Design
B1.1. Purpose/Background
The GAEPD has a comprehensive monitoring program that serves its water quality management needs.
This approach addresses all Georgia groundwater and surface waters including rivers, streams, lakes,
reservoirs, and coastal estuarine waters.
The monitoring strategy provides a logical progression from intensive data collection and assessments to
TMDL development and permit issuance. The key activities involved in sample process design are:
1. Planning – Existing data and reports are compiled and used to review historical water
quality information and identify data gaps that may be needed to fully assess the water
body.
2. Monitoring – Field data are collected for targeted and probabilistic water-bodies in the
river basin. These data supplement existing data and are used for water quality
assessment.
3. Assessment – Monitoring data are compared to existing water quality standards to
determine if the waterbodies support designated uses.
4. Wasteload Allocation/TMDL – Monitoring data are used by the Water Quality
Modeling Unit to determine pollutant limits for treated effluent discharges into the
watershed by permittees. Limits are set to ensure that state water quality is protected.
The TMDL Modeling and Development Unit prepares TMDLs for those waters not
meeting their designated uses by the Monitoring & Assessment QA Officer. The Unit
calculates the TMDL for the pollutant of concern considering all sources of pollution for
the stream segment and includes a margin of safety.
5. Permits – Issuance and expiration of all discharge permits are synchronized with
watershed assessments. Permits are issued in Georgia under the Federally delegated
National Pollutant Discharge Elimination System (NPDES) program.
6. TMDL Implementation Plans – Plans are developed for each TMDL developed. The
plans include the original basis for listing the water-body as impaired, a general
watershed description, identification of possible cause for the impairment, actions to
correct the problem, and additional water monitoring to confirm the water body has been
restored to meeting water-quality standards.
Georgia Environmental Protection Division
QAPP for Water Quality Modeling and Ground Water and Surface Monitoring WPMP-QAPP 3 rev 1
June 2018
Page 46 of 132
This approach considers all sources of water pollution including discharges from municipalities and
industries, as well as runoff from urban and agricultural areas. EPD accepts public participation and
coordination with other local governmental agencies during water sampling process design.
B1.2. Monitoring Design
Georgia generally uses several methodologies in its water-body monitoring design.
For many of the sites that are sampled, it is already known whether a water body represented by a
particular site is compliant with current water quality standards. The design assumptions for monitoring
are as follows:
1. Samples represent average water quality conditions at the time of day, water
temperature, and flow conditions that existed during collection.
2. The bias and variability of sampling protocols are not affected by sampling platform
(bridge, wading, or boat) or type of sampler used (weighted bottle vs. weighted
bucket).
3. The bias and variability of field measurements are not affected by using different
personnel using different instruments.
4. The bias and variability of lab analyses are not affected by using two different
laboratories or by samples analyzed on different days.
5. Sample contamination is minimal and does not affect constituent concentration in
samples.
B1.2.1. River Basins
Georgia’s 14 major river basins are sampled each year, resources permitting. Sampling state-wide allows
for comparison of different climatic conditions across years.
B1.2.2. Ecoregions
Georgia has 25 Level IV sub-ecoregions in the State. Selection criteria for reference sites included
minimal impairment and representativeness. 78 candidate reference sites were evaluated as part of the
eco-region project. The reference sites were chosen to represent the best attainable conditions for streams
with similar characteristics in a given sub-ecoregion. Reference conditions represented a set of
expectations for physical habitat, general water quality, and the health of the biological communities in
the absence of human disturbance and pollution. This reference database has been used to establish
regional guidelines for wadeable streams.
B1.3. Indicator Variables
A variety of core and supplemental indicators are used to assess compliance with water quality standards,
to support individual use classifications, and for other information needs and programs. A common set of
water quality criteria including pathogen indicators (fecal coliform), dissolved oxygen, pH, temperature,
and toxic substances apply to all water uses in Georgia including recreation, drinking water, fishing, wild
river, scenic river, and coastal fishing. In assessing water quality in lakes, additional indicators include
nutrients, and chlorophyll a. Core and supplemental indicators are shown in Table 7.
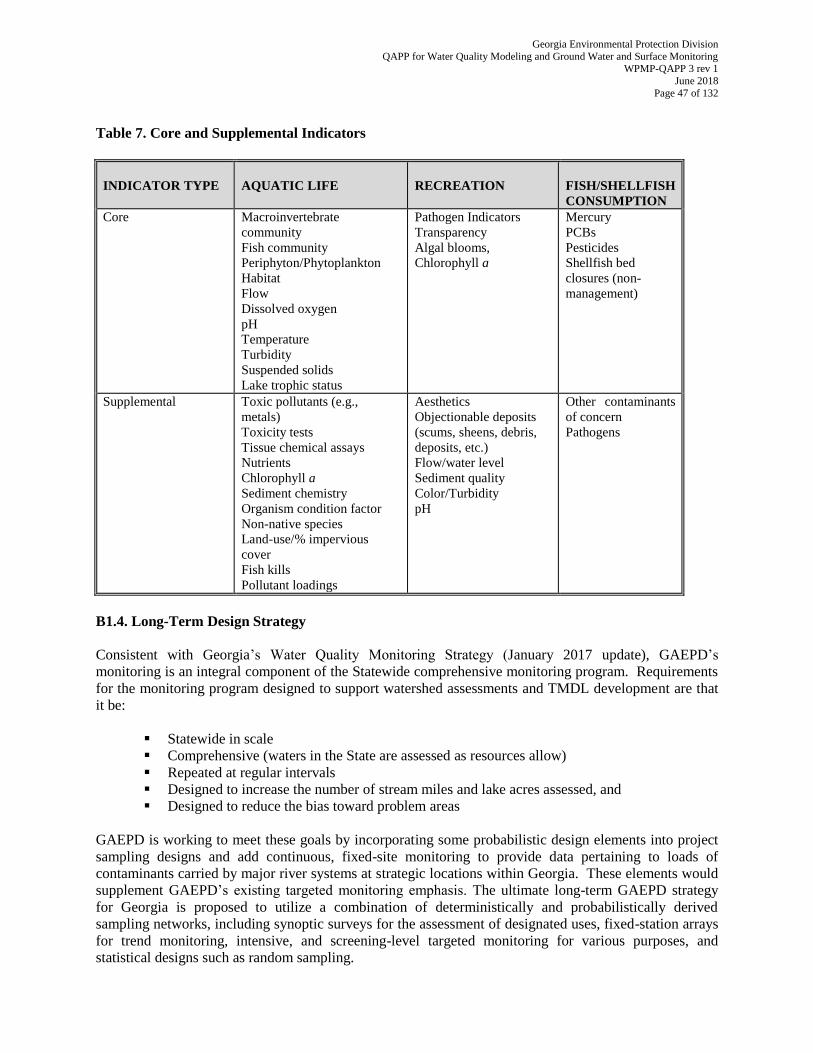
Georgia Environmental Protection Division
QAPP for Water Quality Modeling and Ground Water and Surface Monitoring WPMP-QAPP 3 rev 1
June 2018
Page 47 of 132
Table 7. Core and Supplemental Indicators
INDICATOR TYPE
AQUATIC LIFE
RECREATION
FISH/SHELLFISH
CONSUMPTION
Core Macroinvertebrate
community
Fish community
Periphyton/Phytoplankton
Habitat
Flow
Dissolved oxygen
pH
Temperature
Turbidity
Suspended solids
Lake trophic status
Pathogen Indicators
Transparency
Algal blooms,
Chlorophyll a
Mercury
PCBs
Pesticides
Shellfish bed
closures (non-
management)
Supplemental Toxic pollutants (e.g.,
metals)
Toxicity tests
Tissue chemical assays
Nutrients
Chlorophyll a
Sediment chemistry
Organism condition factor
Non-native species
Land-use/% impervious
cover
Fish kills
Pollutant loadings
Aesthetics
Objectionable deposits
(scums, sheens, debris,
deposits, etc.)
Flow/water level
Sediment quality
Color/Turbidity
pH
Other contaminants
of concern
Pathogens
B1.4. Long-Term Design Strategy
Consistent with Georgia’s Water Quality Monitoring Strategy (January 2017 update), GAEPD’s
monitoring is an integral component of the Statewide comprehensive monitoring program. Requirements
for the monitoring program designed to support watershed assessments and TMDL development are that
it be:
Statewide in scale
Comprehensive (waters in the State are assessed as resources allow)
Repeated at regular intervals
Designed to increase the number of stream miles and lake acres assessed, and
Designed to reduce the bias toward problem areas
GAEPD is working to meet these goals by incorporating some probabilistic design elements into project
sampling designs and add continuous, fixed-site monitoring to provide data pertaining to loads of
contaminants carried by major river systems at strategic locations within Georgia. These elements would
supplement GAEPD’s existing targeted monitoring emphasis. The ultimate long-term GAEPD strategy
for Georgia is proposed to utilize a combination of deterministically and probabilistically derived
sampling networks, including synoptic surveys for the assessment of designated uses, fixed-station arrays
for trend monitoring, intensive, and screening-level targeted monitoring for various purposes, and
statistical designs such as random sampling.
Georgia Environmental Protection Division
QAPP for Water Quality Modeling and Ground Water and Surface Monitoring WPMP-QAPP 3 rev 1
June 2018
Page 48 of 132
The strategy also includes significant efforts by the GAEPD to enable two-way sharing of data.
Monitoring data and information are shared with other programs, within the Department, as well as in
other agencies, for use in their work. In addition, data from external groups can also be used (based on
case-by-case evaluations) to supplement information available to decision makers.
B1.5. Site Selection Criteria
Actual river and stream sampling points are generally a composite of three sub-samples using equal width
increments (EWI) for rivers and streams, photic zone composite samples for lakes and estuaries, or
determined by field staff as representative of the water-body. Overall, the data collection efforts for all
water-body types take the following into consideration:
Site is accessible by wading, from a bridge crossing, or by boat
Flow is significant enough to ensure a relatively well-mixed, homogenous sample
Located outside of effluent mixing zones
Upstream side of bridges whenever possible
Not directly below large amounts of debris
B1.6. Current Design Approach
Stations are established at publicly accessible, generally fixed locations, with a specific latitude and
longitude. Most sites are located at bridge crossings or areas accessible by boat. Targeted stations are
strategically located to monitor a specific area of concern:
Overall water quality in a larger watershed
Effect of point source discharges
Effect of non-point sources of pollution (e.g., urban areas, animal operations,
agriculture)
Effect of land use changes
Waters of significant ecological, recreational, political, or municipal use
Waters which show an impairment due to unknown causes (e.g., biological data
shows possible impairment)
Significant water-bodies as they leave the state
The assessment program is presently the primary means of meeting the CWA objective relating to
assessing the status of designated uses. Prior to each monitoring year, information and data is gathered to
identify data gaps and the need for additional information. Input from other internal programs and
outside agencies is actively solicited in order to gain further insight with respect to water quality goals
and use-objectives. This process culminates in the development of project-specific sampling plans for
obtaining this information.
Water Quality Surveys: consist of monthly sampling for a calendar year for rivers and streams and
during the growing season (April – October) for lakes and reservoirs. The selection of indicators is
focused on those with Georgia water quality standards that can be cost-effectively analyzed. Additional
indicators are also included that may not have specific standards but are useful for interpretation of other
measurements.
River and Streams Monitoring: consists of physical and chemical sampling of wadeable and non-
wadeable rivers and streams. Sampling includes in-situ measurements of water temperature, dissolved
Georgia Environmental Protection Division
QAPP for Water Quality Modeling and Ground Water and Surface Monitoring WPMP-QAPP 3 rev 1
June 2018
Page 49 of 132
oxygen, conductivity, and pH with a multi-parameter probe; field observations to qualify current weather,
water level, water color/clarity, and other factors that may affect the outcome of the sample and; chemical
sampling of a suite of routine parameters that include: nutrients (TP, TN, NH3-N), BOD5, alkalinity,
hardness, suspended solids, total organic carbon and turbidity. Samples are collected monthly for a
minimum of one calendar year obtaining a minimum of 12 data points. As resources allow, a subset of
rivers and streams are sampled quarterly for metals of water quality concern (e.g. Hg, Cu, Pb, Se), or
sampled 16 times in a calendar year for Fecal coliform and/or E.coli bacteria in order to calculate 4
bacterial geometric means representing four calendar quarters capturing seasonal variations.
Lakes and Reservoirs Monitoring: consists of physical and chemical sampling of the open water area
and tributary embayments of public lakes larger than 500 acres. Sampling includes a depth profile of in-
situ measurements of dissolved oxygen, pH, conductivity, and water temperature with a multi-parameter
probe; field observations to quantify the photic zone, water clarity, qualify current weather conditions,
and other factors that may affect the sample and; chemical sampling of a suite of routine parameters that
include: fecal coliform, E. coli, nutrients (TP, TKN, NH3, and NOx), BOD5, chlorophyll-a, alkalinity,
hardness, suspended solids, total organic carbon, and turbidity. Annual sampling for lakes is conducted
once per month during the growing season of April through October when productivity is high.
Biomonitoring: consists of surveys to collect macroinvertebrates and/or periphyton. Chemical sampling
of streams are designed to provide representative information about those waterbodies for a specific
moment. Macroinvertebrates and periphyton are used as integrative measures of water quality on long-
term and short-term scales.
Macroinvertebrates: Rapid Bioassessment Protocols (RBPs), based on those
developed by the USEPA, are used to monitor the health of benthic
macroinvertebrate communities in wadeable streams. Surveys are conducted in
wadeable streams using GAEPD’s methods and protocols. SOPs are available to the
public on the GAEPD’s web site at the following web address: www.gaepd.org
The structure and function of the macroinvertebrate community are a measure of
biological integrity and is also a component of the water quality monitoring program.
GAEPD utilizes a standardized method based on the EPA Rapid Bioassessment
Protocol to improve data comparability among wadeable sampling sites throughout
the State. The macroinvertebrate collection procedures employ a multi-habitat
approach that allows for sampling of habitats in relative proportion to their local
availability. Macroinvertebrate specimens are identified to species when applicable,
counted, and statistically compared to reference conditions with similarities within
the sub-ecoregion.
Periphyton: The analysis of the periphyton (diatoms and soft algae) community in
shallow streams employs an indicator species approach whereby inferences on water
quality conditions are drawn from an understanding of the environmental preferences
and tolerances of the species present. Periphyton communities can exhibit dramatic
temporal shifts in species composition throughout the year and as a result information
from a single sampling event are generally not indicative of historical conditions.
For this reason, the information gained from the algal community assessment is more
useful as a supplement to the assessments of other communities that serve to integrate
conditions over a longer period of time. In some instances, where information
pertaining to primary production is required, algal biomass analysis or chlorophyll
determinations may be performed. Results of these analyses are used to evaluate the
Georgia Environmental Protection Division
QAPP for Water Quality Modeling and Ground Water and Surface Monitoring WPMP-QAPP 3 rev 1
June 2018
Page 50 of 132
trophic status of lakes and reservoirs. Similar information from riverine and coastal
waters is used to identify those water-bodies subjected to excessive nutrient
enrichment. Results at public drinking water reservoirs can indicate whether land
uses need to be addressed as sources of nutrients and can help water suppliers adjust
treatment processes if necessary. Additionally, GAEPD is building a database of
periphyton and nutrients to determine biological response to nutrients in streams to
assist in the development of nutrient criteria.
Wastewater Discharge Monitoring: serves to document pollutant loading from point sources, assess
compliance with NPDES permit limits and supplements river and stream surveys. Discharge
measurements provide data for calculation of pollutant mass loadings as well as for assessing impacts on
stream biota of low-flow conditions resulting from drought or water withdrawals. Additional site-specific
data are collected to assess the facility’s discharge quality relative to permit limitations. These data may
include pH, DO, TRC, BOD, COD, nutrients, Total Suspended Solids, metals, organics, and fecal
coliform bacteria.
Fish Tissue Toxics Monitoring: helps to assess the human health risk associated with the consumption
of fish and shellfish from Georgia’s waters. Uniform protocols designed to ensure accuracy and prevent
cross-contamination of samples are followed for fish collection, processing, and shipping. Lengths and
weights are measured, and fish are visually examined for tumors, lesions, or other indications of disease.
Data are provided to the DNR, which is the agency responsible for performing the risk assessments and
issuing public health advisories. The Department makes a publication available to the public annually on
the recommendations for consumption of fish collected from Georgia waters. Sampling is performed
once per year for a selected number of sites. Parameters tested from fish tissue samples include PCBs,
mercury, and an array of toxic organic chemicals.
Special Project Monitoring: are conducted by GAEPD to address priority issues of concern. These
surveys vary in scope and timeframe depending on data requirements, but maintain the same attention to
quality in the field and in the lab.
B1.7. Detailed Project-Specific Sampling Plans
Project-specific sampling plans indicate locations, frequencies, analytes, and methods to be used in the
project. These plans are supplemental to the programmatic QAPP as they pertain to those projects. The
project-specific sampling plans will be submitted to the USEPA, Region IV for review and approval each
year. If EPD develops a Special Project Monitoring Plans to address a priority issue, the Monitoring Plan
will be available upon request.
GAEPD evaluates its monitoring program during each planning and assessment cycle and incorporates
changes as needed to provide the most comprehensive and effective plan possible with available
resources.
B2. Sampling Methods
Samples and measurements are to be taken following the methods listed in Table 8. Any irregularities or
problems encountered by field staff should be communicated to the responsible WPMP Unit Coordinator,
either verbally or via email, which will assess the situation, consult with other project personnel if needed,
and recommend a course of action for resolution.
An overview of the different methods employed is described below.
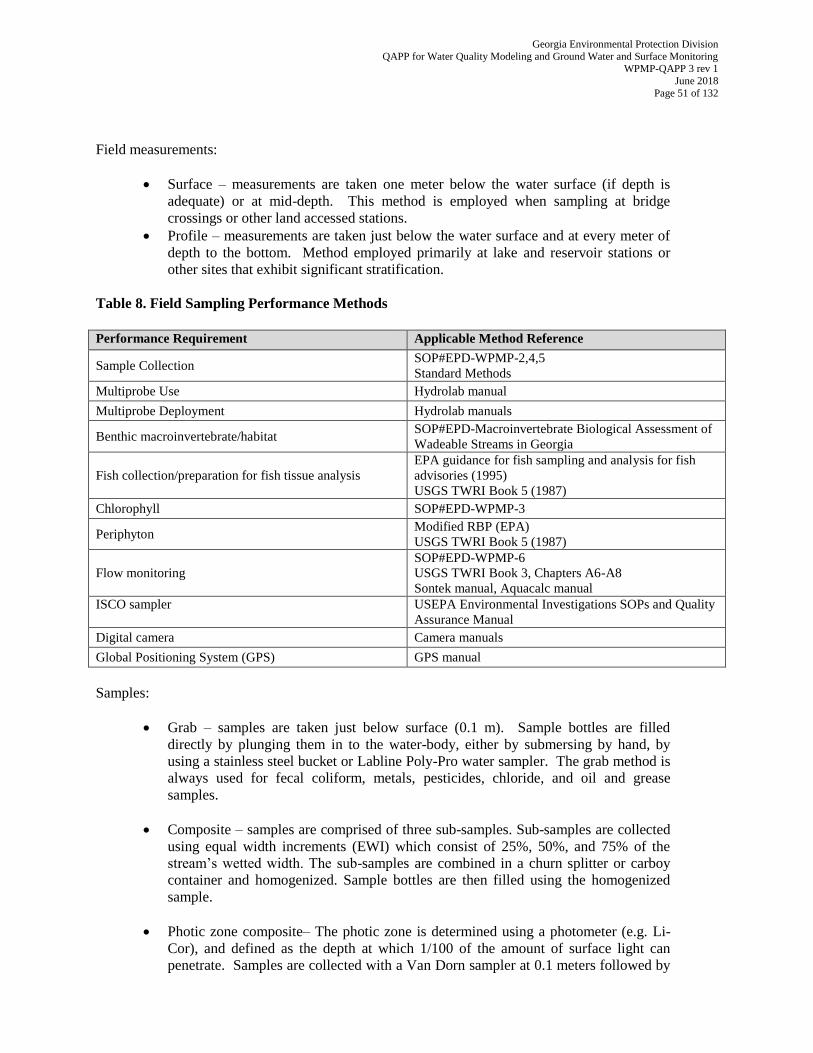
Georgia Environmental Protection Division
QAPP for Water Quality Modeling and Ground Water and Surface Monitoring WPMP-QAPP 3 rev 1
June 2018
Page 51 of 132
Field measurements:
Surface – measurements are taken one meter below the water surface (if depth is
adequate) or at mid-depth. This method is employed when sampling at bridge
crossings or other land accessed stations.
Profile – measurements are taken just below the water surface and at every meter of
depth to the bottom. Method employed primarily at lake and reservoir stations or
other sites that exhibit significant stratification.
Table 8. Field Sampling Performance Methods
Performance Requirement Applicable Method Reference
Sample Collection SOP#EPD-WPMP-2,4,5
Standard Methods
Multiprobe Use Hydrolab manual
Multiprobe Deployment Hydrolab manuals
Benthic macroinvertebrate/habitat SOP#EPD-Macroinvertebrate Biological Assessment of
Wadeable Streams in Georgia
Fish collection/preparation for fish tissue analysis
EPA guidance for fish sampling and analysis for fish
advisories (1995)
USGS TWRI Book 5 (1987)
Chlorophyll SOP#EPD-WPMP-3
Periphyton Modified RBP (EPA)
USGS TWRI Book 5 (1987)
Flow monitoring
SOP#EPD-WPMP-6
USGS TWRI Book 3, Chapters A6-A8
Sontek manual, Aquacalc manual
ISCO sampler
USEPA Environmental Investigations SOPs and Quality
Assurance Manual
Digital camera Camera manuals
Global Positioning System (GPS) GPS manual
Samples:
Grab – samples are taken just below surface (0.1 m). Sample bottles are filled
directly by plunging them in to the water-body, either by submersing by hand, by
using a stainless steel bucket or Labline Poly-Pro water sampler. The grab method is
always used for fecal coliform, metals, pesticides, chloride, and oil and grease
samples.
Composite – samples are comprised of three sub-samples. Sub-samples are collected
using equal width increments (EWI) which consist of 25%, 50%, and 75% of the
stream’s wetted width. The sub-samples are combined in a churn splitter or carboy
container and homogenized. Sample bottles are then filled using the homogenized
sample.
Photic zone composite– The photic zone is determined using a photometer (e.g. Li-
Cor), and defined as the depth at which 1/100 of the amount of surface light can
penetrate. Samples are collected with a Van Dorn sampler at 0.1 meters followed by
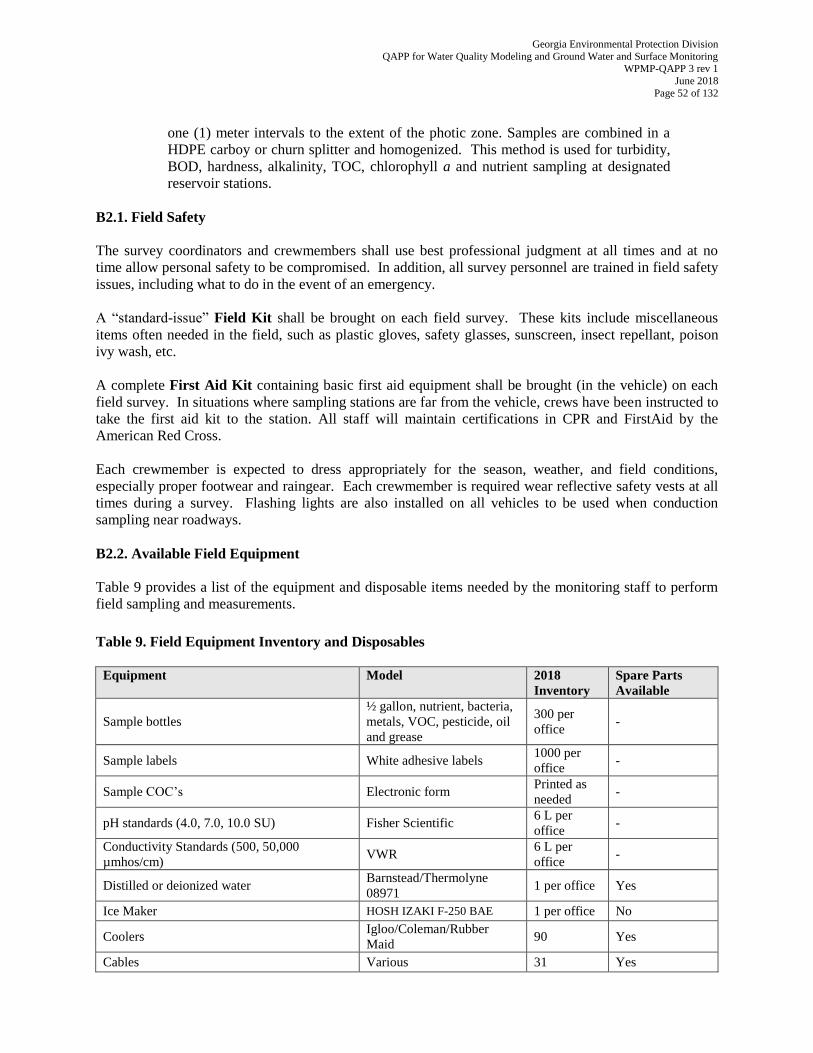
Georgia Environmental Protection Division
QAPP for Water Quality Modeling and Ground Water and Surface Monitoring WPMP-QAPP 3 rev 1
June 2018
Page 52 of 132
one (1) meter intervals to the extent of the photic zone. Samples are combined in a
HDPE carboy or churn splitter and homogenized. This method is used for turbidity,
BOD, hardness, alkalinity, TOC, chlorophyll a and nutrient sampling at designated
reservoir stations.
B2.1. Field Safety
The survey coordinators and crewmembers shall use best professional judgment at all times and at no
time allow personal safety to be compromised. In addition, all survey personnel are trained in field safety
issues, including what to do in the event of an emergency.
A “standard-issue” Field Kit shall be brought on each field survey. These kits include miscellaneous
items often needed in the field, such as plastic gloves, safety glasses, sunscreen, insect repellant, poison
ivy wash, etc.
A complete First Aid Kit containing basic first aid equipment shall be brought (in the vehicle) on each
field survey. In situations where sampling stations are far from the vehicle, crews have been instructed to
take the first aid kit to the station. All staff will maintain certifications in CPR and FirstAid by the
American Red Cross.
Each crewmember is expected to dress appropriately for the season, weather, and field conditions,
especially proper footwear and raingear. Each crewmember is required wear reflective safety vests at all
times during a survey. Flashing lights are also installed on all vehicles to be used when conduction
sampling near roadways.
B2.2. Available Field Equipment
Table 9 provides a list of the equipment and disposable items needed by the monitoring staff to perform
field sampling and measurements.
Table 9. Field Equipment Inventory and Disposables
Equipment Model 2018
Inventory
Spare Parts
Available
Sample bottles
½ gallon, nutrient, bacteria,
metals, VOC, pesticide, oil
and grease
300 per
office -
Sample labels White adhesive labels 1000 per
office -
Sample COC’s Electronic form Printed as
needed -
pH standards (4.0, 7.0, 10.0 SU) Fisher Scientific 6 L per
office -
Conductivity Standards (500, 50,000
µmhos/cm) VWR
6 L per
office -
Distilled or deionized water Barnstead/Thermolyne
08971 1 per office Yes
Ice Maker HOSH IZAKI F-250 BAE 1 per office No
Coolers Igloo/Coleman/Rubber
Maid 90 Yes
Cables Various 31 Yes
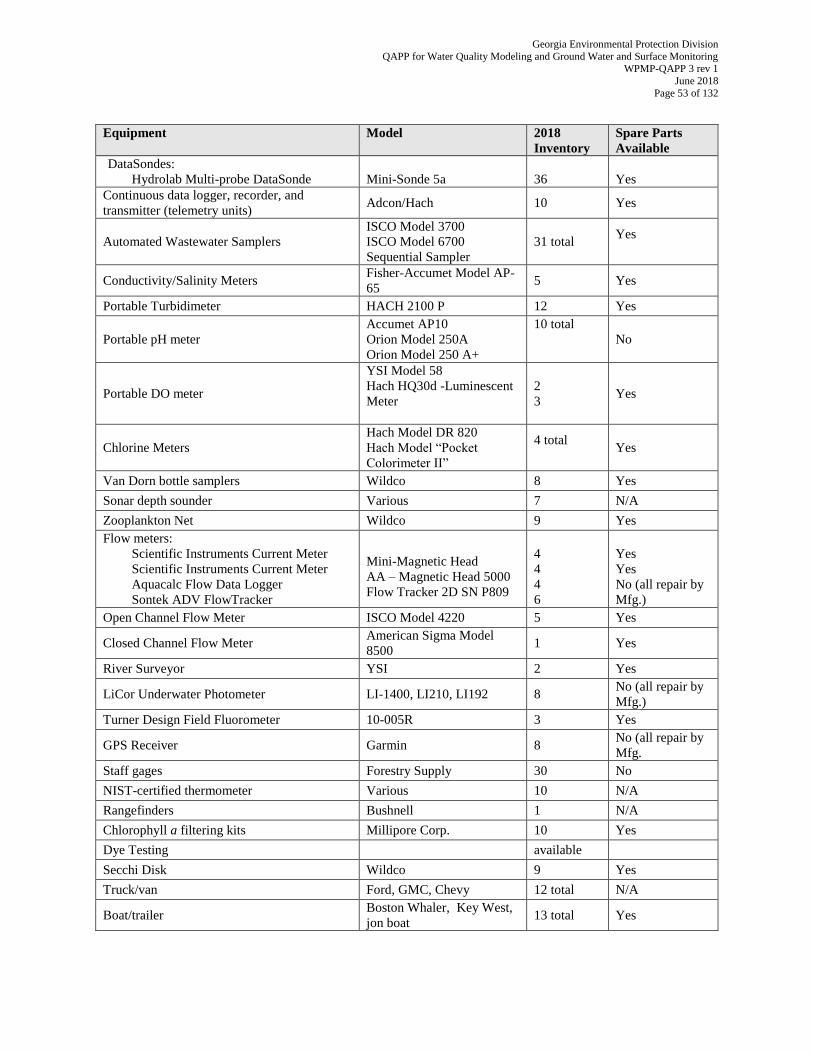
Georgia Environmental Protection Division
QAPP for Water Quality Modeling and Ground Water and Surface Monitoring WPMP-QAPP 3 rev 1
June 2018
Page 53 of 132
Equipment Model 2018
Inventory
Spare Parts
Available
DataSondes:
Hydrolab Multi-probe DataSonde
Mini-Sonde 5a
36
Yes
Continuous data logger, recorder, and
transmitter (telemetry units) Adcon/Hach 10 Yes
Automated Wastewater Samplers
ISCO Model 3700
ISCO Model 6700
Sequential Sampler
31 total Yes
Conductivity/Salinity Meters Fisher-Accumet Model AP-
65 5 Yes
Portable Turbidimeter HACH 2100 P 12 Yes
Portable pH meter
Accumet AP10
Orion Model 250A
Orion Model 250 A+
10 total
No
Portable DO meter
YSI Model 58
Hach HQ30d -Luminescent
Meter
2
3 Yes
Chlorine Meters
Hach Model DR 820
Hach Model “Pocket
Colorimeter II”
4 total
Yes
Van Dorn bottle samplers Wildco 8 Yes
Sonar depth sounder Various 7 N/A
Zooplankton Net Wildco 9 Yes
Flow meters:
Scientific Instruments Current Meter
Scientific Instruments Current Meter
Aquacalc Flow Data Logger
Sontek ADV FlowTracker
Mini-Magnetic Head
AA – Magnetic Head 5000
Flow Tracker 2D SN P809
4
4
4
6
Yes
Yes
No (all repair by
Mfg.)
Open Channel Flow Meter ISCO Model 4220 5 Yes
Closed Channel Flow Meter American Sigma Model
8500 1 Yes
River Surveyor YSI 2 Yes
LiCor Underwater Photometer LI-1400, LI210, LI192 8 No (all repair by
Mfg.)
Turner Design Field Fluorometer 10-005R 3 Yes
GPS Receiver Garmin 8 No (all repair by
Mfg.
Staff gages Forestry Supply 30 No
NIST-certified thermometer Various 10 N/A
Rangefinders Bushnell 1 N/A
Chlorophyll a filtering kits Millipore Corp. 10 Yes
Dye Testing available
Secchi Disk Wildco 9 Yes
Truck/van Ford, GMC, Chevy 12 total N/A
Boat/trailer Boston Whaler, Key West,
jon boat 13 total Yes
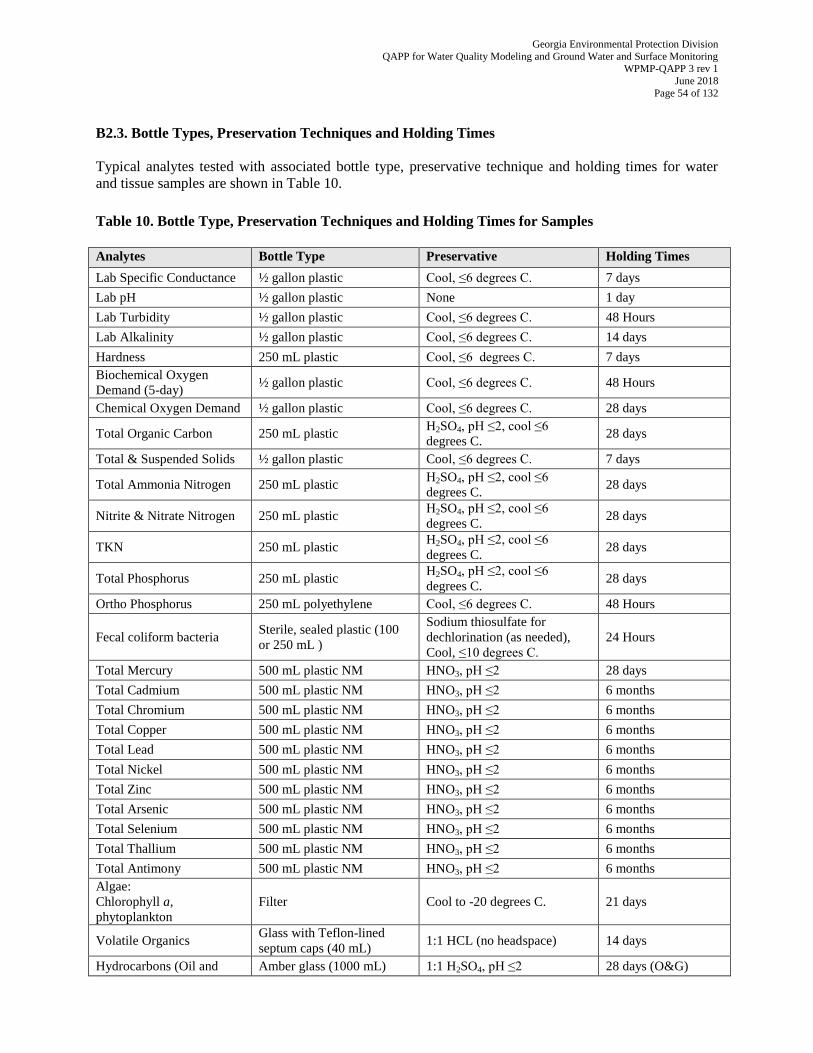
Georgia Environmental Protection Division
QAPP for Water Quality Modeling and Ground Water and Surface Monitoring WPMP-QAPP 3 rev 1
June 2018
Page 54 of 132
B2.3. Bottle Types, Preservation Techniques and Holding Times
Typical analytes tested with associated bottle type, preservative technique and holding times for water
and tissue samples are shown in Table 10.
Table 10. Bottle Type, Preservation Techniques and Holding Times for Samples
Analytes Bottle Type Preservative Holding Times
Lab Specific Conductance ½ gallon plastic Cool, ≤6 degrees C. 7 days
Lab pH ½ gallon plastic None 1 day
Lab Turbidity ½ gallon plastic Cool, ≤6 degrees C. 48 Hours
Lab Alkalinity ½ gallon plastic Cool, ≤6 degrees C. 14 days
Hardness 250 mL plastic Cool, ≤6 degrees C. 7 days
Biochemical Oxygen
Demand (5-day) ½ gallon plastic Cool, ≤6 degrees C. 48 Hours
Chemical Oxygen Demand ½ gallon plastic Cool, ≤6 degrees C. 28 days
Total Organic Carbon 250 mL plastic H2SO4, pH ≤2, cool ≤6
degrees C. 28 days
Total & Suspended Solids ½ gallon plastic Cool, ≤6 degrees C. 7 days
Total Ammonia Nitrogen 250 mL plastic H2SO4, pH ≤2, cool ≤6
degrees C. 28 days
Nitrite & Nitrate Nitrogen 250 mL plastic H2SO4, pH ≤2, cool ≤6
degrees C. 28 days
TKN 250 mL plastic H2SO4, pH ≤2, cool ≤6
degrees C. 28 days
Total Phosphorus 250 mL plastic H2SO4, pH ≤2, cool ≤6
degrees C. 28 days
Ortho Phosphorus 250 mL polyethylene Cool, ≤6 degrees C. 48 Hours
Fecal coliform bacteria Sterile, sealed plastic (100
or 250 mL )
Sodium thiosulfate for
dechlorination (as needed),
Cool, ≤10 degrees C.
24 Hours
Total Mercury 500 mL plastic NM HNO3, pH ≤2 28 days
Total Cadmium 500 mL plastic NM HNO3, pH ≤2 6 months
Total Chromium 500 mL plastic NM HNO3, pH ≤2 6 months
Total Copper 500 mL plastic NM HNO3, pH ≤2 6 months
Total Lead 500 mL plastic NM HNO3, pH ≤2 6 months
Total Nickel 500 mL plastic NM HNO3, pH ≤2 6 months
Total Zinc 500 mL plastic NM HNO3, pH ≤2 6 months
Total Arsenic 500 mL plastic NM HNO3, pH ≤2 6 months
Total Selenium 500 mL plastic NM HNO3, pH ≤2 6 months
Total Thallium 500 mL plastic NM HNO3, pH ≤2 6 months
Total Antimony 500 mL plastic NM HNO3, pH ≤2 6 months
Algae:
Chlorophyll a,
phytoplankton
Filter Cool to -20 degrees C. 21 days
Volatile Organics Glass with Teflon-lined
septum caps (40 mL) 1:1 HCL (no headspace) 14 days
Hydrocarbons (Oil and Amber glass (1000 mL) 1:1 H2SO4, pH ≤2 28 days (O&G)
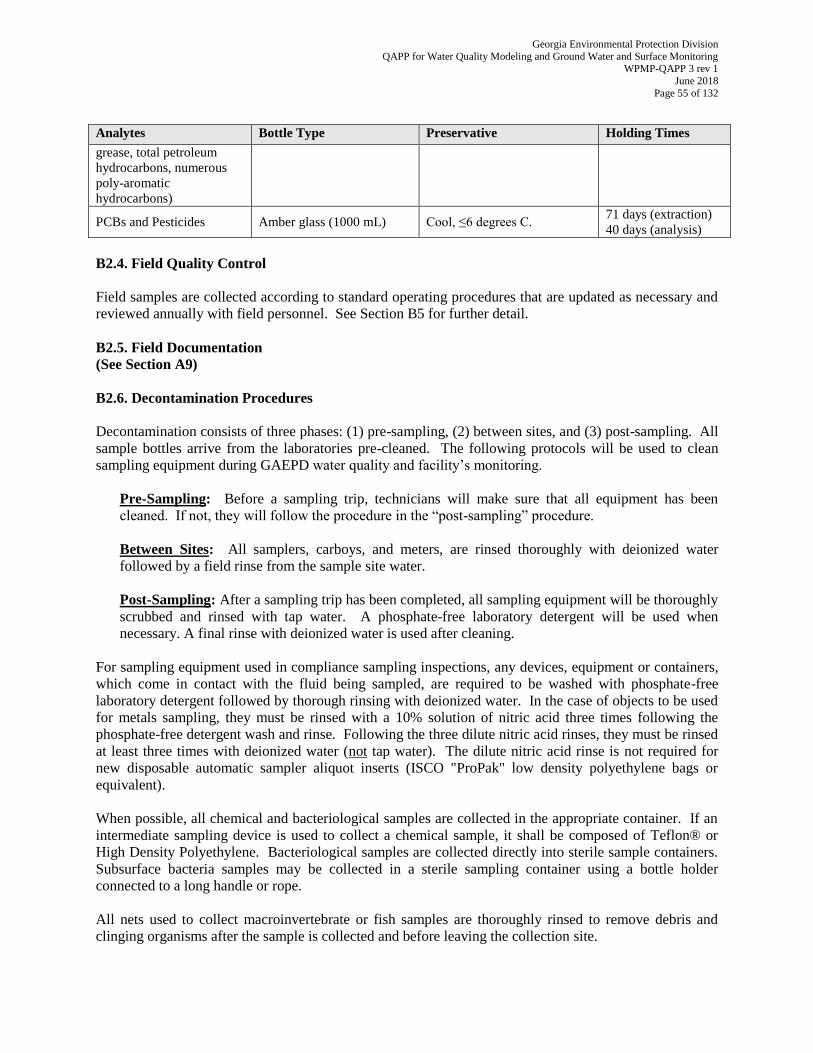
Georgia Environmental Protection Division
QAPP for Water Quality Modeling and Ground Water and Surface Monitoring WPMP-QAPP 3 rev 1
June 2018
Page 55 of 132
Analytes Bottle Type Preservative Holding Times
grease, total petroleum
hydrocarbons, numerous
poly-aromatic
hydrocarbons)
PCBs and Pesticides Amber glass (1000 mL) Cool, ≤6 degrees C. 71 days (extraction)
40 days (analysis)
B2.4. Field Quality Control
Field samples are collected according to standard operating procedures that are updated as necessary and
reviewed annually with field personnel. See Section B5 for further detail.
B2.5. Field Documentation
(See Section A9)
B2.6. Decontamination Procedures
Decontamination consists of three phases: (1) pre-sampling, (2) between sites, and (3) post-sampling. All
sample bottles arrive from the laboratories pre-cleaned. The following protocols will be used to clean
sampling equipment during GAEPD water quality and facility’s monitoring.
Pre-Sampling: Before a sampling trip, technicians will make sure that all equipment has been
cleaned. If not, they will follow the procedure in the “post-sampling” procedure.
Between Sites: All samplers, carboys, and meters, are rinsed thoroughly with deionized water
followed by a field rinse from the sample site water.
Post-Sampling: After a sampling trip has been completed, all sampling equipment will be thoroughly
scrubbed and rinsed with tap water. A phosphate-free laboratory detergent will be used when
necessary. A final rinse with deionized water is used after cleaning.
For sampling equipment used in compliance sampling inspections, any devices, equipment or containers,
which come in contact with the fluid being sampled, are required to be washed with phosphate-free
laboratory detergent followed by thorough rinsing with deionized water. In the case of objects to be used
for metals sampling, they must be rinsed with a 10% solution of nitric acid three times following the
phosphate-free detergent wash and rinse. Following the three dilute nitric acid rinses, they must be rinsed
at least three times with deionized water (not tap water). The dilute nitric acid rinse is not required for
new disposable automatic sampler aliquot inserts (ISCO "ProPak" low density polyethylene bags or
equivalent).
When possible, all chemical and bacteriological samples are collected in the appropriate container. If an
intermediate sampling device is used to collect a chemical sample, it shall be composed of Teflon® or
High Density Polyethylene. Bacteriological samples are collected directly into sterile sample containers.
Subsurface bacteria samples may be collected in a sterile sampling container using a bottle holder
connected to a long handle or rope.
All nets used to collect macroinvertebrate or fish samples are thoroughly rinsed to remove debris and
clinging organisms after the sample is collected and before leaving the collection site.
Georgia Environmental Protection Division
QAPP for Water Quality Modeling and Ground Water and Surface Monitoring WPMP-QAPP 3 rev 1
June 2018
Page 56 of 132
B2.7. System Failure and Corrective Action
All sampling sites are identified prior to beginning sampling in the monitoring calendar or fiscal year and
every attempt is made to collect all of the samples required by the project at each site. In the event that an
unexpected problem arises with the site, equipment failure or inability for the designated laboratory to
complete analyses for the samples received, the measures outlined in Section B2.7.1 below will be taken.
B2.7.1. Sample Collection/Laboratory Analyses
a. If a sample cannot be collected as scheduled (flooding, dry, equipment failure,
temporary inaccessibility, etc.) the project manager or their designee is notified and
the sampling event is rescheduled as soon as possible. If the site has become
permanently inaccessible, it is moved upstream or downstream to the nearest
accessible location.
b. If equipment becomes inoperable in the field, sampling is rescheduled when properly
functioning equipment is available.
c. If samples are lost, or arrive at the laboratory after the holding time has expired, the
laboratory notifies the contact at GAEPD responsible for data collection, and the
affected sample sites are rescheduled. If samples are lost due to a laboratory
accident, the laboratory will notify the GAEPD contact for the project and re-
sampling will be scheduled.
d. Any laboratory instrument that fails QC procedures shall not be used until the
problem is corrected. Duplicate, laboratory fortified blank, laboratory fortified
matrix, and method blanks that fail to meet goals are immediately reviewed for the
source of error.
e. In the event that it is not possible to collect a sample, monitoring is rescheduled as
soon as possible.
B3. Sample Handling and Custody Requirements
B3.1. Sample Processing
Water samples collected at each site will be processed on site. Sample processing will be accomplished
in 4 steps: (1) sample splitting, (2) preserving the sample, (3) storing the sample, and (4) shipment of
samples to the laboratory.
1. Sample Splitting: Samples will be split when sub-samples are needed for different
laboratory analyses. Splitting ensures that all bottles contain an equal amount of all
constituents in the bulk water sample.
2. Sample Preservation: Nutrient samples are preserved with 5 mL 10% H2SO4 for a 250
mL sample. Bacteria samples are preserved with sodium thiosulfate to absorb any
chlorine that may be present during sampling. Trace metal samples are acidified with
nitric acid (HNO3) to a pH <2.
3. Sample Storage: All samples are place immediately on ice and maintained at ≤ 4 °C
until they reach the appropriate laboratory.
4. Sample Shipping: Samples are either delivered directly or shipped to the laboratory in
order to arrive within 24 hours of the first sampling event. A chain-of-custody form
Georgia Environmental Protection Division
QAPP for Water Quality Modeling and Ground Water and Surface Monitoring WPMP-QAPP 3 rev 1
June 2018
Page 57 of 132
designating the shipper and shipping date and type of sample will accompany the
samples.
Samples that are shipped to the laboratory are placed in ice so a temperature of ≤ 4 °C can be maintained.
A heavy bag will be placed in the shipping cooler and the samples will be placed inside the bag. Ice will
then be poured over the samples and sealed within the bags. Before shipping, the associated chain-of-
custody forms are be placed in the cooler in a zipper-lock sealable plastic bag and taped to the under-side
of the ice chest lid. Shipping containers for chilled samples are high-impact-resistant plastic ice chests.
Shipping containers will meet the requirements of the shipping company. All sample bottles will be
clearly identified with the sample information. The chain-of-custody form contained on the inside of each
sampling container will clearly identify the contents and destination. The outside of the shipping
container will be clearly marked with the origin and destination of the shipment. Information on special
handling of any sample shipment will be clearly identified on the outside of each container.
Chlorophyll a samples for lake work require storage in dark bottles and filtration upon returning from the
field. Filters generated must be stored on dry ice until delivered to a laboratory for processing. A
laboratory must process the frozen filters within 22 days of delivery.
B3.2. Sample Custody Procedure
The purpose of sample chain-of-custody forms is to document and maintain the integrity of all samples
during collection, transportation, analysis, and reporting of analytical results.
Chain of Custody
Waterproof labels are used to identify samples. Each label contains the following information:
monitoring location number, monitoring location description, collection date, collection time, and sample
collector.
Other information may be entered on the sample label if space permits. However, any other information
entered on the label must not interfere with the clarity of the required information. Sample labels will be
preprinted and/or filled out in indelible, waterproof ink.
The chain-of-custody contains the same information as the sample label and indicates which analyses to
perform on the sample. A sample set is a collection of sample bottles with the same monitoring location
number, monitoring location description, collection date, collection time, and sample collector. This
form serves as an unbroken link between the sample collectors, sample deliverers/shippers, and the
laboratory. See Appendix E for example chain-of-custody form.
Transfer of Custody and Shipment
Samples and their containers are kept in a secure storage area until they are delivered to the laboratory or
transferred to a commercial courier. Sample containers are sealed prior to delivery to the courier. The
shipper will sign a receipt for the transfer of the sample container from their custody and these receipts
will be kept in a file located in the field office. Before the shipper is released from custody of the
samples, the laboratory will carefully examine the sample container to ensure that it has not been
tampered with and that the container was received by the required time.
Laboratory Custody Procedures
All samples received by the laboratories are checked for label identification, chain-of-custody forms and
any discrepancies. Each sample will be assigned a unique laboratory identification number that will be
written on the sample bottle and on the Water Quality Laboratory Source Document form. Samples will
Georgia Environmental Protection Division
QAPP for Water Quality Modeling and Ground Water and Surface Monitoring WPMP-QAPP 3 rev 1
June 2018
Page 58 of 132
be stored at the appropriate temperature (4 °C in most instances). Internal chain-of-custody procedures
will track the sample from storage through all analytical procedures and its return to storage. Samples
will be held in secure storage until disposal or return to sampling organization. The Laboratory Managers
at both laboratories are the responsible authorities for the samples once they are received from the
shipper. The GAEPD laboratory tracks samples via a Laboratory Information Management System
(LIMS). The GAEPD ensures that similar mechanisms are in place for any contract labs it employs.
B4. Analytical Methods
All samples are analyzed using standard protocols and in accordance with USEPA, Standard Methods
(latest edition), and 40 CFR Part 136.
B4.1. Laboratory SOPs
EPD and contract laboratories follow their most current and approved SOPs. See QAPP CD for specific
Laboratory SOPs.
B4.2. Analytical Units, Methods, and Holding Times
The methods and associated holding times for common GAEPD parameters are provided in Table 10 and
11 primarily for the GAEPD and UGA laboratories. GAEPD ensures that identical (or similar)
established methods are employed by all contract labs in order to be able to compare data from different
labs.
Detection limits using these methods can vary with labs (temporally) and among different labs. For
detection limit information, see Table 6 (Element A9 – Quality Objectives).
B4.3. Lab Data Qualifiers
The GAEPD laboratory makes every effort to avoid the use of data qualifiers through sound lab practices
such as efficient sample tracking, expedient analysis and re-testing. In some instances, however,
qualification of data is necessary and, in all cases, helpful when needed. The GAEPD LIMs may use the
following standard data qualifiers/test results for GAEPD analytes.
GAEPD LIMS Qualifiers:
“TIE” = Tentatively Identified and Estimated (Mass Spectral Library identification).
“B” = Analyte detected above RL in the method blank unless “trace” is reported.
“D” = Analytical results reported are based on a dilution of the sample analyzed on
the date indicated in the sample comment.
“E” = Estimated value due to analysis associated reasons, further explained in the
comment along with the associated corrective action.
“J” = Estimated value due to unacceptable data quality objective or improper
laboratory analysis protocol. Reason for usage must be defined in the sample
comment.
“Trace” = Reported value between the method detection limit and the RL.
“TNTC” = Too many colonies present on the filter membrane to count
(microbiological).
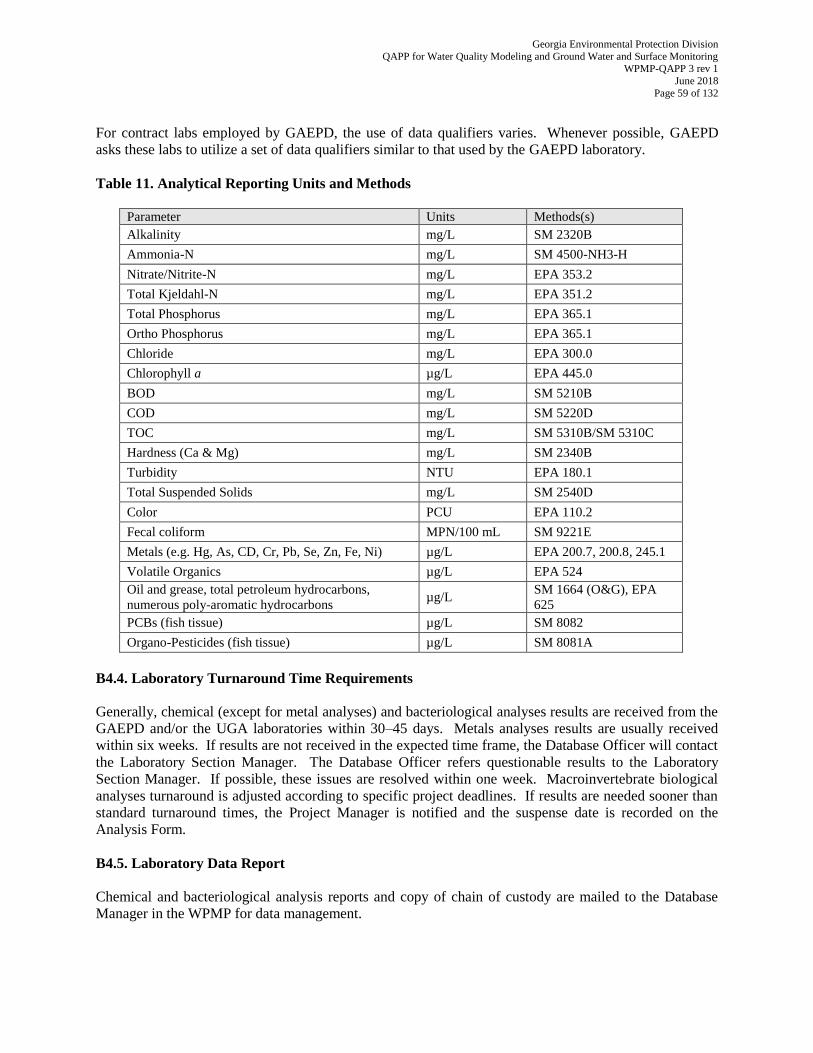
Georgia Environmental Protection Division
QAPP for Water Quality Modeling and Ground Water and Surface Monitoring WPMP-QAPP 3 rev 1
June 2018
Page 59 of 132
For contract labs employed by GAEPD, the use of data qualifiers varies. Whenever possible, GAEPD
asks these labs to utilize a set of data qualifiers similar to that used by the GAEPD laboratory.
Table 11. Analytical Reporting Units and Methods
Parameter Units Methods(s)
Alkalinity mg/L SM 2320B
Ammonia-N mg/L SM 4500-NH3-H
Nitrate/Nitrite-N mg/L EPA 353.2
Total Kjeldahl-N mg/L EPA 351.2
Total Phosphorus mg/L EPA 365.1
Ortho Phosphorus mg/L EPA 365.1
Chloride mg/L EPA 300.0
Chlorophyll a µg/L EPA 445.0
BOD mg/L SM 5210B
COD mg/L SM 5220D
TOC mg/L SM 5310B/SM 5310C
Hardness (Ca & Mg) mg/L SM 2340B
Turbidity NTU EPA 180.1
Total Suspended Solids mg/L SM 2540D
Color PCU EPA 110.2
Fecal coliform MPN/100 mL SM 9221E
Metals (e.g. Hg, As, CD, Cr, Pb, Se, Zn, Fe, Ni) µg/L EPA 200.7, 200.8, 245.1
Volatile Organics µg/L EPA 524
Oil and grease, total petroleum hydrocarbons,
numerous poly-aromatic hydrocarbons µg/L
SM 1664 (O&G), EPA
625
PCBs (fish tissue) µg/L SM 8082
Organo-Pesticides (fish tissue) µg/L SM 8081A
B4.4. Laboratory Turnaround Time Requirements
Generally, chemical (except for metal analyses) and bacteriological analyses results are received from the
GAEPD and/or the UGA laboratories within 30–45 days. Metals analyses results are usually received
within six weeks. If results are not received in the expected time frame, the Database Officer will contact
the Laboratory Section Manager. The Database Officer refers questionable results to the Laboratory
Section Manager. If possible, these issues are resolved within one week. Macroinvertebrate biological
analyses turnaround is adjusted according to specific project deadlines. If results are needed sooner than
standard turnaround times, the Project Manager is notified and the suspense date is recorded on the
Analysis Form.
B4.5. Laboratory Data Report
Chemical and bacteriological analysis reports and copy of chain of custody are mailed to the Database
Manager in the WPMP for data management.
Georgia Environmental Protection Division
QAPP for Water Quality Modeling and Ground Water and Surface Monitoring WPMP-QAPP 3 rev 1
June 2018
Page 60 of 132
If biological assessment is performed in-house, all records are available and placed in the project file. If
taxonomic identification is contracted to an outside laboratory, the results are mailed to the Project
Manager. The biological reporting package will include:
Macroinvertebrate taxonomic identification report
List of taxonomic references utilized
Macroinvertebrate bench sheets
Chain of custody form
B4.6. Safety and Hazardous Material Disposal Requirements
Macroinvertebrate samples are maintained at least five years after the sample is processed and identified.
Since macroinvertebrate samples are preserved in 95% ethanol, they are considered hazardous waste and
are disposed in accordance with MSDS. The Laboratory QA Plan describes handling and disposal
protocols for chemicals used in sample analyses.
B4.7. Method Validation
Chemical analyses results are validated by periodically comparing data systems results with manually
calculated results and reviewing all data. No non-standard or unpublished analyses methods are approved
for 106 monitoring.
Biological data is validated by comparing single habitat samples to multi-habitat samples in 25 sub-
ecoregions with no significant difference in index results.
B4.8. Corrective Action Process for Analytical System Failure
Any instrument failing QC standard is removed from service until the problem is corrected. Corrective
action procedures for Laboratory analyses are described in the Laboratory QA Plan
B5. Quality Control
All modeling and monitoring staff follow the policies and procedures detailed in the GAEPD Standard
Operating Procedures (SOPs), Quality Management Plan (QMP), and this Quality Assurance Project Plan
(QAPP). In general, training programs, materials, manuals, and reports prepared by GAEPD will be
subjected to internal or external technical and editorial reviews before the final versions are submitted.
B5.1. Modeling Quality Control
The data quality of model input and output is addressed, in part, by the training and experience of project
staff (Section A9) and documentation of project activities (Section A10). This QAPP and other
supporting materials will be distributed to all personnel involved in model development. The Project
Managers will ensure that all surface water quality modeling tasks are carried out in accordance with the
QAPP. Staff performance will be reviewed to ensure adherence to project protocols.
QC is defined as the process by which QA is implemented. All project modelers will conform to the
following guidelines:
All modeling activities including data interpretation, load calculations, or other related
computational activities are subject to audit or peer review. Thus, the modelers are
Georgia Environmental Protection Division
QAPP for Water Quality Modeling and Ground Water and Surface Monitoring WPMP-QAPP 3 rev 1
June 2018
Page 61 of 132
instructed to maintain careful written and electronic records for all aspects of model
development.
A record of where the data used in the analysis was obtained will be kept, and any
information on data quality will be documented in the final report.
Surveillance of each modeler’s work will be conducted periodically by the GAEPD Unit QA/QC Officer
or the QA/QC Officer’s designee. Modelers will be asked to provide verbal status reports of their work at periodic modeling workgroup meetings. Detailed modeling documentation will be made available to
members of the modeling workgroup as necessary.
The ability of computer code to represent model theory accurately will be ensured by following rigorous
programming protocols, including documentation within the source code. Specific tests will be required
of all model revisions to ensure that fundamental operations are verified to the extent possible. These
tests include testing of numerical stability and convergence properties of the model code algorithms, if
appropriate. Model results will be generally checked by comparing results to those obtained by other
models or by comparison to hand calculations. Visualization of model results will assist in determining
whether model simulations are realistic. Model calculations will be compared to field data. If
adjustments to model parameters are made to obtain a “fit” to the data, the modelers will provide an
explanation and justification that must agree with scientific knowledge and with process rates within
reasonable ranges as found in the literature.
Both project-generated and non-project-generated data will be used for model development and
calibration. The QA procedures for project-generated data and database development have been
discussed elsewhere in this document. All analytical data for the model’s target parameters and most
supporting data will have been verified through field QAPP processes before release to the modelers.
The DQOs were discussed in Sections A.7 and A.8 of this document. Rigorous examination of precision,
accuracy, completeness, representativeness, detectability, and comparability will be conducted on project-
generated data under direction of the project managers. Project-generated data will be verified and
validated using a process that controls measurement uncertainty, evaluates data, and flags or codes data
against various criteria. This portion of the QA process is also associated with the final database
construction. Modelers will cross-check data for bias, outliers, normality, completeness, precision,
accuracy, and other potential problems.
Non-project-generated data may be obtained from either published or unpublished sources and the
modelers will examine these data as part of a data quality assessment. Databases that have not been
published are also examined in light of a data quality assessment. Data provided by other sources will be
assumed to meet precision objectives established by those entities. The acceptance criteria for individual
data values generally address the issues described in the Appendix C.
B5.2. Field Quality Control
Duplicate field samples for estimating overall precision taken at approximately 10% of the total number
of samples. In addition, ambient field blanks are taken at 5% of the total samples to evaluate blank
contamination from field activities.
Analytical data from equipment blanks is used to determine the potential for cross contamination between
field sampling locations. The water for the equipment blank will be certified inorganic blank water
(IBW). Bacteria and BOD field blanks will use sterile buffer water poured into the sample bottles and
Georgia Environmental Protection Division
QAPP for Water Quality Modeling and Ground Water and Surface Monitoring WPMP-QAPP 3 rev 1
June 2018
Page 62 of 132
sent to the laboratory for analysis. See Table 12 for field sampling quality control requirements for water
quality analytes and Table 13 for quality control requirements for multiprobe instruments (including
continuous deployment).
Training sessions are held in the fall prior to the start of the new sampling year to ensure that field
measurements and samples will be taken consistent with accepted and approved SOPs. In addition, field
checks or audits are performed by GAEPD’s QC Officer to ensure consistent application of field
protocols among different field crews.
B5.3. Lab Quality Control
Required lab quality control procedures include detailed recordkeeping, current SOPs, performance
evaluations, lab blank, duplicate and matrix spike analyses, and control and calibration charts. For
detailed descriptions of calibration and maintenance procedures for GAEPD and the UGA Laboratories,
see the applicable Laboratory QAPs and SOPs, adopted herein by reference.
GAEPD requests quality control data from all labs with submitted data packages. These data are used in
data validation.
B6. Instrument/ Equipment Testing, Inspection and Maintenance
B6.1. Computer Maintenance
Water quality modeling will involve the acquisition or processing of data and the generation of reports
and documents, both of which require the maintenance of computer resources. GAEPD computers are
covered by on-site service agreements. When a problem with a microcomputer occurs, state-contracted
computer specialists diagnose the trouble and correct it if possible. When outside assistance is necessary,
the computer specialists call the appropriate vendor. For other computer equipment requiring outside
repair services and not currently covered by a service contract, local computer service companies are used
on a time-and-materials basis. Routine maintenance on microcomputers is performed by state
contractors. Electric power to each microcomputer flows through a surge suppressor to protect electronic
components from potentially damaging voltage spikes. All computer users have been instructed on the
importance of routinely archiving project data files from hard drive to external disk storage. The GAEPD
office network server is backed up on tape nightly during the week. Screening for viruses on electronic
files loaded on microcomputers or the network is standard GAEPD policy. Automated screening systems
have been placed on GAEPD’s computer systems and are updated regularly to ensure that viruses are
identified and destroyed promptly.
B6.2. Purpose/ Background/Measurement Traceability
Field staff is responsible for regular cleaning, inspection, and maintenance of their assigned equipment.
All equipment should be visually inspected daily for damage or dirt, and repaired or cleaned if needed
before use. If meters are stored for long periods (greater than 1 week) without being used, it is
recommended that they be calibrated and inspected at least weekly to keep them in good working order.
Measurement systems and equipment calibrations are verified accurate to established criteria and are
traceable to national standards of measurement or reference materials. All verifications are ensured
before a measurement system or support equipment is utilized in the generation of analytical data.
All recordings for instrument calibration are kept in bound calibration logbooks in the calibration
laboratory located at the WPB’s 7 MLK office in Atlanta, GA, or the associated regional office.
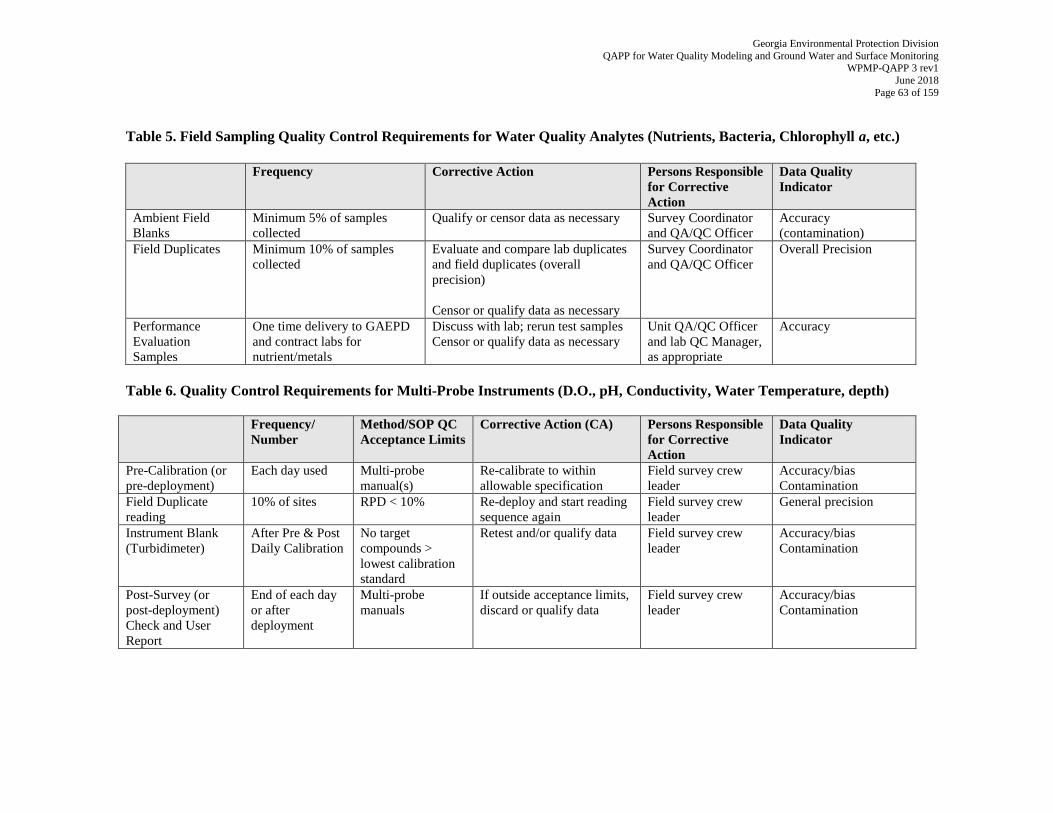
Georgia Environmental Protection Division
QAPP for Water Quality Modeling and Ground Water and Surface Monitoring WPMP-QAPP 3 rev1
June 2018
Page 63 of 159
Table 5. Field Sampling Quality Control Requirements for Water Quality Analytes (Nutrients, Bacteria, Chlorophyll a, etc.)
Frequency Corrective Action Persons Responsible
for Corrective
Action
Data Quality
Indicator
Ambient Field
Blanks
Minimum 5% of samples
collected
Qualify or censor data as necessary Survey Coordinator
and QA/QC Officer
Accuracy
(contamination)
Field Duplicates Minimum 10% of samples
collected
Evaluate and compare lab duplicates
and field duplicates (overall
precision)
Censor or qualify data as necessary
Survey Coordinator
and QA/QC Officer
Overall Precision
Performance
Evaluation
Samples
One time delivery to GAEPD
and contract labs for
nutrient/metals
Discuss with lab; rerun test samples
Censor or qualify data as necessary
Unit QA/QC Officer
and lab QC Manager,
as appropriate
Accuracy
Table 6. Quality Control Requirements for Multi-Probe Instruments (D.O., pH, Conductivity, Water Temperature, depth)
Frequency/
Number
Method/SOP QC
Acceptance Limits
Corrective Action (CA) Persons Responsible
for Corrective
Action
Data Quality
Indicator
Pre-Calibration (or
pre-deployment)
Each day used Multi-probe
manual(s)
Re-calibrate to within
allowable specification
Field survey crew
leader
Accuracy/bias
Contamination
Field Duplicate
reading
10% of sites RPD < 10% Re-deploy and start reading
sequence again
Field survey crew
leader
General precision
Instrument Blank
(Turbidimeter)
After Pre & Post
Daily Calibration
No target
compounds >
lowest calibration
standard
Retest and/or qualify data Field survey crew
leader
Accuracy/bias
Contamination
Post-Survey (or
post-deployment)
Check and User
Report
End of each day
or after
deployment
Multi-probe
manuals
If outside acceptance limits,
discard or qualify data
Field survey crew
leader
Accuracy/bias
Contamination
Georgia Environmental Protection Division
QAPP for Water Quality Modeling and Ground Water and Surface Monitoring WPMP-QAPP 3 rev 1
June 2018
Page 64 of 132
Instrumentation calibrated and maintained by field staff are kept in separate calibration logbooks located
in their offices. Instruments are identified by model and serial number. Field recordings are maintained
for each of the parameters obtained from the Hydrolab Multi-probe DataSonde (water temperature,
specific conductance, pH, and dissolved oxygen) in field books with the model and serial number of the
instrument used. All spare parts for field meters are kept in a room dedicated for the use at the WPB’s 7
MLK office in Atlanta, and at the Cartersville, Tifton and Brunswick District offices. Analytical data
provided by the laboratories are cross-referenced against the field notebooks maintained for the project
for each sampling date.
Stock solutions or standard grade chemicals for calibration of measurement systems are obtained from
commercial vendors under contract with the GAEPD or directly with the laboratories. All stock solutions
are certified traceable to national standards. Standard reference numbers are recorded with the instrument
calibration records.
For detailed descriptions of inspection, testing, and maintenance procedures for GAEPD and other
contract laboratories, see the applicable Lab QAPs and SOPs, adopted herein by reference.
B6.3. Testing, Inspection, and Maintenance
The thermometer is the only field instrument used to collect a field parameter that is not an aquatic
parameter and therefore is not obtained from multi-probe DataSonde. The thermometer measures air
temperature at the time of collection. Values will be recorded to the nearest 0.5° C. Each new
thermometer will be standardized once. Before each measurement, the thermometer will be checked for
liquid separation. After use, the thermometer will be stored in a protective case.
B7. Instrument/ Equipment Calibration
B7.1. Model Calibration
A model calibration is a measure of how well the model results represent field data. Because surface
water quality modeling looks at a variety of scenarios that may, in many cases, require enormous capital
expenditures, the use of a calibrated model, the scientific veracity of which is well defined, is of
paramount importance.
The Project Managers will direct the model calibration efforts. Some model parameters will need to be
estimated using site-specific field data for the application of the model. Some example parameters
follow:
Kinetic coefficients and parameters (e.g., partition coefficients, decay coefficients)
Forcing terms (e.g., sources and sinks for state variables)
Boundary conditions (specified concentrations, flows)
Models are often calibrated through a subjective trial-and-error adjustment of model input data because a
large number of interrelated factors influence model output. However, the experience and judgment of
the modeler are a major factor in calibrating a model both accurately and efficiently. The model
calibration “goodness of fit” measure may be either qualitative or quantitative. Qualitative measures of
calibration progress are commonly based on the following:
Graphical time-series plots of observed and predicted data.
Graphical transect plots of observed and predicted data at a given time interval.
Georgia Environmental Protection Division
QAPP for Water Quality Modeling and Ground Water and Surface Monitoring WPMP-QAPP 3 rev 1
June 2018
Page 65 of 132
Comparison between contour maps of observed and predicted data, providing
information on the spatial distribution of the error.
Scatter plots of observed versus predicted values in which the deviation of points
from a 45-degree straight line gives a sense of fit.
Tabulation of measured and predicted values and their deviations.
The surface water quality models will be calibrated to the best available data, including literature values
and interpolated or extrapolated existing field data. If multiple data sets are available, an appropriate time
period and corresponding data set will be chosen based on factors characterizing the data set, such as
corresponding weather conditions, amount of data, and temporal and spatial variability of data. The
model will be considered calibrated when it reproduces data within an acceptable level of accuracy.
During the initial application of the model, it might be determined that primary data should be collected to
better characterize the model inputs; in most cases, however, it is not feasible to collect additional data for
use in model setup, calibration, or validation, and the modeling effort depends on the best available data.
If primary data must be collected to better characterize the model inputs, a field operations will be
performed under the GAEPD Groundwater and Surface Water Monitoring QAPP.
B7.2. Field Instrument Calibration
The field instruments requiring calibration are the specific conductance meter, the pH meter, and the
dissolved oxygen meter. The thermometer used in the field sampling is standardized prior to issue and
this standardization is checked periodically to ensure the reliability of the measurements. Instrument
calibrations are recorded in a bound calibration logbook with entries recorded with identifying instrument
model and serial number. Table 14 provides the calibration and maintenance activities for field
equipment and instrumentation.
For detailed descriptions of calibration procedures for GAEPD and other contract laboratories, see the
applicable Laboratory QA Plan and SOPs, adopted herein by reference.
B8. Inspection of Supplies
The GAEPD Laboratory performs quality assurance of sample bottles, reagents, and chemical
preservatives that are provided to field staff. Containers that are purchased as pre-cleaned should be
certified by the manufacturer or checked to ensure that the parameters tested are below the published
reporting limits. Containers should be stored in a manner that does not leave them susceptible to
contamination by dust or other particulates and should remain capped until use. Any containers that show
evidence of contamination should be discarded. The Laboratory QC Manager should keep certificates for
glass containers certified by the manufacturer on file.
Additionally, field staff should inspect all bottles before use. Any bottles that are visibly dirty or whose
lids have come off during storage should be discarded. It is recommended that field staff periodically
check bottles for contamination attributed to storage conditions by filling representative containers with
analyte-free water, adding the appropriate preservative(s), and submitting them to the laboratory for
metals and wet chemistry analyses. Any container lots showing analyte levels at or above the reporting
limits should be discarded.
The majority of chemical preservatives used by the GAEPD are either provided by the GAEPD
Laboratory as pre-measured, sealed glass ampules or from a manufacturer with certificates of purity. The
certificates are kept on file in the GAEPD 7 MLK office. Any preservatives that show signs of
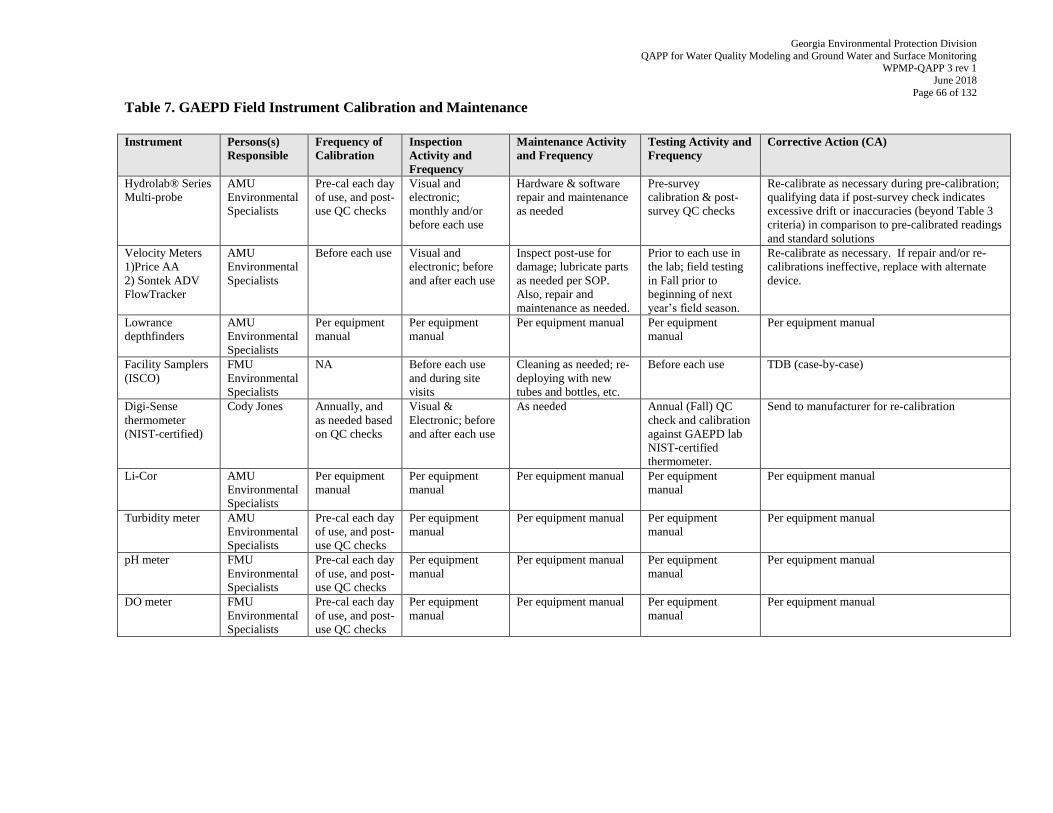
Georgia Environmental Protection Division
QAPP for Water Quality Modeling and Ground Water and Surface Monitoring WPMP-QAPP 3 rev 1
June 2018
Page 66 of 132
Table 7. GAEPD Field Instrument Calibration and Maintenance
Instrument Persons(s)
Responsible
Frequency of
Calibration
Inspection
Activity and
Frequency
Maintenance Activity
and Frequency
Testing Activity and
Frequency
Corrective Action (CA)
Hydrolab® Series
Multi-probe
AMU
Environmental
Specialists
Pre-cal each day
of use, and post-
use QC checks
Visual and
electronic;
monthly and/or
before each use
Hardware & software
repair and maintenance
as needed
Pre-survey
calibration & post-
survey QC checks
Re-calibrate as necessary during pre-calibration;
qualifying data if post-survey check indicates
excessive drift or inaccuracies (beyond Table 3
criteria) in comparison to pre-calibrated readings
and standard solutions
Velocity Meters
1)Price AA
2) Sontek ADV
FlowTracker
AMU
Environmental
Specialists
Before each use Visual and
electronic; before
and after each use
Inspect post-use for
damage; lubricate parts
as needed per SOP.
Also, repair and
maintenance as needed.
Prior to each use in
the lab; field testing
in Fall prior to
beginning of next
year’s field season.
Re-calibrate as necessary. If repair and/or re-
calibrations ineffective, replace with alternate
device.
Lowrance
depthfinders
AMU
Environmental
Specialists
Per equipment
manual
Per equipment
manual
Per equipment manual Per equipment
manual
Per equipment manual
Facility Samplers
(ISCO)
FMU
Environmental
Specialists
NA Before each use
and during site
visits
Cleaning as needed; re-
deploying with new
tubes and bottles, etc.
Before each use TDB (case-by-case)
Digi-Sense
thermometer
(NIST-certified)
Cody Jones Annually, and
as needed based
on QC checks
Visual &
Electronic; before
and after each use
As needed Annual (Fall) QC
check and calibration
against GAEPD lab
NIST-certified
thermometer.
Send to manufacturer for re-calibration
Li-Cor AMU
Environmental
Specialists
Per equipment
manual
Per equipment
manual
Per equipment manual Per equipment
manual
Per equipment manual
Turbidity meter AMU
Environmental
Specialists
Pre-cal each day
of use, and post-
use QC checks
Per equipment
manual
Per equipment manual Per equipment
manual
Per equipment manual
pH meter FMU
Environmental
Specialists
Pre-cal each day
of use, and post-
use QC checks
Per equipment
manual
Per equipment manual Per equipment
manual
Per equipment manual
DO meter FMU
Environmental
Specialists
Pre-cal each day
of use, and post-
use QC checks
Per equipment
manual
Per equipment manual Per equipment
manual
Per equipment manual
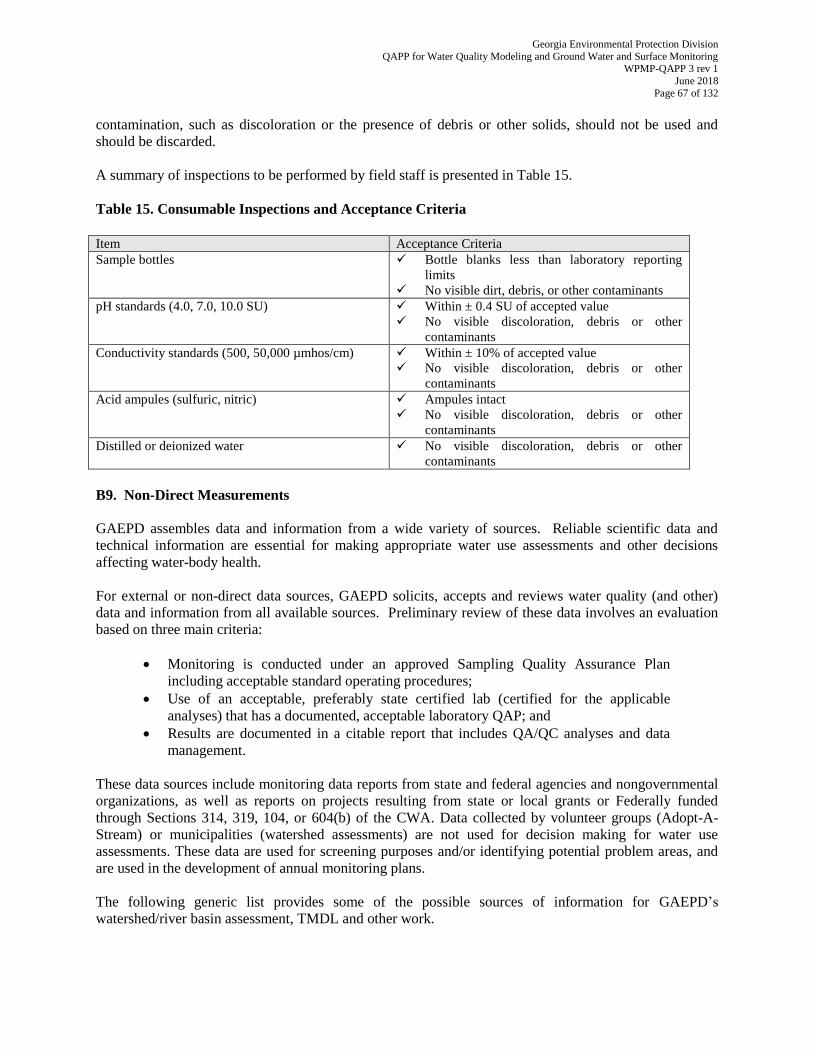
Georgia Environmental Protection Division
QAPP for Water Quality Modeling and Ground Water and Surface Monitoring WPMP-QAPP 3 rev 1
June 2018
Page 67 of 132
contamination, such as discoloration or the presence of debris or other solids, should not be used and
should be discarded.
A summary of inspections to be performed by field staff is presented in Table 15.
Table 15. Consumable Inspections and Acceptance Criteria
Item Acceptance Criteria
Sample bottles Bottle blanks less than laboratory reporting
limits
No visible dirt, debris, or other contaminants
pH standards (4.0, 7.0, 10.0 SU) Within ± 0.4 SU of accepted value
No visible discoloration, debris or other
contaminants
Conductivity standards (500, 50,000 µmhos/cm) Within ± 10% of accepted value
No visible discoloration, debris or other
contaminants
Acid ampules (sulfuric, nitric) Ampules intact
No visible discoloration, debris or other
contaminants
Distilled or deionized water No visible discoloration, debris or other
contaminants
B9. Non-Direct Measurements
GAEPD assembles data and information from a wide variety of sources. Reliable scientific data and
technical information are essential for making appropriate water use assessments and other decisions
affecting water-body health.
For external or non-direct data sources, GAEPD solicits, accepts and reviews water quality (and other)
data and information from all available sources. Preliminary review of these data involves an evaluation
based on three main criteria:
Monitoring is conducted under an approved Sampling Quality Assurance Plan
including acceptable standard operating procedures;
Use of an acceptable, preferably state certified lab (certified for the applicable
analyses) that has a documented, acceptable laboratory QAP; and
Results are documented in a citable report that includes QA/QC analyses and data
management.
These data sources include monitoring data reports from state and federal agencies and nongovernmental
organizations, as well as reports on projects resulting from state or local grants or Federally funded
through Sections 314, 319, 104, or 604(b) of the CWA. Data collected by volunteer groups (Adopt-A-
Stream) or municipalities (watershed assessments) are not used for decision making for water use
assessments. These data are used for screening purposes and/or identifying potential problem areas, and
are used in the development of annual monitoring plans.
The following generic list provides some of the possible sources of information for GAEPD’s
watershed/river basin assessment, TMDL and other work.
Georgia Environmental Protection Division
QAPP for Water Quality Modeling and Ground Water and Surface Monitoring WPMP-QAPP 3 rev 1
June 2018
Page 68 of 132
State Agencies
Federal Agencies
U.S. Geological Survey
U.S. Environmental Protection Agency
U.S. Fish and Wildlife Service
U.S. Army Corps of Engineers
National Oceanic and Atmospheric Administration National Climatic Data Center
Municipal Facilities Plans
Private Consulting Firms
Colleges, Universities and associated academic institutions
Watershed and lake associations (citizen monitoring programs)
Municipal and Industrial NPDES Permit Monitoring Requirements
Public drinking water systems
Other Sources
Non-project-generated data may be obtained from published or unpublished sources. The published
data will have some form of peer review. These data are generally examined by modelers as part of a
data quality assessment. Databases that have not been published are also examined in light of a data
quality assessment. Data provided by other sources are assumed to meet precision objectives
established by those entities. If historical data are used, a written record of where the data were
obtained and any information on their quality will be documented in the final report.
B10. Data Management
Some data are reported electronically and some only as hard copies. Due to the quantity and complexity
of information being produced, organized data management is critical to this program.
B10.1. GAEPD Databases
The GAEPD database system (as of 2018) is composed of the following primary databases:
GOMAS – Georgia envirOnmental Monitoring and Assessment System
o Water Quality Data
o Zooplankton Data
o Diatom Data
o Benthic Macroinvertebrate Data
o Fish Contaminant Data
o 303(d) list/TMDLs
o 305(b) Water Bodies
GAPDES - wastewater, stormwater, 401, and safe dams quality permitting database
The GOMAS database is formatted via MySQL, is dynamically linked to GIS. It is equipped to upload to
external databases, such as EPA’s WQX/STORET and ATTAINS. Each database has specific uses, and
the system is intended to allow fast, easy and standardized access to final data for various purposes.
STORET will be decommissioned in June 2018. STORET currently has minimal functionality and most
data has already been transferred to EPA’s new water quality database (Water Quality Portal).
Georgia Environmental Protection Division
QAPP for Water Quality Modeling and Ground Water and Surface Monitoring WPMP-QAPP 3 rev 1
June 2018
Page 69 of 132
B10.2. Field and Lab Data Entry
Each survey crew leader has primary responsibility for field-sheet data entry. They are additionally
responsible for ensuring the completeness and quality of field data prior to data entry. Internal GAEPD
lab managers are also responsible for lab data. A database entry module is provided by GAEPD’s
Database Manager to facilitate this transfer of information.
All completed GAEPD field sheets, notebook pages, and Chain-of Custody forms are filed with the
QA/QC Officer for preliminary review and hard copy filing. A significant amount of the data contained
on these forms will be entered into the GAEPD’s database. The files are stored at the Sloppy Floyd office
and managed by GAEPD’s Database Manager. Incomplete and/or erroneous field-recorded data and
information will be brought to the attention of the appropriate field crew, coordinator and/or person(s).
Field notebook page(s) will be photocopied and added to the final hard copy file.
Laboratory quality-controlled data from GAEPD’s Laboratory are sent via the LIMS to the WPB
electronically on an approximate monthly basis. These submittals are sent to the Database Manager for
preliminary QC checks relating to holding times and blank/duplicate frequencies. In addition, laboratory
data are also provided to the Database Manager on standard data forms sent via interoffice or via email
for each lab report for the hard copy file folders.
B10.3. Data Availability
After preliminary QC checks, data are available to users as draft data, subject to additional quality control
checks and evaluation. Draft data are for internal, departmental use only, and their use is subject to
management approval. After data validation has been completed, typically within 3-6 months of receipt
of lab data reports, the final data are available in the database and in hard copy files for internal/external
use. It may also be available in published reports.
Chemical and biological data will be sent to EPA’s Water Quality Portal database via WQX/STORET.
WQX/STORET is a repository for water quality, biological, and physical data and is used by state
environmental agencies, the USEPA and other federal agencies, universities, private citizens and many
others. The Water Quality Portal acts as the access point for all water quality data that flows through
WQX/STORET. The WQX website https://www.epa.gov/waterdata/water-quality-data-wqx includes data
retrieval instructions.
Georgia Environmental Protection Division
QAPP for Water Quality Modeling and Ground Water and Surface Monitoring WPMP-QAPP 3 rev 1
June 2018
Page 70 of 132
C. ASSESSMENT AND OVERSIGHT
C1. Assessments and Response Actions
The QA program under which the water quality modeling and monitoring project will operate
includes surveillance, with independent checks of the data obtained from sampling, analysis, and
data-gathering activities. This process is illustrated in Figure 2. The essential steps in the QA
program are as follows:
Identify and define the problem
Assign responsibility for investigating the problem
Investigate and determine the cause of the problem
Assign and accept responsibility for implementing appropriate corrective action
Establish the effectiveness of and implement the corrective action
Verify that the corrective action has eliminated the problem
Many of the technical problems that might occur can be solved on the spot by the staff members involved,
for example, by modifying the Initial Technical Approach or correcting errors or deficiencies in
documentation. Immediate corrective actions form part of normal operating procedures and are noted in
records for the project. Problems that cannot be solved in this way require more formalized, long-term
corrective action.
If quality problems that require attention are identified, GAEPD will determine whether attaining
acceptable quality requires either short- or long-term actions. If a failure in an analytical system occurs
(e.g., performance requirements are not met), the Project Manager will be responsible for corrective
action and will immediately inform the Program Manager or the QA/QC Officer, as appropriate.
Subsequent steps taken will depend on the nature and significance of the problem, as illustrated in Figure
2. The Project Manager has primary responsibility for monitoring the activities and identifying or
confirming any quality problems.
The Program Manager and Project Manager will be notified of major corrective actions and stop work
orders. Corrective actions may include the following:
Reemphasizing to staff the project objectives, the limitations in scope, the need to
adhere to the agreed-upon schedule and procedures, and the need to document QC
and QA activities.
Securing additional commitment of staff time to devote to the project.
Retaining outside consultants to review problems in specialized technical areas.
Changing procedures. The Project Manager may replace a staff member, if
appropriate, if it is in the best interest of the project to do so.
Performance audits are quantitative checks on different segments of project activities; they are most
appropriate for sampling, analysis, and data-processing activities. The Project Manager and/or QC
Officer is responsible for overseeing work as it is performed and periodically conducting internal
assessments during the data entry and analysis phases of the project.
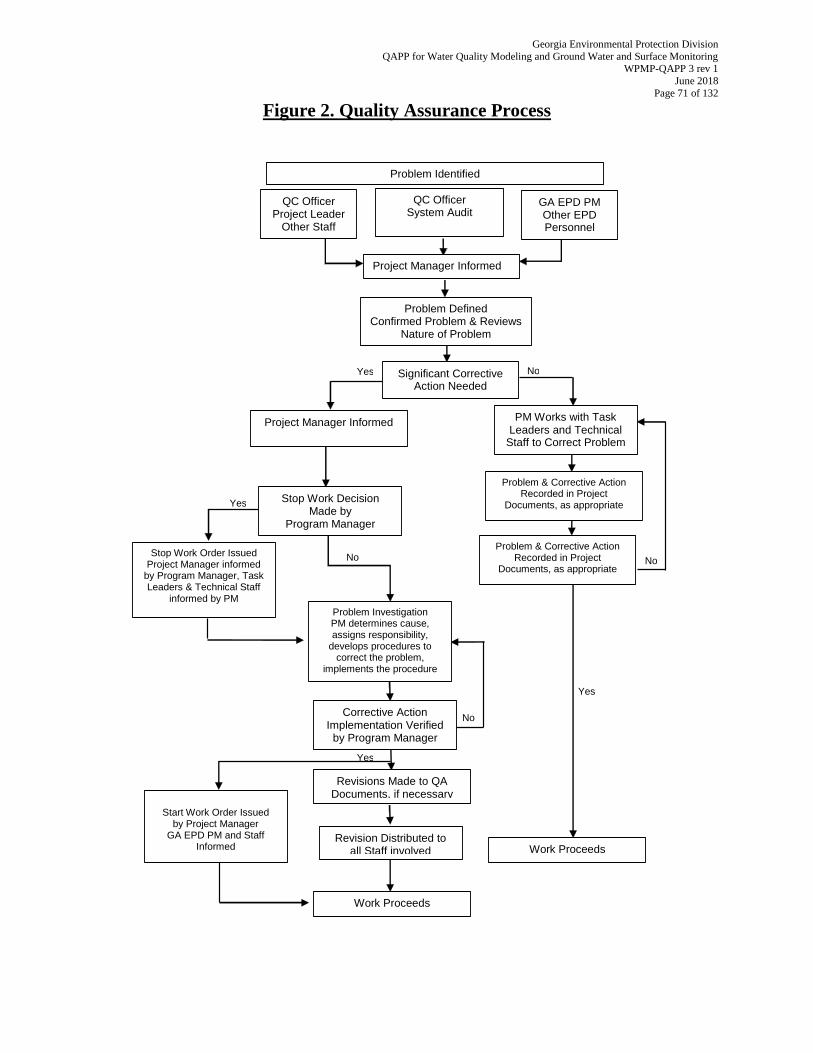
Georgia Environmental Protection Division
QAPP for Water Quality Modeling and Ground Water and Surface Monitoring WPMP-QAPP 3 rev 1
June 2018
Page 71 of 132
Figure 2. Quality Assurance Process
Yes No
Yes
No No
Yes
No
Yes
Problem Identified
QC Officer Project Leader
Other Staff
QC Officer System Audit
GA EPD PM Other EPD Personnel
Project Manager Informed
Problem Defined Confirmed Problem & Reviews
Nature of Problem
PM Works with Task Leaders and Technical
Staff to Correct Problem
Problem & Corrective Action Recorded in Project
Documents, as appropriate
Corrective Action Implementation Verified
by Program Manager Corrective Action has
been implemented
Stop Work Decision Made by
Program Manager
Stop Work Order Issued Project Manager informed
by Program Manager, Task Leaders & Technical Staff
informed by PM
Project Manager Informed
Significant Corrective Action Needed
Problem Investigation PM determines cause, assigns responsibility,
develops procedures to correct the problem,
implements the procedure
Start Work Order Issued
by Project Manager GA EPD PM and Staff
Informed
Work Proceeds
Work Proceeds
Problem & Corrective Action Recorded in Project
Documents, as appropriate
Revisions Made to QA Documents, if necessary
Revision Distributed to all Staff involved
Georgia Environmental Protection Division
QAPP for Water Quality Modeling and Ground Water and Surface Monitoring WPMP-QAPP 3 rev 1
June 2018
Page 72 of 132
C1.1 Modeling Response Actions
The Project Manager may perform or oversee the following qualitative and quantitative assessments
of model performance periodically to ensure that the model is performing the required task while
meeting the quality objectives:
Data acquisition assessments
Model calibration studies
Sensitivity analyses
Uncertainty analyses
Data quality assessments
Model evaluations
Internal peer reviews
Sensitivity to variations, or uncertainty in input parameters, is an important characteristic of a model.
Sensitivity analysis is used to identify the most influential parameters in determining the accuracy and
precision of model predictions. This information is important to the user who must establish the required
accuracy and precision in model application as a function of data quantity and quality. Sensitivity analysis quantitatively or semi-quantitatively defines the dependence of the model’s performance
assessment measure on a specific parameter or set of parameters. Sensitivity analysis can also be used to
decide how to simplify the model simulation and to improve the efficiency of the calibration process.
Model sensitivity can be expressed as the relative rate of change of selected output caused by a unit
change in the input. If the change in the input causes a large change in the output, the model is
considered to be sensitive to that input parameter. Sensitivity analysis methods are mostly non-statistical
or even intuitive by nature. Sensitivity analysis is typically performed by changing one input parameter at
a time and evaluating the effects on the distribution of the dependent variable. Nominal, minimum, and
maximum values are specified for the selected input parameter.
Initially, sensitivity analysis is performed at the beginning of the calibration process to design a
calibration strategy. After the calibration is completed, a more elaborate sensitivity analysis may be
performed to quantify the uncertainty in the calibrated model caused by uncertainty in the estimates of the
model input parameters.
Informal sensitivity analyses (iterative parameter adjustments) are generally performed during model
calibrations to ensure that reasonable values for model parameters will be obtained, resulting in
acceptable model results. The degree of allowable adjustment of any parameter is usually directly
proportional to the uncertainty of its value and is limited to its expected range of values. Formal
sensitivity analyses will be performed based on technical direction from the Program Manager when a
certain aspect of the system requires further investigation. For example, formal sensitivity analyses are
often performed on the effects of loadings from different sources on instream water quality to allow the
development of more feasible and reasonable allocations and load reductions based on the dominant
sources.
The Project Manager will perform surveillance activities throughout the duration of the project to ensure
that management and technical aspects are being properly implemented according to the schedule and
quality requirements specified in this QAPP. These surveillance activities may include assessing how
project milestones are achieved and documented, corrective actions are implemented, peer reviews are
performed, and data are managed.
Georgia Environmental Protection Division
QAPP for Water Quality Modeling and Ground Water and Surface Monitoring WPMP-QAPP 3 rev 1
June 2018
Page 73 of 132
System audits are qualitative reviews of project activity to check that the overall quality program is
functioning, and that the appropriate QC measures identified in the QAPP are being implemented. If
requested by US EPA, GAEPD will conduct an internal system audit and report results to US EPA.
C1.2. Organizational Assessments
Readiness reviews. A readiness review is a technical check to determine if all components of the
monitoring project are in place so work can commence on a specific phase. A readiness review will be
conducted in conjunction with annual 106 work plan development to ensure sufficient equipment, staffing
and funding are available. At a minimum, the following issues will be addressed:
1. Development of project specific Sampling Work Plans and availability and accessibility of an up-
to-date copy of the QAPP and all associated quality system SOPs to the project.
2. Availability of current reference documents including the following:
a. Most recent Monitoring and Assessment Program Plan.
b. Most recent SOPs for Macroinvertebrate Stream Surveys.
c. Most recent SOPs for Chemical and Bacteriological Sampling of Groundwater and
Surface Waters.
d. Most recent version of the 303(d) List.
e. Rules & Regulations for Water Quality Control, Chapter 391-3-6-.03 General Water
Quality Criteria.
3. Availability of electronic data sources including:
a. WQX/STORET – Water Quality Portal
b. ATTAINS
c. GOMAS
d. GAPDES
4. Availability of equipment, operating, and calibration instructions for the equipment, record sheets
and other necessary supplies.
5. Availability of appropriate sampling supplies and equipment.
6. Proper alignment of appropriate laboratory to receive the samples and accessibility of lab sheets,
tags and other necessary supplies.
7. Availability of staff.
8. Appropriate training of staff and opportunity for staff to resolve questions, concerns, and issues
prior to the onset of the monitoring project.
C1.3. Assessment of Project Activities
1. Readiness Review. Monitoring, analyses, and assessment staff is contacted to ensure appropriate
equipment, staffing, and funding are available.
2. Surveillance. Surveillance is the continual or frequent monitoring of the status of the project and
the analyses of records to ensure specified requirements are being fulfilled.
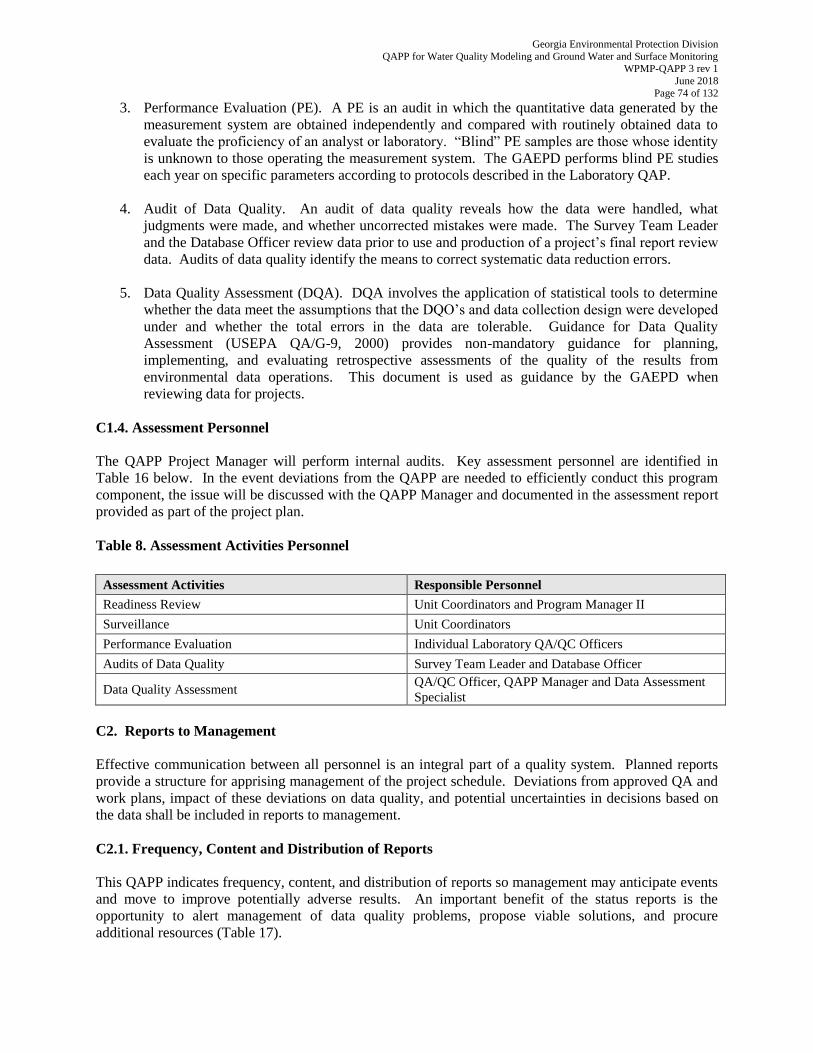
Georgia Environmental Protection Division
QAPP for Water Quality Modeling and Ground Water and Surface Monitoring WPMP-QAPP 3 rev 1
June 2018
Page 74 of 132
3. Performance Evaluation (PE). A PE is an audit in which the quantitative data generated by the
measurement system are obtained independently and compared with routinely obtained data to
evaluate the proficiency of an analyst or laboratory. “Blind” PE samples are those whose identity
is unknown to those operating the measurement system. The GAEPD performs blind PE studies
each year on specific parameters according to protocols described in the Laboratory QAP.
4. Audit of Data Quality. An audit of data quality reveals how the data were handled, what
judgments were made, and whether uncorrected mistakes were made. The Survey Team Leader
and the Database Officer review data prior to use and production of a project’s final report review
data. Audits of data quality identify the means to correct systematic data reduction errors.
5. Data Quality Assessment (DQA). DQA involves the application of statistical tools to determine
whether the data meet the assumptions that the DQO’s and data collection design were developed
under and whether the total errors in the data are tolerable. Guidance for Data Quality
Assessment (USEPA QA/G-9, 2000) provides non-mandatory guidance for planning,
implementing, and evaluating retrospective assessments of the quality of the results from
environmental data operations. This document is used as guidance by the GAEPD when
reviewing data for projects.
C1.4. Assessment Personnel
The QAPP Project Manager will perform internal audits. Key assessment personnel are identified in
Table 16 below. In the event deviations from the QAPP are needed to efficiently conduct this program
component, the issue will be discussed with the QAPP Manager and documented in the assessment report
provided as part of the project plan.
Table 8. Assessment Activities Personnel
Assessment Activities Responsible Personnel
Readiness Review Unit Coordinators and Program Manager II
Surveillance Unit Coordinators
Performance Evaluation Individual Laboratory QA/QC Officers
Audits of Data Quality Survey Team Leader and Database Officer
Data Quality Assessment QA/QC Officer, QAPP Manager and Data Assessment
Specialist
C2. Reports to Management
Effective communication between all personnel is an integral part of a quality system. Planned reports
provide a structure for apprising management of the project schedule. Deviations from approved QA and
work plans, impact of these deviations on data quality, and potential uncertainties in decisions based on
the data shall be included in reports to management.
C2.1. Frequency, Content and Distribution of Reports
This QAPP indicates frequency, content, and distribution of reports so management may anticipate events
and move to improve potentially adverse results. An important benefit of the status reports is the
opportunity to alert management of data quality problems, propose viable solutions, and procure
additional resources (Table 17).
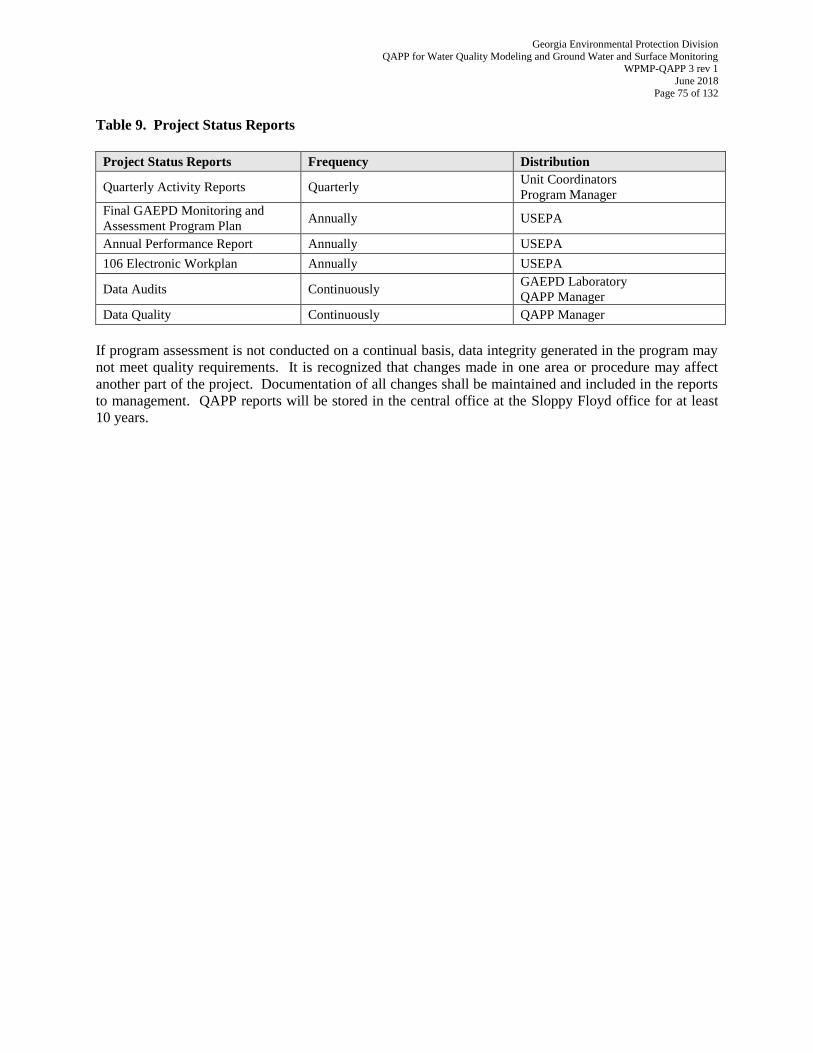
Georgia Environmental Protection Division
QAPP for Water Quality Modeling and Ground Water and Surface Monitoring WPMP-QAPP 3 rev 1
June 2018
Page 75 of 132
Table 9. Project Status Reports
Project Status Reports Frequency Distribution
Quarterly Activity Reports Quarterly Unit Coordinators
Program Manager
Final GAEPD Monitoring and
Assessment Program Plan Annually USEPA
Annual Performance Report Annually USEPA
106 Electronic Workplan Annually USEPA
Data Audits Continuously GAEPD Laboratory
QAPP Manager
Data Quality Continuously QAPP Manager
If program assessment is not conducted on a continual basis, data integrity generated in the program may
not meet quality requirements. It is recognized that changes made in one area or procedure may affect
another part of the project. Documentation of all changes shall be maintained and included in the reports
to management. QAPP reports will be stored in the central office at the Sloppy Floyd office for at least
10 years.
Georgia Environmental Protection Division
QAPP for Water Quality Modeling and Ground Water and Surface Monitoring WPMP-QAPP 3 rev 1
June 2018
Page 76 of 132
D. DATA VALIDATION AND USABILITY
D1. Data Review, Verification, and Validation
Data review and validation services provide a method for determining the usability and limitations of data
and provide a standardized data quality assessment. Verification of new model components or parameters
(when applicable) improves the predictive capabilities of new models or modified existing models.
Experienced professionals will be used in the data review, compilation, and evaluation phases of the
study. GAEPD will be responsible for reviewing data entries, transmittals, and analyses for completeness
and adherence to QA requirements. The data will be organized in a standard database on a computer. A
screening process that scans through the database and flags data outside typical ranges for a given
parameter will be used. Typical ranges are generally determined by reviewing a minimum of one year of
historical data for a particular system. These ranges can vary greatly due to season and location.Values
outside typical ranges will not be used to develop model calibration data sets or model kinetic parameters.
Field staff, laboratory bench chemists, and data entry staff are each responsible for verifying that all
records and results they produce or handle are completely and correctly recorded, transcribed, and
transmitted. Each staff member and analytical Unit Supervisor is also responsible for ensuring that all
activities performed (sampling, measurements, and analyses) comply with all requirements outlined in the
QAPP, Laboratory QAP, and individual sampling SOPs.
The Unit Coordinators are responsible for final verification and validation of all results.
D1.1. Guidance Documents
Documents used to review, verify, and validate data are as follows:
Georgia Rules and Regulations for Water Quality Control, Chapter 391-3-6-.03
Water Use Classifications and Water Quality Standards
Most current version of Georgia’s 305(b)/303(d) List of Waters
SOP for Macroinvertebrate Biological Assessment of Wadeable Streams in Georgia
(May 2007)
SOP for Periphyton
Program SOP#EPD-WPMP-1 Planning & Document Protocols for Water Quality
Assessments (August 2013)
Program SOP#EPD-WPMP-2 Surface Water Sampling (Rivers and Streams) (March
2013)
Program SOP#EPD-WPMP-3 Chlorophyll-a Sample Collection and Processing (Jan.
2008)
Program SOP#EPD-WPMP-4 Lake Profiling and Composite Sample Collection (Jan.
2008)
Program SOP#EPD-WPMP-5 Wastewater Sampling (Jan. 2008)
Program SOP#EPD-WPMP-6 Streamflow Measurements (Jan. 2008)
SOP# EPD-WQMP-7: Data Sonde Calibration and Maintenance (April 2011)
These documents can also be found at https://epd.georgia.gov/ga-epd-standard-operating-procedures-
sops.
Georgia Environmental Protection Division
QAPP for Water Quality Modeling and Ground Water and Surface Monitoring WPMP-QAPP 3 rev 1
June 2018
Page 77 of 132
D1.2. Sample Collection Procedures
For acceptable biological data, samples are collected according to protocols described in the SOP for
Macroinvertebrate Biological Assessment of Wadeable Streams in Georgia (March 2007). Chemical and
bacteriological samples are collected according to protocols for specific water types as described in the
Program SOPs referenced above.
D1.3. Sample Handling
For acceptable biological data, samples are handled and processed according to protocols described in the
SOP for Macroinvertebrate Biological Assessment of Wadeable Streams in Georgia (March 2007).
Chemical and bacteriological samples are handled according to protocols for specific water types as
described in the Program SOPs referenced above.
D1.4. Analytical Procedures
For acceptable biological data, samples are analyzed according to protocols described in the SOP for
Macroinvertebrate Biological Assessment of Wadeable Streams in Georgia (March 2007). All
bacteriological and chemical samples are analyzed according to methods described in the GAEPD’s
Laboratory QA Plan (GAEPD, 2007) and in accordance with Standard Methods for the Examination of
Water and Wastewater, 20th Edition (APHA, 1998).
D1.5. Quality Control
Quality control procedures described in the SOP for Macroinvertebrate Biological Assessment of
Wadeable Streams in Georgia (March 2007), Program SOPs listed above, Standard Methods for the
Examination of Water and Wastewater, 20th Edition (APHA 1998), and GAEPD Laboratory QA Plan
(GAEPD 2007) shall be followed for resulting data to be acceptable for use in water quality assessments
and TMDL development.
D2. Validation and Verification Methods
The Project Manager will review or oversee review of all data related to the project for completeness and
correctness. The Project Manager will resolve these issues with the modeling and monitoring team.
D2.1. Model Data Verification
Raw data received in hard copy format will be entered into a standard database. All entries will be
compared to the original hard copy data sheets by the team personnel. Screening methods will be used to
scan through the database and flag data that are outside typical ranges for a given parameter. Data will
also be manipulated using specialized programs and Microsoft Excel. A percent of the calculations will
be recalculated by hand to ensure that correct formula commands were entered into the program. If 5
percent of the data calculations checked are incorrect, all calculations will be rechecked after the
correction is made to the database. Data quality will be assessed by comparing entered data to original
data; performing the data and model evaluations described in Sections A.7, B.5, and C.1; and comparing
results with the measurement performance or acceptance criteria summarized in the data review and
technical approach documentation to determine whether to accept, reject, or qualify the data. Results of
the review and validation processes will be reported to the Project Manager.
General guidelines and procedures for model data validation and calibration are listed in Section B7.1.
Verification will be performed by comparing new model parameters or components to theory. Model
Georgia Environmental Protection Division
QAPP for Water Quality Modeling and Ground Water and Surface Monitoring WPMP-QAPP 3 rev 1
June 2018
Page 78 of 132
validation evaluates the model’s ability to appropriately simulate conditions under a data set or time
period that is independent from those used in the calibration. The calibration and validation process will
be documented, as necessary, in the surface water modeling report.
Because the goal is to be able to assess water body conditions and predict when point and nonpoint source
loads produce water or sediment-quality impairment based on the ambient water and sediment-quality
criteria, model calibration and validation should strive to reduce errors (deviations between model
predictions and observed measurement data) to zero.
A set of parameters used in the calibrated model might not accurately represent field values, and the
calibrated parameters might not represent the system under a different set of boundary conditions or
hydrologic stresses. Therefore, a second model validation period helps establish greater confidence in the
calibration and the predictive capabilities of the model. A site-specific model is considered “validated” if
its accuracy and predictive capability have been proven to be within acceptable limits of error
independently of the calibration data. In general, model validation is performed using a data set that
differs from the calibration data set (i.e., low-flow data set for calibration versus higher-flow data set for
verification). If only a single time series is available, the series may be split into two sub-series, one for
calibration and another for validation. If the model parameters are changed during the validation, this
exercise becomes a second calibration and the first calibration needs to be repeated to account for any
changes.
Model validation will be accomplished by calibration. A model calibration is the process of adjusting
model inputs within acceptable limits until the resulting predictions give good correlation with observed
data. Commonly, the calibration begins with the best estimates for model input based on measurements
and subsequent data analyses. Results from initial simulations are then used to improve the concepts of
the system or to modify the values of the model input parameters. The success of a model calibration is
largely dependent on the validity of the underlying model formulation.
D2.2. Chemical Data Verification
Chemical data are verified according to the GAEPD Laboratory QA Plan (GAEPD, 2007). GAEPD
laboratory personnel are responsible for verifying chain-of-custody, receipt log, calibration logs, and all
applicable quality assurance protocols are properly followed for chemical and bacteriological analyses.
The GAEPD laboratory analytical supervisor is responsible for chemical and bacteriological final data
verification and ensuring the results are mailed to the data users. The GAEPD Laboratory flags any
questionable data. Flags are defined in Section B4.3.
D2.3. Process for Validating and Verifying Data
The GAEPD Laboratory validates results by periodically comparing computer calculation with hand-
calculated results. A second analyst and a supervisor review all results before results are reported. The
GAEPD’s QA Plan (GAEPD, 2007) provides additional information.
When analyses results from GAEPD’s Laboratory are received by project personnel, the data are
reviewed. The appropriate GAEPD Laboratory analytical supervisor is contacted to confirm unusual or
unlikely results. Project field staff are contacted about questionable field data. No specific software is
used for data validation. Examples of data receipt and verification audit forms are contained in Appendix
E.
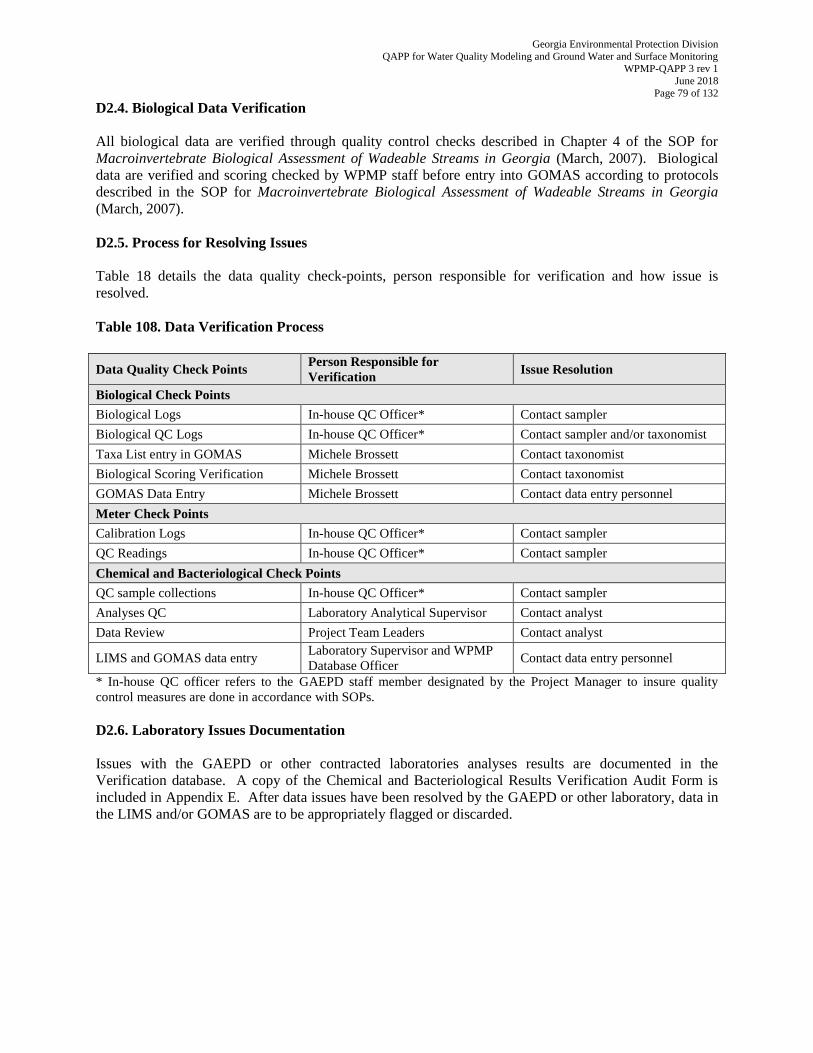
Georgia Environmental Protection Division
QAPP for Water Quality Modeling and Ground Water and Surface Monitoring WPMP-QAPP 3 rev 1
June 2018
Page 79 of 132
D2.4. Biological Data Verification
All biological data are verified through quality control checks described in Chapter 4 of the SOP for
Macroinvertebrate Biological Assessment of Wadeable Streams in Georgia (March, 2007). Biological
data are verified and scoring checked by WPMP staff before entry into GOMAS according to protocols
described in the SOP for Macroinvertebrate Biological Assessment of Wadeable Streams in Georgia
(March, 2007).
D2.5. Process for Resolving Issues
Table 18 details the data quality check-points, person responsible for verification and how issue is
resolved.
Table 108. Data Verification Process
Data Quality Check Points Person Responsible for
Verification Issue Resolution
Biological Check Points
Biological Logs In-house QC Officer* Contact sampler
Biological QC Logs In-house QC Officer* Contact sampler and/or taxonomist
Taxa List entry in GOMAS Michele Brossett Contact taxonomist
Biological Scoring Verification Michele Brossett Contact taxonomist
GOMAS Data Entry Michele Brossett Contact data entry personnel
Meter Check Points
Calibration Logs In-house QC Officer* Contact sampler
QC Readings In-house QC Officer* Contact sampler
Chemical and Bacteriological Check Points
QC sample collections In-house QC Officer* Contact sampler
Analyses QC Laboratory Analytical Supervisor Contact analyst
Data Review Project Team Leaders Contact analyst
LIMS and GOMAS data entry Laboratory Supervisor and WPMP
Database Officer Contact data entry personnel
* In-house QC officer refers to the GAEPD staff member designated by the Project Manager to insure quality
control measures are done in accordance with SOPs.
D2.6. Laboratory Issues Documentation
Issues with the GAEPD or other contracted laboratories analyses results are documented in the
Verification database. A copy of the Chemical and Bacteriological Results Verification Audit Form is
included in Appendix E. After data issues have been resolved by the GAEPD or other laboratory, data in
the LIMS and/or GOMAS are to be appropriately flagged or discarded.
Georgia Environmental Protection Division
QAPP for Water Quality Modeling and Ground Water and Surface Monitoring WPMP-QAPP 3 rev 1
June 2018
Page 80 of 132
D3. Reconciliation with Data Quality Objectives
All data quality indicators will be calculated at the completion of the data analysis phase.
Measurement quality requirements will be met and compared with the DQOs to confirm that the
correct type, quality, and quantity of data are being used for the project. The interpretation and
presentation stage includes inspection of the form of the results, and the meaning and
reasonableness of the computation results and post-simulation analysis.
D3.1. Reconciliation of Project Results with Data Quality Objectives
These data and data collection by other organizations (e.g. USGS, EPA, GAEPD contractors, etc.) will be
subsequently analyzed and used by the GAEPD for water quality assessments, TMDL development,
stream and lake standards modifications, and permit decisions. Data quality will be reconciled with
objectives of the project following the procedures outlined in Section B.10 and with the following.
D3.1.1. Chemical and Bacteriological Data Reconciliation
When chemical and bacteriological data are received from the GAEPD or other laboratories, the Survey
Crew Leader and Database Manager review the data for unusual or unlikely results (outliers). The
appropriate laboratory manager is contacted by email regarding any questionable results. The Laboratory
Manager reviews the analyses, blank logs analyses, and data recording errors and responds by email.
Survey Crew Leader and Database Officer make corrections on associated paperwork and data entry.
D3.1.2. Biological Data Reconciliation
When biological data are received by AMU staff, taxa lists and biological index scoring is reviewed. If
discrepancies in scoring are found, AMU contacts the taxonomist that identified the sample to discuss
differences. After mutual agreement is reached, all paperwork is corrected and data are entered into
GOMAS.
D3.1.3. Field Data Reconciliation
When field data are received, measurements will be reviewed by the Project technical staff. Field staff
will be contacted concerning any questionable information. Field staff will review equipment calibration
logs and field notes to determine data quality. Project staff will make corrections and/or flag data on
associated paperwork and data entry.
D3.2. How Data Limitation Will Be Reported
Electronic chemical, bacteriological, biological, and habitat assessment data are obtained by data users
from the GAEPD. Chemical and bacteriological data limitations are marked in GOMAS by the
appropriate flag (Section B4.3). Biological and habitat assessment limitations are noted in the GOMAS
comments section. Limitations are also recorded in the field notes stored in the watershed files.
D3.3. Data Rejection
In the event data cannot be reconciled with DQO, it is removed from the data set. If possible, additional
monitoring is conducted. Project staff will be responsible for ensuring data reconciliation or data removal
if reconciliation is not possible. The guidance document used to reconcile data is the Guidance for Data
Quality Assessment – Practical Methods for Data Analyses EPA QA/G-9 (USEPA, 2000).
Georgia Environmental Protection Division
QAPP for Water Quality Modeling and Ground Water and Surface Monitoring WPMP-QAPP 3 rev 1
June 2018
Page 81 of 132
REFERENCES
APHA, 1998. Standard Methods for the Examination of Water and Wastewater, 20th edition.
American Public Health Association, Washington, D.C.
Georgia Department of Natural Resources, Environmental Protection Division, Rules and Regulations for
Water Quality Control, Georgia Rules, Chapter 391-3-6, revised August 2013.
Georgia Department of Natural Resources, Environmental Protection Division, Laboratory Quality
Assurance Plan, April 2017.
Georgia Department of Natural Resources, Environmental Protection Division, Standard Operating
Procedures EPD-WPMP-1 through 6, December 2007, January 2008, April 2011, and March
2013.
Georgia Department of Natural Resources, Environmental Protection Division, Macroinvertebrate
Biological Assessment of Wadeable Streams in Georgia, March 2007.
Georgia Department of Natural Resources, Environmental Protection Division, Safety Manual, Atlanta,
GA, 1990.
Lumb, A.M., R.B. McCammon, and J.L. Kittle, Jr. 1994. User’s Manual for an Expert System
(HSPEXP) for Calibration of the Hydrologic Simulation ProgramBFortran. U.S. Geological
Survey Water-Resources Investigations Report 94-4168. 102 pp.
Myers, D.N., and Wilde, F.D., 1997, National Field Manual for the Collection of Water-Quality Data:
U.S. Geological Survey Techniques of Water-Resources Investigations, book 9, Chapter A7, 38p.
OEPA (Ohio Environmental Protection Agency). 1999. Association Between Nutrients, Habitat and
the Aquatic Biota in Ohio Rivers and Streams. Technical Bulletin MAS/1999 1-1. Ohio
Environmental Protection Agency, Division of Surface Water, Columbus, OH.
USEPA (U.S. Environmental Protection Agency). 1999. Draft Guidance for Water Quality-based
Decisions: The TMDL Process, 2nd ed. EPA 841-D-99-001. U.S. Environmental Protection
Agency, Office of Water, Washington, DC.
USEPA. 2000. Guidance for the Data Quality Objectives Process (G-4). EPA 600-R-96-055. U.S.
Environmental Protection Agency, Office of Environmental Information, Washington, DC.
USEPA. 2001. EPA Requirements for Quality Assurance Project Plans, QA/R-5. EPA 240-B-01-
003. U.S. Environmental Protection Agency, Office of Environmental Information,
Washington, DC.
United States Government Printing Office, Code of Federal Regulations, Title 40, 1996.
University of Georgia, Agricultural and Environmental Services Laboratory, Feed and Environmental
Laboratory, Quality Assurance Plan for the Analysis of Coliform Bacteria in Water, March 2018.
University of Georgia, Agricultural and Environmental Services Laboratory, Laboratory Quality
Assurance Project Plan, March 2018.
Georgia Environmental Protection Division
QAPP for Water Quality Modeling and Ground Water and Surface Monitoring WPMP-QAPP 3 rev 1
June 2018
Page 82 of 132
U.S. Environmental Protection Agency. 1983. Methods for Chemical Analysis of Water and Wastes,
EPA-600/ 4-79-020. U.S. Environmental Protection Agency, Cincinnati, Ohio, USA.
U.S. Environmental Protection Agency. 2002. Guidance on Environmental Data Verification and Data
Validation, EPA/240/R-02/004. U.S. Environmental Protection Agency, Washington, DC, USA.
U.S. Environmental Protection Agency. 2000. Guidance for Data Quality Assessment – Practical
Methods for Data Analyses, EPA QA/G-9. U.S. Environmental Protection Agency, Cincinnati,
Ohio, USA.
U.S. Environmental Protection Agency. 2001. Guidance for Quality Assurance Project Plans, EPA
QA/G-5. U.S. Environmental Protection Agency, Washington, DC, USA.
U.S. Environmental Protection Agency. 2001. EPA Requirements for Quality Assurance Project Plans,
EPA QA/R-5. U.S. Environmental Protection Agency, Washington, DC, USA.

Georgia Environmental Protection Division
QAPP for Water Quality Modeling and Ground Water and Surface Monitoring WPMP-QAPP 3 rev 1
June 2018
Page 83 of 132
APPENDIX A
Organization Chart for Water Quality Modeling
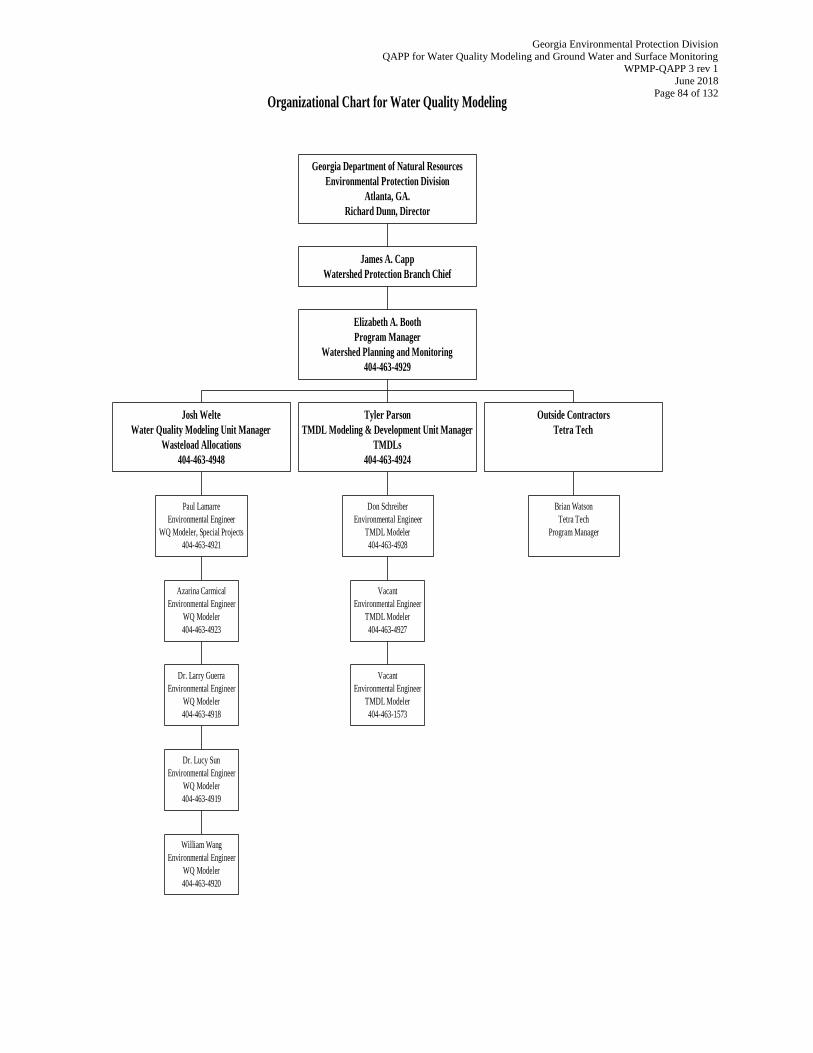
Georgia Environmental Protection Division
QAPP for Water Quality Modeling and Ground Water and Surface Monitoring WPMP-QAPP 3 rev 1
June 2018
Page 84 of 132
Organizational Chart for Water Quality Modeling
William Wang
Environmental Engineer
WQ Modeler
404-463-4920
Dr. Lucy Sun
Environmental Engineer
WQ Modeler
404-463-4919
Dr. Larry Guerra
Environmental Engineer
WQ Modeler
404-463-4918
Azarina Carmical
Environmental Engineer
WQ Modeler
404-463-4923
Paul Lamarre
Environmental Engineer
WQ Modeler, Special Projects
404-463-4921
Josh Welte
Water Quality Modeling Unit Manager
Wasteload Allocations
404-463-4948
Vacant
Environmental Engineer
TMDL Modeler
404-463-1573
Vacant
Environmental Engineer
TMDL Modeler
404-463-4927
Don Schreiber
Environmental Engineer
TMDL Modeler
404-463-4928
Tyler Parson
TMDL Modeling & Development Unit Manager
TMDLs
404-463-4924
Brian Watson
Tetra Tech
Program Manager
Outside Contractors
Tetra Tech
Elizabeth A. Booth
Program Manager
Watershed Planning and Monitoring
404-463-4929
James A. Capp
Watershed Protection Branch Chief
Georgia Department of Natural Resources
Environmental Protection Division
Atlanta, GA.
Richard Dunn, Director
Georgia Environmental Protection Division
QAPP for Water Quality Modeling and Ground Water and Surface Monitoring WPMP-QAPP 3 rev 1
June 2018
Page 85 of 132
Jennifer Shadle of EPA Region IV will serve as the EPA project officer (PO) for any water quality
modeling projects funded by federal 106 or 604(b) funds. While the water quality modeling work is
technically being administered by GAEPD, since it may be funded using federal funds, EPA retains
signatory and approval authority for its performance. The EPA PO, with the assistance of EPA’s
Region IV QA officer (QAO), Liza Montalvo, will review and approve the QAPP. Additional EPA
QA Officers responsibilities may include conducting external performance and system audits and
participating in EPA QA reviews of the study.
Elizabeth Booth, of GAEPD Watershed Protection Branch, is the GAEPD Program Manager (PM)
providing oversight for the water quality modeling contract. She will review and approve the QAPP
and ensure that all contractual issues are addressed as work is performed on projects. In addition, she
will provide overall project/program oversight for studies. She will work with the GAEPD Project
Managers to ensure that the project objectives are attained. She will also have the following
responsibilities:
Providing oversight for analytical model design, model selection, data selection,
model calibration, model validation, and adherence to project objectives.
Reviewing and approving the project work plan, QAPP, and other materials
developed by a contractor to support the project.
Coordinating with contractors, reviewers, and others to ensure technical quality
and contract adherence.
The GAEPD Project Managers responsible for day-to-day activities are Josh Welte for Water Quality
Modeling and Tyler Parsons, for TMDL Modeling. EPD may also employ contractor assistance for
additional modeling. Contract documents will require adherence to a QAPP. Josh Welte and Tyler
Parsons supervise the overall project, including study design and model applications. Specific
responsibilities include the following:
Coordinating project assignments, establishing priorities, and scheduling.
Ensuring completion of high-quality projects within established budgets and time
schedules.
Acting as primary point of contact for the Program Manager.
Providing guidance, technical advice, and performance evaluations to those
assigned to the project.
Implementing corrective actions and providing professional advice to staff.
Preparing or reviewing preparation of project deliverables, including the QAPP
and other materials developed to support the project.
Providing guidance on development of new site-specific models and peer review
of GAEPD-developed models.
Providing QC evaluations to ensure that QC is maintained throughout the data
collection and analysis process, including reviewing site-specific model equations
and codes (when necessary) and double-checking work as it is completed.
Providing support to GAEPD in interacting with the project team, technical
reviewers, and others to ensure that technical quality requirements of the study
design objectives are met.
The GAEPD QA Officer is Susan Salter, whose primary responsibilities include the following:
Georgia Environmental Protection Division
QAPP for Water Quality Modeling and Ground Water and Surface Monitoring WPMP-QAPP 3 rev 1
June 2018
Page 86 of 132
Providing support to the Managers in preparation and distribution of the QAPP.
Reviewing and approving the QAPP.
Monitoring QC activities, as necessary, to determine conformance.
If contractors are used, the contractor Project Lead (PL) will supervise the overall project, including
study design and model applications. Specific responsibilities of the PL include the following:
Coordinating project assignments, establishing priorities, and scheduling.
Ensuring completion of high-quality projects within established budgets and time
schedules.
Acting as primary point of contact for the Project Manager.
Providing guidance, technical advice, and performance evaluations to those
assigned to the project.
Implementing corrective actions and providing professional advice to staff.
Preparing or reviewing preparation of project deliverables, including the QAPP
and other materials developed to support the project.
Providing guidance on development of new site-specific models and peer review
of GAEPD-developed models.
Providing support to GAEPD in interacting with the project team, technical
reviewers, and others to ensure that technical quality requirements of the study
design objectives are met.
If contractors are used, the contractor QA Officer primary responsibilities include the following:
Providing support to the PL in preparation and distribution of the QAPP.
Reviewing and approving the QAPP.
Monitoring QC activities to determine conformance.
Contractor (if used) and EPD modeling staff will be responsible for the development of model input
data sets, calibration and validation of the model, application of the model results, and writing of a
final report. They will implement the QA/QC program, complete assigned work on schedule and
with strict adherence to the established procedures, and complete required documentation. Other
technical staff will perform literature searches; assist in secondary data collection, compilation, and
QA review; and aid in completing draft and final modeling reports, which will support draft and final
TMDL reports developed by GAEPD.
Other QA/QC staff, including technical reviewers and technical editors selected, as needed, will
provide peer review oversight of the content of the work products and ensure that the work products
comply with GAEPD’s specifications.

Georgia Environmental Protection Division
QAPP for Water Quality Modeling and Ground Water and Surface Monitoring WPMP-QAPP 3 rev 1
June 2018
Page 87 of 132
APPENDIX B
Organization Chart for Water Quality Data Collection and Assessment
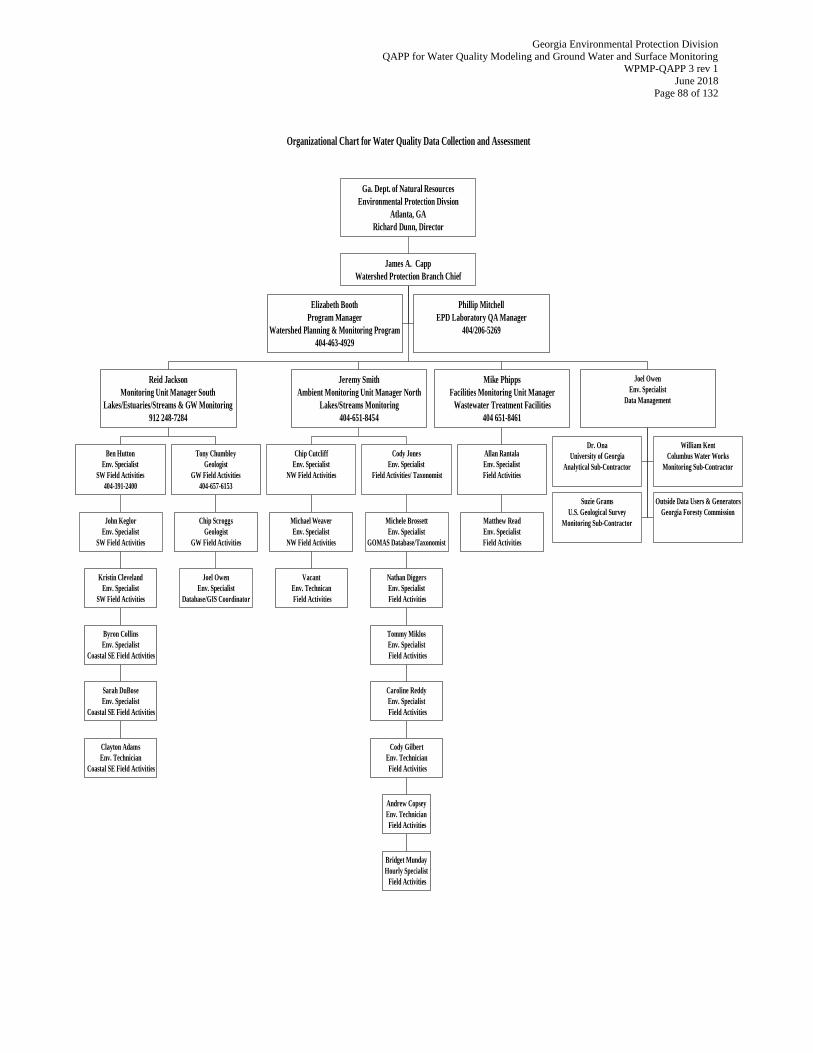
Georgia Environmental Protection Division
QAPP for Water Quality Modeling and Ground Water and Surface Monitoring WPMP-QAPP 3 rev 1
June 2018
Page 88 of 132
Organizational Chart for Water Quality Data Collection and Assessment
Elizabeth Booth
Program Manager
Watershed Planning & Monitoring Program
404-463-4929
Phillip Mitchell
EPD Laboratory QA Manager
404/206-5269
Clayton Adams
Env. Technician
Coastal SE Field Activities
Sarah DuBose
Env. Specialist
Coastal SE Field Activities
Byron Collins
Env. Specialist
Coastal SE Field Activities
Kristin Cleveland
Env. Specialist
SW Field Activities
John Keglor
Env. Specialist
SW Field Activities
Ben Hutton
Env. Specialist
SW Field Activities
404-391-2400
Joel Owen
Env. Specialist
Database/GIS Coordinator
Chip Scroggs
Geologist
GW Field Activities
Tony Chumbley
Geologist
GW Field Activities
404-657-6153
Reid Jackson
Monitoring Unit Manager South
Lakes/Estuaries/Streams & GW Monitoring
912 248-7284
Vacant
Env. Technican
Field Activities
Michael Weaver
Env. Specialist
NW Field Activities
Chip Cutcliff
Env. Specialist
NW Field Activities
Bridget Munday
Hourly Specialist
Field Activities
Andrew Copsey
Env. Technician
Field Activities
Cody Gilbert
Env. Technician
Field Activities
Caroline Reddy
Env. Specialist
Field Activities
Tommy Miklos
Env. Specialist
Field Activities
Nathan Diggers
Env. Specialist
Field Activities
Michele Brossett
Env. Specialist
GOMAS Database/Taxonomist
Cody Jones
Env. Specialist
Field Activities/ Taxonomist
Jeremy Smith
Ambient Monitoring Unit Manager North
Lakes/Streams Monitoring
404-651-8454
Matthew Read
Env. Specialist
Field Activities
Allan Rantala
Env. Specialist
Field Activities
Mike Phipps
Facilities Monitoring Unit Manager
Wastewater Treatment Facilities
404 651-8461
Dr. Ona
University of Georgia
Analytical Sub-Contractor
William Kent
Columbus Water Works
Monitoring Sub-Contractor
Suzie Grams
U.S. Geological Survey
Monitoring Sub-Contractor
Outside Data Users & Generators
Georgia Foresty Commission
Joel Owen
Env. Specialist
Data Management
James A. Capp
Watershed Protection Branch Chief
Ga. Dept. of Natural Resources
Environmental Protection Divsion
Atlanta, GA
Richard Dunn, Director

Georgia Environmental Protection Division
QAPP for Water Quality Modeling and Ground Water and Surface Monitoring WPMP-QAPP 3 rev 1
June 2018
Page 89 of 132
APPENDIX C
Data Quality Indicator Definitions
Georgia Environmental Protection Division
QAPP for Water Quality Modeling and Ground Water and Surface Monitoring WPMP-QAPP 3 rev 1
June 2018
Page 90 of 132
DATA QUALITY INDICATOR DEFINITIONS
Measurement acceptance or performance criteria are quantitative statistics used to interpret the degree of
acceptability or utility of the data to the user. The quality of existing environmental monitoring data and
generated data is some measure of the types and amount of error associated with the data. These criteria,
also known as data quality indicators, include the following:
Precision
Accuracy
Representativeness
Comparability
Completeness
Data used in water quality modeling are generally data contained in federal and state government water
quality databases. It is assumed that data obtained from government agency databases have been
screened and have met specified measurement performance criteria. These criteria may not be reported
for the parameters of interest in the databases. Measurement performance or acceptance criteria for
various parameters will be documented in the final report. Parameters for which measurement
performance or acceptance criteria may be set include the following:
Software run time
Software processing capabilities
Model prediction results relative to decision error
Data used in model(s)
Precision is a measure of internal method consistency. It is demonstrated by the degree of mutual
agreement between individual measurements or enumerated values of the same property of a sample,
usually under demonstrated similar conditions. Precision of field sampling methods is estimated by
taking duplicate samples for analysis. This QC calculation also addresses uncertainty due to natural
variation and sampling error. Precision of available data used will be noted if available. Precision of
generated data produced by the model may be examined by performing replicate runs.
Accuracy is defined as the degree of agreement between an observed value and an accepted reference or
true value. Accuracy is a combination of random error (precision) and systematic error (bias), which are
due to sampling and analytical operations. Bias is the systematic distortion of a measurement process that
causes errors in one direction so that the expected sample measurement is always greater or lesser to the
same degree than the sample’s true value. Because accuracy is the measurement of a parameter and
comparison with a “truth,” and the true values of environmental physicochemical characteristics cannot
be known, use of a surrogate is required.
Accuracy of non-direct data obtained from government agency databases and entered into the project
database can be expressed as the percentage of values, by field, not included as valid values in their
associated system reference tables. For example, a code entered incorrectly or in the wrong field would
constitute inaccurate data. The accuracy of non-direct data will be controlled by double-checking all
automatically mapped data. Accuracy of the model will be determined by comparing the contaminant
concentrations calculated for a given area with actually measured contaminant concentrations reported in
the database under conditions used in the model simulation. Accuracy of data entry into the project
database will be controlled by double-checking all manual data entries.
Georgia Environmental Protection Division
QAPP for Water Quality Modeling and Ground Water and Surface Monitoring WPMP-QAPP 3 rev 1
June 2018
Page 91 of 132
Data representativeness is defined as the degree to which data accurately and precisely represents a
characteristic of a population, a parameter, and variations at a sampling point, a process condition, or an
environmental condition. It therefore addresses the natural variability or the spatial and temporal
heterogeneity of a population. Comparisons of the loadings data and measured environmental
concentrations will be made to examine sources and sinks of materials. Preliminary knowledge of the
area will be used to select appropriate sites and stations in the vicinity of point source discharges for the
initial and later modeling phases.
Two data sets are considered to be comparable when there is confidence that the two sets can be
considered equivalent with respect to the measurement of a specific variable or group of variables.
Measurement data used in the model will follow protocols established by the appropriate government
agency to permit comparisons of water quality data at different sites on the study site. Data sets will be
examined with respect to variables of interest, commonality of units of measurement, and similarity in
analytical and QA procedures. Additional comparability of data may be ensured by similarity in
geographic, seasonal, and sampling method characteristics.
Completeness is defined as the percentage of measurements made that are judged to be valid according to
specific criteria and entered into the data management system. To achieve this objective, every effort is
made to avoid accidental or inadvertent sample or data loss. Lack of data entered into the databases will
reduce the ability of the project to calibrate and verify the model. Although some fields in the project
database should never contain blanks (e.g., facility name), other fields could be impossible to fill or might
not be filled until later (e.g., completion date of an activity). Completeness is thus also defined as the
percentage of data available to cover all aspects of model development. In any complex model study it is
inevitable that there will be some data gaps. These data gaps and the assumptions used in filling the gaps
will be documented. Percent completeness (%C) for measurement parameters can be defined as follows:
Where v = the number of measurements judged valid
T = the total number of measurements
The model application will be considered complete when no less than 85 percent of the measurement
data, parameter variables, and output values are judged valid; however, other considerations must be
taken into account as well, depending on the use of the data.
Acceptance criteria will be obtained from any existing QAPPs, sampling and analysis plans, standard
operating procedures, laboratory reports, and other correspondence for a given source of non-direct
measurement data, if available. The data assessment and quality guidelines associated with a given type
of measurement will be developed from these sources and documented. The secondary data will be
reviewed and compared with the guidelines in this plan. Data not meeting the acceptance criteria
requirements will be rejected or their status documented, as deemed appropriate by the Project Manager.
Model Sensitivity Analysis
The sensitivity to variations or uncertainty in input parameters is an important characteristic of a model.
Sensitivity analysis is used to identify the most influential parameters in determining the accuracy and
precision of model predictions. This information is of importance to the user who must establish required
accuracy and precision in model application as a function of data quantity and quality. Sensitivity
100 x T
v = %C
Georgia Environmental Protection Division
QAPP for Water Quality Modeling and Ground Water and Surface Monitoring WPMP-QAPP 3 rev 1
June 2018
Page 92 of 132
analysis quantitatively or semi-quantitatively defines the dependence of the model’s performance
assessment measure on a specific parameter or set of parameters. Sensitivity analysis can also be used to
decide how to simplify the model simulation and to improve the efficiency of the calibration process.
Model sensitivity may be expressed as the relative rate of change of selected output caused by a unit
change in the input. If the change in the input causes a large change in the output, the model is then
considered to be sensitive to that input parameter. Sensitivity analysis methods are mostly non-statistical,
or even intuitive by nature. Sensitivity analysis is typically performed by changing one input parameter at
a time and evaluating the effects on the distribution of the dependent variable. Nominal, minimum, and
maximum values are specified for the selected input parameter.
Initially, sensitivity analysis is performed at the beginning of the calibration process to design a
calibration strategy. After a calibration is completed, a more elaborate sensitivity analysis is performed to
quantify the uncertainty in the calibrated model caused by uncertainty in the estimates of the model input
parameters.
Informal sensitivity analyses (iterative parameter adjustments) are generally performed during model
calibrations, to ensure that reasonable values for model parameters will be obtained, resulting in
acceptable model results. The degree of allowable adjustment of any parameter is usually directly
proportional to the uncertainty of its value and is limited to its expected range of values. Formal
sensitivity analyses will be performed based on technical direction from the Program Manager when there
is a certain aspect of the system, which requires further investigation. For example, formal sensitivity
analyses are often performed on the effects of loadings from different sources on instream water quality to
allow the development of more feasible and reasonable allocations and load reductions based on the
dominant sources.
Georgia Environmental Protection Division
QAPP for Water Quality Modeling and Ground Water and Surface Monitoring WPMP-QAPP 3 rev 1
June 2018
Page 93 of 132
APPENDIX D
Monitoring Stations and Facilities
1. 2018 Surface Water Monitoring Stations
2. 2019 Surface Water Monitoring Stations
3. Coastal Shellfish Monitoring Stations
4. Coastal Beach Monitoring Stations
5. DNR State Parks Lake Beach Monitoring Stations
6. 2018 Ground Water Monitoring Wells
7. 2019 Ground Water Monitoring Wells
8. Mercury Fish Trend Toxics Monitoring Sites
9. 2018 Major NPDES Facilities and Industrial Pretreatment Facilities
10. 2019 Major NPDES Facilities and Industrial Pretreatment Facilities
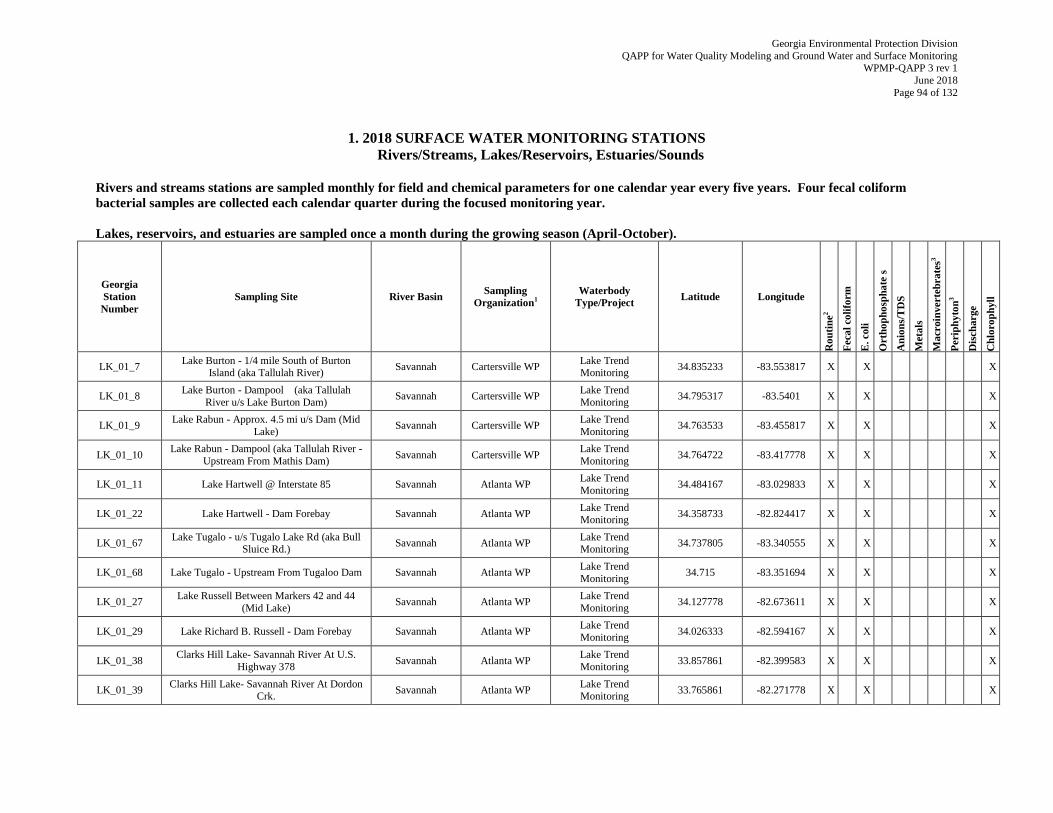
Georgia Environmental Protection Division
QAPP for Water Quality Modeling and Ground Water and Surface Monitoring WPMP-QAPP 3 rev 1
June 2018
Page 94 of 132
1. 2018 SURFACE WATER MONITORING STATIONS
Rivers/Streams, Lakes/Reservoirs, Estuaries/Sounds
Rivers and streams stations are sampled monthly for field and chemical parameters for one calendar year every five years. Four fecal coliform
bacterial samples are collected each calendar quarter during the focused monitoring year.
Lakes, reservoirs, and estuaries are sampled once a month during the growing season (April-October).
Georgia
Station
Number
Sampling Site River Basin Sampling
Organization1
Waterbody
Type/Project Latitude Longitude
Ro
uti
ne
2
Feca
l co
lifo
rm
E. coli
Ort
ho
ph
osp
ha
te s
An
ion
s/T
DS
Meta
ls
Ma
croin
verte
bra
tes3
Peri
ph
yto
n3
Dis
charge
Ch
loro
ph
yll
LK_01_7 Lake Burton - 1/4 mile South of Burton
Island (aka Tallulah River) Savannah Cartersville WP
Lake Trend Monitoring
34.835233 -83.553817 X X X
LK_01_8 Lake Burton - Dampool (aka Tallulah
River u/s Lake Burton Dam) Savannah Cartersville WP
Lake Trend
Monitoring 34.795317 -83.5401 X X X
LK_01_9 Lake Rabun - Approx. 4.5 mi u/s Dam (Mid
Lake) Savannah Cartersville WP
Lake Trend
Monitoring 34.763533 -83.455817 X X X
LK_01_10 Lake Rabun - Dampool (aka Tallulah River -
Upstream From Mathis Dam) Savannah Cartersville WP
Lake Trend
Monitoring 34.764722 -83.417778 X X X
LK_01_11 Lake Hartwell @ Interstate 85 Savannah Atlanta WP Lake Trend
Monitoring 34.484167 -83.029833 X X X
LK_01_22 Lake Hartwell - Dam Forebay Savannah Atlanta WP Lake Trend Monitoring
34.358733 -82.824417 X X X
LK_01_67 Lake Tugalo - u/s Tugalo Lake Rd (aka Bull
Sluice Rd.) Savannah Atlanta WP
Lake Trend Monitoring
34.737805 -83.340555 X X X
LK_01_68 Lake Tugalo - Upstream From Tugaloo Dam Savannah Atlanta WP Lake Trend
Monitoring 34.715 -83.351694 X X X
LK_01_27 Lake Russell Between Markers 42 and 44
(Mid Lake) Savannah Atlanta WP
Lake Trend
Monitoring 34.127778 -82.673611 X X X
LK_01_29 Lake Richard B. Russell - Dam Forebay Savannah Atlanta WP Lake Trend
Monitoring 34.026333 -82.594167 X X X
LK_01_38 Clarks Hill Lake- Savannah River At U.S.
Highway 378 Savannah Atlanta WP
Lake Trend
Monitoring 33.857861 -82.399583 X X X
LK_01_39 Clarks Hill Lake- Savannah River At Dordon
Crk. Savannah Atlanta WP
Lake Trend Monitoring
33.765861 -82.271778 X X X

Georgia Environmental Protection Division
QAPP for Water Quality Modeling and Ground Water and Surface Monitoring WPMP-QAPP 3 rev 1
June 2018
Page 95 of 132
Georgia
Station
Number
Sampling Site River Basin Sampling
Organization1
Waterbody
Type/Project Latitude Longitude
Ro
uti
ne
2
Feca
l co
lifo
rm
E. coli
Ort
ho
ph
osp
ha
te s
An
ion
s/T
DS
Meta
ls
Ma
croin
verte
bra
tes3
Peri
ph
yto
n3
Dis
charge
Ch
loro
ph
yll
LK_01_40 Clarks Hill Lake - Dam Forebay Savannah Atlanta WP Lake Trend Monitoring
33.662694 -82.198528 X X X
LK_01_71 Clarks Hill Lake - Little River At Highway
47 Savannah Atlanta WP
Lake Trend Monitoring
33.692722 -82.338805 X X X
LK_03_520 Lake Oconee At Highway 44, Oconee River
Arm Oconee Atlanta WP
Lake Trend
Monitoring 33.431394 -83.265734 X X X
LK_03_525 Lake Sinclair - Little River & Murder Creek
Arm, U/S U.S. Hwy 441 Oconee Atlanta WP
Lake Trend
Monitoring 33.189 -83.2953 X X X
LK_03_526 Lake Sinclair - 300 Meters Upstream Dam
(Dam Forebay) Oconee Atlanta WP
Lake Trend
Monitoring 33.142817 -83.202617 X X X
LK_03_530 Lake Sinclair - Midlake, Oconee River Arm Oconee Atlanta WP Lake Trend
Monitoring 33.1968 -83.2742 X X X
LK_03_538 Lake Oconee 300 Meters Upstream Wallace
Dam (Dam Forebay) Oconee Atlanta WP
Lake Trend
Monitoring 33.351667 -83.160833 X X X
LK_03_545 Lake Oconee - Richland Creek Arm Oconee Atlanta WP Lake Trend Monitoring
33.3947 -83.1767 X X X
LK_04_893 Lake Jackson at confluence of Alcovy River
and Yellow/South River Branch Ocmulgee Atlanta WP
Lake Trend
Monitoring 33.368229 -83.863339 X X X
LK_04_897 Lake Jackson - Dam Forebay Ocmulgee Atlanta WP Lake Trend
Monitoring 33.322 -83.8409 X X X
LK_05_2076 High Falls Lake - Midlake Ocmulgee Atlanta WP Lake Trend
Monitoring 33.1973 -84.031 X X X
LK_05_2078 High Falls Lake - Dam Forebay Ocmulgee Atlanta WP Lake Trend
Monitoring 33.1799 -84.0209 X X X
LK_05_2131 Lake Juliette - Midlake Ocmulgee Atlanta WP Lake Trend Monitoring
33.0464 -83.8106 X X X
LK_05_2132 Lake Juliette - Dam Forebay Ocmulgee Atlanta WP Lake Trend Monitoring
33.0338 -83.7572 X X X
LK_05_2144 Lake Tobesofkee - Midlake Ocmulgee Atlanta WP Lake Trend
Monitoring 32.8346 -83.8161 X X X
LK_05_2146 Lake Tobesofkee - Dam Forebay Ocmulgee Atlanta WP Lake Trend
Monitoring 32.8215 -83.7706 X X X
LK_09_3199 Banks Lake - Near Lakeland, Ga. Suwanee Tifton WP Lake Trend
Monitoring 31.026667 -83.105555 X X X
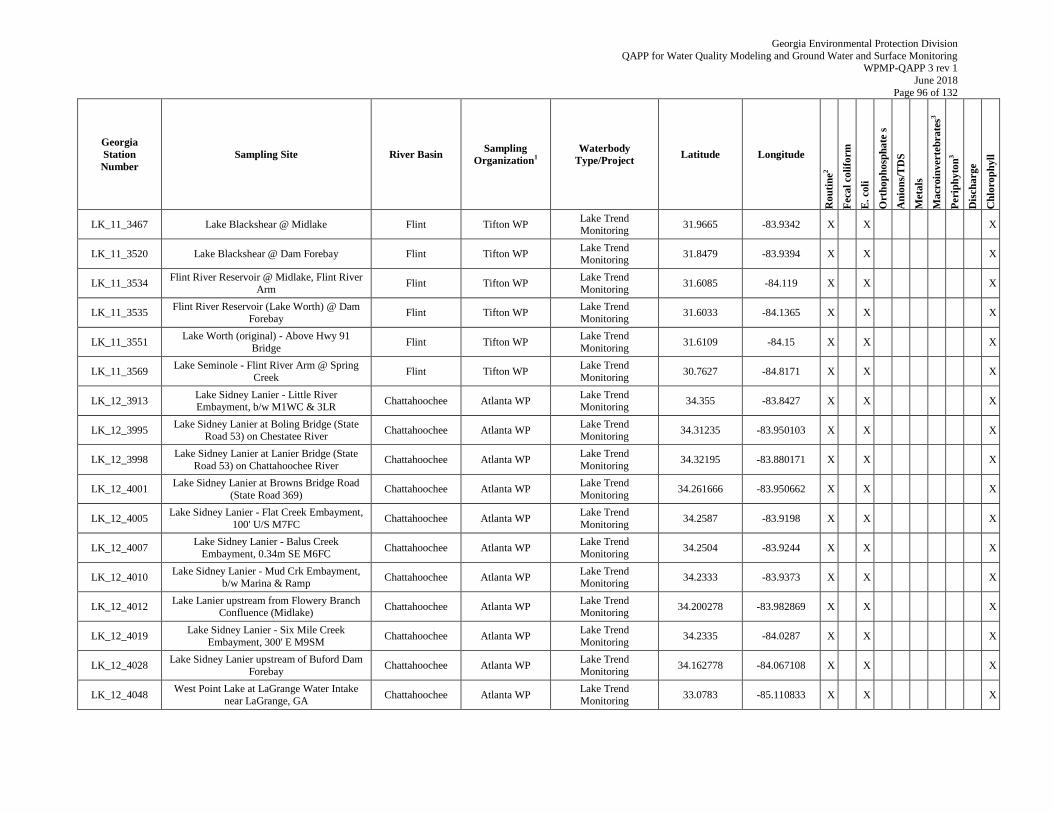
Georgia Environmental Protection Division
QAPP for Water Quality Modeling and Ground Water and Surface Monitoring WPMP-QAPP 3 rev 1
June 2018
Page 96 of 132
Georgia
Station
Number
Sampling Site River Basin Sampling
Organization1
Waterbody
Type/Project Latitude Longitude
Ro
uti
ne
2
Feca
l co
lifo
rm
E. coli
Ort
ho
ph
osp
ha
te s
An
ion
s/T
DS
Meta
ls
Ma
croin
verte
bra
tes3
Peri
ph
yto
n3
Dis
charge
Ch
loro
ph
yll
LK_11_3467 Lake Blackshear @ Midlake Flint Tifton WP Lake Trend Monitoring
31.9665 -83.9342 X X X
LK_11_3520 Lake Blackshear @ Dam Forebay Flint Tifton WP Lake Trend Monitoring
31.8479 -83.9394 X X X
LK_11_3534 Flint River Reservoir @ Midlake, Flint River
Arm Flint Tifton WP
Lake Trend
Monitoring 31.6085 -84.119 X X X
LK_11_3535 Flint River Reservoir (Lake Worth) @ Dam
Forebay Flint Tifton WP
Lake Trend
Monitoring 31.6033 -84.1365 X X X
LK_11_3551 Lake Worth (original) - Above Hwy 91
Bridge Flint Tifton WP
Lake Trend
Monitoring 31.6109 -84.15 X X X
LK_11_3569 Lake Seminole - Flint River Arm @ Spring
Creek Flint Tifton WP
Lake Trend
Monitoring 30.7627 -84.8171 X X X
LK_12_3913 Lake Sidney Lanier - Little River
Embayment, b/w M1WC & 3LR Chattahoochee Atlanta WP
Lake Trend
Monitoring 34.355 -83.8427 X X X
LK_12_3995 Lake Sidney Lanier at Boling Bridge (State
Road 53) on Chestatee River Chattahoochee Atlanta WP
Lake Trend Monitoring
34.31235 -83.950103 X X X
LK_12_3998 Lake Sidney Lanier at Lanier Bridge (State
Road 53) on Chattahoochee River Chattahoochee Atlanta WP
Lake Trend
Monitoring 34.32195 -83.880171 X X X
LK_12_4001 Lake Sidney Lanier at Browns Bridge Road
(State Road 369) Chattahoochee Atlanta WP
Lake Trend
Monitoring 34.261666 -83.950662 X X X
LK_12_4005 Lake Sidney Lanier - Flat Creek Embayment,
100' U/S M7FC Chattahoochee Atlanta WP
Lake Trend
Monitoring 34.2587 -83.9198 X X X
LK_12_4007 Lake Sidney Lanier - Balus Creek
Embayment, 0.34m SE M6FC Chattahoochee Atlanta WP
Lake Trend
Monitoring 34.2504 -83.9244 X X X
LK_12_4010 Lake Sidney Lanier - Mud Crk Embayment,
b/w Marina & Ramp Chattahoochee Atlanta WP
Lake Trend Monitoring
34.2333 -83.9373 X X X
LK_12_4012 Lake Lanier upstream from Flowery Branch
Confluence (Midlake) Chattahoochee Atlanta WP
Lake Trend Monitoring
34.200278 -83.982869 X X X
LK_12_4019 Lake Sidney Lanier - Six Mile Creek
Embayment, 300' E M9SM Chattahoochee Atlanta WP
Lake Trend
Monitoring 34.2335 -84.0287 X X X
LK_12_4028 Lake Sidney Lanier upstream of Buford Dam
Forebay Chattahoochee Atlanta WP
Lake Trend
Monitoring 34.162778 -84.067108 X X X
LK_12_4048 West Point Lake at LaGrange Water Intake
near LaGrange, GA Chattahoochee Atlanta WP
Lake Trend
Monitoring 33.0783 -85.110833 X X X
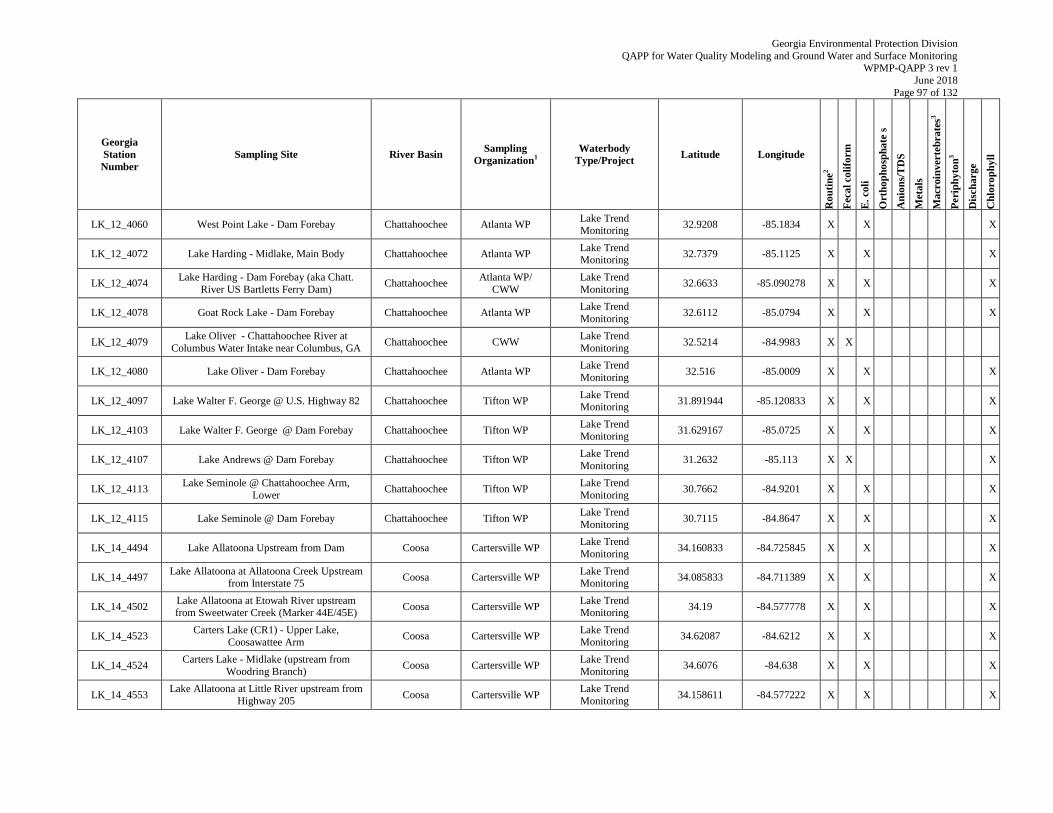
Georgia Environmental Protection Division
QAPP for Water Quality Modeling and Ground Water and Surface Monitoring WPMP-QAPP 3 rev 1
June 2018
Page 97 of 132
Georgia
Station
Number
Sampling Site River Basin Sampling
Organization1
Waterbody
Type/Project Latitude Longitude
Ro
uti
ne
2
Feca
l co
lifo
rm
E. coli
Ort
ho
ph
osp
ha
te s
An
ion
s/T
DS
Meta
ls
Ma
croin
verte
bra
tes3
Peri
ph
yto
n3
Dis
charge
Ch
loro
ph
yll
LK_12_4060 West Point Lake - Dam Forebay Chattahoochee Atlanta WP Lake Trend Monitoring
32.9208 -85.1834 X X X
LK_12_4072 Lake Harding - Midlake, Main Body Chattahoochee Atlanta WP Lake Trend Monitoring
32.7379 -85.1125 X X X
LK_12_4074 Lake Harding - Dam Forebay (aka Chatt.
River US Bartletts Ferry Dam) Chattahoochee
Atlanta WP/
CWW
Lake Trend
Monitoring 32.6633 -85.090278 X X X
LK_12_4078 Goat Rock Lake - Dam Forebay Chattahoochee Atlanta WP Lake Trend
Monitoring 32.6112 -85.0794 X X X
LK_12_4079 Lake Oliver - Chattahoochee River at
Columbus Water Intake near Columbus, GA Chattahoochee CWW
Lake Trend
Monitoring 32.5214 -84.9983 X X
LK_12_4080 Lake Oliver - Dam Forebay Chattahoochee Atlanta WP Lake Trend
Monitoring 32.516 -85.0009 X X X
LK_12_4097 Lake Walter F. George @ U.S. Highway 82 Chattahoochee Tifton WP Lake Trend
Monitoring 31.891944 -85.120833 X X X
LK_12_4103 Lake Walter F. George @ Dam Forebay Chattahoochee Tifton WP Lake Trend Monitoring
31.629167 -85.0725 X X X
LK_12_4107 Lake Andrews @ Dam Forebay Chattahoochee Tifton WP Lake Trend
Monitoring 31.2632 -85.113 X X X
LK_12_4113 Lake Seminole @ Chattahoochee Arm,
Lower Chattahoochee Tifton WP
Lake Trend
Monitoring 30.7662 -84.9201 X X X
LK_12_4115 Lake Seminole @ Dam Forebay Chattahoochee Tifton WP Lake Trend
Monitoring 30.7115 -84.8647 X X X
LK_14_4494 Lake Allatoona Upstream from Dam Coosa Cartersville WP Lake Trend
Monitoring 34.160833 -84.725845 X X X
LK_14_4497 Lake Allatoona at Allatoona Creek Upstream
from Interstate 75 Coosa Cartersville WP
Lake Trend Monitoring
34.085833 -84.711389 X X X
LK_14_4502 Lake Allatoona at Etowah River upstream from Sweetwater Creek (Marker 44E/45E)
Coosa Cartersville WP Lake Trend Monitoring
34.19 -84.577778 X X X
LK_14_4523 Carters Lake (CR1) - Upper Lake,
Coosawattee Arm Coosa Cartersville WP
Lake Trend
Monitoring 34.62087 -84.6212 X X X
LK_14_4524 Carters Lake - Midlake (upstream from
Woodring Branch) Coosa Cartersville WP
Lake Trend
Monitoring 34.6076 -84.638 X X X
LK_14_4553 Lake Allatoona at Little River upstream from
Highway 205 Coosa Cartersville WP
Lake Trend
Monitoring 34.158611 -84.577222 X X X
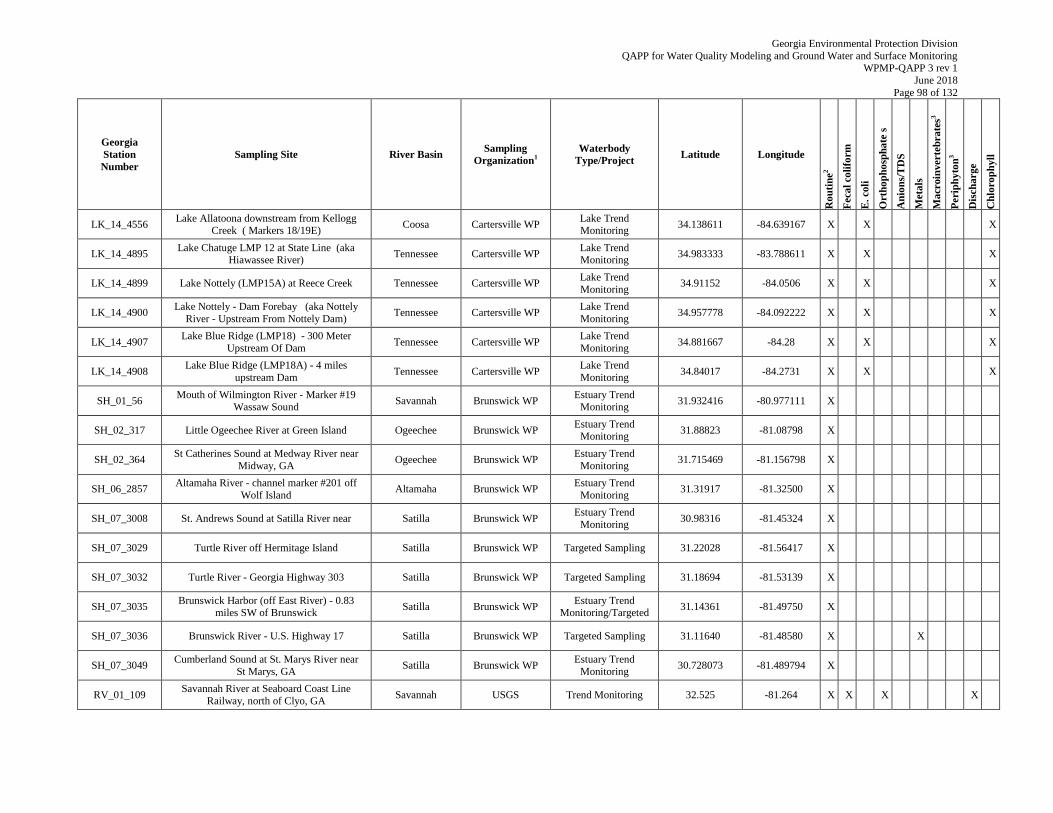
Georgia Environmental Protection Division
QAPP for Water Quality Modeling and Ground Water and Surface Monitoring WPMP-QAPP 3 rev 1
June 2018
Page 98 of 132
Georgia
Station
Number
Sampling Site River Basin Sampling
Organization1
Waterbody
Type/Project Latitude Longitude
Ro
uti
ne
2
Feca
l co
lifo
rm
E. coli
Ort
ho
ph
osp
ha
te s
An
ion
s/T
DS
Meta
ls
Ma
croin
verte
bra
tes3
Peri
ph
yto
n3
Dis
charge
Ch
loro
ph
yll
LK_14_4556 Lake Allatoona downstream from Kellogg
Creek ( Markers 18/19E) Coosa Cartersville WP
Lake Trend Monitoring
34.138611 -84.639167 X X X
LK_14_4895 Lake Chatuge LMP 12 at State Line (aka
Hiawassee River) Tennessee Cartersville WP
Lake Trend Monitoring
34.983333 -83.788611 X X X
LK_14_4899 Lake Nottely (LMP15A) at Reece Creek Tennessee Cartersville WP Lake Trend
Monitoring 34.91152 -84.0506 X X X
LK_14_4900 Lake Nottely - Dam Forebay (aka Nottely
River - Upstream From Nottely Dam) Tennessee Cartersville WP
Lake Trend
Monitoring 34.957778 -84.092222 X X X
LK_14_4907 Lake Blue Ridge (LMP18) - 300 Meter
Upstream Of Dam Tennessee Cartersville WP
Lake Trend
Monitoring 34.881667 -84.28 X X X
LK_14_4908 Lake Blue Ridge (LMP18A) - 4 miles
upstream Dam Tennessee Cartersville WP
Lake Trend
Monitoring 34.84017 -84.2731 X X X
SH_01_56 Mouth of Wilmington River - Marker #19
Wassaw Sound Savannah Brunswick WP
Estuary Trend
Monitoring 31.932416 -80.977111 X
SH_02_317 Little Ogeechee River at Green Island Ogeechee Brunswick WP Estuary Trend
Monitoring 31.88823 -81.08798 X
SH_02_364 St Catherines Sound at Medway River near
Midway, GA Ogeechee Brunswick WP
Estuary Trend
Monitoring 31.715469 -81.156798 X
SH_06_2857 Altamaha River - channel marker #201 off
Wolf Island Altamaha Brunswick WP
Estuary Trend
Monitoring 31.31917 -81.32500 X
SH_07_3008 St. Andrews Sound at Satilla River near Satilla Brunswick WP Estuary Trend
Monitoring 30.98316 -81.45324 X
SH_07_3029 Turtle River off Hermitage Island Satilla Brunswick WP Targeted Sampling 31.22028 -81.56417 X
SH_07_3032 Turtle River - Georgia Highway 303 Satilla Brunswick WP Targeted Sampling 31.18694 -81.53139 X
SH_07_3035 Brunswick Harbor (off East River) - 0.83
miles SW of Brunswick Satilla Brunswick WP
Estuary Trend Monitoring/Targeted
31.14361 -81.49750 X
SH_07_3036 Brunswick River - U.S. Highway 17 Satilla Brunswick WP Targeted Sampling 31.11640 -81.48580 X X
SH_07_3049 Cumberland Sound at St. Marys River near
St Marys, GA Satilla Brunswick WP
Estuary Trend
Monitoring 30.728073 -81.489794 X
RV_01_109 Savannah River at Seaboard Coast Line
Railway, north of Clyo, GA Savannah USGS Trend Monitoring 32.525 -81.264 X X X X
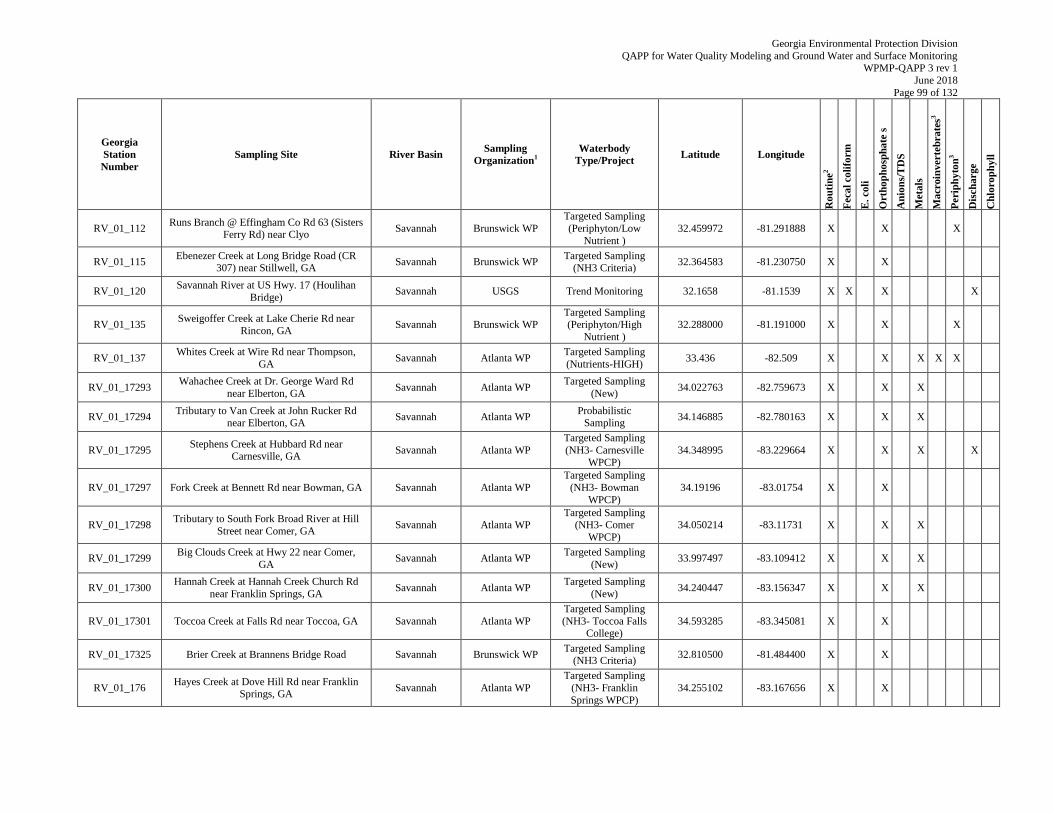
Georgia Environmental Protection Division
QAPP for Water Quality Modeling and Ground Water and Surface Monitoring WPMP-QAPP 3 rev 1
June 2018
Page 99 of 132
Georgia
Station
Number
Sampling Site River Basin Sampling
Organization1
Waterbody
Type/Project Latitude Longitude
Ro
uti
ne
2
Feca
l co
lifo
rm
E. coli
Ort
ho
ph
osp
ha
te s
An
ion
s/T
DS
Meta
ls
Ma
croin
verte
bra
tes3
Peri
ph
yto
n3
Dis
charge
Ch
loro
ph
yll
RV_01_112 Runs Branch @ Effingham Co Rd 63 (Sisters
Ferry Rd) near Clyo Savannah Brunswick WP
Targeted Sampling
(Periphyton/Low
Nutrient )
32.459972 -81.291888 X X X
RV_01_115 Ebenezer Creek at Long Bridge Road (CR
307) near Stillwell, GA Savannah Brunswick WP
Targeted Sampling (NH3 Criteria)
32.364583 -81.230750 X X
RV_01_120 Savannah River at US Hwy. 17 (Houlihan
Bridge) Savannah USGS Trend Monitoring 32.1658 -81.1539 X X X X
RV_01_135 Sweigoffer Creek at Lake Cherie Rd near
Rincon, GA Savannah Brunswick WP
Targeted Sampling (Periphyton/High
Nutrient )
32.288000 -81.191000 X X X
RV_01_137 Whites Creek at Wire Rd near Thompson,
GA Savannah Atlanta WP
Targeted Sampling
(Nutrients-HIGH) 33.436 -82.509 X X X X X
RV_01_17293 Wahachee Creek at Dr. George Ward Rd
near Elberton, GA Savannah Atlanta WP
Targeted Sampling
(New) 34.022763 -82.759673 X X X
RV_01_17294 Tributary to Van Creek at John Rucker Rd
near Elberton, GA Savannah Atlanta WP
Probabilistic Sampling
34.146885 -82.780163 X X X
RV_01_17295 Stephens Creek at Hubbard Rd near
Carnesville, GA Savannah Atlanta WP
Targeted Sampling
(NH3- Carnesville
WPCP)
34.348995 -83.229664 X X X X
RV_01_17297 Fork Creek at Bennett Rd near Bowman, GA Savannah Atlanta WP
Targeted Sampling
(NH3- Bowman
WPCP)
34.19196 -83.01754 X X
RV_01_17298 Tributary to South Fork Broad River at Hill
Street near Comer, GA Savannah Atlanta WP
Targeted Sampling (NH3- Comer
WPCP)
34.050214 -83.11731 X X X
RV_01_17299 Big Clouds Creek at Hwy 22 near Comer,
GA Savannah Atlanta WP
Targeted Sampling
(New) 33.997497 -83.109412 X X X
RV_01_17300 Hannah Creek at Hannah Creek Church Rd
near Franklin Springs, GA Savannah Atlanta WP
Targeted Sampling
(New) 34.240447 -83.156347 X X X
RV_01_17301 Toccoa Creek at Falls Rd near Toccoa, GA Savannah Atlanta WP
Targeted Sampling
(NH3- Toccoa Falls College)
34.593285 -83.345081 X X
RV_01_17325 Brier Creek at Brannens Bridge Road Savannah Brunswick WP Targeted Sampling
(NH3 Criteria) 32.810500 -81.484400 X X
RV_01_176 Hayes Creek at Dove Hill Rd near Franklin
Springs, GA Savannah Atlanta WP
Targeted Sampling
(NH3- Franklin
Springs WPCP)
34.255102 -83.167656 X X
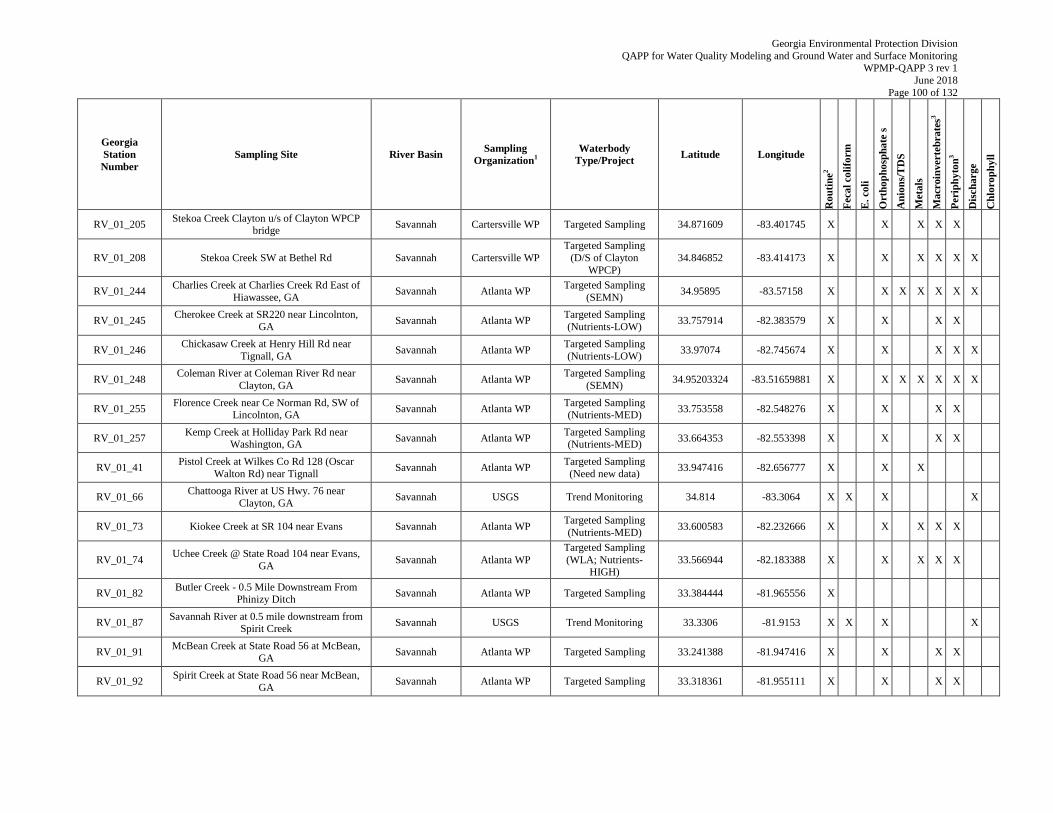
Georgia Environmental Protection Division
QAPP for Water Quality Modeling and Ground Water and Surface Monitoring WPMP-QAPP 3 rev 1
June 2018
Page 100 of 132
Georgia
Station
Number
Sampling Site River Basin Sampling
Organization1
Waterbody
Type/Project Latitude Longitude
Ro
uti
ne
2
Feca
l co
lifo
rm
E. coli
Ort
ho
ph
osp
ha
te s
An
ion
s/T
DS
Meta
ls
Ma
croin
verte
bra
tes3
Peri
ph
yto
n3
Dis
charge
Ch
loro
ph
yll
RV_01_205 Stekoa Creek Clayton u/s of Clayton WPCP
bridge Savannah Cartersville WP Targeted Sampling 34.871609 -83.401745 X X X X X
RV_01_208 Stekoa Creek SW at Bethel Rd Savannah Cartersville WP
Targeted Sampling
(D/S of Clayton
WPCP)
34.846852 -83.414173 X X X X X X
RV_01_244 Charlies Creek at Charlies Creek Rd East of
Hiawassee, GA Savannah Atlanta WP
Targeted Sampling
(SEMN) 34.95895 -83.57158 X X X X X X X
RV_01_245 Cherokee Creek at SR220 near Lincolnton,
GA Savannah Atlanta WP
Targeted Sampling
(Nutrients-LOW) 33.757914 -82.383579 X X X X
RV_01_246 Chickasaw Creek at Henry Hill Rd near
Tignall, GA Savannah Atlanta WP
Targeted Sampling
(Nutrients-LOW) 33.97074 -82.745674 X X X X X
RV_01_248 Coleman River at Coleman River Rd near
Clayton, GA Savannah Atlanta WP
Targeted Sampling
(SEMN) 34.95203324 -83.51659881 X X X X X X X
RV_01_255 Florence Creek near Ce Norman Rd, SW of
Lincolnton, GA Savannah Atlanta WP
Targeted Sampling (Nutrients-MED)
33.753558 -82.548276 X X X X
RV_01_257 Kemp Creek at Holliday Park Rd near
Washington, GA Savannah Atlanta WP
Targeted Sampling (Nutrients-MED)
33.664353 -82.553398 X X X X
RV_01_41 Pistol Creek at Wilkes Co Rd 128 (Oscar
Walton Rd) near Tignall Savannah Atlanta WP
Targeted Sampling
(Need new data) 33.947416 -82.656777 X X X
RV_01_66 Chattooga River at US Hwy. 76 near
Clayton, GA Savannah USGS Trend Monitoring 34.814 -83.3064 X X X X
RV_01_73 Kiokee Creek at SR 104 near Evans Savannah Atlanta WP Targeted Sampling
(Nutrients-MED) 33.600583 -82.232666 X X X X X
RV_01_74 Uchee Creek @ State Road 104 near Evans,
GA Savannah Atlanta WP
Targeted Sampling
(WLA; Nutrients-HIGH)
33.566944 -82.183388 X X X X X
RV_01_82 Butler Creek - 0.5 Mile Downstream From
Phinizy Ditch Savannah Atlanta WP Targeted Sampling 33.384444 -81.965556 X
RV_01_87 Savannah River at 0.5 mile downstream from
Spirit Creek Savannah USGS Trend Monitoring 33.3306 -81.9153 X X X X
RV_01_91 McBean Creek at State Road 56 at McBean,
GA Savannah Atlanta WP Targeted Sampling 33.241388 -81.947416 X X X X
RV_01_92 Spirit Creek at State Road 56 near McBean,
GA Savannah Atlanta WP Targeted Sampling 33.318361 -81.955111 X X X X
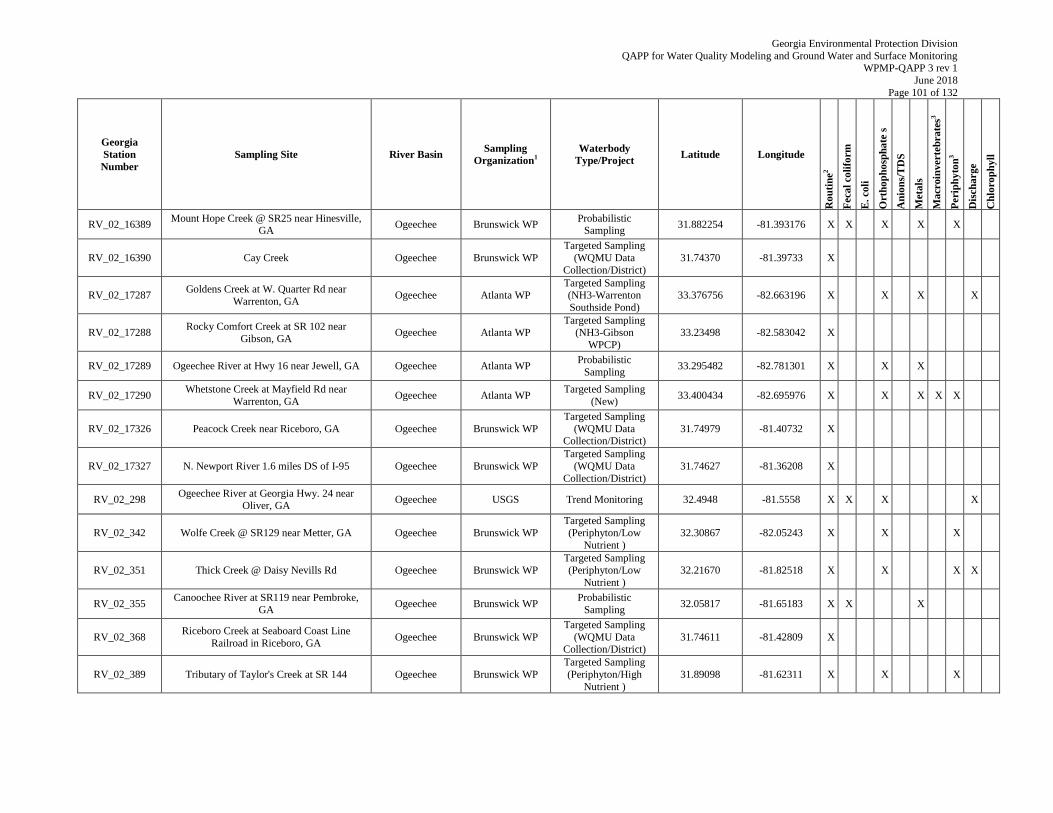
Georgia Environmental Protection Division
QAPP for Water Quality Modeling and Ground Water and Surface Monitoring WPMP-QAPP 3 rev 1
June 2018
Page 101 of 132
Georgia
Station
Number
Sampling Site River Basin Sampling
Organization1
Waterbody
Type/Project Latitude Longitude
Ro
uti
ne
2
Feca
l co
lifo
rm
E. coli
Ort
ho
ph
osp
ha
te s
An
ion
s/T
DS
Meta
ls
Ma
croin
verte
bra
tes3
Peri
ph
yto
n3
Dis
charge
Ch
loro
ph
yll
RV_02_16389 Mount Hope Creek @ SR25 near Hinesville,
GA Ogeechee Brunswick WP
Probabilistic Sampling
31.882254 -81.393176 X X X X X
RV_02_16390 Cay Creek Ogeechee Brunswick WP
Targeted Sampling
(WQMU Data
Collection/District)
31.74370 -81.39733 X
RV_02_17287 Goldens Creek at W. Quarter Rd near
Warrenton, GA Ogeechee Atlanta WP
Targeted Sampling (NH3-Warrenton
Southside Pond)
33.376756 -82.663196 X X X X
RV_02_17288 Rocky Comfort Creek at SR 102 near
Gibson, GA Ogeechee Atlanta WP
Targeted Sampling (NH3-Gibson
WPCP)
33.23498 -82.583042 X
RV_02_17289 Ogeechee River at Hwy 16 near Jewell, GA Ogeechee Atlanta WP Probabilistic
Sampling 33.295482 -82.781301 X X X
RV_02_17290 Whetstone Creek at Mayfield Rd near
Warrenton, GA Ogeechee Atlanta WP
Targeted Sampling
(New) 33.400434 -82.695976 X X X X X
RV_02_17326 Peacock Creek near Riceboro, GA Ogeechee Brunswick WP
Targeted Sampling
(WQMU Data Collection/District)
31.74979 -81.40732 X
RV_02_17327 N. Newport River 1.6 miles DS of I-95 Ogeechee Brunswick WP
Targeted Sampling
(WQMU Data
Collection/District)
31.74627 -81.36208 X
RV_02_298 Ogeechee River at Georgia Hwy. 24 near
Oliver, GA Ogeechee USGS Trend Monitoring 32.4948 -81.5558 X X X X
RV_02_342 Wolfe Creek @ SR129 near Metter, GA Ogeechee Brunswick WP Targeted Sampling (Periphyton/Low
Nutrient )
32.30867 -82.05243 X X X
RV_02_351 Thick Creek @ Daisy Nevills Rd Ogeechee Brunswick WP
Targeted Sampling
(Periphyton/Low
Nutrient )
32.21670 -81.82518 X X X X
RV_02_355 Canoochee River at SR119 near Pembroke,
GA Ogeechee Brunswick WP
Probabilistic
Sampling 32.05817 -81.65183 X X X
RV_02_368 Riceboro Creek at Seaboard Coast Line
Railroad in Riceboro, GA Ogeechee Brunswick WP
Targeted Sampling
(WQMU Data Collection/District)
31.74611 -81.42809 X
RV_02_389 Tributary of Taylor's Creek at SR 144 Ogeechee Brunswick WP
Targeted Sampling
(Periphyton/High
Nutrient )
31.89098 -81.62311 X X X
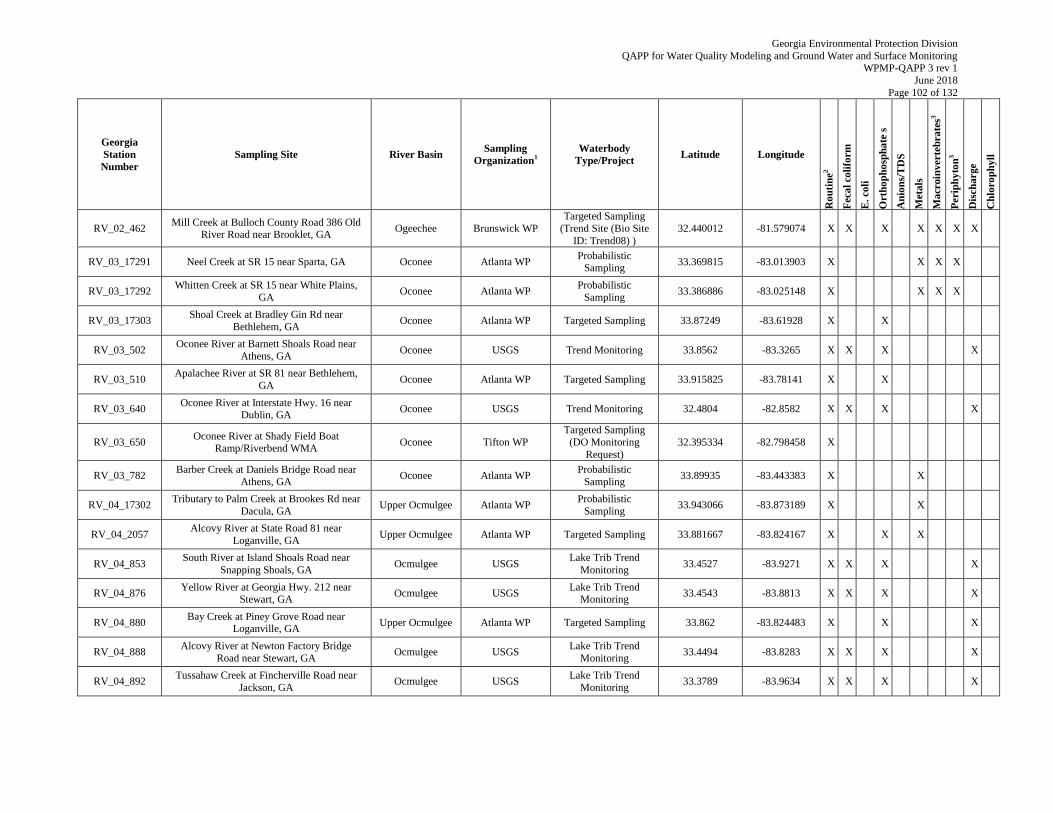
Georgia Environmental Protection Division
QAPP for Water Quality Modeling and Ground Water and Surface Monitoring WPMP-QAPP 3 rev 1
June 2018
Page 102 of 132
Georgia
Station
Number
Sampling Site River Basin Sampling
Organization1
Waterbody
Type/Project Latitude Longitude
Ro
uti
ne
2
Feca
l co
lifo
rm
E. coli
Ort
ho
ph
osp
ha
te s
An
ion
s/T
DS
Meta
ls
Ma
croin
verte
bra
tes3
Peri
ph
yto
n3
Dis
charge
Ch
loro
ph
yll
RV_02_462 Mill Creek at Bulloch County Road 386 Old
River Road near Brooklet, GA Ogeechee Brunswick WP
Targeted Sampling
(Trend Site (Bio Site
ID: Trend08) )
32.440012 -81.579074 X X X X X X X
RV_03_17291 Neel Creek at SR 15 near Sparta, GA Oconee Atlanta WP Probabilistic
Sampling 33.369815 -83.013903 X X X X
RV_03_17292 Whitten Creek at SR 15 near White Plains,
GA Oconee Atlanta WP
Probabilistic
Sampling 33.386886 -83.025148 X X X X
RV_03_17303 Shoal Creek at Bradley Gin Rd near
Bethlehem, GA Oconee Atlanta WP Targeted Sampling 33.87249 -83.61928 X X
RV_03_502 Oconee River at Barnett Shoals Road near
Athens, GA Oconee USGS Trend Monitoring 33.8562 -83.3265 X X X X
RV_03_510 Apalachee River at SR 81 near Bethlehem,
GA Oconee Atlanta WP Targeted Sampling 33.915825 -83.78141 X X
RV_03_640 Oconee River at Interstate Hwy. 16 near
Dublin, GA Oconee USGS Trend Monitoring 32.4804 -82.8582 X X X X
RV_03_650 Oconee River at Shady Field Boat
Ramp/Riverbend WMA Oconee Tifton WP
Targeted Sampling
(DO Monitoring
Request)
32.395334 -82.798458 X
RV_03_782 Barber Creek at Daniels Bridge Road near
Athens, GA Oconee Atlanta WP
Probabilistic
Sampling 33.89935 -83.443383 X X
RV_04_17302 Tributary to Palm Creek at Brookes Rd near
Dacula, GA Upper Ocmulgee Atlanta WP
Probabilistic
Sampling 33.943066 -83.873189 X X
RV_04_2057 Alcovy River at State Road 81 near
Loganville, GA Upper Ocmulgee Atlanta WP Targeted Sampling 33.881667 -83.824167 X X X
RV_04_853 South River at Island Shoals Road near
Snapping Shoals, GA Ocmulgee USGS
Lake Trib Trend
Monitoring 33.4527 -83.9271 X X X X
RV_04_876 Yellow River at Georgia Hwy. 212 near
Stewart, GA Ocmulgee USGS
Lake Trib Trend Monitoring
33.4543 -83.8813 X X X X
RV_04_880 Bay Creek at Piney Grove Road near
Loganville, GA Upper Ocmulgee Atlanta WP Targeted Sampling 33.862 -83.824483 X X X
RV_04_888 Alcovy River at Newton Factory Bridge
Road near Stewart, GA Ocmulgee USGS
Lake Trib Trend
Monitoring 33.4494 -83.8283 X X X X
RV_04_892 Tussahaw Creek at Fincherville Road near
Jackson, GA Ocmulgee USGS
Lake Trib Trend
Monitoring 33.3789 -83.9634 X X X X
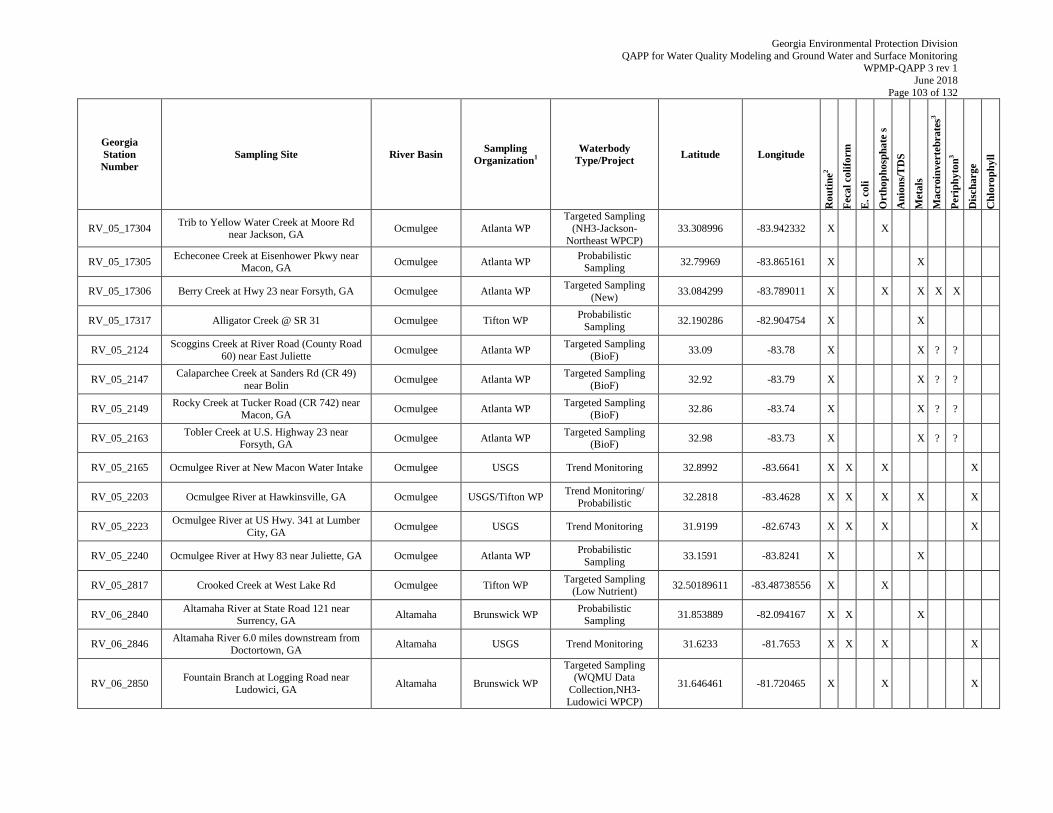
Georgia Environmental Protection Division
QAPP for Water Quality Modeling and Ground Water and Surface Monitoring WPMP-QAPP 3 rev 1
June 2018
Page 103 of 132
Georgia
Station
Number
Sampling Site River Basin Sampling
Organization1
Waterbody
Type/Project Latitude Longitude
Ro
uti
ne
2
Feca
l co
lifo
rm
E. coli
Ort
ho
ph
osp
ha
te s
An
ion
s/T
DS
Meta
ls
Ma
croin
verte
bra
tes3
Peri
ph
yto
n3
Dis
charge
Ch
loro
ph
yll
RV_05_17304 Trib to Yellow Water Creek at Moore Rd
near Jackson, GA Ocmulgee Atlanta WP
Targeted Sampling
(NH3-Jackson-
Northeast WPCP)
33.308996 -83.942332 X X
RV_05_17305 Echeconee Creek at Eisenhower Pkwy near
Macon, GA Ocmulgee Atlanta WP
Probabilistic Sampling
32.79969 -83.865161 X X
RV_05_17306 Berry Creek at Hwy 23 near Forsyth, GA Ocmulgee Atlanta WP Targeted Sampling
(New) 33.084299 -83.789011 X X X X X
RV_05_17317 Alligator Creek @ SR 31 Ocmulgee Tifton WP Probabilistic
Sampling 32.190286 -82.904754 X X
RV_05_2124 Scoggins Creek at River Road (County Road
60) near East Juliette Ocmulgee Atlanta WP
Targeted Sampling
(BioF) 33.09 -83.78 X X ? ?
RV_05_2147 Calaparchee Creek at Sanders Rd (CR 49)
near Bolin Ocmulgee Atlanta WP
Targeted Sampling
(BioF) 32.92 -83.79 X X ? ?
RV_05_2149 Rocky Creek at Tucker Road (CR 742) near
Macon, GA Ocmulgee Atlanta WP
Targeted Sampling (BioF)
32.86 -83.74 X X ? ?
RV_05_2163 Tobler Creek at U.S. Highway 23 near
Forsyth, GA Ocmulgee Atlanta WP
Targeted Sampling (BioF)
32.98 -83.73 X X ? ?
RV_05_2165 Ocmulgee River at New Macon Water Intake Ocmulgee USGS Trend Monitoring 32.8992 -83.6641 X X X X
RV_05_2203 Ocmulgee River at Hawkinsville, GA Ocmulgee USGS/Tifton WP Trend Monitoring/
Probabilistic 32.2818 -83.4628 X X X X X
RV_05_2223 Ocmulgee River at US Hwy. 341 at Lumber
City, GA Ocmulgee USGS Trend Monitoring 31.9199 -82.6743 X X X X
RV_05_2240 Ocmulgee River at Hwy 83 near Juliette, GA Ocmulgee Atlanta WP Probabilistic
Sampling 33.1591 -83.8241 X X
RV_05_2817 Crooked Creek at West Lake Rd Ocmulgee Tifton WP Targeted Sampling
(Low Nutrient) 32.50189611 -83.48738556 X X
RV_06_2840 Altamaha River at State Road 121 near
Surrency, GA Altamaha Brunswick WP
Probabilistic Sampling
31.853889 -82.094167 X X X
RV_06_2846 Altamaha River 6.0 miles downstream from
Doctortown, GA Altamaha USGS Trend Monitoring 31.6233 -81.7653 X X X X
RV_06_2850 Fountain Branch at Logging Road near
Ludowici, GA Altamaha Brunswick WP
Targeted Sampling (WQMU Data
Collection,NH3-
Ludowici WPCP)
31.646461 -81.720465 X X X
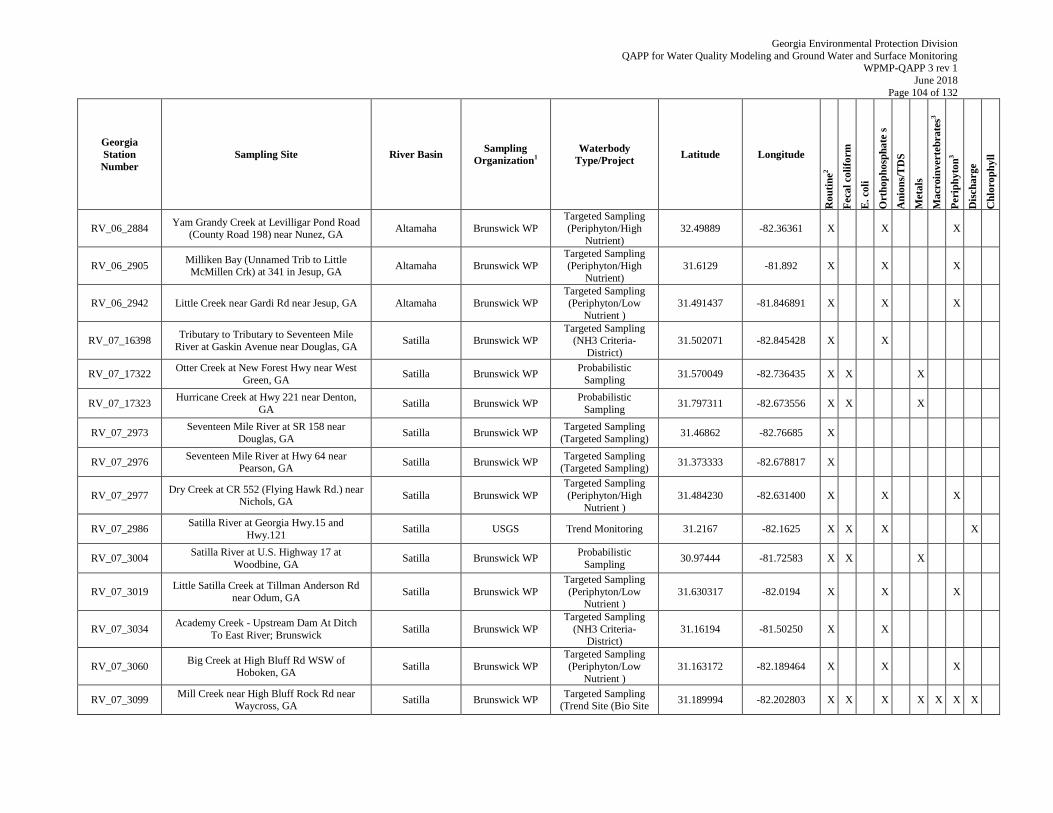
Georgia Environmental Protection Division
QAPP for Water Quality Modeling and Ground Water and Surface Monitoring WPMP-QAPP 3 rev 1
June 2018
Page 104 of 132
Georgia
Station
Number
Sampling Site River Basin Sampling
Organization1
Waterbody
Type/Project Latitude Longitude
Ro
uti
ne
2
Feca
l co
lifo
rm
E. coli
Ort
ho
ph
osp
ha
te s
An
ion
s/T
DS
Meta
ls
Ma
croin
verte
bra
tes3
Peri
ph
yto
n3
Dis
charge
Ch
loro
ph
yll
RV_06_2884 Yam Grandy Creek at Levilligar Pond Road
(County Road 198) near Nunez, GA Altamaha Brunswick WP
Targeted Sampling
(Periphyton/High
Nutrient)
32.49889 -82.36361 X X X
RV_06_2905 Milliken Bay (Unnamed Trib to Little McMillen Crk) at 341 in Jesup, GA
Altamaha Brunswick WP
Targeted Sampling
(Periphyton/High
Nutrient)
31.6129 -81.892 X X X
RV_06_2942 Little Creek near Gardi Rd near Jesup, GA Altamaha Brunswick WP Targeted Sampling (Periphyton/Low
Nutrient )
31.491437 -81.846891 X X X
RV_07_16398 Tributary to Tributary to Seventeen Mile
River at Gaskin Avenue near Douglas, GA Satilla Brunswick WP
Targeted Sampling (NH3 Criteria-
District)
31.502071 -82.845428 X X
RV_07_17322 Otter Creek at New Forest Hwy near West
Green, GA Satilla Brunswick WP
Probabilistic
Sampling 31.570049 -82.736435 X X X
RV_07_17323 Hurricane Creek at Hwy 221 near Denton,
GA Satilla Brunswick WP
Probabilistic
Sampling 31.797311 -82.673556 X X X
RV_07_2973 Seventeen Mile River at SR 158 near
Douglas, GA Satilla Brunswick WP
Targeted Sampling
(Targeted Sampling) 31.46862 -82.76685 X
RV_07_2976 Seventeen Mile River at Hwy 64 near
Pearson, GA Satilla Brunswick WP
Targeted Sampling (Targeted Sampling)
31.373333 -82.678817 X
RV_07_2977 Dry Creek at CR 552 (Flying Hawk Rd.) near
Nichols, GA Satilla Brunswick WP
Targeted Sampling
(Periphyton/High
Nutrient )
31.484230 -82.631400 X X X
RV_07_2986 Satilla River at Georgia Hwy.15 and
Hwy.121 Satilla USGS Trend Monitoring 31.2167 -82.1625 X X X X
RV_07_3004 Satilla River at U.S. Highway 17 at
Woodbine, GA Satilla Brunswick WP
Probabilistic
Sampling 30.97444 -81.72583 X X X
RV_07_3019 Little Satilla Creek at Tillman Anderson Rd
near Odum, GA Satilla Brunswick WP
Targeted Sampling
(Periphyton/Low Nutrient )
31.630317 -82.0194 X X X
RV_07_3034 Academy Creek - Upstream Dam At Ditch
To East River; Brunswick Satilla Brunswick WP
Targeted Sampling
(NH3 Criteria-District)
31.16194 -81.50250 X X
RV_07_3060 Big Creek at High Bluff Rd WSW of
Hoboken, GA Satilla Brunswick WP
Targeted Sampling
(Periphyton/Low
Nutrient )
31.163172 -82.189464 X X X
RV_07_3099 Mill Creek near High Bluff Rock Rd near
Waycross, GA Satilla Brunswick WP
Targeted Sampling (Trend Site (Bio Site
31.189994 -82.202803 X X X X X X X
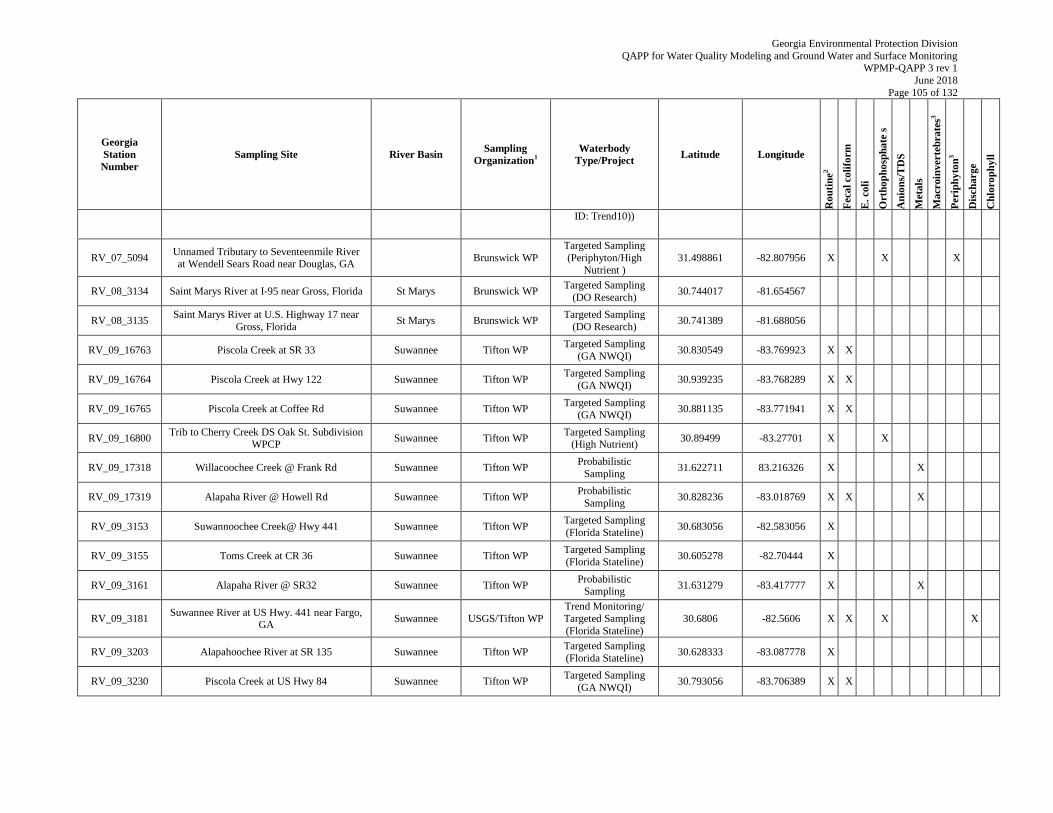
Georgia Environmental Protection Division
QAPP for Water Quality Modeling and Ground Water and Surface Monitoring WPMP-QAPP 3 rev 1
June 2018
Page 105 of 132
Georgia
Station
Number
Sampling Site River Basin Sampling
Organization1
Waterbody
Type/Project Latitude Longitude
Ro
uti
ne
2
Feca
l co
lifo
rm
E. coli
Ort
ho
ph
osp
ha
te s
An
ion
s/T
DS
Meta
ls
Ma
croin
verte
bra
tes3
Peri
ph
yto
n3
Dis
charge
Ch
loro
ph
yll
ID: Trend10))
RV_07_5094 Unnamed Tributary to Seventeenmile River at Wendell Sears Road near Douglas, GA
Brunswick WP
Targeted Sampling
(Periphyton/High
Nutrient )
31.498861 -82.807956 X X X
RV_08_3134 Saint Marys River at I-95 near Gross, Florida St Marys Brunswick WP Targeted Sampling
(DO Research) 30.744017 -81.654567
RV_08_3135 Saint Marys River at U.S. Highway 17 near
Gross, Florida St Marys Brunswick WP
Targeted Sampling
(DO Research) 30.741389 -81.688056
RV_09_16763 Piscola Creek at SR 33 Suwannee Tifton WP Targeted Sampling
(GA NWQI) 30.830549 -83.769923 X X
RV_09_16764 Piscola Creek at Hwy 122 Suwannee Tifton WP Targeted Sampling
(GA NWQI) 30.939235 -83.768289 X X
RV_09_16765 Piscola Creek at Coffee Rd Suwannee Tifton WP Targeted Sampling
(GA NWQI) 30.881135 -83.771941 X X
RV_09_16800 Trib to Cherry Creek DS Oak St. Subdivision
WPCP Suwannee Tifton WP
Targeted Sampling (High Nutrient)
30.89499 -83.27701 X X
RV_09_17318 Willacoochee Creek @ Frank Rd Suwannee Tifton WP Probabilistic
Sampling 31.622711 83.216326 X X
RV_09_17319 Alapaha River @ Howell Rd Suwannee Tifton WP Probabilistic
Sampling 30.828236 -83.018769 X X X
RV_09_3153 Suwannoochee Creek@ Hwy 441 Suwannee Tifton WP Targeted Sampling
(Florida Stateline) 30.683056 -82.583056 X
RV_09_3155 Toms Creek at CR 36 Suwannee Tifton WP Targeted Sampling
(Florida Stateline) 30.605278 -82.70444 X
RV_09_3161 Alapaha River @ SR32 Suwannee Tifton WP Probabilistic
Sampling 31.631279 -83.417777 X X
RV_09_3181 Suwannee River at US Hwy. 441 near Fargo,
GA Suwannee USGS/Tifton WP
Trend Monitoring/
Targeted Sampling
(Florida Stateline)
30.6806 -82.5606 X X X X
RV_09_3203 Alapahoochee River at SR 135 Suwannee Tifton WP Targeted Sampling
(Florida Stateline) 30.628333 -83.087778 X
RV_09_3230 Piscola Creek at US Hwy 84 Suwannee Tifton WP Targeted Sampling
(GA NWQI) 30.793056 -83.706389 X X
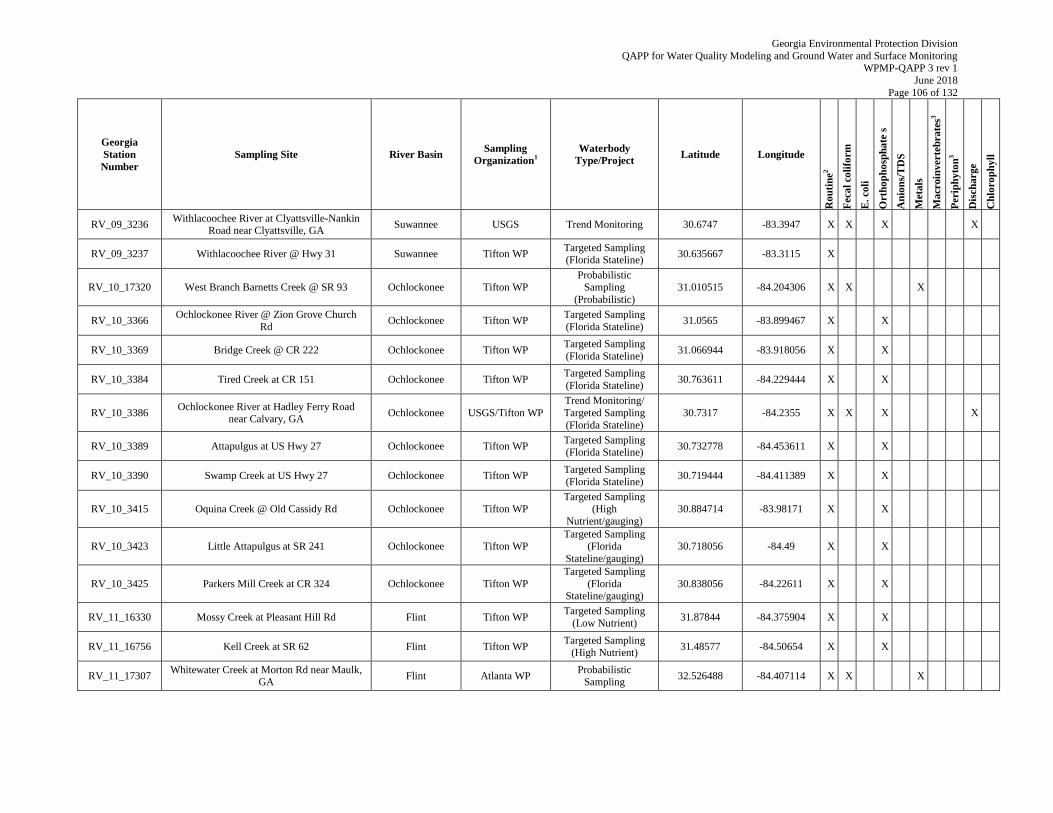
Georgia Environmental Protection Division
QAPP for Water Quality Modeling and Ground Water and Surface Monitoring WPMP-QAPP 3 rev 1
June 2018
Page 106 of 132
Georgia
Station
Number
Sampling Site River Basin Sampling
Organization1
Waterbody
Type/Project Latitude Longitude
Ro
uti
ne
2
Feca
l co
lifo
rm
E. coli
Ort
ho
ph
osp
ha
te s
An
ion
s/T
DS
Meta
ls
Ma
croin
verte
bra
tes3
Peri
ph
yto
n3
Dis
charge
Ch
loro
ph
yll
RV_09_3236 Withlacoochee River at Clyattsville-Nankin
Road near Clyattsville, GA Suwannee USGS Trend Monitoring 30.6747 -83.3947 X X X X
RV_09_3237 Withlacoochee River @ Hwy 31 Suwannee Tifton WP Targeted Sampling (Florida Stateline)
30.635667 -83.3115 X
RV_10_17320 West Branch Barnetts Creek @ SR 93 Ochlockonee Tifton WP Probabilistic
Sampling
(Probabilistic)
31.010515 -84.204306 X X X
RV_10_3366 Ochlockonee River @ Zion Grove Church
Rd Ochlockonee Tifton WP
Targeted Sampling
(Florida Stateline) 31.0565 -83.899467 X X
RV_10_3369 Bridge Creek @ CR 222 Ochlockonee Tifton WP Targeted Sampling
(Florida Stateline) 31.066944 -83.918056 X X
RV_10_3384 Tired Creek at CR 151 Ochlockonee Tifton WP Targeted Sampling
(Florida Stateline) 30.763611 -84.229444 X X
RV_10_3386 Ochlockonee River at Hadley Ferry Road
near Calvary, GA Ochlockonee USGS/Tifton WP
Trend Monitoring/
Targeted Sampling
(Florida Stateline)
30.7317 -84.2355 X X X X
RV_10_3389 Attapulgus at US Hwy 27 Ochlockonee Tifton WP Targeted Sampling (Florida Stateline)
30.732778 -84.453611 X X
RV_10_3390 Swamp Creek at US Hwy 27 Ochlockonee Tifton WP Targeted Sampling
(Florida Stateline) 30.719444 -84.411389 X X
RV_10_3415 Oquina Creek @ Old Cassidy Rd Ochlockonee Tifton WP Targeted Sampling
(High
Nutrient/gauging)
30.884714 -83.98171 X X
RV_10_3423 Little Attapulgus at SR 241 Ochlockonee Tifton WP Targeted Sampling
(Florida
Stateline/gauging)
30.718056 -84.49 X X
RV_10_3425 Parkers Mill Creek at CR 324 Ochlockonee Tifton WP
Targeted Sampling
(Florida Stateline/gauging)
30.838056 -84.22611 X X
RV_11_16330 Mossy Creek at Pleasant Hill Rd Flint Tifton WP Targeted Sampling
(Low Nutrient) 31.87844 -84.375904 X X
RV_11_16756 Kell Creek at SR 62 Flint Tifton WP Targeted Sampling
(High Nutrient) 31.48577 -84.50654 X X
RV_11_17307 Whitewater Creek at Morton Rd near Maulk,
GA Flint Atlanta WP
Probabilistic Sampling
32.526488 -84.407114 X X X
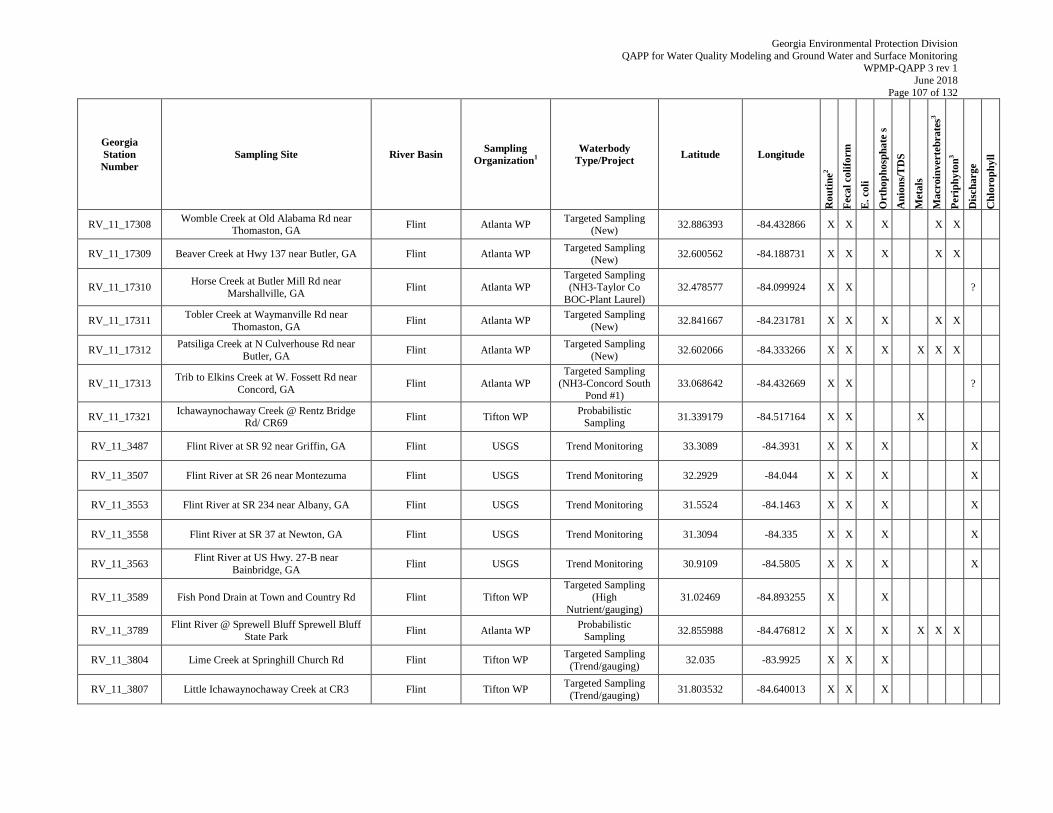
Georgia Environmental Protection Division
QAPP for Water Quality Modeling and Ground Water and Surface Monitoring WPMP-QAPP 3 rev 1
June 2018
Page 107 of 132
Georgia
Station
Number
Sampling Site River Basin Sampling
Organization1
Waterbody
Type/Project Latitude Longitude
Ro
uti
ne
2
Feca
l co
lifo
rm
E. coli
Ort
ho
ph
osp
ha
te s
An
ion
s/T
DS
Meta
ls
Ma
croin
verte
bra
tes3
Peri
ph
yto
n3
Dis
charge
Ch
loro
ph
yll
RV_11_17308 Womble Creek at Old Alabama Rd near
Thomaston, GA Flint Atlanta WP
Targeted Sampling (New)
32.886393 -84.432866 X X X X X
RV_11_17309 Beaver Creek at Hwy 137 near Butler, GA Flint Atlanta WP Targeted Sampling
(New) 32.600562 -84.188731 X X X X X
RV_11_17310 Horse Creek at Butler Mill Rd near
Marshallville, GA Flint Atlanta WP
Targeted Sampling (NH3-Taylor Co
BOC-Plant Laurel)
32.478577 -84.099924 X X ?
RV_11_17311 Tobler Creek at Waymanville Rd near
Thomaston, GA Flint Atlanta WP
Targeted Sampling
(New) 32.841667 -84.231781 X X X X X
RV_11_17312 Patsiliga Creek at N Culverhouse Rd near
Butler, GA Flint Atlanta WP
Targeted Sampling
(New) 32.602066 -84.333266 X X X X X X
RV_11_17313 Trib to Elkins Creek at W. Fossett Rd near
Concord, GA Flint Atlanta WP
Targeted Sampling
(NH3-Concord South Pond #1)
33.068642 -84.432669 X X ?
RV_11_17321 Ichawaynochaway Creek @ Rentz Bridge
Rd/ CR69 Flint Tifton WP
Probabilistic Sampling
31.339179 -84.517164 X X X
RV_11_3487 Flint River at SR 92 near Griffin, GA Flint USGS Trend Monitoring 33.3089 -84.3931 X X X X
RV_11_3507 Flint River at SR 26 near Montezuma Flint USGS Trend Monitoring 32.2929 -84.044 X X X X
RV_11_3553 Flint River at SR 234 near Albany, GA Flint USGS Trend Monitoring 31.5524 -84.1463 X X X X
RV_11_3558 Flint River at SR 37 at Newton, GA Flint USGS Trend Monitoring 31.3094 -84.335 X X X X
RV_11_3563 Flint River at US Hwy. 27-B near
Bainbridge, GA Flint USGS Trend Monitoring 30.9109 -84.5805 X X X X
RV_11_3589 Fish Pond Drain at Town and Country Rd Flint Tifton WP
Targeted Sampling
(High
Nutrient/gauging)
31.02469 -84.893255 X X
RV_11_3789 Flint River @ Sprewell Bluff Sprewell Bluff
State Park Flint Atlanta WP
Probabilistic Sampling
32.855988 -84.476812 X X X X X X
RV_11_3804 Lime Creek at Springhill Church Rd Flint Tifton WP Targeted Sampling
(Trend/gauging) 32.035 -83.9925 X X X
RV_11_3807 Little Ichawaynochaway Creek at CR3 Flint Tifton WP Targeted Sampling
(Trend/gauging) 31.803532 -84.640013 X X X
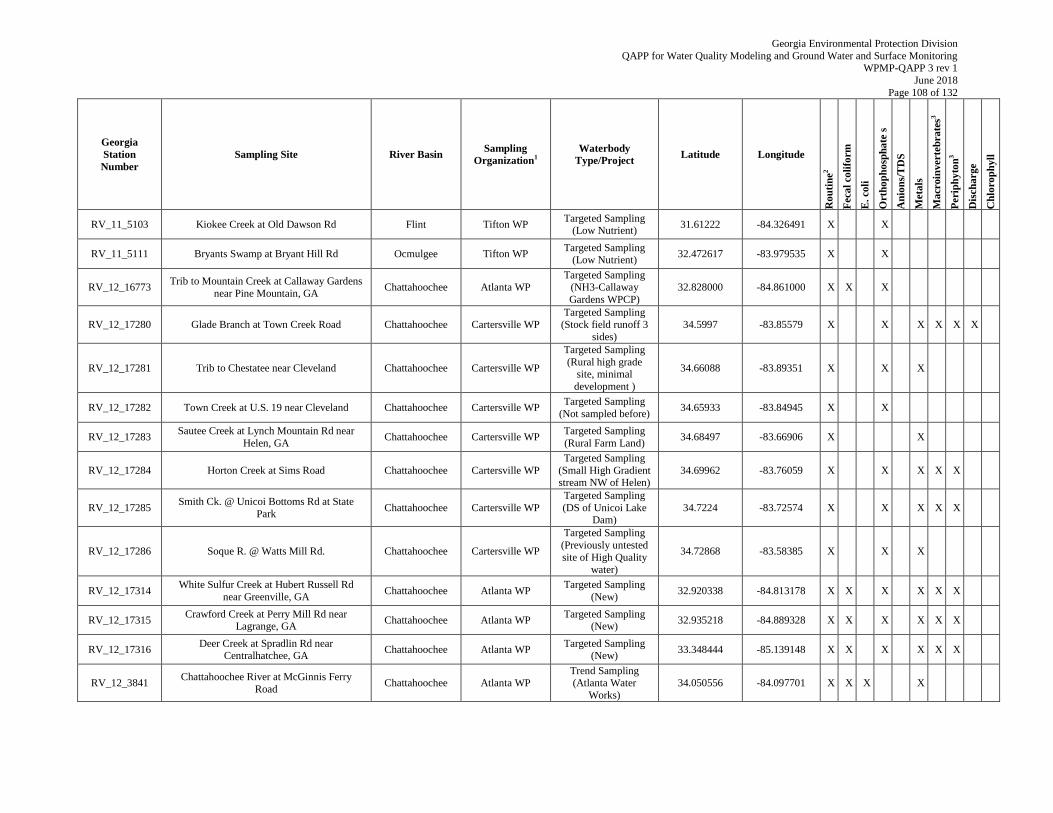
Georgia Environmental Protection Division
QAPP for Water Quality Modeling and Ground Water and Surface Monitoring WPMP-QAPP 3 rev 1
June 2018
Page 108 of 132
Georgia
Station
Number
Sampling Site River Basin Sampling
Organization1
Waterbody
Type/Project Latitude Longitude
Ro
uti
ne
2
Feca
l co
lifo
rm
E. coli
Ort
ho
ph
osp
ha
te s
An
ion
s/T
DS
Meta
ls
Ma
croin
verte
bra
tes3
Peri
ph
yto
n3
Dis
charge
Ch
loro
ph
yll
RV_11_5103 Kiokee Creek at Old Dawson Rd Flint Tifton WP Targeted Sampling
(Low Nutrient) 31.61222 -84.326491 X X
RV_11_5111 Bryants Swamp at Bryant Hill Rd Ocmulgee Tifton WP Targeted Sampling
(Low Nutrient) 32.472617 -83.979535 X X
RV_12_16773 Trib to Mountain Creek at Callaway Gardens
near Pine Mountain, GA Chattahoochee Atlanta WP
Targeted Sampling (NH3-Callaway
Gardens WPCP)
32.828000 -84.861000 X X X
RV_12_17280 Glade Branch at Town Creek Road Chattahoochee Cartersville WP Targeted Sampling
(Stock field runoff 3
sides)
34.5997 -83.85579 X X X X X X
RV_12_17281 Trib to Chestatee near Cleveland Chattahoochee Cartersville WP
Targeted Sampling
(Rural high grade site, minimal
development )
34.66088 -83.89351 X X X
RV_12_17282 Town Creek at U.S. 19 near Cleveland Chattahoochee Cartersville WP Targeted Sampling
(Not sampled before) 34.65933 -83.84945 X X
RV_12_17283 Sautee Creek at Lynch Mountain Rd near
Helen, GA Chattahoochee Cartersville WP
Targeted Sampling
(Rural Farm Land) 34.68497 -83.66906 X X
RV_12_17284 Horton Creek at Sims Road Chattahoochee Cartersville WP
Targeted Sampling
(Small High Gradient stream NW of Helen)
34.69962 -83.76059 X X X X X
RV_12_17285 Smith Ck. @ Unicoi Bottoms Rd at State
Park Chattahoochee Cartersville WP
Targeted Sampling
(DS of Unicoi Lake Dam)
34.7224 -83.72574 X X X X X
RV_12_17286 Soque R. @ Watts Mill Rd. Chattahoochee Cartersville WP
Targeted Sampling
(Previously untested
site of High Quality
water)
34.72868 -83.58385 X X X
RV_12_17314 White Sulfur Creek at Hubert Russell Rd
near Greenville, GA Chattahoochee Atlanta WP
Targeted Sampling
(New) 32.920338 -84.813178 X X X X X X
RV_12_17315 Crawford Creek at Perry Mill Rd near
Lagrange, GA Chattahoochee Atlanta WP
Targeted Sampling (New)
32.935218 -84.889328 X X X X X X
RV_12_17316 Deer Creek at Spradlin Rd near
Centralhatchee, GA Chattahoochee Atlanta WP
Targeted Sampling (New)
33.348444 -85.139148 X X X X X X
RV_12_3841 Chattahoochee River at McGinnis Ferry
Road Chattahoochee Atlanta WP
Trend Sampling (Atlanta Water
Works)
34.050556 -84.097701 X X X X
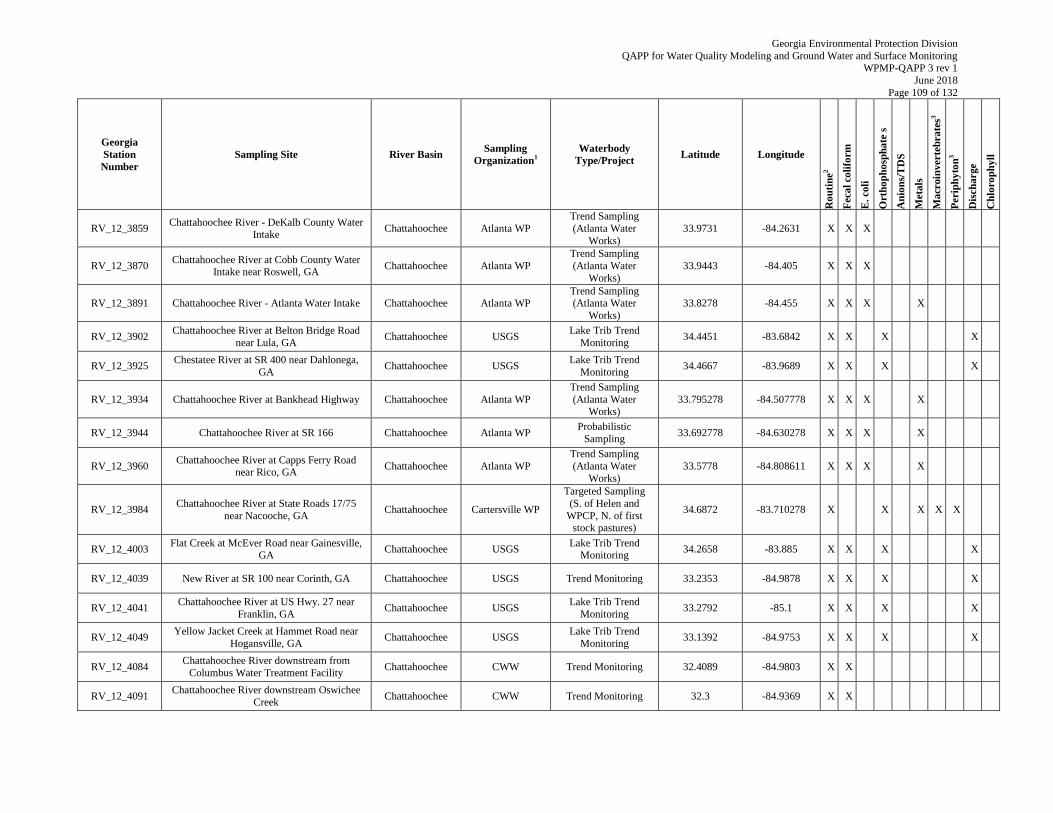
Georgia Environmental Protection Division
QAPP for Water Quality Modeling and Ground Water and Surface Monitoring WPMP-QAPP 3 rev 1
June 2018
Page 109 of 132
Georgia
Station
Number
Sampling Site River Basin Sampling
Organization1
Waterbody
Type/Project Latitude Longitude
Ro
uti
ne
2
Feca
l co
lifo
rm
E. coli
Ort
ho
ph
osp
ha
te s
An
ion
s/T
DS
Meta
ls
Ma
croin
verte
bra
tes3
Peri
ph
yto
n3
Dis
charge
Ch
loro
ph
yll
RV_12_3859 Chattahoochee River - DeKalb County Water
Intake Chattahoochee Atlanta WP
Trend Sampling
(Atlanta Water
Works)
33.9731 -84.2631 X X X
RV_12_3870 Chattahoochee River at Cobb County Water
Intake near Roswell, GA Chattahoochee Atlanta WP
Trend Sampling
(Atlanta Water
Works)
33.9443 -84.405 X X X
RV_12_3891 Chattahoochee River - Atlanta Water Intake Chattahoochee Atlanta WP Trend Sampling (Atlanta Water
Works)
33.8278 -84.455 X X X X
RV_12_3902 Chattahoochee River at Belton Bridge Road
near Lula, GA Chattahoochee USGS
Lake Trib Trend
Monitoring 34.4451 -83.6842 X X X X
RV_12_3925 Chestatee River at SR 400 near Dahlonega,
GA Chattahoochee USGS
Lake Trib Trend
Monitoring 34.4667 -83.9689 X X X X
RV_12_3934 Chattahoochee River at Bankhead Highway Chattahoochee Atlanta WP
Trend Sampling
(Atlanta Water Works)
33.795278 -84.507778 X X X X
RV_12_3944 Chattahoochee River at SR 166 Chattahoochee Atlanta WP Probabilistic
Sampling 33.692778 -84.630278 X X X X
RV_12_3960 Chattahoochee River at Capps Ferry Road
near Rico, GA Chattahoochee Atlanta WP
Trend Sampling
(Atlanta Water
Works)
33.5778 -84.808611 X X X X
RV_12_3984 Chattahoochee River at State Roads 17/75
near Nacooche, GA Chattahoochee Cartersville WP
Targeted Sampling
(S. of Helen and
WPCP, N. of first stock pastures)
34.6872 -83.710278 X X X X X
RV_12_4003 Flat Creek at McEver Road near Gainesville,
GA Chattahoochee USGS
Lake Trib Trend Monitoring
34.2658 -83.885 X X X X
RV_12_4039 New River at SR 100 near Corinth, GA Chattahoochee USGS Trend Monitoring 33.2353 -84.9878 X X X X
RV_12_4041 Chattahoochee River at US Hwy. 27 near
Franklin, GA Chattahoochee USGS
Lake Trib Trend
Monitoring 33.2792 -85.1 X X X X
RV_12_4049 Yellow Jacket Creek at Hammet Road near
Hogansville, GA Chattahoochee USGS
Lake Trib Trend
Monitoring 33.1392 -84.9753 X X X X
RV_12_4084 Chattahoochee River downstream from
Columbus Water Treatment Facility Chattahoochee CWW Trend Monitoring 32.4089 -84.9803 X X
RV_12_4091 Chattahoochee River downstream Oswichee
Creek Chattahoochee CWW Trend Monitoring 32.3 -84.9369 X X
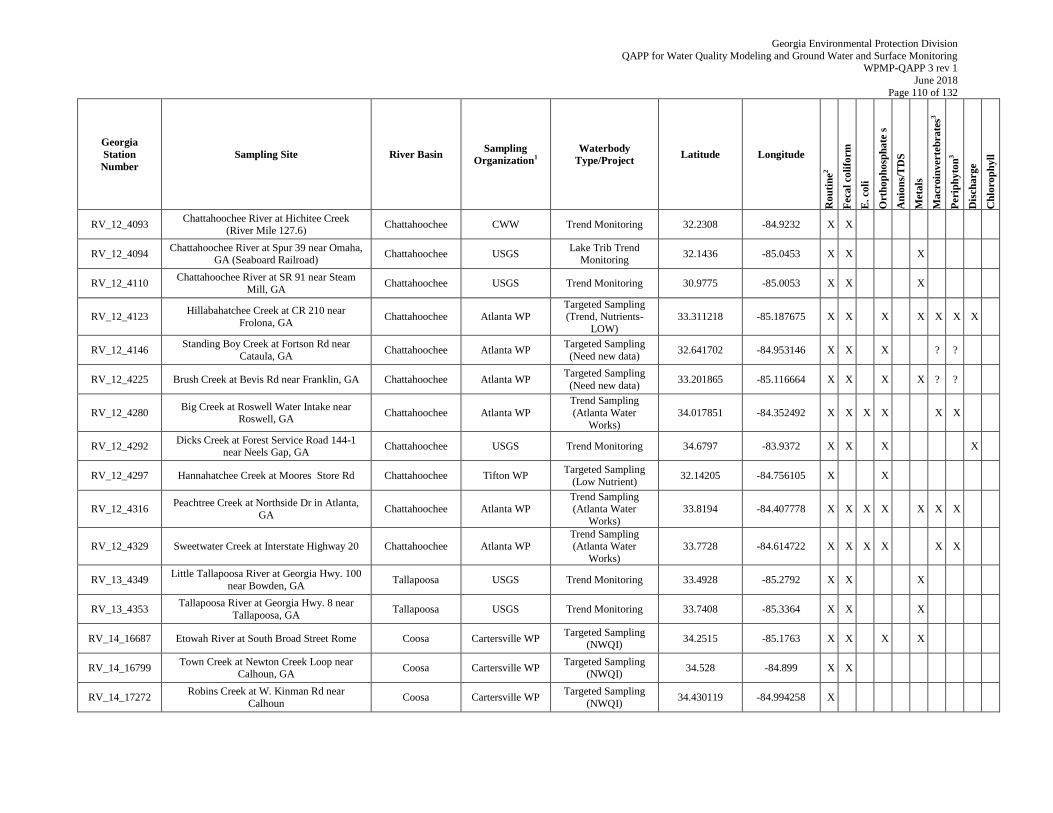
Georgia Environmental Protection Division
QAPP for Water Quality Modeling and Ground Water and Surface Monitoring WPMP-QAPP 3 rev 1
June 2018
Page 110 of 132
Georgia
Station
Number
Sampling Site River Basin Sampling
Organization1
Waterbody
Type/Project Latitude Longitude
Ro
uti
ne
2
Feca
l co
lifo
rm
E. coli
Ort
ho
ph
osp
ha
te s
An
ion
s/T
DS
Meta
ls
Ma
croin
verte
bra
tes3
Peri
ph
yto
n3
Dis
charge
Ch
loro
ph
yll
RV_12_4093 Chattahoochee River at Hichitee Creek
(River Mile 127.6) Chattahoochee CWW Trend Monitoring 32.2308 -84.9232 X X
RV_12_4094 Chattahoochee River at Spur 39 near Omaha,
GA (Seaboard Railroad) Chattahoochee USGS
Lake Trib Trend Monitoring
32.1436 -85.0453 X X X
RV_12_4110 Chattahoochee River at SR 91 near Steam
Mill, GA Chattahoochee USGS Trend Monitoring 30.9775 -85.0053 X X X
RV_12_4123 Hillabahatchee Creek at CR 210 near
Frolona, GA Chattahoochee Atlanta WP
Targeted Sampling (Trend, Nutrients-
LOW)
33.311218 -85.187675 X X X X X X X
RV_12_4146 Standing Boy Creek at Fortson Rd near
Cataula, GA Chattahoochee Atlanta WP
Targeted Sampling
(Need new data) 32.641702 -84.953146 X X X ? ?
RV_12_4225 Brush Creek at Bevis Rd near Franklin, GA Chattahoochee Atlanta WP Targeted Sampling
(Need new data) 33.201865 -85.116664 X X X X ? ?
RV_12_4280 Big Creek at Roswell Water Intake near
Roswell, GA Chattahoochee Atlanta WP
Trend Sampling
(Atlanta Water
Works)
34.017851 -84.352492 X X X X X X
RV_12_4292 Dicks Creek at Forest Service Road 144-1
near Neels Gap, GA Chattahoochee USGS Trend Monitoring 34.6797 -83.9372 X X X X
RV_12_4297 Hannahatchee Creek at Moores Store Rd Chattahoochee Tifton WP Targeted Sampling
(Low Nutrient) 32.14205 -84.756105 X X
RV_12_4316 Peachtree Creek at Northside Dr in Atlanta,
GA Chattahoochee Atlanta WP
Trend Sampling (Atlanta Water
Works)
33.8194 -84.407778 X X X X X X X
RV_12_4329 Sweetwater Creek at Interstate Highway 20 Chattahoochee Atlanta WP Trend Sampling (Atlanta Water
Works)
33.7728 -84.614722 X X X X X X
RV_13_4349 Little Tallapoosa River at Georgia Hwy. 100
near Bowden, GA Tallapoosa USGS Trend Monitoring 33.4928 -85.2792 X X X
RV_13_4353 Tallapoosa River at Georgia Hwy. 8 near
Tallapoosa, GA Tallapoosa USGS Trend Monitoring 33.7408 -85.3364 X X X
RV_14_16687 Etowah River at South Broad Street Rome Coosa Cartersville WP Targeted Sampling
(NWQI) 34.2515 -85.1763 X X X X
RV_14_16799 Town Creek at Newton Creek Loop near
Calhoun, GA Coosa Cartersville WP
Targeted Sampling (NWQI)
34.528 -84.899 X X
RV_14_17272 Robins Creek at W. Kinman Rd near
Calhoun Coosa Cartersville WP
Targeted Sampling
(NWQI) 34.430119 -84.994258 X
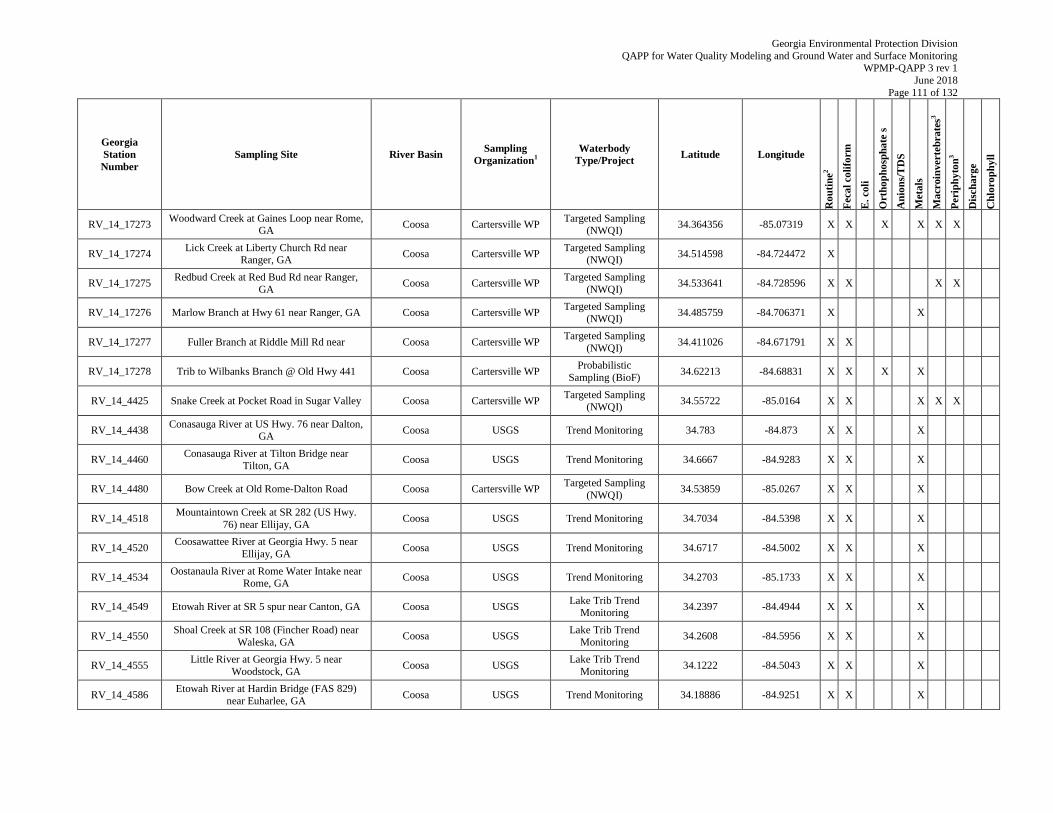
Georgia Environmental Protection Division
QAPP for Water Quality Modeling and Ground Water and Surface Monitoring WPMP-QAPP 3 rev 1
June 2018
Page 111 of 132
Georgia
Station
Number
Sampling Site River Basin Sampling
Organization1
Waterbody
Type/Project Latitude Longitude
Ro
uti
ne
2
Feca
l co
lifo
rm
E. coli
Ort
ho
ph
osp
ha
te s
An
ion
s/T
DS
Meta
ls
Ma
croin
verte
bra
tes3
Peri
ph
yto
n3
Dis
charge
Ch
loro
ph
yll
RV_14_17273 Woodward Creek at Gaines Loop near Rome,
GA Coosa Cartersville WP
Targeted Sampling (NWQI)
34.364356 -85.07319 X X X X X X
RV_14_17274 Lick Creek at Liberty Church Rd near
Ranger, GA Coosa Cartersville WP
Targeted Sampling (NWQI)
34.514598 -84.724472 X
RV_14_17275 Redbud Creek at Red Bud Rd near Ranger,
GA Coosa Cartersville WP
Targeted Sampling
(NWQI) 34.533641 -84.728596 X X X X
RV_14_17276 Marlow Branch at Hwy 61 near Ranger, GA Coosa Cartersville WP Targeted Sampling
(NWQI) 34.485759 -84.706371 X X
RV_14_17277 Fuller Branch at Riddle Mill Rd near Coosa Cartersville WP Targeted Sampling
(NWQI) 34.411026 -84.671791 X X
RV_14_17278 Trib to Wilbanks Branch @ Old Hwy 441 Coosa Cartersville WP Probabilistic
Sampling (BioF) 34.62213 -84.68831 X X X X
RV_14_4425 Snake Creek at Pocket Road in Sugar Valley Coosa Cartersville WP Targeted Sampling
(NWQI) 34.55722 -85.0164 X X X X X
RV_14_4438 Conasauga River at US Hwy. 76 near Dalton,
GA Coosa USGS Trend Monitoring 34.783 -84.873 X X X
RV_14_4460 Conasauga River at Tilton Bridge near
Tilton, GA Coosa USGS Trend Monitoring 34.6667 -84.9283 X X X
RV_14_4480 Bow Creek at Old Rome-Dalton Road Coosa Cartersville WP Targeted Sampling
(NWQI) 34.53859 -85.0267 X X X
RV_14_4518 Mountaintown Creek at SR 282 (US Hwy.
76) near Ellijay, GA Coosa USGS Trend Monitoring 34.7034 -84.5398 X X X
RV_14_4520 Coosawattee River at Georgia Hwy. 5 near
Ellijay, GA Coosa USGS Trend Monitoring 34.6717 -84.5002 X X X
RV_14_4534 Oostanaula River at Rome Water Intake near
Rome, GA Coosa USGS Trend Monitoring 34.2703 -85.1733 X X X
RV_14_4549 Etowah River at SR 5 spur near Canton, GA Coosa USGS Lake Trib Trend
Monitoring 34.2397 -84.4944 X X X
RV_14_4550 Shoal Creek at SR 108 (Fincher Road) near
Waleska, GA Coosa USGS
Lake Trib Trend
Monitoring 34.2608 -84.5956 X X X
RV_14_4555 Little River at Georgia Hwy. 5 near
Woodstock, GA Coosa USGS
Lake Trib Trend
Monitoring 34.1222 -84.5043 X X X
RV_14_4586 Etowah River at Hardin Bridge (FAS 829)
near Euharlee, GA Coosa USGS Trend Monitoring 34.18886 -84.9251 X X X
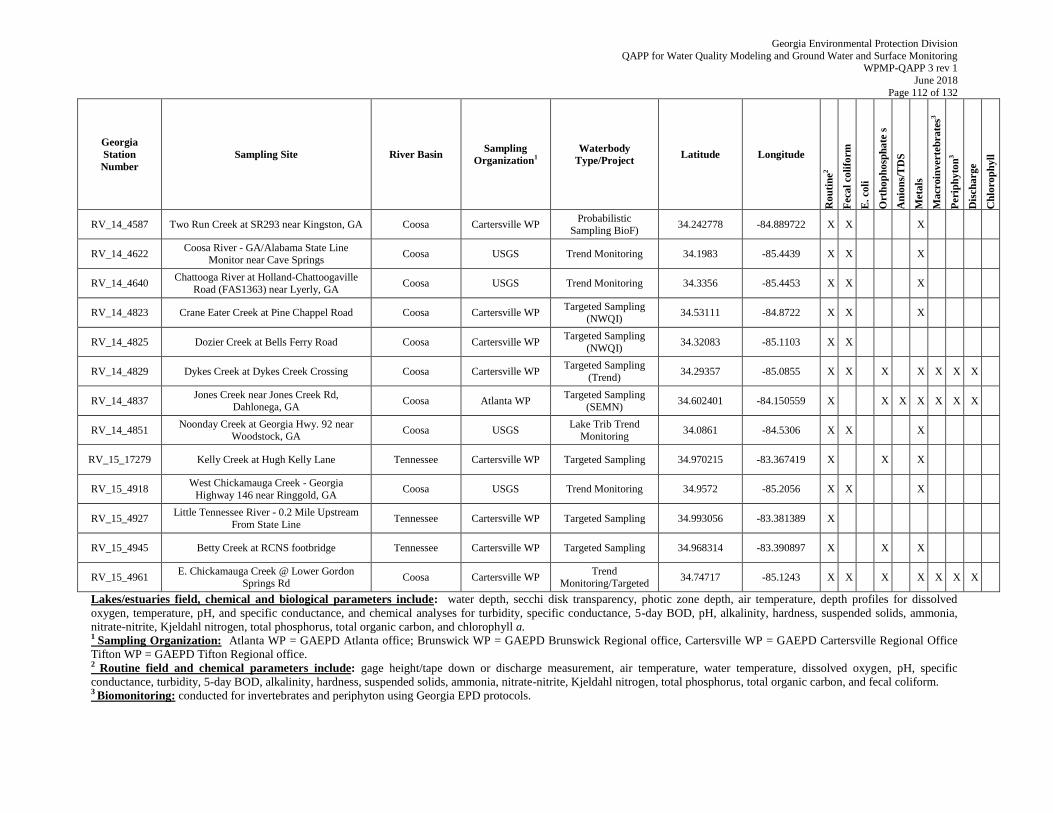
Georgia Environmental Protection Division
QAPP for Water Quality Modeling and Ground Water and Surface Monitoring WPMP-QAPP 3 rev 1
June 2018
Page 112 of 132
Georgia
Station
Number
Sampling Site River Basin Sampling
Organization1
Waterbody
Type/Project Latitude Longitude
Ro
uti
ne
2
Feca
l co
lifo
rm
E. coli
Ort
ho
ph
osp
ha
te s
An
ion
s/T
DS
Meta
ls
Ma
croin
verte
bra
tes3
Peri
ph
yto
n3
Dis
charge
Ch
loro
ph
yll
RV_14_4587 Two Run Creek at SR293 near Kingston, GA Coosa Cartersville WP Probabilistic
Sampling BioF) 34.242778 -84.889722 X X X
RV_14_4622 Coosa River - GA/Alabama State Line
Monitor near Cave Springs Coosa USGS Trend Monitoring 34.1983 -85.4439 X X X
RV_14_4640 Chattooga River at Holland-Chattoogaville
Road (FAS1363) near Lyerly, GA Coosa USGS Trend Monitoring 34.3356 -85.4453 X X X
RV_14_4823 Crane Eater Creek at Pine Chappel Road Coosa Cartersville WP Targeted Sampling
(NWQI) 34.53111 -84.8722 X X X
RV_14_4825 Dozier Creek at Bells Ferry Road Coosa Cartersville WP Targeted Sampling
(NWQI) 34.32083 -85.1103 X X
RV_14_4829 Dykes Creek at Dykes Creek Crossing Coosa Cartersville WP Targeted Sampling
(Trend) 34.29357 -85.0855 X X X X X X X
RV_14_4837 Jones Creek near Jones Creek Rd,
Dahlonega, GA Coosa Atlanta WP
Targeted Sampling
(SEMN) 34.602401 -84.150559 X X X X X X X
RV_14_4851 Noonday Creek at Georgia Hwy. 92 near
Woodstock, GA Coosa USGS
Lake Trib Trend Monitoring
34.0861 -84.5306 X X X
RV_15_17279 Kelly Creek at Hugh Kelly Lane Tennessee Cartersville WP Targeted Sampling 34.970215 -83.367419 X X X
RV_15_4918 West Chickamauga Creek - Georgia
Highway 146 near Ringgold, GA Coosa USGS Trend Monitoring 34.9572 -85.2056 X X X
RV_15_4927 Little Tennessee River - 0.2 Mile Upstream
From State Line Tennessee Cartersville WP Targeted Sampling 34.993056 -83.381389 X
RV_15_4945 Betty Creek at RCNS footbridge Tennessee Cartersville WP Targeted Sampling 34.968314 -83.390897 X X X
RV_15_4961 E. Chickamauga Creek @ Lower Gordon
Springs Rd Coosa Cartersville WP
Trend Monitoring/Targeted
34.74717 -85.1243 X X X X X X X
Lakes/estuaries field, chemical and biological parameters include: water depth, secchi disk transparency, photic zone depth, air temperature, depth profiles for dissolved
oxygen, temperature, pH, and specific conductance, and chemical analyses for turbidity, specific conductance, 5-day BOD, pH, alkalinity, hardness, suspended solids, ammonia,
nitrate-nitrite, Kjeldahl nitrogen, total phosphorus, total organic carbon, and chlorophyll a. 1 Sampling Organization: Atlanta WP = GAEPD Atlanta office; Brunswick WP = GAEPD Brunswick Regional office, Cartersville WP = GAEPD Cartersville Regional Office
Tifton WP = GAEPD Tifton Regional office. 2 Routine field and chemical parameters include: gage height/tape down or discharge measurement, air temperature, water temperature, dissolved oxygen, pH, specific
conductance, turbidity, 5-day BOD, alkalinity, hardness, suspended solids, ammonia, nitrate-nitrite, Kjeldahl nitrogen, total phosphorus, total organic carbon, and fecal coliform. 3 Biomonitoring: conducted for invertebrates and periphyton using Georgia EPD protocols.
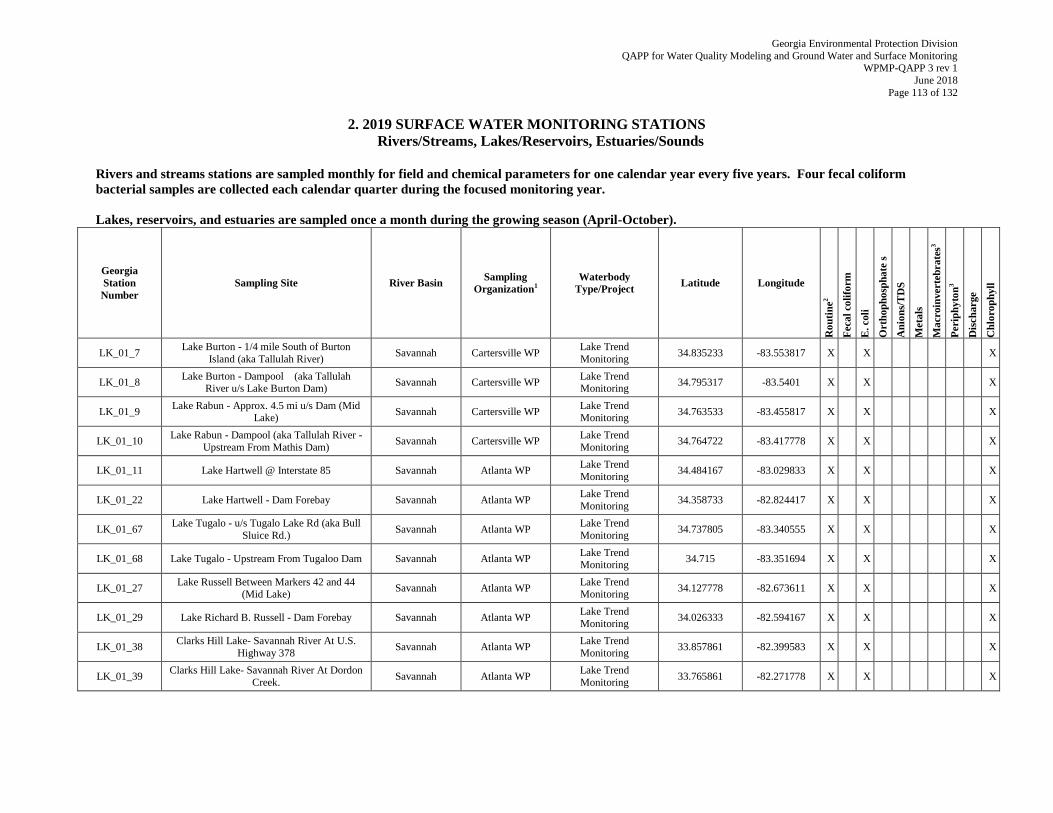
Georgia Environmental Protection Division
QAPP for Water Quality Modeling and Ground Water and Surface Monitoring WPMP-QAPP 3 rev 1
June 2018
Page 113 of 132
2. 2019 SURFACE WATER MONITORING STATIONS
Rivers/Streams, Lakes/Reservoirs, Estuaries/Sounds
Rivers and streams stations are sampled monthly for field and chemical parameters for one calendar year every five years. Four fecal coliform
bacterial samples are collected each calendar quarter during the focused monitoring year.
Lakes, reservoirs, and estuaries are sampled once a month during the growing season (April-October).
Georgia
Station
Number
Sampling Site River Basin Sampling
Organization1
Waterbody
Type/Project Latitude Longitude
Ro
uti
ne
2
Feca
l co
lifo
rm
E. coli
Ort
ho
ph
osp
ha
te s
An
ion
s/T
DS
Meta
ls
Ma
croin
verte
bra
tes3
Peri
ph
yto
n3
Dis
charge
Ch
loro
ph
yll
LK_01_7 Lake Burton - 1/4 mile South of Burton
Island (aka Tallulah River) Savannah Cartersville WP
Lake Trend
Monitoring 34.835233 -83.553817 X X X
LK_01_8 Lake Burton - Dampool (aka Tallulah
River u/s Lake Burton Dam) Savannah Cartersville WP
Lake Trend Monitoring
34.795317 -83.5401 X X X
LK_01_9 Lake Rabun - Approx. 4.5 mi u/s Dam (Mid
Lake) Savannah Cartersville WP
Lake Trend Monitoring
34.763533 -83.455817 X X X
LK_01_10 Lake Rabun - Dampool (aka Tallulah River -
Upstream From Mathis Dam) Savannah Cartersville WP
Lake Trend
Monitoring 34.764722 -83.417778 X X X
LK_01_11 Lake Hartwell @ Interstate 85 Savannah Atlanta WP Lake Trend
Monitoring 34.484167 -83.029833 X X X
LK_01_22 Lake Hartwell - Dam Forebay Savannah Atlanta WP Lake Trend
Monitoring 34.358733 -82.824417 X X X
LK_01_67 Lake Tugalo - u/s Tugalo Lake Rd (aka Bull
Sluice Rd.) Savannah Atlanta WP
Lake Trend
Monitoring 34.737805 -83.340555 X X X
LK_01_68 Lake Tugalo - Upstream From Tugaloo Dam Savannah Atlanta WP Lake Trend
Monitoring 34.715 -83.351694 X X X
LK_01_27 Lake Russell Between Markers 42 and 44
(Mid Lake) Savannah Atlanta WP
Lake Trend Monitoring
34.127778 -82.673611 X X X
LK_01_29 Lake Richard B. Russell - Dam Forebay Savannah Atlanta WP Lake Trend
Monitoring 34.026333 -82.594167 X X X
LK_01_38 Clarks Hill Lake- Savannah River At U.S.
Highway 378 Savannah Atlanta WP
Lake Trend
Monitoring 33.857861 -82.399583 X X X
LK_01_39 Clarks Hill Lake- Savannah River At Dordon
Creek. Savannah Atlanta WP
Lake Trend
Monitoring 33.765861 -82.271778 X X X
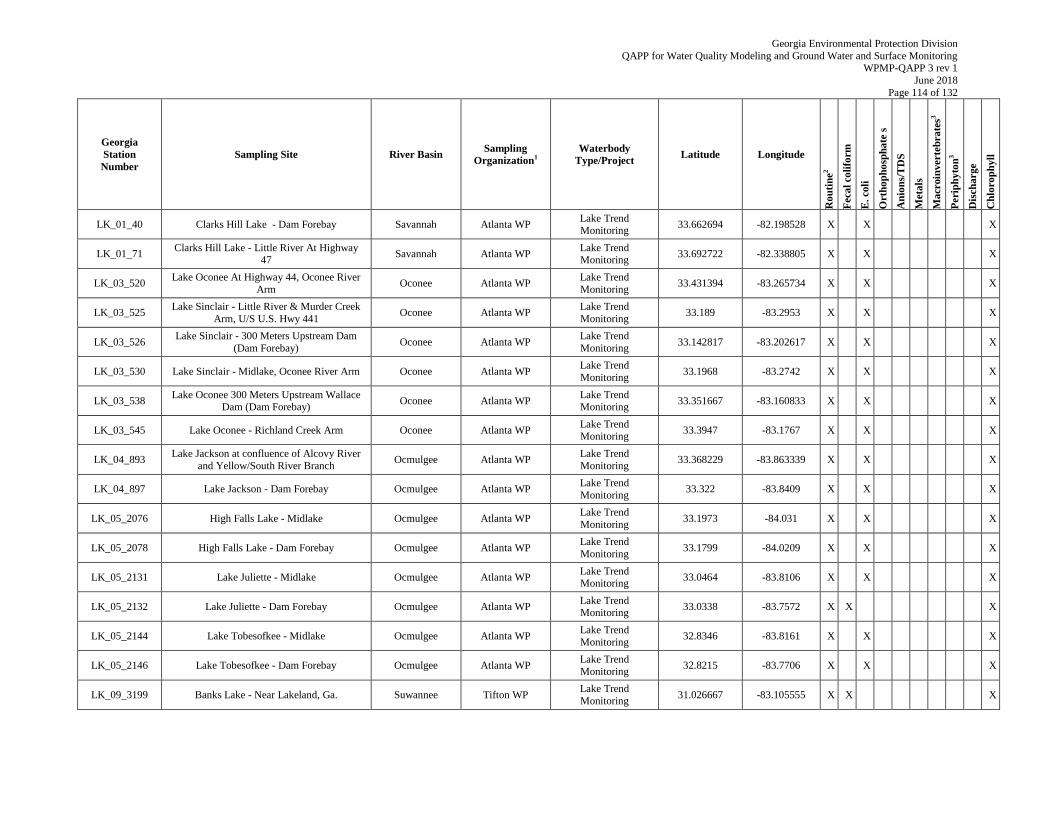
Georgia Environmental Protection Division
QAPP for Water Quality Modeling and Ground Water and Surface Monitoring WPMP-QAPP 3 rev 1
June 2018
Page 114 of 132
Georgia
Station
Number
Sampling Site River Basin Sampling
Organization1
Waterbody
Type/Project Latitude Longitude
Ro
uti
ne
2
Feca
l co
lifo
rm
E. coli
Ort
ho
ph
osp
ha
te s
An
ion
s/T
DS
Meta
ls
Ma
croin
verte
bra
tes3
Peri
ph
yto
n3
Dis
charge
Ch
loro
ph
yll
LK_01_40 Clarks Hill Lake - Dam Forebay Savannah Atlanta WP Lake Trend Monitoring
33.662694 -82.198528 X X X
LK_01_71 Clarks Hill Lake - Little River At Highway
47 Savannah Atlanta WP
Lake Trend Monitoring
33.692722 -82.338805 X X X
LK_03_520 Lake Oconee At Highway 44, Oconee River
Arm Oconee Atlanta WP
Lake Trend
Monitoring 33.431394 -83.265734 X X X
LK_03_525 Lake Sinclair - Little River & Murder Creek
Arm, U/S U.S. Hwy 441 Oconee Atlanta WP
Lake Trend
Monitoring 33.189 -83.2953 X X X
LK_03_526 Lake Sinclair - 300 Meters Upstream Dam
(Dam Forebay) Oconee Atlanta WP
Lake Trend
Monitoring 33.142817 -83.202617 X X X
LK_03_530 Lake Sinclair - Midlake, Oconee River Arm Oconee Atlanta WP Lake Trend
Monitoring 33.1968 -83.2742 X X X
LK_03_538 Lake Oconee 300 Meters Upstream Wallace
Dam (Dam Forebay) Oconee Atlanta WP
Lake Trend
Monitoring 33.351667 -83.160833 X X X
LK_03_545 Lake Oconee - Richland Creek Arm Oconee Atlanta WP Lake Trend Monitoring
33.3947 -83.1767 X X X
LK_04_893 Lake Jackson at confluence of Alcovy River
and Yellow/South River Branch Ocmulgee Atlanta WP
Lake Trend
Monitoring 33.368229 -83.863339 X X X
LK_04_897 Lake Jackson - Dam Forebay Ocmulgee Atlanta WP Lake Trend
Monitoring 33.322 -83.8409 X X X
LK_05_2076 High Falls Lake - Midlake Ocmulgee Atlanta WP Lake Trend
Monitoring 33.1973 -84.031 X X X
LK_05_2078 High Falls Lake - Dam Forebay Ocmulgee Atlanta WP Lake Trend
Monitoring 33.1799 -84.0209 X X X
LK_05_2131 Lake Juliette - Midlake Ocmulgee Atlanta WP Lake Trend Monitoring
33.0464 -83.8106 X X X
LK_05_2132 Lake Juliette - Dam Forebay Ocmulgee Atlanta WP Lake Trend Monitoring
33.0338 -83.7572 X X X
LK_05_2144 Lake Tobesofkee - Midlake Ocmulgee Atlanta WP Lake Trend
Monitoring 32.8346 -83.8161 X X X
LK_05_2146 Lake Tobesofkee - Dam Forebay Ocmulgee Atlanta WP Lake Trend
Monitoring 32.8215 -83.7706 X X X
LK_09_3199 Banks Lake - Near Lakeland, Ga. Suwannee Tifton WP Lake Trend
Monitoring 31.026667 -83.105555 X X X
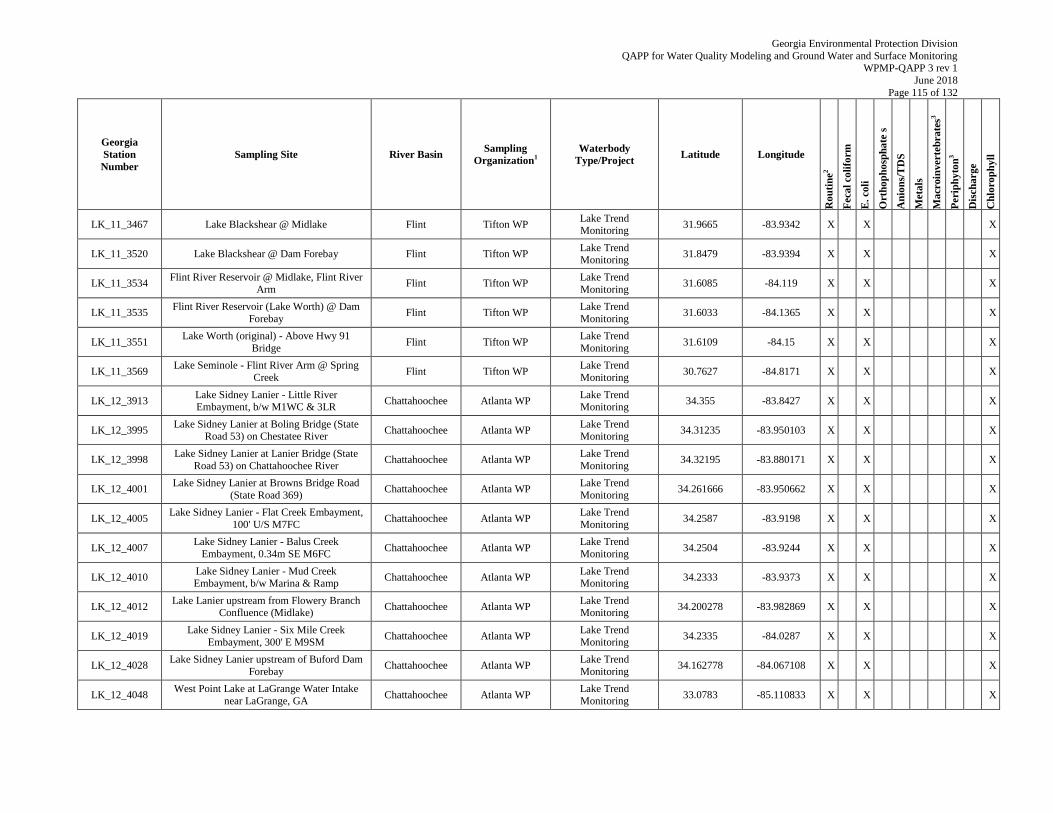
Georgia Environmental Protection Division
QAPP for Water Quality Modeling and Ground Water and Surface Monitoring WPMP-QAPP 3 rev 1
June 2018
Page 115 of 132
Georgia
Station
Number
Sampling Site River Basin Sampling
Organization1
Waterbody
Type/Project Latitude Longitude
Ro
uti
ne
2
Feca
l co
lifo
rm
E. coli
Ort
ho
ph
osp
ha
te s
An
ion
s/T
DS
Meta
ls
Ma
croin
verte
bra
tes3
Peri
ph
yto
n3
Dis
charge
Ch
loro
ph
yll
LK_11_3467 Lake Blackshear @ Midlake Flint Tifton WP Lake Trend Monitoring
31.9665 -83.9342 X X X
LK_11_3520 Lake Blackshear @ Dam Forebay Flint Tifton WP Lake Trend Monitoring
31.8479 -83.9394 X X X
LK_11_3534 Flint River Reservoir @ Midlake, Flint River
Arm Flint Tifton WP
Lake Trend
Monitoring 31.6085 -84.119 X X X
LK_11_3535 Flint River Reservoir (Lake Worth) @ Dam
Forebay Flint Tifton WP
Lake Trend
Monitoring 31.6033 -84.1365 X X X
LK_11_3551 Lake Worth (original) - Above Hwy 91
Bridge Flint Tifton WP
Lake Trend
Monitoring 31.6109 -84.15 X X X
LK_11_3569 Lake Seminole - Flint River Arm @ Spring
Creek Flint Tifton WP
Lake Trend
Monitoring 30.7627 -84.8171 X X X
LK_12_3913 Lake Sidney Lanier - Little River
Embayment, b/w M1WC & 3LR Chattahoochee Atlanta WP
Lake Trend
Monitoring 34.355 -83.8427 X X X
LK_12_3995 Lake Sidney Lanier at Boling Bridge (State
Road 53) on Chestatee River Chattahoochee Atlanta WP
Lake Trend Monitoring
34.31235 -83.950103 X X X
LK_12_3998 Lake Sidney Lanier at Lanier Bridge (State
Road 53) on Chattahoochee River Chattahoochee Atlanta WP
Lake Trend
Monitoring 34.32195 -83.880171 X X X
LK_12_4001 Lake Sidney Lanier at Browns Bridge Road
(State Road 369) Chattahoochee Atlanta WP
Lake Trend
Monitoring 34.261666 -83.950662 X X X
LK_12_4005 Lake Sidney Lanier - Flat Creek Embayment,
100' U/S M7FC Chattahoochee Atlanta WP
Lake Trend
Monitoring 34.2587 -83.9198 X X X
LK_12_4007 Lake Sidney Lanier - Balus Creek
Embayment, 0.34m SE M6FC Chattahoochee Atlanta WP
Lake Trend
Monitoring 34.2504 -83.9244 X X X
LK_12_4010 Lake Sidney Lanier - Mud Creek Embayment, b/w Marina & Ramp
Chattahoochee Atlanta WP Lake Trend Monitoring
34.2333 -83.9373 X X X
LK_12_4012 Lake Lanier upstream from Flowery Branch
Confluence (Midlake) Chattahoochee Atlanta WP
Lake Trend Monitoring
34.200278 -83.982869 X X X
LK_12_4019 Lake Sidney Lanier - Six Mile Creek
Embayment, 300' E M9SM Chattahoochee Atlanta WP
Lake Trend
Monitoring 34.2335 -84.0287 X X X
LK_12_4028 Lake Sidney Lanier upstream of Buford Dam
Forebay Chattahoochee Atlanta WP
Lake Trend
Monitoring 34.162778 -84.067108 X X X
LK_12_4048 West Point Lake at LaGrange Water Intake
near LaGrange, GA Chattahoochee Atlanta WP
Lake Trend
Monitoring 33.0783 -85.110833 X X X
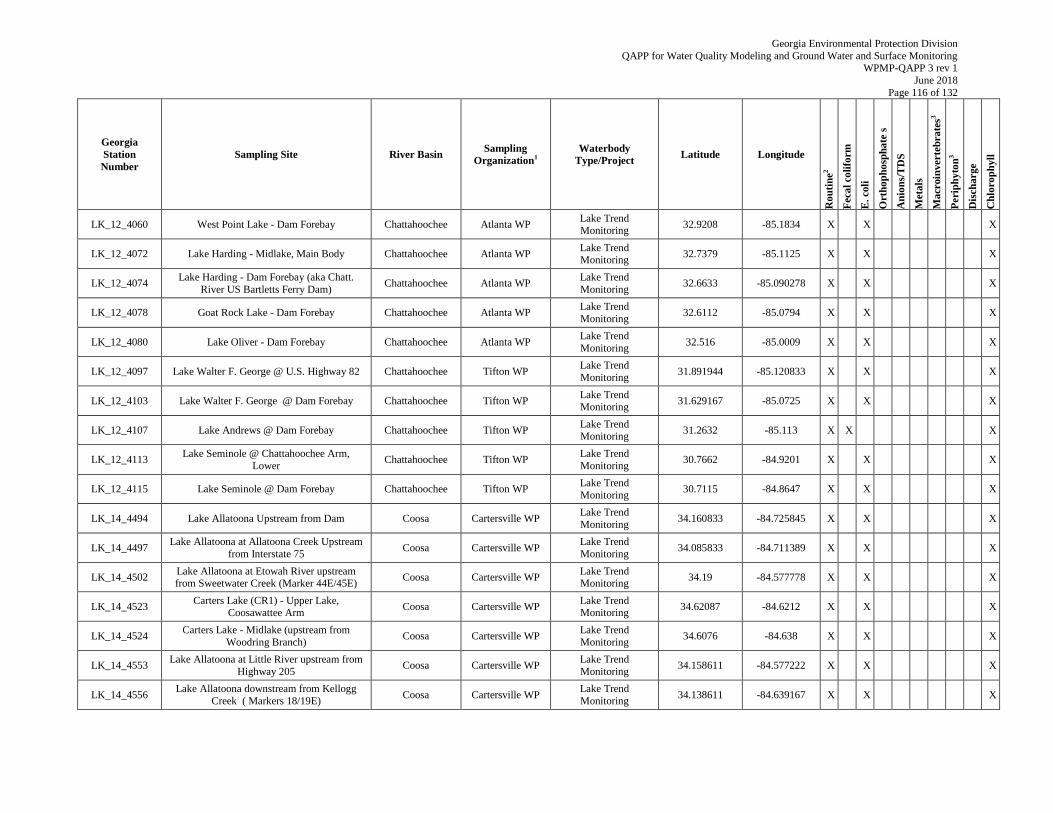
Georgia Environmental Protection Division
QAPP for Water Quality Modeling and Ground Water and Surface Monitoring WPMP-QAPP 3 rev 1
June 2018
Page 116 of 132
Georgia
Station
Number
Sampling Site River Basin Sampling
Organization1
Waterbody
Type/Project Latitude Longitude
Ro
uti
ne
2
Feca
l co
lifo
rm
E. coli
Ort
ho
ph
osp
ha
te s
An
ion
s/T
DS
Meta
ls
Ma
croin
verte
bra
tes3
Peri
ph
yto
n3
Dis
charge
Ch
loro
ph
yll
LK_12_4060 West Point Lake - Dam Forebay Chattahoochee Atlanta WP Lake Trend Monitoring
32.9208 -85.1834 X X X
LK_12_4072 Lake Harding - Midlake, Main Body Chattahoochee Atlanta WP Lake Trend Monitoring
32.7379 -85.1125 X X X
LK_12_4074 Lake Harding - Dam Forebay (aka Chatt.
River US Bartletts Ferry Dam) Chattahoochee Atlanta WP
Lake Trend
Monitoring 32.6633 -85.090278 X X X
LK_12_4078 Goat Rock Lake - Dam Forebay Chattahoochee Atlanta WP Lake Trend
Monitoring 32.6112 -85.0794 X X X
LK_12_4080 Lake Oliver - Dam Forebay Chattahoochee Atlanta WP Lake Trend
Monitoring 32.516 -85.0009 X X X
LK_12_4097 Lake Walter F. George @ U.S. Highway 82 Chattahoochee Tifton WP Lake Trend
Monitoring 31.891944 -85.120833 X X X
LK_12_4103 Lake Walter F. George @ Dam Forebay Chattahoochee Tifton WP Lake Trend
Monitoring 31.629167 -85.0725 X X X
LK_12_4107 Lake Andrews @ Dam Forebay Chattahoochee Tifton WP Lake Trend Monitoring
31.2632 -85.113 X X X
LK_12_4113 Lake Seminole @ Chattahoochee Arm,
Lower Chattahoochee Tifton WP
Lake Trend
Monitoring 30.7662 -84.9201 X X X
LK_12_4115 Lake Seminole @ Dam Forebay Chattahoochee Tifton WP Lake Trend
Monitoring 30.7115 -84.8647 X X X
LK_14_4494 Lake Allatoona Upstream from Dam Coosa Cartersville WP Lake Trend
Monitoring 34.160833 -84.725845 X X X
LK_14_4497 Lake Allatoona at Allatoona Creek Upstream
from Interstate 75 Coosa Cartersville WP
Lake Trend
Monitoring 34.085833 -84.711389 X X X
LK_14_4502 Lake Allatoona at Etowah River upstream from Sweetwater Creek (Marker 44E/45E)
Coosa Cartersville WP Lake Trend Monitoring
34.19 -84.577778 X X X
LK_14_4523 Carters Lake (CR1) - Upper Lake,
Coosawattee Arm Coosa Cartersville WP
Lake Trend Monitoring
34.62087 -84.6212 X X X
LK_14_4524 Carters Lake - Midlake (upstream from
Woodring Branch) Coosa Cartersville WP
Lake Trend
Monitoring 34.6076 -84.638 X X X
LK_14_4553 Lake Allatoona at Little River upstream from
Highway 205 Coosa Cartersville WP
Lake Trend
Monitoring 34.158611 -84.577222 X X X
LK_14_4556 Lake Allatoona downstream from Kellogg
Creek ( Markers 18/19E) Coosa Cartersville WP
Lake Trend
Monitoring 34.138611 -84.639167 X X X
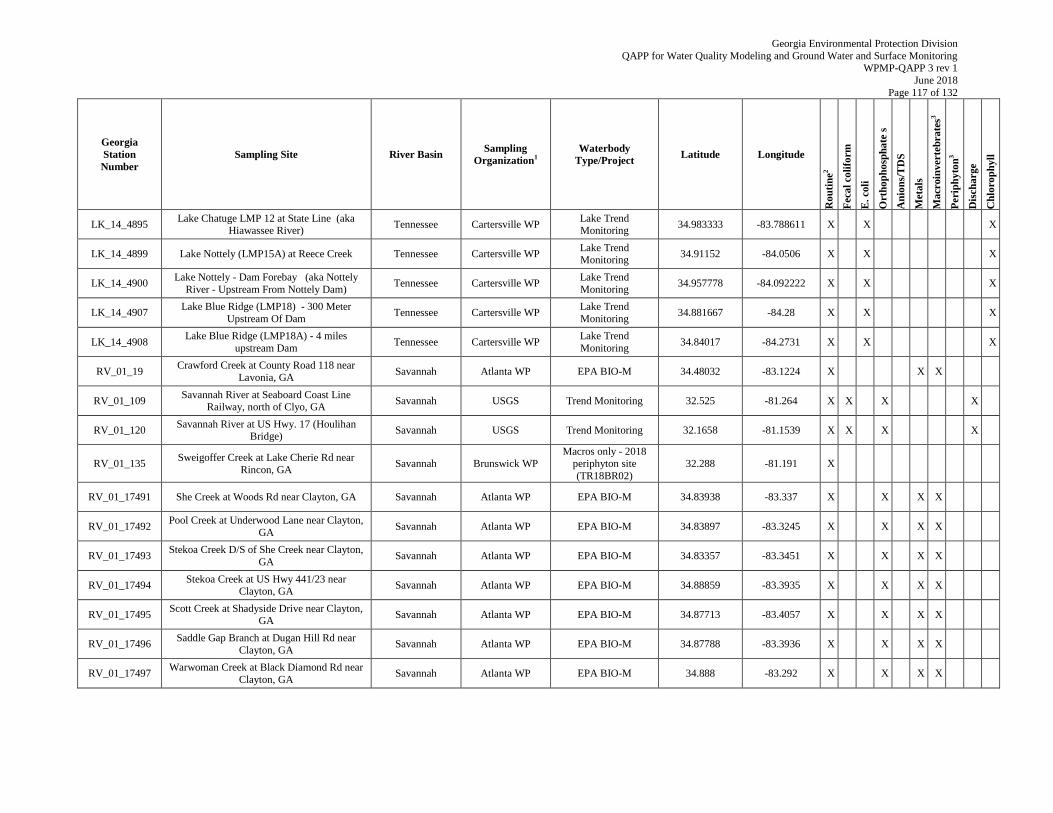
Georgia Environmental Protection Division
QAPP for Water Quality Modeling and Ground Water and Surface Monitoring WPMP-QAPP 3 rev 1
June 2018
Page 117 of 132
Georgia
Station
Number
Sampling Site River Basin Sampling
Organization1
Waterbody
Type/Project Latitude Longitude
Ro
uti
ne
2
Feca
l co
lifo
rm
E. coli
Ort
ho
ph
osp
ha
te s
An
ion
s/T
DS
Meta
ls
Ma
croin
verte
bra
tes3
Peri
ph
yto
n3
Dis
charge
Ch
loro
ph
yll
LK_14_4895 Lake Chatuge LMP 12 at State Line (aka
Hiawassee River) Tennessee Cartersville WP
Lake Trend Monitoring
34.983333 -83.788611 X X X
LK_14_4899 Lake Nottely (LMP15A) at Reece Creek Tennessee Cartersville WP Lake Trend Monitoring
34.91152 -84.0506 X X X
LK_14_4900 Lake Nottely - Dam Forebay (aka Nottely
River - Upstream From Nottely Dam) Tennessee Cartersville WP
Lake Trend
Monitoring 34.957778 -84.092222 X X X
LK_14_4907 Lake Blue Ridge (LMP18) - 300 Meter
Upstream Of Dam Tennessee Cartersville WP
Lake Trend
Monitoring 34.881667 -84.28 X X X
LK_14_4908 Lake Blue Ridge (LMP18A) - 4 miles
upstream Dam Tennessee Cartersville WP
Lake Trend
Monitoring 34.84017 -84.2731 X X X
RV_01_19 Crawford Creek at County Road 118 near
Lavonia, GA Savannah Atlanta WP EPA BIO-M 34.48032 -83.1224 X X X
RV_01_109 Savannah River at Seaboard Coast Line
Railway, north of Clyo, GA Savannah USGS Trend Monitoring 32.525 -81.264 X X X X
RV_01_120 Savannah River at US Hwy. 17 (Houlihan
Bridge) Savannah USGS Trend Monitoring 32.1658 -81.1539 X X X X
RV_01_135 Sweigoffer Creek at Lake Cherie Rd near
Rincon, GA Savannah Brunswick WP
Macros only - 2018 periphyton site
(TR18BR02)
32.288 -81.191 X
RV_01_17491 She Creek at Woods Rd near Clayton, GA Savannah Atlanta WP EPA BIO-M 34.83938 -83.337 X X X X
RV_01_17492 Pool Creek at Underwood Lane near Clayton,
GA Savannah Atlanta WP EPA BIO-M 34.83897 -83.3245 X X X X
RV_01_17493 Stekoa Creek D/S of She Creek near Clayton,
GA Savannah Atlanta WP EPA BIO-M 34.83357 -83.3451 X X X X
RV_01_17494 Stekoa Creek at US Hwy 441/23 near
Clayton, GA Savannah Atlanta WP EPA BIO-M 34.88859 -83.3935 X X X X
RV_01_17495 Scott Creek at Shadyside Drive near Clayton,
GA Savannah Atlanta WP EPA BIO-M 34.87713 -83.4057 X X X X
RV_01_17496 Saddle Gap Branch at Dugan Hill Rd near
Clayton, GA Savannah Atlanta WP EPA BIO-M 34.87788 -83.3936 X X X X
RV_01_17497 Warwoman Creek at Black Diamond Rd near
Clayton, GA Savannah Atlanta WP EPA BIO-M 34.888 -83.292 X X X X
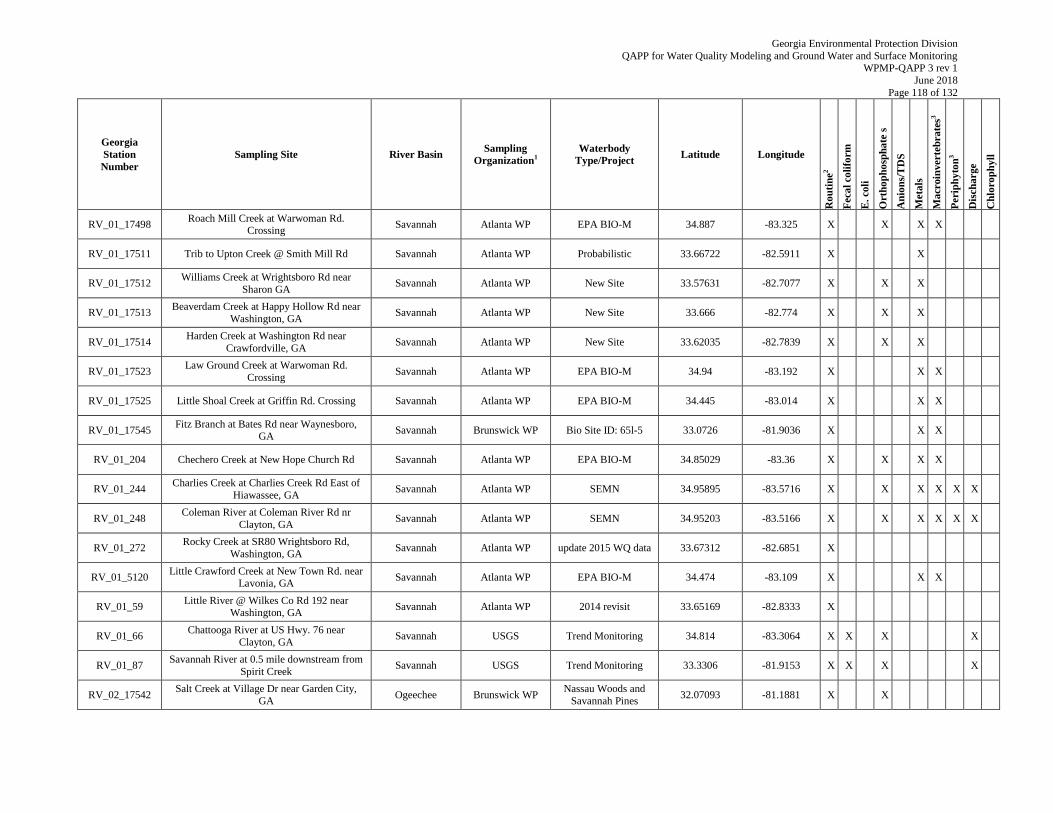
Georgia Environmental Protection Division
QAPP for Water Quality Modeling and Ground Water and Surface Monitoring WPMP-QAPP 3 rev 1
June 2018
Page 118 of 132
Georgia
Station
Number
Sampling Site River Basin Sampling
Organization1
Waterbody
Type/Project Latitude Longitude
Ro
uti
ne
2
Feca
l co
lifo
rm
E. coli
Ort
ho
ph
osp
ha
te s
An
ion
s/T
DS
Meta
ls
Ma
croin
verte
bra
tes3
Peri
ph
yto
n3
Dis
charge
Ch
loro
ph
yll
RV_01_17498 Roach Mill Creek at Warwoman Rd.
Crossing Savannah Atlanta WP EPA BIO-M 34.887 -83.325 X X X X
RV_01_17511 Trib to Upton Creek @ Smith Mill Rd Savannah Atlanta WP Probabilistic 33.66722 -82.5911 X X
RV_01_17512 Williams Creek at Wrightsboro Rd near
Sharon GA Savannah Atlanta WP New Site 33.57631 -82.7077 X X X
RV_01_17513 Beaverdam Creek at Happy Hollow Rd near
Washington, GA Savannah Atlanta WP New Site 33.666 -82.774 X X X
RV_01_17514 Harden Creek at Washington Rd near
Crawfordville, GA Savannah Atlanta WP New Site 33.62035 -82.7839 X X X
RV_01_17523 Law Ground Creek at Warwoman Rd.
Crossing Savannah Atlanta WP EPA BIO-M 34.94 -83.192 X X X
RV_01_17525 Little Shoal Creek at Griffin Rd. Crossing Savannah Atlanta WP EPA BIO-M 34.445 -83.014 X X X
RV_01_17545 Fitz Branch at Bates Rd near Waynesboro,
GA Savannah Brunswick WP Bio Site ID: 65l-5 33.0726 -81.9036 X X X
RV_01_204 Chechero Creek at New Hope Church Rd Savannah Atlanta WP EPA BIO-M 34.85029 -83.36 X X X X
RV_01_244 Charlies Creek at Charlies Creek Rd East of
Hiawassee, GA Savannah Atlanta WP SEMN 34.95895 -83.5716 X X X X X X
RV_01_248 Coleman River at Coleman River Rd nr
Clayton, GA Savannah Atlanta WP SEMN 34.95203 -83.5166 X X X X X X
RV_01_272 Rocky Creek at SR80 Wrightsboro Rd,
Washington, GA Savannah Atlanta WP update 2015 WQ data 33.67312 -82.6851 X
RV_01_5120 Little Crawford Creek at New Town Rd. near
Lavonia, GA Savannah Atlanta WP EPA BIO-M 34.474 -83.109 X X X
RV_01_59 Little River @ Wilkes Co Rd 192 near
Washington, GA Savannah Atlanta WP 2014 revisit 33.65169 -82.8333 X
RV_01_66 Chattooga River at US Hwy. 76 near
Clayton, GA Savannah USGS Trend Monitoring 34.814 -83.3064 X X X X
RV_01_87 Savannah River at 0.5 mile downstream from
Spirit Creek Savannah USGS Trend Monitoring 33.3306 -81.9153 X X X X
RV_02_17542 Salt Creek at Village Dr near Garden City,
GA Ogeechee Brunswick WP
Nassau Woods and
Savannah Pines 32.07093 -81.1881 X X
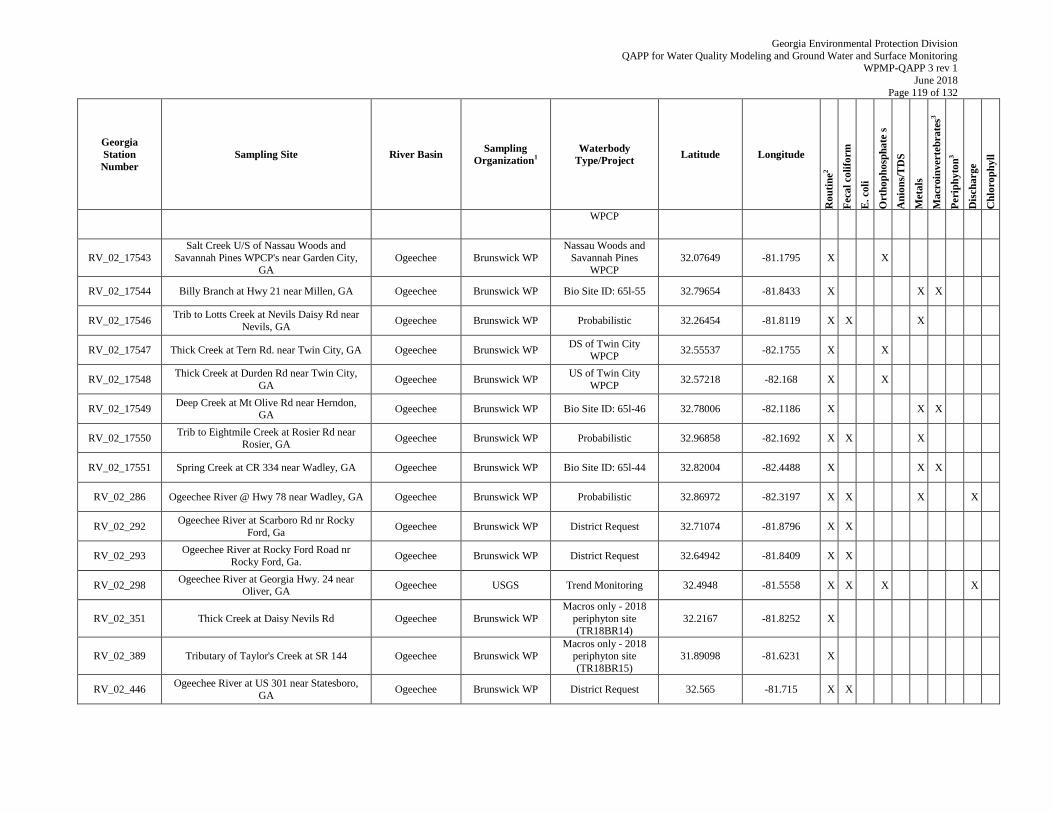
Georgia Environmental Protection Division
QAPP for Water Quality Modeling and Ground Water and Surface Monitoring WPMP-QAPP 3 rev 1
June 2018
Page 119 of 132
Georgia
Station
Number
Sampling Site River Basin Sampling
Organization1
Waterbody
Type/Project Latitude Longitude
Ro
uti
ne
2
Feca
l co
lifo
rm
E. coli
Ort
ho
ph
osp
ha
te s
An
ion
s/T
DS
Meta
ls
Ma
croin
verte
bra
tes3
Peri
ph
yto
n3
Dis
charge
Ch
loro
ph
yll
WPCP
RV_02_17543
Salt Creek U/S of Nassau Woods and
Savannah Pines WPCP's near Garden City,
GA
Ogeechee Brunswick WP
Nassau Woods and
Savannah Pines
WPCP
32.07649 -81.1795 X X
RV_02_17544 Billy Branch at Hwy 21 near Millen, GA Ogeechee Brunswick WP Bio Site ID: 65l-55 32.79654 -81.8433 X X X
RV_02_17546 Trib to Lotts Creek at Nevils Daisy Rd near
Nevils, GA Ogeechee Brunswick WP Probabilistic 32.26454 -81.8119 X X X
RV_02_17547 Thick Creek at Tern Rd. near Twin City, GA Ogeechee Brunswick WP DS of Twin City
WPCP 32.55537 -82.1755 X X
RV_02_17548 Thick Creek at Durden Rd near Twin City,
GA Ogeechee Brunswick WP
US of Twin City
WPCP 32.57218 -82.168 X X
RV_02_17549 Deep Creek at Mt Olive Rd near Herndon,
GA Ogeechee Brunswick WP Bio Site ID: 65l-46 32.78006 -82.1186 X X X
RV_02_17550 Trib to Eightmile Creek at Rosier Rd near
Rosier, GA Ogeechee Brunswick WP Probabilistic 32.96858 -82.1692 X X X
RV_02_17551 Spring Creek at CR 334 near Wadley, GA Ogeechee Brunswick WP Bio Site ID: 65l-44 32.82004 -82.4488 X X X
RV_02_286 Ogeechee River @ Hwy 78 near Wadley, GA Ogeechee Brunswick WP Probabilistic 32.86972 -82.3197 X X X X
RV_02_292 Ogeechee River at Scarboro Rd nr Rocky
Ford, Ga Ogeechee Brunswick WP District Request 32.71074 -81.8796 X X
RV_02_293 Ogeechee River at Rocky Ford Road nr
Rocky Ford, Ga. Ogeechee Brunswick WP District Request 32.64942 -81.8409 X X
RV_02_298 Ogeechee River at Georgia Hwy. 24 near
Oliver, GA Ogeechee USGS Trend Monitoring 32.4948 -81.5558 X X X X
RV_02_351 Thick Creek at Daisy Nevils Rd Ogeechee Brunswick WP
Macros only - 2018
periphyton site
(TR18BR14)
32.2167 -81.8252 X
RV_02_389 Tributary of Taylor's Creek at SR 144 Ogeechee Brunswick WP Macros only - 2018
periphyton site
(TR18BR15)
31.89098 -81.6231 X
RV_02_446 Ogeechee River at US 301 near Statesboro,
GA Ogeechee Brunswick WP District Request 32.565 -81.715 X X
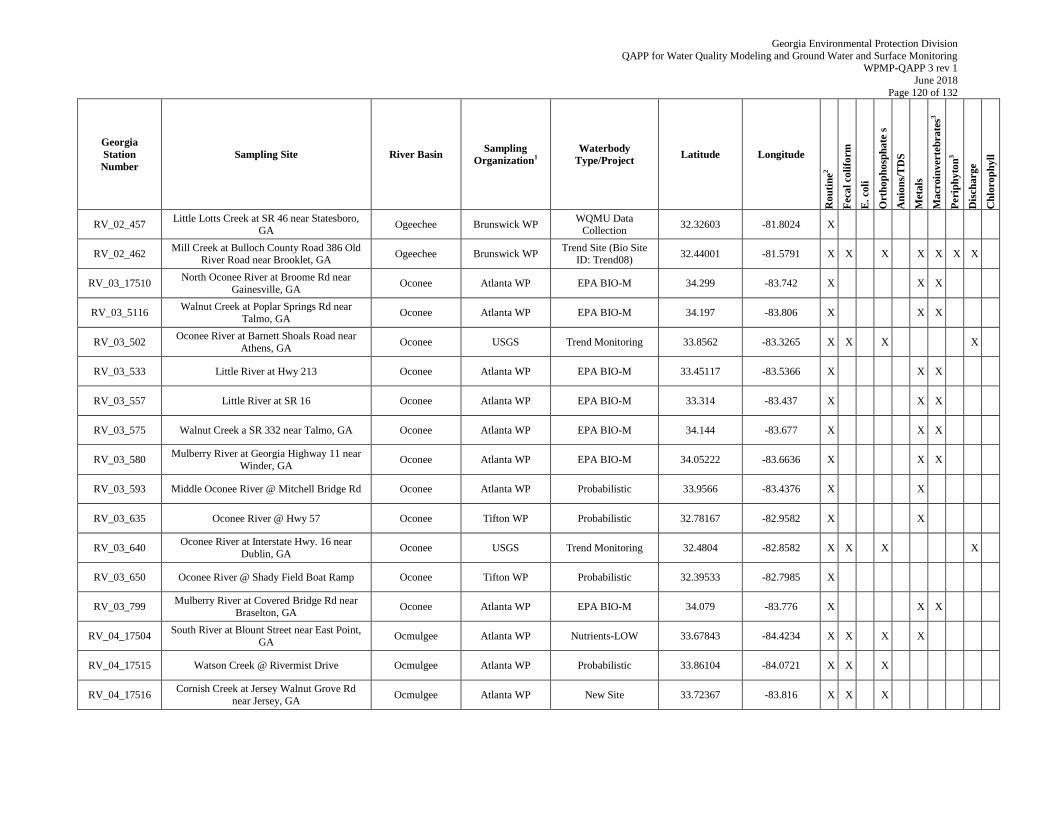
Georgia Environmental Protection Division
QAPP for Water Quality Modeling and Ground Water and Surface Monitoring WPMP-QAPP 3 rev 1
June 2018
Page 120 of 132
Georgia
Station
Number
Sampling Site River Basin Sampling
Organization1
Waterbody
Type/Project Latitude Longitude
Ro
uti
ne
2
Feca
l co
lifo
rm
E. coli
Ort
ho
ph
osp
ha
te s
An
ion
s/T
DS
Meta
ls
Ma
croin
verte
bra
tes3
Peri
ph
yto
n3
Dis
charge
Ch
loro
ph
yll
RV_02_457 Little Lotts Creek at SR 46 near Statesboro,
GA Ogeechee Brunswick WP
WQMU Data Collection
32.32603 -81.8024 X
RV_02_462 Mill Creek at Bulloch County Road 386 Old
River Road near Brooklet, GA Ogeechee Brunswick WP
Trend Site (Bio Site ID: Trend08)
32.44001 -81.5791 X X X X X X X
RV_03_17510 North Oconee River at Broome Rd near
Gainesville, GA Oconee Atlanta WP EPA BIO-M 34.299 -83.742 X X X
RV_03_5116 Walnut Creek at Poplar Springs Rd near
Talmo, GA Oconee Atlanta WP EPA BIO-M 34.197 -83.806 X X X
RV_03_502 Oconee River at Barnett Shoals Road near
Athens, GA Oconee USGS Trend Monitoring 33.8562 -83.3265 X X X X
RV_03_533 Little River at Hwy 213 Oconee Atlanta WP EPA BIO-M 33.45117 -83.5366 X X X
RV_03_557 Little River at SR 16 Oconee Atlanta WP EPA BIO-M 33.314 -83.437 X X X
RV_03_575 Walnut Creek a SR 332 near Talmo, GA Oconee Atlanta WP EPA BIO-M 34.144 -83.677 X X X
RV_03_580 Mulberry River at Georgia Highway 11 near
Winder, GA Oconee Atlanta WP EPA BIO-M 34.05222 -83.6636 X X X
RV_03_593 Middle Oconee River @ Mitchell Bridge Rd Oconee Atlanta WP Probabilistic 33.9566 -83.4376 X X
RV_03_635 Oconee River @ Hwy 57 Oconee Tifton WP Probabilistic 32.78167 -82.9582 X X
RV_03_640 Oconee River at Interstate Hwy. 16 near
Dublin, GA Oconee USGS Trend Monitoring 32.4804 -82.8582 X X X X
RV_03_650 Oconee River @ Shady Field Boat Ramp Oconee Tifton WP Probabilistic 32.39533 -82.7985 X
RV_03_799 Mulberry River at Covered Bridge Rd near
Braselton, GA Oconee Atlanta WP EPA BIO-M 34.079 -83.776 X X X
RV_04_17504 South River at Blount Street near East Point,
GA Ocmulgee Atlanta WP Nutrients-LOW 33.67843 -84.4234 X X X X
RV_04_17515 Watson Creek @ Rivermist Drive Ocmulgee Atlanta WP Probabilistic 33.86104 -84.0721 X X X
RV_04_17516 Cornish Creek at Jersey Walnut Grove Rd
near Jersey, GA Ocmulgee Atlanta WP New Site 33.72367 -83.816 X X X
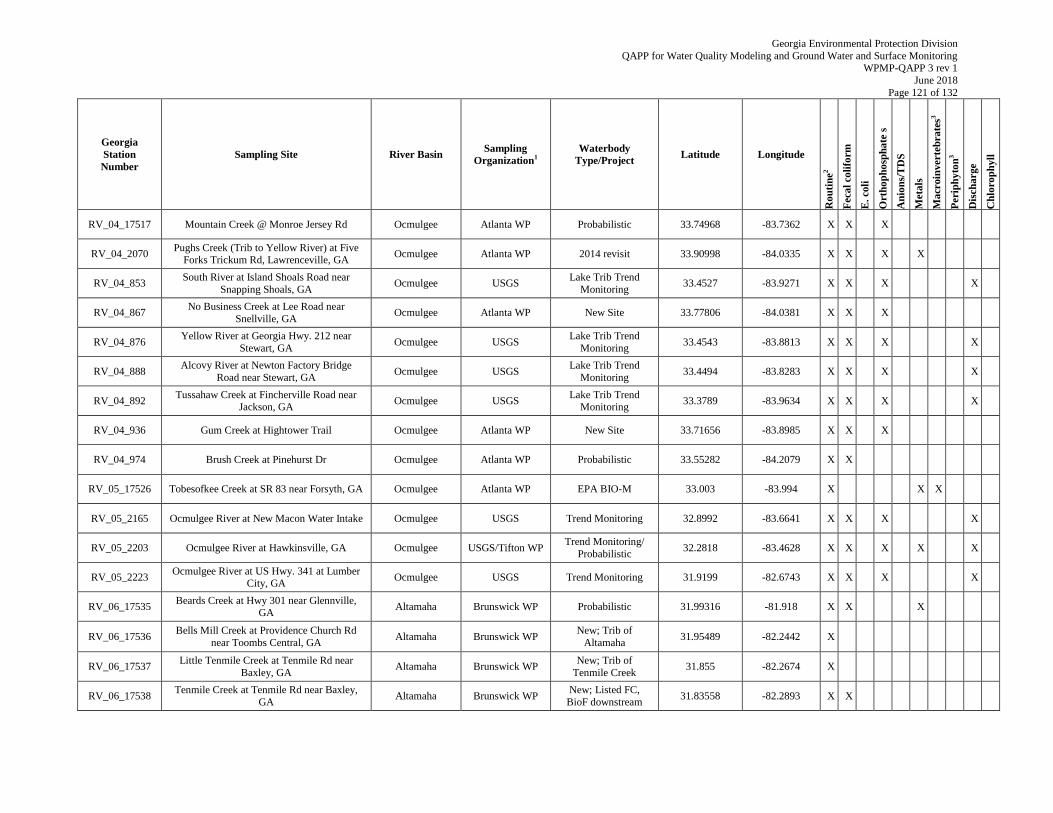
Georgia Environmental Protection Division
QAPP for Water Quality Modeling and Ground Water and Surface Monitoring WPMP-QAPP 3 rev 1
June 2018
Page 121 of 132
Georgia
Station
Number
Sampling Site River Basin Sampling
Organization1
Waterbody
Type/Project Latitude Longitude
Ro
uti
ne
2
Feca
l co
lifo
rm
E. coli
Ort
ho
ph
osp
ha
te s
An
ion
s/T
DS
Meta
ls
Ma
croin
verte
bra
tes3
Peri
ph
yto
n3
Dis
charge
Ch
loro
ph
yll
RV_04_17517 Mountain Creek @ Monroe Jersey Rd Ocmulgee Atlanta WP Probabilistic 33.74968 -83.7362 X X X
RV_04_2070 Pughs Creek (Trib to Yellow River) at Five
Forks Trickum Rd, Lawrenceville, GA Ocmulgee Atlanta WP 2014 revisit 33.90998 -84.0335 X X X X
RV_04_853 South River at Island Shoals Road near
Snapping Shoals, GA Ocmulgee USGS
Lake Trib Trend
Monitoring 33.4527 -83.9271 X X X X
RV_04_867 No Business Creek at Lee Road near
Snellville, GA Ocmulgee Atlanta WP New Site 33.77806 -84.0381 X X X
RV_04_876 Yellow River at Georgia Hwy. 212 near
Stewart, GA Ocmulgee USGS
Lake Trib Trend
Monitoring 33.4543 -83.8813 X X X X
RV_04_888 Alcovy River at Newton Factory Bridge
Road near Stewart, GA Ocmulgee USGS
Lake Trib Trend
Monitoring 33.4494 -83.8283 X X X X
RV_04_892 Tussahaw Creek at Fincherville Road near
Jackson, GA Ocmulgee USGS
Lake Trib Trend
Monitoring 33.3789 -83.9634 X X X X
RV_04_936 Gum Creek at Hightower Trail Ocmulgee Atlanta WP New Site 33.71656 -83.8985 X X X
RV_04_974 Brush Creek at Pinehurst Dr Ocmulgee Atlanta WP Probabilistic 33.55282 -84.2079 X X
RV_05_17526 Tobesofkee Creek at SR 83 near Forsyth, GA Ocmulgee Atlanta WP EPA BIO-M 33.003 -83.994 X X X
RV_05_2165 Ocmulgee River at New Macon Water Intake Ocmulgee USGS Trend Monitoring 32.8992 -83.6641 X X X X
RV_05_2203 Ocmulgee River at Hawkinsville, GA Ocmulgee USGS/Tifton WP Trend Monitoring/
Probabilistic 32.2818 -83.4628 X X X X X
RV_05_2223 Ocmulgee River at US Hwy. 341 at Lumber
City, GA Ocmulgee USGS Trend Monitoring 31.9199 -82.6743 X X X X
RV_06_17535 Beards Creek at Hwy 301 near Glennville,
GA Altamaha Brunswick WP Probabilistic 31.99316 -81.918 X X X
RV_06_17536 Bells Mill Creek at Providence Church Rd
near Toombs Central, GA Altamaha Brunswick WP
New; Trib of
Altamaha 31.95489 -82.2442 X
RV_06_17537 Little Tenmile Creek at Tenmile Rd near
Baxley, GA Altamaha Brunswick WP
New; Trib of
Tenmile Creek 31.855 -82.2674 X
RV_06_17538 Tenmile Creek at Tenmile Rd near Baxley,
GA Altamaha Brunswick WP
New; Listed FC,
BioF downstream 31.83558 -82.2893 X X
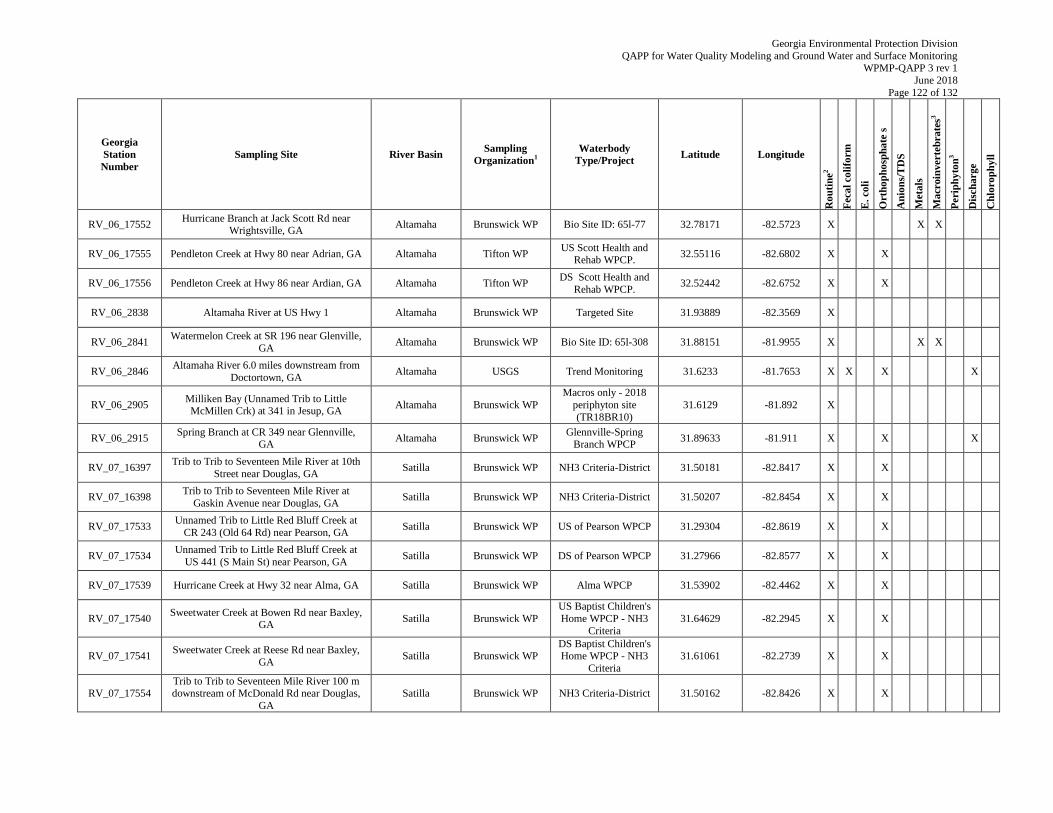
Georgia Environmental Protection Division
QAPP for Water Quality Modeling and Ground Water and Surface Monitoring WPMP-QAPP 3 rev 1
June 2018
Page 122 of 132
Georgia
Station
Number
Sampling Site River Basin Sampling
Organization1
Waterbody
Type/Project Latitude Longitude
Ro
uti
ne
2
Feca
l co
lifo
rm
E. coli
Ort
ho
ph
osp
ha
te s
An
ion
s/T
DS
Meta
ls
Ma
croin
verte
bra
tes3
Peri
ph
yto
n3
Dis
charge
Ch
loro
ph
yll
RV_06_17552 Hurricane Branch at Jack Scott Rd near
Wrightsville, GA Altamaha Brunswick WP Bio Site ID: 65l-77 32.78171 -82.5723 X X X
RV_06_17555 Pendleton Creek at Hwy 80 near Adrian, GA Altamaha Tifton WP US Scott Health and
Rehab WPCP. 32.55116 -82.6802 X X
RV_06_17556 Pendleton Creek at Hwy 86 near Ardian, GA Altamaha Tifton WP DS Scott Health and
Rehab WPCP. 32.52442 -82.6752 X X
RV_06_2838 Altamaha River at US Hwy 1 Altamaha Brunswick WP Targeted Site 31.93889 -82.3569 X
RV_06_2841 Watermelon Creek at SR 196 near Glenville,
GA Altamaha Brunswick WP Bio Site ID: 65l-308 31.88151 -81.9955 X X X
RV_06_2846 Altamaha River 6.0 miles downstream from
Doctortown, GA Altamaha USGS Trend Monitoring 31.6233 -81.7653 X X X X
RV_06_2905 Milliken Bay (Unnamed Trib to Little McMillen Crk) at 341 in Jesup, GA
Altamaha Brunswick WP
Macros only - 2018
periphyton site
(TR18BR10)
31.6129 -81.892 X
RV_06_2915 Spring Branch at CR 349 near Glennville,
GA Altamaha Brunswick WP
Glennville-Spring Branch WPCP
31.89633 -81.911 X X X
RV_07_16397 Trib to Trib to Seventeen Mile River at 10th
Street near Douglas, GA Satilla Brunswick WP NH3 Criteria-District 31.50181 -82.8417 X X
RV_07_16398 Trib to Trib to Seventeen Mile River at
Gaskin Avenue near Douglas, GA Satilla Brunswick WP NH3 Criteria-District 31.50207 -82.8454 X X
RV_07_17533 Unnamed Trib to Little Red Bluff Creek at
CR 243 (Old 64 Rd) near Pearson, GA Satilla Brunswick WP US of Pearson WPCP 31.29304 -82.8619 X X
RV_07_17534 Unnamed Trib to Little Red Bluff Creek at
US 441 (S Main St) near Pearson, GA Satilla Brunswick WP DS of Pearson WPCP 31.27966 -82.8577 X X
RV_07_17539 Hurricane Creek at Hwy 32 near Alma, GA Satilla Brunswick WP Alma WPCP 31.53902 -82.4462 X X
RV_07_17540 Sweetwater Creek at Bowen Rd near Baxley,
GA Satilla Brunswick WP
US Baptist Children's
Home WPCP - NH3
Criteria
31.64629 -82.2945 X X
RV_07_17541 Sweetwater Creek at Reese Rd near Baxley,
GA Satilla Brunswick WP
DS Baptist Children's Home WPCP - NH3
Criteria
31.61061 -82.2739 X X
RV_07_17554 Trib to Trib to Seventeen Mile River 100 m downstream of McDonald Rd near Douglas,
GA
Satilla Brunswick WP NH3 Criteria-District 31.50162 -82.8426 X X
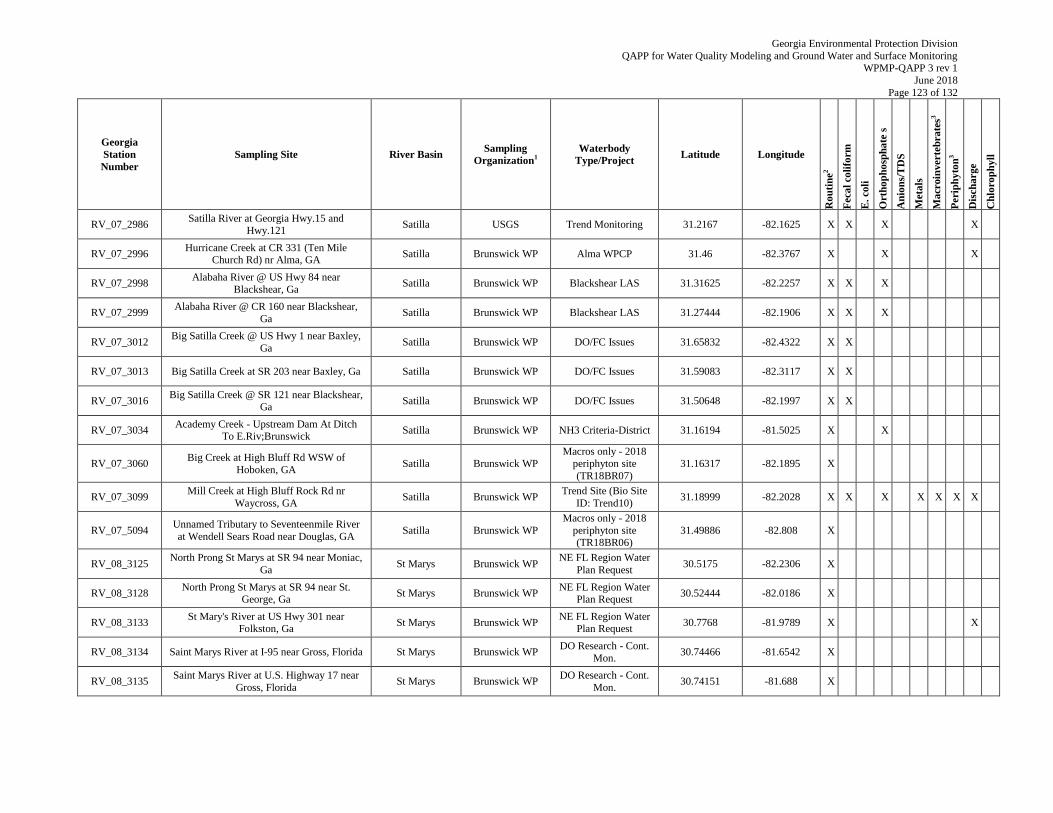
Georgia Environmental Protection Division
QAPP for Water Quality Modeling and Ground Water and Surface Monitoring WPMP-QAPP 3 rev 1
June 2018
Page 123 of 132
Georgia
Station
Number
Sampling Site River Basin Sampling
Organization1
Waterbody
Type/Project Latitude Longitude
Ro
uti
ne
2
Feca
l co
lifo
rm
E. coli
Ort
ho
ph
osp
ha
te s
An
ion
s/T
DS
Meta
ls
Ma
croin
verte
bra
tes3
Peri
ph
yto
n3
Dis
charge
Ch
loro
ph
yll
RV_07_2986 Satilla River at Georgia Hwy.15 and
Hwy.121 Satilla USGS Trend Monitoring 31.2167 -82.1625 X X X X
RV_07_2996 Hurricane Creek at CR 331 (Ten Mile
Church Rd) nr Alma, GA Satilla Brunswick WP Alma WPCP 31.46 -82.3767 X X X
RV_07_2998 Alabaha River @ US Hwy 84 near
Blackshear, Ga Satilla Brunswick WP Blackshear LAS 31.31625 -82.2257 X X X
RV_07_2999 Alabaha River @ CR 160 near Blackshear,
Ga Satilla Brunswick WP Blackshear LAS 31.27444 -82.1906 X X X
RV_07_3012 Big Satilla Creek @ US Hwy 1 near Baxley,
Ga Satilla Brunswick WP DO/FC Issues 31.65832 -82.4322 X X
RV_07_3013 Big Satilla Creek at SR 203 near Baxley, Ga Satilla Brunswick WP DO/FC Issues 31.59083 -82.3117 X X
RV_07_3016 Big Satilla Creek @ SR 121 near Blackshear,
Ga Satilla Brunswick WP DO/FC Issues 31.50648 -82.1997 X X
RV_07_3034 Academy Creek - Upstream Dam At Ditch
To E.Riv;Brunswick Satilla Brunswick WP NH3 Criteria-District 31.16194 -81.5025 X X
RV_07_3060 Big Creek at High Bluff Rd WSW of
Hoboken, GA Satilla Brunswick WP
Macros only - 2018 periphyton site
(TR18BR07)
31.16317 -82.1895 X
RV_07_3099 Mill Creek at High Bluff Rock Rd nr
Waycross, GA Satilla Brunswick WP
Trend Site (Bio Site
ID: Trend10) 31.18999 -82.2028 X X X X X X X
RV_07_5094 Unnamed Tributary to Seventeenmile River
at Wendell Sears Road near Douglas, GA Satilla Brunswick WP
Macros only - 2018
periphyton site (TR18BR06)
31.49886 -82.808 X
RV_08_3125 North Prong St Marys at SR 94 near Moniac,
Ga St Marys Brunswick WP
NE FL Region Water
Plan Request 30.5175 -82.2306 X
RV_08_3128 North Prong St Marys at SR 94 near St.
George, Ga St Marys Brunswick WP
NE FL Region Water Plan Request
30.52444 -82.0186 X
RV_08_3133 St Mary's River at US Hwy 301 near
Folkston, Ga St Marys Brunswick WP
NE FL Region Water Plan Request
30.7768 -81.9789 X X
RV_08_3134 Saint Marys River at I-95 near Gross, Florida St Marys Brunswick WP DO Research - Cont.
Mon. 30.74466 -81.6542 X
RV_08_3135 Saint Marys River at U.S. Highway 17 near
Gross, Florida St Marys Brunswick WP
DO Research - Cont.
Mon. 30.74151 -81.688 X
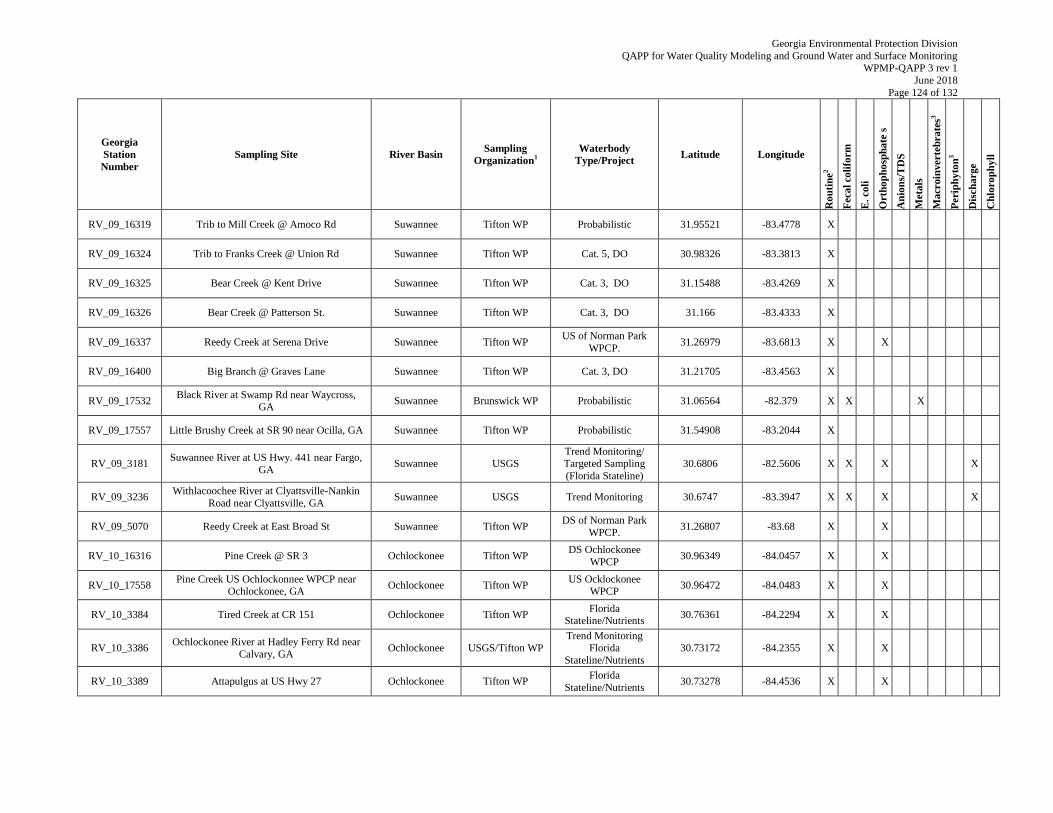
Georgia Environmental Protection Division
QAPP for Water Quality Modeling and Ground Water and Surface Monitoring WPMP-QAPP 3 rev 1
June 2018
Page 124 of 132
Georgia
Station
Number
Sampling Site River Basin Sampling
Organization1
Waterbody
Type/Project Latitude Longitude
Ro
uti
ne
2
Feca
l co
lifo
rm
E. coli
Ort
ho
ph
osp
ha
te s
An
ion
s/T
DS
Meta
ls
Ma
croin
verte
bra
tes3
Peri
ph
yto
n3
Dis
charge
Ch
loro
ph
yll
RV_09_16319 Trib to Mill Creek @ Amoco Rd Suwannee Tifton WP Probabilistic 31.95521 -83.4778 X
RV_09_16324 Trib to Franks Creek @ Union Rd Suwannee Tifton WP Cat. 5, DO 30.98326 -83.3813 X
RV_09_16325 Bear Creek @ Kent Drive Suwannee Tifton WP Cat. 3, DO 31.15488 -83.4269 X
RV_09_16326 Bear Creek @ Patterson St. Suwannee Tifton WP Cat. 3, DO 31.166 -83.4333 X
RV_09_16337 Reedy Creek at Serena Drive Suwannee Tifton WP US of Norman Park
WPCP. 31.26979 -83.6813 X X
RV_09_16400 Big Branch @ Graves Lane Suwannee Tifton WP Cat. 3, DO 31.21705 -83.4563 X
RV_09_17532 Black River at Swamp Rd near Waycross,
GA Suwannee Brunswick WP Probabilistic 31.06564 -82.379 X X X
RV_09_17557 Little Brushy Creek at SR 90 near Ocilla, GA Suwannee Tifton WP Probabilistic 31.54908 -83.2044 X
RV_09_3181 Suwannee River at US Hwy. 441 near Fargo,
GA Suwannee USGS
Trend Monitoring/ Targeted Sampling
(Florida Stateline)
30.6806 -82.5606 X X X X
RV_09_3236 Withlacoochee River at Clyattsville-Nankin
Road near Clyattsville, GA Suwannee USGS Trend Monitoring 30.6747 -83.3947 X X X X
RV_09_5070 Reedy Creek at East Broad St Suwannee Tifton WP DS of Norman Park
WPCP. 31.26807 -83.68 X X
RV_10_16316 Pine Creek @ SR 3 Ochlockonee Tifton WP DS Ochlockonee
WPCP 30.96349 -84.0457 X X
RV_10_17558 Pine Creek US Ochlockonnee WPCP near
Ochlockonee, GA Ochlockonee Tifton WP
US Ocklockonee WPCP
30.96472 -84.0483 X X
RV_10_3384 Tired Creek at CR 151 Ochlockonee Tifton WP Florida
Stateline/Nutrients 30.76361 -84.2294 X X
RV_10_3386 Ochlockonee River at Hadley Ferry Rd near
Calvary, GA Ochlockonee USGS/Tifton WP
Trend Monitoring Florida
Stateline/Nutrients
30.73172 -84.2355 X X
RV_10_3389 Attapulgus at US Hwy 27 Ochlockonee Tifton WP Florida
Stateline/Nutrients 30.73278 -84.4536 X X
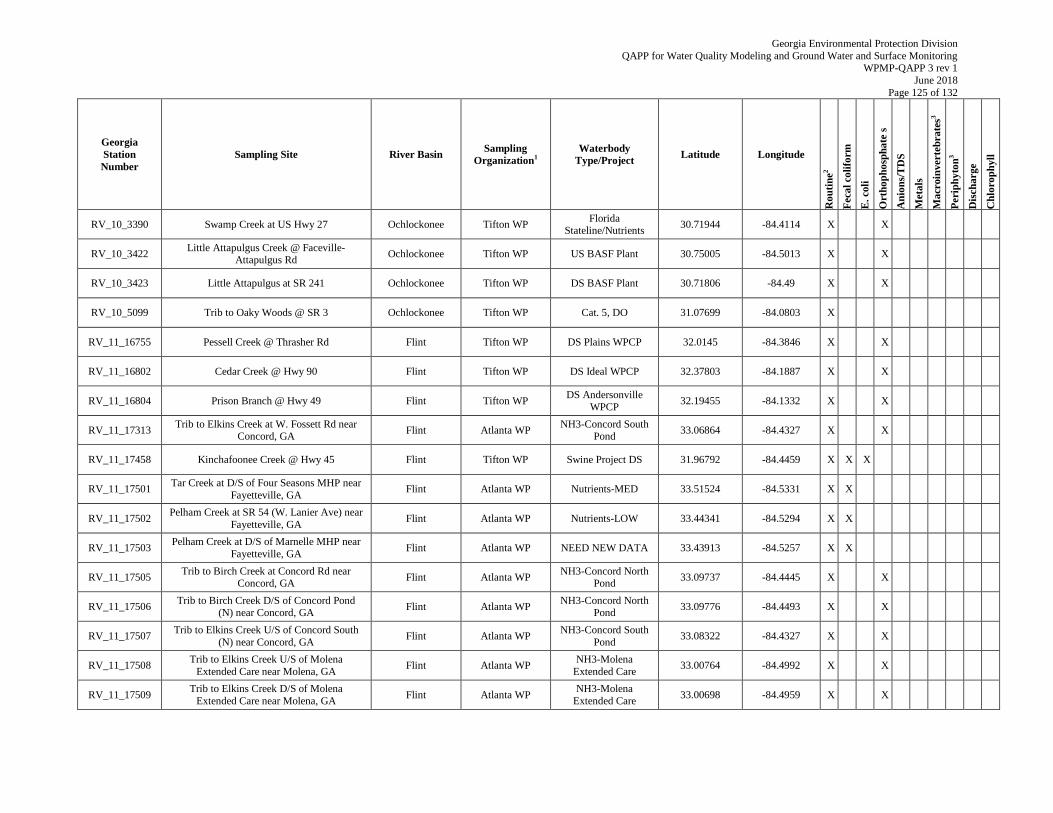
Georgia Environmental Protection Division
QAPP for Water Quality Modeling and Ground Water and Surface Monitoring WPMP-QAPP 3 rev 1
June 2018
Page 125 of 132
Georgia
Station
Number
Sampling Site River Basin Sampling
Organization1
Waterbody
Type/Project Latitude Longitude
Ro
uti
ne
2
Feca
l co
lifo
rm
E. coli
Ort
ho
ph
osp
ha
te s
An
ion
s/T
DS
Meta
ls
Ma
croin
verte
bra
tes3
Peri
ph
yto
n3
Dis
charge
Ch
loro
ph
yll
RV_10_3390 Swamp Creek at US Hwy 27 Ochlockonee Tifton WP Florida
Stateline/Nutrients 30.71944 -84.4114 X X
RV_10_3422 Little Attapulgus Creek @ Faceville-
Attapulgus Rd Ochlockonee Tifton WP US BASF Plant 30.75005 -84.5013 X X
RV_10_3423 Little Attapulgus at SR 241 Ochlockonee Tifton WP DS BASF Plant 30.71806 -84.49 X X
RV_10_5099 Trib to Oaky Woods @ SR 3 Ochlockonee Tifton WP Cat. 5, DO 31.07699 -84.0803 X
RV_11_16755 Pessell Creek @ Thrasher Rd Flint Tifton WP DS Plains WPCP 32.0145 -84.3846 X X
RV_11_16802 Cedar Creek @ Hwy 90 Flint Tifton WP DS Ideal WPCP 32.37803 -84.1887 X X
RV_11_16804 Prison Branch @ Hwy 49 Flint Tifton WP DS Andersonville
WPCP 32.19455 -84.1332 X X
RV_11_17313 Trib to Elkins Creek at W. Fossett Rd near
Concord, GA Flint Atlanta WP
NH3-Concord South Pond
33.06864 -84.4327 X X
RV_11_17458 Kinchafoonee Creek @ Hwy 45 Flint Tifton WP Swine Project DS 31.96792 -84.4459 X X X
RV_11_17501 Tar Creek at D/S of Four Seasons MHP near
Fayetteville, GA Flint Atlanta WP Nutrients-MED 33.51524 -84.5331 X X
RV_11_17502 Pelham Creek at SR 54 (W. Lanier Ave) near
Fayetteville, GA Flint Atlanta WP Nutrients-LOW 33.44341 -84.5294 X X
RV_11_17503 Pelham Creek at D/S of Marnelle MHP near
Fayetteville, GA Flint Atlanta WP NEED NEW DATA 33.43913 -84.5257 X X
RV_11_17505 Trib to Birch Creek at Concord Rd near
Concord, GA Flint Atlanta WP
NH3-Concord North Pond
33.09737 -84.4445 X X
RV_11_17506 Trib to Birch Creek D/S of Concord Pond
(N) near Concord, GA Flint Atlanta WP
NH3-Concord North Pond
33.09776 -84.4493 X X
RV_11_17507 Trib to Elkins Creek U/S of Concord South
(N) near Concord, GA Flint Atlanta WP
NH3-Concord South
Pond 33.08322 -84.4327 X X
RV_11_17508 Trib to Elkins Creek U/S of Molena
Extended Care near Molena, GA Flint Atlanta WP
NH3-Molena
Extended Care 33.00764 -84.4992 X X
RV_11_17509 Trib to Elkins Creek D/S of Molena
Extended Care near Molena, GA Flint Atlanta WP
NH3-Molena
Extended Care 33.00698 -84.4959 X X
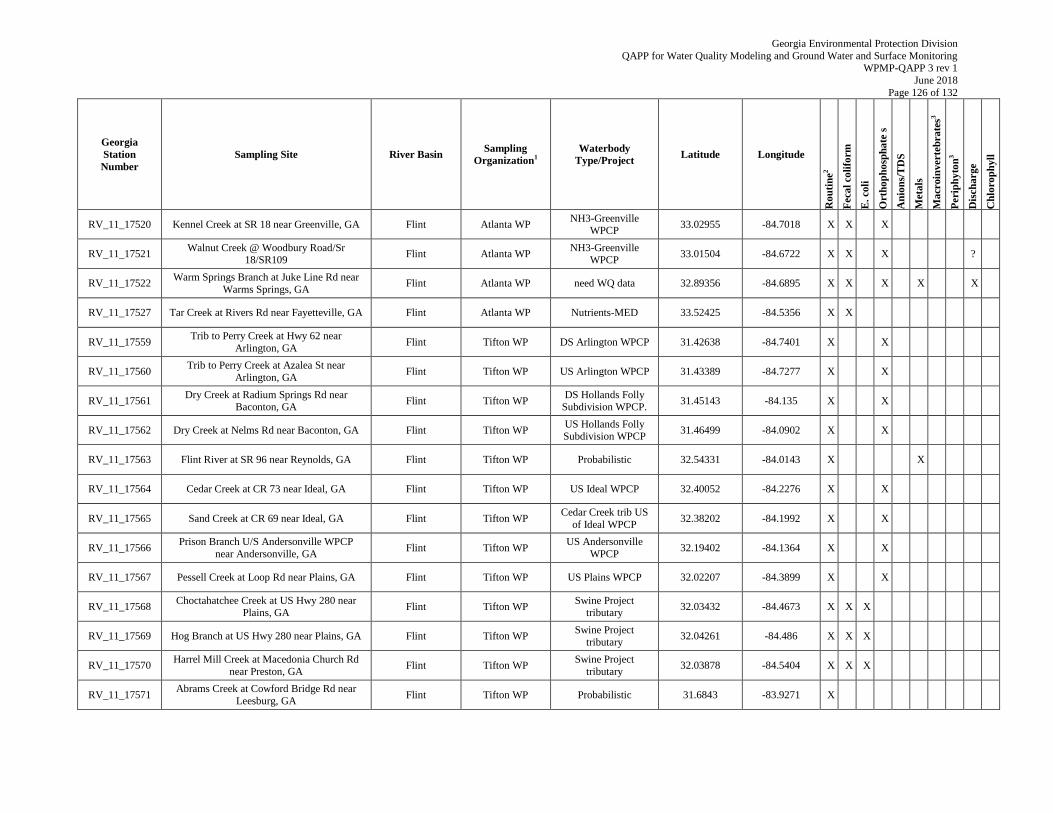
Georgia Environmental Protection Division
QAPP for Water Quality Modeling and Ground Water and Surface Monitoring WPMP-QAPP 3 rev 1
June 2018
Page 126 of 132
Georgia
Station
Number
Sampling Site River Basin Sampling
Organization1
Waterbody
Type/Project Latitude Longitude
Ro
uti
ne
2
Feca
l co
lifo
rm
E. coli
Ort
ho
ph
osp
ha
te s
An
ion
s/T
DS
Meta
ls
Ma
croin
verte
bra
tes3
Peri
ph
yto
n3
Dis
charge
Ch
loro
ph
yll
RV_11_17520 Kennel Creek at SR 18 near Greenville, GA Flint Atlanta WP NH3-Greenville
WPCP 33.02955 -84.7018 X X X
RV_11_17521 Walnut Creek @ Woodbury Road/Sr
18/SR109 Flint Atlanta WP
NH3-Greenville WPCP
33.01504 -84.6722 X X X ?
RV_11_17522 Warm Springs Branch at Juke Line Rd near
Warms Springs, GA Flint Atlanta WP need WQ data 32.89356 -84.6895 X X X X X
RV_11_17527 Tar Creek at Rivers Rd near Fayetteville, GA Flint Atlanta WP Nutrients-MED 33.52425 -84.5356 X X
RV_11_17559 Trib to Perry Creek at Hwy 62 near
Arlington, GA Flint Tifton WP DS Arlington WPCP 31.42638 -84.7401 X X
RV_11_17560 Trib to Perry Creek at Azalea St near
Arlington, GA Flint Tifton WP US Arlington WPCP 31.43389 -84.7277 X X
RV_11_17561 Dry Creek at Radium Springs Rd near
Baconton, GA Flint Tifton WP
DS Hollands Folly
Subdivision WPCP. 31.45143 -84.135 X X
RV_11_17562 Dry Creek at Nelms Rd near Baconton, GA Flint Tifton WP US Hollands Folly Subdivision WPCP
31.46499 -84.0902 X X
RV_11_17563 Flint River at SR 96 near Reynolds, GA Flint Tifton WP Probabilistic 32.54331 -84.0143 X X
RV_11_17564 Cedar Creek at CR 73 near Ideal, GA Flint Tifton WP US Ideal WPCP 32.40052 -84.2276 X X
RV_11_17565 Sand Creek at CR 69 near Ideal, GA Flint Tifton WP Cedar Creek trib US
of Ideal WPCP 32.38202 -84.1992 X X
RV_11_17566 Prison Branch U/S Andersonville WPCP
near Andersonville, GA Flint Tifton WP
US Andersonville
WPCP 32.19402 -84.1364 X X
RV_11_17567 Pessell Creek at Loop Rd near Plains, GA Flint Tifton WP US Plains WPCP 32.02207 -84.3899 X X
RV_11_17568 Choctahatchee Creek at US Hwy 280 near
Plains, GA Flint Tifton WP
Swine Project tributary
32.03432 -84.4673 X X X
RV_11_17569 Hog Branch at US Hwy 280 near Plains, GA Flint Tifton WP Swine Project
tributary 32.04261 -84.486 X X X
RV_11_17570 Harrel Mill Creek at Macedonia Church Rd
near Preston, GA Flint Tifton WP
Swine Project
tributary 32.03878 -84.5404 X X X
RV_11_17571 Abrams Creek at Cowford Bridge Rd near
Leesburg, GA Flint Tifton WP Probabilistic 31.6843 -83.9271 X
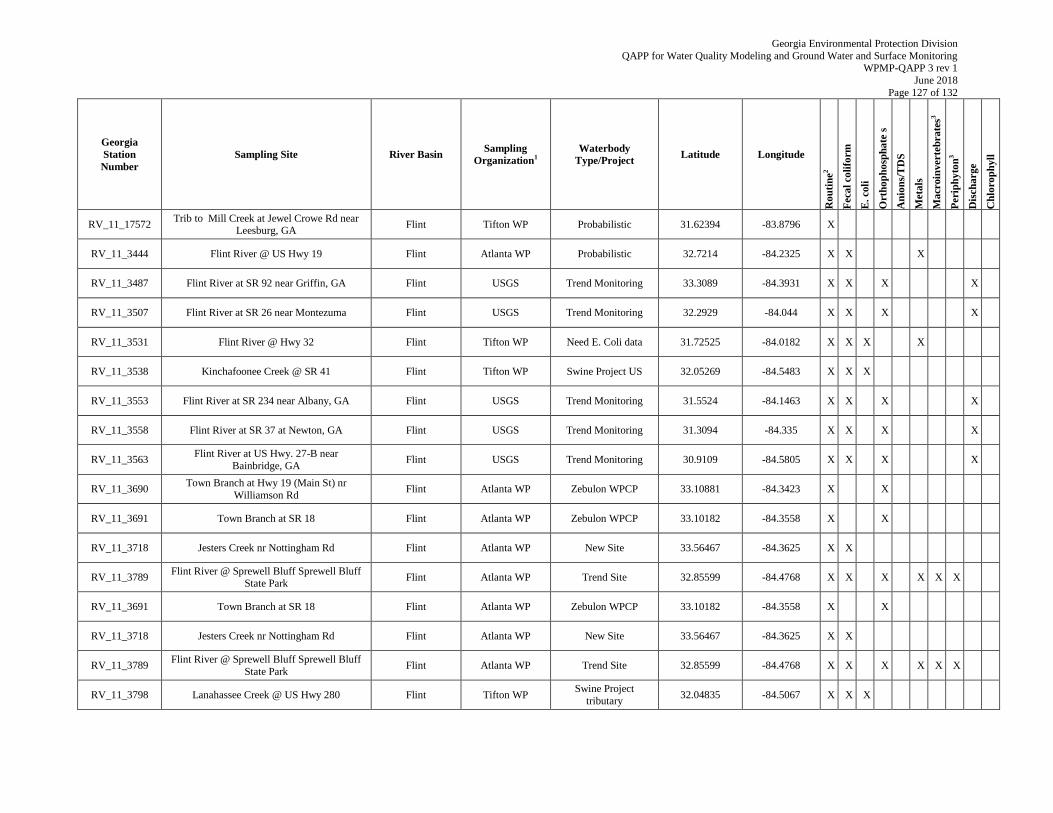
Georgia Environmental Protection Division
QAPP for Water Quality Modeling and Ground Water and Surface Monitoring WPMP-QAPP 3 rev 1
June 2018
Page 127 of 132
Georgia
Station
Number
Sampling Site River Basin Sampling
Organization1
Waterbody
Type/Project Latitude Longitude
Ro
uti
ne
2
Feca
l co
lifo
rm
E. coli
Ort
ho
ph
osp
ha
te s
An
ion
s/T
DS
Meta
ls
Ma
croin
verte
bra
tes3
Peri
ph
yto
n3
Dis
charge
Ch
loro
ph
yll
RV_11_17572 Trib to Mill Creek at Jewel Crowe Rd near
Leesburg, GA Flint Tifton WP Probabilistic 31.62394 -83.8796 X
RV_11_3444 Flint River @ US Hwy 19 Flint Atlanta WP Probabilistic 32.7214 -84.2325 X X X
RV_11_3487 Flint River at SR 92 near Griffin, GA Flint USGS Trend Monitoring 33.3089 -84.3931 X X X X
RV_11_3507 Flint River at SR 26 near Montezuma Flint USGS Trend Monitoring 32.2929 -84.044 X X X X
RV_11_3531 Flint River @ Hwy 32 Flint Tifton WP Need E. Coli data 31.72525 -84.0182 X X X X
RV_11_3538 Kinchafoonee Creek @ SR 41 Flint Tifton WP Swine Project US 32.05269 -84.5483 X X X
RV_11_3553 Flint River at SR 234 near Albany, GA Flint USGS Trend Monitoring 31.5524 -84.1463 X X X X
RV_11_3558 Flint River at SR 37 at Newton, GA Flint USGS Trend Monitoring 31.3094 -84.335 X X X X
RV_11_3563 Flint River at US Hwy. 27-B near
Bainbridge, GA Flint USGS Trend Monitoring 30.9109 -84.5805 X X X X
RV_11_3690 Town Branch at Hwy 19 (Main St) nr
Williamson Rd Flint Atlanta WP Zebulon WPCP 33.10881 -84.3423 X X
RV_11_3691 Town Branch at SR 18 Flint Atlanta WP Zebulon WPCP 33.10182 -84.3558 X X
RV_11_3718 Jesters Creek nr Nottingham Rd Flint Atlanta WP New Site 33.56467 -84.3625 X X
RV_11_3789 Flint River @ Sprewell Bluff Sprewell Bluff
State Park Flint Atlanta WP Trend Site 32.85599 -84.4768 X X X X X X
RV_11_3691 Town Branch at SR 18 Flint Atlanta WP Zebulon WPCP 33.10182 -84.3558 X X
RV_11_3718 Jesters Creek nr Nottingham Rd Flint Atlanta WP New Site 33.56467 -84.3625 X X
RV_11_3789 Flint River @ Sprewell Bluff Sprewell Bluff
State Park Flint Atlanta WP Trend Site 32.85599 -84.4768 X X X X X X
RV_11_3798 Lanahassee Creek @ US Hwy 280 Flint Tifton WP Swine Project
tributary 32.04835 -84.5067 X X X
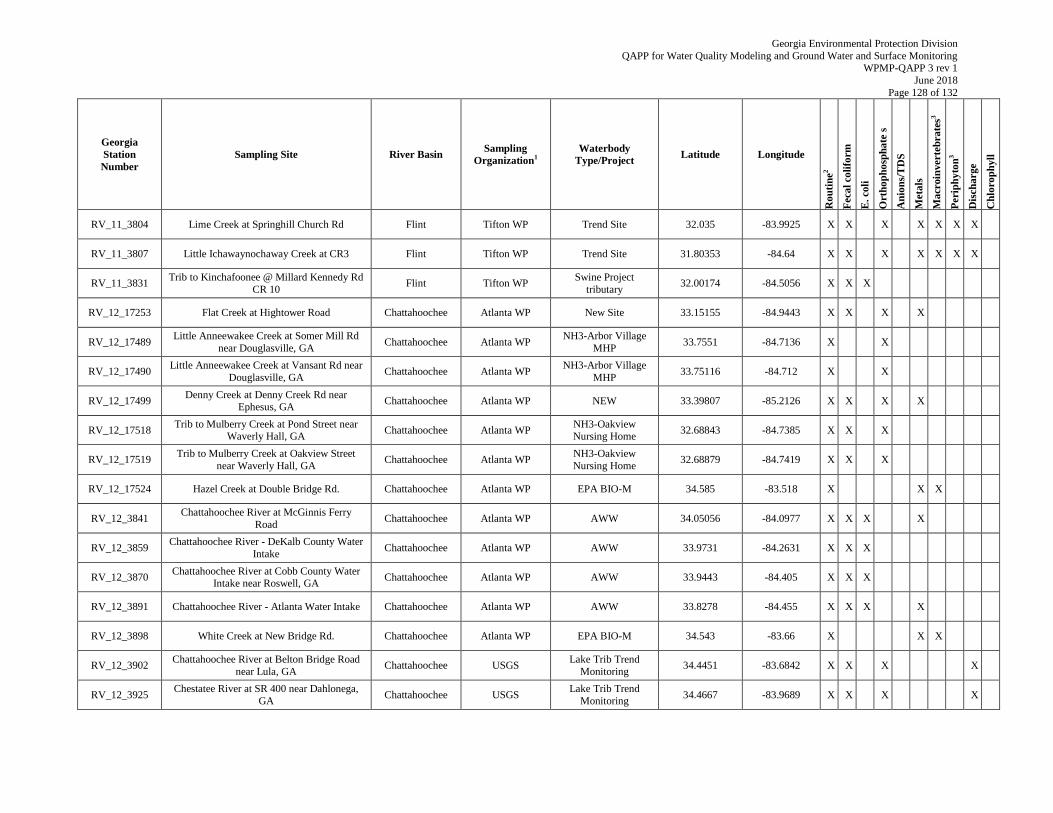
Georgia Environmental Protection Division
QAPP for Water Quality Modeling and Ground Water and Surface Monitoring WPMP-QAPP 3 rev 1
June 2018
Page 128 of 132
Georgia
Station
Number
Sampling Site River Basin Sampling
Organization1
Waterbody
Type/Project Latitude Longitude
Ro
uti
ne
2
Feca
l co
lifo
rm
E. coli
Ort
ho
ph
osp
ha
te s
An
ion
s/T
DS
Meta
ls
Ma
croin
verte
bra
tes3
Peri
ph
yto
n3
Dis
charge
Ch
loro
ph
yll
RV_11_3804 Lime Creek at Springhill Church Rd Flint Tifton WP Trend Site 32.035 -83.9925 X X X X X X X
RV_11_3807 Little Ichawaynochaway Creek at CR3 Flint Tifton WP Trend Site 31.80353 -84.64 X X X X X X X
RV_11_3831 Trib to Kinchafoonee @ Millard Kennedy Rd
CR 10 Flint Tifton WP
Swine Project
tributary 32.00174 -84.5056 X X X
RV_12_17253 Flat Creek at Hightower Road Chattahoochee Atlanta WP New Site 33.15155 -84.9443 X X X X
RV_12_17489 Little Anneewakee Creek at Somer Mill Rd
near Douglasville, GA Chattahoochee Atlanta WP
NH3-Arbor Village
MHP 33.7551 -84.7136 X X
RV_12_17490 Little Anneewakee Creek at Vansant Rd near
Douglasville, GA Chattahoochee Atlanta WP
NH3-Arbor Village
MHP 33.75116 -84.712 X X
RV_12_17499 Denny Creek at Denny Creek Rd near
Ephesus, GA Chattahoochee Atlanta WP NEW 33.39807 -85.2126 X X X X
RV_12_17518 Trib to Mulberry Creek at Pond Street near
Waverly Hall, GA Chattahoochee Atlanta WP
NH3-Oakview Nursing Home
32.68843 -84.7385 X X X
RV_12_17519 Trib to Mulberry Creek at Oakview Street
near Waverly Hall, GA Chattahoochee Atlanta WP
NH3-Oakview
Nursing Home 32.68879 -84.7419 X X X
RV_12_17524 Hazel Creek at Double Bridge Rd. Chattahoochee Atlanta WP EPA BIO-M 34.585 -83.518 X X X
RV_12_3841 Chattahoochee River at McGinnis Ferry
Road Chattahoochee Atlanta WP AWW 34.05056 -84.0977 X X X X
RV_12_3859 Chattahoochee River - DeKalb County Water
Intake Chattahoochee Atlanta WP AWW 33.9731 -84.2631 X X X
RV_12_3870 Chattahoochee River at Cobb County Water
Intake near Roswell, GA Chattahoochee Atlanta WP AWW 33.9443 -84.405 X X X
RV_12_3891 Chattahoochee River - Atlanta Water Intake Chattahoochee Atlanta WP AWW 33.8278 -84.455 X X X X
RV_12_3898 White Creek at New Bridge Rd. Chattahoochee Atlanta WP EPA BIO-M 34.543 -83.66 X X X
RV_12_3902 Chattahoochee River at Belton Bridge Road
near Lula, GA Chattahoochee USGS
Lake Trib Trend
Monitoring 34.4451 -83.6842 X X X X
RV_12_3925 Chestatee River at SR 400 near Dahlonega,
GA Chattahoochee USGS
Lake Trib Trend
Monitoring 34.4667 -83.9689 X X X X
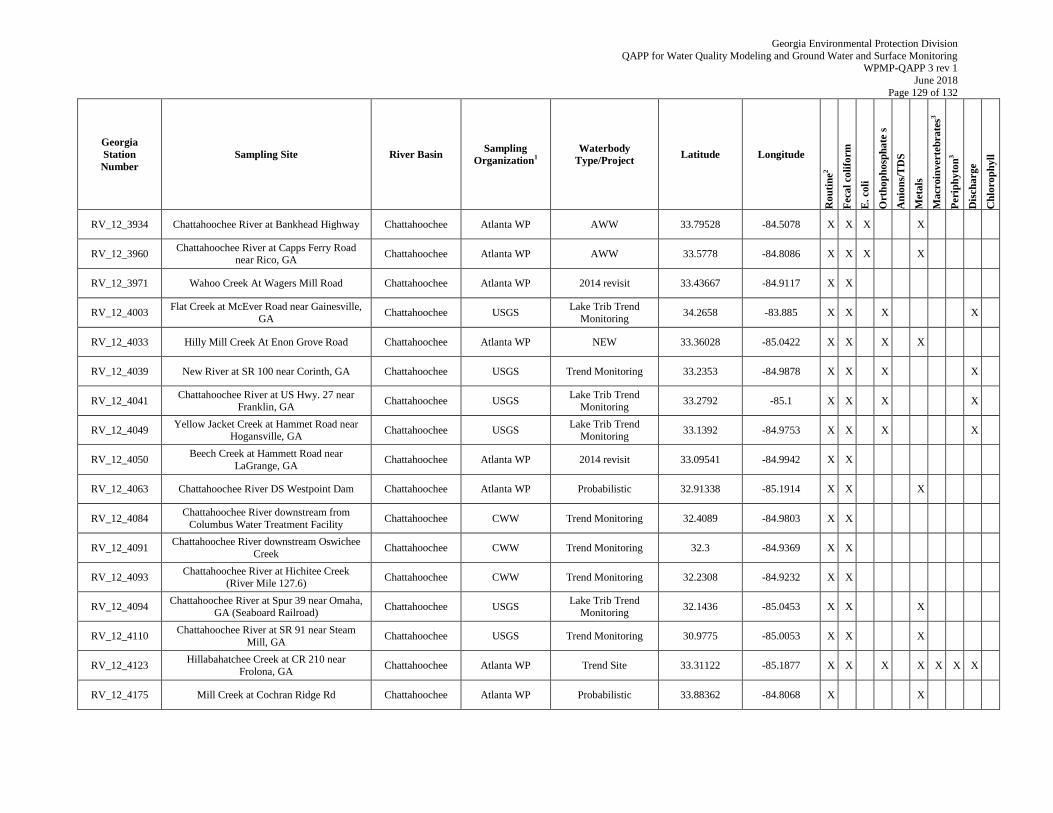
Georgia Environmental Protection Division
QAPP for Water Quality Modeling and Ground Water and Surface Monitoring WPMP-QAPP 3 rev 1
June 2018
Page 129 of 132
Georgia
Station
Number
Sampling Site River Basin Sampling
Organization1
Waterbody
Type/Project Latitude Longitude
Ro
uti
ne
2
Feca
l co
lifo
rm
E. coli
Ort
ho
ph
osp
ha
te s
An
ion
s/T
DS
Meta
ls
Ma
croin
verte
bra
tes3
Peri
ph
yto
n3
Dis
charge
Ch
loro
ph
yll
RV_12_3934 Chattahoochee River at Bankhead Highway Chattahoochee Atlanta WP AWW 33.79528 -84.5078 X X X X
RV_12_3960 Chattahoochee River at Capps Ferry Road
near Rico, GA Chattahoochee Atlanta WP AWW 33.5778 -84.8086 X X X X
RV_12_3971 Wahoo Creek At Wagers Mill Road Chattahoochee Atlanta WP 2014 revisit 33.43667 -84.9117 X X
RV_12_4003 Flat Creek at McEver Road near Gainesville,
GA Chattahoochee USGS
Lake Trib Trend
Monitoring 34.2658 -83.885 X X X X
RV_12_4033 Hilly Mill Creek At Enon Grove Road Chattahoochee Atlanta WP NEW 33.36028 -85.0422 X X X X
RV_12_4039 New River at SR 100 near Corinth, GA Chattahoochee USGS Trend Monitoring 33.2353 -84.9878 X X X X
RV_12_4041 Chattahoochee River at US Hwy. 27 near
Franklin, GA Chattahoochee USGS
Lake Trib Trend
Monitoring 33.2792 -85.1 X X X X
RV_12_4049 Yellow Jacket Creek at Hammet Road near
Hogansville, GA Chattahoochee USGS
Lake Trib Trend Monitoring
33.1392 -84.9753 X X X X
RV_12_4050 Beech Creek at Hammett Road near
LaGrange, GA Chattahoochee Atlanta WP 2014 revisit 33.09541 -84.9942 X X
RV_12_4063 Chattahoochee River DS Westpoint Dam Chattahoochee Atlanta WP Probabilistic 32.91338 -85.1914 X X X
RV_12_4084 Chattahoochee River downstream from
Columbus Water Treatment Facility Chattahoochee CWW Trend Monitoring 32.4089 -84.9803 X X
RV_12_4091 Chattahoochee River downstream Oswichee
Creek Chattahoochee CWW Trend Monitoring 32.3 -84.9369 X X
RV_12_4093 Chattahoochee River at Hichitee Creek
(River Mile 127.6) Chattahoochee CWW Trend Monitoring 32.2308 -84.9232 X X
RV_12_4094 Chattahoochee River at Spur 39 near Omaha,
GA (Seaboard Railroad) Chattahoochee USGS
Lake Trib Trend Monitoring
32.1436 -85.0453 X X X
RV_12_4110 Chattahoochee River at SR 91 near Steam
Mill, GA Chattahoochee USGS Trend Monitoring 30.9775 -85.0053 X X X
RV_12_4123 Hillabahatchee Creek at CR 210 near
Frolona, GA Chattahoochee Atlanta WP Trend Site 33.31122 -85.1877 X X X X X X X
RV_12_4175 Mill Creek at Cochran Ridge Rd Chattahoochee Atlanta WP Probabilistic 33.88362 -84.8068 X X
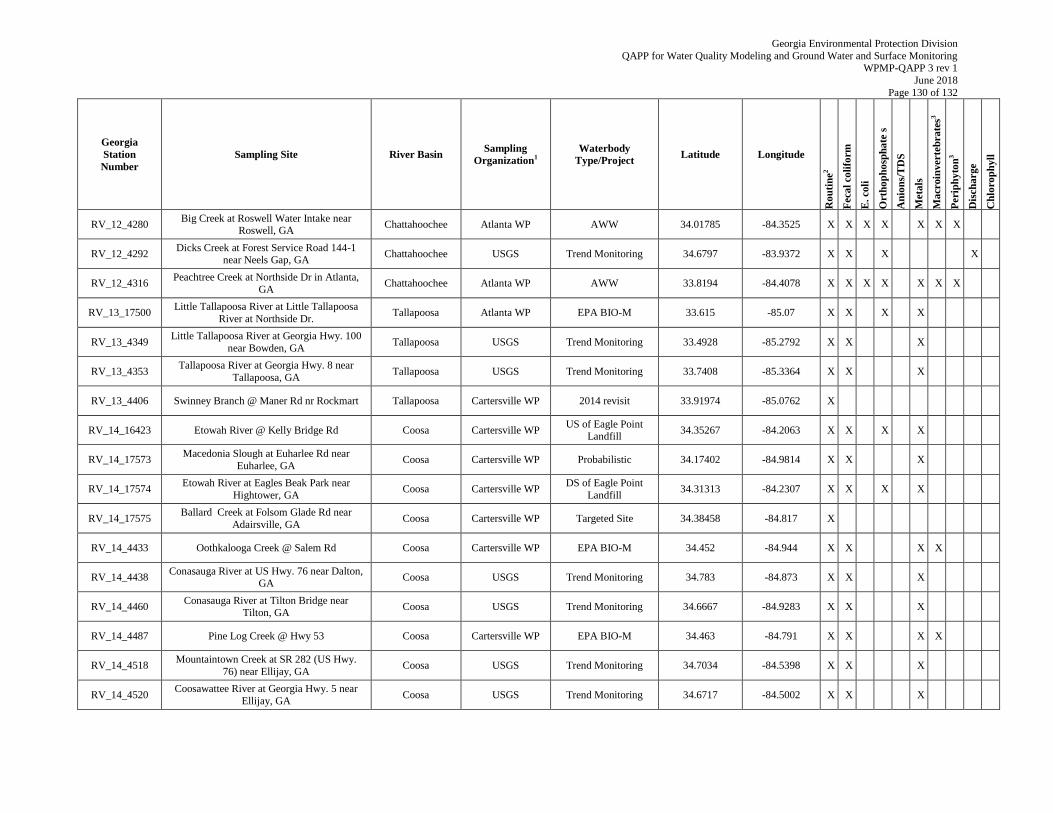
Georgia Environmental Protection Division
QAPP for Water Quality Modeling and Ground Water and Surface Monitoring WPMP-QAPP 3 rev 1
June 2018
Page 130 of 132
Georgia
Station
Number
Sampling Site River Basin Sampling
Organization1
Waterbody
Type/Project Latitude Longitude
Ro
uti
ne
2
Feca
l co
lifo
rm
E. coli
Ort
ho
ph
osp
ha
te s
An
ion
s/T
DS
Meta
ls
Ma
croin
verte
bra
tes3
Peri
ph
yto
n3
Dis
charge
Ch
loro
ph
yll
RV_12_4280 Big Creek at Roswell Water Intake near
Roswell, GA Chattahoochee Atlanta WP AWW 34.01785 -84.3525 X X X X X X X
RV_12_4292 Dicks Creek at Forest Service Road 144-1
near Neels Gap, GA Chattahoochee USGS Trend Monitoring 34.6797 -83.9372 X X X X
RV_12_4316 Peachtree Creek at Northside Dr in Atlanta,
GA Chattahoochee Atlanta WP AWW 33.8194 -84.4078 X X X X X X X
RV_13_17500 Little Tallapoosa River at Little Tallapoosa
River at Northside Dr. Tallapoosa Atlanta WP EPA BIO-M 33.615 -85.07 X X X X
RV_13_4349 Little Tallapoosa River at Georgia Hwy. 100
near Bowden, GA Tallapoosa USGS Trend Monitoring 33.4928 -85.2792 X X X
RV_13_4353 Tallapoosa River at Georgia Hwy. 8 near
Tallapoosa, GA Tallapoosa USGS Trend Monitoring 33.7408 -85.3364 X X X
RV_13_4406 Swinney Branch @ Maner Rd nr Rockmart Tallapoosa Cartersville WP 2014 revisit 33.91974 -85.0762 X
RV_14_16423 Etowah River @ Kelly Bridge Rd Coosa Cartersville WP US of Eagle Point
Landfill 34.35267 -84.2063 X X X X
RV_14_17573 Macedonia Slough at Euharlee Rd near
Euharlee, GA Coosa Cartersville WP Probabilistic 34.17402 -84.9814 X X X
RV_14_17574 Etowah River at Eagles Beak Park near
Hightower, GA Coosa Cartersville WP
DS of Eagle Point
Landfill 34.31313 -84.2307 X X X X
RV_14_17575 Ballard Creek at Folsom Glade Rd near
Adairsville, GA Coosa Cartersville WP Targeted Site 34.38458 -84.817 X
RV_14_4433 Oothkalooga Creek @ Salem Rd Coosa Cartersville WP EPA BIO-M 34.452 -84.944 X X X X
RV_14_4438 Conasauga River at US Hwy. 76 near Dalton,
GA Coosa USGS Trend Monitoring 34.783 -84.873 X X X
RV_14_4460 Conasauga River at Tilton Bridge near
Tilton, GA Coosa USGS Trend Monitoring 34.6667 -84.9283 X X X
RV_14_4487 Pine Log Creek @ Hwy 53 Coosa Cartersville WP EPA BIO-M 34.463 -84.791 X X X X
RV_14_4518 Mountaintown Creek at SR 282 (US Hwy.
76) near Ellijay, GA Coosa USGS Trend Monitoring 34.7034 -84.5398 X X X
RV_14_4520 Coosawattee River at Georgia Hwy. 5 near
Ellijay, GA Coosa USGS Trend Monitoring 34.6717 -84.5002 X X X
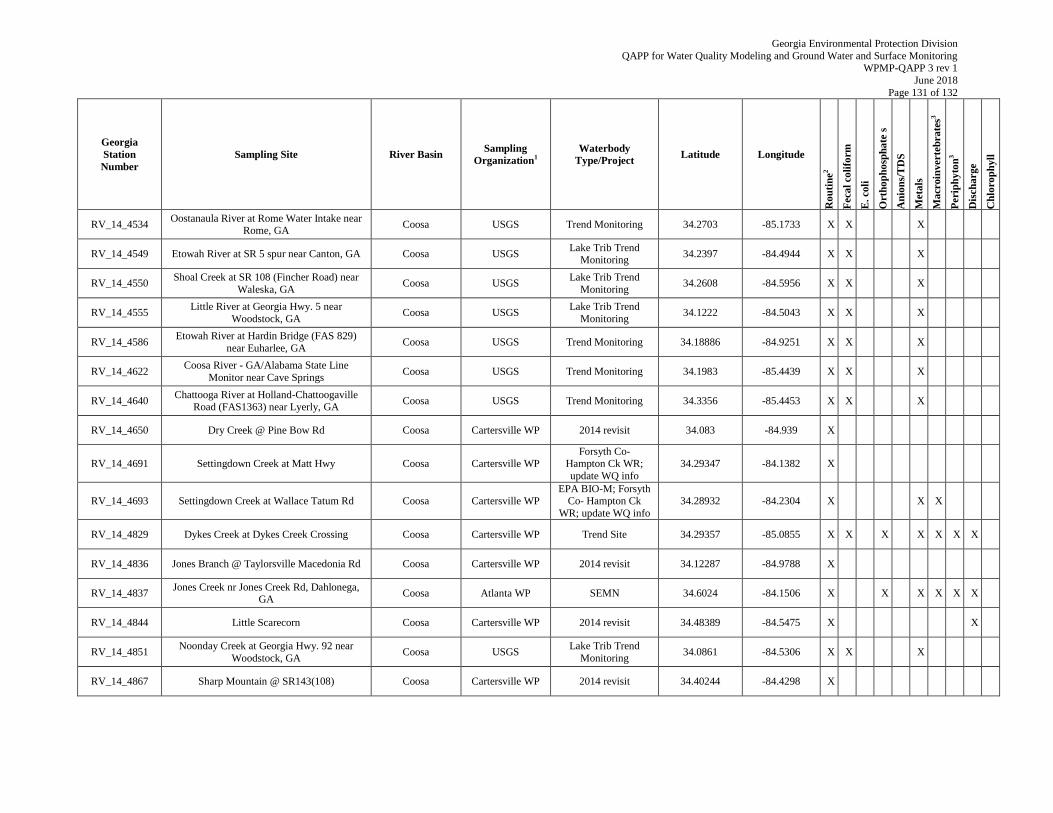
Georgia Environmental Protection Division
QAPP for Water Quality Modeling and Ground Water and Surface Monitoring WPMP-QAPP 3 rev 1
June 2018
Page 131 of 132
Georgia
Station
Number
Sampling Site River Basin Sampling
Organization1
Waterbody
Type/Project Latitude Longitude
Ro
uti
ne
2
Feca
l co
lifo
rm
E. coli
Ort
ho
ph
osp
ha
te s
An
ion
s/T
DS
Meta
ls
Ma
croin
verte
bra
tes3
Peri
ph
yto
n3
Dis
charge
Ch
loro
ph
yll
RV_14_4534 Oostanaula River at Rome Water Intake near
Rome, GA Coosa USGS Trend Monitoring 34.2703 -85.1733 X X X
RV_14_4549 Etowah River at SR 5 spur near Canton, GA Coosa USGS Lake Trib Trend
Monitoring 34.2397 -84.4944 X X X
RV_14_4550 Shoal Creek at SR 108 (Fincher Road) near
Waleska, GA Coosa USGS
Lake Trib Trend
Monitoring 34.2608 -84.5956 X X X
RV_14_4555 Little River at Georgia Hwy. 5 near
Woodstock, GA Coosa USGS
Lake Trib Trend
Monitoring 34.1222 -84.5043 X X X
RV_14_4586 Etowah River at Hardin Bridge (FAS 829)
near Euharlee, GA Coosa USGS Trend Monitoring 34.18886 -84.9251 X X X
RV_14_4622 Coosa River - GA/Alabama State Line
Monitor near Cave Springs Coosa USGS Trend Monitoring 34.1983 -85.4439 X X X
RV_14_4640 Chattooga River at Holland-Chattoogaville
Road (FAS1363) near Lyerly, GA Coosa USGS Trend Monitoring 34.3356 -85.4453 X X X
RV_14_4650 Dry Creek @ Pine Bow Rd Coosa Cartersville WP 2014 revisit 34.083 -84.939 X
RV_14_4691 Settingdown Creek at Matt Hwy Coosa Cartersville WP Forsyth Co-
Hampton Ck WR;
update WQ info
34.29347 -84.1382 X
RV_14_4693 Settingdown Creek at Wallace Tatum Rd Coosa Cartersville WP EPA BIO-M; Forsyth
Co- Hampton Ck
WR; update WQ info
34.28932 -84.2304 X X X
RV_14_4829 Dykes Creek at Dykes Creek Crossing Coosa Cartersville WP Trend Site 34.29357 -85.0855 X X X X X X X
RV_14_4836 Jones Branch @ Taylorsville Macedonia Rd Coosa Cartersville WP 2014 revisit 34.12287 -84.9788 X
RV_14_4837 Jones Creek nr Jones Creek Rd, Dahlonega,
GA Coosa Atlanta WP SEMN 34.6024 -84.1506 X X X X X X
RV_14_4844 Little Scarecorn Coosa Cartersville WP 2014 revisit 34.48389 -84.5475 X X
RV_14_4851 Noonday Creek at Georgia Hwy. 92 near
Woodstock, GA Coosa USGS
Lake Trib Trend
Monitoring 34.0861 -84.5306 X X X
RV_14_4867 Sharp Mountain @ SR143(108) Coosa Cartersville WP 2014 revisit 34.40244 -84.4298 X
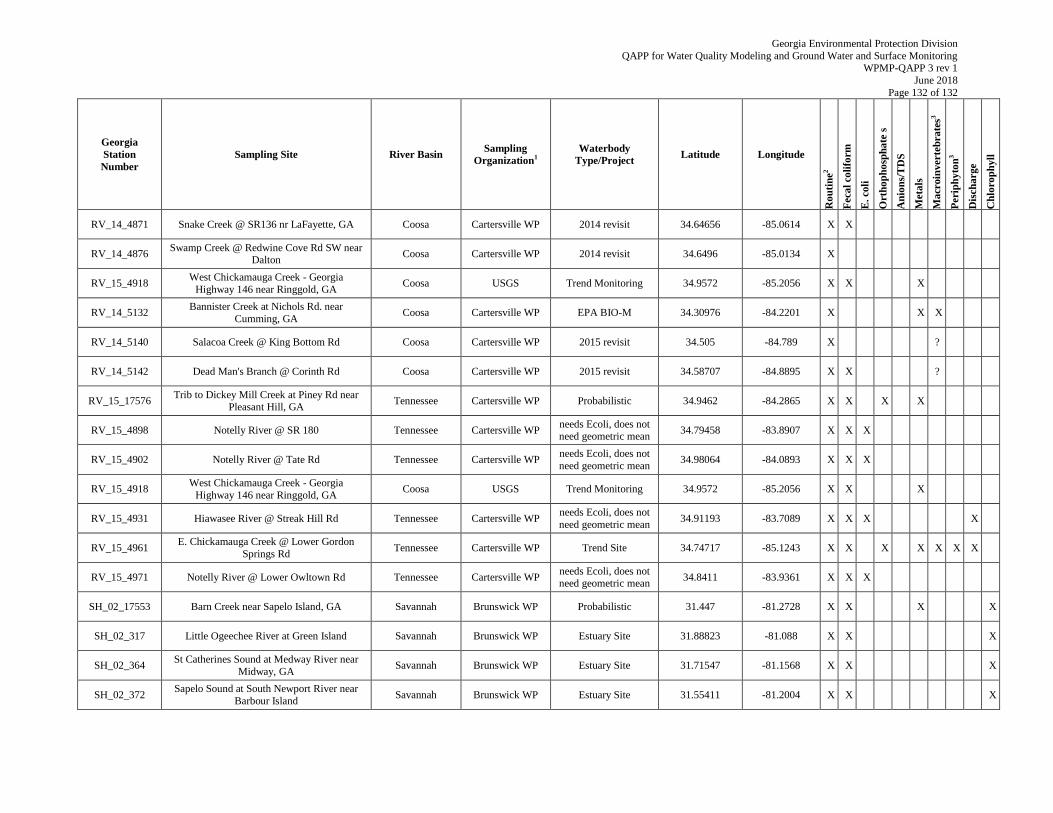
Georgia Environmental Protection Division
QAPP for Water Quality Modeling and Ground Water and Surface Monitoring WPMP-QAPP 3 rev 1
June 2018
Page 132 of 132
Georgia
Station
Number
Sampling Site River Basin Sampling
Organization1
Waterbody
Type/Project Latitude Longitude
Ro
uti
ne
2
Feca
l co
lifo
rm
E. coli
Ort
ho
ph
osp
ha
te s
An
ion
s/T
DS
Meta
ls
Ma
croin
verte
bra
tes3
Peri
ph
yto
n3
Dis
charge
Ch
loro
ph
yll
RV_14_4871 Snake Creek @ SR136 nr LaFayette, GA Coosa Cartersville WP 2014 revisit 34.64656 -85.0614 X X
RV_14_4876 Swamp Creek @ Redwine Cove Rd SW near
Dalton Coosa Cartersville WP 2014 revisit 34.6496 -85.0134 X
RV_15_4918 West Chickamauga Creek - Georgia
Highway 146 near Ringgold, GA Coosa USGS Trend Monitoring 34.9572 -85.2056 X X X
RV_14_5132 Bannister Creek at Nichols Rd. near
Cumming, GA Coosa Cartersville WP EPA BIO-M 34.30976 -84.2201 X X X
RV_14_5140 Salacoa Creek @ King Bottom Rd Coosa Cartersville WP 2015 revisit 34.505 -84.789 X ?
RV_14_5142 Dead Man's Branch @ Corinth Rd Coosa Cartersville WP 2015 revisit 34.58707 -84.8895 X X ?
RV_15_17576 Trib to Dickey Mill Creek at Piney Rd near
Pleasant Hill, GA Tennessee Cartersville WP Probabilistic 34.9462 -84.2865 X X X X
RV_15_4898 Notelly River @ SR 180 Tennessee Cartersville WP needs Ecoli, does not need geometric mean
34.79458 -83.8907 X X X
RV_15_4902 Notelly River @ Tate Rd Tennessee Cartersville WP needs Ecoli, does not
need geometric mean 34.98064 -84.0893 X X X
RV_15_4918 West Chickamauga Creek - Georgia
Highway 146 near Ringgold, GA Coosa USGS Trend Monitoring 34.9572 -85.2056 X X X
RV_15_4931 Hiawasee River @ Streak Hill Rd Tennessee Cartersville WP needs Ecoli, does not
need geometric mean 34.91193 -83.7089 X X X X
RV_15_4961 E. Chickamauga Creek @ Lower Gordon
Springs Rd Tennessee Cartersville WP Trend Site 34.74717 -85.1243 X X X X X X X
RV_15_4971 Notelly River @ Lower Owltown Rd Tennessee Cartersville WP needs Ecoli, does not need geometric mean
34.8411 -83.9361 X X X
SH_02_17553 Barn Creek near Sapelo Island, GA Savannah Brunswick WP Probabilistic 31.447 -81.2728 X X X X
SH_02_317 Little Ogeechee River at Green Island Savannah Brunswick WP Estuary Site 31.88823 -81.088 X X X
SH_02_364 St Catherines Sound at Medway River near
Midway, GA Savannah Brunswick WP Estuary Site 31.71547 -81.1568 X X X
SH_02_372 Sapelo Sound at South Newport River near
Barbour Island Savannah Brunswick WP Estuary Site 31.55411 -81.2004 X X X
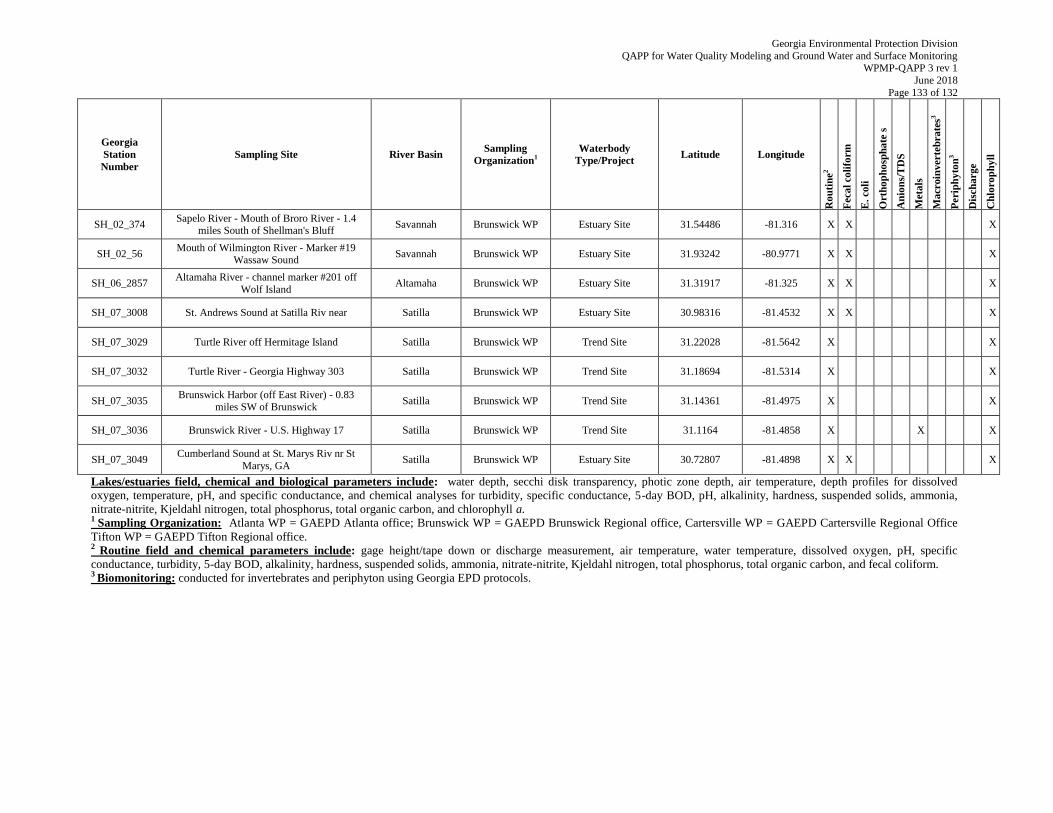
Georgia Environmental Protection Division
QAPP for Water Quality Modeling and Ground Water and Surface Monitoring WPMP-QAPP 3 rev 1
June 2018
Page 133 of 132
Georgia
Station
Number
Sampling Site River Basin Sampling
Organization1
Waterbody
Type/Project Latitude Longitude
Ro
uti
ne
2
Feca
l co
lifo
rm
E. coli
Ort
ho
ph
osp
ha
te s
An
ion
s/T
DS
Meta
ls
Ma
croin
verte
bra
tes3
Peri
ph
yto
n3
Dis
charge
Ch
loro
ph
yll
SH_02_374 Sapelo River - Mouth of Broro River - 1.4
miles South of Shellman's Bluff Savannah Brunswick WP Estuary Site 31.54486 -81.316 X X X
SH_02_56 Mouth of Wilmington River - Marker #19
Wassaw Sound Savannah Brunswick WP Estuary Site 31.93242 -80.9771 X X X
SH_06_2857 Altamaha River - channel marker #201 off
Wolf Island Altamaha Brunswick WP Estuary Site 31.31917 -81.325 X X X
SH_07_3008 St. Andrews Sound at Satilla Riv near Satilla Brunswick WP Estuary Site 30.98316 -81.4532 X X X
SH_07_3029 Turtle River off Hermitage Island Satilla Brunswick WP Trend Site 31.22028 -81.5642 X X
SH_07_3032 Turtle River - Georgia Highway 303 Satilla Brunswick WP Trend Site 31.18694 -81.5314 X X
SH_07_3035 Brunswick Harbor (off East River) - 0.83
miles SW of Brunswick Satilla Brunswick WP Trend Site 31.14361 -81.4975 X X
SH_07_3036 Brunswick River - U.S. Highway 17 Satilla Brunswick WP Trend Site 31.1164 -81.4858 X X X
SH_07_3049 Cumberland Sound at St. Marys Riv nr St
Marys, GA Satilla Brunswick WP Estuary Site 30.72807 -81.4898 X X X
Lakes/estuaries field, chemical and biological parameters include: water depth, secchi disk transparency, photic zone depth, air temperature, depth profiles for dissolved
oxygen, temperature, pH, and specific conductance, and chemical analyses for turbidity, specific conductance, 5-day BOD, pH, alkalinity, hardness, suspended solids, ammonia,
nitrate-nitrite, Kjeldahl nitrogen, total phosphorus, total organic carbon, and chlorophyll a. 1 Sampling Organization: Atlanta WP = GAEPD Atlanta office; Brunswick WP = GAEPD Brunswick Regional office, Cartersville WP = GAEPD Cartersville Regional Office
Tifton WP = GAEPD Tifton Regional office. 2 Routine field and chemical parameters include: gage height/tape down or discharge measurement, air temperature, water temperature, dissolved oxygen, pH, specific
conductance, turbidity, 5-day BOD, alkalinity, hardness, suspended solids, ammonia, nitrate-nitrite, Kjeldahl nitrogen, total phosphorus, total organic carbon, and fecal coliform. 3 Biomonitoring: conducted for invertebrates and periphyton using Georgia EPD protocols.

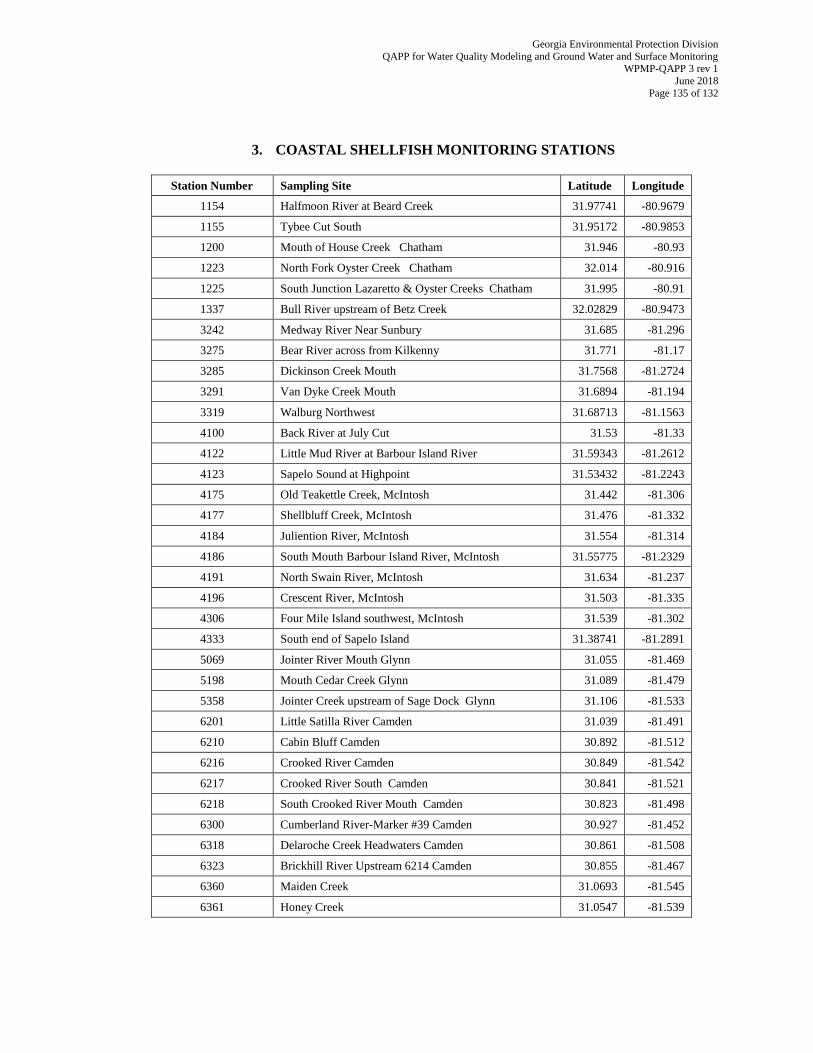
Georgia Environmental Protection Division
QAPP for Water Quality Modeling and Ground Water and Surface Monitoring WPMP-QAPP 3 rev 1
June 2018
Page 135 of 132
3. COASTAL SHELLFISH MONITORING STATIONS
Station Number Sampling Site Latitude Longitude
1154 Halfmoon River at Beard Creek 31.97741 -80.9679
1155 Tybee Cut South 31.95172 -80.9853
1200 Mouth of House Creek Chatham 31.946 -80.93
1223 North Fork Oyster Creek Chatham 32.014 -80.916
1225 South Junction Lazaretto & Oyster Creeks Chatham 31.995 -80.91
1337 Bull River upstream of Betz Creek 32.02829 -80.9473
3242 Medway River Near Sunbury 31.685 -81.296
3275 Bear River across from Kilkenny 31.771 -81.17
3285 Dickinson Creek Mouth 31.7568 -81.2724
3291 Van Dyke Creek Mouth 31.6894 -81.194
3319 Walburg Northwest 31.68713 -81.1563
4100 Back River at July Cut 31.53 -81.33
4122 Little Mud River at Barbour Island River 31.59343 -81.2612
4123 Sapelo Sound at Highpoint 31.53432 -81.2243
4175 Old Teakettle Creek, McIntosh 31.442 -81.306
4177 Shellbluff Creek, McIntosh 31.476 -81.332
4184 Juliention River, McIntosh 31.554 -81.314
4186 South Mouth Barbour Island River, McIntosh 31.55775 -81.2329
4191 North Swain River, McIntosh 31.634 -81.237
4196 Crescent River, McIntosh 31.503 -81.335
4306 Four Mile Island southwest, McIntosh 31.539 -81.302
4333 South end of Sapelo Island 31.38741 -81.2891
5069 Jointer River Mouth Glynn 31.055 -81.469
5198 Mouth Cedar Creek Glynn 31.089 -81.479
5358 Jointer Creek upstream of Sage Dock Glynn 31.106 -81.533
6201 Little Satilla River Camden 31.039 -81.491
6210 Cabin Bluff Camden 30.892 -81.512
6216 Crooked River Camden 30.849 -81.542
6217 Crooked River South Camden 30.841 -81.521
6218 South Crooked River Mouth Camden 30.823 -81.498
6300 Cumberland River-Marker #39 Camden 30.927 -81.452
6318 Delaroche Creek Headwaters Camden 30.861 -81.508
6323 Brickhill River Upstream 6214 Camden 30.855 -81.467
6360 Maiden Creek 31.0693 -81.545
6361 Honey Creek 31.0547 -81.539
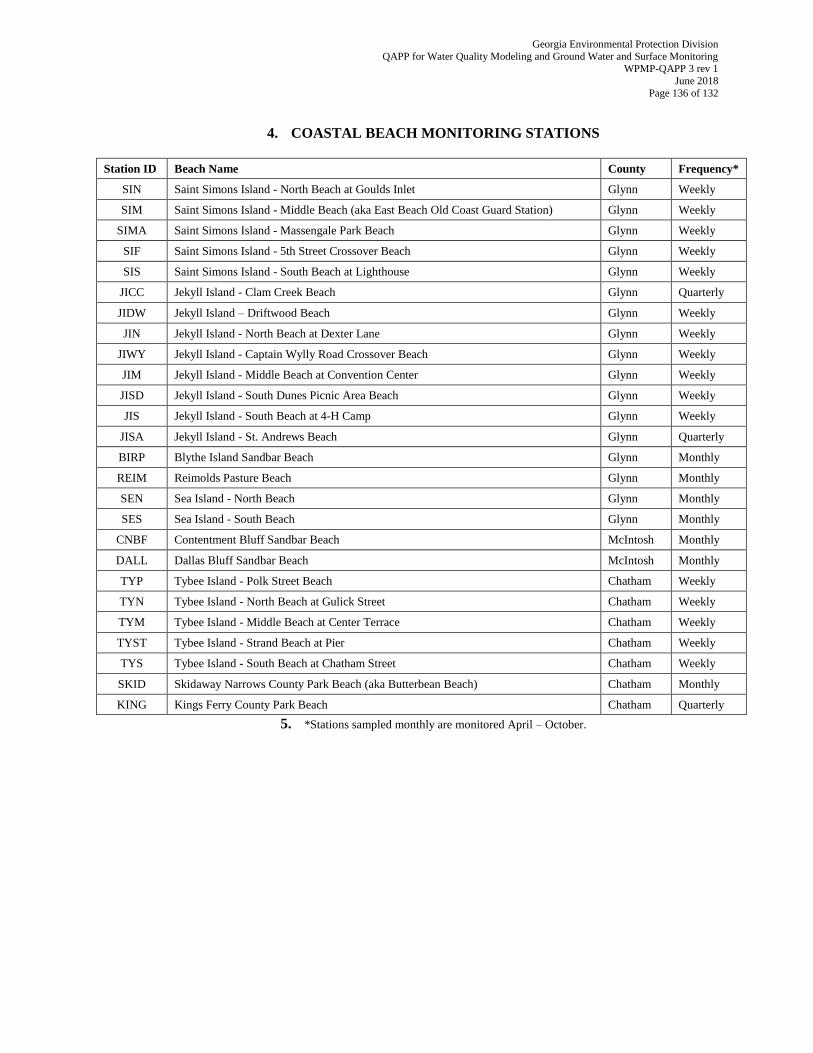
Georgia Environmental Protection Division
QAPP for Water Quality Modeling and Ground Water and Surface Monitoring WPMP-QAPP 3 rev 1
June 2018
Page 136 of 132
4. COASTAL BEACH MONITORING STATIONS
Station ID Beach Name County Frequency*
SIN Saint Simons Island - North Beach at Goulds Inlet Glynn Weekly
SIM Saint Simons Island - Middle Beach (aka East Beach Old Coast Guard Station) Glynn Weekly
SIMA Saint Simons Island - Massengale Park Beach Glynn Weekly
SIF Saint Simons Island - 5th Street Crossover Beach Glynn Weekly
SIS Saint Simons Island - South Beach at Lighthouse Glynn Weekly
JICC Jekyll Island - Clam Creek Beach Glynn Quarterly
JIDW Jekyll Island – Driftwood Beach Glynn Weekly
JIN Jekyll Island - North Beach at Dexter Lane Glynn Weekly
JIWY Jekyll Island - Captain Wylly Road Crossover Beach Glynn Weekly
JIM Jekyll Island - Middle Beach at Convention Center Glynn Weekly
JISD Jekyll Island - South Dunes Picnic Area Beach Glynn Weekly
JIS Jekyll Island - South Beach at 4-H Camp Glynn Weekly
JISA Jekyll Island - St. Andrews Beach Glynn Quarterly
BIRP Blythe Island Sandbar Beach Glynn Monthly
REIM Reimolds Pasture Beach Glynn Monthly
SEN Sea Island - North Beach Glynn Monthly
SES Sea Island - South Beach Glynn Monthly
CNBF Contentment Bluff Sandbar Beach McIntosh Monthly
DALL Dallas Bluff Sandbar Beach McIntosh Monthly
TYP Tybee Island - Polk Street Beach Chatham Weekly
TYN Tybee Island - North Beach at Gulick Street Chatham Weekly
TYM Tybee Island - Middle Beach at Center Terrace Chatham Weekly
TYST Tybee Island - Strand Beach at Pier Chatham Weekly
TYS Tybee Island - South Beach at Chatham Street Chatham Weekly
SKID Skidaway Narrows County Park Beach (aka Butterbean Beach) Chatham Monthly
KING Kings Ferry County Park Beach Chatham Quarterly
5. *Stations sampled monthly are monitored April – October.
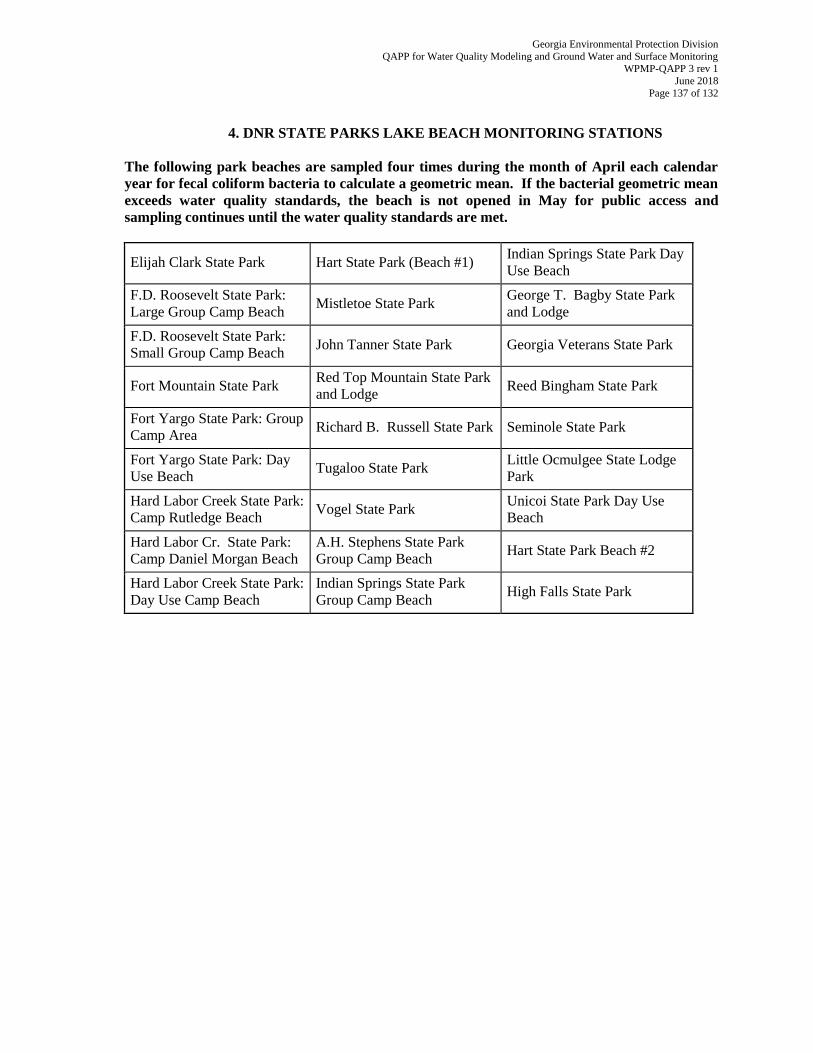
Georgia Environmental Protection Division
QAPP for Water Quality Modeling and Ground Water and Surface Monitoring WPMP-QAPP 3 rev 1
June 2018
Page 137 of 132
4. DNR STATE PARKS LAKE BEACH MONITORING STATIONS
The following park beaches are sampled four times during the month of April each calendar
year for fecal coliform bacteria to calculate a geometric mean. If the bacterial geometric mean
exceeds water quality standards, the beach is not opened in May for public access and
sampling continues until the water quality standards are met.
Elijah Clark State Park Hart State Park (Beach #1) Indian Springs State Park Day
Use Beach
F.D. Roosevelt State Park:
Large Group Camp Beach Mistletoe State Park
George T. Bagby State Park
and Lodge
F.D. Roosevelt State Park:
Small Group Camp Beach John Tanner State Park Georgia Veterans State Park
Fort Mountain State Park Red Top Mountain State Park
and Lodge Reed Bingham State Park
Fort Yargo State Park: Group
Camp Area Richard B. Russell State Park Seminole State Park
Fort Yargo State Park: Day
Use Beach Tugaloo State Park
Little Ocmulgee State Lodge
Park
Hard Labor Creek State Park:
Camp Rutledge Beach Vogel State Park
Unicoi State Park Day Use
Beach
Hard Labor Cr. State Park:
Camp Daniel Morgan Beach
A.H. Stephens State Park
Group Camp Beach Hart State Park Beach #2
Hard Labor Creek State Park:
Day Use Camp Beach
Indian Springs State Park
Group Camp Beach High Falls State Park
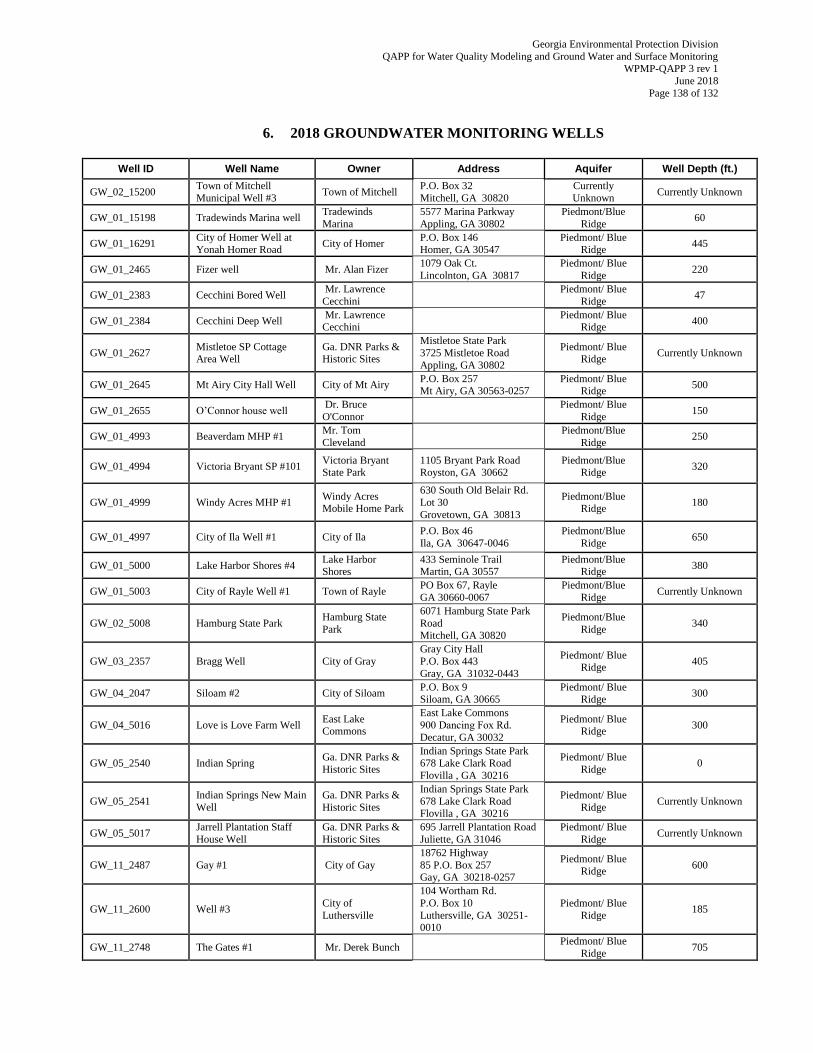
Georgia Environmental Protection Division
QAPP for Water Quality Modeling and Ground Water and Surface Monitoring WPMP-QAPP 3 rev 1
June 2018
Page 138 of 132
6. 2018 GROUNDWATER MONITORING WELLS
Well ID Well Name Owner Address Aquifer Well Depth (ft.)
GW_02_15200 Town of Mitchell
Municipal Well #3 Town of Mitchell
P.O. Box 32
Mitchell, GA 30820
Currently
Unknown Currently Unknown
GW_01_15198 Tradewinds Marina well Tradewinds
Marina
5577 Marina Parkway
Appling, GA 30802
Piedmont/Blue
Ridge 60
GW_01_16291 City of Homer Well at Yonah Homer Road
City of Homer P.O. Box 146 Homer, GA 30547
Piedmont/ Blue Ridge
445
GW_01_2465 Fizer well Mr. Alan Fizer 1079 Oak Ct.
Lincolnton, GA 30817
Piedmont/ Blue
Ridge 220
GW_01_2383 Cecchini Bored Well Mr. Lawrence
Cecchini
Piedmont/ Blue
Ridge 47
GW_01_2384 Cecchini Deep Well Mr. Lawrence
Cecchini
Piedmont/ Blue
Ridge 400
GW_01_2627 Mistletoe SP Cottage Area Well
Ga. DNR Parks & Historic Sites
Mistletoe State Park
3725 Mistletoe Road
Appling, GA 30802
Piedmont/ Blue Ridge
Currently Unknown
GW_01_2645 Mt Airy City Hall Well City of Mt Airy P.O. Box 257 Mt Airy, GA 30563-0257
Piedmont/ Blue Ridge
500
GW_01_2655 O’Connor house well Dr. Bruce
O'Connor
Piedmont/ Blue
Ridge 150
GW_01_4993 Beaverdam MHP #1 Mr. Tom
Cleveland
Piedmont/Blue
Ridge 250
GW_01_4994 Victoria Bryant SP #101 Victoria Bryant State Park
1105 Bryant Park Road Royston, GA 30662
Piedmont/Blue Ridge
320
GW_01_4999 Windy Acres MHP #1 Windy Acres Mobile Home Park
630 South Old Belair Rd.
Lot 30
Grovetown, GA 30813
Piedmont/Blue Ridge
180
GW_01_4997 City of Ila Well #1 City of Ila P.O. Box 46
Ila, GA 30647-0046
Piedmont/Blue
Ridge 650
GW_01_5000 Lake Harbor Shores #4 Lake Harbor Shores
433 Seminole Trail Martin, GA 30557
Piedmont/Blue Ridge
380
GW_01_5003 City of Rayle Well #1 Town of Rayle PO Box 67, Rayle
GA 30660-0067
Piedmont/Blue
Ridge Currently Unknown
GW_02_5008 Hamburg State Park Hamburg State
Park
6071 Hamburg State Park
Road Mitchell, GA 30820
Piedmont/Blue
Ridge 340
GW_03_2357 Bragg Well City of Gray
Gray City Hall
P.O. Box 443
Gray, GA 31032-0443
Piedmont/ Blue Ridge
405
GW_04_2047 Siloam #2 City of Siloam P.O. Box 9 Siloam, GA 30665
Piedmont/ Blue Ridge
300
GW_04_5016 Love is Love Farm Well East Lake Commons
East Lake Commons
900 Dancing Fox Rd .
Decatur, GA 30032
Piedmont/ Blue Ridge
300
GW_05_2540 Indian Spring Ga. DNR Parks &
Historic Sites
Indian Springs State Park
678 Lake Clark Road
Flovilla , GA 30216
Piedmont/ Blue
Ridge 0
GW_05_2541 Indian Springs New Main
Well
Ga. DNR Parks &
Historic Sites
Indian Springs State Park
678 Lake Clark Road Flovilla , GA 30216
Piedmont/ Blue
Ridge Currently Unknown
GW_05_5017 Jarrell Plantation Staff
House Well
Ga. DNR Parks &
Historic Sites
695 Jarrell Plantation Road
Juliette, GA 31046
Piedmont/ Blue
Ridge Currently Unknown
GW_11_2487 Gay #1 City of Gay
18762 Highway
85 P.O. Box 257 Gay, GA 30218-0257
Piedmont/ Blue
Ridge 600
GW_11_2600 Well #3 City of
Luthersville
104 Wortham Rd.
P.O. Box 10
Luthersville, GA 30251-0010
Piedmont/ Blue
Ridge 185
GW_11_2748 The Gates #1 Mr. Derek Bunch Piedmont/ Blue
Ridge 705
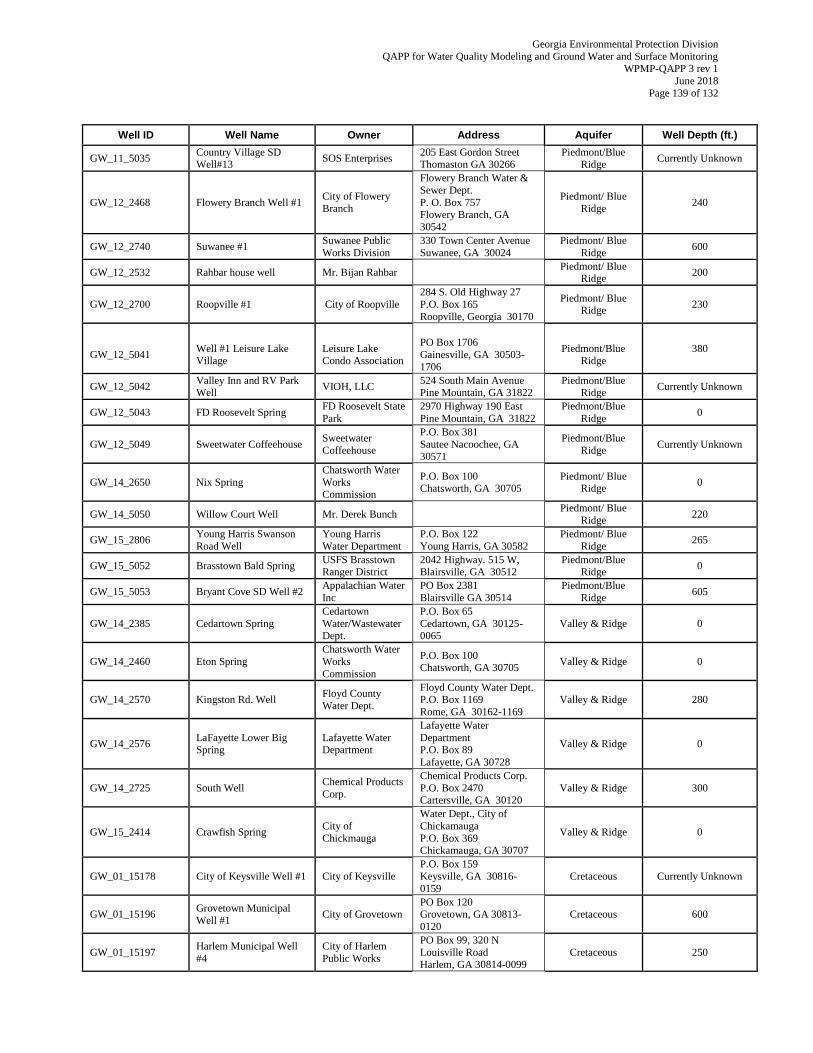
Georgia Environmental Protection Division
QAPP for Water Quality Modeling and Ground Water and Surface Monitoring WPMP-QAPP 3 rev 1
June 2018
Page 139 of 132
Well ID Well Name Owner Address Aquifer Well Depth (ft.)
GW_11_5035 Country Village SD Well#13
SOS Enterprises 205 East Gordon Street Thomaston GA 30266
Piedmont/Blue Ridge
Currently Unknown
GW_12_2468 Flowery Branch Well #1 City of Flowery
Branch
Flowery Branch Water &
Sewer Dept.
P. O. Box 757 Flowery Branch, GA
30542
Piedmont/ Blue
Ridge 240
GW_12_2740 Suwanee #1 Suwanee Public
Works Division
330 Town Center Avenue
Suwanee, GA 30024
Piedmont/ Blue
Ridge 600
GW_12_2532 Rahbar house well Mr. Bijan Rahbar Piedmont/ Blue
Ridge 200
GW_12_2700 Roopville #1 City of Roopville
284 S. Old Highway 27
P.O. Box 165
Roopville, Georgia 30170
Piedmont/ Blue Ridge
230
GW_12_5041
Well #1 Leisure Lake Village
Leisure Lake Condo Association
PO Box 1706
Gainesville, GA 30503-
1706
Piedmont/Blue Ridge
380
GW_12_5042 Valley Inn and RV Park Well
VIOH, LLC 524 South Main Avenue Pine Mountain, GA 31822
Piedmont/Blue Ridge
Currently Unknown
GW_12_5043 FD Roosevelt Spring FD Roosevelt State
Park
2970 Highway 190 East
Pine Mountain, GA 31822
Piedmont/Blue
Ridge 0
GW_12_5049 Sweetwater Coffeehouse Sweetwater
Coffeehouse
P.O. Box 381
Sautee Nacoochee, GA 30571
Piedmont/Blue
Ridge Currently Unknown
GW_14_2650 Nix Spring
Chatsworth Water
Works Commission
P.O. Box 100 Chatsworth, GA 30705
Piedmont/ Blue Ridge
0
GW_14_5050 Willow Court Well Mr. Derek Bunch Piedmont/ Blue
Ridge 220
GW_15_2806 Young Harris Swanson
Road Well
Young Harris
Water Department
P.O. Box 122
Young Harris, GA 30582
Piedmont/ Blue
Ridge 265
GW_15_5052 Brasstown Bald Spring USFS Brasstown Ranger District
2042 Highway. 515 W, Blairsville, GA 30512
Piedmont/Blue Ridge
0
GW_15_5053 Bryant Cove SD Well #2 Appalachian Water
Inc
PO Box 2381
Blairsville GA 30514
Piedmont/Blue
Ridge 605
GW_14_2385 Cedartown Spring
Cedartown
Water/Wastewater Dept.
P.O. Box 65
Cedartown, GA 30125-0065
Valley & Ridge 0
GW_14_2460 Eton Spring
Chatsworth Water
Works
Commission
P.O. Box 100 Chatsworth, GA 30705
Valley & Ridge 0
GW_14_2570 Kingston Rd. Well Floyd County
Water Dept.
Floyd County Water Dept. P.O. Box 1169
Rome, GA 30162-1169
Valley & Ridge 280
GW_14_2576 LaFayette Lower Big Spring
Lafayette Water Department
Lafayette Water
Department P.O. Box 89
Lafayette, GA 30728
Valley & Ridge 0
GW_14_2725 South Well Chemical Products
Corp.
Chemical Products Corp.
P.O. Box 2470 Cartersville, GA 30120
Valley & Ridge 300
GW_15_2414 Crawfish Spring City of
Chickmauga
Water Dept., City of
Chickamauga
P.O. Box 369 Chickamauga, GA 30707
Valley & Ridge 0
GW_01_15178 City of Keysville Well #1 City of Keysville
P.O. Box 159
Keysville, GA 30816-
0159
Cretaceous Currently Unknown
GW_01_15196 Grovetown Municipal
Well #1 City of Grovetown
PO Box 120 Grovetown, GA 30813-
0120
Cretaceous 600
GW_01_15197 Harlem Municipal Well
#4
City of Harlem
Public Works
PO Box 99, 320 N
Louisville Road Harlem, GA 30814-0099
Cretaceous 250
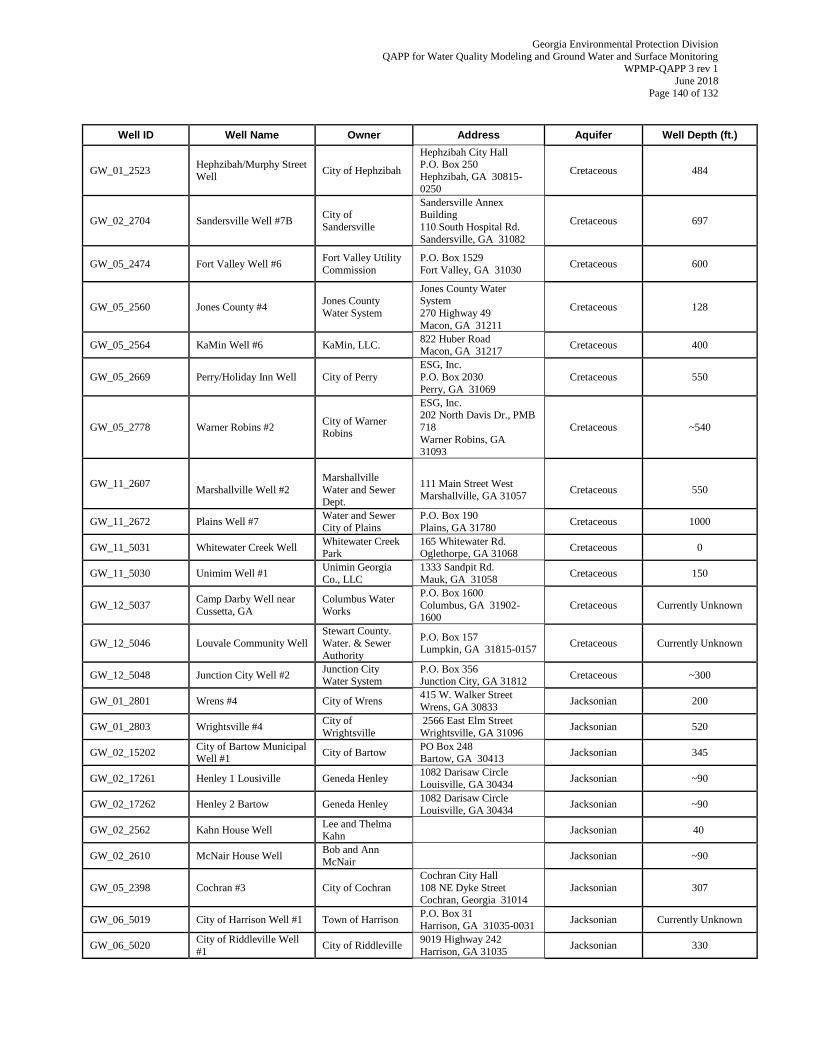
Georgia Environmental Protection Division
QAPP for Water Quality Modeling and Ground Water and Surface Monitoring WPMP-QAPP 3 rev 1
June 2018
Page 140 of 132
Well ID Well Name Owner Address Aquifer Well Depth (ft.)
GW_01_2523 Hephzibah/Murphy Street
Well City of Hephzibah
Hephzibah City Hall P.O. Box 250
Hephzibah, GA 30815-
0250
Cretaceous 484
GW_02_2704 Sandersville Well #7B City of
Sandersville
Sandersville Annex Building
110 South Hospital Rd.
Sandersville, GA 31082
Cretaceous 697
GW_05_2474 Fort Valley Well #6 Fort Valley Utility
Commission
P.O. Box 1529
Fort Valley, GA 31030 Cretaceous 600
GW_05_2560 Jones County #4 Jones County
Water System
Jones County Water System
270 Highway 49
Macon, GA 31211
Cretaceous 128
GW_05_2564 KaMin Well #6 KaMin, LLC. 822 Huber Road Macon, GA 31217
Cretaceous 400
GW_05_2669 Perry/Holiday Inn Well City of Perry
ESG, Inc.
P.O. Box 2030
Perry, GA 31069
Cretaceous 550
GW_05_2778 Warner Robins #2 City of Warner Robins
ESG, Inc. 202 North Davis Dr., PMB
718
Warner Robins, GA 31093
Cretaceous ~540
GW_11_2607
Marshallville Well #2
Marshallville
Water and Sewer Dept.
111 Main Street West
Marshallville, GA 31057
Cretaceous
550
GW_11_2672 Plains Well #7 Water and Sewer
City of Plains
P.O. Box 190
Plains, GA 31780 Cretaceous 1000
GW_11_5031 Whitewater Creek Well Whitewater Creek Park
165 Whitewater Rd. Oglethorpe, GA 31068
Cretaceous 0
GW_11_5030 Unimim Well #1 Unimin Georgia
Co., LLC
1333 Sandpit Rd.
Mauk, GA 31058 Cretaceous 150
GW_12_5037 Camp Darby Well near
Cussetta, GA
Columbus Water
Works
P.O. Box 1600
Columbus, GA 31902-1600
Cretaceous Currently Unknown
GW_12_5046 Louvale Community Well
Stewart County.
Water. & Sewer
Authority
P.O. Box 157 Lumpkin, GA 31815-0157
Cretaceous Currently Unknown
GW_12_5048 Junction City Well #2 Junction City Water System
P.O. Box 356 Junction City, GA 31812
Cretaceous ~300
GW_01_2801 Wrens #4 City of Wrens 415 W. Walker Street
Wrens, GA 30833 Jacksonian 200
GW_01_2803 Wrightsville #4 City of
Wrightsville
2566 East Elm Street
Wrightsville, GA 31096 Jacksonian 520
GW_02_15202 City of Bartow Municipal
Well #1 City of Bartow
PO Box 248
Bartow, GA 30413 Jacksonian 345
GW_02_17261 Henley 1 Lousiville Geneda Henley 1082 Darisaw Circle
Louisville, GA 30434 Jacksonian ~90
GW_02_17262 Henley 2 Bartow Geneda Henley 1082 Darisaw Circle
Louisville, GA 30434 Jacksonian ~90
GW_02_2562 Kahn House Well Lee and Thelma Kahn
Jacksonian 40
GW_02_2610 McNair House Well Bob and Ann
McNair Jacksonian ~90
GW_05_2398 Cochran #3 City of Cochran
Cochran City Hall
108 NE Dyke Street Cochran, Georgia 31014
Jacksonian 307
GW_06_5019 City of Harrison Well #1 Town of Harrison P.O. Box 31
Harrison, GA 31035-0031 Jacksonian Currently Unknown
GW_06_5020 City of Riddleville Well
#1 City of Riddleville
9019 Highway 242
Harrison, GA 31035 Jacksonian 330
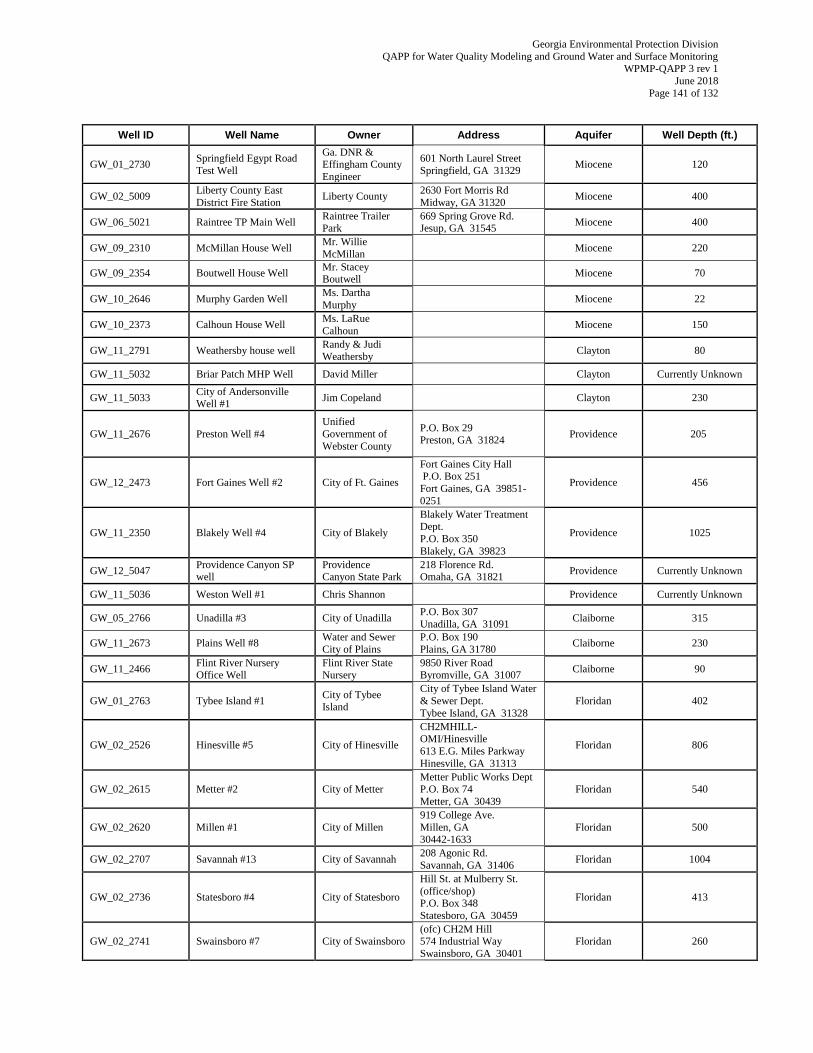
Georgia Environmental Protection Division
QAPP for Water Quality Modeling and Ground Water and Surface Monitoring WPMP-QAPP 3 rev 1
June 2018
Page 141 of 132
Well ID Well Name Owner Address Aquifer Well Depth (ft.)
GW_01_2730 Springfield Egypt Road
Test Well
Ga. DNR & Effingham County
Engineer
601 North Laurel Street
Springfield, GA 31329 Miocene 120
GW_02_5009 Liberty County East
District Fire Station Liberty County
2630 Fort Morris Rd
Midway, GA 31320 Miocene 400
GW_06_5021 Raintree TP Main Well Raintree Trailer Park
669 Spring Grove Rd. Jesup, GA 31545
Miocene 400
GW_09_2310 McMillan House Well Mr. Willie
McMillan Miocene 220
GW_09_2354 Boutwell House Well Mr. Stacey Boutwell
Miocene 70
GW_10_2646 Murphy Garden Well Ms. Dartha
Murphy Miocene 22
GW_10_2373 Calhoun House Well Ms. LaRue
Calhoun Miocene 150
GW_11_2791 Weathersby house well Randy & Judi Weathersby
Clayton 80
GW_11_5032 Briar Patch MHP Well David Miller Clayton Currently Unknown
GW_11_5033 City of Andersonville Well #1
Jim Copeland Clayton 230
GW_11_2676 Preston Well #4
Unified
Government of
Webster County
P.O. Box 29 Preston, GA 31824
Providence 205
GW_12_2473 Fort Gaines Well #2 City of Ft. Gaines
Fort Gaines City Hall P.O. Box 251
Fort Gaines, GA 39851-
0251
Providence 456
GW_11_2350 Blakely Well #4 City of Blakely
Blakely Water Treatment Dept.
P.O. Box 350
Blakely, GA 39823
Providence 1025
GW_12_5047 Providence Canyon SP well
Providence Canyon State Park
218 Florence Rd. Omaha, GA 31821
Providence Currently Unknown
GW_11_5036 Weston Well #1 Chris Shannon Providence Currently Unknown
GW_05_2766 Unadilla #3 City of Unadilla P.O. Box 307
Unadilla, GA 31091 Claiborne 315
GW_11_2673 Plains Well #8 Water and Sewer
City of Plains
P.O. Box 190
Plains, GA 31780 Claiborne 230
GW_11_2466 Flint River Nursery Office Well
Flint River State Nursery
9850 River Road Byromville, GA 31007
Claiborne 90
GW_01_2763 Tybee Island #1 City of Tybee Island
City of Tybee Island Water
& Sewer Dept.
Tybee Island, GA 31328
Floridan 402
GW_02_2526 Hinesville #5 City of Hinesville
CH2MHILL-OMI/Hinesville
613 E.G. Miles Parkway
Hinesville, GA 31313
Floridan 806
GW_02_2615 Metter #2 City of Metter Metter Public Works Dept P.O. Box 74
Metter, GA 30439
Floridan 540
GW_02_2620 Millen #1 City of Millen
919 College Ave.
Millen, GA 30442-1633
Floridan 500
GW_02_2707 Savannah #13 City of Savannah 208 Agonic Rd.
Savannah, GA 31406 Floridan 1004
GW_02_2736 Statesboro #4 City of Statesboro
Hill St. at Mulberry St.
(office/shop) P.O. Box 348
Statesboro, GA 30459
Floridan 413
GW_02_2741 Swainsboro #7 City of Swainsboro (ofc) CH2M Hill 574 Industrial Way
Swainsboro, GA 30401
Floridan 260
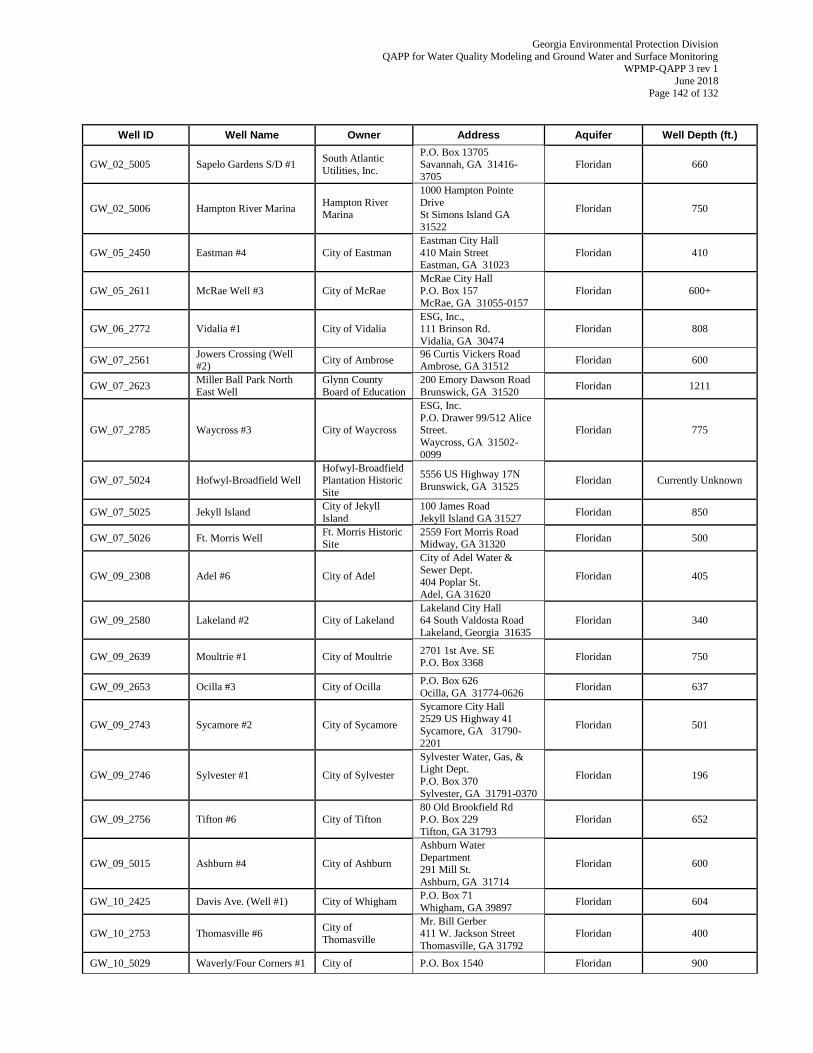
Georgia Environmental Protection Division
QAPP for Water Quality Modeling and Ground Water and Surface Monitoring WPMP-QAPP 3 rev 1
June 2018
Page 142 of 132
Well ID Well Name Owner Address Aquifer Well Depth (ft.)
GW_02_5005 Sapelo Gardens S/D #1 South Atlantic
Utilities, Inc.
P.O. Box 13705 Savannah, GA 31416-
3705
Floridan 660
GW_02_5006 Hampton River Marina Hampton River Marina
1000 Hampton Pointe
Drive St Simons Island GA
31522
Floridan 750
GW_05_2450 Eastman #4 City of Eastman
Eastman City Hall
410 Main Street Eastman, GA 31023
Floridan 410
GW_05_2611 McRae Well #3 City of McRae
McRae City Hall
P.O. Box 157
McRae, GA 31055-0157
Floridan 600+
GW_06_2772 Vidalia #1 City of Vidalia
ESG, Inc.,
111 Brinson Rd.
Vidalia, GA 30474
Floridan 808
GW_07_2561 Jowers Crossing (Well #2)
City of Ambrose 96 Curtis Vickers Road Ambrose, GA 31512
Floridan 600
GW_07_2623 Miller Ball Park North
East Well
Glynn County
Board of Education
200 Emory Dawson Road
Brunswick, GA 31520 Floridan 1211
GW_07_2785 Waycross #3 City of Waycross
ESG, Inc.
P.O. Drawer 99/512 Alice Street.
Waycross, GA 31502-
0099
Floridan 775
GW_07_5024 Hofwyl-Broadfield Well Hofwyl-Broadfield Plantation Historic
Site
5556 US Highway 17N
Brunswick, GA 31525 Floridan Currently Unknown
GW_07_5025 Jekyll Island City of Jekyll
Island
100 James Road
Jekyll Island GA 31527 Floridan 850
GW_07_5026 Ft. Morris Well Ft. Morris Historic
Site
2559 Fort Morris Road
Midway, GA 31320 Floridan 500
GW_09_2308 Adel #6 City of Adel
City of Adel Water &
Sewer Dept.
404 Poplar St. Adel, GA 31620
Floridan 405
GW_09_2580 Lakeland #2 City of Lakeland
Lakeland City Hall
64 South Valdosta Road
Lakeland, Georgia 31635
Floridan 340
GW_09_2639 Moultrie #1 City of Moultrie 2701 1st Ave. SE P.O. Box 3368
Floridan 750
GW_09_2653 Ocilla #3 City of Ocilla P.O. Box 626
Ocilla, GA 31774-0626 Floridan 637
GW_09_2743 Sycamore #2 City of Sycamore
Sycamore City Hall 2529 US Highway 41
Sycamore, GA 31790-
2201
Floridan 501
GW_09_2746 Sylvester #1 City of Sylvester
Sylvester Water, Gas, &
Light Dept.
P.O. Box 370
Sylvester, GA 31791-0370
Floridan 196
GW_09_2756 Tifton #6 City of Tifton 80 Old Brookfield Rd P.O. Box 229
Tifton, GA 31793
Floridan 652
GW_09_5015 Ashburn #4 City of Ashburn
Ashburn Water
Department 291 Mill St.
Ashburn, GA 31714
Floridan 600
GW_10_2425 Davis Ave. (Well #1) City of Whigham P.O. Box 71
Whigham, GA 39897 Floridan 604
GW_10_2753 Thomasville #6 City of
Thomasville
Mr. Bill Gerber 411 W. Jackson Street
Thomasville, GA 31792
Floridan 400
GW_10_5029 Waverly/Four Corners #1 City of P.O. Box 1540 Floridan 900
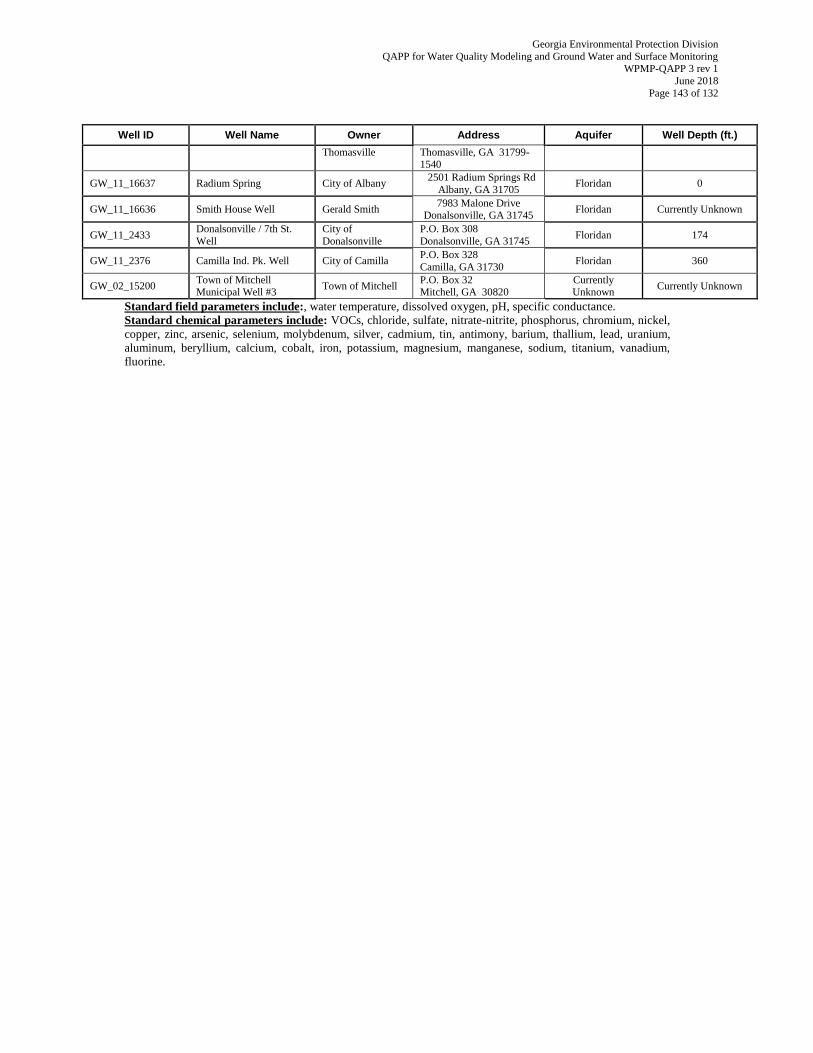
Georgia Environmental Protection Division
QAPP for Water Quality Modeling and Ground Water and Surface Monitoring WPMP-QAPP 3 rev 1
June 2018
Page 143 of 132
Well ID Well Name Owner Address Aquifer Well Depth (ft.)
Thomasville Thomasville, GA 31799-1540
GW_11_16637 Radium Spring City of Albany 2501 Radium Springs Rd
Albany, GA 31705 Floridan 0
GW_11_16636 Smith House Well Gerald Smith 7983 Malone Drive
Donalsonville, GA 31745 Floridan Currently Unknown
GW_11_2433 Donalsonville / 7th St.
Well
City of
Donalsonville
P.O. Box 308
Donalsonville, GA 31745 Floridan 174
GW_11_2376 Camilla Ind. Pk. Well City of Camilla P.O. Box 328
Camilla, GA 31730 Floridan 360
GW_02_15200 Town of Mitchell Municipal Well #3
Town of Mitchell P.O. Box 32 Mitchell, GA 30820
Currently Unknown
Currently Unknown
Standard field parameters include:, water temperature, dissolved oxygen, pH, specific conductance.
Standard chemical parameters include: VOCs, chloride, sulfate, nitrate-nitrite, phosphorus, chromium, nickel,
copper, zinc, arsenic, selenium, molybdenum, silver, cadmium, tin, antimony, barium, thallium, lead, uranium,
aluminum, beryllium, calcium, cobalt, iron, potassium, magnesium, manganese, sodium, titanium, vanadium,
fluorine.
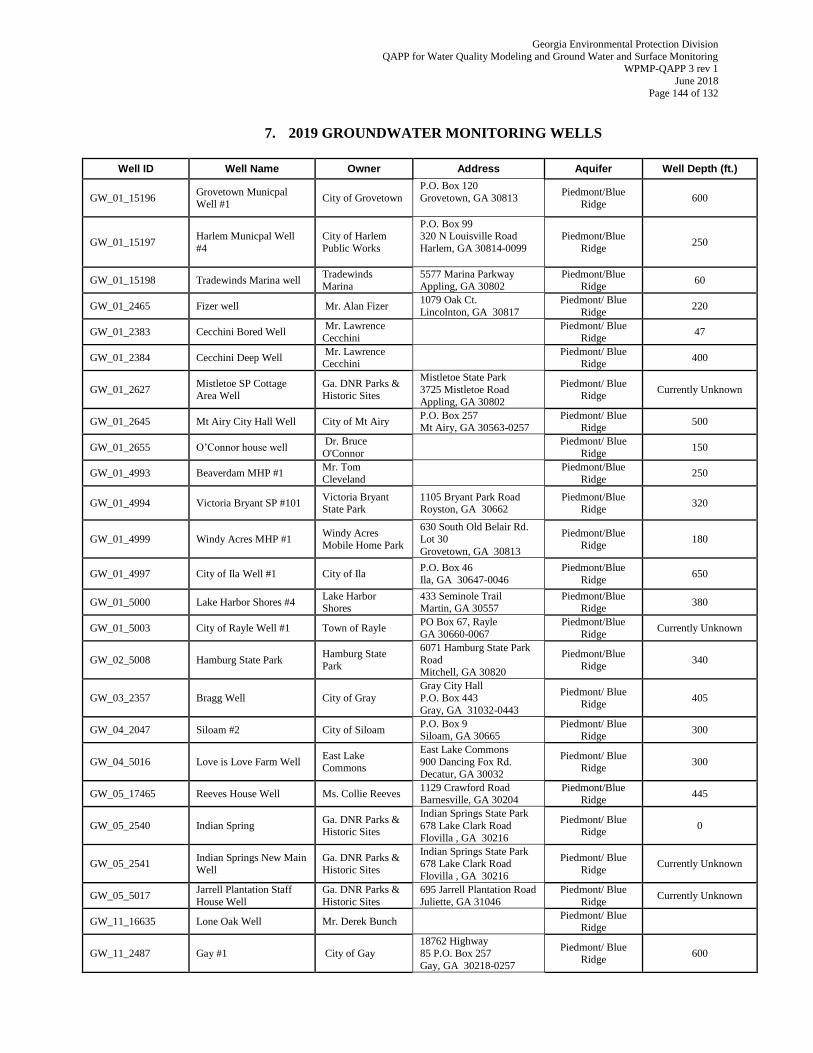
Georgia Environmental Protection Division
QAPP for Water Quality Modeling and Ground Water and Surface Monitoring WPMP-QAPP 3 rev 1
June 2018
Page 144 of 132
7. 2019 GROUNDWATER MONITORING WELLS
Well ID Well Name Owner Address Aquifer Well Depth (ft.)
GW_01_15196 Grovetown Municpal Well #1
City of Grovetown
P.O. Box 120
Grovetown, GA 30813
Piedmont/Blue Ridge
600
GW_01_15197 Harlem Municpal Well
#4
City of Harlem
Public Works
P.O. Box 99 320 N Louisville Road
Harlem, GA 30814-0099
Piedmont/Blue
Ridge 250
GW_01_15198 Tradewinds Marina well Tradewinds Marina
5577 Marina Parkway Appling, GA 30802
Piedmont/Blue Ridge
60
GW_01_2465 Fizer well Mr. Alan Fizer 1079 Oak Ct.
Lincolnton, GA 30817
Piedmont/ Blue
Ridge 220
GW_01_2383 Cecchini Bored Well Mr. Lawrence
Cecchini
Piedmont/ Blue
Ridge 47
GW_01_2384 Cecchini Deep Well Mr. Lawrence Cecchini
Piedmont/ Blue
Ridge 400
GW_01_2627 Mistletoe SP Cottage Area Well
Ga. DNR Parks & Historic Sites
Mistletoe State Park
3725 Mistletoe Road
Appling, GA 30802
Piedmont/ Blue Ridge
Currently Unknown
GW_01_2645 Mt Airy City Hall Well City of Mt Airy P.O. Box 257 Mt Airy, GA 30563-0257
Piedmont/ Blue Ridge
500
GW_01_2655 O’Connor house well Dr. Bruce
O'Connor
Piedmont/ Blue
Ridge 150
GW_01_4993 Beaverdam MHP #1 Mr. Tom
Cleveland
Piedmont/Blue
Ridge 250
GW_01_4994 Victoria Bryant SP #101 Victoria Bryant State Park
1105 Bryant Park Road Royston, GA 30662
Piedmont/Blue Ridge
320
GW_01_4999 Windy Acres MHP #1 Windy Acres
Mobile Home Park
630 South Old Belair Rd.
Lot 30
Grovetown, GA 30813
Piedmont/Blue
Ridge 180
GW_01_4997 City of Ila Well #1 City of Ila P.O. Box 46
Ila, GA 30647-0046
Piedmont/Blue
Ridge 650
GW_01_5000 Lake Harbor Shores #4 Lake Harbor Shores
433 Seminole Trail Martin, GA 30557
Piedmont/Blue Ridge
380
GW_01_5003 City of Rayle Well #1 Town of Rayle PO Box 67, Rayle
GA 30660-0067
Piedmont/Blue
Ridge Currently Unknown
GW_02_5008 Hamburg State Park Hamburg State
Park
6071 Hamburg State Park
Road Mitchell, GA 30820
Piedmont/Blue
Ridge 340
GW_03_2357 Bragg Well City of Gray
Gray City Hall
P.O. Box 443
Gray, GA 31032-0443
Piedmont/ Blue Ridge
405
GW_04_2047 Siloam #2 City of Siloam P.O. Box 9 Siloam, GA 30665
Piedmont/ Blue Ridge
300
GW_04_5016 Love is Love Farm Well East Lake
Commons
East Lake Commons
900 Dancing Fox Rd .
Decatur, GA 30032
Piedmont/ Blue
Ridge 300
GW_05_17465 Reeves House Well Ms. Collie Reeves 1129 Crawford Road Barnesville, GA 30204
Piedmont/Blue Ridge
445
GW_05_2540 Indian Spring Ga. DNR Parks & Historic Sites
Indian Springs State Park
678 Lake Clark Road
Flovilla , GA 30216
Piedmont/ Blue Ridge
0
GW_05_2541 Indian Springs New Main
Well
Ga. DNR Parks &
Historic Sites
Indian Springs State Park 678 Lake Clark Road
Flovilla , GA 30216
Piedmont/ Blue
Ridge Currently Unknown
GW_05_5017 Jarrell Plantation Staff
House Well
Ga. DNR Parks &
Historic Sites
695 Jarrell Plantation Road
Juliette, GA 31046
Piedmont/ Blue
Ridge Currently Unknown
GW_11_16635 Lone Oak Well Mr. Derek Bunch Piedmont/ Blue
Ridge
GW_11_2487 Gay #1 City of Gay
18762 Highway
85 P.O. Box 257
Gay, GA 30218-0257
Piedmont/ Blue Ridge
600
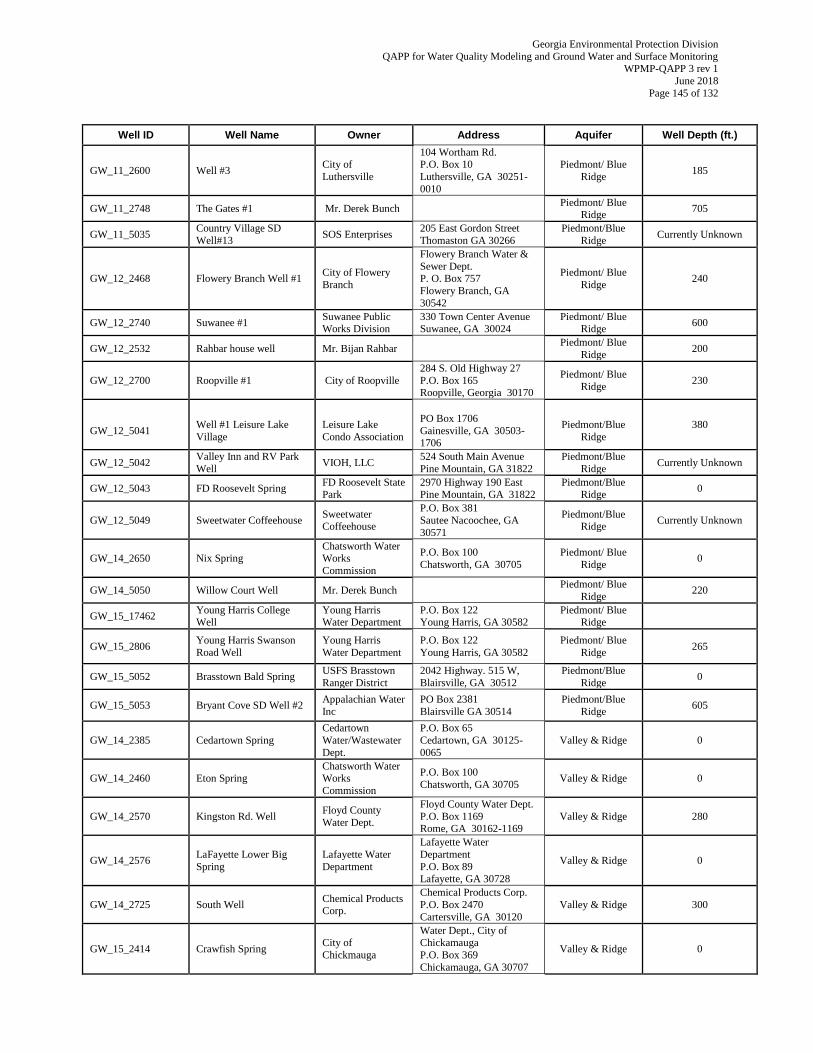
Georgia Environmental Protection Division
QAPP for Water Quality Modeling and Ground Water and Surface Monitoring WPMP-QAPP 3 rev 1
June 2018
Page 145 of 132
Well ID Well Name Owner Address Aquifer Well Depth (ft.)
GW_11_2600 Well #3 City of
Luthersville
104 Wortham Rd. P.O. Box 10
Luthersville, GA 30251-
0010
Piedmont/ Blue
Ridge 185
GW_11_2748 The Gates #1 Mr. Derek Bunch Piedmont/ Blue
Ridge 705
GW_11_5035 Country Village SD
Well#13 SOS Enterprises
205 East Gordon Street
Thomaston GA 30266
Piedmont/Blue
Ridge Currently Unknown
GW_12_2468 Flowery Branch Well #1 City of Flowery
Branch
Flowery Branch Water &
Sewer Dept. P. O. Box 757
Flowery Branch, GA
30542
Piedmont/ Blue
Ridge 240
GW_12_2740 Suwanee #1 Suwanee Public
Works Division
330 Town Center Avenue
Suwanee, GA 30024
Piedmont/ Blue
Ridge 600
GW_12_2532 Rahbar house well Mr. Bijan Rahbar Piedmont/ Blue
Ridge 200
GW_12_2700 Roopville #1 City of Roopville
284 S. Old Highway 27
P.O. Box 165 Roopville, Georgia 30170
Piedmont/ Blue
Ridge 230
GW_12_5041
Well #1 Leisure Lake
Village
Leisure Lake
Condo Association
PO Box 1706
Gainesville, GA 30503-1706
Piedmont/Blue
Ridge
380
GW_12_5042 Valley Inn and RV Park
Well VIOH, LLC
524 South Main Avenue
Pine Mountain, GA 31822
Piedmont/Blue
Ridge Currently Unknown
GW_12_5043 FD Roosevelt Spring FD Roosevelt State Park
2970 Highway 190 East Pine Mountain, GA 31822
Piedmont/Blue Ridge
0
GW_12_5049 Sweetwater Coffeehouse Sweetwater Coffeehouse
P.O. Box 381
Sautee Nacoochee, GA
30571
Piedmont/Blue Ridge
Currently Unknown
GW_14_2650 Nix Spring Chatsworth Water Works
Commission
P.O. Box 100
Chatsworth, GA 30705
Piedmont/ Blue
Ridge 0
GW_14_5050 Willow Court Well Mr. Derek Bunch Piedmont/ Blue
Ridge 220
GW_15_17462 Young Harris College Well
Young Harris Water Department
P.O. Box 122 Young Harris, GA 30582
Piedmont/ Blue Ridge
GW_15_2806 Young Harris Swanson
Road Well
Young Harris
Water Department
P.O. Box 122
Young Harris, GA 30582
Piedmont/ Blue
Ridge 265
GW_15_5052 Brasstown Bald Spring USFS Brasstown
Ranger District
2042 Highway. 515 W,
Blairsville, GA 30512
Piedmont/Blue
Ridge 0
GW_15_5053 Bryant Cove SD Well #2 Appalachian Water
Inc
PO Box 2381
Blairsville GA 30514
Piedmont/Blue
Ridge 605
GW_14_2385 Cedartown Spring
Cedartown
Water/Wastewater
Dept.
P.O. Box 65
Cedartown, GA 30125-
0065
Valley & Ridge 0
GW_14_2460 Eton Spring Chatsworth Water Works
Commission
P.O. Box 100
Chatsworth, GA 30705 Valley & Ridge 0
GW_14_2570 Kingston Rd. Well Floyd County
Water Dept.
Floyd County Water Dept.
P.O. Box 1169 Rome, GA 30162-1169
Valley & Ridge 280
GW_14_2576 LaFayette Lower Big
Spring
Lafayette Water
Department
Lafayette Water
Department
P.O. Box 89 Lafayette, GA 30728
Valley & Ridge 0
GW_14_2725 South Well Chemical Products Corp.
Chemical Products Corp.
P.O. Box 2470
Cartersville, GA 30120
Valley & Ridge 300
GW_15_2414 Crawfish Spring City of
Chickmauga
Water Dept., City of Chickamauga
P.O. Box 369
Chickamauga, GA 30707
Valley & Ridge 0
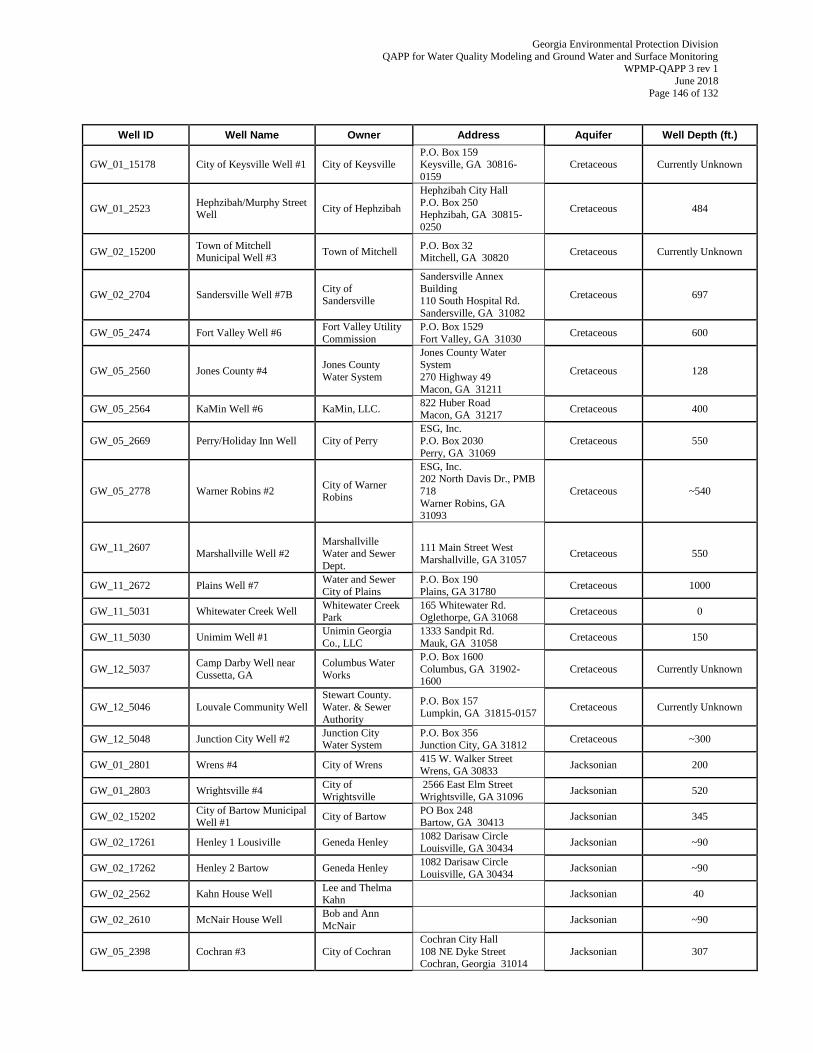
Georgia Environmental Protection Division
QAPP for Water Quality Modeling and Ground Water and Surface Monitoring WPMP-QAPP 3 rev 1
June 2018
Page 146 of 132
Well ID Well Name Owner Address Aquifer Well Depth (ft.)
GW_01_15178 City of Keysville Well #1 City of Keysville P.O. Box 159 Keysville, GA 30816-
0159
Cretaceous Currently Unknown
GW_01_2523 Hephzibah/Murphy Street Well
City of Hephzibah
Hephzibah City Hall
P.O. Box 250 Hephzibah, GA 30815-
0250
Cretaceous 484
GW_02_15200 Town of Mitchell Municipal Well #3
Town of Mitchell P.O. Box 32 Mitchell, GA 30820
Cretaceous Currently Unknown
GW_02_2704 Sandersville Well #7B City of Sandersville
Sandersville Annex
Building 110 South Hospital Rd.
Sandersville, GA 31082
Cretaceous 697
GW_05_2474 Fort Valley Well #6 Fort Valley Utility
Commission
P.O. Box 1529
Fort Valley, GA 31030 Cretaceous 600
GW_05_2560 Jones County #4 Jones County
Water System
Jones County Water System
270 Highway 49
Macon, GA 31211
Cretaceous 128
GW_05_2564 KaMin Well #6 KaMin, LLC. 822 Huber Road Macon, GA 31217
Cretaceous 400
GW_05_2669 Perry/Holiday Inn Well City of Perry
ESG, Inc.
P.O. Box 2030
Perry, GA 31069
Cretaceous 550
GW_05_2778 Warner Robins #2 City of Warner Robins
ESG, Inc. 202 North Davis Dr., PMB
718
Warner Robins, GA 31093
Cretaceous ~540
GW_11_2607 Marshallville Well #2
Marshallville Water and Sewer
Dept.
111 Main Street West
Marshallville, GA 31057
Cretaceous
550
GW_11_2672 Plains Well #7 Water and Sewer
City of Plains
P.O. Box 190
Plains, GA 31780 Cretaceous 1000
GW_11_5031 Whitewater Creek Well Whitewater Creek Park
165 Whitewater Rd. Oglethorpe, GA 31068
Cretaceous 0
GW_11_5030 Unimim Well #1 Unimin Georgia
Co., LLC
1333 Sandpit Rd.
Mauk, GA 31058 Cretaceous 150
GW_12_5037 Camp Darby Well near
Cussetta, GA
Columbus Water
Works
P.O. Box 1600
Columbus, GA 31902-1600
Cretaceous Currently Unknown
GW_12_5046 Louvale Community Well
Stewart County.
Water. & Sewer
Authority
P.O. Box 157 Lumpkin, GA 31815-0157
Cretaceous Currently Unknown
GW_12_5048 Junction City Well #2 Junction City Water System
P.O. Box 356 Junction City, GA 31812
Cretaceous ~300
GW_01_2801 Wrens #4 City of Wrens 415 W. Walker Street
Wrens, GA 30833 Jacksonian 200
GW_01_2803 Wrightsville #4 City of
Wrightsville
2566 East Elm Street
Wrightsville, GA 31096 Jacksonian 520
GW_02_15202 City of Bartow Municipal Well #1
City of Bartow PO Box 248 Bartow, GA 30413
Jacksonian 345
GW_02_17261 Henley 1 Lousiville Geneda Henley 1082 Darisaw Circle
Louisville, GA 30434 Jacksonian ~90
GW_02_17262 Henley 2 Bartow Geneda Henley 1082 Darisaw Circle
Louisville, GA 30434 Jacksonian ~90
GW_02_2562 Kahn House Well Lee and Thelma Kahn
Jacksonian 40
GW_02_2610 McNair House Well Bob and Ann
McNair Jacksonian ~90
GW_05_2398 Cochran #3 City of Cochran
Cochran City Hall
108 NE Dyke Street Cochran, Georgia 31014
Jacksonian 307
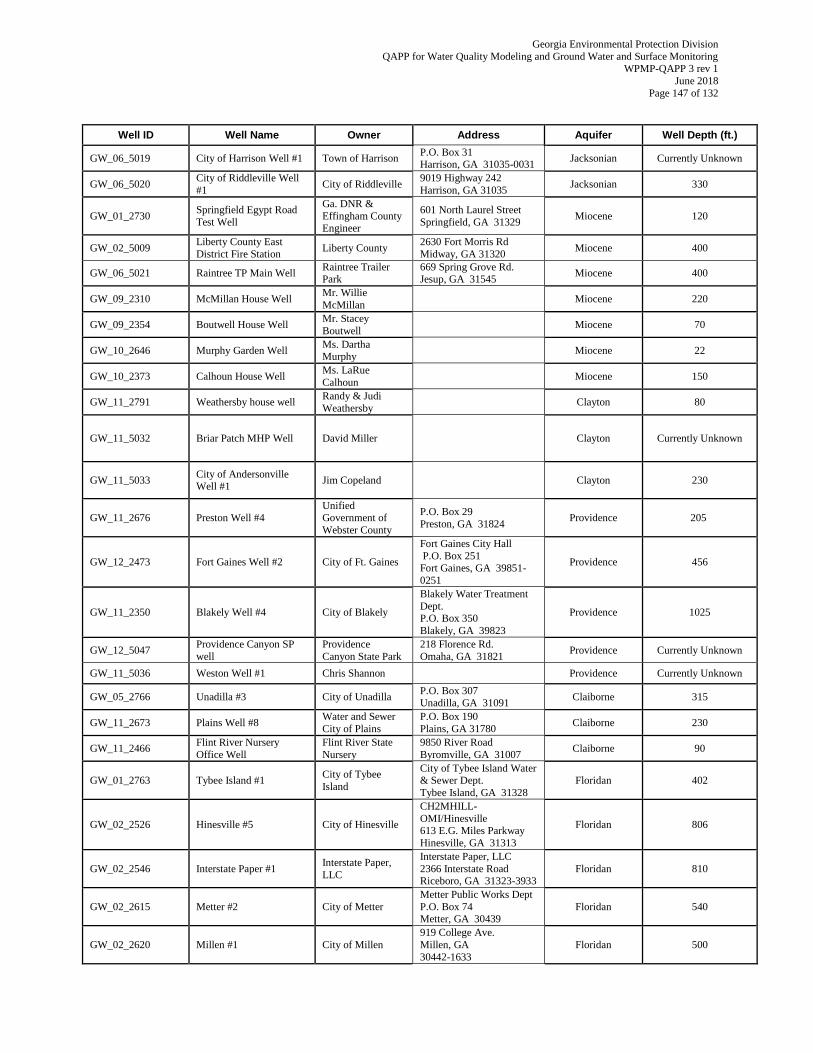
Georgia Environmental Protection Division
QAPP for Water Quality Modeling and Ground Water and Surface Monitoring WPMP-QAPP 3 rev 1
June 2018
Page 147 of 132
Well ID Well Name Owner Address Aquifer Well Depth (ft.)
GW_06_5019 City of Harrison Well #1 Town of Harrison P.O. Box 31 Harrison, GA 31035-0031
Jacksonian Currently Unknown
GW_06_5020 City of Riddleville Well
#1 City of Riddleville
9019 Highway 242
Harrison, GA 31035 Jacksonian 330
GW_01_2730 Springfield Egypt Road
Test Well
Ga. DNR &
Effingham County Engineer
601 North Laurel Street
Springfield, GA 31329 Miocene 120
GW_02_5009 Liberty County East
District Fire Station Liberty County
2630 Fort Morris Rd
Midway, GA 31320 Miocene 400
GW_06_5021 Raintree TP Main Well Raintree Trailer Park
669 Spring Grove Rd. Jesup, GA 31545
Miocene 400
GW_09_2310 McMillan House Well Mr. Willie
McMillan Miocene 220
GW_09_2354 Boutwell House Well Mr. Stacey
Boutwell Miocene 70
GW_10_2646 Murphy Garden Well Ms. Dartha Murphy
Miocene 22
GW_10_2373 Calhoun House Well Ms. LaRue
Calhoun Miocene 150
GW_11_2791 Weathersby house well Randy & Judi
Weathersby Clayton 80
GW_11_5032 Briar Patch MHP Well David Miller Clayton Currently Unknown
GW_11_5033 City of Andersonville Well #1
Jim Copeland Clayton 230
GW_11_2676 Preston Well #4 Unified Government of
Webster County
P.O. Box 29
Preston, GA 31824 Providence 205
GW_12_2473 Fort Gaines Well #2 City of Ft. Gaines
Fort Gaines City Hall
P.O. Box 251 Fort Gaines, GA 39851-
0251
Providence 456
GW_11_2350 Blakely Well #4 City of Blakely
Blakely Water Treatment
Dept. P.O. Box 350
Blakely, GA 39823
Providence 1025
GW_12_5047 Providence Canyon SP
well
Providence
Canyon State Park
218 Florence Rd.
Omaha, GA 31821 Providence Currently Unknown
GW_11_5036 Weston Well #1 Chris Shannon Providence Currently Unknown
GW_05_2766 Unadilla #3 City of Unadilla P.O. Box 307 Unadilla, GA 31091
Claiborne 315
GW_11_2673 Plains Well #8 Water and Sewer
City of Plains
P.O. Box 190
Plains, GA 31780 Claiborne 230
GW_11_2466 Flint River Nursery
Office Well
Flint River State
Nursery
9850 River Road
Byromville, GA 31007 Claiborne 90
GW_01_2763 Tybee Island #1 City of Tybee
Island
City of Tybee Island Water & Sewer Dept.
Tybee Island, GA 31328
Floridan 402
GW_02_2526 Hinesville #5 City of Hinesville
CH2MHILL-
OMI/Hinesville 613 E.G. Miles Parkway
Hinesville, GA 31313
Floridan 806
GW_02_2546 Interstate Paper #1 Interstate Paper,
LLC
Interstate Paper, LLC
2366 Interstate Road Riceboro, GA 31323-3933
Floridan 810
GW_02_2615 Metter #2 City of Metter
Metter Public Works Dept
P.O. Box 74 Metter, GA 30439
Floridan 540
GW_02_2620 Millen #1 City of Millen
919 College Ave.
Millen, GA
30442-1633
Floridan 500
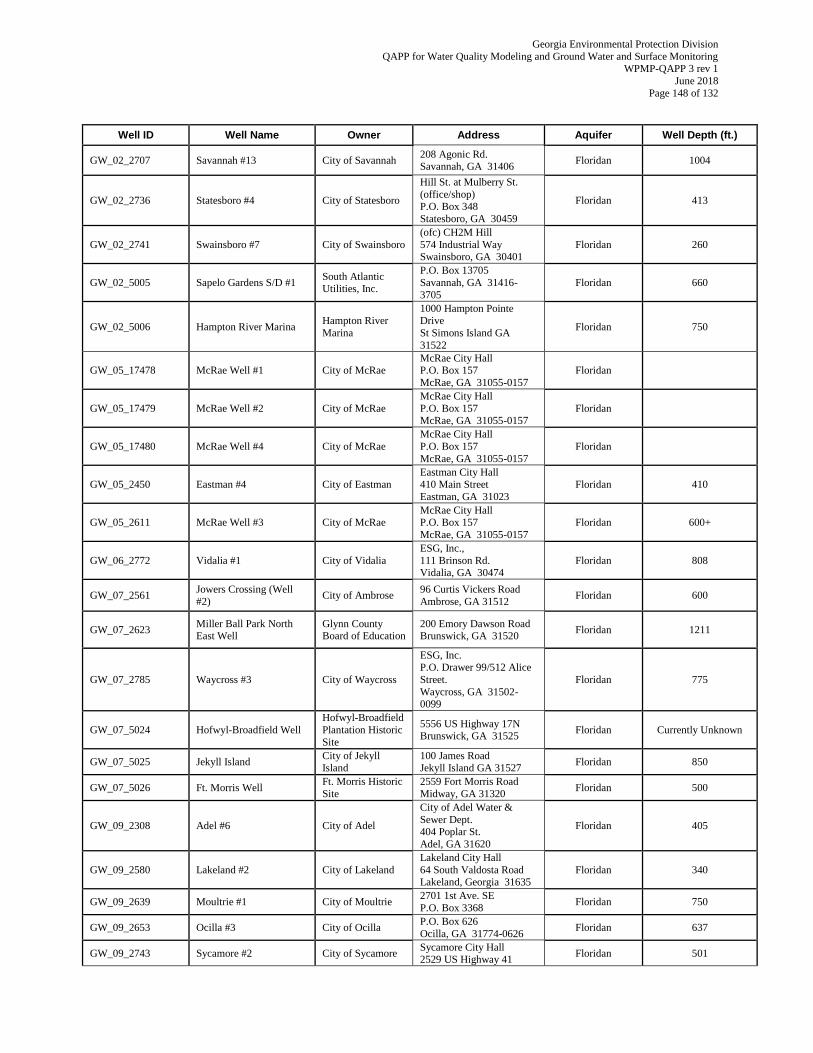
Georgia Environmental Protection Division
QAPP for Water Quality Modeling and Ground Water and Surface Monitoring WPMP-QAPP 3 rev 1
June 2018
Page 148 of 132
Well ID Well Name Owner Address Aquifer Well Depth (ft.)
GW_02_2707 Savannah #13 City of Savannah 208 Agonic Rd. Savannah, GA 31406
Floridan 1004
GW_02_2736 Statesboro #4 City of Statesboro
Hill St. at Mulberry St.
(office/shop) P.O. Box 348
Statesboro, GA 30459
Floridan 413
GW_02_2741 Swainsboro #7 City of Swainsboro
(ofc) CH2M Hill
574 Industrial Way Swainsboro, GA 30401
Floridan 260
GW_02_5005 Sapelo Gardens S/D #1 South Atlantic Utilities, Inc.
P.O. Box 13705
Savannah, GA 31416-
3705
Floridan 660
GW_02_5006 Hampton River Marina Hampton River
Marina
1000 Hampton Pointe Drive
St Simons Island GA
31522
Floridan 750
GW_05_17478 McRae Well #1 City of McRae McRae City Hall P.O. Box 157
McRae, GA 31055-0157
Floridan
GW_05_17479 McRae Well #2 City of McRae
McRae City Hall
P.O. Box 157 McRae, GA 31055-0157
Floridan
GW_05_17480 McRae Well #4 City of McRae
McRae City Hall
P.O. Box 157
McRae, GA 31055-0157
Floridan
GW_05_2450 Eastman #4 City of Eastman Eastman City Hall 410 Main Street
Eastman, GA 31023
Floridan 410
GW_05_2611 McRae Well #3 City of McRae McRae City Hall P.O. Box 157
McRae, GA 31055-0157
Floridan 600+
GW_06_2772 Vidalia #1 City of Vidalia
ESG, Inc.,
111 Brinson Rd. Vidalia, GA 30474
Floridan 808
GW_07_2561 Jowers Crossing (Well
#2) City of Ambrose
96 Curtis Vickers Road
Ambrose, GA 31512 Floridan 600
GW_07_2623 Miller Ball Park North East Well
Glynn County Board of Education
200 Emory Dawson Road Brunswick, GA 31520
Floridan 1211
GW_07_2785 Waycross #3 City of Waycross
ESG, Inc. P.O. Drawer 99/512 Alice
Street.
Waycross, GA 31502-0099
Floridan 775
GW_07_5024 Hofwyl-Broadfield Well
Hofwyl-Broadfield
Plantation Historic
Site
5556 US Highway 17N Brunswick, GA 31525
Floridan Currently Unknown
GW_07_5025 Jekyll Island City of Jekyll
Island
100 James Road
Jekyll Island GA 31527 Floridan 850
GW_07_5026 Ft. Morris Well Ft. Morris Historic
Site
2559 Fort Morris Road
Midway, GA 31320 Floridan 500
GW_09_2308 Adel #6 City of Adel
City of Adel Water &
Sewer Dept. 404 Poplar St.
Adel, GA 31620
Floridan 405
GW_09_2580 Lakeland #2 City of Lakeland
Lakeland City Hall
64 South Valdosta Road Lakeland, Georgia 31635
Floridan 340
GW_09_2639 Moultrie #1 City of Moultrie 2701 1st Ave. SE
P.O. Box 3368 Floridan 750
GW_09_2653 Ocilla #3 City of Ocilla P.O. Box 626
Ocilla, GA 31774-0626 Floridan 637
GW_09_2743 Sycamore #2 City of Sycamore Sycamore City Hall 2529 US Highway 41
Floridan 501
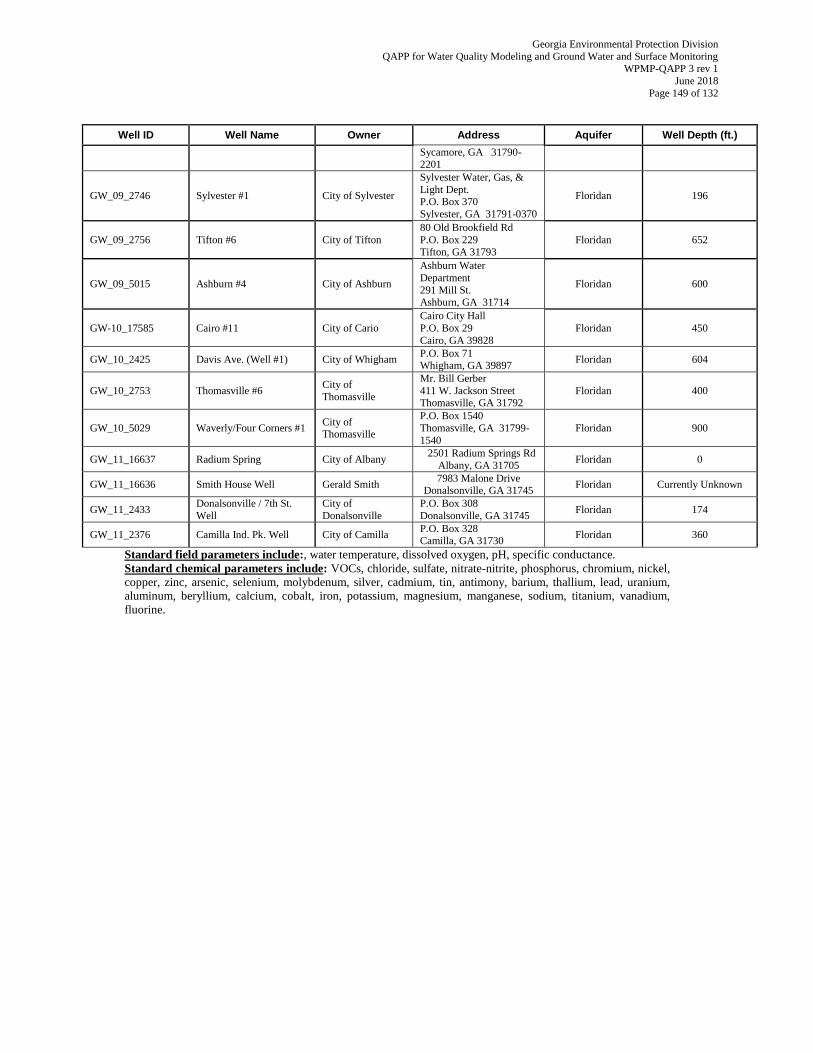
Georgia Environmental Protection Division
QAPP for Water Quality Modeling and Ground Water and Surface Monitoring WPMP-QAPP 3 rev 1
June 2018
Page 149 of 132
Well ID Well Name Owner Address Aquifer Well Depth (ft.)
Sycamore, GA 31790-2201
GW_09_2746 Sylvester #1 City of Sylvester
Sylvester Water, Gas, &
Light Dept. P.O. Box 370
Sylvester, GA 31791-0370
Floridan 196
GW_09_2756 Tifton #6 City of Tifton
80 Old Brookfield Rd
P.O. Box 229 Tifton, GA 31793
Floridan 652
GW_09_5015 Ashburn #4 City of Ashburn
Ashburn Water
Department
291 Mill St. Ashburn, GA 31714
Floridan 600
GW-10_17585 Cairo #11 City of Cario
Cairo City Hall
P.O. Box 29
Cairo, GA 39828
Floridan 450
GW_10_2425 Davis Ave. (Well #1) City of Whigham P.O. Box 71 Whigham, GA 39897
Floridan 604
GW_10_2753 Thomasville #6 City of
Thomasville
Mr. Bill Gerber
411 W. Jackson Street Thomasville, GA 31792
Floridan 400
GW_10_5029 Waverly/Four Corners #1 City of Thomasville
P.O. Box 1540
Thomasville, GA 31799-
1540
Floridan 900
GW_11_16637 Radium Spring City of Albany 2501 Radium Springs Rd
Albany, GA 31705 Floridan 0
GW_11_16636 Smith House Well Gerald Smith 7983 Malone Drive
Donalsonville, GA 31745 Floridan Currently Unknown
GW_11_2433 Donalsonville / 7th St.
Well
City of
Donalsonville
P.O. Box 308
Donalsonville, GA 31745 Floridan 174
GW_11_2376 Camilla Ind. Pk. Well City of Camilla P.O. Box 328
Camilla, GA 31730 Floridan 360
Standard field parameters include:, water temperature, dissolved oxygen, pH, specific conductance.
Standard chemical parameters include: VOCs, chloride, sulfate, nitrate-nitrite, phosphorus, chromium, nickel,
copper, zinc, arsenic, selenium, molybdenum, silver, cadmium, tin, antimony, barium, thallium, lead, uranium,
aluminum, beryllium, calcium, cobalt, iron, potassium, magnesium, manganese, sodium, titanium, vanadium,
fluorine.
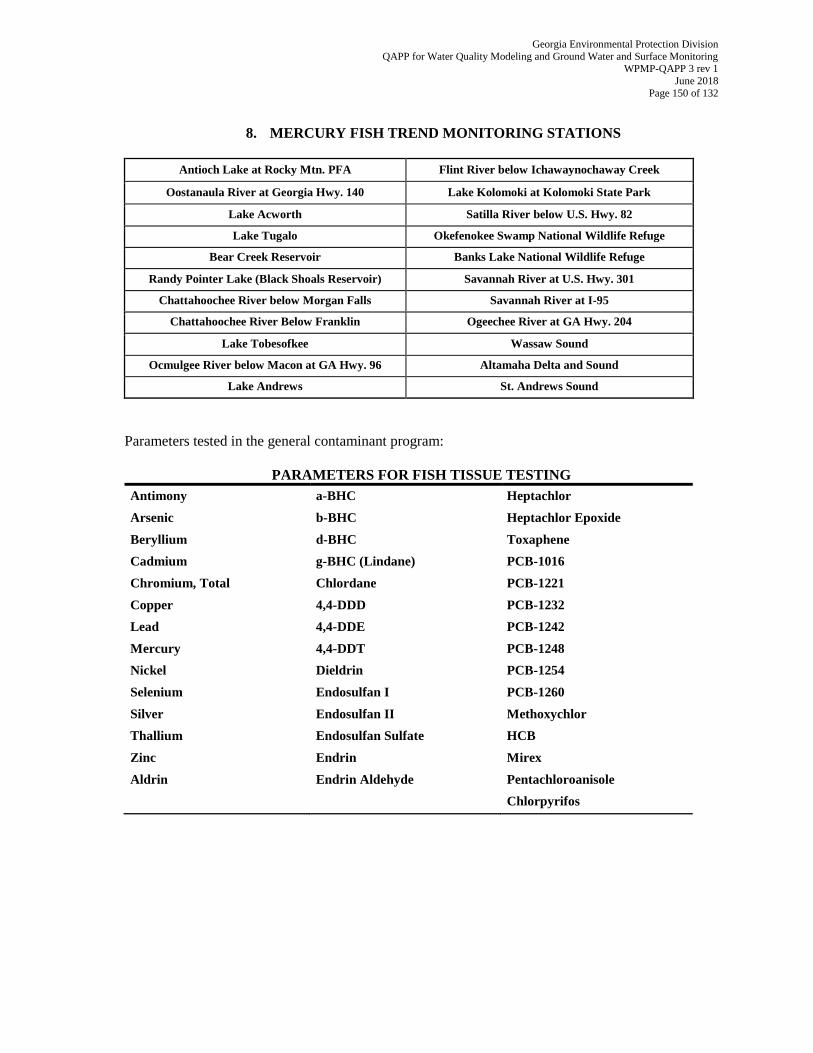
Georgia Environmental Protection Division
QAPP for Water Quality Modeling and Ground Water and Surface Monitoring WPMP-QAPP 3 rev 1
June 2018
Page 150 of 132
8. MERCURY FISH TREND MONITORING STATIONS
Antioch Lake at Rocky Mtn. PFA Flint River below Ichawaynochaway Creek
Oostanaula River at Georgia Hwy. 140 Lake Kolomoki at Kolomoki State Park
Lake Acworth Satilla River below U.S. Hwy. 82
Lake Tugalo Okefenokee Swamp National Wildlife Refuge
Bear Creek Reservoir Banks Lake National Wildlife Refuge
Randy Pointer Lake (Black Shoals Reservoir) Savannah River at U.S. Hwy. 301
Chattahoochee River below Morgan Falls Savannah River at I-95
Chattahoochee River Below Franklin Ogeechee River at GA Hwy. 204
Lake Tobesofkee Wassaw Sound
Ocmulgee River below Macon at GA Hwy. 96 Altamaha Delta and Sound
Lake Andrews St. Andrews Sound
Parameters tested in the general contaminant program:
PARAMETERS FOR FISH TISSUE TESTING
Antimony a-BHC Heptachlor
Arsenic b-BHC Heptachlor Epoxide
Beryllium d-BHC Toxaphene
Cadmium g-BHC (Lindane) PCB-1016
Chromium, Total Chlordane PCB-1221
Copper 4,4-DDD PCB-1232
Lead 4,4-DDE PCB-1242
Mercury 4,4-DDT PCB-1248
Nickel Dieldrin PCB-1254
Selenium Endosulfan I PCB-1260
Silver Endosulfan II Methoxychlor
Thallium Endosulfan Sulfate HCB
Zinc Endrin Mirex
Aldrin Endrin Aldehyde Pentachloroanisole
Chlorpyrifos
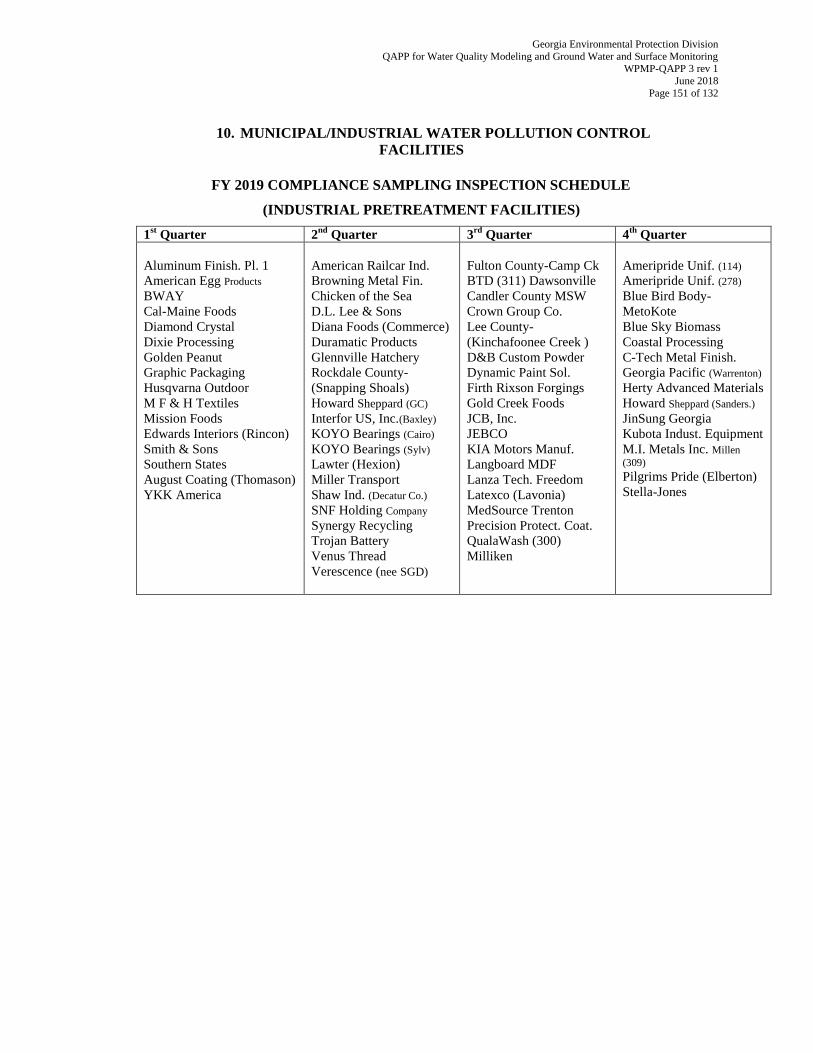
Georgia Environmental Protection Division
QAPP for Water Quality Modeling and Ground Water and Surface Monitoring WPMP-QAPP 3 rev 1
June 2018
Page 151 of 132
10. MUNICIPAL/INDUSTRIAL WATER POLLUTION CONTROL
FACILITIES
FY 2019 COMPLIANCE SAMPLING INSPECTION SCHEDULE
(INDUSTRIAL PRETREATMENT FACILITIES)
1st Quarter 2
nd Quarter 3
rd Quarter 4
th Quarter
Aluminum Finish. Pl. 1
American Egg Products
BWAY
Cal-Maine Foods
Diamond Crystal
Dixie Processing
Golden Peanut
Graphic Packaging
Husqvarna Outdoor
M F & H Textiles
Mission Foods
Edwards Interiors (Rincon)
Smith & Sons
Southern States
August Coating (Thomason)
YKK America
American Railcar Ind.
Browning Metal Fin.
Chicken of the Sea
D.L. Lee & Sons
Diana Foods (Commerce)
Duramatic Products
Glennville Hatchery
Rockdale County-
(Snapping Shoals)
Howard Sheppard (GC)
Interfor US, Inc.(Baxley)
KOYO Bearings (Cairo)
KOYO Bearings (Sylv)
Lawter (Hexion)
Miller Transport
Shaw Ind. (Decatur Co.)
SNF Holding Company
Synergy Recycling
Trojan Battery
Venus Thread
Verescence (nee SGD)
Fulton County-Camp Ck
BTD (311) Dawsonville
Candler County MSW
Crown Group Co.
Lee County-
(Kinchafoonee Creek )
D&B Custom Powder
Dynamic Paint Sol.
Firth Rixson Forgings
Gold Creek Foods
JCB, Inc.
JEBCO
KIA Motors Manuf.
Langboard MDF
Lanza Tech. Freedom
Latexco (Lavonia)
MedSource Trenton
Precision Protect. Coat.
QualaWash (300)
Milliken
Ameripride Unif. (114)
Ameripride Unif. (278)
Blue Bird Body-
MetoKote
Blue Sky Biomass
Coastal Processing
C-Tech Metal Finish.
Georgia Pacific (Warrenton)
Herty Advanced Materials
Howard Sheppard (Sanders.)
JinSung Georgia
Kubota Indust. Equipment
M.I. Metals Inc. Millen (309) Pilgrims Pride (Elberton)
Stella-Jones
Georgia Environmental Protection Division
QAPP for Water Quality Modeling and Ground Water and Surface Monitoring WPMP-QAPP 3 rev 1
June 2018
Page 152 of 132
APPENDIX E
Example Forms
1. Example Sample Label
2. Chain of Custody Record - AMU
3. Chain of Custody Record - FMU
4. Monitoring Audit Report Form
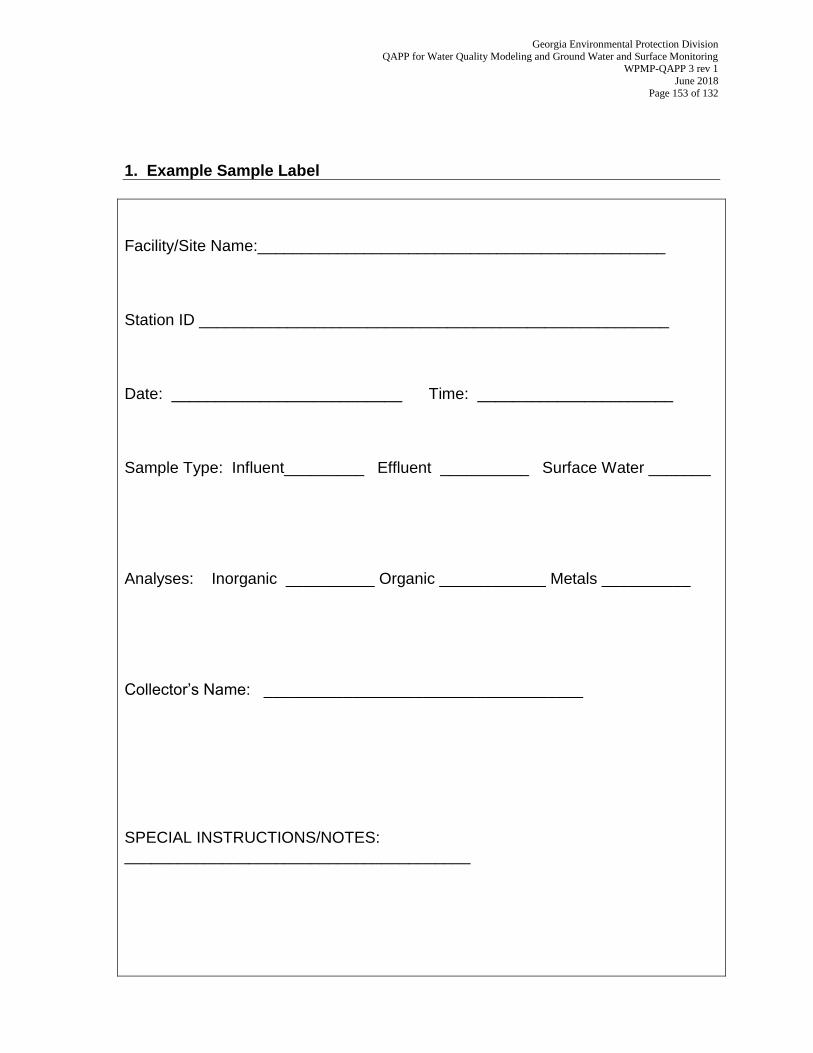
Georgia Environmental Protection Division
QAPP for Water Quality Modeling and Ground Water and Surface Monitoring WPMP-QAPP 3 rev 1
June 2018
Page 153 of 132
1. Example Sample Label
Facility/Site Name:______________________________________________
Station ID _____________________________________________________
Date: __________________________ Time: ______________________
Sample Type: Influent_________ Effluent __________ Surface Water _______
Analyses: Inorganic __________ Organic ____________ Metals __________
Collector’s Name: ____________________________________
SPECIAL INSTRUCTIONS/NOTES: _______________________________________
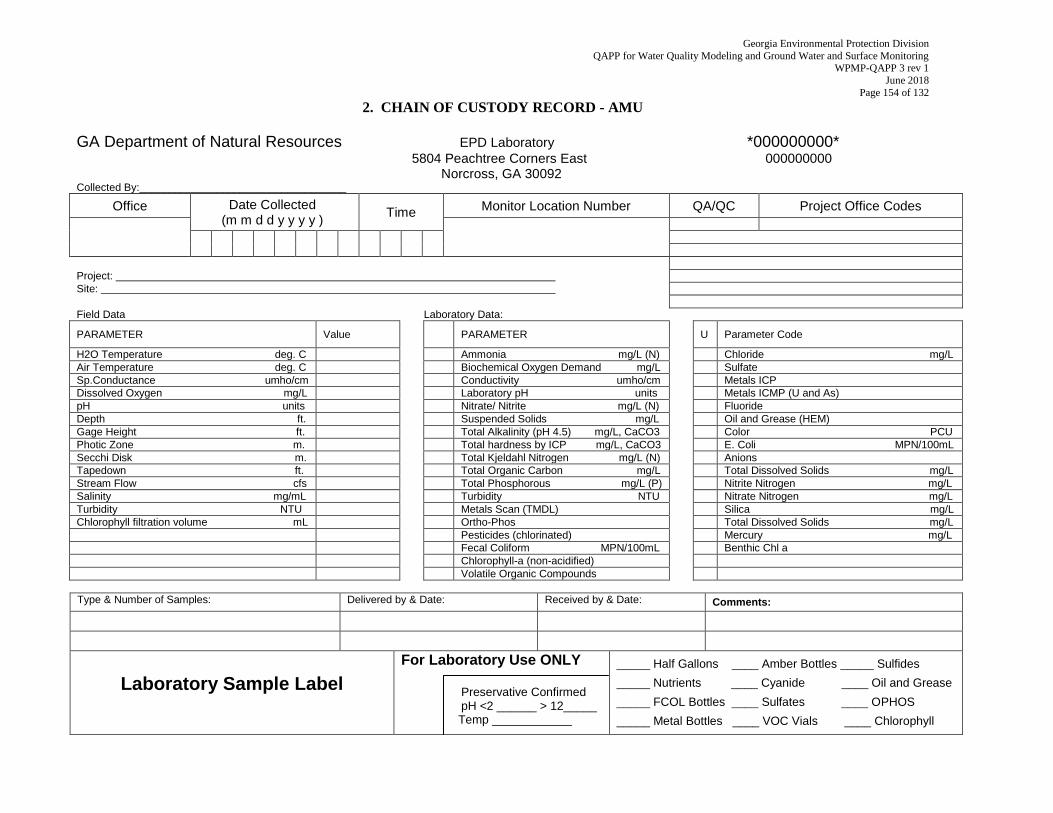
Georgia Environmental Protection Division
QAPP for Water Quality Modeling and Ground Water and Surface Monitoring WPMP-QAPP 3 rev 1
June 2018
Page 154 of 132
2. CHAIN OF CUSTODY RECORD - AMU
GA Department of Natural Resources EPD Laboratory *000000000*
5804 Peachtree Corners East 000000000 Norcross, GA 30092 Collected By:___________________________________
Office Date Collected (m m d d y y y y )
Time Monitor Location Number QA/QC Project Office Codes
Project:
Site:
Field Data Laboratory Data:
PARAMETER Value
PARAMETER
U Parameter Code
H2O Temperature deg. C Ammonia mg/L (N) Chloride mg/L
Air Temperature deg. C Biochemical Oxygen Demand mg/L Sulfate
Sp.Conductance umho/cm Conductivity umho/cm Metals ICP
Dissolved Oxygen mg/L Laboratory pH units Metals ICMP (U and As)
pH units Nitrate/ Nitrite mg/L (N) Fluoride
Depth ft. Suspended Solids mg/L Oil and Grease (HEM)
Gage Height ft. Total Alkalinity (pH 4.5) mg/L, CaCO3 Color PCU
Photic Zone m. Total hardness by ICP mg/L, CaCO3 E. Coli MPN/100mL
Secchi Disk m. Total Kjeldahl Nitrogen mg/L (N) Anions
Tapedown ft. Total Organic Carbon mg/L Total Dissolved Solids mg/L
Stream Flow cfs Total Phosphorous mg/L (P) Nitrite Nitrogen mg/L
Salinity mg/mL Turbidity NTU Nitrate Nitrogen mg/L
Turbidity NTU Metals Scan (TMDL) Silica mg/L
Chlorophyll filtration volume mL Ortho-Phos Total Dissolved Solids mg/L
Pesticides (chlorinated) Mercury mg/L
Fecal Coliform MPN/100mL Benthic Chl a
Chlorophyll-a (non-acidified)
Volatile Organic Compounds
Type & Number of Samples: Delivered by & Date: Received by & Date: Comments:
Laboratory Sample Label
For Laboratory Use ONLY Preservative Confirmed pH <2 ______ > 12_____ Temp ____________
_____ Half Gallons ____ Amber Bottles _____ Sulfides
_____ Nutrients ____ Cyanide ____ Oil and Grease
_____ FCOL Bottles ____ Sulfates ____ OPHOS
_____ Metal Bottles ____ VOC Vials ____ Chlorophyll
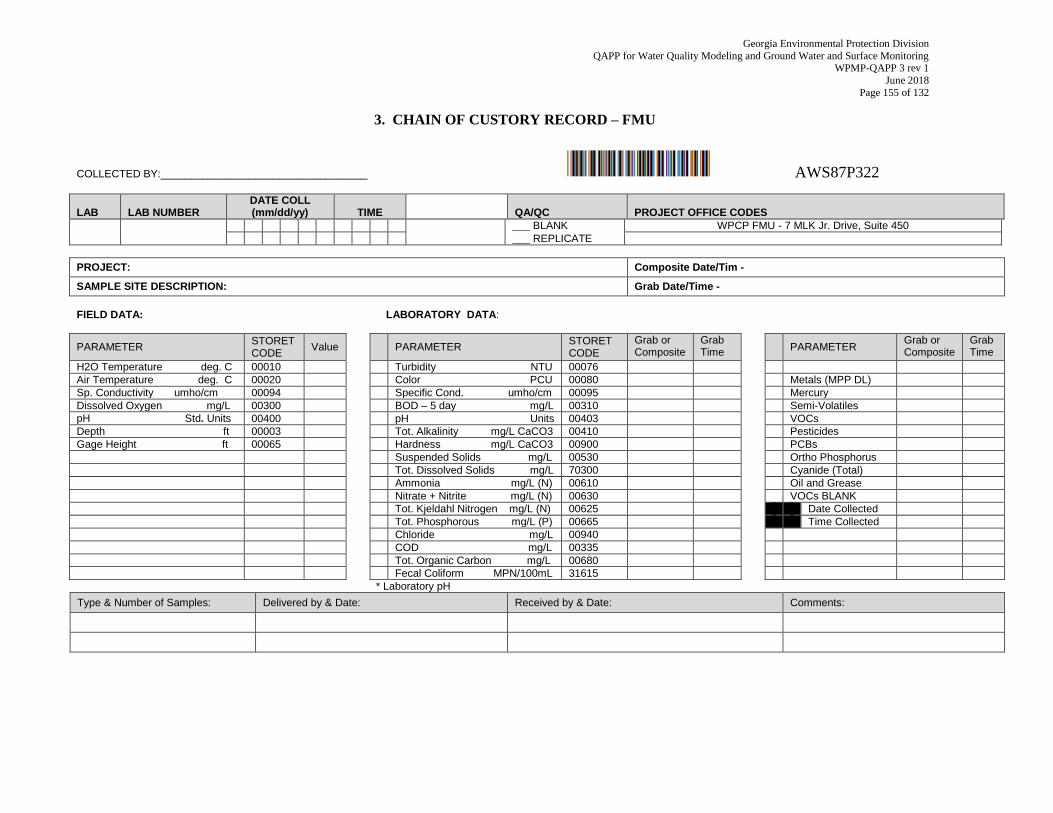
Georgia Environmental Protection Division
QAPP for Water Quality Modeling and Ground Water and Surface Monitoring WPMP-QAPP 3 rev 1
June 2018
Page 155 of 132
3. CHAIN OF CUSTORY RECORD – FMU
COLLECTED BY:___________________________________ AWS87P322
LAB LAB NUMBER DATE COLL (mm/dd/yy) TIME QA/QC PROJECT OFFICE CODES
___ BLANK WPCP FMU - 7 MLK Jr. Drive, Suite 450
___ REPLICATE
PROJECT: Composite Date/Tim -
SAMPLE SITE DESCRIPTION: Grab Date/Time -
FIELD DATA: LABORATORY DATA:
PARAMETER STORET CODE
Value
PARAMETER STORET CODE
Grab or Composite
Grab Time
PARAMETER
Grab or Composite
Grab Time
H2O Temperature deg. C 00010 Turbidity NTU 00076
Air Temperature deg. C 00020 Color PCU 00080 Metals (MPP DL)
Sp. Conductivity umho/cm 00094 Specific Cond. umho/cm 00095 Mercury
Dissolved Oxygen mg/L 00300 BOD – 5 day mg/L 00310 Semi-Volatiles
pH Std. Units 00400 pH Units 00403 VOCs
Depth ft 00003 Tot. Alkalinity mg/L CaCO3 00410 Pesticides
Gage Height ft 00065 Hardness mg/L CaCO3 00900 PCBs
Suspended Solids mg/L 00530 Ortho Phosphorus
Tot. Dissolved Solids mg/L 70300 Cyanide (Total)
Ammonia mg/L (N) 00610 Oil and Grease
Nitrate + Nitrite mg/L (N) 00630 VOCs BLANK
Tot. Kjeldahl Nitrogen mg/L (N) 00625 Date Collected
Tot. Phosphorous mg/L (P) 00665 Time Collected
Chloride mg/L 00940
COD mg/L 00335
Tot. Organic Carbon mg/L 00680
Fecal Coliform MPN/100mL 31615
* Laboratory pH
Type & Number of Samples: Delivered by & Date: Received by & Date: Comments:
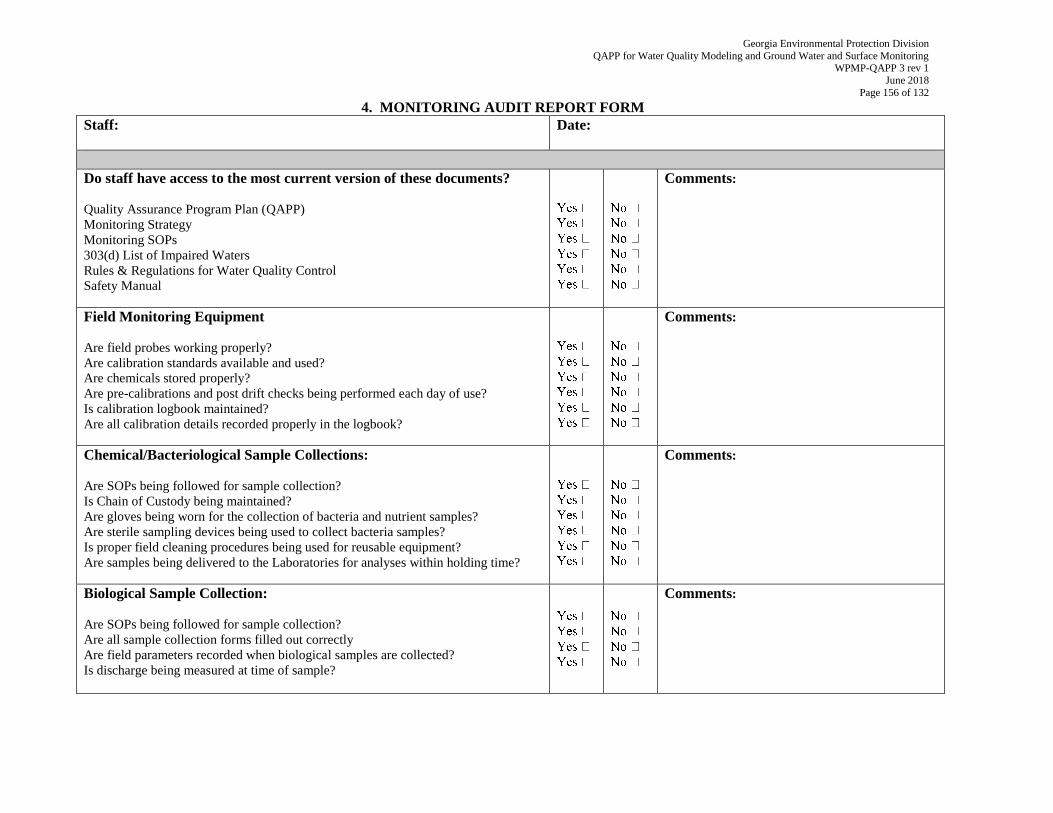
Georgia Environmental Protection Division
QAPP for Water Quality Modeling and Ground Water and Surface Monitoring WPMP-QAPP 3 rev 1
June 2018
Page 156 of 132
4. MONITORING AUDIT REPORT FORM
Staff:
Date:
Do staff have access to the most current version of these documents?
Quality Assurance Program Plan (QAPP)
Monitoring Strategy
Monitoring SOPs
303(d) List of Impaired Waters
Rules & Regulations for Water Quality Control
Safety Manual
Comments:
Field Monitoring Equipment
Are field probes working properly?
Are calibration standards available and used?
Are chemicals stored properly?
Are pre-calibrations and post drift checks being performed each day of use?
Is calibration logbook maintained?
Are all calibration details recorded properly in the logbook?
Comments:
Chemical/Bacteriological Sample Collections:
Are SOPs being followed for sample collection?
Is Chain of Custody being maintained?
Are gloves being worn for the collection of bacteria and nutrient samples?
Are sterile sampling devices being used to collect bacteria samples?
Is proper field cleaning procedures being used for reusable equipment?
Are samples being delivered to the Laboratories for analyses within holding time?
Comments:
Biological Sample Collection:
Are SOPs being followed for sample collection?
Are all sample collection forms filled out correctly
Are field parameters recorded when biological samples are collected?
Is discharge being measured at time of sample?
Comments:
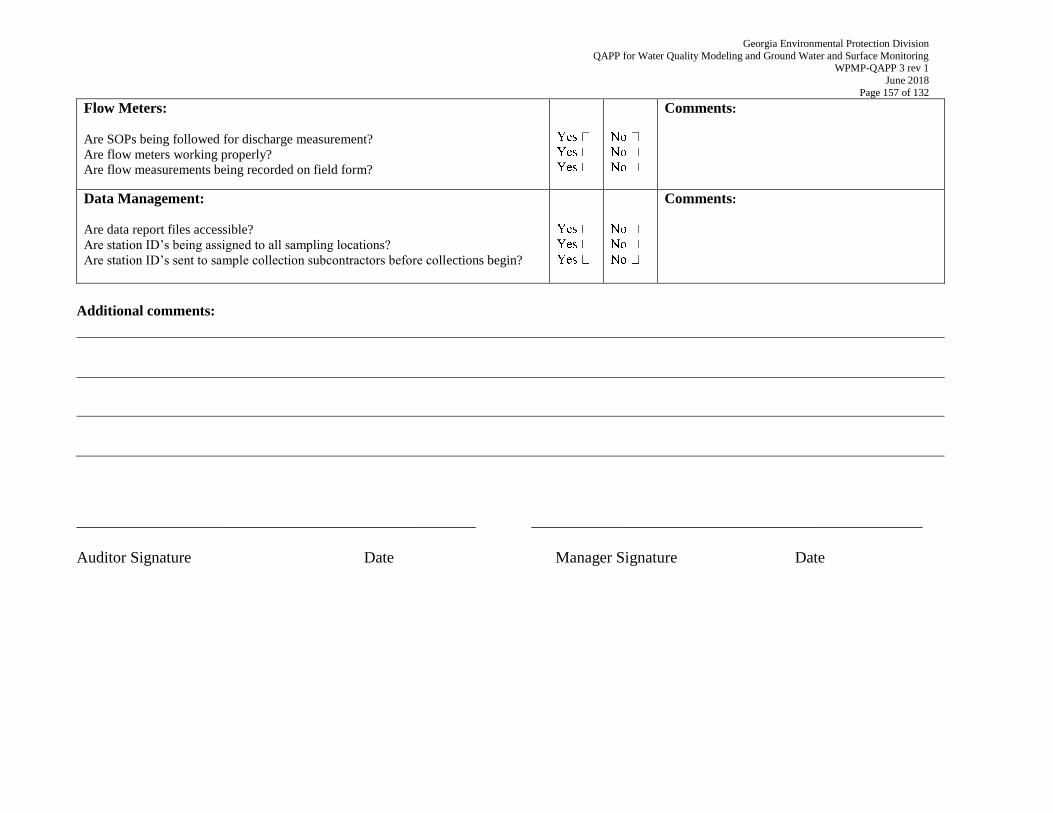
Georgia Environmental Protection Division
QAPP for Water Quality Modeling and Ground Water and Surface Monitoring WPMP-QAPP 3 rev 1
June 2018
Page 157 of 132
Flow Meters:
Are SOPs being followed for discharge measurement?
Are flow meters working properly?
Are flow measurements being recorded on field form?
Comments:
Data Management:
Are data report files accessible?
Are station ID’s being assigned to all sampling locations?
Are station ID’s sent to sample collection subcontractors before collections begin?
Comments:
Additional comments:
__________________________________________________ _________________________________________________
Auditor Signature Date Manager Signature Date
Georgia Environmental Protection Division
QAPP for Water Quality Modeling and Ground Water and Surface Monitoring WPMP-QAPP 3 rev 1
June 2018
Page 158 of 132
APPENDIX F
Standard Operating Procedures and Quality Assurance Plans
(Available on CD-R disk)
SOP# EPD-WQMP-1: Planning and Documentary Protocols for Water Quality Assessments
(August 2013)
SOP# EPD-WQMP-2: Surface Water Sampling (Rivers/Streams) (March 2013)
SOP# EPD-WQMP-3: Chlorophyll-a Sample Collection and Processing (Jan. 2008)
SOP# EPD-WQMP-4: Lake Profiling and Composite Sample Collection (Jan. 2008)
SOP# EPD-WQMP-5: Wastewater Sampling (Jan. 2008)
SOP# EPD-WQMP-6: Streamflow Measurement (Jan. 2008)
SOP# EPD-WQMP-7: Data Sonde Calibration and Maintenance (April 2011)
SOP: Macroinvertebrate Biological Assessment of Wadeable Streams in Georgia (May. 2007)
US EPA R4: SESDPROC-301-R3, Operating Procedure for Groundwater Sampling (March
2013)
QA Plan: Laboratory Quality Assurance Plan EPD Laboratory (April 2017)
QA Plan: UGA Laboratory Quality Assurance Plan (March 2018)
Georgia Environmental Protection Division
QAPP for Water Quality Modeling and Ground Water and Surface Monitoring WPMP-QAPP 3 rev 1
June 2018
Page 159 of 132
(Page Intentionally Left Blank)