city of atlanta, georgia
TRANSCRIPT

CITY OF ATLANTA, GEORGIA Comprehensive Annual Financial Report
For the Year Ended June 30, 2009
TABLE OF CONTENTS
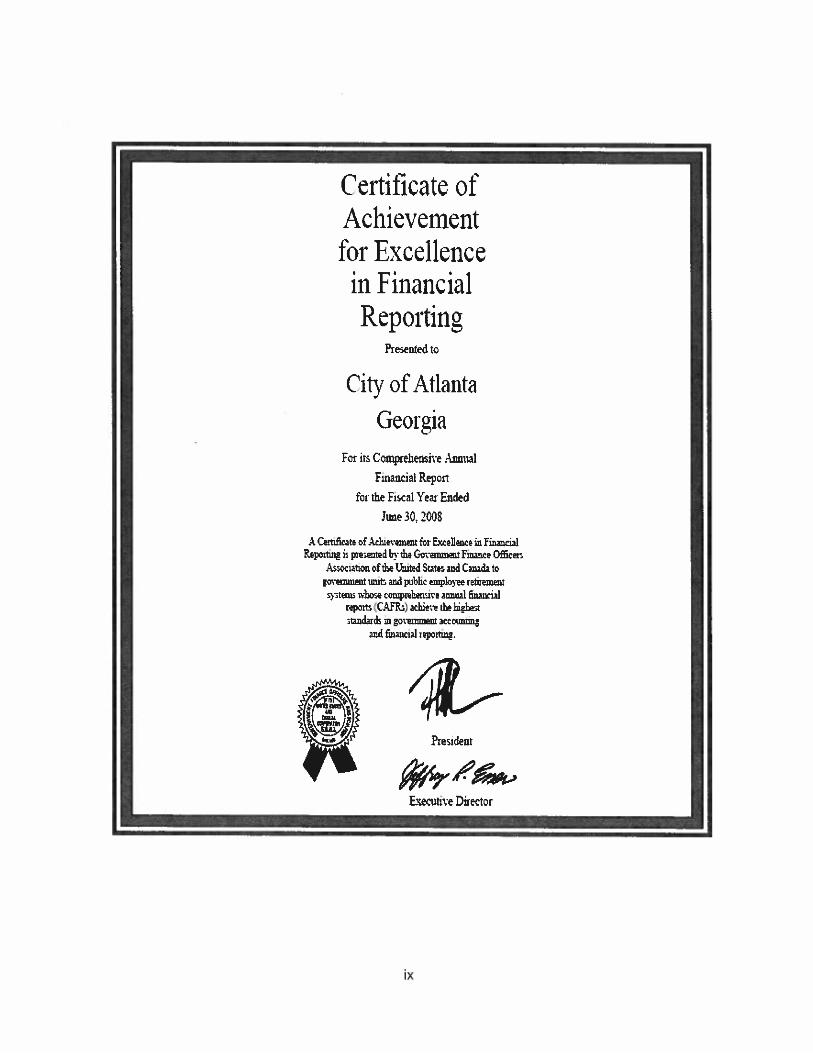
INTRODUCTORY SECTION Page Letter of Transmittal…………………...…………………………………………………..….....i GFOA Certificate of Achievement…...………………………...…………………………........ix
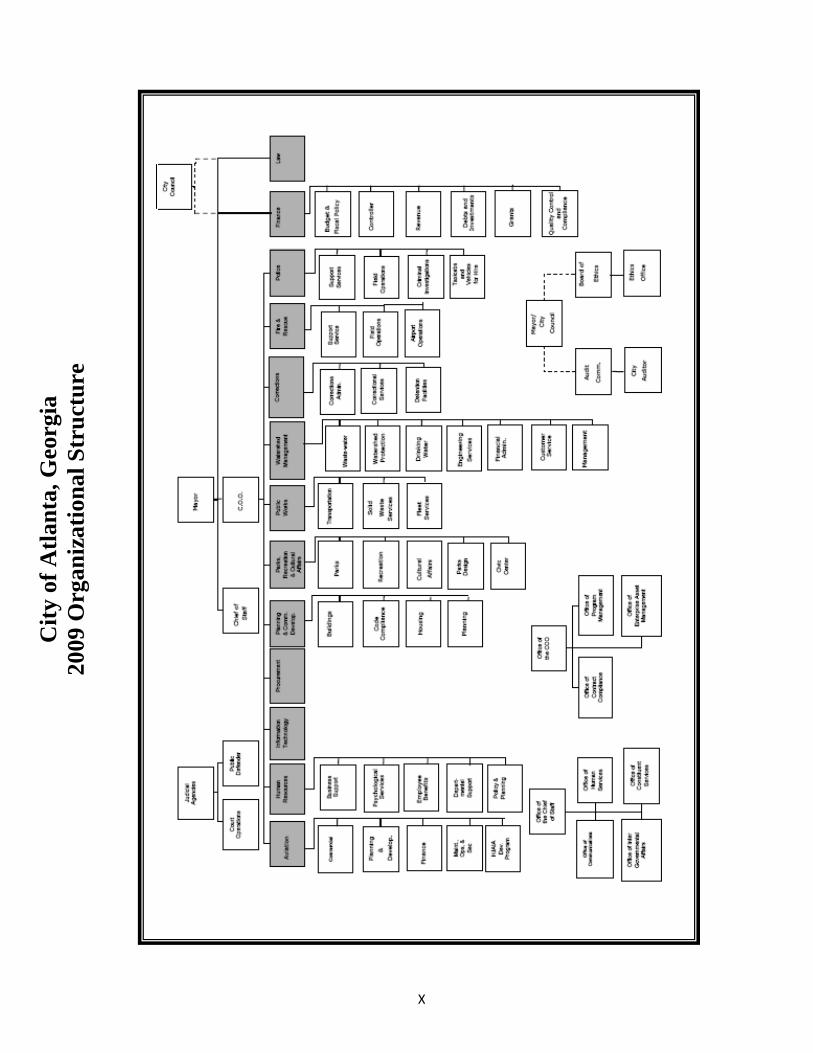
Organization Chart…………………..………………………….………………………...……..x List of Elected and Appointed Officials…….…………………..………….………….….……xi
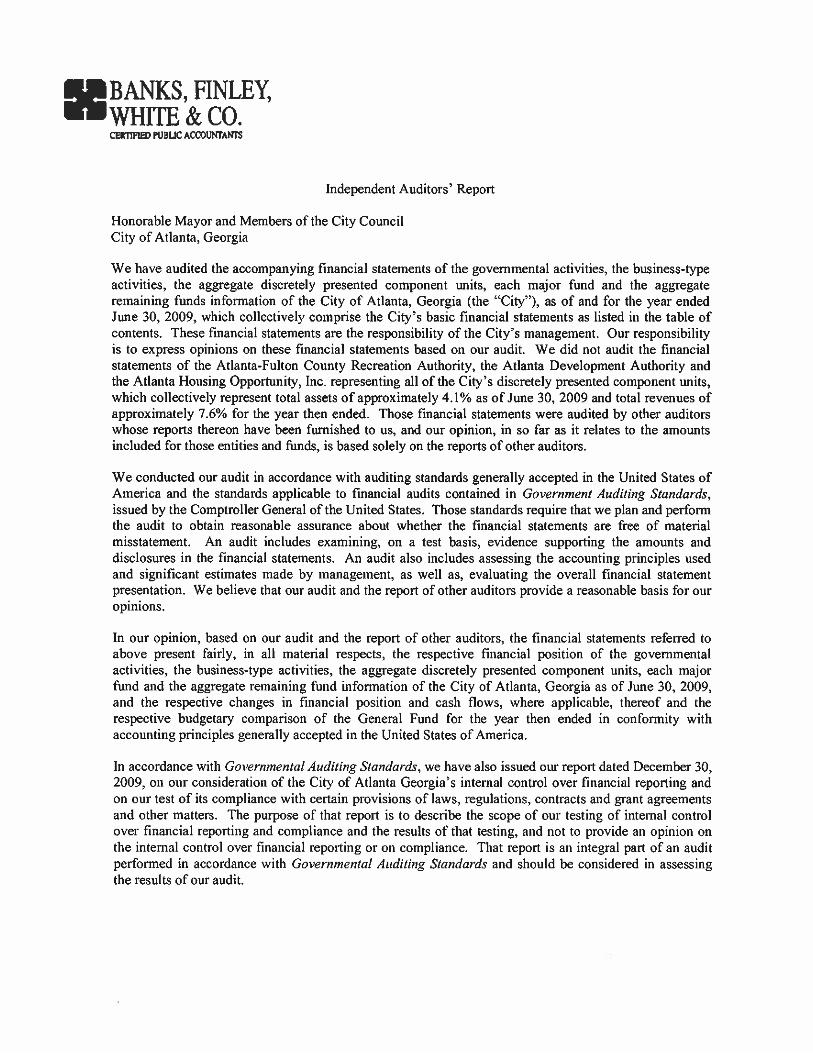
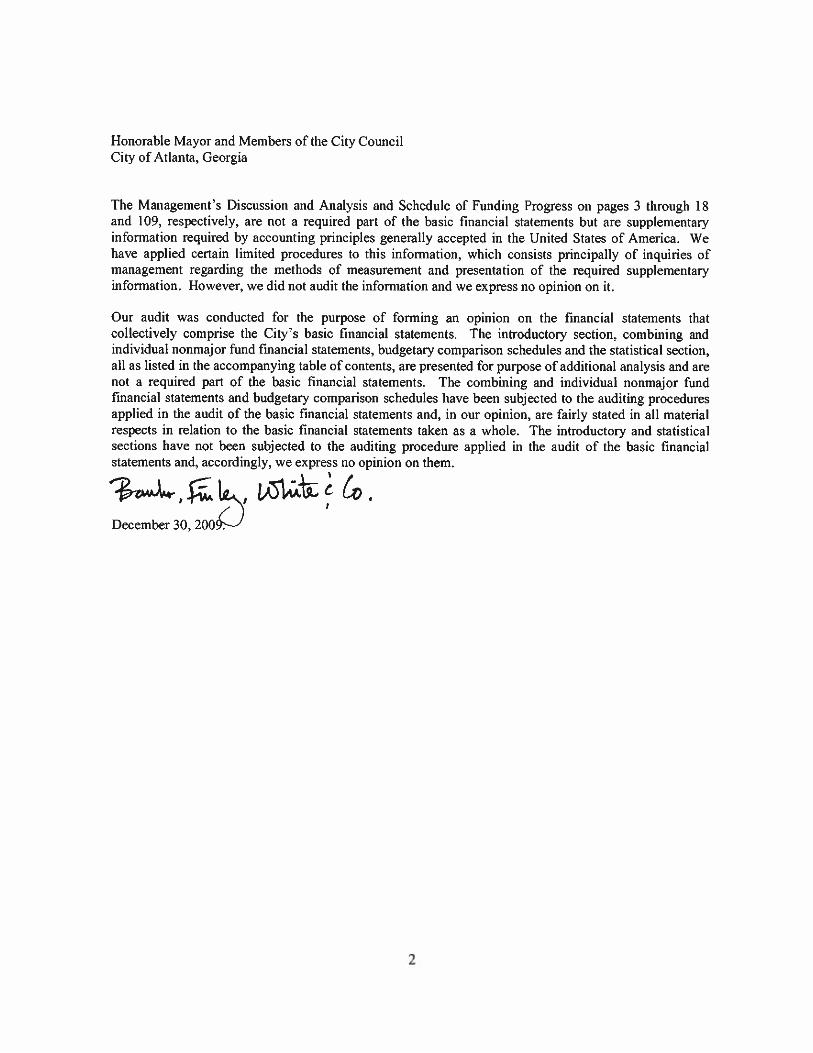
FINANCIAL SECTION Independent Auditors’ Report………………………………….……………………………… 1 Management’s Discussion and Analysis……………………….……………………………… 3 Basic Financial Statements:
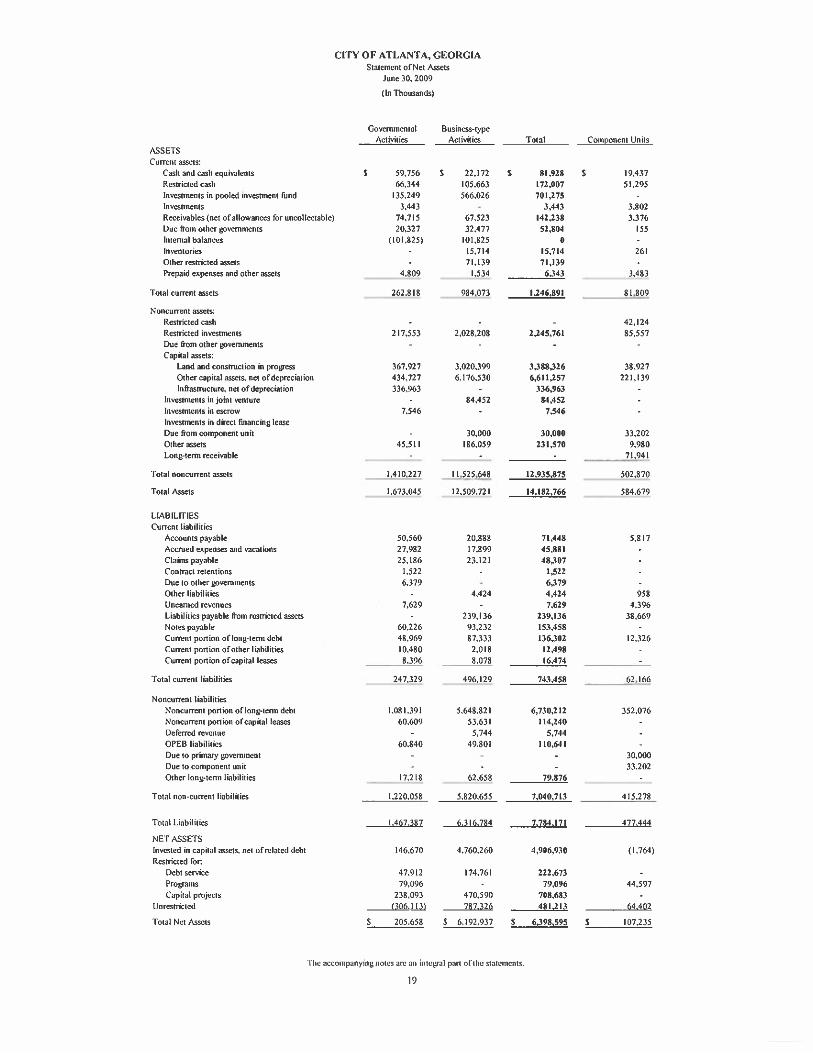
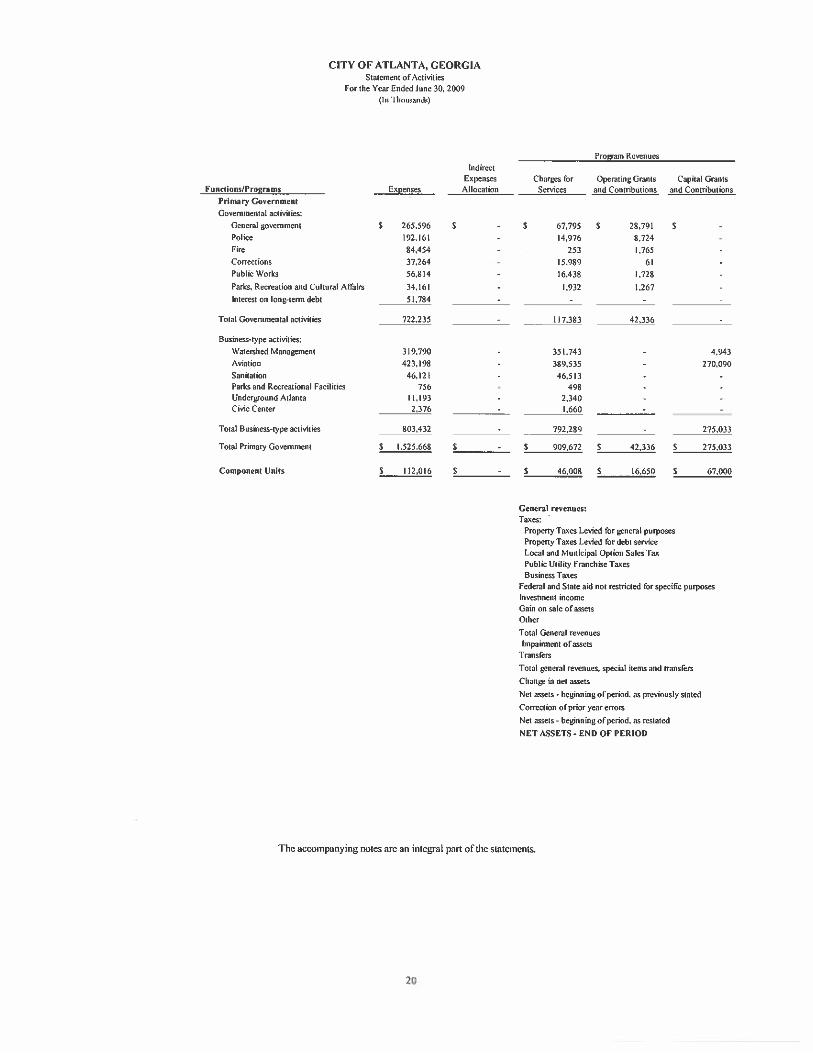
Government-wide Financial Statements: Statement of Net Assets.......................................................................................................19 Statement of Activities….................................................................................................... 20
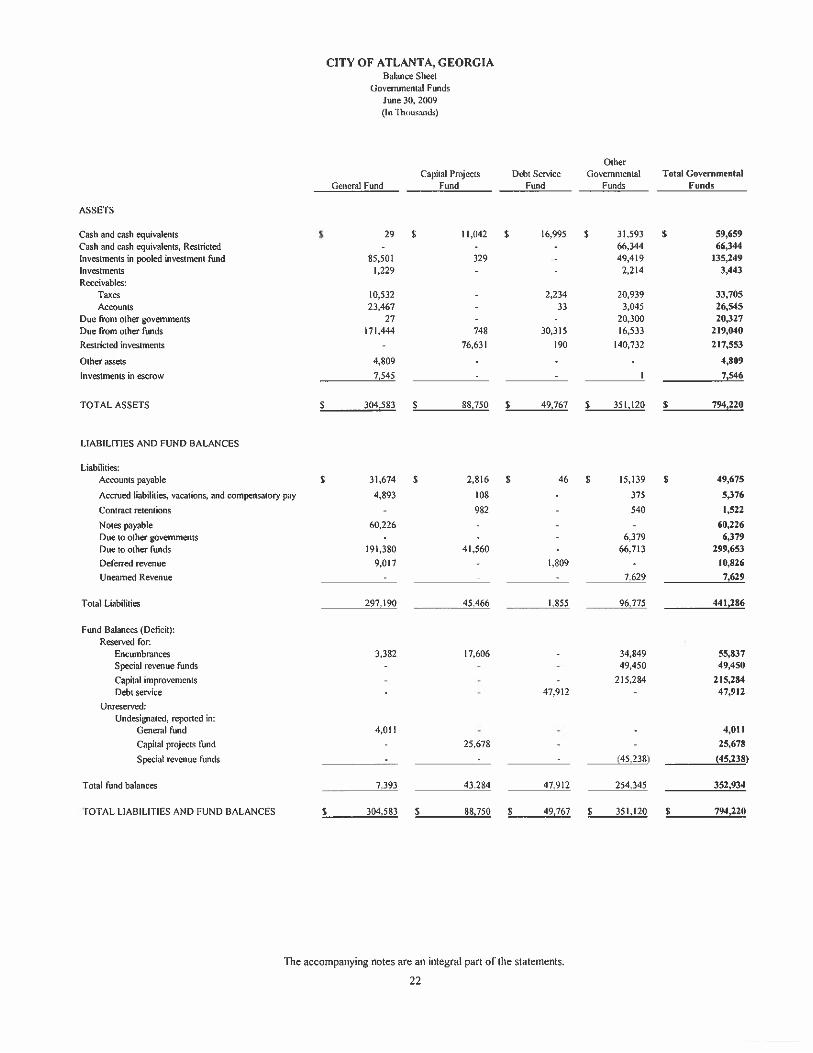
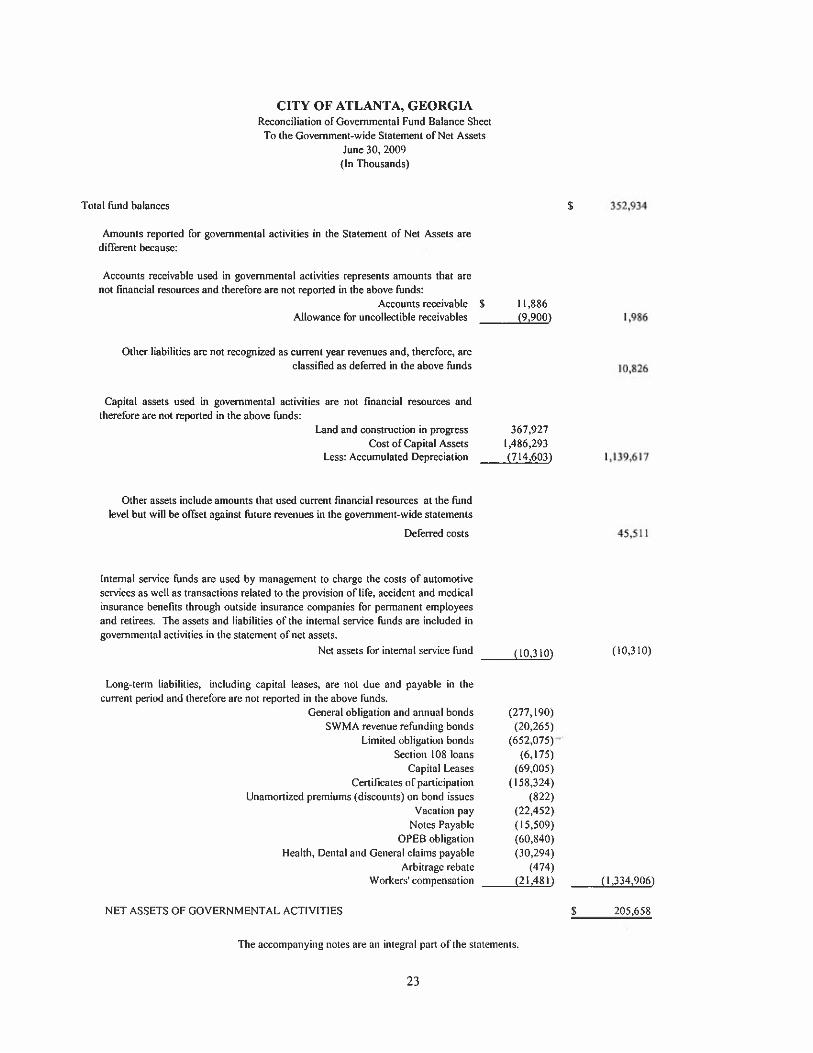
Fund Financial Statements: Balance Sheet-Governmental Funds….……..….………………………….…….…...…...22 Reconciliation of Governmental Fund Balance Sheet to the Government-wide Statement of Net Assets..…..….……..…..…….….….…….…......23
Statement of Revenues, Expenditures, and Changes in Fund Balance – Governmental Funds………………..………………………….....…..24
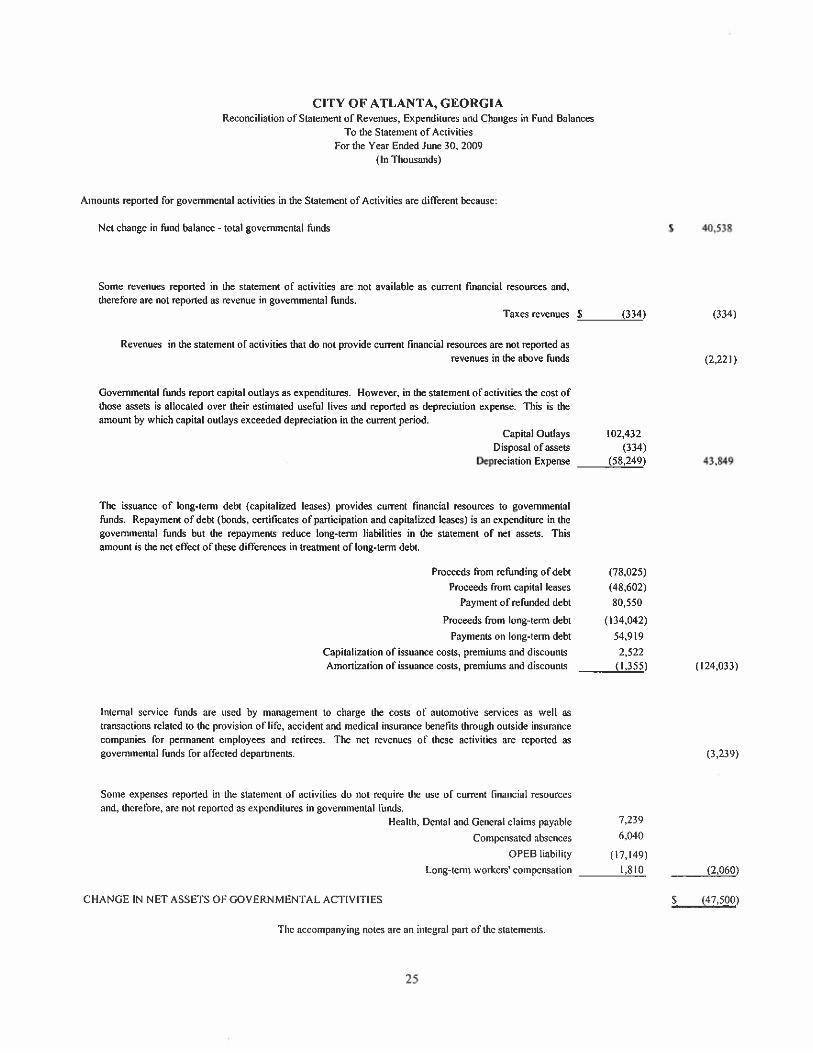
Reconciliation of the Statement of Revenues, Expenditures, and Changes in Fund Balances to the Statement of Activities………………………..….....……......25
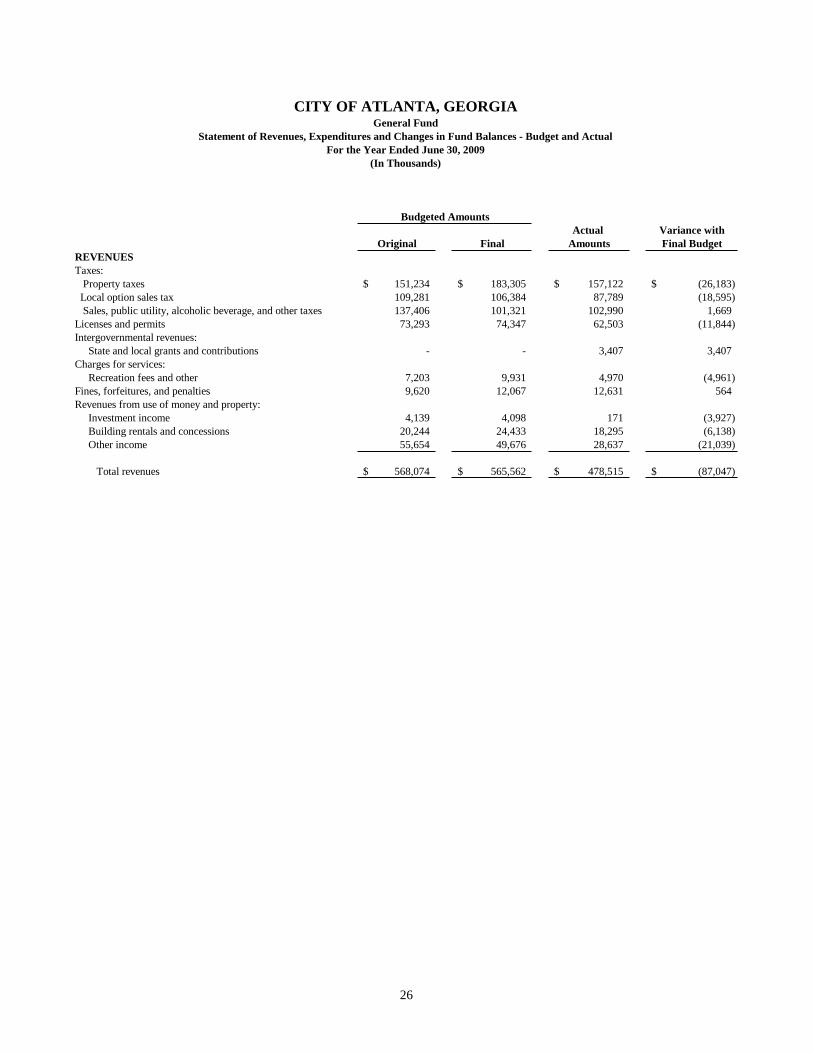
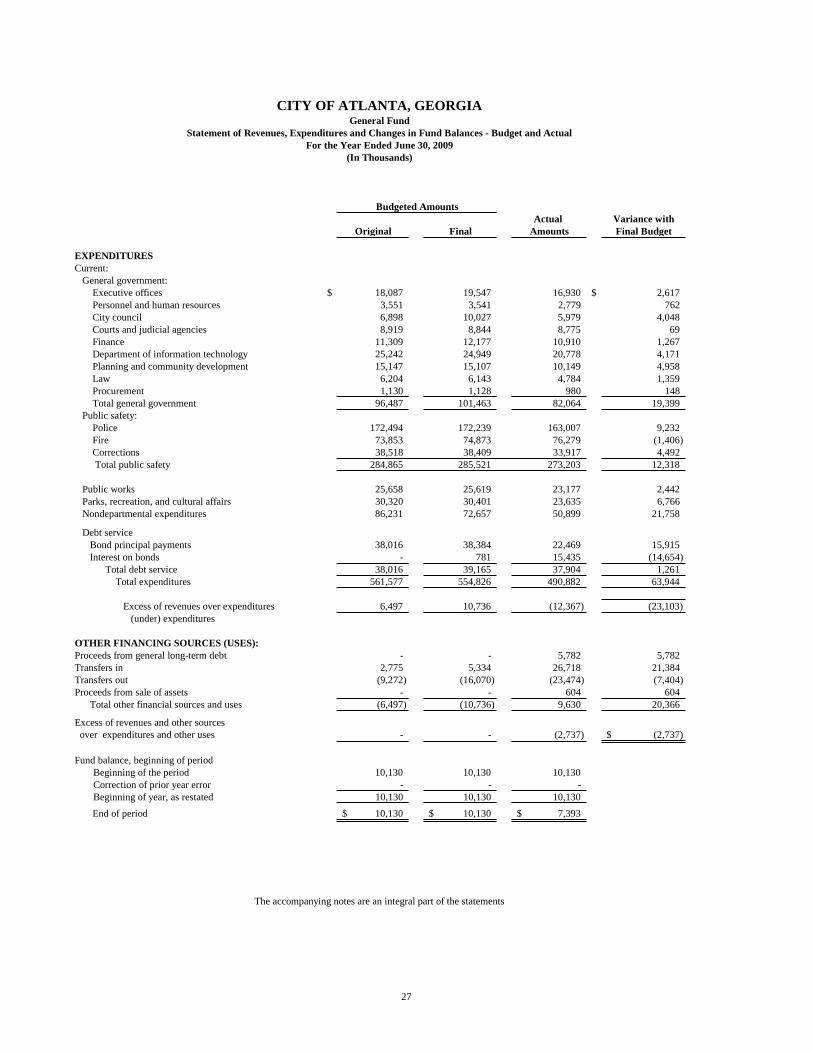
Statement of Revenues, Expenditures, and Changes in Fund Balances – Budget and Actual – General Fund……………………….……..…..26
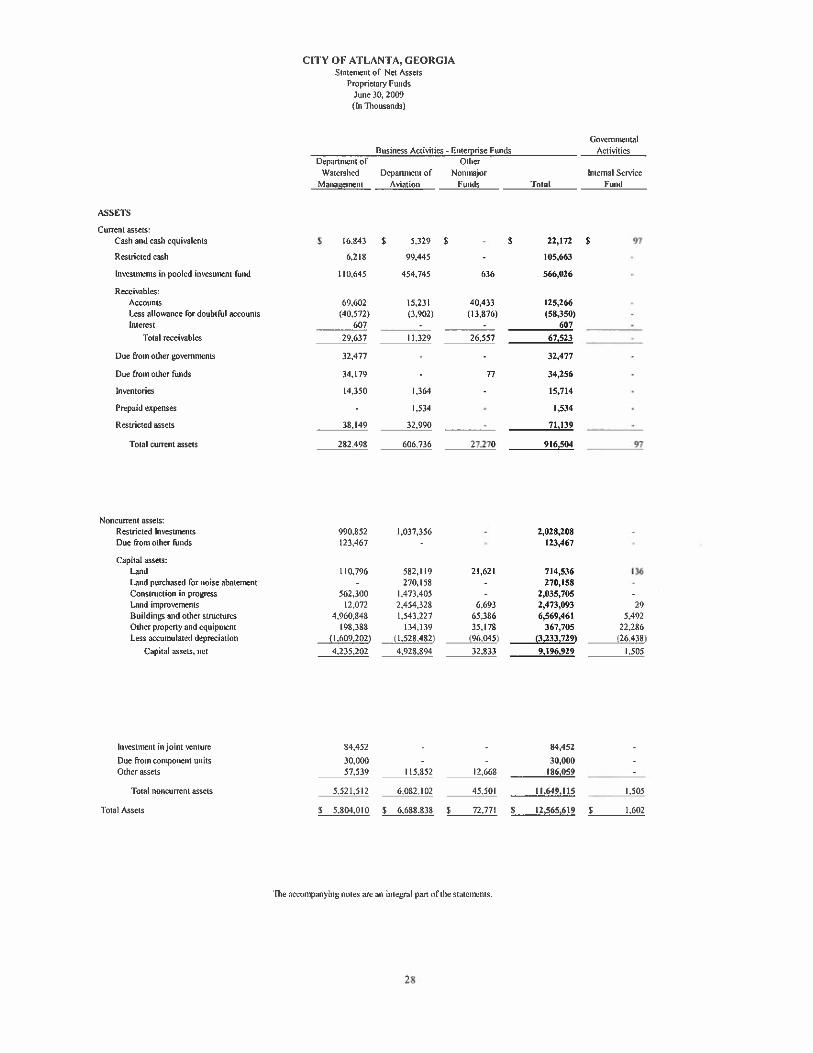
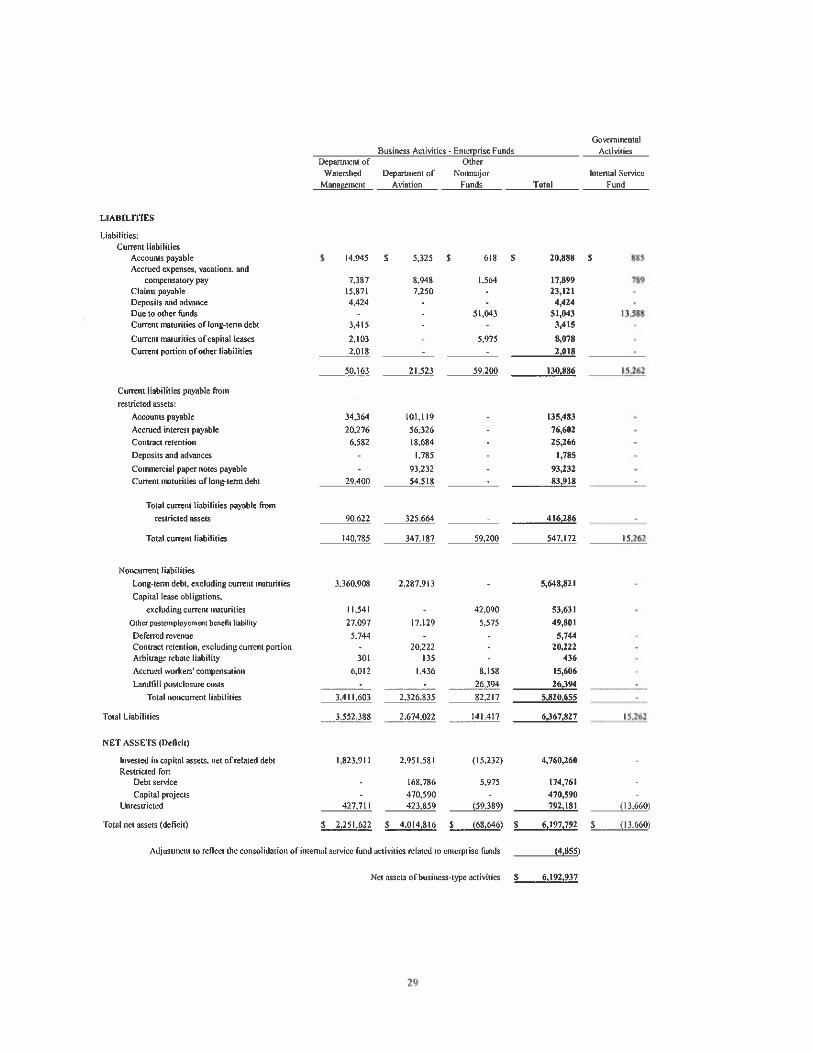
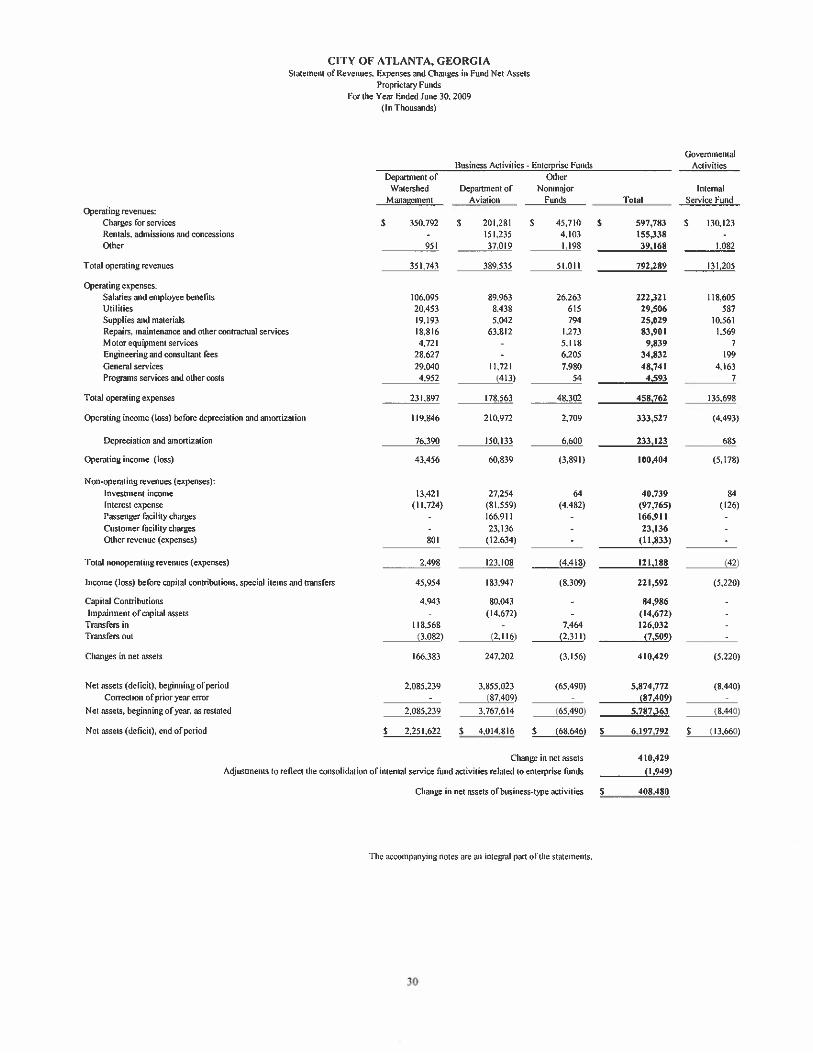
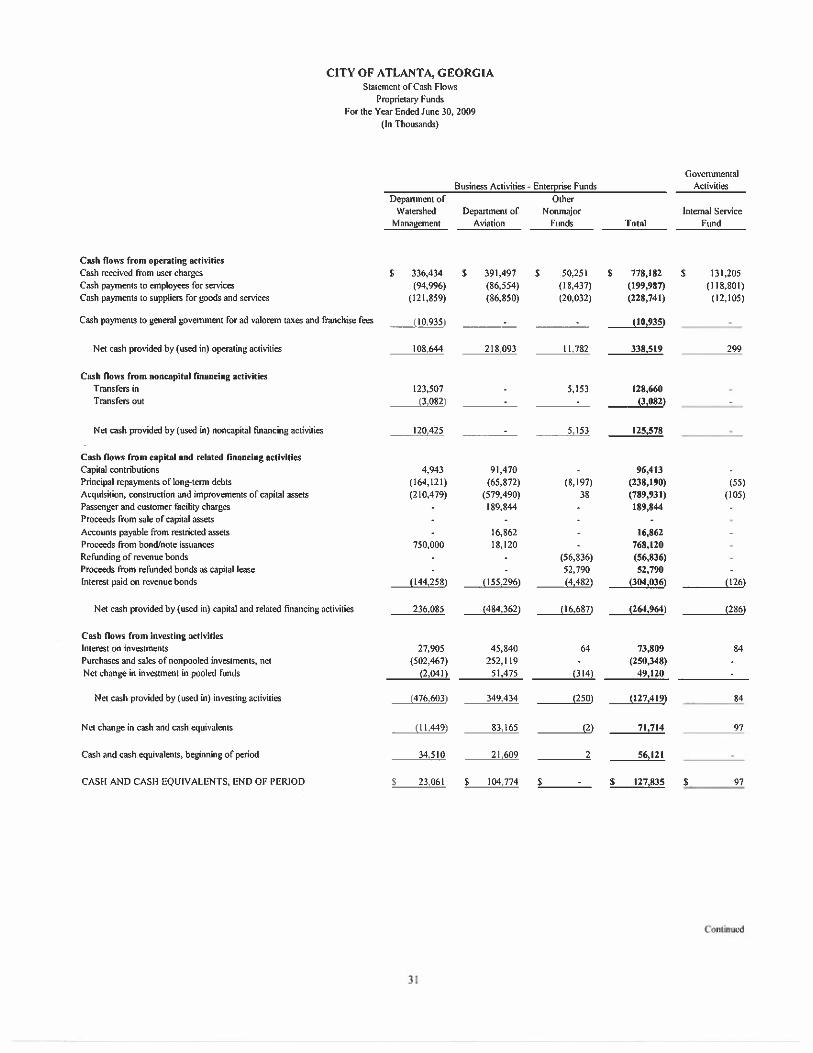
Statements of Net Assets – Proprietary Funds…………….…………………….……...... 28 Statements of Revenues, Expenses, and Changes in Fund Net Assets – Proprietary Funds………………………………………....……......30 Statement of Cash Flows – Proprietary Funds……………………….…….……...............31
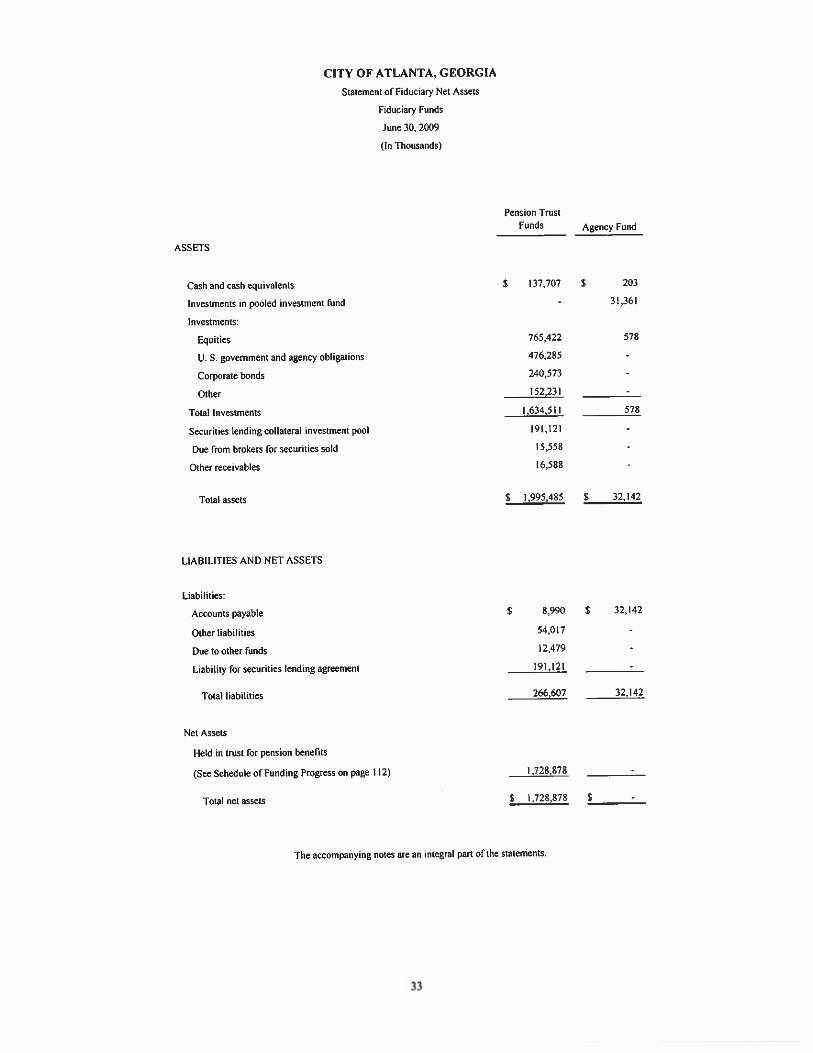
Statement of Fiduciary Net Assets – Fiduciary Funds……………….….………………...33
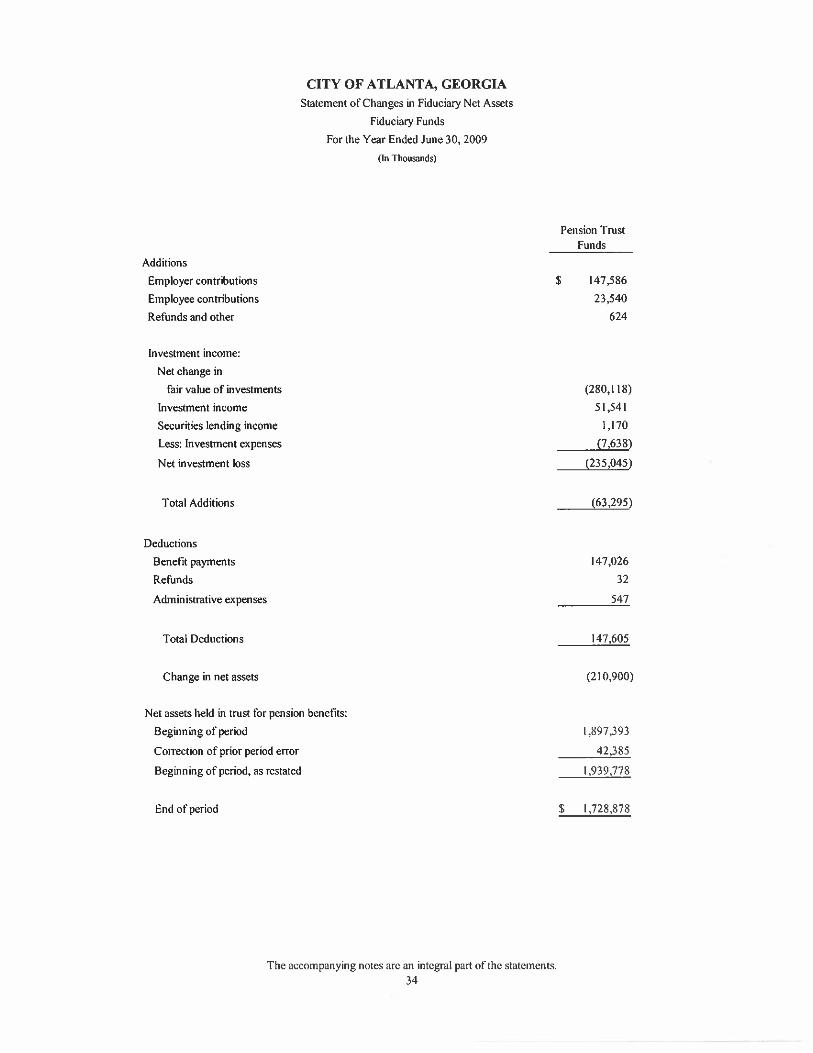
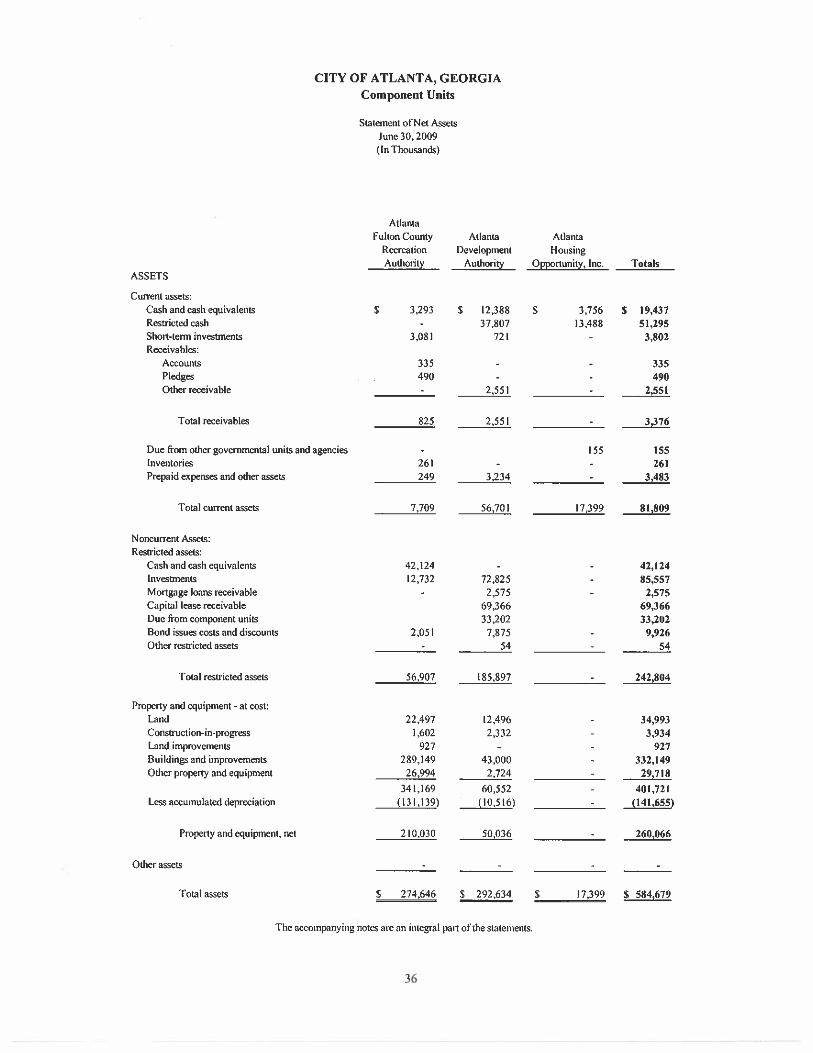
Statement of Changes in Fiduciary Net Assets – Fiduciary Funds……….….……………34 Component Units’ Financial Statements Statement of Net Assets – Component Units………………….…………………………..36 Statement of Activities – Component Units…...……………...…………………………. 38 Notes to Financial Statements…………………………………………….…………….….. 39
CITY OF ATLANTA, GEORGIA Comprehensive Annual Financial Report
For the Year Ended June 30, 2009
TABLE OF CONTENTS
PageRequired Supplementary Information: Schedule of Funding Progress – General Employees, Police Officers, and Firefighters Pension Plans .............................................................................................109 Schedule of Funding Progress – Other Post Employment Benefits………………………109
Combining and Individual Fund Statements and Schedules: Combining Balance Sheet – Nonmajor Governmental Funds ............................................112 Combining Statement of Revenues, Expenditures and Changes In Fund Balances – Nonmajor Governmental Funds……….……….…..……………...114 Combining Balance Sheet – Nonmajor Governmental Funds Tax Allocation Districts ..................................................................................................116 Combining Statement of Revenues, Expenditures and Changes In Fund Balances – Nonmajor Governmental Funds – Tax Allocation Districts ..................................................................................................117 Combining Balance Sheet – Nonmajor Governmental Funds Other Special Revenue ...................................................................................................118 Combining Statement of Revenue, Expenditures and Changes In Fund Balances – Nonmajor Governmental Funds – Other Special Revenue…………………………………………………………………119
Combining Schedule of Revenues, Expenditures, and Changes In Fund Balances – Budget and Actual: Nonmajor Special Revenue Funds……………………………………………….........120 Debt Service Fund …………………………………………………………………….139 Combining Statement of Net Assets – Nonmajor Proprietary Funds ................................141 Combining Statement of Revenues, Expenses, and Changes In Net Assets – Nonmajor Proprietary Funds ..................................................................142 Combining Statement of Cash Flows – Nonmajor Proprietary Funds ...............................143 Combining Statement of Net Assets – Internal Service Funds ..........................................144 Combining Statement of Revenues, Expenses, and Changes In Net Assets – Internal Service Funds ............................................................................145 Combining Statement of Cash Flows – Internal Service Funds .........................................146 Combining Statement of Plan Net Assets – Pension Trust Funds ......................................147 Combining Statement of Changes in Plan Net Assets – Pension Trust Funds ...................................................................................148 Statement of Changes in Assets and Liabilities – Agency Fund ........................................149
CITY OF ATLANTA, GEORGIA Comprehensive Annual Financial Report
For the Year Ended June 30, 2009
TABLE OF CONTENTS
PageSTATISTICAL SECTION
Net Assets by Component .........................................................................................................151Changes in Net Assets ..............................................................................................................152Program Revenues by Function/Program .................................................................................153 Fund Balances, Governmental Funds .......................................................................................154 Changes in Fund Balances, Governmental Funds ....................................................................155 Assessed and Estimated Actual Value of Taxable Property .....................................................156 Direct and Overlapping Property Tax Rates .............................................................................157 Principal Property Tax Payers ..................................................................................................158Property Tax Levies and Collections ........................................................................................159Taxable Sales by Category........................................................................................................160Direct and Overlapping Sales Tax Rates ..................................................................................161 Principal Sales Tax Remitters ...................................................................................................162Ratio of Outstanding Debt by Type ..........................................................................................163Ratio of General Bonded Debt Outstanding ............................................................................164 Direct and Overlapping Governmental Activities Debt ............................................................165 Legal Debt Margin Information ................................................................................................166Schedule of Revenue Bond Coverage- Department of Aviation ..............................................167 Schedule of Revenue Bond Coverage – Department of Watershed Management ...................168 Demographic and Economic Statistics .....................................................................................169 Principal Employers ..................................................................................................................170Full-time Equivalent City Government Employees by Function/Program ...............................171 Operating Indicators by Function/Program ..............................................................................172 Capital Asset Statistics by Function/Program...........................................................................173


C I T Y O F A T L A N T A SHIRLEY FRANKLIN
MAYOR DEPARTMENT OF FINANCE
68 MITCHELL STREET, S. W., SUITE 11100 ATLANTA, GEORGIA 30335-0312
VOICE (404) 330-6430 FAX (404) 658-6667
JAMES W. GLASSCHIEF FINANCIAL OFFICER
December 30, 2009
Honorable City Council President Honorable Members, Atlanta City Council, City of Atlanta, Georgia
Ladies and Gentlemen:
We are pleased to present the 2009 Comprehensive Annual Financial Report (CAFR) for the City of Atlanta, Georgia (City).
State law requires that all general-purpose local governments publish within six months of the close of each fiscal year a complete set of audited financial statements, presented in conformity with accounting principles generally accepted in the United States of America (GAAP). The law further requires that these statements be audited in accordance with generally accepted auditing standards by a firm of licensed certified public accountants. In accordance with these requirements, we hereby issue the CAFR of the City of Atlanta for the year ended June 30, 2009.
This report consists of management’s representations concerning the finances of the City. Consequently, management assumes full responsibility for the completeness and reliability of all of the information presented in the CAFR. To provide a reasonable basis for making these representations, management of the City has established an internal control framework that is designed both to protect the government’s assets from loss, theft, or misuse and to compile sufficient reliable information for the preparation of the City’s financial statements in conformity with GAAP. The cost of internal controls should never outweigh their benefits. A framework of internal controls has been designed to provide reasonable rather than absolute assurance that the financial statements are free from material misstatement. As management, we assert, to the best of our knowledge and belief, that the CAFR is complete and reliable in all material respects.
In accordance with Section 6-308 of the City Charter, the governing body shall provide annually for an independent audit of the accounts and other evidences of financial transactions of the City. This audit is to be performed by a certified public accounting firm. The City’s financial statements have been audited by Banks, Finley, White & Co; with additional support provided by Tabb & Tabb. The goal of the independent audit is to provide reasonable assurance that the financial statements of the City for the year ended June 30, 2009, are free of material misstatement. The independent audit involved examining, on a test basis, evidence supporting the amounts and disclosures in the financial statements; assessing the accounting principles used and significant estimates made by management; and evaluating the overall

iii
separate boards that act independently of the City of Atlanta. These include the Atlanta Independent School System (School System) and the Atlanta Housing Authority (AHA).
In March of 2009, the City of Atlanta’s Department of Parks, Recreation and Cultural Affairs was awarded accreditation status through the National Parks and Recreation Association’s Commission for Accreditation of Park and Recreation Agencies (CAPRA) program. CAPRA reviews best practices of parks and recreation departments’ operations, management and service to the community. This award is the highest honor that can be bestowed on this type of agency and reflects diligence responding to 155 standards of effective and efficient operations. Of over 5,000 agencies in the country, the City of Atlanta is the 81st agency to be accredited.
Local economy
The City of Atlanta has a strong economic base grounded in a diverse set of industries. Substantial concentrations of employers in government, manufacturing, education, finance, logistics and health care provide high paying jobs and a relatively reliable tax revenue base. The vitality of these industries – combined with an increased interest in living in urban centers – has generated substantial population growth in the City. Following several decades of stagnant or declining population growth, Atlanta has grown by a 3.4% estimated, annual rate since 2000 (US Census Bureau, based on July 1, 2008 and July 1, 2000 estimates). By all accounts the City of Atlanta has achieved its goal of becoming a “global city”. In a recent study published in Foreign Policy magazine, the City of Atlanta ranked 37th among 60 global cities for their importance as national engines of economic growth and connectivity to the global economy. The City ranked 8th among those cities located in the United States1.
In the medium and long-term, Atlanta is in a very strong competitive position. Prevailing migration patterns should continue to support strong population and business growth. Migration from overseas has increasingly moved inland from the coastal cities. Migration internal to the US continues to flow south with transplants from the northeast and industrial Midwest moving in large numbers to Georgia, Florida and North Carolina. And the national population shifts from suburbs and exurbs back to urban cores – driven by transportation costs, traffic congestion, and a renewed interest in urban living - is particularly prevalent in the Atlanta metro region.
New arrivals to the City are also wealthier than in the past. Per capita income in the City of Atlanta now far exceeds that of the metro region. Demand for housing has been strong and once neglected neighborhoods are attracting new residents and investment. This residential growth is in turn generating retail and commercial investment in transportation corridors that had been until recently rapidly deteriorating.
New tourist attractions – including the Georgia Aquarium, the World of Coke, the future Center for Civil and Human Rights, and the College Football Hall of Fame – are turning downtown Atlanta into a major national tourist destination. Downtown Atlanta has clearly turned the corner economically and is attracting residents, retailers, and new businesses at an accelerated rate. The City is moving ahead with the Beltline Project, which is generating investments in previously neglected corridors of the City and will eventually serve to unify the residential neighborhoods of the City through its network of transit, trails and parks.
1 In October 2008, Foreign Policy magazine, in conjunction with consulting firm A. T. Kearney and the Chicago Council on GlobalAffairs, published a ranking of global cities. Foreign Policy noted "[t]he world’s biggest, most interconnected cities help setglobal agendas, weather transnational dangers, and serve as the hubs of global integration. They are the engines of growth fortheir countries and the gateways to the resources of their regions." The rankings are based on the evaluation of 24 metrics infive areas: business activity, human capital, information exchange, cultural experience, and political engagement.
v
The City is required to adopt a balanced budget each year and maintains budgetary controls to ensure compliance with legal provisions of the annual budget approved by the Mayor and City Council. A Budget Report and Capital Improvement Plan are published each year. Activities of the general fund, special revenue funds and the debt service fund are included in the annual budget. Project life financial plans are adopted for the capital project funds. The official level of the City budget control (the level at which expenditures may not legally exceed appropriations) for each legally adopted annual operating budget is the department, function or activity, and major category or expenditure group within funds. Budgets for capital projects and grant projects are adopted at the project level within departments and funds, but budgets may be adopted for each category of expenditure within projects if necessary to meet grantor or other control requirements. Transfers of appropriations within the budget of a department in the operating, internal service, and grant funds of the City may be authorized by the approval of the affected department head, the Chief Financial Officer, the Chief Operating Officer, and the chairperson of the Finance Executive Committee. Such transfers are filed with the City Council, but require no Council action. Transfers of appropriations from one department to another require an ordinance adopted by City Council and approved by the Mayor. The City’s budget procedures, together with such procedures for included component units, are more fully explained in the accompanying “Notes to the Financial Statements”. The City maintains an encumbrance accounting system and an allotment system to accomplish budgetary control. Appropriations for encumbered amounts at year-end are usually carried forward to the ensuing year if they exceed a certain percentage of the ensuing year’s budget, and are contractually obligated or dedicated for approved projects or programs.
Long-Term Capital Planning
The City’s approach to long-term capital planning is guided by the development of the Atlanta Strategic Action Plan (ASAP) and the Capital Improvement Program (CIP). The ASAP captures the City’s vision for the next 5, 10 and 15 years and identifies the City's needs and policies while recommending future projects for implementation. Citizen input is vital to the ASAP and is obtained through Neighborhood Planning Units serving as citizen advisory councils, making recommendations to the Mayor and City Council on zoning, land-use and other planning issues.
The CIP covers a 10-year period and identifies the specific improvements to City infrastructure and facilities needed to support and implement the Comprehensive Development Plan (CDP). The CIP is intended to ensure that necessary projects will be undertaken according to an established set of priorities and that revenue will be available to finance such projects when it is needed. Both the CDP and CIP are updated annually.
Economic Development
To promote economic development in undeveloped or underdeveloped areas, the City, with the assistance of its designated redevelopment agent, The Atlanta Development Authority (ADA), issues limited obligation Tax Allocation District (TAD) bonds on behalf of the City. TAD bonds are not secured by the full faith and credit of the City, but are secured solely by and payable from specified pledged revenues. The pledged revenues are the tax allocation increments, or the amount of property taxes generated within the TAD that exceed the amount collected from the same area prior to development. Tax allocation districts have proven to be an effective and useful economic development tool. The Atlantic Station mixed-use development and the opening of the world’s largest Aquarium were products of TAD bonds and further strengthen the City’s core business districts. The City’s designation as a
X
Cit
y of
Atl
anta
, Geo
rgia
2009
Org
aniz
atio
nal S
truc
ture
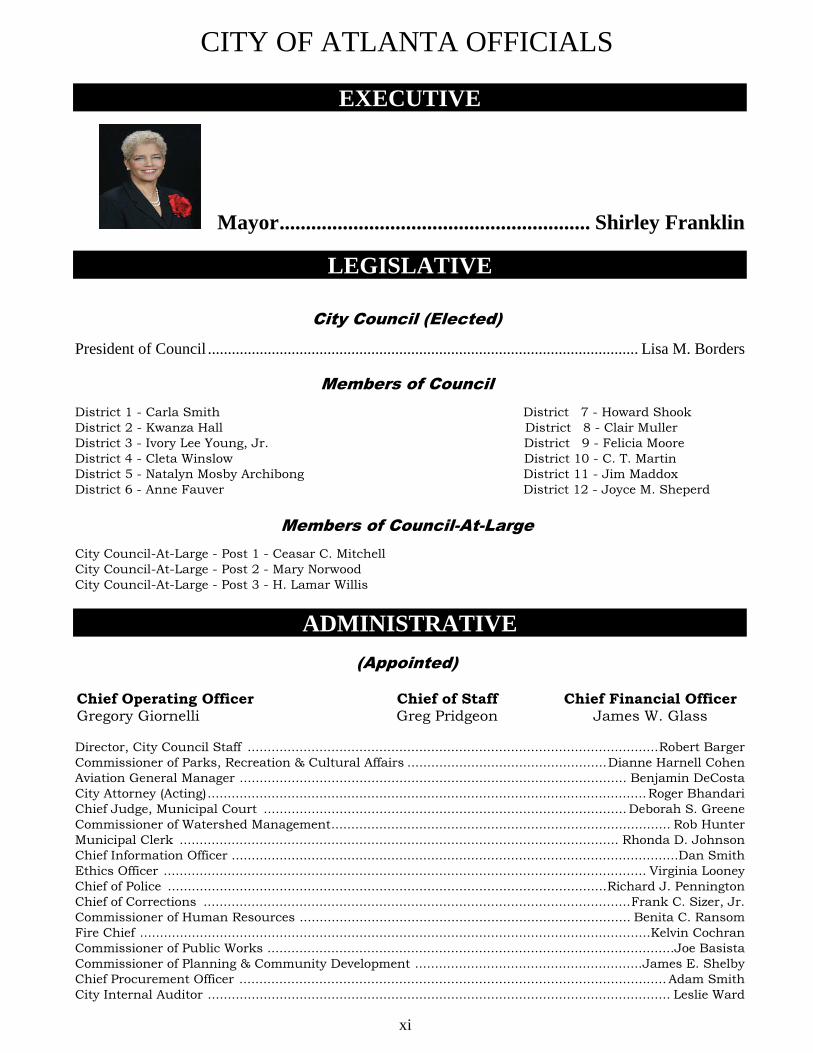
CITY OF ATLANTA OFFICIALS
xi
EXECUTIVE
Mayor........................................................... Shirley Franklin
LEGISLATIVE
City Council (Elected)
President of Council ............................................................................................................ Lisa M. Borders
Members of CouncilDistrict 1 - Carla Smith District 7 - Howard ShookDistrict 2 - Kwanza Hall District 8 - Clair MullerDistrict 3 - Ivory Lee Young, Jr. District 9 - Felicia MooreDistrict 4 - Cleta Winslow District 10 - C. T. MartinDistrict 5 - Natalyn Mosby Archibong District 11 - Jim MaddoxDistrict 6 - Anne Fauver District 12 - Joyce M. Sheperd
Members of Council-At-LargeCity Council-At-Large - Post 1 - Ceasar C. MitchellCity Council-At-Large - Post 2 - Mary NorwoodCity Council-At-Large - Post 3 - H. Lamar Willis
ADMINISTRATIVE
(Appointed)
Chief Operating Officer Chief of Staff Chief Financial OfficerGregory Giornelli Greg Pridgeon James W. Glass
Director, City Council Staff .......................................................................................................Robert BargerCommissioner of Parks, Recreation & Cultural Affairs ..................................................Dianne Harnell CohenAviation General Manager ................................................................................................. Benjamin DeCostaCity Attorney (Acting)..............................................................................................................Roger BhandariChief Judge, Municipal Court ........................................................................................... Deborah S. GreeneCommissioner of Watershed Management..................................................................................... Rob HunterMunicipal Clerk .............................................................................................................. Rhonda D. JohnsonChief Information Officer ................................................................................................................Dan SmithEthics Officer ......................................................................................................................... Virginia LooneyChief of Police ..............................................................................................................Richard J. PenningtonChief of Corrections ...........................................................................................................Frank C. Sizer, Jr.Commissioner of Human Resources ................................................................................... Benita C. RansomFire Chief ................................................................................................................................Kelvin CochranCommissioner of Public Works ......................................................................................................Joe BasistaCommissioner of Planning & Community Development .........................................................James E. ShelbyChief Procurement Officer ........................................................................................................... Adam SmithCity Internal Auditor .................................................................................................................... Leslie Ward


3
Management’s Discussion and Analysis
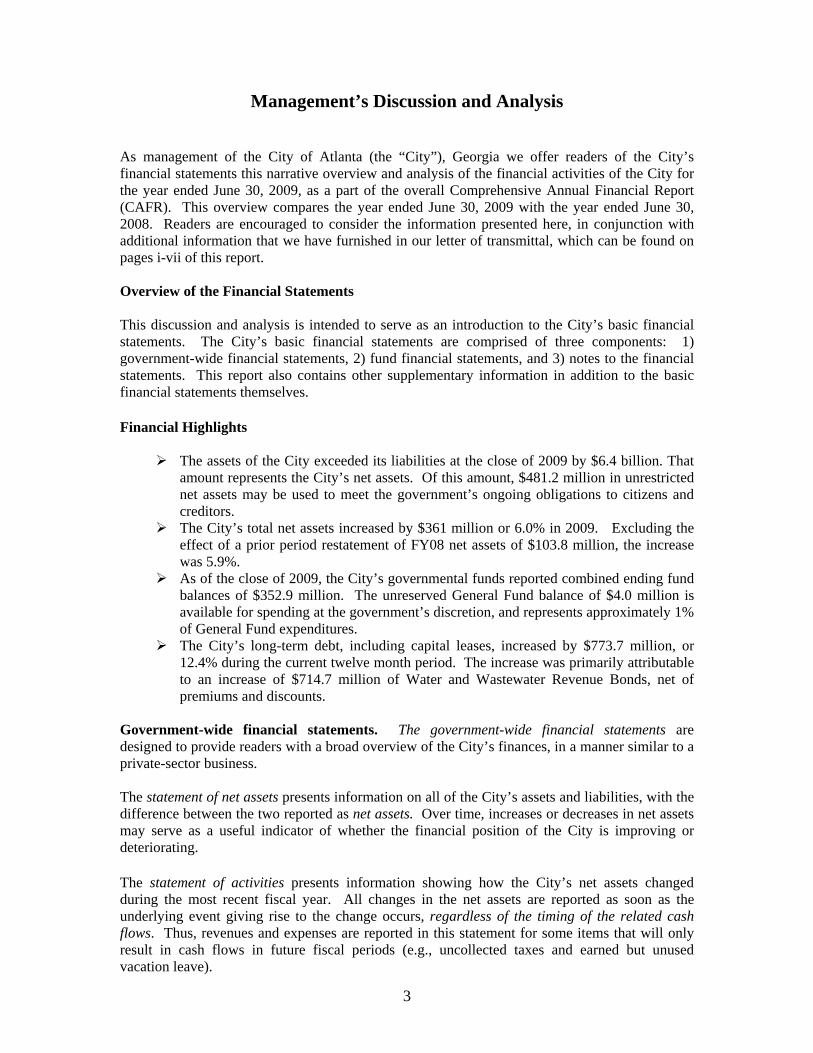
As management of the City of Atlanta (the “City”), Georgia we offer readers of the City’s financial statements this narrative overview and analysis of the financial activities of the City for the year ended June 30, 2009, as a part of the overall Comprehensive Annual Financial Report (CAFR). This overview compares the year ended June 30, 2009 with the year ended June 30, 2008. Readers are encouraged to consider the information presented here, in conjunction with additional information that we have furnished in our letter of transmittal, which can be found on pages i-vii of this report.
Overview of the Financial Statements
This discussion and analysis is intended to serve as an introduction to the City’s basic financial statements. The City’s basic financial statements are comprised of three components: 1) government-wide financial statements, 2) fund financial statements, and 3) notes to the financial statements. This report also contains other supplementary information in addition to the basic financial statements themselves.
Financial Highlights
The assets of the City exceeded its liabilities at the close of 2009 by $6.4 billion. That amount represents the City’s net assets. Of this amount, $481.2 million in unrestricted net assets may be used to meet the government’s ongoing obligations to citizens and creditors.The City’s total net assets increased by $361 million or 6.0% in 2009. Excluding the effect of a prior period restatement of FY08 net assets of $103.8 million, the increase was 5.9%. As of the close of 2009, the City’s governmental funds reported combined ending fund balances of $352.9 million. The unreserved General Fund balance of $4.0 million is available for spending at the government’s discretion, and represents approximately 1% of General Fund expenditures.The City’s long-term debt, including capital leases, increased by $773.7 million, or 12.4% during the current twelve month period. The increase was primarily attributable to an increase of $714.7 million of Water and Wastewater Revenue Bonds, net of premiums and discounts.
Government-wide financial statements. The government-wide financial statements aredesigned to provide readers with a broad overview of the City’s finances, in a manner similar to a private-sector business.
The statement of net assets presents information on all of the City’s assets and liabilities, with the difference between the two reported as net assets. Over time, increases or decreases in net assets may serve as a useful indicator of whether the financial position of the City is improving or deteriorating.
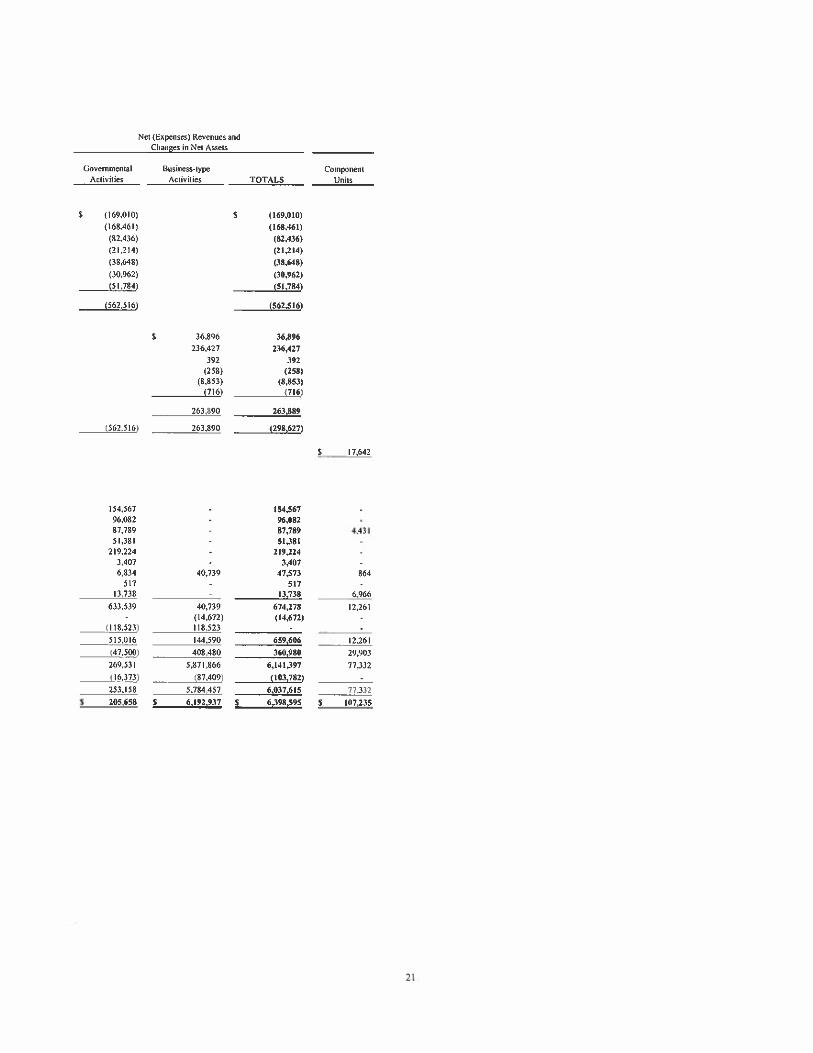
The statement of activities presents information showing how the City’s net assets changed during the most recent fiscal year. All changes in the net assets are reported as soon as the underlying event giving rise to the change occurs, regardless of the timing of the related cash flows. Thus, revenues and expenses are reported in this statement for some items that will only result in cash flows in future fiscal periods (e.g., uncollected taxes and earned but unused vacation leave).

4
Both of the government-wide financial statements distinguish functions of the City that are principally supported by taxes and intergovernmental revenues (governmental activities) from other functions that are designed to recover all or a significant portion of their costs through user fees and charges (business-type activities). The governmental activities of the City include general government, public safety, highways and streets, economic development, and cultural and recreation. The business-type activities of the City include the Department of Aviation (Hartsfield-Jackson Atlanta International Airport), Department of Watershed Management (Water and Wastewater System), Parks and Recreational Facilities, Solid Waste Services, Underground Atlanta and the Civic Center.
The government-wide financial statements include not only the City itself (known as the primary government), but also the legally separate Atlanta Fulton County Recreation Authority, Atlanta CoRA Inc., Atlanta Development Authority, and the Atlanta Housing Opportunity, Inc., for which the City is financially accountable. Financial information for these component units isreported separately from the financial information presented for the primary government itself, except for Atlanta CoRA, Inc., whose statements are blended with the primary government. Certain organizations are not included within the scope of this report since they were established by the Constitution of the State of Georgia or state laws and are administered by separate boards that act independently of the City. Included in this category are the Atlanta Independent School System and the Atlanta Housing Authority.
The government-wide financial statements can be found following this section of the report.
Fund financial statements. A fund is a grouping of related accounts that is used to maintain control over resources that have been segregated for specific activities or objectives. The City, like other state and local governments, uses fund accounting to ensure and demonstrate compliance with finance-related legal requirements. All of the funds of the City can be divided into three categories: governmental funds, proprietary funds, and fiduciary funds.
Governmental funds are used to account for essentially the same functions reported as governmental activities in the government-wide financial statements. However, unlike the government-wide financial statements, governmental fund financial statements focus on near-term inflows and outflows of spendable resources, as well as on balances of spendable resources available at the end of the fiscal year. Such information may be useful in evaluating a government’s near-term financing requirements.
Because the focus of governmental funds is narrower than that of the government-wide financial statements, it is useful to compare the information presented for governmental funds with similar information presented for governmental activities in the government-wide financial statements. By doing so, readers may better understand the long-term impact of the government’s near-term financing decisions. Both the governmental fund balance sheet and the governmental fund statement of revenues, expenditures, and changes in fund balances provide a reconciliation to facilitate this comparison between governmental funds and governmental activities.
The City utilizes four generic fund types of governmental funds (see section I note C in the notes to the financial statements). The City maintains twenty seven individual funds within the generic fund types. Information is presented separately in the governmental fund balance sheet and in the governmental fund statement of revenues, expenditures, and changes in fund balances for the general fund, capital projects fund and debt service fund, which are considered to be major funds. Data from the other twenty four governmental funds are combined into a single, aggregated presentation. Individual fund data for each of these non-major governmental funds is provided in the form of combining statements elsewhere in this report.
5
The City adopts an annual appropriated budget for its general fund. A budgetary comparison statement has been provided for the general fund to demonstrate compliance with this budget.
The governmental funds financial statements immediately follow the government-wide financial statements.
Proprietary funds. The City maintains two different types of proprietary funds. Enterprise funds are used to report the same functions presented as business-type activities in the government-wide financial statements. The City uses enterprise funds to account for the business-type activities of the Hartsfield-Jackson Atlanta International Airport, Water and Wastewater System, Parks and Recreational Facilities, Solid Waste Services, Underground Atlanta, and the Civic Center. Aninternal service fund is an accounting device used to accumulate and allocate costs internally among the City’s various functions. The City uses an internal service fund to account for the maintenance and operation of its fleet of vehicles and its group insurance fund for employees and retirees. Because these services benefit both governmental and business-type functions, the net assets and change in net assets have been allocated between governmental activities and business-type activities in the government-wide financial statements.
Proprietary funds provide the same type of information as the government-wide financial statements. The proprietary fund financial statements provide separate information for the Department of Aviation, and the Department of Watershed Management, which are considered to be major funds of the City. Conversely, both internal service funds are combined into a single, aggregated presentation in the proprietary fund financial statements. Individual fund data for the internal service funds is provided in the form of combining statements elsewhere in this report.
The proprietary funds financial statements follow the governmental funds statements.
Fiduciary funds. Fiduciary funds are used to account for resources held for the benefit of parties outside the government. Fiduciary funds are not reflected in the government-wide financial statement because the resources of those funds are not available to support the City’s own programs. The accounting used for fiduciary funds is much like that used for proprietary funds.
The fiduciary funds financial statements follow the proprietary funds statements.
Notes to the financial statements. The notes provide additional information that is essential to a full understanding of the data provided in the government-wide and fund financial statements. The notes can be found following the basic financial statements in this report.
Other information. In addition to the basic financial statements, this report also presents certain required supplementary information concerning the City’s progress in funding its obligation to provide pension benefits to its employees. Required supplementary information can be found following the notes in this report.
The combining and individual funds statements, referred to earlier in connection with non-major governmental and proprietary funds, are presented immediately following the required supplementary information on pensions.
6
Financial Analysis - Government-wide Statements
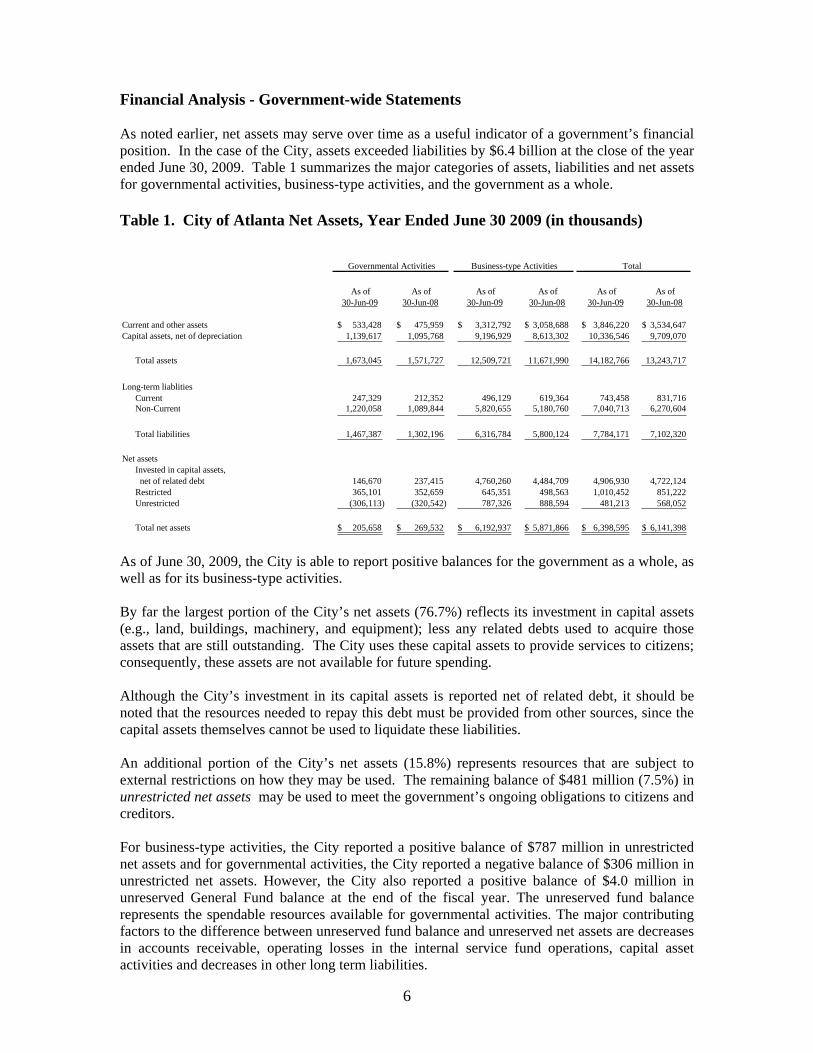
As noted earlier, net assets may serve over time as a useful indicator of a government’s financial position. In the case of the City, assets exceeded liabilities by $6.4 billion at the close of the year ended June 30, 2009. Table 1 summarizes the major categories of assets, liabilities and net assets for governmental activities, business-type activities, and the government as a whole.
Table 1. City of Atlanta Net Assets, Year Ended June 30 2009 (in thousands)
As of As of As of As of As of As of 30-Jun-09 30-Jun-08 30-Jun-09 30-Jun-08 30-Jun-09 30-Jun-08
Current and other assets 533,428$ 475,959$ 3,312,792$ 3,058,688$ 3,846,220$ 3,534,647$Capital assets, net of depreciation 1,139,617 1,095,768 9,196,929 8,613,302 10,336,546 9,709,070
Total assets 1,673,045 1,571,727 12,509,721 11,671,990 14,182,766 13,243,717
Long-term liablitiesCurrent 247,329 212,352 496,129 619,364 743,458 831,716 Non-Current 1,220,058 1,089,844 5,820,655 5,180,760 7,040,713 6,270,604
Total liabilities 1,467,387 1,302,196 6,316,784 5,800,124 7,784,171 7,102,320
Net assetsInvested in capital assets, net of related debt 146,670 237,415 4,760,260 4,484,709 4,906,930 4,722,124 Restricted 365,101 352,659 645,351 498,563 1,010,452 851,222 Unrestricted (306,113) (320,542) 787,326 888,594 481,213 568,052
Total net assets 205,658$ 269,532$ 6,192,937$ 5,871,866$ 6,398,595$ 6,141,398$
Total Governmental Activities Business-type Activities
As of June 30, 2009, the City is able to report positive balances for the government as a whole, as well as for its business-type activities.
By far the largest portion of the City’s net assets (76.7%) reflects its investment in capital assets (e.g., land, buildings, machinery, and equipment); less any related debts used to acquire those assets that are still outstanding. The City uses these capital assets to provide services to citizens; consequently, these assets are not available for future spending.
Although the City’s investment in its capital assets is reported net of related debt, it should be noted that the resources needed to repay this debt must be provided from other sources, since the capital assets themselves cannot be used to liquidate these liabilities.
An additional portion of the City’s net assets (15.8%) represents resources that are subject to external restrictions on how they may be used. The remaining balance of $481 million (7.5%) in unrestricted net assets may be used to meet the government’s ongoing obligations to citizens and creditors.
For business-type activities, the City reported a positive balance of $787 million in unrestricted net assets and for governmental activities, the City reported a negative balance of $306 million in unrestricted net assets. However, the City also reported a positive balance of $4.0 million in unreserved General Fund balance at the end of the fiscal year. The unreserved fund balance represents the spendable resources available for governmental activities. The major contributing factors to the difference between unreserved fund balance and unreserved net assets are decreases in accounts receivable, operating losses in the internal service fund operations, capital asset activities and decreases in other long term liabilities.

7
Governmental Activities
Total revenue was largely unchanged compared to the year ended June 30, 2008 (down $571,000). An increase of $18.9 million in Charges for Services helped offset the substantial decline in consumer spending and construction activity, which impacted the City’s tax and permit receipts. The City’s economically sensitive revenues which include sales tax, hotel/motel tax, building permits, and real estate transfer taxes have declined during this economic downturn. Property tax revenues increased $19.1 million during the current period.
The municipal option sales tax (MOST) was recognized as general, non-operating revenue in the business-type funds during 2008. For the fiscal year 2009, the MOST revenue is recorded in Other Taxes of the Governmental funds ($117 million) and is primarily responsible for the respective changes in reported Governmental Activities and Business-type Activities revenue. An operating transfer is subsequently recorded from the Special Revenue Fund of the General Government to the Department of Watershed Management for use in its operations, and is reflected as such in the financial statements.
The City’s net assets increased by $361 million, or 6.0% during the current period. The majority of this is attributable to increases in property tax revenues, and charges for services within both governmental and business type activities.
Table 2. City of Atlanta’s Changes in Net Assets, Year Ended June 30, 2009 (in thousands)
Year Ended Year Ended Year Ended Year Ended Year Ended Year Ended 30-Jun-09 30-Jun-08 30-Jun-09 30-Jun-08 30-Jun-09 30-Jun-08
RevenuesProgram revenues
Charges for services 117,383$ 131,915$ 792,289$ 759,630$ 909,672$ 891,545$ Operating grants and contributions 42,336 49,832 - - 42,336 49,832 Capital grants and contributions - - 275,033 250,113 275,033 250,113
General revenuesProperty taxes 250,649 231,541 - - 250,649 231,541 Other taxes 358,394 246,336 - 127,470 358,394 373,806 State formula aid 3,407 4,461 - - 3,407 4,461 Investment Income 6,834 18,302 40,739 66,342 47,573 84,644 Other 14,255 14,474 - 1,474 14,255 15,948
Total revenues 793,258 696,861 1,108,061 1,205,029 1,901,319 1,901,890
Expenses:General government: 265,596 234,198 - - 265,596 234,198 Police 192,161 219,614 - - 192,161 219,614 Fire 84,454 94,871 - - 84,454 94,871 Corrections 37,264 50,714 - - 37,264 50,714 Public Works 56,814 79,823 - - 56,814 79,823 Parks, Recreation and Cultural Affairs 34,161 48,626 - - 34,161 48,626 Nondepartmental - - - - - - Interest on long-term debt 51,784 43,734 - - 51,784 43,734 Water and Wastewater System - - 319,790 326,279 319,790 326,279 Department of Aviation - - 423,198 356,414 423,198 356,414 Sanitation - - 46,121 48,613 46,121 48,613
Other - - 14,323 14,017 14,323 14,017
Total Expenses 722,235 771,580 803,432 745,323 1,525,667 1,516,903
Increase (decrease) in net assets before transfers 71,023 (74,719) 304,629 459,706 375,652 384,987
Impairment of assets - - (14,672) - (14,672) - Transfers in(out) (118,523) 2,311 118,523 (2,311) - -
Increase (decrease) in net assets (47,500) (72,408) 408,480 457,395 360,980 384,987
Net Assets, Beginning of Period as previously reported 269,532 572,600 5,871,866 4,854,281 6,141,398 5,426,881
Correction of Prior Year Error (16,373) (230,660) (87,409) 560,190 (103,783) 329,530
Net Assets, Beginning of Period as restated 253,159 341,940 5,784,457 5,414,471 6,037,615 5,756,411
Net Assets, End of Period 205,659$ 269,532$ 6,192,937$ 5,871,866$ 6,398,596$ 6,141,398$
Business-type Activities Total Governmental Activities
8
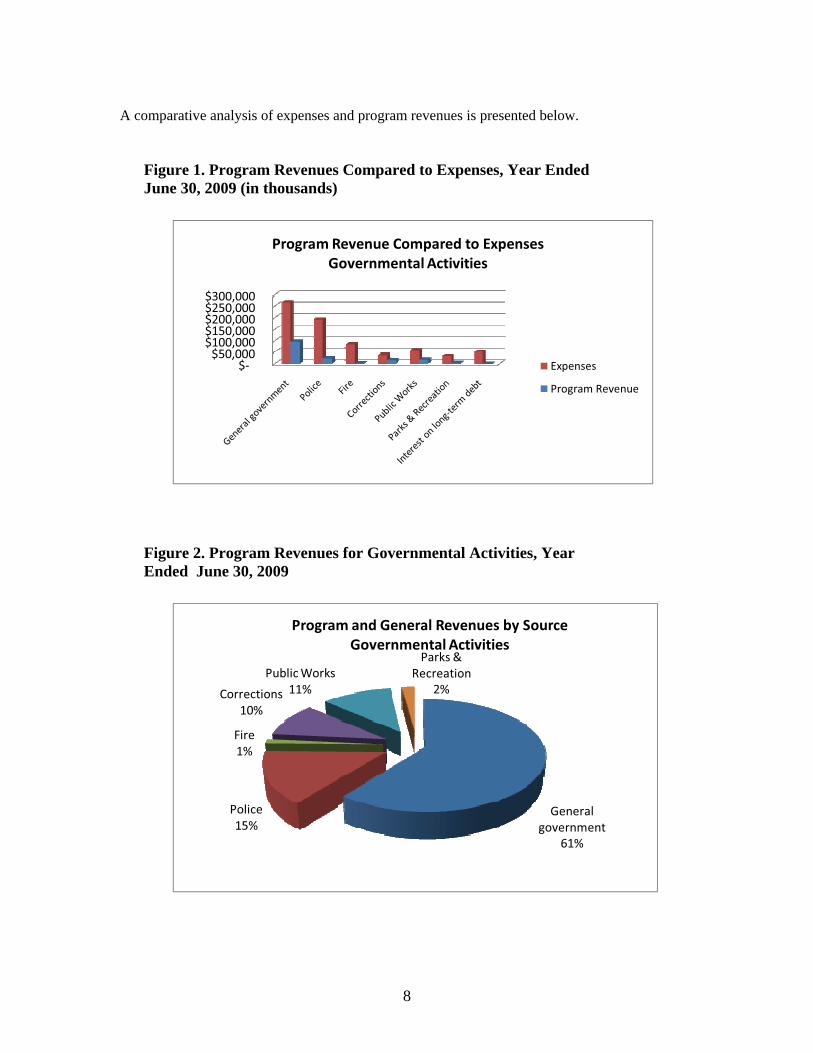
A comparative analysis of expenses and program revenues is presented below.
Figure 1. Program Revenues Compared to Expenses, Year Ended June 30, 2009 (in thousands)
$$50,000$100,000$150,000$200,000$250,000$300,000
Program Revenue Compared to ExpensesGovernmental Activities
Expenses
Program Revenue
Figure 2. Program Revenues for Governmental Activities, Year Ended June 30, 2009
Generalgovernment
61%
Police15%
Fire1%
Corrections10%
PublicWorks11%
Parks &Recreation
2%
Program and General Revenues by SourceGovernmental Activities
9
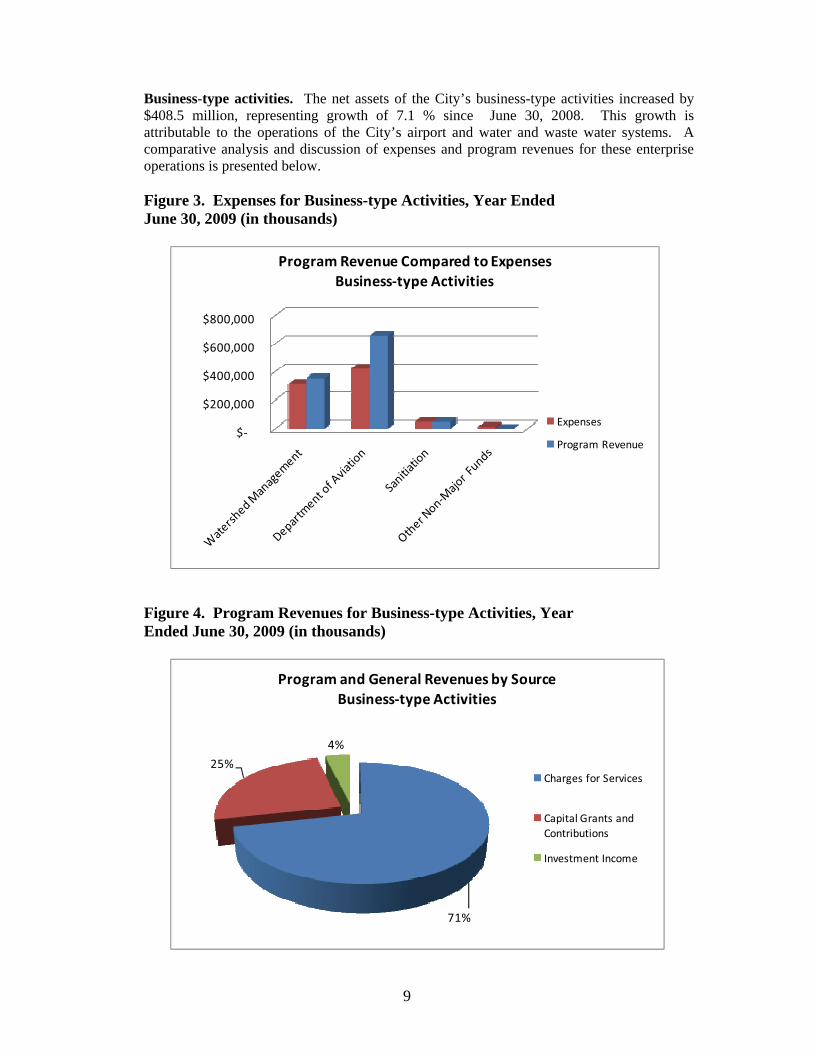
Business-type activities. The net assets of the City’s business-type activities increased by $408.5 million, representing growth of 7.1 % since June 30, 2008. This growth is attributable to the operations of the City’s airport and water and waste water systems. A comparative analysis and discussion of expenses and program revenues for these enterprise operations is presented below.
Figure 3. Expenses for Business-type Activities, Year Ended June 30, 2009 (in thousands)
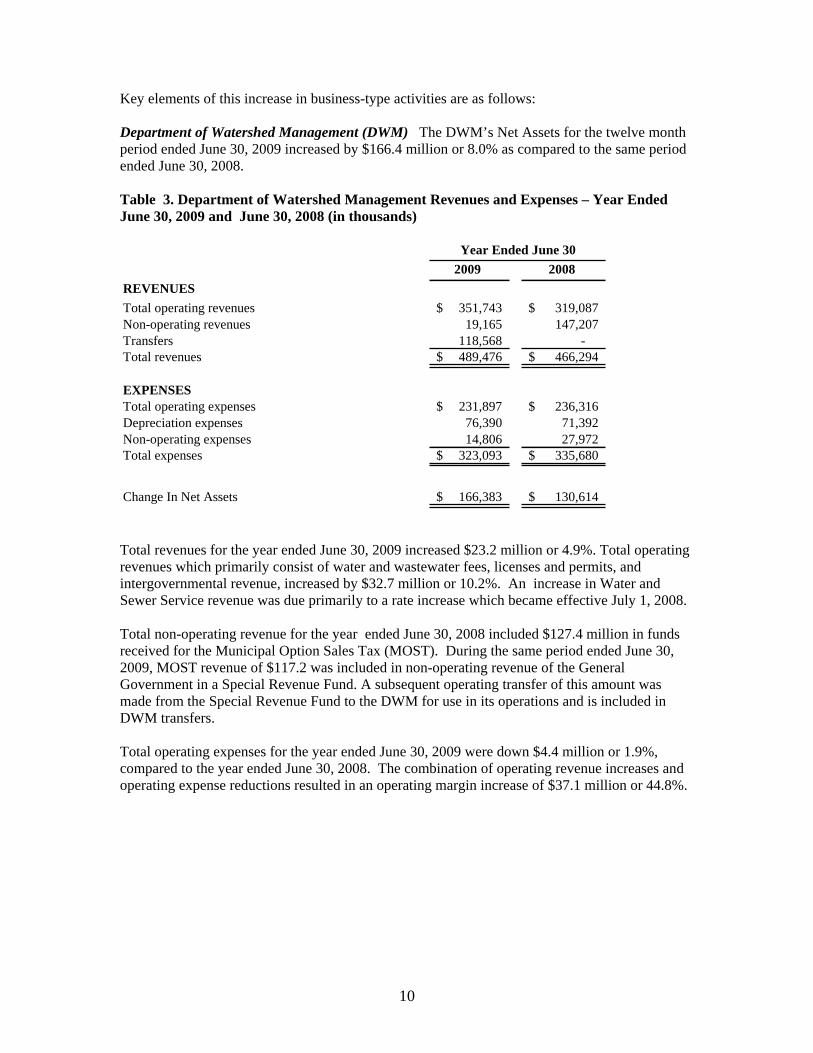
Figure 4. Program Revenues for Business-type Activities, YearEnded June 30, 2009 (in thousands)
$
$200,000
$400,000
$600,000
$800,000
Program Revenue Compared to ExpensesBusiness type Activities
Expenses
Program Revenue
71%
25%
4%
Program and General Revenues by SourceBusiness type Activities
Charges for Services
Capital Grants andContributions
Investment Income
10
Key elements of this increase in business-type activities are as follows:
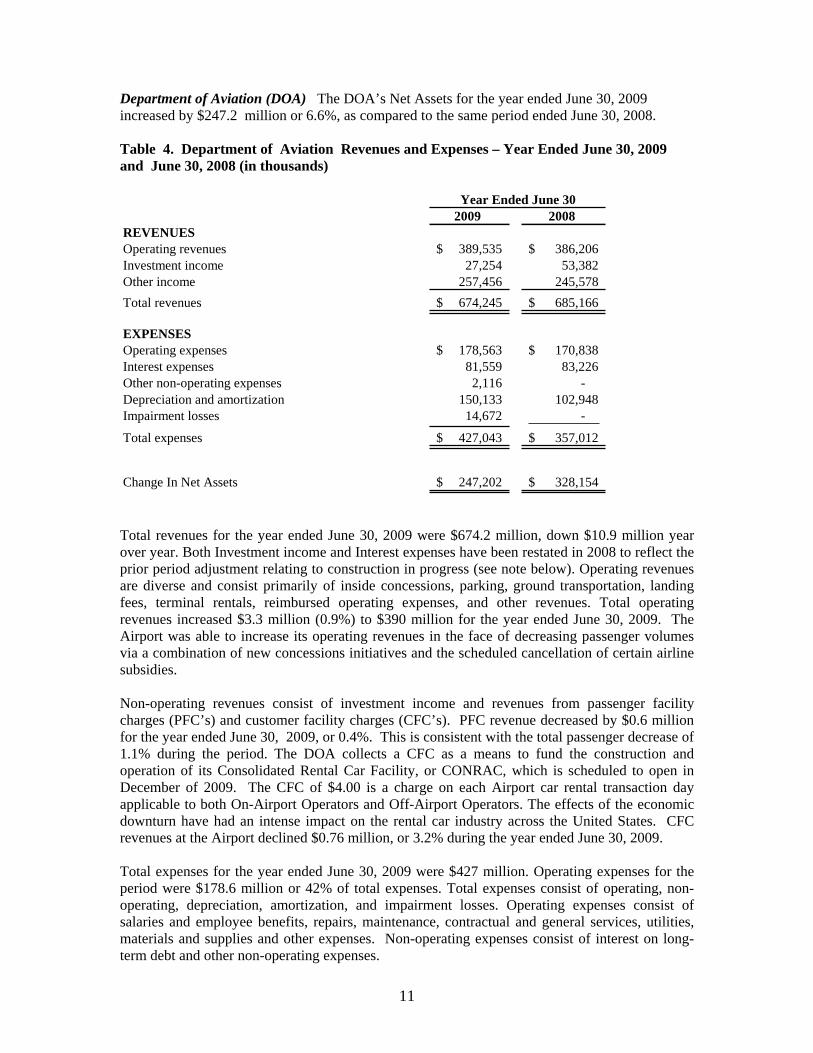
Department of Watershed Management (DWM) The DWM’s Net Assets for the twelve month period ended June 30, 2009 increased by $166.4 million or 8.0% as compared to the same period ended June 30, 2008.
Table 3. Department of Watershed Management Revenues and Expenses – Year Ended June 30, 2009 and June 30, 2008 (in thousands)
2009 2008
REVENUES
Total operating revenues 351,743$ 319,087$Non-operating revenues 19,165 147,207Transfers 118,568 - Total revenues 489,476$ 466,294$
EXPENSESTotal operating expenses 231,897$ 236,316$Depreciation expenses 76,390 71,392Non-operating expenses 14,806 27,972Total expenses 323,093$ 335,680$
Change In Net Assets 166,383$ 130,614$
Year Ended June 30
Total revenues for the year ended June 30, 2009 increased $23.2 million or 4.9%. Total operating revenues which primarily consist of water and wastewater fees, licenses and permits, and intergovernmental revenue, increased by $32.7 million or 10.2%. An increase in Water and Sewer Service revenue was due primarily to a rate increase which became effective July 1, 2008.
Total non-operating revenue for the year ended June 30, 2008 included $127.4 million in funds received for the Municipal Option Sales Tax (MOST). During the same period ended June 30, 2009, MOST revenue of $117.2 was included in non-operating revenue of the General Government in a Special Revenue Fund. A subsequent operating transfer of this amount was made from the Special Revenue Fund to the DWM for use in its operations and is included in DWM transfers.
Total operating expenses for the year ended June 30, 2009 were down $4.4 million or 1.9%, compared to the year ended June 30, 2008. The combination of operating revenue increases and operating expense reductions resulted in an operating margin increase of $37.1 million or 44.8%.
11
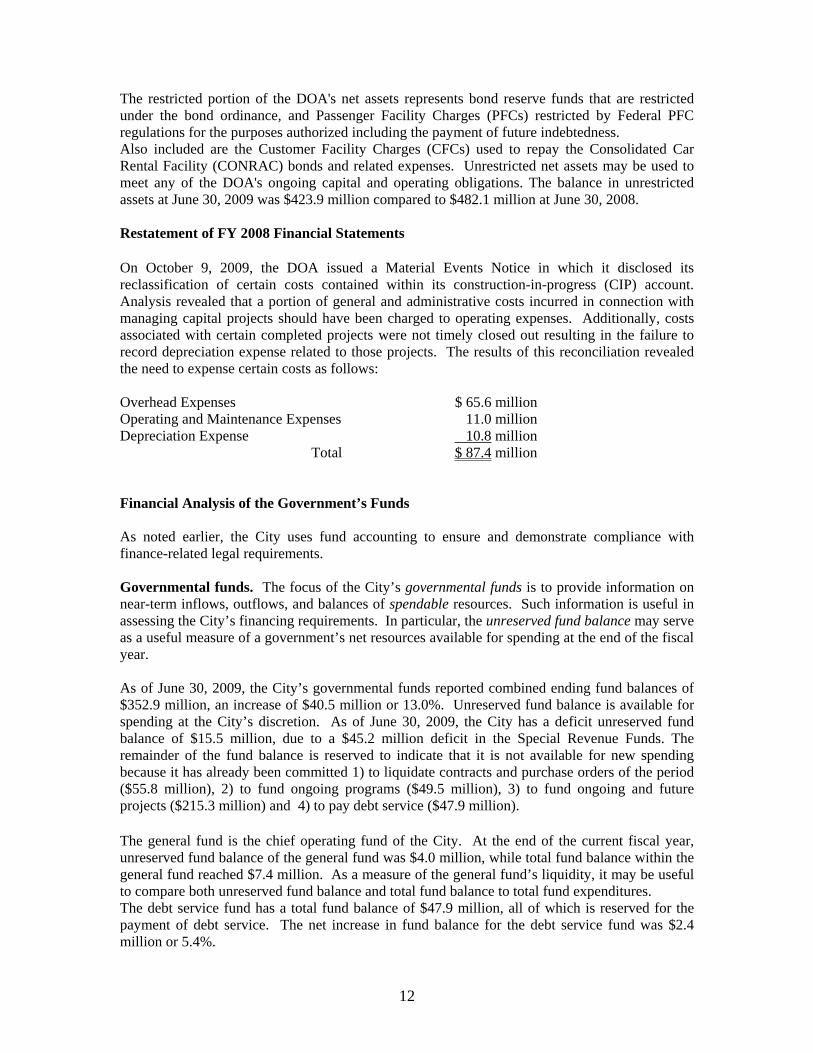
Department of Aviation (DOA) The DOA’s Net Assets for the year ended June 30, 2009 increased by $247.2 million or 6.6%, as compared to the same period ended June 30, 2008.
Table 4. Department of Aviation Revenues and Expenses – Year Ended June 30, 2009 and June 30, 2008 (in thousands)
2009 2008REVENUESOperating revenues 389,535$ 386,206$Investment income 27,254 53,382Other income 257,456 245,578
Total revenues 674,245$ 685,166$
EXPENSESOperating expenses 178,563$ 170,838$Interest expenses 81,559 83,226 Other non-operating expenses 2,116 - Depreciation and amortization 150,133 102,948Impairment losses 14,672 -
Total expenses 427,043$ 357,012$
Change In Net Assets 247,202$ 328,154$
Year Ended June 30
Total revenues for the year ended June 30, 2009 were $674.2 million, down $10.9 million year over year. Both Investment income and Interest expenses have been restated in 2008 to reflect the prior period adjustment relating to construction in progress (see note below). Operating revenues are diverse and consist primarily of inside concessions, parking, ground transportation, landing fees, terminal rentals, reimbursed operating expenses, and other revenues. Total operating revenues increased $3.3 million (0.9%) to $390 million for the year ended June 30, 2009. The Airport was able to increase its operating revenues in the face of decreasing passenger volumes via a combination of new concessions initiatives and the scheduled cancellation of certain airline subsidies.
Non-operating revenues consist of investment income and revenues from passenger facility charges (PFC’s) and customer facility charges (CFC’s). PFC revenue decreased by $0.6 million for the year ended June 30, 2009, or 0.4%. This is consistent with the total passenger decrease of 1.1% during the period. The DOA collects a CFC as a means to fund the construction and operation of its Consolidated Rental Car Facility, or CONRAC, which is scheduled to open in December of 2009. The CFC of $4.00 is a charge on each Airport car rental transaction day applicable to both On-Airport Operators and Off-Airport Operators. The effects of the economic downturn have had an intense impact on the rental car industry across the United States. CFC revenues at the Airport declined $0.76 million, or 3.2% during the year ended June 30, 2009.
Total expenses for the year ended June 30, 2009 were $427 million. Operating expenses for the period were $178.6 million or 42% of total expenses. Total expenses consist of operating, non-operating, depreciation, amortization, and impairment losses. Operating expenses consist of salaries and employee benefits, repairs, maintenance, contractual and general services, utilities, materials and supplies and other expenses. Non-operating expenses consist of interest on long-term debt and other non-operating expenses.
12
The restricted portion of the DOA's net assets represents bond reserve funds that are restricted under the bond ordinance, and Passenger Facility Charges (PFCs) restricted by Federal PFC regulations for the purposes authorized including the payment of future indebtedness. Also included are the Customer Facility Charges (CFCs) used to repay the Consolidated Car Rental Facility (CONRAC) bonds and related expenses. Unrestricted net assets may be used to meet any of the DOA's ongoing capital and operating obligations. The balance in unrestricted assets at June 30, 2009 was $423.9 million compared to $482.1 million at June 30, 2008.
Restatement of FY 2008 Financial Statements
On October 9, 2009, the DOA issued a Material Events Notice in which it disclosed its reclassification of certain costs contained within its construction-in-progress (CIP) account. Analysis revealed that a portion of general and administrative costs incurred in connection with managing capital projects should have been charged to operating expenses. Additionally, costs associated with certain completed projects were not timely closed out resulting in the failure to record depreciation expense related to those projects. The results of this reconciliation revealed the need to expense certain costs as follows:
Overhead Expenses $ 65.6 million Operating and Maintenance Expenses 11.0 million Depreciation Expense 10.8 million Total $ 87.4 million
Financial Analysis of the Government’s Funds
As noted earlier, the City uses fund accounting to ensure and demonstrate compliance with finance-related legal requirements.
Governmental funds. The focus of the City’s governmental funds is to provide information on near-term inflows, outflows, and balances of spendable resources. Such information is useful in assessing the City’s financing requirements. In particular, the unreserved fund balance may serve as a useful measure of a government’s net resources available for spending at the end of the fiscal year.
As of June 30, 2009, the City’s governmental funds reported combined ending fund balances of $352.9 million, an increase of $40.5 million or 13.0%. Unreserved fund balance is available for spending at the City’s discretion. As of June 30, 2009, the City has a deficit unreserved fund balance of $15.5 million, due to a $45.2 million deficit in the Special Revenue Funds. The remainder of the fund balance is reserved to indicate that it is not available for new spending because it has already been committed 1) to liquidate contracts and purchase orders of the period ($55.8 million), 2) to fund ongoing programs ($49.5 million), 3) to fund ongoing and future projects ($215.3 million) and 4) to pay debt service ($47.9 million).
The general fund is the chief operating fund of the City. At the end of the current fiscal year, unreserved fund balance of the general fund was $4.0 million, while total fund balance within the general fund reached $7.4 million. As a measure of the general fund’s liquidity, it may be useful to compare both unreserved fund balance and total fund balance to total fund expenditures. The debt service fund has a total fund balance of $47.9 million, all of which is reserved for the payment of debt service. The net increase in fund balance for the debt service fund was $2.4 million or 5.4%.
13
Proprietary funds The statements of the City’s proprietary funds provide the same type of information as business-type activities in the government-wide financial statements, but in more detail. Factors concerning the finances of these funds were previously addressed in the discussion of the City’s business-type activities.
General Fund Budgetary Highlights
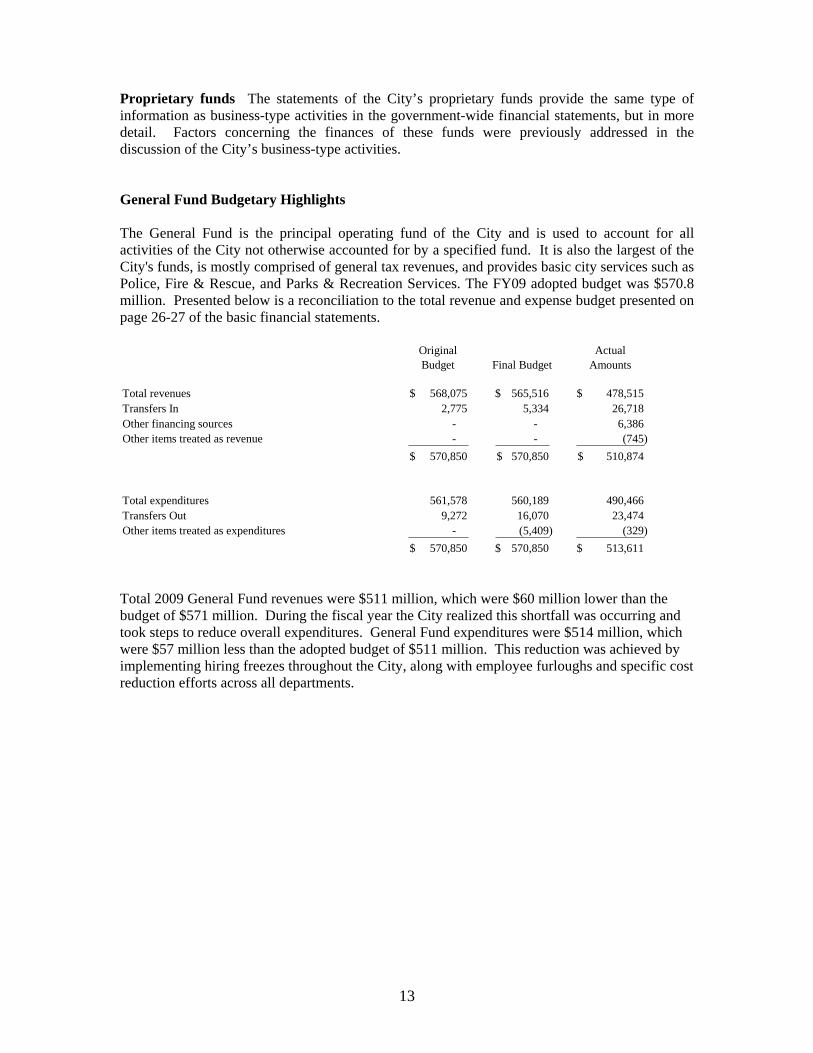
The General Fund is the principal operating fund of the City and is used to account for all activities of the City not otherwise accounted for by a specified fund. It is also the largest of the City's funds, is mostly comprised of general tax revenues, and provides basic city services such as Police, Fire & Rescue, and Parks & Recreation Services. The FY09 adopted budget was $570.8 million. Presented below is a reconciliation to the total revenue and expense budget presented on page 26-27 of the basic financial statements.
Original Budget Final Budget
Actual Amounts
Total revenues 568,075$ 565,516$ 478,515$Transfers In 2,775 5,334 26,718 Other financing sources - - 6,386 Other items treated as revenue - - (745)
570,850$ 570,850$ 510,874$
Total expenditures 561,578 560,189 490,466Transfers Out 9,272 16,070 23,474 Other items treated as expenditures - (5,409) (329)
570,850$ 570,850$ 513,611$
Total 2009 General Fund revenues were $511 million, which were $60 million lower than the budget of $571 million. During the fiscal year the City realized this shortfall was occurring and took steps to reduce overall expenditures. General Fund expenditures were $514 million, which were $57 million less than the adopted budget of $511 million. This reduction was achieved by implementing hiring freezes throughout the City, along with employee furloughs and specific cost reduction efforts across all departments.
14
Capital Assets and Debt Administration
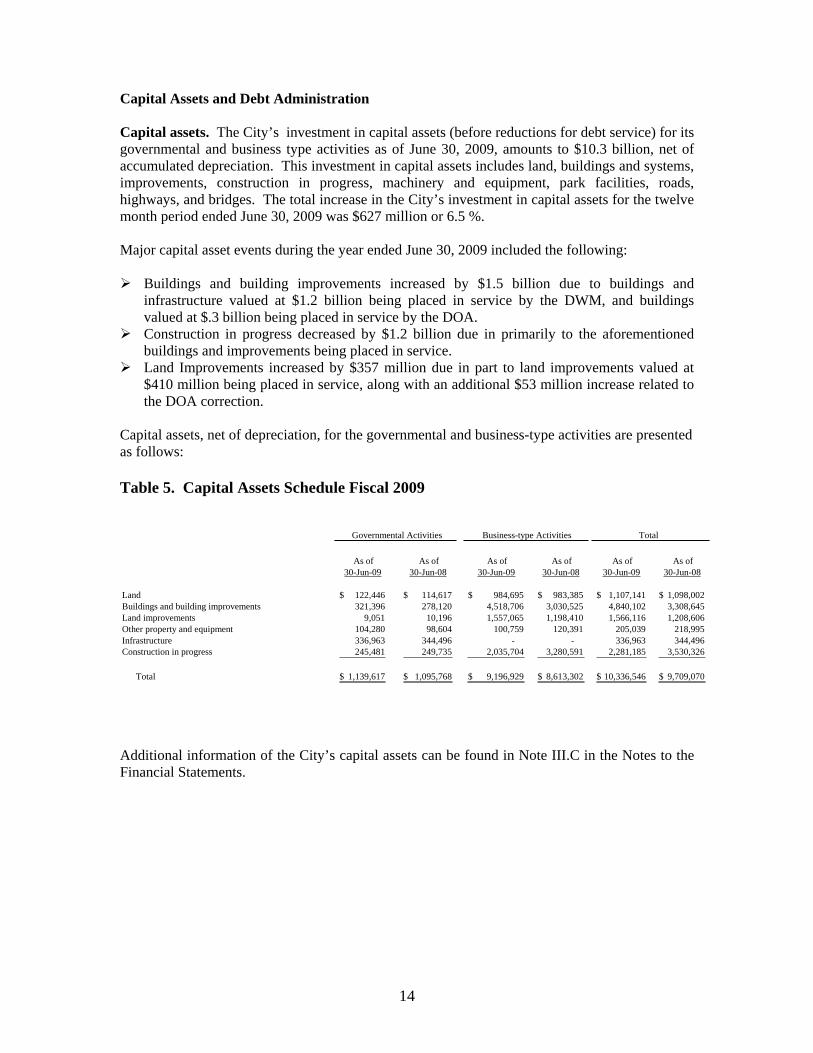
Capital assets. The City’s investment in capital assets (before reductions for debt service) for its governmental and business type activities as of June 30, 2009, amounts to $10.3 billion, net of accumulated depreciation. This investment in capital assets includes land, buildings and systems, improvements, construction in progress, machinery and equipment, park facilities, roads, highways, and bridges. The total increase in the City’s investment in capital assets for the twelve month period ended June 30, 2009 was $627 million or 6.5 %.
Major capital asset events during the year ended June 30, 2009 included the following:
Buildings and building improvements increased by $1.5 billion due to buildings and infrastructure valued at $1.2 billion being placed in service by the DWM, and buildings valued at $.3 billion being placed in service by the DOA. Construction in progress decreased by $1.2 billion due in primarily to the aforementioned buildings and improvements being placed in service. Land Improvements increased by $357 million due in part to land improvements valued at $410 million being placed in service, along with an additional $53 million increase related to the DOA correction.
Capital assets, net of depreciation, for the governmental and business-type activities are presented as follows:
Table 5. Capital Assets Schedule Fiscal 2009
As of As of As of As of As of As of 30-Jun-09 30-Jun-08 30-Jun-09 30-Jun-08 30-Jun-09 30-Jun-08
Land 122,446$ 114,617$ 984,695$ 983,385$ 1,107,141$ 1,098,002$Buildings and building improvements 321,396 278,120 4,518,706 3,030,525 4,840,102 3,308,645 Land improvements 9,051 10,196 1,557,065 1,198,410 1,566,116 1,208,606 Other property and equipment 104,280 98,604 100,759 120,391 205,039 218,995 Infrastructure 336,963 344,496 - - 336,963 344,496 Construction in progress 245,481 249,735 2,035,704 3,280,591 2,281,185 3,530,326
Total 1,139,617$ 1,095,768$ 9,196,929$ 8,613,302$ 10,336,546$ 9,709,070$
Governmental Activities Total Business-type Activities
Additional information of the City’s capital assets can be found in Note III.C in the Notes to the Financial Statements.
15
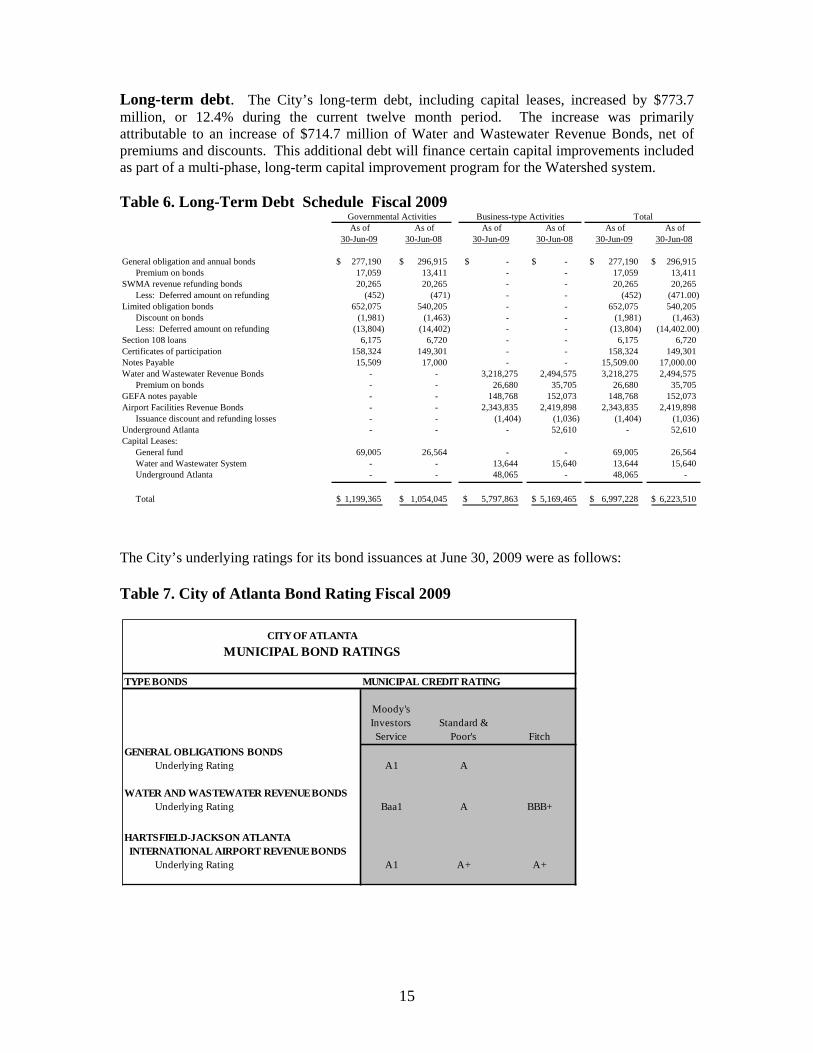
Long-term debt. The City’s long-term debt, including capital leases, increased by $773.7 million, or 12.4% during the current twelve month period. The increase was primarily attributable to an increase of $714.7 million of Water and Wastewater Revenue Bonds, net of premiums and discounts. This additional debt will finance certain capital improvements included as part of a multi-phase, long-term capital improvement program for the Watershed system.
Table 6. Long-Term Debt Schedule Fiscal 2009 Total
As of As of As of As of As of As of 30-Jun-09 30-Jun-08 30-Jun-09 30-Jun-08 30-Jun-09 30-Jun-08
General obligation and annual bonds 277,190$ 296,915$ -$ -$ 277,190$ 296,915$ Premium on bonds 17,059 13,411 - - 17,059 13,411
SWMA revenue refunding bonds 20,265 20,265 - - 20,265 20,265Less: Deferred amount on refunding (452) (471) - - (452) (471.00)
Limited obligation bonds 652,075 540,205 - - 652,075 540,205Discount on bonds (1,981) (1,463) - - (1,981) (1,463)Less: Deferred amount on refunding (13,804) (14,402) - - (13,804) (14,402.00)
Section 108 loans 6,175 6,720 - - 6,175 6,720Certificates of participation 158,324 149,301 - - 158,324 149,301Notes Payable 15,509 17,000 - - 15,509.00 17,000.00 Water and Wastewater Revenue Bonds - - 3,218,275 2,494,575 3,218,275 2,494,575
Premium on bonds - - 26,680 35,705 26,680 35,705GEFA notes payable - - 148,768 152,073 148,768 152,073Airport Facilities Revenue Bonds - - 2,343,835 2,419,898 2,343,835 2,419,898
Issuance discount and refunding losses - - (1,404) (1,036) (1,404) (1,036)Underground Atlanta - - - 52,610 - 52,610Capital Leases:
General fund 69,005 26,564 - - 69,005 26,564Water and Wastewater System - - 13,644 15,640 13,644 15,640Underground Atlanta - - 48,065 - 48,065 -
Total 1,199,365$ 1,054,045$ 5,797,863$ 5,169,465$ 6,997,228$ 6,223,510$
Business-type ActivitiesGovernmental Activities
The City’s underlying ratings for its bond issuances at June 30, 2009 were as follows:
Table 7. City of Atlanta Bond Rating Fiscal 2009
TYPE BONDS MUNICIPAL CREDIT RATING
Moody's Investors Service
Standard & Poor's Fitch
GENERAL OBLIGATIONS BONDSUnderlying Rating A1 A
WATER AND WASTEWATER REVENUE BONDSUnderlying Rating Baa1 A BBB+
INTERNATIONAL AIRPORT REVENUE BONDSUnderlying Rating A1 A+ A+
HARTSFIELD-JACKSON ATLANTA
CITY OF ATLANTA
MUNICIPAL BOND RATINGS
16
State statutes limit the amount of general obligation debt a governmental entity may issue to 8% of its total assessed valuation. The current debt limitation for the City is $2.4 billion, which is significantly in excess of the City’s outstanding general obligation debt. See the Legal Debt Margin Information in the Statistical Section of the CAFR.
Additional information regarding the City’s Long-term Obligations can be found in Note III. G. in the Notes to the Financial Statements.
Economic Factors and Next Year’s Budgets and Rates
The City, although weathering the current recession pressures, benefits from a reliable economic base, primarily attributable to its diverse employment sectors and its strategic location within the southeast region. The City’s diverse industry mix is anchored by the government, services, trade, health, education, finance, insurance and real estate, and manufacturing sectors.
The 2010 Atlanta economic outlook is expected to recover in the second half of the year as both the state and nation rebound from one of the most severe economic recessions on record. Key sectors that have contributed to the decline are the construction, business service, and retail trade sectors. Education and health have been stable sectors for the local economy offsetting the unemployment reductions in the aforementioned sectors.
Property tax, building permits and sales taxes continue to be monitored closely as the economy recovers from the slower economic period. The City has made substantial improvements in its financial reporting and forecasting efforts which have enabled management to more timely respond to economic and business cycles. The City has also taken several measures to respond to the current economic environment including the adoption of a 3.12 mill tax rate increase, and focused efforts to both aggressively collect and audit aged and under-reporting accounts. These prudent fiscal policies are expected to offset the challenges of a slowly recovering state and national economy.
The City recently created a Strategic Planning Unit (SPU), dedicated to the enhancement of the City’s ability to apply a long-range perspective to critical planning and funding decisions. The unit is organized around four key tasks:
Articulate the City’s strategic objectives Apply a long-range perspective to City budgetary planning Align City funding choices with strategic objectives Monitor progress towards strategic objectives
The unit will be responsible for identifying and monitoring key internal and external impacts and trends that affect the City’s fiscal outcome; translating key impacts into long-range forecasts of City operating needs, capital requirements and funding policy; and assessing fiscal and economic impact of major economic development proposals and projects.

17
Requests for Information
This financial report is designed to provide a general overview of the City’s finances for all those with an interest in the government’s finances. Questions concerning any of the information provided in this report or requests for additional financial information should be addressed to the City’s Chief Financial Officer, 11100 City Hall Tower, 68 Mitchell St., SW, Atlanta, Georgia 30303.


18
THIS PAGE IS INTENTIONALLY LEFT BLANK


Actual Variance withOriginal Final Amounts Final Budget
REVENUESTaxes: Property taxes 151,234$ 183,305$ 157,122$ (26,183)$ Local option sales tax 109,281 106,384 87,789 (18,595) Sales, public utility, alcoholic beverage, and other taxes 137,406 101,321 102,990 1,669Licenses and permits 73,293 74,347 62,503 (11,844)Intergovernmental revenues: State and local grants and contributions - - 3,407 3,407Charges for services: Recreation fees and other 7,203 9,931 4,970 (4,961)Fines, forfeitures, and penalties 9,620 12,067 12,631 564Revenues from use of money and property: Investment income 4,139 4,098 171 (3,927) Building rentals and concessions 20,244 24,433 18,295 (6,138) Other income 55,654 49,676 28,637 (21,039)
Total revenues 568,074$ 565,562$ 478,515$ (87,047)$
(In Thousands)
Budgeted Amounts
CITY OF ATLANTA, GEORGIAGeneral Fund
Statement of Revenues, Expenditures and Changes in Fund Balances - Budget and ActualFor the Year Ended June 30, 2009
26
Actual Variance withOriginal Final Amounts Final Budget
EXPENDITURESCurrent: General government: Executive offices $ 18,087 19,547 16,930 $ 2,617 Personnel and human resources 3,551 3,541 2,779 762 City council 6,898 10,027 5,979 4,048 Courts and judicial agencies 8,919 8,844 8,775 69 Finance 11,309 12,177 10,910 1,267 Department of information technology 25,242 24,949 20,778 4,171 Planning and community development 15,147 15,107 10,149 4,958 Law 6,204 6,143 4,784 1,359 Procurement 1,130 1,128 980 148 Total general government 96,487 101,463 82,064 19,399 Public safety: Police 172,494 172,239 163,007 9,232 Fire 73,853 74,873 76,279 (1,406) Corrections 38,518 38,409 33,917 4,492 Total public safety 284,865 285,521 273,203 12,318
Public works 25,658 25,619 23,177 2,442 Parks, recreation, and cultural affairs 30,320 30,401 23,635 6,766 Nondepartmental expenditures 86,231 72,657 50,899 21,758
Debt service Bond principal payments 38,016 38,384 22,469 15,915 Interest on bonds - 781 15,435 (14,654) Total debt service 38,016 39,165 37,904 1,261 Total expenditures 561,577 554,826 490,882 63,944
Excess of revenues over expenditures 6,497 10,736 (12,367) (23,103) (under) expenditures
OTHER FINANCING SOURCES (USES):Proceeds from general long-term debt - - 5,782 5,782Transfers in 2,775 5,334 26,718 21,384Transfers out (9,272) (16,070) (23,474) (7,404)Proceeds from sale of assets - - 604 604 Total other financial sources and uses (6,497) (10,736) 9,630 20,366
Excess of revenues and other sources over expenditures and other uses - - (2,737) (2,737)$
Fund balance, beginning of period Beginning of the period 10,130 10,130 10,130 Correction of prior year error - - - Beginning of year, as restated 10,130 10,130 10,130
End of period 10,130$ 10,130$ 7,393$
The accompanying notes are an integral part of the statements
(In Thousands)
Budgeted Amounts
CITY OF ATLANTA, GEORGIAGeneral Fund
Statement of Revenues, Expenditures and Changes in Fund Balances - Budget and ActualFor the Year Ended June 30, 2009
27


39
CITY OF ATLANTA, GEORGIA Notes to Financial Statements
Year ended June 30, 2009
I. Summary of Significant Accounting Policies
The accounting principles of the City of Atlanta ("City") conform to accounting principles generally accepted in the United States of America ("GAAP") applicable to governmental entities. The Governmental Accounting Standards Board ("GASB") is the standards-setting body for establishing governmental accounting and financial reporting principles. The significant accounting policies of the City are described herein.
A. Reporting Entity
The Financial Reporting Entity
The City is a municipal corporation governed by the Mayor and the City Council. In evaluating how to define the City for financial reporting purposes, the management of the City has considered all potential component units. The decision to include a potential component unit in the reporting entity is made by applying the criteria set forth by the GASB. The concept underlying the definition of the reporting entity is that elected officials are accountable. The component units discussed below are included because of the significance of their operational or financial relationships with the City.
All blended component units have a June 30 year end. All discretely presented component units have a December 31 year end with the exception of the Atlanta Development Authority, which has a June 30 fiscal year end.
Blended Component Units
The Urban Design Commission (“UDC”), Keep Atlanta Beautiful (“KAB”), Atlanta Public Safety and Judicial Facilities Authority (“APSJFA”), Atlanta CoRA, Inc. (“ACoRA”), and Solid Waste Management Authority ("SWMA") are governed by boards appointed by the Mayor and/or the City Council who have the ability to impose their will on UDC, KAB, APSJFA and SWMA. Although they are legally separate from the City, UDC, KAB, APSJFA, ACoRA and SWMA are reported as if they are a part of the primary government because their primary purpose is to provide services to the City. The general funds of each of these entities are reported as special revenue funds of the City. APSJFA and SWMA's capital project funds are reported as capital project funds of the City.
In January 2002, the Department of Housing and Urban Development (“HUD”) awarded the City the Renewal Community (RC) status. As a result of the City being awarded an RC status, the City’s designation as an Empowerment Zone was terminated. At the time of the RC designation, the City’s EZ program had an estimate of $53 million of unspent grant funds. The City petitioned the U.S. Department of Health and Human Services’ Office of Community Service for permission to continue the use of the EZ Social Service Block Grant Title XX funds and the request was granted until December 31, 2009.
40
Notes to the Financial Statements - Continued
A. Reporting Entity, continued
The RC statute required the City to form a coordinating responsible authority (“CoRA”) to develop, submit and implement the strategic plan or course of action that met the RC statute. The City formed ACoRA as an independent non-profit Georgia corporation and a cooperative agreement transferring the responsibility of administering the remaining $53 million EZ funds was executed between ACoRA and the City.
UDC and KAB did not have any financial activity during the year ended June 30, 2009. Separate financial statements are not prepared for the blended component units.
Discretely Presented Component Units
The component unit column in the government-wide financial statements includes the Atlanta Fulton County Recreation Authority ("Recreation Authority"), the Atlanta Development Authority ("ADA”), and the Atlanta Housing Opportunity, Inc. (“AHOI”). They are reported in a separate column to emphasize that they are legally separate from the City. All the discreetly presented component units are accounted for as proprietary fund types.
Recreation Authority - Created in 1961, the principal activities of the Recreation Authority include the maintenance and oversight of an athletic stadium (the "Stadium"), an athletic coliseum (the "Arena"), and the Atlanta Zoo ("Zoo"), in which the Recreation Authority acts as lessee under a leasehold interest granted by the City. The Mayor appoints the majority of the governing body of the Recreation Authority. The City has a two-thirds interest in the Recreation Authority. Fulton County's one-third interest is reported as minority interest in the accompanying financial statements. The separate financial statements which comprise the Recreation Authority may be obtained from the Atlanta Fulton County Recreation Authority, 755 Hank Aaron Drive, Atlanta, Georgia 30315.
The City and Fulton County ("County"), by contractual agreement with the Recreation Authority, will fund any deficiencies in principal and interest payments on the applicable revenue bonds issued for construction and capital improvements of the Arena and the Zoo. The funding of any deficiencies related to the Arena is based on the proportionate ownership interest noted above for the City and the County (See Note IV D). When the related Arena revenue bonds have been fully paid, the Recreation Authority will convey fee simple title of the Arena to the City and the County based on their proportionate shares noted above, upon joint request of the City and the County. There were no such deficiencies during the fiscal year that required funding by the City or County related to the Arena
The financial statements of the Recreation Authority consolidate the operations of the Stadium, Zoo and Arena.
41
Notes to the Financial Statements - Continued
A. Reporting Entity, continued
ADA - ADA was created effective January 1, 1997, to promote the revitalization and growth of the City through a comprehensive and centralized program focusing on community development and redevelopment. It combined many previously separate organizations, including the Downtown Development Authority (DDA), which were performing similar economic development functions. The Mayor and City Council are responsible for appointing the members of the Board of Directors of ADA and have the ability to impose their will on ADA. The separate audited financial statements of ADA may be obtained from the Atlanta Development Authority, 86 Pryor St. S.W., Suite 300, Atlanta, Georgia 30303.
AHOI – The AHOI is an affiliate organization of the Atlanta Housing Authority (“AHA”) whose board members are indirectly appointed by the Mayor in that only members of the AHA’s Board of Commissioners can fill these roles. AHOI was created for the sole purpose of facilitating the Housing Opportunity Program for the City. AHOI is financially dependent on the City to pay its debt and cover its operating costs. AHOI is included as a separate component unit for the first time in 2009.
Joint Venture
The Atlanta-Fulton County Water Resource Commission ("Commission") is a joint venture between the County and the City for the construction and operation of a water treatment plant accounted for under the equity method of accounting. The Commission is governed by a seven-member management commission; three members are appointed by the City, three by the County, and one independent member is elected by majority vote of the other members. The City and County also approve the annual budget of the Commission.
Under the terms of the amended Joint Venture Agreement, the City and the County equally share the costs of all capital expenditures. Capital contributions are recorded during the year in which the additions to capital assets are accrued, whether paid or recorded as a liability, including retainage. The City and the County each contributed $594,000 during the fiscal year ended June 30, 2009. These capital costs are reflected as Investment in the Joint Venture.
The costs of operations of the plant are paid directly by the County as incurred. The County is subsequently reimbursed by the City for its pro rata share of the cost of operations, net of personnel costs paid by the City. The costs of operations, including personnel cost, are allocated between the City and the County on the basis of water delivered to each. The City's share of those operating costs was $2,698,000 for the year ended June 30, 2009. The costs are reflected in operating costs.
At June 30, 2009 the City owes the County approximately $312,000 for expenses associated with the joint venture.
42
Notes to the Financial Statements - Continued
A. Reporting Entity, continued
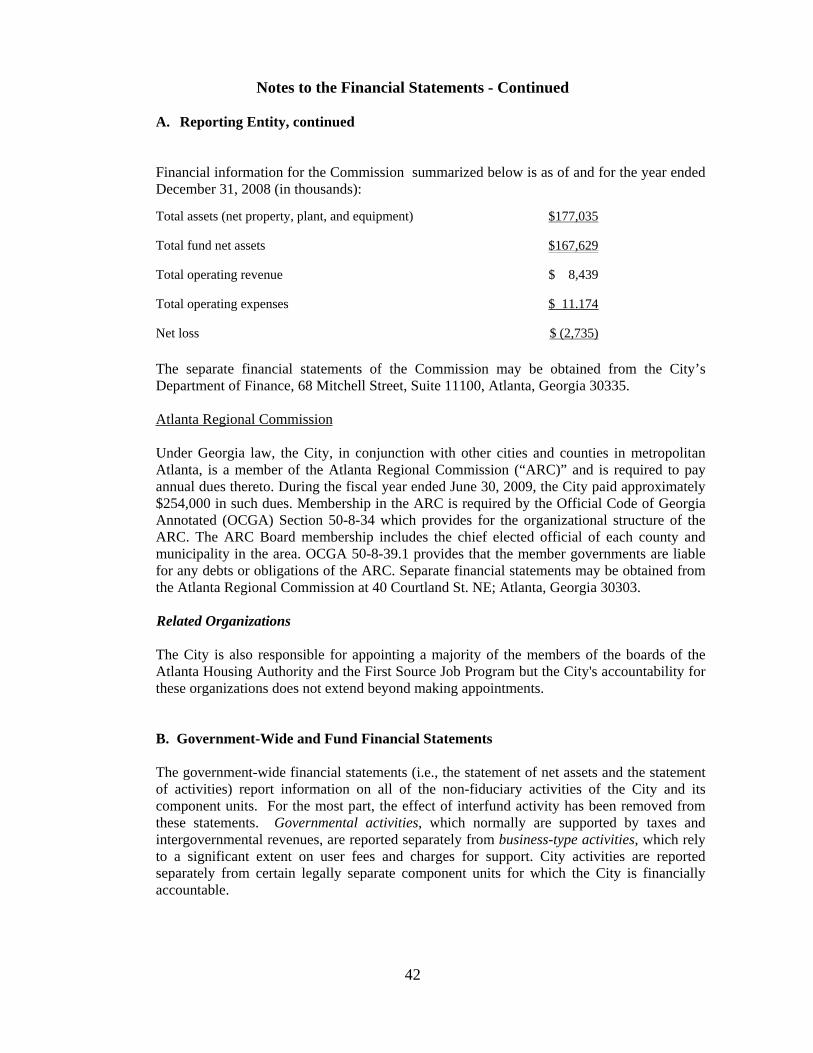
Financial information for the Commission summarized below is as of and for the year ended December 31, 2008 (in thousands):
Total assets (net property, plant, and equipment) $177,035
Total fund net assets $167,629
Total operating revenue $ 8,439
Total operating expenses $ 11.174
Net loss $ (2,735)
The separate financial statements of the Commission may be obtained from the City’s Department of Finance, 68 Mitchell Street, Suite 11100, Atlanta, Georgia 30335.
Atlanta Regional Commission
Under Georgia law, the City, in conjunction with other cities and counties in metropolitan Atlanta, is a member of the Atlanta Regional Commission (“ARC)” and is required to pay annual dues thereto. During the fiscal year ended June 30, 2009, the City paid approximately $254,000 in such dues. Membership in the ARC is required by the Official Code of Georgia Annotated (OCGA) Section 50-8-34 which provides for the organizational structure of the ARC. The ARC Board membership includes the chief elected official of each county and municipality in the area. OCGA 50-8-39.1 provides that the member governments are liable for any debts or obligations of the ARC. Separate financial statements may be obtained from the Atlanta Regional Commission at 40 Courtland St. NE; Atlanta, Georgia 30303.
Related Organizations
The City is also responsible for appointing a majority of the members of the boards of the Atlanta Housing Authority and the First Source Job Program but the City's accountability for these organizations does not extend beyond making appointments.
B. Government-Wide and Fund Financial Statements
The government-wide financial statements (i.e., the statement of net assets and the statement of activities) report information on all of the non-fiduciary activities of the City and its component units. For the most part, the effect of interfund activity has been removed from these statements. Governmental activities, which normally are supported by taxes and intergovernmental revenues, are reported separately from business-type activities, which rely to a significant extent on user fees and charges for support. City activities are reported separately from certain legally separate component units for which the City is financially accountable.
43
Notes to the Financial Statements - Continued
B. Government-Wide and Fund Financial Statements, continued
The statement of activities demonstrates the degree to which the direct expenses of a given function or segment are offset by program revenues. Direct expenses are those that are clearly identifiable with a specific function or segment. Program revenues include; 1) charges to applicants who use, or directly benefit from goods, services, or privileges provided by a given function or segment and 2) grants and contributions that are restricted to meeting the operational or capital requirements of a particular function or segment. Taxes and other items not meeting the definition of program revenues are reported as general revenues.
Interfund activity has been eliminated from the government-wide financial statements except for charges between the governmental and business-type activities. Elimination of these charges would distort the direct costs and program revenues reported in the various functions concerned.
Separate financial statements are provided for governmental funds, proprietary funds, and fiduciary funds, even though the latter are excluded from the government-wide financial statements. Major individual governmental funds and proprietary funds are reported as separate columns in the fund financial statements.
C. Measurement Focus and Basis of Accounting
The government-wide financial statements are reported using the economic resources measurement focus and the accrual basis of accounting, as are the proprietary fund and fiduciary fund financial statements. Revenues are recorded when earned and expenses are recorded when a liability is incurred, regardless of the timing of related cash flows. Property taxes are recognized as revenues in the year for which they are levied. Grants and similar items are recognized as revenue as soon as all eligibility requirements imposed by the provider have been met. Agency funds, as part of fiduciary funds, while on the accrual basis do not have a measurement focus since they do not report equity.
Governmental fund financial statements are reported using the current financial resources measurement focus and the modified accrual basis of accounting. Revenues are recognized as soon as they are both measurable and available. Revenues are considered to be available when they are collectible within the current period or soon enough thereafter to pay liabilities of the current period. For this purpose, the City considers revenues to be available if they are collected within 60 days of the end of the current fiscal period. Expenditures generally are recorded when a liability is incurred, as under accrual accounting. However, debt service expenditures, as well as expenditures related to compensated absences and claims and judgments, are recorded only when payment is due.
Property taxes, franchise taxes, licenses and interest associated with the current fiscal period are all considered to be susceptible to accrual and have been recognized as revenues of the current fiscal period. All other revenue items are considered to be measurable and available only when cash is received by the City.
44
Notes to the Financial Statements - Continued
C. Measurement Focus and Basis of Accounting, continued
The City reports the following major governmental funds:
The General Fund is the City’s primary operating fund. It accounts for all financial transactions of the City, except those required to be accounted for in another fund.
The Capital Projects Fund (Annual Bond Fund only) is used to account for capital project activities funded by General Obligation Bonds, which are issued pursuant to special referenda, or annual issues authorized by the City of Atlanta Charter. The annual issues of $8 million are allocated equally between the City and the Atlanta Independent School System.
The Debt Service Fund is used to account for the accumulation of resources and the subsequent disbursement of such resources to pay principal and interest on long-term debt of the City (other than certificates of participation and the debt of the tax allocation districts funds and enterprise funds). Bond ordinances require the City to account for debt service transactions in separate funds, to restrict the flow of cash between such funds, and to comply with various other covenants.
Proprietary funds distinguish operating revenues and expenses from non-operating items. Operating revenues and expenses generally result from providing services and producing and delivering goods in connection with a proprietary fund’s principal ongoing operations. Operating expenses for enterprise funds include the cost of sales and services, administrative expenses, and depreciation on capital assets. All revenues and expenses not meeting this definition are reported as non-operating revenues and expenses.
The City reports the following major proprietary funds:
The Department of Watershed Management Fund (DWM) accounts for all activities associated with the provision and management of clean water, wastewater and stormwater systems, and water pollution control services to individuals, organizations and other governmental units within and around the City.
The Department of Aviation Fund (DOA) accounts for the activities of the William B. Hartsfield –Maynard H. Jackson Atlanta International Airport.
Additionally, the City reports the following fund types:
Internal Service Funds account for the activities of Motor Transport Services, as well as group insurance transactions related to the provision of life, accident, and medical insurance benefits through outside insurance companies for permanent employees and retirees of the City.
45
Notes to the Financial Statements, Continued
C. Measurement Focus and Basis of Accounting, continued
Private-sector standards of accounting and financial reporting issued prior to December 1, 1989, generally are followed in both the government-wide and proprietary fund financial statements to the extent that those standards do not conflict with or contradict guidance of the Governmental Accounting Standards Board. Governments also have the option of following subsequent private-sector guidance for their business-type activities and enterprise funds, subject to this same limitation. The City has elected not to follow subsequent private-sector guidance.
Fiduciary Fund Types
The trust funds account for activities in which the City acts as trustee for an individual or organization. Additionally, these funds account for pension trust funds which accumulate resources for pension benefit payments to members of the Plans and their beneficiaries.
The Agency Fund accounts for various taxes and other receipts held in escrow for individuals, outside organizations, other governments and/or other funds.
46
Notes to the Financial Statements, Continued
D. Assets, Liabilities and Net Assets or Equity
1. Cash Equivalents
The City considers all highly liquid debt securities with an original maturity of three months or less to be cash equivalents.
2. Investments
Statutes authorize the City to invest in U.S. Government obligations, U.S. Government agency obligations, State of Georgia obligations, obligations of a corporation of the U.S. Government, and the Georgia Fund 1 (a local government investment pool maintained by the State of Georgia). The City invests in repurchase agreements only when collateralized by U.S. Government or agency obligations.
By statute, up to 55% of the cost basis of the investment portfolio for the pension plans may consist of U.S. corporate equity securities. Additionally, in accordance with authorized investment laws, the City, in its pension funds, can invest in various mortgage-backed securities, such as collateralized mortgage obligations ("CMOs") and government backed mortgage securities. These are separately identified in the disclosure of custodial credit risk (see Note III. A).
Investments, other than repurchase agreements, are carried at fair value, based on quoted market prices, and include any accrued interest. Repurchase agreements are valued at their amortized cost.
The City maintains a pooled investment fund. All investments, except those held in debt service, special revenue, pension funds, various capital project funds, and for construction projects of enterprise funds, are held in this fund. This fund is not considered a separate accounting entity for financial reporting purposes; instead, each participating fund's equity in the pooled investment fund is recorded as investments in the pooled fund on the accompanying combined balance sheet. Investment income of this pooled fund is allocated to each participating fund based on that fund's recorded equity in the pooled fund.
The Georgia Fund 1 is a stable net asset value investment pool managed by the State of Georgia (Office of Treasury and Fiscal Services) and is not registered with the SEC. The fund operates in a manner consistent with Rule 2a-7 of the Investment Company Act of 1940 and is considered a 2a-7 like pool. The fair value of the participant shares is computed weekly with pool earnings distributed on a monthly basis based on equivalent shares owned by participants based on $1.00 per share.
Separate financial statements of the Georgia Fund 1 may be obtained from the Office of Treasury and Fiscal Services, 200 Piedmont Avenue, Suite 1202, West Tower, Atlanta Georgia 30334-5527.
The activity related to certain short-term investments of the component units is reported as a net change in the investment balance in the cash flow statements as their turnover is quick and their maturities are generally short-term.
47
Notes to the Financial Statements, Continued
D. Assets, Liabilities and Net Assets or Equity, continued
3. Materials and Supplies
Materials and supplies are stated at cost (substantially first-in, first-out) which is not in excess of market. Inventories are accounted for using the consumption method.
4. Prepaid Items
Payments for services that benefit future periods are recorded as prepaid expenses in accordance with the consumption method. This method is also used for budgetary purposes; accordingly, no reservation of fund balance is required.
5. Restricted Assets
Restricted assets represent amounts which are required to be maintained pursuant to City ordinances relating to the passenger and customer facility charges (Department of Aviation only); construction, renewal and extension and sinking funds; funds received for specific purposes pursuant to U. S. government grants; municipal option sales tax (Department of Watershed Management only); various reserves required under certain bond agreements; and investments related to a state wide municipal lease pool agreement (General Fund only).
The City’s policy is to use restricted resources first, then unrestricted resources, when both are available for use to fund an activity.
6. Capital Assets
Capital assets, which include property, plant, equipment and infrastructure (e.g. roads, bridges, sidewalks, and similar items) used in governmental and business-type activities of the City, are recorded in the statement of net assets at historical cost (or estimated historical cost). This capitalization included infrastructure that could be identified and has been acquired since July 1, 1980. Capital assets are defined by the City as assets with an initial, individual cost of $5,000 and an estimated useful life in excess of two years. Donated capital assets are recorded at their estimated fair value at the date of donation.
48
Notes to the Financial Statements - Continued
D. Assets, Liabilities and Net Assets or Equity, continued
Expenses for replacements, maintenance, repairs, and betterments which do not materially prolong the life of the related asset are charged to expenditures/expenses when incurred.
All reported capital assets except land and construction in progress are depreciated. Depreciation is computed using the straight-line method over the following estimated useful lives:
Governmental-type activities:
Buildings 20-50 yearsBuilding improvements 20 yearsFurniture and equipment 3-10 yearsVehicles 5-8 yearsInfrastructure 25-50 years
Business-type activities:
Department of Aviation:Runways, taxiways and other land improvements 15-35 years
Terminal and maintenance buildings and other structures 15-35 yearsOther property and equipment 2-20 years
Department of Watershed Management:Water and wastewater plant and treatment facilities 50-75 yearsWater collection and distribution system 75 yearsWastewater system 67 yearsStormwater drainage system 75 yearsMachinery, equipment, and other 4-10 years
Sanitation:Buildings 20-25 yearsEquipment 5-20 years
Parks and Recreational Facilities:Buildings 40 yearsOther property and equipment 15-20 years
Underground Atlanta:Parking garage 30 yearsBuildings 15-30 yearsMachinery, equipment, and other 5 years
Internal Service Fund:Buildings 40 yearsOther property and equipment 3-8 years
City of Atlanta and Fulton County Recreation Authority(as a discretely presented component unit):Buildings and improvements 7-30 yearsOther property and equipment 3-20 years
Atlanta Development Authority(as a discretely presented component unit):Buildings and improvements 26-30 yearsFurniture and equipment 3-5 years
Atlanta Housing Opportunity, Inc.(as a discretely presented component unit):No capital assets recorded
49
Notes to the Financial Statements - Continued
D. Assets, Liabilities and Net Assets or Equity, continued
The City has elected not to capitalize works of art and historical treasures based on its policy that these items are not held for financial gain. They will be preserved and any proceeds from the sale of the items will be used to acquire other collections.
Interest is capitalized on proprietary fund assets constructed with the proceeds of tax-exempt debt. The amount of interest to be capitalized is calculated by offsetting interest expense incurred from the date of the borrowing until completion of the project against interest earned on invested proceeds over the same period. The Department of Watershed Management and the Department of Aviation capitalized $112,985,000 and $35,881,000 respectively, in net interest costs during the year ended June 30, 2009.
7. Compensated Absences
City employees can accrue a maximum of 25 to 45 days of annual leave, depending upon their length of service. Vested or accumulated vacation expected to be liquidated with expendable available financial resources is reported as an expenditure and a fund liability of the governmental fund that will pay it. Amounts of vested or accumulated vacation leave that are not expected to be liquidated with expendable available financial resources are reported as long-term debt in the government-wide financial statements. Amounts are reported in governmental funds only to the extent they have matured. Vested or accumulated vacation leave of proprietary funds is recorded as an expense and liability of those funds as the benefits accrue to employees.
Employees can accrue unlimited amounts of sick leave. Sick leave can be taken only due to personal illness or, in certain cases, illness of family members. Sick leave is not intended to be paid out except under special circumstances where the City Council has given approval and the necessary funds are available. Consequently the City does not record an accrued liability for accumulated sick pay.
8. Long-term Obligations
All payables, accrued liabilities, and long-term obligations are reported in the government-wide financial statements, and all payables, accrued liabilities, and long-term obligations payable from proprietary funds are reported on the proprietary fund financial statements.
In general, payables and accrued liabilities that will be paid from governmental funds are reported on the governmental fund financial statements regardless of whether they will be liquidated with current resources. However claims and judgments, the noncurrent portion of capital leases, compensated absences, health and dental claims, contractually required pension contributions and special termination benefits that will be paid from governmental funds are reported as a liability in the fund financial statements only to the extent that they will be paid with current, expendable, available financial resources. In general, payments made within 60 days after year end are considered to have been made with current available financial resources. Bonds and other long-term obligations that will be paid from governmental funds are not recognized as a liability in the fund financial statements until due.

50
Notes to the Financial Statements - Continued
D. Assets, Liabilities and Net Assets or Equity, continued
Bond discounts and issuance costs in the government-wide financial statements are deferred and amortized over the term of the bonds using the bonds outstanding method, which approximates the effective interest method. Bond discounts are presented as other assets in the financial statements. Gains and losses from refundings of government-wide and proprietary fund types are deferred and amortized over the shorter of the life of the new or old debt on a straight-line basis.
9. Reservations of Net Assets / Fund Balances
The unreserved fund balances for governmental funds represent the amount available for future operations. The reserved fund balances for governmental funds represent the amounts that have been legally identified for specific purposes. Unreserved net assets for proprietary funds represent the net assets available for future operations or distribution. Reserved net assets for proprietary funds represent the net assets that have been legally restricted for specific purposes. The following reservations have been established by the City:
Net Assets - Reserved for Capital Projects and Debt Service - This portion of net assets represents various restricted assets of the Enterprise Funds, less liabilities payable from such assets that are not available for appropriation.
Fund Balance - Reserved for Encumbrances, Special Programs and Capital Improvements - This portion of fund balance represents various restricted assets or resources of the City which have been encumbered or appropriated for purchase orders or contractual obligations.
Fund Balance - Reserved for Debt Service - This portion of fund balance represents resources of the City which have been formally set aside for future debt service payments.
10. Net Assets Classifications
Equity for government-wide and proprietary fund statements is classified as net assets and displayed in three components:
Invested in capital assets, net of related debt – Consists of capital assets including restricted capital assets, net of accumulated depreciation and reduced by the outstanding balances of any bonds, notes, or other borrowings that are attributable to the acquisition, construction or improvement of those assets.
Restricted net assets – Consists of net assets with constraints placed on the use either by (1) external groups, such as creditors, grantors, contributors, or laws or regulations of other governments; or (2) law through constitutional provisions or enabling legislation.
Unrestricted net assets – All other net assets that do not meet the definition of “restricted” or “invested in capital assets, net of related debt”.
51
Notes to the Financial Statements - Continued
D. Assets, Liabilities and Net Assets or Equity, continued
11. Grants From Other Governments
Federal and state governmental units represent an important source of supplementary funding used to finance housing, employment, construction programs, and other activities beneficial to the community. This funding, primarily in the form of grants, is recorded in the governmental and proprietary funds. All grant contributions in the proprietary funds are for the purpose of construction activities, principal debt service reimbursements or land or easement acquisitions. Accordingly, they are recorded in the statement of revenues, expenses, and changes in net assets as a separate line item after non-operating revenues and expenses as capital contributions. For all funds, a grant receivable is recorded when the City has met all applicable eligibility requirements.
12. General Services Costs
The City allocates a portion of general services costs (such as purchasing, accounting, budgeting, personnel administration, and certain other costs based on allocation methods determined by an independent study) to the Department of Aviation, the Department of Watershed Management, the Sanitation Fund, and the Internal Service Fund in order to more fully reflect the actual cost of operating these Proprietary Funds. For the year ended June 30, 2009, such allocated expenses amounted to $8,870,000 for the Department of Aviation, $ 12,966,000 for the Department of Watershed Management, $8,326,000 for the Sanitation Fund, and $3,963,000 for the Internal Service Fund.
Costs allocated to the Community Development Fund are based upon a negotiated indirect cost rate, determined by an independent study. The City's indirect cost rate is based upon the prior year’s cost calculation, documented in the Cost Allocation Plan. Such expenditures charged to Community Development for the year ended June 30, 2009 amounted to approximately $123,000. The reimbursement of these costs to the General Fund is recorded as a reduction in expenditures.
52
Notes to the Financial Statements - Continued
E. New Accounting Pronouncements
The City will adopt the following new accounting pronouncements in future years:
In June 2007, GASB issued Statement No. 51, Accounting and Financial Reporting for Intangible Assets, which provides additional guidance to state and local governments to determine whether and when intangible assets should be considered capital assets for financial reporting purposes. The statement requires that an intangible asset be recognized in the statement of net assets only if it is considered identifiable. This statement establishes guidance on recognizing internally generated computer software as an intangible asset, as well as guidance specific to intangible assets related to amortization. It also provides guidance on determining the useful life of intangible assets when the length of their life is limited by contractual or legal provisions. Application of this statement is effective for the City’s fiscal year ending June 30, 2010.
In June 2008, GASB issued Statement No. 53, Accounting and Financial Reporting for Derivative Instruments, which addresses the recognition, measurement, and disclosure of information regarding derivative instruments entered into by state and local governments. This statement improves the financial reporting by requiring governments to measure derivative instruments, with the exception synthetic guaranteed investment contracts that are fully benefit-responsive, at fair value in their economic resources measurement financial statements. Application of this statement is effective for the City’s fiscal year ending June 30, 2010.
In March 2009, GASB issued Statement No. 54, Fund Balance Reporting and Governmental Fund Type Definitions, which is intended to enhance the usefulness of fund balance information by providing clearer fund balance classifications that can be more consistently applied and by clarifying the existing governmental type definitions. Application of this statement is effective for the City’s fiscal year ending June 30, 2011.
The impact of these pronouncements on the City’s financial statements has not been determined.
F. Use of Estimates
The preparation of financial statements in conformity with accounting principles generally accepted in the United States of America requires management to make estimates and assumptions that affect the reported amounts of assets, liabilities, revenues, expenditures/expenses and disclosures. Actual results could differ from those estimates.
53
Notes to the Financial Statements - Continued
II. Stewardship, Compliance and Accountability
A. Budgets and Budgetary Accounting
The City is required to adopt a balanced budget each year and maintains budgetary controls to ensure compliance with legal provisions of the annual appropriated budget approved by the Mayor and City Council. Annual budgets are adopted for the General Fund, Community Development, Emergency Telephone System, Intergovernmental Grant, Tax Allocation Districts, Other Special Revenue, and the Debt Service Fund with the level of legal budgetary control established by the City Council at the department level. The Capital Projects Funds adopt project-length budgets.
The amounts of anticipated revenues and appropriated expenditures for the annual budget are controlled by the City Charter and various ordinances adopted by the City Council.
The accompanying Statement (Schedules) of Revenues, Expenditures and Changes in Fund Balances Budget and Actual Comparison - General, Special Revenue Funds as defined above and Debt Service Fund, presents comparisons of the legally adopted budget, and legally adopted interdepartmental transfers of appropriations, with actual operating results on a budgetary basis.
The responsibility for revenue anticipations and specified appropriations is fixed by law by the Budget Commission, which is composed of the Mayor, the Chief Financial Officer, the Chair of the City Council Finance Committee, and two other members of City Council. The Budget Commission may not anticipate in any year an amount in excess of 99% of the normal revenues of the City actually collected during the previous year (unless tax rates or fees are increased) plus any accumulated cash surplus carried forward from the previous year. Grant revenues are anticipated in the Community Development and Intergovernmental Grant Funds in the year the grant is awarded to the City, although the funds may not be received in the same year. Grant revenue is therefore not considered to be over-anticipated until the activity for which the funds were granted is completed, and actual revenues are less than anticipated revenues.
After the initial annual budget is adopted, it may be amended for interdepartmental transfers of appropriations with the approval of City Council. Intradepartmental transfers of appropriations among individual budgetary accounts may be initiated by a department head with the approval of the Chief Operating Officer, the Chair of the City Council Finance Committee, and the Chief Financial Officer.
Total appropriations for any fund may be increased if, during the year, sources of revenue become available to the City in excess of original anticipations, and these amounts are anticipated by the Budget Commission and subsequently appropriated by City Council. No such additional appropriations were required during the year ended June 30, 2009.
Encumbrance accounting, under which purchase orders and contracts are recorded in order to reserve that portion of the applicable appropriation, is employed as an extension of the formal budgetary process. All appropriations, except for the General Fund's reserved fund balance, construction, bond proceed funds, and Special Revenue funds, lapse at the end of the year, but are considered during the following year's budgeting process. Contractually encumbered appropriations and certain unencumbered appropriations in the General Fund do not lapse, but are carried forward to the ensuing budget year as budgetary amendments.

54
Notes to the Financial Statements - Continued
B. Excess of Expenditures Over Appropriations
The City, within its General Fund, had the following departmental expenditures in excess of appropriations for the fiscal year ended June 30, 2009 (in thousands):
Interest on bonds $14,654 Fire $ 1,406
The excess related to Interest on bonds was offset by lower than budgeted expenses for Bond principal payments, which was $15,915 under the budgeted amount.
C. Deficit Fund Equity
The following funds reported deficits in fund balance at June 30, 2009:
Sanitation Fund had an accumulated deficit of $55,407,000 due to deficiencies in operating revenues. Approximately $20 million of the fund deficit is related to landfill post-closure costs which are being amortized over 15 years. The City is working to eliminate remaining negative net assets in future periods.
Parks and Recreation Facilities Fund had an accumulated deficit of $48,000.
Underground Atlanta Fund had an accumulated deficit of $14,719,000 due to deficiencies in operating revenue. The management company of the Underground project hopes to eliminate this deficit in the future through better management and cost reductions.
Emergency Telephone System had an accumulated deficit of $31,001,000 due to increased public safety expenditures. The City plans to increase the General fund appropriations to fund the Emergency Telephone System. Additionally, plans are being made to better manage the costs of E-911 operations.
Car Rental Fund had an accumulated deficit of $58,000. Due to timing differences between the receipt of funds and the transfer to the Car Rental Fund, this deficit should be eliminated in fiscal year 2010.
55
Notes to the Financial Statements - Continued
III. Detailed Notes on All Funds
A. Deposits and Investments
Pooled Cash and Investments Held in City Treasury
The City maintains a cash and investment pool that is available for use by all funds. Each participating fund’s portion of this pool is displayed on the accompanying financial statements as “Investment in pooled investments fund”.
Investments Authorized by the Georgia State Code Section 36-83-4 and the City of Atlanta Investment Policy
The City has adopted an investment policy (the “Policy”) to minimize the inherent risks associated with deposits and investments. The primary objective of the Policy is to invest funds to provide for the maximum safety of principal.
Identified below are the investment types that are authorized for the City by the Policy. The Policy also identifies certain provisions of the Official Code of Georgia (“OCGA”) that address interest rate risk, credit risk and concentration of credit risk. The Policy governs all governmental and business-type activities for the City, but does not govern the City of Atlanta Pension Plans.
The City’s investments are limited to U.S. Government guaranteed securities and U.S. government agency securities which are limited to issues of the Federal Farm Credit Bank (“FFCB”), Federal Home Loan Bank System (“FHLBS”), Federal Home Loan Mortgage Corporation (“FHLMC”), and Federal National Mortgage Association (“FNMA”). Under the Policy, the City restricts investments in eligible obligations to discount notes and callable or non-callable fixed-rate securities with a fixed principal repayment amount.
The City may invest in fully collateralized repurchase agreements provided the City has on file a signed Master Repurchase Agreement, approved by the City Attorney, detailing eligible collateral, collateralization ratios, standards for collateral custody and control, collateral valuation, and conditions for agreement termination. It also requires the securities being purchased by the City to be assigned to the City, held in the City’s name, and deposited at the time the investment is made with the City or with a third party selected and approved by the City; and is placed through a primary government securities dealer, as defined by the Federal Reserve, or a financial institution doing business in the state of Georgia, and is rated no less than A or its equivalent by two nationally recognized rating services.
Under the Policy, the City’s investment portfolio, in aggregate, is to be diversified to limit its exposure to interest rate, credit and concentration risks by observing the above limitations.
56
Notes to the Financial Statements – Continued
A. Deposits and Investments, continued
Investments in Employee Retirement Plans
The City has three defined benefit pension plans for full-time employees; the General Employees’ Pension Plan, the Police Officers’ Pension Plan and the Firefighters’ Pension Plan (the “Plans”). Each Plan is administered by its own Board of Trustees. The respective Boards are ultimately responsible for making all decisions with regard to the administration of their respective Plans, including the management of Plan assets, and for carrying out the investment policy on behalf of their respective Plans.
The Plans’ investments are managed by various investment managers under contracts with the respective Plans who have discretionary authority over the assets managed by them, within the investment guidelines, established by the respective Boards. The investments are held in trust by the Plans’ custodians in the Plans’ name. These assets are held exclusively for the purpose of providing benefits to members of the plans and their beneficiaries.
Identified below are the investment types authorized by the respective Boards for each of the Plans. The investment policies also identify certain provisions addressing interest rate risk, credit risk and concentration of credit risk.
The Plans, by policy, are to invest their cash in domestic equities, domestic fixed income securities and cash equivalents. These instruments consist of common and preferred stock, obligations of the U.S. government and agencies (GNMA, FHLMC, and FNMA securities and CMO’s), corporate bonds, and certificates of deposit. The Plans have strict limitations on the amounts managers are allowed to invest in any one issuer in all classes of securities. The Plans also invest in repurchase agreements which must be fully collateralized by U.S. government or agency guaranteed securities.
Respective Board policies permit the Plans to engage in securities lending transactions with an authorized agent, provided that the securities are fully collateralized for at least 102% of securities loaned and that collateral is received prior to the release of the securities by the custodian.
INVESTMENT RISK DISCLOSURES
Governmental and Business-Type Activities
Interest Rate Risk. Interest rate risk is the risk that changes in market rates will adversely affect the fair market value of an investment. Generally, the longer the maturity of an investment the greater the sensitivity of its fair value to changes in market interest rates. Additionally, the fair values of the investments may be highly sensitive to interest rate fluctuations. By policy, the City establishes maximum maturity dates by investment type in order to limit interest rate risk. The City manages its exposure to interest rate risk by purchasing a combination of shorter-term and longer-term investments, and by timing cash flows from maturities so that a portion is maturing, or coming close to maturing, evenly over time as necessary to provide the cash flow and liquidity needs for operations.
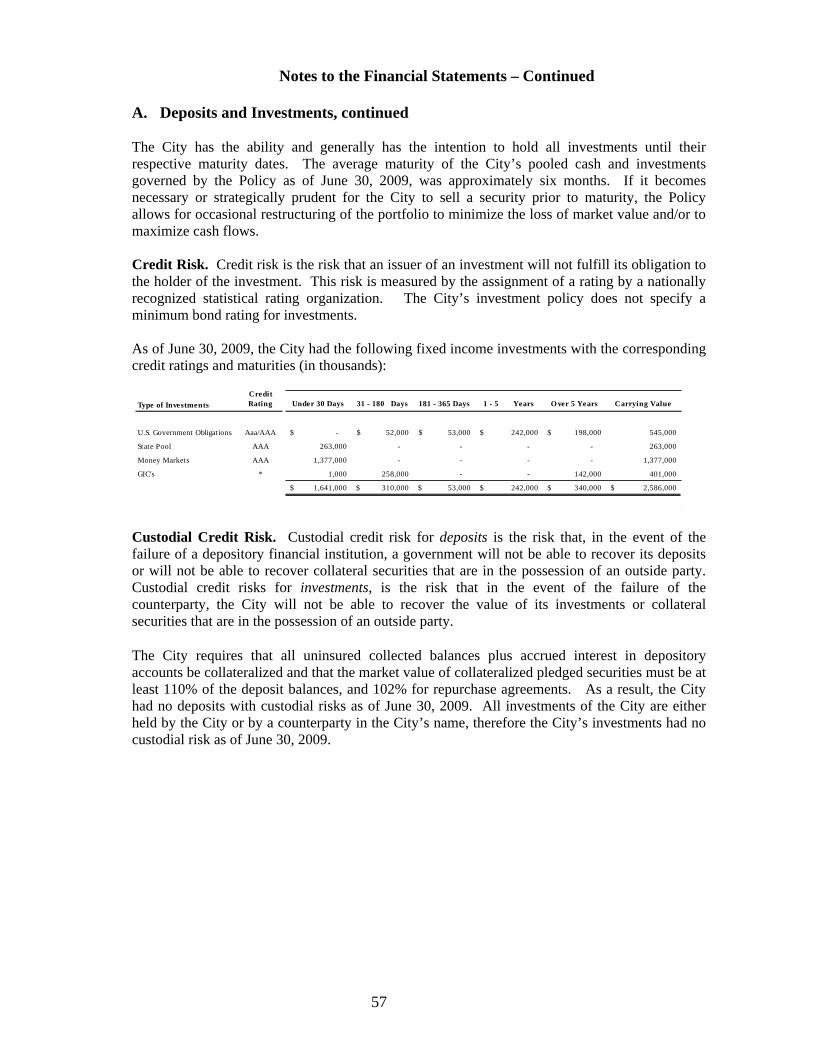
57
Notes to the Financial Statements – Continued
A. Deposits and Investments, continued
The City has the ability and generally has the intention to hold all investments until their respective maturity dates. The average maturity of the City’s pooled cash and investments governed by the Policy as of June 30, 2009, was approximately six months. If it becomes necessary or strategically prudent for the City to sell a security prior to maturity, the Policy allows for occasional restructuring of the portfolio to minimize the loss of market value and/or to maximize cash flows.
Credit Risk. Credit risk is the risk that an issuer of an investment will not fulfill its obligation to the holder of the investment. This risk is measured by the assignment of a rating by a nationally recognized statistical rating organization. The City’s investment policy does not specify a minimum bond rating for investments.
As of June 30, 2009, the City had the following fixed income investments with the corresponding credit ratings and maturities (in thousands):
Type of Investments
Credit Rating Under 30 Days 31 - 180 Days 181 - 365 Days 1 - 5 Years O ver 5 Years Carrying Value
U.S. Government Obligations Aaa/AAA -$ 52,000$ 53,000$ 242,000$ 198,000$ 545,000
State Pool AAA 263,000 - - - - 263,000
Money Markets AAA 1,377,000 - - - - 1,377,000
GIC's * 1,000 258,000 - - 142,000 401,000
1,641,000$ 310,000$ 53,000$ 242,000$ 340,000$ 2,586,000$
Custodial Credit Risk. Custodial credit risk for deposits is the risk that, in the event of the failure of a depository financial institution, a government will not be able to recover its deposits or will not be able to recover collateral securities that are in the possession of an outside party. Custodial credit risks for investments, is the risk that in the event of the failure of the counterparty, the City will not be able to recover the value of its investments or collateral securities that are in the possession of an outside party.
The City requires that all uninsured collected balances plus accrued interest in depository accounts be collateralized and that the market value of collateralized pledged securities must be at least 110% of the deposit balances, and 102% for repurchase agreements. As a result, the City had no deposits with custodial risks as of June 30, 2009. All investments of the City are either held by the City or by a counterparty in the City’s name, therefore the City’s investments had no custodial risk as of June 30, 2009.
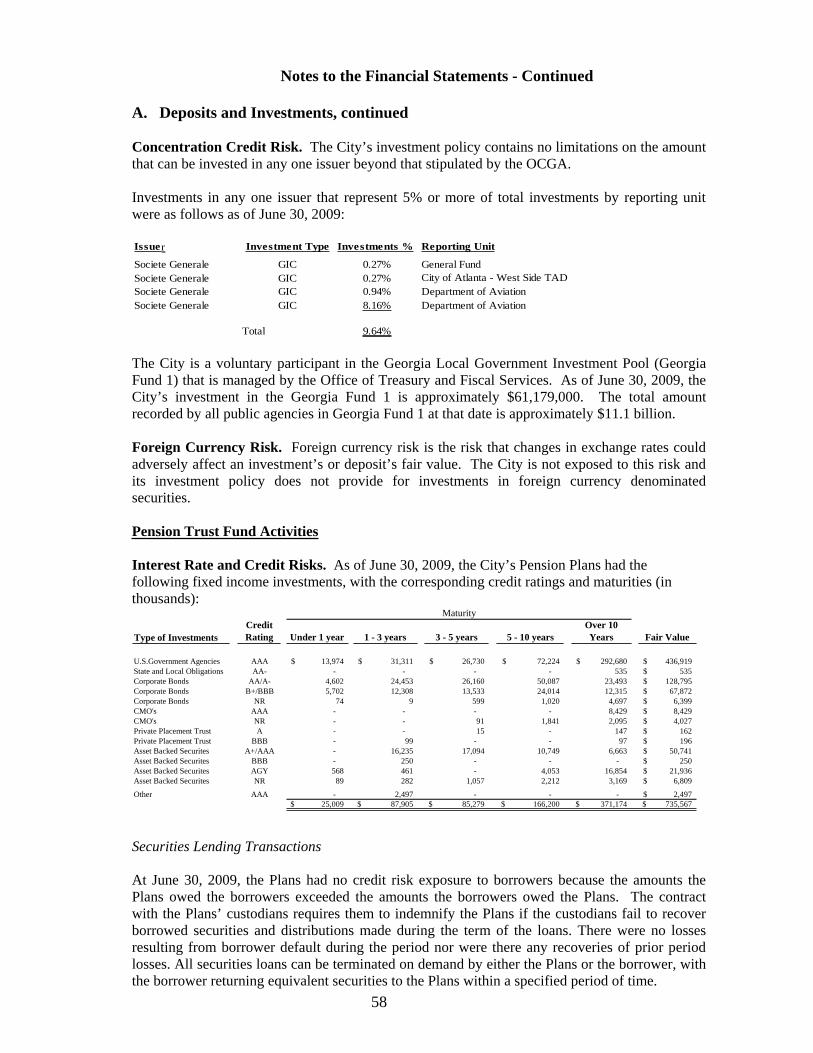
58
Notes to the Financial Statements - Continued
A. Deposits and Investments, continued
Concentration Credit Risk. The City’s investment policy contains no limitations on the amount that can be invested in any one issuer beyond that stipulated by the OCGA.
Investments in any one issuer that represent 5% or more of total investments by reporting unitwere as follows as of June 30, 2009:
Issuer Investment Type Investments % Reporting Unit
Societe Generale GIC 0.27% General FundSociete Generale GIC 0.27% City of Atlanta - West Side TADSociete Generale GIC 0.94% Department of AviationSociete Generale GIC 8.16% Department of Aviation
Total 9.64%
The City is a voluntary participant in the Georgia Local Government Investment Pool (Georgia Fund 1) that is managed by the Office of Treasury and Fiscal Services. As of June 30, 2009, the City’s investment in the Georgia Fund 1 is approximately $61,179,000. The total amount recorded by all public agencies in Georgia Fund 1 at that date is approximately $11.1 billion.
Foreign Currency Risk. Foreign currency risk is the risk that changes in exchange rates could adversely affect an investment’s or deposit’s fair value. The City is not exposed to this risk and its investment policy does not provide for investments in foreign currency denominated securities.
Pension Trust Fund Activities
Interest Rate and Credit Risks. As of June 30, 2009, the City’s Pension Plans had the following fixed income investments, with the corresponding credit ratings and maturities (in thousands):
Type of InvestmentsCredit Rating Under 1 year 1 - 3 years 3 - 5 years 5 - 10 years
Over 10 Years Fair Value
U.S.Government Agencies AAA 13,974$ 31,311$ 26,730$ 72,224$ 292,680$ 436,919$ State and Local Obligations AA- - - - - 535 535$ Corporate Bonds AA/A- 4,602 24,453 26,160 50,087 23,493 128,795$ Corporate Bonds B+/BBB 5,702 12,308 13,533 24,014 12,315 67,872$ Corporate Bonds NR 74 9 599 1,020 4,697 6,399$ CMO's AAA - - - - 8,429 8,429$ CMO's NR - - 91 1,841 2,095 4,027$ Private Placement Trust A - - 15 - 147 162$ Private Placement Trust BBB - 99 - - 97 196$ Asset Backed Securites A+/AAA - 16,235 17,094 10,749 6,663 50,741$ Asset Backed Securites BBB - 250 - - - 250$ Asset Backed Securites AGY 568 461 - 4,053 16,854 21,936$ Asset Backed Securites NR 89 282 1,057 2,212 3,169 6,809$
Other AAA - 2,497 - - - 2,497$ 25,009$ 87,905$ 85,279$ 166,200$ 371,174$ 735,567$
Maturity
Securities Lending Transactions
At June 30, 2009, the Plans had no credit risk exposure to borrowers because the amounts the Plans owed the borrowers exceeded the amounts the borrowers owed the Plans. The contract with the Plans’ custodians requires them to indemnify the Plans if the custodians fail to recover borrowed securities and distributions made during the term of the loans. There were no losses resulting from borrower default during the period nor were there any recoveries of prior period losses. All securities loans can be terminated on demand by either the Plans or the borrower, with the borrower returning equivalent securities to the Plans within a specified period of time.
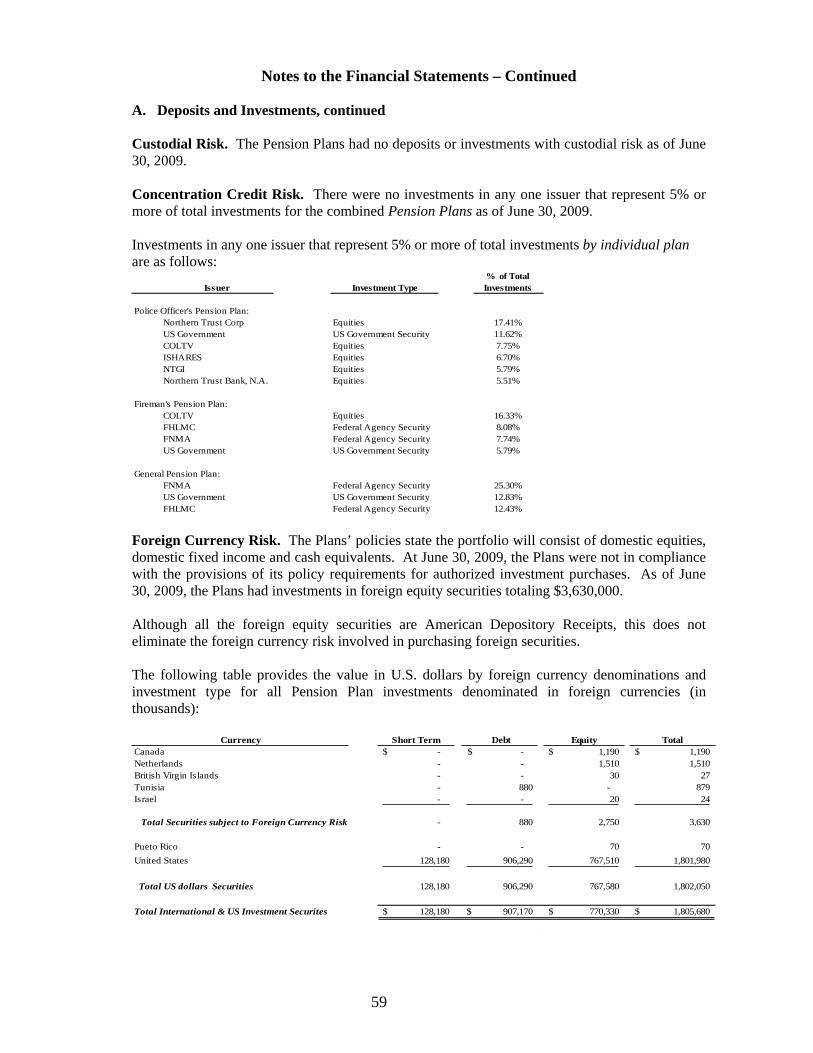
59
Notes to the Financial Statements – Continued
A. Deposits and Investments, continued
Custodial Risk. The Pension Plans had no deposits or investments with custodial risk as of June 30, 2009.
Concentration Credit Risk. There were no investments in any one issuer that represent 5% or more of total investments for the combined Pension Plans as of June 30, 2009.
Investments in any one issuer that represent 5% or more of total investments by individual planare as follows:
Issuer Investment Type% of Total Investments
Police Officer's Pension Plan:Northern Trust Corp Equities 17.41%US Government US Government Security 11.62%COLTV Equities 7.75%ISHARES Equities 6.70%NTGI Equities 5.79%Northern Trust Bank, N.A. Equities 5.51%
Fireman's Pension Plan:COLTV Equities 16.33%FHLMC Federal Agency Security 8.08%FNMA Federal Agency Security 7.74%US Government US Government Security 5.79%
General Pension Plan:FNMA Federal Agency Security 25.30%US Government US Government Security 12.83%FHLMC Federal Agency Security 12.43%
Foreign Currency Risk. The Plans’ policies state the portfolio will consist of domestic equities, domestic fixed income and cash equivalents. At June 30, 2009, the Plans were not in compliance with the provisions of its policy requirements for authorized investment purchases. As of June 30, 2009, the Plans had investments in foreign equity securities totaling $3,630,000.
Although all the foreign equity securities are American Depository Receipts, this does not eliminate the foreign currency risk involved in purchasing foreign securities.
The following table provides the value in U.S. dollars by foreign currency denominations and investment type for all Pension Plan investments denominated in foreign currencies (in thousands):
Currency Short Term Debt Equity TotalCanada -$ -$ 1,190$ 1,190$ Netherlands - - 1,510 1,510 British Virgin Islands - - 30 27 Tunisia - 880 - 879 Israel - - 20 24
Total Securities subject to Foreign Currency Risk - 880 2,750 3,630
Pueto Rico - - 70 70
United States 128,180 906,290 767,510 1,801,980
Total US dollars Securities 128,180 906,290 767,580 1,802,050
Total International & US Investment Securites 128,180$ 907,170$ 770,330$ 1,805,680$
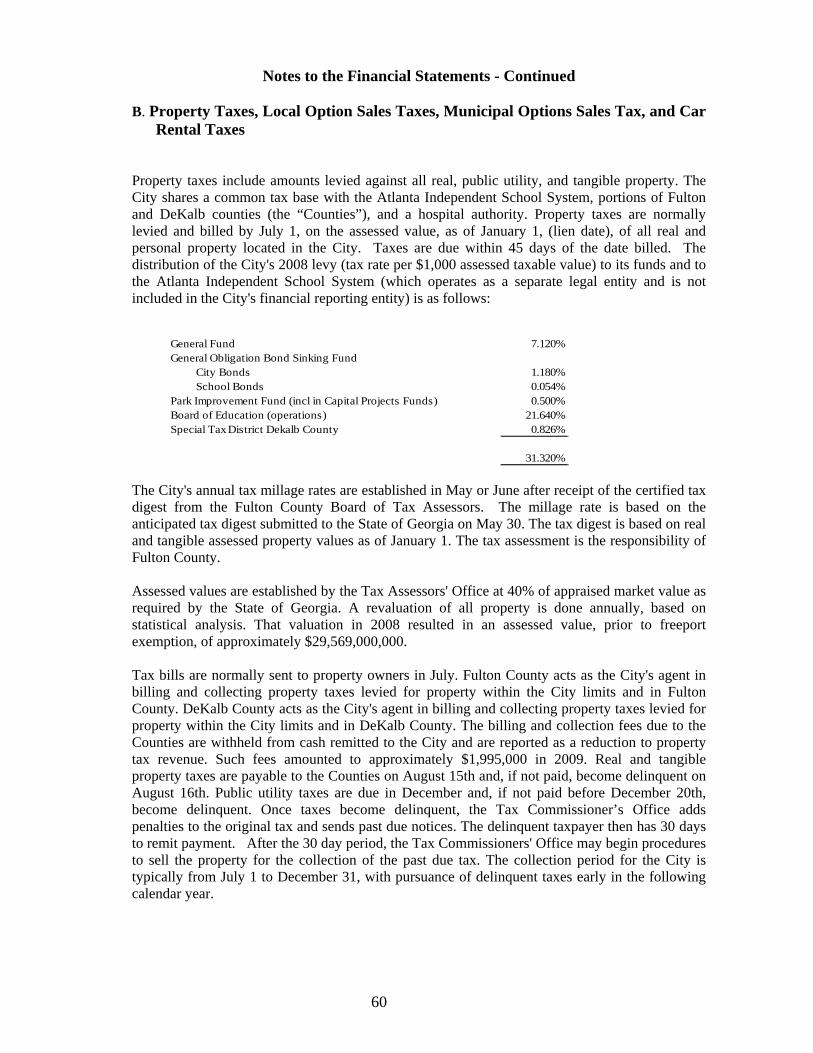
60
Notes to the Financial Statements - Continued
B. Property Taxes, Local Option Sales Taxes, Municipal Options Sales Tax, and Car Rental Taxes
Property taxes include amounts levied against all real, public utility, and tangible property. The City shares a common tax base with the Atlanta Independent School System, portions of Fulton and DeKalb counties (the “Counties”), and a hospital authority. Property taxes are normally levied and billed by July 1, on the assessed value, as of January 1, (lien date), of all real and personal property located in the City. Taxes are due within 45 days of the date billed. The distribution of the City's 2008 levy (tax rate per $1,000 assessed taxable value) to its funds and to the Atlanta Independent School System (which operates as a separate legal entity and is not included in the City's financial reporting entity) is as follows:
General Fund 7.120%General Obligation Bond Sinking Fund
City Bonds 1.180%School Bonds 0.054%
Park Improvement Fund (incl in Capital Projects Funds) 0.500%Board of Education (operations) 21.640%Special Tax District Dekalb County 0.826%
31.320%
The City's annual tax millage rates are established in May or June after receipt of the certified tax digest from the Fulton County Board of Tax Assessors. The millage rate is based on the anticipated tax digest submitted to the State of Georgia on May 30. The tax digest is based on real and tangible assessed property values as of January 1. The tax assessment is the responsibility of Fulton County.
Assessed values are established by the Tax Assessors' Office at 40% of appraised market value as required by the State of Georgia. A revaluation of all property is done annually, based on statistical analysis. That valuation in 2008 resulted in an assessed value, prior to freeport exemption, of approximately $29,569,000,000.
Tax bills are normally sent to property owners in July. Fulton County acts as the City's agent in billing and collecting property taxes levied for property within the City limits and in Fulton County. DeKalb County acts as the City's agent in billing and collecting property taxes levied for property within the City limits and in DeKalb County. The billing and collection fees due to the Counties are withheld from cash remitted to the City and are reported as a reduction to property tax revenue. Such fees amounted to approximately $1,995,000 in 2009. Real and tangible property taxes are payable to the Counties on August 15th and, if not paid, become delinquent on August 16th. Public utility taxes are due in December and, if not paid before December 20th, become delinquent. Once taxes become delinquent, the Tax Commissioner’s Office adds penalties to the original tax and sends past due notices. The delinquent taxpayer then has 30 days to remit payment. After the 30 day period, the Tax Commissioners' Office may begin procedures to sell the property for the collection of the past due tax. The collection period for the City is typically from July 1 to December 31, with pursuance of delinquent taxes early in the following calendar year.
61
Notes to the Financial Statements – Continued
B. Property Taxes, Local Option Sales Taxes, Municipal Option Sales Tax, and Car Rental Taxes, continued
A 1% local option sales tax is levied in Fulton County and the City receives a percentage of that amount based on a pre-defined formula. This amount is collected by the State of Georgia and remitted to the City on a one-month lag. The tax law requires an offsetting reduction in property tax during each subsequent year of assessment equal to the amount of sales tax revenue received in the prior year.
A 3% excise tax on all rental motor vehicles was implemented in June 1996. This car rental tax is intended to be used to promote industry trade, commerce, and tourism and to fund various capital outlay projects throughout the City. The capital outlay projects include infrastructure improvements necessary for the City to continue building a community that is stable, diverse and economically feasible.
See Note Section IV-C- CSO – Consent Decree regarding the levy of a 1% Municipal Option Sales Tax.
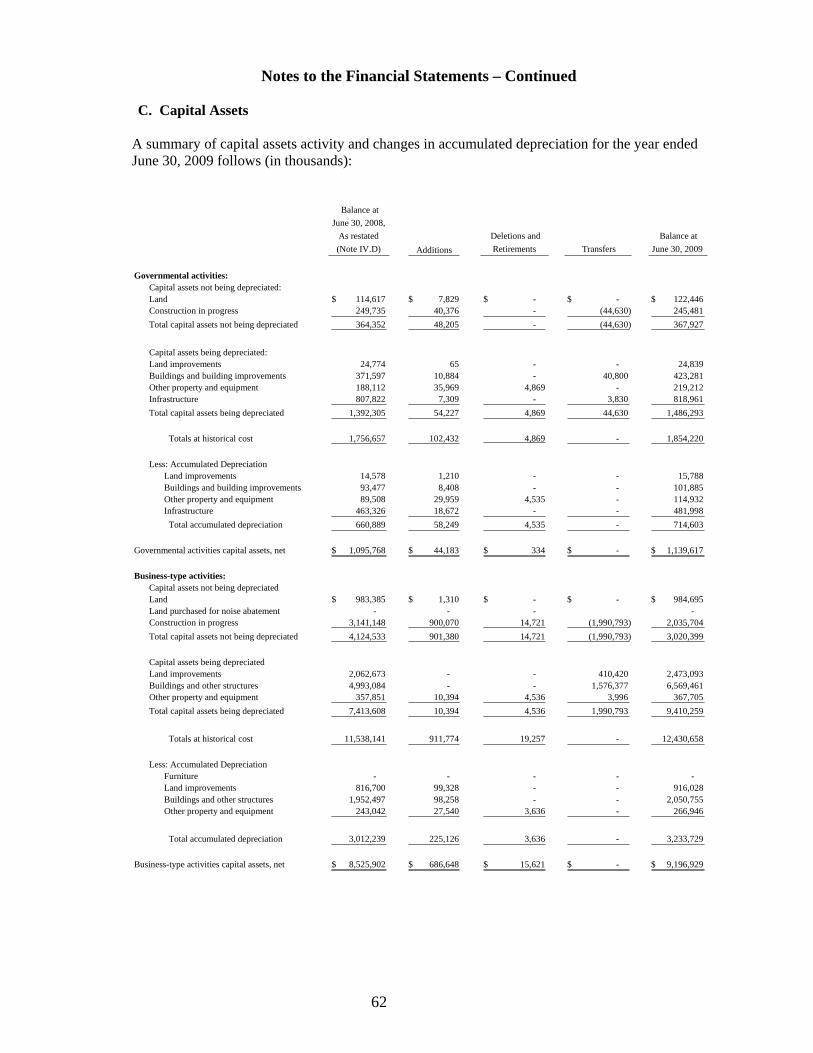
62
Notes to the Financial Statements – Continued
C. Capital Assets
A summary of capital assets activity and changes in accumulated depreciation for the year ended June 30, 2009 follows (in thousands):
Balance at
June 30, 2008,
As restated
(Note IV.D) Additions
Deletions and
Retirements Transfers
Balance at
June 30, 2009
Governmental activities:Capital assets not being depreciated:Land 114,617$ 7,829$ -$ -$ 122,446$ Construction in progress 249,735 40,376 - (44,630) 245,481
Total capital assets not being depreciated 364,352 48,205 - (44,630) 367,927
Capital assets being depreciated:Land improvements 24,774 65 - - 24,839 Buildings and building improvements 371,597 10,884 - 40,800 423,281 Other property and equipment 188,112 35,969 4,869 - 219,212 Infrastructure 807,822 7,309 - 3,830 818,961
Total capital assets being depreciated 1,392,305 54,227 4,869 44,630 1,486,293
Totals at historical cost 1,756,657 102,432 4,869 - 1,854,220
Less: Accumulated DepreciationLand improvements 14,578 1,210 - - 15,788 Buildings and building improvements 93,477 8,408 - - 101,885 Other property and equipment 89,508 29,959 4,535 - 114,932 Infrastructure 463,326 18,672 - - 481,998
Total accumulated depreciation 660,889 58,249 4,535 - 714,603
Governmental activities capital assets, net 1,095,768$ 44,183$ 334$ -$ 1,139,617$
Business-type activities:Capital assets not being depreciatedLand 983,385$ 1,310$ -$ -$ 984,695$ Land purchased for noise abatement - - - - Construction in progress 3,141,148 900,070 14,721 (1,990,793) 2,035,704
Total capital assets not being depreciated 4,124,533 901,380 14,721 (1,990,793) 3,020,399
Capital assets being depreciatedLand improvements 2,062,673 - - 410,420 2,473,093 Buildings and other structures 4,993,084 - - 1,576,377 6,569,461 Other property and equipment 357,851 10,394 4,536 3,996 367,705
Total capital assets being depreciated 7,413,608 10,394 4,536 1,990,793 9,410,259
Totals at historical cost 11,538,141 911,774 19,257 - 12,430,658
Less: Accumulated DepreciationFurniture - - - - - Land improvements 816,700 99,328 - - 916,028 Buildings and other structures 1,952,497 98,258 - - 2,050,755 Other property and equipment 243,042 27,540 3,636 - 266,946
Total accumulated depreciation 3,012,239 225,126 3,636 - 3,233,729
Business-type activities capital assets, net 8,525,902$ 686,648$ 15,621$ -$ 9,196,929$

63
Notes to the Financial Statements – Continued
C. Capital Assets, continued
Depreciation expense was charged to governmental funds as follows (in thousands):
General government: $ 19,074 Police 3,041 Fire 5,292 Correction 232 Public Works 28,094 Parks, Recreation & Cultural Affairs 2,516
Total governmental funds capital assets $ 58,249
Department of Aviation (DOA)
In accordance with GASB Statement No. 42, Accounting and Financial Reporting for Impairment of Capital Assets and for Insurance Recoveries, certain amounts previously reported as Construction-in-Progress (CIP) in the amount of $14.7 million have been deemed to be impaired. Asset adjustments have been made accordingly.
D. Interfund Receivables, Payables, and Transfers
During the course of its operations, the City makes transfers between funds to finance operations, provide services, acquire assets and service debt. To the extent that certain transfers between funds had not occurred as of year-end, balances of interfund amounts receivable or payable have been recorded.
Interfund receivable and payable balances as of June 30, 2009, are as follows (in thousands):
Due from Due toother funds other funds
General Fund 171,444$ 191,380$
Capital projects fund 748 41,560
Debt service fund 30,315 -
Nonmajor governmental funds 16,533 66,713
Department of Watershed Management 157,646 -
Nonmajor enterprise funds 77 51,043
Internal Service Fund - 13,588
Fiduciary funds - 12,479
Total Primary Government 376,763$ 376,763$
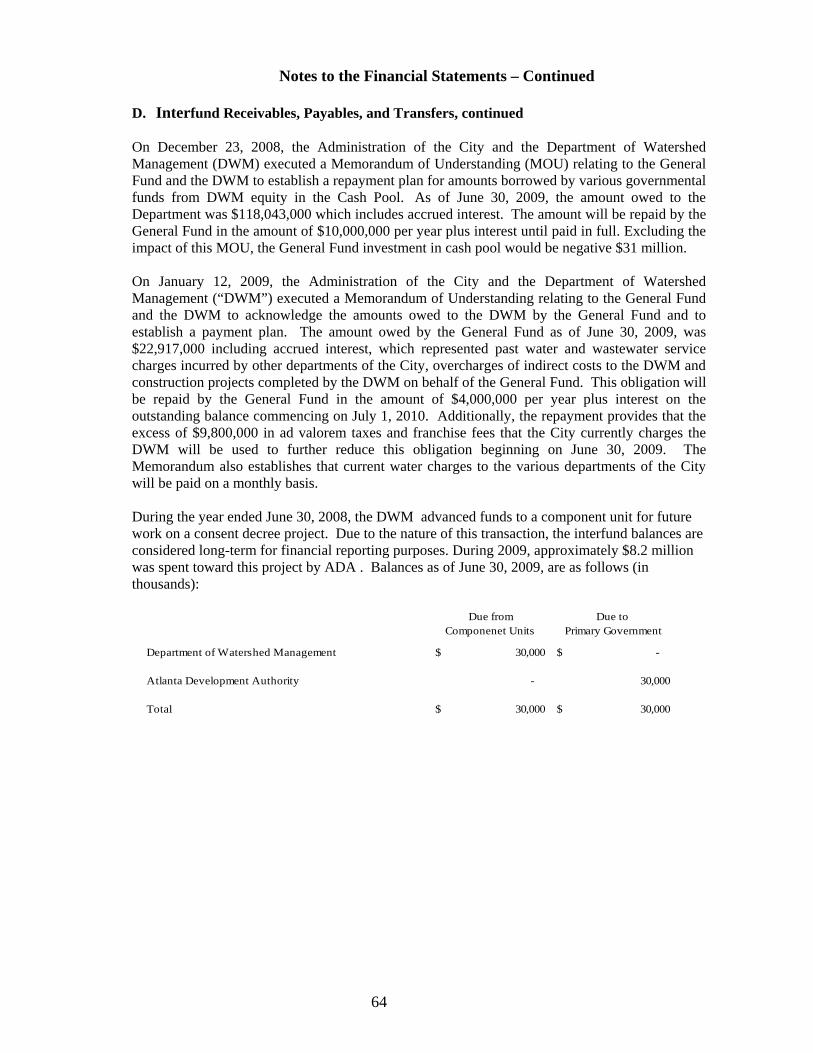
64
Notes to the Financial Statements – Continued
D. Interfund Receivables, Payables, and Transfers, continued
On December 23, 2008, the Administration of the City and the Department of Watershed Management (DWM) executed a Memorandum of Understanding (MOU) relating to the General Fund and the DWM to establish a repayment plan for amounts borrowed by various governmental funds from DWM equity in the Cash Pool. As of June 30, 2009, the amount owed to the Department was $118,043,000 which includes accrued interest. The amount will be repaid by the General Fund in the amount of $10,000,000 per year plus interest until paid in full. Excluding the impact of this MOU, the General Fund investment in cash pool would be negative $31 million.
On January 12, 2009, the Administration of the City and the Department of Watershed Management (“DWM”) executed a Memorandum of Understanding relating to the General Fund and the DWM to acknowledge the amounts owed to the DWM by the General Fund and to establish a payment plan. The amount owed by the General Fund as of June 30, 2009, was $22,917,000 including accrued interest, which represented past water and wastewater service charges incurred by other departments of the City, overcharges of indirect costs to the DWM and construction projects completed by the DWM on behalf of the General Fund. This obligation will be repaid by the General Fund in the amount of $4,000,000 per year plus interest on the outstanding balance commencing on July 1, 2010. Additionally, the repayment provides that the excess of $9,800,000 in ad valorem taxes and franchise fees that the City currently charges the DWM will be used to further reduce this obligation beginning on June 30, 2009. The Memorandum also establishes that current water charges to the various departments of the City will be paid on a monthly basis.
During the year ended June 30, 2008, the DWM advanced funds to a component unit for future work on a consent decree project. Due to the nature of this transaction, the interfund balances are considered long-term for financial reporting purposes. During 2009, approximately $8.2 million was spent toward this project by ADA . Balances as of June 30, 2009, are as follows (in thousands):
Due from Due to Componenet Units Primary Government
Department of Watershed Management 30,000$ -$
Atlanta Development Authority - 30,000
Total 30,000$ 30,000$
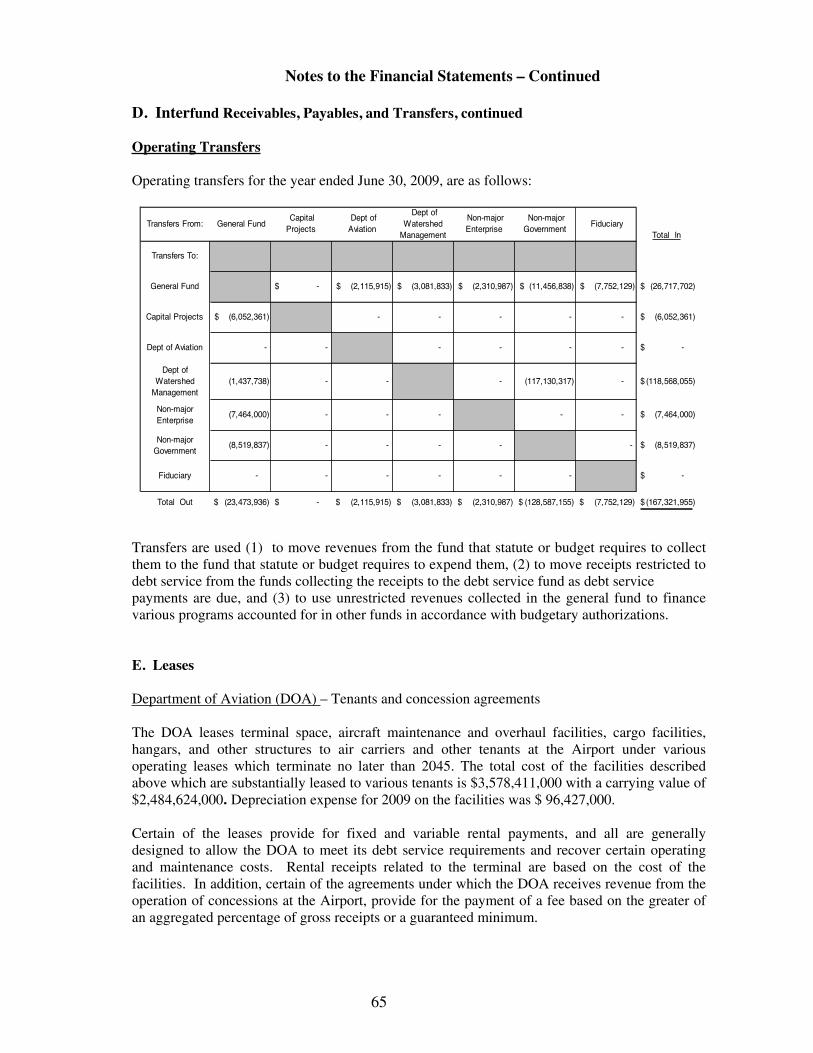
65
Notes to the Financial Statements – Continued
D. Interfund Receivables, Payables, and Transfers, continued
Operating Transfers
Operating transfers for the year ended June 30, 2009, are as follows:
Transfers are used (1) to move revenues from the fund that statute or budget requires to collect them to the fund that statute or budget requires to expend them, (2) to move receipts restricted to debt service from the funds collecting the receipts to the debt service fund as debt service payments are due, and (3) to use unrestricted revenues collected in the general fund to finance various programs accounted for in other funds in accordance with budgetary authorizations.
E. Leases
Department of Aviation (DOA) – Tenants and concession agreements
The DOA leases terminal space, aircraft maintenance and overhaul facilities, cargo facilities, hangars, and other structures to air carriers and other tenants at the Airport under various operating leases which terminate no later than 2045. The total cost of the facilities described above which are substantially leased to various tenants is $3,578,411,000 with a carrying value of $2,484,624,000. Depreciation expense for 2009 on the facilities was $ 96,427,000.
Certain of the leases provide for fixed and variable rental payments, and all are generally designed to allow the DOA to meet its debt service requirements and recover certain operating and maintenance costs. Rental receipts related to the terminal are based on the cost of the facilities. In addition, certain of the agreements under which the DOA receives revenue from the operation of concessions at the Airport, provide for the payment of a fee based on the greater of an aggregated percentage of gross receipts or a guaranteed minimum.
Transfers From: General Fund Capital Projects
Dept of Aviation
Dept of Watershed
Management
Non-major Enterprise
Non-major Government
Fiduciary Total In
Transfers To:
General Fund -$ (2,115,915)$ (3,081,833)$ (2,310,987)$ (11,456,838)$ (7,752,129)$ (26,717,702)$
Capital Projects (6,052,361)$ - - - - - (6,052,361)$
Dept of Aviation - - - - - - -$
Dept of Watershed
Management(1,437,738) - - - (117,130,317) - (118,568,055)$
Non-major Enterprise
(7,464,000) - - - - - (7,464,000)$
Non-major Government
(8,519,837) - - - - - (8,519,837)$
Fiduciary - - - - - - -$
Total Out (23,473,936)$ -$ (2,115,915)$ (3,081,833)$ (2,310,987)$ (128,587,155)$ (7,752,129)$ (167,321,955)$
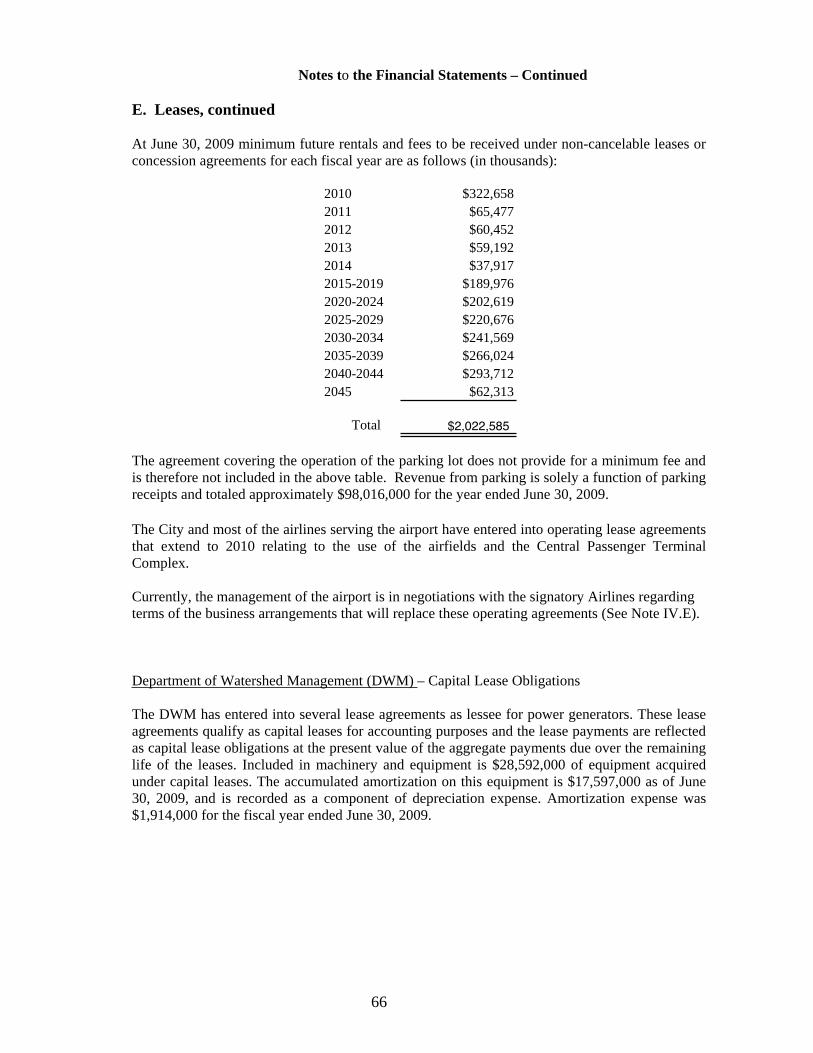
66
Notes to the Financial Statements – Continued
E. Leases, continued
At June 30, 2009 minimum future rentals and fees to be received under non-cancelable leases or concession agreements for each fiscal year are as follows (in thousands):
2010 $322,658 2011 $65,477 2012 $60,452 2013 $59,192 2014 $37,917 2015-2019 $189,976 2020-2024 $202,619 2025-2029 $220,676 2030-2034 $241,569 2035-2039 $266,024 2040-2044 $293,712 2045 $62,313
Total $2,022,585
The agreement covering the operation of the parking lot does not provide for a minimum fee and is therefore not included in the above table. Revenue from parking is solely a function of parking receipts and totaled approximately $98,016,000 for the year ended June 30, 2009.
The City and most of the airlines serving the airport have entered into operating lease agreements that extend to 2010 relating to the use of the airfields and the Central Passenger Terminal Complex.
Currently, the management of the airport is in negotiations with the signatory Airlines regarding terms of the business arrangements that will replace these operating agreements (See Note IV.E).
Department of Watershed Management (DWM) – Capital Lease Obligations
The DWM has entered into several lease agreements as lessee for power generators. These lease agreements qualify as capital leases for accounting purposes and the lease payments are reflected as capital lease obligations at the present value of the aggregate payments due over the remaining life of the leases. Included in machinery and equipment is $28,592,000 of equipment acquired under capital leases. The accumulated amortization on this equipment is $17,597,000 as of June 30, 2009, and is recorded as a component of depreciation expense. Amortization expense was $1,914,000 for the fiscal year ended June 30, 2009.
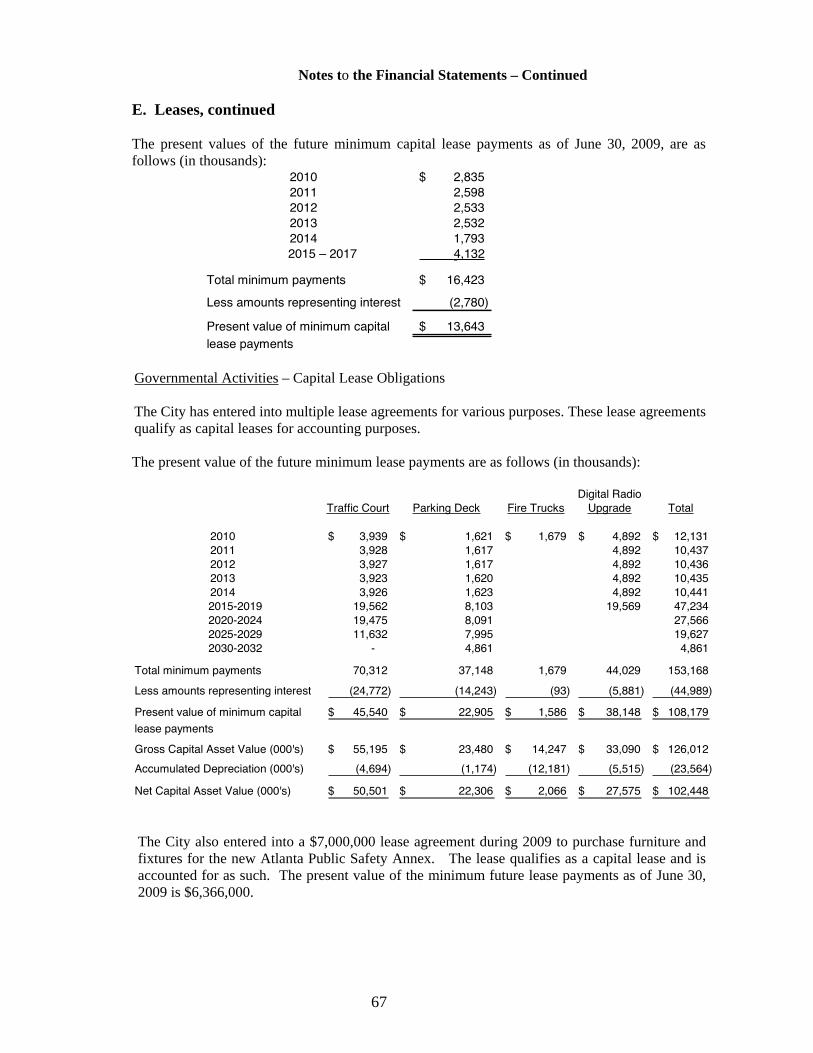
67
Notes to the Financial Statements – Continued
E. Leases, continued
The present values of the future minimum capital lease payments as of June 30, 2009, are as follows (in thousands):
2010 2,835$ 2011 2,598 2012 2,533 2013 2,532 2014 1,793
2015 – 2017 4,132
Total minimum payments 16,423$
Less amounts representing interest (2,780)
Present value of minimum capital 13,643$ lease payments
Governmental Activities – Capital Lease Obligations
The City has entered into multiple lease agreements for various purposes. These lease agreements qualify as capital leases for accounting purposes.
The present value of the future minimum lease payments are as follows (in thousands):
Traffic Court Parking Deck Fire TrucksDigital Radio
Upgrade Total
2010 3,939$ 1,621$ 1,679$ 4,892$ 12,131$ 2011 3,928 1,617 4,892 10,437 2012 3,927 1,617 4,892 10,436 2013 3,923 1,620 4,892 10,435 2014 3,926 1,623 4,892 10,441
2015-2019 19,562 8,103 19,569 47,234 2020-2024 19,475 8,091 27,566 2025-2029 11,632 7,995 19,627 2030-2032 - 4,861 4,861
Total minimum payments 70,312 37,148 1,679 44,029 153,168
Less amounts representing interest (24,772) (14,243) (93) (5,881) (44,989)
Present value of minimum capital 45,540$ 22,905$ 1,586$ 38,148$ 108,179$
lease payments
Gross Capital Asset Value (000's) 55,195$ 23,480$ 14,247$ 33,090$ 126,012$
Accumulated Depreciation (000's) (4,694) (1,174) (12,181) (5,515) (23,564)
Net Capital Asset Value (000's) 50,501$ 22,306$ 2,066$ 27,575$ 102,448$
The City also entered into a $7,000,000 lease agreement during 2009 to purchase furniture and fixtures for the new Atlanta Public Safety Annex. The lease qualifies as a capital lease and is accounted for as such. The present value of the minimum future lease payments as of June 30, 2009 is $6,366,000.
68
Notes to the Financial Statements – Continued
E. Leases, continued
Downtown Development Authority of the City of Atlanta (DDA)
In 2009, the Atlanta Development Authority, through DDA issued $52,790,000 of refunding revenue bonds ($44,975,000, Series 2009A, and $7,815,000, Series 2009B). The bonds were used in part to refund the principal of the City of Atlanta Series 2002, Variable Rate Refunding Revenue Bonds (Underground Atlanta Project ). The principal and interest on the Series 2009 Revenue Bonds are special limited obligations of DDA and shall be payable solely from moneys payable to DDA by the City of Atlanta under a capital lease arrangement for the Underground Parking Deck.
The lease agreement qualifies as capital lease for accounting purposes (titles transfer at the end of the lease term) and has been recorded in the government-wide financial statements at the present value of the future minimum lease payments as of the date of inception.
The present value of the future minimum lease payments are as follows (in thousands):
2011 8,112 2012 8,114
2013 8,113
2014 8,111
2015 - 2017 24,337
Total minumum payments 56,787$
Less amounts representing interest (8,722)
Present value of minumum capitallease payments 48,065$
General Fund
For its General Fund, the City has entered into several lease agreements for operating purposes. These lease agreements qualify as operating leases for accounting purposes.
The future minimum lease payments are as follows (in thousands):
2010 3,147$ 2011 3,147 2012 3,147
Total minimum payments 9,441$
F. Notes Payable
General Fund
On February 27, 2008 the City borrowed $17,000,000 for construction and build-out expenses related to the Public Safety Annex. The loan, in the form of a note payable, has a ten year term and is scheduled to be paid in full by February 1, 2018. The outstanding principal balance as of June 30, 2009 is $15,509,000.
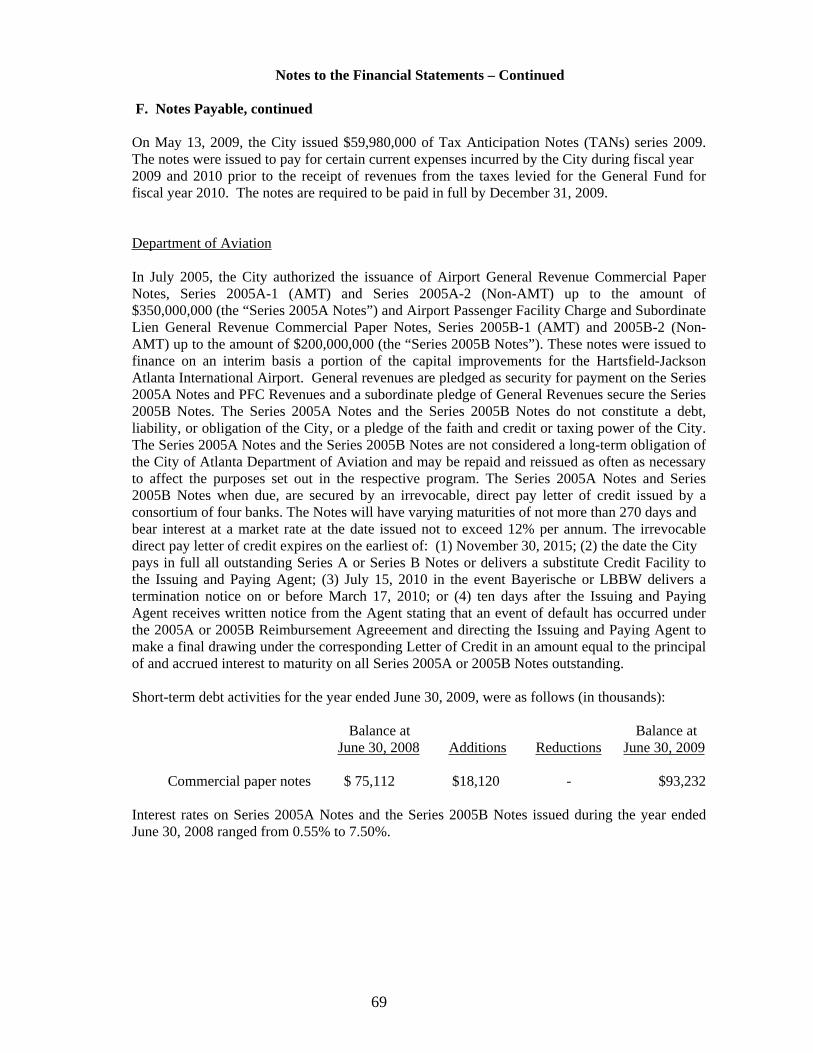
69
Notes to the Financial Statements – Continued
F. Notes Payable, continued
On May 13, 2009, the City issued $59,980,000 of Tax Anticipation Notes (TANs) series 2009. The notes were issued to pay for certain current expenses incurred by the City during fiscal year 2009 and 2010 prior to the receipt of revenues from the taxes levied for the General Fund for fiscal year 2010. The notes are required to be paid in full by December 31, 2009.
Department of Aviation
In July 2005, the City authorized the issuance of Airport General Revenue Commercial Paper Notes, Series 2005A-1 (AMT) and Series 2005A-2 (Non-AMT) up to the amount of $350,000,000 (the “Series 2005A Notes”) and Airport Passenger Facility Charge and Subordinate Lien General Revenue Commercial Paper Notes, Series 2005B-1 (AMT) and 2005B-2 (Non-AMT) up to the amount of $200,000,000 (the “Series 2005B Notes”). These notes were issued to finance on an interim basis a portion of the capital improvements for the Hartsfield-Jackson Atlanta International Airport. General revenues are pledged as security for payment on the Series 2005A Notes and PFC Revenues and a subordinate pledge of General Revenues secure the Series 2005B Notes. The Series 2005A Notes and the Series 2005B Notes do not constitute a debt, liability, or obligation of the City, or a pledge of the faith and credit or taxing power of the City. The Series 2005A Notes and the Series 2005B Notes are not considered a long-term obligation of the City of Atlanta Department of Aviation and may be repaid and reissued as often as necessary to affect the purposes set out in the respective program. The Series 2005A Notes and Series 2005B Notes when due, are secured by an irrevocable, direct pay letter of credit issued by a consortium of four banks. The Notes will have varying maturities of not more than 270 days and bear interest at a market rate at the date issued not to exceed 12% per annum. The irrevocable direct pay letter of credit expires on the earliest of: (1) November 30, 2015; (2) the date the City pays in full all outstanding Series A or Series B Notes or delivers a substitute Credit Facility to the Issuing and Paying Agent; (3) July 15, 2010 in the event Bayerische or LBBW delivers a termination notice on or before March 17, 2010; or (4) ten days after the Issuing and Paying Agent receives written notice from the Agent stating that an event of default has occurred under the 2005A or 2005B Reimbursement Agreeement and directing the Issuing and Paying Agent to make a final drawing under the corresponding Letter of Credit in an amount equal to the principal of and accrued interest to maturity on all Series 2005A or 2005B Notes outstanding.
Short-term debt activities for the year ended June 30, 2009, were as follows (in thousands):
Balance at Balance at June 30, 2008 Additions Reductions June 30, 2009
Commercial paper notes $ 75,112 $18,120 - $93,232
Interest rates on Series 2005A Notes and the Series 2005B Notes issued during the year ended June 30, 2008 ranged from 0.55% to 7.50%.
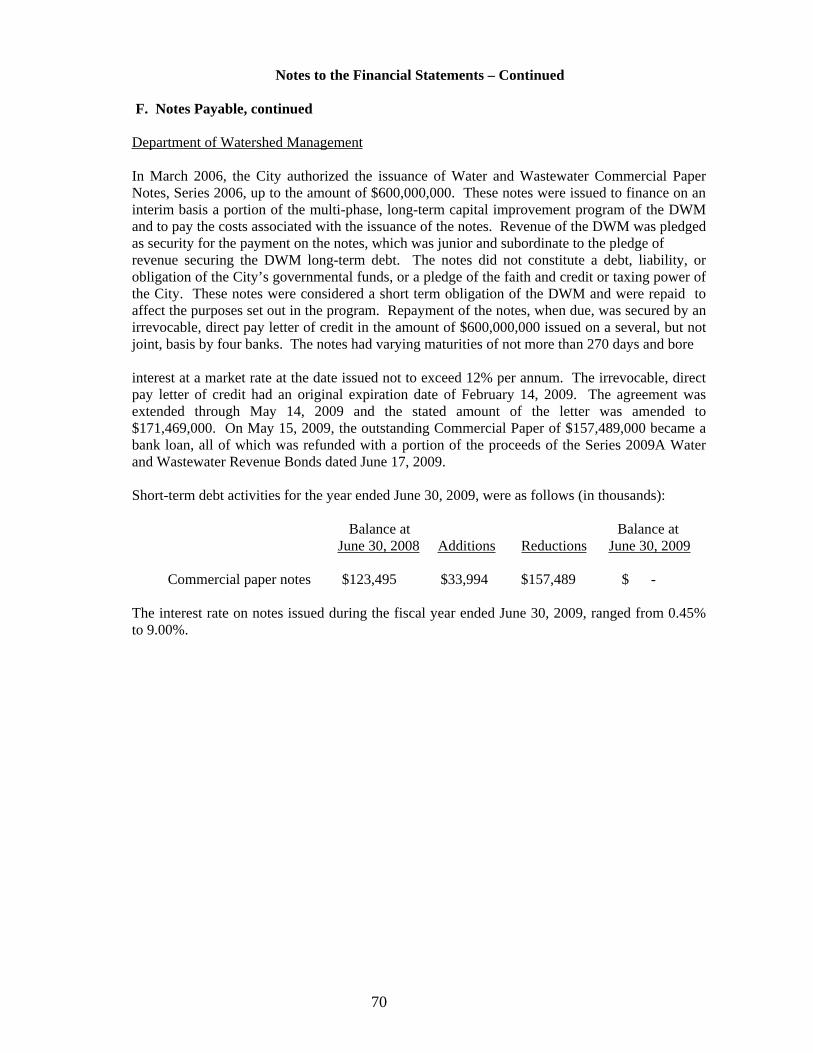
70
Notes to the Financial Statements – Continued
F. Notes Payable, continued
Department of Watershed Management
In March 2006, the City authorized the issuance of Water and Wastewater Commercial Paper Notes, Series 2006, up to the amount of $600,000,000. These notes were issued to finance on an interim basis a portion of the multi-phase, long-term capital improvement program of the DWM and to pay the costs associated with the issuance of the notes. Revenue of the DWM was pledged as security for the payment on the notes, which was junior and subordinate to the pledge of revenue securing the DWM long-term debt. The notes did not constitute a debt, liability, or obligation of the City’s governmental funds, or a pledge of the faith and credit or taxing power of the City. These notes were considered a short term obligation of the DWM and were repaid to affect the purposes set out in the program. Repayment of the notes, when due, was secured by an irrevocable, direct pay letter of credit in the amount of $600,000,000 issued on a several, but not joint, basis by four banks. The notes had varying maturities of not more than 270 days and bore
interest at a market rate at the date issued not to exceed 12% per annum. The irrevocable, direct pay letter of credit had an original expiration date of February 14, 2009. The agreement was extended through May 14, 2009 and the stated amount of the letter was amended to $171,469,000. On May 15, 2009, the outstanding Commercial Paper of $157,489,000 became a bank loan, all of which was refunded with a portion of the proceeds of the Series 2009A Water and Wastewater Revenue Bonds dated June 17, 2009.
Short-term debt activities for the year ended June 30, 2009, were as follows (in thousands):
Balance at Balance at June 30, 2008 Additions Reductions June 30, 2009
Commercial paper notes $123,495 $33,994 $157,489 $ -
The interest rate on notes issued during the fiscal year ended June 30, 2009, ranged from 0.45% to 9.00%.
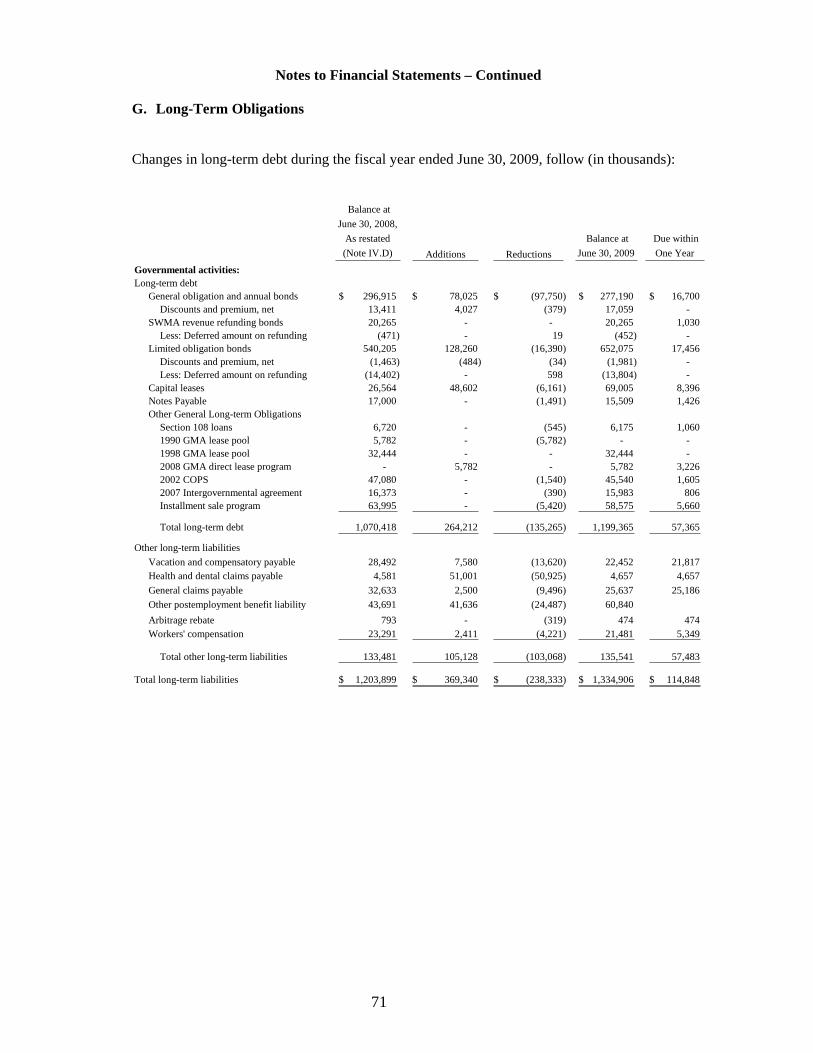
71
Notes to Financial Statements – Continued
G. Long-Term Obligations
Changes in long-term debt during the fiscal year ended June 30, 2009, follow (in thousands):
Balance at
June 30, 2008,
As restated
(Note IV.D) Additions Reductions
Balance at
June 30, 2009
Due within
One Year
Governmental activities:Long-term debt
General obligation and annual bonds 296,915$ 78,025$ (97,750)$ 277,190$ 16,700$ 13,411 4,027 (379) 17,059 -
SWMA revenue refunding bonds 20,265 - - 20,265 1,030 Less: Deferred amount on refunding (471) - 19 (452) -
Limited obligation bonds 540,205 128,260 (16,390) 652,075 17,456 (1,463) (484) (34) (1,981) -
Less: Deferred amount on refunding (14,402) - 598 (13,804) - Capital leases 26,564 48,602 (6,161) 69,005 8,396 Notes Payable 17,000 - (1,491) 15,509 1,426 Other General Long-term Obligations
Section 108 loans 6,720 - (545) 6,175 1,060 1990 GMA lease pool 5,782 - (5,782) - - 1998 GMA lease pool 32,444 - - 32,444 - 2008 GMA direct lease program - 5,782 - 5,782 3,226 2002 COPS 47,080 - (1,540) 45,540 1,605 2007 Intergovernmental agreement 16,373 - (390) 15,983 806 Installment sale program 63,995 - (5,420) 58,575 5,660
Total long-term debt 1,070,418 264,212 (135,265) 1,199,365 57,365
Other long-term liabilities
Vacation and compensatory payable 28,492 7,580 (13,620) 22,452 21,817 Health and dental claims payable 4,581 51,001 (50,925) 4,657 4,657
General claims payable 32,633 2,500 (9,496) 25,637 25,186 Other postemployment benefit liability 43,691 41,636 (24,487) 60,840
Arbitrage rebate 793 - (319) 474 474 Workers' compensation 23,291 2,411 (4,221) 21,481 5,349
Total other long-term liabilities 133,481 105,128 (103,068) 135,541 57,483
Total long-term liabilities 1,203,899$ 369,340$ (238,333)$ 1,334,906$ 114,848$
Discounts and premium, net
Discounts and premium, net
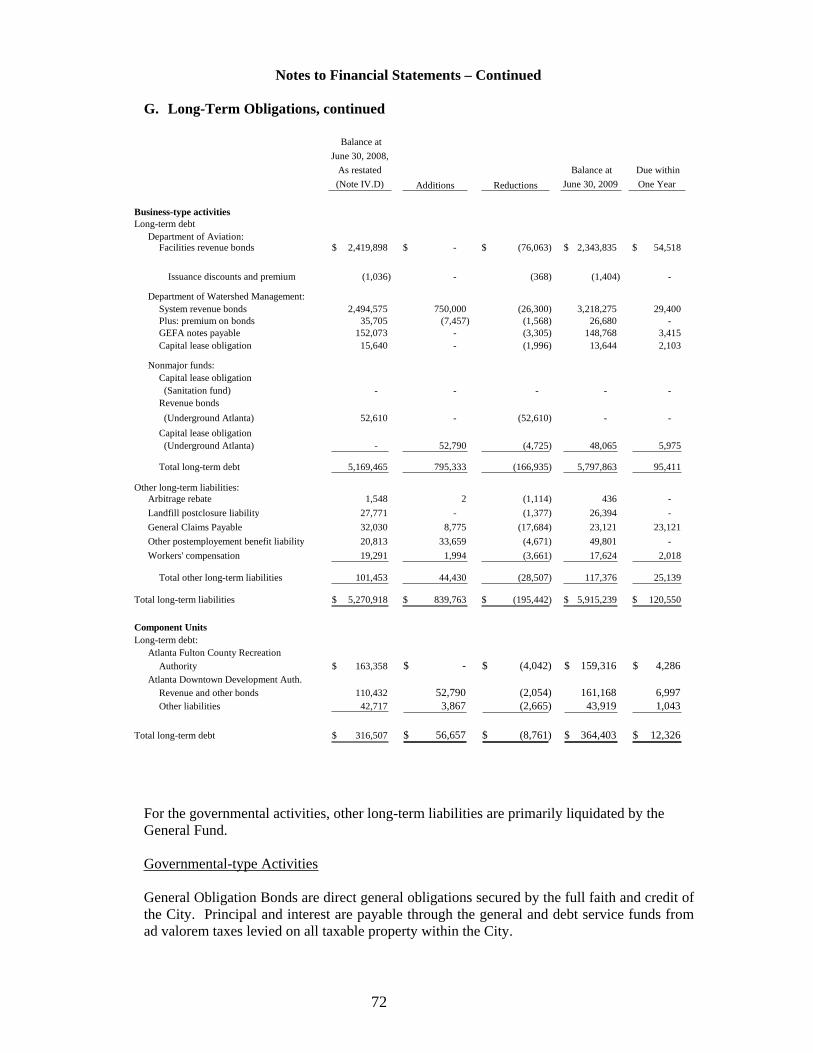
72
Notes to Financial Statements – Continued
G. Long-Term Obligations, continued
Balance at
June 30, 2008,
As restated
(Note IV.D) Additions Reductions
Balance at
June 30, 2009
Due within
One Year
Business-type activitiesLong-term debt
Department of Aviation:Facilities revenue bonds 2,419,898$ -$ (76,063)$ 2,343,835$ 54,518$
(1,036) - (368) (1,404) -
Department of Watershed Management:System revenue bonds 2,494,575 750,000 (26,300) 3,218,275 29,400Plus: premium on bonds 35,705 (7,457) (1,568) 26,680 -GEFA notes payable 152,073 - (3,305) 148,768 3,415Capital lease obligation 15,640 - (1,996) 13,644 2,103
Nonmajor funds:Capital lease obligation (Sanitation fund) - - - - -Revenue bonds
(Underground Atlanta) 52,610 - (52,610) - -
Capital lease obligation (Underground Atlanta) - 52,790 (4,725) 48,065 5,975
Total long-term debt 5,169,465 795,333 (166,935) 5,797,863 95,411
Other long-term liabilities:Arbitrage rebate 1,548 2 (1,114) 436 -
Landfill postclosure liability 27,771 - (1,377) 26,394 -
General Claims Payable 32,030 8,775 (17,684) 23,121 23,121
Other postemployement benefit liability 20,813 33,659 (4,671) 49,801 -
Workers' compensation 19,291 1,994 (3,661) 17,624 2,018
Total other long-term liabilities 101,453 44,430 (28,507) 117,376 25,139
Total long-term liabilities 5,270,918$ 839,763$ (195,442)$ 5,915,239$ 120,550$
Component UnitsLong-term debt:
Atlanta Fulton County Recreation Authority 163,358$ -$ (4,042)$ 159,316$ 4,286$
Atlanta Downtown Development Auth.Revenue and other bonds 110,432 52,790 (2,054) 161,168 6,997
Other liabilities 42,717 3,867 (2,665) 43,919 1,043
Total long-term debt 316,507$ 56,657$ (8,761)$ 364,403$ 12,326$
Issuance discounts and premium
For the governmental activities, other long-term liabilities are primarily liquidated by the General Fund.
Governmental-type Activities
General Obligation Bonds are direct general obligations secured by the full faith and credit of the City. Principal and interest are payable through the general and debt service funds from ad valorem taxes levied on all taxable property within the City.
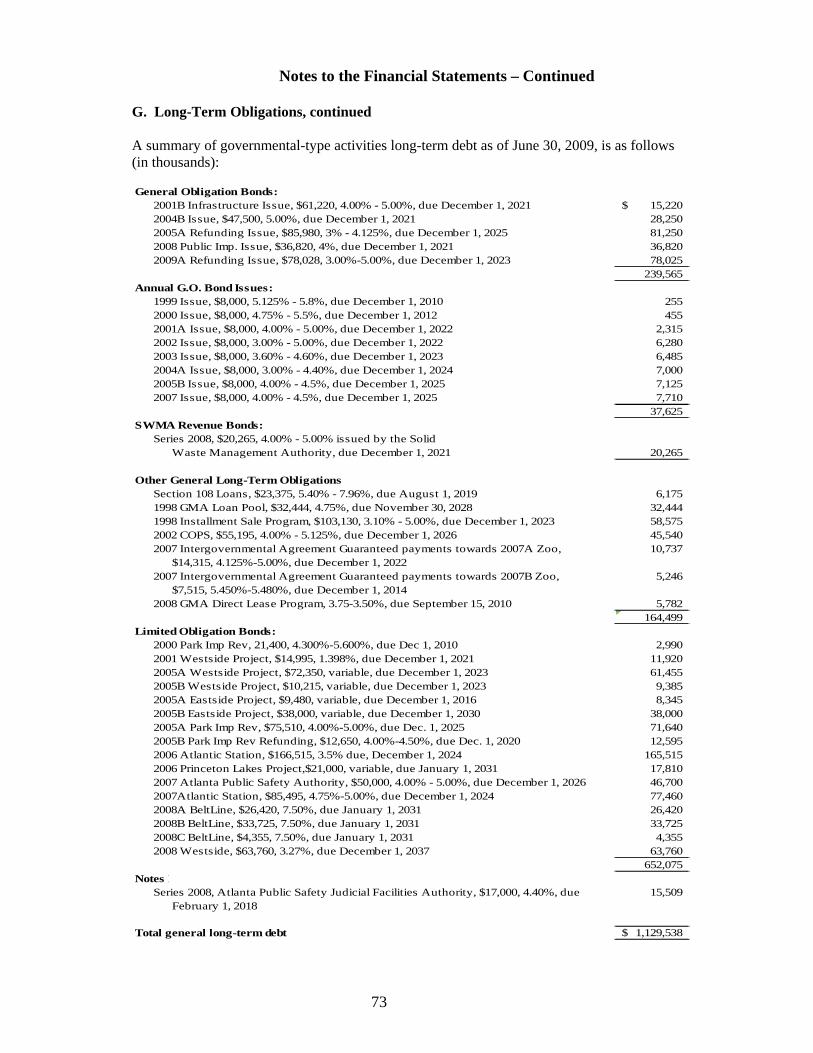
73
Notes to the Financial Statements – Continued
G. Long-Term Obligations, continued
A summary of governmental-type activities long-term debt as of June 30, 2009, is as follows (in thousands):
General Obligation Bonds:2001B Infrastructure Issue, $61,220, 4.00% - 5.00%, due December 1, 2021 15,220$ 2004B Issue, $47,500, 5.00%, due December 1, 2021 28,250 2005A Refunding Issue, $85,980, 3% - 4.125%, due December 1, 2025 81,250 2008 Public Imp. Issue, $36,820, 4%, due December 1, 2021 36,820 2009A Refunding Issue, $78,028, 3.00%-5.00%, due December 1, 2023 78,025
239,565 Annual G.O. Bond Issues:
1999 Issue, $8,000, 5.125% - 5.8%, due December 1, 2010 255 2000 Issue, $8,000, 4.75% - 5.5%, due December 1, 2012 455 2001A Issue, $8,000, 4.00% - 5.00%, due December 1, 2022 2,315 2002 Issue, $8,000, 3.00% - 5.00%, due December 1, 2022 6,280 2003 Issue, $8,000, 3.60% - 4.60%, due December 1, 2023 6,485 2004A Issue, $8,000, 3.00% - 4.40%, due December 1, 2024 7,000 2005B Issue, $8,000, 4.00% - 4.5%, due December 1, 2025 7,125 2007 Issue, $8,000, 4.00% - 4.5%, due December 1, 2025 7,710
37,625 SWMA Revenue Bonds:
Series 2008, $20,265, 4.00% - 5.00% issued by the SolidWaste Management Authority, due December 1, 2021 20,265
Other General Long-Term ObligationsSection 108 Loans, $23,375, 5.40% - 7.96%, due August 1, 2019 6,175 1998 GMA Loan Pool, $32,444, 4.75%, due November 30, 2028 32,444 1998 Installment Sale Program, $103,130, 3.10% - 5.00%, due December 1, 2023 58,575 2002 COPS, $55,195, 4.00% - 5.125%, due December 1, 2026 45,540 2007 Intergovernmental Agreement Guaranteed payments towards 2007A Zoo, 10,737
$14,315, 4.125%-5.00%, due December 1, 20222007 Intergovernmental Agreement Guaranteed payments towards 2007B Zoo, 5,246
$7,515, 5.450%-5.480%, due December 1, 20142008 GMA Direct Lease Program, 3.75-3.50%, due September 15, 2010 5,782
164,499 Limited Obligation Bonds:
2000 Park Imp Rev, 21,400, 4.300%-5.600%, due Dec 1, 2010 2,990 2001 Westside Project, $14,995, 1.398%, due December 1, 2021 11,920 2005A Westside Project, $72,350, variable, due December 1, 2023 61,455 2005B Westside Project, $10,215, variable, due December 1, 2023 9,385 2005A Eastside Project, $9,480, variable, due December 1, 2016 8,345 2005B Eastside Project, $38,000, variable, due December 1, 2030 38,000 2005A Park Imp Rev, $75,510, 4.00%-5.00%, due Dec. 1, 2025 71,640 2005B Park Imp Rev Refunding, $12,650, 4.00%-4.50%, due Dec. 1, 2020 12,595 2006 Atlantic Station, $166,515, 3.5% due, December 1, 2024 165,515 2006 Princeton Lakes Project,$21,000, variable, due January 1, 2031 17,810 2007 Atlanta Public Safety Authority, $50,000, 4.00% - 5.00%, due December 1, 2026 46,700 2007Atlantic Station, $85,495, 4.75%-5.00%, due December 1, 2024 77,460 2008A BeltLine, $26,420, 7.50%, due January 1, 2031 26,420 2008B BeltLine, $33,725, 7.50%, due January 1, 2031 33,725 2008C BeltLine, $4,355, 7.50%, due January 1, 2031 4,355 2008 Westside, $63,760, 3.27%, due December 1, 2037 63,760
652,075 Notes P
Series 2008, Atlanta Public Safety Judicial Facilities Authority, $17,000, 4.40%, due 15,509 February 1, 2018
Total general long-term debt 1,129,538$
74
Notes to the Financial Statements – Continued
G. Long-Term Obligations, continued
The City participates in a lease pool arrangement with 29 other local governments through the Georgia Municipal Association, Inc. (“GMA”). GMA issued Certificate of Participation (“COP”) in 1998 which are governed by a master lease agreement. The purpose of the COP is to fund the purchase of eligible capital assets that are leased back to each of the participating governments. The City’s interest in this arrangement functions similar to a line of credit whereby eligible capital assets may be purchased up to the City’s share. The lease of eligible capital assets decreases the City’s net available credit and repayments of principal increase the City’s net available credit. Lease terms are generally between three and five years from the date the equipment is purchased. The agreements terminate upon the financial due date of the COP in 2028.
Advance Refunding
In 2009, the City issued $78,025,000 General Obligation Refunding Bonds, Series 2009. The bonds were issued to: (a) refund and redeem certain of the City’s General Obligation Refunding Bonds Series 1998, with a principal amount equal to $79,360,000 and the City’s Various Purpose General Obligation Bonds Series 1998 with a principal amount of $1,190,000, and (b) pay the costs of issuance related to the Bonds. The Bonds maturing on or after December 1, 2020 are subject to redemption prior to maturity, at the option of the City, on or after December 1, 2019. The net premium paid on the new debt was $4,027,000 and is being amortized over the remaining term of the Series 2009 debt. This advance refunding was undertaken to reduce total debt service payments by $4,712,000 and resulted in an economic gain of $4,443,000.
Arbitrage Rebate
The arbitrage rebate liability, on all City issued obligations, is treated as a claim or judgment upon occurrence. Certain City long-term debt obligations are subject to Section 148 of the Internal Revenue Code which requires that interest earned on proceeds from tax-exempt debt be rebated to the Federal government to the extent that those earnings exceed the interest cost on the related tax-exempt debt. At June 30, 2009, the City calculated the arbitrage rebate liability to be $436,000 on business type activities long-term debt and $474,000 on governmental activities long-term debt.
Business-type Activities
Revenue bonds are payable solely from revenues generated by enterprise fund activities. The various revenue bond indentures contain significant limitations and restrictions on annual debt service requirements, maintenance of a flow of monies through various restricted accounts, minimum amounts to be maintained in various sinking funds, and minimum revenue bond coverages. As of June 30, 2009, the City believes it was in compliance with all such significant financial limitations and restrictions.
The Department of Watershed Management issued $750,000,000 of Water and Wastewater Revenue Bonds Series 2009A to finance certain capital improvements included as part of a multi-phase long-term capital improvement program for the Watershed system; to repay outstanding Commercial Paper Notes held by the liquidity providers as bank loans for the DWM Commercial Paper Program in the amount of $157,489,000 plus interest; to fund the Debt Service Reserve Account requirement for the Series 2009A bonds and; to pay the costs of issuance related to the Series 2009A Bonds. The DWM Commercial Paper program is deemed paid and is no longer outstanding at June 30, 2009.
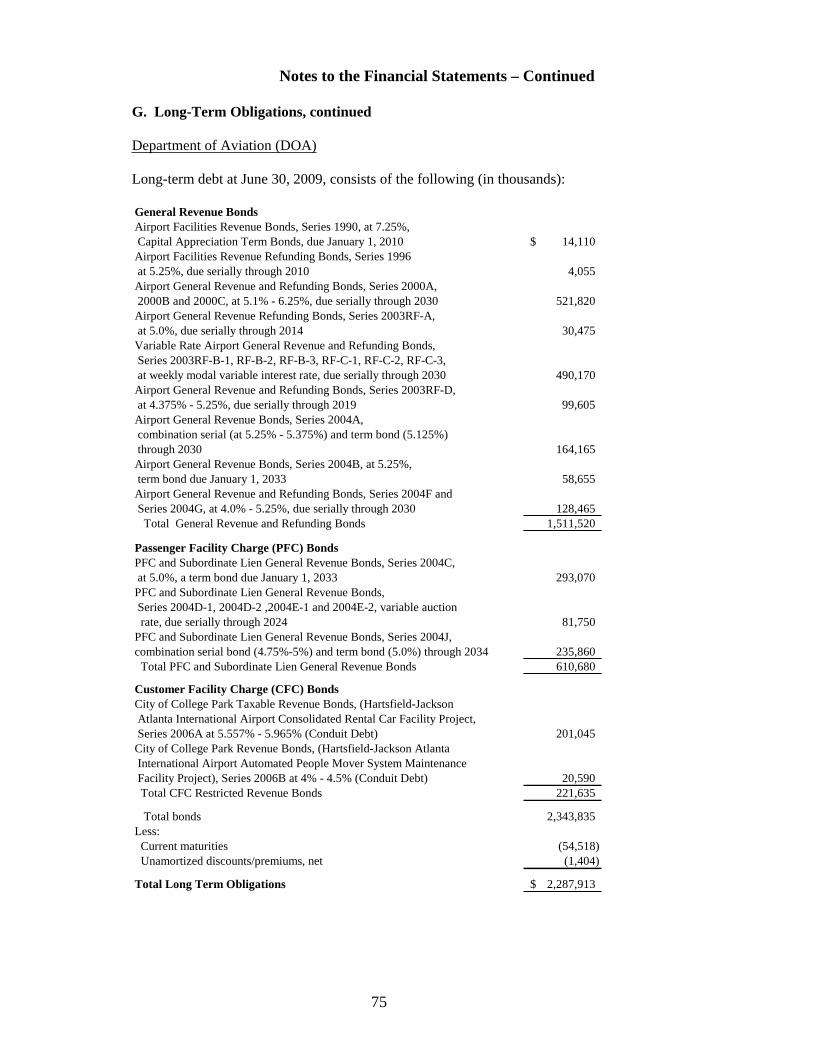
75
Notes to the Financial Statements – Continued
G. Long-Term Obligations, continued
Department of Aviation (DOA)
Long-term debt at June 30, 2009, consists of the following (in thousands):
General Revenue BondsAirport Facilities Revenue Bonds, Series 1990, at 7.25%, Capital Appreciation Term Bonds, due January 1, 2010 14,110$Airport Facilities Revenue Refunding Bonds, Series 1996 at 5.25%, due serially through 2010 4,055Airport General Revenue and Refunding Bonds, Series 2000A, 2000B and 2000C, at 5.1% - 6.25%, due serially through 2030 521,820Airport General Revenue Refunding Bonds, Series 2003RF-A, at 5.0%, due serially through 2014 30,475Variable Rate Airport General Revenue and Refunding Bonds, Series 2003RF-B-1, RF-B-2, RF-B-3, RF-C-1, RF-C-2, RF-C-3, at weekly modal variable interest rate, due serially through 2030 490,170Airport General Revenue and Refunding Bonds, Series 2003RF-D, at 4.375% - 5.25%, due serially through 2019 99,605Airport General Revenue Bonds, Series 2004A, combination serial (at 5.25% - 5.375%) and term bond (5.125%) through 2030 164,165Airport General Revenue Bonds, Series 2004B, at 5.25%, term bond due January 1, 2033 58,655Airport General Revenue and Refunding Bonds, Series 2004F and Series 2004G, at 4.0% - 5.25%, due serially through 2030 128,465 Total General Revenue and Refunding Bonds 1,511,520
Passenger Facility Charge (PFC) BondsPFC and Subordinate Lien General Revenue Bonds, Series 2004C, at 5.0%, a term bond due January 1, 2033 293,070PFC and Subordinate Lien General Revenue Bonds, Series 2004D-1, 2004D-2 ,2004E-1 and 2004E-2, variable auction rate, due serially through 2024 81,750PFC and Subordinate Lien General Revenue Bonds, Series 2004J, combination serial bond (4.75%-5%) and term bond (5.0%) through 2034 235,860 Total PFC and Subordinate Lien General Revenue Bonds 610,680
Customer Facility Charge (CFC) BondsCity of College Park Taxable Revenue Bonds, (Hartsfield-Jackson Atlanta International Airport Consolidated Rental Car Facility Project, Series 2006A at 5.557% - 5.965% (Conduit Debt) 201,045City of College Park Revenue Bonds, (Hartsfield-Jackson Atlanta International Airport Automated People Mover System Maintenance Facility Project), Series 2006B at 4% - 4.5% (Conduit Debt) 20,590 Total CFC Restricted Revenue Bonds 221,635
Total bonds 2,343,835Less: Current maturities (54,518) Unamortized discounts/premiums, net (1,404)
Total Long Term Obligations 2,287,913$
76
Notes to the Financial Statements – Continued
G. Long-Term Obligations, continued
On June 21, 2006, the City of College Park, Georgia issued $211,880,000 in Taxable Revenue Bonds (Hartsfield Jackson Atlanta International Airport Consolidated Rental Car Facility Project), Series 2006A for the purpose of acquiring, constructing and installing a consolidated rental car facility. In addition, College Park issued $21,980,000 in Revenue Bonds (Hartsfield Jackson Atlanta International Airport Automated People Mover System Maintenance Facility Project), Series 2006B for the purpose of acquiring, constructing and installing a maintenance facility for an automated people mover. Pursuant to the issuance of the bonds, City adopted an Ordinance imposing a customer facility charge (CFC) and has pledged revenues generated from the CFC to secure debt service payments on the bonds. The City recorded these transactions as released revenue bonds. At June 30, 2009, the balance of outstanding conduit debt totaled $221,635,000. The City of College Park has no obligation to make debt service payments on these bonds.
Interest Rate Exchange Agreements (SWAPs) and Associated Bonds
Department of Aviation (DOA)
The DOA is a party to interest rate swap agreements that are not recorded in the financial statements. Following are disclosures of key aspects of the agreements.
Objective of Interest Rate Swaps – DOA’s strategy is to use interest rate swaps as a tool to achieve a lower cost of borrowing when compared to a traditional fixed-rate bond financing and as a hedge against variable interest rate exposure.
General - The derivative contract uses the International Swap Dealers Association Master Agreement, which includes standard termination events, such as failure to pay and bankruptcy. The DOA, or the Counterparty, may terminate the swap if the other party fails to perform under the terms of the contract. A termination of any swap agreement may result in the DOA or the City making or receiving a termination payment. If at the time of termination the swap has a negative fair value, the DOA would be liable to the Counterparty for a payment equal to the swap's fair value.
Swaps One and Two - On June 17, 2003, the DOA entered into an interest rate swap with Goldman Sachs Mitsui Marine Derivative Products, L.P. and JP Morgan Chase Bank (Counterparties) in connection with its Variable Rate Airport General Revenue Refunding Bonds (Series 2003RF-B-1, RF-B-2, RF-B-3, RF-C-1, RF-C-2 and RF-C-3). The objective was to lower borrowing costs by synthetically fixing interest rates on the subject bonds.
Term - The swaps, with a combined notional amount of $490.17 million, became effective on June 26, 2003. The notional amount decreases over time, matching the outstanding balance of the variable rate debt. The first notional decrease for both is January 1, 2016, with the final maturity of January 1, 2030. Under the terms of the swap agreements, the DOA will pay the Counterparties a fixed annual interest rate of 3.009%. The DOA will receive from the Counterparties a variable payment based on the SIFMA Municipal Swap Index for the first year of the swap and thereafter based on a percentage equal to 67.5% of the monthly LIBOR-BBA (U.S. Dollars).
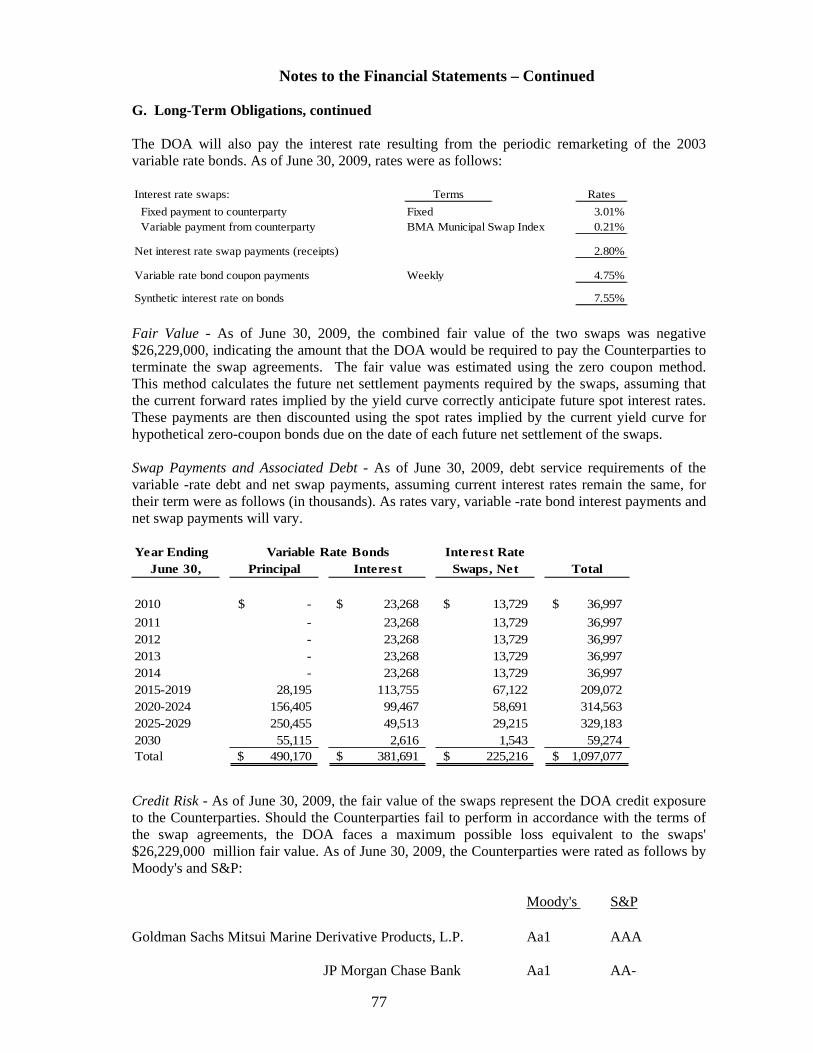
77
Notes to the Financial Statements – Continued
G. Long-Term Obligations, continued
The DOA will also pay the interest rate resulting from the periodic remarketing of the 2003 variable rate bonds. As of June 30, 2009, rates were as follows:
Interest rate swaps: Terms Rates
Fixed payment to counterparty Fixed 3.01% Variable payment from counterparty BMA Municipal Swap Index 0.21%
Net interest rate swap payments (receipts) 2.80%
Variable rate bond coupon payments Weekly 4.75%
Synthetic interest rate on bonds 7.55%
Fair Value - As of June 30, 2009, the combined fair value of the two swaps was negative $26,229,000, indicating the amount that the DOA would be required to pay the Counterparties to terminate the swap agreements. The fair value was estimated using the zero coupon method. This method calculates the future net settlement payments required by the swaps, assuming that the current forward rates implied by the yield curve correctly anticipate future spot interest rates. These payments are then discounted using the spot rates implied by the current yield curve for hypothetical zero-coupon bonds due on the date of each future net settlement of the swaps.
Swap Payments and Associated Debt - As of June 30, 2009, debt service requirements of the variable -rate debt and net swap payments, assuming current interest rates remain the same, for their term were as follows (in thousands). As rates vary, variable -rate bond interest payments and net swap payments will vary.
Year Ending Variable Rate Bonds Interest Rate June 30, Principal Interest Swaps, Net Total
2010 -$ 23,268$ 13,729$ 36,997$
2011 - 23,268 13,729 36,9972012 - 23,268 13,729 36,9972013 - 23,268 13,729 36,9972014 - 23,268 13,729 36,9972015-2019 28,195 113,755 67,122 209,0722020-2024 156,405 99,467 58,691 314,5632025-2029 250,455 49,513 29,215 329,1832030 55,115 2,616 1,543 59,274Total 490,170$ 381,691$ 225,216$ 1,097,077$
Credit Risk - As of June 30, 2009, the fair value of the swaps represent the DOA credit exposure to the Counterparties. Should the Counterparties fail to perform in accordance with the terms of the swap agreements, the DOA faces a maximum possible loss equivalent to the swaps' $26,229,000 million fair value. As of June 30, 2009, the Counterparties were rated as follows by Moody's and S&P:
Moody's S&P
Goldman Sachs Mitsui Marine Derivative Products, L.P. Aa1 AAA
JP Morgan Chase Bank Aa1 AA-
78
Notes to the Financial Statements – Continued
G. Long-Term Obligations, continued
Basis Risk - As noted above, the swap exposes the DOA to basis risk should the relationship between SIFMA and/or LIBOR and the variable rates converge, changing the synthetic rate on the bonds. If a change occurs that results in the rates moving to convergence, the expected cost savings may not be realized.
Termination Risk - The derivative contract uses the International Swap Dealers Association Master Agreement, which includes standard termination events, such as failure to pay and bankruptcy. The Schedule to the Master Agreement includes an "additional termination event."
That is, the swap may be terminated by the DOA if the Counterparty has one or more outstanding issues or rated unsecured, unenhanced senior debt or long term deposits and none of such issues has at least two ratings of at least (i)" BAA1" or higher as determined by Moody's, (ii) BBB+ or higher as determined by S&P, (iii)"BBB+" or higher from Fitch, or (iv) an equivalent investment grade rating determined by a nationally-recognized rating service acceptable to both parties. The DOA or the Counterparty may terminate the swap if the other party fails to perform under the terms of the contract. If the swap is terminated, the variable-rate bond would no longer carry a synthetic interest rate. Also, if at the time of termination the swap has a negative fair value, the DOA would be liable to the Counterparty for a payment equal to the swap's fair value.
Swaps Three and Four - On October 24, 2007, the DOA entered into a forward starting interest rate swap with Bear Stearns Capital Markets Inc. and UBS Loan Finance, LLC (Counterparties) in connection with the Airport General Revenue Refunding Bonds (Series 2000A and 2000B). The objective is to lock in savings and to synthetically fix the cost of borrowing on one or more series of bonds expected to be issued in 2010 for the purpose of currently refunding all or a portion of its outstanding bonds.
Term - The forward starting swaps, with a combined notional amount of $455.9 million, will become effective on January 1, 2010. The notional amount decreases over time, expecting to match the 2010 variable rate bonds. The swap notional amounts amortize beginning January 1, 2011, with the final maturity of January 1, 2021 and 2030, respectively. Under the terms of Swap Three and Four, the DOA will pay the Counterparty a fixed annual interest rate of 3.814% and 4.10255%, respectively. The DOA will receive from the Counterparties a variable payment based on the SIFMA Municipal Swap Index.
Fair Value - As of June 30, 2009, the combined fair value of the two swaps was negative $22,581,000 , indicating the amount that the DOA would be required to pay the Counterparties to terminate the swap agreements. The fair value was estimated using the zero coupon method. This method calculates the future net settlement payments required by the swaps, assuming that the current forward rates implied by the yield curve correctly anticipate future spot interest rates. These payments are then discounted using the spot rates implied by the current yield curve for hypothetical zero-coupon bonds due on the date of each future net settlement of the swaps.
Credit Risk - As of June 30, 2009, the DOA was not exposed to credit risk because the Swaps had a negative fair value. However, should interest rates change and the fair market value of the Swaps become positive, the DOA would be subject to credit risk in the amount of the Swap’s fair value. In addition, should the Counterparties fail to perform in accordance with the terms of the
79
Notes to the Financial Statements – Continued
G. Long-Term Obligations, continued
swap agreements, the DOA would face a maximum possible loss equivalent to the swaps' positive fair value.
As of June 30, 2009, the Counterparties were rated as follows by Moody's and S&P:
Moody's S&P
JP Morgan Chase Bank Aaa AA- UBS Loan Finance, LLC NR A+
Basis Risk - As noted above, the swap exposes the DOA to basis risk should there be a mismatch between the SIFMA Municipal Swap Index and the variable rate on the 2010 bonds. This mismatch would result in a change in the synthetic rate on the 2010 bonds. If a mismatch occurs, the expected cost savings may not be realized.
Termination Risk - The derivative contract uses the International Swap Dealers Association Master Agreement, which includes standard termination events, such as failure to pay and bankruptcy. The Schedule to the Master Agreement includes an "additional termination event." That is, the swaps may be terminated by the DOA if the Counterparty’s long-term, senior, unsecured, unsubordinated debt fails to be rated (i)" Baa2" or higher as determined by Moody's, (ii) BBB or higher as determined by S&P. The DOA or the Counterparty may terminate the swap if the other party fails to perform under the terms of the contract. If the swap is terminated, the 2010 variable rate bonds would no longer carry a synthetic interest rate. Also, if at the time of termination the swap has a negative fair value, the DOA would be liable to the Counterparty for a payment equal to the swap's fair value.

80
Notes to the Financial Statements – Continued
G. Long-Term Obligations, continued
Department of Watershed Management
Long-term debt at June 30, 2009 consists of the following (in thousands):
Revenue BondsWater and Wastewater Revenue Bonds, $1,096,140 Series 1999A, 5.00% - 5.50%, due serially through 2038 $686,095Water and Wastewater Revenue Bonds, $415,310 Series 2001A, variable rate demand, due serially through 2039 415,310 Water and Wastewater Revenue Bonds, Series $335,640 2001B, variable rate demand, due serially through 2038 330,530 Water and Wastewater Revenue Bonds, $105,705 Series 2001C, variable rate demand, due serially through 2041 105,705 Water and Wastewater Revenue Bonds, $849,330 Series 2004A, combination serial (3.00% - 5.75%) and term bonds (5.00%) through 2043 823,840 Water and Wastewater Revenue Bonds, $106,795 Series 2008, variable rate demand, due serially through 2041 106,795 Water and Wastewater Refunding Revenue Bonds, $750,000 Series 2009A, combination serial (3.00% - 6.00%) and term bonds (6.25%) through 2039 750,000
3,218,275 Less: Current maturities (29,400) Unamortized discounts and premium costs 26,680 Total revenue bonds 3,215,555
Other Debt:Georgia Environmental Facilities Authority (GEFA) $4,669 Loan, 3% due serially through 2023 3,702 Georgia Environmental Facilities Authority (GEFA) $19,006 Loan, 3.82%, due serially through 2035 17,705 Georgia Environmental Facilities Authority (GEFA) $19,034 Loan, 3.92%, due serially through 2036 18,159 Georgia Environmental Facilities Authority (GEFA) $19,021 Loan, 3.00 %, due serially through 2038 18,552 Georgia Environmental Facilities Authority (GEFA) $31,216 Loan, 3.00%, due serially through 2028 29,852 Georgia Environmental Facilities Authority (GEFA) $31,053 Loan, 3.00%, due serially through 2028 30,181 Georgia Environmental Facilities Authority (GEFA) $31,409 Loan, 3.00%, due serially through 2037 30,617
148,768 Less: Current maturities (3,415) Total other debt 145,353
Total long-term debt $3,360,908
The proceeds of the GEFA loan were used to finance a portion of the cost associated with the DWM Clean Water Atlanta Program (See Note IV. C. CSO Decree).
81
Notes to the Financial Statements – Continued
G. Long-Term Obligations, continued
Interest Rate Exchange Agreements (SWAPs) and Associated Bonds
Department of Watershed Management (DWM)
The City is a party to interest rate swap agreements that are not recorded in the financial statements. Following are disclosures of key aspects of the agreements.
Objective of Interest Rate Swaps - The DWM strategy is to use swaps as a tool to achieve an overall lower cost of capital, increase the diversity of the capital structure, and better match the asset to liability portfolio by matching variable rate obligations with the large amount of the DWM short-term, variable rate assets. Also, the Department uses swaps to convert fixed-rate debt to variable-rate debt without incurring refinancing costs.
General - The derivative contract uses the International Swap Dealers Association Master Agreement, which includes standard termination events, such as failure to pay and bankruptcy. The Department, or the Counterparty, may terminate the swap if the other party fails to perform under the terms of the contract. A termination of any swap agreement may result in the Department or the City making or receiving a termination payment. If at the time of termination the swap has a negative fair value, the Department would be liable to the Counterparty for a payment equal to the swap's fair value.
Swap One - On March 5, 2001, the Department entered into an interest rate swap option agreement with UBS AG in which it agreed to essentially convert, at the financial institution’s request, $145,000,000 of the DWM Water and Wastewater Revenue Bonds, Series 1999, from 5% fixed rate bonds to floating rate bonds in which the interest rate is based on the Securities Industry and Financial Markets Association (SIFMA) Municipal Swap Index. The option for conversion began in 2005. The DWM will continue to service the debt at the fixed rate. For entering into this agreement, the DWM received a nonrefundable $2,700,000 commitment fee which has been deferred and is being amortized over the life of the agreement.
Swap Two - Also, on March 5, 2001, the Department entered into a similar interest rate swap option agreement with the Counterparty in which it agreed to essentially convert, at the Counterparty’s request, $71,850,000 of the DWM Water and Wastewater Revenue Bonds, Series 1999, from 5% fixed rate bonds to floating-rate bonds in which the interest rate is based on the SIFMA Municipal Swap Index. The option for conversion began in 2004 and the DWM received a nonrefundable $4,800,000 commitment fee which has been deferred and is being amortized over the life of the agreement.
Term - The swaps, with a total notional amount of $216,850,000 million, became effective on May 1, 2005 and May 1, 2004 respectively. The notional amount decreases over time. The first notional decrease is November 1, 2023 and November 1, 2022 respectively, with the final maturity for both of November 1, 2038. Under the terms of the Swap One agreement, the DWM will pay the Counterparty a variable interest rate equal to the SIFMA Municipal Swap Index less 6.56 basis points or the fixed rate (5.00%). The DWM will receive from the Counterparty for both a fixed rate of 5.00%.

82
Notes to the Financial Statements – Continued
G. Long-Term Obligations, continued
Interest Rate Exchange Agreements (SWAPs) and Associated Bonds
As of June 30, 2009, rates were as follows:
1999 Swap One Rates
Interest rate swap:
Fixed payment from Counterparty -5.00%
Variable payment to Counterparty 0.35%
Net interest rate swap payments (receipts) -4.65%
Fixed rate bond coupons 5.00%
Synthetic interest rate on bonds 0.35%
1999 Swap Two Rates
Interest rate swap:
Fixed payment from Counterparty -5.00%
Variable payment to Counterparty 5.00%
Net interest rate SWAP payments (receipts) -
Fixed rate bond coupons 5.00%
Synthetic interest rate on bonds 5.00%
Fair Value – As of June 30, 2009, Swap One had a positive fair value of $479,000 and Swap Two had a negative fair value of $7,095,000. A positive fair value indicates the amount that the Counterparty is required to pay the DWM to terminate Swap One. A negative fair value indicates the amount that the DWM would be required to pay the Counterparty to terminate Swap Two. The fair value was estimated using the zero coupon method. This method calculates the future net settlement payments required by the swaps, assuming that the current forward rates implied by the yield curve correctly anticipate future spot interest rates. These payments are then discounted using the spot rates implied by the current yield curve for hypothetical zero-coupon bonds due on the date of each future net settlement of the swaps.
Swap Payments and Associated Debt - As of June 30, 2009, debt service requirements of the fixed-rate debt and net swap payments, assuming current interest rates remain the same, for their term were as follows (in thousands). As rates vary, variable-rate bond interest payments and net swap payments will vary.
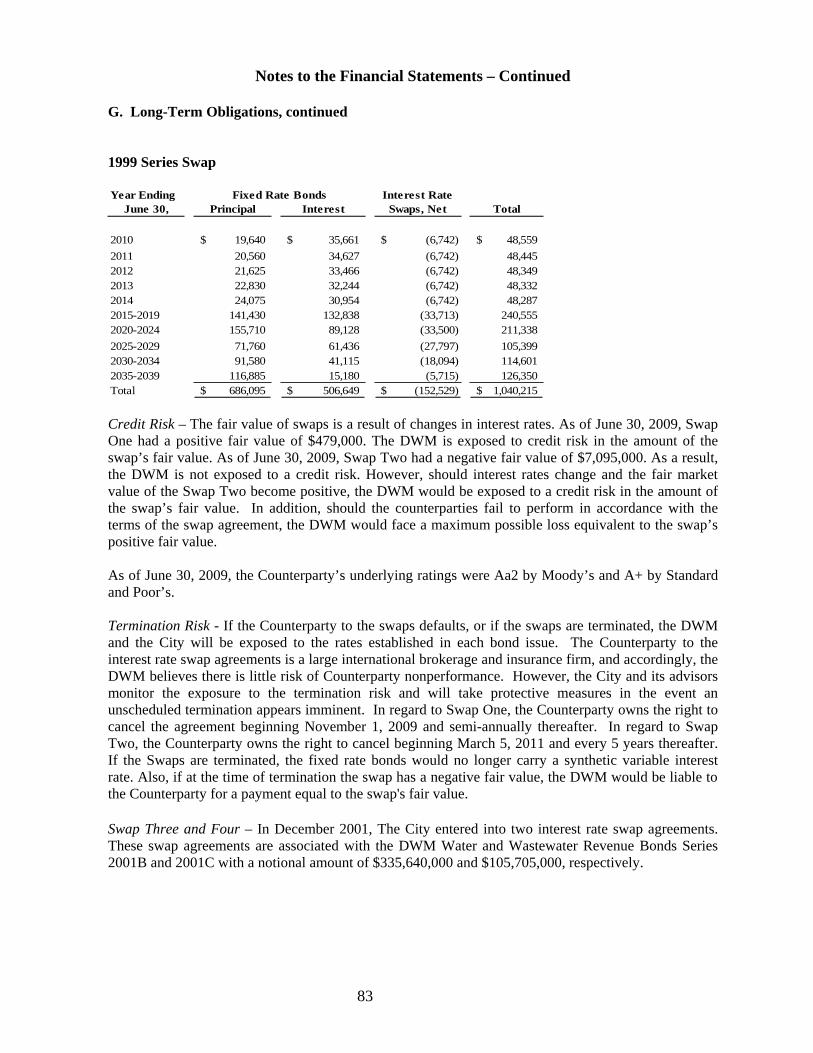
83
Notes to the Financial Statements – Continued
G. Long-Term Obligations, continued
1999 Series Swap
Year Ending Fixed Rate Bonds Interest Rate June 30, Principal Interest Swaps, Net Total
2010 19,640$ 35,661$ (6,742)$ 48,559$
2011 20,560 34,627 (6,742) 48,4452012 21,625 33,466 (6,742) 48,3492013 22,830 32,244 (6,742) 48,3322014 24,075 30,954 (6,742) 48,2872015-2019 141,430 132,838 (33,713) 240,5552020-2024 155,710 89,128 (33,500) 211,338
2025-2029 71,760 61,436 (27,797) 105,3992030-2034 91,580 41,115 (18,094) 114,6012035-2039 116,885 15,180 (5,715) 126,350Total 686,095$ 506,649$ (152,529)$ 1,040,215$
Credit Risk – The fair value of swaps is a result of changes in interest rates. As of June 30, 2009, Swap One had a positive fair value of $479,000. The DWM is exposed to credit risk in the amount of the swap’s fair value. As of June 30, 2009, Swap Two had a negative fair value of $7,095,000. As a result, the DWM is not exposed to a credit risk. However, should interest rates change and the fair market value of the Swap Two become positive, the DWM would be exposed to a credit risk in the amount of the swap’s fair value. In addition, should the counterparties fail to perform in accordance with the terms of the swap agreement, the DWM would face a maximum possible loss equivalent to the swap’s positive fair value.
As of June 30, 2009, the Counterparty’s underlying ratings were Aa2 by Moody’s and A+ by Standard and Poor’s. Termination Risk - If the Counterparty to the swaps defaults, or if the swaps are terminated, the DWM and the City will be exposed to the rates established in each bond issue. The Counterparty to the interest rate swap agreements is a large international brokerage and insurance firm, and accordingly, the DWM believes there is little risk of Counterparty nonperformance. However, the City and its advisors monitor the exposure to the termination risk and will take protective measures in the event an unscheduled termination appears imminent. In regard to Swap One, the Counterparty owns the right to cancel the agreement beginning November 1, 2009 and semi-annually thereafter. In regard to Swap Two, the Counterparty owns the right to cancel beginning March 5, 2011 and every 5 years thereafter. If the Swaps are terminated, the fixed rate bonds would no longer carry a synthetic variable interest rate. Also, if at the time of termination the swap has a negative fair value, the DWM would be liable to the Counterparty for a payment equal to the swap's fair value.
Swap Three and Four – In December 2001, The City entered into two interest rate swap agreements. These swap agreements are associated with the DWM Water and Wastewater Revenue Bonds Series 2001B and 2001C with a notional amount of $335,640,000 and $105,705,000, respectively.
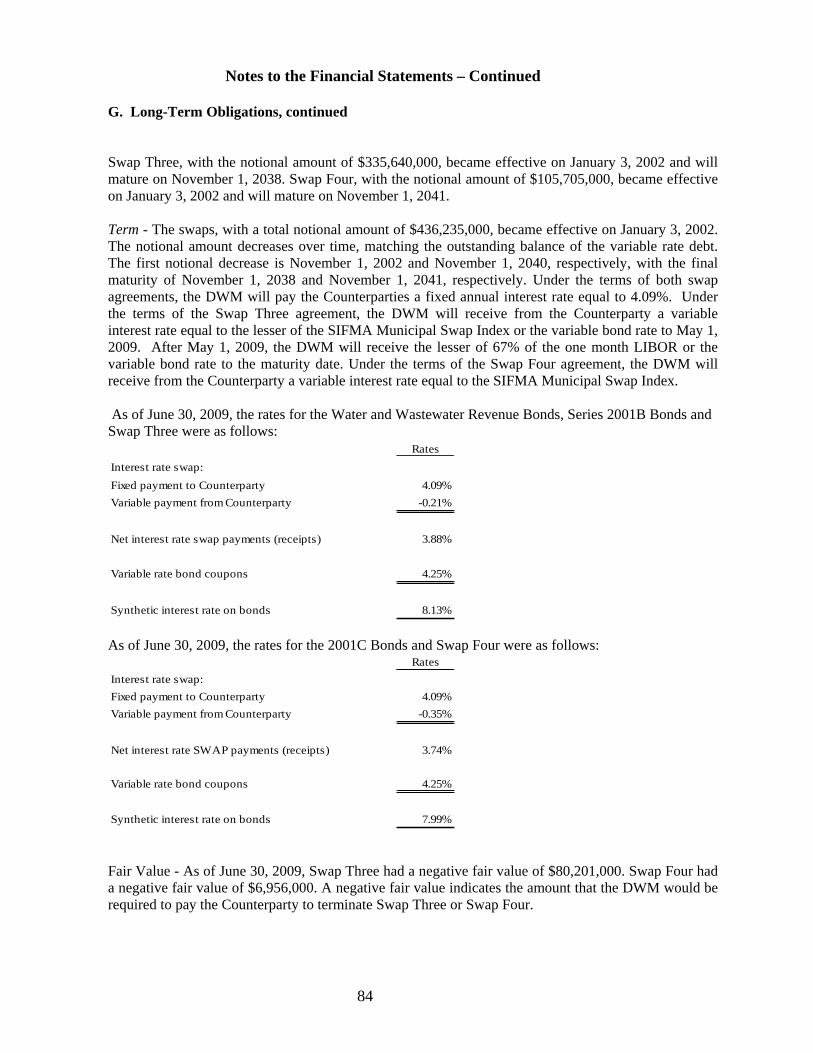
84
Notes to the Financial Statements – Continued
G. Long-Term Obligations, continued
Swap Three, with the notional amount of $335,640,000, became effective on January 3, 2002 and will mature on November 1, 2038. Swap Four, with the notional amount of $105,705,000, became effective on January 3, 2002 and will mature on November 1, 2041.
Term - The swaps, with a total notional amount of $436,235,000, became effective on January 3, 2002. The notional amount decreases over time, matching the outstanding balance of the variable rate debt. The first notional decrease is November 1, 2002 and November 1, 2040, respectively, with the final maturity of November 1, 2038 and November 1, 2041, respectively. Under the terms of both swap agreements, the DWM will pay the Counterparties a fixed annual interest rate equal to 4.09%. Under the terms of the Swap Three agreement, the DWM will receive from the Counterparty a variable interest rate equal to the lesser of the SIFMA Municipal Swap Index or the variable bond rate to May 1, 2009. After May 1, 2009, the DWM will receive the lesser of 67% of the one month LIBOR or the variable bond rate to the maturity date. Under the terms of the Swap Four agreement, the DWM will receive from the Counterparty a variable interest rate equal to the SIFMA Municipal Swap Index.
As of June 30, 2009, the rates for the Water and Wastewater Revenue Bonds, Series 2001B Bonds and Swap Three were as follows:
Rates
Interest rate swap:
Fixed payment to Counterparty 4.09%
Variable payment from Counterparty -0.21%
Net interest rate swap payments (receipts) 3.88%
Variable rate bond coupons 4.25%
Synthetic interest rate on bonds 8.13%
As of June 30, 2009, the rates for the 2001C Bonds and Swap Four were as follows: Rates
Interest rate swap:
Fixed payment to Counterparty 4.09%
Variable payment from Counterparty -0.35%
Net interest rate SWAP payments (receipts) 3.74%
Variable rate bond coupons 4.25%
Synthetic interest rate on bonds 7.99%
Fair Value - As of June 30, 2009, Swap Three had a negative fair value of $80,201,000. Swap Four had a negative fair value of $6,956,000. A negative fair value indicates the amount that the DWM would be required to pay the Counterparty to terminate Swap Three or Swap Four.
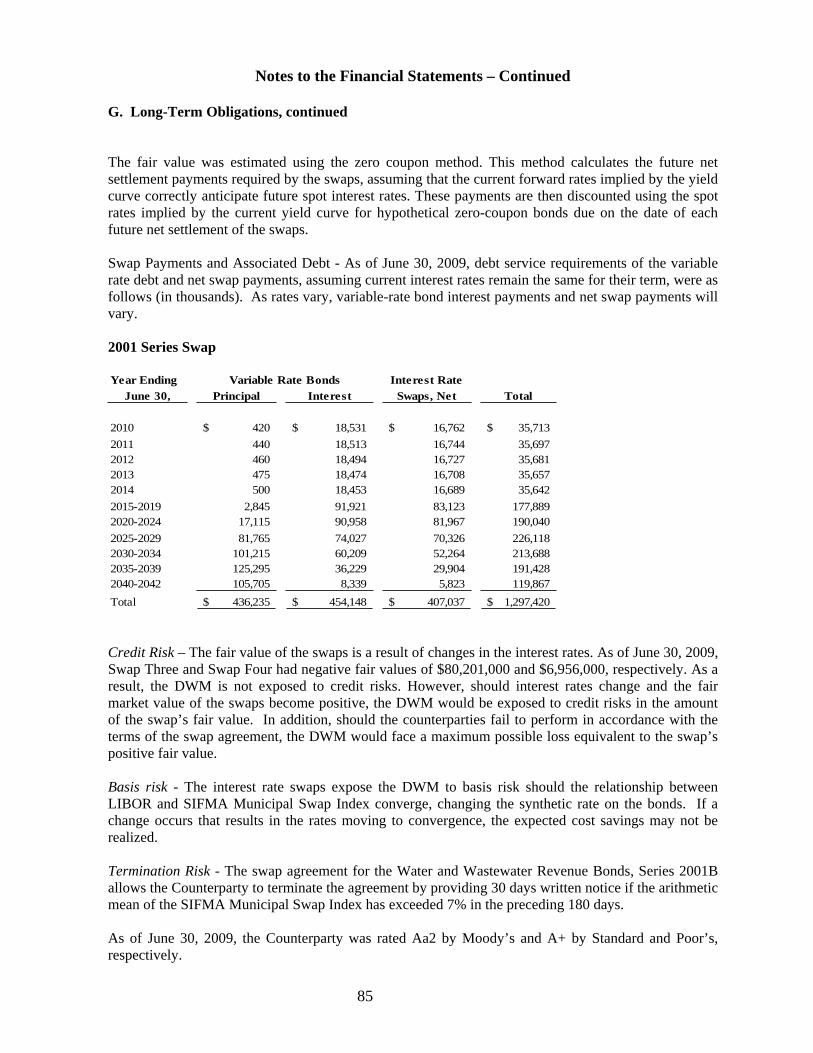
85
Notes to the Financial Statements – Continued
G. Long-Term Obligations, continued
The fair value was estimated using the zero coupon method. This method calculates the future net settlement payments required by the swaps, assuming that the current forward rates implied by the yield curve correctly anticipate future spot interest rates. These payments are then discounted using the spot rates implied by the current yield curve for hypothetical zero-coupon bonds due on the date of each future net settlement of the swaps.
Swap Payments and Associated Debt - As of June 30, 2009, debt service requirements of the variable rate debt and net swap payments, assuming current interest rates remain the same for their term, were as follows (in thousands). As rates vary, variable-rate bond interest payments and net swap payments will vary.
2001 Series Swap
Year Ending Variable Rate Bonds Interest Rate June 30, Principal Interest Swaps, Net Total
2010 420$ 18,531$ 16,762$ 35,713$
2011 440 18,513 16,744 35,6972012 460 18,494 16,727 35,6812013 475 18,474 16,708 35,6572014 500 18,453 16,689 35,642
2015-2019 2,845 91,921 83,123 177,8892020-2024 17,115 90,958 81,967 190,040
2025-2029 81,765 74,027 70,326 226,1182030-2034 101,215 60,209 52,264 213,6882035-2039 125,295 36,229 29,904 191,4282040-2042 105,705 8,339 5,823 119,867
Total 436,235$ 454,148$ 407,037$ 1,297,420$
Credit Risk – The fair value of the swaps is a result of changes in the interest rates. As of June 30, 2009, Swap Three and Swap Four had negative fair values of $80,201,000 and $6,956,000, respectively. As a result, the DWM is not exposed to credit risks. However, should interest rates change and the fair market value of the swaps become positive, the DWM would be exposed to credit risks in the amount of the swap’s fair value. In addition, should the counterparties fail to perform in accordance with the terms of the swap agreement, the DWM would face a maximum possible loss equivalent to the swap’s positive fair value.
Basis risk - The interest rate swaps expose the DWM to basis risk should the relationship between LIBOR and SIFMA Municipal Swap Index converge, changing the synthetic rate on the bonds. If a change occurs that results in the rates moving to convergence, the expected cost savings may not be realized.
Termination Risk - The swap agreement for the Water and Wastewater Revenue Bonds, Series 2001B allows the Counterparty to terminate the agreement by providing 30 days written notice if the arithmetic mean of the SIFMA Municipal Swap Index has exceeded 7% in the preceding 180 days.
As of June 30, 2009, the Counterparty was rated Aa2 by Moody’s and A+ by Standard and Poor’s, respectively.

86
Notes to the Financial Statements – Continued
G. Long-Term Obligations, continued
The termination option for the Counterparty on the Water and Wastewater Revenue Bonds, Series 2001C has expired.
Interest Rate Risk - The interest rate swap option agreements increase the interest rate risk of the DWM; however, management believes the agreements will achieve an overall lower cost of capital by entering into the agreements, increase the diversity of the capital structure of the DWM, and better matches the asset to liability portfolio by matching variable rate obligations with the large amount of the DWM short-term, variable rate assets.
Sanitation Fund
State and federal laws and regulations require the City to place final covers on its four landfill sites when each site stops accepting waste and to perform certain maintenance and monitoring functions at the sites for 30 years after closure. The City has landfill sites at Cascade Road, Key Road, Gun Club Road, and East Confederate Road. All City landfills were certified by the State of Georgia as closed during 2001 and only post-closure care costs will be incurred in the future. Although post-closure care costs will be paid over the remaining number of post-closure years, the City accrued a liability for those costs as the landfills were accepting waste. The $26,394,000 reported as the landfill post-closure costs liability at June 30, 2009, represents the cumulative amount of post-closure costs expected to be incurred over the required 30 year monitoring period which began in 2001. These amounts are estimates calculated by the management of the City of what it would cost to perform all post-closure care. Actual costs may differ from estimates due to inflation, changes in technology or regulations. Post-closure care costs will be funded by future sanitary charges of the Sanitation Fund or from future contributions from the General Fund if necessary.
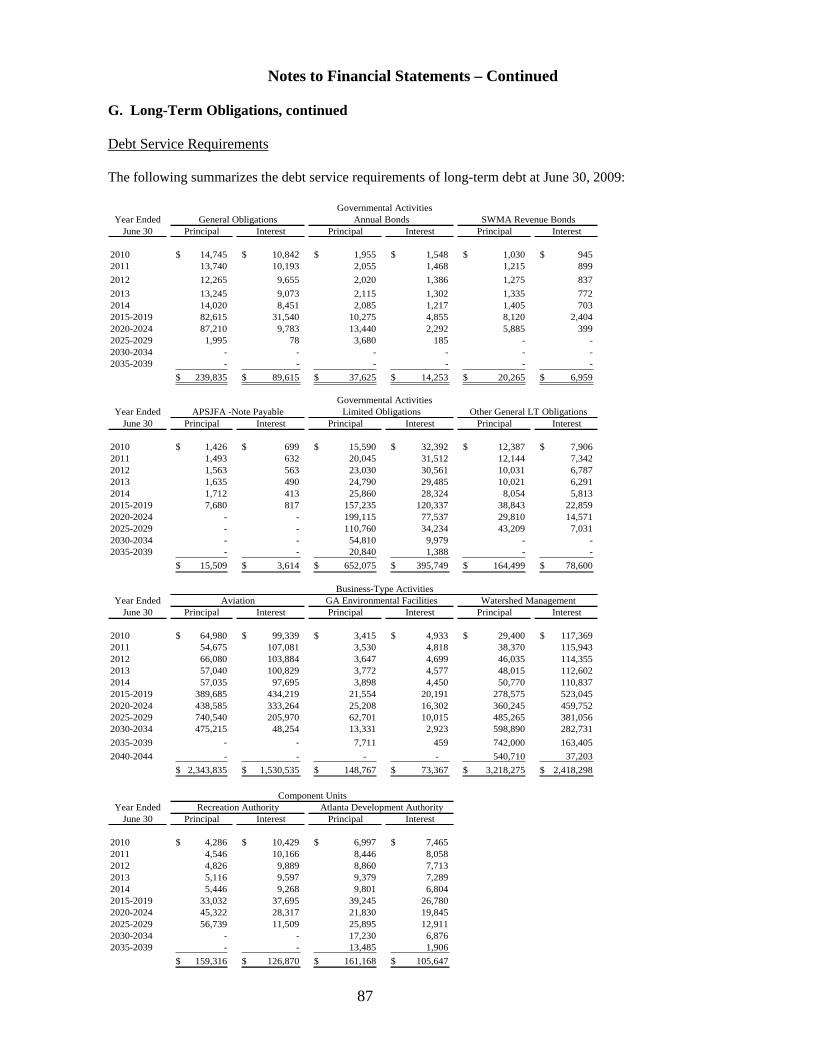
87
Notes to Financial Statements – Continued
G. Long-Term Obligations, continued
Debt Service Requirements
The following summarizes the debt service requirements of long-term debt at June 30, 2009:
Year EndedJune 30 Principal Interest Principal Interest Principal Interest
2010 14,745$ 10,842$ 1,955$ 1,548$ 1,030$ 945$ 2011 13,740 10,193 2,055 1,468 1,215 899
2012 12,265 9,655 2,020 1,386 1,275 837
2013 13,245 9,073 2,115 1,302 1,335 772 2014 14,020 8,451 2,085 1,217 1,405 703 2015-2019 82,615 31,540 10,275 4,855 8,120 2,404 2020-2024 87,210 9,783 13,440 2,292 5,885 399 2025-2029 1,995 78 3,680 185 - - 2030-2034 - - - - - - 2035-2039 - - - - - -
239,835$ 89,615$ 37,625$ 14,253$ 20,265$ 6,959$
Year EndedJune 30 Principal Interest Principal Interest Principal Interest
2010 1,426$ 699$ 15,590$ 32,392$ 12,387$ 7,906$ 2011 1,493 632 20,045 31,512 12,144 7,342 2012 1,563 563 23,030 30,561 10,031 6,787 2013 1,635 490 24,790 29,485 10,021 6,291 2014 1,712 413 25,860 28,324 8,054 5,813 2015-2019 7,680 817 157,235 120,337 38,843 22,859 2020-2024 - - 199,115 77,537 29,810 14,571 2025-2029 - - 110,760 34,234 43,209 7,031 2030-2034 - - 54,810 9,979 - - 2035-2039 - - 20,840 1,388 - -
15,509$ 3,614$ 652,075$ 395,749$ 164,499$ 78,600$
Year EndedJune 30 Principal Interest Principal Interest Principal Interest
2010 64,980$ 99,339$ 3,415$ 4,933$ 29,400$ 117,369$ 2011 54,675 107,081 3,530 4,818 38,370 115,943 2012 66,080 103,884 3,647 4,699 46,035 114,355 2013 57,040 100,829 3,772 4,577 48,015 112,602 2014 57,035 97,695 3,898 4,450 50,770 110,837 2015-2019 389,685 434,219 21,554 20,191 278,575 523,045 2020-2024 438,585 333,264 25,208 16,302 360,245 459,752 2025-2029 740,540 205,970 62,701 10,015 485,265 381,056 2030-2034 475,215 48,254 13,331 2,923 598,890 282,731
2035-2039 - - 7,711 459 742,000 163,405
2040-2044 - - - - 540,710 37,203
2,343,835$ 1,530,535$ 148,767$ 73,367$ 3,218,275$ 2,418,298$
Component UnitsYear Ended
June 30 Principal Interest Principal Interest
2010 4,286$ 10,429$ 6,997$ 7,465$ 2011 4,546 10,166 8,446 8,058 2012 4,826 9,889 8,860 7,713 2013 5,116 9,597 9,379 7,289 2014 5,446 9,268 9,801 6,804 2015-2019 33,032 37,695 39,245 26,780 2020-2024 45,322 28,317 21,830 19,845 2025-2029 56,739 11,509 25,895 12,911 2030-2034 - - 17,230 6,876 2035-2039 - - 13,485 1,906
159,316$ 126,870$ 161,168$ 105,647$
Governmental ActivitiesGeneral Obligations Annual Bonds SWMA Revenue Bonds
Governmental ActivitiesAPSJFA -Note Payable Limited Obligations Other General LT Obligations
Business-Type ActivitiesAviation GA Environmental Facilities Watershed Management
Recreation Authority Atlanta Development Authority
88
Notes to Financial Statements – Continued
G. Long-Term Obligations, continued
Defeased Debt
The City has defeased various bond issues by creating separate irrevocable trust funds. New debt was issued and the proceeds were used to purchase U.S. government securities that were placed in trust funds. The investments and fixed earnings from the investments are sufficient to fully service the defeased debt until the debt is called or matures. For financial reporting purposes, the debt has been considered defeased and, therefore, removed as a liability from the City's government-wide and proprietary fund financial statements. At June 30, 2009, the City has $106,055,000 in defeased Various Purpose General Obligation Bonds, $431,385,000 in defeased Airport Extension and Improvement Bonds, and $8,910,000 in defeased Water and Wastewater Revenue Bonds. At June 30, 2009, the unamortized losses on the defeased bonds were $86,568,000 and $33,684,000 for the Airport Extension and Improvement Bonds and the Water and Wastewater Revenue Bonds, respectively.

89
Notes to the Financial Statements - Continued
H. Reserved Net Assets and Restricted Assets
The various bond covenants require certain reservations of Net Assets of the Department of Aviation. Reserved Net Assets at June 30, 2009 are as follows (in thousands):
Department of Aviation
Passenger and customer facility charges 471,102$
Debt service and debt service reserve 168,786 Total 639,888$
Enterprise Funds, because of certain bond covenants, are required to establish and maintain prescribed amounts of resources that can be used only to service outstanding debt. Other assets are restricted by bond ordinances for capital purposes. The General Fund, because of covenants required by various Certificates of Participation is required to keep certain reserve balances. This includes the investment account established by the 1998 Georgia Municipal Association Certificates of Participation related to the 1998 lease pool, as discussed further in Note III. G. related to long-term obligations. Restricted assets of the enterprise funds at June 30, 2009 are as follows (in thousands):
Department of Watershed
ManagementDepartment of
Aviation Total
Passenger Facility Charges Fund:Investments 358,317$ 358,317$ Cash 61,398 61,398 Accounts Receivable 28,359 28,359 Interest receivable 2,492 2,492
Customer Facility Charge Fund:Investments 4,102 4,102 Cash 2,138 2,138 Accounts Receivable 16,934 16,934
CONRAC and APM Funds:Investments 76,291 76,291
Construction Funds:Construction:
Investments 778,556$ 470,018 1,248,574 Debt Reserve Fund:
Investments 142,730 - 142,730
Sinking Fund:Cash 6,218 115,796 122,014 Investments 31,929 33,946 65,875 Debt Reserve Fund 76,312 - 76,312
Total 1,035,745$ 1,169,791$ 2,205,536$
90
Notes to the Financial Statements-Continued
IV. Other Information
A. Risk Management
General
The City purchases property insurance in the amount of $300 million, subject to a range of deductibles up to $250,000. This coverage protects City owned facilities for covered perils, such as fire, flood and earthquake. There is also a separate property insurance policy for the Airport with a limit of $1 billion, subject to a range of deductibles up to $250,000.
Insurance requirements are imposed on contractors and consultants that do business with the City. They are generally asked to maintain certain types of insurance coverages including, but not limited to general liability, workers’ compensation, automobile liability, performance and payment bonds and professional liability. There is also an Owner Controlled Insurance Program (OCIP) that the airport participates in. The OCIP has its own set of policies that cover contractor work for certain construction projects at the airport. Policies include but are not limited to builders risk, general employees liability, workers compensation and pollution coverage.
There has not been any material change to the insurance coverages from the previous year. Settlement claims have not exceeded commercial coverage in any of the past three years.
Self-insurance
The City is self-insured for workers' compensation, parts of the medical and dental plan, and general claims liabilities. The City pays for such claims as they become due. These claims liabilities are accounted for in the general fund and the applicable enterprise funds. Claims generated by governmental funds expected to be paid subsequent to one year are recorded only in the government-wide financial statements.
Workers’ Compensation
The City's workers' compensation liability is calculated by an outside actuary. Liabilities are reported when it is probable a loss has occurred and the amount can be reasonably estimated including amounts for claims incurred but not yet reported. The calculation of the present value of future workers' compensation liabilities, as calculated by the outside actuary, is based on a discount rate of 3.5 % for both 2009 and 2008.
Health and Dental Insurance
The City’s medical plan under Blue Cross Blue Shield Point of Service and its dental plan under Cigna are fully self insured. In addition, the CIGNA dental plan is now self insured. The Kaiser HMO, OHS dental access plan and Spectra vision plan are fully insured. The City’s health and dental liability is calculated by an outside actuary firm. Liabilities are reported when it is probable that a loss has occurred and the amount of the loss can be reasonably estimated. Liabilities include an amount for claims that have been incurred but not reported.
91
Notes to the Financial Statements-Continued
A. Risk Management, continued
Changes in the balances of claims liabilities for workers' compensation, health/dental insurance and general claims liabilities during the year ended June 30, 2009 and the year ended June 30, 2008 were as follows (in thousands):
Beginning of period
Period claims and changes in
estimatesClaim
paymentsEnd of period
Workers' compensation:2008 42,421$ 6,913$ (6,752)$ 42,582$2009 42,582$ 4,405$ (8,082)$ 38,905$
Health and Dental claims:2008 4,575$ 51,173$ (51,167)$ 4,581$2009 4,581$ 51,120$ (51,045)$ 4,657$
General claims liability:2008 36,745$ 13,617$ (17,729)$ 32,633$2009 32,633$ 2,500$ (9,496)$ 25,637$
The City participates in the State Subsequent Injury Trust Fund, a public entity managed by the State of Georgia. The pool is designed to provide the insurance coverage for employees who are hired with previous medical conditions. Historically, premiums have not been significant.
B. Employee Retirement Systems and Pension Plans
Pension Plans
The City maintains the following separately administered pension plans:
Plan Type Plan Name Agent, multiple-employer, defined benefit The General Employees’ Pension Plan
Single employer, defined benefit Firefighters’ Pension Plan Single employer, defined benefit Police Officers’ Pension Plan
Single employer, defined contribution General Employees’ Defined Contribution Plan
The funding methods and determination of benefits payable were established by the legislative acts creating such plans, as amended, and in general, provide that the pension funds are to be accumulated from employee contributions, City contributions, and income from the investment of accumulated funds.
The plans are administered by separate boards of trustees which include an appointee of the Mayor, the Chief Financial Officer, a member of City Council, and members elected from active and retired employees of the respective plans.
92
Notes to the Financial Statements - Continued
B. Employee Retirement Systems and Pension Plans, continued
Prior to July 1, 2001, all permanent employees of the City, excluding sworn personnel of the Police and Fire Departments and including employees of the Atlanta Independent School System (the “School System”) who were not covered under the Teachers Retirement System of Georgia, were eligible to participate in the General Employees' Pension Plan. Certain School System employees, employed prior to July 1, 1979, also participate in the City's General Employees' Pension Plan (the "Plan"). Unless previously enrolled in the Plan, the City has no obligation to pay any costs related to retirement benefits of employees of the School System. The financial information herein relates only to City obligations for City employees and retirees.
Effective July 1, 2001, all new, permanent employees of the City, excluding sworn personnel of the Police and Fire Departments, are only eligible to participate in the Defined Contribution Plan. During 2002 persons employed prior to July 1, 2001 were given the option of transferring to the Defined Contribution Plan. As of December 31, 2002, employees previously participating in the General Employees' Defined Benefit Plan do not have the option of transferring to the new Defined Contribution Plan. Sworn personnel of the Police and Fire Departments are eligible to participate in the Police Officers' and Firefighters' plans, respectively.
Effective September 1, 2005, classified employees and certain non-classified employees pay grade 18 and below enrolled in the Defined Contribution Plan had a one-time option of transferring to the General Employee’s Pension Plan. Classified employees and certain non-classified employees pay grade 18 and below not covered by either the Police Officers or Firefighters’ Pension Plans, and hired after September 1, 2005, are required to become members of the General Employee’s Pension Plan.
Complete financial statements for all Plans, except the General Employees' Defined Contribution Plan, can be obtained at the following address:
City of Atlanta 68 Mitchell Street, S.W. Suite 1600 Atlanta, Georgia 30335
Separate financial statements have not been prepared for the General Employees’ Defined Contribution Plan.
Defined Benefit Plans
The City's defined benefit plans provide retirement benefits based on the average of the highest 36 months earnings based on the following percentages:
General employees – 2.5% for each year of service to a maximum of 32 years or 80% of salary. Firefighters – 3% for each year of service to a maximum of 26.67 years or 80% of salary. Police Officers – 3% for each year of service to a maximum of 26.67 years or 80% of salary.
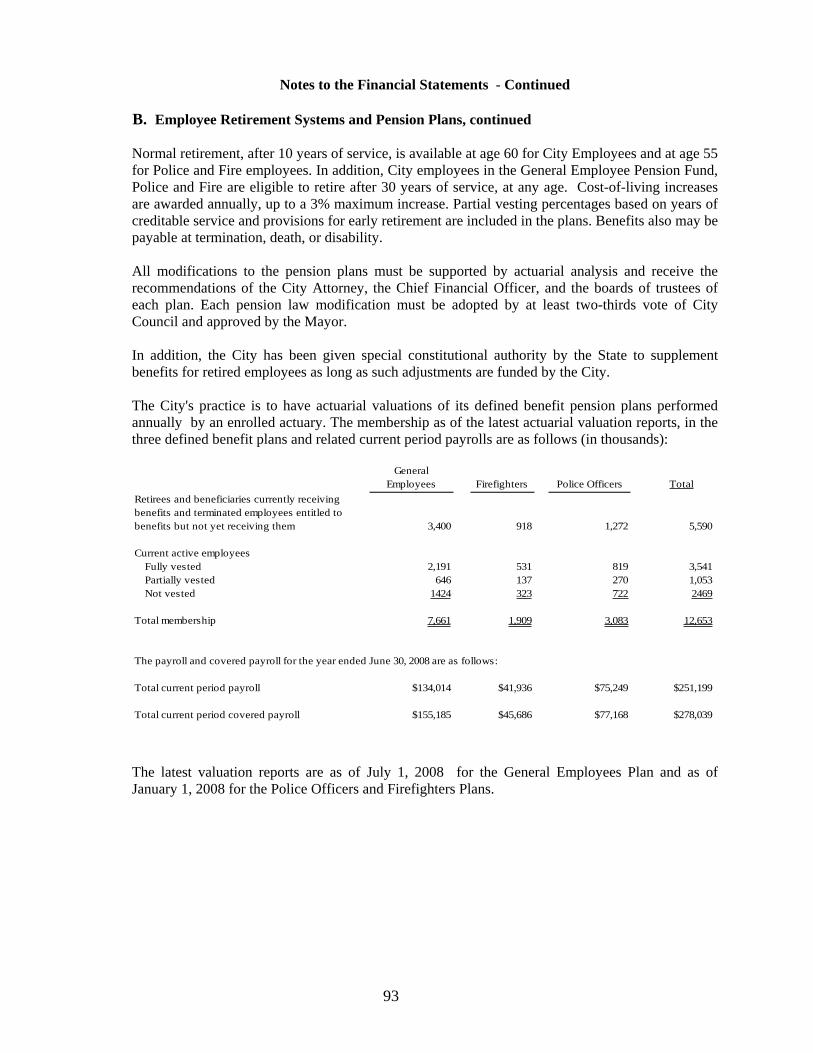
93
Notes to the Financial Statements - Continued
B. Employee Retirement Systems and Pension Plans, continued
Normal retirement, after 10 years of service, is available at age 60 for City Employees and at age 55 for Police and Fire employees. In addition, City employees in the General Employee Pension Fund, Police and Fire are eligible to retire after 30 years of service, at any age. Cost-of-living increases are awarded annually, up to a 3% maximum increase. Partial vesting percentages based on years of creditable service and provisions for early retirement are included in the plans. Benefits also may be payable at termination, death, or disability.
All modifications to the pension plans must be supported by actuarial analysis and receive the recommendations of the City Attorney, the Chief Financial Officer, and the boards of trustees of each plan. Each pension law modification must be adopted by at least two-thirds vote of City Council and approved by the Mayor.
In addition, the City has been given special constitutional authority by the State to supplement benefits for retired employees as long as such adjustments are funded by the City.
The City's practice is to have actuarial valuations of its defined benefit pension plans performed annually by an enrolled actuary. The membership as of the latest actuarial valuation reports, in the three defined benefit plans and related current period payrolls are as follows (in thousands):
General Employees Firefighters Police Officers Total
Retirees and beneficiaries currently receiving benefits and terminated employees entitled to benefits but not yet receiving them 3,400 918 1,272 5,590
Current active employees Fully vested 2,191 531 819 3,541 Partially vested 646 137 270 1,053 Not vested 1424 323 722 2469
Total membership 7,661 1,909 3,083 12,653
The payroll and covered payroll for the year ended June 30, 2008 are as follows:
Total current period payroll $134,014 $41,936 $75,249 $251,199
Total current period covered payroll $155,185 $45,686 $77,168 $278,039
The latest valuation reports are as of July 1, 2008 for the General Employees Plan and as of January 1, 2008 for the Police Officers and Firefighters Plans.
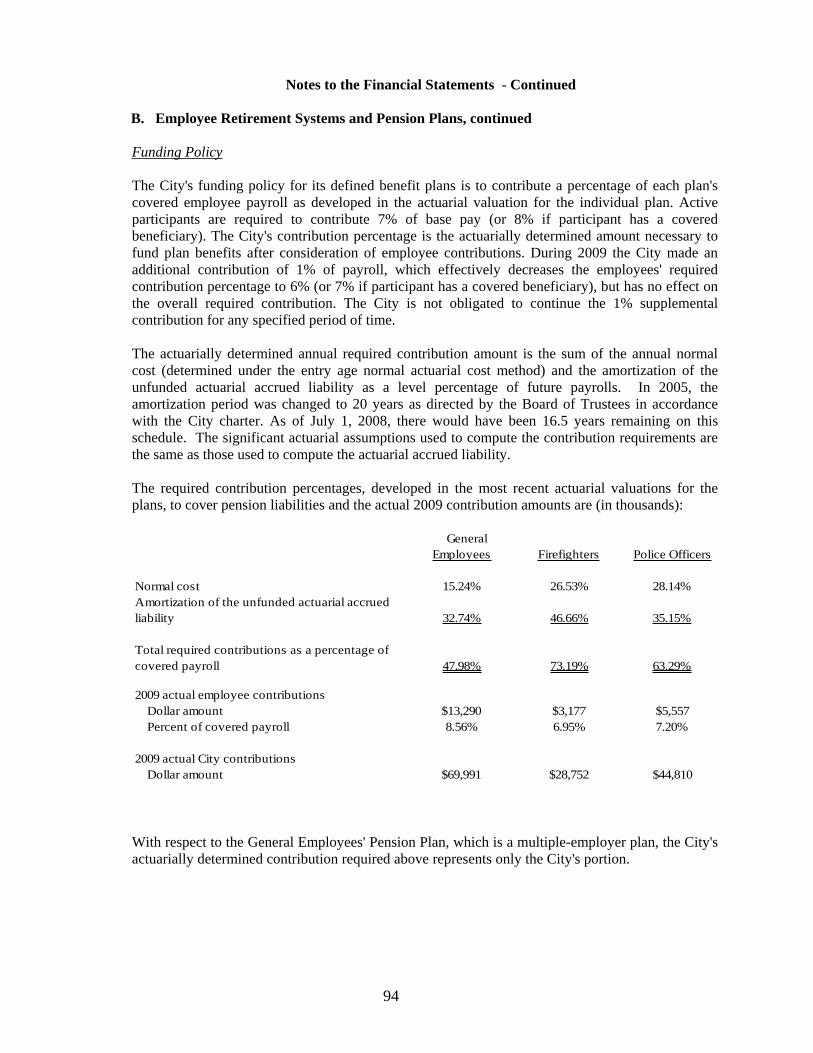
94
Notes to the Financial Statements - Continued
B. Employee Retirement Systems and Pension Plans, continued
Funding Policy
The City's funding policy for its defined benefit plans is to contribute a percentage of each plan's covered employee payroll as developed in the actuarial valuation for the individual plan. Active participants are required to contribute 7% of base pay (or 8% if participant has a covered beneficiary). The City's contribution percentage is the actuarially determined amount necessary to fund plan benefits after consideration of employee contributions. During 2009 the City made an additional contribution of 1% of payroll, which effectively decreases the employees' required contribution percentage to 6% (or 7% if participant has a covered beneficiary), but has no effect on the overall required contribution. The City is not obligated to continue the 1% supplemental contribution for any specified period of time.
The actuarially determined annual required contribution amount is the sum of the annual normal cost (determined under the entry age normal actuarial cost method) and the amortization of the unfunded actuarial accrued liability as a level percentage of future payrolls. In 2005, the amortization period was changed to 20 years as directed by the Board of Trustees in accordance with the City charter. As of July 1, 2008, there would have been 16.5 years remaining on this schedule. The significant actuarial assumptions used to compute the contribution requirements are the same as those used to compute the actuarial accrued liability.
The required contribution percentages, developed in the most recent actuarial valuations for the plans, to cover pension liabilities and the actual 2009 contribution amounts are (in thousands):
General Employees Firefighters Police Officers
Normal cost 15.24% 26.53% 28.14%Amortization of the unfunded actuarial accrued liability 32.74% 46.66% 35.15%
Total required contributions as a percentage of covered payroll 47.98% 73.19% 63.29%
2009 actual employee contributions Dollar amount $13,290 $3,177 $5,557 Percent of covered payroll 8.56% 6.95% 7.20%
2009 actual City contributions Dollar amount $69,991 $28,752 $44,810
With respect to the General Employees' Pension Plan, which is a multiple-employer plan, the City's actuarially determined contribution required above represents only the City's portion.

95
Notes to the Financial Statements - Continued
B. Employee Retirement Systems and Pension Plans, continued
The actual City contributions shown above include amounts used to fund retiree supplemental cost of living increases and other minimum benefits. These amounts are components of the City’s contributions for purposes of meeting its actuarially determined funding requirements.
Annual Pension CostThe City’s annual pension cost for the year ended June 30, 2009, were as follows for the respective plans:
General Employees 69,991$ Firefighters 28,752$ Police Officers 44,810$
These amounts equaled the required and actual contributions for each of the respective plans.
The City’s annual pension cost and net pension obligation for the current year ended June 30, 2009 and each of the two preceding years were as follows (in thousands):
Plan/PeriodAnnual Pension
Cost (APC)
Percentage of APC
ContributedNet Pension Obligation
General Employees:Year Ended 6/30/07 $ 51,772 100% $ - Year Ended 6/30/08 $ 59,780 100% $ - Year Ended 6/30/09 $ 69,991 100% $ -
Firefighters:Year Ended 6/30/07 $ 27,502 100% $ - Year Ended 6/30/08 $ 26,373 100% $ - Year Ended 6/30/09 $ 28,752 100% $ -
Police Officers:Year Ended 6/30/07 $ 47,365 100% $ - Year Ended 6/30/08 $ 45,730 100% $ - Year Ended 6/30/09 $ 44,810 100% $ -
The actuarial cost method used for funding purposes and to calculate the actuarial accrued liability is the Entry Age Normal Cost Method. This method is one of the approved methods for such plans in Georgia, and provides for contributions estimated to be a level percentage of future payroll. The unfunded actuarial accrued liability for funding purposes, effective with the January 1, 2006 actuarial report, is to be amortized over a closed period of 19 years as a level percentage of estimated future payroll, with a remaining amortization period of 16 years, in accordance with State of Georgia guidelines.
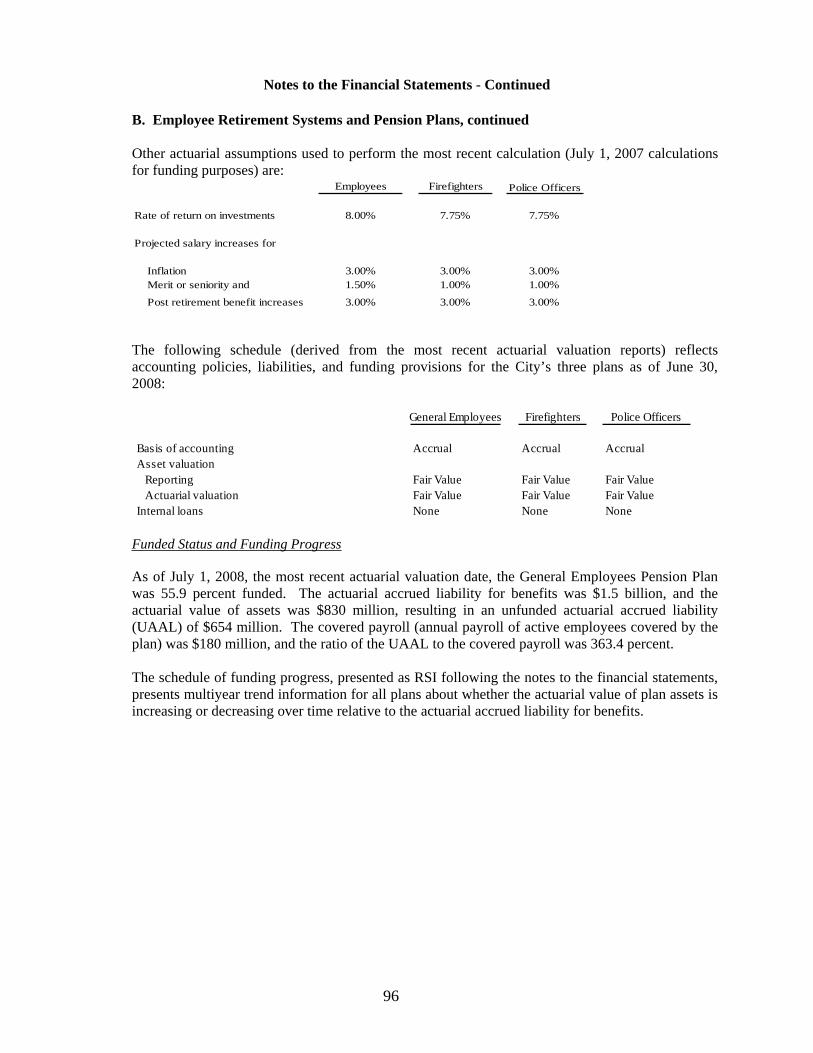
96
Notes to the Financial Statements - Continued
B. Employee Retirement Systems and Pension Plans, continued
Other actuarial assumptions used to perform the most recent calculation (July 1, 2007 calculations for funding purposes) are:
Firefighters
Rate of return on investments 8.00% 7.75% 7.75%
Projected salary increases for
Inflation 3.00% 3.00% 3.00% Merit or seniority and 1.50% 1.00% 1.00%
Post retirement benefit increases 3.00% 3.00% 3.00%
Police OfficersEmployees
The following schedule (derived from the most recent actuarial valuation reports) reflects accounting policies, liabilities, and funding provisions for the City’s three plans as of June 30, 2008:
Funded Status and Funding Progress
As of July 1, 2008, the most recent actuarial valuation date, the General Employees Pension Plan was 55.9 percent funded. The actuarial accrued liability for benefits was $1.5 billion, and the actuarial value of assets was $830 million, resulting in an unfunded actuarial accrued liability (UAAL) of $654 million. The covered payroll (annual payroll of active employees covered by the plan) was $180 million, and the ratio of the UAAL to the covered payroll was 363.4 percent.
The schedule of funding progress, presented as RSI following the notes to the financial statements, presents multiyear trend information for all plans about whether the actuarial value of plan assets is increasing or decreasing over time relative to the actuarial accrued liability for benefits.
General Employees Firefighters Police Officers
Basis of accounting Accrual Accrual AccrualAsset valuation Reporting Fair Value Fair Value Fair Value Actuarial valuation Fair Value Fair Value Fair ValueInternal loans None None None

97
Notes to the Financial Statements - Continued
B. Employee Retirement Systems and Pension Plans, continued
Defined Contribution Plan
The City's General Employees' Defined Contribution Plan provides funds at retirement for employees of the City and in the event of death, provides funds for their beneficiaries, through an arrangement by which contributions are made to the Plan by employees and the City. The current contribution of the City is 6% of employee payroll.
Employees also make a mandatory pretax contribution of 6% plus have the option to contribute amounts up to the amount legally limited for retirement contributions. All modifications to the Plan, including contribution requirements, must receive the recommendations and advice from the offices of the Chief Financial Officer and the City Attorney, respectively. Each pension law modification must be adopted by at least two-thirds vote of the City Council and approved by the Mayor.
All new employees, hired after July 1, 2001, who previously would have been enrolled in the General Employees' Defined Benefit Plan, were enrolled in the General Employees' Defined Contribution Plan. During 2002, persons employed prior to July 1, 2001 were given the option to transfer to the Defined Contribution Plan.
Effective September 1, 2005, classified employees and certain non-classified employees pay grade 18 and below then enrolled in the Defined Contribution Plan had the one-time option of transferring to the General Employee’s Pension Plan. Classified employees and certain non-classified employees pay grade 18 and below, not covered by either the Police Officers or Firefighters’ Pension Plans, hired after September 1, 2005 are required to become members of the General Employee’s Pension Plan.
As of June 30, 2009 there were 1,632 participants in the Defined Contribution Plan. The covered payroll for employees in the Plan was $55,782,000. Employee contributions for the year ended June 30, 2009 were $4,060,000 and employer contributions were $4,034,000 or 14.5% of covered payroll.
The Defined Contribution Plan uses the accrual basis of accounting. Investments are reported at fair value, based on quoted market prices and there were no nongovernmental individual investments that exceeded 5% of the net assets of the Plan.

98
Notes to the Financial Statements - Continued
B. Employee Retirement Systems and Pension Plans, continued
Condensed financial statement information for the Defined Contribution Plan for the year ended June 30, 2009 is shown below (in thousands):
Current assets: Investments 36,332$ Other Assets 47 Total assets 36,379$
Current liabilities: Due to other funds 757 Total current liabilities 757$
Additions: Employer contributions 4,034 Employee contributions 4,060 Net Investment income (loss) (2,415) Total additions 5,679
Deductions: Benefit Payments 3,738 Administrative expenses 127 Total deductions: 3,865
Change in Net Assets held in trust 1,814
Net Assets held in trust for pension benefits: Beginning of period 33,758
End of period 35,572$
Postretirement Benefits
Plan Description: The City of Atlanta Retiree Healthcare Plan (Plan) is a single-employer defined benefit healthcare plan which provides Other Postemployment Benefits (OPEB) to eligible retirees, dependents and their beneficiaries. The Plan was established by legislative acts and functions in accordance with existing City laws. OPEB of the City includes health, dental, and vision care and life insurance. Separate financial statements are not prepared for the Plan.
Funding Policy: The City is not required by law or contractual agreement to provide funding for OPEB other than the pay-as-you-go amounts necessary to provide current benefits to retirees, eligible dependents and beneficiaries. For the fiscal year ended June 30, 2009, the City made $29.2 million “pay-as-you-go” payments on behalf of the Plan. Retiree contributions vary based on the plan elected, dependent coverage and Medicare eligibility. Eligible retirees receiving benefits contributed $11.1 million through their required contributions.
Annual OPEB Cost and Net OPEB Obligation: The City’s annual OPEB cost (expense) is calculated based on the annual required contribution of the employer (ARC), an amount actuarially determined using the Projected Unit Credit Actuarial Cost Method. The ARC represents a level of funding that, if paid on an ongoing basis, is projected to cover normal cost each year and amortize any unfunded actuarial liabilities over a period not to exceed thirty years.
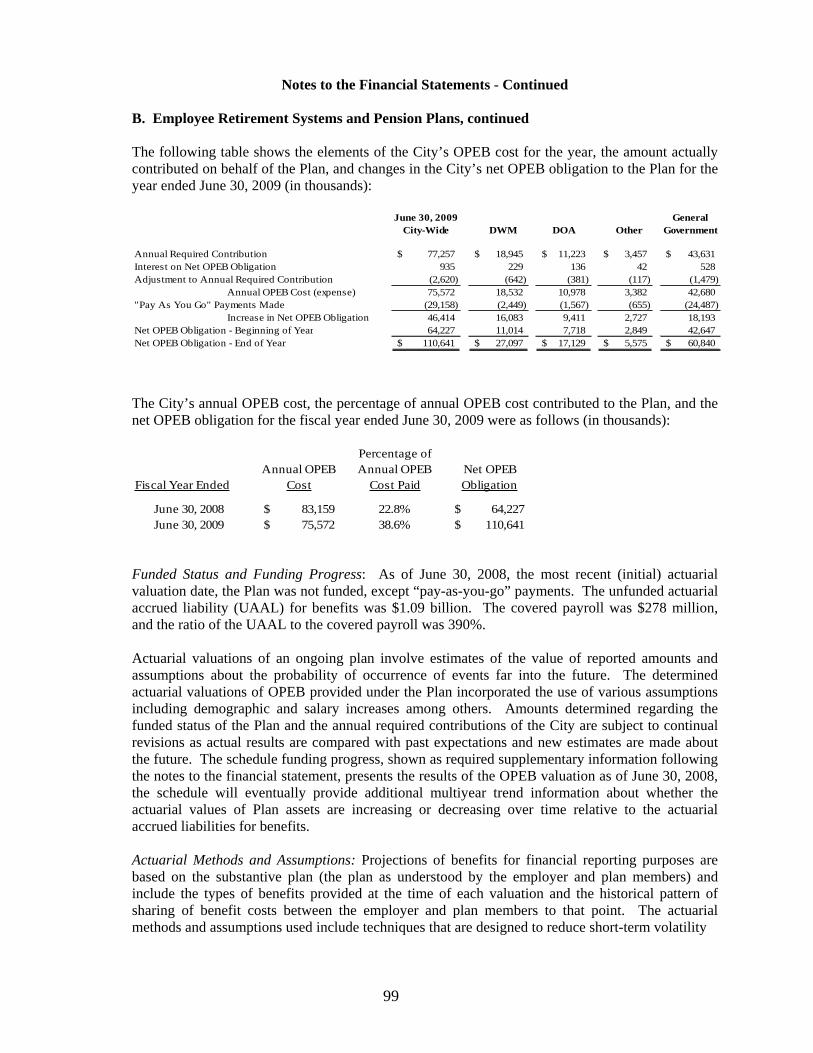
99
Notes to the Financial Statements - Continued
B. Employee Retirement Systems and Pension Plans, continued
The following table shows the elements of the City’s OPEB cost for the year, the amount actually contributed on behalf of the Plan, and changes in the City’s net OPEB obligation to the Plan for the year ended June 30, 2009 (in thousands):
June 30, 2009 GeneralCity-Wide Government
Annual Required Contribution 77,257$ 18,945$ 11,223$ 3,457$ 43,631$ Interest on Net OPEB Obligation 935 229 136 42 528 Adjustment to Annual Required Contribution (2,620) (642) (381) (117) (1,479)
Annual OPEB Cost (expense) 75,572 18,532 10,978 3,382 42,680 "Pay As You Go" Payments Made (29,158) (2,449) (1,567) (655) (24,487)
Increase in Net OPEB Obligation 46,414 16,083 9,411 2,727 18,193 Net OPEB Obligation - Beginning of Year 64,227 11,014 7,718 2,849 42,647 Net OPEB Obligation - End of Year 110,641$ 27,097$ 17,129$ 5,575$ 60,840$
DOADWM Other
The City’s annual OPEB cost, the percentage of annual OPEB cost contributed to the Plan, and the net OPEB obligation for the fiscal year ended June 30, 2009 were as follows (in thousands):
Fiscal Year EndedAnnual OPEB
Cost
Percentage of Annual OPEB
Cost PaidNet OPEB Obligation
June 30, 2008 83,159$ 22.8% 64,227$ June 30, 2009 75,572$ 38.6% 110,641$
Funded Status and Funding Progress: As of June 30, 2008, the most recent (initial) actuarial valuation date, the Plan was not funded, except “pay-as-you-go” payments. The unfunded actuarial accrued liability (UAAL) for benefits was $1.09 billion. The covered payroll was $278 million, and the ratio of the UAAL to the covered payroll was 390%.
Actuarial valuations of an ongoing plan involve estimates of the value of reported amounts and assumptions about the probability of occurrence of events far into the future. The determined actuarial valuations of OPEB provided under the Plan incorporated the use of various assumptions including demographic and salary increases among others. Amounts determined regarding the funded status of the Plan and the annual required contributions of the City are subject to continual revisions as actual results are compared with past expectations and new estimates are made about the future. The schedule funding progress, shown as required supplementary information following the notes to the financial statement, presents the results of the OPEB valuation as of June 30, 2008, the schedule will eventually provide additional multiyear trend information about whether the actuarial values of Plan assets are increasing or decreasing over time relative to the actuarial accrued liabilities for benefits.
Actuarial Methods and Assumptions: Projections of benefits for financial reporting purposes are based on the substantive plan (the plan as understood by the employer and plan members) and include the types of benefits provided at the time of each valuation and the historical pattern of sharing of benefit costs between the employer and plan members to that point. The actuarial methods and assumptions used include techniques that are designed to reduce short-term volatility

100
Notes to the Financial Statements - Continued
B. Employee Retirement Systems and Pension Plans, continued
in actuarial accrued liabilities and the actuarial value of assets, consistent with the long-term perspective of the calculations.
In the June 30, 2008 actuarial valuation, the projected unit credit actuarial cost method was used. The actuarial assumptions included 4.5 percent investment rate of return (net of administrative expenses) and an annual medical cost trend rate of 11 percent initially, reduced by decrements to an ultimate trend rate of 5 percent after ten years. Both rates include a 3 percent inflation assumption. Currently there are no assets set aside that are legally held exclusively for OPEB. The UAAL is being amortized as level percentage of projected payroll on an open basis. The remaining amortization period at June 30, 2008, was twenty-eight years.
Deferred Compensation Plan
The City has adopted a deferred compensation plan in accordance with the 1997 revisions of Section 457 of the Internal Revenue Code. The plan, available to all City employees, allows an employee to voluntarily defer up to 25% of his/her gross compensation, not to exceed certain limits per year. Each participant selects one of three providers to administer the investment of the deferred funds. Administrative costs of the plan are deducted from the participants' accounts. The plan assets are held in custodial accounts for the exclusive benefit of the plan participants and their beneficiaries, and are therefore not included in the City's financial statements.
101
Notes to the Financial Statements - Continued
C. Commitments and Contingent Liabilities
Litigation
The City is subject to various suits and proceedings arising in the ordinary conduct of its affairs and has been named as defendant in numerous lawsuits. The City has accrued amounts related to litigation where an outcome unfavorable to the City is probable and the amount can be reasonably estimated. The City has been named as defendant in several other suits and actions claiming personal and property damages. In the opinion of the City Attorney, all suits and actions now pending, or likely to be filed, will be resolved without a material effect on the financial position of the City.
Grants from Governments
Amounts received or receivable from grantor agencies are subject to audit and adjustment by such agencies, principally the federal government. Any disallowed claims, including amounts already collected, may constitute a liability of the applicable funds. The amount, if any, of expenditures which may be disallowed by the grantor cannot be determined at this time although the City expects such amounts, if any, to be immaterial.
Construction and Commitments
At June 30, 2009, the total estimated costs on committed projects are $432,002,000 and $345,634,000 for the Department of Aviation and Department of Watershed Management, respectively.
Department of Watershed Management
Other Governments
In July 1968, the City and DeKalb County, Georgia (DeKalb County) entered into an agreement (the "Clayton Agreement") providing for the construction of a 120 million gallons per day (MGD) water pollution control facility to be known as the R.M. Clayton Water Reclamation Center (the "Plant"). Pursuant to the Clayton Agreement, the City agreed to assume responsibility for the financing, construction, operation, and maintenance of the Plant. The Clayton Agreement gives DeKalb County the right to use 25 MGD, or 20.83%, of the plant capacity. The Clayton Agreement with DeKalb County was amended in 1999, to increase DeKalb County’s capacity in the Plant to 50 MGD, which is 48.54% of the 103 MGD of average daily flow capacity.

102
Notes to the Financial Statements - Continued
C. Commitments and Contingent Liabilities, continued
In 1977, Dekalb County entered into an agreement for 2.62 MGD, or 5.82%, of the capacity rights in the South River Water Reclamation Center and 2.60 MGD, or 12.38%, of the capacity rights in the Intrenchment Creek Water Reclamation Center.
Additional capital improvements may be made to the Plants to relieve excessive flows and/or loads that impair the efficient operation of the City’s sewer system, to improve existing processes, to improve the efficiency of current operations, or to comply with applicable laws. In any such event, the DWM and Dekalb County have agreed to share the costs of such capital improvements, generally upon the basis of relative sewerage flow contributed by the City and Dekalb County, respectively.
Dekalb County, Fulton County, the City of Hapeville, the City of Forest Park, the City of East Point and the City of College Park (collectively, the “Municipalities") share in the costs of the operation and maintenance of the R.M. Clayton, South River, Intrenchment Creek and Utoy Creek Water Reclamation Centers based upon the ratio that their sewerage flow bears to the total flows to the plants. The Municipalities’ shares of the operation and maintenance costs for the plants for the period ended June 30, 2009 was $20,542,000. These payments are treated as operating revenue for the DWM.
The Municipalities have agreed to share in the capital improvement costs made to certain plants with their share being based on their portion of the sewerage flow. There was $9,084,000 of capital improvement costs for the plants charged to the municipalities in fiscal year 2009. These charges, when earned, are treated as non-operating revenue and are included in capital contributions. The amounts receivable from the Municipalities is included in the amount due from other governmental units in the accompanying financial statements.
Consent Decrees for Wastewater System
The DWM is subject to two related consent decrees the City entered into to resolve alleged violations of the Federal Clean Water Act and the Georgia Water Quality Control Act.
On October 10, 1995, the Upper Chattahoochee Riverkeeper Fund, Inc. (the "Riverkeeper"), brought suit against the City pursuant to the citizen suit provision of the Clean Water Act seeking injunctive relief and the assessment of civil penalties. Subsequently, the United States of America, acting at the request and on behalf of the Environment Protection Agency (EPA), and the State of Georgia, at the request of the Georgia Environmental Protection Division (EPD), also filed a complaint against the City alleging violations of the Clean Water Act and seeking similar relief. The actions were consolidated.
The plaintiffs alleged that the City violated the terms of its permits that authorize discharge of wastewater from the City's Combined Sewer Overflows (CSO) Control Facilities and its wastewater treatment facilities. In 1998, the plaintiffs and the City agreed to the entry of a consent decree relating to the CSO Control Facilities. On December 20, 1999, the First Amended Consent Decree (the "FACD") was entered with the United States District Court for the Northern District of Georgia. The United States, the State of Georgia, and the City are the parties to the FACD. Because claims brought by Riverkeeper were resolved under the CSO Consent Decree, Riverkeeper is not a party to the FACD.
103
Notes to the Financial Statements - Continued
C. Commitments and Contingent Liabilities, continued
CSO Consent Decree
With respect to the October 10, 1995, action brought against the City by the Riverkeeper, the court dismissed allegations regarding the phosphorus reduction program and common law nuisance claims, but found that the City violated federal and State water pollution laws with regard to the City's operation of its Tanyard Creek, Proctors Creek/North Avenue, and Proctor Creek/Greensferry CSO treatment facilities. As mentioned, the City and the citizen plaintiffs settled the lawsuit in what is referred to as the CSO Consent Decree (EPA and the EPD also joined). The CSO Consent Decree required the City to study the performance of the existing CSO treatment facilities, evaluate treatment alternatives that may be necessary for meeting State water quality standards, and improve the performance, maintenance, operation, and management of the existing treatment facilities. As of June 30, 2009, all projects required under the CSO Consent Decree were substantially complete.
First Amended Consent Decree
The FACD resolved allegations regarding the City's wastewater treatment facilities, inter-jurisdictional requirements, and the City's sewerage collection and transmission system. For the wastewater treatment facilities, the FACD requires the City to: continue its ongoing wastewater treatment facilities Capital Improvement Program to complete upgrades at the R.M. Clayton, Utoy Creek, Intrenchment Creek, and South River Water Reclamation Centers; install and implement a maintenance management system, revise the current operations program, and implement upgrades to the current laboratory information system; and review its inter-jurisdictional agreements to address over-loading and pretreatment issues. All capital improvements, upgrades, and repairs under the FACD must be completed by July 1, 2014.
The City is actively seeking federal and state grants and loans and other sources of funding to perform the tasks outlined above as part of its Clean Water Atlanta (the "CWA") Program. Key elements of the comprehensive funding and financing plan include:
Municipal Option Sales Tax (MOST) - Effective October 1, 2004, a 1% Municipal sales and use tax is being collected for retail sales and use occurring in the incorporated city limits of Atlanta. Proceeds from this tax are used for operations, debt service and funding renovations to the City's water and sewer system. The MOST was approved by the residents of the City in the July 2004 general election for a period not to exceed four years and for raising not more than $750,000,000. Up to two extensions, at four years each can be approved by a vote of residents of the City. In the February 2008 elections, the City’s residents approved one of the two extensions. Proceeds from the MOST for fiscal year 2009 were $117,130,000, of which $16,990,000 was receivable from the Georgia Department of Revenue at June 30. For fiscal 2009, the MOST revenue was recorded by law in a Special Revenue fund with the total revenue amount subsequently transferred to the DWM fund.
Federal Appropriation – Some small Federal grants have been obtained and efforts to secure additional federal grants continue.
104
Notes to the Financial Statements - Continued
C. Commitments and Contingent Liabilities, continued
State GEFA Loans - The State of Georgia passed legislation to provide up to $50 million per year in low interest Georgia Environmental Facilities Authority (GEFA) loans to the City. The City is pursuing the maximum loan amount for each year of the CWA Program. In fiscal year 2009, the City received $50,000,000 in GEFA funding. As of June 30, 2009, the City had $148,768,000 of loans outstanding to GEFA.
The Atlanta City Council approved annual increases to the current water and wastewater rates to support revenue bond’s financing the five year portion (2008 – 2012) of the CWA Capital Improvement Program. The graduated three tiered rate structure is intended to minimize, to the extent possible, the impact of rate increases on ratepayers to maintain affordability and to permit water conservation. The fiscal year 2008-2012 rates are summarized below. In addition to the rates shown below, each water and wastewater bill includes a $.15 per 100 cubic feet security surcharge.
Graduated Monthly Wastewater Rate Structure:
Water Consumption 2008 2009 2010 2011 2012 Base charge $3.63 $4.63 $5.21 $5.86 $6.56 0-3 ccf $5.39 $6.87 $7.73 $8.70 $9.74 4-6 ccf $7.55 $9.63 $10.83 $12.18 $13.64 Above 7 ccf $8.68 $11.07 $12.45 $14.01 $15.69
Graduated Monthly Water Rate Structure:
Water Consumption 2008 2009 2010 2011 2012 Base charge $3.63 $4.63 $5.21 $5.86 $6.56 0-3 ccf $1.42 $1.81 $2.04 $2.30 $2.58 4-6 ccf $2.96 $3.77 $4.24 $4.77 $5.34 Above 7 ccf $3.41 $4.35 $4.89 $5.50 $6.16
Consent Orders for Drinking Water System
The City is subject to two administrative Consent Orders issued by the Georgia Department of Natural Resources Environmental Protection Division. They are dated December 9, 1997, and March 21, 2003. Those Orders require capital improvement at the Chattahoochee and Hemphill Treatment Plants, as well as operational improvement to ensure compliance with Georgia Rules for Safe Drinking water. While the City is in substantial compliance with the provisions of both Orders, certain aspects of the capital program remain to be completed.
105
Notes to the Financial Statements - Continued
C. Commitments and Contingent Liabilities, continued
Estimated Capital Costs to Complete Compliance with Decrees and Orders
The DWM is in the midst of a Capital Improvement Program mandated by court orders, regulatory and priority requirements. This Capital Improvement Program details all of the improvements needed through 2014 to meet the aforementioned objectives. The current cost estimate of the overall Capital Improvement Program is approximately $4.1 billion, which has increased over the original cost estimate of $3.9 billion.
The following is a summary of the funded and unfunded future costs to complete projects by type based on the current estimate:
TotalProject Types 2010 2014
CIP(In Millions)
Wastewater Projects: CSO Consent Decree $ 7 First Amended Decree 1,056 Regulatory 45
R&E Fund Projects 116 Subtotal 1,224
Water Projects: Consent Order 69 Non Consent Order 996 Subtotal 1,065
Grand total $ 2,289
Purchase Option
During 2006, the Atlanta Fulton County Recreation Authority (“Recreation Authority”) granted an option to the City to purchase certain real property and improvements owned by Recreation Authority for an option price of $30,000,000. The option may be exercised at any time after the earlier of (1) expiration of the term of the operating agreement dated November 15, 1997 between Recreation Authority, the City, Fulton County, and Arena Operations, LLC; or (2) payment in full of Recreation Authority (Downtown Revenue Bonds) Taxable Series 1997. The option will expire on January 12, 2096. Upon expiration of the option period all of the City’s rights to demand conveyance of the property and improvements will expire and the Recreation Authority will keep the option price and the City will have no further obligations. The purchase option is reflected as a deferred cost in the City’s government-wide financial statements.
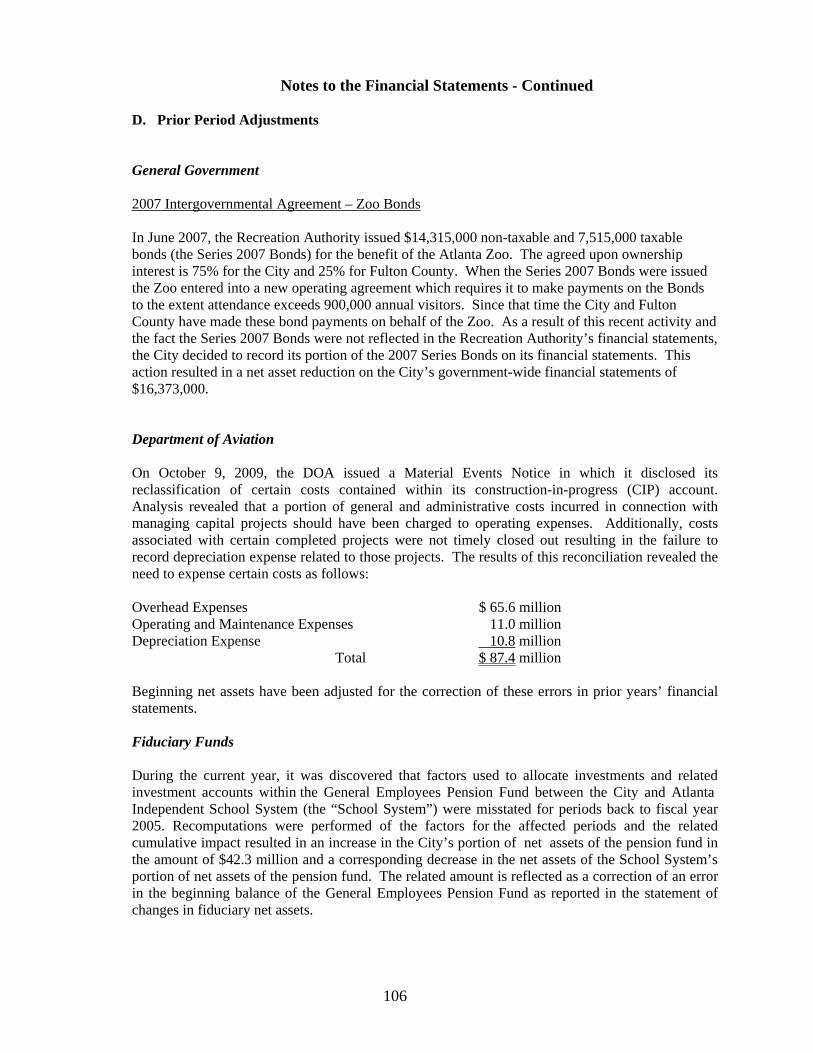
106
Notes to the Financial Statements - Continued
D. Prior Period Adjustments
General Government
2007 Intergovernmental Agreement – Zoo Bonds
In June 2007, the Recreation Authority issued $14,315,000 non-taxable and 7,515,000 taxable bonds (the Series 2007 Bonds) for the benefit of the Atlanta Zoo. The agreed upon ownership interest is 75% for the City and 25% for Fulton County. When the Series 2007 Bonds were issued the Zoo entered into a new operating agreement which requires it to make payments on the Bonds to the extent attendance exceeds 900,000 annual visitors. Since that time the City and Fulton County have made these bond payments on behalf of the Zoo. As a result of this recent activity and the fact the Series 2007 Bonds were not reflected in the Recreation Authority’s financial statements, the City decided to record its portion of the 2007 Series Bonds on its financial statements. This action resulted in a net asset reduction on the City’s government-wide financial statements of $16,373,000.
Department of Aviation
On October 9, 2009, the DOA issued a Material Events Notice in which it disclosed its reclassification of certain costs contained within its construction-in-progress (CIP) account. Analysis revealed that a portion of general and administrative costs incurred in connection with managing capital projects should have been charged to operating expenses. Additionally, costs associated with certain completed projects were not timely closed out resulting in the failure to record depreciation expense related to those projects. The results of this reconciliation revealed the need to expense certain costs as follows:
Overhead Expenses $ 65.6 million Operating and Maintenance Expenses 11.0 million Depreciation Expense 10.8 million Total $ 87.4 million
Beginning net assets have been adjusted for the correction of these errors in prior years’ financial statements.
Fiduciary Funds
During the current year, it was discovered that factors used to allocate investments and related investment accounts within the General Employees Pension Fund between the City and Atlanta Independent School System (the “School System”) were misstated for periods back to fiscal year 2005. Recomputations were performed of the factors for the affected periods and the related cumulative impact resulted in an increase in the City’s portion of net assets of the pension fund in the amount of $42.3 million and a corresponding decrease in the net assets of the School System’s portion of net assets of the pension fund. The related amount is reflected as a correction of an error in the beginning balance of the General Employees Pension Fund as reported in the statement of changes in fiduciary net assets.

107
Notes to the Financial Statements - Continued
E. Subsequent Events
Department of Aviation (DOA)
With the unavailability of credit and the high volatility within the financial markets in fiscal year 2009, the city in consultation with its financial advisors decided to reduce its risk exposure by terminating two outstanding Interest Rate Exchange Agreement (SWAP) transactions with its counterparties. These interest rate agreements were tied to the Series 2003RF-B/C bonds. With approval from the City Council, the DOA negotiated a SWAP termination agreement with the counterparties Goldman Sachs and JP Morgan Chase Bank. On July 6, 2009 the department of Aviation terminated the Interest Rate Exchange Agreements that existed on the Variable Rate Airport General Revenue Refunding Bonds (Series 2003RF-B1, RF-B-2, RF-B-3, RF-C-1, RF-C-2, and RF-C-3) for $18,470,000.
During the fiscal year 2009 the DOA received $17,751,000 from the TSA as grant reimbursements for MOA #HSTS04-04-A-DEPO53 that was entered into on February 17, 2004. These grant reimbursements were to pay down part of the outstanding principal amount that exists on the bonds issued for the MOA project. Redemption notices were issued by the Trustee/Paying establishing July 2, 2009 as the bonds redemption date. On July 2, 2009 $8,875,000 of the City of Atlanta GA Airport PFC Revenue Bonds Series 2004D1(AMT) and $8,875,000 of Series 2004D2 (AMT) bonds were redeemed.
In connection with the prior period adjustment related to the construction in progress accounts, the DOA filed a Material Events Notice on October 9, 2009 pursuant to the City’s continuing disclosure and other obligations related to such Airport General Revenue Bonds.
In connection with ongoing negotiation with the signatory airlines, on December 21, 2009, the DOA entered into an airline lease agreement with Delta Airlines that extends to 2017. This agreement relates to Delta’s continued use and lease of the Central Passenger terminal facility.
The new 70 acre Consolidated Car Rental facility opened on December 8, 2009. All rental car services are centralized off-site and include a 60,000 square foot customer service center with two garages, 8,700 vehicle spaces, and an Automated People Mover train. The elimination of buses is expected to eliminate congestion on terminal roadways.
Department of Watershed Management (DWM)
In October 2009, the DWM issued Series 2009B Revenue Bonds for $ 448,965,000. The DWM used the proceeds to refund all of the Series 2001C outstanding Water and Wastewater Revenue Bonds, to fund the increase in the Debt Service Reserve Requirement resulting from the issuance of the Series 2009B Bonds, and to pay the cost of issuance related to the Series 2009B Bonds.

108
Notes to the Financial Statements - Continued
E. Subsequent Events, continued
General Government
On December 1, 2009 the City of Atlanta Tax Allocation Bonds (BeltLine Project) Series 2008A, 2008B and 2008C bonds were remarketed. In addition to the remarketing, the City sold the initial offering of City of Atlanta Tax Allocation Bonds (BeltLine Project) Series 2009B and Series 2009C. The proceeds of remarketing of the Series 2008 Bonds and the issuance of the Series 2009 Bonds, together with other available funds, will be used by or on behalf of the City to: (a) fund the payment of the Tender Price to the prior holders of the Series 2008 Bonds by operation of an Optional Tender Right and a Purchase in Lieu of Redemption, (b) fund an additional deposit to the Series 2008 Debt Service Reserve Account and a deposit to the Series 2009 Debt Service Reserve Account, (c) fund an additional deposit to the Series 2008 Capitalized Interest Account and a deposit to the Series 2009 Capitalized Interest Account, and (d) pay certain costs of remarketing and/or issuance of the Series 2008/2009. The proceeds from the initial issuance of the Series 2008 Bonds have been or are being used to finance or refinance certain qualified Redevelopment Costs and projects in the Beltline Tax Allocation District.
The City of Atlanta, like many other local municipalities, was impacted by the flooding across North Georgia in September 2009. There has been significant damage because of the flooding to various areas within the City. The cost of the damages has been initially estimated at $61 million. As a result, the City is anticipating up front funds from the insurance carrier totaling $10.5 million. Subsequent funds are anticipated once an assessment is completed by the insurance carrier. FEMA/GEMA are funding sources of last resort; therefore, any funding expected will be net of insurance proceeds at a rate of 85%. The City expects to cover the remaining 15% with operating funds.


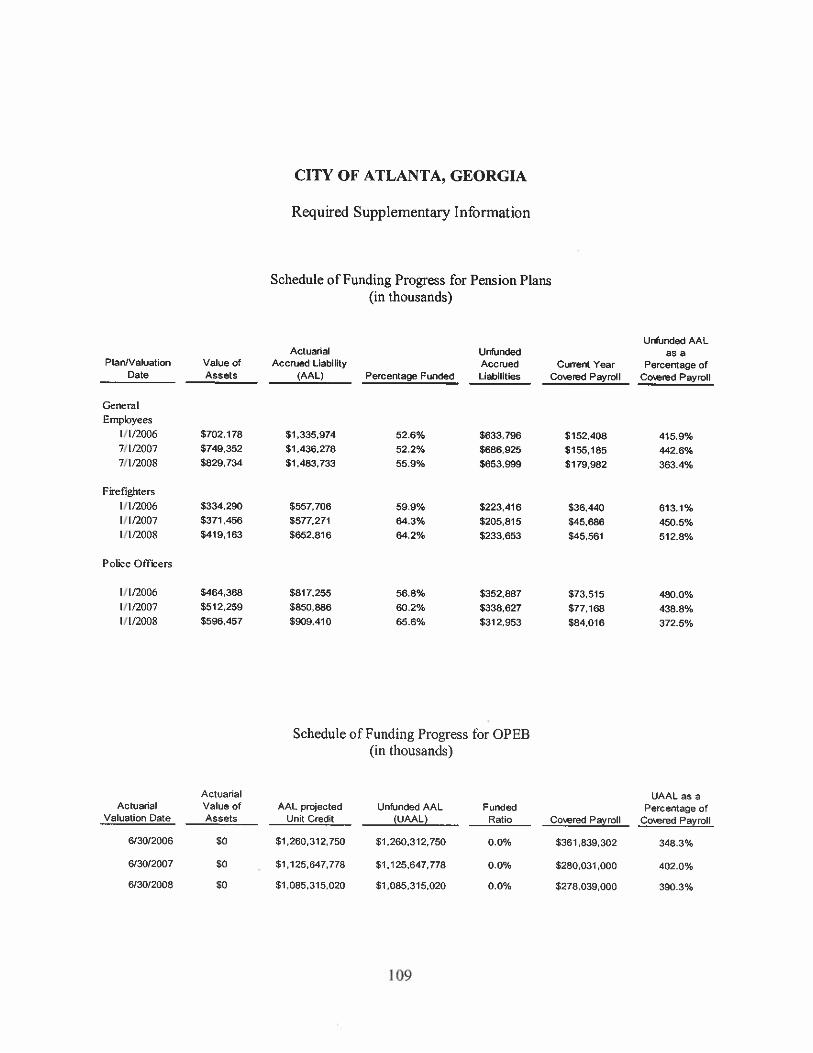

110
THIS PAGE IS INTENTIONALLY LEFT BLANK
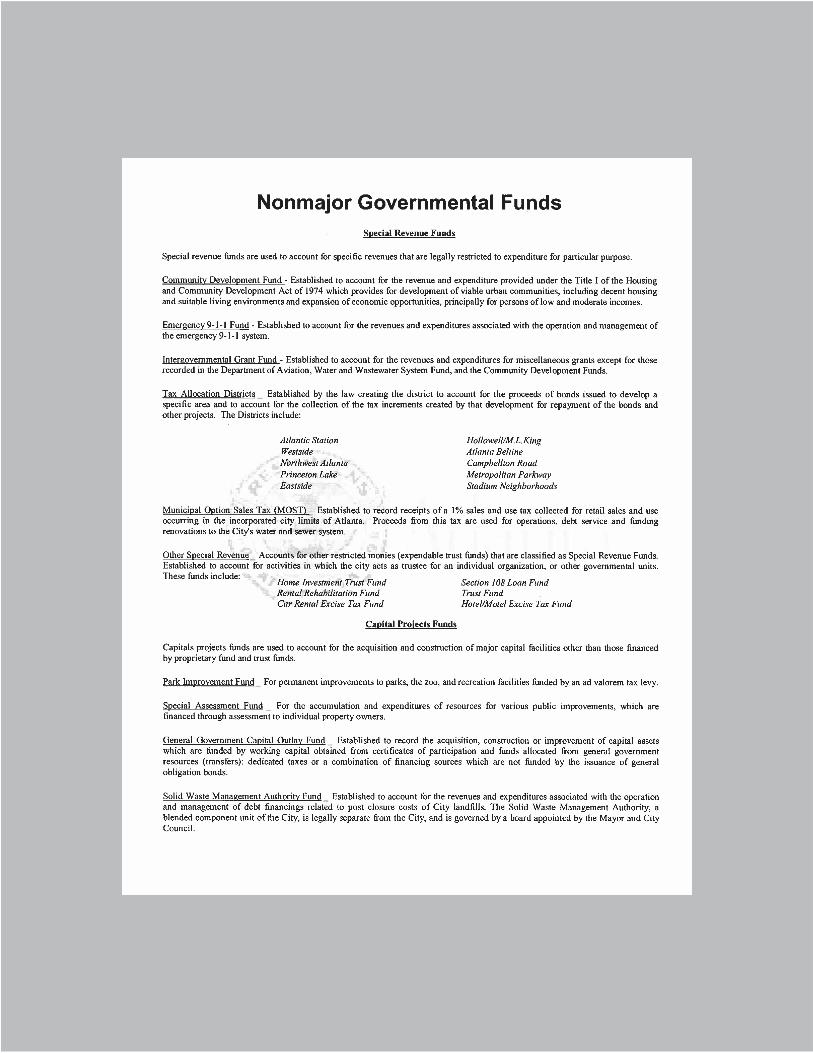


111
THIS PAGE IS INTENTIONALLY LEFT BLANK
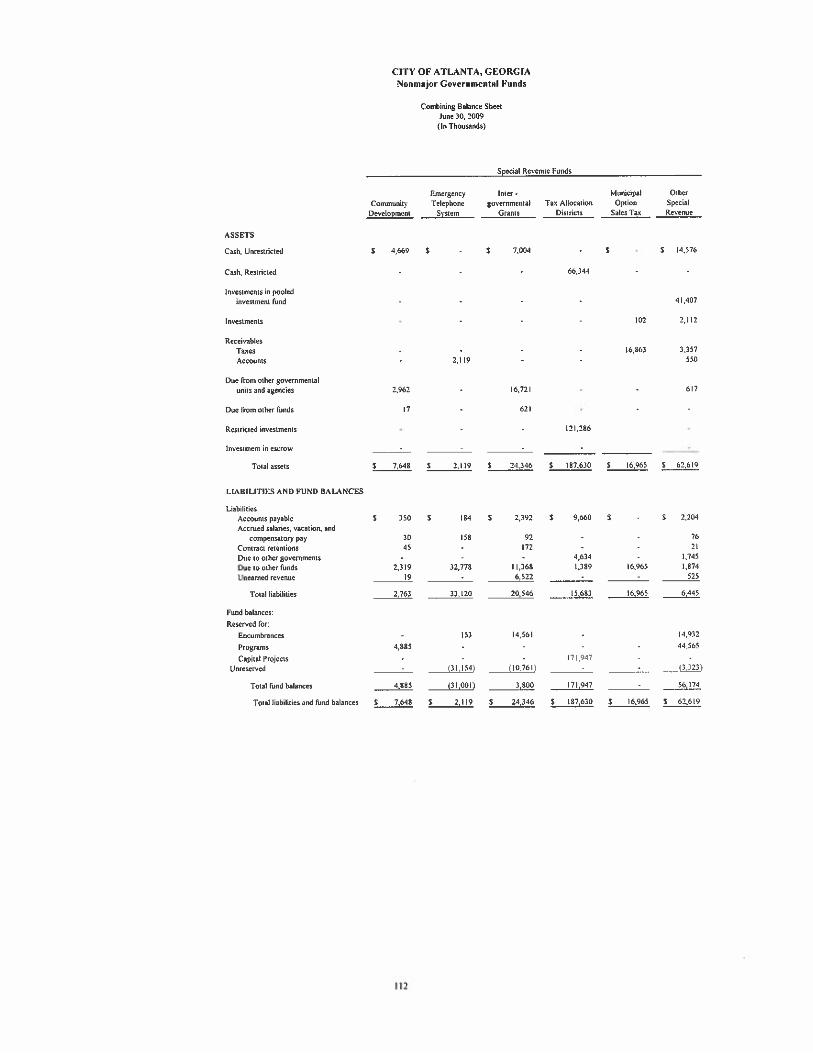
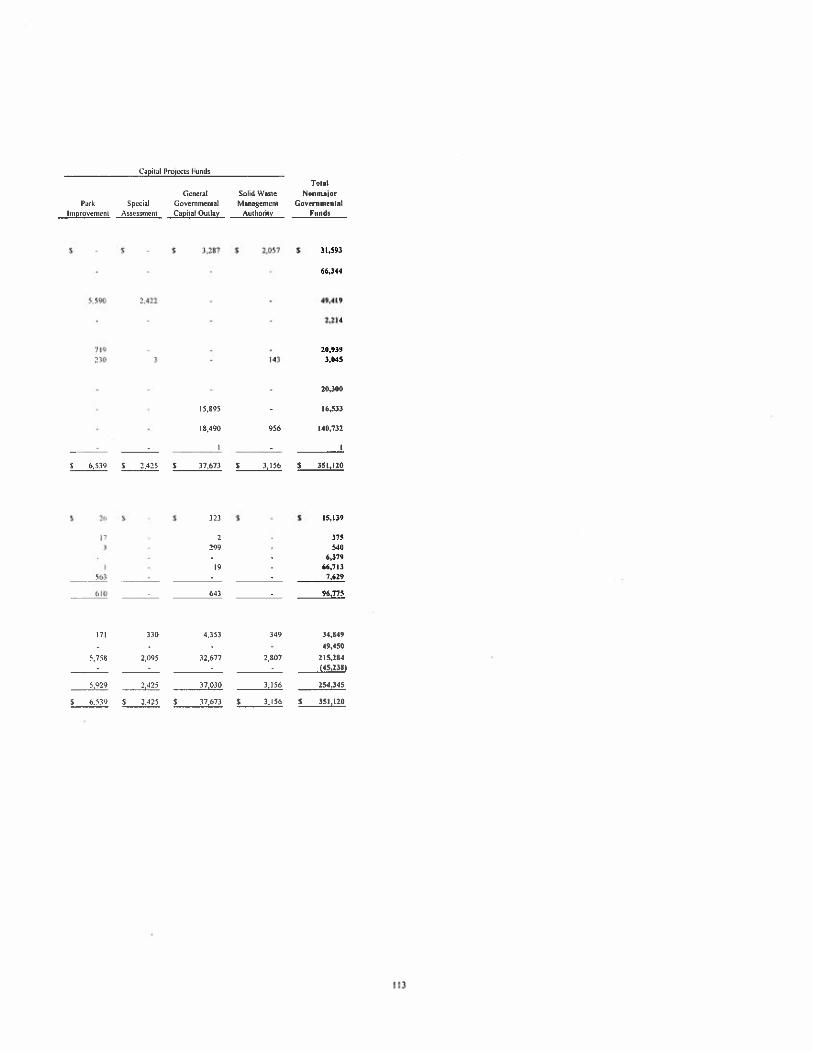
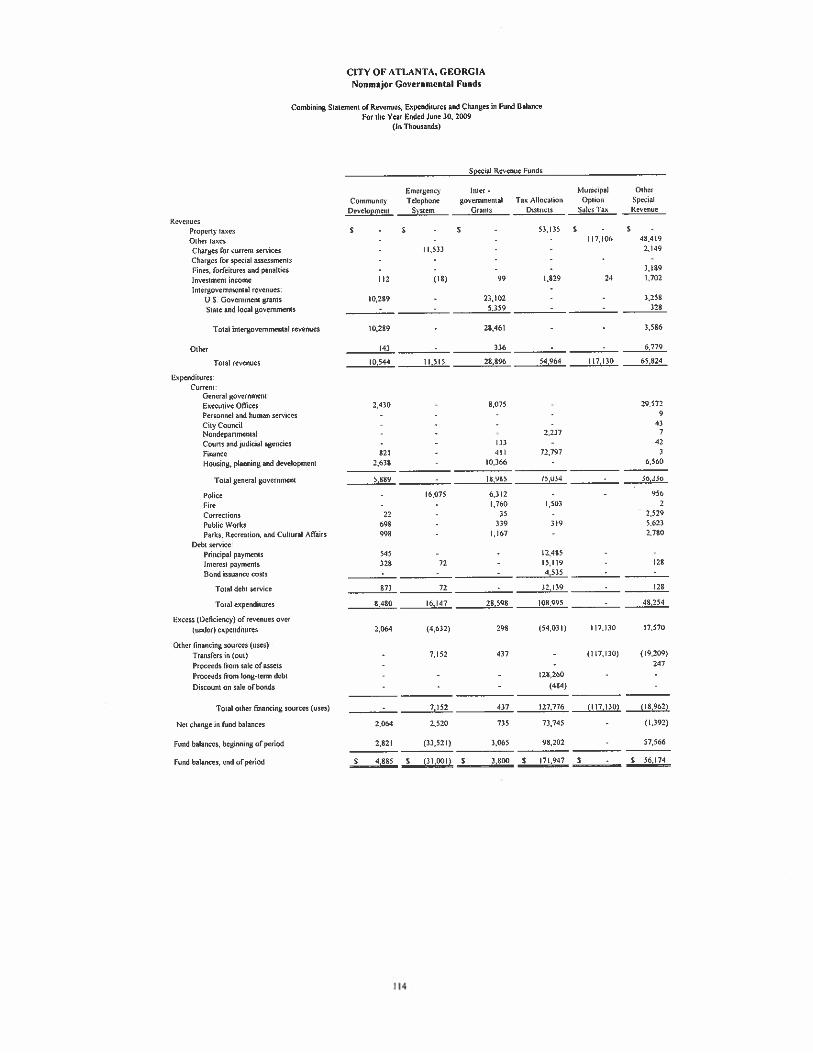
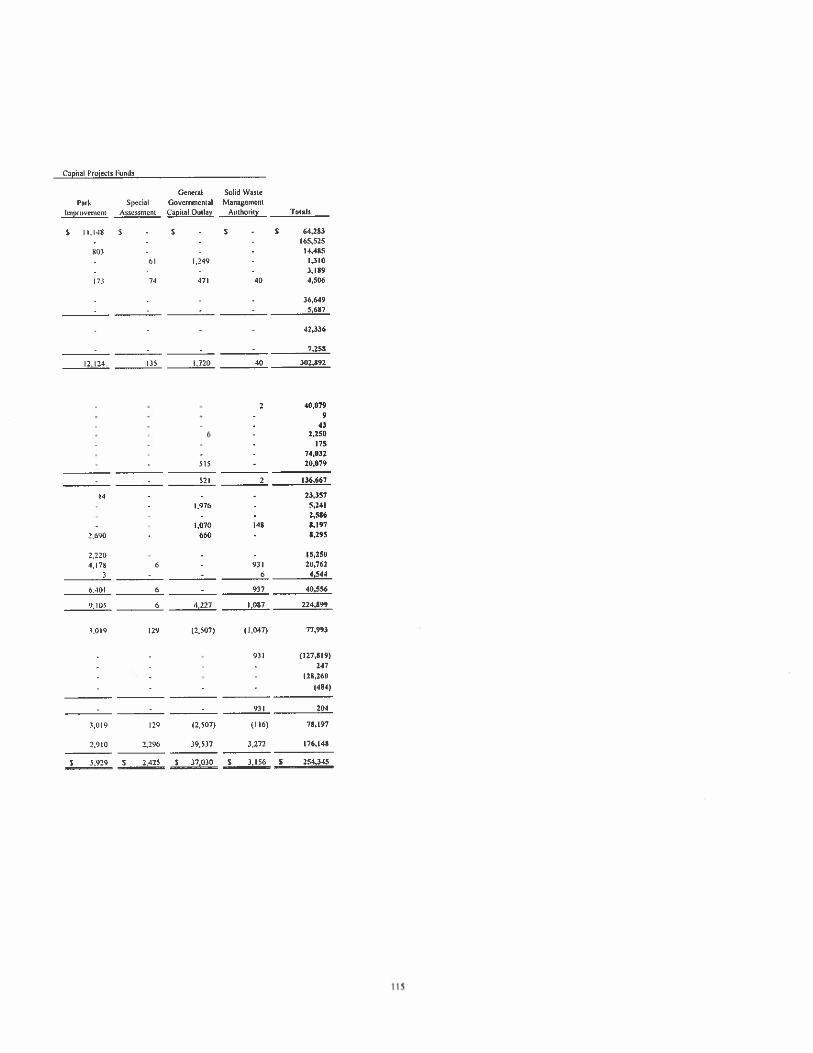
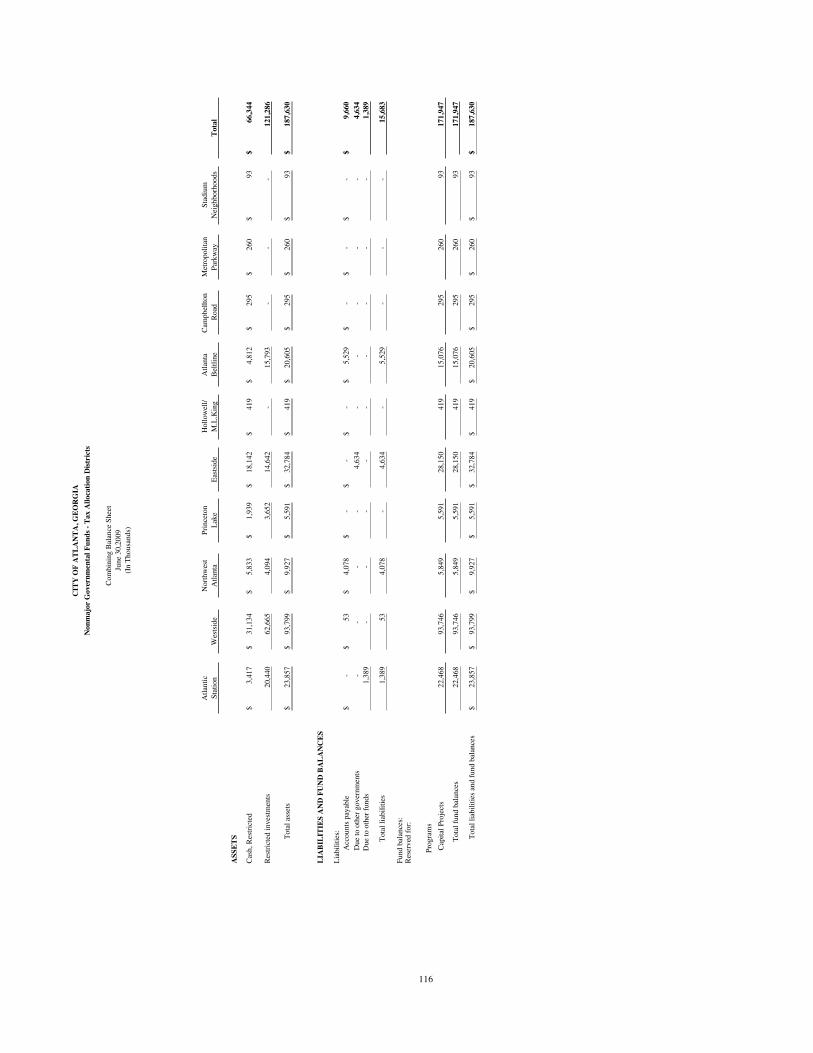
Atla
ntic
Nor
thw
est
Prin
ceto
nH
ollo
wel
l/A
tlant
aC
ampb
ellto
n M
etro
polit
anSt
adiu
mSt
atio
nW
ests
ide
Atla
nta
Lak
eE
asts
ide
M.L
.Kin
gB
eltli
neR
oad
Park
way
Nei
ghbo
rhoo
dsT
otal
ASS
ET
S
Cas
h, R
estr
icte
d3,
417
$
31
,134
$
5,
833
$
1,
939
$
18
,142
$
41
9$
4,81
2$
295
$
260
$
93
$66
,344
$
Res
tric
ted
inve
stm
ents
20,4
4062
,665
4,09
43,
652
14,6
42-
15,7
93-
--
121,
286
Tot
al a
sset
s23
,857
$
93,7
99$
9,
927
$
5,59
1$
32
,784
$
419
$
20,6
05$
29
5$
26
0$
93
$18
7,63
0$
LIA
BIL
ITIE
S A
ND
FU
ND
BA
LA
NC
ES
Lia
bilit
ies:
Acc
ount
s pa
yabl
e-
$
53$
4,07
8$
-
$
-
$
-
$
5,
529
$
-$
-$
-$
9,66
0$
Due
to o
ther
gov
ernm
ents
-
-
-
-
4,
634
-
-
-
-
-4,
634
Due
to o
ther
fun
ds1,
389
-
- -
- -
- -
- -
1,38
9
Tot
al li
abili
ties
1,38
9
53 4,
078
-
4,63
4
- 5,
529
-
- -
15,6
83
Fund
bal
ance
s:R
eser
ved
for:
116
Prog
ram
s
Cap
ital P
roje
cts
22,4
68
93
,746
5,
849
5,59
1
28
,150
41
9
15,0
76
295
26
0
9317
1,94
7
Tot
al f
und
bala
nces
22,4
68
93,7
46
5,84
9
5,59
1
28,1
50
419
15
,076
29
5
260
93
171,
947
Tot
al li
abili
ties
and
fund
bal
ance
s23
,857
$
93,7
99$
9,
927
$
5,59
1$
32
,784
$
419
$
20,6
05$
29
5$
26
0$
93
$18
7,63
0$
Non
maj
or G
over
nmen
tal F
unds
- T
ax A
lloca
tion
Dis
tric
ts
CIT
Y O
F A
TL
AN
TA
, GE
OR
GIA
Com
bini
ng B
alan
ce S
heet
June
30,
2009
(In
Tho
usan
ds)
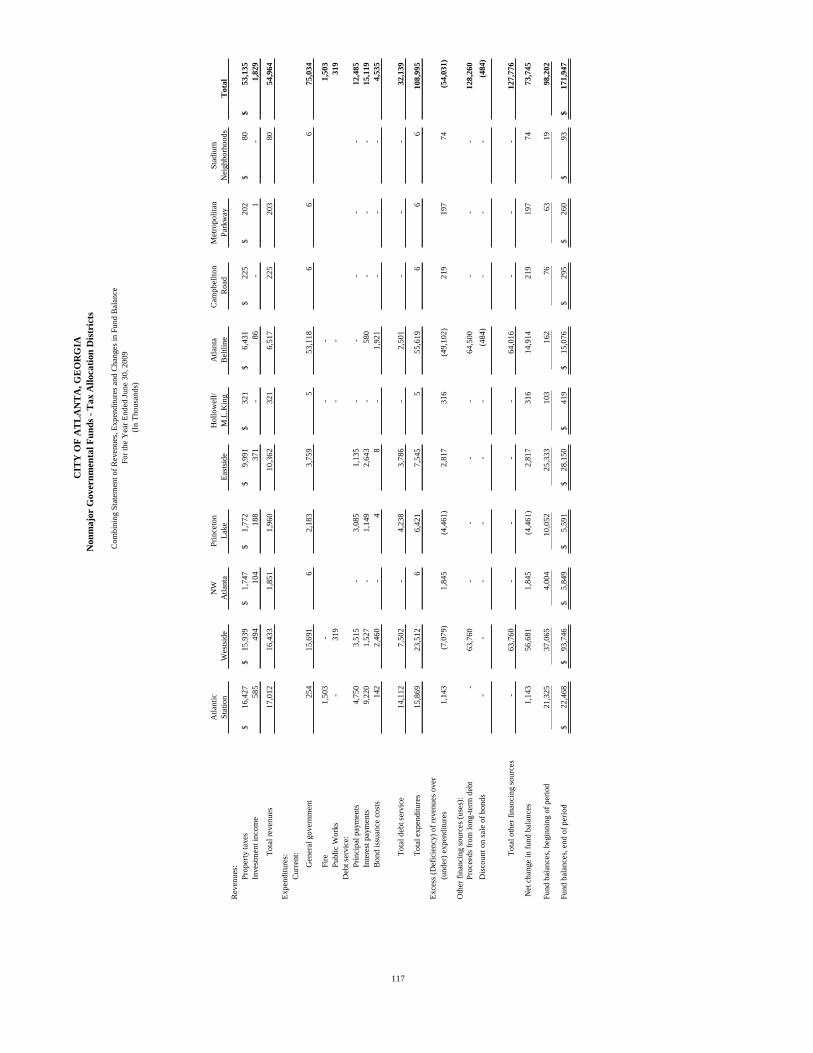
Non
maj
or G
over
nmen
tal F
unds
- T
ax A
lloca
tion
Dis
tric
ts
Com
bini
ng S
tate
men
t of
Rev
enue
s, E
xpen
ditu
res
and
Cha
nges
in F
und
Bal
ance
Atla
ntic
NW
Pri
ncet
onH
ollo
wel
l/A
tlant
aC
ampb
ellto
n M
etro
polit
anSt
adiu
mSt
atio
nW
ests
ide
Atla
nta
Lak
eE
asts
ide
M.L
.Kin
gB
eltli
neR
oad
Par
kway
Nei
ghbo
rhoo
dsT
otal
Rev
enue
s:P
rope
rty
taxe
s16
,427
$
15,9
39$
1,
747
$
1,
772
$
9,
991
$
32
1$
6,
431
$
22
5$
20
2$
80$
53,1
35$
Inve
stm
ent i
ncom
e58
549
410
418
837
1-
86-
1-
1,82
9
Tot
al r
even
ues
17,0
1216
,433
1,85
11,
960
10,3
6232
16,
517
225
203
8054
,964
Exp
endi
ture
s:C
urre
nt:
Gen
eral
gov
ernm
ent
254
15,6
916
2,18
33,
759
553
,118
66
675
,034
Fire
1,50
3-
--
1,50
3P
ublic
Wor
ks-
319
--
319
Deb
t ser
vice
:Pr
inci
pal p
aym
ents
4,75
03,
515
-3,
085
1,13
5-
--
--
12,4
85In
tere
st p
aym
ents
9,22
01,
527
-1,
149
2,64
3-
580
--
-15
,119
Bon
d is
suan
ce c
osts
142
2,46
0-
48
-1,
921
--
-4,
535
117
Tot
al d
ebt s
ervi
ce14
,112
7,50
2-
4,23
83,
786
-2,
501
--
-32
,139
Tot
al e
xpen
ditu
res
15,8
6923
,512
66,
421
7,54
55
55,6
196
66
108,
995
Exc
ess
(Def
icie
ncy)
of
reve
nues
ove
r(u
nder
) ex
pend
iture
s1,
143
(7,0
79)
1,84
5(4
,461
)2,
817
316
(49,
102)
219
197
74(5
4,03
1)
Oth
er f
inan
cing
sou
rces
(us
es):
Pro
ceed
s fr
om lo
ng-t
erm
deb
t-
63,7
60-
--
-64
,500
--
-12
8,26
0
Dis
coun
t on
sale
of
bond
s-
--
--
-(4
84)
--
-(4
84)
Tot
al o
ther
fin
anci
ng s
ourc
es-
63,7
60-
--
-64
,016
--
-12
7,77
6
Net
cha
nge
in f
und
bala
nces
1,14
356
,681
1,84
5(4
,461
)2,
817
316
14,9
1421
919
774
73,7
45
Fund
bal
ance
s, b
egin
ning
of
peri
od21
,325
37,0
654,
004
10,0
5225
,333
103
162
7663
1998
,202
Fund
bal
ance
s, e
nd o
f pe
riod
22,4
68$
93
,746
$
5,84
9$
5,59
1$
28,1
50$
419
$
15,0
76$
295
$
260
$
93
$
17
1,94
7$
CIT
Y O
F A
TL
AN
TA
, GE
OR
GIA
For
the
Yea
r E
nded
Jun
e 30
, 200
9(I
n T
hous
ands
)

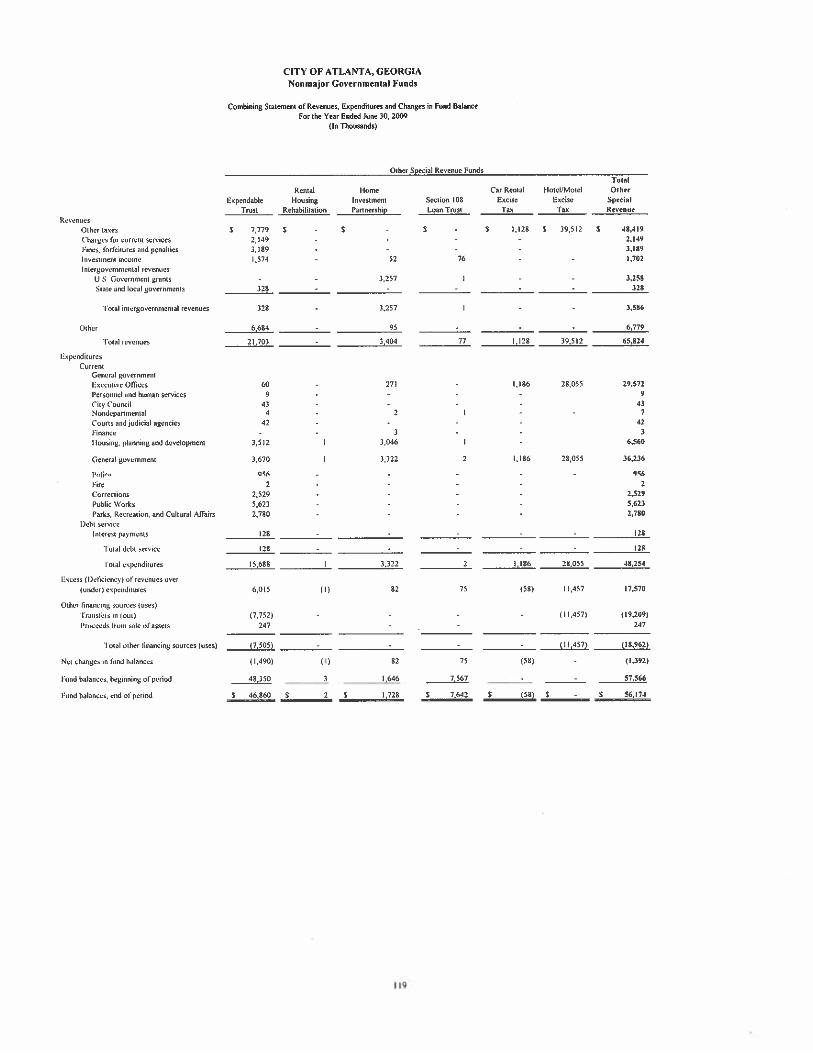
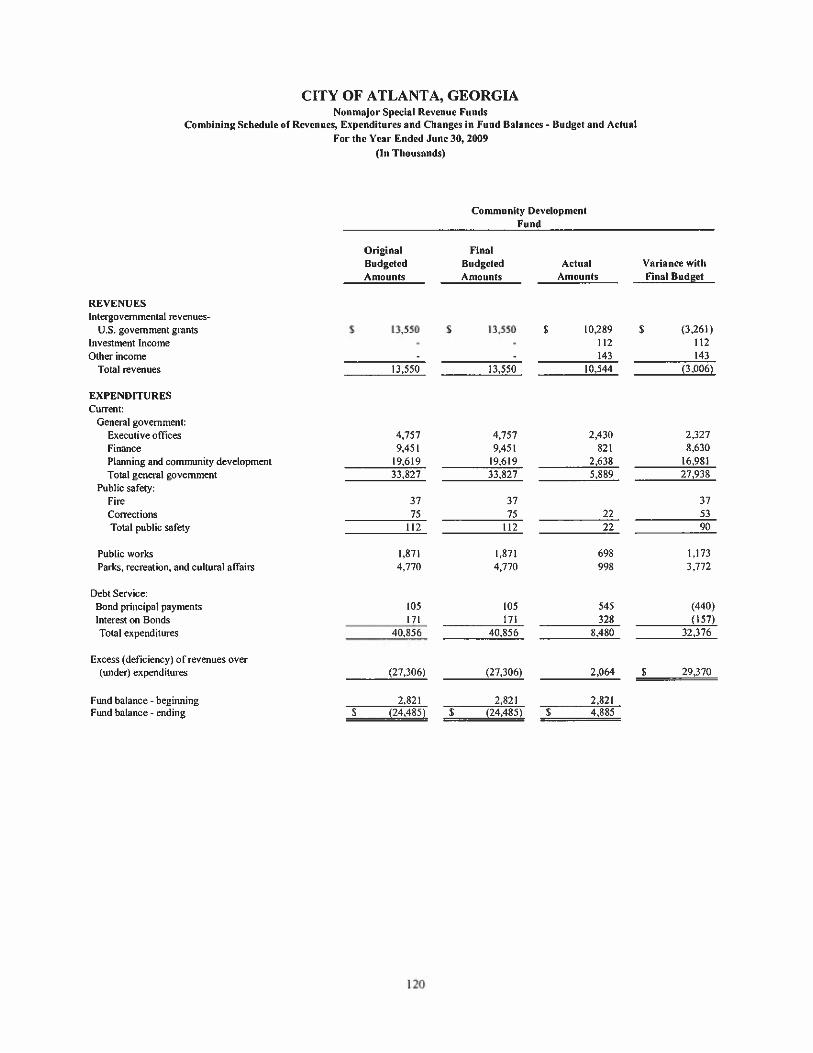
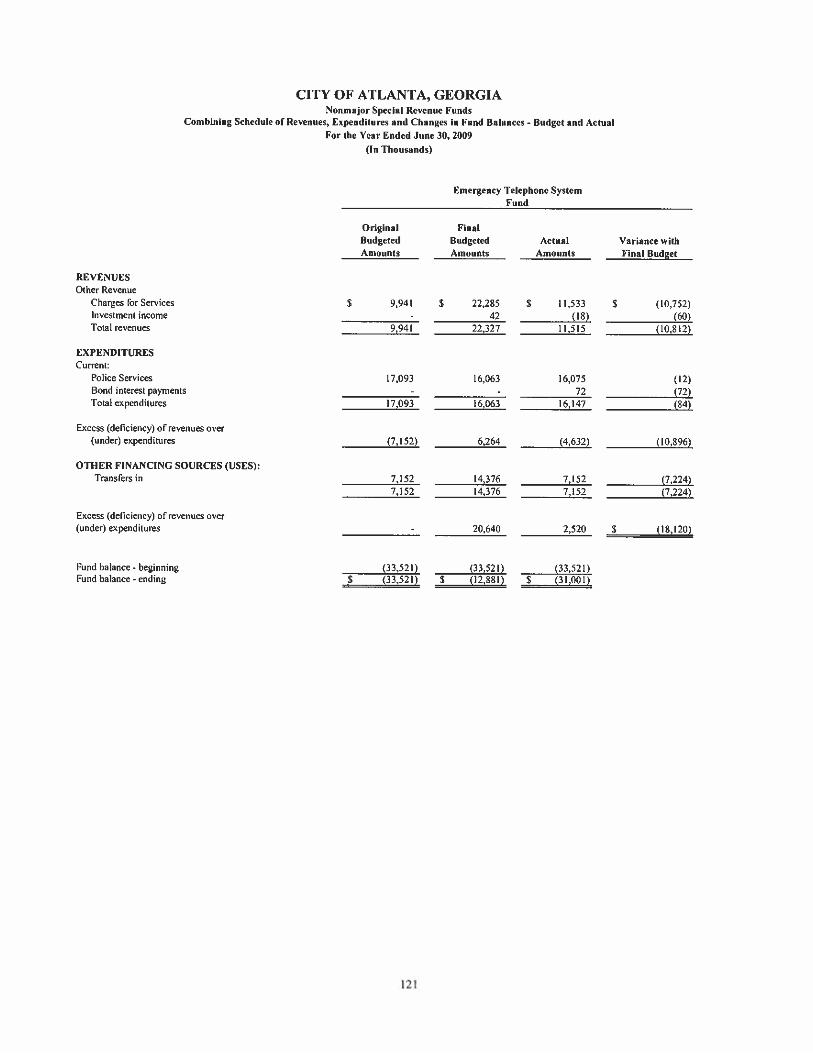
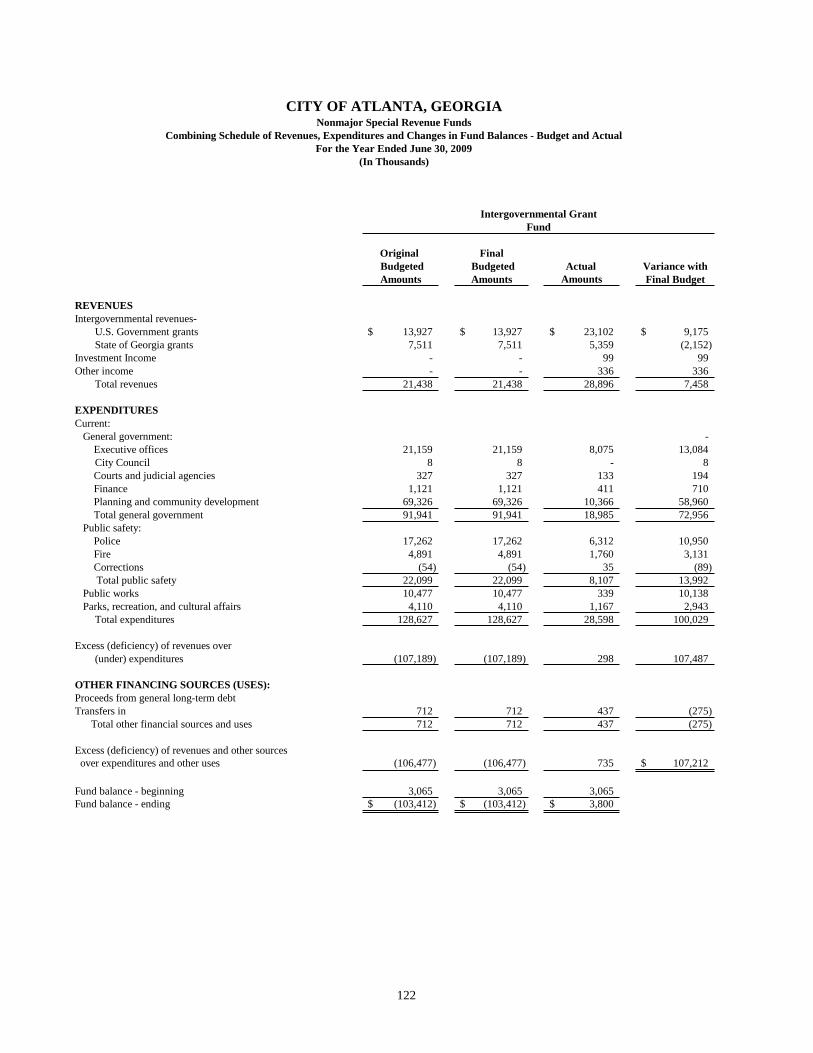
Original Final Budgeted Budgeted Actual Variance withAmounts Amounts Amounts Final Budget
REVENUESIntergovernmental revenues-
U.S. Government grants 13,927$ 13,927$ 23,102$ 9,175$ State of Georgia grants 7,511 7,511 5,359 (2,152)
Investment Income - - 99 99Other income - - 336 336
Total revenues 21,438 21,438 28,896 7,458
EXPENDITURESCurrent: General government: - Executive offices 21,159 21,159 8,075 13,084
City Council 8 8 - 8 Courts and judicial agencies 327 327 133 194 Finance 1,121 1,121 411 710 Planning and community development 69,326 69,326 10,366 58,960 Total general government 91,941 91,941 18,985 72,956 Public safety: Police 17,262 17,262 6,312 10,950 Fire 4,891 4,891 1,760 3,131 Corrections (54) (54) 35 (89) Total public safety 22,099 22,099 8,107 13,992 Public works 10,477 10,477 339 10,138 Parks, recreation, and cultural affairs 4,110 4,110 1,167 2,943
Total expenditures 128,627 128,627 28,598 100,029
Excess (deficiency) of revenues over (under) expenditures (107,189) (107,189) 298 107,487
OTHER FINANCING SOURCES (USES):Proceeds from general long-term debtTransfers in 712 712 437 (275) Total other financial sources and uses 712 712 437 (275)
Excess (deficiency) of revenues and other sources over expenditures and other uses (106,477) (106,477) 735 107,212$
Fund balance - beginning 3,065 3,065 3,065Fund balance - ending (103,412)$ (103,412)$ 3,800$
(In Thousands)
Intergovernmental GrantFund
CITY OF ATLANTA, GEORGIANonmajor Special Revenue Funds
Combining Schedule of Revenues, Expenditures and Changes in Fund Balances - Budget and ActualFor the Year Ended June 30, 2009
122
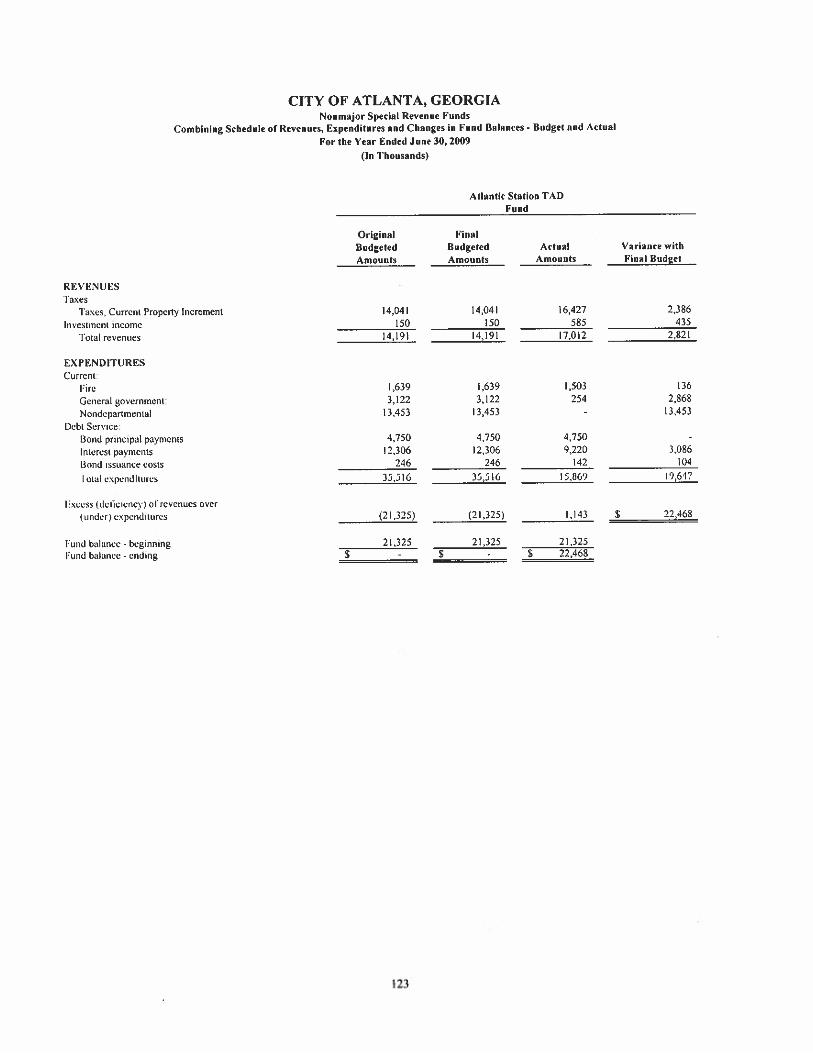
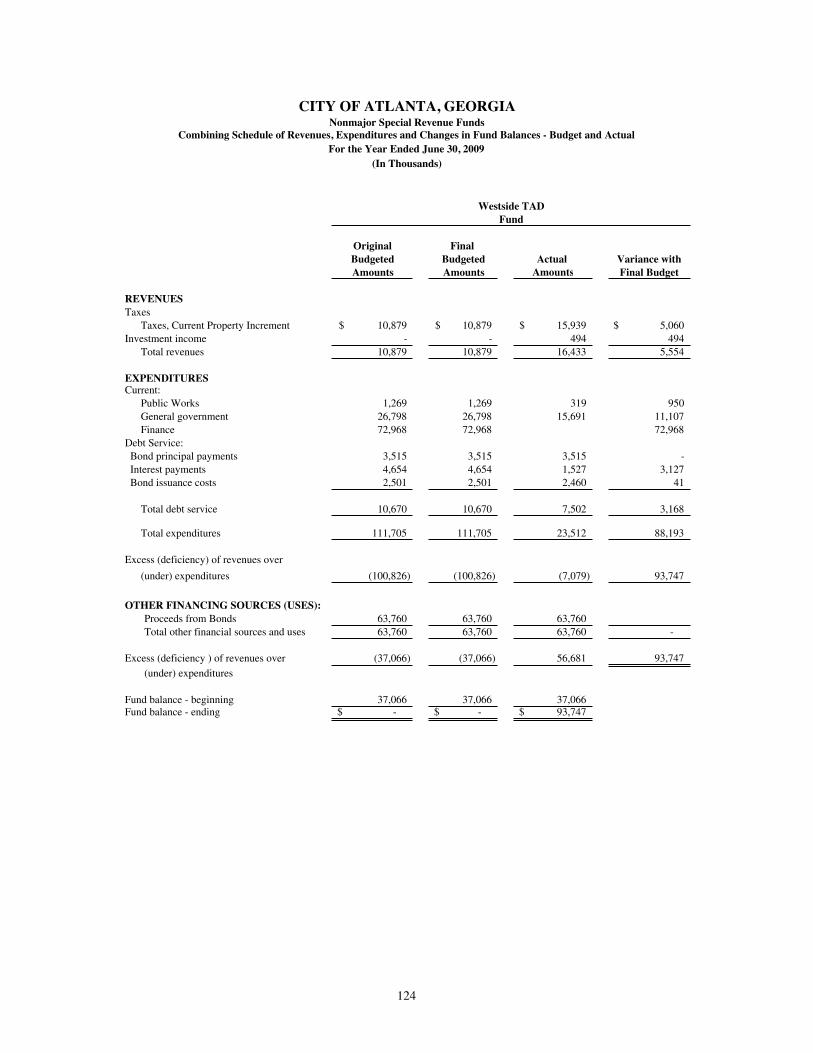
Original Final Budgeted Budgeted Actual Variance withAmounts Amounts Amounts Final Budget
REVENUESTaxes
Taxes, Current Property Increment 10,879$ 10,879$ 15,939$ 5,060$ Investment income - - 494 494
Total revenues 10,879 10,879 16,433 5,554
EXPENDITURESCurrent:
Public Works 1,269 1,269 319 950 General government 26,798 26,798 15,691 11,107 Finance 72,968 72,968 72,968
Debt Service: Bond principal payments 3,515 3,515 3,515 - Interest payments 4,654 4,654 1,527 3,127 Bond issuance costs 2,501 2,501 2,460 41
Total debt service 10,670 10,670 7,502 3,168
Total expenditures 111,705 111,705 23,512 88,193
Excess (deficiency) of revenues over
(under) expenditures (100,826) (100,826) (7,079) 93,747
OTHER FINANCING SOURCES (USES):63,760 63,760 63,760
Total other financial sources and uses 63,760 63,760 63,760 -
(37,066) (37,066) 56,681 93,747
(under) expenditures
Fund balance - beginning 37,066 37,066 37,066 Fund balance - ending -$ -$ 93,747$
Excess (deficiency ) of revenues over
(In Thousands)
Westside TADFund
CITY OF ATLANTA, GEORGIANonmajor Special Revenue Funds
Combining Schedule of Revenues, Expenditures and Changes in Fund Balances - Budget and ActualFor the Year Ended June 30, 2009
Proceeds from Bonds
124
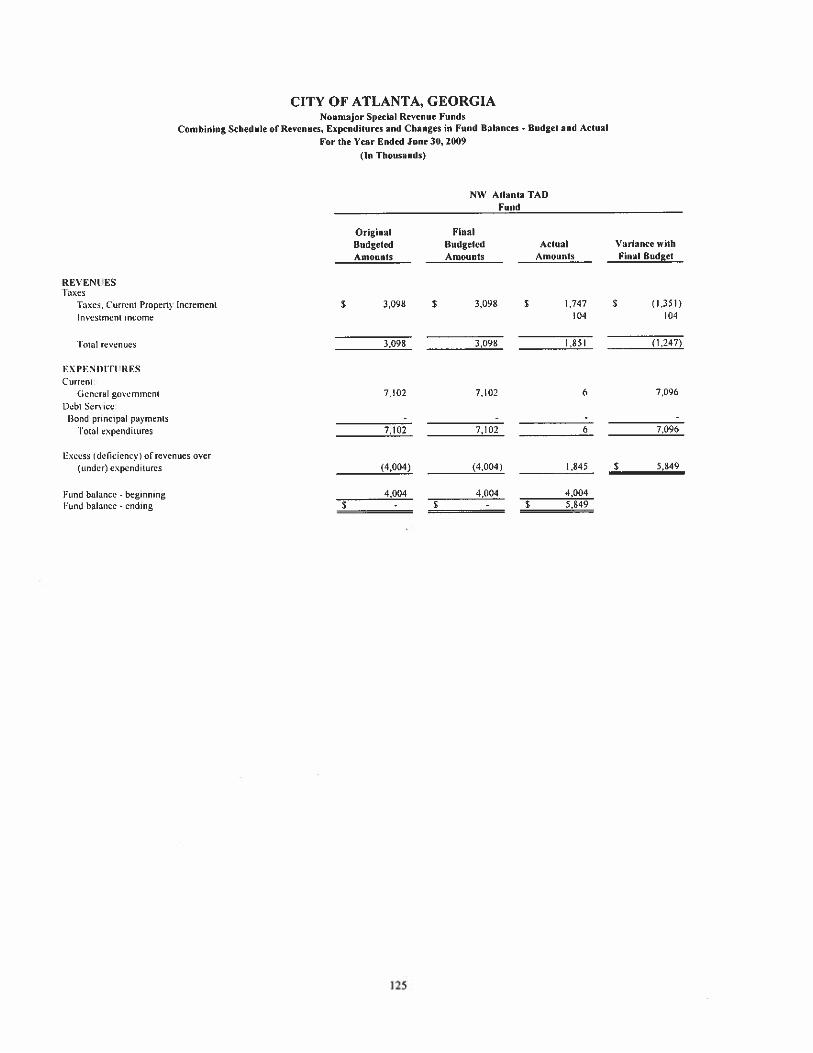
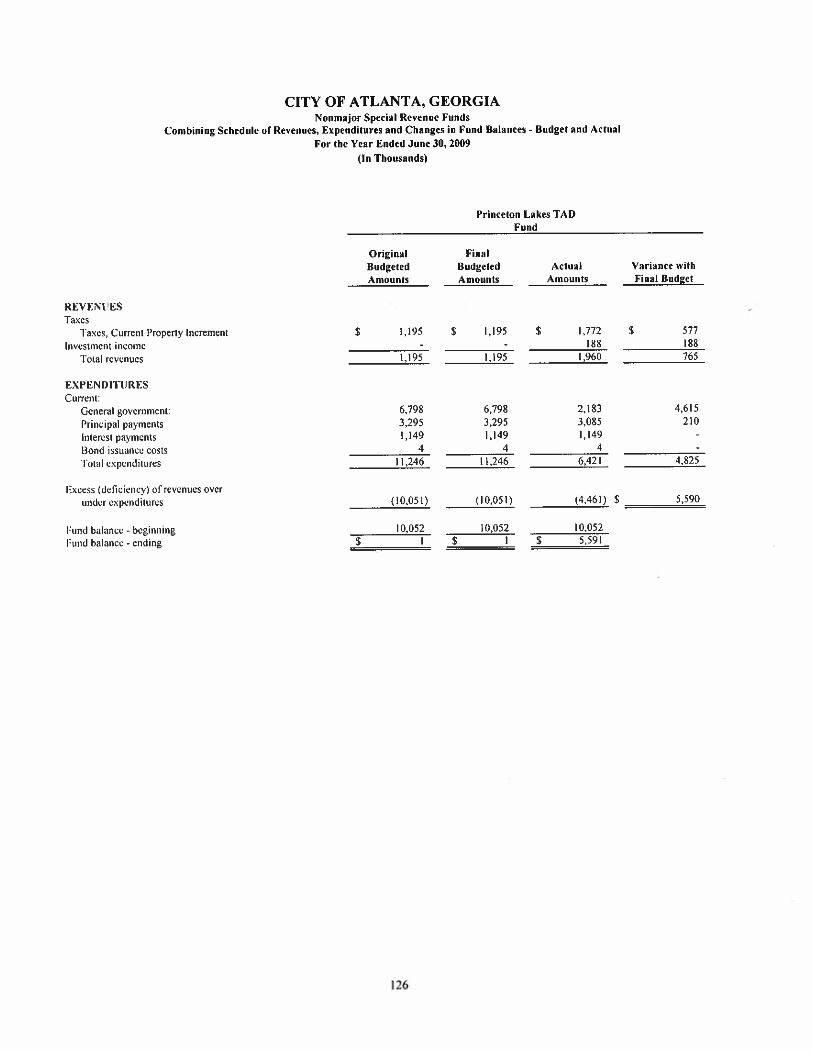
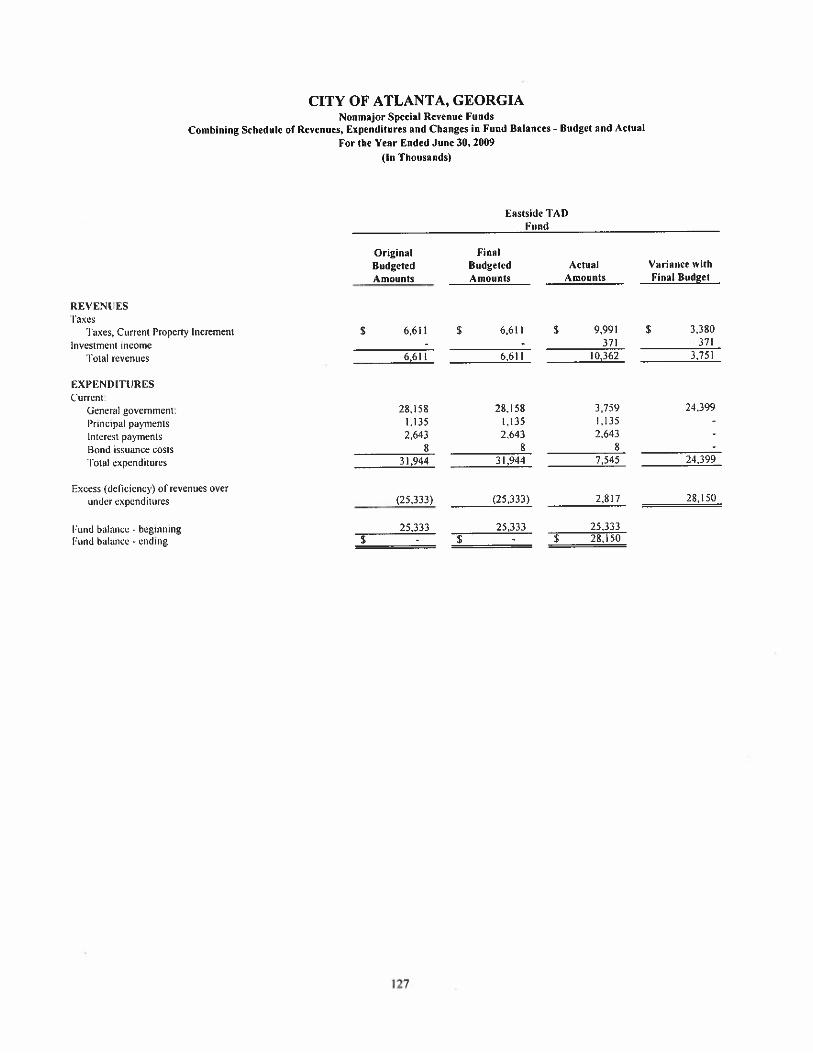

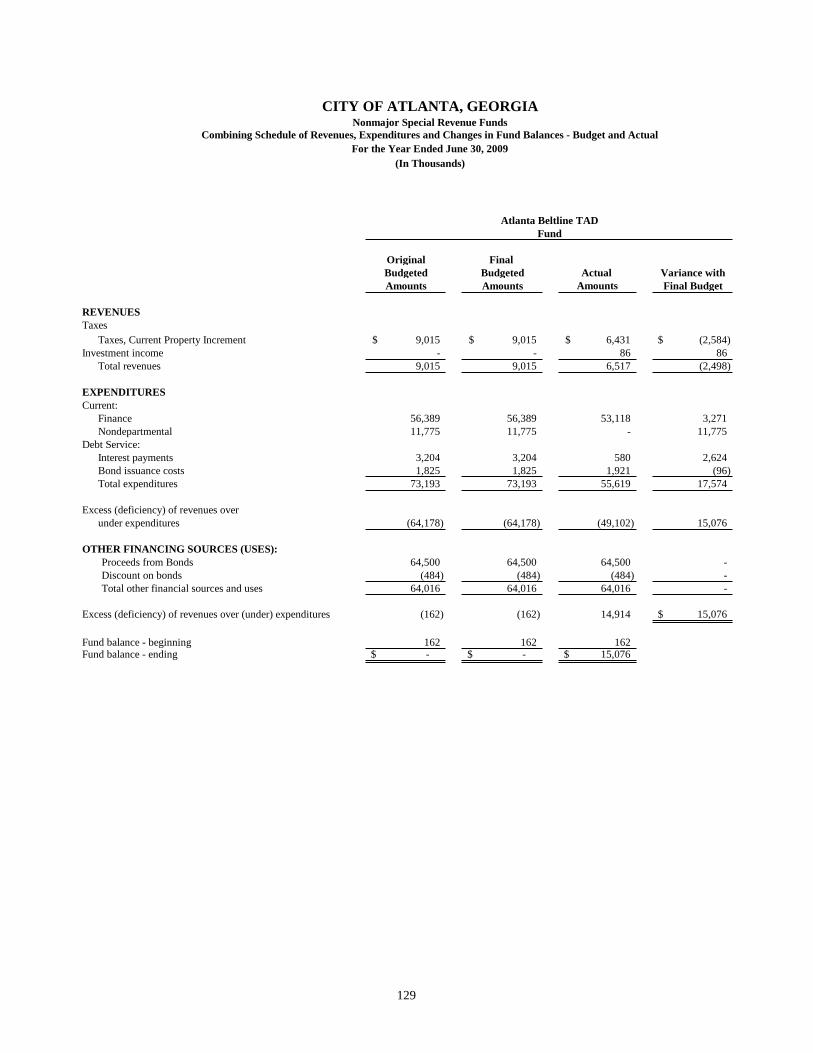
Original Final Budgeted Budgeted Actual Variance withAmounts Amounts Amounts Final Budget
REVENUESTaxes
Taxes, Current Property Increment 9,015$ 9,015$ 6,431$ (2,584)$ Investment income - - 86 86
Total revenues 9,015 9,015 6,517 (2,498)
EXPENDITURESCurrent:
Finance 56,389 56,389 53,118 3,271Nondepartmental 11,775 11,775 - 11,775
Debt Service:Interest payments 3,204 3,204 580 2,624Bond issuance costs 1,825 1,825 1,921 (96)Total expenditures 73,193 73,193 55,619 17,574
Excess (deficiency) of revenues over under expenditures (64,178) (64,178) (49,102) 15,076
OTHER FINANCING SOURCES (USES):64,500 64,500 64,500 -
(484) (484) (484) -Total other financial sources and uses 64,016 64,016 64,016 -
(162) (162) 14,914 15,076$
Fund balance - beginning 162 162 162Fund balance - ending -$ -$ 15,076$
Atlanta Beltline TADFund
Proceeds from BondsDiscount on bonds
Excess (deficiency) of revenues over (under) expenditures
CITY OF ATLANTA, GEORGIANonmajor Special Revenue Funds
Combining Schedule of Revenues, Expenditures and Changes in Fund Balances - Budget and ActualFor the Year Ended June 30, 2009
(In Thousands)
129

Original Final Budgeted Budgeted Actual Variance withAmounts Amounts Amounts Final Budget
REVENUESTaxes
Taxes, Current Property Increment 76$ 76$ 225$ 149$ Investment income - - - -
Total revenues 76 76 225 149
EXPENDITURESCurrent:
General government 152 152 6 (146) Total expenditures 152 152 6 (146)
Excess (deficiency) of revenues over under expenditures (76) (76) 219 295$
Fund balance - beginning 76 76 76 Fund balance - ending -$ -$ 295$
Fund
CITY OF ATLANTA, GEORGIANonmajor Special Revenue Funds
Combining Schedule of Revenues, Expenditures and Changes in Fund Balances - Budget and ActualFor the Year Ended June 30, 2009
(In Thousands)
Campbellton Road TAD
130
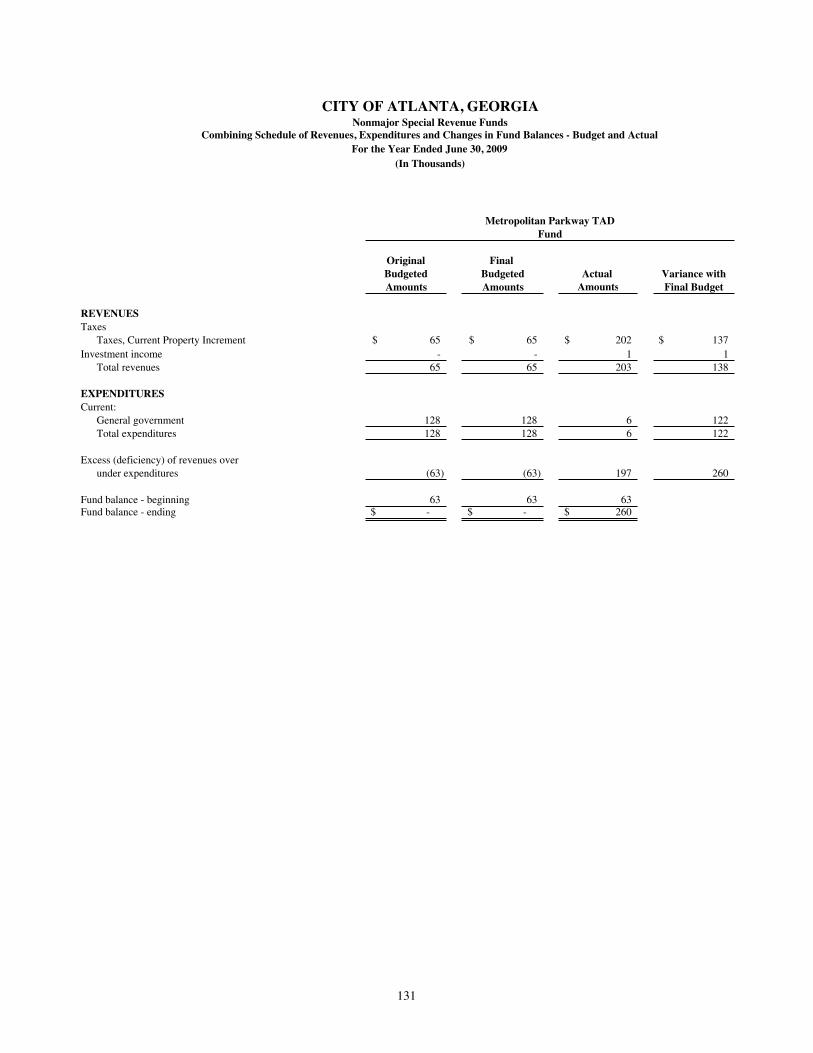
Original Final Budgeted Budgeted Actual Variance withAmounts Amounts Amounts Final Budget
REVENUESTaxes
Taxes, Current Property Increment 65$ 65$ 202$ 137$ Investment income - - 1 1
Total revenues 65 65 203 138
EXPENDITURESCurrent:
General government 128 128 6 122 Total expenditures 128 128 6 122
Excess (deficiency) of revenues over under expenditures (63) (63) 197 260
Fund balance - beginning 63 63 63 Fund balance - ending -$ -$ 260$
Fund
CITY OF ATLANTA, GEORGIANonmajor Special Revenue Funds
Combining Schedule of Revenues, Expenditures and Changes in Fund Balances - Budget and ActualFor the Year Ended June 30, 2009
(In Thousands)
Metropolitan Parkway TAD
131
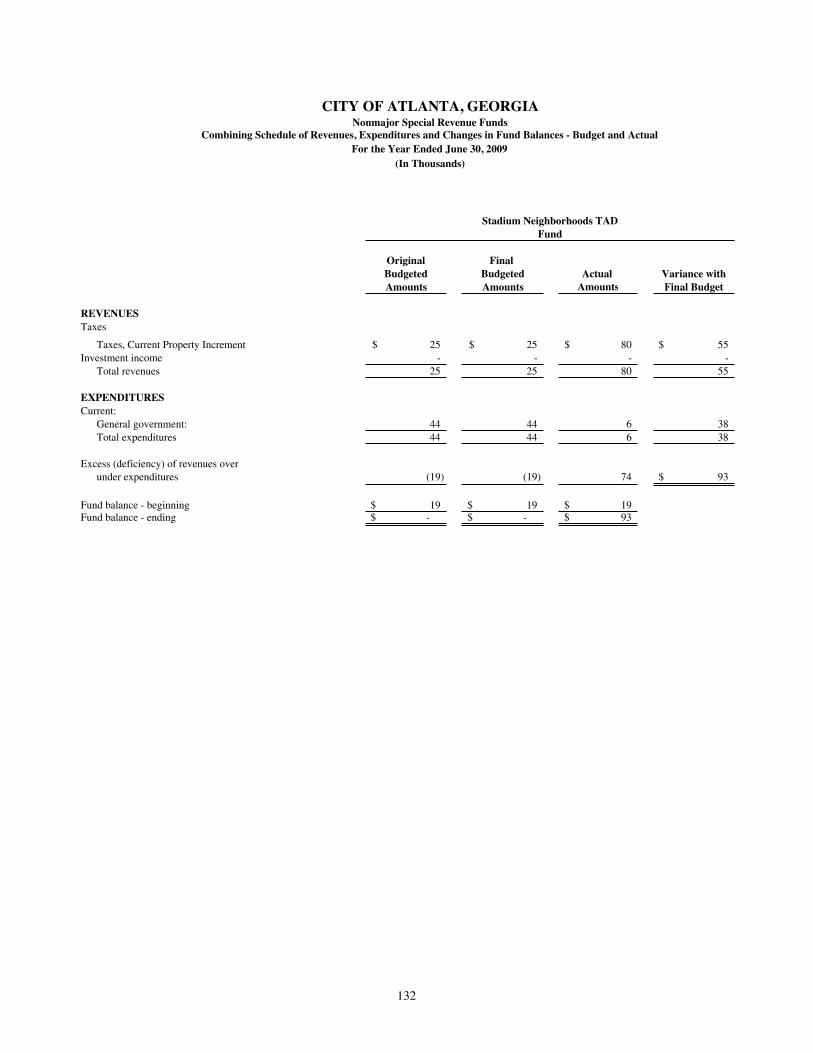
Original Final Budgeted Budgeted Actual Variance withAmounts Amounts Amounts Final Budget
REVENUESTaxes
Taxes, Current Property Increment 25$ 25$ 80$ 55$ Investment income - - - -
Total revenues 25 25 80 55
EXPENDITURESCurrent:
General government: 44 44 6 38 Total expenditures 44 44 6 38
Excess (deficiency) of revenues over under expenditures (19) (19) 74 93$
Fund balance - beginning 19$ 19$ 19$ Fund balance - ending -$ -$ 93$
Fund
CITY OF ATLANTA, GEORGIANonmajor Special Revenue Funds
Combining Schedule of Revenues, Expenditures and Changes in Fund Balances - Budget and ActualFor the Year Ended June 30, 2009
(In Thousands)
Stadium Neighborhoods TAD
132

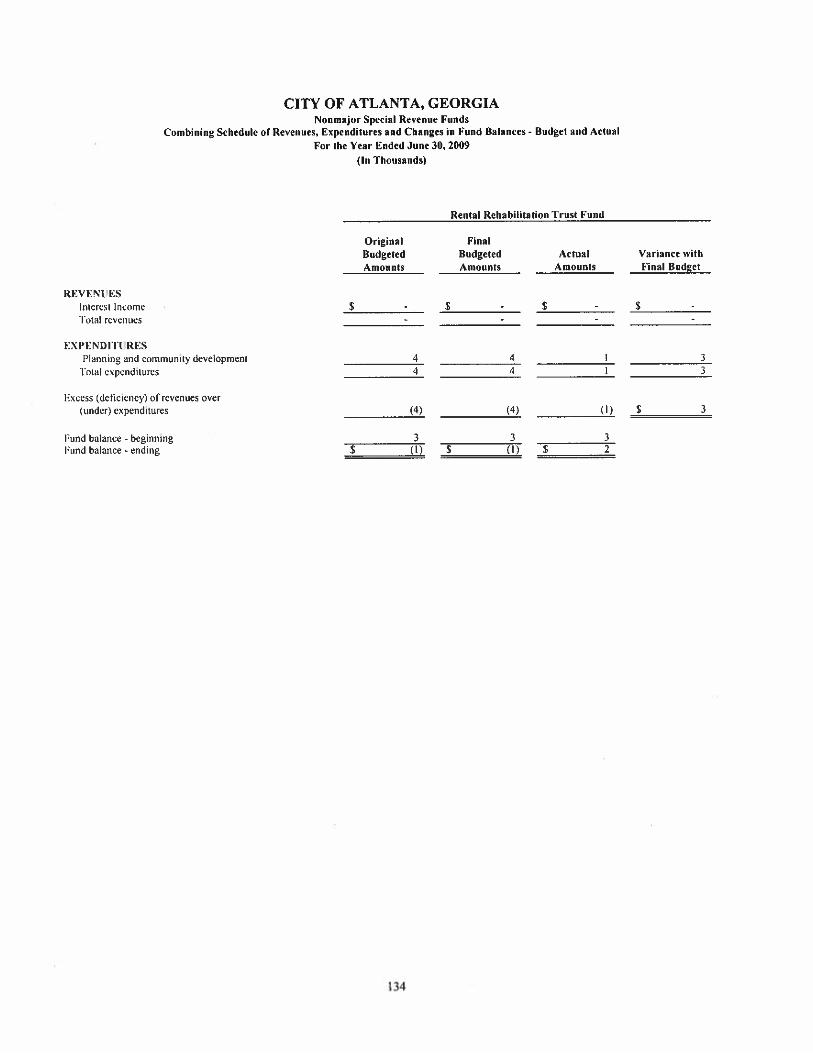
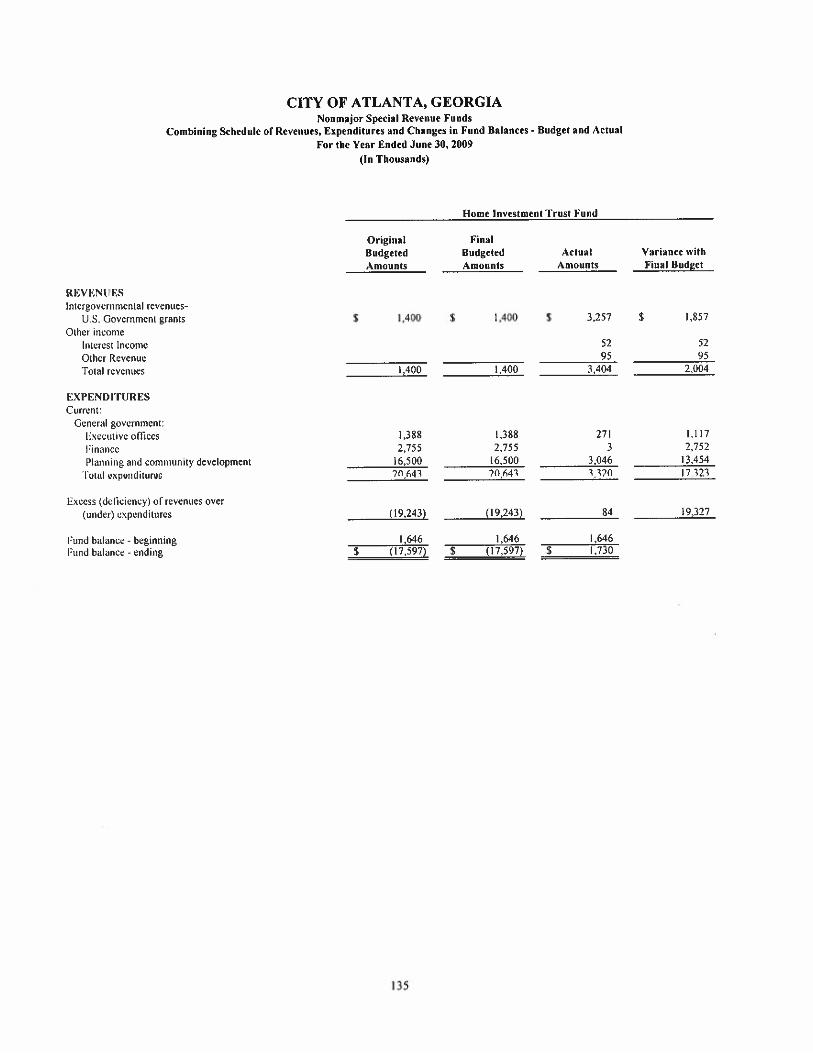
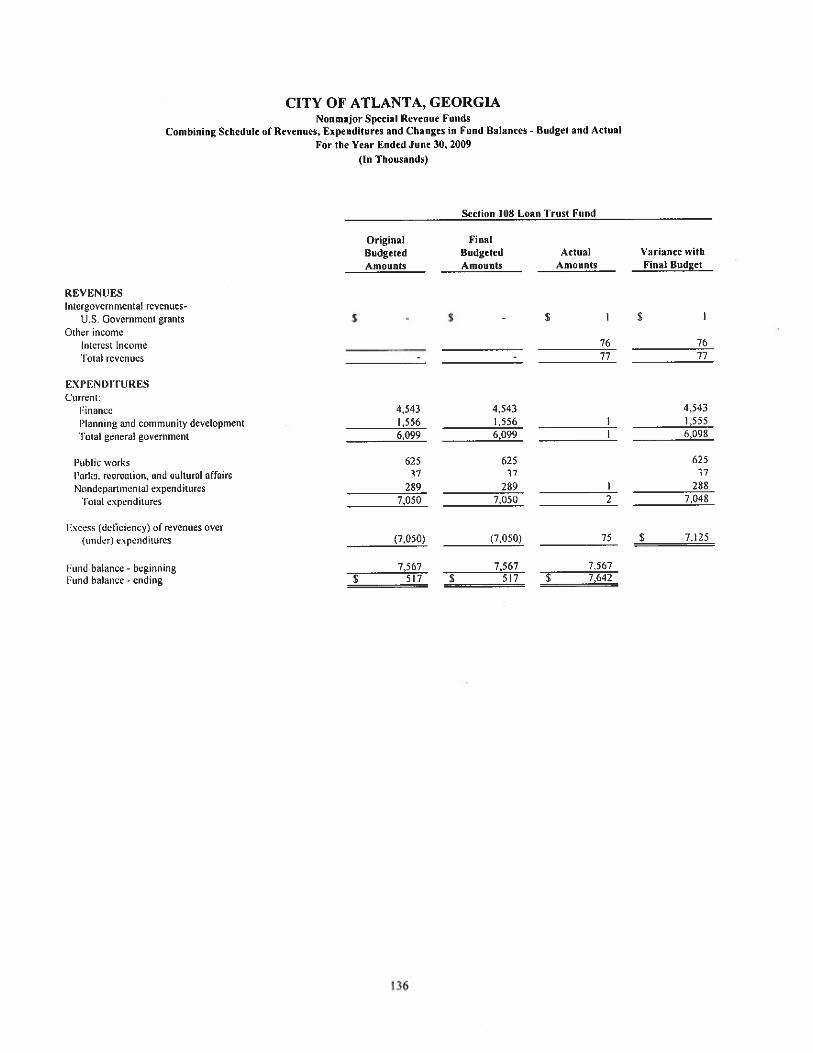
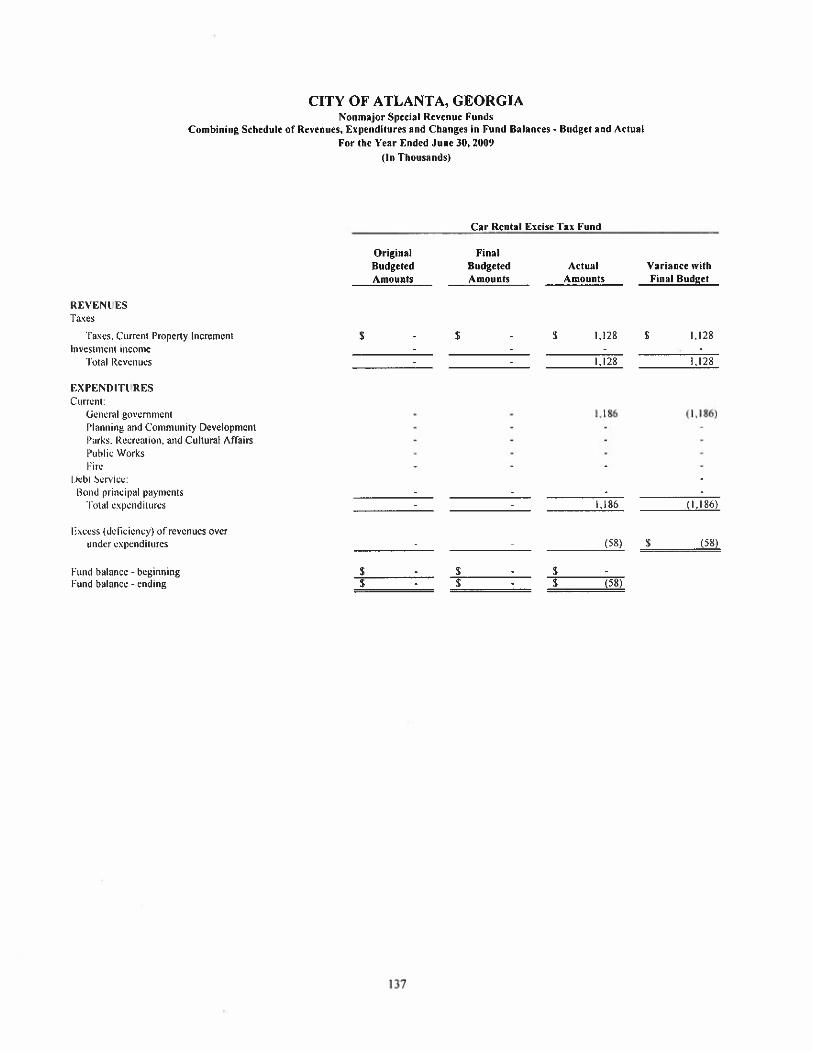
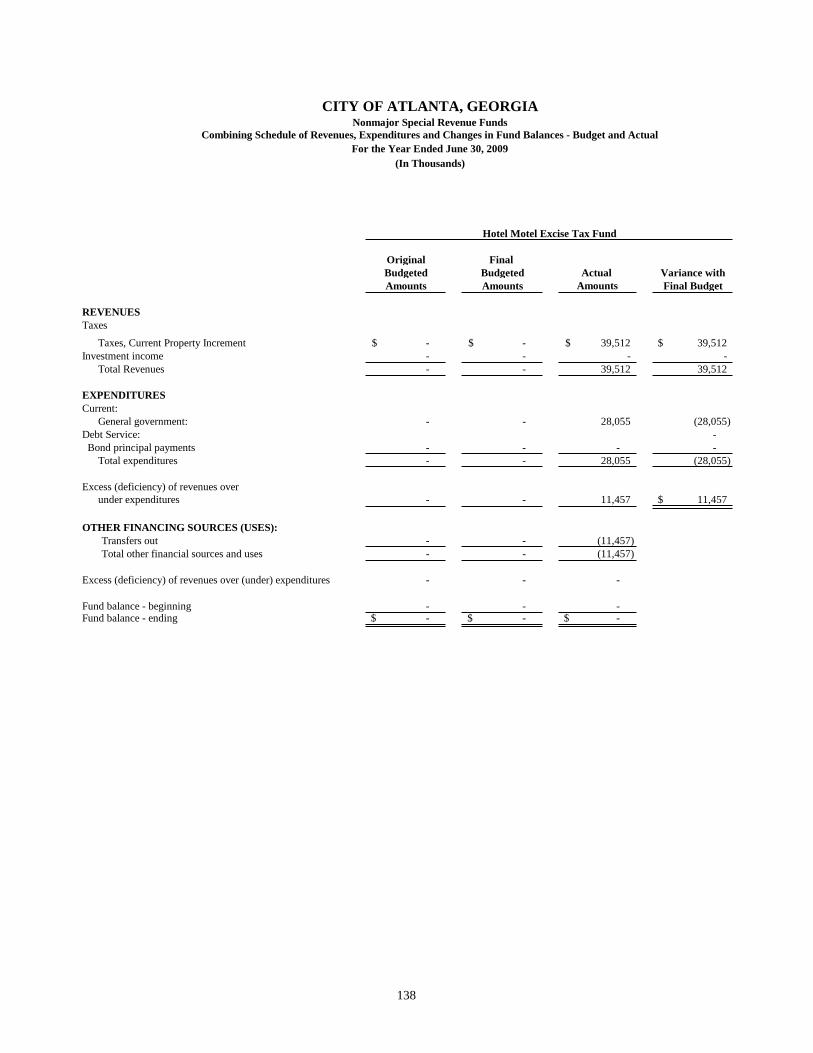
Original Final Budgeted Budgeted Actual Variance withAmounts Amounts Amounts Final Budget
REVENUESTaxes
Taxes, Current Property Increment -$ -$ 39,512$ 39,512$ Investment income - - - -
Total Revenues - - 39,512 39,512
EXPENDITURESCurrent:
General government: - - 28,055 (28,055)Debt Service: - Bond principal payments - - - -
Total expenditures - - 28,055 (28,055)
Excess (deficiency) of revenues over under expenditures - - 11,457 11,457$
OTHER FINANCING SOURCES (USES):- - (11,457)
Total other financial sources and uses - - (11,457)
- - -
Fund balance - beginning - - -Fund balance - ending -$ -$ -$
CITY OF ATLANTA, GEORGIANonmajor Special Revenue Funds
Combining Schedule of Revenues, Expenditures and Changes in Fund Balances - Budget and ActualFor the Year Ended June 30, 2009
(In Thousands)
Hotel Motel Excise Tax Fund
Transfers out
Excess (deficiency) of revenues over (under) expenditures
138
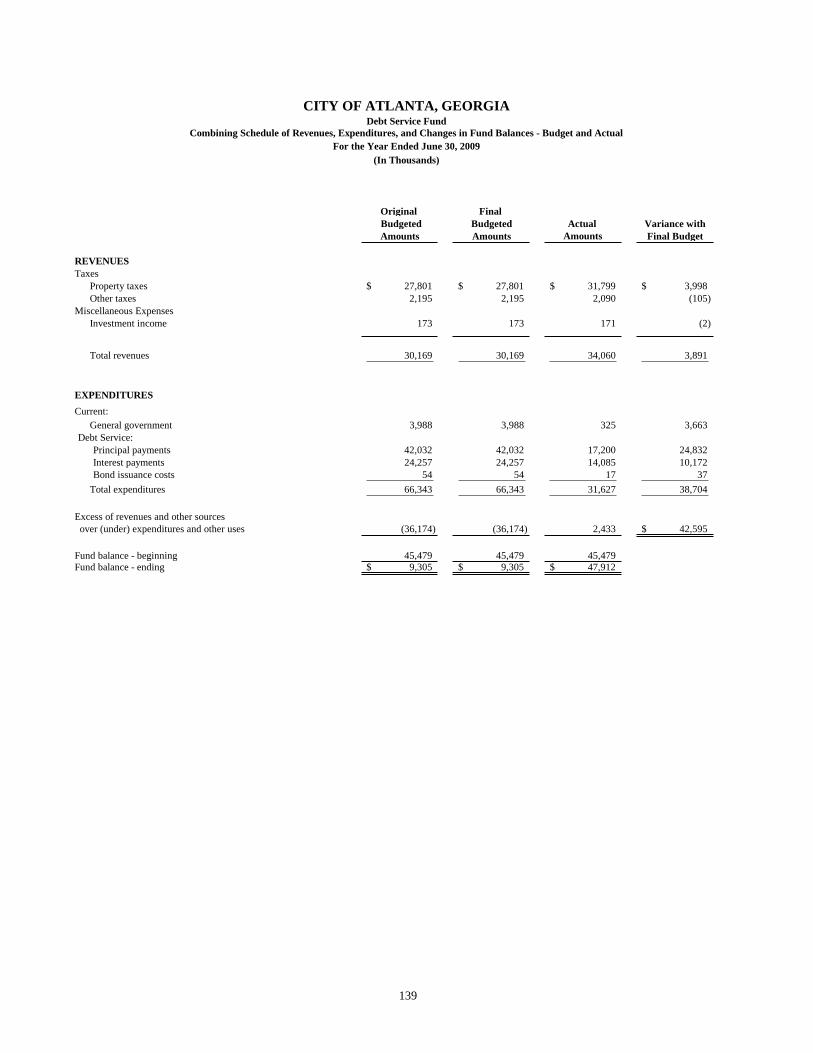
Original Final Budgeted Budgeted Actual Variance withAmounts Amounts Amounts Final Budget
REVENUESTaxes
Property taxes 27,801$ 27,801$ 31,799$ 3,998$ Other taxes 2,195 2,195 2,090 (105)
Miscellaneous ExpensesInvestment income 173 173 171 (2)
Total revenues 30,169 30,169 34,060 3,891
EXPENDITURES
Current:General government 3,988 3,988 325 3,663
Debt Service:Principal payments 42,032 42,032 17,200 24,832Interest payments 24,257 24,257 14,085 10,172Bond issuance costs 54 54 17 37
Total expenditures 66,343 66,343 31,627 38,704
Excess of revenues and other sources over (under) expenditures and other uses (36,174) (36,174) 2,433 42,595$
Fund balance - beginning 45,479 45,479 45,479Fund balance - ending 9,305$ 9,305$ 47,912$
(In Thousands)
CITY OF ATLANTA, GEORGIADebt Service Fund
Combining Schedule of Revenues, Expenditures, and Changes in Fund Balances - Budget and ActualFor the Year Ended June 30, 2009
139


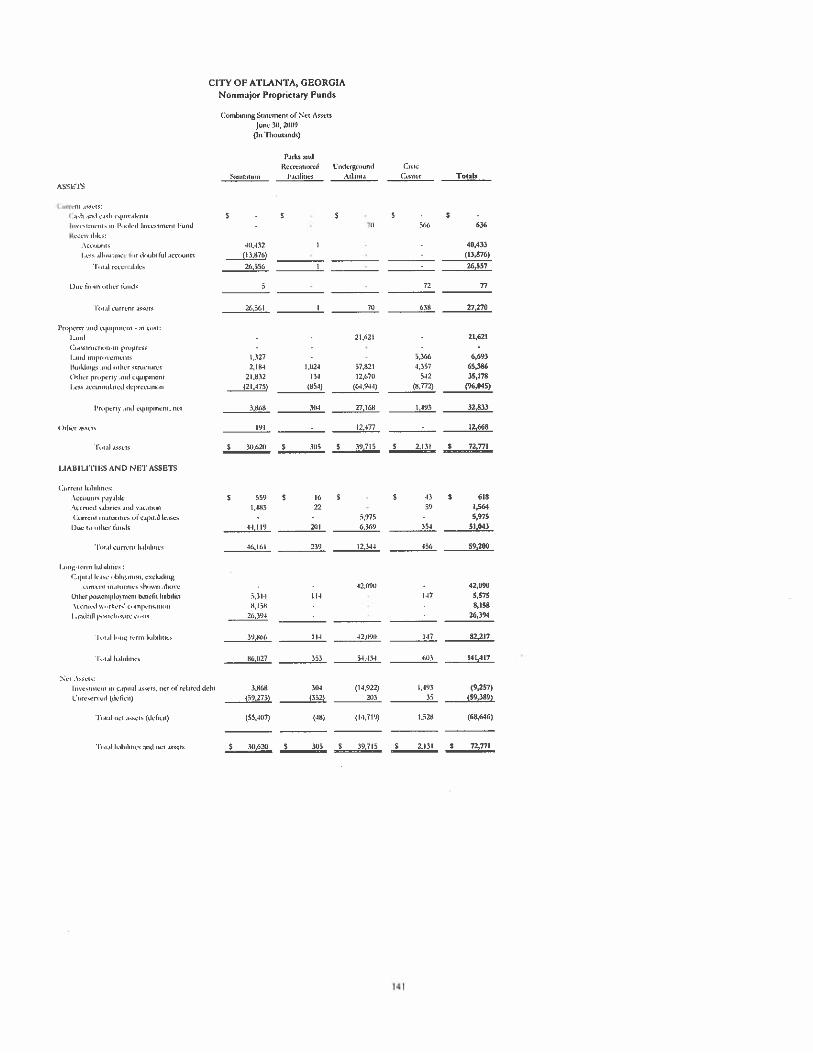
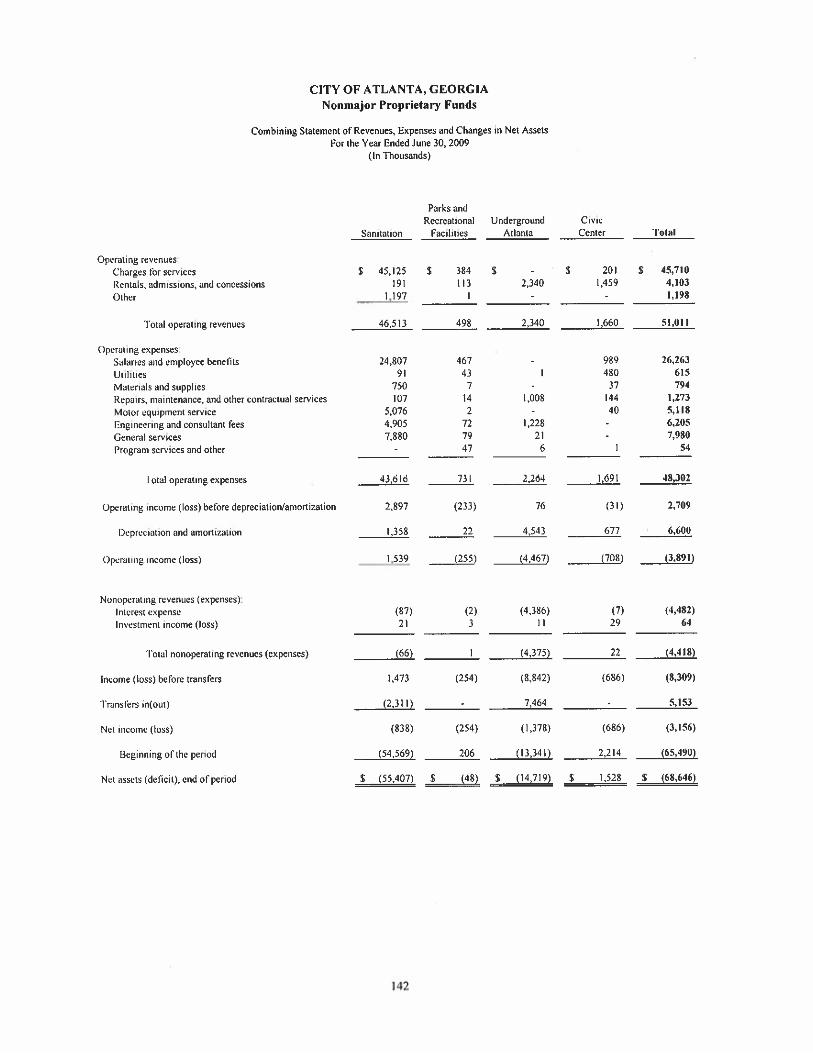
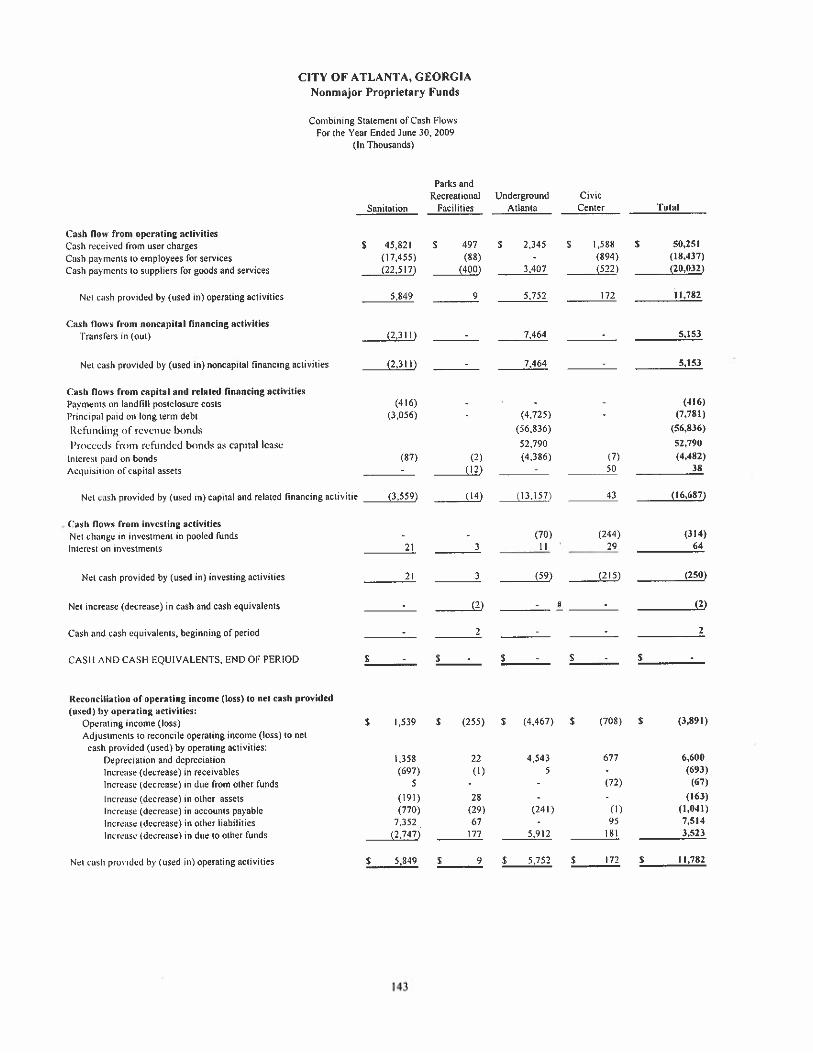
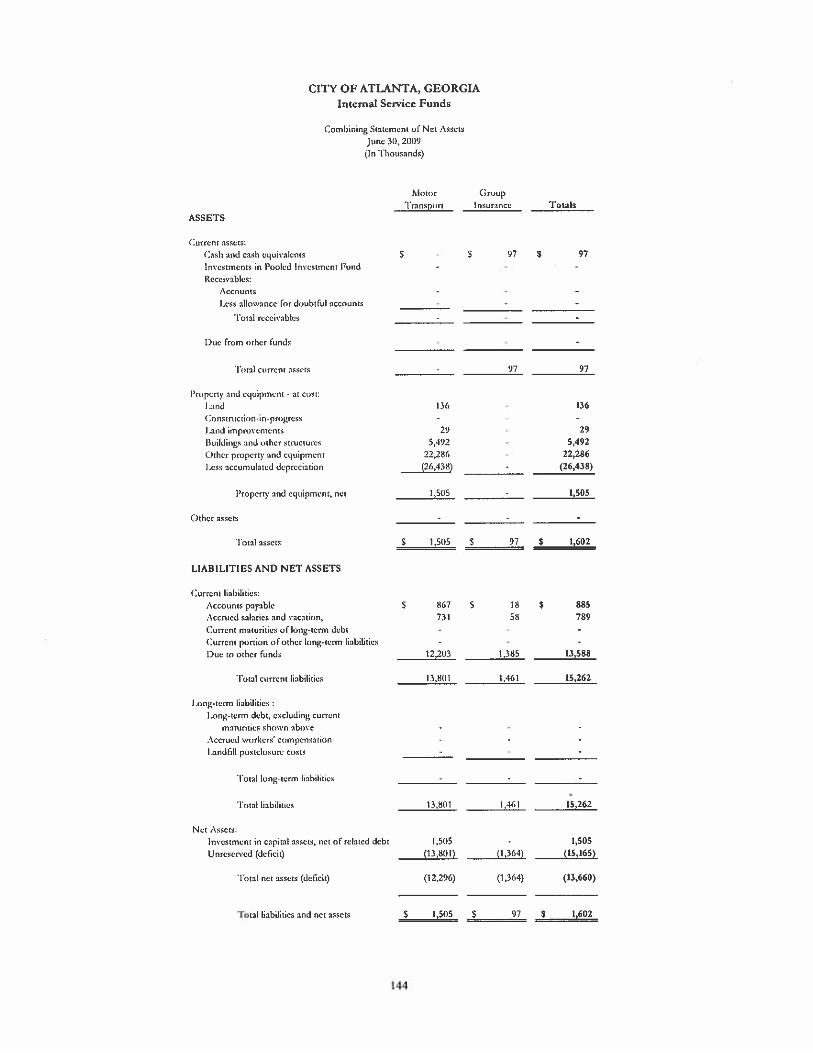
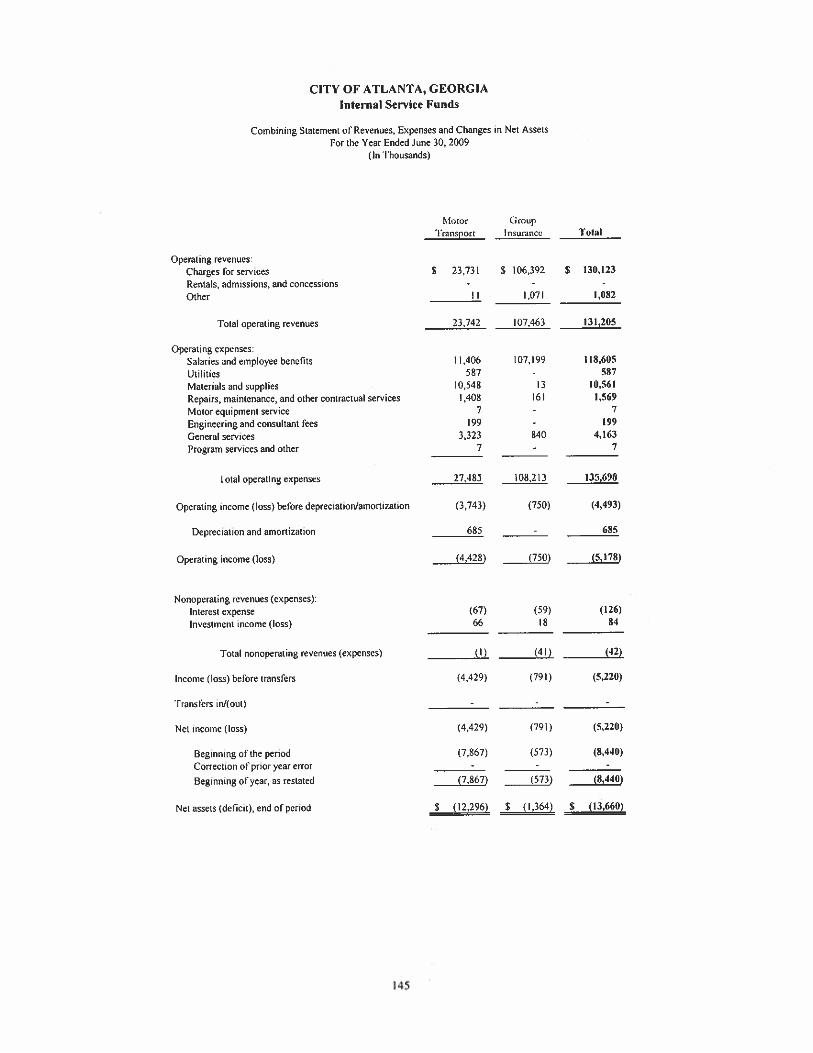
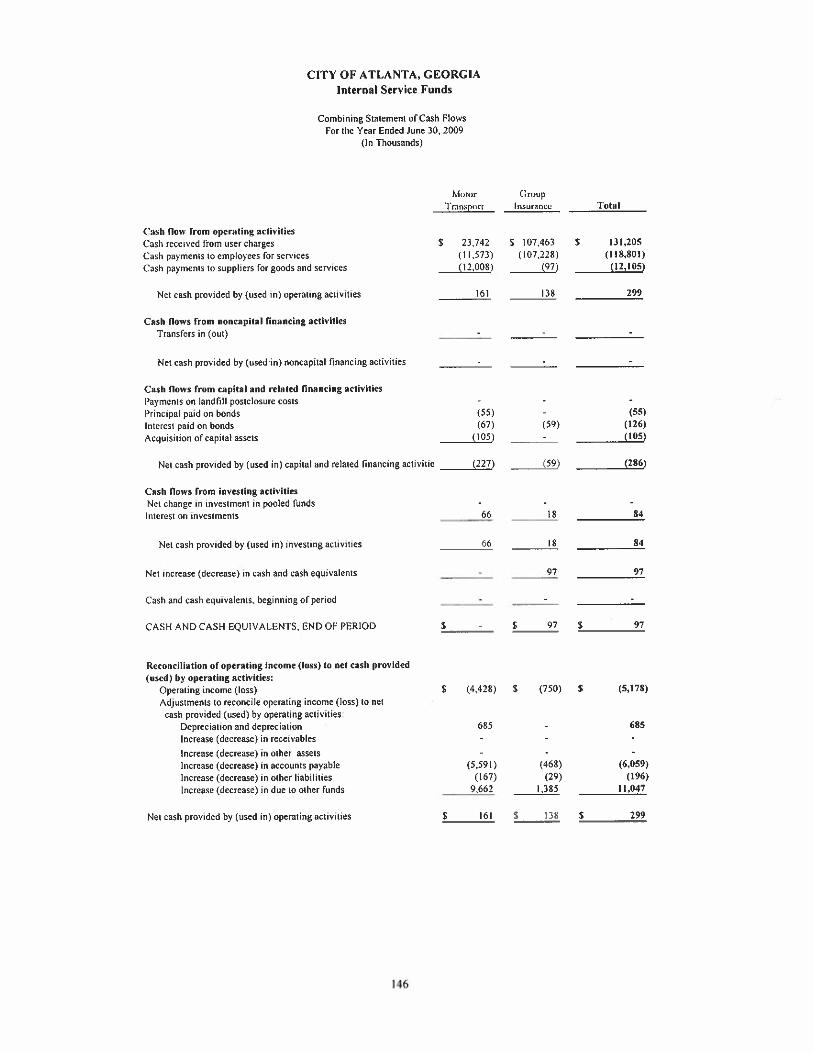

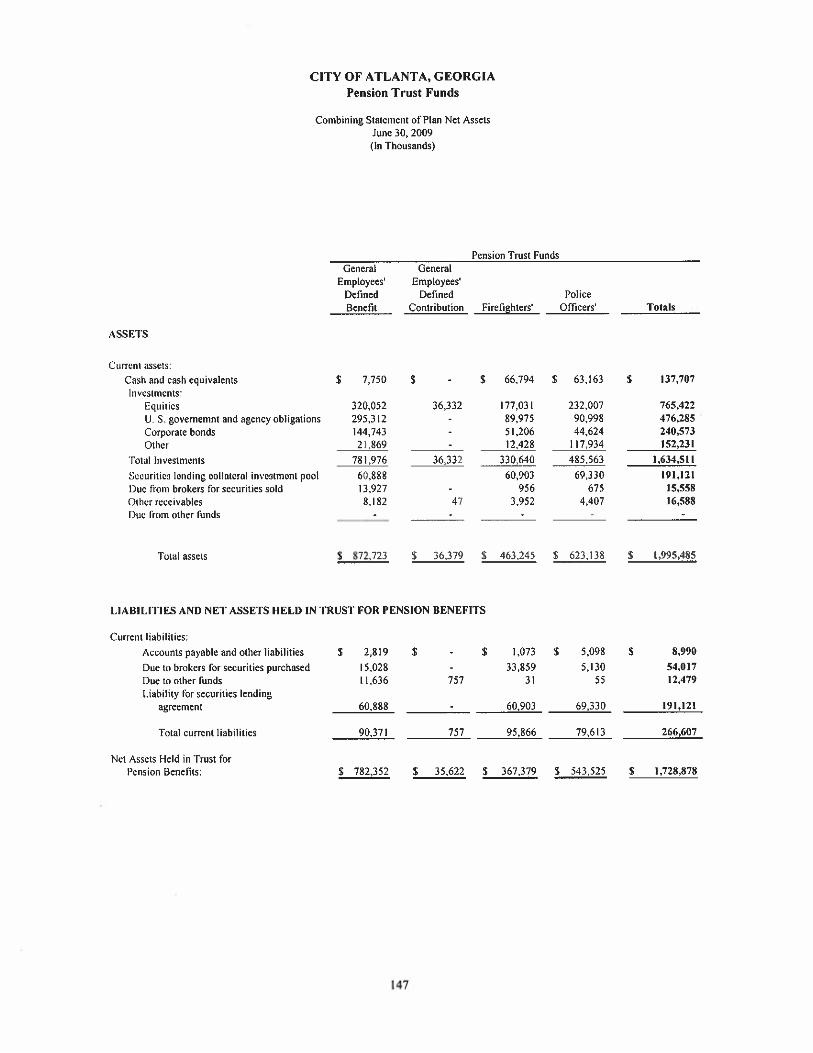
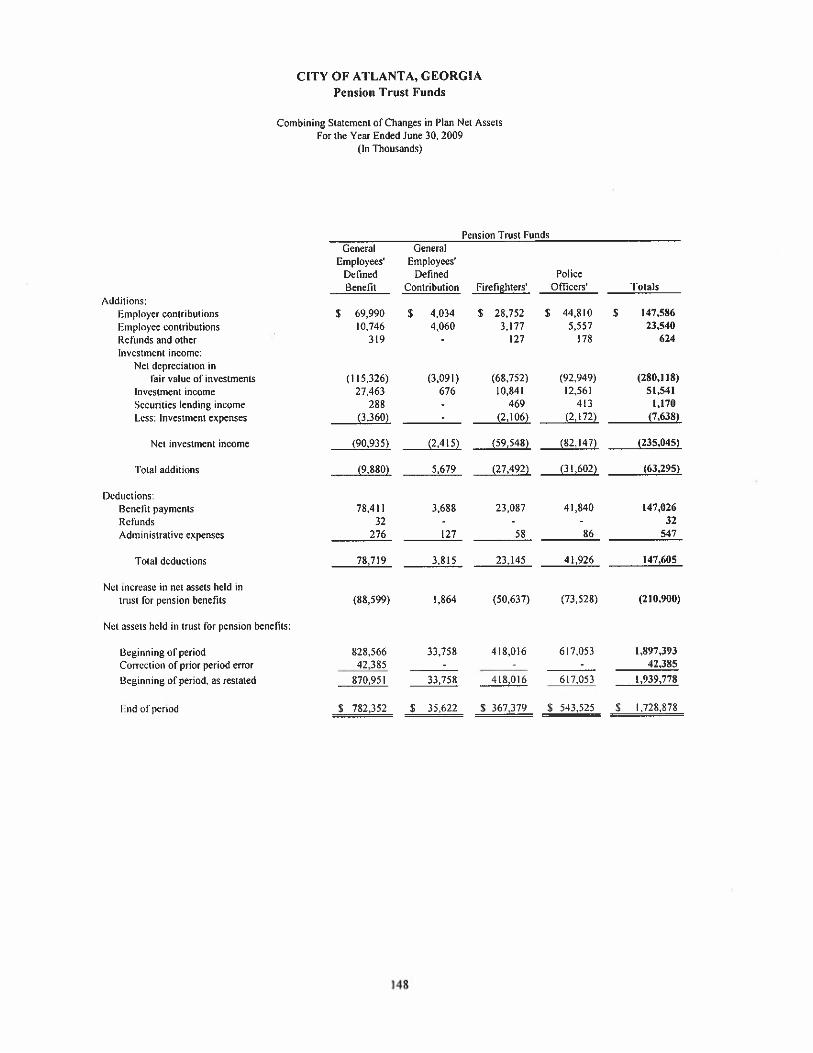
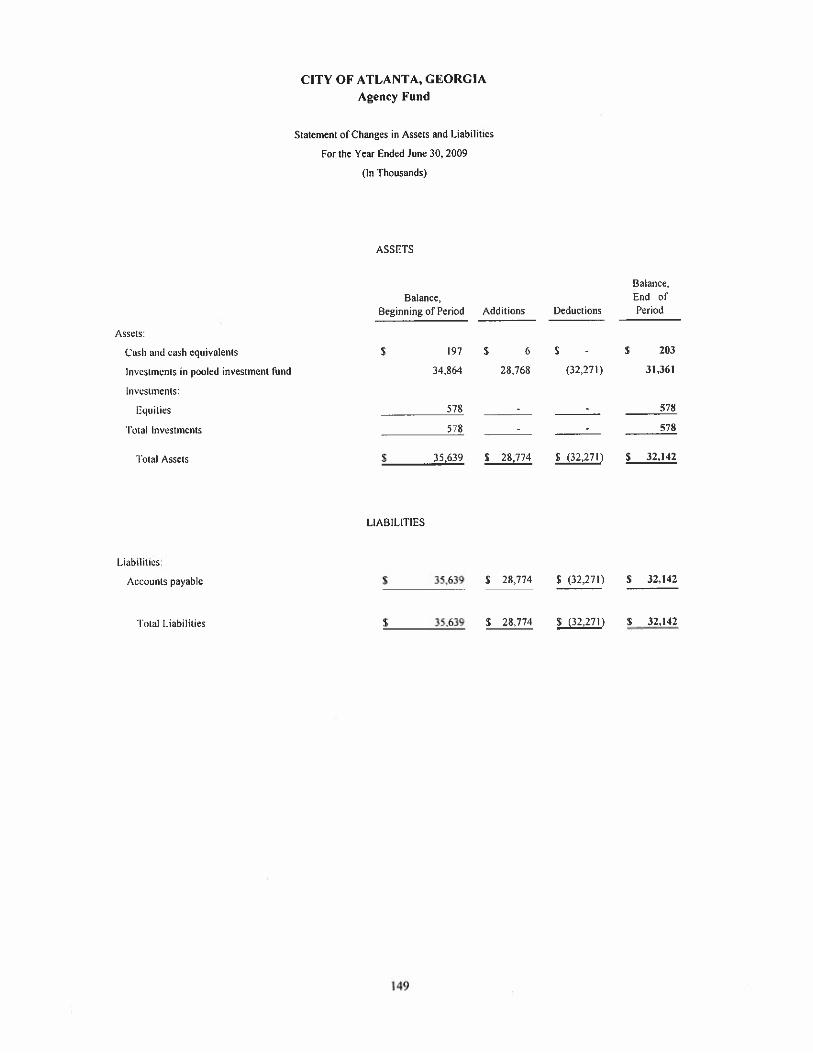

Statistical Section (Unaudited)
Cash Basis
(unless otherwise noted)
The financial information presented provides detailed data on the financial, economic, and physical characteristics of the City. These tables cover multiple fiscal years and provide financial report users with a broader and more complete understanding of the City and its financial affairs.


City of Atlanta, GeorgiaStatistical Section
Contents
Financial Trends (Schedule 1 through 5)These schedules contain trend information to help the reader understand how the City's financial performance and well-being have changed over time.
Revenue Capacity (Schedule 6 through 12)These schedules contain information to help the reader assess the City's most significant local revenue source, the property tax.
Debt Capacity (Schedule 13 through 17)These schedules present information to help the reader assess the affordability of the City's current levels of outstanding debt and the City's ability to issue additional debt in the future.
Demographic and Economic Information (Schedule 18 through 19)These schedules offer demographic and economic indicators to help the reader understand the environment within which the City's financial activities take place.
Operating Information (Schedule 20 through 22)These schedules contain service and infrastructure data to help the reader understand how the information in the City's financial report relates to the services the City provides and the activities it performs.
SourcesUnless otherwise noted, the information in these schedules is derived from the comprehensive annual financial reports for the relevant year. The City implemented GASB Statement 34 in 2002; schedules presenting government-wide information include information beginning in that year.

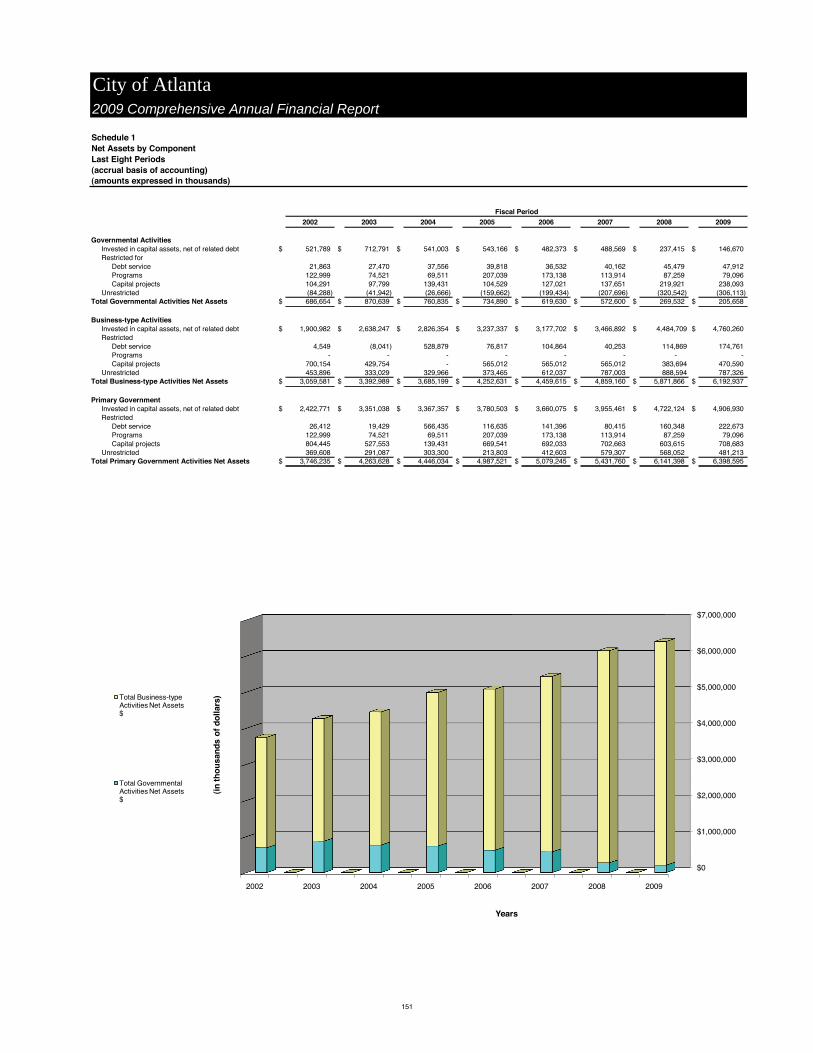
City of Atlanta2009 Comprehensive Annual Financial Report
Schedule 1Net Assets by ComponentLast Eight Periods(accrual basis of accounting)(amounts expressed in thousands)
2002 2003 2004 2005 2006 2007 2008 2009
Governmental ActivitiesInvested in capital assets, net of related debt $ 521,789 $ 712,791 $ 541,003 $ 543,166 $ 482,373 $ 488,569 $ 237,415 $ 146,670 Restricted for
Debt service 21,863 27,470 37,556 39,818 36,532 40,162 45,479 47,912 Programs 122,999 74,521 69,511 207,039 173,138 113,914 87,259 79,096 Capital projects 104,291 97,799 139,431 104,529 127,021 137,651 219,921 238,093
Unrestricted (84,288) (41,942) (26,666) (159,662) (199,434) (207,696) (320,542) (306,113) Total Governmental Activities Net Assets $ 686,654 $ 870,639 $ 760,835 $ 734,890 $ 619,630 $ 572,600 $ 269,532 $ 205,658
Business-type ActivitiesInvested in capital assets, net of related debt $ 1,900,982 $ 2,638,247 $ 2,826,354 $ 3,237,337 $ 3,177,702 $ 3,466,892 $ 4,484,709 $ 4,760,260 Restricted
Debt service 4,549 (8,041) 528,879 76,817 104,864 40,253 114,869 174,761 Programs - - - - - - - - Capital projects 700,154 429,754 - 565,012 565,012 565,012 383,694 470,590
Unrestricted 453,896 333,029 329,966 373,465 612,037 787,003 888,594 787,326 Total Business-type Activities Net Assets $ 3,059,581 $ 3,392,989 $ 3,685,199 $ 4,252,631 $ 4,459,615 $ 4,859,160 $ 5,871,866 $ 6,192,937
Primary GovernmentInvested in capital assets, net of related debt $ 2,422,771 $ 3,351,038 $ 3,367,357 $ 3,780,503 $ 3,660,075 $ 3,955,461 $ 4,722,124 $ 4,906,930 Restricted
Debt service 26,412 19,429 566,435 116,635 141,396 80,415 160,348 222,673 Programs 122,999 74,521 69,511 207,039 173,138 113,914 87,259 79,096 Capital projects 804,445 527,553 139,431 669,541 692,033 702,663 603,615 708,683
Unrestricted 369,608 291,087 303,300 213,803 412,603 579,307 568,052 481,213 Total Primary Government Activities Net Assets $ 3,746,235 $ 4,263,628 $ 4,446,034 $ 4,987,521 $ 5,079,245 $ 5,431,760 $ 6,141,398 $ 6,398,595
Fiscal Period
$0
$1,000,000
$2,000,000
$3,000,000
$4,000,000
$5,000,000
$6,000,000
$7,000,000
2002 2003 2004 2005 2006 2007 2008 2009
(in
tho
usa
nd
s o
f d
olla
rs)
Years
Total Business-type Activities Net Assets $
Total Governmental Activities Net Assets $
151
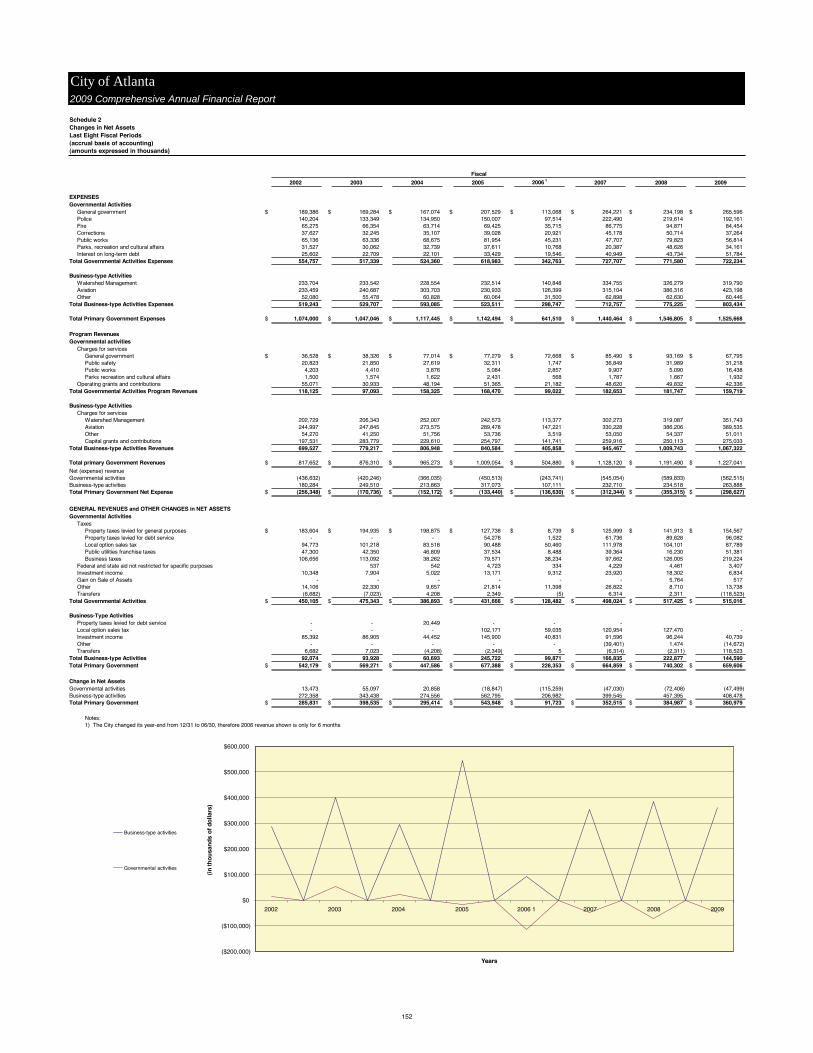
City of Atlanta2009 Comprehensive Annual Financial Report
Schedule 2Changes in Net AssetsLast Eight Fiscal Periods(accrual basis of accounting)(amounts expressed in thousands)
2002 2003 2004 2005 2006 1 2007 2008 2009
EXPENSESGovernmental Activities
General government $ 189,386 $ 169,284 $ 167,074 $ 207,529 $ 113,068 $ 264,221 $ 234,198 $ 265,596 Police 140,204 133,349 134,950 150,007 97,514 222,490 219,614 192,161 Fire 65,275 66,354 63,714 69,425 35,715 86,775 94,871 84,454 Corrections 37,627 32,245 35,107 39,028 20,921 45,178 50,714 37,264 Public works 65,136 63,336 68,675 81,954 45,231 47,707 79,823 56,814 Parks, recreation and cultural affairs 31,527 30,062 32,739 37,611 10,768 20,387 48,626 34,161 Interest on long-term debt 25,602 22,709 22,101 33,429 19,546 40,949 43,734 51,784
Total Governmental Activities Expenses 554,757 517,339 524,360 618,983 342,763 727,707 771,580 722,234
Business-type ActivitiesWatershed Management 233,704 233,542 228,554 232,514 140,848 334,755 326,279 319,790 Aviation 233,459 240,687 303,703 230,933 126,399 315,104 386,316 423,198 Other 52,080 55,478 60,828 60,064 31,500 62,898 62,630 60,446
Total Business-type Activities Expenses 519,243 529,707 593,085 523,511 298,747 712,757 775,225 803,434
Total Primary Government Expenses $ 1,074,000 $ 1,047,046 $ 1,117,445 $ 1,142,494 $ 641,510 $ 1,440,464 $ 1,546,805 $ 1,525,668
Program RevenuesGovernmental activities
Charges for servicesGeneral government $ 36,528 $ 38,326 $ 77,014 $ 77,279 $ 72,668 $ 85,490 $ 93,169 $ 67,795 Public safety 20,823 21,850 27,619 32,311 1,747 36,849 31,989 31,218 Public works 4,203 4,410 3,876 5,084 2,857 9,907 5,090 16,438 Parks recreation and cultural affairs 1,500 1,574 1,622 2,431 568 1,787 1,667 1,932
Operating grants and contributions 55,071 30,933 48,194 51,365 21,182 48,620 49,832 42,336 Total Governmental Activities Program Revenues 118,125 97,093 158,325 168,470 99,022 182,653 181,747 159,719
Business-type ActivitiesCharges for services
Watershed Management 202,729 206,343 252,007 242,573 113,377 302,273 319,087 351,743 Aviation 244,997 247,845 273,575 289,478 147,221 330,228 386,206 389,535 Other 54,270 41,250 51,756 53,736 3,519 53,050 54,337 51,011 Capital grants and contributions 197,531 283,779 229,610 254,797 141,741 259,916 250,113 275,033
Total Business-type Activities Revenues 699,527 779,217 806,948 840,584 405,858 945,467 1,009,743 1,067,322
Total primary Government Revenues $ 817,652 $ 876,310 $ 965,273 $ 1,009,054 $ 504,880 $ 1,128,120 $ 1,191,490 $ 1,227,041
Net (expense) revenueGovernmental activities (436,632) (420,246) (366,035) (450,513) (243,741) (545,054) (589,833) (562,515) Business-type activities 180,284 249,510 213,863 317,073 107,111 232,710 234,518 263,888 Total Primary Government Net Expense $ (256,348) $ (170,736) $ (152,172) $ (133,440) $ (136,630) $ (312,344) $ (355,315) $ (298,627)
GENERAL REVENUES and OTHER CHANGES in NET ASSETSGovernmental Activities
TaxesProperty taxes levied for general purposes $ 183,604 $ 194,935 $ 198,875 $ 127,738 $ 8,739 $ 125,999 $ 141,913 $ 154,567 Property taxes levied for debt service - - - 54,278 1,522 61,736 89,628 96,082 Local option sales tax 94,773 101,218 83,518 90,488 50,460 111,978 104,101 87,789 Public utilities franchise taxes 47,300 42,350 46,809 37,534 8,488 39,364 16,230 51,381 Business taxes 106,656 113,092 38,262 79,571 38,234 97,662 126,005 219,224
Federal and state aid not restricted for specific purposes 537 542 4,723 334 4,229 4,461 3,407 Investment income 10,348 7,904 5,022 13,171 9,312 23,920 18,302 6,834 Gain on Sale of Assets - - - - - - 5,764 517 Other 14,106 22,330 9,657 21,814 11,398 26,822 8,710 13,738 Transfers (6,682) (7,023) 4,208 2,349 (5) 6,314 2,311 (118,523)
Total Governmental Activities $ 450,105 $ 475,343 $ 386,893 $ 431,666 $ 128,482 $ 498,024 $ 517,425 $ 515,016
Business-Type ActivitiesProperty taxes levied for debt service - - 20,449 - - - Local option sales tax - - - 102,171 59,035 120,954 127,470 - Investment income 85,392 86,905 44,452 145,900 40,831 91,596 96,244 40,739 Other - - - - - (39,401) 1,474 (14,672) Transfers 6,682 7,023 (4,208) (2,349) 5 (6,314) (2,311) 118,523
Total Business-type Activities 92,074 93,928 60,693 245,722 99,871 166,835 222,877 144,590 Total Primary Government $ 542,179 $ 569,271 $ 447,586 $ 677,388 $ 228,353 $ 664,859 $ 740,302 $ 659,606
Change in Net AssetsGovernmental activities 13,473 55,097 20,858 (18,847) (115,259) (47,030) (72,408) (47,499) Business-type activities 272,358 343,438 274,556 562,795 206,982 399,545 457,395 408,478 Total Primary Government $ 285,831 $ 398,535 $ 295,414 $ 543,948 $ 91,723 $ 352,515 $ 384,987 $ 360,979
Notes:1) The City changed its year-end from 12/31 to 06/30, therefore 2006 revenue shown is only for 6 months
Fiscal
($200,000)
($100,000)
$0
$100,000
$200,000
$300,000
$400,000
$500,000
$600,000
2002 2003 2004 2005 2006 1 2007 2008 2009
(in
tho
usa
nd
s o
f d
olla
rs)
Years
Business-type activities
Governmental activities
152
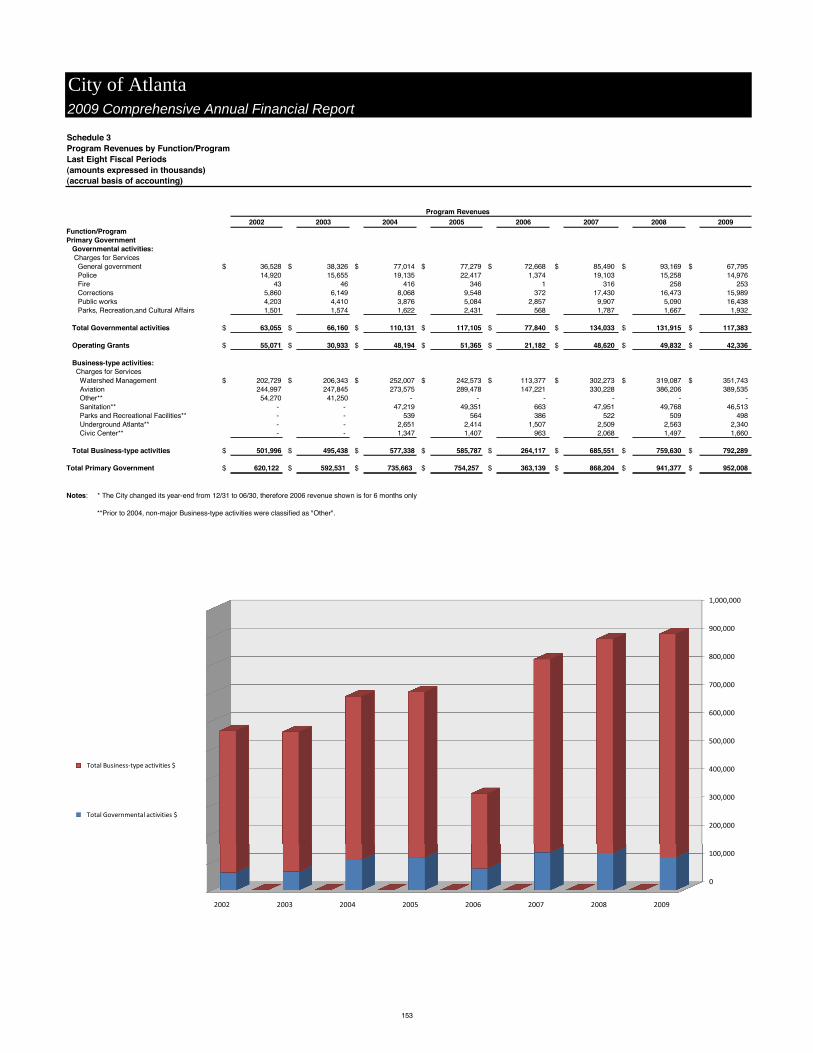
Schedule 3Program Revenues by Function/ProgramLast Eight Fiscal Periods(amounts expressed in thousands)(accrual basis of accounting)
2002 2003 2004 2005 2006 2007 2008 2009Function/ProgramPrimary Government Governmental activities: Charges for Services General government $ 36,528 $ 38,326 $ 77,014 $ 77,279 $ 72,668 $ 85,490 $ 93,169 $ 67,795 Police 14,920 15,655 19,135 22,417 1,374 19,103 15,258 14,976 Fire 43 46 416 346 1 316 258 253 Corrections 5,860 6,149 8,068 9,548 372 17,430 16,473 15,989 Public works 4,203 4,410 3,876 5,084 2,857 9,907 5,090 16,438 Parks, Recreation,and Cultural Affairs 1,501 1,574 1,622 2,431 568 1,787 1,667 1,932
Total Governmental activities $ 63,055 $ 66,160 $ 110,131 $ 117,105 $ 77,840 $ 134,033 $ 131,915 $ 117,383
Operating Grants $ 55,071 $ 30,933 $ 48,194 $ 51,365 $ 21,182 $ 48,620 $ 49,832 $ 42,336
Business-type activities: Charges for Services Watershed Management $ 202,729 $ 206,343 $ 252,007 $ 242,573 $ 113,377 $ 302,273 $ 319,087 $ 351,743 Aviation 244,997 247,845 273,575 289,478 147,221 330,228 386,206 389,535 Other** 54,270 41,250 - - - - - - Sanitation** - - 47,219 49,351 663 47,951 49,768 46,513 Parks and Recreational Facilities** - - 539 564 386 522 509 498 Underground Atlanta** - - 2,651 2,414 1,507 2,509 2,563 2,340 Civic Center** - - 1,347 1,407 963 2,068 1,497 1,660
Total Business-type activities $ 501,996 $ 495,438 $ 577,338 $ 585,787 $ 264,117 $ 685,551 $ 759,630 $ 792,289
Total Primary Government $ 620,122 $ 592,531 $ 735,663 $ 754,257 $ 363,139 $ 868,204 $ 941,377 $ 952,008
Notes: * The City changed its year-end from 12/31 to 06/30, therefore 2006 revenue shown is for 6 months only **Prior to 2004, non-major Business-type activities were classified as "Other".
City of Atlanta2009 Comprehensive Annual Financial Report
Program Revenues
0
100,000
200,000
300,000
400,000
500,000
600,000
700,000
800,000
900,000
1,000,000
2002 2003 2004 2005 2006 2007 2008 2009
Total Business-type activities $
Total Governmental activities $
153

Schedule 4Fund Balances, Governmental FundsLast Eight Fiscal Periods(modified accrual basis of accounting)(amounts expressed in thousands)
2002 2003 2004 2005* 2006 2007 2008 2009
General FundReserved $ 24,002 $ 6,433 $ 6,353 $ 5,783 $ 7,602 $ 2,614 $ 4,367 $ 3,382 Unreserved 50,380 96,504 151,349 140,193 92,947 91,808 5,763 4,011
Total General Fund $ 74,382 $ 102,937 $ 157,702 $ 145,976 $ 100,549 $ 94,422 $ 10,130 $ 7,393
Capital Projects FundReserved $ - $ - $ - $ 95,129 $ 47,397 $ 64,163 $ 73,703 $ 17,606 Unreserved - - - - - - 6,936 25,678
Total Capital Projects Fund $ - $ - $ - $ 95,129 $ 47,397 $ 64,163 $ 80,639 $ 43,284
Debt Service FundReserved $ - $ - $ - $ 39,818 $ 36,532 $ 40,162.00 $ 45,479 $ 47,912
Total Debt Service Fund $ - $ - $ - $ 39,818 $ 36,532 $ 40,162 $ 45,479 $ 47,912
All Other Governmental FundsReserved $ 263,874 $ 218,285 $ 285,892 $ 251,298 $ 245,160 $ 177,862 $ 233,477 $ 299,583 Unreserved, reported in
Special revenue funds - - (21,416) (9,240) (9,240) (20,091) (57,328) (45,238) Total All other Governmental Funds $ 263,874 $ 218,285 $ 264,476 $ 242,058 $ 235,920 $ 157,771 $ 176,149 $ 254,345
* Prior to 2005, the General Fund was considered the only major governmental fund. The capital projects fund and the debt service fund were included in all other governmental funds.
City of Atlanta2009 Comprehensive Annual Financial Report
Fiscal Period
-
100,000
200,000
300,000
400,000
500,000
600,000
2002 2003 2004 2005* 2006 2007 2008 2009
Total All other Governmental Funds
Total Debt Service Fund
Total Capital Projects Fund
Total General Fund
154

Schedule 5Changes in Fund Balances, Governmental FundsLast Eight Fiscal Periods(modified accrual basis of accounting)(amounts expressed in thousands)
2002 2003 2004 2005 2006 2007 2008 2009
REVENUESProperty taxes $ 182,035 $ 193,244 $ 192,927 $ 179,685 $ 10,261 $ 195,048 $ 227,563 $ 253,204Local option sales taxes 94,773 94,374 83,518 90,488 50,460 111,978 104,101 87,789Public utility, alcoholic beverages and other taxes 113,625 100,347 106,449 122,015 8,488 137,922 142,235 270,605Licenses and permits 52,403 50,516 54,327 58,285 38,234 76,915 69,127 62,503Charges for current services 24,060 23,951 24,761 21,576 65,235 23,482 27,729 20,765Fines, forfeitures and penalties 20,390 19,908 18,504 17,895 6,727 14,710 18,323 15,820Investment income 10,301 7,917 4,934 12,926 9,312 23,468 18,182 6,750Intergovernmental revenues and contributions
Federal revenues 39,201 23,067 31,659 30,480 334 28,784 34,709 36,649State and local grants and contributions 16,408 4,181 16,991 20,500 21,182 24,065 17,358 9,094Other - - 542 4,723 - - - -
Building rentals and contributions 8,552 6,981 10,394 11,339 5,877 18,926 18,962 18,295Other 14,106 22,330 9,657 26,584 11,398 19,844 8,710 13,738
TOTAL REVENUES $ 575,854 $ 546,816 $ 554,663 $ 596,496 $ 227,508 $ 675,142 $ 686,999 $ 795,212
EXPENDITURESCurrent
General government $ 175,110 $ 163,041 $ 173,027 $ 231,207 $ 113,068 $ 290,882 $ 285,698 $ 319,202Police 123,021 124,811 142,958 149,450 97,514 225,815 230,571 186,364Fire 54,677 61,473 61,011 67,486 35,715 83,506 87,559 82,581Corrections 34,591 31,111 35,283 38,678 20,921 44,456 47,711 36,503Public works 26,369 25,989 34,506 59,679 45,231 48,393 69,004 45,032Parks, recreation and cultural affairs 26,436 26,766 33,006 42,764 10,768 44,939 53,542 39,569
Capital outlay 56,335 68,164 15,330 - - - -Debt service
Principal 26,672 27,567 13,348 26,573 - 36,290 39,293 54,919Interest 25,602 22,709 25,646 32,706 19,546 40,949 42,879 50,429Bond issuance costs (599) 137 31 723 1,996 4,438 6,065
TOTAL EXPENDITURES $ 548,214 $ 551,768 $ 534,146 $ 649,266 $ 342,763 $ 817,226 $ 860,695 $ 820,664
Excess of Revenues Over (Under) Expenditures 27,640 (4,952) 20,517 (52,770) (115,255) (142,084) (173,696) (25,452)
Other Financing Sources (Uses)Proceeds from borrowing $ 76,840 $ 12,001 $ 58,553 $ 145,809 $ - $ 58,000 $ 53,820 $ 134,042Capital leases - - - 7,097 - - 23,480 48,602Premium on bonds sold - - 3,576 6,221 - 2,548 5,787 4,027Discount on bonds sold - - - (1,581) - (77) - (484)Refunding bonds issued - - - 85,980 - - 105,760 78,025Payment ro refunded bond escrow agent - - - (85,605) - - (106,177) (80,550)Sale of asset - - - 1,600 7,036 9,304 6,794 851Transfers in (out) (6,682) (7,013) 3,322 1,149 (5) 19,280 2,311 (118,523)
Total Other Financing Sources (Uses) $ 70,158 $ 4,988 $ 65,451 $ 160,670 $ 7,031 $ 89,055 $ 91,775 $ 65,990
Correction of a Prior Year Error - (17,069) 14,988 (6,108) - - 37,800 -
NET CHANGE IN FUND BALANCE $ 97,798 $ (17,033) $ 100,956 $ 101,792 $ (108,224) $ (53,029) $ (44,121) $ 40,538
Debt service as a percentage ofnoncapital expenditures 11.7% 11.6% 8.1% 11.2% 15.0% 12.6% 13.5% 18.4%
* Note: Capital outlay expenditures are included in the functional category totals after 2004, but are considered in the above debt service to noncapital expenditures calculation.
City of Atlanta 2009 Comprehensive Annual Financial Report
Fiscal Period
100,000
200,000
300,000
400,000
500,000
600,000
700,000
800,000
900,000
1,000,000
2002 2003 2004 2005 2006 2007 2008 2009
TOTALREVENUES$
TOTALEXPENDITURES$
155
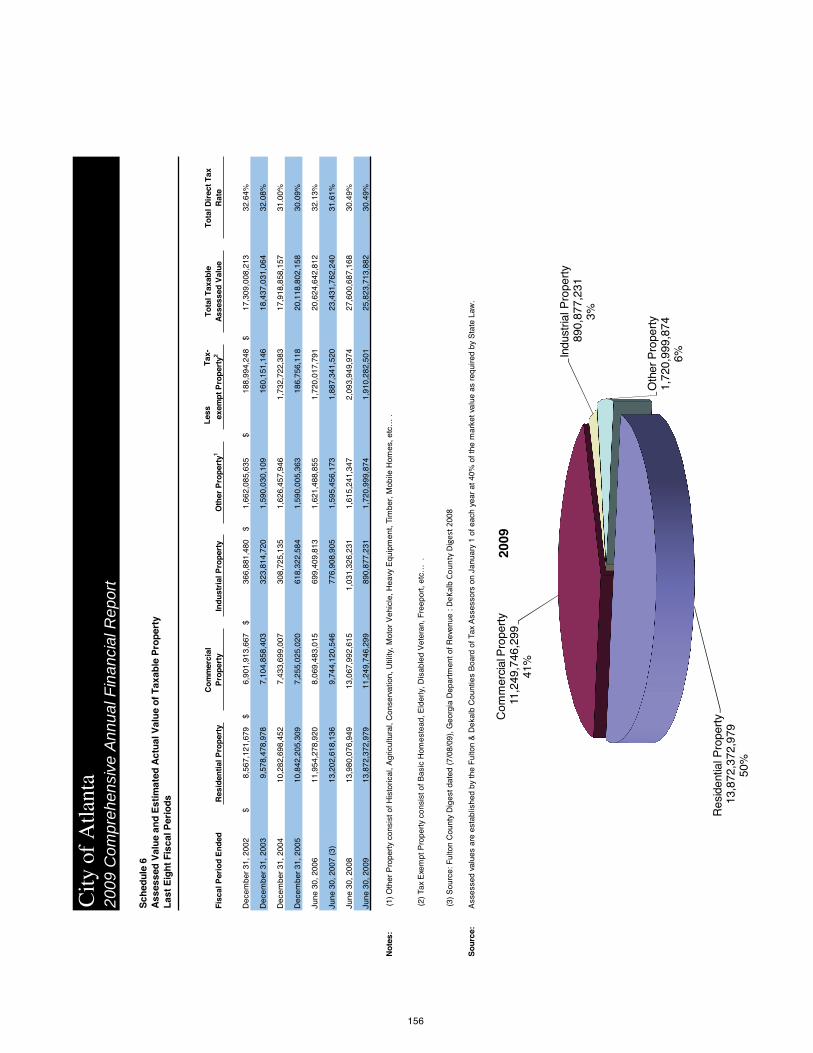
Sch
edu
le 6
Ass
esse
d V
alu
e an
d E
stim
ated
Act
ual
Val
ue
of
Tax
able
Pro
per
tyL
ast
Eig
ht
Fis
cal P
erio
ds
Fis
cal P
erio
d E
nd
edR
esid
enti
al P
rop
erty
Co
mm
erci
al
Pro
per
tyIn
du
stri
al P
rop
erty
Oth
er P
rop
erty
1L
ess
T
ax-
exem
pt
Pro
per
ty2
To
tal T
axab
le
Ass
esse
d V
alu
eT
ota
l Dir
ect
Tax
R
ate
Dec
embe
r 31
, 200
2$
8,56
7,12
1,67
9
$
6,90
1,91
3,66
7
$
366,
881,
480
$
1,66
2,08
5,63
5$
188,
994,
248
$
17,3
09,0
08,2
13
32.6
4%
Dec
embe
r 31
, 200
3
9,57
8,47
8,97
8
7,10
4,85
8,40
3
323,
814,
720
1,59
0,03
0,10
9
160,
151,
146
18,4
37,0
31,0
64
32.0
8%
Dec
embe
r 31
, 200
410
,282
,698
,452
7,
433,
699,
007
308,
725,
135
1,
626,
457,
946
1,73
2,72
2,38
3
17
,918
,858
,157
31
.00%
Dec
embe
r 31
, 200
510
,842
,205
,309
7,
255,
025,
020
618,
322,
584
1,
590,
005,
363
186,
756,
118
20
,118
,802
,158
30
.09%
June
30,
200
6 11
,954
,278
,920
8,
069,
483,
015
699,
409,
813
1,
621,
488,
855
1,72
0,01
7,79
1
20
,624
,642
,812
32
.13%
June
30,
200
7 (3
)13
,202
,618
,136
9,
744,
120,
546
776,
908,
905
1,
595,
456,
173
1,88
7,34
1,52
0
23
,431
,762
,240
31
.61%
June
30,
200
813
,980
,076
,949
13
,067
,992
,615
1,
031,
326,
231
1,61
5,24
1,34
72,
093,
949,
974
27,6
00,6
87,1
68
30.4
9%
June
30,
200
913
,872
,372
,979
11
,249
,746
,299
89
0,87
7,23
1
1,72
0,99
9,87
41,
910,
282,
501
25,8
23,7
13,8
82
30.4
9%
No
tes:
(1)
Oth
er P
rope
rty
cons
ist o
f His
toric
al, A
gric
ultu
ral,
Con
serv
atio
n, U
tility
, Mot
or V
ehic
le, H
eavy
Equ
ipm
ent,
Tim
ber,
Mob
ile H
omes
, etc
… .
156
(2)
Tax
Exe
mpt
Pro
pert
y co
nsis
t of B
asic
Hom
este
ad, E
lder
ly, D
isab
led
Vet
eran
, Fre
epor
t, et
c… .
(3)
Sou
rce:
Ful
ton
Cou
nty
Dig
est d
ated
(7/
08/0
9), G
eorg
ia D
epar
tmen
t of R
even
ue : DeK
albCo
untyDigest2
008
So
urc
e:A
sses
sed
valu
es a
re e
stab
lishe
d by
the
Ful
ton
& D
ekal
b C
ount
ies
Boa
rd o
f Tax
Ass
esso
rs o
n Ja
nuar
y 1
of e
ach
year
at 4
0% o
f the
mar
ket v
alue
as
requ
ired
by S
tate
Law
.
City
of
Atla
nta
2009
Com
preh
ensi
ve A
nnua
l Fin
anci
al R
epor
t
Res
iden
tial P
rope
rty
13,8
72,3
72,9
7950
%
Com
mer
cial
Pro
pert
y11
,249
,746
,299
41
%
Indu
stria
l Pro
pert
y89
0,87
7,23
13%
Oth
er P
rope
rty
1,72
0,99
9,87
46%
2009
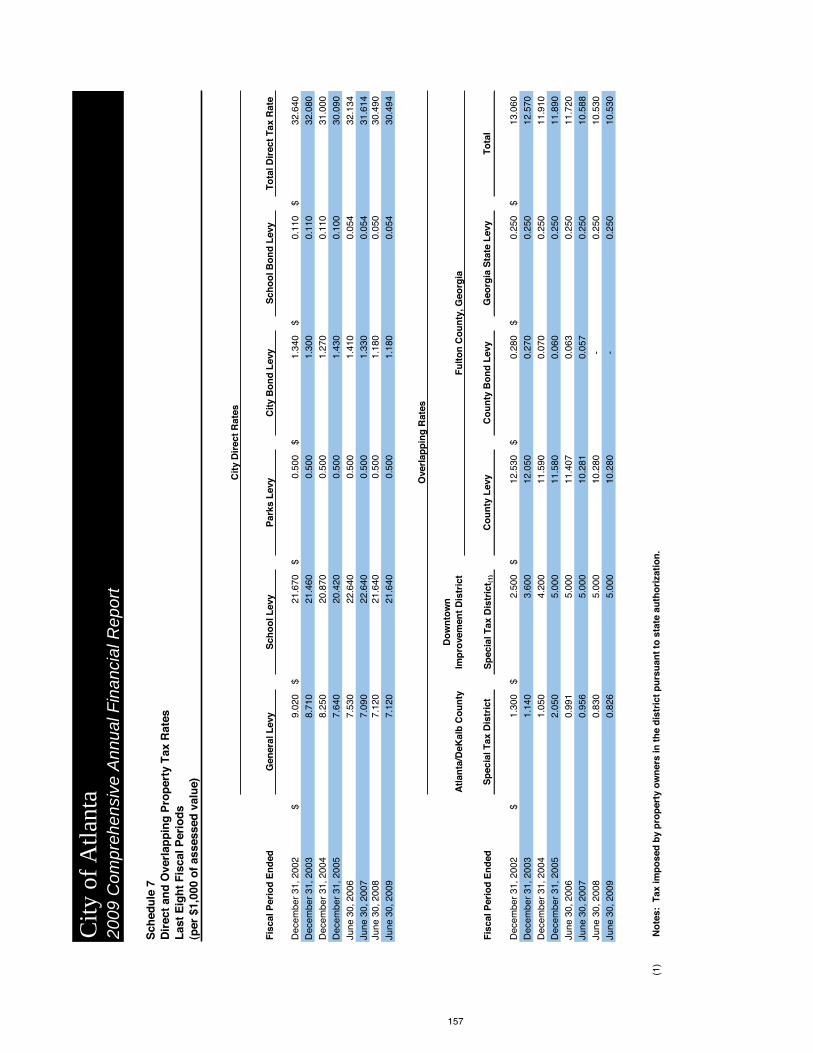
Sch
edu
le 7
Dir
ect
and
Ove
rlap
pin
g P
rop
erty
Tax
Rat
esL
ast
Eig
ht
Fis
cal P
erio
ds
(per
$1,
000
of
asse
ssed
val
ue)
Fis
cal P
erio
d E
nd
edG
ener
al L
evy
Sch
oo
l Lev
yP
arks
Lev
yC
ity
Bo
nd
Lev
yS
cho
ol B
on
d L
evy
Tota
l Dir
ect
Tax
Rat
e
Dec
embe
r 31
, 200
2$
9.02
0
$
21.6
70
$0.
500
$1.
340
$0.
110
$32
.640
Dec
embe
r 31
, 200
38.
710
21.4
60
0.50
0
1.
300
0.11
0
32
.080
Dec
embe
r 31
, 200
48.
250
20.8
70
0.50
0
1.
270
0.11
0
31
.000
Dec
embe
r 31
, 200
57.
640
20.4
20
0.50
0
1.
430
0.10
0
30
.090
June
30,
200
6 7.
530
22.6
40
0.50
0
1.
410
0.05
4
32
.134
June
30,
200
7 7.
090
22.6
40
0.50
0
1.
330
0.05
4
31
.614
Ju
ne 3
0, 2
008
7.12
0
21
.640
0.
500
1.18
0
0.
050
30.4
90
June
30,
200
97.
120
21.6
40
0.50
0
1.
180
0.05
4
30
.494
157
Atl
anta
/DeK
alb
Co
un
tyD
ow
nto
wn
Im
pro
vem
ent
Dis
tric
t
Fis
cal P
erio
d E
nd
edS
pec
ial T
ax D
istr
ict
Sp
ecia
l Tax
Dis
tric
t (1)
Co
un
ty L
evy
Co
un
ty B
on
d L
evy
Geo
rgia
Sta
te L
evy
Tota
l
Dec
embe
r 31
, 200
2$
1.30
0
$
2.50
0
$
12.5
30
$0.
280
$0.
250
$13
.060
Dec
embe
r 31
, 200
31.
140
3.60
0
12
.050
0.
270
0.25
0
12
.570
Dec
embe
r 31
, 200
41.
050
4.20
0
11
.590
0.
070
0.25
0
11
.910
Dec
embe
r 31
, 200
52.
050
5.00
0
11
.580
0.
060
0.25
0
11
.890
June
30,
200
6 0.
991
5.00
0
11
.407
0.
063
0.25
0
11
.720
June
30,
200
70.
956
5.00
0
10
.281
0.
057
0.25
0
10
.588
June
30,
200
80.
830
5.00
0
10
.280
-
0.25
0
10
.530
June
30,
200
90.
826
5.00
0
10
.280
-
0.25
0
10
.530
(1)
No
tes:
Tax
imp
ose
d b
y p
rop
erty
ow
ner
s in
th
e d
istr
ict
pu
rsu
ant
to s
tate
au
tho
riza
tio
n.
Cit
y D
irec
t R
ates
Ove
rlap
pin
g R
ates
Fu
lto
n C
ou
nty
, Geo
rgia
City
of
Atla
nta
2009
Com
preh
ensi
ve A
nnua
l Fin
anci
al R
epor
t
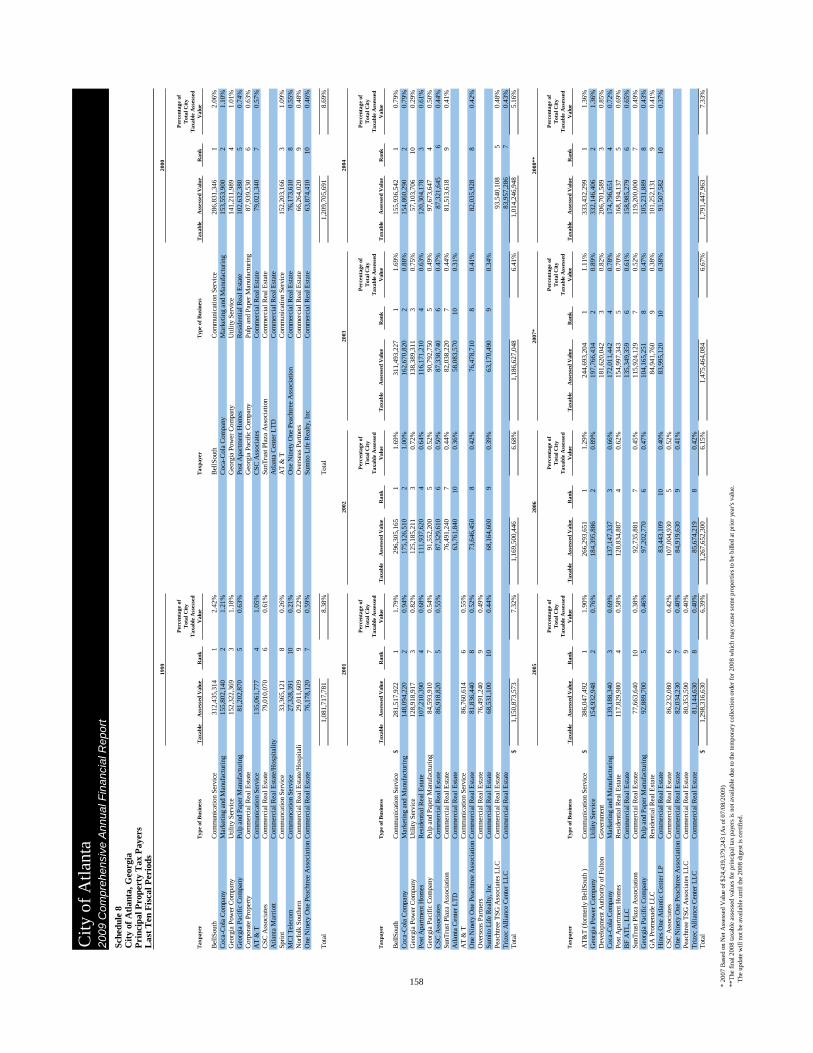
City
of
Atla
nta
2009
Com
preh
ensi
ve A
nnua
l Fin
anci
al R
epor
tSc
hedu
le 8
Cit
y of
Atl
anta
, Geo
rgia
Pri
ncip
al P
rope
rty
Tax
Pay
ers
Las
t T
en F
isca
l Per
iods
Tax
paye
rT
ype
of B
usin
ess
Tax
able
A
sses
sed
Val
ueR
ank
Per
cent
age
of
Tot
al C
ity
Tax
able
Ass
esse
d V
alue
Tax
paye
rT
ype
of B
usin
ess
Tax
able
A
sses
sed
Val
ueR
ank
Per
cent
age
of
Tot
al C
ity
Tax
able
Ass
esse
d V
alue
Bel
lSou
thC
omm
unic
atio
n Se
rvic
e31
2,43
5,31
41
2.42
%B
ellS
outh
Com
mun
icat
ion
Serv
ice
286,
831,
346
1
2.
06%
Coc
a-C
ola
Com
pany
Mar
ketin
g an
d M
anuf
actu
ring
155,
802,
140
21.
21%
Coc
a-C
ola
Com
pany
Mar
ketin
g an
d M
anuf
actu
ring
153,
553,
900
2
1.
10%
Geo
rgia
Pow
er C
ompa
nyU
tility
Ser
vice
152,
322,
369
31.
18%
Geo
rgia
Pow
er C
ompa
nyU
tility
Ser
vice
141,
211,
989
4
1.
01%
Geo
rgia
Pac
ific
Com
pany
Pulp
and
Pap
er M
anuf
actu
ring
81,2
02,8
705
0.63
%Po
st A
part
men
t Hom
esR
esid
entia
l Rea
l Est
ate
102,
632,
380
5
0.
74%
Cor
pora
te P
rope
rty
Com
mer
cial
Rea
l Est
ate
Geo
rgia
Pac
ific
Com
pany
Pulp
and
Pap
er M
anuf
actu
ring
87,9
39,5
30
6
0.
63%
AT
& T
Com
mun
icat
ion
Serv
ice
135,
061,
777
41.
05%
CSC
Ass
ocia
tes
Com
mer
cial
Rea
l Est
ate
79,0
21,3
40
7
0.
57%
CSC
Ass
ocia
tes
Com
mer
cial
Rea
l Est
ate
79,0
10,0
706
0.61
%Su
nTru
st P
laza
Ass
ocia
tion
Com
mer
cial
Rea
l Est
ate
Atla
nta
Mar
riot
tC
omm
erci
al R
eal E
stat
e/H
ospi
talit
yA
tlant
a C
ente
r L
TD
Com
mer
cial
Rea
l Est
ate
Spri
ntC
omm
unca
tion
Serv
ice
33,3
65,1
218
0.26
%A
T &
TC
omm
unic
atio
n Se
rvic
e15
2,20
3,16
6
3
1.09
%M
CI
Tel
ecom
Com
mun
catio
n Se
rvic
e27
,328
,391
100.
21%
One
Nin
ety
One
Pea
chtr
ee A
ssoc
iatio
nC
omm
erci
al R
eal E
stat
e76
,173
,610
8
0.55
%N
orfo
lk S
outh
ern
Com
mer
cial
Rea
l Est
ate/
Hos
pita
l i29
,011
,609
90.
22%
Ove
rsea
s Pa
rtne
rsC
omm
erci
al R
eal E
stat
e66
,264
,020
9
0.48
%O
ne N
inet
y O
ne P
each
tree
Ass
ocia
tion
Com
mer
cial
Rea
l Est
ate
76,1
78,1
207
0.59
%Su
mito
Lif
e R
ealty
, Inc
Com
mer
cial
Rea
l Est
ate
63,8
74,4
10
10
0.46
%
T
otal
1,08
1,71
7,78
1
8.
38%
Tot
al1,
209,
705,
691
8.69
%
Tax
paye
rT
ype
of B
usin
ess
Tax
able
A
sses
sed
Val
ueR
ank
Per
cent
age
of
Tot
al C
ity
Tax
able
Ass
esse
d V
alue
Tax
able
A
sses
sed
Val
ueR
ank
Per
cent
age
of
Tot
al C
ity
Tax
able
Ass
esse
d V
alue
Tax
able
A
sses
sed
Val
ueR
ank
Per
cent
age
of
Tot
al C
ity
Tax
able
Ass
esse
d V
alue
Tax
able
A
sses
sed
Val
ueR
ank
Per
cent
age
of
Tot
al C
ity
Tax
able
Ass
esse
d V
alue
Bel
lSou
thC
omm
unic
atio
n Se
rvic
e$
281,
517,
922
1
1.
79%
296,
305,
165
11.
69%
311,
493,
227
11.
69%
155,
936,
542
1
0.
79%
Coc
a-C
ola
Com
pany
Mar
ketin
g an
d M
anuf
actu
ring
148,
094,
220
2
0.
94%
175,
126,
510
21.
00%
162,
670,
820
20.
88%
154,
860,
290
2
0.
79%
Geo
rgia
Pow
er C
ompa
nyU
tility
Ser
vice
128,
918,
917
3
0.
82%
125,
185,
211
30.
72%
138,
389,
311
30.
75%
57,1
03,7
06
10
0.29
%Po
st A
part
men
t Hom
esR
esid
entia
l Rea
l Est
ate
107,
210,
390
4
0.
68%
111,
937,
620
40.
64%
116,
171,
210
40.
63%
120,
304,
178
3
0.
61%
Geo
rgia
Pac
ific
Com
pany
Pulp
and
Pap
er M
anuf
actu
ring
84,5
93,9
10
7
0.
54%
91,5
52,2
005
0.52
%90
,792
,750
50.
49%
97,6
73,6
47
4
0.
50%
CSC
Ass
ocia
tes
Com
mer
cial
Rea
l Est
ate
86,9
18,8
20
5
0.
55%
87,3
29,6
106
0.50
%87
,338
,740
60.
47%
87,3
21,6
456
0.44
%Su
nTru
st P
laza
Ass
ocia
tion
Com
mer
cial
Rea
l Est
ate
76,4
91,2
407
0.44
%82
,038
,220
70.
44%
81,5
13,6
18
9
0.
41%
Atla
nta
Cen
ter
LT
DC
omm
erci
al R
eal E
stat
e63
,761
,840
100.
36%
58,0
83,5
7010
0.31
%A
T &
TC
omm
unic
atio
n Se
rvic
e86
,760
,614
6
0.55
%O
ne N
inet
y O
ne P
each
tree
Ass
ocia
tion
Com
mer
cial
Rea
l Est
ate
81,8
36,4
40
8
0.
52%
73,6
46,4
508
0.42
%76
,478
,710
80.
41%
82,0
35,9
28
8
0.
42%
Ove
rsea
s Pa
rtne
rsC
omm
erci
al R
eal E
stat
e76
,491
,240
9
0.49
%Su
mito
Lif
e R
ealty
, Inc
Com
mer
cial
Rea
l Est
ate
68,5
31,1
00
10
0.44
%68
,164
,600
90.
39%
63,1
70,4
909
0.34
%Pe
acht
ree
TSG
Ass
ocia
tes
LL
CC
omm
erci
al R
eal E
stat
e93
,540
,108
50.
48%
Tri
zec
Alli
ance
Cen
ter
LL
CC
omm
erci
al R
eal E
stat
e83
,957
,286
70.
43%
T
otal
$1,
150,
873,
573
7.32
%1,
169,
500,
446
6.68
%1,
186,
627,
048
6.41
%1,
014,
246,
948
5.16
%
Tax
paye
rT
ype
of B
usin
ess
Tax
able
A
sses
sed
Val
ueR
ank
Per
cent
age
of
Tot
al C
ity
Tax
able
Ass
esse
d V
alue
Tax
able
A
sses
sed
Val
ueR
ank
Per
cent
age
of
Tot
al C
ity
Tax
able
Ass
esse
d V
alue
Tax
able
A
sses
sed
Val
ueR
ank
Per
cent
age
of
Tot
al C
ity
Tax
able
Ass
esse
d V
alue
Tax
able
A
sses
sed
Val
ueR
ank
Per
cent
age
of
Tot
al C
ity
Tax
able
Ass
esse
d V
alue
AT
&T
(fo
rmer
ly B
ellS
outh
)C
omm
unic
atio
n Se
rvic
e$
386,
047,
492
1
1.
90%
266,
293,
651
1
1.
29%
244,
693,
204
1
1.11
%33
3,43
2,29
9
1
1.36
%G
eorg
ia P
ower
Com
pany
Util
ity S
ervi
ce15
4,93
2,94
8
2
0.76
%18
4,39
5,88
6
2
0.89
%19
7,76
6,43
4
2
0.
89%
332,
146,
406
2
1.
36%
Dev
elop
men
t Aut
hori
ty o
f Fu
lton
Gov
ernm
ent
181,
620,
042
3
0.82
%20
6,70
1,58
9
3
0.85
%C
oca-
Col
a C
ompa
nyM
arke
ting
and
Man
ufac
turi
ng13
9,18
8,34
0
3
0.69
%13
7,14
7,33
7
3
0.66
%17
2,01
1,44
2
4
0.
78%
174,
796,
651
4
0.
72%
Post
Apa
rtm
ent H
omes
Res
iden
tial R
eal E
stat
e11
7,82
9,98
0
4
0.58
%12
8,83
4,88
7
4
0.62
%15
4,99
7,34
3
5
0.
70%
168,
194,
137
5
0.
69%
BF
AT
L, L
LC
Com
mer
cial
Rea
l Est
ate
135,
349,
359
6
0.61
%15
8,98
5,27
9
6
0.65
%Su
nTru
st P
laza
Ass
ocia
tion
Com
mer
cial
Rea
l Est
ate
77,6
63,6
40
10
0.38
%92
,735
,881
7
0.45
%11
5,92
4,12
9
7
0.
52%
119,
200,
000
7
0.
49%
Geo
rgia
Pac
ific
Com
pany
Pulp
and
Pap
er M
anuf
actu
ring
92,8
89,7
00
5
0.
46%
97,2
02,7
70
6
0.
47%
104,
165,
251
8
0.47
%10
5,23
1,88
9
8
0.43
%G
A P
rom
enad
e L
LC
Res
iden
tial R
eal E
stat
e84
,941
,760
9
0.
38%
101,
252,
131
9
0.
41%
Hin
es O
ne A
tlant
ic C
ente
r L
PC
omm
erci
al R
eal E
stat
e83
,443
,109
10
0.
40%
83,9
95,1
20
10
0.
38%
91,5
07,5
82
10
0.37
%C
SC A
ssoc
iate
sC
omm
erci
al R
eal E
stat
e86
,232
,080
6
0.42
%10
7,00
4,93
0
5
0.52
%O
ne N
inet
y O
ne P
each
tree
Ass
ocia
tion
Com
mer
cial
Rea
l Est
ate
82,0
34,2
30
7
0.
40%
84,9
19,6
30
9
0.
41%
Peac
htre
e T
SG A
ssoc
iate
s L
LC
Com
mer
cial
Rea
l Est
ate
80,3
53,5
90
9
0.
40%
Tri
zec
Alli
ance
Cen
ter
LL
CC
omm
erci
al R
eal E
stat
e81
,144
,630
8
0.40
%85
,674
,219
8
0.42
%
Tot
al$
1,29
8,31
6,63
0
6.
39%
1,26
7,65
2,30
0
6.
15%
1,47
5,46
4,08
4
6.67
%1,
791,
447,
963
7.33
%
* 20
07 B
ased
on
Net
Ass
esse
d V
alue
of $
24,4
39,3
79,2
43 (
As
of 0
7/08
/200
9)**
The
fina
l 200
8 ta
xabl
e as
sess
ed v
alue
s fo
r pr
inci
pal t
ax p
ayer
s is
not
ava
ilabl
e du
e to
the
tem
pora
ry c
olle
ctio
n or
der
for
2008
whi
ch m
ay c
ause
som
e pr
oper
ties
to b
e bi
lled
at p
rior
yea
r's v
alue
.
The
upd
ate
will
not
be
avai
labl
e un
til th
e 20
08 d
iges
t is
cert
ified
.
2002
2003
2004
158
2005
2006
2007
*20
08**
1999
2000
2001
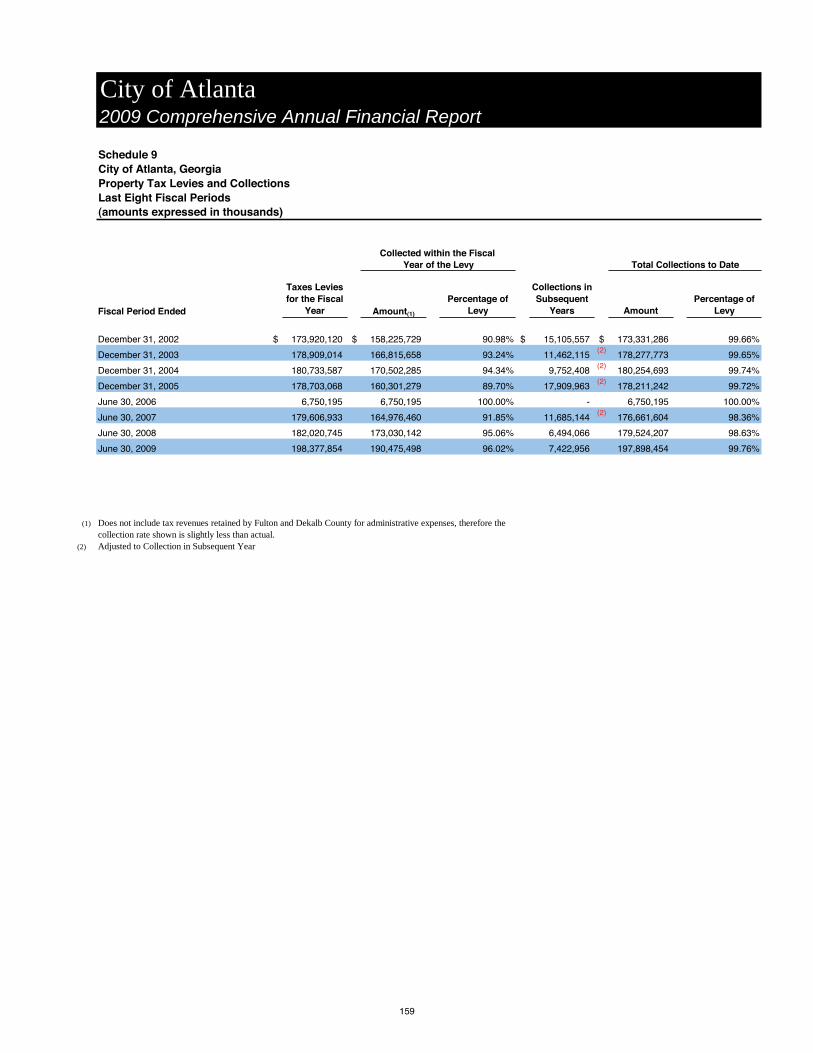
Schedule 9City of Atlanta, GeorgiaProperty Tax Levies and CollectionsLast Eight Fiscal Periods(amounts expressed in thousands)
Fiscal Period Ended
Taxes Levies for the Fiscal
Year Amount(1)
Percentage of Levy
Collections in Subsequent
Years AmountPercentage of
Levy
December 31, 2002 $ 173,920,120 $ 158,225,729 90.98% $ 15,105,557 $ 173,331,286 99.66%
December 31, 2003 178,909,014 166,815,658 93.24% 11,462,115 (2)
178,277,773 99.65%
December 31, 2004 180,733,587 170,502,285 94.34% 9,752,408 (2)
180,254,693 99.74%
December 31, 2005 178,703,068 160,301,279 89.70% 17,909,963 (2)
178,211,242 99.72%
June 30, 2006 6,750,195 6,750,195 100.00% - 6,750,195 100.00%
June 30, 2007 179,606,933 164,976,460 91.85% 11,685,144 (2)
176,661,604 98.36%
June 30, 2008 182,020,745 173,030,142 95.06% 6,494,066 179,524,207 98.63%
June 30, 2009 198,377,854 190,475,498 96.02% 7,422,956 197,898,454 99.76%
(1) Does not include tax revenues retained by Fulton and Dekalb County for administrative expenses, therefore thecollection rate shown is slightly less than actual.
(2) Adjusted to Collection in Subsequent Year
Total Collections to DateYear of the LevyCollected within the Fiscal
City of Atlanta 2009 Comprehensive Annual Financial Report
159
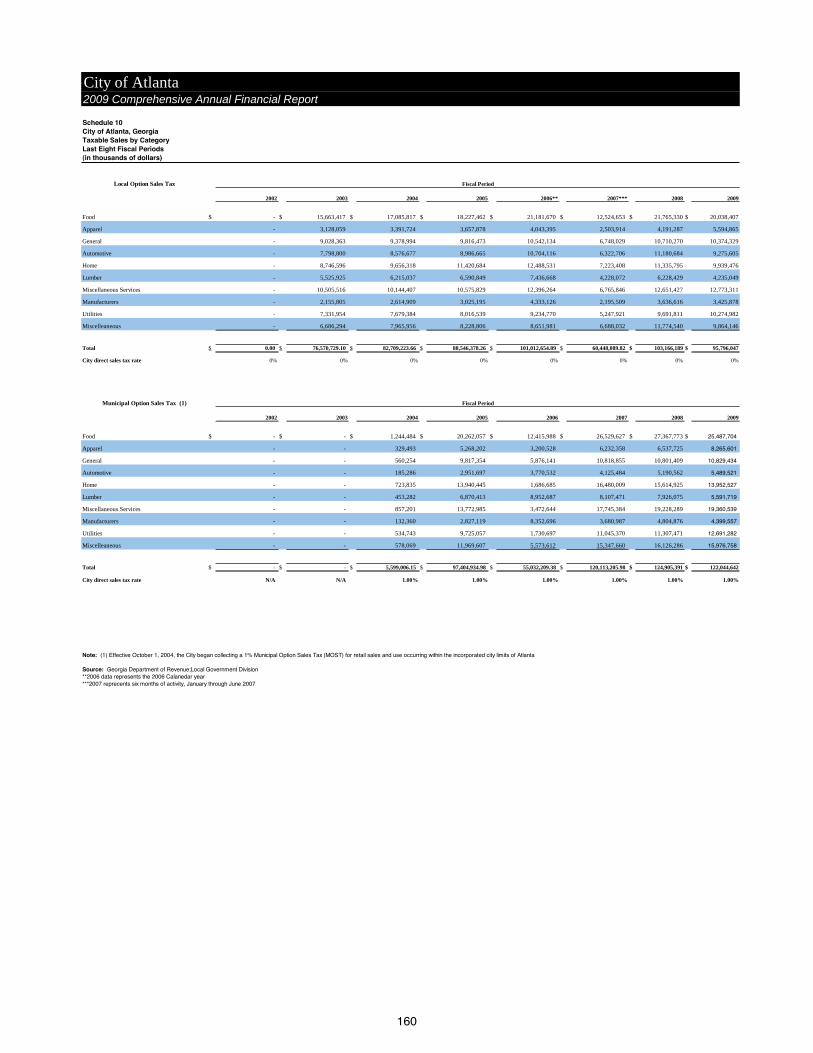
Schedule 10City of Atlanta, GeorgiaTaxable Sales by CategoryLast Eight Fiscal Periods(in thousands of dollars)
Local Option Sales Tax
2002 2003 2004 2005 2006** 2007*** 2008 2009
Food $ - $ 15,663,417 $ 17,085,817 $ 18,227,462 $ 21,181,670 $ 12,524,653 $ 21,765,330 $ 20,038,407
Apparel - 3,128,059 3,391,724 3,657,878 4,043,395 2,503,914 4,191,287 5,594,865
General - 9,028,363 9,378,994 9,816,473 10,542,134 6,748,029 10,710,270 10,374,329
Automotive - 7,798,800 8,576,677 8,986,665 10,704,116 6,322,706 11,180,684 9,275,605
Home - 8,746,596 9,656,318 11,420,684 12,488,531 7,223,408 11,335,795 9,939,476
Lumber - 5,525,925 6,215,037 6,590,849 7,436,668 4,228,072 6,228,429 4,235,049
Miscellaneous Services - 10,505,516 10,144,407 10,575,829 12,396,264 6,765,846 12,651,427 12,773,311
Manufacturers - 2,155,805 2,614,909 3,025,195 4,333,126 2,195,509 3,636,616 3,425,878
Utilities - 7,331,954 7,679,384 8,016,539 9,234,770 5,247,921 9,691,811 10,274,982
Miscelleaneous - 6,686,294 7,965,956 8,228,806 8,651,981 6,688,032 11,774,540 9,864,146
Total $ 0.00 $ 76,570,729.10 $ 82,709,223.66 $ 88,546,378.26 $ 101,012,654.89 $ 60,448,089.82 $ 103,166,189 $ 95,796,047
City direct sales tax rate 0% 0% 0% 0% 0% 0% 0% 0%
Municipal Option Sales Tax (1)
2002 2003 2004 2005 2006 2007 2008 2009
Food $ - $ - $ 1,244,484 $ 20,262,057 $ 12,415,988 $ 26,529,627 $ 27,367,773 $ 25,487,704
Apparel - - 329,493 5,268,202 3,200,528 6,232,358 6,537,725 8,265,601
General - - 560,254 9,817,354 5,876,141 10,818,855 10,801,409 10,829,434
Automotive - - 185,286 2,951,697 3,770,532 4,125,484 5,190,562 5,489,521
Home - - 723,835 13,940,445 1,686,685 16,480,009 15,614,925 13,952,527
Lumber - - 453,282 6,870,413 8,952,687 8,107,471 7,926,075 5,591,719
Miscellaneous Services - - 857,201 13,772,985 3,472,644 17,745,384 19,228,289 19,360,539
Manufacturers - - 132,360 2,827,119 8,352,696 3,680,987 4,804,876 4,399,557
Utilities - - 534,743 9,725,057 1,730,697 11,045,370 11,307,471 12,691,282
Miscelleaneous - - 578,069 11,969,607 5,573,612 15,347,660 16,126,286 15,976,758
Total $ - $ - $ 5,599,006.15 $ 97,404,934.98 $ 55,032,209.38 $ 120,113,205.98 $ 124,905,391 $ 122,044,642
City direct sales tax rate N/A N/A 1.00% 1.00% 1.00% 1.00% 1.00% 1.00%
Note: (1) Effective October 1, 2004, the City began collecting a 1% Municipal Option Sales Tax (MOST) for retail sales and use occurring within the incorporated city limits of Atlanta
Source: Georgia Department of Revenue;Local Government Division **2006 data represents the 2006 Calanedar year ***2007 reprecents six months of activity, January through June 2007
Fiscal Period
Fiscal Period
2009 Comprehensive Annual Financial ReportCity of Atlanta
160
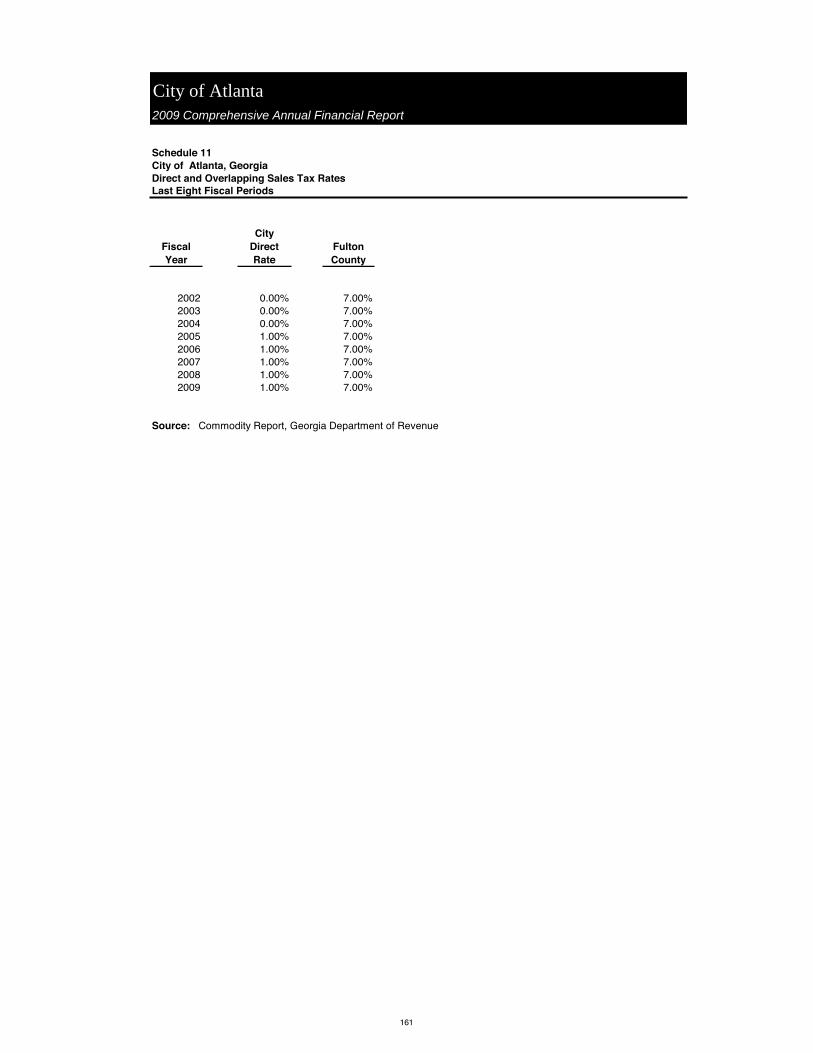
City of Atlanta 2009 Comprehensive Annual Financial Report
Schedule 11City of Atlanta, GeorgiaDirect and Overlapping Sales Tax RatesLast Eight Fiscal Periods
Fiscal Year
City Direct Rate
Fulton County
2002 0.00% 7.00%2003 0.00% 7.00%2004 0.00% 7.00%2005 1.00% 7.00%2006 1.00% 7.00%2007 1.00% 7.00%2008 1.00% 7.00%2009 1.00% 7.00%
Source: Commodity Report, Georgia Department of Revenue
161
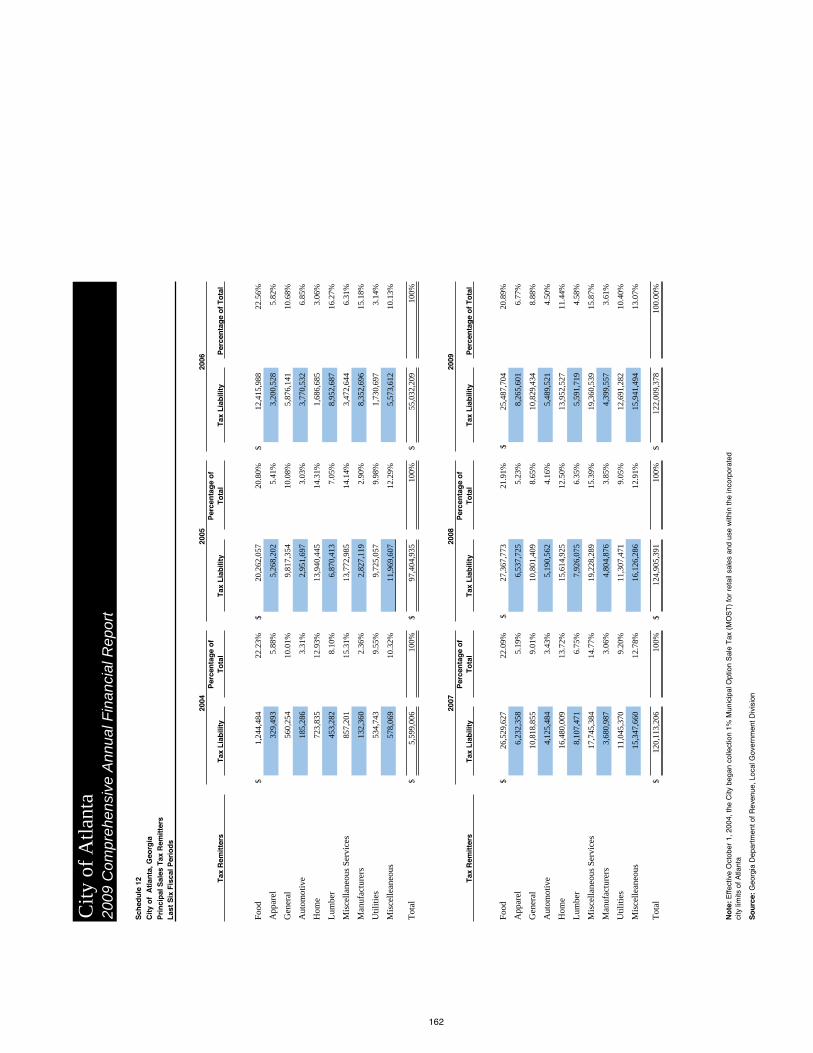
Sch
edu
le 1
2C
ity
of
Atl
anta
, Geo
rgia
Pri
nci
pal
Sal
es T
ax R
emit
ters
Las
t S
ix F
isca
l Per
iod
s
Tax
Rem
itte
rsT
ax L
iab
ility
Per
cen
tag
e o
f T
ota
lT
ax L
iab
ility
Per
cen
tag
e o
f T
ota
lT
ax L
iab
ility
Per
cen
tag
e o
f T
ota
l
Food
$1,
244,
484
22.2
3%$
20,2
62,0
5720
.80%
$12
,415
,988
22.5
6%
App
arel
329,
493
5.88
%5,
268,
202
5.41
%3,
200,
528
5.82
%
Gen
eral
560,
254
10.0
1%9,
817,
354
10.0
8%5,
876,
141
10.6
8%
Aut
omot
ive
185,
286
3.31
%2,
951,
697
3.03
%3,
770,
532
6.85
%
Hom
e72
3,83
512
.93%
13,9
40,4
4514
.31%
1,68
6,68
53.
06%
Lum
ber
453,
282
8.10
%6,
870,
413
7.05
%8,
952,
687
16.2
7%
Mis
cella
neou
s Se
rvic
es85
7,20
115
.31%
13,7
72,9
8514
.14%
3,47
2,64
46.
31%
Man
ufac
ture
rs13
2,36
02.
36%
2,82
7,11
92.
90%
8,35
2,69
615
.18%
Util
ities
534,
743
9.55
%9,
725,
057
9.98
%1,
730,
697
3.14
%
Mis
celle
aneo
us57
8,06
910
.32%
11,9
69,6
0712
.29%
5,57
3,61
210
.13%
Tot
al$
5,59
9,00
610
0%$
97,4
04,9
3510
0%$
55,0
32,2
0910
0%
Tax
Rem
itte
rsT
ax L
iab
ility
Per
cen
tag
e o
f T
ota
lT
ax L
iab
ility
Per
cen
tag
e o
f T
ota
lT
ax L
iab
ility
Per
cen
tag
e o
f T
ota
l
Food
$
26,5
29,6
2722
.09%
$27
,367
,773
21.9
1%$
25,4
87,7
0420
.89%
App
arel
6,23
2,35
85.
19%
6,53
7,72
55.
23%
8,26
5,60
16.
77%
Gen
eral
10,8
18,8
559.
01%
10,8
01,4
098.
65%
10,8
29,4
348.
88%
Aut
omot
ive
4,12
5,48
43.
43%
5,19
0,56
24.
16%
5,48
9,52
14.
50%
Hom
e16
,480
,009
13.7
2%15
,614
,925
12.5
0%13
,952
,527
11.4
4%
Lum
ber
8,10
7,47
16.
75%
7,92
6,07
56.
35%
5,59
1,71
94.
58%
Mis
cella
neou
s Se
rvic
es17
,745
,384
14.7
7%19
,228
,289
15.3
9%19
,360
,539
15.8
7%
Man
ufac
ture
rs3,
680,
987
3.06
%4,
804,
876
3.85
%4,
399,
557
3.61
%
Util
ities
11,0
45,3
709.
20%
11,3
07,4
719.
05%
12,6
91,2
8210
.40%
Mis
celle
aneo
us15
,347
,660
12.7
8%16
,126
,286
12.9
1%15
,941
,494
13.0
7%
Tot
al$
120,
113,
206
100%
$12
4,90
5,39
110
0%$
122,
009,
378
100.
00%
So
urc
e:G
eorg
ia D
epar
tmen
t of R
even
ue, L
ocal
Gov
ernm
ent D
ivis
ion
2009
2006
2005
2007
2008
No
te:
Effe
ctiv
e O
ctob
er 1
, 200
4, th
e C
ity b
egan
col
lect
ion
1% M
unic
ipal
Opt
ion
Sal
e T
ax (
MO
ST
) fo
r re
tail
sale
s an
d us
e w
ithin
the
inco
rpor
ated
city
lim
its o
f Atla
nta
City
of
Atla
nta
2009
Com
preh
ensi
ve A
nnua
l Fin
anci
al R
epor
t
162
2004

Sch
edu
le13
Cit
y o
f A
tlan
ta, G
eorg
iaR
atio
of
Ou
tsta
nd
ing
Deb
t b
y T
ype
Las
t E
igh
t F
isca
l Per
iod
s(a
mo
un
ts e
xpre
ssed
in t
ho
usa
nd
s, e
xcep
t p
er c
apit
a)
Fis
cal P
erio
d E
nd
ed
Gen
eral
O
blig
atio
n
Deb
t*
SW
MA
Rev
enu
e R
efu
nd
ing
B
on
ds
Lim
ited
O
blig
atio
n
Bo
nd
s*S
ecti
on
108
L
oan
sC
apit
al
Lea
ses
1990
GM
A
Lea
se P
oo
l19
98 G
MA
L
ease
Po
ol
2002
Cer
tifi
cate
s o
f P
arti
cip
atio
nC
ityw
ide
Rad
io S
yste
mIn
stal
lmen
t S
ale
Pro
gra
m
Inte
r-
Go
vern
men
tal
Ag
reem
ents
No
tes
Pay
able
Dec
embe
r 31
, 200
2$
2
38,5
10 $
25
,710
$
91
,500
$
14,6
60
$
-
$
59
7 $
18,4
76
$
53,7
85
$
5
,065
$
8
7,61
0 $
-
$
-
Dec
embe
r 31
, 200
3
239
,360
24,8
55
91,5
00
12,9
65
-
-
15,8
27
52
,560
-
8
3,28
0
-
-
Dec
embe
r 31
, 200
4
290
,365
23,9
65
90,9
35
11,2
50
-
3,05
3
32
,444
51,2
80
-
78,
780
-
-
Dec
embe
r 31
, 200
5
283
,865
23,0
35
2
18,7
40
9,5
15
5,8
35
10,0
54
32,4
44
49
,950
-
7
4,08
0
-
-
June
30,
200
6
283
,865
23,0
35
4
06,2
55
9,5
15
5,8
35
11,8
00
32,4
44
49
,950
-
7
4,08
0
-
-
June
30,
200
7
276
,510
22,0
60
3
96,6
75
8,2
00
4,4
99
9,0
55
32,4
44
48
,550
-
6
9,19
0
-
-
June
30,
200
8
296
,915
20,2
65
5
40,2
05
6,7
20
26,5
64
5,7
82
32,4
44
47
,080
-
6
3,99
5
1
6,37
3
17,0
00
June
30.
200
9
277
,190
20,2
65
6
52,0
75
6,1
75
69,0
05
5,7
82
32,4
44
45
,540
-
5
8,57
5
1
5,98
3
15,5
09
163
Fis
cal P
erio
d E
nd
ed
Fac
iliti
es
Rev
enu
e B
on
ds*
Bo
nd
A
nti
cip
atio
n
No
tes
Issu
ance
D
isco
un
ts
and
R
efu
nd
ing
L
oss
es
Sys
tem
R
even
ue
Bo
nd
sP
rem
ium
on
B
on
ds
Issu
ance
D
isco
un
ts
and
R
efu
nd
ing
L
oss
esG
EF
A N
ote
s P
ayab
leC
apit
al L
ease
O
blig
atio
n
San
itat
ion
F
un
d C
apit
al
Lea
se
Ob
ligat
ion
Un
der
gro
un
d
Atl
anta
Rev
enu
e
Bo
nd
s
Un
der
gro
un
d
Atl
anta
Cap
ital
L
ease
Tota
l Pri
mar
y G
ove
rnm
ent
Per
cen
tag
e o
f P
erso
nal
Inco
me
(a)
Per
Cap
ita
(a)
Dec
embe
r 31
, 200
2$
1,6
82,2
73 $
- $
-
$
1
,673
,966
$
-
$
- $
-
$
25
,579
$
5
,075
$
71,
625
$
-
$3,
994,
431
26.6
6%$
9,33
1
Dec
embe
r 31
, 200
3
1
,442
,984
3
95,0
00
(11
6,67
6)
1
,718
,110
-
(
41,5
44)
-
23,9
44
-
69,
190
-
4,
011,
355
26.7
7%9,
224
Dec
embe
r 31
, 200
4
2
,927
,307
-
1
,521
2
,558
,000
39
,867
-
-
22,2
99
3,2
17
6
5,33
0
-
6,19
9,61
3 40
.50%
14,0
23
Dec
embe
r 31
, 200
5
2
,805
,127
-
662
2
,542
,765
38
,881
-
23,3
73
20
,520
2
,205
61,
280
-
6,
202,
331
38.2
2%13
,734
June
30,
200
6
2
,984
,043
-
(19
)
2
,542
,765
38
,388
-
23,1
06
19
,614
1
,134
61,
280
-
6,
567,
090
37.9
3%14
,542
June
30,
200
7
2
,890
,474
-
(575
)
2
,518
,555
37
,402
-
95,7
01
17
,651
-
5
7,05
5
-
6,48
3,44
6 35
.20%
14,3
57
June
30,
200
8
2
,419
,898
(1
,037
)
2
,494
,575
35
,705
(34
,856
)
152
,073
15,7
10
-
52,
610
-
6,
174,
648
33.5
2%13
,366
June
30,
200
9
2
,343
,835
-
(1
,404
)
3
,218
,275
26
,680
(23
,350
)
148
,767
13,6
43
-
-
4
8,06
5 6,
893,
497
35.0
5%14
,443
(*)
Net
of a
ny d
isco
unt o
r pr
emiu
m
No
te:
Det
ails
reg
ardi
ng th
e C
ity's
out
stan
ding
deb
t can
be
foun
d in
the
note
s to
the
finan
cial
sta
tem
ents
.
(a)
See
Exh
ibit
D-1
for
pers
onal
inco
me
and
popu
latio
n da
ta.
Oth
er
Dep
arm
ent
of
Wat
ersh
ed M
anag
emen
tD
epar
tmen
t o
f A
viat
ion
City
of
Atla
nta
2009
Com
preh
ensi
ve A
nnua
l Fin
anci
al R
epor
t
Go
vern
men
tal A
ctiv
itie
s
Bu
sin
ess-
Typ
e A
ctiv
itie
s
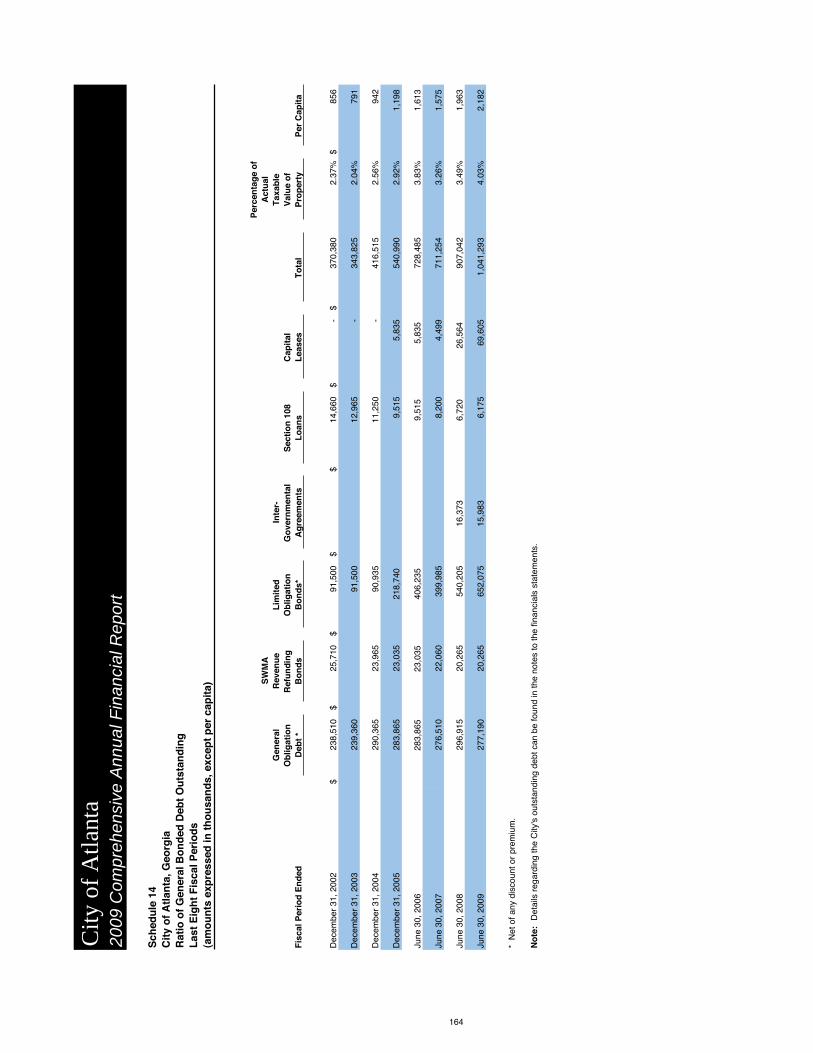
Sch
edu
le 1
4C
ity
of
Atl
anta
, Geo
rgia
Rat
io o
f G
ener
al B
on
ded
Deb
t O
uts
tan
din
gL
ast
Eig
ht
Fis
cal P
erio
ds
(am
ou
nts
exp
ress
ed in
th
ou
san
ds,
exc
ept
per
cap
ita)
Fis
cal P
erio
d E
nd
ed
Gen
eral
Ob
ligat
ion
Deb
t *
SW
MA
Rev
enu
eR
efu
nd
ing
Bo
nd
s
Lim
ited
Ob
ligat
ion
Bo
nd
s*
Inte
r-G
ove
rnm
enta
lA
gre
emen
tsS
ecti
on
108
L
oan
sC
apit
alL
ease
sT
ota
l
Per
cen
tag
e o
f A
ctu
alT
axab
leV
alu
e o
f P
rop
erty
Per
Cap
ita
Dec
embe
r 31
, 200
2$
238,
510
$25
,710
$91
,500
$
$14
,660
$-
$37
0,38
0
2.37
%$
856
Dec
embe
r 31
, 200
323
9,36
0
91
,500
12
,965
-
34
3,82
5
2.04
%79
1
Dec
embe
r 31
, 200
429
0,36
5
23
,965
90,9
35
11,2
50
-
416,
515
2.
56%
942
Dec
embe
r 31
, 200
528
3,86
5
23
,035
2
18,7
40
9,51
5
5,
835
54
0,99
0
2.92
%1,
198
June
30,
200
6
283,
865
2
3,03
5
406
,235
9,5
15
5,8
35
728,
485
3.
83%
1,61
3
June
30,
200
727
6,51
0
22
,060
399,
985
8,20
0
4,
499
71
1,25
4
3.26
%1,
575
164
June
30,
200
829
6,91
5
20
,265
540,
205
16,3
73
6,7
20
26,5
64
907,
042
3.49
%1,
963
June
30,
200
9
277,
190
20
,265
65
2,07
5
15,9
83
6,17
5
69,6
05
1,04
1,29
3
4.03
%
2,18
2
* N
et o
f any
dis
coun
t or
prem
ium
.
No
te:
Det
ails
reg
ardi
ng th
e C
ity's
out
stan
ding
deb
t can
be
foun
d in
the
note
s to
the
finan
cial
s st
atem
ents
.
City
of
Atla
nta
2009
Com
preh
ensi
ve A
nnua
l Fin
anci
al R
epor
t
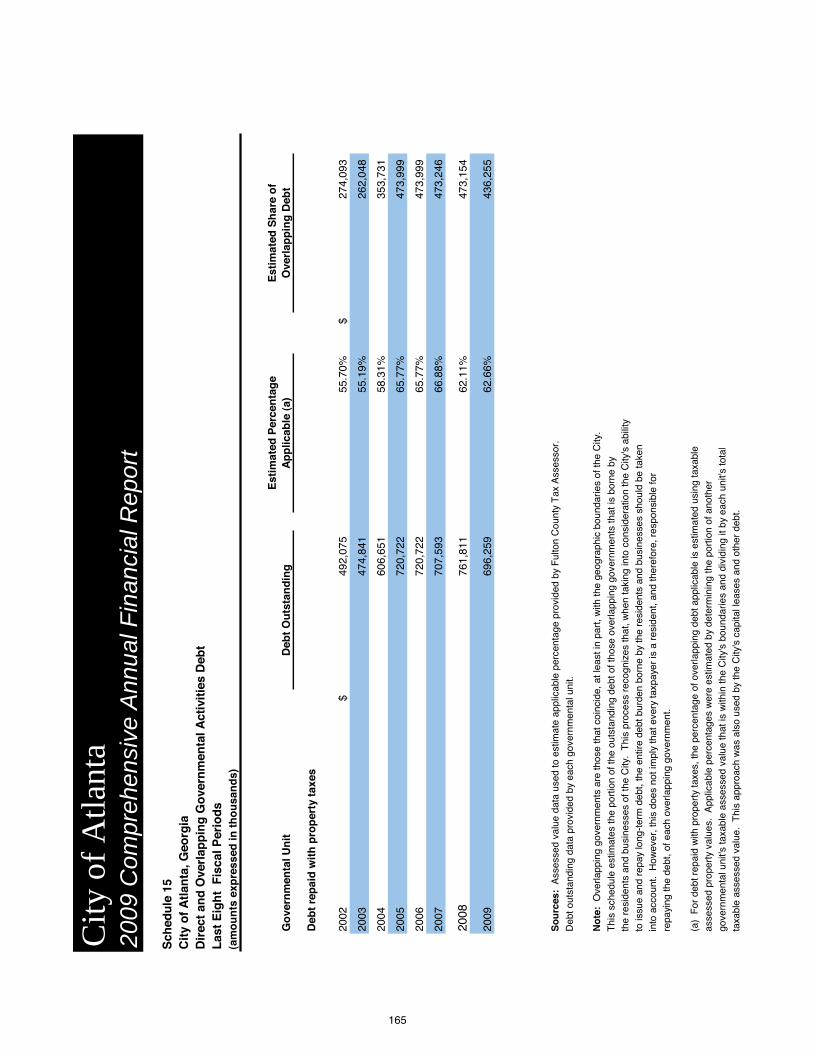
City
of
Atla
nta
2009
Com
preh
ensi
ve A
nnu
al F
inan
cial
Rep
ort
Sch
edu
le 1
5C
ity
of
Atl
anta
, Geo
rgia
Dir
ect
and
Ove
rlap
pin
g G
ove
rnm
enta
l Act
ivit
ies
Deb
tL
ast
Eig
ht
Fis
cal P
erio
ds
(am
ou
nts
exp
ress
ed in
th
ou
san
ds)
Go
vern
men
tal U
nit
Deb
t O
uts
tan
din
gE
stim
ated
Per
cen
tag
e A
pp
licab
le (
a)E
stim
ated
Sh
are
of
Ove
rlap
pin
g D
ebt
Deb
t re
pai
d w
ith
pro
per
ty t
axes
2002
$49
2,07
555
.70%
$27
4,09
3
2003
474,
841
55.1
9%26
2,04
8
2004
606,
651
58.3
1%35
3,73
1
2005
720,
722
65.7
7%47
3,99
9
2006
720,
722
65.7
7%47
3,99
9
2007
707,
593
66.8
8%47
3,24
6
2008
761,
811
62.1
1%47
3,15
4
2009
696,
259
62.6
6%43
6,25
5
So
urc
es:
Ass
esse
d va
lue
data
use
d to
est
imat
e ap
plic
able
per
cent
age
prov
ided
by
Ful
ton
Cou
nty
Tax
Ass
esso
r.
Deb
t out
stan
ding
dat
a pr
ovid
ed b
y ea
ch g
over
nmen
tal u
nit.
No
te:
Ove
rlapp
ing
gove
rnm
ents
are
thos
e th
at c
oinc
ide,
at l
east
in p
art,
with
the
geog
raph
ic b
ound
arie
s of
the
City
.
Thi
s sc
hedu
le e
stim
ates
the
port
ion
of th
e ou
tsta
ndin
g de
bt o
f tho
se o
verla
ppin
g go
vern
men
ts th
at is
bor
ne b
yth
e re
side
nts
and
busi
ness
es o
f the
City
. T
his
proc
ess
reco
gniz
es th
at, w
hen
taki
ng in
to c
onsi
dera
tion
the
City
's a
bilit
yto
issu
e an
d re
pay
long
-ter
m d
ebt,
the
entir
e de
bt b
urde
n bo
rne
by th
e re
side
nts
and
busi
ness
es s
houl
d be
take
nin
to a
ccou
nt.
How
ever
, thi
s do
es n
ot im
ply
that
eve
ry ta
xpay
er is
a r
esid
ent,
and
ther
efor
e, r
espo
nsib
le fo
rre
payi
ng th
e de
bt, o
f eac
h ov
erla
ppin
g go
vern
men
t.
(a)
For
deb
t rep
aid
with
pro
pert
y ta
xes,
the
perc
enta
ge o
f ove
rlapp
ing
debt
app
licab
le is
est
imat
ed u
sing
taxa
ble
asse
ssed
pro
pert
y va
lues
. A
pplic
able
per
cent
ages
wer
e es
timat
ed b
y de
term
inin
g th
e po
rtio
n of
ano
ther
gove
rnm
enta
l uni
t's ta
xabl
e as
sess
ed v
alue
that
is w
ithin
the
City
's b
ound
arie
s an
d di
vidi
ng it
by
each
uni
t's to
tal
taxa
ble
asse
ssed
val
ue.
Thi
s ap
proa
ch w
as a
lso
used
by
the
City
's c
apita
l lea
ses
and
othe
r de
bt.
165
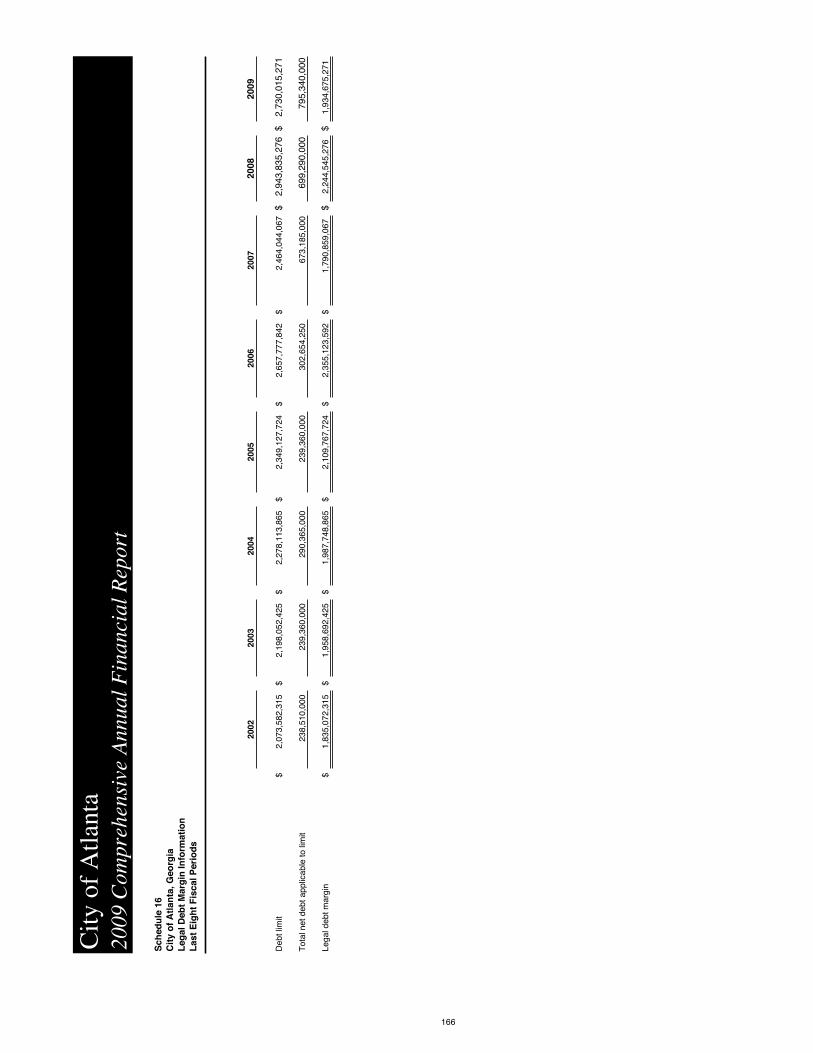
Sch
edu
le 1
6C
ity
of
Atl
anta
, Geo
rgia
Leg
al D
ebt
Mar
gin
Info
rmat
ion
Las
t E
igh
t F
isca
l Per
iod
s
2002
2003
2004
2005
2006
2007
2008
2009
Deb
t lim
it$
2,07
3,58
2,31
5
$2,
198,
052,
425
$
2,27
8,11
3,86
5
$2,
349,
127,
724
$2,
657,
777,
842
$
2,46
4,04
4,06
7$
2,94
3,83
5,27
6$
2,73
0,01
5,27
1
Tot
al n
et d
ebt a
pplic
able
to li
mit
238,
510,
000
239,
360,
000
290,
365,
000
239,
360,
000
30
2,65
4,25
0
67
3,18
5,00
069
9,29
0,00
079
5,34
0,00
0
Lega
l deb
t mar
gin
$1,
835,
072,
315
$
1,95
8,69
2,42
5
$1,
987,
748,
865
$
2,10
9,76
7,72
4
$
2,35
5,12
3,59
2
$1,
790,
859,
067
$
2,24
4,54
5,27
6$
1,93
4,67
5,27
1
166
City
of
Atla
nta
2009
Com
preh
ensi
ve A
nnua
l Fin
anci
al R
epor
t
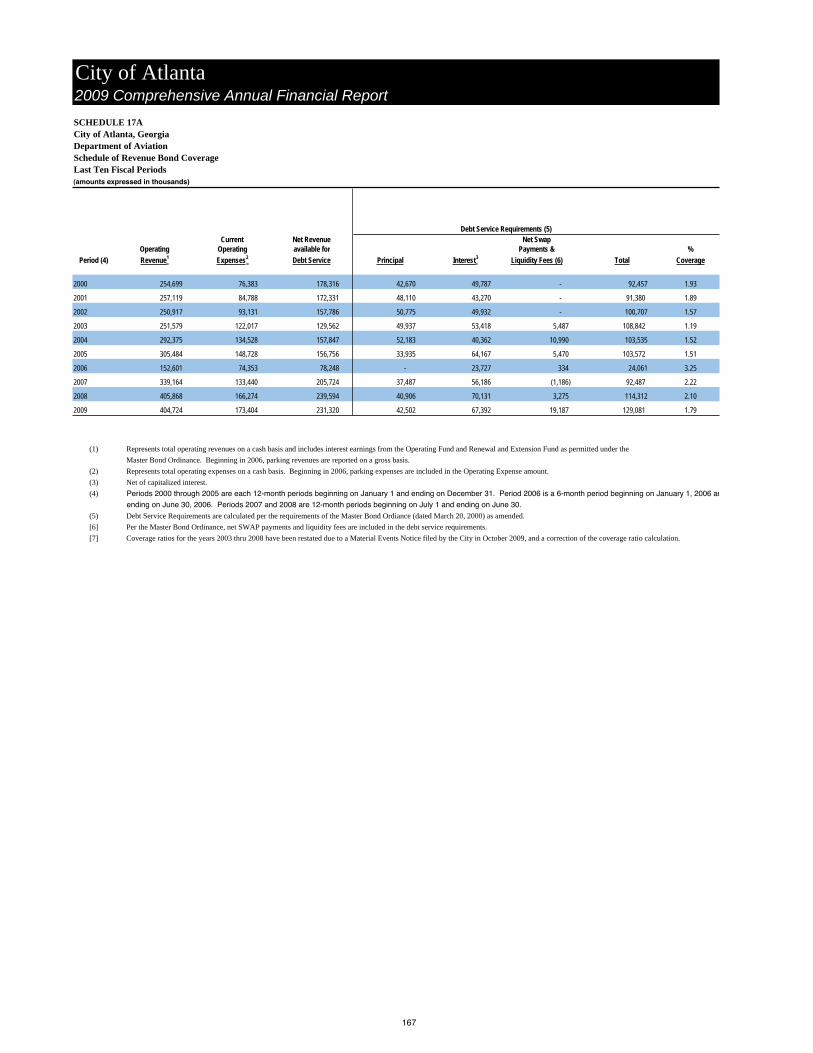
SCHEDULE 17ACity of Atlanta, GeorgiaDepartment of AviationSchedule of Revenue Bond CoverageLast Ten Fiscal Periods(amounts expressed in thousands)
Debt Service Requirements (5)Current Net Revenue Net Swap
Operating Operating available for Payments & %
Period (4) Revenue1 Expenses2 Debt Service Principal Interest3 Liquidity Fees (6) Total Coverage
2000 254,699 76,383 178,316 42,670 49,787 - 92,457 1.93
2001 257,119 84,788 172,331 48,110 43,270 - 91,380 1.89
2002 250,917 93,131 157,786 50,775 49,932 - 100,707 1.57
2003 251,579 122,017 129,562 49,937 53,418 5,487 108,842 1.19
2004 292,375 134,528 157,847 52,183 40,362 10,990 103,535 1.52
2005 305,484 148,728 156,756 33,935 64,167 5,470 103,572 1.51
2006 152,601 74,353 78,248 - 23,727 334 24,061 3.25
2007 339,164 133,440 205,724 37,487 56,186 (1,186) 92,487 2.22
2008 405,868 166,274 239,594 40,906 70,131 3,275 114,312 2.10
2009 404,724 173,404 231,320 42,502 67,392 19,187 129,081 1.79
(1) Represents total operating revenues on a cash basis and includes interest earnings from the Operating Fund and Renewal and Extension Fund as permitted under the
Master Bond Ordinance. Beginning in 2006, parking revenues are reported on a gross basis.
(2) Represents total operating expenses on a cash basis. Beginning in 2006, parking expenses are included in the Operating Expense amount.
(3) Net of capitalized interest.
(4) Periods 2000 through 2005 are each 12-month periods beginning on January 1 and ending on December 31. Period 2006 is a 6-month period beginning on January 1, 2006 an
ending on June 30, 2006. Periods 2007 and 2008 are 12-month periods beginning on July 1 and ending on June 30.
(5) Debt Service Requirements are calculated per the requirements of the Master Bond Ordiance (dated March 20, 2000) as amended.
[6] Per the Master Bond Ordinance, net SWAP payments and liquidity fees are included in the debt service requirements.
[7] Coverage ratios for the years 2003 thru 2008 have been restated due to a Material Events Notice filed by the City in October 2009, and a correction of the coverage ratio calculation.
City of Atlanta 2009 Comprehensive Annual Financial Report
167

2009 Comprehensive Annual Financial Report
Schedule 17BCity of Atlanta, GeorgiaDepartment of Watershed ManagementSchedule of Revenue Bond CoverageLast Ten Fiscal Periods(amounts expressed in thousands)
Current Net RevenueOperating Operating available for Coverage
Period1 Revenue2 Expenses3 Debt Service Principal4 Interest Total Ratio
2000 $ 208,463 $ 125,968 $ 82,495 $ 10,000 $ 30,959 $ 40,959 2.01
2001 185,957 121,102 64,855 10,000 29,334 39,334 1.65
2002 240,954 121,732 119,222 - 42,420 42,420 2.81
2003 227,441 137,284 90,157 325 69,667 69,992 1.29
2004 287,778 133,146 154,632 9,375 82,284 91,659 1.69
2005 385,697 159,081 226,616 10,655 81,519 92,174 2.46
2006 189,844 96,345 93,499 0 61,842 61,842 1.51
2007 435,715 240,848 194,867 24,210 128,435 152,645 1.28
2008 460,285 236,316 223,969 27,647 126,285 153,932 1.45
2009 498,216 220,962 277,254 26,300 127,452 153,752 1.80
(1)
(2)
(3) Total operating expenses exclusive of the payment in lieu of taxes and franchise fee, depreciation and amortization, and contingent liability.
(4) Annual debt service includes sinking fund requirements of the Water and Sewerage Revenue Fund net of capitalized interest
City of Atlanta
Fiscal years 1999 thru 2005 is a 12 month periods beginning January 1 and ending December 31. Fiscal year 2006 is a six month period beginning January 1, 2006 and ending June 30, 2006. Fiscal year 2007 thru 2009 are each 12 month periods beginning July 1 and ending June 30.Total operation revenue plus investment income and sales tax (Sales Tax Revenue in the amount of $117 million was transferred for Special Revenue Fund to DWM for operating expenses.)
168
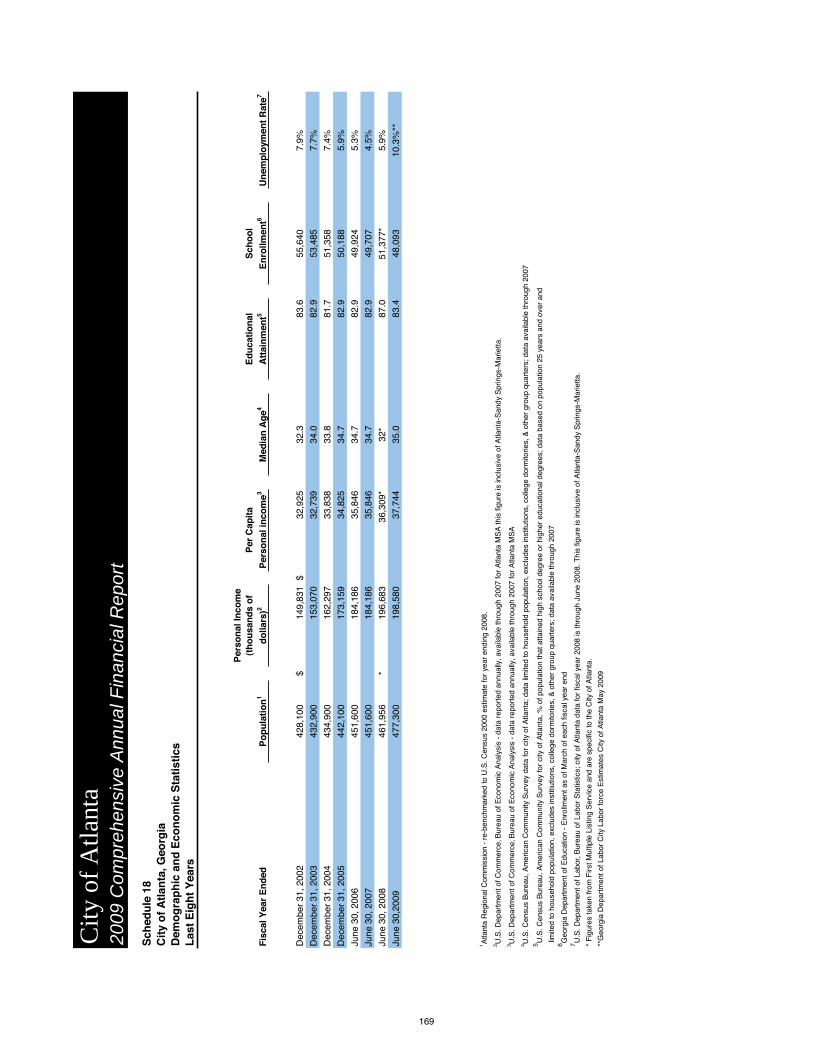
Sch
edu
le 1
8C
ity
of
Atl
anta
, Geo
rgia
Dem
og
rap
hic
an
d E
con
om
ic S
tati
stic
sL
ast
Eig
ht
Yea
rs
Fis
cal Y
ear
En
ded
Po
pu
lati
on
1
Per
son
al In
com
e (t
ho
usa
nd
s o
f d
olla
rs)2
Per
Cap
ita
Per
son
al in
com
e3M
edia
n A
ge4
Ed
uca
tio
nal
A
ttai
nm
ent5
Sch
oo
l E
nro
llmen
t6U
nem
plo
ymen
t R
ate7
Dec
embe
r 31
, 200
242
8,10
0 $
149,
831
$32
,925
32
.3
83.6
55
,640
7.
9%
Dec
embe
r 31
, 200
343
2,90
0 15
3,07
0 32
,739
34
.0
82.9
53
,485
7.
7%
Dec
embe
r 31
, 200
443
4,90
0 16
2,29
7 33
,838
33
.8
81.7
51
,358
7.
4%
Dec
embe
r 31
, 200
544
2,10
0 17
3,15
9 34
,825
34
.7
82.9
50
,188
5.
9%
June
30,
200
645
1,60
0 18
4,18
6 35
,846
34
.7
82.9
49
,924
5.
3%
June
30,
200
745
1,60
0 18
4,18
6 35
,846
34
.7
82.9
49
,707
4.
5%
June
30,
200
846
1,95
6 *
196,
683
36,3
09*
32*
87.0
51
,377
*5.
9%
June
30,
2009
477,
300
198,
580
37,7
44
35.0
83
.4
48,0
93
10.3
%**
169
1 Atla
nta
Reg
iona
l Com
mis
sion
- r
e-be
nchm
arke
d to
U.S
. Cen
sus
2000
est
imat
e fo
r ye
ar e
ndin
g 20
08.
2 U.S
. Dep
artm
ent o
f Com
mer
ce, B
urea
u of
Eco
nom
ic A
naly
sis
- da
ta r
epor
ted
annu
ally
, ava
ilabl
e th
roug
h 20
07 fo
r A
tlant
a M
SA
this
figu
re is
incl
usiv
e of
Atla
nta-
San
dy S
prin
gs-M
arie
tta.
3 U.S
. Dep
artm
ent o
f Com
mer
ce, B
urea
u of
Eco
nom
ic A
naly
sis
- da
ta r
epor
ted
annu
ally
, ava
ilabl
e th
roug
h 20
07 fo
r A
tlant
a M
SA
4 U.S
. Cen
sus
Bur
eau,
Am
eric
an C
omm
unity
Sur
vey
data
for
city
of A
tlant
a; d
ata
limite
d to
hou
seho
ld p
opul
atio
n, e
xclu
des
inst
itutio
ns, c
olle
ge d
orm
itorie
s, &
oth
er g
roup
qua
rter
s; d
ata
avai
labl
e th
roug
h 20
075 U
.S. C
ensu
s B
urea
u, A
mer
ican
Com
mun
ity S
urve
y fo
r ci
ty o
f Atla
nta,
% o
f pop
ulat
ion
that
atta
ined
hig
h sc
hool
deg
ree
or h
ighe
r ed
ucat
iona
l deg
rees
; dat
a ba
sed
on p
opul
atio
n 25
yea
rs a
nd o
ver
and
lim
ited
to h
ouse
hold
pop
ulat
ion,
exc
lude
s in
stiti
utio
ns, c
olle
ge d
orm
itorie
s, &
oth
er g
roup
qua
rter
s; d
ata
avai
labl
e th
roug
h 20
076 G
eorg
ia D
epar
tmen
t of E
duca
tion
- E
nrol
lmen
t as
of M
arch
of e
ach
fisca
l yea
r en
d7 U
.S. D
epar
tmen
t of L
abor
, Bur
eau
of L
abor
Sta
tistic
s; c
ity o
f Atla
nta
data
for
fisca
l yea
r 20
08 is
thro
ugh
June
200
8. T
his
figur
e is
incl
usiv
e of
Atla
nta-
San
dy S
prin
gs-M
arie
tta.
* F
igur
es ta
ken
from
Firs
t Mul
tiple
Lis
ting
Ser
vice
and
are
spe
cific
to th
e C
ity o
f Atla
nta.
**G
eorg
ia D
epar
tmen
t of L
abor
City
Lab
or fo
rce
Est
imat
es C
ity o
f Atla
nta
May
200
9
City
of
Atla
nta
2009
Com
preh
ensi
ve A
nnua
l Fin
anci
al R
epor
t
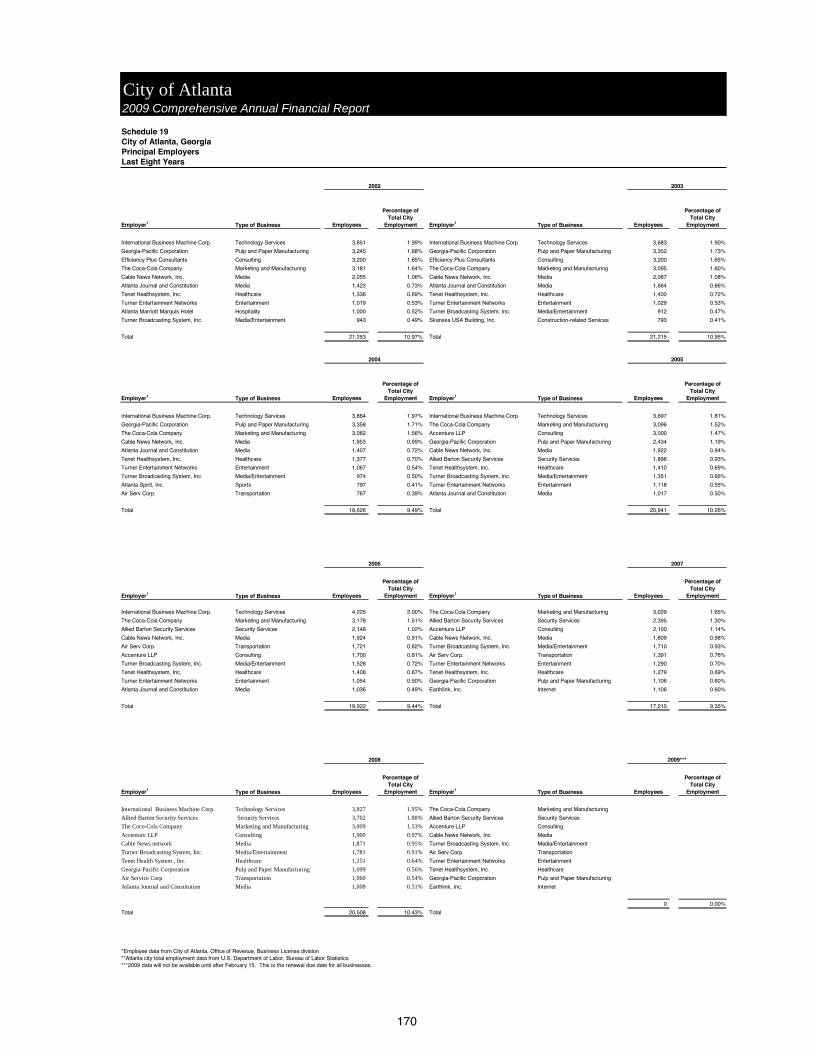
2009 Comprehensive Annual Financial Report
Schedule 19City of Atlanta, GeorgiaPrincipal EmployersLast Eight Years
Employer1 Type of Business Employees
Percentage of Total City
Employment Employer1 Type of Business Employees
Percentage of Total City
Employment
International Business Machine Corp. Technology Services 3,851 1.99% International Business Machine Corp. Technology Services 3,683 1.90%
Georgia-Pacific Corporation Pulp and Paper Manufacturing 3,245 1.68% Georgia-Pacific Corporation Pulp and Paper Manufacturing 3,352 1.73%
Efficiency Plus Consultants Consulting 3,200 1.65% Efficiency Plus Consultants Consulting 3,200 1.65%
The Coca-Cola Company Marketing and Manufacturing 3,181 1.64% The Coca-Cola Company Marketing and Manufacturing 3,095 1.60%
Cable News Network, Inc. Media 2,055 1.06% Cable News Network, Inc. Media 2,087 1.08%
Atlanta Journal and Constitution Media 1,423 0.73% Atlanta Journal and Constitution Media 1,664 0.86%
Tenet Healthsystem, Inc. Healthcare 1,336 0.69% Tenet Healthsystem, Inc. Healthcare 1,400 0.72%
Turner Entertainment Networks Entertainment 1,019 0.53% Turner Entertainment Networks Entertainment 1,029 0.53%
Atlanta Marriott Marquis Hotel Hospitality 1,000 0.52% Turner Broadcasting System, Inc. Media/Entertainment 912 0.47%
Turner Broadcasting System, Inc. Media/Entertainment 943 0.49% Skanska USA Building, Inc. Construction-related Services 793 0.41%
Total 21,253 10.97% Total 21,215 10.95%
Employer1 Type of Business Employees
Percentage of Total City
Employment Employer1 Type of Business Employees
Percentage of Total City
Employment
International Business Machine Corp. Technology Services 3,864 1.97% International Business Machine Corp. Technology Services 3,697 1.81%
Georgia-Pacific Corporation Pulp and Paper Manufacturing 3,358 1.71% The Coca-Cola Company Marketing and Manufacturing 3,096 1.52%
The Coca-Cola Company Marketing and Manufacturing 3,062 1.56% Accenture LLP Consulting 3,000 1.47%
Cable News Network, Inc. Media 1,953 0.99% Georgia-Pacific Corporation Pulp and Paper Manufacturing 2,434 1.19%
Atlanta Journal and Constitution Media 1,407 0.72% Cable News Network, Inc. Media 1,922 0.94%
Tenet Healthsystem, Inc. Healthcare 1,377 0.70% Allied Barton Security Services Security Services 1,896 0.93%
Turner Entertainment Networks Entertainment 1,067 0.54% Tenet Healthsystem, Inc. Healthcare 1,410 0.69%
Turner Broadcasting System, Inc. Media/Entertainment 974 0.50% Turner Broadcasting System, Inc. Media/Entertainment 1,351 0.66%
Atlanta Spirit, Inc. Sports 797 0.41% Turner Entertainment Networks Entertainment 1,118 0.55%
Air Serv Corp. Transportation 767 0.39% Atlanta Journal and Constitution Media 1,017 0.50%
Total 18,626 9.49% Total 20,941 10.26%
193,820 196,352
Employer1 Type of Business Employees
Percentage of Total City
Employment Employer1 Type of Business Employees
Percentage of Total City
Employment
International Business Machine Corp. Technology Services 4,225 2.00% The Coca-Cola Company Marketing and Manufacturing 3,029 1.65%
The Coca-Cola Company Marketing and Manufacturing 3,178 1.51% Allied Barton Security Services Security Services 2,395 1.30%
Allied Barton Security Services Security Services 2,148 1.02% Accenture LLP Consulting 2,100 1.14%
Cable News Network, Inc. Media 1,924 0.91% Cable News Network, Inc. Media 1,809 0.98%
Air Serv Corp. Transportation 1,721 0.82% Turner Broadcasting System, Inc. Media/Entertainment 1,710 0.93%
Accenture LLP Consulting 1,700 0.81% Air Serv Corp. Transportation 1,391 0.76%
Turner Broadcasting System, Inc. Media/Entertainment 1,528 0.72% Turner Entertainment Networks Entertainment 1,290 0.70%
Tenet Healthsystem, Inc. Healthcare 1,408 0.67% Tenet Healthsystem, Inc. Healthcare 1,279 0.69%
Turner Entertainment Networks Entertainment 1,054 0.50% Georgia-Pacific Corporation Pulp and Paper Manufacturing 1,106 0.60%
Atlanta Journal and Constitution Media 1,036 0.49% Earthlink, Inc. Internet 1,106 0.60%
Total 19,922 9.44% Total 17,215 9.35%
204,066 210992
Employer1 Type of Business Employees
Percentage of Total City
Employment Employer1 Type of Business Employees
Percentage of Total City
Employment
International Business Machine Corp. Technology Services 3,827 1.95% The Coca-Cola Company Marketing and Manufacturing
Allied Barton Security Services Security Services 3,702 1.88% Allied Barton Security Services Security Services
The Coco-Cola Company Marketing and Manufacturing 3,009 1.53% Accenture LLP Consulting
Accenture LLP Consulting 1,900 0.97% Cable News Network, Inc. Media
Cable News network Media 1,871 0.95% Turner Broadcasting System, Inc. Media/Entertainment
Turner Broadcasting System, Inc. Media/Entertainment 1,781 0.91% Air Serv Corp. Transportation
Tenet Health System , Inc. Healthcare 1,251 0.64% Turner Entertainment Networks Entertainment
Georgia-Pacific Corporation Pulp and Paper Manufacturing 1,099 0.56% Tenet Healthsystem, Inc. Healthcare
Air Service Corp Transportation 1,060 0.54% Georgia-Pacific Corporation Pulp and Paper Manufacturing
Atlanta Journal and Constitution Media 1,008 0.51% Earthlink, Inc. Internet
0 0.00%
Total 20,508 10.43% Total
184,107.00 184,107.00
*Employee data from City of Atlanta, Office of Revenue, Business License division**Atlanta city total employment data from U.S. Department of Labor, Bureau of Labor Statistics***2009 data will not be available until after February 15. This is the renewal due date for all businesses.
2003
City of Atlanta
2004 2005
2002
2008 2009***
2006 2007
170

Schedule 20City of Atlanta, GeorgiaFull-time Equivalent City Government Employees by Function/ProgramLast Eight Fiscal Periods
2002 2003 2004 2005 2006 2007 2008 2009
General GovernmentMayors Office 2 4 4 4 4 4 3 3City Council 48 48 48 49 49 46 42 39Finance 183 200 187 200 239 233 210 183Planning 346 303 310 322 354 388 295 227Procurement 0 39 49 50 56 56 50 40Human Resources 59 50 49 53 73 74 73 62
PoliceOfficers 1,481 1,478 1,558 1,585 1,647 1,780 1,836 1,786Civilian 443 441 466 473 483 527 543 434
FireOfficers 914 899 949 976 1,005 1,054 1,070 939Civilian 61 61 63 65 67 83 49 38
Corrections 507 321 454 551 615 620 560 473
Public WorksStreets 624 438 354 358 358 416 399 468Refuse collection 508 426 418 418 418 453 452 385
Parks, Recreation and Cultural Affairs 90 331 341 346 405 405 441 377
Water/Wastewater 655 591 1,064 1,133 1,351 1,547 1,964 1,816
Aviation 451 488 593 606 633 690 707
Total full-time equivalent employees 5,921 6,081 6,802 7,176 7,730 8,319 8,677 7,977
Sources: Department of Human Resources and MSO (Police and Fire)
Fiscal Period
City of Atlanta 2009 Comprehensive Annual Financial Report
171
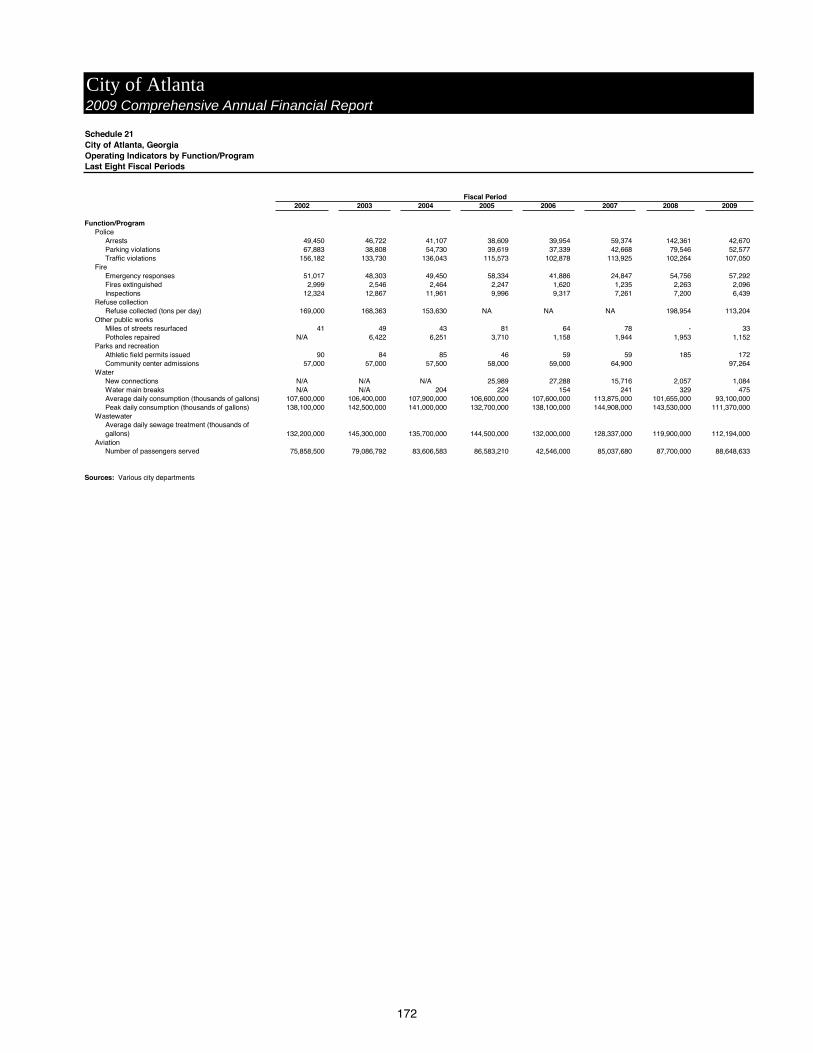
Schedule 21City of Atlanta, GeorgiaOperating Indicators by Function/ProgramLast Eight Fiscal Periods
2002 2003 2004 2005 2006 2007 2008 2009
Function/ProgramPolice
Arrests 49,450 46,722 41,107 38,609 39,954 59,374 142,361 42,670Parking violations 67,883 38,808 54,730 39,619 37,339 42,668 79,546 52,577Traffic violations 156,182 133,730 136,043 115,573 102,878 113,925 102,264 107,050
FireEmergency responses 51,017 48,303 49,450 58,334 41,886 24,847 54,756 57,292Fires extinguished 2,999 2,546 2,464 2,247 1,620 1,235 2,263 2,096Inspections 12,324 12,867 11,961 9,996 9,317 7,261 7,200 6,439
Refuse collectionRefuse collected (tons per day) 169,000 168,363 153,630 NA NA NA 198,954 113,204
Other public worksMiles of streets resurfaced 41 49 43 81 64 78 - 33Potholes repaired N/A 6,422 6,251 3,710 1,158 1,944 1,953 1,152
Parks and recreationAthletic field permits issued 90 84 85 46 59 59 185 172Community center admissions 57,000 57,000 57,500 58,000 59,000 64,900 97,264
WaterNew connections N/A N/A N/A 25,989 27,288 15,716 2,057 1,084Water main breaks N/A N/A 204 224 154 241 329 475Average daily consumption (thousands of gallons) 107,600,000 106,400,000 107,900,000 106,600,000 107,600,000 113,875,000 101,655,000 93,100,000Peak daily consumption (thousands of gallons) 138,100,000 142,500,000 141,000,000 132,700,000 138,100,000 144,908,000 143,530,000 111,370,000
WastewaterAverage daily sewage treatment (thousands of gallons) 132,200,000 145,300,000 135,700,000 144,500,000 132,000,000 128,337,000 119,900,000 112,194,000
AviationNumber of passengers served 75,858,500 79,086,792 83,606,583 86,583,210 42,546,000 85,037,680 87,700,000 88,648,633
Sources: Various city departments
Fiscal Period
City of Atlanta 2009 Comprehensive Annual Financial Report
172
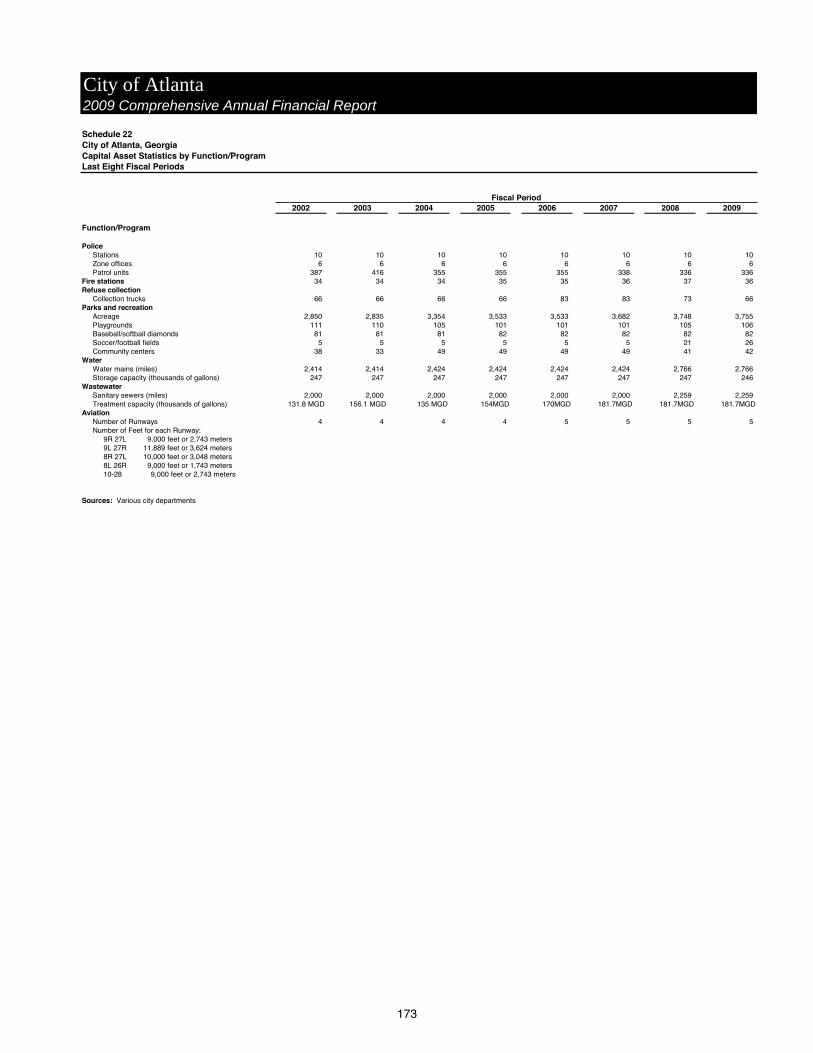
Schedule 22City of Atlanta, GeorgiaCapital Asset Statistics by Function/ProgramLast Eight Fiscal Periods
2002 2003 2004 2005 2006 2007 2008 2009
Function/Program
PoliceStations 10 10 10 10 10 10 10 10Zone offices 6 6 6 6 6 6 6 6Patrol units 387 416 355 355 355 338 336 336
Fire stations 34 34 34 35 35 36 37 36Refuse collection
Collection trucks 66 66 66 66 83 83 73 66Parks and recreation
Acreage 2,850 2,835 3,354 3,533 3,533 3,682 3,748 3,755Playgrounds 111 110 105 101 101 101 105 106Baseball/softball diamonds 81 81 81 82 82 82 82 82Soccer/football fields 5 5 5 5 5 5 21 26Community centers 38 33 49 49 49 49 41 42
WaterWater mains (miles) 2,414 2,414 2,424 2,424 2,424 2,424 2,766 2,766Storage capacity (thousands of gallons) 247 247 247 247 247 247 247 246
WastewaterSanitary sewers (miles) 2,000 2,000 2,000 2,000 2,000 2,000 2,259 2,259Treatment capacity (thousands of gallons) 131.8 MGD 156.1 MGD 135 MGD 154MGD 170MGD 181.7MGD 181.7MGD 181.7MGD
AviationNumber of Runways 4 4 4 4 5 5 5 5Number of Feet for each Runway:
9R 27L 9,000 feet or 2,743 meters9L 27R 11,889 feet or 3,624 meters8R 27L 10,000 feet or 3,048 meters8L 26R 9,000 feet or 1,743 meters10-28 9,000 feet or 2,743 meters
Sources: Various city departments
City of Atlanta
Fiscal Period
2009 Comprehensive Annual Financial Report
173