interepochal changes in summer precipitation in the southeastern united states: evidence of possible...
TRANSCRIPT
Interepochal Changes in Summer Precipitation in the Southeastern United States:Evidence of Possible Urban Effects near Atlanta, Georgia
JEREMY E. DIEM
Department of Anthropology and Geography, Georgia State University, Atlanta, Georgia
THOMAS L. MOTE
Department of Geography, University of Georgia, Athens, Georgia
(Manuscript received 14 June 2004, in final form 9 September 2004)
ABSTRACT
Through modification of the planetary boundary layer, urbanization has the potential to have a significantimpact on precipitation totals locally. Using daily summer-season precipitation data at 30 stations from 1953to 2002, this study explores the possibility of urban effects as causes of spatial anomalies in precipitation ina zone within 180 km of Atlanta, Georgia. The time period is divided into consecutive epochs (e.g., 1953–77and 1978–2002), and interepochal differences in precipitation totals, heavy-precipitation days, cumulativeheavy precipitation, and atmospheric conditions are explored. The southern stations experienced significantdecreases in precipitation, whereas significant precipitation increases occurred at central/west-central sta-tions. The most striking increases occurred at Norcross, Georgia, which is �30 km northeast of downtownAtlanta; Norcross had the third smallest number of heavy-precipitation days during 1953–77, but, during1978–2002, it had the most heavy-precipitation days. Not only did the amount of urban land cover upwindof Norcross increase substantially from the earlier to the later epochs, but regionwide dewpoint tempera-tures also increased significantly. Therefore, it is suspected that the increased precipitation at Norcross wascaused by urban effects, and these effects may have been enhanced by increased atmospheric humidity.
1. Introduction
Changes in land cover and land use can have a sig-nificant impact on land–atmosphere interactions. Inturn, changes in those interactions can cause climaticchanges, such as changes in precipitation. The initiationand enhancement of convective clouds—and, subse-quently, precipitation modification—can occur in con-cert with other changes in landscape heterogeneity(Rabin et al. 1990), such as through the juxtaposition ofcrop lands and forest lands (Brown and Arnold 1998),irrigated lands and grasslands (Barnston andSchickedanz 1984), and urban lands and rural lands(e.g., Changnon 1981). Therefore, urbanization is oneof the land-altering processes that can lead to changesin precipitation characteristics.
In theoretical terms, land cover and land use changesassociated with urbanization have the potential to ini-tiate and enhance precipitation, which, by way of thun-derstorms, has deleterious impacts on society through
increased flooding, soil erosion, and lightning strikes.Changnon et al. (1976) lists the major potential causesof precipitation enhancement as 1) increased cloud con-densation nuclei (CCN) and ice nuclei; 2) increasedsurface roughness, which results in low-level conver-gence and upward vertical velocities; and 3) increasedsurface temperatures [i.e., urban heat island (UHI)].Empirical work and modeling work suggest that pre-cipitation enhancement is caused primarily by the heatisland and increased surface roughness; the relativelydeep urban planetary boundary layer (PBL) is advecteddownwind of the urban area (in Auer 1981; Hjelmfelt1982). Using multiple numerical modeling simulationsthat only accounted for the UHI, Baik et al. (2001)demonstrated that UHI-forced convection can causeprecipitation downwind of the UHI. In another precipi-tation-initiation study, however, Rozoff et al. (2003)concluded that the effects of increased surface rough-ness and the UHI may not be additive, because surfaceroughness may weaken the UHI. Regarding CCN, thepositive effect of urban CCN on precipitation is notdefinite; in fact, Rosenfeld (2000) noted that particlesemitted by industrial sources can cause small clouddroplets to form, which does not promote precipitationenhancement.
Corresponding author address: Dr. Jeremy E. Diem, Depart-ment of Anthropology and Geography, Georgia State University,Atlanta, GA 30303-3083.E-mail: [email protected]
MAY 2005 D I E M A N D M O T E 717
© 2005 American Meteorological Society
JAM2221
The Metropolitan Meteorological Experiment(METROMEX) study, which was an intensive fieldcampaign conducted in the St. Louis, Missouri, areafrom 1971 to 1975, mostly during June, July, and Au-gust, uncovered a strong relationship between urbanland cover and precipitation enhancement [see Chang-non (1981) for a review]. Rainfall downwind of St.Louis substantially exceeded rainfall upwind of the city.The rainfall difference was most pronounced for heavy-rainfall events—downwind locales had 2 times as manyheavy-rainfall events as did upwind locales (Semonin1981). Major conclusions from the 5-yr project were asfollows: 1) urban convective clouds, when comparedwith rural clouds, generally reached greater heights,lasted longer, and were more likely to merge with otherclouds (Braham 1981); 2) although precipitation en-hancement occurred with a variety of storm systems,enhancement resulted primarily from heavy rains froma relatively small number of squall-line storms (Braham1981); and 3) enhancement also occurred through theinitiation of new storm cells over the city (Changnon etal. 1976). It was generally concluded that precipitationenhancement downwind of St. Louis resulted mostlyfrom the modification of boundary layer dynamics fromthermal and frictional forcing resulting from urban landcover (Braham 1981).
Over the past 40 yr, urban precipitation research inthe United States has not been confined to the St. Louisarea; however, research in other U.S. urban areas hasnot been as rigorous, and thus it has been more open tocriticism. For example, research has been conducted inChicago, Illinois; Cleveland, Ohio; Houston, Texas; In-dianapolis, Indiana; New Orleans, Louisiana; Tulsa,Oklahoma; Washington, D.C. (Huff and Changnon1973); Detroit, Michigan (Sanderson and Gorski 1978);and Pittsburgh, Pennsylvania (Rosenberger and Suck-ling 1989). Based on a thorough critique of urban pre-cipitation studies, Lowry (1998) noted that the urbaneffects being sought usually cannot be distinguishedfrom those of other influences, such as local topographyand temporal changes in the relative frequencies of dif-ferent synoptic weather types. Even the downwind in-crease in precipitation observed during METROMEXmight be explained partially by increased topographicrelief in the form of bluffs (Braham 1981).
Despite the aforementioned drawbacks of precipita-tion-enhancement studies that do not employ intensivefield campaigns, it is those studies based on relativelylong time periods and employing a relatively dense net-work of weather stations that provide the most convinc-ing evidence of urban effects. Those climatologicalstudies include Huff and Changnon (1972, 1973). Huffand Changnon (1972) found increased precipitation to-tals and increased precipitation days, including heavy-precipitation days, downwind of St. Louis from 1941 to1968. Days and seasons were stratified, thereby leadingto the following conclusions: the greatest enhancementoccurred in conjunction with cold fronts; enhancement
was most pronounced in relatively wet summers; andsuppression may have occurred in the dry summers(Huff and Changnon 1972). Huff and Changnon (1973)used similar methods and determined that warm-seasonrainfall increased within and downwind of Chicago,Cleveland, Houston, New Orleans, St. Louis, andWashington during the 1955–70 period.
What appears to be the most serious deficiency of theurban-precipitation research is a lack of a climatologi-cal perspective when analyzing precipitation. Dailydata from a robust number of sites within a geographicdomain for multiple decades that span the developmentof an urban area should be employed in the detection ofprecipitation anomalies associated with urbanization. Along time period can be divided into consecutive epochs(e.g., Karl and Riebsame 1984), thereby enabling thediminution of topographic effects on precipitation forcertain analyses in addition to the elucidation of atmo-spheric-circulation differences between epochs.
It needs to be noted as well that most precipitation-enhancement research has relied on isohyetal maps(i.e., precipitation surfaces created with spatial-interpo-lation techniques) with unknown accuracy as evidenceof increased precipitation within and downwind of ur-ban areas. As a consequence, it is difficult to attach asubstantial amount of credibility to precipitation sur-faces used by various authors in their attempts to verifyprecipitation enhancement.
Based on the need for a novel examination of urbaneffects on precipitation, this study presents a climato-logical analysis of spatial anomalies in precipitation.The major objectives of this study are 1) to determinewhether spatial anomalies in precipitation characteris-tics have existed near Atlanta, Georgia; and 2) to ex-plore changes in land cover and atmospheric conditionsas causes of those anomalies.
2. Study region
The Atlanta region, which is located in the southeast-ern United States, has a humid subtropical climate. Forthis study, the Atlanta region is defined as a circle witha diameter of 360 km centered on downtown Atlanta(Fig. 1). The physiography within the region includesthe Coastal Plain, Piedmont, Blue Ridge, and Valleyand Ridge provinces. The Atlanta region is an excellentstudy region for the following reasons: precipitation isfrequent and often intense during the summer months(Konrad and Meentemeyer 1994; Keim 1997); it con-tains a spatially extensive UHI (Quattrochi et al. 2000);and case-study convergence/precipitation research(Bornstein and Lin 2000) and multiyear precipitation-initiation research (Dixon and Mote 2003) have beenconducted, and results from other precipitation studieshave been debated in the literature (Shepherd et al.2002; Diem et al. 2004; Shepherd 2004).
Metropolitan Atlanta has experienced tremendous
718 J O U R N A L O F A P P L I E D M E T E O R O L O G Y VOLUME 44
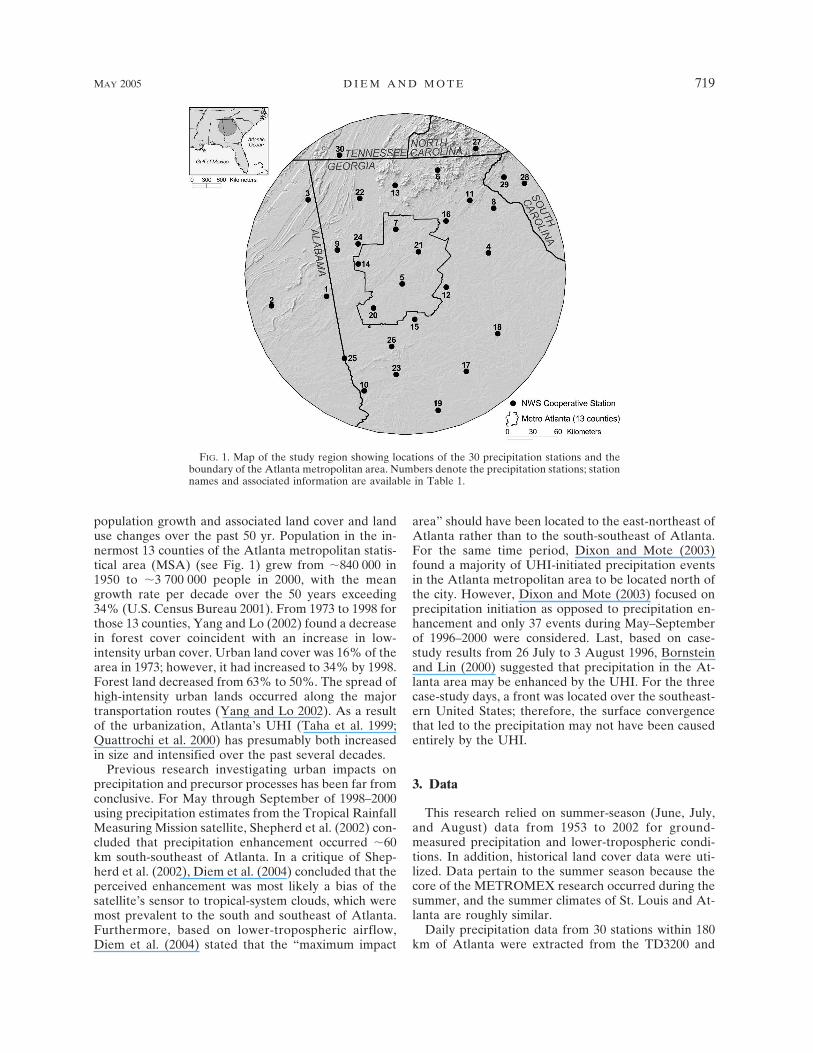
population growth and associated land cover and landuse changes over the past 50 yr. Population in the in-nermost 13 counties of the Atlanta metropolitan statis-tical area (MSA) (see Fig. 1) grew from �840 000 in1950 to �3 700 000 people in 2000, with the meangrowth rate per decade over the 50 years exceeding34% (U.S. Census Bureau 2001). From 1973 to 1998 forthose 13 counties, Yang and Lo (2002) found a decreasein forest cover coincident with an increase in low-intensity urban cover. Urban land cover was 16% of thearea in 1973; however, it had increased to 34% by 1998.Forest land decreased from 63% to 50%. The spread ofhigh-intensity urban lands occurred along the majortransportation routes (Yang and Lo 2002). As a resultof the urbanization, Atlanta’s UHI (Taha et al. 1999;Quattrochi et al. 2000) has presumably both increasedin size and intensified over the past several decades.
Previous research investigating urban impacts onprecipitation and precursor processes has been far fromconclusive. For May through September of 1998–2000using precipitation estimates from the Tropical RainfallMeasuring Mission satellite, Shepherd et al. (2002) con-cluded that precipitation enhancement occurred �60km south-southeast of Atlanta. In a critique of Shep-herd et al. (2002), Diem et al. (2004) concluded that theperceived enhancement was most likely a bias of thesatellite’s sensor to tropical-system clouds, which weremost prevalent to the south and southeast of Atlanta.Furthermore, based on lower-tropospheric airflow,Diem et al. (2004) stated that the “maximum impact
area” should have been located to the east-northeast ofAtlanta rather than to the south-southeast of Atlanta.For the same time period, Dixon and Mote (2003)found a majority of UHI-initiated precipitation eventsin the Atlanta metropolitan area to be located north ofthe city. However, Dixon and Mote (2003) focused onprecipitation initiation as opposed to precipitation en-hancement and only 37 events during May–Septemberof 1996–2000 were considered. Last, based on case-study results from 26 July to 3 August 1996, Bornsteinand Lin (2000) suggested that precipitation in the At-lanta area may be enhanced by the UHI. For the threecase-study days, a front was located over the southeast-ern United States; therefore, the surface convergencethat led to the precipitation may not have been causedentirely by the UHI.
3. Data
This research relied on summer-season (June, July,and August) data from 1953 to 2002 for ground-measured precipitation and lower-tropospheric condi-tions. In addition, historical land cover data were uti-lized. Data pertain to the summer season because thecore of the METROMEX research occurred during thesummer, and the summer climates of St. Louis and At-lanta are roughly similar.
Daily precipitation data from 30 stations within 180km of Atlanta were extracted from the TD3200 and
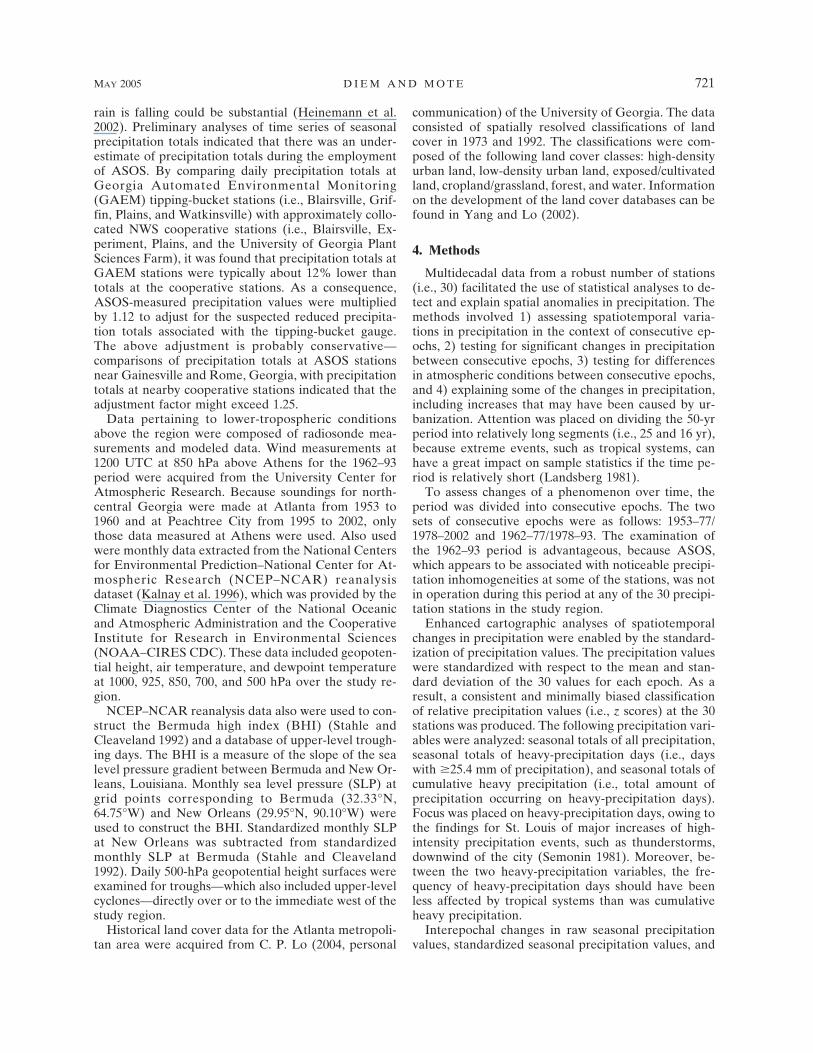
FIG. 1. Map of the study region showing locations of the 30 precipitation stations and theboundary of the Atlanta metropolitan area. Numbers denote the precipitation stations; stationnames and associated information are available in Table 1.
MAY 2005 D I E M A N D M O T E 719
TD3210 databases of the National Climatic Data Cen-ter (NCDC) (Table 1). The National Weather Service(NWS) cooperative stations fulfilled one or both of thefollowing criteria: they did not have more than 20% ofdays missing for any month or they were locations thatimproved the spatial coverage of the station network.Those stations that did not fulfill the first criterion butsatisfied the second criterion were Gainesville, Mil-ledgeville, Talbotton, and Woodbury, Georgia. Lessthan 0.5% of the daily precipitation totals were missing(Table 1), and all 649 missing values were estimatedbased on an inverse-distance weighting scheme—whichwas found by Xia et al. (1999) to be just as accurate asother missing-value-estimation methods—involvingdata from at least two nearby stations. Any station hav-ing data for the selected missing-data day was a poten-tial predictor station; all predictor stations are notshown in Fig. 1. The final database of daily precipita-tion totals is serially complete for all 30 stations.
Using hour-of-observation data obtained frommonthly climatological data publications provided bythe National Oceanic and Atmospheric Administration
for all 50 yr, daily precipitation totals were associatedwith the day on which most of the precipitation prob-ably occurred. Therefore, precipitation totals for morn-ing observations were moved to the previous day. Af-ternoon/evening observations were made only at Ce-dartown (1994–2000), Georgia; Clemson (1957–63),South Carolina; Coweeta (1953–57), North Carolina;Experiment (1993), Georgia; and Talladega (1953–76,1981–94), Alabama. Comparisons of precipitation to-tals at the evening-observation stations with precipita-tion totals at nearby stations with morning observationtimes indicated that only daily totals at Experiment in1993 should be moved to the previous day.
Also concerning daily precipitation totals, the Auto-mated Surface Observation System (ASOS) instrumen-tation was implemented at Athens, Georgia, in 1994,the Hartsfield-Jackson Atlanta International Airport(hereinafter Atlanta airport) in 1995, Chattanooga,Tennessee, in 1996, Columbus, Georgia, in 1994, andMacon, Georgia, in 1994. This system uses a tipping-bucket rain gauge; thus, for high rainfall rates, the un-dercatch resulting from the bucket tipping while the
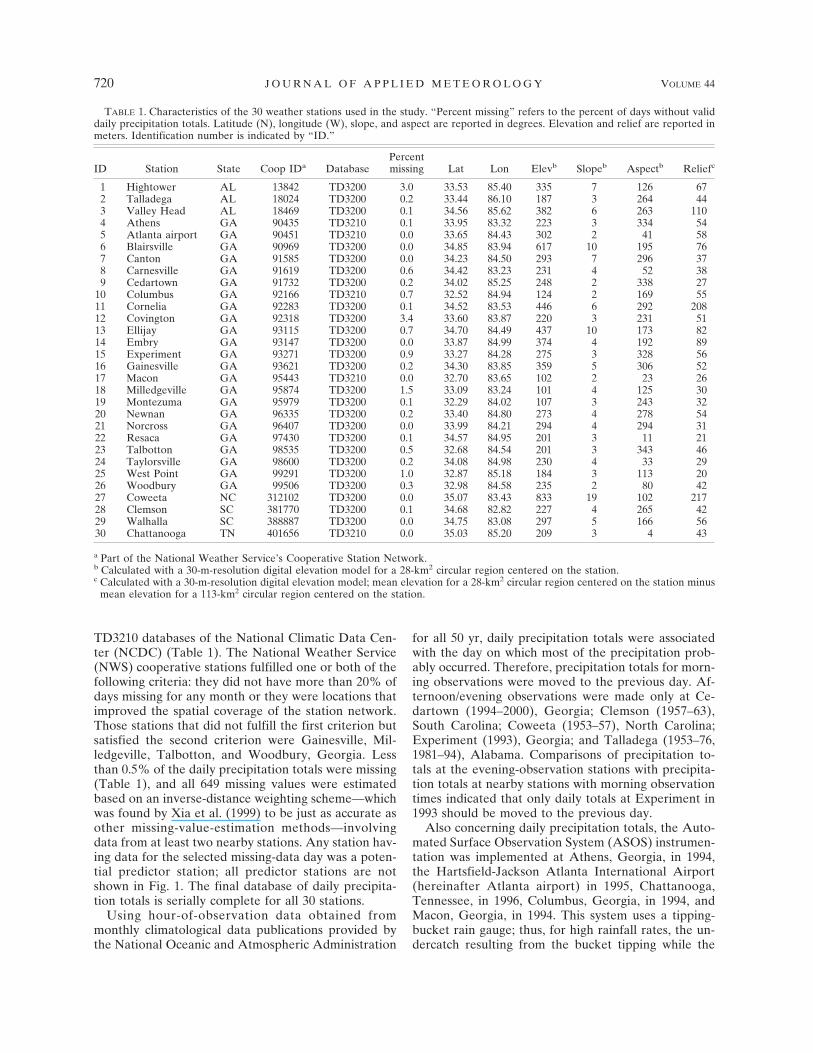
TABLE 1. Characteristics of the 30 weather stations used in the study. “Percent missing” refers to the percent of days without validdaily precipitation totals. Latitude (N), longitude (W), slope, and aspect are reported in degrees. Elevation and relief are reported inmeters. Identification number is indicated by “ID.”
ID Station State Coop IDa DatabasePercentmissing Lat Lon Elevb Slopeb Aspectb Reliefc
1 Hightower AL 13842 TD3200 3.0 33.53 85.40 335 7 126 672 Talladega AL 18024 TD3200 0.2 33.44 86.10 187 3 264 443 Valley Head AL 18469 TD3200 0.1 34.56 85.62 382 6 263 1104 Athens GA 90435 TD3210 0.1 33.95 83.32 223 3 334 545 Atlanta airport GA 90451 TD3210 0.0 33.65 84.43 302 2 41 586 Blairsville GA 90969 TD3200 0.0 34.85 83.94 617 10 195 767 Canton GA 91585 TD3200 0.0 34.23 84.50 293 7 296 378 Carnesville GA 91619 TD3200 0.6 34.42 83.23 231 4 52 389 Cedartown GA 91732 TD3200 0.2 34.02 85.25 248 2 338 27
10 Columbus GA 92166 TD3210 0.7 32.52 84.94 124 2 169 5511 Cornelia GA 92283 TD3200 0.1 34.52 83.53 446 6 292 20812 Covington GA 92318 TD3200 3.4 33.60 83.87 220 3 231 5113 Ellijay GA 93115 TD3200 0.7 34.70 84.49 437 10 173 8214 Embry GA 93147 TD3200 0.0 33.87 84.99 374 4 192 8915 Experiment GA 93271 TD3200 0.9 33.27 84.28 275 3 328 5616 Gainesville GA 93621 TD3200 0.2 34.30 83.85 359 5 306 5217 Macon GA 95443 TD3210 0.0 32.70 83.65 102 2 23 2618 Milledgeville GA 95874 TD3200 1.5 33.09 83.24 101 4 125 3019 Montezuma GA 95979 TD3200 0.1 32.29 84.02 107 3 243 3220 Newnan GA 96335 TD3200 0.2 33.40 84.80 273 4 278 5421 Norcross GA 96407 TD3200 0.0 33.99 84.21 294 4 294 3122 Resaca GA 97430 TD3200 0.1 34.57 84.95 201 3 11 2123 Talbotton GA 98535 TD3200 0.5 32.68 84.54 201 3 343 4624 Taylorsville GA 98600 TD3200 0.2 34.08 84.98 230 4 33 2925 West Point GA 99291 TD3200 1.0 32.87 85.18 184 3 113 2026 Woodbury GA 99506 TD3200 0.3 32.98 84.58 235 2 80 4227 Coweeta NC 312102 TD3200 0.0 35.07 83.43 833 19 102 21728 Clemson SC 381770 TD3200 0.1 34.68 82.82 227 4 265 4229 Walhalla SC 388887 TD3200 0.0 34.75 83.08 297 5 166 5630 Chattanooga TN 401656 TD3210 0.0 35.03 85.20 209 3 4 43
a Part of the National Weather Service’s Cooperative Station Network.b Calculated with a 30-m-resolution digital elevation model for a 28-km2 circular region centered on the station.c Calculated with a 30-m-resolution digital elevation model; mean elevation for a 28-km2 circular region centered on the station minus
mean elevation for a 113-km2 circular region centered on the station.
720 J O U R N A L O F A P P L I E D M E T E O R O L O G Y VOLUME 44
rain is falling could be substantial (Heinemann et al.2002). Preliminary analyses of time series of seasonalprecipitation totals indicated that there was an under-estimate of precipitation totals during the employmentof ASOS. By comparing daily precipitation totals atGeorgia Automated Environmental Monitoring(GAEM) tipping-bucket stations (i.e., Blairsville, Grif-fin, Plains, and Watkinsville) with approximately collo-cated NWS cooperative stations (i.e., Blairsville, Ex-periment, Plains, and the University of Georgia PlantSciences Farm), it was found that precipitation totals atGAEM stations were typically about 12% lower thantotals at the cooperative stations. As a consequence,ASOS-measured precipitation values were multipliedby 1.12 to adjust for the suspected reduced precipita-tion totals associated with the tipping-bucket gauge.The above adjustment is probably conservative—comparisons of precipitation totals at ASOS stationsnear Gainesville and Rome, Georgia, with precipitationtotals at nearby cooperative stations indicated that theadjustment factor might exceed 1.25.
Data pertaining to lower-tropospheric conditionsabove the region were composed of radiosonde mea-surements and modeled data. Wind measurements at1200 UTC at 850 hPa above Athens for the 1962–93period were acquired from the University Center forAtmospheric Research. Because soundings for north-central Georgia were made at Atlanta from 1953 to1960 and at Peachtree City from 1995 to 2002, onlythose data measured at Athens were used. Also usedwere monthly data extracted from the National Centersfor Environmental Prediction–National Center for At-mospheric Research (NCEP–NCAR) reanalysisdataset (Kalnay et al. 1996), which was provided by theClimate Diagnostics Center of the National Oceanicand Atmospheric Administration and the CooperativeInstitute for Research in Environmental Sciences(NOAA–CIRES CDC). These data included geopoten-tial height, air temperature, and dewpoint temperatureat 1000, 925, 850, 700, and 500 hPa over the study re-gion.
NCEP–NCAR reanalysis data also were used to con-struct the Bermuda high index (BHI) (Stahle andCleaveland 1992) and a database of upper-level trough-ing days. The BHI is a measure of the slope of the sealevel pressure gradient between Bermuda and New Or-leans, Louisiana. Monthly sea level pressure (SLP) atgrid points corresponding to Bermuda (32.33°N,64.75°W) and New Orleans (29.95°N, 90.10°W) wereused to construct the BHI. Standardized monthly SLPat New Orleans was subtracted from standardizedmonthly SLP at Bermuda (Stahle and Cleaveland1992). Daily 500-hPa geopotential height surfaces wereexamined for troughs—which also included upper-levelcyclones—directly over or to the immediate west of thestudy region.
Historical land cover data for the Atlanta metropoli-tan area were acquired from C. P. Lo (2004, personal
communication) of the University of Georgia. The dataconsisted of spatially resolved classifications of landcover in 1973 and 1992. The classifications were com-posed of the following land cover classes: high-densityurban land, low-density urban land, exposed/cultivatedland, cropland/grassland, forest, and water. Informationon the development of the land cover databases can befound in Yang and Lo (2002).
4. Methods
Multidecadal data from a robust number of stations(i.e., 30) facilitated the use of statistical analyses to de-tect and explain spatial anomalies in precipitation. Themethods involved 1) assessing spatiotemporal varia-tions in precipitation in the context of consecutive ep-ochs, 2) testing for significant changes in precipitationbetween consecutive epochs, 3) testing for differencesin atmospheric conditions between consecutive epochs,and 4) explaining some of the changes in precipitation,including increases that may have been caused by ur-banization. Attention was placed on dividing the 50-yrperiod into relatively long segments (i.e., 25 and 16 yr),because extreme events, such as tropical systems, canhave a great impact on sample statistics if the time pe-riod is relatively short (Landsberg 1981).
To assess changes of a phenomenon over time, theperiod was divided into consecutive epochs. The twosets of consecutive epochs were as follows: 1953–77/1978–2002 and 1962–77/1978–93. The examination ofthe 1962–93 period is advantageous, because ASOS,which appears to be associated with noticeable precipi-tation inhomogeneities at some of the stations, was notin operation during this period at any of the 30 precipi-tation stations in the study region.
Enhanced cartographic analyses of spatiotemporalchanges in precipitation were enabled by the standard-ization of precipitation values. The precipitation valueswere standardized with respect to the mean and stan-dard deviation of the 30 values for each epoch. As aresult, a consistent and minimally biased classificationof relative precipitation values (i.e., z scores) at the 30stations was produced. The following precipitation vari-ables were analyzed: seasonal totals of all precipitation,seasonal totals of heavy-precipitation days (i.e., dayswith �25.4 mm of precipitation), and seasonal totals ofcumulative heavy precipitation (i.e., total amount ofprecipitation occurring on heavy-precipitation days).Focus was placed on heavy-precipitation days, owing tothe findings for St. Louis of major increases of high-intensity precipitation events, such as thunderstorms,downwind of the city (Semonin 1981). Moreover, be-tween the two heavy-precipitation variables, the fre-quency of heavy-precipitation days should have beenless affected by tropical systems than was cumulativeheavy precipitation.
Interepochal changes in raw seasonal precipitationvalues, standardized seasonal precipitation values, and
MAY 2005 D I E M A N D M O T E 721
atmospheric conditions were tested for statistical sig-nificance. Seasonal precipitation values were standard-ized with respect to the mean and standard deviation ofthe 30 values for each year. The resulting seasonal zscores represented the relative magnitude of a precipi-tation value at a station in comparison with the entiresuite of stations. The Mann–Whitney U test, rather thanthe parametric alternative, the Student’s t test, was usedto assess the significance of changes in precipitation andatmospheric conditions. Because the Mann–Whitney Utest is less affected by extreme events (e.g., tropicalsystems), significant changes between epochs onlycould exist if either relatively high values or relativelylow values were prevalent within an epoch.
Last, the likelihood of urban effects occurring at sta-tions in the Atlanta metropolitan area was assessed.This procedure entailed an examination of relation-ships between precipitation and wind direction. Thus,precipitation values specific to wind direction sectorsfor the consecutive epochs of 1962–77 and 1978–93were determined. Data from the 1962–93 period wereused to avoid the possible impacts of the switch toASOS instrumentation at the Atlanta airport station.
5. Results and discussion
a. Differences in precipitation between epochs
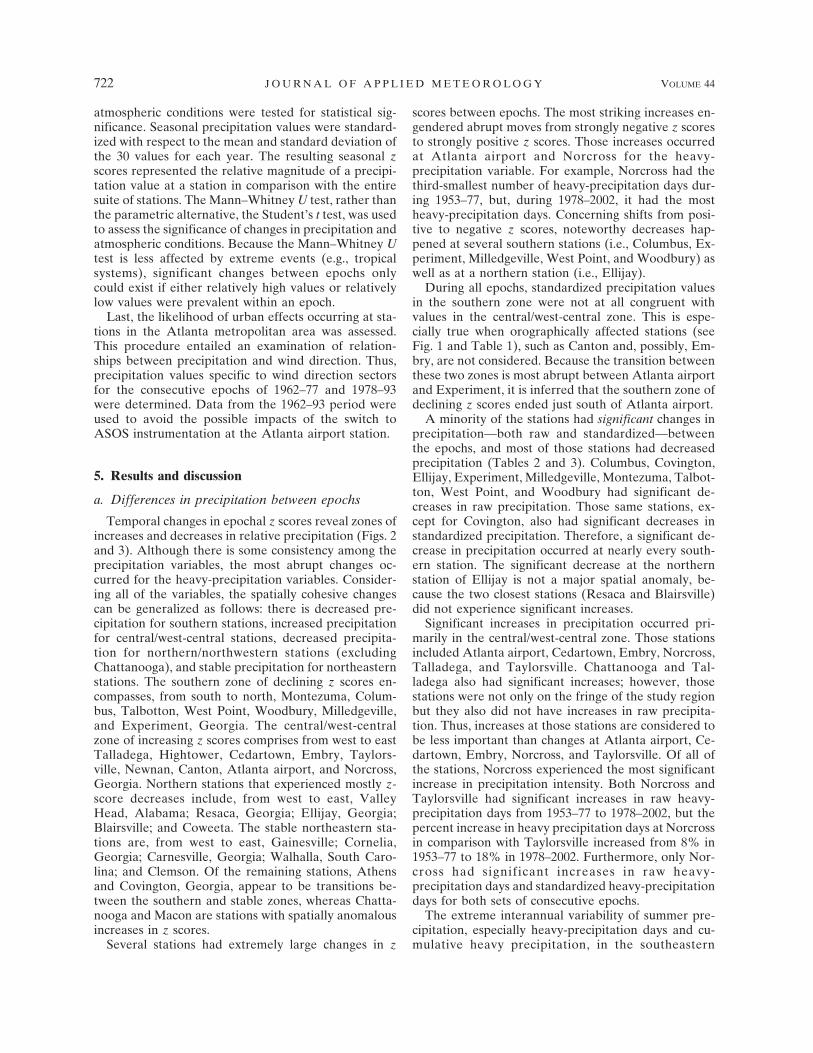
Temporal changes in epochal z scores reveal zones ofincreases and decreases in relative precipitation (Figs. 2and 3). Although there is some consistency among theprecipitation variables, the most abrupt changes oc-curred for the heavy-precipitation variables. Consider-ing all of the variables, the spatially cohesive changescan be generalized as follows: there is decreased pre-cipitation for southern stations, increased precipitationfor central/west-central stations, decreased precipita-tion for northern/northwestern stations (excludingChattanooga), and stable precipitation for northeasternstations. The southern zone of declining z scores en-compasses, from south to north, Montezuma, Colum-bus, Talbotton, West Point, Woodbury, Milledgeville,and Experiment, Georgia. The central/west-centralzone of increasing z scores comprises from west to eastTalladega, Hightower, Cedartown, Embry, Taylors-ville, Newnan, Canton, Atlanta airport, and Norcross,Georgia. Northern stations that experienced mostly z-score decreases include, from west to east, ValleyHead, Alabama; Resaca, Georgia; Ellijay, Georgia;Blairsville; and Coweeta. The stable northeastern sta-tions are, from west to east, Gainesville; Cornelia,Georgia; Carnesville, Georgia; Walhalla, South Caro-lina; and Clemson. Of the remaining stations, Athensand Covington, Georgia, appear to be transitions be-tween the southern and stable zones, whereas Chatta-nooga and Macon are stations with spatially anomalousincreases in z scores.
Several stations had extremely large changes in z
scores between epochs. The most striking increases en-gendered abrupt moves from strongly negative z scoresto strongly positive z scores. Those increases occurredat Atlanta airport and Norcross for the heavy-precipitation variable. For example, Norcross had thethird-smallest number of heavy-precipitation days dur-ing 1953–77, but, during 1978–2002, it had the mostheavy-precipitation days. Concerning shifts from posi-tive to negative z scores, noteworthy decreases hap-pened at several southern stations (i.e., Columbus, Ex-periment, Milledgeville, West Point, and Woodbury) aswell as at a northern station (i.e., Ellijay).
During all epochs, standardized precipitation valuesin the southern zone were not at all congruent withvalues in the central/west-central zone. This is espe-cially true when orographically affected stations (seeFig. 1 and Table 1), such as Canton and, possibly, Em-bry, are not considered. Because the transition betweenthese two zones is most abrupt between Atlanta airportand Experiment, it is inferred that the southern zone ofdeclining z scores ended just south of Atlanta airport.
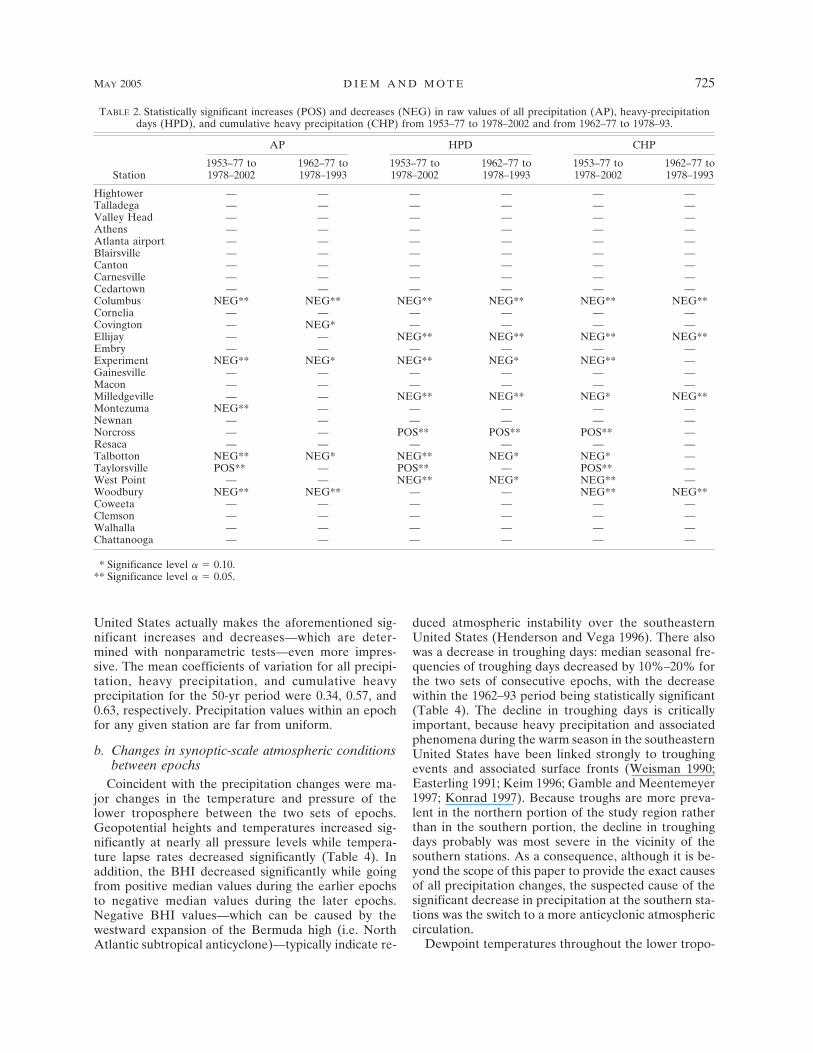
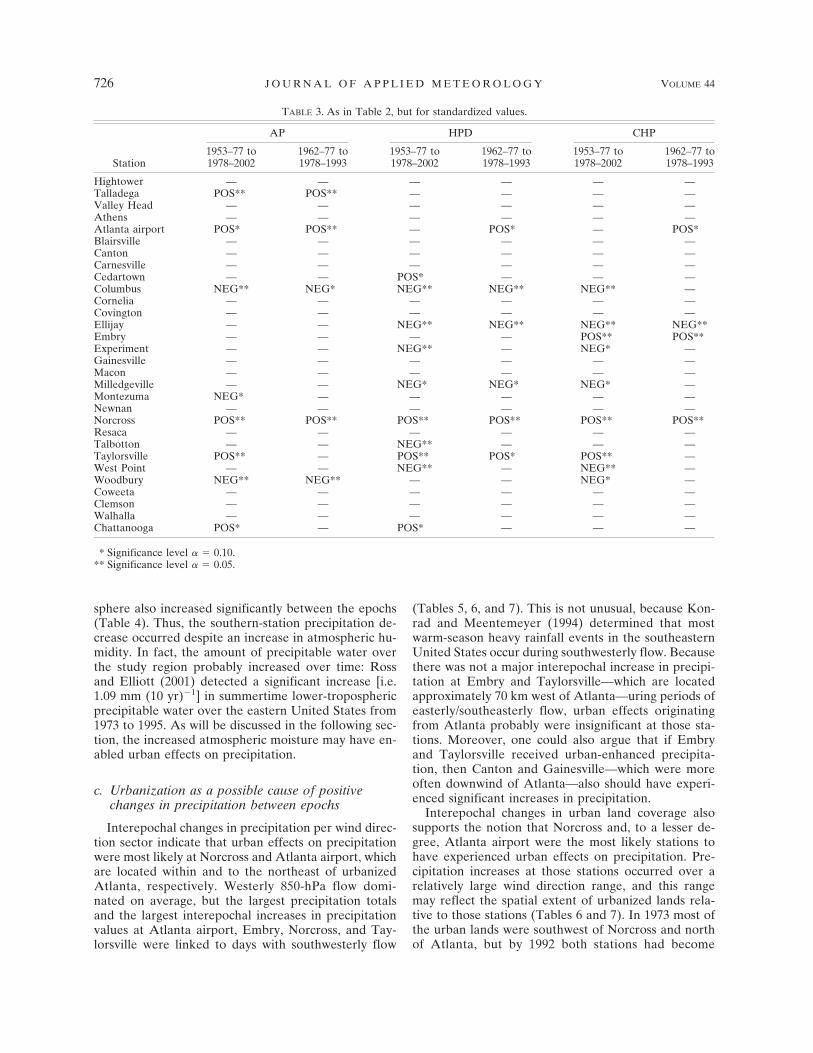
A minority of the stations had significant changes inprecipitation—both raw and standardized—betweenthe epochs, and most of those stations had decreasedprecipitation (Tables 2 and 3). Columbus, Covington,Ellijay, Experiment, Milledgeville, Montezuma, Talbot-ton, West Point, and Woodbury had significant de-creases in raw precipitation. Those same stations, ex-cept for Covington, also had significant decreases instandardized precipitation. Therefore, a significant de-crease in precipitation occurred at nearly every south-ern station. The significant decrease at the northernstation of Ellijay is not a major spatial anomaly, be-cause the two closest stations (Resaca and Blairsville)did not experience significant increases.
Significant increases in precipitation occurred pri-marily in the central/west-central zone. Those stationsincluded Atlanta airport, Cedartown, Embry, Norcross,Talladega, and Taylorsville. Chattanooga and Tal-ladega also had significant increases; however, thosestations were not only on the fringe of the study regionbut they also did not have increases in raw precipita-tion. Thus, increases at those stations are considered tobe less important than changes at Atlanta airport, Ce-dartown, Embry, Norcross, and Taylorsville. Of all ofthe stations, Norcross experienced the most significantincrease in precipitation intensity. Both Norcross andTaylorsville had significant increases in raw heavy-precipitation days from 1953–77 to 1978–2002, but thepercent increase in heavy precipitation days at Norcrossin comparison with Taylorsville increased from 8% in1953–77 to 18% in 1978–2002. Furthermore, only Nor-cross had significant increases in raw heavy-precipitation days and standardized heavy-precipitationdays for both sets of consecutive epochs.
The extreme interannual variability of summer pre-cipitation, especially heavy-precipitation days and cu-mulative heavy precipitation, in the southeastern
722 J O U R N A L O F A P P L I E D M E T E O R O L O G Y VOLUME 44
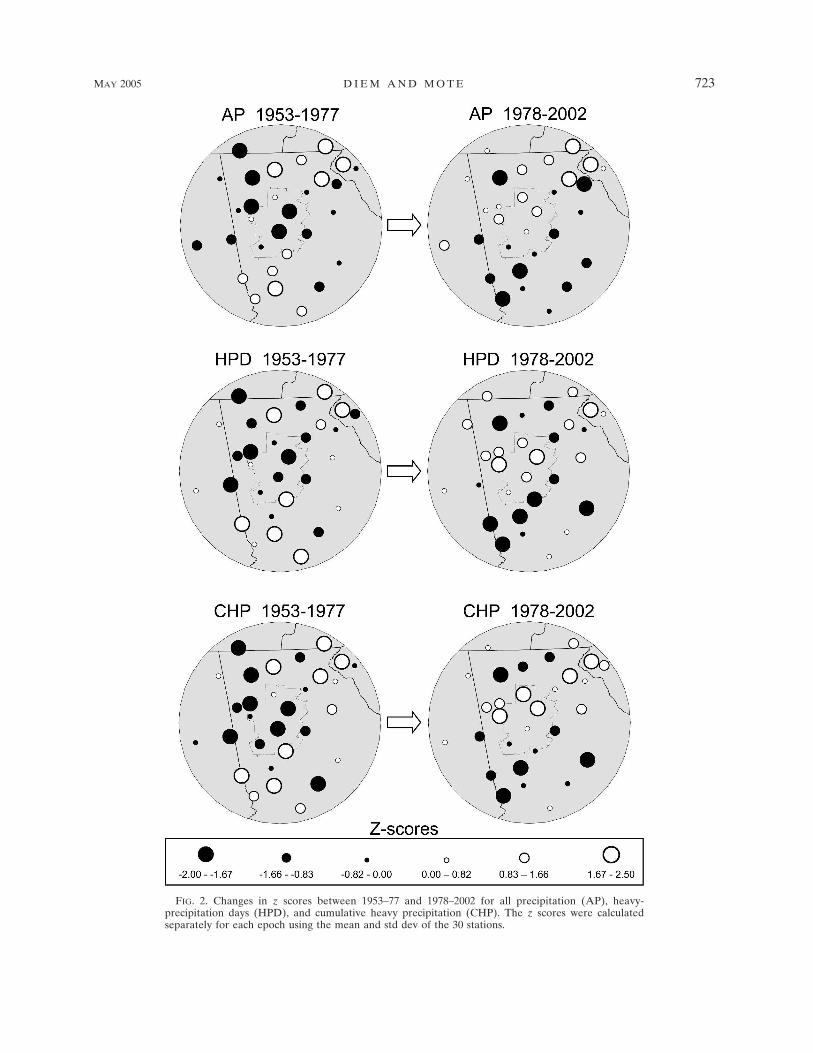
FIG. 2. Changes in z scores between 1953–77 and 1978–2002 for all precipitation (AP), heavy-precipitation days (HPD), and cumulative heavy precipitation (CHP). The z scores were calculatedseparately for each epoch using the mean and std dev of the 30 stations.
MAY 2005 D I E M A N D M O T E 723
FIG. 3. As in Fig. 2 but showing changes in z scores between 1962–77 and 1978–93.
724 J O U R N A L O F A P P L I E D M E T E O R O L O G Y VOLUME 44
United States actually makes the aforementioned sig-nificant increases and decreases—which are deter-mined with nonparametric tests—even more impres-sive. The mean coefficients of variation for all precipi-tation, heavy precipitation, and cumulative heavyprecipitation for the 50-yr period were 0.34, 0.57, and0.63, respectively. Precipitation values within an epochfor any given station are far from uniform.
b. Changes in synoptic-scale atmospheric conditionsbetween epochs
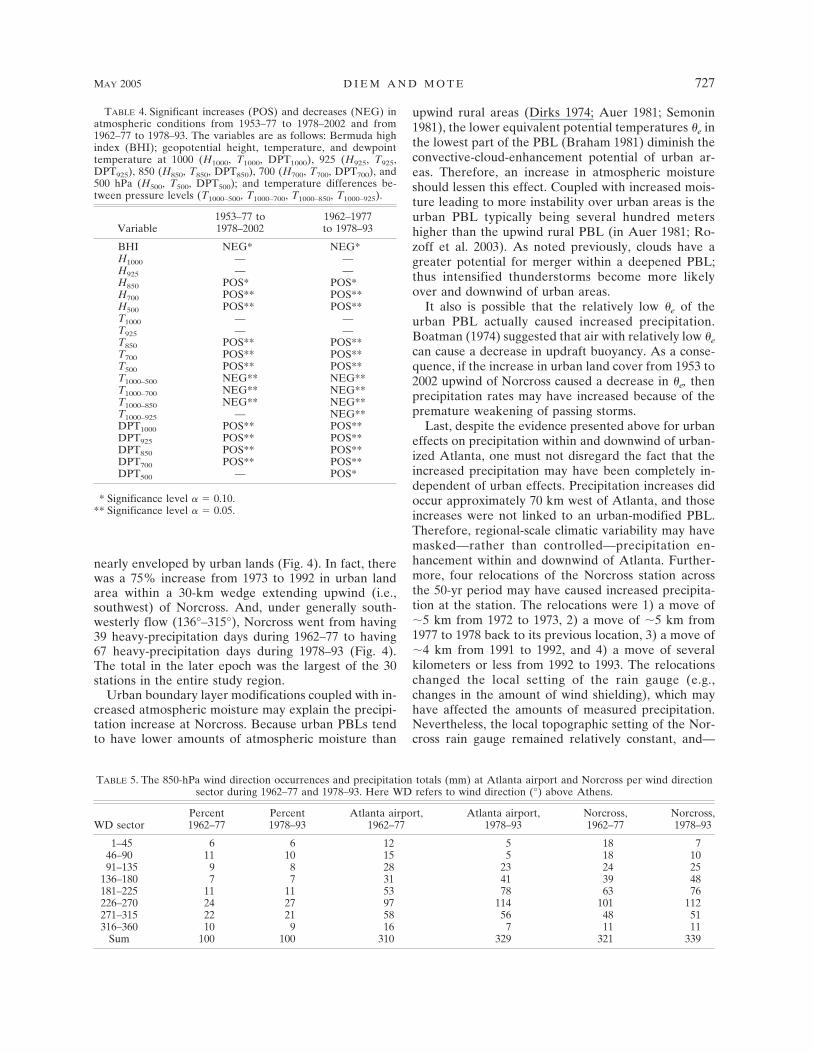
Coincident with the precipitation changes were ma-jor changes in the temperature and pressure of thelower troposphere between the two sets of epochs.Geopotential heights and temperatures increased sig-nificantly at nearly all pressure levels while tempera-ture lapse rates decreased significantly (Table 4). Inaddition, the BHI decreased significantly while goingfrom positive median values during the earlier epochsto negative median values during the later epochs.Negative BHI values—which can be caused by thewestward expansion of the Bermuda high (i.e. NorthAtlantic subtropical anticyclone)—typically indicate re-
duced atmospheric instability over the southeasternUnited States (Henderson and Vega 1996). There alsowas a decrease in troughing days: median seasonal fre-quencies of troughing days decreased by 10%–20% forthe two sets of consecutive epochs, with the decreasewithin the 1962–93 period being statistically significant(Table 4). The decline in troughing days is criticallyimportant, because heavy precipitation and associatedphenomena during the warm season in the southeasternUnited States have been linked strongly to troughingevents and associated surface fronts (Weisman 1990;Easterling 1991; Keim 1996; Gamble and Meentemeyer1997; Konrad 1997). Because troughs are more preva-lent in the northern portion of the study region ratherthan in the southern portion, the decline in troughingdays probably was most severe in the vicinity of thesouthern stations. As a consequence, although it is be-yond the scope of this paper to provide the exact causesof all precipitation changes, the suspected cause of thesignificant decrease in precipitation at the southern sta-tions was the switch to a more anticyclonic atmosphericcirculation.
Dewpoint temperatures throughout the lower tropo-
TABLE 2. Statistically significant increases (POS) and decreases (NEG) in raw values of all precipitation (AP), heavy-precipitationdays (HPD), and cumulative heavy precipitation (CHP) from 1953–77 to 1978–2002 and from 1962–77 to 1978–93.
AP HPD CHP
Station1953–77 to1978–2002
1962–77 to1978–1993
1953–77 to1978–2002
1962–77 to1978–1993
1953–77 to1978–2002
1962–77 to1978–1993
Hightower — — — — — —Talladega — — — — — —Valley Head — — — — — —Athens — — — — — —Atlanta airport — — — — — —Blairsville — — — — — —Canton — — — — — —Carnesville — — — — — —Cedartown — — — — — —Columbus NEG** NEG** NEG** NEG** NEG** NEG**Cornelia — — — — — —Covington — NEG* — — — —Ellijay — — NEG** NEG** NEG** NEG**Embry — — — — — —Experiment NEG** NEG* NEG** NEG* NEG** —Gainesville — — — — — —Macon — — — — — —Milledgeville — — NEG** NEG** NEG* NEG**Montezuma NEG** — — — — —Newnan — — — — — —Norcross — — POS** POS** POS** —Resaca — — — — — —Talbotton NEG** NEG* NEG** NEG* NEG* —Taylorsville POS** — POS** — POS** —West Point — — NEG** NEG* NEG** —Woodbury NEG** NEG** — — NEG** NEG**Coweeta — — — — — —Clemson — — — — — —Walhalla — — — — — —Chattanooga — — — — — —
* Significance level � � 0.10.** Significance level � � 0.05.
MAY 2005 D I E M A N D M O T E 725
sphere also increased significantly between the epochs(Table 4). Thus, the southern-station precipitation de-crease occurred despite an increase in atmospheric hu-midity. In fact, the amount of precipitable water overthe study region probably increased over time: Rossand Elliott (2001) detected a significant increase [i.e.1.09 mm (10 yr)�1] in summertime lower-troposphericprecipitable water over the eastern United States from1973 to 1995. As will be discussed in the following sec-tion, the increased atmospheric moisture may have en-abled urban effects on precipitation.
c. Urbanization as a possible cause of positivechanges in precipitation between epochs
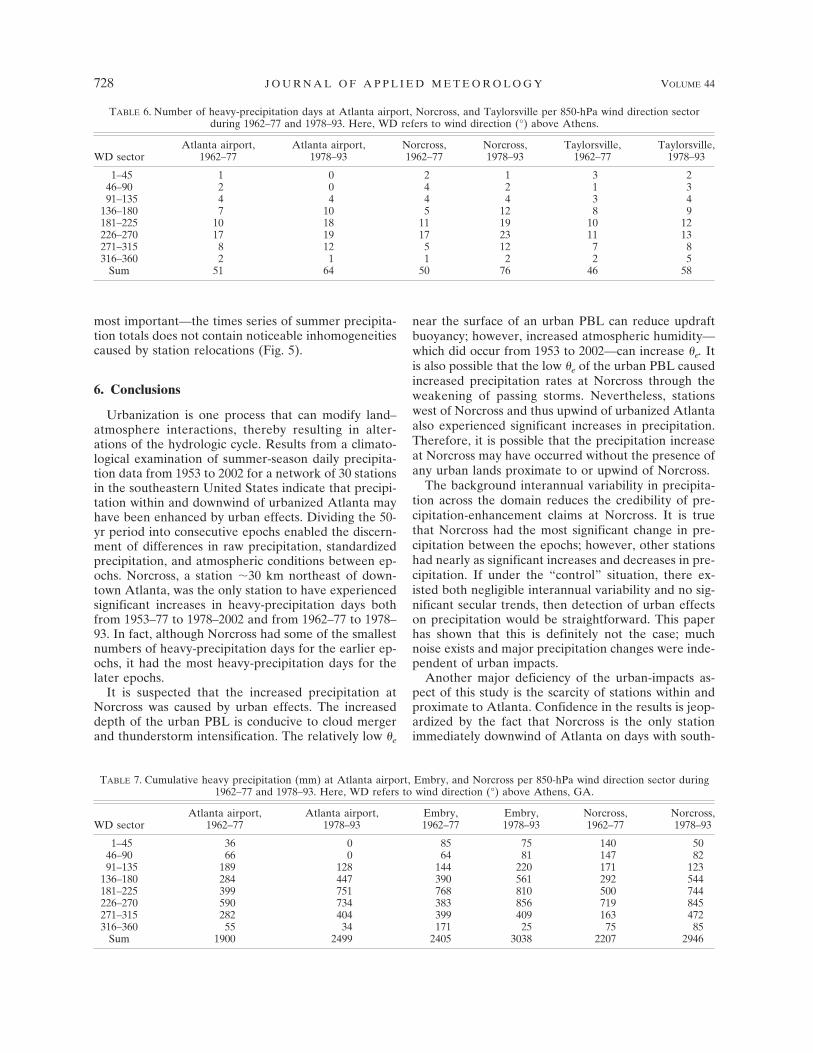
Interepochal changes in precipitation per wind direc-tion sector indicate that urban effects on precipitationwere most likely at Norcross and Atlanta airport, whichare located within and to the northeast of urbanizedAtlanta, respectively. Westerly 850-hPa flow domi-nated on average, but the largest precipitation totalsand the largest interepochal increases in precipitationvalues at Atlanta airport, Embry, Norcross, and Tay-lorsville were linked to days with southwesterly flow
(Tables 5, 6, and 7). This is not unusual, because Kon-rad and Meentemeyer (1994) determined that mostwarm-season heavy rainfall events in the southeasternUnited States occur during southwesterly flow. Becausethere was not a major interepochal increase in precipi-tation at Embry and Taylorsville—which are locatedapproximately 70 km west of Atlanta—uring periods ofeasterly/southeasterly flow, urban effects originatingfrom Atlanta probably were insignificant at those sta-tions. Moreover, one could also argue that if Embryand Taylorsville received urban-enhanced precipita-tion, then Canton and Gainesville—which were moreoften downwind of Atlanta—also should have experi-enced significant increases in precipitation.
Interepochal changes in urban land coverage alsosupports the notion that Norcross and, to a lesser de-gree, Atlanta airport were the most likely stations tohave experienced urban effects on precipitation. Pre-cipitation increases at those stations occurred over arelatively large wind direction range, and this rangemay reflect the spatial extent of urbanized lands rela-tive to those stations (Tables 6 and 7). In 1973 most ofthe urban lands were southwest of Norcross and northof Atlanta, but by 1992 both stations had become
TABLE 3. As in Table 2, but for standardized values.
AP HPD CHP
Station1953–77 to1978–2002
1962–77 to1978–1993
1953–77 to1978–2002
1962–77 to1978–1993
1953–77 to1978–2002
1962–77 to1978–1993
Hightower — — — — — —Talladega POS** POS** — — — —Valley Head — — — — — —Athens — — — — — —Atlanta airport POS* POS** — POS* — POS*Blairsville — — — — — —Canton — — — — — —Carnesville — — — — — —Cedartown — — POS* — — —Columbus NEG** NEG* NEG** NEG** NEG** —Cornelia — — — — — —Covington — — — — — —Ellijay — — NEG** NEG** NEG** NEG**Embry — — — — POS** POS**Experiment — — NEG** — NEG* —Gainesville — — — — — —Macon — — — — — —Milledgeville — — NEG* NEG* NEG* —Montezuma NEG* — — — — —Newnan — — — — — —Norcross POS** POS** POS** POS** POS** POS**Resaca — — — — — —Talbotton — — NEG** — — —Taylorsville POS** — POS** POS* POS** —West Point — — NEG** — NEG** —Woodbury NEG** NEG** — — NEG* —Coweeta — — — — — —Clemson — — — — — —Walhalla — — — — — —Chattanooga POS* — POS* — — —
* Significance level � � 0.10.** Significance level � � 0.05.
726 J O U R N A L O F A P P L I E D M E T E O R O L O G Y VOLUME 44
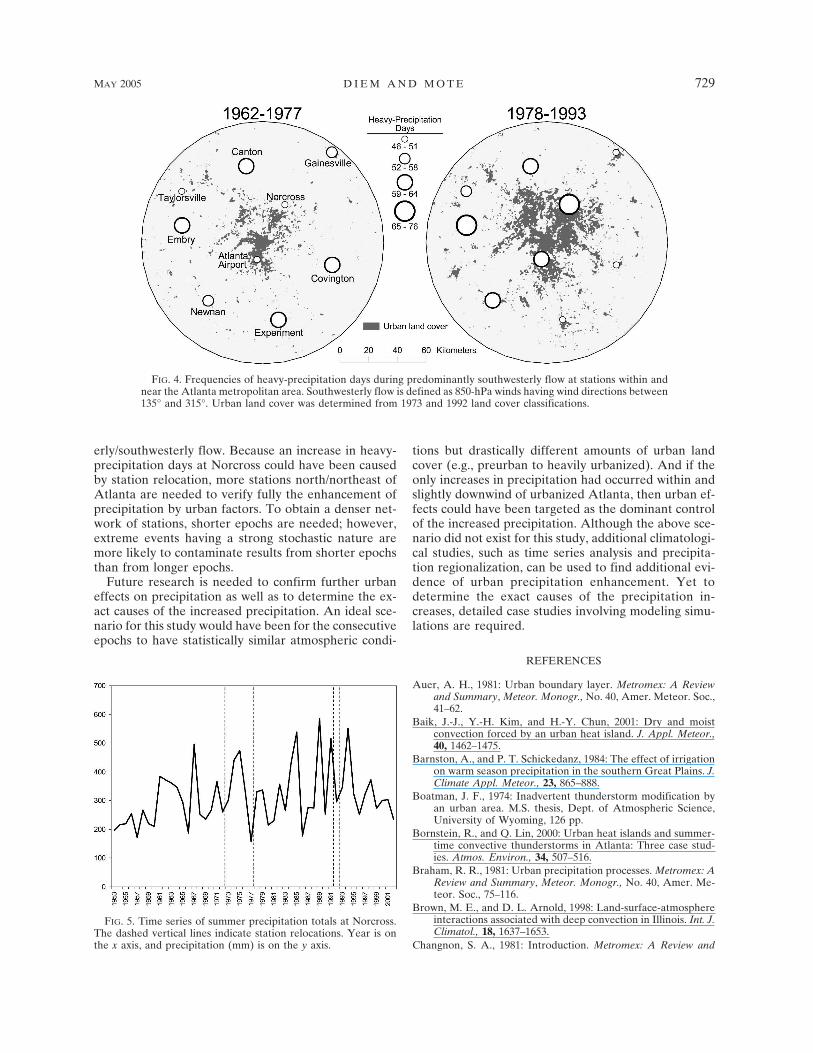
nearly enveloped by urban lands (Fig. 4). In fact, therewas a 75% increase from 1973 to 1992 in urban landarea within a 30-km wedge extending upwind (i.e.,southwest) of Norcross. And, under generally south-westerly flow (136°–315°), Norcross went from having39 heavy-precipitation days during 1962–77 to having67 heavy-precipitation days during 1978–93 (Fig. 4).The total in the later epoch was the largest of the 30stations in the entire study region.
Urban boundary layer modifications coupled with in-creased atmospheric moisture may explain the precipi-tation increase at Norcross. Because urban PBLs tendto have lower amounts of atmospheric moisture than
upwind rural areas (Dirks 1974; Auer 1981; Semonin1981), the lower equivalent potential temperatures �e inthe lowest part of the PBL (Braham 1981) diminish theconvective-cloud-enhancement potential of urban ar-eas. Therefore, an increase in atmospheric moistureshould lessen this effect. Coupled with increased mois-ture leading to more instability over urban areas is theurban PBL typically being several hundred metershigher than the upwind rural PBL (in Auer 1981; Ro-zoff et al. 2003). As noted previously, clouds have agreater potential for merger within a deepened PBL;thus intensified thunderstorms become more likelyover and downwind of urban areas.
It also is possible that the relatively low �e of theurban PBL actually caused increased precipitation.Boatman (1974) suggested that air with relatively low �e
can cause a decrease in updraft buoyancy. As a conse-quence, if the increase in urban land cover from 1953 to2002 upwind of Norcross caused a decrease in �e, thenprecipitation rates may have increased because of thepremature weakening of passing storms.
Last, despite the evidence presented above for urbaneffects on precipitation within and downwind of urban-ized Atlanta, one must not disregard the fact that theincreased precipitation may have been completely in-dependent of urban effects. Precipitation increases didoccur approximately 70 km west of Atlanta, and thoseincreases were not linked to an urban-modified PBL.Therefore, regional-scale climatic variability may havemasked—rather than controlled—precipitation en-hancement within and downwind of Atlanta. Further-more, four relocations of the Norcross station acrossthe 50-yr period may have caused increased precipita-tion at the station. The relocations were 1) a move of�5 km from 1972 to 1973, 2) a move of �5 km from1977 to 1978 back to its previous location, 3) a move of�4 km from 1991 to 1992, and 4) a move of severalkilometers or less from 1992 to 1993. The relocationschanged the local setting of the rain gauge (e.g.,changes in the amount of wind shielding), which mayhave affected the amounts of measured precipitation.Nevertheless, the local topographic setting of the Nor-cross rain gauge remained relatively constant, and—
TABLE 5. The 850-hPa wind direction occurrences and precipitation totals (mm) at Atlanta airport and Norcross per wind directionsector during 1962–77 and 1978–93. Here WD refers to wind direction (°) above Athens.
WD sectorPercent1962–77
Percent1978–93
Atlanta airport,1962–77
Atlanta airport,1978–93
Norcross,1962–77
Norcross,1978–93
1–45 6 6 12 5 18 746–90 11 10 15 5 18 1091–135 9 8 28 23 24 25
136–180 7 7 31 41 39 48181–225 11 11 53 78 63 76226–270 24 27 97 114 101 112271–315 22 21 58 56 48 51316–360 10 9 16 7 11 11
Sum 100 100 310 329 321 339
TABLE 4. Significant increases (POS) and decreases (NEG) inatmospheric conditions from 1953–77 to 1978–2002 and from1962–77 to 1978–93. The variables are as follows: Bermuda highindex (BHI); geopotential height, temperature, and dewpointtemperature at 1000 (H1000, T1000, DPT1000), 925 (H925, T925,DPT925), 850 (H850, T850, DPT850), 700 (H700, T700, DPT700), and500 hPa (H500, T500, DPT500); and temperature differences be-tween pressure levels (T1000–500, T1000–700, T1000–850, T1000–925).
Variable1953–77 to1978–2002
1962–1977to 1978–93
BHI NEG* NEG*H1000 — —H925 — —H850 POS* POS*H700 POS** POS**H500 POS** POS**T1000 — —T925 — —T850 POS** POS**T700 POS** POS**T500 POS** POS**T1000–500 NEG** NEG**T1000–700 NEG** NEG**T1000–850 NEG** NEG**T1000–925 — NEG**DPT1000 POS** POS**DPT925 POS** POS**DPT850 POS** POS**DPT700 POS** POS**DPT500 — POS*
* Significance level � � 0.10.** Significance level � � 0.05.
MAY 2005 D I E M A N D M O T E 727
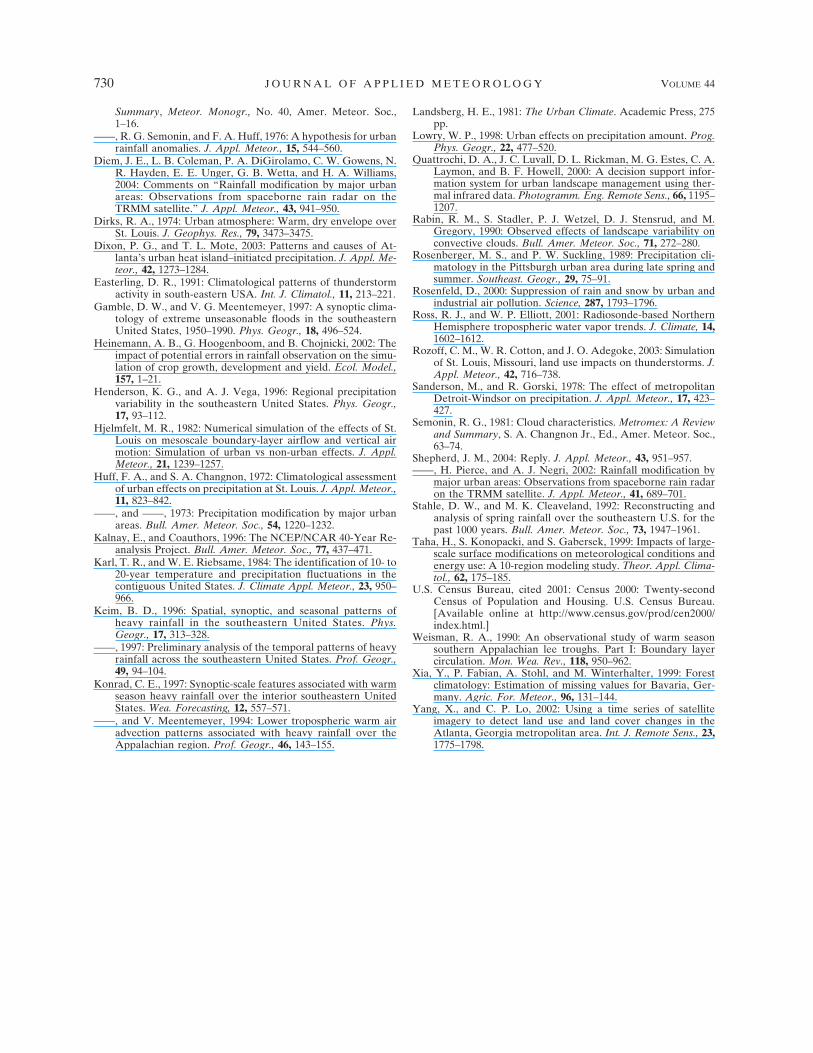
most important—the times series of summer precipita-tion totals does not contain noticeable inhomogeneitiescaused by station relocations (Fig. 5).
6. Conclusions
Urbanization is one process that can modify land–atmosphere interactions, thereby resulting in alter-ations of the hydrologic cycle. Results from a climato-logical examination of summer-season daily precipita-tion data from 1953 to 2002 for a network of 30 stationsin the southeastern United States indicate that precipi-tation within and downwind of urbanized Atlanta mayhave been enhanced by urban effects. Dividing the 50-yr period into consecutive epochs enabled the discern-ment of differences in raw precipitation, standardizedprecipitation, and atmospheric conditions between ep-ochs. Norcross, a station �30 km northeast of down-town Atlanta, was the only station to have experiencedsignificant increases in heavy-precipitation days bothfrom 1953–77 to 1978–2002 and from 1962–77 to 1978–93. In fact, although Norcross had some of the smallestnumbers of heavy-precipitation days for the earlier ep-ochs, it had the most heavy-precipitation days for thelater epochs.
It is suspected that the increased precipitation atNorcross was caused by urban effects. The increaseddepth of the urban PBL is conducive to cloud mergerand thunderstorm intensification. The relatively low �e
near the surface of an urban PBL can reduce updraftbuoyancy; however, increased atmospheric humidity—which did occur from 1953 to 2002—can increase �e. Itis also possible that the low �e of the urban PBL causedincreased precipitation rates at Norcross through theweakening of passing storms. Nevertheless, stationswest of Norcross and thus upwind of urbanized Atlantaalso experienced significant increases in precipitation.Therefore, it is possible that the precipitation increaseat Norcross may have occurred without the presence ofany urban lands proximate to or upwind of Norcross.
The background interannual variability in precipita-tion across the domain reduces the credibility of pre-cipitation-enhancement claims at Norcross. It is truethat Norcross had the most significant change in pre-cipitation between the epochs; however, other stationshad nearly as significant increases and decreases in pre-cipitation. If under the “control” situation, there ex-isted both negligible interannual variability and no sig-nificant secular trends, then detection of urban effectson precipitation would be straightforward. This paperhas shown that this is definitely not the case; muchnoise exists and major precipitation changes were inde-pendent of urban impacts.
Another major deficiency of the urban-impacts as-pect of this study is the scarcity of stations within andproximate to Atlanta. Confidence in the results is jeop-ardized by the fact that Norcross is the only stationimmediately downwind of Atlanta on days with south-
TABLE 7. Cumulative heavy precipitation (mm) at Atlanta airport, Embry, and Norcross per 850-hPa wind direction sector during1962–77 and 1978–93. Here, WD refers to wind direction (°) above Athens, GA.
WD sectorAtlanta airport,
1962–77Atlanta airport,
1978–93Embry,1962–77
Embry,1978–93
Norcross,1962–77
Norcross,1978–93
1–45 36 0 85 75 140 5046–90 66 0 64 81 147 8291–135 189 128 144 220 171 123
136–180 284 447 390 561 292 544181–225 399 751 768 810 500 744226–270 590 734 383 856 719 845271–315 282 404 399 409 163 472316–360 55 34 171 25 75 85
Sum 1900 2499 2405 3038 2207 2946
TABLE 6. Number of heavy-precipitation days at Atlanta airport, Norcross, and Taylorsville per 850-hPa wind direction sectorduring 1962–77 and 1978–93. Here, WD refers to wind direction (°) above Athens.
WD sectorAtlanta airport,
1962–77Atlanta airport,
1978–93Norcross,1962–77
Norcross,1978–93
Taylorsville,1962–77
Taylorsville,1978–93
1–45 1 0 2 1 3 246–90 2 0 4 2 1 391–135 4 4 4 4 3 4
136–180 7 10 5 12 8 9181–225 10 18 11 19 10 12226–270 17 19 17 23 11 13271–315 8 12 5 12 7 8316–360 2 1 1 2 2 5
Sum 51 64 50 76 46 58
728 J O U R N A L O F A P P L I E D M E T E O R O L O G Y VOLUME 44
erly/southwesterly flow. Because an increase in heavy-precipitation days at Norcross could have been causedby station relocation, more stations north/northeast ofAtlanta are needed to verify fully the enhancement ofprecipitation by urban factors. To obtain a denser net-work of stations, shorter epochs are needed; however,extreme events having a strong stochastic nature aremore likely to contaminate results from shorter epochsthan from longer epochs.
Future research is needed to confirm further urbaneffects on precipitation as well as to determine the ex-act causes of the increased precipitation. An ideal sce-nario for this study would have been for the consecutiveepochs to have statistically similar atmospheric condi-
tions but drastically different amounts of urban landcover (e.g., preurban to heavily urbanized). And if theonly increases in precipitation had occurred within andslightly downwind of urbanized Atlanta, then urban ef-fects could have been targeted as the dominant controlof the increased precipitation. Although the above sce-nario did not exist for this study, additional climatologi-cal studies, such as time series analysis and precipita-tion regionalization, can be used to find additional evi-dence of urban precipitation enhancement. Yet todetermine the exact causes of the precipitation in-creases, detailed case studies involving modeling simu-lations are required.
REFERENCES
Auer, A. H., 1981: Urban boundary layer. Metromex: A Reviewand Summary, Meteor. Monogr., No. 40, Amer. Meteor. Soc.,41–62.
Baik, J.-J., Y.-H. Kim, and H.-Y. Chun, 2001: Dry and moistconvection forced by an urban heat island. J. Appl. Meteor.,40, 1462–1475.
Barnston, A., and P. T. Schickedanz, 1984: The effect of irrigationon warm season precipitation in the southern Great Plains. J.Climate Appl. Meteor., 23, 865–888.
Boatman, J. F., 1974: Inadvertent thunderstorm modification byan urban area. M.S. thesis, Dept. of Atmospheric Science,University of Wyoming, 126 pp.
Bornstein, R., and Q. Lin, 2000: Urban heat islands and summer-time convective thunderstorms in Atlanta: Three case stud-ies. Atmos. Environ., 34, 507–516.
Braham, R. R., 1981: Urban precipitation processes. Metromex: AReview and Summary, Meteor. Monogr., No. 40, Amer. Me-teor. Soc., 75–116.
Brown, M. E., and D. L. Arnold, 1998: Land-surface-atmosphereinteractions associated with deep convection in Illinois. Int. J.Climatol., 18, 1637–1653.
Changnon, S. A., 1981: Introduction. Metromex: A Review and
FIG. 4. Frequencies of heavy-precipitation days during predominantly southwesterly flow at stations within andnear the Atlanta metropolitan area. Southwesterly flow is defined as 850-hPa winds having wind directions between135° and 315°. Urban land cover was determined from 1973 and 1992 land cover classifications.
FIG. 5. Time series of summer precipitation totals at Norcross.The dashed vertical lines indicate station relocations. Year is onthe x axis, and precipitation (mm) is on the y axis.
MAY 2005 D I E M A N D M O T E 729
Summary, Meteor. Monogr., No. 40, Amer. Meteor. Soc.,1–16.
——, R. G. Semonin, and F. A. Huff, 1976: A hypothesis for urbanrainfall anomalies. J. Appl. Meteor., 15, 544–560.
Diem, J. E., L. B. Coleman, P. A. DiGirolamo, C. W. Gowens, N.R. Hayden, E. E. Unger, G. B. Wetta, and H. A. Williams,2004: Comments on “Rainfall modification by major urbanareas: Observations from spaceborne rain radar on theTRMM satellite.” J. Appl. Meteor., 43, 941–950.
Dirks, R. A., 1974: Urban atmosphere: Warm, dry envelope overSt. Louis. J. Geophys. Res., 79, 3473–3475.
Dixon, P. G., and T. L. Mote, 2003: Patterns and causes of At-lanta’s urban heat island–initiated precipitation. J. Appl. Me-teor., 42, 1273–1284.
Easterling, D. R., 1991: Climatological patterns of thunderstormactivity in south-eastern USA. Int. J. Climatol., 11, 213–221.
Gamble, D. W., and V. G. Meentemeyer, 1997: A synoptic clima-tology of extreme unseasonable floods in the southeasternUnited States, 1950–1990. Phys. Geogr., 18, 496–524.
Heinemann, A. B., G. Hoogenboom, and B. Chojnicki, 2002: Theimpact of potential errors in rainfall observation on the simu-lation of crop growth, development and yield. Ecol. Model.,157, 1–21.
Henderson, K. G., and A. J. Vega, 1996: Regional precipitationvariability in the southeastern United States. Phys. Geogr.,17, 93–112.
Hjelmfelt, M. R., 1982: Numerical simulation of the effects of St.Louis on mesoscale boundary-layer airflow and vertical airmotion: Simulation of urban vs non-urban effects. J. Appl.Meteor., 21, 1239–1257.
Huff, F. A., and S. A. Changnon, 1972: Climatological assessmentof urban effects on precipitation at St. Louis. J. Appl. Meteor.,11, 823–842.
——, and ——, 1973: Precipitation modification by major urbanareas. Bull. Amer. Meteor. Soc., 54, 1220–1232.
Kalnay, E., and Coauthors, 1996: The NCEP/NCAR 40-Year Re-analysis Project. Bull. Amer. Meteor. Soc., 77, 437–471.
Karl, T. R., and W. E. Riebsame, 1984: The identification of 10- to20-year temperature and precipitation fluctuations in thecontiguous United States. J. Climate Appl. Meteor., 23, 950–966.
Keim, B. D., 1996: Spatial, synoptic, and seasonal patterns ofheavy rainfall in the southeastern United States. Phys.Geogr., 17, 313–328.
——, 1997: Preliminary analysis of the temporal patterns of heavyrainfall across the southeastern United States. Prof. Geogr.,49, 94–104.
Konrad, C. E., 1997: Synoptic-scale features associated with warmseason heavy rainfall over the interior southeastern UnitedStates. Wea. Forecasting, 12, 557–571.
——, and V. Meentemeyer, 1994: Lower tropospheric warm airadvection patterns associated with heavy rainfall over theAppalachian region. Prof. Geogr., 46, 143–155.
Landsberg, H. E., 1981: The Urban Climate. Academic Press, 275pp.
Lowry, W. P., 1998: Urban effects on precipitation amount. Prog.Phys. Geogr., 22, 477–520.
Quattrochi, D. A., J. C. Luvall, D. L. Rickman, M. G. Estes, C. A.Laymon, and B. F. Howell, 2000: A decision support infor-mation system for urban landscape management using ther-mal infrared data. Photogramm. Eng. Remote Sens., 66, 1195–1207.
Rabin, R. M., S. Stadler, P. J. Wetzel, D. J. Stensrud, and M.Gregory, 1990: Observed effects of landscape variability onconvective clouds. Bull. Amer. Meteor. Soc., 71, 272–280.
Rosenberger, M. S., and P. W. Suckling, 1989: Precipitation cli-matology in the Pittsburgh urban area during late spring andsummer. Southeast. Geogr., 29, 75–91.
Rosenfeld, D., 2000: Suppression of rain and snow by urban andindustrial air pollution. Science, 287, 1793–1796.
Ross, R. J., and W. P. Elliott, 2001: Radiosonde-based NorthernHemisphere tropospheric water vapor trends. J. Climate, 14,1602–1612.
Rozoff, C. M., W. R. Cotton, and J. O. Adegoke, 2003: Simulationof St. Louis, Missouri, land use impacts on thunderstorms. J.Appl. Meteor., 42, 716–738.
Sanderson, M., and R. Gorski, 1978: The effect of metropolitanDetroit-Windsor on precipitation. J. Appl. Meteor., 17, 423–427.
Semonin, R. G., 1981: Cloud characteristics. Metromex: A Reviewand Summary, S. A. Changnon Jr., Ed., Amer. Meteor. Soc.,63–74.
Shepherd, J. M., 2004: Reply. J. Appl. Meteor., 43, 951–957.——, H. Pierce, and A. J. Negri, 2002: Rainfall modification by
major urban areas: Observations from spaceborne rain radaron the TRMM satellite. J. Appl. Meteor., 41, 689–701.
Stahle, D. W., and M. K. Cleaveland, 1992: Reconstructing andanalysis of spring rainfall over the southeastern U.S. for thepast 1000 years. Bull. Amer. Meteor. Soc., 73, 1947–1961.
Taha, H., S. Konopacki, and S. Gabersek, 1999: Impacts of large-scale surface modifications on meteorological conditions andenergy use: A 10-region modeling study. Theor. Appl. Clima-tol., 62, 175–185.
U.S. Census Bureau, cited 2001: Census 2000: Twenty-secondCensus of Population and Housing. U.S. Census Bureau.[Available online at http://www.census.gov/prod/cen2000/index.html.]
Weisman, R. A., 1990: An observational study of warm seasonsouthern Appalachian lee troughs. Part I: Boundary layercirculation. Mon. Wea. Rev., 118, 950–962.
Xia, Y., P. Fabian, A. Stohl, and M. Winterhalter, 1999: Forestclimatology: Estimation of missing values for Bavaria, Ger-many. Agric. For. Meteor., 96, 131–144.
Yang, X., and C. P. Lo, 2002: Using a time series of satelliteimagery to detect land use and land cover changes in theAtlanta, Georgia metropolitan area. Int. J. Remote Sens., 23,1775–1798.
730 J O U R N A L O F A P P L I E D M E T E O R O L O G Y VOLUME 44