geotechnical investigations report: vol iii ebenhaeser scheme
TRANSCRIPT

DWS Report No. P WMA 09/E10/00/0417/8
Post Feasibility Bridging Study for the Proposed Bulk Conveyance Infrastructure from the
Raised Clanwilliam Dam (WP0485)
Geotechnical Investigations Report: Vol III Ebenhaeser Scheme
April 2021

Directorate: Water Resource Development Planning April 2021 Page ii
Document control record
Document prepared by:
Zutari (Pty) Ltd
1977/003711/0
1 Century City Drive Waterford Precinct Century City Cape Town 7441
PO Box 494 Cape Town 8000 South Africa T F E W
+27 21 526 940 +27 21 526 950 [email protected] zutari.com
A person using Zutari documents or data accepts the risk of:
a) Using the documents or data in electronic form without requesting and checking them for accuracy against the original hard copy version.
b) Using the documents or data for any purpose not agreed to in writing by Zutari.
Document control
Report title Geotechnical Investigations Report: Vol III Ebenhaeser Scheme
Document ID 12607 Project number 113834
File path P:\Projects\113834 Bridging Study Clanwilliam Dam\03 Prj Del\20 Geotechnical\Reports\Vol III_Ebenhaeser\Version 02
Client Department of Water and Sanitation
Client contact Mr M Mugumo
Rev Date Revision details/status Prepared by Authors Verifier Approver
01 November 2020
Final Zutari Gary Davis Siya Nyathi Keshia Myburgh Mpho Sikwe
G Davis E v/d Berg
02 April 2021 Drilling results added Zutari G Davis E v/d Berg
Current Revision 02
Coordinates 31°35'0.93"S 18°19'40.24"E
Keywords Ebenhaeser, scheme, sand, calcrete, aeolian, schist, pipeline, dam, reservoir, geology; geotechnical
Approval
Author signature Approver signature
Name Gary Davis Pr.Sci.Nat, Name Erik van der Berg
Title Technical Director Title Technical Director
Post Feasibility Bridging Study for the Proposed Bulk Conveyance Infrastructure from the Raised Clanwilliam Dam (WP0485) GEOTECHNICAL INVESTIGATIONS REPORT. VOL III: EBENHAESER SCHEME (P WMA 09/E10/00/0417/8)
Directorate: Water Resource Development Planning April 2021 Page iii
DEPARTMENT OF WATER AND SANITATION
Directorate: Water Resource Development Planning
Post Feasibility Bridging Study for the Proposed Bulk Conveyance Infrastructure from the Raised Clanwilliam Dam
GEOTECHNICAL INVESTIGATIONS REPORT. VOL III: EBENHAESER SCHEME
April 2021 Prepared by: Zutari (Pty) Ltd
P O Box 494
Cape Town, 8000
South Africa
Tel: 021 526 5790
Fax: 086 526 9500
e-mail: [email protected]
Prepared for: Director: Water Resource Development Planning Department of Water and Sanitation Private Bag X313 Pretoria 0001 South Africa Mr Menard Mugumo (CE: OA, South) Tel: 012 336 6838 E-mail: [email protected]
This report is to be referred to in bibliographies as:
Department of Water and Sanitation, South Africa. 2020. Geotechnical Investigations Report. Vol
III: Ebenhaeser Scheme. Prepared by Zutari (Pty) Ltd as part of the Post Feasibility Bridging
Study for the Proposed Bulk Conveyance Infrastructure from the Raised Clanwilliam Dam.

Post Feasibility Bridging Study for the Proposed Bulk Conveyance Infrastructure from the Raised Clanwilliam Dam (WP0485) GEOTECHNICAL INVESTIGATIONS REPORT. VOL III: EBENHAESER SCHEME (P WMA 09/E10/00/0417/8)
Directorate: Water Resource Development Planning April 2021 Page iv
Post Feasibility Bridging Study for the Proposed Bulk Conveyance Infrastructure from the Raised Clanwilliam Dam
Reports produced as part of this project are indicated below. Bold type indicates this report.
Report Index
Report Number Report Title
1 Inception Report
2 P WMA 09/E10/00/0417/2 Capacity Building & Training Year 1
3 P WMA 09/E10/00/0417/3 Capacity Building & Training Year 2
4 P WMA 09/E10/00/0417/4 Water Requirements Assessment
5 P WMA 09/E10/00/0417/5 Distribution of Additional Available Water
6 Existing Infrastructure and Current Agricultural Development
Sub-Report
7 P WMA 09/E10/00/0417/6 Existing Conveyance Infrastructure and Irrigated Land
8 Suitable Agricultural Areas and Land Ownership Report
9 Evaluation of Development Options Sub-Report
10 P WMA 09/E10/00/0417/10 Suitable Areas for Agricultural Development
11 Right Bank Canal Design Sub-Report
12 Conceptual Design Sub-Report
13 Environmental Screening Sub-Report
14 Jan Dissels and Ebenhaeser Schemes Design Sub-Report
15 P WMA 09/E10/00/0417/13 Feasibility Design
16 P WMA 09/E10/00/0417/7 Topographical Surveys
17
P WMA 09/E10/00/0417/8 Geotechnical Investigations. Vol I: Jan Dissels Scheme Geotechnical Investigations. Vol II: Right Bank Canal Scheme Geotechnical Investigations. Vol III: Ebenhaeser Scheme
18 P WMA 09/E10/00/0417/9 Soil Survey
19 Financial Viability of Irrigation Farming Sub-Report
20 P WMA 09/E10/00/0417/11 Agricultural Production and Farm Development
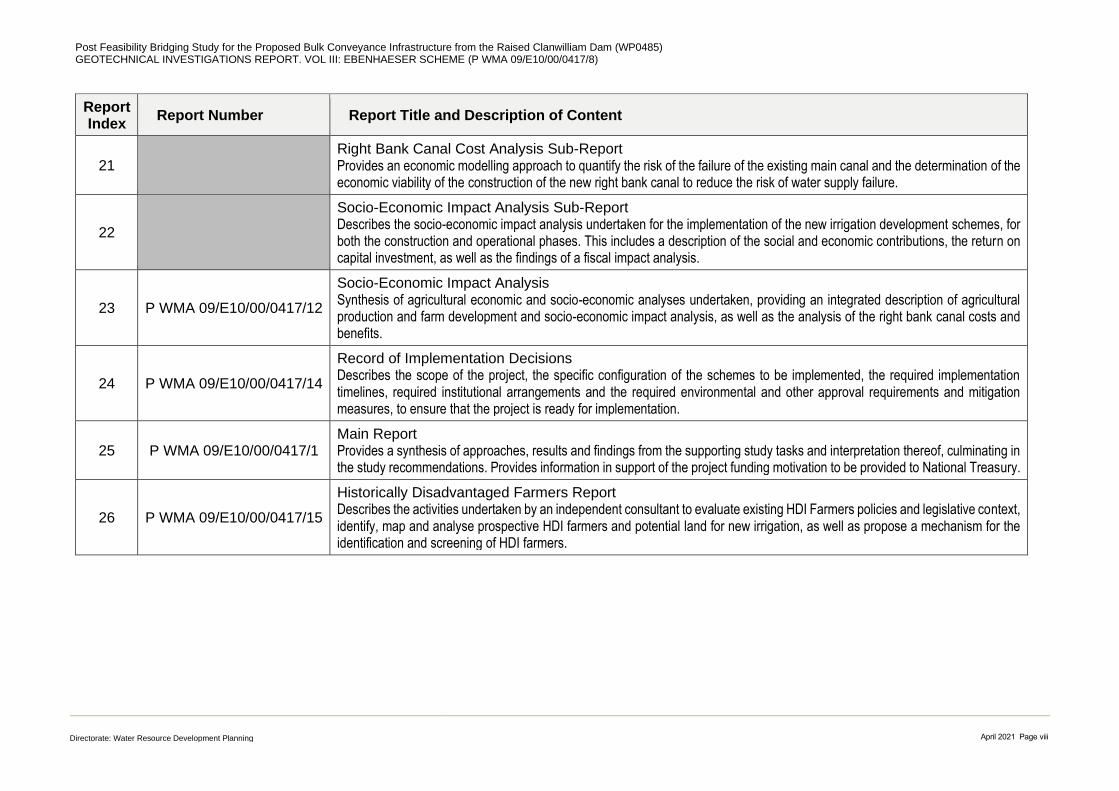
21 Right Bank Canal Cost Analysis Sub-Report
22 Socio-Economic Impact Analysis Sub-Report
23 P WMA 09/E10/00/0417/12 Socio-Economic Impact Analysis
24 P WMA 09/E10/00/0417/14 Record of Implementation Decisions Report
25 P WMA 09/E10/00/0417/1 Main Report
26 P WMA 09/E10/00/0417/15 Historically Disadvantaged Farmers Report
Post Feasibility Bridging Study for the Proposed Bulk Conveyance Infrastructure from the Raised Clanwilliam Dam (WP0485) GEOTECHNICAL INVESTIGATIONS REPORT. VOL III: EBENHAESER SCHEME (P WMA 09/E10/00/0417/8)
Directorate: Water Resource Development Planning April 2021 Page v
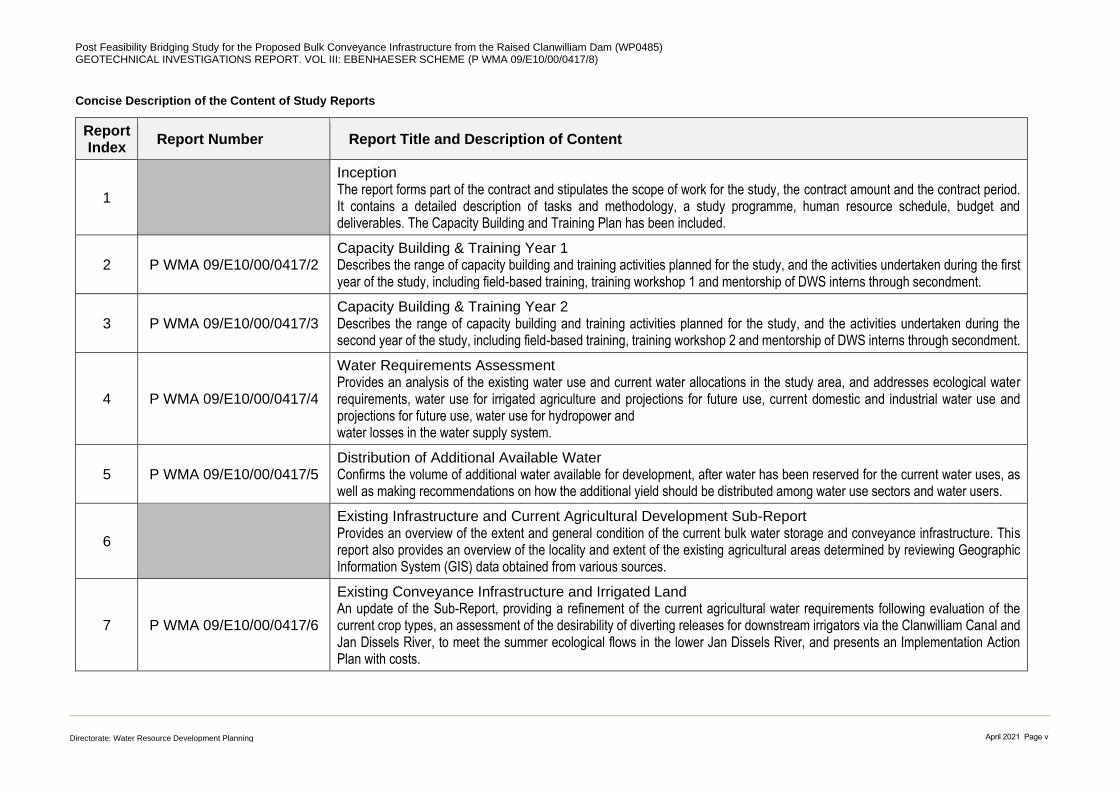
Concise Description of the Content of Study Reports
Report Index
Report Number Report Title and Description of Content
1
Inception The report forms part of the contract and stipulates the scope of work for the study, the contract amount and the contract period. It contains a detailed description of tasks and methodology, a study programme, human resource schedule, budget and deliverables. The Capacity Building and Training Plan has been included.
2 P WMA 09/E10/00/0417/2 Capacity Building & Training Year 1 Describes the range of capacity building and training activities planned for the study, and the activities undertaken during the first year of the study, including field-based training, training workshop 1 and mentorship of DWS interns through secondment.
3 P WMA 09/E10/00/0417/3 Capacity Building & Training Year 2 Describes the range of capacity building and training activities planned for the study, and the activities undertaken during the second year of the study, including field-based training, training workshop 2 and mentorship of DWS interns through secondment.
4 P WMA 09/E10/00/0417/4
Water Requirements Assessment Provides an analysis of the existing water use and current water allocations in the study area, and addresses ecological water requirements, water use for irrigated agriculture and projections for future use, current domestic and industrial water use and projections for future use, water use for hydropower and water losses in the water supply system.
5 P WMA 09/E10/00/0417/5 Distribution of Additional Available Water Confirms the volume of additional water available for development, after water has been reserved for the current water uses, as well as making recommendations on how the additional yield should be distributed among water use sectors and water users.
6
Existing Infrastructure and Current Agricultural Development Sub-Report Provides an overview of the extent and general condition of the current bulk water storage and conveyance infrastructure. This report also provides an overview of the locality and extent of the existing agricultural areas determined by reviewing Geographic Information System (GIS) data obtained from various sources.
7 P WMA 09/E10/00/0417/6
Existing Conveyance Infrastructure and Irrigated Land An update of the Sub-Report, providing a refinement of the current agricultural water requirements following evaluation of the current crop types, an assessment of the desirability of diverting releases for downstream irrigators via the Clanwilliam Canal and Jan Dissels River, to meet the summer ecological flows in the lower Jan Dissels River, and presents an Implementation Action Plan with costs.

Post Feasibility Bridging Study for the Proposed Bulk Conveyance Infrastructure from the Raised Clanwilliam Dam (WP0485) GEOTECHNICAL INVESTIGATIONS REPORT. VOL III: EBENHAESER SCHEME (P WMA 09/E10/00/0417/8)
Directorate: Water Resource Development Planning April 2021 Page vi
Report Index
Report Number Report Title and Description of Content
8
Suitable Agricultural Areas and Land Ownership Sub-Report Description of the collection of information and the preparation undertaken for the analysis of options, which includes a summary of existing irrigated areas and water use, cadastral information, land ownership, environmental sensitivity, soils suitability, water quality considerations and constraints, and the initiation of the process to identify additional areas suitable for irrigation.
9
Evaluation of Development Options Sub-Report Describes the salient features, costs and impacts of identified potential irrigation development options for new irrigation development in the lower Olifants River. This provides the background and an introduction to the discussions at the Options Screening Workshop held in December 2018.
10 P WMA 09/E10/00/0417/10
Suitable Areas for Agricultural Development Describes the supporting information, process followed and the salient features, costs and impacts of identified potential irrigation development options for new irrigation development in the lower Olifants River. Recommends the preferred options to be evaluated at feasibility level.
11
Right Bank Canal Feasibility Design Sub-Report Describes the Design Criteria Memorandum, based on best practice in engineering and complying with recognised codes and standards. Description of route alignments and salient features of the new Right Bank canal. Feasibility-level design of bulk infrastructure, including evaluation of capacities, hydraulic conditions, canal design, surface flow considerations, canal structures, power supply and access roads. Operational considerations and recommendations.
12 Conceptual Design Sub-Report Describes the scheme layouts at a conceptual level and infrastructure components to be designed, alternatives to consider or sub-options, and affected land and infrastructure, as well as the updated recommended schemes for new irrigation development.
13
Environmental Screening Sub-Report Describes and illustrates the opportunities and constraints, and potential ecological risks/impacts and recommendations for the short-listed bulk infrastructure development options at reconnaissance level. Describes relevant legislation that applies to the proposed irrigation developments.
Post Feasibility Bridging Study for the Proposed Bulk Conveyance Infrastructure from the Raised Clanwilliam Dam (WP0485) GEOTECHNICAL INVESTIGATIONS REPORT. VOL III: EBENHAESER SCHEME (P WMA 09/E10/00/0417/8)
Directorate: Water Resource Development Planning April 2021 Page vii
Report Index
Report Number Report Title and Description of Content
14
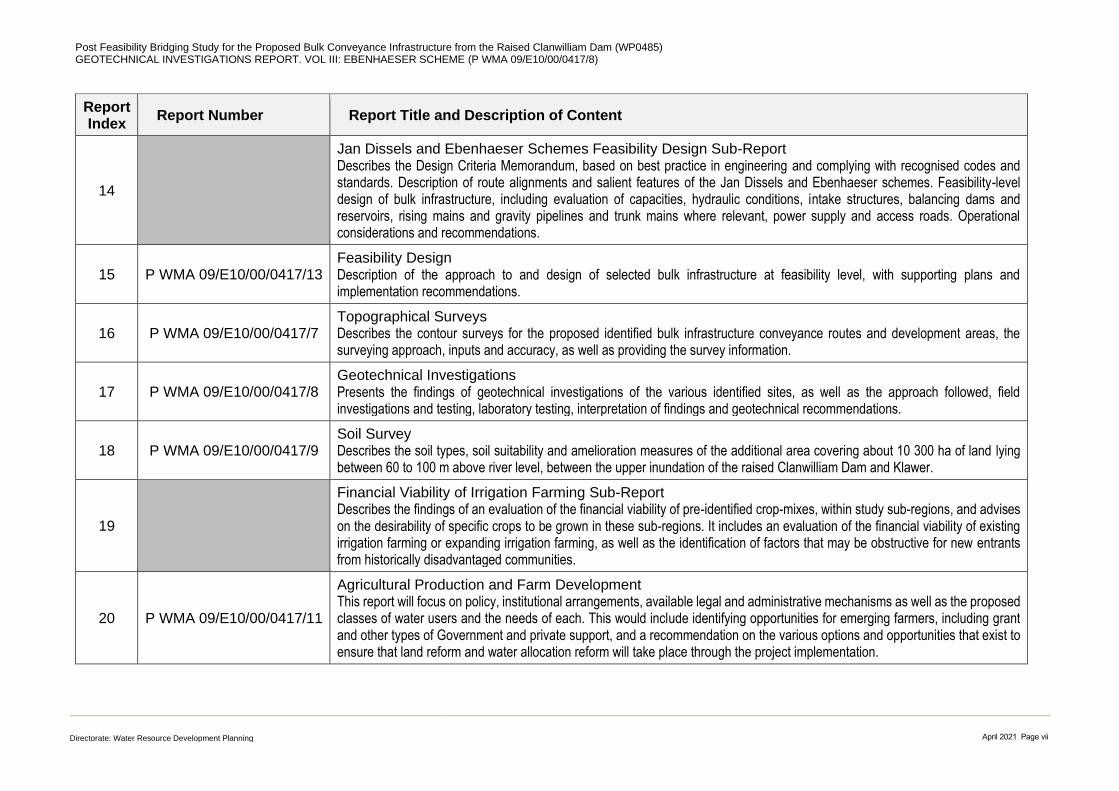
Jan Dissels and Ebenhaeser Schemes Feasibility Design Sub-Report Describes the Design Criteria Memorandum, based on best practice in engineering and complying with recognised codes and standards. Description of route alignments and salient features of the Jan Dissels and Ebenhaeser schemes. Feasibility-level design of bulk infrastructure, including evaluation of capacities, hydraulic conditions, intake structures, balancing dams and reservoirs, rising mains and gravity pipelines and trunk mains where relevant, power supply and access roads. Operational considerations and recommendations.
15 P WMA 09/E10/00/0417/13 Feasibility Design Description of the approach to and design of selected bulk infrastructure at feasibility level, with supporting plans and implementation recommendations.
16 P WMA 09/E10/00/0417/7 Topographical Surveys Describes the contour surveys for the proposed identified bulk infrastructure conveyance routes and development areas, the surveying approach, inputs and accuracy, as well as providing the survey information.
17 P WMA 09/E10/00/0417/8 Geotechnical Investigations Presents the findings of geotechnical investigations of the various identified sites, as well as the approach followed, field investigations and testing, laboratory testing, interpretation of findings and geotechnical recommendations.
18 P WMA 09/E10/00/0417/9 Soil Survey Describes the soil types, soil suitability and amelioration measures of the additional area covering about 10 300 ha of land lying between 60 to 100 m above river level, between the upper inundation of the raised Clanwilliam Dam and Klawer.
19
Financial Viability of Irrigation Farming Sub-Report Describes the findings of an evaluation of the financial viability of pre-identified crop-mixes, within study sub-regions, and advises on the desirability of specific crops to be grown in these sub-regions. It includes an evaluation of the financial viability of existing irrigation farming or expanding irrigation farming, as well as the identification of factors that may be obstructive for new entrants from historically disadvantaged communities.
20 P WMA 09/E10/00/0417/11
Agricultural Production and Farm Development This report will focus on policy, institutional arrangements, available legal and administrative mechanisms as well as the proposed classes of water users and the needs of each. This would include identifying opportunities for emerging farmers, including grant and other types of Government and private support, and a recommendation on the various options and opportunities that exist to ensure that land reform and water allocation reform will take place through the project implementation.
Post Feasibility Bridging Study for the Proposed Bulk Conveyance Infrastructure from the Raised Clanwilliam Dam (WP0485) GEOTECHNICAL INVESTIGATIONS REPORT. VOL III: EBENHAESER SCHEME (P WMA 09/E10/00/0417/8)
Directorate: Water Resource Development Planning April 2021 Page viii
Report Index
Report Number Report Title and Description of Content
21 Right Bank Canal Cost Analysis Sub-Report Provides an economic modelling approach to quantify the risk of the failure of the existing main canal and the determination of the economic viability of the construction of the new right bank canal to reduce the risk of water supply failure.
22
Socio-Economic Impact Analysis Sub-Report Describes the socio-economic impact analysis undertaken for the implementation of the new irrigation development schemes, for both the construction and operational phases. This includes a description of the social and economic contributions, the return on capital investment, as well as the findings of a fiscal impact analysis.
23 P WMA 09/E10/00/0417/12
Socio-Economic Impact Analysis Synthesis of agricultural economic and socio-economic analyses undertaken, providing an integrated description of agricultural production and farm development and socio-economic impact analysis, as well as the analysis of the right bank canal costs and benefits.
24 P WMA 09/E10/00/0417/14
Record of Implementation Decisions Describes the scope of the project, the specific configuration of the schemes to be implemented, the required implementation timelines, required institutional arrangements and the required environmental and other approval requirements and mitigation measures, to ensure that the project is ready for implementation.
25 P WMA 09/E10/00/0417/1 Main Report Provides a synthesis of approaches, results and findings from the supporting study tasks and interpretation thereof, culminating in the study recommendations. Provides information in support of the project funding motivation to be provided to National Treasury.
26 P WMA 09/E10/00/0417/15
Historically Disadvantaged Farmers Report Describes the activities undertaken by an independent consultant to evaluate existing HDI Farmers policies and legislative context, identify, map and analyse prospective HDI farmers and potential land for new irrigation, as well as propose a mechanism for the identification and screening of HDI farmers.

Post Feasibility Bridging Study for the Proposed Bulk Conveyance Infrastructure from the Raised Clanwilliam Dam (WP0485) GEOTECHNICAL INVESTIGATIONS REPORT. VOL III: EBENHAESER SCHEME (P WMA 09/E10/00/0417/8)
Directorate: Water Resource Development Planning April 2021 Page ix
Executive Summary
Introduction
The geotechnical investigations have been conducted with the objective of providing
recommendations on the bulk conveyance infrastructure options (new developments / upgrading
/ rehabilitation) required for the equitable distribution of the existing and additional water from the
raised Clanwilliam Dam, as part of the Post Feasibility Bridging Study for the Proposed Bulk
Conveyance Infrastructure from the Raised Clanwilliam Dam.
This report presents the findings of the geotechnical investigation for the Ebenhaeser Scheme
(Volume III), with Jan Dissels and the Right Bank Canal schemes presented in separate reports,
i.e. Volume I and Volume II, respectively.
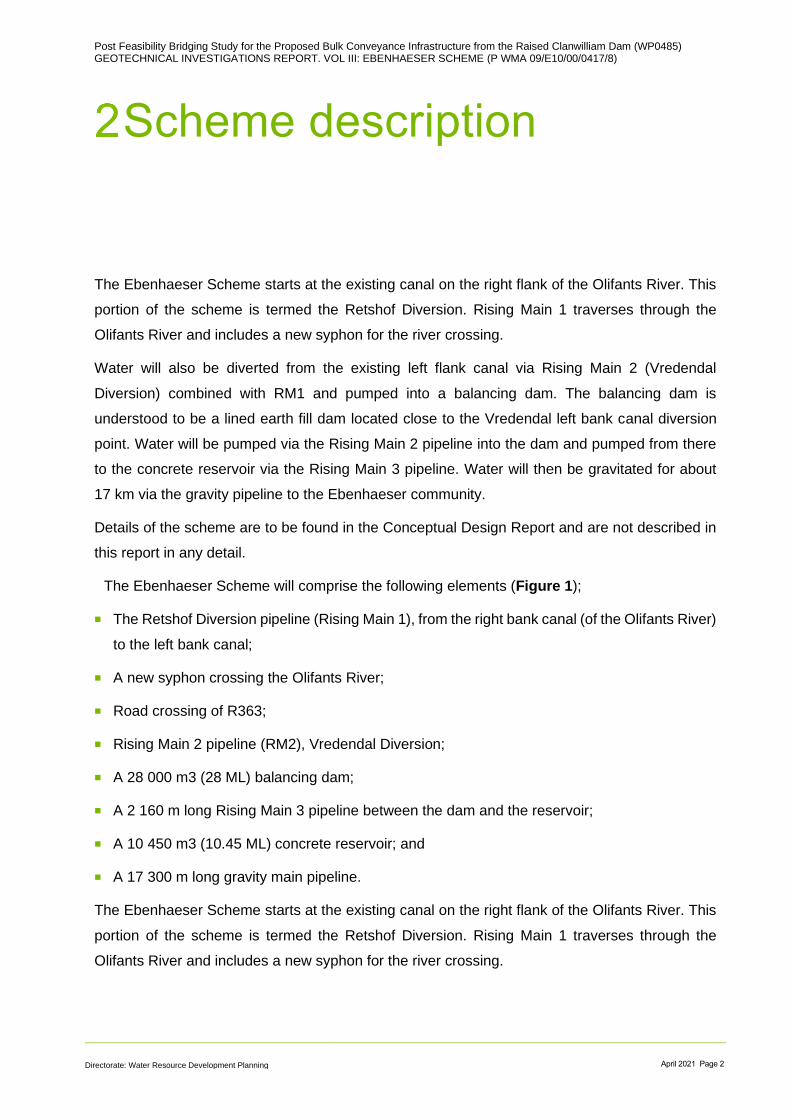
Scheme description
The Ebenhaeser Scheme will comprise the following elements:
◼ Retshof Diversion pipeline (Rising Main 1), from the right bank canal of the Olifants River to
the left bank canal;
◼ A new syphon crossing the Olifants River;
◼ Road crossing at R363;
◼ Rising Main 2 pipeline (RM2), Vredendal Diversion;
◼ A 29 000 m3 (28 ML) balancing dam;
◼ A 2 160 m long Rising Main 3 pipeline between the dam and the reservoir;
◼ A 10 450 m3 (10.45 ML) concrete reservoir; and
◼ A 17 300 m long gravity main pipeline.
Regional geology
According to the 1:250 000 scale geological map 3118 Calvinia (Council for Geoscience, 2001),
the site is underlain by aeolian sands, and in turn underlain by calcareous soils and graphitic and
sericitic schist, phyllite, greywacke, quartzite, impure dolomite, limestone and marble of the Aties
Formation, Gariep Supergroup.

Post Feasibility Bridging Study for the Proposed Bulk Conveyance Infrastructure from the Raised Clanwilliam Dam (WP0485) GEOTECHNICAL INVESTIGATIONS REPORT. VOL III: EBENHAESER SCHEME (P WMA 09/E10/00/0417/8)
Directorate: Water Resource Development Planning April 2021 Page x
Site investigation
A field site visit was conducted by the Aurecon / Zutari design teams on 16th and 17th March 2020
where elements of the various schemes were visited including the Ebenhaeser Scheme.
Representatives of the geotechnical team accompanied the two design teams for this visit.
The fieldwork was subsequently conducted between 23rd and 29th July 2020 for the Ebenhaeser
Scheme after the approval of the Conceptual Design Sub-report, which recommended viable
schemes. The geotechnical investigations included the following elements:
◼ Test pitting.
◼ Field testing including Dynamic Cone Penetration (DCP) testing.
◼ Laboratory testing.
◼ Interpretation, analysis and reporting.
The findings of the abovementioned fieldwork were presented in the Ebenhaeser Geotechnical
Report, Rev01, submitted to DWS in November 2020.
As stated, in places investigation by means of test pits could not be achieved due to the high river
levels and the unstable ground, particularly at the Olifants River crossing. Additional investigation
was subsequently conducted in January and February 2021. These additional investigations
comprised the following;
◼ geophysical surveys and,
◼ rotary core borehole (including Standard Penetration testing) .
The findings of these additional investigations have been included in this revised report
“Ebenhaeser Geotechnical Report, Rev02”.
Investigation findings
The general geological profile across the scheme’s corridor largely comprises very loose to
medium dense, red and orange brown aeolian sand underlain by pedogenic materials (i.e. very
dense ferruginised and calcretised sand and hardpan calcrete), terrace gravels and schist
bedrock.
The scheme is located outside known areas of natural seismic activity and outside regions of
mining-induced seismic activity. As such the site is in a non-seismic activity zone, which means
no specific seismic design requirements other than normal structural design requirements are
required.
Post Feasibility Bridging Study for the Proposed Bulk Conveyance Infrastructure from the Raised Clanwilliam Dam (WP0485) GEOTECHNICAL INVESTIGATIONS REPORT. VOL III: EBENHAESER SCHEME (P WMA 09/E10/00/0417/8)
Directorate: Water Resource Development Planning April 2021 Page xi
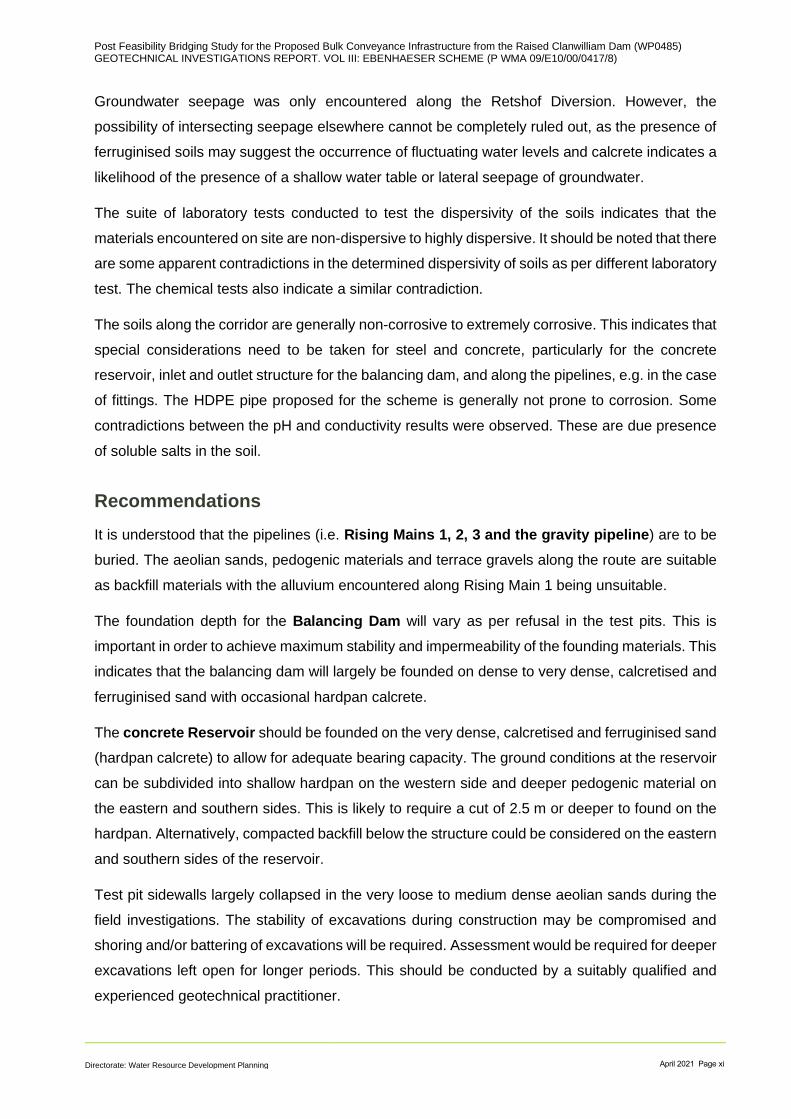
Groundwater seepage was only encountered along the Retshof Diversion. However, the
possibility of intersecting seepage elsewhere cannot be completely ruled out, as the presence of
ferruginised soils may suggest the occurrence of fluctuating water levels and calcrete indicates a
likelihood of the presence of a shallow water table or lateral seepage of groundwater.
The suite of laboratory tests conducted to test the dispersivity of the soils indicates that the
materials encountered on site are non-dispersive to highly dispersive. It should be noted that there
are some apparent contradictions in the determined dispersivity of soils as per different laboratory
test. The chemical tests also indicate a similar contradiction.
The soils along the corridor are generally non-corrosive to extremely corrosive. This indicates that
special considerations need to be taken for steel and concrete, particularly for the concrete
reservoir, inlet and outlet structure for the balancing dam, and along the pipelines, e.g. in the case
of fittings. The HDPE pipe proposed for the scheme is generally not prone to corrosion. Some
contradictions between the pH and conductivity results were observed. These are due presence
of soluble salts in the soil.
Recommendations
It is understood that the pipelines (i.e. Rising Mains 1, 2, 3 and the gravity pipeline) are to be
buried. The aeolian sands, pedogenic materials and terrace gravels along the route are suitable
as backfill materials with the alluvium encountered along Rising Main 1 being unsuitable.
The foundation depth for the Balancing Dam will vary as per refusal in the test pits. This is
important in order to achieve maximum stability and impermeability of the founding materials. This
indicates that the balancing dam will largely be founded on dense to very dense, calcretised and
ferruginised sand with occasional hardpan calcrete.
The concrete Reservoir should be founded on the very dense, calcretised and ferruginised sand
(hardpan calcrete) to allow for adequate bearing capacity. The ground conditions at the reservoir
can be subdivided into shallow hardpan on the western side and deeper pedogenic material on
the eastern and southern sides. This is likely to require a cut of 2.5 m or deeper to found on the
hardpan. Alternatively, compacted backfill below the structure could be considered on the eastern
and southern sides of the reservoir.
Test pit sidewalls largely collapsed in the very loose to medium dense aeolian sands during the
field investigations. The stability of excavations during construction may be compromised and
shoring and/or battering of excavations will be required. Assessment would be required for deeper
excavations left open for longer periods. This should be conducted by a suitably qualified and
experienced geotechnical practitioner.

Post Feasibility Bridging Study for the Proposed Bulk Conveyance Infrastructure from the Raised Clanwilliam Dam (WP0485) GEOTECHNICAL INVESTIGATIONS REPORT. VOL III: EBENHAESER SCHEME (P WMA 09/E10/00/0417/8)
Directorate: Water Resource Development Planning April 2021 Page xii
Soft excavations in terms of SANS 1200D are to be expected in aeolian sand, alluvium and
terrace gravels. Hard excavations, as per SANS 1200D, are encountered in hardpan calcrete and
schist bedrock.
At the time of compiling the geotechnical report the invert level for the pipelines had not been
finalized by the design team hence comparison between the invert level and refusal has not been
included.
It is recommended that foundation excavations at the Balancing Dam and the concrete Reservoir
be inspected by an experienced geotechnical engineer or engineering geologist prior to
placement of materials to ensure that the desired founding materials / horizons have been
attained.
It is recommended that additional chemical testing be conducted to investigate the corrosiveness
of the soils along the pipeline routes.
The Olifants river crossing is expected to comprise a syphon, not more than 8m deep. Based on
borehole data from the additional investigation, deep alluvial soils extending to at least 8m below
NGL are expected, coupled with high water levels. The base of the alluvial deposits was not
intersected, and neither the depth of the underlying bedrock nor the bedrock condition is
confirmed. The alluvial deposits comprise fine-grained sediments and might be considered
relatively uniform. This relatively uniform profile within the upper 8m implies that differential
settlement is not anticipated.
Unsupported excavations within the river section, within these saturated alluvial sands, will be
prone to collapse. All excavations will therefore either require battering or support, such as
shoring, or combinations thereof. It is doubtful whether battering slopes to safe angles will be
practical, as these slopes would of necessity be very flat, and would be subject to continual
collapse.
The alluvial sands to a depth of at least 8 m below NGL will classify as ‘soft excavations’ in
accordance with SANS 1200 D. The profile might include occasional cobbles / boulders, even
though the two boreholes did not intersect such materials and the selected excavation methods
must be able to deal with a coarser fraction.

Post Feasibility Bridging Study for the Proposed Bulk Conveyance Infrastructure from the Raised Clanwilliam Dam (WP0485) GEOTECHNICAL INVESTIGATIONS REPORT. VOL III: EBENHAESER SCHEME (P WMA 09/E10/00/0417/8)
Directorate: Water Resource Development Planning April 2021 Page xiii
List of abbreviations
AASHTO = American Association of State and Highway Transport Officials
BH = borehole
CBR = California Bearing Ratio
CH = Chainage
COLTO = Committee of Land Transport Officials
DCP = Dynamic Cone Penetrometer
DWS = Department of Water & Sanitation
ESP = Extractable Sodium Percentage
FI = Foundation Indicator
g = acceleration due to gravity (9.8 m.s-2)
GM = Grading modulus
LL = Liquid Limit
LS = Linear Shrinkage
MDD = Maximum Dry Density
OMC = Optimum Moisture Content
PGA = Peak Ground Acceleration
PHSA = Probabilistic Seismic Hazard Analysis
PI = Plasticity Index
PL = Plastic Limit
PR + Penetration rate
SAICE = South African Institution of Civil Engineering
SAR = Sodium Adsorption Ratio
TLB = Tractor-loader backhoe (light)
TP = Test pit, or trial pit
USCS = Unified Soil Classification System
WPI = Weighted Plasticity Index

Post Feasibility Bridging Study for the Proposed Bulk Conveyance Infrastructure from the Raised Clanwilliam Dam (WP0485) GEOTECHNICAL INVESTIGATIONS REPORT. VOL III: EBENHAESER SCHEME (P WMA 09/E10/00/0417/8)
Directorate: Water Resource Development Planning April 2021 Page xiv
Post Feasibility Bridging Study for the Proposed Bulk Conveyance Infrastructure from the Raised Clanwilliam Dam (WP0485) GEOTECHNICAL INVESTIGATIONS REPORT. VOL III: EBENHAESER SCHEME (P WMA 09/E10/00/0417/8)
Directorate: Water Resource Development Planning April 2021 Page xv
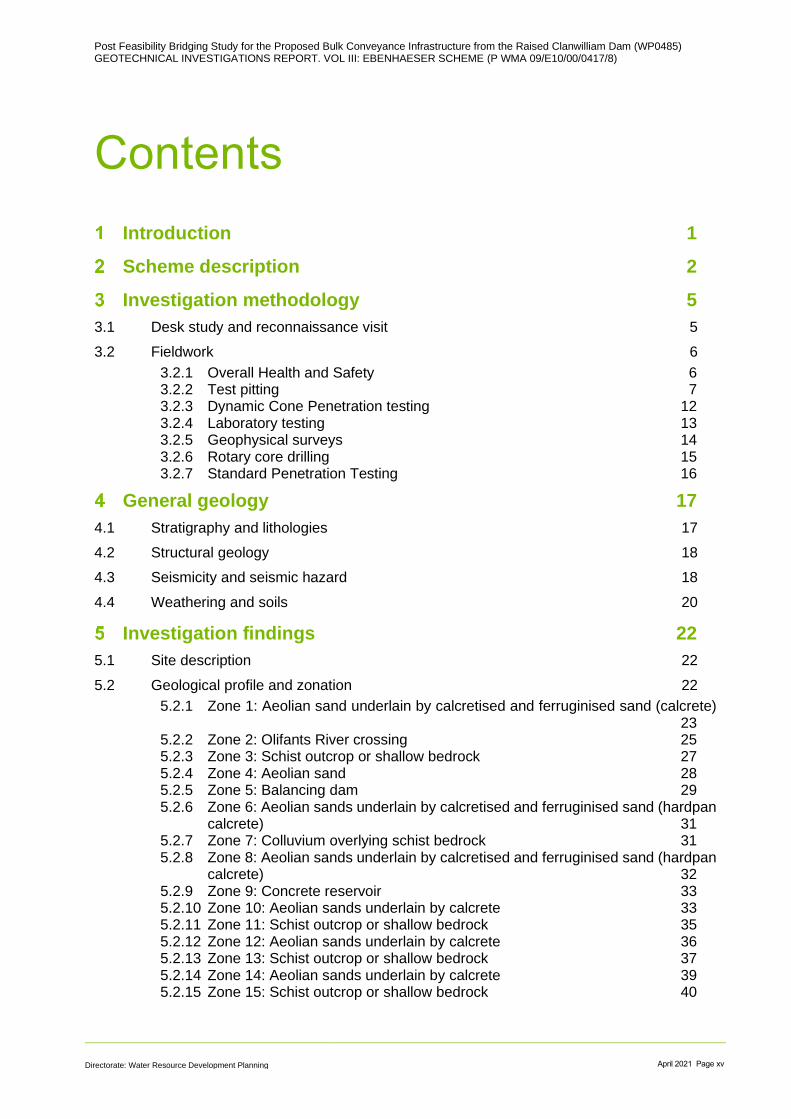
Introduction 1
Scheme description 2
Investigation methodology 5
3.1 Desk study and reconnaissance visit 5
3.2 Fieldwork 6
3.2.1 Overall Health and Safety 6 3.2.2 Test pitting 7 3.2.3 Dynamic Cone Penetration testing 12 3.2.4 Laboratory testing 13 3.2.5 Geophysical surveys 14 3.2.6 Rotary core drilling 15 3.2.7 Standard Penetration Testing 16
General geology 17
4.1 Stratigraphy and lithologies 17
4.2 Structural geology 18
4.3 Seismicity and seismic hazard 18
4.4 Weathering and soils 20
Investigation findings 22
5.1 Site description 22
5.2 Geological profile and zonation 22
5.2.1 Zone 1: Aeolian sand underlain by calcretised and ferruginised sand (calcrete) 23
5.2.2 Zone 2: Olifants River crossing 25 5.2.3 Zone 3: Schist outcrop or shallow bedrock 27 5.2.4 Zone 4: Aeolian sand 28 5.2.5 Zone 5: Balancing dam 29 5.2.6 Zone 6: Aeolian sands underlain by calcretised and ferruginised sand (hardpan
calcrete) 31 5.2.7 Zone 7: Colluvium overlying schist bedrock 31 5.2.8 Zone 8: Aeolian sands underlain by calcretised and ferruginised sand (hardpan
calcrete) 32 5.2.9 Zone 9: Concrete reservoir 33 5.2.10 Zone 10: Aeolian sands underlain by calcrete 33 5.2.11 Zone 11: Schist outcrop or shallow bedrock 35 5.2.12 Zone 12: Aeolian sands underlain by calcrete 36 5.2.13 Zone 13: Schist outcrop or shallow bedrock 37 5.2.14 Zone 14: Aeolian sands underlain by calcrete 39 5.2.15 Zone 15: Schist outcrop or shallow bedrock 40
Contents

Post Feasibility Bridging Study for the Proposed Bulk Conveyance Infrastructure from the Raised Clanwilliam Dam (WP0485) GEOTECHNICAL INVESTIGATIONS REPORT. VOL III: EBENHAESER SCHEME (P WMA 09/E10/00/0417/8)
Directorate: Water Resource Development Planning April 2021 Page xvi
5.3 Laboratory test results 42
5.3.1 Foundation indicator results 42 5.3.2 Compaction test results 44 5.3.3 Shear strength test results 46 5.3.4 Collapse potential test 47 5.3.5 Permeability test 48 5.3.6 Chemical tests (pH and conductivity) 49 5.3.7 Dispersivity 51 5.3.8 In-situ moisture content 53
5.4 Field test results 55
5.4.1 Dynamic Cone Penetrometer (DCP) results 55 5.4.2 Electrical Resistivity Tomography (ERT) results 55 5.4.3 Standard Penetration Test (SPT) results 56
Geotechnical considerations 58
6.1 General considerations 58
6.1.1 Compressible and collapsible soils 58 6.1.2 Dispersive and erodible soils 58 6.1.3 Expansiveness in soils 59 6.1.4 Unstable or steep natural slopes 59 6.1.5 Seismicity 59 6.1.6 Excavation considerations 59 6.1.7 Groundwater conditions 60
6.2 Retshof and Vredendal Diversions - Rising Main Pipeline 1 and 2 respectively 60
6.2.1 Geological profile 60 6.2.2 Excavation 61 6.2.3 Sidewall stability in trenches 61 6.2.4 Corrosiveness 62 6.2.5 Suitability of excavated material for use as selected backfill 63 6.2.6 Olifants River crossing 64 6.2.7 R363 road crossing 65
6.3 Balancing Dam 66
6.3.1 Founding considerations 66 6.3.2 Permeability 66 6.3.3 Stability of natural slopes 67 6.3.4 Excavation 67 6.3.5 Excavation stability 68 6.3.6 Corrosiveness 69 6.3.7 Construction materials 69 6.3.8 Other considerations 70
6.4 Rising Main Pipeline 3 between the dam and the reservoir 70
6.4.1 Excavation 70 6.4.2 Sidewall stability in trenches 71 6.4.3 Corrosiveness 71 6.4.4 Suitability of excavated material for use as selected backfill 72
6.5 Concrete reservoir 72
6.5.1 Founding considerations 72 6.5.2 Excavation 73 6.5.3 Excavation stability 73 6.5.4 Corrosiveness 74
6.6 Gravity pipeline 74
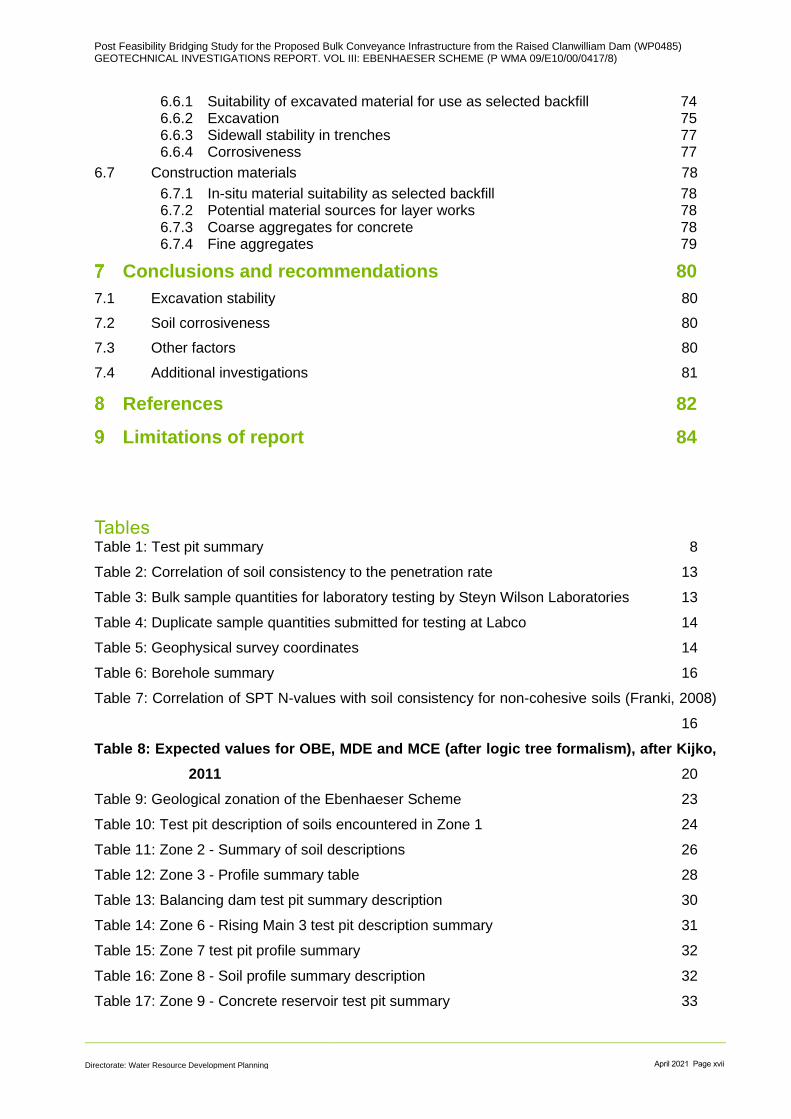
Post Feasibility Bridging Study for the Proposed Bulk Conveyance Infrastructure from the Raised Clanwilliam Dam (WP0485) GEOTECHNICAL INVESTIGATIONS REPORT. VOL III: EBENHAESER SCHEME (P WMA 09/E10/00/0417/8)
Directorate: Water Resource Development Planning April 2021 Page xvii
6.6.1 Suitability of excavated material for use as selected backfill 74 6.6.2 Excavation 75 6.6.3 Sidewall stability in trenches 77 6.6.4 Corrosiveness 77
6.7 Construction materials 78
6.7.1 In-situ material suitability as selected backfill 78 6.7.2 Potential material sources for layer works 78 6.7.3 Coarse aggregates for concrete 78 6.7.4 Fine aggregates 79
Conclusions and recommendations 80
7.1 Excavation stability 80
7.2 Soil corrosiveness 80
7.3 Other factors 80
7.4 Additional investigations 81
References 82
Limitations of report 84
Tables Table 1: Test pit summary 8
Table 2: Correlation of soil consistency to the penetration rate 13
Table 3: Bulk sample quantities for laboratory testing by Steyn Wilson Laboratories 13
Table 4: Duplicate sample quantities submitted for testing at Labco 14
Table 5: Geophysical survey coordinates 14
Table 6: Borehole summary 16
Table 7: Correlation of SPT N-values with soil consistency for non-cohesive soils (Franki, 2008)
16
Table 8: Expected values for OBE, MDE and MCE (after logic tree formalism), after Kijko,
2011 20
Table 9: Geological zonation of the Ebenhaeser Scheme 23
Table 10: Test pit description of soils encountered in Zone 1 24
Table 11: Zone 2 - Summary of soil descriptions 26
Table 12: Zone 3 - Profile summary table 28
Table 13: Balancing dam test pit summary description 30
Table 14: Zone 6 - Rising Main 3 test pit description summary 31
Table 15: Zone 7 test pit profile summary 32
Table 16: Zone 8 - Soil profile summary description 32
Table 17: Zone 9 - Concrete reservoir test pit summary 33
Post Feasibility Bridging Study for the Proposed Bulk Conveyance Infrastructure from the Raised Clanwilliam Dam (WP0485) GEOTECHNICAL INVESTIGATIONS REPORT. VOL III: EBENHAESER SCHEME (P WMA 09/E10/00/0417/8)
Directorate: Water Resource Development Planning April 2021 Page xviii
Table 18: Zone 10 - Summary of soil profiles 34
Table 19: Zone 11: Summary of soil profiles 36
Table 20: Aeolian sands and pedogenic material summaries for Zone 12 37
Table 21: Zone 13 - Test pit summary description 38
Table 22: Zone 14 - Summary description of test pit profiles 39
Table 23: Zone 15 - Test pit profile summary 40
Table 24: Summarised foundation indicator results 42
Table 25: Summarised compaction test results 45
Table 26: Summarised shear box test results 46
Table 27: Collapse potential summary results 47
Table 28: Guideline values for interpretation of the collapse potential test (after Jennings and
Knight, 1957) 47
Table 29: Permeability summary results 48
Table 30: Typical values for coefficient of permeability, after Das (2002) 48
Table 31: Guideline values for interpretation of soil conductivity (Duligal, 1996) 49
Table 32: Chemical test summary results 49
Table 33: Summarised dispersivity results 51
Table 34: Criteria for evaluation of degree of dispersion from double hydrometer test (after Bell
and Maud, 1994) 52
Table 35: Criteria for evaluation of degree of dispersion from ESP results (after Gerber, 1983)
52
Table 36: Criteria for evaluation of degree of dispersion from SAR results 52
Table 37: In-situ moisture conditions along the proposed Ebenhaeser Scheme 53
Table 38: DCP test summary results along the gravity pipeline 55
Table 39: SPT N-Values summary 57
Table 40: Summary of geological profiles along Rising Main 1 and 2 60
Table 41: Excavation summary along RM1 and RM2 61
Table 42: Corrosiveness of soil along Rising Main 1 and 2 route 63
Table 43: Bedding material type requirements as per SANS 1200 DB 63
Table 44: Assumed re-use of in-situ material for RM 1 and RM2 pipelines 64
Table 45: Summary of the dam site permeability 67
Table 46: Balancing Dam - Average depths of anticipated excavation 68
Table 47: Corrosiveness of the materials encountered at the Balancing Dam site 69
Table 48: Suitability of in-situ material for embankment construction 69
Table 49: Average depths of anticipated excavation for the Rising Main pipeline 3 70
Table 50: Corrosiveness of materials along the Rising Main 3 pipeline route 71
Post Feasibility Bridging Study for the Proposed Bulk Conveyance Infrastructure from the Raised Clanwilliam Dam (WP0485) GEOTECHNICAL INVESTIGATIONS REPORT. VOL III: EBENHAESER SCHEME (P WMA 09/E10/00/0417/8)
Directorate: Water Resource Development Planning April 2021 Page xix
Table 51: RM 3 pipeline: Assumed material re-use of the in-situ material 72
Table 52: Excavation summary at the reservoir site 73
Table 53: Gravity pipeline: Assumed re-use of the in situ material 74
Table 54: Gravity pipeline: Average depths of anticipated excavation 75
Table 55: Corrosiveness of the materials encountered along the gravity pipeline route 77
Figures Figure 1: Layout of the Ebenhaeser Scheme 4
Figure 2: Location of field resistivity tests. 15
Figure 3: Ebenhaeser Scheme, extract from the 1:250 000 scale geological map 3118 Calvinia
(Council for Geoscience, 2001) 17
Figure 4: Seismic hazard map showing peak ground acceleration (g) with 10% probability of being
exceeded in a 50-year period (SANS 10160-4: 2011) 19
Figure 5: Climatic N-values for the area of interest, after Weinert (1980) 21
Figure 6: Aeolian sand encountered in Zone 1, view from the river section towards the existing
right bank canal 24
Figure 7: Panorama view of the Olifants River crossing, view from E-TP04 25
Figure 8: Schist bedrock encountered in Zone 3, dipping, foliated and fissile in places 28
Figure 9: Zone 4 - localised deep aeolian sand profiles that can be expected across the scheme
29
Figure 10: General balancing dam site conditions, showing orange brown aeolian sand cover30
Figure 11: Schist bedrock outcrop in Zone 11 36
Figure 12: Schist bedrock as encountered in Zone 13, exposed in a redundant road cut 38
Figure 13: Calcretised schist at the base of the test pit (E-TP82) 41
Figure 14: ERT Model along Traverse 7 56
Figure 15: ERT Model along Traverse 8 56
Figure 16: Exposed schist dipping between 30° and 40° as encountered along the existing left
bank canal 62
Tables
Figures
Appendix A
Site Layout Drawings
Appendix B
Post Feasibility Bridging Study for the Proposed Bulk Conveyance Infrastructure from the Raised Clanwilliam Dam (WP0485) GEOTECHNICAL INVESTIGATIONS REPORT. VOL III: EBENHAESER SCHEME (P WMA 09/E10/00/0417/8)
Directorate: Water Resource Development Planning April 2021 Page xx
Summary of Soil and Rock Profile Description Terminology
Appendix C
Test Pit Profiles
Appendix D
DCP Test Results
Appendix E
Laboratory Test Results
Appendix F
Electrical Resistivity Tomography Report and Detailed Results
Appendix G
Rotary Core Borehole Logs and Photographs
Appendix H
SPT Results contained in Drillers Daily Logs
Appendix I
Probabilistic Seismic Hazard Analysis for the Clanwilliam Dam (excerpt from Aurecon Report 106310-G5-01 Clanwilliam Dam: Second Engineering Geological Report for Design of Dam Raising)

Post Feasibility Bridging Study for the Proposed Bulk Conveyance Infrastructure from the Raised Clanwilliam Dam (WP0485) GEOTECHNICAL INVESTIGATIONS REPORT. VOL III: EBENHAESER SCHEME (P WMA 09/E10/00/0417/8)
Directorate: Water Resource Development Planning April 2021 Page 1
The objective of the Post Feasibility Bridging Study for the Proposed Bulk Conveyance
Infrastructure from the Raised Clanwilliam Dam is to provide recommendations on the bulk
conveyance infrastructure options (new developments / upgrading / rehabilitation) required for the
equitable distribution of the existing and additional water from the raised Clanwilliam Dam, after
investigation of:
◼ The existing water allocation and projections for the supply area;
◼ New areas for agricultural development;
◼ Options for the required conveyance infrastructure; and
◼ Appropriate farming models and cost of irrigation water.
The study has recommended that the feasibility designs of the following three schemes be
prepared;
◼ Jan Dissels;
◼ Right Bank Canal; and
◼ Ebenhaeser.
To support the respective feasibility designs for these schemes, geotechnical investigations
were initiated at a stage when respective scheme layouts were close to being finalised. In this
way, geotechnical inputs were able to serve as input considerations prior to finalisation of
layouts, although the primary aim of the geotechnical investigations was to support the
respective feasibility designs.
The findings of the geotechnical investigations are presented separately for each of the
respective schemes, as shown below (this report is shown in bold);
◼ Geotechnical Investigations Report. Volume I. Jan Dissels Scheme.
◼ Geotechnical Investigations Report. Volume II. Right Bank Canal Scheme.
◼ Geotechnical Investigations Report. Volume III. Ebenhaeser Scheme.
Introduction
Post Feasibility Bridging Study for the Proposed Bulk Conveyance Infrastructure from the Raised Clanwilliam Dam (WP0485) GEOTECHNICAL INVESTIGATIONS REPORT. VOL III: EBENHAESER SCHEME (P WMA 09/E10/00/0417/8)
Directorate: Water Resource Development Planning April 2021 Page 2
The Ebenhaeser Scheme starts at the existing canal on the right flank of the Olifants River. This
portion of the scheme is termed the Retshof Diversion. Rising Main 1 traverses through the
Olifants River and includes a new syphon for the river crossing.
Water will also be diverted from the existing left flank canal via Rising Main 2 (Vredendal
Diversion) combined with RM1 and pumped into a balancing dam. The balancing dam is
understood to be a lined earth fill dam located close to the Vredendal left bank canal diversion
point. Water will be pumped via the Rising Main 2 pipeline into the dam and pumped from there
to the concrete reservoir via the Rising Main 3 pipeline. Water will then be gravitated for about
17 km via the gravity pipeline to the Ebenhaeser community.
Details of the scheme are to be found in the Conceptual Design Report and are not described in
this report in any detail.
The Ebenhaeser Scheme will comprise the following elements (Figure 1);
◼ The Retshof Diversion pipeline (Rising Main 1), from the right bank canal (of the Olifants River)
to the left bank canal;
◼ A new syphon crossing the Olifants River;
◼ Road crossing of R363;
◼ Rising Main 2 pipeline (RM2), Vredendal Diversion;
◼ A 28 000 m3 (28 ML) balancing dam;
◼ A 2 160 m long Rising Main 3 pipeline between the dam and the reservoir;
◼ A 10 450 m3 (10.45 ML) concrete reservoir; and
◼ A 17 300 m long gravity main pipeline.
The Ebenhaeser Scheme starts at the existing canal on the right flank of the Olifants River. This
portion of the scheme is termed the Retshof Diversion. Rising Main 1 traverses through the
Olifants River and includes a new syphon for the river crossing.
Scheme description

Post Feasibility Bridging Study for the Proposed Bulk Conveyance Infrastructure from the Raised Clanwilliam Dam (WP0485) GEOTECHNICAL INVESTIGATIONS REPORT. VOL III: EBENHAESER SCHEME (P WMA 09/E10/00/0417/8)
Directorate: Water Resource Development Planning April 2021 Page 3
Water will also be diverted from the existing left flank canal via Rising Main 2 (Vredendal
Diversion) combined with RM1 and pumped into a balancing dam. The balancing dam is
understood to be a lined earth fill dam located close to the Vredendal left bank canal diversion
point. Water will be pumped via the Rising Main 2 pipeline into the dam and pumped from there
to the concrete reservoir via the Rising Main 3 pipeline. Water will then be gravitated for about
17 km via the gravity pipeline to the Ebenhaeser community.
Details of the scheme are to be found in the Conceptual Design Report and are not described in
this report in any detail.
The Ebenhaeser Scheme will comprise the following elements (Figure 1);
◼ The Retshof Diversion pipeline (Rising Main 1), from the right bank canal (of the Olifants River)
to the left bank canal;
◼ A new syphon crossing the Olifants River;
◼ Road crossing of R363;
◼ Rising Main 2 pipeline (RM2), Vredendal Diversion;
◼ A 28 000 m3 (28 ML) balancing dam;
◼ A 2 160 m long Rising Main 3 pipeline between the dam and the reservoir;
◼ A 10 450 m3 (10.45 ML) concrete reservoir; and
◼ A 17 300 m long gravity main pipeline.

Post Feasibility Bridging Study for the Proposed Bulk Conveyance Infrastructure from the Raised Clanwilliam Dam (WP0485) GEOTECHNICAL INVESTIGATIONS REPORT. VOL III: EBENHAESER SCHEME (P WMA 09/E10/00/0417/8)
Directorate: Water Resource Development Planning April 2021 Page 4
Figure 1: Layout of the Ebenhaeser Scheme

Post Feasibility Bridging Study for the Proposed Bulk Conveyance Infrastructure from the Raised Clanwilliam Dam (WP0485) GEOTECHNICAL INVESTIGATIONS REPORT. VOL III: EBENHAESER SCHEME (P WMA 09/E10/00/0417/8)
Directorate: Water Resource Development Planning April 2021 Page 5
The investigation commenced with a desk study and site reconnaissance visit conducted by the
Aurecon / Zutari design and geotechnical teams. Subsequently, test pitting, Dynamic Cone
Penetration testing, soil profiling as well as selection of representative samples for laboratory
testing was conducted by the geotechnical team. The findings of the abovementioned fieldwork
were presented in the Ebenhaeser Geotechnical Report, Rev01, submitted to DWS in November
2020.
As stated, in places investigation by means of test pits could not be achieved due to the high river
levels and the unstable ground, particularly at the Olifants River crossing. Additional investigation
was subsequently conducted in January and February 2021. These additional investigations
comprised the following;
◼ geophysical surveys and,
◼ rotary core borehole (including Standard Penetration testing).
The findings of these additional investigations have been included in this revised report
“Ebenhaeser Geotechnical Report, Rev02”.
3.1 Desk study and reconnaissance visit
A field reconnaissance visit was conducted by the Aurecon / Zutari design teams on 16th and 17th
March 2020 where elements of the various schemes were visited. Representatives of the
geotechnical team accompanied the two design teams for this visit. No intrusive geotechnical
investigations were carried out during this visit which was confined to walk-over surveys and
general observations.
Prior to the visit, as well as post-visit, a desk study was carried out of available data and other
relevant information. Available information that was consulted is listed below:
◼ Geological Maps, 1:250 000 Geological Map (Sheet 3118 Calvinia) Council for Geoscience,
2001.
◼ Satellite imagery (Google Earth).
Investigation methodology

Post Feasibility Bridging Study for the Proposed Bulk Conveyance Infrastructure from the Raised Clanwilliam Dam (WP0485) GEOTECHNICAL INVESTIGATIONS REPORT. VOL III: EBENHAESER SCHEME (P WMA 09/E10/00/0417/8)
Directorate: Water Resource Development Planning April 2021 Page 6
◼ Survey data.
Other relevant publications are cross-referenced in the text and listed in Section 8.
3.2 Fieldwork
Fieldwork scoping could only commence when there was reasonable certainty regarding the
layout of the three schemes. Certain elements could only be finalised after the reconnaissance
field visit in March 2020, which allowed detailed scoping of the required fieldwork. The
geotechnical investigation at the Ebenhaeser Scheme included all sub-options as outlined in
Section 2.
A major complication with the execution of the fieldwork was experienced due to the national
COVID-19 lockdown. This lockdown did not allow fieldwork, and only after Level 3 was
announced, was it possible to commence with fieldwork when the necessary permits were in
place.
Fieldwork primarily comprised a test pitting programme, complimented by a laboratory testing
programme. Further details are elaborated below.
3.2.1 Overall Health and Safety
The field teams were fully compliant with Occupational Health and Safety legislation. A detailed
safety file was prepared prior to commencing with fieldwork, complete with risk assessments, and
formalised Section 8 (2) i appointments.
Additional measures were also instituted in recognition of COVID regulations. These included
logging daily temperature measurements, wearing of face masks, maintaining social distancing,
etc.
With the fieldwork essentially comprising test pitting, there was a big focus on test pit safety. This
included the following:
◼ Field teams comprising two persons, as per the SAICE Geotechnical Division guidelines
(SAICE, 2007). Each team was under the leadership of an experienced, professionally
registered individual.
◼ Carrying out a risk assessment for each test pit prior to entering. These risk assessments were
conducted by the appointed Competent Person.
◼ Fully briefing the TLB operators regarding safe practices and expectations in this regard.
◼ Ensuring the spoil heap was not located on the edge of the test pit, to avoid unnecessary
surcharge on the sidewalls.
Post Feasibility Bridging Study for the Proposed Bulk Conveyance Infrastructure from the Raised Clanwilliam Dam (WP0485) GEOTECHNICAL INVESTIGATIONS REPORT. VOL III: EBENHAESER SCHEME (P WMA 09/E10/00/0417/8)
Directorate: Water Resource Development Planning April 2021 Page 7
◼ Where test pits were deemed safe to enter, a ramp was excavated at the one end to facilitate
easy entrance / exit.
◼ Where there were concerns regarding the sidewall stability, the test pits were deemed unsafe
for entry, and the profiling and sampling were done from surface.
◼ All test pits were closed immediately after profiling and sampling had been completed. No test
pits were left open overnight.
3.2.2 Test pitting
Test pits were excavated from the Retshof diversion towards the balancing dam and concrete
reservoir sites, and along the gravity pipeline route, all the way to Ebenhaeser. A total of eighty-
three (83 No) test pits were profiled for the scheme. A test pit summary is presented below in
Table 1, indicating the positions, maximum attained depths of the test pits, as well as conditions
encountered at the termination depth.
Test pit positions are indicated on the site layout plans in Appendix A (Dwg 113834-0001-DRG-
GG-0001-A to 113834-0001-DRG-GG-0004-A). Access difficulties and proximity to the Olifants
River at the river crossing location meant test pits could not be excavated. Cut faces and rock
outcrops were assessed and profiled where possible.
The test pits were excavated using two Bell 315SK light tractor-loader backhoes (TLB’s), supplied
to the geotechnical team by the Construction South team of the Department of Water and
Sanitation (DWS). The investigations were conducted between 23 and 29 July 2020.
Test pits were excavated to 3 m depth, unless refusal was encountered at shallower depth, or the
conditions were deemed unsafe. An average test pit spacing of 300 m was targeted. In places, a
closer spacing was utilised, for example at the concrete reservoir and the balancing dam. The
test pits were profiled by registered engineering geologists in accordance with accepted Southern
African standards (as per Jennings, Brink, and Williams, 1973). A summary of soil and rock profile
description terminology is provided in Appendix B.
Test pit positions were recorded with a Garmin hand-held GPS and are presented in a South
African grid format, WGS84 datum. The test pit profiles with accompanying photographs are
presented in Appendix C.
Post Feasibility Bridging Study for the Proposed Bulk Conveyance Infrastructure from the Raised Clanwilliam Dam (WP0485) GEOTECHNICAL INVESTIGATIONS REPORT. VOL III: EBENHAESER SCHEME (P WMA 09/E10/00/0417/8)
Directorate: Water Resource Development Planning April 2021 Page 8
Table 1: Test pit summary
Test pit no
Proposed structure
Coordinates (SA Lo 19 WGS 84)
Termination depth
Remarks
X Y
E-TP 01
Rising Main 1 pipeline (RM1) Retshof Diversion
- 56066 - 3500000 3.0 No refusal, profiled exposed cut face
E-TP 02 - 56169 - 3500132 1.5 No refusal, profiled exposed cut face
E-TP 03 - 56216 - 3500301 - Not excavated, due to proximity to the
river. Profile expected to be
similar to E-TP07
E-TP 04 - 56193 - 3500305 -
E-TP 05 - 56197 - 3500340 -
E-TP 06 - 56220 - 3500336 -
E-TP 07 - 56404 - 3500747 3.0 No refusal,
terminated in alluvium material
E-TP 08 Rising Main 2 pipeline (RM2) Vredendal Diversion
- 56562 - 3500514 1.5
Not excavated, profiled schist
outcrop on slope along the
existing canal.
E-TP 09 - 56719 - 3500508 3.0
No refusal, terminated on
loose to medium dense aeolian
sand.
E-TP 10
Balancing Dam
- 56714 - 3501122 2.3
Difficult excavation, dense ferruginised
and calcretised sand. Pedogenic
E-TP 11 - 56955 - 3500895 1.4
Refusal, very dense ferruginised
and calcretised sand. Pedogenic
E-TP 12 - 57186 - 3501076 1.5 Refusal on hard
rock schist
E-TP 13 - 57350 - 3500533 2.0
Refusal, very dense ferruginised
and calcretised sand. Pedogenic
E-TP 14 - 57180 - 3500676 2.6
Refusal, very dense ferruginised
and calcretised sand. Pedogenic
E-TP 15 - 56984 - 3500417 1.4
Refusal, very dense ferruginised
and calcretised sand. Pedogenic
E-TP 16 - 56800 - 3500612 1.1 Refusal, very dense terrace
gravels

Post Feasibility Bridging Study for the Proposed Bulk Conveyance Infrastructure from the Raised Clanwilliam Dam (WP0485) GEOTECHNICAL INVESTIGATIONS REPORT. VOL III: EBENHAESER SCHEME (P WMA 09/E10/00/0417/8)
Directorate: Water Resource Development Planning April 2021 Page 9
Test pit no
Proposed structure
Coordinates (SA Lo 19 WGS 84)
Termination depth
Remarks
X Y
E-TP 17 - 56939 - 3500687 1.7
Refusal, very dense ferruginised
and calcretised sand. Pedogenic
E-TP 18 - 57137 - 3500819 2.0
No refusal, terminated on
loose to medium dense aeolian
sand
E-TP 19
Rising Main 3 pipeline (RM3) from balancing
dam to concrete reservoir
- 57508 - 3500316 - Not excavated due to no site access
E-TP 20 - 57791 - 3500420 - Not excavated due to no site access
E-TP 21 - 58165 - 3500626 0.7 Refusal on soft to
medium hard schist.
E-TP 22 - 58266 - 3500145 2.0
Refusal on assumed hardpan calcrete, but hole
collapsed.
E-TP 23 - 58440 - 3499887 2.5
No refusal, terminated on
loose to medium dense aeolian
sand
E-TP 24
Concrete reservoir
- 58511 - 3499819 0.8
Refusal, very dense ferruginised
and calcretised sand. Pedogenic
E-TP 24 ADD - 58522 - 3500123 2.2
No refusal, terminated on
loose to medium dense aeolian
sand
E-TP 25 - 58465 - 3499783 2.4 Refusal on
hardpan calcrete
E-TP 26
Gravity main pipeline
- 58215 - 3499636 1.8
Refusal, very dense ferruginised
and calcretised sand. Pedogenic
E-TP 27 - 58004 - 3499417 0.5 Refusal on medium
hard rock schist
E-TP 28 - 57775 - 3499208 2.5
Refusal on hardpan
calcretised and ferruginised sand.
E-TP 29 - 57753 - 3499278 2.3 No refusal,
terminated on loose to medium

Post Feasibility Bridging Study for the Proposed Bulk Conveyance Infrastructure from the Raised Clanwilliam Dam (WP0485) GEOTECHNICAL INVESTIGATIONS REPORT. VOL III: EBENHAESER SCHEME (P WMA 09/E10/00/0417/8)
Directorate: Water Resource Development Planning April 2021 Page 10
Test pit no
Proposed structure
Coordinates (SA Lo 19 WGS 84)
Termination depth
Remarks
X Y
dense aeolian sand
E-TP 30 - 57951 - 3499043 1.3 Refusal on
hardpan calcrete
E-TP 31 - 58096 - 3498788 0.65 Refusal on
hardpan calcrete
E-TP 32 - 58224 - 3498240 1.8 Refusal on
hardpan calcrete
E-TP 33 - 58436 - 3498034 1.6
Refusal, very dense ferruginised
and calcretised sand. Pedogenic
E-TP 34 - 58696 - 3497847 2.5
No refusal, terminated on
loose to medium dense aeolian
sand
E-TP 35 - 58954 - 3497674 1.5
Refusal, very dense ferruginised
and calcretised sand. Pedogenic
E-TP 36 - 59196 - 3497506 1.0 Refusal on
hardpan calcrete
E-TP 37 - 59449 - 3497337 1.2 Refusal on
hardpan calcrete
E-TP 38 - 59694 - 3497163 1.1 Refusal on
hardpan calcrete
E-TP 39 - 59948 - 3497015 0.5 Refusal on
hardpan calcrete
E-TP 40 - 60210 - 3496865 2.0 Refusal on
hardpan calcrete
E-TP 41 - 60485 - 3496754 0.9 Refusal on
hardpan calcrete
E-TP 42 - 60769 - 3496672 0.6 Refusal on
hardpan calcrete
E-TP 43 - 61120 - 3496872 1.3 Refusal on
hardpan calcrete
E-TP 44 - 61401 - 3496753 1.1 Refusal on
hardpan calcrete
E-TP 45 - 61723 - 3496692 1.1 Refusal on
hardpan calcrete
E-TP 46 - 61988 - 3496622 0.9 Refusal on very soft rock schist.
E-TP 47 - 62302 - 3496593 0.5 Logged cut face, schist outcrop in
the area.
E-TP 48 - 62588 - 3496479 2.4 No refusal,
terminated on loose aeolian sand
Post Feasibility Bridging Study for the Proposed Bulk Conveyance Infrastructure from the Raised Clanwilliam Dam (WP0485) GEOTECHNICAL INVESTIGATIONS REPORT. VOL III: EBENHAESER SCHEME (P WMA 09/E10/00/0417/8)
Directorate: Water Resource Development Planning April 2021 Page 11
Test pit no
Proposed structure
Coordinates (SA Lo 19 WGS 84)
Termination depth
Remarks
X Y
E-TP 49 - 62850 - 3496314 2.5
No refusal, terminated on medium dense aeolian sand
E-TP 50 - 63109 - 3496151 1.4 Refusal on
hardpan calcrete
E-TP 51 - 63372 - 3495982 1.0 Refusal on
hardpan calcrete
E-TP 52 - 63624 - 3495823 0.7 Refusal on
hardpan calcrete
E-TP 53 - 63874 - 3495654 1.5 Refusal on
hardpan calcrete
E-TP 54 - 64133 - 3495478 0.9 Refusal on
hardpan calcrete
E-TP 55 - 64382 - 3495314 0.7 Refusal on
hardpan calcrete
E-TP 56 - 64632 - 3495151 1.1 Refusal on
hardpan calcrete
E-TP 57 - 64919 - 3495108 1.9 Refusal on
hardpan calcrete
E-TP 58 - 65229 - 3495089 0.2 Refusal on
hardpan calcrete
E-TP 59 - 65690 - 3495115 1.5 Refusal on
hardpan calcrete
E-TP 60 - 65836 - 3495035 0.4 Refusal on
hardpan calcrete
E-TP 61 - 66076 - 3494899 2.1 Refusal on
hardpan calcrete
E-TP 62 - 66350 - 3494809 - Not excavated, schist outcrop in
the area,
E-TP 63 - 66601 - 3494618 0.75 Refusal on very soft rock schist
E-TP 64 - 66837 - 3494371 4.0 Logged a cut face of redundant road
E-TP 65 - 67046 - 3494221 0.4 Refusal on
hardpan calcrete
E-TP 66 - 67272 - 3494001 1.3 Refusal on
hardpan calcrete
E-TP 67 - 67483 - 3493799 1.4 Refusal on
hardpan calcrete
E-TP 68 - 67733 - 3493672 0.3 Refusal on
hardpan calcrete
E-TP 69 - 68045 - 3493652 2.5
Refusal on hardpan calcrete, logged a cut face of a borrow pit.
E-TP 70 - 68344 - 3493589 0.4 Refusal on
hardpan calcrete
Post Feasibility Bridging Study for the Proposed Bulk Conveyance Infrastructure from the Raised Clanwilliam Dam (WP0485) GEOTECHNICAL INVESTIGATIONS REPORT. VOL III: EBENHAESER SCHEME (P WMA 09/E10/00/0417/8)
Directorate: Water Resource Development Planning April 2021 Page 12
Test pit no
Proposed structure
Coordinates (SA Lo 19 WGS 84)
Termination depth
Remarks
X Y
E-TP 71 - 68543 - 3493553 0.5 Refusal on
hardpan calcrete
E-TP 72 - 68701 - 3493776 1.3 Refusal on
hardpan calcrete
ETP 73 - 68925 - 3493651 0.6 Refusal on
hardpan calcrete
E-TP 74 - 69167 - 3493862 1.2 Logged open pit,
terminated on hardpan calcrete
E-TP 75 - 69307 - 3494029 2.1 Logged open pit,
terminated on hardpan calcrete
E-TP 76 - 69411 - 3494269 1.2 Logged open pit,
terminated on hardpan calcrete
E-TP 77 - 69585 - 3494570 0.15 Refusal on
hardpan calcrete
E-TP 78 - 69792 - 3494858 0.6 Refusal on
hardpan calcrete
E-TP 79 - 69985 - 3495017 0.4 Refusal on
hardpan calcrete
E-TP 80 - 70244 - 3495135 0.4 Refusal on
hardpan calcrete
E-TP 81 - 70526 - 3495248 - Refusal on
hardpan calcrete on surface
E-TP 82 - 70817 - 3495341 0.4
Refusal on calcretised schist,
immediate surroundings on calcretised schist
3.2.3 Dynamic Cone Penetration testing
The dynamic cone penetration (DCP) test is conducted by driving a 20 mm diameter, 60° cone
into the ground by an 8-kg hammer. The hammer is lifted by hand and dropped 575 mm and the
results are expressed as the penetration rate (PR) in mm per blow. Four 1.0 m DCP tests were
conducted adjacent to the test pit positions along the gravity pipeline to evaluate and correlate
the stiffness of the soil profile. Where shallow refusal was encountered at the test pits no DCP
tests were conducted.
Results obtained from the dynamic cone penetrometer give a rough indication of the consistency
of the soil. The relationship between the penetration rates and material description, as shown in
Table 2, is regarded as a guideline for non-cohesive soils.

Post Feasibility Bridging Study for the Proposed Bulk Conveyance Infrastructure from the Raised Clanwilliam Dam (WP0485) GEOTECHNICAL INVESTIGATIONS REPORT. VOL III: EBENHAESER SCHEME (P WMA 09/E10/00/0417/8)
Directorate: Water Resource Development Planning April 2021 Page 13
Detailed results are included in Appendix D.
Table 2: Correlation of soil consistency to the penetration rate
Penetration rate (mm / blow) Material description
> 75 Very loose
40 - 75 Loose
15 - 30 Medium dense
5 – 15 Dense
< 5 Very dense
3.2.4 Laboratory testing
The majority of laboratory tests have been carried by Steyn Wilson Laboratories (Pty) Ltd., who
were appointed by means of a competitive bidding process. Duplicate samples, approximately
10%, were submitted to another independent laboratory, Labco South Africa (Pty) Ltd., essentially
for quality control purposes.
The tests conducted and respective quantities are summarised in Table 3 and Table 4 for the
bulk and duplicate samples respectively. Detailed laboratory test results are included in Appendix
E and are summarised within the text.
Table 3: Bulk sample quantities for laboratory testing by Steyn Wilson Laboratories
Test Quantity
Foundation Indicators, comprising grading analyses (both sieve as well as
hydrometer) as well as Atterberg limits and Linear Shrinkage 35
Mod AASHTO Compaction and CBR 15
Chemical tests, including pH and conductivity 20
Quick Direct Shear (at 98% Compaction) (Shear box) 13
Dispersiveness suite (pinhole, crumb, double hydrometer and chemical test
(SAR and ESP)) 15
Collapse potential 3
Falling head permeability test 8
Post Feasibility Bridging Study for the Proposed Bulk Conveyance Infrastructure from the Raised Clanwilliam Dam (WP0485) GEOTECHNICAL INVESTIGATIONS REPORT. VOL III: EBENHAESER SCHEME (P WMA 09/E10/00/0417/8)
Directorate: Water Resource Development Planning April 2021 Page 14
Table 4: Duplicate sample quantities submitted for testing at Labco
Test Quantity
Foundation Indicators, comprising grading analyses (both sieve as well as
hydrometer) as well as Atterberg limits and Linear Shrinkage 7
Mod AASHTO Compaction and CBR 3
Dispersiveness suite (pinhole, crumb, double hydrometer and chemical test
(SAR and ESP)) 3
Chemical tests, including pH and conductivity 7
3.2.5 Geophysical surveys
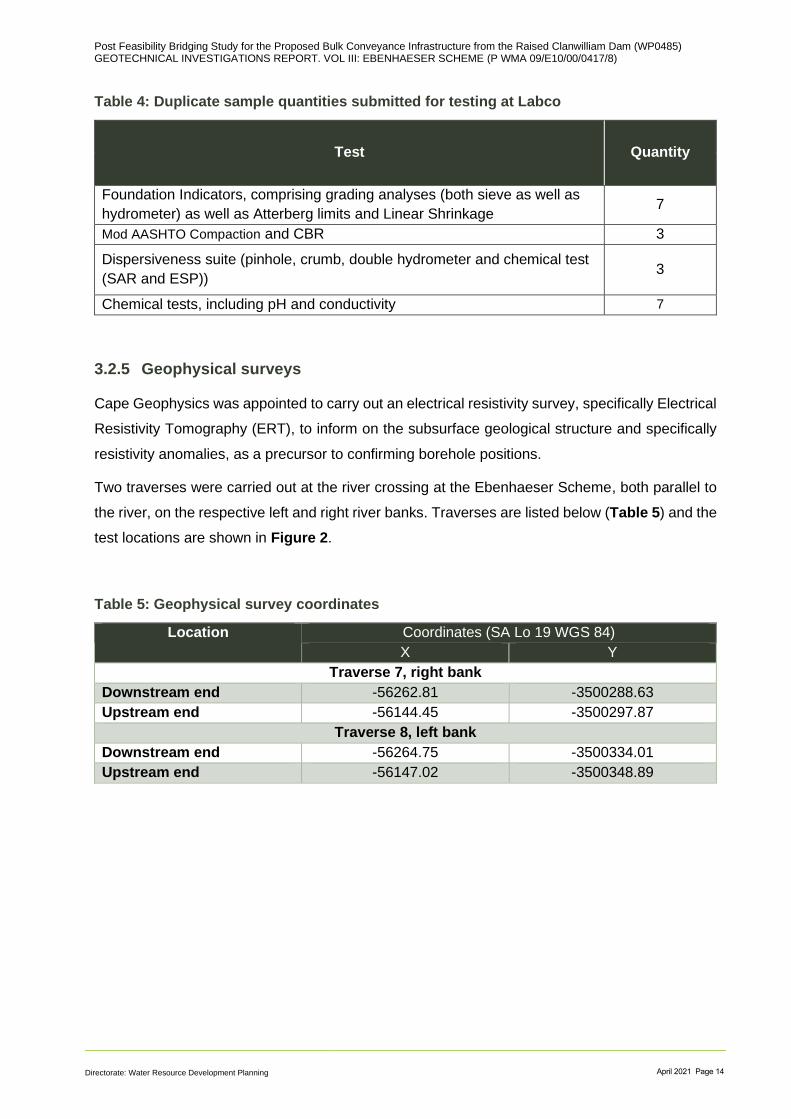
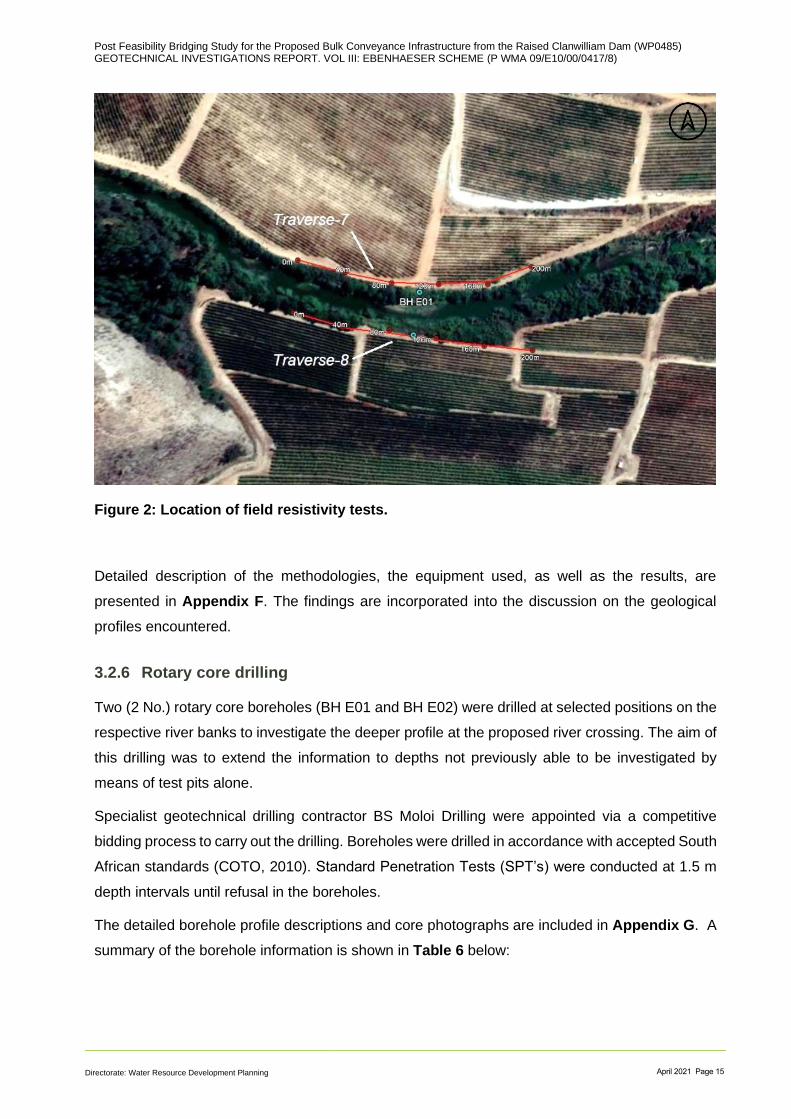
Cape Geophysics was appointed to carry out an electrical resistivity survey, specifically Electrical
Resistivity Tomography (ERT), to inform on the subsurface geological structure and specifically
resistivity anomalies, as a precursor to confirming borehole positions.
Two traverses were carried out at the river crossing at the Ebenhaeser Scheme, both parallel to
the river, on the respective left and right river banks. Traverses are listed below (Table 5) and the
test locations are shown in Figure 2.
Table 5: Geophysical survey coordinates
Location Coordinates (SA Lo 19 WGS 84)
X Y
Traverse 7, right bank
Downstream end -56262.81 -3500288.63
Upstream end -56144.45 -3500297.87
Traverse 8, left bank
Downstream end -56264.75 -3500334.01
Upstream end -56147.02 -3500348.89
Post Feasibility Bridging Study for the Proposed Bulk Conveyance Infrastructure from the Raised Clanwilliam Dam (WP0485) GEOTECHNICAL INVESTIGATIONS REPORT. VOL III: EBENHAESER SCHEME (P WMA 09/E10/00/0417/8)
Directorate: Water Resource Development Planning April 2021 Page 15
Figure 2: Location of field resistivity tests.
Detailed description of the methodologies, the equipment used, as well as the results, are
presented in Appendix F. The findings are incorporated into the discussion on the geological
profiles encountered.
3.2.6 Rotary core drilling
Two (2 No.) rotary core boreholes (BH E01 and BH E02) were drilled at selected positions on the
respective river banks to investigate the deeper profile at the proposed river crossing. The aim of
this drilling was to extend the information to depths not previously able to be investigated by
means of test pits alone.
Specialist geotechnical drilling contractor BS Moloi Drilling were appointed via a competitive
bidding process to carry out the drilling. Boreholes were drilled in accordance with accepted South
African standards (COTO, 2010). Standard Penetration Tests (SPT’s) were conducted at 1.5 m
depth intervals until refusal in the boreholes.
The detailed borehole profile descriptions and core photographs are included in Appendix G. A
summary of the borehole information is shown in Table 6 below:

Post Feasibility Bridging Study for the Proposed Bulk Conveyance Infrastructure from the Raised Clanwilliam Dam (WP0485) GEOTECHNICAL INVESTIGATIONS REPORT. VOL III: EBENHAESER SCHEME (P WMA 09/E10/00/0417/8)
Directorate: Water Resource Development Planning April 2021 Page 16
Table 6: Borehole summary
Hole
number
Coordinates
(Lo 19 WGS 84)
Borehole
collar
Elevation**
(masl)
Depth to
bedrock
(m)
Total
depth
(m)
Orientation and
Comments X Y
BH E01 -56200.94 -3500304.49 10 - 7.75 Vertical; SPT’s
BH E02 -56205.82 -3500340.06 9 - 7.95 Vertical: SPT’s
** NOTE: Collar elevations provided in Table 6 was not derived from surveys. These are estimated values and
should therefore be considered as approximate.
3.2.7 Standard Penetration Testing
Standard Penetration Tests (SPT) were conducted in the boreholes to confirm the consistency of
the material on site.
The SPT is conducted by driving a split spoon sampler into the ground using a 63,5 kg hammer.
The hammer is mechanically lifted and dropped a vertical distance of 762 mm. The SPT spoon
is driven 450 mm into the ground and the number of blows required for the final 300 mm of
penetration (referred to as the N-value) is recorded on the borehole profile descriptions. A
guideline for the relationship between the SPT N-values and consistency of cohesive and non-
cohesive soil are given in Table 7.
Table 7: Correlation of SPT N-values with soil consistency for non-cohesive soils (Franki,
2008)
Cohesive soils Non-Cohesive soils
N-Value Material Consistency N-Value Material Consistency
1 – 2 Very soft < 4 Very loose
2 – 4 Soft 4 – 10 Loose
4 – 8 Firm 10 – 30 Medium dense
8 – 15 Stiff 30 – 50 Dense
15 – 30 Very stiff > 50 Very dense
SPT results are embedded into the borehole profile descriptions included in Appendix G.

Post Feasibility Bridging Study for the Proposed Bulk Conveyance Infrastructure from the Raised Clanwilliam Dam (WP0485) GEOTECHNICAL INVESTIGATIONS REPORT. VOL III: EBENHAESER SCHEME (P WMA 09/E10/00/0417/8)
Directorate: Water Resource Development Planning April 2021 Page 17
4.1 Stratigraphy and lithologies
According to the 1:250 000 scale geological map 3118 Calvinia (Council for Geoscience, 2001),
the Ebenhaeser scheme is located in an area underlain by graphitic and sericitic schist, phyllite,
greywacke, quartzite, impure dolomite, limestone and marble from the Aties Formation (Nat),
Gariep Supergroup. These lithologies are covered predominantly by Quaternary aged calcareous
soil (Q-r2) towards the north-western portion along the gravity pipeline route, and red aeolian sand
(Ҫ-s) towards the centre and south-east (Figure 3).
Figure 3: Ebenhaeser Scheme, extract from the 1:250 000 scale geological map 3118
Calvinia (Council for Geoscience, 2001)
General geology

Post Feasibility Bridging Study for the Proposed Bulk Conveyance Infrastructure from the Raised Clanwilliam Dam (WP0485) GEOTECHNICAL INVESTIGATIONS REPORT. VOL III: EBENHAESER SCHEME (P WMA 09/E10/00/0417/8)
Directorate: Water Resource Development Planning April 2021 Page 18
4.2 Structural geology
The principal rock types in the vicinity of the Ebenhaeser Scheme are schists and greywackes
dipping at 20° to 40° in the southerly and south-westerly directions.
The Cape Fold Belt also affected the sequence of sedimentary rock layers of the Gariep
Supergroup through faulting, folding and subsequent weathering. This has produced a rugged
mountainous terrain characterised by a sequence of elevated ridges and peaks separated by
broad linear valleys. No major faulting or folding was noted in the area, probably due to the fact
that most of the scheme area has been covered by the recent sediments. However, the general
area was affected by the regional Cape Fold Belt, a fold and thrust belt of late Palaeozoic age.
4.3 Seismicity and seismic hazard
The Peak Ground Acceleration (PGA) associated with the area is roughly 0.05 g, with a 10%
probability of being exceeded in a 50-year period (Figure 4). According to (SANS 10160-4: 2011),
the scheme is located outside natural seismic activity and outside the region of mining-induced
seismic activity. It is considered a non-seismic activity zone and as such, no specific seismic
design requirements, other than normal structural design requirements, are required.
A Probabilistic Seismic Hazard Analysis (PSHA) was conducted for the raising of the Clanwilliam
Dam (Kijko, 2011). The full PSHA report was part of the ‘Second Engineering Geological Report
for Design of Dam Raising’, compiled by Zutari (then Aurecon) for DWS (then the Department of
Water Affairs), and is included in this report as Appendix G.
A brief summary below covers testing procedure, methodology, results and the detailed
discussions can be obtained from Section 5: Seismic Hazard Assessment of Aurecon - issued in
January 2012.
The PSHA considered all previously recorded earthquakes within a radius of 320 km of the
Clanwilliam Dam. Given the existence of four faults in vicinity of the dam site, an investigation of
the effect of seismic activity of the faults on the seismic hazard assessment was performed. A
key assumption of this PSHA is that the structure is founded on hard rock; considered to be true
in the case of this mass concrete dam.

Post Feasibility Bridging Study for the Proposed Bulk Conveyance Infrastructure from the Raised Clanwilliam Dam (WP0485) GEOTECHNICAL INVESTIGATIONS REPORT. VOL III: EBENHAESER SCHEME (P WMA 09/E10/00/0417/8)
Directorate: Water Resource Development Planning April 2021 Page 19
Figure 4: Seismic hazard map showing peak ground acceleration (g) with 10% probability
of being exceeded in a 50-year period (SANS 10160-4: 2011)
The results were given in terms of mean return periods and probabilities of being exceeded for
specified values of horizontal component of the PGA, with subsequent conversion to yield the
vertical component of PGA.
Importantly, the PSHA incorporates a number of uncertainties, the main ones being the lack of a
reliable regional ground motion prediction equation and lack of seismic potential of four identified
faults in vicinity of the dam. These uncertainties were considered through logic tree formalism that
allowed inclusions of alternative scenarios and interpretations that are weighted according to their
probability of being correct.
After application of logic tree formalism to the uniform horizontal ground acceleration spectra, the
expected values for the horizontal component of the Operating Basis Earthquake (OBE),
Maximum Design Earthquake (MDE) and the Maximum Credible Earthquake (MCE) are listed
below in Table 8.
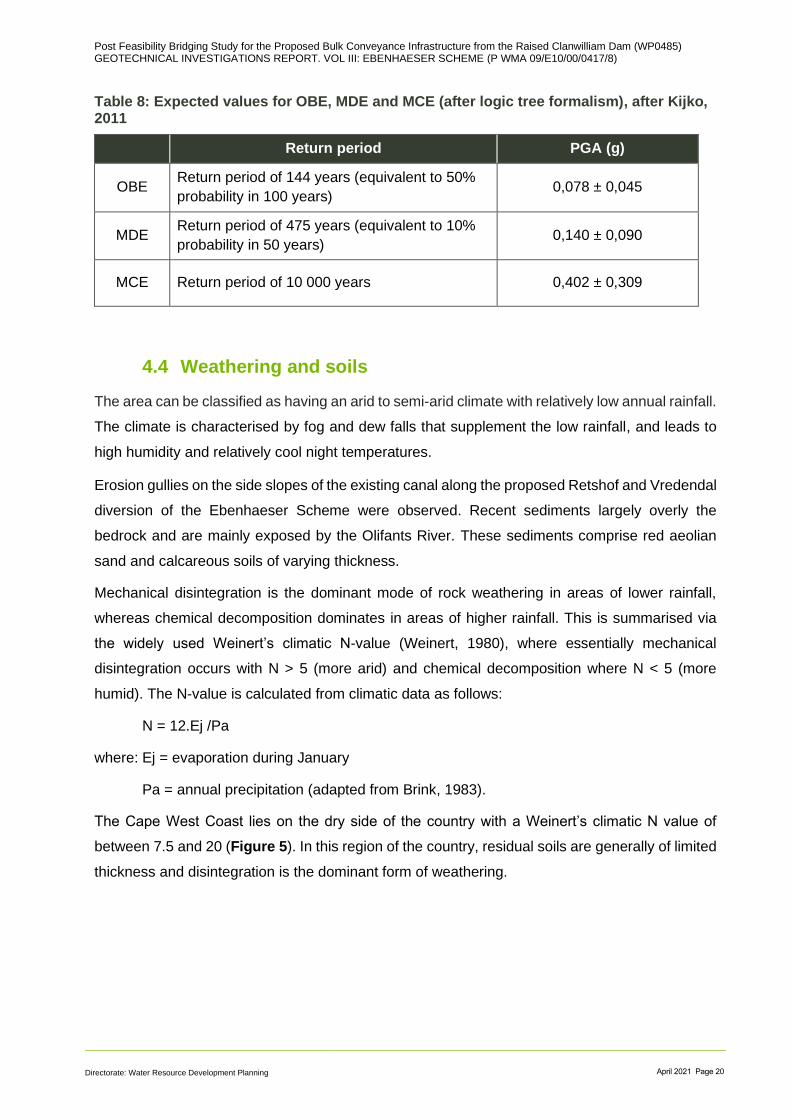
Post Feasibility Bridging Study for the Proposed Bulk Conveyance Infrastructure from the Raised Clanwilliam Dam (WP0485) GEOTECHNICAL INVESTIGATIONS REPORT. VOL III: EBENHAESER SCHEME (P WMA 09/E10/00/0417/8)
Directorate: Water Resource Development Planning April 2021 Page 20
Table 8: Expected values for OBE, MDE and MCE (after logic tree formalism), after Kijko, 2011
Return period PGA (g)
OBE Return period of 144 years (equivalent to 50%
probability in 100 years) 0,078 ± 0,045
MDE Return period of 475 years (equivalent to 10%
probability in 50 years) 0,140 ± 0,090
MCE Return period of 10 000 years 0,402 ± 0,309
4.4 Weathering and soils
The area can be classified as having an arid to semi-arid climate with relatively low annual rainfall.
The climate is characterised by fog and dew falls that supplement the low rainfall, and leads to
high humidity and relatively cool night temperatures.
Erosion gullies on the side slopes of the existing canal along the proposed Retshof and Vredendal
diversion of the Ebenhaeser Scheme were observed. Recent sediments largely overly the
bedrock and are mainly exposed by the Olifants River. These sediments comprise red aeolian
sand and calcareous soils of varying thickness.
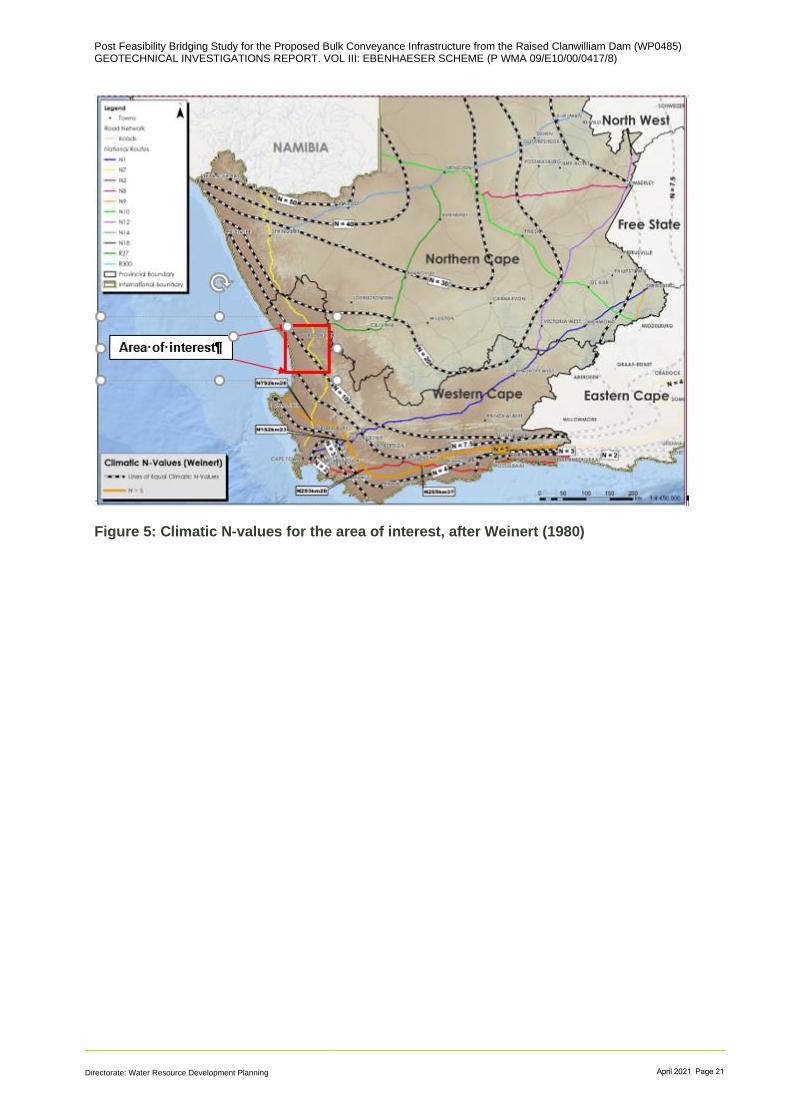
Mechanical disintegration is the dominant mode of rock weathering in areas of lower rainfall,
whereas chemical decomposition dominates in areas of higher rainfall. This is summarised via
the widely used Weinert’s climatic N-value (Weinert, 1980), where essentially mechanical
disintegration occurs with N > 5 (more arid) and chemical decomposition where N < 5 (more
humid). The N-value is calculated from climatic data as follows:
N = 12.Ej /Pa
where: Ej = evaporation during January
Pa = annual precipitation (adapted from Brink, 1983).
The Cape West Coast lies on the dry side of the country with a Weinert’s climatic N value of
between 7.5 and 20 (Figure 5). In this region of the country, residual soils are generally of limited
thickness and disintegration is the dominant form of weathering.
Post Feasibility Bridging Study for the Proposed Bulk Conveyance Infrastructure from the Raised Clanwilliam Dam (WP0485) GEOTECHNICAL INVESTIGATIONS REPORT. VOL III: EBENHAESER SCHEME (P WMA 09/E10/00/0417/8)
Directorate: Water Resource Development Planning April 2021 Page 21
Figure 5: Climatic N-values for the area of interest, after Weinert (1980)
Post Feasibility Bridging Study for the Proposed Bulk Conveyance Infrastructure from the Raised Clanwilliam Dam (WP0485) GEOTECHNICAL INVESTIGATIONS REPORT. VOL III: EBENHAESER SCHEME (P WMA 09/E10/00/0417/8)
Directorate: Water Resource Development Planning April 2021 Page 22
5.1 Site description
The diversions are located on the flanks of the Olifants River (dwg 113834-0001-DRG-GG-0001-
A) where the right flank, lower left flank and the river section are largely characterised by aeolian
sands and alluvium material. The RM1 route traverses a floodplain and the topography near the
river is generally flat.
The upper left flank is characterised by rock outcrop of the highly weathered schist bedrock, which
is associated with steep slopes. The topography in this area (i.e. left flank of RM1 and RM2 routes)
is generally moderately to gently sloping towards the dam and reservoir.
The remainder of the route is generally flat all the way to Ebenhaeser with a few moderate to
steep slopes.
Natural vegetation is mainly shrubs, bushes and grass. Trees were encountered along the
Olifants River. The route traverses a few cultivated areas, and sand dunes which are located
mainly in the mid-section of the route.
5.2 Geological profile and zonation
Several different geological profiles have been encountered along the scheme. A distinction
between the profiles has been made according to the origin of the soils, allowing different
geological zones to be defined. Most of the route is covered by aeolian sand or colluvium
underlain by pedogenic materials, terrace gravels and schist bedrock.
The geological zones have been classified as Zones 1 to Zone 15 and are summarised in Table
9, with each zone described in more detailed below. Test pits E-TP15 and E-TP16 cover both the
dam and the Rising Main 3, in particular the vicinity of the inlet / outlet area, and as such they are
repeated under both element summaries.
The zonation is based on test pit information and general observations of the site, and variability
between test pit positions cannot be excluded. The zonation has been presented in a sequence
i.e. from Chainage 00 to Chainage 20 676 along the pipeline route. Refer to the site layout plans
(Dwg 113834-0001-DRG-GG-0001-A to 113834-0001-DRG-GG-0004-A) in Appendix A.
Investigation findings
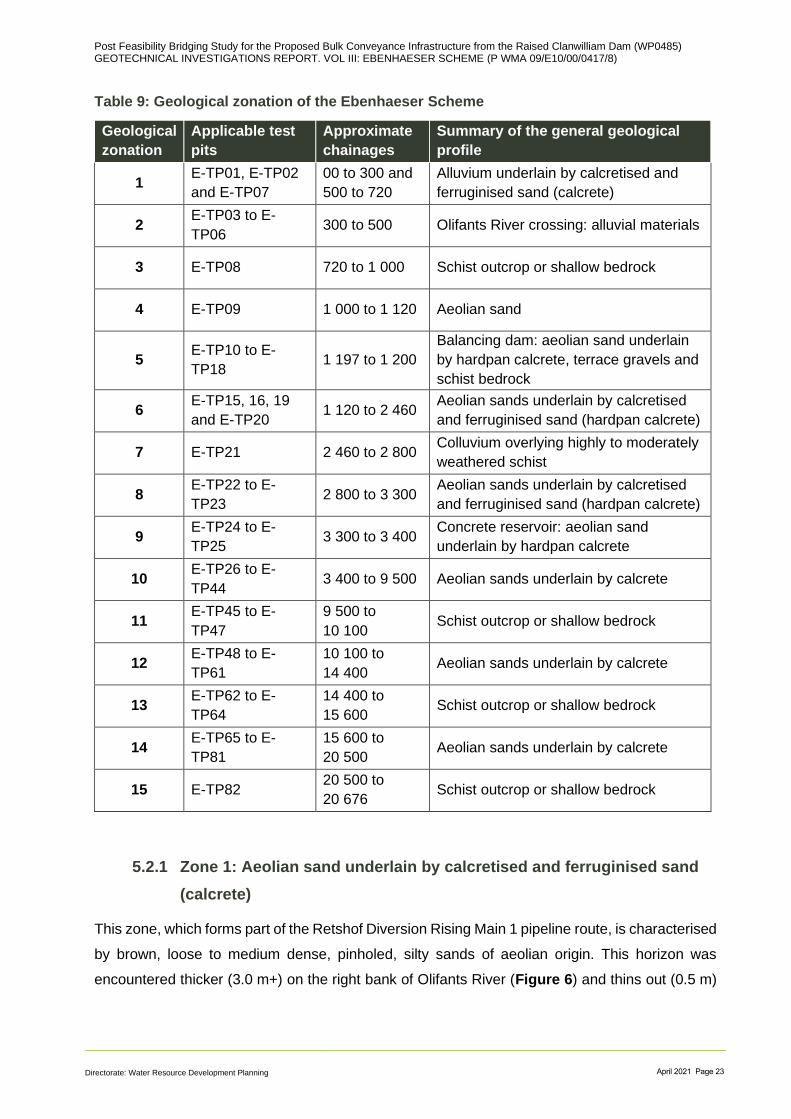
Post Feasibility Bridging Study for the Proposed Bulk Conveyance Infrastructure from the Raised Clanwilliam Dam (WP0485) GEOTECHNICAL INVESTIGATIONS REPORT. VOL III: EBENHAESER SCHEME (P WMA 09/E10/00/0417/8)
Directorate: Water Resource Development Planning April 2021 Page 23
Table 9: Geological zonation of the Ebenhaeser Scheme
Geological
zonation
Applicable test
pits
Approximate
chainages
Summary of the general geological
profile
1 E-TP01, E-TP02
and E-TP07
00 to 300 and
500 to 720
Alluvium underlain by calcretised and
ferruginised sand (calcrete)
2 E-TP03 to E-
TP06 300 to 500 Olifants River crossing: alluvial materials
3 E-TP08 720 to 1 000 Schist outcrop or shallow bedrock
4 E-TP09 1 000 to 1 120 Aeolian sand
5 E-TP10 to E-
TP18 1 197 to 1 200
Balancing dam: aeolian sand underlain
by hardpan calcrete, terrace gravels and
schist bedrock
6 E-TP15, 16, 19
and E-TP20 1 120 to 2 460
Aeolian sands underlain by calcretised
and ferruginised sand (hardpan calcrete)
7 E-TP21 2 460 to 2 800 Colluvium overlying highly to moderately
weathered schist
8 E-TP22 to E-
TP23 2 800 to 3 300
Aeolian sands underlain by calcretised
and ferruginised sand (hardpan calcrete)
9 E-TP24 to E-
TP25 3 300 to 3 400
Concrete reservoir: aeolian sand
underlain by hardpan calcrete
10 E-TP26 to E-
TP44 3 400 to 9 500 Aeolian sands underlain by calcrete
11 E-TP45 to E-
TP47
9 500 to
10 100 Schist outcrop or shallow bedrock
12 E-TP48 to E-
TP61
10 100 to
14 400 Aeolian sands underlain by calcrete
13 E-TP62 to E-
TP64
14 400 to
15 600 Schist outcrop or shallow bedrock
14 E-TP65 to E-
TP81
15 600 to
20 500 Aeolian sands underlain by calcrete
15 E-TP82 20 500 to
20 676 Schist outcrop or shallow bedrock
5.2.1 Zone 1: Aeolian sand underlain by calcretised and ferruginised sand
(calcrete)
This zone, which forms part of the Retshof Diversion Rising Main 1 pipeline route, is characterised
by brown, loose to medium dense, pinholed, silty sands of aeolian origin. This horizon was
encountered thicker (3.0 m+) on the right bank of Olifants River (Figure 6) and thins out (0.5 m)

Post Feasibility Bridging Study for the Proposed Bulk Conveyance Infrastructure from the Raised Clanwilliam Dam (WP0485) GEOTECHNICAL INVESTIGATIONS REPORT. VOL III: EBENHAESER SCHEME (P WMA 09/E10/00/0417/8)
Directorate: Water Resource Development Planning April 2021 Page 24
towards the river section. A slightly moist, very dense, pinholed, calcretised and ferruginised silty
sand horizon underlies the aeolian sand between 0.5 m and 1.5 m (Table 10).
Table 10: Test pit description of soils encountered in Zone 1
Test pit
No:
Soft to firm,
clayey sandy
silt. Made
ground
(m)
Loose to
medium dense
silty sand.
Aeolian
Firm, clayey
sandy silt.
Alluvium
(m) (m)
Very dense,
calcretised and
ferruginised silty
sand. Pedogenic
material from aeolian
(m)
E-TP01 0.0-3.0+ -
E-TP02 0.0-0.5 0.5-1.5+
Figure 6: Aeolian sand encountered in Zone 1, view from the river section towards the
existing right bank canal

Post Feasibility Bridging Study for the Proposed Bulk Conveyance Infrastructure from the Raised Clanwilliam Dam (WP0485) GEOTECHNICAL INVESTIGATIONS REPORT. VOL III: EBENHAESER SCHEME (P WMA 09/E10/00/0417/8)
Directorate: Water Resource Development Planning April 2021 Page 25
5.2.2 Zone 2: Olifants River crossing
No test pits were excavated at the actual river crossing, primarily due to the proximity to the river
and the expected high water inflows, but also due to buried services on the left flank. Two test
pits were planned on each river bank, i.e. test pits E-TP03 to E-TP06 (Table 11). No evidence of
shallow bedrock was noted during the site visit (Figure 7), but river levels were still relatively high.
The local farmer also reported that various materials (building rubble, etc.) have also been
dumped into the river.
However, Test pit E-TP07, excavated within the flood plain in proximity to vineyards, indicates a
thin layer of made ground encountered as soft to firm, clayey sandy silt from surface to 0.3 m
depth, underlain by the firm, clayey sandy silt of alluvial origin. No refusal was encountered, and
groundwater seepage was encountered at 2.3 m with water ponding generally observed in the
test pit vicinity. It is pertinent that these floodplains had been inundated immediately prior to the
test pitting.
Figure 7: Panorama view of the Olifants River crossing, view from E-TP04
The geophysical profiles (Traverse 7 on the right bank and Traverse 8 on the left bank) parallel
to the river indicate that the profile on both sides of the river is characterised by a surface resistor
which is likely representative of saturated sands, underlain by a conductor, expected to be
weathered bedrock, aligned roughly sub-parallel to the surface. These traverses indicated
bedrock is likely at depths greater than 10 m to 15 m.
On the right bank, the surface resistor, that is interpreted as saturated sands becomes more
pronounced towards the west and the east of the traverse and extends to a depth of approximately
15 m. This is underlain by a conductor that is interpreted to be silty sands. The bedrock profile
shows some undulations in sub-surface topography and suggest a possible fault – although this
is of little significance for the envisaged crossing. Borehole BH E01 intersects this feature but not
deep enough to intersect the bedrock interface (note that borehole depths were limited to the
maximum expected depth of the syphon only),

Post Feasibility Bridging Study for the Proposed Bulk Conveyance Infrastructure from the Raised Clanwilliam Dam (WP0485) GEOTECHNICAL INVESTIGATIONS REPORT. VOL III: EBENHAESER SCHEME (P WMA 09/E10/00/0417/8)
Directorate: Water Resource Development Planning April 2021 Page 26
On the left bank, the surface resistor is more uniform along the length of the traverse. The higher
resistivity values are interpreted as saturated sands, which extend to a depth of approximately 10
m. This is underlain by a conductor that is interpreted to be silty sands. The bedrock interface is
relatively uniform in sub-surface topography, although some undulations are still evident.
Borehole BH E02 intersects the traverse profile along the left bank.
The rotary core boreholes (BH E01 and BH E02) drilled from surface to 7.75 m and 7.95 m
respectively confirmed the alluvial origin, with some variation in the soil type.
The geological profile as confirmed by the geophysical tests and the rotary core boreholes can
be summarised as below (Table 11). Borehole BH E01 was drilled on the right bank, while
borehole BH E02 is located on the left bank.
Table 11: Zone 2 - Summary of soil descriptions
Test
position
No:
Alluvium Loose
to medium
dense, silty to
fine sand.
(m)
Alluvium
Loose to
medium
dense, silty
sand.
(m)
Alluvium.
Loose to
medium
dense, clayey
silty sand to
silty to clayey
sand and soft
to firm, clayey
sandy silt in
E-TP07
(m)
Alluvium.
Medium
dense, silty
to coarse
sand (m)
Alluvium.
Medium
dense,
slightly
clayey
silty sand
(m)
Test pits
E-TP03
Not excavated, immediately next to the river
Not excavated, immediately next to the river.
E-TP04
E-TP05
E-TP06
E-TP07 0.0 – 0.3 0.3-3.0+
Boreholes
BH E01 0.0 – 0.15 0.15 – 1.8 1.8 – 7.75+
BH E02 0.0 – 3.44 3.44 – 5.8 5.8 – 6.0 6.0 –
7.95+
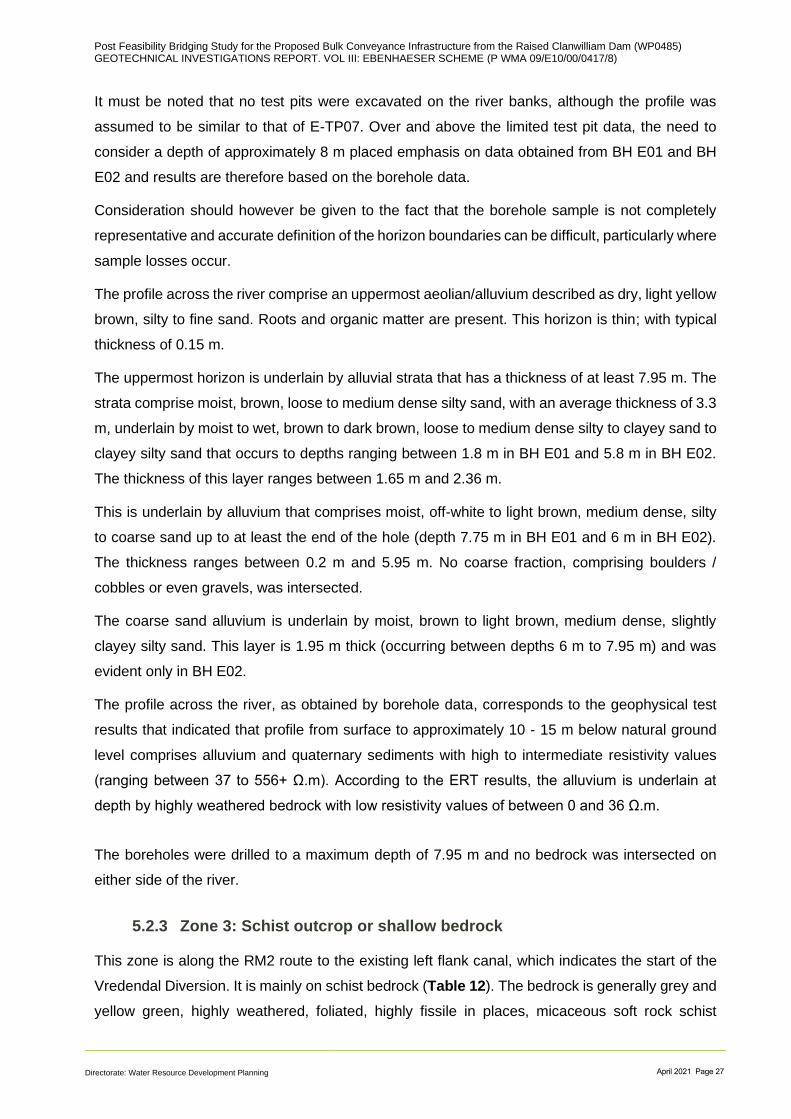
Post Feasibility Bridging Study for the Proposed Bulk Conveyance Infrastructure from the Raised Clanwilliam Dam (WP0485) GEOTECHNICAL INVESTIGATIONS REPORT. VOL III: EBENHAESER SCHEME (P WMA 09/E10/00/0417/8)
Directorate: Water Resource Development Planning April 2021 Page 27
It must be noted that no test pits were excavated on the river banks, although the profile was
assumed to be similar to that of E-TP07. Over and above the limited test pit data, the need to
consider a depth of approximately 8 m placed emphasis on data obtained from BH E01 and BH
E02 and results are therefore based on the borehole data.
Consideration should however be given to the fact that the borehole sample is not completely
representative and accurate definition of the horizon boundaries can be difficult, particularly where
sample losses occur.
The profile across the river comprise an uppermost aeolian/alluvium described as dry, light yellow
brown, silty to fine sand. Roots and organic matter are present. This horizon is thin; with typical
thickness of 0.15 m.
The uppermost horizon is underlain by alluvial strata that has a thickness of at least 7.95 m. The
strata comprise moist, brown, loose to medium dense silty sand, with an average thickness of 3.3
m, underlain by moist to wet, brown to dark brown, loose to medium dense silty to clayey sand to
clayey silty sand that occurs to depths ranging between 1.8 m in BH E01 and 5.8 m in BH E02.
The thickness of this layer ranges between 1.65 m and 2.36 m.
This is underlain by alluvium that comprises moist, off-white to light brown, medium dense, silty
to coarse sand up to at least the end of the hole (depth 7.75 m in BH E01 and 6 m in BH E02).
The thickness ranges between 0.2 m and 5.95 m. No coarse fraction, comprising boulders /
cobbles or even gravels, was intersected.
The coarse sand alluvium is underlain by moist, brown to light brown, medium dense, slightly
clayey silty sand. This layer is 1.95 m thick (occurring between depths 6 m to 7.95 m) and was
evident only in BH E02.
The profile across the river, as obtained by borehole data, corresponds to the geophysical test
results that indicated that profile from surface to approximately 10 - 15 m below natural ground
level comprises alluvium and quaternary sediments with high to intermediate resistivity values
(ranging between 37 to 556+ Ω.m). According to the ERT results, the alluvium is underlain at
depth by highly weathered bedrock with low resistivity values of between 0 and 36 Ω.m.
The boreholes were drilled to a maximum depth of 7.95 m and no bedrock was intersected on
either side of the river.
5.2.3 Zone 3: Schist outcrop or shallow bedrock
This zone is along the RM2 route to the existing left flank canal, which indicates the start of the
Vredendal Diversion. It is mainly on schist bedrock (Table 12). The bedrock is generally grey and
yellow green, highly weathered, foliated, highly fissile in places, micaceous soft rock schist
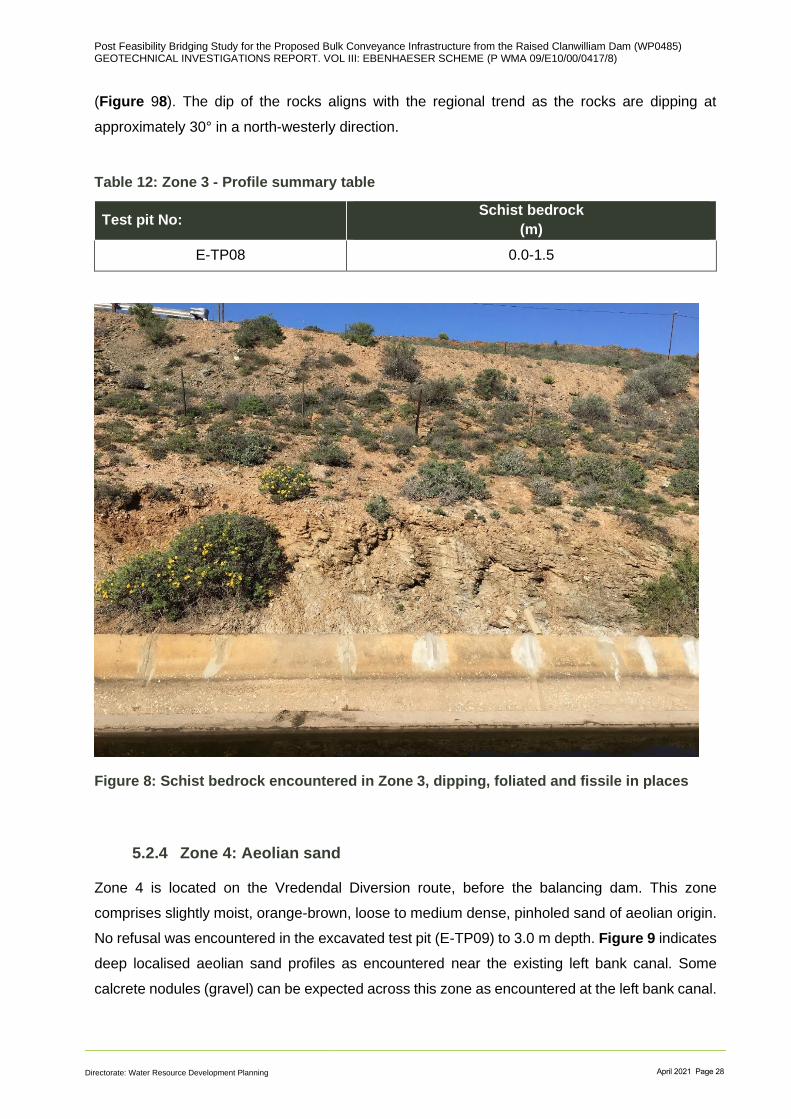
Post Feasibility Bridging Study for the Proposed Bulk Conveyance Infrastructure from the Raised Clanwilliam Dam (WP0485) GEOTECHNICAL INVESTIGATIONS REPORT. VOL III: EBENHAESER SCHEME (P WMA 09/E10/00/0417/8)
Directorate: Water Resource Development Planning April 2021 Page 28
(Figure 98). The dip of the rocks aligns with the regional trend as the rocks are dipping at
approximately 30° in a north-westerly direction.
Table 12: Zone 3 - Profile summary table
Test pit No: Schist bedrock
(m)
E-TP08 0.0-1.5
Figure 8: Schist bedrock encountered in Zone 3, dipping, foliated and fissile in places
5.2.4 Zone 4: Aeolian sand
Zone 4 is located on the Vredendal Diversion route, before the balancing dam. This zone
comprises slightly moist, orange-brown, loose to medium dense, pinholed sand of aeolian origin.
No refusal was encountered in the excavated test pit (E-TP09) to 3.0 m depth. Figure 9 indicates
deep localised aeolian sand profiles as encountered near the existing left bank canal. Some
calcrete nodules (gravel) can be expected across this zone as encountered at the left bank canal.

Post Feasibility Bridging Study for the Proposed Bulk Conveyance Infrastructure from the Raised Clanwilliam Dam (WP0485) GEOTECHNICAL INVESTIGATIONS REPORT. VOL III: EBENHAESER SCHEME (P WMA 09/E10/00/0417/8)
Directorate: Water Resource Development Planning April 2021 Page 29
Figure 9: Zone 4 - localised deep aeolian sand profiles that can be expected across the
scheme
5.2.5 Zone 5: Balancing dam
Soil profiles in this dam footprint area largely comprise loose to medium dense, pinholed sand of
aeolian origin from surface to an average depth of 1.0 m (Figure 10) Aeolian sands are thicker at
the centre and towards the southern end of the dam site, and deepest at 2.0 m around E-TP18
(Table 13). These transported soils are underlain by dense to very dense, pinholed, calcretised
and ferruginised sand, occasionally hardpan calcrete to an average depth of 1.8 m. Generally,
the TLB refused on this material across the site. The thickness of this horizon is unconfirmed as
it was not possible to intersect the base.
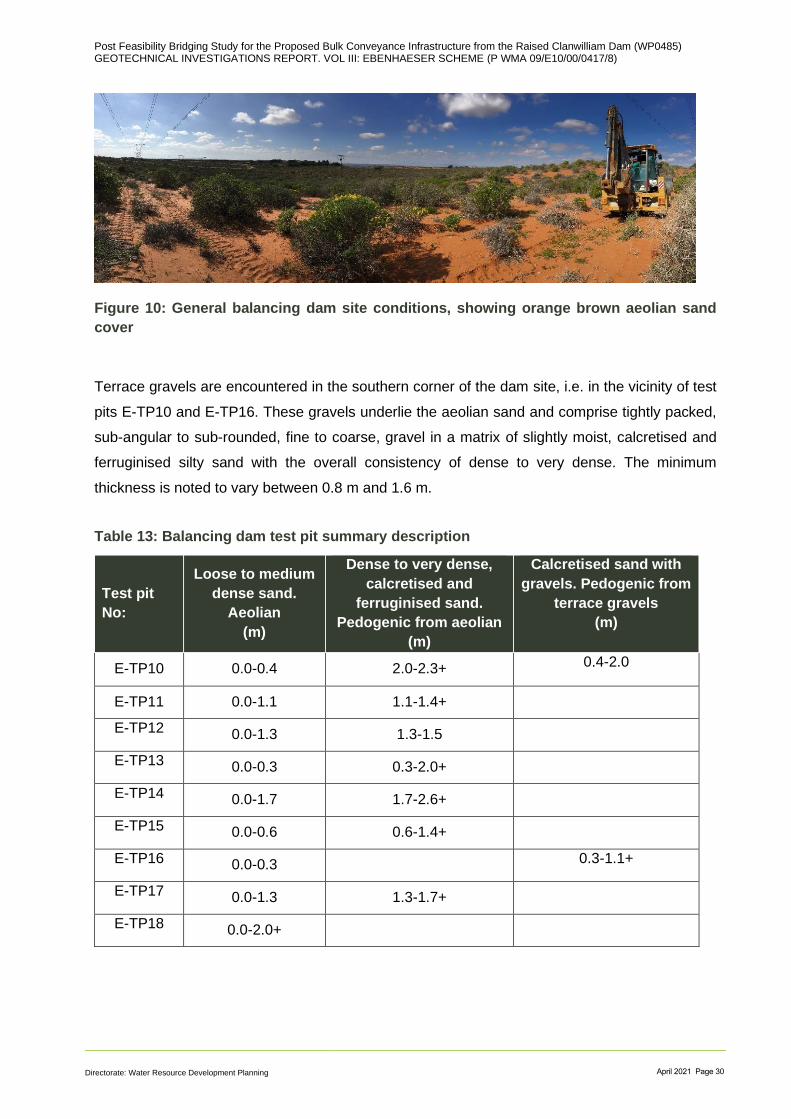
Post Feasibility Bridging Study for the Proposed Bulk Conveyance Infrastructure from the Raised Clanwilliam Dam (WP0485) GEOTECHNICAL INVESTIGATIONS REPORT. VOL III: EBENHAESER SCHEME (P WMA 09/E10/00/0417/8)
Directorate: Water Resource Development Planning April 2021 Page 30
Figure 10: General balancing dam site conditions, showing orange brown aeolian sand
cover
Terrace gravels are encountered in the southern corner of the dam site, i.e. in the vicinity of test
pits E-TP10 and E-TP16. These gravels underlie the aeolian sand and comprise tightly packed,
sub-angular to sub-rounded, fine to coarse, gravel in a matrix of slightly moist, calcretised and
ferruginised silty sand with the overall consistency of dense to very dense. The minimum
thickness is noted to vary between 0.8 m and 1.6 m.
Table 13: Balancing dam test pit summary description
Test pit
No:
Loose to medium
dense sand.
Aeolian
(m)
Dense to very dense,
calcretised and
ferruginised sand.
Pedogenic from aeolian
(m)
Calcretised sand with
gravels. Pedogenic from
terrace gravels
(m)
E-TP10 0.0-0.4 2.0-2.3+ 0.4-2.0
E-TP11 0.0-1.1 1.1-1.4+
E-TP12 0.0-1.3 1.3-1.5
E-TP13 0.0-0.3 0.3-2.0+
E-TP14 0.0-1.7 1.7-2.6+
E-TP15 0.0-0.6 0.6-1.4+
E-TP16 0.0-0.3 0.3-1.1+
E-TP17 0.0-1.3 1.3-1.7+
E-TP18 0.0-2.0+
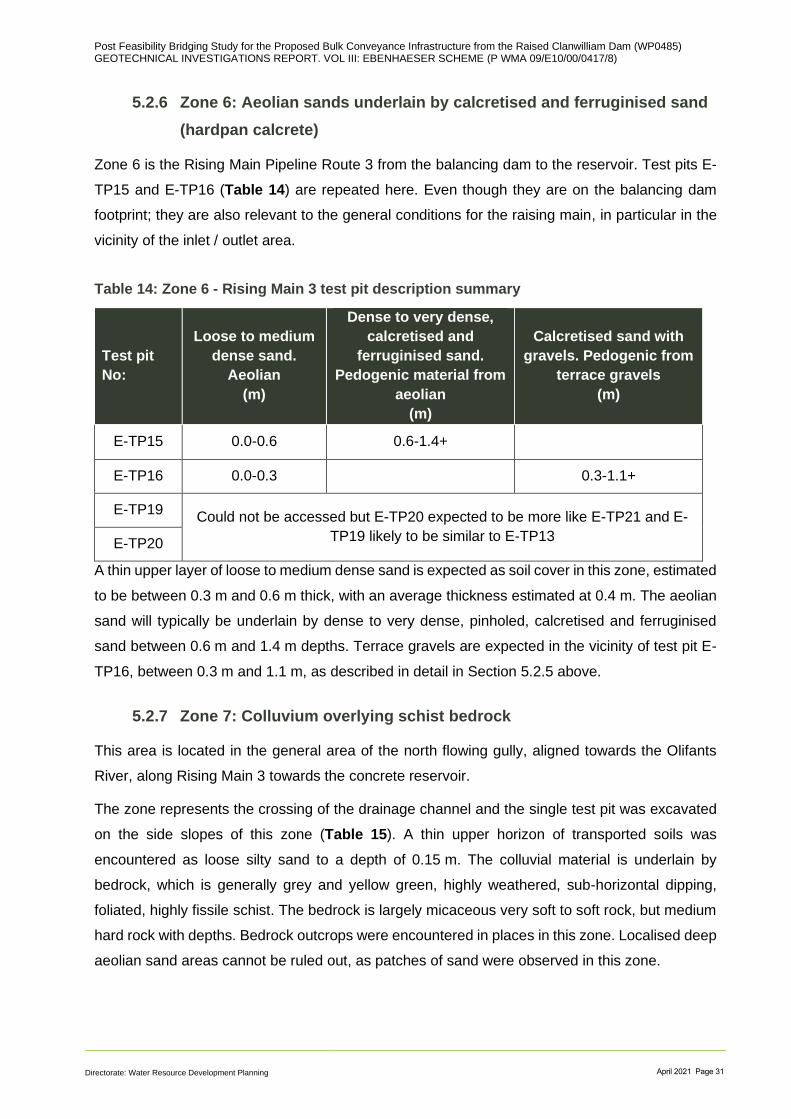
Post Feasibility Bridging Study for the Proposed Bulk Conveyance Infrastructure from the Raised Clanwilliam Dam (WP0485) GEOTECHNICAL INVESTIGATIONS REPORT. VOL III: EBENHAESER SCHEME (P WMA 09/E10/00/0417/8)
Directorate: Water Resource Development Planning April 2021 Page 31
5.2.6 Zone 6: Aeolian sands underlain by calcretised and ferruginised sand
(hardpan calcrete)
Zone 6 is the Rising Main Pipeline Route 3 from the balancing dam to the reservoir. Test pits E-
TP15 and E-TP16 (Table 14) are repeated here. Even though they are on the balancing dam
footprint; they are also relevant to the general conditions for the raising main, in particular in the
vicinity of the inlet / outlet area.
Table 14: Zone 6 - Rising Main 3 test pit description summary
Test pit
No:
Loose to medium
dense sand.
Aeolian
(m)
Dense to very dense,
calcretised and
ferruginised sand.
Pedogenic material from
aeolian
(m)
Calcretised sand with
gravels. Pedogenic from
terrace gravels
(m)
E-TP15 0.0-0.6 0.6-1.4+
E-TP16 0.0-0.3 0.3-1.1+
E-TP19 Could not be accessed but E-TP20 expected to be more like E-TP21 and E-
TP19 likely to be similar to E-TP13 E-TP20
A thin upper layer of loose to medium dense sand is expected as soil cover in this zone, estimated
to be between 0.3 m and 0.6 m thick, with an average thickness estimated at 0.4 m. The aeolian
sand will typically be underlain by dense to very dense, pinholed, calcretised and ferruginised
sand between 0.6 m and 1.4 m depths. Terrace gravels are expected in the vicinity of test pit E-
TP16, between 0.3 m and 1.1 m, as described in detail in Section 5.2.5 above.
5.2.7 Zone 7: Colluvium overlying schist bedrock
This area is located in the general area of the north flowing gully, aligned towards the Olifants
River, along Rising Main 3 towards the concrete reservoir.
The zone represents the crossing of the drainage channel and the single test pit was excavated
on the side slopes of this zone (Table 15). A thin upper horizon of transported soils was
encountered as loose silty sand to a depth of 0.15 m. The colluvial material is underlain by
bedrock, which is generally grey and yellow green, highly weathered, sub-horizontal dipping,
foliated, highly fissile schist. The bedrock is largely micaceous very soft to soft rock, but medium
hard rock with depths. Bedrock outcrops were encountered in places in this zone. Localised deep
aeolian sand areas cannot be ruled out, as patches of sand were observed in this zone.
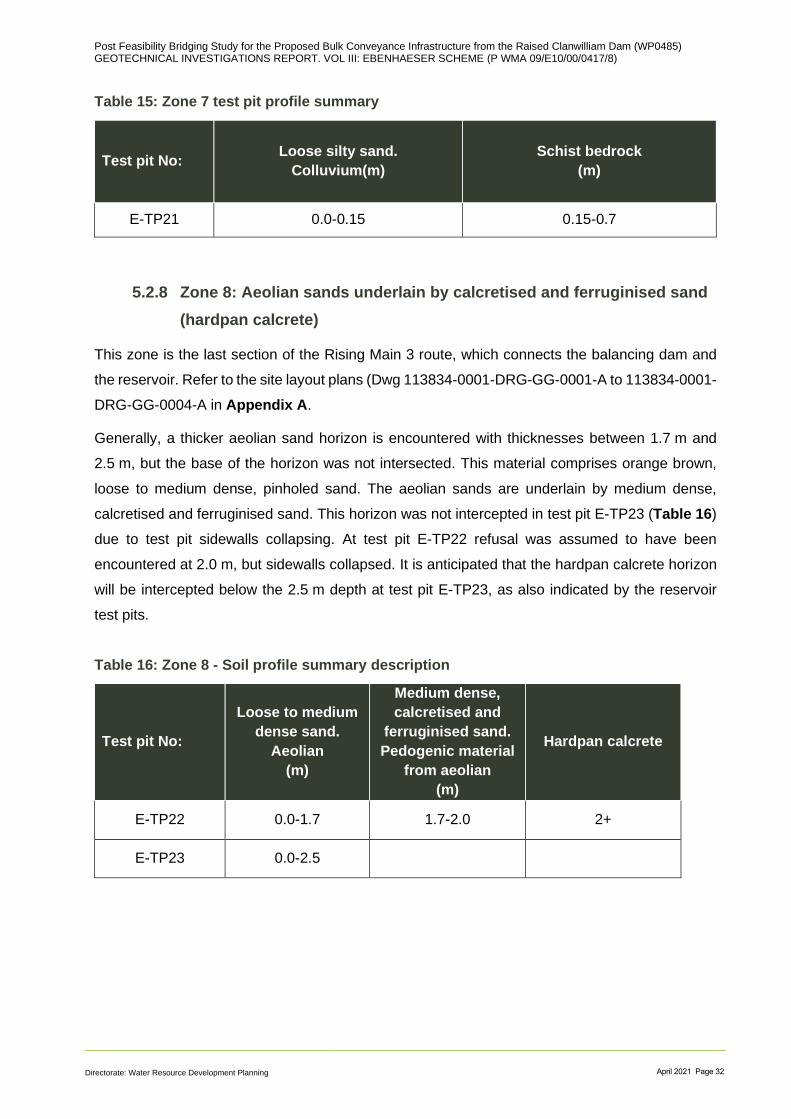
Post Feasibility Bridging Study for the Proposed Bulk Conveyance Infrastructure from the Raised Clanwilliam Dam (WP0485) GEOTECHNICAL INVESTIGATIONS REPORT. VOL III: EBENHAESER SCHEME (P WMA 09/E10/00/0417/8)
Directorate: Water Resource Development Planning April 2021 Page 32
Table 15: Zone 7 test pit profile summary
Test pit No: Loose silty sand.
Colluvium(m)
Schist bedrock
(m)
E-TP21 0.0-0.15 0.15-0.7
5.2.8 Zone 8: Aeolian sands underlain by calcretised and ferruginised sand
(hardpan calcrete)
This zone is the last section of the Rising Main 3 route, which connects the balancing dam and
the reservoir. Refer to the site layout plans (Dwg 113834-0001-DRG-GG-0001-A to 113834-0001-
DRG-GG-0004-A in Appendix A.
Generally, a thicker aeolian sand horizon is encountered with thicknesses between 1.7 m and
2.5 m, but the base of the horizon was not intersected. This material comprises orange brown,
loose to medium dense, pinholed sand. The aeolian sands are underlain by medium dense,
calcretised and ferruginised sand. This horizon was not intercepted in test pit E-TP23 (Table 16)
due to test pit sidewalls collapsing. At test pit E-TP22 refusal was assumed to have been
encountered at 2.0 m, but sidewalls collapsed. It is anticipated that the hardpan calcrete horizon
will be intercepted below the 2.5 m depth at test pit E-TP23, as also indicated by the reservoir
test pits.
Table 16: Zone 8 - Soil profile summary description
Test pit No:
Loose to medium
dense sand.
Aeolian
(m)
Medium dense,
calcretised and
ferruginised sand.
Pedogenic material
from aeolian
(m)
Hardpan calcrete
E-TP22 0.0-1.7 1.7-2.0 2+
E-TP23 0.0-2.5

Post Feasibility Bridging Study for the Proposed Bulk Conveyance Infrastructure from the Raised Clanwilliam Dam (WP0485) GEOTECHNICAL INVESTIGATIONS REPORT. VOL III: EBENHAESER SCHEME (P WMA 09/E10/00/0417/8)
Directorate: Water Resource Development Planning April 2021 Page 33
5.2.9 Zone 9: Concrete reservoir
The reservoir footprint was investigated by excavation of three test pits (Table 17). The western
portion of the reservoir footprint (E-TP24 and E-TP25) is underlain by aeolian sand with an
average thickness of 1.5 m (between 0.7 m and 2.3 m). This material comprises orange brown,
loose to medium dense, pinholed sand. Aeolian sand overlies pedogenic material which
comprises dense to very dense, calcretised and ferruginised sand. Hardpan calcrete is
encountered in the vicinity of test pit E-TP25. The thickness could not be confirmed as it was not
possible to intersect the base.
The eastern portion of the reservoir footprint (test pit E-TP24 ADD) is underlain by aeolian sand
to 2.2 m depth. The calcrete horizon was not intercepted on this portion of the reservoir due to
test pit sidewalls collapsing, which meant the intended depths could not be reached. As for the
rising main towards the reservoir, ground conditions comprise loose to medium dense sand.
Table 17: Zone 9 - Concrete reservoir test pit summary
Test pit No:
Loose to medium dense
sand. Aeolian
(m)
Dense to very dense, calcretised and
ferruginised sand. Pedogenic material
from aeolian (calcrete)
(m)
E-TP24 0.0-0.7 0.7-0.8+
E-TP24 ADD 0.0-2.2+
E-TP25 0.0-2.3 2.3-2.4+
5.2.10 Zone 10: Aeolian sands underlain by calcrete
This zone mainly comprises aeolian sands (sand dunes), which are underlain by pedogenic
material (from aeolian) and occasional hardpan calcrete. The orange and red brown, loose to
medium dense sand is generally encountered with an average thickness of 1.0 m. Occasionally
these sands may exhibit a maximum thickness of 2.5 m and minimum thickness at 0.3 m. Where
no refusal was encountered, deep localised aeolian sands can be expected, i.e. test pits E-TP29
and E-TP34. In such cases, the total thickness of aeolian sands can be regarded as unconfirmed
as the base was not intercepted. The pedogenic material is largely dense to very dense,
calcretised and ferruginised sand. Refusal is mainly on hardpan calcrete along the route. Difficult
excavations and refusal was also encountered on the very dense sand (Table 18).
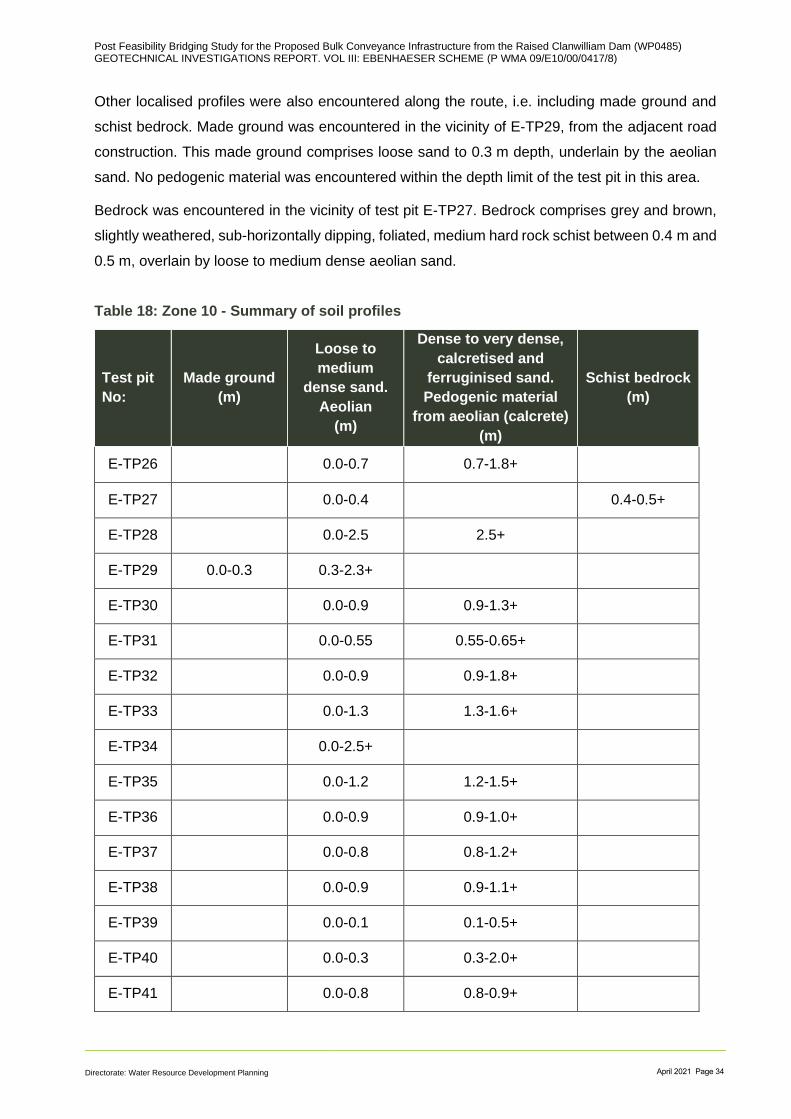
Post Feasibility Bridging Study for the Proposed Bulk Conveyance Infrastructure from the Raised Clanwilliam Dam (WP0485) GEOTECHNICAL INVESTIGATIONS REPORT. VOL III: EBENHAESER SCHEME (P WMA 09/E10/00/0417/8)
Directorate: Water Resource Development Planning April 2021 Page 34
Other localised profiles were also encountered along the route, i.e. including made ground and
schist bedrock. Made ground was encountered in the vicinity of E-TP29, from the adjacent road
construction. This made ground comprises loose sand to 0.3 m depth, underlain by the aeolian
sand. No pedogenic material was encountered within the depth limit of the test pit in this area.
Bedrock was encountered in the vicinity of test pit E-TP27. Bedrock comprises grey and brown,
slightly weathered, sub-horizontally dipping, foliated, medium hard rock schist between 0.4 m and
0.5 m, overlain by loose to medium dense aeolian sand.
Table 18: Zone 10 - Summary of soil profiles
Test pit
No:
Made ground
(m)
Loose to
medium
dense sand.
Aeolian
(m)
Dense to very dense,
calcretised and
ferruginised sand.
Pedogenic material
from aeolian (calcrete)
(m)
Schist bedrock
(m)
E-TP26 0.0-0.7 0.7-1.8+
E-TP27 0.0-0.4 0.4-0.5+
E-TP28 0.0-2.5 2.5+
E-TP29 0.0-0.3 0.3-2.3+
E-TP30 0.0-0.9 0.9-1.3+
E-TP31 0.0-0.55 0.55-0.65+
E-TP32 0.0-0.9 0.9-1.8+
E-TP33 0.0-1.3 1.3-1.6+
E-TP34 0.0-2.5+
E-TP35 0.0-1.2 1.2-1.5+
E-TP36 0.0-0.9 0.9-1.0+
E-TP37 0.0-0.8 0.8-1.2+
E-TP38 0.0-0.9 0.9-1.1+
E-TP39 0.0-0.1 0.1-0.5+
E-TP40 0.0-0.3 0.3-2.0+
E-TP41 0.0-0.8 0.8-0.9+
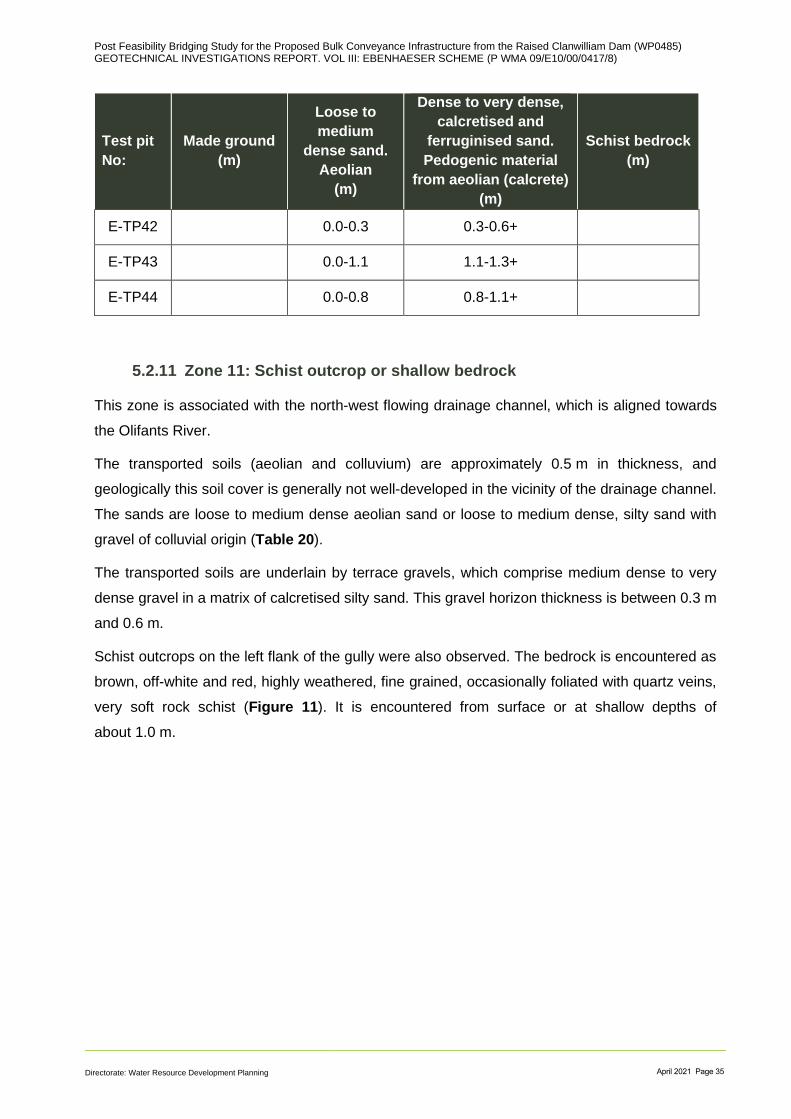
Post Feasibility Bridging Study for the Proposed Bulk Conveyance Infrastructure from the Raised Clanwilliam Dam (WP0485) GEOTECHNICAL INVESTIGATIONS REPORT. VOL III: EBENHAESER SCHEME (P WMA 09/E10/00/0417/8)
Directorate: Water Resource Development Planning April 2021 Page 35
Test pit
No:
Made ground
(m)
Loose to
medium
dense sand.
Aeolian
(m)
Dense to very dense,
calcretised and
ferruginised sand.
Pedogenic material
from aeolian (calcrete)
(m)
Schist bedrock
(m)
E-TP42 0.0-0.3 0.3-0.6+
E-TP43 0.0-1.1 1.1-1.3+
E-TP44 0.0-0.8 0.8-1.1+
5.2.11 Zone 11: Schist outcrop or shallow bedrock
This zone is associated with the north-west flowing drainage channel, which is aligned towards
the Olifants River.
The transported soils (aeolian and colluvium) are approximately 0.5 m in thickness, and
geologically this soil cover is generally not well-developed in the vicinity of the drainage channel.
The sands are loose to medium dense aeolian sand or loose to medium dense, silty sand with
gravel of colluvial origin (Table 20).
The transported soils are underlain by terrace gravels, which comprise medium dense to very
dense gravel in a matrix of calcretised silty sand. This gravel horizon thickness is between 0.3 m
and 0.6 m.
Schist outcrops on the left flank of the gully were also observed. The bedrock is encountered as
brown, off-white and red, highly weathered, fine grained, occasionally foliated with quartz veins,
very soft rock schist (Figure 11). It is encountered from surface or at shallow depths of
about 1.0 m.
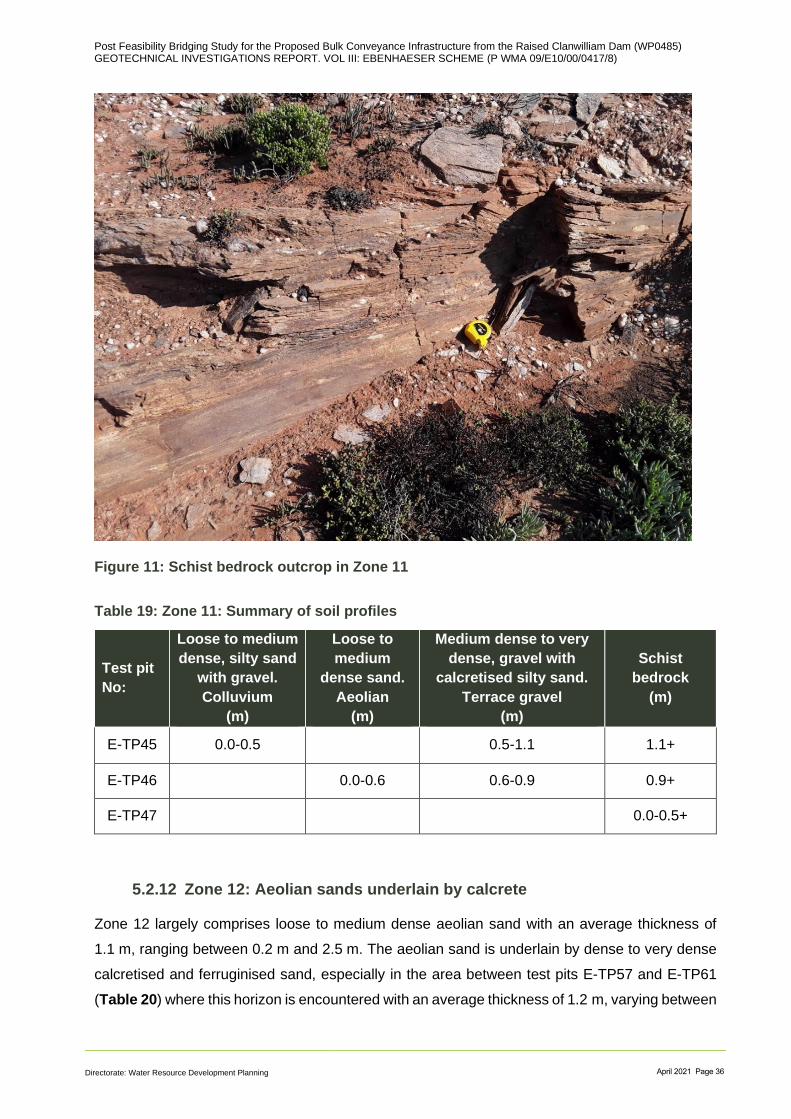
Post Feasibility Bridging Study for the Proposed Bulk Conveyance Infrastructure from the Raised Clanwilliam Dam (WP0485) GEOTECHNICAL INVESTIGATIONS REPORT. VOL III: EBENHAESER SCHEME (P WMA 09/E10/00/0417/8)
Directorate: Water Resource Development Planning April 2021 Page 36
Figure 11: Schist bedrock outcrop in Zone 11
Table 19: Zone 11: Summary of soil profiles
Test pit
No:
Loose to medium
dense, silty sand
with gravel.
Colluvium
(m)
Loose to
medium
dense sand.
Aeolian
(m)
Medium dense to very
dense, gravel with
calcretised silty sand.
Terrace gravel
(m)
Schist
bedrock
(m)
E-TP45 0.0-0.5 0.5-1.1 1.1+
E-TP46 0.0-0.6 0.6-0.9 0.9+
E-TP47 0.0-0.5+
5.2.12 Zone 12: Aeolian sands underlain by calcrete
Zone 12 largely comprises loose to medium dense aeolian sand with an average thickness of
1.1 m, ranging between 0.2 m and 2.5 m. The aeolian sand is underlain by dense to very dense
calcretised and ferruginised sand, especially in the area between test pits E-TP57 and E-TP61
(Table 20) where this horizon is encountered with an average thickness of 1.2 m, varying between

Post Feasibility Bridging Study for the Proposed Bulk Conveyance Infrastructure from the Raised Clanwilliam Dam (WP0485) GEOTECHNICAL INVESTIGATIONS REPORT. VOL III: EBENHAESER SCHEME (P WMA 09/E10/00/0417/8)
Directorate: Water Resource Development Planning April 2021 Page 37
0.2 m and 2.1 m. Generally, refusal occurred on the well-cemented, very soft rock hardpan
calcrete encountered throughout Zone 12.
Table 20: Aeolian sands and pedogenic material summaries for Zone 12
Test pit
No:
Loose to medium
dense sand.
Aeolian
(m)
Dense to very dense,
calcretised and
ferruginised sand.
Pedogenic material from
aeolian (calcrete)
(m)
Refusal on hardpan
calcrete
(m)
E-TP48 0.0-2.4+
E-TP49 0.0-2.5+
E-TP50 0.0-1.4 1.4+
E-TP51 0.0-1.0 1.0+
E-TP52 0.0-0.7 0.7+
E-TP53 0.0-1.5 1.5+
E-TP54 0.0-0.9 0.9+
E-TP55 0.0-0.7 0.7+
E-TP56 0.0-1.1 1.1+
E-TP57 0.0-0.5 0.5-1.9 1.9
E-TP58 0.0-0.2 0.2+
E-TP59 0.0-0.2 0.2-1.5 1.5+
E-TP60 0.0-0.4 0.4+
E-TP61 0.0-0.5 0.5-2.1 2.1+
5.2.13 Zone 13: Schist outcrop or shallow bedrock
This zone is largely on schist bedrock (Figure 12) as encountered along the drainage channel.
Bedrock here is encountered as outcrop with the road cut at 4.0 m thick (Table 21). It is
encountered as dark grey, off-white and brown, highly to moderately weathered, laminated, fine
grained, very soft to soft rock with abundant quartz veins, micaceous schist bedrock.

Post Feasibility Bridging Study for the Proposed Bulk Conveyance Infrastructure from the Raised Clanwilliam Dam (WP0485) GEOTECHNICAL INVESTIGATIONS REPORT. VOL III: EBENHAESER SCHEME (P WMA 09/E10/00/0417/8)
Directorate: Water Resource Development Planning April 2021 Page 38
Figure 12: Schist bedrock as encountered in Zone 13, exposed in a redundant road cut
Terrace gravels are generally encountered on the upper flank of the drainage channel with a
thickness of approximately 0.6 m from surface (Table 21). These are encountered as medium
dense to dense, angular to sub-angular, fine to medium, gravel in a matrix of slightly moist
ferruginised and calcretised silty sand.
Table 21: Zone 13 - Test pit summary description
Test pit No:
Medium dense to dense, gravel with
calcretised silty sand. Terrace gravel
(m)
Schist bedrock
(m)
E-TP62 0.0+
E-TP63 0.0-0.6 0.6-0.75+
E-TP64* 0.0-4.0+
*Note: E-TP64 logged a cut face of a redundant farm road
Post Feasibility Bridging Study for the Proposed Bulk Conveyance Infrastructure from the Raised Clanwilliam Dam (WP0485) GEOTECHNICAL INVESTIGATIONS REPORT. VOL III: EBENHAESER SCHEME (P WMA 09/E10/00/0417/8)
Directorate: Water Resource Development Planning April 2021 Page 39
5.2.14 Zone 14: Aeolian sands underlain by calcrete
Zone 14 is mainly characterised by shallow refusal on the off-white and brown, highly cemented,
very soft rock hardpan calcrete. In places the hardpan is observed on surface. The hardpan is
encountered at an average depth of 1.1 m (Table 22).
Hardpan is largely overlain by dense to very dense, calcrete nodules and honeycomb calcrete, in
a matrix of calcretised and ferruginised sand material. This is encountered with an average
thickness of 0.7 m, between the depths of 0.4 m and 1.1 m.
Aeolian sand either overlies the dense to very dense pedogenic materials or the hardpan, with an
average thickness of 0.4 m.
Table 22: Zone 14 - Summary description of test pit profiles
Test pit
No:
Loose to medium
dense sand.
Aeolian
(m)
Dense to very dense,
calcretised and
ferruginised sand.
Pedogenic material from
aeolian (calcrete)
(m)
Refusal on well
cemented hardpan
calcrete
(m)
E-TP65 0.0-0.2 0.2-0.4+
E-TP66 0.0-0.5 0.5-1.3 1.3+
E-TP67 0.0-0.5 0.5-1.4 1.4+
E-TP68 0.0-0.3+
E-TP69 0.0-0.2 0.2-2.5 2.5+
E-TP70 0.0-0.2 0.2-0.4+
E-TP71 0.0-0.3 0.3-0.5+
E-TP72 0.0-0.6 0.6-1.3 1.3+
E-TP73 0.0-0.4 0.4-0.6 0.6+
E-TP74 0.0-0.4 0.4-1.2+
E-TP75 0.0-0.7 0.7-1.1 1.1-2.1+
E-TP76 0.0-0.4 0.4-1.2+
E-TP77 0.0-0.1 0.1-0.15+
E-TP78 0.0-0.3 0.3-0.6 0.6+

Post Feasibility Bridging Study for the Proposed Bulk Conveyance Infrastructure from the Raised Clanwilliam Dam (WP0485) GEOTECHNICAL INVESTIGATIONS REPORT. VOL III: EBENHAESER SCHEME (P WMA 09/E10/00/0417/8)
Directorate: Water Resource Development Planning April 2021 Page 40
Test pit
No:
Loose to medium
dense sand.
Aeolian
(m)
Dense to very dense,
calcretised and
ferruginised sand.
Pedogenic material from
aeolian (calcrete)
(m)
Refusal on well
cemented hardpan
calcrete
(m)
E-TP79 0.0-0.35 0.35-0.4+
E-TP80 0.0-0.3 0.3-0.4+
E-TP81 0.0+
5.2.15 Zone 15: Schist outcrop or shallow bedrock
Shallow schist bedrock was encountered as off-white, grey and brown, highly weathered, very
soft rock, calcretised schist, from 0.3 m to refusal at 0.4 m (Figure 13). The bedrock is overlain
by aeolian sands which comprise loose sand to a depth of 0.3 m (Table 23).
Table 23: Zone 15 - Test pit profile summary
Test pit No: Loose sand. Aeolian
(m)
Schist bedrock
(m)
E-TP82 0.0-0.3 0.3-0.4+
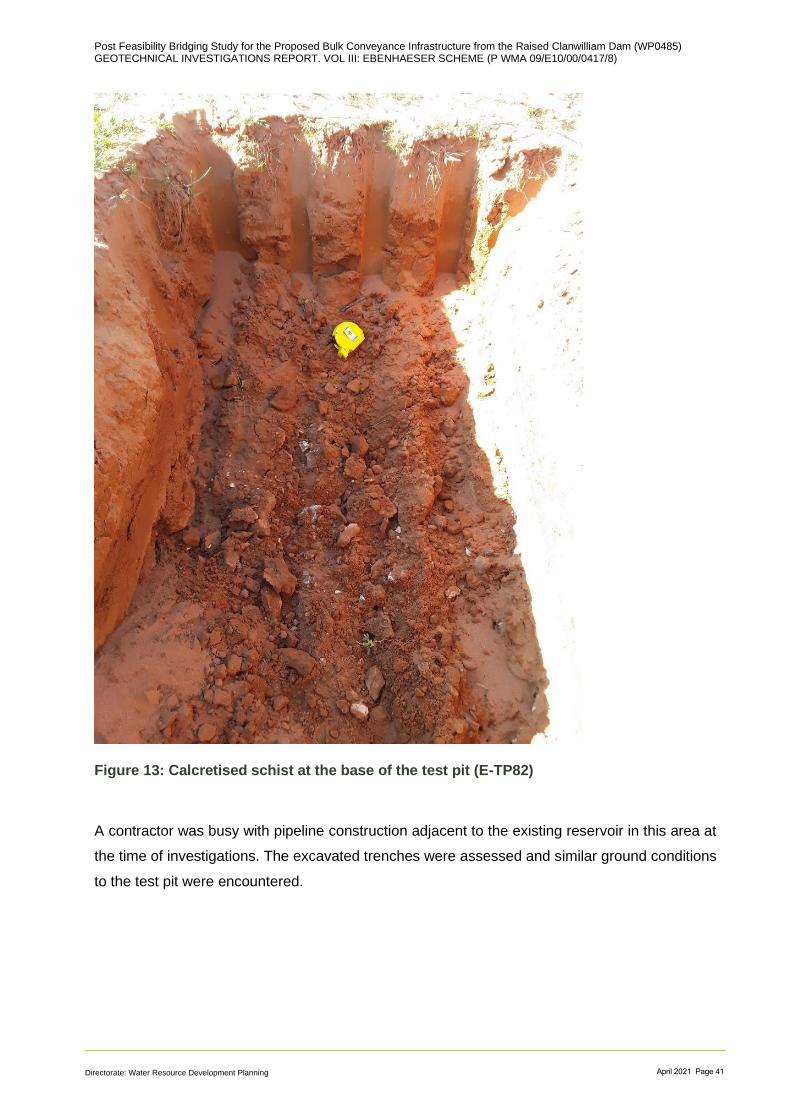
Post Feasibility Bridging Study for the Proposed Bulk Conveyance Infrastructure from the Raised Clanwilliam Dam (WP0485) GEOTECHNICAL INVESTIGATIONS REPORT. VOL III: EBENHAESER SCHEME (P WMA 09/E10/00/0417/8)
Directorate: Water Resource Development Planning April 2021 Page 41
Figure 13: Calcretised schist at the base of the test pit (E-TP82)
A contractor was busy with pipeline construction adjacent to the existing reservoir in this area at
the time of investigations. The excavated trenches were assessed and similar ground conditions
to the test pit were encountered.
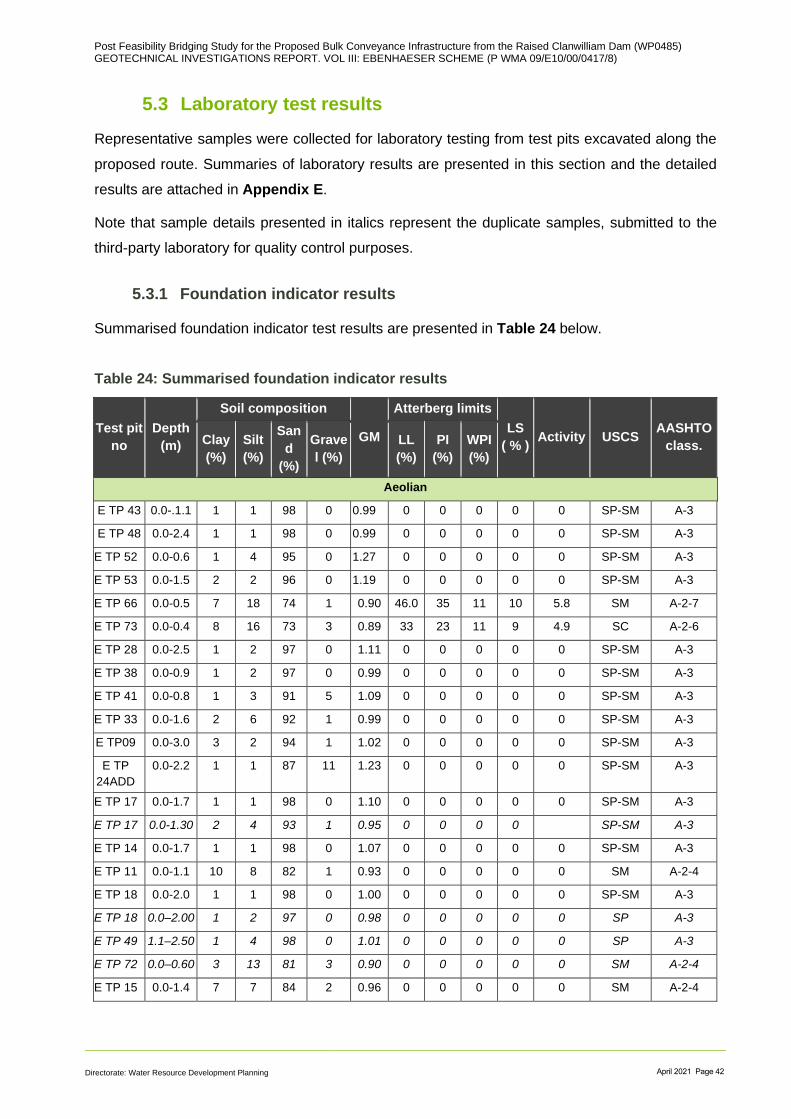
Post Feasibility Bridging Study for the Proposed Bulk Conveyance Infrastructure from the Raised Clanwilliam Dam (WP0485) GEOTECHNICAL INVESTIGATIONS REPORT. VOL III: EBENHAESER SCHEME (P WMA 09/E10/00/0417/8)
Directorate: Water Resource Development Planning April 2021 Page 42
5.3 Laboratory test results
Representative samples were collected for laboratory testing from test pits excavated along the
proposed route. Summaries of laboratory results are presented in this section and the detailed
results are attached in Appendix E.
Note that sample details presented in italics represent the duplicate samples, submitted to the
third-party laboratory for quality control purposes.
5.3.1 Foundation indicator results
Summarised foundation indicator test results are presented in Table 24 below.
Table 24: Summarised foundation indicator results
Test pit
no
Depth
(m)
Soil composition
GM
Atterberg limits
LS
( % ) Activity USCS
AASHTO
class. Clay
(%)
Silt
(%)
San
d
(%)
Grave
l (%)
LL
(%)
PI
(%)
WPI
(%)
Aeolian
E TP 43 0.0-.1.1 1 1 98 0 0.99 0 0 0 0 0 SP-SM A-3
E TP 48 0.0-2.4 1 1 98 0 0.99 0 0 0 0 0 SP-SM A-3
E TP 52 0.0-0.6 1 4 95 0 1.27 0 0 0 0 0 SP-SM A-3
E TP 53 0.0-1.5 2 2 96 0 1.19 0 0 0 0 0 SP-SM A-3
E TP 66 0.0-0.5 7 18 74 1 0.90 46.0 35 11 10 5.8 SM A-2-7
E TP 73 0.0-0.4 8 16 73 3 0.89 33 23 11 9 4.9 SC A-2-6
E TP 28 0.0-2.5 1 2 97 0 1.11 0 0 0 0 0 SP-SM A-3
E TP 38 0.0-0.9 1 2 97 0 0.99 0 0 0 0 0 SP-SM A-3
E TP 41 0.0-0.8 1 3 91 5 1.09 0 0 0 0 0 SP-SM A-3
E TP 33 0.0-1.6 2 6 92 1 0.99 0 0 0 0 0 SP-SM A-3
E TP09 0.0-3.0 3 2 94 1 1.02 0 0 0 0 0 SP-SM A-3
E TP
24ADD
0.0-2.2 1 1 87 11 1.23 0 0 0 0 0 SP-SM A-3
E TP 17 0.0-1.7 1 1 98 0 1.10 0 0 0 0 0 SP-SM A-3
E TP 17 0.0-1.30 2 4 93 1 0.95 0 0 0 0 SP-SM A-3
E TP 14 0.0-1.7 1 1 98 0 1.07 0 0 0 0 0 SP-SM A-3
E TP 11 0.0-1.1 10 8 82 1 0.93 0 0 0 0 0 SM A-2-4
E TP 18 0.0-2.0 1 1 98 0 1.00 0 0 0 0 0 SP-SM A-3
E TP 18 0.0–2.00 1 2 97 0 0.98 0 0 0 0 0 SP A-3
E TP 49 1.1–2.50 1 4 98 0 1.01 0 0 0 0 0 SP A-3
E TP 72 0.0–0.60 3 13 81 3 0.90 0 0 0 0 0 SM A-2-4
E TP 15 0.0-1.4 7 7 84 2 0.96 0 0 0 0 0 SM A-2-4

Post Feasibility Bridging Study for the Proposed Bulk Conveyance Infrastructure from the Raised Clanwilliam Dam (WP0485) GEOTECHNICAL INVESTIGATIONS REPORT. VOL III: EBENHAESER SCHEME (P WMA 09/E10/00/0417/8)
Directorate: Water Resource Development Planning April 2021 Page 43
Test pit
no
Depth
(m)
Soil composition
GM
Atterberg limits
LS
( % ) Activity USCS
AASHTO
class. Clay
(%)
Silt
(%)
San
d
(%)
Grave
l (%)
LL
(%)
PI
(%)
WPI
(%)
Alluvium
E TP 07 0.3-3.0 19 32 43 5 0.62 27.6 14 13 12 0.7 CL A-6
Pedogenic material
E TP 35 1.2-1.5 8 3 89 0 0.93 0 0 0 0 0 SP-SM A-2-4
E TP 45 0.5-1.1 5 11 58 26 1.60 0 0 0 0 0 SM A-1-B
E TP 57 0.5-1.9 4 10 78 8 1.14 0 0 0 0 0 SM A-2-4
E TP 59 0.2-1.5 4 13 58 25 1.53 0 0 0 0 0 SM A-2-4
E TP 61 0.5-2.1 4 13 49 34 1.65 0 0 0 0 0 SM A-2-4
E TP 78 0.3-0.6 1 44 53 32 1.66 0 0 0 0 0 SM A-2-4
E TP 33 1.3-1.6 8 5 86 1 0.93 0 0 0 0 0 SM A-2-4
E TP 10 1.0-2.0 13 22 59 6 0.84 35 23 10 5.4 0.9 SC A-6
E TP 11 1.1-1.4 2 9 89 0 0.94 0 0 0 0 0 SP-SM A-2-4
Terrace gravels
E TP 16 0.3- 0.5 3 1 34 62 2.32 0 0 0 0 0 GP A-1-A
E TP 46 0.6-0.9 1 1 87 11 1.23 0 0 0 0 0 SM A-3
E TP 46 0.0-0.6 1 2 89 11 1.87 37 30 7 3 1.2 SM A-3
E TP 63 0.0-0.6 15 13 24 49 1.79 23 15 8 3 3.8 SC A-2-4
Legend GM = Grading modulus
LL = Liquid Limit
PI = Plasticity Index
WPI = Weighted Plasticity Index (PI x % passing the 0.425 mm sieve)
LS = Linear Shrinkage
USCS = Classification of the soil according to the USC classification system
Activity = Potential expansiveness of the soil according to Van der Merwe’s method
(Van der Merwe, 1964)
The aeolian sands predominantly comprise poorly graded sand (SP), silty sands (SM) and
occasionally clayey sands (SC). The sand fraction is high; between 73% and 98%, the clay and
silt fractions are generally negligible; clay typically between 1% and 3% but occasionally 7% to
10%, while the silt fraction is also generally between 1% and 3%, but occasionally 4% to 18%.
Gravel is generally absent, but where encountered it is between 1% and 3%, but occasionally at
11%. These sands are generally non-plastic, but on rare occasions might prove to be slightly
plastic, with a Weighted Plasticity Index (WPI) of 11%. This material generally displays no
plasticity, which is indicative of low potential expansiveness, after Van der Merwe (1964).
The single sample of alluvium indicates a high fraction of fines; with the silt content at 32% and
the clay fraction at 19%. The sand fraction is 43% and the gravel content is low at 5%. The

Post Feasibility Bridging Study for the Proposed Bulk Conveyance Infrastructure from the Raised Clanwilliam Dam (WP0485) GEOTECHNICAL INVESTIGATIONS REPORT. VOL III: EBENHAESER SCHEME (P WMA 09/E10/00/0417/8)
Directorate: Water Resource Development Planning April 2021 Page 44
alluvium is considered slightly plastic with the Weighted Plasticity Index of 13% and moderate
Liquid Limit at 28%. This material is of low potential expansiveness.
The pedogenic materials predominantly comprise poorly graded sand (SP), silty sands (SM)
and occasionally clayey sands (SC). The sand fraction is high; between 49% and 89%, the clay
fraction is generally negligible; between 1% and 4%, but occasionally between 8% and 13%, the
silt fraction is between 3% and 44%. Gravel is generally between 26% and 34%, but occasionally
less than 6% to zero. These gravelly sands are generally non-plastic, but on rare occasions might
prove to be slightly plastic, with a Weighted Plasticity Index (WPI) of 10%. This material generally
displays no plasticity, which is indicative of low potential expansiveness, after Van der Merwe
(1964).
The terrace gravels comprise silty sands (SM), poorly graded gravels (GP), and occasionally
clayey sands (SC). The sand and gravel fractions are high, with the sand content between 24%
and 89%, while the gravel fraction is 11% to 62%. It must be remembered that the coarse fraction
is not fully included in the laboratory samples, and in truth the coarse fraction can be significantly
greater than reflected here. The clay and silt fractions are generally negligible; clay typically
between 1% and 3%, but occasionally (outlier) 15%, while the silt fraction is also generally
between 1% and 2%, but occasionally 13%. The terrace gravels are generally non-plastic, but on
rare occasions might prove to be slightly plastic, with a Weighted Plasticity Index (WPI) of 8% and
moderate to high Liquid Limits between 23% and 37%. This material generally displays no or
slight plasticity, which is indicative of low potential expansiveness, after Van der Merwe (1964).
5.3.2 Compaction test results
Representative samples were subjected to compaction tests in which the moisture-density
relationship was established, with California Bearing Ratio (CBR) tests carried out to determine
the suitability of the soils for use in constructing layer works. The results are summarised in Table
25 below.

Post Feasibility Bridging Study for the Proposed Bulk Conveyance Infrastructure from the Raised Clanwilliam Dam (WP0485) GEOTECHNICAL INVESTIGATIONS REPORT. VOL III: EBENHAESER SCHEME (P WMA 09/E10/00/0417/8)
Directorate: Water Resource Development Planning April 2021 Page 45
Table 25: Summarised compaction test results
Legend: OMC = Optimum moisture content
MDD = Maximum dry density (Mod AASHTO)
Swell = Soaked at 100% Mod AASHTO compaction
COLTO = Committee of Land Transport Officials guidelines (2009)
The aeolian sands are characterised by low to moderate maximum dry densities (1650 to 2023
kg/m3) and moderate optimum moisture contents between 9% and 12%. The CBR swell values
are zero. These materials yielded very low or low CBR values at densities typically specified in
the field (93 % to 95 %). These sands would only be suitable for construction of engineered fills
of low stiffness and classify as G8 or G10 material in accordance with COLTO guidelines
(COLTO, 2009), and thus only suitable as selected fill or subgrade road layer works. G10 can
alternatively be used for landscaping or be spoiled. .
The single alluvium sample indicates a moderate maximum dry density at 2028 kg/m3 and
moderate optimum moisture content at 10%. The CBR swell value is zero. These materials
yielded very low or low CBR values at densities typically specified in the field (93 % to 95 %). This
material is classified as a G10 according to COLTO guidelines, indicating it is suitable for use in
subgrade and engineered fills of low stiffness; alternatively, it can be used for landscaping or
spoiled.
Test No.
Depth (m)
OMC (%)
MDD (kg-/m3)
Swell (%)
CBR at various densities COLTO
90(%) 93(%) 95(%) 98(%)
Aeolian
E TP 53 0.0-1.5 11.1 1771 0 3 5 6 9 G10
E TP 28 0.0-2.5 10.5 1821 0 7 8 9 11 G9
E TP 38 0.0-0.9 11.2 1769 0 5 7 9 14 G9
E TP 46 0.0-0.6 9.5 1964 0 11 14 18 24 G8
E TP 33 0.0-1.6 11.3 1650 0 5 7 8 10 G9
E TP09 0.0-3.0 11.6 1859 0 6 8 10 13 G9
E TP 24ADD
0.0-2.2 10.4 1718 0 6 7 8 11 G9
E TP 14 0.0-1.7 10.8 1744 0 8 10 12 15 G8
E TP 72* 0.0–0.60 11.6 1902 0 6 7 8 9 G10
E TP 49* 1.1–2.50 11.4 1772 0 9 12 14 19 G8
E TP 15 0.0-1.4 10.4 2023 0 6 9 12 18 G9
Alluvium
E TP 07 0.3-3.0 10.4 2028 0.80 5 6 7 9 G10
Pedogenic material
E TP 57 0.5-1.9 9.6 2014 0 9 13 16 22 G8
E TP 45 0.5-1.1 9.6 1912 0 12 15 17 22 G7
E TP 10 1.0-2.0 10 1970 0.76 3 4 5 7 G10
E TP 61* 1.1–2.50 17 1769 0 9 12 14 18 G8
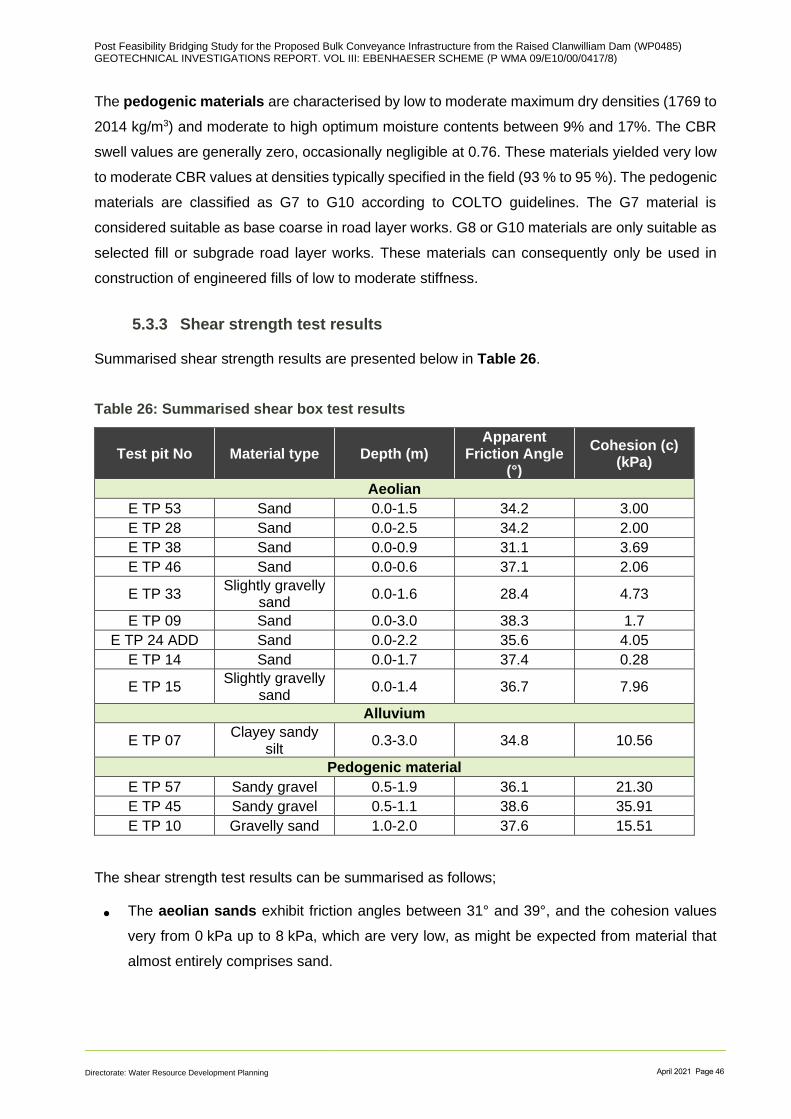
Post Feasibility Bridging Study for the Proposed Bulk Conveyance Infrastructure from the Raised Clanwilliam Dam (WP0485) GEOTECHNICAL INVESTIGATIONS REPORT. VOL III: EBENHAESER SCHEME (P WMA 09/E10/00/0417/8)
Directorate: Water Resource Development Planning April 2021 Page 46
The pedogenic materials are characterised by low to moderate maximum dry densities (1769 to
2014 kg/m3) and moderate to high optimum moisture contents between 9% and 17%. The CBR
swell values are generally zero, occasionally negligible at 0.76. These materials yielded very low
to moderate CBR values at densities typically specified in the field (93 % to 95 %). The pedogenic
materials are classified as G7 to G10 according to COLTO guidelines. The G7 material is
considered suitable as base coarse in road layer works. G8 or G10 materials are only suitable as
selected fill or subgrade road layer works. These materials can consequently only be used in
construction of engineered fills of low to moderate stiffness.
5.3.3 Shear strength test results
Summarised shear strength results are presented below in Table 26.
Table 26: Summarised shear box test results
Test pit No Material type Depth (m) Apparent
Friction Angle (°)
Cohesion (c) (kPa)
Aeolian
E TP 53 Sand 0.0-1.5 34.2 3.00
E TP 28 Sand 0.0-2.5 34.2 2.00
E TP 38 Sand 0.0-0.9 31.1 3.69
E TP 46 Sand 0.0-0.6 37.1 2.06
E TP 33 Slightly gravelly
sand 0.0-1.6 28.4 4.73
E TP 09 Sand 0.0-3.0 38.3 1.7
E TP 24 ADD Sand 0.0-2.2 35.6 4.05
E TP 14 Sand 0.0-1.7 37.4 0.28
E TP 15 Slightly gravelly
sand 0.0-1.4 36.7 7.96
Alluvium
E TP 07 Clayey sandy
silt 0.3-3.0 34.8 10.56
Pedogenic material
E TP 57 Sandy gravel 0.5-1.9 36.1 21.30
E TP 45 Sandy gravel 0.5-1.1 38.6 35.91
E TP 10 Gravelly sand 1.0-2.0 37.6 15.51
The shear strength test results can be summarised as follows;
• The aeolian sands exhibit friction angles between 31° and 39°, and the cohesion values
very from 0 kPa up to 8 kPa, which are very low, as might be expected from material that
almost entirely comprises sand.

Post Feasibility Bridging Study for the Proposed Bulk Conveyance Infrastructure from the Raised Clanwilliam Dam (WP0485) GEOTECHNICAL INVESTIGATIONS REPORT. VOL III: EBENHAESER SCHEME (P WMA 09/E10/00/0417/8)
Directorate: Water Resource Development Planning April 2021 Page 47
• The single sample of alluvium exhibits a friction angle of 35° which is within the usual range
that might be expected for such soils and the cohesion value at 11 kPa, which is considered
low.
• The pedogenic materials show friction angles between 36° and 38°. Cohesion values were
typically between 15 kPa and 36 kPa.
5.3.4 Collapse potential test
Undisturbed blocks of the calcretised and ferruginised sands were sampled and submitted for
laboratory testing to be subjected to a standard collapse potential test (i.e. soaked at 200 kPa).
The results are summarised in Table 27.
Table 27: Collapse potential summary results
Test pit No: Depth
(m) Material type
DD
(kg/m3)
MC
( % )
CP
( % )
Aeolian
E TP 33 0.0-1.6 Slightly
gravelly sand 1.73 12.1 0.2
E TP 15 0.0-1.4 Slightly
gravelly sand 1.74 13.4 0.3
Pedogenic material
E TP 57 0.5-1.9 Sandy gravel 1.85 12.6 0.6 Legend DD = In situ dry density
MC = In situ moisture content
CP = Collapse potential ( soaked at 200 kPa )
Jennings and Knight (1957) provided guidelines on the interpretation of collapse potential tests,
which are summarised in Table 28.
Table 28: Guideline values for interpretation of the collapse potential test (after Jennings
and Knight, 1957)
Collapse Potential Severity of the problem
0 % - 1 % No problem
1 % - 5 % Moderate trouble
5 % - 10 % Trouble
10 % - 20 % Severe trouble
> 20 % Very severe trouble

Post Feasibility Bridging Study for the Proposed Bulk Conveyance Infrastructure from the Raised Clanwilliam Dam (WP0485) GEOTECHNICAL INVESTIGATIONS REPORT. VOL III: EBENHAESER SCHEME (P WMA 09/E10/00/0417/8)
Directorate: Water Resource Development Planning April 2021 Page 48
The above guidelines indicate that there is “no problem” in terms of severity of collapse potential.
However, the soil samples are characterised by a pinholed structure which is known to indicate
potentially collapsible conditions (Brink,1996).
5.3.5 Permeability test
The results of permeability tests conducted on remoulded soil samples compacted to
approximately 98% Proctor are summarised in Table 29.
Table 29: Permeability summary results
Test pit No:
Material type Depth
(m) Permeability (cm/s)
Aeolian
E TP 09 Sand 0.0-3.0 1.34 x 10⁻⁵
E TP 53 Sand 0.0-1.5 1.93 x 10⁻³
E TP 46 Sand 0.0-0.6 4.81 x 10⁻³
E TP 28 Sand 0.0-2.5 1.93 x 10⁻³
E TP 17 Sand 0.0-1.7 5.71 x 10⁻³
E TP 14 Sand 0.0-1.7 5.42 x 10⁻³
E TP 15 Slightly gravelly sand 0.0-1.4 9.74 x 10⁻⁷
Pedogenic material
E TP 10 Gravelly sand 1.0-2.0 5.19 x 10⁻⁸
Das (2002) summarised typical values for the coefficient of permeability (k, cm/sec) in relation to
the degree of permeability, based on laboratory results in Table 29.
Table 30: Typical values for coefficient of permeability, after Das (2002)
Coefficient of permeability
(k, cm/sec) Degree of permeability
>10-1 Very highly permeable
10-1 > k > 10-3 High to moderately permeable
10-3 > k > 10-5 Low permeability
10-5 > k > 10-7 Very low permeability
<10-7 Virtually impermeable
The sand materials of aeolian origin generally exhibit permeabilities between 5.71 x 10⁻³ and
1.34 x 10⁻⁵ cm/s, which are considered low permeability. The slightly gravely sand material proved
to be of very low permeability at 9.74 x 10⁻⁷ cm/s.
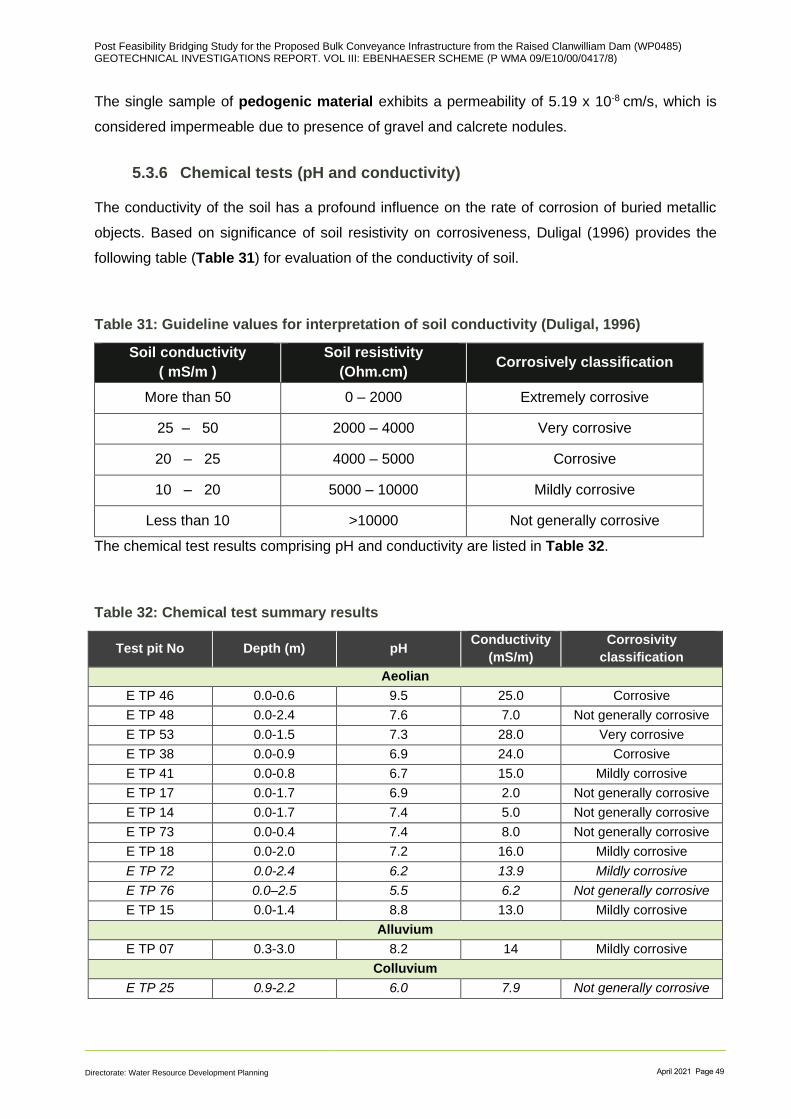
Post Feasibility Bridging Study for the Proposed Bulk Conveyance Infrastructure from the Raised Clanwilliam Dam (WP0485) GEOTECHNICAL INVESTIGATIONS REPORT. VOL III: EBENHAESER SCHEME (P WMA 09/E10/00/0417/8)
Directorate: Water Resource Development Planning April 2021 Page 49
The single sample of pedogenic material exhibits a permeability of 5.19 x 10⁻⁸ cm/s, which is
considered impermeable due to presence of gravel and calcrete nodules.
5.3.6 Chemical tests (pH and conductivity)
The conductivity of the soil has a profound influence on the rate of corrosion of buried metallic
objects. Based on significance of soil resistivity on corrosiveness, Duligal (1996) provides the
following table (Table 31) for evaluation of the conductivity of soil.
Table 31: Guideline values for interpretation of soil conductivity (Duligal, 1996)
Soil conductivity
( mS/m )
Soil resistivity
(Ohm.cm) Corrosively classification
More than 50 0 – 2000 Extremely corrosive
25 – 50 2000 – 4000 Very corrosive
20 – 25 4000 – 5000 Corrosive
10 – 20 5000 – 10000 Mildly corrosive
Less than 10 >10000 Not generally corrosive
The chemical test results comprising pH and conductivity are listed in Table 32.
Table 32: Chemical test summary results
Test pit No Depth (m) pH Conductivity
(mS/m)
Corrosivity
classification
Aeolian
E TP 46 0.0-0.6 9.5 25.0 Corrosive
E TP 48 0.0-2.4 7.6 7.0 Not generally corrosive
E TP 53 0.0-1.5 7.3 28.0 Very corrosive
E TP 38 0.0-0.9 6.9 24.0 Corrosive
E TP 41 0.0-0.8 6.7 15.0 Mildly corrosive
E TP 17 0.0-1.7 6.9 2.0 Not generally corrosive
E TP 14 0.0-1.7 7.4 5.0 Not generally corrosive
E TP 73 0.0-0.4 7.4 8.0 Not generally corrosive
E TP 18 0.0-2.0 7.2 16.0 Mildly corrosive
E TP 72 0.0-2.4 6.2 13.9 Mildly corrosive
E TP 76 0.0–2.5 5.5 6.2 Not generally corrosive
E TP 15 0.0-1.4 8.8 13.0 Mildly corrosive
Alluvium
E TP 07 0.3-3.0 8.2 14 Mildly corrosive
Colluvium
E TP 25 0.9-2.2 6.0 7.9 Not generally corrosive
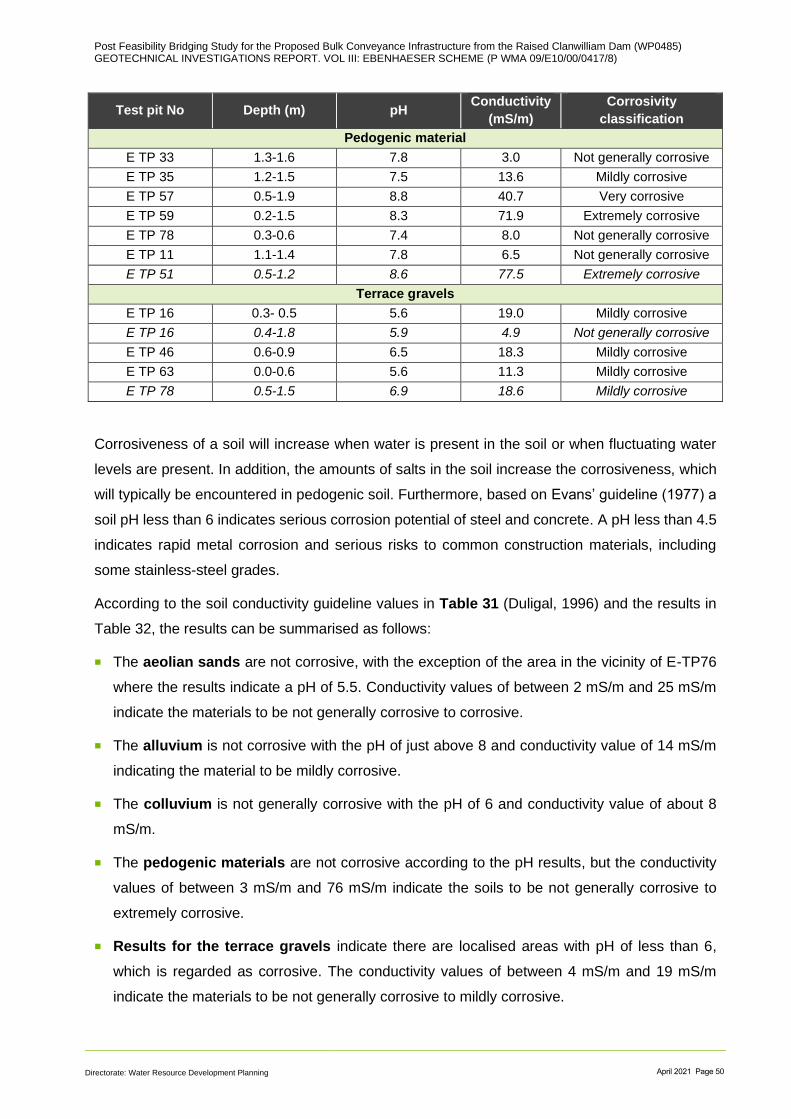
Post Feasibility Bridging Study for the Proposed Bulk Conveyance Infrastructure from the Raised Clanwilliam Dam (WP0485) GEOTECHNICAL INVESTIGATIONS REPORT. VOL III: EBENHAESER SCHEME (P WMA 09/E10/00/0417/8)
Directorate: Water Resource Development Planning April 2021 Page 50
Test pit No Depth (m) pH Conductivity
(mS/m)
Corrosivity
classification
Pedogenic material
E TP 33 1.3-1.6 7.8 3.0 Not generally corrosive
E TP 35 1.2-1.5 7.5 13.6 Mildly corrosive
E TP 57 0.5-1.9 8.8 40.7 Very corrosive
E TP 59 0.2-1.5 8.3 71.9 Extremely corrosive
E TP 78 0.3-0.6 7.4 8.0 Not generally corrosive
E TP 11 1.1-1.4 7.8 6.5 Not generally corrosive
E TP 51 0.5-1.2 8.6 77.5 Extremely corrosive
Terrace gravels
E TP 16 0.3- 0.5 5.6 19.0 Mildly corrosive
E TP 16 0.4-1.8 5.9 4.9 Not generally corrosive
E TP 46 0.6-0.9 6.5 18.3 Mildly corrosive
E TP 63 0.0-0.6 5.6 11.3 Mildly corrosive
E TP 78 0.5-1.5 6.9 18.6 Mildly corrosive
Corrosiveness of a soil will increase when water is present in the soil or when fluctuating water
levels are present. In addition, the amounts of salts in the soil increase the corrosiveness, which
will typically be encountered in pedogenic soil. Furthermore, based on Evans’ guideline (1977) a
soil pH less than 6 indicates serious corrosion potential of steel and concrete. A pH less than 4.5
indicates rapid metal corrosion and serious risks to common construction materials, including
some stainless-steel grades.
According to the soil conductivity guideline values in Table 31 (Duligal, 1996) and the results in
Table 32, the results can be summarised as follows:
◼ The aeolian sands are not corrosive, with the exception of the area in the vicinity of E-TP76
where the results indicate a pH of 5.5. Conductivity values of between 2 mS/m and 25 mS/m
indicate the materials to be not generally corrosive to corrosive.
◼ The alluvium is not corrosive with the pH of just above 8 and conductivity value of 14 mS/m
indicating the material to be mildly corrosive.
◼ The colluvium is not generally corrosive with the pH of 6 and conductivity value of about 8
mS/m.
◼ The pedogenic materials are not corrosive according to the pH results, but the conductivity
values of between 3 mS/m and 76 mS/m indicate the soils to be not generally corrosive to
extremely corrosive.
◼ Results for the terrace gravels indicate there are localised areas with pH of less than 6,
which is regarded as corrosive. The conductivity values of between 4 mS/m and 19 mS/m
indicate the materials to be not generally corrosive to mildly corrosive.
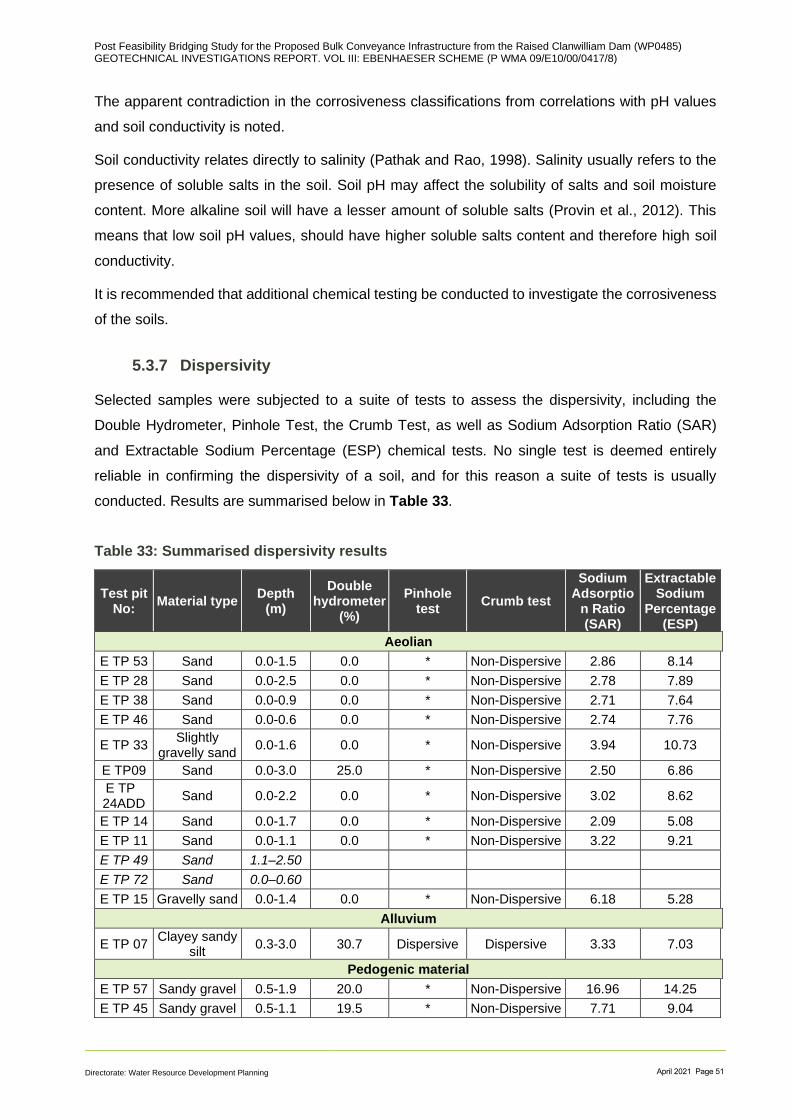
Post Feasibility Bridging Study for the Proposed Bulk Conveyance Infrastructure from the Raised Clanwilliam Dam (WP0485) GEOTECHNICAL INVESTIGATIONS REPORT. VOL III: EBENHAESER SCHEME (P WMA 09/E10/00/0417/8)
Directorate: Water Resource Development Planning April 2021 Page 51
The apparent contradiction in the corrosiveness classifications from correlations with pH values
and soil conductivity is noted.
Soil conductivity relates directly to salinity (Pathak and Rao, 1998). Salinity usually refers to the
presence of soluble salts in the soil. Soil pH may affect the solubility of salts and soil moisture
content. More alkaline soil will have a lesser amount of soluble salts (Provin et al., 2012). This
means that low soil pH values, should have higher soluble salts content and therefore high soil
conductivity.
It is recommended that additional chemical testing be conducted to investigate the corrosiveness
of the soils.
5.3.7 Dispersivity
Selected samples were subjected to a suite of tests to assess the dispersivity, including the
Double Hydrometer, Pinhole Test, the Crumb Test, as well as Sodium Adsorption Ratio (SAR)
and Extractable Sodium Percentage (ESP) chemical tests. No single test is deemed entirely
reliable in confirming the dispersivity of a soil, and for this reason a suite of tests is usually
conducted. Results are summarised below in Table 33.
Table 33: Summarised dispersivity results
Test pit No:
Material type Depth
(m)
Double hydrometer
(%)
Pinhole test
Crumb test
Sodium Adsorptio
n Ratio (SAR)
Extractable Sodium
Percentage (ESP)
Aeolian
E TP 53 Sand 0.0-1.5 0.0 * Non-Dispersive 2.86 8.14
E TP 28 Sand 0.0-2.5 0.0 * Non-Dispersive 2.78 7.89
E TP 38 Sand 0.0-0.9 0.0 * Non-Dispersive 2.71 7.64
E TP 46 Sand 0.0-0.6 0.0 * Non-Dispersive 2.74 7.76
E TP 33 Slightly
gravelly sand 0.0-1.6 0.0 * Non-Dispersive 3.94 10.73
E TP09 Sand 0.0-3.0 25.0 * Non-Dispersive 2.50 6.86
E TP 24ADD
Sand 0.0-2.2 0.0 * Non-Dispersive 3.02 8.62
E TP 14 Sand 0.0-1.7 0.0 * Non-Dispersive 2.09 5.08
E TP 11 Sand 0.0-1.1 0.0 * Non-Dispersive 3.22 9.21
E TP 49 Sand 1.1–2.50
E TP 72 Sand 0.0–0.60
E TP 15 Gravelly sand 0.0-1.4 0.0 * Non-Dispersive 6.18 5.28
Alluvium
E TP 07 Clayey sandy
silt 0.3-3.0 30.7 Dispersive Dispersive 3.33 7.03
Pedogenic material
E TP 57 Sandy gravel 0.5-1.9 20.0 * Non-Dispersive 16.96 14.25
E TP 45 Sandy gravel 0.5-1.1 19.5 * Non-Dispersive 7.71 9.04

Post Feasibility Bridging Study for the Proposed Bulk Conveyance Infrastructure from the Raised Clanwilliam Dam (WP0485) GEOTECHNICAL INVESTIGATIONS REPORT. VOL III: EBENHAESER SCHEME (P WMA 09/E10/00/0417/8)
Directorate: Water Resource Development Planning April 2021 Page 52
Test pit No:
Material type Depth
(m)
Double hydrometer
(%)
Pinhole test
Crumb test
Sodium Adsorptio
n Ratio (SAR)
Extractable Sodium
Percentage (ESP)
E TP 10 Gravelly sand 1.0-2.0 19.0 Slightly
Dispersive Slightly
Dispersive 27.99 29.94
Terrace Gravels
E TP 16 Gravel in silty sand matrix
0.3- 0.5 0.0 Slightly
Dispersive Slightly
Dispersive 6.17 7.95
* The Crumb Test is not applicable for samples with 12% or less particles passing 0.005mm and having a plasticity index less than or equal to 8
In assessing the results, the following tables are used i.e. Table 34, Table 35 and Table 36.
Table 34: Criteria for evaluation of degree of dispersion from double hydrometer test
(after Bell and Maud, 1994)
Percent dispersion (%) Degree of dispersion
<30 Non-dispersive
30 to 50 Intermediate
>50 Dispersive
Table 35: Criteria for evaluation of degree of dispersion from ESP results (after Gerber,
1983)
Extractable Sodium Percentage
ESP (%) Degree of dispersion
<15 Highly dispersive
6 to 15 Dispersive
4 to 6 Marginal
<4 Non-dispersive
Table 36: Criteria for evaluation of degree of dispersion from SAR results
Sodium Adsorption Ratio
SAR (%) Degree of dispersion
<1.5 Non-dispersive
1.5 to 2 Intermediate
>2 Dispersive
Based on the laboratory results and evaluation tables above, the following comments can be
made with regards to dispersivity.

Post Feasibility Bridging Study for the Proposed Bulk Conveyance Infrastructure from the Raised Clanwilliam Dam (WP0485) GEOTECHNICAL INVESTIGATIONS REPORT. VOL III: EBENHAESER SCHEME (P WMA 09/E10/00/0417/8)
Directorate: Water Resource Development Planning April 2021 Page 53
The aeolian sands are considered non-dispersive based on the pinhole test results, double
hydrometer and crumb tests. However, the SAR results indicate that materials are dispersive, and
the ESP result indicate marginal to dispersive for aeolian sands.
Double hydrometer results indicate that the alluvial material is of intermediate dispersivity.
However, all the other suite of tests show the material is dispersive.
The pedogenic materials are non-dispersive according to double hydrometer results while
pinhole and crumb test indicate non-dispersivity to slightly dispersive results. However, SAR and
ESP indicate dispersive to highly dispersive results for the pedogenic materials.
Terrace gravels are also non-dispersive according to double hydrometer results while pinhole
and crumb test indicate non-dispersivity to slightly dispersive results. However, SAR and ESP
indicate dispersive results.
It should be noted that there are some apparent contradictions in the determined dispersivity of
soils as per different laboratory tests. The chemical tests also indicate a similar contradiction likely
due to the presence of soluble salts in the soil. Further testing is recommended to confirm the
dispersivity of the soils.
5.3.8 In-situ moisture content
Various samples were taken from different horizons and tested for their in-situ moisture content.
Table 37 below compares the in-situ moisture content at the time of the geotechnical investigation
with the optimum moisture content (obtained from compaction testing).
Table 37: In-situ moisture conditions along the proposed Ebenhaeser Scheme
Test pit No:
Depth (m)
Material type In-situ moisture
content (%) OMC available from
CBR testing (%)
Aeolian
E TP 43 0.0-.1.1 Sand 1.9
E TP 48 0.0-2.4 Sand 1.4
E TP 52 0.0-0.6 Sand 3.2
E TP 53 0.0-1.5 Sand 1.6 11.1
E TP 46 0.0-0.6 Sand 4.6 9.5
E TP 66 0.0-0.5 Sand 5
E TP 73 0.0-0.4 Sand 4
E TP 28 0.0-2.5 Sand 1.2 10.5
E TP 38 0.0-0.9 Sand 2.2 11.2
E TP 41 0.0-0.8 Sand 4.1
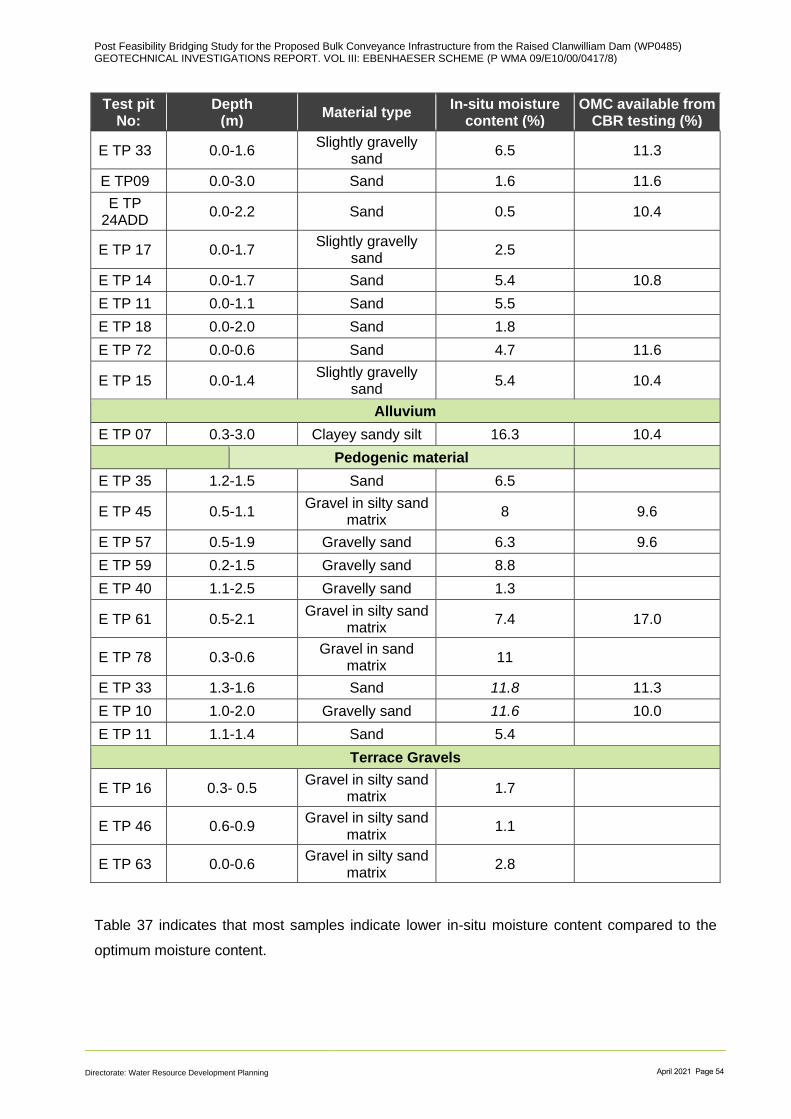
Post Feasibility Bridging Study for the Proposed Bulk Conveyance Infrastructure from the Raised Clanwilliam Dam (WP0485) GEOTECHNICAL INVESTIGATIONS REPORT. VOL III: EBENHAESER SCHEME (P WMA 09/E10/00/0417/8)
Directorate: Water Resource Development Planning April 2021 Page 54
Test pit No:
Depth (m)
Material type In-situ moisture
content (%) OMC available from
CBR testing (%)
E TP 33 0.0-1.6 Slightly gravelly
sand 6.5 11.3
E TP09 0.0-3.0 Sand 1.6 11.6
E TP 24ADD
0.0-2.2 Sand 0.5 10.4
E TP 17 0.0-1.7 Slightly gravelly
sand 2.5
E TP 14 0.0-1.7 Sand 5.4 10.8
E TP 11 0.0-1.1 Sand 5.5
E TP 18 0.0-2.0 Sand 1.8
E TP 72 0.0-0.6 Sand 4.7 11.6
E TP 15 0.0-1.4 Slightly gravelly
sand 5.4 10.4
Alluvium
E TP 07 0.3-3.0 Clayey sandy silt 16.3 10.4
Pedogenic material
E TP 35 1.2-1.5 Sand 6.5
E TP 45 0.5-1.1 Gravel in silty sand
matrix 8 9.6
E TP 57 0.5-1.9 Gravelly sand 6.3 9.6
E TP 59 0.2-1.5 Gravelly sand 8.8
E TP 40 1.1-2.5 Gravelly sand 1.3
E TP 61 0.5-2.1 Gravel in silty sand
matrix 7.4 17.0
E TP 78 0.3-0.6 Gravel in sand
matrix 11
E TP 33 1.3-1.6 Sand 11.8 11.3
E TP 10 1.0-2.0 Gravelly sand 11.6 10.0
E TP 11 1.1-1.4 Sand 5.4
Terrace Gravels
E TP 16 0.3- 0.5 Gravel in silty sand
matrix 1.7
E TP 46 0.6-0.9 Gravel in silty sand
matrix 1.1
E TP 63 0.0-0.6 Gravel in silty sand
matrix 2.8
Table 37 indicates that most samples indicate lower in-situ moisture content compared to the
optimum moisture content.
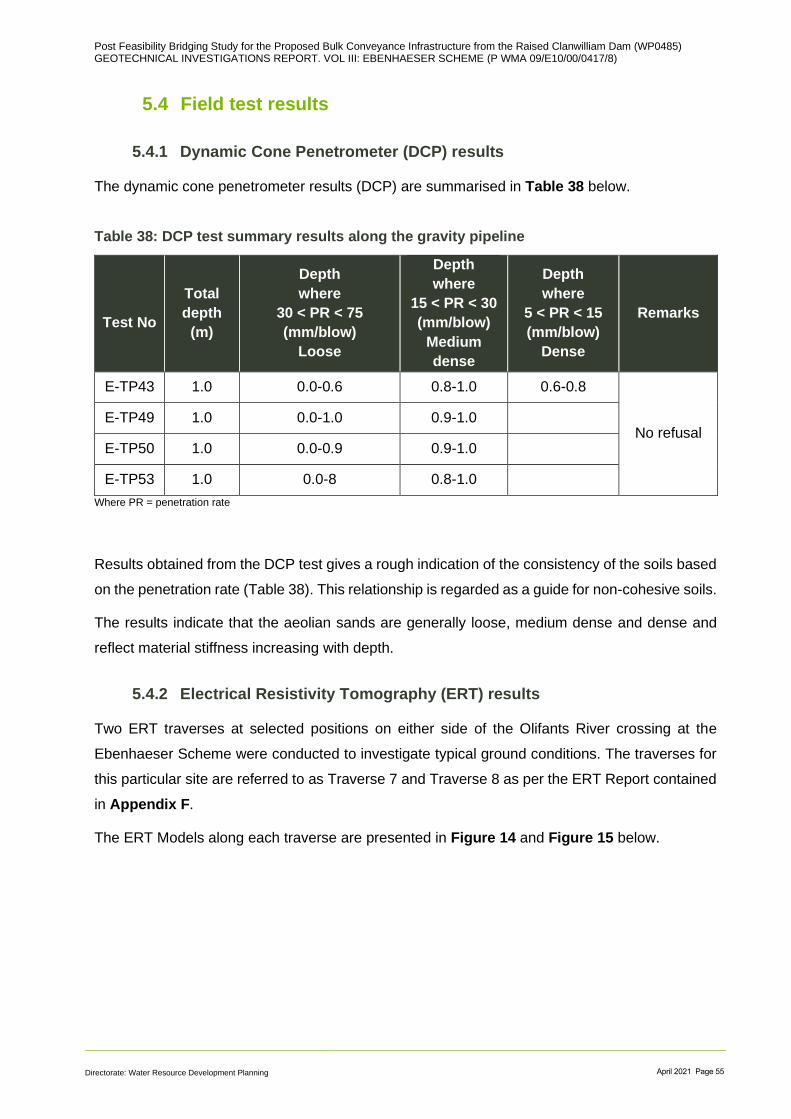
Post Feasibility Bridging Study for the Proposed Bulk Conveyance Infrastructure from the Raised Clanwilliam Dam (WP0485) GEOTECHNICAL INVESTIGATIONS REPORT. VOL III: EBENHAESER SCHEME (P WMA 09/E10/00/0417/8)
Directorate: Water Resource Development Planning April 2021 Page 55
5.4 Field test results
5.4.1 Dynamic Cone Penetrometer (DCP) results
The dynamic cone penetrometer results (DCP) are summarised in Table 38 below.
Table 38: DCP test summary results along the gravity pipeline
Test No
Total
depth
(m)
Depth
where
30 < PR < 75
(mm/blow)
Loose
Depth
where
15 < PR < 30
(mm/blow)
Medium
dense
Depth
where
5 < PR < 15
(mm/blow)
Dense
Remarks
E-TP43 1.0 0.0-0.6 0.8-1.0 0.6-0.8
No refusal E-TP49 1.0 0.0-1.0 0.9-1.0
E-TP50 1.0 0.0-0.9 0.9-1.0
E-TP53 1.0 0.0-8 0.8-1.0
Where PR = penetration rate
Results obtained from the DCP test gives a rough indication of the consistency of the soils based
on the penetration rate (Table 38). This relationship is regarded as a guide for non-cohesive soils.
The results indicate that the aeolian sands are generally loose, medium dense and dense and
reflect material stiffness increasing with depth.
5.4.2 Electrical Resistivity Tomography (ERT) results
Two ERT traverses at selected positions on either side of the Olifants River crossing at the
Ebenhaeser Scheme were conducted to investigate typical ground conditions. The traverses for
this particular site are referred to as Traverse 7 and Traverse 8 as per the ERT Report contained
in Appendix F.
The ERT Models along each traverse are presented in Figure 14 and Figure 15 below.
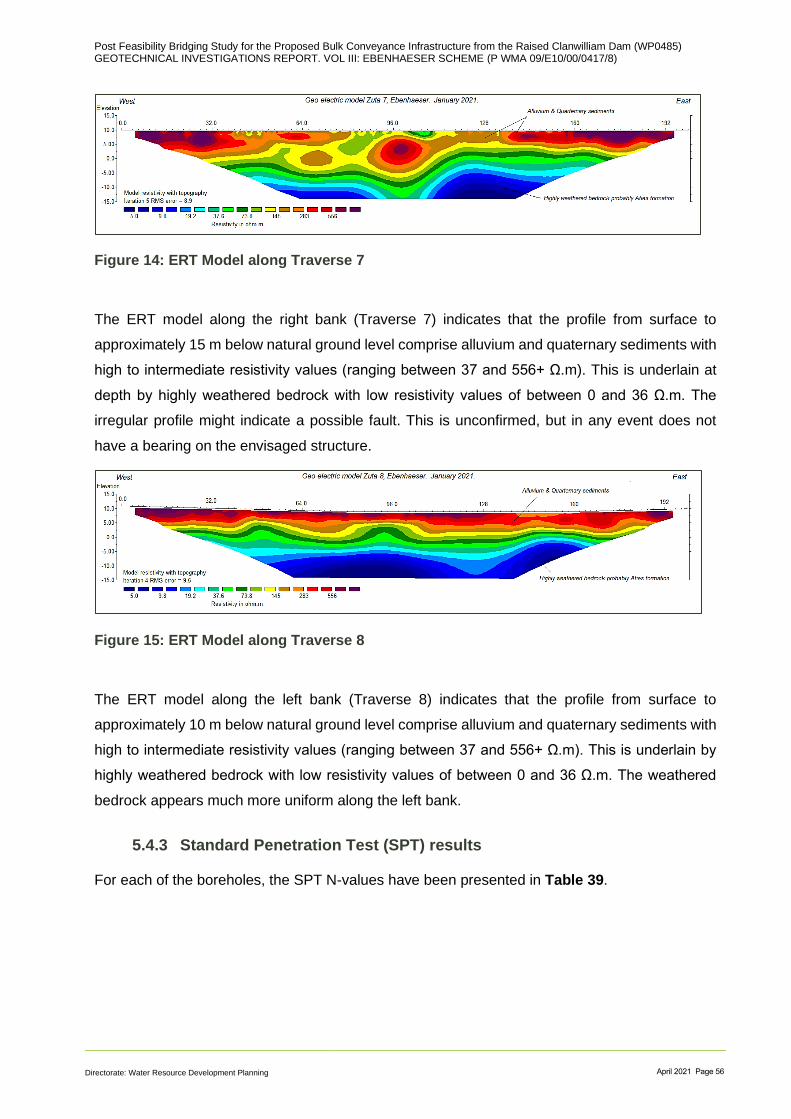
Post Feasibility Bridging Study for the Proposed Bulk Conveyance Infrastructure from the Raised Clanwilliam Dam (WP0485) GEOTECHNICAL INVESTIGATIONS REPORT. VOL III: EBENHAESER SCHEME (P WMA 09/E10/00/0417/8)
Directorate: Water Resource Development Planning April 2021 Page 56
Figure 14: ERT Model along Traverse 7
The ERT model along the right bank (Traverse 7) indicates that the profile from surface to
approximately 15 m below natural ground level comprise alluvium and quaternary sediments with
high to intermediate resistivity values (ranging between 37 and 556+ Ω.m). This is underlain at
depth by highly weathered bedrock with low resistivity values of between 0 and 36 Ω.m. The
irregular profile might indicate a possible fault. This is unconfirmed, but in any event does not
have a bearing on the envisaged structure.
Figure 15: ERT Model along Traverse 8
The ERT model along the left bank (Traverse 8) indicates that the profile from surface to
approximately 10 m below natural ground level comprise alluvium and quaternary sediments with
high to intermediate resistivity values (ranging between 37 and 556+ Ω.m). This is underlain by
highly weathered bedrock with low resistivity values of between 0 and 36 Ω.m. The weathered
bedrock appears much more uniform along the left bank.
5.4.3 Standard Penetration Test (SPT) results
For each of the boreholes, the SPT N-values have been presented in Table 39.
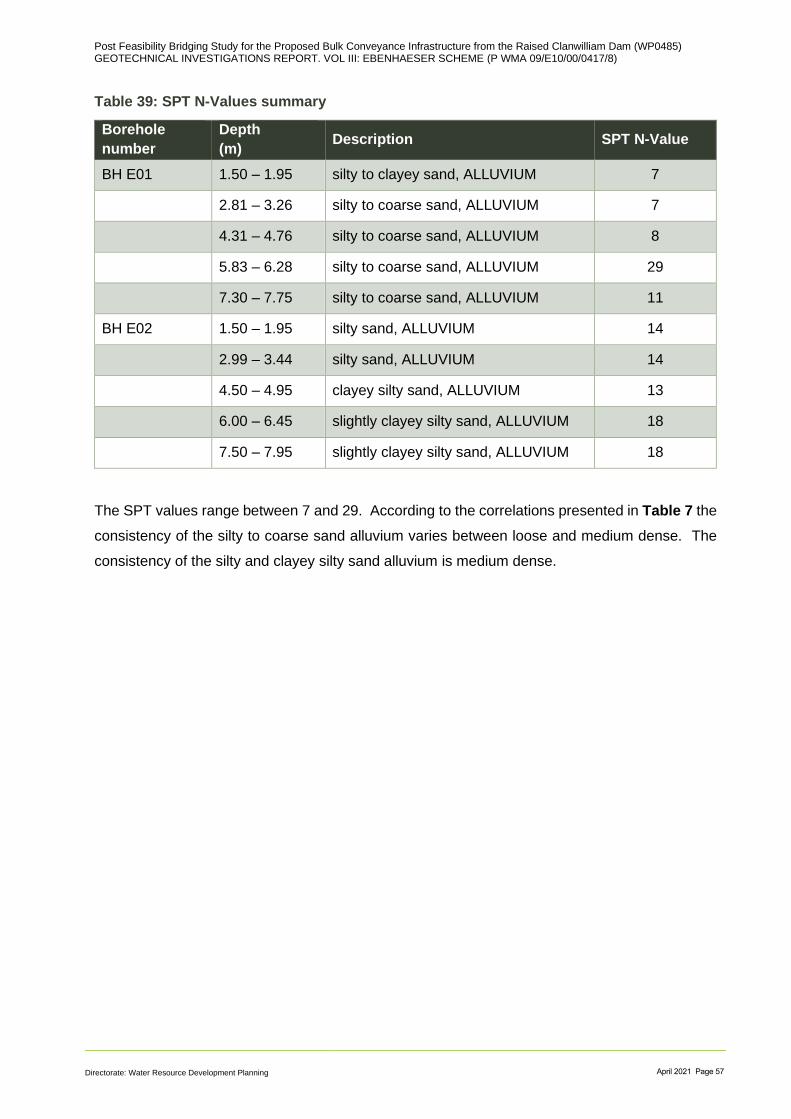
Post Feasibility Bridging Study for the Proposed Bulk Conveyance Infrastructure from the Raised Clanwilliam Dam (WP0485) GEOTECHNICAL INVESTIGATIONS REPORT. VOL III: EBENHAESER SCHEME (P WMA 09/E10/00/0417/8)
Directorate: Water Resource Development Planning April 2021 Page 57
Table 39: SPT N-Values summary
Borehole
number
Depth
(m) Description SPT N-Value
BH E01 1.50 – 1.95 silty to clayey sand, ALLUVIUM 7
2.81 – 3.26 silty to coarse sand, ALLUVIUM 7
4.31 – 4.76 silty to coarse sand, ALLUVIUM 8
5.83 – 6.28 silty to coarse sand, ALLUVIUM 29
7.30 – 7.75 silty to coarse sand, ALLUVIUM 11
BH E02 1.50 – 1.95 silty sand, ALLUVIUM 14
2.99 – 3.44 silty sand, ALLUVIUM 14
4.50 – 4.95 clayey silty sand, ALLUVIUM 13
6.00 – 6.45 slightly clayey silty sand, ALLUVIUM 18
7.50 – 7.95 slightly clayey silty sand, ALLUVIUM 18
The SPT values range between 7 and 29. According to the correlations presented in Table 7 the
consistency of the silty to coarse sand alluvium varies between loose and medium dense. The
consistency of the silty and clayey silty sand alluvium is medium dense.
Post Feasibility Bridging Study for the Proposed Bulk Conveyance Infrastructure from the Raised Clanwilliam Dam (WP0485) GEOTECHNICAL INVESTIGATIONS REPORT. VOL III: EBENHAESER SCHEME (P WMA 09/E10/00/0417/8)
Directorate: Water Resource Development Planning April 2021 Page 58
The following geotechnical aspects must be considered in the design and construction of the
proposed Ebenhaeser Scheme.
Elements of the scheme’s geological and geotechnical considerations are discussed separately
in sections below and the general considerations are also grouped together.
6.1 General considerations
6.1.1 Compressible and collapsible soils
The red or orange brown, very loose to medium dense, aeolian sand encountered across the
scheme is known to be potentially collapsible (Brink,1985). However, the collapse potential test
results indicate no problems are expected on site with regards to the aeolian sand and pedogenic
materials.
The pinholed soil structure observed in the aeolian sand during fieldwork is characteristic of
collapsible fabric which can lead to differential settlement of the soils under load. The soft to firm,
clayey sandy silt, alluvium encountered along the Retshof Diversion at the flanks of Olifants River
are likely to be compressible under load. These soil deposits are normally found near river
mouths, floodplains and drainage channels, as is the case on site.
Further laboratory testing such as consolidation testing should be considered to confirm the
potential collapsibility of the soils or alternatively considerations to be taken for the design of
foundations.
6.1.2 Dispersive and erodible soils
The suite of laboratory tests conducted to test the dispersivity of the soils indicates that the
materials encountered on site are non-dispersive to highly dispersive.
Geotechnical considerations
Post Feasibility Bridging Study for the Proposed Bulk Conveyance Infrastructure from the Raised Clanwilliam Dam (WP0485) GEOTECHNICAL INVESTIGATIONS REPORT. VOL III: EBENHAESER SCHEME (P WMA 09/E10/00/0417/8)
Directorate: Water Resource Development Planning April 2021 Page 59
It should be noted that there are some apparent contradictions in the determined dispersivity of
soils as per different laboratory test. The chemical tests also indicate a similar contradiction; likely
due to the presence of soluble salts in the soil. Further testing is recommended to investigate the
dispersivity of the soils.
6.1.3 Expansiveness in soils
Based on the laboratory test results, the materials encountered on site generally display no or
slight plasticity, which is indicative of low potential expansiveness, after Van der Merwe (1964).
6.1.4 Unstable or steep natural slopes
The scheme is generally characterised by flat or gently sloping topography except along the
Retshof and Vredendal Diversion routes where steep natural slopes are encountered. For the
remainder of the pipeline route no evidence of unstable natural slopes was observed.
6.1.5 Seismicity
As per Section 4.3, the scheme is located outside a known area of natural seismic activity and
outside regions of mining-induced seismic activity, and is considered a non-seismic activity zone.
As such, no specific seismic design requirements, other than normal structural design
requirements, are required (SANS 10160-4: 2011).
6.1.6 Excavation considerations
The excavation of the materials encountered along the corridor of the proposed scheme has been
assessed in terms of SANS 1200D (1988) guidelines, which classifies excavations as follows:
Soft excavation shall be excavation in material which can be efficiently removed or loaded
without prior ripping by any of the following plant:
• A bulldozer with a mass of approximately 22 tons, (which includes the mass of a ripper if
fitted) and an engine developing approximately 145 kW at the flywheel; or
• A tractor-scraper unit with a mass of approximately 28 tons and an engine developing
approximately 245 kW at the flywheel, pushed during loading by a bulldozer.
• A track-type front-end loader with a mass of approximately 22 tons and an engine
developing approximately 140 kW at the flywheel.
Intermediate excavation shall be excavation (excluding soft excavation) in material which can
be efficiently ripped by a bulldozer with a mass of approximately 35 tons when fitted with a single
tine ripper and an engine developing approximately 220 kW at the flywheel.

Post Feasibility Bridging Study for the Proposed Bulk Conveyance Infrastructure from the Raised Clanwilliam Dam (WP0485) GEOTECHNICAL INVESTIGATIONS REPORT. VOL III: EBENHAESER SCHEME (P WMA 09/E10/00/0417/8)
Directorate: Water Resource Development Planning April 2021 Page 60
Hard excavation shall be excavation (excluding boulder excavation) in material which cannot be
efficiently ripped by a bulldozer. This type of excavation generally includes excavation in material
such as formations of unweathered rock, which can be removed only after blasting.
The details are provided under each element as part of considerations.
6.1.7 Groundwater conditions
Groundwater seepage was encountered at 2.3 m at test pit E-TP07. However, the entire river
crossing area was under water during the fieldwork, as it is located on the floodplain and was
inundated immediately prior to the fieldwork.
Depending on the construction method favoured for the syphon, pumping of groundwater at the
Olifants River crossing may be necessary or even the construction of a coffer dam.
Where no water seepage was encountered, the possibility of intersecting groundwater cannot be
ruled out as the presence of ferruginised sand suggests the occurrence of fluctuating water level.
The presence of calcrete along the route indicates the likelihood of the presence of a shallow
water table or possible lateral seepage of groundwater.
6.2 Retshof and Vredendal Diversions - Rising Main Pipeline 1
and 2 respectively
It is understood that all Rising Main pipelines (1-3) and the gravity pipeline will be buried below
the natural ground level. The pipes are understood to be High-Density Polyethylene (HDPE) with
steel pipes used at road and river crossings.
6.2.1 Geological profile
Zoning of the pipeline route, by sub-dividing into approximate sections of similar geological
conditions, has already been carried out and has been described previously (Sections 5.2). This
is not generally repeated here but is broadly summarised in Table 40.
Table 40: Summary of geological profiles along Rising Main 1 and 2
Zone Summary of geological profiles
1 Alluvium and aeolian sand underlain by calcretised and ferruginised sand
2 Alluvial materials
3 Schist outcrop or shallow bedrock
4 Aeolian sand
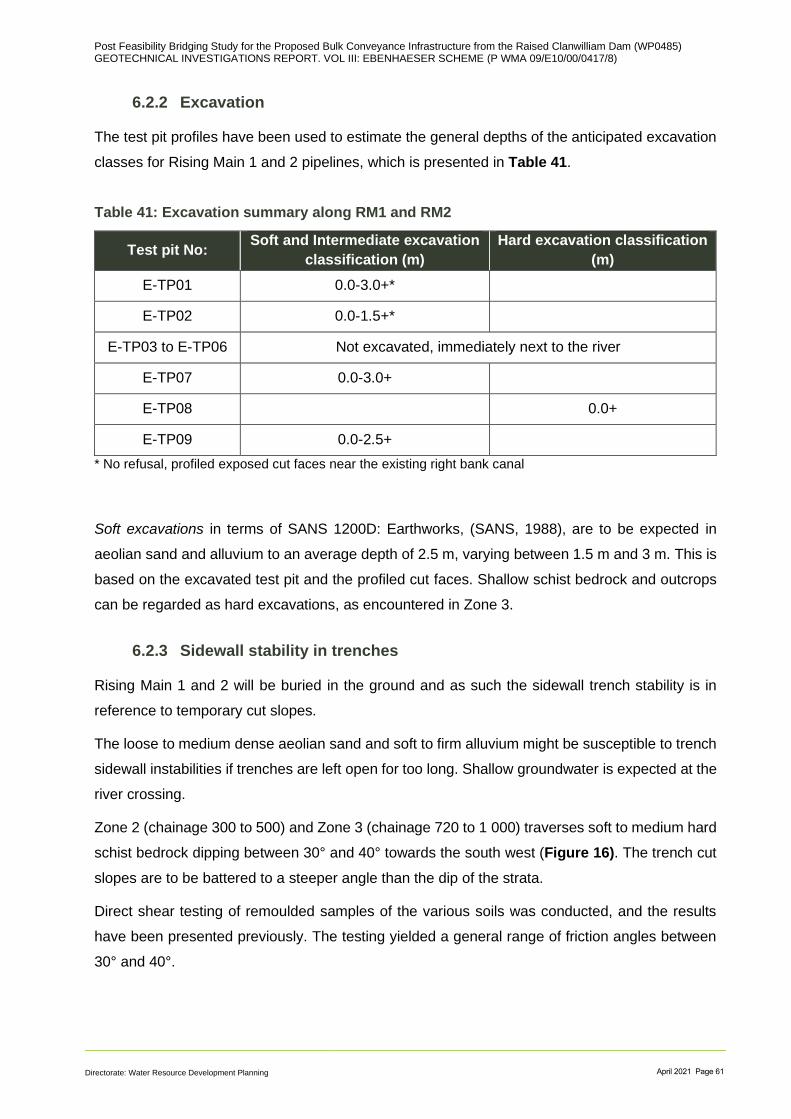
Post Feasibility Bridging Study for the Proposed Bulk Conveyance Infrastructure from the Raised Clanwilliam Dam (WP0485) GEOTECHNICAL INVESTIGATIONS REPORT. VOL III: EBENHAESER SCHEME (P WMA 09/E10/00/0417/8)
Directorate: Water Resource Development Planning April 2021 Page 61
6.2.2 Excavation
The test pit profiles have been used to estimate the general depths of the anticipated excavation
classes for Rising Main 1 and 2 pipelines, which is presented in Table 41.
Table 41: Excavation summary along RM1 and RM2
Test pit No: Soft and Intermediate excavation
classification (m)
Hard excavation classification
(m)
E-TP01 0.0-3.0+*
E-TP02 0.0-1.5+*
E-TP03 to E-TP06 Not excavated, immediately next to the river
E-TP07 0.0-3.0+
E-TP08 0.0+
E-TP09 0.0-2.5+
* No refusal, profiled exposed cut faces near the existing right bank canal
Soft excavations in terms of SANS 1200D: Earthworks, (SANS, 1988), are to be expected in
aeolian sand and alluvium to an average depth of 2.5 m, varying between 1.5 m and 3 m. This is
based on the excavated test pit and the profiled cut faces. Shallow schist bedrock and outcrops
can be regarded as hard excavations, as encountered in Zone 3.
6.2.3 Sidewall stability in trenches
Rising Main 1 and 2 will be buried in the ground and as such the sidewall trench stability is in
reference to temporary cut slopes.
The loose to medium dense aeolian sand and soft to firm alluvium might be susceptible to trench
sidewall instabilities if trenches are left open for too long. Shallow groundwater is expected at the
river crossing.
Zone 2 (chainage 300 to 500) and Zone 3 (chainage 720 to 1 000) traverses soft to medium hard
schist bedrock dipping between 30° and 40° towards the south west (Figure 16). The trench cut
slopes are to be battered to a steeper angle than the dip of the strata.
Direct shear testing of remoulded samples of the various soils was conducted, and the results
have been presented previously. The testing yielded a general range of friction angles between
30° and 40°.
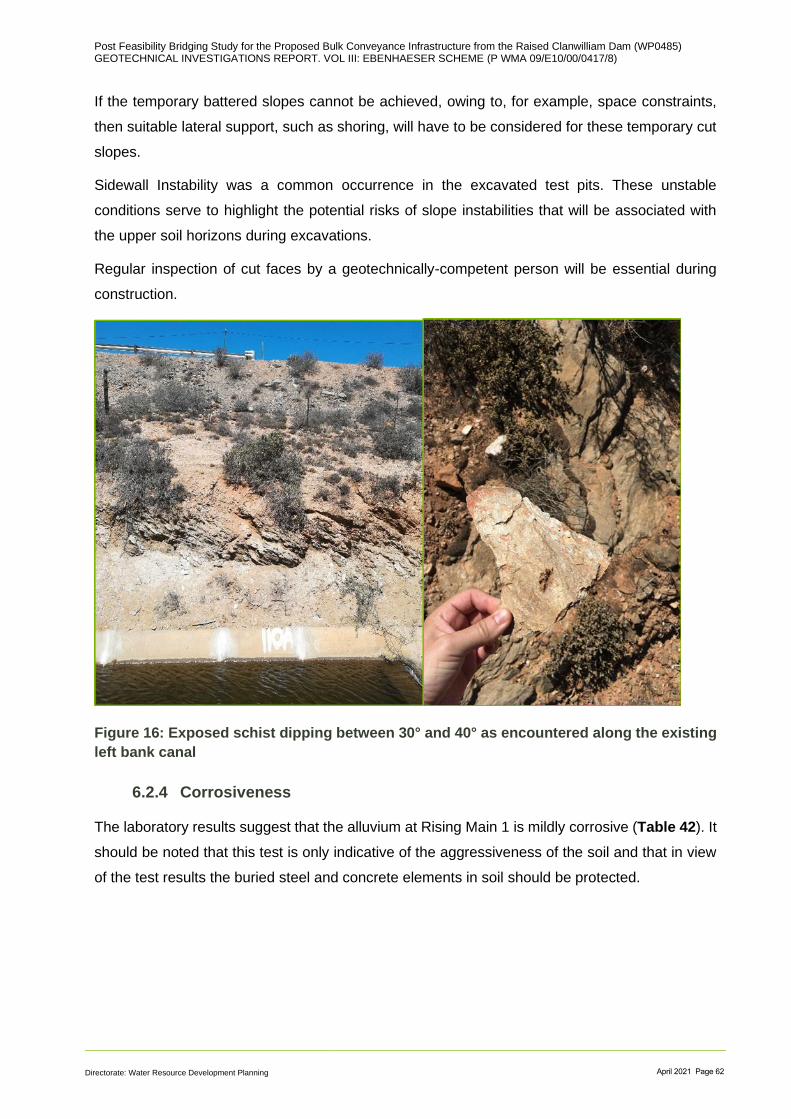
Post Feasibility Bridging Study for the Proposed Bulk Conveyance Infrastructure from the Raised Clanwilliam Dam (WP0485) GEOTECHNICAL INVESTIGATIONS REPORT. VOL III: EBENHAESER SCHEME (P WMA 09/E10/00/0417/8)
Directorate: Water Resource Development Planning April 2021 Page 62
If the temporary battered slopes cannot be achieved, owing to, for example, space constraints,
then suitable lateral support, such as shoring, will have to be considered for these temporary cut
slopes.
Sidewall Instability was a common occurrence in the excavated test pits. These unstable
conditions serve to highlight the potential risks of slope instabilities that will be associated with
the upper soil horizons during excavations.
Regular inspection of cut faces by a geotechnically-competent person will be essential during
construction.
Figure 16: Exposed schist dipping between 30° and 40° as encountered along the existing
left bank canal
6.2.4 Corrosiveness
The laboratory results suggest that the alluvium at Rising Main 1 is mildly corrosive (Table 42). It
should be noted that this test is only indicative of the aggressiveness of the soil and that in view
of the test results the buried steel and concrete elements in soil should be protected.

Post Feasibility Bridging Study for the Proposed Bulk Conveyance Infrastructure from the Raised Clanwilliam Dam (WP0485) GEOTECHNICAL INVESTIGATIONS REPORT. VOL III: EBENHAESER SCHEME (P WMA 09/E10/00/0417/8)
Directorate: Water Resource Development Planning April 2021 Page 63
Table 42: Corrosiveness of soil along Rising Main 1 and 2 route
Test pit No Depth (m) pH Conductivit
y (mS/m)
Corrosivity
classification
Alluvium
E TP 07 0.3-3.0 8.2 14 Mildly corrosive
6.2.5 Suitability of excavated material for use as selected backfill
Table 43 below summarises the suggested soil material types classified according to AASHTO
M-145 as a function of pipe bedding type. In addition, the material was also classified according
to SANS 1200 LB and 1200 DB.
Table 43: Bedding material type requirements as per SANS 1200 DB
The re-use of in situ material as bedding material for Rising Main 1 and 2, according to
AASHTO M-145, SANS 1200LB and 1200DB, is summarised in Table 44 below.

Post Feasibility Bridging Study for the Proposed Bulk Conveyance Infrastructure from the Raised Clanwilliam Dam (WP0485) GEOTECHNICAL INVESTIGATIONS REPORT. VOL III: EBENHAESER SCHEME (P WMA 09/E10/00/0417/8)
Directorate: Water Resource Development Planning April 2021 Page 64
Table 44: Assumed re-use of in-situ material for RM 1 and RM2 pipelines
Material origin Material
Classification
Plasticity
Index
Range
Grading
Modulus
Range
Percent
clay Assumed re-use
Alluvium CL
A-6 14 0.62 19%
Not suitable as bedding and
backfill material
Aeolian sand SP-SM
A-3 0 1.02 3%
Suitable as bedding material and
selected fill blanket, i.e. SC2
bedding material types.
Note: 1. Pipe material assumed to be HDPE (High Density Polyethylene) – Assumed to be a flexible pipe. 2. Assumed requirements for bedding: Selected granular fill for bedding cradle and selected fill for the blanket. 3. According to SANS 1200 LB, selected granular material shall be granular, non- cohesive nature, singularly
graded between 0.6 mm and 19 mm, free-draining and has a compatibility factor not exceeding 0.4. 4. According to SANS 1200 LB, selected fill material shall be material that has a PI not exceeding 6, free from
vegetation and lumps and stones of diameter exceeding 30 mm. 5. Backfill shall contain little or no organic material, excludes stones of average dimension exceeding 150 mm,
and be placed without significant voids and so compacted as to avoid significant settlement. Material containing more than10%of rock or hard fragments that are retained on a 50 mm aperture sieve is unsuitable. Material containing large clay lumps that do not break under the action of compaction equipment shall be deemed unsuitable for backfill. In areas subject to loads from road traffic and other specified areas, backfill shall have a PI not exceeding 12 and a minimum CBR of 15% at specified density if the backfill is to be placed in the upper 150 mm of the subgrade, and a minimum CBR of 7% if the backfill is to be placed lower in the subgrade.
6.2.6 Olifants River crossing
The river crossing is expected to comprise a syphon, and the discussion points that follow are
tailored on that assumption. The discussion therefore does not address all possibilities, for
instance, the discussion does not consider alternatives such as a bridge crossing, for example.
6.2.6.1 Ground conditions
Based on boreholes BH E01 and BH E02, deep alluvial soils are expected, coupled with high
water levels. The alluvial soils extend to at least 8 m below NGL (the maximum depths of the
boreholes).
The base of the alluvial deposits was not intersected, and neither the depth of the underlying
bedrock nor the bedrock condition is confirmed. The envisaged syphon will not extend deeper
than 8 m, hence the termination depth of the respective boreholes. Within this ‘zone’ the alluvial
deposits might be considered relatively uniform, i.e. comprising fine-grained sediments. Lateral
variation must be expected, however, in this active river environment. No coarse fraction (gravel
/ cobble / boulders) was recorded in the two boreholes, but a coarse fraction of scattered cobbles
/ possible boulders cannot be completely discounted.
The relatively uniform profile within the upper 8 m implies that differential settlement is not
anticipated
Post Feasibility Bridging Study for the Proposed Bulk Conveyance Infrastructure from the Raised Clanwilliam Dam (WP0485) GEOTECHNICAL INVESTIGATIONS REPORT. VOL III: EBENHAESER SCHEME (P WMA 09/E10/00/0417/8)
Directorate: Water Resource Development Planning April 2021 Page 65
6.2.6.2 Water table
This river crossing will be within the active river channel and appropriate measures to deal with
high flows and even flooding would be required. Construction methodologies will have to deal
with high water levels, saturated soils and water inflows even during periods of normal river flow.
6.2.6.3 Stability of excavations
Unsupported excavations within the river section, within these saturated alluvial sands, will be
prone to collapse. This was borne out by the single test pit (E-TP07) excavated in proximity to the
river crossing, which exhibited failure of the sidewalls. In general, the alluvial sands encountered
in the boreholes (BH E01 and BH E02) must be considered to be saturated and therefore prone
to collapse.
All excavations will therefore either require battering or will require support, such as shoring, or
combinations thereof. It is doubtful whether battering of slopes to safe angles only will be practical,
as these slopes would of necessity be very flat, and would be subject to continual collapse.
No decisions have yet been taken regarding the favoured method of construction, but
consideration of stabilisation of excavations, and lateral support requirements, are some of the
implications of a decision on the favoured construction methodology.
6.2.6.4 Excavation
The alluvial sands to a depth of at least 8 m below NGL (as encountered in the two boreholes)
will classify as ‘soft excavations’ in accordance with SANS 1200 D. The profile might include
occasional cobbles / boulders, even though the two boreholes did not intersect such materials
and the selected excavation methods must be able to deal with a coarser fraction.
6.2.7 R363 road crossing
Rising Main 2 will be crossing the provincial road R363 between the balancing dam and Olifants
River.
The closest test pit indicates loose to medium dense aeolian sand to 3.0 m with sidewalls
collapsing during the investigation. These soils are susceptible to trench sidewall instabilities if
trenches are left open for too long. These temporary cut faces must be cut to safe angles, and /
or shored.
It is understood that this road crossing will comprise a steel pipe. At this stage, a method of
construction has not been determined. Options for this road crossing would include a cut-and-
cover option or pipe-jacking. Considering the low traffic levels on the R363, it is likely that a cut-
and-cover option would be optimal. No detailed information is available about the diameter of the
steel pipe, founding levels or the construction method at this stage.
Post Feasibility Bridging Study for the Proposed Bulk Conveyance Infrastructure from the Raised Clanwilliam Dam (WP0485) GEOTECHNICAL INVESTIGATIONS REPORT. VOL III: EBENHAESER SCHEME (P WMA 09/E10/00/0417/8)
Directorate: Water Resource Development Planning April 2021 Page 66
It is recommended that this section is re-visited after subsequent refinements in the design during
the detailed design phase to determine whether additional deeper geotechnical investigations are
required.
6.3 Balancing Dam
The geology of the dam site has been detailed under Section 5.2.5 and is zoned as Zone 5.
6.3.1 Founding considerations
It is understood that the balancing dam will be a lined earth fill structure.
The test pits provide insight into the expected founding conditions; from which required excavation
depths can be deduced. Because the dam is to be lined, the foundation does not have to prescribe
to permeability criteria. The founding for the dam can be estimated using a dam centreline e.g. E-
TP11 (1.4 m), E-TP17 (1.7 m), E-TP18 (2.0 m) and E-TP14 (2.6 m).
The base of the balancing dam will largely be the dense to very dense, calcretised and
ferruginised sand with occasional hardpan calcrete. Adequate bearing capacity may be obtained
from these materials to an average depth of 1.8 m, i.e. between 1.4 m and 2.6 m.
Concerns are on the southern corner of the site, i.e. around E-TP10 and E-TP16 where terrace
gravels are encountered. These gravels are calcretised, ferruginised and cemented to dense or
very dense consistencies. However the risk regarding foundation permeability or a seepage path
into the dam cannot be ruled out. Consideration is that the balancing dam should be founded
below terrace gravels on the calcretised and ferruginised sand. The terrace gravels also pose
stability concerns on this southern side of the dam and this is discussed in detail in Section 6.3.5
below.
6.3.2 Permeability
As stated, the entire balancing dam will be fully lined and neither the permeability of the founding
materials of the embankment, nor of the wider basin are therefore defining material parameters.
At the time of the investigation, however, the need for lining had not been resolved, and
permeability tests were conducted to inform this design choice. Permeability test results have
been included above (Section 5.3.5), but the results relevant to the balancing dam are
summarised below (Table 45).
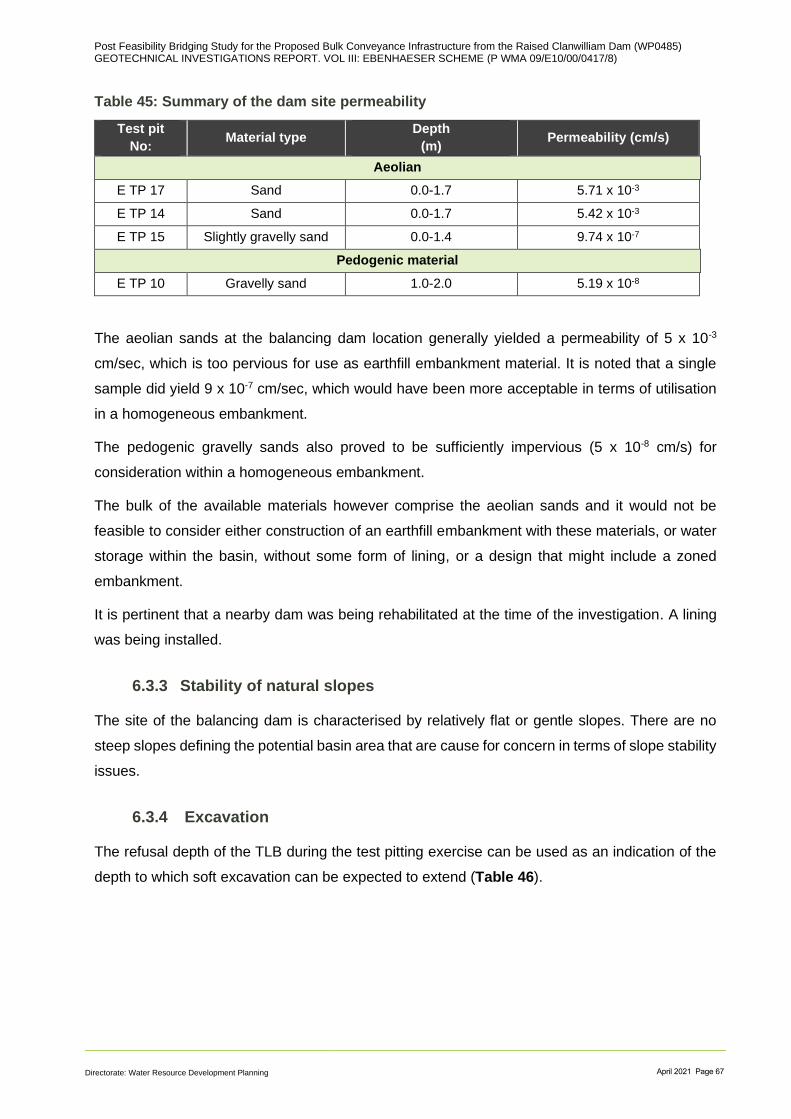
Post Feasibility Bridging Study for the Proposed Bulk Conveyance Infrastructure from the Raised Clanwilliam Dam (WP0485) GEOTECHNICAL INVESTIGATIONS REPORT. VOL III: EBENHAESER SCHEME (P WMA 09/E10/00/0417/8)
Directorate: Water Resource Development Planning April 2021 Page 67
Table 45: Summary of the dam site permeability
Test pit
No: Material type
Depth
(m) Permeability (cm/s)
Aeolian
E TP 17 Sand 0.0-1.7 5.71 x 10⁻³
E TP 14 Sand 0.0-1.7 5.42 x 10⁻³
E TP 15 Slightly gravelly sand 0.0-1.4 9.74 x 10⁻⁷
Pedogenic material
E TP 10 Gravelly sand 1.0-2.0 5.19 x 10⁻⁸
The aeolian sands at the balancing dam location generally yielded a permeability of 5 x 10⁻³
cm/sec, which is too pervious for use as earthfill embankment material. It is noted that a single
sample did yield 9 x 10⁻⁷ cm/sec, which would have been more acceptable in terms of utilisation
in a homogeneous embankment.
The pedogenic gravelly sands also proved to be sufficiently impervious (5 x 10⁻⁸ cm/s) for
consideration within a homogeneous embankment.
The bulk of the available materials however comprise the aeolian sands and it would not be
feasible to consider either construction of an earthfill embankment with these materials, or water
storage within the basin, without some form of lining, or a design that might include a zoned
embankment.
It is pertinent that a nearby dam was being rehabilitated at the time of the investigation. A lining
was being installed.
6.3.3 Stability of natural slopes
The site of the balancing dam is characterised by relatively flat or gentle slopes. There are no
steep slopes defining the potential basin area that are cause for concern in terms of slope stability
issues.
6.3.4 Excavation
The refusal depth of the TLB during the test pitting exercise can be used as an indication of the
depth to which soft excavation can be expected to extend (Table 46).
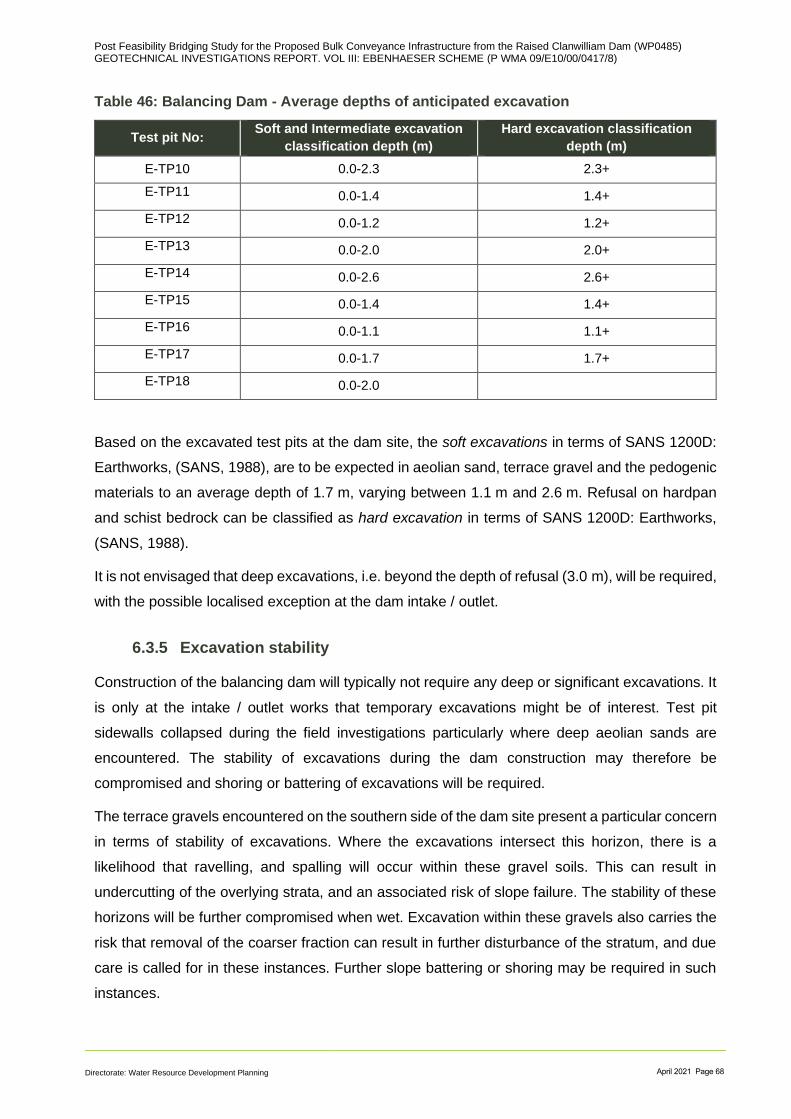
Post Feasibility Bridging Study for the Proposed Bulk Conveyance Infrastructure from the Raised Clanwilliam Dam (WP0485) GEOTECHNICAL INVESTIGATIONS REPORT. VOL III: EBENHAESER SCHEME (P WMA 09/E10/00/0417/8)
Directorate: Water Resource Development Planning April 2021 Page 68
Table 46: Balancing Dam - Average depths of anticipated excavation
Test pit No: Soft and Intermediate excavation
classification depth (m)
Hard excavation classification
depth (m)
E-TP10 0.0-2.3 2.3+
E-TP11 0.0-1.4 1.4+
E-TP12 0.0-1.2 1.2+
E-TP13 0.0-2.0 2.0+
E-TP14 0.0-2.6 2.6+
E-TP15 0.0-1.4 1.4+
E-TP16 0.0-1.1 1.1+
E-TP17 0.0-1.7 1.7+
E-TP18 0.0-2.0
Based on the excavated test pits at the dam site, the soft excavations in terms of SANS 1200D:
Earthworks, (SANS, 1988), are to be expected in aeolian sand, terrace gravel and the pedogenic
materials to an average depth of 1.7 m, varying between 1.1 m and 2.6 m. Refusal on hardpan
and schist bedrock can be classified as hard excavation in terms of SANS 1200D: Earthworks,
(SANS, 1988).
It is not envisaged that deep excavations, i.e. beyond the depth of refusal (3.0 m), will be required,
with the possible localised exception at the dam intake / outlet.
6.3.5 Excavation stability
Construction of the balancing dam will typically not require any deep or significant excavations. It
is only at the intake / outlet works that temporary excavations might be of interest. Test pit
sidewalls collapsed during the field investigations particularly where deep aeolian sands are
encountered. The stability of excavations during the dam construction may therefore be
compromised and shoring or battering of excavations will be required.
The terrace gravels encountered on the southern side of the dam site present a particular concern
in terms of stability of excavations. Where the excavations intersect this horizon, there is a
likelihood that ravelling, and spalling will occur within these gravel soils. This can result in
undercutting of the overlying strata, and an associated risk of slope failure. The stability of these
horizons will be further compromised when wet. Excavation within these gravels also carries the
risk that removal of the coarser fraction can result in further disturbance of the stratum, and due
care is called for in these instances. Further slope battering or shoring may be required in such
instances.

Post Feasibility Bridging Study for the Proposed Bulk Conveyance Infrastructure from the Raised Clanwilliam Dam (WP0485) GEOTECHNICAL INVESTIGATIONS REPORT. VOL III: EBENHAESER SCHEME (P WMA 09/E10/00/0417/8)
Directorate: Water Resource Development Planning April 2021 Page 69
6.3.6 Corrosiveness
The laboratory results suggest that the aeolian sand, pedogenic materials and terrace gravels at
the Balancing Dam site are generally non-corrosive to mildly corrosive (Table 47). Due to mild
corrosivity, buried steel and concrete elements in soil will need to be protected.
Table 47: Corrosiveness of the materials encountered at the Balancing Dam site
Test pit No Depth (m) pH Conductivit
y (mS/m)
Corrosivity
classification
Aeolian
E TP 17 0.0-1.7 6.9 2.0 Not generally
corrosive
E TP 14 0.0-1.7 7.4 5.0 Not generally
corrosive
E TP 18 0.0-2.0 7.2 16.0 Mildly corrosive
E TP 15 0.0-1.4 8.8 13.0 Mildly corrosive
Pedogenic material
E TP 11 1.1-1.4 7.8 6.5 Not generally
corrosive
Terrace gravels
E TP 16 0.3- 0.5 5.6 19.0 Mildly corrosive
6.3.7 Construction materials
Considering that the balancing dam will be a lined structure, the embankment would not have to
be considered as a conventional water-retaining earth structure, but rather as an earth structure
that would primarily be required to support the lining system.
The aeolian sands and pedogenic materials encountered in the dam footprint are classified as G7
to G10 according to COLTO guidelines. The G7 material is considered suitable as base coarse
in road layer works. G8 or G10 materials are only suitable as selected fill or subgrade road layer
works. Alternatively, they need to be spoiled or can be used for landscaping. These materials
would only be suitable for construction of engineered fills of low stiffness in layerworks.
The general material suitability for use in embankments is summarised in Table 48.
Table 48: Suitability of in-situ material for embankment construction
Material origin Main constituents USCS Suitability for use in embankment
Aeolian Mainly sand SM, SP and
occasional SC
Medium desirability; low compressibility,
but good shear strengths when
compacted
Alluvium Clayey sandy silt CL Poor to fair suitability

Post Feasibility Bridging Study for the Proposed Bulk Conveyance Infrastructure from the Raised Clanwilliam Dam (WP0485) GEOTECHNICAL INVESTIGATIONS REPORT. VOL III: EBENHAESER SCHEME (P WMA 09/E10/00/0417/8)
Directorate: Water Resource Development Planning April 2021 Page 70
Material origin Main constituents USCS Suitability for use in embankment
Terrace gravels
Variable sand gravel
mainly, sometimes
minor clay, silt
Mainly SM and
some GP and
SC
Medium to fair suitability Good to fair
shear strengths and low compressibility
Pedogenic
materials
Highly variable, mainly
blends of silts, sands,
also gravels
SM, SP and
occasional SC
Medium desirability; low compressibility,
but good shear strengths when
compacted
6.3.8 Other considerations
Overhead powerlines traverse the dam site and consideration will need to be given to whether
these powerlines need to be relocated, or not. It is to be noted that there are currently two
transmission lines crossing the planned balancing dam site, but that a third line is also planned,
which will run between the two existing lines.
6.4 Rising Main Pipeline 3 between the dam and the reservoir
Rising Main Pipeline 3 constitutes Zone 6 to 8 in Section 5.2, which provides detailed geological
profiles and zonation.
6.4.1 Excavation
The refusal depth in the test pits (Table 49) during the fieldwork can be used as an estimate for
excavation classifications.
Table 49: Average depths of anticipated excavation for the Rising Main pipeline 3
Test pit No:
Soft and Intermediate
excavation classification depth
(m)
Hard rock excavation
classification depth (m)
E-TP15 0.0-1.4 1.4+
E-TP16 0.0-1.1 1.1+
E-TP19 and E-
TP20 Not excavated due to accessibility constrains
E-TP21 0.0-0.7 0.7+
E-TP22 0.0-2.0 2.0+
E-TP23 0.0-2.5+
Based on the excavated test pits the rising main route can be classified as soft excavations in
terms of SANS 1200D: Earthworks, (SANS, 1988), to an average depth of 1.3 m. Shallow schist
bedrock is encountered around the gully and the general refusal on hardpan can be classified as
hard excavation in terms of SANS 1200D.
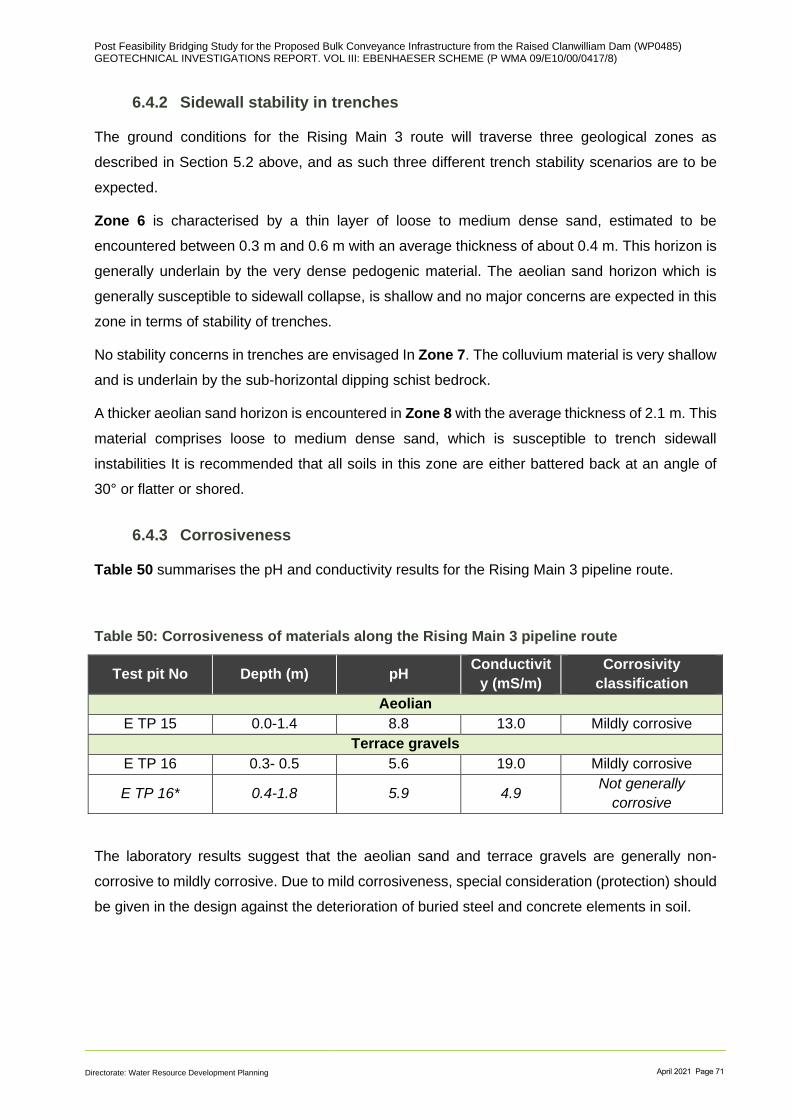
Post Feasibility Bridging Study for the Proposed Bulk Conveyance Infrastructure from the Raised Clanwilliam Dam (WP0485) GEOTECHNICAL INVESTIGATIONS REPORT. VOL III: EBENHAESER SCHEME (P WMA 09/E10/00/0417/8)
Directorate: Water Resource Development Planning April 2021 Page 71
6.4.2 Sidewall stability in trenches
The ground conditions for the Rising Main 3 route will traverse three geological zones as
described in Section 5.2 above, and as such three different trench stability scenarios are to be
expected.
Zone 6 is characterised by a thin layer of loose to medium dense sand, estimated to be
encountered between 0.3 m and 0.6 m with an average thickness of about 0.4 m. This horizon is
generally underlain by the very dense pedogenic material. The aeolian sand horizon which is
generally susceptible to sidewall collapse, is shallow and no major concerns are expected in this
zone in terms of stability of trenches.
No stability concerns in trenches are envisaged In Zone 7. The colluvium material is very shallow
and is underlain by the sub-horizontal dipping schist bedrock.
A thicker aeolian sand horizon is encountered in Zone 8 with the average thickness of 2.1 m. This
material comprises loose to medium dense sand, which is susceptible to trench sidewall
instabilities It is recommended that all soils in this zone are either battered back at an angle of
30° or flatter or shored.
6.4.3 Corrosiveness
Table 50 summarises the pH and conductivity results for the Rising Main 3 pipeline route.
Table 50: Corrosiveness of materials along the Rising Main 3 pipeline route
Test pit No Depth (m) pH Conductivit
y (mS/m)
Corrosivity
classification
Aeolian
E TP 15 0.0-1.4 8.8 13.0 Mildly corrosive
Terrace gravels
E TP 16 0.3- 0.5 5.6 19.0 Mildly corrosive
E TP 16* 0.4-1.8 5.9 4.9 Not generally
corrosive
The laboratory results suggest that the aeolian sand and terrace gravels are generally non-
corrosive to mildly corrosive. Due to mild corrosiveness, special consideration (protection) should
be given in the design against the deterioration of buried steel and concrete elements in soil.
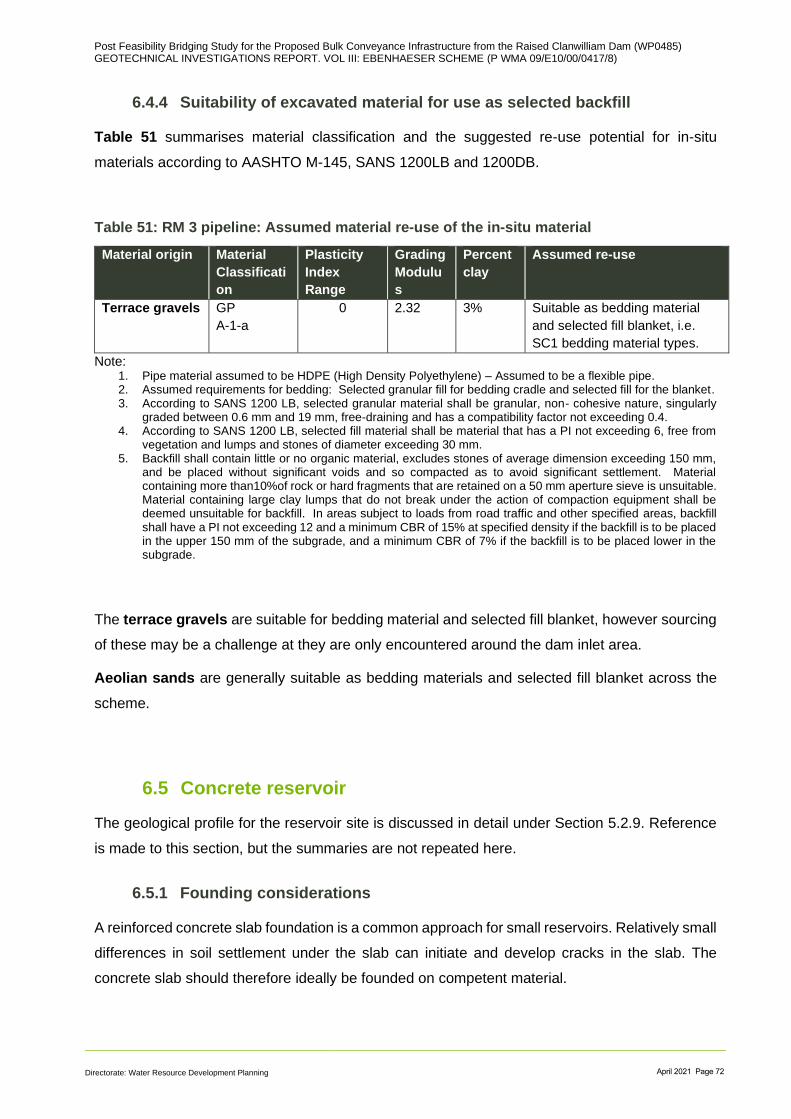
Post Feasibility Bridging Study for the Proposed Bulk Conveyance Infrastructure from the Raised Clanwilliam Dam (WP0485) GEOTECHNICAL INVESTIGATIONS REPORT. VOL III: EBENHAESER SCHEME (P WMA 09/E10/00/0417/8)
Directorate: Water Resource Development Planning April 2021 Page 72
6.4.4 Suitability of excavated material for use as selected backfill
Table 51 summarises material classification and the suggested re-use potential for in-situ
materials according to AASHTO M-145, SANS 1200LB and 1200DB.
Table 51: RM 3 pipeline: Assumed material re-use of the in-situ material
Material origin Material
Classificati
on
Plasticity
Index
Range
Grading
Modulu
s
Percent
clay
Assumed re-use
Terrace gravels GP
A-1-a
0 2.32 3% Suitable as bedding material
and selected fill blanket, i.e.
SC1 bedding material types.
Note: 1. Pipe material assumed to be HDPE (High Density Polyethylene) – Assumed to be a flexible pipe. 2. Assumed requirements for bedding: Selected granular fill for bedding cradle and selected fill for the blanket. 3. According to SANS 1200 LB, selected granular material shall be granular, non- cohesive nature, singularly
graded between 0.6 mm and 19 mm, free-draining and has a compatibility factor not exceeding 0.4. 4. According to SANS 1200 LB, selected fill material shall be material that has a PI not exceeding 6, free from
vegetation and lumps and stones of diameter exceeding 30 mm. 5. Backfill shall contain little or no organic material, excludes stones of average dimension exceeding 150 mm,
and be placed without significant voids and so compacted as to avoid significant settlement. Material containing more than10%of rock or hard fragments that are retained on a 50 mm aperture sieve is unsuitable. Material containing large clay lumps that do not break under the action of compaction equipment shall be deemed unsuitable for backfill. In areas subject to loads from road traffic and other specified areas, backfill shall have a PI not exceeding 12 and a minimum CBR of 15% at specified density if the backfill is to be placed in the upper 150 mm of the subgrade, and a minimum CBR of 7% if the backfill is to be placed lower in the subgrade.
The terrace gravels are suitable for bedding material and selected fill blanket, however sourcing
of these may be a challenge at they are only encountered around the dam inlet area.
Aeolian sands are generally suitable as bedding materials and selected fill blanket across the
scheme.
6.5 Concrete reservoir
The geological profile for the reservoir site is discussed in detail under Section 5.2.9. Reference
is made to this section, but the summaries are not repeated here.
6.5.1 Founding considerations
A reinforced concrete slab foundation is a common approach for small reservoirs. Relatively small
differences in soil settlement under the slab can initiate and develop cracks in the slab. The
concrete slab should therefore ideally be founded on competent material.

Post Feasibility Bridging Study for the Proposed Bulk Conveyance Infrastructure from the Raised Clanwilliam Dam (WP0485) GEOTECHNICAL INVESTIGATIONS REPORT. VOL III: EBENHAESER SCHEME (P WMA 09/E10/00/0417/8)
Directorate: Water Resource Development Planning April 2021 Page 73
The concrete reservoir should be founded on the very dense calcretised and ferruginised sand
(hardpan calcrete) to allow for adequate bearing capacity. The perimeter of the reservoir site can
be subdivided into shallow hardpan on the western side and deeper pedogenic material on the
east and southern sides. This is likely to require a cut of 2.5 m or deeper to found on the hardpan.
Alternatively, a compacted backfill below the structure could be considered on the east and
southern side of the reservoir.
6.5.2 Excavation
The test pit profiles have been used to estimate the general depths of the anticipated excavation
classes, which are presented in Table 52.
Table 52: Excavation summary at the reservoir site
Test pit No:
Soft and Intermediate
excavation classification depth
(m)
Hard excavation classification
depth (m)
E-TP23* 0.0-2.5
E-TP24 ADD 0.0-2.2
E-TP25 0.0-2.4 2.4
E-TP24 0.0-0.8 0.8+
* Part of RM3 but added here for discussion purposes
The soft excavations in terms of SANS 1200D: Earthworks, (SANS, 1988), are expected on
aeolian sand to an average depth of 2.0 m. The western side of the reservoir has shallow hardpan
at less than a meter and deeper towards the east and south. Hard excavations can be expected
in the hardpan calcrete which underlies the aeolian sands.
6.5.3 Excavation stability
Should the design approach require cutting to 2.5 m depth for founding the reservoir on hardpan,
this will create slope stability concerns in the overlying aeolian sands.
The test pit sidewalls collapsed during the field investigations. The stability of excavations during
the reservoir construction may be compromised and shoring or battering of excavations will be
required.
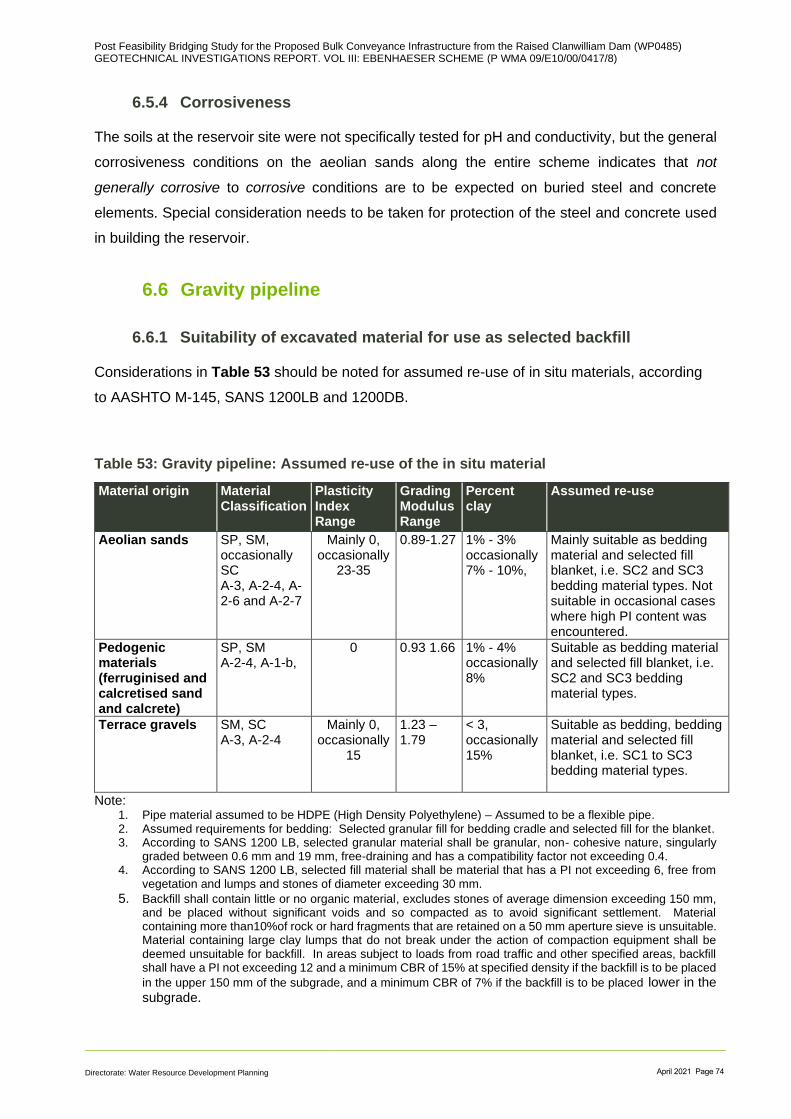
Post Feasibility Bridging Study for the Proposed Bulk Conveyance Infrastructure from the Raised Clanwilliam Dam (WP0485) GEOTECHNICAL INVESTIGATIONS REPORT. VOL III: EBENHAESER SCHEME (P WMA 09/E10/00/0417/8)
Directorate: Water Resource Development Planning April 2021 Page 74
6.5.4 Corrosiveness
The soils at the reservoir site were not specifically tested for pH and conductivity, but the general
corrosiveness conditions on the aeolian sands along the entire scheme indicates that not
generally corrosive to corrosive conditions are to be expected on buried steel and concrete
elements. Special consideration needs to be taken for protection of the steel and concrete used
in building the reservoir.
6.6 Gravity pipeline
6.6.1 Suitability of excavated material for use as selected backfill
Considerations in Table 53 should be noted for assumed re-use of in situ materials, according
to AASHTO M-145, SANS 1200LB and 1200DB.
Table 53: Gravity pipeline: Assumed re-use of the in situ material
Material origin Material Classification
Plasticity Index Range
Grading Modulus Range
Percent clay
Assumed re-use
Aeolian sands SP, SM, occasionally SC A-3, A-2-4, A-2-6 and A-2-7
Mainly 0, occasionally
23-35
0.89-1.27 1% - 3% occasionally 7% - 10%,
Mainly suitable as bedding material and selected fill blanket, i.e. SC2 and SC3 bedding material types. Not suitable in occasional cases where high PI content was encountered.
Pedogenic materials (ferruginised and calcretised sand and calcrete)
SP, SM A-2-4, A-1-b,
0 0.93 1.66 1% - 4% occasionally 8%
Suitable as bedding material and selected fill blanket, i.e. SC2 and SC3 bedding material types.
Terrace gravels SM, SC A-3, A-2-4
Mainly 0, occasionally
15
1.23 – 1.79
< 3, occasionally 15%
Suitable as bedding, bedding material and selected fill blanket, i.e. SC1 to SC3 bedding material types.
Note: 1. Pipe material assumed to be HDPE (High Density Polyethylene) – Assumed to be a flexible pipe. 2. Assumed requirements for bedding: Selected granular fill for bedding cradle and selected fill for the blanket. 3. According to SANS 1200 LB, selected granular material shall be granular, non- cohesive nature, singularly
graded between 0.6 mm and 19 mm, free-draining and has a compatibility factor not exceeding 0.4. 4. According to SANS 1200 LB, selected fill material shall be material that has a PI not exceeding 6, free from
vegetation and lumps and stones of diameter exceeding 30 mm.
5. Backfill shall contain little or no organic material, excludes stones of average dimension exceeding 150 mm, and be placed without significant voids and so compacted as to avoid significant settlement. Material containing more than10%of rock or hard fragments that are retained on a 50 mm aperture sieve is unsuitable. Material containing large clay lumps that do not break under the action of compaction equipment shall be deemed unsuitable for backfill. In areas subject to loads from road traffic and other specified areas, backfill shall have a PI not exceeding 12 and a minimum CBR of 15% at specified density if the backfill is to be placed
in the upper 150 mm of the subgrade, and a minimum CBR of 7% if the backfill is to be placed lower in the subgrade.
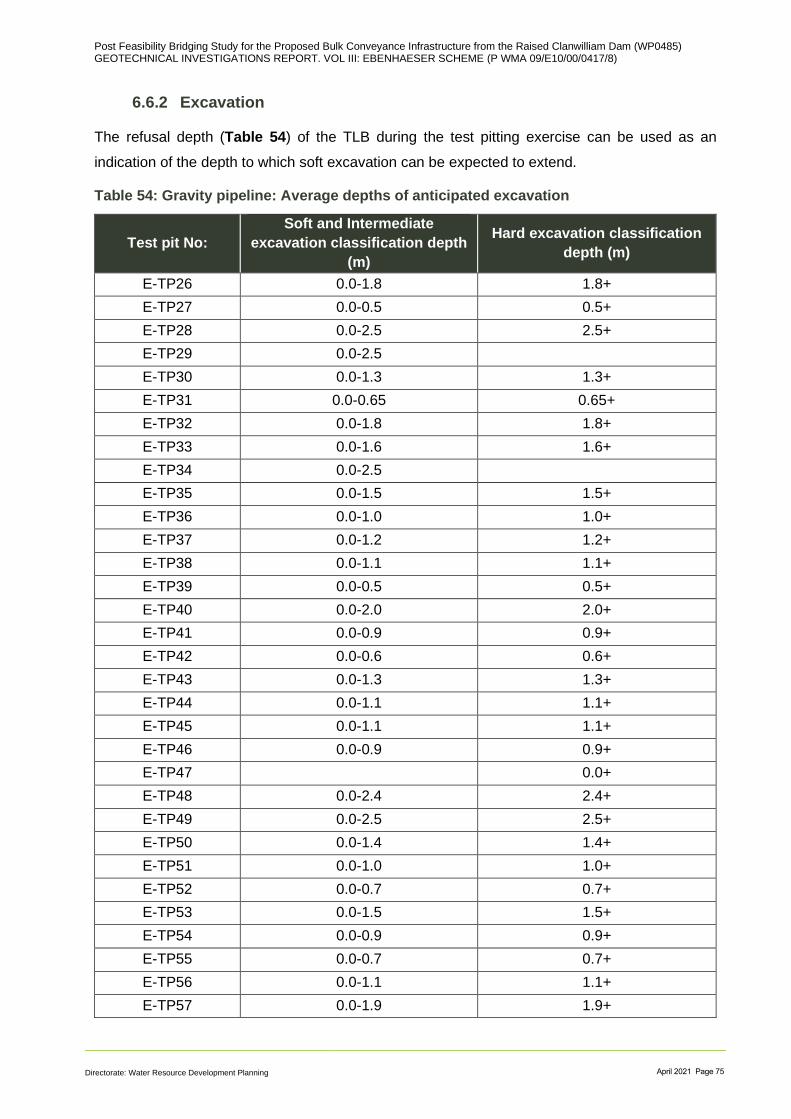
Post Feasibility Bridging Study for the Proposed Bulk Conveyance Infrastructure from the Raised Clanwilliam Dam (WP0485) GEOTECHNICAL INVESTIGATIONS REPORT. VOL III: EBENHAESER SCHEME (P WMA 09/E10/00/0417/8)
Directorate: Water Resource Development Planning April 2021 Page 75
6.6.2 Excavation
The refusal depth (Table 54) of the TLB during the test pitting exercise can be used as an
indication of the depth to which soft excavation can be expected to extend.
Table 54: Gravity pipeline: Average depths of anticipated excavation
Test pit No:
Soft and Intermediate
excavation classification depth
(m)
Hard excavation classification
depth (m)
E-TP26 0.0-1.8 1.8+
E-TP27 0.0-0.5 0.5+
E-TP28 0.0-2.5 2.5+
E-TP29 0.0-2.5
E-TP30 0.0-1.3 1.3+
E-TP31 0.0-0.65 0.65+
E-TP32 0.0-1.8 1.8+
E-TP33 0.0-1.6 1.6+
E-TP34 0.0-2.5
E-TP35 0.0-1.5 1.5+
E-TP36 0.0-1.0 1.0+
E-TP37 0.0-1.2 1.2+
E-TP38 0.0-1.1 1.1+
E-TP39 0.0-0.5 0.5+
E-TP40 0.0-2.0 2.0+
E-TP41 0.0-0.9 0.9+
E-TP42 0.0-0.6 0.6+
E-TP43 0.0-1.3 1.3+
E-TP44 0.0-1.1 1.1+
E-TP45 0.0-1.1 1.1+
E-TP46 0.0-0.9 0.9+
E-TP47 0.0+
E-TP48 0.0-2.4 2.4+
E-TP49 0.0-2.5 2.5+
E-TP50 0.0-1.4 1.4+
E-TP51 0.0-1.0 1.0+
E-TP52 0.0-0.7 0.7+
E-TP53 0.0-1.5 1.5+
E-TP54 0.0-0.9 0.9+
E-TP55 0.0-0.7 0.7+
E-TP56 0.0-1.1 1.1+
E-TP57 0.0-1.9 1.9+

Post Feasibility Bridging Study for the Proposed Bulk Conveyance Infrastructure from the Raised Clanwilliam Dam (WP0485) GEOTECHNICAL INVESTIGATIONS REPORT. VOL III: EBENHAESER SCHEME (P WMA 09/E10/00/0417/8)
Directorate: Water Resource Development Planning April 2021 Page 76
Test pit No:
Soft and Intermediate
excavation classification depth
(m)
Hard excavation classification
depth (m)
E-TP58 0.0+
E-TP59 0.0-1.5 1.5+
E-TP60 0.0+
E-TP61 0.0-2.1 2.1+
E-TP62 0.0+
E-TP63 0.0-0.75 0.75+
E-TP64 0.0+
E-TP65 0.0-0.4 0.4+
E-TP66 0.0-1.3 1.3+
E-TP67 0.0-1.4 1.4+
E-TP68 0.0+
E-TP69 0.0-2.5 2.5+
E-TP70 0.0-0.4 0.4+
E-TP71 0.0-0.5 0.5+
E-TP72 0.0-1.3 1.3+
E-TP73 0.0-0.6 0.6+
E-TP74 0.0-1.2 1.2+
E-TP75 0.0-2.1 2.1+
E-TP76 0.0-1.2 1.2+
E-TP77 0.0+
E-TP78 0.0-0.6 0.6+
E-TP79 0.0-0.4 0.4+
E-TP80 0.0-0.4 0.4+
E-TP81 0.0+
E-TP82 0.0-0.4 0.4+
The soft excavations in terms of SANS 1200D: Earthworks, (SANS, 1988), are to be expected on
aeolian sand, alluvium and terrace gravels to an average depth of 1.2 m with pockets of deep
sand profiles to a maximum depth of 2.5 m. The hard excavations, as per SANS 1200D, are
encountered in hardpan calcrete and schist bedrock.
At the time of compiling the geotechnical report the invert level for the gravity pipeline was not
finalised by the design team. Hence comparison between the invert level and refusal has not been
included.
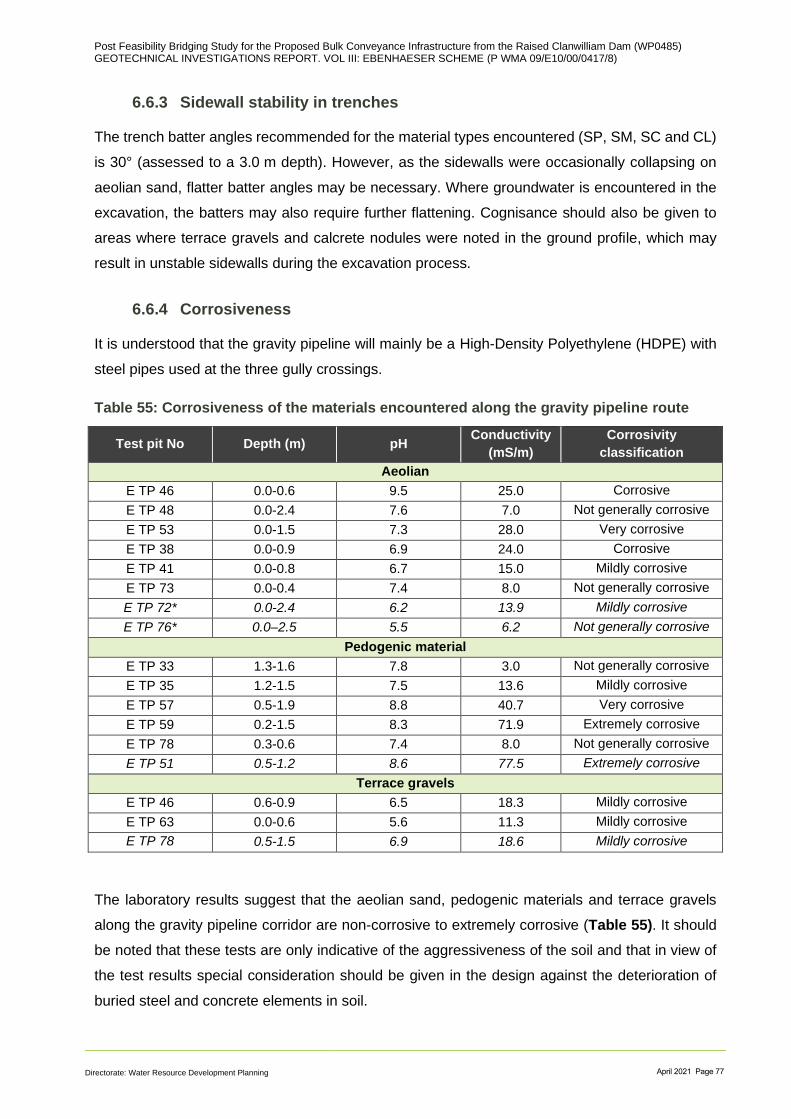
Post Feasibility Bridging Study for the Proposed Bulk Conveyance Infrastructure from the Raised Clanwilliam Dam (WP0485) GEOTECHNICAL INVESTIGATIONS REPORT. VOL III: EBENHAESER SCHEME (P WMA 09/E10/00/0417/8)
Directorate: Water Resource Development Planning April 2021 Page 77
6.6.3 Sidewall stability in trenches
The trench batter angles recommended for the material types encountered (SP, SM, SC and CL)
is 30° (assessed to a 3.0 m depth). However, as the sidewalls were occasionally collapsing on
aeolian sand, flatter batter angles may be necessary. Where groundwater is encountered in the
excavation, the batters may also require further flattening. Cognisance should also be given to
areas where terrace gravels and calcrete nodules were noted in the ground profile, which may
result in unstable sidewalls during the excavation process.
6.6.4 Corrosiveness
It is understood that the gravity pipeline will mainly be a High-Density Polyethylene (HDPE) with
steel pipes used at the three gully crossings.
Table 55: Corrosiveness of the materials encountered along the gravity pipeline route
Test pit No Depth (m) pH Conductivity
(mS/m)
Corrosivity
classification
Aeolian
E TP 46 0.0-0.6 9.5 25.0 Corrosive
E TP 48 0.0-2.4 7.6 7.0 Not generally corrosive
E TP 53 0.0-1.5 7.3 28.0 Very corrosive
E TP 38 0.0-0.9 6.9 24.0 Corrosive
E TP 41 0.0-0.8 6.7 15.0 Mildly corrosive
E TP 73 0.0-0.4 7.4 8.0 Not generally corrosive
E TP 72* 0.0-2.4 6.2 13.9 Mildly corrosive
E TP 76* 0.0–2.5 5.5 6.2 Not generally corrosive
Pedogenic material
E TP 33 1.3-1.6 7.8 3.0 Not generally corrosive
E TP 35 1.2-1.5 7.5 13.6 Mildly corrosive
E TP 57 0.5-1.9 8.8 40.7 Very corrosive
E TP 59 0.2-1.5 8.3 71.9 Extremely corrosive
E TP 78 0.3-0.6 7.4 8.0 Not generally corrosive
E TP 51 0.5-1.2 8.6 77.5 Extremely corrosive
Terrace gravels
E TP 46 0.6-0.9 6.5 18.3 Mildly corrosive
E TP 63 0.0-0.6 5.6 11.3 Mildly corrosive
E TP 78 0.5-1.5 6.9 18.6 Mildly corrosive
The laboratory results suggest that the aeolian sand, pedogenic materials and terrace gravels
along the gravity pipeline corridor are non-corrosive to extremely corrosive (Table 55). It should
be noted that these tests are only indicative of the aggressiveness of the soil and that in view of
the test results special consideration should be given in the design against the deterioration of
buried steel and concrete elements in soil.

Post Feasibility Bridging Study for the Proposed Bulk Conveyance Infrastructure from the Raised Clanwilliam Dam (WP0485) GEOTECHNICAL INVESTIGATIONS REPORT. VOL III: EBENHAESER SCHEME (P WMA 09/E10/00/0417/8)
Directorate: Water Resource Development Planning April 2021 Page 78
6.7 Construction materials
The geotechnical investigations have considered the suitability of the in-situ soils for use in
pipeline construction and also for the balancing dam. The investigations have however not
focused on sourcing materials such as coarse aggregates for concrete, e.g. for the construction
of the reservoir.
6.7.1 In-situ material suitability as selected backfill
Aeolian sands and pedogenic materials are generally suitable as bedding materials across the
scheme, and selected fill blanket, i.e. SC1 and SC3 bedding material types according to SANS
1200 LB and 1200 DB.
The terrace gravels are suitable for bedding material and selected fill blanket. However, sourcing
these materials may be a challenge at they are only encountered in localised areas (i.e. in zone
5, zone 11 and zone 13) along the scheme.
Alluvial material, as encountered along the Rising Main 1 pipeline route, is considered unsuitable
as bedding and backfill material.
6.7.2 Potential material sources for layer works
The aeolian sands would only be suitable for construction of engineered fills of low stiffness.
These sands classify as G8 or G10 material, in accordance with COLTO guidelines, and thus are
only suitable as selected fill or subgrade road layer works and engineered fills of low stiffness.
G10 material can alternatively be used for landscaping or spoiled.
The alluvium is classified as a G10 according to COLTO guidelines, indicating that it is suitable
for use in subgrade and engineered fills of low stiffness. Alternatively, it can be used for
landscaping or spoiled.
The pedogenic materials are classified as G7 to G10 according to COLTO guidelines. The G7
material is considered suitable as base coarse in road layer works. G8 or G10 are only suitable
as selected fill or subgrade road layer works.
6.7.3 Coarse aggregates for concrete
It is unlikely that a new hard rock source will be developed purely for sourcing of crushed stone
for construction of the concrete reservoir, and other minor areas of concrete structures. Due to
the limited quantities required, coarse aggregates for construction purposes will likely need to be
sourced from a commercial source, for example Cape Lime (Pty) Ltd., which produces crushed
stone of G1-G7 and is located in Vredendal.
Post Feasibility Bridging Study for the Proposed Bulk Conveyance Infrastructure from the Raised Clanwilliam Dam (WP0485) GEOTECHNICAL INVESTIGATIONS REPORT. VOL III: EBENHAESER SCHEME (P WMA 09/E10/00/0417/8)
Directorate: Water Resource Development Planning April 2021 Page 79
Due to unfavourable physical and mechanical properties of schist, that include low strengths and
platy mineral alignment, this rock type is not considered to be acceptable to be used for the
manufacture of coarse aggregate. No other bedrock was encountered along the scheme except
for the schist.
6.7.4 Fine aggregates
Various potential sources of natural sand were encountered along the route, including areas
underlain by aeolian sands. Exploitation of the various sources of natural sands would be
dependent on overcoming environmental limitations. Should these options still be favoured, it
would be necessary to confirm the various sand deposits are compliant in terms of meeting
specifications. Fine aggregate (sand) for concrete manufacture is also likely to be sourced from
commercial sources.

Post Feasibility Bridging Study for the Proposed Bulk Conveyance Infrastructure from the Raised Clanwilliam Dam (WP0485) GEOTECHNICAL INVESTIGATIONS REPORT. VOL III: EBENHAESER SCHEME (P WMA 09/E10/00/0417/8)
Directorate: Water Resource Development Planning April 2021 Page 80
7.1 Excavation stability
The test pit sidewalls largely collapsed in the very loose to medium dense aeolian sands during
the field investigations. The stability of excavations during construction may be compromised and
shoring or battering of excavations will be required. Attention must be paid to the presence of
seepage and terrace gravels.
As part of safe practice during construction, stability assessment would be required for deeper
excavations left open for longer periods. These assessments should be conducted by a suitably
qualified and experienced geotechnical practitioner.
7.2 Soil corrosiveness
The soils along the Ebenhaeser scheme corridor are generally non-corrosive to extremely
corrosive. This indicates that special considerations need to be taken for the steel and concrete,
in particular for the concrete reservoir, inlet and outlet structure for the balancing dam, and where
used along the pipelines, e.g. fittings.
The HDPE pipe that is proposed for the scheme generally has an excellent corrosion resistance
Therefore, no corrosion problems are likely to be encountered along the pipelines.
7.3 Other factors
It is recommended that foundation excavations at the balancing dam and the concrete reservoir
be inspected by an experienced geotechnical engineer or engineering geologist prior to placing
of concrete or earthfill respectively to ensure that suitable founding material has been obtained in
the excavations. This is an important aspect because the investigation findings rely on point
information (test pits) and localized variations may be revealed in the excavations.
The scheme is located outside natural seismic activity, and outside regions of mining-induced and
natural seismic activity. The area is considered a non-seismic activity zone and as such, no
Conclusions and recommendations
Post Feasibility Bridging Study for the Proposed Bulk Conveyance Infrastructure from the Raised Clanwilliam Dam (WP0485) GEOTECHNICAL INVESTIGATIONS REPORT. VOL III: EBENHAESER SCHEME (P WMA 09/E10/00/0417/8)
Directorate: Water Resource Development Planning April 2021 Page 81
specific seismic design requirements other than normal structural design requirements are
required.
Groundwater seepage was only encountered along the Retshof Diversion. However, the
possibility of intersecting seepage elsewhere cannot be completely ruled out, as the presence of
pedogenic materials suggests the occurrence of fluctuating water levels.
The suite of laboratory tests conducted to test the dispersivity of the soils indicates that the
materials encountered on site are non-dispersive to highly dispersive.
The aeolian sands, pedogenic materials and terrace gravels along the route are suitable as
backfill materials with the alluvium encountered along Rising Main 1 being unsuitable.
The Concrete Reservoir should be founded on the very dense, calcretised and ferruginised sand
(hardpan calcrete) to allow for adequate bearing capacity. The ground conditions at the reservoir
can be subdivided into shallow hardpan on the western side and deeper pedogenic material on
the eastern and southern sides. This is likely to require a cut of 2.5 m or deeper to found on the
hardpan. Alternatively, compacted backfill below the structure could be considered on the eastern
and southern sides of the reservoir.
Soft excavations in terms of SANS 1200D are to be expected in aeolian sand, alluvium and
terrace gravels. Hard excavations, as per SANS 1200D, are encountered in hardpan calcrete and
schist bedrock.
7.4 Additional investigations
Investigations conducted to date are sufficient for the current feasibility-phase of the project, and
no additional investigations are identified at this stage.
The possibility that the detailed design phase might require further geotechnical inputs cannot be
excluded, however.

Post Feasibility Bridging Study for the Proposed Bulk Conveyance Infrastructure from the Raised Clanwilliam Dam (WP0485) GEOTECHNICAL INVESTIGATIONS REPORT. VOL III: EBENHAESER SCHEME (P WMA 09/E10/00/0417/8)
Directorate: Water Resource Development Planning April 2021 Page 82
ASTM D 4221 – 99 (reapproved 2006). Standard Test Method for Dispersive Characteristics of
Clay Soil by Double Hydrometer.
Brink A. B. A. (1985). Engineering Geology of South Africa. Printed in South Africa by the Natal
Witness printing and publishing company (Pty) Ltd.
COLTO, 2009. Standard specification for material grading. Committee of Land Transport Officials,
Halfway House, South Africa.
COTO, (2010). Standard Specifications for Subsurface Investigations. The South African National
Roads Agency Limited (SANRAL), South Africa.
Das, B.M., (2002). Soil mechanics laboratory manual sixth edition. New York Oxford, Oxford
University Press
Duligal, E. (1996). Significance of Soil Resistivity on Corrosivity. Unpublished report compiled for
Africon.
Franki Africa (2008). A guide to practical geotechnical engineering in Southern Africa. 4th Ed.
December 2008. Johannesburg: Franki Africa.
Kijko, A., (2011). Probabilistic Seismic Hazard Analysis for the Clanwilliam Dam, South Africa.
Report No.: 2011-002 (Rev 1.01).
Evans, U.R. (1977). The Corrosion and Oxidation of Metals: Scientific Principles and Practical
Applications. Edward Arnold (Publishers) Ltd. 1977.
Harmse, H.J von M. 1980. Dispersive soils; their origin, identification and stabilisation (in
Afrikaans), Ground Profile No 22, April 1980
Jennings, J E B, Brink, A B A and Williams, A A B. 1973. Revised Guide to Soil Profiling for Civil
Engineering Purposes in Southern Africa. The Civil Engineer in S A, p 3-12. January 1973.
Jennings and Knight, 1957. A guide to construction on or with materials exhibiting additional
settlement due to collapse of grain structure. Proceedings of the 6th Regional Conference for
Africa on Soil Mechanics and Foundation Engineering, Durban, South Africa, 1: 99-105.
References
Post Feasibility Bridging Study for the Proposed Bulk Conveyance Infrastructure from the Raised Clanwilliam Dam (WP0485) GEOTECHNICAL INVESTIGATIONS REPORT. VOL III: EBENHAESER SCHEME (P WMA 09/E10/00/0417/8)
Directorate: Water Resource Development Planning April 2021 Page 83
Pathak H, & Rao D. L. N. (1998). Carbon and nitrogen mineralization from added organic matter
in saline and alkali soils. Soil Biology and Biochemistry. 30(6):695–702. doi: 10.1016/S0038-
0717(97)00208-3.
Powell, R., Puls, R., Hightower, S. and Sabatini, D., (1995). Coupled Iron Corrosion and Chromate
Reduction: Mechanisms for Subsurface Remediation. Environmental Science & Technology,
29(8), pp.1913-1922.
Provin, T. and Pitt, J.L., (2012), Managing Soil Salinity. Agricultural communication, The Texas
A&M University System Web page: http://texaserc.tamu.edu
SANS (South African National Standard), (2017). SANS 10160-4-2017. Basis of Structural Design
and 34 Actions for Buildings and Industrial Structures. Part 4: Seismic Actions and General
Requirements for 35 Buildings. Pretoria: South African Bureau of Standards. ISBN 978-0-626-
30384-6.
The South African Institution of Civil Engineering (SAICE) – Geotechnical Division. 2007. The
Safety of Persons Working in Small Diameter Shafts and Test Pits for Geotechnical Engineering
Purposes – Code of Practice, 1st Edition.
SABS 1200D (1988) Standardised specification for civil engineering construction. D: Earthworks,
South African Bureau of Standards, Pretoria.
Van der Merwe, D.H. 1964. The prediction of heave from the plasticity index and percentage clay
fraction of soils. The Civil Engineer in S A. June 1964.
Weinert, H.H. 1980. The Natural Road Construction Materials of Southern Africa. Academica.
Pretoria.

Post Feasibility Bridging Study for the Proposed Bulk Conveyance Infrastructure from the Raised Clanwilliam Dam (WP0485) GEOTECHNICAL INVESTIGATIONS REPORT. VOL III: EBENHAESER SCHEME (P WMA 09/E10/00/0417/8)
Directorate: Water Resource Development Planning April 2021 Page 84
1. Zutari Ground Engineering has prepared this report for use by Zutari design colleagues
as well as our Client, the DWS. The report has not been prepared for use by parties other than
Zutari and DWS.
2. There are always some variations in subsurface conditions across a site due to geological
conditions that cannot be defined fully even by exhaustive investigation. Hence, it is possible that
the measurements and values obtained from sampling and testing during the investigation may
not represent the extremes of conditions which exist within the site. The precision with which
subsurface conditions are identified depends on the method of investigation, the frequency and
recovery of samples, the method of sampling, and the uniformity of the subsurface conditions.
Subsurface conditions at locations other than the investigation positions may vary from conditions
at the investigation locations.
3. Further, subsurface conditions, including groundwater levels can change over time. The
groundwater conditions described in this report refer only to those observed at the place and time
of observation noted in the report. These conditions may vary seasonally or as a consequence of
construction or agricultural activities in the area. This should be borne in mind, particularly if the
report is used after a protracted delay or a period of protracted climatic conditions.
4. Should conditions exposed at the site during subsequent investigation or construction
works vary significantly from those provided in this report, we request that Zutari Ground
Engineering be informed and have the opportunity to review any of the findings or conclusions of
this report. It is highly recommended that during construction the site conditions be inspected by
a representative of Zutari Ground Engineering to confirm the geotechnical interpretations in this
design.
5. Unless otherwise stated, this design does not address potential environmental hazards,
or groundwater contamination that may be present.
6. The investigation logs represent the subsurface conditions at the specific test locations
only. Boundaries between zones on the logs are not often distinct, but rather are transitional and
have been interpreted. The soil / rock descriptions in this report are based on commonly accepted
Limitations of report

Post Feasibility Bridging Study for the Proposed Bulk Conveyance Infrastructure from the Raised Clanwilliam Dam (WP0485) GEOTECHNICAL INVESTIGATIONS REPORT. VOL III: EBENHAESER SCHEME (P WMA 09/E10/00/0417/8)
Directorate: Water Resource Development Planning April 2021 Page 85
methods of classification and identification employed in geotechnical practice, as stated.
Classification and identification of soil involves judgement, and Zutari Ground Engineering infers
accuracy in the classification and identification methods to the extent that is common in current
geotechnical practice, and within the limitations of the ground investigation that was performed.
7. It is recommended that further geotechnical input from Zutari Ground Engineering should
be sought as the project moves into the next phase to confirm that the geotechnical assumptions
made in this report are compatible with the structural performance requirements and are being
applied appropriately.

Post Feasibility Bridging Study for the Proposed Bulk Conveyance Infrastructure from the Raised Clanwilliam Dam (WP0485) GEOTECHNICAL INVESTIGATIONS REPORT. VOL III: EBENHAESER SCHEME (P WMA 09/E10/00/0417/8)
Directorate: Water Resource Development Planning April 2021 Page 86

Appendix A Site Layout Drawings

10
m
12
m
14m
14
m
14
m
16m
16m
16
m
16m
18m
18m
18
m
18
m
20
m
20
m
20
m
20m22m
22
m
22
m
22
m
24
m
24
m
24
m
24
m
24m26m
26
m
26
m
26m
26
m
28m
28
m
28m
28
m
28
m
28
m
30m
30
m
30m
30m
30
m
30m
32m
32m
32
m
32m
32
m
32
m
32m
32m
34
m
34
m
34m
34m
34m
34m
34
m
34m
34
m
34m
34m
36
m
36
m
36m
36m
36
m
36
m
36
m
36
m
36m
36
m
38m
38
m
38
m
38
m
38m
38m
38
m
38
m
38
m
38
m
40m
40m
40m
40
m
40m
40m
40m
40
m
40
m
40m
40m
40m
42m
42m
42
m
42
m
42m
42
m
42m 42m
42m
42m
42
m
42
m
42m
42
m
44m
44m
44m
44
m
44m
44m
44
m
44m
44
m
44m
44
m44
m
44m
44
m
46m
46m
46m
46
m
46m
46
m
46
m
46
m
46
m
46
m
46
m
46
m
46
m
46m
46
m
46
m
48m
48m
48
m
48m
48m
48
m
48
m
48
m
48m
48m
48
m
48m
48
m
48m
48
m
48m
48
m
50m
50
m
50m
50
m
50m
50m
50m
50
m
50
m
50
m
50
m
50m
50m
50
m
50
m
50
m
50
m
50
m
50
m
52m
52m
52m
52
m
52
m
52m
52
m
52m 52
m
52
m
52
m
52m
52
m
52
m
52
m
52m
52m
52m
52
m
52
m
52
m
52m
52m
52
m
52
m
52
m
54
m
54
m
54m
54m
54m
54
m
54m
54
m
54m
54
m
54m
54
m
54
m
54
m
54
m
54m
54m
54
m
54
m
54
m
54m
54
m54
m
54
m
56m
56m
56m
56
m
56
m
56m
56m
56m
56m
56m
56
m
56m
56
m
56
m
56m
56m
56
m
56m
56m56m
56m
56
m
56
m56
m
56
m
58
m
58
m
58
m
58
m
58
m
58m
58m
58m
58m
58m
58
m
58m
58
m
58
m
58
m
58
m
58
m
58
m
58m
58
m
58
m
58m
60m
60m
60m
60m60
m
60m
60m
60m
60m
60m
60m
60m
60
m
60m
60
m
60
m
60
m
60
m
60
m
60
m
60m
60
m
62
m
62
m
62
m
62m
62m
62m
62
m
62m
62m
62
m
62
m
62m
62
m
62
m
62m
62
m
64m
64m
64
m
64m
64
m
64m64m
64
m
64
m
64
m
64m
64
m
64
m
64
m
64
m
66
m
66m
66
m
66
m
66
m
66
m
66
m
66
m
66
m
66
m
66
m
68
m
68
m
68m
68m
68
m
68m
68m
68
m
68
m
68
m
68m
70
m
70m
70m
70
m
70m 70m
70
m
70
m
70
m
70
m
70
m
72
m
72m
72m
72m
72m
72
m
72m
72
m
72m
72
m
72
m
74m
74
m
74
m
74
m
74
m
74
m
74m
74
m
74m
74
m
74
m
76
m
76
m
76
m
76m
76m
76
m
76
m
76
m
76
m
76m
78m
78m
78
m
78
m
78
m
78m
78
m
78
m
78
m
78
m
80
m
80
m
80m
80m
80
m
80
m
80m
80
m
80
m
82
m
82
m
82
m
82
m
82
m
82m
82
m
82
m
82
m
84
m
84
m
84m
84
m
84m
84
m
84
m
84
m
86
m
86
m
86m
86m
86
m
86m
86
m
86
m
88
m
88
m
88m 8
8m
88m
88
m
88
m
88
m
90
m
90m
90m
90
m
90m
90
m
90m
92
m
92
m 92m
92
m
92
m
92m
92
m
94m
94m
94
m
94
m
94
m
94
m
94
m
94m
96
m
96m
96m
96
m
96
m
96
m
96
m
96m
98m
98m
98m
98
m
98
m
98
m
98m
98
m
100
m
100m
100m
100
m
100
m
100
m
100
m10
2m
102m
102m
102m
102
m
104
m
104
m
104m
104
m
104
m
106m
106m
106m
106
m
108
m 108
m
108m
108
m
110m
110m 110
m
112
m
112m
112m
112
m
114
m
114m
114m
114
m
116m
116m
116
m
118m
118m
118m
118
m12
0m
120m
120m
120
m
122m
122m12
2m
124m
124m
124m
124
m
126m
126m
126m
126
m
128
m
128m
128m
130m
130
m
130m
132m
132
m132
m134m
134
m
134m
136m
136
m
136m
138
m
138
m
140
m
142m
142m
RES RES
RESRES
CULTI
VATI
ON
CULTI
VATI
ON
CULTI
VATI
ON
CULTI
VATI
ON
CULTI
VATI
ON
CULTI
VATI
ON
CULTI
VATI
ON
CULTI
VATI
ON
CULTI
VATI
ON
CULTI
VATI
ON
CULTI
VATI
ON
CULTI
VATI
ON
CULTI
VATI
ON
CULTI
VATI
ON
CULTI
VATI
ON
CULTI
VATI
ON
CULTI
VATI
ON
CULTI
VATI
ON
CULTI
VATI
ON
CULTI
VATI
ON
CULTI
VATI
ON
CULTI
VATI
ON
CULTI
VATI
ON
CULTI
VATI
ON
CULTI
VATI
ON
CULTI
VATI
ON
CULTI
VATI
ON
CULTI
VATI
ON
CULTI
VATI
ON
CULTI
VATI
ON
CULTI
VATI
ON
CULTI
VATI
ON
CULTI
VATI
ON
RES
CULTI
VATI
ON
MHMHM
H
CA
NAL
CA
NAL
CA
NAL
CA
NAL
CA
NAL
CA
NAL
CA
NAL
CONCRETE RESERVOIR
LUTZVILLE CONSERVATION AREA
VREDENDAL DIVERSION
RETSHOF DIVERSION
BAL DAM TO RESERVOIR
EBENHAESER PIPELINE
LOWER
VREDENDAL-RETSHOF 1 -
BAL DAM
33.0
39
m
237°5
4'3
9"
144.8
47
m215
°04'0
9"
63.924m
184°06'37"
100.6
06
m19
5°4
2'3
5"
31.10
8m
187°4
3'59"
19.118
m18
7°5
5'44"
44.102
m
276°40'02"
56.620
m
187°5
9'26"
49.6
95m
284°
47'0
7"
48.8
23m
282°
42'5
2"
19.916
m
185°40'20"
34.067m
184°51'00"
25.955
m19
0°15'37"
26.8
47
m
224°4
0'0
5"
36.186
m
247°0
0'4
8"
34.8
01m
259°2
8'0
4"
29.230
m
261°36'11"
31.889
m
262°3
1'55"
31.258
m
248°4
9'0
7"
25.6
58
m
250°2
0'2
5"
8.7
62
m
229°3
7'3
2"
29.5
95
m
256°19'13"
17.855m
268°14'39"
16.875m
265°0
2'18"
18.3
79m
283°
12'2
4"
1.177m
178°44'35
"
22.711
m296°26'34
"
0.601m
357°30'43"
18.210m
301°05'3
1"
31.43
6m288°
39'20
"
9.38
9m28
0°04'49"
11.2
70
m
248°17'12"
20.7
79
m
223°2
6'15"
1 0.8
96
m
225°4
6'14"
16.9
09
m
228°4
7'3
2"
25.7
47
m
227°5
0'2
2"
34.6
61m
229°3
3'4
4"
13.6
51m
226°4
7'2
0"
0.000POB
33.039P.I.
177.886P.I.
241.810P.I.
342.416P.I.
373.523P.I.
392.641P.I.
436.744P.I.
493.363P.I.
543.05
8P.I.
591.88
2P.I.
611.797P.I.
645.864P.I.
671.820P.I.
698.667P.I.
734.85
3P.I.
769.6
54P.I.
798.8
83P.I.
830.773P.I.
862.03
0P.I.
887.68
8P.I.
896.450P.I.
926.0
45P.I.
943.900P.I.
960.775P.I.
979.15
4P.I.
980.331P.I.
1003.042P.I.
1003.642
P.I.
1021.852P.I.
1053.288P.I.
1062.677
P.I.
1073.9
47P.I.
1094.726P.I.
1105.622P.I.
1122.532P.I.
1148.278P.I.
1182.939P.I.
1196.590POE
38.0
32
m
43°0
2'4
8"
140.592m
316°54'31"147.815m
316°04'47"178.609m
317°58'19"
214.3
08
m
248°4
2'0
5"
222.4
12m
251°09'18"
276.8
96
m
249°5
5'19"
114.
339m
281°29'32"
177.
571m
282°
55'3
6"
98.977m
318°13'35"
189.313m
326°19'33"
130.493m
325°35'03"
114.343m
326°17'24"
118.169m
327°32'06"
1196.590POB
1234.622P.I.
1375.213P.I.
1523.029P.I.
1701.638P.I.
1915.9
46P.I.
2138.3
58P.I.
2415.2
54P.I.
2529.593
P.I.
2707.165
P.I.
2806.141P.I.
2995.454P.I.
3125.947P.I.
3240.289P.I.
3358.459P
OE
124.3
41m
75°3
1'36"
247.3
83
m
43°5
2'5
7"
294.2
84
m
43°3
1'53"
245.6
05
m
46°3
4'16"
200.8
74
m
42°3
8'4
4"
169.041m
311°56'19"
124.292m
316°22'24"
159.200m
325°52'12"
426.296m
331°10'15"
192.986m
321°33'21"
117.721m
313°35'59"
141.779m
311°03'39"
205.975m
304°41'57"
335.081m
304°32'01
"
3358.459POB
3482.800P.I.
3730.182P.I.
4024.467P.I.
4270.071P.I.
4470.945P.I.
4639.986P.I.
4764.278P.I.
4923.477P.I.
5349.773P.I.
5542.759P.I.
5660.480P.I.
5802.259P.I.
6008.234P.I.
6343.314P.I.
3+200
3+100
3+000
3+358
3+358
3+300
2+900
2+50
0
2+400
2+300
2+800
2+70
0
2+60
0
4+200
4+100
4+000
4+500
4+400
4+300
3+900
3+500
3+4003+358
3+800
3+700
3+600
2+200
0+900
0+800
0+700
1+197
1+100
1+000
0+600
0+200
0+100
0+000
0+50
0
0+400
0+300
1+800
1+700
1+600
2+100
2+000
1+900
1+500
1+1971+197 1+197
1+400
1+300
1+200
4+600
5+600
5+500
5+400
5+900
5+800
5+700
5+300
4+900
4+800
4+700
5+200
5+100
5+000
6+200
6+100
6+000
6+400
6+300
-59000
Y
-59000
Y
-60000
Y
-60000
Y
-58000
Y
-57000
Y
-56000
Y
-58000
Y
-57000
Y
-3498000
X
-3501000
X
-3501000
X
-3502000
X
-3500000
X
-3499000
X
-3498000
X
-3500000
X
-3499000
X
-56000
Y
E-TP1
E-TP2
E-TP3
E-TP4E-TP5
E-TP6
E-TP7
E-TP8
E-TP9
E-TP10
E-TP11
E-TP12E-TP13
E-TP14
E-TP15 E-TP16
E-TP17E-TP18
E-TP19
E-TP20
E-TP21E-TP22
E-TP23E-TP24
E-TP24 ADDE-TP25
E-TP26
E-TP27
E-TP28
E-TP29E-TP30
E-TP31E-TP32E-TP33
E-TP34
E-TP35
DATE TITLE
REVISION DETAILSDATEREV APPROVED
CHECKED
APPROVED
PROJECT
DRAWN
DESIGNED
PROJECT No. TYPE REVWBS DISC NUMBER
DRAWING No.
SCALE SIZE
A1
.
0001 DRG A
AS SHOWNINFORMATION
NOT FOR CONSTRUCTION
A
AU
DR
WFile
name:
Plot Date:
Office:
E:\A
UR
EC
ON\M
AN
UALS\_
AD
G\V
02\C
UST
OMIS
ATIO
N\A
UT
OC
AD\D
RGS
HTS\A
DG_A1H
T.D
WG
----
CLANWILLIAMBRIDGING STUDY
TEST PIT LAYOUT PLAN
113834 GG
D.BULL
G.DAVIS
G.DAVIS
FOR INFORMATION09.2020
CLIENT
TEST PIT
BAL DAM
50 0 100 200m
SCALE 1:5000 ON A1
AREA
LUTZVILLE CONSERVATIVE
ROUTE
EBENHAESER SCHEME
LEGEND
TAKEN FOR TESTING.
ONLY APPLY TO THE PATH
STAKE VALUES SHOWN 1)
NOTE:
0001
SHEET 01 OF 04
22m24m
26
m
26m
28m
28
m
28
m
28
m
30
m
30m
30
m
30
m
32m
32
m
32m
34m
34
m
34
m
34
m
34
m
36
m
36m
36
m
36m
36
m
36
m
38
m
38m
38m
38m
38
m
38m
38
m
38
m
38m
40
m
40
m
40m
40
m
40
m
40
m
40
m
40
m
40m
42
m
42
m
42
m
42m
42
m
42m
42
m
42
m
42m
42
m
42
m
42
m
42
m
44
m
44
m
44m
44
m
44m
44m
44m
44
m
44
m
44
m
44
m
44
m 44m
44
m
44
m
46
m
46
m
46m
46
m
46m
46
m
46
m
46
m
46m
46m
46m
46
m
46
m
46m
46
m
46
m
48
m
48m
48
m
48
m
48m
48
m
48m
48
m
48m
48m
48
m
48
m
48m
48
m
48
m
50
m
50
m
50
m
50
m
50m
50m
50
m
50
m
50
m
50
m
50m
50
m
50
m
50m
50
m
50m
52
m
52m
52
m
52
m
52m
52
m
52
m
52
m
52
m
52m
52m
52m
52
m
52
m
52m
52
m
54
m
54
m
54m
54
m
54
m
54
m
54
m
54
m
54m
54
m
54m
54
m
54m
54
m
54m
54
m
54m
56
m
56m
56m
56m
56
m
56m
56
m
56
m
56m
56
m
56
m
56
m
56m
56
m
56m
56m
56m
58
m
58
m
58
m
58
m
58
m
58
m
58
m
58
m
58
m
58m
58
m
58
m
58
m
58
m
58
m
60
m
60
m
60
m
60
m
60
m
60
m
60
m
60m
60m
60
m
60m
60m
60m
60m
62m
62
m
62
m
62
m
62
m
62
m
62
m
62
m
62
m
62
m
62
m
62m
62m
62
m64
m
64m
64m
64
m
64m
64
m
64
m
64
m
64
m
64
m
64m
64
m
64m
64m
64m
66m
66
m
66
m
66m
66
m
66
m
66
m
66m
66
m
66
m
66
m
66m
66m
66m
66m
68m
68m
68
m
68
m
68
m
68m
68m
68
m
68
m
68m
68m
68
m
68
m
68
m
68
m
68
m
70
m
70
m
70
m
70
m
70
m
70m
70
m
70
m
70m
70m
70m
70m
70
m
70
m
72
m
72
m
72
m
72
m
72
m
72
m
72
m
72
m
72
m
72m
72
m
72m
72
m
72m
72
m
74m
74m
74
m
74
m
74
m
74
m
74
m
74m
74
m
74
m
74
m
74
m
74m
74
m
74m
76
m
76
m
76
m
76
m
76m
76
m
76
m
76
m
76
m
76m
76m
76m
76m
78
m
78
m 78
m
78m
78
m
78m
78
m
78
m
78
m
78
m
78m
78m
80
m
80m
80
m
80m
80
m
80
m
80m
80m
80m
80m
80
m
80
m
82
m
82m
82
m
82m
82
m
82
m
82
m
82m
82m
82
m
82
m
82
m
84
m
84m
84
m
84
m
84
m
84
m
84
m
84
m 84m
84m
84m
86
m
86
m
86
m
86
m
86
m
86m
86m
86
m
86
m
86m
86
m
88m
88
m
88m
88m
88
m
88
m
88
m
88
m
88
m
88
m
90
m
90m 9
0m
90
m
90m
90m
90
m
90m
90
m
92m
92
m
92
m
92
m
92m
92
m
92m
92
m
94m
94m
94
m
94m
94
m
94
m
94m
94m
96
m
96
m
96m
96
m
96
m
96m
96m
98
m
98
m
98
m
98
m
98
m
98m
100
m
100
m
100
m
100
m
100
m
100m
102
m
102m
102
m
102
m
102m
102
m
104
m
104m
104
m
104
m
104
m
104m
104
m
106
m
106m
106
m
106
m
106
m
106m
106m
108
m
108
m
108
m
108
m
108m
108
m
108
m
110
m
110
m
110m
110m
110
m
112m
112
m
112
m
112
m
112m
114m
114m
114
m
114m
114
m
116m
116m
116
m
116m
116
m
118
m
118
m
118m
118m
118m
120
m
120
m
120m
120m
122
m
122
m
122
m
122m
124
m
124
m
124
m
124m
126
m
126
m
126m
126m
128
m
128
m
128m
130m
130
m
130m
132
m
132m
134
m
134m
136
m
136m
138
m
138m
140
m
140m
142
m
142m
144
m
146
m
CULTI
VATI
ON
CULTI
VATI
ON
CULTI
VATI
ON
CULTI
VATI
ON
CULTI
VATI
ON
CULTI
VATI
ON
EX
CA
VATI
ON
CULTI
VATI
ON
CULTI
VATI
ON
CULTI
VATI
ON
CULTI
VATI
ON
CULTI
VATI
ON
CULTI
VATI
ON
CULTI
VATI
ON
CA
NAL
499.92
3m305°02'30
"
489.93
7m305°33'57
"
326.9
40m29
9°30'3
0"
337.1
09m
296°
24'23
"
215.
220m
293°
51'18
"
519.92
3m
284°
59'44"
135.7
83m29
6°42'0
1"
109.
870m
293°
21'3
6"
104.
300m
293°
05'2
4"
162.112m
280°15'58"
156.483m
278°30'21"
176.4
02m
297°2
0'45"
225.733m
269°4
6'01"
264.621m
277°43'50"
265.
187m
293°
39'15
"
534.7
77m30
2°06'3
5"
6343.314P.I.
6843.237P.I.
7333.174P.I.
7660.114P.I.
7997.223P.I.
8212.443
P.I.
8732.366
P.I.
8868.149P.I.
8978.020
P.I.
9082.319
P.I.
9244.432
P.I.
9400.915
P.I.
9577.317P.I.
9803.050
P.I.
10067.671P.I.
1033
2.85
8P.I.
10+800
10+700
10+30
0 10+20
0 10+10
0
10+600
10+500
10+400
10+000
8+30
0
8+20
0
8+10
0
8+60
0
8+50
0
8+40
0
8+00
0
7+600 7+500 7+400
7+900
7+800
7+700
9+600
9+500
9+400
9+900
9+800
9+700
9+300
8+90
0
8+800
8+70
0
9+200
9+100
9+00
0
7+300
6+900 6+800 6+700
7+200 7+100 7+000
6+600
6+200
6+500 6+400 6+300
-59000
Y
-62000
Y
-349
5000
X
-63000
Y
-62000
Y
-60000
Y
-60000
Y
-61000
Y
-349
5000
X
-349
9000
X
-349
8000
X
-349
9000
X
-349
8000
X
-349
6000
X
-349
6000
X
-349
7000
X
-349
7000
X
E-TP35
E-TP36
E-TP37
E-TP38
E-TP39
E-TP40
E-TP41
E-TP42
E-TP46
E-TP47
E-TP45
E-TP43
E-TP44
E-TP50
E-TP48
E-TP49
DATE TITLE
REVISION DETAILSDATEREV APPROVED
CHECKED
APPROVED
PROJECT
DRAWN
DESIGNED
PROJECT No. TYPE REVWBS DISC NUMBER
DRAWING No.
SCALE SIZE
A1
.
0001 DRG A
AS SHOWNINFORMATION
NOT FOR CONSTRUCTION
A
AU
DR
WFile
name:
Plot Date:
Office:
E:\A
UR
EC
ON\M
AN
UALS\_
AD
G\V
02\C
UST
OMIS
ATIO
N\A
UT
OC
AD\D
RGS
HTS\A
DG_A1H
T.D
WG
----
CLANWILLIAMBRIDGING STUDY
TEST PIT LAYOUT PLAN
113834 GG
D.BULL
G.DAVIS
G.DAVIS
FOR INFORMATION09.2020
CLIENT
TEST PIT
BAL DAM
50 0 100 200m
SCALE 1:5000 ON A1
AREA
LUTZVILLE CONSERVATIVE
ROUTE
EBENHAESER SCHEME
LEGEND
TAKEN FOR TESTING.
ONLY APPLY TO THE PATH
STAKE VALUES SHOWN 1)
NOTE:
0002
SHEET 02 OF 04
6m
6m
8m
8m10m
10m
10m
12m
12m
12m
12m
12m
14m
14m
14m
14m
14
m
14m
14m
16m
16m
16
m
16
m
16m
16m
16m
18m
18m
18
m
18m
18m
18
m
18
m
18
m
18m
20
m
20m
20m
20
m
20m
20
m
20m
20m
20
m
20
m
22
m
22m
22
m
22m
22m
22
m
22
m
22m
22m
22m
22
m
22m
24
m
24m
24m
24
m
24m
24m
24
m
24
m
24m
24
m
24
m
24m
24m
24m
26
m
26
m
26
m
26m
26m
26m
26m
26
m
26
m
26m
26
m
26
m
26
m
26
m
28m
28
m
28
m
28m
28
m
28
m
28m
28
m
28
m
28
m
28
m
28
m
28
m
28m
28
m
30
m
30m
30
m
30
m
30m
30
m
30m
30
m
30m
30
m 30
m
30
m
30
m
30m
30
m
30m
30
m
30
m
30m
30m
32m
32
m
32m
32m
32m
32m
32m
32
m
32
m
32
m
32
m
32m
32m
32
m32
m
32
m
32m
34
m
34
m
34
m
34m
34m
34
m
34
m
34m
34
m
34
m
34
m
34
m
34m
34
m
34
m34m
34m
34m
36
m
36m
36
m
36m
36
m
36
m
36m
36m
36
m
36
m
36
m
36
m
36
m
36
m
36m
36m
36
m
38m
38m
38m
38m
38m
38
m
38m
38m
38
m
38
m
38
m
38
m
38m
38m
38m
38m
38
m
40m
40
m
40m
40m
40
m
40
m
40m 40m
40
m
40
m40
m
40
m
40
m
40m
40m
40m
40m
42
m
42
m
42m
42
m
42m
42m
42
m
42
m
42
m
42
m
42
m
42
m
42
m
42
m
42
m
42
m
42m
42m
42m
44
m
44
m
44
m
44m
44
m
44
m
44
m
44
m
44
m
44
m
44
m
44
m
44
m
44
m
44m
44
m
44
m
46m
46m
46
m
46m
46
m
46m
46m46m
46m
46m
46
m
46
m
46
m
46m
46m
46
m
46
m
46
m
48
m
48
m
48m
48
m
48m
48m
48
m
48m
48m
48m
48
m
48m
48
m
48
m
48m
48
m
48
m
48
m
50
m
50m
50
m
50
m
50m
50
m
50m
50
m
50
m
50
m
50
m
50
m
50
m
50
m
50
m
50
m
52
m
52
m
52m
52
m
52
m
52m
52
m
52
m
52m
52
m
52
m
52
m
52m
52
m
52
m
52
m
52
m
52
m
54m
54
m
54
m
54m
54m
54
m
54
m
54
m
54
m
54
m
54
m
54
m
54
m
54
m
54
m
54
m
56
m
56
m
56
m
56m
56m
56m
56m
56m
56m
56m
56
m
56
m
56
m
56
m
58
m
58
m
58m
58
m
58m
58m
58m
58
m
58m
58
m
58
m
58
m
58m
58
m
58
m
60
m
60
m
60m
60
m
60m
60
m
60m
60m
60
m
60
m
60
m
60
m
60m
62
m
62m
62m
62m
62
m
62m
62
m
62
m
62
m
62m
64
m
64
m
64m
64
m
64
m
64m
64
m
66m
66m
66
m
66
m
66m
68m
68m
68m
70
m
70m
72
m 72
m
72m
74m
74
m
74m
76m
76m
78m
78m
80
m
RES
CA
RP
OR
T
RES
RES
PL
AY
GR
OU
ND
CA
RP
OR
T
CU
LTI
VA
TI
ON
CU
LTI
VA
TI
ON
CU
LTI
VA
TI
ON
CU
LTI
VA
TI
ON
CU
LTI
VA
TI
ON
CU
LTI
VA
TI
ON
CU
LTI
VA
TI
ON
CU
LTI
VA
TI
ON
CU
LTI
VA
TI
ON
CU
LTI
VA
TI
ON
CU
LTI
VA
TI
ON
CU
LTI
VA
TI
ON
CU
LTI
VA
TI
ON
CU
LTI
VA
TI
ON
CU
LTI
VA
TI
ON
CU
LTI
VA
TI
ON
CU
LTI
VA
TI
ON
CA
NA
L
MH
MH
SP
OR
TS
CO
UR
T
MH MH
MH
MH
MH
MH
MH
MH
MH
MH
MH
MH
MH
MH
MH
CU
LTI
VA
TI
ON
MH
MH
MH
MH
MH
MH
MH
MH
MH
MH
MH
MH
MH
MH
MH
MH
MH
MH
MH
MH
MH
MH
MH
MH
MH
MH
MH
MH
MH
MH
MHM
H
MH
MH
MH
SP
OR
TS FI
EL
D
MH
MH
CA
NA
L
MH
CE
ME
TE
RY
MH
MH
CU
LTI
VA
TI
ON
CU
LTI
VA
TI
ON
CU
LTI
VA
TI
ON
CA
NA
L
CU
LTI
VA
TI
ON
MHM
H
CU
LTI
VA
TI
ON
MH
MH
CU
LTI
VA
TI
ON
CU
LTI
VA
TI
ON
MH
MH
MH
R
RES
RES
CA
NA
L
CA
NA
L
CU
LTI
VA
TI
ON
CU
LTI
VA
TI
ON
CU
LTI
VA
TI
ON
CU
LTI
VA
TI
ON
CU
LTI
VA
TI
ON
CU
LTI
VA
TI
ON
CU
LTI
VA
TI
ON
CU
LTI
VA
TI
ON
RES
R
CU
LTI
VA
TI
ON
CU
LTI
VA
TI
ON
CU
LTI
VA
TI
ON
CU
LTI
VA
TI
ON
CU
LTI
VA
TI
ON
CU
LTI
VA
TI
ON
CU
LTI
VA
TI
ON
CU
LTI
VA
TI
ON
CU
LTI
VA
TI
ON
CU
LTI
VA
TI
ON
CU
LTI
VA
TI
ON
CU
LTI
VA
TI
ON
CU
LTI
VA
TI
ON
CU
LTI
VA
TI
ON
CU
LTI
VA
TI
ON
CU
LTI
VA
TI
ON
CU
LTI
VA
TI
ON
RES
R
RES
RES
RES
R
RES
RES
RES
R
RES
CE
ME
TE
RY
CU
LTI
VA
TI
ON
R
MH
RES
R
MH
R
CU
LTI
VA
TI
ON
CU
LTI
VA
TI
ON
534.7
77m
302°
06'35
"
432.0
02m
302°
47'28
"
374.3
02m
302°
32'51
"
219.5
44m30
4°13'4
0"
251.3
04m30
4°42'2
2"
345.8
15m30
3°19'3
6"
202.5
22m30
3°35'3
1"
137.
560m
301°2
5'48
"
347.2
80
m
273°4
5'17"
323.6
58
m
272°5
7'0
5"
274.196
m
274°4
4'51"
249.174
m
275°4
0'23"
93.628m
344°22'32"
299.890m
284°41'39"
89.0
99
m
269°5
8'2
2"
357.9
18m308°0
5'52"
354.24
0m309°23'45
"
348.268
m313°13'
20"
10867.635P.I.
11299.637P.I.
11673.938P.I.
11893.482P.I.
12144.787P.I.
12490.601P.I.
12693.123P.I.
12830.683P.I.
13177.9
63P.I.
13501.6
22P.I.
13775.817P.I.
14024.991P.I.
14118.619P.I.
14418.509P.I.
14507.6
08P.I.
14865.526P.I.
15219.766P.I.
13+700
13+600
13+500
14+000
13+900
13+800
13+400
13+000
12+900
12+800
13+300
13+200
13+100
15+000
14+900
14+800
15+300
15+200
15+100
14+700
14+300
14+200
14+100
14+600 14
+500
14+400
12+700
11+000 10+900 10+800
11+300 11+200 11+100
10+700 10+600
12+300 12+200 12+100
12+600 12+500 12+400
12+000
11+600 11+500 11+400
11+900 11+800 11+700
15+400
15+500
-66000Y
-66000Y
-67000Y
-65000Y
-64000Y
-63000Y
-65000Y
-64000Y
-349
3000
X
-349
6000
X
-349
6000
X
-349
7000
X
-349
7000
X
-349
5000
X
-349
4000
X
-349
5000
X
-349
4000
X
-63000Y
E-TP56
E-TP57
E-TP55
E-TP53
E-TP54
E-TP61
E-TP62
E-TP60
E-TP58
E-TP59
E-TP51
E-TP52
E-TP50
E-TP49
E-TP63
E-TP
64
E-TP
65
DATE TITLE
REVISION DETAILSDATEREV APPROVED
CHECKED
APPROVED
PROJECT
DRAWN
DESIGNED
PROJECT No. TYPE REVWBS DISC NUMBER
DRAWING No.
SCALE SIZE
A1
.
0001 DRG A
AS SHOWNINFORMATION
NOT FOR CONSTRUCTION
A
AU
DR
WFile
name:
Plot Date:
Office:
E:\A
UR
EC
ON\M
AN
UALS\_
AD
G\V
02\C
UST
OMIS
ATIO
N\A
UT
OC
AD\D
RGS
HTS\A
DG_A1H
T.D
WG
----
CLANWILLIAMBRIDGING STUDY
TEST PIT LAYOUT PLAN
113834 GG
D.BULL
G.DAVIS
G.DAVIS
FOR INFORMATION09.2020
CLIENT
TEST PIT
BAL DAM
50 0 100 200m
SCALE 1:5000 ON A1
AREA
LUTZVILLE CONSERVATIVE
ROUTE
EBENHAESER SCHEME
LEGEND
TAKEN FOR TESTING.
ONLY APPLY TO THE PATH
STAKE VALUES SHOWN 1)
NOTE:
0003
SHEET 03 OF 04

4m
4m
6m
6m
6m
8m
8m
8m
8m
10m
10m
10
m
10m
10
m
12m
12
m
12m
12m
12m
12
m
14m
14m
14m
14
m
14m
14m
16m
16
m
16m
16m
16m
16
m
16m
16m
18m
18m
18
m
18
m
18m
18m
18
m
18m
20m
20
m
20
m
20m
20m
20
m
20
m
20
m
20
m
22m
22
m
22
m
22m
22m
22
m
22m
22
m
22
m
24m
24m
24m
24m
24
m
24
m
24
m
24
m
24
m 26
m26
m
26
m
26
m
26m
26
m
26
m
26
m
26
m
28
m
28
m
28
m
28
m
28
m
28
m
28
m
28
m
28
m
28
m
28
m
28
m
30
m
30m
30
m
30
m
30
m
30
m
30m
30
m
30
m
30m
30
m
32
m
32m
32
m
32
m
32
m
32
m
32
m
32
m
32m
32m
32
m
34m
34
m
34
m
34
m
34
m
34
m
34
m
34
m
34
m
34
m
36m
36
m
36
m
36
m
36
m
36m
36
m
36
m
36m
36
m
38
m
38
m
38
m
38
m
38
m
38
m
38m
38
m
38m
38
m
40
m
40
m
40m
40
m
40
m
40
m
40
m
40
m
40m
40
m
42
m
42
m
42m
42
m
42
m
42
m
42m
42
m
42m
42
m
42
m
44
m
44
m
44
m
44
m
44m
44
m
44
m
44
m
44
m
44m
46
m
46
m
46
m
46m
46
m
46m
46
m
46
m
46m
46
m
46
m
48m
48
m
48
m
48
m
48
m
48
m
48
m
48
m
48
m
48
m
48
m
48m
50m
50
m
50
m
50
m
50
m
50m
50
m50
m
50
m
50
m
50
m
50
m
50
m
52m
52m
52
m
52
m
52
m
52
m
52
m
52
m
52
m
52
m
52m
52
m
52
m
54m
54m
54
m
54
m
54
m
54
m
54
m
54
m
54
m
54m
54m
54
m
54
m
54
m
54
m
56m
56
m
56
m
56
m
56
m
56m
56
m
56
m
56
m
56m
56m
56
m
56
m
56
m
56m
56m
56m 56m
56m
56m
56
m
56
m
58
m
58
m
58
m
58
m
58
m
58
m
58
m
58
m
58
m
58m
58m
58m
58
m
58
m
58m
60
m
60m
60
m
60
m
60
m
60
m
60
m
60
m
60
m
60m
60
m 60m
60m
60
m
60
m
60
m
62m
62
m
62
m
62m
62m
62
m
62
m
62
m
62m
62m
62m
62
m
62
m
62m
62m
64
m
64
m
64m
64
m
64
m
64m
64m
64m
64m
64m
64
m
64m
64m
66m
66
m
66
m
66
m
66
m
66
m
66
m
66
m
66
m
66
m
66m
66m
68
m
68
m
68
m
68m
68
m
68m
68m
68m
68
m
68m
70
m
70
m
70
m
70
m
70m
70m
70
m
70
m
70m
70
m
72
m
72
m
72
m
72
m
72
m
72
m
72m
72
m
72
m
72
m
72
m
74
m
74m
74
m
74m
74
m
74m
74
m
74
m
74
m
74m
74
m
76
m
76
m
76
m
76
m
76
m
76
m
76m
76
m
76
m
76
m
78
m
78
m
78
m
78
m
78
m
78m
78
m
78
m
78m
78
m
80
m
80
m
80
m
80m
80m
80
m
80
m
80
m
80
m
82
m
82m
82m
82
m
82m
82m
82m
82
m
82m
82m
84
m
84m
84
m
84
m
84
m
84m
84
m
84
m
84m
86
m
86
m
86
m
86
m
86m
86
m
86
m
86
m
86
m
88
m
88
m
88m
88
m
88m
88
m
88
m
88
m
88m
90
m
90
m
90
m
90m
90m
90
m
90m
90m
92
m
92m
92
m
92m92
m
92
m
92m
92m
94
m94
m
94
m
94m
94m
94
m
94m
94m
94m
96
m
96
m
96
m
96m
96
m
96
m
96
m
96
m
96m
96
m
98
m
98
m
98
m
98m
98m
98
m
98
m
98
m
98m
98
m
98
m
98
m
98m
100
m
100m
100
m
100
m
100
m
100
m
100
m100
m
100m
102
m
102
m
102m
104
m
104m
CANAL
CANAL
CULTIVATION
CULTIVATION
CULTIVATION
CULTIVATION
CULTIVATION
CULTIVATION
CULTIVATION
CULTIVATION
CULTIVATION
CULTIVATION
CULTIVATION
CULTIVATION
CULTIVATION
CULTIVATION
CULTIVATION
CULTIVATION
CULTIVATION
CULTIVATION
RES
R
RES
RES
R
RES
R
R
R
R
CULTIVATION
CULTIVATION
CULTIVATION
R
CARPORT
R
CULTIVATION
CULTIVATION
CULTIVATION
CULTIVATION
CULTIVATION
CULTIVATION
CULTIVATION
CULTIVATION
CULTIVATION
CULTIVATION
CULTIVATION
MH
R
RES
MH
CULTIVATION
RES
MH
R
CULTIVATION
CULTIVATION
MH
MH
MHMH
348.268m
313°13'20"
363.076m
314°33'41"
397.021m
313°08'17"
234.739m
272°38'30"
225.518m
271°01'33"
166.357
m268
°52'23"
294.923m
312°50'02"
467.4
02
m
214
°38'5
7"
325.132m
311°40'27"
151.417
m
213°19'4
6"
276.4
14m
212
°17'2
6"
189.5
41m
211°0
5'0
4"
185.3
94
m
210
°03'5
7"
244.5
39
m
214
°02'4
8"
211.9
87
m
211°14'19"
149.3
05
m
220°2
4'0
9"
156.8
55
m
221°38'0
0"
241.068m
231°41'58"
269.
160m
250°
02'0
8"
251.6
33m
247°
49'00"
306.
646m
252°
12'4
7"
15219.766P.I.
1556
8.03
4P.I.
1593
1.11
0P.I.
1632
8.13
1P.I.
16562.870P.I.
16788.387P.I.
16954.744P.I.
1724
9.66
7P.I.
17717.
069P.I.
1804
2.201P.I.
18193.6
19P.I.
18470.0
33P.I.
18659.5
74P.I.
18844.9
68P.I.
19089.
507P.I.
19301.4
94P.I.
19450.7
99P.I.
19607.6
54P.I.
19848.722P.I.
2011
7.88
2P.I.
2036
9.51
5P.I.
2067
6.16
1POE
15+30
0
15+200
15+100
15+40
0
19+100
19+000
18+900
19+400
19+300
19+200
18+800
18+400
18+300
18+200
18+700
18+600
18+500
20+40
0
20+3
00
20+2
00
20+67
6 20+60
0
20+50
0
20+10
0
19+700
19+600
19+500
20+00
0
19+90
0
19+800
18+100
16+400
16+30
0
16+20
0
16+700
16+600
16+500
16+10
0
15+70
0
15+60
0
15+50
0
16+00
0
15+90
0
15+80
0
17+700
17+600
17+500
18+000
17+
900
17+
800
17+400
17+00
0
16+900
16+800
17+300 17
+20
0
17+10
0
-70000Y
-69000Y
-71000Y
-70000Y
-69000Y
-67000Y
-67000Y
-68000Y
-68000Y
-71000Y
-3496000X
-3495000X
-3496000X
-3495000X
-3493000X
-3493000X
-3494000X
-3494000X
E-TP77
E-TP78
E-TP76
E-TP74
E-TP75
E-TP82
E-TP81
E-TP79
E-TP80
E-TP67
E-TP68
E-TP66
E-TP64
E-TP65
E-TP72
E-TP73
E-TP71E-TP69E-TP70
DATE TITLE
REVISION DETAILSDATEREV APPROVED
CHECKED
APPROVED
PROJECT
DRAWN
DESIGNED
PROJECT No. TYPE REVWBS DISC NUMBER
DRAWING No.
SCALE SIZE
A1
.
0001 DRG A
AS SHOWNINFORMATION
NOT FOR CONSTRUCTION
A
AU
DR
WFile
name:
Plot Date:
Office:
E:\A
UR
EC
ON\M
AN
UALS\_
AD
G\V
02\C
UST
OMIS
ATIO
N\A
UT
OC
AD\D
RGS
HTS\A
DG_A1H
T.D
WG
----
CLANWILLIAMBRIDGING STUDY
TEST PIT LAYOUT PLAN
113834 GG
D.BULL
G.DAVIS
G.DAVIS
FOR INFORMATION09.2020
CLIENT
TEST PIT
BAL DAM
50 0 100 200m
SCALE 1:5000 ON A1
AREA
LUTZVILLE CONSERVATIVE
ROUTE
EBENHAESER SCHEME
LEGEND
TAKEN FOR TESTING.
ONLY APPLY TO THE PATH
STAKE VALUES SHOWN 1)
NOTE:
SHEET 04 OF 04
0004
Post Feasibility Bridging Study for the Proposed Bulk Conveyance Infrastructure from the Raised Clanwilliam Dam (WP0485). Geotechnical Investigations Report. Vol III: Ebenhaeser Scheme (P WMA 09/E10/00/0417/8)
Directorate: Water Resource Development Planning April 2021 Page 99
Appendix B Summary of Soil and Rock Profile Description Terminology


Post Feasibility Bridging Study for the Proposed Bulk Conveyance Infrastructure from the Raised Clanwilliam Dam (WP0485). Geotechnical Investigations Report. Vol III: Ebenhaeser Scheme (P WMA 09/E10/00/0417/8)
Directorate: Water Resource Development Planning April 2021 Page 100
STANDARD DESCRIPTIONS USED IN SOIL PROFILING
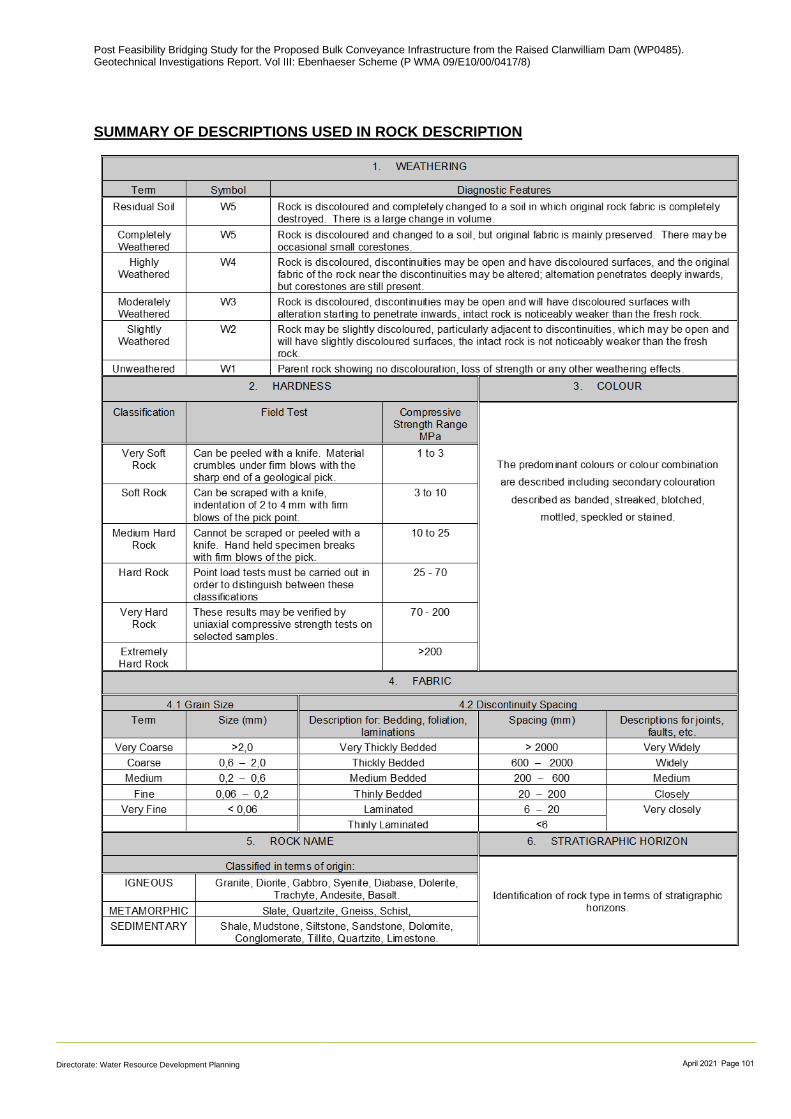
Post Feasibility Bridging Study for the Proposed Bulk Conveyance Infrastructure from the Raised Clanwilliam Dam (WP0485). Geotechnical Investigations Report. Vol III: Ebenhaeser Scheme (P WMA 09/E10/00/0417/8)
Directorate: Water Resource Development Planning April 2021 Page 101
SUMMARY OF DESCRIPTIONS USED IN ROCK DESCRIPTION

Post Feasibility Bridging Study for the Proposed Bulk Conveyance Infrastructure from the Raised Clanwilliam Dam (WP0485). Geotechnical Investigations Report. Vol III: Ebenhaeser Scheme (P WMA 09/E10/00/0417/8)
Directorate: Water Resource Development Planning April 2021 Page 102
Appendix C Test Pit Profiles


Scale1:25
0.00 Slightly moist, orange brown, loose to medium dense,pinholed, silty SAND. Aeolian
NOTES:
1. No refusal, profiled exposed road cut.2. No groundwater seepage was encountered.3. Sidewalls stable.4. No sample taken.
Y COORD:
ELEVATION:
EBENHAESER SCHEME.GPJ
DATE PROFILED:
- 56066
- 3500000
INCLINATION:
DIAM:
DATE DRILLED:
X COORD:
Department of Water and Sanitation
HOLE No: E-TP01
DWS
Bridging Study Clanwilliam Dam
CONTRACTOR:
MACHINE:
PROFILED BY:
TYPE SET BY: 7/28/2020
K Myburgh and G Davis 7/28/2020
Ebenhaeser Scheme
Rep
ort I
D: _
ZA
TR
AIL
PIT
LO
G |
| Pro
ject
: EB
EN
HA
ES
ER
SC
HE
ME
.GP
J ||
Lib
rary
: GIN
T S
TD
AG
S 4
_0_
SA
.GLB
|| D
ate:
Oct
ober
1, 2
020
JOB NUMBER: 113834
Sheet 1 of 1
HOLE No: E-TP01
0.00
3.00

Scale1:25
0.00 Slightly moist, light brown, loose, pinholed, silty SAND.Aeolian or hillwash
Slightly moist, light brown blotchd yellow and red, verydense, pinholed, calcretised and ferruginised siltySAND. Pedogenic material
NOTES:
1. No refusal, profiled exposed road cut about 85m SWof E-TP02.2. No groundwater seepage was encountered.3. Sidewalls stable.4. No sample taken.
Y COORD:
ELEVATION:
EBENHAESER SCHEME.GPJ
DATE PROFILED:
- 56169
- 3500132
INCLINATION:
DIAM:
DATE DRILLED:
X COORD:
Department of Water and Sanitation
HOLE No: E-TP02
DWS
Bridging Study Clanwilliam Dam
CONTRACTOR:
MACHINE:
PROFILED BY:
TYPE SET BY: 7/28/2020
K Myburgh and G Davis 7/28/2020
Ebenhaeser Scheme
Rep
ort I
D: _
ZA
TR
AIL
PIT
LO
G |
| Pro
ject
: EB
EN
HA
ES
ER
SC
HE
ME
.GP
J ||
Lib
rary
: GIN
T S
TD
AG
S 4
_0_
SA
.GLB
|| D
ate:
Oct
ober
1, 2
020
JOB NUMBER: 113834
Sheet 1 of 1
HOLE No: E-TP02
0.00
0.50
1.50
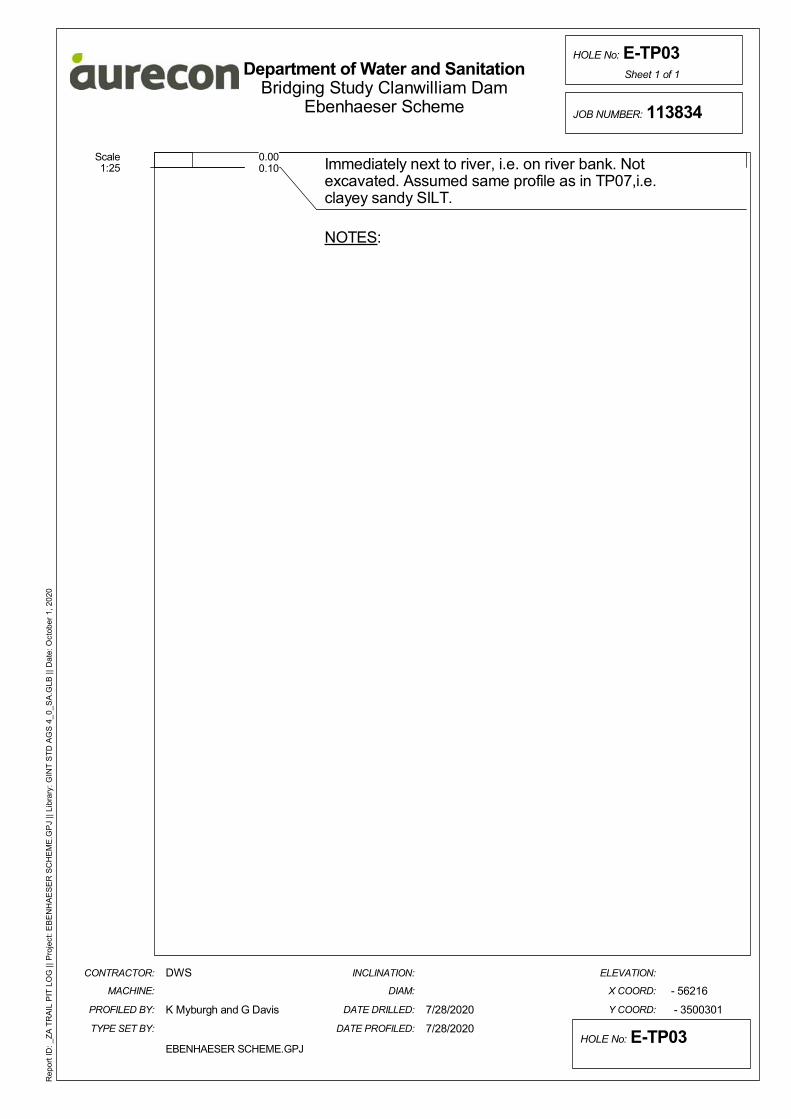
Scale1:25
0.00 Immediately next to river, i.e. on river bank. Notexcavated. Assumed same profile as in TP07,i.e.clayey sandy SILT.
NOTES:
Y COORD:
ELEVATION:
EBENHAESER SCHEME.GPJ
DATE PROFILED:
- 56216
- 3500301
INCLINATION:
DIAM:
DATE DRILLED:
X COORD:
Department of Water and Sanitation
HOLE No: E-TP03
DWS
Bridging Study Clanwilliam Dam
CONTRACTOR:
MACHINE:
PROFILED BY:
TYPE SET BY: 7/28/2020
K Myburgh and G Davis 7/28/2020
Ebenhaeser Scheme
Rep
ort I
D: _
ZA
TR
AIL
PIT
LO
G |
| Pro
ject
: EB
EN
HA
ES
ER
SC
HE
ME
.GP
J ||
Lib
rary
: GIN
T S
TD
AG
S 4
_0_
SA
.GLB
|| D
ate:
Oct
ober
1, 2
020
JOB NUMBER: 113834
Sheet 1 of 1
HOLE No: E-TP03
0.000.10

Scale1:25
0.00 Immediately next to river, i.e. on river bank. Notexcavated. Assumed same profile as in TP07,i.e.clayey sandy SILT.
NOTES:
Y COORD:
ELEVATION:
EBENHAESER SCHEME.GPJ
DATE PROFILED:
- 56193
- 3500305
INCLINATION:
DIAM:
DATE DRILLED:
X COORD:
Department of Water and Sanitation
HOLE No: E-TP04
DWS
Bridging Study Clanwilliam Dam
CONTRACTOR:
MACHINE:
PROFILED BY:
TYPE SET BY: 7/28/2020
K Myburgh and G Davis 7/28/2020
Ebenhaeser Scheme
Rep
ort I
D: _
ZA
TR
AIL
PIT
LO
G |
| Pro
ject
: EB
EN
HA
ES
ER
SC
HE
ME
.GP
J ||
Lib
rary
: GIN
T S
TD
AG
S 4
_0_
SA
.GLB
|| D
ate:
Oct
ober
1, 2
020
JOB NUMBER: 113834
Sheet 1 of 1
HOLE No: E-TP04
0.000.10
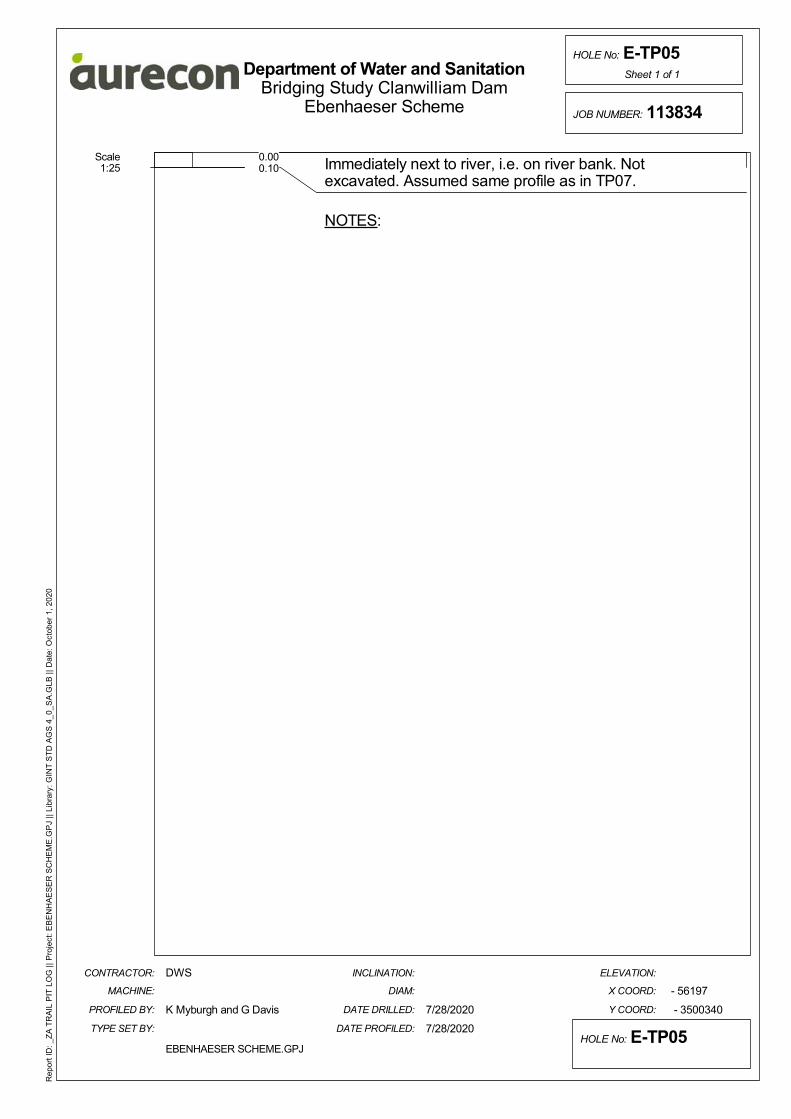
Scale1:25
0.00 Immediately next to river, i.e. on river bank. Notexcavated. Assumed same profile as in TP07.
NOTES:
Y COORD:
ELEVATION:
EBENHAESER SCHEME.GPJ
DATE PROFILED:
- 56197
- 3500340
INCLINATION:
DIAM:
DATE DRILLED:
X COORD:
Department of Water and Sanitation
HOLE No: E-TP05
DWS
Bridging Study Clanwilliam Dam
CONTRACTOR:
MACHINE:
PROFILED BY:
TYPE SET BY: 7/28/2020
K Myburgh and G Davis 7/28/2020
Ebenhaeser Scheme
Rep
ort I
D: _
ZA
TR
AIL
PIT
LO
G |
| Pro
ject
: EB
EN
HA
ES
ER
SC
HE
ME
.GP
J ||
Lib
rary
: GIN
T S
TD
AG
S 4
_0_
SA
.GLB
|| D
ate:
Oct
ober
1, 2
020
JOB NUMBER: 113834
Sheet 1 of 1
HOLE No: E-TP05
0.000.10

Scale1:25
0.00 Immediately next to river, i.e. on river bank. Notexcavated. Assumed same profile as in TP07.
NOTES:
Y COORD:
ELEVATION:
EBENHAESER SCHEME.GPJ
DATE PROFILED:
- 56220
- 3500336
INCLINATION:
DIAM:
DATE DRILLED:
X COORD:
Department of Water and Sanitation
HOLE No: E-TP06
DWS
Bridging Study Clanwilliam Dam
CONTRACTOR:
MACHINE:
PROFILED BY:
TYPE SET BY: 7/28/2020
K Myburgh and G Davis 7/28/2020
Ebenhaeser Scheme
Rep
ort I
D: _
ZA
TR
AIL
PIT
LO
G |
| Pro
ject
: EB
EN
HA
ES
ER
SC
HE
ME
.GP
J ||
Lib
rary
: GIN
T S
TD
AG
S 4
_0_
SA
.GLB
|| D
ate:
Oct
ober
1, 2
020
JOB NUMBER: 113834
Sheet 1 of 1
HOLE No: E-TP06
0.000.10

Scale1:25
0.00 Wet, brown blotched red, soft to firm, intact, clayeysandy SILT. Made ground next to vineyards
Wet, dark brown, firm, intact, clayey sandy SILT.Alluvium
NOTES:
1. No refusal, pit terminated at 3.0m.2. Seepage encountered at 2.3m, area is on flood plainand was recentely underwater.3. Sidewalls collapsed.4. Bulk and small bags sampled between 0.3-3.0m.5. Test pit moved from original location due to pondingof water.
Y COORD:
ELEVATION:
EBENHAESER SCHEME.GPJ
DATE PROFILED:
- 56404
- 3500747
INCLINATION:
DIAM:
DATE DRILLED:
X COORD:
Department of Water and Sanitation
HOLE No: E-TP07
DWS
Bridging Study Clanwilliam Dam
CONTRACTOR:
MACHINE:
PROFILED BY:
TYPE SET BY: 7/28/2020
K Myburgh and G Davis 7/28/2020
Ebenhaeser Scheme
Rep
ort I
D: _
ZA
TR
AIL
PIT
LO
G |
| Pro
ject
: EB
EN
HA
ES
ER
SC
HE
ME
.GP
J ||
Lib
rary
: GIN
T S
TD
AG
S 4
_0_
SA
.GLB
|| D
ate:
Oct
ober
1, 2
020
JOB NUMBER: 113834
Sheet 1 of 1
HOLE No: E-TP07
0.00
0.30
3.00
sample

Scale1:25
0.00 Grey and yellow green, highly weathered, dipping at 30degrees, foliated, micaceous soft rock and highly fissilein places. Schist
NOTES:
1. Test pit not excavated, profiled outcrop on slopealong the existing canal.2. No groundwater seepage was encountered.3. Sidewalls stable.4. No sample taken.
Y COORD:
ELEVATION:
EBENHAESER SCHEME.GPJ
DATE PROFILED:
- 56562
- 3500514
INCLINATION:
DIAM:
DATE DRILLED:
X COORD:
Department of Water and Sanitation
HOLE No: E-TP08
DWS
Bell 315SK TLB
Bridging Study Clanwilliam Dam
CONTRACTOR:
MACHINE:
PROFILED BY:
TYPE SET BY: 7/28/2020
K Myburgh and G Davis 7/28/2020
Ebenhaeser Scheme
Rep
ort I
D: _
ZA
TR
AIL
PIT
LO
G |
| Pro
ject
: EB
EN
HA
ES
ER
SC
HE
ME
.GP
J ||
Lib
rary
: GIN
T S
TD
AG
S 4
_0_
SA
.GLB
|| D
ate:
Oct
ober
1, 2
020
JOB NUMBER: 113834
Sheet 1 of 1
HOLE No: E-TP08
0.00
1.50

Scale1:25
0.00 Slightly moist, orange brown , loose to medium dense,pinholed, SAND. Aeolian
NOTES:
1. No refusal, test pit terminated at end of reach.2. No groundwater seepage was encountered.3. Slight sidewall collapse. .4. Bulk and small bag sample between 0.0-3.0m.
Y COORD:
ELEVATION:
EBENHAESER SCHEME.GPJ
DATE PROFILED:
- 56719
- 3500508
INCLINATION:
DIAM:
DATE DRILLED:
X COORD:
Department of Water and Sanitation
HOLE No: E-TP09
DWS
Bell 315SK TLB
Bridging Study Clanwilliam Dam
CONTRACTOR:
MACHINE:
PROFILED BY:
TYPE SET BY: 7/28/2020
K Myburgh and G Davis 7/28/2020
Ebenhaeser Scheme
Rep
ort I
D: _
ZA
TR
AIL
PIT
LO
G |
| Pro
ject
: EB
EN
HA
ES
ER
SC
HE
ME
.GP
J ||
Lib
rary
: GIN
T S
TD
AG
S 4
_0_
SA
.GLB
|| D
ate:
Oct
ober
1, 2
020
JOB NUMBER: 113834
Sheet 1 of 1
HOLE No: E-TP09
0.00
3.00
sample

Scale1:25
0.00 Slightly moist, orange brown , loose, pinholed,ferruginised SAND. Pedogenic material
Slightly moist, yellow and orange brown with whitepockets, dense, intact, calcretised and ferruginisedSAND with hardpan calcrete gravel sized particles.Pedogenic material from terrace gravels
Slightly moist, red brown, dense to very dense,honeycomb, nodular fine to medium gravel sizedferruginised SAND. Pedogenic material from terracegravels
Slightly moist, orange and red brown, dense, intact,ferruginised and calcritised SAND. Pedogenic material
NOTES:
1. Difficults excavation.2. No groundwater seepage was encountered.3. Sidewalls stable.4. Bulk and small bag sampled between 1.0-2.0m.
Y COORD:
ELEVATION:
EBENHAESER SCHEME.GPJ
DATE PROFILED:
- 56714
- 3501122
INCLINATION:
DIAM:
DATE DRILLED:
X COORD:
Department of Water and Sanitation
HOLE No: E-TP10
DWS
Bell 315SK TLB
Bridging Study Clanwilliam Dam
CONTRACTOR:
MACHINE:
PROFILED BY:
TYPE SET BY: 7/29/2020
K Myburgh and G Davis 7/29/2020
Ebenhaeser Scheme
Rep
ort I
D: _
ZA
TR
AIL
PIT
LO
G |
| Pro
ject
: EB
EN
HA
ES
ER
SC
HE
ME
.GP
J ||
Lib
rary
: GIN
T S
TD
AG
S 4
_0_
SA
.GLB
|| D
ate:
Oct
ober
1, 2
020
JOB NUMBER: 113834
Sheet 1 of 1
HOLE No: E-TP10
0.00
0.40
0.90
2.00
2.30
sample
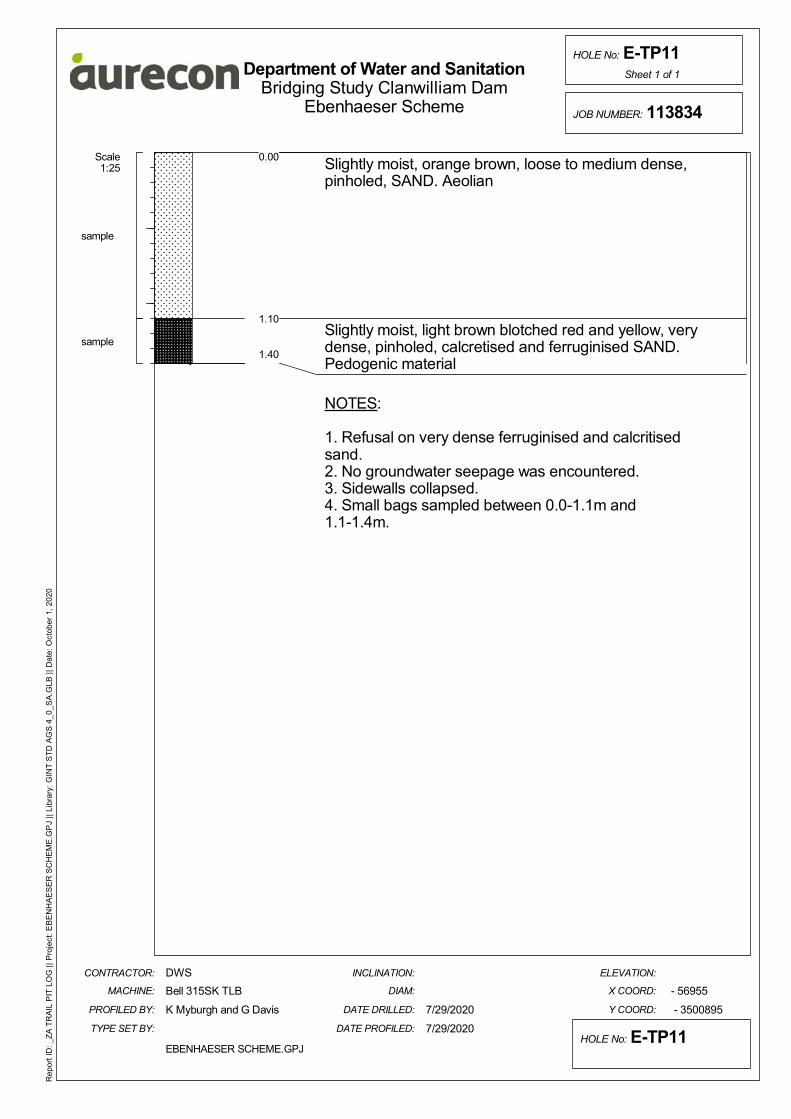
Scale1:25
0.00 Slightly moist, orange brown, loose to medium dense,pinholed, SAND. Aeolian
Slightly moist, light brown blotched red and yellow, verydense, pinholed, calcretised and ferruginised SAND.Pedogenic material
NOTES:
1. Refusal on very dense ferruginised and calcritisedsand.2. No groundwater seepage was encountered.3. Sidewalls collapsed.4. Small bags sampled between 0.0-1.1m and1.1-1.4m.
Y COORD:
ELEVATION:
EBENHAESER SCHEME.GPJ
DATE PROFILED:
- 56955
- 3500895
INCLINATION:
DIAM:
DATE DRILLED:
X COORD:
Department of Water and Sanitation
HOLE No: E-TP11
DWS
Bell 315SK TLB
Bridging Study Clanwilliam Dam
CONTRACTOR:
MACHINE:
PROFILED BY:
TYPE SET BY: 7/29/2020
K Myburgh and G Davis 7/29/2020
Ebenhaeser Scheme
Rep
ort I
D: _
ZA
TR
AIL
PIT
LO
G |
| Pro
ject
: EB
EN
HA
ES
ER
SC
HE
ME
.GP
J ||
Lib
rary
: GIN
T S
TD
AG
S 4
_0_
SA
.GLB
|| D
ate:
Oct
ober
1, 2
020
JOB NUMBER: 113834
Sheet 1 of 1
HOLE No: E-TP11
0.00
1.10
1.40
sample
sample
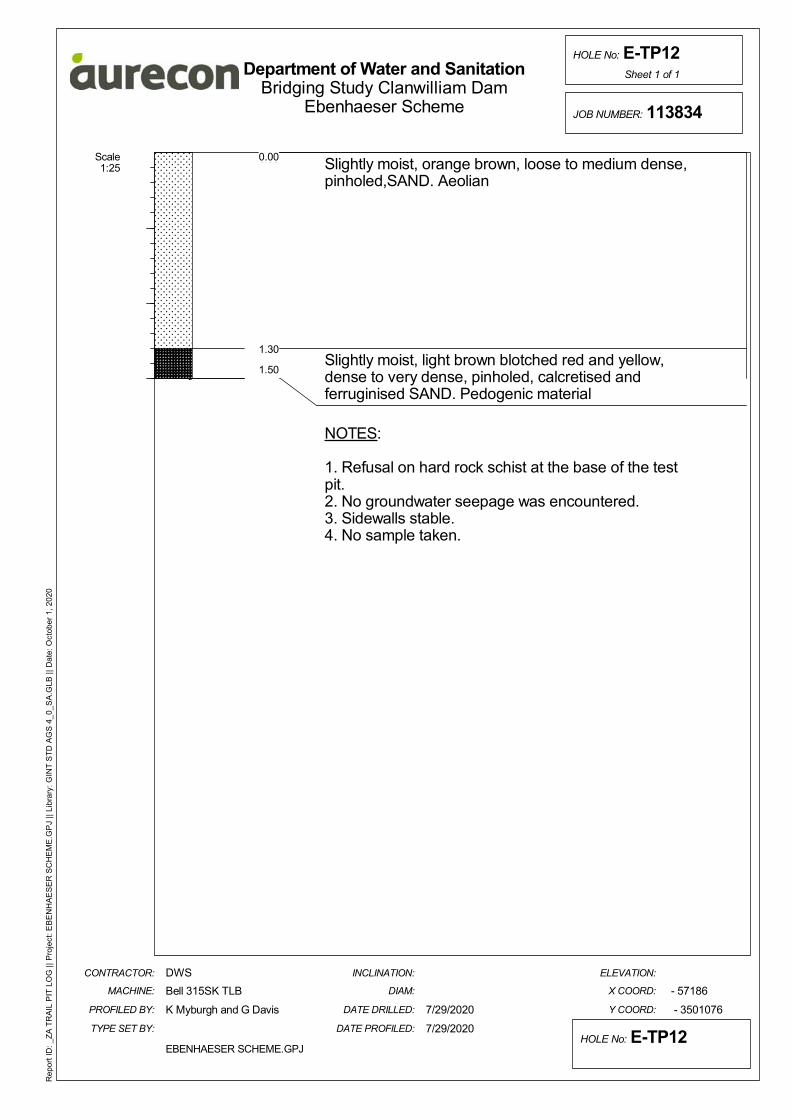
Scale1:25
0.00 Slightly moist, orange brown, loose to medium dense,pinholed,SAND. Aeolian
Slightly moist, light brown blotched red and yellow,dense to very dense, pinholed, calcretised andferruginised SAND. Pedogenic material
NOTES:
1. Refusal on hard rock schist at the base of the testpit.2. No groundwater seepage was encountered.3. Sidewalls stable.4. No sample taken.
Y COORD:
ELEVATION:
EBENHAESER SCHEME.GPJ
DATE PROFILED:
- 57186
- 3501076
INCLINATION:
DIAM:
DATE DRILLED:
X COORD:
Department of Water and Sanitation
HOLE No: E-TP12
DWS
Bell 315SK TLB
Bridging Study Clanwilliam Dam
CONTRACTOR:
MACHINE:
PROFILED BY:
TYPE SET BY: 7/29/2020
K Myburgh and G Davis 7/29/2020
Ebenhaeser Scheme
Rep
ort I
D: _
ZA
TR
AIL
PIT
LO
G |
| Pro
ject
: EB
EN
HA
ES
ER
SC
HE
ME
.GP
J ||
Lib
rary
: GIN
T S
TD
AG
S 4
_0_
SA
.GLB
|| D
ate:
Oct
ober
1, 2
020
JOB NUMBER: 113834
Sheet 1 of 1
HOLE No: E-TP12
0.00
1.30
1.50
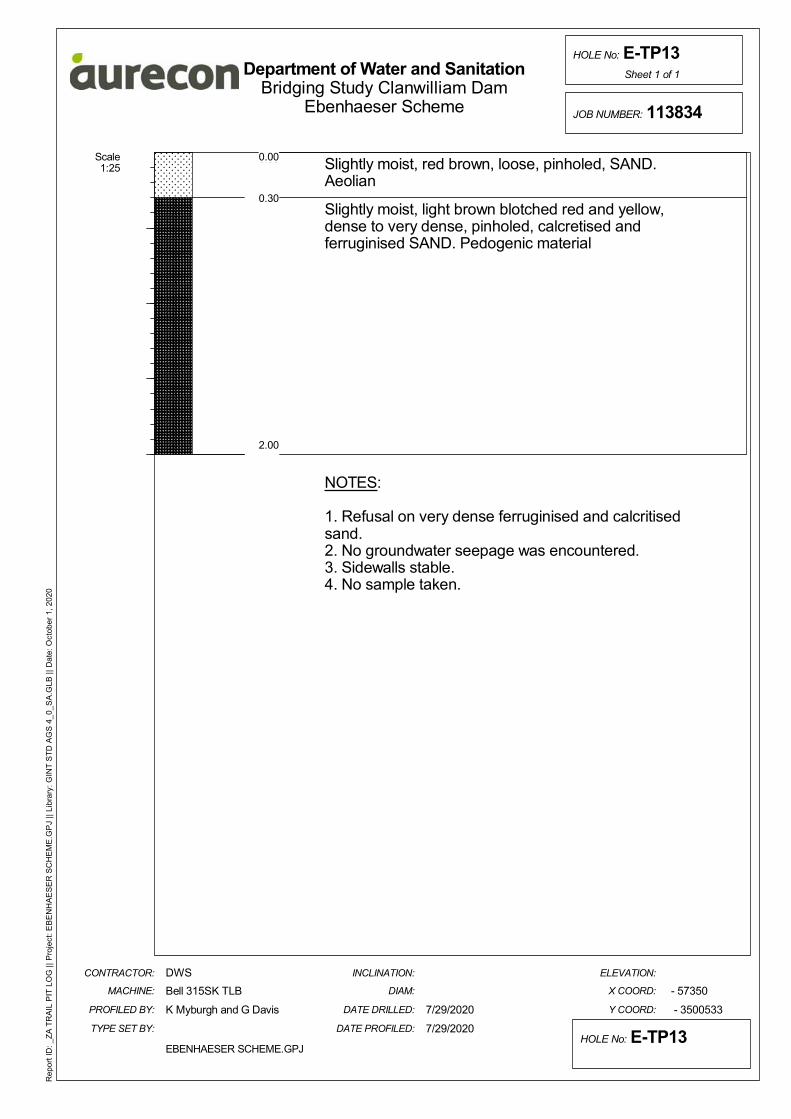
Scale1:25
0.00 Slightly moist, red brown, loose, pinholed, SAND.Aeolian
Slightly moist, light brown blotched red and yellow,dense to very dense, pinholed, calcretised andferruginised SAND. Pedogenic material
NOTES:
1. Refusal on very dense ferruginised and calcritisedsand.2. No groundwater seepage was encountered.3. Sidewalls stable.4. No sample taken.
Y COORD:
ELEVATION:
EBENHAESER SCHEME.GPJ
DATE PROFILED:
- 57350
- 3500533
INCLINATION:
DIAM:
DATE DRILLED:
X COORD:
Department of Water and Sanitation
HOLE No: E-TP13
DWS
Bell 315SK TLB
Bridging Study Clanwilliam Dam
CONTRACTOR:
MACHINE:
PROFILED BY:
TYPE SET BY: 7/29/2020
K Myburgh and G Davis 7/29/2020
Ebenhaeser Scheme
Rep
ort I
D: _
ZA
TR
AIL
PIT
LO
G |
| Pro
ject
: EB
EN
HA
ES
ER
SC
HE
ME
.GP
J ||
Lib
rary
: GIN
T S
TD
AG
S 4
_0_
SA
.GLB
|| D
ate:
Oct
ober
1, 2
020
JOB NUMBER: 113834
Sheet 1 of 1
HOLE No: E-TP13
0.00
0.30
2.00
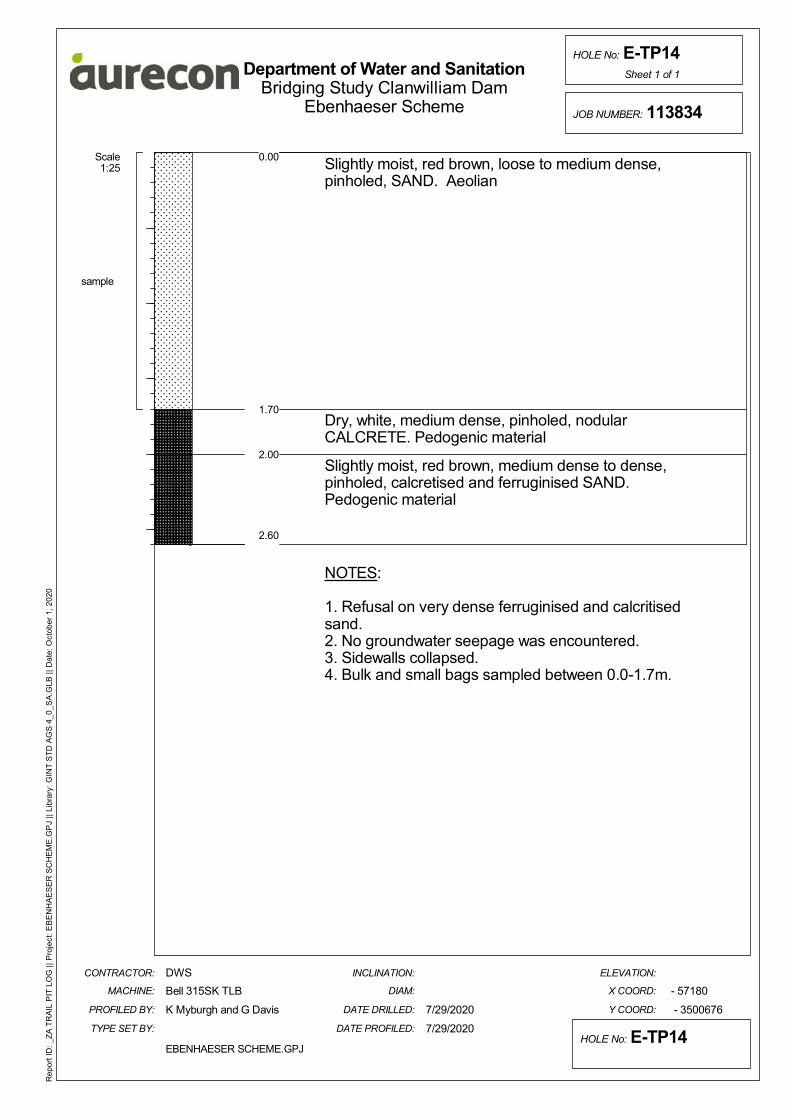
Scale1:25
0.00 Slightly moist, red brown, loose to medium dense,pinholed, SAND. Aeolian
Dry, white, medium dense, pinholed, nodularCALCRETE. Pedogenic material
Slightly moist, red brown, medium dense to dense,pinholed, calcretised and ferruginised SAND.Pedogenic material
NOTES:
1. Refusal on very dense ferruginised and calcritisedsand.2. No groundwater seepage was encountered.3. Sidewalls collapsed.4. Bulk and small bags sampled between 0.0-1.7m.
Y COORD:
ELEVATION:
EBENHAESER SCHEME.GPJ
DATE PROFILED:
- 57180
- 3500676
INCLINATION:
DIAM:
DATE DRILLED:
X COORD:
Department of Water and Sanitation
HOLE No: E-TP14
DWS
Bell 315SK TLB
Bridging Study Clanwilliam Dam
CONTRACTOR:
MACHINE:
PROFILED BY:
TYPE SET BY: 7/29/2020
K Myburgh and G Davis 7/29/2020
Ebenhaeser Scheme
Rep
ort I
D: _
ZA
TR
AIL
PIT
LO
G |
| Pro
ject
: EB
EN
HA
ES
ER
SC
HE
ME
.GP
J ||
Lib
rary
: GIN
T S
TD
AG
S 4
_0_
SA
.GLB
|| D
ate:
Oct
ober
1, 2
020
JOB NUMBER: 113834
Sheet 1 of 1
HOLE No: E-TP14
0.00
1.70
2.00
2.60
sample

Scale1:25
0.00 Slightly moist, orange brown, loose to medium dense,pinholed, SAND. Aeolian
Slightly moist, light brown blotched red and yellow,dense to very dense, pinholed, calcretised andferruginised SAND. Pedogenic material
NOTES:
1. Refusal on very dense ferruginised and calcritisedsand.2. No groundwater seepage was encountered.3. Sidewalls collapsed.4. Bulk and small bags sampled between 0.0-1.4m.
Y COORD:
ELEVATION:
EBENHAESER SCHEME.GPJ
DATE PROFILED:
- 56984
- 3500417
INCLINATION:
DIAM:
DATE DRILLED:
X COORD:
Department of Water and Sanitation
HOLE No: E-TP15
DWS
Bell 315SK TLB
Bridging Study Clanwilliam Dam
CONTRACTOR:
MACHINE:
PROFILED BY:
TYPE SET BY: 7/29/2020
K Myburgh and G Davis 7/29/2020
Ebenhaeser Scheme
Rep
ort I
D: _
ZA
TR
AIL
PIT
LO
G |
| Pro
ject
: EB
EN
HA
ES
ER
SC
HE
ME
.GP
J ||
Lib
rary
: GIN
T S
TD
AG
S 4
_0_
SA
.GLB
|| D
ate:
Oct
ober
1, 2
020
JOB NUMBER: 113834
Sheet 1 of 1
HOLE No: E-TP15
0.00
0.60
1.40
sample
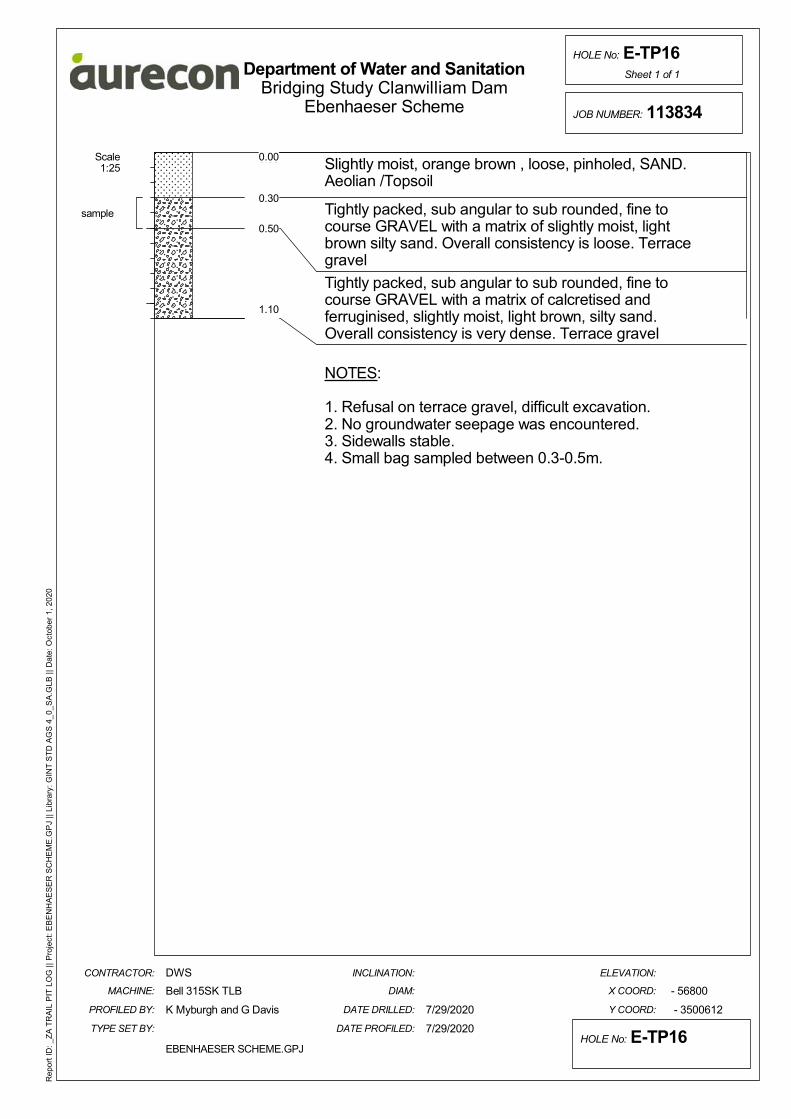
Scale1:25
0.00 Slightly moist, orange brown , loose, pinholed, SAND.Aeolian /Topsoil
Tightly packed, sub angular to sub rounded, fine tocourse GRAVEL with a matrix of slightly moist, lightbrown silty sand. Overall consistency is loose. Terracegravel
Tightly packed, sub angular to sub rounded, fine tocourse GRAVEL with a matrix of calcretised andferruginised, slightly moist, light brown, silty sand.Overall consistency is very dense. Terrace gravel
NOTES:
1. Refusal on terrace gravel, difficult excavation.2. No groundwater seepage was encountered.3. Sidewalls stable.4. Small bag sampled between 0.3-0.5m.
Y COORD:
ELEVATION:
EBENHAESER SCHEME.GPJ
DATE PROFILED:
- 56800
- 3500612
INCLINATION:
DIAM:
DATE DRILLED:
X COORD:
Department of Water and Sanitation
HOLE No: E-TP16
DWS
Bell 315SK TLB
Bridging Study Clanwilliam Dam
CONTRACTOR:
MACHINE:
PROFILED BY:
TYPE SET BY: 7/29/2020
K Myburgh and G Davis 7/29/2020
Ebenhaeser Scheme
Rep
ort I
D: _
ZA
TR
AIL
PIT
LO
G |
| Pro
ject
: EB
EN
HA
ES
ER
SC
HE
ME
.GP
J ||
Lib
rary
: GIN
T S
TD
AG
S 4
_0_
SA
.GLB
|| D
ate:
Oct
ober
1, 2
020
JOB NUMBER: 113834
Sheet 1 of 1
HOLE No: E-TP16
0.00
0.30
0.50
1.10
sample
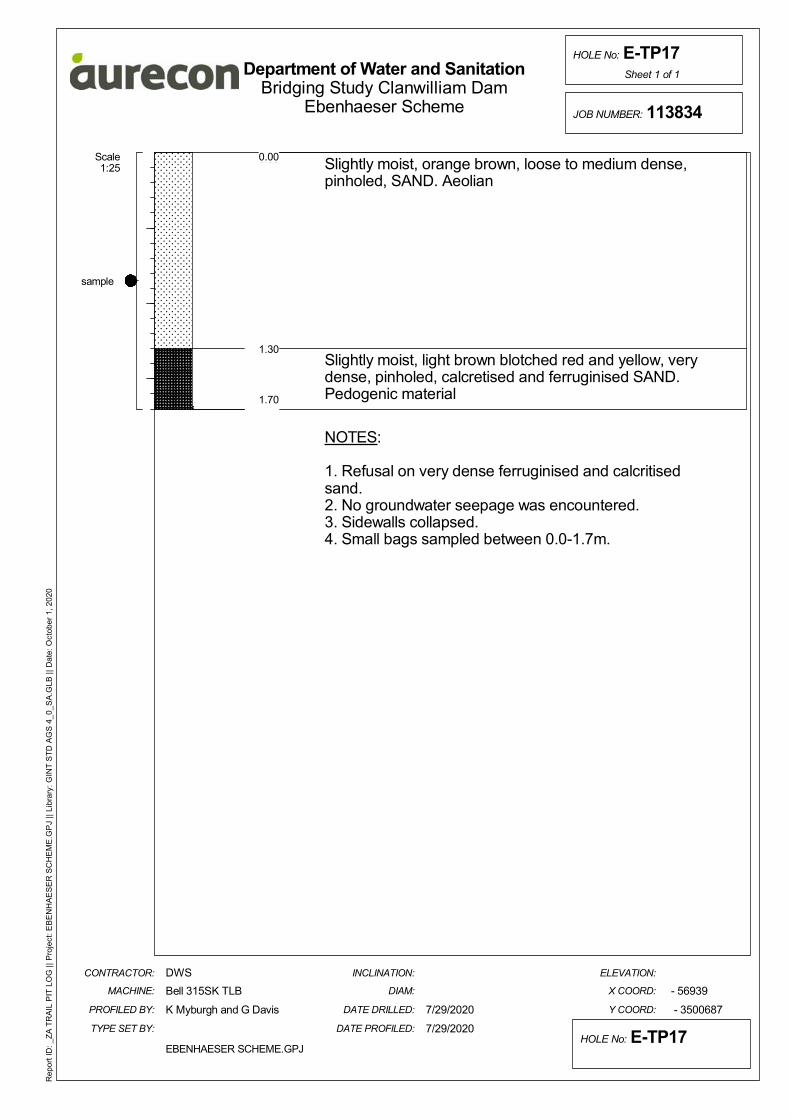
Scale1:25
0.00 Slightly moist, orange brown, loose to medium dense,pinholed, SAND. Aeolian
Slightly moist, light brown blotched red and yellow, verydense, pinholed, calcretised and ferruginised SAND.Pedogenic material
NOTES:
1. Refusal on very dense ferruginised and calcritisedsand.2. No groundwater seepage was encountered.3. Sidewalls collapsed.4. Small bags sampled between 0.0-1.7m.
Y COORD:
ELEVATION:
EBENHAESER SCHEME.GPJ
DATE PROFILED:
- 56939
- 3500687
INCLINATION:
DIAM:
DATE DRILLED:
X COORD:
Department of Water and Sanitation
HOLE No: E-TP17
DWS
Bell 315SK TLB
Bridging Study Clanwilliam Dam
CONTRACTOR:
MACHINE:
PROFILED BY:
TYPE SET BY: 7/29/2020
K Myburgh and G Davis 7/29/2020
Ebenhaeser Scheme
Rep
ort I
D: _
ZA
TR
AIL
PIT
LO
G |
| Pro
ject
: EB
EN
HA
ES
ER
SC
HE
ME
.GP
J ||
Lib
rary
: GIN
T S
TD
AG
S 4
_0_
SA
.GLB
|| D
ate:
Oct
ober
1, 2
020
JOB NUMBER: 113834
Sheet 1 of 1
HOLE No: E-TP17
0.00
1.30
1.70
sample
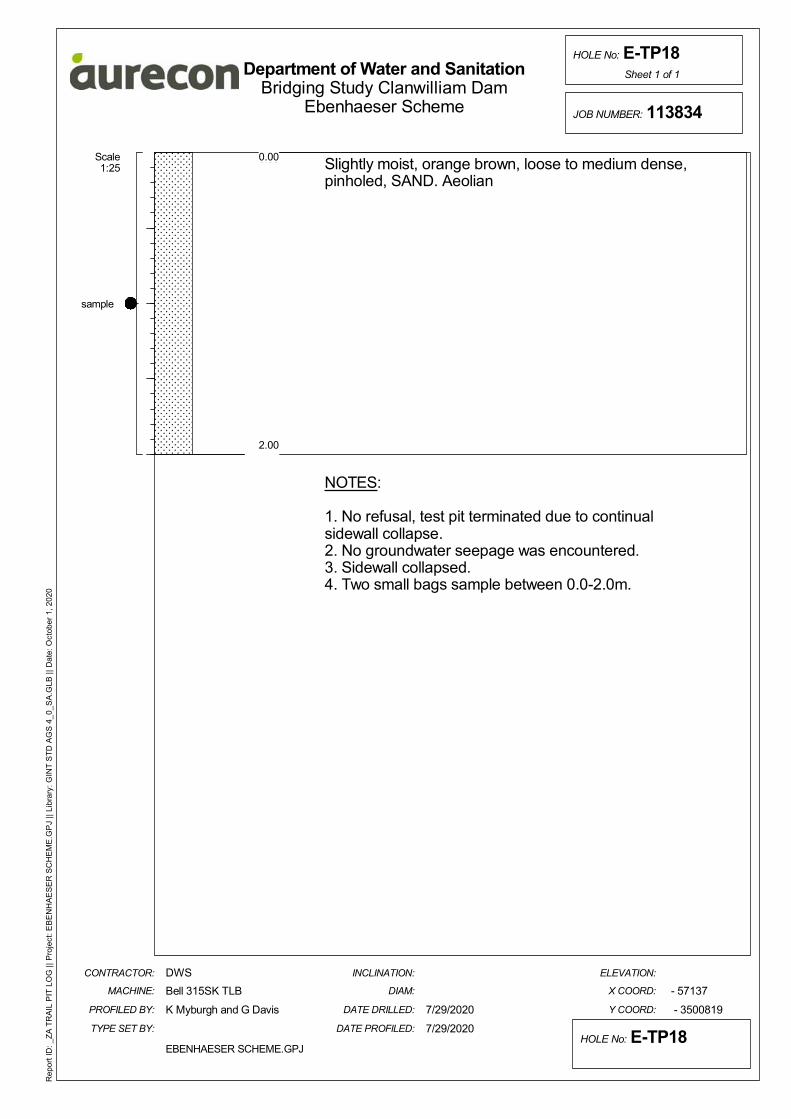
Scale1:25
0.00 Slightly moist, orange brown, loose to medium dense,pinholed, SAND. Aeolian
NOTES:
1. No refusal, test pit terminated due to continualsidewall collapse.2. No groundwater seepage was encountered.3. Sidewall collapsed.4. Two small bags sample between 0.0-2.0m.
Y COORD:
ELEVATION:
EBENHAESER SCHEME.GPJ
DATE PROFILED:
- 57137
- 3500819
INCLINATION:
DIAM:
DATE DRILLED:
X COORD:
Department of Water and Sanitation
HOLE No: E-TP18
DWS
Bell 315SK TLB
Bridging Study Clanwilliam Dam
CONTRACTOR:
MACHINE:
PROFILED BY:
TYPE SET BY: 7/29/2020
K Myburgh and G Davis 7/29/2020
Ebenhaeser Scheme
Rep
ort I
D: _
ZA
TR
AIL
PIT
LO
G |
| Pro
ject
: EB
EN
HA
ES
ER
SC
HE
ME
.GP
J ||
Lib
rary
: GIN
T S
TD
AG
S 4
_0_
SA
.GLB
|| D
ate:
Oct
ober
1, 2
020
JOB NUMBER: 113834
Sheet 1 of 1
HOLE No: E-TP18
0.00
2.00
sample
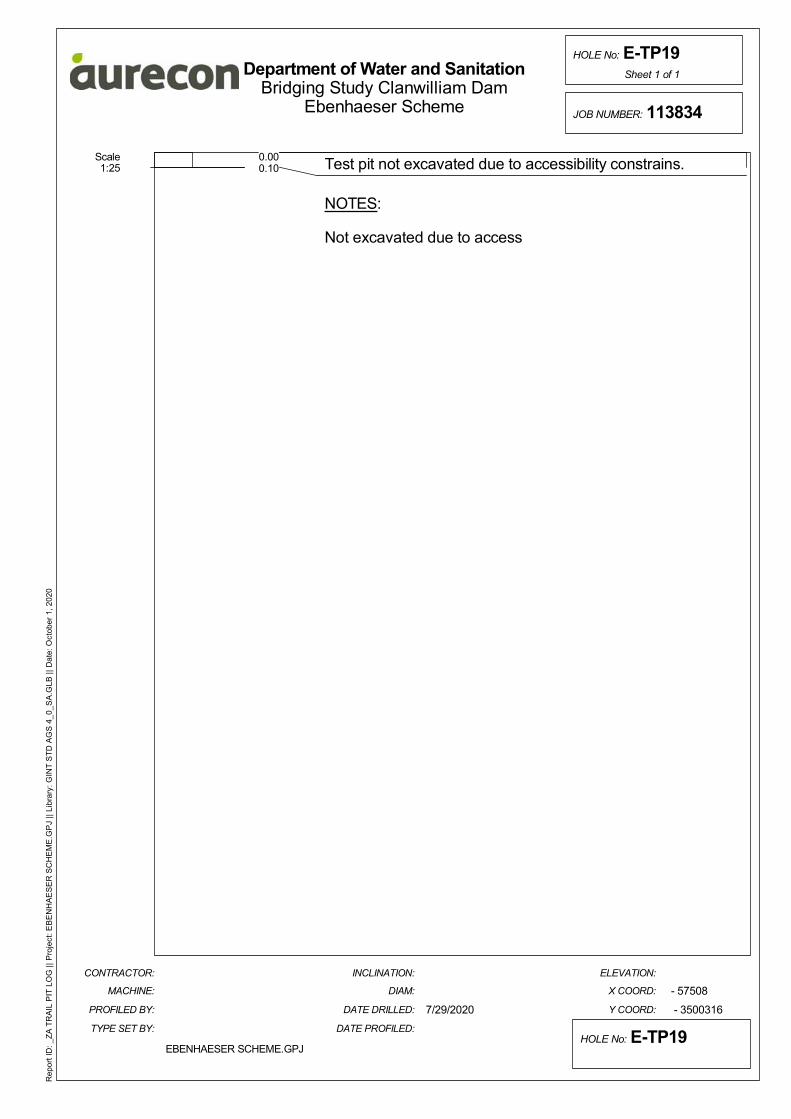
Scale1:25
0.00 Test pit not excavated due to accessibility constrains.
NOTES:
Not excavated due to access
Y COORD:
ELEVATION:
EBENHAESER SCHEME.GPJ
DATE PROFILED:
- 57508
- 3500316
INCLINATION:
DIAM:
DATE DRILLED:
X COORD:
Department of Water and Sanitation
HOLE No: E-TP19
Bridging Study Clanwilliam Dam
CONTRACTOR:
MACHINE:
PROFILED BY:
TYPE SET BY:
7/29/2020
Ebenhaeser Scheme
Rep
ort I
D: _
ZA
TR
AIL
PIT
LO
G |
| Pro
ject
: EB
EN
HA
ES
ER
SC
HE
ME
.GP
J ||
Lib
rary
: GIN
T S
TD
AG
S 4
_0_
SA
.GLB
|| D
ate:
Oct
ober
1, 2
020
JOB NUMBER: 113834
Sheet 1 of 1
HOLE No: E-TP19
0.000.10
Scale1:25
0.00 Test pit not excavated due to accessibility constrains.
NOTES:
Not excavated due to access
Y COORD:
ELEVATION:
EBENHAESER SCHEME.GPJ
DATE PROFILED:
- 57791
- 3500420
INCLINATION:
DIAM:
DATE DRILLED:
X COORD:
Department of Water and Sanitation
HOLE No: E-TP20
Bridging Study Clanwilliam Dam
CONTRACTOR:
MACHINE:
PROFILED BY:
TYPE SET BY:
7/29/2020
Ebenhaeser Scheme
Rep
ort I
D: _
ZA
TR
AIL
PIT
LO
G |
| Pro
ject
: EB
EN
HA
ES
ER
SC
HE
ME
.GP
J ||
Lib
rary
: GIN
T S
TD
AG
S 4
_0_
SA
.GLB
|| D
ate:
Oct
ober
1, 2
020
JOB NUMBER: 113834
Sheet 1 of 1
HOLE No: E-TP20
0.000.10
Scale1:25
0.00 Slightly moist, light brown , loose, intact, silty SAND.Colluvium
Grey and yellow green, highly weathered,sub-horizontally dipping, foliated, micaceous very softto soft rock and highly fissile. Schist
Grey and yellow green, highly to moderately weathered,sub-horizontally dipping, foliated, micaceous soft tomedium hard rock. Schist
NOTES:
1. Refusal on soft to medium hard schist.2. No groundwater seepage was encountered.3. Sidewall stable.4. No sample taken.
Y COORD:
ELEVATION:
EBENHAESER SCHEME.GPJ
DATE PROFILED:
- 58165
- 3500626
INCLINATION:
DIAM:
DATE DRILLED:
X COORD:
Department of Water and Sanitation
HOLE No: E-TP21
DWS
Bell 315SK TLB
Bridging Study Clanwilliam Dam
CONTRACTOR:
MACHINE:
PROFILED BY:
TYPE SET BY: 7/28/2020
K Myburgh and G Davis 7/28/2020
Ebenhaeser Scheme
Rep
ort I
D: _
ZA
TR
AIL
PIT
LO
G |
| Pro
ject
: EB
EN
HA
ES
ER
SC
HE
ME
.GP
J ||
Lib
rary
: GIN
T S
TD
AG
S 4
_0_
SA
.GLB
|| D
ate:
Oct
ober
1, 2
020
JOB NUMBER: 113834
Sheet 1 of 1
HOLE No: E-TP21
0.00
0.15
0.50
0.70
Scale1:25
0.00 Slightly moist, red brown, loose to medium dense,pinholed, SAND. Aeolian
Slightly moist, red brown blotched yellow, mediumdense, pinholed, calcretised and ferrugunisd SAND.Pedogenic material
NOTES:
1. Refusal on assumed hardpan calcrete, but holecollapsed.2. No groundwater seepage was encountered.3. Sidewall collapsed.4. No sample taken.
Y COORD:
ELEVATION:
EBENHAESER SCHEME.GPJ
DATE PROFILED:
- 58266
- 3500145
INCLINATION:
DIAM:
DATE DRILLED:
X COORD:
Department of Water and Sanitation
HOLE No: E-TP22
DWS
Bell 315SK TLB
Bridging Study Clanwilliam Dam
CONTRACTOR:
MACHINE:
PROFILED BY:
TYPE SET BY: 7/27/2020
K Myburgh and G Davis 7/27/2020
Ebenhaeser Scheme
Rep
ort I
D: _
ZA
TR
AIL
PIT
LO
G |
| Pro
ject
: EB
EN
HA
ES
ER
SC
HE
ME
.GP
J ||
Lib
rary
: GIN
T S
TD
AG
S 4
_0_
SA
.GLB
|| D
ate:
Oct
ober
1, 2
020
JOB NUMBER: 113834
Sheet 1 of 1
HOLE No: E-TP22
0.00
1.70
2.00

Scale1:25
0.00 Slightly moist, orange brown, loose to medium dense,pinholed, SAND. Aeolian
NOTES:
1. No refusal, terminated due to continual sidewallcollapse.2. No groundwater seepage was encountered.3. Sidewall collapsed.4. No sample taken.
Y COORD:
ELEVATION:
EBENHAESER SCHEME.GPJ
DATE PROFILED:
- 58440
- 3499887
INCLINATION:
DIAM:
DATE DRILLED:
X COORD:
Department of Water and Sanitation
HOLE No: E-TP23
DWS
Bell 315SK TLB
Bridging Study Clanwilliam Dam
CONTRACTOR:
MACHINE:
PROFILED BY:
TYPE SET BY: 7/27/2020
K Myburgh and G Davis 7/27/2020
Ebenhaeser Scheme
Rep
ort I
D: _
ZA
TR
AIL
PIT
LO
G |
| Pro
ject
: EB
EN
HA
ES
ER
SC
HE
ME
.GP
J ||
Lib
rary
: GIN
T S
TD
AG
S 4
_0_
SA
.GLB
|| D
ate:
Oct
ober
1, 2
020
JOB NUMBER: 113834
Sheet 1 of 1
HOLE No: E-TP23
0.00
2.50
Scale1:25
0.00 Slightly moist, orange brown, loose to medium dense,pinholed, SAND. Aeolian
Slightly moist, brown, dense, intact, calcretised andferruginised sand, gravels are calcretised andferruginised SAND and quartzite. Pedogenic material
NOTES:
1. Refusal on very dense ferruginised and calcritisedgravel layer.2. No groundwater seepage was encountered.3. Sidewall collapsed.4. No sample taken.
Y COORD:
ELEVATION:
EBENHAESER SCHEME.GPJ
DATE PROFILED:
- 58511
- 3499819
INCLINATION:
DIAM:
DATE DRILLED:
X COORD:
Department of Water and Sanitation
HOLE No: E-TP24
DWS
Bell 315SK TLB
Bridging Study Clanwilliam Dam
CONTRACTOR:
MACHINE:
PROFILED BY:
TYPE SET BY: 7/27/2020
K Myburgh and G Davis 7/27/2020
Ebenhaeser Scheme
Rep
ort I
D: _
ZA
TR
AIL
PIT
LO
G |
| Pro
ject
: EB
EN
HA
ES
ER
SC
HE
ME
.GP
J ||
Lib
rary
: GIN
T S
TD
AG
S 4
_0_
SA
.GLB
|| D
ate:
Oct
ober
1, 2
020
JOB NUMBER: 113834
Sheet 1 of 1
HOLE No: E-TP24
0.00
0.700.80
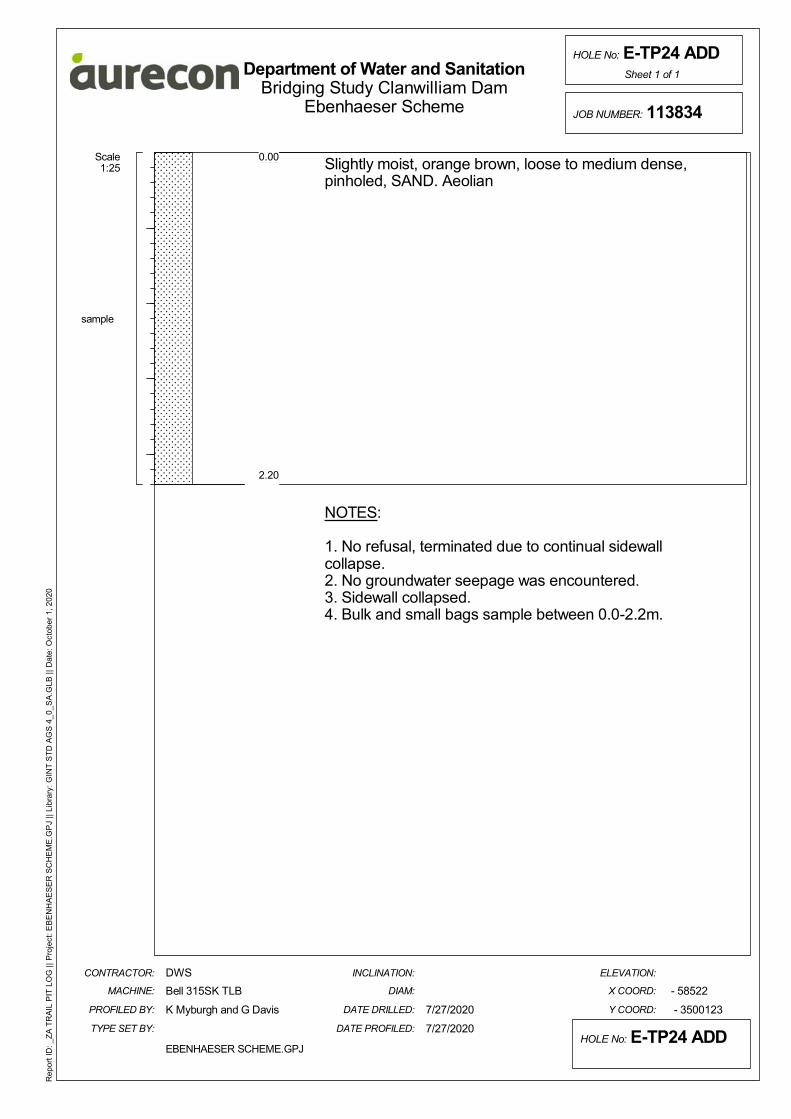
Scale1:25
0.00 Slightly moist, orange brown, loose to medium dense,pinholed, SAND. Aeolian
NOTES:
1. No refusal, terminated due to continual sidewallcollapse.2. No groundwater seepage was encountered.3. Sidewall collapsed.4. Bulk and small bags sample between 0.0-2.2m.
Y COORD:
ELEVATION:
EBENHAESER SCHEME.GPJ
DATE PROFILED:
- 58522
- 3500123
INCLINATION:
DIAM:
DATE DRILLED:
X COORD:
Department of Water and Sanitation
HOLE No: E-TP24 ADD
DWS
Bell 315SK TLB
Bridging Study Clanwilliam Dam
CONTRACTOR:
MACHINE:
PROFILED BY:
TYPE SET BY: 7/27/2020
K Myburgh and G Davis 7/27/2020
Ebenhaeser Scheme
Rep
ort I
D: _
ZA
TR
AIL
PIT
LO
G |
| Pro
ject
: EB
EN
HA
ES
ER
SC
HE
ME
.GP
J ||
Lib
rary
: GIN
T S
TD
AG
S 4
_0_
SA
.GLB
|| D
ate:
Oct
ober
1, 2
020
JOB NUMBER: 113834
Sheet 1 of 1
HOLE No: E-TP24 ADD
0.00
2.20
sample
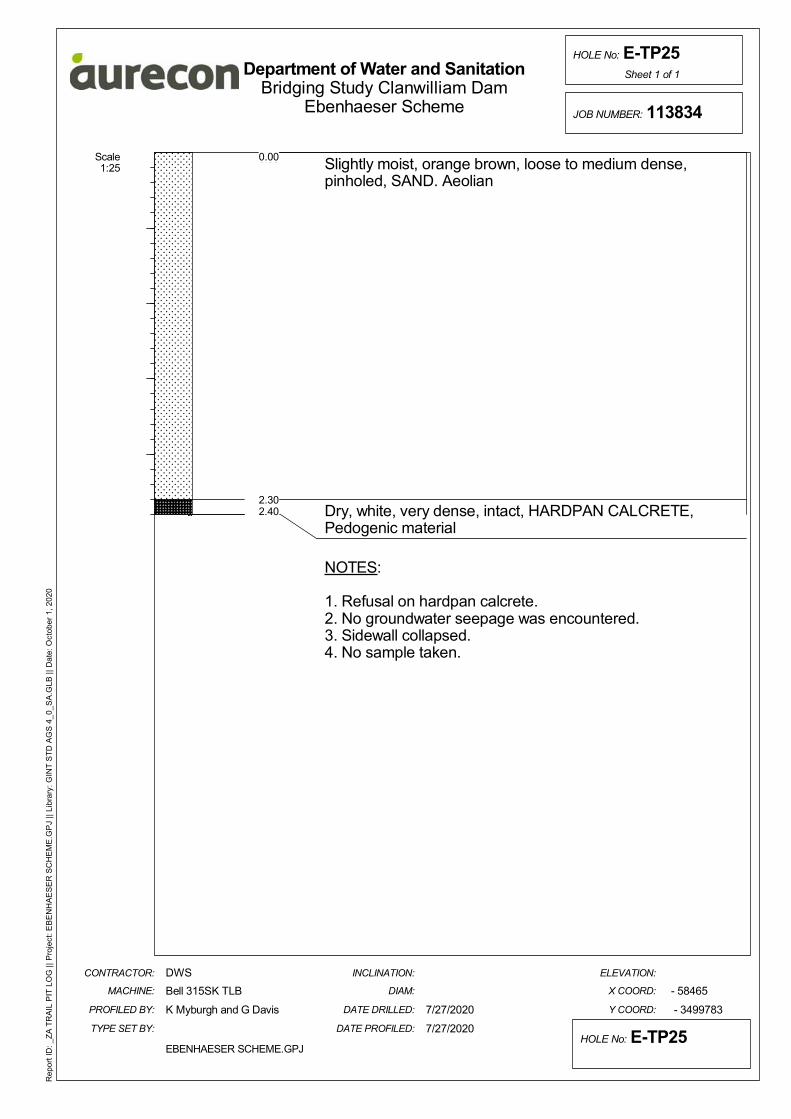
Scale1:25
0.00 Slightly moist, orange brown, loose to medium dense,pinholed, SAND. Aeolian
Dry, white, very dense, intact, HARDPAN CALCRETE,Pedogenic material
NOTES:
1. Refusal on hardpan calcrete.2. No groundwater seepage was encountered.3. Sidewall collapsed.4. No sample taken.
Y COORD:
ELEVATION:
EBENHAESER SCHEME.GPJ
DATE PROFILED:
- 58465
- 3499783
INCLINATION:
DIAM:
DATE DRILLED:
X COORD:
Department of Water and Sanitation
HOLE No: E-TP25
DWS
Bell 315SK TLB
Bridging Study Clanwilliam Dam
CONTRACTOR:
MACHINE:
PROFILED BY:
TYPE SET BY: 7/27/2020
K Myburgh and G Davis 7/27/2020
Ebenhaeser Scheme
Rep
ort I
D: _
ZA
TR
AIL
PIT
LO
G |
| Pro
ject
: EB
EN
HA
ES
ER
SC
HE
ME
.GP
J ||
Lib
rary
: GIN
T S
TD
AG
S 4
_0_
SA
.GLB
|| D
ate:
Oct
ober
1, 2
020
JOB NUMBER: 113834
Sheet 1 of 1
HOLE No: E-TP25
0.00
2.302.40
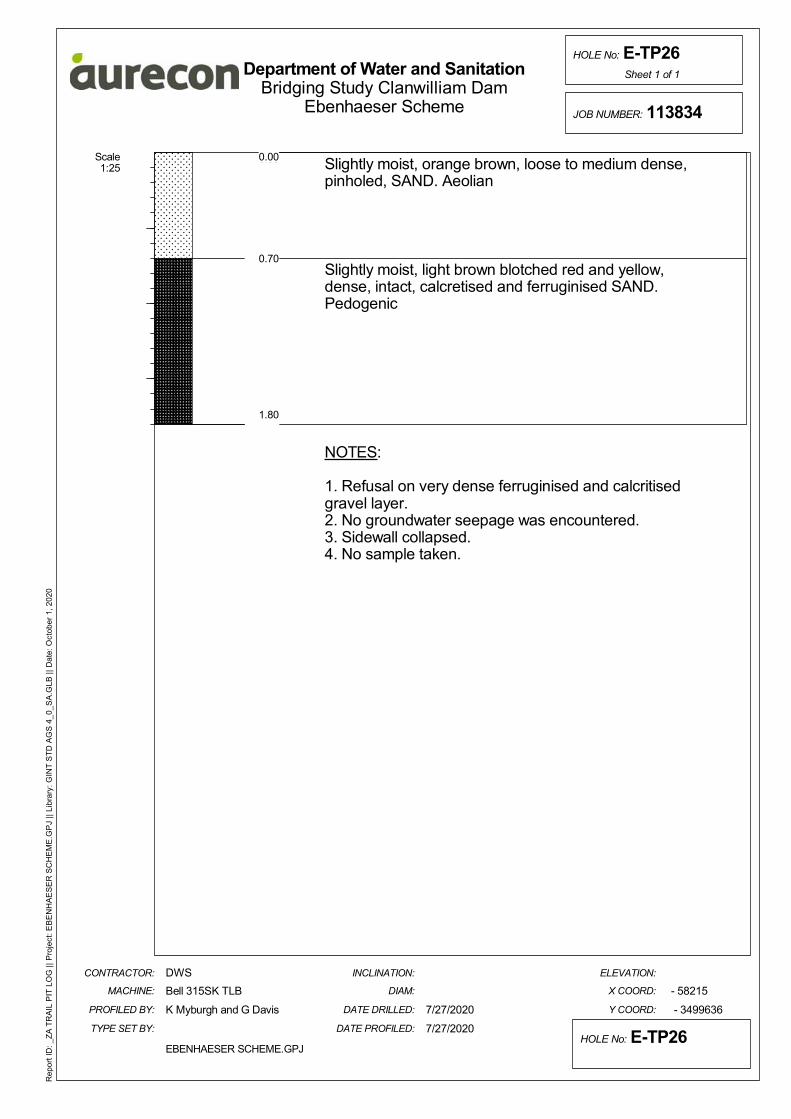
Scale1:25
0.00 Slightly moist, orange brown, loose to medium dense,pinholed, SAND. Aeolian
Slightly moist, light brown blotched red and yellow,dense, intact, calcretised and ferruginised SAND.Pedogenic
NOTES:
1. Refusal on very dense ferruginised and calcritisedgravel layer.2. No groundwater seepage was encountered.3. Sidewall collapsed.4. No sample taken.
Y COORD:
ELEVATION:
EBENHAESER SCHEME.GPJ
DATE PROFILED:
- 58215
- 3499636
INCLINATION:
DIAM:
DATE DRILLED:
X COORD:
Department of Water and Sanitation
HOLE No: E-TP26
DWS
Bell 315SK TLB
Bridging Study Clanwilliam Dam
CONTRACTOR:
MACHINE:
PROFILED BY:
TYPE SET BY: 7/27/2020
K Myburgh and G Davis 7/27/2020
Ebenhaeser Scheme
Rep
ort I
D: _
ZA
TR
AIL
PIT
LO
G |
| Pro
ject
: EB
EN
HA
ES
ER
SC
HE
ME
.GP
J ||
Lib
rary
: GIN
T S
TD
AG
S 4
_0_
SA
.GLB
|| D
ate:
Oct
ober
1, 2
020
JOB NUMBER: 113834
Sheet 1 of 1
HOLE No: E-TP26
0.00
0.70
1.80
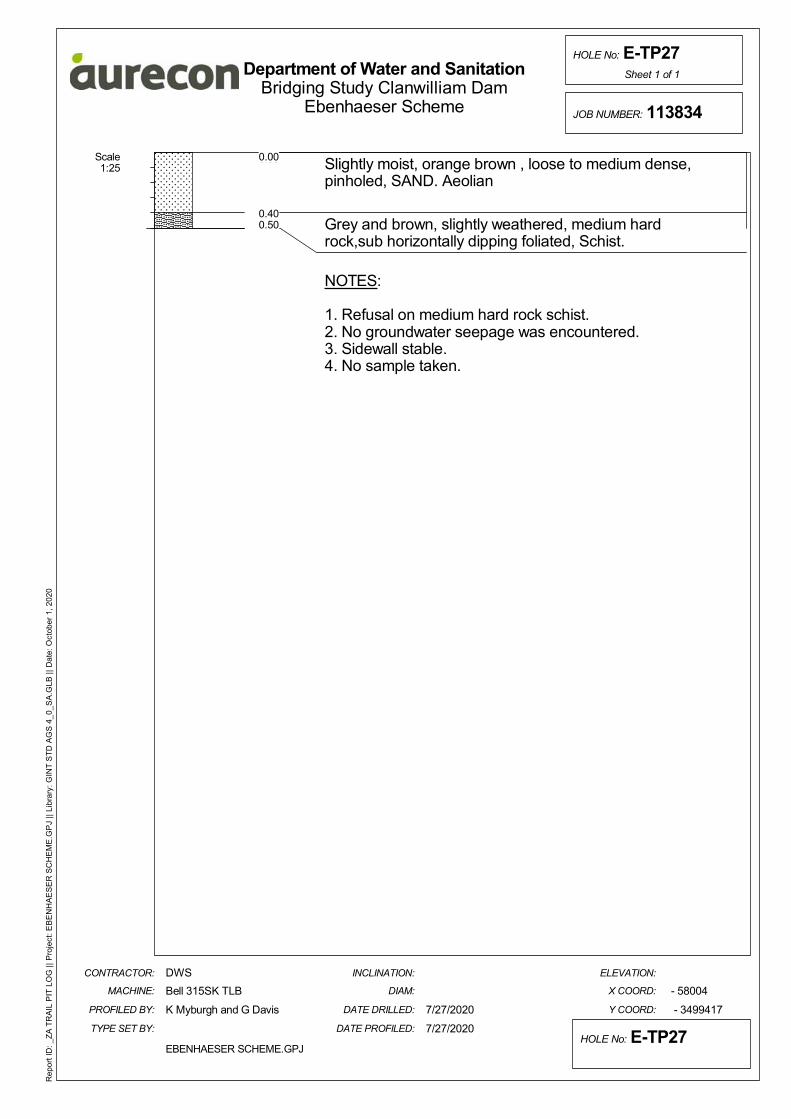
Scale1:25
0.00 Slightly moist, orange brown , loose to medium dense,pinholed, SAND. Aeolian
Grey and brown, slightly weathered, medium hardrock,sub horizontally dipping foliated, Schist.
NOTES:
1. Refusal on medium hard rock schist.2. No groundwater seepage was encountered.3. Sidewall stable.4. No sample taken.
Y COORD:
ELEVATION:
EBENHAESER SCHEME.GPJ
DATE PROFILED:
- 58004
- 3499417
INCLINATION:
DIAM:
DATE DRILLED:
X COORD:
Department of Water and Sanitation
HOLE No: E-TP27
DWS
Bell 315SK TLB
Bridging Study Clanwilliam Dam
CONTRACTOR:
MACHINE:
PROFILED BY:
TYPE SET BY: 7/27/2020
K Myburgh and G Davis 7/27/2020
Ebenhaeser Scheme
Rep
ort I
D: _
ZA
TR
AIL
PIT
LO
G |
| Pro
ject
: EB
EN
HA
ES
ER
SC
HE
ME
.GP
J ||
Lib
rary
: GIN
T S
TD
AG
S 4
_0_
SA
.GLB
|| D
ate:
Oct
ober
1, 2
020
JOB NUMBER: 113834
Sheet 1 of 1
HOLE No: E-TP27
0.00
0.400.50
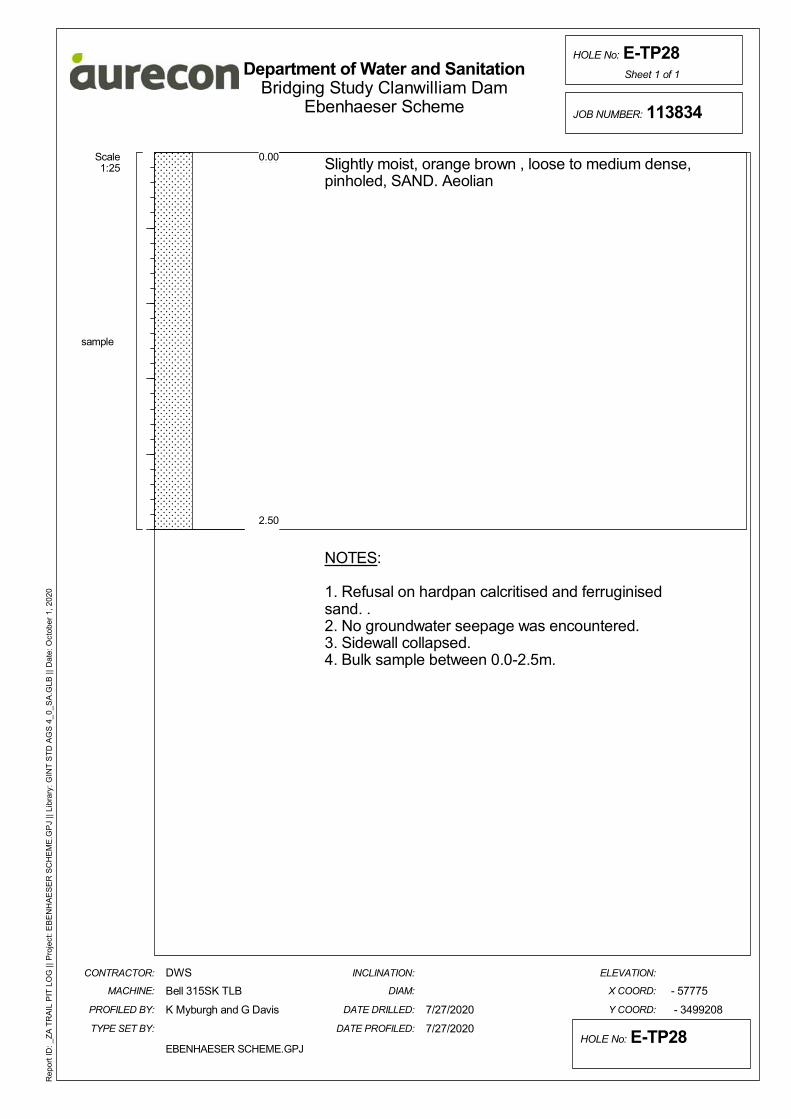
Scale1:25
0.00 Slightly moist, orange brown , loose to medium dense,pinholed, SAND. Aeolian
NOTES:
1. Refusal on hardpan calcritised and ferruginisedsand. .2. No groundwater seepage was encountered.3. Sidewall collapsed.4. Bulk sample between 0.0-2.5m.
Y COORD:
ELEVATION:
EBENHAESER SCHEME.GPJ
DATE PROFILED:
- 57775
- 3499208
INCLINATION:
DIAM:
DATE DRILLED:
X COORD:
Department of Water and Sanitation
HOLE No: E-TP28
DWS
Bell 315SK TLB
Bridging Study Clanwilliam Dam
CONTRACTOR:
MACHINE:
PROFILED BY:
TYPE SET BY: 7/27/2020
K Myburgh and G Davis 7/27/2020
Ebenhaeser Scheme
Rep
ort I
D: _
ZA
TR
AIL
PIT
LO
G |
| Pro
ject
: EB
EN
HA
ES
ER
SC
HE
ME
.GP
J ||
Lib
rary
: GIN
T S
TD
AG
S 4
_0_
SA
.GLB
|| D
ate:
Oct
ober
1, 2
020
JOB NUMBER: 113834
Sheet 1 of 1
HOLE No: E-TP28
0.00
2.50
sample

Scale1:25
0.00 Dry, brown, loose, intact, SAND. Made ground
Dry, red brown, loose to medium dense, pinholed,SAND. Aeolian
NOTES:
1. No refusal, terminated due to continual sidewallcollapse.2. No groundwater seepage was encountered.3. Sidewall collapsed.4. No sample taken.
Y COORD:
ELEVATION:
EBENHAESER SCHEME.GPJ
DATE PROFILED:
- 57753
- 3499278
INCLINATION:
DIAM:
DATE DRILLED:
X COORD:
Department of Water and Sanitation
HOLE No: E-TP29
DWS
Bell 315SK TLB
Bridging Study Clanwilliam Dam
CONTRACTOR:
MACHINE:
PROFILED BY:
TYPE SET BY: 7/24/2020
K Myburgh and G Davis 7/24/2020
Ebenhaeser Scheme
Rep
ort I
D: _
ZA
TR
AIL
PIT
LO
G |
| Pro
ject
: EB
EN
HA
ES
ER
SC
HE
ME
.GP
J ||
Lib
rary
: GIN
T S
TD
AG
S 4
_0_
SA
.GLB
|| D
ate:
Oct
ober
1, 2
020
JOB NUMBER: 113834
Sheet 1 of 1
HOLE No: E-TP29
0.00
0.30
2.30

Scale1:25
0.00 Slightly moist, red brown, loose to medium dense,pinholed, SAND. Aeolian
Slightly moist, red brown blotched yellow, dense to verydense, intact, calcretised and ferrugunisd SAND.Pedogenic material
NOTES:
1. Refusal on very dense calcretised and ferruginisedsand, intersection between aeolian and pedogenic.2. No groundwater seepage was encountered.3. Sidewall collapsed.4. No sample taken.
Y COORD:
ELEVATION:
EBENHAESER SCHEME.GPJ
DATE PROFILED:
- 57951
- 3499043
INCLINATION:
DIAM:
DATE DRILLED:
X COORD:
Department of Water and Sanitation
HOLE No: E-TP30
DWS
Bell 315SK TLB
Bridging Study Clanwilliam Dam
CONTRACTOR:
MACHINE:
PROFILED BY:
TYPE SET BY: 7/24/2020
K Myburgh and G Davis 7/24/2020
Ebenhaeser Scheme
Rep
ort I
D: _
ZA
TR
AIL
PIT
LO
G |
| Pro
ject
: EB
EN
HA
ES
ER
SC
HE
ME
.GP
J ||
Lib
rary
: GIN
T S
TD
AG
S 4
_0_
SA
.GLB
|| D
ate:
Oct
ober
1, 2
020
JOB NUMBER: 113834
Sheet 1 of 1
HOLE No: E-TP30
0.00
0.90
1.30

Scale1:25
0.00 Slightly moist, red brown, loose to medium dense,pinholed, SAND. Aeolian
Slightly moist, red brown blotched yellow, dense to verydense, intact, calcretised and ferrugunisd SAND.Pedogenic material
NOTES:
1. Refusal on very dense calcretised and ferruginisedsand.2. No groundwater seepage was encountered.3. Sidewall collapsed.4. No sample taken. .
Y COORD:
ELEVATION:
EBENHAESER SCHEME.GPJ
DATE PROFILED:
- 58096
- 3498788
INCLINATION:
DIAM:
DATE DRILLED:
X COORD:
Department of Water and Sanitation
HOLE No: E-TP31
DWS
Bell 315SK TLB
Bridging Study Clanwilliam Dam
CONTRACTOR:
MACHINE:
PROFILED BY:
TYPE SET BY: 7/24/2020
K Myburgh and G Davis 7/24/2020
Ebenhaeser Scheme
Rep
ort I
D: _
ZA
TR
AIL
PIT
LO
G |
| Pro
ject
: EB
EN
HA
ES
ER
SC
HE
ME
.GP
J ||
Lib
rary
: GIN
T S
TD
AG
S 4
_0_
SA
.GLB
|| D
ate:
Oct
ober
1, 2
020
JOB NUMBER: 113834
Sheet 1 of 1
HOLE No: E-TP31
0.00
0.550.65
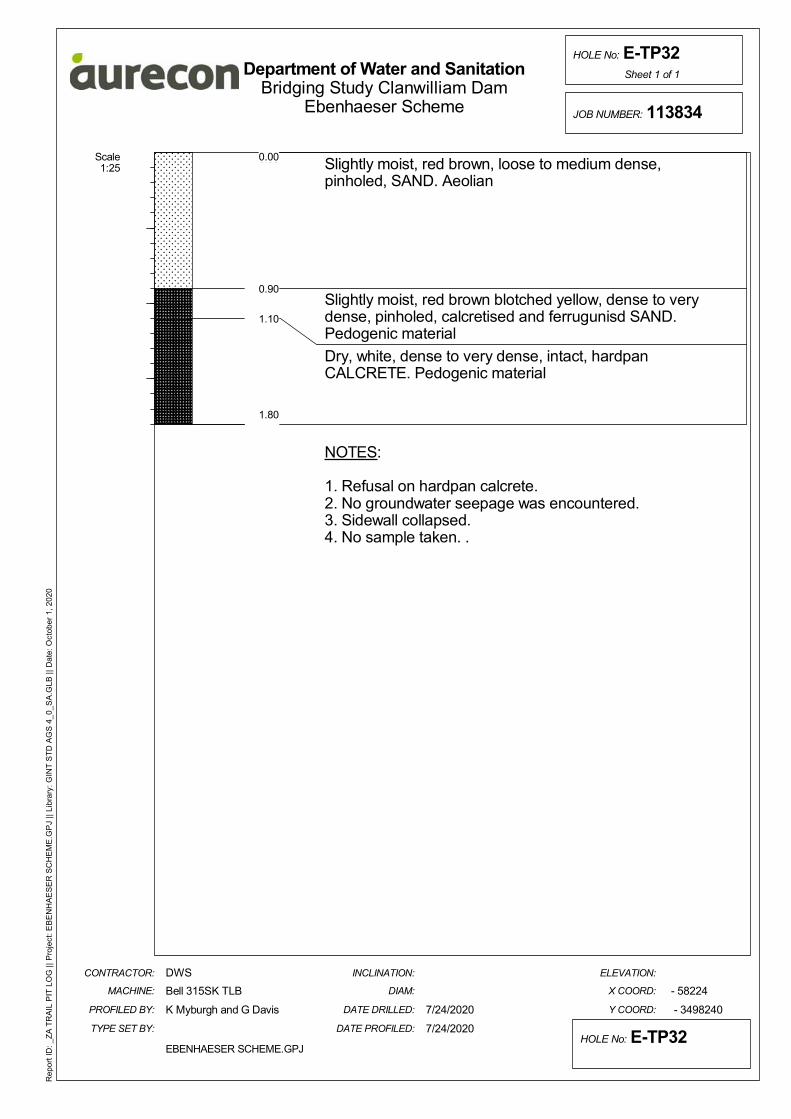
Scale1:25
0.00 Slightly moist, red brown, loose to medium dense,pinholed, SAND. Aeolian
Slightly moist, red brown blotched yellow, dense to verydense, pinholed, calcretised and ferrugunisd SAND.Pedogenic material
Dry, white, dense to very dense, intact, hardpanCALCRETE. Pedogenic material
NOTES:
1. Refusal on hardpan calcrete.2. No groundwater seepage was encountered.3. Sidewall collapsed.4. No sample taken. .
Y COORD:
ELEVATION:
EBENHAESER SCHEME.GPJ
DATE PROFILED:
- 58224
- 3498240
INCLINATION:
DIAM:
DATE DRILLED:
X COORD:
Department of Water and Sanitation
HOLE No: E-TP32
DWS
Bell 315SK TLB
Bridging Study Clanwilliam Dam
CONTRACTOR:
MACHINE:
PROFILED BY:
TYPE SET BY: 7/24/2020
K Myburgh and G Davis 7/24/2020
Ebenhaeser Scheme
Rep
ort I
D: _
ZA
TR
AIL
PIT
LO
G |
| Pro
ject
: EB
EN
HA
ES
ER
SC
HE
ME
.GP
J ||
Lib
rary
: GIN
T S
TD
AG
S 4
_0_
SA
.GLB
|| D
ate:
Oct
ober
1, 2
020
JOB NUMBER: 113834
Sheet 1 of 1
HOLE No: E-TP32
0.00
0.90
1.10
1.80

Scale1:25
0.00 Slightly moist, red brown, loose to medium dense,pinholed, SAND. Aeolian
Slightly moist, red brown blotched yellow, dense to verydense, pinholed, calcretised and ferrugunisd SAND.Pedogenic material
NOTES:
1. Refusal on very dense calcretised and ferruginisedsand.2. No groundwater seepage was encountered.3. Sidewall collapsed.4. Bulk sampled between 0.0-1.6m.5. Small bag taken between 1.3-1.6m.
Y COORD:
ELEVATION:
EBENHAESER SCHEME.GPJ
DATE PROFILED:
- 58436
- 3498034
INCLINATION:
DIAM:
DATE DRILLED:
X COORD:
Department of Water and Sanitation
HOLE No: E-TP33
DWS
Bell 315SK TLB
Bridging Study Clanwilliam Dam
CONTRACTOR:
MACHINE:
PROFILED BY:
TYPE SET BY: 7/24/2020
K Myburgh and G Davis 7/24/2020
Ebenhaeser Scheme
Rep
ort I
D: _
ZA
TR
AIL
PIT
LO
G |
| Pro
ject
: EB
EN
HA
ES
ER
SC
HE
ME
.GP
J ||
Lib
rary
: GIN
T S
TD
AG
S 4
_0_
SA
.GLB
|| D
ate:
Oct
ober
1, 2
020
JOB NUMBER: 113834
Sheet 1 of 1
HOLE No: E-TP33
0.00
1.30
1.60
sample
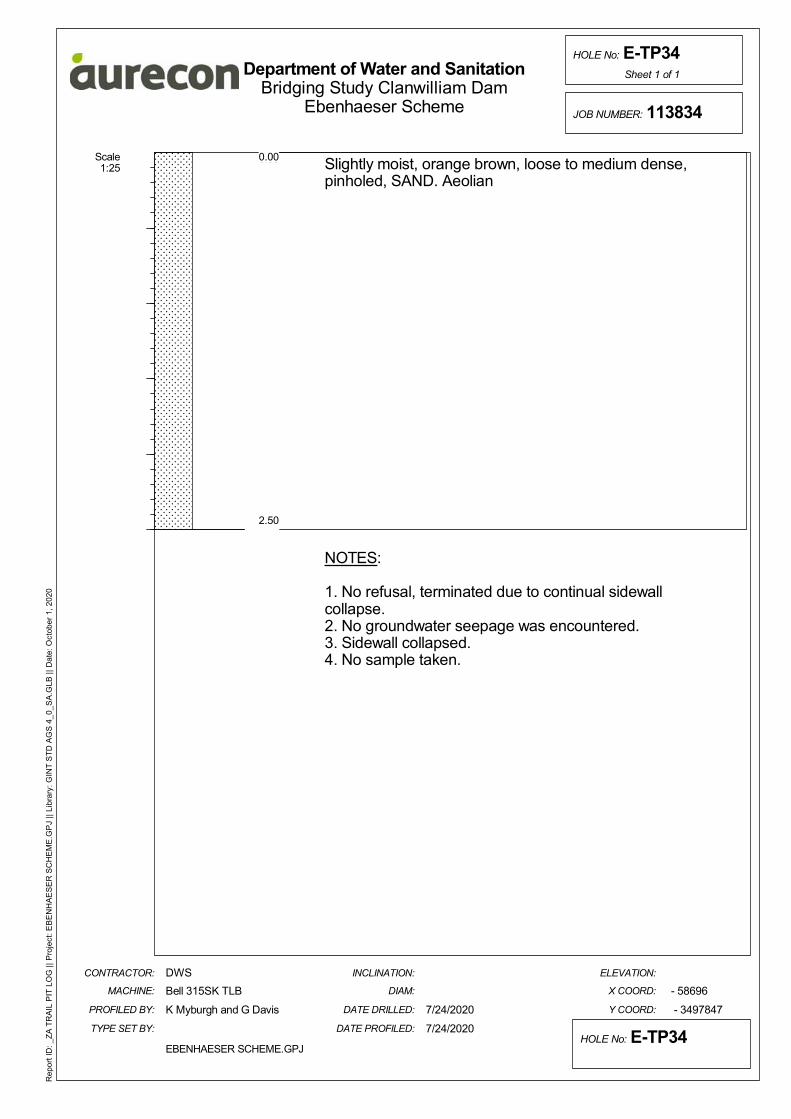
Scale1:25
0.00 Slightly moist, orange brown, loose to medium dense,pinholed, SAND. Aeolian
NOTES:
1. No refusal, terminated due to continual sidewallcollapse.2. No groundwater seepage was encountered.3. Sidewall collapsed.4. No sample taken.
Y COORD:
ELEVATION:
EBENHAESER SCHEME.GPJ
DATE PROFILED:
- 58696
- 3497847
INCLINATION:
DIAM:
DATE DRILLED:
X COORD:
Department of Water and Sanitation
HOLE No: E-TP34
DWS
Bell 315SK TLB
Bridging Study Clanwilliam Dam
CONTRACTOR:
MACHINE:
PROFILED BY:
TYPE SET BY: 7/24/2020
K Myburgh and G Davis 7/24/2020
Ebenhaeser Scheme
Rep
ort I
D: _
ZA
TR
AIL
PIT
LO
G |
| Pro
ject
: EB
EN
HA
ES
ER
SC
HE
ME
.GP
J ||
Lib
rary
: GIN
T S
TD
AG
S 4
_0_
SA
.GLB
|| D
ate:
Oct
ober
1, 2
020
JOB NUMBER: 113834
Sheet 1 of 1
HOLE No: E-TP34
0.00
2.50
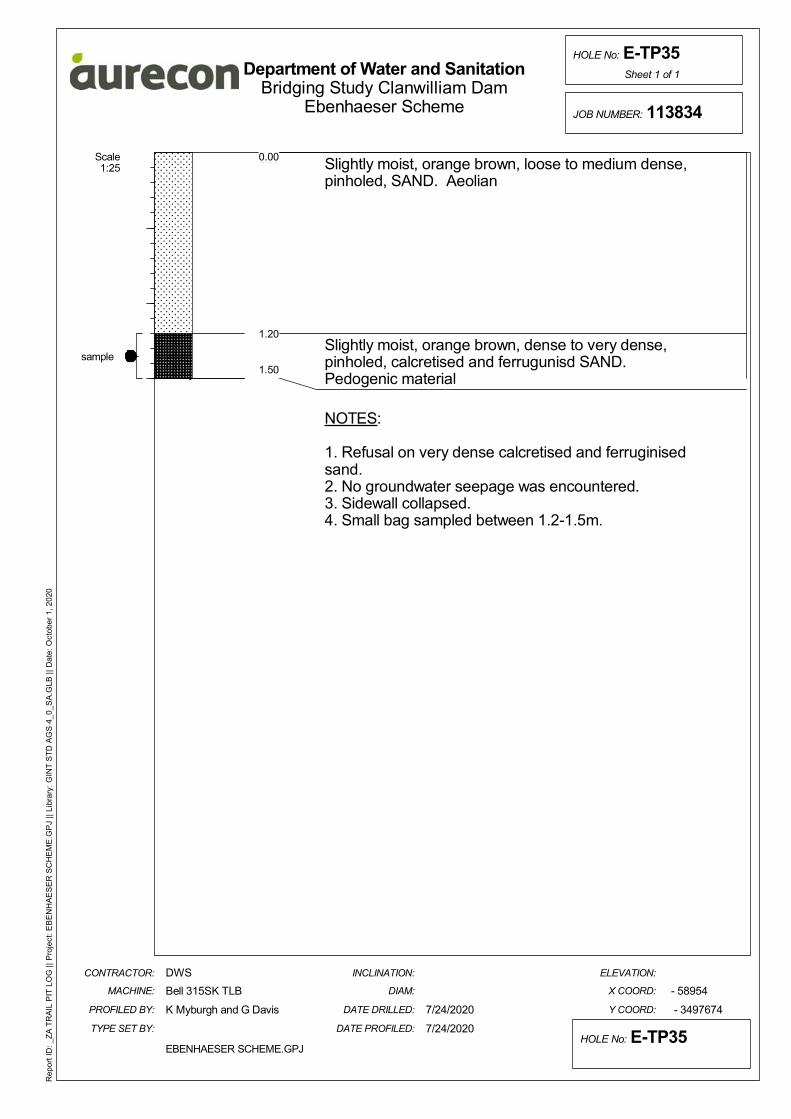
Scale1:25
0.00 Slightly moist, orange brown, loose to medium dense,pinholed, SAND. Aeolian
Slightly moist, orange brown, dense to very dense,pinholed, calcretised and ferrugunisd SAND.Pedogenic material
NOTES:
1. Refusal on very dense calcretised and ferruginisedsand.2. No groundwater seepage was encountered.3. Sidewall collapsed.4. Small bag sampled between 1.2-1.5m.
Y COORD:
ELEVATION:
EBENHAESER SCHEME.GPJ
DATE PROFILED:
- 58954
- 3497674
INCLINATION:
DIAM:
DATE DRILLED:
X COORD:
Department of Water and Sanitation
HOLE No: E-TP35
DWS
Bell 315SK TLB
Bridging Study Clanwilliam Dam
CONTRACTOR:
MACHINE:
PROFILED BY:
TYPE SET BY: 7/24/2020
K Myburgh and G Davis 7/24/2020
Ebenhaeser Scheme
Rep
ort I
D: _
ZA
TR
AIL
PIT
LO
G |
| Pro
ject
: EB
EN
HA
ES
ER
SC
HE
ME
.GP
J ||
Lib
rary
: GIN
T S
TD
AG
S 4
_0_
SA
.GLB
|| D
ate:
Oct
ober
1, 2
020
JOB NUMBER: 113834
Sheet 1 of 1
HOLE No: E-TP35
0.00
1.20
1.50sample

Scale1:25
0.00 Slightly moist, red brown, loose to medium dense,pinholed, SAND. Aeolian
Slightly moist, brown blotched red and white, verydense, honeycomb, hardpan calcretised andferrugunisd SAND and hardpan NODULES. Pedogenicmaterial
NOTES:
1. Refusal on hardpan calcretised and ferruginisedsand.2. No groundwater seepage was encountered.3. Sidewalls collapsed.4. No sample taken.
Y COORD:
ELEVATION:
EBENHAESER SCHEME.GPJ
DATE PROFILED:
- 59196
- 3497506
INCLINATION:
DIAM:
DATE DRILLED:
X COORD:
Department of Water and Sanitation
HOLE No: E-TP36
DWS
Bell 315SK TLB
Bridging Study Clanwilliam Dam
CONTRACTOR:
MACHINE:
PROFILED BY:
TYPE SET BY: 7/24/2020
K Myburgh and G Davis 7/24/2020
Ebenhaeser Scheme
Rep
ort I
D: _
ZA
TR
AIL
PIT
LO
G |
| Pro
ject
: EB
EN
HA
ES
ER
SC
HE
ME
.GP
J ||
Lib
rary
: GIN
T S
TD
AG
S 4
_0_
SA
.GLB
|| D
ate:
Oct
ober
1, 2
020
JOB NUMBER: 113834
Sheet 1 of 1
HOLE No: E-TP36
0.00
0.901.00
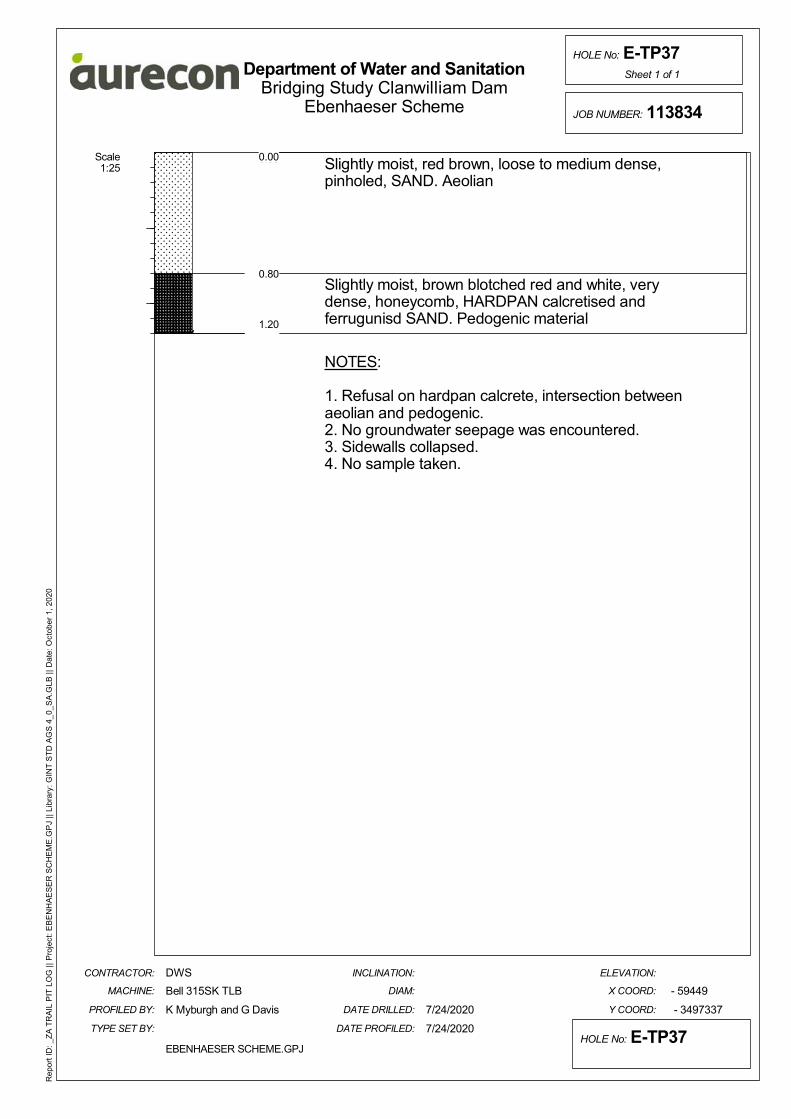
Scale1:25
0.00 Slightly moist, red brown, loose to medium dense,pinholed, SAND. Aeolian
Slightly moist, brown blotched red and white, verydense, honeycomb, HARDPAN calcretised andferrugunisd SAND. Pedogenic material
NOTES:
1. Refusal on hardpan calcrete, intersection betweenaeolian and pedogenic.2. No groundwater seepage was encountered.3. Sidewalls collapsed.4. No sample taken.
Y COORD:
ELEVATION:
EBENHAESER SCHEME.GPJ
DATE PROFILED:
- 59449
- 3497337
INCLINATION:
DIAM:
DATE DRILLED:
X COORD:
Department of Water and Sanitation
HOLE No: E-TP37
DWS
Bell 315SK TLB
Bridging Study Clanwilliam Dam
CONTRACTOR:
MACHINE:
PROFILED BY:
TYPE SET BY: 7/24/2020
K Myburgh and G Davis 7/24/2020
Ebenhaeser Scheme
Rep
ort I
D: _
ZA
TR
AIL
PIT
LO
G |
| Pro
ject
: EB
EN
HA
ES
ER
SC
HE
ME
.GP
J ||
Lib
rary
: GIN
T S
TD
AG
S 4
_0_
SA
.GLB
|| D
ate:
Oct
ober
1, 2
020
JOB NUMBER: 113834
Sheet 1 of 1
HOLE No: E-TP37
0.00
0.80
1.20

Scale1:25
0.00 Slightly moist, red brown, loose to medium dense,pinholed, SAND. Aeolian
Dry, white, very dense, intact, hardpan CALCRETE.Pedogenic material
NOTES:
1. Refusal on hardpan calcrete.2. No groundwater seepage was encountered.3. Sidewall collapsed.4. Bulk and small bags sample between 0.0-0.9m.
Y COORD:
ELEVATION:
EBENHAESER SCHEME.GPJ
DATE PROFILED:
- 59694
- 3497163
INCLINATION:
DIAM:
DATE DRILLED:
X COORD:
Department of Water and Sanitation
HOLE No: E-TP38
DWS
Bell 315SK TLB
Bridging Study Clanwilliam Dam
CONTRACTOR:
MACHINE:
PROFILED BY:
TYPE SET BY: 7/24/2020
K Myburgh and G Davis 7/24/2020
Ebenhaeser Scheme
Rep
ort I
D: _
ZA
TR
AIL
PIT
LO
G |
| Pro
ject
: EB
EN
HA
ES
ER
SC
HE
ME
.GP
J ||
Lib
rary
: GIN
T S
TD
AG
S 4
_0_
SA
.GLB
|| D
ate:
Oct
ober
1, 2
020
JOB NUMBER: 113834
Sheet 1 of 1
HOLE No: E-TP38
0.00
0.90
1.10
sample
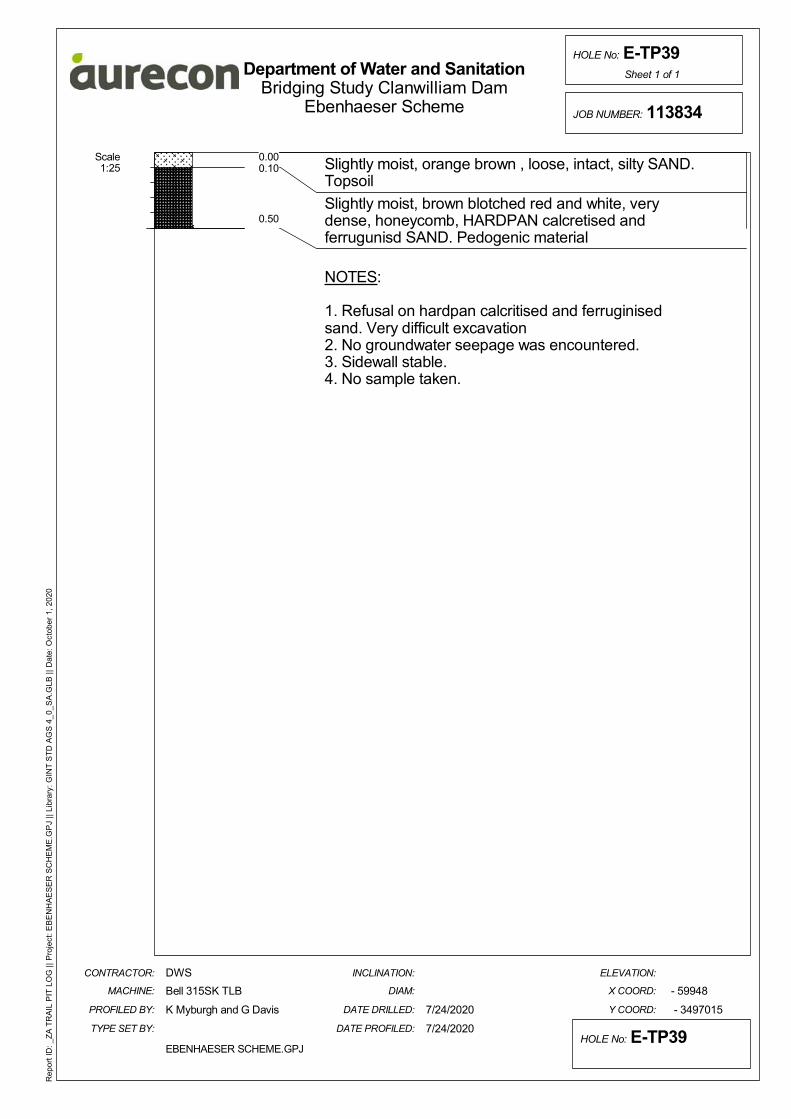
Scale1:25
0.00 Slightly moist, orange brown , loose, intact, silty SAND.Topsoil
Slightly moist, brown blotched red and white, verydense, honeycomb, HARDPAN calcretised andferrugunisd SAND. Pedogenic material
NOTES:
1. Refusal on hardpan calcritised and ferruginisedsand. Very difficult excavation2. No groundwater seepage was encountered.3. Sidewall stable.4. No sample taken.
Y COORD:
ELEVATION:
EBENHAESER SCHEME.GPJ
DATE PROFILED:
- 59948
- 3497015
INCLINATION:
DIAM:
DATE DRILLED:
X COORD:
Department of Water and Sanitation
HOLE No: E-TP39
DWS
Bell 315SK TLB
Bridging Study Clanwilliam Dam
CONTRACTOR:
MACHINE:
PROFILED BY:
TYPE SET BY: 7/24/2020
K Myburgh and G Davis 7/24/2020
Ebenhaeser Scheme
Rep
ort I
D: _
ZA
TR
AIL
PIT
LO
G |
| Pro
ject
: EB
EN
HA
ES
ER
SC
HE
ME
.GP
J ||
Lib
rary
: GIN
T S
TD
AG
S 4
_0_
SA
.GLB
|| D
ate:
Oct
ober
1, 2
020
JOB NUMBER: 113834
Sheet 1 of 1
HOLE No: E-TP39
0.000.10
0.50
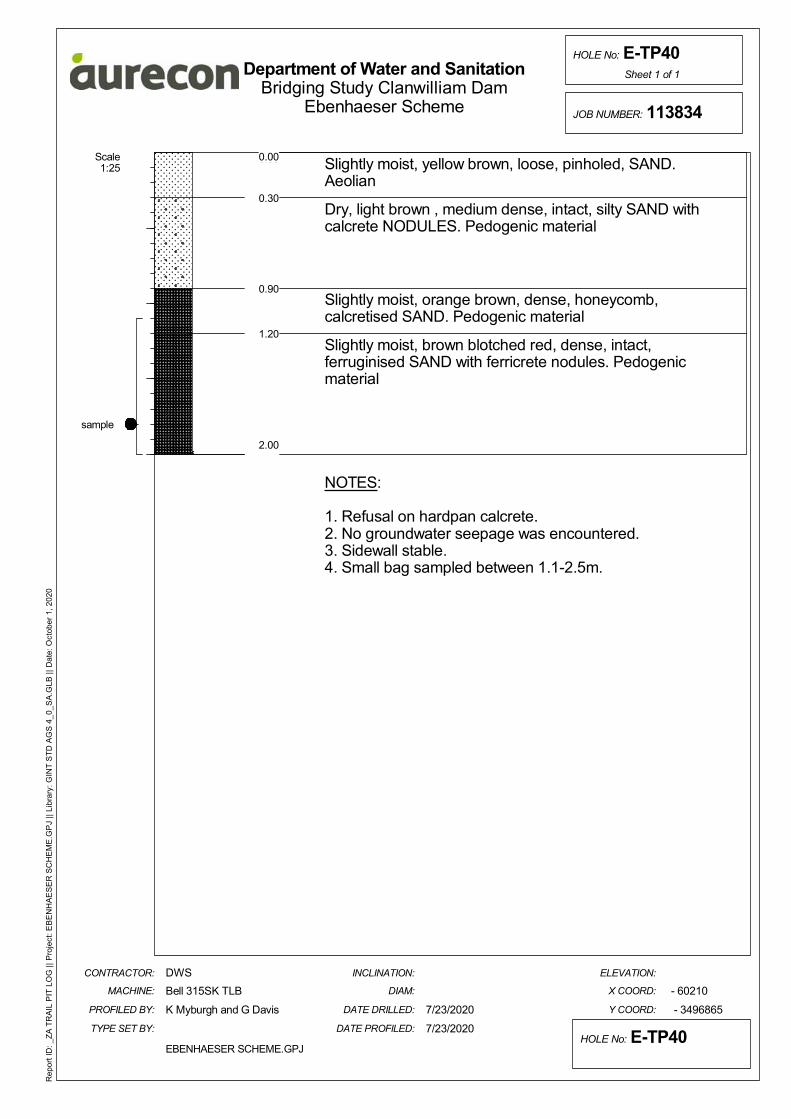
Scale1:25
0.00 Slightly moist, yellow brown, loose, pinholed, SAND.Aeolian
Dry, light brown , medium dense, intact, silty SAND withcalcrete NODULES. Pedogenic material
Slightly moist, orange brown, dense, honeycomb,calcretised SAND. Pedogenic material
Slightly moist, brown blotched red, dense, intact,ferruginised SAND with ferricrete nodules. Pedogenicmaterial
NOTES:
1. Refusal on hardpan calcrete.2. No groundwater seepage was encountered.3. Sidewall stable.4. Small bag sampled between 1.1-2.5m.
Y COORD:
ELEVATION:
EBENHAESER SCHEME.GPJ
DATE PROFILED:
- 60210
- 3496865
INCLINATION:
DIAM:
DATE DRILLED:
X COORD:
Department of Water and Sanitation
HOLE No: E-TP40
DWS
Bell 315SK TLB
Bridging Study Clanwilliam Dam
CONTRACTOR:
MACHINE:
PROFILED BY:
TYPE SET BY: 7/23/2020
K Myburgh and G Davis 7/23/2020
Ebenhaeser Scheme
Rep
ort I
D: _
ZA
TR
AIL
PIT
LO
G |
| Pro
ject
: EB
EN
HA
ES
ER
SC
HE
ME
.GP
J ||
Lib
rary
: GIN
T S
TD
AG
S 4
_0_
SA
.GLB
|| D
ate:
Oct
ober
1, 2
020
JOB NUMBER: 113834
Sheet 1 of 1
HOLE No: E-TP40
0.00
0.30
0.90
1.20
2.00
sample

Scale1:25
0.00 Slightly moist, orange brown, loose to medium dense,pinholed, SAND. Aeolian
Dry, white, very dense, intact, HARDPAN calcrete.Pedogenic material
NOTES:
1. Refusal on hardpan calcrete.2. No groundwater seepage was encountered.3. Sidewall stable.4. Small bag sampled between 0.0-0.8m.
Y COORD:
ELEVATION:
EBENHAESER SCHEME.GPJ
DATE PROFILED:
- 60485
- 3496754
INCLINATION:
DIAM:
DATE DRILLED:
X COORD:
Department of Water and Sanitation
HOLE No: E-TP41
DWS
Bell 315SK TLB
Bridging Study Clanwilliam Dam
CONTRACTOR:
MACHINE:
PROFILED BY:
TYPE SET BY: 7/23/2020
K Myburgh and G Davis 7/23/2020
Ebenhaeser Scheme
Rep
ort I
D: _
ZA
TR
AIL
PIT
LO
G |
| Pro
ject
: EB
EN
HA
ES
ER
SC
HE
ME
.GP
J ||
Lib
rary
: GIN
T S
TD
AG
S 4
_0_
SA
.GLB
|| D
ate:
Oct
ober
1, 2
020
JOB NUMBER: 113834
Sheet 1 of 1
HOLE No: E-TP41
0.00
0.800.90
sample

Scale1:25
0.00 Slightly moist, brown , medium dense, intact, siltySAND. Colluvium
Dry, white, very dense, intact, HARDPAN calcrete.Pedogenic material
NOTES:
1. Refusal on hardpan calcrete.2. No groundwater seepage was encountered.3. Sidewall stable.4. No sample taken.
Y COORD:
ELEVATION:
EBENHAESER SCHEME.GPJ
DATE PROFILED:
- 60769
- 3496672
INCLINATION:
DIAM:
DATE DRILLED:
X COORD:
Department of Water and Sanitation
HOLE No: E-TP42
DWS
Bell 315SK TLB
Bridging Study Clanwilliam Dam
CONTRACTOR:
MACHINE:
PROFILED BY:
TYPE SET BY: 7/23/2020
K Myburgh and G Davis 7/23/2020
Ebenhaeser Scheme
Rep
ort I
D: _
ZA
TR
AIL
PIT
LO
G |
| Pro
ject
: EB
EN
HA
ES
ER
SC
HE
ME
.GP
J ||
Lib
rary
: GIN
T S
TD
AG
S 4
_0_
SA
.GLB
|| D
ate:
Oct
ober
1, 2
020
JOB NUMBER: 113834
Sheet 1 of 1
HOLE No: E-TP42
0.00
0.30
0.60

Scale1:25
0.00 Slightly moist to moist, brown , very loose, intact,SAND. Aeolian
Brown and black, clast supported highly cementedcalcritised angular gravel, very dense to very soft rock.Hardpan calcrete
NOTES:
1. Refusal on hardpan calcrete.2. No groundwater seepage was encountered.3. Sidewall collapsed.4. Small bag sampled between 0.0-1.1m.
Y COORD:
ELEVATION:
EBENHAESER SCHEME.GPJ
DATE PROFILED:
- 61120
- 3496872
INCLINATION:
DIAM:
DATE DRILLED:
X COORD:
Department of Water and Sanitation
HOLE No: E-TP43
DWS
Bell 315SK TLB
Bridging Study Clanwilliam Dam
CONTRACTOR:
MACHINE:
PROFILED BY:
TYPE SET BY: 7/24/2020
S. Nyathi and M Sikwe 7/24/2020
Ebenhaeser Scheme
Rep
ort I
D: _
ZA
TR
AIL
PIT
LO
G |
| Pro
ject
: EB
EN
HA
ES
ER
SC
HE
ME
.GP
J ||
Lib
rary
: GIN
T S
TD
AG
S 4
_0_
SA
.GLB
|| D
ate:
Oct
ober
1, 2
020
JOB NUMBER: 113834
Sheet 1 of 1
HOLE No: E-TP43
0.00
1.10
1.30
sample
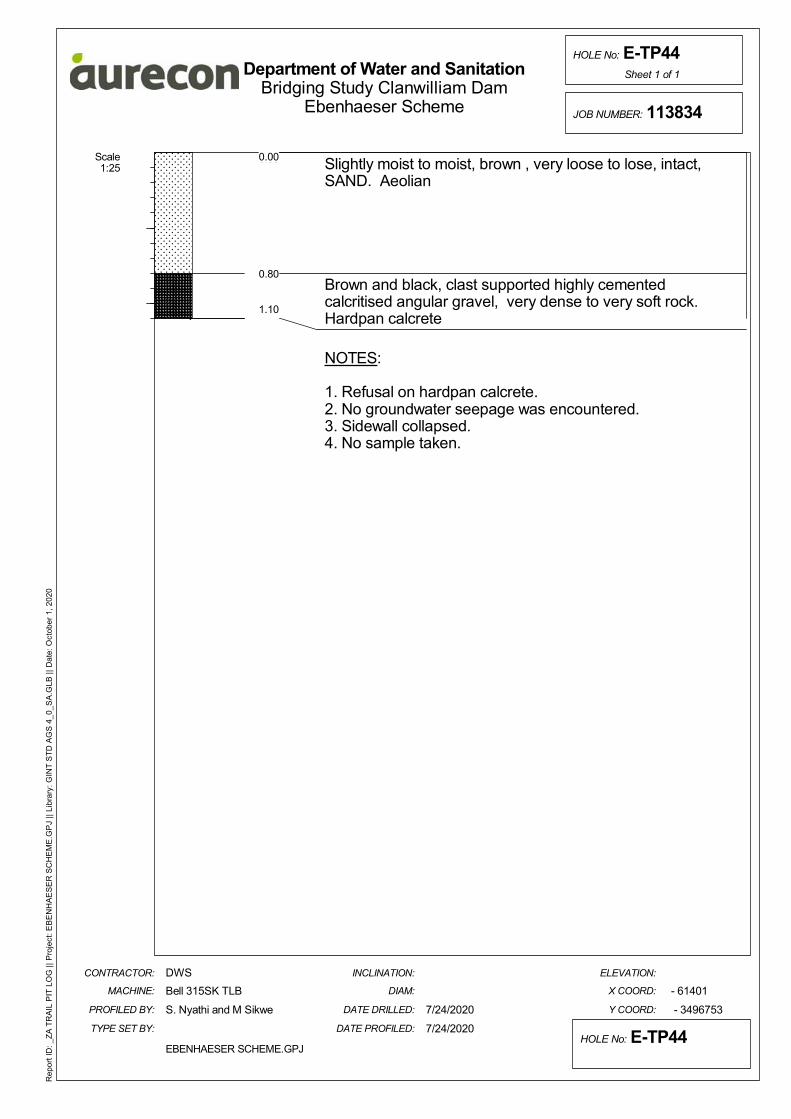
Scale1:25
0.00 Slightly moist to moist, brown , very loose to lose, intact,SAND. Aeolian
Brown and black, clast supported highly cementedcalcritised angular gravel, very dense to very soft rock.Hardpan calcrete
NOTES:
1. Refusal on hardpan calcrete.2. No groundwater seepage was encountered.3. Sidewall collapsed.4. No sample taken.
Y COORD:
ELEVATION:
EBENHAESER SCHEME.GPJ
DATE PROFILED:
- 61401
- 3496753
INCLINATION:
DIAM:
DATE DRILLED:
X COORD:
Department of Water and Sanitation
HOLE No: E-TP44
DWS
Bell 315SK TLB
Bridging Study Clanwilliam Dam
CONTRACTOR:
MACHINE:
PROFILED BY:
TYPE SET BY: 7/24/2020
S. Nyathi and M Sikwe 7/24/2020
Ebenhaeser Scheme
Rep
ort I
D: _
ZA
TR
AIL
PIT
LO
G |
| Pro
ject
: EB
EN
HA
ES
ER
SC
HE
ME
.GP
J ||
Lib
rary
: GIN
T S
TD
AG
S 4
_0_
SA
.GLB
|| D
ate:
Oct
ober
1, 2
020
JOB NUMBER: 113834
Sheet 1 of 1
HOLE No: E-TP44
0.00
0.80
1.10

Scale1:25
0.00 Slightly moist to moist, brown speckled off-white , looseto medium dense, intact, silty SAND with fine tomedium GRAVEL. Colluvium
Off-white and brown, matrix supported, angular, highlycemented, very dense CALCRETE nodules andhoneycombed in a matrix of slightly moist silty sand.Pedogenic material from terrace gravels
NOTES:
1. Refusal on very soft rock schist.2. No groundwater seepage was encountered.3. Sidewall stable.4. Bulk sampled between 0.5-1.1m.
Y COORD:
ELEVATION:
EBENHAESER SCHEME.GPJ
DATE PROFILED:
- 61723
- 3496692
INCLINATION:
DIAM:
DATE DRILLED:
X COORD:
Department of Water and Sanitation
HOLE No: E-TP45
DWS
Bell 315SK TLB
Bridging Study Clanwilliam Dam
CONTRACTOR:
MACHINE:
PROFILED BY:
TYPE SET BY: 7/24/2020
S. Nyathi and M Sikwe 7/24/2020
Ebenhaeser Scheme
Rep
ort I
D: _
ZA
TR
AIL
PIT
LO
G |
| Pro
ject
: EB
EN
HA
ES
ER
SC
HE
ME
.GP
J ||
Lib
rary
: GIN
T S
TD
AG
S 4
_0_
SA
.GLB
|| D
ate:
Oct
ober
1, 2
020
JOB NUMBER: 113834
Sheet 1 of 1
HOLE No: E-TP45
0.00
0.50
1.10
sample
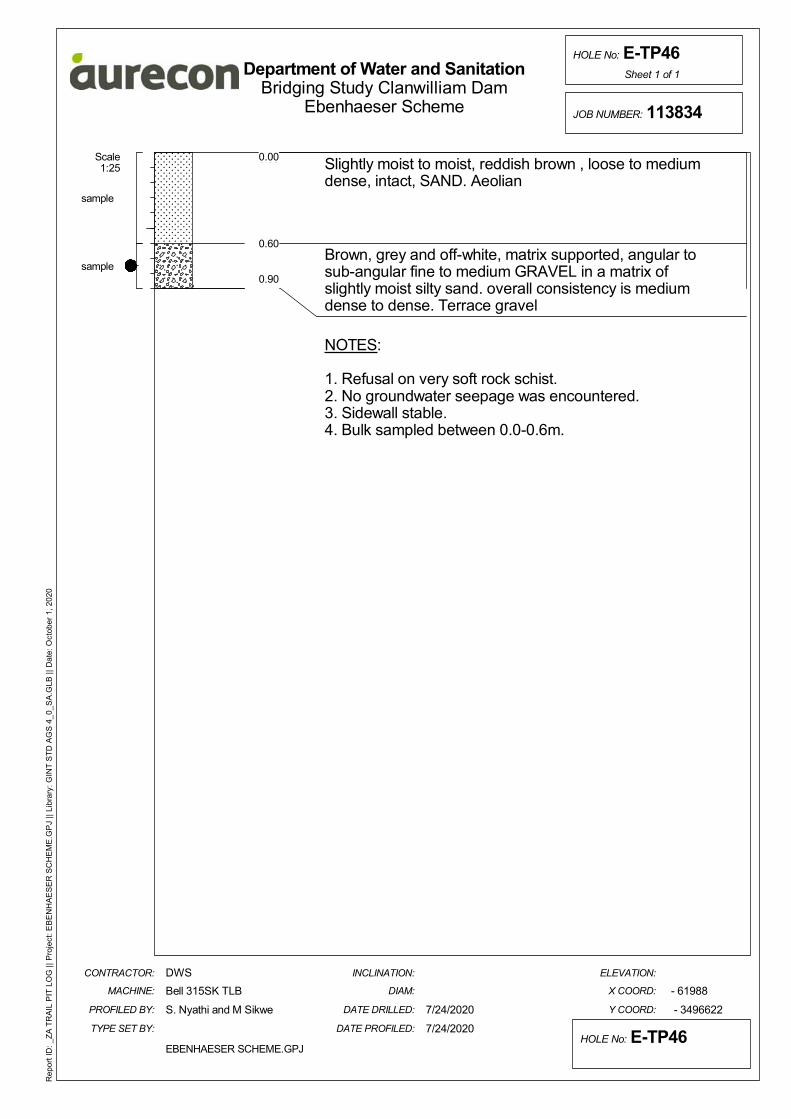
Scale1:25
0.00 Slightly moist to moist, reddish brown , loose to mediumdense, intact, SAND. Aeolian
Brown, grey and off-white, matrix supported, angular tosub-angular fine to medium GRAVEL in a matrix ofslightly moist silty sand. overall consistency is mediumdense to dense. Terrace gravel
NOTES:
1. Refusal on very soft rock schist.2. No groundwater seepage was encountered.3. Sidewall stable.4. Bulk sampled between 0.0-0.6m.
Y COORD:
ELEVATION:
EBENHAESER SCHEME.GPJ
DATE PROFILED:
- 61988
- 3496622
INCLINATION:
DIAM:
DATE DRILLED:
X COORD:
Department of Water and Sanitation
HOLE No: E-TP46
DWS
Bell 315SK TLB
Bridging Study Clanwilliam Dam
CONTRACTOR:
MACHINE:
PROFILED BY:
TYPE SET BY: 7/24/2020
S. Nyathi and M Sikwe 7/24/2020
Ebenhaeser Scheme
Rep
ort I
D: _
ZA
TR
AIL
PIT
LO
G |
| Pro
ject
: EB
EN
HA
ES
ER
SC
HE
ME
.GP
J ||
Lib
rary
: GIN
T S
TD
AG
S 4
_0_
SA
.GLB
|| D
ate:
Oct
ober
1, 2
020
JOB NUMBER: 113834
Sheet 1 of 1
HOLE No: E-TP46
0.00
0.60
0.90
sample
sample

Scale1:25
0.00 Brown, off-white and red, highly weathered, finegrained, laminated, very soft rock with quartz veins.Schist
NOTES:
1. Logged cut face, outcrops in the area. .2. No groundwater seepage was encountered.3. Sidewall stable.4. No sample taken.
Y COORD:
ELEVATION:
EBENHAESER SCHEME.GPJ
DATE PROFILED:
- 62302
- 3496593
INCLINATION:
DIAM:
DATE DRILLED:
X COORD:
Department of Water and Sanitation
HOLE No: E-TP47
DWS
Bell 315SK TLB
Bridging Study Clanwilliam Dam
CONTRACTOR:
MACHINE:
PROFILED BY:
TYPE SET BY: 7/24/2020
S. Nyathi and M Sikwe 7/24/2020
Ebenhaeser Scheme
Rep
ort I
D: _
ZA
TR
AIL
PIT
LO
G |
| Pro
ject
: EB
EN
HA
ES
ER
SC
HE
ME
.GP
J ||
Lib
rary
: GIN
T S
TD
AG
S 4
_0_
SA
.GLB
|| D
ate:
Oct
ober
1, 2
020
JOB NUMBER: 113834
Sheet 1 of 1
HOLE No: E-TP47
0.00
0.50
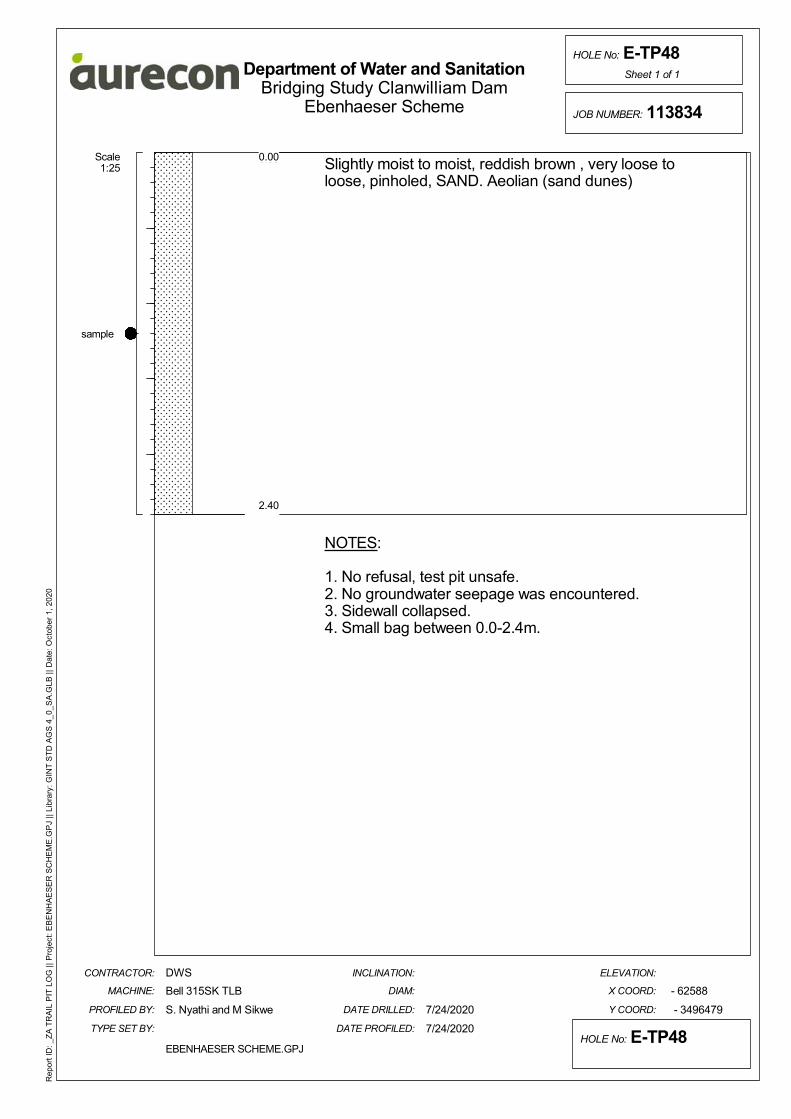
Scale1:25
0.00 Slightly moist to moist, reddish brown , very loose toloose, pinholed, SAND. Aeolian (sand dunes)
NOTES:
1. No refusal, test pit unsafe.2. No groundwater seepage was encountered.3. Sidewall collapsed.4. Small bag between 0.0-2.4m.
Y COORD:
ELEVATION:
EBENHAESER SCHEME.GPJ
DATE PROFILED:
- 62588
- 3496479
INCLINATION:
DIAM:
DATE DRILLED:
X COORD:
Department of Water and Sanitation
HOLE No: E-TP48
DWS
Bell 315SK TLB
Bridging Study Clanwilliam Dam
CONTRACTOR:
MACHINE:
PROFILED BY:
TYPE SET BY: 7/24/2020
S. Nyathi and M Sikwe 7/24/2020
Ebenhaeser Scheme
Rep
ort I
D: _
ZA
TR
AIL
PIT
LO
G |
| Pro
ject
: EB
EN
HA
ES
ER
SC
HE
ME
.GP
J ||
Lib
rary
: GIN
T S
TD
AG
S 4
_0_
SA
.GLB
|| D
ate:
Oct
ober
1, 2
020
JOB NUMBER: 113834
Sheet 1 of 1
HOLE No: E-TP48
0.00
2.40
sample

Scale1:25
0.00 Slightly moist to moist, reddish brown , very loose toloose, pinholed, SAND. Aeolian (sand dunes)
Moist, reddish brown , medium dense, pinholed, SAND.Aeolian (sand dunes)
NOTES:
1. No refusal, test pit unsafe.2. No groundwater seepage was encountered.3. Sidewall collapsed.4. No sample taken.
Y COORD:
ELEVATION:
EBENHAESER SCHEME.GPJ
DATE PROFILED:
- 62850
- 3496314
INCLINATION:
DIAM:
DATE DRILLED:
X COORD:
Department of Water and Sanitation
HOLE No: E-TP49
DWS
Bell 315SK TLB
Bridging Study Clanwilliam Dam
CONTRACTOR:
MACHINE:
PROFILED BY:
TYPE SET BY: 7/24/2020
S. Nyathi and M Sikwe 7/24/2020
Ebenhaeser Scheme
Rep
ort I
D: _
ZA
TR
AIL
PIT
LO
G |
| Pro
ject
: EB
EN
HA
ES
ER
SC
HE
ME
.GP
J ||
Lib
rary
: GIN
T S
TD
AG
S 4
_0_
SA
.GLB
|| D
ate:
Oct
ober
1, 2
020
JOB NUMBER: 113834
Sheet 1 of 1
HOLE No: E-TP49
0.00
1.10
2.50
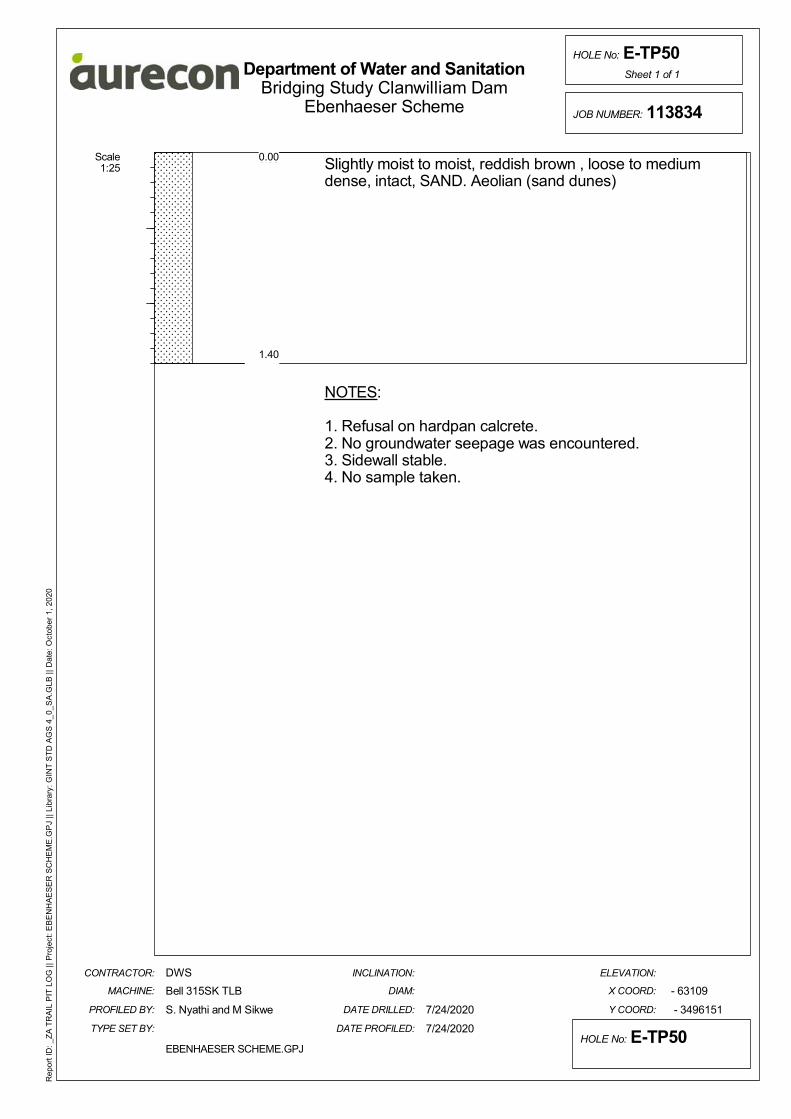
Scale1:25
0.00 Slightly moist to moist, reddish brown , loose to mediumdense, intact, SAND. Aeolian (sand dunes)
NOTES:
1. Refusal on hardpan calcrete.2. No groundwater seepage was encountered.3. Sidewall stable.4. No sample taken.
Y COORD:
ELEVATION:
EBENHAESER SCHEME.GPJ
DATE PROFILED:
- 63109
- 3496151
INCLINATION:
DIAM:
DATE DRILLED:
X COORD:
Department of Water and Sanitation
HOLE No: E-TP50
DWS
Bell 315SK TLB
Bridging Study Clanwilliam Dam
CONTRACTOR:
MACHINE:
PROFILED BY:
TYPE SET BY: 7/24/2020
S. Nyathi and M Sikwe 7/24/2020
Ebenhaeser Scheme
Rep
ort I
D: _
ZA
TR
AIL
PIT
LO
G |
| Pro
ject
: EB
EN
HA
ES
ER
SC
HE
ME
.GP
J ||
Lib
rary
: GIN
T S
TD
AG
S 4
_0_
SA
.GLB
|| D
ate:
Oct
ober
1, 2
020
JOB NUMBER: 113834
Sheet 1 of 1
HOLE No: E-TP50
0.00
1.40
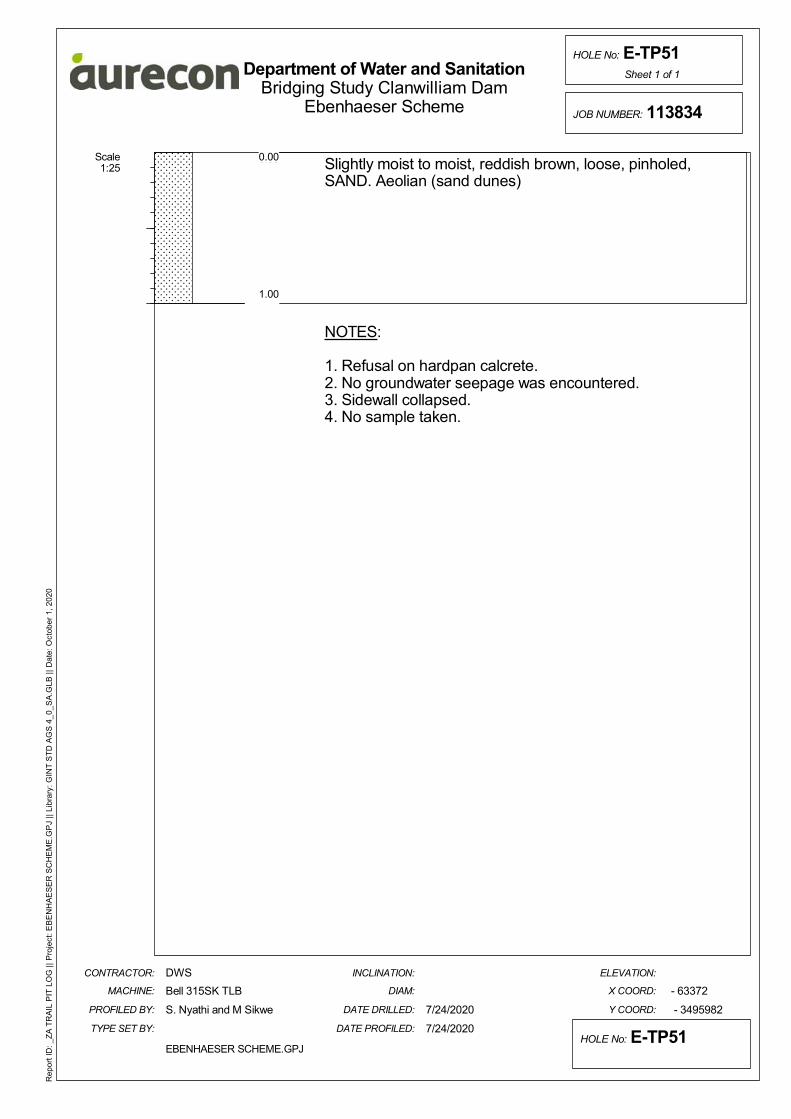
Scale1:25
0.00 Slightly moist to moist, reddish brown, loose, pinholed,SAND. Aeolian (sand dunes)
NOTES:
1. Refusal on hardpan calcrete.2. No groundwater seepage was encountered.3. Sidewall collapsed.4. No sample taken.
Y COORD:
ELEVATION:
EBENHAESER SCHEME.GPJ
DATE PROFILED:
- 63372
- 3495982
INCLINATION:
DIAM:
DATE DRILLED:
X COORD:
Department of Water and Sanitation
HOLE No: E-TP51
DWS
Bell 315SK TLB
Bridging Study Clanwilliam Dam
CONTRACTOR:
MACHINE:
PROFILED BY:
TYPE SET BY: 7/24/2020
S. Nyathi and M Sikwe 7/24/2020
Ebenhaeser Scheme
Rep
ort I
D: _
ZA
TR
AIL
PIT
LO
G |
| Pro
ject
: EB
EN
HA
ES
ER
SC
HE
ME
.GP
J ||
Lib
rary
: GIN
T S
TD
AG
S 4
_0_
SA
.GLB
|| D
ate:
Oct
ober
1, 2
020
JOB NUMBER: 113834
Sheet 1 of 1
HOLE No: E-TP51
0.00
1.00
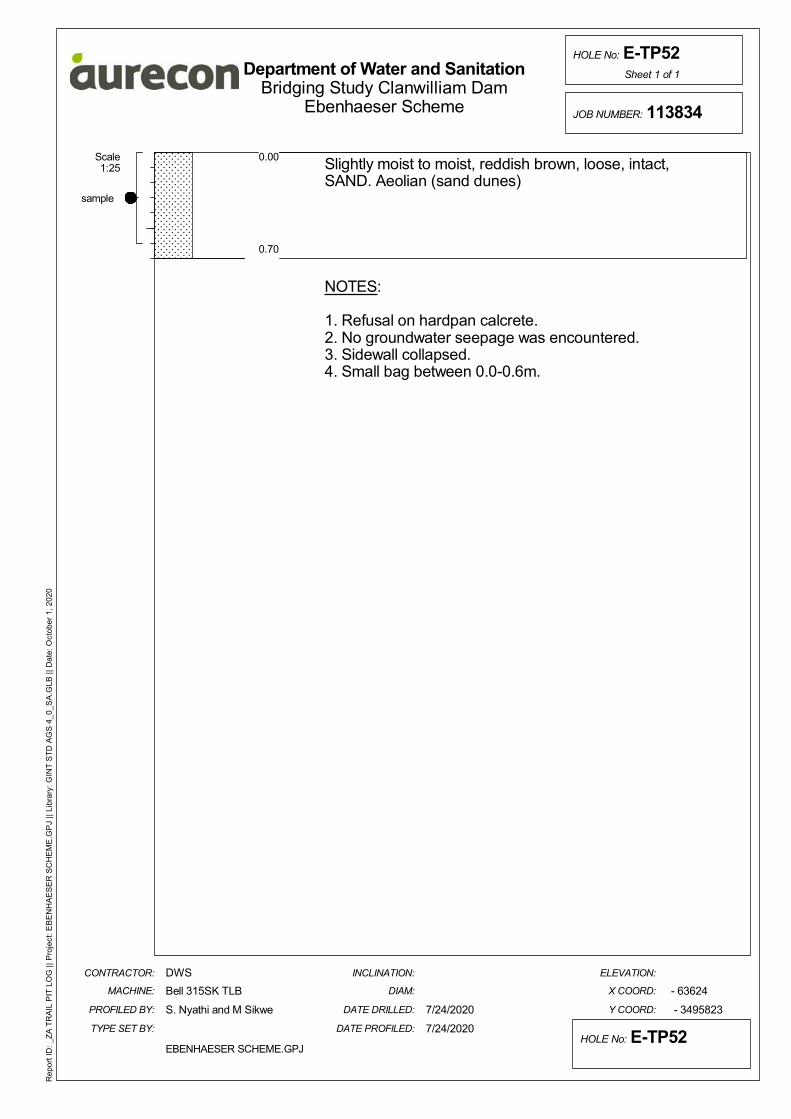
Scale1:25
0.00 Slightly moist to moist, reddish brown, loose, intact,SAND. Aeolian (sand dunes)
NOTES:
1. Refusal on hardpan calcrete.2. No groundwater seepage was encountered.3. Sidewall collapsed.4. Small bag between 0.0-0.6m.
Y COORD:
ELEVATION:
EBENHAESER SCHEME.GPJ
DATE PROFILED:
- 63624
- 3495823
INCLINATION:
DIAM:
DATE DRILLED:
X COORD:
Department of Water and Sanitation
HOLE No: E-TP52
DWS
Bell 315SK TLB
Bridging Study Clanwilliam Dam
CONTRACTOR:
MACHINE:
PROFILED BY:
TYPE SET BY: 7/24/2020
S. Nyathi and M Sikwe 7/24/2020
Ebenhaeser Scheme
Rep
ort I
D: _
ZA
TR
AIL
PIT
LO
G |
| Pro
ject
: EB
EN
HA
ES
ER
SC
HE
ME
.GP
J ||
Lib
rary
: GIN
T S
TD
AG
S 4
_0_
SA
.GLB
|| D
ate:
Oct
ober
1, 2
020
JOB NUMBER: 113834
Sheet 1 of 1
HOLE No: E-TP52
0.00
0.70
sample
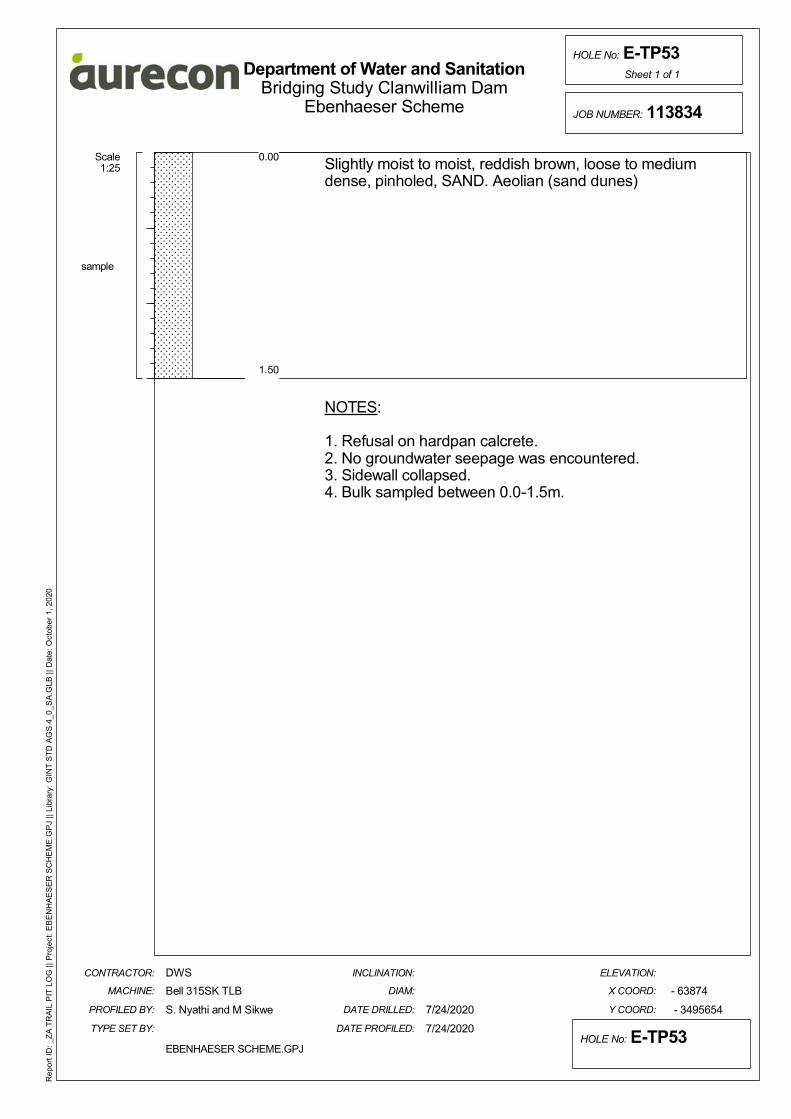
Scale1:25
0.00 Slightly moist to moist, reddish brown, loose to mediumdense, pinholed, SAND. Aeolian (sand dunes)
NOTES:
1. Refusal on hardpan calcrete.2. No groundwater seepage was encountered.3. Sidewall collapsed.4. Bulk sampled between 0.0-1.5m.
Y COORD:
ELEVATION:
EBENHAESER SCHEME.GPJ
DATE PROFILED:
- 63874
- 3495654
INCLINATION:
DIAM:
DATE DRILLED:
X COORD:
Department of Water and Sanitation
HOLE No: E-TP53
DWS
Bell 315SK TLB
Bridging Study Clanwilliam Dam
CONTRACTOR:
MACHINE:
PROFILED BY:
TYPE SET BY: 7/24/2020
S. Nyathi and M Sikwe 7/24/2020
Ebenhaeser Scheme
Rep
ort I
D: _
ZA
TR
AIL
PIT
LO
G |
| Pro
ject
: EB
EN
HA
ES
ER
SC
HE
ME
.GP
J ||
Lib
rary
: GIN
T S
TD
AG
S 4
_0_
SA
.GLB
|| D
ate:
Oct
ober
1, 2
020
JOB NUMBER: 113834
Sheet 1 of 1
HOLE No: E-TP53
0.00
1.50
sample
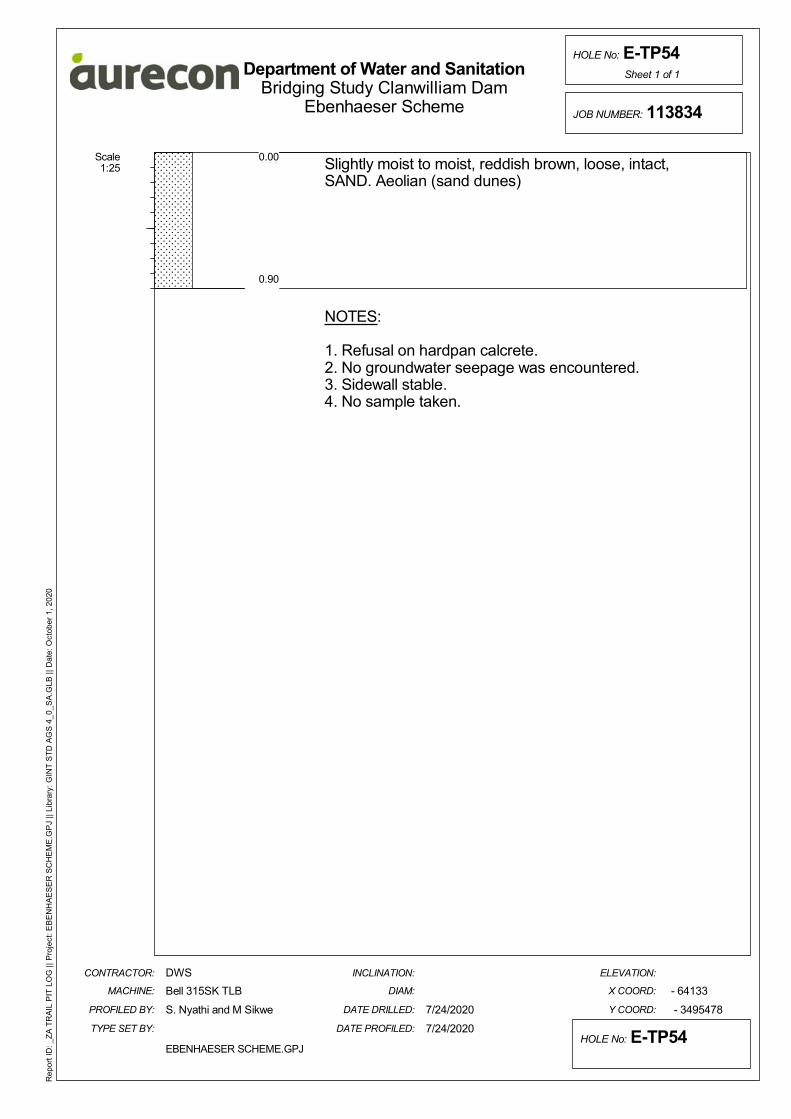
Scale1:25
0.00 Slightly moist to moist, reddish brown, loose, intact,SAND. Aeolian (sand dunes)
NOTES:
1. Refusal on hardpan calcrete.2. No groundwater seepage was encountered.3. Sidewall stable.4. No sample taken.
Y COORD:
ELEVATION:
EBENHAESER SCHEME.GPJ
DATE PROFILED:
- 64133
- 3495478
INCLINATION:
DIAM:
DATE DRILLED:
X COORD:
Department of Water and Sanitation
HOLE No: E-TP54
DWS
Bell 315SK TLB
Bridging Study Clanwilliam Dam
CONTRACTOR:
MACHINE:
PROFILED BY:
TYPE SET BY: 7/24/2020
S. Nyathi and M Sikwe 7/24/2020
Ebenhaeser Scheme
Rep
ort I
D: _
ZA
TR
AIL
PIT
LO
G |
| Pro
ject
: EB
EN
HA
ES
ER
SC
HE
ME
.GP
J ||
Lib
rary
: GIN
T S
TD
AG
S 4
_0_
SA
.GLB
|| D
ate:
Oct
ober
1, 2
020
JOB NUMBER: 113834
Sheet 1 of 1
HOLE No: E-TP54
0.00
0.90
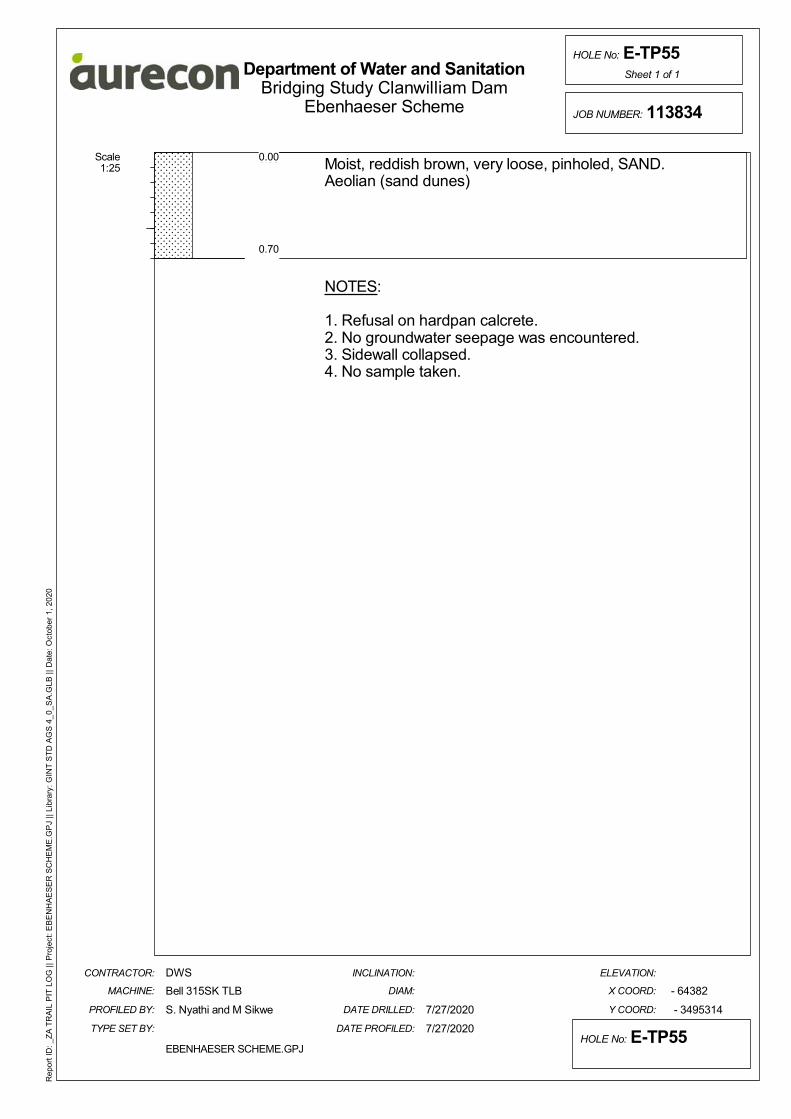
Scale1:25
0.00 Moist, reddish brown, very loose, pinholed, SAND.Aeolian (sand dunes)
NOTES:
1. Refusal on hardpan calcrete.2. No groundwater seepage was encountered.3. Sidewall collapsed.4. No sample taken.
Y COORD:
ELEVATION:
EBENHAESER SCHEME.GPJ
DATE PROFILED:
- 64382
- 3495314
INCLINATION:
DIAM:
DATE DRILLED:
X COORD:
Department of Water and Sanitation
HOLE No: E-TP55
DWS
Bell 315SK TLB
Bridging Study Clanwilliam Dam
CONTRACTOR:
MACHINE:
PROFILED BY:
TYPE SET BY: 7/27/2020
S. Nyathi and M Sikwe 7/27/2020
Ebenhaeser Scheme
Rep
ort I
D: _
ZA
TR
AIL
PIT
LO
G |
| Pro
ject
: EB
EN
HA
ES
ER
SC
HE
ME
.GP
J ||
Lib
rary
: GIN
T S
TD
AG
S 4
_0_
SA
.GLB
|| D
ate:
Oct
ober
1, 2
020
JOB NUMBER: 113834
Sheet 1 of 1
HOLE No: E-TP55
0.00
0.70

Scale1:25
0.00 Moist, reddish brown, loose, intact, SAND. Aeolian(sand dunes)
NOTES:
1. Refusal on hardpan calcrete.2. No groundwater seepage was encountered.3. Sidewall stable.4. No sample taken.
Y COORD:
ELEVATION:
EBENHAESER SCHEME.GPJ
DATE PROFILED:
- 64632
- 3495151
INCLINATION:
DIAM:
DATE DRILLED:
X COORD:
Department of Water and Sanitation
HOLE No: E-TP56
DWS
Bell 315SK TLB
Bridging Study Clanwilliam Dam
CONTRACTOR:
MACHINE:
PROFILED BY:
TYPE SET BY: 7/27/2020
S. Nyathi and M Sikwe 7/27/2020
Ebenhaeser Scheme
Rep
ort I
D: _
ZA
TR
AIL
PIT
LO
G |
| Pro
ject
: EB
EN
HA
ES
ER
SC
HE
ME
.GP
J ||
Lib
rary
: GIN
T S
TD
AG
S 4
_0_
SA
.GLB
|| D
ate:
Oct
ober
1, 2
020
JOB NUMBER: 113834
Sheet 1 of 1
HOLE No: E-TP56
0.00
1.10
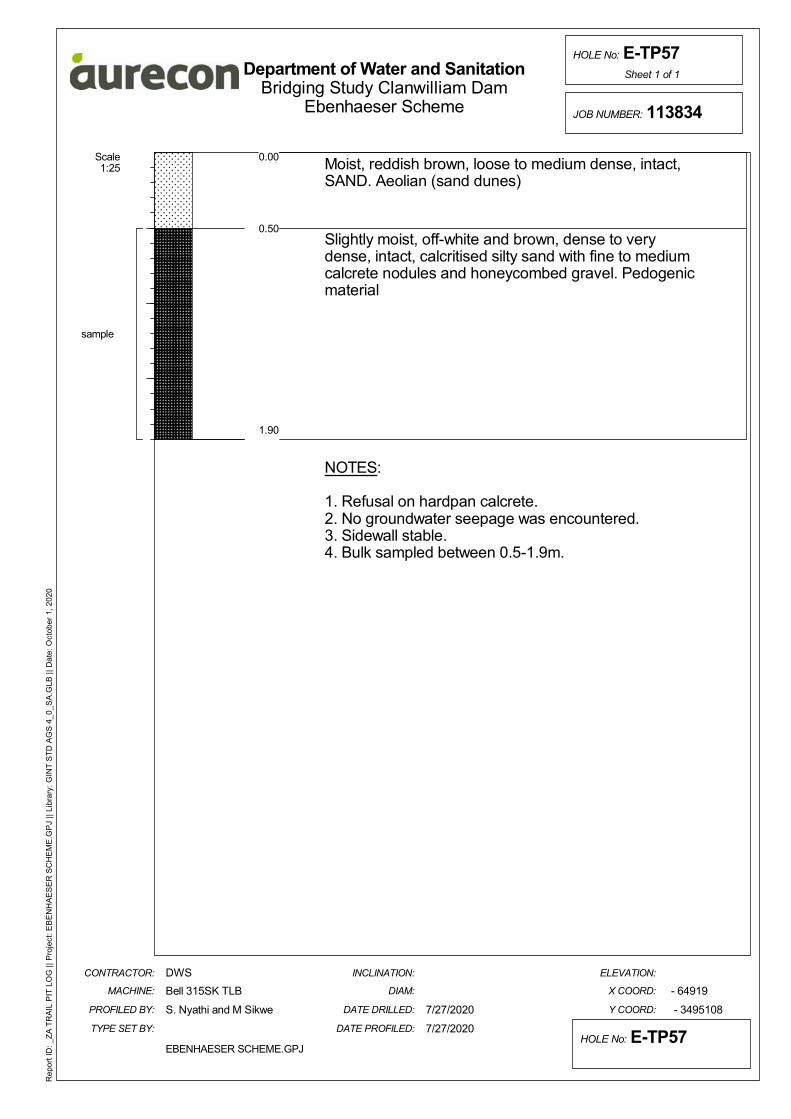
Scale1:25
0.00 Moist, reddish brown, loose to medium dense, intact,SAND. Aeolian (sand dunes)
Slightly moist, off-white and brown, dense to verydense, intact, calcritised silty sand with fine to mediumcalcrete nodules and honeycombed gravel. Pedogenicmaterial
NOTES:
1. Refusal on hardpan calcrete.2. No groundwater seepage was encountered.3. Sidewall stable.4. Bulk sampled between 0.5-1.9m.
Y COORD:
ELEVATION:
EBENHAESER SCHEME.GPJ
DATE PROFILED:
- 64919
- 3495108
INCLINATION:
DIAM:
DATE DRILLED:
X COORD:
Department of Water and Sanitation
HOLE No: E-TP57
DWS
Bell 315SK TLB
Bridging Study Clanwilliam Dam
CONTRACTOR:
MACHINE:
PROFILED BY:
TYPE SET BY: 7/27/2020
S. Nyathi and M Sikwe 7/27/2020
Ebenhaeser Scheme
Rep
ort I
D: _
ZA
TR
AIL
PIT
LO
G |
| Pro
ject
: EB
EN
HA
ES
ER
SC
HE
ME
.GP
J ||
Lib
rary
: GIN
T S
TD
AG
S 4
_0_
SA
.GLB
|| D
ate:
Oct
ober
1, 2
020
JOB NUMBER: 113834
Sheet 1 of 1
HOLE No: E-TP57
0.00
0.50
1.90
sample
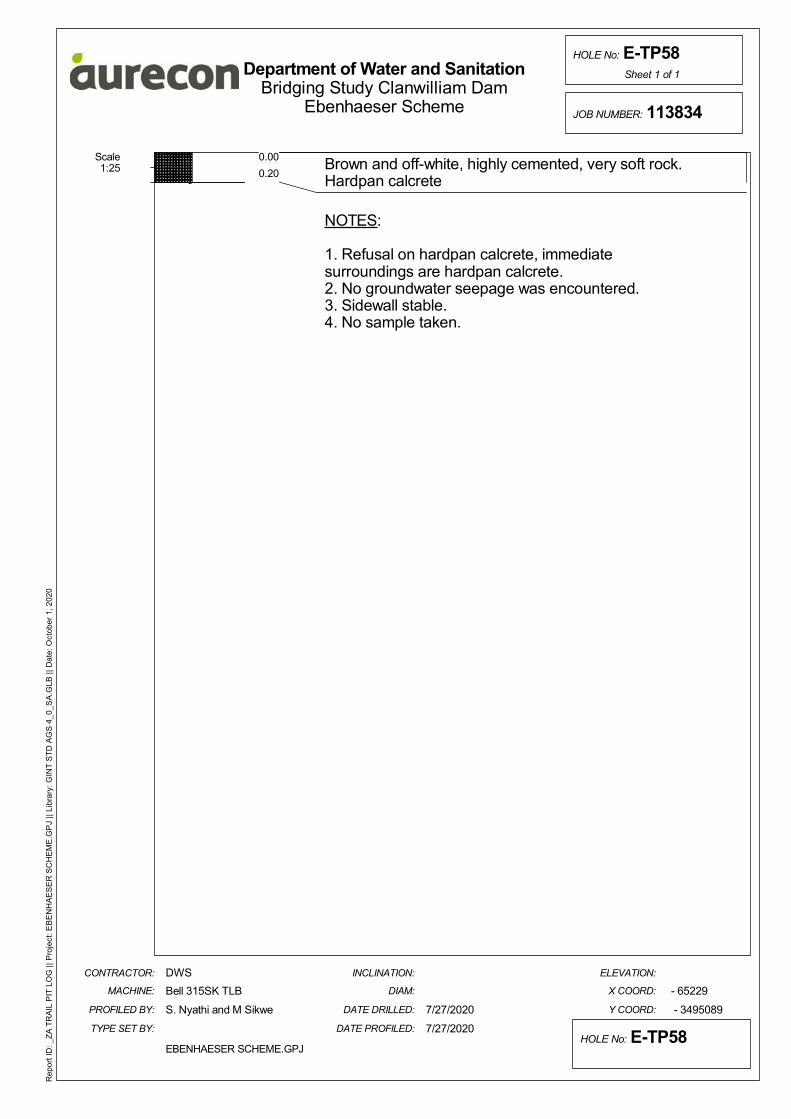
Scale1:25
0.00 Brown and off-white, highly cemented, very soft rock.Hardpan calcrete
NOTES:
1. Refusal on hardpan calcrete, immediatesurroundings are hardpan calcrete.2. No groundwater seepage was encountered.3. Sidewall stable.4. No sample taken.
Y COORD:
ELEVATION:
EBENHAESER SCHEME.GPJ
DATE PROFILED:
- 65229
- 3495089
INCLINATION:
DIAM:
DATE DRILLED:
X COORD:
Department of Water and Sanitation
HOLE No: E-TP58
DWS
Bell 315SK TLB
Bridging Study Clanwilliam Dam
CONTRACTOR:
MACHINE:
PROFILED BY:
TYPE SET BY: 7/27/2020
S. Nyathi and M Sikwe 7/27/2020
Ebenhaeser Scheme
Rep
ort I
D: _
ZA
TR
AIL
PIT
LO
G |
| Pro
ject
: EB
EN
HA
ES
ER
SC
HE
ME
.GP
J ||
Lib
rary
: GIN
T S
TD
AG
S 4
_0_
SA
.GLB
|| D
ate:
Oct
ober
1, 2
020
JOB NUMBER: 113834
Sheet 1 of 1
HOLE No: E-TP58
0.00
0.20
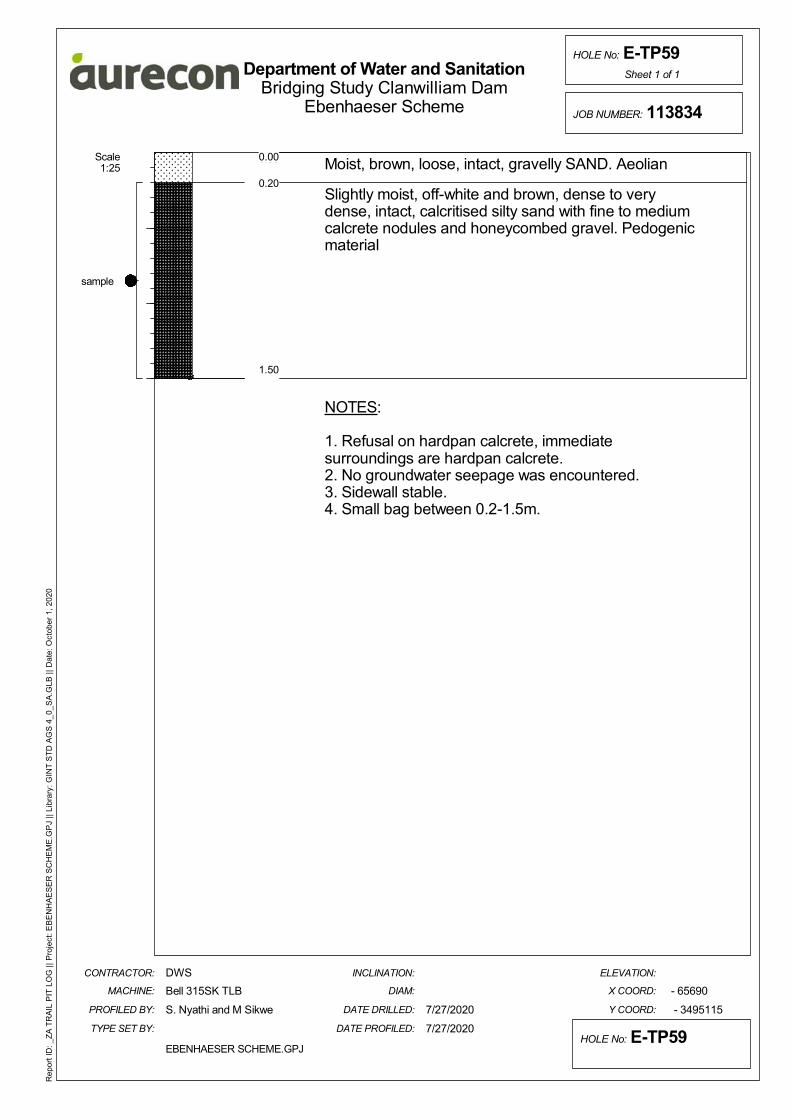
Scale1:25
0.00 Moist, brown, loose, intact, gravelly SAND. Aeolian
Slightly moist, off-white and brown, dense to verydense, intact, calcritised silty sand with fine to mediumcalcrete nodules and honeycombed gravel. Pedogenicmaterial
NOTES:
1. Refusal on hardpan calcrete, immediatesurroundings are hardpan calcrete.2. No groundwater seepage was encountered.3. Sidewall stable.4. Small bag between 0.2-1.5m.
Y COORD:
ELEVATION:
EBENHAESER SCHEME.GPJ
DATE PROFILED:
- 65690
- 3495115
INCLINATION:
DIAM:
DATE DRILLED:
X COORD:
Department of Water and Sanitation
HOLE No: E-TP59
DWS
Bell 315SK TLB
Bridging Study Clanwilliam Dam
CONTRACTOR:
MACHINE:
PROFILED BY:
TYPE SET BY: 7/27/2020
S. Nyathi and M Sikwe 7/27/2020
Ebenhaeser Scheme
Rep
ort I
D: _
ZA
TR
AIL
PIT
LO
G |
| Pro
ject
: EB
EN
HA
ES
ER
SC
HE
ME
.GP
J ||
Lib
rary
: GIN
T S
TD
AG
S 4
_0_
SA
.GLB
|| D
ate:
Oct
ober
1, 2
020
JOB NUMBER: 113834
Sheet 1 of 1
HOLE No: E-TP59
0.00
0.20
1.50
sample
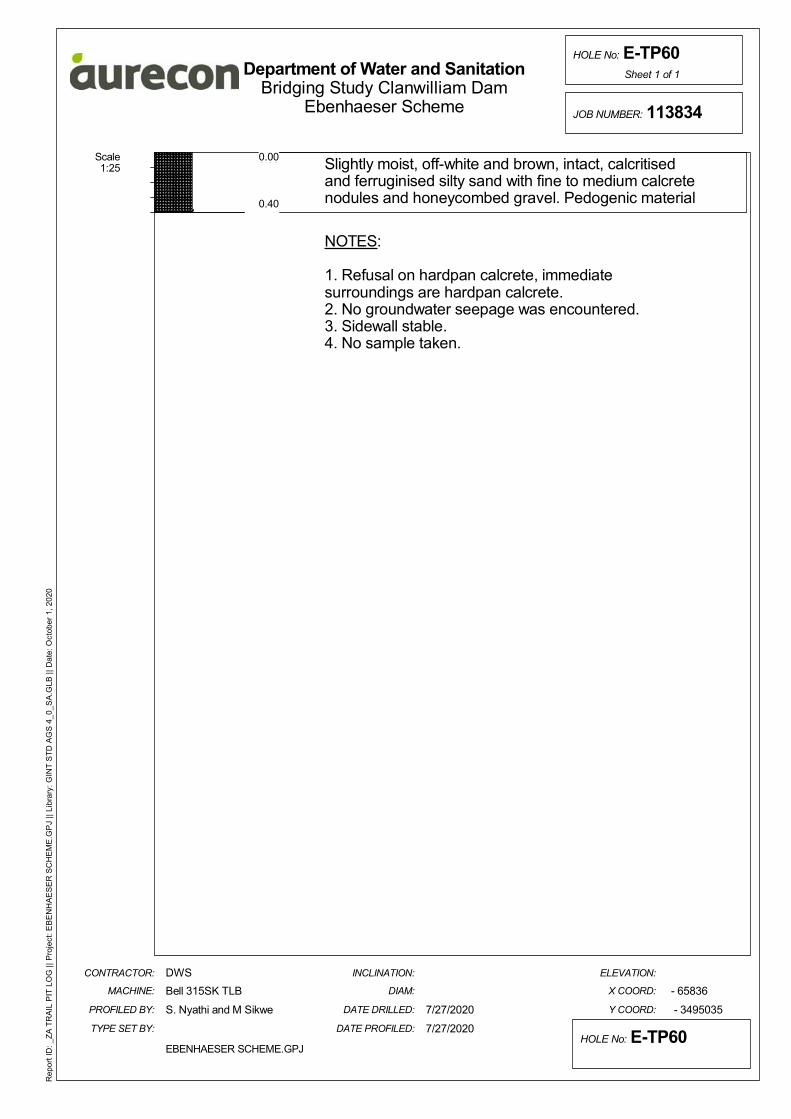
Scale1:25
0.00 Slightly moist, off-white and brown, intact, calcritisedand ferruginised silty sand with fine to medium calcretenodules and honeycombed gravel. Pedogenic material
NOTES:
1. Refusal on hardpan calcrete, immediatesurroundings are hardpan calcrete.2. No groundwater seepage was encountered.3. Sidewall stable.4. No sample taken.
Y COORD:
ELEVATION:
EBENHAESER SCHEME.GPJ
DATE PROFILED:
- 65836
- 3495035
INCLINATION:
DIAM:
DATE DRILLED:
X COORD:
Department of Water and Sanitation
HOLE No: E-TP60
DWS
Bell 315SK TLB
Bridging Study Clanwilliam Dam
CONTRACTOR:
MACHINE:
PROFILED BY:
TYPE SET BY: 7/27/2020
S. Nyathi and M Sikwe 7/27/2020
Ebenhaeser Scheme
Rep
ort I
D: _
ZA
TR
AIL
PIT
LO
G |
| Pro
ject
: EB
EN
HA
ES
ER
SC
HE
ME
.GP
J ||
Lib
rary
: GIN
T S
TD
AG
S 4
_0_
SA
.GLB
|| D
ate:
Oct
ober
1, 2
020
JOB NUMBER: 113834
Sheet 1 of 1
HOLE No: E-TP60
0.00
0.40
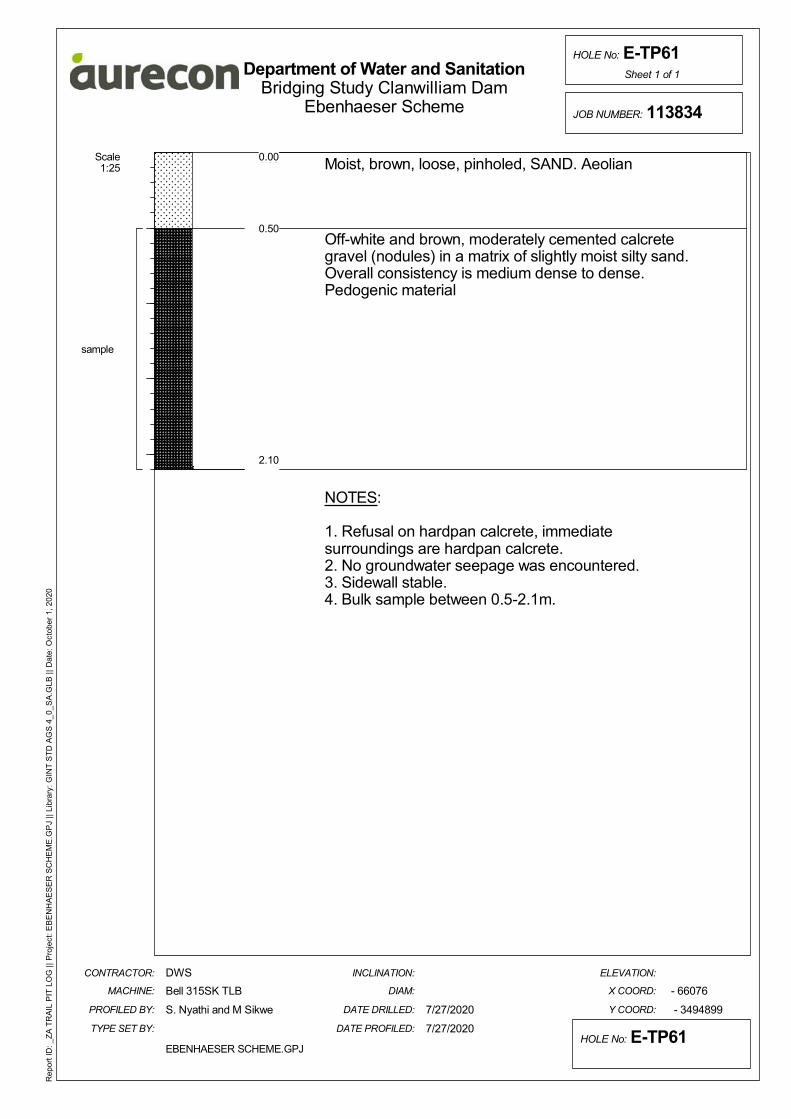
Scale1:25
0.00 Moist, brown, loose, pinholed, SAND. Aeolian
Off-white and brown, moderately cemented calcretegravel (nodules) in a matrix of slightly moist silty sand.Overall consistency is medium dense to dense.Pedogenic material
NOTES:
1. Refusal on hardpan calcrete, immediatesurroundings are hardpan calcrete.2. No groundwater seepage was encountered.3. Sidewall stable.4. Bulk sample between 0.5-2.1m.
Y COORD:
ELEVATION:
EBENHAESER SCHEME.GPJ
DATE PROFILED:
- 66076
- 3494899
INCLINATION:
DIAM:
DATE DRILLED:
X COORD:
Department of Water and Sanitation
HOLE No: E-TP61
DWS
Bell 315SK TLB
Bridging Study Clanwilliam Dam
CONTRACTOR:
MACHINE:
PROFILED BY:
TYPE SET BY: 7/27/2020
S. Nyathi and M Sikwe 7/27/2020
Ebenhaeser Scheme
Rep
ort I
D: _
ZA
TR
AIL
PIT
LO
G |
| Pro
ject
: EB
EN
HA
ES
ER
SC
HE
ME
.GP
J ||
Lib
rary
: GIN
T S
TD
AG
S 4
_0_
SA
.GLB
|| D
ate:
Oct
ober
1, 2
020
JOB NUMBER: 113834
Sheet 1 of 1
HOLE No: E-TP61
0.00
0.50
2.10
sample

Scale1:25
0.00 Brown, off-white and red, highly weathered, finegrained, laminated, very soft rock with quartz veins.Schist
NOTES:
1. Outcrop in the area, hard excavation expected.2. No sample taken.
Y COORD:
ELEVATION:
EBENHAESER SCHEME.GPJ
DATE PROFILED:
- 66350
- 3494809
INCLINATION:
DIAM:
DATE DRILLED:
X COORD:
Department of Water and Sanitation
HOLE No: E-TP62
DWS
Bell 315SK TLB
Bridging Study Clanwilliam Dam
CONTRACTOR:
MACHINE:
PROFILED BY:
TYPE SET BY: 7/27/2020
S. Nyathi and M Sikwe 7/27/2020
Ebenhaeser Scheme
Rep
ort I
D: _
ZA
TR
AIL
PIT
LO
G |
| Pro
ject
: EB
EN
HA
ES
ER
SC
HE
ME
.GP
J ||
Lib
rary
: GIN
T S
TD
AG
S 4
_0_
SA
.GLB
|| D
ate:
Oct
ober
1, 2
020
JOB NUMBER: 113834
Sheet 1 of 1
HOLE No: E-TP62
0.000.10
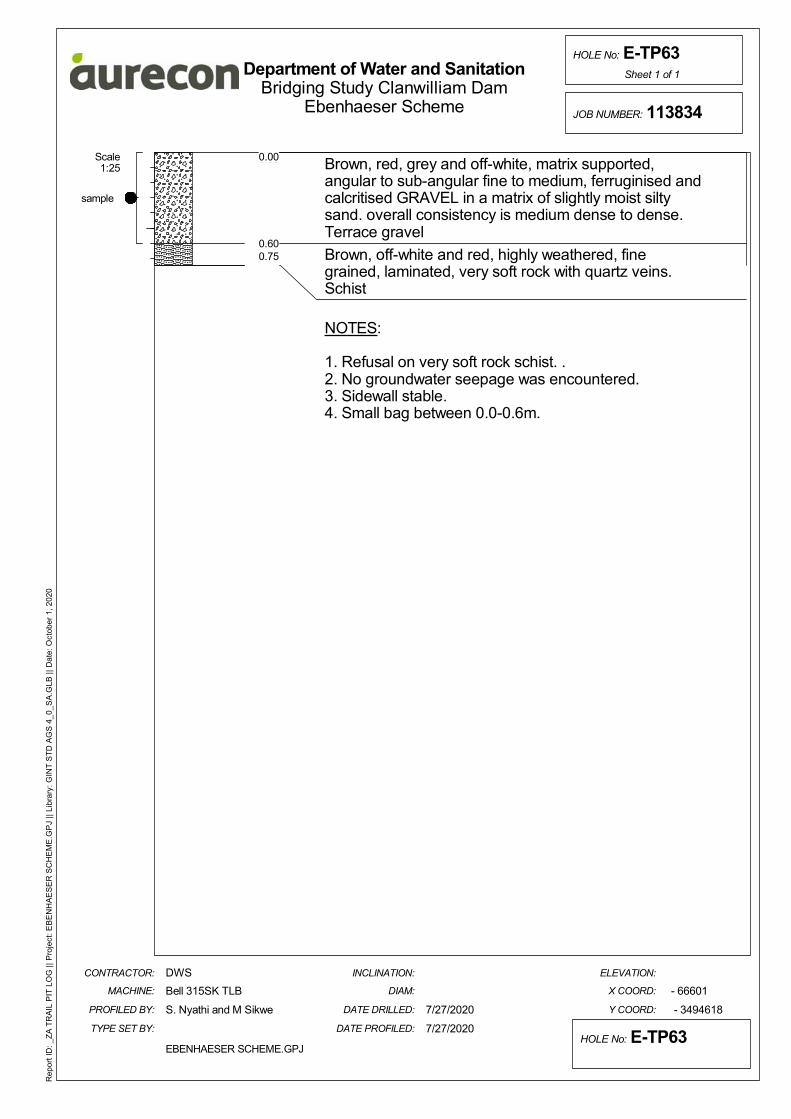
Scale1:25
0.00 Brown, red, grey and off-white, matrix supported,angular to sub-angular fine to medium, ferruginised andcalcritised GRAVEL in a matrix of slightly moist siltysand. overall consistency is medium dense to dense.Terrace gravel
Brown, off-white and red, highly weathered, finegrained, laminated, very soft rock with quartz veins.Schist
NOTES:
1. Refusal on very soft rock schist. .2. No groundwater seepage was encountered.3. Sidewall stable.4. Small bag between 0.0-0.6m.
Y COORD:
ELEVATION:
EBENHAESER SCHEME.GPJ
DATE PROFILED:
- 66601
- 3494618
INCLINATION:
DIAM:
DATE DRILLED:
X COORD:
Department of Water and Sanitation
HOLE No: E-TP63
DWS
Bell 315SK TLB
Bridging Study Clanwilliam Dam
CONTRACTOR:
MACHINE:
PROFILED BY:
TYPE SET BY: 7/27/2020
S. Nyathi and M Sikwe 7/27/2020
Ebenhaeser Scheme
Rep
ort I
D: _
ZA
TR
AIL
PIT
LO
G |
| Pro
ject
: EB
EN
HA
ES
ER
SC
HE
ME
.GP
J ||
Lib
rary
: GIN
T S
TD
AG
S 4
_0_
SA
.GLB
|| D
ate:
Oct
ober
1, 2
020
JOB NUMBER: 113834
Sheet 1 of 1
HOLE No: E-TP63
0.00
0.600.75
sample
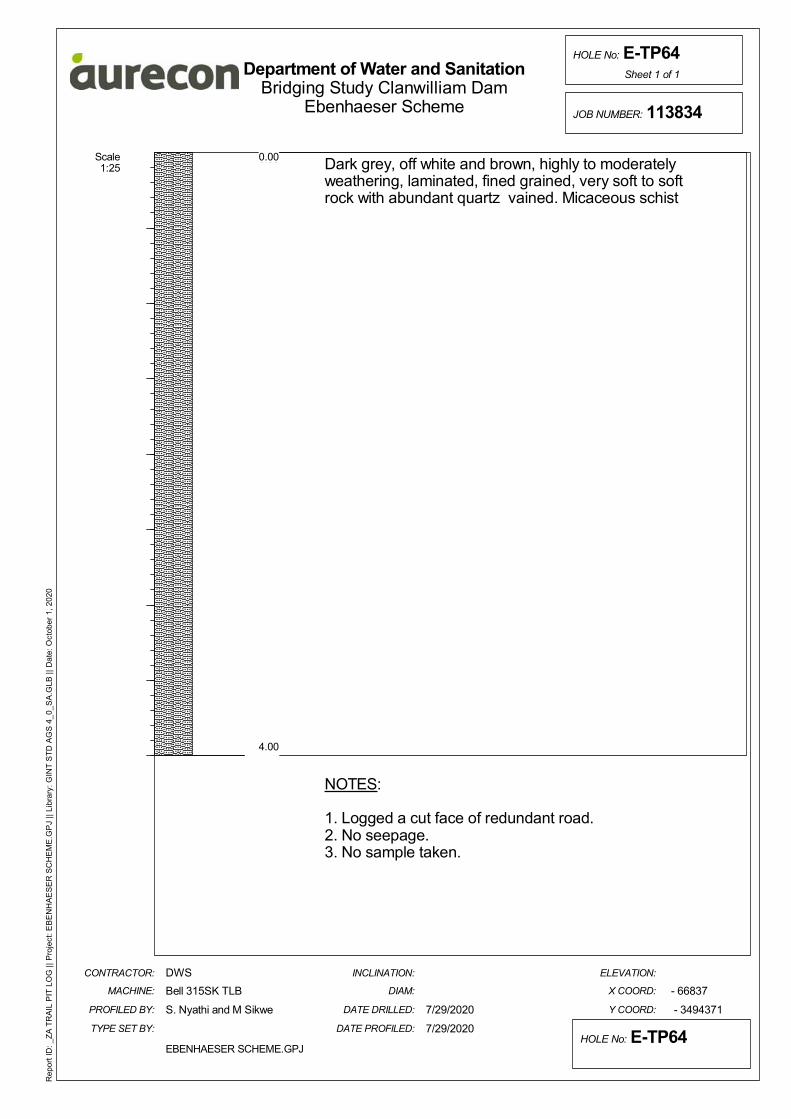
Scale1:25
0.00 Dark grey, off white and brown, highly to moderatelyweathering, laminated, fined grained, very soft to softrock with abundant quartz vained. Micaceous schist
NOTES:
1. Logged a cut face of redundant road.2. No seepage.3. No sample taken.
Y COORD:
ELEVATION:
EBENHAESER SCHEME.GPJ
DATE PROFILED:
- 66837
- 3494371
INCLINATION:
DIAM:
DATE DRILLED:
X COORD:
Department of Water and Sanitation
HOLE No: E-TP64
DWS
Bell 315SK TLB
Bridging Study Clanwilliam Dam
CONTRACTOR:
MACHINE:
PROFILED BY:
TYPE SET BY: 7/29/2020
S. Nyathi and M Sikwe 7/29/2020
Ebenhaeser Scheme
Rep
ort I
D: _
ZA
TR
AIL
PIT
LO
G |
| Pro
ject
: EB
EN
HA
ES
ER
SC
HE
ME
.GP
J ||
Lib
rary
: GIN
T S
TD
AG
S 4
_0_
SA
.GLB
|| D
ate:
Oct
ober
1, 2
020
JOB NUMBER: 113834
Sheet 1 of 1
HOLE No: E-TP64
0.00
4.00

Scale1:25
0.00 Slightly moist to moist, brown, loose, intact, silty SANDwith roots. Aeolian
Brown, red, grey and off-white, matrix supported,angular to sub-angular fine to medium, ferruginised andcalcritised gravel in a matrix of slightly moist silty sand.Overall consistency is medium dense to dense. Terracegravels
NOTES:
1. Refusal on hardpan calcrete.2. No groundwater seepage was encountered.3. Sidewall stable.4. No sample taken.
Y COORD:
ELEVATION:
EBENHAESER SCHEME.GPJ
DATE PROFILED:
- 67046
- 3494221
INCLINATION:
DIAM:
DATE DRILLED:
X COORD:
Department of Water and Sanitation
HOLE No: E-TP65
DWS
Bell 315SK TLB
Bridging Study Clanwilliam Dam
CONTRACTOR:
MACHINE:
PROFILED BY:
TYPE SET BY: 7/27/2020
S. Nyathi and M Sikwe 7/27/2020
Ebenhaeser Scheme
Rep
ort I
D: _
ZA
TR
AIL
PIT
LO
G |
| Pro
ject
: EB
EN
HA
ES
ER
SC
HE
ME
.GP
J ||
Lib
rary
: GIN
T S
TD
AG
S 4
_0_
SA
.GLB
|| D
ate:
Oct
ober
1, 2
020
JOB NUMBER: 113834
Sheet 1 of 1
HOLE No: E-TP65
0.00
0.20
0.40
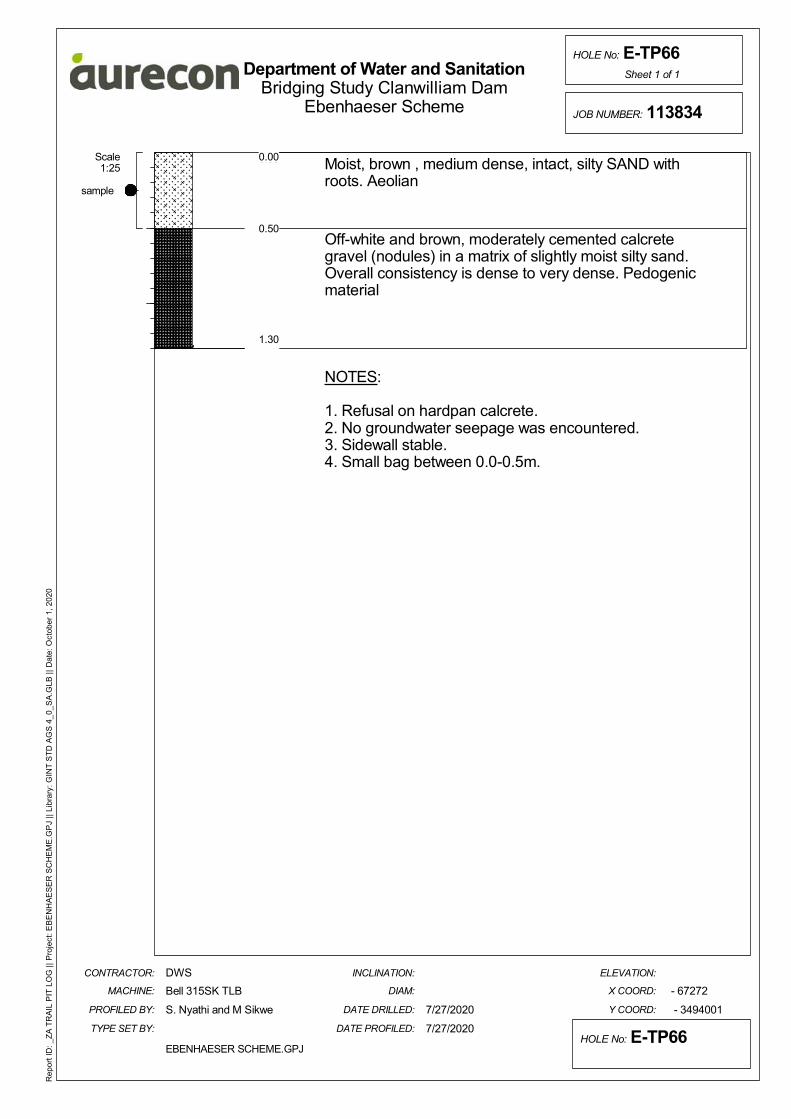
Scale1:25
0.00 Moist, brown , medium dense, intact, silty SAND withroots. Aeolian
Off-white and brown, moderately cemented calcretegravel (nodules) in a matrix of slightly moist silty sand.Overall consistency is dense to very dense. Pedogenicmaterial
NOTES:
1. Refusal on hardpan calcrete.2. No groundwater seepage was encountered.3. Sidewall stable.4. Small bag between 0.0-0.5m.
Y COORD:
ELEVATION:
EBENHAESER SCHEME.GPJ
DATE PROFILED:
- 67272
- 3494001
INCLINATION:
DIAM:
DATE DRILLED:
X COORD:
Department of Water and Sanitation
HOLE No: E-TP66
DWS
Bell 315SK TLB
Bridging Study Clanwilliam Dam
CONTRACTOR:
MACHINE:
PROFILED BY:
TYPE SET BY: 7/27/2020
S. Nyathi and M Sikwe 7/27/2020
Ebenhaeser Scheme
Rep
ort I
D: _
ZA
TR
AIL
PIT
LO
G |
| Pro
ject
: EB
EN
HA
ES
ER
SC
HE
ME
.GP
J ||
Lib
rary
: GIN
T S
TD
AG
S 4
_0_
SA
.GLB
|| D
ate:
Oct
ober
1, 2
020
JOB NUMBER: 113834
Sheet 1 of 1
HOLE No: E-TP66
0.00
0.50
1.30
sample
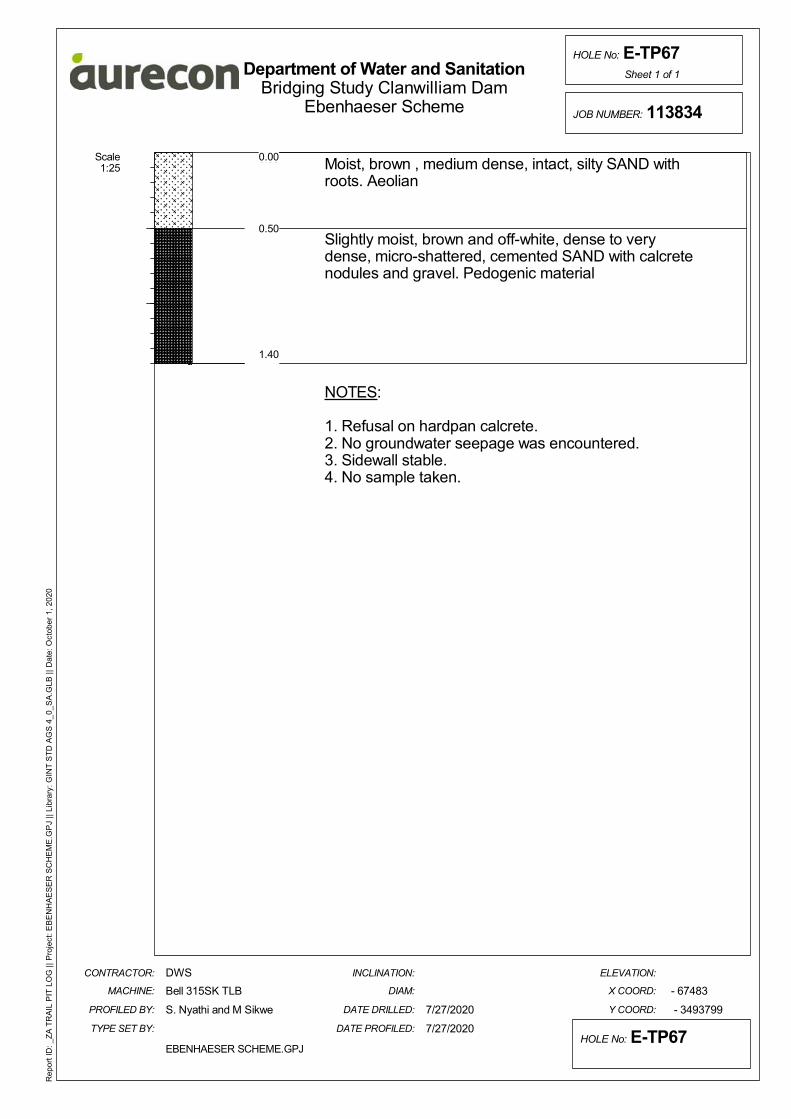
Scale1:25
0.00 Moist, brown , medium dense, intact, silty SAND withroots. Aeolian
Slightly moist, brown and off-white, dense to verydense, micro-shattered, cemented SAND with calcretenodules and gravel. Pedogenic material
NOTES:
1. Refusal on hardpan calcrete.2. No groundwater seepage was encountered.3. Sidewall stable.4. No sample taken.
Y COORD:
ELEVATION:
EBENHAESER SCHEME.GPJ
DATE PROFILED:
- 67483
- 3493799
INCLINATION:
DIAM:
DATE DRILLED:
X COORD:
Department of Water and Sanitation
HOLE No: E-TP67
DWS
Bell 315SK TLB
Bridging Study Clanwilliam Dam
CONTRACTOR:
MACHINE:
PROFILED BY:
TYPE SET BY: 7/27/2020
S. Nyathi and M Sikwe 7/27/2020
Ebenhaeser Scheme
Rep
ort I
D: _
ZA
TR
AIL
PIT
LO
G |
| Pro
ject
: EB
EN
HA
ES
ER
SC
HE
ME
.GP
J ||
Lib
rary
: GIN
T S
TD
AG
S 4
_0_
SA
.GLB
|| D
ate:
Oct
ober
1, 2
020
JOB NUMBER: 113834
Sheet 1 of 1
HOLE No: E-TP67
0.00
0.50
1.40

Scale1:25
0.00 Brown and off-white, highly cemented, very soft rock.Hardpan calcrete
NOTES:
1. Refusal on hardpan calcrete, immediatesurroundings are hardpan calcrete.2. No groundwater seepage was encountered.3. Sidewall stable.4. No sample taken.
Y COORD:
ELEVATION:
EBENHAESER SCHEME.GPJ
DATE PROFILED:
- 67733
- 3493672
INCLINATION:
DIAM:
DATE DRILLED:
X COORD:
Department of Water and Sanitation
HOLE No: E-TP68
DWS
Bell 315SK TLB
Bridging Study Clanwilliam Dam
CONTRACTOR:
MACHINE:
PROFILED BY:
TYPE SET BY: 7/27/2020
S. Nyathi and M Sikwe 7/27/2020
Ebenhaeser Scheme
Rep
ort I
D: _
ZA
TR
AIL
PIT
LO
G |
| Pro
ject
: EB
EN
HA
ES
ER
SC
HE
ME
.GP
J ||
Lib
rary
: GIN
T S
TD
AG
S 4
_0_
SA
.GLB
|| D
ate:
Oct
ober
1, 2
020
JOB NUMBER: 113834
Sheet 1 of 1
HOLE No: E-TP68
0.00
0.30
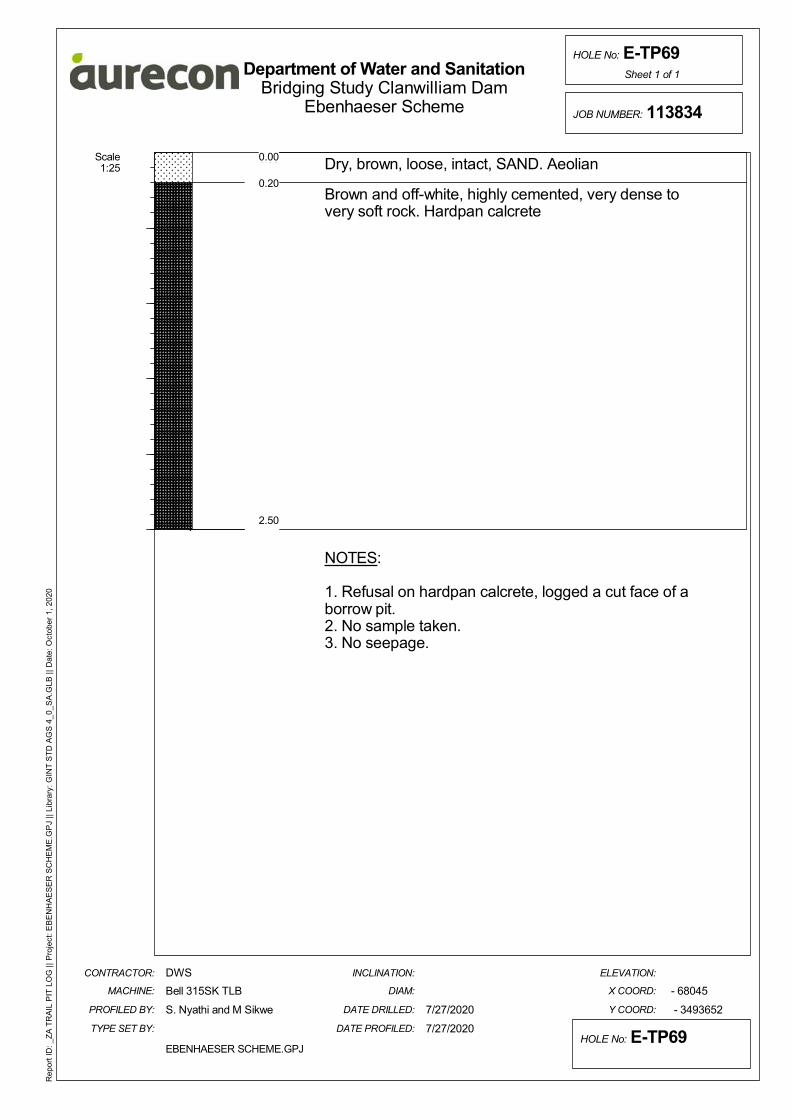
Scale1:25
0.00 Dry, brown, loose, intact, SAND. Aeolian
Brown and off-white, highly cemented, very dense tovery soft rock. Hardpan calcrete
NOTES:
1. Refusal on hardpan calcrete, logged a cut face of aborrow pit.2. No sample taken.3. No seepage.
Y COORD:
ELEVATION:
EBENHAESER SCHEME.GPJ
DATE PROFILED:
- 68045
- 3493652
INCLINATION:
DIAM:
DATE DRILLED:
X COORD:
Department of Water and Sanitation
HOLE No: E-TP69
DWS
Bell 315SK TLB
Bridging Study Clanwilliam Dam
CONTRACTOR:
MACHINE:
PROFILED BY:
TYPE SET BY: 7/27/2020
S. Nyathi and M Sikwe 7/27/2020
Ebenhaeser Scheme
Rep
ort I
D: _
ZA
TR
AIL
PIT
LO
G |
| Pro
ject
: EB
EN
HA
ES
ER
SC
HE
ME
.GP
J ||
Lib
rary
: GIN
T S
TD
AG
S 4
_0_
SA
.GLB
|| D
ate:
Oct
ober
1, 2
020
JOB NUMBER: 113834
Sheet 1 of 1
HOLE No: E-TP69
0.00
0.20
2.50

Scale1:25
0.00 Moist, brown, loose, intact, SAND. Aeolian
Brown and off-white, highly cemented, very soft rock.Hardpan calcrete
NOTES:
1. Refusal on hardpan calcrete, immediatesurroundings are hardpan calcrete.2. No groundwater seepage was encountered.3. Sidewall stable.4. No sample taken.
Y COORD:
ELEVATION:
EBENHAESER SCHEME.GPJ
DATE PROFILED:
- 68344
- 3493589
INCLINATION:
DIAM:
DATE DRILLED:
X COORD:
Department of Water and Sanitation
HOLE No: E-TP70
DWS
Bell 315SK TLB
Bridging Study Clanwilliam Dam
CONTRACTOR:
MACHINE:
PROFILED BY:
TYPE SET BY: 7/27/2020
S. Nyathi and M Sikwe 7/27/2020
Ebenhaeser Scheme
Rep
ort I
D: _
ZA
TR
AIL
PIT
LO
G |
| Pro
ject
: EB
EN
HA
ES
ER
SC
HE
ME
.GP
J ||
Lib
rary
: GIN
T S
TD
AG
S 4
_0_
SA
.GLB
|| D
ate:
Oct
ober
1, 2
020
JOB NUMBER: 113834
Sheet 1 of 1
HOLE No: E-TP70
0.00
0.20
0.40
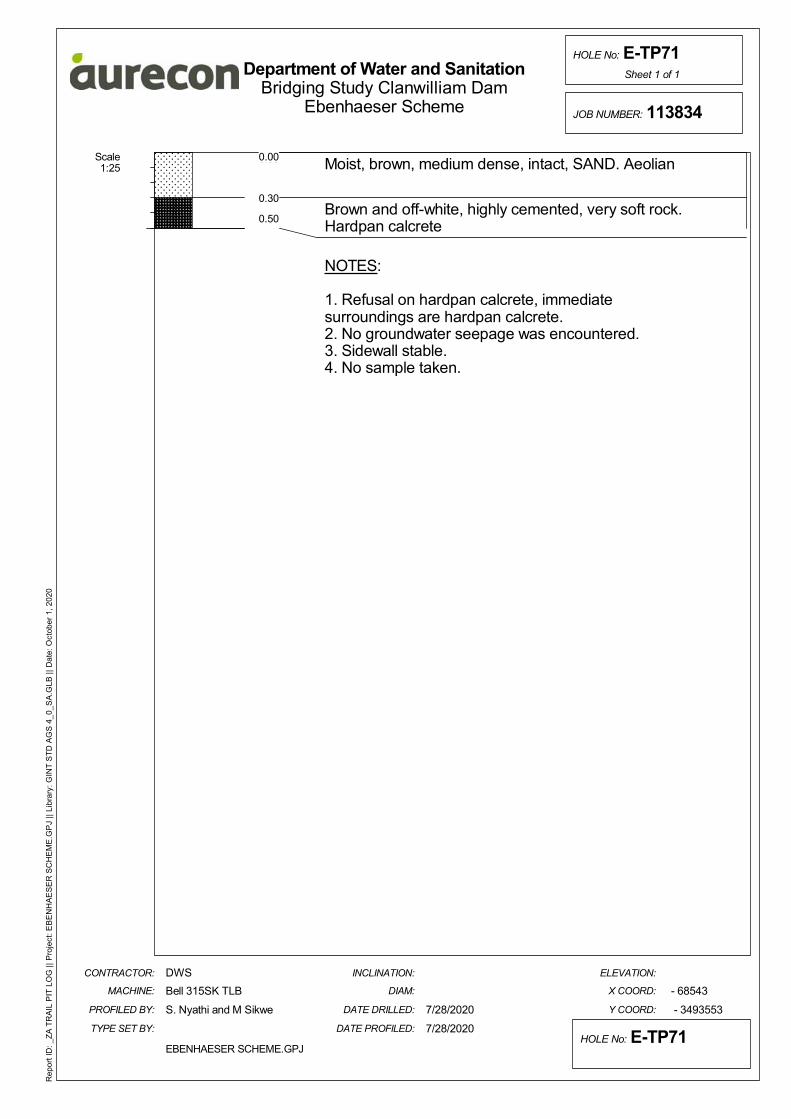
Scale1:25
0.00 Moist, brown, medium dense, intact, SAND. Aeolian
Brown and off-white, highly cemented, very soft rock.Hardpan calcrete
NOTES:
1. Refusal on hardpan calcrete, immediatesurroundings are hardpan calcrete.2. No groundwater seepage was encountered.3. Sidewall stable.4. No sample taken.
Y COORD:
ELEVATION:
EBENHAESER SCHEME.GPJ
DATE PROFILED:
- 68543
- 3493553
INCLINATION:
DIAM:
DATE DRILLED:
X COORD:
Department of Water and Sanitation
HOLE No: E-TP71
DWS
Bell 315SK TLB
Bridging Study Clanwilliam Dam
CONTRACTOR:
MACHINE:
PROFILED BY:
TYPE SET BY: 7/28/2020
S. Nyathi and M Sikwe 7/28/2020
Ebenhaeser Scheme
Rep
ort I
D: _
ZA
TR
AIL
PIT
LO
G |
| Pro
ject
: EB
EN
HA
ES
ER
SC
HE
ME
.GP
J ||
Lib
rary
: GIN
T S
TD
AG
S 4
_0_
SA
.GLB
|| D
ate:
Oct
ober
1, 2
020
JOB NUMBER: 113834
Sheet 1 of 1
HOLE No: E-TP71
0.00
0.30
0.50
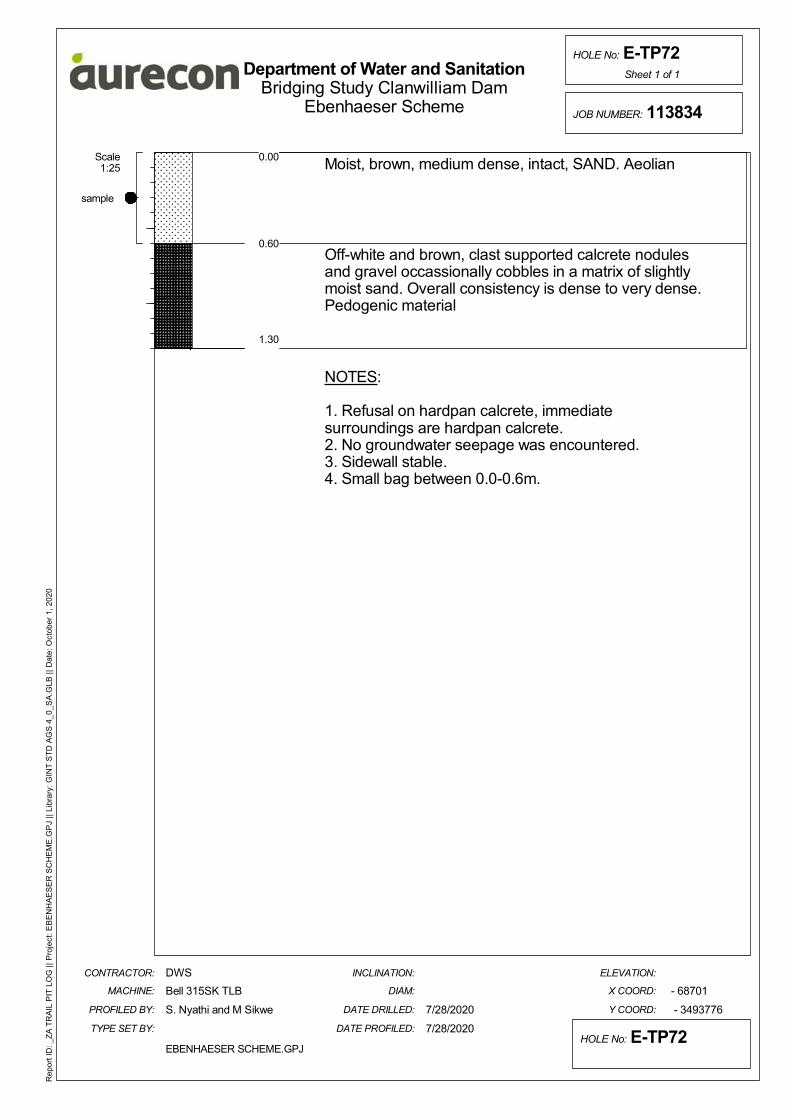
Scale1:25
0.00 Moist, brown, medium dense, intact, SAND. Aeolian
Off-white and brown, clast supported calcrete nodulesand gravel occassionally cobbles in a matrix of slightlymoist sand. Overall consistency is dense to very dense.Pedogenic material
NOTES:
1. Refusal on hardpan calcrete, immediatesurroundings are hardpan calcrete.2. No groundwater seepage was encountered.3. Sidewall stable.4. Small bag between 0.0-0.6m.
Y COORD:
ELEVATION:
EBENHAESER SCHEME.GPJ
DATE PROFILED:
- 68701
- 3493776
INCLINATION:
DIAM:
DATE DRILLED:
X COORD:
Department of Water and Sanitation
HOLE No: E-TP72
DWS
Bell 315SK TLB
Bridging Study Clanwilliam Dam
CONTRACTOR:
MACHINE:
PROFILED BY:
TYPE SET BY: 7/28/2020
S. Nyathi and M Sikwe 7/28/2020
Ebenhaeser Scheme
Rep
ort I
D: _
ZA
TR
AIL
PIT
LO
G |
| Pro
ject
: EB
EN
HA
ES
ER
SC
HE
ME
.GP
J ||
Lib
rary
: GIN
T S
TD
AG
S 4
_0_
SA
.GLB
|| D
ate:
Oct
ober
1, 2
020
JOB NUMBER: 113834
Sheet 1 of 1
HOLE No: E-TP72
0.00
0.60
1.30
sample
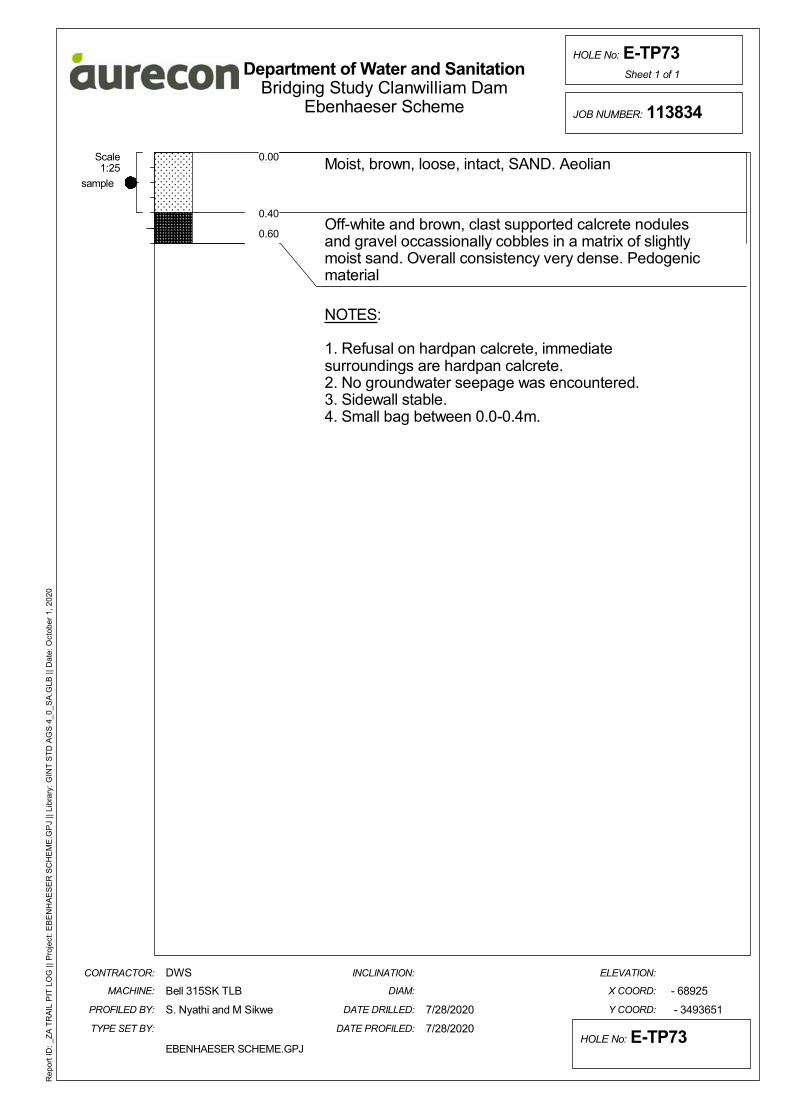
Scale1:25
0.00 Moist, brown, loose, intact, SAND. Aeolian
Off-white and brown, clast supported calcrete nodulesand gravel occassionally cobbles in a matrix of slightlymoist sand. Overall consistency very dense. Pedogenicmaterial
NOTES:
1. Refusal on hardpan calcrete, immediatesurroundings are hardpan calcrete.2. No groundwater seepage was encountered.3. Sidewall stable.4. Small bag between 0.0-0.4m.
Y COORD:
ELEVATION:
EBENHAESER SCHEME.GPJ
DATE PROFILED:
- 68925
- 3493651
INCLINATION:
DIAM:
DATE DRILLED:
X COORD:
Department of Water and Sanitation
HOLE No: E-TP73
DWS
Bell 315SK TLB
Bridging Study Clanwilliam Dam
CONTRACTOR:
MACHINE:
PROFILED BY:
TYPE SET BY: 7/28/2020
S. Nyathi and M Sikwe 7/28/2020
Ebenhaeser Scheme
Rep
ort I
D: _
ZA
TR
AIL
PIT
LO
G |
| Pro
ject
: EB
EN
HA
ES
ER
SC
HE
ME
.GP
J ||
Lib
rary
: GIN
T S
TD
AG
S 4
_0_
SA
.GLB
|| D
ate:
Oct
ober
1, 2
020
JOB NUMBER: 113834
Sheet 1 of 1
HOLE No: E-TP73
0.00
0.40
0.60
sample

Scale1:25
0.00 Off-white and brown, moderately cemented calcretegravel (nodules) in a matrix of slightly moist silty sand.Overall consistency is dense to very dense. Pedogenicmaterial
Off-white and brown, highly cemented, very soft rock.Hardpan calcrete
NOTES:
1. Logged open pit.2. Sidewalls stable.3. No sample taken.4. No seepage.
Y COORD:
ELEVATION:
EBENHAESER SCHEME.GPJ
DATE PROFILED:
- 69167
- 3493862
INCLINATION:
DIAM:
DATE DRILLED:
X COORD:
Department of Water and Sanitation
HOLE No: E-TP74
DWS
Bell 315SK TLB
Bridging Study Clanwilliam Dam
CONTRACTOR:
MACHINE:
PROFILED BY:
TYPE SET BY: 7/28/2020
S. Nyathi and M Sikwe 7/28/2020
Ebenhaeser Scheme
Rep
ort I
D: _
ZA
TR
AIL
PIT
LO
G |
| Pro
ject
: EB
EN
HA
ES
ER
SC
HE
ME
.GP
J ||
Lib
rary
: GIN
T S
TD
AG
S 4
_0_
SA
.GLB
|| D
ate:
Oct
ober
1, 2
020
JOB NUMBER: 113834
Sheet 1 of 1
HOLE No: E-TP74
0.00
0.40
1.20

Scale1:25
0.00 Dry, brown, dense, intact, SAND. Aeolian
Dry, brown speckled black, dense to very dense, intact,sand with ferricrete nodules (gravel). Pedogenicmaterial
Off-white and brown, highly cemented, very soft rock.Hardpan calcrete
NOTES:
1. Logged open pit.2. Sidewalls stable.3. No sample taken.4. No seepage.
Y COORD:
ELEVATION:
EBENHAESER SCHEME.GPJ
DATE PROFILED:
- 69307
- 3494029
INCLINATION:
DIAM:
DATE DRILLED:
X COORD:
Department of Water and Sanitation
HOLE No: E-TP75
DWS
Bell 315SK TLB
Bridging Study Clanwilliam Dam
CONTRACTOR:
MACHINE:
PROFILED BY:
TYPE SET BY: 7/28/2020
S. Nyathi and M Sikwe 7/28/2020
Ebenhaeser Scheme
Rep
ort I
D: _
ZA
TR
AIL
PIT
LO
G |
| Pro
ject
: EB
EN
HA
ES
ER
SC
HE
ME
.GP
J ||
Lib
rary
: GIN
T S
TD
AG
S 4
_0_
SA
.GLB
|| D
ate:
Oct
ober
1, 2
020
JOB NUMBER: 113834
Sheet 1 of 1
HOLE No: E-TP75
0.00
0.70
1.10
2.10

Scale1:25
0.00 Off-white and brown, moderately cemented calcretegravel (nodules) in a matrix of slightly moist silty sand.Overall consistency is dense to very dense. Pedogenicmaterial
Off-white and brown, highly cemented, very soft rock.Hardpan calcrete
NOTES:
1. Logged open pit.2. Sidewalls stable.3. No sample taken.4. No seepage.
Y COORD:
ELEVATION:
EBENHAESER SCHEME.GPJ
DATE PROFILED:
- 69411
- 3494269
INCLINATION:
DIAM:
DATE DRILLED:
X COORD:
Department of Water and Sanitation
HOLE No: E-TP76
DWS
Bell 315SK TLB
Bridging Study Clanwilliam Dam
CONTRACTOR:
MACHINE:
PROFILED BY:
TYPE SET BY: 7/28/2020
S. Nyathi and M Sikwe 7/28/2020
Ebenhaeser Scheme
Rep
ort I
D: _
ZA
TR
AIL
PIT
LO
G |
| Pro
ject
: EB
EN
HA
ES
ER
SC
HE
ME
.GP
J ||
Lib
rary
: GIN
T S
TD
AG
S 4
_0_
SA
.GLB
|| D
ate:
Oct
ober
1, 2
020
JOB NUMBER: 113834
Sheet 1 of 1
HOLE No: E-TP76
0.00
0.40
1.20
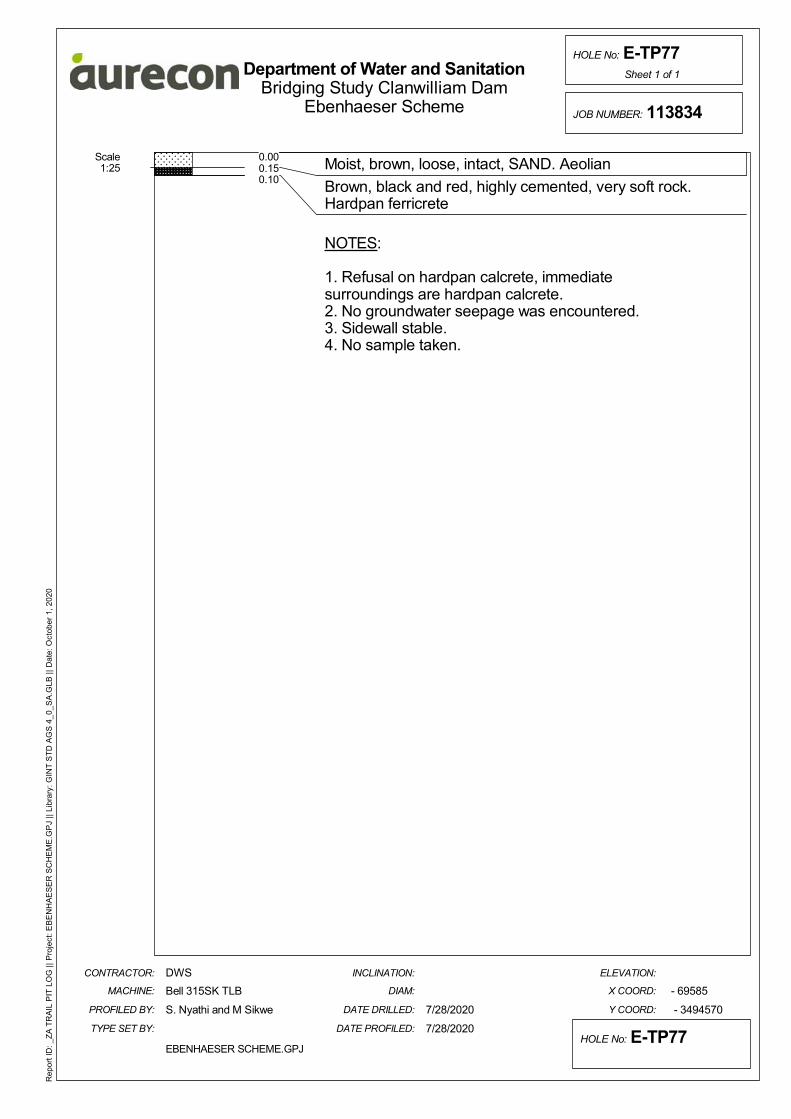
Scale1:25
0.00 Moist, brown, loose, intact, SAND. Aeolian
Brown, black and red, highly cemented, very soft rock.Hardpan ferricrete
NOTES:
1. Refusal on hardpan calcrete, immediatesurroundings are hardpan calcrete.2. No groundwater seepage was encountered.3. Sidewall stable.4. No sample taken.
Y COORD:
ELEVATION:
EBENHAESER SCHEME.GPJ
DATE PROFILED:
- 69585
- 3494570
INCLINATION:
DIAM:
DATE DRILLED:
X COORD:
Department of Water and Sanitation
HOLE No: E-TP77
DWS
Bell 315SK TLB
Bridging Study Clanwilliam Dam
CONTRACTOR:
MACHINE:
PROFILED BY:
TYPE SET BY: 7/28/2020
S. Nyathi and M Sikwe 7/28/2020
Ebenhaeser Scheme
Rep
ort I
D: _
ZA
TR
AIL
PIT
LO
G |
| Pro
ject
: EB
EN
HA
ES
ER
SC
HE
ME
.GP
J ||
Lib
rary
: GIN
T S
TD
AG
S 4
_0_
SA
.GLB
|| D
ate:
Oct
ober
1, 2
020
JOB NUMBER: 113834
Sheet 1 of 1
HOLE No: E-TP77
0.000.150.10
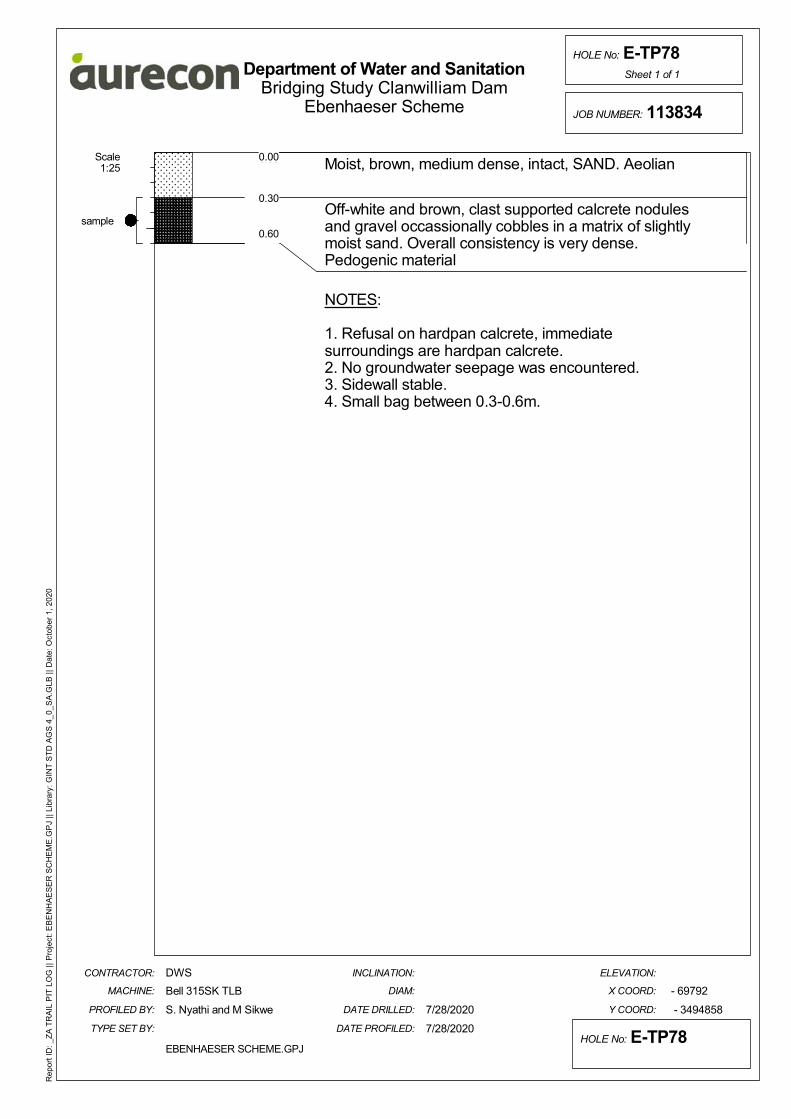
Scale1:25
0.00 Moist, brown, medium dense, intact, SAND. Aeolian
Off-white and brown, clast supported calcrete nodulesand gravel occassionally cobbles in a matrix of slightlymoist sand. Overall consistency is very dense.Pedogenic material
NOTES:
1. Refusal on hardpan calcrete, immediatesurroundings are hardpan calcrete.2. No groundwater seepage was encountered.3. Sidewall stable.4. Small bag between 0.3-0.6m.
Y COORD:
ELEVATION:
EBENHAESER SCHEME.GPJ
DATE PROFILED:
- 69792
- 3494858
INCLINATION:
DIAM:
DATE DRILLED:
X COORD:
Department of Water and Sanitation
HOLE No: E-TP78
DWS
Bell 315SK TLB
Bridging Study Clanwilliam Dam
CONTRACTOR:
MACHINE:
PROFILED BY:
TYPE SET BY: 7/28/2020
S. Nyathi and M Sikwe 7/28/2020
Ebenhaeser Scheme
Rep
ort I
D: _
ZA
TR
AIL
PIT
LO
G |
| Pro
ject
: EB
EN
HA
ES
ER
SC
HE
ME
.GP
J ||
Lib
rary
: GIN
T S
TD
AG
S 4
_0_
SA
.GLB
|| D
ate:
Oct
ober
1, 2
020
JOB NUMBER: 113834
Sheet 1 of 1
HOLE No: E-TP78
0.00
0.30
0.60sample

Scale1:25
0.00 Moist, brown, loose, intact, SAND. Aeolian
Brown and off-white, highly cemented, very soft rock.Hardpan calcrete
NOTES:
1. Refusal on hardpan calcrete, immediatesurroundings are hardpan calcrete.2. No groundwater seepage was encountered.3. Sidewall stable.4. No sample taken.
Y COORD:
ELEVATION:
EBENHAESER SCHEME.GPJ
DATE PROFILED:
- 69985
- 3495017
INCLINATION:
DIAM:
DATE DRILLED:
X COORD:
Department of Water and Sanitation
HOLE No: E-TP79
DWS
Bell 315SK TLB
Bridging Study Clanwilliam Dam
CONTRACTOR:
MACHINE:
PROFILED BY:
TYPE SET BY: 7/28/2020
S. Nyathi and M Sikwe 7/28/2020
Ebenhaeser Scheme
Rep
ort I
D: _
ZA
TR
AIL
PIT
LO
G |
| Pro
ject
: EB
EN
HA
ES
ER
SC
HE
ME
.GP
J ||
Lib
rary
: GIN
T S
TD
AG
S 4
_0_
SA
.GLB
|| D
ate:
Oct
ober
1, 2
020
JOB NUMBER: 113834
Sheet 1 of 1
HOLE No: E-TP79
0.00
0.400.35
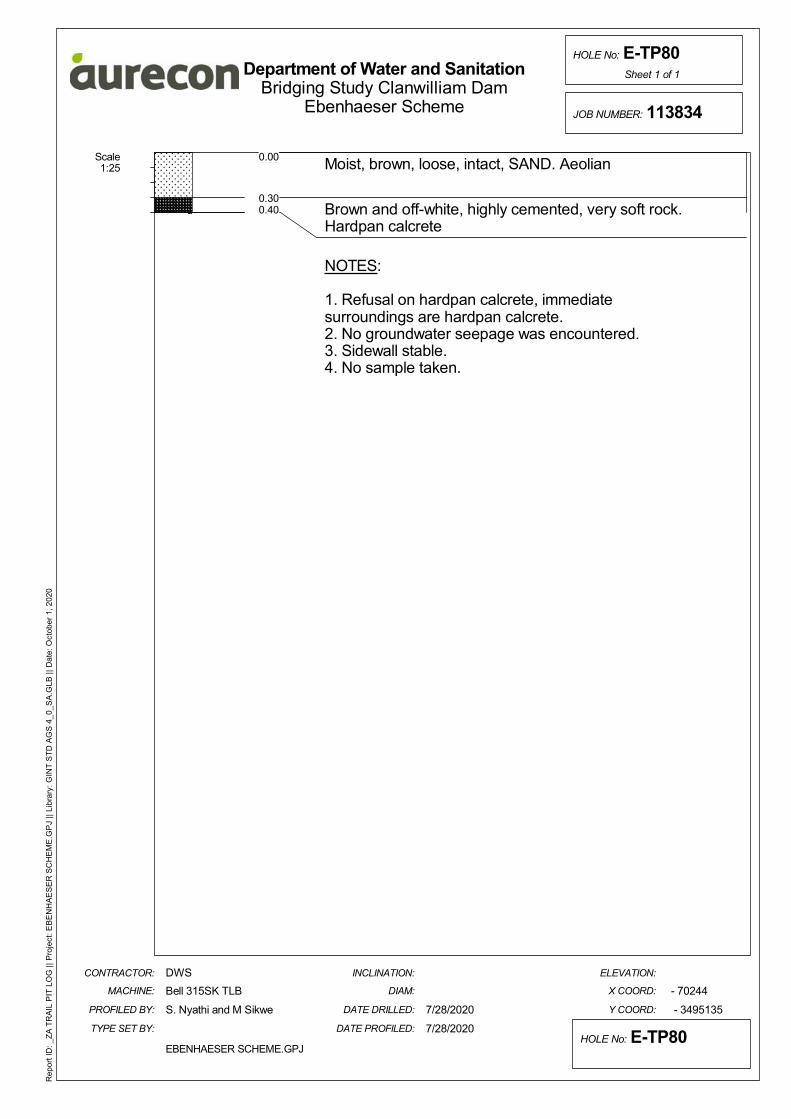
Scale1:25
0.00 Moist, brown, loose, intact, SAND. Aeolian
Brown and off-white, highly cemented, very soft rock.Hardpan calcrete
NOTES:
1. Refusal on hardpan calcrete, immediatesurroundings are hardpan calcrete.2. No groundwater seepage was encountered.3. Sidewall stable.4. No sample taken.
Y COORD:
ELEVATION:
EBENHAESER SCHEME.GPJ
DATE PROFILED:
- 70244
- 3495135
INCLINATION:
DIAM:
DATE DRILLED:
X COORD:
Department of Water and Sanitation
HOLE No: E-TP80
DWS
Bell 315SK TLB
Bridging Study Clanwilliam Dam
CONTRACTOR:
MACHINE:
PROFILED BY:
TYPE SET BY: 7/28/2020
S. Nyathi and M Sikwe 7/28/2020
Ebenhaeser Scheme
Rep
ort I
D: _
ZA
TR
AIL
PIT
LO
G |
| Pro
ject
: EB
EN
HA
ES
ER
SC
HE
ME
.GP
J ||
Lib
rary
: GIN
T S
TD
AG
S 4
_0_
SA
.GLB
|| D
ate:
Oct
ober
1, 2
020
JOB NUMBER: 113834
Sheet 1 of 1
HOLE No: E-TP80
0.00
0.300.40
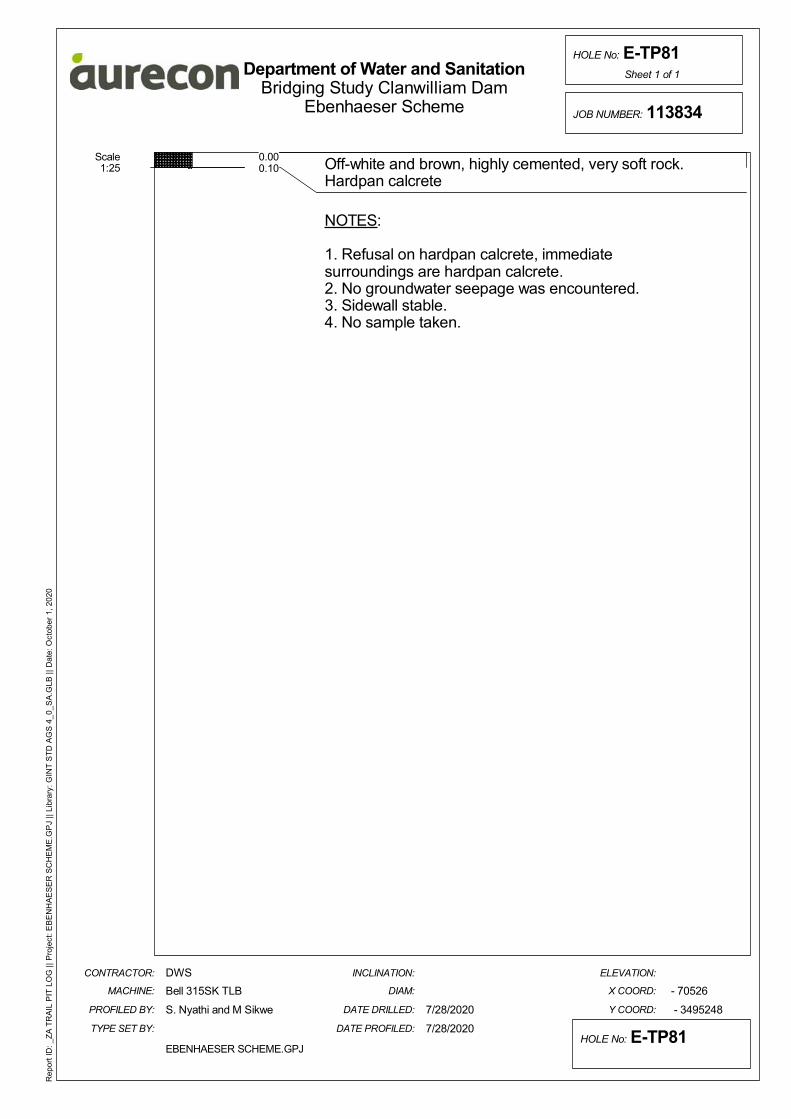
Scale1:25
0.00 Off-white and brown, highly cemented, very soft rock.Hardpan calcrete
NOTES:
1. Refusal on hardpan calcrete, immediatesurroundings are hardpan calcrete.2. No groundwater seepage was encountered.3. Sidewall stable.4. No sample taken.
Y COORD:
ELEVATION:
EBENHAESER SCHEME.GPJ
DATE PROFILED:
- 70526
- 3495248
INCLINATION:
DIAM:
DATE DRILLED:
X COORD:
Department of Water and Sanitation
HOLE No: E-TP81
DWS
Bell 315SK TLB
Bridging Study Clanwilliam Dam
CONTRACTOR:
MACHINE:
PROFILED BY:
TYPE SET BY: 7/28/2020
S. Nyathi and M Sikwe 7/28/2020
Ebenhaeser Scheme
Rep
ort I
D: _
ZA
TR
AIL
PIT
LO
G |
| Pro
ject
: EB
EN
HA
ES
ER
SC
HE
ME
.GP
J ||
Lib
rary
: GIN
T S
TD
AG
S 4
_0_
SA
.GLB
|| D
ate:
Oct
ober
1, 2
020
JOB NUMBER: 113834
Sheet 1 of 1
HOLE No: E-TP81
0.000.10
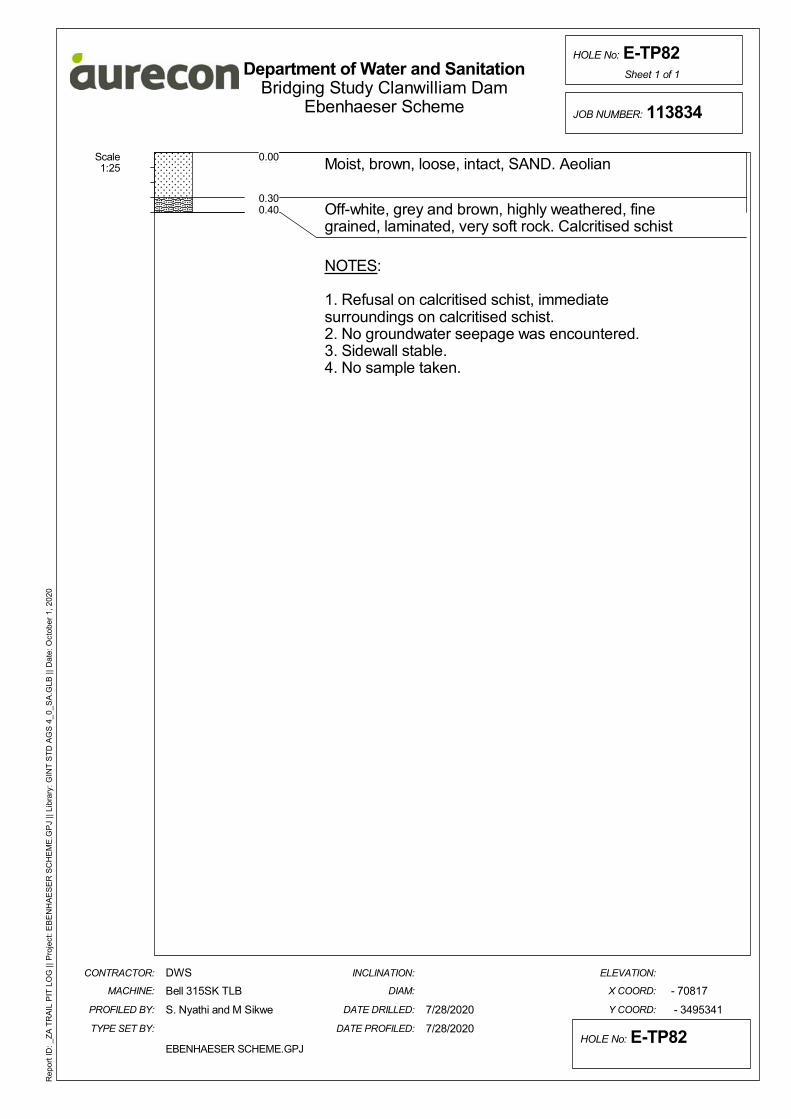
Scale1:25
0.00 Moist, brown, loose, intact, SAND. Aeolian
Off-white, grey and brown, highly weathered, finegrained, laminated, very soft rock. Calcritised schist
NOTES:
1. Refusal on calcritised schist, immediatesurroundings on calcritised schist.2. No groundwater seepage was encountered.3. Sidewall stable.4. No sample taken.
Y COORD:
ELEVATION:
EBENHAESER SCHEME.GPJ
DATE PROFILED:
- 70817
- 3495341
INCLINATION:
DIAM:
DATE DRILLED:
X COORD:
Department of Water and Sanitation
HOLE No: E-TP82
DWS
Bell 315SK TLB
Bridging Study Clanwilliam Dam
CONTRACTOR:
MACHINE:
PROFILED BY:
TYPE SET BY: 7/28/2020
S. Nyathi and M Sikwe 7/28/2020
Ebenhaeser Scheme
Rep
ort I
D: _
ZA
TR
AIL
PIT
LO
G |
| Pro
ject
: EB
EN
HA
ES
ER
SC
HE
ME
.GP
J ||
Lib
rary
: GIN
T S
TD
AG
S 4
_0_
SA
.GLB
|| D
ate:
Oct
ober
1, 2
020
JOB NUMBER: 113834
Sheet 1 of 1
HOLE No: E-TP82
0.00
0.300.40


Post Feasibility Bridging Study for the Proposed Bulk Conveyance Infrastructure from the Raised Clanwilliam Dam (WP0485). Geotechnical Investigations Report. Vol III: Ebenhaeser Scheme (P WMA 09/E10/00/0417/8)
Directorate: Water Resource Development Planning April 2021 Page 103
Appendix D DCP Test Results

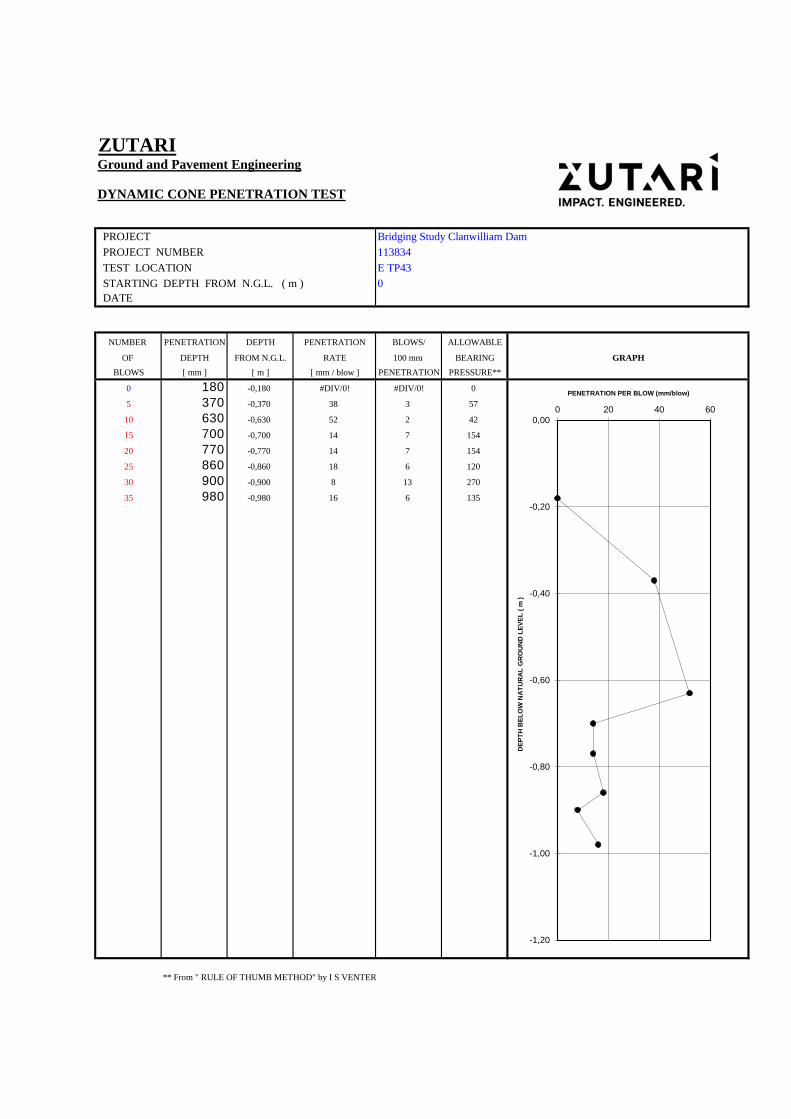
ZUTARIGround and Pavement Engineering
DYNAMIC CONE PENETRATION TEST
PROJECT Bridging Study Clanwilliam Dam
PROJECT NUMBER 113834
TEST LOCATION E TP43
STARTING DEPTH FROM N.G.L. ( m ) 0
DATE
NUMBER PENETRATION DEPTH PENETRATION BLOWS/ ALLOWABLE
OF DEPTH FROM N.G.L. RATE 100 mm BEARING GRAPH
BLOWS [ mm ] [ m ] [ mm / blow ] PENETRATION PRESSURE**
0 180 -0,180 #DIV/0! #DIV/0! 0
5 370 -0,370 38 3 57
10 630 -0,630 52 2 42
15 700 -0,700 14 7 154
20 770 -0,770 14 7 154
25 860 -0,860 18 6 120
30 900 -0,900 8 13 270
35 980 -0,980 16 6 135
** From " RULE OF THUMB METHOD" by I S VENTER
-1,20
-1,00
-0,80
-0,60
-0,40
-0,20
0,00
0 20 40 60
DE
PT
H B
EL
OW
NA
TU
RA
L G
RO
UN
D L
EV
EL
( m
)
PENETRATION PER BLOW (mm/blow)

ZUTARIGround and Pavement Engineering
DYNAMIC CONE PENETRATION TEST
PROJECT Bridging Study Clanwilliam Dam
PROJECT NUMBER 113834
TEST LOCATION E TP49
STARTING DEPTH FROM N.G.L. ( m ) 0
DATE
NUMBER PENETRATION DEPTH PENETRATION BLOWS/ ALLOWABLE
OF DEPTH FROM N.G.L. RATE 100 mm BEARING GRAPH
BLOWS [ mm ] [ m ] [ mm / blow ] PENETRATION PRESSURE**
0 160 -0,160 #DIV/0! #DIV/0! 0
5 890 -0,890 146 1 15
10 1000 -1,000 22 5 98
** From " RULE OF THUMB METHOD" by I S VENTER
-1,20
-1,00
-0,80
-0,60
-0,40
-0,20
0,00
0 50 100 150 200
DE
PT
H B
EL
OW
NA
TU
RA
L G
RO
UN
D L
EV
EL
( m
)
PENETRATION PER BLOW (mm/blow)
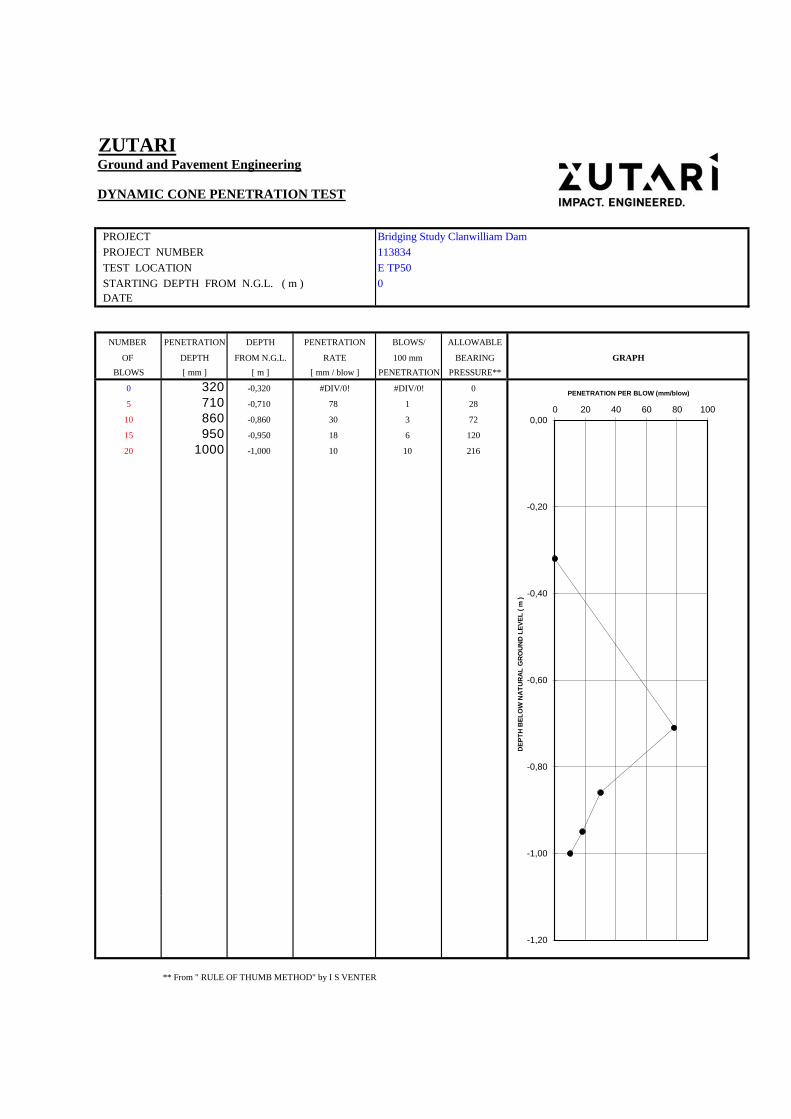
ZUTARIGround and Pavement Engineering
DYNAMIC CONE PENETRATION TEST
PROJECT Bridging Study Clanwilliam Dam
PROJECT NUMBER 113834
TEST LOCATION E TP50
STARTING DEPTH FROM N.G.L. ( m ) 0
DATE
NUMBER PENETRATION DEPTH PENETRATION BLOWS/ ALLOWABLE
OF DEPTH FROM N.G.L. RATE 100 mm BEARING GRAPH
BLOWS [ mm ] [ m ] [ mm / blow ] PENETRATION PRESSURE**
0 320 -0,320 #DIV/0! #DIV/0! 0
5 710 -0,710 78 1 28
10 860 -0,860 30 3 72
15 950 -0,950 18 6 120
20 1000 -1,000 10 10 216
** From " RULE OF THUMB METHOD" by I S VENTER
-1,20
-1,00
-0,80
-0,60
-0,40
-0,20
0,00
0 20 40 60 80 100
DE
PT
H B
EL
OW
NA
TU
RA
L G
RO
UN
D L
EV
EL
( m
)
PENETRATION PER BLOW (mm/blow)

ZUTARIGround and Pavement Engineering
DYNAMIC CONE PENETRATION TEST
PROJECT Bridging Study Clanwilliam Dam
PROJECT NUMBER 113834
TEST LOCATION E TP53
STARTING DEPTH FROM N.G.L. ( m ) 0
DATE
NUMBER PENETRATION DEPTH PENETRATION BLOWS/ ALLOWABLE
OF DEPTH FROM N.G.L. RATE 100 mm BEARING GRAPH
BLOWS [ mm ] [ m ] [ mm / blow ] PENETRATION PRESSURE**
0 130 -0,130 0
5 570 -0,570 88 1 25
10 840 -0,840 54 2 40
15 920 -0,920 16 6 135
20 1000 -1,000 16 6 135
** From " RULE OF THUMB METHOD" by I S VENTER
-1,20
-1,00
-0,80
-0,60
-0,40
-0,20
0,00
0 20 40 60 80 100
DE
PT
H B
EL
OW
NA
TU
RA
L G
RO
UN
D L
EV
EL
( m
)
PENETRATION PER BLOW (mm/blow)

Post Feasibility Bridging Study for the Proposed Bulk Conveyance Infrastructure from the Raised Clanwilliam Dam (WP0485). Geotechnical Investigations Report. Vol III: Ebenhaeser Scheme (P WMA 09/E10/00/0417/8)
Directorate: Water Resource Development Planning April 2021 Page 104
Appendix E Laboratory Test Results

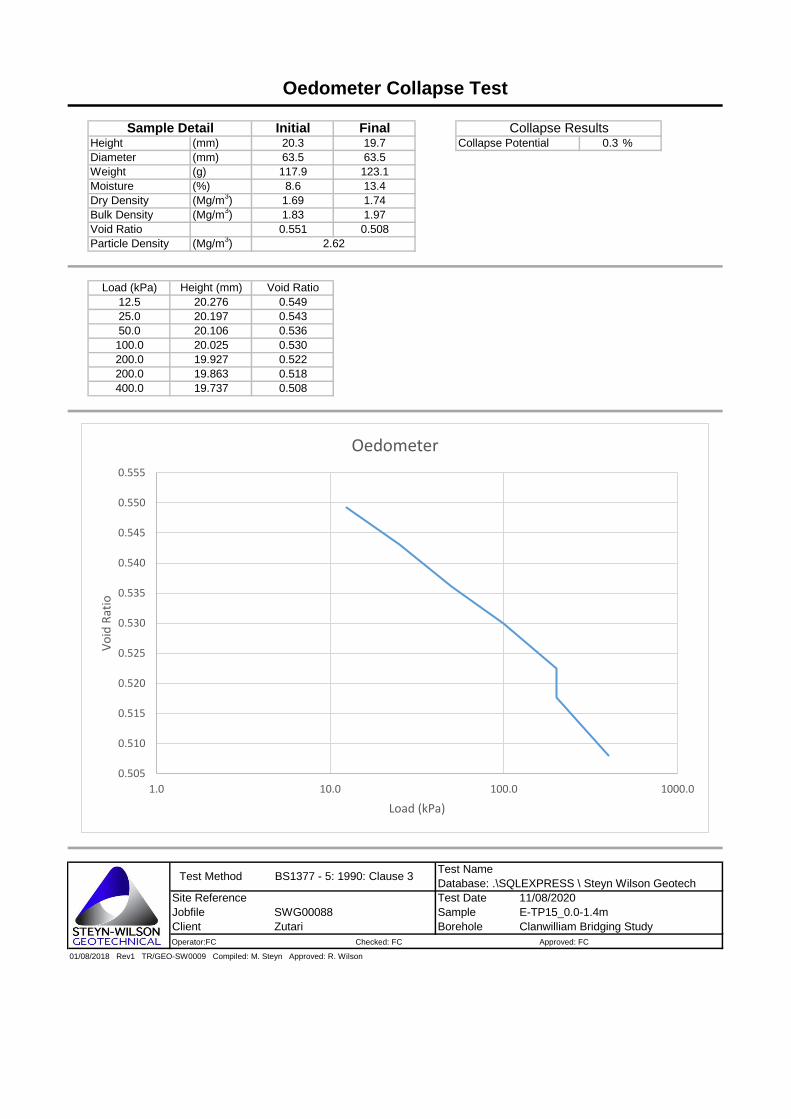
Test Name
Database: .\SQLEXPRESS \ Steyn Wilson Geotech
Site Reference Test Date
Jobfile Sample
Client Borehole
Operator:FC Checked: FC Approved: FC
01/08/2018 Rev1 TR/GEO-SW0009 Compiled: M. Steyn Approved: R. Wilson
Collapse ResultsCollapse Potential 0.3 %
1.83
Initial
2.62
0.530
0.522
0.518
0.508
Void Ratio
0.549
0.543
0.536
Oedometer Collapse Test
Test Method BS1377 - 5: 1990: Clause 3
(Mg/m3)
(%)
(g)
(mm)
(mm) 20.3
63.5
117.9
8.6
1.69
Sample Detail
Particle Density
Void Ratio
Height
(Mg/m3)
Final19.7
63.5
123.1
13.4
1.74
(Mg/m3)Bulk Density
Dry Density
Moisture
1.97
0.551 0.508
Weight
Diameter
20.025
19.927
19.863
100.0
200.0
200.0
400.0 19.737
Height (mm)
20.276
20.197
20.106
Load (kPa)
12.5
25.0
50.0
SWG00088
Zutari
11/08/2020
E-TP15_0.0-1.4m
Clanwilliam Bridging Study
0.505
0.510
0.515
0.520
0.525
0.530
0.535
0.540
0.545
0.550
0.555
1.0 10.0 100.0 1000.0
Vo
id R
atio
Load (kPa)
Oedometer
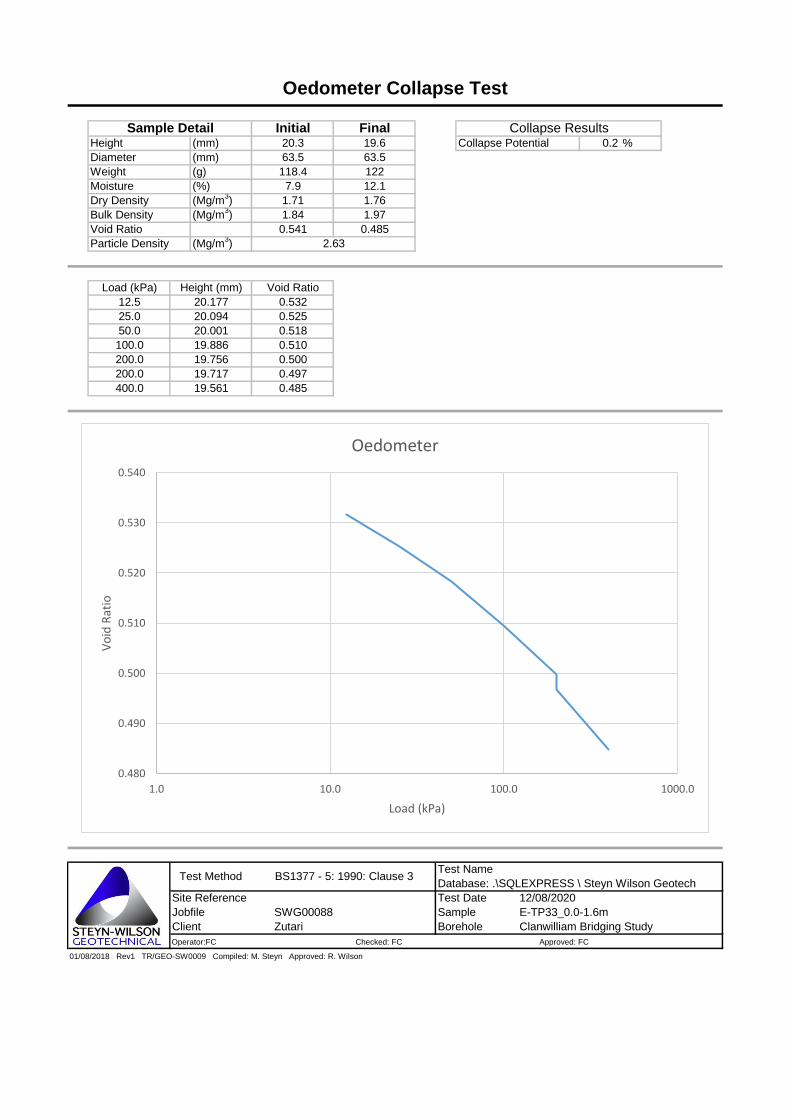
Test Name
Database: .\SQLEXPRESS \ Steyn Wilson Geotech
Site Reference Test Date
Jobfile Sample
Client Borehole
Operator:FC Checked: FC Approved: FC
01/08/2018 Rev1 TR/GEO-SW0009 Compiled: M. Steyn Approved: R. Wilson
Collapse ResultsCollapse Potential 0.2 %
1.84
Initial
2.63
0.510
0.500
0.497
0.485
Void Ratio
0.532
0.525
0.518
Oedometer Collapse Test
Test Method BS1377 - 5: 1990: Clause 3
(Mg/m3)
(%)
(g)
(mm)
(mm) 20.3
63.5
118.4
7.9
1.71
Sample Detail
Particle Density
Void Ratio
Height
(Mg/m3)
Final19.6
63.5
122
12.1
1.76
(Mg/m3)Bulk Density
Dry Density
Moisture
1.97
0.541 0.485
Weight
Diameter
19.886
19.756
19.717
100.0
200.0
200.0
400.0 19.561
Height (mm)
20.177
20.094
20.001
Load (kPa)
12.5
25.0
50.0
SWG00088
Zutari
12/08/2020
E-TP33_0.0-1.6m
Clanwilliam Bridging Study
0.480
0.490
0.500
0.510
0.520
0.530
0.540
1.0 10.0 100.0 1000.0
Vo
id R
atio
Load (kPa)
Oedometer

Test Name
Database: .\SQLEXPRESS \ Steyn Wilson Geotech
Site Reference Test Date
Jobfile Sample
Client Borehole
Operator:FC Checked: FC Approved: FC
01/08/2018 Rev1 TR/GEO-SW0009 Compiled: M. Steyn Approved: R. Wilson
Collapse ResultsCollapse Potential 0.6 %
1.93
Initial
2.60
0.406
0.398
0.390
0.377
Void Ratio
0.419
0.415
0.412
Oedometer Collapse Test
Test Method BS1377 - 5: 1990: Clause 3
(Mg/m3)
(%)
(g)
(mm)
(mm) 20.3
63.5
123.8
5.4
1.83
Sample Detail
Particle Density
Void Ratio
Height
(Mg/m3)
Final19.6
63.5
129.9
12.6
1.85
(Mg/m3)Bulk Density
Dry Density
Moisture
2.09
0.423 0.377
Weight
Diameter
20.057
19.947
19.827
100.0
200.0
200.0
400.0 19.646
Height (mm)
20.236
20.189
20.136
Load (kPa)
12.5
25.0
50.0
SWG00088
Zutari
13/08/2020
E-TP57_0.5-1.9m
Clanwilliam Bridging Study
0.370
0.380
0.390
0.400
0.410
0.420
0.430
1.0 10.0 100.0 1000.0
Vo
id R
atio
Load (kPa)
Oedometer
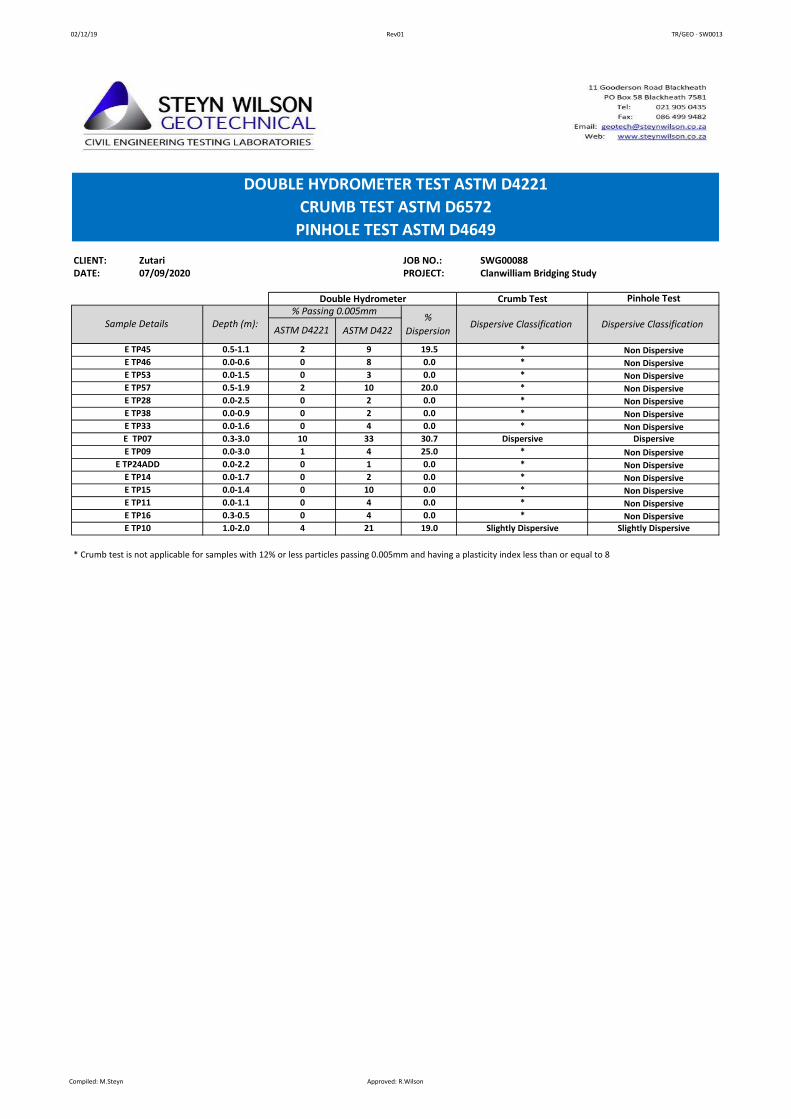
02/12/19 Rev01 TR/GEO - SW0013
* Crumb test is not applicable for samples with 12% or less particles passing 0.005mm and having a plasticity index less than or equal to 8
E TP16 0.3-0.5 0 4 0.0 * Non DispersiveE TP10 1.0-2.0 4 21 19.0 Slightly Dispersive Slightly Dispersive
Pinhole TestCrumb Test
Sample Details
Non Dispersive
Dispersive ClassificationDispersive Classification
*
Double Hydrometer
0.0
0.0
92
0 8
0 3
0.5-1.1
0.0-1.5
0.0-0.6
DOUBLE HYDROMETER TEST ASTM D4221
CRUMB TEST ASTM D6572
PINHOLE TEST ASTM D4649
07/09/2020Zutari
Clanwilliam Bridging StudySWG00088CLIENT:
DATE:JOB NO.:PROJECT:
* Non Dispersive* Non Dispersive
Non Dispersive* Non Dispersive
*
* Non Dispersive
*
0.0-1.6
0.0-0.9 0 2
0 4 0.0
0.0 Non Dispersive
Dispersive
* Non Dispersive
Dispersive
0.0-3.0
0.3-3.0 10 33
1 4 25.0
30.7
Non Dispersive* Non Dispersive
*
0.0-1.7
0.0-2.2 0 1
0 2 0.0
0.0
* Non DispersiveE TP15 0.0-1.4 0 10 0.0
Non DispersiveE TP11 *0.0-1.1 0 4 0.0
E TP53
E TP46
E TP45
E TP14
E TP09
E TP07
E TP33
E TP38
E TP28
E TP24ADD
E TP57
0.0-2.5
0.5-1.9 2 10
0 2 0.0
20.0
Depth (m):ASTM D4221 ASTM D422
%
Dispersion
% Passing 0.005mm
19.5
Compiled: M.Steyn Approved: R.Wilson

01/08/2018 Rev01 TR/GEO - SW0001
Depth(m): %: OMC: % Test: H1 (mm): H2 (mm): h m s
1 1550 1313 1 39 18
2 1313 1180 1 24 45
3 1180 1060 1 47 23
Depth(m): %: OMC: % Test: H1 (cm): H2 (cm): h m s
1 1550 748 0 1 25
2 1550 740 0 1 24
3 1550 744 0 1 22
Depth(m): %: OMC: % Test: H1 (cm): H2 (cm): h m s
1 1462 1435 3 8 31
2 1435 1410 3 3 0
3 1410 1367 5 47 12
Depth(m): %: OMC: % Test: H1 (cm): H2 (cm): h m s
1 1550 744 0 4 12
2 1555 745 0 3 52
3 1560 747 0 3 44
Remould Details (MOD)Sample Details
Dry Density: Dry density:
Specified
1821 kg/m3 98 10.5 1749
Moisture Content:
E TP28 Specified
308 0.0-2.5
Actual
Sample no. Dry Density:
1.0260E-05
Tests
Time
5.4403E-03
Time
Permeability (cm/s)
300
Sample no.
Moisture Content:
Actual
Sample no.
E TP14Dry Density: Dry density: Moisture Content:
1744 kg/m3 98 10.8
Specified Actual
97.1 10.8
Permeability (cm/s)
Sample no. Dry Density: Dry density:
10.4 1906 kg/m3 94.2 10.4304
Moisture Content:
0.0-1.4 2023 kg/m3 98
E TP15
1693 kg/m3
Specified Actual
303 0.0-1.7
FALLING HEAD PERMEABILITY TEST REPORT - TEST METHOD: ASTM D2434 & KH HEAD
E TP09
Average: 1.3458E-05
kg/m30.0-3.0 1859 kg/m3 11.698 95.6 11.6
CLIENT:
DATE:
ZUTARI
25/08/2020
JOB NO.:
PROJECT:
SWG00088
CLANWILLIAM BRIDGING STUDY
Time
1.7168E-05
1.2947E-051778
Permeability (cm/s)
9.7424E-07Average:
Average
Average: 5.4236E-03
5.2981E-03
1.9277E-03
1.7973E-03
1.9572E-03
2.0286E-03
5.5324E-03
1.0172E-06
9.8794E-07
9.1762E-07
kg/m3 96.0 10.5
Time
Permeability (cm/s)Dry density:
Compiled: M.Steyn Approved: R.Wilson

01/08/2018 Rev01 TR/GEO - SW0001
Depth(m): %: OMC: % Test: H1 (cm): H2 (cm): h m s
2 1550 745 0 1 33
3 1550 750 0 1 34
1 1550 749 0 1 33
Depth(m): %: OMC: % Test: H1 (cm): H2 (cm): h m s
3 1550 742 0 4 2
1 1550 741 0 3 55
2 1550 741 0 3 50
Depth(m): %: OMC: % Test: H1 (cm): H2 (cm): h m s
1 1565 1550 1 2 17
2 1550 1538 1 8 57
3 1538 1527 1 9 52
Depth(m): %: OMC: % Test: H1 (cm): H2 (cm): h m s
1 1550 745 0 1 20
2 1550 745 0 1 19
3 1550 743 0 1 19
Average 5.7111E-03
Sample no. Dry Density: Dry density: Moisture Content: Permeability (cm/s)
306 0.0-1.7 1741 kg/m3 98 10.5 1686 kg/m3 96.9 10.5
5.6563E-03
5.7279E-03
5.7489E-03
10.3
6.5082E-08
4.7442E-08
4.3240E-08
Average 5.1921E-08
E TP17 Specified Actual Time
301 1.0-2.0 1967 kg/m3 98 10.3 1916 kg/m3 97.4
E TP10 Specified Actual Time
Sample no. Dry Density: Dry density: Moisture Content: Permeability (cm/s)
E TP46 Specified Actual Time
Sample no. Dry Density: Dry density: Moisture Content: Permeability (cm/s)
11.6
4.8543E-03
4.7588E-03
4.8188E-03
Average 4.8107E-03
E TP53 Specified Actual Time
312 0.0-0.6 1741 kg/m3 98 11.6 1655 kg/m3 95.1
Average 1.9358E-03
Sample no. Dry Density: Dry density: Moisture Content: Permeability (cm/s)
313 0.0-1.5 1771 kg/m3 98 11.1 1730 kg/m3 97.7 11.1
1.8820E-03
1.9416E-03
1.9838E-03
Compiled: M.Steyn Approved: R.Wilson

FOUNDATION INDICATOR TEST RESULTS
TEST LOCATION PROJECT Bridging Study Clanwilliam Dam
SAMPLE NO. PROJECT NUMBER 113834
DEPTH 0,3-3,00 m SITE Ebenhaeser Scheme
Sieve (mm) % Passing Sieve (mm) % Passing
63,000 100 0,425 91 Liquid limit (%) 27,6 % Gravel 5
53,000 100 0,075 52 Plastic limit (%) 14 % Sand 43
37,500 100 0,051 44 Plasticity Index (%) 13 % Silt 32
26,500 100 0,023 38 Weighted PI (%) 12 % Clay 19
19,000 99 0,007 33 Linear Shrinkage (%) 6,3 Activity 0,7
13,200 99 0,002 19 Grading Modulus 0,62 Unified Classification CL
4,750 96 0,000 0 Uniformity coefficient 75 TRB Classification A - 6
2,360 95 0,000 0 Coefficient of curvature 0,4
SOIL CLASSIFICATIONSIEVE ANALYSIS
EB TP 07
13944
ATTERBERG LIMITS
CLAYSILT SAND GRAVEL
FINE MEDIUM COARSE FINE MEDIUM COARSE FINE MEDIUM COARSE
0
20
40
60
80
100
120
0,001 0,01 0,1 1 10 100
PE
RC
EN
TA
GE
FIN
ER
BY
MA
SS
PARTICLE SIZE ( mm )
PARTICLE SIZE DISTRIBUTION
ME
DIU
M
HIG
H
VE
RY
HIG
H
LOW
0
10
20
30
40
50
60
0 10 20 30 40 50 60 70 80 90 100
PI
OF
WH
OL
E S
AM
PL
E
CLAY FRACTION OF WHOLE SAMPLE (< 2 um)
POTENTIAL EXPANSIVENESSVan der Merwe's Activity Chart
CH or OH
CL or OL
CL or ML ML or OL
Ml or OH
0
10
20
30
40
50
60
0 10 20 30 40 50 60 70 80 90 100
PL
AS
TIC
ITY
IN
DE
X
( P
I )
LIQUID LIMIT ( LL )
CASAGRANDE 'A' LINE
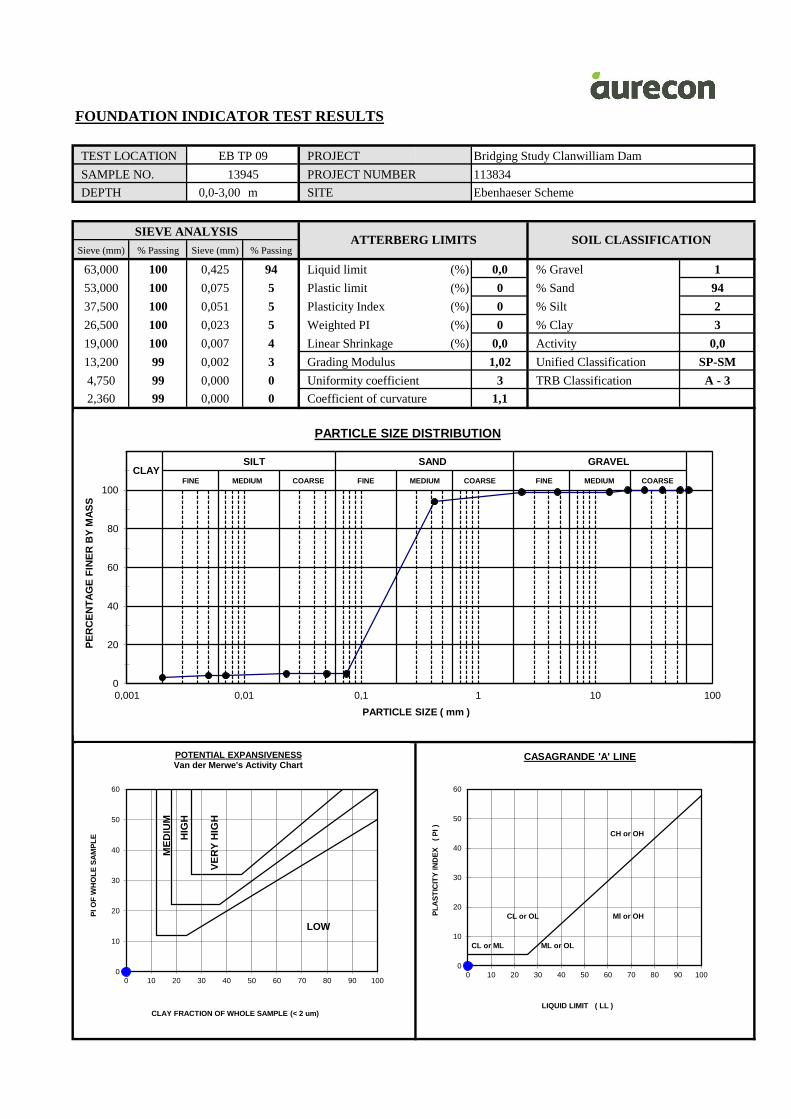
FOUNDATION INDICATOR TEST RESULTS
TEST LOCATION PROJECT Bridging Study Clanwilliam Dam
SAMPLE NO. PROJECT NUMBER 113834
DEPTH 0,0-3,00 m SITE Ebenhaeser Scheme
Sieve (mm) % Passing Sieve (mm) % Passing
63,000 100 0,425 94 Liquid limit (%) 0,0 % Gravel 1
53,000 100 0,075 5 Plastic limit (%) 0 % Sand 94
37,500 100 0,051 5 Plasticity Index (%) 0 % Silt 2
26,500 100 0,023 5 Weighted PI (%) 0 % Clay 3
19,000 100 0,007 4 Linear Shrinkage (%) 0,0 Activity 0,0
13,200 99 0,002 3 Grading Modulus 1,02 Unified Classification SP-SM
4,750 99 0,000 0 Uniformity coefficient 3 TRB Classification A - 3
2,360 99 0,000 0 Coefficient of curvature 1,1
SOIL CLASSIFICATIONSIEVE ANALYSIS
EB TP 09
13945
ATTERBERG LIMITS
CLAYSILT SAND GRAVEL
FINE MEDIUM COARSE FINE MEDIUM COARSE FINE MEDIUM COARSE
0
20
40
60
80
100
120
0,001 0,01 0,1 1 10 100
PE
RC
EN
TA
GE
FIN
ER
BY
MA
SS
PARTICLE SIZE ( mm )
PARTICLE SIZE DISTRIBUTION
ME
DIU
M
HIG
H
VE
RY
HIG
H
LOW
0
10
20
30
40
50
60
0 10 20 30 40 50 60 70 80 90 100
PI
OF
WH
OL
E S
AM
PL
E
CLAY FRACTION OF WHOLE SAMPLE (< 2 um)
POTENTIAL EXPANSIVENESSVan der Merwe's Activity Chart
CH or OH
CL or OL
CL or ML ML or OL
Ml or OH
0
10
20
30
40
50
60
0 10 20 30 40 50 60 70 80 90 100
PL
AS
TIC
ITY
IN
DE
X
( P
I )
LIQUID LIMIT ( LL )
CASAGRANDE 'A' LINE

FOUNDATION INDICATOR TEST RESULTS
TEST LOCATION PROJECT Bridging Study Clanwilliam Dam
SAMPLE NO. PROJECT NUMBER 113834
DEPTH 1,00-2,00 m SITE Ebenhaeser Scheme
Sieve (mm) % Passing Sieve (mm) % Passing
63,000 100 0,425 87 Liquid limit (%) 35,0 % Gravel 6
53,000 100 0,075 35 Plastic limit (%) 23 % Sand 59
37,500 100 0,051 31 Plasticity Index (%) 12 % Silt 22
26,500 100 0,023 29 Weighted PI (%) 10 % Clay 13
19,000 100 0,007 21 Linear Shrinkage (%) 5,4 Activity 0,9
13,200 99 0,002 13 Grading Modulus 0,84 Unified Classification SC
4,750 96 0,000 0 Uniformity coefficient 121 TRB Classification A - 6
2,360 94 0,000 0 Coefficient of curvature 3,9
SOIL CLASSIFICATIONSIEVE ANALYSIS
EB TP 10
13953
ATTERBERG LIMITS
CLAYSILT SAND GRAVEL
FINE MEDIUM COARSE FINE MEDIUM COARSE FINE MEDIUM COARSE
0
20
40
60
80
100
120
0,001 0,01 0,1 1 10 100
PE
RC
EN
TA
GE
FIN
ER
BY
MA
SS
PARTICLE SIZE ( mm )
PARTICLE SIZE DISTRIBUTION
ME
DIU
M
HIG
H
VE
RY
HIG
H
LOW
0
10
20
30
40
50
60
0 10 20 30 40 50 60 70 80 90 100
PI
OF
WH
OL
E S
AM
PL
E
CLAY FRACTION OF WHOLE SAMPLE (< 2 um)
POTENTIAL EXPANSIVENESSVan der Merwe's Activity Chart
CH or OH
CL or OL
CL or ML ML or OL
Ml or OH
0
10
20
30
40
50
60
0 10 20 30 40 50 60 70 80 90 100
PL
AS
TIC
ITY
IN
DE
X
( P
I )
LIQUID LIMIT ( LL )
CASAGRANDE 'A' LINE

FOUNDATION INDICATOR TEST RESULTS
TEST LOCATION PROJECT Bridging Study Clanwilliam Dam
SAMPLE NO. PROJECT NUMBER 113834
DEPTH 1,10-1,40 m SITE Ebenhaeser Scheme
Sieve (mm) % Passing Sieve (mm) % Passing
63,000 100 0,425 95 Liquid limit (%) 0,0 % Gravel 0
53,000 100 0,075 11 Plastic limit (%) 0 % Sand 89
37,500 100 0,051 8 Plasticity Index (%) 0 % Silt 9
26,500 100 0,023 7 Weighted PI (%) 0 % Clay 2
19,000 100 0,007 4 Linear Shrinkage (%) 0,0 Activity 0,0
13,200 100 0,002 2 Grading Modulus 0,94 Unified Classification SP-SM
4,750 100 0,000 0 Uniformity coefficient 4 TRB Classification A - 2 - 4
2,360 100 0,000 0 Coefficient of curvature 1,3
SOIL CLASSIFICATIONSIEVE ANALYSIS
EB TP 11
13981
ATTERBERG LIMITS
CLAYSILT SAND GRAVEL
FINE MEDIUM COARSE FINE MEDIUM COARSE FINE MEDIUM COARSE
0
20
40
60
80
100
120
0,001 0,01 0,1 1 10 100
PE
RC
EN
TA
GE
FIN
ER
BY
MA
SS
PARTICLE SIZE ( mm )
PARTICLE SIZE DISTRIBUTION
ME
DIU
M
HIG
H
VE
RY
HIG
H
LOW
0
10
20
30
40
50
60
0 10 20 30 40 50 60 70 80 90 100
PI
OF
WH
OL
E S
AM
PL
E
CLAY FRACTION OF WHOLE SAMPLE (< 2 um)
POTENTIAL EXPANSIVENESSVan der Merwe's Activity Chart
CH or OH
CL or OL
CL or ML ML or OL
Ml or OH
0
10
20
30
40
50
60
0 10 20 30 40 50 60 70 80 90 100
PL
AS
TIC
ITY
IN
DE
X
( P
I )
LIQUID LIMIT ( LL )
CASAGRANDE 'A' LINE

FOUNDATION INDICATOR TEST RESULTS
TEST LOCATION PROJECT Bridging Study Clanwilliam Dam
SAMPLE NO. PROJECT NUMBER 113834
DEPTH 0,0-1,1 m SITE Ebenhaeser Scheme
Sieve (mm) % Passing Sieve (mm) % Passing
63,000 100 0,425 91 Liquid limit (%) 0,0 % Gravel 1
53,000 100 0,075 17 Plastic limit (%) 0 % Sand 82
37,500 100 0,051 15 Plasticity Index (%) 0 % Silt 8
26,500 100 0,023 13 Weighted PI (%) 0 % Clay 10
19,000 100 0,007 12 Linear Shrinkage (%) 0,0 Activity 0,0
13,200 100 0,002 10 Grading Modulus 0,93 Unified Classification SM
4,750 100 0,000 0 Uniformity coefficient 106 TRB Classification A - 2 - 4
2,360 99 0,000 0 Coefficient of curvature 25,9
SOIL CLASSIFICATIONSIEVE ANALYSIS
EB TP 11
13950
ATTERBERG LIMITS
CLAYSILT SAND GRAVEL
FINE MEDIUM COARSE FINE MEDIUM COARSE FINE MEDIUM COARSE
0
20
40
60
80
100
120
0,001 0,01 0,1 1 10 100
PE
RC
EN
TA
GE
FIN
ER
BY
MA
SS
PARTICLE SIZE ( mm )
PARTICLE SIZE DISTRIBUTION
ME
DIU
M
HIG
H
VE
RY
HIG
H
LOW
0
10
20
30
40
50
60
0 10 20 30 40 50 60 70 80 90 100
PI
OF
WH
OL
E S
AM
PL
E
CLAY FRACTION OF WHOLE SAMPLE (< 2 um)
POTENTIAL EXPANSIVENESSVan der Merwe's Activity Chart
CH or OH
CL or OL
CL or ML ML or OL
Ml or OH
0
10
20
30
40
50
60
0 10 20 30 40 50 60 70 80 90 100
PL
AS
TIC
ITY
IN
DE
X
( P
I )
LIQUID LIMIT ( LL )
CASAGRANDE 'A' LINE

FOUNDATION INDICATOR TEST RESULTS
TEST LOCATION PROJECT Bridging Study Clanwilliam Dam
SAMPLE NO. PROJECT NUMBER 113834
DEPTH 0,0-1,70 m SITE Ebenhaeser Scheme
Sieve (mm) % Passing Sieve (mm) % Passing
63,000 100 0,425 91 Liquid limit (%) 0,0 % Gravel 0
53,000 100 0,075 2 Plastic limit (%) 0 % Sand 98
37,500 100 0,051 2 Plasticity Index (%) 0 % Silt 1
26,500 100 0,023 2 Weighted PI (%) 0 % Clay 1
19,000 100 0,007 2 Linear Shrinkage (%) 0,0 Activity 0,0
13,200 100 0,002 1 Grading Modulus 1,07 Unified Classification
4,750 100 0,000 0 Uniformity coefficient 3 TRB Classification A - 3
2,360 100 0,000 0 Coefficient of curvature 1,1
SOIL CLASSIFICATIONSIEVE ANALYSIS
EB TP 14
13948
ATTERBERG LIMITS
CLAYSILT SAND GRAVEL
FINE MEDIUM COARSE FINE MEDIUM COARSE FINE MEDIUM COARSE
0
20
40
60
80
100
120
0,001 0,01 0,1 1 10 100
PE
RC
EN
TA
GE
FIN
ER
BY
MA
SS
PARTICLE SIZE ( mm )
PARTICLE SIZE DISTRIBUTION
ME
DIU
M
HIG
H
VE
RY
HIG
H
LOW
0
10
20
30
40
50
60
0 10 20 30 40 50 60 70 80 90 100
PI
OF
WH
OL
E S
AM
PL
E
CLAY FRACTION OF WHOLE SAMPLE (< 2 um)
POTENTIAL EXPANSIVENESSVan der Merwe's Activity Chart
CH or OH
CL or OL
CL or ML ML or OL
Ml or OH
0
10
20
30
40
50
60
0 10 20 30 40 50 60 70 80 90 100
PL
AS
TIC
ITY
IN
DE
X
( P
I )
LIQUID LIMIT ( LL )
CASAGRANDE 'A' LINE

FOUNDATION INDICATOR TEST RESULTS
TEST LOCATION PROJECT Bridging Study Clanwilliam Dam
SAMPLE NO. PROJECT NUMBER 113834
DEPTH 0,0-1,40 m SITE Ebenhaeser Scheme
Sieve (mm) % Passing Sieve (mm) % Passing
63,000 100 0,425 92 Liquid limit (%) 0,0 % Gravel 2
53,000 100 0,075 14 Plastic limit (%) 0 % Sand 84
37,500 100 0,051 12 Plasticity Index (%) 0 % Silt 7
26,500 100 0,023 11 Weighted PI (%) 0 % Clay 7
19,000 100 0,007 10 Linear Shrinkage (%) 0,0 Activity 0,0
13,200 100 0,002 7 Grading Modulus 0,96 Unified Classification SM
4,750 99 0,000 0 Uniformity coefficient 20 TRB Classification A - 2 - 4
2,360 98 0,000 0 Coefficient of curvature 5,6
SOIL CLASSIFICATIONSIEVE ANALYSIS
EB TP 15
13949
ATTERBERG LIMITS
CLAYSILT SAND GRAVEL
FINE MEDIUM COARSE FINE MEDIUM COARSE FINE MEDIUM COARSE
0
20
40
60
80
100
120
0,001 0,01 0,1 1 10 100
PE
RC
EN
TA
GE
FIN
ER
BY
MA
SS
PARTICLE SIZE ( mm )
PARTICLE SIZE DISTRIBUTION
ME
DIU
M
HIG
H
VE
RY
HIG
H
LOW
0
10
20
30
40
50
60
0 10 20 30 40 50 60 70 80 90 100
PI
OF
WH
OL
E S
AM
PL
E
CLAY FRACTION OF WHOLE SAMPLE (< 2 um)
POTENTIAL EXPANSIVENESSVan der Merwe's Activity Chart
CH or OH
CL or OL
CL or ML ML or OL
Ml or OH
0
10
20
30
40
50
60
0 10 20 30 40 50 60 70 80 90 100
PL
AS
TIC
ITY
IN
DE
X
( P
I )
LIQUID LIMIT ( LL )
CASAGRANDE 'A' LINE

FOUNDATION INDICATOR TEST RESULTS
TEST LOCATION PROJECT Bridging Study Clanwilliam Dam
SAMPLE NO. PROJECT NUMBER 113834
DEPTH 0,3-0,5 m SITE Ebenhaeser Scheme
Sieve (mm) % Passing Sieve (mm) % Passing
63,000 100 0,425 26 Liquid limit (%) 0,0 % Gravel 62
53,000 100 0,075 4 Plastic limit (%) 0 % Sand 34
37,500 100 0,051 4 Plasticity Index (%) 0 % Silt 1
26,500 91 0,023 4 Weighted PI (%) 0 % Clay 3
19,000 85 0,007 4 Linear Shrinkage (%) 0,0 Activity 0,0
13,200 74 0,002 3 Grading Modulus 2,32 Unified Classification GP
4,750 46 0,000 0 Uniformity coefficient 52 TRB Classification A - 1 - a
2,360 38 0,000 0 Coefficient of curvature 0,7
SOIL CLASSIFICATIONSIEVE ANALYSIS
EB TP 16
13952
ATTERBERG LIMITS
CLAYSILT SAND GRAVEL
FINE MEDIUM COARSE FINE MEDIUM COARSE FINE MEDIUM COARSE
0
20
40
60
80
100
120
0,001 0,01 0,1 1 10 100
PE
RC
EN
TA
GE
FIN
ER
BY
MA
SS
PARTICLE SIZE ( mm )
PARTICLE SIZE DISTRIBUTION
ME
DIU
M
HIG
H
VE
RY
HIG
H
LOW
0
10
20
30
40
50
60
0 10 20 30 40 50 60 70 80 90 100
PI
OF
WH
OL
E S
AM
PL
E
CLAY FRACTION OF WHOLE SAMPLE (< 2 um)
POTENTIAL EXPANSIVENESSVan der Merwe's Activity Chart
CH or OH
CL or OL
CL or ML ML or OL
Ml or OH
0
10
20
30
40
50
60
0 10 20 30 40 50 60 70 80 90 100
PL
AS
TIC
ITY
IN
DE
X
( P
I )
LIQUID LIMIT ( LL )
CASAGRANDE 'A' LINE

FOUNDATION INDICATOR TEST RESULTS
TEST LOCATION PROJECT Bridging Study Clanwilliam Dam
SAMPLE NO. PROJECT NUMBER 113834
DEPTH 0.0-1.7 m SITE Ebenhaeser Scheme
Sieve (mm) % Passing Sieve (mm) % Passing
63,000 100 0,425 88 Liquid limit (%) 0,0 % Gravel 0
53,000 100 0,075 2 Plastic limit (%) 0 % Sand 98
37,500 100 0,051 1 Plasticity Index (%) 0 % Silt 1
26,500 100 0,023 1 Weighted PI (%) 0 % Clay 1
19,000 100 0,007 1 Linear Shrinkage (%) 0,0 Activity 0,0
13,200 100 0,002 1 Grading Modulus 1,10 Unified Classification
4,750 100 0,000 0 Uniformity coefficient 3 TRB Classification A - 3
2,360 100 0,000 0 Coefficient of curvature 1,1
SOIL CLASSIFICATIONSIEVE ANALYSIS
EB TP 17
13907
ATTERBERG LIMITS
CLAYSILT SAND GRAVEL
FINE MEDIUM COARSE FINE MEDIUM COARSE FINE MEDIUM COARSE
0
20
40
60
80
100
120
0,001 0,01 0,1 1 10 100
PE
RC
EN
TA
GE
FIN
ER
BY
MA
SS
PARTICLE SIZE ( mm )
PARTICLE SIZE DISTRIBUTION
ME
DIU
M
HIG
H
VE
RY
HIG
H
LOW
0
10
20
30
40
50
60
0 10 20 30 40 50 60 70 80 90 100
PI
OF
WH
OL
E S
AM
PL
E
CLAY FRACTION OF WHOLE SAMPLE (< 2 um)
POTENTIAL EXPANSIVENESSVan der Merwe's Activity Chart
CH or OH
CL or OL
CL or ML ML or OL
Ml or OH
0
10
20
30
40
50
60
0 10 20 30 40 50 60 70 80 90 100
PL
AS
TIC
ITY
IN
DE
X
( P
I )
LIQUID LIMIT ( LL )
CASAGRANDE 'A' LINE

FOUNDATION INDICATOR TEST RESULTS
TEST LOCATION PROJECT Bridging Study Clanwilliam Dam
SAMPLE NO. PROJECT NUMBER 113834
DEPTH 0,0-2,0 m SITE Ebenhaeser Scheme
Sieve (mm) % Passing Sieve (mm) % Passing
63,000 100 0,425 98 Liquid limit (%) 0,0 % Gravel 0
53,000 100 0,075 2 Plastic limit (%) 0 % Sand 98
37,500 100 0,051 2 Plasticity Index (%) 0 % Silt 1
26,500 100 0,023 2 Weighted PI (%) 0 % Clay 1
19,000 100 0,007 2 Linear Shrinkage (%) 0,0 Activity 0,0
13,200 100 0,002 1 Grading Modulus 1,00 Unified Classification
4,750 100 0,000 0 Uniformity coefficient 3 TRB Classification A - 3
2,360 100 0,000 0 Coefficient of curvature 1,1
SOIL CLASSIFICATIONSIEVE ANALYSIS
EB TP 18
13954
ATTERBERG LIMITS
CLAYSILT SAND GRAVEL
FINE MEDIUM COARSE FINE MEDIUM COARSE FINE MEDIUM COARSE
0
20
40
60
80
100
120
0,001 0,01 0,1 1 10 100
PE
RC
EN
TA
GE
FIN
ER
BY
MA
SS
PARTICLE SIZE ( mm )
PARTICLE SIZE DISTRIBUTION
ME
DIU
M
HIG
H
VE
RY
HIG
H
LOW
0
10
20
30
40
50
60
0 10 20 30 40 50 60 70 80 90 100
PI
OF
WH
OL
E S
AM
PL
E
CLAY FRACTION OF WHOLE SAMPLE (< 2 um)
POTENTIAL EXPANSIVENESSVan der Merwe's Activity Chart
CH or OH
CL or OL
CL or ML ML or OL
Ml or OH
0
10
20
30
40
50
60
0 10 20 30 40 50 60 70 80 90 100
PL
AS
TIC
ITY
IN
DE
X
( P
I )
LIQUID LIMIT ( LL )
CASAGRANDE 'A' LINE
FOUNDATION INDICATOR TEST RESULTS
TEST LOCATION PROJECT Bridging Study Clanwilliam Dam
SAMPLE NO. PROJECT NUMBER 113834
DEPTH 0,0-2,20 m SITE Ebenhaeser Scheme
Sieve (mm) % Passing Sieve (mm) % Passing
63,000 100 0,425 1 Liquid limit (%) 0,0 % Gravel 99
53,000 100 0,075 1 Plastic limit (%) 0 % Sand 0
37,500 100 0,051 1 Plasticity Index (%) 0 % Silt 0
26,500 100 0,023 1 Weighted PI (%) 0 % Clay 1
19,000 100 0,007 1 Linear Shrinkage (%) 0,0 Activity 0,0
13,200 100 0,002 1 Grading Modulus 2,97 Unified Classification GP
4,750 90 0,000 0 Uniformity coefficient 2 TRB Classification A - 1 - a
2,360 1 0,000 0 Coefficient of curvature 1,0
SOIL CLASSIFICATIONSIEVE ANALYSIS
EB TP 24ADD
13946
ATTERBERG LIMITS
CLAYSILT SAND GRAVEL
FINE MEDIUM COARSE FINE MEDIUM COARSE FINE MEDIUM COARSE
0
20
40
60
80
100
120
0,001 0,01 0,1 1 10 100
PE
RC
EN
TA
GE
FIN
ER
BY
MA
SS
PARTICLE SIZE ( mm )
PARTICLE SIZE DISTRIBUTION
ME
DIU
M
HIG
H
VE
RY
HIG
H
LOW
0
10
20
30
40
50
60
0 10 20 30 40 50 60 70 80 90 100
PI
OF
WH
OL
E S
AM
PL
E
CLAY FRACTION OF WHOLE SAMPLE (< 2 um)
POTENTIAL EXPANSIVENESSVan der Merwe's Activity Chart
CH or OH
CL or OL
CL or ML ML or OL
Ml or OH
0
10
20
30
40
50
60
0 10 20 30 40 50 60 70 80 90 100
PL
AS
TIC
ITY
IN
DE
X
( P
I )
LIQUID LIMIT ( LL )
CASAGRANDE 'A' LINE
FOUNDATION INDICATOR TEST RESULTS
TEST LOCATION PROJECT Bridging Study Clanwilliam Dam
SAMPLE NO. PROJECT NUMBER 113834
DEPTH 0,0-2,5 m SITE Ebenhaeser Scheme
Sieve (mm) % Passing Sieve (mm) % Passing
63,000 100 0,425 86 Liquid limit (%) 0,0 % Gravel 0
53,000 100 0,075 3 Plastic limit (%) 0 % Sand 97
37,500 100 0,051 2 Plasticity Index (%) 0 % Silt 2
26,500 100 0,023 2 Weighted PI (%) 0 % Clay 1
19,000 100 0,007 2 Linear Shrinkage (%) 0,0 Activity 0,0
13,200 100 0,002 1 Grading Modulus 1,11 Unified Classification
4,750 100 0,000 0 Uniformity coefficient 3 TRB Classification A - 3
2,360 100 0,000 0 Coefficient of curvature 1,1
SOIL CLASSIFICATIONSIEVE ANALYSIS
EB TP 28
13938
ATTERBERG LIMITS
CLAYSILT SAND GRAVEL
FINE MEDIUM COARSE FINE MEDIUM COARSE FINE MEDIUM COARSE
0
20
40
60
80
100
120
0,001 0,01 0,1 1 10 100
PE
RC
EN
TA
GE
FIN
ER
BY
MA
SS
PARTICLE SIZE ( mm )
PARTICLE SIZE DISTRIBUTION
ME
DIU
M
HIG
H
VE
RY
HIG
H
LOW
0
10
20
30
40
50
60
0 10 20 30 40 50 60 70 80 90 100
PI
OF
WH
OL
E S
AM
PL
E
CLAY FRACTION OF WHOLE SAMPLE (< 2 um)
POTENTIAL EXPANSIVENESSVan der Merwe's Activity Chart
CH or OH
CL or OL
CL or ML ML or OL
Ml or OH
0
10
20
30
40
50
60
0 10 20 30 40 50 60 70 80 90 100
PL
AS
TIC
ITY
IN
DE
X
( P
I )
LIQUID LIMIT ( LL )
CASAGRANDE 'A' LINE

FOUNDATION INDICATOR TEST RESULTS
TEST LOCATION PROJECT Bridging Study Clanwilliam Dam
SAMPLE NO. PROJECT NUMBER 113834
DEPTH 0,0-1,60 m SITE Ebenhaeser Scheme
Sieve (mm) % Passing Sieve (mm) % Passing
63,000 100 0,425 95 Liquid limit (%) 0,0 % Gravel 1
53,000 100 0,075 8 Plastic limit (%) 0 % Sand 92
37,500 100 0,051 6 Plasticity Index (%) 0 % Silt 6
26,500 100 0,023 5 Weighted PI (%) 0 % Clay 2
19,000 100 0,007 4 Linear Shrinkage (%) 0,0 Activity 0,0
13,200 100 0,002 2 Grading Modulus 0,99 Unified Classification SP-SM
4,750 99 0,000 0 Uniformity coefficient 3 TRB Classification A - 3
2,360 99 0,000 0 Coefficient of curvature 1,1
SOIL CLASSIFICATIONSIEVE ANALYSIS
EB TP 33
13942
ATTERBERG LIMITS
CLAYSILT SAND GRAVEL
FINE MEDIUM COARSE FINE MEDIUM COARSE FINE MEDIUM COARSE
0
20
40
60
80
100
120
0,001 0,01 0,1 1 10 100
PE
RC
EN
TA
GE
FIN
ER
BY
MA
SS
PARTICLE SIZE ( mm )
PARTICLE SIZE DISTRIBUTION
ME
DIU
M
HIG
H
VE
RY
HIG
H
LOW
0
10
20
30
40
50
60
0 10 20 30 40 50 60 70 80 90 100
PI
OF
WH
OL
E S
AM
PL
E
CLAY FRACTION OF WHOLE SAMPLE (< 2 um)
POTENTIAL EXPANSIVENESSVan der Merwe's Activity Chart
CH or OH
CL or OL
CL or ML ML or OL
Ml or OH
0
10
20
30
40
50
60
0 10 20 30 40 50 60 70 80 90 100
PL
AS
TIC
ITY
IN
DE
X
( P
I )
LIQUID LIMIT ( LL )
CASAGRANDE 'A' LINE

FOUNDATION INDICATOR TEST RESULTS
TEST LOCATION PROJECT Bridging Study Clanwilliam Dam
SAMPLE NO. PROJECT NUMBER 113834
DEPTH 1,3-1,6 m SITE Ebenhaeser Scheme
Sieve (mm) % Passing Sieve (mm) % Passing
63,000 100 0,425 95 Liquid limit (%) 0,0 % Gravel 1
53,000 100 0,075 13 Plastic limit (%) 0 % Sand 86
37,500 100 0,051 12 Plasticity Index (%) 0 % Silt 5
26,500 100 0,023 10 Weighted PI (%) 0 % Clay 8
19,000 100 0,007 10 Linear Shrinkage (%) 0,0 Activity 0,0
13,200 100 0,002 8 Grading Modulus 0,93 Unified Classification SM
4,750 100 0,000 0 Uniformity coefficient 9 TRB Classification A - 2 - 4
2,360 99 0,000 0 Coefficient of curvature 2,7
SOIL CLASSIFICATIONSIEVE ANALYSIS
EB TP 33
13943
ATTERBERG LIMITS
CLAYSILT SAND GRAVEL
FINE MEDIUM COARSE FINE MEDIUM COARSE FINE MEDIUM COARSE
0
20
40
60
80
100
120
0,001 0,01 0,1 1 10 100
PE
RC
EN
TA
GE
FIN
ER
BY
MA
SS
PARTICLE SIZE ( mm )
PARTICLE SIZE DISTRIBUTION
ME
DIU
M
HIG
H
VE
RY
HIG
H
LOW
0
10
20
30
40
50
60
0 10 20 30 40 50 60 70 80 90 100
PI
OF
WH
OL
E S
AM
PL
E
CLAY FRACTION OF WHOLE SAMPLE (< 2 um)
POTENTIAL EXPANSIVENESSVan der Merwe's Activity Chart
CH or OH
CL or OL
CL or ML ML or OL
Ml or OH
0
10
20
30
40
50
60
0 10 20 30 40 50 60 70 80 90 100
PL
AS
TIC
ITY
IN
DE
X
( P
I )
LIQUID LIMIT ( LL )
CASAGRANDE 'A' LINE
FOUNDATION INDICATOR TEST RESULTS
TEST LOCATION PROJECT Bridging Study Clanwilliam Dam
SAMPLE NO. PROJECT NUMBER 113834
DEPTH 1,20-1,50 m SITE Ebenhaeser Scheme
Sieve (mm) % Passing Sieve (mm) % Passing
63,000 100 0,425 96 Liquid limit (%) 0,0 % Gravel 0
53,000 100 0,075 11 Plastic limit (%) 0 % Sand 89
37,500 100 0,051 10 Plasticity Index (%) 0 % Silt 3
26,500 100 0,023 10 Weighted PI (%) 0 % Clay 8
19,000 100 0,007 10 Linear Shrinkage (%) 0,0 Activity 0,0
13,200 100 0,002 8 Grading Modulus 0,93 Unified Classification SP-SM
4,750 100 0,000 0 Uniformity coefficient 5 TRB Classification A - 2 - 4
2,360 100 0,000 0 Coefficient of curvature 1,6
SOIL CLASSIFICATIONSIEVE ANALYSIS
EB TP 35
13939
ATTERBERG LIMITS
CLAYSILT SAND GRAVEL
FINE MEDIUM COARSE FINE MEDIUM COARSE FINE MEDIUM COARSE
0
20
40
60
80
100
120
0,001 0,01 0,1 1 10 100
PE
RC
EN
TA
GE
FIN
ER
BY
MA
SS
PARTICLE SIZE ( mm )
PARTICLE SIZE DISTRIBUTION
ME
DIU
M
HIG
H
VE
RY
HIG
H
LOW
0
10
20
30
40
50
60
0 10 20 30 40 50 60 70 80 90 100
PI
OF
WH
OL
E S
AM
PL
E
CLAY FRACTION OF WHOLE SAMPLE (< 2 um)
POTENTIAL EXPANSIVENESSVan der Merwe's Activity Chart
CH or OH
CL or OL
CL or ML ML or OL
Ml or OH
0
10
20
30
40
50
60
0 10 20 30 40 50 60 70 80 90 100
PL
AS
TIC
ITY
IN
DE
X
( P
I )
LIQUID LIMIT ( LL )
CASAGRANDE 'A' LINE

FOUNDATION INDICATOR TEST RESULTS
TEST LOCATION PROJECT Bridging Study Clanwilliam Dam
SAMPLE NO. PROJECT NUMBER 113834
DEPTH 0,0-0,90 m SITE Ebenhaeser Scheme
Sieve (mm) % Passing Sieve (mm) % Passing
63,000 100 0,425 98 Liquid limit (%) 0,0 % Gravel 0
53,000 100 0,075 3 Plastic limit (%) 0 % Sand 97
37,500 100 0,051 2 Plasticity Index (%) 0 % Silt 2
26,500 100 0,023 2 Weighted PI (%) 0 % Clay 1
19,000 100 0,007 2 Linear Shrinkage (%) 0,0 Activity 0,0
13,200 100 0,002 1 Grading Modulus 0,99 Unified Classification
4,750 100 0,000 0 Uniformity coefficient 3 TRB Classification A - 3
2,360 100 0,000 0 Coefficient of curvature 1,1
SOIL CLASSIFICATIONSIEVE ANALYSIS
EB TP 38
13940
ATTERBERG LIMITS
CLAYSILT SAND GRAVEL
FINE MEDIUM COARSE FINE MEDIUM COARSE FINE MEDIUM COARSE
0
20
40
60
80
100
120
0,001 0,01 0,1 1 10 100
PE
RC
EN
TA
GE
FIN
ER
BY
MA
SS
PARTICLE SIZE ( mm )
PARTICLE SIZE DISTRIBUTION
ME
DIU
M
HIG
H
VE
RY
HIG
H
LOW
0
10
20
30
40
50
60
0 10 20 30 40 50 60 70 80 90 100
PI
OF
WH
OL
E S
AM
PL
E
CLAY FRACTION OF WHOLE SAMPLE (< 2 um)
POTENTIAL EXPANSIVENESSVan der Merwe's Activity Chart
CH or OH
CL or OL
CL or ML ML or OL
Ml or OH
0
10
20
30
40
50
60
0 10 20 30 40 50 60 70 80 90 100
PL
AS
TIC
ITY
IN
DE
X
( P
I )
LIQUID LIMIT ( LL )
CASAGRANDE 'A' LINE

FOUNDATION INDICATOR TEST RESULTS
TEST LOCATION PROJECT Bridging Study Clanwilliam Dam
SAMPLE NO. PROJECT NUMBER 113834
DEPTH 1,1-2,50 m SITE Ebenhaeser Scheme
Sieve (mm) % Passing Sieve (mm) % Passing
63,000 100 0,425 94 Liquid limit (%) 0,0 % Gravel 0
53,000 100 0,075 3 Plastic limit (%) 0 % Sand 97
37,500 100 0,051 2 Plasticity Index (%) 0 % Silt 2
26,500 100 0,023 2 Weighted PI (%) 0 % Clay 1
19,000 100 0,007 2 Linear Shrinkage (%) 0,0 Activity 0,0
13,200 100 0,002 1 Grading Modulus 1,03 Unified Classification
4,750 100 0,000 0 Uniformity coefficient 3 TRB Classification A - 3
2,360 100 0,000 0 Coefficient of curvature 1,1
SOIL CLASSIFICATIONSIEVE ANALYSIS
EB TP 40
13955
ATTERBERG LIMITS
CLAYSILT SAND GRAVEL
FINE MEDIUM COARSE FINE MEDIUM COARSE FINE MEDIUM COARSE
0
20
40
60
80
100
120
0,001 0,01 0,1 1 10 100
PE
RC
EN
TA
GE
FIN
ER
BY
MA
SS
PARTICLE SIZE ( mm )
PARTICLE SIZE DISTRIBUTION
ME
DIU
M
HIG
H
VE
RY
HIG
H
LOW
0
10
20
30
40
50
60
0 10 20 30 40 50 60 70 80 90 100
PI
OF
WH
OL
E S
AM
PL
E
CLAY FRACTION OF WHOLE SAMPLE (< 2 um)
POTENTIAL EXPANSIVENESSVan der Merwe's Activity Chart
CH or OH
CL or OL
CL or ML ML or OL
Ml or OH
0
10
20
30
40
50
60
0 10 20 30 40 50 60 70 80 90 100
PL
AS
TIC
ITY
IN
DE
X
( P
I )
LIQUID LIMIT ( LL )
CASAGRANDE 'A' LINE

FOUNDATION INDICATOR TEST RESULTS
TEST LOCATION PROJECT Bridging Study Clanwilliam Dam
SAMPLE NO. PROJECT NUMBER 113834
DEPTH 0,0-0,80 m SITE Ebenhaeser Scheme
Sieve (mm) % Passing Sieve (mm) % Passing
63,000 100 0,425 92 Liquid limit (%) 0,0 % Gravel 5
53,000 100 0,075 4 Plastic limit (%) 0 % Sand 91
37,500 100 0,051 3 Plasticity Index (%) 0 % Silt 3
26,500 100 0,023 2 Weighted PI (%) 0 % Clay 1
19,000 98 0,007 2 Linear Shrinkage (%) 0,0 Activity 0,0
13,200 98 0,002 1 Grading Modulus 1,09 Unified Classification
4,750 95 0,000 0 Uniformity coefficient 3 TRB Classification A - 3
2,360 95 0,000 0 Coefficient of curvature 1,1
SOIL CLASSIFICATIONSIEVE ANALYSIS
EB TP41
13941
ATTERBERG LIMITS
CLAYSILT SAND GRAVEL
FINE MEDIUM COARSE FINE MEDIUM COARSE FINE MEDIUM COARSE
0
20
40
60
80
100
120
0,001 0,01 0,1 1 10 100
PE
RC
EN
TA
GE
FIN
ER
BY
MA
SS
PARTICLE SIZE ( mm )
PARTICLE SIZE DISTRIBUTION
ME
DIU
M
HIG
H
VE
RY
HIG
H
LOW
0
10
20
30
40
50
60
0 10 20 30 40 50 60 70 80 90 100
PI
OF
WH
OL
E S
AM
PL
E
CLAY FRACTION OF WHOLE SAMPLE (< 2 um)
POTENTIAL EXPANSIVENESSVan der Merwe's Activity Chart
CH or OH
CL or OL
CL or ML ML or OL
Ml or OH
0
10
20
30
40
50
60
0 10 20 30 40 50 60 70 80 90 100
PL
AS
TIC
ITY
IN
DE
X
( P
I )
LIQUID LIMIT ( LL )
CASAGRANDE 'A' LINE

FOUNDATION INDICATOR TEST RESULTS
TEST LOCATION PROJECT Bridging Study Clanwilliam Dam
SAMPLE NO. PROJECT NUMBER 113834
DEPTH 0,0-1,1 m SITE Ebenhaeser Scheme
Sieve (mm) % Passing Sieve (mm) % Passing
63,000 100 0,425 99 Liquid limit (%) 0,0 % Gravel 0
53,000 100 0,075 2 Plastic limit (%) 0 % Sand 98
37,500 100 0,051 2 Plasticity Index (%) 0 % Silt 1
26,500 100 0,023 2 Weighted PI (%) 0 % Clay 1
19,000 100 0,007 2 Linear Shrinkage (%) 0,0 Activity 0,0
13,200 100 0,002 1 Grading Modulus 0,99 Unified Classification
4,750 100 0,000 0 Uniformity coefficient 3 TRB Classification A - 3
2,360 100 0,000 0 Coefficient of curvature 1,1
SOIL CLASSIFICATIONSIEVE ANALYSIS
EB TP 43
13924
ATTERBERG LIMITS
CLAYSILT SAND GRAVEL
FINE MEDIUM COARSE FINE MEDIUM COARSE FINE MEDIUM COARSE
0
20
40
60
80
100
120
0,001 0,01 0,1 1 10 100
PE
RC
EN
TA
GE
FIN
ER
BY
MA
SS
PARTICLE SIZE ( mm )
PARTICLE SIZE DISTRIBUTION
ME
DIU
M
HIG
H
VE
RY
HIG
H
LOW
0
10
20
30
40
50
60
0 10 20 30 40 50 60 70 80 90 100
PI
OF
WH
OL
E S
AM
PL
E
CLAY FRACTION OF WHOLE SAMPLE (< 2 um)
POTENTIAL EXPANSIVENESSVan der Merwe's Activity Chart
CH or OH
CL or OL
CL or ML ML or OL
Ml or OH
0
10
20
30
40
50
60
0 10 20 30 40 50 60 70 80 90 100
PL
AS
TIC
ITY
IN
DE
X
( P
I )
LIQUID LIMIT ( LL )
CASAGRANDE 'A' LINE

FOUNDATION INDICATOR TEST RESULTS
TEST LOCATION PROJECT Bridging Study Clanwilliam Dam
SAMPLE NO. PROJECT NUMBER 113834
DEPTH 0.5-1.1 m SITE Ebenhaeser Scheme
Sieve (mm) % Passing Sieve (mm) % Passing
63,000 100 0,425 50 Liquid limit (%) 0,0 % Gravel 26
53,000 100 0,075 16 Plastic limit (%) 0 % Sand 58
37,500 100 0,051 14 Plasticity Index (%) 0 % Silt 11
26,500 100 0,023 12 Weighted PI (%) 0 % Clay 5
19,000 100 0,007 9 Linear Shrinkage (%) 1,2 Activity 0,0
13,200 100 0,002 5 Grading Modulus 1,60 Unified Classification SM
4,750 87 0,000 0 Uniformity coefficient 61 TRB Classification A-- 1 - b
2,360 74 0,000 0 Coefficient of curvature 2,0
SOIL CLASSIFICATIONSIEVE ANALYSIS
EB TP 45
13925
ATTERBERG LIMITS
CLAYSILT SAND GRAVEL
FINE MEDIUM COARSE FINE MEDIUM COARSE FINE MEDIUM COARSE
0
20
40
60
80
100
120
0,001 0,01 0,1 1 10 100
PE
RC
EN
TA
GE
FIN
ER
BY
MA
SS
PARTICLE SIZE ( mm )
PARTICLE SIZE DISTRIBUTION
ME
DIU
M
HIG
H
VE
RY
HIG
H
LOW
0
10
20
30
40
50
60
0 10 20 30 40 50 60 70 80 90 100
PI
OF
WH
OL
E S
AM
PL
E
CLAY FRACTION OF WHOLE SAMPLE (< 2 um)
POTENTIAL EXPANSIVENESSVan der Merwe's Activity Chart
CH or OH
CL or OL
CL or ML ML or OL
Ml or OH
0
10
20
30
40
50
60
0 10 20 30 40 50 60 70 80 90 100
PL
AS
TIC
ITY
IN
DE
X
( P
I )
LIQUID LIMIT ( LL )
CASAGRANDE 'A' LINE

FOUNDATION INDICATOR TEST RESULTS
TEST LOCATION PROJECT Bridging Study Clanwilliam Dam
SAMPLE NO. PROJECT NUMBER 113834
DEPTH 0,0-0,6 m SITE Ebenhaeser Scheme
Sieve (mm) % Passing Sieve (mm) % Passing
63,000 100 0,425 86 Liquid limit (%) 0,0 % Gravel 11
53,000 100 0,075 2 Plastic limit (%) 0 % Sand 87
37,500 100 0,051 3 Plasticity Index (%) 0 % Silt 1
26,500 94 0,023 3 Weighted PI (%) 0 % Clay 1
19,000 92 0,007 2 Linear Shrinkage (%) 0,0 Activity 0,0
13,200 91 0,002 1 Grading Modulus 1,23 Unified Classification
4,750 89 0,000 0 Uniformity coefficient 3 TRB Classification A - 3
2,360 89 0,000 0 Coefficient of curvature 1,1
SOIL CLASSIFICATIONSIEVE ANALYSIS
EB TP 46
13926
ATTERBERG LIMITS
CLAYSILT SAND GRAVEL
FINE MEDIUM COARSE FINE MEDIUM COARSE FINE MEDIUM COARSE
0
20
40
60
80
100
120
0,001 0,01 0,1 1 10 100
PE
RC
EN
TA
GE
FIN
ER
BY
MA
SS
PARTICLE SIZE ( mm )
PARTICLE SIZE DISTRIBUTION
ME
DIU
M
HIG
H
VE
RY
HIG
H
LOW
0
10
20
30
40
50
60
0 10 20 30 40 50 60 70 80 90 100
PI
OF
WH
OL
E S
AM
PL
E
CLAY FRACTION OF WHOLE SAMPLE (< 2 um)
POTENTIAL EXPANSIVENESSVan der Merwe's Activity Chart
CH or OH
CL or OL
CL or ML ML or OL
Ml or OH
0
10
20
30
40
50
60
0 10 20 30 40 50 60 70 80 90 100
PL
AS
TIC
ITY
IN
DE
X
( P
I )
LIQUID LIMIT ( LL )
CASAGRANDE 'A' LINE

FOUNDATION INDICATOR TEST RESULTS
TEST LOCATION PROJECT Bridging Study Clanwilliam Dam
SAMPLE NO. PROJECT NUMBER 113834
DEPTH 0,6-0,9 m SITE Ebenhaeser Scheme
Sieve (mm) % Passing Sieve (mm) % Passing
63,000 100 0,425 46 Liquid limit (%) 37,0 % Gravel 49
53,000 100 0,075 16 Plastic limit (%) 30 % Sand 35
37,500 100 0,051 16 Plasticity Index (%) 7 % Silt 10
26,500 100 0,023 15 Weighted PI (%) 3 % Clay 6
19,000 98 0,007 8 Linear Shrinkage (%) 3,6 Activity 1,2
13,200 90 0,002 6 Grading Modulus 1,87 Unified Classification SM
4,750 60 0,000 0 Uniformity coefficient 252 TRB Classification A - 2 - 4
2,360 51 0,000 0 Coefficient of curvature 0,6
SOIL CLASSIFICATIONSIEVE ANALYSIS
EB TP 46
13927
ATTERBERG LIMITS
CLAYSILT SAND GRAVEL
FINE MEDIUM COARSE FINE MEDIUM COARSE FINE MEDIUM COARSE
0
20
40
60
80
100
120
0,001 0,01 0,1 1 10 100
PE
RC
EN
TA
GE
FIN
ER
BY
MA
SS
PARTICLE SIZE ( mm )
PARTICLE SIZE DISTRIBUTION
ME
DIU
M
HIG
H
VE
RY
HIG
H
LOW
0
10
20
30
40
50
60
0 10 20 30 40 50 60 70 80 90 100
PI
OF
WH
OL
E S
AM
PL
E
CLAY FRACTION OF WHOLE SAMPLE (< 2 um)
POTENTIAL EXPANSIVENESSVan der Merwe's Activity Chart
CH or OH
CL or OL
CL or ML ML or OL
Ml or OH
0
10
20
30
40
50
60
0 10 20 30 40 50 60 70 80 90 100
PL
AS
TIC
ITY
IN
DE
X
( P
I )
LIQUID LIMIT ( LL )
CASAGRANDE 'A' LINE

FOUNDATION INDICATOR TEST RESULTS
TEST LOCATION PROJECT Bridging Study Clanwilliam Dam
SAMPLE NO. PROJECT NUMBER 113834
DEPTH 0.0 - 1.1 m SITE Ebenhaeser Scheme
Sieve (mm) % Passing Sieve (mm) % Passing
63,000 100 0,425 99 Liquid limit (%) 0,0 % Gravel 0
53,000 100 0,075 2 Plastic limit (%) 0 % Sand 98
37,500 100 0,051 1 Plasticity Index (%) 0 % Silt 1
26,500 100 0,023 1 Weighted PI (%) 0 % Clay 1
19,000 100 0,007 1 Linear Shrinkage (%) 0,0 Activity 0,0
13,200 100 0,002 1 Grading Modulus 0,99 Unified Classification
4,750 100 0,000 0 Uniformity coefficient 3 TRB Classification A - 3
2,360 100 0,000 0 Coefficient of curvature 1,1
SOIL CLASSIFICATIONSIEVE ANALYSIS
EB TP 48
13928
ATTERBERG LIMITS
CLAYSILT SAND GRAVEL
FINE MEDIUM COARSE FINE MEDIUM COARSE FINE MEDIUM COARSE
0
20
40
60
80
100
120
0,001 0,01 0,1 1 10 100
PE
RC
EN
TA
GE
FIN
ER
BY
MA
SS
PARTICLE SIZE ( mm )
PARTICLE SIZE DISTRIBUTION
ME
DIU
M
HIG
H
VE
RY
HIG
H
LOW
0
10
20
30
40
50
60
0 10 20 30 40 50 60 70 80 90 100
PI
OF
WH
OL
E S
AM
PL
E
CLAY FRACTION OF WHOLE SAMPLE (< 2 um)
POTENTIAL EXPANSIVENESSVan der Merwe's Activity Chart
CH or OH
CL or OL
CL or ML ML or OL
Ml or OH
0
10
20
30
40
50
60
0 10 20 30 40 50 60 70 80 90 100
PL
AS
TIC
ITY
IN
DE
X
( P
I )
LIQUID LIMIT ( LL )
CASAGRANDE 'A' LINE

FOUNDATION INDICATOR TEST RESULTS
TEST LOCATION PROJECT Bridging Study Clanwilliam Dam
SAMPLE NO. PROJECT NUMBER 113834
DEPTH 0,0-0,60 m SITE Ebenhaeser Scheme
Sieve (mm) % Passing Sieve (mm) % Passing
63,000 100 0,425 68 Liquid limit (%) 0,0 % Gravel 0
53,000 100 0,075 5 Plastic limit (%) 0 % Sand 95
37,500 100 0,051 4 Plasticity Index (%) 0 % Silt 4
26,500 100 0,023 4 Weighted PI (%) 0 % Clay 1
19,000 100 0,007 3 Linear Shrinkage (%) 0,0 Activity 0,0
13,200 100 0,002 1 Grading Modulus 1,27 Unified Classification
4,750 100 0,000 0 Uniformity coefficient 4 TRB Classification A - 3
2,360 100 0,000 0 Coefficient of curvature 1,2
SOIL CLASSIFICATIONSIEVE ANALYSIS
EB TP 52
13929
ATTERBERG LIMITS
CLAYSILT SAND GRAVEL
FINE MEDIUM COARSE FINE MEDIUM COARSE FINE MEDIUM COARSE
0
20
40
60
80
100
120
0,001 0,01 0,1 1 10 100
PE
RC
EN
TA
GE
FIN
ER
BY
MA
SS
PARTICLE SIZE ( mm )
PARTICLE SIZE DISTRIBUTION
ME
DIU
M
HIG
H
VE
RY
HIG
H
LOW
0
10
20
30
40
50
60
0 10 20 30 40 50 60 70 80 90 100
PI
OF
WH
OL
E S
AM
PL
E
CLAY FRACTION OF WHOLE SAMPLE (< 2 um)
POTENTIAL EXPANSIVENESSVan der Merwe's Activity Chart
CH or OH
CL or OL
CL or ML ML or OL
Ml or OH
0
10
20
30
40
50
60
0 10 20 30 40 50 60 70 80 90 100
PL
AS
TIC
ITY
IN
DE
X
( P
I )
LIQUID LIMIT ( LL )
CASAGRANDE 'A' LINE

FOUNDATION INDICATOR TEST RESULTS
TEST LOCATION PROJECT Bridging Study Clanwilliam Dam
SAMPLE NO. PROJECT NUMBER 113834
DEPTH 0,0-1,5 m SITE Ebenhaeser Scheme
Sieve (mm) % Passing Sieve (mm) % Passing
63,000 100 0,425 77 Liquid limit (%) 0,0 % Gravel 0
53,000 100 0,075 4 Plastic limit (%) 0 % Sand 96
37,500 100 0,051 4 Plasticity Index (%) 0 % Silt 2
26,500 100 0,023 4 Weighted PI (%) 0 % Clay 2
19,000 100 0,007 3 Linear Shrinkage (%) 0,0 Activity 0,0
13,200 100 0,002 2 Grading Modulus 1,19 Unified Classification
4,750 100 0,000 0 Uniformity coefficient 3 TRB Classification A - 3
2,360 100 0,000 0 Coefficient of curvature 1,1
SOIL CLASSIFICATIONSIEVE ANALYSIS
EB TP 53
13930
ATTERBERG LIMITS
CLAYSILT SAND GRAVEL
FINE MEDIUM COARSE FINE MEDIUM COARSE FINE MEDIUM COARSE
0
20
40
60
80
100
120
0,001 0,01 0,1 1 10 100
PE
RC
EN
TA
GE
FIN
ER
BY
MA
SS
PARTICLE SIZE ( mm )
PARTICLE SIZE DISTRIBUTION
ME
DIU
M
HIG
H
VE
RY
HIG
H
LOW
0
10
20
30
40
50
60
0 10 20 30 40 50 60 70 80 90 100
PI
OF
WH
OL
E S
AM
PL
E
CLAY FRACTION OF WHOLE SAMPLE (< 2 um)
POTENTIAL EXPANSIVENESSVan der Merwe's Activity Chart
CH or OH
CL or OL
CL or ML ML or OL
Ml or OH
0
10
20
30
40
50
60
0 10 20 30 40 50 60 70 80 90 100
PL
AS
TIC
ITY
IN
DE
X
( P
I )
LIQUID LIMIT ( LL )
CASAGRANDE 'A' LINE

FOUNDATION INDICATOR TEST RESULTS
TEST LOCATION PROJECT Bridging Study Clanwilliam Dam
SAMPLE NO. PROJECT NUMBER 113834
DEPTH 0,5-1,9 m SITE Ebenhaeser Scheme
Sieve (mm) % Passing Sieve (mm) % Passing
63,000 100 0,425 80 Liquid limit (%) 0,0 % Gravel 8
53,000 100 0,075 14 Plastic limit (%) 0 % Sand 78
37,500 100 0,051 12 Plasticity Index (%) 0 % Silt 10
26,500 100 0,023 10 Weighted PI (%) 0 % Clay 4
19,000 100 0,007 8 Linear Shrinkage (%) 0,0 Activity 0,0
13,200 97 0,002 4 Grading Modulus 1,14 Unified Classification SM
4,750 94 0,000 0 Uniformity coefficient 10 TRB Classification A - 2 - 4
2,360 92 0,000 0 Coefficient of curvature 2,6
SOIL CLASSIFICATIONSIEVE ANALYSIS
EB TP 57
13931
ATTERBERG LIMITS
CLAYSILT SAND GRAVEL
FINE MEDIUM COARSE FINE MEDIUM COARSE FINE MEDIUM COARSE
0
20
40
60
80
100
120
0,001 0,01 0,1 1 10 100
PE
RC
EN
TA
GE
FIN
ER
BY
MA
SS
PARTICLE SIZE ( mm )
PARTICLE SIZE DISTRIBUTION
ME
DIU
M
HIG
H
VE
RY
HIG
H
LOW
0
10
20
30
40
50
60
0 10 20 30 40 50 60 70 80 90 100
PI
OF
WH
OL
E S
AM
PL
E
CLAY FRACTION OF WHOLE SAMPLE (< 2 um)
POTENTIAL EXPANSIVENESSVan der Merwe's Activity Chart
CH or OH
CL or OL
CL or ML ML or OL
Ml or OH
0
10
20
30
40
50
60
0 10 20 30 40 50 60 70 80 90 100
PL
AS
TIC
ITY
IN
DE
X
( P
I )
LIQUID LIMIT ( LL )
CASAGRANDE 'A' LINE

FOUNDATION INDICATOR TEST RESULTS
TEST LOCATION PROJECT Bridging Study Clanwilliam Dam
SAMPLE NO. PROJECT NUMBER 113834
DEPTH 0,20-1,50 m SITE Ebenhaeser Scheme
Sieve (mm) % Passing Sieve (mm) % Passing
63,000 100 0,425 54 Liquid limit (%) 0,0 % Gravel 25
53,000 100 0,075 17 Plastic limit (%) 0 % Sand 58
37,500 100 0,051 16 Plasticity Index (%) 0 % Silt 13
26,500 100 0,023 14 Weighted PI (%) 0 % Clay 4
19,000 100 0,007 10 Linear Shrinkage (%) 1,2 Activity 0,0
13,200 100 0,002 4 Grading Modulus 1,54 Unified Classification SM
4,750 88 0,000 0 Uniformity coefficient 70 TRB Classification A - 2 - 4
2,360 75 0,000 0 Coefficient of curvature 3,0
SOIL CLASSIFICATIONSIEVE ANALYSIS
EB TP 59
13932
ATTERBERG LIMITS
CLAYSILT SAND GRAVEL
FINE MEDIUM COARSE FINE MEDIUM COARSE FINE MEDIUM COARSE
0
20
40
60
80
100
120
0,001 0,01 0,1 1 10 100
PE
RC
EN
TA
GE
FIN
ER
BY
MA
SS
PARTICLE SIZE ( mm )
PARTICLE SIZE DISTRIBUTION
ME
DIU
M
HIG
H
VE
RY
HIG
H
LOW
0
10
20
30
40
50
60
0 10 20 30 40 50 60 70 80 90 100
PI
OF
WH
OL
E S
AM
PL
E
CLAY FRACTION OF WHOLE SAMPLE (< 2 um)
POTENTIAL EXPANSIVENESSVan der Merwe's Activity Chart
CH or OH
CL or OL
CL or ML ML or OL
Ml or OH
0
10
20
30
40
50
60
0 10 20 30 40 50 60 70 80 90 100
PL
AS
TIC
ITY
IN
DE
X
( P
I )
LIQUID LIMIT ( LL )
CASAGRANDE 'A' LINE

FOUNDATION INDICATOR TEST RESULTS
TEST LOCATION PROJECT Bridging Study Clanwilliam Dam
SAMPLE NO. PROJECT NUMBER 113834
DEPTH 0,5-2,1 m SITE Ebenhaeser Scheme
Sieve (mm) % Passing Sieve (mm) % Passing
63,000 100 0,425 52 Liquid limit (%) 0,0 % Gravel 34
53,000 100 0,075 18 Plastic limit (%) 0 % Sand 49
37,500 100 0,051 13 Plasticity Index (%) 0 % Silt 13
26,500 98 0,023 10 Weighted PI (%) 0 % Clay 4
19,000 94 0,007 7 Linear Shrinkage (%) 0,0 Activity 0,0
13,200 90 0,002 4 Grading Modulus 1,65 Unified Classification SM
4,750 73 0,000 0 Uniformity coefficient 52 TRB Classification A - 2 - 4
2,360 66 0,000 0 Coefficient of curvature 0,9
SOIL CLASSIFICATIONSIEVE ANALYSIS
EB TP 61
13933
ATTERBERG LIMITS
CLAYSILT SAND GRAVEL
FINE MEDIUM COARSE FINE MEDIUM COARSE FINE MEDIUM COARSE
0
20
40
60
80
100
120
0,001 0,01 0,1 1 10 100
PE
RC
EN
TA
GE
FIN
ER
BY
MA
SS
PARTICLE SIZE ( mm )
PARTICLE SIZE DISTRIBUTION
ME
DIU
M
HIG
H
VE
RY
HIG
H
LOW
0
10
20
30
40
50
60
0 10 20 30 40 50 60 70 80 90 100
PI
OF
WH
OL
E S
AM
PL
E
CLAY FRACTION OF WHOLE SAMPLE (< 2 um)
POTENTIAL EXPANSIVENESSVan der Merwe's Activity Chart
CH or OH
CL or OL
CL or ML ML or OL
Ml or OH
0
10
20
30
40
50
60
0 10 20 30 40 50 60 70 80 90 100
PL
AS
TIC
ITY
IN
DE
X
( P
I )
LIQUID LIMIT ( LL )
CASAGRANDE 'A' LINE

FOUNDATION INDICATOR TEST RESULTS
TEST LOCATION PROJECT Bridging Study Clanwilliam Dam
SAMPLE NO. PROJECT NUMBER 113834
DEPTH 0,0-0,6 m SITE Ebenhaeser Scheme
Sieve (mm) % Passing Sieve (mm) % Passing
63,000 100 0,425 43 Liquid limit (%) 23,0 % Gravel 49
53,000 100 0,075 27 Plastic limit (%) 15 % Sand 24
37,500 100 0,051 25 Plasticity Index (%) 8 % Silt 13
26,500 100 0,023 22 Weighted PI (%) 3 % Clay 15
19,000 97 0,007 19 Linear Shrinkage (%) 3,8 Activity 0,5
13,200 89 0,002 15 Grading Modulus 1,79 Unified Classification SC
4,750 64 0,000 0 Uniformity coefficient 2007 TRB Classification A - 2 - 4
2,360 51 0,000 0 Coefficient of curvature 2,3
SOIL CLASSIFICATIONSIEVE ANALYSIS
EB TP 63
13934
ATTERBERG LIMITS
CLAYSILT SAND GRAVEL
FINE MEDIUM COARSE FINE MEDIUM COARSE FINE MEDIUM COARSE
0
20
40
60
80
100
120
0,001 0,01 0,1 1 10 100
PE
RC
EN
TA
GE
FIN
ER
BY
MA
SS
PARTICLE SIZE ( mm )
PARTICLE SIZE DISTRIBUTION
ME
DIU
M
HIG
H
VE
RY
HIG
H
LOW
0
10
20
30
40
50
60
0 10 20 30 40 50 60 70 80 90 100
PI
OF
WH
OL
E S
AM
PL
E
CLAY FRACTION OF WHOLE SAMPLE (< 2 um)
POTENTIAL EXPANSIVENESSVan der Merwe's Activity Chart
CH or OH
CL or OL
CL or ML ML or OL
Ml or OH
0
10
20
30
40
50
60
0 10 20 30 40 50 60 70 80 90 100
PL
AS
TIC
ITY
IN
DE
X
( P
I )
LIQUID LIMIT ( LL )
CASAGRANDE 'A' LINE

FOUNDATION INDICATOR TEST RESULTS
TEST LOCATION PROJECT Bridging Study Clanwilliam Dam
SAMPLE NO. PROJECT NUMBER 113834
DEPTH 0,0-0,5 m SITE Ebenhaeser Scheme
Sieve (mm) % Passing Sieve (mm) % Passing
63,000 100 0,425 86 Liquid limit (%) 46,0 % Gravel 1
53,000 100 0,075 25 Plastic limit (%) 35 % Sand 74
37,500 100 0,051 21 Plasticity Index (%) 11 % Silt 18
26,500 100 0,023 17 Weighted PI (%) 10 % Clay 7
19,000 100 0,007 11 Linear Shrinkage (%) 5,8 Activity 1,6
13,200 100 0,002 7 Grading Modulus 0,90 Unified Classification SM
4,750 99 0,000 0 Uniformity coefficient 26 TRB Classification A - 2 - 7
2,360 99 0,000 0 Coefficient of curvature 3,9
SOIL CLASSIFICATIONSIEVE ANALYSIS
EB TP 66
13935
ATTERBERG LIMITS
CLAYSILT SAND GRAVEL
FINE MEDIUM COARSE FINE MEDIUM COARSE FINE MEDIUM COARSE
0
20
40
60
80
100
120
0,001 0,01 0,1 1 10 100
PE
RC
EN
TA
GE
FIN
ER
BY
MA
SS
PARTICLE SIZE ( mm )
PARTICLE SIZE DISTRIBUTION
ME
DIU
M
HIG
H
VE
RY
HIG
H
LOW
0
10
20
30
40
50
60
0 10 20 30 40 50 60 70 80 90 100
PI
OF
WH
OL
E S
AM
PL
E
CLAY FRACTION OF WHOLE SAMPLE (< 2 um)
POTENTIAL EXPANSIVENESSVan der Merwe's Activity Chart
CH or OH
CL or OL
CL or ML ML or OL
Ml or OH
0
10
20
30
40
50
60
0 10 20 30 40 50 60 70 80 90 100
PL
AS
TIC
ITY
IN
DE
X
( P
I )
LIQUID LIMIT ( LL )
CASAGRANDE 'A' LINE

FOUNDATION INDICATOR TEST RESULTS
TEST LOCATION PROJECT Bridging Study Clanwilliam Dam
SAMPLE NO. PROJECT NUMBER 113834
DEPTH 0,6-1,3 m SITE Ebenhaeser Scheme
Sieve (mm) % Passing Sieve (mm) % Passing
63,000 100 0,425 85 Liquid limit (%) 38,0 % Gravel 4
53,000 100 0,075 18 Plastic limit (%) 26 % Sand 78
37,500 100 0,051 17 Plasticity Index (%) 12 % Silt 9
26,500 100 0,023 16 Weighted PI (%) 10 % Clay 9
19,000 100 0,007 15 Linear Shrinkage (%) 5,3 Activity 1,3
13,200 98 0,002 9 Grading Modulus 1,01 Unified Classification SM
4,750 97 0,000 0 Uniformity coefficient 113 TRB Classification A - 2 - 6
2,360 96 0,000 0 Coefficient of curvature 24,9
SOIL CLASSIFICATIONSIEVE ANALYSIS
EB TP 72
13956
ATTERBERG LIMITS
CLAYSILT SAND GRAVEL
FINE MEDIUM COARSE FINE MEDIUM COARSE FINE MEDIUM COARSE
0
20
40
60
80
100
120
0,001 0,01 0,1 1 10 100
PE
RC
EN
TA
GE
FIN
ER
BY
MA
SS
PARTICLE SIZE ( mm )
PARTICLE SIZE DISTRIBUTION
ME
DIU
M
HIG
H
VE
RY
HIG
H
LOW
0
10
20
30
40
50
60
0 10 20 30 40 50 60 70 80 90 100
PI
OF
WH
OL
E S
AM
PL
E
CLAY FRACTION OF WHOLE SAMPLE (< 2 um)
POTENTIAL EXPANSIVENESSVan der Merwe's Activity Chart
CH or OH
CL or OL
CL or ML ML or OL
Ml or OH
0
10
20
30
40
50
60
0 10 20 30 40 50 60 70 80 90 100
PL
AS
TIC
ITY
IN
DE
X
( P
I )
LIQUID LIMIT ( LL )
CASAGRANDE 'A' LINE
FOUNDATION INDICATOR TEST RESULTS
TEST LOCATION PROJECT Bridging Study Clanwilliam Dam
SAMPLE NO. PROJECT NUMBER 113834
DEPTH 0,0-0,40 m SITE Ebenhaeser Scheme
Sieve (mm) % Passing Sieve (mm) % Passing
63,000 100 0,425 90 Liquid limit (%) 33,0 % Gravel 3
53,000 100 0,075 24 Plastic limit (%) 23 % Sand 73
37,500 100 0,051 22 Plasticity Index (%) 11 % Silt 16
26,500 100 0,023 19 Weighted PI (%) 9 % Clay 8
19,000 100 0,007 14 Linear Shrinkage (%) 4,9 Activity 1,3
13,200 100 0,002 8 Grading Modulus 0,89 Unified Classification SC
4,750 98 0,000 0 Uniformity coefficient 66 TRB Classification A - 2 - 6
2,360 97 0,000 0 Coefficient of curvature 10,9
SOIL CLASSIFICATIONSIEVE ANALYSIS
EB TP 73
13937
ATTERBERG LIMITS
CLAYSILT SAND GRAVEL
FINE MEDIUM COARSE FINE MEDIUM COARSE FINE MEDIUM COARSE
0
20
40
60
80
100
120
0,001 0,01 0,1 1 10 100
PE
RC
EN
TA
GE
FIN
ER
BY
MA
SS
PARTICLE SIZE ( mm )
PARTICLE SIZE DISTRIBUTION
ME
DIU
M
HIG
H
VE
RY
HIG
H
LOW
0
10
20
30
40
50
60
0 10 20 30 40 50 60 70 80 90 100
PI
OF
WH
OL
E S
AM
PL
E
CLAY FRACTION OF WHOLE SAMPLE (< 2 um)
POTENTIAL EXPANSIVENESSVan der Merwe's Activity Chart
CH or OH
CL or OL
CL or ML ML or OL
Ml or OH
0
10
20
30
40
50
60
0 10 20 30 40 50 60 70 80 90 100
PL
AS
TIC
ITY
IN
DE
X
( P
I )
LIQUID LIMIT ( LL )
CASAGRANDE 'A' LINE

FOUNDATION INDICATOR TEST RESULTS
TEST LOCATION PROJECT Bridging Study Clanwilliam Dam
SAMPLE NO. PROJECT NUMBER 113834
DEPTH 0,3-0,6 m SITE Ebenhaeser Scheme
Sieve (mm) % Passing Sieve (mm) % Passing
63,000 100 0,425 51 Liquid limit (%) 0,0 % Gravel 32
53,000 100 0,075 15 Plastic limit (%) 0 % Sand 53
37,500 100 0,051 14 Plasticity Index (%) 0 % Silt 11
26,500 100 0,023 12 Weighted PI (%) 0 % Clay 4
19,000 99 0,007 10 Linear Shrinkage (%) 0,0 Activity 0,0
13,200 93 0,002 4 Grading Modulus 1,66 Unified Classification SM
4,750 75 0,000 0 Uniformity coefficient 92 TRB Classification A - 2 - 4
2,360 68 0,000 0 Coefficient of curvature 2,2
SOIL CLASSIFICATIONSIEVE ANALYSIS
EB TP 78
13936
ATTERBERG LIMITS
CLAYSILT SAND GRAVEL
FINE MEDIUM COARSE FINE MEDIUM COARSE FINE MEDIUM COARSE
0
20
40
60
80
100
120
0,001 0,01 0,1 1 10 100
PE
RC
EN
TA
GE
FIN
ER
BY
MA
SS
PARTICLE SIZE ( mm )
PARTICLE SIZE DISTRIBUTION
ME
DIU
M
HIG
H
VE
RY
HIG
H
LOW
0
10
20
30
40
50
60
0 10 20 30 40 50 60 70 80 90 100
PI
OF
WH
OL
E S
AM
PL
E
CLAY FRACTION OF WHOLE SAMPLE (< 2 um)
POTENTIAL EXPANSIVENESSVan der Merwe's Activity Chart
CH or OH
CL or OL
CL or ML ML or OL
Ml or OH
0
10
20
30
40
50
60
0 10 20 30 40 50 60 70 80 90 100
PL
AS
TIC
ITY
IN
DE
X
( P
I )
LIQUID LIMIT ( LL )
CASAGRANDE 'A' LINE
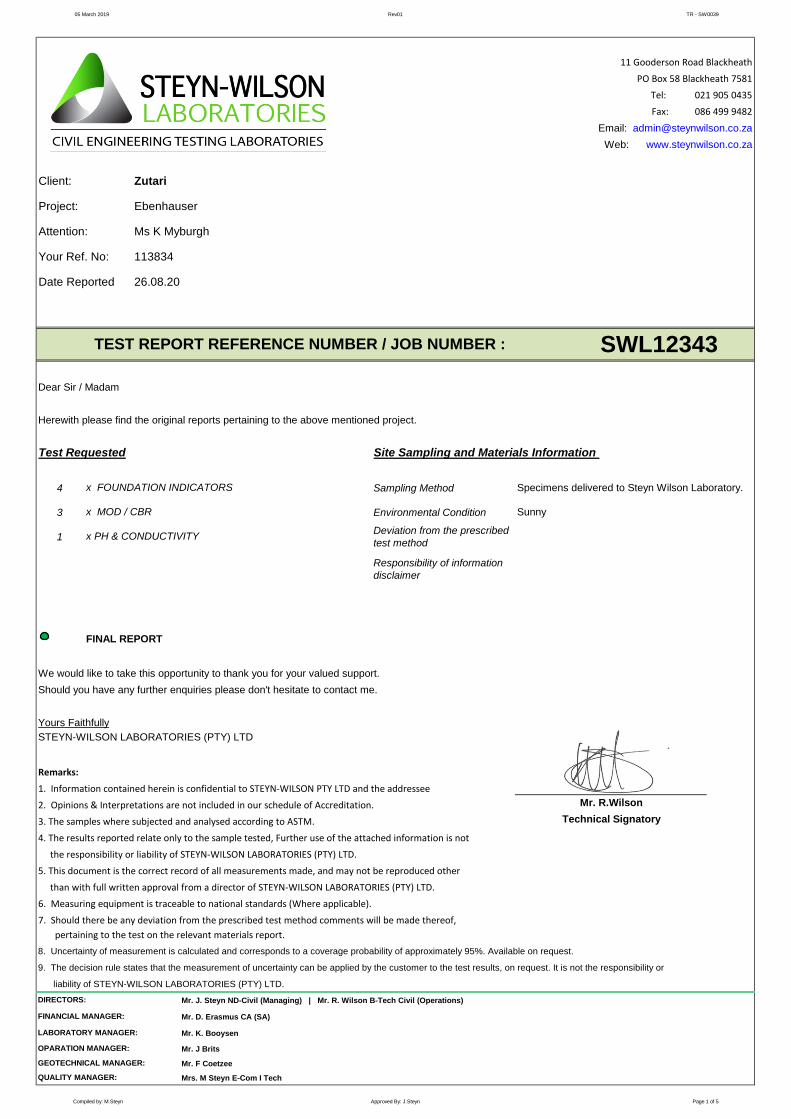
05 March 2019 Rev01 TR - SW0039
11 Gooderson Road Blackheath
PO Box 58 Blackheath 7581
Tel: 021 905 0435
Fax: 086 499 9482
Email: [email protected]
Web: www.steynwilson.co.za
Dear Sir / Madam
Herewith please find the original reports pertaining to the above mentioned project.
Test Requested Site Sampling and Materials Information
4 Sampling Method
3 Environmental Condition
1
FINAL REPORT
We would like to take this opportunity to thank you for your valued support.
Should you have any further enquiries please don't hesitate to contact me.
1. Information contained herein is confidential to STEYN-WILSON PTY LTD and the addressee
2. Opinions & Interpretations are not included in our schedule of Accreditation.
3. The samples where subjected and analysed according to ASTM.
4. The results reported relate only to the sample tested, Further use of the attached information is not
the responsibility or liability of STEYN-WILSON LABORATORIES (PTY) LTD.
5. This document is the correct record of all measurements made, and may not be reproduced other
than with full written approval from a director of STEYN-WILSON LABORATORIES (PTY) LTD.
6. Measuring equipment is traceable to national standards (Where applicable).
7. Should there be any deviation from the prescribed test method comments will be made thereof,
pertaining to the test on the relevant materials report.
8. Uncertainty of measurement is calculated and corresponds to a coverage probability of approximately 95%. Available on request.
9. The decision rule states that the measurement of uncertainty can be applied by the customer to the test results, on request. It is not the responsibility or
liability of STEYN-WILSON LABORATORIES (PTY) LTD.
Mr. J. Steyn ND-Civil (Managing) | Mr. R. Wilson B-Tech Civil (Operations)
Mr. D. Erasmus CA (SA)
Mr. K. Booysen
Mr. J Brits
Mr. F Coetzee
Mrs. M Steyn E-Com I Tech
LABORATORY MANAGER:
OPARATION MANAGER:
GEOTECHNICAL MANAGER:
QUALITY MANAGER:
Sunny
Deviation from the prescribed
test method0
Responsibility of information
disclaimer0
DIRECTORS:
Client:
Project:
Your Ref. No:
SWL12343TEST REPORT REFERENCE NUMBER / JOB NUMBER :
FINANCIAL MANAGER:
Zutari
Remarks:
Mr. R.Wilson
Technical Signatory
STEYN-WILSON LABORATORIES (PTY) LTD
x FOUNDATION INDICATORS
x MOD / CBR
x PH & CONDUCTIVITY
Yours Faithfully
Ebenhauser
Ms K Myburgh
113834
26.08.20Date Reported
Specimens delivered to Steyn Wilson Laboratory.
Attention:
Compiled by: M.Steyn Approved By: J.Steyn Page 1 of 5
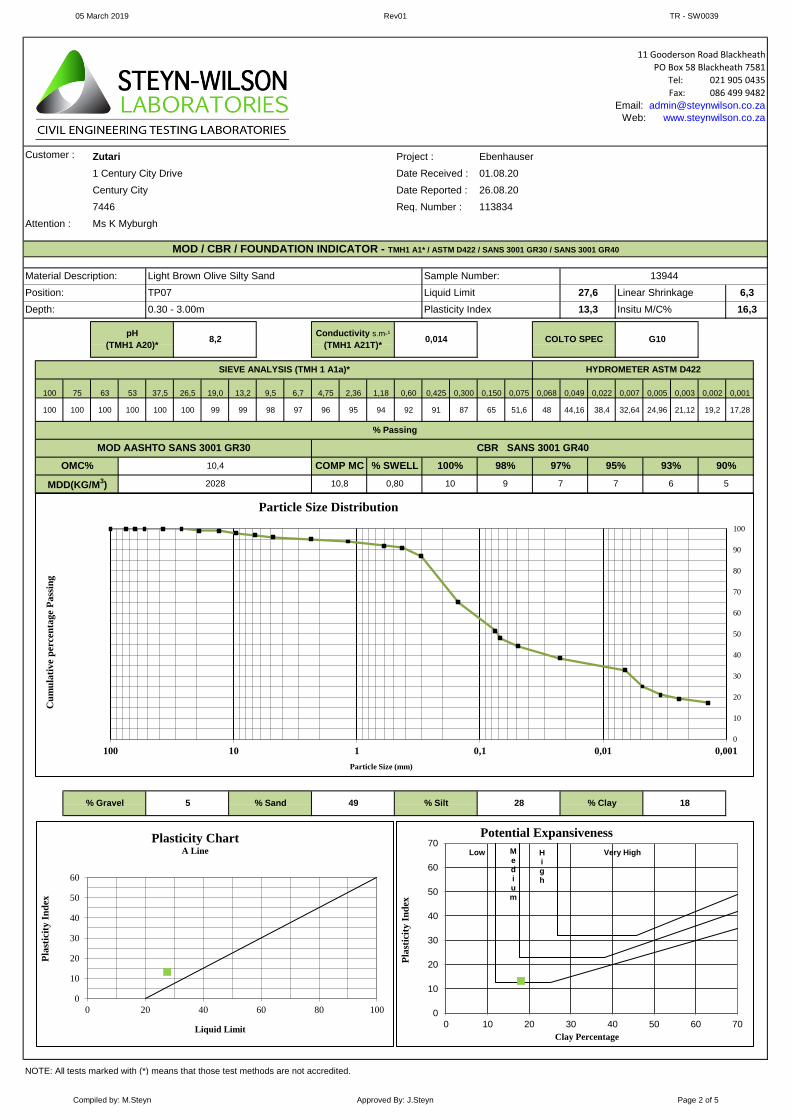
05 March 2019 Rev01 TR - SW0039
11 Gooderson Road Blackheath
PO Box 58 Blackheath 7581
Tel: 021 905 0435
Fax: 086 499 9482
Email: [email protected]
Web: www.steynwilson.co.za
Customer : Zutari Project :
1 Century City Drive Date Received :
Century City Date Reported :
7446 Req. Number :
Attention : Ms K Myburgh
100 75 63 53 37,5 26,5 19,0 13,2 9,5 6,7 4,75 2,36 1,18 0,60 0,425 0,300 0,150 0,075 0,068 0,049 0,022 0,007 0,005 0,003 0,002 0,001
100 100 100 100 100 100 99 99 98 97 96 95 94 92 91 87 65 51,6 48 44,16 38,4 32,64 24,96 21,12 19,2 17,28
NOTE: All tests marked with (*) means that those test methods are not accredited.
CBR SANS 3001 GR40MOD AASHTO SANS 3001 GR30
10,8 0,80 10 9 7 5
10,4
2028
28
COMP MC 90%98%100%% SWELLOMC%
MDD(KG/M3)
93%95%97%
7 6
% Gravel 5 % Sand
6,3
16,3
Linear Shrinkage
Insitu M/C%
49 % Silt % Clay 18
MOD / CBR / FOUNDATION INDICATOR - TMH1 A1* / ASTM D422 / SANS 3001 GR30 / SANS 3001 GR40
% Passing
Material Description:
Position:
SIEVE ANALYSIS (TMH 1 A1a)*
Conductivity s.m-¹
(TMH1 A21T)* 0,014
Depth: Plasticity Index
Light Brown Olive Silty Sand
Liquid Limit 27,6
13,3
TP07
0.30 - 3.00m
Sample Number: 13944
HYDROMETER ASTM D422
Ebenhauser
01.08.20
26.08.20
113834
G10pH
(TMH1 A20)*8,2 COLTO SPEC
0
10
20
30
40
50
60
70
80
90
100
0,0010,010,1110100
Cu
mu
lati
ve
per
cen
tag
e P
ass
ing
Particle Size (mm)
Particle Size Distribution
0
10
20
30
40
50
60
0 20 40 60 80 100
Pla
stic
ity
In
dex
Liquid Limit
Plasticity ChartA Line
0
10
20
30
40
50
60
70
0 10 20 30 40 50 60 70
Pla
stic
ity
In
dex
Clay Percentage
Potential Expansiveness
Low M ediu m
High
Very High
Compiled by: M.Steyn Approved By: J.Steyn Page 2 of 5

05 March 2019 Rev01 TR - SW0039
11 Gooderson Road Blackheath
PO Box 58 Blackheath 7581
Tel: 021 905 0435
Fax: 086 499 9482
Email: [email protected]
Web: www.steynwilson.co.za
Customer : Zutari Project :
1 Century City Drive Date Received :
Century City Date Reported :
7446 Req. Number :
Attention : Ms K Myburgh
100 75 63 53 37,5 26,5 19,0 13,2 9,5 6,7 4,75 2,36 1,18 0,60 0,425 0,300 0,150 0,075 0,068 0,049 0,022 0,007 0,005 0,003 0,002 0,001
100 100 100 100 100 100 100 99 99 99 99 99 98,4 97 94 70 15 5 5 5 5 4 4 3 3 2
NOTE: All tests marked with (*) means that those test methods are not accredited.
13 12 10 8 6
97% 95% 93% 90%11,6 COMP MC % SWELL 100% 98%
MDD(KG/M3) 1859 11,2 0.0 15
Ebenhauser
01.08.20
26.08.20
113834
MOD / CBR / FOUNDATION INDICATOR - TMH1 A1* / ASTM D422 / SANS 3001 GR30 / SANS 3001 GR40
Material Description: Brown Reddish Fine Sand Sample Number: 13945
Position: TP09 Liquid Limit NP Linear Shrinkage 0.0
Depth: 0.0 - 3.00m Plasticity Index NP Insitu M/C% 1,6
PH (TMH1 A20)* 0
(TMH1 A21T)*
Conductivity
s.m-1
0 COLTO SPEC G9
SIEVE ANALYSIS (TMH 1 A1a)* HYDROMETER ASTM D422
% Passing
MOD AASHTO SANS 3001 GR30 CBR SANS 3001 GR40
OMC%
3 % Clay 2% Gravel 1 % Sand 94 % Silt
0
10
20
30
40
50
60
70
80
90
100
0,0010,010,1110100
Cu
mu
lati
ve
per
cen
tag
e P
ass
ing
Particle Size (mm)
Particle Size Distribution
0
10
20
30
40
50
60
0 20 40 60 80 100
Pla
stic
ity
In
dex
Liquid Limit
Plasticity ChartA Line
0
10
20
30
40
50
60
70
0 10 20 30 40 50 60 70
Pla
stic
ity
In
dex
Clay Percentage
Potential Expansiveness
Low M ediu m
High
Very High
Compiled by: M.Steyn Approved By: J.Steyn Page 3 of 5

05 March 2019 Rev01 TR - SW0039
11 Gooderson Road Blackheath
PO Box 58 Blackheath 7581
Tel: 021 905 0435
Fax: 086 499 9482
Email: [email protected]
Web: www.steynwilson.co.za
Customer : Zutari Project :
1 Century City Drive Date Received :
Century City Date Reported :
7446 Req. Number :
Attention : Ms K Myburgh
100 75 63 53 37,5 26,5 19,0 13,2 9,5 6,7 4,75 2,36 1,18 0,60 0,425 0,300 0,150 0,075 0,068 0,049 0,022 0,007 0,005 0,003 0,002 0,001
100 100 100 100 100 100 100 99 98 97 96 94 91,8 89 87 78 47 35,2 32,64 30,72 28,8 21,12 19,2 15,36 13,44 11,52
NOTE: All tests marked with (*) means that those test methods are not accredited.
6 5 4 3
97% 95% 93% 90%
MDD(KG/M3) 1970 10,4 0,76 9 7
OMC% 10,0 COMP MC % SWELL 100% 98%
Ebenhauser
01.08.20
26.08.20
113834
MOD / CBR / FOUNDATION INDICATOR - TMH1 A1* / ASTM D422 / SANS 3001 GR30 / SANS 3001 GR40
Material Description: Light Brown Olive Silty Soil with Calcrete Sample Number: 13953
Position: TP10 Liquid Limit 35 Linear Shrinkage 5,4
Depth: 1.00 - 2.00m Plasticity Index 11,6 Insitu M/C% 16,3
PH (TMH1 A20)* 0
(TMH1 A21T)*
Conductivity
s.m-1
0 COLTO SPEC G10
SIEVE ANALYSIS (TMH 1 A1a)* HYDROMETER ASTM D422
% Passing
% Passing
MOD AASHTO SANS 3001 GR30 CBR SANS 3001 GR40
% Gravel 7 % Sand 61 % Silt 19 % Clay 13
0
10
20
30
40
50
60
70
80
90
100
0,0010,010,1110100
Cu
mu
lati
ve
per
cen
tag
e P
ass
ing
Particle Size (mm)
Particle Size Distribution
0
10
20
30
40
50
60
0 20 40 60 80 100
Pla
stic
ity
In
dex
Liquid Limit
Plasticity ChartA Line
0
10
20
30
40
50
60
70
0 10 20 30 40 50 60 70
Pla
stic
ity
In
dex
Clay Percentage
Potential Expansiveness
Low M ediu m
High
Very High
Compiled by: M.Steyn Approved By: J.Steyn Page 4 of 5
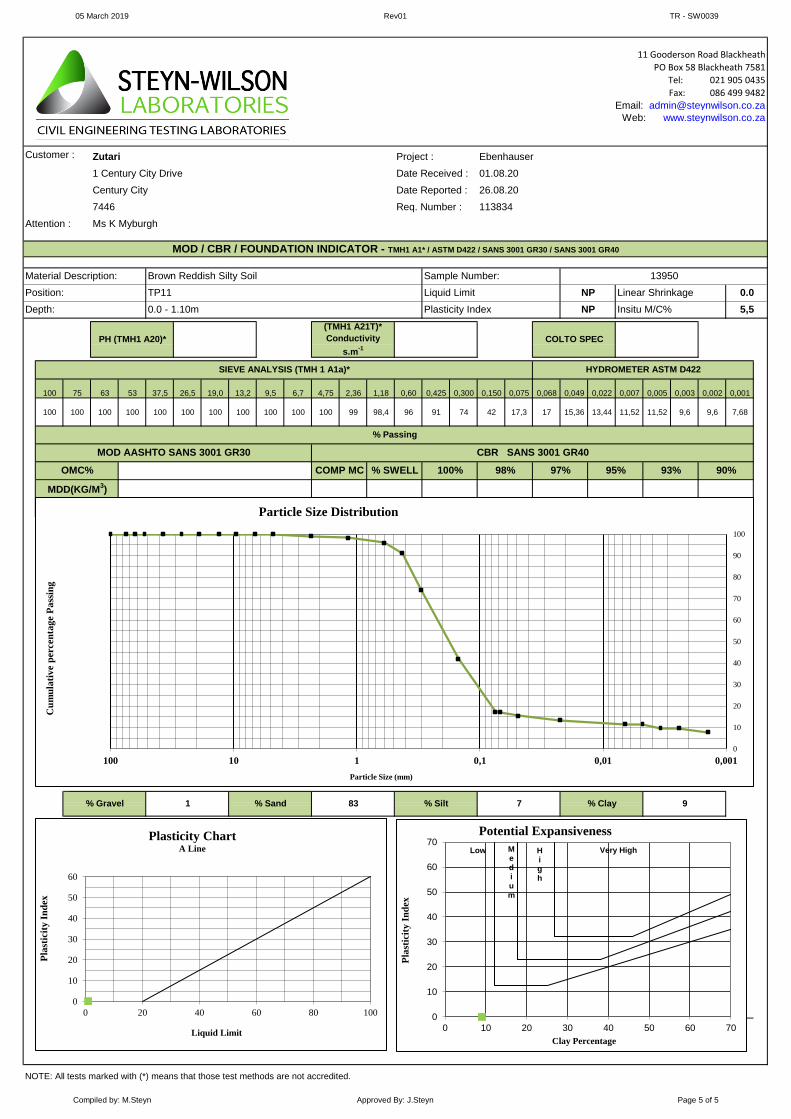
05 March 2019 Rev01 TR - SW0039
11 Gooderson Road Blackheath
PO Box 58 Blackheath 7581
Tel: 021 905 0435
Fax: 086 499 9482
Email: [email protected]
Web: www.steynwilson.co.za
Customer : Zutari Project :
1 Century City Drive Date Received :
Century City Date Reported :
7446 Req. Number :
Attention : Ms K Myburgh
100 75 63 53 37,5 26,5 19,0 13,2 9,5 6,7 4,75 2,36 1,18 0,60 0,425 0,300 0,150 0,075 0,068 0,049 0,022 0,007 0,005 0,003 0,002 0,001
100 100 100 100 100 100 100 100 100 100 100 99 98,4 96 91 74 42 17,3 17 15,36 13,44 11,52 11,52 9,6 9,6 7,68
NOTE: All tests marked with (*) means that those test methods are not accredited.
0 0 0 0
97% 95% 93% 90%
MDD(KG/M3) 0 0 0,0 0 0
OMC% 0,0 COMP MC % SWELL 100% 98%
% Sand 83 % Silt 7 % Clay 9% Gravel 1
SIEVE ANALYSIS (TMH 1 A1a)* HYDROMETER ASTM D422
% Passing
% Passing
MOD AASHTO SANS 3001 GR30 CBR SANS 3001 GR40
PH (TMH1 A20)* 0
(TMH1 A21T)*
Conductivity
s.m-1
0 COLTO SPEC 0
Depth: 0.0 - 1.10m Plasticity Index NP Insitu M/C% 5,5
Material Description: Brown Reddish Silty Soil Sample Number: 13950
Position: TP11 Liquid Limit NP Linear Shrinkage 0.0
Ebenhauser
01.08.20
26.08.20
113834
MOD / CBR / FOUNDATION INDICATOR - TMH1 A1* / ASTM D422 / SANS 3001 GR30 / SANS 3001 GR40
0
10
20
30
40
50
60
70
80
90
100
0,0010,010,1110100
Cu
mu
lati
ve
per
cen
tag
e P
ass
ing
Particle Size (mm)
Particle Size Distribution
0
10
20
30
40
50
60
0 20 40 60 80 100
Pla
stic
ity
In
dex
Liquid Limit
Plasticity ChartA Line
0
10
20
30
40
50
60
70
0 10 20 30 40 50 60 70
Pla
stic
ity
In
dex
Clay Percentage
Potential Expansiveness
Low M ediu m
High
Very High
Compiled by: M.Steyn Approved By: J.Steyn Page 5 of 5
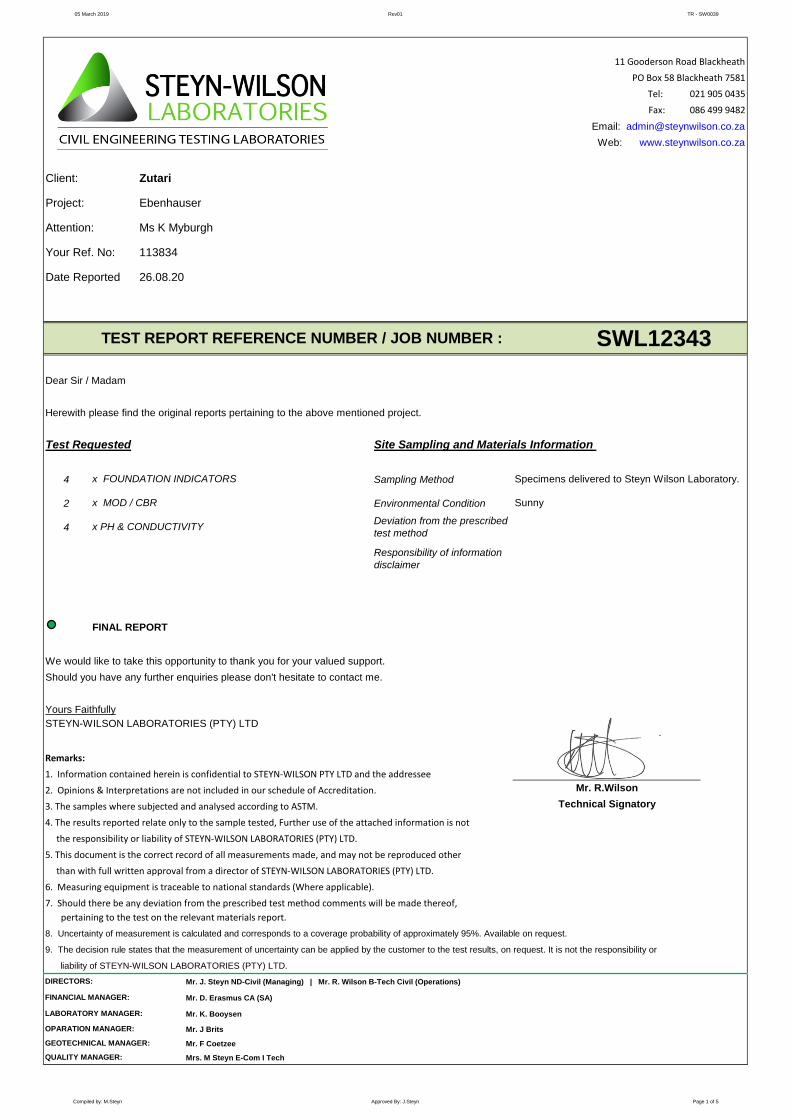
05 March 2019 Rev01 TR - SW0039
11 Gooderson Road Blackheath
PO Box 58 Blackheath 7581
Tel: 021 905 0435
Fax: 086 499 9482
Email: [email protected]
Web: www.steynwilson.co.za
Dear Sir / Madam
Herewith please find the original reports pertaining to the above mentioned project.
Test Requested Site Sampling and Materials Information
4 Sampling Method
2 Environmental Condition
4
FINAL REPORT
We would like to take this opportunity to thank you for your valued support.
Should you have any further enquiries please don't hesitate to contact me.
1. Information contained herein is confidential to STEYN-WILSON PTY LTD and the addressee
2. Opinions & Interpretations are not included in our schedule of Accreditation.
3. The samples where subjected and analysed according to ASTM.
4. The results reported relate only to the sample tested, Further use of the attached information is not
the responsibility or liability of STEYN-WILSON LABORATORIES (PTY) LTD.
5. This document is the correct record of all measurements made, and may not be reproduced other
than with full written approval from a director of STEYN-WILSON LABORATORIES (PTY) LTD.
6. Measuring equipment is traceable to national standards (Where applicable).
7. Should there be any deviation from the prescribed test method comments will be made thereof,
pertaining to the test on the relevant materials report.
8. Uncertainty of measurement is calculated and corresponds to a coverage probability of approximately 95%. Available on request.
9. The decision rule states that the measurement of uncertainty can be applied by the customer to the test results, on request. It is not the responsibility or
liability of STEYN-WILSON LABORATORIES (PTY) LTD.
Mr. J. Steyn ND-Civil (Managing) | Mr. R. Wilson B-Tech Civil (Operations)
Mr. D. Erasmus CA (SA)
Mr. K. Booysen
Mr. J Brits
Mr. F Coetzee
Mrs. M Steyn E-Com I Tech
Yours Faithfully
Ebenhauser
Ms K Myburgh
113834
26.08.20Date Reported
Specimens delivered to Steyn Wilson Laboratory.
Attention:
FINANCIAL MANAGER:
Zutari
Remarks:
Mr. R.Wilson
Technical Signatory
STEYN-WILSON LABORATORIES (PTY) LTD
x FOUNDATION INDICATORS
x MOD / CBR
x PH & CONDUCTIVITY
Client:
Project:
Your Ref. No:
SWL12343TEST REPORT REFERENCE NUMBER / JOB NUMBER :
LABORATORY MANAGER:
OPARATION MANAGER:
GEOTECHNICAL MANAGER:
QUALITY MANAGER:
Sunny
Deviation from the prescribed
test method0
Responsibility of information
disclaimer0
DIRECTORS:
Compiled by: M.Steyn Approved By: J.Steyn Page 1 of 5

05 March 2019 Rev01 TR - SW0039
11 Gooderson Road Blackheath
PO Box 58 Blackheath 7581
Tel: 021 905 0435
Fax: 086 499 9482
Email: [email protected]
Web: www.steynwilson.co.za
Customer : Zutari Project :
1 Century City Drive Date Received :
Century City Date Reported :
7446 Req. Number :
Attention : Ms K Myburgh
100 75 63 53 37,5 26,5 19,0 13,2 9,5 6,7 4,75 2,36 1,18 0,60 0,425 0,300 0,150 0,075 0,074 0,052 0,023 0,007 0,005 0,003 0,002 0,001
100 100 100 100 100 100 100 100 100 100 100 100 99,4 98 95 73 22 10,9 10 8 7 4 3 3 2 2
NOTE: All tests marked with (*) means that those test methods are not accredited.
HYDROMETER ASTM D422
Ebenhauser
01.08.20
26.08.20
113834
0pH
(TMH1 A20)*7,8 COLTO SPEC
Dark Brown Silty Soil
Liquid Limit NP
NP
TP11
1.10 - 1.40m
Sample Number: 13981
Position:
SIEVE ANALYSIS (TMH 1 A1a)*
Conductivity s.m-¹
(TMH1 A21T)* 0,065
Depth: Plasticity Index
% Clay 2
MOD / CBR / FOUNDATION INDICATOR - TMH1 A1* / ASTM D422 / SANS 3001 GR30 / SANS 3001 GR40
% Passing
Material Description:
% Gravel 0 % Sand
0.0
5,4
Linear Shrinkage
Insitu M/C%
91 % Silt
OMC%
MDD(KG/M3)
93%95%97%
0 0
7
COMP MC 90%98%100%% SWELL
CBR SANS 3001 GR40MOD AASHTO SANS 3001 GR30
0 0,00 0 0 0 0
0,0
0
0
10
20
30
40
50
60
70
80
90
100
0,0010,010,1110100
Cu
mu
lati
ve
per
cen
tag
e P
ass
ing
Particle Size (mm)
Particle Size Distribution
0
10
20
30
40
50
60
0 20 40 60 80 100
Pla
stic
ity
In
dex
Liquid Limit
Plasticity ChartA Line
0
10
20
30
40
50
60
70
0 10 20 30 40 50 60 70
Pla
stic
ity
In
dex
Clay Percentage
Potential Expansiveness
Low M ediu m
High
Very High
Compiled by: M.Steyn Approved By: J.Steyn Page 2 of 5

05 March 2019 Rev01 TR - SW0039
11 Gooderson Road Blackheath
PO Box 58 Blackheath 7581
Tel: 021 905 0435
Fax: 086 499 9482
Email: [email protected]
Web: www.steynwilson.co.za
Customer : Zutari Project :
1 Century City Drive Date Received :
Century City Date Reported :
7446 Req. Number :
Attention : Ms K Myburgh
100 75 63 53 37,5 26,5 19,0 13,2 9,5 6,7 4,75 2,36 1,18 0,60 0,425 0,300 0,150 0,075 0,074 0,052 0,023 0,007 0,005 0,003 0,002 0,001
100 100 100 100 100 100 100 100 100 100 100 100 99,5 99 91 60 14 2,2 2 2 2 2 1 1 1 1
NOTE: All tests marked with (*) means that those test methods are not accredited.
% Clay 1% Gravel 0 % Sand 98 % Silt 1
SIEVE ANALYSIS (TMH 1 A1a)* HYDROMETER ASTM D422
% Passing
MOD AASHTO SANS 3001 GR30 CBR SANS 3001 GR40
OMC%
PH (TMH1 A20)* 7,4
(TMH1 A21T)*
Conductivity
s.m-1
0,005 COLTO SPEC G8
Depth: 0.0 - 1.70m Plasticity Index NP Insitu M/C% 5,1
Material Description: Dark Brown Orange Soil Sample Number: 13948
Position: TP14 Liquid Limit NP Linear Shrinkage 0.0
Ebenhauser
01.08.20
26.08.20
113834
MOD / CBR / FOUNDATION INDICATOR - TMH1 A1* / ASTM D422 / SANS 3001 GR30 / SANS 3001 GR40
10,8 COMP MC % SWELL 100% 98%
MDD(KG/M3) 1744 10,4 0.0 17 15 13 12 10 8
97% 95% 93% 90%
0
10
20
30
40
50
60
70
80
90
100
0,0010,010,1110100
Cu
mu
lati
ve
per
cen
tag
e P
ass
ing
Particle Size (mm)
Particle Size Distribution
0
10
20
30
40
50
60
0 20 40 60 80 100
Pla
stic
ity
In
dex
Liquid Limit
Plasticity ChartA Line
0
10
20
30
40
50
60
70
0 10 20 30 40 50 60 70
Pla
stic
ity
In
dex
Clay Percentage
Potential Expansiveness
Low M ediu m
High
Very High
Compiled by: M.Steyn Approved By: J.Steyn Page 3 of 5

05 March 2019 Rev01 TR - SW0039
11 Gooderson Road Blackheath
PO Box 58 Blackheath 7581
Tel: 021 905 0435
Fax: 086 499 9482
Email: [email protected]
Web: www.steynwilson.co.za
Customer : Zutari Project :
1 Century City Drive Date Received :
Century City Date Reported :
7446 Req. Number :
Attention : Ms K Myburgh
100 75 63 53 37,5 26,5 19,0 13,2 9,5 6,7 4,75 2,36 1,18 0,60 0,425 0,300 0,150 0,075 0,074 0,052 0,023 0,007 0,005 0,003 0,002 0,001
100 100 100 100 100 100 100 100 99 99 99 98 96,9 95 92 79 29 13,9 13 12 11 10 9 8 7 6
NOTE: All tests marked with (*) means that those test methods are not accredited.
% Silt 5 % Clay 7% Gravel 2 % Sand 86
SIEVE ANALYSIS (TMH 1 A1a)* HYDROMETER ASTM D422
% Passing
% Passing
MOD AASHTO SANS 3001 GR30 CBR SANS 3001 GR40
PH (TMH1 A20)* 8,8
(TMH1 A21T)*
Conductivity
s.m-1
0,130 COLTO SPEC G9
Depth: 0.0 - 1.40m Plasticity Index NP Insitu M/C% 5,4
Material Description: Dark Brown Orange Sand Sample Number: 13949
Position: TP15 Liquid Limit NP Linear Shrinkage 0.0
Ebenhauser
01.08.20
26.08.20
113834
MOD / CBR / FOUNDATION INDICATOR - TMH1 A1* / ASTM D422 / SANS 3001 GR30 / SANS 3001 GR40
OMC% 10,4 COMP MC % SWELL 100% 98%
MDD(KG/M3) 2023 10,8 0,0 24 18 15 12 9 6
97% 95% 93% 90%
0
10
20
30
40
50
60
70
80
90
100
0,0010,010,1110100
Cu
mu
lati
ve
per
cen
tag
e P
ass
ing
Particle Size (mm)
Particle Size Distribution
0
10
20
30
40
50
60
0 20 40 60 80 100
Pla
stic
ity
In
dex
Liquid Limit
Plasticity ChartA Line
0
10
20
30
40
50
60
70
0 10 20 30 40 50 60 70
Pla
stic
ity
In
dex
Clay Percentage
Potential Expansiveness
Low M ediu m
High
Very High
Compiled by: M.Steyn Approved By: J.Steyn Page 4 of 5

05 March 2019 Rev01 TR - SW0039
11 Gooderson Road Blackheath
PO Box 58 Blackheath 7581
Tel: 021 905 0435
Fax: 086 499 9482
Email: [email protected]
Web: www.steynwilson.co.za
Customer : Zutari Project :
1 Century City Drive Date Received :
Century City Date Reported :
7446 Req. Number :
Attention : Ms K Myburgh
100 75 63 53 37,5 26,5 19,0 13,2 9,5 6,7 4,75 2,36 1,18 0,60 0,425 0,300 0,150 0,075 0,074 0,052 0,023 0,007 0,005 0,003 0,002 0,001
100 100 100 100 100 91 85 74 63 55 49 38 32,9 29 26 22 8 4 4 4 4 4 3 3 3 3
NOTE: All tests marked with (*) means that those test methods are not accredited.
Ebenhauser
01.08.20
26.08.20
113834
MOD / CBR / FOUNDATION INDICATOR - TMH1 A1* / ASTM D422 / SANS 3001 GR30 / SANS 3001 GR40
Material Description: Dark Brown Orange Soil with Pebbles Sample Number: 13952
Position: TP16 Liquid Limit NP Linear Shrinkage 0.0
Depth: 0.3 - 0.5m Plasticity Index NP Insitu M/C% 1,7
PH (TMH1 A20)* 5,6
(TMH1 A21T)*
Conductivity
s.m-1
0,190 COLTO SPEC 0
SIEVE ANALYSIS (TMH 1 A1a)* HYDROMETER ASTM D422
% Passing
% Passing
MOD AASHTO SANS 3001 GR30 CBR SANS 3001 GR40
% Gravel 64 % Sand 32 % Silt 1 % Clay 3
OMC% 0,0 COMP MC % SWELL 100% 98%
MDD(KG/M3) 0 0 0,0 0 0 0 0 0 0
97% 95% 93% 90%
0
10
20
30
40
50
60
70
80
90
100
0,0010,010,1110100
Cu
mu
lati
ve
per
cen
tag
e P
ass
ing
Particle Size (mm)
Particle Size Distribution
0
10
20
30
40
50
60
0 20 40 60 80 100
Pla
stic
ity
In
dex
Liquid Limit
Plasticity ChartA Line
0
10
20
30
40
50
60
70
0 10 20 30 40 50 60 70
Pla
stic
ity
In
dex
Clay Percentage
Potential Expansiveness
Low M ediu m
High
Very High
Compiled by: M.Steyn Approved By: J.Steyn Page 5 of 5

05 March 2019 Rev01 TR - SW0039
11 Gooderson Road Blackheath
PO Box 58 Blackheath 7581
Tel: 021 905 0435
Fax: 086 499 9482
Email: [email protected]
Web: www.steynwilson.co.za
Dear Sir / Madam
Herewith please find the original reports pertaining to the above mentioned project.
Test Requested Site Sampling and Materials Information
4 Sampling Method
2 Environmental Condition
2
FINAL REPORT
We would like to take this opportunity to thank you for your valued support.
Should you have any further enquiries please don't hesitate to contact me.
1. Information contained herein is confidential to STEYN-WILSON PTY LTD and the addressee
2. Opinions & Interpretations are not included in our schedule of Accreditation.
3. The samples where subjected and analysed according to ASTM.
4. The results reported relate only to the sample tested, Further use of the attached information is not
the responsibility or liability of STEYN-WILSON LABORATORIES (PTY) LTD.
5. This document is the correct record of all measurements made, and may not be reproduced other
than with full written approval from a director of STEYN-WILSON LABORATORIES (PTY) LTD.
6. Measuring equipment is traceable to national standards (Where applicable).
7. Should there be any deviation from the prescribed test method comments will be made thereof,
pertaining to the test on the relevant materials report.
8. Uncertainty of measurement is calculated and corresponds to a coverage probability of approximately 95%. Available on request.
9. The decision rule states that the measurement of uncertainty can be applied by the customer to the test results, on request. It is not the responsibility or
liability of STEYN-WILSON LABORATORIES (PTY) LTD.
Mr. J. Steyn ND-Civil (Managing) | Mr. R. Wilson B-Tech Civil (Operations)
Mr. D. Erasmus CA (SA)
Mr. K. Booysen
Mr. J Brits
Mr. F Coetzee
Mrs. M Steyn E-Com I Tech
Yours Faithfully
Ebenhauser
Ms K Myburgh
113834
26.08.20Date Reported
Specimens delivered to Steyn Wilson Laboratory.
Attention:
FINANCIAL MANAGER:
Zutari
Remarks:
Mr. R.Wilson
Technical Signatory
STEYN-WILSON LABORATORIES (PTY) LTD
x FOUNDATION INDICATORS
x MOD / CBR
x PH & CONDUCTIVITY
Client:
Project:
Your Ref. No:
SWL12343TEST REPORT REFERENCE NUMBER / JOB NUMBER :
LABORATORY MANAGER:
OPARATION MANAGER:
GEOTECHNICAL MANAGER:
QUALITY MANAGER:
Sunny
Deviation from the prescribed
test method0
Responsibility of information
disclaimer0
DIRECTORS:
Compiled by: M.Steyn Approved By: J.Steyn Page 1 of 5

05 March 2019 Rev01 TR - SW0039
11 Gooderson Road Blackheath
PO Box 58 Blackheath 7581
Tel: 021 905 0435
Fax: 086 499 9482
Email: [email protected]
Web: www.steynwilson.co.za
Customer : Zutari Project :
1 Century City Drive Date Received :
Century City Date Reported :
7446 Req. Number :
Attention : Ms K Myburgh
100 75 63 53 37,5 26,5 19,0 13,2 9,5 6,7 4,75 2,36 1,18 0,60 0,425 0,300 0,150 0,075 0,074 0,052 0,023 0,007 0,005 0,003 0,002 0,001
100 100 100 100 100 100 100 100 100 100 100 100 100 99 88 55 13 1,6 1 1 1 1 1 1 1 1
NOTE: All tests marked with (*) means that those test methods are not accredited.
HYDROMETER ASTM D422
Ebenhauser
01.08.20
26.08.20
113834
0pH
(TMH1 A20)*6,9 COLTO SPEC
Dark Brown Reddish Sand
Liquid Limit NP
NP
TP17
0.0 - 1.7m
Sample Number: 13907
Position:
SIEVE ANALYSIS (TMH 1 A1a)*
Conductivity s.m-¹
(TMH1 A21T)* 0,002
Depth: Plasticity Index
% Clay 1
MOD / CBR / FOUNDATION INDICATOR - TMH1 A1* / ASTM D422 / SANS 3001 GR30 / SANS 3001 GR40
% Passing
Material Description:
% Gravel 0 % Sand
0.0
2,5
Linear Shrinkage
Insitu M/C%
99 % Silt
OMC%
MDD(KG/M3)
93%95%97%
0 0
0
COMP MC 90%98%100%% SWELL
CBR SANS 3001 GR40MOD AASHTO SANS 3001 GR30
0 0,00 0 0 0 0
0,0
0
0
10
20
30
40
50
60
70
80
90
100
0,0010,010,1110100
Cu
mu
lati
ve
per
cen
tag
e P
ass
ing
Particle Size (mm)
Particle Size Distribution
0
10
20
30
40
50
60
0 20 40 60 80 100
Pla
stic
ity
In
dex
Liquid Limit
Plasticity ChartA Line
0
10
20
30
40
50
60
70
0 10 20 30 40 50 60 70
Pla
stic
ity
In
dex
Clay Percentage
Potential Expansiveness
Low M ediu m
High
Very High
Compiled by: M.Steyn Approved By: J.Steyn Page 2 of 5
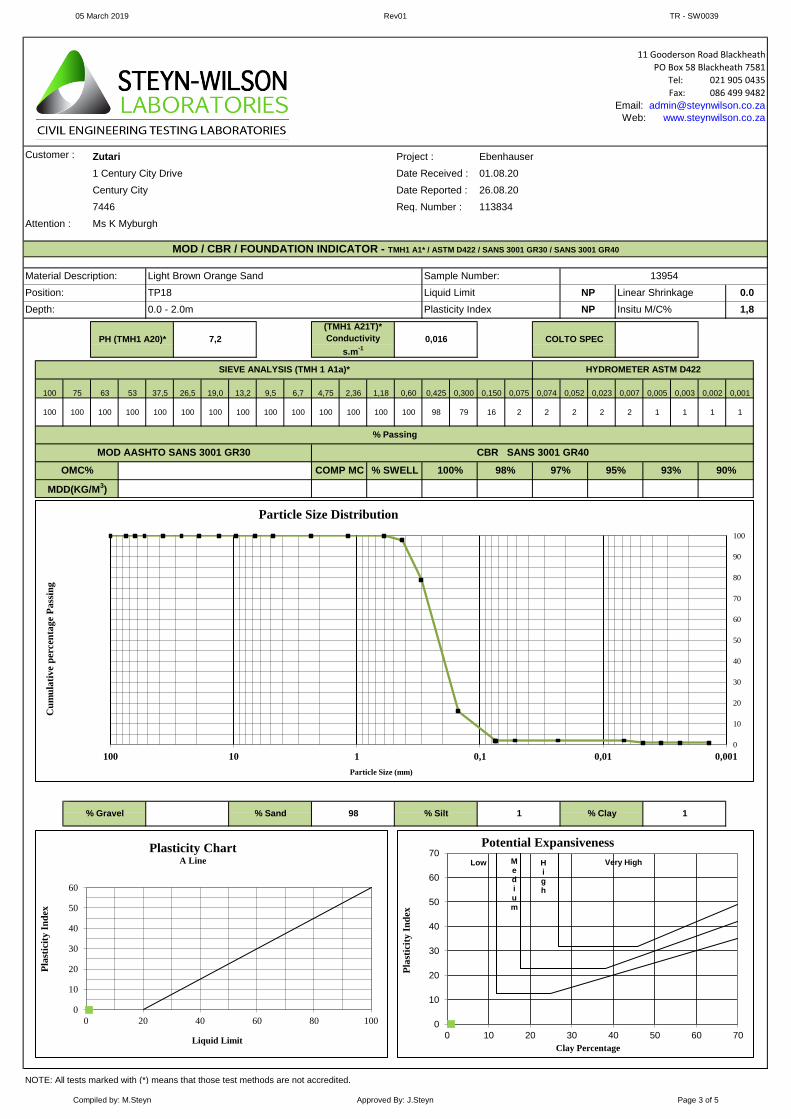
05 March 2019 Rev01 TR - SW0039
11 Gooderson Road Blackheath
PO Box 58 Blackheath 7581
Tel: 021 905 0435
Fax: 086 499 9482
Email: [email protected]
Web: www.steynwilson.co.za
Customer : Zutari Project :
1 Century City Drive Date Received :
Century City Date Reported :
7446 Req. Number :
Attention : Ms K Myburgh
100 75 63 53 37,5 26,5 19,0 13,2 9,5 6,7 4,75 2,36 1,18 0,60 0,425 0,300 0,150 0,075 0,074 0,052 0,023 0,007 0,005 0,003 0,002 0,001
100 100 100 100 100 100 100 100 100 100 100 100 100 100 98 79 16 2 2 2 2 2 1 1 1 1
NOTE: All tests marked with (*) means that those test methods are not accredited.
% Clay 1% Gravel 0 % Sand 98 % Silt 1
SIEVE ANALYSIS (TMH 1 A1a)* HYDROMETER ASTM D422
% Passing
MOD AASHTO SANS 3001 GR30 CBR SANS 3001 GR40
OMC%
PH (TMH1 A20)* 7,2
(TMH1 A21T)*
Conductivity
s.m-1
0,016 COLTO SPEC 0
Depth: 0.0 - 2.0m Plasticity Index NP Insitu M/C% 1,8
Material Description: Light Brown Orange Sand Sample Number: 13954
Position: TP18 Liquid Limit NP Linear Shrinkage 0.0
Ebenhauser
01.08.20
26.08.20
113834
MOD / CBR / FOUNDATION INDICATOR - TMH1 A1* / ASTM D422 / SANS 3001 GR30 / SANS 3001 GR40
0,0 COMP MC % SWELL 100% 98%
MDD(KG/M3) 0 0,0 0,0 0 0 0 0 0 0
97% 95% 93% 90%
0
10
20
30
40
50
60
70
80
90
100
0,0010,010,1110100
Cu
mu
lati
ve
per
cen
tag
e P
ass
ing
Particle Size (mm)
Particle Size Distribution
0
10
20
30
40
50
60
0 20 40 60 80 100
Pla
stic
ity
In
dex
Liquid Limit
Plasticity ChartA Line
0
10
20
30
40
50
60
70
0 10 20 30 40 50 60 70
Pla
stic
ity
In
dex
Clay Percentage
Potential Expansiveness
Low M ediu m
High
Very High
Compiled by: M.Steyn Approved By: J.Steyn Page 3 of 5

05 March 2019 Rev01 TR - SW0039
11 Gooderson Road Blackheath
PO Box 58 Blackheath 7581
Tel: 021 905 0435
Fax: 086 499 9482
Email: [email protected]
Web: www.steynwilson.co.za
Customer : Zutari Project :
1 Century City Drive Date Received :
Century City Date Reported :
7446 Req. Number :
Attention : Ms K Myburgh
100 75 63 53 37,5 26,5 19,0 13,2 9,5 6,7 4,75 2,36 1,18 0,60 0,425 0,300 0,150 0,075 0,074 0,052 0,023 0,007 0,005 0,003 0,002 0,001
100 100 100 100 100 100 100 100 100 100 100 100 100 99 90 45 3,3 1 1 1 1 1 1 1 1 1
NOTE: All tests marked with (*) means that those test methods are not accredited.
% Silt 0 % Clay 1% Gravel 0 % Sand 99
SIEVE ANALYSIS (TMH 1 A1a)* HYDROMETER ASTM D422
% Passing
% Passing
MOD AASHTO SANS 3001 GR30 CBR SANS 3001 GR40
PH (TMH1 A20)* 0
(TMH1 A21T)*
Conductivity
s.m-1
0,000 COLTO SPEC G9
Depth: 0.0 - 2.20m Plasticity Index NP Insitu M/C% 0,5
Material Description: Light Brown Reddish Fine Sand Sample Number: 13946
Position: TP24 ADD Liquid Limit NP Linear Shrinkage 0.0
Ebenhauser
01.08.20
26.08.20
113834
MOD / CBR / FOUNDATION INDICATOR - TMH1 A1* / ASTM D422 / SANS 3001 GR30 / SANS 3001 GR40
OMC% 10,4 COMP MC % SWELL 100% 98%
MDD(KG/M3) 1718 10,8 0,0 13 11 10 8 7 6
97% 95% 93% 90%
0
10
20
30
40
50
60
70
80
90
100
0,0010,010,1110100
Cu
mu
lati
ve
per
cen
tag
e P
ass
ing
Particle Size (mm)
Particle Size Distribution
0
10
20
30
40
50
60
0 20 40 60 80 100
Pla
stic
ity
In
dex
Liquid Limit
Plasticity ChartA Line
0
10
20
30
40
50
60
70
0 10 20 30 40 50 60 70
Pla
stic
ity
In
dex
Clay Percentage
Potential Expansiveness
Low M ediu m
High
Very High
Compiled by: M.Steyn Approved By: J.Steyn Page 4 of 5

05 March 2019 Rev01 TR - SW0039
11 Gooderson Road Blackheath
PO Box 58 Blackheath 7581
Tel: 021 905 0435
Fax: 086 499 9482
Email: [email protected]
Web: www.steynwilson.co.za
Customer : Zutari Project :
1 Century City Drive Date Received :
Century City Date Reported :
7446 Req. Number :
Attention : Ms K Myburgh
100 75 63 53 37,5 26,5 19,0 13,2 9,5 6,7 4,75 2,36 1,18 0,60 0,425 0,300 0,150 0,075 0,074 0,052 0,023 0,007 0,005 0,003 0,002 0,001
100 100 100 100 100 100 100 100 100 100 100 100 99,9 97 86 54 11 2,8 2 2 2 2 1 1 1 1
NOTE: All tests marked with (*) means that those test methods are not accredited.
Ebenhauser
01.08.20
26.08.20
113834
MOD / CBR / FOUNDATION INDICATOR - TMH1 A1* / ASTM D422 / SANS 3001 GR30 / SANS 3001 GR40
Material Description: Light Brown Reddish Sand Sample Number: 13938
Position: TP28 Liquid Limit NP Linear Shrinkage 0.0
Depth: 0.0 - 2.5m Plasticity Index NP Insitu M/C% 1,2
PH (TMH1 A20)* 0
(TMH1 A21T)*
Conductivity
s.m-1
0,000 COLTO SPEC G9
SIEVE ANALYSIS (TMH 1 A1a)* HYDROMETER ASTM D422
% Passing
% Passing
MOD AASHTO SANS 3001 GR30 CBR SANS 3001 GR40
% Gravel 0 % Sand 98 % Silt 1 % Clay 1
OMC% 10,5 COMP MC % SWELL 100% 98%
MDD(KG/M3) 1821 10,1 0,0 12 11 10 9 8 7
97% 95% 93% 90%
0
10
20
30
40
50
60
70
80
90
100
0,0010,010,1110100
Cu
mu
lati
ve
per
cen
tag
e P
ass
ing
Particle Size (mm)
Particle Size Distribution
0
10
20
30
40
50
60
0 20 40 60 80 100
Pla
stic
ity
In
dex
Liquid Limit
Plasticity ChartA Line
0
10
20
30
40
50
60
70
0 10 20 30 40 50 60 70
Pla
stic
ity
In
dex
Clay Percentage
Potential Expansiveness
Low M ediu m
High
Very High
Compiled by: M.Steyn Approved By: J.Steyn Page 5 of 5

05 March 2019 Rev01 TR - SW0039
11 Gooderson Road Blackheath
PO Box 58 Blackheath 7581
Tel: 021 905 0435
Fax: 086 499 9482
Email: [email protected]
Web: www.steynwilson.co.za
Dear Sir / Madam
Herewith please find the original reports pertaining to the above mentioned project.
Test Requested Site Sampling and Materials Information
3 Sampling Method
1 Environmental Condition
2
FINAL REPORT
We would like to take this opportunity to thank you for your valued support.
Should you have any further enquiries please don't hesitate to contact me.
1. Information contained herein is confidential to STEYN-WILSON PTY LTD and the addressee
2. Opinions & Interpretations are not included in our schedule of Accreditation.
3. The samples where subjected and analysed according to ASTM.
4. The results reported relate only to the sample tested, Further use of the attached information is not
the responsibility or liability of STEYN-WILSON LABORATORIES (PTY) LTD.
5. This document is the correct record of all measurements made, and may not be reproduced other
than with full written approval from a director of STEYN-WILSON LABORATORIES (PTY) LTD.
6. Measuring equipment is traceable to national standards (Where applicable).
7. Should there be any deviation from the prescribed test method comments will be made thereof,
pertaining to the test on the relevant materials report.
8. Uncertainty of measurement is calculated and corresponds to a coverage probability of approximately 95%. Available on request.
9. The decision rule states that the measurement of uncertainty can be applied by the customer to the test results, on request. It is not the responsibility or
liability of STEYN-WILSON LABORATORIES (PTY) LTD.
Mr. J. Steyn ND-Civil (Managing) | Mr. R. Wilson B-Tech Civil (Operations)
Mr. D. Erasmus CA (SA)
Mr. K. Booysen
Mr. J Brits
Mr. F Coetzee
Mrs. M Steyn E-Com I Tech
LABORATORY MANAGER:
OPARATION MANAGER:
GEOTECHNICAL MANAGER:
QUALITY MANAGER:
Sunny
Deviation from the prescribed
test method0
Responsibility of information
disclaimer0
DIRECTORS:
Client:
Project:
Your Ref. No:
SWL12343TEST REPORT REFERENCE NUMBER / JOB NUMBER :
FINANCIAL MANAGER:
Zutari
Remarks:
Mr. R.Wilson
Technical Signatory
STEYN-WILSON LABORATORIES (PTY) LTD
x FOUNDATION INDICATORS
x MOD / CBR
x PH & CONDUCTIVITY
Yours Faithfully
Ebenhauser
Ms K Myburgh
113834
26.08.20Date Reported
Specimens delivered to Steyn Wilson Laboratory.
Attention:
Compiled by: M.Steyn Approved By: J.Steyn Page 1 of 4

05 March 2019 Rev01 TR - SW0039
11 Gooderson Road Blackheath
PO Box 58 Blackheath 7581
Tel: 021 905 0435
Fax: 086 499 9482
Email: [email protected]
Web: www.steynwilson.co.za
Customer : Zutari Project :
1 Century City Drive Date Received :
Century City Date Reported :
7446 Req. Number :
Attention : Ms K Myburgh
100 75 63 53 37,5 26,5 19,0 13,2 9,5 6,7 4,75 2,36 1,18 0,60 0,425 0,300 0,150 0,075 0,074 0,052 0,023 0,007 0,005 0,003 0,002 0,001
100 100 100 100 100 100 100 100 99 99 99 99 98,5 98 95 75 23 7,5 7 6 5 4 3 3 2 2
NOTE: All tests marked with (*) means that those test methods are not accredited.
CBR SANS 3001 GR40MOD AASHTO SANS 3001 GR30
11,7 0,0 12 10 9 5
11,3
1650
4
COMP MC 90%98%100%% SWELLOMC%
MDD(KG/M3)
93%95%97%
8 7
% Gravel 1 % Sand
0.0
6,5
Linear Shrinkage
Insitu M/C%
93 % Silt % Clay 2
MOD / CBR / FOUNDATION INDICATOR - TMH1 A1* / ASTM D422 / SANS 3001 GR30 / SANS 3001 GR40
% Passing
Material Description:
Position:
SIEVE ANALYSIS (TMH 1 A1a)*
Conductivity s.m-¹
(TMH1 A21T)* 0
Depth: Plasticity Index
Dark Brown Orange Soil
Liquid Limit NP
NP
TP33
0.0 - 1.60m
Sample Number: 13942
HYDROMETER ASTM D422
Ebenhauser
01.08.20
26.08.20
113834
G9pH
(TMH1 A20)*0 COLTO SPEC
0
10
20
30
40
50
60
70
80
90
100
0,0010,010,1110100
Cu
mu
lati
ve
per
cen
tag
e P
ass
ing
Particle Size (mm)
Particle Size Distribution
0
10
20
30
40
50
60
0 20 40 60 80 100
Pla
stic
ity
In
dex
Liquid Limit
Plasticity ChartA Line
0
10
20
30
40
50
60
70
0 10 20 30 40 50 60 70
Pla
stic
ity
In
dex
Clay Percentage
Potential Expansiveness
Low M ediu m
High
Very High
Compiled by: M.Steyn Approved By: J.Steyn Page 2 of 4

05 March 2019 Rev01 TR - SW0039
11 Gooderson Road Blackheath
PO Box 58 Blackheath 7581
Tel: 021 905 0435
Fax: 086 499 9482
Email: [email protected]
Web: www.steynwilson.co.za
Customer : Zutari Project :
1 Century City Drive Date Received :
Century City Date Reported :
7446 Req. Number :
Attention : Ms K Myburgh
100 75 63 53 37,5 26,5 19,0 13,2 9,5 6,7 4,75 2,36 1,18 0,60 0,425 0,300 0,150 0,075 0,074 0,052 0,023 0,007 0,005 0,003 0,002 0,001
100 100 100 100 100 100 100 100 100 100 100 99 98,6 97 95 77 29 12,6 12 12 10 10 8 8 8 8
NOTE: All tests marked with (*) means that those test methods are not accredited.
0 0 0 0 0
97% 95% 93% 90%0,0 COMP MC % SWELL 100% 98%
MDD(KG/M3) 0 0,0 0,0 0
Ebenhauser
01.08.20
26.08.20
113834
MOD / CBR / FOUNDATION INDICATOR - TMH1 A1* / ASTM D422 / SANS 3001 GR30 / SANS 3001 GR40
Material Description: Light Brown Reddish Orange Silty Soil Sample Number: 13943
Position: TP33 Liquid Limit NP Linear Shrinkage 0.0
Depth: 1.3 - 1.6m Plasticity Index NP Insitu M/C% 1,8
PH (TMH1 A20)* 7,8
(TMH1 A21T)*
Conductivity
s.m-1
0,030 COLTO SPEC 0
SIEVE ANALYSIS (TMH 1 A1a)* HYDROMETER ASTM D422
% Passing
MOD AASHTO SANS 3001 GR30 CBR SANS 3001 GR40
OMC%
4 % Clay 8% Gravel 1 % Sand 87 % Silt
0
10
20
30
40
50
60
70
80
90
100
0,0010,010,1110100
Cu
mu
lati
ve
per
cen
tag
e P
ass
ing
Particle Size (mm)
Particle Size Distribution
0
10
20
30
40
50
60
0 20 40 60 80 100
Pla
stic
ity
In
dex
Liquid Limit
Plasticity ChartA Line
0
10
20
30
40
50
60
70
0 10 20 30 40 50 60 70
Pla
stic
ity
In
dex
Clay Percentage
Potential Expansiveness
Low M ediu m
High
Very High
Compiled by: M.Steyn Approved By: J.Steyn Page 3 of 4

05 March 2019 Rev01 TR - SW0039
11 Gooderson Road Blackheath
PO Box 58 Blackheath 7581
Tel: 021 905 0435
Fax: 086 499 9482
Email: [email protected]
Web: www.steynwilson.co.za
Customer : Zutari Project :
1 Century City Drive Date Received :
Century City Date Reported :
7446 Req. Number :
Attention : Ms K Myburgh
100 75 63 53 37,5 26,5 19,0 13,2 9,5 6,7 4,75 2,36 1,18 0,60 0,425 0,300 0,150 0,075 0,074 0,052 0,023 0,007 0,005 0,003 0,002 0,001
100 100 100 100 100 100 100 100 100 100 100 100 99,5 99 96 76 22 10,6 9,9 9,9 9,9 9,9 7,92 7,92 7,92 7,92
NOTE: All tests marked with (*) means that those test methods are not accredited.
0 0 0 0
97% 95% 93% 90%
MDD(KG/M3) 0 0,0 0,00 0 0
OMC% 0,0 COMP MC % SWELL 100% 98%
Ebenhauser
01.08.20
26.08.20
113834
MOD / CBR / FOUNDATION INDICATOR - TMH1 A1* / ASTM D422 / SANS 3001 GR30 / SANS 3001 GR40
Material Description: Light Brown Reddish Orange Silty Soil Sample Number: 13939
Position: TP35 Liquid Limit NP Linear Shrinkage 0.0
Depth: 1.20 - 1.50m Plasticity Index NP Insitu M/C% 6,5
PH (TMH1 A20)* 7,5
(TMH1 A21T)*
Conductivity
s.m-1
0,136 COLTO SPEC 0
SIEVE ANALYSIS (TMH 1 A1a)* HYDROMETER ASTM D422
% Passing
% Passing
MOD AASHTO SANS 3001 GR30 CBR SANS 3001 GR40
% Gravel 0 % Sand 90 % Silt 2 % Clay 8
0
10
20
30
40
50
60
70
80
90
100
0,0010,010,1110100
Cu
mu
lati
ve
per
cen
tag
e P
ass
ing
Particle Size (mm)
Particle Size Distribution
0
10
20
30
40
50
60
0 20 40 60 80 100
Pla
stic
ity
In
dex
Liquid Limit
Plasticity ChartA Line
0
10
20
30
40
50
60
70
0 10 20 30 40 50 60 70
Pla
stic
ity
In
dex
Clay Percentage
Potential Expansiveness
Low M ediu m
High
Very High
Compiled by: M.Steyn Approved By: J.Steyn Page 4 of 4

05 March 2019 Rev01 TR - SW0039
11 Gooderson Road Blackheath
PO Box 58 Blackheath 7581
Tel: 021 905 0435
Fax: 086 499 9482
Email: [email protected]
Web: www.steynwilson.co.za
Dear Sir / Madam
Herewith please find the original reports pertaining to the above mentioned project.
Test Requested Site Sampling and Materials Information
4 Sampling Method
1 Environmental Condition
2
FINAL REPORT
We would like to take this opportunity to thank you for your valued support.
Should you have any further enquiries please don't hesitate to contact me.
1. Information contained herein is confidential to STEYN-WILSON PTY LTD and the addressee
2. Opinions & Interpretations are not included in our schedule of Accreditation.
3. The samples where subjected and analysed according to ASTM.
4. The results reported relate only to the sample tested, Further use of the attached information is not
the responsibility or liability of STEYN-WILSON LABORATORIES (PTY) LTD.
5. This document is the correct record of all measurements made, and may not be reproduced other
than with full written approval from a director of STEYN-WILSON LABORATORIES (PTY) LTD.
6. Measuring equipment is traceable to national standards (Where applicable).
7. Should there be any deviation from the prescribed test method comments will be made thereof,
pertaining to the test on the relevant materials report.
8. Uncertainty of measurement is calculated and corresponds to a coverage probability of approximately 95%. Available on request.
9. The decision rule states that the measurement of uncertainty can be applied by the customer to the test results, on request. It is not the responsibility or
liability of STEYN-WILSON LABORATORIES (PTY) LTD.
Mr. J. Steyn ND-Civil (Managing) | Mr. R. Wilson B-Tech Civil (Operations)
Mr. D. Erasmus CA (SA)
Mr. K. Booysen
Mr. J Brits
Mr. F Coetzee
Mrs. M Steyn E-Com I Tech
Yours Faithfully
Ebenhauzer
Ms K Myburgh
113834
31.08.20Date Reported
Specimens delivered to Steyn Wilson Laboratory.
Attention:
FINANCIAL MANAGER:
Zutari
Remarks:
Mr. R.Wilson
Technical Signatory
STEYN-WILSON LABORATORIES (PTY) LTD
x FOUNDATION INDICATORS
x MOD / CBR
x PH & CONDUCTIVITY
Client:
Project:
Your Ref. No:
SWL12343TEST REPORT REFERENCE NUMBER / JOB NUMBER :
LABORATORY MANAGER:
OPARATION MANAGER:
GEOTECHNICAL MANAGER:
QUALITY MANAGER:
Sunny
Deviation from the prescribed
test method0
Responsibility of information
disclaimer0
DIRECTORS:
Compiled by: M.Steyn Approved By: J.Steyn Page 1 of 5
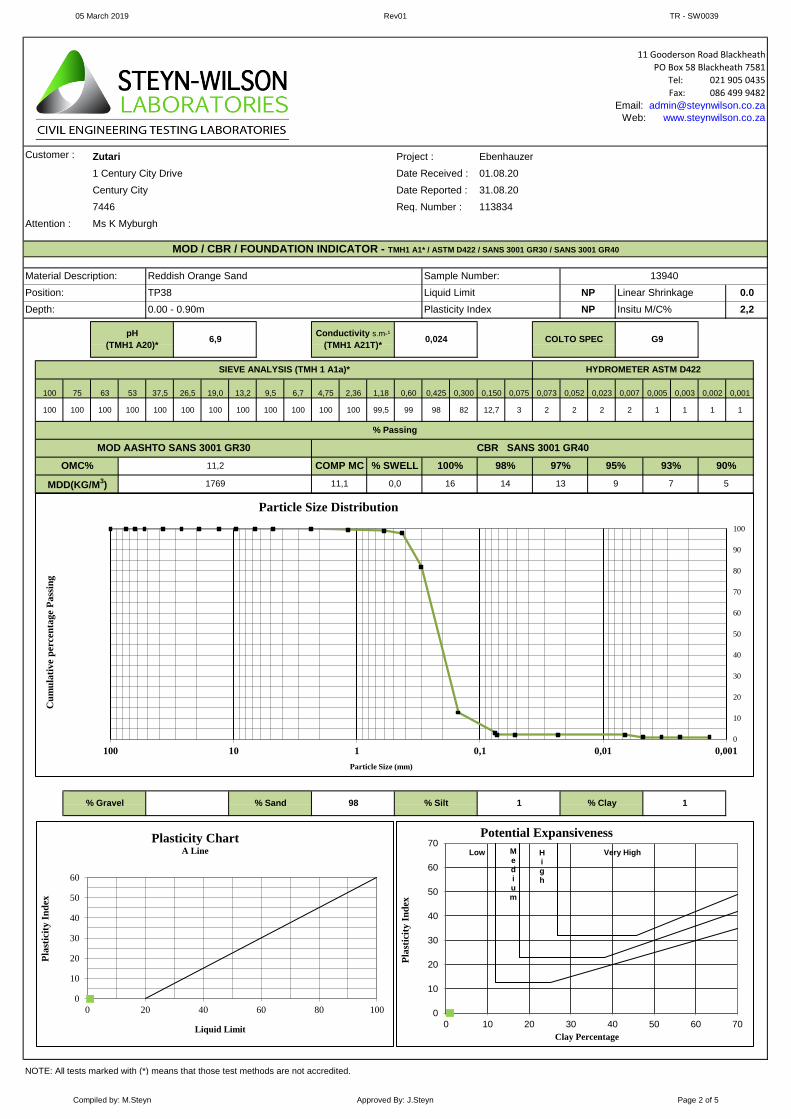
05 March 2019 Rev01 TR - SW0039
11 Gooderson Road Blackheath
PO Box 58 Blackheath 7581
Tel: 021 905 0435
Fax: 086 499 9482
Email: [email protected]
Web: www.steynwilson.co.za
Customer : Zutari Project :
1 Century City Drive Date Received :
Century City Date Reported :
7446 Req. Number :
Attention : Ms K Myburgh
100 75 63 53 37,5 26,5 19,0 13,2 9,5 6,7 4,75 2,36 1,18 0,60 0,425 0,300 0,150 0,075 0,073 0,052 0,023 0,007 0,005 0,003 0,002 0,001
100 100 100 100 100 100 100 100 100 100 100 100 99,5 99 98 82 12,7 3 2 2 2 2 1 1 1 1
NOTE: All tests marked with (*) means that those test methods are not accredited.
HYDROMETER ASTM D422
Ebenhauzer
01.08.20
31.08.20
113834
G9pH
(TMH1 A20)*6,9 COLTO SPEC
Reddish Orange Sand
Liquid Limit NP
NP
TP38
0.00 - 0.90m
Sample Number: 13940
Position:
SIEVE ANALYSIS (TMH 1 A1a)*
Conductivity s.m-¹
(TMH1 A21T)* 0,024
Depth: Plasticity Index
% Clay 1
MOD / CBR / FOUNDATION INDICATOR - TMH1 A1* / ASTM D422 / SANS 3001 GR30 / SANS 3001 GR40
% Passing
Material Description:
% Gravel 0 % Sand
0.0
2,2
Linear Shrinkage
Insitu M/C%
98 % Silt
OMC%
MDD(KG/M3)
93%95%97%
9 7
1
COMP MC 90%98%100%% SWELL
CBR SANS 3001 GR40MOD AASHTO SANS 3001 GR30
11,1 0,0 16 14 13 5
11,2
1769
0
10
20
30
40
50
60
70
80
90
100
0,0010,010,1110100
Cu
mu
lati
ve
per
cen
tag
e P
ass
ing
Particle Size (mm)
Particle Size Distribution
0
10
20
30
40
50
60
0 20 40 60 80 100
Pla
stic
ity
In
dex
Liquid Limit
Plasticity ChartA Line
0
10
20
30
40
50
60
70
0 10 20 30 40 50 60 70
Pla
stic
ity
In
dex
Clay Percentage
Potential Expansiveness
Low M ediu m
High
Very High
Compiled by: M.Steyn Approved By: J.Steyn Page 2 of 5

05 March 2019 Rev01 TR - SW0039
11 Gooderson Road Blackheath
PO Box 58 Blackheath 7581
Tel: 021 905 0435
Fax: 086 499 9482
Email: [email protected]
Web: www.steynwilson.co.za
Customer : Zutari Project :
1 Century City Drive Date Received :
Century City Date Reported :
7446 Req. Number :
Attention : Ms K Myburgh
100 75 63 53 37,5 26,5 19,0 13,2 9,5 6,7 4,75 2,36 1,18 0,60 0,425 0,300 0,150 0,075 0,073 0,052 0,023 0,007 0,005 0,003 0,002 0,001
100 100 100 100 100 100 100 100 100 100 100 100 100 99 94 71 14 3,2 3 2 2 2 1 1 1 1
NOTE: All tests marked with (*) means that those test methods are not accredited.
% Clay 1% Gravel 0 % Sand 98 % Silt 1
SIEVE ANALYSIS (TMH 1 A1a)* HYDROMETER ASTM D422
% Passing
MOD AASHTO SANS 3001 GR30 CBR SANS 3001 GR40
OMC%
PH (TMH1 A20)* 0
(TMH1 A21T)*
Conductivity
s.m-1
0 COLTO SPEC 0
Depth: 1.1 - 2.5m Plasticity Index NP Insitu M/C% 1,3
Material Description: Light Brown Reddish Sand Sample Number: 13955
Position: TP40 Liquid Limit NP Linear Shrinkage 0,0
Ebenhauzer
01.08.20
31.08.20
113834
MOD / CBR / FOUNDATION INDICATOR - TMH1 A1* / ASTM D422 / SANS 3001 GR30 / SANS 3001 GR40
COMP MC % SWELL 100% 98%
MDD(KG/M3)
97% 95% 93% 90%
0
10
20
30
40
50
60
70
80
90
100
0,0010,010,1110100
Cu
mu
lati
ve
per
cen
tag
e P
ass
ing
Particle Size (mm)
Particle Size Distribution
0
10
20
30
40
50
60
0 20 40 60 80 100
Pla
stic
ity
In
dex
Liquid Limit
Plasticity ChartA Line
0
10
20
30
40
50
60
70
0 10 20 30 40 50 60 70
Pla
stic
ity
In
dex
Clay Percentage
Potential Expansiveness
Low M ediu m
High
Very High
Compiled by: M.Steyn Approved By: J.Steyn Page 3 of 5

05 March 2019 Rev01 TR - SW0039
11 Gooderson Road Blackheath
PO Box 58 Blackheath 7581
Tel: 021 905 0435
Fax: 086 499 9482
Email: [email protected]
Web: www.steynwilson.co.za
Customer : Zutari Project :
1 Century City Drive Date Received :
Century City Date Reported :
7446 Req. Number :
Attention : Ms K Myburgh
100 75 63 53 37,5 26,5 19,0 13,2 9,5 6,7 4,75 2,36 1,18 0,60 0,425 0,300 0,150 0,075 0,073 0,052 0,023 0,007 0,005 0,003 0,002 0,001
100 100 100 100 100 100 98 98 97 96 95 95 94,4 94 92 63 14 4,3 4 3 2 2 2 1 1 1
NOTE: All tests marked with (*) means that those test methods are not accredited.
% Silt 2 % Clay 1% Gravel 5 % Sand 92
SIEVE ANALYSIS (TMH 1 A1a)* HYDROMETER ASTM D422
% Passing
% Passing
MOD AASHTO SANS 3001 GR30 CBR SANS 3001 GR40
PH (TMH1 A20)* 6,7
(TMH1 A21T)*
Conductivity
s.m-1
0,015 COLTO SPEC 0
Depth: 0.00 - 0.80m Plasticity Index NP Insitu M/C% 4,1
Material Description: Reddish Brown Orange Sand with Pebbles Sample Number: 13941
Position: TP41 Liquid Limit NP Linear Shrinkage 0,0
Ebenhauzer
01.08.20
31.08.20
113834
MOD / CBR / FOUNDATION INDICATOR - TMH1 A1* / ASTM D422 / SANS 3001 GR30 / SANS 3001 GR40
OMC% COMP MC % SWELL 100% 98%
MDD(KG/M3)
97% 95% 93% 90%
0
10
20
30
40
50
60
70
80
90
100
0,0010,010,1110100
Cu
mu
lati
ve
per
cen
tag
e P
ass
ing
Particle Size (mm)
Particle Size Distribution
0
10
20
30
40
50
60
0 20 40 60 80 100
Pla
stic
ity
In
dex
Liquid Limit
Plasticity ChartA Line
0
10
20
30
40
50
60
70
0 10 20 30 40 50 60 70
Pla
stic
ity
In
dex
Clay Percentage
Potential Expansiveness
Low M ediu m
High
Very High
Compiled by: M.Steyn Approved By: J.Steyn Page 4 of 5

05 March 2019 Rev01 TR - SW0039
11 Gooderson Road Blackheath
PO Box 58 Blackheath 7581
Tel: 021 905 0435
Fax: 086 499 9482
Email: [email protected]
Web: www.steynwilson.co.za
Customer : Zutari Project :
1 Century City Drive Date Received :
Century City Date Reported :
7446 Req. Number :
Attention : Ms K Myburgh
100 75 63 53 37,5 26,5 19,0 13,2 9,5 6,7 4,75 2,36 1,18 0,60 0,425 0,300 0,150 0,075 0,073 0,052 0,023 0,007 0,005 0,003 0,002 0,001
100 100 100 100 100 100 100 100 100 100 100 100 100 100 99 75 8,5 2 2 2 2 2 1 1 1 1
NOTE: All tests marked with (*) means that those test methods are not accredited.
Ebenhauzer
01.08.20
31.08.20
113834
MOD / CBR / FOUNDATION INDICATOR - TMH1 A1* / ASTM D422 / SANS 3001 GR30 / SANS 3001 GR40
Material Description: Light Brown Reddish Orange Soil Sample Number: 13924
Position: TP43 Liquid Limit NP Linear Shrinkage 0.0
Depth: 0.0 - 1.1m Plasticity Index NP Insitu M/C% 1,9
PH (TMH1 A20)* 0
(TMH1 A21T)*
Conductivity
s.m-1
0 COLTO SPEC 0
SIEVE ANALYSIS (TMH 1 A1a)* HYDROMETER ASTM D422
% Passing
% Passing
MOD AASHTO SANS 3001 GR30 CBR SANS 3001 GR40
% Gravel 0 % Sand 98 % Silt 1 % Clay 1
OMC% COMP MC % SWELL 100% 98%
MDD(KG/M3)
97% 95% 93% 90%
0
10
20
30
40
50
60
70
80
90
100
0,0010,010,1110100
Cu
mu
lati
ve
per
cen
tag
e P
ass
ing
Particle Size (mm)
Particle Size Distribution
0
10
20
30
40
50
60
0 20 40 60 80 100
Pla
stic
ity
In
dex
Liquid Limit
Plasticity ChartA Line
0
10
20
30
40
50
60
70
0 10 20 30 40 50 60 70
Pla
stic
ity
In
dex
Clay Percentage
Potential Expansiveness
Low M ediu m
High
Very High
Compiled by: M.Steyn Approved By: J.Steyn Page 5 of 5

05 March 2019 Rev01 TR - SW0039
11 Gooderson Road Blackheath
PO Box 58 Blackheath 7581
Tel: 021 905 0435
Fax: 086 499 9482
Email: [email protected]
Web: www.steynwilson.co.za
Dear Sir / Madam
Herewith please find the original reports pertaining to the above mentioned project.
Test Requested Site Sampling and Materials Information
4 Sampling Method
2 Environmental Condition
3
FINAL REPORT
We would like to take this opportunity to thank you for your valued support.
Should you have any further enquiries please don't hesitate to contact me.
1. Information contained herein is confidential to STEYN-WILSON PTY LTD and the addressee
2. Opinions & Interpretations are not included in our schedule of Accreditation.
3. The samples where subjected and analysed according to ASTM.
4. The results reported relate only to the sample tested, Further use of the attached information is not
the responsibility or liability of STEYN-WILSON LABORATORIES (PTY) LTD.
5. This document is the correct record of all measurements made, and may not be reproduced other
than with full written approval from a director of STEYN-WILSON LABORATORIES (PTY) LTD.
6. Measuring equipment is traceable to national standards (Where applicable).
7. Should there be any deviation from the prescribed test method comments will be made thereof,
pertaining to the test on the relevant materials report.
8. Uncertainty of measurement is calculated and corresponds to a coverage probability of approximately 95%. Available on request.
9. The decision rule states that the measurement of uncertainty can be applied by the customer to the test results, on request. It is not the responsibility or
liability of STEYN-WILSON LABORATORIES (PTY) LTD.
Mr. J. Steyn ND-Civil (Managing) | Mr. R. Wilson B-Tech Civil (Operations)
Mr. D. Erasmus CA (SA)
Mr. K. Booysen
Mr. J Brits
Mr. F Coetzee
Mrs. M Steyn E-Com I Tech
LABORATORY MANAGER:
OPARATION MANAGER:
GEOTECHNICAL MANAGER:
QUALITY MANAGER:
Sunny
Deviation from the prescribed
test method0
Responsibility of information
disclaimer0
DIRECTORS:
Client:
Project:
Your Ref. No:
SWL12343TEST REPORT REFERENCE NUMBER / JOB NUMBER :
FINANCIAL MANAGER:
Zutari
Remarks:
Mr. R.Wilson
Technical Signatory
STEYN-WILSON LABORATORIES (PTY) LTD
x FOUNDATION INDICATORS
x MOD / CBR
x PH & CONDUCTIVITY
Yours Faithfully
Ebenhauser
Ms K Myburgh
113834
31.08.20Date Reported
Specimens delivered to Steyn Wilson Laboratory.
Attention:
Compiled by: M.Steyn Approved By: J.Steyn Page 1 of 5

05 March 2019 Rev01 TR - SW0039
11 Gooderson Road Blackheath
PO Box 58 Blackheath 7581
Tel: 021 905 0435
Fax: 086 499 9482
Email: [email protected]
Web: www.steynwilson.co.za
Customer : Zutari Project :
1 Century City Drive Date Received :
Century City Date Reported :
7446 Req. Number :
Attention : Ms K Myburgh
100 75 63 53 37,5 26,5 19,0 13,2 9,5 6,7 4,75 2,36 1,18 0,60 0,425 0,300 0,150 0,075 0,074 0,053 0,024 0,007 0,005 0,003 0,002 0,001
100 100 100 100 100 100 100 100 97 92 87 74 65,4 54 50 43 26 16 15,66 13,92 12,18 8,7 6,96 6,96 5,22 5,22
NOTE: All tests marked with (*) means that those test methods are not accredited.
CBR SANS 3001 GR40MOD AASHTO SANS 3001 GR30
10 0,0 27 22 20 12
9,6
1912
10
COMP MC 90%98%100%% SWELLOMC%
MDD(KG/M3)
93%95%97%
17 15
% Gravel 29 % Sand
1.2
8
Linear Shrinkage
Insitu M/C%
56 % Silt % Clay 5
MOD / CBR / FOUNDATION INDICATOR - TMH1 A1* / ASTM D422 / SANS 3001 GR30 / SANS 3001 GR40
% Passing
Material Description:
Position:
SIEVE ANALYSIS (TMH 1 A1a)*
Conductivity s.m-¹
(TMH1 A21T)* 0
Depth: Plasticity Index
Light Brown Olive Silty Soil with Calcrete
Liquid Limit SP
SP
TP45
0.5 - 1.1m
Sample Number: 13925
HYDROMETER ASTM D422
Ebenhauser
01.08.20
31.08.20
113834
G7pH
(TMH1 A20)*0 COLTO SPEC
0
10
20
30
40
50
60
70
80
90
100
0,0010,010,1110100
Cu
mu
lati
ve
per
cen
tag
e P
ass
ing
Particle Size (mm)
Particle Size Distribution
0
10
20
30
40
50
60
0 20 40 60 80 100
Pla
stic
ity
In
dex
Liquid Limit
Plasticity ChartA Line
0
10
20
30
40
50
60
70
0 10 20 30 40 50 60 70
Pla
stic
ity
In
dex
Clay Percentage
Potential Expansiveness
Low M ediu m
High
Very High
Compiled by: M.Steyn Approved By: J.Steyn Page 2 of 5

05 March 2019 Rev01 TR - SW0039
11 Gooderson Road Blackheath
PO Box 58 Blackheath 7581
Tel: 021 905 0435
Fax: 086 499 9482
Email: [email protected]
Web: www.steynwilson.co.za
Customer : Zutari Project :
1 Century City Drive Date Received :
Century City Date Reported :
7446 Req. Number :
Attention : Ms K Myburgh
100 75 63 53 37,5 26,5 19,0 13,2 9,5 6,7 4,75 2,36 1,18 0,60 0,425 0,300 0,150 0,075 0,074 0,053 0,024 0,007 0,005 0,003 0,002 0,001
100 100 100 100 100 94 92 91 91 90 89 89 88 88 86 82 14 1,9 3 3 3 2 2 2 1 1
NOTE: All tests marked with (*) means that those test methods are not accredited.
24 22 18 14 11
97% 95% 93% 90%9,5 COMP MC % SWELL 100% 98%
MDD(KG/M3) 1964 7 0,0 30
Ebenhauser
01.08.20
31.08.20
113834
MOD / CBR / FOUNDATION INDICATOR - TMH1 A1* / ASTM D422 / SANS 3001 GR30 / SANS 3001 GR40
Material Description: Dark Brown Orange Soil Sample Number: 13926
Position: TP46 Liquid Limit NP Linear Shrinkage 0,0
Depth: 0.0 - 0.6m Plasticity Index NP Insitu M/C% 4,6
PH (TMH1 A20)* 6,8
(TMH1 A21T)*
Conductivity
s.m-1
0,025 COLTO SPEC G8
SIEVE ANALYSIS (TMH 1 A1a)* HYDROMETER ASTM D422
% Passing
MOD AASHTO SANS 3001 GR30 CBR SANS 3001 GR40
OMC%
2 % Clay 1% Gravel 11 % Sand 86 % Silt
0
10
20
30
40
50
60
70
80
90
100
0,0010,010,1110100
Cu
mu
lati
ve
per
cen
tag
e P
ass
ing
Particle Size (mm)
Particle Size Distribution
0
10
20
30
40
50
60
0 20 40 60 80 100
Pla
stic
ity
In
dex
Liquid Limit
Plasticity ChartA Line
0
10
20
30
40
50
60
70
0 10 20 30 40 50 60 70
Pla
stic
ity
In
dex
Clay Percentage
Potential Expansiveness
Low M ediu m
High
Very High
Compiled by: M.Steyn Approved By: J.Steyn Page 3 of 5

05 March 2019 Rev01 TR - SW0039
11 Gooderson Road Blackheath
PO Box 58 Blackheath 7581
Tel: 021 905 0435
Fax: 086 499 9482
Email: [email protected]
Web: www.steynwilson.co.za
Customer : Zutari Project :
1 Century City Drive Date Received :
Century City Date Reported :
7446 Req. Number :
Attention : Ms K Myburgh
100 75 63 53 37,5 26,5 19,0 13,2 9,5 6,7 4,75 2,36 1,18 0,60 0,425 0,300 0,150 0,075 0,074 0,053 0,024 0,007 0,005 0,003 0,002 0,001
100 100 100 100 100 100 98 90 77 67 60 51 48,4 47 46 43 28 16 16 16 15 8 7 7 6 5
NOTE: All tests marked with (*) means that those test methods are not accredited.
97% 95% 93% 90%
MDD(KG/M3)
OMC% COMP MC % SWELL 100% 98%
Ebenhauser
01.08.20
31.08.20
113834
MOD / CBR / FOUNDATION INDICATOR - TMH1 A1* / ASTM D422 / SANS 3001 GR30 / SANS 3001 GR40
Material Description: Dark Brown Terrace Gravel Sample Number: 13927
Position: TP46 Liquid Limit 37 Linear Shrinkage 3,6
Depth: 0.6 - 0.9m Plasticity Index 7,4 Insitu M/C% 1,1
PH (TMH1 A20)* 6,5
(TMH1 A21T)*
Conductivity
s.m-1
0,183 COLTO SPEC 0
SIEVE ANALYSIS (TMH 1 A1a)* HYDROMETER ASTM D422
% Passing
% Passing
MOD AASHTO SANS 3001 GR30 CBR SANS 3001 GR40
% Gravel 50 % Sand 34 % Silt 10 % Clay 6
0
10
20
30
40
50
60
70
80
90
100
0,0010,010,1110100
Cu
mu
lati
ve
per
cen
tag
e P
ass
ing
Particle Size (mm)
Particle Size Distribution
0
10
20
30
40
50
60
0 20 40 60 80 100
Pla
stic
ity
In
dex
Liquid Limit
Plasticity ChartA Line
0
10
20
30
40
50
60
70
0 10 20 30 40 50 60 70
Pla
stic
ity
In
dex
Clay Percentage
Potential Expansiveness
Low M ediu m
High
Very High
Compiled by: M.Steyn Approved By: J.Steyn Page 4 of 5

05 March 2019 Rev01 TR - SW0039
11 Gooderson Road Blackheath
PO Box 58 Blackheath 7581
Tel: 021 905 0435
Fax: 086 499 9482
Email: [email protected]
Web: www.steynwilson.co.za
Customer : Zutari Project :
1 Century City Drive Date Received :
Century City Date Reported :
7446 Req. Number :
Attention : Ms K Myburgh
100 75 63 53 37,5 26,5 19,0 13,2 9,5 6,7 4,75 2,36 1,18 0,60 0,425 0,300 0,150 0,075 0,074 0,053 0,024 0,007 0,005 0,003 0,002 0,001
100 100 100 100 100 100 100 100 100 100 100 100 100 100 99 88 17 2 2 1 1 1 1 1 1 1
NOTE: All tests marked with (*) means that those test methods are not accredited.
97% 95% 93% 90%
MDD(KG/M3)
OMC% COMP MC % SWELL 100% 98%
% Sand 99 % Silt 0 % Clay 1% Gravel 0
SIEVE ANALYSIS (TMH 1 A1a)* HYDROMETER ASTM D422
% Passing
% Passing
MOD AASHTO SANS 3001 GR30 CBR SANS 3001 GR40
PH (TMH1 A20)* 7,6
(TMH1 A21T)*
Conductivity
s.m-1
0,007 COLTO SPEC 0
Depth: 0.0 - 2.4m Plasticity Index NP Insitu M/C% 1,4
Material Description: Light Brown Reddish Fine Sand Sample Number: 13928
Position: TP48 Liquid Limit NP Linear Shrinkage 0.0
Ebenhauser
01.08.20
31.08.20
113834
MOD / CBR / FOUNDATION INDICATOR - TMH1 A1* / ASTM D422 / SANS 3001 GR30 / SANS 3001 GR40
0
10
20
30
40
50
60
70
80
90
100
0,0010,010,1110100
Cu
mu
lati
ve
per
cen
tag
e P
ass
ing
Particle Size (mm)
Particle Size Distribution
0
10
20
30
40
50
60
0 20 40 60 80 100
Pla
stic
ity
In
dex
Liquid Limit
Plasticity ChartA Line
0
10
20
30
40
50
60
70
0 10 20 30 40 50 60 70
Pla
stic
ity
In
dex
Clay Percentage
Potential Expansiveness
Low M ediu m
High
Very High
Compiled by: M.Steyn Approved By: J.Steyn Page 5 of 5

05 March 2019 Rev01 TR - SW0039
11 Gooderson Road Blackheath
PO Box 58 Blackheath 7581
Tel: 021 905 0435
Fax: 086 499 9482
Email: [email protected]
Web: www.steynwilson.co.za
Dear Sir / Madam
Herewith please find the original reports pertaining to the above mentioned project.
Test Requested Site Sampling and Materials Information
4 Sampling Method
2 Environmental Condition
3
FINAL REPORT
We would like to take this opportunity to thank you for your valued support.
Should you have any further enquiries please don't hesitate to contact me.
1. Information contained herein is confidential to STEYN-WILSON PTY LTD and the addressee
2. Opinions & Interpretations are not included in our schedule of Accreditation.
3. The samples where subjected and analysed according to ASTM.
4. The results reported relate only to the sample tested, Further use of the attached information is not
the responsibility or liability of STEYN-WILSON LABORATORIES (PTY) LTD.
5. This document is the correct record of all measurements made, and may not be reproduced other
than with full written approval from a director of STEYN-WILSON LABORATORIES (PTY) LTD.
6. Measuring equipment is traceable to national standards (Where applicable).
7. Should there be any deviation from the prescribed test method comments will be made thereof,
pertaining to the test on the relevant materials report.
8. Uncertainty of measurement is calculated and corresponds to a coverage probability of approximately 95%. Available on request.
9. The decision rule states that the measurement of uncertainty can be applied by the customer to the test results, on request. It is not the responsibility or
liability of STEYN-WILSON LABORATORIES (PTY) LTD.
Mr. J. Steyn ND-Civil (Managing) | Mr. R. Wilson B-Tech Civil (Operations)
Mr. D. Erasmus CA (SA)
Mr. K. Booysen
Mr. J Brits
Mr. F Coetzee
Mrs. M Steyn E-Com I Tech
Yours Faithfully
Ebenhauser
Ms K Myburgh
113834
31.08.20Date Reported
Specimens delivered to Steyn Wilson Laboratory.
Attention:
FINANCIAL MANAGER:
Zutari
Remarks:
Mr. R.Wilson
Technical Signatory
STEYN-WILSON LABORATORIES (PTY) LTD
x FOUNDATION INDICATORS
x MOD / CBR
x PH & CONDUCTIVITY
Client:
Project:
Your Ref. No:
SWL12343TEST REPORT REFERENCE NUMBER / JOB NUMBER :
LABORATORY MANAGER:
OPARATION MANAGER:
GEOTECHNICAL MANAGER:
QUALITY MANAGER:
Sunny
Deviation from the prescribed
test method0
Responsibility of information
disclaimer0
DIRECTORS:
Compiled by: M.Steyn Approved By: J.Steyn Page 1 of 5

05 March 2019 Rev01 TR - SW0039
11 Gooderson Road Blackheath
PO Box 58 Blackheath 7581
Tel: 021 905 0435
Fax: 086 499 9482
Email: [email protected]
Web: www.steynwilson.co.za
Customer : Zutari Project :
1 Century City Drive Date Received :
Century City Date Reported :
7446 Req. Number :
Attention : Ms K Myburgh
100 75 63 53 37,5 26,5 19,0 13,2 9,5 6,7 4,75 2,36 1,18 0,60 0,425 0,300 0,150 0,075 0,073 0,052 0,023 0,007 0,005 0,003 0,002 0,001
100 100 100 100 100 100 100 100 100 100 100 100 99,2 89 68 44 14 4,7 4 4 4 3 3 2 1 1
NOTE: All tests marked with (*) means that those test methods are not accredited.
HYDROMETER ASTM D422
Ebenhauser
01.08.20
31.08.20
113834
0pH
(TMH1 A20)*0 COLTO SPEC
Dark Brown Reddish Sand
Liquid Limit NP
NP
TP52
0.0 - 0.6m
Sample Number: 13929
Position:
SIEVE ANALYSIS (TMH 1 A1a)*
Conductivity s.m-¹
(TMH1 A21T)* 0
Depth: Plasticity Index
% Clay 1
MOD / CBR / FOUNDATION INDICATOR - TMH1 A1* / ASTM D422 / SANS 3001 GR30 / SANS 3001 GR40
% Passing
Material Description:
% Gravel 0 % Sand
0,0
3,2
Linear Shrinkage
Insitu M/C%
96 % Silt
OMC%
MDD(KG/M3)
93%95%97%
3
COMP MC 90%98%100%% SWELL
CBR SANS 3001 GR40MOD AASHTO SANS 3001 GR30
0
10
20
30
40
50
60
70
80
90
100
0,0010,010,1110100
Cu
mu
lati
ve
per
cen
tag
e P
ass
ing
Particle Size (mm)
Particle Size Distribution
0
10
20
30
40
50
60
0 20 40 60 80 100
Pla
stic
ity
In
dex
Liquid Limit
Plasticity ChartA Line
0
10
20
30
40
50
60
70
0 10 20 30 40 50 60 70
Pla
stic
ity
In
dex
Clay Percentage
Potential Expansiveness
Low M ediu m
High
Very High
Compiled by: M.Steyn Approved By: J.Steyn Page 2 of 5

05 March 2019 Rev01 TR - SW0039
11 Gooderson Road Blackheath
PO Box 58 Blackheath 7581
Tel: 021 905 0435
Fax: 086 499 9482
Email: [email protected]
Web: www.steynwilson.co.za
Customer : Zutari Project :
1 Century City Drive Date Received :
Century City Date Reported :
7446 Req. Number :
Attention : Ms K Myburgh
100 75 63 53 37,5 26,5 19,0 13,2 9,5 6,7 4,75 2,36 1,18 0,60 0,425 0,300 0,150 0,075 0,073 0,052 0,023 0,007 0,005 0,003 0,002 0,001
100 100 100 100 100 100 100 100 100 100 100 100 99,8 93 77 53 16 4,3 4 4 4 3 3 2 2 1
NOTE: All tests marked with (*) means that those test methods are not accredited.
% Clay 2% Gravel 0 % Sand 96 % Silt 2
SIEVE ANALYSIS (TMH 1 A1a)* HYDROMETER ASTM D422
% Passing
MOD AASHTO SANS 3001 GR30 CBR SANS 3001 GR40
OMC%
PH (TMH1 A20)* 7,3
(TMH1 A21T)*
Conductivity
s.m-1
0,028 COLTO SPEC G10
Depth: 0.0 - 1.5m Plasticity Index NP Insitu M/C% 1,6
Material Description: Reddish Brown Sand Sample Number: 13930
Position: TP53 Liquid Limit NP Linear Shrinkage 0,0
Ebenhauser
01.08.20
31.08.20
113834
MOD / CBR / FOUNDATION INDICATOR - TMH1 A1* / ASTM D422 / SANS 3001 GR30 / SANS 3001 GR40
11,1 COMP MC % SWELL 100% 98%
MDD(KG/M3) 1771 11,5 0,0 13 9 8 6 5 3
97% 95% 93% 90%
0
10
20
30
40
50
60
70
80
90
100
0,0010,010,1110100
Cu
mu
lati
ve
per
cen
tag
e P
ass
ing
Particle Size (mm)
Particle Size Distribution
0
10
20
30
40
50
60
0 20 40 60 80 100
Pla
stic
ity
In
dex
Liquid Limit
Plasticity ChartA Line
0
10
20
30
40
50
60
70
0 10 20 30 40 50 60 70
Pla
stic
ity
In
dex
Clay Percentage
Potential Expansiveness
Low M ediu m
High
Very High
Compiled by: M.Steyn Approved By: J.Steyn Page 3 of 5

05 March 2019 Rev01 TR - SW0039
11 Gooderson Road Blackheath
PO Box 58 Blackheath 7581
Tel: 021 905 0435
Fax: 086 499 9482
Email: [email protected]
Web: www.steynwilson.co.za
Customer : Zutari Project :
1 Century City Drive Date Received :
Century City Date Reported :
7446 Req. Number :
Attention : Ms K Myburgh
100 75 63 53 37,5 26,5 19,0 13,2 9,5 6,7 4,75 2,36 1,18 0,60 0,425 0,300 0,150 0,075 0,073 0,052 0,023 0,007 0,005 0,003 0,002 0,001
100 100 100 100 100 100 100 97 96 95 94 92 90 87 80 63 28 14,1 14 12 10 8 8 6 4 2
NOTE: All tests marked with (*) means that those test methods are not accredited.
% Silt 10 % Clay 3% Gravel 9 % Sand 78
SIEVE ANALYSIS (TMH 1 A1a)* HYDROMETER ASTM D422
% Passing
% Passing
MOD AASHTO SANS 3001 GR30 CBR SANS 3001 GR40
PH (TMH1 A20)* 8,8
(TMH1 A21T)*
Conductivity
s.m-1
0,407 COLTO SPEC G8
Depth: 0.5 - 1.9m Plasticity Index NP Insitu M/C% 6,3
Material Description: Reddish Olive Soil with Calcrete Sample Number: 13931
Position: TP57 Liquid Limit NP Linear Shrinkage 0,0
Ebenhauser
01.08.20
31.08.20
113834
MOD / CBR / FOUNDATION INDICATOR - TMH1 A1* / ASTM D422 / SANS 3001 GR30 / SANS 3001 GR40
OMC% 9,6 COMP MC % SWELL 100% 98%
MDD(KG/M3) 2014 9,2 0,0 27 22 20 16 13 9
97% 95% 93% 90%
0
10
20
30
40
50
60
70
80
90
100
0,0010,010,1110100
Cu
mu
lati
ve
per
cen
tag
e P
ass
ing
Particle Size (mm)
Particle Size Distribution
0
10
20
30
40
50
60
0 20 40 60 80 100
Pla
stic
ity
In
dex
Liquid Limit
Plasticity ChartA Line
0
10
20
30
40
50
60
70
0 10 20 30 40 50 60 70
Pla
stic
ity
In
dex
Clay Percentage
Potential Expansiveness
Low M ediu m
High
Very High
Compiled by: M.Steyn Approved By: J.Steyn Page 4 of 5

05 March 2019 Rev01 TR - SW0039
11 Gooderson Road Blackheath
PO Box 58 Blackheath 7581
Tel: 021 905 0435
Fax: 086 499 9482
Email: [email protected]
Web: www.steynwilson.co.za
Customer : Zutari Project :
1 Century City Drive Date Received :
Century City Date Reported :
7446 Req. Number :
Attention : Ms K Myburgh
100 75 63 53 37,5 26,5 19,0 13,2 9,5 6,7 4,75 2,36 1,18 0,60 0,425 0,300 0,150 0,075 0,073 0,052 0,023 0,007 0,005 0,003 0,002 0,001
100 100 100 100 100 100 100 100 98 93 88 75 66,9 59 54 45 27 16,8 16 16 14 10 8 6 4 2
NOTE: All tests marked with (*) means that those test methods are not accredited.
Ebenhauser
01.08.20
31.08.20
113834
MOD / CBR / FOUNDATION INDICATOR - TMH1 A1* / ASTM D422 / SANS 3001 GR30 / SANS 3001 GR40
Material Description: Light Brown Olive Silty Soil with Calcrete Sample Number: 13932
Position: TP59 Liquid Limit SP Linear Shrinkage 1.2
Depth: 0.2 - 1.5m Plasticity Index SP Insitu M/C% 8,8
PH (TMH1 A20)* 8,3
(TMH1 A21T)*
Conductivity
s.m-1
0,719 COLTO SPEC 0
SIEVE ANALYSIS (TMH 1 A1a)* HYDROMETER ASTM D422
% Passing
% Passing
MOD AASHTO SANS 3001 GR30 CBR SANS 3001 GR40
% Gravel 27 % Sand 57 % Silt 13 % Clay 3
OMC% COMP MC % SWELL 100% 98%
MDD(KG/M3)
97% 95% 93% 90%
0
10
20
30
40
50
60
70
80
90
100
0,0010,010,1110100
Cu
mu
lati
ve
per
cen
tag
e P
ass
ing
Particle Size (mm)
Particle Size Distribution
0
10
20
30
40
50
60
0 20 40 60 80 100
Pla
stic
ity
In
dex
Liquid Limit
Plasticity ChartA Line
0
10
20
30
40
50
60
70
0 10 20 30 40 50 60 70
Pla
stic
ity
In
dex
Clay Percentage
Potential Expansiveness
Low M ediu m
High
Very High
Compiled by: M.Steyn Approved By: J.Steyn Page 5 of 5

05 March 2019 Rev01 TR - SW0039
11 Gooderson Road Blackheath
PO Box 58 Blackheath 7581
Tel: 021 905 0435
Fax: 086 499 9482
Email: [email protected]
Web: www.steynwilson.co.za
Dear Sir / Madam
Herewith please find the original reports pertaining to the above mentioned project.
Test Requested Site Sampling and Materials Information
4 Sampling Method
1 Environmental Condition
1
FINAL REPORT
We would like to take this opportunity to thank you for your valued support.
Should you have any further enquiries please don't hesitate to contact me.
1. Information contained herein is confidential to STEYN-WILSON PTY LTD and the addressee
2. Opinions & Interpretations are not included in our schedule of Accreditation.
3. The samples where subjected and analysed according to ASTM.
4. The results reported relate only to the sample tested, Further use of the attached information is not
the responsibility or liability of STEYN-WILSON LABORATORIES (PTY) LTD.
5. This document is the correct record of all measurements made, and may not be reproduced other
than with full written approval from a director of STEYN-WILSON LABORATORIES (PTY) LTD.
6. Measuring equipment is traceable to national standards (Where applicable).
7. Should there be any deviation from the prescribed test method comments will be made thereof,
pertaining to the test on the relevant materials report.
8. Uncertainty of measurement is calculated and corresponds to a coverage probability of approximately 95%. Available on request.
9. The decision rule states that the measurement of uncertainty can be applied by the customer to the test results, on request. It is not the responsibility or
liability of STEYN-WILSON LABORATORIES (PTY) LTD.
Mr. J. Steyn ND-Civil (Managing) | Mr. R. Wilson B-Tech Civil (Operations)
Mr. D. Erasmus CA (SA)
Mr. K. Booysen
Mr. J Brits
Mr. F Coetzee
Mrs. M Steyn E-Com I Tech
Yours Faithfully
Ebenhauser
Ms K Myburgh
113834
31.08.20Date Reported
Specimens delivered to Steyn Wilson Laboratory.
Attention:
FINANCIAL MANAGER:
Zutari
Remarks:
Mr. R.Wilson
Technical Signatory
STEYN-WILSON LABORATORIES (PTY) LTD
x FOUNDATION INDICATORS
x MOD / CBR
x PH & CONDUCTIVITY
Client:
Project:
Your Ref. No:
SWL12343TEST REPORT REFERENCE NUMBER / JOB NUMBER :
LABORATORY MANAGER:
OPARATION MANAGER:
GEOTECHNICAL MANAGER:
QUALITY MANAGER:
Sunny
Deviation from the prescribed
test method0
Responsibility of information
disclaimer0
DIRECTORS:
Compiled by: M.Steyn Approved By: J.Steyn Page 1 of 5

05 March 2019 Rev01 TR - SW0039
11 Gooderson Road Blackheath
PO Box 58 Blackheath 7581
Tel: 021 905 0435
Fax: 086 499 9482
Email: [email protected]
Web: www.steynwilson.co.za
Customer : Zutari Project :
1 Century City Drive Date Received :
Century City Date Reported :
7446 Req. Number :
Attention : Ms K Myburgh
100 75 63 53 37,5 26,5 19,0 13,2 9,5 6,7 4,75 2,36 1,18 0,60 0,425 0,300 0,150 0,075 0,074 0,053 0,024 0,007 0,005 0,004 0,003 0,001
100 100 100 100 100 98 94 90 83 77 73 66 62,1 58 52 46 32 17,5 17,52 13,14 10,22 7,3 5,84 5,84 4,38 2,92
NOTE: All tests marked with (*) means that those test methods are not accredited.
HYDROMETER ASTM D422
Ebenhauser
01.08.20
31.08.20
113834
G8pH
(TMH1 A20)*0 COLTO SPEC
Light Reddish Olive Silty Soil with Calcrete
Liquid Limit NP
NP
TP61
0.5 - 2.1m
Sample Number: 13933
Position:
SIEVE ANALYSIS (TMH 1 A1a)*
Conductivity s.m-¹
(TMH1 A21T)* 0
Depth: Plasticity Index
% Clay 4
MOD / CBR / FOUNDATION INDICATOR - TMH1 A1* / ASTM D422 / SANS 3001 GR30 / SANS 3001 GR40
% Passing
Material Description:
% Gravel 35 % Sand
0,0
7,4
Linear Shrinkage
Insitu M/C%
50 % Silt
OMC%
MDD(KG/M3)
93%95%97%
17 12
11
COMP MC 90%98%100%% SWELL
CBR SANS 3001 GR40MOD AASHTO SANS 3001 GR30
10,6 0,0 32 25 22 8
10,2
1980
0
10
20
30
40
50
60
70
80
90
100
0,0010,010,1110100
Cu
mu
lati
ve
per
cen
tag
e P
ass
ing
Particle Size (mm)
Particle Size Distribution
0
10
20
30
40
50
60
0 20 40 60 80 100
Pla
stic
ity
In
dex
Liquid Limit
Plasticity ChartA Line
0
10
20
30
40
50
60
70
0 10 20 30 40 50 60 70
Pla
stic
ity
In
dex
Clay Percentage
Potential Expansiveness
Low M ediu m
High
Very High
Compiled by: M.Steyn Approved By: J.Steyn Page 2 of 5

05 March 2019 Rev01 TR - SW0039
11 Gooderson Road Blackheath
PO Box 58 Blackheath 7581
Tel: 021 905 0435
Fax: 086 499 9482
Email: [email protected]
Web: www.steynwilson.co.za
Customer : Zutari Project :
1 Century City Drive Date Received :
Century City Date Reported :
7446 Req. Number :
Attention : Ms K Myburgh
100 75 63 53 37,5 26,5 19,0 13,2 9,5 6,7 4,75 2,36 1,18 0,60 0,425 0,300 0,150 0,075 0,074 0,053 0,024 0,007 0,005 0,004 0,003 0,001
100 100 100 100 100 100 97 89 82 72 64 51 47,1 45 43 41 36 27,3 26,28 24,82 21,9 18,98 17,52 16,06 14,6 13,14
NOTE: All tests marked with (*) means that those test methods are not accredited.
% Clay 14% Gravel 50 % Sand 25 % Silt 11
SIEVE ANALYSIS (TMH 1 A1a)* HYDROMETER ASTM D422
% Passing
MOD AASHTO SANS 3001 GR30 CBR SANS 3001 GR40
OMC%
PH (TMH1 A20)* 5,6
(TMH1 A21T)*
Conductivity
s.m-1
0,113 COLTO SPEC 0
Depth: 0.0 - 0.6m Plasticity Index 7,9 Insitu M/C% 2,8
Material Description: Orange Brown Soil with Calcrete Sample Number: 13934
Position: TP63 Liquid Limit 23 Linear Shrinkage 3,8
Ebenhauser
01.08.20
31.08.20
113834
MOD / CBR / FOUNDATION INDICATOR - TMH1 A1* / ASTM D422 / SANS 3001 GR30 / SANS 3001 GR40
COMP MC % SWELL 100% 98%
MDD(KG/M3)
97% 95% 93% 90%
0
10
20
30
40
50
60
70
80
90
100
0,0010,010,1110100
Cu
mu
lati
ve
per
cen
tag
e P
ass
ing
Particle Size (mm)
Particle Size Distribution
0
10
20
30
40
50
60
0 20 40 60 80 100
Pla
stic
ity
In
dex
Liquid Limit
Plasticity ChartA Line
0
10
20
30
40
50
60
70
0 10 20 30 40 50 60 70
Pla
stic
ity
In
dex
Clay Percentage
Potential Expansiveness
Low M ediu m
High
Very High
Compiled by: M.Steyn Approved By: J.Steyn Page 3 of 5

05 March 2019 Rev01 TR - SW0039
11 Gooderson Road Blackheath
PO Box 58 Blackheath 7581
Tel: 021 905 0435
Fax: 086 499 9482
Email: [email protected]
Web: www.steynwilson.co.za
Customer : Zutari Project :
1 Century City Drive Date Received :
Century City Date Reported :
7446 Req. Number :
Attention : Ms K Myburgh
100 75 63 53 37,5 26,5 19,0 13,2 9,5 6,7 4,75 2,36 1,18 0,60 0,425 0,300 0,150 0,075 0,074 0,053 0,024 0,007 0,005 0,004 0,003 0,001
100 100 100 100 100 100 100 100 99 99 99 99 98,7 95 86 72 46 25 24 21 17 11 9 8 7 6
NOTE: All tests marked with (*) means that those test methods are not accredited.
% Silt 16 % Clay 6% Gravel 1 % Sand 77
SIEVE ANALYSIS (TMH 1 A1a)* HYDROMETER ASTM D422
% Passing
% Passing
MOD AASHTO SANS 3001 GR30 CBR SANS 3001 GR40
PH (TMH1 A20)* 0
(TMH1 A21T)*
Conductivity
s.m-1
0 COLTO SPEC 0
Depth: 0.0 - 0.5m Plasticity Index 11,3 Insitu M/C% 5
Material Description: Dark Reddish Brown Fine Sand Sample Number: 13935
Position: TP66 Liquid Limit 46 Linear Shrinkage 5,8
Ebenhauser
01.08.20
31.08.20
113834
MOD / CBR / FOUNDATION INDICATOR - TMH1 A1* / ASTM D422 / SANS 3001 GR30 / SANS 3001 GR40
OMC% COMP MC % SWELL 100% 98%
MDD(KG/M3)
97% 95% 93% 90%
0
10
20
30
40
50
60
70
80
90
100
0,0010,010,1110100
Cu
mu
lati
ve
per
cen
tag
e P
ass
ing
Particle Size (mm)
Particle Size Distribution
0
10
20
30
40
50
60
0 20 40 60 80 100
Pla
stic
ity
In
dex
Liquid Limit
Plasticity ChartA Line
0
10
20
30
40
50
60
70
0 10 20 30 40 50 60 70
Pla
stic
ity
In
dex
Clay Percentage
Potential Expansiveness
Low M ediu m
High
Very High
Compiled by: M.Steyn Approved By: J.Steyn Page 4 of 5

05 March 2019 Rev01 TR - SW0039
11 Gooderson Road Blackheath
PO Box 58 Blackheath 7581
Tel: 021 905 0435
Fax: 086 499 9482
Email: [email protected]
Web: www.steynwilson.co.za
Customer : Zutari Project :
1 Century City Drive Date Received :
Century City Date Reported :
7446 Req. Number :
Attention : Ms K Myburgh
100 75 63 53 37,5 26,5 19,0 13,2 9,5 6,7 4,75 2,36 1,18 0,60 0,425 0,300 0,150 0,075 0,074 0,053 0,024 0,007 0,005 0,004 0,003 0,001
100 100 100 100 100 100 100 98 98 97 97 96 96 93 85 69 38 18,4 18 17 16 15 14 11 9 6
NOTE: All tests marked with (*) means that those test methods are not accredited.
Ebenhauser
01.08.20
31.08.20
113834
MOD / CBR / FOUNDATION INDICATOR - TMH1 A1* / ASTM D422 / SANS 3001 GR30 / SANS 3001 GR40
Material Description: Dark Reddish Brown Fine Sand Sample Number: 13956
Position: TP72 Liquid Limit 38 Linear Shrinkage 5,3
Depth: Not specified Plasticity Index 11,7 Insitu M/C% 4,7
PH (TMH1 A20)* 0
(TMH1 A21T)*
Conductivity
s.m-1
0 COLTO SPEC 0
SIEVE ANALYSIS (TMH 1 A1a)* HYDROMETER ASTM D422
% Passing
% Passing
MOD AASHTO SANS 3001 GR30 CBR SANS 3001 GR40
% Gravel 4 % Sand 79 % Silt 10 % Clay 7
OMC% COMP MC % SWELL 100% 98%
MDD(KG/M3)
97% 95% 93% 90%
0
10
20
30
40
50
60
70
80
90
100
0,0010,010,1110100
Cu
mu
lati
ve
per
cen
tag
e P
ass
ing
Particle Size (mm)
Particle Size Distribution
0
10
20
30
40
50
60
0 20 40 60 80 100
Pla
stic
ity
In
dex
Liquid Limit
Plasticity ChartA Line
0
10
20
30
40
50
60
70
0 10 20 30 40 50 60 70
Pla
stic
ity
In
dex
Clay Percentage
Potential Expansiveness
Low M ediu m
High
Very High
Compiled by: M.Steyn Approved By: J.Steyn Page 5 of 5

05 March 2019 Rev01 TR - SW0039
11 Gooderson Road Blackheath
PO Box 58 Blackheath 7581
Tel: 021 905 0435
Fax: 086 499 9482
Email: [email protected]
Web: www.steynwilson.co.za
Dear Sir / Madam
Herewith please find the original reports pertaining to the above mentioned project.
Test Requested Site Sampling and Materials Information
2 Sampling Method
2 Environmental Condition
FINAL REPORT
We would like to take this opportunity to thank you for your valued support.
Should you have any further enquiries please don't hesitate to contact me.
1. Information contained herein is confidential to STEYN-WILSON PTY LTD and the addressee
2. Opinions & Interpretations are not included in our schedule of Accreditation.
3. The samples where subjected and analysed according to ASTM.
4. The results reported relate only to the sample tested, Further use of the attached information is not
the responsibility or liability of STEYN-WILSON LABORATORIES (PTY) LTD.
5. This document is the correct record of all measurements made, and may not be reproduced other
than with full written approval from a director of STEYN-WILSON LABORATORIES (PTY) LTD.
6. Measuring equipment is traceable to national standards (Where applicable).
7. Should there be any deviation from the prescribed test method comments will be made thereof,
pertaining to the test on the relevant materials report.
8. Uncertainty of measurement is calculated and corresponds to a coverage probability of approximately 95%. Available on request.
9. The decision rule states that the measurement of uncertainty can be applied by the customer to the test results, on request. It is not the responsibility or
liability of STEYN-WILSON LABORATORIES (PTY) LTD.
Mr. J. Steyn ND-Civil (Managing) | Mr. R. Wilson B-Tech Civil (Operations)
Mr. D. Erasmus CA (SA)
Mr. K. Booysen
Mr. J Brits
Mr. F Coetzee
Mrs. M Steyn E-Com I Tech
Yours Faithfully
Ebenhauser
Ms K Myburgh
113834
31.08.20Date Reported
Specimens delivered to Steyn Wilson Laboratory.
Attention:
FINANCIAL MANAGER:
Zutari
Remarks:
Mr. R.Wilson
Technical Signatory
STEYN-WILSON LABORATORIES (PTY) LTD
x FOUNDATION INDICATORS
x PH & CONDUCTIVITY
Client:
Project:
Your Ref. No:
SWL12343TEST REPORT REFERENCE NUMBER / JOB NUMBER :
LABORATORY MANAGER:
OPARATION MANAGER:
GEOTECHNICAL MANAGER:
QUALITY MANAGER:
Sunny
Deviation from the prescribed
test method0
Responsibility of information
disclaimer0
DIRECTORS:
Compiled by: M.Steyn Approved By: J.Steyn Page 1 of 3

05 March 2019 Rev01 TR - SW0039
11 Gooderson Road Blackheath
PO Box 58 Blackheath 7581
Tel: 021 905 0435
Fax: 086 499 9482
Email: [email protected]
Web: www.steynwilson.co.za
Customer : Zutari Project :
1 Century City Drive Date Received :
Century City Date Reported :
7446 Req. Number :
Attention : Ms K Myburgh
100 75 63 53 37,5 26,5 19,0 13,2 9,5 6,7 4,75 2,36 1,18 0,60 0,425 0,300 0,150 0,075 0,079 0,056 0,025 0,007 0,005 0,004 0,003 0,001
100 100 100 100 100 100 100 100 99 98 98 97 96,6 96 90 74 48 24,3 24 22 19 14 11 10 8 7
NOTE: All tests marked with (*) means that those test methods are not accredited.
HYDROMETER ASTM D422
Ebenhauser
01.08.20
31.08.20
113834
0pH
(TMH1 A20)*7,4 COLTO SPEC
Dark Reddish Brown Fine Sand
Liquid Limit 33
10,5
TP73
0.0 - 0.4m
Sample Number: 13937
Position:
SIEVE ANALYSIS (TMH 1 A1a)*
Conductivity s.m-¹
(TMH1 A21T)* 0,008
Depth: Plasticity Index
% Clay 7
MOD / CBR / FOUNDATION INDICATOR - TMH1 A1* / ASTM D422 / SANS 3001 GR30 / SANS 3001 GR40
% Passing
Material Description:
% Gravel 3 % Sand
4,9
4
Linear Shrinkage
Insitu M/C%
75 % Silt
OMC%
MDD(KG/M3)
93%95%97%
15
COMP MC 90%98%100%% SWELL
CBR SANS 3001 GR40MOD AASHTO SANS 3001 GR30
0
10
20
30
40
50
60
70
80
90
100
0,0010,010,1110100
Cu
mu
lati
ve
per
cen
tag
e P
ass
ing
Particle Size (mm)
Particle Size Distribution
0
10
20
30
40
50
60
0 20 40 60 80 100
Pla
stic
ity
In
dex
Liquid Limit
Plasticity ChartA Line
0
10
20
30
40
50
60
70
0 10 20 30 40 50 60 70
Pla
stic
ity
In
dex
Clay Percentage
Potential Expansiveness
Low M ediu m
High
Very High
Compiled by: M.Steyn Approved By: J.Steyn Page 2 of 3

05 March 2019 Rev01 TR - SW0039
11 Gooderson Road Blackheath
PO Box 58 Blackheath 7581
Tel: 021 905 0435
Fax: 086 499 9482
Email: [email protected]
Web: www.steynwilson.co.za
Customer : Zutari Project :
1 Century City Drive Date Received :
Century City Date Reported :
7446 Req. Number :
Attention : Ms K Myburgh
100 75 63 53 37,5 26,5 19,0 13,2 9,5 6,7 4,75 2,36 1,18 0,60 0,425 0,300 0,150 0,075 0,079 0,056 0,025 0,007 0,005 0,004 0,003 0,001
100 100 100 100 100 100 99 93 86 80 75 68 64,7 57 51 43 29 15 14,7 13,72 11,76 9,8 7,84 5,88 3,92 3,92
NOTE: All tests marked with (*) means that those test methods are not accredited.
% Clay 4% Gravel 33 % Sand 53 % Silt 10
SIEVE ANALYSIS (TMH 1 A1a)* HYDROMETER ASTM D422
% Passing
MOD AASHTO SANS 3001 GR30 CBR SANS 3001 GR40
OMC%
PH (TMH1 A20)* 7,2
(TMH1 A21T)*
Conductivity
s.m-1
0,146 COLTO SPEC 0
Depth: 0.3 - 0.6m Plasticity Index NP Insitu M/C% 11
Material Description: Light Reddish Olive Silty Soil with Ferricrete Sample Number: 13936
Position: TP78 Liquid Limit NP Linear Shrinkage 0,0
Ebenhauser
01.08.20
31.08.20
113834
MOD / CBR / FOUNDATION INDICATOR - TMH1 A1* / ASTM D422 / SANS 3001 GR30 / SANS 3001 GR40
COMP MC % SWELL 100% 98%
MDD(KG/M3)
97% 95% 93% 90%
0
10
20
30
40
50
60
70
80
90
100
0,0010,010,1110100
Cu
mu
lati
ve
per
cen
tag
e P
ass
ing
Particle Size (mm)
Particle Size Distribution
0
10
20
30
40
50
60
0 20 40 60 80 100
Pla
stic
ity
In
dex
Liquid Limit
Plasticity ChartA Line
0
10
20
30
40
50
60
70
0 10 20 30 40 50 60 70
Pla
stic
ity
In
dex
Clay Percentage
Potential Expansiveness
Low M ediu m
High
Very High
Compiled by: M.Steyn Approved By: J.Steyn Page 3 of 3

Test Name
Database: .\SQLEXPRESS \ Steyn Wilson Geotech
Site Reference Test Date
Jobfile Sample
Client Borehole
Operator:FC Checked: FC Approved: FC
11/05/2020 Rev2 TR/GEO-SW0007 Compiled: M. Steyn Approved: R. Wilson
Particle Density 2.60
Bulk Density
Void Ratio
Direct Shear Test
Remoulded Desity (Mg/m3)
Disturbed/Undisturbed
Sample Method
Height
Diameter
Mass
Moisture
Dry Density
Initial Sample Details
1.99
10.4
124.0
60.0
20.0(mm)
(Mg/m3)
21/09/2020
SWG00088 E TP07_0.3-3.0m
Zutari Clanwilliam Bridging Study
Test Method BS1377 - 7: 1990
0.238(mm)Verical Stain at Failure
0.012
Specimen 3123.1
12.8Moisture
Mass
12.9
123.5
Specimen 1 Specimen 2124.5
13.2(%)
Specimen 2
100
79.9
2.3
0.300
10.56
34.8
45.3
Specimen 3
150
114.9
2.9
0.482
2.2
50
Specimen 1
Cohesion (c) (kPa)
0.022
Horizontal Strain at Failure
Peak Shear Stress
Normal Stress
Rate of Shear (mm/min) 0.019
(mm)
(kPa)
(kPa)
(Mg/m3)
(Mg/m3)
(%)
(g)
(mm)
1.99 (98%)
Disturbed
Bag
Specimen 3
20.0
60.0
124.1
10.4
1.99
2.19
0.308
Specimen 1
0.309
Specimen 2
20.0
60.0
124.0
10.4
1.99
2.19
0.309
2.19
Void Ratio 0.263 0.240 0.214
Consolidation Details
0.460 0.750 0.948
Void Ratio After Consolidation 0.279 0.260 0.246
Specimen 1 Specimen 2 Specimen 3Vertical Displacement (mm)
(g)
Maximum Shear Stress Results
Final Sample Details
Friction Angle (ɸ) (°)

Test Name
Database: .\SQLEXPRESS \ Steyn Wilson Geotech
Site Reference Test Date
Jobfile Sample
Client Borehole
Operator:FC Checked: FC Approved: FC
11/05/2020 Rev1 TR/GEO-SW0007 Compiled: M. Steyn Approved: R. Wilson
Direct Shear Test
Graphs
Cohesion (c) (kPa)
SWG00088 E TP07_0.3-3.0m
Zutari Clanwilliam Bridging Study
Test Method BS1377 - 7: 1990
Friction Angle (ɸ) (°) 34.8
10.56
21/09/2020
-1
-0.5
0
0.00 2.00 4.00 6.00 8.00 10.00 12.00
Ver
tica
l Dis
pla
cem
ent
(mm
)
Sqrt Time (min)
Consolidation
Specimen 1
Specimen 2
Specimen 3
0.0
20.0
40.0
60.0
80.0
100.0
120.0
140.0
0 20 40 60 80 100 120 140 160
Shea
r St
ress
(kP
a)
Normal Load (kPa)
Shear Summary
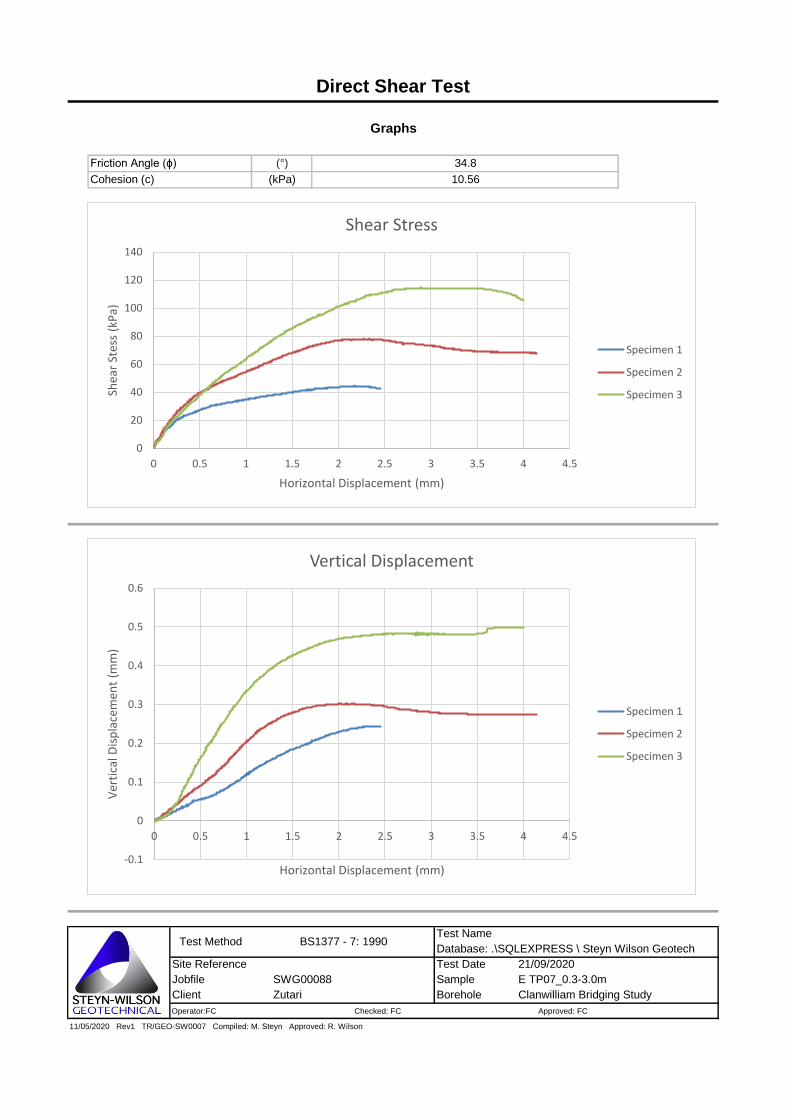
Test Name
Database: .\SQLEXPRESS \ Steyn Wilson Geotech
Site Reference Test Date
Jobfile Sample
Client Borehole
Operator:FC Checked: FC Approved: FC
11/05/2020 Rev1 TR/GEO-SW0007 Compiled: M. Steyn Approved: R. Wilson
Cohesion (c) (kPa) 10.56
Direct Shear Test
Graphs
Friction Angle (ɸ) (°) 34.8
Zutari Clanwilliam Bridging Study
Test Method BS1377 - 7: 1990
21/09/2020
SWG00088 E TP07_0.3-3.0m
0
20
40
60
80
100
120
140
0 0.5 1 1.5 2 2.5 3 3.5 4 4.5
Shea
r St
ess
(kP
a)
Horizontal Displacement (mm)
Shear Stress
Specimen 1
Specimen 2
Specimen 3
-0.1
0
0.1
0.2
0.3
0.4
0.5
0.6
0 0.5 1 1.5 2 2.5 3 3.5 4 4.5
Ver
tica
l Dis
pla
cem
ent
(mm
)
Horizontal Displacement (mm)
Vertical Displacement
Specimen 1
Specimen 2
Specimen 3

Test Name
Database: .\SQLEXPRESS \ Steyn Wilson Geotech
Site Reference Test Date
Jobfile Sample
Client Borehole
Operator:FC Checked: FC Approved: FC
11/05/2020 Rev2 TR/GEO-SW0007 Compiled: M. Steyn Approved: R. Wilson
Particle Density 2.59
Bulk Density
Void Ratio
Direct Shear Test
Remoulded Desity (Mg/m3)
Disturbed/Undisturbed
Sample Method
Height
Diameter
Mass
Moisture
Dry Density
Initial Sample Details
1.82
11.6
114.9
60.0
20.0(mm)
(Mg/m3)
05/03/2020
SWG00088 E_TP09_0.0-3.0m
Zutari Clanwilliam Bridging Study
Test Method BS1377 - 7: 1990
0.168(mm)Verical Stain at Failure
0.018
Specimen 3114.8
18.4Moisture
Mass
17.1
111.4
Specimen 1 Specimen 2115.7
17.3(%)
Specimen 2
100
79.2
2.3
0.210
1.78
38.3
41.7
Specimen 3
142
114.2
2.3
0.206
3.0
50
Specimen 1
Cohesion (c) (kPa)
0.058
Horizontal Strain at Failure
Peak Shear Stress
Normal Stress
Rate of Shear (mm/min) 0.047
(mm)
(kPa)
(kPa)
(Mg/m3)
(Mg/m3)
(%)
(g)
(mm)
1.85 (98%)
Disturbed
Bag
Specimen 3
20.0
60.0
114.8
11.6
1.82
2.03
0.424
Specimen 1
0.423
Specimen 2
20.0
60.0
114.9
11.6
1.82
2.03
0.423
2.03
Void Ratio 0.391 0.379 0.377
Consolidation Details
0.281 0.403 0.456
Void Ratio After Consolidation 0.403 0.394 0.391
Specimen 1 Specimen 2 Specimen 3Vertical Displacement (mm)
(g)
Maximum Shear Stress Results
Final Sample Details
Friction Angle (ɸ) (°)
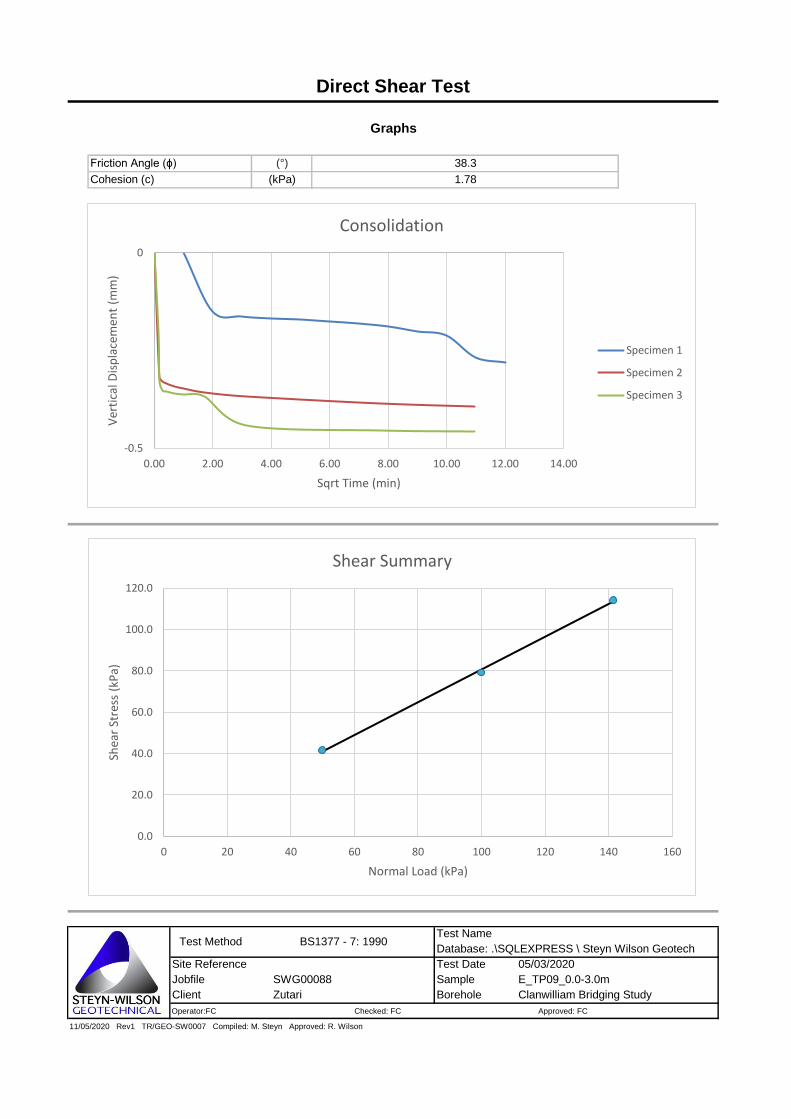
Test Name
Database: .\SQLEXPRESS \ Steyn Wilson Geotech
Site Reference Test Date
Jobfile Sample
Client Borehole
Operator:FC Checked: FC Approved: FC
11/05/2020 Rev1 TR/GEO-SW0007 Compiled: M. Steyn Approved: R. Wilson
Direct Shear Test
Graphs
Cohesion (c) (kPa)
SWG00088 E_TP09_0.0-3.0m
Zutari Clanwilliam Bridging Study
Test Method BS1377 - 7: 1990
Friction Angle (ɸ) (°) 38.3
1.78
05/03/2020
-0.5
0
0.00 2.00 4.00 6.00 8.00 10.00 12.00 14.00
Ver
tica
l Dis
pla
cem
ent
(mm
)
Sqrt Time (min)
Consolidation
Specimen 1
Specimen 2
Specimen 3
0.0
20.0
40.0
60.0
80.0
100.0
120.0
0 20 40 60 80 100 120 140 160
Shea
r St
ress
(kP
a)
Normal Load (kPa)
Shear Summary

Test Name
Database: .\SQLEXPRESS \ Steyn Wilson Geotech
Site Reference Test Date
Jobfile Sample
Client Borehole
Operator:FC Checked: FC Approved: FC
11/05/2020 Rev1 TR/GEO-SW0007 Compiled: M. Steyn Approved: R. Wilson
Cohesion (c) (kPa) 1.78
Direct Shear Test
Graphs
Friction Angle (ɸ) (°) 38.3
Zutari Clanwilliam Bridging Study
Test Method BS1377 - 7: 1990
05/03/2020
SWG00088 E_TP09_0.0-3.0m
0
20
40
60
80
100
120
0 1 2 3 4 5 6
Shea
r St
ess
(kP
a)
Horizontal Displacement (mm)
Shear Stress
Specimen 1
Specimen 2
Specimen 3
0
0.05
0.1
0.15
0.2
0.25
0.3
0 1 2 3 4 5 6
Ver
tica
l Dis
pla
cem
ent
(mm
)
Horizontal Displacement (mm)
Vertical Displacement
Specimen 1
Specimen 2
Specimen 3

Test Name
Database: .\SQLEXPRESS \ Steyn Wilson Geotech
Site Reference Test Date
Jobfile Sample
Client Borehole
Operator:FC Checked: FC Approved: FC
11/05/2020 Rev2 TR/GEO-SW0007 Compiled: M. Steyn Approved: R. Wilson
Void Ratio 0.319 0.300 0.287
Consolidation Details
0.397 0.515 0.663
Void Ratio After Consolidation 0.321 0.312 0.302
Specimen 1 Specimen 2 Specimen 3Vertical Displacement (mm)
(g)
Maximum Shear Stress Results
Final Sample Details
Friction Angle (ɸ) (°)
Specimen 3
20.0
60.0
120.1
10.0
1.93
2.12
0.347
Specimen 1
0.348
Specimen 2
20.0
60.0
120.1
10.0
1.93
2.12
0.347
2.12(Mg/m3)
(Mg/m3)
(%)
(g)
(mm)
1.93 (98%)
Disturbed
Bag
Cohesion (c) (kPa)
0.021
Horizontal Strain at Failure
Peak Shear Stress
Normal Stress
Rate of Shear (mm/min) 0.017
(mm)
(kPa)
(kPa)
Specimen 2
100
89.1
1.8
0.172
15.51
37.6
55.5
Specimen 3
150
132.6
1.9
0.221
1.1
50
Specimen 1
22/09/2020
SWG00088 E TP10_1.0-2.0m
Zutari Clanwilliam Bridging Study
Test Method BS1377 - 7: 1990
0.026(mm)Verical Stain at Failure
0.020
Specimen 3124.9
19.0Moisture
Mass
20.3
125.1
Specimen 1 Specimen 2125.1
21.5(%)
Particle Density 2.60
Bulk Density
Void Ratio
Direct Shear Test
Remoulded Desity (Mg/m3)
Disturbed/Undisturbed
Sample Method
Height
Diameter
Mass
Moisture
Dry Density
Initial Sample Details
1.93
10.0
120.0
60.0
20.0(mm)
(Mg/m3)

Test Name
Database: .\SQLEXPRESS \ Steyn Wilson Geotech
Site Reference Test Date
Jobfile Sample
Client Borehole
Operator:FC Checked: FC Approved: FC
11/05/2020 Rev1 TR/GEO-SW0007 Compiled: M. Steyn Approved: R. Wilson
Zutari Clanwilliam Bridging Study
Test Method BS1377 - 7: 1990
Friction Angle (ɸ) (°) 37.6
15.51
22/09/2020
Direct Shear Test
Graphs
Cohesion (c) (kPa)
SWG00088 E TP10_1.0-2.0m
-1
-0.5
0
0.00 2.00 4.00 6.00 8.00 10.00 12.00 14.00
Ver
tica
l Dis
pla
cem
ent
(mm
)
Sqrt Time (min)
Consolidation
Specimen 1
Specimen 2
Specimen 3
0.0
20.0
40.0
60.0
80.0
100.0
120.0
140.0
0 20 40 60 80 100 120 140 160
Shea
r St
ress
(kP
a)
Normal Load (kPa)
Shear Summary
Test Name
Database: .\SQLEXPRESS \ Steyn Wilson Geotech
Site Reference Test Date
Jobfile Sample
Client Borehole
Operator:FC Checked: FC Approved: FC
11/05/2020 Rev1 TR/GEO-SW0007 Compiled: M. Steyn Approved: R. Wilson
Zutari Clanwilliam Bridging Study
Test Method BS1377 - 7: 1990
22/09/2020
SWG00088 E TP10_1.0-2.0m
Cohesion (c) (kPa) 15.51
Direct Shear Test
Graphs
Friction Angle (ɸ) (°) 37.6
0
20
40
60
80
100
120
140
0 0.5 1 1.5 2 2.5 3 3.5
Shea
r St
ess
(kP
a)
Horizontal Displacement (mm)
Shear Stress
Specimen 1
Specimen 2
Specimen 3
-0.1
-0.05
0
0.05
0.1
0.15
0.2
0.25
0 0.5 1 1.5 2 2.5 3 3.5Ver
tica
l Dis
pla
cem
ent
(mm
)
Horizontal Displacement (mm)
Vertical Displacement
Specimen 1
Specimen 2
Specimen 3

Test Name
Database: .\SQLEXPRESS \ Steyn Wilson Geotech
Site Reference Test Date
Jobfile Sample
Client Borehole
Operator:FC Checked: FC Approved: FC
11/05/2020 Rev2 TR/GEO-SW0007 Compiled: M. Steyn Approved: R. Wilson
Void Ratio 0.503 0.507 0.459
Consolidation Details
0.107 0.200 0.665
Void Ratio After Consolidation 0.510 0.506 0.468
Specimen 1 Specimen 2 Specimen 3Vertical Displacement (mm)
(g)
Maximum Shear Stress Results
Final Sample Details
Friction Angle (ɸ) (°)
Specimen 3
20.0
60.0
107.3
10.8
1.71
1.90
0.518
Specimen 1
0.518
Specimen 2
20.0
60.0
107.1
10.8
1.71
1.89
0.521
1.90(Mg/m3)
(Mg/m3)
(%)
(g)
(mm)
98% (1.71)
Disturbed
Bag
Cohesion (c) (kPa)
0.039
Horizontal Strain at Failure
Peak Shear Stress
Normal Stress
Rate of Shear (mm/min) 0.027
(mm)
(kPa)
(kPa)
Specimen 2
100
73.2
1.7
-0.015
0.28
37.4
40.0
Specimen 3
144
112.5
1.8
0.113
1.7
50
Specimen 1
14/09/2020
SWG00088 E_TP14_0.0-1.7m
Zutari Clanwilliam Bridging Study
Test Method BS1377 - 7: 1990
0.095(mm)Verical Stain at Failure
0.038
Specimen 3109.8
19.1Moisture
Mass
19.1
108.4
Specimen 1 Specimen 2107.5
19.2(%)
Particle Density 2.60
Bulk Density
Void Ratio
Direct Shear Test
Remoulded Desity (Mg/m3)
Disturbed/Undisturbed
Sample Method
Height
Diameter
Mass
Moisture
Dry Density
Initial Sample Details
1.71
10.8
107.3
60.0
20.0(mm)
(Mg/m3)
Test Name
Database: .\SQLEXPRESS \ Steyn Wilson Geotech
Site Reference Test Date
Jobfile Sample
Client Borehole
Operator:FC Checked: FC Approved: FC
11/05/2020 Rev1 TR/GEO-SW0007 Compiled: M. Steyn Approved: R. Wilson
Zutari Clanwilliam Bridging Study
Test Method BS1377 - 7: 1990
Friction Angle (ɸ) (°) 37.4
0.28
14/09/2020
Direct Shear Test
Graphs
Cohesion (c) (kPa)
SWG00088 E_TP14_0.0-1.7m
-1
-0.5
0
0.00 2.00 4.00 6.00 8.00 10.00 12.00
Ver
tica
l Dis
pla
cem
ent
(mm
)
Sqrt Time (min)
Consolidation
Specimen 1
Specimen 2
Specimen 3
0.0
20.0
40.0
60.0
80.0
100.0
120.0
0 20 40 60 80 100 120 140 160
Shea
r St
ress
(kP
a)
Normal Load (kPa)
Shear Summary
Test Name
Database: .\SQLEXPRESS \ Steyn Wilson Geotech
Site Reference Test Date
Jobfile Sample
Client Borehole
Operator:FC Checked: FC Approved: FC
11/05/2020 Rev1 TR/GEO-SW0007 Compiled: M. Steyn Approved: R. Wilson
Zutari Clanwilliam Bridging Study
Test Method BS1377 - 7: 1990
14/09/2020
SWG00088 E_TP14_0.0-1.7m
Cohesion (c) (kPa) 0.28
Direct Shear Test
Graphs
Friction Angle (ɸ) (°) 37.4
0
20
40
60
80
100
120
0 0.5 1 1.5 2 2.5 3 3.5
Shea
r St
ess
(kP
a)
Horizontal Displacement (mm)
Shear Stress
Specimen 1
Specimen 2
Specimen 3
-0.1
-0.05
0
0.05
0.1
0.15
0 0.5 1 1.5 2 2.5 3 3.5
Ver
tica
l Dis
pla
cem
ent
(mm
)
Horizontal Displacement (mm)
Vertical Displacement
Specimen 1
Specimen 2
Specimen 3

Test Name
Database: .\SQLEXPRESS \ Steyn Wilson Geotech
Site Reference Test Date
Jobfile Sample
Client Borehole
Operator:FC Checked: FC Approved: FC
11/05/2020 Rev2 TR/GEO-SW0007 Compiled: M. Steyn Approved: R. Wilson
Particle Density 2.59
Bulk Density
Void Ratio
Direct Shear Test
Remoulded Desity (Mg/m3)
Disturbed/Undisturbed
Sample Method
Height
Diameter
Mass
Moisture
Dry Density
Initial Sample Details
1.98
10.4
123.4
60.0
20.0(mm)
(Mg/m3)
14/09/2020
SWG00088 E_TP15_0.0-1.4m
Zutari Clanwilliam Bridging Study
Test Method BS1377 - 7: 1990
0.053(mm)Verical Stain at Failure
0.030
Specimen 3123.2
14.3Moisture
Mass
15.0
121.0
Specimen 1 Specimen 2123.9
15.0(%)
Specimen 2
100
80.6
2.2
0.177
7.96
36.7
46.0
Specimen 3
150
120.6
2.4
0.248
2.1
50
Specimen 1
Cohesion (c) (kPa)
0.400
Horizontal Strain at Failure
Peak Shear Stress
Normal Stress
Rate of Shear (mm/min) 0.027
(mm)
(kPa)
(kPa)
(Mg/m3)
(Mg/m3)
(%)
(g)
(mm)
98% (1.98)
Disturbed
Bag
Specimen 3
20.0
60.0
123.5
10.4
1.98
2.18
0.309
Specimen 1
0.310
Specimen 2
20.0
60.0
123.6
10.4
1.98
2.19
0.308
2.18
Void Ratio 0.291 0.273 0.269
Consolidation Details
0.245 0.357 0.363
Void Ratio After Consolidation 0.294 0.285 0.285
Specimen 1 Specimen 2 Specimen 3Vertical Displacement (mm)
(g)
Maximum Shear Stress Results
Final Sample Details
Friction Angle (ɸ) (°)
Test Name
Database: .\SQLEXPRESS \ Steyn Wilson Geotech
Site Reference Test Date
Jobfile Sample
Client Borehole
Operator:FC Checked: FC Approved: FC
11/05/2020 Rev1 TR/GEO-SW0007 Compiled: M. Steyn Approved: R. Wilson
Direct Shear Test
Graphs
Cohesion (c) (kPa)
SWG00088 E_TP15_0.0-1.4m
Zutari Clanwilliam Bridging Study
Test Method BS1377 - 7: 1990
Friction Angle (ɸ) (°) 36.7
7.96
14/09/2020
-0.5
0
0.00 2.00 4.00 6.00 8.00 10.00 12.00
Ver
tica
l Dis
pla
cem
ent
(mm
)
Sqrt Time (min)
Consolidation
Specimen 1
Specimen 2
Specimen 3
0.0
20.0
40.0
60.0
80.0
100.0
120.0
140.0
0 20 40 60 80 100 120 140 160
Shea
r St
ress
(kP
a)
Normal Load (kPa)
Shear Summary

Test Name
Database: .\SQLEXPRESS \ Steyn Wilson Geotech
Site Reference Test Date
Jobfile Sample
Client Borehole
Operator:FC Checked: FC Approved: FC
11/05/2020 Rev1 TR/GEO-SW0007 Compiled: M. Steyn Approved: R. Wilson
Cohesion (c) (kPa) 7.96
Direct Shear Test
Graphs
Friction Angle (ɸ) (°) 36.7
Zutari Clanwilliam Bridging Study
Test Method BS1377 - 7: 1990
14/09/2020
SWG00088 E_TP15_0.0-1.4m
0
20
40
60
80
100
120
140
0 0.5 1 1.5 2 2.5 3 3.5
Shea
r St
ess
(kP
a)
Horizontal Displacement (mm)
Shear Stress
Specimen 1
Specimen 2
Specimen 3
-0.05
0
0.05
0.1
0.15
0.2
0.25
0.3
0 0.5 1 1.5 2 2.5 3 3.5
Ver
tica
l Dis
pla
cem
ent
(mm
)
Horizontal Displacement (mm)
Vertical Displacement
Specimen 1
Specimen 2
Specimen 3

Test Name
Database: .\SQLEXPRESS \ Steyn Wilson Geotech
Site Reference Test Date
Jobfile Sample
Client Borehole
Operator:FC Checked: FC Approved: FC
11/05/2020 Rev2 TR/GEO-SW0007 Compiled: M. Steyn Approved: R. Wilson
Particle Density 2.60
Bulk Density
Void Ratio
Direct Shear Test
Remoulded Desity (Mg/m3)
Disturbed/Undisturbed
Sample Method
Height
Diameter
Mass
Moisture
Dry Density
Initial Sample Details
1.68
10.4
105.1
60.0
20.0(mm)
(Mg/m3)
09/09/2020
SWG00088 E_TP24 ADD_0.0-2.2m
Zutari Clanwilliam Bridging Study
Test Method BS1377 - 7: 1990
0.063(mm)Verical Stain at Failure
0.049
Specimen 3106.9
20.2Moisture
Mass
19.7
106.3
Specimen 1 Specimen 2107.8
19.4(%)
Specimen 2
100
76.0
1.9
0.040
4.05
35.6
39.6
Specimen 3
142
105.7
1.6
0.019
1.9
50
Specimen 1
Cohesion (c) (kPa)
0.053
Horizontal Strain at Failure
Peak Shear Stress
Normal Stress
Rate of Shear (mm/min) 0.066
(mm)
(kPa)
(kPa)
(Mg/m3)
(Mg/m3)
(%)
(g)
(mm)
1.68 (98%)
Disturbed
Bag
Specimen 3
20.0
60.0
105.1
10.4
1.68
1.86
0.544
Specimen 1
0.544
Specimen 2
20.0
60.0
105.2
10.4
1.69
1.86
0.543
1.86
Void Ratio 0.529 0.522 0.518
Consolidation Details
0.137 0.228 0.320
Void Ratio After Consolidation 0.534 0.525 0.520
Specimen 1 Specimen 2 Specimen 3Vertical Displacement (mm)
(g)
Maximum Shear Stress Results
Final Sample Details
Friction Angle (ɸ) (°)

Test Name
Database: .\SQLEXPRESS \ Steyn Wilson Geotech
Site Reference Test Date
Jobfile Sample
Client Borehole
Operator:FC Checked: FC Approved: FC
11/05/2020 Rev1 TR/GEO-SW0007 Compiled: M. Steyn Approved: R. Wilson
Direct Shear Test
Graphs
Cohesion (c) (kPa)
SWG00088 E_TP24 ADD_0.0-2.2m
Zutari Clanwilliam Bridging Study
Test Method BS1377 - 7: 1990
Friction Angle (ɸ) (°) 35.6
4.05
09/09/2020
-0.5
0
0.00 2.00 4.00 6.00 8.00 10.00 12.00
Ver
tica
l Dis
pla
cem
ent
(mm
)
Sqrt Time (min)
Consolidation
Specimen 1
Specimen 2
Specimen 3
0.0
20.0
40.0
60.0
80.0
100.0
120.0
0 20 40 60 80 100 120 140 160
Shea
r St
ress
(kP
a)
Normal Load (kPa)
Shear Summary
Test Name
Database: .\SQLEXPRESS \ Steyn Wilson Geotech
Site Reference Test Date
Jobfile Sample
Client Borehole
Operator:FC Checked: FC Approved: FC
11/05/2020 Rev1 TR/GEO-SW0007 Compiled: M. Steyn Approved: R. Wilson
Cohesion (c) (kPa) 4.05
Direct Shear Test
Graphs
Friction Angle (ɸ) (°) 35.6
Zutari Clanwilliam Bridging Study
Test Method BS1377 - 7: 1990
09/09/2020
SWG00088 E_TP24 ADD_0.0-2.2m
0
20
40
60
80
100
120
0 0.5 1 1.5 2 2.5 3 3.5
Shea
r St
ess
(kP
a)
Horizontal Displacement (mm)
Shear Stress
Specimen 1
Specimen 2
Specimen 3
-0.15
-0.1
-0.05
0
0.05
0.1
0.15
0 0.5 1 1.5 2 2.5 3 3.5
Ver
tica
l Dis
pla
cem
ent
(mm
)
Horizontal Displacement (mm)
Vertical Displacement
Specimen 1
Specimen 2
Specimen 3

Test Name
Database: .\SQLEXPRESS \ Steyn Wilson Geotech
Site Reference Test Date
Jobfile Sample
Client Borehole
Operator:FC Checked: FC Approved: FC
11/05/2020 Rev2 TR/GEO-SW0007 Compiled: M. Steyn Approved: R. Wilson
Void Ratio 0.519 0.518 0.496
Consolidation Details
0.210 0.249 0.325
Void Ratio After Consolidation 0.522 0.518 0.515
Specimen 1 Specimen 2 Specimen 3Vertical Displacement (mm)
(g)
Maximum Shear Stress Results
Final Sample Details
Friction Angle (ɸ) (°)
Specimen 3
20.0
60.0
104.7
10.5
1.68
1.85
0.540
Specimen 1
0.538
Specimen 2
20.0
60.0
104.9
10.5
1.68
1.86
0.537
1.85(Mg/m3)
(Mg/m3)
(%)
(g)
(mm)
Disturbed
Bag
Cohesion (c) (kPa)
0.045
Horizontal Strain at Failure
Peak Shear Stress
Normal Stress
Rate of Shear (mm/min) 0.055
(mm)
(kPa)
(kPa)
Specimen 2
100
73.9
1.3
-0.003
2.00
34.2
37.1
Specimen 3
150
93.4
2.5
0.243
1.0
50
Specimen 1
15/09/2020
SWG00088 E TP53_0.0-1.5m
Zutari Clanwilliam Bridging Study
Test Method BS1377 - 7: 1990
0.035(mm)Verical Stain at Failure
0.041
Specimen 3104.4
18.1Moisture
Mass
18.6
103.5
Specimen 1 Specimen 2106.1
17.9(%)
Particle Density 2.58
Bulk Density
Void Ratio
Direct Shear Test
Remoulded Desity (Mg/m3)
Disturbed/Undisturbed
Sample Method
Height
Diameter
Mass
Moisture
Dry Density
Initial Sample Details
1.68
10.5
104.8
60.0
20.0(mm)
(Mg/m3)

Test Name
Database: .\SQLEXPRESS \ Steyn Wilson Geotech
Site Reference Test Date
Jobfile Sample
Client Borehole
Operator:FC Checked: FC Approved: FC
11/05/2020 Rev1 TR/GEO-SW0007 Compiled: M. Steyn Approved: R. Wilson
Zutari Clanwilliam Bridging Study
Test Method BS1377 - 7: 1990
Friction Angle (ɸ) (°) 34.2
2.00
15/09/2020
Direct Shear Test
Graphs
Cohesion (c) (kPa)
SWG00088 E TP53_0.0-1.5m
-0.5
0
0.00 2.00 4.00 6.00 8.00 10.00 12.00
Ver
tica
l Dis
pla
cem
ent
(mm
)
Sqrt Time (min)
Consolidation
Specimen 1
Specimen 2
Specimen 3
0.0
20.0
40.0
60.0
80.0
100.0
120.0
0 20 40 60 80 100 120 140 160
Shea
r St
ress
(kP
a)
Normal Load (kPa)
Shear Summary
Test Name
Database: .\SQLEXPRESS \ Steyn Wilson Geotech
Site Reference Test Date
Jobfile Sample
Client Borehole
Operator:FC Checked: FC Approved: FC
11/05/2020 Rev1 TR/GEO-SW0007 Compiled: M. Steyn Approved: R. Wilson
Zutari Clanwilliam Bridging Study
Test Method BS1377 - 7: 1990
15/09/2020
SWG00088 E TP53_0.0-1.5m
Cohesion (c) (kPa) 2.00
Direct Shear Test
Graphs
Friction Angle (ɸ) (°) 34.2
0
10
20
30
40
50
60
70
80
90
100
0 0.5 1 1.5 2 2.5 3 3.5 4 4.5
Shea
r St
ess
(kP
a)
Horizontal Displacement (mm)
Shear Stress
Specimen 1
Specimen 2
Specimen 3
-0.1
-0.05
0
0.05
0.1
0.15
0.2
0.25
0.3
0 0.5 1 1.5 2 2.5 3 3.5 4 4.5
Ver
tica
l Dis
pla
cem
ent
(mm
)
Horizontal Displacement (mm)
Vertical Displacement
Specimen 1
Specimen 2
Specimen 3

Test Name
Database: .\SQLEXPRESS \ Steyn Wilson Geotech
Site Reference Test Date
Jobfile Sample
Client Borehole
Operator:FC Checked: FC Approved: FC
11/05/2020 Rev2 TR/GEO-SW0007 Compiled: M. Steyn Approved: R. Wilson
Void Ratio 0.570 0.521 0.471
Consolidation Details
0.158 0.304 1.124
Void Ratio After Consolidation 0.592 0.578 0.514
Specimen 1 Specimen 2 Specimen 3Vertical Displacement (mm)
(g)
Maximum Shear Stress Results
Final Sample Details
Friction Angle (ɸ) (°)
Specimen 3
20.0
60.0
102.0
11.3
1.62
1.80
0.604
Specimen 1
0.604
Specimen 2
20.0
60.0
102.1
11.3
1.62
1.81
0.603
1.80(Mg/m3)
(Mg/m3)
(%)
(g)
(mm)
98% (1.62)
Disturbed
Bag
Cohesion (c) (kPa)
0.072
Horizontal Strain at Failure
Peak Shear Stress
Normal Stress
Rate of Shear (mm/min) 0.074
(mm)
(kPa)
(kPa)
Specimen 2
100
57.6
8.8
0.717
4.73
28.4
32.2
Specimen 3
150
86.3
7.0
0.543
4.3
50
Specimen 1
16/09/2020
SWG00088 E TP33_0.0-1.6m
Zutari Clanwilliam Bridging Study
Test Method BS1377 - 7: 1990
0.275(mm)Verical Stain at Failure
0.038
Specimen 3102.2
16.9Moisture
Mass
17.6
103.1
Specimen 1 Specimen 297.7
18.0(%)
Particle Density 2.60
Bulk Density
Void Ratio
Direct Shear Test
Remoulded Desity (Mg/m3)
Disturbed/Undisturbed
Sample Method
Height
Diameter
Mass
Moisture
Dry Density
Initial Sample Details
1.62
11.3
102.0
60.0
20.0(mm)
(Mg/m3)

Test Name
Database: .\SQLEXPRESS \ Steyn Wilson Geotech
Site Reference Test Date
Jobfile Sample
Client Borehole
Operator:FC Checked: FC Approved: FC
11/05/2020 Rev1 TR/GEO-SW0007 Compiled: M. Steyn Approved: R. Wilson
Zutari Clanwilliam Bridging Study
Test Method BS1377 - 7: 1990
Friction Angle (ɸ) (°) 28.4
4.73
16/09/2020
Direct Shear Test
Graphs
Cohesion (c) (kPa)
SWG00088 E TP33_0.0-1.6m
-1.5
-1
-0.5
0
0.00 2.00 4.00 6.00 8.00 10.00 12.00
Ver
tica
l Dis
pla
cem
ent
(mm
)
Sqrt Time (min)
Consolidation
Specimen 1
Specimen 2
Specimen 3
0.0
10.0
20.0
30.0
40.0
50.0
60.0
70.0
80.0
90.0
100.0
0 20 40 60 80 100 120 140 160
Shea
r St
ress
(kP
a)
Normal Load (kPa)
Shear Summary
Test Name
Database: .\SQLEXPRESS \ Steyn Wilson Geotech
Site Reference Test Date
Jobfile Sample
Client Borehole
Operator:FC Checked: FC Approved: FC
11/05/2020 Rev1 TR/GEO-SW0007 Compiled: M. Steyn Approved: R. Wilson
Zutari Clanwilliam Bridging Study
Test Method BS1377 - 7: 1990
16/09/2020
SWG00088 E TP33_0.0-1.6m
Cohesion (c) (kPa) 4.73
Direct Shear Test
Graphs
Friction Angle (ɸ) (°) 28.4
0
10
20
30
40
50
60
70
80
90
100
0 2 4 6 8 10 12
Shea
r St
ess
(kP
a)
Horizontal Displacement (mm)
Shear Stress
Specimen 1
Specimen 2
Specimen 3
0
0.1
0.2
0.3
0.4
0.5
0.6
0.7
0.8
0.9
0 2 4 6 8 10 12
Ver
tica
l Dis
pla
cem
ent
(mm
)
Horizontal Displacement (mm)
Vertical Displacement
Specimen 1
Specimen 2
Specimen 3
Test Name
Database: .\SQLEXPRESS \ Steyn Wilson Geotech
Site Reference Test Date
Jobfile Sample
Client Borehole
Operator:FC Checked: FC Approved: FC
11/05/2020 Rev2 TR/GEO-SW0007 Compiled: M. Steyn Approved: R. Wilson
Void Ratio 0.561 0.556 0.533
Consolidation Details
0.247 0.298 0.582
Void Ratio After Consolidation 0.568 0.564 0.544
Specimen 1 Specimen 2 Specimen 3Vertical Displacement (mm)
(g)
Maximum Shear Stress Results
Final Sample Details
Friction Angle (ɸ) (°)
Specimen 3
20.0
60.0
102.0
11.2
1.62
1.80
0.591
Specimen 1
0.587
Specimen 2
20.0
60.0
102.2
11.2
1.63
1.81
0.587
1.81(Mg/m3)
(Mg/m3)
(%)
(g)
(mm)
Disturbed
Bag
Cohesion (c) (kPa)
0.047
Horizontal Strain at Failure
Peak Shear Stress
Normal Stress
Rate of Shear (mm/min) 0.030
(mm)
(kPa)
(kPa)
Specimen 2
100
67.2
2.4
0.101
3.69
31.1
32.2
Specimen 3
141
87.0
2.9
0.138
2.1
50
Specimen 1
12/09/2020
SWG00088 E_TP38_0.0-0.9m
Zutari Clanwilliam Bridging Study
Test Method BS1377 - 7: 1990
0.090(mm)Verical Stain at Failure
0.052
Specimen 399.6
21.9Moisture
Mass
21.1
103.9
Specimen 1 Specimen 2102.8
20.1(%)
Particle Density 2.58
Bulk Density
Void Ratio
Direct Shear Test
Remoulded Desity (Mg/m3)
Disturbed/Undisturbed
Sample Method
Height
Diameter
Mass
Moisture
Dry Density
Initial Sample Details
1.63
11.2
102.2
60.0
20.0(mm)
(Mg/m3)
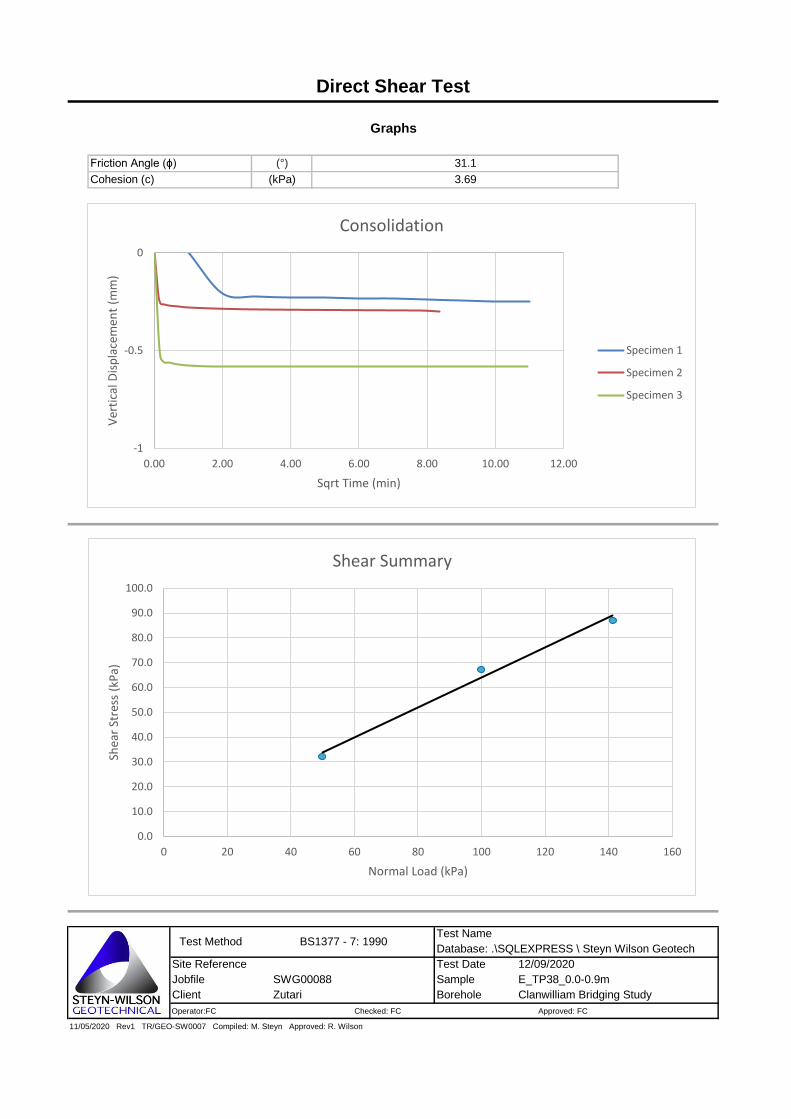
Test Name
Database: .\SQLEXPRESS \ Steyn Wilson Geotech
Site Reference Test Date
Jobfile Sample
Client Borehole
Operator:FC Checked: FC Approved: FC
11/05/2020 Rev1 TR/GEO-SW0007 Compiled: M. Steyn Approved: R. Wilson
Zutari Clanwilliam Bridging Study
Test Method BS1377 - 7: 1990
Friction Angle (ɸ) (°) 31.1
3.69
12/09/2020
Direct Shear Test
Graphs
Cohesion (c) (kPa)
SWG00088 E_TP38_0.0-0.9m
-1
-0.5
0
0.00 2.00 4.00 6.00 8.00 10.00 12.00
Ver
tica
l Dis
pla
cem
ent
(mm
)
Sqrt Time (min)
Consolidation
Specimen 1
Specimen 2
Specimen 3
0.0
10.0
20.0
30.0
40.0
50.0
60.0
70.0
80.0
90.0
100.0
0 20 40 60 80 100 120 140 160
Shea
r St
ress
(kP
a)
Normal Load (kPa)
Shear Summary
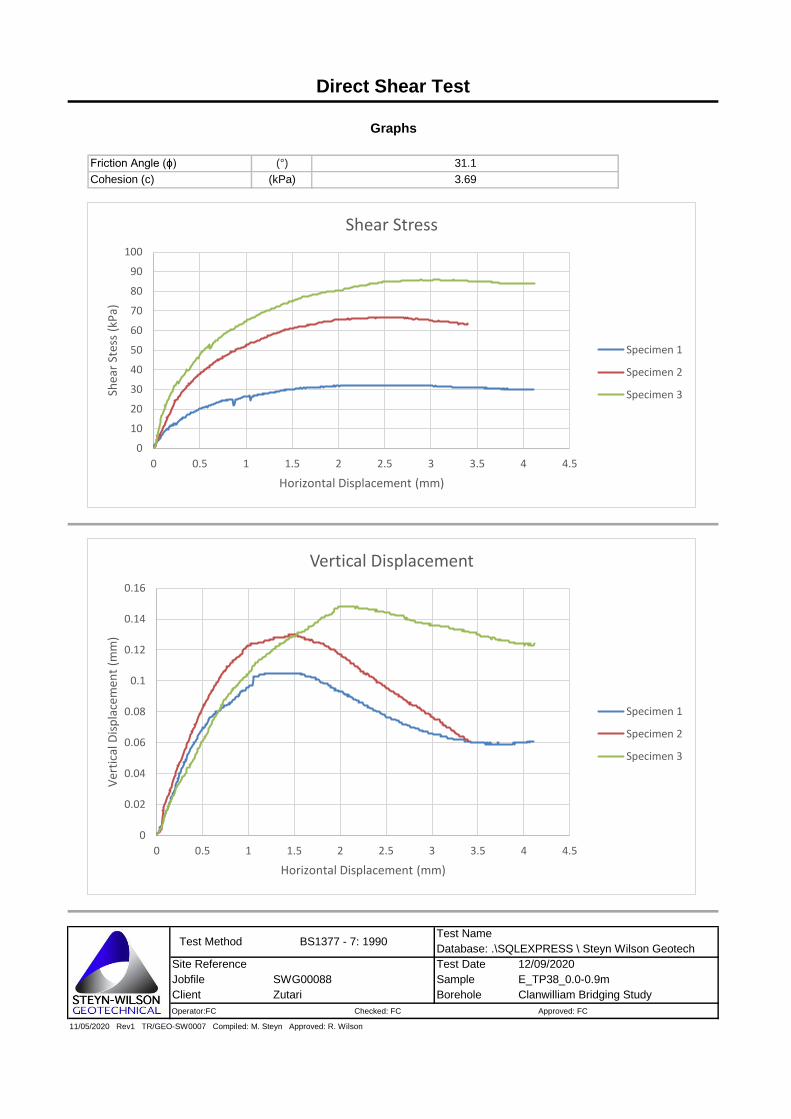
Test Name
Database: .\SQLEXPRESS \ Steyn Wilson Geotech
Site Reference Test Date
Jobfile Sample
Client Borehole
Operator:FC Checked: FC Approved: FC
11/05/2020 Rev1 TR/GEO-SW0007 Compiled: M. Steyn Approved: R. Wilson
Zutari Clanwilliam Bridging Study
Test Method BS1377 - 7: 1990
12/09/2020
SWG00088 E_TP38_0.0-0.9m
Cohesion (c) (kPa) 3.69
Direct Shear Test
Graphs
Friction Angle (ɸ) (°) 31.1
0
10
20
30
40
50
60
70
80
90
100
0 0.5 1 1.5 2 2.5 3 3.5 4 4.5
Shea
r St
ess
(kP
a)
Horizontal Displacement (mm)
Shear Stress
Specimen 1
Specimen 2
Specimen 3
0
0.02
0.04
0.06
0.08
0.1
0.12
0.14
0.16
0 0.5 1 1.5 2 2.5 3 3.5 4 4.5
Ver
tica
l Dis
pla
cem
ent
(mm
)
Horizontal Displacement (mm)
Vertical Displacement
Specimen 1
Specimen 2
Specimen 3

Test Name
Database: .\SQLEXPRESS \ Steyn Wilson Geotech
Site Reference Test Date
Jobfile Sample
Client Borehole
Operator:FC Checked: FC Approved: FC
11/05/2020 Rev2 TR/GEO-SW0007 Compiled: M. Steyn Approved: R. Wilson
Void Ratio 0.377 0.352 0.350
Consolidation Details
0.261 0.515 0.600
Void Ratio After Consolidation 0.369 0.353 0.348
Specimen 1 Specimen 2 Specimen 3Vertical Displacement (mm)
(g)
Maximum Shear Stress Results
Final Sample Details
Friction Angle (ɸ) (°)
Specimen 3
20.0
60.0
114.6
9.6
1.85
2.03
0.390
Specimen 1
0.387
Specimen 2
20.0
60.0
114.7
9.6
1.85
2.03
0.389
2.03(Mg/m3)
(Mg/m3)
(%)
(g)
(mm)
Disturbed
Bag
Cohesion (c) (kPa)
0.024
Horizontal Strain at Failure
Peak Shear Stress
Normal Stress
Rate of Shear (mm/min) 0.017
(mm)
(kPa)
(kPa)
Specimen 2
100
115.7
1.3
0.018
35.91
38.6
75.7
Specimen 3
150
155.6
2.0
-0.032
0.9
50
Specimen 1
23/09/2020
SWG00088 E TP45_0.5-1.1m
Zutari Clanwilliam Bridging Study
Test Method BS1377 - 7: 1990
-0.103(mm)Verical Stain at Failure
0.015
Specimen 3124.0
25.5Moisture
Mass
24.6
122.6
Specimen 1 Specimen 2121.9
24.0(%)
Particle Density 2.57
Bulk Density
Void Ratio
Direct Shear Test
Remoulded Desity (Mg/m3)
Disturbed/Undisturbed
Sample Method
Height
Diameter
Mass
Moisture
Dry Density
Initial Sample Details
1.85
9.6
114.8
60.0
20.0(mm)
(Mg/m3)
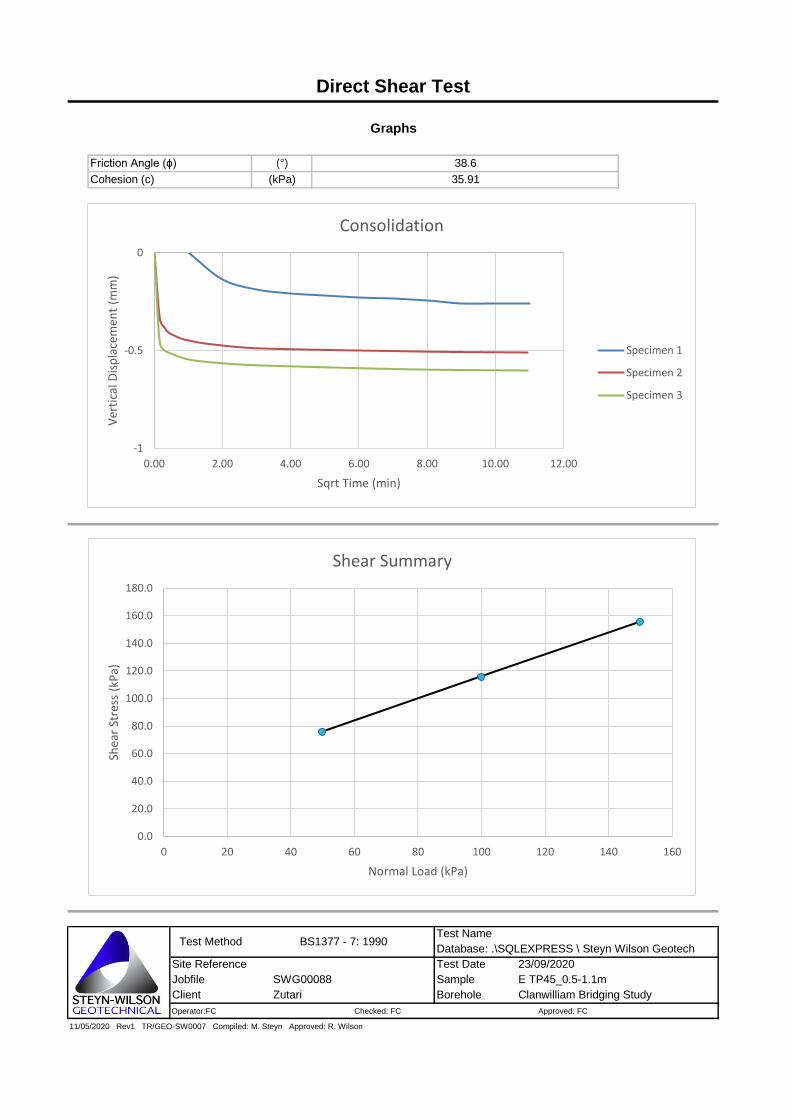
Test Name
Database: .\SQLEXPRESS \ Steyn Wilson Geotech
Site Reference Test Date
Jobfile Sample
Client Borehole
Operator:FC Checked: FC Approved: FC
11/05/2020 Rev1 TR/GEO-SW0007 Compiled: M. Steyn Approved: R. Wilson
Zutari Clanwilliam Bridging Study
Test Method BS1377 - 7: 1990
Friction Angle (ɸ) (°) 38.6
35.91
23/09/2020
Direct Shear Test
Graphs
Cohesion (c) (kPa)
SWG00088 E TP45_0.5-1.1m
-1
-0.5
0
0.00 2.00 4.00 6.00 8.00 10.00 12.00
Ver
tica
l Dis
pla
cem
ent
(mm
)
Sqrt Time (min)
Consolidation
Specimen 1
Specimen 2
Specimen 3
0.0
20.0
40.0
60.0
80.0
100.0
120.0
140.0
160.0
180.0
0 20 40 60 80 100 120 140 160
Shea
r St
ress
(kP
a)
Normal Load (kPa)
Shear Summary
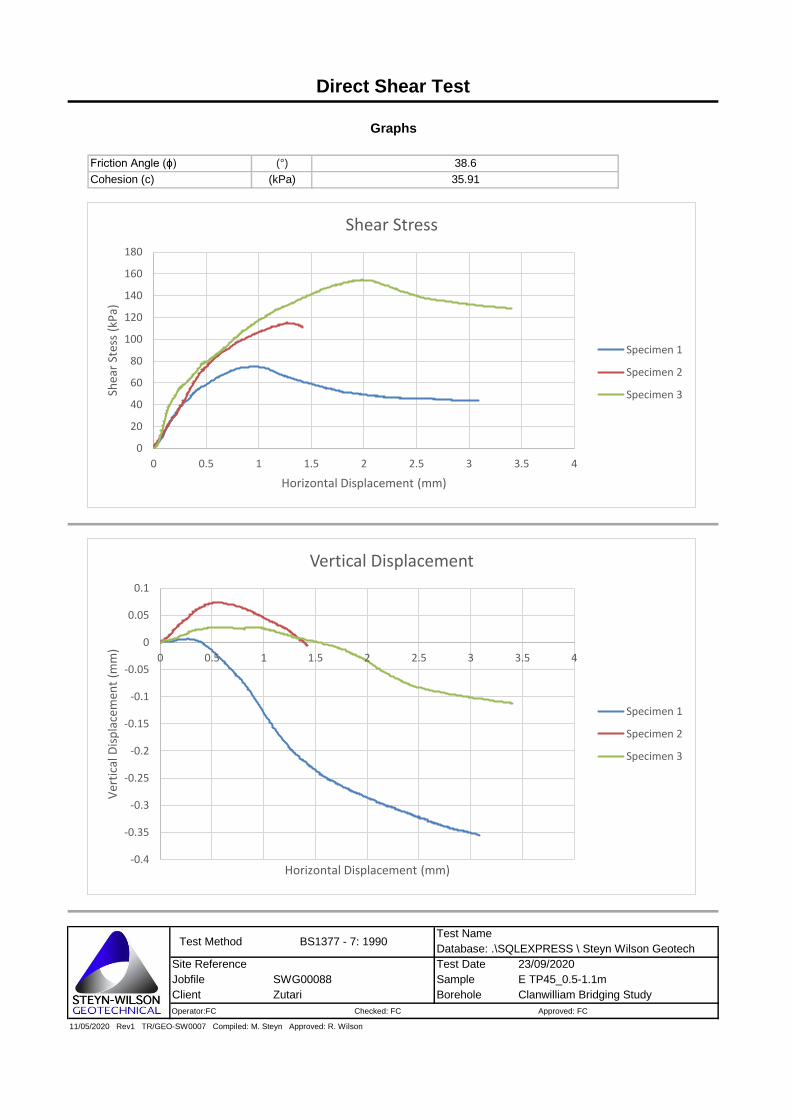
Test Name
Database: .\SQLEXPRESS \ Steyn Wilson Geotech
Site Reference Test Date
Jobfile Sample
Client Borehole
Operator:FC Checked: FC Approved: FC
11/05/2020 Rev1 TR/GEO-SW0007 Compiled: M. Steyn Approved: R. Wilson
Zutari Clanwilliam Bridging Study
Test Method BS1377 - 7: 1990
23/09/2020
SWG00088 E TP45_0.5-1.1m
Cohesion (c) (kPa) 35.91
Direct Shear Test
Graphs
Friction Angle (ɸ) (°) 38.6
0
20
40
60
80
100
120
140
160
180
0 0.5 1 1.5 2 2.5 3 3.5 4
Shea
r St
ess
(kP
a)
Horizontal Displacement (mm)
Shear Stress
Specimen 1
Specimen 2
Specimen 3
-0.4
-0.35
-0.3
-0.25
-0.2
-0.15
-0.1
-0.05
0
0.05
0.1
0 0.5 1 1.5 2 2.5 3 3.5 4
Ver
tica
l Dis
pla
cem
ent
(mm
)
Horizontal Displacement (mm)
Vertical Displacement
Specimen 1
Specimen 2
Specimen 3

Test Name
Database: .\SQLEXPRESS \ Steyn Wilson Geotech
Site Reference Test Date
Jobfile Sample
Client Borehole
Operator:FC Checked: FC Approved: FC
11/05/2020 Rev2 TR/GEO-SW0007 Compiled: M. Steyn Approved: R. Wilson
Void Ratio 0.484 0.482 0.469
Consolidation Details
0.298 0.410 0.525
Void Ratio After Consolidation 0.489 0.481 0.469
Specimen 1 Specimen 2 Specimen 3Vertical Displacement (mm)
(g)
Maximum Shear Stress Results
Final Sample Details
Friction Angle (ɸ) (°)
Specimen 3
20.0
60.0
106.7
9.5
1.72
1.89
0.509
Specimen 1
0.512
Specimen 2
20.0
60.0
106.5
9.5
1.72
1.88
0.512
1.88(Mg/m3)
(Mg/m3)
(%)
(g)
(mm)
Disturbed
Bag
Cohesion (c) (kPa)
0.044
Horizontal Strain at Failure
Peak Shear Stress
Normal Stress
Rate of Shear (mm/min) 0.049
(mm)
(kPa)
(kPa)
Specimen 2
100
78.5
1.6
-0.014
2.06
37.1
39.3
Specimen 3
150
114.9
2.1
0.000
2.0
50
Specimen 1
17/09/2020
SWG00088 E TP46_0.0-0.6m
Zutari Clanwilliam Bridging Study
Test Method BS1377 - 7: 1990
0.067(mm)Verical Stain at Failure
0.022
Specimen 3109.1
19.5Moisture
Mass
19.8
106.1
Specimen 1 Specimen 2107.0
19.6(%)
Particle Density 2.60
Bulk Density
Void Ratio
Direct Shear Test
Remoulded Desity (Mg/m3)
Disturbed/Undisturbed
Sample Method
Height
Diameter
Mass
Moisture
Dry Density
Initial Sample Details
1.72
9.5
106.5
60.0
20.0(mm)
(Mg/m3)

Test Name
Database: .\SQLEXPRESS \ Steyn Wilson Geotech
Site Reference Test Date
Jobfile Sample
Client Borehole
Operator:FC Checked: FC Approved: FC
11/05/2020 Rev1 TR/GEO-SW0007 Compiled: M. Steyn Approved: R. Wilson
Zutari Clanwilliam Bridging Study
Test Method BS1377 - 7: 1990
Friction Angle (ɸ) (°) 37.1
2.06
17/09/2020
Direct Shear Test
Graphs
Cohesion (c) (kPa)
SWG00088 E TP46_0.0-0.6m
-1
-0.5
0
0.00 2.00 4.00 6.00 8.00 10.00 12.00 14.00
Ver
tica
l Dis
pla
cem
ent
(mm
)
Sqrt Time (min)
Consolidation
Specimen 1
Specimen 2
Specimen 3
0.0
20.0
40.0
60.0
80.0
100.0
120.0
140.0
0 20 40 60 80 100 120 140 160
Shea
r St
ress
(kP
a)
Normal Load (kPa)
Shear Summary
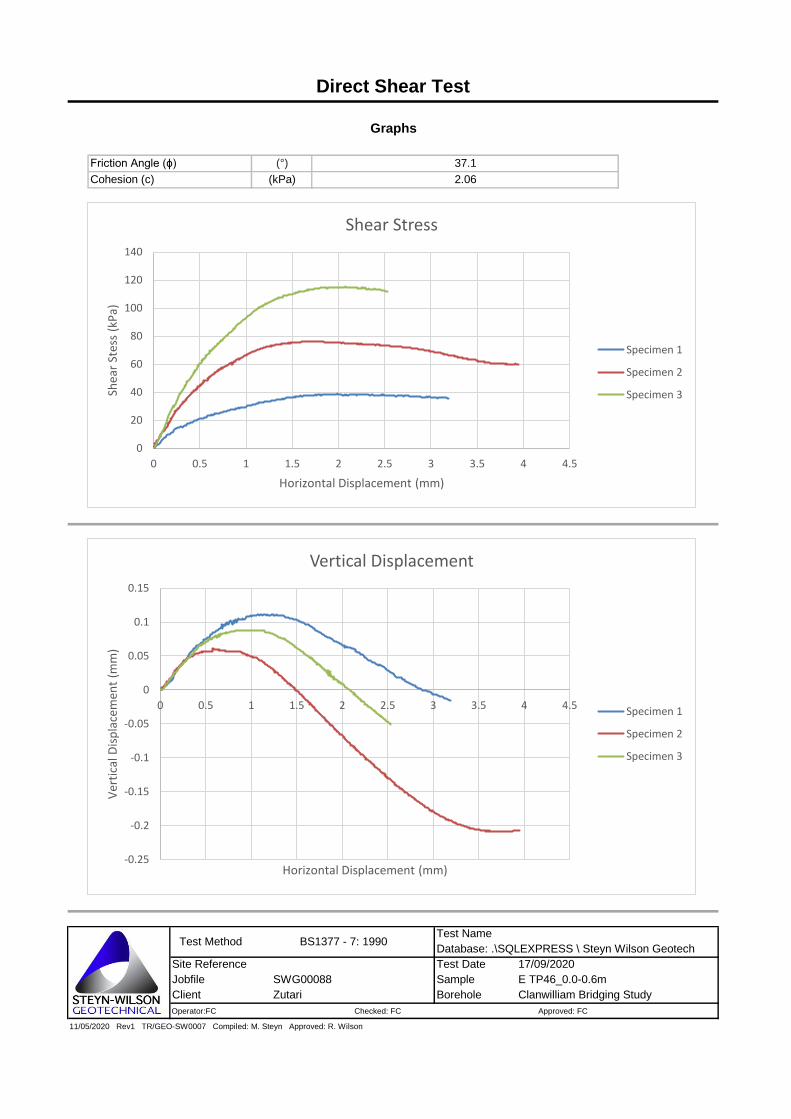
Test Name
Database: .\SQLEXPRESS \ Steyn Wilson Geotech
Site Reference Test Date
Jobfile Sample
Client Borehole
Operator:FC Checked: FC Approved: FC
11/05/2020 Rev1 TR/GEO-SW0007 Compiled: M. Steyn Approved: R. Wilson
Zutari Clanwilliam Bridging Study
Test Method BS1377 - 7: 1990
17/09/2020
SWG00088 E TP46_0.0-0.6m
Cohesion (c) (kPa) 2.06
Direct Shear Test
Graphs
Friction Angle (ɸ) (°) 37.1
0
20
40
60
80
100
120
140
0 0.5 1 1.5 2 2.5 3 3.5 4 4.5
Shea
r St
ess
(kP
a)
Horizontal Displacement (mm)
Shear Stress
Specimen 1
Specimen 2
Specimen 3
-0.25
-0.2
-0.15
-0.1
-0.05
0
0.05
0.1
0.15
0 0.5 1 1.5 2 2.5 3 3.5 4 4.5
Ver
tica
l Dis
pla
cem
ent
(mm
)
Horizontal Displacement (mm)
Vertical Displacement
Specimen 1
Specimen 2
Specimen 3

Test Name
Database: .\SQLEXPRESS \ Steyn Wilson Geotech
Site Reference Test Date
Jobfile Sample
Client Borehole
Operator:FC Checked: FC Approved: FC
11/05/2020 Rev2 TR/GEO-SW0007 Compiled: M. Steyn Approved: R. Wilson
Void Ratio 0.469 0.464 0.458
Consolidation Details
0.210 0.299 0.325
Void Ratio After Consolidation 0.471 0.463 0.476
Specimen 1 Specimen 2 Specimen 3Vertical Displacement (mm)
(g)
Maximum Shear Stress Results
Final Sample Details
Friction Angle (ɸ) (°)
Specimen 3
20.0
60.0
108.0
11.1
1.72
1.91
0.501
Specimen 1
0.487
Specimen 2
20.0
60.0
109.1
11.1
1.74
1.93
0.486
1.93(Mg/m3)
(Mg/m3)
(%)
(g)
(mm)
1.73 (98%)
Disturbed
Bag
Cohesion (c) (kPa)
0.045
Horizontal Strain at Failure
Peak Shear Stress
Normal Stress
Rate of Shear (mm/min) 0.055
(mm)
(kPa)
(kPa)
Specimen 2
100
73.9
1.3
-0.003
3.00
34.2
37.1
Specimen 3
150
93.4
2.5
0.243
1.0
50
Specimen 1
20/09/2020
SWG00088 E TP53_0.0-1.5m
Zutari Clanwilliam Bridging Study
Test Method BS1377 - 7: 1990
0.035(mm)Verical Stain at Failure
0.041
Specimen 3109.5
17.1Moisture
Mass
16.2
108.5
Specimen 1 Specimen 2106.9
17.7(%)
Particle Density 2.58
Bulk Density
Void Ratio
Direct Shear Test
Remoulded Desity (Mg/m3)
Disturbed/Undisturbed
Sample Method
Height
Diameter
Mass
Moisture
Dry Density
Initial Sample Details
1.73
11.1
109.0
60.0
20.0(mm)
(Mg/m3)

Test Name
Database: .\SQLEXPRESS \ Steyn Wilson Geotech
Site Reference Test Date
Jobfile Sample
Client Borehole
Operator:FC Checked: FC Approved: FC
11/05/2020 Rev1 TR/GEO-SW0007 Compiled: M. Steyn Approved: R. Wilson
Zutari Clanwilliam Bridging Study
Test Method BS1377 - 7: 1990
Friction Angle (ɸ) (°) 34.2
3.00
20/09/2020
Direct Shear Test
Graphs
Cohesion (c) (kPa)
SWG00088 E TP53_0.0-1.5m
-0.5
0
0.00 2.00 4.00 6.00 8.00 10.00 12.00
Ver
tica
l Dis
pla
cem
ent
(mm
)
Sqrt Time (min)
Consolidation
Specimen 1
Specimen 2
Specimen 3
0.0
20.0
40.0
60.0
80.0
100.0
120.0
0 20 40 60 80 100 120 140 160
Shea
r St
ress
(kP
a)
Normal Load (kPa)
Shear Summary

Test Name
Database: .\SQLEXPRESS \ Steyn Wilson Geotech
Site Reference Test Date
Jobfile Sample
Client Borehole
Operator:FC Checked: FC Approved: FC
11/05/2020 Rev1 TR/GEO-SW0007 Compiled: M. Steyn Approved: R. Wilson
Zutari Clanwilliam Bridging Study
Test Method BS1377 - 7: 1990
20/09/2020
SWG00088 E TP53_0.0-1.5m
Cohesion (c) (kPa) 3.00
Direct Shear Test
Graphs
Friction Angle (ɸ) (°) 34.2
0
10
20
30
40
50
60
70
80
90
100
0 0.5 1 1.5 2 2.5 3 3.5 4 4.5
Shea
r St
ess
(kP
a)
Horizontal Displacement (mm)
Shear Stress
Specimen 1
Specimen 2
Specimen 3
-0.1
-0.05
0
0.05
0.1
0.15
0.2
0.25
0.3
0 0.5 1 1.5 2 2.5 3 3.5 4 4.5
Ver
tica
l Dis
pla
cem
ent
(mm
)
Horizontal Displacement (mm)
Vertical Displacement
Specimen 1
Specimen 2
Specimen 3

Test Name
Database: .\SQLEXPRESS \ Steyn Wilson Geotech
Site Reference Test Date
Jobfile Sample
Client Borehole
Operator:FC Checked: FC Approved: FC
11/05/2020 Rev2 TR/GEO-SW0007 Compiled: M. Steyn Approved: R. Wilson
Void Ratio 0.294 0.271 0.231
Consolidation Details
0.322 0.516 0.787
Void Ratio After Consolidation 0.289 0.279 0.260
Specimen 1 Specimen 2 Specimen 3Vertical Displacement (mm)
(g)
Maximum Shear Stress Results
Final Sample Details
Friction Angle (ɸ) (°)
Specimen 3
20.0
60.0
122.4
9.6
1.97
2.16
0.311
Specimen 1
0.310
Specimen 2
20.0
60.0
122.3
9.6
1.97
2.16
0.313
2.17(Mg/m3)
(Mg/m3)
(%)
(g)
(mm)
98% (1.97)
Disturbed
Bag
Cohesion (c) (kPa)
0.030
Horizontal Strain at Failure
Peak Shear Stress
Normal Stress
Rate of Shear (mm/min) 0.031
(mm)
(kPa)
(kPa)
Specimen 2
100
97.6
2.1
0.111
21.30
36.1
55.9
Specimen 3
149
128.0
2.7
0.434
1.9
50
Specimen 1
18/09/2020
SWG00088 E TP57_0.5-1.9m
Zutari Clanwilliam Bridging Study
Test Method BS1377 - 7: 1990
-0.069(mm)Verical Stain at Failure
0.019
Specimen 3124.3
17.2Moisture
Mass
18.3
124.7
Specimen 1 Specimen 2125.7
18.9(%)
Particle Density 2.59
Bulk Density
Void Ratio
Direct Shear Test
Remoulded Desity (Mg/m3)
Disturbed/Undisturbed
Sample Method
Height
Diameter
Mass
Moisture
Dry Density
Initial Sample Details
1.98
9.6
122.5
60.0
20.0(mm)
(Mg/m3)
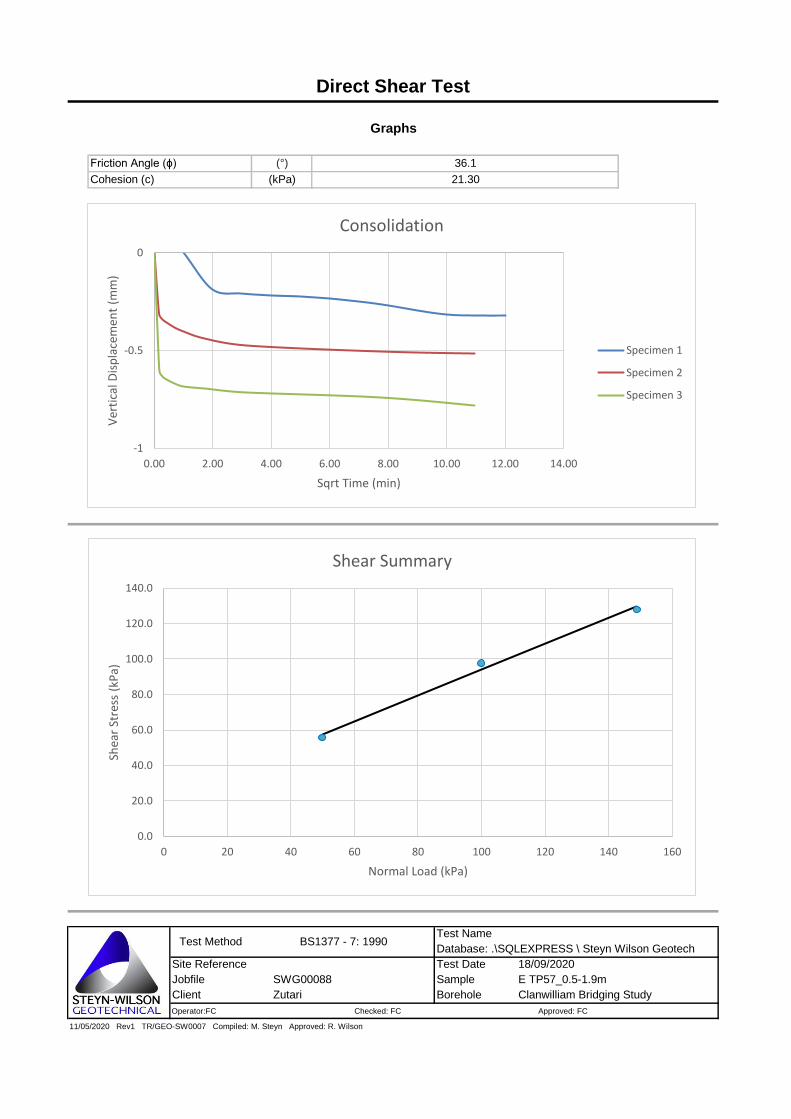
Test Name
Database: .\SQLEXPRESS \ Steyn Wilson Geotech
Site Reference Test Date
Jobfile Sample
Client Borehole
Operator:FC Checked: FC Approved: FC
11/05/2020 Rev1 TR/GEO-SW0007 Compiled: M. Steyn Approved: R. Wilson
Zutari Clanwilliam Bridging Study
Test Method BS1377 - 7: 1990
Friction Angle (ɸ) (°) 36.1
21.30
18/09/2020
Direct Shear Test
Graphs
Cohesion (c) (kPa)
SWG00088 E TP57_0.5-1.9m
-1
-0.5
0
0.00 2.00 4.00 6.00 8.00 10.00 12.00 14.00
Ver
tica
l Dis
pla
cem
ent
(mm
)
Sqrt Time (min)
Consolidation
Specimen 1
Specimen 2
Specimen 3
0.0
20.0
40.0
60.0
80.0
100.0
120.0
140.0
0 20 40 60 80 100 120 140 160
Shea
r St
ress
(kP
a)
Normal Load (kPa)
Shear Summary
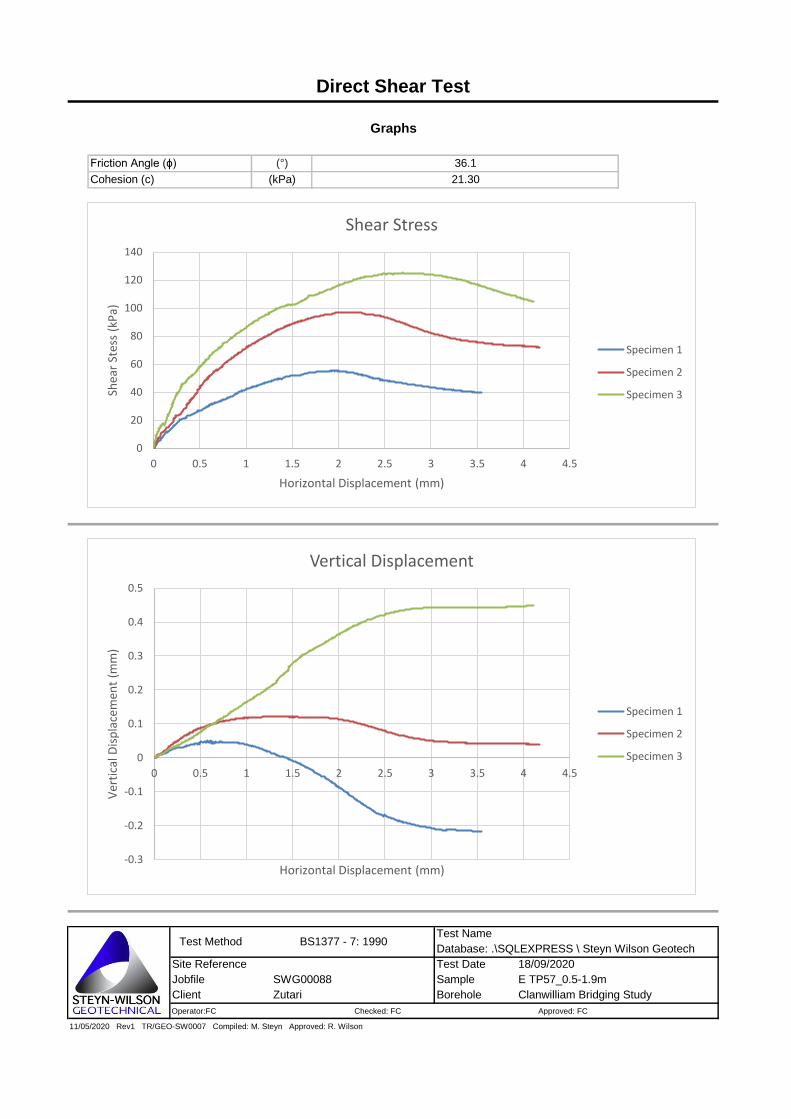
Test Name
Database: .\SQLEXPRESS \ Steyn Wilson Geotech
Site Reference Test Date
Jobfile Sample
Client Borehole
Operator:FC Checked: FC Approved: FC
11/05/2020 Rev1 TR/GEO-SW0007 Compiled: M. Steyn Approved: R. Wilson
Zutari Clanwilliam Bridging Study
Test Method BS1377 - 7: 1990
18/09/2020
SWG00088 E TP57_0.5-1.9m
Cohesion (c) (kPa) 21.30
Direct Shear Test
Graphs
Friction Angle (ɸ) (°) 36.1
0
20
40
60
80
100
120
140
0 0.5 1 1.5 2 2.5 3 3.5 4 4.5
Shea
r St
ess
(kP
a)
Horizontal Displacement (mm)
Shear Stress
Specimen 1
Specimen 2
Specimen 3
-0.3
-0.2
-0.1
0
0.1
0.2
0.3
0.4
0.5
0 0.5 1 1.5 2 2.5 3 3.5 4 4.5
Ver
tica
l Dis
pla
cem
ent
(mm
)
Horizontal Displacement (mm)
Vertical Displacement
Specimen 1
Specimen 2
Specimen 3

Post Feasibility Bridging Study for the Proposed Bulk Conveyance Infrastructure from the Raised Clanwilliam Dam (WP0485). Geotechnical Investigations Report. Vol III: Ebenhaeser Scheme (P WMA 09/E10/00/0417/8)
Directorate: Water Resource Development Planning April 2021 Page 105
Appendix F Electrical Resistivity Tomography Report and Detailed Results

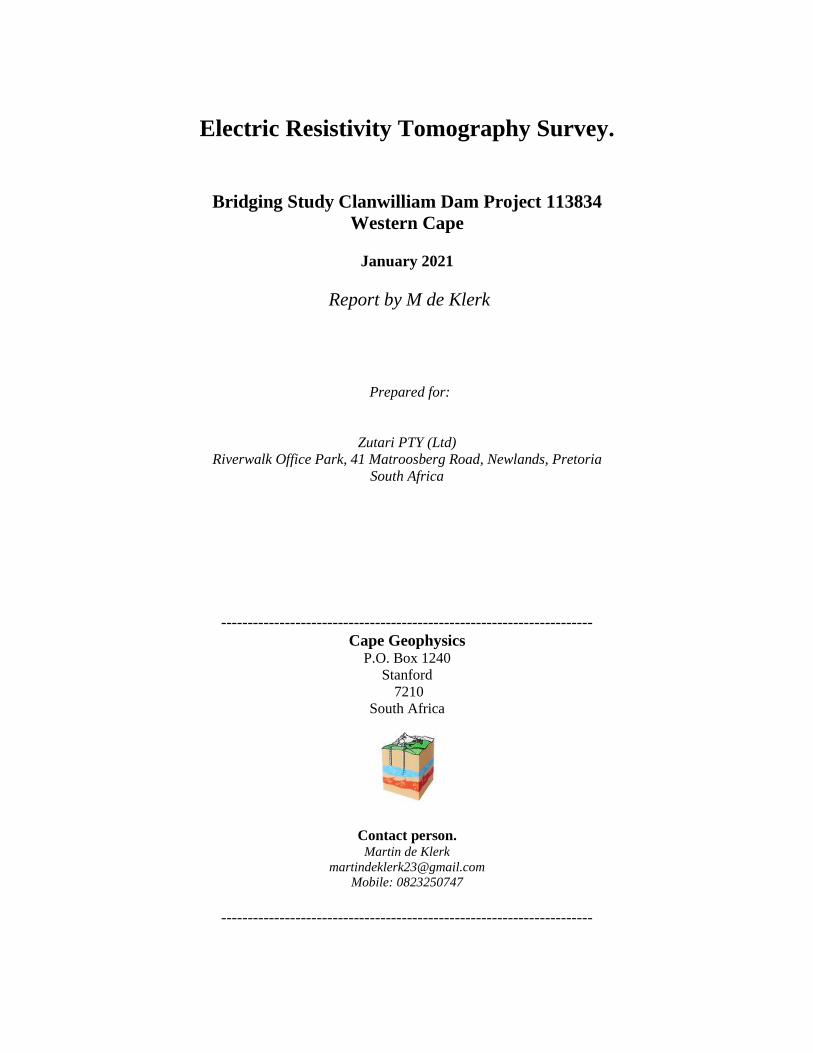
Electric Resistivity Tomography Survey.
Bridging Study Clanwilliam Dam Project 113834
Western Cape
January 2021
Report by M de Klerk
Prepared for:
Zutari PTY (Ltd)
Riverwalk Office Park, 41 Matroosberg Road, Newlands, Pretoria
South Africa
----------------------------------------------------------------------
Cape Geophysics P.O. Box 1240
Stanford
7210
South Africa
Contact person.
Martin de Klerk
Mobile: 0823250747
----------------------------------------------------------------------

2
Mr. G Davis of Zutari PTY(Ltd) Newlands Pretoria, requested Cape
Geophysics, Stanford to conduct eight ERT traverses at selected positions
for the post feasibility bridging study, raised Clanwilliam dam project,
(Figure-1).
Google Earth Locality Map
Figure-1
1. Terms of Reference
Conduct one ERT-2D traverse at the Olifants crossing, four traverses at the
Doring river crossing, one traverse at the Doring river extension syphon and
two traverses at the Ebenhaeser site.
Conduct the ERT surveys with a 4m electrode spacing to obtain an
investigation depth of approximately 24m, using the Wenner measuring
protocol.
The paragraphs below summarize the basic principles, field survey method
and data reduction of the multi-electrode resistivity imaging technique used.
The method is also referred to as ERT (Electrical Resistivity Tomography).
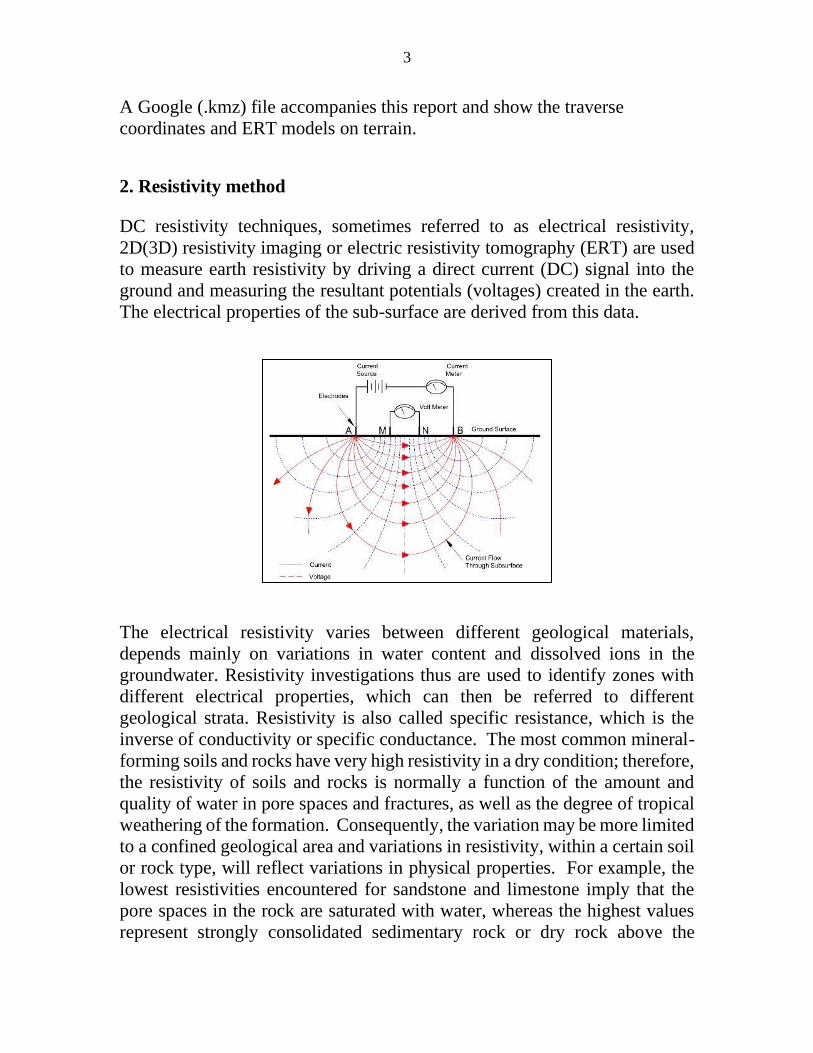
3
A Google (.kmz) file accompanies this report and show the traverse
coordinates and ERT models on terrain.
2. Resistivity method
DC resistivity techniques, sometimes referred to as electrical resistivity,
2D(3D) resistivity imaging or electric resistivity tomography (ERT) are used
to measure earth resistivity by driving a direct current (DC) signal into the
ground and measuring the resultant potentials (voltages) created in the earth.
The electrical properties of the sub-surface are derived from this data.
The electrical resistivity varies between different geological materials,
depends mainly on variations in water content and dissolved ions in the
groundwater. Resistivity investigations thus are used to identify zones with
different electrical properties, which can then be referred to different
geological strata. Resistivity is also called specific resistance, which is the
inverse of conductivity or specific conductance. The most common mineral-
forming soils and rocks have very high resistivity in a dry condition; therefore,
the resistivity of soils and rocks is normally a function of the amount and
quality of water in pore spaces and fractures, as well as the degree of tropical
weathering of the formation. Consequently, the variation may be more limited
to a confined geological area and variations in resistivity, within a certain soil
or rock type, will reflect variations in physical properties. For example, the
lowest resistivities encountered for sandstone and limestone imply that the
pore spaces in the rock are saturated with water, whereas the highest values
represent strongly consolidated sedimentary rock or dry rock above the
4
groundwater surface. Sand, gravel and sedimentary rock may also have very
low resistivities, provided that the pore spaces are saturated with saline water.
Fresh crystalline rock is highly resistive, despite the fact that it may contain
certain conductive ore minerals; however, weathering commonly produces
highly conductive clay-rich saprolite. Variation in characteristics within one
geological material type necessitates calibration of resistivity data against
geological documentation, from, for example, surface mapping, test pit
exposures or drilling. However, this applies to all geophysical methods.
The degree of saturation, of course, will affect the resistivity; the resistivity
above the groundwater level will be higher than that below this level, i.e. if
the material is similar. Consequently, this method can be used to determine
the depth to the water table, where a distinct water table exists. However, if
the content of fine-grained material is significant, the water content above the
groundwater surface, held by hygroscopic and capillary forces, may be large
enough to dominate the electrical behaviour of the material. The resistivity of
the pore water is determined by concentrations of ions in solution, the type of
ions and temperature. The presence of clay minerals strongly affects the
resistivity of sediments and weathered rock. The clay minerals may be
regarded as electrically conductive particles, which can absorb and release
ions and water molecules on its surface through an ion exchange process.
Note.
It is impossible to determine hydrologeogical parameters, such as porosity
and transmissivities of a formation through geophysical results. Lower
electric resistivities in a homogeneous formation are normally associated with
higher porosities and transmissivities. Very low resistivities on the other hand,
are associated with clayey and, consequently, low transmissive- or saline-
saturated formations.
2.1. Field survey method.
An Abem SAS 1000 Terrameter and ES 10-64 switching unit were used for
data acquisition during January 2021. Electrical resistivity measurements
were conducted with the Wenner measuring protocol and a 4m electrode
spacing. This measuring protocol and electrode spacing yield a maximum
investigation depth of approximately 24 meters.

5
Measurement of the resistivity of the ground is carried out by transmitting a
controlled current (I) between two electrodes inserted in the ground, while
measuring the potential (V) between two other electrodes. Direct current
(DC) or a very low frequency alternating current is used; the method is often
called DC-resistivity. The resistance (R) is calculated using Ohm’s law.
Traverse coordinates were obtained with a handheld GPS. Elevations along
the traverses were obtained from Google Earth.
2.2. Data Reduction.
The RES2Dinv (GEOTOMO) version 3.52-inversion program was used to
invert the measured apparent resistivities to obtain the true ground resistivity
values below the survey line.
The inversion routine used by the program is based on the smoothness-
constrained least-squares method (de Groot-Hedlin and Constable 1990,
Sasaki 1992). One advantage of the method is that the damping factor and
flatness filters can be adjusted to suit different types of data. The 2-D model
used by this program divides the subsurface into a number of rectangular
blocks that will produce an apparent resistivity pseudo section that agrees
with the actual measurements. A forward modelling subroutine is used to
calculate the apparent resistivity values, and a non-linear least-squares
optimisation technique is used for the inversion routine. The optimisation
method basically tries to reduce the difference between the calculated and
measured apparent resistivity values by adjusting the resistivities of the
model blocks. A measure of this difference is given by the root-mean-
squared (RMS) error. However, the model with the lowest RMS error can
sometimes show large and unrealistic variations in the model resistivity
values and might not always be the “best” model from a geological
perspective. In general, the most prudent approach is to choose the model at
the iteration after the RMS error does not change significantly.
It is important to note that the inversion process that translates raw resistivity
data into a resistivity cross section is non-unique. The inversion program
chooses the smoothest, least heterogeneous, solution. This solves the
mathematical problem of non-uniqueness but produces a slightly blurred
image of the actual geology. Abrupt transitions between layers become
gradational transitions in the resistivity section. Second, the data are
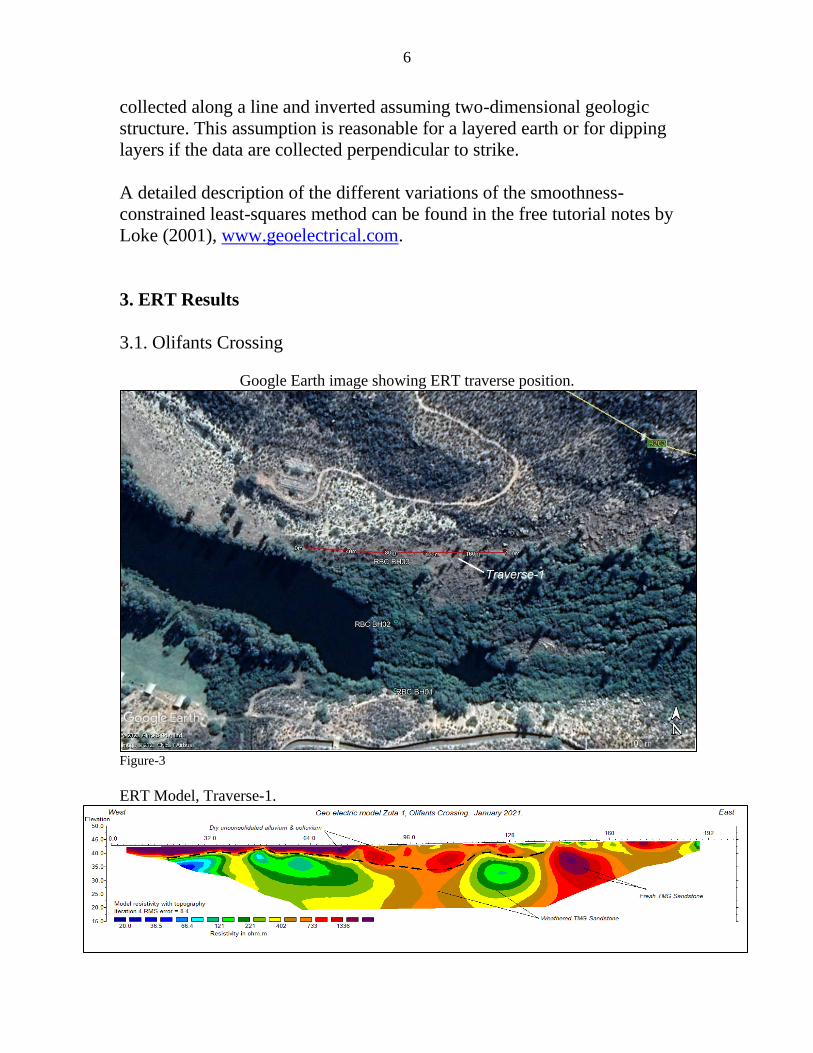
6
collected along a line and inverted assuming two-dimensional geologic
structure. This assumption is reasonable for a layered earth or for dipping
layers if the data are collected perpendicular to strike.
A detailed description of the different variations of the smoothness-
constrained least-squares method can be found in the free tutorial notes by
Loke (2001), www.geoelectrical.com.
3. ERT Results
3.1. Olifants Crossing
Google Earth image showing ERT traverse position.
Figure-3
ERT Model, Traverse-1.

7
3.2. Doring River Crossing
Google Earth image showing ERT traverse positions.
Figure-4
ERT Model, Traverse-2.
ERT Model, Traverse-3.
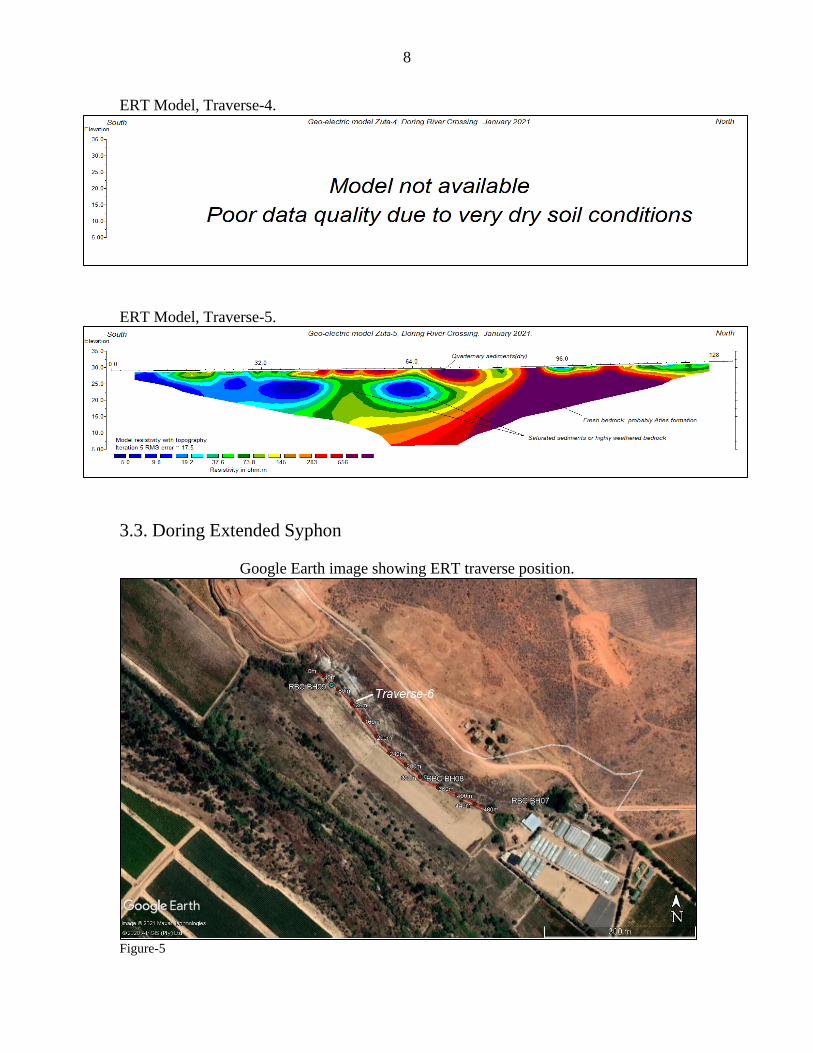
8
ERT Model, Traverse-4.
ERT Model, Traverse-5.
3.3. Doring Extended Syphon
Google Earth image showing ERT traverse position.
Figure-5
9
ERT Model, Traverse-6.
3.4. Ebenhaeser
Google Earth image showing ERT traverse positions.
Figure-6
ERT Model, Traverse-7.

10
ERT Model, Traverse-8.
4. References
Van Zyl, J.S.V., 1985. A practical manual on the Resistivity method (revised
edition).
Loke, M.H., 2004. Tutorial: Rapid 2D Resistivity & IP Inversion, Geotomo
software, Malaysia.
Loke, M.H., Baker, R.D Geophysical Prospecting Volume 44, Issue 1,
Pages131 - 152
1996 European Association of Geoscientists & Engineers
******************************
M de Klerk (Pr. Sci.Nat)
(Geophysicist)
January 2021

Post Feasibility Bridging Study for the Proposed Bulk Conveyance Infrastructure from the Raised Clanwilliam Dam (WP0485). Geotechnical Investigations Report. Vol III: Ebenhaeser Scheme (P WMA 09/E10/00/0417/8)
Directorate: Water Resource Development Planning April 2021 Page 106
Appendix G Rotary Core Borehole Logs and Photographs


0
0
0
0
0
0
0
0
0
0
0
0
0
0
0
0
10.009.85
8.20
2.25
100
71
80
66
444
40
69
64
51
45
40
47
87
38
34
31
0
0
0
0
0
0
0
0
0
0
0
0
0
0
0
0
7
7
8
29
11
-
-
-
Dry, light yellow brown, silty to fine sand, ALLUVIUM / AEOLIAN. Roots and organicmatter in layer.Moist to wet, brown to dark brown, silty to clayey sand, ALLUVIUM.
Moist, off-white to light brown, silty to coarse sand, ALLUVIUM.
NOTES:
1. End of hole at 7.75m.2. Some turns wash-bored.
N/A
N/A
N/A
N/A
N/A
N/A
0.000.15
1.80
7.75
N/A
N/A
N/A
Logged date: 2021/03/02Machine: YWE
Drilled date: 2021/03/02 -
Logged by: GD/KM
Ebenhaeser
Department of Water and Sanitation
JOINT INFILLClSltSndStCn
ClaySiltSandStainedClean
JOINT SPACINGVCJCJMJWJVWJ
JOINT ROUGHNESSSSRR
ABREVIATIONSN/AN/MITNT
not applicablenot measureableinvalid testno test
WEATHERING SHADINGBROWN100%75%50%25%0%
113834
RQD(%)
ReducedLevel
Contractor: BS Moloi Drilling
Drilled by: J.Katjedi
Elevation: 10
North: -3500304.52
soilcompletely weatheredhighly weatheredmoderately weatheredslightly weatheredunweathered
East: -56200.6
very close spacingclose spacingmedium spacingwide spacingvery wide spacing
smoothslightly roughrough
Clanwilliam Bridging Study
MaterialRecovery
%
CoreRecovery
%
SPTTest
Sheet 1 of 1
HOLE No: EB BH01
Scale1:60
JointInclin.(deg)
JointInfill
JointRough-
ness
JointSpacing
Scale1:60
1
2
3
4
5
6
7
8
Weathering
0
0
0
0
0
0
0
0
0
0
0
0
0
0
9.00
5.56
3.20
3.00
1.05
98
55
70
49
91
96
47
89
89
92
67
44
36
69
0
0
0
0
0
0
0
0
0
0
0
0
0
0
14
14
13
18
18
-
-
-
-
Moist, brown, silty sand, ALLUVIUM.
Moist, brown to dark brown, clayey silty sand, ALLUVIUM.
Very moist, light brown, coarse sand, ALLUVIUM.Moist, brown to light brown, slightly clayey silty sand, ALLUVIUM.
NOTES:
1. End of hole at 7.95m.
N/A
N/A
N/A
N/A
N/A
N/A
N/A
N/A
0.00
3.44
5.806.00
7.95
N/A
N/A
N/A
N/A
Logged date: 2021/03/02Machine: YWE
Drilled date: 2021/03/02 -
Logged by: GD/KM
Ebenhaeser
Department of Water and Sanitation
JOINT INFILLClSltSndStCn
ClaySiltSandStainedClean
JOINT SPACINGVCJCJMJWJVWJ
JOINT ROUGHNESSSSRR
ABREVIATIONSN/AN/MITNT
not applicablenot measureableinvalid testno test
WEATHERING SHADINGBROWN100%75%50%25%0%
113834
RQD(%)
ReducedLevel
Contractor: BS Moloi Drilling
Drilled by: J.Katjedi
Elevation: 9
North: -3500336.28
soilcompletely weatheredhighly weatheredmoderately weatheredslightly weatheredunweathered
East: -56205.97
very close spacingclose spacingmedium spacingwide spacingvery wide spacing
smoothslightly roughrough
Clanwilliam Bridging Study
MaterialRecovery
%
CoreRecovery
%
SPTTest
Sheet 1 of 1
HOLE No: EB BH02
Scale1:60
JointInclin.(deg)
JointInfill
JointRough-
ness
JointSpacing
Scale1:60
1
2
3
4
5
6
7
8
Weathering

DATE DRILLED
BS Moloi DrillingCONTRACTOR
0,00DEPTH (m) FROM to
BH E01BH No.
PROJECT NAME
1/1BOX No.SITE
Ebenhaeser
DATE PROFILED 01 Mar 2021
23 Feb 2021
7,75SCHEME
Olifants River Crossing
Bridging Study, Clanwilliam Dam
DATE DRILLED
BS Moloi DrillingCONTRACTOR
0,00DEPTH (m) FROM to
BH E02BH No.
PROJECT NAME
1/1BOX No.SITE
Ebenhaeser
DATE PROFILED 02 Mar 2021
25 Feb 2021
7,95SCHEME
Olifants River Crossing
Bridging Study, Clanwilliam Dam

Post Feasibility Bridging Study for the Proposed Bulk Conveyance Infrastructure from the Raised Clanwilliam Dam (WP0485). Geotechnical Investigations Report. Vol III: Ebenhaeser Scheme (P WMA 09/E10/00/0417/8)
Directorate: Water Resource Development Planning April 2021 Page 107
Appendix H SPT Results contained in Drillers Daily Logs

DAILY DRILLING JOURNAL
Client: DWS Drilling Rig: YWE Drilling and CasingProject: Clanwilliam Bridging Study Driller: Johannes Katjedi Type From To TotalContract No: Supervisor: R. Weppelmann DIGSite: Olifants Crossing (Ebenhaeser) 23 February 2021 NXC 0.00 1.50 1.50Borehole No: BH E01 Set Up: Drive On NWD4 1.50 7.75 6.25Water Levels: 2.30m 5 TNWDrilling Angle: Vertical Block : 1 GROUTDirection: Standpipe: none PiezoShelby's 0 Core Boxes: 1 Casing 0.00 7.30 7.30
Strata Description
Depth Drilled Runs Drilling Core Recovery cat Strata Depth Test S.P.T.Nr.W/T Depth Of Blows
Date From To Adv. Type Meters % From To Meter per 7.5 cm
23-Feb-21 0.00 0.15 0.15 NXC 0.15 100
0.15 0.50 0.35 “ 0.24 69 Loose brown river sand. A 0.00 7.75
0.50 1.00 0.50 “ 0.40 80
1.00 1.50 0.50 “ 0.31 62
1.50 1.95 0.45 SPT 0.33 73 1.50 1/2/1/2/2/2
1.95 2.42 0.47 “ 0.18 38
2.42 2.81 0.39 “ wash
2.81 3.26 0.45 SPT 0.33 73 2.81 1/1/1/2/2/2
3.26 4.31 1.05 “ 0.52 50
4.31 4.76 0.45 SPT 0.28 62 4.31 2/1/2/2/2/2/
4.76 5.28 0.52 “ wash
5.28 5.83 0.55 “ 0.29 53
5.83 6.28 0.45 SPT 0.45 100 5.83 2/4/6/6/8/9
6.28 6.80 0.52 “ wash
6.80 7.30 0.50 “ wash
Wl=3.30m 7.30 7.75 0.45 SPT 0.21 47 7.30 2/2/4/3/2/2
3.69 Core Recovery
01-Feb-26
Wl-2.30m
7.75m End of BHRemarks: New GPS Location : S 31 37' 35.5”, E 018 24' 25.3”
Date:
S.P.T. No:
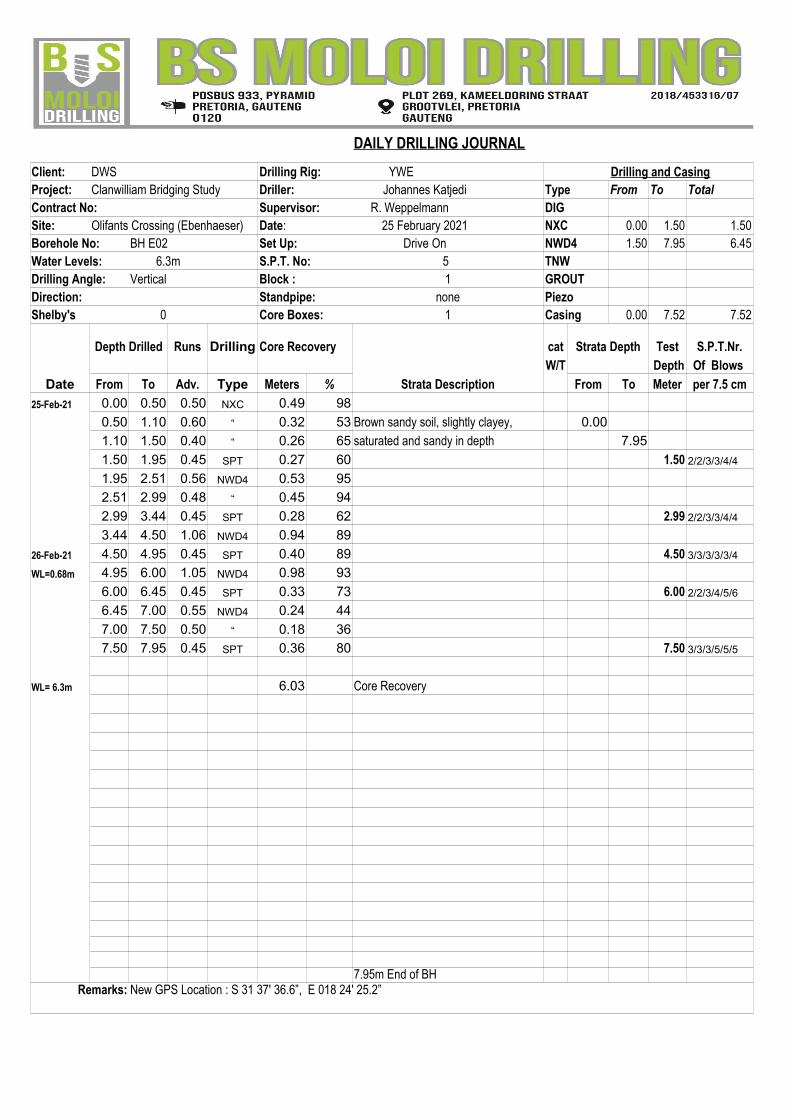
DAILY DRILLING JOURNAL
Client: DWS Drilling Rig: YWE Drilling and CasingProject: Clanwilliam Bridging Study Driller: Johannes Katjedi Type From To TotalContract No: Supervisor: R. Weppelmann DIGSite: Olifants Crossing (Ebenhaeser) 25 February 2021 NXC 0.00 1.50 1.50Borehole No: BH E02 Set Up: Drive On NWD4 1.50 7.95 6.45Water Levels: 6.3m 5 TNWDrilling Angle: Vertical Block : 1 GROUTDirection: Standpipe: none PiezoShelby's 0 Core Boxes: 1 Casing 0.00 7.52 7.52
Strata Description
Depth Drilled Runs Drilling Core Recovery cat Strata Depth Test S.P.T.Nr.W/T Depth Of Blows
Date From To Adv. Type Meters % From To Meter per 7.5 cm
25-Feb-21 0.00 0.50 0.50 NXC 0.49 98
0.50 1.10 0.60 “ 0.32 53 Brown sandy soil, slightly clayey, 0.00
1.10 1.50 0.40 “ 0.26 65 saturated and sandy in depth 7.95
1.50 1.95 0.45 SPT 0.27 60 1.50 2/2/3/3/4/4
1.95 2.51 0.56 NWD4 0.53 95
2.51 2.99 0.48 “ 0.45 94
2.99 3.44 0.45 SPT 0.28 62 2.99 2/2/3/3/4/4
3.44 4.50 1.06 NWD4 0.94 89
26-Feb-21 4.50 4.95 0.45 SPT 0.40 89 4.50 3/3/3/3/3/4
WL=0.68m 4.95 6.00 1.05 NWD4 0.98 93
6.00 6.45 0.45 SPT 0.33 73 6.00 2/2/3/4/5/6
6.45 7.00 0.55 NWD4 0.24 44
7.00 7.50 0.50 “ 0.18 36
7.50 7.95 0.45 SPT 0.36 80 7.50 3/3/3/5/5/5
WL= 6.3m 6.03 Core Recovery
7.95m End of BHRemarks: New GPS Location : S 31 37' 36.6”, E 018 24' 25.2”
Date:
S.P.T. No:

Post Feasibility Bridging Study for the Proposed Bulk Conveyance Infrastructure from the Raised Clanwilliam Dam (WP0485). Geotechnical Investigations Report. Vol III: Ebenhaeser Scheme (P WMA 09/E10/00/0417/8)
Directorate: Water Resource Development Planning April 2021 Page 108
Appendix I Probabilistic Seismic Hazard Analysis for the Clanwilliam Dam (excerpt from Aurecon Report 106310-G5-01 Clanwilliam Dam: Second Engineering Geological Report for Design of Dam Raising)


- 1 -
PROBABILISTIC SEISMIC HAZARD
ANALYSIS FOR THE CLANWILLIAM DAM,
SOUTH AFRICA
Submitted to
AURECON South Africa (Pty) Ltd (Reg. No: 1997/003711/07)
(“AURECON”)
Aurecon Centre, 1040 Burnett Street, Hatfield, Tshwane,
South Africa
Prepared by
A Kijko
Natural Hazard Assessment Consultancy
8 Birch St Clubview ext 2,
Centurion 0157
South Africa
cell: 0829394002
e-mail: [email protected]
Report No: 2011-002 (Rev 1.01)

- 2 -
Table of Content
1. Executive Summary
2. Definition of Terms, Symbols and Abbreviations
3. List of Figures and Tables
3.1. List of Figures
3.2. List of Tables
4. Terms of Reference
5. Introduction
6. Regional Geology (by G. Davis, AURECON South Africa)
7. Seismic Sources and their Parameters
8. Ground Motion Prediction Equations (GMPE)
9. Probabilistic Seismic Hazard Analysis for the Dam Site
9.1 Maximum Credible Earthquake (MCE), Maximum Design Earthquake
(MDE) and Operating Basis Earthquake (OBE).
9.2 Newmark-Hall Elastic Response Spectra
9.3 Uniform Hazard Spectra (UHS)
10. Account of Uncertainties: Logic Tree Approach
11. Conclusions
12. References
Appendices
Appendix A: Seismicity of area surrounding a Clanwilliam Dam, South Africa
in the radius 320 km
Appendix B: Applied Methodology for Probabilistic Seismic Hazard Analysis
1. Introduction
2. Estimation of the Seismic Source Recurrence Parameters – Bayesian
Approach
2.1. Nature of input data
2.2. Statistical preliminaries
2.3. Estimation of the seismic source recurrence parameters
2.3.1 Extreme magnitude distribution as applied to prehistoric
(paleo) and historic events
2.3.2. Combination of extreme and complete seismic catalogues
with different levels of completeness
2.4. Estimation of the maximum regional earthquake magnitude maxm
- 3 -
3. The Cornell-McGuire PSHA Methodology
4. References to Methodology Description
Appendix C: Seismic Sources and their Recurrence Parameters
Appendix D: Applied Ground Motion Perdition Equations
Appendix E: Results of PSHA. Tabulated values of mean activity rate, return
periods and probability of exceedance in 1, 50, 100 and 1 000 years for specified
values of PGA
Appendix F: Attenuation of vertical peak acceleration (by N. A. Abrahamson
and J.J. Litehiser)
Compiled by:
………………………………………………….............…...............…..….
Prof. A. Kijko 3 March 2011 (Rev. 1.00); 9 April 2011 (Rev. 1.01)
NHAC

- 4 -
1. Executive Summary
A Probabilistic Seismic Hazard Analysis (PSHA) has been performed for the
considered Clanwilliam Dam site, South Africa. All earthquakes located within a
radius of 320 km from the dam site were used in the assessment. The PSHA was
performed using the Cornell-McGuire procedure which can be broken down into
two phases: 1) spatial delineation of seismogenic sources within 320 km from the
site and 2) integration of all possible earthquake scenarios from each source to
obtain probabilities of exceedance of specified ground motion parameters.
All calculations are repeated two times, each for different ground motion
prediction equation (GMPE). The models of ground motion prediction are:
• Atkinson and Boore, 2006 [GMPE-1]
• Spudich et al., 1999 [GMPE-2]
The first GMPE (Atkinson and Boore, 2006) was developed for the central and
eastern United States which is situated in a type of tectonic environment known as
an intraplate region, or equivalently, stable continental area. Because of the
limited number of strong-motion records in the stable continental areas, the
attenuation relation (horizontal component) has been developed mainly by help of
stochastic modelling.
The second GMPE (Spudich et al., 1999) is appropriate for predicting earthquake
generated horizontal component of ground motions in extensional tectonic
regimes. The area which is located between the Sierra Nevada Mountains in
eastern California and the Wasatch Mountains in central Utah, are an example of
shallow extensional tectonic environment. Some parts of Western Europe, parts of
Italy and Greece, the East African Rift System are other examples of extensional
environment. In general, the relationships predict lower ground motions than any
other applied ground motion prediction equation.

- 5 -
The PSHA was performed using conventional, Cornell-McGuire procedure
(Cornell, 1968; McGuire, 1976; 1978), where the integration across the
uncertainty in the PGA prediction equation is an integral part of the methodology.
In accordance to the guideline ICOLD (1989), and current seismic regulations as
e.g. Eurocode 8 (2004) and ASCE (2005), three seismic designed levels were
considered: Operating Basis Earthquake (OBE), Maximum Design Earthquake
(MDE) and Maximum Credible Earthquake (MCE).
Given the existence of four faults in vicinity of the dam site, an investigation of
the effect of seismic activity of the faults on the seismic hazard assessment was
performed.
The results of PSHA are given in terms of mean return periods and probabilities
of being exceeded, for horizontal component of PGA. The uniform response
spectra are also provided.
After application of logic tree formalism to the uniform horizontal ground
acceleration spectra, the service, abnormal and extreme curves show a spectral
acceleration peak of approximately 0,3 g, 0,6 g and 1,6 g at 40 Hz, respectively.
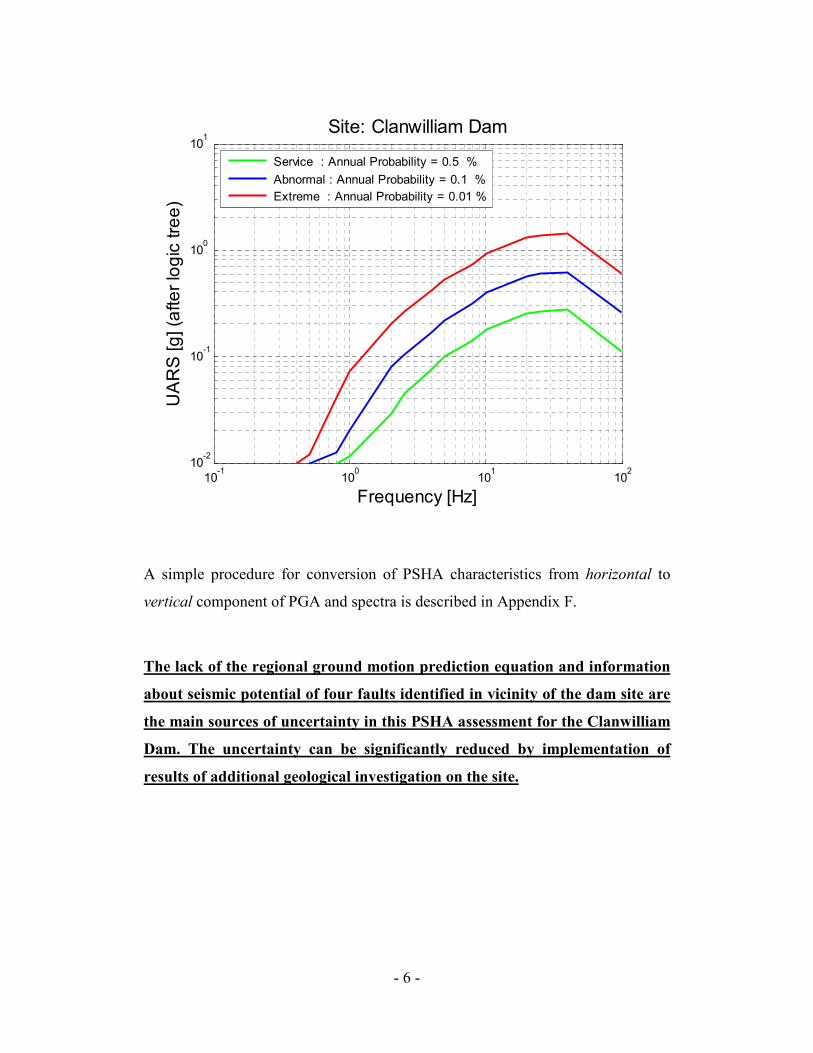
- 6 -
A simple procedure for conversion of PSHA characteristics from horizontal to
vertical component of PGA and spectra is described in Appendix F.
The lack of the regional ground motion prediction equation and information
about seismic potential of four faults identified in vicinity of the dam site are
the main sources of uncertainty in this PSHA assessment for the Clanwilliam
Dam. The uncertainty can be significantly reduced by implementation of
results of additional geological investigation on the site.
10-1
100
101
102
10-2
10-1
100
101
Site: Clanwilliam Dam
Frequency [Hz]
UA
RS
[g] (a
fter lo
gic
tre
e)
Service : Annual Probability = 0.5 %
Abnormal : Annual Probability = 0.1 %
Extreme : Annual Probability = 0.01 %
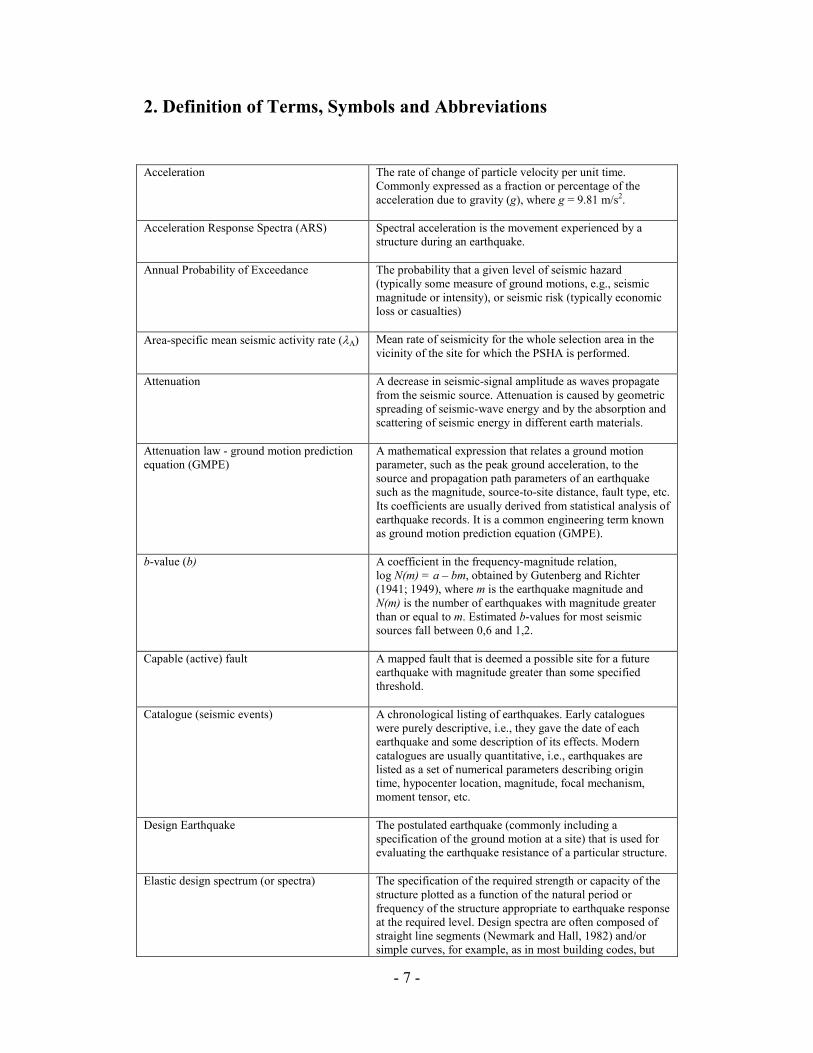
- 7 -
2. Definition of Terms, Symbols and Abbreviations
Acceleration The rate of change of particle velocity per unit time.
Commonly expressed as a fraction or percentage of the
acceleration due to gravity (g), where g = 9.81 m/s2.
Acceleration Response Spectra (ARS) Spectral acceleration is the movement experienced by a
structure during an earthquake.
Annual Probability of Exceedance The probability that a given level of seismic hazard
(typically some measure of ground motions, e.g., seismic
magnitude or intensity), or seismic risk (typically economic
loss or casualties)
Area-specific mean seismic activity rate (λA) Mean rate of seismicity for the whole selection area in the
vicinity of the site for which the PSHA is performed.
Attenuation A decrease in seismic-signal amplitude as waves propagate
from the seismic source. Attenuation is caused by geometric
spreading of seismic-wave energy and by the absorption and
scattering of seismic energy in different earth materials.
Attenuation law - ground motion prediction
equation (GMPE)
A mathematical expression that relates a ground motion
parameter, such as the peak ground acceleration, to the
source and propagation path parameters of an earthquake
such as the magnitude, source-to-site distance, fault type, etc.
Its coefficients are usually derived from statistical analysis of
earthquake records. It is a common engineering term known
as ground motion prediction equation (GMPE).
b-value (b) A coefficient in the frequency-magnitude relation,
log N(m) = a – bm, obtained by Gutenberg and Richter
(1941; 1949), where m is the earthquake magnitude and
N(m) is the number of earthquakes with magnitude greater
than or equal to m. Estimated b-values for most seismic
sources fall between 0,6 and 1,2.
Capable (active) fault
A mapped fault that is deemed a possible site for a future
earthquake with magnitude greater than some specified
threshold.
Catalogue (seismic events) A chronological listing of earthquakes. Early catalogues
were purely descriptive, i.e., they gave the date of each
earthquake and some description of its effects. Modern
catalogues are usually quantitative, i.e., earthquakes are
listed as a set of numerical parameters describing origin
time, hypocenter location, magnitude, focal mechanism,
moment tensor, etc.
Design Earthquake The postulated earthquake (commonly including a
specification of the ground motion at a site) that is used for
evaluating the earthquake resistance of a particular structure.
Elastic design spectrum (or spectra) The specification of the required strength or capacity of the
structure plotted as a function of the natural period or
frequency of the structure appropriate to earthquake response
at the required level. Design spectra are often composed of
straight line segments (Newmark and Hall, 1982) and/or
simple curves, for example, as in most building codes, but

- 8 -
they can also be constructed from statistics of response
spectra of a suite of ground motions appropriate to the design
earthquake(s). To be implemented, the requirements of a
design spectrum are associated with allowable levels of
stresses, ductilities, displacements or other measures of
response.
Earthquake Ground shaking and radiated seismic energy caused most
commonly by sudden slip on a fault, volcanic or magmatic
activity, or other sudden stress changes in the Earth.
Epicentre The epicentre is the point on the earth's surface vertically
above the hypocenter (or focus).
Epicentral distance (∆) Distance from the site to the epicentre of an earthquake.
Fault A fracture or fracture zone in the Earth along which the two
sides have been displaced relative to one another parallel to
the fracture. The accumulated displacement may range from
a fraction of a meter to many kilometres. The type of fault is
specified according to the direction of this slip. Sudden
movement along a fault produces earthquakes. Slow
movement produces a seismic creep.
Focal depth (h) Focal depth is the vertical distance between the hypocentre
and epicentre.
Frequency
The number of cycles of a periodic motion (such as the
ground shaking up and down or back and forth during an
earthquake) per unit time; the reciprocal of period. Hertz
(Hz), the unit of frequency, is equal to the number of cycles
per second.
Ground motion
The movement of the earth's surface from earthquakes or
explosions. Ground motion is produced by waves that are
generated by sudden slip on a fault or sudden pressure at the
explosive source and travel through the earth and along its
surface.
Ground motion parameter A parameter characterizing ground motion, such as peak
acceleration, peak velocity, and peak displacement (peak
parameters) or ordinates of response spectra and Fourier
spectra (spectral parameters).
Heterogeneity A medium is heterogeneous when its physical properties
change along the space coordinates. A critical parameter
affecting seismic phenomena is the scale of heterogeneities
as compared with the seismic wavelengths. For a relatively
large wavelength, for example, an intrinsically isotropic
medium with oriented heterogeneities may behave as a
homogeneous anisotropic medium.
Hypocenter The hypocenter is the point within the earth where an
earthquake rupture starts. The epicentre is the point directly
above it at the surface of the Earth. Also commonly termed
the focus.
Hypocentral distance (r)
Distance from the site to the hypocenter of an earthquake.
Induced earthquake An earthquake that results from changes in crustal stress
and/or strength due to man-made sources (e.g., underground

- 9 -
mining and filling of a water reservoir), or natural sources
(e.g., the fault slip of a major earthquake). As defined less
rigorously, “induced” is used interchangeably with
“triggered” and applies to any earthquake associated with a
stress change, large or small.
Local Magnitude (ML) A magnitude scale introduced by Richter (1935) for
earthquakes in southern California. ML was originally
defined as the logarithm of the maximum amplitude of
seismic waves on a seismogram written by the Wood-
Anderson seismograph (Anderson and Wood, 1925) at a
distance of 100 km from the epicentre. In practice,
measurements are reduced to the standard distance of 100
km by a calibrating function established empirically.
Because Wood-Anderson seismographs have been out of use
since the 1970s, ML is now computed with simulated Wood-
Anderson records or by some more practical methods.
Magnitude In seismology, a quantity intended to measure the size of
earthquake and is independent of the place of observation.
Richter magnitude or local magnitude (ML) was originally
defined in Richter (1935) as the logarithm of the maximum
amplitude in micrometers of seismic waves in a seismogram
written by a standard Wood-Anderson seismograph at a
distance of 100 km from the epicentre. Empirical tables were
constructed to reduce measurements to the standard distance
of 100 km, and the zero of the scale was fixed arbitrarily to
fit the smallest earthquake then recorded. The concept was
extended later to construct magnitude scales based on other
data, resulting in many types of magnitudes, such as body-
wave magnitude (mb), surface-wave magnitude (MS), and
moment magnitude (MW). In some cases, magnitudes are
estimated from seismic intensity data, tsunami data, or
duration of coda waves. The word “magnitude” or the
symbol M, without a subscript, is sometimes used when the
specific type of magnitude is clear from the context, or is not
really important.
Maximum Regional Earthquake Magnitude
(mmax)
Upper limit of magnitude for a given seismogenic zone or
entire region. Often also referred to as the maximum credible
earthquake (MCE).
Operating Basis Event (OBE) Event with an average return period in the order of 145 years
i.e. 50 % probability of exceedance in 100 years.
Oscillator In earthquake engineering, an oscillator is an idealized
damped mass-spring system used as a model of the response
of a structure to earthquake ground motion. A seismograph is
also an oscillator of this type
Peak Ground Acceleration (PGA) The maximum acceleration amplitude measured (or
expected) of an earthquake.
Probabilistic Seismic Hazard Analysis
(PSHA)
Available information on earthquake sources in a given
region is combined with theoretical and empirical relations
among earthquake magnitude, distance from the source and
local site conditions to evaluate the exceedance probability
of a certain ground motion parameter, such as the peak
acceleration, at a given site during a prescribed period.
Response spectrum The response of the structure to a specified acceleration time
series of a set of single-degree-of-freedom oscillators with
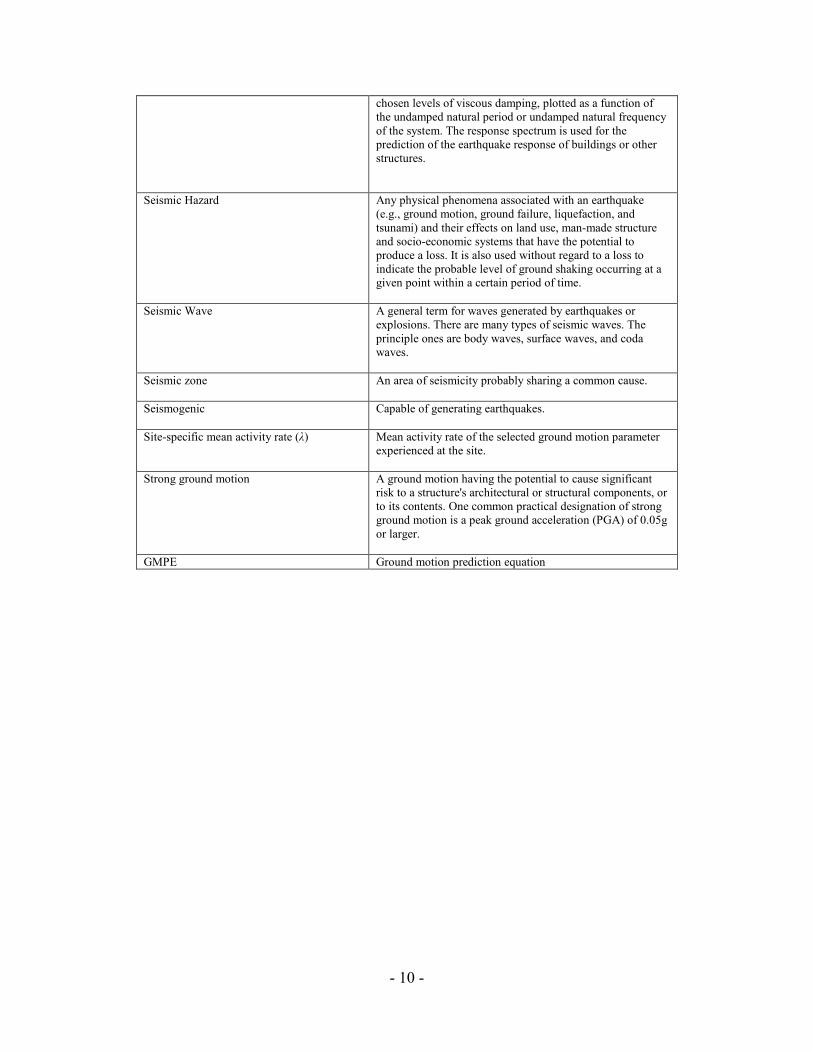
- 10 -
chosen levels of viscous damping, plotted as a function of
the undamped natural period or undamped natural frequency
of the system. The response spectrum is used for the
prediction of the earthquake response of buildings or other
structures.
Seismic Hazard Any physical phenomena associated with an earthquake
(e.g., ground motion, ground failure, liquefaction, and
tsunami) and their effects on land use, man-made structure
and socio-economic systems that have the potential to
produce a loss. It is also used without regard to a loss to
indicate the probable level of ground shaking occurring at a
given point within a certain period of time.
Seismic Wave
A general term for waves generated by earthquakes or
explosions. There are many types of seismic waves. The
principle ones are body waves, surface waves, and coda
waves.
Seismic zone An area of seismicity probably sharing a common cause.
Seismogenic Capable of generating earthquakes.
Site-specific mean activity rate (λ) Mean activity rate of the selected ground motion parameter
experienced at the site.
Strong ground motion A ground motion having the potential to cause significant
risk to a structure's architectural or structural components, or
to its contents. One common practical designation of strong
ground motion is a peak ground acceleration (PGA) of 0.05g
or larger.
GMPE Ground motion prediction equation

- 11 -
3. List of Figures and Tables
3.1. List of Figures
Figure 6.1 Regional geological setting; from the 1:250 000 geological map, Sheet
3218 Clanwilliam (Council for Geoscience, Pretoria)
Figure 6.2 Regional geology of the Clanwilliam Dam environs (after 1:50 000
geological field sheet – Council for Geoscience, Pretoria)
Figure 7.1 Distribution of largest seismic events within 320 km radius of the
Clanwilliam Dam site. The location of dam wall is shown as a blue square.
Figure 7.2 Close-up view of four faults in vicinity of Clanwilliam Dam (G. Davis,
personal communication). The location of dam wall is shown as a blue square.
Figure 7.3 Schematic illustration of the doubly truncated frequency-magnitude
Gutenberg-Richter relation. The slope of the curve is described by parameter b,
known as the b-value of the Gutenberg-Richter. Value mmin is the minimum
earthquake magnitude to be considered and mmax is the regional characteristic,
maximum possible earthquake magnitude.
Figure 9.1(a) Annual probability of exceedance of median value of horizontal
PGA at the site of the dam, calculated for ground motion prediction equation by
Atkinson and Boore (2006), (GMPE-1). Scenario #1: four known faults in vicinity
of the dam are not active.
Figure 9.1(b) Annual probability of exceedance of median value of horizontal
PGA at the site of the dam, calculated for ground motion prediction equation by
Atkinson and Boore (2006), (GMPE-1). Scenario #2: four known faults in vicinity
of the dam are active.
Figure 9.1(c) Annual probability of exceedance of median value of horizontal
Figure 9.1(d) Annual probability of exceedance of median value of PGA at the
site of the dam, calculated for ground motion prediction equation by Spudich et
al. (1999), (GMPE-2). Scenario #2: four known faults in vicinity of the dam are
active.
Figure 9.2(a) Mean return period of median value of horizontal PGA at the site of
the dam, calculated for ground motion prediction equation by Atkinson and Boore
(2006), (GMPE-1). Scenario #1: four known faults in vicinity of the dam are not
active.
Figure 9.2(b) Mean return period of median value of horizontal PGA at the site of
the dam, calculated for ground motion prediction equation by Atkinson and Boore

- 12 -
(2006), (GMPE-1). Scenario #2: four known faults in vicinity of the dam are
active.
Figure 9.2(c) Mean return period of median value of horizontal PGA at the site of
the dam, calculated for ground motion prediction equation by Spudich et al.
(1999), (GMPE-2). Scenario #1: four known faults in vicinity of the dam are not
active.
Figure 9.2(d) Mean return period of median value of horizontal PGA at the site of
the dam, calculated for ground motion prediction equation by Spudich et al.
(1999), (GMPE-2). Scenario #2: four known faults in vicinity of the dam are
active.
Figure 9.3(a) Newmark-Hall elastic design spectra anchored at the OBE, MDE
and MCE values of horizontal PGA, calculated for ground motion prediction
equation by Atkinson and Boore (2006), (GMPE-1). Scenario #1: four known
faults in vicinity of the dam are not active.
Figure 9.3(b) Newmark-Hall elastic design spectra anchored at the OBE, MDE
and MCE values of horizontal PGA, calculated for ground motion prediction
equation by Atkinson and Boore (2006), (GMPE-1). Scenario #2: four known
faults in vicinity of the dam are active.
Figure 9.3(c) Newmark-Hall elastic design spectra anchored at the OBE, MDE
and MCE values of horizontal PGA, calculated for ground motion prediction
equation by Spudich et al. (1999), (GMPE-2). Scenario #1: four known faults in
vicinity of the dam are not active.
Figure 9.3(d) Newmark-Hall elastic design spectra anchored at the OBE, MDE
and MCE values of horizontal PGA, calculated for ground motion prediction
equation by Spudich et al. (1999), (GMPE-2). Scenario #2: four known faults in
vicinity of the dam are active.
Figure 9.4(a). Uniform Acceleration Response Spectra (horizontal component) in
terms of ground motion vibration frequency, calculated for ground motion
prediction equation by Atkinson and Boore (2006), (GMPE-1). Scenario #1: four
known faults in vicinity of the dam are not active.
Figure 9.4(b). Uniform Acceleration Response Spectra (horizontal component) in
terms of ground motion vibration frequency, calculated for ground motion
prediction equation by Atkinson and Boore (2006), (GMPE-1). Scenario #2: four
known faults in vicinity of the dam are active.
Figure 9.4 (c) Effect of application of logic tree formalism to the uniform
horizontal ground motion acceleration spectra shown in Figure 9.4 (a)-(b). It was

- 13 -
assumed that probabilities that faults are active (scenario #2) and not active
(scenario #1) are the same and equal to 0,5.
Figure 9.5 Newmark-Hall elastic design spectra (horizontal component) anchored
at the OBE, MDE and MCE values of PGA resulting from logic tree analysis.
Appendix B. Figure 1. Illustration of data which can be used to obtain
reccurence parameters for the specified seismic source. The approach permits the
combination of the largest earthquakes (prehistoric/paleo- and historic) data and
complete (instrumental) data having variable threshold magnitudes. It accepts
‘gaps’ (Tg) when records were missing or the seismic networks were out of
operation. The procedure is capable of accounting for uncertainties of occurrence
time of prehistoric earthquakes. Uncertainty in earthquake magnitude is also taken
into account, in that an assumption is made that the observed magnitude, is true
magnitude subjected to a random error that follows a Gaussian distribution having
zero mean and a known standard deviation. (Modified after Kijko and Sellevoll,
1992)
3.2. List of Tables
Table 7-1. Division of seismic event catalogue used in the analysis.
Table 9-1. OBE, MDE and MCE estimates

- 14 -
4. Terms of Reference
The Natural Hazard Assessment Consultancy (NHAC) Centurion, was requested
by AURECON South Africa (Pty) Ltd (Reg. No: 1997/003711/07), Aurecon
Centre, 1040 Burnett Street, Hatfield, Tshwane, South Africa, represented by
Dr Teb Vorster as Project Director (SUB-CONTRACT AGREEMENT of 14
January 2011) to provide desk study of a probabilistic seismic hazard analysis
(PSHA) for the site of the Clanwilliam Dam, South Africa, having approximate
coordinates latitude 32010’59.00”S and longitude 18
052’29.90” E.
In general, the hazardous effects of earthquakes can be divided into three
categories:
1. Those resulting directly from a certain level of ground shaking
2. Those at the site resulting from surface faulting or deformations
3. Those triggered or activated by a certain level of ground shaking such as
the generation of a tsunami or landslide.
This study covers Category 1 only and in case of PSHA is limited to the
following investigations:
1. Selection of earthquakes within a radius of 320 km from the site
2. Assessment of earthquake recurrence parameters for the area.
3. Discussion on applicable ground motion prediction equation (GMPE) used
in this study.
4. PSHA calculations and provision of seismic hazard curves in terms of
peak ground acceleration (PGA) and Uniform (acceleration) response
spectra (URS).
5. PGA calculation for the Operating Basis Earthquake (OBE), Maximum
Design Earthquake (MDE) and the Maximum Credible Earthquake
(MCE). In this report, following the ICOLD guideline (ICOLD, 1989),

- 15 -
the OBE is defined as PGA having return period of 144 years or
equivalently having a 50% probability of exceedance in 100 years. The
MCE is suggested as PGA having return period of 10,000 years. In
addition, following e.g. regulation ER No. 1110-2-1806, (1995),
Eurocode 8 (2004), or ASCE 7-05 (2005), the MDE is calculated as PGA
having return period of 475 years or equivalently having a 10%
probability of exceedance in 50 years.
6. The classic, Newmark and Hall (1982) elastic design spectra for 5%
damping anchored at the OBE, MDE and MCE values.
The PSHA was performed using conventional, Cornell-McGuire procedure
(Cornell, 1968; McGuire, 1976; 1978), where the integration across the
uncertainty in the ground motion prediction equation is an integral part of the
methodology.
The procedure used in this seismic hazard assessment consists essentially of two
steps. The first step is applicable to seismic sources (known also as seismogenic
sources or seismic zones) in the vicinity of the site, for which the seismic hazard
analysis is required. The procedure requires an estimation of the seismic source
parameters. The second step is applicable to a specified site, and consists of
assessing the site-specific parameters, which describe the amplitude distribution
of ground motion parameter PGA.
The PGA is the maximum acceleration of the ground shaking during an
earthquake. Spectral acceleration is the movement experienced by a structure
during an earthquake. The acceleration is expressed in units of gravity, g, which is
equal to 9.81 m/s2.
The results are given in terms of mean return periods and probabilities of being
exceeded for specified values of horizontal component of PGA. Simple procedure
- 16 -
of conversion of above results from horizontal to vertical component of PGA is
described in paper by Abrahamson and Litehiser, Appendix F.
Lists of all seismic events used in the study are given in Appendix A. The
procedure for PSHA as applied in this work is described in Appendix B.
Appendix C lists seismic hazard occurrence parameters for identified fault in
vicinity of the dam and for background seismicity. Appendix D provides
information on the applied GMPE. Appendix E shows the results of the PSHA
calculations for the site of the dam. It contains details of the computations, input
data and respective hazard parameters. Appendix F provides paper by N. A.
Abrahamson and J.J. Litehiser on attenuation of vertical peak acceleration.
All results of calculations are based on the assumption that the dam structure
is founded on hard rock. It such assumption is not correct, results of
calculations must be corrected for ground conditions.
5. Introduction
The Natural Hazard Assessment Consultancy (NHAC) Centurion, was requested
by AURECON South Africa (Pty) Ltd (Reg. No: 1997/003711/07), Aurecon
Centre, 1040 Burnett Street, Hatfield, Tshwane, South Africa, represented by
Dr Teb Vorster as Project Director (SUB-CONTRACT AGREEMENT of 14
January 2011) to provide desk study of a probabilistic seismic hazard analysis
(PSHA) for the site of the Clanwilliam Dam, South Africa, having approximate
coordinates latitude 32010’59.00”S and longitude 18
052’29.90” E.
The objective of a PSHA is to obtain the probabilities of the occurrence of seismic
events of a specified size in a given time interval. The methodology used in most
PSHA was first defined by Cornell (1968). There are four basic steps in a PSHA:
- 17 -
• Step 1 is the definition of seismotectonic sources. Sources may range from
small faults to large seismotectonic provinces.
• Step 2 is the definition of earthquake parameters for each source, where
each source is defined by an earthquake probability distribution or
earthquake recurrence relationship. A recurrence relationship indicates the
chance of an earthquake of a given size occurring anywhere inside the
source during a specified period. An upper bound for the earthquakes for
each source is chosen, which represents the source characteristic,
maximum possible earthquake magnitude.
• Step 3 is the estimation of the earthquake effects, using several GMPE,
each relating a ground motion parameter, such as PGA with distance and
earthquake magnitude.
• Step 4 is the determination of the hazard at the site. The effects of all
earthquakes of different sizes occurring at different locations in different
earthquake sources at different probabilities of exceedance are integrated
into one hazard curve that shows the probability of exceeding different
levels of ground motion (such as PGA) at the site during a specified period
of time.
The PSHA was performed using the conventional, Cornell-McGuire procedure
(Cornell, 1968; McGuire, 1976; 1978), where the integration across the
uncertainty in the ground motion prediction equation is an integral part of the
methodology.
6. Regional Geology (by G. Davis, AURECON, South Africa)
The regional geology is illustrated in Figures 6.1 and 6.22. The accompanying
geological sections are available from the author. The Skurweberg Formation is
Silurian in age, i.e. between 444 Ma and 416 Ma; the latter representing the
boundary between the Silurian and Devonian Periods. The depositional
- 18 -
environments varied between shallow marine and fluvial. The Skurweberg
Formation is characterized by thick-bedded (1000 – 2000 mm), profusely cross-
bedded, white weathering, medium to coarse grained sandstone and minor
conglomerate and is generally 200 m to 400 m thick.
A large-scale change occurred from general subsidence and sedimentation tode
formation and uplift; a process known as inversion, when the Cape Fold Belt was
formed. The Cape Fold Belt comprises two limbs; a western fold branch
characterised by northwest to north striking folds, and an eastern branch
characterised by east-west striking folds. The Clanwilliam Dam is located within
this western arm of the Cape Fold Belt where the folds comprise relatively open
and upright box-folds. At least four pulses of deformation are recognized starting
roughly at about 280 Ma with the final event at approximately 230 Ma.
Deformation within the Cape Fold Belt was associated with large scale faulting.
Normal faults are common in the western limb of the Cape Fold Belt, forming the
north-west trending swarm visible in Figure 1 and defining horst and graben
structures.
The area of interest lies within a major synclinal structure. The regional dip of the
strata in the vicinity of Clanwilliam Dam is eastwards at angles between 7° and
15°, although there is some variation. Shallower as well as steeper dips are locally
present, with dip directions towards the north and west also being recorded.
The Cape folding and thrusting was also associated with lower greenschist grade
metamorphism. Although the effects are more pronounced in the southern limb,
recrystallization of the quartz framework grains is typical.
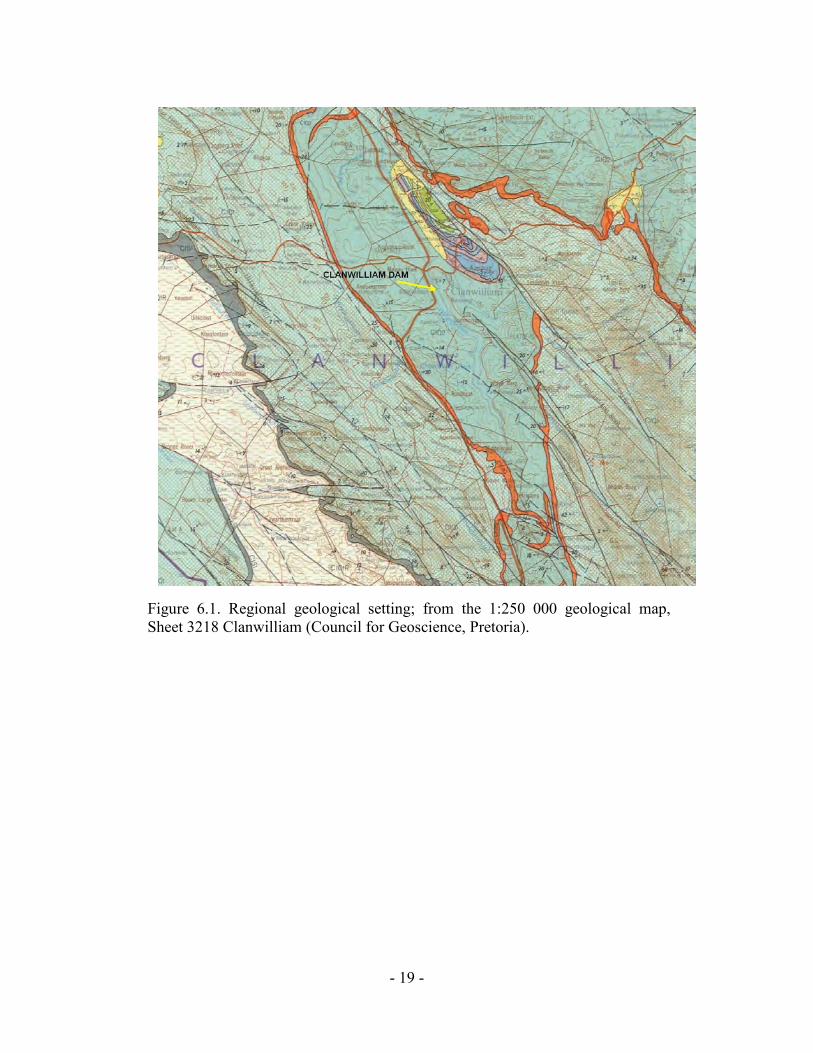
- 19 -
Figure 6.1. Regional geological setting; from the 1:250 000 geological map,
Sheet 3218 Clanwilliam (Council for Geoscience, Pretoria).
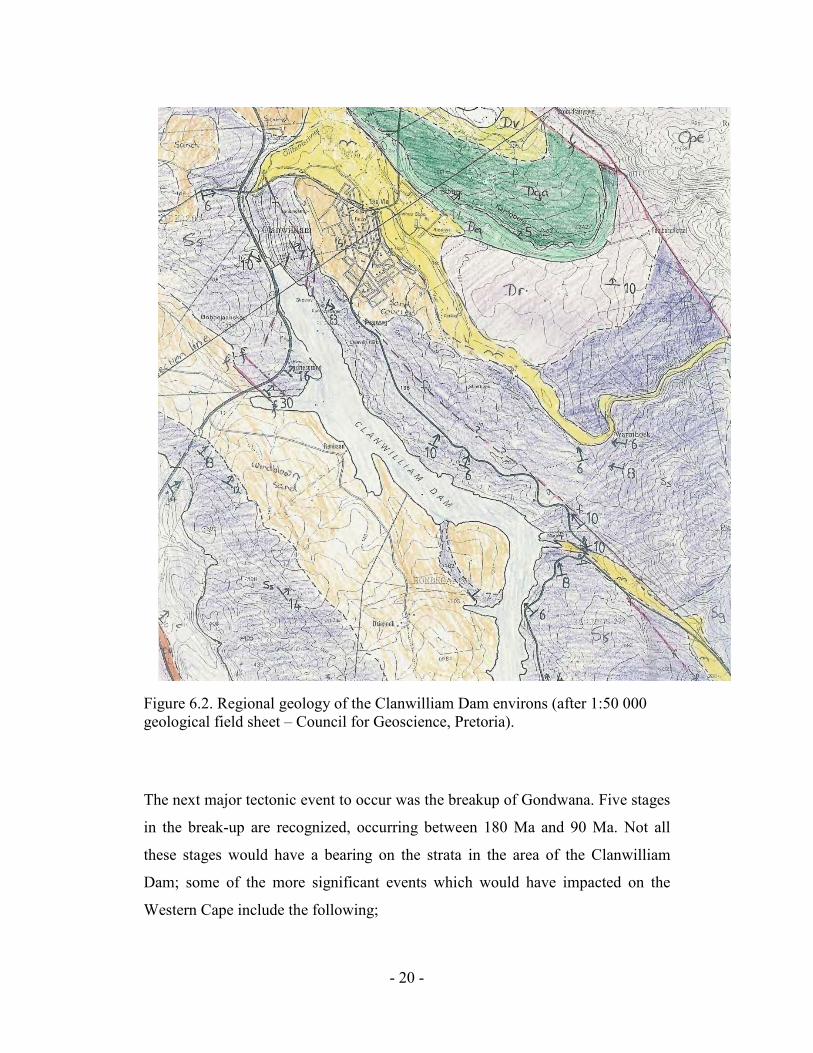
- 20 -
Figure 6.2. Regional geology of the Clanwilliam Dam environs (after 1:50 000
geological field sheet – Council for Geoscience, Pretoria).
The next major tectonic event to occur was the breakup of Gondwana. Five stages
in the break-up are recognized, occurring between 180 Ma and 90 Ma. Not all
these stages would have a bearing on the strata in the area of the Clanwilliam
Dam; some of the more significant events which would have impacted on the
Western Cape include the following;
- 21 -
• Development of the Agulhas Falklands Fracture Zone (AFFZ) which is
located off the southern coast and has a NE-SW orientation. Strike-slip
movement was associated with this zone.
• Further movement along the AFFZ may have been responsible for N-S
rifting in the South Atlantic.
• On a regional scale (refer 1:250 000 Geological Map), a number of
major faults can be identified within these Table Mountain Group rocks.
The general trend of these features is striking in a rough north-west to
south-east direction.
• A number of north-east striking lineaments are evident on aerial
photographs. It is not clear, however, exactly what these lineaments
represent. Brecciated rock present in the road cutting immediately to the
north of the dam suggests this lineament might be a fault, but the extent
and direction are not clear. A north-northwest to south-southeast strike is
most likely.
The locality of the Clanwilliam Dam coincides roughly with the climatic N-value
of N = 10 (Weinert, 1980), indicating that disintegration, i.e. physical breakdown
of the rock, is the dominant mode of weathering. This implies that the weathering
profile is not developed to any significant extent, although some secondary
minerals may develop.
7. Seismic Sources and their Parameters
Figure 7.1 shows the distribution of all known seismic events with magnitude
MW=3.0 and stronger, that occurred within a radius of 320 km from the dam site.
Only largest events within a radius of 320 km from the dam site were used in the
analysis, as only these events can be considered to contribute to the seismic

- 22 -
hazard at the dam site. Events at larger distances from the structure will not likely
generate PGA’s large enough to be of engineering concern. The seismic event
catalogue used in this study was compiled from several sources. After critical
analysis of each of the data source, the main contribution to applied catalogue
come from databases provided by International Seismological Centre in UK. List
of seismic events used in the study is given in Appendix A.
Figure 7.1 Distribution of largest seismic events within 320 km radius of the
Clanwilliam Dam site used in the study. The location of dam wall is shown as a
blue square.
16 17 18 19 20 21 22 23
-36
-35
-34
-33
-32
-31
-30
-29
Longitude
Latitu
de
Alexander Bay
Cape Tow n
Springbok
Beaufort West
Calvinia
Ceres
Vredendal
Oudtshoorn
Upington
George
Worcester
Provincial Boundary
Places
3.00 <= Mag < 4.00
4.00 <= Mag < 5.00
5.00 <= Mag < 6.00
6.00 <= Mag <= 7.00

- 23 -
The close-up view of four faults in vicinity of Clanwilliam Dam (G. Davis,
personal communication), is shown in Figure 7.2. The location of dam wall is
shown as a blue square.
Figure 7.2 Close-up view of four faults in vicinity of Clanwilliam Dam (G. Davis,
personal communication). The location of dam wall is shown as a blue square.
It is assumed that magnitudes of earthquakes recorded within specified area are
distributed according to the Gutenberg-Richter relation
18.82 18.84 18.86 18.88 18.9 18.92
-32.195
-32.19
-32.185
-32.18
-32.175
-32.17
Longitude
Latitu
de
fault #1
fault #4
fault #3
fault #2
Clanwilliam Dam
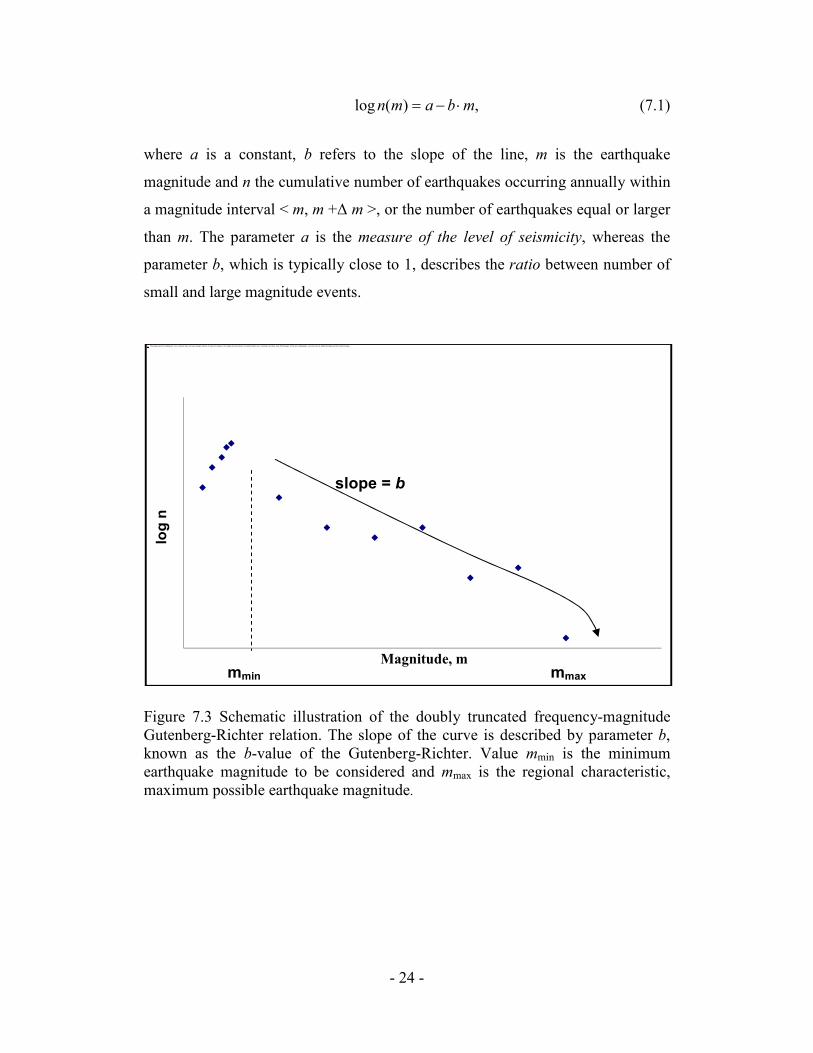
- 24 -
,)(log mbamn ⋅−= (7.1)
where a is a constant, b refers to the slope of the line, m is the earthquake
magnitude and n the cumulative number of earthquakes occurring annually within
a magnitude interval < m, m +∆ m >, or the number of earthquakes equal or larger
than m. The parameter a is the measure of the level of seismicity, whereas the
parameter b, which is typically close to 1, describes the ratio between number of
small and large magnitude events.
Figure 7.3 Schematic illustration of the doubly truncated frequency-magnitude
Gutenberg-Richter relation. The slope of the curve is described by parameter b,
known as the b-value of the Gutenberg-Richter. Value mmin is the minimum
earthquake magnitude to be considered and mmax is the regional characteristic,
maximum possible earthquake magnitude.
The image cannot be displayed. Your computer may not have enough memory to open the image, or the image may have been corrupted. Restart your computer, and then open the file again. If the red x still appears, you may have to delete the image and then insert it again.
log n
Magnitude, mmmin mmax
slope = b
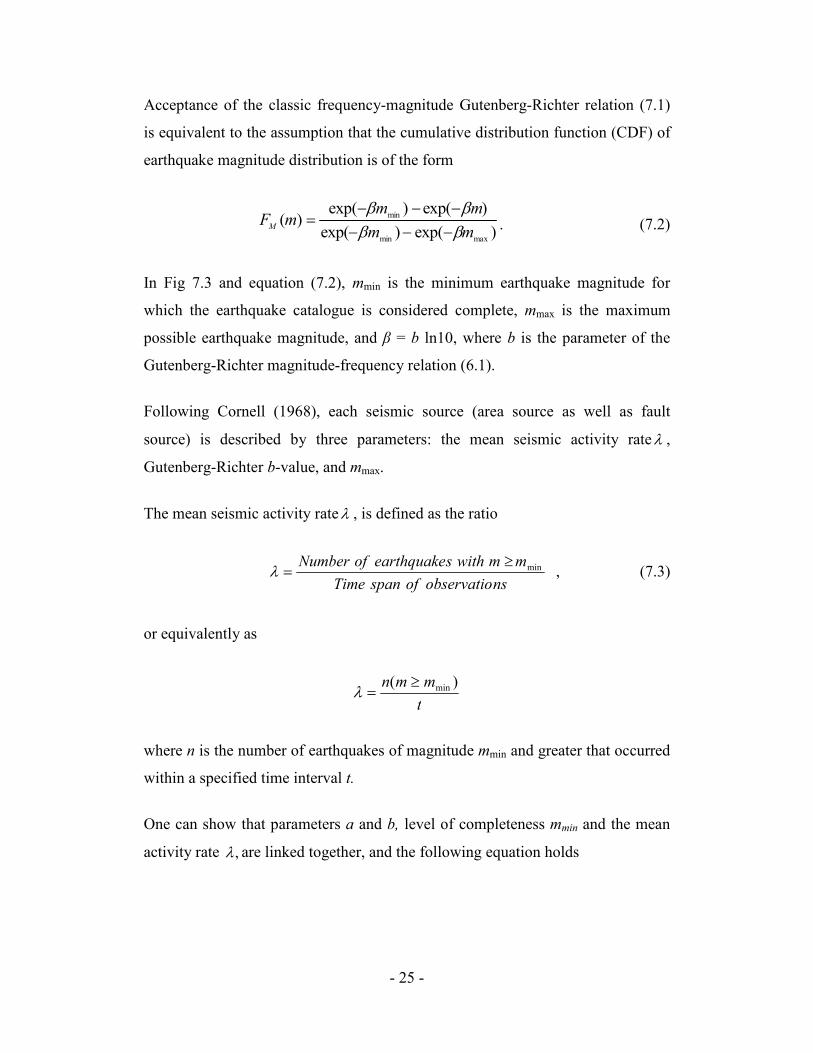
- 25 -
Acceptance of the classic frequency-magnitude Gutenberg-Richter relation (7.1)
is equivalent to the assumption that the cumulative distribution function (CDF) of
earthquake magnitude distribution is of the form
)exp()exp(
)exp()exp()(
maxmin
min
mm
mmmF
M ββββ
−−−
−−−= . (7.2)
In Fig 7.3 and equation (7.2), mmin is the minimum earthquake magnitude for
which the earthquake catalogue is considered complete, mmax is the maximum
possible earthquake magnitude, and β = b ln10, where b is the parameter of the
Gutenberg-Richter magnitude-frequency relation (6.1).
Following Cornell (1968), each seismic source (area source as well as fault
source) is described by three parameters: the mean seismic activity rateλ ,
Gutenberg-Richter b-value, and mmax.
The mean seismic activity rateλ , is defined as the ratio
nsobservatioofspanTime
mmwithsearthquakeofNumber min≥=λ , (7.3)
or equivalently as
t
mmn )( min≥=λ
where n is the number of earthquakes of magnitude mmin and greater that occurred
within a specified time interval t.
One can show that parameters a and b, level of completeness mmin and the mean
activity rate ,λ are linked together, and the following equation holds
- 26 -
min10log mba ⋅+= λ (7.4)
The parameters of area sources,λ , b-value and mmax were calculated for a grid
spanning the area of 320 km radius. For the site, the area of 320 km radius was
divided into 50km x 50km seismic sources for which the parameters were selected
from the grid.
In this investigation the recurrence parameters: the mean activity rate λ , b-value
of Gutenberg-Richter and seismic source characteristic mmax are calculated
according to maximum likelihood procedure developed Kijko and Sellevoll
(1992) and Kijko (2004). The applied approach accounts for incompleteness and
uncertainty in the seismic event catalogues. More details can be found in the
description of the applied methodology in Appendix B.
Reports of seismic phenomena in South Africa go back as far as 1620, to the early
Dutch settlers. The seismicity is typically that of an intra-plate region. The natural
seismic regime of a region of this type is characterised by a low-level activity by
world standards, with earthquakes randomly distributed in space and time. The
correlation between most of the earthquakes and the surface expression of major
geological features is not clear (Fernandez and Guzman, 1979, Brandt et al.,
2003).
Seismic events resulting from the deep-mining operations in the gold fields of the
Gauteng, Klerksdorp and Welkom, form the majority of the seismic events
recorded by the regional network of seismic stations. Usually, the depth of these
events varies in the range of 2-3 km below the surface.
The seismic event catalogue used in this study was compiled from several
sources. After critical analysis of each of the data source, the main contribution to
pre-instrumentally recorded seismicity come from Brandt et al. (2003). The

- 27 -
instrumentally recorded events are mainly selected from databases provided by
the International Seismological Centre in UK.
The database of seismic events for South Africa is incomplete, due to the fact that
large parts of the area were very sparsely populated and the detection capabilities
of the seismic network are far from uniform.
Following extensive analysis of the earthquake database it was established that
the catalogue of the tectonic origin earthquakes can be divided into 8 parts, each
with different level of completeness, (Table 7-1).
Table 7-1. Division of the catalogue used in the analysis.
Subcatalogue
number
Level of
completeness
(Mw)
Beginning of the
subcatalogue
End of subcatalogue
1 5.9 1806/01/01 1905/12/31
2 5.3 1906/01/01 1909/12/31
3 4.9 1910/01/01 1949/12/31
4 4.6 1950/01/01 1970/12/31
5 4.0 1971/01/01 1980/12/31
6 3.8 1981/01/01 1990/12/31
7 3.5 1991/01/01 2002/12/31
8 3.3 2003/01/01 2006/09/30
The parameters of area sources, λ , b-value and mmax were calculated for a grid
spanning the whole country. For the site, the area of 320 km radius was divided
- 28 -
into 50km x 50km seismic sources for which the parameters were selected from
the grid.
From all faults identified in vicinity of the dam site, four faults have been
considered as potential sources of seismicity (G. Davis, personal communication,
Figure 7.2). Unfortunately, current geological knowledge of the area does not
provide information on potential movement of identified faults during the recent
(Quaternary) geological past, especially during last 35,000 years. No relationships
between instrumentally recorded seismicity or historic events and faults location
could be established. Also, no information on paleo-seismicity of the area was
available. Therefore, in this report, the assessment of the maximum possible
earthquake magnitude mmax, which can be generated by the faults, is based on
faults length. Our procedure of mmax estimation for each fault consists from two
steps: (1) estimation of the most probable rupture length of the fault, and (2)
estimation of the maximum possible fault-characteristic earthquake magnitude
mmax based on empirical equations relating surface rupture length with moment
magnitude.
In step one, estimation of the most probable rupture length of the fault was
performed according to procedure developed by Slemmons and Chung (1982).
Slemmons and Chung (1982) has show that in average, fraction of a fault that
ruptures, increases linearly with fault length according to formula PRC(L) = 15.76
+ 0.012·L, where PRC(L) is percent of total fault length that ruptures and L is total
fault in km.
In Step 2, we input estimated rupture length into well known Wells and
Coppersmith (1994) empirical equation, relating surface rupture length to moment
magnitude. So estimated earthquake magnitude is considered as a fault
characteristic, maximum earthquake magnitude mmax. The other two hazard
recurrence parameters (the Gutenberg-Richter b-value and the mean activity rate

- 29 -
λ ) for each source fault has been estimated according to procedure developed by
Kijko and Sellevoll (1992) and are based on knowledge of seismicity of the area.
It must be noted once again, that seismicity of the studied area cannot be directly
correlated with tectonic or known geologic structures (Fernandez and Guzman,
1979). Even in case of localization of a few seismic events in the vicinity of the
fault, a significant correlation could not be established due to the poor earthquake
location. The earthquake locations in the studied area have a considerable error,
order of 100 km for the events located prior 1971 (Saunders et al., 2008).
All characteristics of four considered faults (Figure 7.2), as coordinates of its
edges, total fault length, segment length with corresponding maximum earthquake
magnitude, the assumed mean seismic activity rate λ , b-value of Gutenberg-
Richter and shortest distance to the dam site are given in Appendix C.
8. Ground Motion Prediction Equations (GMPE)
Attenuation is the reduction in amplitude or energy of seismic waves caused by
the physical characteristics of the transmitting media or system. It usually
includes geometric effects such as the decrease in amplitude of a wave with
increasing distance from the source.
Attenuation relationships known as ground motion prediction equations (GMPE)
for the investigated area established on base of strong motion data are practically
non-existent (Minzi et al., 1999). Two attempts to establish horizontal component
of PGA attenuation for the Eastern and Southern Africa are published: one by
Jonathan (1996) and one by Twesigomwe (1997). Jonathan’s GMPE is based on
the random vibration theory and scaled by some seismic records recorded by local
seismic stations. Twesigomwe’s equation is a modification of GMPE by
Krinitzky et al. (1988). Comparison of the two regional GMPE with the e.g.
global equation by Joyner and Boore (1988), Boore et al., 1993; 1994) shows

- 30 -
relatively good agreement between regional attenuations and used globally. No
doubt, that lack of reliable regional GMPE is one of the biggest sources of
uncertainty in this seismic hazard assessment.
In this study, all assessments of seismic hazard are based on two, more recent and
well studied models of ground motion prediction equations.
The first applied GMPE of horizontal component (Atkinson and Boore, 2006),
was developed for the central and eastern United States which is situated in a type
of tectonic environment known as an intraplate region, or equivalently, stable
continental area.
The second, considered as “classic” GMPE (one by Spudich et al., 1999) is
appropriate for predicting earthquake generated horizontal component of ground
motions in extensional tectonic regimes. The area which is located between the
Sierra Nevada Mountains in eastern California and the Wasatch Mountains in
central Utah, are an example of shallow extensional tectonic environment. Some
parts of Western Europe, parts of Italy and Greece, the East African Rift System
are other examples of extensional environment. The relationships predict lower
ground motions than any other applied ground motion prediction equation. One
has to note, that in literature are known at least two updated versions of Spudich
et al. (1999) GMAE, (Pankow and Pechmann, 2004; 2006).
Based on very limited number of PGA observations in the area and some
macroseismic comparisons, based on exclusion criteria developed by Cotton et al
(2006), we understand that of the four mentioned attenuation relationships, the
one by Atkinson and Boore (2006), and one by Spudich et al. (1999) are most
likely most appropriate to local conditions.
The two selected GMPEs, including their functional form and respective
coefficients are provided in Appendix D.

- 31 -
9. Probabilistic Seismic Hazard Analysis for the Dam Site
In order to determine the seismic hazard curve for the site, i.e. probabilities of
exceedance of specified values of PGA, the earthquake recurrence parameters
obtained for each seismic source, together with the GMPE’s are integrated.
Details of the applied procedure are described in Appendix B.
Taking into account that very little is known about seismic potential of the four
identified faults in vicinity of the dam site (Figure 7.2), two scenarios regarding
their seismic activity were considered:
(a) the four faults identified in vicinity of the dam site are not active,
(b) all four faults are active, the sum, mean activity rate λ = 0.01 [eq/year],
where activity rate refers to events with moment magnitude 4.0 and larger.
The respective seismic hazard curves (the annual probabilities of exceedance of
median value of PGA at the site) for two considered GMPE-s and two seismic
activity scenarios of four identified faults are shown in Figs 9.1(a)-(d). Figure
9.2(a)-(d) show the associated, respective return periods of specified values of
median PGA.
- 32 -
Figure 9.1(a) Annual probability of exceedance of median value of horizontal
PGA at the site of the dam, calculated for ground motion prediction equation by
Atkinson and Boore (2006), (GMPE-1). Scenario #1: four known faults in vicinity
of the dam are not active.
10-2
10-1
100
10-6
10-5
10-4
10-3
10-2
10-1
SITE: Clanwilliam (no faults) att#1
PGA [g]
Annual P
robability o
f E
xceedance

- 33 -
Figure 9.1(b) Annual probability of exceedance of median value of horizontal
PGA at the site of the dam, calculated for ground motion prediction equation by
Atkinson and Boore (2006), (GMPE-1). Scenario #2: four known faults in vicinity
of the dam are active.
10-2
10-1
100
101
10-5
10-4
10-3
10-2
10-1
SITE: Clanwilliam Dam (with faults)
PGA [g]
Annual P
robability o
f E
xceedance
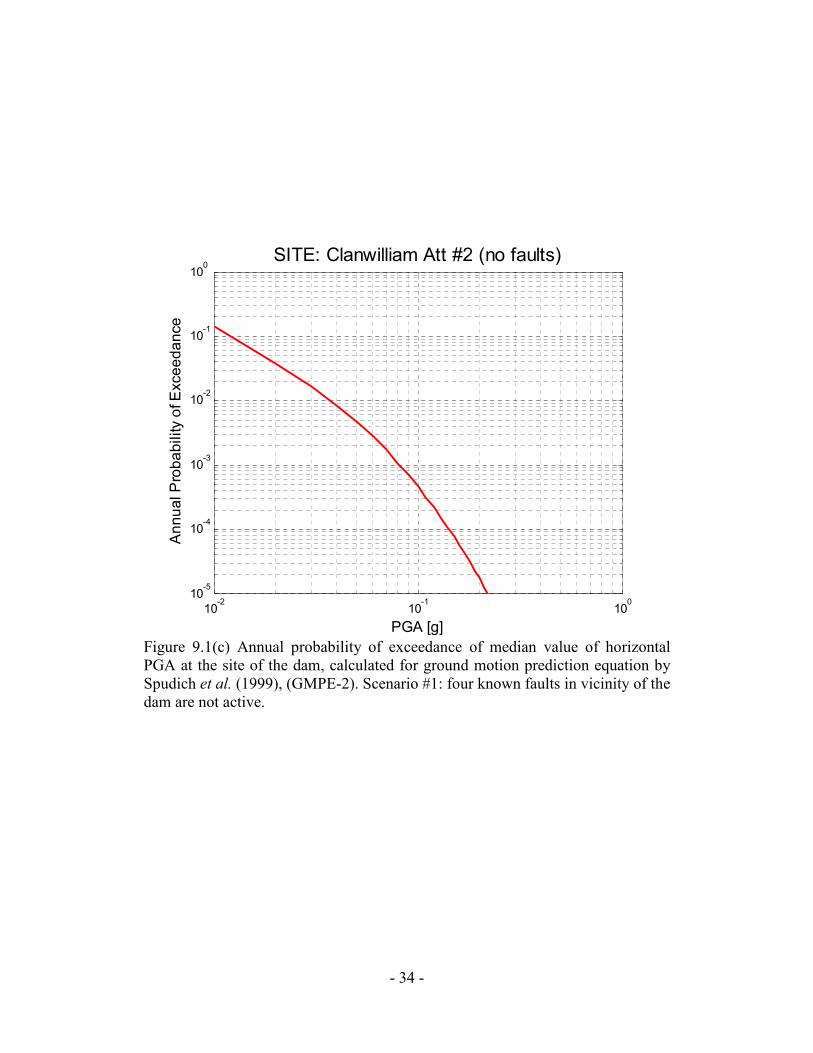
- 34 -
Figure 9.1(c) Annual probability of exceedance of median value of horizontal
PGA at the site of the dam, calculated for ground motion prediction equation by
Spudich et al. (1999), (GMPE-2). Scenario #1: four known faults in vicinity of the
dam are not active.
10-2
10-1
100
10-5
10-4
10-3
10-2
10-1
100
SITE: Clanwilliam Att #2 (no faults)
PGA [g]
Annual P
robability o
f E
xceedance
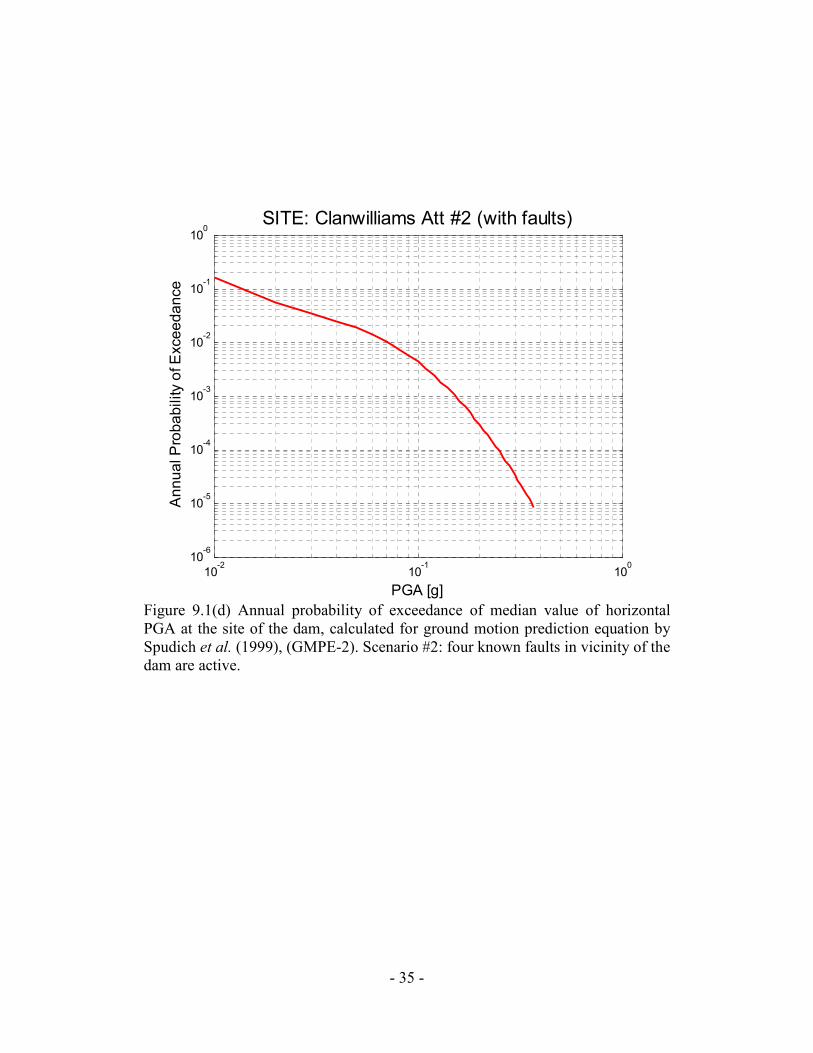
- 35 -
Figure 9.1(d) Annual probability of exceedance of median value of horizontal
PGA at the site of the dam, calculated for ground motion prediction equation by
Spudich et al. (1999), (GMPE-2). Scenario #2: four known faults in vicinity of the
dam are active.
10-2
10-1
100
10-6
10-5
10-4
10-3
10-2
10-1
100
SITE: Clanwilliams Att #2 (with faults)
PGA [g]
Annual P
robability o
f E
xceedance

- 36 -
Figure 9.2(a) Mean return period of median value of horizontal PGA at the site of
the dam, calculated for ground motion prediction equation by Atkinson and Boore
(2006), (GMPE-1). Scenario #1: four known faults in vicinity of the dam are not
active.
10-2
10-1
100
101
102
103
104
105
106
SITE: Clanwilliam (no faults) att#1
PGA [g]
Retu
rn P
eriod [Y
EA
RS
]

- 37 -
Figure 9.2(b) Mean return period of median value of horizontal PGA at the site of
the dam, calculated for ground motion prediction equation by Atkinson and Boore
(2006), (GMPE-1). Scenario #2: four known faults in vicinity of the dam are
active.
10-2
10-1
100
101
101
102
103
104
105
SITE: Clanwilliam Dam (with faults)
PGA [g]
Retu
rn P
eriod [Y
EA
RS
]

- 38 -
Figure 9.2(c) Mean return period of median value of horizontal PGA at the site of
the dam, calculated for ground motion prediction equation by Spudich et al.
(1999), (GMPE-2). Scenario #1: four known faults in vicinity of the dam are not
active.
10-2
10-1
100
100
101
102
103
104
105
SITE: Clanwilliam Att #2 (no faults)
PGA [g]
Retu
rn P
eriod [Y
EA
RS
]
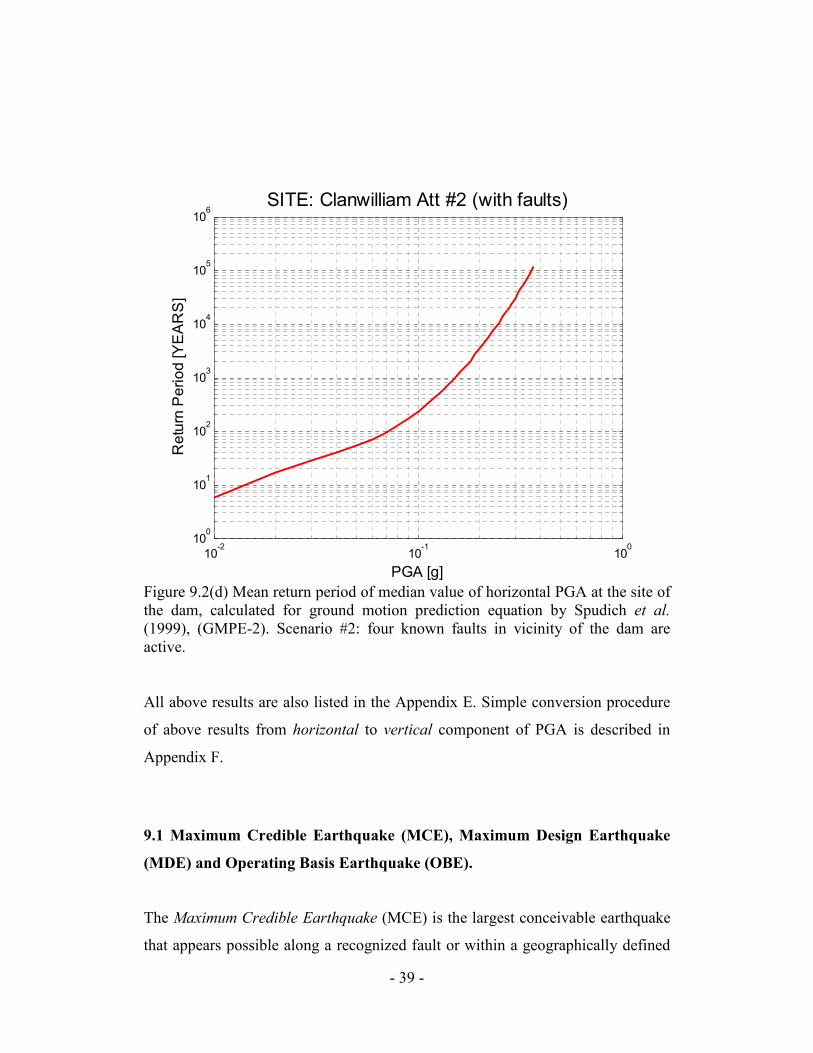
- 39 -
Figure 9.2(d) Mean return period of median value of horizontal PGA at the site of
the dam, calculated for ground motion prediction equation by Spudich et al.
(1999), (GMPE-2). Scenario #2: four known faults in vicinity of the dam are
active.
All above results are also listed in the Appendix E. Simple conversion procedure
of above results from horizontal to vertical component of PGA is described in
Appendix F.
9.1 Maximum Credible Earthquake (MCE), Maximum Design Earthquake
(MDE) and Operating Basis Earthquake (OBE).
The Maximum Credible Earthquake (MCE) is the largest conceivable earthquake
that appears possible along a recognized fault or within a geographically defined
10-2
10-1
100
100
101
102
103
104
105
106
SITE: Clanwilliam Att #2 (with faults)
PGA [g]
Retu
rn P
eriod [Y
EA
RS
]
- 40 -
tectonic province, under the presently known or presumed tectonic framework. In
this report MCE is defined, as PGA having a return period of 10,000 years, or
equivalently, 0.5% probability of exceedance in 50 years. The selected time
period of 10,000 years is standard for critical structures for areas with low to
moderate seismicity, ICOLD (1989).
The Operating Basis Earthquake (OBE) represents the level of ground motion at
the dam site at which only minor damage is acceptable. The dam operation should
remain functional and damage easily repairable from the occurrence of earthquake
shaking not exceeding the OBE (ICOLD, 1989; Engineering and Design, ER
1110, 1995). The quoted documents specifies that for civil works projects like a
Clanwilliam Dam, one could use for the OBE a 50% probability of not being
exceeded in 100 years, or equivalently, PGA with return period of 144 years.
The Maximum Design Earthquake (MDE) is the maximum level of ground
motion for which a structure is designed. The associated performance requirement
is that the structure performs without catastrophic failure, although severe damage
or economic loss may be tolerated. For critical structures, the MDE is the same as
the MCE. For all other structures (like a Clanwilliam Dam), the MDE can be
selected lower than the MCE (Engineering and Design, ER 1110-2-1806; 1995).
In this report MDE is defined as earthquake with return period of 475 years, or
equivalently as PGA with 10% probability of exceedance within 50 years.
Table 9-1 lists the OBE, MDE and MCE estimates for four considered cases: (the
two GMPE-s and two scenarios of seismic potential of faults in vicinity of the
dam). The OBE values fall within range of 0.04g - 0.15g. The MDE values fall
within range 0.08.g - 0.29g and MCE values fall within range of 0.14g to 0.93g.
The value of MCE equal to 0.93g, predicted by GMPE #1 by Atkinson and
Boore (2006), in case of active faults in vicinity of the dam, seems to be
unrealistically high.
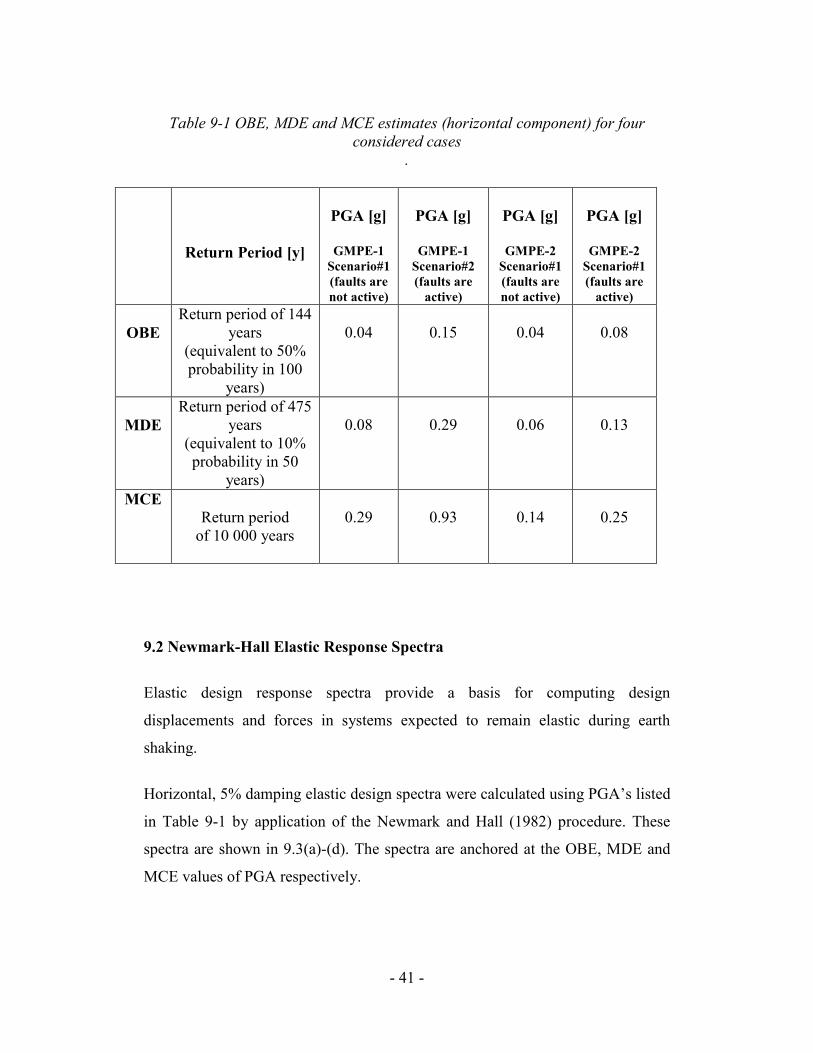
- 41 -
Table 9-1 OBE, MDE and MCE estimates (horizontal component) for four
considered cases
.
Return Period [y]
PGA [g]
GMPE-1
Scenario#1
(faults are
not active)
PGA [g]
GMPE-1
Scenario#2
(faults are
active)
PGA [g]
GMPE-2
Scenario#1
(faults are
not active)
PGA [g]
GMPE-2
Scenario#1
(faults are
active)
OBE
Return period of 144
years
(equivalent to 50%
probability in 100
years)
0.04
0.15
0.04
0.08
MDE
Return period of 475
years
(equivalent to 10%
probability in 50
years)
0.08
0.29
0.06
0.13
MCE
Return period
of 10 000 years
0.29
0.93
0.14
0.25
9.2 Newmark-Hall Elastic Response Spectra
Elastic design response spectra provide a basis for computing design
displacements and forces in systems expected to remain elastic during earth
shaking.
Horizontal, 5% damping elastic design spectra were calculated using PGA’s listed
in Table 9-1 by application of the Newmark and Hall (1982) procedure. These
spectra are shown in 9.3(a)-(d). The spectra are anchored at the OBE, MDE and
MCE values of PGA respectively.

- 42 -
Figure 9.3(a). Newmark-Hall elastic design spectra anchored at the OBE, MDE
and MCE values of horizontal PGA, calculated for ground motion prediction
equation by Atkinson and Boore (2006), (GMPE-1). Scenario #1: four known
faults in vicinity of the dam are not active.
10-2
10-1
100
101
102
10-5
10-4
10-3
10-2
10-1
100
Frequency [Hz]
New
mark
& H
all
Accele
ration D
esig
n S
pectrum
[g]
Clanwilliam (GMPE-1, no faults)
5% Damping Design Spectrum anchored at PGA = 0.04 [g] (OBE)
5% Damping Design Spectrum anchored at PGA = 0.08 [g] (MDE)
5% Damping Design Spectrum anchored at PGA = 0.29 [g] (MCE)
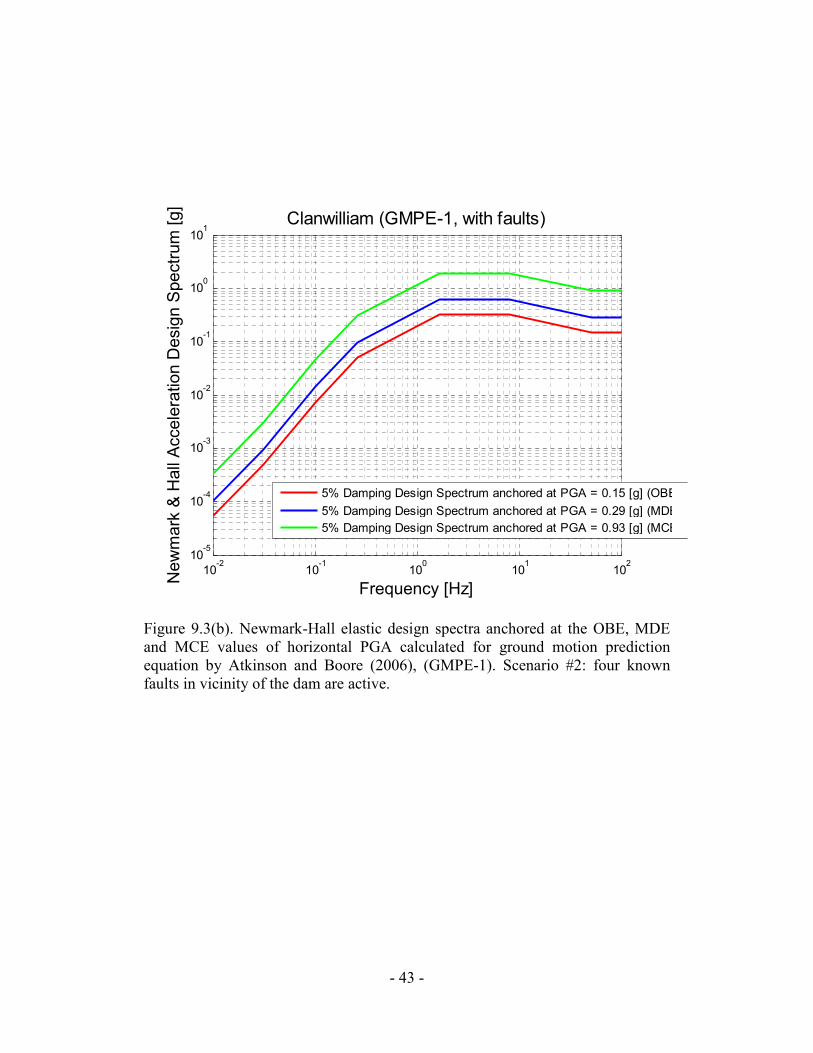
- 43 -
Figure 9.3(b). Newmark-Hall elastic design spectra anchored at the OBE, MDE
and MCE values of horizontal PGA calculated for ground motion prediction
equation by Atkinson and Boore (2006), (GMPE-1). Scenario #2: four known
faults in vicinity of the dam are active.
10-2
10-1
100
101
102
10-5
10-4
10-3
10-2
10-1
100
101
Frequency [Hz]
New
mark
& H
all
Accele
ration D
esig
n S
pectrum
[g]
Clanwilliam (GMPE-1, with faults)
5% Damping Design Spectrum anchored at PGA = 0.15 [g] (OBE)
5% Damping Design Spectrum anchored at PGA = 0.29 [g] (MDE)
5% Damping Design Spectrum anchored at PGA = 0.93 [g] (MCE)

- 44 -
Figure 9.3(c). Newmark-Hall elastic design spectra anchored at the OBE, MDE
and MCE values of horizontal PGA calculated for ground motion prediction
equation by Spudich et al. (1999), (GMPE-2). Scenario #1: four known faults in
vicinity of the dam are not active.
10-2
10-1
100
101
102
10-5
10-4
10-3
10-2
10-1
100
Frequency [Hz]
New
mark
& H
all
Accele
ration D
esig
n S
pectrum
[g]
Clanwilliam (GMPE-2, no faults)
5% Damping Design Spectrum anchored at PGA = 0.04 [g] (OBE)
5% Damping Design Spectrum anchored at PGA = 0.06 [g] (MDE)
5% Damping Design Spectrum anchored at PGA = 0.14 [g] (MCE)

- 45 -
Figure 9.3(d). Newmark-Hall elastic design spectra anchored at the OBE, MDE
and MCE values of horizontal PGA calculated for ground motion prediction
equation by Spudich et al. (1999), (GMPE-2). Scenario #2: four known faults in
vicinity of the dam are active.
10-2
10-1
100
101
102
10-5
10-4
10-3
10-2
10-1
100
Frequency [Hz]
New
mark
& H
all
Accele
ration D
esig
n S
pectrum
[g]
Clanwilliam (GMPE-2, with faults)
5% Damping Design Spectrum anchored at PGA = 0.08 [g] (OBE)
5% Damping Design Spectrum anchored at PGA = 0.13 [g] (MDE)
5% Damping Design Spectrum anchored at PGA = 0.25 [g] (MCE)
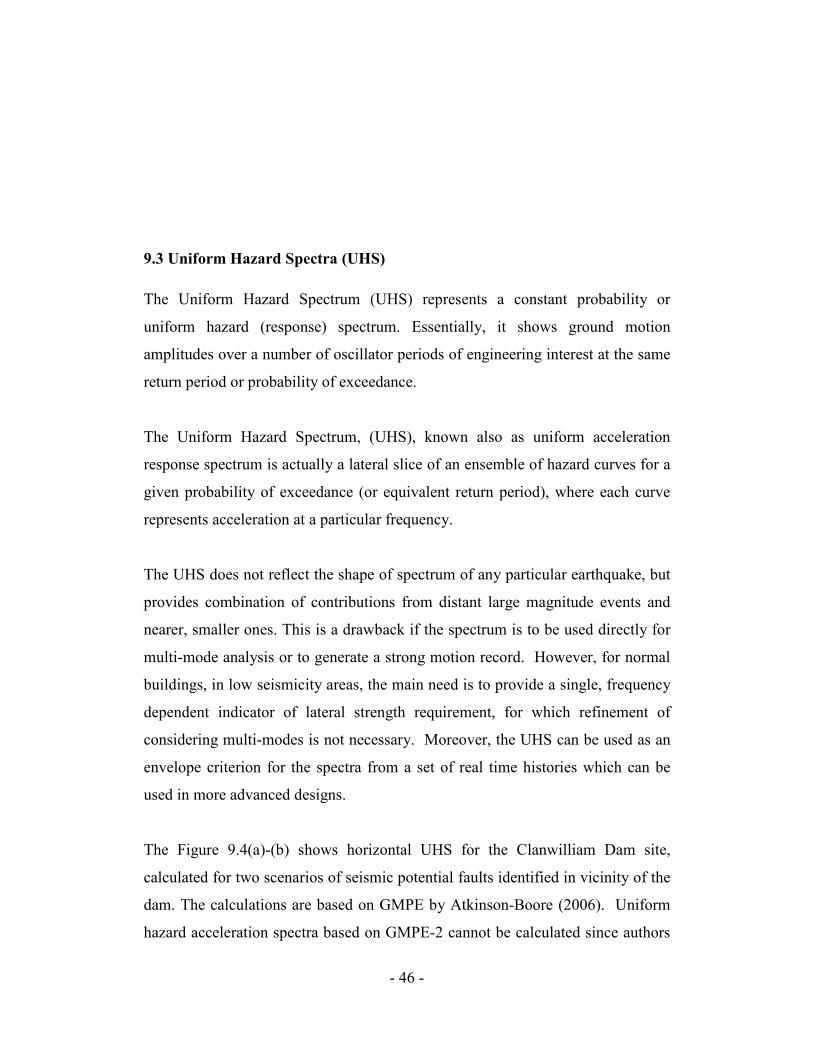
- 46 -
9.3 Uniform Hazard Spectra (UHS)
The Uniform Hazard Spectrum (UHS) represents a constant probability or
uniform hazard (response) spectrum. Essentially, it shows ground motion
amplitudes over a number of oscillator periods of engineering interest at the same
return period or probability of exceedance.
The Uniform Hazard Spectrum, (UHS), known also as uniform acceleration
response spectrum is actually a lateral slice of an ensemble of hazard curves for a
given probability of exceedance (or equivalent return period), where each curve
represents acceleration at a particular frequency.
The UHS does not reflect the shape of spectrum of any particular earthquake, but
provides combination of contributions from distant large magnitude events and
nearer, smaller ones. This is a drawback if the spectrum is to be used directly for
multi-mode analysis or to generate a strong motion record. However, for normal
buildings, in low seismicity areas, the main need is to provide a single, frequency
dependent indicator of lateral strength requirement, for which refinement of
considering multi-modes is not necessary. Moreover, the UHS can be used as an
envelope criterion for the spectra from a set of real time histories which can be
used in more advanced designs.
The Figure 9.4(a)-(b) shows horizontal UHS for the Clanwilliam Dam site,
calculated for two scenarios of seismic potential faults identified in vicinity of the
dam. The calculations are based on GMPE by Atkinson-Boore (2006). Uniform
hazard acceleration spectra based on GMPE-2 cannot be calculated since authors
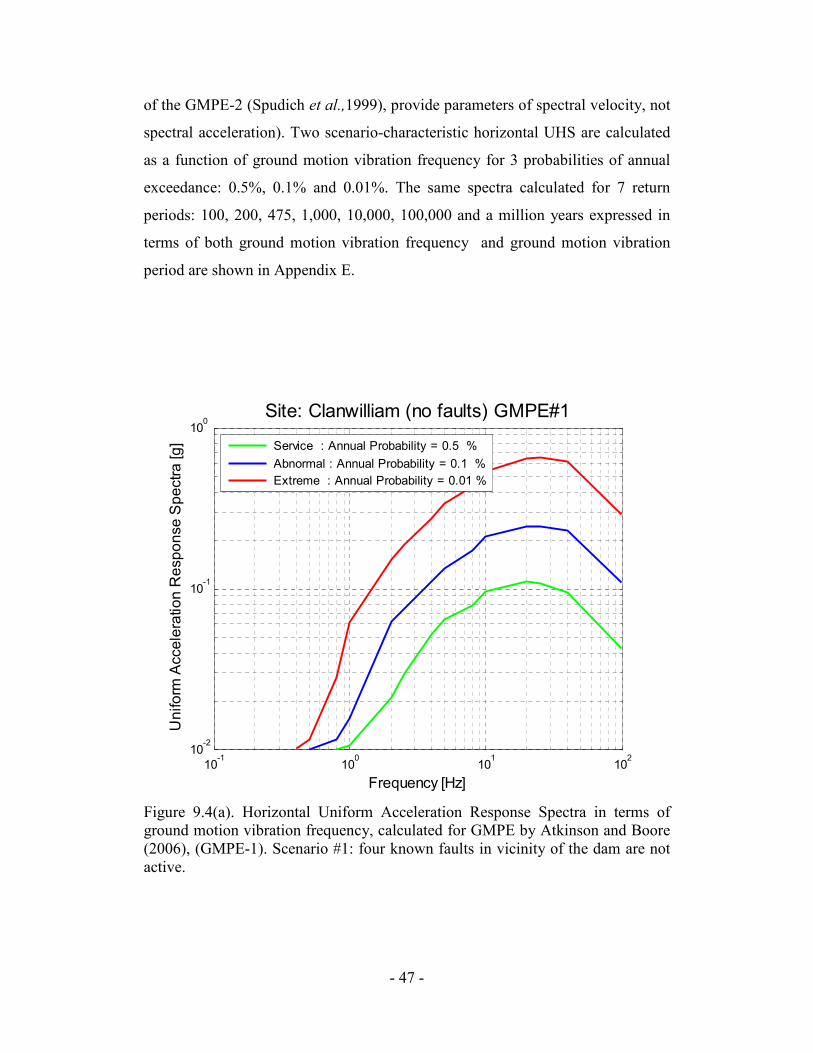
- 47 -
of the GMPE-2 (Spudich et al.,1999), provide parameters of spectral velocity, not
spectral acceleration). Two scenario-characteristic horizontal UHS are calculated
as a function of ground motion vibration frequency for 3 probabilities of annual
exceedance: 0.5%, 0.1% and 0.01%. The same spectra calculated for 7 return
periods: 100, 200, 475, 1,000, 10,000, 100,000 and a million years expressed in
terms of both ground motion vibration frequency and ground motion vibration
period are shown in Appendix E.
Figure 9.4(a). Horizontal Uniform Acceleration Response Spectra in terms of
ground motion vibration frequency, calculated for GMPE by Atkinson and Boore
(2006), (GMPE-1). Scenario #1: four known faults in vicinity of the dam are not
active.
10-1
100
101
102
10-2
10-1
100
Site: Clanwilliam (no faults) GMPE#1
Frequency [Hz]
Uniform
Accele
ration R
esponse S
pectra [g]
Service : Annual Probability = 0.5 %
Abnormal : Annual Probability = 0.1 %
Extreme : Annual Probability = 0.01 %
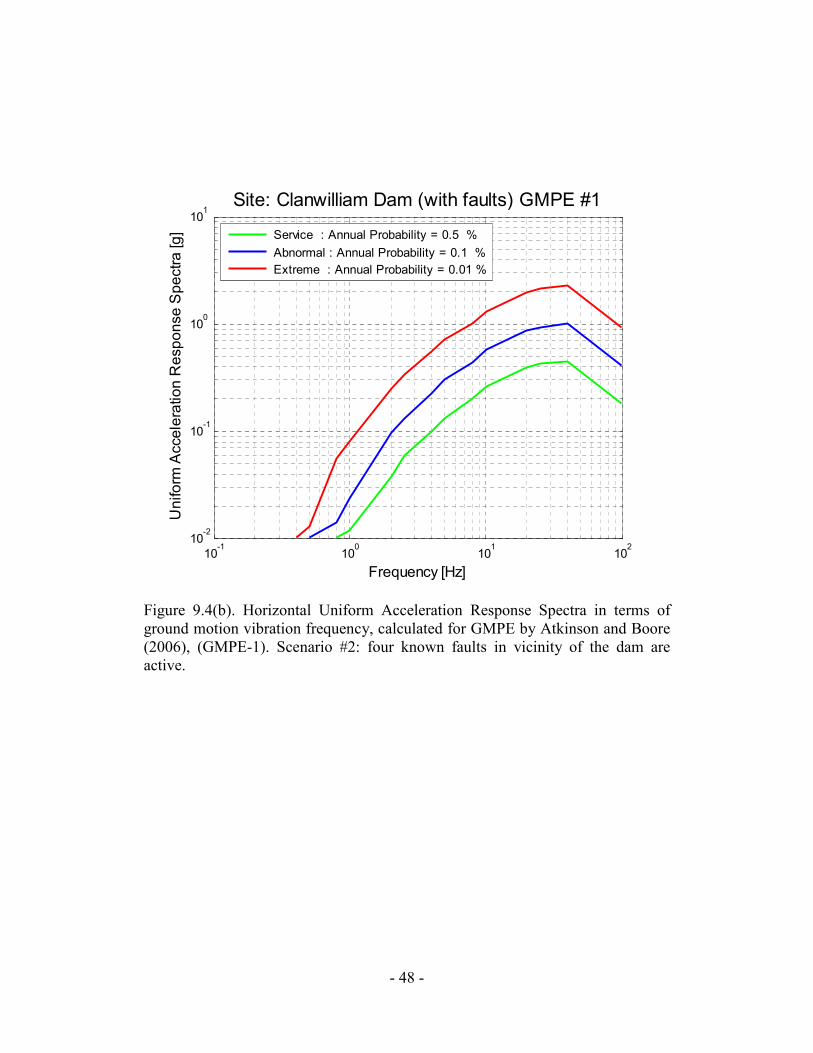
- 48 -
Figure 9.4(b). Horizontal Uniform Acceleration Response Spectra in terms of
ground motion vibration frequency, calculated for GMPE by Atkinson and Boore
(2006), (GMPE-1). Scenario #2: four known faults in vicinity of the dam are
active.
10-1
100
101
102
10-2
10-1
100
101
Site: Clanwilliam Dam (with faults) GMPE #1
Frequency [Hz]
Uniform
Accele
ration R
esponse S
pectra [g]
Service : Annual Probability = 0.5 %
Abnormal : Annual Probability = 0.1 %
Extreme : Annual Probability = 0.01 %

- 49 -
10. Account of Uncertainties: Logic Tree Approach
The purpose of this section is to provide an interpretation of the uncertainties
associated with the PSHA assessment performed for the site of the Clanwilliam
Dam.
The development of any complexity seismotectonic model needed by PSHA
requires several essential assumptions about its parameters, parameters which are
uncertain and allow a wide range of interpretations.
There are two types of uncertainty (variability) that can be included in PSHA.
These are aleatory and epistemic (e.g. Budnitz et al., 1997; Bernreuter et al.,
1989).
Aleatory variability is uncertainty in the data used in an analysis which accounts
for randomness associated with the prediction of a parameter from a specific
model, assuming that the model is correct. For example, standard deviation of the
mean value of ground motion represents typical aleatory variability. Aleatory
variability is included, by default, in the PSHA calculations by means of
mathematical integration, which are an integral part of the applied methodology.
Epistemic variability accounts for incomplete knowledge in the predictive models
and the variability in the interpretations of the data. Epistemic uncertainty is
included in the PSHA by account of alternative hypothesis and models. For
example, the alternative hypothesis accounts for uncertainty in earthquake source
zonation, their seismic potential, seismic source hazard parameters and GMPE’s.
- 50 -
The lack of the reliable regional ground motion prediction equation and lack of
knowledge of seismic potential of four identified faults in vicinity of the dam wall
(Figure 7-2), are the main sources of uncertainty in this PSHA assessment for the
site of a Clanwilliam Dam. For this reason the effect of several alternative
assumptions regarding GMPEs and seismic potential of the faults is investigated
in detail.
In this report, two models of horizontal component of GMPEs have been apply
• Atkinson and Boore, 2006 [GMPE-1], and
• Spudich et al., 1999 [GMPE-2].
The well known GMPE-1 by Atkinson and Boore, (2006) was developed for the
central and eastern United States which is situated in a type of tectonic
environment known as an intraplate region, or equivalently, stable continental
area.
The GMPE-2 by Spudich et al. (1999) has been developed for estimation
earthquake generated ground motions in extensional tectonic regimes. The East
African Rift system is an example of a shallow extensional tectonic environment.
The GMPE is well known and usually it predicts lower ground motions than any
other ground motion prediction equation.
Let us apply formalism of the logic tree to the two GMPE’s and uncertainty of
seismic potential of identified faults in vicinity of the dam wall and calculate the
horizontal PGA corresponding to the Operating Basis Earthquake (OBE),
Maximum Design Earthquake (MDE), and Maximum Credible Earthquake
(MCE).

- 51 -
Let us assume that that the probability of being correct for each one of the two
GMPE’s is: 0.50 (GMPE-1) and 0.50 (GMPE-2).
Following information provided by the Client, the subsequent assumptions were
made regarding seismic potential of four identified faults in vicinity of the dam:
Probability [faults are not active] = 0.5
Probability [faults are active] = 0.5.
Based on the logic tree formalism and Table 9-1, the expected values and standard
deviations of horizontal component of OBE, MDE and MCE for the site of
Clanwilliam Dam are:
PGA (OBE. Return Period 144 years) =
0.5 * 0.5 * 0.04g + 0.5 * 0.5 * 0.15g + 0.5 * 0.5 * 0.04g + 0.5 * 0.5 * 0.08g =
0.078±0.045g
PGA (MDE. Return Period 475 years) =
0.5 * 0.5 * 0.08g + 0.5 * 0.5 * 0.29g + 0.5 * 0.5 * 0.06g + 0.5 * 0.5 * 0.13g =
0.140±0.090g
PGA (MCE. Return Period 10,000 years) =
0.5 * 0.5 * 0.29g + 0.5 * 0.5 * 0.93g + 0.5 * 0.5 * 0.14g + 0.5 * 0.5 * 0.25g =
0.402±0.309 g
It is important to note that the map of seismic hazard for South Africa (Kijko et
al., 2003) shows value of MDE ca. 0.1g, which is less than computed above
(0.014g). But the same time, if uncertainty of the estimated value of MDE is taken
into account, the map MDE value is within the range mean +/- standard deviation
which is <0.05g-0.23g>. Of course the resolution of the hazard map is too low
and it can be used only as guidance.

- 52 -
Figure 9.4 (c) shows effect of application of logic tree formalism to the uniform,
horizontal ground motion acceleration spectra, Figure 9.4 (a)-(b), after assumption
that probabilities that faults are active(scenario #2) and not active (scenario #1)
are the same and equal 0,5. The resulting uniform ground acceleration spectra are
shown in Figure 9.4 (c). The service, abnormal and extreme curves show a
spectral acceleration peak of approximately 0,3g, 0,6g and 1,6g at 40 Hz,
respectively.
Figure 9.4 (c) Effect of application of logic tree formalism to the uniform
horizontal ground motion acceleration spectra shown in Figure 9.4 (a)-(b). It was
assumed that probabilities that faults are active (scenario #2) and not active
(scenario #1) are the same and equal to 0,5.
10-1
100
101
102
10-2
10-1
100
101
Site: Clanwilliam Dam
Frequency [Hz]
UA
RS
[g] (a
fter lo
gic
tre
e)
Service : Annual Probability = 0.5 %
Abnormal : Annual Probability = 0.1 %
Extreme : Annual Probability = 0.01 %
- 53 -
11. Conclusions
The PSHA was performed using the conventional, Cornell-McGuire procedure
(Cornell, 1968; McGuire, 1976, 1978). The earthquake recurrence parameters b-
value, λ, and mmax were calculated by the procedure of Kijko and Sellevoll (1989,
1992) and Kijko (2004).
The applied procedure requires knowledge of regional geology, tectonics, paleo-
historic and instrumentally recorded seismicity. Such information was provided
by client. Unfortunately the provided information is highly incomplete. The
incompleteness of geological model of the area contributes to the uncertainties of
PSHA assessment.
All calculations are repeated four times, each for two considered ground motion
prediction equations and two different assumptions about seismic potential of four
faults identified in vicinity of the dam wall.
The uncertainties have been taken into account thorough logic tree formalism.
The logic tree allows inclusions of alternative scenarios and interpretations that
are weighted according to their probability of being correct.
Following the international guidance, (ICOLD, 1989; Engineering and Design,
ER 1110, 1995), three designed levels of PGA were considered, Operating Basis
Earthquake, OBE, (return period 144 years), Maximum Credible Earthquake,
MCE (return period 475 years), and the Maximum Design Earthquake, MDE
(10,000 years). The estimated value of MDE (0.14g) is slightly higher than MDE
(ca. 0.1g) predicted by seismic hazard map of SA (Kijko et al., 2003). However, if

- 54 -
uncertainty of the estimated value of MDE is taken into account, the map value is
within the range mean +/- standard deviation, which is <0.05g-0.23g>.
The uniform acceleration response spectra and 5% damping the Newmark-Hall
elastic design spectra are also provided.
The lack of the regional ground motion prediction equation and information
about seismic potential of four faults identified in vicinity of the dam site are
the main sources of uncertainty in this PSHA assessment for the planned
Clanwilliam Dam. The uncertainty can be significantly reduced by
implementation of results of additional geological investigation on the site.
55
11. References
ASCE 7-05 (2005). Minimum design loads for buildings and other structures. Standard SCE/SEI
7-05, American Society of Civil Engineers, Reston, VA, 424 pp.
Atkinson, G.M. and D.M. Boore (2006). Earthquake ground-motion prediction equations for
Eastern North America. Bull. Seism. Soc. Am. 96, 2181-2205.
Bernreuter, D.L., J.B. Savy, R.W. Mensing, and J.C. Chen (1989). Seismic Hazard
Characterization of 69 Nuclear Plant Sites East of the Rocky Mountains. Report
NUREG/CR-5250, vols 1-8, prepared by Lawrence Livermore National Laboratory for
the U.S. Nuclear Regulatory Commission.
Brandt, M.B.C., I. Saunders and G. Graham. (2003). Frequency-magnitude relationship and
estimated mmax from micro-seismic data, and regional- and historical data sets for the
Southern part of South Africa, Africa Geoscience Review.
Budnitz, R.J., G. Apostolakis, D.M. Boore, L.S. Cluff, K.J. Coppersmith, C.A. Cornell and P.A.
Morris (1997). Recommendations for Probabilistic Seismic Hazard Analysis: Guidance
on Uncertainty and Use of Experts. NUREG/CR-6372, UCR-ID-122160, Main Report 1.
Prepared for Lawrence Livermore National Laboratory.
Cornell, C., (1968). Engineering seismic risk analysis, Bull. Seism. Soc. Am., 58, 1583–1606.
Cotton, F., F. Scherbaum, J. J. Bommer, and H. Bungum. (2006). Criteria for selecting and
adjusting ground motion models for specific target regions: Application to central Europe
and rock sites. Journal of Seismology, 10, 137–156. Apr 2006. doi: 10.1007/s10950-005-
9006-7.
McGuire, R.K., (1995). PSHA and design earthquakes: closing the loops, Bull. Seism. Soc. Am.,
85, 1275–1284.
Engineering and Design. Earthquake Design and Evaluation for Civil Works Projects.
Regulation No. 1110-2-1-1806. Department of the Army U.S. Army Corpus of Engineers
Washington, DC 20314-1000, 1995.
Eurocode 8 (2004). Design of Structures for Earthquake Resistance – Part 1: General rules,
seismic actions and rules for buildings. EN 1998-1: 2004. Comité Européen de
Normalisation, Brussels.
Fernandez, L.M. and J.A. Guzman (1979). Earthquake hazard in Southern Africa. Seismologic
Series No 10, Geological Survey of South Africa, 22 pp.
Johnston, A.C., (1996). Seismic moment assessment of earthquakes in stable continental regions-
I. Instrumental seismicity. Geophys. J. Int., 124, 381–414.

56
ICOLD (1989). Guidelines: Selecting seismic parameters for large dams. Bulletin 72,
International Commission on Large Dams, Paris, France, 73 pp.
Jonathan, E., (1996). Some aspects of seismicity in Zimbabwe and Eastern and Southern Africa.
M. Sc. Thesis Institute of Solid Earth Physics, Bergen University, Bergen, Norway,
p.100.
Kijko, A., (2004). Estimation of the maximum earthquake magnitude mmax. Pageoph, 161, 1655–
1681.
Kijko, A., and M.A. Sellevoll, (1989). Estimation of earthquake hazard parameters from
incomplete data files, Part I, Utilization of extreme and complete catalogues with
different threshold magnitudes, Bull. Seism. Soc. Am., 79, 645-654.
Kijko, A. and M.A. Sellevoll, (1992). Estimation of earthquake hazard parameters from
incomplete data files. Part II. Incorporation of magnitude heterogeneity. Bull. Seism.
Soc. Am. 82, 120-134.
Kijko, A., G. Graham, M. Bejaichund, D. Roblin and M. B. C. Brandt. (2003). Probabilistic
Peak Ground Acceleration and Spectral Seismic Hazard Maps for South Africa. CD
and Report Number 2003-0053. Council for Geoscience, Pretoria, 2003
Krinitzky, E.L., F.K. Chang, and O.W. Nuttli (1988). Magnitude related earthquake ground
motion. Bull. Ass. Eng. Geol., 25, 399-423.
McGuire, R.K. Fortran Computer Program for Seismic Risk Analysis, USGS. Open File Rep.
76-67. 1976.
McGuire, R.K. FRISK: Computer Program for Seismic Risk Analysis Using Faults as
Earthquake Sources, USGS. Open File Rep. 78-1007. 1978.
Newmark, N.M and W.J. Hall. Earthquake Spectra and Designs, EERI, Monograph Series,
Berkley, 1982.
Minzi, V, D.J. Hlatywayo, L.S. Chapola, F.Kebeda, K. Atakan, F. Kebede, K. Atakan, D.K.
Lombe, G. Turyomurugyendo and F.A. Tugume (1999). Seismic Hazard Assessment in
Eastern and Southern Africa. Annali di Geofisica, 42, 1067-1083.
Pankow, K. L. and J. C. Pechmann (2004). The SEA99 ground-motion predictive relations for
extensional tectonic regimes: Revisions and a new peak ground velocity relation. Bull.
Seismol. Soc. Am., 94, 341–348.
Pankow and K. L. and J. C. Pechmann (2006) Erratum: The SEA99 ground-motion predictive
relations for extensional tectonic regimes: Revisions and a new peak ground velocity
relation. Bull. Seismol. Soc. Am., 96, 364.
57
Saunders, I., M. Brandt, J. Steyn, D. Roblin and A. Kijko (2008). The South African National
Seismograph Network. Seismol. Research Letters, 79, Number 2, 203-210.
Slemmons, D.B. and D.H. Chung (1982). Maximum credible earthquake magnitudes for the
Calaveras and Hayward fault zone, California. Proceedings Conference on
Earthquake Hazard in the Dan Francisco Bay Area, Special Publication 62, pp.115-
124. Sacramento, CA: California Division of Mines and Geology.
Twesigomwe, E. (1997). Probabilistic seismic hazard assessment of Uganda. Ph.D. Thesis,
Makarere University, Uganda.
Wells, D.L. and K.J. Coppersmith, (1994). Empirical relationships among magnitude, rupture
length, rupture area, and surface displacement. Bull. Seismol. Soc. Am. 84, 974-1002.
Weinert, H.H., (1980). The Natural Road Construction Materials of Southern Africa.
Academica, Pretoria, Cape Town.
58
Appendix A
Seismicity of area surrounding Clanwilliam Dam site
year month day lat long magnitude
============================================
1620 4 7 -33.80 18.40 3.70 1690 6 15 -33.90 18.40 3.70 1695 10 4 -33.90 18.40 3.70 1696 1 11 -33.90 18.40 3.70 1739 9 5 -33.90 18.40 3.70 1749 8 27 -33.90 18.40 3.00 1766 7 14 -34.20 18.50 4.30 1809 12 4 -34.00 18.40 6.30 1809 12 28 -33.90 18.40 3.70 1810 1 29 -33.90 18.40 3.00 1810 4 11 -33.90 18.40 3.70 1810 12 26 -34.10 19.50 3.00 1811 1 7 -33.90 18.40 3.00 1811 6 2 -33.90 18.40 5.70 1811 6 19 -33.90 18.40 5.00 1819 4 14 -30.30 18.10 4.30 1819 6 24 -32.90 18.80 3.00 1826 6 15 -33.00 18.00 3.70 1826 4 14 -33.90 18.40 3.00 1835 11 11 -33.90 18.40 4.30 1857 8 14 -33.50 19.00 5.00 1869 10 31 -33.90 18.40 3.70 1869 11 23 -30.00 17.20 3.70 1882 4 29 -29.70 17.90 3.70 1884 7 11 -30.60 21.40 3.00 1885 5 10 -33.90 18.40 3.00 1899 9 13 -33.90 18.40 5.00 1902 5 28 -33.90 18.40 4.30 1903 7 9 -33.90 18.40 3.70 1908 12 30 -29.70 17.90 4.00 1919 1 13 -31.40 19.80 3.00 1920 8 13 -33.90 18.50 3.00 1921 2 19 -31.60 18.70 3.70 1921 10 9 -33.30 19.10 5.00 1922 1 3 -33.30 19.10 3.70 1924 2 22 -34.00 18.40 3.00 1926 8 11 -33.40 18.40 4.00 1937 8 19 -33.40 18.40 3.00 1941 10 23 -31.00 17.70 4.30 1947 2 27 -32.80 17.80 3.70 1950 9 30 -30.50 18.00 5.50 1950 11 19 -34.00 18.00 4.20 1952 1 26 -32.90 20.50 4.90 1952 1 26 -32.90 20.50 4.60 1952 1 26 -32.90 20.50 4.30 1952 1 27 -32.90 20.50 5.00 1952 1 27 -33.00 20.50 5.30 1952 1 28 -33.00 20.50 4.00 1952 1 28 -32.90 20.50 5.40 1952 1 28 -32.90 20.50 5.00 1952 1 29 -32.90 20.50 4.70 1952 2 1 -32.90 20.50 4.90 1952 2 26 -34.00 20.40 4.20 1952 5 13 -32.90 20.50 4.40 1953 2 26 -30.00 21.00 4.40 1957 9 20 -34.00 18.20 4.20
59
1957 9 30 -34.00 18.20 4.20 1960 8 29 -33.40 19.30 4.80 1963 8 27 -33.10 19.00 5.00 1963 9 17 -33.30 19.30 4.80 1964 2 21 -34.10 18.00 4.30 1966 3 1 -34.10 18.00 4.30 1966 7 31 -30.00 19.00 4.20 1967 6 16 -30.40 18.40 4.30 1967 7 12 -30.00 20.00 3.70 1968 2 24 -30.20 20.00 3.60 1969 9 11 -33.40 21.00 5.20 1969 9 29 -33.20 19.20 3.70 1969 9 29 -33.10 19.30 3.50 1969 9 29 -33.28 19.24 6.30 1969 9 29 -33.20 19.20 3.90 1969 9 29 -33.20 19.40 3.50 1969 9 29 -33.20 19.10 3.40 1969 9 29 -33.10 19.40 3.50 1969 9 29 -33.10 19.40 3.50 1969 9 29 -33.40 19.30 3.50 1969 9 29 -33.40 19.40 3.80 1969 9 29 -33.40 19.40 3.40 1969 9 29 -33.40 19.40 3.30 1969 9 29 -33.40 19.40 3.70 1969 9 29 -33.00 19.10 4.30 1969 9 30 -33.00 19.10 3.40 1969 9 30 -33.30 19.20 3.90 1969 9 30 -33.30 19.20 3.70 1969 9 30 -33.30 19.20 3.90 1969 9 30 -33.30 19.20 3.90 1969 9 30 -33.30 19.20 3.50 1969 9 30 -33.30 19.20 3.90 1969 9 30 -33.10 19.00 4.20 1969 9 30 -33.10 19.00 3.90 1969 9 30 -33.00 20.10 3.90 1969 9 30 -33.40 19.20 4.50 1969 9 30 -33.10 19.40 3.80 1969 9 30 -33.10 19.40 3.40 1969 10 1 -33.50 19.40 4.10 1969 10 1 -33.50 19.40 3.40 1969 10 2 -33.50 19.40 3.40 1969 10 2 -33.50 19.40 3.40 1969 10 2 -33.50 19.40 4.10 1969 10 3 -33.50 19.40 4.00 1969 10 3 -33.50 19.40 3.40 1969 10 3 -33.40 19.20 4.70 1969 10 5 -33.40 19.30 5.10 1969 10 5 -33.40 19.30 3.50 1969 10 6 -33.40 19.30 3.90 1969 10 6 -33.30 19.20 4.40 1969 10 8 -32.20 19.20 3.80 1969 10 8 -32.20 19.20 4.10 1969 10 10 -33.20 19.30 4.80 1969 10 11 -33.20 19.00 4.10 1969 10 11 -33.20 19.00 3.70 1969 10 13 -33.20 19.00 3.40 1969 10 13 -33.20 19.00 3.40 1969 10 19 -33.20 19.00 3.70 1969 11 5 -33.40 19.40 5.40 1969 11 6 -33.40 19.40 3.40 1969 11 6 -33.30 19.10 4.30 1969 11 8 -33.30 19.00 3.80 1969 11 8 -33.30 19.20 4.30 1969 11 8 -33.30 19.20 4.20 1969 11 9 -33.30 19.20 4.80 1969 11 9 -33.30 19.20 3.80 1969 11 9 -33.30 19.20 3.40 1969 11 9 -33.30 19.20 3.30 1969 11 9 -33.30 19.20 3.40 1969 11 9 -33.30 19.20 3.60 1969 11 9 -33.30 19.20 3.90

60
1969 11 9 -33.30 19.20 4.50 1969 11 9 -33.30 19.20 4.20 1969 11 9 -33.30 19.20 3.40 1969 11 9 -33.30 19.20 4.30 1969 11 9 -33.30 19.20 3.40 1969 11 9 -33.30 19.30 4.60 1969 11 10 -33.30 19.30 3.40 1969 11 10 -33.30 19.70 5.10 1969 11 10 -33.30 19.70 3.80 1969 11 10 -33.30 19.70 3.40 1969 11 10 -33.30 19.70 3.90 1969 11 11 -33.30 19.70 3.80 1969 11 12 -33.30 19.70 3.50 1969 11 13 -33.30 19.70 4.10 1969 11 13 -33.30 19.70 3.90 1969 11 16 -33.30 19.70 3.90 1969 11 17 -33.30 19.70 3.50 1969 11 19 -33.20 19.20 3.70 1969 11 23 -33.20 19.20 3.40 1969 12 4 -33.20 19.20 3.90 1969 12 6 -33.20 19.20 3.70 1970 4 6 -33.70 21.40 4.00 1970 4 14 -33.30 19.30 5.70 1970 4 14 -32.90 19.20 4.60 1970 4 14 -33.00 19.30 4.10 1970 4 14 -32.90 19.20 4.20 1970 4 16 -33.00 19.00 4.10 1971 9 28 -33.00 19.50 5.46 1973 1 12 -33.33 19.09 4.50 1974 12 19 -33.29 19.25 3.10 1974 12 23 -33.39 18.84 3.40 1977 3 2 -33.48 19.49 5.30 1977 3 2 -33.30 19.50 4.10 1977 4 28 -33.20 19.10 3.80 1977 6 7 -33.52 18.97 5.50 1978 4 11 -33.40 19.30 3.10 1981 3 20 -30.18 20.90 3.70 1981 8 24 -33.30 19.00 4.60 1982 11 3 -33.30 19.20 3.10 1983 2 24 -33.49 18.85 4.64 1987 3 5 -33.10 17.62 3.20 1987 4 21 -29.72 19.82 3.68 1987 4 26 -29.96 19.64 4.36 1987 4 27 -29.96 19.73 4.62 1987 9 26 -30.30 18.62 3.45 1987 12 11 -29.50 19.80 3.66 1988 8 5 -29.46 19.96 3.78 1991 6 3 -33.45 19.24 3.10 1991 6 24 -30.09 18.68 3.40 1991 8 11 -29.94 18.35 4.10 1991 10 31 -33.35 19.16 5.10 1993 3 11 -29.53 18.34 4.70 1993 6 3 -29.67 17.97 4.20 1993 11 20 -29.68 19.43 3.70 1994 7 15 -33.91 18.10 5.46 1994 12 31 -30.36 20.87 5.10 1995 2 27 -29.58 18.51 4.10 1996 2 4 -29.65 18.10 4.50 1996 4 26 -29.55 17.87 3.80 1996 9 15 -30.05 19.24 5.70 1998 10 5 -31.73 22.00 3.90 2001 3 24 -29.83 18.98 4.50 2001 4 6 -29.59 19.51 5.20 2002 11 18 -33.22 19.62 3.10 2002 11 18 -32.86 20.83 3.50 2003 5 19 -32.85 19.66 3.30 2003 9 30 -30.10 19.90 3.10 2003 10 22 -33.35 19.17 3.00 2003 11 10 -33.23 19.15 3.00 2003 12 12 -33.18 19.23 3.70 2003 12 12 -31.22 18.34 3.60

61
2004 8 9 -31.30 19.67 3.20 2004 9 16 -30.07 20.98 3.20 2004 10 10 -32.71 18.19 3.60 2004 10 27 -33.25 19.05 3.70 2005 1 17 -31.25 20.66 3.10 2006 9 27 -33.40 18.93 3.80
62
Appendix B
Applied Methodology for Probabilistic Seismic Hazard Analysis
1. Introduction
The essence of the Probabilistic Seismic Hazard Analysis (PSHA) is the calculation of the
probability of exceedance of a specified ground motion level at a specified site (Cornell, 1968;
Reiter, 1990). In principle, PSHA can address a very broad range of natural hazards associated
with earthquakes, including ground shaking and ground rupture, landslide, liquefaction or
tsunami. However, in most cases, the interest of designers is in the estimation of likelihood of a
specified level of ground shaking, since it causes the greatest economic losses.
The typical output of the PSHA is seismic hazard curve (often, a set of seismic curves), i.e.
plots of the estimated probability, per unit time, of the ground motion variable, e.g. peak ground
acceleration (PGA) being equal to or exceeding the level as a function of PGA (Budnitz et al.,
1997). The essence of the PSHA is that its product – the seismic hazard curve, quantifies the
hazard at the site from all possible earthquakes of all possible magnitudes at all significant
distances from the site of interest, by taking into account their frequency of occurrences. In
addition to hazard curve, the output of PSHA includes results of the so called deaggregation
procedure. The procedure provides information on earthquake magnitudes and distances that
contribute to the hazard at a specified return period, and at a structural period of engineering
interest (Budnitz et al., 1997).
In general, the standard PSHA procedure is based on two sources of information: (1) observed
seismicity, recapitulated by seismic event catalogue, and (2) area-specific, geological data. After
the combination of a selected model of earthquake occurrence with the information on the
regional seismic wave attenuation or ground motion prediction equation (GMPE), a regional
seismotectonic model of the area is formulated. In addition, the PSHA takes into account the site
specific soil properties.
63
Complete PSHA can be performed only when information on the regional seismotectonic model
and the site-specific soil properties are known.
Clearly, all above information, required by a complete PSHA is subjective and often, highly
uncertain especially in stable continental areas where the earthquake activity is very low.
According to convention established in the fundamental document by Budnitz et al. (1997), there
are two types of uncertainties, associated with PSHA: these are aleatory and epistemic
uncertainties. According to Budnitz et al. (1997), the uncertainties that are part of the applied
model used in the analysis, are called aleatory uncertainties. The other names for the aleatory
uncertainty are ‘stochastic’ or ‘random’ uncertainties. Even when the model is perfectly correct,
and the numerical values of its parameters are known without any errors, aleatory uncertainties
(for a given model) are still present (Budnitz et al. 1997).
The uncertainties which come from incomplete knowledge of the models, i.e. when wrong
models are applied or/and the numerical values of their parameters are not known, are called
epistemic uncertainties. As relevant information is collected, the epistemic uncertainties can be
reduced (Budnitz et al., 1997).
By definition of the PSHA procedure, the aleatory uncertainty is included in the process of
PSHA calculations by means of applied models (statistical distributions) and by mathematical
integration. Epistemic uncertainty can be incorporated in the PSHA by consideration of an
alternative hypothesis (e.g. alternative boundaries of the seismic sources and their recurrence
parameters), and alternative models (e.g. alternative earthquake distributions or/and application
of alternative PGA attenuation equations). Incorporation of this type of uncertainties into the
PSHA is performed by application of the logic tree formalism.
A complete PSHA includes an account of aleatory as well as epistemic uncertainties. Any PSHA
without the incorporation of the above uncertainties is considered to be incomplete.
This Appendix concentrates on two major mathematical aspects of the PSHA:

64
(1) The procedure for assessment of the seismic source characteristic, recurrence parameters
when the data are incomplete and uncertain. Use is made of the most common
assumptions in engineering seismology i.e. those earthquake occurrences in time follow a
Poisson process and that earthquake magnitudes are distributed according to a Gutenberg-
Richter doubly-truncated distribution. Following the above assumptions, seismic source
recurrence parameters: the mean seismic activity rate, λ (which is a parameter of the
Poisson distribution); the level of completeness of the earthquake catalogue mmin, the
maximum regional earthquake magnitude mmax, and the Gutenberg-Richter parameter b.
To assess the above parameters, a seismic event catalogue containing origin times, size of
seismic events and spatial locations is needed. The maximum seismic source
characteristic earthquake magnitude mmax is of paramount importance in this approach;
therefore a statistical technique that can be used for evaluating this important parameter is
presented.
(2) PSHA methodology i.e. calculating the probability of exceedance of a specified ground
motion level at a specified site. Often, the presented approach is known as the Cornell-
McGuire procedure.
2. Estimation of the Seismic Source Recurrence Parameters – Bayesian Approach
This section gives an outline of the procedure used to determine the seismic source recurrence
parameters: the mean seismic activity rateλ, the Gutenberg-Richter parameter b, and the
maximum regional earthquake magnitude mmax.
2.1 Nature of input data
The lack, or incompleteness, of data in earthquake catalogues is a frequent issue in a statistical
analysis of seismic hazard. Contributing factors include the historical and socio–economic
context, demographic variations and alterations in the seismic network. Generally, the degree
of completeness is a monotonically increasing function of time, i.e. the more recent portion of
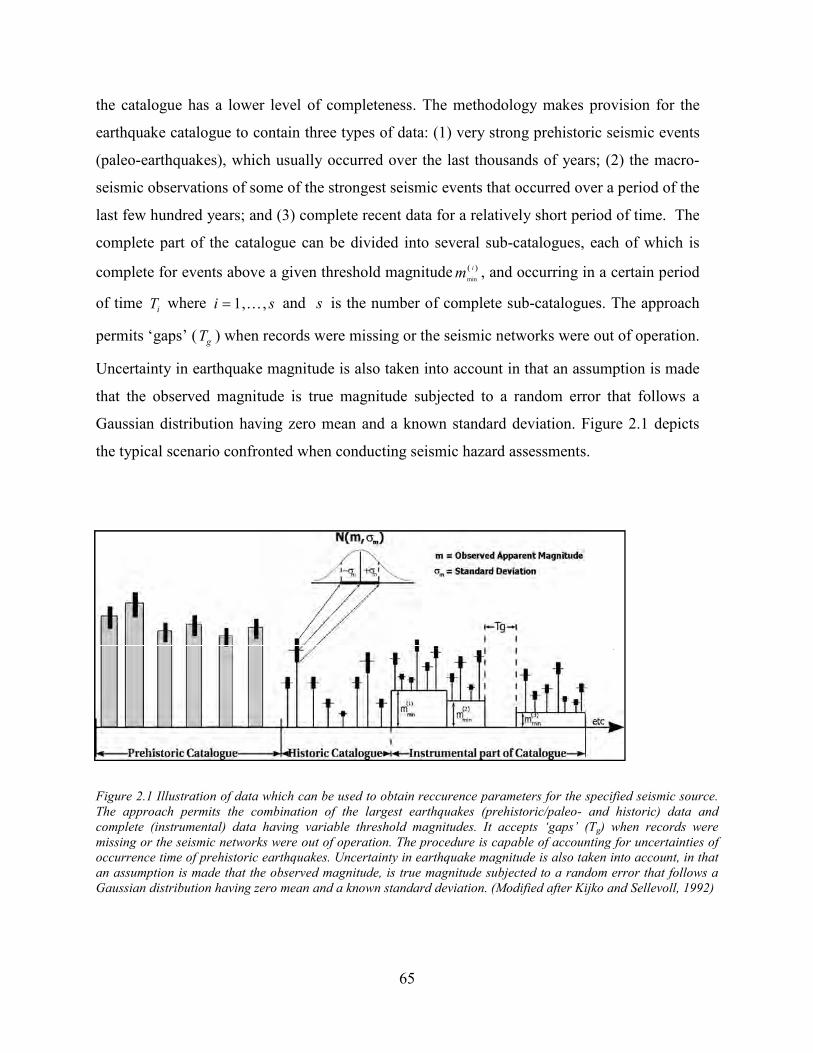
the catalogue has a lower level of completeness.
earthquake catalogue to contain three types of data: (1) very strong prehistoric seismic events
(paleo-earthquakes), which usually occurred over the last thousands of years; (2) the macro
seismic observations of some of the strongest seismic events that occurred over a period of the
last few hundred years; and (3) complete recent data for a relatively short period of time. The
complete part of the catalogue can be divided into several sub
complete for events above a given threshold magnitude
of time iT where si ,,1 K= and
permits ‘gaps’ ( gT ) when records were missing or the seismic networks were out of operation.
Uncertainty in earthquake magnitude is also taken int
that the observed magnitude is true magnitude subjected to a random error that follows a
Gaussian distribution having zero mean and a known standard deviation. Figure 2.1 depicts
the typical scenario confronted when
Figure 2.1 Illustration of data which can be used to obtain reccurence parameters for the specified seismic source.
The approach permits the combination of the largest earthquakes (prehistoric/paleo
complete (instrumental) data having variable threshold magnitudes. It accepts ‘gaps’ (T
missing or the seismic networks were out of operation. The procedure is capable of accounting for uncertainties of
occurrence time of prehistoric earthquakes. Uncertainty in earthquake magnitude is also taken into account, in that
an assumption is made that the observed magnitude, is true magnitude subjected to a random error that follows a
Gaussian distribution having zero mean and a known
65
the catalogue has a lower level of completeness. The methodology makes provision for the
earthquake catalogue to contain three types of data: (1) very strong prehistoric seismic events
sually occurred over the last thousands of years; (2) the macro
seismic observations of some of the strongest seismic events that occurred over a period of the
last few hundred years; and (3) complete recent data for a relatively short period of time. The
complete part of the catalogue can be divided into several sub-catalogues, each of which is
complete for events above a given threshold magnitude ( )i
mmin
, and occurring in a certain period
and s is the number of complete sub-catalogues. The approach
) when records were missing or the seismic networks were out of operation.
Uncertainty in earthquake magnitude is also taken into account in that an assumption is made
that the observed magnitude is true magnitude subjected to a random error that follows a
Gaussian distribution having zero mean and a known standard deviation. Figure 2.1 depicts
the typical scenario confronted when conducting seismic hazard assessments.
Illustration of data which can be used to obtain reccurence parameters for the specified seismic source.
The approach permits the combination of the largest earthquakes (prehistoric/paleo- and historic
complete (instrumental) data having variable threshold magnitudes. It accepts ‘gaps’ (Tg) when records were
missing or the seismic networks were out of operation. The procedure is capable of accounting for uncertainties of
historic earthquakes. Uncertainty in earthquake magnitude is also taken into account, in that
an assumption is made that the observed magnitude, is true magnitude subjected to a random error that follows a
Gaussian distribution having zero mean and a known standard deviation. (Modified after Kijko and Sellevoll, 1992)
The methodology makes provision for the
earthquake catalogue to contain three types of data: (1) very strong prehistoric seismic events
sually occurred over the last thousands of years; (2) the macro-
seismic observations of some of the strongest seismic events that occurred over a period of the
last few hundred years; and (3) complete recent data for a relatively short period of time. The
catalogues, each of which is
, and occurring in a certain period
catalogues. The approach
) when records were missing or the seismic networks were out of operation.
o account in that an assumption is made
that the observed magnitude is true magnitude subjected to a random error that follows a
Gaussian distribution having zero mean and a known standard deviation. Figure 2.1 depicts
Illustration of data which can be used to obtain reccurence parameters for the specified seismic source.
and historic) data and
) when records were
missing or the seismic networks were out of operation. The procedure is capable of accounting for uncertainties of
historic earthquakes. Uncertainty in earthquake magnitude is also taken into account, in that
an assumption is made that the observed magnitude, is true magnitude subjected to a random error that follows a
standard deviation. (Modified after Kijko and Sellevoll, 1992)
66
2.2 Statistical preliminaries
Basic statistical distributions and quantities utilized in the development of the methodology
are briefly described in what follows.
The Poisson distribution is used to model the number of occurrences of a given earthquake
magnitude or a given amplitude of a selected ground motion parameter being exceeded within
a specified time interval.
( ) ( ) ( )...,2,1,0
!,, ==== − ne
n
ttnNPtnp t
n
λλλλ (1)
Note that λ here refers to the mean of the distribution, and describes the mean activity rate
(mean number of occurrences).
The gamma distribution, given its flexibility, is used to model the distribution of various
parameters in our approach, and is given by
( ) ( )( )
0,1 >Γ
= −−xe
q
pxxf xp
, (2)
where ( )qΓ is the gamma function defined as
( ) 0,0
1 >=Γ −∞
−∫ qdyeyq yq , (3)
The parameters p and q are related to the mean µ , and variance 2σ , of the distribution
according to
p
qx =µ , (4)

67
2
2
p
qx =σ , (5)
The coefficient of variation expresses the uncertainty related to a given parameter, and is
given by
x
xxCOV
µσ
= , (6)
thus describing the variation of a parameter relative to its mean value, with a higher value
indicating a greater dispersion of the parameter.
2.3 Estimation of the seismic source recurrence parameters
The standard assumption adopted is that the distribution of earthquakes, with respect to their
size, obeys the classic Gutenberg-Richter relation
( ) ( )minlog mmbamN −⋅−= , (7)
where ( )mN is the number of earthquakes ofminmm ≥ , occurring within a specified period of
time, and a and b are parameters.
Aki (1965) found that equation (7) implied a singly truncated exponential distribution of the
form
( ) ( )
( )min1mm
M
e
mMPmF
−−−=
≤=β
, (8)
where ( )10lnb=β .

68
The earthquake occurrences over time in the given area are assumed to satisfy a Poisson
process (1) having an unknown mean seismic activity rate λ .
The disregard of temporal and spatial variations of the parameters λ and b can lead to biased
estimates of seismic hazard. An explicit assumption behind most hazard assessment
procedures is that parameters λ and b and remain constant in time. However, examination
of most earthquake catalogues indicates that there are temporal changes of the mean seismic
activity rate λ as well as of the parameter b . For some seismic areas, the b -value has been
reported to change (decrease/increase) its value before large earthquakes. Usually, such
changes are explained by the state of stress; the higher the stress, the lower the b -value.
Other theories connect the b -value with the homogeneity of the rock: the more heterogeneous
the rock, the higher the b -value. Finally, some scientists connect the fluctuation of the b
-value with the seismicity pattern and believe that the b -value is controlled by the buckling of
the stratum. Whatever the mechanism, the phenomenon of space-time b -value fluctuation is
indubitable and well-known. A wide range of international opinions concerning changes of
patterns in seismicity, together with an extensive reference list, are found in a monograph by
Simpson and Richards (1981) and in two special issues of Pure and Applied Geophysics,
(Seismicity Patterns …, 1999; Microscopic and Macroscopic …, 2000). Treating both
parameters λ and b as random variables modelled by respective gamma distributions,
allows for appropriately accounting for the statistical uncertainty in these important
parameters. In practice, the adoption of the gamma distribution does not really introduce
much limitation, since the gamma distribution can fit a large variety of shapes. Combining the
Poisson distribution (1) together with the gamma distribution (2) with parameters λp and λq ,
the probability related to a certain number of earthquakes, n , per unit time t , for randomly
varying seismicity is obtained
( ) ( ) ( )
( )( )
,!
,0
nq
AAA
pt
t
pt
p
qn
qn
dftnptnP
+
+Γ+Γ
=
= ∫∞
λ
λ
λ
λ
λ
λ
λλλ
(9)
69
where2
λσλλ =p ,
22
λσλλ =q and Γ(⋅) is the Gamma function (3). Parameter λ denotes
the mean value of activity rateλ .
Similarly, combining the exponential distribution (8) with the gamma distribution for with
parameters βp and
βq , and normalizing (e.g. Campbell, 1982) upon introducing an upper limit
maxm for the distribution of earthquake magnitudes, the CDF of earthquake magnitudes is
obtained
( )
−+−=
β
β
ββ
q
Mmmp
pCmmF
min
min 1 , (10)
where 2
βσββ =p and
22
βσββ =q . The symbol β denotes the mean value of parameter β ,
βσ denotes the standard deviation of β and the normalizing coefficient βC is given by
1
minmax
1
−
−+−=
β
β
ββ
q
mmp
pC , (11)
Noting that λλ λ pq ⋅= and ββ β pq ⋅= , equations (9) and (10) may alternatively be written
respectively as
( ) ( )( )
,!
nq
qt
t
qt
q
qn
qntnP
A
A
A
+
+Γ+Γ
=λ
λ
λ
λ
λ
λ
λλ
λ (12)
and
( )( )
−+−=
β
ββ
ββ
q
Mmmq
qCmmF
min
min 1 , (13)
β
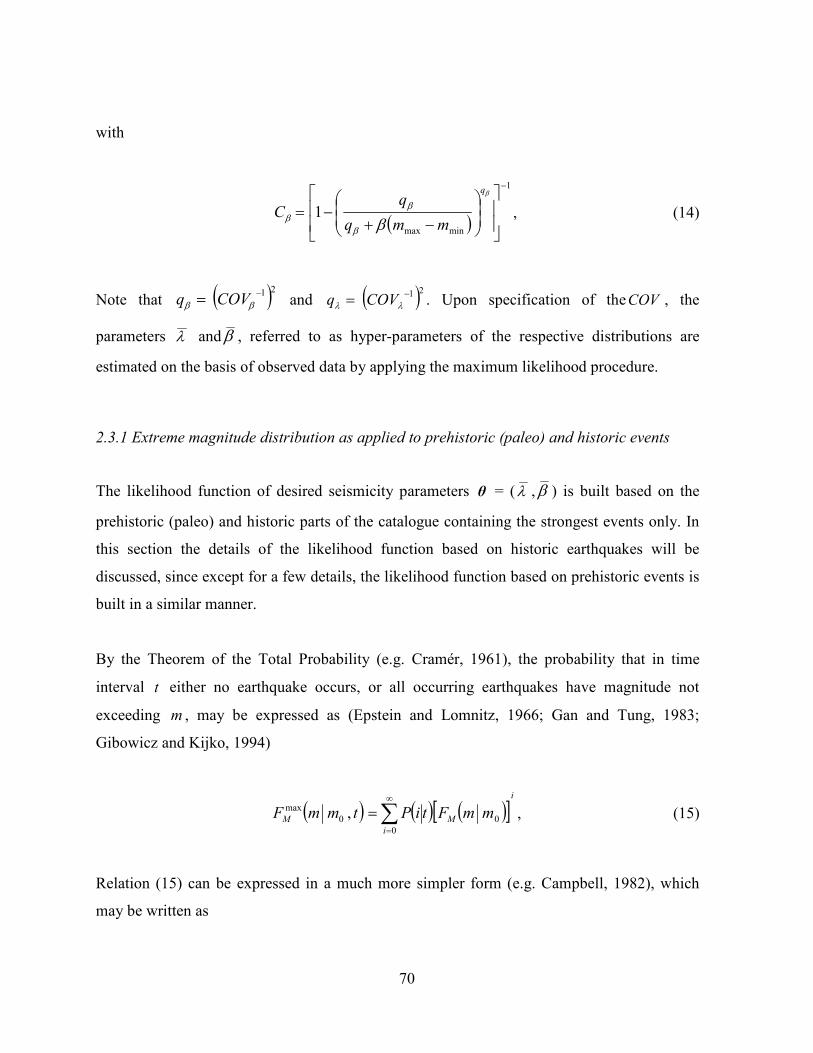
70
with
( )
1
minmax
1
−
−+−=
β
ββ
ββ
q
mmq
qC , (14)
Note that ( )21−= ββ COVq and ( )21−= λλ COVq . Upon specification of theCOV , the
parameters λ and β , referred to as hyper-parameters of the respective distributions are
estimated on the basis of observed data by applying the maximum likelihood procedure.
2.3.1 Extreme magnitude distribution as applied to prehistoric (paleo) and historic events
The likelihood function of desired seismicity parameters θ = (λ , β ) is built based on the
prehistoric (paleo) and historic parts of the catalogue containing the strongest events only. In
this section the details of the likelihood function based on historic earthquakes will be
discussed, since except for a few details, the likelihood function based on prehistoric events is
built in a similar manner.
By the Theorem of the Total Probability (e.g. Cramér, 1961), the probability that in time
interval t either no earthquake occurs, or all occurring earthquakes have magnitude not
exceeding m , may be expressed as (Epstein and Lomnitz, 1966; Gan and Tung, 1983;
Gibowicz and Kijko, 1994)
( ) ( ) ( )[ ]i
i
MM mmFtiPtmmF ∑∞
=
=0
00
max , , (15)
Relation (15) can be expressed in a much more simpler form (e.g. Campbell, 1982), which
may be written as

71
( ) ( )[ ]λ
λλ
λ
q
M
MmmFtq
qtmmF
−+=
00
0
max
1, , (16)
In relations (15) and (16), 0m is the threshold magnitude for the prehistoric or historic part of
the catalogue ( 0m ≥ minm ). Magnitude
minm is the ‘total’ threshold magnitude and has a rather
formal character. The only restriction on the choice of its value is that minm may not exceed
the threshold magnitude of any part - prehistoric, historic or complete - of the catalogue.
It follows from relation (16) that the probability density function (PDF) of the largest
earthquake magnitudes m within a period t is
)]|(1[
),|()|(),|(
00
0
max
000
max
mmFtq
tmmFmmftqtmmf
M
MMM −+
=λ
λ
λ
λ , (17)
0λ represents the mean of the distribution of the mean activity rate for earthquakes with
magnitudes not less than 0m , and is given by
( )[ ]00 1 mmFMA−= λλ , (18)
where Aλ , as defined above, is the mean of the distribution of the mean activity rate
corresponding to magnitude valueminm . ( )0mmfM is the PDF of earthquake magnitude.
Based on (13) and the definition of the probability density function, it takes the following
form:
( )( )
1
0
+
−+=
β
ββ
β
ββ
q
Mmmq
qCmf , (19)
After introducing the PDF (17) of the largest earthquake magnitude m within a period t , the
likelihood function of unknown parameters θ becomes:

72
( ) ( )ii
n
iM tmmfL ,,, 00
1
max000
0
∏=
=covtmθ , (20)
In order to build the likelihood function (20), three kinds of input data are required: 0m , t ,
and cov , where 0m is vector of the largest magnitudes, t denotes vector of the time intervals
within which the largest events occurred, and vector ( )βλ cov,cov=cov , consists of the
coefficients of variation (amount of dispersion (uncertainty relative to the mean) of the
unknown parameters θ = (λ , β ).
2.3.2 Combination of extreme and complete seismic catalogues with different levels of
completeness
If it is assumed that the third, complete part of the catalogue can be divided into s sub-
catalogues (Kijko and Sellevoll, 1992), each of them has a span iT and is complete starting
from the known magnitude( )i
mmin
. For each sub-catalogue i , im is used to denote in earthquake
magnitudesijm , where
( )iij mm min≥ , si ,,1 K= and inj ,,1 K= . Let ( )iiL mθ denote the likelihood
function of the unknown θ = (λ , β ), based on the i -th complete sub-catalogue. If the size of
seismic events is independent of their number, the likelihood function ( )iiL mθ is the product
of two functions, ( )iiL mλ and ( )iiL mβ .
The assumption that the number of earthquakes per unit time is distributed according to (12)
means that ( )iiL mλ has the following form:
( ) ( )( )( )
( )
in
i
iqi
iiqt
tqtconstL
++⋅=
−
λλ λ
λλλ λ
m , (21)

73
where const does not depend on λ and ( )iλ is the mean activity rate corresponding to the
threshold magnitude ( )i
mmin
and is given by,
( )( )[ ]minmin1 mmF i
M
i −= λλ , (22)
Following the definition of the likelihood function based on a set of independent observations,
and (19), ( )iiL mβ takes the form
( ) [ ] ( )( )( )1
1min1
+−
=∏
−+=
β
ββ
βββ
qn
j
iij
n
ii
ii mm
qCL m , (23)
Relations (21) and (23) define the likelihood function of the unknown parameters θ = (A
λ , β
) for each complete sub-catalogue.
Finally, ( )θL , the joint likelihood function based on all data, i.e. the likelihood function based
on the whole catalogue, is calculated as the product of the likelihood functions based on
prehistoric, historic and complete data.
The maximum likelihood estimates of the required hazard parameters θ = (λ , β ), are given
by the value of θ which, for a given maximum regional magnitude maxm , maximizes the
likelihood function ( )θL . The maximum of the likelihood function is obtained by solving the
system of two equations 0=∂∂
Aλl
and 0=∂∂βl
, where ( )[ ]θLln=l .
A variance-covariance matrix ( )θD , of the estimated hazard parameters, λˆ and β̂ , is
calculated according to the formula (Edwards, 1972):
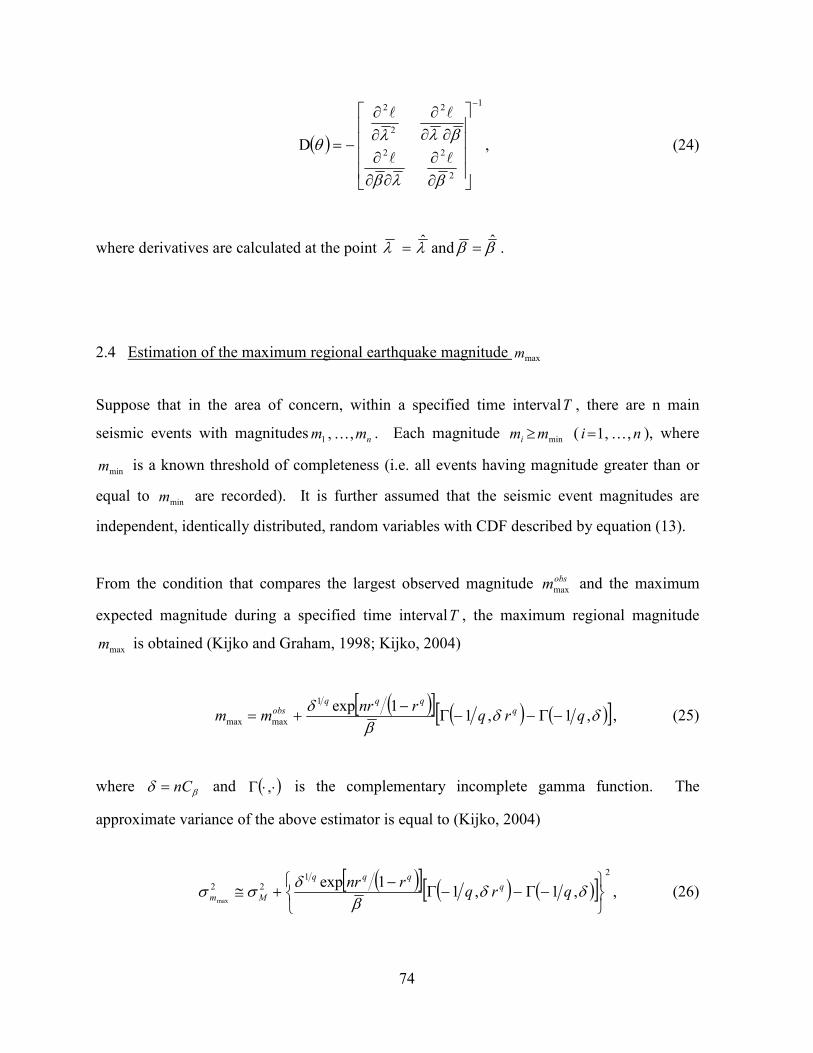
74
( )
1
2
22
2
2
2
D
−
∂
∂∂∂
∂
∂∂∂
∂
∂
−=
βλβ
βλλθ
ll
ll
, (24)
where derivatives are calculated at the point λλ ˆ= and ββ ˆ= .
2.4 Estimation of the maximum regional earthquake magnitude maxm
Suppose that in the area of concern, within a specified time intervalT , there are n main
seismic events with magnitudesnmm ,,1 K . Each magnitude
minmmi ≥ ( ni ,,1 K= ), where
minm is a known threshold of completeness (i.e. all events having magnitude greater than or
equal to minm are recorded). It is further assumed that the seismic event magnitudes are
independent, identically distributed, random variables with CDF described by equation (13).
From the condition that compares the largest observed magnitude obsmmax and the maximum
expected magnitude during a specified time intervalT , the maximum regional magnitude
maxm is obtained (Kijko and Graham, 1998; Kijko, 2004)
( )[ ] ( ) ( )[ ]δδβ
δ,1,1
1exp1
maxmax qrqrnr
mm qqqq
obs −Γ−−Γ−
+= , (25)
where βδ nC= and ( )⋅⋅Γ , is the complementary incomplete gamma function. The
approximate variance of the above estimator is equal to (Kijko, 2004)
( )[ ] ( ) ( )[ ]2
122 ,1,1
1expmax
−Γ−−Γ−
+≅ δδβ
δσσ qrq
rnr qqqq
Mm , (26)

75
where Mσ is the standard error in determination of the largest observed magnitude obsmmax
.
3. The Cornell-McGuire PSHA Methodology
The essence of the PSHA is the calculation of the probability of exceedance of a specified
ground motion level at a specified site. The so called, Cornell-McGuire solution of this problem
consists of four steps: (e.g. Budnitz et al., 1997; Reiter, 1990):
1. Determination of the possible seismic sources around the site. The sources are typically
identified faults, point sources, or area sources, in which it is assumed that the occurrence
of earthquakes is spatially uniform. In the territory of Eastern and Southern Africa, like
the central and eastern United States or Australia, the main contribution to the seismic
hazard comes from the area sources. The seismicity of the area not always correlates well
with geological structures recognizable at the surface therefore identification of the
geological structures that are responsible for earthquakes are difficult.
2. Determination and assessment of the recurrence parameters for each seismic source. This
is typically expressed in terms of three parameters: the mean seismic activity rateλ , b-
value of the Gutenberg – Richter frequency magnitude relation and the upper-bound of
earthquake magnitude mmax.
Selection of the ground motion prediction equation (GMPE), which is most suitable for the
region, is crucial. For Eastern and Southern Africa areas, the strong motion records are very
limited therefore theoretical models of the ground motion attenuation are used. Since the ground
motion attenuation relationship is a major source of uncertainty in the computed PSHA, some
codes and recommendations require use of a number of alternative GMPE’s (Bernreuter et al.,
1989).
3. Computation of the hazard curves. These curves are usually expressed in terms of the
mean annual frequency of events with site ground motion level a or more, )(aλ or
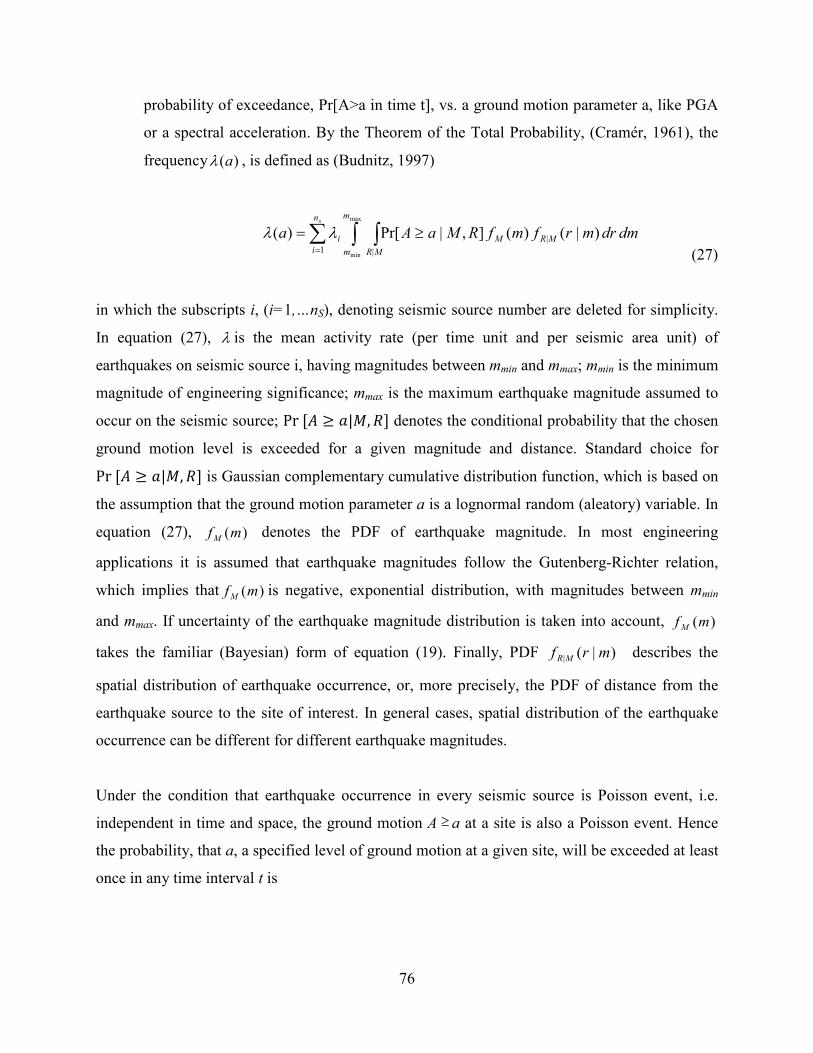
76
probability of exceedance, Pr[A>a in time t], vs. a ground motion parameter a, like PGA
or a spectral acceleration. By the Theorem of the Total Probability, (Cramér, 1961), the
frequency )(aλ , is defined as (Budnitz, 1997)
(27)
in which the subscripts i, (i=1,…nS), denoting seismic source number are deleted for simplicity.
In equation (27), λ is the mean activity rate (per time unit and per seismic area unit) of
earthquakes on seismic source i, having magnitudes between mmin and mmax; mmin is the minimum
magnitude of engineering significance; mmax is the maximum earthquake magnitude assumed to
occur on the seismic source; ����� � �� �� denotes the conditional probability that the chosen
ground motion level is exceeded for a given magnitude and distance. Standard choice for
����� � �� �� is Gaussian complementary cumulative distribution function, which is based on
the assumption that the ground motion parameter a is a lognormal random (aleatory) variable. In
equation (27), )(mfM denotes the PDF of earthquake magnitude. In most engineering
applications it is assumed that earthquake magnitudes follow the Gutenberg-Richter relation,
which implies that )(mfMis negative, exponential distribution, with magnitudes between mmin
and mmax. If uncertainty of the earthquake magnitude distribution is taken into account, )(mf M
takes the familiar (Bayesian) form of equation (19). Finally, PDF )|(| mrf MR describes the
spatial distribution of earthquake occurrence, or, more precisely, the PDF of distance from the
earthquake source to the site of interest. In general cases, spatial distribution of the earthquake
occurrence can be different for different earthquake magnitudes.
Under the condition that earthquake occurrence in every seismic source is Poisson event, i.e.
independent in time and space, the ground motion A a at a site is also a Poisson event. Hence
the probability, that a, a specified level of ground motion at a given site, will be exceeded at least
once in any time interval t is
∑ ∫∫=
≥=sn
i MR
MRM
m
m
i dmdrmrfmfRMaAa1 |
| )|()(],|Pr[)(max
min
λλ
≥

77
Pr[A > a in time t] =
. (28)
The equation (28) is fundamental in PSHA. The plot of this equation vs. ground motion
parameter a, is the hazard curve – the ultimate product of the PSHA assessment.
4. References to Methodology Description
Aki, K. (1965). Maximum likelihood estimate of b in the formula log N = a – bM and its
confidence limits, Bull. Earthq. Res. Inst., Univ Tokyo 47, 237-239.
Ambraseys, N.N. (1995). The prediction of earthquake peak ground acceleration in Europe,
Earthquake Eng. Struct. Dyn. 24, 467-490.
Atkinson, G.M. and Boore, D.M. (1995). Ground-motion relations for eastern North America,
Bull. Seism. Soc. Am. 85, 17-30.
Atkinson, G.M. and D.M. Boore, (1997). Some comparisons between recent ground-motion
relations, Seism. Res. Lett. 68, 24-40.
Bernreuter, D.L., J.B. Savy, R.W. Mensing, and J.C. Chen (1989). Seismic Hazard
Characterization of 69 Nuclear Plant Sites East of the Rocky Mountains. Report
NUREG/CR-5250, vols 1-8, prepared by Lawrence Livermore National Laboratory for
the U.S. Nuclear Regulatory Commission.
Budnitz, R.J., G. Apostolakis, D.M. Boore, L.S. Cluff, K.J. Coppersmith, C.A. Cornell and P.A.
Morris (1997). Recommendations for Probabilistic Seismic Hazard Analysis: Guidance
on Uncertainty and Use of Experts. NUREG/CR-6372, UCR-ID-122160, Main Report 1.
Prepared for Lawrence Livermore National Laboratory.
Campbell, K.W. (1982). Bayesian analysis of extreme earthquake occurrences. Part I.
Probabilistic hazard model, Bull. Seism. Soc. Am., 72, 1689-1705.
Cornell, C.A. (1968). Engineering seismic risk analysis, Bull. Seism. Soc. Am. 58, 1583-1606.
Cornell, C.A. (1971). Bayesian statistical decision theory and reliability based design,
Proceedings of the International Conference on Structural Safety and Reliability, A.M.
Freudenthal, Editor, April 9-11, 1969, Washington, D.C., Smithsonian Institute, 47-66.
≥−− ∑ ∫∫
=
sn
i MR
MRM
m
m
i dmdrmrfmfRMaA1 |
| )|()(],|Pr[exp1max
min
λ

78
Cramér, H. (1961). Mathematical Methods of Statistics, Princeton University Press. Princeton.
Edwards, A.W.F. (1972). Likelihood, Cambridge University Press, New York, p. 235.
Epstein, B., and C. Lomnitz (1966). A model for occurrence of large earthquakes., Nature, 211,
954-956.
Gan, Z.J. and C.C. Tung (1983). Extreme value distribution of earthquake magnitude, Phys.
Earth Planet. Inter. 32, 325-330.
Gibowicz, S.J. and A. Kijko, (1994). An Introduction to Mining Seismology, Academic Press,
San Diego.
Kijko, A. (2004). Estimation of the maximum earthquake magnitude mmax. Pure Appl. Geophys,
161, 1-27.
Kijko, A. and G. Graham, (1998). "Parametric-Historic" procedure for probabilistic seismic
hazard analysis. Part I: Assessment of maximum regional magnitude mmax, Pure Appl.
Geophys, 152, 413-442.
Kijko, A. and M.A. Sellevoll, (1992). Estimation of earthquake hazard parameters from
incomplete data files. Part II. Incorporation of magnitude heterogeneity. Bull. Seism.
Soc. Am. 82, 120-134.
Microscopic and Macroscopic Simulation: Towards Predictive Modelling of the Earthquake
Process, Editors: P. Mora, M. Matsu’ura, R. Madariaga and J-B. Minster, Pure and
Applied Geophysics, 157, pp. 1817-2383, 2000.
Reiter, L. (1990). Earthquake Hazard Analysis: Issues and Insight, Columbia University Press,
New York.
Seismicity Patterns, their Statistical Significance and Physical Meaning, Editors: M. Wyss, K.
Shimazaki and A. Ito, Pure and Applied Geophysics, 155, pp. 203-726, 1999
Simpson, D.W., and P.G. Richards (1981). Earthquake Prediction, An International Review.
Maurice Ewing series IV, Eds: D. W. Simpson, and P.G. Richards. American
Geophysical Union, Washington, D.C., 680 pp.

79
Appendix C
Seismic Sources and their Recurrence Parameters
DIFFUSE AREAL (POINT) SEISMIC SOURCES AND THEIR PARAMETERS -----------------------------------------------------------
Lat Long Depth m_min Lambda b m_max
-34.058 16.500 10.0 4.0 3.688135e-004 0.96 6.32
-33.808 16.500 10.0 4.0 3.698955e-004 0.96 6.32 -30.808 16.500 10.0 4.0 1.060180e-003 0.96 6.20
-30.558 16.500 10.0 4.0 1.062922e-003 0.96 6.20 -30.308 16.500 10.0 4.0 2.131289e-003 0.96 6.20
-30.058 16.500 10.0 4.0 7.962801e-004 0.96 6.20 -34.558 16.750 10.0 4.0 3.667109e-004 0.96 6.33
-34.308 16.750 10.0 4.0 3.677246e-004 0.96 6.32 -34.058 16.750 10.0 4.0 3.688135e-004 0.96 6.32
-33.808 16.750 10.0 4.0 3.698955e-004 0.96 6.32 -33.558 16.750 10.0 4.0 3.709704e-004 0.96 6.32
-33.308 16.750 10.0 4.0 3.720382e-004 0.96 6.32 -31.308 16.750 10.0 4.0 1.054636e-003 0.96 6.20
-31.058 16.750 10.0 4.0 1.057418e-003 0.96 6.20 -30.808 16.750 10.0 4.0 1.060180e-003 0.96 6.20
-30.558 16.750 10.0 4.0 9.320634e-004 0.96 6.20
-30.308 16.750 10.0 4.0 1.530505e-003 0.96 6.20 -30.058 16.750 10.0 4.0 1.534385e-003 0.96 6.20
-34.808 17.000 10.0 4.0 3.656077e-004 0.96 6.33 -34.558 17.000 10.0 4.0 5.815522e-003 0.96 6.32
-34.308 17.000 10.0 4.0 5.832906e-003 0.96 6.32 -34.058 17.000 10.0 4.0 5.850180e-003 0.96 6.32
-33.808 17.000 10.0 4.0 5.867342e-003 0.96 6.32 -33.558 17.000 10.0 4.0 5.884392e-003 0.96 6.32
-33.308 17.000 10.0 4.0 3.720382e-004 0.96 6.32 -33.058 17.000 10.0 4.0 3.730989e-004 0.96 6.32
-31.558 17.000 10.0 4.0 1.047812e-003 0.96 6.34 -31.308 17.000 10.0 4.0 1.054636e-003 0.96 6.20
-31.058 17.000 10.0 4.0 1.057418e-003 0.96 6.20 -30.808 17.000 10.0 4.0 1.060180e-003 0.96 6.20
-30.558 17.000 10.0 4.0 9.079985e-004 0.96 6.20 -30.308 17.000 10.0 4.0 1.178614e-003 1.11 6.20
-30.058 17.000 10.0 4.0 1.342700e-003 1.07 6.20 -29.808 17.000 10.0 4.0 1.456511e-003 1.04 6.20
-34.808 17.250 10.0 4.0 5.798027e-003 0.96 6.32 -34.558 17.250 10.0 4.0 5.815522e-003 0.96 6.32
-34.308 17.250 10.0 4.0 5.832906e-003 0.96 6.32 -34.058 17.250 10.0 4.0 5.850180e-003 0.96 6.32
-33.808 17.250 10.0 4.0 5.867342e-003 0.96 6.32 -33.558 17.250 10.0 4.0 5.404203e-003 0.96 6.32
-33.308 17.250 10.0 4.0 5.901330e-003 0.96 6.32
-33.058 17.250 10.0 4.0 3.730989e-004 0.96 6.32 -31.558 17.250 10.0 4.0 1.048798e-003 0.96 6.30
-31.308 17.250 10.0 4.0 1.050152e-003 0.96 6.36 -31.058 17.250 10.0 4.0 1.057418e-003 0.96 6.20
-30.808 17.250 10.0 4.0 9.056561e-004 0.96 6.20 -30.558 17.250 10.0 4.0 9.079985e-004 0.96 6.20
-30.308 17.250 10.0 4.0 1.449191e-003 1.04 6.20 -30.058 17.250 10.0 4.0 1.452865e-003 1.04 6.20
-29.808 17.250 10.0 4.0 1.571748e-003 1.02 6.20 -34.808 17.500 10.0 4.0 5.798027e-003 0.96 6.32
-34.558 17.500 10.0 4.0 5.815522e-003 0.96 6.32 -34.308 17.500 10.0 4.0 5.832906e-003 0.96 6.32
-34.058 17.500 10.0 4.0 4.987674e-003 0.96 6.32 -33.808 17.500 10.0 4.0 5.031060e-003 0.96 6.32
-33.558 17.500 10.0 4.0 3.800260e-003 1.05 6.32
80
-33.308 17.500 10.0 4.0 3.258533e-003 1.03 6.32
-33.058 17.500 10.0 4.0 3.586147e-003 1.07 6.32 -32.808 17.500 10.0 4.0 9.071819e-004 0.96 6.32
-31.808 17.500 10.0 4.0 1.045727e-003 0.96 6.31 -31.558 17.500 10.0 4.0 1.048798e-003 0.96 6.30
-31.308 17.500 10.0 4.0 1.050375e-003 0.96 6.35 -31.058 17.500 10.0 4.0 9.272368e-004 0.96 6.20
-30.808 17.500 10.0 4.0 9.056561e-004 0.96 6.20 -30.558 17.500 10.0 4.0 8.067876e-004 1.08 6.20
-30.308 17.500 10.0 4.0 1.578143e-003 1.02 6.20 -30.058 17.500 10.0 4.0 1.692854e-003 1.00 6.20
-29.808 17.500 10.0 4.0 1.697102e-003 1.00 6.20 -29.558 17.500 10.0 4.0 1.760101e-003 1.00 6.20
-35.058 17.750 10.0 4.0 5.780422e-003 0.96 6.32 -34.808 17.750 10.0 4.0 5.798027e-003 0.96 6.32
-34.558 17.750 10.0 4.0 5.815522e-003 0.96 6.32 -34.308 17.750 10.0 4.0 4.972947e-003 0.96 6.32
-34.058 17.750 10.0 4.0 3.459280e-003 1.00 6.32 -33.808 17.750 10.0 4.0 4.416341e-003 0.95 6.32
-33.558 17.750 10.0 4.0 4.881096e-003 0.94 6.32 -33.308 17.750 10.0 4.0 4.895146e-003 0.94 6.32
-33.058 17.750 10.0 4.0 4.668607e-003 0.94 6.32 -32.808 17.750 10.0 4.0 1.158476e-003 1.00 6.32
-32.558 17.750 10.0 4.0 8.201065e-004 0.96 6.32
-31.808 17.750 10.0 4.0 1.045727e-003 0.96 6.31 -31.558 17.750 10.0 4.0 1.048798e-003 0.96 6.30
-31.308 17.750 10.0 4.0 1.050375e-003 0.96 6.35 -31.058 17.750 10.0 4.0 9.972541e-004 0.96 6.36
-30.808 17.750 10.0 4.0 8.047064e-004 1.08 6.20 -30.558 17.750 10.0 4.0 9.088384e-004 1.05 6.20
-30.308 17.750 10.0 4.0 1.162729e-003 0.98 6.20 -30.058 17.750 10.0 4.0 1.914667e-003 0.95 6.20
-29.808 17.750 10.0 4.0 1.919472e-003 0.95 6.20 -29.558 17.750 10.0 4.0 1.760101e-003 1.00 6.20
-35.058 18.000 10.0 4.0 5.780422e-003 0.96 6.32 -34.808 18.000 10.0 4.0 5.798027e-003 0.96 6.32
-34.558 18.000 10.0 4.0 4.958126e-003 0.96 6.32 -34.308 18.000 10.0 4.0 3.449066e-003 1.00 6.32
-34.058 18.000 10.0 4.0 5.278962e-003 0.91 6.32 -33.808 18.000 10.0 4.0 5.294449e-003 0.91 6.32
-33.558 18.000 10.0 4.0 5.309834e-003 0.91 6.32 -33.308 18.000 10.0 4.0 5.582161e-003 0.89 6.32
-33.058 18.000 10.0 4.0 5.598077e-003 0.89 6.32 -32.808 18.000 10.0 4.0 5.389025e-003 0.91 6.32
-32.558 18.000 10.0 4.0 1.604218e-003 1.01 6.31 -32.308 18.000 10.0 4.0 8.225244e-004 0.96 6.31
-31.808 18.000 10.0 4.0 1.045727e-003 0.96 6.31 -31.558 18.000 10.0 4.0 1.048798e-003 0.96 6.30
-31.308 18.000 10.0 4.0 9.217909e-004 0.96 6.34
-31.058 18.000 10.0 4.0 9.974029e-004 0.96 6.35 -30.808 18.000 10.0 4.0 1.063265e-003 0.99 6.20
-30.558 18.000 10.0 4.0 1.066015e-003 0.99 6.20 -30.308 18.000 10.0 4.0 1.162729e-003 0.98 6.20
-30.058 18.000 10.0 4.0 1.970990e-003 0.95 6.20 -29.808 18.000 10.0 4.0 2.163105e-003 0.92 6.20
-29.558 18.000 10.0 4.0 2.218295e-003 0.92 6.20 -35.058 18.250 10.0 4.0 5.780422e-003 0.96 6.32
-34.808 18.250 10.0 4.0 5.798027e-003 0.96 6.32 -34.558 18.250 10.0 4.0 4.958126e-003 0.96 6.32
-34.308 18.250 10.0 4.0 5.181776e-003 0.91 6.32 -34.058 18.250 10.0 4.0 5.278962e-003 0.91 6.32
-33.808 18.250 10.0 4.0 5.693527e-003 0.89 6.32 -33.558 18.250 10.0 4.0 5.710072e-003 0.89 6.32
-33.308 18.250 10.0 4.0 5.726508e-003 0.89 6.32 -33.058 18.250 10.0 4.0 5.742836e-003 0.89 6.32
-32.808 18.250 10.0 4.0 5.759054e-003 0.89 6.32 -32.558 18.250 10.0 4.0 3.418271e-003 0.95 6.31
-32.308 18.250 10.0 4.0 1.606025e-003 1.01 6.31 -32.058 18.250 10.0 4.0 1.042894e-003 0.96 6.31
-31.808 18.250 10.0 4.0 1.045727e-003 0.96 6.31 -31.558 18.250 10.0 4.0 1.048541e-003 0.96 6.31
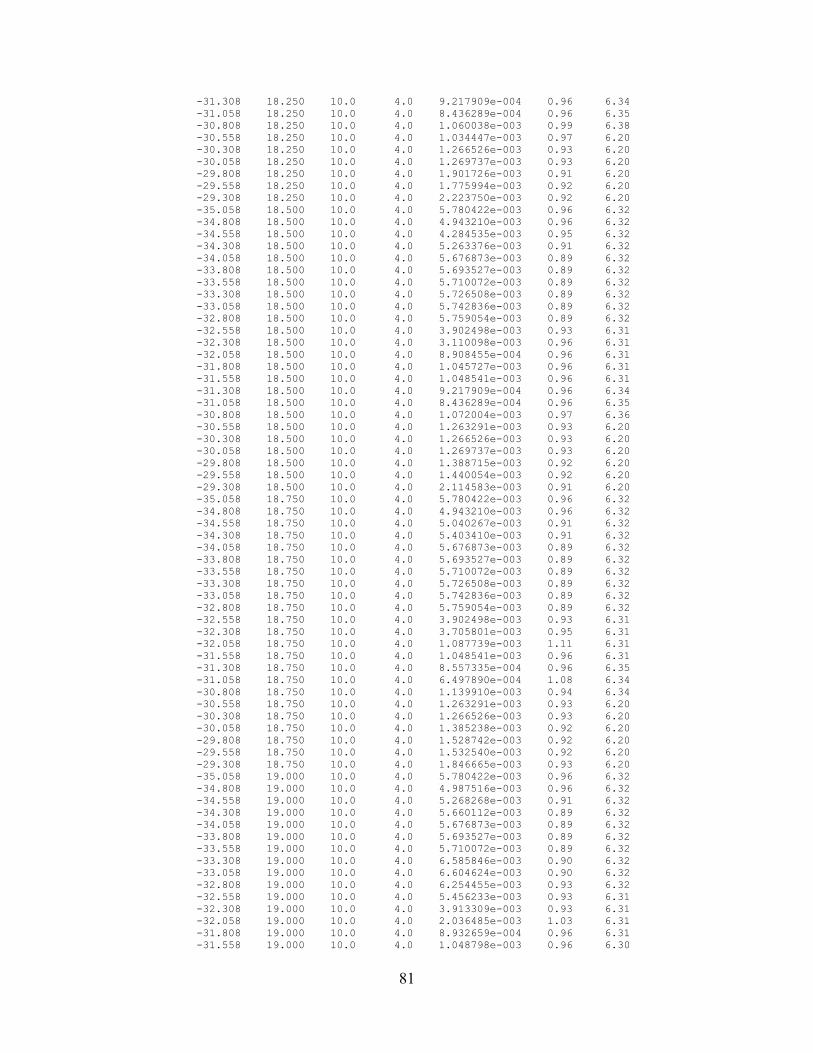
81
-31.308 18.250 10.0 4.0 9.217909e-004 0.96 6.34
-31.058 18.250 10.0 4.0 8.436289e-004 0.96 6.35 -30.808 18.250 10.0 4.0 1.060038e-003 0.99 6.38
-30.558 18.250 10.0 4.0 1.034447e-003 0.97 6.20 -30.308 18.250 10.0 4.0 1.266526e-003 0.93 6.20
-30.058 18.250 10.0 4.0 1.269737e-003 0.93 6.20 -29.808 18.250 10.0 4.0 1.901726e-003 0.91 6.20
-29.558 18.250 10.0 4.0 1.775994e-003 0.92 6.20 -29.308 18.250 10.0 4.0 2.223750e-003 0.92 6.20
-35.058 18.500 10.0 4.0 5.780422e-003 0.96 6.32 -34.808 18.500 10.0 4.0 4.943210e-003 0.96 6.32
-34.558 18.500 10.0 4.0 4.284535e-003 0.95 6.32 -34.308 18.500 10.0 4.0 5.263376e-003 0.91 6.32
-34.058 18.500 10.0 4.0 5.676873e-003 0.89 6.32 -33.808 18.500 10.0 4.0 5.693527e-003 0.89 6.32
-33.558 18.500 10.0 4.0 5.710072e-003 0.89 6.32 -33.308 18.500 10.0 4.0 5.726508e-003 0.89 6.32
-33.058 18.500 10.0 4.0 5.742836e-003 0.89 6.32 -32.808 18.500 10.0 4.0 5.759054e-003 0.89 6.32
-32.558 18.500 10.0 4.0 3.902498e-003 0.93 6.31 -32.308 18.500 10.0 4.0 3.110098e-003 0.96 6.31
-32.058 18.500 10.0 4.0 8.908455e-004 0.96 6.31 -31.808 18.500 10.0 4.0 1.045727e-003 0.96 6.31
-31.558 18.500 10.0 4.0 1.048541e-003 0.96 6.31
-31.308 18.500 10.0 4.0 9.217909e-004 0.96 6.34 -31.058 18.500 10.0 4.0 8.436289e-004 0.96 6.35
-30.808 18.500 10.0 4.0 1.072004e-003 0.97 6.36 -30.558 18.500 10.0 4.0 1.263291e-003 0.93 6.20
-30.308 18.500 10.0 4.0 1.266526e-003 0.93 6.20 -30.058 18.500 10.0 4.0 1.269737e-003 0.93 6.20
-29.808 18.500 10.0 4.0 1.388715e-003 0.92 6.20 -29.558 18.500 10.0 4.0 1.440054e-003 0.92 6.20
-29.308 18.500 10.0 4.0 2.114583e-003 0.91 6.20 -35.058 18.750 10.0 4.0 5.780422e-003 0.96 6.32
-34.808 18.750 10.0 4.0 4.943210e-003 0.96 6.32 -34.558 18.750 10.0 4.0 5.040267e-003 0.91 6.32
-34.308 18.750 10.0 4.0 5.403410e-003 0.91 6.32 -34.058 18.750 10.0 4.0 5.676873e-003 0.89 6.32
-33.808 18.750 10.0 4.0 5.693527e-003 0.89 6.32 -33.558 18.750 10.0 4.0 5.710072e-003 0.89 6.32
-33.308 18.750 10.0 4.0 5.726508e-003 0.89 6.32 -33.058 18.750 10.0 4.0 5.742836e-003 0.89 6.32
-32.808 18.750 10.0 4.0 5.759054e-003 0.89 6.32 -32.558 18.750 10.0 4.0 3.902498e-003 0.93 6.31
-32.308 18.750 10.0 4.0 3.705801e-003 0.95 6.31 -32.058 18.750 10.0 4.0 1.087739e-003 1.11 6.31
-31.558 18.750 10.0 4.0 1.048541e-003 0.96 6.31 -31.308 18.750 10.0 4.0 8.557335e-004 0.96 6.35
-31.058 18.750 10.0 4.0 6.497890e-004 1.08 6.34
-30.808 18.750 10.0 4.0 1.139910e-003 0.94 6.34 -30.558 18.750 10.0 4.0 1.263291e-003 0.93 6.20
-30.308 18.750 10.0 4.0 1.266526e-003 0.93 6.20 -30.058 18.750 10.0 4.0 1.385238e-003 0.92 6.20
-29.808 18.750 10.0 4.0 1.528742e-003 0.92 6.20 -29.558 18.750 10.0 4.0 1.532540e-003 0.92 6.20
-29.308 18.750 10.0 4.0 1.846665e-003 0.93 6.20 -35.058 19.000 10.0 4.0 5.780422e-003 0.96 6.32
-34.808 19.000 10.0 4.0 4.987516e-003 0.96 6.32 -34.558 19.000 10.0 4.0 5.268268e-003 0.91 6.32
-34.308 19.000 10.0 4.0 5.660112e-003 0.89 6.32 -34.058 19.000 10.0 4.0 5.676873e-003 0.89 6.32
-33.808 19.000 10.0 4.0 5.693527e-003 0.89 6.32 -33.558 19.000 10.0 4.0 5.710072e-003 0.89 6.32
-33.308 19.000 10.0 4.0 6.585846e-003 0.90 6.32 -33.058 19.000 10.0 4.0 6.604624e-003 0.90 6.32
-32.808 19.000 10.0 4.0 6.254455e-003 0.93 6.32 -32.558 19.000 10.0 4.0 5.456233e-003 0.93 6.31
-32.308 19.000 10.0 4.0 3.913309e-003 0.93 6.31 -32.058 19.000 10.0 4.0 2.036485e-003 1.03 6.31
-31.808 19.000 10.0 4.0 8.932659e-004 0.96 6.31 -31.558 19.000 10.0 4.0 1.048798e-003 0.96 6.30
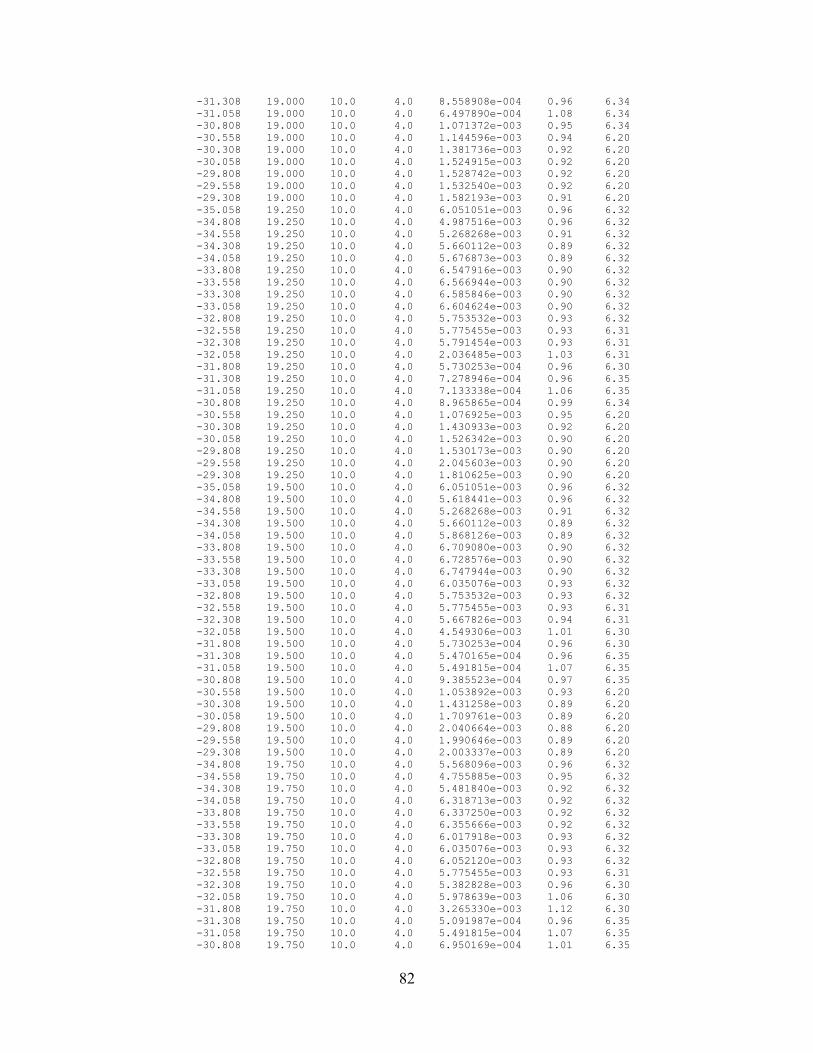
82
-31.308 19.000 10.0 4.0 8.558908e-004 0.96 6.34
-31.058 19.000 10.0 4.0 6.497890e-004 1.08 6.34 -30.808 19.000 10.0 4.0 1.071372e-003 0.95 6.34
-30.558 19.000 10.0 4.0 1.144596e-003 0.94 6.20 -30.308 19.000 10.0 4.0 1.381736e-003 0.92 6.20
-30.058 19.000 10.0 4.0 1.524915e-003 0.92 6.20 -29.808 19.000 10.0 4.0 1.528742e-003 0.92 6.20
-29.558 19.000 10.0 4.0 1.532540e-003 0.92 6.20 -29.308 19.000 10.0 4.0 1.582193e-003 0.91 6.20
-35.058 19.250 10.0 4.0 6.051051e-003 0.96 6.32 -34.808 19.250 10.0 4.0 4.987516e-003 0.96 6.32
-34.558 19.250 10.0 4.0 5.268268e-003 0.91 6.32 -34.308 19.250 10.0 4.0 5.660112e-003 0.89 6.32
-34.058 19.250 10.0 4.0 5.676873e-003 0.89 6.32 -33.808 19.250 10.0 4.0 6.547916e-003 0.90 6.32
-33.558 19.250 10.0 4.0 6.566944e-003 0.90 6.32 -33.308 19.250 10.0 4.0 6.585846e-003 0.90 6.32
-33.058 19.250 10.0 4.0 6.604624e-003 0.90 6.32 -32.808 19.250 10.0 4.0 5.753532e-003 0.93 6.32
-32.558 19.250 10.0 4.0 5.775455e-003 0.93 6.31 -32.308 19.250 10.0 4.0 5.791454e-003 0.93 6.31
-32.058 19.250 10.0 4.0 2.036485e-003 1.03 6.31 -31.808 19.250 10.0 4.0 5.730253e-004 0.96 6.30
-31.308 19.250 10.0 4.0 7.278946e-004 0.96 6.35
-31.058 19.250 10.0 4.0 7.133338e-004 1.06 6.35 -30.808 19.250 10.0 4.0 8.965865e-004 0.99 6.34
-30.558 19.250 10.0 4.0 1.076925e-003 0.95 6.20 -30.308 19.250 10.0 4.0 1.430933e-003 0.92 6.20
-30.058 19.250 10.0 4.0 1.526342e-003 0.90 6.20 -29.808 19.250 10.0 4.0 1.530173e-003 0.90 6.20
-29.558 19.250 10.0 4.0 2.045603e-003 0.90 6.20 -29.308 19.250 10.0 4.0 1.810625e-003 0.90 6.20
-35.058 19.500 10.0 4.0 6.051051e-003 0.96 6.32 -34.808 19.500 10.0 4.0 5.618441e-003 0.96 6.32
-34.558 19.500 10.0 4.0 5.268268e-003 0.91 6.32 -34.308 19.500 10.0 4.0 5.660112e-003 0.89 6.32
-34.058 19.500 10.0 4.0 5.868126e-003 0.89 6.32 -33.808 19.500 10.0 4.0 6.709080e-003 0.90 6.32
-33.558 19.500 10.0 4.0 6.728576e-003 0.90 6.32 -33.308 19.500 10.0 4.0 6.747944e-003 0.90 6.32
-33.058 19.500 10.0 4.0 6.035076e-003 0.93 6.32 -32.808 19.500 10.0 4.0 5.753532e-003 0.93 6.32
-32.558 19.500 10.0 4.0 5.775455e-003 0.93 6.31 -32.308 19.500 10.0 4.0 5.667826e-003 0.94 6.31
-32.058 19.500 10.0 4.0 4.549306e-003 1.01 6.30 -31.808 19.500 10.0 4.0 5.730253e-004 0.96 6.30
-31.308 19.500 10.0 4.0 5.470165e-004 0.96 6.35 -31.058 19.500 10.0 4.0 5.491815e-004 1.07 6.35
-30.808 19.500 10.0 4.0 9.385523e-004 0.97 6.35
-30.558 19.500 10.0 4.0 1.053892e-003 0.93 6.20 -30.308 19.500 10.0 4.0 1.431258e-003 0.89 6.20
-30.058 19.500 10.0 4.0 1.709761e-003 0.89 6.20 -29.808 19.500 10.0 4.0 2.040664e-003 0.88 6.20
-29.558 19.500 10.0 4.0 1.990646e-003 0.89 6.20 -29.308 19.500 10.0 4.0 2.003337e-003 0.89 6.20
-34.808 19.750 10.0 4.0 5.568096e-003 0.96 6.32 -34.558 19.750 10.0 4.0 4.755885e-003 0.95 6.32
-34.308 19.750 10.0 4.0 5.481840e-003 0.92 6.32 -34.058 19.750 10.0 4.0 6.318713e-003 0.92 6.32
-33.808 19.750 10.0 4.0 6.337250e-003 0.92 6.32 -33.558 19.750 10.0 4.0 6.355666e-003 0.92 6.32
-33.308 19.750 10.0 4.0 6.017918e-003 0.93 6.32 -33.058 19.750 10.0 4.0 6.035076e-003 0.93 6.32
-32.808 19.750 10.0 4.0 6.052120e-003 0.93 6.32 -32.558 19.750 10.0 4.0 5.775455e-003 0.93 6.31
-32.308 19.750 10.0 4.0 5.382828e-003 0.96 6.30 -32.058 19.750 10.0 4.0 5.978639e-003 1.06 6.30
-31.808 19.750 10.0 4.0 3.265330e-003 1.12 6.30 -31.308 19.750 10.0 4.0 5.091987e-004 0.96 6.35
-31.058 19.750 10.0 4.0 5.491815e-004 1.07 6.35 -30.808 19.750 10.0 4.0 6.950169e-004 1.01 6.35

83
-30.558 19.750 10.0 4.0 1.115314e-003 0.94 6.20
-30.308 19.750 10.0 4.0 1.326255e-003 0.93 6.20 -30.058 19.750 10.0 4.0 1.604236e-003 0.90 6.20
-29.808 19.750 10.0 4.0 1.841391e-003 0.89 6.20 -29.558 19.750 10.0 4.0 1.949058e-003 0.89 6.20
-34.808 20.000 10.0 4.0 5.538363e-004 0.96 6.32 -34.558 20.000 10.0 4.0 4.112030e-003 1.01 6.32
-34.308 20.000 10.0 4.0 5.546235e-003 0.91 6.32 -34.058 20.000 10.0 4.0 6.318713e-003 0.92 6.32
-33.808 20.000 10.0 4.0 5.983258e-003 0.93 6.32 -33.558 20.000 10.0 4.0 6.000645e-003 0.93 6.32
-33.308 20.000 10.0 4.0 6.017918e-003 0.93 6.32 -33.058 20.000 10.0 4.0 6.035076e-003 0.93 6.32
-32.808 20.000 10.0 4.0 6.052120e-003 0.93 6.32 -32.558 20.000 10.0 4.0 5.953603e-003 0.93 6.31
-32.308 20.000 10.0 4.0 5.382828e-003 0.96 6.30 -32.058 20.000 10.0 4.0 5.310038e-003 1.07 6.30
-31.808 20.000 10.0 4.0 3.995992e-003 1.09 6.30 -31.308 20.000 10.0 4.0 6.200387e-004 0.96 6.35
-31.058 20.000 10.0 4.0 5.105421e-004 0.96 6.35 -30.808 20.000 10.0 4.0 8.849507e-004 0.96 6.35
-30.558 20.000 10.0 4.0 1.032731e-003 0.95 6.20 -30.308 20.000 10.0 4.0 1.164856e-003 0.94 6.20
-30.058 20.000 10.0 4.0 1.652457e-003 0.93 6.20
-29.808 20.000 10.0 4.0 1.544836e-003 0.92 6.20 -29.558 20.000 10.0 4.0 1.838735e-003 0.90 6.20
-34.558 20.250 10.0 4.0 2.238334e-003 0.96 6.32 -34.308 20.250 10.0 4.0 4.208344e-003 0.96 6.32
-34.058 20.250 10.0 4.0 5.715316e-003 0.93 6.32 -33.808 20.250 10.0 4.0 5.983258e-003 0.93 6.32
-33.558 20.250 10.0 4.0 6.000645e-003 0.93 6.32 -33.308 20.250 10.0 4.0 6.017918e-003 0.93 6.32
-33.058 20.250 10.0 4.0 6.035076e-003 0.93 6.32 -32.808 20.250 10.0 4.0 5.930975e-003 0.93 6.32
-32.558 20.250 10.0 4.0 5.659177e-003 0.95 6.30 -32.308 20.250 10.0 4.0 8.658698e-003 1.00 6.30
-32.058 20.250 10.0 4.0 3.985165e-003 1.09 6.30 -31.808 20.250 10.0 4.0 5.183998e-003 1.14 6.34
-31.558 20.250 10.0 4.0 3.795652e-004 0.96 6.35 -31.308 20.250 10.0 4.0 3.805765e-004 0.96 6.35
-31.058 20.250 10.0 4.0 5.105421e-004 0.96 6.35 -30.808 20.250 10.0 4.0 9.740130e-004 0.98 6.36
-30.558 20.250 10.0 4.0 1.512885e-003 0.91 6.20 -30.308 20.250 10.0 4.0 1.649869e-003 0.91 6.20
-30.058 20.250 10.0 4.0 1.960040e-003 0.90 6.20 -29.808 20.250 10.0 4.0 1.964959e-003 0.90 6.20
-29.558 20.250 10.0 4.0 1.859399e-003 0.91 6.20 -34.558 20.500 10.0 4.0 8.655775e-004 0.96 6.32
-34.308 20.500 10.0 4.0 7.274064e-003 1.04 6.32
-34.058 20.500 10.0 4.0 1.119532e-002 0.95 6.32 -33.808 20.500 10.0 4.0 5.614061e-003 0.93 6.32
-33.558 20.500 10.0 4.0 5.880531e-003 0.93 6.32 -33.308 20.500 10.0 4.0 5.897458e-003 0.93 6.32
-33.058 20.500 10.0 4.0 5.615851e-003 0.95 6.32 -32.808 20.500 10.0 4.0 6.245246e-003 0.96 6.32
-32.558 20.500 10.0 4.0 1.006942e-002 0.97 6.30 -32.308 20.500 10.0 4.0 5.395966e-003 1.06 6.30
-32.058 20.500 10.0 4.0 3.375875e-003 1.08 6.30 -31.808 20.500 10.0 4.0 4.086139e-003 1.12 6.35
-31.558 20.500 10.0 4.0 3.162321e-004 0.96 6.35 -31.308 20.500 10.0 4.0 3.805765e-004 0.96 6.35
-31.058 20.500 10.0 4.0 8.354628e-004 0.96 6.35 -30.808 20.500 10.0 4.0 1.025129e-003 0.98 6.20
-30.558 20.500 10.0 4.0 1.401490e-003 0.93 6.20 -30.308 20.500 10.0 4.0 1.536511e-003 0.92 6.20
-30.058 20.500 10.0 4.0 1.960040e-003 0.90 6.20 -29.808 20.500 10.0 4.0 1.964959e-003 0.90 6.20
-34.558 20.750 10.0 4.0 1.013234e-003 0.96 6.32 -34.308 20.750 10.0 4.0 1.879875e-003 0.96 6.32
-34.058 20.750 10.0 4.0 6.134074e-003 1.02 6.32 -33.808 20.750 10.0 4.0 9.824471e-003 0.97 6.32

84
-33.558 20.750 10.0 4.0 9.600870e-003 0.95 6.32
-33.308 20.750 10.0 4.0 1.129321e-002 0.95 6.32 -33.058 20.750 10.0 4.0 1.195810e-002 0.97 6.32
-32.808 20.750 10.0 4.0 8.801326e-003 1.00 6.32 -32.558 20.750 10.0 4.0 4.489438e-003 1.05 6.31
-32.308 20.750 10.0 4.0 3.940669e-003 1.06 6.31 -32.058 20.750 10.0 4.0 4.075067e-003 1.12 6.35
-31.808 20.750 10.0 4.0 4.086139e-003 1.12 6.35 -31.558 20.750 10.0 4.0 3.162321e-004 0.96 6.35
-31.308 20.750 10.0 4.0 3.170747e-004 0.96 6.35 -31.058 20.750 10.0 4.0 9.617194e-004 0.96 6.35
-30.808 20.750 10.0 4.0 1.100229e-003 1.04 6.20 -30.558 20.750 10.0 4.0 1.103075e-003 1.04 6.20
-30.308 20.750 10.0 4.0 1.536511e-003 0.92 6.20 -30.058 20.750 10.0 4.0 1.829589e-003 0.92 6.20
-29.808 20.750 10.0 4.0 1.900727e-003 0.92 6.20 -34.558 21.000 10.0 4.0 8.908249e-004 0.96 6.32
-34.308 21.000 10.0 4.0 1.655710e-003 0.96 6.32 -34.058 21.000 10.0 4.0 5.828112e-003 1.05 6.32
-33.808 21.000 10.0 4.0 4.664418e-003 1.03 6.32 -33.558 21.000 10.0 4.0 5.310288e-003 1.01 6.32
-33.308 21.000 10.0 4.0 5.555254e-003 1.00 6.32 -33.058 21.000 10.0 4.0 5.808353e-003 1.03 6.32
-32.808 21.000 10.0 4.0 4.476916e-003 1.05 6.31
-32.558 21.000 10.0 4.0 4.818448e-003 1.10 6.31 -32.308 21.000 10.0 4.0 4.822199e-003 1.10 6.35
-32.058 21.000 10.0 4.0 4.075067e-003 1.12 6.35 -31.808 21.000 10.0 4.0 4.086139e-003 1.12 6.35
-31.558 21.000 10.0 4.0 3.162321e-004 0.96 6.35 -31.308 21.000 10.0 4.0 6.971008e-004 0.96 6.35
-31.058 21.000 10.0 4.0 9.593698e-004 0.96 6.20 -30.808 21.000 10.0 4.0 9.587134e-004 1.08 6.20
-30.558 21.000 10.0 4.0 1.103075e-003 1.04 6.20 -30.308 21.000 10.0 4.0 1.456804e-003 1.01 6.20
-30.058 21.000 10.0 4.0 1.876606e-003 0.99 6.20 -34.308 21.250 10.0 4.0 8.934878e-004 0.96 6.32
-34.058 21.250 10.0 4.0 5.089516e-003 1.06 6.32 -33.808 21.250 10.0 4.0 5.104446e-003 1.06 6.32
-33.558 21.250 10.0 4.0 5.862195e-003 1.05 6.32 -33.308 21.250 10.0 4.0 5.879069e-003 1.05 6.32
-33.058 21.250 10.0 4.0 5.895832e-003 1.05 6.32 -32.808 21.250 10.0 4.0 4.805008e-003 1.10 6.31
-32.558 21.250 10.0 4.0 4.803597e-003 1.10 6.36 -32.308 21.250 10.0 4.0 4.816904e-003 1.10 6.36
-32.058 21.250 10.0 4.0 4.075067e-003 1.12 6.35 -31.808 21.250 10.0 4.0 3.322341e-003 1.14 6.35
-31.558 21.250 10.0 4.0 3.162321e-004 0.96 6.35 -31.308 21.250 10.0 4.0 6.971008e-004 0.96 6.35
-31.058 21.250 10.0 4.0 6.971628e-004 0.96 6.20
-30.808 21.250 10.0 4.0 1.063926e-003 1.07 6.20 -30.558 21.250 10.0 4.0 1.549823e-003 1.07 6.20
-30.308 21.250 10.0 4.0 1.111976e-003 1.04 6.20 -30.058 21.250 10.0 4.0 1.114795e-003 1.04 6.20
-34.308 21.500 10.0 4.0 8.934878e-004 0.96 6.32 -34.058 21.500 10.0 4.0 1.660613e-003 0.96 6.32
-33.808 21.500 10.0 4.0 5.104446e-003 1.06 6.32 -33.558 21.500 10.0 4.0 5.119279e-003 1.06 6.32
-33.308 21.500 10.0 4.0 5.134015e-003 1.06 6.32 -33.058 21.500 10.0 4.0 5.261921e-003 1.06 6.38
-32.808 21.500 10.0 4.0 4.790198e-003 1.10 6.36 -32.558 21.500 10.0 4.0 4.803597e-003 1.10 6.36
-32.308 21.500 10.0 4.0 4.816904e-003 1.10 6.36 -32.058 21.500 10.0 4.0 4.073927e-003 1.12 6.36
-31.808 21.500 10.0 4.0 2.702847e-004 0.96 6.35 -31.558 21.500 10.0 4.0 3.162321e-004 0.96 6.35
-31.308 21.500 10.0 4.0 6.953284e-004 0.96 6.20 -31.058 21.500 10.0 4.0 7.835372e-004 0.96 6.20
-30.808 21.500 10.0 4.0 7.916896e-004 1.10 6.20 -30.558 21.500 10.0 4.0 1.165875e-003 1.05 6.20
-30.308 21.500 10.0 4.0 1.553792e-003 1.07 6.20 -34.058 21.750 10.0 4.0 8.953172e-004 0.96 6.38
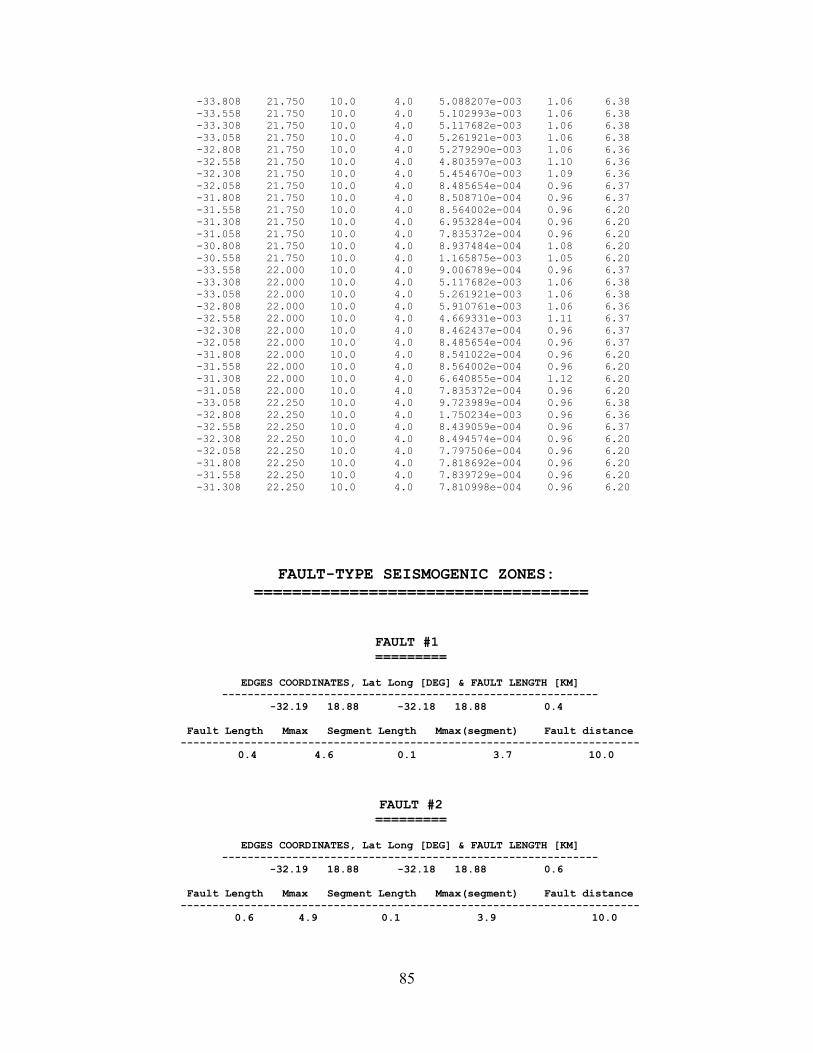
85
-33.808 21.750 10.0 4.0 5.088207e-003 1.06 6.38
-33.558 21.750 10.0 4.0 5.102993e-003 1.06 6.38 -33.308 21.750 10.0 4.0 5.117682e-003 1.06 6.38
-33.058 21.750 10.0 4.0 5.261921e-003 1.06 6.38 -32.808 21.750 10.0 4.0 5.279290e-003 1.06 6.36
-32.558 21.750 10.0 4.0 4.803597e-003 1.10 6.36 -32.308 21.750 10.0 4.0 5.454670e-003 1.09 6.36
-32.058 21.750 10.0 4.0 8.485654e-004 0.96 6.37 -31.808 21.750 10.0 4.0 8.508710e-004 0.96 6.37
-31.558 21.750 10.0 4.0 8.564002e-004 0.96 6.20 -31.308 21.750 10.0 4.0 6.953284e-004 0.96 6.20
-31.058 21.750 10.0 4.0 7.835372e-004 0.96 6.20 -30.808 21.750 10.0 4.0 8.937484e-004 1.08 6.20
-30.558 21.750 10.0 4.0 1.165875e-003 1.05 6.20 -33.558 22.000 10.0 4.0 9.006789e-004 0.96 6.37
-33.308 22.000 10.0 4.0 5.117682e-003 1.06 6.38 -33.058 22.000 10.0 4.0 5.261921e-003 1.06 6.38
-32.808 22.000 10.0 4.0 5.910761e-003 1.06 6.36 -32.558 22.000 10.0 4.0 4.669331e-003 1.11 6.37
-32.308 22.000 10.0 4.0 8.462437e-004 0.96 6.37 -32.058 22.000 10.0 4.0 8.485654e-004 0.96 6.37
-31.808 22.000 10.0 4.0 8.541022e-004 0.96 6.20 -31.558 22.000 10.0 4.0 8.564002e-004 0.96 6.20
-31.308 22.000 10.0 4.0 6.640855e-004 1.12 6.20
-31.058 22.000 10.0 4.0 7.835372e-004 0.96 6.20 -33.058 22.250 10.0 4.0 9.723989e-004 0.96 6.38
-32.808 22.250 10.0 4.0 1.750234e-003 0.96 6.36 -32.558 22.250 10.0 4.0 8.439059e-004 0.96 6.37
-32.308 22.250 10.0 4.0 8.494574e-004 0.96 6.20 -32.058 22.250 10.0 4.0 7.797506e-004 0.96 6.20
-31.808 22.250 10.0 4.0 7.818692e-004 0.96 6.20 -31.558 22.250 10.0 4.0 7.839729e-004 0.96 6.20
-31.308 22.250 10.0 4.0 7.810998e-004 0.96 6.20
FAULT-TYPE SEISMOGENIC ZONES: ===================================
FAULT #1
=========
EDGES COORDINATES, Lat Long [DEG] & FAULT LENGTH [KM] -----------------------------------------------------------
-32.19 18.88 -32.18 18.88 0.4
Fault Length Mmax Segment Length Mmax(segment) Fault distance ------------------------------------------------------------------------
0.4 4.6 0.1 3.7 10.0
FAULT #2 =========
EDGES COORDINATES, Lat Long [DEG] & FAULT LENGTH [KM]
----------------------------------------------------------- -32.19 18.88 -32.18 18.88 0.6
Fault Length Mmax Segment Length Mmax(segment) Fault distance ------------------------------------------------------------------------
0.6 4.9 0.1 3.9 10.0
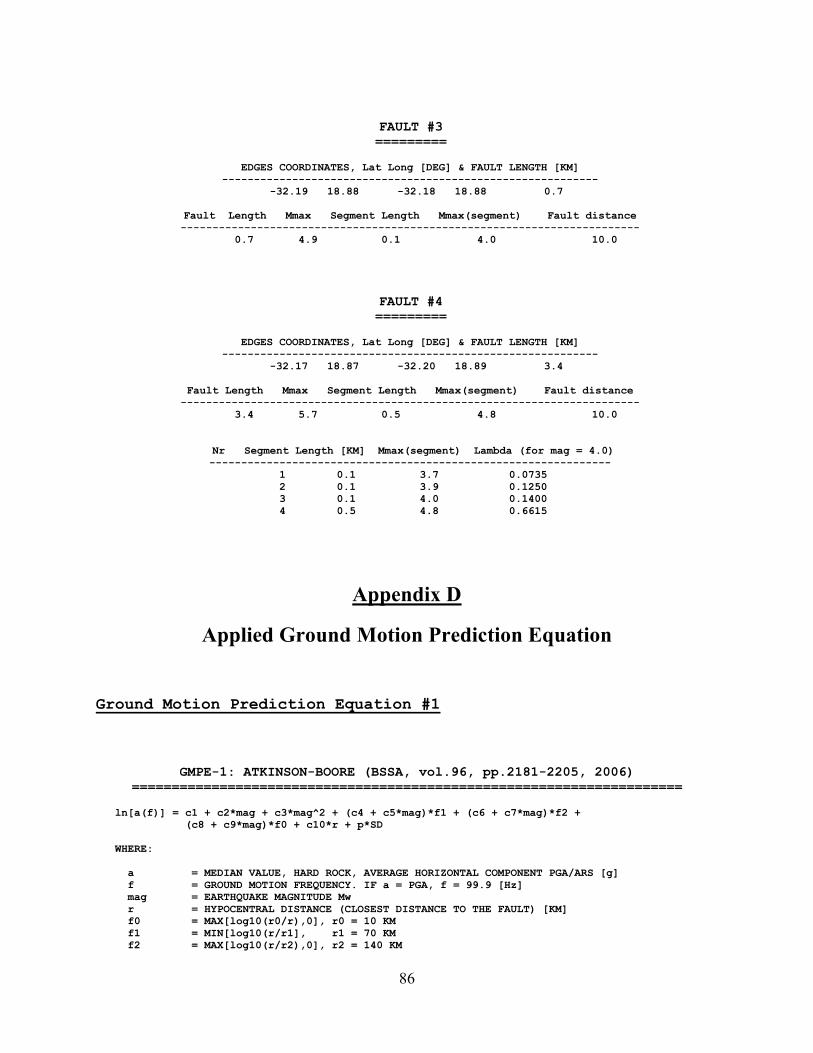
86
FAULT #3 =========
EDGES COORDINATES, Lat Long [DEG] & FAULT LENGTH [KM]
----------------------------------------------------------- -32.19 18.88 -32.18 18.88 0.7
Fault Length Mmax Segment Length Mmax(segment) Fault distance ------------------------------------------------------------------------
0.7 4.9 0.1 4.0 10.0
FAULT #4 =========
EDGES COORDINATES, Lat Long [DEG] & FAULT LENGTH [KM]
----------------------------------------------------------- -32.17 18.87 -32.20 18.89 3.4
Fault Length Mmax Segment Length Mmax(segment) Fault distance ------------------------------------------------------------------------
3.4 5.7 0.5 4.8 10.0
Nr Segment Length [KM] Mmax(segment) Lambda (for mag = 4.0) ---------------------------------------------------------------
1 0.1 3.7 0.0735 2 0.1 3.9 0.1250 3 0.1 4.0 0.1400 4 0.5 4.8 0.6615
Appendix D
Applied Ground Motion Prediction Equation
Ground Motion Prediction Equation #1
GMPE-1: ATKINSON-BOORE (BSSA, vol.96, pp.2181-2205, 2006) =====================================================================
ln[a(f)] = c1 + c2*mag + c3*mag^2 + (c4 + c5*mag)*f1 + (c6 + c7*mag)*f2 + (c8 + c9*mag)*f0 + c10*r + p*SD WHERE: a = MEDIAN VALUE, HARD ROCK, AVERAGE HORIZONTAL COMPONENT PGA/ARS [g] f = GROUND MOTION FREQUENCY. IF a = PGA, f = 99.9 [Hz] mag = EARTHQUAKE MAGNITUDE Mw r = HYPOCENTRAL DISTANCE (CLOSEST DISTANCE TO THE FAULT) [KM] f0 = MAX[log10(r0/r),0], r0 = 10 KM f1 = MIN[log10(r/r1], r1 = 70 KM f2 = MAX[log10(r/r2),0], r2 = 140 KM

87
p = 0. IF p = 1, ln(a) = MEAN[ln(a)] + SD[ln(a)] c1,...,c10 = COEFFICIENTS; SD OF PREDICTED ln(a) = 0.69 ATTENUATION COEFFICIENTS ============================== Freq.(Hz) c1 c2 c3 c4 c5 c6 c7 c8 c9 c10 ---------------------------------------------------------------------------- 0.2 -5.41 1.710 -0.0901 -2.54 0.227 -1.270 0.116 0.979 -0.1770 -0.0002 0.3 -5.79 1.920 -0.1070 -2.44 0.211 -1.160 0.102 1.010 -0.1820 -0.0002 0.4 -6.17 2.210 -0.1350 -2.30 0.190 -0.986 0.079 0.968 -0.1770 -0.0003 0.5 -6.18 2.300 -0.1440 -2.22 0.177 -0.937 0.071 0.952 -0.1770 -0.0003 0.8 -5.72 2.320 -0.1510 -2.10 0.157 -0.820 0.052 0.856 -0.1660 -0.0004 1.0 -5.27 2.260 -0.1480 -2.07 0.150 -0.813 0.047 0.826 -0.1620 -0.0005 2.0 -3.22 1.830 -0.1200 -2.02 0.134 -0.813 0.044 0.884 -0.1750 -0.0008 2.5 -2.44 1.650 -0.1080 -2.05 0.136 -0.843 0.045 0.739 -0.1560 -0.0009 4.0 -1.12 1.340 -0.0872 -2.08 0.135 -0.971 0.056 0.614 0.1430 -0.0011 5.0 -0.61 1.230 -0.0789 -2.09 0.131 -1.120 0.068 0.606 -0.1460 -0.0011 8.0 0.21 1.050 -0.0666 -2.15 0.130 -1.610 0.105 0.427 -0.1300 -0.0012 10.0 0.48 1.020 -0.0640 -2.20 0.127 -2.010 0.133 0.337 -0.1270 -0.0010 20.0 1.11 0.972 -0.0620 -2.47 0.128 -3.390 0.214 -0.139 -0.0984 -0.0003 25.2 1.26 0.968 -0.0623 -2.58 0.132 -3.640 0.228 -0.351 -0.0813 -0.0001 40.0 1.52 0.960 -0.0635 -2.81 0.146 -3.650 0.236 -0.654 -0.0550 -0.0000 99.0 0.91 0.983 -0.0660 -2.70 0.159 -2.800 0.212 -0.301 -0.0653 -0.0004
Ground Motion Prediction Equation #2 GMPE-2: Extensional Tectonic Regimes (SEA99, SPUDICH et al., 1999) ATTENUATION MODEL: SPUDICH et al. (1999) (Extensional Tectonic Regimes) ================================================ ln[a(f)] = c1 + c2*(mag-6) + c3*(mag-6)^2 + c4*r + c5*ln(r) + p*SD WHERE: a = MEDIAN VALUE, AVERAGE HORIZONTAL COMPONENT PGA [g] f = GROUND MOTION FREQUENCY. IF a = PGA, f = 99.9 [Hz] mag = EARTHQUAKE MAGNITUDE Mw r = sqrt(r_JB^2 + c6^2), r_JB= JOYNER-BOORE DISTANCE [KM] p = 0. IF p = 1, ln(a) = MEAN[ln(a)] + SD[ln(a)] c1,...,c8 = COEFFICIENTS, WHERE sqrt(c7^2 + c8^2) IS SD OF ln(a) ATTENUATION COEFFICIENTS ============================== Freq. (Hz) c1 c2 c3 c4 c5 c6 c7 c8 -------------------------------------------------------------------------------- 99.0 0.688 0.527 0.000 0.00 -1.052 7.27 0.396 0.249

88
Appendix E
Results of PSHA. Tabulated values of mean activity rate, return periods and
probability of exceedance in 1, 50, 100 and 1 000 years for specified values of
PGA
GMPR-1. Scenario 1: Four faults identified in vicinity of dam
wall are not active
============================================== File : info_PSHA_att#1 (no faults).txt Created on : 01-Mar-2011 16:32:08 ============================================== PROBABILISTIC SEISMIC HAZARD ASSESSMENT FOR A SELECTED SITE BY THE CORNELL-McGUIRE PROCEDURE ============================================================ THE APPLIED METHODOLOGY IS DESCRIBED IN THE DOCUMENT: "Recommendation for Probabilistic Seismic Hazard Analysis: Guidance on Uncertainty and Use of Experts", Prepared by: Senior Seismic Hazard Analysis Committee (SSHAC), R.J. Budnitz (Chairman), G. Apostolakis, D.M. Boore, L.S. Cluff, K.J. Coppersmith, C.A. Cornell, and P.A. Morris. Lawrence Livermore National Laboratory. Prepared for: U.S. Nuclear Regulatory Commission, U.S. Department of Energy and Electric Power Research Institute. NUREG/CR-6372, UCRL-ID-122160, vol.1, April 1997 THE CODE REQUIRES TWO INPUT FILES: FILE CONTAINING SITE-SPECIFIC INFORMATION: ------------------------------------------ - Site coordinates, LATITUDE & LONGITUDE [DEG] - MINIMUM VALUE OF ANNUAL PROBABILITY OF EXCEEDANCE of PGA for which PSHA calculations are to be performed. Suggested values: for nuclear facilities, between 10^(-6) and 10^(-4), for large water reservoirs/dams between 10^(-4) and 10^(-3). - 3 TIME INTERVALS for which PSHA will be performed. Suggested values: 50, 100 and 1000 years. - Parameter controlling the ACCURACY of numerical integration. If its value = 1,
89
the accuracy of integration is LOW, but computation time is SHORT. If its value = 2, accuracy of integration is MODERATE, but computation time is LONGER. If its value is 3, accuracy of integration is HIGHEST, but computations require SIGNIFICANTLY more time. - Parameter providing provision for increase/decrease of seismicity. - Two parameters controlling UNCERTAINTY of the assumed seismicity model. First parameter controls uncertainty of b-value in the FREQUENCY-MAGNITUDE, Gutenberg-Richter relation. Second parameter controls uncertainty of the level of seismicity described by the mean activity rate LAMBDA. - Parameter controlling predicted value of Ground Motion. If its value is = 1, in all calculations the MEAN value of ln(Ground Motion) is used. If its value is = 2, the predicted, mean value of ln(Ground Motion) is increased by its STANDARD DEVIATION FILE CONTAINING INFORMATION ON SEISMIC SOURCES IN THE VICINITY OF THE SITE -------------------------------------------------------------------------- Each seismic source is described by 7 parameters: (1) latitude [DEG] (2) longitude [DEG] (3) depth [KM] of seismic source, (4) minimum earthquake magnitude Mmin (5) Mean seismic activity rate LAMBDA (6) b-value of the frequency-magnitude Gutenberg-Richter relation (7) MAXIMUM, seismic source-characteristic EQ-e magnitude Mmax. ========================================================================== PROGRAM NAME : HS_C_McG (H = Hazard; S = Site; C = Cornell; McG = McGuire) WRITTEN : 15 SEP 2007 by A.K. REVISED : 27 SEP 2007 by A.K. : 30 SEP 2007 by A.K. : 01 OCT 2007 by A.K. : 20 FEB 2008 by A.K. : 12 MAY 2008 by A.K. : 21 JUN 2008 by A.K. : 15 SEP 2009 by A.K. : 28 OCT 2010 by A.K. REVISION : 1.12 ========================================================================== For more information, contact Dr. A.Kijko Natural Hazard Assessment Consultancy 8 Birch Str. Clubview, ext.2 Centurion 0157 South Africa Phone : +27 (0) 829394002 E-mail : [email protected]/[email protected] ========================================================================== PROBABILISTIC SEISMIC HAZARD ASSESSMENT BY CORNELL-McGuire PROCEDURE ====================================================================== The applied approach takes into account ground motion variability by integrating across the scatter in the attenuation equation NAME OF THE SITE: Clanwilliam Dam (no faults)

90
ATTENUATION MODEL #3: ATKINSON & BOORE (2006) SITE COORDINATES (LATITUDE) = -32.183 [DEG] SITE COORDINATES (LONGITUDE) = 18.875 [DEG] MINIMUM ANNUAL PROBABILITY OF EXCEEDANCE = 1.000e-005 [DEG] PSHA IS CALCULATED FOR TIME INTERVALS = 50 100 and 1000 YEARS ACCURACY OF NUMERICAL INTEGRATION: LOW MAGNITUDE INTEGRATION INTERVAL = 0.5 PROVISION FOR INDUCED SEISMICITY: REQUIRED MULTIPLICATIVE FACTOR OF LAMBDA = 1 MODEL UNCERTAINTY OF THE b-VALUE = 25 [per cent] MODEL UNCERTAINTY OF THE SITE-SPECIFIC LAMBDA = 25 [per cent] ALL CALCULATIONS ARE PERFORMED FOR MEAN VALUE OF ln[PGA/ARS] NAME OF INPUT FILE WITH PARAMETERS OF SEISMIC SOURCES: ss_no_faults.txt Max EXPECTED PGA AT THE SITE = 0.176 [g] (FROM SEISMIC SOURCE #172) SEISMIC HAZARD ========================================================== PGA[g] Lambda[EQ/Y] RP[Y] Prob(T = 1 50 100 1000 [Y]) 0.010 6.2509e-002 1.5998e+001 0.060596 0.956083 0.998071 1.000000 0.020 2.2251e-002 4.4943e+001 0.022005 0.671273 0.891938 1.000000 0.030 1.1528e-002 8.6745e+001 0.011462 0.438083 0.684249 0.999990 0.040 7.0139e-003 1.4257e+002 0.006989 0.295803 0.504107 0.999101 0.050 4.6829e-003 2.1354e+002 0.004672 0.208753 0.373929 0.990748 0.060 3.3268e-003 3.0059e+002 0.003321 0.153243 0.283002 0.964093 0.070 2.4718e-003 4.0456e+002 0.002469 0.116258 0.219000 0.915567 0.080 1.8999e-003 5.2634e+002 0.001898 0.090622 0.173032 0.850416 0.090 1.4995e-003 6.6687e+002 0.001498 0.072235 0.139252 0.776767 0.100 1.2089e-003 8.2720e+002 0.001208 0.058655 0.113869 0.701475 0.110 9.9158e-004 1.0085e+003 0.000991 0.048370 0.094401 0.629011 0.120 8.2506e-004 1.2120e+003 0.000825 0.040413 0.079194 0.561789 0.130 6.9480e-004 1.4393e+003 0.000695 0.034143 0.067121 0.500825 0.140 5.9112e-004 1.6917e+003 0.000591 0.029123 0.057399 0.446292 0.150 5.0735e-004 1.9710e+003 0.000507 0.025048 0.049469 0.397910 0.160 4.3878e-004 2.2790e+003 0.000439 0.021700 0.042930 0.355180 0.170 3.8203e-004 2.6176e+003 0.000382 0.018920 0.037483 0.317527 0.180 3.3459e-004 2.9887e+003 0.000335 0.016590 0.032905 0.284368 0.190 2.9458e-004 3.3946e+003 0.000295 0.014621 0.029029 0.255158 0.200 2.6058e-004 3.8375e+003 0.000261 0.012945 0.025722 0.229399 0.210 2.3149e-004 4.3198e+003 0.000231 0.011508 0.022883 0.206650 0.220 2.0644e-004 4.8441e+003 0.000206 0.010269 0.020432 0.186523 0.230 1.8474e-004 5.4129e+003 0.000185 0.009195 0.018305 0.168684 0.240 1.6586e-004 6.0290e+003 0.000166 0.008259 0.016450 0.152838 0.250 1.4935e-004 6.6955e+003 0.000149 0.007440 0.014824 0.138736 0.260 1.3486e-004 7.4153e+003 0.000135 0.006720 0.013395 0.126158 0.270 1.2207e-004 8.1917e+003 0.000122 0.006085 0.012133 0.114918 0.280 1.1077e-004 9.0280e+003 0.000111 0.005523 0.011015 0.104852 0.290 1.0073e-004 9.9278e+003 0.000101 0.005024 0.010022 0.095820 0.300 9.1787e-005 1.0895e+004 0.000092 0.004579 0.009137 0.087701 0.310 8.3804e-005 1.1933e+004 0.000084 0.004181 0.008345 0.080388 0.320 7.6654e-005 1.3046e+004 0.000077 0.003825 0.007636 0.073790 0.330 7.0236e-005 1.4238e+004 0.000070 0.003506 0.006999 0.067826 0.340 6.4461e-005 1.5513e+004 0.000064 0.003218 0.006425 0.062427 0.350 5.9252e-005 1.6877e+004 0.000059 0.002958 0.005908 0.057531 0.360 5.4544e-005 1.8334e+004 0.000055 0.002723 0.005440 0.053083 0.370 5.0281e-005 1.9888e+004 0.000050 0.002511 0.005015 0.049037 0.380 4.6412e-005 2.1546e+004 0.000046 0.002318 0.004630 0.045352 0.390 4.2896e-005 2.3312e+004 0.000043 0.002143 0.004280 0.041989 0.400 3.9695e-005 2.5192e+004 0.000040 0.001983 0.003962 0.038918
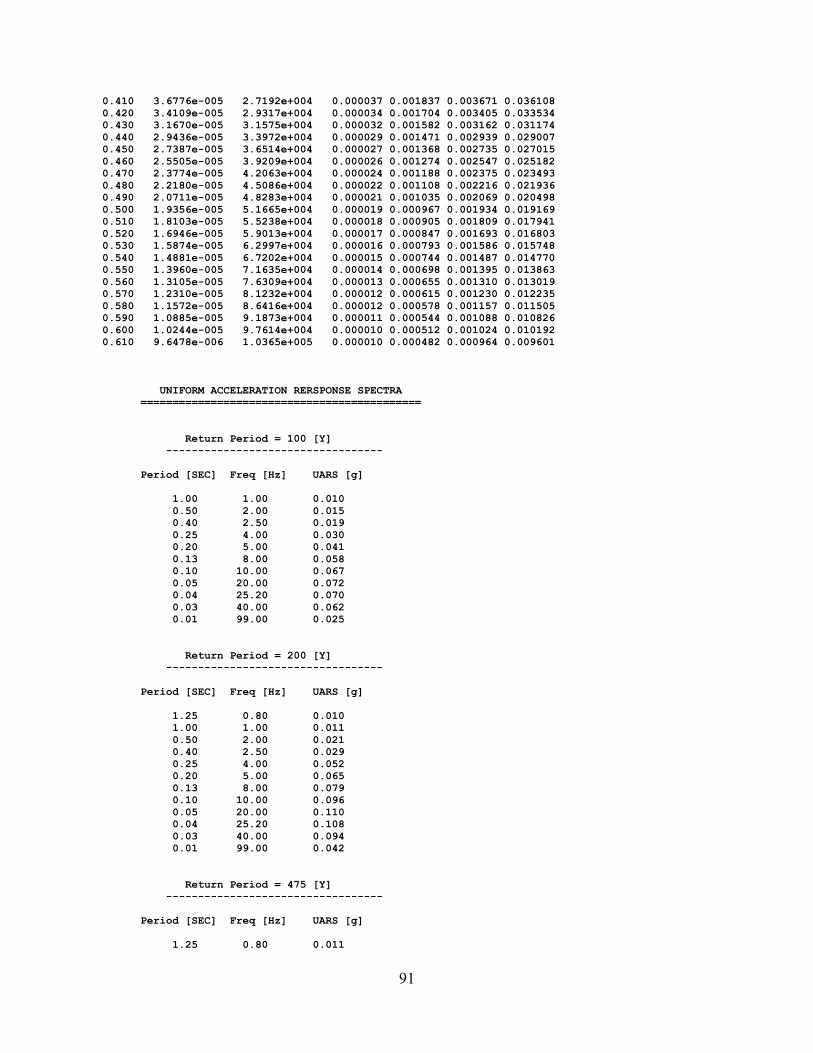
91
0.410 3.6776e-005 2.7192e+004 0.000037 0.001837 0.003671 0.036108 0.420 3.4109e-005 2.9317e+004 0.000034 0.001704 0.003405 0.033534 0.430 3.1670e-005 3.1575e+004 0.000032 0.001582 0.003162 0.031174 0.440 2.9436e-005 3.3972e+004 0.000029 0.001471 0.002939 0.029007 0.450 2.7387e-005 3.6514e+004 0.000027 0.001368 0.002735 0.027015 0.460 2.5505e-005 3.9209e+004 0.000026 0.001274 0.002547 0.025182 0.470 2.3774e-005 4.2063e+004 0.000024 0.001188 0.002375 0.023493 0.480 2.2180e-005 4.5086e+004 0.000022 0.001108 0.002216 0.021936 0.490 2.0711e-005 4.8283e+004 0.000021 0.001035 0.002069 0.020498 0.500 1.9356e-005 5.1665e+004 0.000019 0.000967 0.001934 0.019169 0.510 1.8103e-005 5.5238e+004 0.000018 0.000905 0.001809 0.017941 0.520 1.6946e-005 5.9013e+004 0.000017 0.000847 0.001693 0.016803 0.530 1.5874e-005 6.2997e+004 0.000016 0.000793 0.001586 0.015748 0.540 1.4881e-005 6.7202e+004 0.000015 0.000744 0.001487 0.014770 0.550 1.3960e-005 7.1635e+004 0.000014 0.000698 0.001395 0.013863 0.560 1.3105e-005 7.6309e+004 0.000013 0.000655 0.001310 0.013019 0.570 1.2310e-005 8.1232e+004 0.000012 0.000615 0.001230 0.012235 0.580 1.1572e-005 8.6416e+004 0.000012 0.000578 0.001157 0.011505 0.590 1.0885e-005 9.1873e+004 0.000011 0.000544 0.001088 0.010826 0.600 1.0244e-005 9.7614e+004 0.000010 0.000512 0.001024 0.010192 0.610 9.6478e-006 1.0365e+005 0.000010 0.000482 0.000964 0.009601 UNIFORM ACCELERATION RERSPONSE SPECTRA ============================================ Return Period = 100 [Y] ---------------------------------- Period [SEC] Freq [Hz] UARS [g] 1.00 1.00 0.010 0.50 2.00 0.015 0.40 2.50 0.019 0.25 4.00 0.030 0.20 5.00 0.041 0.13 8.00 0.058 0.10 10.00 0.067 0.05 20.00 0.072 0.04 25.20 0.070 0.03 40.00 0.062 0.01 99.00 0.025 Return Period = 200 [Y] ---------------------------------- Period [SEC] Freq [Hz] UARS [g] 1.25 0.80 0.010 1.00 1.00 0.011 0.50 2.00 0.021 0.40 2.50 0.029 0.25 4.00 0.052 0.20 5.00 0.065 0.13 8.00 0.079 0.10 10.00 0.096 0.05 20.00 0.110 0.04 25.20 0.108 0.03 40.00 0.094 0.01 99.00 0.042 Return Period = 475 [Y] ---------------------------------- Period [SEC] Freq [Hz] UARS [g] 1.25 0.80 0.011
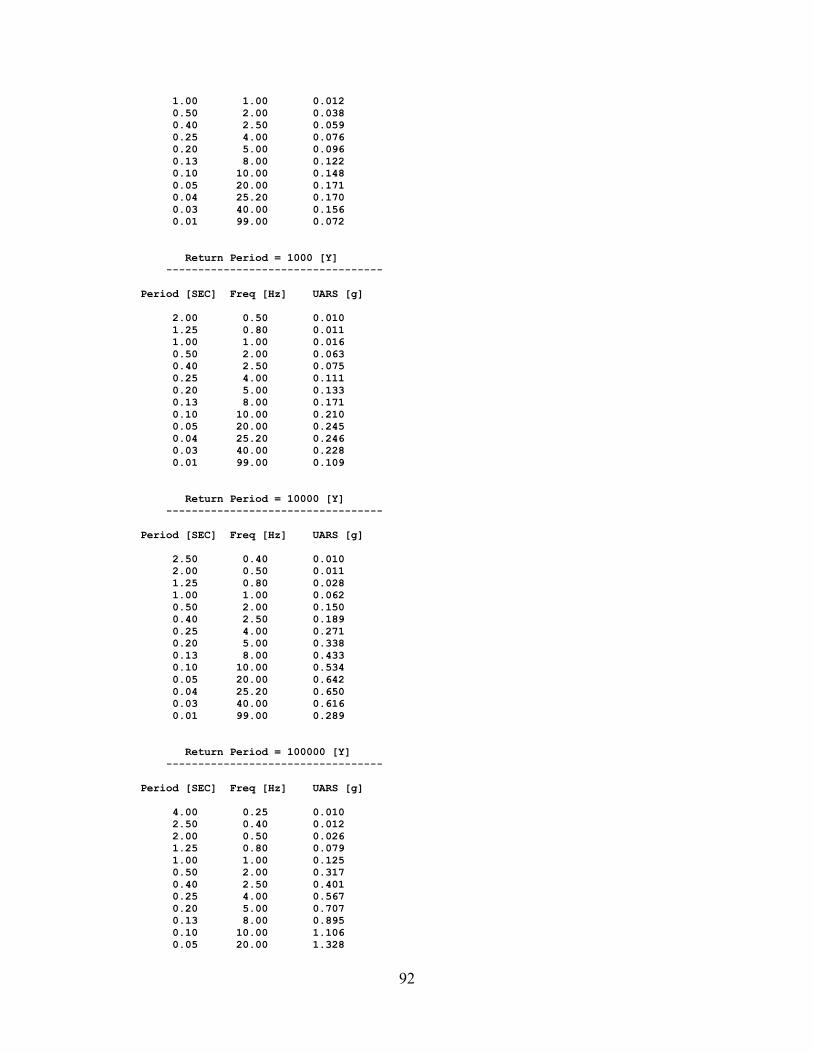
92
1.00 1.00 0.012 0.50 2.00 0.038 0.40 2.50 0.059 0.25 4.00 0.076 0.20 5.00 0.096 0.13 8.00 0.122 0.10 10.00 0.148 0.05 20.00 0.171 0.04 25.20 0.170 0.03 40.00 0.156 0.01 99.00 0.072 Return Period = 1000 [Y] ---------------------------------- Period [SEC] Freq [Hz] UARS [g] 2.00 0.50 0.010 1.25 0.80 0.011 1.00 1.00 0.016 0.50 2.00 0.063 0.40 2.50 0.075 0.25 4.00 0.111 0.20 5.00 0.133 0.13 8.00 0.171 0.10 10.00 0.210 0.05 20.00 0.245 0.04 25.20 0.246 0.03 40.00 0.228 0.01 99.00 0.109 Return Period = 10000 [Y] ---------------------------------- Period [SEC] Freq [Hz] UARS [g] 2.50 0.40 0.010 2.00 0.50 0.011 1.25 0.80 0.028 1.00 1.00 0.062 0.50 2.00 0.150 0.40 2.50 0.189 0.25 4.00 0.271 0.20 5.00 0.338 0.13 8.00 0.433 0.10 10.00 0.534 0.05 20.00 0.642 0.04 25.20 0.650 0.03 40.00 0.616 0.01 99.00 0.289 Return Period = 100000 [Y] ---------------------------------- Period [SEC] Freq [Hz] UARS [g] 4.00 0.25 0.010 2.50 0.40 0.012 2.00 0.50 0.026 1.25 0.80 0.079 1.00 1.00 0.125 0.50 2.00 0.317 0.40 2.50 0.401 0.25 4.00 0.567 0.20 5.00 0.707 0.13 8.00 0.895 0.10 10.00 1.106 0.05 20.00 1.328
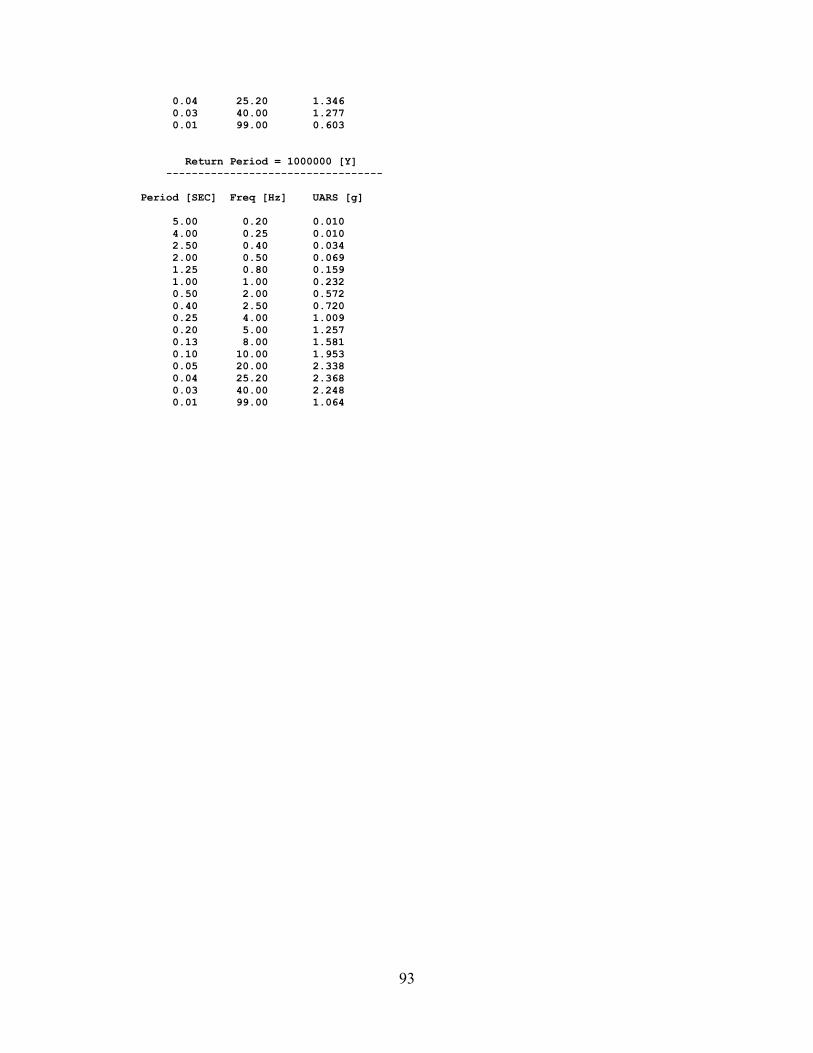
93
0.04 25.20 1.346 0.03 40.00 1.277 0.01 99.00 0.603 Return Period = 1000000 [Y] ---------------------------------- Period [SEC] Freq [Hz] UARS [g] 5.00 0.20 0.010 4.00 0.25 0.010 2.50 0.40 0.034 2.00 0.50 0.069 1.25 0.80 0.159 1.00 1.00 0.232 0.50 2.00 0.572 0.40 2.50 0.720 0.25 4.00 1.009 0.20 5.00 1.257 0.13 8.00 1.581 0.10 10.00 1.953 0.05 20.00 2.338 0.04 25.20 2.368 0.03 40.00 2.248 0.01 99.00 1.064

94
GMPR-1. Scenario 2: Four faults identified in vicinity of dam wall are active
================================================= File : info_PSHA_att#1 (with faults).txt Created on : 01-Mar-2011 16:50:09 ================================================= PROBABILISTIC SEISMIC HAZARD ASSESSMENT FOR A SELECTED SITE BY THE CORNELL-McGUIRE PROCEDURE ============================================================ THE APPLIED METHODOLOGY IS DESCRIBED IN THE DOCUMENT: "Recommendation for Probabilistic Seismic Hazard Analysis: Guidance on Uncertainty and Use of Experts", Prepared by: Senior Seismic Hazard Analysis Committee (SSHAC), R.J. Budnitz (Chairman), G. Apostolakis, D.M. Boore, L.S. Cluff, K.J. Coppersmith, C.A. Cornell, and P.A. Morris. Lawrence Livermore National Laboratory. Prepared for: U.S. Nuclear Regulatory Commission, U.S. Department of Energy and Electric Power Research Institute. NUREG/CR-6372, UCRL-ID-122160, vol.1, April 1997 THE CODE REQUIRES TWO INPUT FILES: FILE CONTAINING SITE-SPECIFIC INFORMATION: ------------------------------------------ - Site coordinates, LATITUDE & LONGITUDE [DEG] - MINIMUM VALUE OF ANNUAL PROBABILITY OF EXCEEDANCE of PGA for which PSHA calculations are to be performed. Suggested values: for nuclear facilities, between 10^(-6) and 10^(-4), for large water reservoirs/dams between 10^(-4) and 10^(-3). - 3 TIME INTERVALS for which PSHA will be performed. Suggested values: 50, 100 and 1000 years. - Parameter controlling the ACCURACY of numerical integration. If its value = 1, the accuracy of integration is LOW, but computation time is SHORT. If its value = 2, accuracy of integration is MODERATE, but computation time is LONGER. If its value is 3, accuracy of integration is HIGHEST, but computations require SIGNIFICANTLY more time. - Parameter providing provision for increase/decrease of seismicity. - Two parameters controlling UNCERTAINTY of the assumed seismicity model. First parameter controls uncertainty of b-value in the FREQUENCY-MAGNITUDE, Gutenberg-Richter relation. Second parameter controls uncertainty of the level of seismicity described by the mean activity rate LAMBDA.

95
- Parameter controlling predicted value of Ground Motion. If its value is = 1, in all calculations the MEAN value of ln(Ground Motion) is used. If its value is = 2, the predicted, mean value of ln(Ground Motion) is increased by its STANDARD DEVIATION FILE CONTAINING INFORMATION ON SEISMIC SOURCES IN THE VICINITY OF THE SITE -------------------------------------------------------------------------- Each seismic source is described by 7 parameters: (1) latitude [DEG] (2) longitude [DEG] (3) depth [KM] of seismic source, (4) minimum earthquake magnitude Mmin (5) Mean seismic activity rate LAMBDA (6) b-value of the frequency-magnitude Gutenberg-Richter relation (7) MAXIMUM, seismic source-characteristic EQ-e magnitude Mmax. ========================================================================== PROGRAM NAME : HS_C_McG (H = Hazard; S = Site; C = Cornell; McG = McGuire) WRITTEN : 15 SEP 2007 by A.K. REVISED : 27 SEP 2007 by A.K. : 30 SEP 2007 by A.K. : 01 OCT 2007 by A.K. : 20 FEB 2008 by A.K. : 12 MAY 2008 by A.K. : 21 JUN 2008 by A.K. : 15 SEP 2009 by A.K. : 28 OCT 2010 by A.K. REVISION : 1.12 ========================================================================== For more information, contact Dr. A.Kijko Natural Hazard Assessment Consultancy 8 Birch Str. Clubview, ext.2 Centurion 0157 South Africa Phone : +27 (0) 829394002 E-mail : [email protected]/[email protected] ========================================================================== PROBABILISTIC SEISMIC HAZARD ASSESSMENT BY CORNELL-McGUIRE PROCEDURE ====================================================================== The applied approach takes into account ground motion variability by integrating across the scatter in the attenuation equation NAME OF THE SITE: Clanwilliam Dam (with faults) ATTENUATION MODEL #3: ATKINSON & BOORE (2006) SITE COORDINATES (LATITUDE) = -32.183 [DEG] SITE COORDINATES (LONGITUDE) = 18.875 [DEG] MINIMUM ANNUAL PROBABILITY OF EXCEEDANCE = 1.000e-005 [DEG] PSHA IS CALCULATED FOR TIME INTERVALS = 50 100 and 1000 YEARS ACCURACY OF NUMERICAL INTEGRATION: LOW MAGNITUDE INTEGRATION INTERVAL = 0.5 PROVISION FOR INDUCED SEISMICITY: REQUIRED MULTIPLICATIVE FACTOR OF LAMBDA = 1 MODEL UNCERTAINTY OF THE b-VALUE = 25 [per cent]

96
MODEL UNCERTAINTY OF THE SITE-SPECIFIC LAMBDA = 25 [per cent] ALL CALCULATIONS ARE PERFORMED FOR MEAN VALUE OF ln[PGA/ARS] NAME OF INPUT FILE WITH PARAMETERS OF SEISMIC SOURCES: ss.txt Max EXPECTED PGA AT THE SITE = 0.374 [g] (FROM SEISMIC SOURCE #448) SEISMIC HAZARD ========================================================== PGA[g] Lambda[EQ/Y] RP[Y] Prob(T = 1 50 100 1000 [Y]) 0.010 8.2491e-002 1.2123e+001 0.079180 0.983829 0.999738 1.000000 0.020 4.1943e-002 2.3842e+001 0.041075 0.877193 0.984919 1.000000 0.030 3.0455e-002 3.2835e+001 0.029996 0.781888 0.952427 1.000000 0.040 2.4807e-002 4.0311e+001 0.024502 0.710718 0.916316 1.000000 0.050 2.1152e-002 4.7278e+001 0.020929 0.652704 0.879386 1.000000 0.060 1.8417e-002 5.4297e+001 0.018249 0.601825 0.841456 1.000000 0.070 1.6215e-002 6.1670e+001 0.016085 0.555483 0.802405 1.000000 0.080 1.4374e-002 6.9569e+001 0.014271 0.512621 0.762461 0.999999 0.090 1.2804e-002 7.8101e+001 0.012722 0.472809 0.722070 0.999997 0.100 1.1449e-002 8.7344e+001 0.011384 0.435858 0.681744 0.999989 0.110 1.0272e-002 9.7356e+001 0.010219 0.401650 0.641977 0.999965 0.120 9.2431e-003 1.0819e+002 0.009201 0.370077 0.603196 0.999903 0.130 8.3411e-003 1.1989e+002 0.008306 0.341016 0.565740 0.999761 0.140 7.5472e-003 1.3250e+002 0.007519 0.314330 0.529857 0.999472 0.150 6.8462e-003 1.4607e+002 0.006823 0.289871 0.495717 0.998936 0.160 6.2254e-003 1.6063e+002 0.006206 0.267483 0.463419 0.998021 0.170 5.6740e-003 1.7624e+002 0.005658 0.247008 0.433004 0.996566 0.180 5.1830e-003 1.9294e+002 0.005170 0.228293 0.404469 0.994389 0.190 4.7446e-003 2.1077e+002 0.004733 0.211189 0.377778 0.991301 0.200 4.3521e-003 2.2977e+002 0.004343 0.195557 0.352871 0.987120 0.210 3.9999e-003 2.5001e+002 0.003992 0.181264 0.329672 0.981682 0.220 3.6830e-003 2.7151e+002 0.003676 0.168191 0.308093 0.974854 0.230 3.3974e-003 2.9435e+002 0.003392 0.156224 0.288042 0.966539 0.240 3.1392e-003 3.1855e+002 0.003134 0.145262 0.269423 0.956683 0.250 2.9054e-003 3.4418e+002 0.002901 0.135213 0.252143 0.945275 0.260 2.6933e-003 3.7129e+002 0.002690 0.125991 0.236107 0.932341 0.270 2.5004e-003 3.9994e+002 0.002497 0.117520 0.221229 0.917946 0.280 2.3246e-003 4.3017e+002 0.002322 0.109731 0.207421 0.902181 0.290 2.1642e-003 4.6206e+002 0.002162 0.102562 0.194606 0.885162 0.300 2.0176e-003 4.9565e+002 0.002016 0.095957 0.182706 0.867021 0.310 1.8832e-003 5.3100e+002 0.001881 0.089864 0.171653 0.847901 0.320 1.7600e-003 5.6819e+002 0.001758 0.084238 0.161380 0.827952 0.330 1.6467e-003 6.0727e+002 0.001645 0.079038 0.151829 0.807320 0.340 1.5425e-003 6.4830e+002 0.001541 0.074226 0.142942 0.786153 0.350 1.4464e-003 6.9136e+002 0.001445 0.069768 0.134669 0.764590 0.360 1.3578e-003 7.3651e+002 0.001357 0.065635 0.126962 0.742763 0.370 1.2758e-003 7.8382e+002 0.001275 0.061798 0.119777 0.720793 0.380 1.1999e-003 8.3337e+002 0.001199 0.058233 0.113075 0.698791 0.390 1.1297e-003 8.8522e+002 0.001129 0.054917 0.106819 0.676857 0.400 1.0644e-003 9.3946e+002 0.001064 0.051831 0.100975 0.655079 0.410 1.0039e-003 9.9616e+002 0.001003 0.048954 0.095511 0.633537 0.420 9.4751e-004 1.0554e+003 0.000947 0.046271 0.090401 0.612296 0.430 8.9505e-004 1.1173e+003 0.000895 0.043766 0.085617 0.591414 0.440 8.4616e-004 1.1818e+003 0.000846 0.041425 0.081135 0.570940 0.450 8.0054e-004 1.2492e+003 0.000800 0.039236 0.076933 0.550913 0.460 7.5793e-004 1.3194e+003 0.000758 0.037187 0.072992 0.531364 0.470 7.1810e-004 1.3926e+003 0.000718 0.035268 0.069292 0.512321 0.480 6.8082e-004 1.4688e+003 0.000681 0.033468 0.065816 0.493800 0.490 6.4591e-004 1.5482e+003 0.000646 0.031780 0.062549 0.475815 0.500 6.1318e-004 1.6308e+003 0.000613 0.030194 0.059476 0.458377 0.510 5.8248e-004 1.7168e+003 0.000582 0.028704 0.056584 0.441487 0.520 5.5364e-004 1.8062e+003 0.000553 0.027303 0.053860 0.425149 0.530 5.2655e-004 1.8992e+003 0.000526 0.025984 0.051292 0.409358 0.540 5.0106e-004 1.9958e+003 0.000501 0.024742 0.048871 0.394112 0.550 4.7707e-004 2.0961e+003 0.000477 0.023571 0.046587 0.379402 0.560 4.5448e-004 2.2003e+003 0.000454 0.022468 0.044430 0.365219 0.570 4.3318e-004 2.3085e+003 0.000433 0.021426 0.042393 0.351554 0.580 4.1309e-004 2.4208e+003 0.000413 0.020442 0.040467 0.338395 0.590 3.9412e-004 2.5373e+003 0.000394 0.019513 0.038646 0.325729 0.600 3.7621e-004 2.6581e+003 0.000376 0.018635 0.036922 0.313543

97
0.610 3.5928e-004 2.7833e+003 0.000359 0.017804 0.035290 0.301823 0.620 3.4327e-004 2.9131e+003 0.000343 0.017017 0.033745 0.290555 0.630 3.2812e-004 3.0476e+003 0.000328 0.016272 0.032280 0.279725 0.640 3.1378e-004 3.1870e+003 0.000314 0.015566 0.030891 0.269318 0.650 3.0019e-004 3.3313e+003 0.000300 0.014897 0.029573 0.259320 0.660 2.8730e-004 3.4806e+003 0.000287 0.014263 0.028322 0.249716 0.670 2.7508e-004 3.6352e+003 0.000275 0.013660 0.027134 0.240492 0.680 2.6349e-004 3.7952e+003 0.000263 0.013088 0.026005 0.231634 0.690 2.5248e-004 3.9607e+003 0.000252 0.012545 0.024932 0.223128 0.700 2.4202e-004 4.1319e+003 0.000242 0.012028 0.023912 0.214961 0.710 2.3208e-004 4.3088e+003 0.000232 0.011537 0.022941 0.207119 0.720 2.2263e-004 4.4917e+003 0.000223 0.011070 0.022017 0.199590 0.730 2.1364e-004 4.6808e+003 0.000214 0.010625 0.021137 0.192361 0.740 2.0508e-004 4.8761e+003 0.000205 0.010202 0.020299 0.185419 0.750 1.9693e-004 5.0779e+003 0.000197 0.009798 0.019501 0.178755 0.760 1.8917e-004 5.2862e+003 0.000189 0.009414 0.018739 0.172355 0.770 1.8177e-004 5.5014e+003 0.000182 0.009047 0.018013 0.166210 0.780 1.7472e-004 5.7234e+003 0.000175 0.008698 0.017320 0.160308 0.790 1.6799e-004 5.9527e+003 0.000168 0.008364 0.016659 0.154640 0.800 1.6157e-004 6.1892e+003 0.000162 0.008046 0.016027 0.149195 0.810 1.5544e-004 6.4332e+003 0.000155 0.007742 0.015424 0.143966 0.820 1.4959e-004 6.6848e+003 0.000150 0.007452 0.014848 0.138941 0.830 1.4400e-004 6.9443e+003 0.000144 0.007174 0.014297 0.134114 0.840 1.3866e-004 7.2119e+003 0.000139 0.006909 0.013770 0.129476 0.850 1.3355e-004 7.4877e+003 0.000134 0.006655 0.013266 0.125018 0.860 1.2867e-004 7.7720e+003 0.000129 0.006413 0.012784 0.120733 0.870 1.2399e-004 8.0650e+003 0.000124 0.006180 0.012323 0.116614 0.880 1.1952e-004 8.3668e+003 0.000120 0.005958 0.011881 0.112654 0.890 1.1524e-004 8.6776e+003 0.000115 0.005745 0.011458 0.108847 0.900 1.1114e-004 8.9978e+003 0.000111 0.005541 0.011052 0.105185 0.910 1.0721e-004 9.3275e+003 0.000107 0.005346 0.010664 0.101663 0.920 1.0345e-004 9.6669e+003 0.000103 0.005159 0.010291 0.098275 0.930 9.9837e-005 1.0016e+004 0.000100 0.004979 0.009934 0.095015 0.940 9.6377e-005 1.0376e+004 0.000096 0.004807 0.009591 0.091878 0.950 9.3058e-005 1.0746e+004 0.000093 0.004642 0.009263 0.088859 0.960 8.9874e-005 1.1127e+004 0.000090 0.004484 0.008947 0.085953 0.970 8.6817e-005 1.1518e+004 0.000087 0.004331 0.008644 0.083156 0.980 8.3884e-005 1.1921e+004 0.000084 0.004185 0.008353 0.080462 0.990 8.1066e-005 1.2336e+004 0.000081 0.004045 0.008074 0.077868 1.000 7.8360e-005 1.2762e+004 0.000078 0.003910 0.007805 0.075369 1.010 7.5760e-005 1.3199e+004 0.000076 0.003781 0.007547 0.072962 1.020 7.3262e-005 1.3650e+004 0.000073 0.003656 0.007299 0.070642 1.030 7.0860e-005 1.4112e+004 0.000071 0.003537 0.007061 0.068407 1.040 6.8550e-005 1.4588e+004 0.000069 0.003422 0.006832 0.066253 1.050 6.6329e-005 1.5076e+004 0.000066 0.003311 0.006611 0.064177 1.060 6.4192e-005 1.5578e+004 0.000064 0.003204 0.006399 0.062175 1.070 6.2135e-005 1.6094e+004 0.000062 0.003102 0.006194 0.060244 1.080 6.0156e-005 1.6623e+004 0.000060 0.003003 0.005998 0.058382 1.090 5.8250e-005 1.7167e+004 0.000058 0.002908 0.005808 0.056586 1.100 5.6416e-005 1.7726e+004 0.000056 0.002817 0.005626 0.054854 1.110 5.4648e-005 1.8299e+004 0.000055 0.002729 0.005450 0.053182 1.120 5.2946e-005 1.8887e+004 0.000053 0.002644 0.005281 0.051568 1.130 5.1305e-005 1.9491e+004 0.000051 0.002562 0.005117 0.050011 1.140 4.9723e-005 2.0111e+004 0.000050 0.002483 0.004960 0.048507 1.150 4.8199e-005 2.0747e+004 0.000048 0.002407 0.004808 0.047056 1.160 4.6729e-005 2.1400e+004 0.000047 0.002334 0.004662 0.045654 1.170 4.5311e-005 2.2070e+004 0.000045 0.002263 0.004521 0.044300 1.180 4.3944e-005 2.2756e+004 0.000044 0.002195 0.004385 0.042992 1.190 4.2624e-005 2.3461e+004 0.000043 0.002129 0.004253 0.041729 1.200 4.1351e-005 2.4183e+004 0.000041 0.002065 0.004127 0.040508 1.210 4.0122e-005 2.4924e+004 0.000040 0.002004 0.004004 0.039328 1.220 3.8936e-005 2.5683e+004 0.000039 0.001945 0.003886 0.038187 1.230 3.7790e-005 2.6462e+004 0.000038 0.001888 0.003772 0.037085 1.240 3.6683e-005 2.7260e+004 0.000037 0.001832 0.003662 0.036019 1.250 3.5615e-005 2.8078e+004 0.000036 0.001779 0.003555 0.034988 1.260 3.4582e-005 2.8917e+004 0.000035 0.001728 0.003452 0.033991 1.270 3.3584e-005 2.9776e+004 0.000034 0.001678 0.003353 0.033026 1.280 3.2620e-005 3.0656e+004 0.000033 0.001630 0.003257 0.032093 1.290 3.1687e-005 3.1558e+004 0.000032 0.001583 0.003164 0.031191 1.300 3.0786e-005 3.2482e+004 0.000031 0.001538 0.003074 0.030317 1.310 2.9915e-005 3.3429e+004 0.000030 0.001495 0.002987 0.029472
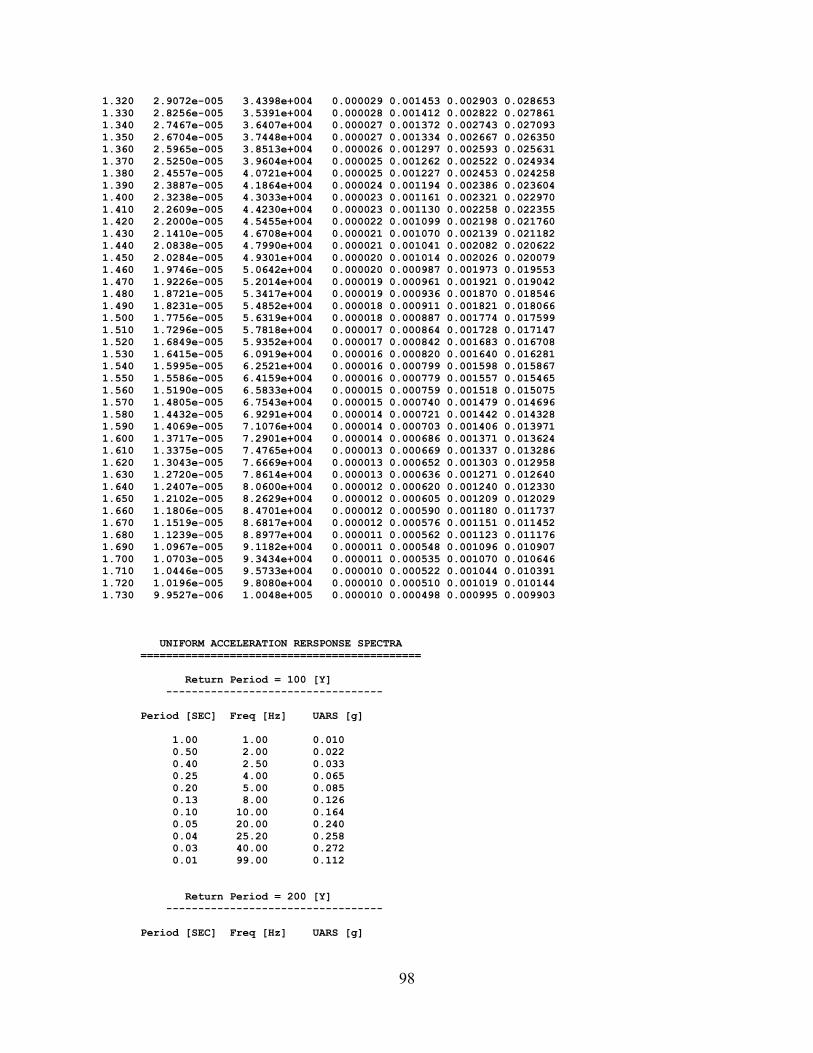
98
1.320 2.9072e-005 3.4398e+004 0.000029 0.001453 0.002903 0.028653 1.330 2.8256e-005 3.5391e+004 0.000028 0.001412 0.002822 0.027861 1.340 2.7467e-005 3.6407e+004 0.000027 0.001372 0.002743 0.027093 1.350 2.6704e-005 3.7448e+004 0.000027 0.001334 0.002667 0.026350 1.360 2.5965e-005 3.8513e+004 0.000026 0.001297 0.002593 0.025631 1.370 2.5250e-005 3.9604e+004 0.000025 0.001262 0.002522 0.024934 1.380 2.4557e-005 4.0721e+004 0.000025 0.001227 0.002453 0.024258 1.390 2.3887e-005 4.1864e+004 0.000024 0.001194 0.002386 0.023604 1.400 2.3238e-005 4.3033e+004 0.000023 0.001161 0.002321 0.022970 1.410 2.2609e-005 4.4230e+004 0.000023 0.001130 0.002258 0.022355 1.420 2.2000e-005 4.5455e+004 0.000022 0.001099 0.002198 0.021760 1.430 2.1410e-005 4.6708e+004 0.000021 0.001070 0.002139 0.021182 1.440 2.0838e-005 4.7990e+004 0.000021 0.001041 0.002082 0.020622 1.450 2.0284e-005 4.9301e+004 0.000020 0.001014 0.002026 0.020079 1.460 1.9746e-005 5.0642e+004 0.000020 0.000987 0.001973 0.019553 1.470 1.9226e-005 5.2014e+004 0.000019 0.000961 0.001921 0.019042 1.480 1.8721e-005 5.3417e+004 0.000019 0.000936 0.001870 0.018546 1.490 1.8231e-005 5.4852e+004 0.000018 0.000911 0.001821 0.018066 1.500 1.7756e-005 5.6319e+004 0.000018 0.000887 0.001774 0.017599 1.510 1.7296e-005 5.7818e+004 0.000017 0.000864 0.001728 0.017147 1.520 1.6849e-005 5.9352e+004 0.000017 0.000842 0.001683 0.016708 1.530 1.6415e-005 6.0919e+004 0.000016 0.000820 0.001640 0.016281 1.540 1.5995e-005 6.2521e+004 0.000016 0.000799 0.001598 0.015867 1.550 1.5586e-005 6.4159e+004 0.000016 0.000779 0.001557 0.015465 1.560 1.5190e-005 6.5833e+004 0.000015 0.000759 0.001518 0.015075 1.570 1.4805e-005 6.7543e+004 0.000015 0.000740 0.001479 0.014696 1.580 1.4432e-005 6.9291e+004 0.000014 0.000721 0.001442 0.014328 1.590 1.4069e-005 7.1076e+004 0.000014 0.000703 0.001406 0.013971 1.600 1.3717e-005 7.2901e+004 0.000014 0.000686 0.001371 0.013624 1.610 1.3375e-005 7.4765e+004 0.000013 0.000669 0.001337 0.013286 1.620 1.3043e-005 7.6669e+004 0.000013 0.000652 0.001303 0.012958 1.630 1.2720e-005 7.8614e+004 0.000013 0.000636 0.001271 0.012640 1.640 1.2407e-005 8.0600e+004 0.000012 0.000620 0.001240 0.012330 1.650 1.2102e-005 8.2629e+004 0.000012 0.000605 0.001209 0.012029 1.660 1.1806e-005 8.4701e+004 0.000012 0.000590 0.001180 0.011737 1.670 1.1519e-005 8.6817e+004 0.000012 0.000576 0.001151 0.011452 1.680 1.1239e-005 8.8977e+004 0.000011 0.000562 0.001123 0.011176 1.690 1.0967e-005 9.1182e+004 0.000011 0.000548 0.001096 0.010907 1.700 1.0703e-005 9.3434e+004 0.000011 0.000535 0.001070 0.010646 1.710 1.0446e-005 9.5733e+004 0.000010 0.000522 0.001044 0.010391 1.720 1.0196e-005 9.8080e+004 0.000010 0.000510 0.001019 0.010144 1.730 9.9527e-006 1.0048e+005 0.000010 0.000498 0.000995 0.009903 UNIFORM ACCELERATION RERSPONSE SPECTRA ============================================ Return Period = 100 [Y] ---------------------------------- Period [SEC] Freq [Hz] UARS [g] 1.00 1.00 0.010 0.50 2.00 0.022 0.40 2.50 0.033 0.25 4.00 0.065 0.20 5.00 0.085 0.13 8.00 0.126 0.10 10.00 0.164 0.05 20.00 0.240 0.04 25.20 0.258 0.03 40.00 0.272 0.01 99.00 0.112 Return Period = 200 [Y] ---------------------------------- Period [SEC] Freq [Hz] UARS [g]
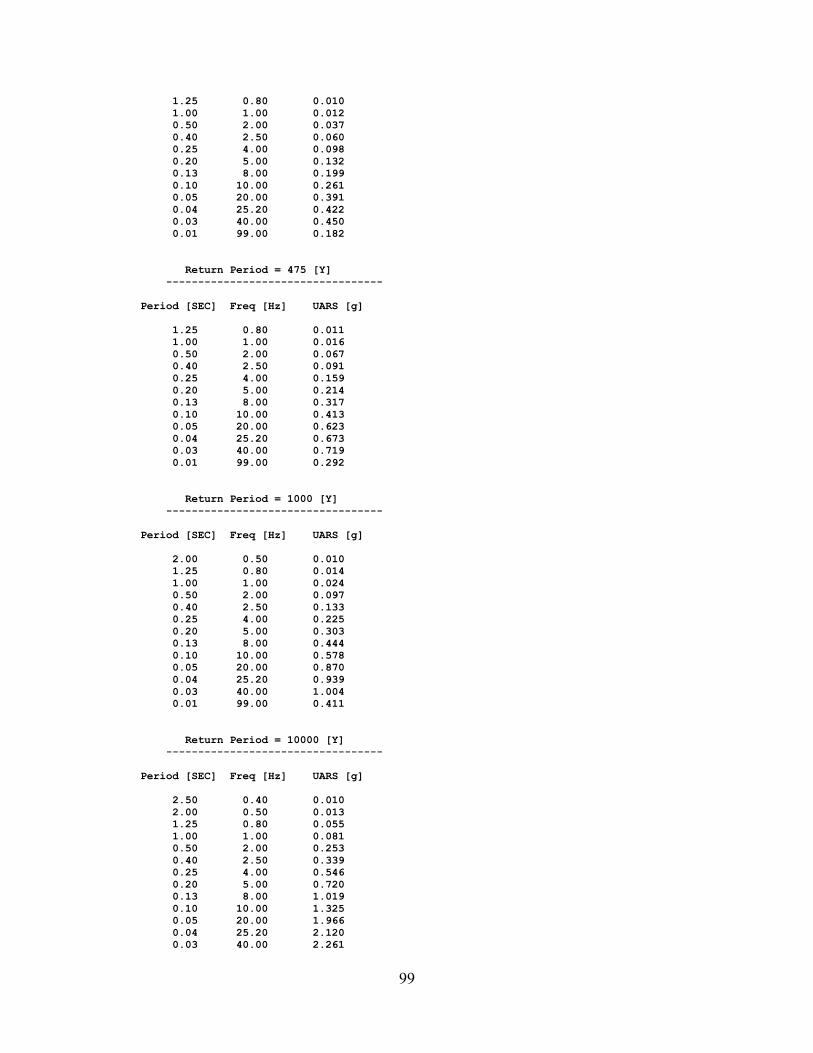
99
1.25 0.80 0.010 1.00 1.00 0.012 0.50 2.00 0.037 0.40 2.50 0.060 0.25 4.00 0.098 0.20 5.00 0.132 0.13 8.00 0.199 0.10 10.00 0.261 0.05 20.00 0.391 0.04 25.20 0.422 0.03 40.00 0.450 0.01 99.00 0.182 Return Period = 475 [Y] ---------------------------------- Period [SEC] Freq [Hz] UARS [g] 1.25 0.80 0.011 1.00 1.00 0.016 0.50 2.00 0.067 0.40 2.50 0.091 0.25 4.00 0.159 0.20 5.00 0.214 0.13 8.00 0.317 0.10 10.00 0.413 0.05 20.00 0.623 0.04 25.20 0.673 0.03 40.00 0.719 0.01 99.00 0.292 Return Period = 1000 [Y] ---------------------------------- Period [SEC] Freq [Hz] UARS [g] 2.00 0.50 0.010 1.25 0.80 0.014 1.00 1.00 0.024 0.50 2.00 0.097 0.40 2.50 0.133 0.25 4.00 0.225 0.20 5.00 0.303 0.13 8.00 0.444 0.10 10.00 0.578 0.05 20.00 0.870 0.04 25.20 0.939 0.03 40.00 1.004 0.01 99.00 0.411 Return Period = 10000 [Y] ---------------------------------- Period [SEC] Freq [Hz] UARS [g] 2.50 0.40 0.010 2.00 0.50 0.013 1.25 0.80 0.055 1.00 1.00 0.081 0.50 2.00 0.253 0.40 2.50 0.339 0.25 4.00 0.546 0.20 5.00 0.720 0.13 8.00 1.019 0.10 10.00 1.325 0.05 20.00 1.966 0.04 25.20 2.120 0.03 40.00 2.261
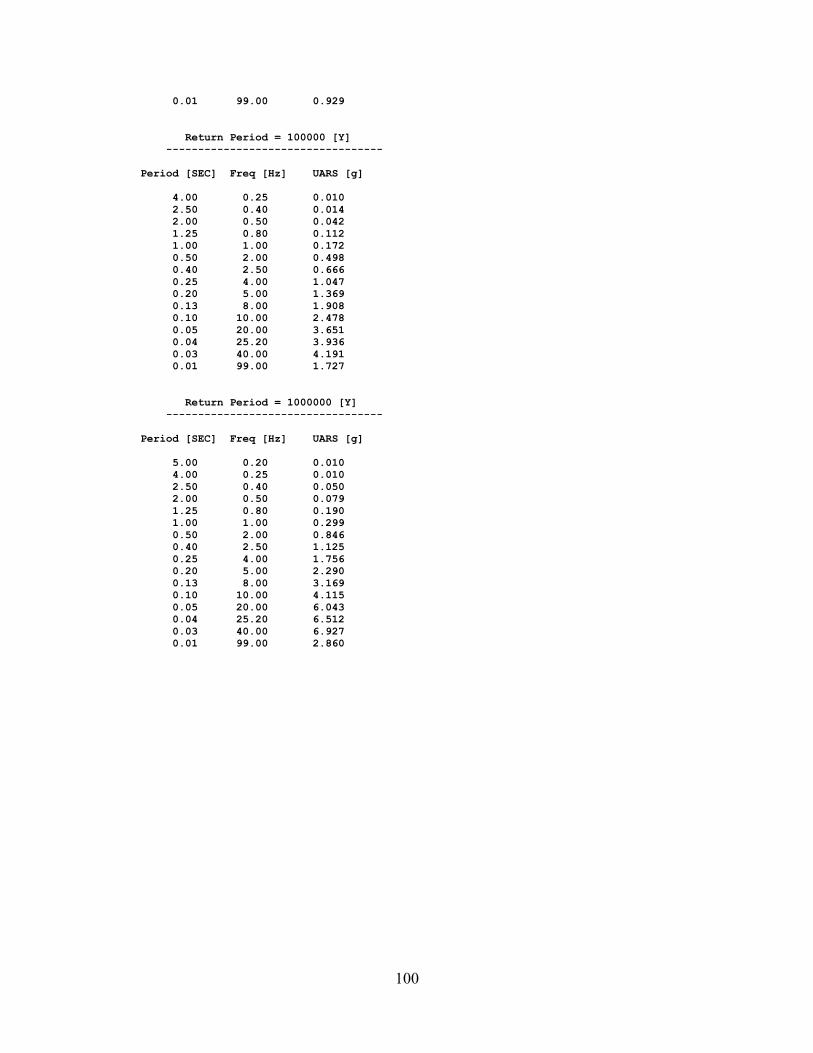
100
0.01 99.00 0.929 Return Period = 100000 [Y] ---------------------------------- Period [SEC] Freq [Hz] UARS [g] 4.00 0.25 0.010 2.50 0.40 0.014 2.00 0.50 0.042 1.25 0.80 0.112 1.00 1.00 0.172 0.50 2.00 0.498 0.40 2.50 0.666 0.25 4.00 1.047 0.20 5.00 1.369 0.13 8.00 1.908 0.10 10.00 2.478 0.05 20.00 3.651 0.04 25.20 3.936 0.03 40.00 4.191 0.01 99.00 1.727 Return Period = 1000000 [Y] ---------------------------------- Period [SEC] Freq [Hz] UARS [g] 5.00 0.20 0.010 4.00 0.25 0.010 2.50 0.40 0.050 2.00 0.50 0.079 1.25 0.80 0.190 1.00 1.00 0.299 0.50 2.00 0.846 0.40 2.50 1.125 0.25 4.00 1.756 0.20 5.00 2.290 0.13 8.00 3.169 0.10 10.00 4.115 0.05 20.00 6.043 0.04 25.20 6.512 0.03 40.00 6.927 0.01 99.00 2.860
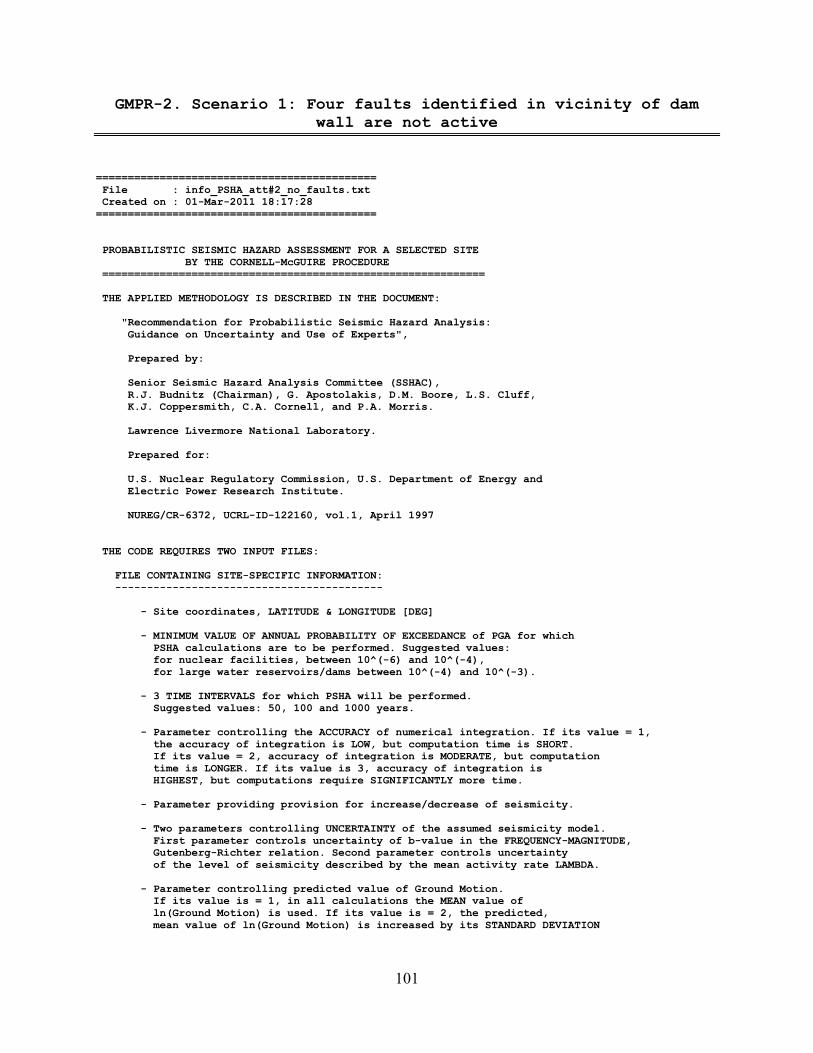
101
GMPR-2. Scenario 1: Four faults identified in vicinity of dam wall are not active
============================================ File : info_PSHA_att#2_no_faults.txt Created on : 01-Mar-2011 18:17:28 ============================================ PROBABILISTIC SEISMIC HAZARD ASSESSMENT FOR A SELECTED SITE BY THE CORNELL-McGUIRE PROCEDURE ============================================================ THE APPLIED METHODOLOGY IS DESCRIBED IN THE DOCUMENT: "Recommendation for Probabilistic Seismic Hazard Analysis: Guidance on Uncertainty and Use of Experts", Prepared by: Senior Seismic Hazard Analysis Committee (SSHAC), R.J. Budnitz (Chairman), G. Apostolakis, D.M. Boore, L.S. Cluff, K.J. Coppersmith, C.A. Cornell, and P.A. Morris. Lawrence Livermore National Laboratory. Prepared for: U.S. Nuclear Regulatory Commission, U.S. Department of Energy and Electric Power Research Institute. NUREG/CR-6372, UCRL-ID-122160, vol.1, April 1997 THE CODE REQUIRES TWO INPUT FILES: FILE CONTAINING SITE-SPECIFIC INFORMATION: ------------------------------------------ - Site coordinates, LATITUDE & LONGITUDE [DEG] - MINIMUM VALUE OF ANNUAL PROBABILITY OF EXCEEDANCE of PGA for which PSHA calculations are to be performed. Suggested values: for nuclear facilities, between 10^(-6) and 10^(-4), for large water reservoirs/dams between 10^(-4) and 10^(-3). - 3 TIME INTERVALS for which PSHA will be performed. Suggested values: 50, 100 and 1000 years. - Parameter controlling the ACCURACY of numerical integration. If its value = 1, the accuracy of integration is LOW, but computation time is SHORT. If its value = 2, accuracy of integration is MODERATE, but computation time is LONGER. If its value is 3, accuracy of integration is HIGHEST, but computations require SIGNIFICANTLY more time. - Parameter providing provision for increase/decrease of seismicity. - Two parameters controlling UNCERTAINTY of the assumed seismicity model. First parameter controls uncertainty of b-value in the FREQUENCY-MAGNITUDE, Gutenberg-Richter relation. Second parameter controls uncertainty of the level of seismicity described by the mean activity rate LAMBDA. - Parameter controlling predicted value of Ground Motion. If its value is = 1, in all calculations the MEAN value of ln(Ground Motion) is used. If its value is = 2, the predicted, mean value of ln(Ground Motion) is increased by its STANDARD DEVIATION

102
FILE CONTAINING INFORMATION ON SEISMIC SOURCES IN THE VICINITY OF THE SITE -------------------------------------------------------------------------- Each seismic source is described by 7 parameters: (1) latitude [DEG] (2) longitude [DEG] (3) depth [KM] of seismic source, (4) minimum earthquake magnitude Mmin (5) Mean seismic activity rate LAMBDA (6) b-value of the frequency-magnitude Gutenberg-Richter relation (7) MAXIMUM, seismic source-characteristic EQ-e magnitude Mmax. ========================================================================== PROGRAM NAME : HS_C_McG (H = Hazard; S = Site; C = Cornell; McG = McGuire) WRITTEN : 15 SEP 2007 by A.K. REVISED : 27 SEP 2007 by A.K. : 30 SEP 2007 by A.K. : 01 OCT 2007 by A.K. : 20 FEB 2008 by A.K. : 12 MAY 2008 by A.K. : 21 JUN 2008 by A.K. : 15 SEP 2009 by A.K. : 28 OCT 2010 by A.K. REVISION : 1.12 ========================================================================== For more information, contact Dr. A.Kijko Natural Hazard Assessment Consultancy 8 Birch Str. Clubview, ext.2 Centurion 0157 South Africa Phone : +27 (0) 829394002 E-mail : [email protected]/[email protected] ========================================================================== PROBABILISTIC SEISMIC HAZARD ASSESSMENT BY CORNELL-McGUIRE PROCEDURE ====================================================================== The applied approach takes into account ground motion variability by integrating across the scatter in the attenuation equation NAME OF THE SITE: Clanwilliam Att #2 (no faults) ATTENUATION MODEL #9: Extensional Tectonic Regimes (SEA99, SPUDICH et al., 1999) SITE COORDINATES (LATITUDE) = -32.183 [DEG] SITE COORDINATES (LONGITUDE) = 18.875 [DEG] MINIMUM ANNUAL PROBABILITY OF EXCEEDANCE = 1.000e-005 [DEG] PSHA IS CALCULATED FOR TIME INTERVALS = 50 100 and 1000 YEARS ACCURACY OF NUMERICAL INTEGRATION: LOW MAGNITUDE INTEGRATION INTERVAL = 0.5 PROVISION FOR INDUCED SEISMICITY: REQUIRED MULTIPLICATIVE FACTOR OF LAMBDA = 1 MODEL UNCERTAINTY OF THE b-VALUE = 25 [per cent] MODEL UNCERTAINTY OF THE SITE-SPECIFIC LAMBDA = 25 [per cent]
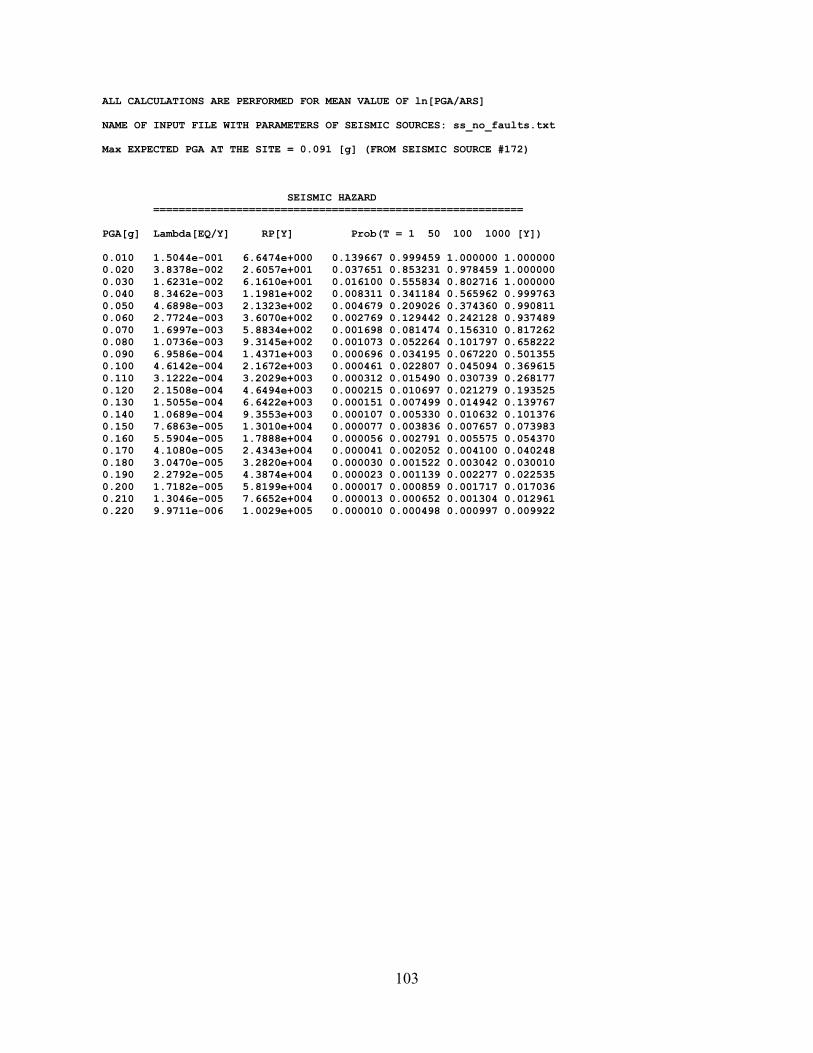
103
ALL CALCULATIONS ARE PERFORMED FOR MEAN VALUE OF ln[PGA/ARS] NAME OF INPUT FILE WITH PARAMETERS OF SEISMIC SOURCES: ss_no_faults.txt Max EXPECTED PGA AT THE SITE = 0.091 [g] (FROM SEISMIC SOURCE #172) SEISMIC HAZARD ========================================================== PGA[g] Lambda[EQ/Y] RP[Y] Prob(T = 1 50 100 1000 [Y]) 0.010 1.5044e-001 6.6474e+000 0.139667 0.999459 1.000000 1.000000 0.020 3.8378e-002 2.6057e+001 0.037651 0.853231 0.978459 1.000000 0.030 1.6231e-002 6.1610e+001 0.016100 0.555834 0.802716 1.000000 0.040 8.3462e-003 1.1981e+002 0.008311 0.341184 0.565962 0.999763 0.050 4.6898e-003 2.1323e+002 0.004679 0.209026 0.374360 0.990811 0.060 2.7724e-003 3.6070e+002 0.002769 0.129442 0.242128 0.937489 0.070 1.6997e-003 5.8834e+002 0.001698 0.081474 0.156310 0.817262 0.080 1.0736e-003 9.3145e+002 0.001073 0.052264 0.101797 0.658222 0.090 6.9586e-004 1.4371e+003 0.000696 0.034195 0.067220 0.501355 0.100 4.6142e-004 2.1672e+003 0.000461 0.022807 0.045094 0.369615 0.110 3.1222e-004 3.2029e+003 0.000312 0.015490 0.030739 0.268177 0.120 2.1508e-004 4.6494e+003 0.000215 0.010697 0.021279 0.193525 0.130 1.5055e-004 6.6422e+003 0.000151 0.007499 0.014942 0.139767 0.140 1.0689e-004 9.3553e+003 0.000107 0.005330 0.010632 0.101376 0.150 7.6863e-005 1.3010e+004 0.000077 0.003836 0.007657 0.073983 0.160 5.5904e-005 1.7888e+004 0.000056 0.002791 0.005575 0.054370 0.170 4.1080e-005 2.4343e+004 0.000041 0.002052 0.004100 0.040248 0.180 3.0470e-005 3.2820e+004 0.000030 0.001522 0.003042 0.030010 0.190 2.2792e-005 4.3874e+004 0.000023 0.001139 0.002277 0.022535 0.200 1.7182e-005 5.8199e+004 0.000017 0.000859 0.001717 0.017036 0.210 1.3046e-005 7.6652e+004 0.000013 0.000652 0.001304 0.012961 0.220 9.9711e-006 1.0029e+005 0.000010 0.000498 0.000997 0.009922
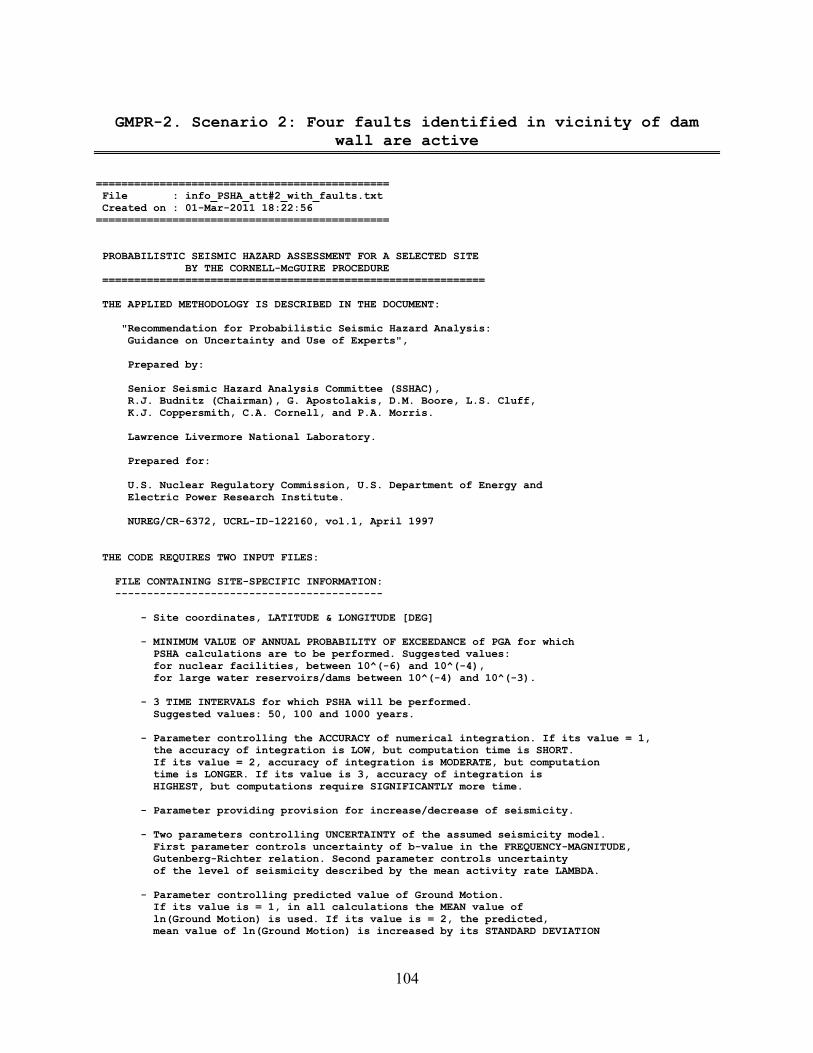
104
GMPR-2. Scenario 2: Four faults identified in vicinity of dam
wall are active
============================================== File : info_PSHA_att#2_with_faults.txt Created on : 01-Mar-2011 18:22:56 ============================================== PROBABILISTIC SEISMIC HAZARD ASSESSMENT FOR A SELECTED SITE BY THE CORNELL-McGUIRE PROCEDURE ============================================================ THE APPLIED METHODOLOGY IS DESCRIBED IN THE DOCUMENT: "Recommendation for Probabilistic Seismic Hazard Analysis: Guidance on Uncertainty and Use of Experts", Prepared by: Senior Seismic Hazard Analysis Committee (SSHAC), R.J. Budnitz (Chairman), G. Apostolakis, D.M. Boore, L.S. Cluff, K.J. Coppersmith, C.A. Cornell, and P.A. Morris. Lawrence Livermore National Laboratory. Prepared for: U.S. Nuclear Regulatory Commission, U.S. Department of Energy and Electric Power Research Institute. NUREG/CR-6372, UCRL-ID-122160, vol.1, April 1997 THE CODE REQUIRES TWO INPUT FILES: FILE CONTAINING SITE-SPECIFIC INFORMATION: ------------------------------------------ - Site coordinates, LATITUDE & LONGITUDE [DEG] - MINIMUM VALUE OF ANNUAL PROBABILITY OF EXCEEDANCE of PGA for which PSHA calculations are to be performed. Suggested values: for nuclear facilities, between 10^(-6) and 10^(-4), for large water reservoirs/dams between 10^(-4) and 10^(-3). - 3 TIME INTERVALS for which PSHA will be performed. Suggested values: 50, 100 and 1000 years. - Parameter controlling the ACCURACY of numerical integration. If its value = 1, the accuracy of integration is LOW, but computation time is SHORT. If its value = 2, accuracy of integration is MODERATE, but computation time is LONGER. If its value is 3, accuracy of integration is HIGHEST, but computations require SIGNIFICANTLY more time. - Parameter providing provision for increase/decrease of seismicity. - Two parameters controlling UNCERTAINTY of the assumed seismicity model. First parameter controls uncertainty of b-value in the FREQUENCY-MAGNITUDE, Gutenberg-Richter relation. Second parameter controls uncertainty of the level of seismicity described by the mean activity rate LAMBDA. - Parameter controlling predicted value of Ground Motion. If its value is = 1, in all calculations the MEAN value of ln(Ground Motion) is used. If its value is = 2, the predicted, mean value of ln(Ground Motion) is increased by its STANDARD DEVIATION

105
FILE CONTAINING INFORMATION ON SEISMIC SOURCES IN THE VICINITY OF THE SITE -------------------------------------------------------------------------- Each seismic source is described by 7 parameters: (1) latitude [DEG] (2) longitude [DEG] (3) depth [KM] of seismic source, (4) minimum earthquake magnitude Mmin (5) Mean seismic activity rate LAMBDA (6) b-value of the frequency-magnitude Gutenberg-Richter relation (7) MAXIMUM, seismic source-characteristic EQ-e magnitude Mmax. ========================================================================== PROGRAM NAME : HS_C_McG (H = Hazard; S = Site; C = Cornell; McG = McGuire) WRITTEN : 15 SEP 2007 by A.K. REVISED : 27 SEP 2007 by A.K. : 30 SEP 2007 by A.K. : 01 OCT 2007 by A.K. : 20 FEB 2008 by A.K. : 12 MAY 2008 by A.K. : 21 JUN 2008 by A.K. : 15 SEP 2009 by A.K. : 28 OCT 2010 by A.K. REVISION : 1.12 ========================================================================== For more information, contact Dr. A.Kijko Natural Hazard Assessment Consultancy 8 Birch Str. Clubview, ext.2 Centurion 0157 South Africa Phone : +27 (0) 829394002 E-mail : [email protected]/[email protected] ========================================================================== PROBABILISTIC SEISMIC HAZARD ASSESSMENT BY CORNELL-McGUIRE PROCEDURE ====================================================================== The applied approach takes into account ground motion variability by integrating across the scatter in the attenuation equation NAME OF THE SITE: Clanwilliam Att #2 (with faults) ATTENUATION MODEL #9: Extensional Tectonic Regimes (SEA99, SPUDICH et al., 1999) SITE COORDINATES (LATITUDE) = -32.183 [DEG] SITE COORDINATES (LONGITUDE) = 18.875 [DEG] MINIMUM ANNUAL PROBABILITY OF EXCEEDANCE = 1.000e-005 [DEG] PSHA IS CALCULATED FOR TIME INTERVALS = 50 100 and 1000 YEARS ACCURACY OF NUMERICAL INTEGRATION: LOW MAGNITUDE INTEGRATION INTERVAL = 0.5 PROVISION FOR INDUCED SEISMICITY: REQUIRED MULTIPLICATIVE FACTOR OF LAMBDA = 1 MODEL UNCERTAINTY OF THE b-VALUE = 25 [per cent]
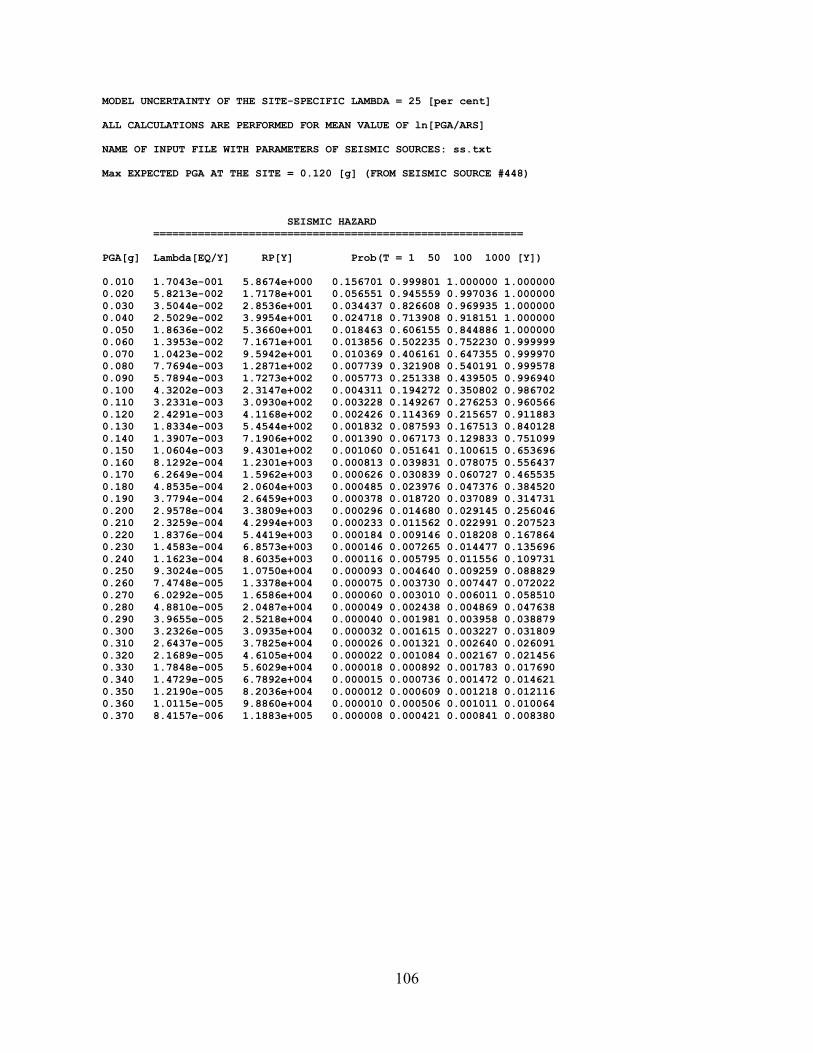
106
MODEL UNCERTAINTY OF THE SITE-SPECIFIC LAMBDA = 25 [per cent] ALL CALCULATIONS ARE PERFORMED FOR MEAN VALUE OF ln[PGA/ARS] NAME OF INPUT FILE WITH PARAMETERS OF SEISMIC SOURCES: ss.txt Max EXPECTED PGA AT THE SITE = 0.120 [g] (FROM SEISMIC SOURCE #448) SEISMIC HAZARD ========================================================== PGA[g] Lambda[EQ/Y] RP[Y] Prob(T = 1 50 100 1000 [Y]) 0.010 1.7043e-001 5.8674e+000 0.156701 0.999801 1.000000 1.000000 0.020 5.8213e-002 1.7178e+001 0.056551 0.945559 0.997036 1.000000 0.030 3.5044e-002 2.8536e+001 0.034437 0.826608 0.969935 1.000000 0.040 2.5029e-002 3.9954e+001 0.024718 0.713908 0.918151 1.000000 0.050 1.8636e-002 5.3660e+001 0.018463 0.606155 0.844886 1.000000 0.060 1.3953e-002 7.1671e+001 0.013856 0.502235 0.752230 0.999999 0.070 1.0423e-002 9.5942e+001 0.010369 0.406161 0.647355 0.999970 0.080 7.7694e-003 1.2871e+002 0.007739 0.321908 0.540191 0.999578 0.090 5.7894e-003 1.7273e+002 0.005773 0.251338 0.439505 0.996940 0.100 4.3202e-003 2.3147e+002 0.004311 0.194272 0.350802 0.986702 0.110 3.2331e-003 3.0930e+002 0.003228 0.149267 0.276253 0.960566 0.120 2.4291e-003 4.1168e+002 0.002426 0.114369 0.215657 0.911883 0.130 1.8334e-003 5.4544e+002 0.001832 0.087593 0.167513 0.840128 0.140 1.3907e-003 7.1906e+002 0.001390 0.067173 0.129833 0.751099 0.150 1.0604e-003 9.4301e+002 0.001060 0.051641 0.100615 0.653696 0.160 8.1292e-004 1.2301e+003 0.000813 0.039831 0.078075 0.556437 0.170 6.2649e-004 1.5962e+003 0.000626 0.030839 0.060727 0.465535 0.180 4.8535e-004 2.0604e+003 0.000485 0.023976 0.047376 0.384520 0.190 3.7794e-004 2.6459e+003 0.000378 0.018720 0.037089 0.314731 0.200 2.9578e-004 3.3809e+003 0.000296 0.014680 0.029145 0.256046 0.210 2.3259e-004 4.2994e+003 0.000233 0.011562 0.022991 0.207523 0.220 1.8376e-004 5.4419e+003 0.000184 0.009146 0.018208 0.167864 0.230 1.4583e-004 6.8573e+003 0.000146 0.007265 0.014477 0.135696 0.240 1.1623e-004 8.6035e+003 0.000116 0.005795 0.011556 0.109731 0.250 9.3024e-005 1.0750e+004 0.000093 0.004640 0.009259 0.088829 0.260 7.4748e-005 1.3378e+004 0.000075 0.003730 0.007447 0.072022 0.270 6.0292e-005 1.6586e+004 0.000060 0.003010 0.006011 0.058510 0.280 4.8810e-005 2.0487e+004 0.000049 0.002438 0.004869 0.047638 0.290 3.9655e-005 2.5218e+004 0.000040 0.001981 0.003958 0.038879 0.300 3.2326e-005 3.0935e+004 0.000032 0.001615 0.003227 0.031809 0.310 2.6437e-005 3.7825e+004 0.000026 0.001321 0.002640 0.026091 0.320 2.1689e-005 4.6105e+004 0.000022 0.001084 0.002167 0.021456 0.330 1.7848e-005 5.6029e+004 0.000018 0.000892 0.001783 0.017690 0.340 1.4729e-005 6.7892e+004 0.000015 0.000736 0.001472 0.014621 0.350 1.2190e-005 8.2036e+004 0.000012 0.000609 0.001218 0.012116 0.360 1.0115e-005 9.8860e+004 0.000010 0.000506 0.001011 0.010064 0.370 8.4157e-006 1.1883e+005 0.000008 0.000421 0.000841 0.008380

107
Appendix F
Attenuation of vertical peak acceleration (by N. A. Abrahamson and J.J. Litehiser)
Attenuation of vertical peak acceleration
N. A. ABRAHAMSON and J. J. LITEHISER
BECHTEL CIVIL, INC., P.O. BOX 3965, SAN FRANCISCO, CALIFORNIA 94119
Peak vertical accelerations from a suite of 585 strong ground motion records from 76 worldwide
earthquakes are fit to an attenuation model that has a magnitude dependent shape. The regression
uses a two-step procedure that is a hybrid of the Joyner and Boore
(1981) and Campbell (1981)
regression methods. The resulting vertical attenuation relation is
where M is magnitude, r is the distance in kilometers to the closest approach of the zone of
energy release, F is a dummy variable that is 1 for reverse or reverse oblique events and
0
otherwise, and E is a dummy variable that is 1 for interplate events and 0 for intraplate events.
The standard error of log10av is 0.296.
Because the vertical to horizontal acceleration ratio is also sought, the attenuation of the
horizontal peaks from the same suite of records is also obtained using the same
regression procedure. The resulting horizontal attenuation relation is
where aH is the peak acceleration of the larger of the two horizontal components. The standard
error of log10aH is 0.277.
108
The expected ratio of peak vertical to peak horizontal strong ground motion predicted by
these equations is enveloped by the widely used rule-of-thumb value of two-thirds for
earthquakes with magnitudes less than 7.0 and distances greater than 20
km. The expected
ratio exceeds 1.0 for earthquakes with magnitudes greater than 8.0 at very short distances.
The standard error of log10(V/H) is 0.20, which is less than the standard error
of either the
vertical or horizontal acceleration. Therefore, the peak vertical and horizontal accelerations for
a given record are strongly correlated and we can have more confidence in the
predicted ratio
than in either the predicted vertical or horizontal peaks.

Zutari (Pty) Ltd
1977/003711/07
1 Century City Drive
Waterford Precinct
Century City
Cape Town
7441
PO Box 494
Cape Town
8000
South Africa
T +27 21 526 9400
F +27 21 526 9500
W zutari.com