dhoop, t. (2015) winchelsea harbour geotechnical survey 2015, geotechnical investigations at the...
TRANSCRIPT
Winchelsea, East Sussex, United Kingdom
Winchelsea Harbour Geotechnical Survey 2015
Geotechnical investigations at the ancient port area
Site locations:
Eastwoods
Grid Ref. TQ 90575 17742
Strand
Grid Ref. TQ 90780 17465
St Thomas
Grid Ref. TQ 90481 17353
Thomas Dhoop
University of Southampton
University Rd. SO17 1BJ
Date: 20th April – 1st May 2015
License: National Trust


Executive Summary
A two-week geotechnical survey was carried out from the 20th of April until the 1st of May 2015 in
Winchelsea, East Sussex, targeting the ancient port area and St Thomas church. The works were
conducted as part of Thomas Dhoop’s PhD research at the University of Southampton.
A number of geophysical anomalies were found in the data from both survey locations at the former
waterfront. In particular the pattern in the southern part of Eastwoods, potentially associated with
the medieval private waterfront plots, is of archaeological interest. Also the feature in the northeast
corner of the strand, possibly the location of a 16th century storehouse, should be considered of
archaeological interest. The auger survey revealed the potential for the study of past climatic events
at Eastwoods. In light of this, in future work, an attempt will be made to date the peat layer found in
one of the cores. Based on those results, a second auger survey to take sleeved cores is a possibility.
The survey at St. Thomas church failed to locate the foundations of the missing part of the structure.
Acknowledgements
This Survey came to fruiting thanks to the backing and support of the Winchelsea Archaeological
Society and in particular Richard Comotto. Also the University of Southampton should be thanked for
their support, specifically Dr. Fraser Sturt, Dr. Julian Whitewright, Kristian Strutt, Dominic Barker and
Penny Copeland. This survey would not have been possible without the effort put forward by the
team: Rodrio Ortiz, Carlos Garrandés, Massimiliano Secci and Catriona Cooper. Also Professor David
Hinton, Professor Jonathan Adams, Dr. Joe Flatman and Casper Johnson should be thanked for their
contributions to the conference Medieval Ports, Ships and Sailors. Finally, Diane and Allen Pope should
be thanked for granting access to their private land where a large of this survey took place.

i
Contents
List of Figures iii
1 Introduction 1
2 Historical Background 1
3 The Cartographic Evidence 3
4 The Survey Sites 4
5 Survey Specific Information 5
6 Eastwoods 6
6.1 Magnetometry Results 6
6.2 Resistivity Results 6
6.3 Core Results 6
6.4 Discussion of Results 7
7 Strand 7
7.1 Magnetometry Results 7
7.2 Resistivity Results 8
7.3 Core Results 8
7.4 Discussion of Results 9
8 St Thomas 9
8.1 Resistivity Results 9
8.2 Discussion of Results 9
9 Conclusions and Future Work 10
Bibliography 11
The Figures 12

ii

iii
List of Figures
Figure 1: Survey areas and previous excavations. 13
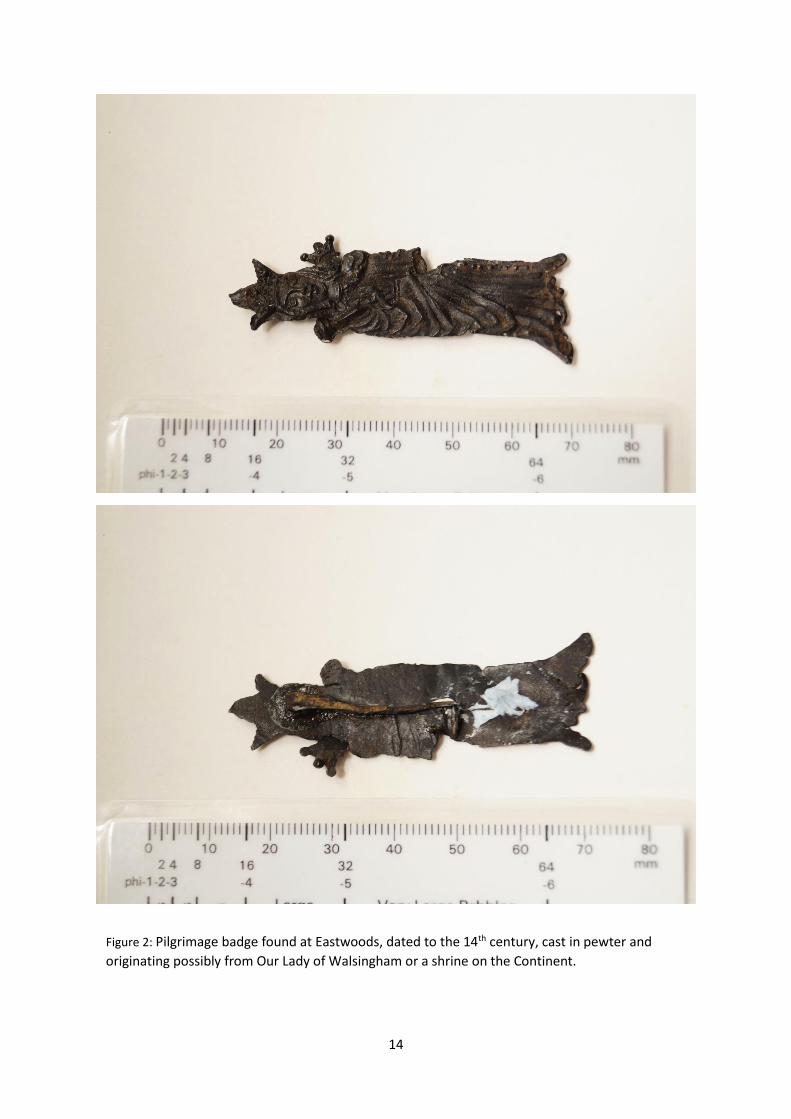
Figure 2: Pilgrimage badge found at Eastwoods, dated to the 14th century, cast in pewter and
originating possibly from Our Lady of Walsingham or a shrine on the Continent. 14
Figure 3: Survey areas plotted on a reconstruction of the AD 1292 layout of Winchelsea. 15
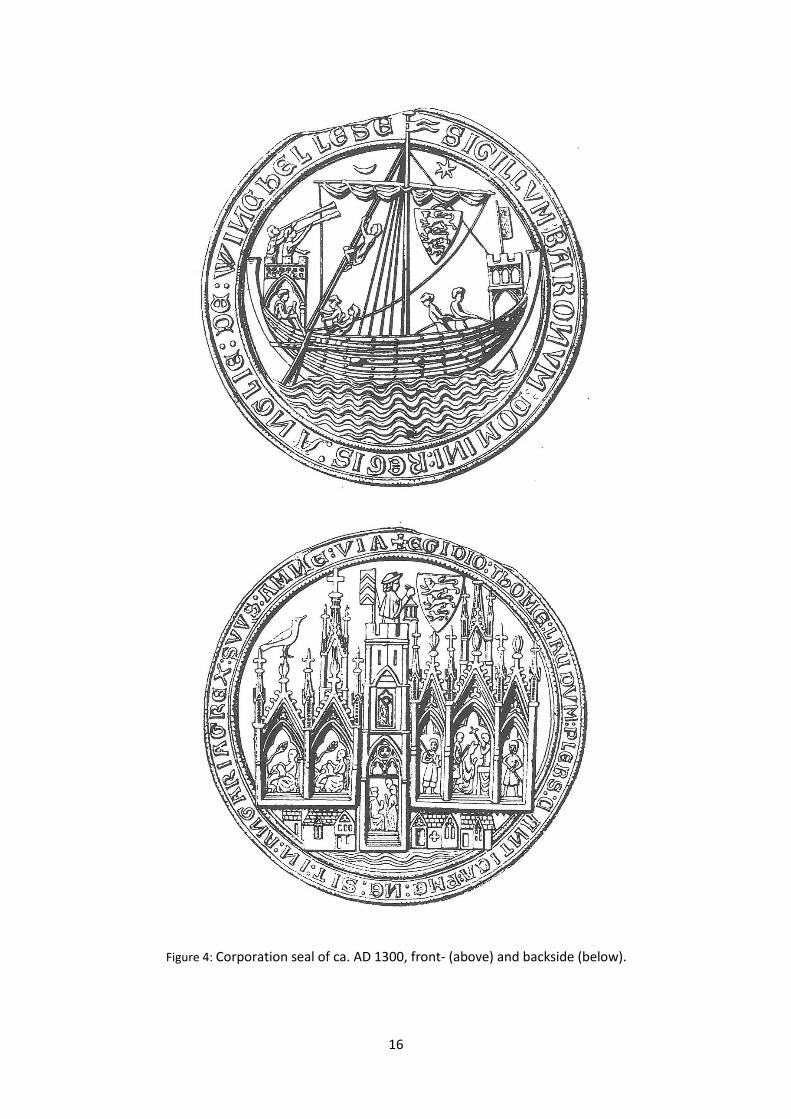
Figure 4: Corporation seal of ca. AD 1300, front- (above) and backside (below). 16
Figure 5: Dugdale map of AD 1662. 17
Figure 6: Stephens’ map of AD 1763. 18
Figure 7: Reconstruction of the AD 1292 map made by Lilley et al. 2005. 19
Figure 8: Second revision of the County Series map showing the word ‘stone’ in the northeast corner
of the strand survey area. 20
Figure 9: Magnetometer results at Eastwoods (scale: 1:1000). 21
Figure 10: Interpretations of the magnetometer results at Eastwoods (scale: 1:1000). 22
Figure 11: Resistivity results at Eastwoods underlying the interpretations (scale: 1:1000). 23
Figure 12: Locations of the cores taken at Eastwoods. 24
Figure 13: BH1-Eastwoods. 25
Figure 14: BH2-Eastwoods. 26
Figure 15: BH3-Eastwoods. 27
Figure 16: BH4-Eastwoods. 28
Figure 17: BH5-Eastwoods. 29
Figure 18: Magnetometer results at the Strand (scale: 1:1000). 30
Figure 19: Interpretations of the magnetometer results at the Strand (scale: 1:1000). 31
Figure 20: Resistivity results at the Strand underlying the interpretations (scale: 1:1000). 32
Figure 21: Locations of the cores taken at the Strand. 33
Figure 22: BH1-Strand. 34
Figure 23: BH2-Strand. 35
Figure 24: BH3-Strand. 36
Figure 25: BH4-Strand. 37
Figure 26: BH5-Strand. 38
Figure 27: Resistivity results at St Thomas church (scale: 1:1000). 39

iv
1
1.0 Introduction
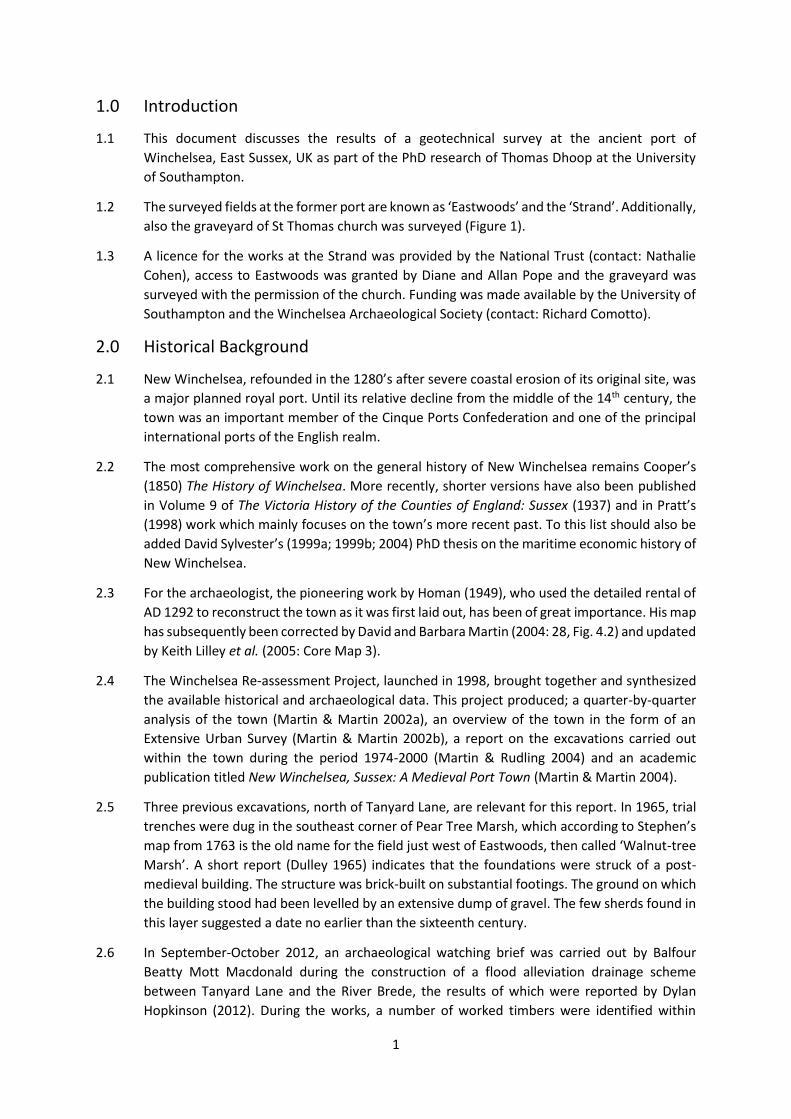
1.1 This document discusses the results of a geotechnical survey at the ancient port of
Winchelsea, East Sussex, UK as part of the PhD research of Thomas Dhoop at the University
of Southampton.
1.2 The surveyed fields at the former port are known as ‘Eastwoods’ and the ‘Strand’. Additionally,
also the graveyard of St Thomas church was surveyed (Figure 1).
1.3 A licence for the works at the Strand was provided by the National Trust (contact: Nathalie
Cohen), access to Eastwoods was granted by Diane and Allan Pope and the graveyard was
surveyed with the permission of the church. Funding was made available by the University of
Southampton and the Winchelsea Archaeological Society (contact: Richard Comotto).
2.0 Historical Background
2.1 New Winchelsea, refounded in the 1280’s after severe coastal erosion of its original site, was
a major planned royal port. Until its relative decline from the middle of the 14th century, the
town was an important member of the Cinque Ports Confederation and one of the principal
international ports of the English realm.
2.2 The most comprehensive work on the general history of New Winchelsea remains Cooper’s
(1850) The History of Winchelsea. More recently, shorter versions have also been published
in Volume 9 of The Victoria History of the Counties of England: Sussex (1937) and in Pratt’s
(1998) work which mainly focuses on the town’s more recent past. To this list should also be
added David Sylvester’s (1999a; 1999b; 2004) PhD thesis on the maritime economic history of
New Winchelsea.
2.3 For the archaeologist, the pioneering work by Homan (1949), who used the detailed rental of
AD 1292 to reconstruct the town as it was first laid out, has been of great importance. His map
has subsequently been corrected by David and Barbara Martin (2004: 28, Fig. 4.2) and updated
by Keith Lilley et al. (2005: Core Map 3).
2.4 The Winchelsea Re-assessment Project, launched in 1998, brought together and synthesized
the available historical and archaeological data. This project produced; a quarter-by-quarter
analysis of the town (Martin & Martin 2002a), an overview of the town in the form of an
Extensive Urban Survey (Martin & Martin 2002b), a report on the excavations carried out
within the town during the period 1974-2000 (Martin & Rudling 2004) and an academic
publication titled New Winchelsea, Sussex: A Medieval Port Town (Martin & Martin 2004).
2.5 Three previous excavations, north of Tanyard Lane, are relevant for this report. In 1965, trial
trenches were dug in the southeast corner of Pear Tree Marsh, which according to Stephen’s
map from 1763 is the old name for the field just west of Eastwoods, then called ‘Walnut-tree
Marsh’. A short report (Dulley 1965) indicates that the foundations were struck of a post-
medieval building. The structure was brick-built on substantial footings. The ground on which
the building stood had been levelled by an extensive dump of gravel. The few sherds found in
this layer suggested a date no earlier than the sixteenth century.
2.6 In September-October 2012, an archaeological watching brief was carried out by Balfour
Beatty Mott Macdonald during the construction of a flood alleviation drainage scheme
between Tanyard Lane and the River Brede, the results of which were reported by Dylan
Hopkinson (2012). During the works, a number of worked timbers were identified within
2
waterborne riverside deposits that may have been related to waterfront structures in the
vicinity. However, these were not found in situ and it remains unclear what their age or
function may have been.
2.7 Prior to the redevelopment of the ‘Bridge Inn’ area, archaeological excavations were carried
out by Chris Butler Archaeological Services. During the works, worked timbers were found,
lining up to form a quay structure, at the bottom of which a side (a number of strakes
connected by two frames) of a 15th century clinker boat was found (Pers. Comm. Caspar
Johnson). At the time of this writing, no report of this excavation has been made available.
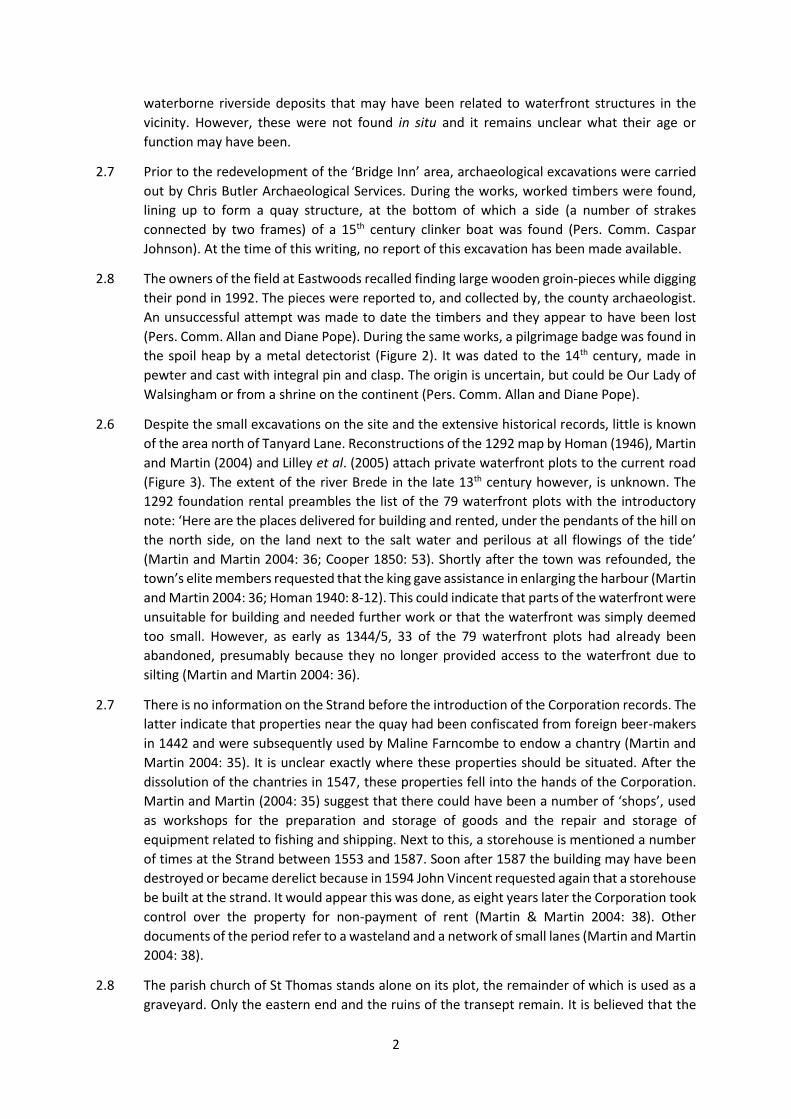
2.8 The owners of the field at Eastwoods recalled finding large wooden groin-pieces while digging
their pond in 1992. The pieces were reported to, and collected by, the county archaeologist.
An unsuccessful attempt was made to date the timbers and they appear to have been lost
(Pers. Comm. Allan and Diane Pope). During the same works, a pilgrimage badge was found in
the spoil heap by a metal detectorist (Figure 2). It was dated to the 14th century, made in
pewter and cast with integral pin and clasp. The origin is uncertain, but could be Our Lady of
Walsingham or from a shrine on the continent (Pers. Comm. Allan and Diane Pope).
2.6 Despite the small excavations on the site and the extensive historical records, little is known
of the area north of Tanyard Lane. Reconstructions of the 1292 map by Homan (1946), Martin
and Martin (2004) and Lilley et al. (2005) attach private waterfront plots to the current road
(Figure 3). The extent of the river Brede in the late 13th century however, is unknown. The
1292 foundation rental preambles the list of the 79 waterfront plots with the introductory
note: ‘Here are the places delivered for building and rented, under the pendants of the hill on
the north side, on the land next to the salt water and perilous at all flowings of the tide’
(Martin and Martin 2004: 36; Cooper 1850: 53). Shortly after the town was refounded, the
town’s elite members requested that the king gave assistance in enlarging the harbour (Martin
and Martin 2004: 36; Homan 1940: 8-12). This could indicate that parts of the waterfront were
unsuitable for building and needed further work or that the waterfront was simply deemed
too small. However, as early as 1344/5, 33 of the 79 waterfront plots had already been
abandoned, presumably because they no longer provided access to the waterfront due to
silting (Martin and Martin 2004: 36).
2.7 There is no information on the Strand before the introduction of the Corporation records. The
latter indicate that properties near the quay had been confiscated from foreign beer-makers
in 1442 and were subsequently used by Maline Farncombe to endow a chantry (Martin and
Martin 2004: 35). It is unclear exactly where these properties should be situated. After the
dissolution of the chantries in 1547, these properties fell into the hands of the Corporation.
Martin and Martin (2004: 35) suggest that there could have been a number of ‘shops’, used
as workshops for the preparation and storage of goods and the repair and storage of
equipment related to fishing and shipping. Next to this, a storehouse is mentioned a number
of times at the Strand between 1553 and 1587. Soon after 1587 the building may have been
destroyed or became derelict because in 1594 John Vincent requested again that a storehouse
be built at the strand. It would appear this was done, as eight years later the Corporation took
control over the property for non-payment of rent (Martin & Martin 2004: 38). Other
documents of the period refer to a wasteland and a network of small lanes (Martin and Martin
2004: 38).
2.8 The parish church of St Thomas stands alone on its plot, the remainder of which is used as a
graveyard. Only the eastern end and the ruins of the transept remain. It is believed that the
3
crossing piers once supported a central tower with a spire, as is seen on the Corporation seal
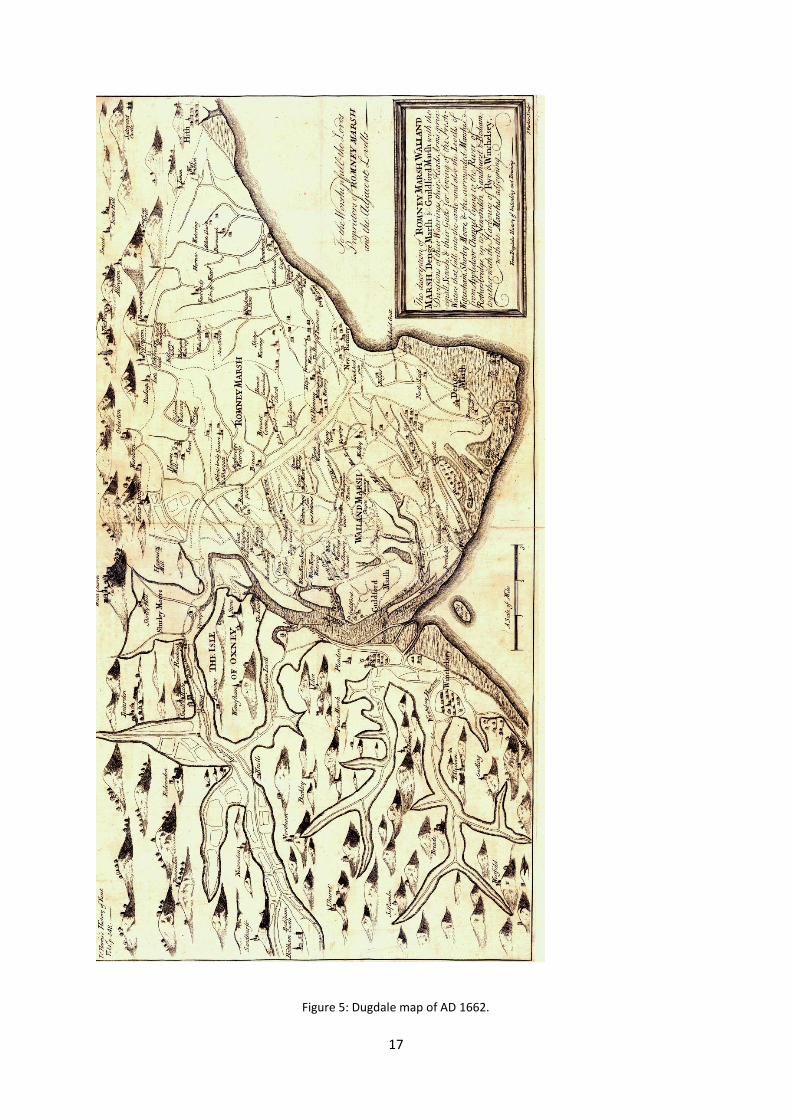
(Figure 4) and in a sketch of the town on Dugdale’s map of 1662 (Figure 5). Cooper (1850)
writes that ‘no trace of the foundations, after a recent and very diligent search could be found,
except for the central great piers and a small portion of the town wall at the SW angle, of what
was the south aisle’. Cooper himself created a plan that shows in hachure the foundations
which he discovered. Elsewhere is stated that stone from the nave foundation was removed
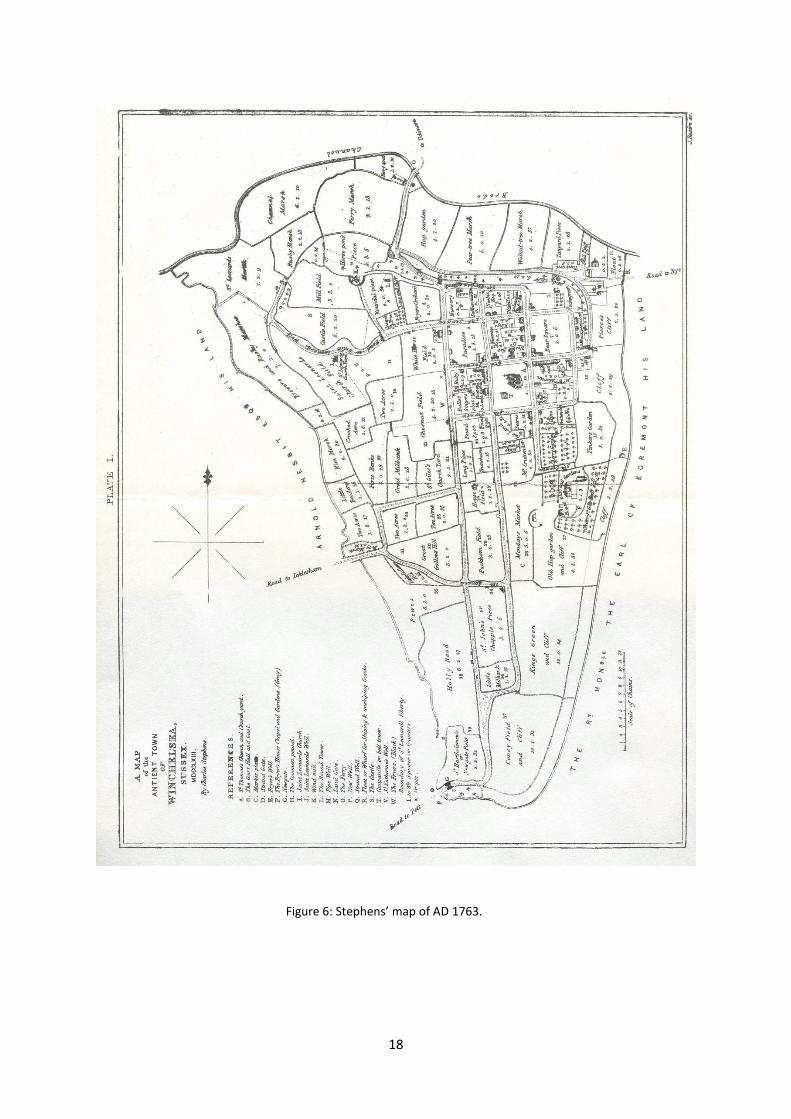
in 1790 to be used at Rye harbour. Stephen’s plan from 1763 (Figure 6) and an 18th century
illustration (see Martin and Martin 2004: 79, Fig. 7.11) show a detached tower standing
immediately to the south of the church’s former western end, near the southwest corner of
the churchyard. Martin and Martin (2004: 78) suggest that it may either have been a bell- or
watchtower and may have been depicted on the Corporation seal. There are various theories
concerning the fate of the nave. Some argue that it was never built, while others suggest that
it was destroyed during one of the French raids. According to Martin and Martin the most
likely explanation is that, following the major decline in population, the church was downsized
and the redundant part sold for its materials (see Martin and Martin 2004: 74-80 for a
discussion).
3.0 The Cartographic Evidence
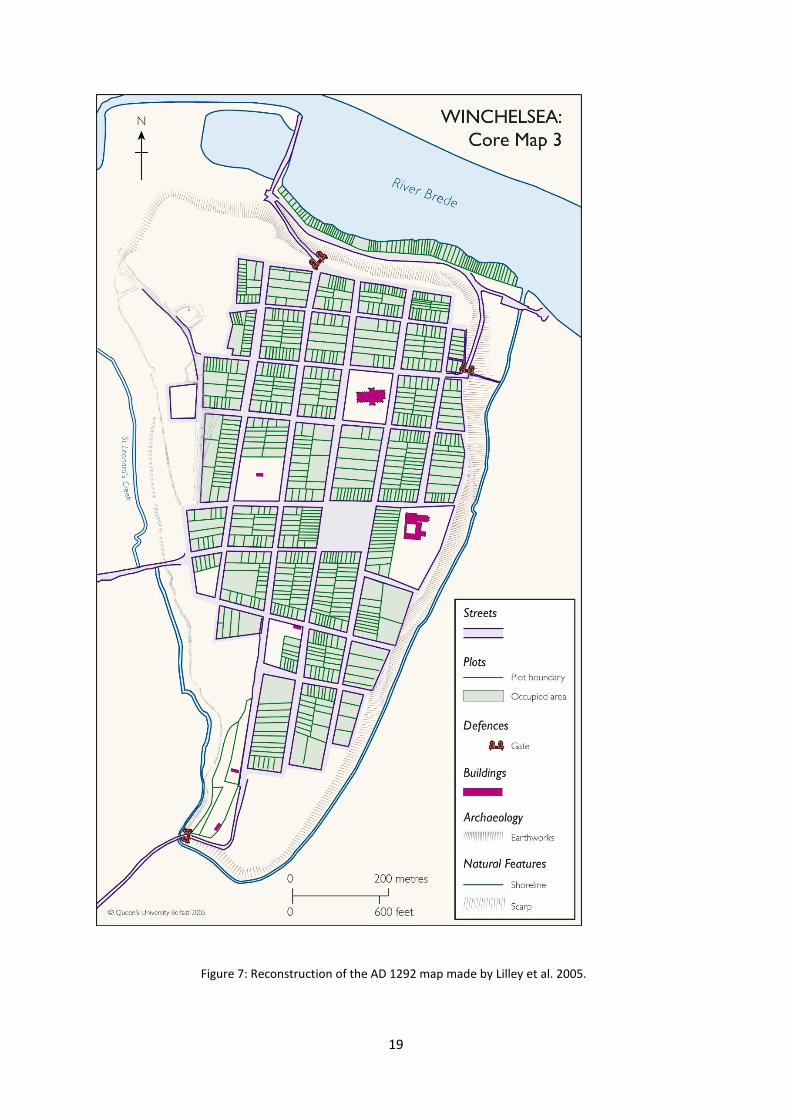
3.1 At Eastwoods, the latest version of the map reconstructed using the 1292 rental roll, produced
by a team from Queens University Belfast (QUB) (Lilley et al. 2005: Core Map 3) (Figure 7),
indicates that, immediately north of Tanyard Lane, private waterfront plots should be located.
The Brede covers the remainder of the field. Dugdale’s map of 1662 (Figure 5) still makes
mention of ‘Winchelsea Harbour’, but the river is situated a certain distance away from the
town hill. The oldest reliable map of the town itself is Stephen’s map from 1763 (Figure 6)
which shows an open field and indicates that the old name for Eastwoods is ‘Walnut-tree
Marsh’. The closest significant structure on the map is the Tanyard, located about 45m east
of the eastern edge of the survey area. Old and recent County Series and National Grid maps
show an open field with no structures.
3.2 At the Strand, the QUB map shows the medieval ditch cutting the survey area in half, leaving
the remainder of the surface blank. Stephens’ maps from 1763 indicates that east of the ditch,
the land was owned by the Earl of Egremont, west of the ditch, the field is called ‘Pierce’s
Cliff’. With the exception of the strand house, the survey is shown as an open field. Across
from the survey area is an area called ‘The Float’, possibly a reference to the location of the
former quay. On the 2nd revision of the County Series map, the word ‘stone’ is written on the
north side of the field (Figure 8). Other versions of the County Series and National Grid maps
show no structures or channels.
3.3 At St Thomas, the QUB map shows the church as complete. Stephens’ map form 1763 shows
a church with three naves and a ruined square tower in the southwest corner of the plot. This
tower is no longer present in the 1st edition of the County Series map and St Thomas is
depicted in its current partial state. The same is true for the other County Series and National
Grid maps. The remainder of the plot is identified as a graveyard. Other than the locations of
the pathways, nothing changes in the succession of County Series and National Grid maps.

4
4.0 The Survey Sites
4.1 Eastwoods, site specific information
Site Name: Eastwoods
Grid Ref.: TQ 90575 17742
County: East Sussex
Date of Survey: 20th April – 1st May 2015
Surveyors: Thomas Dhoop, Fraser Sturt, Julian Whitewright, Kristian Strutt, Dominic
Barker, Rodrigo Ortiz, Carlos Garrandes, Massimilano Secci
Size of area surveyed: 1.18 ha
Weather conditions: Dry and sunny
Geology: Sandstone bedrock, clay, silt and sand superficial lithology
Current land use: Grazing field
Survey types: Magnetometery, resistivity, power auger, hand auger
4.2 Strand, site specific information
Site Name: Strand
Grid Ref.: TQ 90780 17465
County: East Sussex
Date of Survey: 20th April – 1st May 2015
Surveyors: Thomas Dhoop, Julian Whitewright, Rodrigo Ortiz, Carlos Garrandes,
Massimiliano Secci
Size of area surveyed: 1.14 ha
Weather conditions: Dry and sunny
Geology: Sandstone bedrock, clay, silt and sand superficial lithology
Current land use: Grazing fields
Survey types: Magnetometry, resistivity, hand auger
4.3 St Thomas, site specific information
Site Name: St Thomas
Grid Ref.: TQ 90481 17353
County: East Sussex

5
Date of Survey: 25th April 2015
Surveyors: Thomas Dhoop, Rodrigo Ortiz, Carlos Garrandes, Massimiliano Secci
Size of area surveyed: 0.26 ha
Weather conditions: Sunny and dry at the start, slight drizzle near the end
Geology: Sandstone bedrock, clay, silt and sand superficial lithology
Current land use: Churchyard
Survey types: Resistivity
5.0 Survey Specific Information
5.1 Details of equipment and methodology employed:
Survey type Magnetometry
Instrumentation Bartington Grad-01 Data Logger DL-601
Probe/sensor configuration Parallel twin (2 probes)
Probe/sensor spacing 1 m
Grid size 30 m x 30 m
Traverse interval 0.5 m
Sample interval 0.125 m
Traverse pattern Zig-Zag
Spatial accuracy Grids set out using a Leica CS15 Real Time Kinematic (RTK) GPS
Survey type Electrical Earth Resistance
Instrumentation Geoscan Research RM15 Resistance Meter
Probe/sensor configuration Parallel twin (2 probes)
Probe/sensor spacing 0.5 m
Grid size 30 m x 30 m
Traverse interval 0.5 m
Sample interval 1 m
Traverse pattern Zig-Zag
Spatial accuracy Grids set out using a Leica CS15 Real Time Kinematic (RTK) GPS
Survey type Power Auger
Instrumentation Atlas Cobra TT
Spatial accuracy Points stored using a Leica CS15 Real Time Kinematic (RTK) GPS
Survey type Hand Auger
Instrumentation Eijkelkamp
Spatial accuracy Points stored using a Leica CS15 Real Time Kinematic (RTK) GPS
6
6.0 Eastwoods
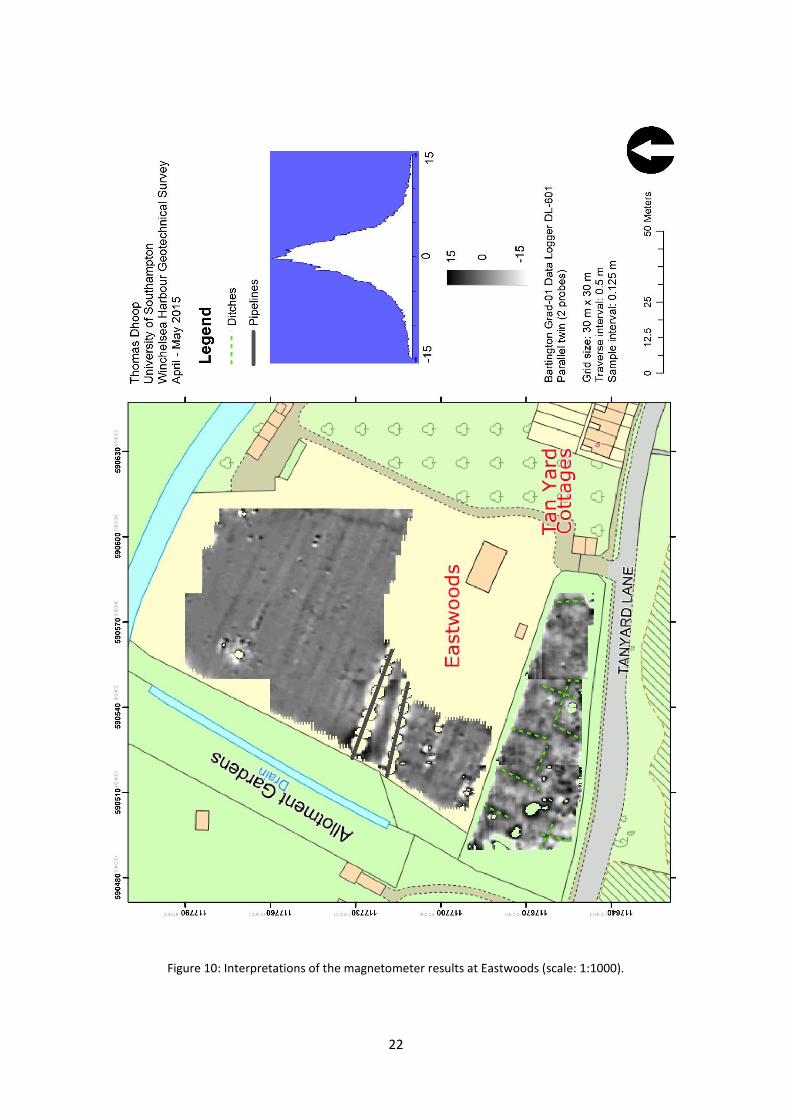
6.1 Magnetometry Results (Figures 9 & 10)
6.1.1 In the northern half of the field a distinct pattern of alternating high and low magnetometry
lines is visible. This was also noted in the surface topography of the field while conducting the
survey. These might be the remains of canals dug for past agricultural use of the field. Two
lines of very strong positive and negative values have been confirmed with the resident to be
sewage pipelines. In the southern part of the field, distinct lines of high magnetometry appear
in right angles to one another. These could be drainage ditches which were later infilled, dug
to drain the area of water for some form of construction. They are in the location where the
QUB map places the private waterfront plots and correlate well with the description of these
plots in the 1292 rental roll as ‘perilous at all flowings of the tide’. Alternatively, they could
also be related to the ‘expansion’ of the harbour shortly after the new site was taken into use.
6.2 Resistivity Results (Figure 11)
6.2.1 Only the southern half of the field was surveyed using resistivity. In the western half of the
field, linear features of low resistivity are apparent which line up with the high magnetometry
features discussed above. This appears to confirm the presence of infilled ditches, possibly
drainage canals. Inside these features, areas of marked high resistivity are apparent. Although
these might indicate the presence of structural features, it is impossible to say conclusively
based on the resistivity data alone. The eastern side of the field is less clear-cut. A zone of high
resistivity with no clear pattern can be discerned, but the resolution of the survey is not great
enough to make any reasonable suggestions as to what is present.
6.3 Core Results
6.3.1 Five cores were taken in a northeast to southwest alignment in between Tanyard Lane and
the river Brede. The average spacing between cores is ca. 30 m. Two were taken with a power
auger (BH1 & BH2), the remaining three (BH3, BH4, BH5) with a hand auger (Figure 12).
6.3.2 BH1-Eastwoods (Figure 13): A modern turf horizon of sandy silt loam with a possible made
ground horizon (0.57 m from the surface) of large rock, brick and flint overlays a subsoil of
sandy clay with a high content of iron resulting in manganese staining. At ca. 1.66 m a gradual
boundary occurs to grey riverine silts with clear tidal rhythmites, intersected by a pocket of
sand between 4.66 m and 4.86 m. The sandstone bedrock was hit at ca. 6.66 m.
6.3.4 BH2-Eastwoods (Figure 14): A modern turf horizon of clayish sand with brick and flint
inclusions overlays a subsoil of the same lithology mottled with dark grey inclusions and a high
content of iron resulting in manganese staining. Underlying the subsoil, at ca. 1.29 m deep, a
0.93 m thick layer of peat was found. Grey riverine silts were struck immediately underneath
the peat layer. At a depth of ca. 5.64 m the colour of sediments turned to a slightly darker
grey and the bottom 2 m of the core contained tidal rhythmites.
6.3.5 BH3-Eastwoods (Figure 15): A modern turf horizon of sandy silt with a layer of pebbles and
brick at the bottom overlays a subsoil of sandy clay with a pocket of sand and pebbles from
0.66 m to 0.88 m. From 0.88 m to 2.45 m the sandy clay is mottled with grey riverine silts.
From that point onwards only grey riverine silts were present.
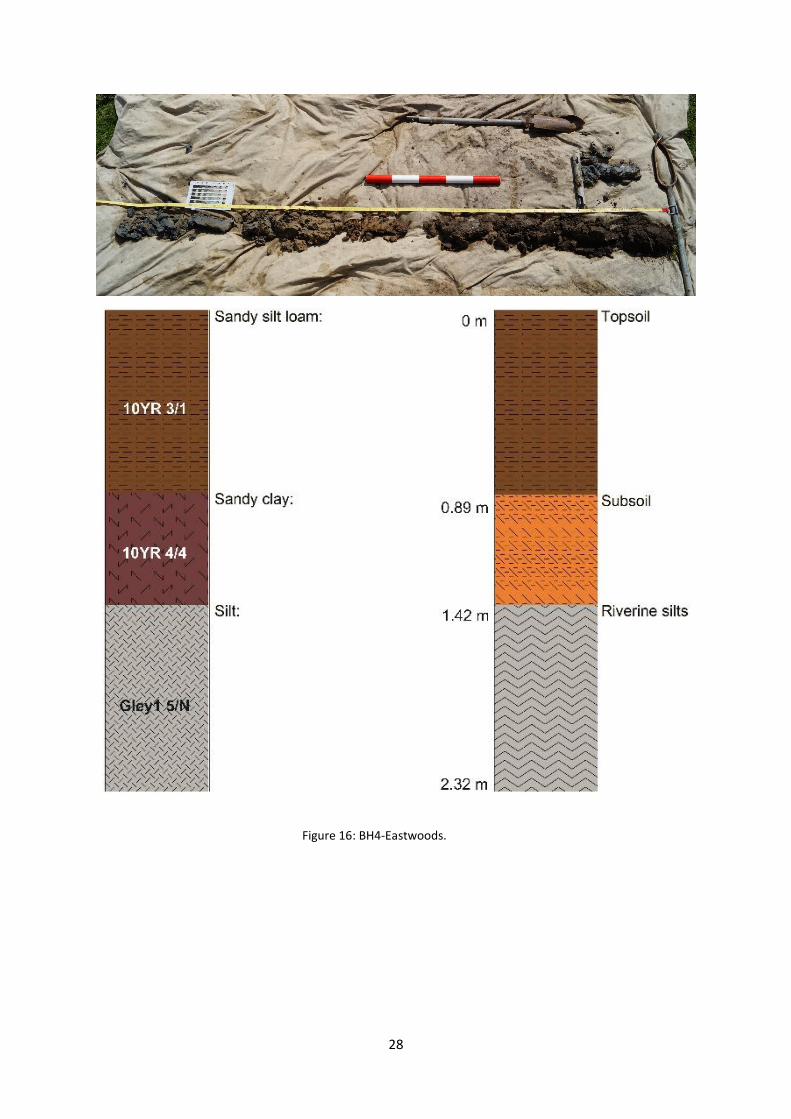
6.3.3 BH4-Eastwoods (Figure 16): A modern turf horizon of sandy clay loam with anthropogenic
disturbance overlays a subsoil of sandy clay with a high content of iron. From 1.2 m to 1.42 m
7
the soil became moister and had fragmented shells in it. Riverine silts were found from 1.42
m onwards, becoming more compact as the depth increased.
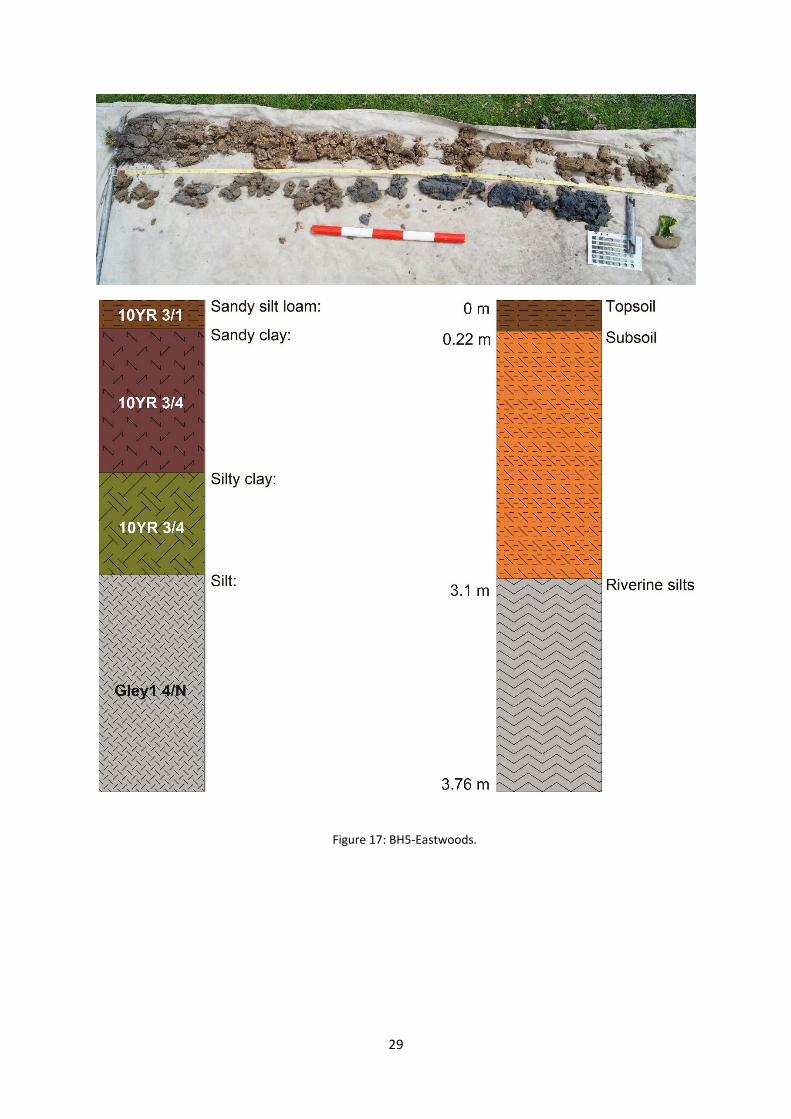
6.3.6 BH5-Eastwoods (Figure 17): A modern turf horizon of sandy clay loam overlays a subsoil of
sandy clay with iron inclusions. Underneath lies a layer of sandy clay mottled with grey riverine
silts. From 3.1 m only grey silts are present, becoming increasingly darker and more solid.
6.4 Discussion of Results
6.4.1 The results of the geophysics and the core BH1-Eastwoods suggest the presence of
archaeologically relevant layers just north of Tanyard Lane, the location where maps based on
the 1292 rental have traditionally positioned the private waterfront plots. The orientation of
the presumed drainage ditches however, do not line up with the orientation of the plots
depicted in the reconstructed maps, suggesting that a revision is needed.
6.4.2 The auger survey at Eastwoods demonstrated potential for the study of the development of
the river Brede on the one hand and the relationship between a surge in storm activity,
coinciding with the advent of the Little Ice Age in the late 13th century, and the history of Old
and New Winchelsea on the other.
6.4.3 The power core BH1-Eastwoods was taken in a location of high magnetometry and high
resistivity and contained a possible made ground layer of brick and rock, suggesting a layer
with archaeological structures might be present in the southern area of Eastwoods. The
second power core, BH2-Eastwoods, contained a significant peat layer overlaying riverine
sediments indicating that at a certain point in time, at ca. 90 m of the current location of
Tanyard Lane and ca. 50 m from where geophysical anomalies were found, the silting process
overtook the tidal energy and organics were able to accumulate and decompose.
Interestingly, both power cores (BH1-Eastwoods and BH2-Eastwoods) contained tidal
rhythmites, but at different depths. In BH1, from ca. 1.66 m to 2.66 m, in BH2, from ca. 5.64
m to 7.64 m. These indicate episodes of alternating high and low energy levels in the tidal river
Brede, which might correspond to the increase in storminess at the advent of the little Ice Age
in the late 13th century, the same episode that drove the people of Winchelsea from their
original site to the new one.
6.4.4 Further analysis of the cores will attempt to date the peat layer through association with other
cores taken in the Brede valley. The results of this will be included in the PhD thesis of the
author. Based on this analysis, the potential for more work in the immediate future will be
evaluated.
7.0 Strand
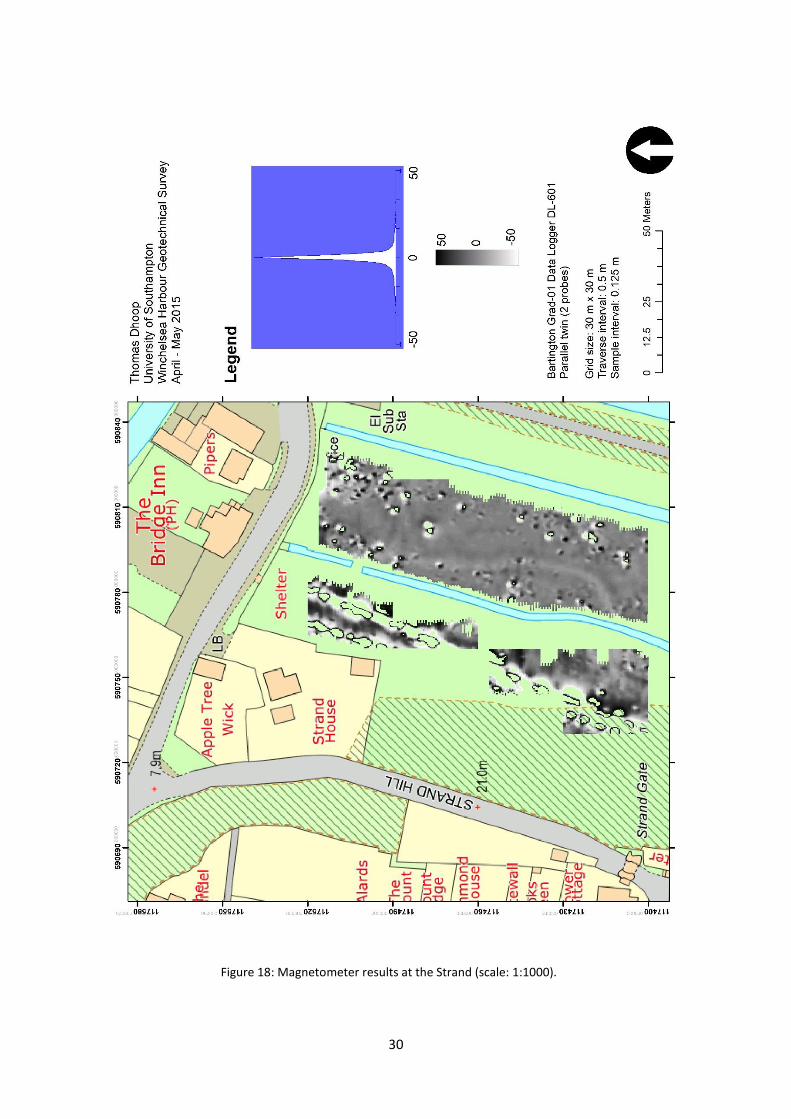
7.1 Magnetometery Results (Figures 18 & 19)
7.1.1 Due to the presence of excessive amounts of reed or a very steep surface-topography, parts
of certain grids could not be surveyed.
7.1.2 Two distinct lines of high alternating positive and negative values cross the field at the western
edge, most likely indicating the presence of two pipelines. Just east of these pipelines there is
a possible amount of runoff from the high magnetometry readings. In the southwest corner,
two lines of high magnetomery meet each other at a right angle. These might be dug ditches,
possible for foundations, but it is impossible to say conclusively based on the magnetometry
data alone. To the east of the medieval ditch that cuts the field in half, a linear feature of low

8
values runs from the southwest end to the northern end of the field. Most likely, this is a dug
channel for drainage or sewage. Finally, at the northern end of the field, a high amount of
noise occurs, with an empty square in the middle. Given the straight lines and angles, it is
possible that some structure lies underneath.
7.2 Resistivity Results (Figure 20)
7.2.1 The resistivity survey targeted the areas where possible features could be expected, based on
the magnetometry results. Three separate areas were selected and surveyed.
7.2.2 In the southwest corner of the surveyed area, the eastern edge is dominated by high and low
resistivity values. This corresponds to the area where the two possible pipelines were situated
in the magnetometery data. The remainder of the area is largely filled with thick lines of
alternating high and low resistivity. This pattern was also picked up on the surface topography.
For a large part, this pattern falls within the two ‘ditches’ identified in the magnetometry data,
but a correlation between the two is not straightforward. In the southernmost area, east of
the medieval ditch, a thick loop of low resistivity values is lined by high resistivity. The right-
leg of the loop corresponds to the channel identified in the magnetometry data. The left leg
might be another arm of the channel, hidden behind noise in the magnetometry. The lines of
high resistivity might correspond to the embankments of the old and current ditch. The survey
of the northernmost end of the field shows a network of linear low-resistivity features. The
bank of the current military canal on the other hand is lined with high resistivity values. Inside
the ‘empty’ square on the magnetometry data, two semi-circular features of high resistivity
are present. If there was indeed a storehouse built at the Strand, this area appears to be the
most likely location.
7.3 Core Results
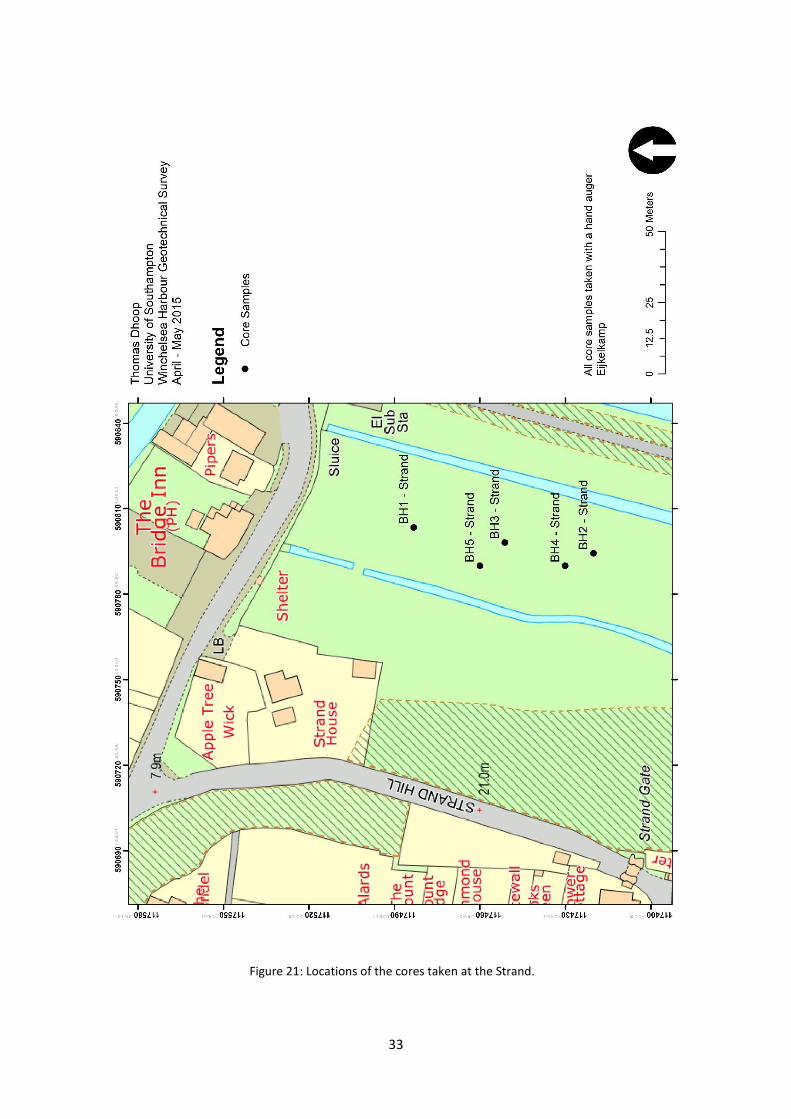
7.3.1 Five cores were taken in this field, all of them east of the medieval ditch, using a hand auger.
Three (BH1, BH2 & BH3) were taken along a north to south line while the remaining two (BH4
& BH5) were placed inside the channel picked up on the magnetometry and resistivity data
(Figure 21).
7.3.4 BH1-Strand (Figure 22): A modern turf horizon of sandy loam with semi-rounded pebbles
overlays a subsoil of sandy clay. Through a gradual boundary, a more greyish sandy clay
appeared continuing as a silty clay from 1.54 m to 2.84 m. Underneath, a humified peat
horizon was found going as deep as at least 3.1 m (and onwards).
7.3.2 BH2-Strand (Figure 23): A modern turf horizon of sandy clay with flint inclusions overlays a
subsoil of sandy clay (becoming increasingly more clayish with depth) with iron inclusions and
a layer of small bits of brick and ceramic at 0.9 m deep. From 1.62 m a grey silty clay was found
overlying humified peat which started from 2.86 m onwards.
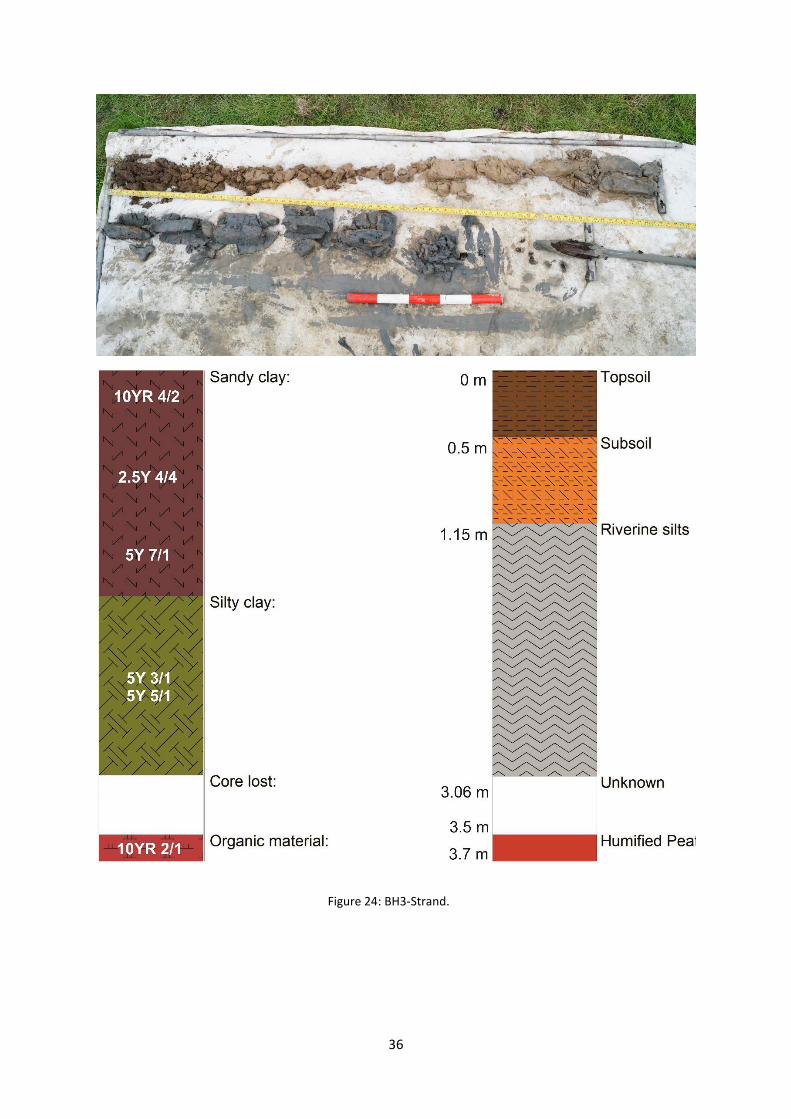
7.3.3 BH3-Strand (Figure 24): A modern turf horizon of sandy clay overlays a subsoil of grey sandy
clay (becoming increasingly more clayish and grey with depth) with a small horizon of iron
inclusions from ca. 1.6 m to 1.7 m. Underneath was a layer of grey silty clay to 3.05 m after
which cores were lost to about 3.5 m. From 3.5 m to 3.7 m humified peat was found.
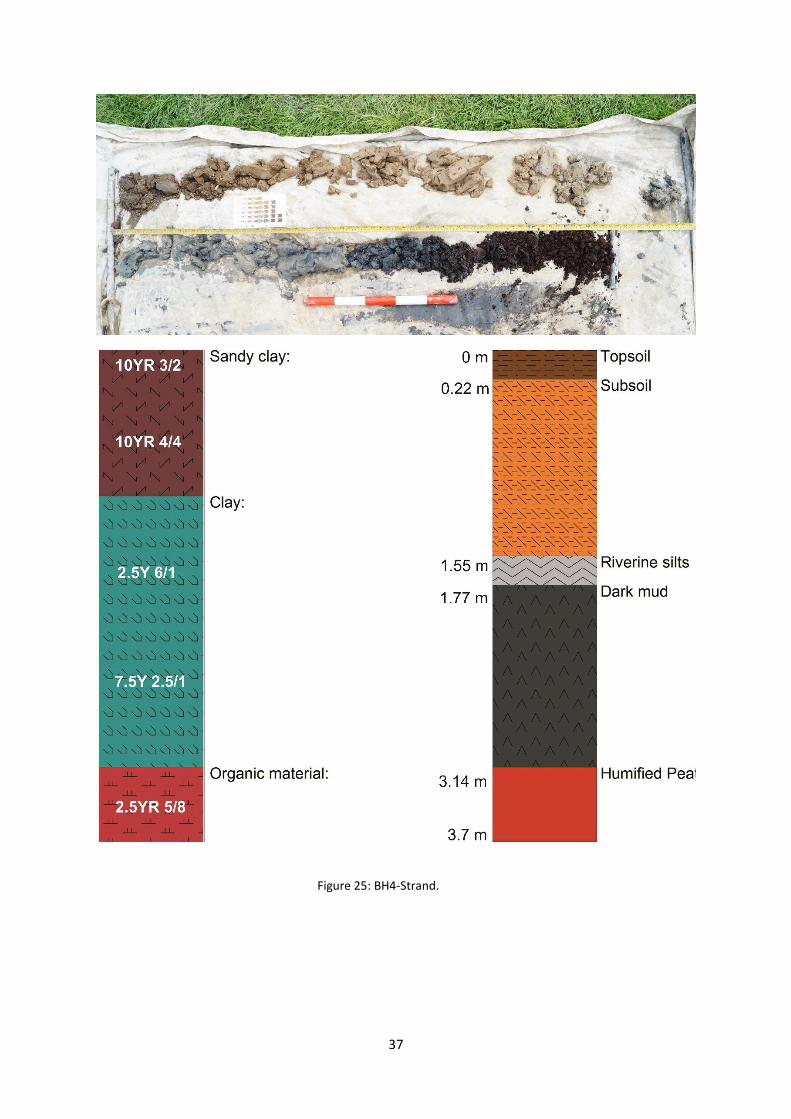
7.3.5 BH4-Strand (Figure 25): A modern turf horizon of sandy clay overlays a subsoil of sandy clay
(becoming increasingly more clayish with depth) with a high content of iron. Between 0.22 m
and 0.44 m a piece of the stem of a clay tobacco pipe was found. Underneath lies a moist grey
clay which overlies a layer of very moist dark grey clay. The layer of dark moist clay can be
9
found between 1.76 m and 3.14 m deep. Beneath this layer lies a horizon of humified peat
which goes down to at least 3.48 m.
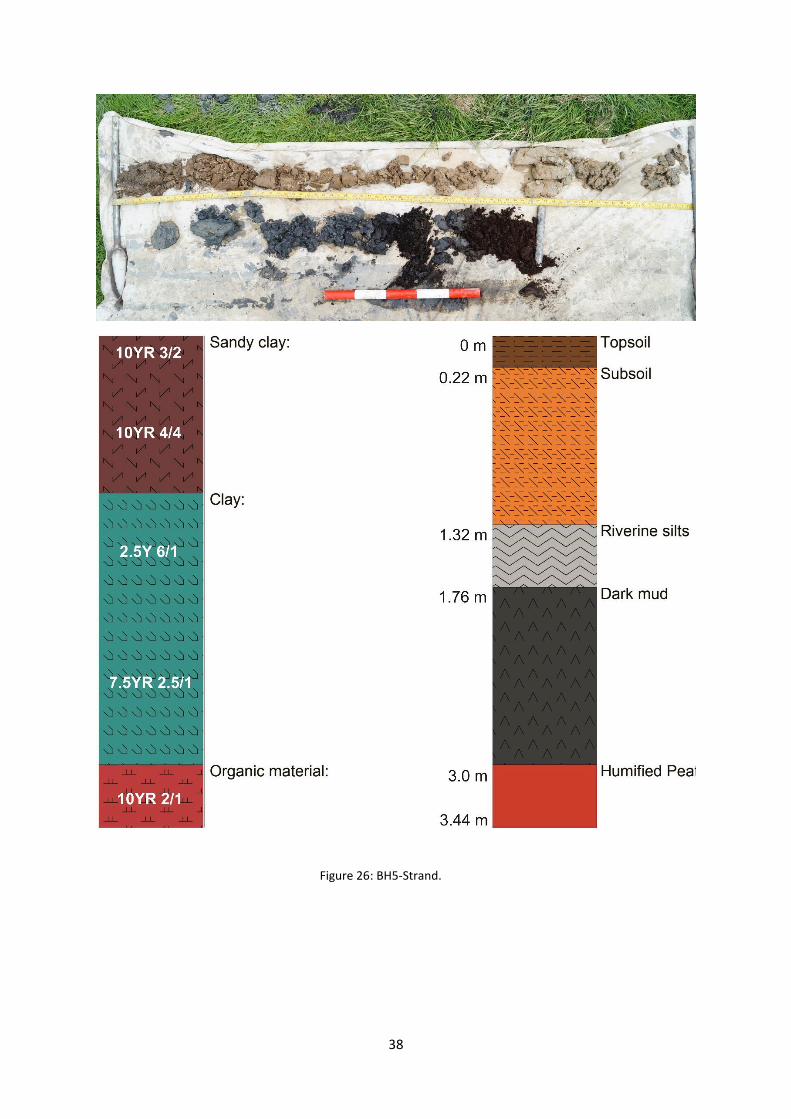
7.3.6 BH5-Strand (Figure 26): A modern turf horizon of sandy clay overlays a subsoil of sandy clay
(becoming increasingly more clayish with depth) with iron inclusions. Underneath lies a grey
clay which overlies a horizon of very moist dark grey clay. The layer of dark moist clay can be
found between 1.76 and 3 m deep. Beneath it lies a horizon of humified peat reaching a depth
of at least 3.24 m.
7.4 Discussion of Results
7.4.1 The feature consisting out of two possible ditches meeting at a 90 degree angle is impossible
to interpret without further research. The combination of the linear feature of low
magnetometry values, low resistivity numbers and a layer of black moist clay in cores BH4-
strand and BH5-strand (which is not present in the other three cores) indicates that a large
ditch of ca 3 m wide runs across the eastern part of the surveyed area. There is no mention of
such a feature in the historical record and without further research it is impossible to date.
The feature on the northern edge of the eastern side of the surveyed area might be structural.
If, as the historical records indicate, there was a storehouse built at the Strand, this would be
the most likely location. It is located across from the area called the ‘float’ on Stephens’ map
from 1763 and is angled so that it faces the road and possible waterfront. Some stone features
might have appeared on the surface of the field in the early 1900’s as the 2nd revision of the
County Series map has the word ‘stone’ written on this location.
7.4.2 The five cores taken at the Strand suggest that at some point in time, the area transitioned
from a very low energy and moist (swampy) environment, allowing for the accumulation of
humified peat, to a high energy environment as evidenced by the grey silts. This might indicate
a significant flooding or storm event in the past. Later, the area was drained naturally or by
human intervention as at least from the medieval period, a ditch was cut for drainage.
8.0 St Thomas
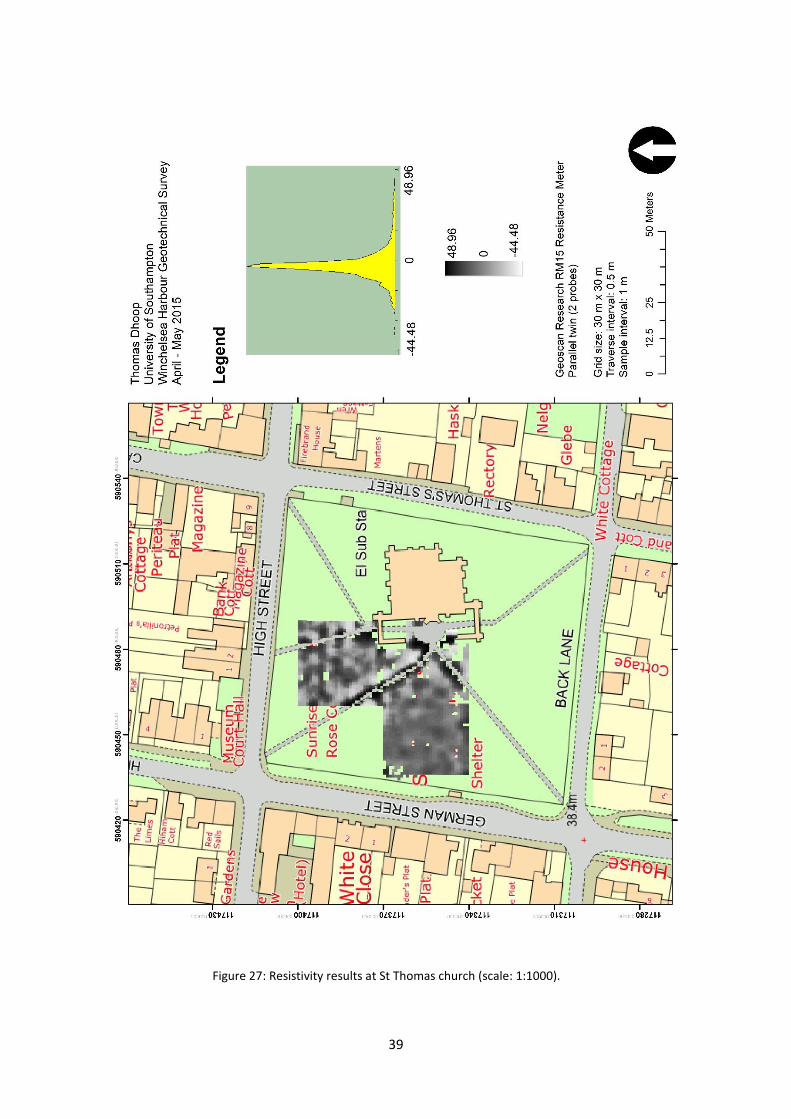
8.1 Resistivity Results (Figure 27)
8.1.1 Due to time constraints only three 30 m by 30 m grids were surveyed, targeting those areas
where foundations of the missing part of the church were expected.
8.1.2 Across the entire surveyed area a pattern of amorphous high resistivity features are visible
against a background of lower resistivity. These areas most likely correspond to current and
old graves. The high resistivity values near the entrance of the church are possibly the result
of the presence of the old pathways visible on the 1st edition of the County Series map.
8.2 Discussion of Results
8.2.1 There is no sign of the foundations of the missing parts of the church in the resistivity data.
This might be due to interference from modern and old graves, old pathways, but also the low
resolution of the survey (1 m x 1 m) itself. The detached tower is most likely situated further
southwest of the surveyed grids.
10
9 Conclusions and Future Work
9.1 The survey at the ancient waterfront of Winchelsea highlighted a number of geophysical
anomalies, some of which may be archaeological in nature. In particular the pattern found in
the southern end of Eastwoods, potentially associated with the medieval port, shows an area
of high archaeological potential. Also the feature found in the northeast corner of the Strand
should be considered of potential archaeological interest.
9.2 The results of the auger survey illuminated some aspects of the past landscape use and
demonstrated the potential for research into recent episodes of climatic change. Combined
with the rich historical record describing the effects of, and the actions taken against, the
surge in storm activity during the late 13th century, the site offers great potential for the study
of human interaction with a changing environment. In light of this, an attempt will be made
to date the peat layer found in BH2-Eastwoods through association with other cores from the
Brede valley. Based on those results, a second auger survey aimed at taking sleeved cores at
Eastwoods is a possibility.
9.3 The resistivity survey at St. Thomas church failed to locate the foundation of the missing part
of the structure. This might be due to interference from modern and old stone graves or the
low resolution (1 m x 1 m) of the conducted survey. A resistivity survey with a higher resolution
or a (~500 Mhz) ground penetrating radar (GPR) survey is recommended for future work.
11
Bibliography
Cooper, W. D. 1850. The History of Winchelsea, one of the Ancient Towns added to the Cinque Ports.
Lewes: East Sussex County Council.
Dulley, A. J. F. 1965. Excavations at Winchelsea, Sussex Notes and Queries ?: 205-206.
Homan, W. M. 1949. The founding of New Winchelsea, Sussex Archaeological Collection 88: 22-41.
Hopkinson, D. 2012. Archaeological Watching Brief Report. Land North of Tanyard Lane. Winchelsea,
East Sussex. TN36 4JY. Archaeology South-East. Unpublished.
Martin, D. & Martin, B. 2002a. A Quarter-by-Quarter Analysis of the Town of winchelsea, East Sussex.
Unpublished. A copy is available at the East Sussex Record Office.
Martin, D. & Martin, B. 2002b. An Extensive Urban Survey of the Town of Winchelsea, East Sussex.
Unpublished. A copy is available at the East Sussex Record Office.
Martin, D. & Martin, B. 2004. New Winchelsea Sussex: A Medieval Port Town. King’s Lynn: Heritage
Marketing and Publications.
Martin, D. & Rudling, D. 2004. Excavations in Winchelsea, Sussex, 1974-2000. King’s Lynn: Heritage
Marketing and Publications.
Pratt, M. 1998. Winchelsea, A port of stranded pride. Bexhill-on-Sea: Privately published.
Salzman, L. F. 1937. The Victoria History of the County of Essex. Volume 9. Oxford: Oxford University
Press.
Sylvester, D. 1999a. Shaping the Urban Landscape of Maritime England: the Role of the King and
Barons in the 1292 Founding of New Winchelsea. In J. Bill & B. L. Clausen (ed.) Maritime Topography
and the Medieval Town; Proceedings of the Third International Waterfront Conference. pp. 153-160.
Copenhagen: The National Museum.
Sylvester, D. 1999b. Maritime Communities in Pre-Plague England: Winchelsea and the Cinque Ports.
PhD Thesis. Department of History, Fordham University, New York, USA. A copy is available at the East
Sussex Record Office.
Sylvester, D. 2004. The Development of Winchelsea and its Maritime Economy. In D. Martin & B.
Martin (eds.) New Winchelsea Sussex: A Medieval Port Town. pp. 7-19. King’s Lynn: Heritage Marketing
and Publications.
Lilley, K., Lloyd, C. & Trick, S. 2005. Mapping the Medieval Townscape: a digital atlas of the new towns
of Edward I. Published online on the Archaeology Data Service:
http://archaeologydataservice.ac.uk/archives/view/atlas_ahrb_2005/index.cfm

12

13
The Figures
Figure 1: Survey areas and previous excavations.
14
Figure 2: Pilgrimage badge found at Eastwoods, dated to the 14th century, cast in pewter and
originating possibly from Our Lady of Walsingham or a shrine on the Continent.

15
Figure 3: Survey areas plotted on a reconstruction of the AD 1292 layout of Winchelsea.
16
Figure 4: Corporation seal of ca. AD 1300, front- (above) and backside (below).
17
Figure 5: Dugdale map of AD 1662.
18
Figure 6: Stephens’ map of AD 1763.
19
Figure 7: Reconstruction of the AD 1292 map made by Lilley et al. 2005.

20
Figure 8: Second revision of the County Series map showing the word ‘stone’ in the northeast corner of
the strand survey area.

21
Figure 9: Magnetometer results at Eastwoods (scale: 1:1000).
22
Figure 10: Interpretations of the magnetometer results at Eastwoods (scale: 1:1000).

23
Figure 11: Resistivity results at Eastwoods underlying the interpretations (scale: 1:1000).

24
Figure 12: Locations of the cores taken at Eastwoods.

25
Figure 13: BH1-Eastwoods

26
Figure 14: BH2-Eastwoods.

27
Figure 15: BH3-Eastwoods.
28
Figure 16: BH4-Eastwoods.
29
Figure 17: BH5-Eastwoods.
30
Figure 18: Magnetometer results at the Strand (scale: 1:1000).

31
Figure 19: Interpretations of the magnetometer results at the Strand (scale: 1:1000).

32
Figure 20: Resistivity results at the Strand underlying the interpretations (scale: 1:1000).
33
Figure 21: Locations of the cores taken at the Strand.

34
Figure 22: BH1-Strand.

35
Figure 23: BH2-Strand.
36
Figure 24: BH3-Strand.
37
Figure 25: BH4-Strand.
38
Figure 26: BH5-Strand.
39
Figure 27: Resistivity results at St Thomas church (scale: 1:1000).
