phytoplankton productivity
TRANSCRIPT

This article was originally published in the Encyclopedia of Inland Waters published by Elsevier, and the attached copy is provided by Elsevier for the
author's benefit and for the benefit of the author's institution, for non-commercial research and educational use including without limitation use in
instruction at your institution, sending it to specific colleagues who you know, and providing a copy to your institution’s administrator.
All other uses, reproduction and distribution, including without limitation commercial reprints, selling or licensing copies or access, or posting on open
internet sites, your personal or institution’s website or repository, are prohibited. For exceptions, permission may be sought for such use through
Elsevier's permissions site at:
http://www.elsevier.com/locate/permissionusematerial
Dokulil M T and Kaiblinger C. (2009) Phytoplankton Productivity. In: Gene E. Likens, (Editor) Encyclopedia of Inland Waters. volume 1, pp. 210-218 Oxford:
Elsevier.

Author's personal copy
Phytoplankton ProductivityM T Dokulil and C Kaiblinger, Austrian Academy of Sciences, Mondsee, Austria
ã 2009 Elsevier Inc. All rights reserved.
Defining Productivity
Ecologists prefer the term phytoplankton productivityalthough what is usually measured are photosyntheticrates. Moreover, the term productivity is frequentlyconfused with production. It has therefore been arguedto abandon one of the two terms or to replace it byactivity. Strictly speaking, there is a clear difference.Productivity is a time dependent process; it is a ratewith dimensions ofmass per unit area/volume per time.Production is a quantity, with dimensions of mass.Biological processes perceive and adjust to changes
in the external environment. Many regulatory pro-cesses occur rapidly to allow photosynthesis to trackinstantaneously changes in the surrounding medium(Figure 1). In nature, photosynthetic processes aretherefore constantly modified. Regulation describesadjustments of catalytic or energetic efficiency, whichinvolve slight structural modifications. Physical, bio-chemical, or physiological response on a short timescale within the life span of individual organisms orassemblages are collectively called acclimations,which are nonlinearely related to temporal variationsin irradiance, temperature, and nutrients. Ecologicalor evolutionary adaptations by assemblages throughselection of phenotypic traits occur on a longer timescale. Associated changes in community structureaffect photosynthetic rates.
Terminology
Conceptually, photosynthesis or productivity is definedas an instantaneous rate according to dB/dt over in-finite time intervals, which cannot be measured. Nor-mally, integral rates over time are obtained. Estimationby fluorescence techniques however come closest toinstantaneous rates.Gross photosynthesis (PG) is defined as the light-
dependent rate of electron flow from water to theterminal electron acceptors (e.g., CO2) in the absenceof any respiration losses. This definition is directlyproportional to linear photosynthetic electron trans-port, and, hence, gross oxygen evolution. Therefore,gross photosynthesis should be defined on the basis ofoxygen evolution rather than carbon fixation. Thedifference is critical, especially when photorespira-tion is high. Respiratory losses (RP) in photosyntheticorganisms are rates of electron flow from organiccarbon to O2 with the concomitant production of
210Encyclopedia of Inland Water
CO2, including photorespiration. The difference ofthese two processes is called net photosynthesis (PN):
PN ¼ PG � RP ½1�Gross primary production is identical to gross
photosynthesis. Net primary production, howeverdenotes organic carbon produced by photosyntheticprocesses within a specified time period available toother trophic levels.
In natural aquatic environments, direct measure-ments of primary production are virtually impossibleto obtain because it is difficult to determine the con-tribution of algal respiration to total respiratorylosses. Measurements of respiration include the met-abolic contribution of heterotrophs, and thereforereflect community respiration (Rc). In fact, net pri-mary production values, when reported, are usuallyconfused with net photosynthesis.
Estimating Photosynthesis in AquaticEcosystems
The simple basic reaction equation of photosynthesisin green plants is as follows:
CO2 þH2Oþ 8 photons ! 1
6C6H12O6 þH2O ½2�
Measurements of photosynthesis for autotrophicplankton organisms in aquatic ecosystems are thereforeusually based on rates of either oxygen evolution orinorganic carbon uptake. Various modifications andalternatives of the basic techniques exist. In addition,fluorescence techniques recently become increasinglyimportant. All methods are used either in situ or inlaboratory simulations. Avariety ofmathematicalmod-els describe photosynthetic rates in space and time andtheir acclimation to environmental conditions.
The O2-Technique
The rate of oxygen evolution is usually quantifiedfrom chemical, electrochemical or, most recently,from optochemicalmethods. Because absolute changesin oxygen concentration are usually small and the back-ground concentration of the gas in most situations isvery large, precise data are relatively difficult to obtain.Moreover, even if done precisely, evolution of oxygenin the light represents net community photosynthesis,and fluxes of oxygen in the light and dark include total
s (2009), vol. 1, pp. 210-218

10−1 10−2100101102103104
s
Xantophyll cycle
minhourdayweek
State transition
RUBISCO activation/deactivation
PSII photodamage and repair
PmChl
Chl-a quota
μm
Time(min)
Figure 1 First-order time constants for acclimation of algal
photosynthesis to step changes in photon flux density. Modified
from Raven and Geider (2003) in Larkum AWD, Douglas SE, andRaven JA (eds.) (2003) Photosynthesis in algae. In: Advances in
Photosynthesis and Respiration, Vol. 14, p. 407. Dordrecht:
Kluwer.
Algae (Incl. Cyanobacteria) _ Phytoplankton Productivity 211
Author's personal copy
community respiration. Adding dark respiratory lossesto light-dependent oxygen evolution gives a measure ofgross photosynthesis.Estimates of net photosynthesis in natural aquatic
ecosystems based on measurements of oxygen fluxesare more uncertain than measurements of grossphotosynthesis.
The 14C Method
By far the most commonly used method is based onthe rate of incorporation of radioactive 14C in theform of inorganic carbon into acid-stable (usuallyparticulate) organic carbon. This method was intro-duced first to oceanography and is, in principle, rela-tively straightforward. If we assume that over somefinite time period, the change in concentration oftotal dissolved inorganic carbon in the bulk water issmall relative to the photosynthetic rate of the cells,and the addition of a small amount of radioactivelylabeled inorganic carbon does not perturb the con-centration of the dissolved inorganic carbon, then therate of incorporation of radioactivity into organicmaterial obeys the rules of tracer analysis. These con-ditions are met in many environments, but care mustbe taken in freshwaters having low total concentra-tions of inorganic carbon.The rationale for the 14C-based tracer method is
that the light-dependent rate of incorporation of theradioactively labeled carbon into organic material isquantitatively proportional to the rate of incorpora-tion of nonradioactive inorganic carbon.
12Cuptake :12Cavailable ¼ 14Cuptake :
14Cavailable ½3�Fro m eqn [3] follow s that carbo n uptake is
12Cuptake ¼ 14Cuptake=14Cavailable
� � � 12Cavailable ½4�
Encyclopedia of Inland Wat
Because 14C is heavier than the stable natural iso-tope 12C, there is an isotopic discrimination againstthe radioactive isotope during carbon fixation. Thecommonly accepted discrimination factor is taken asabout 5% and this factor is taken into account incalculations by multiplication with 1.05.
Over short periods of time, before a significantfraction of organic carbon becomes labeled, themethod gives a reasonable estimate of gross photo-synthetic rates. As the exposure time continues, theorganic carbon pool becomes increasingly labeled,ultimately reaching equilibrium with the isotope inthe bulk water. A fraction of the labeled carbon isthen respired, and the incorporation of the tracerbegins to approximate the rate of net photosynthesis.
The rate at which equilibrium labeling is ap-proached is dependent on the growth rate of theorganism(s). The faster the growth rate is, the fasterthe equilibrium will occur. Thus the interpretation ofradioactive carbon incorporation as gross or net pho-tosynthesis is generally somewhat ambiguous, and iscomplicated by the duration of the experiment inrelation to the growth rate. In nature, the latterparameter is usually unknown and numerous discus-sions have emerged concerning the validity, accuracy,and interpretation of the method.
Fluorescence Techniques
The major problem of the methods mentioned previ-ously is the timescale. Photosynthetic rates obtainedby in situ incubation techniques are average valuesover a given time. To overcome theses problems, bio-optical models have been developed in oceanographyto extrapolate photosynthesis vs. irradiance curves(P/E). In bio-optical models, it is assumed that theP/E relationship does not depend on the incubationtime, which is not true. Most of the short term adjust-ments of phytoplankton are expressed in changesof the functional absorption cross-section sPSII.To keep the timescale short, rapid measurementtechniques based on in vivo fluorescence have beendeveloped mainly for marine use. Recent active fluo-rescence techniques opened the possibility for quanti-fying small-scale, rapid changes in physiology byproviding estimates of primary productivity with atemporal resolution of seconds.
Fluorescence is a phenomenon based on theabsorption of light by photosynthetic pigments andits reemittance at a longer wave length. When lightenergy (photons) reaches the light trapping ant-ennapigments of a photosynthetic unit (PSU), thechlorophyll-a (Chl-a) molecule is excited. To returnto the ground state, the Chl-a molecule needs to
ers (2009), vol. 1, pp. 210-218

212 Algae (Incl. Cyanobacteria) _ Phytoplankton Productivity
Author's personal copy
release energy, most of whi ch is lost as heat. What isleft is used to ‘close’ the reaction center or is reemitte das fluor escen ce. Chl orophyll fluoresc ence is verymuch dep endent on the wave length and inte nsity ofthe incoming light. Either photosyn thesis or thermaldissipat ion influen ce fluoresc ence resulti ng in pho-tochem ical quenchi ng (qP) or nonphot ochem icalquench ing (NPQ), respe ctively. Wh ile high light con-ditions can cause NPQ , weak ligh t that is con tinu-ously applied is correlat ed to in vivo chlor ophyll.When phy topla nkton is in a dark adap ted state (e.g.,during night or when the lig ht is very wea k), allreaction centers are in an active, open state an d thefluoresc ence yield is mi nimal. In this stat e, fluor es-cence is at a basel ine value F0 . When all the traps areclosed the maximum fluor escen ce level (Fm ) isreache d. Variab le fluoresc ence is obta ined by sub-tracti ng F0 from Fm ( Fv ¼ Fm � F0 ). The potent ialyield of the photochem ical reaction is thereforegiven by Fv/Fm , which is quanti tatively related to thephoto chemica l eff iciency of PSII. On the basis ofthese param eters fluor ometri c meth ods hav e beendevelo ped sinc e the early 1970s :
Pump-a nd-Probe fluor ometry Pump-and-Probe(P & P ) F luorometry us es an intense ‘pump’ flash t oclose the reaction centers of natural phytoplankt on as-se mblages and re ac h Fm. After a decay of 80 –100 ms, aweak ‘probe’ flash is induced to r eopen the traps andyield F0. By controlling the intensity of the pump flashand the time-delay be tween t he pu mp and p robe flashes,more phys iological infor mation can b e r etrie ve d.
Pulse-Ampl itude-Mod ulation fluor ometry Pulse-amplitude-modulation (PAM) fluorometry is a variantof the P & P technique and was introduced to distin-guish between photochemical and nonphotochemicalquenching. Repeated intense flashes are used against abackground of low light to obtain Fm and F0. PAM aswell as P & P fluorometry are methods that are basedon multiple turnover rates. However, both these twomethods have limitations. PAM fluorometry providesonly variable fluorescence and some features of the PSUsuch as the functional absorption cross-section (s PS II )cannot be described, while P&P fluorometry is tooslow to follow the dynamic changes in PSII.
Fast repetit ion rate fluor ometry This fluoro metryhas be en devel oped to overcome the defici encies ofits pr edecessors . The instrum ent is based on highfreque ncy emissi on of blue ligh t flashes at subsat urat-ing energy, which gradually saturates the PS II reac-tion cente rs withi n a single turno ver. The raterequi red to satur ate the PS II reaction centr e is propo r-tiona l to the functional absorpt ion cross-se ction of
Encyclopedia of Inland Water
PSII ( sPS II). After reachi ng the satur ation leve l ( Fm ),relaxa tion fla shes with longer interflash delay areemitted to reopen the react ion centre. The rate ofrelaxa tion is rel ated to the turnove r rate of PSII ( t ).The satur ation protocol is set to pro vide 50–10 0satur ation fla shes per sequenc e, followed by 20 relax-ation flashes with a longer time-delay between theflashes to allow reoxidation.
Primary productivity estimates can be derived fromvariable fluorescence. By introducing the photosyn-thetic quotient (PQ) in the equation, the rate of car-bon fixation can be obtained to qualitatively predictphotosynthetic rates from changes in the quantumyield of fluorescence.
Physiology of Photosynthesis
Photosynthesis involves a series of reactions that startwith light absorption, which is followed by synthesisof intermediate energy-conserving compounds, finallyleading to CO2 fixation in the Calvin cycle. Althougheqn [3] cap tures the esse nce of phot osynthe sis, it is anincomplete model because of the Mehler reaction,photorespiration, allocation of photosynthate to pro-tein synthesis, and incorporation of carbon by non-photosynthetic reactions. Hence, interpretation ofproductivity measurements in freshwaters is difficult,dependent on the technique used, and further compli-cated by the complex and variable composition ofnatural algal assemblages.
Light Harvesting
Photosynthesis begins with photoabsorption by pig-ments located in the thylakoid membranes. The onlypigment present in all oxygen producing phytoplank-ton is Chl-a and it is the essential pigment required forphotosynthesis. Most light absorption, however, isdue to accessory pigments such as other chlorophyllspecies, carotenoids, or phycobilins. Major differ-ences in pigment composition among higher taxo-nomic groups can significantly affect the ability ofphytoplankton to absorb light. Chl-a-specific lightabsorption is not only affected by the pigment com-plement, but also by cell size and intracellular pig-ment concentration.
Photosynthetic electron transfer (PET), linking oxy-gen evolution to reductant production, is located inlarge membrane located complexes harboring Photo-system I (PSI) and Photosystem II (PSII). The struc-tural complexity of the PET chain allows considerableversatility in electron flow to match varying require-ments of nutrient transport, photo-, and biosynthesis.The ratio of PSII:PSI however, remains ambiguous innature because of variability among algal divisions
s (2009), vol. 1, pp. 210-218
Algae (Incl. Cyanobacteria) _ Phytoplankton Productivity 213
Author's personal copy
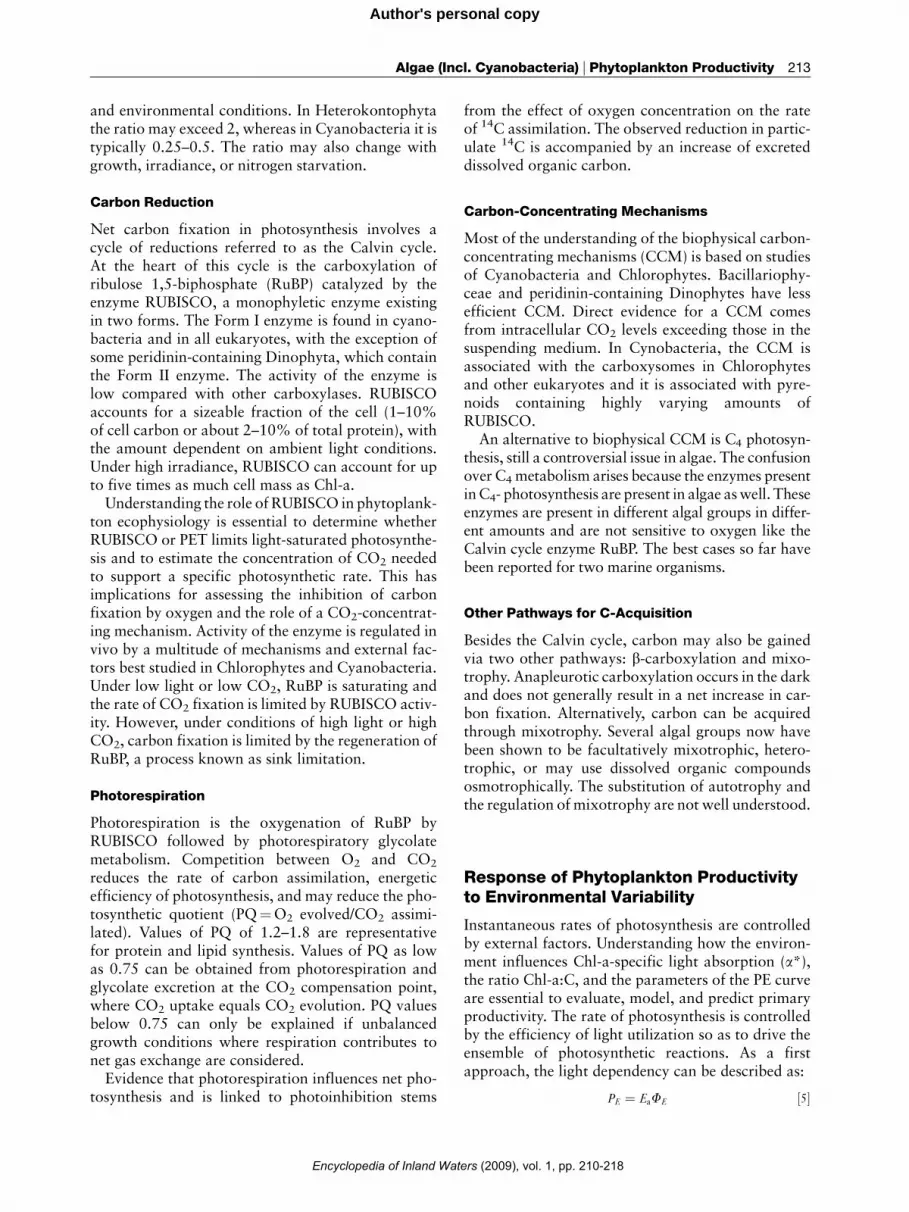
and environmental conditions. In Heterokontophytathe ratio may exceed 2, whereas in Cyanobacteria it istypically 0.25–0.5. The ratio may also change withgrowth, irradiance, or nitrogen starvation.
Carbon Reduction
Net carbon fixation in photosynthesis involves acycle of reductions referred to as the Calvin cycle.At the heart of this cycle is the carboxylation ofribulose 1,5-biphosphate (RuBP) catalyzed by theenzyme RUBISCO, a monophyletic enzyme existingin two forms. The Form I enzyme is found in cyano-bacteria and in all eukaryotes, with the exception ofsome peridinin-containing Dinophyta, which containthe Form II enzyme. The activity of the enzyme islow compared with other carboxylases. RUBISCOaccounts for a sizeable fraction of the cell (1–10%of cell carbon or about 2–10% of total protein), withthe amount dependent on ambient light conditions.Under high irradiance, RUBISCO can account for upto five times as much cell mass as Chl-a.Understanding the role of RUBISCO in phytoplank-
ton ecophysiology is essential to determine whetherRUBISCO or PET limits light-saturated photosynthe-sis and to estimate the concentration of CO2 neededto support a specific photosynthetic rate. This hasimplications for assessing the inhibition of carbonfixation by oxygen and the role of a CO2-concentrat-ing mechanism. Activity of the enzyme is regulated invivo by a multitude of mechanisms and external fac-tors best studied in Chlorophytes and Cyanobacteria.Under low light or low CO2, RuBP is saturating andthe rate of CO2 fixation is limited by RUBISCO activ-ity. However, under conditions of high light or highCO2, carbon fixation is limited by the regeneration ofRuBP, a process known as sink limitation.
Photorespiration
Photorespiration is the oxygenation of RuBP byRUBISCO followed by photorespiratory glycolatemetabolism. Competition between O2 and CO2
reduces the rate of carbon assimilation, energeticefficiency of photosynthesis, and may reduce the pho-tosynthetic quotient (PQ¼O2 evolved/CO2 assimi-lated). Values of PQ of 1.2–1.8 are representativefor protein and lipid synthesis. Values of PQ as lowas 0.75 can be obtained from photorespiration andglycolate excretion at the CO2 compensation point,where CO2 uptake equals CO2 evolution. PQ valuesbelow 0.75 can only be explained if unbalancedgrowth conditions where respiration contributes tonet gas exchange are considered.Evidence that photorespiration influences net pho-
tosynthesis and is linked to photoinhibition stems
Encyclopedia of Inland Wat
from the effect of oxygen concentration on the rateof 14C assimilation. The observed reduction in partic-ulate 14C is accompanied by an increase of excreteddissolved organic carbon.
Carbon-Concentrating Mechanisms
Most of the understanding of the biophysical carbon-concentrating mechanisms (CCM) is based on studiesof Cyanobacteria and Chlorophytes. Bacillariophy-ceae and peridinin-containing Dinophytes have lessefficient CCM. Direct evidence for a CCM comesfrom intracellular CO2 levels exceeding those in thesuspending medium. In Cynobacteria, the CCM isassociated with the carboxysomes in Chlorophytesand other eukaryotes and it is associated with pyre-noids containing highly varying amounts ofRUBISCO.
An alternative to biophysical CCM is C4 photosyn-thesis, still a controversial issue in algae. The confusionover C4metabolism arises because the enzymes presentinC4- photosynthesis are present in algae aswell. Theseenzymes are present in different algal groups in differ-ent amounts and are not sensitive to oxygen like theCalvin cycle enzyme RuBP. The best cases so far havebeen reported for two marine organisms.
Other Pathways for C-Acquisition
Besides the Calvin cycle, carbon may also be gainedvia two other pathways: b-carboxylation and mixo-trophy. Anapleurotic carboxylation occurs in the darkand does not generally result in a net increase in car-bon fixation. Alternatively, carbon can be acquiredthrough mixotrophy. Several algal groups now havebeen shown to be facultatively mixotrophic, hetero-trophic, or may use dissolved organic compoundsosmotrophically. The substitution of autotrophy andthe regulation of mixotrophy are not well understood.
Response of Phytoplankton Productivityto Environmental Variability
Instantaneous rates of photosynthesis are controlledby external factors. Understanding how the environ-ment influences Chl-a-specific light absorption (a*),the ratio Chl-a:C, and the parameters of the PE curveare essential to evaluate, model, and predict primaryproductivity. The rate of photosynthesis is controlledby the efficiency of light utilization so as to drive theensemble of photosynthetic reactions. As a firstapproach, the light dependency can be described as:
PE ¼ EaFE ½5�
ers (2009), vol. 1, pp. 210-218
214 Algae (Incl. Cyanobacteria) _ Phytoplankton Productivity
Author's personal copy
where PE is the photosynthetic rate at incident irradi-ance E, Ea is the light absorbed by the organism, andFE is the quantum yield at irradiance E. The absor-bed light is calculated from incident spectral irradi-ance E0(l) and a*:
Ea ¼ E0ðlÞ�� ½6�The quantum yield must be specifically related to a
product of the photochemical reaction. For oxygenicphotoautotrophs, this is usually oxygen evolved orcarbon fixed as discussed earlier; hence units forquantum yield are normally moles of O2 evolved orCO2 fixed per moles of photons absorbed.The photosynthesis–irradiance response (PE
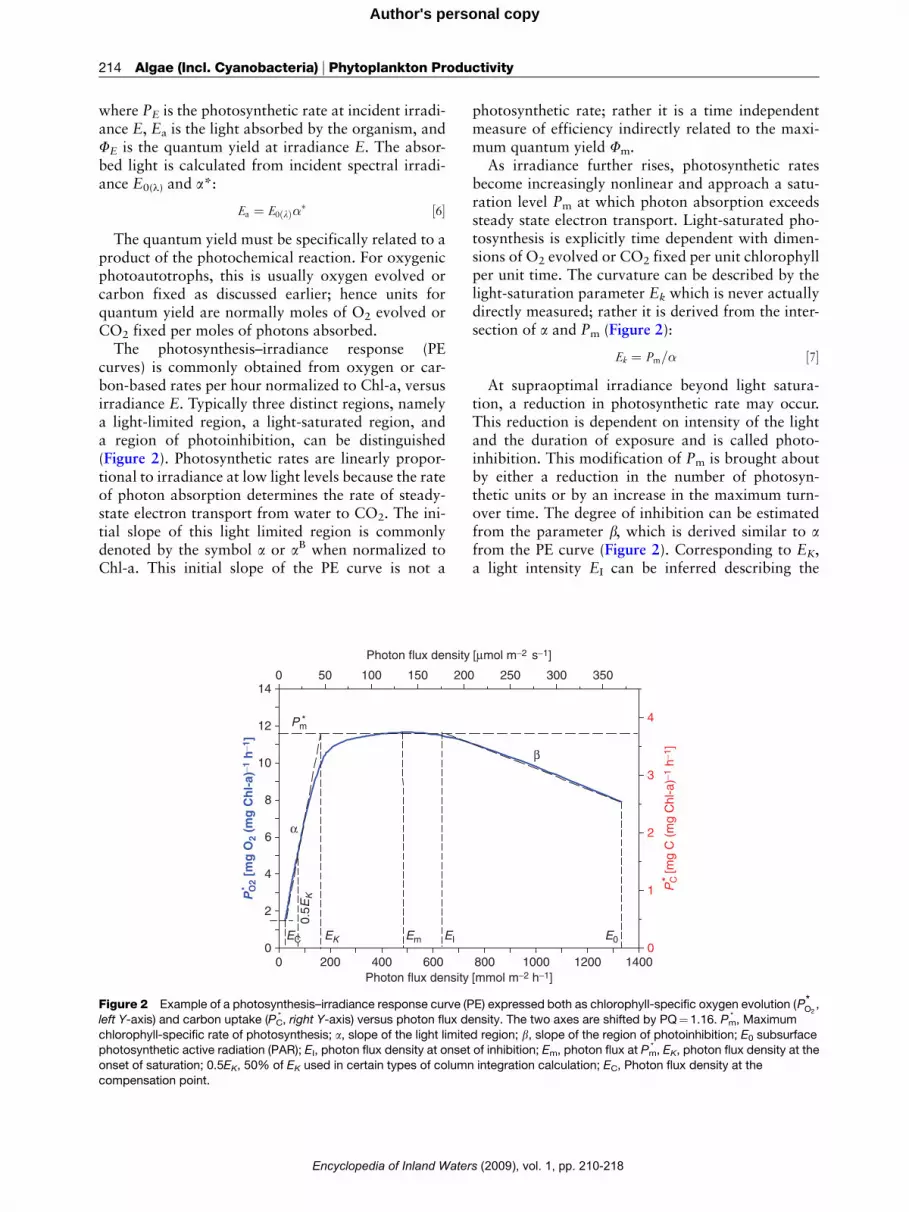
curves) is commonly obtained from oxygen or car-bon-based rates per hour normalized to Chl-a, versusirradiance E. Typically three distinct regions, namelya light-limited region, a light-saturated region, anda region of photoinhibition, can be distinguished(Figure 2). Photosynthetic rates are linearly propor-tional to irradiance at low light levels because the rateof photon absorption determines the rate of steady-state electron transport from water to CO2. The ini-tial slope of this light limited region is commonlydenoted by the symbol a or aB when normalized toChl-a. This initial slope of the PE curve is not a
Photon flux density
PO
2 [m
g O
2 (m
g C
hl-
a)−1
h−1
]
0
2
4
6
8
10
12
140 50 100 150 200
0 200 400 600
Photon flux density
EC EK Em EI
Pm*
α
0.5E
K
*
Figure 2 Example of a photosynthesis–irradiance response curve (P
left Y-axis) and carbon uptake (PC* , right Y-axis) versus photon flux d
chlorophyll-specific rate of photosynthesis; a, slope of the light limitephotosynthetic active radiation (PAR); EI, photon flux density at onset
onset of saturation; 0.5EK, 50% of EK used in certain types of column
compensation point.
Encyclopedia of Inland Water
photosynthetic rate; rather it is a time independentmeasure of efficiency indirectly related to the maxi-mum quantum yield Fm.
As irradiance further rises, photosynthetic ratesbecome increasingly nonlinear and approach a satu-ration level Pm at which photon absorption exceedssteady state electron transport. Light-saturated pho-tosynthesis is explicitly time dependent with dimen-sions of O2 evolved or CO2 fixed per unit chlorophyllper unit time. The curvature can be described by thelight-saturation parameter Ek which is never actuallydirectly measured; rather it is derived from the inter-section of a and Pm (Figure 2):
Ek ¼ Pm=� ½7�At supraoptimal irradiance beyond light satura-
tion, a reduction in photosynthetic rate may occur.This reduction is dependent on intensity of the lightand the duration of exposure and is called photo-inhibition. This modification of Pm is brought aboutby either a reduction in the number of photosyn-thetic units or by an increase in the maximum turn-over time. The degree of inhibition can be estimatedfrom the parameter b, which is derived similar to afrom the PE curve (Figure 2). Corresponding to EK,a light intensity EI can be inferred describing the
[mmol m−2 h−1]
250 300 350
800 1000 1200 1400
[μmol m−2 s−1]P
C* [m
g C
(m
g C
hl-a
)−1
h−1 ]
0
1
2
3
4
E0
β
E) expressed both as chlorophyll-specific oxygen evolution (P*O2,
ensity. The two axes are shifted by PQ¼1.16. Pm* , Maximum
d region; b, slope of the region of photoinhibition; E0 subsurfaceof inhibition; Em, photon flux at Pm
* , EK, photon flux density at the
integration calculation; EC, Photon flux density at the
s (2009), vol. 1, pp. 210-218

Algae (Incl. Cyanobacteria) _ Phytoplankton Productivity 215
Author's personal copy
onset of inhibition. A number of further light inten-sities can be deduced from PE curves as indicated inthe caption to Figure 2. Most notable is the compen-sation irradiance (EC) when net gas exchangebecomes zero because R equals GPP. The compensa-tion irradiance can be related to aChl and chlorophyllnormalized respiration:
EC ¼ RChl=�Chl ½8�The irradiance at the compensation point is not
fixed but varies primarily with respiration and to alesser extent with aChl, both of which depend onenvironmental conditions.Physiological acclimation of the PE parameter aChl
appears to follow several simple rules under condi-tions of balanced growth (Figure 3). As a first approx-imation aChl can be considered constant, with changesto the carbon-specific light-saturated rate ðPc
mÞ induc-ing changes in the ratio Chl-a:C. At constant temper-ature and when cells are nutrient-repleted, maximumcarbon-specific rate is largely independent of irradi-ance, but is highly correlated with maximum specificgrowth rate, mm and temperature because temperatureaffects enzymatic reactions. The light-saturated rateoften is also determined by CO2 availability.Several empirical mathematical descriptions of
the PE curve exist. The various formulations mainly
PmC
aC
hl
Relative irradiance(E/Ek)
1010.1
Ch
l-a
: C
Relative growth rate(μ/μm)
0.0 0.5 1.0
Temperature(°C)
0 10 20 30
Figure 3 Schematic relationships of photoacclimation of Pcm,
aChl, and Chl:C for light (left), nutrient (center), or temperature
(right) limitations.
Encyclopedia of Inland Wat
differ in the abruptness of the transition from light-limited to light-saturated photosynthesis. Some mod-els include photoinhibition.
One simple mechanistic interpretation using theterms and notations mentioned already is the expo-nential function:
PChl ¼ PChlm ½1� exp ð��ChlE=PChl
m Þ� ½9�
Productivity in the ‘Real’ World
Let us now consider photosynthesis in a planktonicsystem in a water column, a planar representation ofsurface area projected to a depth z. Light (E) incidenton the water surface is attenuated with depth,approximately following an exponential function(Figure 4). We define a depth zeu equal to the 1%light intensity as the base of the euphotic zone. Thisis the portion of the water column supporting pri-mary production in most instances. In some cases,extremely light-adapted assemblages can survive atmuch lower photon flux densities. The euphoticdepth is often confused with the compensationdepth (zc), defined as the depth at which daily grossproductivity balances respiratory losses over a day.Above zc, net photosynthesis is possible; below zc thebalance of oxygen production and consumption isnegative. The average compensation depth is depen-dent on the surface light intensity E0 and can behighly variable; it may however, frequently corre-spond to the euphotic depth. If the portion of thewater column mixed by wind (zmix) extends beyondthe euphotic zone, a critical depth (zcr) can be defined,where integral net photosynthesis balances integralrespiratory losses (Figure 4).
Also in Figure 4, an idealized daily integrated pro-file of photosynthetic rates is presented with algalbiomass assumed to be homogeneous, and thereforeunimportant to the shape of the curve. At the surface,photosynthetic rates are typically depressed as a man-ifestation of photoinhibition, which, at least partly, isan artifact of in situ methodology. Common methodskeep algae constantly at high irradiance over pro-longed periods of time, which otherwise would floatfreely through the light gradient. Rates rise to Pm
lower in the column and then decline monotonical-ly as light becomes limiting, representing the low irra-diance-dependent region of the PE curve. Respirationlosses (RP) are assumed to be constant throughout thewater column. Traditionally, respiration of the pho-toautotrophs has been assumed to be 10% of themaximum photosynthetic rate, and independentof irradiance. Many freshwater studies however,
ers (2009), vol. 1, pp. 210-218

216 Algae (Incl. Cyanobacteria) _ Phytoplankton Productivity
Author's personal copy
indicate that respiratory losses relative to Pm are var-iable. Additionally, the euphotic zone is influencedby temperature, supraoptimal light levels, nutrientlimitations, nonhomogenous distribution of phyto-plankton biomass, or even compositional changes ofthe assemblage within the water column. Planktonrespiration on average increases with Chl-a, totalphosphorus (TP), and dissolved organic carbon(DOC) concentrations. Accurate measurements ofRP are one of the biggest problem in estimations ofprimary production, and will also affect the deter-mination of the compensation depth as well as thecritical depth.
zmix
ZC= compen
zeu
1% light inte
RP PN
PG
EK
Zcr= critical
Figure 4 Conceptual diagram showing a schematic vertical profile
and attenuation of irradiance (E ) in a hypothetical lake. Maximum ph
indicated. The regions of photoinhibition, light saturation, and light limthe euphotic zone (zeu), equal to 1% light intensity, the compensation
zone (zmix) are given.
Photosynthetic rate
Dep
th [m
]
00 1 2 3
2
4
6
8
10
12
14
16
0 100 200.0
0.2
0.4
0.6
0.8
1.0
Figure 5 Examples of vertical productivity profiles.
Encyclopedia of Inland Water
Depending on the composition and vertical distri-bution of phytoplankton biomass, vertical profiles ofphytoplankton productivity can substantially deviatefrom the schematic profile shown in Figure 4. Threeexamples are depicted in Figure 5. Deep chlorophyllmaxima of various types of algae, such as picoplank-ton, Cyanobacteria etc., can produce secondary peaksof productivity at a greater depth. Turbid shallowlakes often do not show photoinhibition at the sur-face and have steep, compressed vertical profiles.High mountain lakes may have profiles reaching Pm
near the sediment because motile phytoplanktonspecies dominate, which tend to avoid large UV
sation depth [PG= RP]
nsity
Pm
E
Inhibition
Saturation
Limitation
depth
zRPPN =
0∫
z
0∫
of gross-photosynthesis (PG), phytoplankton respiration (RP),
otosynthetic (Pm) and net-photosynthetic rates (PN) are
itation are indicated on the right-hand side. The depth ofdepth (zc), and the critical depth (zcr) as well as the mixing
[mg C m−3 h−1]
0 300 0 1 2 3 4 50
2
4
6
8
s (2009), vol. 1, pp. 210-218

Algae (Incl. Cyanobacteria) _ Phytoplankton Productivity 217
Author's personal copy
doses associated to the high photon flux at such ele-vations (Figure 5). Such ‘irregular’ types of verticalprofiles cannot be transferred to PE curves; hence,physiologically meaningful parameters are extremelydifficult to deduce. Moreover, these profiles cannot bedescribed in simple mathematical terms, and model-ing therefore is complicated if not impossible.
Photosynthetic rate [mg C m−3 h−1]
0.01 0.1 1 10 100 1000 10 000
Dep
th [m
]
0
5
10
15
20
25
30
100
Daily, Seasonal, and InterannualVariability of Production
One of the major determinants of variability in photo-synthetic response is the daily variation in irradiance.Both the light-saturated and the light-limited chloro-phyll-specific photosynthetic rates are generally ele-vated during the photoperiod. The correlationbetween these two parameters suggests an increaseeither in the number of active reaction centers or intheir turnover rate. The dial irradiance cycle is thenatural synchronizing agent for algal populations inthe environment constraining growth rates. Algalassemblages must cope with short term changes inirradiance during a day, and acclimate photosyntheticrates to variations from day to day.Superimposed is the annual cycle of solar radiation,
which depends on latitude and altitude. Dependingon the geographical position, annual variation ofirradiance ranges from moderate (near the equator)to very pronounced (at high latitudes). Accordingly,the magnitude of primary production strongly varieswith climatic regions (Table 1).
(a)
0.01 0.1 1 10 100
Specific photosynthetic rate [mg C mg Chl-a−1 h−1]
pth
0
2
4
Assessment of Primary Production atthe Global Scale
Several thousand vertical profiles of daily integratedphotosynthetic rates have been obtained worldwidefrom many different freshwater ecosystems. Verticalprofiles of photosynthetic rates from a large numberof lakes using different measurement techniques are
Table 1 Ranges of average daily and annual net-productivity inecosystems of the world
Ecosystem Mean dailyproduction(mg C m�2 day�1)
Average annualproduction(g Cm�2 year�1)
Tropical lakes 100–7600 30–2500
Temperate lakes 5–3600 2–950
Arctic lakes 1–170 <1–35Antarctic lakes 1–35 1–10
Alpine lakes 1–900 <1–250
Temperate rivers <1–3000 <1–650
Tropical rivers <1–24000 1–5000
Encyclopedia of Inland Wat
summarized and expressed as volumetric carbonuptake per day in Figure 6(a). The profiles display ahigh degree of variability from as low as 0.1mgC m�3 day�1 to way over 1000mg C m�3 day�1.The range in freshwaters, therefore, is at least fourorders of magnitude while it is only three in the sea.This is not surprising, considering the wide variety oflake types from extremely nutrient poor (ultraoligo-trophic) to nutrient rich (hypertrophic), from veryshallow lakes (< 2m) to deep lakes (>200m). Simi-larly, average daily column productivity (SSP) ranges
(b)
Opt
ical
de
6
8
10
12
1% L.I.
Figure 6 One hundred vertical profiles of carbon fixation as a
function of physical depth (a) and normalized to chlorophyll-a,
and optical depth (b). One unit of optical depth is equal to ahalving of light intensity.
ers (2009), vol. 1, pp. 210-218
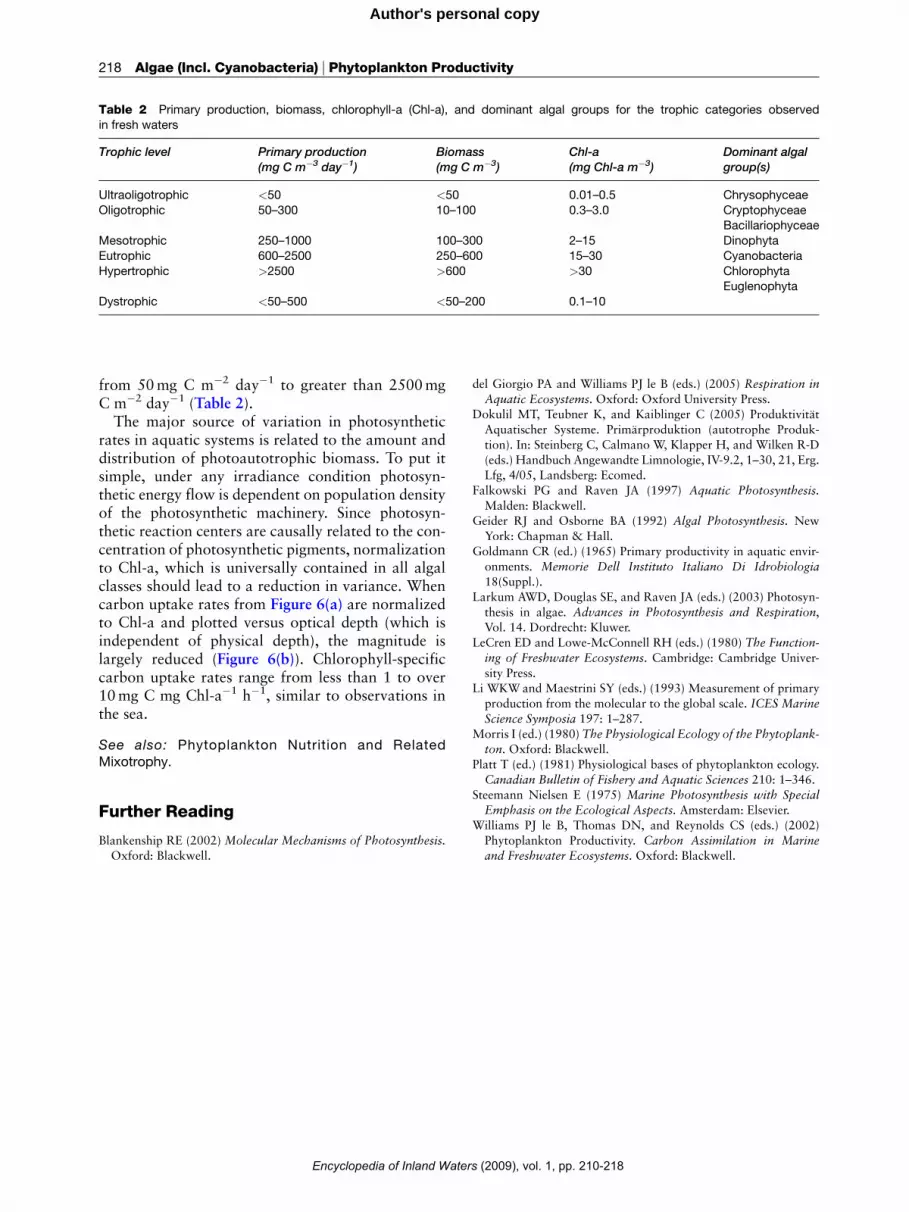
Table 2 Primary production, biomass, chlorophyll-a (Chl-a), and dominant algal groups for the trophic categories observed
in fresh waters
Trophic level Primary production(mg C m�3 day�1)
Biomass(mg C m�3)
Chl-a(mg Chl-a m�3)
Dominant algalgroup(s)
Ultraoligotrophic <50 <50 0.01–0.5 Chrysophyceae
Oligotrophic 50–300 10–100 0.3–3.0 CryptophyceaeBacillariophyceae
Mesotrophic 250–1000 100–300 2–15 Dinophyta
Eutrophic 600–2500 250–600 15–30 Cyanobacteria
Hypertrophic >2500 >600 >30 ChlorophytaEuglenophyta
Dystrophic <50–500 <50–200 0.1–10
218 Algae (Incl. Cyanobacteria) _ Phytoplankton Productivity
Author's personal copy
from 50mg C m�2 day�1 to greater than 2500mgC m�2 day�1 (Table 2).The major source of variation in photosynthetic
rates in aquatic systems is related to the amount anddistribution of photoautotrophic biomass. To put itsimple, under any irradiance condition photosyn-thetic energy flow is dependent on population densityof the photosynthetic machinery. Since photosyn-thetic reaction centers are causally related to the con-centration of photosynthetic pigments, normalizationto Chl-a, which is universally contained in all algalclasses should lead to a reduction in variance. Whencarbon uptake rates from Figure 6(a) are normalizedto Chl-a and plotted versus optical depth (which isindependent of physical depth), the magnitude islargely reduced (Figure 6(b)). Chlorophyll-specificcarbon uptake rates range from less than 1 to over10mg C mg Chl-a�1 h�1, similar to observations inthe sea.
See also: Phytoplankton Nutrition and RelatedMixotrophy.
Further Reading
Blankenship RE (2002) Molecular Mechanisms of Photosynthesis.Oxford: Blackwell.
Encyclopedia of Inland Water
del Giorgio PA and Williams PJ le B (eds.) (2005) Respiration inAquatic Ecosystems. Oxford: Oxford University Press.
Dokulil MT, Teubner K, and Kaiblinger C (2005) Produktivitat
Aquatischer Systeme. Primarproduktion (autotrophe Produk-
tion). In: Steinberg C, Calmano W, Klapper H, and Wilken R-D(eds.) Handbuch Angewandte Limnologie, IV-9.2, 1–30, 21, Erg.
Lfg, 4/05, Landsberg: Ecomed.
Falkowski PG and Raven JA (1997) Aquatic Photosynthesis.Malden: Blackwell.
Geider RJ and Osborne BA (1992) Algal Photosynthesis. New
York: Chapman & Hall.
Goldmann CR (ed.) (1965) Primary productivity in aquatic envir-
onments. Memorie Dell Instituto Italiano Di Idrobiologia18(Suppl.).
Larkum AWD, Douglas SE, and Raven JA (eds.) (2003) Photosyn-
thesis in algae. Advances in Photosynthesis and Respiration,Vol. 14. Dordrecht: Kluwer.
LeCren ED and Lowe-McConnell RH (eds.) (1980) The Function-ing of Freshwater Ecosystems. Cambridge: Cambridge Univer-
sity Press.Li WKWand Maestrini SY (eds.) (1993) Measurement of primary
production from the molecular to the global scale. ICES MarineScience Symposia 197: 1–287.
Morris I (ed.) (1980) The Physiological Ecology of the Phytoplank-ton. Oxford: Blackwell.
Platt T (ed.) (1981) Physiological bases of phytoplankton ecology.
Canadian Bulletin of Fishery and Aquatic Sciences 210: 1–346.Steemann Nielsen E (1975) Marine Photosynthesis with Special
Emphasis on the Ecological Aspects. Amsterdam: Elsevier.
Williams PJ le B, Thomas DN, and Reynolds CS (eds.) (2002)
Phytoplankton Productivity. Carbon Assimilation in Marineand Freshwater Ecosystems. Oxford: Blackwell.
s (2009), vol. 1, pp. 210-218