productivity in exploration drilling
TRANSCRIPT
1
Productivity in Exploration Drilling1
by
Petter Osmundsen*, Kristin Helen Roll** and Ragnar Tveterås**
* University of Stavanger / Norwegian School of Economics and Bus. Adm.
** University of Stavanger / International Research Institute of Stavanger
Lead author: Petter Osmundsen, Professor, Department of industrial economics and risk management,
University of Stavanger, NO-4036 Stavanger, Norway. Email: [email protected]. Tel: +47 51 83
15 68. Mobile: +47 99 62 51 43. Home page:
http://www5.uis.no/kompetansekatalog/visCV.aspx?ID=08643&sprak=BOKMAL
Abstract
Recently, we have seen falling oil prices combined with sticky costs at a high level in the
petroleum industry. This causes project postponements, thus challenging reserve replacement of
oil companies and security of supply for consumers. Costs are particularly high for drilling. High
rig rates are obviously important. In addition we experience a dramatic fall in drilling
productivity. This paper analyses the development in drilling productivity in exploration wells at
the Norwegian continental shelf. A unique dataset allows us to apply econometric analyses to
ascertain vital explanatory factors for variation in drilling productivity over time and between
different wells.
1 We would express our thanks for rewarding conversations with and comments on the article itself from a number of key specialists in oil the Norwegian Petroleum Directorate, oil companies, rig contractors and oil service enterprises.
2
1. Introduction
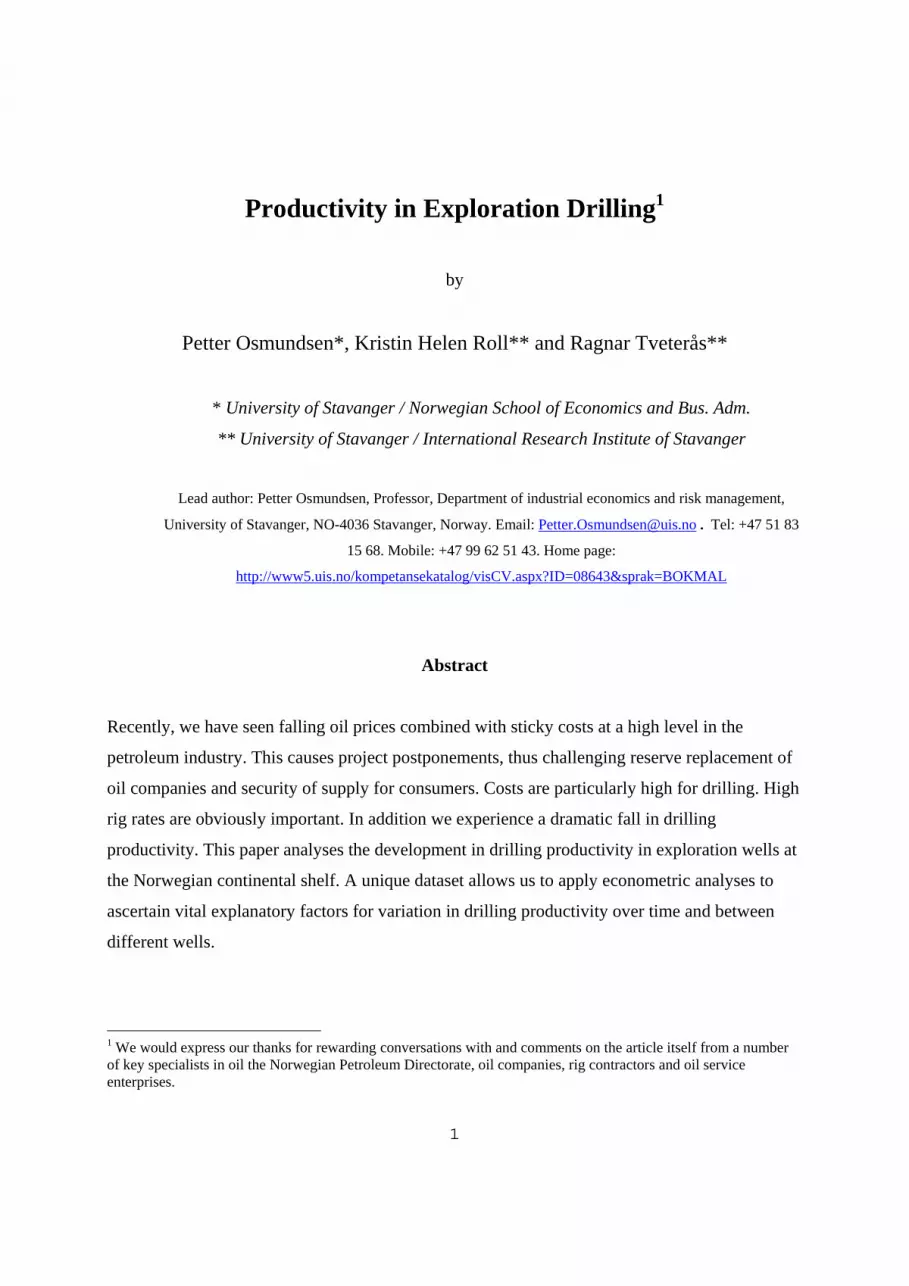
Rig hire and the cost of oil services are the dominant components in drilling expenses, as
illustrated in Figure 1 by a representative well. Drilling expenses have increased sharply in
recent years. Key causes of this increase include declining drilling productivity and higher rig
rates. Oil operations on the NCS - as in other petroleum provinces – have recently been
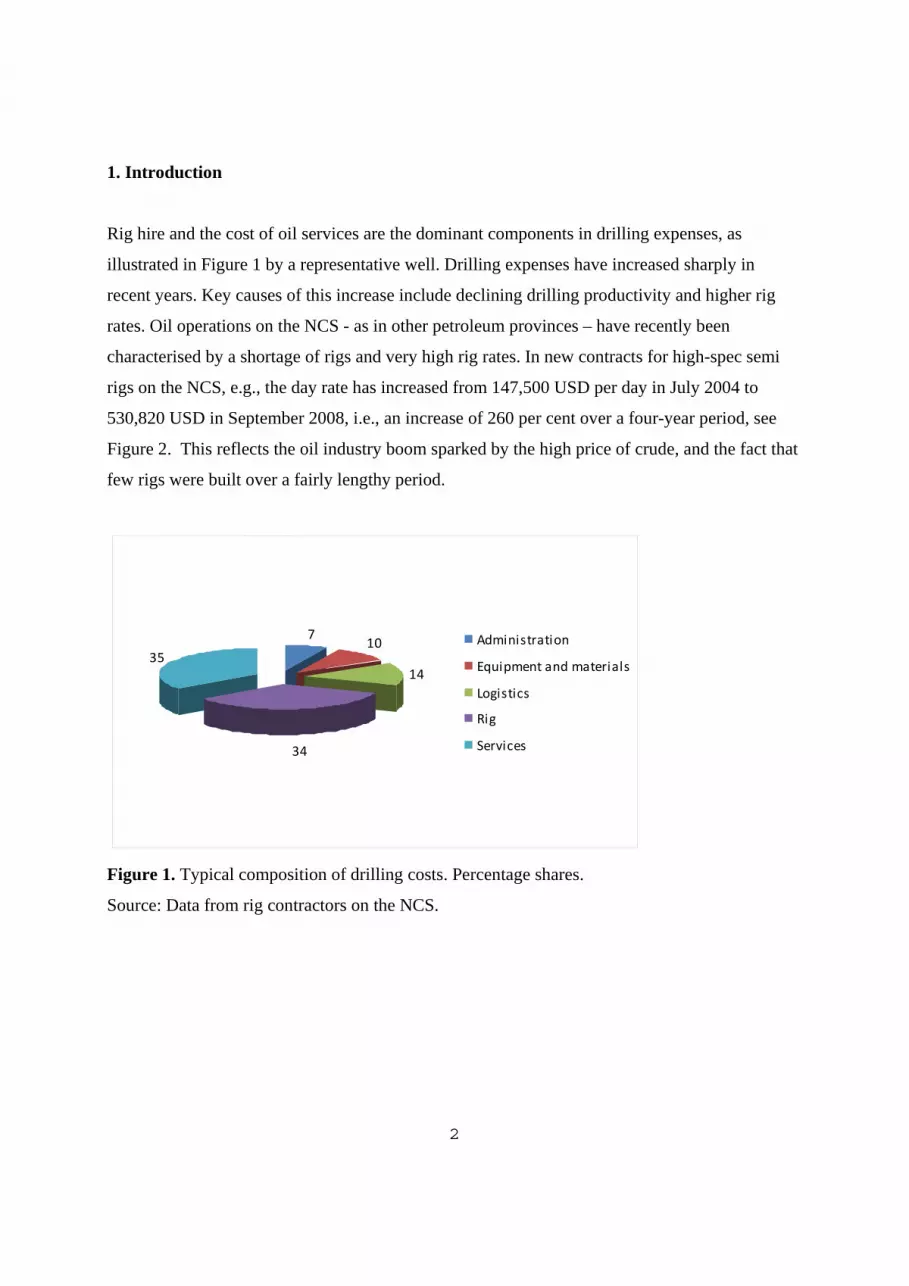
characterised by a shortage of rigs and very high rig rates. In new contracts for high-spec semi
rigs on the NCS, e.g., the day rate has increased from 147,500 USD per day in July 2004 to
530,820 USD in September 2008, i.e., an increase of 260 per cent over a four-year period, see
Figure 2. This reflects the oil industry boom sparked by the high price of crude, and the fact that
few rigs were built over a fairly lengthy period.
710
14
34
35Administration
Equipment and materials
Logistics
Rig
Services
Figure 1. Typical composition of drilling costs. Percentage shares.
Source: Data from rig contractors on the NCS.
3
Figure 2: Development in day rates for high-spec semi rigs operating on the NCS (new contracts), and high-spec jackups in North West Europe, from 2004 to 2008. Note from the diagram that there are not available data for new semi contracts mid 2008. Data source: ODS-Petrodata and North Sea Rig Report.
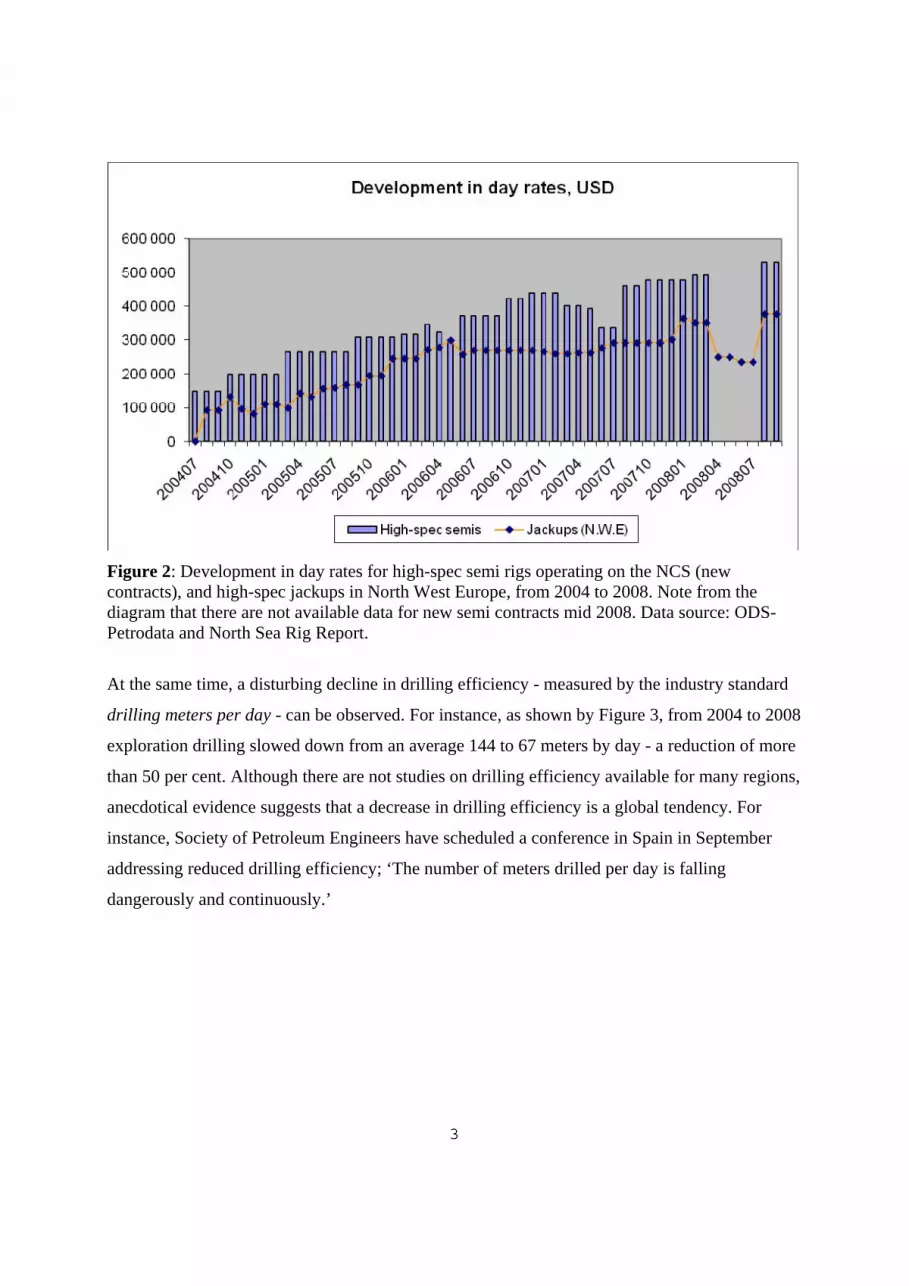
At the same time, a disturbing decline in drilling efficiency - measured by the industry standard
drilling meters per day - can be observed. For instance, as shown by Figure 3, from 2004 to 2008
exploration drilling slowed down from an average 144 to 67 meters by day - a reduction of more
than 50 per cent. Although there are not studies on drilling efficiency available for many regions,
anecdotical evidence suggests that a decrease in drilling efficiency is a global tendency. For
instance, Society of Petroleum Engineers have scheduled a conference in Spain in September
addressing reduced drilling efficiency; ‘The number of meters drilled per day is falling
dangerously and continuously.’
4
Figure 3: Average meters drilled per day. Exploration wells on the NCS, from 1966 to 2008. Annual number of wells in brackets. Black vertical lines indicate standard deviation. Data source: Norwegian Petroleum Directorate.
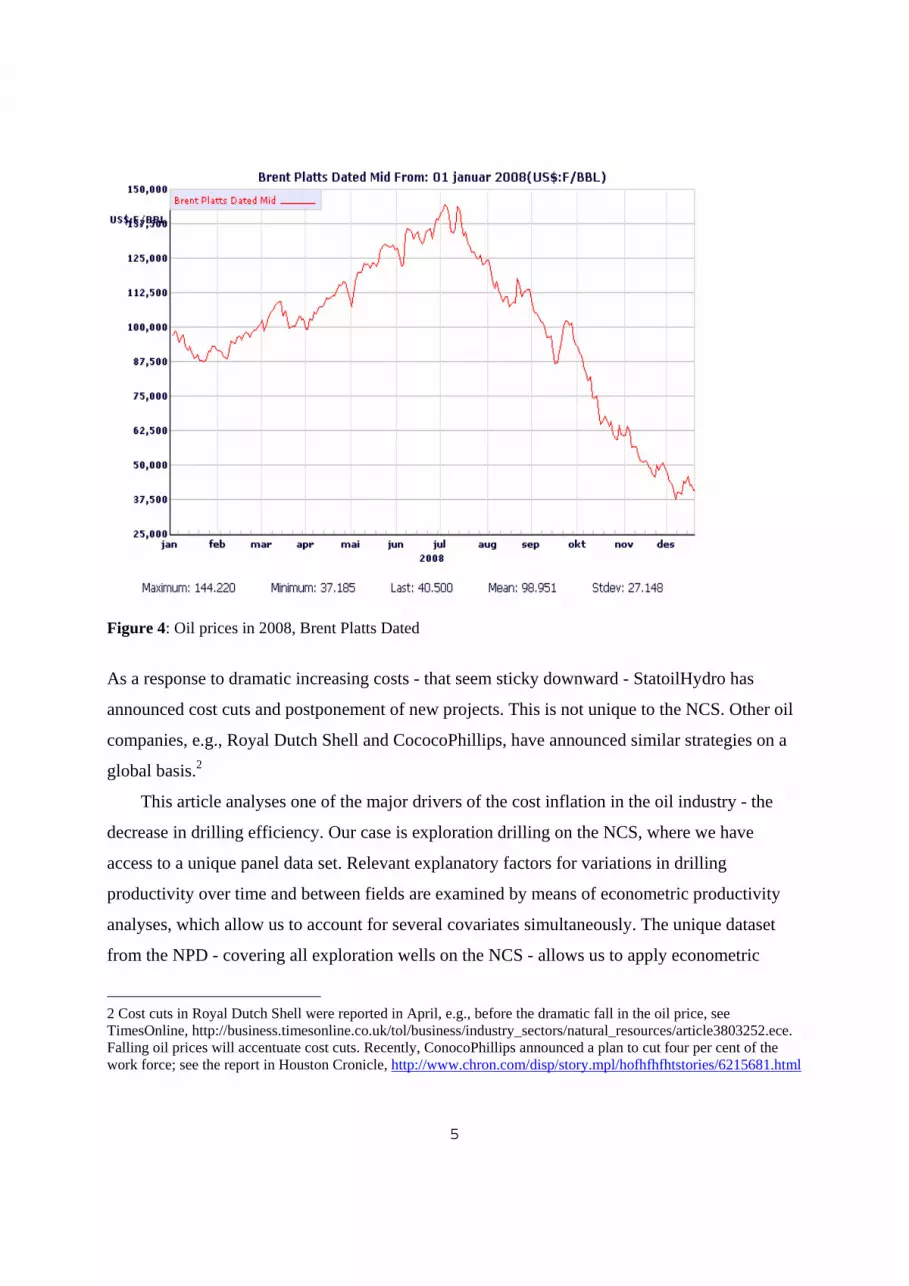
The combination of falling drilling efficiency and increased rig rates have led to a dramatic
increase in costs. Helge Lund, CEO of the major player at the NCS – the oil company
StatoilHydro - has referred to this as a ‘cost tsunami’. The oil companies could cope with the
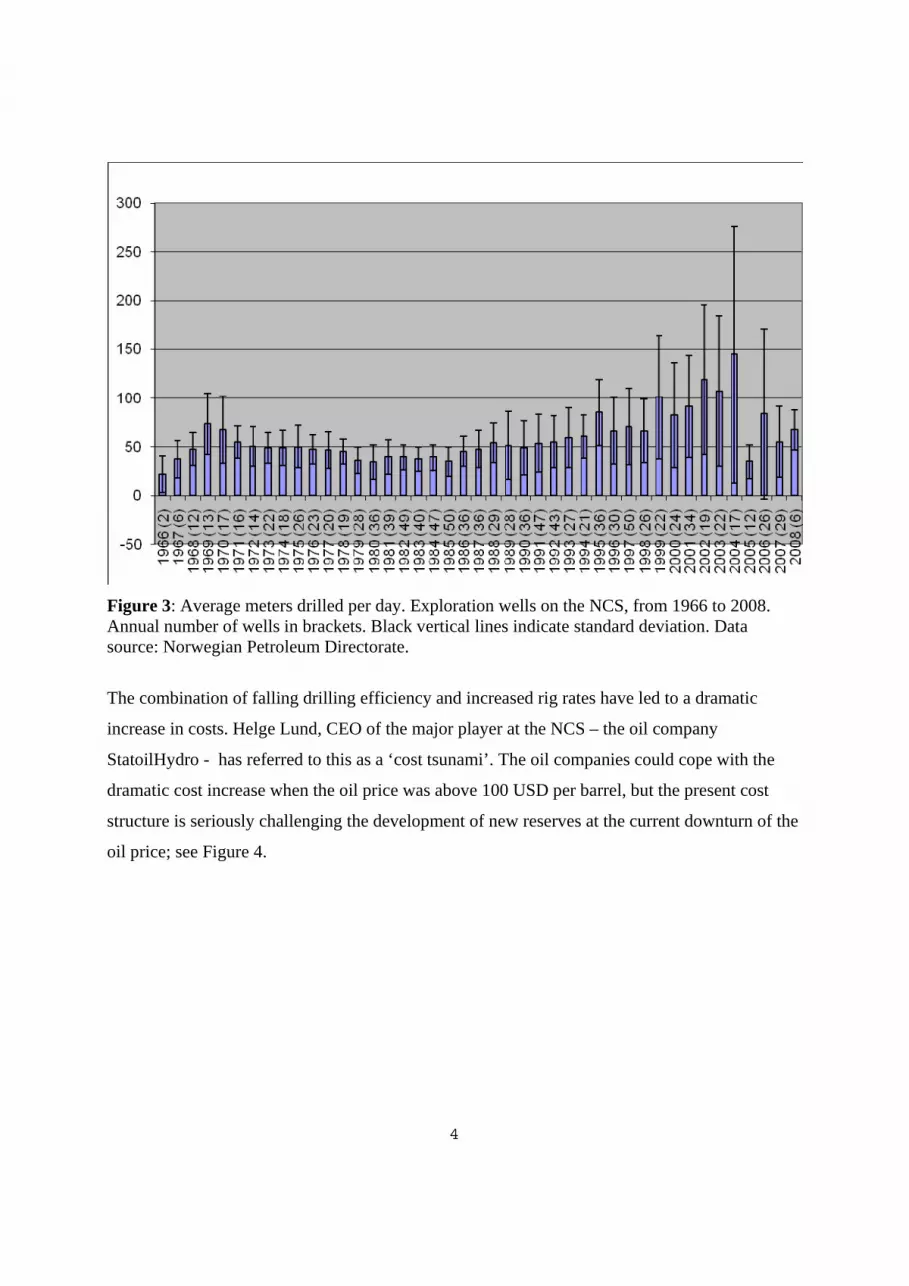
dramatic cost increase when the oil price was above 100 USD per barrel, but the present cost
structure is seriously challenging the development of new reserves at the current downturn of the
oil price; see Figure 4.
5
Figure 4: Oil prices in 2008, Brent Platts Dated
As a response to dramatic increasing costs - that seem sticky downward - StatoilHydro has
announced cost cuts and postponement of new projects. This is not unique to the NCS. Other oil
companies, e.g., Royal Dutch Shell and CococoPhillips, have announced similar strategies on a
global basis.2
This article analyses one of the major drivers of the cost inflation in the oil industry - the
decrease in drilling efficiency. Our case is exploration drilling on the NCS, where we have
access to a unique panel data set. Relevant explanatory factors for variations in drilling
productivity over time and between fields are examined by means of econometric productivity
analyses, which allow us to account for several covariates simultaneously. The unique dataset
from the NPD - covering all exploration wells on the NCS - allows us to apply econometric
2 Cost cuts in Royal Dutch Shell were reported in April, e.g., before the dramatic fall in the oil price, see TimesOnline, http://business.timesonline.co.uk/tol/business/industry_sectors/natural_resources/article3803252.ece. Falling oil prices will accentuate cost cuts. Recently, ConocoPhillips announced a plan to cut four per cent of the work force; see the report in Houston Cronicle, http://www.chron.com/disp/story.mpl/hofhfhfhtstories/6215681.html
6
analyses to ascertain the vital explanatory factors for variation in drilling productivity over time
and between different wells.
As dependent variable in the econometric analysis we use meter per day, which is the
industry standard for measuring drilling efficiency. We do want to emphasize that other
measures than drilling speed are necessary to identify value creation in drilling. In addition to
drilling speed, which affects the cost side, the amount of oil and gas which can be produced must
certainly be taken into account. It is not only a question of drilling fast, but also of drilling
correctly. A trade-off may need to be made here, at least in parts of the well path. Drilling speed
in exploration must not come at the expense of the primary objective of gathering well
information. When rigs are scarce, however, efficient utilization of rig time becomes particularly
important.
We analyse an extensive panel data set from the Norwegian Petroleum Directorate (NPD),
providing detailed information on all exploration wells drilled on the NCS in the time of
operation, i.e., from 1966 to 2008. The article also draws on a number of meetings, presentations
and conversations with key specialists in the NPD, oil companies, rig contractors and oil service
enterprises.
2. Existing literature
In this section we discuss relevant studies and position our paper in the literature. It seems like
the literature analyzing recent developments in exploration drilling productivity and underlying
causes is fairly limited, particularly studies published in peer-reviewed journals.
Parts of the dataset on exploration drilling on the NCS that is employed in this paper has
been analysed previously, to ascertain the determinants of variations in the overall exploration
level and reserve generation. Mohn and Osmundsen (2008) specify and estimate an econometric
model of exploration and appraisal drilling for the NCS, having the number of wells as the
dependent variable, and with explanatory variables including the oil price, cumulative
discoveries and open exploration acreage. In Mohn (2008) the dataset is used to analyse the
generation of oil and gas reserves from exploration, having drilling efforts, drilling success and
average discovery size as endogenous variables. Petroleum reserve additions per unit of drilling
effort has also been analysed previously on US data by Iledare and Pulsipher (1999) and on
7
British data by Kemp and Kasim (2006). Note that our approach is complementary in that we
analyse productivity at a different level. A full economic approach would be to examine the net
present value of exploration activity. To do so one would have to account for the quality and
future value of the volumes of the discovered oil and gas, which of course is hard to achieve. The
common approach, therefore, is to analyse the volumes of oil and gas that are added. We move
even farther up the value chain by analyzing a purely technical drilling efficiency, i.e., the metres
drilled per day, and ascertain how this measure is affected by economic and technical
parameters. Meters drilled per day is the standard key performance parameter in drilling. Our
rationale for choosing this approach is that a dramatic drop in meters per day - combined with
very high rig rates - is currently perceived by oil companies as one of the main challenges to
exploration drilling on the NCS. The maturity of the Norwegian shelf and small discovery sizes
is certainly challenging. However, success rates of drilling have been very high on the NCS over
the last years, and although discovery sizes are considerably down many of the discoveries are
economic to develop by tying in to existing infrastructure. Surging drilling costs, however, are
now seriously challenging the economics of exploration drilling. Accordingly, there is much
focus in the industry as to the underlying factors that determine drilling speed.
Kellogg (2007) empirically examines the importance of relationship-specific learning using
high-frequency data from onshore oil and gas drilling in Texas. He uses the time necessary to
drill a well as the measure of drilling productivity, accounting for the depth of the well being
drilled. He argues that the measure of drilling speed parallels the way producers and engineers
actually view drilling efficiency. The analyses show that the joint productivity of a lead firm and
its drilling contractor is enhanced significantly as they accumulate experience working together.
Snead (2005) analyses the increased role of deep drilling in Oklahoma. His descriptive
analysis of the relationship between well costs and well depth suggests that there is an
exponential increase in average well costs per feet as depth increases. In addition to a decline in
productivity this also implies that exploration becomes more capital intensive as well depth
increases. On the other hand, there is a potential payoff from deep drilling as the average gas
production from deep wells has been much higher than for shallow wells.
As drilling operations usually are subject to outsourcing, there is a strand of literature on
drilling and oil service contracts that shed light on drilling efficiency. Corts (2000) describes the
trade-off between turnkey and day-rate contracts. Turnkey contracts give the rig contractor
8
stronger cost incentives and can cut drilling time and costs. The limited utilisation of turnkey
contracts for drilling is attributed by Corts in part to the multi-task problem - rewarding one
measurable dimension (metres drilled per day) can be at the expense of other important and hard-
to-measure quality indicators such as efficient reservoir drainage and information gathering.
Corts and Singh (2004) show that repeat contracts between an oil company and a drilling
contractor led increasingly to the abandonment of the turnkey model in favour of day rates. They
explain this by the build-up of relationships and trust, which reduces the incentive problems and
thereby the need for high incentive intensity. Osmundsen et al. (2008) describe and analyse
incentives for drilling contractors on the NCS. These are directly represented by the
compensation formats utilised in the present and in the consecutive drilling contracts, which are
analysed. The paper also analyses incentives are indirectly provided by the evaluation criteria
that oil companies use for awarding drilling assignments. An analogous study for oil service
contractors on the NCS is provided in Osmundsen et al. (2009). For a discussion of the
relationship between health, safety and the environment (HSE) and incentive systems in drilling,
see Osmundsen et al (2006).
3. Empirical specification and data
We estimate an econometric model of drilling productivity on a log-log form for the continuous
variables, which simplifies derivation of elasticities. The model is flexible in the sense that
continuous variables are specified as second-order and interacted variables, and will therefore
allow for a complete specification of substitution patterns among continues variables, i.e. we
have a translog type model. The model is on a general form specified as
(1) lnY = ΣiαilnXi + 0.5ΣiΣjαijlnXilnXj
+ αtt + αt2t2 + αt3t3 + ΣiαitlnXi·t
+ αOPlnOilPrice + αOP2lnOilPrice2
+ αWNCSlnWellsNCS + αWNSC2lnWellsNCS2
9
+ ΣrμrOilCoTyper + ΣsμsFacilityTypes + ΣeμeFacilityExperiencee
+ μDDiscovery + μWPurpose +μWBSWellboreStatusPA + ΣaμaAreaa,
where the dependent productivity variable, Y, is as previously mentioned, drilled meters per day
and represents drilling efficiency. X is continuous variables in the model, including well depth in
meters, water depth in meters, and well temperature. The terms with the time-trend variable t are
included to control for technological change. The “WellsNCS” variable is the total number of
exploration wells drilled in current year on the NCS, and is together with “OilPrice” (which is
lagged one year) a proxy for the supply and demand conditions in the drilling market. An
“OilCoType” dummy describes the type of oil company, with “mid caps am” and “three sisters”
as reference category, “rest” as dummy variable 1 and “mid caps euro” as dummy variable 2.
The “FacilityExperience” dummy variables control for drilling experience among drilling
facilities, where the facilities are separated in three groups based on their drilling experience on
NCS.3 A “FacilityType” dummy variable is included to control for the type of drilling rig. The
most common facility type is semisub steel, and this is the default category. Several
characteristics of the well are included in the model as dummy variables. The
“WellboreStatusPA” variable controls for the wellbore status of the well. Most of the well’s
status is plugged and abandoned (P&A). We also control for discovery status of the well through
the “Discovery” dummy variable, and the area where the well has been drilled by the “Area”
dummy variables. The wells are drilled in the three major offshore regions on the Norwegian
Continental Shelf – the North Sea, the Norwegian Sea and the Barents Sea. Finally, we control
for the “Purpose” the drilling of specifying if the well is a wildcat or appraisal.
3 If the drilling facility has drilled less than 10 times at NCS over the data period it is calcified as less experienced,
between 10-30 times intermediate experienced, and above 30 times much experienced.
10
Our data set is retrieved from the data bases of the Norwegian Petroleum Directorate, who
has collected and processed information and statistics on Norwegian oil and gas activities since
the early 1970s. We have time series for all variables over the period 1965-2008, split between
the three major offshore regions on the Norwegian Continental Shelf – the North Sea, the
Norwegian Sea and the Barents Sea. The long time span of our data allows us to account for
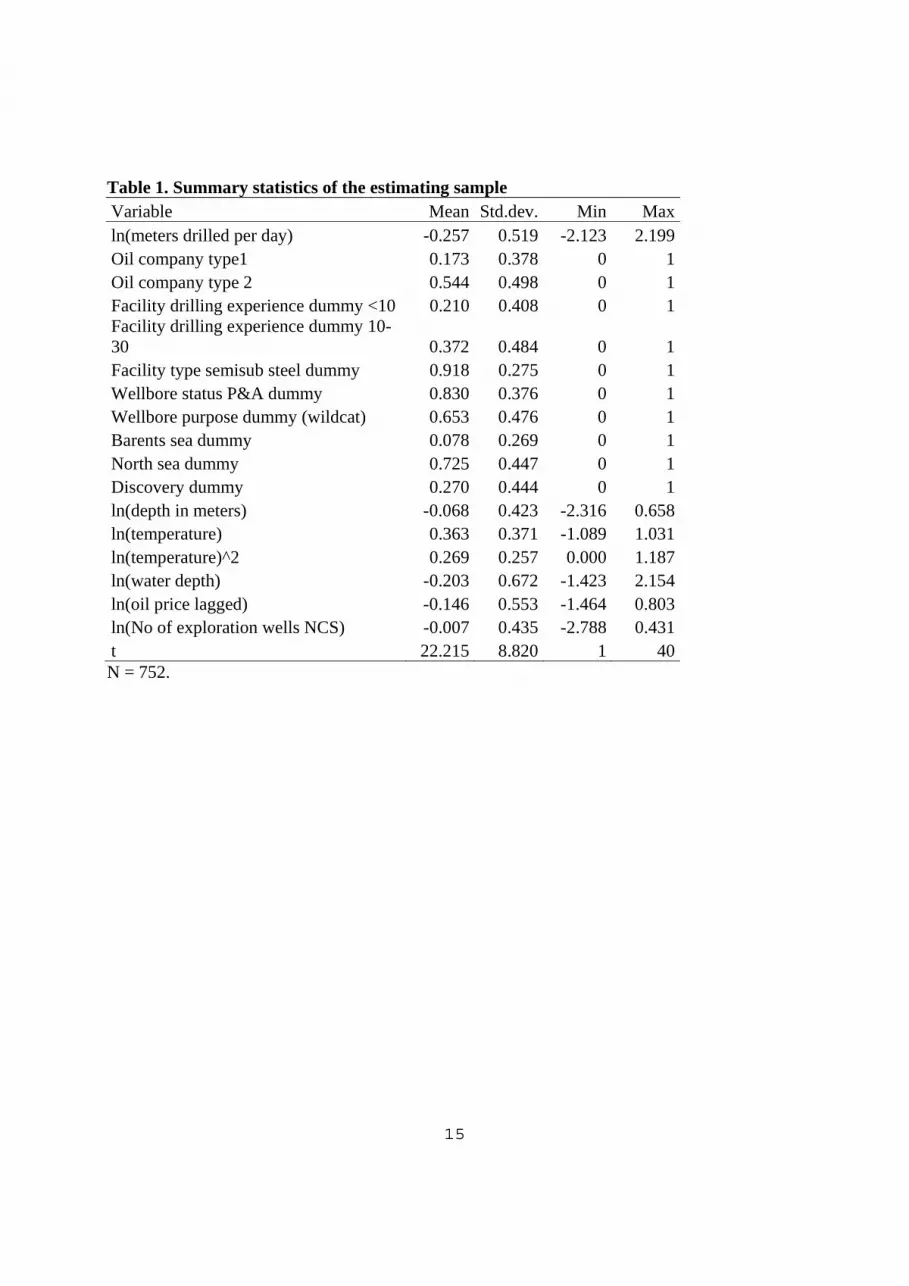
several oil price cycles, as well as technological development. Summary statistics of the
estimating sample is provided in table 1. Given the challenging nature of large-scale offshore oil
and gas operations on the NCS, the dataset comprises the vital companies in the oil business. The
companies participating as operators on the NCS include all super majors, and major oil service
companies like Halliburton, Baker Hughes and Schlumberger are present in Norway. For details
on NCS resources and participants, see Norwegian Petroleum Directorate (2007) and Ministry of
Petroleum and Energy (2008).
4. Empirical results
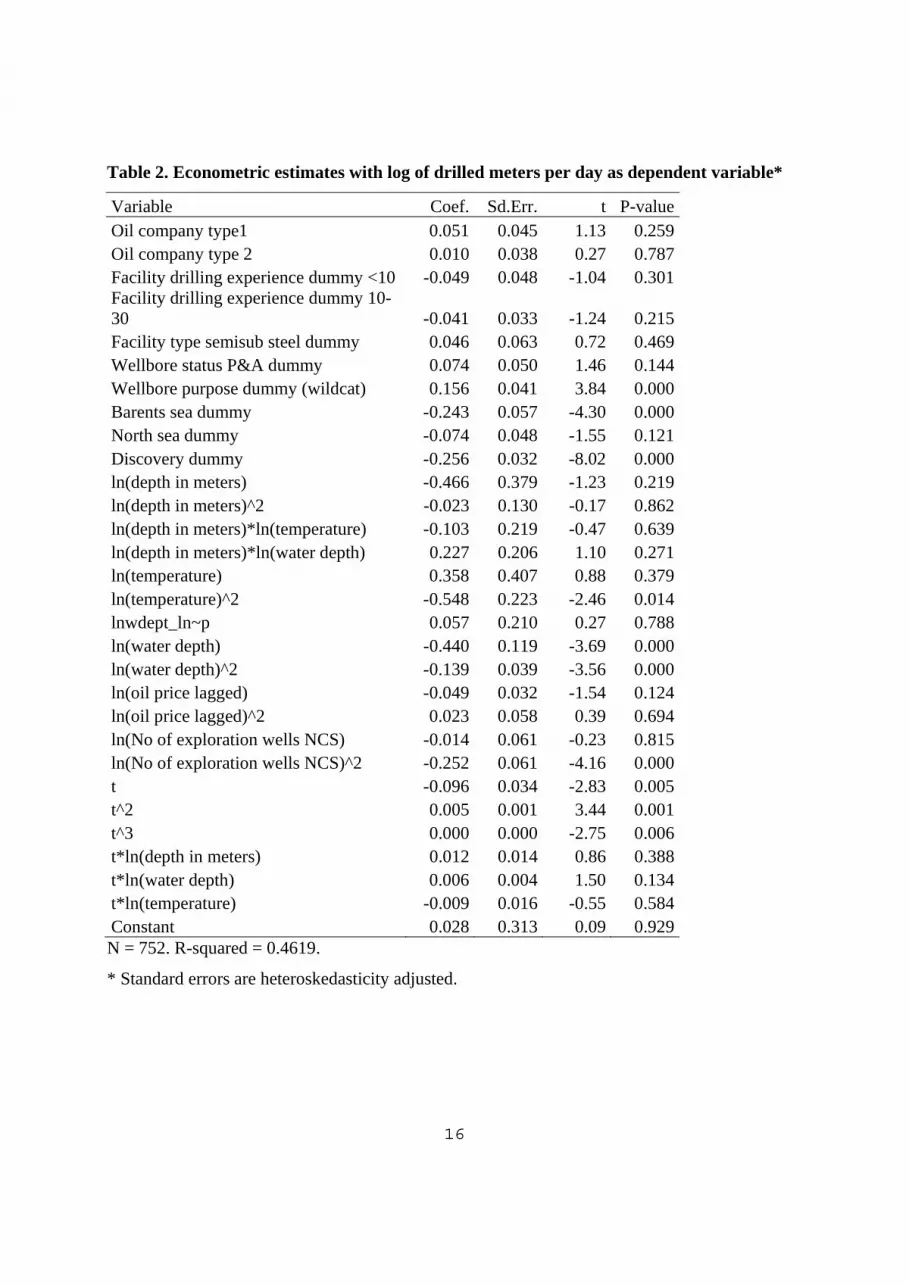
The production function is estimated using OLS.4 Before estimation, a classical additive
disturbance term is appended to the model. Estimated coefficients with heteroskedasticity-
consistent standard errors and associated t- and p-values are presented in Tables 2, and derived
elasticity estimates from the model is presented in Table 3. Our empirical findings correspond
largely with the a priori expectations that we have made from conversations with industry
specialists. According to the estimated model the contribution from different factors in
explaining drilling efficiency are as follows: (1) Purpose: Wildcats are more productive than
appraisal wells. (2) Area: The Barents Sea wells are the least productive, Norwegian Sea wells
are most productive, and North Sea wells are in between. (3) Discovery status: Wells with
discovery are less productive than dry wells. (4) Drilling depth: Deeper wells are less productive
than shallow wells, although the negative effect of increasing drilling depth is not statistically
significant. (5) Water depth: Water depth has a negative effect on productivity. (6) Oil price:
4 Stata (10) software was used for estimation.
11
Drilling productivity slows down when oil prices increase. (7) Total number of exploration wells
drilled on NCS: Drilling productivity is lower in years when many wells are drilled on the NCS,
although the effect is not statistically significant. Part of the explanation for this is that a high
activity level is associated with a high oil price. (8) Technological change over time: We can
trace a positive effect on productivity that we can attribute primarily to technological progress.
(9) Well temperature: There is no statistically significant effect from well temperature on drilling
productivity.
Our findings can be explained as follows. Drilling speed is lower in appraisal wells than for
wildcats, due to more testing time. Our time measure includes the testing time. We find that
drilling is slower in the Barents Sea, even if we account for differences in see deep, water depth,
etc. Possible explanation to this is tougher climate conditions and larger logistic challenges due
to longer distances from supply clusters. The lower number of wells in the north also means that
this region has travelled a shorter distance down the learning curve. The oil industry also faces
tougher environmental standards in the north, negatively affecting drilling speed. Wells with
discovery are slower to drill due to time spent on testing. High water depth slows down drilling
speed. This is not surprising, as our drilling metre measure starts at the sea bed. Thus, a high
water depth takes time for the drilling company without contribution to the key performance
indicator - metres per day. High oil prices are associated with a strong business cycle for the oil
industry. High activity levels imply scarcity of rigs. Thus, less adequate rigs are being used at the
margin, reducing average productivity. Moreover, at a high business cycle for the oil industry
there are more likely to scarcity of personnel and bottle necks at other crucial supply services in
drilling, thus driving up the non-productive time. The same reasoning applies to our finding that
productivity is lower at years of a high number of exploration wells. Finally, over time there
have been several technological changes that have contributed positively to drilling speed, e.g.,
the introductions of the top drive and measurement while drilling. Industry specialists are not
surprised of our finding that temperature is insignificant for drilling speed, as temperatures are
12
not especially high on the NCS. Moreover, high temperatures impose special requirements on
equipment, thus affecting costs more than drilling speed.
5. Conclusions
A dramatic increase in drilling costs is a particular challenge in the current situation when much
effort is put into increased oil recovery from mature fields and development of new deep-water
fields, as both these project types are drilling intensive. The increase in drilling costs represents a
challenge both to international oil companies (IOCs) and oil consumers. The IOCs are already
struggling to maintain production and reserves, and sticky costs at a high level combined with a
decrease in oil price make this much harder. Even for projects that are still profitable, the
decrease in drilling efficiency is problematic as it reinforces the problem posed by scarcity of
rigs.
In World Energy Outlook 2008, IEA undertakes a field-by-field analysis of production
trends at 800 of the world’s largest oilfields. Through a bottom-up analysis of upstream costs and
investment, they make an assessment of the potential for finding and developing new reserves.
They conclude that the immediate risk to supply is not one of lack of global resources (estimated
remaining proven reserves have almost doubled since 1980), but rather a lack of investment.
Upstream investments have been rising rapidly in nominal terms, but much of the increase is due
to surging costs. In cost-inflation adjusted terms, investments in 2007 were according to IEA 70
per cent higher than in 2000. Worldwide, upstream costs rose on average by an estimated 90 per
cent between 2000 and 2007. Most of the increase occurred in the period 2004-2007. IEA warn
that there remains a real risk that underinvestment will cause an oil-supply crunch.
This article analyses one of the major drivers of the cost inflation in the oil industry - the
decrease in drilling efficiency. The output of our analyses can be useful, in two ways: 1) by
detecting the underlying factors that influence drilling efficiency, we provide a basis for making
predictions of future drilling efficiency levels. For instance, what is the likely effect on drilling
efficiency of the current oil price fall? 2) By indicating the major explanatory factors for
variations in drilling efficiency over time, we can give advice on where the oil industry has the
13
largest potential for improvement. - Is it in a careful management of drilling capacity versus
drilling tasks, or is it primarily in better handling of deep-water drilling?
State-of-the-art rig activity monitoring presents an opportunity to revolutionize the way in
which contractors are rewarded for above average performance, technically or in safety terms.
For many years the few contractual incentives available and utilized have concentrated on very
simple metrics, such as rig uptime and on drilling rates. A successful well for most old-time
drillers was one that reached total depth quickly and without significant lost time. Whether the
well ultimately became an effective producer, drilled and completed with minimum damage to
the formation and with high mechanical integrity, was not considered. Rapid drilling is not
always compatible with good reservoir utilisation and efficient information gathering, so a trade-
off must be made here.
The companies and the authorities basically share a common interest in the best possible
utilisation of scarce drilling capacity. Losing resources which could otherwise have been
profitably produced because of rig capacity shortages and reduced drilling efficiency is also a
matter of concern from a socio-economic perspective. A number of resources are time-critical in
that their recovery depends on the use of existing infrastructure, and irreversible losses may be
incurred. But the authorities - who take a rather different (more long-term) view of the trade-off
between current and future production - are perhaps also more open to the counterargument that
drilling fast is less important than drilling correctly, and that incentives tied to drilling speed can
reduce reservoir drainage and thereby resource utilisation. Challenges related to health, safety
and the environment (HSE) can also arise. Another source of concern is that additional
incentives can have the effect of driving up costs on top of already high rates. The question is
whether new incentives will primarily encourage a reallocation of the best equipment and
expertise.
Literature
Corts, K (2000), ‘Turnkey Contracts as a Response to Incentive Problems: Evidence from the Offshore Drilling Industry’, working paper, Harvard University. Corts, K S and J Singh (2004), ‘The Effect of Repeated Interaction on Contract Choice: Evidence from Offshore Drilling’, Journal of Law, Economics, and Organization 20 (1), 2004, 230-260.
14
IEA (2008), World Energy Outlook, International Energy Agency, Paris.
Iledare, O. O. and A. Pulsipher. 1999. Sources of change in petroleum drilling productivity in onshore Lousiana in the US, 1977-1994. Energy Economics 21, 261-271. Kellogg, R. 2007. Learning by drilling: Inter-Firm Learning and Relationship Persistence in the Texas Oilpatch. Mimeo. Department of Agricultural and Resource Economics at UC Berkeley, and University of California Energy Institute (UCEI). Kemp, A. and S. Kasim. 2006. A regional model of oil and gas exploration in the UKCS. Scottish Journal of Political Economy 53 (2), 198-221. Norwegian Petroleum Directorate. 2007. The Resource Report 2007. (http://www.npd.no/English/Produkter+og+tjenester/Publikasjoner/Ressursrapporter/2007/coverpage.htm) Ministry of Petroleum and Energy. 2008. Fact Sheet 2008. Norwegian petroleum activity. (http://www.npd.no/English/Produkter+og+tjenester/Publikasjoner/Faktaheftet/Faktaheftet+2008/fakta2008.htm). Mohn, K. 2008. Efforts and Efficiency in Oil Exploration: A Vector Error-Correction Approach. The Energy Journal 30 (4), 53-78. Mohn, K. and P. Osmundsen. 2008. Exploration economics in a regulated petroleum Province. Energy Economics 30 (2), 303-320. Osmundsen, P, A Toft and K A Dragvik (2006), ‘Design of Drilling Contracts - Economic Incentives and Safety Issues’, Energy Policy 34, 2324-2329. Osmundsen, P., T. Sørenes, and A. Toft (2008), ’Drilling Contracts and Incentives’, Energy Policy 36, 8, 3138-3144. Osmundsen, P, T. Sørenes, and A. Toft (2009), ‘Oil Service Contracts – New Incentive Schemes to Promote Drilling Efficiency”, Working paper, The University of Stavanger.
Snead, M.C. (2005). ‘The Economics of Deep Drilling in Oklahoma’. Working paper, Oklahoma
State University.
15
Table 1. Summary statistics of the estimating sample Variable Mean Std.dev. Min Max ln(meters drilled per day) -0.257 0.519 -2.123 2.199 Oil company type1 0.173 0.378 0 1 Oil company type 2 0.544 0.498 0 1 Facility drilling experience dummy <10 0.210 0.408 0 1 Facility drilling experience dummy 10-30 0.372 0.484 0 1 Facility type semisub steel dummy 0.918 0.275 0 1 Wellbore status P&A dummy 0.830 0.376 0 1 Wellbore purpose dummy (wildcat) 0.653 0.476 0 1 Barents sea dummy 0.078 0.269 0 1 North sea dummy 0.725 0.447 0 1 Discovery dummy 0.270 0.444 0 1 ln(depth in meters) -0.068 0.423 -2.316 0.658 ln(temperature) 0.363 0.371 -1.089 1.031 ln(temperature)^2 0.269 0.257 0.000 1.187 ln(water depth) -0.203 0.672 -1.423 2.154 ln(oil price lagged) -0.146 0.553 -1.464 0.803 ln(No of exploration wells NCS) -0.007 0.435 -2.788 0.431 t 22.215 8.820 1 40 N = 752.
16
Table 2. Econometric estimates with log of drilled meters per day as dependent variable*
Variable Coef. Sd.Err. t P-value Oil company type1 0.051 0.045 1.13 0.259 Oil company type 2 0.010 0.038 0.27 0.787 Facility drilling experience dummy <10 -0.049 0.048 -1.04 0.301 Facility drilling experience dummy 10-30 -0.041 0.033 -1.24 0.215 Facility type semisub steel dummy 0.046 0.063 0.72 0.469 Wellbore status P&A dummy 0.074 0.050 1.46 0.144 Wellbore purpose dummy (wildcat) 0.156 0.041 3.84 0.000 Barents sea dummy -0.243 0.057 -4.30 0.000 North sea dummy -0.074 0.048 -1.55 0.121 Discovery dummy -0.256 0.032 -8.02 0.000 ln(depth in meters) -0.466 0.379 -1.23 0.219 ln(depth in meters)^2 -0.023 0.130 -0.17 0.862 ln(depth in meters)*ln(temperature) -0.103 0.219 -0.47 0.639 ln(depth in meters)*ln(water depth) 0.227 0.206 1.10 0.271 ln(temperature) 0.358 0.407 0.88 0.379 ln(temperature)^2 -0.548 0.223 -2.46 0.014 lnwdept_ln~p 0.057 0.210 0.27 0.788 ln(water depth) -0.440 0.119 -3.69 0.000 ln(water depth)^2 -0.139 0.039 -3.56 0.000 ln(oil price lagged) -0.049 0.032 -1.54 0.124 ln(oil price lagged)^2 0.023 0.058 0.39 0.694 ln(No of exploration wells NCS) -0.014 0.061 -0.23 0.815 ln(No of exploration wells NCS)^2 -0.252 0.061 -4.16 0.000 t -0.096 0.034 -2.83 0.005 t^2 0.005 0.001 3.44 0.001 t^3 0.000 0.000 -2.75 0.006 t*ln(depth in meters) 0.012 0.014 0.86 0.388 t*ln(water depth) 0.006 0.004 1.50 0.134 t*ln(temperature) -0.009 0.016 -0.55 0.584 Constant 0.028 0.313 0.09 0.929 N = 752. R-squared = 0.4619.
* Standard errors are heteroskedasticity adjusted.
17
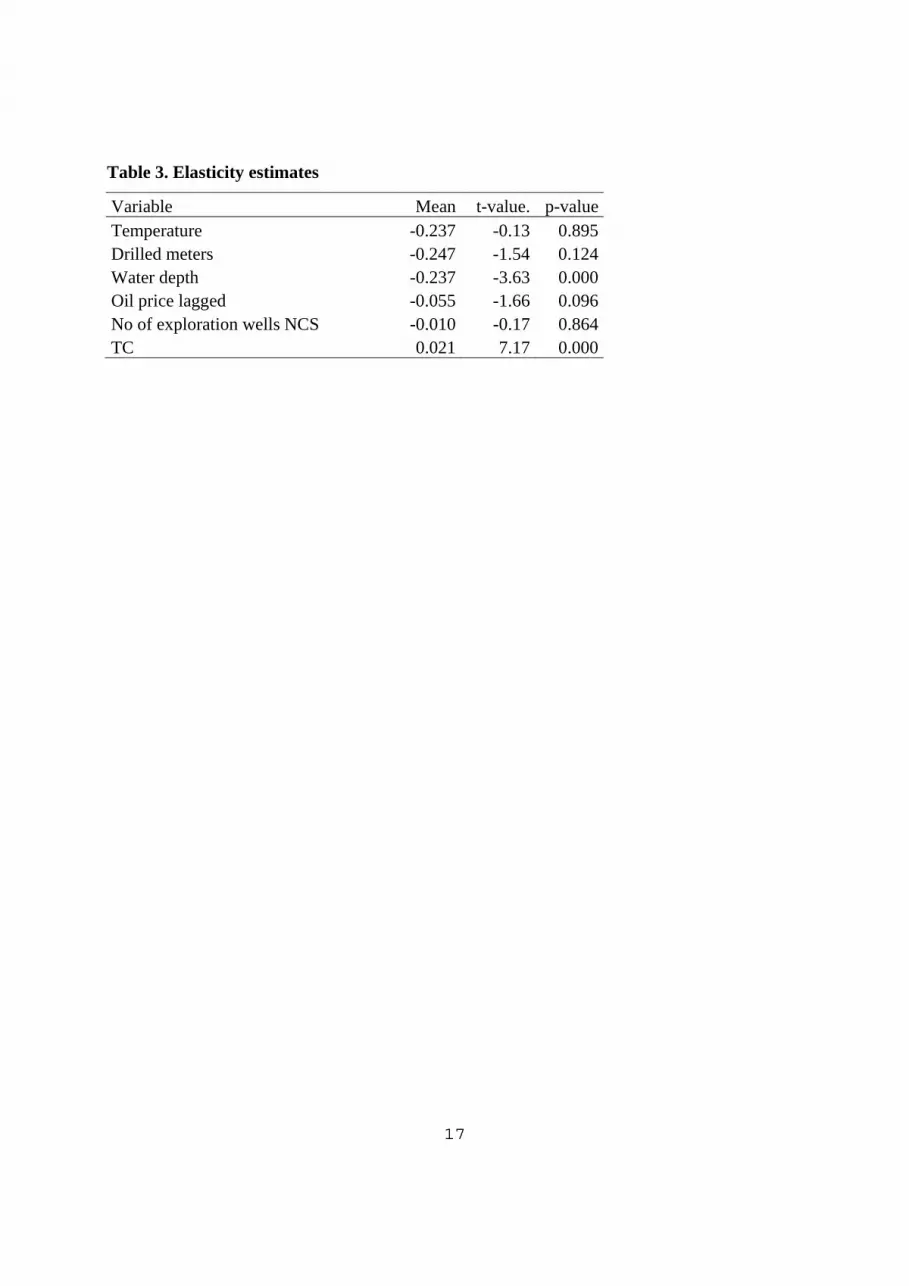
Table 3. Elasticity estimates
Variable Mean t-value. p-valueTemperature -0.237 -0.13 0.895Drilled meters -0.247 -1.54 0.124Water depth -0.237 -3.63 0.000Oil price lagged -0.055 -1.66 0.096No of exploration wells NCS -0.010 -0.17 0.864TC 0.021 7.17 0.000