analytical phytoplankton carbon measurements spanning diverse ecosystems
TRANSCRIPT
Analytical phytoplankton carbon measurements spanningdiverse ecosystems
Jason R. Graff a,n, Toby K. Westberry a, Allen J. Milligan a, Matthew B. Brown a,Giorgio Dall’Olmo b, Virginie van Dongen-Vogels a,1, Kristen M. Reifel a,Michael J. Behrenfeld a
a Oregon State University, Department of Botany and Plant Pathology, 2082 Cordley Hall, Corvallis, OR, United Statesb Plymouth Marine Laboratory, Prospect Place, The Hoe, Plymouth, United Kingdom and National Centre for Earth Observation, United States
a r t i c l e i n f o
Article history:Received 24 November 2014Received in revised form8 April 2015Accepted 8 April 2015Available online 28 April 2015
Keywords:Phytoplankton carbonBackscatteringChlorophyllParticulate organic carbonAtlantic Meridional TransectSatellite
a b s t r a c t
The measurement of phytoplankton carbon (Cphyto) in the field has been a long-sought but elusive goal inoceanography. Proxy measurements of Cphyto have been employed in the past, but are subject to manyconfounding influences that undermine their accuracy. Here we report the first directly measured Cphytovalues from the open ocean. The Cphyto samples were collected from a diversity of environments, rangingfrom Pacific and Atlantic oligotrophic gyres to equatorial upwelling systems to temperate spring conditions.When compared to earlier proxies, direct measurements of Cphyto exhibit the strongest relationship withparticulate backscattering coefficients (bbp) (R2¼0.69). Chlorophyll concentration and total particulateorganic carbon (POC) concentration accounted for �20% less variability in Cphyto than bbp. Ratios of Cphytoto Chl a span an order of magnitude moving across and within distinct ecosystems. Similarly, Cphyto:POCratios were variable with the lowest values coming from productive temperate waters and the highest fromoligotrophic gyres. A strong relationship between Cphyto and bbp is particularly significant because bbp is aproperty retrievable from satellite ocean color measurements. Our results, therefore, are highly encouragingfor the global monitoring of phytoplankton biomass from space. The continued application of our Cphytomeasurement approach will enable validation of satellite retrievals and contribute to an improvedunderstanding of environmental controls on phytoplankton biomass and physiology.& 2015 The Authors. Published by Elsevier Ltd. This is an open access article under the CC BY-NC-ND license
(http://creativecommons.org/licenses/by-nc-nd/4.0/).
1. Introduction
The direct measurement of phytoplankton carbon (Cphyto) in thefield has long been recognized as critical for understanding planktondynamics (e.g. growth, production) in the marine environment(Sutherland, 1913; Eppley, 1968; Laws, 2013). Accurate estimates ofCphyto at local, regional, and global scales provide a means to observephytoplankton standing stocks and seasonal or inter-annual biomasstrends relative to environmental variability. Despite this ongoingneed, the direct assessment of Cphyto has proven an elusive goal. Keyto this challenge has been an inability to isolate phytoplankton fromthe pool of other particulate forms of carbon that are abundant inseawater (zooplankton, detritus, bacteria, etc.). Consequently, proxymeasurements or conversions of properties related to phytoplanktonhave been heavily relied upon to evaluate Cphyto.
Historical biomass proxies have included cell counts (Sutherland,1913), color indices (Reid et al., 1998), chlorophyll (Kreps andVerjbinskaya, 1930), adenosine triphosphate (ATP) (Sinclair et al.,1979), proportions of particulate organic carbon (Strickland, 1960),and cell volume (Strathmann, 1967; Verity et al., 1992; Montagneset al., 1994), all of which require conversions to biomass estimates.Single cell elemental analysis (Heldal et al., 2003) has been performedand has potential, but thus far is very limited in the number of cellsthat have been analyzed from a sample. Some of the proxy estimatesare uniquely tied to phytoplankton (e.g. cell counts, pigments) whileothers are clearly influenced by non-phytoplankton organisms andnon-living seawater constituents (e.g. ATP, POC). Nevertheless, theseestimates have greatly influenced our understanding of phytoplanktonabundance and community dynamics, as well as the interpretation oflong-term trends in phytoplankton properties (Reid et al., 1998;Mcquatters-Gollop et al., 2011). More thorough discussions of theseproxies and their relationships with Cphyto can be found elsewhere (e.g.Banse, 1977; Geider et al., 1997; Graff et al., 2012).
A more recent alternative approach to assessing Cphyto has beenthrough analyzing variability in light scattering properties, specifi-cally the particulate beam attenuation coefficient (cp) and the
Contents lists available at ScienceDirect
journal homepage: www.elsevier.com/locate/dsri
Deep-Sea Research I
http://dx.doi.org/10.1016/j.dsr.2015.04.0060967-0637/& 2015 The Authors. Published by Elsevier Ltd. This is an open access article under the CC BY-NC-ND license (http://creativecommons.org/licenses/by-nc-nd/4.0/).
n Corresponding author. Tel.: þ1 541 737 5274.E-mail address: [email protected] (J.R. Graff).1 Current address: University of Technology Sydney, Plant Functional Biology &
Climate Change Cluster, Sydney, Australia.
Deep-Sea Research I 102 (2015) 16–25

particulate backscatter coefficient (bbp). An appealing aspect of thisapproach is that these light scattering properties can be continuouslymeasured in situ (Behrenfeld and Boss, 2003, 2006; Huot et al., 2007)and bbp can be retrieved from space (Behrenfeld et al., 2005; Siegelet al., 2005; Westberry et al., 2008). These optical properties have theadditional important advantage that they vary with particle abun-dance but, unlike chlorophyll, do not register physiological variabilityassociated with light and nutrient conditions (i.e., variability incellular Chl:C ratios). However, a drawback of the optical indices ofCphyto is that a portion of the scattered light is due to non-algalparticles. The severity of this issue has not been quantified because,like all the other Cphyto proxies, direct comparisons with analyticalfield measurements of biomass have not been possible.
A solution to the long standing Cphyto problem was introducedin Graff et al. (2012) where a method was described for isolatingthe phytoplankton community from field samples and thenassessing Cphyto of the sorted sample through elemental analysis.The approach employs sorting flow-cytometry to identify phyto-plankton and separate them from non-algal particles. As demon-strated in Graff et al. (2012), the resultant sorted sample is highlyrepresentative of the in situ phytoplankton community. Carbonmeasured in the sorted sample is converted to in situ Cphyto using acell count ratio calculated from cell counts from the sorted andwhole seawater samples. In the original report (Graff et al., 2012)only a small set of samples collected off the Oregon Coast werecollected to demonstrate the field application of the approach.
Here, we report analytical measurements of Cphyto covering adiversity of open ocean conditions, ranging from Pacific andAtlantic oligotrophic gyres to equatorial upwelling systems andtemperate waters. We compare our direct phytoplankton biomassestimates to simultaneous measurements of bbp, cp, Chl a concen-tration and total particulate organic carbon (POC). From thiscomparison, we provide a new parameterization for the relation-ship between Cphyto and bbp, the latter property being the biomassproxy exhibiting the best correlation with Cphyto. The new relation-ship can be applied to satellite retrievals of bbp and resultant Cphytoestimates employed, for example, in the Carbon-based Productiv-ity Model (CbPM) (Westberry et al., 2008), to re-evaluate globalvariability in ocean net primary production. Validated assessmentsof Cphyto will also help discern underlying drivers of change (e.g.nutrients, light environment, etc.) in historical field and satellitechlorophyll records (Boyce et al., 2010, 2014; Siegel et al., 2013).
2. Material and methods
Field samples were collected during two cruises (Fig. 1). The firstcruise took place in the Equatorial Pacific Ocean (EPO) in conjunc-tion with the National Oceanic and Atmospheric Administration's(NOAA) Tropical Atmospheric Ocean (TAO) project aboard the NOAAVessel Ka’imimoana from 7 May to 28 June 2012 (Fig. 1). The secondfield effort was part of the 22nd Atlantic Meridional Transect (AMT-22) on the RSS James Cook from 10 October to 24 November 2012(Fig. 1). During each cruise, surface optical properties were con-tinuously measured and discrete samples were collected for Cphyto,high-pressure liquid chromatography (HPLC) pigments and POC.
2.1. Analytical Cphyto measurements
Collection and elemental analyses of Cphyto samples, heretoreferred to as direct or analytical Cphyto, were made following amodified procedure first described in Graff et al. (2012). Surfacesamples were collected from seawater flow-through lines on bothcruises and from a Niskin rosette when possible on the EPO cruise.Comparative tests (data not shown here) were performed duringthe TAO cruise to compare samples collected using a Niskin and
flow-through lines. No differences in the abundance or communitycomposition of the samples were apparent. Samples for sorting andcollecting phytoplankton cells were processed on a BD BiosciencesInflux Cell Sorter (BD ICS) flow-cytometer. The BD ICS was alignedand calibrated for cell sorting before whole seawater was collected.Sample lines were flushed for approximately 30 min prior to samplecollection and cell sorting to remove potential contamination fromthe fluorescent beads used for alignment and calibration and thedetergents in which they are stored. Our BD ICS is equipped with a488 nm (blue) excitation laser, fluorescence collection at 530 nmand 692 nm, side scatter detection, and forward scatter detectionfor resolving small particles (down to 0.2 mm). A 100 mm nozzle tipwas used for all samples. Gates for selecting and sorting cells weredrawn to select for the scatter and fluorescence signatures of allphytoplankton groups present in the samples. Up to 4 mL of wholeseawater were sorted at sea for each sample. Sort times rangedfrom less than 1 h up to 4 h, resulting in 0.75–1 mL samplescomposed of sorted phytoplankton cells suspended in artificialsheath fluid (deionized water and sodium chloride) (Graff et al.,2012). A sample of sheath water was collected from the nozzlefollowing each sort and used to correct carbon values for sortedsamples for the dissolved organic contribution from the sheathfluid. All samples were immediately frozen in liquid nitrogen (LN)and stored at �80 1C or in LN until they were analyzed.
Analysis of sorted phytoplankton and sheath fluid samples wasperformed on a Shimadzu TOC-N analyzer using manual injectiontechniques. Manual injection methods require less volume comparedto automated protocols, which use a portion of a sample for filling andrinsing the sample lines and syringe. Due to sample salinity, ceramicwool in the combustion column was replaced with platinum wirebeads (Carlson et al., 2004). The Shimadzu TOC-N provides anintegrated area under a response curve for each sample. The differencein area between the sorted phytoplankton sample and the sheath fluidis attributed to Cphyto. Each sample analyzed was first acidified to apHo2.0 and sparged for 10 minwith 75 mLmin�1 of ultra pure air toremove inorganic carbon. A minimum of three 100 μl replicateinjections per sample were analyzed and the mean area was calcu-lated using 2–3 of the replicates with the lowest coefficient ofvariation (average CV for field samples¼0.047). Instrument accuracyand precision were checked throughout the day and prior to sampleanalysis with deionized water and a seawater reference standard(�40–44 mmol L�1 carbon) from the Consensus Reference MaterialsProject hosted at the Hansell Lab at the University of Miami.
Phytoplankton carbon in the sorted sample was determined bysubtracting the mean area of the sheath fluid sample from the meanarea of the sorted phytoplankton sample and converting to biomassusing the instrument calibration. The areas for the sheath samples(�18–20 mM) are generally half of the values obtained whenanalyzing the standard reference material and well above thedetection limits of the instrument. Measured signals for sortedsamples containing cells are higher than their paired sheath samplevalues. The additional signal area due to cells is a variable fraction ofthe sheath signal and is dependent upon the concentration andtypes of cells in the sorted sample. The low coefficient of variationfor each sample (median¼0.04) provides the resolution required todetermine the difference between the sheath and sorted samples.Cell counts for the whole seawater samples and for each sortedsample were determined on the BD ICS. In situ Cphyto was calculatedby dividing the carbon attributed to the phytoplankton portion ofthe sorted sample by the cell concentration ratio between thesorted and natural samples (Graff et al., 2012). Synechococcus cellcount ratios were used here as they are easily discernible as a groupfrom both noise and other cell types based on fluorescence andscatter properties and were present in all samples.
To calibrate the Shimadzu TOC-N, natural phytoplankton wereused as a standard material. Whole seawater was collected 25 miles
J.R. Graff et al. / Deep-Sea Research I 102 (2015) 16–25 17

off the Oregon Coast on three separate cruises. Phytoplankton fromeach sample were sorted at Oregon State University on the BD-ICS forup to 7 h to obtain enough sample volume for TOC-N analysis and forfiltration onto a pre-combusted 25 mm Whatman glass fiber filter(GF/F, combusted at 450 1C for 4 h). Sorted phytoplankton filterswere analyzed on an Exeter Analytical CE-440 elemental analyzerfollowing the protocol for POC analysis outlined below. Filters withcells (plus DOC) contained carbon ranging from 8.5 to 20 mg per filter.To obtain phytoplankton carbon values from the filters, GF/F carbonwas corrected for the filter blank and dissolved organic carbon (DOC)adsorption (Morán et al., 1999; Cetinić et al., 2012).
To determine filter blank and DOC contributions to GF/F filtersover the mass and volume range for sorted and filtered phytoplank-ton samples, 20 mm cellulose particles (Sigma-Aldrich) were sus-pended in 0.22 mm filtered artificial sheath medium and volumesranging from 0.5 mL up to 1 L were filtered through pre-combustedGF/Fs. Cellulose particles of this size should be effectively retained bya GF/F filter with an effective pore size after combustion of o0.5 mm(Chavez et al., 1995). Cellulose has a carbon composition of 33% bymass. All filters were frozen and analyzed after acidification anddesiccation as described below for POC samples. These resultsprovided a measure of carbon above and beyond the known massof cellulose that should be retained by the filter in the mass andvolume ranges of the sorted phytoplankton filtered onto GF/Fs. Alinear model was developed using the ratio of the carbon from theGF/F filters containing cellulose and the actual mass of the cellulose
on the filter (i.e. GF/F carbon:cellulose carbon) regressed against themeasured carbon mass of the GF/F. This provided a correction toapply to the sorted and filtered phytoplankton samples. The calibra-tion was created using the corrected GF/F phytoplankton carbonvalues and the Shimadzu TOC-N area difference between the sortedphytoplankton and sheath fluid samples (calibration R2¼0.98).
2.2. Pigments and particulate organic carbon
For HPLC pigment samples, 1–3 L of whole seawater werefiltered onto a pre-combusted GF/F. Each filter was immediatelyplaced into a cryovial and stored in LN. Samples were analyzed atthe NASA Goddard Space Flight Center Ocean Ecology Laboratoryfollowing established protocols (Van Heukelem and Thomas, 2001).
For POC samples, three volumes of 0.5 L, 1 L, and 2.135 L werefiltered onto pre-combusted GF/F filters. Filters were wrapped inpre-combusted foil (450 1C, 4 h) and stored in LN until samplepreparation and analysis. Prior to analysis, filters were fumed withhydrochloric acid for 4 h and then dried at 50 1C for 24 h. All POCfilters were analyzed on an Exeter Analytics CE-440 elementalanalyzer calibrated with acetanilide following manufacturer proto-cols. POC values reported here were corrected for non-target carbonfrom filter blanks and DOC adsorption.
At each station, two blank values were determined in order tocorrect POC measurements for non-target carbon. The blanksincluded (1) a 1 L sample of seawater retained from each 1 L POC
Fig. 1. (A) Cruise tracks for (B) the Equatorial Pacific Ocean (EPO) and (C) and the 22nd Atlantic Meridional Transect (AMT-22). Red circles indicate locations where samplesfor analytical phytoplankton carbon measurements were collected.
J.R. Graff et al. / Deep-Sea Research I 102 (2015) 16–2518
filtration and then re-filtered through a new pre-combusted GF/Fand (2) an intercept blank from the regression of carbon values andvolumes for three POC samples at each station. Tests were con-ducted to determine the relationship of dissolved organic carbon(DOC) adsorption with volume filtered. For these tests, multiplevolumes, 0.01–3 L, of GF/F pre-filtered Equatorial Pacific and OregonCoastal seawater re-filtered through pre-combusted GF/F filters. Allfilters were frozen in LN and analyzed after acidification anddesiccation as described above.
Results from the natural pre-filtered seawater tests showed thatDOC adsorptionwas linear with volume, with no saturation observedup to 3 L. As such, a linear approach was taken in order to correcteach multi-volume set of field POC samples. For each station, a linearregression between POC values and volume provided a y-interceptblank that represents a filter that has been handled but has not beenused for filtration. The 1 L blank value for pre-filtered seawater ateach station represents DOC adsorption to a GF/F specific for thatwater source. Thus, a linear model between the y-intercept and the1 L blank sample represents the filter blank plus a linear dependenceof DOC adsorption. We used this approach to determine the non-target carbon contribution for each volume filtered at each stationand subtracted this from the corresponding POC filter value. Themethod accounts for variable DOC constituents and their adsorptionto a GF/F specific at each station where the sample was collected.
2.3. Optical properties
Optical parameters were continuously measured on the flow-through seawater systems of both research vessels using 2 WETLabsECO-BB3 backscattering sensors (470�2, 532�2, 595, and 656 nm)mounted in custom-made backscattering flow chambers (Dall'Olmoet al., 2009), 2C-star transmissometers (532 and 660 nm), and1 WETLabs AC-s hyperspectral absorption and attenuation meter.Optical seawater blanks, which were used to remove the non-particulate portion of the optical signals, were collected by switchingthe flowing seawater through a 0.22 mm filter using an automaticvalve-switch and controller (Slade et al., 2010). Particulate back-scattering at 470 nm (bbp) from the ECO-BB3 and particulate beamattenuation at 660 nm (cp) from a C-star transmissometer werecalculated following Dall'Olmo et al. (2009). Values reported hererepresent an average for 3–60 min centered at the time of samplecollection for analytical measurements of Cphyto, pigments, and POC.Shorter time averages were used in temperate waters whereheterogeneity in particle fields resulted in extremely high variabilityin each parameter over longer time scales, and thus distances, whileunderway. Growth irradiance (Eg (mol quanta m�2 s�1)) values werecalculated from the daily noon CTD casts as the median mixed layerlight level following Behrenfeld et al. (2005) and interpolatedbetween casts to estimate Eg where samples were collected.
3. Results
Fifty-three Cphyto samples were collected and analyzed for the twocruises, 32 of which were from the EPO cruise and 21 from AMT-22(Fig. 1B and C, red circles). The Cphyto samples were from distinctoceanographic regions traversed during the two cruises, rangingfrom oligotrophic gyres to temperate spring conditions in the south-ern hemisphere. POC and HPLC samples were collected at a total of302 stations, with 107 from the EPO cruise and 195 from AMT-22.
3.1. Analytical and optical measurements
For AMT-22, analytical Cphyto values ranged from 4 to 58 mg L�1
(Table 1), with the lowest values observed in the South Atlantic sub-tropical gyre and the highest biomass observed in the austral-spring
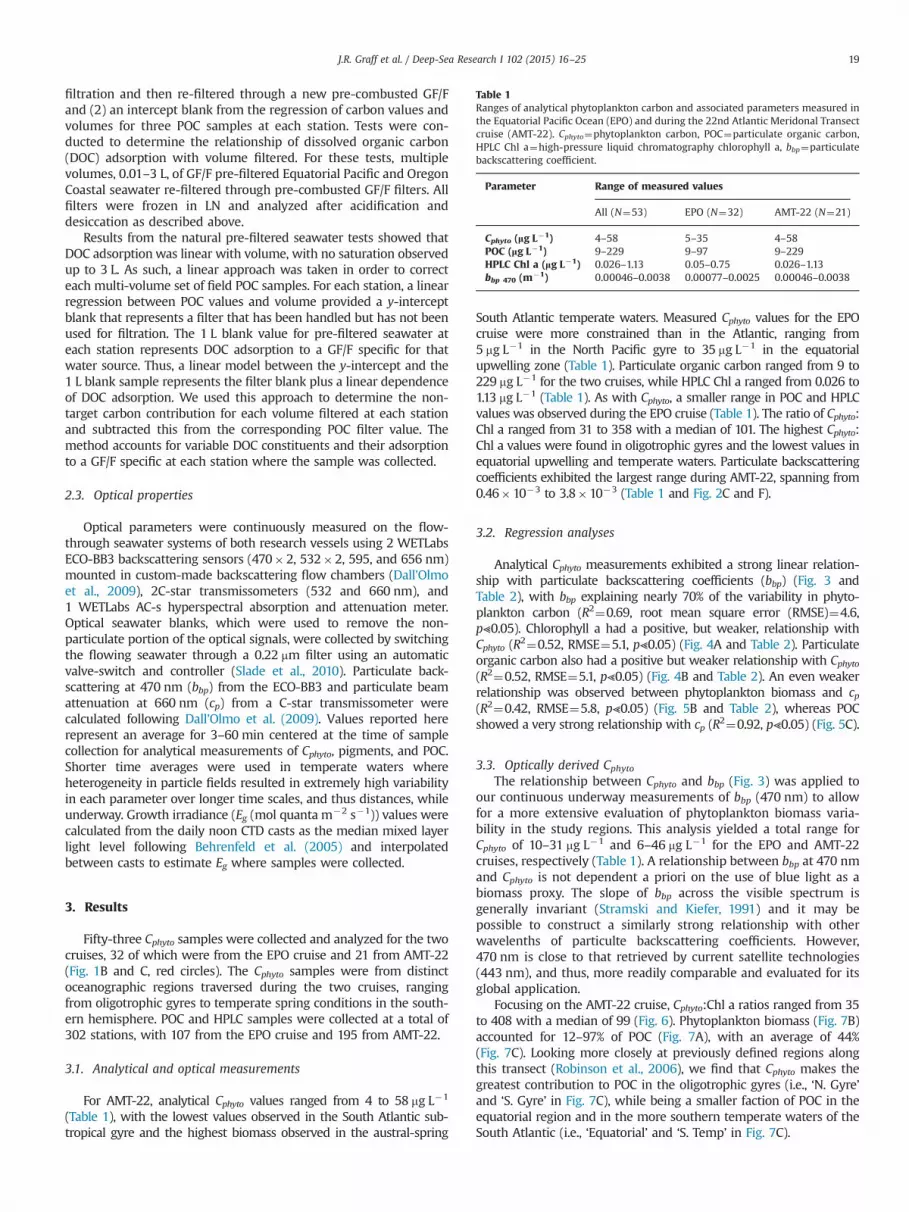
South Atlantic temperate waters. Measured Cphyto values for the EPOcruise were more constrained than in the Atlantic, ranging from5 mg L�1 in the North Pacific gyre to 35 mg L�1 in the equatorialupwelling zone (Table 1). Particulate organic carbon ranged from 9 to229 mg L�1 for the two cruises, while HPLC Chl a ranged from 0.026 to1.13 mg L�1 (Table 1). As with Cphyto, a smaller range in POC and HPLCvalues was observed during the EPO cruise (Table 1). The ratio of Cphyto:Chl a ranged from 31 to 358 with a median of 101. The highest Cphyto:Chl a values were found in oligotrophic gyres and the lowest values inequatorial upwelling and temperate waters. Particulate backscatteringcoefficients exhibited the largest range during AMT-22, spanning from0.46�10�3 to 3.8�10�3 (Table 1 and Fig. 2C and F).
3.2. Regression analyses
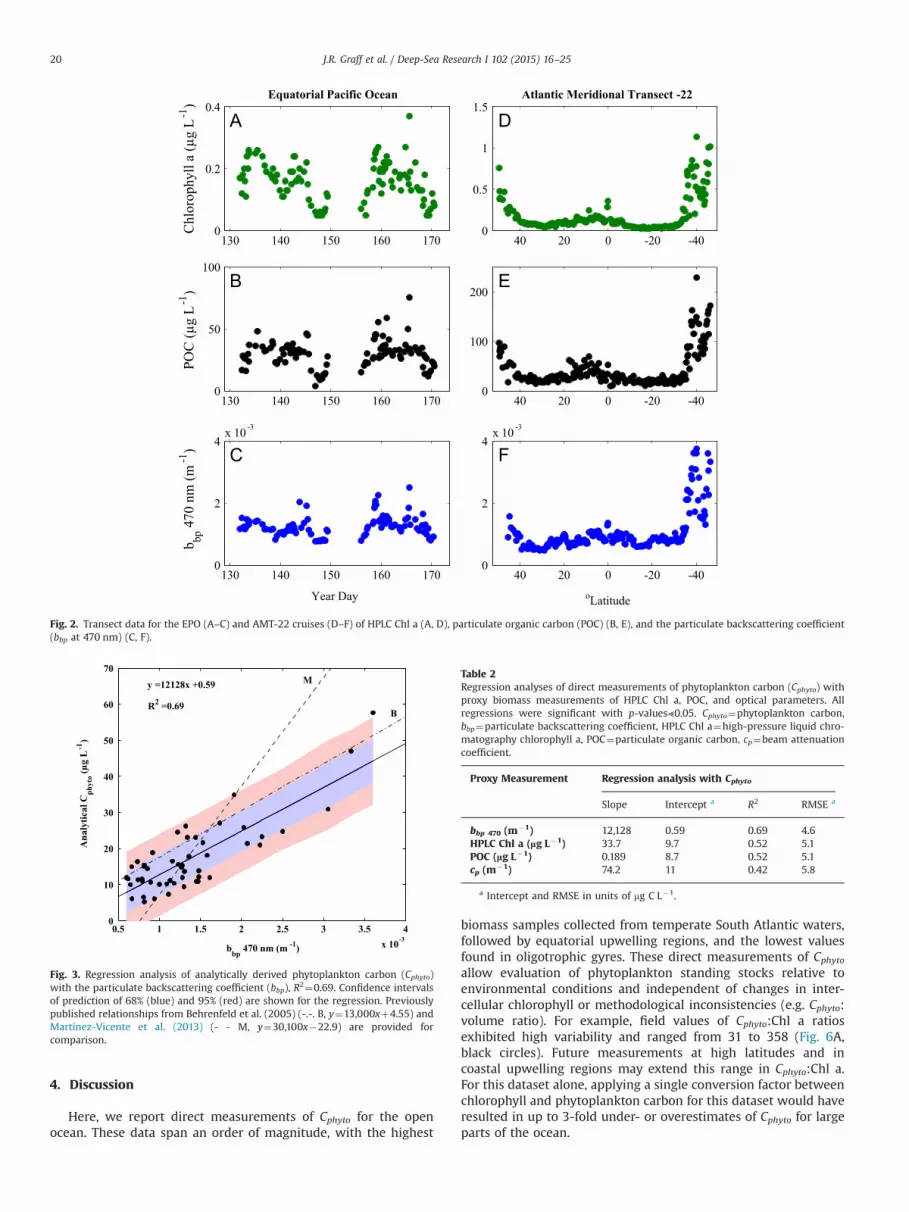
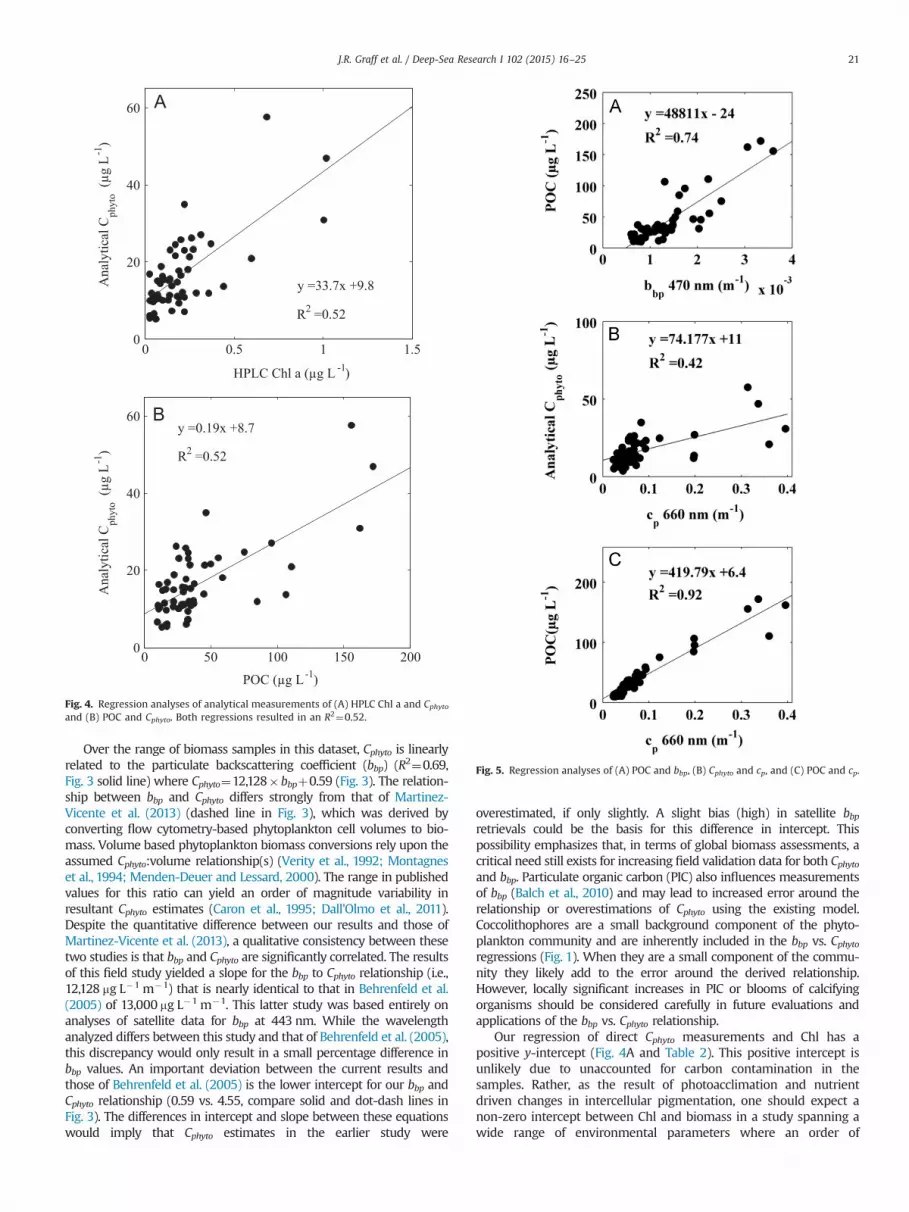
Analytical Cphyto measurements exhibited a strong linear relation-ship with particulate backscattering coefficients (bbp) (Fig. 3 andTable 2), with bbp explaining nearly 70% of the variability in phyto-plankton carbon (R2¼0.69, root mean square error (RMSE)¼4.6,p⪡0.05). Chlorophyll a had a positive, but weaker, relationship withCphyto (R2¼0.52, RMSE¼5.1, p⪡0.05) (Fig. 4A and Table 2). Particulateorganic carbon also had a positive but weaker relationship with Cphyto(R2¼0.52, RMSE¼5.1, p⪡0.05) (Fig. 4B and Table 2). An even weakerrelationship was observed between phytoplankton biomass and cp(R2¼0.42, RMSE¼5.8, p⪡0.05) (Fig. 5B and Table 2), whereas POCshowed a very strong relationship with cp (R2¼0.92, p⪡0.05) (Fig. 5C).
3.3. Optically derived CphytoThe relationship between Cphyto and bbp (Fig. 3) was applied to
our continuous underway measurements of bbp (470 nm) to allowfor a more extensive evaluation of phytoplankton biomass varia-bility in the study regions. This analysis yielded a total range forCphyto of 10–31 mg L�1 and 6–46 mg L�1 for the EPO and AMT-22cruises, respectively (Table 1). A relationship between bbp at 470 nmand Cphyto is not dependent a priori on the use of blue light as abiomass proxy. The slope of bbp across the visible spectrum isgenerally invariant (Stramski and Kiefer, 1991) and it may bepossible to construct a similarly strong relationship with otherwavelenths of particulte backscattering coefficients. However,470 nm is close to that retrieved by current satellite technologies(443 nm), and thus, more readily comparable and evaluated for itsglobal application.
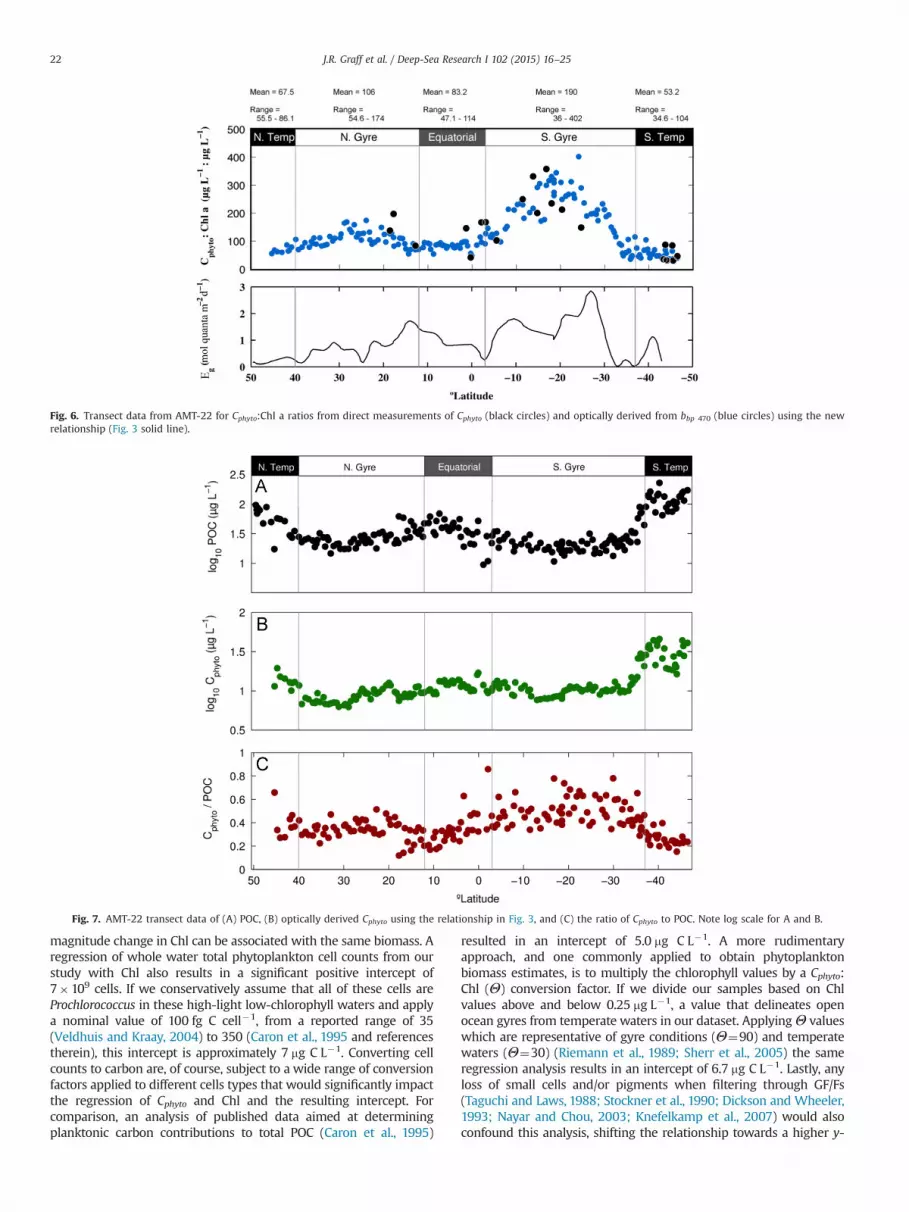
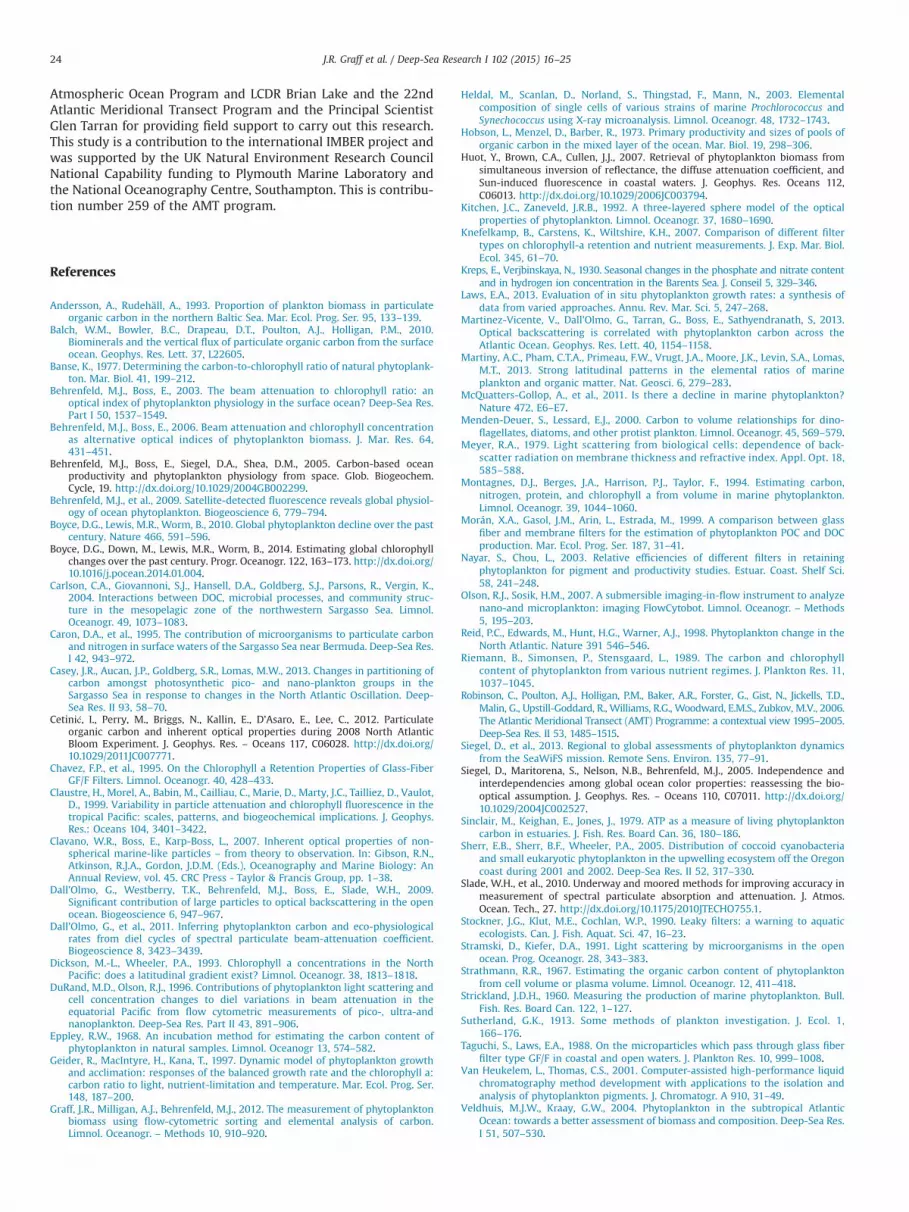
Focusing on the AMT-22 cruise, Cphyto:Chl a ratios ranged from 35to 408 with a median of 99 (Fig. 6). Phytoplankton biomass (Fig. 7B)accounted for 12–97% of POC (Fig. 7A), with an average of 44%(Fig. 7C). Looking more closely at previously defined regions alongthis transect (Robinson et al., 2006), we find that Cphyto makes thegreatest contribution to POC in the oligotrophic gyres (i.e., ‘N. Gyre’and ‘S. Gyre’ in Fig. 7C), while being a smaller faction of POC in theequatorial region and in the more southern temperate waters of theSouth Atlantic (i.e., ‘Equatorial’ and ‘S. Temp’ in Fig. 7C).
Table 1Ranges of analytical phytoplankton carbon and associated parameters measured inthe Equatorial Pacific Ocean (EPO) and during the 22nd Atlantic Meridonal Transectcruise (AMT-22). Cphyto¼phytoplankton carbon, POC¼particulate organic carbon,HPLC Chl a¼high-pressure liquid chromatography chlorophyll a, bbp¼particulatebackscattering coefficient.
Parameter Range of measured values
All (N¼53) EPO (N¼32) AMT-22 (N¼21)
Cphyto (lg L�1) 4–58 5–35 4–58POC (lg L�1) 9–229 9–97 9–229HPLC Chl a (lg L�1) 0.026–1.13 0.05–0.75 0.026–1.13bbp 470 (m�1) 0.00046–0.0038 0.00077–0.0025 0.00046–0.0038
J.R. Graff et al. / Deep-Sea Research I 102 (2015) 16–25 19
4. Discussion
Here, we report direct measurements of Cphyto for the openocean. These data span an order of magnitude, with the highest
biomass samples collected from temperate South Atlantic waters,followed by equatorial upwelling regions, and the lowest valuesfound in oligotrophic gyres. These direct measurements of Cphytoallow evaluation of phytoplankton standing stocks relative toenvironmental conditions and independent of changes in inter-cellular chlorophyll or methodological inconsistencies (e.g. Cphyto:volume ratio). For example, field values of Cphyto:Chl a ratiosexhibited high variability and ranged from 31 to 358 (Fig. 6A,black circles). Future measurements at high latitudes and incoastal upwelling regions may extend this range in Cphyto:Chl a.For this dataset alone, applying a single conversion factor betweenchlorophyll and phytoplankton carbon for this dataset would haveresulted in up to 3-fold under- or overestimates of Cphyto for largeparts of the ocean.
130 140 150 160 1700
0.2
0.4
Chl
orop
hyll
a(µ
gL
-1)
Equatorial Pacific Ocean
130 140 150 160 1700
50
100
POC
(µg
L-1
)
130 140 150 160 1700
2
4x 10⁻³
Year Day
b bp47
0nm
(m-1
)
-40-20020400
0.5
1
1.5Atlantic Meridional Transect -22
-40-20020400
100
200
-40-20020400
2
4x 10 -3
oLatitude
Fig. 2. Transect data for the EPO (A–C) and AMT-22 cruises (D–F) of HPLC Chl a (A, D), particulate organic carbon (POC) (B, E), and the particulate backscattering coefficient(bbp at 470 nm) (C, F).
0.5 1 1.5 2 2.5 3 3.5 4x 10⁻³
0
10
20
30
40
50
60
70
bbp 470 nm (m -1)
Ana
lytic
alC
phy t
o(µ
gL
-1)
M
B
y =12128x +0.59
R2 =0.69
Fig. 3. Regression analysis of analytically derived phytoplankton carbon (Cphyto)with the particulate backscattering coefficient (bbp), R2¼0.69. Confidence intervalsof prediction of 68% (blue) and 95% (red) are shown for the regression. Previouslypublished relationships from Behrenfeld et al. (2005) (-.-. B, y¼13,000xþ4.55) andMartinez‐Vicente et al. (2013) (- - M, y¼30,100x�22.9) are provided forcomparison.
Table 2Regression analyses of direct measurements of phytoplankton carbon (Cphyto) withproxy biomass measurements of HPLC Chl a, POC, and optical parameters. Allregressions were significant with p-values⪡0.05. Cphyto¼phytoplankton carbon,bbp¼particulate backscattering coefficient, HPLC Chl a¼high-pressure liquid chro-matography chlorophyll a, POC¼particulate organic carbon, cp¼beam attenuationcoefficient.
Proxy Measurement Regression analysis with Cphyto
Slope Intercept a R2 RMSE a
bbp 470 (m�1) 12,128 0.59 0.69 4.6HPLC Chl a (lg L�1) 33.7 9.7 0.52 5.1POC (lg L�1) 0.189 8.7 0.52 5.1cp (m�1) 74.2 11 0.42 5.8
a Intercept and RMSE in units of mg C L�1.
J.R. Graff et al. / Deep-Sea Research I 102 (2015) 16–2520
Over the range of biomass samples in this dataset, Cphyto is linearlyrelated to the particulate backscattering coefficient (bbp) (R2¼0.69,Fig. 3 solid line) where Cphyto¼12,128� bbpþ0.59 (Fig. 3). The relation-ship between bbp and Cphyto differs strongly from that of Martinez‐Vicente et al. (2013) (dashed line in Fig. 3), which was derived byconverting flow cytometry-based phytoplankton cell volumes to bio-mass. Volume based phytoplankton biomass conversions rely upon theassumed Cphyto:volume relationship(s) (Verity et al., 1992; Montagneset al., 1994; Menden-Deuer and Lessard, 2000). The range in publishedvalues for this ratio can yield an order of magnitude variability inresultant Cphyto estimates (Caron et al., 1995; Dall'Olmo et al., 2011).Despite the quantitative difference between our results and those ofMartinez‐Vicente et al. (2013), a qualitative consistency between thesetwo studies is that bbp and Cphyto are significantly correlated. The resultsof this field study yielded a slope for the bbp to Cphyto relationship (i.e.,12,128 mg L�1 m�1) that is nearly identical to that in Behrenfeld et al.(2005) of 13,000 mg L�1 m�1. This latter study was based entirely onanalyses of satellite data for bbp at 443 nm. While the wavelengthanalyzed differs between this study and that of Behrenfeld et al. (2005),this discrepancy would only result in a small percentage difference inbbp values. An important deviation between the current results andthose of Behrenfeld et al. (2005) is the lower intercept for our bbp andCphyto relationship (0.59 vs. 4.55, compare solid and dot-dash lines inFig. 3). The differences in intercept and slope between these equationswould imply that Cphyto estimates in the earlier study were
overestimated, if only slightly. A slight bias (high) in satellite bbpretrievals could be the basis for this difference in intercept. Thispossibility emphasizes that, in terms of global biomass assessments, acritical need still exists for increasing field validation data for both Cphytoand bbp. Particulate organic carbon (PIC) also influences measurementsof bbp (Balch et al., 2010) and may lead to increased error around therelationship or overestimations of Cphyto using the existing model.Coccolithophores are a small background component of the phyto-plankton community and are inherently included in the bbp vs. Cphytoregressions (Fig. 1). When they are a small component of the commu-nity they likely add to the error around the derived relationship.However, locally significant increases in PIC or blooms of calcifyingorganisms should be considered carefully in future evaluations andapplications of the bbp vs. Cphyto relationship.
Our regression of direct Cphyto measurements and Chl has apositive y-intercept (Fig. 4A and Table 2). This positive intercept isunlikely due to unaccounted for carbon contamination in thesamples. Rather, as the result of photoacclimation and nutrientdriven changes in intercellular pigmentation, one should expect anon-zero intercept between Chl and biomass in a study spanning awide range of environmental parameters where an order of
0 0.5 1 1.50
20
40
60
HPLC Chl a (µg L -1)
Ana
lytic
alC
phyt
o(µ
gL
-1)
y =33.7x +9.8
R2 =0.52
0 50 100 150 2000
20
40
60
POC (µg L-1)
Ana
lytic
alC
phyt
o(µ
gL
-1)
y =0.19x +8.7
R2 =0.52
Fig. 4. Regression analyses of analytical measurements of (A) HPLC Chl a and Cphytoand (B) POC and Cphyto. Both regressions resulted in an R2¼0.52.
Fig. 5. Regression analyses of (A) POC and bbp, (B) Cphyto and cp, and (C) POC and cp.
J.R. Graff et al. / Deep-Sea Research I 102 (2015) 16–25 21
magnitude change in Chl can be associated with the same biomass. Aregression of whole water total phytoplankton cell counts from ourstudy with Chl also results in a significant positive intercept of7�109 cells. If we conservatively assume that all of these cells areProchlorococcus in these high-light low-chlorophyll waters and applya nominal value of 100 fg C cell�1, from a reported range of 35(Veldhuis and Kraay, 2004) to 350 (Caron et al., 1995 and referencestherein), this intercept is approximately 7 mg C L�1. Converting cellcounts to carbon are, of course, subject to a wide range of conversionfactors applied to different cells types that would significantly impactthe regression of Cphyto and Chl and the resulting intercept. Forcomparison, an analysis of published data aimed at determiningplanktonic carbon contributions to total POC (Caron et al., 1995)
resulted in an intercept of 5.0 mg C L�1. A more rudimentaryapproach, and one commonly applied to obtain phytoplanktonbiomass estimates, is to multiply the chlorophyll values by a Cphyto:Chl (Θ) conversion factor. If we divide our samples based on Chlvalues above and below 0.25 mg L�1, a value that delineates openocean gyres from temperate waters in our dataset. ApplyingΘ valueswhich are representative of gyre conditions (Θ¼90) and temperatewaters (Θ¼30) (Riemann et al., 1989; Sherr et al., 2005) the sameregression analysis results in an intercept of 6.7 mg C L�1. Lastly, anyloss of small cells and/or pigments when filtering through GF/Fs(Taguchi and Laws, 1988; Stockner et al., 1990; Dickson and Wheeler,1993; Nayar and Chou, 2003; Knefelkamp et al., 2007) would alsoconfound this analysis, shifting the relationship towards a higher y-
Fig. 6. Transect data from AMT-22 for Cphyto:Chl a ratios from direct measurements of Cphyto (black circles) and optically derived from bbp 470 (blue circles) using the newrelationship (Fig. 3 solid line).
Fig. 7. AMT-22 transect data of (A) POC, (B) optically derived Cphyto using the relationship in Fig. 3, and (C) the ratio of Cphyto to POC. Note log scale for A and B.
J.R. Graff et al. / Deep-Sea Research I 102 (2015) 16–2522

intercept by shifting chlorophyll values for samples with small cellsto lower chlorophyll values. Thus, the results of our analysis are notunusual and only serve to emphasize the point that Chl is not thebest estimator of biomass.
We find that chlorophyll and POC concentrations exhibit weakerrelationships with Cphyto than that observed for bbp (Fig. 4A and B).Cellular chlorophyll concentration is strongly influenced by photo-acclimation (i.e. changes in pigmentation in response to changes ingrowth irradiance) and nutrient-driven growth rate (Geider et al.,1997; Behrenfeld et al., 2005). Accordingly, the capacity to routinelymeasure Cphyto and Chl a simultaneously in the field represents a newopportunity to decipher and understand Chl:Cphyto variability innatural phytoplankton assemblages. Similarly, POC is not solely afunction of phytoplankton biomass, but also registers non-algalparticulate matter (Banse, 1977). Thus, simultaneous measurementsof Cphyto and POC can contribute to improved understanding of factorscontrolling trophic level carbon balances in marine ecosystems.
In the current investigation using direct measurements of phyto-plankton biomass, there is a closer relationship between directmeasurements of Cphyto and bbp than for Cphyto and cp (Figs. 3 and5B). Previous studies have found tight correlations with both of theseoptical indices and proxy estimates of Cphyto (DuRand and Olson,1996; Claustre et al., 1999; Behrenfeld and Boss, 2006). The particu-late beam attenuation coefficient (cp), in theory, is most sensitive toparticles in the size range of the majority of phytoplankton (0.5–20 mm) while smaller particles are thought to dominate the bbp signal(Stramski and Kiefer, 1991). Thus, we were somewhat surprised bythe weaker relationship between Cphyto and cp. However, it isnoteworthy that the correlation coefficient for this relationship issignificantly influenced by a relatively small number of samples thathave high POC values from the temperate South Atlantic. Asdiscussed below, these springtime conditions were potentially sup-porting an enhanced grazing community relative to phytoplanktonconcentration that was being detected in measurements of cp but notbbp. While bbp is supposed to be most sensitive to small sphericalparticles, phytoplankton have more complex shapes and internalcomponents and backscatter light more efficiently than theory wouldpredict for perfect spheres (Meyer, 1979; Kitchen and Zaneveld, 1992;Vaillancourt et al., 2004; Clavano et al., 2007).
With respect to future field measurements of Cphyto, a cautionarynote is needed regarding samples containing very large cells, particu-larly chain-forming phytoplankton species (e.g. Chaetoceros species).These cells are difficult (at best) to sort using a BD ICS. Consequently,assessments of Cphyto need to include an additional measurement forquantifying the carbon contribution of very large cells (e.g. handsorted cell collection, imaging flow-cytometry (Olson and Sosik, 2007),microscopic enumeration) when such species are abundant (e.g., openocean blooms, coastal upwelling areas, nearshore regions, estuaries).With respect to the current study, it is very unlikely that our Cphytovalues are biased by unaccounted for large phytoplankton. DuringAMT-22, samples were collected at 20 m depth in the temperatesouthern region (i.e., the area of highest production for our fieldstudies) and analyzedwith a FlowCam. Thesemeasurements indicatedthat the average cell diameter for the largest cells, which were diatomsand dinoflagellates, was 34.5 mm (E. Fileman, Plymouth Marine Labs,personal communication). The set-up for our BD-ICS for these cruisesused a 100 mm diameter sort nozzle and thus was able to sort cells inthis size class.
Application of the Cphyto to bbp relationship for the AMT-22 cruiseextends our Cphyto observations along the transect. Ratios of Cphyto:Chl acalculated using optically derived Cphyto exhibit an order of magnituderange (35–408, median¼99) (Fig. 6A, green circles). While much ofthis range can be attributed to changes in intercellular pigments dueto growth irradiance (Eg) differences between similar light environ-ments are also apparent. For example, 251N and 351S have similar Egvalues (� 0.2 mol quanta m�2 s�1) yet very different Cphyto:Chl a
ratios, approximately 35 and 110 respectively, possibly reflectingdifferences in nutrient availability. There are dramatic trends in thisratio even within an environment like the South Atlantic oligotrophicgyre (Fig. 6A, S. Gyre). This variability illustrates the potential errorassociated with extracting Cphyto estimates from Chl a data.
Another interesting relationship observed during AMT-22 was thelatitudinal pattern in the Cphyto:POC ratio (Fig. 7C). Regions with thehighest Cphyto and highest net primary production (i.e. EquatorialUpwelling and temperate Spring waters) exhibited Cphyto:POC valuesthat rarely exceeded 40% (average�25%). This observation contrastswith enhanced biomass at coastal upwelling sites where phytoplank-ton can dominate POC (Hobson et al., 1973). A low contribution ofCphyto to POC in productive offshore waters, however, is consistentwith the studies of Andersson and Rudehäll (1993) and Hobson et al.(1973), which included peak bloom conditions in a coastal region(Hobson et al., 1973; Andersson and Rudehäll, 1993). These differencesbetween environments reflect system variability in producer andconsumer dynamics, processes influencing the particle field, andpossibly the export efficiency of different particle types. The substan-tial variability in Cphyto:POC values documented in these studies andillustrated in Fig. 7C illustrates the potential for significant error whenextracting Cphyto estimates from POC.
The absence of analytical Cphyto measurements in the field hasresulted in a prolonged reliance on proxies with tentative relationshipsto phytoplankton biomass, in particular chlorophyll concentration.Historical in situ and satellite records of chlorophyll have been usedto evaluate trends and draw conclusion on phytoplankton biomassand its relation to climate forcings (e.g. Boyce et al., 2010, 2014;McQuatters-Gollop et al., 2011). The recent assessment of Cphyto fromsatellite bbp (Behrenfeld et al., 2005; Westberry et al., 2008) hasallowed a re-evaluation of chlorophyll variability, with some importantconclusions. In particular, such studies have shown that temporalchanges in chlorophyll over large ocean regions can be predominantlydue to physiologically-driven modifications in cellular Chl:C ratios,rather than changes in biomass (Behrenfeld et al., 2005, 2009; Siegelet al., 2013). These findings have strong implications regardingecosystem trophic dynamics, carbon export, and assessments ofchange in net primary production. However, confidence in theseresults has been hampered by a lack of validation data for evaluatingthe satellite Cphyto retrievals. Results presented here represent a firststep in this validation (Fig. 3). We strongly endorse the continuedapplication of this Cphyto measurement approach in future field studies,particularly in concert with paired measurements of pigment con-centration and POC, to both improve global assessments of phyto-plankton biomass and to allow more detailed in situ investigations ofphytoplankton physiology and its relation to environmental variability.
Advances in technology (sorting flow-cytometery, high-sensitivity elemental analyses) have allowed quantitative assess-ment of a key ocean ecosystem property, Cphyto, that has historicallybeen impossible. Direct Cphyto measurements reported here andelsewhere (Casey et al., 2013) have (Martiny et al., 2013; Wallheadet al., 2014) and will continue to be applied to evaluate phyto-plankton biomass and physiology on multiple spatial and temporalscales. It will be important to continue testing and improving themeasurement approach and building toward a more extensive setof field data, particularly in high biomass waters. In the meantime,the strong relationship reported here between bbp and Cphytoprovides a path for exploring local-to-global scale phytoplanktoncarbon distributions at high spatial and temporal resolution usingin situ and satellite optical measurements.
Acknowledgments
This work was funded by NASA Grant NNX10AT70G toM. Behrenfeld. We would like to thank the NOAA Tropical
J.R. Graff et al. / Deep-Sea Research I 102 (2015) 16–25 23
Atmospheric Ocean Program and LCDR Brian Lake and the 22ndAtlantic Meridional Transect Program and the Principal ScientistGlen Tarran for providing field support to carry out this research.This study is a contribution to the international IMBER project andwas supported by the UK Natural Environment Research CouncilNational Capability funding to Plymouth Marine Laboratory andthe National Oceanography Centre, Southampton. This is contribu-tion number 259 of the AMT program.
References
Andersson, A., Rudehäll, A., 1993. Proportion of plankton biomass in particulateorganic carbon in the northern Baltic Sea. Mar. Ecol. Prog. Ser. 95, 133–139.
Balch, W.M., Bowler, B.C., Drapeau, D.T., Poulton, A.J., Holligan, P.M., 2010.Biominerals and the vertical flux of particulate organic carbon from the surfaceocean. Geophys. Res. Lett. 37, L22605.
Banse, K., 1977. Determining the carbon-to-chlorophyll ratio of natural phytoplank-ton. Mar. Biol. 41, 199–212.
Behrenfeld, M.J., Boss, E., 2003. The beam attenuation to chlorophyll ratio: anoptical index of phytoplankton physiology in the surface ocean? Deep-Sea Res.Part I 50, 1537–1549.
Behrenfeld, M.J., Boss, E., 2006. Beam attenuation and chlorophyll concentrationas alternative optical indices of phytoplankton biomass. J. Mar. Res. 64,431–451.
Behrenfeld, M.J., Boss, E., Siegel, D.A., Shea, D.M., 2005. Carbon‐based oceanproductivity and phytoplankton physiology from space. Glob. Biogeochem.Cycle, 19. http://dx.doi.org/10.1029/2004GB002299.
Behrenfeld, M.J., et al., 2009. Satellite-detected fluorescence reveals global physiol-ogy of ocean phytoplankton. Biogeoscience 6, 779–794.
Boyce, D.G., Lewis, M.R., Worm, B., 2010. Global phytoplankton decline over the pastcentury. Nature 466, 591–596.
Boyce, D.G., Down, M., Lewis, M.R., Worm, B., 2014. Estimating global chlorophyllchanges over the past century. Progr. Oceanogr. 122, 163–173. http://dx.doi.org/10.1016/j.pocean.2014.01.004.
Carlson, C.A., Giovannoni, S.J., Hansell, D.A., Goldberg, S.J., Parsons, R., Vergin, K.,2004. Interactions between DOC, microbial processes, and community struc-ture in the mesopelagic zone of the northwestern Sargasso Sea. Limnol.Oceanogr. 49, 1073–1083.
Caron, D.A., et al., 1995. The contribution of microorganisms to particulate carbonand nitrogen in surface waters of the Sargasso Sea near Bermuda. Deep-Sea Res.I 42, 943–972.
Casey, J.R., Aucan, J.P., Goldberg, S.R., Lomas, M.W., 2013. Changes in partitioning ofcarbon amongst photosynthetic pico- and nano-plankton groups in theSargasso Sea in response to changes in the North Atlantic Oscillation. Deep-Sea Res. II 93, 58–70.
Cetinić, I., Perry, M., Briggs, N., Kallin, E., D’Asaro, E., Lee, C., 2012. Particulateorganic carbon and inherent optical properties during 2008 North AtlanticBloom Experiment. J. Geophys. Res. – Oceans 117, C06028. http://dx.doi.org/10.1029/2011JC007771.
Chavez, F.P., et al., 1995. On the Chlorophyll a Retention Properties of Glass-FiberGF/F Filters. Limnol. Oceanogr. 40, 428–433.
Claustre, H., Morel, A., Babin, M., Cailliau, C., Marie, D., Marty, J.C., Tailliez, D., Vaulot,D., 1999. Variability in particle attenuation and chlorophyll fluorescence in thetropical Pacific: scales, patterns, and biogeochemical implications. J. Geophys.Res.: Oceans 104, 3401–3422.
Clavano, W.R., Boss, E., Karp-Boss, L., 2007. Inherent optical properties of non-spherical marine-like particles – from theory to observation. In: Gibson, R.N.,Atkinson, R.J.A., Gordon, J.D.M. (Eds.), Oceanography and Marine Biology: AnAnnual Review, vol. 45. CRC Press - Taylor & Francis Group, pp. 1–38.
Dall'Olmo, G., Westberry, T.K., Behrenfeld, M.J., Boss, E., Slade, W.H., 2009.Significant contribution of large particles to optical backscattering in the openocean. Biogeoscience 6, 947–967.
Dall'Olmo, G., et al., 2011. Inferring phytoplankton carbon and eco-physiologicalrates from diel cycles of spectral particulate beam-attenuation coefficient.Biogeoscience 8, 3423–3439.
Dickson, M.-L., Wheeler, P.A., 1993. Chlorophyll a concentrations in the NorthPacific: does a latitudinal gradient exist? Limnol. Oceanogr. 38, 1813–1818.
DuRand, M.D., Olson, R.J., 1996. Contributions of phytoplankton light scattering andcell concentration changes to diel variations in beam attenuation in theequatorial Pacific from flow cytometric measurements of pico-, ultra-andnanoplankton. Deep-Sea Res. Part II 43, 891–906.
Eppley, R.W., 1968. An incubation method for estimating the carbon content ofphytoplankton in natural samples. Limnol. Oceanogr 13, 574–582.
Geider, R., MacIntyre, H., Kana, T., 1997. Dynamic model of phytoplankton growthand acclimation: responses of the balanced growth rate and the chlorophyll a:carbon ratio to light, nutrient-limitation and temperature. Mar. Ecol. Prog. Ser.148, 187–200.
Graff, J.R., Milligan, A.J., Behrenfeld, M.J., 2012. The measurement of phytoplanktonbiomass using flow-cytometric sorting and elemental analysis of carbon.Limnol. Oceanogr. – Methods 10, 910–920.
Heldal, M., Scanlan, D., Norland, S., Thingstad, F., Mann, N., 2003. Elementalcomposition of single cells of various strains of marine Prochlorococcus andSynechococcus using X-ray microanalysis. Limnol. Oceanogr. 48, 1732–1743.
Hobson, L., Menzel, D., Barber, R., 1973. Primary productivity and sizes of pools oforganic carbon in the mixed layer of the ocean. Mar. Biol. 19, 298–306.
Huot, Y., Brown, C.A., Cullen, J.J., 2007. Retrieval of phytoplankton biomass fromsimultaneous inversion of reflectance, the diffuse attenuation coefficient, andSun-induced fluorescence in coastal waters. J. Geophys. Res. Oceans 112,C06013. http://dx.doi.org/10.1029/2006JC003794.
Kitchen, J.C., Zaneveld, J.R.B., 1992. A three-layered sphere model of the opticalproperties of phytoplankton. Limnol. Oceanogr. 37, 1680–1690.
Knefelkamp, B., Carstens, K., Wiltshire, K.H., 2007. Comparison of different filtertypes on chlorophyll-a retention and nutrient measurements. J. Exp. Mar. Biol.Ecol. 345, 61–70.
Kreps, E., Verjbinskaya, N., 1930. Seasonal changes in the phosphate and nitrate contentand in hydrogen ion concentration in the Barents Sea. J. Conseil 5, 329–346.
Laws, E.A., 2013. Evaluation of in situ phytoplankton growth rates: a synthesis ofdata from varied approaches. Annu. Rev. Mar. Sci. 5, 247–268.
Martinez‐Vicente, V., Dall'Olmo, G., Tarran, G., Boss, E., Sathyendranath, S, 2013.Optical backscattering is correlated with phytoplankton carbon across theAtlantic Ocean. Geophys. Res. Lett. 40, 1154–1158.
Martiny, A.C., Pham, C.T.A., Primeau, F.W., Vrugt, J.A., Moore, J.K., Levin, S.A., Lomas,M.T., 2013. Strong latitudinal patterns in the elemental ratios of marineplankton and organic matter. Nat. Geosci. 6, 279–283.
McQuatters-Gollop, A., et al., 2011. Is there a decline in marine phytoplankton?Nature 472, E6–E7.
Menden-Deuer, S., Lessard, E.J., 2000. Carbon to volume relationships for dino-flagellates, diatoms, and other protist plankton. Limnol. Oceanogr. 45, 569–579.
Meyer, R.A., 1979. Light scattering from biological cells: dependence of back-scatter radiation on membrane thickness and refractive index. Appl. Opt. 18,585–588.
Montagnes, D.J., Berges, J.A., Harrison, P.J., Taylor, F., 1994. Estimating carbon,nitrogen, protein, and chlorophyll a from volume in marine phytoplankton.Limnol. Oceanogr. 39, 1044–1060.
Morán, X.A., Gasol, J.M., Arin, L., Estrada, M., 1999. A comparison between glassfiber and membrane filters for the estimation of phytoplankton POC and DOCproduction. Mar. Ecol. Prog. Ser. 187, 31–41.
Nayar, S., Chou, L., 2003. Relative efficiencies of different filters in retainingphytoplankton for pigment and productivity studies. Estuar. Coast. Shelf Sci.58, 241–248.
Olson, R.J., Sosik, H.M., 2007. A submersible imaging-in-flow instrument to analyzenano-and microplankton: imaging FlowCytobot. Limnol. Oceanogr. – Methods5, 195–203.
Reid, P.C., Edwards, M., Hunt, H.G., Warner, A.J., 1998. Phytoplankton change in theNorth Atlantic. Nature 391 546–546.
Riemann, B., Simonsen, P., Stensgaard, L., 1989. The carbon and chlorophyllcontent of phytoplankton from various nutrient regimes. J. Plankton Res. 11,1037–1045.
Robinson, C., Poulton, A.J., Holligan, P.M., Baker, A.R., Forster, G., Gist, N., Jickells, T.D.,Malin, G., Upstill-Goddard, R., Williams, R.G., Woodward, E.M.S., Zubkov, M.V., 2006.The Atlantic Meridional Transect (AMT) Programme: a contextual view 1995–2005.Deep-Sea Res. II 53, 1485–1515.
Siegel, D., et al., 2013. Regional to global assessments of phytoplankton dynamicsfrom the SeaWiFS mission. Remote Sens. Environ. 135, 77–91.
Siegel, D., Maritorena, S., Nelson, N.B., Behrenfeld, M.J., 2005. Independence andinterdependencies among global ocean color properties: reassessing the bio-optical assumption. J. Geophys. Res. – Oceans 110, C07011. http://dx.doi.org/10.1029/2004JC002527.
Sinclair, M., Keighan, E., Jones, J., 1979. ATP as a measure of living phytoplanktoncarbon in estuaries. J. Fish. Res. Board Can. 36, 180–186.
Sherr, E.B., Sherr, B.F., Wheeler, P.A., 2005. Distribution of coccoid cyanobacteriaand small eukaryotic phytoplankton in the upwelling ecosystem off the Oregoncoast during 2001 and 2002. Deep-Sea Res. II 52, 317–330.
Slade, W.H., et al., 2010. Underway and moored methods for improving accuracy inmeasurement of spectral particulate absorption and attenuation. J. Atmos.Ocean. Tech., 27. http://dx.doi.org/10.1175/2010JTECHO755.1.
Stockner, J.G., Klut, M.E., Cochlan, W.P., 1990. Leaky filters: a warning to aquaticecologists. Can. J. Fish. Aquat. Sci. 47, 16–23.
Stramski, D., Kiefer, D.A., 1991. Light scattering by microorganisms in the openocean. Prog. Oceanogr. 28, 343–383.
Strathmann, R.R., 1967. Estimating the organic carbon content of phytoplanktonfrom cell volume or plasma volume. Limnol. Oceanogr. 12, 411–418.
Strickland, J.D.H., 1960. Measuring the production of marine phytoplankton. Bull.Fish. Res. Board Can. 122, 1–127.
Sutherland, G.K., 1913. Some methods of plankton investigation. J. Ecol. 1,166–176.
Taguchi, S., Laws, E.A., 1988. On the microparticles which pass through glass fiberfilter type GF/F in coastal and open waters. J. Plankton Res. 10, 999–1008.
Van Heukelem, L., Thomas, C.S., 2001. Computer-assisted high-performance liquidchromatography method development with applications to the isolation andanalysis of phytoplankton pigments. J. Chromatogr. A 910, 31–49.
Veldhuis, M.J.W., Kraay, G.W., 2004. Phytoplankton in the subtropical AtlanticOcean: towards a better assessment of biomass and composition. Deep-Sea Res.I 51, 507–530.
J.R. Graff et al. / Deep-Sea Research I 102 (2015) 16–2524

Verity, P.G., Robertson, C.Y, Tronzo, C.R., Andrews, M.G., Nelson, J.R., Sieracki, M.E.,1992. Relationships between cell volume and the carbon and nitrogen contentof marine photosynthetic nanoplankton. Limnol. Oceanogr. 37, 1434–1446.
Vaillancourt, R.D., Brown, C.W., Guillard, R.R.L., Balch, W.M., 2004. Light back-scattering properties of marine phytoplankton: relationships to cell size,chemical composition and taxonomy. J. Plankton Res. 26, 191–212.
Wallhead, P.J., Garçon, V.C., Casey, J.R., Lomas, M.W., 2014. Long-term variability ofphytoplankton carbon biomass in the Sargasso Sea. Glob. Biogeochem. Cycles28, 825–841.
Westberry, T.K., Behrenfeld, M.J., Siegel, D.A., Boss, E., 2008. Carbon‐based primaryproductivity modeling with vertically resolved photoacclimation. Glob. Biogeo-chem. Cycles 22, GB2024. http://dx.doi.org/10.1029/2007GB003078.
J.R. Graff et al. / Deep-Sea Research I 102 (2015) 16–25 25