overconfidence increases productivity
TRANSCRIPT

Electronic copy available at: http://ssrn.com/abstract=1904692
Discussion Paper No. 814
OVERCONFIDENCE INCREASES
PRODUCTIVITY
Yusuke Kinaria Noriko Mizutani Fumio Ohtake
Hiroko Okudaira
August 2011
The Institute of Social and Economic Research Osaka University
6-1 Mihogaoka, Ibaraki, Osaka 567-0047, Japan

Electronic copy available at: http://ssrn.com/abstract=1904692
Overconfidence Increases Productivity*
Yusuke Kinaria
Graduate School of Economics, Kyushu University
Noriko Mizutanib
Institute for Research on Household Economics
Fumio Ohtakec
Institute of Social and Economic Research, Osaka University
Hiroko Okudairad
Graduate School of Economics, Okayama University
* We thank Kan Takeuchi, Hideaki Kato, and participants at the fourth annual meeting of the Association of Behavioral Economics and Finance. This work was financially supported by a Grant-in-Aid for Challenging Exploratory Research from the Japan Society for the Promotion of Science and the Collaborative Program of the Institute of Social and Economic Research, Osaka University. a Corresponding author: Graduate School of Economics, Kyushu University, 6-19-1, Hakozaki, Higashi-ku, Fukuoka, 812-8581, Japan. Tel: +81-92-642-2493; e-mail: [email protected]. b Institute for Research on Household Economics, 2-3-7, Kudan-kita, Chiyoda-ku, Tokyo, 102-0073, Japan. E-mail: [email protected]. c Institute of Social and Economic Research, Osaka University, 6-1, Mihogaoka, Ibaraki, 567-0047, Japan. E-mail: [email protected]. d Graduate School of Economics, Okayama University, 3-1-1, Tsushima-naka, Kita-ku, Okayama 700-8530, Japan. E-mail: [email protected].

Overconfidence Increases Productivity
Abstract
Recent studies report that productivity increases under tournament reward structures
than under piece rate reward structures. We conduct maze-solving experiments under
both reward structures and reveal that overconfidence is a significant factor in
increasing productivity. Specifically, subjects exhibiting progressively higher degrees of
overconfidence solve more mazes. This result shows a positive aspect of
overconfidence, which usually has been examined in its negative aspect as an
expectation bias.
JEL: C9, D03, J33
Keywords: Expectation, Overconfidence, Reward structure, Productivity, Experiment

1. Introduction
There are many ways of paying rewards. Under a piece rate reward structure, the
reward people earn depends solely on their individual productivity, whereas under a
tournament reward structure, it depends on not only their productivity but also their
competitors’ productivities. It is important to know how different reward structures
affect productivity. In the field of labor economics and business, such knowledge could
guide firms in setting employee rewards to increase profits, and in the context of
education, it helps educators understand how to motivate children toward their best
efforts.
Recent studies examine the relationship between reward structures and productivity
and report that productivity increases under the tournament structure compared with the
piece rate structure (Gneezy et al., 2003; Freeman and Gelber, 2010; Mizutani et al.,
2009; Niederle and Vesterlund, 2007).1 Freeman and Gelber (2010), whose research is
most relevant for this study, conducted maze-solving experiments and investigated the
effects of the tournament prize structure and the disclosure of information about other
subjects’ skills. They asked groups of six subjects to participate in two rounds of
maze-solving problems. In Round 1, subjects were rewarded by piece rate. After the
groups completed Round 1, researchers informed subjects in half of the groups about
the distribution of mazes solved in Round 1 in their groups, but they withheld that
information from subjects in the remaining half. In Round 2, subjects solved mazes
under three different reward structures: fixed, single-prize tournament, and
multiple-prize tournament. Using the number of mazes solved as the measure of
1 Although Mizutani et al. (2009) and Niederle and Vesterlund (2007) do not focus on productivity, their experimental results demonstrate that productivity increases under the tournament structure compared with the piece rate structure.
performance, they found that performance was lowest under the fixed-reward structure,
higher under the single-prize tournament structure, and highest under the multiple-prize
tournament structure. They also found that revealing information on performance of
other group members affected productivity. When this information was disclosed to
subjects who scored highly in Round 1, their subsequent performance was greater than
when the information was withheld. In contrast, performance among subjects who
scored low in Round 1, decreased when the information was disclosed and increased
when it was withheld.
Freeman and Gelber (2010) interpret their results as demonstrating the effect of
incentives on effort. Under the multiple-prize tournament structure, all subjects have an
incentive to increase their rewards, whereas the fixed-prize structure provides no such
incentive. Under the single-prize structure, subjects with a high chance of winning earn
the incentive, and those with a low chance of winning lose the incentive.
This study examines the changes in productivity that occur when subjects receive no
information about the distribution of competitors’ skills. We conduct maze-solving
experiments under the piece rate and tournament reward structures and explore the
effects of subjective expectations and overconfidence on productivity. Subjects are
divided into groups of four individuals and are asked to anticipate their rankings within
their groups. If we offer information about other subjects’ skills, it would act as an
incentive; if we withhold information about other subjects’ skills, subjective
expectations would act as the incentive. That is, if subjects regard themselves as good
performers, they will try harder to win the tournament. If they do not regard themselves
as good performers, they will give up the attempt to win the tournament.
These subjective expectations are based on two factors: subjects’ actual ability and
their confidence levels. We refer to the latter as “overconfidence” or “underconfidence.”
The results of Freeman and Gelber (2010) suggest that overconfidence may affect
productivity. They report that the performance of subjects who scored low in Round 1
increases when the information regarding other subjects’ performance is withheld. This
may occur because subjects do not realize that their skills are less than their
competitors’—that is, they are overconfident. Moreover, it is considered that the
performance of subjects who scored highly in Round 1 decreases more when the
information is withheld because they are underconfident.
We have other grounds for concluding that overconfidence increases productivity.
Gneezy et al. (2003) conduct maze-solving experiments and observe a gender difference
in increases in performance from the piece rate to the tournament reward structure. In
particular, female subjects perform better in all-female groups, whereas their
performance does not increase in mixed-gender groups. Mizutani et al. (2009) conduct
computational experiments and report that women become overconfident in all-female
groups, whereas they are under-confident in mixed-gender groups. These results imply
that overconfidence increases productivity and that a gender difference in
overconfidence causes the gender difference in increased productivity. We test this
hypothesis using actual overconfidence measures constructed from participants’
subjective estimates of their rankings within their groups and the number of mazes
solved.
The remainder of this paper is organized as follows. Section 2 describes our
experiment. Section 3 presents our results and reveals that subjective expectations and
overconfidence affect subjects’ performance significantly. Specifically, subjects who
expect worse rankings increase their performance more than those who expect better
rankings, and overconfident subjects increase their performance. This is evidence that
overconfidence has a positive aspect, which previously has been studied mainly in its
negative aspect as an expectation bias. Section 4 concludes.
2. Method
We conducted the experiment at Osaka University on October 25, November 15 and
29, and December 6, 2009. Subjects included 132 students (67 males and 65 females)
affiliated with Osaka University. We assigned subjects to groups of four participants
and asked them to solve mazes. Subjects were not aware of which members were
included in their groups, but knew their groups’ gender ratios. We organized groups
according to five gender ratios: nine groups of four males; one group of three males and
one female; 13 groups of two males and two females; two groups of one male and three
females; and eight groups of four females each.2 Our subjects’ tasks included solving as
many mazes as possible within three minutes, and the time remaining always appeared
with the maze on their computer screens. Subjects moved cursors from the start to the
goal point using arrow keys on their keyboards. They could skip a maze by clicking a
radio button on their screens and move to the next maze whenever they were willing to
do so. The number of skips was unlimited.
The experiment consisted of three tasks—Task 1, Task 2, and Task 3. For Task 1, we
rewarded subjects by piece rate; their reward of ¥100 per maze solved depended solely
on their individual performance. Task 2 was completed under the tournament reward
structure; only the winner in each group received a reward of ¥400 per maze solved. For
2 We initially intended to conduct our experiments using three gender groups (all-male, all-female, and two males-two females). However, two additional groups (one male-three females and three males-one female) emerged as we recruited subjects hastily to replace those who cancelled at the last minute.

Task 3, subjects could choose the piece rate or tournament reward structure before
solving mazes, and rewards were paid on the basis of their choices. To accustom
subjects to maze-solving using a computer, we conducted one-minute training sessions
before Task 1.
In addition, subjects were asked to anticipate their ranking within their groups after
completing each task. We asked them not only their expected rankings but also their
probability distribution forecasts. In estimating the expected ranking, subjects pick a
rank between 1 and 4. In estimating the probability distribution, subjects were required
to give their expected probabilities of each rank by percentages. We also asked them to
complete a questionnaire at the end of the experiment to measure their attitudes toward
risk and competition.
All subjects received a ¥3,000 show-up fee for participation. At the end of the
experiment, we randomly selected one task among the three, for which we actually paid
the reward. Subjects were paid on the basis of their performance in the tasks plus the
show-up fee.
3. Results
3.1. Gender differences in performance
Table 1 reports the mean number of mazes solved and the standard errors for Tasks 1
and 2. For both tasks, the mean number of mazes solved by males was greater than that
by females. The gender differences in mean mazes solved are approximately 2.5 in Task
1 and 1.9 in Task 2 and are significant at 1%. Niederle and Vesturland (2007) and
Mizutani et al. (2009) conduct computational experiments under the piece rate and
tournament structures and find no gender differences in performance, perhaps indicating

gender differences in the ability to solve mazes.3
Table 2 presents the change in performance from Task 1 to Task 2. Both males and
females increase their performance significantly. For male subjects, the mean
performance increases about 0.9 (9.4%), and for female subjects, it increases about 1.5
(18.5%). The gender difference in increase in performance, approximately 0.6 (9.1%), is
significant at 1%. Our result is inconsistent with that of Gneezy et al. (2003), who report
that performance of males improve under the tournament compared with that under the
piece rate, but female performance do not. However, this result does not reject our
hypothesis that the gender difference in overconfidence causes the gender difference in
increased performance. This is because females were more overconfident than males in
our experiment, as reported in 3-3.
3.2. Expected ranking and performance
Table 3 demonstrates subjects’ performance in Tasks 1 and 2 and compares the
change in performance with subjects’ expected rankings following Task 1. While nearly
half the subjects estimated that they ranked second within their groups, only three
subjects believed they ranked fourth. Subjects’ actual performance tends to be lower
when their estimated ranking is lower, indicating that subjects to some extent ranked
themselves reasonably. However, given that more than half estimated their rankings as
above average, the result resembles that of Svenson (1981), who reports that a majority
of subjects regarded themselves as more skillful and less risky than the average driver.
On the other hand, performance in Task 2 tends to increase when subjects’ expected
rankings following completion of Task 1 were lower. That is, the increase in
3 Perhaps gender stereotyping produces the result. In fact, Steele and Ambady (2006) and Shih, Pittinsky, and Ambady (1999) report that gender stereotypes influenced performance.

performance of subjects who ranked themselves lower was greater than that of subjects
who ranked themselves higher. This result differs slightly from Freeman and Gelber
(2010), who report that the increase in performance among highly-skilled subjects is
greater than the increase among lowly-skilled subjects, even when subjects have no
information about other subjects’ skills. Our result may indicate that individuals never
give up trying to win, even when they ranked themselves low.
3.3. Overconfidence and performance
We asked subjects to estimate their rankings within their groups after each task. This
expected ranking is based on two factors: subject’s actual ability and their confidence
level. We refer to the latter as “overconfidence” or “underconfidence.” Many studies
document gender differences in overconfidence.4
We define overconfidence numerically by deducting expected ranking from subject’s
actual ranking after completing both the tasks. As a proxy for each subject’s actual
ranking, we use his or her average ranking within the group generated by 1 million
times random grouping. As a proxy for each subject’s expected ranking, we use both the
mean of the expected probability distribution (Overconfidence 1) and the point forecast
(Overconfidence 2). For both measures, a positive (negative) value implies that subjects
are overconfident (underconfident) because their expected rankings were higher (lower)
compared with their actual ranking.
Table 4 shows the means of the overconfidence measures and their gender differences.
Means of overconfidence measures for all subjects are 0.266 for Overconfidence 1 and
0.391 for Overconfidence 2. Both are significant at 1%, which implies that our subjects
4 Croson and Gneezy (2009) introduced many studies on the gender difference in overconfidence.
are generally overconfident. Furthermore, women are more overconfident than men in
both measures. Gender differences are significant at 1% for Overconfidence 1 and at
10% for Overconfidence 2. Previous literature reports that men are more overconfident
than women (Barber and Odean, 2001). Mizutani et al. (2009) conduct almost the same
experiment employing computational rather than maze-solving tasks, and they report
that male subjects are more overconfident than female subjects. These results indicate
that gender differences in overconfidence depend on the task assigned.
Figure 1 shows the means of Overconfidence 1 by the change in performance from
Task 1 to Task 2. The horizontal and vertical axes present the change in performance
from Task 1 to Task 2 and the degree of overconfidence, respectively. We find a
positive correlation between the increase in performance and degree of overconfidence.
Subjects whose performance increased are generally overconfident, as we define it here,
and those whose performance decreased are generally underconfident. Further, greater
increases in performance are associated with greater degrees of overconfidence. It is
noteworthy that subjects whose performance does not change are neither overconfident
nor underconfident.
Overconfidence has been studied mainly in its negative aspect as an expectation bias.
Barber and Odean (2001) report that overconfidence increases frequency of stock
trading, but returns decrease because of high transaction costs. Mizutani et al. (2009)
and Niederle and Vesturland (2007) report that overconfidence leads subjects to
overestimate their capabilities and enter competitions, which consequently decreases
their returns. While these studies emphasize how overconfidence decreases returns, our
experiment demonstrates that overconfidence can improve subjects’ performance, even
if their performance does not improve sufficiently to earn or increase a reward. This is
evidence that overconfidence has a positive aspect.5
3.4. Gender and performance
Table 5 presents the change in performance from Task 1 to Task 2 by gender and
gender grouping, although one group of three males-one female and two groups of one
male-three females are excluded because the number of observation is few. Male
subjects in two male-two female groups improve their performance compared with
those in all-male groups, although the difference is not significant. The gender
composition of groups did not affect female subjects’ performance. Women improve
their performance from Task 1 to Task 2 irrespective of whether men belong to their
group. This finding is inconsistent with that of Gneezy et al. (2003), suggesting that the
effect of gender on performance may differ by country or culture.
Table 6 shows the means of overconfidence measures by gender and gender grouping,
although one group of three males-one female and two groups of one male-three
females are excluded because the number of observations is few. Male subjects tend to
be more overconfident when grouped with females, and female subjects tend to be more
overconfident in all-female groups. These results are consistent with those of Mizutani
et al. (2009), although differences in overconfidence measures between groups are
insignificant.
Results from Tables 5 and 6 are inconsistent with those of Gneezy et al. (2003) and
Mizutani et al. (2009) in that differences in the changes in performance and
overconfidence between groups are not significant. However, these results still support
5 Several recent studies demonstrate the positive roles of overconfidence. Galasso and Simcoe (2010) and Hirshleifer et al. (2010) reveal that CEO overconfidence encourages innovation. The latter also find that CEO overconfidence increases the firm’s profitability. Anderson and Brion (2010) reveal that overconfidence helps individuals gain status.
our hypothesis that overconfidence increases performance. Tables 5 and 6 demonstrate
that overconfidence and performance tend to correlate positively, although the
correlation for women is ambiguous.
3.5. Regression analysis
We run the OLS regression to evaluate quantitatively the effect of expected rankings
and overconfidence on increase in performance. We use the increase in performance
and the rate of increase as dependent variables. As independent variables, we use
dummy variables constructed by subjects’ point forecasts for Task 1 and
Overconfidence 1 plus a female dummy and a constant term.6
Table 7 presents the regression results. In Eq.1, the coefficient of the constant term is
significantly positive at 1%, indicating that productivity increases under the tournament
reward structure. This result is consistent with previous literature. The coefficient of the
female dummy is also significantly positive at 1%, which is inconsistent with the result
of Gneezy et al. (2003). However, as noted above, this result does not reject our
hypothesis that the gender difference in overconfidence causes the gender difference in
increased performance, for women are more overconfident than men in our experiment.
In Eq.2, we added Overconfidence 1 as an independent variable in Eq.1. The
coefficient of Overconfidence 1 is significantly positive at 1%, but the coefficient of the
female dummy is no longer significant. These results support our hypothesis that the
gender difference in overconfidence causes gender difference in the increase in
performance.
6 We use expected rankings on Task 1 rather than Task 2 because we wish to investigate how subjects’ expectations affect subsequent performance. To use expected rankings of Task 1 is useful in that we can ignore the endogeneity problem that subjects ranked themselves low because they did not perform well.

In Eq.3, we added dummies for subjects’ expected rankings as independent variables
to Eq.1. Coefficients of all dummies are positive, and dummies for second- and
fourth-place rankings are significant at 10%. This result indicates that subjects who
ranked themselves second and fourth improved their performance more than subjects
who ranked themselves first. The significance of the constant term weakened compared
with Eq.1, indicating that performance increases under the tournament reward structure
are engendered by the incentive to earn higher rankings or greater rewards. Our results
are consistent with that of Freeman and Gelber (2010) in suggesting that subjects try
harder to win and elevate their performance. However, they differ from Freeman and
Gelber (2010) in that the increase in performance of subjects who ranked themselves
lower within their groups exceeded that of subjects who ranked themselves higher.
In Eq.4, we added Overconfidence 1 and the expected ranking dummies to Eq.1.
Coefficients of the constant term and the female dummy are not significant, whereas
coefficients are significantly positive for Overconfidence 1 and the expected ranking
dummies. Therefore, we retain our result that the increase in performance and its gender
difference are brought about by incentives for higher rankings or larger rewards and
overconfidence.
Table 8 shows the results of OLS regressions using the rate of increase in
performance from Task 1 to Task 2 as the dependent variable. The results robustly
support our hypothesis. Coefficients of the expected ranking dummies and
Overconfidence 1 are significantly positive. Subjects who ranked themselves lower tend
to increase performance more than subjects who ranked themselves higher. Furthermore,
the significance of the constant term and the female dummy are weakened by adding
Overconfidence 1 and the expected ranking dummies to the regression. Our results

remained unchanged when we added the variance of the expected probability
distribution, risk aversion, the number of skips in solving mazes, dummy variables for
gender ratio, and attitudes toward competition. Our results are also retained when we
substituted Overconfidence 2 for Overconfidence 1 as an independent variable.
3.6. Learning and reward structure
To accustom themselves to maze-solving on a computer, subjects attended
one-minute training sessions before Task 1. However, we cannot rule out the possibility
that one minute was too brief for subjects to master their tasks and that the increase in
performance from Task 1 to Task 2 indicates a learning effect.
To measure the effects of overconfidence and expected rankings while controlling for
the learning effect, we run the OLS regressions after restricting the sample to subjects
who chose the tournament reward structure for Task 3—the same reward structure as
Task 2. Thus, we can control for both the learning effect and attitudes toward
competition. Dependent variables are the increase in performance from Task 2 to Task 3
and its rate of increase. Independent variables are the dummies constructed by subjects’
point forecasts in Task 2. We also use Overconfidence 1 as an independent variable,
which is calculated on the basis of subjects’ performance and their expected rankings
for Task 2.
Table 9 presents the results of OLS regression. In Eqs. 1 and 3, the constant terms are
not significant, indicating we can dismiss the learning effect and the effect of the reward
structure. On the other hand, we find the gender difference in increase in performance
even from tournament to tournament. Although insignificant in Eq.1, the female dummy
is significant at 10% in Eq.3. However, its significance weakens when we add
Overconfidence 1 and the expected ranking dummies as independent variables,
supporting our hypothesis that the gender difference in overconfidence causes the
gender difference in increased performance. Overconfidence remains significant for
increased performance: its coefficient is significantly positive at 1%. Conversely, it is
unclear whether performance of subjects, who ranked themselves lower, increases more
than performance of subjects who ranked themselves higher. The coefficient of the
second-rank dummy is significant at 5%, but that of the third-rank dummy is
insignificant.7 However, subjects who expected their rankings second within their
groups increased their performance more than those who expected their rankings first.
Accordingly, our results are robust with regard to the learning effect and subjects’
attitudes toward competition.
3.7. Upper half and lower half
Freeman and Gelber (2010) report that subjects who ranked poorly in ability do not
increase their performance, whereas those who ranked highly increase their
performance when informed about the distribution of mazes solved in their group.
Based on our finding that overconfidence increases performance, we could re-interpret
the result of Freeman and Gelber (2010). We might conclude that overconfidence
among lesser-performing subjects is corrected by providing them objective information
and as a result their performance does not increase. If this is the case, lower-performing
subjects might increase their performance when information about the distribution of
mazes solved is withheld.
Table 10 presents the results of OLS regressions by subjects’ skills. We divided the
7 No subjects in the restricted sample expected their rankings to be the lowest.

sample into upper and lower halves based on their average rankings in a group of four
subjects generated by 1 million times random grouping. Subjects in the lower half who
ranked themselves fourth in their groups increased their performance, implying that we
could improve their performance by withholding the objective information—that is, by
not correcting overconfidence. It is noteworthy that the effect of overconfidence for the
upper half is stronger than for the bottom half. It may imply that the effect of
overconfidence on increased performance depends on subjects’ skill.
4. Conclusion
This study has clarified the effect of subjective expectations and overconfidence on
productivity by conducting experiments in which subjects solved as many mazes as
possible in three minutes. Subjects were divided into groups of four. In Task 1, subjects
solved mazes under a piece rate reward structure that paid ¥100 per correct answer. In
Task 2, they solved mazes under a tournament reward structure in which only the
winner received ¥400 per correct answer. In Task 3, subjects could choose either reward
structure and were paid based on their choices. They were asked to anticipate their
rankings within their groups after completing each task.
Previous literature reveals that performance increases under the tournament reward
structure. Freeman and Gelber (2010), the research most relevant for this study,
conclude that incentives contribute substantially to improving performance, and they
investigate how performance changes by informing subjects’ about the performance of
other group members. However, we focused on subjective expectations, which serve as
an incentive when information about other subjects’ performance is withheld. In
addition, Gneezy et al. (2003) report a gender difference in increased performance under
the tournament reward structure. We focus on the gender difference in overconfidence
as a cause of the gender difference in higher performance, and examine the effect of
overconfidence on productivity.
We found that subjective expectations and overconfidence significantly affect
productivity. Subjects who ranked themselves lower than other group members increase
their performance more than subjects who ranked themselves higher, and overconfident
subjects increase their performance. This reveals the positive aspect of overconfidence,
which previously has been examined mainly in its negative aspect as an expectation
bias.

References
Anderson, Cameron and Sebastien Brion (2010), “Overconfidence and the attainment of
status in groups,” Working Paper Series, Institute for Research on Labor and
Employment, UC Berkeley.
Barber, Brad M. and Terrance Odean (2001), “Boys will be Boys: Gender,
Overconfidence, and Common Stock Investment,” Quarterly Journal of
Economics, 116(1), pp. 261-292.
Croson, Rachel and Uri Gneezy (2009), “Gender Differences in Preferences,” Journal of
Economic Literature, 47(2), pp.448-474.
Freeman, Richard B. and Alexander M. Gelber (2010), “Prize Structure and Information
in Tournaments: Experimental Evidence,” American Economic Journal:
Applied Economics, 2(1), pp.149-164.
Galasso, Alberto and Timothy S. Simcoe (2010), “CEO Overconfidence and
Innovation,” NBER Working paper No. 16041.
Gneezy, Uri, Muriel Niederle, and Aldo Rustichini (2003), “Performance in
Competitive Environments: Gender Differences,” Quarterly Journal of
Economics, 118(3), pp. 1049-1074.
Hirshleifer, David A., Angie Low, and Siew H. Teoh (2010), “Are Overconfident CEOs
Better Innovators?” MPRA Paper No. 22425.
Mizutani, Noriko, Hiroko Okudaira, Yusuke Kinari, and Fumio Ohtake (2009),
“Overconfidence Makes Men Compete More,” Journal of Behavioral
Economics and Finance, 2(1), pp.1-26, (in Japanese).
Niederle, Muriel and Lise Vesturland (2007), “Do Women Shy Away from
Competition? Do Men Compete Too Much?,” Quarterly Journal of
Economics, 122(3), pp.1067-1101.
Shih, Margaret, Todd L. Pittinsky, and Nalini Ambady (1999), “Stereotype
Susceptibility: Identity Salience and Shifts in Quantitative Performance,”
Psychological Science, 10(1), pp.80-83.
Steele, Jennifer R. and Nalini Ambady (2006), “Math is Hard! The effect of gender
priming on women’s attitudes,” Journal of Experimental Social Psychology,
42, pp.428-436.
Svenson, Ola (1981), “Are we all less risky and more skillful than our fellow drivers?”
Acta Psychologica, 47(2), pp.143-148.
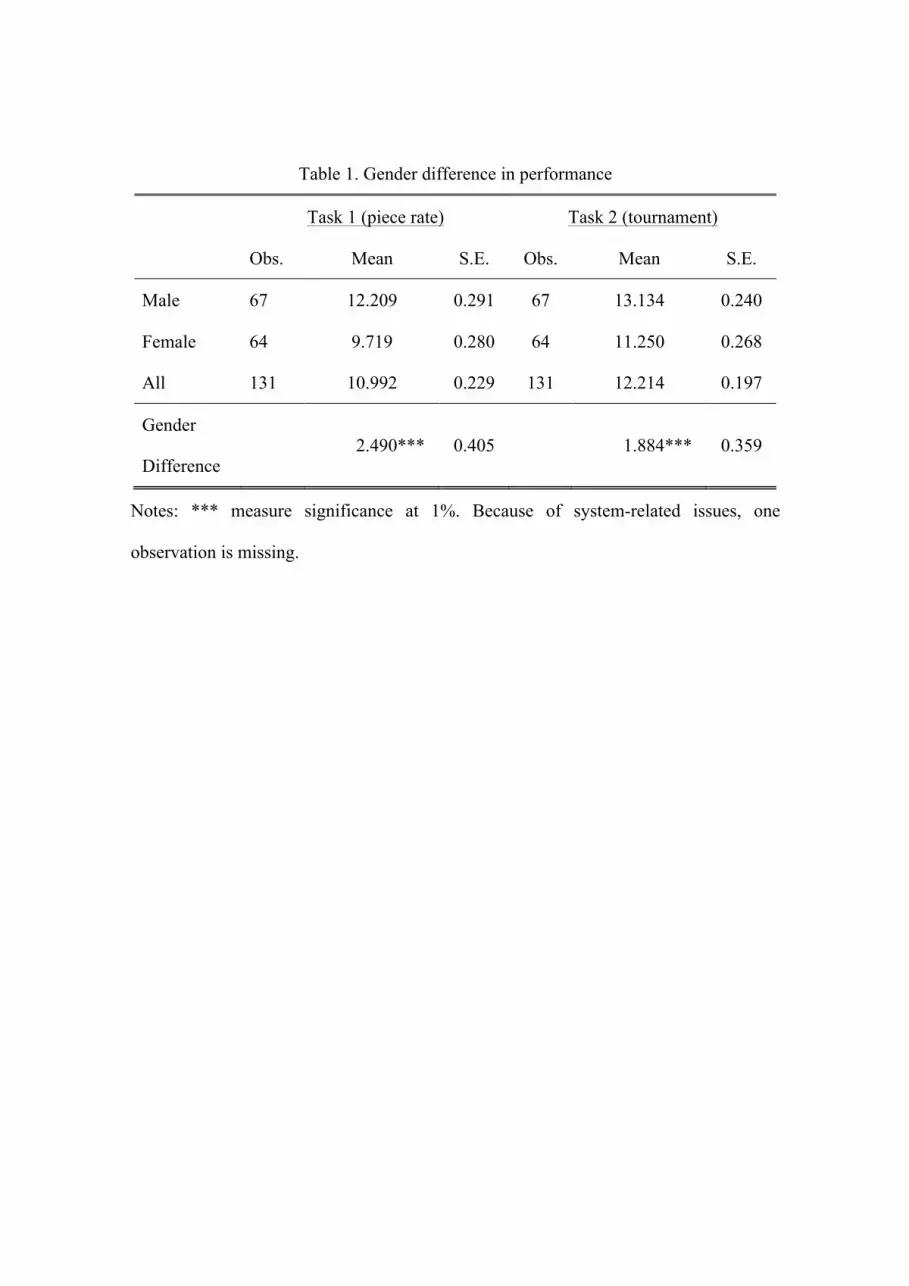
Table 1. Gender difference in performance
Task 1 (piece rate) Task 2 (tournament)
Obs. Mean S.E. Obs. Mean S.E.
Male 67 12.209 0.291 67 13.134 0.240
Female 64 9.719 0.280 64 11.250 0.268
All 131 10.992 0.229 131 12.214 0.197
Gender
Difference 2.490*** 0.405 1.884*** 0.359
Notes: *** measure significance at 1%. Because of system-related issues, one
observation is missing.
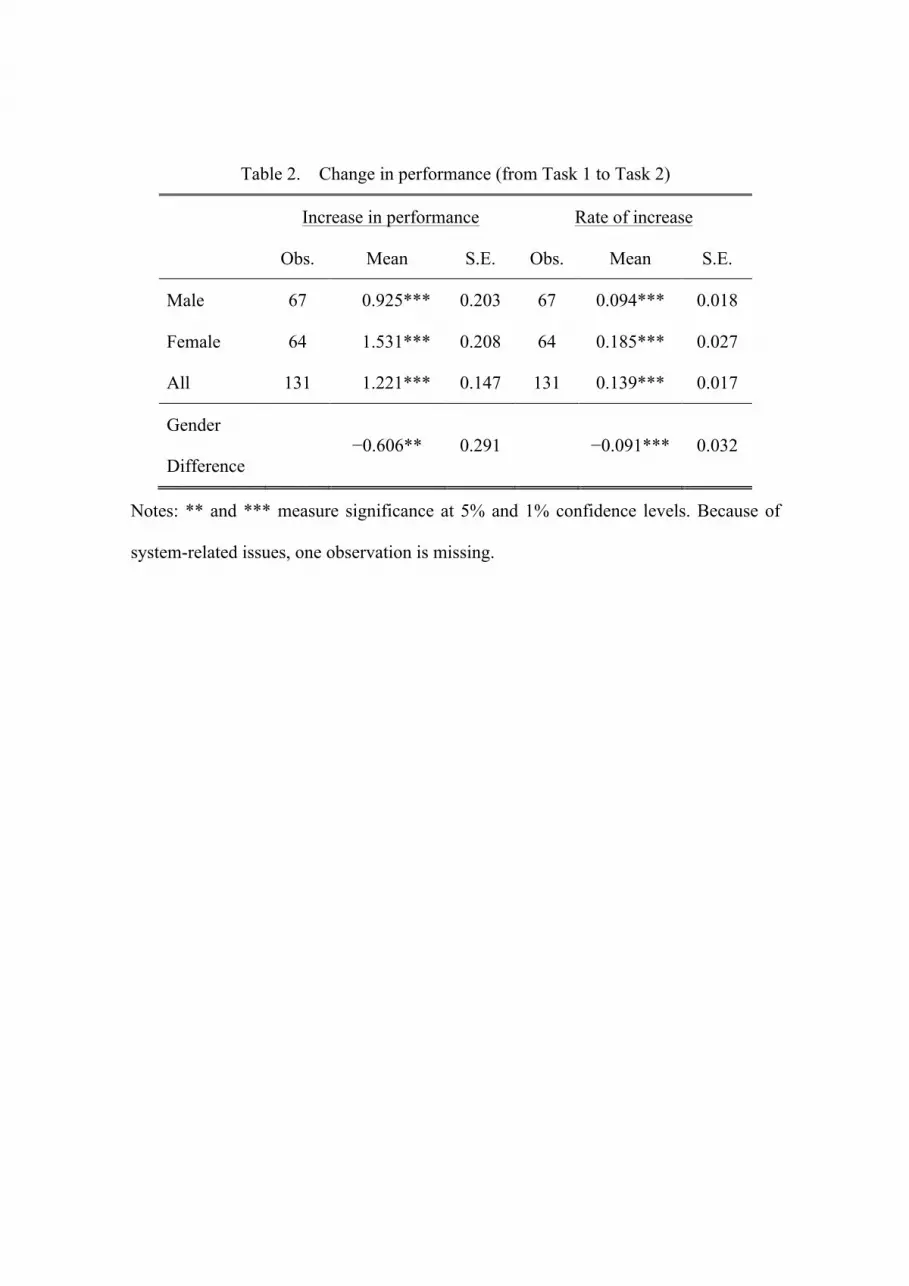
Table 2. Change in performance (from Task 1 to Task 2)
Increase in performance Rate of increase
Obs. Mean S.E. Obs. Mean S.E.
Male 67 0.925*** 0.203 67 0.094*** 0.018
Female 64 1.531*** 0.208 64 0.185*** 0.027
All 131 1.221*** 0.147 131 0.139*** 0.017
Gender
Difference −0.606** 0.291 −0.091*** 0.032
Notes: ** and *** measure significance at 5% and 1% confidence levels. Because of
system-related issues, one observation is missing.

Table 3. Performance by expected rankings on Task 1
Expected ranking on task 1
Obs. Task 1
(piece rate)
Task 2
(tournament)
Increase in
performance
Rate of
increase
First 28 12.714 13.321 0.607** 0.060**
(2.386) (2.161) (1.524) (0.127)
Second 62 10.500 11.984 1.484*** 0.167***
(2.455) (2.229) (1.667) (0.192)
Third 38 10.711 11.842 1.132*** 0.130***
(2.535) (2.236) (1.663) (0.177)
Fourth 3 8.667 11.333 2.667* 0.403
(3.055) (0.577) (2.517) (0.417)
Notes: The table shows subjects’ performance by expected rankings on Task 1. *, **, and *** measure significance at 10%, 5%, and 1%, respectively. Because of system-related issues, one observation is missing.
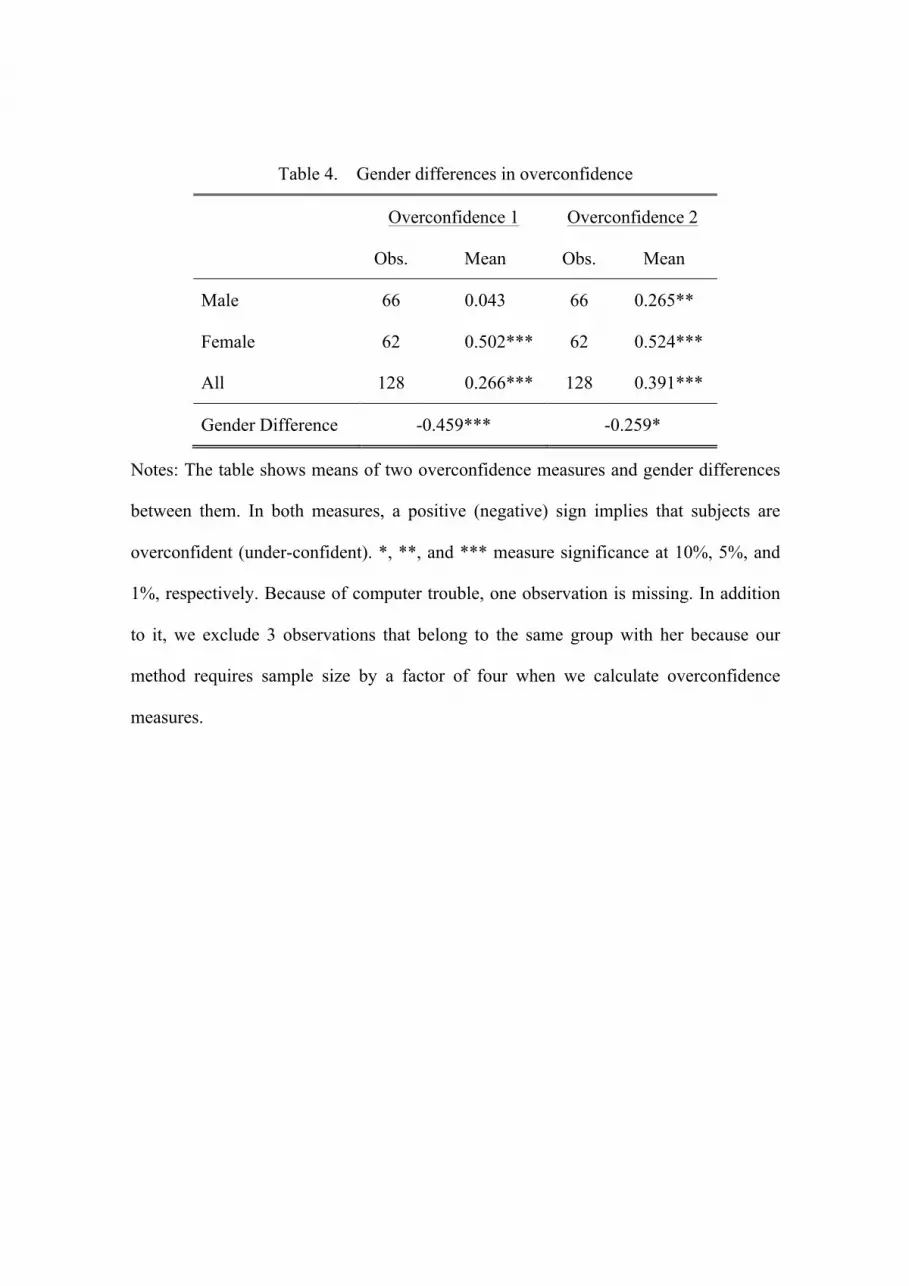
Table 4. Gender differences in overconfidence
Overconfidence 1 Overconfidence 2
Obs. Mean Obs. Mean
Male 66 0.043 66 0.265**
Female 62 0.502*** 62 0.524***
All 128 0.266*** 128 0.391***
Gender Difference -0.459*** -0.259*
Notes: The table shows means of two overconfidence measures and gender differences
between them. In both measures, a positive (negative) sign implies that subjects are
overconfident (under-confident). *, **, and *** measure significance at 10%, 5%, and
1%, respectively. Because of computer trouble, one observation is missing. In addition
to it, we exclude 3 observations that belong to the same group with her because our
method requires sample size by a factor of four when we calculate overconfidence
measures.

Table 5. Gender and performance
Gender Obs. Increase in
performance
Rate of
increase
Male
4 males 36 0.694*** 0.071***
(1.527) (0.138)
2 males and
2 females 26
0.923*** 0.098***
(1.742) (0.160)
Female
4 females 32 1.500*** 0.174***
(1.666) (0.185)
2 males and
2 females 25
1.400*** 0.177***
(1.708) (0.229)
Notes: *** measure significance at 1%. Because of computer trouble, one observation is
missing.

Table 6. Gender and overconfidence
Gender Obs. Overconfidence 1 Overconfidence 2
Male
4 male 36 −0.027 0.226
(0.833) (1.007)
2 males and
2 females 24
0.043 0.235
(0.764) (0.894)
Female
4 female 32 0.606*** 0.731***
(0.726) (0.933)
2 males and
2 females 24
0.437** 0.371*
(0.965) (0.981)
Notes: The table shows means of two overconfidence measures by gender and gender. In both measures, a positive (negative) sign means that people are overconfident (under-confident). *, **, and *** measure significance at 10%, 5%, and 1%, respectively. Because of system-related issues, one observation is missing. In addition to it, we exclude 3 observations that belong to the same group with her because our method requires sample size by a factor of four when we calculate overconfidence measures.

Table 7. Effects of expected rankings and overconfidence on increase in performance
Eq.1 Eq.2 Eq.3 Eq.4
Constant 0.925*** 0.992*** 0.552* 0.449
(0.203) (0.187) (0.315) (0.288)
Female dummy 0.606** 0.120 0.385 −0.270
(0.291) (0.279) (0.312) (0.300)
Overconfidence 1 0.843*** 0.974***
(0.166) (0.173)
Second 0.715* 0.742**
(0.398) (0.359)
Third 0.357 1.015**
(0.433) (0.411)
Fourth 1.730* 2.447**
(1.037) (0.936)
Obs.
R2
131 128 131 128
0.033 0.193 0.069 0.254
Notes: The table shows the estimation results by OLS regressions. The dependent variable is increase in performance from Task 1 (piece rate) to Task 2 (tournament). *, **, and *** measure significance at 10%, 5%, and 1%, respectively. Because of system-related issues, one observation is missing. In addition to it, in estimating Eq.2 and Eq.4, we exclude 3 observations that belong to the same group with her because our method requires sample size by a factor of four when we calculate overconfidence measures.

Table 8. Effects of expected rankings and overconfidence on rate of increase in
performance
Eq.1 Eq.2 Eq.3 Eq.4
Constant 0.094*** 0.099*** 0.051 0.030
(0.022) (0.020) (0.034) (0.030)
Female dummy 0.091*** 0.031 0.061* -0.024
(0.032) (0.030) (0.034) (0.031)
Overconfidence 1 0.112*** 0.132***
(0.018) (0.018)
Second 0.082* 0.091**
(0.044) (0.037)
Third 0.043 0.136***
(0.047) (0.042)
Fourth 0.291** 0.392***
(0.113) (0.096)
Obs. 131 128 131 128
R2 0.058 0.283 0.117 0.387
Notes: The table shows the result by OLS regressions. The dependent variable is the rate of increase in performance from Task 1 (piece rate) to Task 2 (tournament). *, **, and *** measure significance at 10%, 5%, and 1%, respectively. Because of system-related issues, one observation is missing. In addition to it, in estimating Eq.2 and Eq.4, we exclude 3 observations that belong to the same group with her because our method requires sample size by a factor of four when we calculate overconfidence measures.

Table 9. Effects of expected rankings and overconfidence on increase in performance
from Task 2 (tournament) to Task 3 (tournament)
Increase in performance Rate of increase
Eq.1 Eq.2 Eq.3 Eq.4
Constant 0.122 −0.625 0.014 −0.062
(0.296) (0.414) (0.029) (0.041)
Female dummy 0.489 0.169 0.089* 0.060
(0.536) (0.576) (0.053) (0.057)
Overconfidence 1 0.802*** 0.086***
(0.294) (0.029)
Second 1.085** 0.113**
(0.512) (0.050)
Third 0.399 0.008
(1.026) (0.101)
Observations 59 57 59 57
R2 0.014 0.178 0.047 0.236
Notes: The table shows the result by OLS regressions. The dependent variables are
increases in performance from Task 2 to Task 3 in Eq.1 and Eq.2 and the rate of
increase in performance from Task 2 to Task 3 in Eq.3 and Eq.4. ** and *** measure
significance at 5% and 1%.

Table 10. Effects of expected rankings and overconfidence on increase in performance
by subjects’ maze-solving skills
Increase in performance Rate of increase
Bottom half Upper half Bottom half Upper half
Constant −0.102 −0.838 −0.009 −0.073
(1.344) (1.027) (0.169) (0.084)
Female dummy −0.971** 0.053 -0.070 0.011
(0.426) (0.481) (0.053) (0.039)
Overconfidence 1 0.357 2.019*** 0.097** 0.160***
(0.292) (0.497) (0.037) (0.041)
Second 1.280* 1.038** 0.160* 0.088**
(0.681) (0.516) (0.085) (0.042)
Third 1.252 1.576** 0.177* 0.126**
(0.777) (0.679) (0.098) (0.056)
Fourth 3.577*** 3.211* 0.579*** 0.249
(1.209) (1.885) (0.152) (0.155)
Observations 64 64 64 64
R2 0.225 0.291 0.305 0.286
Notes: The table presents results from OLS regression. The dependent variables are the increase in performance and rate of increase in performance from Task 1 to Task 2. Standard errors are reported in parentheses. *, **, and *** measure significance at 10%, 5%, and 1%, respectively. “Bottom half” (“Upper half”) refers to subjects whose average ranking in a group of four subjects generated by 1 million times random grouping is above (below) median (2.165). Because of system-related issues, one observation is missing. In addition to it, we exclude 3 observations that belong to the same group with her because our method requires sample size by a factor of four when we calculate overconfidence measures.
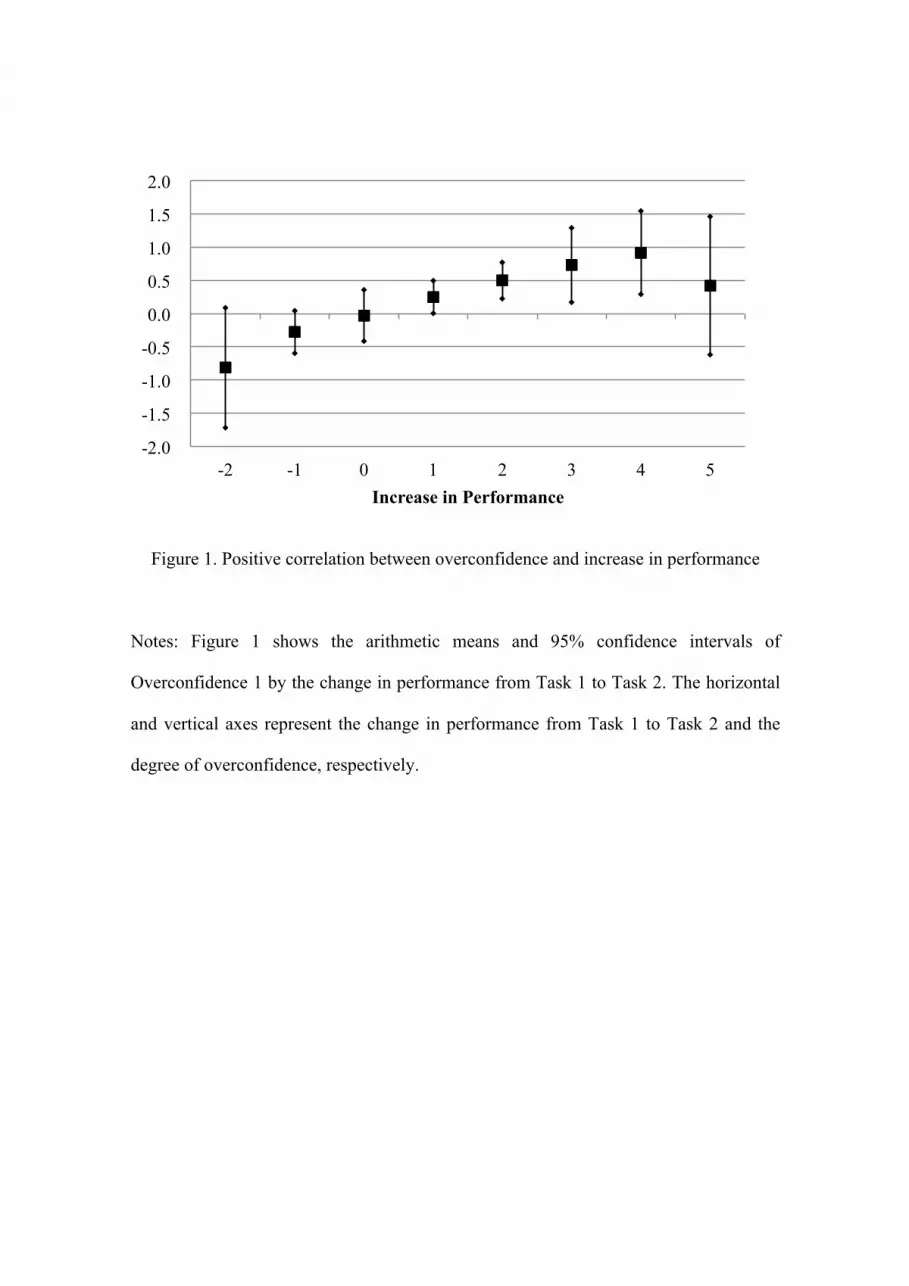
Figure 1. Positive correlation between overconfidence and increase in performance
Notes: Figure 1 shows the arithmetic means and 95% confidence intervals of
Overconfidence 1 by the change in performance from Task 1 to Task 2. The horizontal
and vertical axes represent the change in performance from Task 1 to Task 2 and the
degree of overconfidence, respectively.
-2.0
-1.5
-1.0
-0.5
0.0
0.5
1.0
1.5
2.0
-2 -1 0 1 2 3 4 5 Increase in Performance