peanut/cotton intercropping increases productivity - research
TRANSCRIPT
Page 1/27
Peanut/Cotton Intercropping Increases Productivityand Economic Returns by Regulating NutrientAccumulation and Soil Microbial Communities Underboth Normal and Saline Soil ConditionsWei Xie
Qingdao Agricultural UniversityKai Zhang
Qingdao Agricultural UniversityXiaoying Wang
Qingdao Agricultural UniversityXiaoxia Zou
Qingdao Agricultural UniversityXiaojun Zhang
Qingdao Agricultural UniversityXiaona Yu
Qingdao Agricultural UniversityYuefu Wang
Qingdao Agricultural UniversityTong Si ( [email protected] )
Qingdao Agricultural University
Research Article
Keywords: Intercropping, saline soil, economic returns, belowground interactions
Posted Date: December 10th, 2021
DOI: https://doi.org/10.21203/rs.3.rs-1145699/v1
License: This work is licensed under a Creative Commons Attribution 4.0 International License. ReadFull License
Version of Record: A version of this preprint was published at BMC Plant Biology on March 16th, 2022. Seethe published version at https://doi.org/10.1186/s12870-022-03506-y.
Page 2/27
Abstract
BackgroundIntercropping has been widely adopted by farmers for it often enhances crop productivity and economicreturns; however, the underpinning mechanisms from the perspective of belowground interspeci�cinteractions are only partly understood especially when intercropping under saline soil conditions. By usingpermeable (100 µm) and impermeable (solid) root barriers in a multi-site �eld experiment, we aimed to studythe impact of root-root interactions on nutrient accumulation, soil microbial communities, crop yield, andeconomic returns in a peanut/cotton intercropping system under non-saline, secondary-saline, and coastalsaline soil conditions.
ResultsThe results indicate that intercropping (IC) decreased the peanut pods yield while increased the seed cottonyield, and consequently enhanced the economic returns compared with monoculture of peanut (MP) andcotton (MC). The higher accumulations of nutrients such as nitrogen (N), phosphorus (P), and potassium (K)were also observed in IC not only in the soil but also in vegetative tissues and reproductive organs. Bacterialcommunity structure analysis under normal growth conditions reveals that IC dramatically altered the soilbacterial abundance composition in both peanut and cotton strips of the top soil whereas the bacterialdiversity was barely affected compared with MP and MC. At blossom-needling stage, the metabolicfunctional features of the bacterial communities such as fatty acid biosynthesis, lipoic acid metabolism,peptidoglycan biosynthesis, and biosynthesis of ansamycins were signi�cantly enriched in MP comparedwith other treatments. Conversely, these metabolic functional features were dramatically depleted in MPwhile signi�cantly enriched in IC at podding stage. Permeable root barrier treatments (NC-P and NC-C)counteracted the bene�ts of IC and the side effects were more pronounced in impermeable treatments (SC-Pand SC-C).
ConclusionPeanut/cotton intercropping increases crop yield as well as economic returns under non-saline, secondary-saline, and coastal saline soil conditions probably by modulating the soil bacterial abundance compositionand accelerating nutrients accumulation.
BackgroundIntercropping has been de�ned as simultaneously cultivation of two or more crop species in close proximity[1–3]. Generally, intercropping system has been widely adopted by farmers for it shows a positiverelationship between plant diversity and agricultural productivity worldwide [1, 4]. Compared withmonocropping systems, the advantages of intercropping in overyielding have been explained by nichecomplementarity and interspeci�c facilitation [5–7]. In a cropping system, the interspeci�c facilitation might
Page 3/27
come from the aboveground and underground parts of the crops. Literatures indicated that plantingarrangements e.g. plant density and strip width achieve a dominant position in controlling the strength ofinterspeci�c crop interactions and yields [8–10]. An earlier report indicated that cotton/peanut intercroppingsystem could increase the crop productivity through regulating the photosystem and the maximum leaf areaindex of peanut [11]. These studies documented the profound role of the aboveground organs in theinterspeci�c facilitation. Alternatively, from the perspective of the underground part of the crops, theinterspeci�c facilitation may occur via transfer of nutrients through co-cultivated crop species or stimulationof bene�cial soil microbes as affected by root exudates [12–15]. Although intercropping has been proved tobe an e�cient land use and sustainable agricultural practice that is widely practiced worldwide, knowledgeon this intercropping system is still lacking from the perspective of saline growth conditions.
Saline is one of the major abiotic stresses and has become an ever-increasing threat to agriculturalproduction around the globe [16–19]. It is estimated that over 50% of the arable land on our planet will besalinized by the middle of this century [20, 21]. Crop species show great variability in their inherent salinetolerance. Plants have evolved sophisticated physiological mechanisms to cope with salinity [22]. Upon asalinity stress, the �rst and rapid phase is to accumulate osmolytes to maintain the turgor pressure [23, 24].In the past decade, plant growth regulators have been extensively applied in researches to alleviate cropsalinity stress including polyamines [25], epibrassinolide [26], jasmonate [27], melatonin [28], and silicon [29];however, sustainable agricultural practices are still needed to achieve the goal of green ecological agriculture.
Being a leguminous crop, peanut (Arachis hypogaea L.) is a good source of protein and vegetable oil forhumans [16, 30]. Peanut is relatively sensitive to saline stress [31–33]. Soil saline severely decreases seedgermination, morphogenesis, and production of peanut [34–36]. In spite of this, peanut is often grown underpoor soil conditions such as saline affected soil because nearly one-third of the global arable irrigatedploughland is already affected by salinity [37, 38]. As an important source of �ber, commercial cotton(Gossypium hirsutum L.) is moderately salt-tolerant [39, 40]. Recent years, peanut/cotton intercroppingcombined with rotation system has been increasingly adopted by farmers in North China Plain [11, 41]. Theadvantages of this cropping system could be to alleviate the constraints of continuous cropping andincrease the productivity; however, whether this kind of intercropping system could be conducted undersalinity conditions remains unknown. To address this concern, the current research was performed toelucidate the effects of peanut/cotton intercropping on crop productivity and economic returns under bothnormal and saline soil conditions. By using different root barriers, we were able to detect the interspeci�cfacilitation between the underground parts of peanut strip and cotton strip. We therefore hypothesized thatpeanut/cotton intercropping could increase crop yield and economic returns through regulation of soilmicrobial communities and accumulation of nutrients in the crops. Our study may guide managementdecisions to enhance productivity in the era of soil salinization and develop sustainable agriculture.
Methods
Field experimental site
Page 4/27
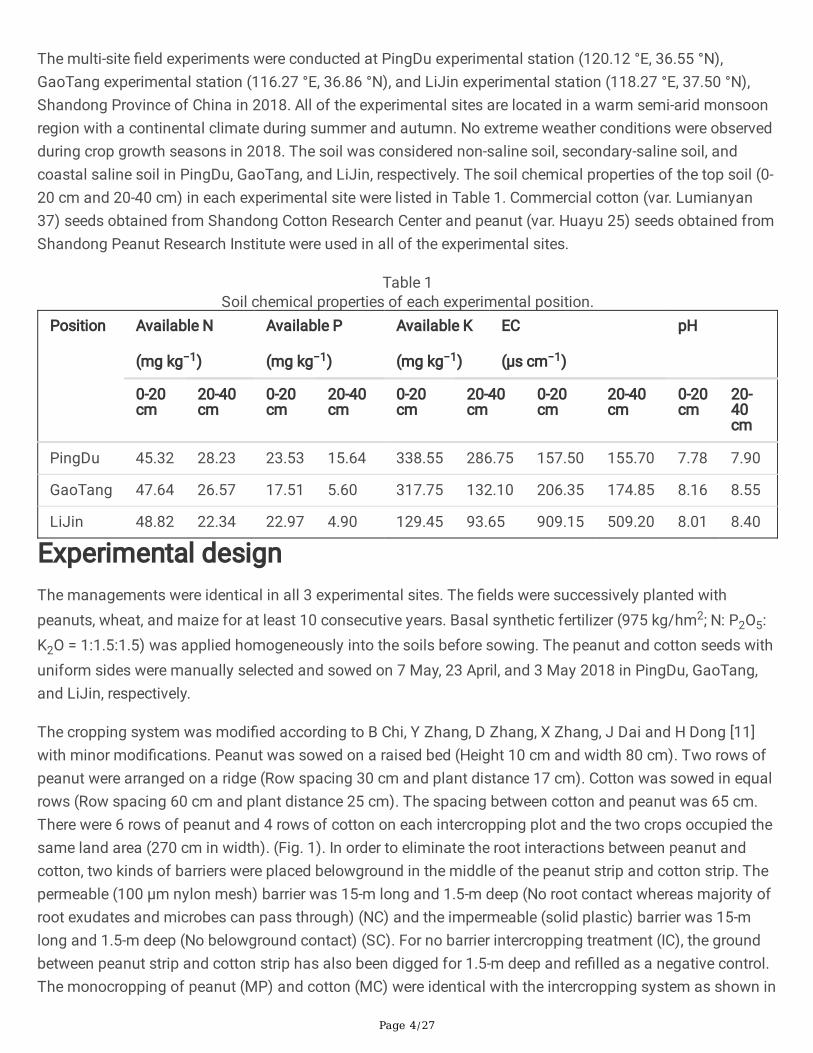
The multi-site �eld experiments were conducted at PingDu experimental station (120.12 °E, 36.55 °N),GaoTang experimental station (116.27 °E, 36.86 °N), and LiJin experimental station (118.27 °E, 37.50 °N),Shandong Province of China in 2018. All of the experimental sites are located in a warm semi-arid monsoonregion with a continental climate during summer and autumn. No extreme weather conditions were observedduring crop growth seasons in 2018. The soil was considered non-saline soil, secondary-saline soil, andcoastal saline soil in PingDu, GaoTang, and LiJin, respectively. The soil chemical properties of the top soil (0-20 cm and 20-40 cm) in each experimental site were listed in Table 1. Commercial cotton (var. Lumianyan37) seeds obtained from Shandong Cotton Research Center and peanut (var. Huayu 25) seeds obtained fromShandong Peanut Research Institute were used in all of the experimental sites.
Table 1Soil chemical properties of each experimental position.
Position Available N
(mg kg−1)
Available P
(mg kg−1)
Available K
(mg kg−1)
EC
(µs cm−1)
pH
0-20cm
20-40cm
0-20cm
20-40cm
0-20cm
20-40cm
0-20cm
20-40cm
0-20cm
20-40cm
PingDu 45.32 28.23 23.53 15.64 338.55 286.75 157.50 155.70 7.78 7.90
GaoTang 47.64 26.57 17.51 5.60 317.75 132.10 206.35 174.85 8.16 8.55
LiJin 48.82 22.34 22.97 4.90 129.45 93.65 909.15 509.20 8.01 8.40
Experimental designThe managements were identical in all 3 experimental sites. The �elds were successively planted withpeanuts, wheat, and maize for at least 10 consecutive years. Basal synthetic fertilizer (975 kg/hm2; N: P2O5:K2O = 1:1.5:1.5) was applied homogeneously into the soils before sowing. The peanut and cotton seeds withuniform sides were manually selected and sowed on 7 May, 23 April, and 3 May 2018 in PingDu, GaoTang,and LiJin, respectively.
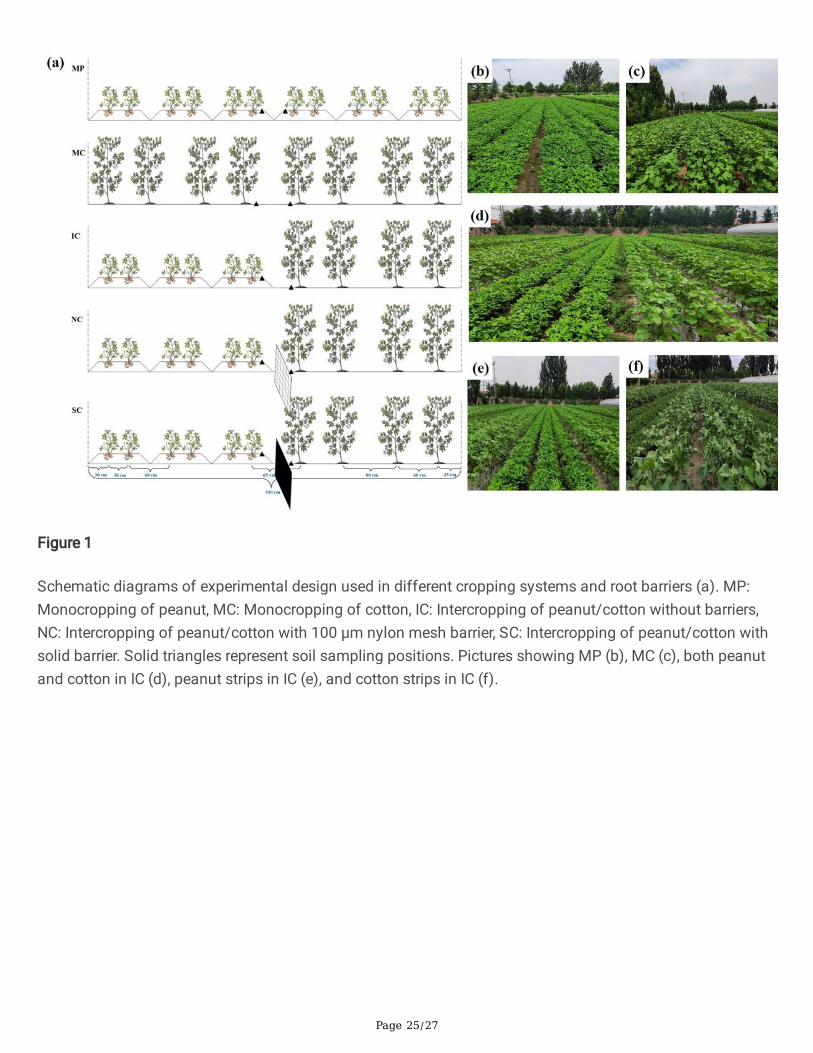
The cropping system was modi�ed according to B Chi, Y Zhang, D Zhang, X Zhang, J Dai and H Dong [11]with minor modi�cations. Peanut was sowed on a raised bed (Height 10 cm and width 80 cm). Two rows ofpeanut were arranged on a ridge (Row spacing 30 cm and plant distance 17 cm). Cotton was sowed in equalrows (Row spacing 60 cm and plant distance 25 cm). The spacing between cotton and peanut was 65 cm.There were 6 rows of peanut and 4 rows of cotton on each intercropping plot and the two crops occupied thesame land area (270 cm in width). (Fig. 1). In order to eliminate the root interactions between peanut andcotton, two kinds of barriers were placed belowground in the middle of the peanut strip and cotton strip. Thepermeable (100 µm nylon mesh) barrier was 15-m long and 1.5-m deep (No root contact whereas majority ofroot exudates and microbes can pass through) (NC) and the impermeable (solid plastic) barrier was 15-mlong and 1.5-m deep (No belowground contact) (SC). For no barrier intercropping treatment (IC), the groundbetween peanut strip and cotton strip has also been digged for 1.5-m deep and re�lled as a negative control.The monocropping of peanut (MP) and cotton (MC) were identical with the intercropping system as shown in
Page 5/27
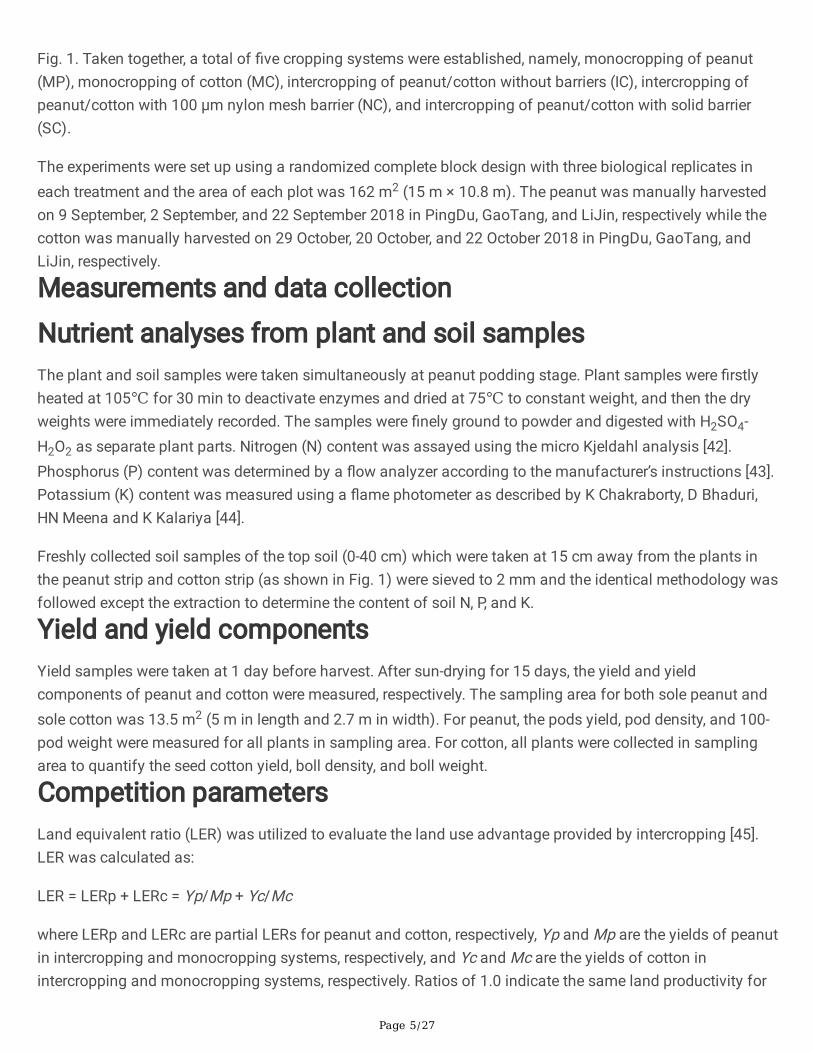
Fig. 1. Taken together, a total of �ve cropping systems were established, namely, monocropping of peanut(MP), monocropping of cotton (MC), intercropping of peanut/cotton without barriers (IC), intercropping ofpeanut/cotton with 100 µm nylon mesh barrier (NC), and intercropping of peanut/cotton with solid barrier(SC).
The experiments were set up using a randomized complete block design with three biological replicates ineach treatment and the area of each plot was 162 m2 (15 m × 10.8 m). The peanut was manually harvestedon 9 September, 2 September, and 22 September 2018 in PingDu, GaoTang, and LiJin, respectively while thecotton was manually harvested on 29 October, 20 October, and 22 October 2018 in PingDu, GaoTang, andLiJin, respectively.
Measurements and data collection
Nutrient analyses from plant and soil samplesThe plant and soil samples were taken simultaneously at peanut podding stage. Plant samples were �rstlyheated at 105℃ for 30 min to deactivate enzymes and dried at 75℃ to constant weight, and then the dryweights were immediately recorded. The samples were �nely ground to powder and digested with H2SO4-H2O2 as separate plant parts. Nitrogen (N) content was assayed using the micro Kjeldahl analysis [42].Phosphorus (P) content was determined by a �ow analyzer according to the manufacturer’s instructions [43].Potassium (K) content was measured using a �ame photometer as described by K Chakraborty, D Bhaduri,HN Meena and K Kalariya [44].
Freshly collected soil samples of the top soil (0-40 cm) which were taken at 15 cm away from the plants inthe peanut strip and cotton strip (as shown in Fig. 1) were sieved to 2 mm and the identical methodology wasfollowed except the extraction to determine the content of soil N, P, and K.
Yield and yield componentsYield samples were taken at 1 day before harvest. After sun-drying for 15 days, the yield and yieldcomponents of peanut and cotton were measured, respectively. The sampling area for both sole peanut andsole cotton was 13.5 m2 (5 m in length and 2.7 m in width). For peanut, the pods yield, pod density, and 100-pod weight were measured for all plants in sampling area. For cotton, all plants were collected in samplingarea to quantify the seed cotton yield, boll density, and boll weight.
Competition parametersLand equivalent ratio (LER) was utilized to evaluate the land use advantage provided by intercropping [45].LER was calculated as:
LER = LERp + LERc = Yp/Mp + Yc/Mc
where LERp and LERc are partial LERs for peanut and cotton, respectively, Yp and Mp are the yields of peanutin intercropping and monocropping systems, respectively, and Yc and Mc are the yields of cotton inintercropping and monocropping systems, respectively. Ratios of 1.0 indicate the same land productivity for

Page 6/27
intercropping and monocropping systems, ratios greater than 1.0 indicate that intercropping isadvantageous, whereas ratios smaller than 1.0 indicate a land use disadvantage for intercropping.
Bene�t-cost measurementMaterial inputs such as seeds, fertilizer, pesticide, irrigation system, and labor cost including fertilizerapplication, irrigation, insect and weed control, and harvesting were recorded in each experimental station.The input cost was calculated based on the local prices of the material and labor days, meanwhile, theoutput cost of the peanut pods and seed cotton was determined according to the average prices of the localmarket in 2018.
Soil sampling and determination of soil bacterialcommunitiesSoil samples were taken from both 0-20 cm and 20-40 cm depth on 15 July (blossom-needling stage ofpeanut) and 25 August (podding stage of peanut) in PingDu. The sampling positions were 15 cm away fromthe plants in the peanut strip and cotton strip as marked in solid triangles (Fig. 1). Soil samples werecollected from 3 random points within each replicate plot and mixed thoroughly, and each treatmentcomposed of 3 replicates. In MP, MC, and IC, soil samples from the two strips were further mixed together tomake the composite samples. In NC and SC, the peanut strip and cotton strip samples were collectedseparately as NC-P, NC-C, SC-P, and SC-C, respectively. The obtained soil samples were �rstly frozen in liquidnitrogen and then immediately transported to Gene Denovo Biotechnology Co., Ltd., Guangzhou, China indrikold for DNA extraction and soil microbial determinations.
High-throughput sequencing analysis of the 16S rRNA gene was performed with Illumina Novaseq 6000 todetermine soil bacterial diversities and communities as previously described [43]. Total genomic DNA wasextracted from 0.5 g soil using the HiPure Soil DNA Kit (Magen, Guangzhou, China) following themanufacturer's protocols [46]. The hypervariable regions of V3 and V4 of the 16S rRNA genes were ampli�edusing the speci�c primers 341F (5’-CCT ACG GGN GGC WGC AG-3’) and 806R (5’-GGA CTA CHV GGG TAT CTAAT-3’) according to A Ali, M Imran Ghani, Y Li, H Ding, H Meng and Z Cheng [47]. The concentration andquality of the DNA samples were �rstly determined before polymerase chain reaction (PCR) ampli�cationwas carried out. Amplicons extracted from 2% agarose gels were further puri�ed with a AxyPrep DNA GelExtraction Kit (Axygen Biosciences, Union City, CA, USA). The puri�ed triplicate ampli�cation products werepooled in equimolar amounts and quanti�ed using NanoDrop (Thermo Scienti�c, USA) according to standardprotocols [35]. Afterwards, the prepared libraries were sequenced on an Illumina HiSeq 2500 PE 250 platform.The raw sequences data generated in the current research were deposited into the National Center forBiotechnology Information (NCBI) Sequence Read Archive (SRA) database under Submission ID ofSUB10633613 and Accession of PRJNA779843.
Raw data containing adapters or low quality reads would affect the following assembly and analysis. To gethigh quality clean reads, raw reads were further �ltered when they were containing more than 10% ofunknown nucleotides or containing less than 80% of bases with quality (Q-value) > 20. Consequently,effective tags were used for the subsequent analysis. Then, paired end clean reads were merged as raw tagsusing FLSAH (V1.2.11) according to T Magoč and SL Salzberg [48] with a minimum overlap of 10bp and
Page 7/27
mismatch error rates of 2%. Noisy sequences of raw tags were �ltered by QIIME (V1.9.1) [49] pipeline underspeci�c �ltering conditions [50] to obtain the high quality clean tags. Then, clean tags were searched againstthe reference database (http://drive5.com/uchime/uchime_download.html) to perform Reference basedchimera checking using UCHIME algorithm (http://www.drive5.com/usearch/manual/uchime_algo.html). Allchimeric tags were removed and �nally obtained effective tags were used for further analysis.
The effective tags were clustered into operational taxonomic units OTUs of ≥ 97% similarity using UPARSE[51] pipeline. The tag sequence with highest abundance was selected as reprehensive sequence within eachcluster. The representative sequences were classi�ed into organisms by a naive Bayesian model using RDPclassi�er (V2.2) [52] based on UNITE Database (https://unite.ut.ee/). The abundance statistics of eachtaxonomy and phylogenetic tree was construction in a Perl script and visualized using SVG [53]. Biomarkerfeatures in each group were screened by Metastats and LEfSe software. Additionally, Chao1, Simpson, andall other alpha diversity index were calculation in QIIME. OTU rarefaction curve and Rank abundance curveswas plotted in QIIME. Alpha index comparing among groups was computed by a Tukey’s HSD test and aKruskal-Wallis H test in R. The principal coordinates analysis (PCoA) in Hellinger distance was calculated andplotted in R. The metabolic functional features of the bacterial communities were predicted using Tax4Fun(version 1.0) [54] with Kyoto Encyclopedia of Genes and Genomes (KEGG) database [55].
Statistical analysisThe physiological data were �rstly tested for homogeneity of variance with boxplot and subjected to the one-way analysis of variance (ANOVA). The difference was considered to be statistically signi�cant when P <0.05 using Tukey’s test.
Results
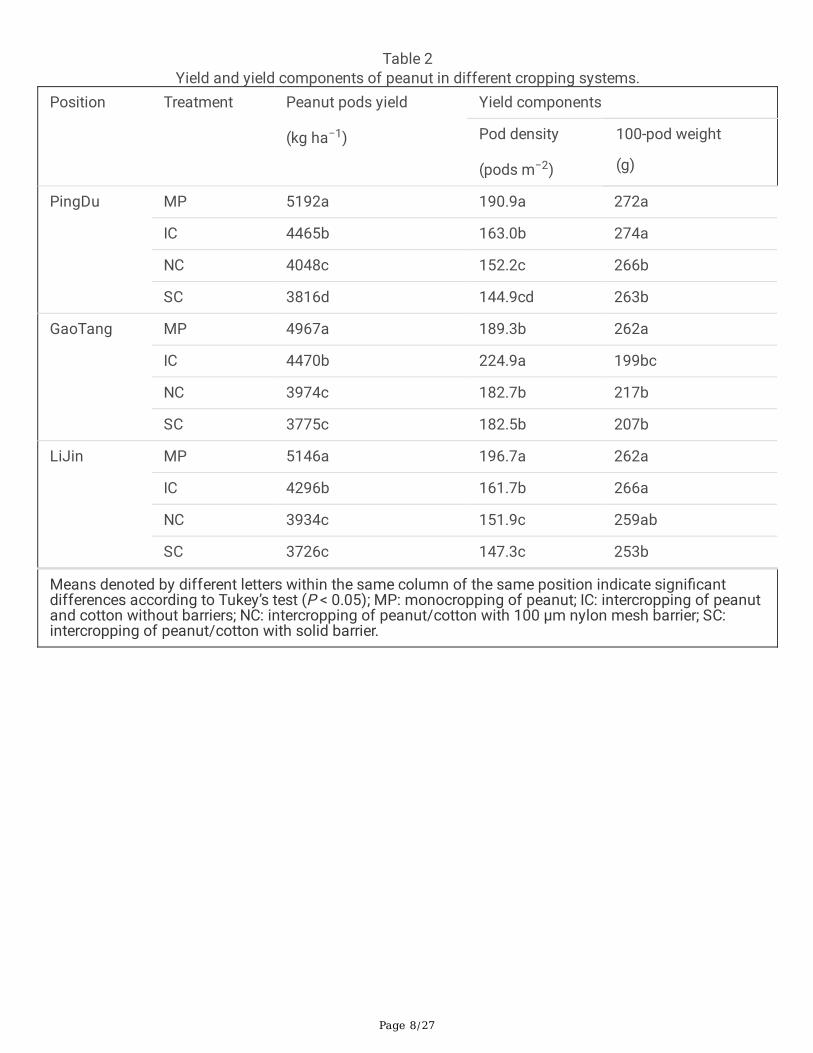
Yield and yield components of peanut and cottonThe highest peanut pods yield was observed in treatment MP (5,192 kg/ha in PingDu, 4,967 kg/ha inGaoTang, and 5,146 kg/ha in LiJin), while the lowest peanut pods yield was obtained under treatment SC(3,816 kg/ha in PingDu, 3,775 kg/ha in GaoTang, and 3,726 kg/ha in LiJin) (Table 2). In addition, themaximum seed cotton yield was found under IC treatment (7,160 kg/ha in PingDu, 6,846 kg/ha in GaoTang,and 6,778 kg/ha in LiJin), whereas the lowest seed cotton yield (4,420 kg/ha in PingDu, 4,124 kg/ha inGaoTang, and 4,276 kg/ha in LiJin) was recorded in MC treatment in 3 positions (Table 3). Intercropping withroot barriers signi�cantly reduced peanut pods yield by 9.34% (NC) and 14.54% (SC) in PingDu, 11.10% (NC)and 15.55% (SC) in GaoTang, and 8.43% (NC) and 13.27% (SC) in LiJin, compared with no root barriertreatment (IC) (Table 2). In seed cotton yield, the reduction was 17.26% (NC) and 20.67% (SC) in PingDu,12.05% (NC) and 16.87% (SC) in GaoTang, and 10.70% (NC) and 14.46% (SC) in LiJin, compared with IC(Table 3).
Page 8/27
Table 2Yield and yield components of peanut in different cropping systems.
Position Treatment Peanut pods yield
(kg ha−1)
Yield components
Pod density
(pods m−2)
100-pod weight
(g)
PingDu MP 5192a 190.9a 272a
IC 4465b 163.0b 274a
NC 4048c 152.2c 266b
SC 3816d 144.9cd 263b
GaoTang MP 4967a 189.3b 262a
IC 4470b 224.9a 199bc
NC 3974c 182.7b 217b
SC 3775c 182.5b 207b
LiJin MP 5146a 196.7a 262a
IC 4296b 161.7b 266a
NC 3934c 151.9c 259ab
SC 3726c 147.3c 253b
Means denoted by different letters within the same column of the same position indicate signi�cantdifferences according to Tukey’s test (P < 0.05); MP: monocropping of peanut; IC: intercropping of peanutand cotton without barriers; NC: intercropping of peanut/cotton with 100 µm nylon mesh barrier; SC:intercropping of peanut/cotton with solid barrier.

Page 9/27
Table 3Seed cotton yield and yield components in different cropping systems.
Position Treatment Seed cotton yield
(kg ha−1)
Yield components
Boll density
(bolls m−2)
Boll weight
(g boll−1)
PingDu MC 4420d 82.53d 5.36a
IC 7160a 158.18a 4.53b
NC 5924b 133.78b 4.43b
SC 5680c 105.86c 5.37a
GaoTang MC 4124d 80.69c 5.11bc
IC 6846a 115.93a 5.91a
NC 6021b 117.23a 5.14b
SC 5691c 108.83b 5.23b
LiJin MC 4276d 73.39d 5.83b
IC 6778a 108.66b 6.24a
NC 6053b 114.20a 5.30c
SC 5798c 98.83c 5.87b
Means denoted by different letters within the same column of the same position indicate signi�cantdifferences according to Tukey’s test (P < 0.05); MC: monocropping of cotton; IC: intercropping of peanutand cotton without barriers; NC: intercropping of peanut/cotton with 100 µm nylon mesh barrier; SC:intercropping of peanut/cotton with solid barrier.
We then measured the peanut pod density and cotton boll density where intercropping (IC) signi�cantlydecreased peanut pod density by 14.61% and 17.79% in PingDu and LiJin, respectively, while increasedpeanut pod density by 18.81% in GaoTang compared with MP. The boll density of cotton in IC wassigni�cantly increased by 91.66%, 43.67%, and 48.06% in PingDu, GaoTang, and LiJin, respectively comparedwith MC. Root barriers signi�cantly reduced the pod density of peanut and the reduction was 6.63% (NC) and11.10% (SC) in PingDu, 18.76% (NC) and 18.85% (SC) in GaoTang, and 6.06% (NC) and 8.91% (SC) in LiJincompared with IC. The changes of boll density of cotton by root barriers were -18.24% (NC) and -33.08% (SC)in PingDu, 1.12% (NC) and -6.12% (SC) in GaoTang, and 5.10% (NC) and -9.05% (SC) in LiJin, compared withIC. Intercropping did not change 100-pod weight of peanut except for that in GaoTang where 100-pod weightwas signi�cantly decreased by 24.05% compared with MP. Intercropping signi�cantly reduced boll weight ofcotton by 15.49% in PingDu, while increased boll weight of cotton by15.66% and 7.03% in GaoTang and
Page 10/27
LiJin, respectively, compared with IC. Compared with IC, the 100-pod weight was reduced (2.92% of NC and4.01% of SC) in PingDu and (2.63% of NC and 4.89% of SC) in LiJin, while induced (9.05% of NC and 4.02%of SC) in GaoTang. In PingDu, SC signi�cantly increased boll weight of cotton by 18.54% while NC did notchange this parameter, compared with IC. In GaoTang and LiJin, root barriers signi�cantly reduced bollweight of cotton by (13.03% of NC and 11.51% of SC) and (15.06% of NC and 5.93% of SC), respectively,compared with IC (Tables 2 and 3).
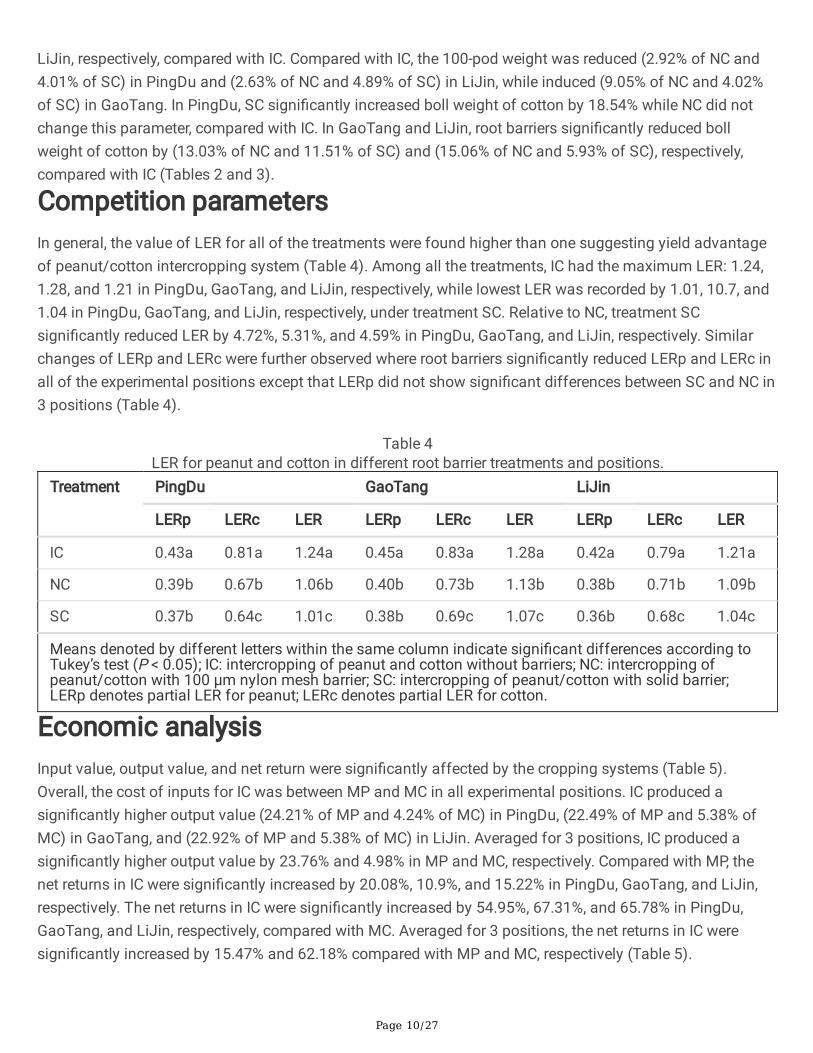
Competition parametersIn general, the value of LER for all of the treatments were found higher than one suggesting yield advantageof peanut/cotton intercropping system (Table 4). Among all the treatments, IC had the maximum LER: 1.24,1.28, and 1.21 in PingDu, GaoTang, and LiJin, respectively, while lowest LER was recorded by 1.01, 10.7, and1.04 in PingDu, GaoTang, and LiJin, respectively, under treatment SC. Relative to NC, treatment SCsigni�cantly reduced LER by 4.72%, 5.31%, and 4.59% in PingDu, GaoTang, and LiJin, respectively. Similarchanges of LERp and LERc were further observed where root barriers signi�cantly reduced LERp and LERc inall of the experimental positions except that LERp did not show signi�cant differences between SC and NC in3 positions (Table 4).
Table 4LER for peanut and cotton in different root barrier treatments and positions.
Treatment PingDu GaoTang LiJin
LERp LERc LER LERp LERc LER LERp LERc LER
IC 0.43a 0.81a 1.24a 0.45a 0.83a 1.28a 0.42a 0.79a 1.21a
NC 0.39b 0.67b 1.06b 0.40b 0.73b 1.13b 0.38b 0.71b 1.09b
SC 0.37b 0.64c 1.01c 0.38b 0.69c 1.07c 0.36b 0.68c 1.04c
Means denoted by different letters within the same column indicate signi�cant differences according toTukey’s test (P < 0.05); IC: intercropping of peanut and cotton without barriers; NC: intercropping ofpeanut/cotton with 100 µm nylon mesh barrier; SC: intercropping of peanut/cotton with solid barrier;LERp denotes partial LER for peanut; LERc denotes partial LER for cotton.
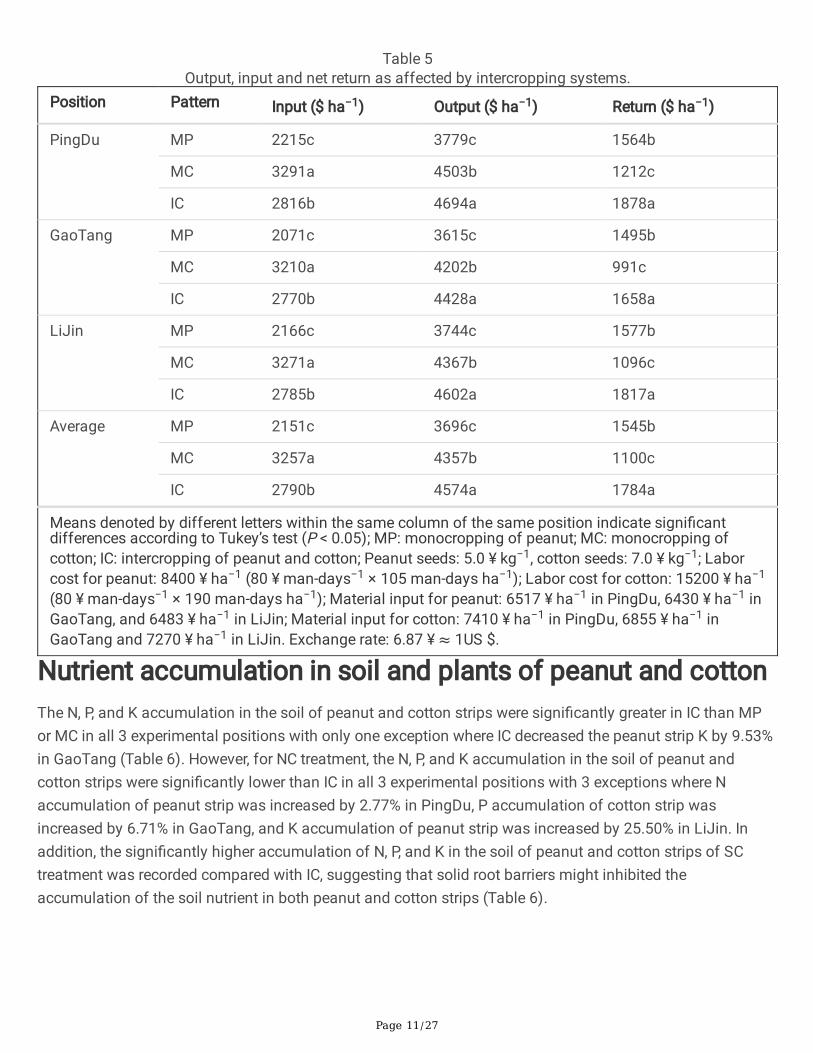
Economic analysisInput value, output value, and net return were signi�cantly affected by the cropping systems (Table 5).Overall, the cost of inputs for IC was between MP and MC in all experimental positions. IC produced asigni�cantly higher output value (24.21% of MP and 4.24% of MC) in PingDu, (22.49% of MP and 5.38% ofMC) in GaoTang, and (22.92% of MP and 5.38% of MC) in LiJin. Averaged for 3 positions, IC produced asigni�cantly higher output value by 23.76% and 4.98% in MP and MC, respectively. Compared with MP, thenet returns in IC were signi�cantly increased by 20.08%, 10.9%, and 15.22% in PingDu, GaoTang, and LiJin,respectively. The net returns in IC were signi�cantly increased by 54.95%, 67.31%, and 65.78% in PingDu,GaoTang, and LiJin, respectively, compared with MC. Averaged for 3 positions, the net returns in IC weresigni�cantly increased by 15.47% and 62.18% compared with MP and MC, respectively (Table 5).
Page 11/27
Table 5Output, input and net return as affected by intercropping systems.
Position Pattern Input ($ ha−1) Output ($ ha−1) Return ($ ha−1)
PingDu MP 2215c 3779c 1564b
MC 3291a 4503b 1212c
IC 2816b 4694a 1878a
GaoTang MP 2071c 3615c 1495b
MC 3210a 4202b 991c
IC 2770b 4428a 1658a
LiJin MP 2166c 3744c 1577b
MC 3271a 4367b 1096c
IC 2785b 4602a 1817a
Average MP 2151c 3696c 1545b
MC 3257a 4357b 1100c
IC 2790b 4574a 1784a
Means denoted by different letters within the same column of the same position indicate signi�cantdifferences according to Tukey’s test (P < 0.05); MP: monocropping of peanut; MC: monocropping ofcotton; IC: intercropping of peanut and cotton; Peanut seeds: 5.0 ¥ kg−1, cotton seeds: 7.0 ¥ kg−1; Laborcost for peanut: 8400 ¥ ha−1 (80 ¥ man-days−1 × 10⁵ man-days ha−1); Labor cost for cotton: 15200 ¥ ha−1
(80 ¥ man-days−1 × 190 man-days ha−1); Material input for peanut: 6517 ¥ ha−1 in PingDu, 6430 ¥ ha−1 inGaoTang, and 6483 ¥ ha−1 in LiJin; Material input for cotton: 7410 ¥ ha−1 in PingDu, 6855 ¥ ha−1 inGaoTang and 7270 ¥ ha−1 in LiJin. Exchange rate: 6.87 ¥ ≈ 1US $.
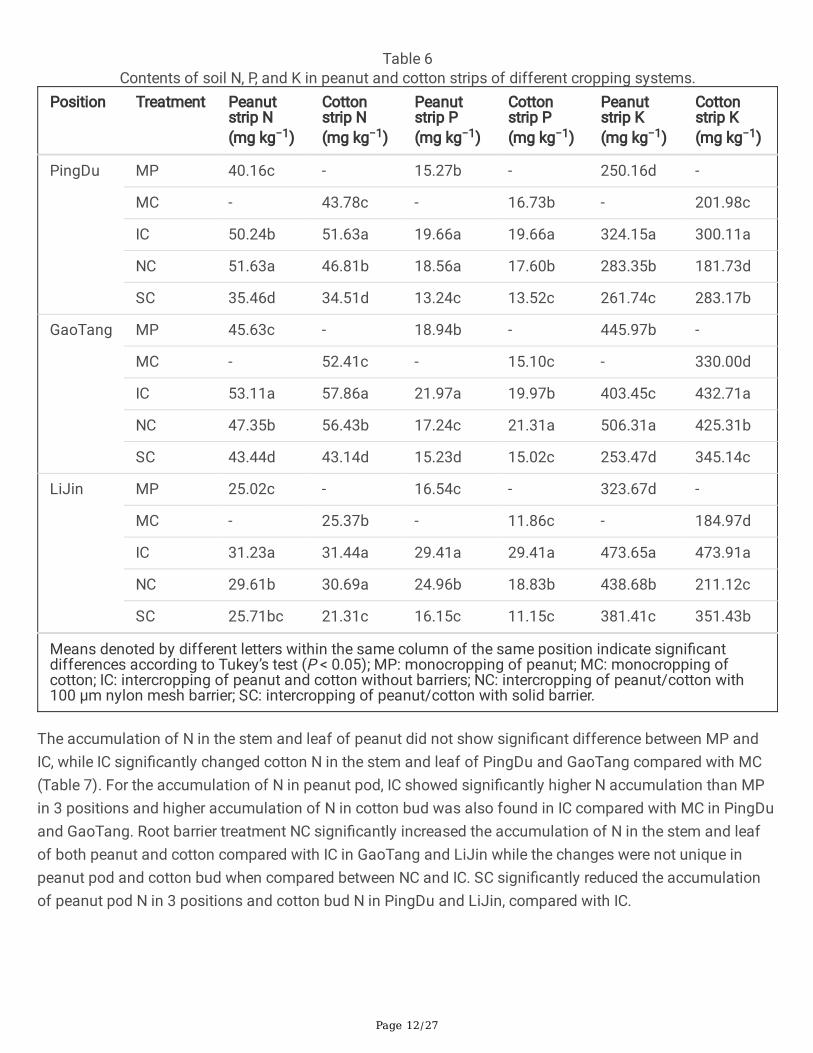
Nutrient accumulation in soil and plants of peanut and cottonThe N, P, and K accumulation in the soil of peanut and cotton strips were signi�cantly greater in IC than MPor MC in all 3 experimental positions with only one exception where IC decreased the peanut strip K by 9.53%in GaoTang (Table 6). However, for NC treatment, the N, P, and K accumulation in the soil of peanut andcotton strips were signi�cantly lower than IC in all 3 experimental positions with 3 exceptions where Naccumulation of peanut strip was increased by 2.77% in PingDu, P accumulation of cotton strip wasincreased by 6.71% in GaoTang, and K accumulation of peanut strip was increased by 25.50% in LiJin. Inaddition, the signi�cantly higher accumulation of N, P, and K in the soil of peanut and cotton strips of SCtreatment was recorded compared with IC, suggesting that solid root barriers might inhibited theaccumulation of the soil nutrient in both peanut and cotton strips (Table 6).
Page 12/27
Table 6Contents of soil N, P, and K in peanut and cotton strips of different cropping systems.
Position Treatment Peanutstrip N(mg kg−1)
Cottonstrip N(mg kg−1)
Peanutstrip P(mg kg−1)
Cottonstrip P(mg kg−1)
Peanutstrip K(mg kg−1)
Cottonstrip K(mg kg−1)
PingDu MP 40.16c - 15.27b - 250.16d -
MC - 43.78c - 16.73b - 201.98c
IC 50.24b 51.63a 19.66a 19.66a 324.15a 300.11a
NC 51.63a 46.81b 18.56a 17.60b 283.35b 181.73d
SC 35.46d 34.51d 13.24c 13.52c 261.74c 283.17b
GaoTang MP 45.63c - 18.94b - 445.97b -
MC - 52.41c - 15.10c - 330.00d
IC 53.11a 57.86a 21.97a 19.97b 403.45c 432.71a
NC 47.35b 56.43b 17.24c 21.31a 506.31a 425.31b
SC 43.44d 43.14d 15.23d 15.02c 253.47d 345.14c
LiJin MP 25.02c - 16.54c - 323.67d -
MC - 25.37b - 11.86c - 184.97d
IC 31.23a 31.44a 29.41a 29.41a 473.65a 473.91a
NC 29.61b 30.69a 24.96b 18.83b 438.68b 211.12c
SC 25.71bc 21.31c 16.15c 11.15c 381.41c 351.43b
Means denoted by different letters within the same column of the same position indicate signi�cantdifferences according to Tukey’s test (P < 0.05); MP: monocropping of peanut; MC: monocropping ofcotton; IC: intercropping of peanut and cotton without barriers; NC: intercropping of peanut/cotton with100 µm nylon mesh barrier; SC: intercropping of peanut/cotton with solid barrier.
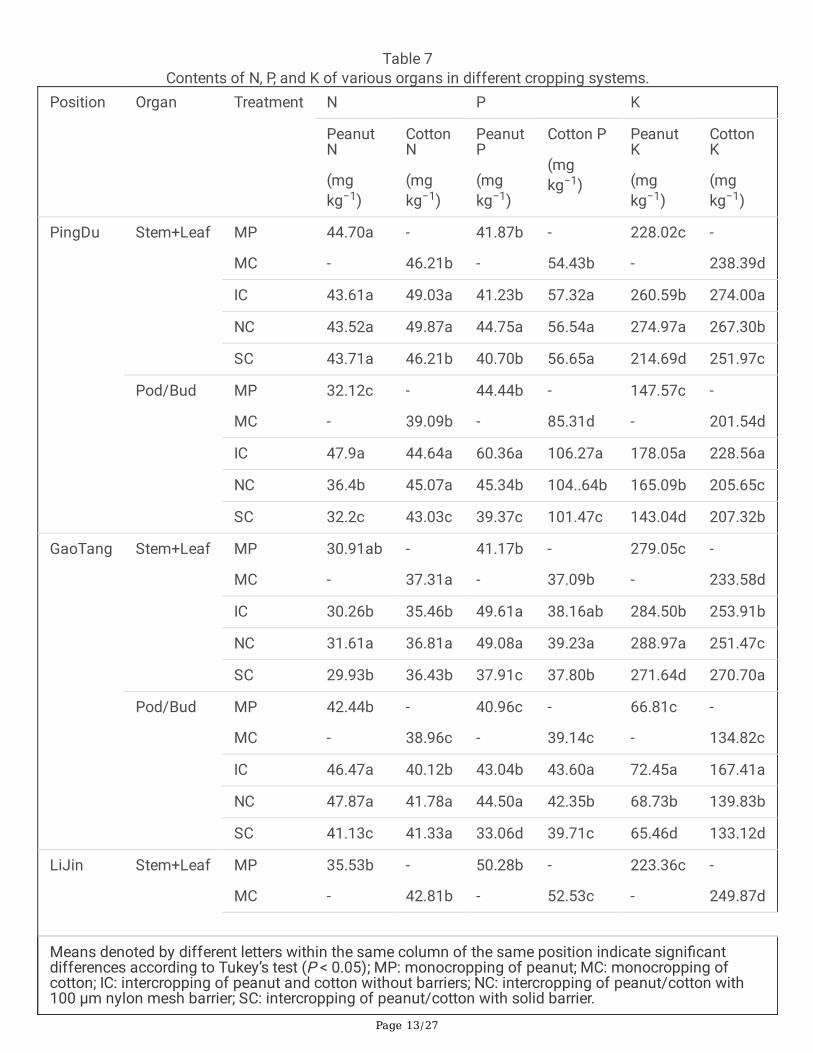
The accumulation of N in the stem and leaf of peanut did not show signi�cant difference between MP andIC, while IC signi�cantly changed cotton N in the stem and leaf of PingDu and GaoTang compared with MC(Table 7). For the accumulation of N in peanut pod, IC showed signi�cantly higher N accumulation than MPin 3 positions and higher accumulation of N in cotton bud was also found in IC compared with MC in PingDuand GaoTang. Root barrier treatment NC signi�cantly increased the accumulation of N in the stem and leafof both peanut and cotton compared with IC in GaoTang and LiJin while the changes were not unique inpeanut pod and cotton bud when compared between NC and IC. SC signi�cantly reduced the accumulationof peanut pod N in 3 positions and cotton bud N in PingDu and LiJin, compared with IC.
Page 13/27
Table 7Contents of N, P, and K of various organs in different cropping systems.
Position Organ Treatment N P K
PeanutN
(mgkg−1)
CottonN
(mgkg−1)
PeanutP
(mgkg−1)
Cotton P
(mgkg−1)
PeanutK
(mgkg−1)
CottonK
(mgkg−1)
PingDu Stem+Leaf MP
MC
44.70a
-
-
46.21b
41.87b
-
-
54.43b
228.02c
-
-
238.39d
IC 43.61a 49.03a 41.23b 57.32a 260.59b 274.00a
NC 43.52a 49.87a 44.75a 56.54a 274.97a 267.30b
SC 43.71a 46.21b 40.70b 56.65a 214.69d 251.97c
Pod/Bud MP
MC
32.12c
-
-
39.09b
44.44b
-
-
85.31d
147.57c
-
-
201.54d
IC 47.9a 44.64a 60.36a 106.27a 178.05a 228.56a
NC 36.4b 45.07a 45.34b 104..64b 165.09b 205.65c
SC 32.2c 43.03c 39.37c 101.47c 143.04d 207.32b
GaoTang Stem+Leaf MP
MC
30.91ab
-
-
37.31a
41.17b
-
-
37.09b
279.05c
-
-
233.58d
IC 30.26b 35.46b 49.61a 38.16ab 284.50b 253.91b
NC 31.61a 36.81a 49.08a 39.23a 288.97a 251.47c
SC 29.93b 36.43b 37.91c 37.80b 271.64d 270.70a
Pod/Bud MP
MC
42.44b
-
-
38.96c
40.96c
-
-
39.14c
66.81c
-
-
134.82c
IC 46.47a 40.12b 43.04b 43.60a 72.45a 167.41a
NC 47.87a 41.78a 44.50a 42.35b 68.73b 139.83b
SC 41.13c 41.33a 33.06d 39.71c 65.46d 133.12d
LiJin Stem+Leaf MP
MC
35.53b
-
-
42.81b
50.28b
-
-
52.53c
223.36c
-
-
249.87d
Means denoted by different letters within the same column of the same position indicate signi�cantdifferences according to Tukey’s test (P < 0.05); MP: monocropping of peanut; MC: monocropping ofcotton; IC: intercropping of peanut and cotton without barriers; NC: intercropping of peanut/cotton with100 µm nylon mesh barrier; SC: intercropping of peanut/cotton with solid barrier.

Page 14/27
IC 35.41b 42.93b 52.52a 56.60a 228.07b 342.51b
NC 36.88a 45.96a 51.19b 56.76a 235.87a 353.30a
SC 33.63c 38.71c 48.61c 55.27b 220.91d 309.16c
Pod/Bud MP
MC
38.30b
-
-
45.13a
39.67b
-
-
49.27d
100.38c
-
-
162.13d
IC 39.61a 45.16a 43.09a 61.70a 103.87a 259.40b
NC 40.72a 13.45c 43.62a 55.02b 102.31b 268.68a
SC 38.27b 42.62b 37.38c 51.34c 99.46c 257.25c
Means denoted by different letters within the same column of the same position indicate signi�cantdifferences according to Tukey’s test (P < 0.05); MP: monocropping of peanut; MC: monocropping ofcotton; IC: intercropping of peanut and cotton without barriers; NC: intercropping of peanut/cotton with100 µm nylon mesh barrier; SC: intercropping of peanut/cotton with solid barrier.
IC signi�cantly increased the accumulation of peanut P in the stem and leaf of GaoTang and LiJin comparedwith MP and increased the cotton P in the stem and leaf of PingDu and LiJin compared with MC.Additionally, IC showed signi�cantly higher P accumulation in peanut pod and cotton bud of 3 positions,compared with MP and MC. Root barrier treatment NC and SC showed lower P accumulation in the stem,leaf, peanut pod, and cotton bud of the seedlings in 3 positions than IC with a few exceptions, suggestingthat root barriers inhibited the accumulation of P in both peanut and cotton plants.
For the K accumulation, intercropping increased the K in the stem, leaf, peanut pod, and cotton bud within acertain range compared with MP and MC. In peanut, NC showed signi�cant higher K in stem and leaf whilelower K in the pod, compared with IC. SC showed signi�cant lower K in all of the organs of peanut comparedwith IC. In cotton, similar results were observed where root barrier treatment NC and SC signi�cantly reducedthe K in all of the organs in 3 positions except the SC of stem and leaf in GaoTang and NC of all of theorgans in LiJin, compared with IC. These results indicated that root barriers reduced the accumulation ofplant K in the organs of both cotton and peanut (Table 7).
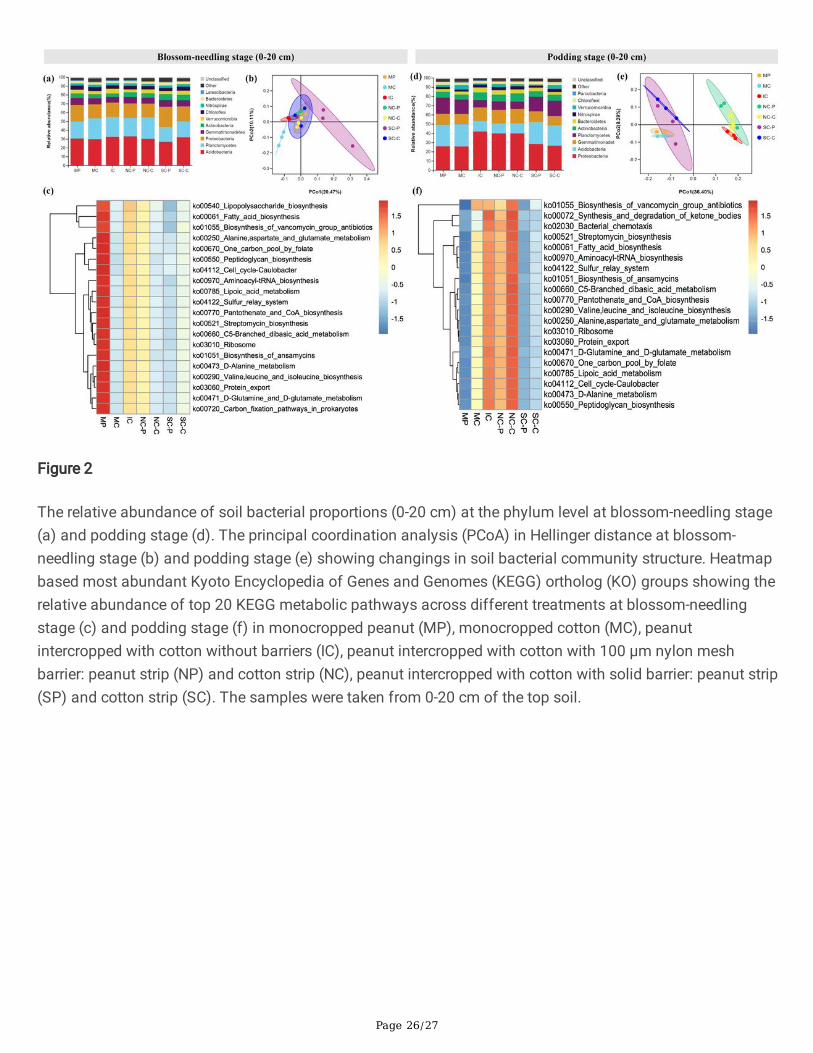
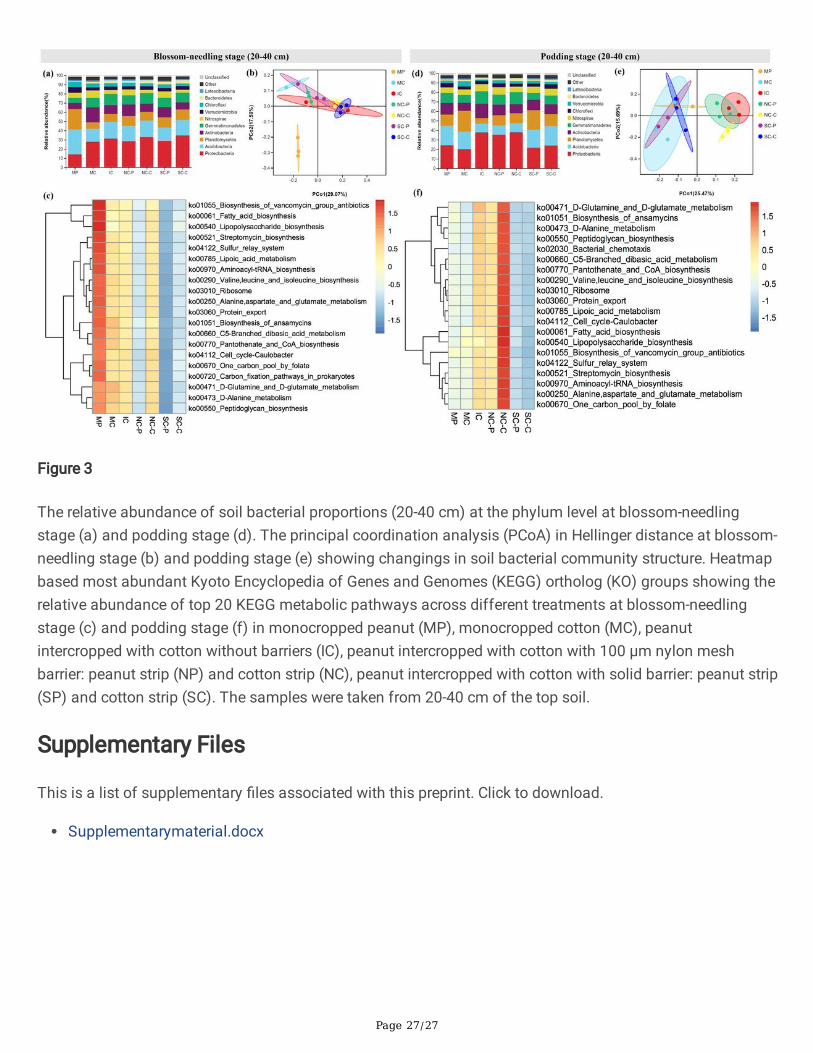
Soil bacterial communitiesMost of the root barrier intercropping treatments signi�cantly affected diversity indices and affectedcommunity structure of soil bacterial community in both peanut strip and cotton strip (Table S1). At blossom-needling stage (0-20 cm), MP showed signi�cantly higher number of OTUs, ACE, and Chao index values thanother treatments, while at blossom-needling stage (20-40 cm), NC-C showed signi�cantly higher number ofOTUs, Shannon index, ACE, and Chao index values compared with other treatments. Again, NC-C processedhigher number of OTUs, ACE, and Chao index values than other treatments, whereas SC-C processed thehighest Shannon and Simpson index values at podding stage (0-20 cm). In 20-40 cm top soil of podding
Page 15/27
stage, however, only NC-C showed signi�cant higher Shannon index values compared with other treatments(Table S1).
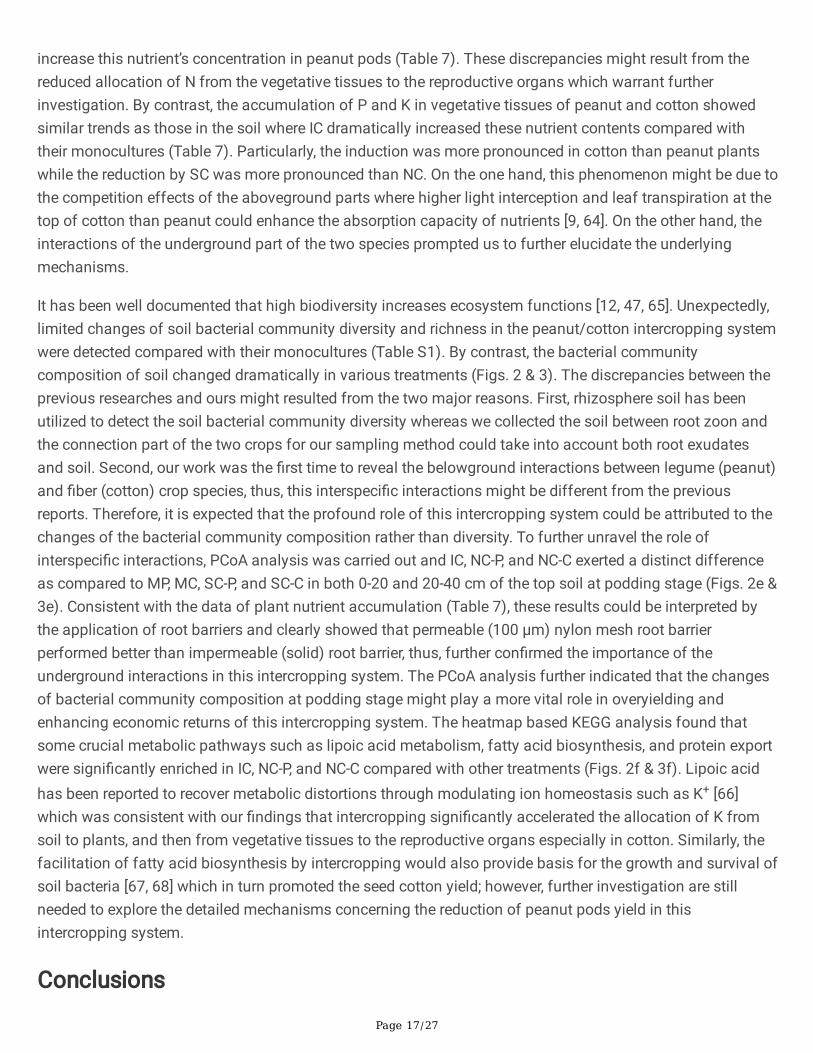
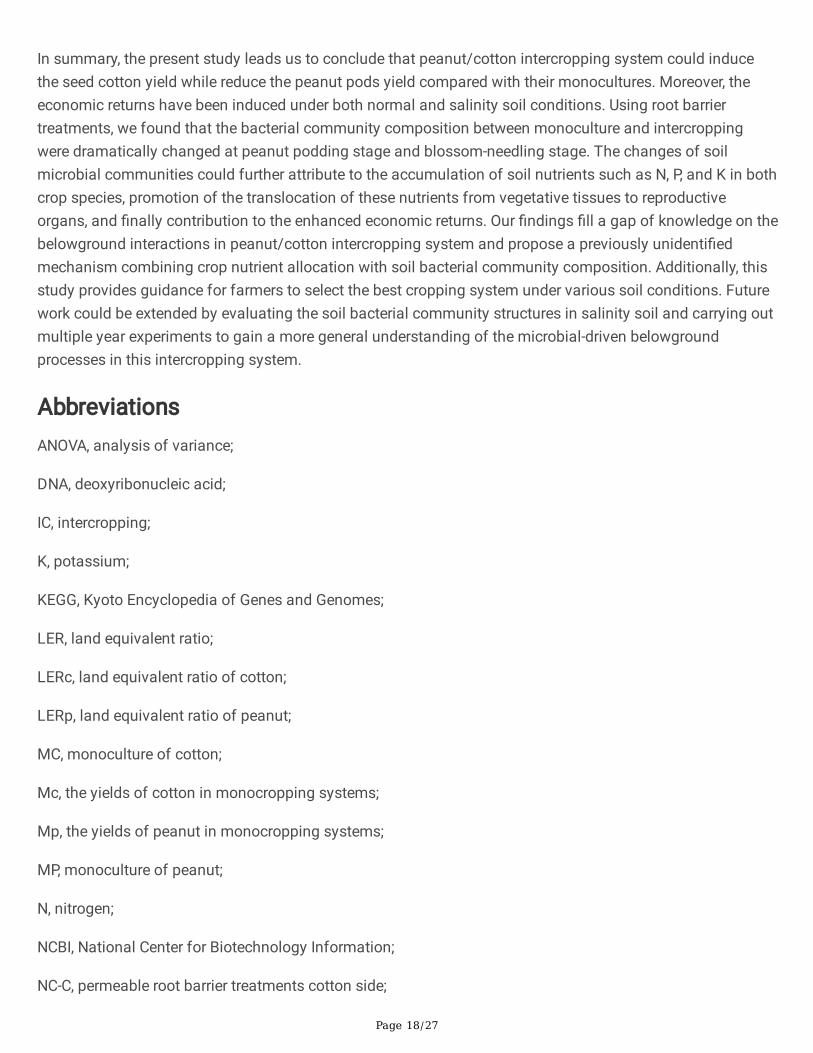
At the phylum level, IC obviously raised the relative abundance of Acidobacteria and Verrucomicrobia, whiledeclined the relative abundance of Gemmatimonadetes, Actinobacteria, and Chloro�exi compared with MPand MC at blossom-needling stage (0-20 cm). NC-P and NC-C did not show obvious changes of the bacterialcommunities, whereas SC-P and SC-C visibly increased the relative abundance of Proteobacteria andActinobacteria, and greatly declined the relative abundance of Planctomycetes, and Verrucomicrobiacompared with IC (Fig. 2a & Fig. S1). At podding stage (0-20 cm), IC greatly induced the relative abundanceof Proteobacteria, Gemmatimonadetes, Actinobacteria, and Bacteroidetes whereas reduced the relativeabundance of Acidobacteria, Planctomycetes, and Verrucomicrobia compared with MP and MC. NC-P andNC-C did not show signi�cant changes compared with IC. By contrast, the relative abundance ofProteobacteria, Gemmatimonadetes, Actinobacteria, and Bacteroidetes were obviously declined while therelative abundance of Acidobacteria and Planctomycetes were clearly elevated in SC-P and SC-C comparedwith IC (Fig. 2d). At blossom-needling stage (0-20 cm), the relative abundance of Proteobacteria,Gemmatimonadetes, and Bacteroidetes were induced while the relative abundance of Nitrospirae andChloro�exi were reduced in IC compared with MP and MC. Compared NC-P and SC-P with IC, the relativeabundance of Planctomycetes, Actinobacteria, and Nitrospirae were increased while Proteobacteria,Gemmatimonadetes, and Bacteroidetes were decreased. Compared NC-C and SC-C with IC, the relativeabundance of Proteobacteria and Planctomycetes were induced while Actinobacteria, andGemmatimonadetes were reduced (Fig. 3a & Fig. S1). At blossom-needling stage (20-40 cm), the relativeabundance of Proteobacteria, Actinobacteria, Gemmatimonadetes, Nitrospirae, and Bacteroidetes were higherwhile Acidobacteria, Planctomycetes, Verrucomicrobia, and Latescibacteria were lower in IC than MP and MC.Additionally, the relative abundance of Planctomycetes and Verrucomicrobia showed higher whereasActinobacteria, and Gemmatimonadetes showed lower in NC-P and NC-C than IC. SC-P and SC-C processedhigher relative abundance of Acidobacteria, Planctomycetes, Verrucomicrobia, and Latescibacteria whilelower Proteobacteria, Actinobacteria, Gemmatimonadetes, and Nitrospirae compared with IC (Fig. 3d).
The PCoA analysis revealed evident change in soil community structure of different cropping systems andthe bacterial community of all of the treatments grouped well. At blossom-needling stage, no obviousdifference was detected among treatments (Figs. 2b & 3b). However, IC, NC-P, and NC-C exerted a distinctdifference as compared to the communities of other treatments in both 0-20 and 20-40 cm of the top soil atpodding stage (Figs. 2e & 3e).
We then used the novel Tax4Fun tool to further explain the predictive functional pro�ling of microbialcommunities. At blossom-needling stage, the metabolic functions related to fatty acid biosynthesis, lipoicacid metabolism, peptidoglycan biosynthesis, biosynthesis of ansamycins, D-Alanine metabolism, cell cycle-Caulobacter, sulfur rely system, ribosome, protein export, etc. were signi�cantly higher in the MP group inboth 0-20 and 20-40 cm of the top soil especially compared with SC-P and SC-C groups (Figs. 2c & 3c).Strikingly, these putative KEGG pathways were signi�cantly depleted in MP group, but visibly enriched in IC,NC-P, and NC-C groups at podding stage in both 0-20 and 20-40 cm of the top soil (Figs. 2f & 3f). These
Page 16/27
metabolic results indicate differential regulation of the soil bacterial community functional pro�les by thedifferent cropping systems and crop growth stages.
DiscussionThe main objective of this paper was to present a peanut/cotton intercropping system that signi�cantlyraised the crop productivity and economic returns under non-saline, secondary-saline, and coastal saline soilconditions. The present intercropping system also showed signi�cant advantages over traditionalmonoculture systems. Based on multi-site �eld experiments with permeable (100 µm) and impermeable(solid) root barriers, we demonstrated that this phenomenon could be mainly attributed to the altering of thesoil bacterial abundance distribution which can enhance the nutrient accumulation including N, P, and K inthe soils, peanut pods, and cotton buds. Similarly, B Chi, Y Zhang, D Zhang, X Zhang, J Dai and H Dong [11]examined the advantages of this intercropping system from the point of leaf photosynthesis, dry matterpartitioning, and the interactions between border and inner rows; however, our study provides evidence fromthe perspective of the belowground interspeci�c interactions and clear indicate the involvement of soilmicrobial community in peanut and cotton interaction. These �ndings highlight the importance of thispromising intercropping system and provide an important reference for farmers to lower inputs and obtainmore economic returns under various soil conditions.
In the peanut/cotton intercropping system, cotton is a tall crop with a high ground cover from June toSeptember which is in a dominant position; however, peanut is a short crop during the whole cogrowth phaseexcept seedling stage which is in a disadvantage position. This could be ascribed to the strong competitionof cotton such as light, nutrients, and water [11, 56]. In conformity with earlier reports, we observed thatintercropping clearly decreased the peanut pods yield while profoundly increased seed cotton yield comparedwith their monocultures [11, 57]. Strikingly, the reduction of peanut pods yield were even more aggravatedunder root barrier treatments especially in solid barrier treatment (SC). Similar results were obtained in seedcotton yield where NC and SC partially eliminated the bene�cial effects of intercropping on cottonproductivity (Tables 2 & 3). These results have been further demonstrated by land use e�ciency ofintercropping as quanti�ed by LER where NC and SC dramatically decreased the LER compared with IC(Table 4). Therefore, we speculate that the above observations could be mainly ascribed to the belowgroundinteractions between the two crop species.
It is well accepted that nutrient translocation from soil to belowground and from belowground toaboveground components of crops could further in�uence the concentrations of these nutrients in peanutpods and cotton buds [58–60]. Consistent with previous reports, we observed that intercropping acceleratedthe accumulations of N, P, and K at various degrees in both peanut and cotton strips of soil compared withtheir monocultures (Table 6). It can be presumed that this intercropping system could promote the adequateavailability and improve the acquisition of these nutrients in soil [4]. Indeed, crops are known to bene�t fromintercropping with legumes such as peanut for the symbiotic relationship between rhizobia and legume rootscould provide more available N for their neighboring crop species [61–63]. It is worth noting that theenhanced accumulation of N was only observed in stems, leaves, and buds of cotton of IC treatment;however, although intercropping stimulated the uptake of N in the aboveground parts of peanut, it failed to
Page 17/27
increase this nutrient’s concentration in peanut pods (Table 7). These discrepancies might result from thereduced allocation of N from the vegetative tissues to the reproductive organs which warrant furtherinvestigation. By contrast, the accumulation of P and K in vegetative tissues of peanut and cotton showedsimilar trends as those in the soil where IC dramatically increased these nutrient contents compared withtheir monocultures (Table 7). Particularly, the induction was more pronounced in cotton than peanut plantswhile the reduction by SC was more pronounced than NC. On the one hand, this phenomenon might be due tothe competition effects of the aboveground parts where higher light interception and leaf transpiration at thetop of cotton than peanut could enhance the absorption capacity of nutrients [9, 64]. On the other hand, theinteractions of the underground part of the two species prompted us to further elucidate the underlyingmechanisms.
It has been well documented that high biodiversity increases ecosystem functions [12, 47, 65]. Unexpectedly,limited changes of soil bacterial community diversity and richness in the peanut/cotton intercropping systemwere detected compared with their monocultures (Table S1). By contrast, the bacterial communitycomposition of soil changed dramatically in various treatments (Figs. 2 & 3). The discrepancies between theprevious researches and ours might resulted from the two major reasons. First, rhizosphere soil has beenutilized to detect the soil bacterial community diversity whereas we collected the soil between root zoon andthe connection part of the two crops for our sampling method could take into account both root exudatesand soil. Second, our work was the �rst time to reveal the belowground interactions between legume (peanut)and �ber (cotton) crop species, thus, this interspeci�c interactions might be different from the previousreports. Therefore, it is expected that the profound role of this intercropping system could be attributed to thechanges of the bacterial community composition rather than diversity. To further unravel the role ofinterspeci�c interactions, PCoA analysis was carried out and IC, NC-P, and NC-C exerted a distinct differenceas compared to MP, MC, SC-P, and SC-C in both 0-20 and 20-40 cm of the top soil at podding stage (Figs. 2e &3e). Consistent with the data of plant nutrient accumulation (Table 7), these results could be interpreted bythe application of root barriers and clearly showed that permeable (100 µm) nylon mesh root barrierperformed better than impermeable (solid) root barrier, thus, further con�rmed the importance of theunderground interactions in this intercropping system. The PCoA analysis further indicated that the changesof bacterial community composition at podding stage might play a more vital role in overyielding andenhancing economic returns of this intercropping system. The heatmap based KEGG analysis found thatsome crucial metabolic pathways such as lipoic acid metabolism, fatty acid biosynthesis, and protein exportwere signi�cantly enriched in IC, NC-P, and NC-C compared with other treatments (Figs. 2f & 3f). Lipoic acidhas been reported to recover metabolic distortions through modulating ion homeostasis such as K+ [66]which was consistent with our �ndings that intercropping signi�cantly accelerated the allocation of K fromsoil to plants, and then from vegetative tissues to the reproductive organs especially in cotton. Similarly, thefacilitation of fatty acid biosynthesis by intercropping would also provide basis for the growth and survival ofsoil bacteria [67, 68] which in turn promoted the seed cotton yield; however, further investigation are stillneeded to explore the detailed mechanisms concerning the reduction of peanut pods yield in thisintercropping system.
Conclusions
Page 18/27
In summary, the present study leads us to conclude that peanut/cotton intercropping system could inducethe seed cotton yield while reduce the peanut pods yield compared with their monocultures. Moreover, theeconomic returns have been induced under both normal and salinity soil conditions. Using root barriertreatments, we found that the bacterial community composition between monoculture and intercroppingwere dramatically changed at peanut podding stage and blossom-needling stage. The changes of soilmicrobial communities could further attribute to the accumulation of soil nutrients such as N, P, and K in bothcrop species, promotion of the translocation of these nutrients from vegetative tissues to reproductiveorgans, and �nally contribution to the enhanced economic returns. Our �ndings �ll a gap of knowledge on thebelowground interactions in peanut/cotton intercropping system and propose a previously unidenti�edmechanism combining crop nutrient allocation with soil bacterial community composition. Additionally, thisstudy provides guidance for farmers to select the best cropping system under various soil conditions. Futurework could be extended by evaluating the soil bacterial community structures in salinity soil and carrying outmultiple year experiments to gain a more general understanding of the microbial-driven belowgroundprocesses in this intercropping system.
AbbreviationsANOVA, analysis of variance;
DNA, deoxyribonucleic acid;
IC, intercropping;
K, potassium;
KEGG, Kyoto Encyclopedia of Genes and Genomes;
LER, land equivalent ratio;
LERc, land equivalent ratio of cotton;
LERp, land equivalent ratio of peanut;
MC, monoculture of cotton;
Mc, the yields of cotton in monocropping systems;
Mp, the yields of peanut in monocropping systems;
MP, monoculture of peanut;
N, nitrogen;
NCBI, National Center for Biotechnology Information;
NC-C, permeable root barrier treatments cotton side;

Page 19/27
NC-P, permeable root barrier treatments peanut side;
SC-C, impermeable root barrier treatments cotton side;
SC-P, impermeable root barrier treatments peanut side;
SRA, Sequence Read Archive;
P, phosphorus;
PCR, polymerase chain reaction;
PCoA, the principal coordinates analysis;
Yc, the yields of cotton in intercropping systems;
Yp, the yields of peanut in intercropping systems.
DeclarationsEthics approval and consent to participate
Not applicable.
Consent for publication
Not applicable.
Availability of data and material
The datasets generated during and/or analyses during the current study are available in the National Centerfor Biotechnology Information (NCBI) Sequence Read Archive (SRA) database under Submission ID ofSUB10633613 and Accession of PRJNA779843.
Competing interests
The authors declare that they have no competing interests.
Funding
This study was supported by the National Natural Science Foundation of China (31901461), the ShandongProvincial Modern Agriculture Industrial Technology (SDAIT-04-05), and the Opening Foundation ofShandong Provincial Crop Varieties Improvement (2020LZGC001).
Authors' contributions
TS, WX, and KZ conceived and designed the experiments. XW, XXZ, XJZ, XY, and YW performed theexperiments. TS, WX, and KZ contributed to the writing of the manuscript and performed the �nal editing of
Page 20/27
the manuscript.
Acknowledgements
Not applicable.
References1. Brooker RW, Bennett AE, Cong W-F, Daniell TJ, George TS, Hallett PD, Hawes C, Iannetta PPM, Jones HG,
Karley AJ et al: Improving intercropping: a synthesis of research in agronomy, plant physiology andecology. New Phytol 2015, 206(1):107-117.
2. Gou F, van Ittersum MK, Simon E, Leffelaar PA, van der Putten PEL, Zhang L, van der Werf W:Intercropping wheat and maize increases total radiation interception and wheat RUE but lowers maizeRUE. European Journal of Agronomy 2017, 84:125-139.
3. Li R, Chen N, Zhang X, Zeng L, Wang X, Tang S, Li D, Niyogi D: Quantitative analysis of agriculturaldrought propagation process in the Yangtze River Basin by using cross wavelet analysis and spatialautocorrelation. Agricultural and Forest Meteorology 2020, 280:107809.
4. Xue Y, Xia H, Christie P, Zhang Z, Li L, Tang C: Crop acquisition of phosphorus, iron and zinc from soil incereal/legume intercropping systems: a critical review. Ann Bot 2016, 117(3):363-377.
5. Fridley JD: The in�uence of species diversity on ecosystem productivity: how, where, and why?Oikos2001, 93(3):514-526.
�. Hauggaard-Nielsen H, Jensen ES: Facilitative root interactions in intercrops. Plant Soil 2005, 274(1):237-250.
7. Tilman D, Reich PB, Knops J, Wedin D, Mielke T, Lehman C: Diversity and productivity in a long-termgrassland experiment. Science 2001, 294(5543):843.
�. Wang R, Sun Z, Zhang L, Yang N, Feng L, Bai W, Zhang D, Wang Q, Evers JB, Liu Y et al: Border-rowproportion determines strength of interspeci�c interactions and crop yields in maize/peanut stripintercropping. Field Crops Res 2020, 253:107819.
9. Raza MA, Feng LY, van der Werf W, Cai GR, Khalid MHB, Iqbal N, Hassan MJ, Meraj TA, Naeem M, Khan Iet al: Narrow-wide-row planting pattern increases the radiation use e�ciency and seed yield of intercropspecies in relay-intercropping system. Food and Energy Security 2019, 8(3):e170.
10. Zhang D, Sun Z, Feng L, Bai W, Yang N, Zhang Z, Du G, Feng C, Cai Q, Wang Q et al: Maize plant densityaffects yield, growth and source-sink relationship of crops in maize/peanut intercropping. Field CropsRes 2020, 257:107926.
11. Chi B, Zhang Y, Zhang D, Zhang X, Dai J, Dong H: Wide-strip intercropping of cotton and peanutcombined with strip rotation increases crop productivity and economic returns. Field Crops Res 2019,243:107617.
12. Li B, Li Y-Y, Wu H-M, Zhang F-F, Li C-J, Li X-X, Lambers H, Li L: Root exudates drive interspeci�cfacilitation by enhancing nodulation and N2 �xation. Proc Natl Acad USA 2016, 113(23):6496-6501.
Page 21/27
13. Ehrmann J, Ritz K: Plant: soil interactions in temperate multi-cropping production systems. Plant Soil2014, 376(1):1-29.
14. Li S, Wu F: Diversity and co-occurrence patterns of soil bacterial and fungal communities in sevenintercropping systems. Frontiers in Microbiology 2018, 9(1521).
15. Callaway RM: Positive interactions among plants. The Botanical Review 1995, 61(4):306-349.
1�. Meena HN, Meena M, Yadav RS: Comparative performance of seed types on yield potential of peanut(Arachis hypogaea L.) under saline irrigation. Field Crops Res 2016, 196:305-310.
17. Qin W, Yan H, Zou B, Guo R, Ci D, Tang Z, Zou X, Zhang X, Yu X, Wang Y et al: Arbuscular mycorrhizalfungi alleviate salinity stress in peanut: Evidence from pot-grown and �eld experiments. Food andEnergy Security 2021, 10(4):e314.
1�. Deinlein U, Stephan AB, Horie T, Luo W, Xu G, Schroeder JI: Plant salt-tolerance mechanisms. TrendsPlant Sci 2014, 19(6):371-379.
19. Zhang X, Chen N, Li J, Chen Z, Niyogi D: Multi-sensor integrated framework and index for agriculturaldrought monitoring. Remote Sensing of Environment 2017, 188:141-163.
20. Khorsandi F, Anagholi A: Reproductive compensation of cotton after salt stress relief at different growthstages. J Agron Crop Sci 2009, 195(4):278-283.
21. Hasegawa PM: Sodium (Na+) homeostasis and salt tolerance of plants. Environmental & ExperimentalBotany 2013, 92(8):19-31.
22. Tanji KK: Salinity in the soil environment. In: Salinity: Environment - Plants - Molecules. Edited by LäuchliA, Lüttge U. Dordrecht: Springer Netherlands; 2002: 21-51.
23. Hanin M, Ebel C, Ngom M, Laplaze L, Masmoudi K: New insights on plant salt tolerance mechanismsand their potential use for breeding. Front Plant Sci 2016, 7:1787.
24. Puniran-Hartley N, Hartley J, Shabala L, Shabala S: Salinity-induced accumulation of organic osmolytesin barley and wheat leaves correlates with increased oxidative stress tolerance: In planta evidence forcross-tolerance. Plant Physiol Biochem 2014, 83:32-39.
25. Zarza X, Atanasov KE, Marco F, Arbona V, Carrasco P, Kopka J, Fotopoulos V, Munnik T, Gómez-CadenasA, Tiburcio AF et al: Polyamine oxidase 5 loss-of-function mutations in Arabidopsis thaliana triggermetabolic and transcriptional reprogramming and promote salt stress tolerance. Plant Cell Environ 2016,40(4):527-542.
2�. Wani AS, Ahmad A, Hayat S, Tahir I: Epibrassinolide and proline alleviate the photosynthetic and yieldinhibition under salt stress by acting on antioxidant system in mustard. Plant Physiol Biochem 2019,135:385-394.
27. Zhao Y, Dong W, Zhang N, Ai X, Wang M, Huang Z, Xiao L, Xia G: A wheat Allene Oxide Cyclase Geneenhances salinitytolerance via jasmonate signaling. Plant Physiol 2013, 164:1068–1076.
2�. Li X, Yu B, Cui Y, Yin Y: Melatonin application confers enhanced salt tolerance by regulating Na+ and Cl−
accumulation in rice. Plant Growth Regul 2017, 83(3):441-454.
29. Zhu Y, Guo J, Feng R, Jia J, Han W, Gong H: The regulatory role of silicon on carbohydrate metabolism inCucumis sativus L. under salt stress. Plant Soil 2016, 406(1):231-249.
Page 22/27
30. Tian S, Guo R, Zou X, Zhang X, Yu X, Zhan Y, Ci D, Wang M, Wang Y, Si T: Priming with the green leafvolatile (Z)-3-Hexeny-1-yl Acetate enhances salinity stress tolerance in peanut (Arachis hypogaea L.)seedlings. Front Plant Sci 2019, 10:785.
31. Greenway H, Munns R: Mechanisms of salt tolerance in nonhalophytes. Annual Review of PlantPhysiology 1980, 31(1):149-190.
32. Guo R, Yan H, Li X, Zou X, Zhang X, Yu X, Ci D, Wang Y, Si T: Green leaf volatile (Z)-3-hexeny-1-yl acetatereduces salt stress in peanut by affecting photosynthesis and cellular redox homeostasis. Physiol Plant2020, 170(1):75-92.
33. El-Akhal MR, Rincón A, Coba de la Peña T, Lucas MM, El Mourabit N, Barrijal S, Pueyo JJ: Effects of saltstress and rhizobial inoculation on growth and nitrogen �xation of three peanut cultivars. Plant Biol2012, 15(2):415-421.
34. Wang Z, Yan L, Wan L, Huai D, Kang Y, Shi L, Jiang H, Lei Y, Liao B: Genome-wide systematiccharacterization of bZIP transcription factors and their expression pro�les during seed development andin response to salt stress in peanut. Bmc Genomics 2019, 20(1):51.
35. Ci D, Tang Z, Ding H, Cui L, Zhang G, Li S, Dai L, Qin F, Zhang Z, Yang J et al: The synergy effect ofarbuscular mycorrhizal fungi symbiosis and exogenous calcium on bacterial community compositionand growth performance of peanut (Arachis hypogaea L.) in saline alkali soil. Journal of Microbiology2021, 59(1):51-63.
3�. Zhang X, Chen N, Sheng H, Ip C, Yang L, Chen Y, Sang Z, Tadesse T, Lim TPY, Rajabifard A et al: Urbandrought challenge to 2030 sustainable development goals. Science of The Total Environment 2019,693:133536.
37. Lazof DB, Bernstein N: The NaCl induced inhibition of shoot growth: The case for disturbed nutrition withspecial consideration of calcium. In: Advances in Botanical Research. Edited by Callow JA, vol. 29:Academic Press; 1998: 113-189.
3�. Feghhenabi F, Hadi H, Khodaverdiloo H, van Genuchten MT: Seed priming alleviated salinity stressduring germination and emergence of wheat (Triticum aestivum L.). Agricultural Water Management2020, 231:106022.
39. Dong Y, Hu G, Yu J, Thu SW, Grover CE, Zhu S, Wendel JF: Salt-tolerance diversity in diploid and polyploidcotton (Gossypium) species. Plant J 2020, 101(5):1135-1151.
40. Rodriguez-Uribe L, Higbie SM, Stewart JM, Wilkins T, Lindemann W, Sengupta-Gopalan C, Zhang J:Identi�cation of salt responsive genes using comparative microarray analysis in Upland cotton(Gossypium hirsutum L.). Plant Sci 2011, 180(3):461-469.
41. Li X-F, Wang Z-G, Bao X-G, Sun J-H, Yang S-C, Wang P, Wang C-B, Wu J-P, Liu X-R, Tian X-L et al: Long-term increased grain yield and soil fertility from intercropping. Nature Sustainability 2021.
42. Barbano DM, Lynch JM, Fleming JR: Direct and indirect determination of true protein content of milk byKjeldahl analysis: collaborative study. Journal of Association of O�cial Analytical Chemists 1991,74(2):281-288.
43. Khashi u Rahman M, Wang X, Gao D, Zhou X, Wu F: Root exudates increase phosphorus availability inthe tomato/potato onion intercropping system. Plant Soil 2021.
Page 23/27
44. Chakraborty K, Bhaduri D, Meena HN, Kalariya K: External potassium (K+) application improves salinitytolerance by promoting Na+-exclusion, K+-accumulation and osmotic adjustment in contrasting peanutcultivars. Plant Physiol Biochem 2016, 103:143-153.
45. Rao MR, Willey RW: Evaluation of yield stability in intercropping: studies on sorghum/pigeonpea.Experimental agriculture 1980, 16(2):105-116.
4�. Cheng H, Wu B, Wei M, Wang S, Rong X, Du D, Wang C: Changes in community structure and metabolicfunction of soil bacteria depending on the type restoration processing in the degraded alpine grasslandecosystems in Northern Tibet. Science of The Total Environment 2021, 755:142619.
47. Ali A, Imran Ghani M, Li Y, Ding H, Meng H, Cheng Z: Hiseq base molecular characterization of soilmicrobial community, diversity structure, and predictive functional pro�ling in continuous cucumberplanted soil affected by diverse cropping systems in an intensive greenhouse region of Northern China.International Journal of Molecular Sciences 2019, 20(11).
4�. Magoč T, Salzberg SL: FLASH: fast length adjustment of short reads to improve genome assemblies.Bioinformatics 2011, 27(21):2957-2963.
49. Caporaso JG, Kuczynski J, Stombaugh J, Bittinger K, Bushman FD, Costello EK, Fierer N, Peña AG,Goodrich JK, Gordon JI et al: QIIME allows analysis of high-throughput community sequencing data. NatMethods 2010, 7(5):335-336.
50. Bokulich NA, Subramanian S, Faith JJ, Gevers D, Gordon JI, Knight R, Mills DA, Caporaso JG: Quality-�ltering vastly improves diversity estimates from Illumina amplicon sequencing. Nat Methods 2013,10(1):57-59.
51. Edgar RC: UPARSE: highly accurate OTU sequences from microbial amplicon reads. Nat Methods 2013,10(10):996-998.
52. Wang Q, Garrity George M, Tiedje James M, Cole James R: Naïve Bayesian classi�er for rapidassignment of rRNA sequences into the new bacterial taxonomy. Applied and EnvironmentalMicrobiology 2007, 73(16):5261-5267.
53. Kõljalg U, Larsson K-H, Abarenkov K, Nilsson RH, Alexander IJ, Eberhardt U, Erland S, Høiland K, Kjøller R,Larsson E et al: UNITE: a database providing web-based methods for the molecular identi�cation ofectomycorrhizal fungi. New Phytol 2005, 166(3):1063-1068.
54. Aßhauer KP, Wemheuer B, Daniel R, Meinicke P: Tax4Fun: predicting functional pro�les frommetagenomic 16S rRNA data. Bioinformatics 2015, 31(17):2882-2884.
55. Langille MGI, Zaneveld J, Caporaso JG, McDonald D, Knights D, Reyes JA, Clemente JC, Burkepile DE,Vega Thurber RL, Knight R et al: Predictive functional pro�ling of microbial communities using 16S rRNAmarker gene sequences. Nat Biotechnol 2013, 31(9):814-821.
5�. Raza MA, Feng LY, van der Werf W, Iqbal N, Khan I, Khan A, Din AMU, Naeem M, Meraj TA, Hassan MJ etal: Optimum strip width increases dry matter, nutrient accumulation, and seed yield of intercrops underthe relay intercropping system. Food and Energy Security 2020, 9(2):e199.
57. Singh RJ, Ahlawat IPS, Sharma NK: Resource use e�ciency of transgenic cotton and peanutintercropping system using modi�ed fertilization technique. International Journal of Plant Production2015, 9(4):523-540.
Page 24/27
5�. Wang X, Deng X, Pu T, Song C, Yong T, Yang F, Sun X, Liu W, Yan Y, Du J et al: Contribution of interspeci�cinteractions and phosphorus application to increasing soil phosphorus availability in relay intercroppingsystems. Field Crops Res 2017, 204:12-22.
59. Malézieux E, Crozat Y, Dupraz C, Laurans M, Makowski D, Ozier-Lafontaine H, Rapidel B, de TourdonnetS, Valantin-Morison M: Mixing plant species in cropping systems: concepts, tools and models. A review.Agronomy for Sustainable Development 2009, 29(1):43-62.
�0. Wu K, Fullen MA, An T, Fan Z, Zhou F, Xue G, Wu B: Above- and below-ground interspeci�c interaction inintercropped maize and potato: A �eld study using the ‘target’ technique. Field Crops Res 2012, 139:63-70.
�1. Bais HP, Weir TL, Perry LG, Gilroy S, Vivanco JM: The role of root exudates in rhizosphere interactionswith plants and other organisms. Annu Rev Plant Biol 2006, 57:233-266.
�2. Mulder L, Hogg B, Bersoult A, Cullimore JV: Integration of signalling pathways in the establishment ofthe legume-rhizobia symbiosis. Physiol Plant 2005, 123(2):207-218.
�3. Guo F, Wang M, Si T, Wang Y, Zhao H, Zhang X, Yu X, Wan S, Zou X: Maize-peanut intercropping led to anoptimization of soil from the perspective of soil microorganism. Archives of Agronomy and Soil Science2021, 67(14):1986-1999.
�4. Yang F, Liao D, Wu X, Gao R, Fan Y, Raza MA, Wang X, Yong T, Liu W, Liu J et al: Effect of abovegroundand belowground interactions on the intercrop yields in maize-soybean relay intercropping systems.Field Crops Res 2017, 203:16-23.
�5. Yu R-P, Lambers H, Callaway RM, Wright AJ, Li L: Belowground facilitation and trait matching: two orthree to tango?Trends Plant Sci 2021.
��. Gorcek Z, Erdal S: Lipoic acid mitigates oxidative stress and recovers metabolic distortions in salt-stressed wheat seedlings by modulating ion homeostasis, the osmo-regulator level and antioxidantsystem. Journal of the Science of Food and Agriculture 2015, 95(14):2811-2817.
�7. Paulucci NS, Medeot DB, Dardanelli MS, de Lema MG: Growth temperature and salinity impact fatty acidcomposition and degree of unsaturation in peanut-nodulating rhizobia. Lipids 2011, 46(5):435-441.
��. Paulucci NS, Medeot DB, Woelke M, Dardanelli MS, de Lema MG: Monounsaturated fatty acid aerobicsynthesis in Bradyrhizobium TAL1000 peanut-nodulating is affected by temperature. Journal of AppliedMicrobiology 2013, 114(5):1457-1467.
Figures
Page 25/27
Figure 1
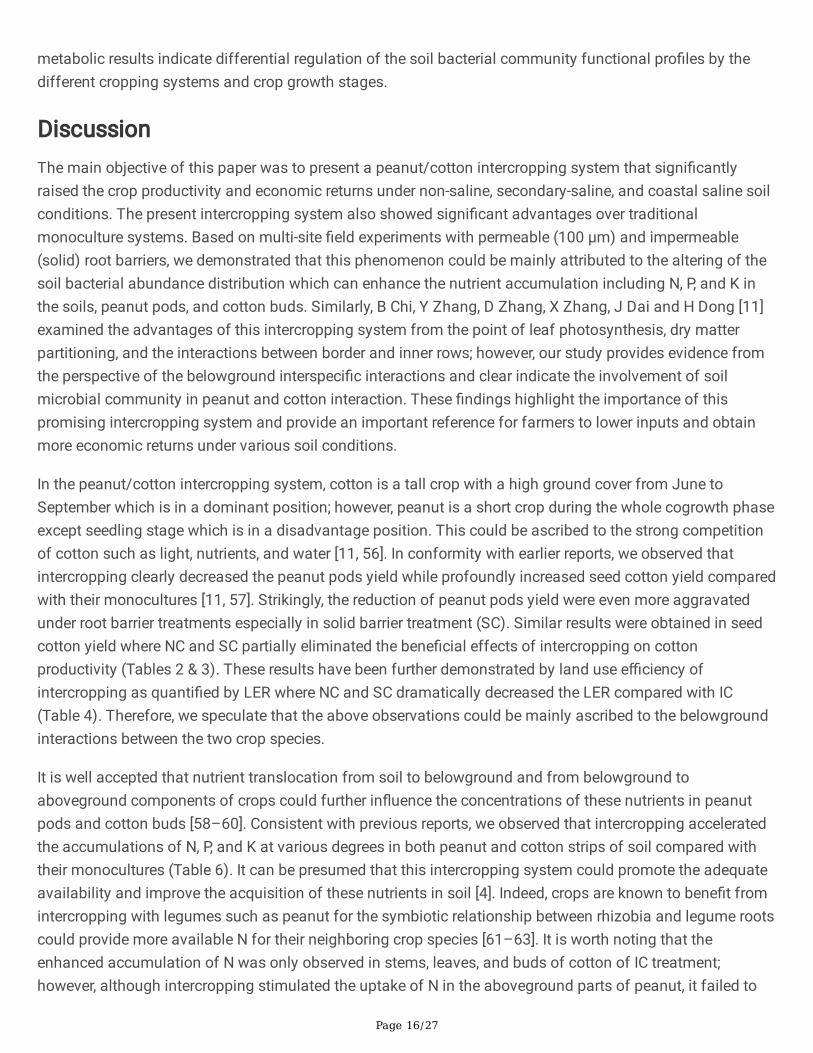
Schematic diagrams of experimental design used in different cropping systems and root barriers (a). MP:Monocropping of peanut, MC: Monocropping of cotton, IC: Intercropping of peanut/cotton without barriers,NC: Intercropping of peanut/cotton with 100 μm nylon mesh barrier, SC: Intercropping of peanut/cotton withsolid barrier. Solid triangles represent soil sampling positions. Pictures showing MP (b), MC (c), both peanutand cotton in IC (d), peanut strips in IC (e), and cotton strips in IC (f).
Page 26/27
Figure 2
The relative abundance of soil bacterial proportions (0-20 cm) at the phylum level at blossom-needling stage(a) and podding stage (d). The principal coordination analysis (PCoA) in Hellinger distance at blossom-needling stage (b) and podding stage (e) showing changings in soil bacterial community structure. Heatmapbased most abundant Kyoto Encyclopedia of Genes and Genomes (KEGG) ortholog (KO) groups showing therelative abundance of top 20 KEGG metabolic pathways across different treatments at blossom-needlingstage (c) and podding stage (f) in monocropped peanut (MP), monocropped cotton (MC), peanutintercropped with cotton without barriers (IC), peanut intercropped with cotton with 100 μm nylon meshbarrier: peanut strip (NP) and cotton strip (NC), peanut intercropped with cotton with solid barrier: peanut strip(SP) and cotton strip (SC). The samples were taken from 0-20 cm of the top soil.
Page 27/27
Figure 3
The relative abundance of soil bacterial proportions (20-40 cm) at the phylum level at blossom-needlingstage (a) and podding stage (d). The principal coordination analysis (PCoA) in Hellinger distance at blossom-needling stage (b) and podding stage (e) showing changings in soil bacterial community structure. Heatmapbased most abundant Kyoto Encyclopedia of Genes and Genomes (KEGG) ortholog (KO) groups showing therelative abundance of top 20 KEGG metabolic pathways across different treatments at blossom-needlingstage (c) and podding stage (f) in monocropped peanut (MP), monocropped cotton (MC), peanutintercropped with cotton without barriers (IC), peanut intercropped with cotton with 100 μm nylon meshbarrier: peanut strip (NP) and cotton strip (NC), peanut intercropped with cotton with solid barrier: peanut strip(SP) and cotton strip (SC). The samples were taken from 20-40 cm of the top soil.
Supplementary Files
This is a list of supplementary �les associated with this preprint. Click to download.
Supplementarymaterial.docx