can overconfidence be used as an indicator of reconstructive rather than retrieval processes?
TRANSCRIPT
ELSEVIER Cognition 54 (1994) 99-130
C O G N I T I O N
Can overconfidence be used as an indicator of reconstructive rather than retrieval processes?
Peter Juslin*, Anders Winman, Thomas Persson Department of Psychology, Uppsala University, Box 1854, S-751 48 Uppsala, Sweden
Received 15 November 1993, final version accepted 20 June 1994
Abstract
In a recent paper Wagenaar (1988) suggested that overconfidence can be used as an indicator of reconstructive processes which allow responses based on inference to be distinguished from responses based on retrieval. The ecological models (Bj6rkman, in press; Gigerenzer, Hoffrage, & Kleinbflting, 1991; Juslin, 1993a, 1993b, 1994) pro- vide a more positive view of the calibration of reconstructive responses. In this paper we compare these two views and argue that overconfidence cannot be considered a reliable indicator of reconstructive processes since people may be well calibrated for tasks that require inference, provided that tasks are selected in an unbiased manner. Instead, we discuss two different models: the response-independence model which is appropriate to retrieval, and the response-dependence model which applies to infer- ence. These two models predict different distributions of solution probabilities and they therefore provide a criterion by which we can distinguish between direct retrieval and reconstruction. In two empirical studies modelled after Experiment 1 in Wagenaar 's (1988) paper it is shown that calibration can be very similar and quite reasonable both for tasks that are dominated by inference and tasks that are domi- nated by retrieval processes. In Experiment 2 we show that the two conditions never- theless differ in regard to the distributions of solution probabilities in the manner predicted by the two response models presented in the paper. It is proposed that the issue of which is the most appropriate interpretation of solution probabilities is neg- lected, and that the criterion should be of interest also to applications outside the domain of calibration research.
1. Introduction
T h e r e is a cu r r en t d e b a t e on the s ta tus of the overconfidence phenomenon
* Corresponding author.
0010-0277/95/$09.50 © 1995 Elsevier Science B.V. All rights reserved SSDI 0010-0277(94)00642-X

100 P. Juslin et al. / Cognition 54 (1995) 99-130
in the area of general knowledge. According to a common method, subjects are provided with sets of two-alternative, almanac items, for example, "Which country has the larger population: (a) France, (b) Italy?" Subjects are requested to select the answer believed to be the correct one, and to assess their confidence in this decision as a subjective probability on the interval [.5, 1.0]. The overconfidence phenomenon is evidenced by too low hit-rates as compared to expressed levels of confidence, for example, only 70% correct when 100% certain, only 65% correct when 90% certain, and so on, something that leads to a mean confidence :~ considerably higher than the proportion ? of correct answers. This result (~?- ? > 0) has been a frequent finding in studies with informally selected general knowledge items (e.g., Allwood & Montgomery, 1987; Arkes, Christensen, Lai, & Blumer, 1987; Keren, 1985; Lichtenstein & Fischhoff, 1977; Ronis & Yates, 1987). The norm in studies on overconfidence, referred to as calibration or realism, requires that the subjective probabilities are realized in terms of the corresponding relative frequencies, for example, 90% correct when 90% certain, making x - c = 0.
According to a common conception among researchers in the heuristics and biases tradition, the overconfidence phenomenon reflects a general, "cognitive overconfidence bias", due to a tendency to over-estimate the validity of inferences of limited validity (e.g., Dawes, 1980; Keren, 1988). Wagenaar (1988) thus suggested that overconfidence and poor calibration could be regarded as an indicator of inferential processes, whereas direct retrieval of stored information should be associated with good calibration. A more recent proposal is that overconfidence has been severely over-empha- sized due to biased selection of almanac items. The ecological models (Bj6rkman, in press; Gigerenzer, Hoffrage, & Kleinb61ting; 1991; Juslin, 1993a, 1993b, 1994) suggest that confidence reflects relative frequencies that hold within naturally constrained reference classes. The subjects are as- sumed to be reasonably adapted to these reference classes, and the over- confidence phenomenon is largely seen as the consequence of the creation of a biased and (in a broader perspective) artificial reference class in the laboratory. This view stresses the adaptive significance of inferential and reconstructive processes, rather than their role for creating poor adjustment and overconfidence.
The purpose of the present paper is to compare these two views of reconstructive and inferential processes. This will be done by means of empirical data from two studies on the calibration of recognition memory. We will argue that overconfidence cannot be regarded as an indicator of inferential and reconstruction processes, that is, since these processes can yield very good calibration, provided that tasks are selected in an unbiased way (in a sense to be defined below). Instead, we propose another criterion that may help to differentiate reconstructive and inferential processes from, for example, immediate retrieval, a criterion formulated in terms of the distribution of expected solution probabilities.

P. Juslin et al. / Cognition 54 (1995) 99-130 101
2. Overconfidence as an indicator of reconstructive and inferential processes
The most severe overconfidence bias has been documented with trivia material, that is, with general knowledge, or "almanac", items (for reviews, see Keren, 1991; Lichtenstein, Fischhoff, & Phillips, 1982; O'Connor, 1989; Wallsten & Budescu, 1983; and Yates, 1990). A large number of cognitive mechanisms have been suggested as responsible for overconfidence in the area of general knowledge, for example, confirmatory post-decision in- formation search (Hoch, 1985; Koriat, Lichtenstein, & Fischhoff, 1980), pre-attentive information processing strategies (Evans, 1989), too much reliance on the strength (extremeness) of evidence at the expense of the weight (reliability) of evidence (Griffin & Tversky, 1992). A common denominator of most attempted explanations in the heuristics and biases tradition is a rather negative view of probabilistic inferences and reconstruc- tive processes, or in the words of Wagenaar (1988):
The traditional explanation of overconfidence is that people who do not know the correct responses, try to infer them and that overconfidence reflects the unwarranted trust in their own inferential reasoning. In the extreme it is entirely possible that all subjects respond incorrectly, and remain very confident, because the response was based on a totally plausible inference. Thus, overconfidence revealed by calibration plots is taken to reflect the substitution of knowledge by reconstruction. (Wagenaar, 1988, p. 279)
The findings of poor calibration and overconfidence with trivia material may be contrasted with the finding that confidence is a reliable indicator of accuracy in memory studies performed in more controlled settings with meaningless material (e.g., Groningen, 1976). Wagenaar (1988) interpreted the different conclusions from these two areas in terms of a distinction between inferential and reconstructive processes commonly characterized by overconfidence, and immediate retrieval of stored information associated with good (or, at least, considerably better) calibration. He suggested that the degree of calibration can be taken as an indicator of the underlying cognitive process, with overconfidence being the sign of inferential and reconstructive processes.
Wagenaar (1988) reported three experiments that attempt to show the validity and usefulness of overconfidence as an indicator of inferential and reconstructive processes. In Experiment 1, three groups of subjects were exposed to unintentional learning of three-letter (nonsense) syllables, three- digit numbers, and words, respectively. Half an hour later the subjects had to decide whether each of 32 presented items where "old" (part of the training list) or "new" (not part of the training list). They were informed that 16 out of 32 test items were old. After each decision the subjects made confidence assessments on a scale from .5 to 1.0.
A common way to represent calibration data is in terms of a so called calibration plot where hit-rates (accuracy) are plotted against confidence. In

102 P. Juslin et al. / Cognition 54 (1995) 99-130
all three conditions Wagenaar (1988) reported quite good calibration for old items, with hit-rates that increased steadily with confidence levels. For new items, on the other hand, there was extremely poor calibration with almost no relationship between stated confidence and hit-rates (i.e., with almost entirely fiat calibration curves). Wagenaar interpreted these results in terms of the distinction between retrieval and inferential processes (no over/ underconfidence scores were reported, however). He suggested that, while subjects could base their confidence on the strength of a retrieved memory trace in the case of old items, for new items they necessarily had to rely on some form of inference, since they had never been presented with these items. Hence, according to this theory one should expect good calibration for old items (retrieval processes), but poorer calibration for new items (inferential processes).
In Experiment 2 Wagenaar (1988) compared calibration of memory for visual and factual (abstract) items. He argued that one should expect inferences and reconstructions to be less pronounced for memory of visual contents, than for factual items (a debatable assumption since many studies that have demonstrated reconstructive memory have used visual content; e.g., the classical study of Loftus, Miller, & Burns, 1978). In agreement with predictions, Wagenaar reported better calibration for memory of visual contents. Experiment 3 was modelled after studies on eyewitness reliability and tried to show that overconfidence for single tasks can be used for determining whether the task was solved by retrieval or reconstructive processes. But as we shall see, on the most reasonable assumptions about the cognitive processes involved, the notions of over/underconfidence are simply not applicable to single tasks.
3. Well-calibrated inferential responses: the ecological models
A more positive conception of inferential and reconstructive processes might suggest that these inferences reflect proper adaptation to frequencies and correlations that obtain in the environment. This view is presented by the ecological models (Bjrrkman, in press; Gigerenzer et al., 1991; Juslin, 1993a, 1993b, 1994), which focus on the relationship between beliefs formed by experience with naturally constrained reference classes and the reference classes created in laboratory (ideas that were foreshadowed by May, 1986a, 1986b). The ecological models have been formulated with reference to two-alternative, almanac items, and we present the ideas with the example of one such item (for more extensive discussions, see Gigerenzer et al., 1991; Juslin, 1993b).
Consider the almanac item "Which country has the larger population: (a) Spain, (b) Greece?" When faced with this item, one possibility is that the subject retrieves the stored population statistics. More likely, however, the subject has no memory of the exact population statistics, but instead

P. Juslin et al. / Cognition 54 (1995) 99-130 103
retrieves some other seemingly relevant information, for example, that Spain has a fairly large area, while Greece has a smaller area. The subject may believe that large area tends to go with large population and use the retr ieved information for making a probabilistic inference on the basis of this "area cue". The subject therefore selects the country with the larger area (Spain) as his /her best guess as to which answer is correct. Most cues define an extension, which is a naturally constrained reference class of situations in the environment where the cue can be applied (e.g., pairs of countries with different area). For most situations, or items, within the extension the cue will lead to selection of the correct answer (e.g., for Spain and Greece), but for some items it will not (e.g., Saudi Arabia and Iraq, since Saudi Arabia has a larger area but a smaller population). Since the area cue has an ecological cue validity better than chance within the extension (i.e., better than .5 for a two-alternative item), selecting the country with the larger area amounts to a "best bet" within the environmental reference class. An examination of the 178 countries of the world shows that the area cue leads to the correct decision in 77% of the cases that may be encountered, suggesting that the area cue has an ecological cue validity of .77. The ecological models assume that confidence is determined by the ecological validity of the cue used for selection of answer, for example, that confidence will approximate .77 when subjects rely on the area cue. A decision based on a cue that leads to selection of the correct answer in most or all situations that may be encountered (high ecological cue validity) will thus be associated with high confidence, whereas a cue that only allows a success rate somewhat bet ter than chance (low ecological cue validity) leads to lower confidence. After life-long experience with an environment, subjects have become reasonably adapted (calibrated) to these environmental refer- ence classes.
The ecological models suggest that the overconfidence bias in most research on general knowledge has been severely "boos ted" by item selection that (incidentally) creates an "over-representat ion" of those items where the cues lead to failure (e.g., Saudi Arabia and Iraq), at the expense of the items where the same cues lead to success (e.g., France and Greece). This creates a laboratory reference class where cues get a sample cue validity below the ecological cue validity and, since confidence reflects experience with the ecological cue validities, subjects appear overconfident. This hypothesis has received support in a number of studies (see Gigerenzer et al., 1991; Juslin, 1993a, 1993b, 1994).
In summary: the ecological models assume that people act according to what is the best bet within naturally constrained reference classes and confidence reflects the validity of the cues within these environmental reference classes. In the natural environment (i.e., outside the context of Trivial Pursuit games and elementary school exams), as well as in most professional decision environments, there is no "over-selection" of situa- tions where the cues fail at the expense of situations where they lead to

104 P. Juslin et al. / Cognition 54 (1995) 99-130
correct decisions, and'people can thus often achieve reasonable calibration (see Gigerenzer et al., 1991; Juslin, 1993b).
To the extent that items are randomly selected from these naturally constrained reference classes ("representative item samples"), the ecologi- cal models predict good calibration of general knowledge (Gigerenzer et al., 1991; Juslin, 1993a, 1993b, 1994). Fig. 1 presents the calibration curve for a representative sample of two-alternative, general knowledge items that concern six target variables that describe the world countries (e.g., popula- tion of countries, population of capitals, mean life expectancy of countries). The items were generated by selecting the countries (capitals) compared in the items randomly among the world countries (capitals). As is evident from Fig. 1, the subjects revealed a quite remarkable calibration with close to zero over/underconfidence ( x - c = -0.01; see Juslin, 1993a, for more details). If we reject the idea that subjects have stored the exact population statistics of all the world countries, we have to admit that the answers must
0.9
0.s Q
0
z_ 0
0.7
0.6
0.5
.-[
/ • , """ """ I -O- Observed
," , ' " [ - - - Ideal
I I I 0.5 0.6 0.7 0.8 0.9 1
Confidence
Fig. 1. The calibration curve for a representative set of general knowledge items, where most answers have been generated by means of inferences. The ideal line in the figure is bent at the end-points .5 and 1.0. This is because subjects are forced to use predetermined values on the confidence scale. A confidence rating of .7 is considered to consist of "true" confidence ratings between .65 and .75 with an expectation of .7. For the extreme categories these expected values are .525 and .975, given the assumption of uniform distributions in these categories.
P. Juslin et al. / Cognition 54 (1995) 99-130 105
have been arrived on by inferences. Hence, inferences are not necessarily associated with overconfidence.
The ecological models have been formulated with reference to general knowledge items, but the arguments can be generalized to other situations where inferential and reconstructive processes are at work, e.g., to recon- structive memory processes and to eyewitness testimony (Wells & Loftus, 1984; Wells, 1993). As with general knowledge items, there are some situations where the inferences ("cues") and reconstructive processes lead to the correct identifications, but other (and distinctly different) situations where the same cues lead to erroneous decisions. Further, it is possible to create an impression of poor performance and overconfidence by over- representing situations where the subjects are cued to the wrong answer, for example, by selecting misleading stimuli, providing misleading post-trial information or leading questions. The point is not to argue that, for example, eyewitness testimony is well calibrated (up to date, empirical evidence certainly does not suggest this to be the case; see Deffenbacher, 1980; Wells & Murray, 1984), but only to point out that the same problems are relevant in these settings.
Without doubt, there are also biases that cannot be accounted for in terms of biased selection of items, but the explanation of these biases cannot be effectively conceptualized in terms of the distinction between retrieval and reconstructive processes. Provided that we can not take overconfidence to be an infallible sign of reconstructive and inferential processes; can we find some other criterion by which we can discriminate between inference and retrieval?
4. A modified criterion for inferential processes
A criterion that preserves some of the gist of Wagenaar's (1988) proposal can be formulated in terms of the distributions of expected solution probabilities for tasks that require retrieval, on the one hand, and infer- ences, on the other. This criterion is based on two models with different assumptions about the dependence, or correlation, between the decisions made by different subjects that respond to a single item. This criterion will be illustrated with reference to 20 subjects that respond to a two-alternative item ("Which alternative is correct: (a) or (b)?").
4.1. A response- independence mode l
First consider 20 subjects that respond to a two-alternative item which requires retrieval of the correct answer, that is, where the correct answer cannot be inferred. This situation is properly modelled by the response- independence m o d e l (RI-model) which is appropriate to situations where erroneous responses reflect covert, neural events that are independent across

106 P. Juslin et al. / Cognition 54 (1995) 99-130
subjects. Perhaps the most paradigmatic situation where the RI-model is appropriate is for sensory discrimination on one-dimensional continua, for example, "Which weight is heavier: (a) or (b)?", where errors are due to discriminal dispersion in the nervous system (Thurstone, 1927). Of par- ticular concern, the RI-model seems appropriate also to errors that occur in the process of retrieval, e.g., due to trace decay or interference in memory.
According to the RI-model, there is a fixed probability p of producing the correct answer, and each subject that tries to generate the correct answer can be considered an independent random experiment with probability p. The situation of 20 subjects trying to produce the correct answer is not unlike that of 20 independent throws with a coin (where p = .5). The expectation for the solution probability (i.e., the proportion of subjects that select the correct answer) equals p and the solution probability can be considered an estimate of p. A well-calibrated subject will produce confi- dence assessments that match p and the mean confidence across a number of well-calibrated subjects responding to a single item will match the solution probability ("item-wise calibration", in the words of May, 1986a, 1986b). The sensory system and the memory system generally allow performance better than chance, for example, the probability of retrieving the correct fact from memory will be greater than the probability of retrieving the wrong fact (which has presumably never been encoded). Therefore, p will equal or exceed .5 (or 1/n in a n-alternative task), and since all p equals or exceeds .5 and the events are independent, all expected solution probabilities will fall in the interval [.5, 1.0].
4.2. A response-dependence model
Inferential and reconstructive processes, on the other hand, are more appropriately modelled in terms of the response-dependence model (RD- model) where responses are assumed to be correlated (dependent) across subjects. This model applies to situations where erroneous responses are due to the less than perfect ecological validity of the cues (strategies, heuristics) used by the subjects, rather than due to covert neural events that reflect the limited reliability of the cognitive system. The RD-model is thus relevant to most "higher" cognitive and perceptual processes that reflect adaptation to a whole range of (different) situations that may be en- countered in the environment. The correlation between the responses by different subjects, that form part of the RD-model, is a consequence of the fact that all subjects have become adapted to the same environment.
Consider the case of 20 subjects faced with a specific item, but this time an item where the correct answer must be inferred. Again, with the RD-model there is a fixed probability p ' that the correct answer is selected and a well-calibrated subject provides a confidence assessment that matches p'. But this probability p ' is defined by a relative frequency within an environmental reference class of situations, that is, the cue used for selection

P, Juslin et al. / Cognition 54 (1995) 99-130 107
of answer leads to the correct response with a relative frequency p ' within the environmental reference class. In particular, 20 subjects responding to the same item cannot be considered as 20 independent random experiments. The inferences and reconstructions will reflect experience with the same env i ronmen t (e.g., we all live in a world where countries with larger area tend to have larger populations). Hence, in the extreme case all 20 subjects may use exactly the same cue or strategy (e.g., the area cue) and thus select the same answer. Depending on whether this is an item where the cue leads to selection of the correct answer (e.g., Poland and Denmark) or not (Italy and Spain), this will result in a solution probability of either 1.0 or 0. The situation is more like that of 20 subjects putting their trust in a single throw with the same coin. For most situations (items), all subjects will pick the correct answer, but on a few occasions they will all be wrong. In the latter case, there will be high mean confidence associated with the wrong answer. The fact that all subjects selected the wrong answer merely indicates that there was some strong evidence available to all subjects which suggested the chosen alternative.
The solution probability for an item cannot be considered an estimate of p ' , which is the probability mirrored in the subject's confidence assessments. Therefore there are no reasons to expect the mean confidence across a number of subjects responding to a single item to coincide with the solution probability, i.e., no reasons to expect "item-wise calibration". Since the probability p ' is defined within the environmental reference class (e.g., pairs of Asian and European countries), it is only under random sampling of items from this reference class that we can expect a proportion p ' of correct answers (i.e., good calibration). While we expect solution probabilities in the interval [.5, 1.0] under the RI-model, it is perfectly reasonable to expect solution probabilities in the entire interval [0, 1.0] under the RD-model.
Both the RI-model and the RD-model are, of course, idealizations. It will be difficult to find pure cases of the RI-model, i.e., tasks where there is no room for inferential processes. Similarly, in general, different subjects may use different cues or strategies in reasoning tasks, suggesting different answers, leading most solution probabilities to fall between 0 and 1.0. Nevertheless, we propose that the distribution of solution probabilities may be a useful cue to the nature of the underlying processes. Specifically, if we can estimate p, the RI-model can be treated as a null hypothesis which can be rejected at specified levels of significance for single items (i.e., by the binomial distribution). In a content area where the RI-model is rejected for many items we conclude that (probably) reconstructive processes are important.
Figs. 2(a) and (b) present item-specific computations for 120 two-alter- native tasks that concern sensory discrimination and general knowledge, respectively. On the x-axis we have the mean confidence assigned by 20 subjects to their choice of alternative, and on the y-axis we have the solution probability, that is, the proportion of subjects that selected the correct

108 P. Juslin et al. / Cognition 54 (1995) 99-130
0.9
o.B
0.7
~'~ 0.6
0.5
• 5 0.4
0 0..t
0.2
0.1
o.s
• l l • R i l l n m
I I I I
i l l i I I
I i l
nu
l i B I
l l
I I
l mR
i l i i l
l
R
i
I I I [ 0.6 0.7 0.8 0.9
Mean confidence
Fig. 2(a). The example of a situation where the RI-model is appropriate. The distribution of solution probabilities for 120 sensory weight discrimination tasks investigated with the method of constant stimuli. Twenty subjects responded to each discrimination task.
response. Fig. 2(a) presents data from an unpublished study by the authors that concerned weight discrimination for pairs of weights ("Which weight is heavier: (a) or (b)?"). After deciding on one of the weights, subjects rated confidence on the interval [.5, 1.0] . 1 Subjects were presented with 10 different pairs of weights and each pair was presented 12 times to each subject, with all 120 stimulus presentations randomly intermixed. The RI-model is appropriate to sensory discrimination since errors reflect the (independent) processes of discriminal dispersion and there is nothing that will make all subjects pick the easier (wrong) weight on a single, specific stimulus presentation. We thus expected all solution probabilities to equal or exceed .5, that is, sampling errors aside (at n = 20). Indeed, from Fig. 2(a) we see that for only 5 out of 120 stimulus presentations we have a solution probability below .5.
The data in Fig. 2(b) are from an unpublished study by the authors with
1The methods in this unpublished study were the same as the methods described in Bj6rkman, Juslin, and Winman (1993) and the reader is referred to this study for further details. The instructions and the procedures conformed to standard practice in calibration research.

P. Juslin et al. / Cognition 54 (1995) 99-130 109
I
0.9
0.8
0.7
0.6
0.5 t~
O "~ 0.4
0 ~rj 0.3
0.2
0.1
0.5
n n n nn nu n n u
I mum i •
I I l l I l
u i u
l l R g l i l
I i l l • l
i U I i n
I n u n I n
i n | • RumBa
I l i b
l I n i l
B i l l
l l
i l l l •
nn l
nn I n
g •
nl i l
I I I I 0.6 0.7 0.8 0.9
Mean confidence
Fig. 2(b). The example of a situation where the RD-model is appropriate. The distribution of solution probabilities for 120 two-alternative, general knowledge items of the half-range format. Twenty subjects responded to each item.
an informal selection of general knowledge items that concern geography, for example, "Which country has the larger population: (a) France, (b) Italy?" (the data in Fig. 2(b) are a replication of the results in Juslin, 1993b, for informal selection). 2 Subjects selected their answer and rated confidence on the interval [.5, 1.0]. The RD-model is appropriate for most of the responses to these general knowledge items and we thus expected the solution probabilities to fall on the entire interval [0, 1.0]. In Fig. 2(b) we see that 29 out of 120 items have a solution probability below .5 and there is a much larger variance of the solution probabilities as compared to Fig. 2(a). These results support the distinction between the RI- and the RD-models, as well as the prediction that the RI-model should apply to sensory discrimination on a single stimulus continuum, whereas the RD-model should apply to general knowledge items solved by inference. The RD- model has been formulated in the context of an ecological theory of confidence with a PMM-like algorithm in mind (Gigerenzer et al., 1991).
2 The methods in this unpublished study were the same as the methods described in Juslin (1993b, 1994) for the informal item sample. The reader is referred to these studies for further details. The instructions and methods conformed to standard practice in calibration research.

110 P. Juslin et al. / Cognition 54 (1995) 99-130
But the two models are obviously based on simple statistical assumptions and the distinction is not dependent on any particular theoretical persua- sion.
We propose that the same criterion may be useful for distinguishing between retrieval (RI-model) and reconstructive memory processes (RD- model). In Experiment 1 below we show that calibration can be just as good for contents that allow considerable inference and reconstruction as for contents that mainly allow retrieval, that is, contrary to Wagenaar's proposal. In Experiment 2 we show that at the same time (i.e., despite the same overall proportion correct and calibration in the two conditions) the distributions of solution probabilities differ for the two contents in the manner predicted by the RI- and RD-models discussed here.
Much confusion in the calibration literature stems from the fact that many researchers interpret data from general knowledge items in terms of an implicit variant of the RI-model, where the RD-model actually is more appropriate. In particular, many researchers view "misleading items", items with a solution probability below .5, as reflecting something of a "pathologi- cal state" which necessarily implies overconfidence (i.e., as it would under the RI-model). For instance, misleading items may be regarded as extreme cases of overconfidence which are responsible for the general overconfi- dence bias in an item sample (May 1986a, 1986b). However, calibration can only be expected for independent events and, under the RD-model, the responses by a number of subjects responding to a single item may be highly correlated.
This means that the notions of "item-wise calibration", and over- or underconfidence for single items, are essentially meaningless under the RD-model. Under this model, we can expect calibration only if items have been randomly selected from the environmental reference class, something that allows approximation of the precondition of independent events. With the RD-model, only "population-wise calibration" makes sense (in the words of May, 1986a, 1986b). In agreement with the suggestion that the RD-model is the most appropriate model for general knowledge items, the existence of misleading items has been shown to be perfectly consistent with good overall calibration (see, for example, Juslin, 1993b, 1994, and Experi- ment 2 below). In brief, items with solution probability below .5 may be said to indicate processes of inference and reconstruction, but the concepts of calibration and over/underconfidence are not applicable to single items and these items do not imply overconfidence in any substantial sense (see, for example, the data reported in Juslin, 1993b, 1994).
It should also be noted that it is the response dependence represented in the RD-model that allows a person selecting almanac items to "over-select" items where many or most subjects select the wrong answer. If the "selector" knows the correct answer and shares his/her knowledge struc- tures with those that respond to the items, the selector can predict what items will "really put the respondent to the test". Hence, overconfidence
P. Juslin et al. / Cognition 54 (1995) 99-130 111
due to the creation of biased reference classes is mainly a problem in areas where the RD-model applies (see Gigerenzer et al., 1991; Juslin, 1993a, 1993b, 1994).
EXPERIMENT 1
Wagenaar (1988) proposed that since inference and reconstruction is associated with overconfidence and retrieval with good (better) calibration, overconfidence can be used as an indicator of inferential processes. As argued above, however, we propose that inference often reflect proper adaptation to frequencies and correlations that obtain in the environment, and if tasks are selected in an unbiased manner (i.e., in a way that does not "over-represent" misleading distractors), there should often be good cali- bration for both inferences and retrieval. As a consequence, overconfidence cannot be considered a valid and reliable indicator of inferential processes.
A few comments on the distinction between retrieval and inference might be in order. First, it is notable that the distinction between retrieval and inference does not imply that there is no retrieval involved in reconstruc- tion. Inferential processes are dependent on retrieval of facts which are used as raw material for inference. Second, as noted by Wagenaar (1988), we can't prove that subjects used retrieval in one condition and inference in another merely by varying the contents of the two conditions. As we shall see, however, one can manipulate the contents and make a reasonable assumption that one content provides larger opportunity for inference, an assumption which can be validated by observations in the results (see the introduction to Experiment 2). For instance, we expected responses based on reconstruction to be associated with longer response latencies, since the time consumed by the processes of inference will add to the time for retrieval of information. Finally, we acknowledge that the distinction may be inherently problematic on some theories of memory, but the distinction is common in cognitive theories as well as an integral part of common sense. We therefore contend that the distinction remains of, at least, heuristic value.
Experiment 1 compared calibration of recognition for abstract and artificial material that mainly requires retrieval (association) to complex and realistic material that allows reconstruction and inference. The first con- dition was similar to Wagenaar's (1988) Experiment 1 and involved the incidental learning of a list of nonsense (CVC) syllables. In the second condition, the training list consisted of 50 words randomly selected from 20 texts taken from Swedish morning and evening papers. In the third condition, each subject was presented with one of the 20 texts as a whole. The conditions were similar aside from the fact that as we go from Condition 1 (nonsense syllables) to Condition 3 (coherent texts) there is more and more room for inferential processes based on the semantic

112 P. Juslin et al. / Cognition 54 (1995) 99-130
representations of stimuli. In all three conditions distractor items were selected randomly from pools of similar contents.
For example, a subject reading a text about a car race might infer that the word "drive" probably appeared in the text, although unable to retrieve the word (i.e., within the reference class of texts on car racing, the word "drive" appears with high relative frequency). Similarly, subjects may rely on the base-rate of the words; for example, the word "and" appears with high relative frequencY in most texts. In the nonsense syllables condition, on the other hand, there is little opportunity to infer what items must have been part of the list. In rare cases, of course, a subject might be able to use inference, since some syllables may have "personal" connotations for particular subjects; for example, the syllable BEF may lead a subject to infer that if it had been part of the training list he/she would have remembered it because these letters appear in the licence plate of his/her car. But in general there will be much more opportunity for inference in the text condition. Hence, although we cannot prove which processes subjects use in the different conditions it does not seem like a bold guess to assume that subjects in the text condition make more inferences.
Further, Wagenaar (1988) interpreted the almost flat calibration curve for "new items", that is, items that were not part of the training list, as evidence for the poor calibration of inferential and reconstructive responses. First, we point out that the whole idea of a post hoc division of the material into separate calibration curves for old and new items is questionable. While it seems reasonable to expect calibration in regard to the reference class defined by the entire material (i.e., to the relative frequencies within the relevant environmental reference classes), it is far from clear that subjects at the same time also can be separately calibrated to relative frequencies (probabilities) conditioned on the fact that the item indeed was old or new. Subjects' probability assessments were obviously not conditioned on know- ledge that the fact was old or new. It is thus not clear how these calibration curves should be interpreted.
In order to illustrate the problem, the reader may consider the following example: If subjects follow the (quite reasonable) strategy of responding "new" whenever they do not recognize the presented item, there will be an overall response bias towards "new" in the entire material (truly new items + non-recognized old items). If subjects are poor learners and thus unable to recognize any item, they will have a proportion correct of 1.0 for the new items (implying perfect calibration or, more likely, underconfi- dence), but a proportion correct of 0 for old items (implying overconfi- dence). This miscalibration is an artificial consequence of the post hoc division of the material, and it does not preclude good calibration in regard to the entire material. More precisely, the subjects will be perfectly calibrated in regard to the entire material if old and new items appear equally often and they assess confidence to .5 for each presented item.
With this concern clearly in mind, we nevertheless performed the same

P. Juslin et al. / Cognition 54 (1995) 99-130 113
analysis as Wagenaar with the purpose of testing an alternative explanation of the flatter curve for new items. We agree that the responses for new items must have been generated by means of reconstruction, but we suspected that the main explanation of the poor calibration was the artificially poor cue structure allowed by the material in Wagenaar's experiment (in par- ticular, the numbers and nonsense syllables). These materials may allow mainly one inference for new items: "I do not recognize this item, therefore probably it was not part of the training list". If subjects' decisions are dominated by one such "cue", and the reported validity of this inference is perturbed by response errors and individual differences in the confidence assessments, we should expect a fiat calibration curve (see Bj6rkman, in press; and Erev, Wallsten, & Budescu, in press, for discussions of errors). We thus hypothesized that if we use a more real-life-like material that allows a richer cue structure for both new and old items, the difference should diminish and there should be quite good calibration for both new and old items.
To summarize: we expected quite good calibration both for reconstruction and for retrieval, provided that test items are generated in a way that does not over-represent misleading distractors. For materials that allow a richer cue structure for both old and new items, there should be quite reasonable calibration both for old and new items, even when both kinds of responses are based on inferences and reconstructions. In order to investigate the stability of the results, subjects were approached at two retention intervals: 30 min and 2 months.
5. Method
5.1. Subjects
Sixty subjects, 24 males and 36 females with an average age of 23 years, were randomly assigned to the three experimental conditions. Subjects were undergraduate psychology students at Uppsala University who participated in order to get course credit.
5.2. Material
The stimulus material in the training phase of the syllable condition was 50CVC syllables selected randomly from a pool of 1000CVC syllables generated by a computer. This pool was screened for syllables with "semantic associations". Each subject received an independent sample of 50 syllables that were presented on the computer screen in two parallel lists. In the training phase of the second condition, subjects were presented with 50 words selected randomly from a pool of approximately 1200 words. This pool was defined by 20 texts taken from Swedish morning and evening

114 P. Juslin et al. / Cognition 54 (1995) 99-130
papers covering a variety of topics (e.g., entertainment, sports, economics). Each text contained approximately 60 words. Each subject received an independent sample of 50 words that were presented in two parallel lists on the screen. In the third condition, subjects were presented with one of the 20 texts as a whole and each subject received a different text. The texts were presented on the computer screen in their original shape.
5.3. Procedure
In the training phase of the syllable condition, subjects were presented with a sorting task intended to provide incidental learning of the list of CVC syllables. The subjects were told that they were to participate in a test of administrative accuracy and were provided with probe-lists that contained the same syllables as the ones shown on the computer screen, but with a new random order of the syllables. For each presented probe-list, the subjects were to indicate on the probe-list whether each of the syllables was in the left list on the computer screen, in the right list, or in both lists (never occurred). Subjects were told to complete as many probe-lists (each probe- list had a new random order of the syllables) as they could in 20 min. After 20 min the list disappeared from the computer screen. The probe-lists and the list on the computer screen contained the same syllables in order to avoid interference.
In the condition with lists of words from everyday texts the subjects performed the same task but only for 8 rain. In the text condition subjects were simply asked to read a text that would be visible on the screen for 30 s, that is, without further instructions. The exposure times in each condition (20 min, 8 min, and 30 s) were selected to get proportions correct similar to those reported by Wagenaar (1988) in his Experiment 1. It was assumed that the meaningless CVC syllables would minimize the role of reconstruction and that the subjects therefore would have to rely on association. The text condition, on the other hand, provides ample opportunities for inference and reconstruction, for example, on the basis of the semantic representa- tion, or the base-rate of the words.
After 30 min subjects were presented with a recognition test for the syllables or words that they had been presented with in the training phase (in the retention interval they performed an unrelated perceptual task). In the syllable condition subjects were provided with 50 syllables, one by one, 25 of which were part of the training list. The remaining 25 distractors were selected randomly from the same original pool of 800 syllables. For each presented syllable the subject had to decide whether the syllable was o/d (part of the training list) or new (not part of the list). After each decision a confidence scale appeared below the syllable, where confidence in the decision was assessed on a scale with six alternatives- 50%, 60%, 70%, 80%, 90%, and 100%-anchored with the labels "random" (50%) and "certain" (100%). In the word-list condition subjects performed the same

P. Juslin et al. / Cognition 54 (1995) 99-130 115
task but with 50 words, 25 out of which were randomly selected from the training list. The 25 distractors were randomly selected from the same original pool of 1200 words (i.e., minus the 50 words that were part of the training list). In the text condition subjects encountered 50 words, 25 out of which were part of the text read they read in the training phase. The 25 distractor words were randomly selected among the words of the remaining 19 texts that were not presented to the subjects in the training phase.
In all conditions subjects were informed that 25 out of 50 items were selected from the training material and they were briefly introduced to the notion of calibration. The test phase took between 15 and 30 min with the entire session taking between 50 and 90 min.
5.4. Design and dependent measures
The experiment was a between-subjects design, where the independent variable was the degree to which the stimulus material (syllables, word-list, or coherent texts) allowed the decisions to be arrived on by means of inference. The main dependent measure is calibration as defined by the calibration score C (Bj6rkman, in press; Murphy, 1973; Yates, 1982):
C = -~ n,(x, - c,) 2 (1) t= l
where N refers to the number of confidence judgments, n, to the number of responses in confidence category t (t = 1 . . . T) , x, to confidence category t, and c, to the hit-rate in confidence category t. A person for whom the hit-rates coincide with the confidence levels gets a zero calibration score. The calibration score can be decomposed into three additive components (see Bj6rkman, in press):
C = D 2 + R 2 + L (2)
where D 2= ( £ - c - ) 2, R 2= (s X - s c ) 2, and L = 2sxsc(1- rx~ ). s x refers to the standard deviation of confidence, r~c to the correlation between x, and c, (weighted by n,), and s~ to the standard deviation of c, around ? (i.e., the square root of "Murphy resolution").
Over/underconf idence is defined by the difference between mean confi- dence £ and the overall proportion of correct decisions ~, with a positive difference (D --- £ - c3 indicating overconfidence and a negative, underconfi- dence. The first component of Eq. (2), D 2, accounts for the observed miscalibration that is due to bias, that is, over- or underconfidence. The second component, R 2 or resolution, reflects the degree to which poor calibration is due to a poor slope b of the calibration curve, where b is s c/s~. The slope b is 1 for perfect calibration and 0 for a "flat" calibration curve. The third component, L or linearity, measures the degree to which, systematic or non-systematic, deviations from linearity of the calibration

116 P. Juslin et al. / Cognition 54 (1995) 99-130
curve contributes to poor calibration (see Bj6rkman, in press, for further details on these measures).
6. Results
Calibration diagrams for the three conditions are presented in Fig. 3 and dependent measures in Table 1. The calibration curves were similar with quite good calibration and close to zero overconfidence in all three conditions. The manipulation of exposure times was successful in holding proportions correct the same in all conditions. Analysis of variance (ANOVA) revealed no significant differences between the conditions on any of the dependent measures that satisfy the assumption of normality (propor- tion correct, F(2, 57)= .10, p = .90; mean confidence, F(2, 57)= .318, p = .72; and over/underconfidence, F(2, 57)= .075, p = .95). The dependent variable of main concern is over/underconfidence. The two (extreme) conditions with texts and syllables are most relevant for distinguishing between the two hypotheses relevant here. The observed difference between
0.9
0.8 t - O
O
0 e ~ .o 0.7
0.6 I ' - - Ideal
Syllables
Text
--X-- Words
o.5 | I I I I
0.5 0.6 0.7 0.8 0.9 1
Confidence Fig. 3. Calibration curves for the three experimental conditions of Experiment 1 with a retention interval of 30 min.

P. Juslin et al. / Cognition 54 (1995) 99-130 117
Table 1 Measures of calibration and resolution for the three conditions of Exper iment 1. The retention interval was 30 rain
Condi t ion Measures
J? s~ ~ s 2 D C D 2 R 2 L
Text .77 .0348 .75 .0155 +0.02 .0048 .0004 .0039 .0005 Words .78 .0338 .76 .0192 +0.02 .0036 .0009 .0021 .0006 Syllables .80 .0270 .77 .0115 +0.03 .0054 .0010 .0033 .0011
The over /underconf idence scores (D) were not significantly different from zero by one-sample t-test (at p < .05; H 0 = 0).
the text condition and the syllable condition was - . 0 1 (and the difference should be positive if there is more overconfidence in the text condition). The null hypothesis H 0 of zero difference was compared to an alternative hypothesis H~ of a positive difference of .06, where .06 was the minimum difference we considered to be of practical significance. On the standard assumptions for parametric, statistical tests, a standard error of .021, and an a- level of .05 (one-tail) the power is .88 when it comes to detection of the alternative hypothesis H 1.
Calibration was tested with the Kruskal-Wallis test, but the difference between the conditions failed to reach significance (test statistic = 1.39; df = 2, p = .50). These results confirm the prediction that, if distractors have been selected in an unbiased manner, there should be no differences between the conditions with quite reasonable calibration in all three conditions.
ANOVA on response latencies for o ld/new decisions showed significant differences between the groups (F(2, 57 )= 8.96, p < .001). The text con- dition had longer response times than the other two groups. Mean response latencies were 3.55, 3.34 and 4.75s for the syllables, word, and text conditions, respectively. The second response latency, time for selection of confidence assessment, was almost the same in the three conditions. Mean response latencies were 2.35, 2.25 and 2.40 for syllables, word-lists, and texts, respectively (F(2, 5 7 ) = .217, p = .80). We interpret the longer re- sponse time for deciding whether a presented item was new or old in the text condition as support for the assumption that the text condition was more dominated by processes of inference.
In Figs. 4(a), (b), and (c) the calibration curves and the slope, b, are compared for old and new items, separately for each of the three ex- perimental conditions (see also Table 2). As predicted, the difference between new and old items diminishes when a more real-life-like material is used. It can be seen that the difference is largest for the nonsense syllable condition (old items, b = 1.03 and new items, b = .33) and smallest in the text condition (old items, b = .77 and new items, b = .65), with the word list condition falling between the "ex t reme" conditions. There was reasonable calibration for both old and new items in the text condition (C = .0056 and

118 P. Juslin et al. / Cognition 54 (1995) 99-130
0.9
0.8
0.7
0.6
" 0.5 .2
o e~ 0.4 .=
0.3
0.2
0.1
0
0.5
/
- - Slope old i t ems
- - - Slope new items
-41- Old items
New items
l
0.8 / ~ / , . - ' " * " ' "
0.7 • / /
0.6
0.5
~ 0.4
"E
0.3
0.2
0.1
0
0.5
I I I I
0.6 0.7 0.8 0.9
C o n f i d e n c e C o n f i d e n c e
- - Slope old ] items [
- - - Slope new [ items [
4 - Old items [
--t(- New itemsJ
I I I I
0.6 0.7 0.8 0.9
o9 (c) S
0.8
0.7
0.6
~ 0.5
o ~ 0.4
I~ - - Slope old 0.3 items
-- - Slope new 0.2 items
Old items
O.l -t(- New items
0 I I I I
0.5 0.6 0.7 0.8 0.9
C o n f i d e n c e
F ig . 4. T h e c a l i b r a t i o n c u r v e s a n d the s lopes f o r o ld a n d n e w i t ems o f t he (a) t ex t c o n d i t i o n , (b )
w o r d c o n d i t i o n , (c) sy l lab les c o n d i t i o n .

P. Juslin et al. / Cognition 54 (1995) 99-130 119
T a b l e 2
C a l i b r a t i on and o v e r / u n d e r c o n f i d e n c e for ne w and old in each of the th ree condi t ions of
E x p e r i m e n t 1. T h e r e t e n t i on in terval is 30 min
S t imulus m a t e r i a l T y p e of i t em
Old i t em N e w i t em
T e x t
W o r d s
Syllables
D = 0 C = .0056 D = +0 .04 C = .0093
~ = .78 b = .77 ~ = .73 b = .65
£ = .78 s~ = .0350 £ = .77 s~ = .0348
D = +0 . 04 C = .0046 D = +0 .02 C = .0109
= .77 b = 1.05 ~ = .74 b = .49
£ = .82 s~ z = .0345 £ = .75 s 2 = .0308
D = +0 .07* C = .0053 D = 0 C = .0147
( = .76 b = 1.03 ? = .77 b = .33
£ = .83 s~ = .0278 £" = .76 s~ = .0238
* Ind ica t e s significant o v e r / u n d e r c o n f i d e n c e by o n e - s a m p l e t-test; p < .05; H 0 = 0.
C = .0093), but considerably poorer calibration for new as compared to old items in the syllable condition ( C = .0147 vs. C = .0053). Since these measures fail to satisfy the assumption of normality we were unable to ascertain a significant interaction with an ANOVA (it may be noted that these measures are based on only 25 responses in each old/new category when computed for single subjects).
We thus replicate Wagenaar's (1988) result with an almost fiat calibration curve for new items in the syllable condition. Contrary to Wagenaar's proposal, however, the old items in the nonsense syllable condition, which is the response set most likely to be dominated by processes of retrieval and association, was the only condition with significant overconfidence (D = + . 0 7 ; t19 = 2.56, p < .02). This overconfidence may be a consequence of subjects following the strategy which was discussed in the introduction to Experiment 1, that is, responding with "new" and confidence .5 when unable to recognize a presented item. This explanation is confirmed by the asymmetry in confidence category .5 for old and new items in Fig. 4(c). As might be expected if subjects rely on this strategy, in confidence category .5 there is an extremely high proportion correct for new items (c t = .77), and an extremely low proportion correct for old items (c, = .38). This pulls in the direction of underconfidence for new items and towards overconfidence for old items (D was 0 for new items and +.07 for old items, as compared to +.03 for the entire material). In the text condition, on the other hand, where there is a richer cue structure for both old and new items, the corresponding asymmetry is in the reverse direction and considerably smaller (c, = .54 for new items and c, = .64 for old items; see Fig. 4a).
120 P. Juslin et al. / Cognition 54 (1995) 99-130
6.1. After 2 months retention interval
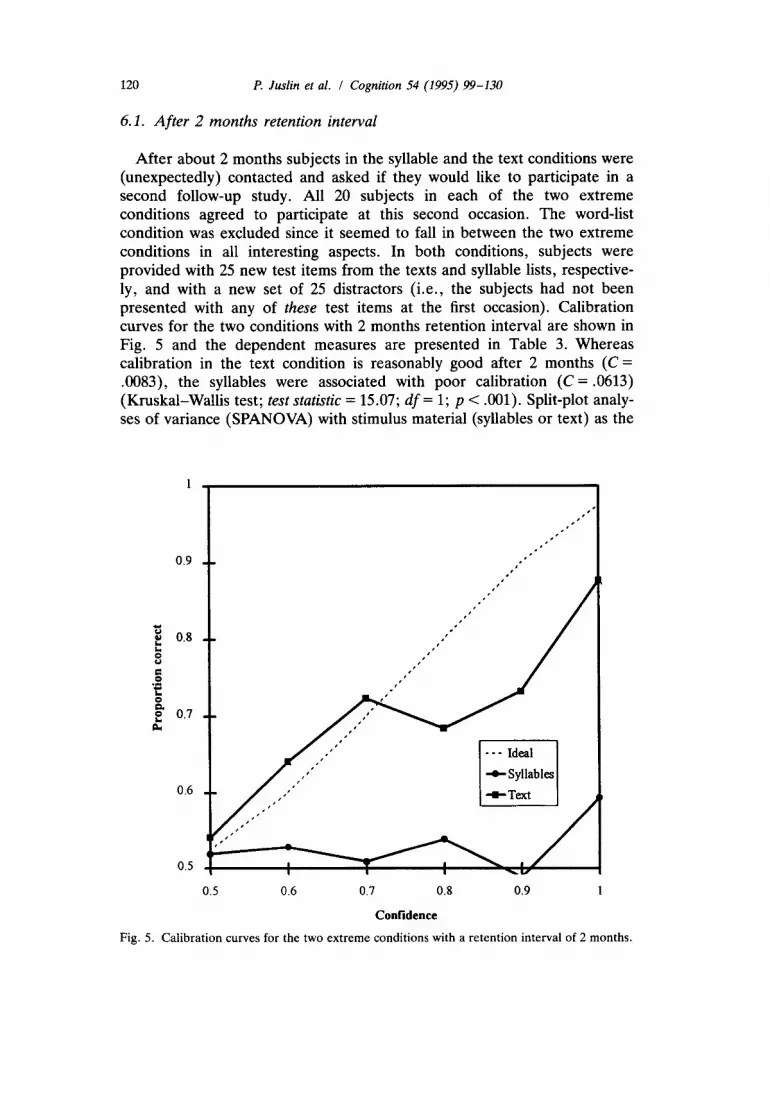
After about 2 months subjects in the syllable and the text conditions were (unexpectedly) contacted and asked if they would like to participate in a second follow-up study. All 20 subjects in each of the two extreme conditions agreed to participate at this second occasion. The word-list condition was excluded since it seemed to fall in between the two extreme conditions in all interesting aspects. In both conditions, subjects were provided with 25 new test items from the texts and syllable lists, respective- ly, and with a new set of 25 distractors (i.e., the subjects had not been presented with any of these test items at the first occasion). Calibration curves for the two conditions with 2 months retention interval are shown in Fig. 5 and the dependent measures are presented in Table 3. Whereas calibration in the text condition is reasonably good after 2 months (C = .0083), the syllables were associated with poor calibration ( C = .0613) (Kruskal-Wallis test; test statistic = 15.07; df = 1; p < .001). Split-plot analy- ses of variance (SPANOVA) with stimulus material (syllables or text) as the
0.9 te,'°°''e''r'e°°'l 0.8
"~ 0.7 I.
0.6
0 . 5 I , ~ ~ - ~
0.5 0.6 0.7 0.8 0.9 1
Confidence
Fig. 5. Calibration curves for the two extreme conditions with a retention interval of 2 months.

P. Juslin et al. / Cognition 54 (1995) 99-130 121
Table 3 Measures of calibration and resolution for the two extreme conditions of Exper iment 1 with a re tent ion interval of 2 mon ths
Condi t ion Measures
£ s~ ( s 2 D C D 2 R 2 L
Text .72 .0331 .69 .0125 .03 .0083 .0011 .0049 .0023 Syllables .72 .0226 .52 .0008 .20* .0613 .0937 .0151 .0066
* Indicates significant over /underconf idence by one-sample t-test; p < .05; H 0 = 0.
between-groups factor and repeated measurements for retention interval (30 min or 2 months) were computed for over/underconfidence (D), mean confidence (x-), and proportion correct (c-).
The SPANOVA for over/underconfidence (D) was dominated by a significant interaction between stimulus material and retention interval (F(1, 38) = 15.32; p < .001). While there was close to zero overconfidence in the text condition at both retention intervals (D = .02 and D = .03) and for the nonsense syllables after 30 min (D = .03), there was profound overconfi- dence for the nonsense syllables after 2 months (D = .20). Hence, the only condition with significant overconfidence was syllables after 2 months ( / 1 9 =
9.82, p < .001; the other ps were greater than .10). As a consequence of the significant interaction there were also significant main effects of stimulus material (F(1,38)= 12.98; p< .001) and retention interval (F(1,38)= 20.70; p < .001). However, the means presented above suggest that these main effects can be traced entirely to the significant interaction.
The SPANOVA for mean confidence 5 indicates a significant main effect of retention interval (F(1, 38) --- 31.23; p < .001), but no significant effect of stimulus material (F(1,38)= .17; p = .68) and no significant interaction (F(1,38)= 1.04; p =.31). There thus was a significant drop in mean confidence from the first occasion (£ = .79) to the second occasion (5 = .72). The SPANOVA for proportion correct ( revealed a significant interaction (F(1, 38)= 24.03; p < .001), a significant main effect of stimulus material (F(1, 38)= 12.55; p< .001) , and a significant main effect of retention interval (F(1, 38)=71.37; p < .001). Inspection of Table 3 suggests that there is a decrease in proportion correct at the second occasion for both texts and syllables, but that this drop is particularly large for syllables (from .77 to .52).
In summary: in the text condition there was a significant decrease in proportion correct after 2 months, a decrease matched by a significant decrease in mean confidence allowing quite reasonable calibration also after 2 months with close to zero overconfidence. In the syllable condition, however, the decrease in mean confidence is insufficient to account for the massive drop in proportion correct, something that creates considerable overconfidence. These results suggest that for more real-life-like material

122 P. Juslin et al. / Cognition 54 (1995) 99-130
(everyday texts) there may be good calibration even for prolonged retention intervals, whereas calibration and accuracy deteriorate rapidly for more artificial and abstract materials (nonsense syllables).
EXPERIMENT 2
A first aim of Experiment 2 was to provide an independent replication of the major results of Experiment 1. These were (a) that there is at least as good calibration for the more real-life-like material in the text condition (reconstruction) as in the syllable condition (retrieval), and (b) that the difference in calibration between new and old items diminishes in the text condition which allows a richer cue structure for both old and new items.
Experiment 1 also provided several observations that support our assump- tion that there is more inference and reconstruction in the text condition. First, the exposure times in the training phase needed to reach the same proportion correct in the test phase suggest very different processes. In order to reach the level of performance that results from a quick reading of the text (30 s), subjects in the syllable condition have to sort the syllables for 20 min. Second, the response latencies for old/new decisions were higher in the text condition, a result which is highly consistent with the idea that the retrieval processes are supplemented by processes of inference in the text condition.
Experiment 1 thus showed that there was no difference in calibration and proportion correct for materials which differed in the degree to which the processes were dominated by retrieval and inference, respectively. Hence, we see that calibration fails to distinguish between these processes. Our discussion of the RI- and the RD-models suggests that there nevertheless is a criterion by which we can distinguish between retrieval and inference, namely, the distributions of solution probabilities. More precisely, the RI-model should be appropriate to the retrieval processes based on association in the syllable condition, where errors reflect covert neural events and idiosyncrasies that can be considered independent across in- dividuals. With this material we expect solution probabilities in the interval [.5, 1.0]. The RD-model should be more appropriate for the reconstructive processes in the text condition where errors reflect (probabilistic) adaptation to the same environment. With this material we expect more uniform response patterns across individuals and thus solution probabilities in the entire interval [0, 1.0]. At the same time, there should be good calibration in both conditions. In order to estimate solution probabilities the procedures of Experiment 1 were repeated with the difference that all subjects received the same sample of test items. Only the syllables and text conditions were administered in Experiment 2.

P. Juslin et al. / Cognition 54 (1995) 99-130 123
7. Method
7.1. Subjects
Forty subjects, 23 females and 17 males, were randomly assigned to one of two conditions with 20 subjects in each group. Their average age was 21.9 years and they were undergraduate psychology students at Uppsala Uni- versity who participated to fulfil a course requirement.
7.2. Material and procedure
The same materials and procedures as in Experiment 1 were used, but this time all subjects were presented with the same text (which was selected at random) or list of syllables in the training phase and received the same sample of test items and distractors in the text phase. The number of test items was increased from 50 to 80 to improve reliability of data. Thus, in the test phase of the text condition subjects received the same sequence of 80 items, 40 of which were part of the text and 40 items that were distractors. Similarly, in the syllable condition all subjects were provided with the same set of test items and distractors in the test phase. This allowed us to estimate the solution probability for each of the items in the two sets.
8. Results
The results of Experiment 2 replicate the main results of Experiment 1. The calibration curves for the two conditions are presented in Fig. 6 and the dependent measures in Table 4. There was good calibration in both conditions with close to zero overconfidence. ANOVA for mean confidence (x-), proportion correct (c-), and over/underconfidence (D) revealed no significant differences between the conditions (~?, F(1, 38) = 1.55, p = .22; 8, F(1, 38)= .05, p = .83; and ~ f - 8 , F(1, 38)= 1.42, p = .24). The observed difference between the over/underconfidence in the text and the syllable conditions was -0.03; again, a difference which is positive when there is more overconfidence in the text condition. The null hypothesis H 0 of zero difference was compared to an alternative hypothesis H 1 of a difference .06, where .06 was the minimum difference considered to be of practical significance. On the standard assumptions for parametric, statistical tests, a standard error of .018, and an a-level of .05 (one-tail) the power is .95 when it comes to detection of the alternative hypothesis H 1.
The difference in calibration was not significant (Kruskal-Wallis test: test statistic = .75; d f = 2, p = .39). Again, there was no sign of better calibration for nonsense syllables (association) than for texts (reconstruction). There

124 P. Juslin et al. / Cognition 54 (1995) 99-130
0.9
0 . 8
o om
o
0.7
0 6
0.5
p tf
tS I°
- - - Ideal
Syllables
Text
f j t~ ~SO~O
I I I I 0.5 0.6 0.7 0.8 0.9
Confidence
Fig. 6. Calibration curves for the two conditions of Exper iment 2.
was a tendency towards overconfidence in the syllables condition (+.03), but not in the text condition (0).
As in Experiment 1 there was a smaller difference in slope for old versus new items in the text condition (old items, b = .93; new items, b = .48), than in the syllable condition (old items, b = 1.0; new items, b = .43). Again, contrary to Wagenaar's (1988) claim, the only condition with significant overconfidence was the old items in the syllable condition (D = .056; t19 =
2.94, p < .01). These results replicate the results of Experiment 1 and suggest that the poor calibration for new items in Wagenaar's (1988) study is due to the impoverished cue structure, rather than to the poor calibration of inferential processes in any more general sense.
Table 4 Measures of calibration and resolution for the two conditions of Exper iment 2
Condi t ion Measures
2 2 D 2 R 2 ~? s x ~ s c D C L
Text .75 .0325 .75 .0149 .00 .0053 .00 .0034 .0019 Syllables .79 .0334 .75 .0154 .03 .0057 .0012 .0034 .0011

P. Juslin et al. / Cognition 54 (1995) 99-130 125
8. i . The distribution o f solution probabili t ies
It was predicted that there should be greater variance of the solution probabilities in the text condition, the condition more dominated by the RD-model (inferences). The RD-model allows expected solution prob- abilities on the entire interval [0, 1.0], whereas the RI-model restricts the expected solution probabilities to the interval [.5, 1.0]. In Figs. 7 and 8 the solution probabilites c i are plotted against mean confidence £i separately for each item i. The difference between the conditions is evident from Figs. 7 and 8. As predicted, the variance of the solution probabilities c~ was almost twice as large in the text condition (F(79, 79)= 1.92; p < .002). The more uniform response pattern across individuals in the text condition should also lead to larger variance in the mean confidence assessments £i for single items. For some items, all subjects may rely on an inference with low ecological validity leading all subjects to express low confidence in their response. For other items, all subjects may rely on inferences with high ecological validity leading to high mean confidence. However, if we have been successful in creating nonsense syllables there should be nothing that
1
0.9
0.8
0.7
.-~ 0.6 ,.o
o ~:~ 0.5
o
0.4 o
0.3
0.2
o.i
0
0.5
_-_- _- _-
I I I n
i n I i l l l
l l l l l • l
RE I l l i l l l
• l l l l I I
I l l
I l l
I I I I I I
l i
I I I I
l
I
l
I I I I
0.6 0.7 0.8 0.9
Mean confidence Fig. 7. Mean confidence and solution prob- ability for the 80 items in the syllables con- dition. Twenty subjects responded to each item.
I
0.9
o.$
0.7
0.6
0.5
0A
0.3 J
0.2
0.1 .
0
0.5
i n E l l I
I l l E l l I l
i | l l
l m l l
l • I
I l
I l I I
I l l
l I l
I I
I [ ]
I I |
I I
l l I l
I I
I I I I 0.6 0.7 0.8 0,9
Mean confidence Fig. 8. Mean confidence and solution prob- ability for the 80 items in the text condition. Twenty subjects responded to each item.

126 P. Juslin et al. / Cognition 54 (1995) 99-130
make all subjects express high confidence for some items, but low confi- dence for others, that is, since the processes are assumed to be idiosyncratic and independent across different subjects. Indeed, the variance of mean confidence £i across items is greater in the text condition than in the syllables condition (F(79, 79) = 1.73; p < .01).
Remember that under the RI-model, good calibration implies that the mean confidence £i for an item i should coincide with the solution probability c~ (itemwise calibration), that is, since both £i and ci reflect the probability p. But for most items in the text condition the RD-model should be more approPriate. This would imply a greater difference x i - ci (poorer itemwise calibration) in the text condition. Indeed, the null hypothesis that the average difference £~ - cg is the same in both conditions was rejected in favor of a difference in the predicted direction (Mann-Whitney test; two- tail; z = 2.68; p < .01). In general, then, these results support the prediction that the RI-model is appropriate for the syllables condition, whereas the RD-model is appropriate for the text condition.
DISCUSSION
In everyday situations memory is probably always more or less reconstruc- tive and a division of situations into those involving only retrieval or only reconstruction may seem unrealistic. The use of artificial material, such as lists of nonsense syllables, has a long tradition in psychology, but in view of our current knowledge of memory this method should be applied with caution. We used this material for two reasons: (a) we wanted to minimize the role of inferential processes (in itself an artificial situation) since this is central to the issue of the paper; and (b) we aimed to provide a replication of one of the conditions of Experiment 1 in Wagenaar's study (1988). The experiments above tested the hypothesis that involvement of inference in remembering leads to overconfidence. Little doubt can be put in the assumption that subjects in the text condition actually employed reconstruc- tion to a higher degree than subjects in the syllables condition. It would seem hard to explain how subjects by reading a text for only 30 s could be able to retain anything but the general semantic context of the material. The results show that calibration need not deteriorate with degree of reconstruc- tion. On the contrary, significant overconfidence was found only in the old-syllables conditions of both experiments, and after 2 months retention interval for the syllables condition of Experiment 1. This is contrary to Wagenaar's (1988) claim that retrieval should be associated with less overconfidence. In general, subjects were reasonably calibrated regardless of the degree to which reconstructive processes were involved. Hence, it seems that overconfidence is not a reliable and valid indicator of reconstruc- tive and inferential processes.
Wagenaar's finding that calibration is worse for new as compared to old

P. Juslin et al. / Cognition 54 (1995) 99-130 127
items is replicated in this study with the modification that the difference is less in the text condition than in the syllables condition. Given the results of this study which show that calibration need not deteriorate with degree of reconstruction, Wagenaar's (1988) explanation of this phenomenon as depending on new items involving more inferences seems less plausible. A more likely explanation may focus on the different means that are available to the subjects when discriminating between old and new items. People have a greater opportunity to be well calibrated in a task where there are many cues available that differ in validity, that is, when there is little true variation in the cue validates most of the variance in confidence will reflect response errors leading to poor calibration (see Bjfrkman, in press). The cue structure seems particularly impoverished for new nonsense syllables which is the condition associated with an almost flat calibration curve (Fig. 4c). The poor calibration for new nonsense syllables may thus more be a consequence of the hindering of effective inference, rather than of a general association between inference and poor calibration. Further, it is unclear whether this old/new asymmetry reflects an interesting psychological differ- ence. As noted in the Introduction, post hoc division of the material into new and old items is questionable in the context of investigations of calibration, as illustrated by the extreme proportions correct in confidence category .5 for the nonsense syllables (Fig. 4c: see also the demonstrations in Juslin, 1993a).
As proposed by Wagenaar (1988), items with solution probabilities below .5 indicate inferential processes. The itemwise plots, where solution prob- abilities were plotted against mean confidence, illustrated that there were more items with solution probabilities below .5 in the text condition than in the syllables condition. As was shown, however, the appearance of these misleading items was not associated with overconfidence or poor calibration in the overall task, but was perfectly compatible with good calibration in this more general sense (i.e., which is the only sense relevant in the context of the RD-model). Although items where all subjects make the same plausible but erroneous inference may occur with reconstructive material, these are exceptions that are outweighed by the larger number of items where all subjects select the correct answer.
Two models, the response-independence model and the response-depen- dence model, were discussed in order to illustrate the relationship between the cognitive processes that underlie the observed solution probabilities and the notions of calibration and over/underconfidence. Under the RD-model, calibration does not apply to a number of probability assessments for a single item, but only to probability assessments for a number of independent events randomly selected from an environmental reference class (i.e., a decision environment). Hence, "itemwise calibration" cannot be expected under the RD-model. We propose that overconfidence cannot be used as a reliable indicator of inferential processes and suggest that the variance in solution probabilities may be considered for this purpose. Experiment 2

128 P. Juslin et al. / Cognition 54 (1995) 99-130
shows that this criterion is useful for distinguishing between retrieval and inference also in tasks where the two processes lead to almost identical calibration and proportions correct. No doubt, this criterion needs to be subjected to further empirical tests, and the criterion itself may need further theoretical elaboration. But we do think that this criterion may prove to be more promising and conceptually sound than a criterion formulated in terms of calibration per se. In addition, a clear formulation of the assumptions that form part of the RI- and the RD-models is important in research on calibration too, as illustrated by the above discussion of itemwise cali- bration.
The relationship between degrees of belief in memories and corre- sponding true states is of great practical and theoretical importance. The application of calibration methodology to memory research as proposed by Wagenaar (1988) may be a fruitful approach. The measures used in research on calibration may be more informative than the rather crude measures often employed in research on eyewitness testimony, for example, correla- tions between confidence and accuracy (Deffenbacher, 1980; Wells & Murray, 1984; Wells, 1993). For instance, the point-biserial correlation for the data in Fig. 1 is .32, a correlation that would be interpreted as poor performance in most studies on eyewitness accuracy (note the impressive calibration in Fig. 1, however). An interesting question is how the common methods applied in line-ups and court settings affect the relationship between confidence and accuracy.
Acknowledgements
The authors are indebted to Mats Bj6rkman, Anders Jansson, and two anonymous reviewers for comments on an earlier version of the paper. The research reported in this paper was supported by the Swedish Council for Research in the Humanities and Social Sciences.
References
Allwood, C.M., & Montgomery, H. (1987). Response selection strategies and realism of confidence judgments. Organizational Behavior and Human Decision Processes, 39, 365-383.
Arkes, H.R. Christensen, C., Lai, C., & Blumer, C. (1987). Two methods of reducing overconfidence. Organizational Behavior and Human Decision Processes, 39, 133-144.
Bj6rkman, M. (in press). Internal cue theory: calibration and resolution of confidence in general knowledge. Organizational Behavior and Human Decision Processes.
Bj6rkman, M., Juslin, P., & Winman A. (1993). Realism of confidence in sensory discrimina- tion: the underconfidence phenomenon. Perception and Psychophysics, 54, 75-81.
Dawes, R.M. (1980). Confidence in intellectual judgments vs. confidence in perceptual judgments. In E.D. Lanterman & H. Feger (Eds.), Similarly and choice: papers in honour of Clyde Coombs (pp. 327-345). Bern: Huber.

P. Juslin et al. / Cognition 54 (1995) 99-130 129
Deffenbacher, K. (1980). Eyewitness accuracy and confidence: can we infer anything about their relationship? Law and Human Behavior, 4, 243-260.
Erev, I., Wallsten, T.S., & Budescu, D.V, (in press). Simultaneous overconfidence and conservatism in judgment: the role of error in judgment process. Psychological Review.
Evans, J.St.B,T. (1989). Bias in human reasoning: causes and consequences. Hove, UK: Erlbaum.
Gigerenzer, G., Hoffrage, U., & Kleinb61ting, H. (1991). Probabilistic mental models: a Brunswikian theory of confidence. Psychological Review, 98, 506-528.
Griffin, D., & Tversky, A. (1992). The weighing of evidence and the determinants of confidence. Cognitive Psychology, 24, 411-435.
Groningen, L.D. (1976). Predicting recognition during storage: the capacity of the memory system to evaluate itself. Bulletin of Psychonomic Society, 7, 425-428.
Hoch, S.J. (1985). Counterfactual reasoning and accuracy in predicting personal events. Journal of Experimental Psychology: Learning, Memory, and Cognition, 11,719-731.
Juslin, P. (1993a). An explanation of the hard-easy effect in studies of realism of confidence in one's general knowledge. European Journal of Cognitive Psychology, 5 (1), 55-71.
Juslin, P. (1993b). An ecological model of realism of confidence in one's general knowledge. Acta Universitatis Upsaliensis: Studia Psychologica Upsaliensia, 14 (doctoral dissertation).
Juslin, P. (1994). The overconfidence phenomenon as a consequence of informal experimenter- guided selection of almanac items. Organizational Behavior and Human Decision Processes, 57, 226-246.
Keren, G. (1985). On the calibration of experts and lay people. Paper presented at the 10th SPUDM conference in Helsinki, 1985.
Keren, G. (1988). On the ability of monitoring non-veridical perceptions and uncertain knowledge: some calibration studies. Acta Psychologica, 67, 95-119.
Keren, G. (1991). Calibration and probability judgments: conceptual and methodological issues. Acta Psychologica, 77, 217-273.
Koriat, A., Lichtenstein, S., & Fischhoff, B. (1980). Reasons for confidence. Journal of Experimental Psychology: Human Learning and Memory, 6, 107-118.
Lichtenstein, S., & Fischhoff, B. (1977). Do those who know more also know more about how much they know? Organizational Behavior and Human Performance, 20, 159-183.
Lichtenstein, S., Fischhoff, B., & Phillips, L.D. (1982). Calibration of subjective probabilities: the state of the art up to 1980. In D. Kahneman, P. Slovic, & A. Tversky (Eds.), Judgments under uncertainty: heuristics and biases (pp. 306-334). New York: Cambridge University Press.
Loftus, E.F., Miller, D.G., & Burns, H.J. (1978). Semantic integration of verbal information into a visual memory. Journal of Experimental Psychology: Human Learning and Memory, 4, 19-31.
May, R.S. (1986a). Inferences, subjective probability and frequency of correct answers: a cognitive approach to the overconfidence phenomenon. In B. Brehmer, H. Jungermann, P. Lourens, & G. Sevon (Eds.), New directions in research on decision making. New York: North-Holland.
May, R.S. (1986b). Overconfidence as a result of incomplete and wrong knowledge. In R. Scholz (Ed.), Current issues in West German decision research, Frankfurt: Peter Lang.
Murphv, A.H. (1973). A new vector partition of the probability score. Journal of Applied Meteorology, 12, 595-600.
O'Connor, M. (1989). Models of human behavior and confidence in judgment: a review. International Journal of Forecasting, 5, 159-169.
Ronis, D.L., & Yates, J.F. (1987). Components of probability judgement accuracy: individual consistency and effects of subject matter and assessment method. Organizational Behavior and Human Decision Processes, 40, 193-218.
Thurstone, L.L. (1927). A law of comparative judgment. Psychological Review, 34, 273-286. Wagenaar, W.A. (1988). Calibration and the effects of knowledge and reconstruction in
retrieval from memory. Cognition, 28, 277-296.

130 P. Juslin et al. / Cognition 54 (1995) 99-130
Wallsten, T.S., & Budescu, D.V. (1983). Encoding subjective probabilities: a psychological and psychometric review. Management Science, 29 (2), 152-173.
Wells, G.L. (1993). What do we know about eyewitness identification? American Psychologist, 48, 553-571.
Wells, G.L., & Loftus, D.M. (1984). Eyewitness testimony. Cambridge, UK: Cambridge University Press.
Wells, G.L., & Murray, D.M. (1984). Eyewitness confidence. In G.L. Wells & E.F. Loftus (Eds,), Eyewitness testimony, Cambridge, UK: Cambridge University Press.
Yates, J.F. (1982). External correspondence: decompositions of the mean probability score. Organizational Behavior and Human Performance, 30, 132-156.
Yates, J.F. (1990). Judgment and decision making. Englewood Cliffs, N J: Prentice-Hall.