overconfidence: it depends on how, what, and whom you ask
TRANSCRIPT
Organizational Behavior and Human Decision ProcessesVol. 79, No. 3, September, pp. 216–247, 1999Article ID obhd.1999.2847, available online at http://www.idealibrary.com on
Overconfidence: It Depends on How,What, and Whom You Ask
Joshua Klayman
University of Chicago
Jack B. Soll
INSEAD
Claudia Gonzalez-Vallejo
Ohio University
and
Sema Barlas
Experian Direct Tech
Many studies have reported that the confidence people have intheir judgments exceeds their accuracy and that overconfidenceincreases with the difficulty of the task. However, some commonanalyses confound systematic psychological effects with statisti-cal effects that are inevitable if judgments are imperfect. Wepresent three experiments using new methods to separatesystematic effects from the statistically inevitable. We still findsystematic differences between confidence and accuracy, includ-ing an overall bias toward overconfidence. However, theseeffects vary greatly with the type of judgment. There is littlegeneral overconfidence with two-choice questions and pro-nounced overconfidence with subjective confidence intervals.Over- and underconfidence also vary systematically with thedomain of questions asked, but not as a function of difficulty. Wealso find stable individual differences. Determining why some
This research was supported by Grant SBR-9409627 from the Decision, Risk, and ManagementSciences Program of the National Science Foundation. We thank Peter Juslin, Eldar Shafir, DavidBudescu, Robin Hogarth, Christopher Hsee, J. Edward Russo, William Ferrell, Terry Connolly,and an anonymous reviewer for their helpful comments on earlier drafts.
Address correspondence and reprint requests to Joshua Klayman, Graduate School of Business,University of Chicago, 1101 East 58th Street, Chicago, IL 60637. E-mail:[email protected].
2160749-5978/99 $30.00Copyright q 1999 by Academic PressAll rights of reproduction in any form reserved.
OVERCONFIDENCE: HOW, WHAT, AND WHOM 217
people, some domains, and some types of judgments are moreprone to overconfidence will be important to understanding howconfidence judgments are made. q 1999 Academic Press
A variety of scientists, including meteorologists, statisticians, and psycholo-gists, have been interested in measuring and explaining judgments of confi-dence and their relation to accuracy (e.g., see Budescu, Erev, Wallsten, & Yates,1997; Gigerenzer, Hoffrage, & Kleinbo
¨lting, 1991; Harvey, 1997; Lichtenstein,
Fischhoff, & Phillips, 1982; McClelland & Bolger, 1994; Yates, 1990). Many ofthese studies report that people are systematically overconfident about theaccuracy of their knowledge and judgment. That is, they tend to express confi-dence in their judgments that exceeds the accuracy of those judgments. At thesame time, the extent to which overconfidence occurs seems to depend verymuch on the difficulty of the judgment task. With easy tasks, overconfidenceseems to disappear, or underconfidence is observed. With hard tasks, overconfi-dence seems to be rampant.
Recently, a number of researchers have challenged the validity of both theconclusion that people are systematically overconfident and the finding thattask difficulty affects the level of over- or underconfidence. In this paper, wepresent the results of three studies that take into account legitimate objectionsraised about past methods of research on confidence. We present new analyticalmethods that can be used to distinguish different sources of error and accuracyin confidence. Our findings confirm that there are systematic differences be-tween subjective confidence judgments and observed accuracy. The more confi-dent people are, the more overconfident they are, and, overall, confidence tendsto exceed accuracy. These effects result from a combination of unsystematicimperfections in judgment and systematic effects of cognitive processes. Beyondthis generalization, we find that there are systematic individual differences inover- or underconfidence as well as systematic differences between domains ofquestions—differences that are not a function of difficulty. We also find thatresults vary greatly with the way in which confidence judgments are elicited.Questions that require a choice between two alternatives elicit only a modestbias toward overconfidence; questions that request a subjective confidenceinterval elicit a very large bias. The inability of recent research to determineany simple explanation for the phenomena of confidence judgments probablyreflects that they are multiply determined, and that some of the standardmethods are not well suited to distinguishing different aspects of the process.
The Overconfidence Phenomenon
The most often used stimuli in studies of confidence are sets of two-choicequestions, such as “Which of these nations has higher life expectancy, averagedacross men and women: (A) Argentina, or (B) Canada?”1 Participants mayanswer anywhere from 20 to 300 such questions. For each question, participants
1 Argentina 71, Canada 77.
218 KLAYMAN ET AL.
choose the answer they think is more likely to be right and indicate, on a scalefrom 50% to 100%, how sure they are that they have chosen correctly. Anothermethod that has been used in several studies is to ask participants about asingle, numerical estimate such as “How many calories are there in 1/2-cup ofbread pudding?”2 Participants might, for example, be asked to estimate fractiles(e.g., stating a value for which there is a 25% chance that the correct answeris higher) or to provide a range corresponding to a given level of confidence(e.g., stating a high and a low estimate such that there is a 90% chance thatthe correct answer falls somewhere between those numbers).
Two-choice and confidence-range judgments both have important analoguesin the real world. We are often called upon to make a choice between twoalternatives, and then our subjective confidence in that choice determines howmuch we commit to one course, how much we seek further information, andhow much we hedge our bets. Confidence-range estimates may seem less natu-ral, but they also have everyday counterparts. Confidence ranges are impliedwhenever one plans a “margin of error.” In budgeting, for example, the goal isto allocate an amount that is sufficiently certain to cover needs, yet not somuch that resources are tied up unnecessarily. Research by Yaniv and Foster(1995) also indicates that people communicate something akin to a confidencerange in natural language by varying the “grain” of an estimate. For example,someone who did not know the exact price of an item might report a best guessof “a few hundred bucks” or “around $350” or “$347.50.”
From the early 1970s until the early 1990s, there was a general consensusthat judges in both two-choice and confidence-range tasks showed consistentand substantial overconfidence. In a review of previous two-choice studies, forexample, Lichtenstein et al. (1982) report that when participants say they areabout 70% sure they have the correct answer, they are right less than 60% ofthe time; when they say they are 90% sure, they are right about 75% of thetime. Overconfidence with range questions may be even more extreme (Lich-tenstein et al., 1982). Russo and Schoemaker (1992), for example, found thatbusiness managers asked to provide 90% confidence ranges had the correctanswer within the stated range between 42 and 62% of the time, dependingon the domain and the participant group. Fifty-percent ranges contained thecorrect answer about 20% of the time.
Studies also reveal a significant difference between easy and hard questions.Hard questions are typically defined as those for which many participantsguess the wrong answer, and a hard set of questions is defined as one for whichthe average participant has a low percentage correct. It is widely found thatoverconfidence is more pronounced for harder sets of questions and for harderquestions within a set. For easy questions, judges may even be underconfident.
Why Are People Generally Overconfident?
Two main categories of explanations have been offered for overconfidence.These are (a) biases in information processing and (b) effects of unbiased
2 Approximately 200 calories.
OVERCONFIDENCE: HOW, WHAT, AND WHOM 219
judgmental error. (Although they have sometimes been treated as competingexplanations, both may be true.) Most early investigators attributed overconfi-dence to information-search strategies and motivation. They hypothesized thatthe judge first searches memory for relevant information and arrives at atentative answer. Then, with this answer in mind, the judge searches for moreevidence. Mechanisms of associative memory facilitate retrieval of informationthat is consistent with initial impressions, and those impressions also colorthe interpretation of subsequent ambiguous evidence. Judges, however, believetheir processes to be unbiased, and thus perceive more consistent support forthe initial guess than is warranted (e.g., Hoch, 1985; Klayman, 1995; Koriat,Lichtenstein, & Fischhoff, 1980). In many situations, motivational factors canexacerbate the bias. People like to think that they are intelligent and knowl-edgeable, and they may have reasons for wanting a particular answer to betrue (e.g., Babad, 1987; Kunda, 1990; Langer, 1975; Larrick, 1993).
Another class of explanations highlights the role of unbiased judgmentalerror in producing overconfidence. Possible sources of error include imperfec-tions in learning the predictive validity of different sources of information(Gigerenzer et al., 1991; Soll, 1996), in evaluating the available information(Erev, Wallsten, & Budescu, 1994), and in mapping one’s subjective feeling ofconfidence to a response scale (Erev et al., 1994; Ferrell, 1994). Both accuracyand confidence are affected by random variation. With regard to accuracy,sometimes even good-quality information can point in the wrong direction; howoften that happens is partly a matter of chance. With regard to confidence,people’s judgments about the quality of their information include some unsys-tematic error. Given an imperfect correlation between accuracy and confidence,it is inevitable that low accuracy is on average associated with not-so-lowconfidence, and so on. This produces the typical pattern of “miscalibration”:overconfidence when confidence is high, underconfidence when confidence islow (see Fig. 1, for example). It also leads to an effect of difficulty: overconfidencefor those questions that show low accuracy (hard questions), underconfidencewhen accuracy is high (easy questions). People may also make errors in estimat-ing what the mean level of accuracy will be for a whole set of questions, soharder sets of questions are more likely to also be those that are harder thanthey seem. This results in more overconfidence on harder sets of questions (seeFerrell, 1994; Ferrell & McGoey, 1980; Suantak, Bolger, & Ferrell, 1996). Notethat none of these explanations assumes that judgments are systematicallybiased, only that they are imperfect (see also Harvey, 1997; Soll, 1996).
It has also been suggested that the apparent predominance of overconfidencein research stems not from pervasive cognitive bias, but from experimenters’tendency to choose harder-than-normal questions (Gigerenzer et al., 1991;Juslin, 1993, 1994; May, 1986). To test this possibility, Gigerenzer et al. (1991)and Juslin (1993, 1994) conducted experiments using two-choice questions thatwere randomly sampled from a domain, thus approximating the natural levelof difficulty for questions in that domain. They found that overconfidence (butnot miscalibration) disappeared. These results are intriguing, but the question
220 KLAYMAN ET AL.
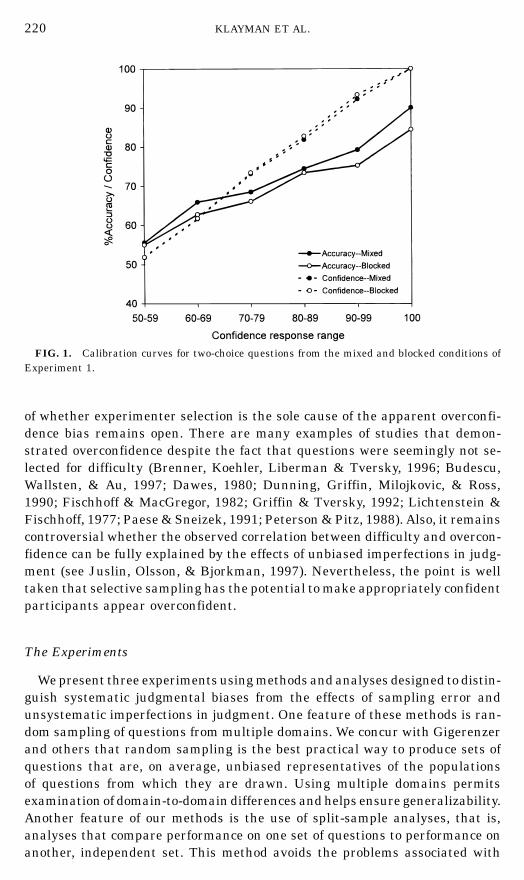
FIG. 1. Calibration curves for two-choice questions from the mixed and blocked conditions ofExperiment 1.
of whether experimenter selection is the sole cause of the apparent overconfi-dence bias remains open. There are many examples of studies that demon-strated overconfidence despite the fact that questions were seemingly not se-lected for difficulty (Brenner, Koehler, Liberman & Tversky, 1996; Budescu,Wallsten, & Au, 1997; Dawes, 1980; Dunning, Griffin, Milojkovic, & Ross,1990; Fischhoff & MacGregor, 1982; Griffin & Tversky, 1992; Lichtenstein &Fischhoff, 1977; Paese & Sneizek, 1991; Peterson & Pitz, 1988). Also, it remainscontroversial whether the observed correlation between difficulty and overcon-fidence can be fully explained by the effects of unbiased imperfections in judg-ment (see Juslin, Olsson, & Bjo
¨rkman, 1997). Nevertheless, the point is well
taken that selective sampling has the potential to make appropriately confidentparticipants appear overconfident.
The Experiments
We present three experiments using methods and analyses designed to distin-guish systematic judgmental biases from the effects of sampling error andunsystematic imperfections in judgment. One feature of these methods is ran-dom sampling of questions from multiple domains. We concur with Gigerenzerand others that random sampling is the best practical way to produce sets ofquestions that are, on average, unbiased representatives of the populationsof questions from which they are drawn. Using multiple domains permitsexamination of domain-to-domain differences and helps ensure generalizability.Another feature of our methods is the use of split-sample analyses, that is,analyses that compare performance on one set of questions to performance onanother, independent set. This method avoids the problems associated with
OVERCONFIDENCE: HOW, WHAT, AND WHOM 221
sorting questions according to performance measures (see the following sectionfor details).
In the three studies presented here we look for (a) overconfidence and miscali-bration; (b) variations in overconfidence from domain to domain, in particularas a function of difficulty; and (c) individual differences in the accuracy ofconfidence judgments. In addition, we test whether calibration and overconfi-dence are affected by whether participants make repeated judgments of thesame type in the same domain or a variety of different judgments on differenttopics. Many recent studies have used a procedure in which participants areasked questions from only a single domain of knowledge. This contrasts withearlier experiments which usually presented a mix of questions on a widevariety of topics.3 It is possible that larger and more homogeneous sets ofquestions are less prone to biased information processing. If judges have toanswer hundreds of similar questions, they may settle on a consistent judg-mental policy, using the same types of information and weighing evidencesimilarly from trial to trial. Doing so might reduce the tendency to favor infor-mation consistent with an initial impression, which has been hypothesized tobe a major source of bias. Sources of unsystematic error in judgments mightalso be reduced with repeated practice in making the same judgments. Thus,large, homogeneous sets of questions might be expected to show less overconfi-dence than heterogeneous sets. The first two experiments use two-choice ques-tions with confidence judgments expressed on a scale from 50% to 100%. Thethird experiment extends the use of representative question sets into anotherkind of judgmental task for which systematic overconfidence has also beendemonstrated, namely estimates of subjective confidence ranges.
APPROPRIATE METHODS OF MEASURING (OVER)CONFIDENCEAND DIFFICULTY
Before presenting the studies, we describe a model of the role of unsystematicerror in confidence judgments, integrating many of the constructs proposed byresearchers over the last decade. Using this model, we explain how our split-sample analyses can be used to separate the effects of systematic and unsystem-atic error. We argue that the crux of the analytical problem is as follows. Thereare always some questions for which the answer runs counter to the judges’information; these are the questions judges get wrong. We call these contraryquestions.4 Hard questions are those that are contrary for many judges (or,alternatively, a set of which many are contrary for a given judge). Some ques-tions are hard because judges have little useful information to go on. They are
3 Gigerenzer et al. (1991) used both mixed- and single-domain question sets and found nodifference. However, the two sets were not randomly selected. Rather, they were selected to bedifficult, and equally so. Also, only one domain was tested in a single-domain presentation. Thus, theGigerenzer et al. study does not afford a direct comparison of mixed- and single-domain procedures.
4 They have also been referred to as “misleading” (May, 1986) and as “deceptive” (Fischhoff,Slovic, & Lichtenstein, 1977). We avoid these terms because they imply some special features thatfool people; in fact, contrary questions merely fail to conform to one’s prediction.
222 KLAYMAN ET AL.
mostly guessing, and in nearly half the cases, the answer will run contrary towhatever slight inclination their information suggests. The better the availableinformation, the smaller the chance of a contrary question, and we might hopethat judges tune their confidence to the strength of the available informationaccordingly. However, there are always some contrary questions, regardless ofhow good the judges’ information is (assuming it is less than perfect). Thus, aquestion may be hard not because judges lack information, but because theanswer happens to run contrary to some usually good sources of informationthat many judges use. In such cases, reasonable judges will be both wrong andconfident. For these hard questions, then, overconfidence is inevitable even ifjudges are right about how accurate their information usually is. The betterthe judges’ information, the fewer contrary questions there will be, but themore confidence they will have in their wrong answers.
Researchers are interested in how well judges estimate the strength of theirinformation, not in whether they can tell which particular questions are con-trary. The latter is impossible; if judges could tell then the questions wouldnot be contrary. It is therefore necessary to devise analytical methods thatmeasure the ability to judge information strength independent of the inabilityto recognize contrary questions.
To explain the potential problems in measuring overconfidence and its rela-tion to difficulty, we use a general model of confidence judgments in the two-alternative task. This model incorporates conceptual elements common to sev-eral more specific models that have been recently proposed (e.g., Erev et al.,1994; Ferrell, 1994; Ferrell & McGoey, 1980; Gigerenzer et al., 1991; Juslin,1993, 1994; Soll, 1996):
(a) To answer a question, the judge retrieves and weighs some information,which produces an internal stimulus signal that favors one or the other alterna-tive with some strength.5
(b) The judge chooses an answer according to the direction or sign of thatsignal.
(c) The stronger the internal signal, the more likely is a correct answer,on average.
(d) The judge makes a confidence judgment based on the subjective strengthof the signal.
(e) The stronger the internal signal, the higher is the expressed confidence,on average.
(f) The judge attempts to match the confidence judgment to the probabilityof a correct answer given the signal strength, but does so with some error(systematic error, random error, or both).
Suppose you are interested in the performance of a judge or group of judgeson some population of questions, Q. Q could be a domain, such as distancesbetween cities, or it might be broader, such as almanac questions in general.In principle, you could measure the average confidence, CQ, and the proportion
5 In the models of Ferrell and colleagues, what we refer to as a signal is modeled as the separationbetween two signals, one for each alternative.
OVERCONFIDENCE: HOW, WHAT, AND WHOM 223
correct, PQ, across the entire population of questions. These are each a functionof the overall information strength of this population of questions, IQ. In otherwords, CQ 5 C(IQ) and PQ 5 P(IQ). Overconfidence in the population is thedifference,
OQ 5 C(IQ) 2 P(IQ). (1)
(A negative OQ represents underconfidence.)In practice, though, one usually tests only a subset of questions, S. The
selected questions will have an average signal strength of IS. The proportionof correct answers obtained in response to the subset of questions is PS 5
P(IS) 1 dPS. Performance on the sample of course depends on the strength ofinformation available: P(IS) is the proportion of correct answers among thepopulation of all questions or all sets of questions with information strengthIS. The added term, dPS, is there because the proportion of contrary and noncon-trary questions in subset S will vary some from the expected proportions givensignal strength IS, just by luck in drawing particular questions. (The conceptof “representative sample” presented by Gigerenzer et al., 1991, correspondsto a sample in which dPS 5 0.) Similarly, the average confidence for the subsetof questions will be CS 5 C(IS). (Most, but not all, models also assume someunsystematic variation in confidence judgments. This would not affect ouranalysis, so we omit it for simplicity.) Overconfidence in the subset, then, is
OS 5 CS 2 PS 5 C(IS) 2 P(IS) 2 dPS. (2)
How will overconfidence in the subset compare to overconfidence in theoverall population? Combining Eqs. 1 and 2,
OS 2 OQ 5 [C(IS) 2 P(IS) 2 dPS] 2 [C(IQ) 2 P(IQ)]
5 [C(IS) 2 C(IQ)] 2 [P(IS) 2 P(IQ)]2 dPS. (3)
If you generate your subsample of questions by randomly sampling from allquestions in the population (as suggested by Gigerenzer et al., 1991, and Juslin,1993), then overconfidence in subset and population should be the same, onaverage. Information strength, IS, will average the same as the populationstrength, IQ, and luck in drawing contrary and noncontrary questions into thesample, dPS, should average out to about zero.
Sometimes, though, researchers have been interested in sets of questionsthat do not match the whole population. In particular, they have been interestedin comparing hard and easy questions to test the hypothesis that, in our terms,confidence errors vary with signal strength. Signal strength per se is not anobservable quantity, so harder questions are typically defined as those forwhich the proportion correct (P) is low. A set of questions may be harder thanthe overall population for two reasons: The average signal strength for thesequestions is lower, or there are more contrary questions in the sample thanone might expect given the signal strengths, or both. Suppose, for example,
224 KLAYMAN ET AL.
that an experimenter selects a question that is correctly answered by 55%of participants in a domain in which the average percentage correct is 70.Performance may be poor because the informational signal is weak for mostparticipants (IS , IQ). They have little information to draw upon, or the avail-able information does not clearly distinguish the answers. Or performance maybe poor because this question happens to be a contrary one for many partici-pants (dPS , 0). The answer runs counter to some usually good informationthat many participants use.
Whether overconfidence varies with difficulty depends on how judges respondto these two aspects of difficulty. The question of primary interest to researchersis whether judges lower their confidence appropriately when there is less validinformation (lower signal strength). In our terms, does [C(IS) 2 C(IQ)] 5
[P(IS) 2 P(IQ)]? Perhaps it does, on average. Alternatively, in accord with earlierhypotheses, judges may lower their confidence insufficiently in response tolower signal strength. In that case, overconfidence will increase as signals getweaker (see Eq. 3). The other element that makes a set of questions hard is ifthere are more contrary questions in it than expected given the signal strengths.Do judges lower their confidence appropriately in response to that? They cannot.If there are more contrary questions than expected given the signal strengths(dPS , 0), judges have no way of detecting that. So, to the extent that thereare more contrary questions than expected, the proportion of correct answerswill be lower, but confidence will not. This kind of difficulty effect is not apsychological phenomenon, but a statistical inevitability.
How could one test for the first, cognitive type of difficulty effect, withoutconfounding it with the second, statistical type? One might suppose that theseproblems could be avoided by defining difficulty independently of observedproportion correct. For example, one could measure how close together the twoanswers are on the dimension in question (e.g., the absolute difference betweenthe two city populations for a “Which city is larger . . .” question). Call thisdifference measure D. The measure D is presumably correlated with signalstrength, because questions whose alternatives are far apart are more likelyto provide strong directional signals, on average. Unfortunately, as Juslin,Olsson, and Winman (1998) demonstrate, selecting questions with high or lowD also selects for low and high proportions of contrary questions, respectively.So, questions with lower than average D have lower than average signalstrengths, but they also have a lower than average proportion correct giventhe signal strengths (in our terms, dPS , 0). Intuitively, consider that whenunderdogs win elections, the outcome is usually close; underdogs seldom winby a landslide. The contrary questions (upset victories) are almost always lowD (close races), regardless of how sure the outcome seemed ahead of time (signalstrength). (See Juslin et al., 1998, for a computer simulation of this effect.)
A different approach is to select large, random samples of questions fromdifferent domains and then compare samples with different proportions ofcorrect answers (e.g., see Juslin et al., 1997). Sampling from different domainsshould produce samples that differ widely in the strength of available informa-tion. Selecting large, random samples from each domain should minimize the
OVERCONFIDENCE: HOW, WHAT, AND WHOM 225
effect of accidental over- or undersampling of contrary questions. Thus, differ-ences in overconfidence from sample to sample should be influenced mostly bythe relationship between confidence and signal strength, and not much byaccidents of sampling. Nevertheless, if participants do lower their confidenceappropriately, on average, in response to weaker signals, accidental variationsin the proportion of contrary questions could still produce a statistical difficultyeffect. Accuracy will be negatively correlated with confidence-minus-accuracy(i.e., overconfidence) as long as both are measured on the same sample ofquestions (Juslin et al., 1997, 1998). This could explain the finding of Juslinet al. (1997) that there is a strong correlation between domain difficulty andoverconfidence, but the actual magnitude of the effect is small.
The Split-Sample Method
To avoid the difficulties highlighted above, we use a method in which weselect two separate samples of questions from each of a number of differentdomains. We measure domain difficulty on one sample of questions, and wemeasure over- or underconfidence on the other sample from that domain. Ifthe two samples are independent and random, then accidents of sampling inthe first should not affect performance on the second. Thus, tests of differencesbetween domains are not confounded with effects of sampling errors.
Each domain of questions, Q, has an associated strength of information, IQ.If S1 and S2 are two independent, random samples of questions from DomainQ, their information strengths will differ some from the whole population ofQ, just by luck of the draw. Thus, IS1 5 IQ 1 eIS1 and IS2 5 IQ 1 eIS2. Theproportion of correct answers for questions in S1 depends on the signalstrengths in S1, plus some variation due to accidentally sampling more orfewer contrary questions than expected given the signal strength (see Eq. 2).That is,
PS1 5 P(IQ 1 eIS1) 1 dPS1. (4)
Next, consider the second sample from this domain, S2. Confidence in thissample is CS2 5 C(IQ 1 eIS2) and the proportion correct is PS2 5 P(IQ 1 eIS2)1 dPS2 (see Eqs. 2 and 3). Subtracting the latter from the former, we get theoverconfidence for sample S2:
OS2 5 C(IQ 1 eIS2) 2 P(IQ 1 eIS2) 2 dPS2. (5)
Now, suppose we compare one domain to another, and observe that domainswith lower proportion correct in one subsample (as in Eq. 4) tend to showhigher overconfidence in the other sample from the same domain (as in Eq.5). The eI and dP elements represent random variations due to accidents ofsampling; none is correlated with anything else. The only thing that can accountfor a correlation from domain to domain between PS1 and OS2 is a correlationbetween P(IQ) and C(IQ) 2 P(IQ), that is, a “real” difficulty effect. The split-sample technique can similarly provide tests of individual differences and
226 KLAYMAN ET AL.
domain differences that are unconfounded with effects of sampling andselection.
EXPERIMENT 1
Method
Participants. The participants were 32 University of Chicago students solic-ited by posted advertisements. They were paid $6 for participating. Sessionswere self-paced, and required about 30 min to complete.
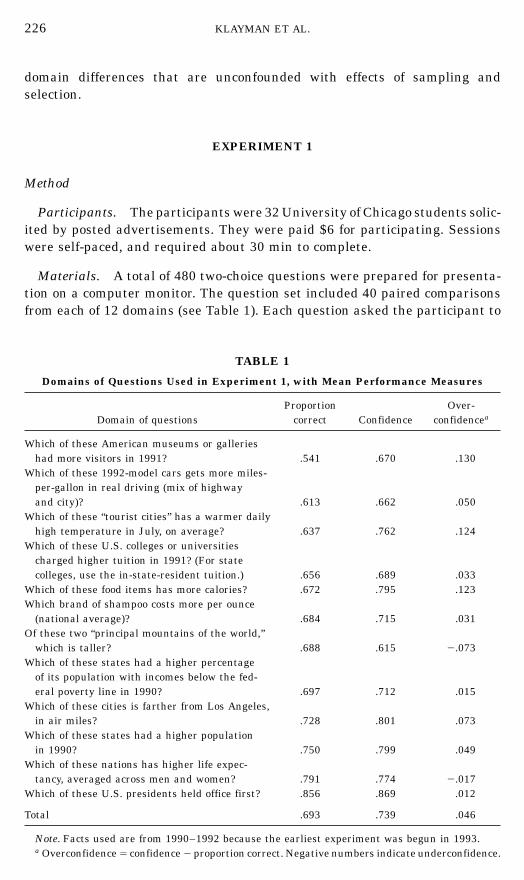
Materials. A total of 480 two-choice questions were prepared for presenta-tion on a computer monitor. The question set included 40 paired comparisonsfrom each of 12 domains (see Table 1). Each question asked the participant to
TABLE 1
Domains of Questions Used in Experiment 1, with Mean Performance Measures
Proportion Over-Domain of questions correct Confidence confidencea
Which of these American museums or gallerieshad more visitors in 1991? .541 .670 .130
Which of these 1992-model cars gets more miles-per-gallon in real driving (mix of highwayand city)? .613 .662 .050
Which of these “tourist cities” has a warmer dailyhigh temperature in July, on average? .637 .762 .124
Which of these U.S. colleges or universitiescharged higher tuition in 1991? (For statecolleges, use the in-state-resident tuition.) .656 .689 .033
Which of these food items has more calories? .672 .795 .123Which brand of shampoo costs more per ounce
(national average)? .684 .715 .031Of these two “principal mountains of the world,”
which is taller? .688 .615 2.073Which of these states had a higher percentage
of its population with incomes below the fed-eral poverty line in 1990? .697 .712 .015
Which of these cities is farther from Los Angeles,in air miles? .728 .801 .073
Which of these states had a higher populationin 1990? .750 .799 .049
Which of these nations has higher life expec-tancy, averaged across men and women? .791 .774 2.017
Which of these U.S. presidents held office first? .856 .869 .012
Total .693 .739 .046
Note. Facts used are from 1990–1992 because the earliest experiment was begun in 1993.a Overconfidence 5 confidence 2 proportion correct. Negative numbers indicate underconfidence.
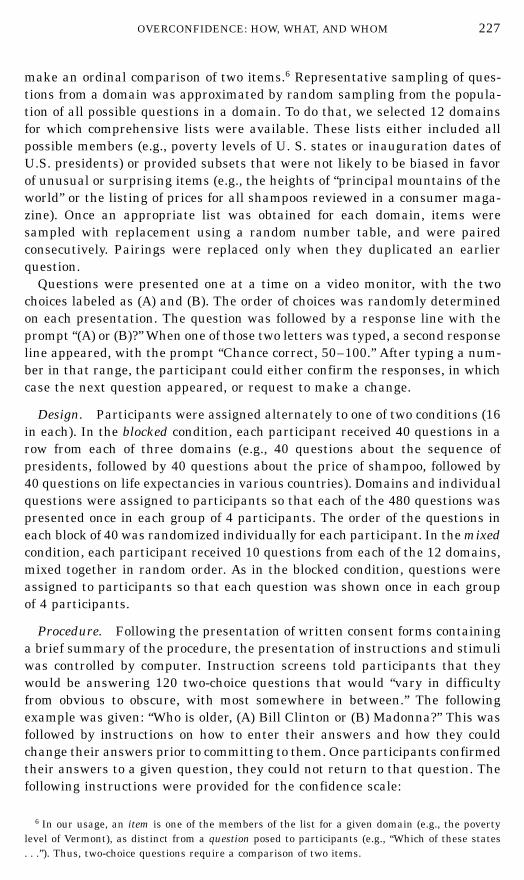
OVERCONFIDENCE: HOW, WHAT, AND WHOM 227
make an ordinal comparison of two items.6 Representative sampling of ques-tions from a domain was approximated by random sampling from the popula-tion of all possible questions in a domain. To do that, we selected 12 domainsfor which comprehensive lists were available. These lists either included allpossible members (e.g., poverty levels of U. S. states or inauguration dates ofU.S. presidents) or provided subsets that were not likely to be biased in favorof unusual or surprising items (e.g., the heights of “principal mountains of theworld” or the listing of prices for all shampoos reviewed in a consumer maga-zine). Once an appropriate list was obtained for each domain, items weresampled with replacement using a random number table, and were pairedconsecutively. Pairings were replaced only when they duplicated an earlierquestion.
Questions were presented one at a time on a video monitor, with the twochoices labeled as (A) and (B). The order of choices was randomly determinedon each presentation. The question was followed by a response line with theprompt “(A) or (B)?” When one of those two letters was typed, a second responseline appeared, with the prompt “Chance correct, 50–100.” After typing a num-ber in that range, the participant could either confirm the responses, in whichcase the next question appeared, or request to make a change.
Design. Participants were assigned alternately to one of two conditions (16in each). In the blocked condition, each participant received 40 questions in arow from each of three domains (e.g., 40 questions about the sequence ofpresidents, followed by 40 questions about the price of shampoo, followed by40 questions on life expectancies in various countries). Domains and individualquestions were assigned to participants so that each of the 480 questions waspresented once in each group of 4 participants. The order of the questions ineach block of 40 was randomized individually for each participant. In the mixedcondition, each participant received 10 questions from each of the 12 domains,mixed together in random order. As in the blocked condition, questions wereassigned to participants so that each question was shown once in each groupof 4 participants.
Procedure. Following the presentation of written consent forms containinga brief summary of the procedure, the presentation of instructions and stimuliwas controlled by computer. Instruction screens told participants that theywould be answering 120 two-choice questions that would “vary in difficultyfrom obvious to obscure, with most somewhere in between.” The followingexample was given: “Who is older, (A) Bill Clinton or (B) Madonna?” This wasfollowed by instructions on how to enter their answers and how they couldchange their answers prior to committing to them. Once participants confirmedtheir answers to a given question, they could not return to that question. Thefollowing instructions were provided for the confidence scale:
6 In our usage, an item is one of the members of the list for a given domain (e.g., the povertylevel of Vermont), as distinct from a question posed to participants (e.g., “Which of these states. . .”). Thus, two-choice questions require a comparison of two items.
228 KLAYMAN ET AL.
In addition to choosing answer A or B, we ask you to also indicate your confidence by tellingus what you think the chance is you are right. If you are absolutely in the dark, no betterthan flipping a coin, that would correspond to a 50% chance of getting it right. If you areabsolutely certain you have the answer, so you think the odds are less than one in a hundredyou might be wrong, then that’s a 100% chance your answer is right.Please feel free to use any number between 50 and 100 to indicate what you think the chanceis that your answer is right. Numbers less than 50 are not allowed, because if you thinkthere’s LESS than a 50/50 chance your answer is right, you ought to choose the other answer!
Participants in the blocked condition were told to expect “40 questions oneach of three different topics”; in the mixed condition, “120 questions on a widevariety of different topics.”
Results and Discussion
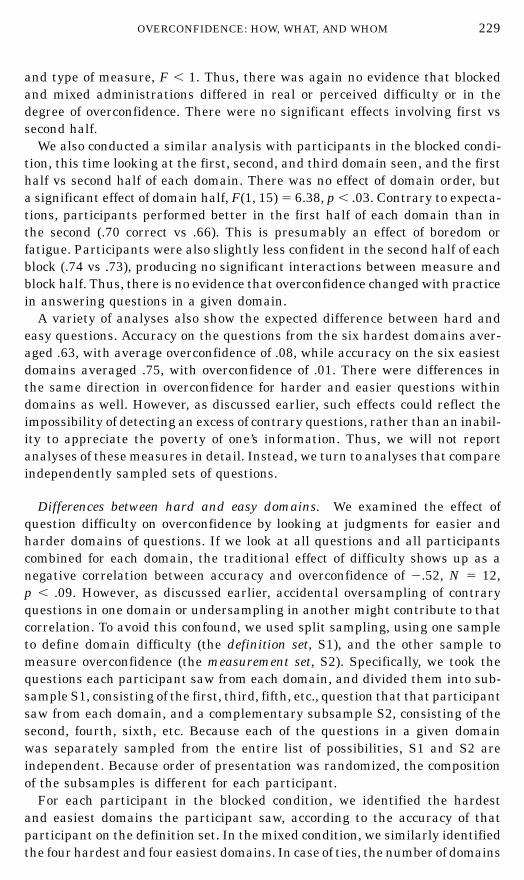
Overall calibration and confidence. First, we examined calibration usingthe traditional technique of plotting actual percent correct contingent on par-ticipants’ stated level of confidence. In plotting such calibration curves, it isnecessary to group participants’ responses into categories, in order to obtaina reasonable sample of responses from which to calculate the actual percentcorrect. To facilitate comparison to past results, we used the most commonmethod, grouping together responses in the ranges of .50–.59, .60–.69, .70–.79,.80–.89, .90–.99, and 1.0. Figure 1 shows the calibration curves obtained forthe mixed and blocked conditions.
The results in Fig. 1 replicate earlier calibration findings, in that (a) theoverall calibration curve is flatter than the ideal line, matching average confi-dence to percent correct, and (b) it lies almost completely below the ideal line,indicating a predominance of overconfident judgments. There is little differencebetween the mixed and blocked conditions; if anything, the participants in theblocked condition may have done worse, contrary to our prediction.
Data like these can be formally analyzed using components of the Brierscore, chiefly the calibration and resolution components (Lichtenstein & Fisch-hoff, 1977; Murphy, 1973). The calibration component of the Brier score mea-sures the degree to which participants’ confidence judgments match the ob-tained percentage correct across different segments of the confidence scale.Resolution is the degree to which participants’ confidence judgments differenti-ate between correct and incorrect answers. The mixed and blocked conditionsdid not differ significantly on either of these measures.
We also performed an ANOVA with condition as a between-participantsvariable and first half (i.e., first 60 questions) vs second half as a within-participants variable, with objective percentage correct and subjective confi-dence as repeated measures. (In these and subsequent statistical tests, bothobjective and subjective measures were converted to unbounded scales usinga log-odds transform.) There was a significant difference between the objectiveand subjective measures, F(1, 30) 5 8.49, p , .007, with a mean percentagecorrect of .69 and a mean confidence of .74. There was no significant maineffect for condition, F , 1, and no significant interaction between condition
OVERCONFIDENCE: HOW, WHAT, AND WHOM 229
and type of measure, F , 1. Thus, there was again no evidence that blockedand mixed administrations differed in real or perceived difficulty or in thedegree of overconfidence. There were no significant effects involving first vssecond half.
We also conducted a similar analysis with participants in the blocked condi-tion, this time looking at the first, second, and third domain seen, and the firsthalf vs second half of each domain. There was no effect of domain order, buta significant effect of domain half, F(1, 15) 5 6.38, p , .03. Contrary to expecta-tions, participants performed better in the first half of each domain than inthe second (.70 correct vs .66). This is presumably an effect of boredom orfatigue. Participants were also slightly less confident in the second half of eachblock (.74 vs .73), producing no significant interactions between measure andblock half. Thus, there is no evidence that overconfidence changed with practicein answering questions in a given domain.
A variety of analyses also show the expected difference between hard andeasy questions. Accuracy on the questions from the six hardest domains aver-aged .63, with average overconfidence of .08, while accuracy on the six easiestdomains averaged .75, with overconfidence of .01. There were differences inthe same direction in overconfidence for harder and easier questions withindomains as well. However, as discussed earlier, such effects could reflect theimpossibility of detecting an excess of contrary questions, rather than an inabil-ity to appreciate the poverty of one’s information. Thus, we will not reportanalyses of these measures in detail. Instead, we turn to analyses that compareindependently sampled sets of questions.
Differences between hard and easy domains. We examined the effect ofquestion difficulty on overconfidence by looking at judgments for easier andharder domains of questions. If we look at all questions and all participantscombined for each domain, the traditional effect of difficulty shows up as anegative correlation between accuracy and overconfidence of 2.52, N 5 12,p , .09. However, as discussed earlier, accidental oversampling of contraryquestions in one domain or undersampling in another might contribute to thatcorrelation. To avoid this confound, we used split sampling, using one sampleto define domain difficulty (the definition set, S1), and the other sample tomeasure overconfidence (the measurement set, S2). Specifically, we took thequestions each participant saw from each domain, and divided them into sub-sample S1, consisting of the first, third, fifth, etc., question that that participantsaw from each domain, and a complementary subsample S2, consisting of thesecond, fourth, sixth, etc. Because each of the questions in a given domainwas separately sampled from the entire list of possibilities, S1 and S2 areindependent. Because order of presentation was randomized, the compositionof the subsamples is different for each participant.
For each participant in the blocked condition, we identified the hardestand easiest domains the participant saw, according to the accuracy of thatparticipant on the definition set. In the mixed condition, we similarly identifiedthe four hardest and four easiest domains. In case of ties, the number of domains
230 KLAYMAN ET AL.
in each category was adjusted to keep equally difficult domains together. Foreach participant, we then took two dependent variables from the measurementset: the differences in accuracy between domains designated as easy and hard,and the difference in overconfidence. The mean difference in accuracy was .10(mean proportions correct were .73 and .63). This was significantly differentfrom zero, t(30) 5 2.28, p 5 .01. The mean difference in overconfidence was2.04 (overconfidence means were .03 and .07). This is in the direction of moreoverconfidence for harder domains, but is not significant, t(30) 5 21.15,p 5 .26. We double-checked the results by reversing the roles of the definitionand measurement sets. The difference between domains designated as easyand hard was .05, which was different from zero, t(30) 5 2.09, p , .05. Thedifference for overconfidence was .03, this time in the direction of less overconfi-dence for harder domains, but was again not significant, t(30) 5 1.08, p 5 .29.There were no significant differences between conditions on any of thesemeasures.
The evidence regarding the effect of difficulty on overconfidence is clearlyequivocal. However, the ability to analyze differences between domains is lim-ited in the present study. In the mixed condition each participant saw only asmall number of questions from each domain, and in the blocked condition,each domain was seen by only a few participants. Experiment 2 affords morepowerful tests of difficulty effects, and we will return to the question of domaindifferences there.
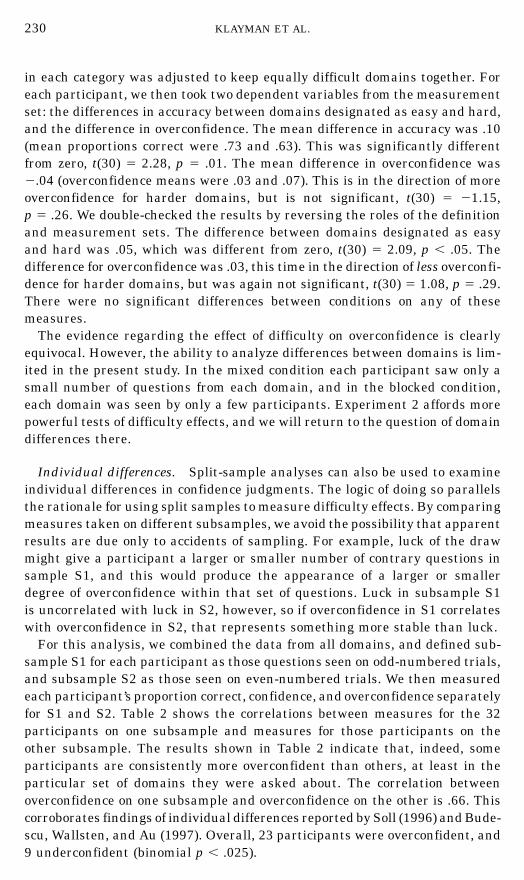
Individual differences. Split-sample analyses can also be used to examineindividual differences in confidence judgments. The logic of doing so parallelsthe rationale for using split samples to measure difficulty effects. By comparingmeasures taken on different subsamples, we avoid the possibility that apparentresults are due only to accidents of sampling. For example, luck of the drawmight give a participant a larger or smaller number of contrary questions insample S1, and this would produce the appearance of a larger or smallerdegree of overconfidence within that set of questions. Luck in subsample S1is uncorrelated with luck in S2, however, so if overconfidence in S1 correlateswith overconfidence in S2, that represents something more stable than luck.
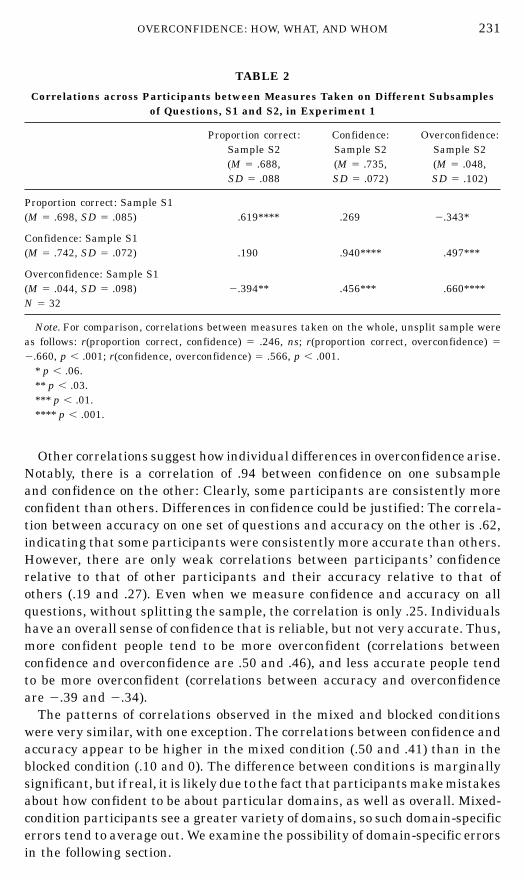
For this analysis, we combined the data from all domains, and defined sub-sample S1 for each participant as those questions seen on odd-numbered trials,and subsample S2 as those seen on even-numbered trials. We then measuredeach participant’s proportion correct, confidence, and overconfidence separatelyfor S1 and S2. Table 2 shows the correlations between measures for the 32participants on one subsample and measures for those participants on theother subsample. The results shown in Table 2 indicate that, indeed, someparticipants are consistently more overconfident than others, at least in theparticular set of domains they were asked about. The correlation betweenoverconfidence on one subsample and overconfidence on the other is .66. Thiscorroborates findings of individual differences reported by Soll (1996) and Bude-scu, Wallsten, and Au (1997). Overall, 23 participants were overconfident, and9 underconfident (binomial p , .025).
OVERCONFIDENCE: HOW, WHAT, AND WHOM 231
TABLE 2
Correlations across Participants between Measures Taken on Different Subsamplesof Questions, S1 and S2, in Experiment 1
Proportion correct: Confidence: Overconfidence:Sample S2 Sample S2 Sample S2(M 5 .688, (M 5 .735, (M 5 .048,SD 5 .088 SD 5 .072) SD 5 .102)
Proportion correct: Sample S1(M 5 .698, SD 5 .085) .619**** .269 2.343*
Confidence: Sample S1(M 5 .742, SD 5 .072) .190 .940**** .497***
Overconfidence: Sample S1(M 5 .044, SD 5 .098) 2.394** .456*** .660****N 5 32
Note. For comparison, correlations between measures taken on the whole, unsplit sample wereas follows: r(proportion correct, confidence) 5 .246, ns; r(proportion correct, overconfidence) 5
2.660, p , .001; r(confidence, overconfidence) 5 .566, p , .001.* p , .06.** p , .03.*** p , .01.**** p , .001.
Other correlations suggest how individual differences in overconfidence arise.Notably, there is a correlation of .94 between confidence on one subsampleand confidence on the other: Clearly, some participants are consistently moreconfident than others. Differences in confidence could be justified: The correla-tion between accuracy on one set of questions and accuracy on the other is .62,indicating that some participants were consistently more accurate than others.However, there are only weak correlations between participants’ confidencerelative to that of other participants and their accuracy relative to that ofothers (.19 and .27). Even when we measure confidence and accuracy on allquestions, without splitting the sample, the correlation is only .25. Individualshave an overall sense of confidence that is reliable, but not very accurate. Thus,more confident people tend to be more overconfident (correlations betweenconfidence and overconfidence are .50 and .46), and less accurate people tendto be more overconfident (correlations between accuracy and overconfidenceare 2.39 and 2.34).
The patterns of correlations observed in the mixed and blocked conditionswere very similar, with one exception. The correlations between confidence andaccuracy appear to be higher in the mixed condition (.50 and .41) than in theblocked condition (.10 and 0). The difference between conditions is marginallysignificant, but if real, it is likely due to the fact that participants make mistakesabout how confident to be about particular domains, as well as overall. Mixed-condition participants see a greater variety of domains, so such domain-specificerrors tend to average out. We examine the possibility of domain-specific errorsin the following section.
232 KLAYMAN ET AL.
Cross-domain comparisons. Another way to look at individual differencesis to compare participants’ overconfidence in one domain with their overconfi-dence in another domain. In the blocked condition, we identified the first,second, and third domains each participant saw. In the mixed condition, weidentified the earliest four, middle four, and latest four domains seen, accordingto the average trial number of the questions in each domain. The sequentialordering is more meaningful in the blocked condition, but for these purposes,any arbitrary division of domains will suffice. We compared the overconfidencescores of the 32 participants on their first domain or set of domains withtheir overconfidence on the second. The correlation was .60. Between the firstdomains and the third the correlation was .58, and between the second andthe third, .51. These are all significant at p , .003, N 5 32. Similar results wereobtained looking at each condition separately. All single-condition correlationswere significant at p , .06, N 5 16. These results confirm that some participantsare generally more overconfident than others, and not just in particular do-mains.
Conclusions. It is clear from Fig. 1 and subsequent analyses that people’sconfidence judgments about two-choice questions are not well calibrated, evenwhen tested in a large, varied, and representative sample of two-choice ques-tions. Contrary to our expectations, the accuracy of confidence judgments isnot materially affected by whether the participant receives three blocks of 40questions from a single domain, or a mix of 120 questions from 12 domains.
The finding of miscalibrated judgments is not controversial: The same pat-tern is observed in Gigerenzer et al.’s (1991) study of German city sizes andin a variety of domains studied by Juslin and colleagues (see Juslin et al.,1997). People are not sure enough when they are very unsure, and they aretoo sure when they are very sure. We also find stable individual differences inoverconfidence, such that more confident people tend to be more overconfident,as do less accurate people. These findings are consistent with models in whichconfidence judgments are imperfect, but unbiased. Miscalibration implies errorin reading the accuracy of the information available in answering each question.The patterns of individual differences imply that errors occur not only in eachindividual confidence judgment, but also in setting one’s overall level of confi-dence (see also Suantak et al., 1996). There is some evidence in this study thatthe errors people make are not completely unbiased, however. About 70% ofindividuals err in the direction of overconfidence. Overall, overconfidence isreliable but modest: between 4% and 5%. It seems likely that the tendencytoward under- or overconfidence varies not only from individual to individual,but also from domain to domain. However, the present study provides littleevidence that differences in difficulty account for differences in overconfidencebetween one domain and another.
EXPERIMENT 2
In this experiment we adopt the method used by Gigerenzer and others ofasking each participant a long series of question in a single domain. Accordingly,
OVERCONFIDENCE: HOW, WHAT, AND WHOM 233
domain is a between-participants variable. Although this design precludessome of the analyses performed in Experiment 1, the larger sample of questionsfrom a given domain for each participant permits some more powerful compari-sons of different domains. The single-domain procedure also allows a morepowerful test of the effects of repeated questioning within one domain. Theresults of Experiment 1 suggest that the use of blocks of single-domain ques-tions cannot explain previous findings of little or no overconfidence in represen-tative sets of two-choice questions. Net overconfidence was statistically signifi-cant but modest, and mixed and blocked conditions did not differ. Nevertheless,we might still find a difference between mixed and blocked administrations ifwe used a stronger manipulation. Perhaps it takes more than 40 questions fora typical participant to settle on a consistent policy for retrieving and weighinginformation. Also, in most representative-sample studies, the questions arecomposed of different pairwise combinations of a smaller set of individualitems. Repetition of the same items might also contribute to a more consistentuse of information. Accordingly, we also constructed our question sets usingrepetitions of individual items in different pairwise combinations.
Method
Participants. The participants in this study were 54 University of Chicagostudents who had not participated in the earlier study. They were solicitedand reimbursed as in Experiment 1. One participant was excluded and replacedbecause he repeated the same confidence value for nearly all of his answers.
Procedures. Each participant received a total of 150 questions presentedin the same manner as in the previous study, except all from a single domain.A short break was provided at the halfway point. The 150 questions consistedof pairs composed from the 40 to 80 individual items used in each domain inthe previous study.
Six domains were used, with nine participants assigned to each. The domainswere shampoo prices, order of U.S. presidents, height of mountains, tempera-tures of cities, populations of U.S. states, and poverty levels of U.S. states.These were selected on the basis of being domains with small lists of itemsfrom which to draw (i.e., there are only 51 states/districts and 41 former presi-dents, and the published lists of shampoos, principal mountains, and majorcities were limited in size). This was done to enhance the extent to which asample of questions composed from a randomly selected subset of items wouldapproximate representative sampling of the domain.
Results and Discussion
Comparing the two studies. We first checked our hypothesis that answeringlarge numbers of questions from a single domain would improve judgments ofconfidence. To do this, we contrasted the present data with those of Experiment1. We combined the two conditions of Experiment 1, and looked only at questionsfrom the six domains that were also used in Experiment 2. (Two participants
234 KLAYMAN ET AL.
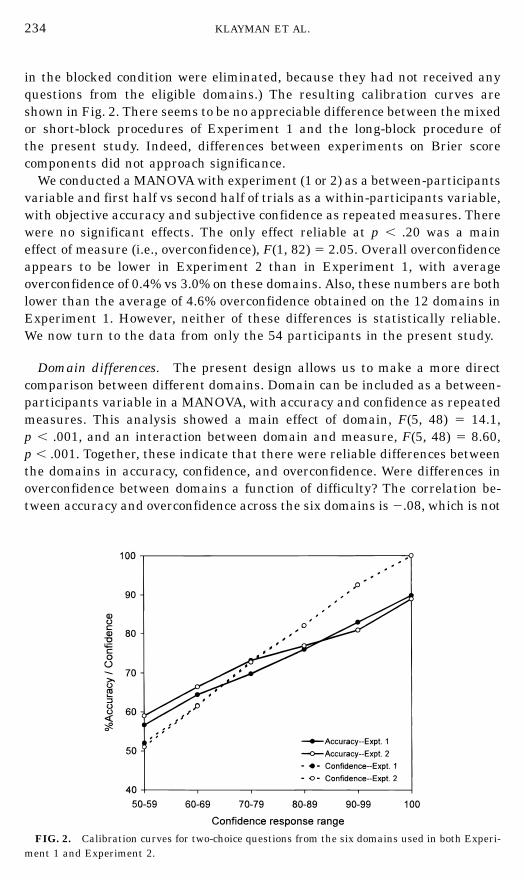
in the blocked condition were eliminated, because they had not received anyquestions from the eligible domains.) The resulting calibration curves areshown in Fig. 2. There seems to be no appreciable difference between the mixedor short-block procedures of Experiment 1 and the long-block procedure ofthe present study. Indeed, differences between experiments on Brier scorecomponents did not approach significance.
We conducted a MANOVA with experiment (1 or 2) as a between-participantsvariable and first half vs second half of trials as a within-participants variable,with objective accuracy and subjective confidence as repeated measures. Therewere no significant effects. The only effect reliable at p , .20 was a maineffect of measure (i.e., overconfidence), F(1, 82) 5 2.05. Overall overconfidenceappears to be lower in Experiment 2 than in Experiment 1, with averageoverconfidence of 0.4% vs 3.0% on these domains. Also, these numbers are bothlower than the average of 4.6% overconfidence obtained on the 12 domains inExperiment 1. However, neither of these differences is statistically reliable.We now turn to the data from only the 54 participants in the present study.
Domain differences. The present design allows us to make a more directcomparison between different domains. Domain can be included as a between-participants variable in a MANOVA, with accuracy and confidence as repeatedmeasures. This analysis showed a main effect of domain, F(5, 48) 5 14.1,p , .001, and an interaction between domain and measure, F(5, 48) 5 8.60,p , .001. Together, these indicate that there were reliable differences betweenthe domains in accuracy, confidence, and overconfidence. Were differences inoverconfidence between domains a function of difficulty? The correlation be-tween accuracy and overconfidence across the six domains is 2.08, which is not
FIG. 2. Calibration curves for two-choice questions from the six domains used in both Experi-ment 1 and Experiment 2.
OVERCONFIDENCE: HOW, WHAT, AND WHOM 235
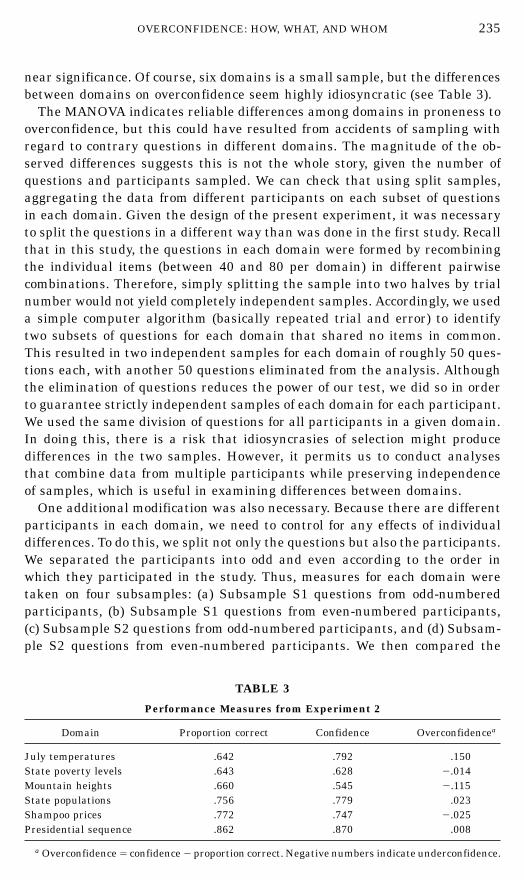
near significance. Of course, six domains is a small sample, but the differencesbetween domains on overconfidence seem highly idiosyncratic (see Table 3).
The MANOVA indicates reliable differences among domains in proneness tooverconfidence, but this could have resulted from accidents of sampling withregard to contrary questions in different domains. The magnitude of the ob-served differences suggests this is not the whole story, given the number ofquestions and participants sampled. We can check that using split samples,aggregating the data from different participants on each subset of questionsin each domain. Given the design of the present experiment, it was necessaryto split the questions in a different way than was done in the first study. Recallthat in this study, the questions in each domain were formed by recombiningthe individual items (between 40 and 80 per domain) in different pairwisecombinations. Therefore, simply splitting the sample into two halves by trialnumber would not yield completely independent samples. Accordingly, we useda simple computer algorithm (basically repeated trial and error) to identifytwo subsets of questions for each domain that shared no items in common.This resulted in two independent samples for each domain of roughly 50 ques-tions each, with another 50 questions eliminated from the analysis. Althoughthe elimination of questions reduces the power of our test, we did so in orderto guarantee strictly independent samples of each domain for each participant.We used the same division of questions for all participants in a given domain.In doing this, there is a risk that idiosyncrasies of selection might producedifferences in the two samples. However, it permits us to conduct analysesthat combine data from multiple participants while preserving independenceof samples, which is useful in examining differences between domains.
One additional modification was also necessary. Because there are differentparticipants in each domain, we need to control for any effects of individualdifferences. To do this, we split not only the questions but also the participants.We separated the participants into odd and even according to the order inwhich they participated in the study. Thus, measures for each domain weretaken on four subsamples: (a) Subsample S1 questions from odd-numberedparticipants, (b) Subsample S1 questions from even-numbered participants,(c) Subsample S2 questions from odd-numbered participants, and (d) Subsam-ple S2 questions from even-numbered participants. We then compared the
TABLE 3
Performance Measures from Experiment 2
Domain Proportion correct Confidence Overconfidencea
July temperatures .642 .792 .150State poverty levels .643 .628 2.014Mountain heights .660 .545 2.115State populations .756 .779 .023Shampoo prices .772 .747 2.025Presidential sequence .862 .870 .008
a Overconfidence 5 confidence 2 proportion correct. Negative numbers indicate underconfidence.
236 KLAYMAN ET AL.
TABLE 4
Correlations across Domains between Measures Taken on Different Subsamples ofQuestions, S1 and S2, and Presented to Different Subgroups of Participants in
Experiment 2
Proportion correct: Confidence: Overconfidence:Sample S2 Sample S2 Sample S2
(M 5 .738, .772; (M 5 .742, .741; (M 5 .004, 2.031;SD 5 .096, .088) SD 5 .142, .114) SD 5 .126, .090)
Proportion correct: Sample S1(M 5 .696, .690; SD 5 .074, .091) .624, .861** .499, .838** .088, .216
Confidence: Sample S1(M 5 .703, .720; SD 5 .102, .130) .295, .600 .870,**.901** .757,* .551
Overconfidence: Sample S1(M 5 .008, .030; SD 5 .079, .094) 2.203, .002 .655, .442 .893,**.556N 5 6
Note. For the first number in each pair, Subsample S1 of questions was seen by odd-numberedparticipants and Subsample S2 by even-numbered participants, and vice versa for the secondnumber. For comparison, correlations between measures taken on the whole, unsplit sample wereas follows: r(proportion correct, confidence) 5 .671, p , .15.; r(proportion correct, overconfid-ence) 5 2.115, ns; r(confidence, overconfidence) 5 .660, p , .16.
* p , .10.** p , .05.
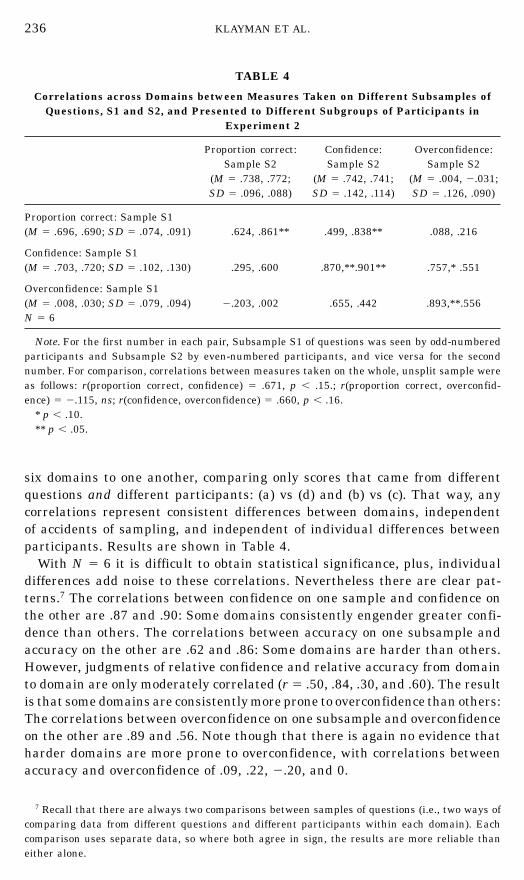
six domains to one another, comparing only scores that came from differentquestions and different participants: (a) vs (d) and (b) vs (c). That way, anycorrelations represent consistent differences between domains, independentof accidents of sampling, and independent of individual differences betweenparticipants. Results are shown in Table 4.
With N 5 6 it is difficult to obtain statistical significance, plus, individualdifferences add noise to these correlations. Nevertheless there are clear pat-terns.7 The correlations between confidence on one sample and confidence onthe other are .87 and .90: Some domains consistently engender greater confi-dence than others. The correlations between accuracy on one subsample andaccuracy on the other are .62 and .86: Some domains are harder than others.However, judgments of relative confidence and relative accuracy from domainto domain are only moderately correlated (r 5 .50, .84, .30, and .60). The resultis that some domains are consistently more prone to overconfidence than others:The correlations between overconfidence on one subsample and overconfidenceon the other are .89 and .56. Note though that there is again no evidence thatharder domains are more prone to overconfidence, with correlations betweenaccuracy and overconfidence of .09, .22, 2.20, and 0.
7 Recall that there are always two comparisons between samples of questions (i.e., two ways ofcomparing data from different questions and different participants within each domain). Eachcomparison uses separate data, so where both agree in sign, the results are more reliable thaneither alone.
OVERCONFIDENCE: HOW, WHAT, AND WHOM 237
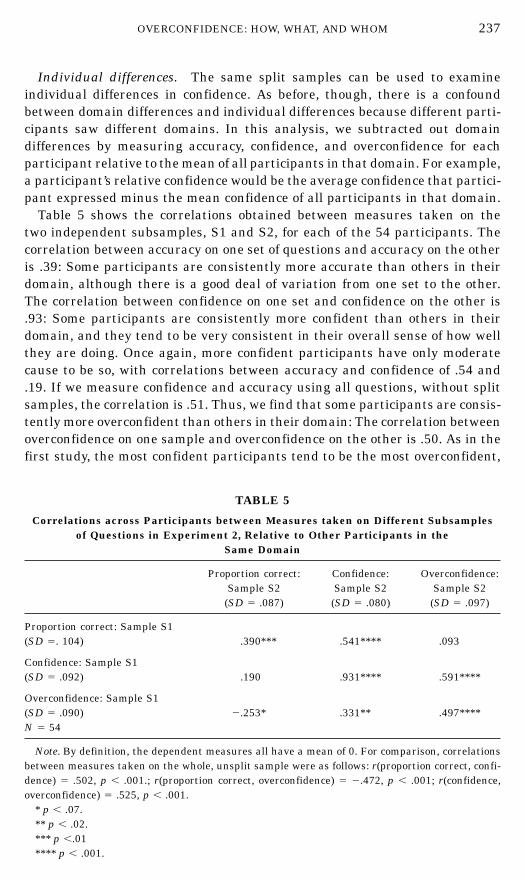
Individual differences. The same split samples can be used to examineindividual differences in confidence. As before, though, there is a confoundbetween domain differences and individual differences because different parti-cipants saw different domains. In this analysis, we subtracted out domaindifferences by measuring accuracy, confidence, and overconfidence for eachparticipant relative to the mean of all participants in that domain. For example,a participant’s relative confidence would be the average confidence that partici-pant expressed minus the mean confidence of all participants in that domain.
Table 5 shows the correlations obtained between measures taken on thetwo independent subsamples, S1 and S2, for each of the 54 participants. Thecorrelation between accuracy on one set of questions and accuracy on the otheris .39: Some participants are consistently more accurate than others in theirdomain, although there is a good deal of variation from one set to the other.The correlation between confidence on one set and confidence on the other is.93: Some participants are consistently more confident than others in theirdomain, and they tend to be very consistent in their overall sense of how wellthey are doing. Once again, more confident participants have only moderatecause to be so, with correlations between accuracy and confidence of .54 and.19. If we measure confidence and accuracy using all questions, without splitsamples, the correlation is .51. Thus, we find that some participants are consis-tently more overconfident than others in their domain: The correlation betweenoverconfidence on one sample and overconfidence on the other is .50. As in thefirst study, the most confident participants tend to be the most overconfident,
TABLE 5
Correlations across Participants between Measures taken on Different Subsamplesof Questions in Experiment 2, Relative to Other Participants in the
Same Domain
Proportion correct: Confidence: Overconfidence:Sample S2 Sample S2 Sample S2
(SD 5 .087) (SD 5 .080) (SD 5 .097)
Proportion correct: Sample S1(SD 5. 104) .390*** .541**** .093
Confidence: Sample S1(SD 5 .092) .190 .931**** .591****
Overconfidence: Sample S1(SD 5 .090) 2.253* .331** .497****N 5 54
Note. By definition, the dependent measures all have a mean of 0. For comparison, correlationsbetween measures taken on the whole, unsplit sample were as follows: r(proportion correct, confi-dence) 5 .502, p , .001.; r(proportion correct, overconfidence) 5 2.472, p , .001; r(confidence,overconfidence) 5 .525, p , .001.
* p , .07.** p , .02.*** p ,.01**** p , .001.
238 KLAYMAN ET AL.
with correlations of .59 and .33. We did not replicate the earlier finding thatless accurate participants also tend to be more overconfident, although theassociation was marginally significant in one of the two tests.
Conclusions. In most ways, the findings of the present study confirm thoseof Experiment 1. Answering long sets of questions from a single domain, evenusing the same items repeatedly in different combinations, does not seem tohave any important effect on performance compared to receiving a mixed setof questions. This, then, is not a likely explanation for the finding of little orno overall overconfidence in recent studies such as those of Gigerenzer et al.(1991) and Juslin (1994), although there may be some effect in that direction.As in the first study, we also find that some participants are consistently moreoverconfident that others.
With the present study, we can also say that some domains are consistentlymore prone to overconfidence than others, at least for our population of partici-pants. However, we still find no evidence that the harder domains are the onesmore prone to overconfidence when we use split samples that control for thepossibility of accidental missampling of contrary questions. At this point, wehave no explanation for what makes some domains seem harder than theyare, and others easier.
EXPERIMENT 3
Like the majority of earlier studies, our first two experiments examine onlyone kind of confidence judgment, namely how likely it is that one of two alterna-tives is the correct answer. There is no guarantee, however, that the processesbehind such judgments are the same as those required in other tasks. In thisstudy, we examine another type of confidence judgment, namely the setting ofa confidence range of fixed probability for a single estimate. As noted earlier,there have been a number of studies documenting overconfidence in such tasks,but none that we know of has used questions randomly sampled from a varietyof domains. As with earlier studies of two-choice tasks, it is possible that thequestions used were selected for difficulty, and thus are artificially prone tooverconfidence. This experiment serves two goals: (a) to test findings of overcon-fidence in confidence-range tasks using representative samples from multipledomains and (b) to determine if the patterns found in the first two experimentsare also observed in range estimates.
Method
Participants. Thirty-two University of Chicago students were recruited asin Experiment 1. None participated in either of the other two studies.
Procedure. This study used the same procedures as in Experiment 1, exceptthat participants were asked single-item questions for which they were toprovide 90% confidence ranges. A total of 480 questions of this kind wereprepared, 40 in each of the same 12 domains used in Experiment 1 (see Table
OVERCONFIDENCE: HOW, WHAT, AND WHOM 239
1), sampled randomly from the same sources as were used in that study. Priorto presenting the questions, the concept of a 90% range was explained as follows:
You will be asked 150 questions for which you are to make an estimate of some number, like“How old is Madonna?” However, instead of estimating an exact number, we ask that you givea range, such that you think there is a 90% chance that the correct answer lies somewherein the range. In other words, give a range such that you would expect to be wrong only aboutone out of ten times. (Answers that hit your high or low number exactly will be counted ascorrect.) . . . Type in your range by typing
NUMBER ^Enter&
NUMBER ^Enter&
indicating that you think there is a 90% chance the right answer is between one number andthe other. It doesn’t matter if you give the lower number first or the higher number.
Participants were reminded of the intended criterion for the range witheach question because the request for responses said “90% sure the answer isbetween this .[then, on the next line, following the first response] and this..” Participants were also told how to change their responses once entered,but were not permitted to return to earlier questions.
Results and Discussion
Normatively, participants who indicate their 90% confidence ranges shouldobtain approximately 90% correct answers.8 In the present study, the correctanswer fell inside the participants’ confidence ranges 43% of the time. It is clearthat the degree of overconfidence with these range estimates is much greaterthan for two-choice questions from the same domains. For a direct comparison,consider that when participants in Experiment 1 indicated a confidence of .90 6
.03, they were right 75% of the time. Alternatively, range judgments may be morelike two separate judgments of .95 confidence, one for each end of the range. InExperiment 1, confidence of .95 6 .03 yielded 80% correct answers. So, given thelevel of confidence observed for two-choice questions, we might expect 60–75%of answers to be within range, compared with the observed 43%. In the generaldiscussion we consider possible explanations for this substantial difference be-tween two-choice and confidence-range questions.
As in Experiment 1, we performed a MANOVA to look for effects of condition(mixed questions from all 12 domains vs blocks of 40 questions from each of 3domains) and time on the task. Condition was a between-participants variable,and first half vs second half of trials was within participants. Because reportedconfidence is held constant at 90%, the only dependent measure was the log-odds of the proportion of responses that were inside the range. Participants inthe blocked condition seem to have done slightly better, with 49% of theiranswers inside their ranges compared to 37% in the mixed condition. However,the MANOVA indicated no effects that approached significance. We also lookedat the blocked condition alone, separating trials into first, second, and third
8 In the absence of complicated proper-scoring rules and incentives, participants could obtainthis result by giving impossible answers on 10% of the questions and near-infinite ranges on 90%.However, neither we nor other researchers have found any evidence of this.
240 KLAYMAN ET AL.
domain seen, and into first vs second half of each domain. There were nosignificant effects.
As in the two previous studies, we can use split samples to look for stable differ-ences between individuals and between domains. To look for differences betweendomains, we divided the questions in each domain randomly into two subsam-ples, keeping the same division of questions for all participants. Because all ofthe items asked about in the present study were different, we did not have toexclude any, as we did in the previous study. For each of the 12 domains, weobtained the average proportion of in-range answers for each of the two subsam-ples. In the blocked condition, different participants see different combinationsof 3 domains each, so domain differences may be confounded with individualdifferences. Therefore, we consider only the mixed condition, in which all partici-pants see questions from all domains. Combining data from all participants, wefind a correlation of .92 between a domain’s average on one subsample and theother.Clearly, therearestabledifferencesbetweendomains. Inthemostovercon-fidence-prone domain (distance from Los Angeles), 22% of answers were withinrange; in the least overconfident domain (car mileage), 65%.
Previous research suggests that there may be a difficulty effect in confidence-range estimates (Lichtenstein et al., 1982; O’Connor & Lawrence, 1989), withmore excessively narrow ranges for harder domains. There is no direct way tocheck for difficulty effects with the present method: Accuracy and overconfi-dence are one and the same. However, we can check whether the domains thatwere hardest or most prone to overconfidence in Experiment 1 were also moreprone to overconfidence here. They were not: Across the 12 domains, overconfi-dence in this study correlated .22 with accuracy in Experiment 1, and 2.07with overconfidence. Neither is near significance.
Next, we examine individual differences. To do this, we switch to dividingthe questions for each participant into those seen on even- vs odd-numberedtrials, as in Experiment 1. This splitting method can be used when data arenot to be combined across participants, and it has the advantage of varyingwhich particular questions fall into which subset for each participant. Weobtained measures of accuracy for each of the participants on each of the twosubsamples. As before, data from the blocked condition confound individualdifferences with domain differences, so we examined the mixed condition sepa-rately. The correlation between a participant’s accuracy on one subsample andthe other was .84 (N 5 16, p , .001). Clearly, there are strong, stable individualdifferences in overconfidence in this task. The most overconfident participanthad 1% of the answers inside his or her ranges; the single underconfidentparticipant had 92%.9
9 The worst participant’s answers were all off by orders of magnitude, and the single within-range answer seems to have been the result of a typing error. However, this participant did appearto take the task seriously (did not use the same number repeatedly, did not use arbitrary numberssuch as 0, used different scales of numbers for the different domains, etc.) The next-worst partici-pants had 8% and 9% of their answers within range. We reran our analyses eliminating the worstparticipant, in case he or she had misunderstood something. The results were substantively thesame; the overall proportion of within-range answers rose to .45.
OVERCONFIDENCE: HOW, WHAT, AND WHOM 241
Conclusions. Confidence judgments based on setting 90% confidence rangesdo not behave like confidence judgments in two-choice questions. In the two-choice task, it is clear that people make errors on each judgment, on how harda particular domain is, and on how well they are performing overall. However,the amount of overall bias is modest: less than 5% overconfidence on average.With confidence-range questions, overconfidence is large, on the order of 45%.Differences between domains and between individuals are strong as well.
GENERAL DISCUSSION
As a number of investigators have shown, some familiar methods for studyingconfidence can produce misleading results. Researchers must be careful toselect questions and to measure performance in ways that do not confound theeffects of accidents of sampling, unsystematic judgment errors, and cognitivebiases. What do we find when we do so? As in the vast majority of previousstudies, the more confident participants are, the more overconfident (or lessunderconfident) they are. That is, in calibration curves like those in Figs. 1and 2, the slope of the curve is less than 1. We also find evidence of systematicbias toward overconfidence. That bias does not depend much on the difficultyof the domain, nor on the opportunity to consider many questions from asingle domain, as we expected it would. However, there are reliable differencesbetween types of questions, between domains of questions, and betweenindividuals.
How You Ask
The distinction that makes the biggest difference in our studies is the natureof the questions, two-choice vs confidence range. In our studies of two-choicequestions, the overall difference between accuracy and confidence was modest(about 5% across 12 domains) and it varied considerably from person to personand from domain to domain. These findings are consistent with the conclusionthat miscalibration results principally from unsystematic error rather thanfrom biased retrieval and interpretation of information.
There are good reasons to expect that two-choice questions would not befertile ground for biased information gathering. That is because both alterna-tives are explicit and available to the judge at the time of judgment. Manystudies of hypothesis testing have shown that asking participants “is it A oris it B?” produces much less biased processing than asking “is it A?” (seeKlayman, 1995; also Tversky & Koehler, 1994). This suggests that the mainproblem with two-choice questions is not that people base their answers oninformation that is biased toward consistency. Rather, people do not seem toappreciate how difficult it is to estimate what a collection of information impliesabout the chance of getting the answer right. In the absence of clear andplentiful feedback, people fail to learn that when they feel 90% sure, they areright only 77% of the time, and when they feel they are purely guessing, theyare right about 56% of the time (if the findings of our studies are typical).
242 KLAYMAN ET AL.
Instead, they maintain a kind of overconfidence about their judgments of confi-dence. It may also be that people do have a reasonable sense of the fallibilityof their confidence judgments, but fail to regress feelings of extreme confidenceor unconfidence toward the mean as much as they should, given that fallibility(see Griffin & Varey, 1996; Kahneman & Tversky, 1973). One can argue, asFerrell (1994) has, that people cannot be expected to regress their estimatestoward the mean if they do not know what the mean should be. Note, though,that when Gigerenzer et al. (1991) asked participants to estimate after thefact how many questions they got right, they were quite accurate, underestimat-ing by a little.
The story is different for confidence-range judgments. Overconfidence aver-aged 47% across the 12 domains. This is consistent with earlier findings ofvery large overconfidence for range estimates (e.g., Russo & Schoemaker, 1992).We suspect that range judgments are more prone to overconfidence than aretwo-choice questions because they are more susceptible to biased informationprocessing. With confidence-range questions there are no explicit alternatives.Rather, one can form an initial impression of a single answer and attempt torecruit information that supports or refutes that estimate. It is exactly thiskind of one-sided situation that is most prone to confirmation bias (Klayman,1995). Thus, biased retrieval and interpretation of evidence may very wellexplain the substantial overconfidence observed in confidence-range questions,even if their importance in two-choice judgments is in doubt.
What You Ask
With both two-choice and confidence-range questions, we found significantdifferences between performance on different domains of questions. It is a long-standing finding that miscalibration and overconfidence differ for different setsof questions. In particular, the conclusion has been that harder questions showgreater overconfidence. Recently, though, Gigerenzer et al. (1991) and Juslin(1993, 1994) have concluded that the apparent difference between hard andeasy sets of questions was an artifact of experimental methods, and woulddisappear with random sampling from defined populations of questions. Ourresults generally support that contention. We find no reliable signs of a relationbetween the amount of overconfidence and the difficulty of the domain ofquestions. (Some recent studies that have looked at larger amounts of datafrom a larger array of domains have found modest effects of difficulty, however;see Juslin et al., 1997). Nevertheless, we do find that domains differ signifi-cantly in the extent to which they elicit under- or overconfidence. Some domainsare harder than they seem and some easier, and our split-sample analysesshow that those differences are not attributable to accidents of sampling. Atpresent, we have no hypotheses about what features of a domain predict itsdegree of overconfidence. This finding highlights the advice given by Brunswik(1952) that researchers who wish to make generalizations need to have goodsamples of the population of stimuli, as well as of the population of participants.
OVERCONFIDENCE: HOW, WHAT, AND WHOM 243
Whom You Ask
We also found consistent individual differences in the degree of overconfi-dence participants expressed (see also Soll, 1996). At its least interesting, thisfinding might simply mean that different judges have consistently differentideas about how to use the numerical response scale. However, the magnitudeof individual differences observed in Experiment 3 is such that it seems veryunlikely they result from differing interpretations of what a probability of90% means.
A recent study (Klayman & Burt, 1998) provides further evidence that indi-vidual differences in overconfidence are psychologically substantive. That studyfound a correlation between MBA students’ overconfidence on confidence-rangequestions and the social environment in which they worked. Greater overconfi-dence was associated with more “constrained” social networks. Those are smallnetworks with many strong interconnections; someone in a central, coordinat-ing position; and weak connections to outsiders (Burt, 1992, 1997). Such socialstructures are good for forming shared beliefs and they provide many opportuni-ties for members to tell one another that they are right and few opportunitiesfor prevailing ideas to be challenged.
If there are real differences among people in their proneness to overconfi-dence, that has interesting implications for the real world. In a world in whichcompetence is hard to measure, confidence often wins the day. This is troublingif, as our results suggest, the most confident people are also the most overconfi-dent. The whole issue of individual differences in judgment is worthy of fur-ther study.
Conclusions
In the 1980s, the question of bias in confidence judgments seemed settled:People are grossly overconfident on all but the easiest of questions. In the1990s, the matter was reopened, and a new conclusion was proposed: Peopleare imperfect but generally unbiased judges of confidence; only the choice ofquestions was biased. Miscalibration of confidence judgments has importantimplications in either case, but the distinction is significant. If people arematerially overconfident, then we can aid them by developing debiasing tech-niques that help them attend to contradictory evidence (Fischhoff, 1982; Hoch,1985; Koriat et al., 1980; Lord, Lepper, & Preston, 1984). If random error isthe main culprit, then such “debiasing” might be misguided, merely tradingone direction of error for another. Instead, the focus might be on better feedbackand training to reduce noise, or on means of extracting valid information fromnoisy judges (see Clemen, 1986, 1989; Wallsten, Budescu, Erev, & Diederich,1997). The finding that biased samples of questions can produce apparent over-or underconfidence has additional implications. Many judges receive a biasedsubset of questions in their work. For example, doctors, lawyers, and consul-tants get questions that are harder than those in the environment at large.Do they know enough to adjust their confidence accordingly?
Our understanding of subjective confidence is limited by a lack of evidence
244 KLAYMAN ET AL.
concerning underlying cognitive processes (as Griffin & Varey, 1996, also pointout; for some recent efforts in this direction, see, e.g., Gigerenzer & Goldstein,1996; Yates, Lee, Shinotsuka, & Sieck, 1998). For example, both two-choicejudgments and range estimates are of theoretical and practical importance.These two types of judgments must share some cognitive elements, but theyclearly have unique elements as well. There are also many other interestingkinds of confidence judgments. How sure are you about the meaning of “super-cilious”? How certain are you that you heard the phone ring on your way outof your house (cf. Bjo
¨rkman, Juslin, & Winman, 1993; Juslin & Olsson, 1997)?
It is unlikely that any single mechanism can explain all types of confidencejudgments. Similarly, differences in overconfidence between domains and be-tween individuals point to systematic effects of information content, informa-tion processing, and the relation between them. Why are some people, somedomains, and some types of judgment more prone to overconfidence than oth-ers? The present studies do not provide definitive answers, but they do under-score the importance of asking these questions in seeking to understand theprocesses by which confidence judgments are made, and how they might beaided.
REFERENCES
Ayton, P., & McClelland, A. G. R. (1997). How real is overconfidence? Journal of Behavioral DecisionMaking, 10, 153–285.
Babad, E. (1987). Wishful thinking and objectivity among sports fans. Social Behavior, 4, 231–240.
Bjo¨rkman, M. (1994). Internal cue theory: Calibration and resolution of confidence in general
knowledge. Organizational Behavior and Human Decision Processes, 58, 386–405.
Bjo¨rkman, M., Juslin, P., & Winman, A. (1993). Realism of confidence in sensory discrimination:
The underconfidence phenomenon. Perception & Psychophysics, 54, 75–81.
Brenner, L. A., Koehler, D. J., Liberman, V., & Tversky, A. (1996). Overconfidence in probabilityand frequency judgments: A critical examination. Organizational Behavior and Human DecisionProcesses, 65, 212–219.
Brunswik, E. (1952). The conceptual framework of psychology. Chicago: Univ. of Chicago Press.
Budescu, D. V., Erev, I., & Wallsten, T. S. (1997). On the importance of random error in the studyof probability judgment: Part I. New theoretical developments. Journal of Behavioral DecisionMaking, 10, 157–171.
Budescu, D. V., Erev, I., Wallsten, T. S., & Yates, J. F. (Eds.). (1997). Stochastic and cognitivemodels of confidence [Special issue]. Journal of Behavioral Decision Making, 10.
Budescu, D. V., Wallsten, T. S., & Au, W. T. (1997). On the importance of random error in thestudy of probability judgment: Part II. Applying the stochastic judgment model to detect system-atic trends. Journal of Behavioral Decision Making, 10, 173–188.
Burt, R. S. (1992). Structural holes. Cambridge, MA: Harvard Univ. Press.
Burt, R. S. (1997). The contingent value of social capital. Administrative Science Quarterly, 42,339–365.
Clemen, R. T. (1986). Calibration and the aggregation of probabilities. Management Science, 32,312–314.
Clemen, R. T. (1989). Combining forecasts: A review and annotated bibliography. InternationalJournal of Forecasting, 5, 559–609.
Dawes, R. M. (1980). Confidence in intellectual judgments vs. confidence in perceptual judgments.
OVERCONFIDENCE: HOW, WHAT, AND WHOM 245
In E. D. Lantermann & H. Feger (Eds.), Similarity and choice: Papers in honor of Clyde Coombs(pp. 327–345). Bern, Switzerland: Huber.
Dunning, D., Griffin, D. W., Milojkovic, J., & Ross, L. (1990). The overconfidence effect in socialprediction. Journal of Personality and Social Psychology, 58, 568–581.
Erev, I., Wallsten, T. S., & Budescu, D. V. (1994). Simultaneous over- and underconfidence: Therole of error in judgment processes. Psychological Review, 101, 519–528.
Ferrell, W. R. (1994). Discrete subjective probabilities and decision analysis: Elicitation, calibrationand combination. In G. Wright & P. Ayton (Eds.), Subjective probability (pp. 411–451). Chiches-ter: Wiley.
Ferrell, W. R., & McGoey, P. J. (1980). A mode of calibration for subjective probabilities. Organiza-tional Behavior and Human Performance, 26, 32–53.
Fischhoff, B. (1982). Debiasing. In D. Kahneman, P. Slovic, & A. Tversky (Eds.), Judgment underuncertainty: Heuristics and biases (pp. 422–444). Cambridge, UK: Cambridge Univ. Press.
Fischhoff, B., & MacGregor, D. (1983). Judged lethality: How much people seem to know dependson how they are asked. Risk Analysis, 3, 229–236.
Fischhoff, B., Slovic, P., & Lichtenstein, S. (1977). Knowing with certainty: The appropriatenessof extreme confidence. Journal of Experimental Psychology: Human Perception and Performance,3, 552–564.
Gigerenzer, G., & Goldstein, D. G. (1996). Reasoning the fast and frugal way: Models of boundedrationality. Psychological Review, 103, 650–669.
Gigerenzer, G., Hoffrage, U., & Kleinbo¨lting, H. (1991). Probabilistic mental models: A Brunswikian
theory of confidence. Psychological Review, 98, 506–528.
Griffin, D. W., & Tversky, A. (1992). The weighing of evidence and the determinants of confidence.Cognitive Psychology, 24, 411–435.
Griffin, D. W., & Varey, C. A. (1996). Towards a consensus on overconfidence. OrganizationalBehavior and Human Decision Processes, 65, 227–231.
Harvey, N. (1997). Confidence in judgment. Trends in Cognitive Science, 1, 78–82.
Hoch, S. J. (1985). Counterfactual reasoning and accuracy in predicting personal events. Journalof Experimental Psychology: Learning, Memory, and Cognition, 11, 719–731.
Juslin, P. (1993). An explanation of the hard–easy effect in studies of realism of confidence inone’s general knowledge. European Journal of Cognitive Psychology, 5, 55–71.
Juslin, P. (1994). The overconfidence phenomenon as a consequence of informal experimenter-guided selection of almanac items. Organizational Behavior and Human Decision Processes,57, 226–246.
Juslin, P., & Olsson, H. (1997). Thurstonian and Brunswikian origins of uncertainty in judgment:A sampling model of confidence in sensory discrimination. Psychological Review, 104, 344–366.
Juslin, P., Olsson, H., & Bjo¨rkman, M. (1997). Brunswikian and Thurstonian origins of bias in
probability assessment: On the interpretation of stochastic components of judgment. Journalof Behavioral Decision Making, 10, 189–209.
Juslin, P., Olsson, H., & Winman, A. (1998). The calibration issue: Theoretical comments onSuantak, Bolger, and Ferrell (1996). Organizational Behavior and Human Decision Processes,73, 3–26.
Kahneman, D., & Tversky, A. (1973). On the psychology of prediction. Psychological Review, 80,237–251.
Kahneman, D., & Tversky, A. (1982). Variants of uncertainty. In D. Kahneman, P. Slovic, & A.Tversky (Eds.), Judgment under uncertainty: Heuristics and biases (pp. 509–520). Cambridge,UK: Cambridge Univ. Press.
Keren, G. (1991). Calibration and probability judgments: Conceptual and methodological issues.Acta Psychologica, 77, 217–273.
Klayman, J. (1995). Varieties of confirmation bias. In J. Busemeyer, R. Hastie, & D. L. Medin (Eds.),
246 KLAYMAN ET AL.
Psychology of learning and motivation: Vol. 32. Decision making from a cognitive perspective (pp.365–418). New York: Academic Press.
Klayman, J., & Burt, R. S. (1998). Individual differences in confidence and experiences in socialnetworks. Working paper, Center for Decision Research, Graduate School of Business, Universityof Chicago.
Koriat, A., Lichtenstein, S., & Fischhoff, B. (1980). Reasons for confidence. Journal of ExperimentalPsychology: Human Learning and Memory, 6, 107–118.
Kunda, Z. (1990). The case for motivated reasoning. Psychological Bulletin, 108, 480–498.
Langer, E. J. (1975). The illusion of control. Journal of Personality and Social Psychology, 32,311–328.
Larrick, R. P. (1993). Motivational factors in decision theories: The role of self-protection. Psycholog-ical Bulletin, 113, 440–450.
Lichtenstein, S., & Fischhoff, B. (1977). Do those who know more also know more about how muchthey know?: The calibration of probability judgments. Organizational Behavior and HumanPerformance, 20, 159–183.
Lichtenstein, S., Fischhoff, B., & Phillips, L. D. (1982). Calibration of probabilities: The state ofthe art to 1980. In D. Kahneman, P. Slovic, & A. Tversky (Eds.), Judgment under uncertainty:Heuristics and biases. Cambridge, UK: Cambridge Univ. Press.
Lord, C. G., Lepper, M. R., & Preston, E. (1984). Considering the opposite: A corrective strategyfor social judgment. Journal of Personality and Social Psychology, 47, 1231–1243.
May, R. S. (1986). Inferences, subjective probability, and frequency of correct answers: A cognitiveapproach to the overconfidence phenomenon. In B. Brehmer, B. Jungermann, P. Lourens, & G.Sevon (Eds.), New directions in research on decision making. Amsterdam: North-Holland.
McClelland, A. G. R., & Bolger, F. (1994). The calibration of subjective probabilities: Theoriesand models 1980–1994. In G. Wright & P. Ayton (Eds.), Subjective probability (pp.453–482).Chichester: Wiley.
Murphy, A. H. (1973). A new vector partition of the probability score. Journal of Applied Meteorology,12, 595–600.
Murphy, A. H., & Winkler R. (1984). Probability forecasting in meteorology. Journal of the AmericanStatistical Association, 79, 489–500.
O’Connor, M., & Lawrence, M. (1989). An examination of the accuracy of judgment confidenceintervals in time series forecasting. International Journal of Forecasting, 8, 141–155.
Paese, P. W., & Sniezek, J. A. (1991). Influences on the appropriateness of confidence in judgment:Practice, effort, information, and decision making. Organizational Behavior and Human DecisionProcesses, 48, 100–130.
Peterson, D. K., & Pitz, G. F. (1988). Confidence, uncertainty, and the use of information. Journalof Experimental Psychology: Learning, Memory and Cognition, 14, 85–92.
Pfeifer, P. E. (1994). Are we overconfident in the belief that probability forecasters are overconfident?Organizational Behavior and Human Decision Processes, 58, 203–213.
Russo, J. E., & Schoemaker, P. J. H. (1992). Managing overconfidence. Sloan Management Review,33, 7–17.
Soll, J. B. (1996). Determinants of overconfidence and miscalibration: The roles of random errorand ecological structure. Organizational Behavior and Human Decision Processes, 65, 117–137.
Suantak, L., Bolger, F., & Ferrell, W. R. (1996). The hard–easy effect in subjective probabilitycalibration. Organizational Behavior and Human Decision Processes, 67, 201–221.
Tversky, A., & Koehler, D. J. (1994). Support theory: A nonextensional representation of subjectiveprobability. Psychological Review, 101, 547–567.
Wallsten, T. S., Budescu, D. V., Erev, I., & Diederich, A. (1997). Evaluating and combining subjectiveprobability estimates. Journal of Behavioral Decision Making, 10, 243–268.
OVERCONFIDENCE: HOW, WHAT, AND WHOM 247
Yaniv, I., & Foster, D. P. (1995). Graininess of judgment under uncertainty: An accuracy–informativeness tradeoff. Journal of Experimental Psychology: General, 124, 424–432.
Yates, J. F. (1990). Judgment and decision making. Englewood Cliffs, NJ: Prentice Hall.
Yates, J. F., Lee, J.-W., Shinotsuka, H., & Sieck, W. R. (1998, November). Oppositional deliberation:Toward explaining overconfidence and its cross-cultural variations. Paper presented at the meet-ing of the Psychonomics Society, Dallas, TX.
Received September 21, 1998