managing service productivity
TRANSCRIPT


Comput., Enwran, and Urban Systems, Val, 14, pp, 89-102.1990
0198-9715/90 $3 .00 . .00 Printed in the USA, AN rights reserved.
Copyright v 1990 Pergamon Press pfc
PERSPECTIVE
MANAGING SERVICE PRODUCTIVITY : THE DATA ENVELOPMENT ANALYSIS PERSPECTIVE
Boa-, Golany
Industrial Engineering and Management Technion-Israel Institute of Technology
David B. Learner
MRCA Information Services
Fred Y- Phillips
IC2 Institute University of Texas at Austin
John J. Rousseau
MRCA Information Services
ABSTRACT. This paper outlines a new productivity assessment based on Data Envelopment Analysis (DEA) methodology. DEA offers the first satisfactory multi-input, multi-output measure of productivity, and allows for productivity management at the intrafirm and interfirm levels with particular application in marketing . Efflciencv and ejketiveness are distinguished as productivity components, and means for managing each one is discussed and illustrated by an esample from a marketing perspective .
Service industries in the US now provide 68% of the gross national product and 71 % of all jobs (New York Times, 1987). The proportions of GNP and jobs accounted for by service activ-ities are considerably higher, because much of the payroll and overhead of manufacturing firms go to marketing, customer service, and internal (e .g ., accounting and secretarial) services . Some observers believe that the economy's m9~ of manufacturing and services is now stabiliz-ing- Others believe the service sector will continue to grow to as much as 92% of jobs and 85% of GNP by the year 2000 . Although much attention has been focused on American manu-facturing productivity in recent years, it is in services that greater productivity-related dangers
Requests for reprints should be sent to Boaz Golany, Industrial Engineering and Mapagernent, Technion-!srael Institute of Technology, Technion City, Haifa 320,000 Israel .
89

B. Golany D. B. Learner, F. Y. Phillips, and J. J. Rousseau
and opoortutufes are found . The evidence shows our manufacturing productivity rising at a respectable rate, while productivity in the larger service sector declines both in absolute terms and relative to other countries .
Productivity increases are essential because they represent the only long-term source of increased wealth when resources are finite and markets are static, a circumstance increasingly apparent in the U.S . economy . Our standard of living, international competitiveness, and economic leadership depend on enhancing services productivity growth. At the level of the firm, ignoring productivity eventually means losing market share to competitors who have eliminated or avoided inefficiencies .
SERVICES AND PRODUCTIVITY
Services output per labor hour has been fairly steady since 1977 but is now lower than its very modest peak in 1983 (American Productivity Center, 1988) . International comparisons in certain sectors show the US to be a leader in productivity levels but a laggard in productivity growth . Smith and Hitchens (1985) found American productivity in retailing and wholesai ranged from 1 .4 to 2.5 times greater than that of the UK and West Germany . But, in retai during 1970-79, West German productivity growth was twenty times that of the US The miniscule U .S . increase in service productivity is remarkable for a decade during which the US pioneered such retail marketing innovations as catalog and warehouse stores . The "productivity" numbers are simple ratios of sales to labor hours . They are computable
from Census data and facilitate international comparisons . They are somewhat appropriate in that most services are labor-intensive . However, for retailers, sales per square foot of selling space is as great a concern as labor efficiency . This additional criterion suggests more detailed, meaningful and complete measures of productivity must be made at the microeeonomie level, that is, at the level of the firm or groups of firms .
Managing Productivity
White collar and service productivity have traditionally been harder to measure than manu-facturing productivity because of its less routine nature and the fact that white collar workers' output is not usually a matter of tangible, countable objects . Until recently such measurement was rarely tried. Modern group dynamics techniques are now used for identifying perfor-mance criteria, and techniques from market research are used to measure them. The advent of computerized databases and computer-aided interviewing has made white collar productivity measurement less troublesome and more widely practiced . One component of productivity is a ratio of results achieved to resources used, or of output
to input; that is, efficiency. The other component of productivity is effectiveness, which per-tains to choosing and achieving appropriate goals . Efficiency means doing what one is doing as well as possible . Effectiveness means making sure one is doing the right thing in the first place. These definitions highlight the tradeoffs possible between efficiency and effectiveness, and take an appropriately broad view of productivity. An organization or manager can achieve short-term efficiency and profits by postponing the replacement of aged or obsolete facilities or the retraining of personnel . Although this may be sensible for certain market conditions and certain sages of a product's life cycle, in general it leads to a dimunition of assets . The drive toward efficiency must be balanced by correct goals for profit, growth, and market position .
Efficiency. Ideas from Engineering, Economics, and Statistics
Readers may be familiar with the engineering definition of efficiency as a ratio of work per-formed to energy consumed . For a machine, this ratio is less than unity. In manufacturing,

SALES
OUTPUT
Managing Service Productivity
91
there may be "engineering benchmarks" indicating the maximum efficiency (a number less than 100%) that may be expected from a machine built to a given blueprint. Often machines are not expected to meet the benchmark under real usage conditions .
In economic terms, efficiency has three aspects : technical, allocative, and scale . Technical efficiency means minimizing waste . Allocative efficiency means using the best mix of inputs at prevailing market prices . Pareto efficiency is a special case of allocative efficiency such that the distribution of resources cannot be altered to benefit one recipient without worsening another. Scale efficiency results from producing at optimum volume under given prices. The relative ability to produce at a given rate with lower costs than other producers is sometimes called cost efficiency. An efficient market in economics is a theoretical market in. which goods are available at equilibrium prices (because all inefficient competitors have been eliminated) and in which the values of all goods are completely reflected by their prices . While they are idealized in economics, the evidence asserts that efficient markets do not in fact occur in prac-tice. The notion of a production function serves as a focus for nearly all discussions of economic
efficiency. A production function defines the output an enterprise can produce from any given set of inputs . Productivity increase may result from eliminating inefficiencies so as to acmally produce at the maximum level specified by the function, or from moving the entire function to a new and higher level through technological innovation . Figure 1 shows a scatterplot of hypothetical business units where the points represent
observed values of advertising dollars spent and dollar sales achieved . No perfect causal rela-tionship between advertising and sales can be discerned, and some units suffer from technical inefficiencies . Of the units enclosed by squares, the upper box is more efficient, getting more sales for the same advertising as the lower boxed unit . Two other units are circied; the leftmost of these is more efficient by virtue of getting the same sales for less advertising expenditure .
Classical economic theory usually assumes all firms operate at full technica efficiency. Writers in managerial economics enriched the discussion by showing that firms are not always strict profit maximizers . This implied that firms intentionally occupy nonequilibrium posi-
AD $ INPUT
Points are observed business units .
FIGURE 1. Scatterpiot of Hypothetical Business Units.
92
tions, and further suggested, quite sensibly, that inefficiency may be present in real-world busi-nesses.ll
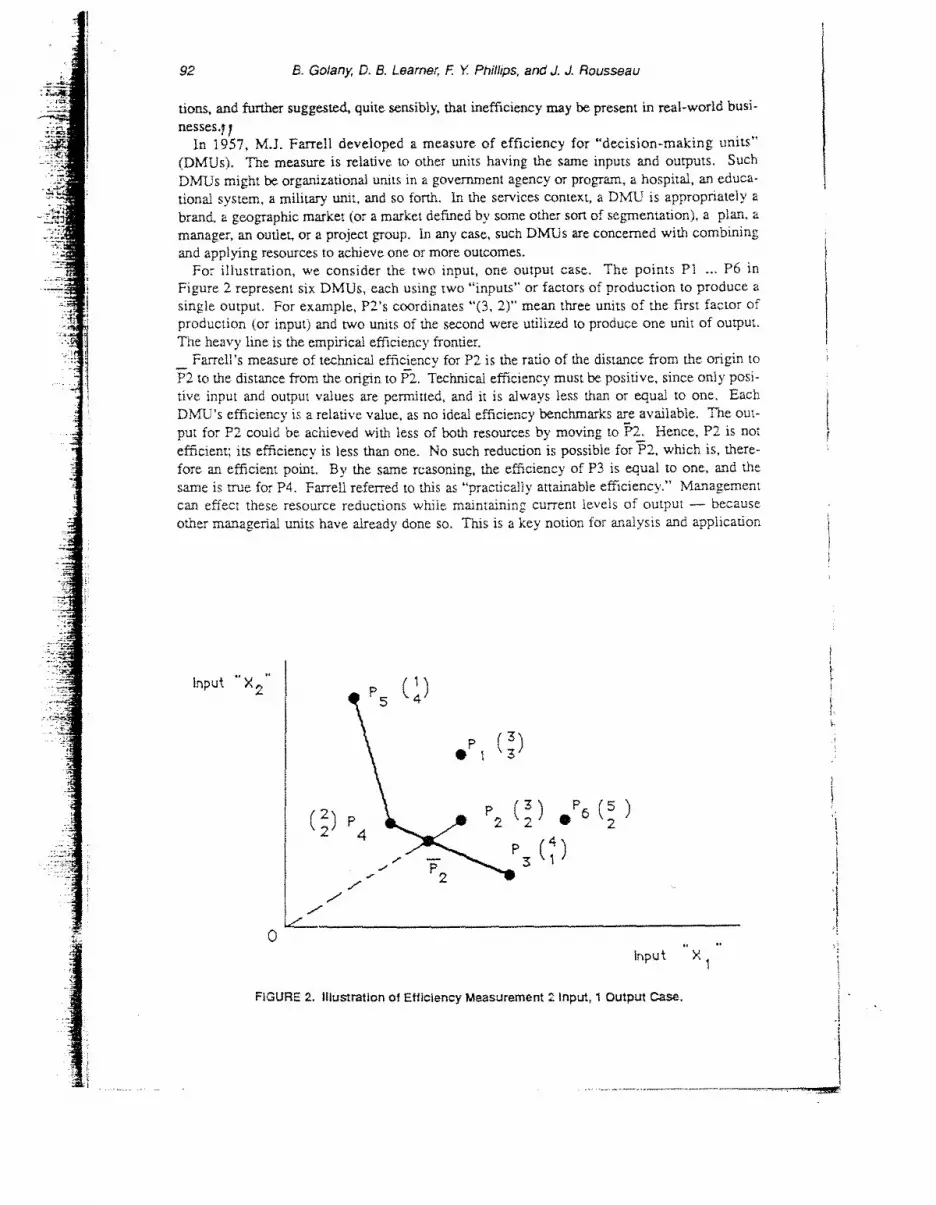
In 1957, M-J. Farrell developed a measure of efficiency for "decision-making units" (DMUs). The measure is relative to other units having the same inputs and outputs . Such DMUs might be organizational units in a government agency or program, a hospital, an educa-tional system, a military unit, and so forth . In the services context, a DMU is appropriately a brand, a geographic market (or a market defined by some other sort of segmentation), a plan, a manager, an outlet, or a project group . In any case, such DMUs are concerned with combining and applying resources to achieve one or more outcomes . For illustration, we consider the two input, one output case . The points PI . . . P6 in
Figure 2 represent six DMUs, each using two "inputs" or factors of production to produce a single output . For example, P2's coordinates "(3, 2)" mean three units of the first factor of production (or input) and two units of the second were utilized to produce one unit of output . The heavy line is the empirical efficiency frontier. _ Farrell's measure of technical efficiency for P2 is the ratio of the distance from the origin to P2 to the distance from the origin to P2 . Technical efficiency must be positive, since only posi-tive input and output values are permitted, and it is always less than or equal to one . Each DMU''s efficiency is a relative value, as no ideal efficiency benchmarks are available . The out-put for F2 could be achieved with less of both resources by moving to P2 . Hence, P2 is not efficient; its efficiency is less than one . No such reduction is possible for P2, which is, there-fore an efficient point . By the same reasoning, the efficiency of P3 is equal to one, and the same is true for P4 . Farrell referred to this as "practically attainable efficiency." Management can effect these resource reductions while maintaining current levels of output - because other managerial units have already done so . This is a key notion for analysis and application.
Input
B. Golany, D. B. Learner, F Y Phillips, and J. J. Rousseau
0 Input
FIGURE 2. Illustration of Efficiency Measurement 2 Input, 1 Output Case .

SALES
OUTPUT
Managing Service Productivity
AD $ INPUT
Possibility Frontier
.^ -- Least-Sovares Regression
Points are observed business units .
FIGURE 3. Efficient Role Models : Possibility (Frontier) Relationship v Average (Leaset Squares Regression) Relationship .
93
of productivity improvement. Engineers and statisticians have also worked to analyze and improve productivity . Some
productivity programs are based on the feedback principle: a worker's past performance is posted along with the plantwide average and range. This practice can improve productivity, but without supervisory guidance it may give mixed signals to a worker, leaving the worker unclear whether he or she should strive to avoid the bottom range, aim for the average, or feel responsible for attaining the maximum rating . This maximum may have beer. achieved by a senior person with much experience and newer equipment, making the implied comparison an unfair one. More sophisticated manufacturing productivity tools, based or. statistical quality and process
control, have strengths and weaknesses when applied to services . In traditional use, a defective product is defined as a departure from the product specification . This begs the question of whether the product specification is an appropriate one to begin will,.., an issue we have defined as "effectiveness." Also, the individualized nature of a service occasion ensures that departure from the "book" is the norm rather than the exception . Many services are created and con-sumed at the same moment . In such cases there is no time to test-and possibly reject-each specific realization of a service before it "reaches" the consumer. Three major difficulties with traditional statistics led us to concentrate on other avenues for
analyzing service productivity . First, statistical procedures are based on averages. For exam-ple, a least-square regression line reveals an average relationship between two variables such as advertising and sales . It is inappropriate to set performance standards or productivity improvement goals based on average performance . Rather, the best possible practices should be used as targets . The empirical efficiency frontier of Figure 3 is a "possibility (frontier; rela-tionship" between inputs and outputs . This frontier function is neither average nor causal . For
94 8 . Golany, D. 8. Learner, F Y. Phillips, and J . J. Rousseau
each unit on the frontier it can be said that no other unit gets more output for less input. Other business units might achieve this "best possible sales return on advertising" if they can elimi-nate their inefficiencies .
Second, traditional statistical quality control methods are not capable of handling many out-puts at once . Multiple regression, for example, uses only one dependent variable . Third, regression-type relationships are usually interpreted (or misinterpreted) as causal and universal . Experience has shown that a statement like "If you spend $X on advertising, you will sell Y units" is rarely valid, and even then is not valid for very long in a changing world . The management process is a cycle: Set goals, implement programs to meet the goals, evalu-
ate the results, and revise the goals or programs as necessary. Productivity enhancement must fit into this cycle, while striving for customer satisfaction, making use of employees' insights, initia-tive, and participation in the goal setting and performance evaluation processes, and (ai the same time) recognizing that markets, technologies and environments are ever changing .
Efficiency : Ideas from Management Science
To date the best known contributions of management science to efficiency analysis have been concerned with allocatioe efficiency. Linear programming models consider the amount of materi-als and processing needed to produce and allocate resources to determine the mix of products that will maximize profit or minimize costs . Variants, using nonlinear functions, address scale efficien-cy 'oy recognizing that marginal costs decrease with production volume, over a relevant range . We now describe a new methodology for managing productivity . I: builds on linear pro-
gramming (LP) techniques, introduced some 40 years ago and used extensively° to allocate pro-ductive resources . The first LP models were applied to manufacturing . It was there that the greatest scope for application existed due to the predominance of the manufacturing sector and the lack of data within the nascent service industries . However, the resource allocation model is a general one that gave rise to a large class of models finding application in government and marketing as well as manufacturing .
In marketing, such models have been applied to the selection of advertising media, where the resources to be allocated are advertising budgets and the "production technologies" are the reach (the number of viewers, readers, or listeners in the audience) and frequency (the number of advert
sires) promised by the candidate media . Also of importance to marketing are the many logistical applications of these models - in routing, scheduling, inventory, and location. These techniques improve the allocation of products, trucks, salesmen, and stores to places,
and routes . owever, such applications did not address technical efficiency, and in fact assumed the tech-coefficients-the amounts of each resource input needed to produce a unit of each ou:-
t-were constant for all levels of production. For example, they assume that it will always take three minutes on a milling machine to produce a widget, that Time magazine will not increase its audience (that is, the rate at which Tracts advertisers can turn ad expendirures into ad exposures), and that a delivery truck will continue to get nine miles to the gallon and travel no faster than 55 miles per hour. The sensitivity analysis capabilities of linear programming, although very power-ful when applied to other parameters of the LP problem, extend to the technology coefficients only in the form of approximations . The model, usually solved for a single DMU, made no con-structive use of comparisons with other DMUs.
Efficiency: New Ideas for Services and Marketing
The new methodology described here recognizes that technical efficiency can be improved, and shows how to do it. To use i:, we must sharpen the concepts of inputs and outputs in set-

~.J
Managing Service Productivity 95
}
vice and marketing enterprises . The inputs to a service or marketing process are the resources that it has available . These
include human, financial, and physical resources and their related expenses . Such resources
may be divided into those managers control, and those that are beyond their discretion . The
population of a sales region, or its mean temperature, may determine much of the variation in
consumption of a product . When comparing regions' productivity, it would be unfair to ignore
these environmental variables . We call them nondiscretionary inputs, to emphasize that unlike
the others, they are not under the control of management. Some inputs imply no consumption
of resources, being in the form of decisions or information . The price of the service or product
is one of these inputs, and we shall see that managing price is an important issue .
Any results of the process are called outputs .
Desirable outputs are sales revenues, repeat
buyers, brand loyalty, and many other kinds of market responses . Some outputs, like toxic
effluents or delinquent loans, must be considered "negative outputs ." Although they car. be
managed so as to comprise as little as possible of the enterprise's overall output, they are
unavoidable under current technology and corporate strategy . Popular articles often identify
frequency of shutdowns, major and minor accidents, NRC fines, contaminated garbage, and
workers` exposure to radiation as outputs of nuclear power plants (in addition to electricity),
offering these as relevant performance criteria . In brand marketing, inputs are product, advertising, promotion, distribution, and related
"marketing mix" decisions . Or, the output side of brand management are revenue, market
share, market penetration, brand awareness, and so forth . In salesforce evaluation, relevant
inputs are force level, salespeople's years of experience in the industry and in sales, and so on.
Productive outputs are sales booked, new customers brought on board, new orders to old cus-
tomers, and others . This characterization of inputs and outputs implies regarding the service
process as a "black box." Indeed most approaches to productivity adopt ius such a viewpoint
in Lie early stages of analysis, with the qualification that the process may be seer, as composed
of many business units, each using the same kinds of inputs to produce Lie same kinds of out-
puts . . A new idea for measuring efficiency with multiple inputs and outputs was introduced by A.
Charnes, V.W. Cooper and E . Rhodes (1978), who generalized the engineering efficiency ratio
to the multiple-input multiple-output situation . They showed that their approach encompassed Farrell's formulation, and set forth more general developments and extensions that are now known collectively as Data Envelopment Analysis (DEA). Their original work was motivated
by a project to evaluate the efficiency of a major experimental educational program called
"Program Follow Through ." In this and in many later applications to public or nonprofit situa-
tions, the several productive outputs were not of a type that could be reduced to a single "prof-it" figure. Later extensions of these efficiency techniques addressed productivity in profit-ori-
ented enterprises . Hence, the more general term "decision making unit" rather that. "business unit" is applied in DEA. The method is based on an audacious strategy unthinkable in the days of slower computers ;
a linear programming problem is solved for each decision making unit . Each LP solved in this
process uses the input/output values of all of the units under consideration. This reference set for a decision making unit is the set of other units to which a comparison might be appropriate . A reference set may consist of competing units, or cooperating units . All units in a reference set may be internal to the firm or agency, or competition might be considered by comparing different firms (e.g ., the marketing of different brands of soft drinks) if data are available.
Suppose we have ten sales regions using advertising and promotion as inputs . They produce revenue and wish to build a consumer franchise by encouraging repeat buying . The data for
s simplified example, given for a certain time period, appear in Table 1 . The units of mea-
surement for the inputs and outputs have been arranged to keep the numbers simple, and note

96 B . Golany, D . B . Learner, F Y Phillips, and J. J. Rousseau
TABLE 1 . Marketing Costs and Benefits
that they do not have to be (and usually won't be) in common dollar terms . Clearly, some regions perform better than others. Region 8 is less efficient than region 4
since it uses more of each input and produces less of each output than region 4 . To evaluate region 4, we assign variable "multipliers" to each of the inputs and outputs, and use these mul-tipliers to form an efficiency ratio for region 4 . Using the symbol AM for "advertising multi-plier," and PM, RM, and RBM for the remaining input and output multipliers, the generalized efficiency ratio for region 4 is (4RM+2RBM)!(6AM+6PM). In thus ratio, the actual input and output values for region 4 are paired with their respective multipliers ; generalized efficiency ratios for each remaining region are formed in the same manner. To compute the value of region 4's efficiency ratio, we find positive values for the four multipliers so that they make reDon 4's efficiency ratio as large as possible while limiting the efficiency ratios of every region-constructed using the same multipliers-to less than or equal to 10Q°rc . No other regions are more efficient than region 4 ; the method assigns an efficiency score of
1.00 (100% relative efficiency) to region 4 . Similarly, the program associated with region ¬ finds a different set of multipliers, by maximizing (3RM+IRBM)l(8AM+12PM) while keep-ing the efficiency ratios of all regions (now formed using the new multipliers) no greater than 100% . This results in an efficiency score of 0.61 (61% relative efficiency) for region 8 . The procedure is repeated for each remaining region. It can be expanded for any number of busi-ness units, inputs, and outputs . These nonlinear models, known as fractional programming problems, can be reduced to ordinary LP problems by a transformation of variables . This transformation makes DEA methods practicable by speeding the computations manyfold .
Solving a separate LP for each decision making unit assigns each unit its own set of multipli-ers . This ingenious feature of DEA distinguishes it from methods that assign common input and output "weights" for all units analyzed. Each LP gives its decision unit a set of multipliers such that the unit's assessed efficiency is as high as possible, given that the efficiencies of the remaining units-using the same multipliers-are less than or equal to 100%. This allows each unit to be evaluated according to its individual character, and to "put its best foot for-ward." Thus two or more units that excel in different areas-that are economic in the use of different inputs and prolific in the production of different outputs-could each be rated 100% efficient . Thus is appropriate because at this stage of the analysis we do not have available, or have chosen not to assign, relative importances to the various inputs and outputs . When known, these relative importances are usually expressed in dollars and are used in the "effec-tiveness" phase, which is the second part of the productivity analysis .
en this process is completed for many sales regions, a valuable management aid results .
Regions
Inputs
Advertising Promotion
Outputs
Revenue Repeat-buying
Efficiency
Region 1 4 6 2 1 86'90 Region 2 12 8 3 1 61 Region 3 8 2 2 2 100% Region 4 6 6 4 2 100% Region 5 2 8 2 3 100% Region 6 3 9 1 2 760i, Region 7 3 7 2 4 100% Region 8 8 12 3 1 61% Region 9 4 10 1 3 73% Regionl0 6 5 2 2 87%

Managing Service Productivity
97
Each inefficient region is enveloped by a number of efficient regions that operate on a similar scale, as illustrated in Figure 3 . The boxed unit is better than average, but not an efficiency leader. The two circled units are the closest efficient units, and will be used as role models in setting performance goals for the boxed unit . This simplified picture shows a two-dimensional, static view of a multidimensional process that changes with time . Thus "efficient role models" are provided for every inefficient regional manager. The role
models are fair comparisons, as they belong to the same "market segment" as the inefficient manager . In our example, region 8's solution assigns it regions 4 and 7 as efficient role mod-els . These are the closest efficient units, in terms of the values of inputs and outputs . Region 8, along with other inefficient units enveloped by 4 and 7, will form a segment or fair- compar-ison set The supervisor may use these role models to evaluate the performance of regional managers and to set differential goats for those who are less than fully efficient, based on per-formance insights supplied by the efficient role models . The subordinate manager's participa-tion is central to this process, as he or she is the key to learning why the role model is perform-ing more efficiently, and whether all relevant inputs and outputs are accounted for. The original DEA ratio model, labeled the CCR model, was supplemented with at, "addi-
tive" model by Chores, Cooper, Golany, Seiford and Stutz (1985) . That model forged the link between engineering efficiency and Pareto efficiency. The additive model constructs a Pareto optimal empirical production function for a set of input-output observations on a number of decision malting units . It does this by means of envelopment constraints . Suppose one of the variables XI, X2, and so on up to X10, is associated with each of the 10 regions . All of the X variables are greater than or equal to zero, and they all add up to one . To. ensure that region #1 is enveloped on the advertising dimension, we use the advertising levels of all 10 regions to
4x1+12x2+8x3+6x4+2x5+3x6+3x7+8x8+4x9+6xlO 54 .
The 4 on the right hand side of this inequality is region #I's advertising level . For envelop-ment on the output side, the inequality is reversed; for region #I's repeat buyi
lxl+Ix2+2x3+2x4+3x5+2x6+4x7+Ix$+3x9+2x10 21 .
To solve the additive model, we also use envelopment inequalities for region #1's revenue and promotion . These constraints ensure that region #1 is at best "between" other Pareto effi-cient regions on the efficient frontier in which case it too is efficient-or that region #1 lies "below" the frontier, where it is inefficient. In the ensuing optimization, the two sides of each inequality are made to be as unequal as possible . This gives a stringent test for Pareto efficien-cy, ensuring that an inefficient decision unit will lie "as far below" the frontier as its operating characteristics allow. This optimization is repeated for each region . The LP for the additive model bears a close resemblance to the transformed ratio model, and
although there are technical differences between the ratio and additive models they may be comprehended as embodying the same efficiency concept. Any decision unit rated 100% effi-cient by the ratio model will also be 100% efficient under the additive model . Reaching a single virtual output and a single virtual input via summation is only one of
many possible ways of reducing the multidimensional situation to Che regular "engineering" situation of single-input, single-output measurements . Cherries, Cooper, Seiford and Stutz (1983) devised a multiplicative model, where the product of the inputs raised to positive pow-ers is a single composite input, and a similar product yields the single composite output . Otherwise similar in form to the ratio model (but with the exponents required to be greater than one), it too can be transformed to an ordinary linear programming problem . In the multipliea-
98
SALES
OUTPUT
B . Golany, D. B . Learner, F. Y. Phillips, and J. J. Rousseau
AD $ INPUT
FIGURE 4. Shortest Path to Efficiency .
tive model each "optimal envelopment," that is, each representation of an inefficient decision unit as a function of its efficient neighbors, is a Cobb-Douglas function, one of the most com-monly (and successfully) used production functions in classical economics . This means the multiplicative model car. be employed to estimate "piecewise Cobb-Douglas" production func-tions directly from empirical data . This establishes an important relation between the DEA concept and the mainstream of economics .
Variations of these models have been formulated to ,,am further desirable properties, such as increasing, constant or decreasing returns to scale at a point, and "units-invariance," under which the DEA efficiency ratings are not sensitive to the units in which the inputs and outputs are expressed Dynamic DEA models can now capture the time-varving aspects of business productivity, and as pan of a company's management information system can serve as continu-ing monitoring and control instruments (for a bibliographic summary, see Seiford, 1989 ) The DEA model also determines the "closest" point on the efficiency frontier for each ineffi-
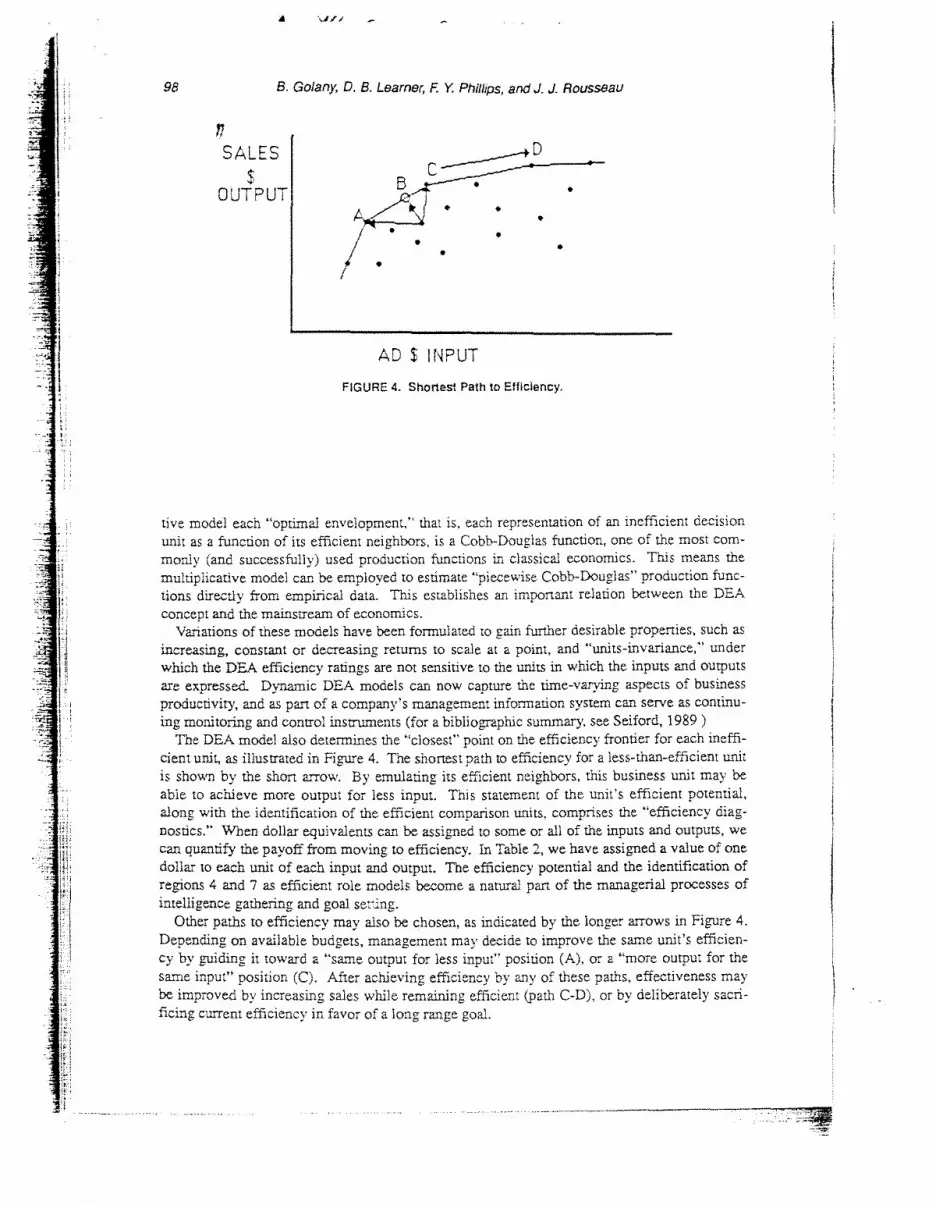
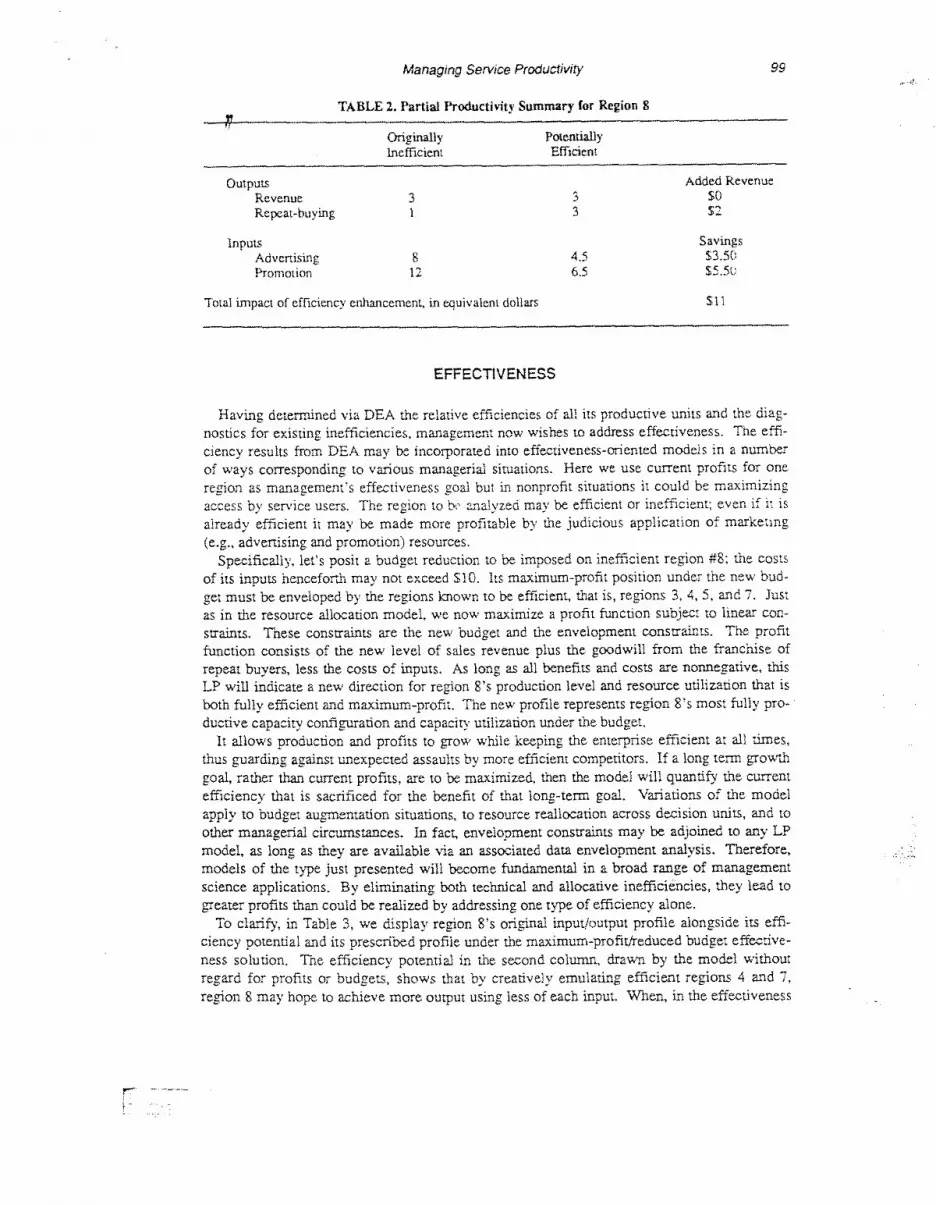
cient unit, as illustrated in Figure 4 . The shortest path to efficiency for a less-than-efficient unit is shown by the short arrow. By emulating its efficient neighbors, this business unit may be able to achieve more output for less input . This statement of the unit's efficient potential, along with the identification of the efficient comparison units, comprises the "efficiency diag-nostics." When dollar equivalents can be assigned to some or all of the inputs and outputs, we can quantify the payoff from moving to efficiency . in Table 2, we have assigned a value of one dollar to each unit of each input and output . The efficiency potential and the identification of regions 4 and 7 as efficient role models become a natural pan of the managerial processes of intelligence gathering and goal seting .
Other paths to efficiency may also be chosen, as indicated by the longer arrows in Figure 4 . Depending on available budgets, management may decide to improve the same unit's efficien-cy by guiding it toward a "sarne output for less input" position (A), or a "more output for the same input" position (C) . After achieving efficiency by any of these paths, effectiveness may be improved by increasing sales while remaining efficient (path C-D), or by deliberately sacri-ficing current efficiency in favor of a long range goal .
Managing Service Productivity
99
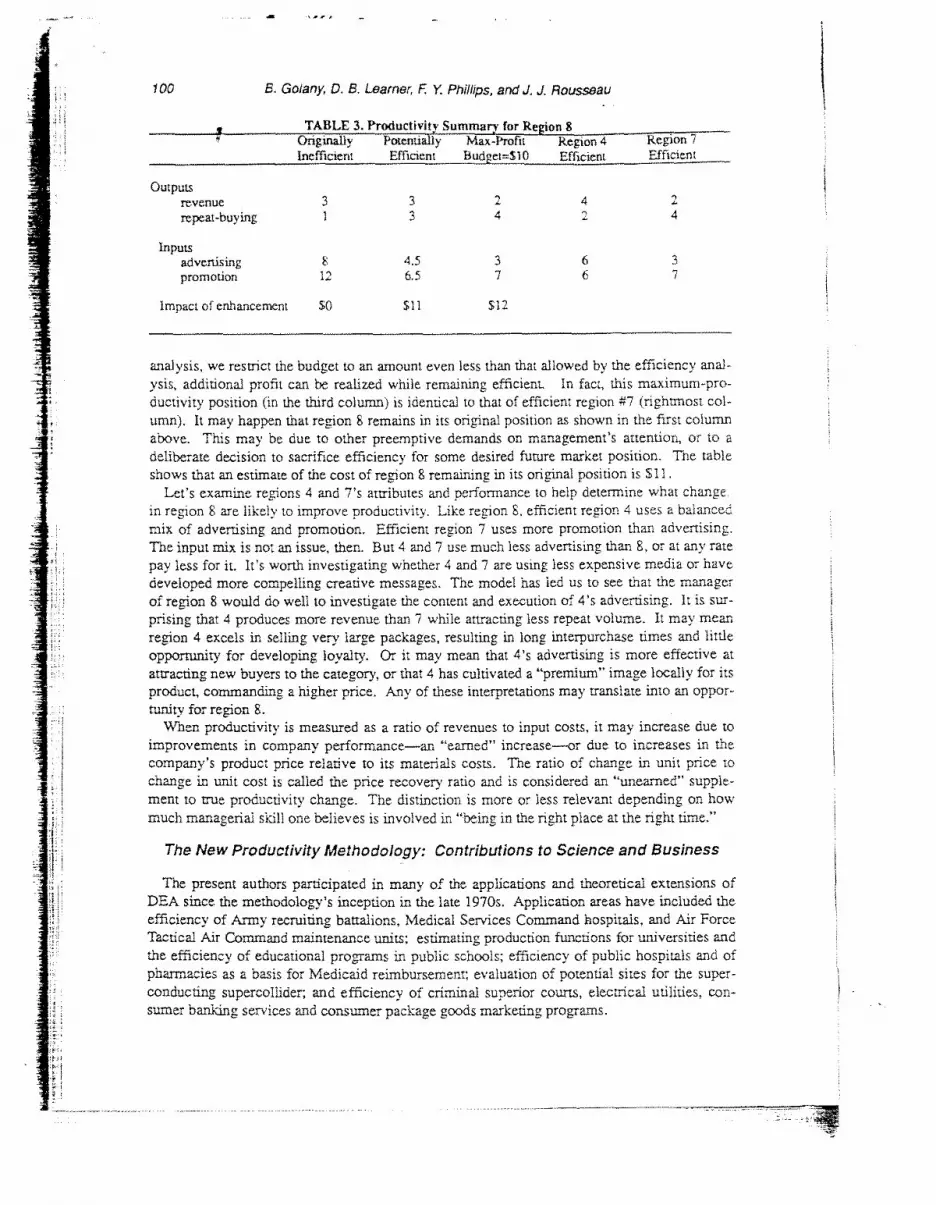
TABLE 2 . Partial Productivity Summary for Region 8
EFFECTIVENESS
Having determined via DEA the relative efficiencies of all its productive units and the diag-nostics for existing inefficiencies, management now wishes to address effectiveness . The effi-ciency results from DEA may be incorporated into effectiveness-oriented models in a number of ways corresponding to various managerial situations . Here we use current profits for one region as management's effectiveness goal but in nonprofit situations it could be maximizing access by service users . The region to lx° analyzed may be efficient or inefficient; even if ii is already efficient it may be made more profitable by the judicious application of marketing (e.g ., advertising and promotion) resources .
Specifically, let's posit a budget reduction to be imposed on inefficient region n8; the costs of its inputs henceforth may not exceed SIO . Its maximum-profit position under the new bud-get must be enveloped by the regions known to be efficient, that is, regions 3, 4, 5, and 7 . Just as in the resource allocation model, we now maximize a profit function subject to linear con-straints. These constraints are the new budget and the envelopment constraints . The profit function consists of the new level of sales revenue plus the goodwill from the franchise of repeat buyers, less the costs of inputs . As long as all benefits and costs are nonnegative, this LP will indicate a new direction for region 8's production level and resource utilization that is both fully efficient and maximum-profit . The new profile represents region 8's most fully pro-ductive capacity configuration and capacity utilization under the budget .
It allows production and profits to grow while keeping the enterprise efficient at all times, thus guarding against unexpected assaults by more efficient competitors . If a long term growth goal, rather than current profits, are to be maximized, then the model will quantify the current efficiency that is sacrificed for the benefit of that long-term goal . Variations of the model apply to budget augmentation situations, to resource reallocation across decision units, and to other managerial circumstances . In fact, envelopment constraints may be adjoined to any LP model, as long as they are available via an associated data envelopment analysis . Therefore, models of the tyTe just presented will become fundamental in a broad range of management science applications . By eliminating both technical and allocatioe inefficiencies, they lead to greater profits than could be realized by addressing one type of efficiency alone . To clarify, in Table 3, we display region 8's original input/output profile alongside its effi-
ciency potential and its prescribed profile under the maximum-profit/reduced budget effective-ness solution . The efficiency potential in the second column, drawn by the model without regard for profits or budges, shows that by creatively emulating efficient regions 4 and 7, region 8 may hope to achieve more output using less of each input . When, in the effectiveness
Originally Inefficient
Potentially Efficient
Output Added Revenue Revenue 3 3 S0 Repeat-buying 1 3 $2
Input Savings Advertising 8 4 .5 53.50 Promotion 12 65 $5.5U
Total impact of efficiency enhancement, in equivalent dollars $1l
100 B. Golany, D. B. Learner, F. Y. Phillips, and J. J. Rousseau
The present authors participated in many of the applications and theoretical extensions o.` DEA since the methodology's inception in the late 1970s . Application areas have included the efficiency of Army recruiting battalions, Medical Services Command hospitals, and Air Force Tactical Air Command maintenance units ; estimating production functions for universities and the efficiency of educational programs in public schools; efficiency of public hospitals and of pharmacies as a basis for Medicaid reimbursement ; evaluation of potential sites for the super-conducting supercollider; and efficiency of criminal superior courts, electrical utilities, con-sumer banking services and consumer package goods marketing programs .
analysis, we restrict the budget to an amount even less than that allowed by the efficiency anal-ysis, additional profit can be realized while remaining efficient In fact, this maximum-pro-ductivity position (in the third column) is identical to that of efficient region #7 (rightmost col-umn) . It may happen that region 8 remains in its original position as shown in the first column above. This may be due to other preemptive demands on management's attention, or to a deliberate decision to sacrifice efficiency for some desired future market position . The table shows that an estimate of the cost of region 8 remaining in its original position is $11 .
Let's examine regions 4 and 7's attributes and performance to help determine what change . is region 8 are likely to improve productivity . Like region 8, efficient region 4 uses a balanced mix of advertising and promotion . Efficient region 7 uses more promotion than advertising . The input mix is not an issue, then. But 4 and 7 use much less advertising than 8, or at any rate pay less for it. It's worth investigating whether 4 and 7 are using less expensive media or have developed more compelling creative messages. The model has led us to see that the manager of region 8 would do well to investigate the content and execution of 4's advertising . It is sur-prising that 4 produces more revenue than 7 while attracting less repeat volume . It may mear. region 4 excels in selling very large packages, resulting in long interpurchase times and little opportunity for developing loyalty. Or it may mean that 4's advertising is more effective at attracting new buyers to the category, or that 4 has cultivated a "premium" image locally for its product, commanding a higher price . Any of these interpretations may translate into an oppor-tunity for region 8 .
y When productivity is measured as a ratio of revenues to input costs, it may increase due to
improvements in company performance-an "earned" increase-or due to increases in the company's product price relative to its materials costs . The ratio of change it .. unit price to change in unit cost is called the price recovery ratio and is considered an "unearned" supple-ment to true productivity change . The distinction is more or less relevant depending or, how much managerial skill one believes is involved in "bring in the right place at the right time."
The New Productivity Methodology. Contributions to Science and Business
t TABLE 3 . Productivity Summary far Region 8 y
Outputs
Ongmally Inefficient
Potentially Efficient
Max-Profit Budget=SIO
Region 4 Efficient
Region 7 Efficient
revenue 3 3 2 4 2 repeat-buying 1 3 4 ., 4
Inputs advertising ¬ 4 .5 3 6 3 promotion 12 6.5 7 6 7
Impact of enhancement so $11 S12

Managing Service Productivity
101
Using these techniques, an organization can measure the efficiency of service earn unit an objective efficiency rating, within a meaningful segment of units, eye- ., when there is no agreement on the relative importance of outputs . Productivity and profitability are improved by improving the goal setting and performance evaluation processes . The method provides diagnosis of inefficiencies and possible paths toward improved efficiency. The cur-rent efficiency that may need to be sacrificed for long-term effectiveness may be quantified. All this now can be done in the context of reaitime management control . Decisions for budget-ing, for resource allocation and reallocation, for long versus short term emphasis, and decisions to gather competitive intelligence are supported . Through the envelopment constraints, DNA techniques link to and enhance traditional LP models for capital budgeting, scheduling and
product mix, and others . e efficiency frontier is a statement of the relationship between inputs and outputs that is
more managerially meaningful than the traditional regression relationships . The reduction of a large number of performance measures to a single efficiency score helps make sense of the flood of data that threatens to inundate today's managers . The DEA efficiency curve differs from the production function of microeconomics in ways
that imply greater realism, easier measurement, and hence greater potential for actual manage-ment use . The first among many differences is that it is not smooth, but piecewise linear or piecewise loglinear . The classical production function does not claim to lead to efficient posi-tions, except indirectly through prices . in fact, it is typically claimed in economic theory that attention may be restricted to efficient points, though the theorists do not specify how one can be sure of the points' efficiency. If the output represented by the classical function were a composite of severe; outputs, a common set of weights, usually dollars, would reduce these outputs to a single figure of merit . The DEA effiency curve does not use common weights ; each decision unit is assigned a unique set of "multipliers" for its inputs and outputs . The DEA production function is a vector function (many outputs) as opposed to the one-output function of microeconomie theory. The DEA efficiency frontier is "faceted" (see Figure 4, e.g ., A to C ; C to D, etc .) . The facets
are defined by neighboring efficient units, and every inefficient unit is enveloped by, and asso-ciated with, efficient neighbors within a single facet . (This is a mathematically necessary result of the linear programming formulation .) The DEA efficiency frontier is not an analytic function ; it must be computed via repeated constrained optimizations . As such, all variables are simultaneously adjusted to new optimum values with each alteration in the original data . This realistic "all things considered simultaneously" or muraris mutandis approach may be con-sidered a system-wide analysis . The traditional "all other things being equal," or ceteris paribus viewpoint, relies on the calculus notion of a partial derivative in which variation it, only one variable at a time is permitted with all other variables held constant, as in the concept of marginal cost . In addition, the classical function claims (or aims) to show the entire set of production possibilities for a single decision unit. The efficiency curve uses comparative or relative analysis to derive the frontier from the behavior of many units ; a unit's position is then flexible only in its immediate neighborhood . The subset of observed regions that are efficient define an empirical efficiency frontier, since they have, in the manner defined by DEA, the lowest technology coefficients in their respective ranges of production and input utilization . When applied to productivity analysis, DEA extends production function concepts from eco-
nomics and operationalizes them. It reconciles engineering efficiency, Pareto efficiency and Cobb-Douglas functions, and resolves some tension between "production function" and "activ-ity analysis" approaches in microeconomics . The former mode of analysis has allowed subsd-rution o .` factors, but is more conceptual than operational . The "activity analysis" approach is computable but suffers from "fixed coefficients ." In this article we have outlined the new methodology that combines the best features of these divergent microeeonomic methods .

102
B. Golany. D. B. Learner, F Y Phillips, and J. J. Rousseau
This new methodology challenges some conventions of statistics . According to these con-
venti¢lrs, the "spread" of a set of observations is interpreted as measurement error plus random
deviations that obscure an underlying "true" relationship . This relationship is further interpret-
ed as causal when it is between an output and one or more inputs in an input-output process .
Since random deviations from the overall relationship are of no intrinsic interest, observed
points have no meaningful individual identity . In the new productivity analysis, we presume
the normal fluctuations and measurement errors are small compared to the actual differences in
performance among observed decision making units. The empirically derived efficiency fron-
tier is interpreted as a statement of possibilities rather than of causation. Each unit is a separate
and interesting individual . DEA based effectiveness models extend traditional linear programming tools by integrating
allocative and technical efficiency considerations in a multiple-unit situation. The task of collecting and preparing data for productivity analysis can be foreign to a com-
pany, and often has a logic that goes crosswise to the company's cost accounting system .
Another potential hurdle is the necessity to develop a customer-oriented mentality that will lead to the assembly of customer satisfaction data and the willingness to act upon it .
Unequivocal commitment is needed at all levels of an organization if it is to benefit from the
modem productivity improvement programs we envision (Kendrick, 1984) . The new productivity analysis is timely as well as powerful . DEA-based methods recognize
and take advantage of diversity by considering each decision unit as a unique entity, allowing
flexible evaluations through individualized assessments, then proceeding to a market segmen-
tation step . This is appropriate in an era of custom and niche marketing, and we have placed
this approach in contrast to the leveling methods of statistics that date from the age of mass
production and mass markets. The idea of discretionary inputs at the subsidiary unit level rec-
ognizes these units' latitude for decision making, as must be in today's decentralized organiza-
tions . Finally, the new analysis takes advantage of and furthers trends in computing and statis-
tics, by solving an LP for each observed unit on at . ongoing basis and by using and extending
the techniques of exploratory data analysis . The rapid diffusion of these methods and the many
ongoing applications nationwide hold the promise of a renewal in services productivity .
REFERENCES
American Productivity Center (1988) . Business Week_ Chimes, A., Cooper, W.W., & Rhodes, E. (November, 1978). Measuring the efficiency of decision making units .
European Journal of Operations Research, 2 . 6.429-444 . Charnes, A., Cooper, W.W., Golany, B ., Seiford, L., & Smtz, J . (1985) . Foundations of data envelopment analysis for
Pareto-Koopmans efficient empirical production funetiors.lournal cl Econornetrics, 30,91-107 . Chart es, A., Cooper, A.A., Seiford, L., & Stutz, J, (August, 1983). Invariant muluplicative efficiency and piecewm
Cobb-Douglas envelopmems. Operations Research Letters, 2, 3, l01-103 . Ferret :, M.J . (1957). Tnc measurement of productive efficiency. Journa! of the Royal Statistical Society, Series A, 12G,
3, 25-290. Kendrick, J.W. (1984). Improving company productivity . Baltimore: Ttte Johns Hopkins University Press. Seiford, L. (19861 . A bibliography of data envelopment analysis . Working Paper, College of Business, Amherst, MA: The University of M&ssachrueus at AmhersL
(1987, June 29) . Services hurt by technology : Productivity is declining. New York Tunes, pp. DI Smith, AD., & 1Tttcheas, D.KWN . (1985). Productivity in the distribution trades . Cambridge: Cambridge University Press.