a context aware self-adapting algorithm for managing the energy efficiency of it service centres
TRANSCRIPT
A CONTEXT AWARE SELF-ADAPTING ALGORITHM FOR
MANAGING THE ENERGY EFFICIENCY OF IT SERVICE CENTRES
Tudor Cioara1, Ionut Anghel
1, Ioan Salomie
1, Georgiana Copil
1, Daniel Moldovan
1 and Barbara Pernici
2
1Technical University of Cluj-Napoca, Computer Science Department, Cluj-Napoca, Romania
{tudor.cioara, ionut.anghel, ioan.salomie, georgiana.copil, daniel.moldovan}@cs.utcluj.ro
2 Politecnico di Milano, Dipartimento di Elettronica e Informazione, Milano, Italy
ABSTRACT
This paper addresses the problem of run-time management of a service centre
energy efficiency by using a context aware self-adapting algorithm. The algorithm
considers the service centre current context situation and predefined Green/Key
Performance Indicators (GPI/KPI) to adapt and optimize the service centre energy
consumption to the incoming workload. The service centre energy performance
context situation is obtained by collecting service centre current context data
related to the business applications scheduled to run on service centre resources,
service centre IT computing resources and the service centre facilities. A
reinforcement learning approach is used to decide the best sequence of actions to
be executed to bring the service centre resources as close as possible to a GPI and
KPI compliant state while minimizing the energy consumption.
Keywords: energy efficiency, service centre, context aware computing, self-
adaptive algorithm.
1 INTRODUCTION AND RELATED WORK
Over the last years the energy efficiency
management of IT processes, systems and service
centres has emerged as one of the most critical
environmental challenges to be dealt with. Since
computing demand and electricity price is
continuously rising, energy consumption of IT
systems and service centres is expected to become a
priority for the industry. Nowadays, service centre
electricity consumption accounts for almost 2% of
the world electricity production and their overall
carbon emissions [1], [2]. The GAMES (Green
Active Management of Energy in IT Service
Centres) [3] research project aims at developing a set
of innovative methodologies, metrics, services and
tools for the active management of energy efficiency
of IT service centres. The GAMES vision is to create
a new generation of Green and Energy Aware IT
service centres by designing energy efficient service
centres and also by managing at run-time the service
centre energy efficiency.
This paper addresses the problem of run-time
managing the service centre energy efficiency by
proposing a context aware self-adapting algorithm for
adjusting the resources usage to the incoming
workload. The service centre context consists of the
following categories of energy / performance data: (i)
data related to business applications to be executed on
the service centre IT computing resources, (ii) data
related to the workload and energy consumption of
the service centre IT computing resources and (iii)
ambient data related to the service centre
environment. The self-adapting algorithm implements
the four phases of a MAPE control loop: Monitoring,
Analyzing, Planning and Execution. In the
monitoring phase, the service centre energy /
performance context data is collected and represented
in a programmatic manner by using our RAP context
model [4]. In the analyzing phase, the service centre
Green and Key Performance Indicators (GPIs/KPIs)
are evaluated on the service centre energy
performance context instance and compared against
their predefined values. If the GPIs/KPIs are not
fulfilled in the planning phase a reinforcement
learning approach is used to generate the best
sequence of actions to be taken in the execution phase
for bringing the service centre as close as possible to
a GPIs/KPIs compliant state. The adaptation
algorithm decides on two types of adaptation actions:
consolidation actions and DPM (Dynamic Power
Management) actions. The consolidation actions are
executed for balancing the service centre workload in
an energy efficient manner. DPM actions identify the
service centre over-provisioned resources targeting to
set them into low power states.
In the literature, the development of energy-aware
computing systems is proposed in [5]. Different
energy aware techniques based on integer
programming, genetic algorithms or heuristics have
been proposed in the last years [6], [7], [8], [9]. A
systematic analysis of cost issues in the design of
hardware and network systems is presented in [10]
while a cost-oriented design of data centres in which
Special issue of The Romanian Educational Network - RoEduNet
UbiCC Journal, Volume 6 619

applications are allocated with a fixed number of tiers
for satisfying response time requirements is proposed
in [11].
To reduce energy consumption, autonomic
techniques have been developed to manage workload
fluctuations [12] and to determine the optimum
trade-offs between performance and energy costs,
mainly by switching servers on and off. It has been
shown that by implementing Dynamic Voltage
Scaling (DVS) mechanisms (i.e., reduction of CPU
frequency), significant energy reduction can be
obtained [13], [14]. Self-* algorithms for ad-hoc
networks, in which the connections between nodes
are added / removed for energy efficiency purposes
are proposed in [15], [16]. An agent based solution
for power management in complex service centres
comes from the IBM researchers R. Das and J. O.
Kephart [17]. The authors use virtualization and
load-balancing techniques for efficiently and energy
aware management of service centre’s resources. In
[18], a self-adaptive solution for optimizing and
balancing performance and energy consumption for
RAID storage is proposed. This technique groups the
available data into hot (frequently accessed data) and
cold data. Hot data is kept on an active disk group
while the cold data is kept in an inactive disk group
which spins at low speed in order to save energy.
Energy–aware provisioning and load dispatching
algorithms that take into consideration the energy /
performance models and user experience are
designed for servers that host a large number of long-
lived TCP connections [19]. An architecture which
supports the design and programming of self-
optimizing algorithms for data locality and access in
distributed systems is considered in [20]. Based on
application's run-time behaviour, the data access and
distribution is re-modelled with respect to a set of
predefined energy performance objectives.
The rest of the paper is organized as follows:
Section 2 details each MAPE phase of our context
aware self-adapting algorithm; Section 3 shows a
how the context aware self-adapting algorithm can
be used to manage the energy efficiency of a service
centre while Section 4 concludes the paper.
2 THE CONTEXT AWARE SELF-
ADAPTING ALGORITHM
To define the self-adapting property for a
context aware system we have used three main
situation calculus concepts: (1) the situation concept
also referred as system situation or context situation,
represents the state of a context aware system
(system’s self and execution environment) at a
moment of time, (2) the set of conditions concept,
represents a set of rules that defines the possible
system-context interactions and are used to guide and
control the system execution (3) the action concept,
represents the adaptation actions or actions plans that
are executed by the system to enforce the set of
conditions in a specific context situation. We define
the self-adapting property for a context aware system
as a function, which associates to each context
situation that fails to fulfil the prescribed set of
conditions, an adaptation action plan, that should be
executed in order to re-enforce the set of conditions.
Fig. 1 presents the proposed self-adapting
algorithm for context aware systems. The algorithm
is based on a control feedback loop with the
following MAPE phases: (i) the Monitoring Phase –
collects raw data about the system’s self and
execution environment and uses it to construct and
represent the system context situation in a
programmatic manner (lines 7-9), (ii) the Analysis
Phase – analysis the context situation in order to
detect significant abnormal changes (lines 10-11),
(iii) the Planning Phase – decides and selects the
appropriate adaptation action plan to be executed
(lines 12-24), (iv) the Execution Phase – executes
the selected action plan (lines 25-26).
Figure 1: The self-adapting algorithm.
The following sub-sections detail the first three
phases of the self-adapting algorithm. The execution
phase is trivial and is not further detailed.
2.1 The Monitoring Phase
The goal of the self-adapting algorithm
monitoring phase is to collect the system’s self and
execution environment raw context data and to
construct / represent the system context situation in a
programmatic manner. The system’s self raw context
data refer to the system internal state and is used to
assure the system’s self-awareness. This kind of
context data is usually gathered using low level
system calls, logging or life cycle events. The
Special issue of The Romanian Educational Network - RoEduNet
UbiCC Journal, Volume 6 620

system’s execution environment raw context data are
used to ensure the system environmental awareness.
This kind of context data is captured using sensor
networks or intelligent devices with the goal of
assuring the system context awareness.
The system’s self and execution environment
context data collected from various sources is
represented in heterogeneous formats and difficult to
interpret and analyze. There is an evident need for
providing an integrated, uniform and semantically
enhanced context data representation model that can
be automatically processed and interpreted at run-
time. To solve these problems we have used our
RAP (Resources, Actions and Policies) context
model defined in [4] to represent the system’s
context situation in a programmatic manner. The
RAP model defines two types of context information
representations: (i) set based, used to determine the
context changes and (ii) ontology based, used to infer
new context information by means of reasoning and
learning algorithms.
In the set based approach, the context information
is modelled as a triple, C = <R, A, P >, where R is
the set of context resources that provide raw data
about the system’s self and execution environment,
A is the set of adaptation actions which are executed
to enforce system execution guiding rules and P is a
set of policies which define the rules that guide the
system execution. In the ontology-based
representation, the relationships between the context
model sets are modelled in a general purpose context
ontology core. The domain specific concepts are
represented as sub trees of the core ontology by
using is-a type relations. A RAP context model
instance represents a context situation and contains
the values of the RAP context model sets elements in
a specific moment of time.
2.2 The Analysis Phase
In the analysis the context policies that guide the
system execution are evaluated for the current
context situation with the goal of identifying those
context situations in which the rules are broken. The
context policies are represented in XML and
automatically converted in SWRL for evaluation
using our policy representation / evaluation model
proposed in [22]. For measuring the degree of
fulfilling the context policies in a context situation,
we have defined the concept of context situation
entropy (ES) and its associated threshold (TE). The
next sub-sections present a short overview of our the
policy representation / evaluation model and
introduce the context situation entropy concept.
2.2.1 The context policy representation / evaluation model
The context policies are represented into XML
using three elements: Reference, Subject and Target.
The XML Reference element represents a
collection of context resources (see Fig. 12 for an
example). Each Reference has a unique name that
can be referred from all the other XML elements of
the policy. The reference resources collection is
defined by applying three types of restrictions:
domain restriction (location as criteria), type
restriction (context resource class as criteria) and
property restriction (context resource properties other
than location as criteria).
The XML Subject element uses an Reference
name to identify the context resources collection on
which the policy imposes restrictions. The Subject
element has two children: (i) EvaluationTrigger
XML element that contains a set of possible events
that may trigger the policy evaluation and (ii)
EvaluationCondition XML element containing a set
of conditions for which the policy is enforced.
The XML Target element represents a collection
of context resources for which the goals specified by
the PolicyGoals XML element applies. The
PolicyGoals element is used to determine the action
plan that has to be executed to enforce the policy.
To be evaluated, the policies are automatically
converted into SWRL (Semantic Web Rule
Language) rules and injected into the RAP specific
context model instance ontology. The SWRL rules
are used to reason about RAP context model instance
ontology individuals in terms of ontology classes and
properties. Rules are written in the form of an
implication between an antecedent (body) and a
consequent (head).
The process of obtaining the SWRL rule
antecedent from the XML policy description consists
from two phases: (i) the generation of the SWRL
atoms used to identify the specific context model
instance ontology individuals involved in the
reasoning process and (ii) the transformation of the
XML policy evaluation condition into SWRL rules.
The SWRL rule consequent contains a SWRL
atom that sets the EvaluationResultProp attribute to
true for all RAP context model Policy class
individuals, which correspond to the XML broken
policies.
2.2.2 The context situation entropy The system context situation entropy measures
the level of system’s self and execution environment
disorder by evaluating the degree of fulfilling the
context policies. If the evaluated system context
situation entropy is below a predefined threshold TE,
then all the policies are fulfilled and adaptation is not
required. Otherwise the system must execute
adaptation actions to bring the entropy below TE. The
entropy for a context situation is:
∑ ∑ (1)
where:
Special issue of The Romanian Educational Network - RoEduNet
UbiCC Journal, Volume 6 621

- pwi
is the weight of the policy i, and
represents the importance of the policy in the
context
- rwij is the weight of the system resource i in
the policy j. The resource weight reflects the
system resource importance for the policy. If
a policy imposes no restrictions to a resource
then the weight of the resource for that
policy is zero.
- vij is the deviation between the system
resource j recorded value and the policy i
accepted value.
We also define the entropy contribution (Ei) of a
policy:
Ei pwi∑ riij vij (2)
Taking into account the system toleration to
changes, we have defined two types of entropy
thresholds: restrictive threshold and relaxed
threshold. In the first case, we define the threshold
TE = 0 as lowest entropy value. This means that,
whenever a policy-imposed restriction is broken, the
self-healing algorithm is triggered. In the second
case, for each policy we define an accepted entropy
contribution value Ei and compute current threshold
TE as in (3). For the relaxed threshold, broken
policies are tolerated if their entropy contribution is
lower than the accepted value.
E ∑ pwi vij ( Ei (3)
2.3 The Planning Phase
This phase deals with deciding and planning the
actions that need to be taken in order to enforce the
broken policies. The phase starts with identifying
previously encountered similar context situations in
which the same policies were broken (Section 2.3.1).
If a similar situation is found, the same action plan is
selected and executed, otherwise a new action plan is
constructed using a reinforcement learning based
approach (Section 2.3.2) .
2.3.1 Equivalent System Context Situations To identify and classify similar system context
situations we have defined the equivalence context
situation class concept and an equivalence relation.
Two context situations are equivalent if both fulfil
and break the same policies. To classify the system
context situations in equivalence classes we use the
information system theory. An information system is
defined as an association (W, Atr) where: W is a
non-empty finite set of objects and Atr is a non-
empty finite set of attributes. For this association a
function af that assigns to every object in W, a value
for each attribute in Atr, can be defined. For a
context aware system, the non-empty set of objects
W is mapped onto the set of context situations S
while Atr is mapped to the set of policies P. We
define a function, Fsk, that assigns to every system
context situation sk, a list of values returned by
evaluating all the defined policies in that context
situation. Two system context situations s1 and s2
belong to the same equivalence class if and only if
Fs1 and Fs2 generate the same lists of policy
evaluation values (Table 1).
Table 1: Determining the equivalence classes for the
system context situations.
As a result, the equivalence class is defined as the
set of system context situations in which the same
adaptation action plan a is executed (we use the
notation Sa, where a is the adaptation action plan).
2.3.2 Adaptation actions selection The action selection phase of the self-adapting
algorithm considers the broken policies one by one,
ordered by their contribution to the overall entropy
(see relation 2). The action selection phase can be
divided in three main steps (Fig. 2): (1) select the
policy with the highest contribution to entropy (line
9), (2) for the selected policy, determine the set of
affected system resources and organize them into
inter-independent resource groups (IIRGs) (line 10)
and (3) use reinforcement learning (if necessary) to
generate the best action sequence to be taken in order
to bring the IIRG’s resources as close as possible to a
policy compliant state (lines 11-15). The last two
steps of the action selection phase are detailed in the
following subsections.
Figure 2: The actions selection phase procedure
pseudo-code.
Special issue of The Romanian Educational Network - RoEduNet
UbiCC Journal, Volume 6 622
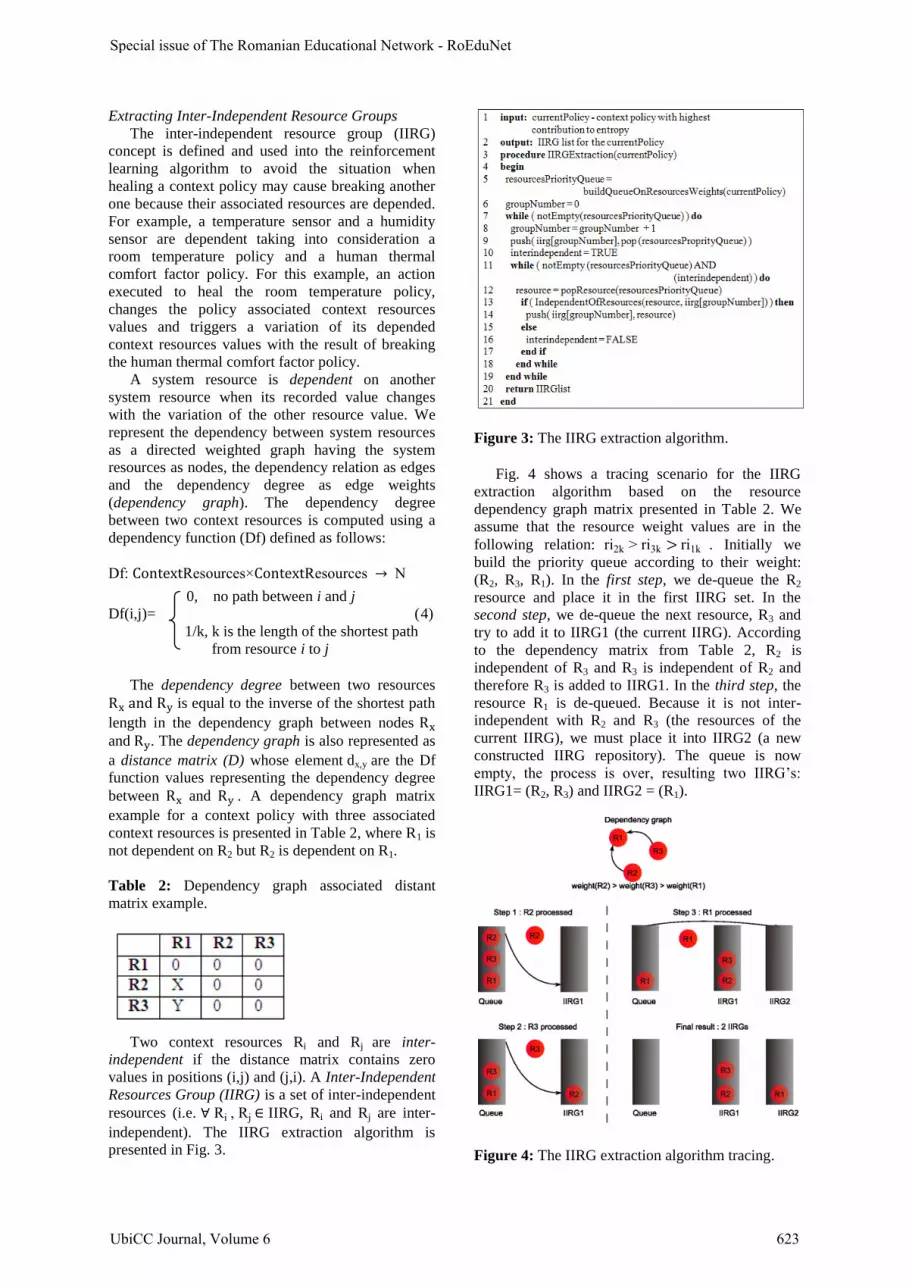
Extracting Inter-Independent Resource Groups
The inter-independent resource group (IIRG)
concept is defined and used into the reinforcement
learning algorithm to avoid the situation when
healing a context policy may cause breaking another
one because their associated resources are depended.
For example, a temperature sensor and a humidity
sensor are dependent taking into consideration a
room temperature policy and a human thermal
comfort factor policy. For this example, an action
executed to heal the room temperature policy,
changes the policy associated context resources
values and triggers a variation of its depended
context resources values with the result of breaking
the human thermal comfort factor policy.
A system resource is dependent on another
system resource when its recorded value changes
with the variation of the other resource value. We
represent the dependency between system resources
as a directed weighted graph having the system
resources as nodes, the dependency relation as edges
and the dependency degree as edge weights
(dependency graph). The dependency degree
between two context resources is computed using a
dependency function (Df) defined as follows:
Df Resources Resources →
0, no path between i and j
Df(i,j)= (4)
1/k, k is the length of the shortest path
from resource i to j
The dependency degree between two resources
is equal to the inverse of the shortest path
length in the dependency graph between nodes
and . The dependency graph is also represented as
a distance matrix (D) whose element dx,y are the Df
function values representing the dependency degree
between and . A dependency graph matrix
example for a context policy with three associated
context resources is presented in Table 2, where R1 is
not dependent on R2 but R2 is dependent on R1.
Table 2: Dependency graph associated distant
matrix example.
Two context resources Ri and Rj are inter-
independent if the distance matrix contains zero
values in positions (i,j) and (j,i). A Inter-Independent
Resources Group (IIRG) is a set of inter-independent
resources (i.e. Ri Rj IIRG, Ri and Rj are inter-
independent). The IIRG extraction algorithm is
presented in Fig. 3.
Figure 3: The IIRG extraction algorithm.
Fig. 4 shows a tracing scenario for the IIRG
extraction algorithm based on the resource
dependency graph matrix presented in Table 2. We
assume that the resource weight values are in the
following relation: ri k ri k ri k . Initially we
build the priority queue according to their weight:
(R2, R3, R1). In the first step, we de-queue the R2
resource and place it in the first IIRG set. In the
second step, we de-queue the next resource, R3 and
try to add it to IIRG1 (the current IIRG). According
to the dependency matrix from Table 2, R2 is
independent of R3 and R3 is independent of R2 and
therefore R3 is added to IIRG1. In the third step, the
resource R1 is de-queued. Because it is not inter-
independent with R2 and R3 (the resources of the
current IIRG), we must place it into IIRG2 (a new
constructed IIRG repository). The queue is now
empty the process is over resulting two IIRG’s
IIRG1= (R2, R3) and IIRG2 = (R1).
Figure 4: The IIRG extraction algorithm tracing.
Special issue of The Romanian Educational Network - RoEduNet
UbiCC Journal, Volume 6 623

Determining the Best Action Sequence
The best actions sequence to be taken for a
certain IIRG is found by merging the best sequences
of actions determined for each IIRG resources. For
an IIRG resource, the sequence of actions is
computed through a reinforcement learning
algorithm, by using a policy iteration technique (see
Fig. 5).
Figure 5: The reinforcement learning algorithm.
The learning process considers all possible
system context situations and builds a decision tree
by simulating the execution of all available actions
for each system context situation. A tree node
represents a system context situation. A tree path
between two nodes A and B defines a sequence of
actions which, executed on the system context
situation represented by the node A, generates a new
system context situation represented by the node B.
The reinforcement learning process uses a reward /
penalty approach to find the best sequence of actions
that the system may execute in a given context
situation. In our case, the minimum entropy path in
the reinforcement learning decision tree represents
the best sequence of actions.
The learning process may generate different type
of results discussed below (as shown in Fig. 6).
Case 1: The algorithm finds only a possible
system context situation that has its entropy lower
than the predefined threshold. In this case the
sequence of actions that lead to this context situation
is selected and the search is stopped.
Case 2: The current system context situation
entropy is higher than the threshold, but smaller than
the minimum entropy determined so far. We replace
the minimum entropy with the new entropy and
continue with the search process.
Case 3: The current entropy is higher than both
the threshold and the minimum entropy; the
reinforcement learning algorithm continues the
search process. If all exercised paths of the decision
tree are cycles, the algorithm stops and chooses the
path leading to a state with the minimum entropy.
Figure 6: Reinforcement Learning Process Tracing.
3 SERVICE CENTER ENERGY AWARE
ADAPTATION CASE STUDY
The proposed self-adapting algorithm for context
aware systems has been used to manage the energy efficiency of a service centre. We have considered a service centre with the following IT resources (see Fig. 7): (i) a server cluster composed from three physical servers on which virtualized applications are executed, (ii) an external shared storage server and (iii) a set of sensors and facilities interconnected through a sensor network which controls the service centre environment. The self-adapting algorithm resides on a Service Centre Control Unit.
Figure 7: The test case service centre resources.
We also consider the service centre workload is
composed of virtualized activities annotated with Quality-of-Service (QoS) requirements.
Table 3: QoS annotations of the virtualized activities.
Act.
No.
Activity KPI
Cores
No.
CPU
Frequency
Memory Storage
1 4 2000 MHz 2000 MB 520 MB
2 4 1000 MHz 2000 MB 600 MB
3 3 1200 MHz 750 MB 512 MB
4 4 2000 MHz 1000 MB 400 MB
5 1 600 MHz 1000 MB 512 MB
6 1 1200 MHz 500 MB 600 MB
Special issue of The Romanian Educational Network - RoEduNet
UbiCC Journal, Volume 6 624

Table 3 presents the QoS annotations of the virtualized activities considered in our case study. We use virtualization as an abstraction level, because it allows us to manage the activities in a uniform manner and enables activity migration.
The hardware configuration each service centre physical server part of the server cluster together with the configuration of the external shared storage server is presented in Table 4. The workload virtualized activities are kept on the external shared storage because: (i) the virtual machines hypervisors requires that all virtual machines reside on a ISCSI-3 compatible shared storage to enable real-time migration, (ii) the virtualized activity migration time is significantly reduced and (iii) the un-deployed virtual machines are accessible from all service centre servers cluster.
Table 4: The case study service centre hardware resources.
Name Cores
No.
CPU
Freq.
Memory Storage Power
source
Server1 8 2930 MHz
6144 MB - 500 W
Server2 8 2930
MHz
6144 MB - 500 W
Server3 8 2930 MHz
6144 MB - 500 W
Storage
Server
2 2400
MHz
2048 MB 600 GB 350 W
The service centre ambient monitoring
infrastructure components (sensors and actuators)
and their range of values / available actions are
shown in Table 5. The actuators are used to control
the service centre ambient characteristics and to
enact the adaptation actions.
Table 5: The service centre ambient monitoring
infrastructure components.
Infrastructure
Component
Type Range of values /
Available actions
Temperature Sensor [-20, 40] ℃ / -
Humidity Sensor [0, 100] % / -
Light Sensor {ON, OFF} /-
Air Conditioning Unit Actuator - / {Decrease by 5℃,
Increase by 2 ℃}
Humidity Controller Actuator - / {Increase by 3 %,Decrease by 3 %}
Light Controller Actuator - / {Turn ON, Turn OFF}
In the following sub-sections each of the self-
adapting algorithms MAPE phases are used to optimize the energy consumption of the test case service centre. For each MAPE phase, the involved hardware/software resources and their interaction are presented and discussed.
3.1 The Monitoring Phase
The goal of the self-adapting algorithm
monitoring phase is to collect the service centre
energy/performance related context data (section
3.1.1) and to update/represent the service centre
context, in a programmatic manner (Section 3.1.2).
We have identified the following categories of service
centre context data: (i) business data related to the
application which is executed on the service centre IT
computing resources, (ii) current workload and
energy consumption data of the service centre IT
computing resources and (iii) ambient data related to
the service centre environment.
3.1.1 The Service Centre Monitoring Infrastructure
In this section we present the software/hardware
monitoring infrastructure the monitoring
infrastructures used to gather the current workload /
energy consumption data and environment data.
Regarding the business context data they are
gathered from the application QoS requirements and
therefore no monitoring infrastructure is needed. To accurately capture the workload and energy
consumption data of the service centre IT computing resources, we have adapted and used the monitoring architecture recommended by The Standard Performance Evaluation Corporation [24] which defines the following monitoring components (see Fig. 8): System Under Test (SUT), Software Driver, Monitor, Measurement Server.
Figure 8: Workload and energy consumption
monitoring infrastructure.
The System Under Test represent the service centre IT computing resources whose workload and energy consumption data is collected. The configuration of each SUT is shown in Table 4. The Software Driver represents the virtualized activities that are used to stress the service centre servers. The Monitor represents a third-party software component that registers the workload and energy consumption data of the U ’s. In our test case the agios monitoring framework [25] has been used. Nagios defines two major components: (i) Nagios Software Server, runs on the Measurement Sever and collects data about the SUTs and (ii) Nagios Software Daemons, run on each monitored SUT and send data to the Nagios Software Server. The Measurement Server represent the physical system on which the
Special issue of The Romanian Educational Network - RoEduNet
UbiCC Journal, Volume 6 625

monitor and driver resides, in our case the Service Centre Control Unit.
The service centre context ambient data is
collected through the Wi-microSystem wireless
sensor network [26]. The sensor collected data is
encoded as MIDI messages which are real-time
wirelessly transmitted, through Bluetooth waves, to
the Measurement Server for analysis. The Bluetooth
receiver, located on the Measurement Server, is
mapped as a Virtual Serial Port (VSP). The MIDI
message information is extracted using the Microsoft
Windows API multimedia operations and published
through web services (see Fig. 9).
Figure 9: Environment monitoring infrastructure.
For simulation purposes, we have implemented a
sensor Random Manipulation Mechanism (RMM),
which assigns values to the service centre sensors
using a predefined pattern (or random values). The
mechanism is used to generate context situations in
which adaptation is needed (i.e. the temperature and
humidity in the service centre are above a predefined
limit).
3.1.2 Context Data Representation To represent the service centre context data we
have developed the Energy Aware Context Model
(EACM model). The EACM model was constructed
by mapping the RAP context model onto the service
centre energy efficiency domain aiming at
identifying / classifying the specific elements that
populate the RAP context model sets (see Fig. 10).
Context Resources (R). Three types of context
resources that generate/collect context data were
identified in service centres: (1) Service Centre IT
Facility Context Resources (Facility Resource for
short), (2) Service Centre IT Computing Context
Resources (Computing Resource for short) and (3)
Business Context Resources (Business Resource for
short). Facility Resources are physical or virtual
entities which provide or enforce the service centre
ambient properties. Passive Resources capture and
store service centre ambient data (e.g. sensors), while
Active Resources execute adaptation actions to
modify the service centre ambient properties (e.g.
actuators). Computing Resources are physical or
virtual entities which supply context data related to
service centre actual workload and performance
capabilities. A Computing Resource is characterized
by the list of energy consuming states property. For
example, an Intel Core i7 [email protected] processor has
12 P-states varying from 1197Mhz (40%) up to
2926Mhz (100%). The Computing Resources are
classified as Simple and Complex. A Simple
Computing Resource provides only one atomic
performance property throughout its lifecycle. For
example, CPU energy-related performance is
characterized only by its frequency value. A
Complex Computing Resource is composed from a
set of Simple Resources and is characterized by a set
of performance properties. For example the server
energy-related performance is expressed by means of
its component’s energy-related performance
properties such as spindle speed for HDD or clock
rate for CPU. A Business Resource is a virtual entity
which provides information about the application,
executed on the service centre, QoS requirements.
Figure 10: The EACM model ontology
representation.
Context Actions (A). Three types of service
centre adaptation actions are identified by
considering the category of context resources with
which they are enforced: (i) IT Computing Resources
Adaptation Actions and (ii) IT Facility Resources
Adaptation Actions and (iii) Application Adaptation
Actions. IT Facility Resources Adaptation Actions
(e.g. adjust the room temperature or start the CRAC)
are enforced through the Active Resources. IT
Computing Resources Adaptation Actions are
executed to enforce the set of predefined GPI and
KPI indicators on the Computing Resources. We
have defined two types of adaptation actions:
Consolidation Actions and Dynamic Power
Management Actions (DPM). Consolidation Actions
aim at identifying the Computing Resources for
which the workload is inefficiently distributed from
the energy efficiency point of view and balancing
workload distribution in an energy efficient manner.
DPM Actions aim at determining the over
provisioned resources with the goal of putting them
into low power states for minimizing energy
consumption. Application Adaptation Actions are
executed on the service centre applications activities
(such as application redesign for energy efficiency).
Special issue of The Romanian Educational Network - RoEduNet
UbiCC Journal, Volume 6 626

Context Policies (P). The constraints regarding
the service centre energy / performance are modelled
through a predefined set of GPI/KPI policies. We
have identified and modelled three categories of
GPI/KPI policies: (i) Environmental Policies,
imposing restrictions about the service centre
ambient conditions, (ii) IT Computing Policies,
describing the energy/performance characteristics of
the service centre that and (iii) Business Policies,
describing the rules imposed by the business for the
application execution. Table 6 shows the set of
GPI/KPI policies defined and used in the current
case study.
Table 6: Service centre energy/performance and
environmental policies.
Environmental
Policy
Accepted values
Temperature And Humidity
℃ ℃
Light
{
Energy/Performanc
e Policy
Accepted values
Workload values for
Server 1
Workload values for
Server 2
3.2 The Analysis Phase
In this phase GPI/KPI policies are evaluated to
determine if they are fulfilled in the current service
centre context situation, represented by the EACM
model ontology (see Fig. 11).
Figure 11: GPI/KPI polices evaluation process.
The rest of this section presents the analysis
process steps taken to determine if the energy /
performance policy for SUT1 is fulfilled in the
current context situation:
1. The Server 1 energy / performance policy is
represented in XML according to our policy model
detailed in [22] (see Fig. 12).
Figure 12: SUT1 energy / performance policy XML
representation.
2. The XML of the energy / performance policy
for SUT1 is converted into SWRL rules using our
XML to SWRL conversion model presented in [22]
(see Fig. 13 for the SWRL representation).
Figure 13: Server 1 energy / performance policy
SWRL representation.
3. The Server 1 energy / performance policy
SWRL representation is injected in the service centre
context situation ontology representation and
evaluated using the Pellet [21] reasoner.
4. The evaluation result is used to calculate the
entropy of the current service centre context situation
(relation 1). In our test case the entropy threshold TE
is set to 1 and the GPI/KPI related policies can be
evaluated to true or false (1 / 0).
5. If the obtained entropy is higher than TE, the
planning phase is fired; otherwise nothing happens
because no adaptation is needed.
3.3 The Planning Phase
The phase goal is to decide and select the actions
that need to be taken in order to enforce a broken
GPI.KPI policy. The phase starts with identifying the
previously encountered similar context situations in
which the same policies had been broken. If a similar
situation is found, the same adaptation action is taken.
Otherwise, the sequence of actions is determined
through a reinforcement learning algorithm, by using
a policy iteration technique. The reinforcement
learning process considers all possible service centre
context situations and builds a decision tree by using
SimpleResource(?Server)
^ resourceID(?Server, "Server1") ^ resourceID(?CPU, "Server1_CPU")
^ currentWorkload(?CPU, ?currentCPUWorkload)
^ swrlb:greaterThanOrEqual(?currentCPUWorkload, 600)
^ swrlb:lessThanOrEqual(?currentCPUWorkload, 2065)
^ resourceID(?Memory, "Server1_Memory")
^ currentWorkload(?Memory, ?currentMEMWorkload)
^ swrlb:greaterThanOrEqual(?currentMEMWorkload, 1000)
^ swrlb:lessThanOrEqual(?currentMEMWorkload, 4000)
^ SimpleResource(?CPU)
<Reference Name="Server1 Policy">
<Restrictions Property="Server" Value="Server1" Operator="resourceID"/>
<PropertyRestriction Property="associated-resource" Operator="Cpu">
<PropertyRestriction Property="workload" Operator=">" Value="600" />
<PropertyRestriction Property="workload" Operator="<" Value="2065" />
</PropertyRestriction>
<PropertyRestriction Property="associated-resource" Operator="Memory">
<PropertyRestriction Property="workload" Operator=">" Value="1000" />
<PropertyRestriction Property="workload" Operator="<" Value="4000" />
</PropertyRestriction>
</Restrictions> </Reference
Special issue of The Romanian Educational Network - RoEduNet
UbiCC Journal, Volume 6 627
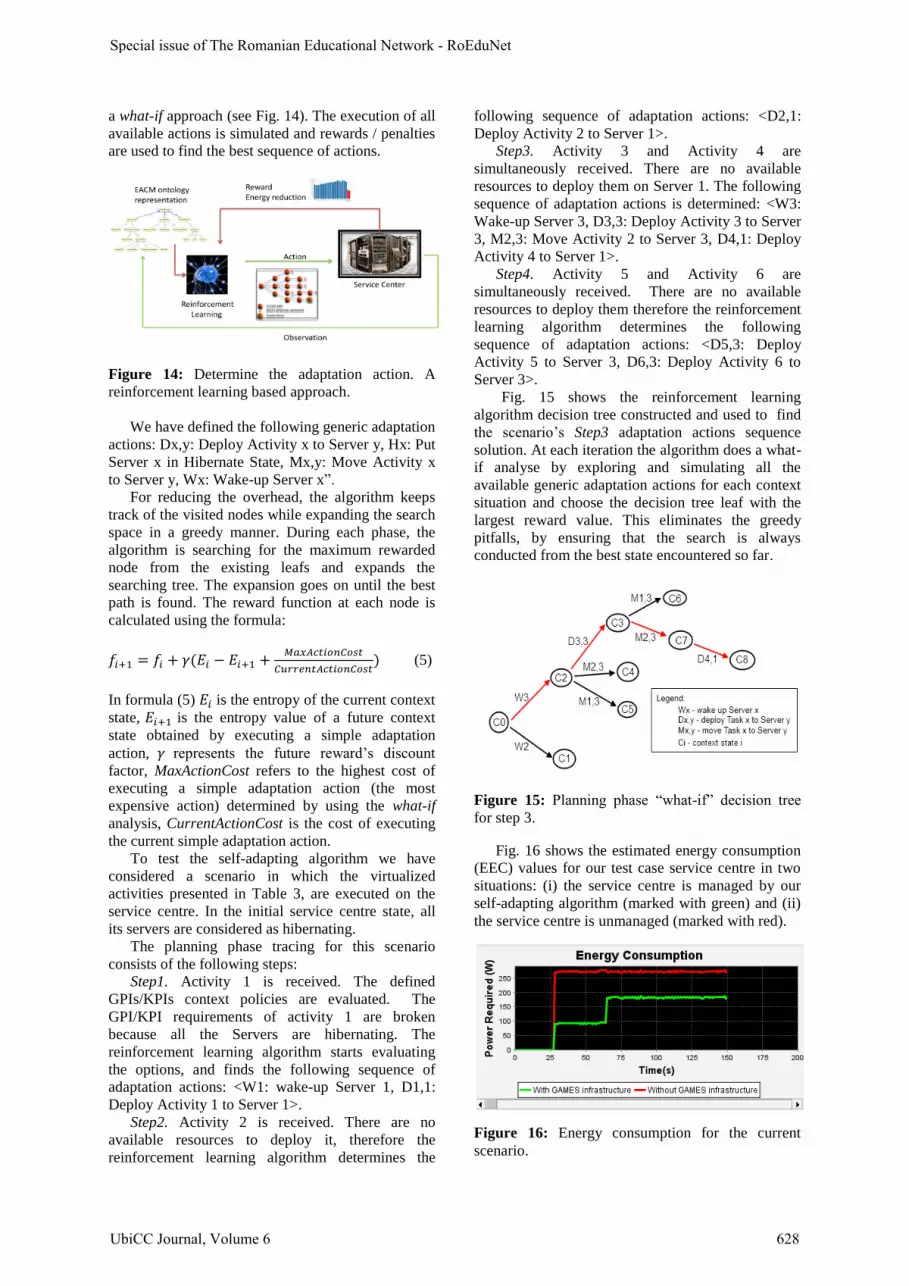
a what-if approach (see Fig. 14). The execution of all
available actions is simulated and rewards / penalties
are used to find the best sequence of actions.
Figure 14: Determine the adaptation action. A
reinforcement learning based approach.
We have defined the following generic adaptation
actions: Dx,y: Deploy Activity x to Server y, Hx: Put
Server x in Hibernate State, Mx,y: Move Activity x
to Server y, Wx: Wake-up Server x”.
For reducing the overhead, the algorithm keeps
track of the visited nodes while expanding the search
space in a greedy manner. During each phase, the
algorithm is searching for the maximum rewarded
node from the existing leafs and expands the
searching tree. The expansion goes on until the best
path is found. The reward function at each node is
calculated using the formula:
(5)
In formula (5) is the entropy of the current context
state, is the entropy value of a future context
state obtained by executing a simple adaptation
action, represents the future reward’s discount
factor, MaxActionCost refers to the highest cost of
executing a simple adaptation action (the most
expensive action) determined by using the what-if
analysis, CurrentActionCost is the cost of executing
the current simple adaptation action.
To test the self-adapting algorithm we have
considered a scenario in which the virtualized
activities presented in Table 3, are executed on the
service centre. In the initial service centre state, all
its servers are considered as hibernating.
The planning phase tracing for this scenario
consists of the following steps:
Step1. Activity 1 is received. The defined
GPIs/KPIs context policies are evaluated. The
GPI/KPI requirements of activity 1 are broken
because all the Servers are hibernating. The
reinforcement learning algorithm starts evaluating
the options, and finds the following sequence of
adaptation actions: <W1: wake-up Server 1, D1,1:
Deploy Activity 1 to Server 1>.
Step2. Activity 2 is received. There are no
available resources to deploy it, therefore the
reinforcement learning algorithm determines the
following sequence of adaptation actions: <D2,1:
Deploy Activity 2 to Server 1>.
Step3. Activity 3 and Activity 4 are
simultaneously received. There are no available
resources to deploy them on Server 1. The following
sequence of adaptation actions is determined: <W3:
Wake-up Server 3, D3,3: Deploy Activity 3 to Server
3, M2,3: Move Activity 2 to Server 3, D4,1: Deploy
Activity 4 to Server 1>.
Step4. Activity 5 and Activity 6 are
simultaneously received. There are no available
resources to deploy them therefore the reinforcement
learning algorithm determines the following
sequence of adaptation actions: <D5,3: Deploy
Activity 5 to Server 3, D6,3: Deploy Activity 6 to
Server 3>.
Fig. 15 shows the reinforcement learning
algorithm decision tree constructed and used to find
the scenario’s Step3 adaptation actions sequence
solution. At each iteration the algorithm does a what-
if analyse by exploring and simulating all the
available generic adaptation actions for each context
situation and choose the decision tree leaf with the
largest reward value. This eliminates the greedy
pitfalls, by ensuring that the search is always
conducted from the best state encountered so far.
Figure 15: Planning phase “what-if” decision tree
for step 3.
Fig. 16 shows the estimated energy consumption
(EEC) values for our test case service centre in two
situations: (i) the service centre is managed by our
self-adapting algorithm (marked with green) and (ii)
the service centre is unmanaged (marked with red).
Figure 16: Energy consumption for the current
scenario.
Special issue of The Romanian Educational Network - RoEduNet
UbiCC Journal, Volume 6 628

To estimate the service centres servers energy
consumption the JouleMeter tool created by
Microsoft research was used [23]. We have also
defined the server base energy consumption as the
energy used by a server in idle mode (can be
estimated using the vendor specification). The
energy consumption of the service centre in normal
operation is computed as:
(6)
Using relation (6) the managed and unmanaged
service centre energy consumption can be computed.
Fig. 16 managed service centre better results are
mainly due to the fact that, for this case, the servers
remain in a low power state while not needed.
The self-adapting algorithm will always try to
find the best solution, by considering both the service
centre energy consumption and workload activities
QoS requests. Fig. 17 results show that the algorithm
converges quite fast, taking less than 600 ms to find
a solution if exists. For improving the real-time
performance of the algorithm, a suboptimal solution
can be returned by limiting the number of search
steps based on a tradeoffs between decision time and
solution quality (energy efficiency). This avoids
exploring the entire search space in case no optimal
solution exists.
Figure 17: Decision time for the current scenario.
4 CONCLUSIONS
This paper proposes a context aware self-adapting
algorithm for balancing the performance and energy consumption of a service centre. The self-adapting algorithm automatically detects / analyzes the workload and performance changes in the service centre then decides on how it should adapt in order to minimize the energy consumption. The obtained results are promising, showing that the algorithm is capable to manage at run-time the service centre energy efficiency by dynamically taking consolidation and dynamic power management actions. The results also show that an energy saving of about 55 % is obtained when the service centre is managed by our self-adapting algorithm.
ACKNOWLEDGEMENT
The work has been done in the context of the EU
FP7 GAMES project [3].
5 REFERENCES
[1] V. Metha: A Holistic Solution to the IT Energy
Crisis, available at http://greenercomputing.com
(2007).
[2] J.M. Kaplan, W. Forrest, N. Kindler:
Revoluzioning Data Center Energy Efficiency,
McKinsey&Company, Technical Report
(2008).
[3] GAMES Research Project, http://www.green-
datacenters.eu/.
[4] T. Cioara, I. Anghel, I. Salomie: A Generic
Context Model Enhanced with Self-configuring
Features, Journal of Digital Information
Management, vol. 7/3, pp.159-165, ISSN 0972-
7272 (2009).
[5] L. A. Barroso U. Hölzle: The Case for Energy-
Proportional Computing, IEEE Computer, vol.
40/12, pp. 33-37 (2007).
[6] L. Zeng, B. Benatallah, M. Dumas, J.
Kalagnamam, H. Chang: QoS-aware
middleware for Web services composition, IEEE
Trans. on Software Engineering, 30/5 (2004).
[7] D. Ardagna, M. Comuzzi, E. Mussi, P. Plebani,
B. Pernici: PAWS: a framework for processes
with adaptive Web services, IEEE Software,
vol. 24/6, pp. 39-46 (2007).
[8] G. Canfora, M. Penta, R. Esposito, M. L.
Villani: QoS-Aware Replanning of Composite
Web Services, Proc. of Int. Conference on Web
ervices (ICW ’ 5 , pp. 121–129 (2005).
[9] T. Yu, Y. Zhang, K.-J. Lin: Efficient algorithms
for web services selection with end-to-end QoS
constraints, ACM Trans. Web, vol. 1/1, pp. 1–26
(2007).
[10] D. Ardagna, C. Francalanci, M. Trubian: Joint
Optimization Of Hardware And Network Costs
For Distributed Computer Systems, IEEE Trans.
on Systems and Cybernetics, vol. 2, (2008).
[11] W. Lin, Z. Liu, C.H. Xia, L. Zhang: Optimal
Capacity Allocation for Multi-Tiered Web
Systems with End-to-End Delay Guarantees,
Perform. Eval., vol. 62/1-4, pp. 400-416, (2005).
[12] J. S. Chase, D. C. Anderson: Managing Energy
and Server Resources in Hosting Centers, In
ACM Symposium on Operating Systems
principles, vol. 35/5 (2001).
[13] D. Ardagna, M. Trubian, L. Zhang: SLA based
resource allocation policies in autonomic
environments, Journal of Parallel and
Distributed Computing, vol. 67/3, pp. 259–270
(2007).
Special issue of The Romanian Educational Network - RoEduNet
UbiCC Journal, Volume 6 629
[14] D. Kusic, N. Kandasamy: Risk-aware limited
lookahead control for dynamic resource
provisioning in enterprise computing systems,
Cluster Computing, vol. 10/4, pp. 395-408
(2007).
[15] S. Ganeriwal, A. Kansal, M. B. Srivastava: Self
Aware Actuation for Fault Repair in Sensor
Networks, Proc. of the IEEE International
Conference on Robotics and Automation, pp.
5244- 5249 (2004).
[16] J. Saia, A. Trehan: Picking up the Pieces: Self-
Healing in reconfigurable networks, In Proc. of
IEEE International Parallel and Distributed
Processing Symposium, pp. 1 - 12 (2008).
[17] R. Das, J. O. Kephart, C. Lefurgy, G. Tesauro,
D. W. Levine, H. Chan: Autonomic multi-agent
management of power and performance in data
centers, In Proc. AAMAS, pp. 107-114 (2008).
[18] Q. Zhu, Y. Zhou: Chameleon: A Self-Adaptive
Energy-Efficient Performance-Aware RAID,
IBM Austin Conference on Energy-Efficient
Design (ACEED) (2005).
[19] G. Chen, W. He: Energy-Aware Server
Provisioning and Load Dispatching for
Connection-Intensive Internet Services, The 5th
USENIX Symp. on Net. Syst. Design and Impl.,
pp. 337-350 (2008).
[20] R. Buchty, J. Tao, W. Karl: Automatic Data
Locality Optimization Through Self-
optimization, LNCS 4124, pp. 187–201,
Springer-Verlag Berlin Heidelberg (2006).
[21] E. Sirin, B. Parsia, B. C. Grau, A. Kalyanpur, Y.
Katz: Pellet: A practical OWL-DL reasoner,
Web Semantics: Science, Services and Agents
on the World Wide Web, vol. 5/2, pp. 51-53,
(2007).
[22] T. Cioara, I. Anghel, I. Salomie: A Policy-based
Context Aware Self-Management Model, 11th
Int. Symp. on Symbolic and Numeric Alg. for
Scientific Comp. (SYNASC), pp.333-341,
ISBN: 978-0-7695-3964-5 (2009).
[23] A. Kansal, F. Zhao, J. Liu, N. Kothari, A.
Bhattacharya: Virtual Machine Power Metering
and Provisioning, Proceedings of the 1st ACM
symposium on Cloud computing, pp. 39-50,
ISBN:978-1-4503-0036-0 (2010).
[24] The Standard Performance Evaluation
Corporation, www.spec.org.
[25] D. Josephsen: Building a Monitoring
Infrastructure with Nagios, Prentice Hall PTR,
ISBN:0132236931 (2007).
[26] I. Anghel, T. Cioara, I. Salomie, M. Dinsoreanu:
An Agent-based Context Awareness
Management Framework, Proceedings of the 8-
th International Conference RoEduNet, pp. 107-
113, ISBN -978-606-8085-15-9 (2009).
Special issue of The Romanian Educational Network - RoEduNet
UbiCC Journal, Volume 6 630