noise in early childhood education centres
TRANSCRIPT
Copyright is owned by the Author of the thesis. Permission is given for a copy to be downloaded by an individual for the purpose of research and private study only. The thesis may not be reproduced elsewhere without the permission of the Author.
Noise in early childhood education centres- the effects on the children
and their teachers
A thesis
presented in partial fulfilment
of the requirements for the degree
of
Doctor of Philosophy
at
Massey University, Wellington,
New Zealand
Stuart Joseph McLAREN
2008
Massey University Human Ethics Approval This project has received full Massey University Human Ethics Committee approvals (Wellington 03/120 and 05/34). More details are given in Appendices 1.
1 Introduction
2 Studies of noise and hearing loss
in education : A literature review
3 Noise levels in New Zealand early childhood education centres - A pilot
study.
4 Speech intelligibility, processing and interference levels
5. The anatomy and physiology of the auditory system and processes
6 Diseases, conditions and disorders, giving rise to auditory
function deficits
7 Noise survey methodology
8 Results of fixed time-average levels taken and personal sound
exposure of children and staff
9 Survey of early education staff and specialists
10 Building and environmental inspection
11 Occupational hearing issues of staff
12 A new regulatory framework
13 Discussion
14 Appendices
i
Abstract Although the effects of noise on children’s learning in school classrooms is well
documented, there is very little on the effects of noise on preschool children. There are
strict legal requirements for the daily noise exposure an adult worker can received in the
workplace but nothing to control the noise children can receive in school and early
education. There is also little or no data on how sound affects a child, compared to an
adult. The early years of life are critical for the development of speech, hearing and
auditory processes, as well as being the most vulnerable time for middle ear infections.
This work sets out to determine the typical noise levels in early childhood centres and
the effects on a range of children and their teachers.
Reverberation times in most centres were found to well exceed the 0.6 seconds
prescribed by the Australasian standard for schools and learning spaces. Very high
levels of noise were recorded in a number of centres with a significant number of
children and staff members, exceeding the maximum daily sound exposure of 100%
permitted for workers in industry. A range of special needs children were identified as
being particularly at-risk to noise, with the most adverse outcomes reported for those
experiencing sensory integration disorder. Yet, even though high levels of noise were
recorded, the majority of respondents in a survey of teachers rated the lack of sufficient
space for the number of children present as the main issue, and inclement weather as the
greatest environmental condition contributing to noise (by confining children indoors,
especially over long periods of time).
Hearing tests on the children were not permitted under the strict human ethics criteria to
which this study had to conform, but simple hearing tests on a small group of teachers,
revealed that hearing loss could be a serious occupational health issue. The legal issues
of noise control and management in early childhood education have been addressed in
this thesis, current legal frameworks reviewed, and recommendations presented for
future consideration.
ii
Acknowledgements This project has involved a large amount of cooperation and assistance from a number
of people and organisations, which I wish to acknowledge.
Firstly I would like to thank my scientific supervisors, Professor Philip Dickinson, and
Associate Professor Doug Hay, and Dr Rachel Page, Wellington Director, Institute of
Food, Nutrition and Human Health, for their constant help encouragement and advice.
In particular, I would not only like to acknowledge Professor Dickinson’s help with the
preparation of this work, but in the preparation of the journal articles, conference papers
and special reports directly attributed to this work. I would like to especially
acknowledge the help and support of Dr Page and Ms Wilma Tielemans who assisted
with the final reading of the thesis. Their input was invaluable. I also acknowledge the
help and support of Dr Page in obtaining a Massey University Advanced Study Award
and attendance at conferences.
I would like to acknowledge the contributions made by my wife, Debbie, in her
unwavering support of this project and acknowledge the special contribution made by
my autistic son, Julian. The direction this project took was greatly influenced by his
experiences in trying to make sense of the world around him and the difficulties he
faces.
I would especially like to thank Ms Sue Thorne, CEO, Early Childhood Council of New
Zealand for her encouragement and support of this project as well as the considerable
time spent reviewing the documents for the Massey University Human Ethics
Committee approval.
Special thanks are due to the many specialists who assist and advise special needs
children in their homes and early education centres. In particular I would like to
acknowledge special contributions made by Speech Language Therapist, Lynne Hayes,
team leaders, Jane Farmer and Susan Clark and their staff of Group Special Education,
Wellington for sharing their experiences and their most valuable contributions to this
iii
project. Special thanks are also due to Barbara Price and Betty Maxwell (Gifted
Development Centre, Denver) for all the information received on giftedness.
I would like to thank with gratitude all the childcare centres staff, and especially the
children and their parents who so willingly contributed to and supported this project.
iv
Table of contents Page
Abstract --------------------------------------------------------------------------------------------i Acknowledgements------------------------------------------------------------------------------ ii Table of contents-------------------------------------------------------------------------------- iv List of Figures----------------------------------------------------------------------------------- ix List of Tables------------------------------------------------------------------------------------ xi 1 Introduction-------------------------------------------------------------------------------1-1
1.1 Research questions -----------------------------------------------------------------1-4 1.2 Aims----------------------------------------------------------------------------------1-5 1.3 Thesis outline -----------------------------------------------------------------------1-6 1.4 Glossary -----------------------------------------------------------------------------1-9 1.5 References ------------------------------------------------------------------------- 1-17
2 Studies of noise and hearing loss in education - A literature review---------------2-1 2.1 Introduction -------------------------------------------------------------------------2-1 2.2 At-risk children and important acoustic conditions-----------------------------2-5
2.2.1 Second language speakers ---------------------------------------------------2-5 2.2.2 Children with hearing loss ---------------------------------------------------2-5 2.2.3 Reverberation time and effects----------------------------------------------2-6 2.2.4 Dealing with background noise ---------------------------------------------2-7 2.2.5 Distance from speaker to listener. ------------------------------------------2-8 2.2.6 Studies on effects of noise on children and their teachers ---------------2-8 2.2.7 Classroom Amplification -------------------------------------------------- 2-12
2.3 Guidelines for community noise - World Health Organization ------------- 2-14 2.4 I-INCE Technical Initiative #4. ------------------------------------------------- 2-16 2.5 Background to the New Zealand situation------------------------------------- 2-17
2.5.1 Classroom acoustics study------------------------------------------------- 2-17 2.6 Review of existing studies------------------------------------------------------- 2-22 2.7 Levels of hearing loss among New Zealand children ------------------------ 2-28
2.7.1 New Zealand hearing screening protocols ------------------------------- 2-29 2.8 Summary--------------------------------------------------------------------------- 2-33 2.9 References ------------------------------------------------------------------------- 2-34
3 Noise in New Zealand early childhood education centres - A pilot study.--------3-1 3.1 Introduction -------------------------------------------------------------------------3-1 3.2 Experimental ------------------------------------------------------------------------3-2 3.3 Results and Discussion-------------------------------------------------------------3-3
3.3.1 Children’s exposure to noise ------------------------------------------------3-3 3.3.2 Staff Exposure to Noise------------------------------------------------------3-5
3.3.2.1 All day centres -------------------------------------------------------------3-5 3.3.2.2 Sessional centres -----------------------------------------------------------3-5
3.4 Conclusion---------------------------------------------------------------------------3-6 3.5 References ---------------------------------------------------------------------------3-8
4 Speech intelligibility, processing and speech interference levels ------------------4-1 4.1 Introduction -------------------------------------------------------------------------4-1 4.2 Speech and intelligibility ----------------------------------------------------------4-1
4.2.1 Effects of speech level on communication---------------------------------4-4 4.2.2 Effects on the listener --------------------------------------------------------4-5
v
4.2.3 Effects of background noise on speech communication.-----------------4-5 4.2.4 Masking and intelligibility---------------------------------------------------4-7 4.2.5 Estimating speech intelligibility --------------------------------------------4-7 4.2.6 Articulation index.------------------------------------------------------------4-8
4.2.6.1 Interpretation of the articulation index -------------------------------- 4-10 4.2.6.2 Recent developments in the articulation index ----------------------- 4-10
4.2.7 Speech interference level (SIL) ------------------------------------------- 4-12 4.2.8 Speech transmission index (STI)------------------------------------------ 4-18
4.2.8.1 Estimation of speech intelligibility in a typical domestic setting. -- 4-18 4.2.8.2 Communication evaluation --------------------------------------------- 4-19
4.3 Summary--------------------------------------------------------------------------- 4-20 4.4 References ------------------------------------------------------------------------- 4-21
5 The anatomy and physiology of the auditory system and processes ---------------5-1 5.1 Introduction -------------------------------------------------------------------------5-1 5.2 The human ear ----------------------------------------------------------------------5-1
5.2.1 The outer ear ------------------------------------------------------------------5-1 5.2.2 The middle ear ----------------------------------------------------------------5-2 5.2.3 The inner ear ------------------------------------------------------------------5-3
5.2.3.1 Characteristics of inner ear fluids----------------------------------------5-4 5.2.3.2 The organ of Corti ---------------------------------------------------------5-7 5.2.3.3 The neuro-auditory pathway-------------------------------------------- 5-10 5.2.3.4 Processing of auditory signals. ----------------------------------------- 5-10
5.3 The development of the ear in the foetus -------------------------------------- 5-12 5.3.1 Formation of the middle ear ----------------------------------------------- 5-12 5.3.2 Formation of the external ear---------------------------------------------- 5-13 5.3.3 Chronological development of the ear ----------------------------------- 5-13
5.4 The hearing process by air conduction. ---------------------------------------- 5-14 5.5 The hearing process by bone conduction -------------------------------------- 5-14 5.6 Auditory response ---------------------------------------------------------------- 5-14 5.7 Threshold of hearing ------------------------------------------------------------- 5-15
5.7.1 Minimum audible field (MAF) threshold. ------------------------------- 5-15 5.7.2 Thresholds of discomfort and pain.--------------------------------------- 5-16
5.8 Discussion ------------------------------------------------------------------------- 5-17 5.9 References ------------------------------------------------------------------------- 5-17
6 Diseases, conditions and disorders giving rise to auditory function deficits.---6-1 6.1 Introduction -------------------------------------------------------------------------6-1 6.2 Hearing impairment and deafness ------------------------------------------------6-1
6.2.1 Tympanometry ----------------------------------------------------------------6-4 6.3 Otitis media with effusion (OME)------------------------------------------------6-9
6.3.1 Treatment and therapeutic management of acute otitis media--------- 6-14 6.4 Children at-risk from exposure to noise---------------------------------------- 6-16 6.5 Pervasive development disability (PDD) -------------------------------------- 6-18
6.5.1 Autistic spectrum disorder (ASD) ---------------------------------------- 6-18 6.5.1.1 Sensory integration disorder-------------------------------------------- 6-20
6.5.2 Difficulties in language and communication processing with those experiencing autistic spectrum disorders -------------------------------------------- 6-22 6.5.3 Auditory integration training/therapy (AIT)----------------------------- 6-25
6.6 Central auditory processing disorder (CAPD)--------------------------------- 6-28 6.7 Attention-deficit/hyperactivity disorder (ADHD) ---------------------------- 6-30 6.8 Down syndrome ------------------------------------------------------------------ 6-33
vi
6.9 Learning spaces ------------------------------------------------------------------- 6-33 6.10 The New Zealand Disability Strategy ------------------------------------------ 6-34 6.11 Building standards---------------------------------------------------------------- 6-34 6.12 Summary--------------------------------------------------------------------------- 6-35 6.13 References ------------------------------------------------------------------------- 6-37
7 Noise survey methodology -------------------------------------------------------------7-1 7.1 Introduction -------------------------------------------------------------------------7-1 7.2 Study development and rationale -------------------------------------------------7-2 7.3 Ethical requirements----------------------------------------------------------------7-3 7.4 Selection of early childhood centres----------------------------------------------7-4 7.5 Equipment used and data collected -----------------------------------------------7-6
7.5.1 Fixed sound level measurements--------------------------------------------7-7 7.5.2 Sound pressure levels of outdoor areas----------------------------------- 7-10 7.5.3 Personal sound exposure of children ------------------------------------- 7-10 7.5.4 Personal sound exposure of teaching staff ------------------------------- 7-14
7.6 Building and environmental inspection/ survey------------------------------- 7-14 7.7 Questionnaire Survey ------------------------------------------------------------ 7-16 7.8 Hearing evaluations of staff ----------------------------------------------------- 7-17 7.9 References ------------------------------------------------------------------------- 7-17
8 Results of fixed time-average levels taken and personal sound exposures of children and staff.------------------------------------------------------------------------8-1
8.1 Introduction -------------------------------------------------------------------------8-1 8.2 Sessional Centres -------------------------------------------------------------------8-2
8.2.1 Children’s exposure to noise ------------------------------------------------8-2 8.2.2 Staff exposure to noise -------------------------------------------------------8-2
8.3 All day centres ----------------------------------------------------------------------8-3 8.3.1 Children’s exposure to noise ------------------------------------------------8-3 8.3.2 Staff exposure to noise -------------------------------------------------------8-4 8.3.3 Discussion of daily sound exposure results--------------------------------8-5
8.4 Fixed sound level measurements -------------------------------------------------8-7 8.4.1 Sessional centres --------------------------------------------------------------8-7 8.4.2 All day centres ----------------------------------------------------------------8-7
8.5 Special areas-------------------------------------------------------------------------8-8 8.5.1 Sleep rooms -------------------------------------------------------------------8-8 8.5.2 Outdoor play areas------------------------------------------------------------8-8
8.6 Specific events ----------------------------------------------------------------------8-8 8.6.1 Music sessions ----------------------------------------------------------------8-8 8.6.2 Walking Excursions -------------------------------------------------------- 8-10 8.6.3 Construction works --------------------------------------------------------- 8-12
8.7 Intensive study in one childcare centre.---------------------------------------- 8-13 8.7.1 Results obtained from individual children over multiple sessions. --- 8-14
8.8 Optimal noise levels in early childhood centres------------------------------- 8-15 8.9 Summary--------------------------------------------------------------------------- 8-16 8.10 References ------------------------------------------------------------------------- 8-17
9 Survey of early education staff and specialists. --------------------------------------9-1 9.1 Introduction -------------------------------------------------------------------------9-1 9.2 Questionnaire - Part 1: Teaching spaces -----------------------------------------9-2
9.2.1 General effects of noise on children ----------------------------------------9-7 9.3 Questionnaire - Part 2: Noise and at-risk children -----------------------------9-8
9.3.1 Hearing impairment ----------------------------------------------------------9-9
vii
9.3.2 Central auditory processing disorder (CAPD)--------------------------- 9-10 9.3.3 Attention-deficit/hyperactivity disorder (ADHD)---------------------- 9-11 9.3.4 Down syndrome------------------------------------------------------------- 9-11 9.3.5 Developmental verbal dyspraxia------------------------------------------ 9-12 9.3.6 Autistic spectrum disorder (autism and Asperger’s syndrome) ------- 9-12 9.3.7 Giftedness ------------------------------------------------------------------- 9-14
9.4 Issues and Strategies ------------------------------------------------------------- 9-15 9.4.1 Lack of space---------------------------------------------------------------- 9-16 9.4.2 Excessively loud fire alarms----------------------------------------------- 9-17
9.5 Other pertinent comments by respondents------------------------------------- 9-18 9.6 Summary--------------------------------------------------------------------------- 9-18
9.6.1 Part 1 Individual teaching spaces ----------------------------------------- 9-19 9.6.2 Part 2 At-risk children------------------------------------------------------ 9-20 9.6.3 Part 3 Specific issues and strategies -------------------------------------- 9-20
9.7 References ------------------------------------------------------------------------- 9-22 10 Building and environmental inspection --------------------------------------------- 10-1
10.1 Introduction ----------------------------------------------------------------------- 10-1 10.2 Results ----------------------------------------------------------------------------- 10-2
10.2.1 Licence details -------------------------------------------------------------- 10-2 10.2.2 Numbers of children-------------------------------------------------------- 10-3
10.2.2.1 Sessional centres ------------------------------------------------------ 10-3 10.2.2.2 All day centres -------------------------------------------------------- 10-3
10.2.3 Observations of building style--------------------------------------------- 10-4 10.2.4 Localities -------------------------------------------------------------------- 10-5 10.2.5 Reverberation times -------------------------------------------------------- 10-6
10.2.5.1 Individual assessments ----------------------------------------------- 10-6 10.2.5.2 Examples of acoustic treatment ------------------------------------10-10
10.3 Summary--------------------------------------------------------------------------10-18 10.4 References ------------------------------------------------------------------------10-19
11 Occupational hearing issues of staff ------------------------------------------------- 11-1 11.1 Introduction ----------------------------------------------------------------------- 11-1 11.2 Experimental ---------------------------------------------------------------------- 11-3 11.3 Results ----------------------------------------------------------------------------- 11-4 11.4 Conclusion------------------------------------------------------------------------11-11 11.5 Recommendations ---------------------------------------------------------------11-12 11.6 References ------------------------------------------------------------------------11-13
12 A new regulatory framework--------------------------------------------------------- 12-1 12.1 Introduction ----------------------------------------------------------------------- 12-1 12.2 Noise provisions of the current legislation------------------------------------- 12-1 12.3 Noise sources and issues--------------------------------------------------------- 12-2
12.3.1 Noise transmitted through or reflected by the building structure------ 12-3 12.3.2 Management of noise generated as part of the centre activities ------- 12-4
12.3.2.1 Setting of sound pressure level standards -------------------------- 12-4 12.3.2.2 All practicable steps model ------------------------------------------ 12-6
12.4 The proposed legislative framework ------------------------------------------- 12-7 12.5 Conclusion------------------------------------------------------------------------12-12 12.6 Recommendations ---------------------------------------------------------------12-13 12.7 References ------------------------------------------------------------------------12-13
13 Discussion ------------------------------------------------------------------------------ 13-1 13.1 Introduction ----------------------------------------------------------------------- 13-1
viii
13.2 Research questions --------------------------------------------------------------- 13-1 13.3 The sound environment ---------------------------------------------------------- 13-2 13.4 Personal exposure ---------------------------------------------------------------- 13-3 13.5 Observed effects of noise on children------------------------------------------ 13-5 13.6 The physical learning environment--------------------------------------------- 13-7 13.7 Strategies to mitigate noise levels ---------------------------------------------- 13-8 13.8 Limitations of this work --------------------------------------------------------- 13-9
13.8.1 Personal sound exposure of children.------------------------------------- 13-9 13.8.2 Fixed sound level measurements------------------------------------------ 13-9 13.8.3 Responses to questionnaires ----------------------------------------------- 13-9 13.8.4 Occupational hearing issues of staff -------------------------------------13-10
13.9 Recommendations for future study --------------------------------------------13-11 14 Appendices ----------------------------------------------------------------------------- 14-1
14.1 Human Ethics Committee approval -------------------------------------------- 14-2 14.2 Development of a noise management plan ------------------------------------ 14-9 14.3 Peer reviewed journal articles directly attributed to this work -------------14-22 14.4 Conference papers directly attributed to this work --------------------------14-23 14.5 Sample doseBadge monitoring report -----------------------------------------14-24 14.6 Survey and questionnaire forms -----------------------------------------------14-27
ix
List of Figures Page
Figure 2-1 Model of classroom communication ................................................... 2-3 Figure 2-2 Developmental aspects of hearing in noise.......................................... 2-4 Figure 2-3 Average occupied reverberation time measurements for good and poor
classrooms........................................................................................ 2-20 Figure 2-4 Average reverberation times in occupied classrooms in original state and
following acoustic modification........................................................ 2-21 Figure 2-5 Summary of overall ambient noise levels typically found in classrooms
occupied by normal-hearing children. ............................................... 2-23 Figure 3-1 Time history of noise levels in an early childhood centre. ................... 3-3 Figure 3-2 The noisy slide.................................................................................... 3-4 Figure 4-1 Long term average speech spectra in ⅓ octave bands at 5 vocal levels for
adult male speakers (a) and adult female speakers (b). ........................ 4-3 Figure 4-2 Distances to achieve ‘Just reliable speech communication’ ................. 4-6 Figure 4-3 Curves to calculate articulation index.................................................. 4-9 Figure 4-4 The simplified method for calculating the articulation index............. 4-11 Figure 4-5 Relationship of speech interference level to distance and vocal effect in
the free field. .................................................................................... 4-14 Figure 4-6 Normal voice intelligibly in relation to steady background noise levels in
typical domestic living room environment. ....................................... 4-19 Figure 5-1 The inner ear....................................................................................... 5-6 Figure 5-2 Activation of cochlear hair cells.......................................................... 5-9 Figure 5-3 Neuro –auditory pathway from the organ of Corti to the auditory cortex
and temporal lobe of the brain.(Right ear pathway shown)................ 5-11 Figure 5-4 Auditory sensation area .................................................................... 5-16 Figure 6-1 Examples of typical audiograms ......................................................... 6-2 Figure 6-2 The insertion of the probe into the ear canal showing the probe tone
being sent, admittance into the middle ear, and reflection back to the probe microphone............................................................................... 6-5
Figure 6-3 The most usual tympanograms Types, A, B, C and B/C...................... 6-7 Figure 7-1 Typical early childhood centre learning space..................................... 7-5 Figure 7-2 Typical setting in an early childhood centre during mat time............... 7-6 Figure 7-3 Fixed sound level meter...................................................................... 7-8 Figure 7-4 Typical time history illustration from fixed sound level measurements
7-10 Figure 7-5 A typical outdoor covered and uncovered play area. ......................... 7-10 Figure 7-6 The doseBadge reader unit with a doseBadge inserted. ..................... 7-13 Figure 7-7 A child wearing a doseBadge............................................................ 7-13 Figure 7-8 Typical time-history from a doseBadge............................................. 7-14 Figure 7-9 Measurement of reverberation times (T60) with Solo Master sound level
meter ................................................................................................ 7-16 Figure 8-1 Time history of personal exposure to noise of a staff member. .......... 8-4 Figure 8-2 An excessively loud music session ..................................................... 8-9 Figure 8-3 Daily Sound exposure of a child (doseBadge)................................... 8-11 Figure 8-4 A walking excursion in the Wellington Central Business District
(expanded from Figure 8-3) .............................................................. 8-11
x
Figure 8-5 Fixed sound level measurement over a full day over an averaged eight-hour day at one inner city centre ....................................................... 8-12
Figure 8-6 Time history of daily sound levels taken in the playground next to major road works........................................................................................ 8-13
Figure 10-1 An all day centre showing a pitched ceiling (with exposed sarking over rafters) and presence of skylights. ..................................................... 10-5
Figure 10-2 Purpose built early childhood centre. (The ceiling and upper wall to top of window sills coated with asbestos containing textured finish). ...... 10-7
Figure 10-3 Graph of reverberation times for Table 10-8 Case 1 ........................ 10-11 Figure 10-4 Acoustic wall treatment to the upper windowsill Case 1: ............... 10-12 Figure 10-5 Acoustic ceiling treatment Case 2 .................................................. 10-13 Figure 10-6 Graph of reverberation times for Table 10-9b Case 2 ...................... 10-14 Figure 10-7 Walls lined with hessian surfaced soft board panels Case 3............. 10-15 Figure 10-8 Graph of reverberation times (T60) in Table 10-9(a) Case 3 ............ 10-16 Figure 10-9 Ceiling tiles painted over (Case 4) .................................................. 10-17 Figure 11-1 Audiograms of a worker pre and post exposure to noise.................... 11-5 Figure 11-2 Time history of a worker experiencing TTS. ..................................... 11-6 Figure 11-3 Audiogram of staff worker exposed to short bursts of noise .............. 11-7 Figure 11-4 Audiograms of a staff worker aged in the 30-35 age group................ 11-8 Figure 11-5 Audiogram of a staff member in the 40-45 age group........................ 11-9 Figure 11-6 Audiogram of staff member in the 60-65 age group. ....................... 11-10 Figure 11-7 Audiogram of staff member (on last shift) ...................................... 11-11 Figure 12-1 Proposed legal framework for licensed early childhood centres......... 12-8
xi
List of Tables Page
Table 2-1 The New Zealand hearing screening statistics....................................... 2-29 Table 2-2 National hearing screening failures and referrals................................... 2-31 Table 2-3 Historical record of hearing loss among prison inmates. ....................... 2-32 Table 3-1 Classification of early childhood centres................................................. 3-1 Table 4-1 Average A-weighted sound pressure levels for different vocal conditions
in quiet conditions. ................................................................................ 4-4 Table 4-2 Interpretation of the articulation index .................................................. 4-10 Table 4-3 Necessary signal-to-noise ratios for different vocal effects.................... 4-13 Table 4-4 Standardized speech interference levels of steady continuous noise at
which just reliable communication can occur....................................... 4-15 Table 5-1 Chemical fluid composition of the inner ear............................................ 5-4 Table 9-1 Teaching aspects .................................................................................... 9-2 Table 9-2 Space Standard ...................................................................................... 9-3 Table 10-1 Staffing requirements for sessional centres included in the study
(Schedule 3- Part 2) ............................................................................. 10-3 Table 10-2 Staffing requirements for all day centres included in the study
(Schedule 3- Part 1) ............................................................................. 10-4 Table 10-3 Reverberation times (T60) for room shown in Figure 10-1 .................... 10-6 Table 10-4 Reverberation times (T60) for room shown in Figure 10-2 .................... 10-8 Table 10-5 Reverberation times (T60) of a purpose built early childhood centre
complex............................................................................................... 10-8 Table 10-6 Reverberation times (T60) for the 4 corporate childcare centres. ........... 10-9 Table 10-7 Reverberation times (T60) of a centre located in a traditional style
classroom building .............................................................................. 10-9 Table 10-8 Reverberation times (T60) for Case 1.................................................. 10-10 Table 10-9 Reverberation times (T60) for room shown in Figure 10-5 Case 2....... 10-14 Table 10-10 Reverberation times(T60) for room in Figure 10-7 Case 3................... 10-16 Table 10-11 Reverberation times in main room (Case 4). ...................................... 10-18
1. Introduction
1-1
1 Introduction
While hearing specialists and acoustical engineers in the USA have requested that
acoustics be considered in the design of classrooms and learning spaces, it remains an
issue largely ignored to the detriment of students and their teachers.1 In New Zealand,
there are numerous cases in preschool, primary, secondary and tertiary educational
facilities where acoustical considerations have not been included in the design, building
or refurbishment. This is largely due to the lack of criteria in building requirements for
school classrooms and similar learning spaces.
While research to date shows that all children are potentially affected by noisy
environments, the impacts will be the most severe for those with hearing impairments,
and auditory function deficits such as autistic spectrum disorders and attention
deficit/hyperactivity disorder. Children who are studying in their second language are
also vulnerable. Research has shown that they perform more poorly than those studying
in their native language.1, 4
Hearing impairment or other auditory function deficit in young children can have a
major effect on their development of speech and communication, resulting in a
detrimental effect on the ability to learn effectively at school. This is likely to have
major consequences for the individual, and the population as a whole. The New
Zealand Ministry of Health has found from research carried out over the last 2 decades
that hearing loss affects 6-10% of children in New Zealand.2 Early diagnosis of such
conditions enables the child to be assessed for special education and educational support
at regular childcare facilities. This is generally not available for children who may
experience such conditions, but have not been formally diagnosed.
The International Institute of Noise Control Engineers (I-INCE), developed the
Technical Initiative #4 -‘Noise and reverberation in school rooms’ as a recognition of
the importance of this issue.3,4 Few studies have been carried out in early childhood
education in New Zealand and internationally, which is surprising as the early education
years are critical for speech and learning development. Preschool children are
1. Introduction
1-2
vulnerable to high incidences of otitis media with effusion (glue ear). In serious cases
(where this remains untreated), this condition can lead to permanent hearing loss.
A preliminary study in New Zealand5,6 found that classroom noise presents a major
concern for teachers and pupils. Modern teaching practices, classroom construction and
means of ventilation all contribute to the number of children unable to comprehend the
teacher’s voice. Nelson and Soli7 have suggested that the recent trends in learning often
involve collaborative interaction of multiple minds and tools as much as individual
possession of information.8 This all amounts to increased activity and noise levels,
which have the potential to be particularly serious for children experiencing auditory
function deficit. Noise in the classrooms and similar learning spaces can only
exacerbate their ability to comprehend and process verbal communication with other
children and instructions from the teacher. Anecdotal evidence also suggests that
teachers in preschool environments are exposed to considerable amounts of noise.
Clearly, exploratory studies are needed to assess the various types of childcare facilities
in New Zealand, the various conditions, which give rise to noise levels, and the typical
noise exposures to which children and their teachers are subjected.
The typical levels of noise in early childhood centres are largely unknown due to the
paucity of data on this topic. Very few studies have been conducted in New Zealand
and internationally on noise levels in preschool education. However, anecdotal
evidence from teaching staff suggests that this is an issue of concern for them and the
children. The current early childhood legislation has a requirement that noise be kept to
a reasonable level, which suggests that this has been an issue in the sector. As an
enforcement or guidance tool for the control of noise, the present legislation is far from
adequate. It is necessary to determine the typical sound pressure levels in a range of
early childhood centres in New Zealand.
Personal sound exposures of young children have not been possible due to the lack of
suitable equipment small enough to fit comfortably on to the clothing of young children.
With the acquisition of new light-weight noise doseBadges, an estimation of noise
exposure levels in early childhood education is now possible.
1. Introduction
1-3
While teachers and other staff are covered by the provisions of the health and safety in
employment legislation of New Zealand, the New Zealand Department of Labour, (the
regulatory agency) has largely ignored this group of workers for exposure to
occupational noise. This is probably due in part to the noise provisions of the
legislation not being designed or envisaged for this group of workers. There is a need to
determine the likely levels of occupational sound exposure among teachers and contact
staff in the early education sector and determine whether or not they are at-risk of
acquiring noise-induced hearing loss as a result of their work.
There has been no acoustical design criteria for schools and preschool classrooms in the
building legislation and promulgated standards for classrooms and other learning
spaces. Most of the schools and preschools do not have any acoustical treatment and
therefore may have substandard conditions, which will accentuate noise levels and
degrade speech communication. In addition, a number of early childhood centres are
placed next to main highways, and other noise producing activities, with few means to
attenuate noise intrusion from such external sources.
There is a worldwide trend to mainstream children with disabilities and special needs
into mainstream education. This began in New Zealand with the enactment of the New
Zealand Education Act 1989. Section 8 of the Act gave all children with disabilities, the
right to go to school and to receive the same level of education as other children. It
became illegal to refuse to enrol any child on account of their disabilities who were
otherwise entitled to enrol at the school. Prior to this legislation, schools were not
obliged to enrol disabled pupils and there were no targeted funds available to provide
the extra support and resources needed. Special classrooms, in some cases, were set up
on hospital campuses to provide education.9 This wide-reaching legislation represented
a major shift in the educational learning, welfare and treatment of special needs
children. Special funds were established to provide targeted support for individual
children at school according to need, along with a range of initiatives and support
services for these children in school - i.e. speech language therapy, occupational
therapy, behavioural management, etc. While early education is not compulsory,
policies extended the rights of special needs children to be mainstreamed in early
education. Medical and educational specialists widely recognise that to achieve the
greatest benefit for special needs children, the earlier the intervention must be
1. Introduction
1-4
implemented for the child and hence the origin of the educational strategy, 'early
intervention'. The New Zealand Ministry of Education has dedicated a high level of
support and funding for early intervention strategies in preschool education.
Unfortunately, the physical environment such as acoustic conditions and special
facilities conducive to the special needs of these children have not been widely
considered and is a major focus of this thesis.
The literature on noise in an educational setting, and on acoustical barriers to learning,
indicates that children with intellectual disabilities and hearing impairment are likely to
be most at-risk. Information on the extent of adverse outcomes or seriousness to such
groups is sparse. However, clinical data and literature on specific disorders and
personal communication with special education specialists reveal that there are likely to
be children with a range of disabilities who are adversely affected. It is critical that the
most at-risk groups are identified, and as far as possible, an investigation be made of the
types of noise that affect them.
Strategies need be developed not only in classroom design but also in legislation and
teaching practice, to ensure that children and their teachers are not placed in a situation
where there is a risk of hearing loss or other harm to children and where there are
barriers to learning. With the review10 of the current legislation11 in New Zealand,
strategies and provisions can now be considered for the most at-risk groups.
1.1 Research questions
The following five research questions are proposed:
1 The sound environment
What are the typical noise levels encountered in a range of early childhood
centres and by how much do they exceed the levels proposed by the World
Health Organization for unoccupied classrooms?
1. Introduction
1-5
2 Personal exposure
What are the likely personal sound exposure levels of the children and their
teachers and how do these relate to the New Zealand and international
occupational noise criteria?
3 Observed effects on children
How does noise affect the learning outcomes and well-being of special needs
children mainstreamed in early education?
4 The physical learning environment
What is the general acoustical quality of early childhood centre learning spaces
and do they comply with the recommended criteria for classrooms and learning
spaces given in the current Australian/New Zealand Standard?
5 Strategies to mitigate noise levels
What strategies can be developed not only in classroom design, but also in
legislation and teaching practice, to ensure that children and their teachers are
not placed in a situation where there is a risk of hearing loss and where there are
barriers to learning for special needs children?
1.2 Aims
The primary aim of the work described in this thesis was to determine the typical noise
levels and exposure in early childhood education centres in New Zealand and critically
examine how they affect the children and teaching staff. This included ambient sound
level measurements in learning spaces of early childhood centres along with personal
sound exposures received by staff and children. At-risk groups of children were
identified and comprehensive information sought from the literature,
questionnaires/interviews of teachers, special education professionals and parents as to
how noise and the acoustical environment affected them.
1. Introduction
1-6
A further aim was to critically investigate the physical parameters of acoustical
environment and how this may contribute to noise levels.
To critically examine the current legislative frameworks and precedents for the control
of noise in New Zealand legislation and to recommend provisions to address noise
issues in early education as part of a major legislative review.
1.3 Thesis outline
The thesis is presented in the following 14 Chapters as follows:
1. Introduction: A brief discourse is given on the important issues of noise in early
education with the research questions proposed and aims of the study presented.
A glossary of terms is listed at the end of this chapter.
2. Studies of noise and hearing loss in education - A literature review: A
comprehensive review of key literature is presented involving classroom noise,
acoustic barriers to learning, speech interference in classrooms and children at
risk. The key material from a New Zealand classroom study was outlined so that
comparison could be made to this work. Finally, a range of available data was
presented from the available New Zealand hearing screening statistics to evaluate
the current status of hearing in young children and examine trends over the last
few decades.
3. Noise in New Zealand early childhood education centres - A pilot study: This
chapter reports on a short exploratory study of noise levels in selected early
childhood centres to give an indication of the levels of noise in these centres and
form the basis from which a comprehensive study could be planned.
4 Speech intelligibility, processing and speech interference levels: This chapter
explains important relevant concepts such as speech intelligibility, the frequency
analysis of the typical male and female voice under different vocal conditions and
introduces important indices such as the articulation index (AI), speech
transmission index (STI), and speech interference level (SIL).
5 The anatomy and physiology of the auditory system and processes: The
anatomy and physiology of the human processes of hearing are discussed in detail.
1. Introduction
1-7
Current knowledge of the composition of the cochlear inner ear fluids is presented
along with the current knowledge on the activation of the cochlear hair cells to
produce nerve energy. The neuro-auditory pathway and the development of the ear
in gestation are also presented.
6 Diseases, conditions and disorders giving rise to auditory function deficits: A
wide range of diseases and disorders affecting hearing and auditory function are
presented and discussed. Assessment tools such as audiometry and tympanometry
are explained. Diseases and conditions relating to hearing such as noise-induced
hearing loss, and middle ear infections such as otitis media with effusion are
explained, together with a wide range of disorders giving rise to auditory
processing problems such as autistic spectrum disorders, central auditory
processing disorders, attention deficit hyperactivity disorder, and developmental
delay.
7 Noise survey methodology: This chapter presents the experimental
investigations undertaken, the equipment/tools used, and the noise
descriptors/criteria measured.
8 Results of fixed time-average levels taken and personal sound exposure levels
of children and staff: This chapter reports on responses to a questionnaire and
survey of teachers about the teaching aspects of their workplace and the specific
issues of noise in their centres. In addition, affects of noise on at-risk children are
reported as assessed by respondents such as teachers, professionals who work with
these children, and parents. Information was obtained on the affects of noise on a
wide range of children with disabilities such as sensory integration disorder
(autistic spectrum disorder and a subset of giftedness), hearing impairment, central
processing disorder, developmental delay, and attention-deficit/hyperactivity
disorder etc. Deficiencies in the physical and acoustical environment necessary to
meet the needs of these children were identified.
9 Survey of early education staff and specialists: This chapter reports on sound
pressure levels measured in early childhood centres and includes time average
levels taken by fixed sound level meters, personal sound exposures recorded by
doseBadges fitted to the clothing of individual children, and personal sound
exposures of staff. Special events and activities such as music sessions and
walking excursions were monitored.
1. Introduction
1-8
10 Building and environmental inspection: This chapter reports on survey work on
the physical aspects of the premises and surrounding environment, which is likely
to impact on the acoustic quality of the learning space, and noise intrusion from
activities outside the premises. Acoustical properties of the learning spaces were
measured by recording reverberation times. Several centres had acoustic
wallboard and ceiling tiles retrofitted. Reverberation times were recorded before
and after treatment and differences evaluated.
11 Occupational hearing issues of staff: This chapter reports on a small extension
study carried out at the specific request of two large early childhood centres.
Audiograms were taken of staff before and after work, along with personal sound
exposures to assess the level of noise encountered and what affects this had on the
temporary threshold shift at the end of the working day. As there was a good
spread of age among participants from those in the early stage of their working life
to those nearing retirement, the hearing status of staff in relation to their age was
evaluated to see if any particular trend emerged.
12 A new regulatory framework: The current New Zealand legislation governing
early childhood centres is undergoing a major review and early consultation with
stakeholders revealed noise as a major issue, which has to be dealt with. Legal
frameworks, which could be considered, are discussed and evaluated and the
recommendations made are presented.
13 Discussion: The results of the full study are summarised and discussed. Pertinent
findings are highlighted with recommendations suggested for further
consideration.
14 Appendices Included are details of the ethics committee approvals to conduct the
study, the development of a noise management plan, published papers directly
attributed to this work, sample monitoring reports and the interview/survey sheets
used.
1. Introduction
1-9
1.4 Glossary A Acoustics: The science of sound including its production transmission, reception and effects.12 Acoustics of a room: Those characteristics that determine the room character in respect of human auditory perception. Reverberation time and the speech transmission index are two measures for determining the acoustical quality of a room.12 All day centre∗: (licensed under Regulation 7, Education (Early Childhood Centres) Regulations 1988). An early childhood centre permitted to operate where any child attends for a period of more than 4 hours on any day. All practicable steps∗: (as defined by Clause 2A, Health and Safety in Employment Act 1992). All steps to achieve the result that is reasonably practical to take in the circumstances, having regard to set criteria as specified in the Act which includes i.e. nature and severity of harm, current state of knowledge, cost, and means available to achieve the result. Ambient sound/noise: The all-encompassing sound/noise associated with a given environment at a specified time. This is usually a composite sound including any sounds of interest.12 Anion: A negatively charged ion. Articulation (intelligibility): The percentage of speech units correctly received by a listener out of those transmitted. ‘Articulation’ refers to units of speech material which are meaningless syllables or fragments. ‘Intelligibility’ is used to refer to units of speech, which are complete meaningful words, phrases or sentences.12 Articulation index: A number from 0-1, which is a measure of the intelligibility of speech.12 Audiogram: A standardized template or graph on which the hearing threshold of each ear is separately plotted as a function of frequency. Across the top horizontal axis the audible frequency bands are listed and on the left axis, Hearing threshold levels (in dB) descending in 10 dB increments are listed (-10 dB to 110 dB Hearing loss). The tracing is usually plotted by hand using the following convention:
• red circles joined by solid lines for the right ear • black crosses joined by dashed line for the left ear
Audiometry: Pure tone audiometry is the measurement of the hearing threshold level of a person by a bilateral pure tone air conduction threshold test. The preferred method is
∗ (in italics) Denotes a legal term which has specific meaning in the legislation.
1. Introduction
1-10
based on the technique developed by Carthart and Jerker and later modified by Hughson and Westlake.15 The test is conducted by presenting a series of individual pure tones to the person (usually through headphones) in the audible frequency bands of 250, 500, 1000, 2,000, 4,000 and 8,000 Hz. Tones are presented by a standardized procedure to determine the hearing threshold level in the particular frequency band. The results are presented in an audiogram. Auditory integration training (AIT): A form of sound stimulation claiming to desensitise individuals with sensory integration problems. Attention-deficit/hyperactivity disorder (ADHD): A disorder characterised by over activity, impulsiveness and inattention although all may not be present. Autistic spectrum disorder (ASD): A life long neurological and genetic disorder that causes deficits in the way information is processed.13 ASD is continuum of disorders ranging from severe or classical autism, also known as Kanner’s Syndrome, to the more able or high functioning autism and Asperger’s syndrome. A-frequency weighting: A network incorporated into a sound level meter to provide a simple measure of how loud a sound is perceived. A-frequency weighting has the response equal to the inverse of the equal loudness contour that passes through the 1000Hz at 30 dB. Other frequency weightings such as B and C were developed, but now by international consensus and standardisation, A-frequency weighting is the weighting almost exclusively used for sound level measurement.14 B Background noise: The total noise from all sources other than a particular sound of interest or that under investigation.12 C Cation: A positively charged ion. Central auditory processing disorder: (CAPD): A deficiency in transmitting auditory impulses to the higher brain centre. CAPD describes a deficit in the entire analysis of auditory information due to a dysfunction of the central nervous system.15 D Daily sound exposure: The amount of sound energy a person receives during a representative working day. It is the time integral of the squared instantaneous frequency weighted sound pressure over an 8-hour working day. The standard units are pascal squared seconds (Pa2s) but in industry it is more convenient to use pascal squared hours (Pa2h).12,16 decibel or deciBel (dB): a term used to identify 10 times the logarithm to the base 10 of the ratio to two like quantities proportional to intensity, power or energy.17
1. Introduction
1-11
Dyspraxia: a neurological disorder involving difficulty in planning, sequencing, and carrying unfamiliar actions in a skilful manner.18 Dose: the amount of noise exposure relative to the exposure limit for a working day and is stated as a percentage of the limit.22 In New Zealand, a noise dose of 100% is equivalent to 1 pascal squared hour or an A-frequency weighted time-average level of 85 dB over an 8-hour working day (LAeq 8h = 85 dB). E Early intervention: Treatment or therapy given to young children usually in their preschool and early years of school to prevent or mitigate problems as well as to enhance the child’s health and development.18 Speech language therapy, music therapy and occupational therapy are common therapies provided in New Zealand for speech, communication and developmental problems. F Frequency: A measure in Hertz (Hz) of the repetition rates of components of an acoustic oscillation expressing the number of cycles per second.12 G Gestalt perception: A difficulty to distinguish between foreground and background information.19 I Inclusive education: UNESCO20 defines inclusive education as “A developmental approach to the learning needs of all children, youth and adults, especially those who are vulnerable to marginalization and exclusion. The principle of inclusive education was adopted at the World Conference on Special Needs Education: Access and Quality (Salamanca, Spain, 1994), restated at the World Education Forum (Dakar, Senegal, 2000) and is supported by the UN Standard Rules on the Equalization of Opportunities for Persons with Disabilities.” I-INCE: The International Institute of Noise Control Engineering Integrating-averaging sound level meter: An instrument that is used for measuring sound pressure level with standard frequency weighting components and a standard time averaging facility. These instruments are able to log, integrate and process data collected over a specified time period(s) to give values for a sweep of standardised sound descriptors such as time-average level, peak level, maximum sound pressure level (in some instruments exceedance levels and sound exposure levels depending on usage) for the period sampled. In addition to giving numerical values for these parameters, many modern meters are produced with accompanying software to allow data to be downloaded to a PC for further processing and production of graphics such as time histories.
1. Introduction
1-12
Intelligibility: See ‘Articulation’ Italics: Words and phrases presented in italics (except in the References) denote legal terms or definitions, which have specific meanings in the legislation. In addition, the legal title of legislation is presented in italics. For example: Education (Early Childhood Centres) Regulations 1998. L Language deficiency (receptive aphasia): A deficiency in the interpretation of auditory impulses after they have been transmitted.12 Lombard effect: The automatic raising of one’s voice when speaking in a noisy environment. Also known as the “Café effect”. M Maximum A-frequency weighted sound pressure level (LAmax): This is 10 times the logarithm to the base 10 of the square of the ratio of the maximum sound pressure, to the reference value 20µPa. This is an RMS value and must not be confused with the peak level (Lpeak), a non-RMS value. Minimum audible field (MAF) Threshold: The sound pressure at threshold of hearing for young adults with normal hearing.21 N New Zealand Disability Strategy 2001: A formal policy document adopted by the New Zealand government which presents a long-term plan for changing New Zealand from a “disabling” to an “inclusive” society. The strategy has adopted wide reaching actions and objectives in ensuring rights, the provision of the best education, the advancement of employment opportunities, the provision of support systems etc, and to enable the disabled to lead full and active lives. Noise: (1) Any disagreeable or undesired sound or other disturbance. It may also include any unwanted disturbance within a useful frequency band such as undesirable electric waves in a transmission channel.12 (2) Sound of a general random nature. The spectrum does not show any defined frequency components.12 Noise - induced hearing loss (NIHL): A sensorineural hearing loss resulting from excessive exposure to noise usually over periods of time. It is characterised initially by loss in the frequency range 4,000-6,000Hz. This form of hearing loss is usually permanent.12,22,23 Noise reduction coefficient (NRC): An index of the ability of a material to absorb sound. This is calculated by averaging the sound absorption coefficients at the frequencies 250, 500, 1000, and 2000 Hz.24
1. Introduction
1-13
Notifiable or Notified consent*: The public notification of a consent application (under the Resource Management 1991) to invite public submissions to be considered as part of the approval process. O Occupational therapy: An allied health profession that helps people improve the functioning of their nervous system in order to develop skills leading to independence in personal, social academic and vocational pursuits.18 Octave bands: The division of the audible frequency range into a standardized series of adjacent frequency bands where the upper frequency is twice the lower frequency. Each of these bands can be further divided into one-third octave band frequencies. Osmolarity: The concentration of osmotically active particles in solution, which may be quantitatively expressed in osmoles of solute per litre of solution.25 Osmole: A unit of osmotic pressure equal to the molecular weight of solute expressed in grams divided by the number of ions or other particles into which it dissociates in solution.26 Otitis media with effusion (OME): An inflammation of the middle ear in which a collection of fluid is present in the middle ear space.27 P Peak level (Lpeak): The peak level, expressed in decibels, is 10 times the logarithm, to base 10 of the square of the ratio of the peak sound pressure to the reference value 20µPa.12 It is a non-RMS value and should not be confused with LAmax. It has no frequency weighting, but to limit the measurement to sound in the audio-frequency range, a “Z” weighting is used to provide a cut off at high and at low frequencies. A “C’weighting is often used if no “Z” weighting is provided on the sound level meter and is stipulated in some standards. In New Zealand it is measured according to NZS 6801:1999 Acoustics –the measurement of sound. Perilymph: The fluid between the bony and membranous labyrinths of the ear.26 Pervasive developmental disability: Severe overall impairment in the ability to regulate sensory experiences, affecting the child’s behaviour, interaction with others and communication skills.18 Presbyacusis: The sensorineural hearing deterioration associated with age.23 Public Health Commission: The Public Health Commission was established as a government body, independent of the Ministry of Health, by the New Zealand Government in the early 1990s, as a result of the major health reforms carried out at the time. Key functions included direct advice to the Minister of Health on improving and * (in italics) denotes a legal term which has specific meaning in the legislation
1. Introduction
1-14
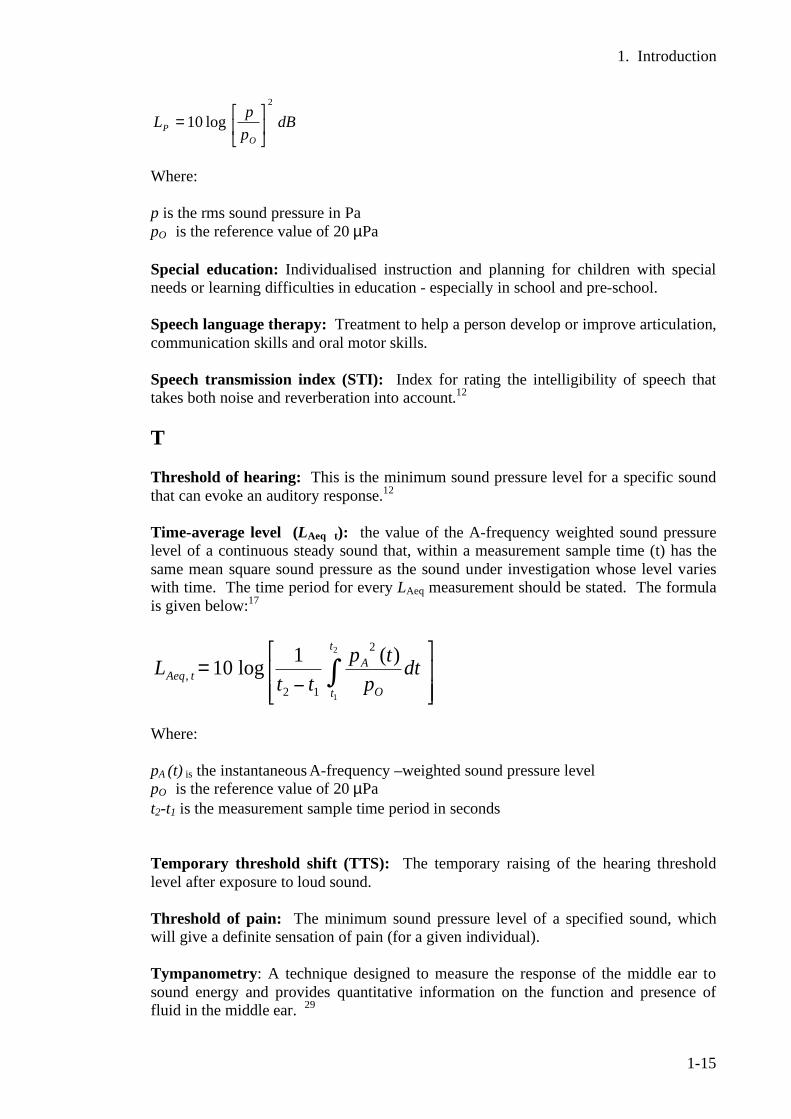
protecting the public health of New Zealanders, and to ensure that government funds dedicated for public health were used appropriately. The Commission was disestablished in 1996 and the functions transferred to the Ministry of Health. R Reverberation: Sound that persists in an enclosed space, as a result of repeated reflection or scattering after the sound source has been stopped Reverberation time (T60) or (RT 60)of an enclosure: The time (expressed in seconds) that is required for a sound pressure level of a given frequency or frequency band to drop 60 dB in any enclosure after the source of the sound has stopped.28 RMS: Root mean square S Sensory diet: (1) the multi-sensory experiences that one normally seeks on a daily basis to satisfy one’s sensory appetite. It is not just related to sensory experiences with food. (2) a planned and detailed activity programme developed by an occupational therapist to assist the self regulation of an individual. A sensory diet is a tool often prescribed for individuals experiencing sensory integration disorder. Sensory integration disorder: The inefficient neurological processing of information received through the senses, causing problems with learning, development and behaviour. (Also known as ‘sensory integrative dysfunction’, or ‘sensory modulated dysfunction’).18 Sessional centre∗: (licensed under Regulation 7, Education (Early Childhood Centres) Regulations 1988). An early childhood centre permitted to operate only where no child attends for a period of more than 4 hours on any day. Signal-to-noise ratio (SNR): The signal level minus the noise level (dB).12 Sound exposure: The time integral of the squared instantaneous frequency weighted sound pressure over a specified time interval or event. The standard units are in pascal squared seconds (Pa2s) but can also be quoted in pascal squared hours (Pa2h).12 Sound level meter: an instrument for the measurement of sound pressure level that complies with either or both IEC 60651 or IEC 61672.12 Sound pressure level (LP): expressed in decibels is ten times the logarithm of the square of the ratio of the frequency weighted and time weighted sound pressure level to the reference value 20 µPa. The formula is given below:17
∗ (in italics) denotes a legal term which has specific meaning in the legislation.
1. Introduction
1-15
dBppLO
P
2
log10 !"
#$%
&=
Where: p is the rms sound pressure in Pa pO is the reference value of 20 µPa Special education: Individualised instruction and planning for children with special needs or learning difficulties in education - especially in school and pre-school. Speech language therapy: Treatment to help a person develop or improve articulation, communication skills and oral motor skills. Speech transmission index (STI): Index for rating the intelligibility of speech that takes both noise and reverberation into account.12 T Threshold of hearing: This is the minimum sound pressure level for a specific sound that can evoke an auditory response.12 Time-average level (LAeq t): the value of the A-frequency weighted sound pressure level of a continuous steady sound that, within a measurement sample time (t) has the same mean square sound pressure as the sound under investigation whose level varies with time. The time period for every LAeq measurement should be stated. The formula is given below:17
!!"
#
$$%
&
'= ( dt
ptp
ttL
t
t O
AtAeq
2
1
)(1log102
12,
Where: pA (t) is the instantaneous A-frequency –weighted sound pressure level pO is the reference value of 20 µPa t2-t1 is the measurement sample time period in seconds Temporary threshold shift (TTS): The temporary raising of the hearing threshold level after exposure to loud sound. Threshold of pain: The minimum sound pressure level of a specified sound, which will give a definite sensation of pain (for a given individual). Tympanometry: A technique designed to measure the response of the middle ear to sound energy and provides quantitative information on the function and presence of fluid in the middle ear. 29
1. Introduction
1-16
W Weighting: This refers to the effect on a signal of electronic circuits that modify the signal in a standardised manner. Frequency weighting refers to modifiers of frequency response. Time weighting refers to modifiers of the integration time. WHO: The World Health Organization
1. Introduction
1-17
1.5 References 1 Sorkin, D., The classroom acoustical environment and the Americans with
Disabilities Act. Language, Speech and Hearing Services in Schools, 2000. 31: p. 385-388.
2 Public Health Commission, Preventing child hearing loss: Guidelines for public
health services. 1995, Wellington: Public Health Commission. 3 Technical Initiative #4 Noise and reverberation control for schoolrooms I-
INCE document, International Institute of Noise control Engineers (retrieved from the World wide web on 1 June 2001 (http://users.aol.com/iince/tech02.html.)
4 Karabiber, Z., Lubman, D., Sutherland, L. The I-INCE Technical Initiative:
Noise and reverberation control in schoolrooms in Internoise 2002, The International Congress and Exposition of Noise Control Engineering. 2002. Dearborn, MI, USA: International Institute of Noise Control Engineering.
5 Wilson, O., Valentine, J., Halstead, M., McGunnigle, K., Dodd, G., Hellier, A,
Wood, J, Simpson, R., Classroom acoustics, a New Zealand Perspective. 2002: Oticon Foundation in New Zealand.
6 Classrooms fail noise test., in Education Today. , Issue 3, New Zealand, August
2000. 7 Nelson, P., Soli, S., Acoustical barriers to learning: Children at risk in every
classroom. Language, Speech and Hearing Services in Schools, 2000. 31: p. 356-361.
8 Wolf, D., Bixley, J., Glenn J., Gardener, H., To use their minds well:
investigating new forms of student assessment. Review of Research in Education, 1991. 17: p. 31-74.
9 Hayes, L., Personal communication. 2007, Group Special Education, Ministry
of Education: Porirua District office. 10 Ministry of Education, Draft criteria for the licensing or certification of ECE
services: Discussion document. 2005, Wellington: Ministry of Education. 11 Education (Early Childhood Centres) Regulations 1998. (New Zealand
Legislation). 12 Harris, C.M., Definitions, abbreviations and symbols, in Handbook of acoustical
measurements and noise control, 3rd edition., C.M. Harris, Editor. 1998, Acoustical Society of America: New York.
1. Introduction
1-18
13 Janzen, J.E., Understanding the nature of autism. 1996, Texas: Therapy Skill
Builders. 14 Dickinson, P. Personal Communication, 2004. Institute of Food, Nutrition and
Human Health, Massey University, Wellington. 15 Hall, J., Muellar, H., Audiologists' desktop reference : Diagnostic audiology,
principles, procedures, and practices. Vol. 1. 1997: Singular Thomson Learning.
16 Draft Glossary of Terms Used in Noise Control Engineering (undated).
http//:users.aol.com/inceusa/glossary.html 17 New Zealand Standard, NZS 6801:1999, Acoustics- Measurement of
Environmental Sound. 1999: Standards New Zealand. 18 Kranowitz, C., The out-of-sync child -recognising and coping with sensory
integration dysfunction. 1998, New York: Berkley Publishing Group. 19 Bogodshina, D. Sensory issues in autism are recognised but.... in Awares Online
Conference. 2005. http://www.awares.org/conferences. 20 United Nations Educational, Scientific and Cultural Organisation (UNESCO),
Inclusive Education. Retrieved 25 July 2007 from the Education-inclusive education homepage (http://portal.unesco.org/education).
21 Small, A., Gales, R., Hearing characteristics. 3rd ed. Handbook of Acoustical
Measurements and Noise Control, ed. C.M. Harris. 1998, New York: Acoustical Society of America.
22 Occupational Safety and Health, Approved code of practice for the management
of noise in the workplace. 2002, Wellington: Occupational Safety and Health, New Zealand Department of Labour.
23 Occupational Safety and Health., Noise-induced hearing loss of occupational
origin: A guide for medical practitioners. 1994, Department of Labour: Wellington
24 May, D., Handbook of noise assessment., ed. D.N. May. 1978, New York.: Van
Nostrand Reinhold. 25 Retrieved 1 March 2007 from http://www.medicinenet.com 26 Concise Oxford Medical dictionary, 2nd edition, 1996 27 Wong, D., Whaley and Wong's nursing care of infants and children. 5th ed, ed.
D. Wilson. 1995: Mosby.
1. Introduction
1-19
28 Harris, C.M., Handbook of acoustical measurements and noise control. 3rd ed.
1988, New York: Acoustical Society of America. 29 Ferguson, A. Tympanometry. in ANZAI Conference. 2004. Auckland: Academy
of New Zealand Audiometrists Inc.
2 Studies of noise and hearing loss in education: A literature review
2-1
2 Studies of noise and hearing loss in education - A literature review
2.1 Introduction Despite considerable searching of available databases and personal contact with experts
worldwide on this topic, it appears that very little work has been carried out on noise in
early education. Information to date reveals that this work is likely to be the first study
of its kind internationally to investigate noise levels in this educational sector. This is
surprising as the preschool years are critical to language development in children, and
are very high-risk times for otitis media infections with effusions. Poor acoustical
environments in preschools are likely to have significant detrimental effects on learning
at preschool level and later on in school.
There is an increasing level of awareness of noise in schoolrooms and the effects that
this is having on children’s ability to learn, their development and behaviour. Studies
are now beginning to address the issues of children with auditory function disorders and
how these are affected by noise in formal school learning situations. In 2000, a number
of papers were published in the clinical forum of ‘Language, Speech and Hearing
Services in Schools’ (a journal published by the American Speech Language Hearing
Association). Included in this literature were papers on relevant legislation (USA),1
acoustical barriers to learning and at-risk children,2 children with normal hearing and
hearing impairment,3 intervention technology4 and methods to provide a high quality
acoustical environment.5 Included in New Zealand literature are studies by Bennetts
and Flynn,6 Blake and Busby7 and Wilson et al.8
Hearing specialists, and probably other professionals dealing with special needs
children who are profoundly affected by noise, have long requested that acoustics be
considered in the design of classrooms and learning spaces, but this issue up to the
present time has received little attention.1 The Americans with Disabilities Act, passed
by the US Congress in 1990, has been described by Sorkin1 as a landmark piece of
legislation, requiring new and innovative structures to meet specific accessibility
2 Studies of noise and hearing loss in education: A literature review
2-2
guidelines for people with disabilities. While specialists dealing with hearing and
auditory processing disorders have long recognised the importance of the acoustical
environment for children with auditory problems, few legal mechanisms are available at
school to secure this important accommodation for their special needs children.1 In an
informal survey of parents conducted in North America by Sorkin1, it was reported that
few personnel at the schools were willing to include acoustics as part of their child's
individual education plan (IEP).* Sorkin emphasised that the IEP process should allow
for consideration and inclusion of acoustical improvements to existing learning spaces,
but in reality few parents have been successful in their efforts to gain improvements.
From comments received from respondents, Sorkin reported that there were serious
problems in schools with background noise and reverberant surfaces. Many of the
respondents described a wide range of special populations that may benefit, which
included not only the hearing impaired, but also those children with central auditory
processing disorders (CAPD), and attention-deficit/hyperactivity disorder (ADHD).
This work identified a major at-risk group, not highlighted in most other publications, as
those on the autistic spectrum and a subset of gifted children, both of which experience
sensory integration disorder. (See Chapters 6 and 9)
A number of authors including Sorkin,1 Nelson and Solti,2 and Solti and Sullivan9 state
that younger children (generally before their teenage years) are immature listeners.
Hearing and noise tests carried out with children have found that children's ability to
understand sentences in noise improves through the early childhood years, which
reaches the adult level in the teenage years. Nelson and Solti concluded that young
children need a good acoustical environment for full understanding. Likewise they are
at risk of impaired learning in a noisy or reverberant environment. Sorkin concluded
that the entire population (with or without disabilities) would benefit from improved
acoustics in their learning environments.
Nelson and Solti2 proposed a model of classroom (verbal) communication where they
presented the interlinking factors or parameters influencing effective communication
* An individual education plan (IEP) process is a system used widely for special needs children unable to meet the normal curriculum level. It involves the setting and review of an individual plan of education for the child with the school teachers, education support workers, education specialists assigned to the child, and the parents.
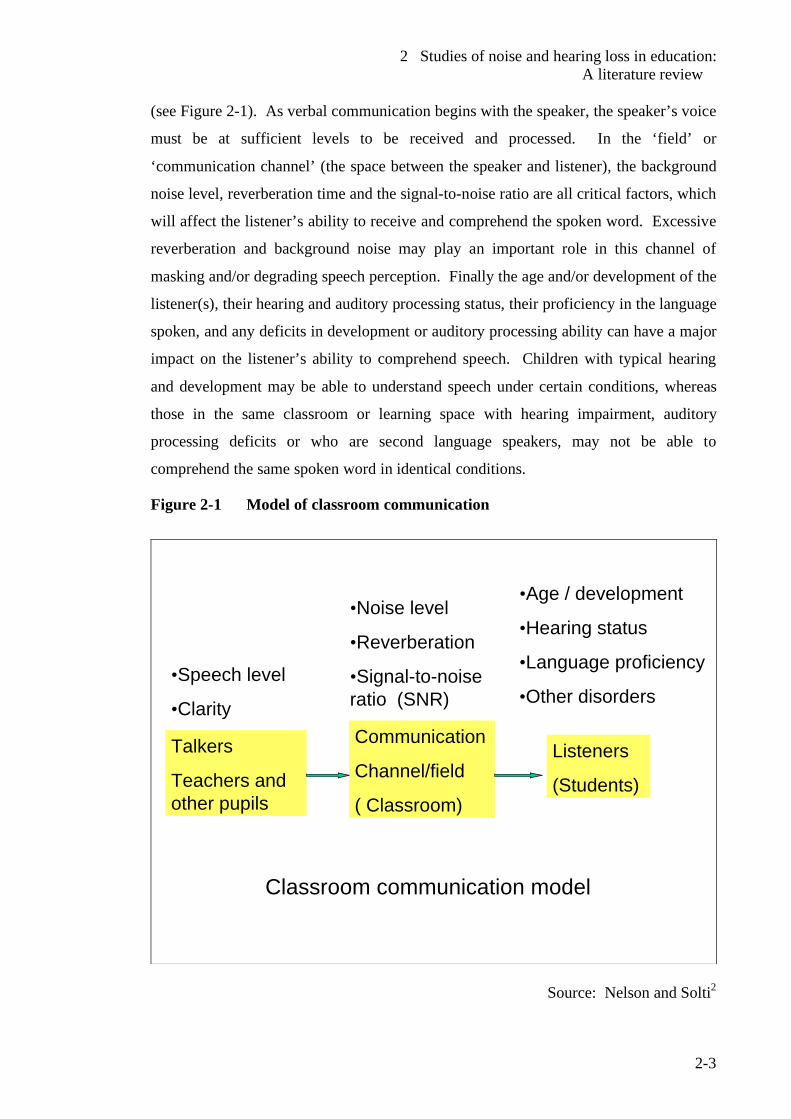
2 Studies of noise and hearing loss in education: A literature review
2-3
(see Figure 2-1). As verbal communication begins with the speaker, the speaker’s voice
must be at sufficient levels to be received and processed. In the ‘field’ or
‘communication channel’ (the space between the speaker and listener), the background
noise level, reverberation time and the signal-to-noise ratio are all critical factors, which
will affect the listener’s ability to receive and comprehend the spoken word. Excessive
reverberation and background noise may play an important role in this channel of
masking and/or degrading speech perception. Finally the age and/or development of the
listener(s), their hearing and auditory processing status, their proficiency in the language
spoken, and any deficits in development or auditory processing ability can have a major
impact on the listener’s ability to comprehend speech. Children with typical hearing
and development may be able to understand speech under certain conditions, whereas
those in the same classroom or learning space with hearing impairment, auditory
processing deficits or who are second language speakers, may not be able to
comprehend the same spoken word in identical conditions.
Figure 2-1 Model of classroom communication
Talkers
Teachers and other pupils
Communication
Channel/field
( Classroom)
Listeners
(Students)
•Speech level
•Clarity
•Noise level
•Reverberation
•Signal-to-noise ratio (SNR)
•Age / development
•Hearing status
•Language proficiency
•Other disorders
Classroom communication model
Source: Nelson and Solti2
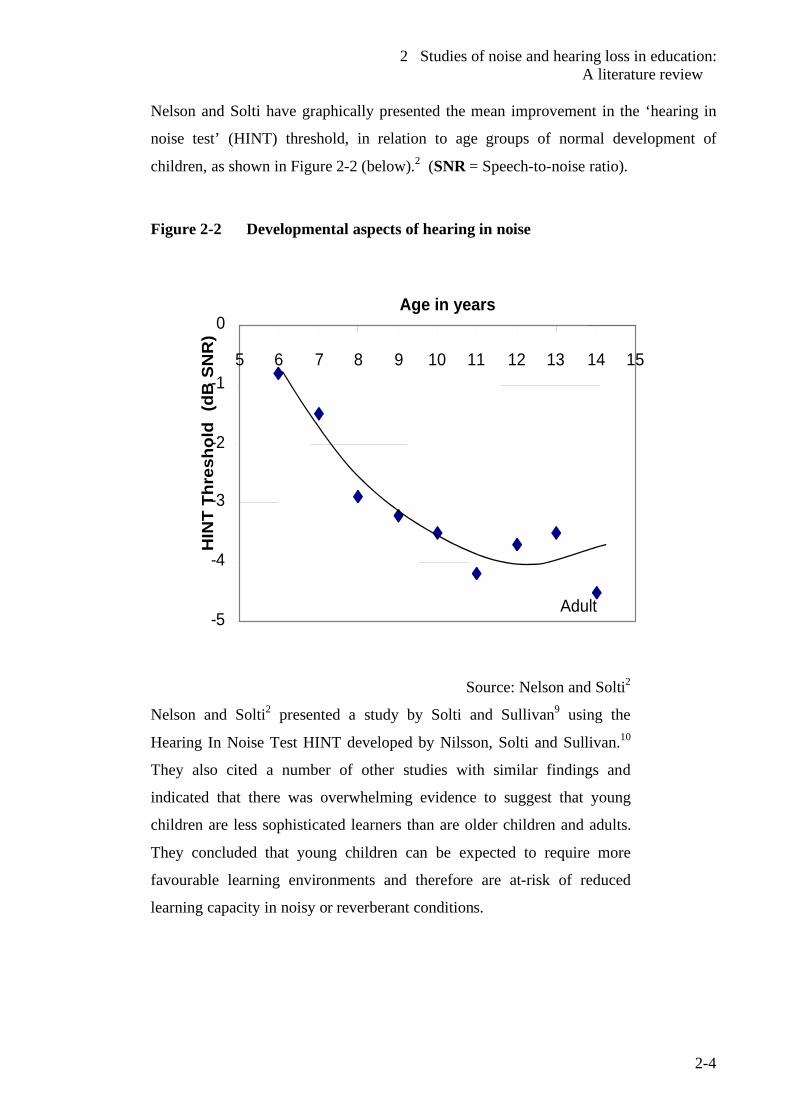
2 Studies of noise and hearing loss in education: A literature review
2-4
Nelson and Solti have graphically presented the mean improvement in the ‘hearing in
noise test’ (HINT) threshold, in relation to age groups of normal development of
children, as shown in Figure 2-2 (below).2 (SNR = Speech-to-noise ratio).
Figure 2-2 Developmental aspects of hearing in noise
-5
-4
-3
-2
-1
0
5 6 7 8 9 10 11 12 13 14 15
HIN
T Th
resh
old
(dB
SN
R)
Adult
Age in years
Source: Nelson and Solti2
Nelson and Solti2 presented a study by Solti and Sullivan9 using the
Hearing In Noise Test HINT developed by Nilsson, Solti and Sullivan.10
They also cited a number of other studies with similar findings and
indicated that there was overwhelming evidence to suggest that young
children are less sophisticated learners than are older children and adults.
They concluded that young children can be expected to require more
favourable learning environments and therefore are at-risk of reduced
learning capacity in noisy or reverberant conditions.
2 Studies of noise and hearing loss in education: A literature review
2-5
2.2 At-risk children and important acoustic conditions
Nelson and Solti2 list the following groups of at-risk children. These are children who
have a disability, impairment or impediment which compromises their ability to learn to
the same extent as their peers, particularly when placed in unfavourable physical,
environmental or social learning conditions.
2.2.1 Second language speakers As the ability to understand the language spoken is related to the proficiency and
experience with the language, second language speakers performed more poorly than
their peers who were native speakers. Children, who are less experienced in the
language of instruction, require more favourable conditions for understanding
classroom conversations.
2.2.2 Children with hearing loss This group of children are at great risk for the detrimental effects of poor classroom
acoustics. The USA, like New Zealand, has a high incidence of otitis media with
effusion (glue ear). The authors have cited studies, which have found a large number of
children with slight or mild hearing loss in parts of the USA who, while unaware of
their loss, showed significant dysfunction when compared to their peers with normal
hearing and auditory function. Other studies cited by Nelson and Solti2 have found
major educational consequences with incidence of minimal hearing loss. This is
supported by Allen11 in New Zealand, who reported on a large study in Dunedin, where
just over 1000 children were enrolled in a multi-disciplinary study with regular follow-
up until 15 years of age. A group of these children who had otitis media in both ears
were found to be significantly behind the children with normal hearing at age 3 years.
Allen suggested that this condition had been present for sometime and that significant
harm had already been done by that age. Despite receiving treatment at age 5 with
antibiotics or insertion of ventilation tubes, this group by the time they were 15 years
old, were on average 2 years behind their peers with normal hearing in their reading
2 Studies of noise and hearing loss in education: A literature review
2-6
ability. This significant difference means these children will have a lower chance of
passing school examinations along with reduced chances of employment. Allen11 also
indicated a strong association in this group with otitis media with effusion and later
development of eardrum abnormalities.
Classrooms have been described as active and noisy places. Increased noise is a
consequence of the recent trends in education which often involve collaborative
interaction of multiple minds and tools as much as individual possession of
information.2,12 Nelson and Solti2 suggest that background noise levels of most
unoccupied classrooms are too high for maximum understanding by all students. They
found only one in eight of these classrooms had A-frequency weighted background
sound levels below the 30 dB level recommended by the American Speech Language
Hearing Association, which is identical to that recommended by the World Health
Organization.13
2.2.3 Reverberation time and effects Reverberation time is an important physical acoustical characteristic and can degrade
speech perception in the classroom by smearing or masking the temporal properties of
speech signals, making them more difficult to understand.2,3 Like noise, reverberation
tends to degrade the perception of the softer consonant sounds. In highly reverberant
spaces, where there is an audible echo, words may overlap and the reverberant sound
energy fills temporal pauses between words.3
Crandell and Smaldino3 suggested that the combination of noise and reverberation
combine synergistically to affect speech perception. This means that if either noise or
reverberation was present, speech perception could be degraded by 10%, but if both
noise and reverberation quantities were present in the same room, the combined
degradation of speech perception could equate to 40%-50%. They indicated that such
synergistic effects appear, because the reflections, which fill temporal gaps in the noise,
make it into a more steady state in nature, and therefore the information in those gaps is
no longer available for the ear to discern.3
2 Studies of noise and hearing loss in education: A literature review
2-7
2.2.4 Dealing with background noise Background noise, as described by Crandell and Smaldino,3 refers to any undesirable
auditory stimuli that hinders or obscures the audio information a child wants or needs to
understand in a classroom setting. This, of course, includes noise generated externally
intruding into the classroom or learning space. It can include transport, aircraft, road
works and where mechanical heaters or ventilation systems are installed. Background
noise often varies considerably depending on the time of the day. Many studies have
reported background noise as measured by single number descriptors such as an A –
frequency weighted time-average level (LAeq). There is difficulty in obtaining this
acoustic descriptor at the important time (i.e. when the children are normally present).
At times when children are not present, such as school holidays and weekends, the
background noise levels can be very different due to different traffic flow etc.
However these authors3 suggest a more thorough procedure for background noise
assessment is via the use of noise criteria (NC) curves developed by Beranek,14 where a
spectral analysis in octave bands or preferably one-third octave bands is conducted
across the eight standardized frequencies between 125Hz to 8000Hz.3 This method has
the distinct advantage of a broadband time-average level by isolating the low frequency
noise present. This is, perhaps, of greater importance, when central heating or air
conditioning systems are in use. Most New Zealand early childhood centres and
schools do not have central heating or air conditioning systems, but a number have fan
type heaters where hot air generated by the unit is circulated by a mechanical fan.
Wilson et al8 chose to use C-weighting for time-average level measurements to evaluate
low frequency noise. This is discussed in more detail in Section 2.5 ‘Background to the
New Zealand situation’ (on page 2-16).
Crandel and Smaldino3 state that the masking effect of background noise interferes with
the child’s ability to perceive speech by masking the acoustic and linguistic cues that are
available in the teacher’s spoken word. In particular, background noise has the greatest
impact on consonant perception because the spectral energy of consonants is less
intensive than that of the vowels. They find that minimal decreases in consonant
perception can significantly influence speech perception because consonantal energy is
a critical factor in the listener’s ability to understand speech.3
2 Studies of noise and hearing loss in education: A literature review
2-8
The most significant maskers for speech are invariably noises with long-term spectra
similar to the speech spectrum, because all speech frequencies are affected to the same
degree. Therefore typical classroom chatter generally produces the greatest effect on
speech perception because the teacher’s voice has a similar spectrum.3 As noise
generally produces more effective masking for speech of a higher frequency (described
as an upward spread of masking), low frequency noises (e.g. air conditioning units and
similar type machine noise) tend to produce the higher levels of masking. Continuous
noises (hums etc from fans, fluorescent lighting and chatter) are generally more
significant maskers than impulse or interrupted noise.3
2.2.5 Distance from speaker to listener. Distance is an important factor in influencing speech perception. At close distances the
teacher’s voice predominates in this sound-field with minimal interference from other
acoustic factors such as background noise and reverberation from room surfaces.3
Generally the sound decreases by 6 dB for doubling of the distance (inverse square
law). This law more often applies outdoors but inside rooms the reverberant field
increasingly plays a part with increased distance.3 An indirect sound-field (not directly
from the speaker) originates at a critical distance, which is defined as:3
nRTVQDc /2.0=
where:
Dc = critical distance for start of indirect sound field.
V = volume of room (m3)
Q = Directivity factor of the source (human voice generally a value of 2.5)
n = number of sources
RT = Reverberation time of enclosure at 1400 Hz.
The distance a child is from the teacher can have a major effect, as beyond the critical
distance, the indirect sound-field can significantly reduce speech perception.3
2.2.6 Studies on effects of noise on children and their teachers
Maxwell and Evans15 undertook a study on the effects of noise on preschool children's
pre-reading skills. This is a particularly important study, as few studies on such young
children exist. Ninety children participated over a 2-year period. Tests were conducted
2 Studies of noise and hearing loss in education: A literature review
2-9
in a childcare centre with poor acoustics before and after the modifications were carried
out to improve this aspect of the learning environment. The authors took time-average
levels over a 4-hour period for similar activities before and repeated after renovation.
Children were found to perform better in quieter conditions on cognitive measures and
to answer more questions correctly on the measure of pre-reading skills. Children in the
quieter conditions were rated by their teachers on the language scale as using the
understanding language to a higher degree than their peers in noisier environments.
These children in quieter rooms solved puzzles significantly faster than their peers in
the noisier rooms. The authors concluded that chronic exposure to high noise levels
affects preschool children's language and pre-reading skills.
It is unclear whether monitoring was done over multiple sessions and the result
averaged or if monitoring in each case was a single event. As sound pressure levels can
vary from day to day, how such confounding factors were addressed is not clear in the
report. It would usually be necessary to monitor several sessions before and after the
modifications to the room as there are a number of confounding factors which cause
time-average levels to vary considerably as a function of time (as indicated by Crandel
and Smaldino3) and from day to day. These include such factors as numbers of children
present, activities undertaken and inclement weather, which keeps children indoors. In
addition, peak levels (Lpeak) were used as a measure of acoustical characteristics. Peak
level measurements are not RMS values but a measure of the over-pressure of short
instantaneous events of sound such as sharp impact type events as a door slamming or
the striking an object with a hammer etc. This descriptor would depend on the
frequency and intensity of such events and it is difficult to see how this can be related to
building characteristics. For example, peak levels will be influenced by how hard and
how often a door is slammed. Reverberation time is a more effective descriptor to
compare the acoustical properties of the room before and after renovation and could
have been used in this case. The nature of the renovations carried out was not discussed
in detail. The authors described the preschools room with a ceiling higher than 12 feet
(3.6 metres) and some walls not of full height partitions. However from photographs in
the report, the room appears to be an open plan type room with open trusses and the
ceiling following the roof line. The modifications appeared to be largely an installation
2 Studies of noise and hearing loss in education: A literature review
2-10
of sound absorbent panels hanging from the roof trusses. Semi-height partitions may
have been extended to full height partitions but whether any other modifications were
made (e.g. to the wall surfaces) is unknown. It would have been helpful for
considerably more detail on the original room characteristics and then to present in
detail what modifications were made. It would have also been helpful to give the
specifications of any acoustic material fitted, or at least information given on where this
can be obtained.
Due to other fundamental errors in this report, the reliability of the acoustics section is
questionable. The authors referring to a ‘sound level meter’ as a ‘decibel meter’ and
time- average level (Leq) as "Leg" are two fundamental errors which bring into question
the competency of the authors in acoustical techniques and the peer-review process of
this section. Confusion between the RMS maximum sound pressure levels and the non-
RMS peak levels cannot be discounted. From the data presented, it does seem that the
renovations resulted in significant improvements to the learning of young children.
A comprehensive study by Enmarker and Bowman16 examined the responses to
annoyance of teachers and their pupils. There were 207 responses from pupils aged 13-
14 years and 166 responses from teachers aged 21-65 years. Models that fitted both
pupils and teachers were tested. The majority of participants perceived activity noise
such as classroom chatter, and furniture scrape as the most disturbing noise sources with
the rating for teachers significantly higher than those from the pupils. On the self-
evaluation of their health, teachers rated themselves as more adversely affected than
pupils with more frequent sleeping problems, tinnitus, tension and fatigue after work.
Pupils rated themselves as more irritable. Teachers experienced the noise as less
predictable compared to the pupils. The authors suggested that the ability to predict
noise is of more importance and that unpredictable noise may cause a higher degree of
annoyance of teachers. This could reflect that teachers are more sensitive to
information overload. Findings over gender difference were inconsistent.16
Haines et al17 investigated the effects of chronic aircraft noise on mental health and
cognitive performance in 340 children aged 8-11 years attending schools in areas of
high aircraft noise and compared these to children in matched controlled schools with
2 Studies of noise and hearing loss in education: A literature review
2-11
lower levels of noise. They found that chronic aircraft noise exposure resulted in higher
levels of annoyance and poorer reading comprehension using standardized scales where
adjustments were made for age, deprivation and language spoken. However they found
that chronic exposure to aircraft noise was not associated with mental health problems
e.g. (anxiety, hyperactivity, behaviour etc) in children.17
Classroom noise is an occupational concern for teachers particularly as they are exposed
to this throughout their working life. An interesting study by Grebennikov18 in Sydney,
Australia investigated the effects on 25 preschool staff in 14 early education settings.
Noise dose exposure was assessed by fitting doseBadges identical to those used in this
work. Of the 25 teachers, the four highest individual A-frequency weighted time-
average ranged from 85-86 dB during contact hours but reduced slightly with a
correction to 8 hours due to the non-contact working hours. Australia and New Zealand
use the same noise exposure criteria. Personal exposures of these teachers ranged from
70-103% dose, with one exceeding the maximum permissible level of 100% dose. Nine
staff members recorded peak levels (Lpeak) exceeding the permissible levels of 140 dB.
High levels of noise were found from the following activities:
• Inclement weather confining students indoors
• Insufficient space (confined indoor area)
• A resonant floor, furniture and / or play equipment
• Distressed students
• Those students who are over exuberant
• Noisy indoor activities (assemblies, music, bells)
• Air conditioning
• Alarms
Oberdorster and Tiesler 19 found that room acoustics had a major effect on the A-
frequency weighted time-average levels (LAeq t) in teaching spaces. The shorter the
reverberation time (T60), the greater the speech intelligibility. They established a near
linear relationship with a decrease of 2 dB in sound pressure levels per 0.1-second
reduction in reverberation times between reverberation times of 0.3-0.8 seconds.
Oberdorster and Tiesler19 suggest that stress (which they measured by monitoring
individual heart rates) in teaching is dependent on the ergonomic factor of room
2 Studies of noise and hearing loss in education: A literature review
2-12
acoustics and claim to have established a clear relationship between stress responses and
noise in teaching. They found that if the A-frequency time-average levels over the
period in teaching falls due to improved room acoustics, the stress state of teaching staff
is simultaneously reduced. This was demonstrated by the heart rate of a teacher
reducing by 10 beats per minute when she was teaching in a quieter lesson (less 5 dB).
All other confounding factors, which could give rise to the same response, were
accounted for as far as could be monitored in a field investigation.
Finally, these authors found that noise did have a major effect, not only in regard to
heart rate, but changes in sensitivity to noise. Under improved acoustic conditions, the
impact of noise was to have a less stressful effect with far less elevation in heart rate.
The reduced noise was not the causal factor, but the resultant improved speech
intelligibility and communication conditions.19
2.2.7 Classroom Amplification
A number of reports have shown that some classroom characteristics produce barriers in
listening and learning to at-risk children. Smaldino and Crandell 4 state the following
reasons why classroom acoustics are important:
1. Classrooms are auditory verbal environments that require accurate reception of
verbal speech signals from the teachers or pupils.
2. Excessive background noise can mask key elements of speech and render it less
identifiable.
3. Reflected sound in a classroom (reverberation) can both mask speech and smear
important temporal cues that are necessary for accurate speech and language
perception.
4. Excessive noise, reverberation, and loss of speech energy over distance
occurring simultaneously result in synergistic effects in that they impact on
speech perception to a greater extent than when any one of the these
characteristic are considered separately.
5. The provision of early intervention, especially for children who have hearing
impairment or speech and language problems, improves the possibility of
2 Studies of noise and hearing loss in education: A literature review
2-13
normal auditory-verbal development. This appears to lessen, the longer early
intervention is delayed.
Hearing aids have a serious limitation in that they cannot distinguish the speech signal
when there is competing noise or when the listener cannot be close to the speaker. In
the classroom, an enhanced signal-to-noise ratio (SNR) is required to deliver a clear
complete speech signal, which is essential for oral expressive language and reading
skills.20
Individual and sound-field FM systems are 2 types of devices now in common use to
enhance the SNR. Both use a remote microphone attached to a headset worn by the
speaker (usually the teacher) and the signal is transmitted to the unit by radio waves. In
individual units, it is the child who wears an FM receiver. In sound-field systems the
sound is distributed to a class from a series of high quality speakers placed strategically
in the room to maximise the benefit to all students. Both individual and sound-field
systems improve the signal to noise ratio around the room.4,20
Flexer20 and Palmer21 suggest that all children could benefit from a sound-field system
because the improved SNR creates a more favourable learning environment. There is
ample evidence in literature to highlight the benefits of these systems. Canning22 found
that passages spoken through an FM sound-field system were understood better than
comparable non-amplified passages. Bennetts and Flynn6 investigated the use of sound-
field systems with children experiencing Down syndrome. They found that despite the
limited number of subjects, a sound-field system was of benefit to this group of special
needs children. Their subjects only had mild hearing loss (middle ear infections are
prevalent in this group) and for more severe cases they indicated that the benefits would
be greater.
In a particularly relevant study by Palmer,23 a sound-field system was experimentally
controlled in a study carried out in a kindergarten. When the sound-field was in use,
there was a marked decrease in the level of inappropriate student behaviour but when
the system was turned off, a significant increase in inappropriate behaviour occurred.
2 Studies of noise and hearing loss in education: A literature review
2-14
The students also demonstrated a marked increase in appropriate task management
immediately following the use of a sound-field system.
In the ‘Guidelines for classroom acoustics in new construction’(USA),24 the authors
point out that sound-field amplification systems will add background noise in work
areas within the room and can intrude into adjacent spaces without adequate acoustic
insulation. As the typical system uses a microphone it may not be ideal in group
learning situations. These devices enhance the speech signal but will not compensate
for poor classroom acoustics. Control of reverberation and background noise is also
essential for amplification to be effective. It has to be remembered that amplified
background noise can be very painful and disruptive for children with auditory
disabilities such as those with sensory integration problems.24 This is very much the
case with children experiencing sensory integration disorder such as those on the
autistic spectrum.
2.3 Guidelines for community noise - World Health Organization
The World Health Organiszation13 has published its ‘Guidelines for community noise’,
which have covered extensively, the wide ranging adverse effects of noise, including
hearing impairment, interference with speech communication, sleep disturbance,
cardiovascular and physiological effects, mental health effects, effects on performance,
effects on residential behaviour and annoyance, effects of combined sources and
vulnerable groups. The WHO suggests from evidence collected from animal
experiments that children may be more vulnerable to acquiring noise-induced hearing
loss than the adult population. This is difficult to quantify due to individual
susceptibilities and cultural/ethnic factors through the populations of the World. From
the limited data available, the WHO suggests that occupational hearing loss at A-
frequency weighted time-average levels of 75 dB or less over an 8-hour day (LAeq 8h <
75 dB) is unlikely to cause any hearing impairment even over prolonged exposure. In
the absence of other data this is particularly important for children. Taking into account
total noise exposure (including environmental and leisure time) over 24 hours/day, the
2 Studies of noise and hearing loss in education: A literature review
2-15
WHO finds that A-frequency weighted time-average levels of less than 70 dB
(LAeq 24h <70 dB) would not cause hearing impairment in a large majority of people
(over 95%). The WHO suggests that the calculation method from ISO 199925 for
specifying hearing impairment should be accepted for environmental and leisure time
noise. As large-scale epidemiological studies are not available to support this
proposition, the WHO advises care with respect to the following aspects for children:
• Children may be more vulnerable in acquiring noise-induced hearing loss than
adults.
• The peak level exposure to which children are subjected should never exceed
120 dB as noise from activities such as fireworks and playing with noisy toys
can potentially reach such levels. Some audiologists and hearing specialists
recommend a lower figure of no more than 100 dB.26
Sleep disturbance is an issue in New Zealand all day centres, which are required by the
Education (Early Childhood Centres) Regulations 1998 to provide areas for sleep. It is
important that children requiring sleep have appropriate quiet sleeping spaces and are
not disturbed by other activities inside or outside the centre. The WHO recommends
that indoor sound pressure levels should not exceed an A-frequency weighted time-
average level of 30 dB (LAeq <30 dB) for continuous noise. For non-continuous noise,
an A-frequency weighted maximum sound pressure level (LAmax) of 45 dB should not be
exceeded more than 15 times during the sleep period. This was based on a study by
Vallet & Vernet27 on night time aircraft noise and sleep disturbance where they found
tolerance to noise passes through a maximum value for an optimum value of 10-15
flights per night. With sensitive individuals a lower level is preferred. Vallet and
Vernet recommended that the A-frequency weighted maximum sound pressure levels
(LAmax) should not exceed 48 dB when measured inside dwellings. This level would be
difficult to achieve in sleep rooms of early childhood centres. More work is needed to
determine appropriate noise levels and the types of sounds most disturbing to the sleep
of babies and young children in daytime childcare facilities.
The WHO has identified children as vulnerable to the adverse effects of noise and cited
studies by Cohen et al28 and Evans et al29 as providing enough compelling evidence to
warrant monitoring programmes at schools and preschools. It is necessary to protect
2 Studies of noise and hearing loss in education: A literature review
2-16
children from the effects of noise including those on speech perception and reading
acquisition.13
2.4 I-INCE Technical Initiative #4. In December 1999, the general assembly of the International Institute of Noise Control
Engineers, (I-INCE), developed the Technical Initiative #4-‘Noise and reverberation in
school rooms’.30 ,31 A technical study group was formed from members of I-INCE
member societies TSG#4, which has been a major thrust in further studies and increased
awareness of this issue. Vallet and Karabiber32 prepared a preparatory document on
European policies regarding acoustical comfort in educational settings to support the
Technical Iniatiave #4. Annual conferences of the I-INCE now include forums on
classroom acoustics and noise in education. Reporting on Technical Initiative #4 is now
due.
The I-INCE Technical Initiative #4 recognised good acoustical environments as being
central to learning in classrooms and therefore vital in every knowledge-based
economy. Karabiber et al4 reported that the main objective of this technical initiative,
was to develop recommendations for schoolroom acoustical criteria, including practical
knowledge of the costs and benefits of noise and reverberation control. This was to
optimise the acoustical environment in learning spaces. The aims of these
recommendations were to provide acoustical and noise control guidance to educational
space designers and those who set standards and codes of practice for schoolroom
design. The Institute noted that at that time, some countries including the UK, Portugal,
and Sweden had already taken steps to establish standards and guidelines for
schoolroom acoustics. The initiative would also provide support for countries where
comprehensive standards and guidelines did not exist.
This technical initiative needs to promote dialogue and cooperation between those
designing classrooms and those delivering education in them. It is particularly
important for those designing or advising on appropriate acoustic criteria, to be aware of
the needs of the students in the classroom and to cater for the most vulnerable in the
design stages. The worldwide trend to mainstream special needs children with targeted
2 Studies of noise and hearing loss in education: A literature review
2-17
education support, means that children adversely affected by noise will be present in
many classrooms.
2.5 Background to the New Zealand situation A number of studies indicate that much of what is learnt in the typical classroom occurs
through the auditory channel i.e. by speaking and listening.8,33 Wilson et al8 state that
optimum acoustics for ease of listening and good intelligibility are essential as school
children spend up to 5 hours per week day in classrooms. In addition, because
children's auditory and neurological systems are not fully developed until they are about
16 years of age, they lack experience to predict from context and have to learn to
distinguish the important sounds such as the teacher's voice from background noise.8
In New Zealand, it seems that very little thought has been given to the acoustical design
of classrooms in the past. This is probably due to the lack of legislation, standards and
guidelines, as well as an expectation that noise in classrooms was an inevitable
consequence of modern teaching practices.
2.5.1 Classroom acoustics study One of the most extensive studies to be completed in New Zealand on classroom
acoustics was carried out by Wilson et al8 with sponsorship from the Oticon
Foundation. This study was conducted among schools in the Auckland region, which
were chosen across the socio-economic spectrum and each school had a small number
of hearing impaired students wearing hearing aids. Approximately 120 teachers were
surveyed with questionnaires. Classroom buildings were examined for construction
details and internal finishings. Speech perceptions tests were carried out with children
having normal hearing and those with hearing aids in occupied classrooms with
background sound pressure levels recorded. Reverberation times were recorded along
with noise levels over full school days. Acoustic modifications were made to some
rooms to improve the acoustic environment and then the tests were carried out to
monitor any changes and improvements. The authors of this study chose to assess
background sound pressure levels as C-weighted time-average levels. This was carried
2 Studies of noise and hearing loss in education: A literature review
2-18
out to address a concept known as ‘upward spread of masking’ where the loud low
frequency noise masks the quiet high frequency sounds in speech. The authors claimed
that this allowed them to consider the effects of low frequency noise on speech
intelligibility. While this is an interesting concept, the authors could have given
background sound pressure levels in both A and C weightings. This would allow more
valid comparisons to be made with other studies using A-weighted sound pressure level
recordings. A comparison of A and C weighted processing of the same sound pressure
levels, would have given some account of the levels of low frequency noise occurring.
In assessing the SNR, the authors proposed the use of high and low percentile levels
(e.g. L5 and L90), which they considered, should be a realistic measure of SNR during
periods of classroom instruction by the teacher. It is an interesting proposition and
would provide a very straightforward approximation of SNR from a single monitoring
event of sound pressure levels. Picard and Bradley35 suggest that conventional methods
for determining speech-to-noise ratio can overestimate speech levels by integrating the
signal (voice of the teacher) with background noise, which is a characteristic of using
exceedance levels. More work on the concept of using exceedance levels to estimate
signal to noise ratios is certainly warranted. Wilson et al8 found that approximately
69% of teaching time occurs as interactive teaching and group work with the teacher
moving around the classroom, while only 12% of teaching time occurs in didactic
whiteboard teaching from the front of the room. The acoustic dynamics are very
different with these two basic styles of instruction. In group work, higher levels of
background noise were found as children complete their tasks by interacting with each
other and the teacher who moves around the room. This has been described as ‘on the
mat’ style of teaching by Wilson et al.8 However, when the teacher stands close to
individual students and speaks to them, the signal would be stronger than from a
distance. When giving traditional didactic teaching from the front, one would expect
the background sound levels to be lower than what occurs the modern style of teaching*
as the teacher is commanding the students' attention, but a weaker teacher's voice
(signal) as distance increases.
The report describes classrooms as noisy places with 59% of teachers surveyed
reporting that while student-generated noise comprised most or all noise created inside *This often involves group work with the teacher moving around the classroom addressing individuals or small groups of children rather than the whole class from the front
2 Studies of noise and hearing loss in education: A literature review
2-19
the classrooms, a large number of teachers surveyed (86%) indicated difficulty at times
with externally generated noise intruding into the classroom. Some of these sources
included road traffic, other classrooms, sports fields, lawn mowing, corridors, decks
(from foot traffic) etc. The 'other' noise included rain, and electric hand dryers from
toilet areas.
The authors described classroom noise as a serious occupational hazard for teachers due
to speaking for long periods of time over elevated noise levels and found that a third of
teachers they surveyed had to often raise their voices to be heard. Such judgements are
subjective because there would be quite a difference between a speaker with a naturally
loud, well-projecting speaking voice when compared to a person who naturally speaks
softly.
It is interesting to note that the occupational sound level exposure of teachers was not
assessed in this study nor was any assessment made of teachers’ hearing. Teachers, like
any other workers, should be subject to the noise provisions of the New Zealand Health
and Safety in Employment Act 1992 and Health and Safety in Employment Regulations
1995 although these provisions are probably not legally enforceable as this legislation
was never designed to control noise generated in educational settings.
The hearing impaired subjects were found on average to be 1 year behind the mean
reading age and two years behind the normal hearing subjects. Allen11 reported similar
findings. An interesting observation was that children with mild to moderate hearing
loss who were fitted with conventional hearing aids (without FM radio hearing aids)
performed poorly. Those children with severe hearing loss who were fitted with FM
radio hearing aids (in addition to their normal hearing aids) performed quite well in both
live noise and recorded noise learning environments. This suggests that those with mild
hearing loss could be severely disadvantaged, due to the difficulty of filtering out the
signal from high levels of background noise received either naturally or through their
hearing aids. It is worthy of note that the FM hearing aids fitted to those with severe
hearing loss will deliver the signal directly to the student’s ears and therefore largely
bypasses the levels of background noise encountered by the other students. It appears
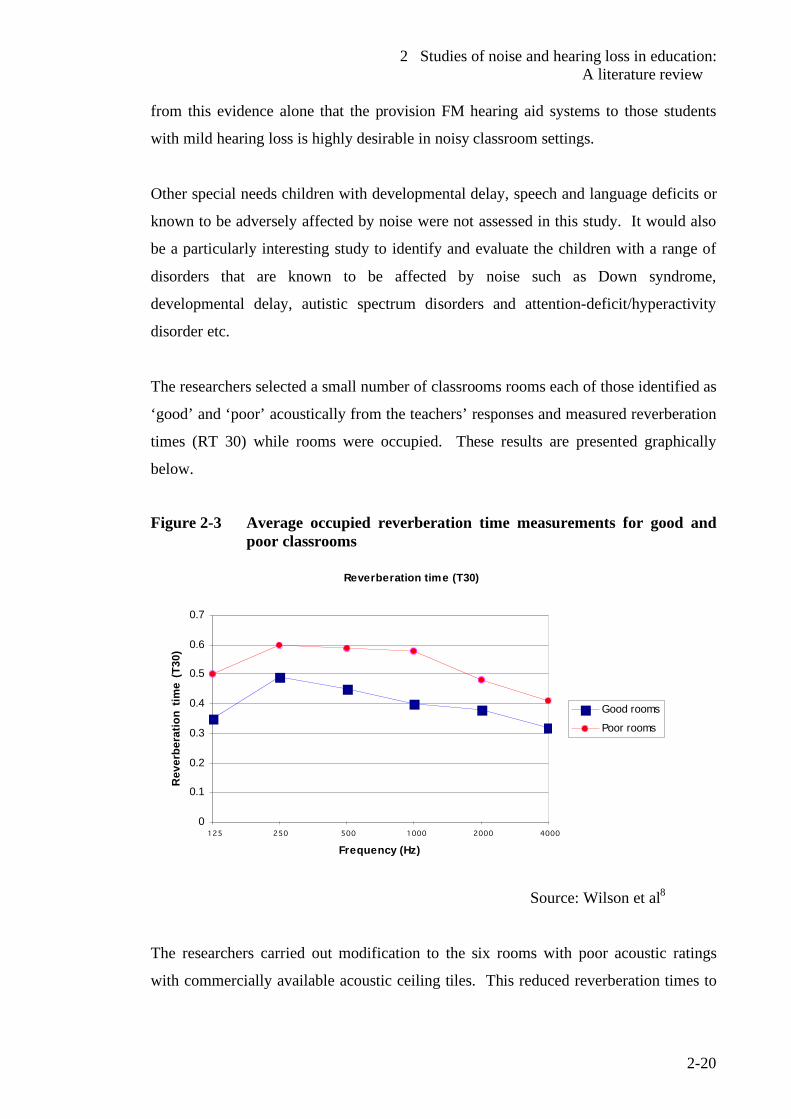
2 Studies of noise and hearing loss in education: A literature review
2-20
from this evidence alone that the provision FM hearing aid systems to those students
with mild hearing loss is highly desirable in noisy classroom settings.
Other special needs children with developmental delay, speech and language deficits or
known to be adversely affected by noise were not assessed in this study. It would also
be a particularly interesting study to identify and evaluate the children with a range of
disorders that are known to be affected by noise such as Down syndrome,
developmental delay, autistic spectrum disorders and attention-deficit/hyperactivity
disorder etc.
The researchers selected a small number of classrooms rooms each of those identified as
‘good’ and ‘poor’ acoustically from the teachers’ responses and measured reverberation
times (RT 30) while rooms were occupied. These results are presented graphically
below.
Figure 2-3 Average occupied reverberation time measurements for good and
poor classrooms
Reverberation time (T30)
0
0.1
0.2
0.3
0.4
0.5
0.6
0.7
125 250 500 1000 2000 4000
Frequency (Hz)
Rev
erbe
ratio
n tim
e (T
30)
Good rooms
Poor rooms
Source: Wilson et al8
The researchers carried out modification to the six rooms with poor acoustic ratings
with commercially available acoustic ceiling tiles. This reduced reverberation times to
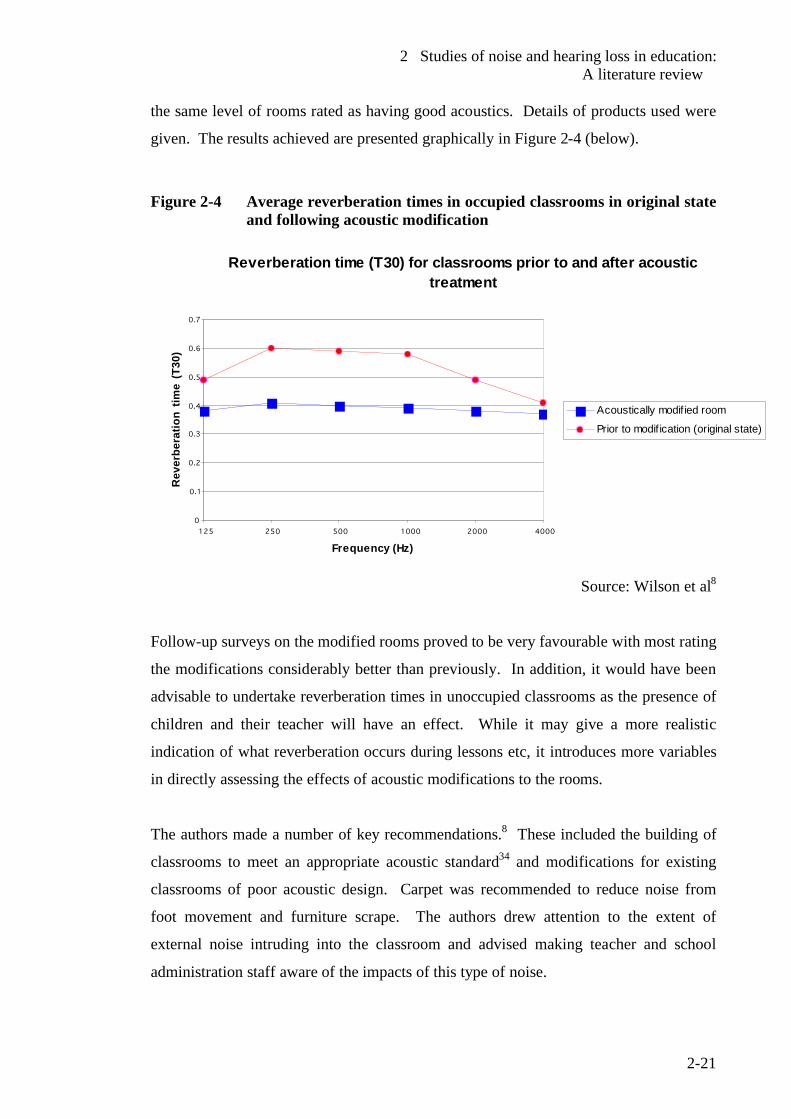
2 Studies of noise and hearing loss in education: A literature review
2-21
the same level of rooms rated as having good acoustics. Details of products used were
given. The results achieved are presented graphically in Figure 2-4 (below).
Figure 2-4 Average reverberation times in occupied classrooms in original state and following acoustic modification
Reverberation time (T30) for classrooms prior to and after acoustic treatment
0
0.1
0.2
0.3
0.4
0.5
0.6
0.7
125 250 500 1000 2000 4000
Frequency (Hz)
Rev
erbe
ratio
n tim
e (T
30)
Acoustically modif ied room
Prior to modif ication (original state)
Source: Wilson et al8
Follow-up surveys on the modified rooms proved to be very favourable with most rating
the modifications considerably better than previously. In addition, it would have been
advisable to undertake reverberation times in unoccupied classrooms as the presence of
children and their teacher will have an effect. While it may give a more realistic
indication of what reverberation occurs during lessons etc, it introduces more variables
in directly assessing the effects of acoustic modifications to the rooms.
The authors made a number of key recommendations.8 These included the building of
classrooms to meet an appropriate acoustic standard34 and modifications for existing
classrooms of poor acoustic design. Carpet was recommended to reduce noise from
foot movement and furniture scrape. The authors drew attention to the extent of
external noise intruding into the classroom and advised making teacher and school
administration staff aware of the impacts of this type of noise.
2 Studies of noise and hearing loss in education: A literature review
2-22
Recommendations, in addition to those proposed by Wilson et al,8 are presented in
Section 2.9 of this chapter (see page 2-34).
2.6 Review of existing studies Problems of classroom noise are not limited to New Zealand and there seem to be issues
in many countries over noisy classrooms and learning environments. Picard and
Bradley have recently published one of the most comprehensive reviews of noise and
speech interference in classrooms.35 These authors find that excessive ambient noise
and reverberation in classrooms are serious obstacles to learning principally because of
the effects on speech recognition. Significantly they point to these combined effects
being extremely detrimental during the early years of school and preschool where
student groups are noisier while learning the essential skills upon which all other
knowledge is built, i.e. the basics of literacy and numeracy.
These authors35 cite the 1995 survey of physical conditions of school facilities in the
USA by their General Accounting Office where 28% of all schools across the USA
were found to be excessively noisy. No such nationwide study has yet been done in
New Zealand. The above study by Wilson et al8 suggests that New Zealand classrooms
suffer similar problems. They suggest the open plan style classrooms (or barns as they
are sometimes referred to), which were widely promoted in many countries, to be a
major cause. These comprised large open teaching spaces where several groups could
be taught simultaneously resulting in spill over of teachers’ voices as well as noise from
student activities. While it was intended to foster shared learning experiences, the lack
of acoustical privacy and the combined shared noise quickly became the undesirable
outcome. Investigations pointed to the open plan style actively contributing to the level
of noise and found that intruding speech from adjacent groups to be the most disturbing.
A-frequency weighted time-average background noise levels in the range of 66 - 73 dB
were a characteristic of these learning spaces.35
Ambient or background noise is generally of greater nuisance potential than excessive
reverberation times, because it often in excess of values detrimental to speech
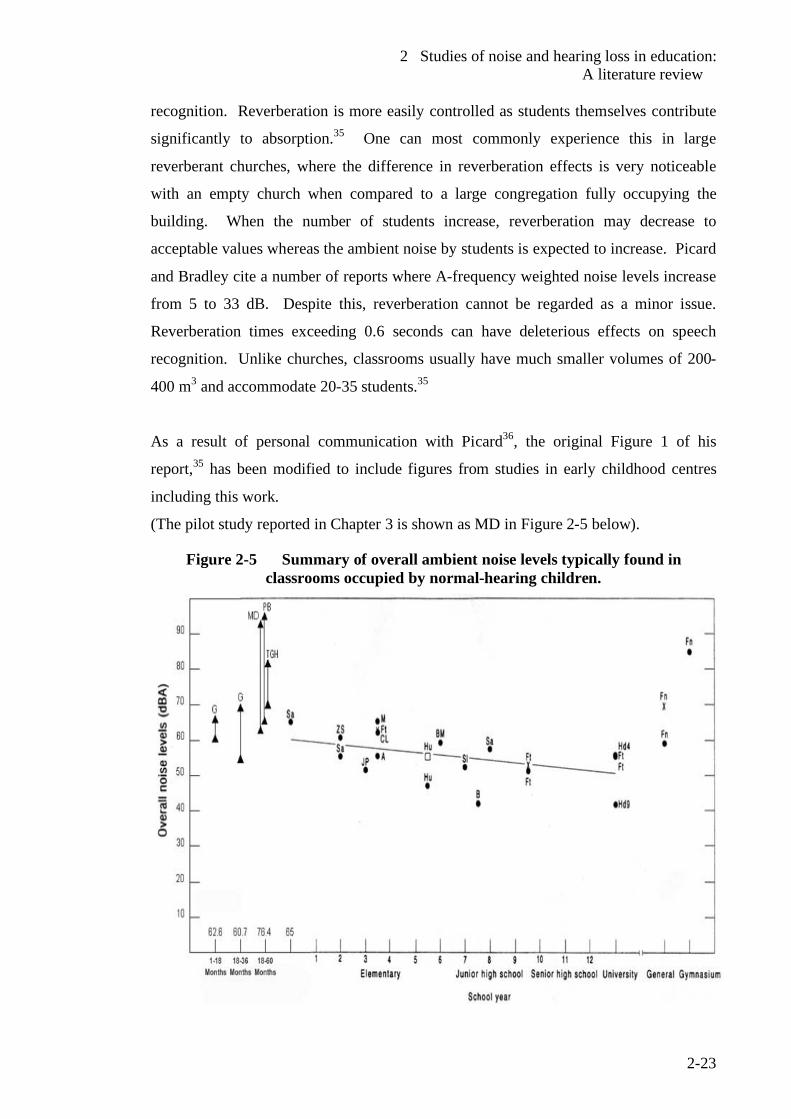
2 Studies of noise and hearing loss in education: A literature review
2-23
recognition. Reverberation is more easily controlled as students themselves contribute
significantly to absorption.35 One can most commonly experience this in large
reverberant churches, where the difference in reverberation effects is very noticeable
with an empty church when compared to a large congregation fully occupying the
building. When the number of students increase, reverberation may decrease to
acceptable values whereas the ambient noise by students is expected to increase. Picard
and Bradley cite a number of reports where A-frequency weighted noise levels increase
from 5 to 33 dB. Despite this, reverberation cannot be regarded as a minor issue.
Reverberation times exceeding 0.6 seconds can have deleterious effects on speech
recognition. Unlike churches, classrooms usually have much smaller volumes of 200-
400 m3 and accommodate 20-35 students.35
As a result of personal communication with Picard36, the original Figure 1 of his
report,35 has been modified to include figures from studies in early childhood centres
including this work.
(The pilot study reported in Chapter 3 is shown as MD in Figure 2-5 below).
Figure 2-5 Summary of overall ambient noise levels typically found in classrooms occupied by normal-hearing children.
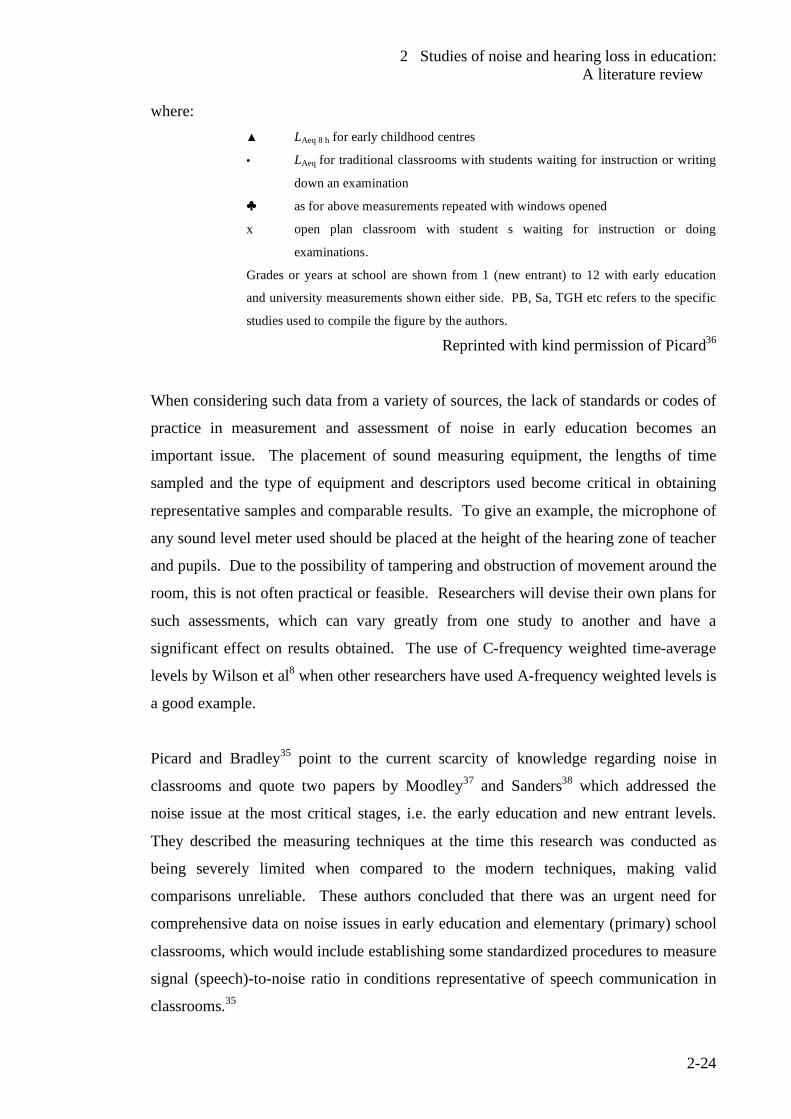
2 Studies of noise and hearing loss in education: A literature review
2-24
where: ▲ LAeq 8 h for early childhood centres
• LAeq for traditional classrooms with students waiting for instruction or writing
down an examination
as for above measurements repeated with windows opened
x open plan classroom with student s waiting for instruction or doing
examinations. Grades or years at school are shown from 1 (new entrant) to 12 with early education
and university measurements shown either side. PB, Sa, TGH etc refers to the specific
studies used to compile the figure by the authors.
Reprinted with kind permission of Picard36
When considering such data from a variety of sources, the lack of standards or codes of
practice in measurement and assessment of noise in early education becomes an
important issue. The placement of sound measuring equipment, the lengths of time
sampled and the type of equipment and descriptors used become critical in obtaining
representative samples and comparable results. To give an example, the microphone of
any sound level meter used should be placed at the height of the hearing zone of teacher
and pupils. Due to the possibility of tampering and obstruction of movement around the
room, this is not often practical or feasible. Researchers will devise their own plans for
such assessments, which can vary greatly from one study to another and have a
significant effect on results obtained. The use of C-frequency weighted time-average
levels by Wilson et al8 when other researchers have used A-frequency weighted levels is
a good example.
Picard and Bradley35 point to the current scarcity of knowledge regarding noise in
classrooms and quote two papers by Moodley37 and Sanders38 which addressed the
noise issue at the most critical stages, i.e. the early education and new entrant levels.
They described the measuring techniques at the time this research was conducted as
being severely limited when compared to the modern techniques, making valid
comparisons unreliable. These authors concluded that there was an urgent need for
comprehensive data on noise issues in early education and elementary (primary) school
classrooms, which would include establishing some standardized procedures to measure
signal (speech)-to-noise ratio in conditions representative of speech communication in
classrooms.35
2 Studies of noise and hearing loss in education: A literature review
2-25
Some studies cited by Picard and Bradley35 where separate contributions of students and
ventilation systems were identified may not be widely applicable in New Zealand. Due
to the New Zealand temperate climate, few early childhood centres and classrooms have
mechanical ventilation systems. While New Zealand facilities may largely be exempt
from the issues of noise in ventilation systems, natural forms of ventilation have their
own set of consequences, especially when windows are opened (noise intrusion from
outside activities) as found by Wilson et al.8
Picard and Bradley35 find that noise levels in classrooms are usually of more serious
concern than reverberation due to small spaces of early childhood facilities.
They indicate the need for more in-depth research to overcome interfering noise levels
in classrooms and similar learning spaces. They suggest the following:
• The rationale for excessive background noise to impede recognition and verbal
learning in classrooms must be fully described and the associated risk specified.
• The reporting of children's speech recognition performance in unfavourable
listening conditions, as may be representative of classes in session. An
important point raised by them was that besides providing the basis for
establishing performance criteria and leading to acoustical standards for
classrooms, it will help identify the more sensitive subgroups and specify the
need for remedial solutions.
The current literature on noise in classrooms and learning spaces focuses heavily on the
effects on mainstream children with normal healthy hearing and those with hearing
impairment. Children with other forms of auditory and / or developmental disabilities
are barely considered. Yet, comprehensive reports by Shields39 and Janzen40 on autism
and related disorders, as one example, point very strongly to the likelihood of these
children being profoundly affected by the type of noise found in classrooms. It can
therefore be reasonably generalised that children with these disabilities could be
severely affected.
A 1980 study by Zentall and Shaw41 specifically examined the effects of student-
generated noise on hyperactive children when compared to a control group. Due to the
age of the study and the more recent advances in the diagnostic characterisation of such
2 Studies of noise and hearing loss in education: A literature review
2-26
disorders, it is possible that children in this study may now fit the current diagnostic
criteria of attention-deficit/hyperactivity disorder (ADHD).42 The authors used a
teachers’ rating scale developed by Conner43 in 1973 to assess hyperactivity. Two
groups of students (hyperactive group and a control group) were subjected to typical
noise generated by student activity. The authors found significantly lower performance
on mathematical and alphabet reading tasks with a higher level of activity with the
hyperactive group. In other words, both groups of children were affected but the
hyperactive group was the most profoundly affected. It would be interesting to repeat
this study with the modern diagnostic tools available such as the current diagnostic
criteria for such disorders.42 A study by Evans et al44 showed that children in noisy
environments are less likely to solve difficult challenging puzzles and are more likely to
give up on a task. They describe the associated feeling of frustration and anger as being
part of the overall picture in chronic exposure to noise.
Picard and Bradley35 reported extensively on background or ambient noise affecting
speech production, recognition and learning in classrooms. They report that
background noise competing with the voice of the teacher to produce a less than ideal
signal (speech)-to-noise ratio of 0-10 dB will inevitably result in difficulties in
communication for both speakers and listeners. They quoted studies where 70%
teachers reported problems with voice strain at some time with 17% indicating it to be a
current issue. Compare this to the New Zealand study by Wilson et al8 where 80% of
teachers reported vocal fatigue as an issue. Voice problems have been described in both
studies as a serious occupational hazard and a highly prevalent recurrent and
incapacitating condition.8,35 They also raise the issue of progressive vocal exhaustion
from continual use of the voice, and concluded that decreasing intelligibility as a result
of altered voice quality and level would represent a serious impediment to academic
progress.
There are a number of accounts of reading deficits and problems associated with
children living near sources of transport noise. A study by Evans and Lepore45on the
non-auditory effects of noise in children reported reading deficits in children living near
major sources of transport noise. Another study by Evans and Maxwell46 found that
Year 1 and 2 school children with normal hearing, that were exposed to chronic aircraft
2 Studies of noise and hearing loss in education: A literature review
2-27
noise, had significant deficits in speech perception and reading skills when compared to
children in a quiet school.
Picard and Bradley35 corroborate the findings of our New Zealand work in assessing
noise in early education and report that preschool children and new entrants would be
among the noisiest groups of children. They report A-frequency weighted time-average
levels averaged over 8 hours (LAeq 8 hours ) as being between 72-80 dB, which is in the
same range as found in this work. Picard and Boudreau47 found representative noise
levels between 66-94 dB for 10 minutes. This was of the same order as the pilot study
(reported in Chapter 3), where the quietest activities, such as sleeping, ranged from A-
frequency weighted time-averaged levels (LAeq) of 63-69 dB. Events such as a children
screaming, or very noisy activities reached levels of 94 dB for similar periods. In the
pilot study, a short burst of noise (integrated over 1-2 second duration) reached over 100
dB A. Such levels of noise exposure can induce cochlear damage in preschool and new
entrant children, but would have no such effect in adults. Such evidence is indeed
disturbing that noise exposure could be hazardous with the potential damage such as
noise-induced hearing loss.35 Picard and Bradley suggest that increased noise levels in
the years of early education and new entrant classes are due to these children becoming
engaged in regular structured activities. These children have limited attention span and
are learning classroom discipline. It is expected that due to the casual semi-formal
structure of the early years of education, young children would be more talkative and
exuberant, resulting in a complex mixture of sounds including talking, furniture
movement and shuffling of books and stationery.35
In their summary, Picard and Bradley35 find that excessive noise exposure of young
children will induce a synergistic interaction of noise and developmental factors. They
suggest that this would be particularly detrimental to speech understanding right at the
beginning of their schooling (in early education and new entrant years) in addition to
other adverse consequences.
There are a number of studies which show a clear trend for spoken word recognition to
increase with age for normal hearing school children and for this skill to fully develop
by age 18.35 This evidence is corroborated by Nelson and Soli.7 Picard and Bradley35
2 Studies of noise and hearing loss in education: A literature review
2-28
conclude that despite confounding factors such as the variations of degree of hearing
loss or the use of hearing aids and other standard prosthetic devices in classrooms, the
performance of the hearing impaired is well under the performance levels of their
normal hearing peers.
Hearing aids are known to provide little help in each situations amplifying both speech
and other competing signals and therefore failing to increase signal (speech)-to-noise
ratios. A main thrush of new technologies is to improve the signal (speech) against
other competing noise.35
2.7 Levels of hearing loss among New Zealand children
Vision and hearing screening of preschool, new entrant, and primary school children
has been carried our for many years in New Zealand by public health authorities. The
programme is contracted by the Ministry of Health and coordinated by the National
Audiology Centre. Vision and hearing technicians, who are employed by district health
boards to test children in their geographical areas, do the screening.
The Hearing Report of 198448 by the Board of Health indicated failure rates in 1983 as
shown in Table 2-1 but pointed out that these results may be unreliable as they were
based on individual tester returns, and was not part of a uniformly conducted study.
Separate estimates for Maori and Pacific Island children were not available. Screening
of preschoolers in 1983 would have been carried out with pure tone audiometry, which
was subsequently changed to tympanometry due to the difficulty of conducting pure
tone audiometry with preschool children. Furthermore, testing was often done in noisy
test conditions adding to the unreliability of these evaluations. In regions such as
Northland and Gisborne with a large number of Maori, high failure rates of over 20%
were reported in the 1984 study.48 The change of the testing regime from pure tone
audiometry to tympanometry also completely changed the criteria being assessed from
the threshold hearing level to middle ear compliance. Ignoring the very different
demographics of the population of 1983, the difference in testing protocols and
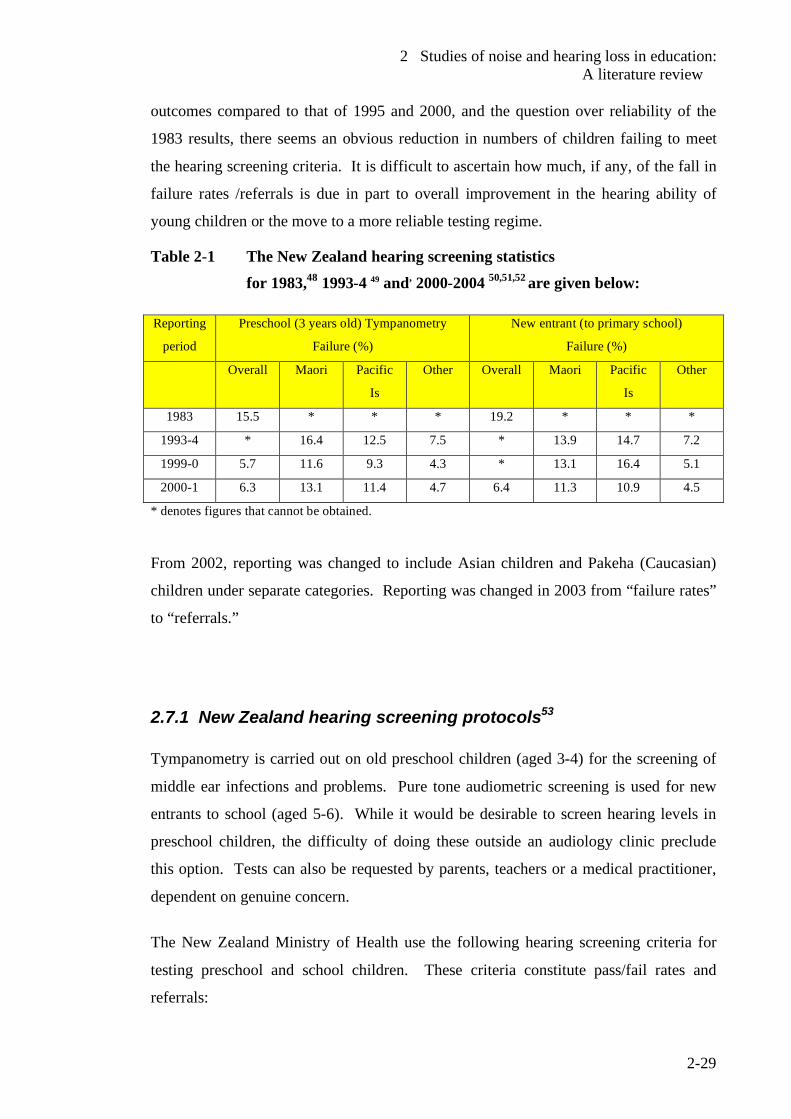
2 Studies of noise and hearing loss in education: A literature review
2-29
outcomes compared to that of 1995 and 2000, and the question over reliability of the
1983 results, there seems an obvious reduction in numbers of children failing to meet
the hearing screening criteria. It is difficult to ascertain how much, if any, of the fall in
failure rates /referrals is due in part to overall improvement in the hearing ability of
young children or the move to a more reliable testing regime.
Table 2-1 The New Zealand hearing screening statistics for 1983,48 1993-4 49 and, 2000-2004 50,51,52 are given below:
Reporting
period
Preschool (3 years old) Tympanometry
Failure (%)
New entrant (to primary school)
Failure (%)
Overall Maori Pacific
Is
Other Overall Maori Pacific
Is
Other
1983 15.5 * * * 19.2 * * *
1993-4 * 16.4 12.5 7.5 * 13.9 14.7 7.2
1999-0 5.7 11.6 9.3 4.3 * 13.1 16.4 5.1
2000-1 6.3 13.1 11.4 4.7 6.4 11.3 10.9 4.5
* denotes figures that cannot be obtained.
From 2002, reporting was changed to include Asian children and Pakeha (Caucasian)
children under separate categories. Reporting was changed in 2003 from “failure rates”
to “referrals.”
2.7.1 New Zealand hearing screening protocols53 Tympanometry is carried out on old preschool children (aged 3-4) for the screening of
middle ear infections and problems. Pure tone audiometric screening is used for new
entrants to school (aged 5-6). While it would be desirable to screen hearing levels in
preschool children, the difficulty of doing these outside an audiology clinic preclude
this option. Tests can also be requested by parents, teachers or a medical practitioner,
dependent on genuine concern.
The New Zealand Ministry of Health use the following hearing screening criteria for
testing preschool and school children. These criteria constitute pass/fail rates and
referrals:
2 Studies of noise and hearing loss in education: A literature review
2-30
1. Pure tone audiometry* for new entrants
• Pass criteria - no further action required
o 20 (or less) dB at 1000, 2000, 4000,Hz
o 30 dB (or less) at 500Hz
• Marginal failure requiring a retest
o Results elevated but do not meet or exceed hearing loss of 45 dB on
two frequencies
o Fail criteria – immediate referral
o Hearing loss of 45 dB or greater on two or more frequencies.
2. Tympanometry#
• Pass criteria
o Tympanogram shows a peak (rising and descending graph) i.e. a
Type ‘A’ tympanogram
• Marginal failure requiring a retest
o Tympanogram is flat (B/C tympanograms) (i.e. no peak or physical
volume (PV) between 0.3-1.5 ml
• Fail criteria – immediate referral
o Tympanogram is Type ‘B’ flat (no peak and physical volume (PV)
less than 0.3 ml
In both cases a retest (also referred to a serial test) which does not meet the pass criteria,
then becomes a fail and referral. It is not necessary to carry out audiometry on children
already under the care of an audiologist or wearing a hearing aid. Although not listed in
the protocol, the testing of some special needs children such as those on the autistic
spectrum would, in many cases, be impossible and distressing for the child. Tests
would then have to be carried out by an audiologist.
* Typical audiograms are given in 6.3 Hearing impairment and deafness (Chapter 6). # The procedure and examples of typical tympanograms are given in 6.2.2.1 Tympanometry
(Chapter 6)
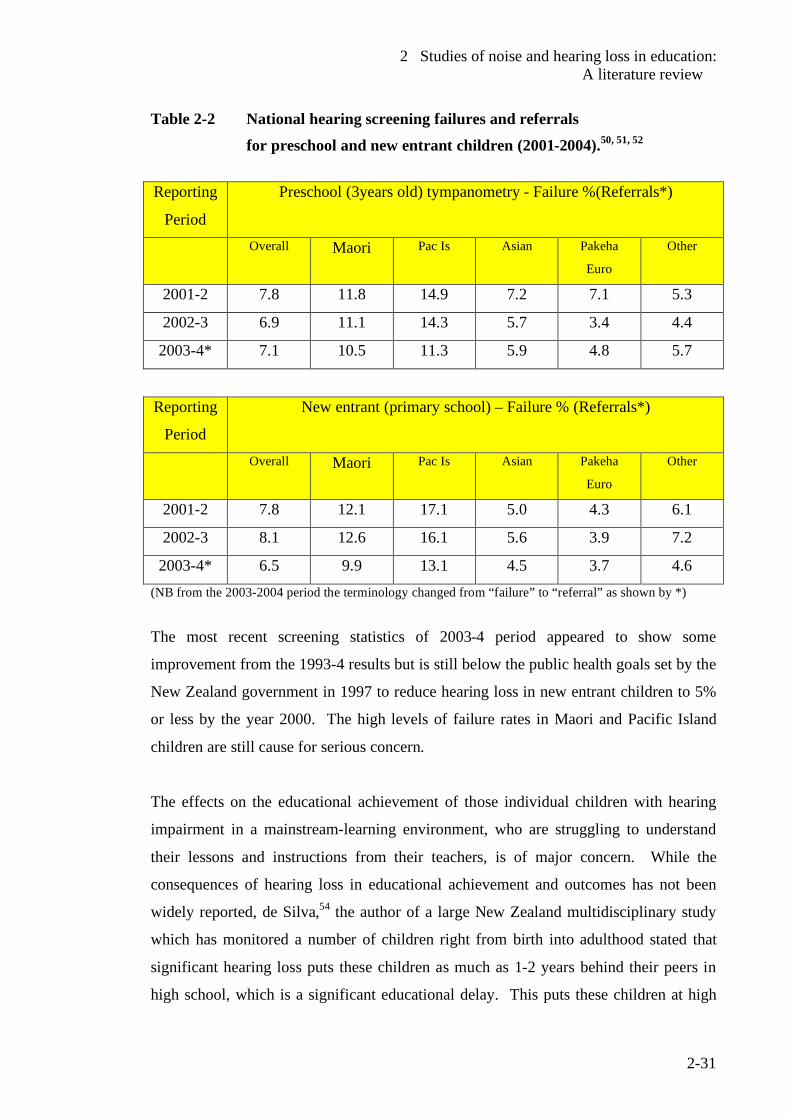
2 Studies of noise and hearing loss in education: A literature review
2-31
Table 2-2 National hearing screening failures and referrals for preschool and new entrant children (2001-2004).50, 51, 52
Reporting
Period
Preschool (3years old) tympanometry - Failure %(Referrals*)
Overall Maori Pac Is Asian Pakeha
Euro
Other
2001-2 7.8 11.8 14.9 7.2 7.1 5.3
2002-3 6.9 11.1 14.3 5.7 3.4 4.4
2003-4* 7.1 10.5 11.3 5.9 4.8 5.7
Reporting
Period
New entrant (primary school) – Failure % (Referrals*)
Overall Maori Pac Is Asian Pakeha
Euro
Other
2001-2 7.8 12.1 17.1 5.0 4.3 6.1
2002-3 8.1 12.6 16.1 5.6 3.9 7.2
2003-4* 6.5 9.9 13.1 4.5 3.7 4.6 (NB from the 2003-2004 period the terminology changed from “failure” to “referral” as shown by *)
The most recent screening statistics of 2003-4 period appeared to show some
improvement from the 1993-4 results but is still below the public health goals set by the
New Zealand government in 1997 to reduce hearing loss in new entrant children to 5%
or less by the year 2000. The high levels of failure rates in Maori and Pacific Island
children are still cause for serious concern.
The effects on the educational achievement of those individual children with hearing
impairment in a mainstream-learning environment, who are struggling to understand
their lessons and instructions from their teachers, is of major concern. While the
consequences of hearing loss in educational achievement and outcomes has not been
widely reported, de Silva,54 the author of a large New Zealand multidisciplinary study
which has monitored a number of children right from birth into adulthood stated that
significant hearing loss puts these children as much as 1-2 years behind their peers in
high school, which is a significant educational delay. This puts these children at high
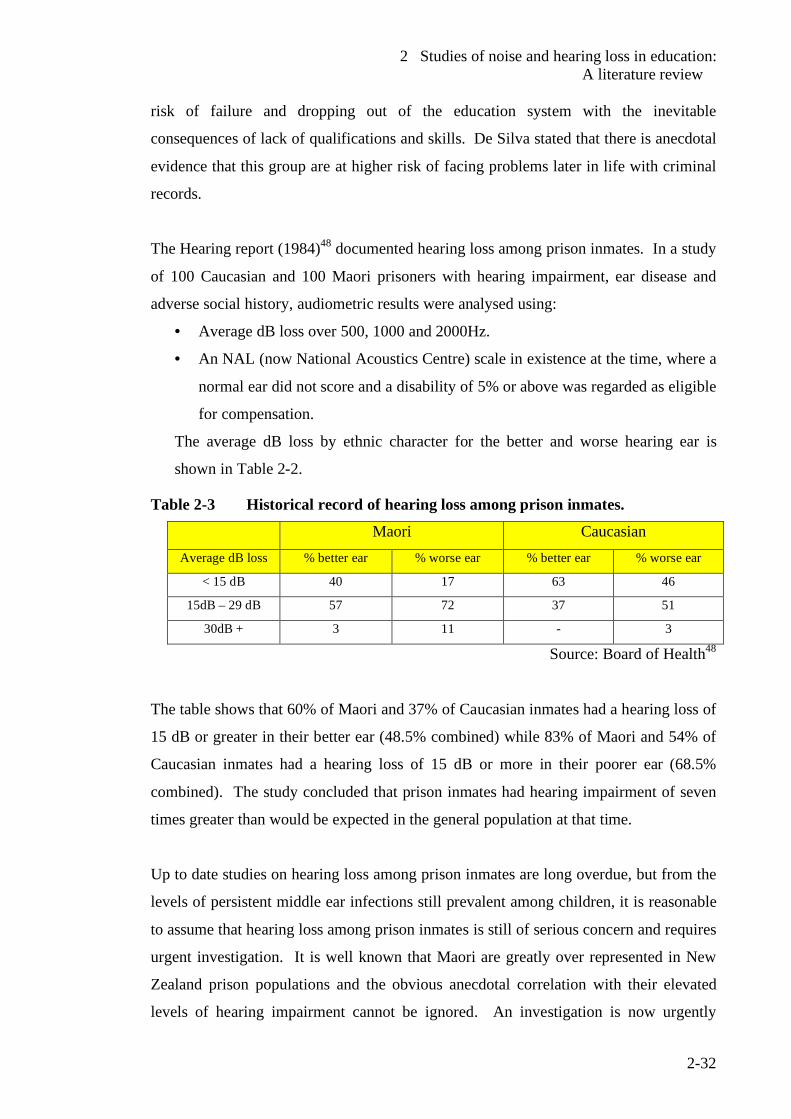
2 Studies of noise and hearing loss in education: A literature review
2-32
risk of failure and dropping out of the education system with the inevitable
consequences of lack of qualifications and skills. De Silva stated that there is anecdotal
evidence that this group are at higher risk of facing problems later in life with criminal
records.
The Hearing report (1984)48 documented hearing loss among prison inmates. In a study
of 100 Caucasian and 100 Maori prisoners with hearing impairment, ear disease and
adverse social history, audiometric results were analysed using:
• Average dB loss over 500, 1000 and 2000Hz.
• An NAL (now National Acoustics Centre) scale in existence at the time, where a
normal ear did not score and a disability of 5% or above was regarded as eligible
for compensation.
The average dB loss by ethnic character for the better and worse hearing ear is
shown in Table 2-2.
Table 2-3 Historical record of hearing loss among prison inmates.
Maori Caucasian Average dB loss % better ear % worse ear % better ear % worse ear
< 15 dB 40 17 63 46
15dB – 29 dB 57 72 37 51
30dB + 3 11 - 3
Source: Board of Health48
The table shows that 60% of Maori and 37% of Caucasian inmates had a hearing loss of
15 dB or greater in their better ear (48.5% combined) while 83% of Maori and 54% of
Caucasian inmates had a hearing loss of 15 dB or more in their poorer ear (68.5%
combined). The study concluded that prison inmates had hearing impairment of seven
times greater than would be expected in the general population at that time.
Up to date studies on hearing loss among prison inmates are long overdue, but from the
levels of persistent middle ear infections still prevalent among children, it is reasonable
to assume that hearing loss among prison inmates is still of serious concern and requires
urgent investigation. It is well known that Maori are greatly over represented in New
Zealand prison populations and the obvious anecdotal correlation with their elevated
levels of hearing impairment cannot be ignored. An investigation is now urgently
2 Studies of noise and hearing loss in education: A literature review
2-33
needed to establish if a link exists between the levels of hearing impairment in Maori,
their levels of educational achievement and representation in prison populations and
crime statistics.
2.8 Summary Studies in New Zealand and overseas show classroom noise in schools and preschools
to be of serious concern for both teachers and pupils. It appears that the noise levels are
generally the greatest in the early education and new entrant years. Voice strain of
teachers and hearing loss have been identified as serious concerns for both pupils and
their teachers. Excessive noise levels, while impacting on all children, were found to
have the greatest impact on children with hearing impairment and other auditory
disorders. Anecdotal evidence appears to link hearing impairment with increased
failure rates at school and the inevitable consequences which in some cases leading to
criminal activity and imprisonment. The failure / referral rates of the New Zealand
hearing screening statistics were reported for the 1993-4 year and all the data available
since the year 2000. The Ministry of Health target to reduce the failure rate of new
entrant (school) children to less than 5% by the year 2000 has not been met with
reported failure rates in the 2003-4 screening period still exceeding the 5% figure.
Recent data on hearing loss among prison inmates is not available but a 1984 report
found high levels of hearing loss among prison inmates to be 7 times higher than the
general population with a rating scale in use at the time.
There is now an urgent need to establish standardised procedures for the measurement
and assessment of noise levels in education and for the accurate assessment of signal-to-
noise ratios. The establishment of international procedures would enable researchers in
many countries to compare data with greater certainty than what is currently possible.
2 Studies of noise and hearing loss in education: A literature review
2-34
2.9 References 1 Sorkin, D.L., The classroom acoustical environment and the Americans with
Disabilities Act. Language, Speech and Hearing Services in Schools, 2000. 31: p. 385-388.
2 Nelson, P.B., Soli, S., Acoustical barriers to learning: Children at risk in every
classroom. Language, Speech and Hearing Services in Schools, 2000. 31: p. 356-361.
3 Crandell, C.C., Smaldino, J. J, Classroom acoustics for children with normal
hearing and hearing impairment. Language, Speech and Hearing Services in Schools, 2000. 31: p. 362-370.
4 Smaldino, J.J., Crandell, C.C., Classroom amplification technology: Theory and
practice. Language, Speech and Hearing Services in Schools, 2000. 31: p. 371-375.
5 Siebein, G., W., Gold, M. A., Siebein, G.W., Ermann, M. G, Ten ways to
provide a high quality acoustical environment in schools. Language, Speech and Hearing Services in Schools, 2000. 31: p. 376-384.
6 Bennetts, L., Flynn, M., Improving the classroom listening skills of children with
Down Syndrome by using sound-field amplification. Down Syndrome Research and Practice, 2002. 8(1): p. 19-24.
7 Blake, P., Busby, S., Noise levels in New Zealand junior classrooms. New
Zealand Medical Journal, 1994. 8 Wilson, O., Valentine, J., Halstead, M., McGunnigle, K., Dodd, G., Hellier, A,
Wood, J, Simpson, R. Classroom acoustics, a New Zealand Perspective. Oticon Foundation in New Zealand, 2002.
9 Solti, S., Sullivan, J., Factors affecting children's speech communication in
classrooms. Journal of the Acoustical Society of America, 1997. 101(S3070). 10 Nilsson, M., Solti, S., Sullivan, J.,, Development of the Hearing in Noise Test for
the measurement of speech reception thresholds in quiet and noise. Journal of the Acoustical Society of America, 1994. 95(2): p. 1085 - 1099.
11 Allen, P., Understanding ear infections. 2002, Whangarei: Dr Peter Allen. 12 Wolf, D.B., J. Glenn J., Gardener, H, To use their minds well: investigating new
forms of student assessment. Review of Research in Education, 1991. 17: p. 31-74.
2 Studies of noise and hearing loss in education: A literature review
2-35
13 World Health Organization, WHO Guidelines for community noise, Berglund,
B., Lindvall, T., Schwela, D., Editors. 1999, Occupational and Environmental Health Unit, World Health Organization: Geneva.
14 Beranek, L., Acoustics. 1954, New York: McGraw Hill. 15 Maxwell, L.E., Evans, G.W., The effects of noise on preschool children's pre-
reading skills. Journal of Environmental Psychology, 2000. 20(1): p. 91-97. 16 Enmarker, I., Boman, E., Noise annoyance responses of middle school pupils
and teachers. Journal of Environmental Psychology, 2004. 34(4): p. 527-536. 17 Haines, M., Stanfield, S., Job, R., Berglund, B., Head, J, Chronic aircraft noise
exposure, stress responses, mental health and cognitive performance in school children. Psychological Medicine, 2001. 31: p. 265-277.
18 Grebennikov, L., Preschool teachers' exposure to noise. International Journal of
Early Years Education, 2006. 14(1): p. 35-44. 19 Oberdorster, M., Tiesler, G., Acoustics ergonomics of school-Research report
Fb 1071. 2006, Dortmund, Germany: Federal Institute of Occupational Safety and Health.
20 Flexer, C., Individual and sound-field FM systems, Rationale description and
use. Volta Review, 1997. 99(3): p. 133-162. 21 Palmer, C., Hearing and listening in a typical classroom. Language, Speech and
Hearing Services in Schools, 1997. 28(3): p. 213-220. 22 Canning, A., Does classroom amplification aid comprehension? British Journal
of Audiology, 1999. 33(3): p. 171-178. 23 Palmer, A., Quantification of the ecobehavioral impact of a sound-field
loudspeaker system in elementary classrooms. Journal of Speech Language Hearing Research, 1998. 41(4): p. 819-834.
24 Workshop on Acoustics and Learning, Guidelines for classroom acoustics in
new construction Acoustical Society of America, December 1997. 25 ISO, Acoustics-Determination of occupational noise exposure and estimation of
noise-induced hearing impairment. 1990, International Organization for Standardization: Geneva.
26 Sivaraj, S,.Personal communication, Team Leader-Audiology, Capital and
Coast District Health Board, 2006: Wellington , New Zealand. 27 Vallet, M., Vernet, I.,. Night aircraft noise index and sleep research results. in
Internoise 91 - The costs of noise: The 1991 International Conference on Noise
2 Studies of noise and hearing loss in education: A literature review
2-36
Control Engineering. 1991. Sydney: International Institute of Noise Control Engineering.
28 Cohen, S., Evans, G., Stokols, D., Krantz, D., Behavior, health and
environmental stress. 1986, New York: Plenum Press. 29 Evans, G., Bullinger, M., Hygge, S, Chronic noise exposure and physiological
response: A prospective study of children living under environmental stress. Psychological Science, 1998. 9: p. 75-77.
30 Technical Initiative #4 Noise and reverberation control for schoolrooms I-
INCE document, International Institute of Noise control Engineers (retrieved from the Worldwide Web on 1 June 2001, (http://users.aol.com/iince/tech02.html. )
31 Karabiber, Z., Lubman, D., Sutherland, L. ,. The I-INCE Technical Initiative,
Noise and reverberation control in schoolrooms. in Internoise 2002, The International Congress and Exposition of Noise Control Engineering. 2002. Dearborn, MI, USA: International Instititute of Noise Control Enginneering.
32 Vallet, M., Karabiber, Z., Some European policies regarding acoustical comfort
in educational buildings. Noise Control Engineering Journal, 2002. 50(2): p. 58-62.
33 Hodgson, L. Visual strategies for improving communication. Quirk Roberts
Publishing. 34 Australian and New Zealand Standard, AS/NZS 2107:2000, Acoustics –
recommended design sound levels and reverberation times for building interiors, December 2000, Wellington: Standards New Zealand.
35 Picard, M., Bradley, J., Revisiting speech interference in classrooms. Audiology,
2001. 40: p. 221-244. 36 Picard M. Personal Communication, 2003. 37 Moodley, A., Acoustic conditions in mainstream classrooms. Journal of the
British Association of Teachers of the Deaf, 1989. 13: p. 48-54. 38 Sanders, D., Noise conditions in normal school classrooms. Exceptional
Children, 1965. 31: p. 48-54. 39 Shields, J. Early bird programme – Parent manual. National Autistic
Association (UK), 1998. 40 Janzen, J.E. Understanding the nature of autism. 1996, Texas: Therapy Skill
Builders.
2 Studies of noise and hearing loss in education: A literature review
2-37
41 Zentall, S., Shaw, J., Effects of classroom noise on performance and activity of
second grade hyperactive children. Journal of Educational Psychology, 1980. 72(6): p. 830-840.
42 American Psychiatric Association., Diagnostic and statistical manual of mental
disorders. 4 ed. 1994, Washington DC: American Psychiatric Association. 43 Conners, C., Rating scales for use in drug studies with children.
Psychopharmacology Bulletin (Special issue : Pharmacotherapy of children), 1973: p. 24-84.
44 Evans, G., Bullinger, M., Hygge, S, Chronic noise and psychological stress.
Psychological Science, 1995. 6: p. 333-338. 45 Evans, G.W., Lepore, S.J., Non-auditory effects of noise on children. Child
Environment, 1993. 10: p. 31-51. 46 Evans, G., Maxwell, L., Chronic noise exposure and reading deficits.
Environmental Behavior, 1997. 29: p. 638-656. 47 Picard, M., Boudreau, C, Characteristics of the noise found in day care centres.
Journal of the Acoustical Society of America, 1999. 105(2): p. 1127. 48 Hearing report of the New Zealand Board of Health. 1984: New Zealand Board
of Health. 49 Public Health Commission, Preventing Child Hearing loss- Guidelines for
public health services. Public Health Commission, Wellington, 1995. 50 New Zealand Hearing Screening Statistics: July 2000 - June 2001- A report to
the Ministry of Health. 2002, National Audiology Centre: Auckland. 51 New Zealand Hearing Screening Statistics : July 2001- June 2002 - A report to
the Ministry of Health. 2003, National Audiology Centre: Auckland. 52 New Zealand Hearing Screening Statistics: July 2002 - June 2003 - A report to
the Ministry of Health. 2004, National Audiology Centre: Auckland. 53 National Audiology Centre, National vision hearing screening protocol. 2004
National Audiology Centre: Auckland 54 Allen, P., What is glue ear? (Audiovisual educational material). 1981, Dr Peter
Allen: Whangarei.
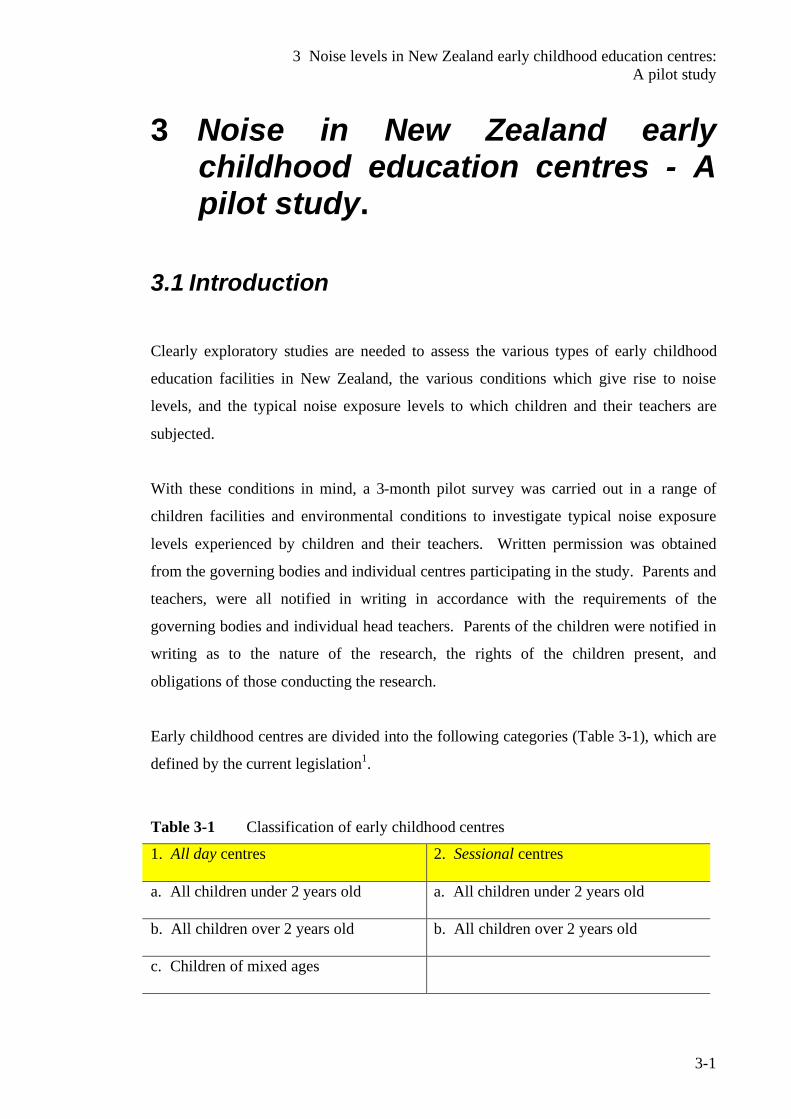
3 Noise levels in New Zealand early childhood education centres: A pilot study
3-1
3 Noise in New Zealand early childhood education centres - A pilot study.
3.1 Introduction
Clearly exploratory studies are needed to assess the various types of early childhood
education facilities in New Zealand, the various conditions which give rise to noise
levels, and the typical noise exposure levels to which children and their teachers are
subjected.
With these conditions in mind, a 3-month pilot survey was carried out in a range of
children facilities and environmental conditions to investigate typical noise exposure
levels experienced by children and their teachers. Written permission was obtained
from the governing bodies and individual centres participating in the study. Parents and
teachers, were all notified in writing in accordance with the requirements of the
governing bodies and individual head teachers. Parents of the children were notified in
writing as to the nature of the research, the rights of the children present, and
obligations of those conducting the research.
Early childhood centres are divided into the following categories (Table 3-1), which are
defined by the current legislation1.
Table 3-1 Classification of early childhood centres
1. All day centres
2. Sessional centres
a. All children under 2 years old
a. All children under 2 years old
b. All children over 2 years old
b. All children over 2 years old
c. Children of mixed ages
3 Noise levels in New Zealand early childhood education centres: A pilot study
3-2
Eight all day centres and five sessional centres, as licensed by the Ministry of
Education, were selected for evaluation. The all day centres included centres in each
licensing category as shown above in Table 3-1. The five sessional centres were
selected from kindergartens in the greater Wellington area.
3.2 Experimental No standards exist for specifically measuring noise in early childhood centres and the
effects on children. While the most effective way of monitoring a child's exposure is to
fit a logging personal sound exposure meter (PSEM) to individual children, ethical
considerations and practicalities precluded this option. The equipment was bulky and
heavy, and could not be supported on the clothing of the child. The likely exposure a
child would receive was simulated by an adult using a Cirrus 831A integrating sound
level meter as a PSEM with the microphone placed at the height representing the ear
level of the child, selecting a child at random and moving around the centre with that
child. In addition, different activities were monitored to gain information on the noise
levels generated from very quiet activities such as sleep/rest to those generating high
levels of noise. One-second time histories were recorded. A detailed log was kept to
relate the data collected to actual sounds and activities.
The daily sound exposures (DSEs) of ten staff members at all day centres and three
sessional centres were also measured. The noise exposure of teaching staff was
measured by fitting PSEMs to workers, which they carried with them to monitor their
exposure to noise over their full working day. The daily sound exposures were
measured using Class 2 Quest PSEMs in accordance with the approved code of
practice.2 The New Zealand legislation3 requires an employer to take all practicable
steps to ensure that no worker be exposed to a time-average level (LAeq) greater than 85
dB for a maximum of 8 hours a day, 5 days a week, or the equivalent sound exposure.
That is a maximum daily sound exposure of 100% dose, or alternatively in acoustical
terms, 1.0 pascal-squared hour (Pa2h).
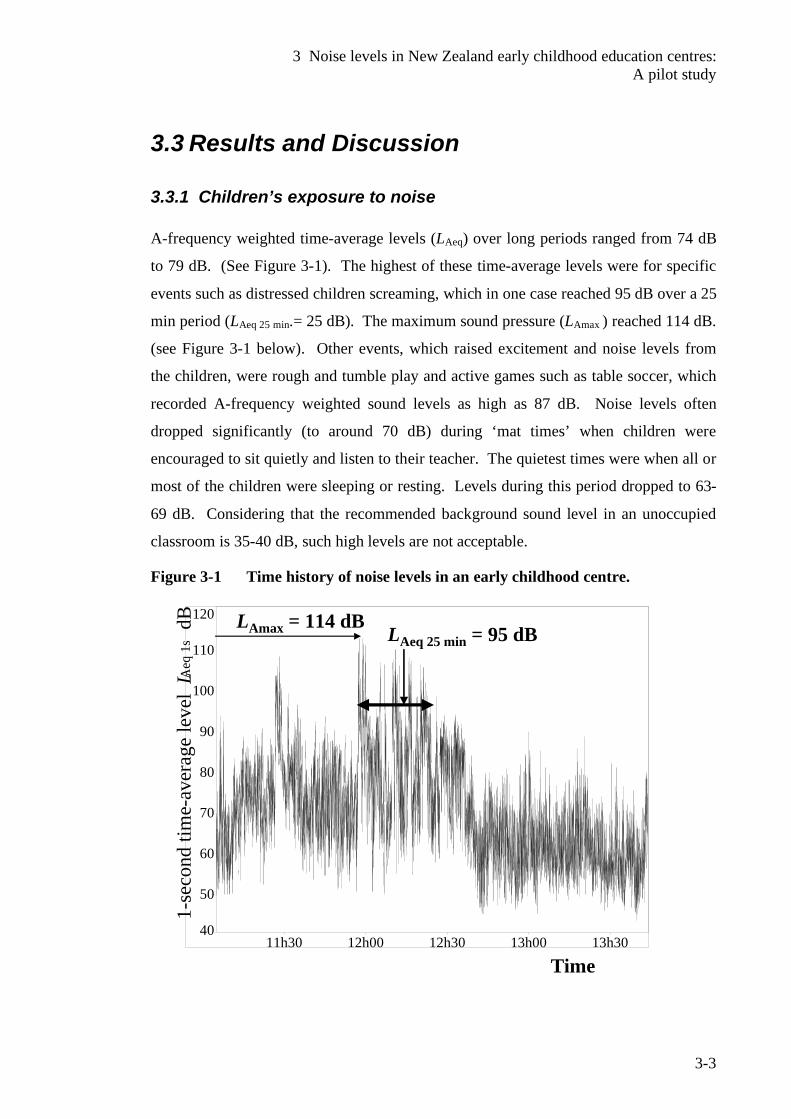
3 Noise levels in New Zealand early childhood education centres: A pilot study
3-3
3.3 Results and Discussion
3.3.1 Children’s exposure to noise A-frequency weighted time-average levels (LAeq) over long periods ranged from 74 dB
to 79 dB. (See Figure 3-1). The highest of these time-average levels were for specific
events such as distressed children screaming, which in one case reached 95 dB over a 25
min period (LAeq 25 min.= 25 dB). The maximum sound pressure (LAmax ) reached 114 dB.
(see Figure 3-1 below). Other events, which raised excitement and noise levels from
the children, were rough and tumble play and active games such as table soccer, which
recorded A-frequency weighted sound levels as high as 87 dB. Noise levels often
dropped significantly (to around 70 dB) during ‘mat times’ when children were
encouraged to sit quietly and listen to their teacher. The quietest times were when all or
most of the children were sleeping or resting. Levels during this period dropped to 63-
69 dB. Considering that the recommended background sound level in an unoccupied
classroom is 35-40 dB, such high levels are not acceptable.
Figure 3-1 Time history of noise levels in an early childhood centre.
40
50
60
70
80
90
100
110
120
11h30 12h00 12h30 13h00 13h30
1-se
cond
tim
e-av
erag
e le
vel
LAeq
1sdB
Time
LAeq 25 min = 95 dBLAmax = 114 dB
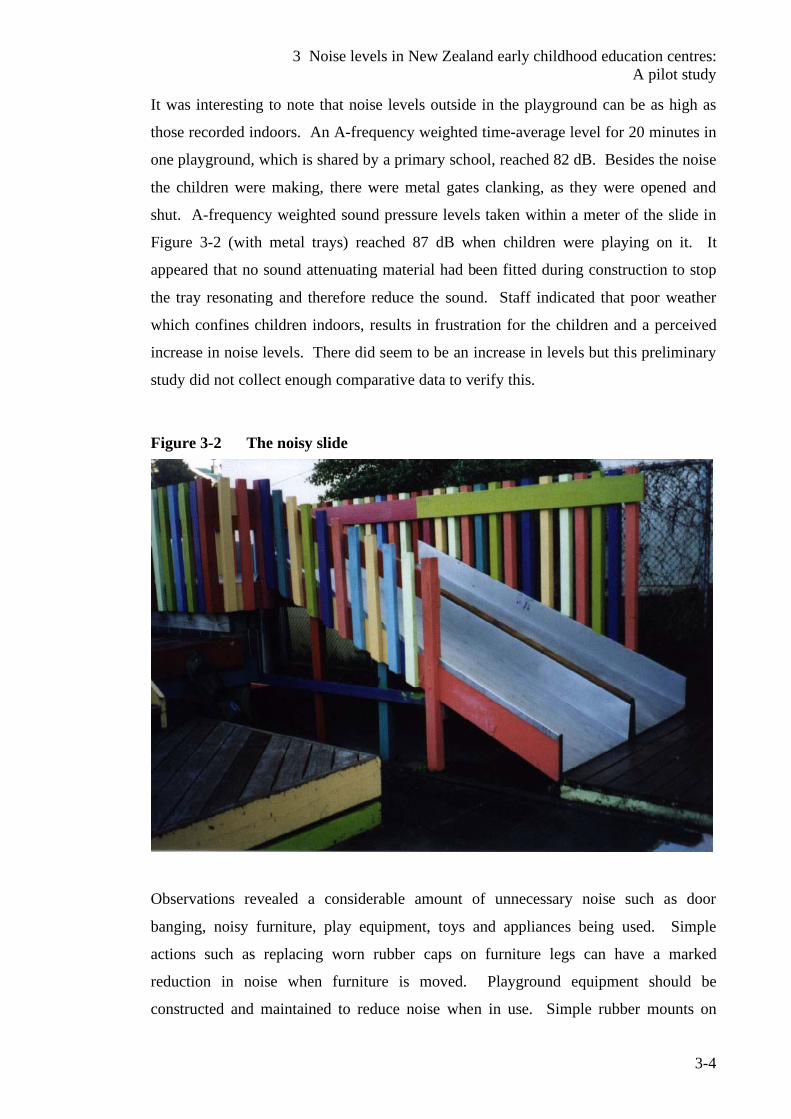
3 Noise levels in New Zealand early childhood education centres: A pilot study
3-4
It was interesting to note that noise levels outside in the playground can be as high as
those recorded indoors. An A-frequency weighted time-average level for 20 minutes in
one playground, which is shared by a primary school, reached 82 dB. Besides the noise
the children were making, there were metal gates clanking, as they were opened and
shut. A-frequency weighted sound pressure levels taken within a meter of the slide in
Figure 3-2 (with metal trays) reached 87 dB when children were playing on it. It
appeared that no sound attenuating material had been fitted during construction to stop
the tray resonating and therefore reduce the sound. Staff indicated that poor weather
which confines children indoors, results in frustration for the children and a perceived
increase in noise levels. There did seem to be an increase in levels but this preliminary
study did not collect enough comparative data to verify this.
Figure 3-2 The noisy slide
Observations revealed a considerable amount of unnecessary noise such as door
banging, noisy furniture, play equipment, toys and appliances being used. Simple
actions such as replacing worn rubber caps on furniture legs can have a marked
reduction in noise when furniture is moved. Playground equipment should be
constructed and maintained to reduce noise when in use. Simple rubber mounts on
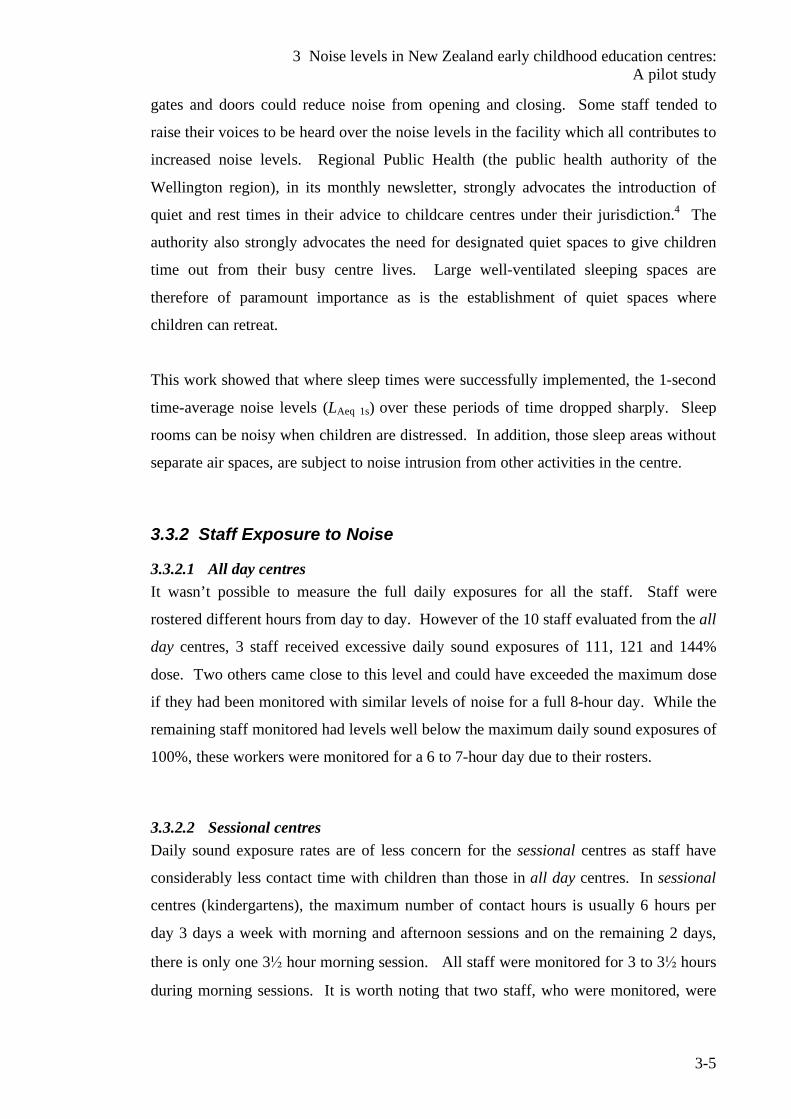
3 Noise levels in New Zealand early childhood education centres: A pilot study
3-5
gates and doors could reduce noise from opening and closing. Some staff tended to
raise their voices to be heard over the noise levels in the facility which all contributes to
increased noise levels. Regional Public Health (the public health authority of the
Wellington region), in its monthly newsletter, strongly advocates the introduction of
quiet and rest times in their advice to childcare centres under their jurisdiction.4 The
authority also strongly advocates the need for designated quiet spaces to give children
time out from their busy centre lives. Large well-ventilated sleeping spaces are
therefore of paramount importance as is the establishment of quiet spaces where
children can retreat.
This work showed that where sleep times were successfully implemented, the 1-second
time-average noise levels (LAeq 1s) over these periods of time dropped sharply. Sleep
rooms can be noisy when children are distressed. In addition, those sleep areas without
separate air spaces, are subject to noise intrusion from other activities in the centre.
3.3.2 Staff Exposure to Noise
3.3.2.1 All day centres It wasn’t possible to measure the full daily exposures for all the staff. Staff were
rostered different hours from day to day. However of the 10 staff evaluated from the all
day centres, 3 staff received excessive daily sound exposures of 111, 121 and 144%
dose. Two others came close to this level and could have exceeded the maximum dose
if they had been monitored with similar levels of noise for a full 8-hour day. While the
remaining staff monitored had levels well below the maximum daily sound exposures of
100%, these workers were monitored for a 6 to 7-hour day due to their rosters.
3.3.2.2 Sessional centres Daily sound exposure rates are of less concern for the sessional centres as staff have
considerably less contact time with children than those in all day centres. In sessional
centres (kindergartens), the maximum number of contact hours is usually 6 hours per
day 3 days a week with morning and afternoon sessions and on the remaining 2 days,
there is only one 3½ hour morning session. All staff were monitored for 3 to 3½ hours
during morning sessions. It is worth noting that two staff, who were monitored, were
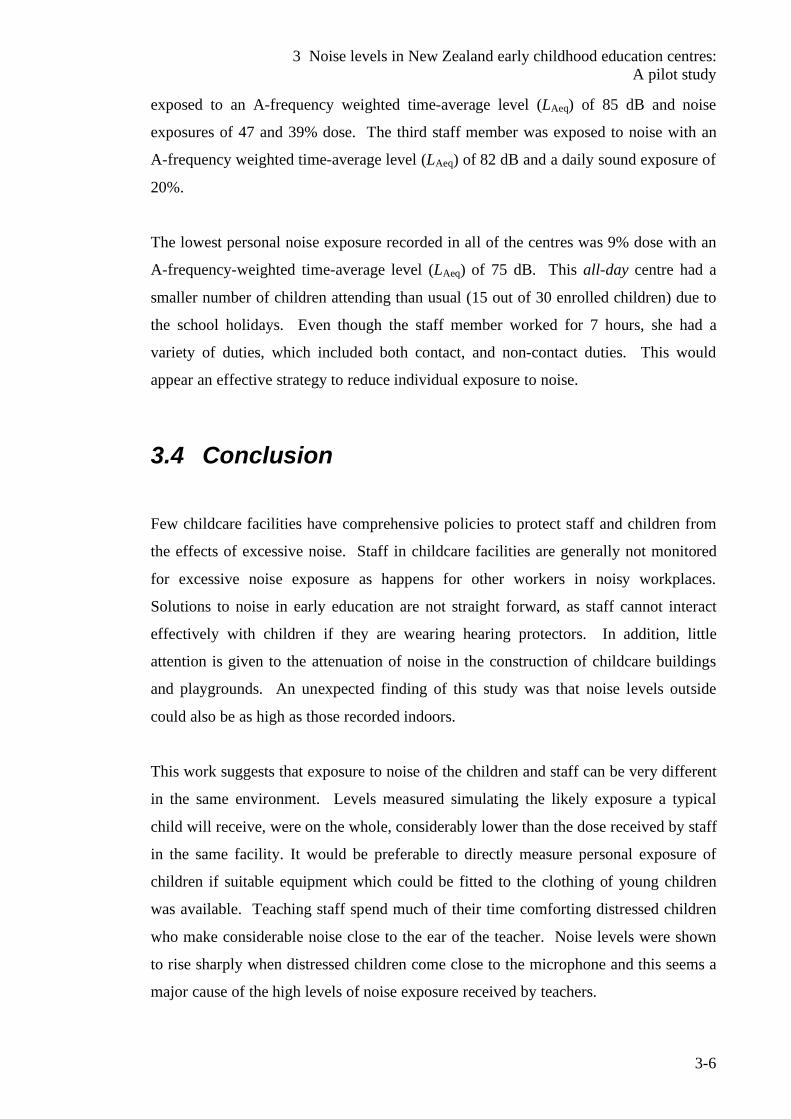
3 Noise levels in New Zealand early childhood education centres: A pilot study
3-6
exposed to an A-frequency weighted time-average level (LAeq) of 85 dB and noise
exposures of 47 and 39% dose. The third staff member was exposed to noise with an
A-frequency weighted time-average level (LAeq) of 82 dB and a daily sound exposure of
20%.
The lowest personal noise exposure recorded in all of the centres was 9% dose with an
A-frequency-weighted time-average level (LAeq) of 75 dB. This all-day centre had a
smaller number of children attending than usual (15 out of 30 enrolled children) due to
the school holidays. Even though the staff member worked for 7 hours, she had a
variety of duties, which included both contact, and non-contact duties. This would
appear an effective strategy to reduce individual exposure to noise.
3.4 Conclusion
Few childcare facilities have comprehensive policies to protect staff and children from
the effects of excessive noise. Staff in childcare facilities are generally not monitored
for excessive noise exposure as happens for other workers in noisy workplaces.
Solutions to noise in early education are not straight forward, as staff cannot interact
effectively with children if they are wearing hearing protectors. In addition, little
attention is given to the attenuation of noise in the construction of childcare buildings
and playgrounds. An unexpected finding of this study was that noise levels outside
could also be as high as those recorded indoors.
This work suggests that exposure to noise of the children and staff can be very different
in the same environment. Levels measured simulating the likely exposure a typical
child will receive, were on the whole, considerably lower than the dose received by staff
in the same facility. It would be preferable to directly measure personal exposure of
children if suitable equipment which could be fitted to the clothing of young children
was available. Teaching staff spend much of their time comforting distressed children
who make considerable noise close to the ear of the teacher. Noise levels were shown
to rise sharply when distressed children come close to the microphone and this seems a
major cause of the high levels of noise exposure received by teachers.
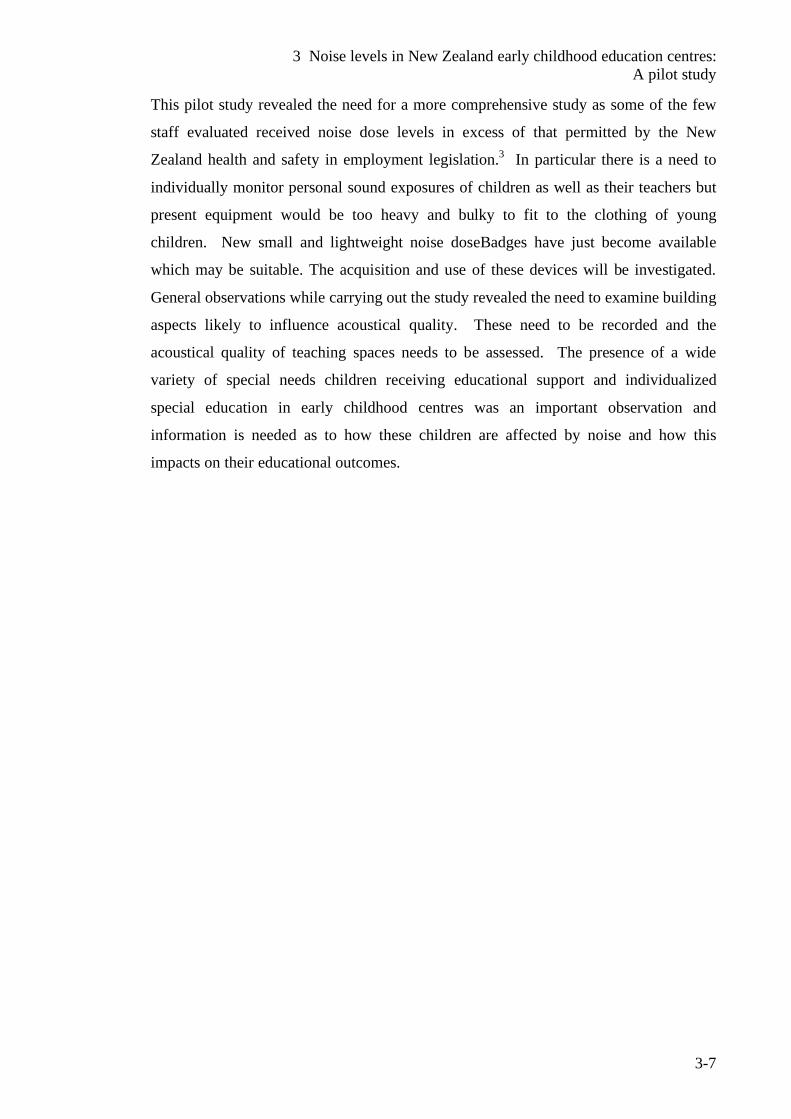
3 Noise levels in New Zealand early childhood education centres: A pilot study
3-7
This pilot study revealed the need for a more comprehensive study as some of the few
staff evaluated received noise dose levels in excess of that permitted by the New
Zealand health and safety in employment legislation.3 In particular there is a need to
individually monitor personal sound exposures of children as well as their teachers but
present equipment would be too heavy and bulky to fit to the clothing of young
children. New small and lightweight noise doseBadges have just become available
which may be suitable. The acquisition and use of these devices will be investigated.
General observations while carrying out the study revealed the need to examine building
aspects likely to influence acoustical quality. These need to be recorded and the
acoustical quality of teaching spaces needs to be assessed. The presence of a wide
variety of special needs children receiving educational support and individualized
special education in early childhood centres was an important observation and
information is needed as to how these children are affected by noise and how this
impacts on their educational outcomes.
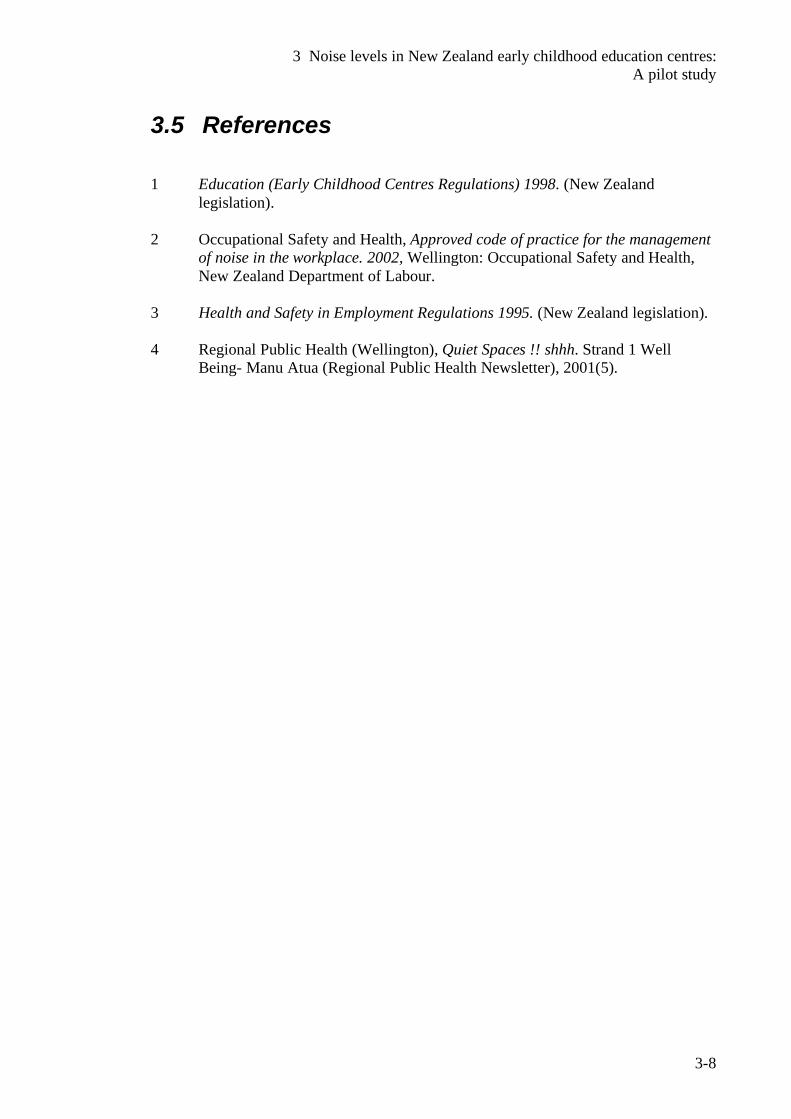
3 Noise levels in New Zealand early childhood education centres: A pilot study
3-8
3.5 References 1 Education (Early Childhood Centres Regulations) 1998. (New Zealand
legislation). 2 Occupational Safety and Health, Approved code of practice for the management
of noise in the workplace. 2002, Wellington: Occupational Safety and Health, New Zealand Department of Labour.
3 Health and Safety in Employment Regulations 1995. (New Zealand legislation). 4 Regional Public Health (Wellington), Quiet Spaces !! shhh. Strand 1 Well
Being- Manu Atua (Regional Public Health Newsletter), 2001(5).
4. Speech intelligibility, processing and interference levels
4-1
4 Speech intelligibility, processing and speech interference levels
4.1 Introduction The most important method of communication between humans is still speech, despite
the recent advances in communication technologies. The human auditory system has
the capacity to discriminate differences in the signal received and the ability to
assimilate and process information.1 A serious consequence of noise is that it prevents
one person from understanding another whether it is face to face, by telephone or a
voice amplification system.2 Communication, where the listener can clearly see the
speaker, is often enhanced by cues such as facial expression, lip reading, and other
forms of body language. The importance of such indirect forms of communication is
demonstrated by difficulties encountered by those with disabilities such as autism,
where there are major deficits in indirect communication skills and abilities.
4.2 Speech and intelligibility Intelligibility is defined by Webster 2 as the understanding of the spoken word. It does
not include the more complex forms of communication such as nuance, the
identification of a speaker from his/her voice, or emotions from the tone of voice.
Speech is a result of a learned motor behaviour.1 A speaker generates complex sound
waves, which change continuously. These sounds vary greatly in overall sound
pressure and frequency content over time. 2 Cues are found between frequencies 100 -
8,000Hz with most acoustical energy of speech falling within the 100 - 6,000Hz range.
Of this, the most important cue-bearing energy falls between frequencies of 300-
3,000Hz. An informative spoken language must consist of mutually exclusive sounds
of which the fundamental elements are called phonemes. These can be described as a
unique code related to the articulatory characteristics of a given language.1,3 Speech
also includes temporal features such as loudness, pitch and rhythm, which give a
4. Speech intelligibility, processing and interference levels
4-2
temporal pattern in which the phonemes are embedded.2 Alongside phoneme
discrimination, the study of speech rhythms (called prosody) is required for correct
speech perception.1
The extent to which the speech signal exceeds the background noise level is known as
the signal-to-noise ratio (SNR), which is a function of speech intelligibility.4 A speaker
in a noisy environment must do one of the following if speech communication is
deficient:4
• Move closer to the listener
• Increase the level of their voice
• Reduce the level of background noise
There is an acceptable limit beyond which the increased levels of speech add to the
overall noise level. Communication with a normal voice is easy when only a few
people are present. As the numbers rise, the background noise increases until speech
communication is near impossible even with raised voices at close range. Hegyold and
May4 describe this as the cocktail party effect.
While the frequency of occurrence of speech varies greatly from one individual and
situation to another, Levitt and Webster5 has given (in Figure 4-1), a long-term average
of data of a typical male subject, showing the one-third octave band sound pressure
levels versus frequency for typical speaking conditions. This figure shows that the
typical male voice is louder (exerts higher sound pressure levels) than the typical female
voice in the lower audible frequency range (125-250 Hz). The average male voice
when shouting can reach a sound pressure level of 80 dB at 1250 Hz whereas the
average for the female voice when shouting will only reach 75 dB at 1600 Hz. The
long-term average speech spectra for the male voice is generally higher than that for the
female voice for the 5 different vocal effects given across the audible one-third octave
band frequencies.
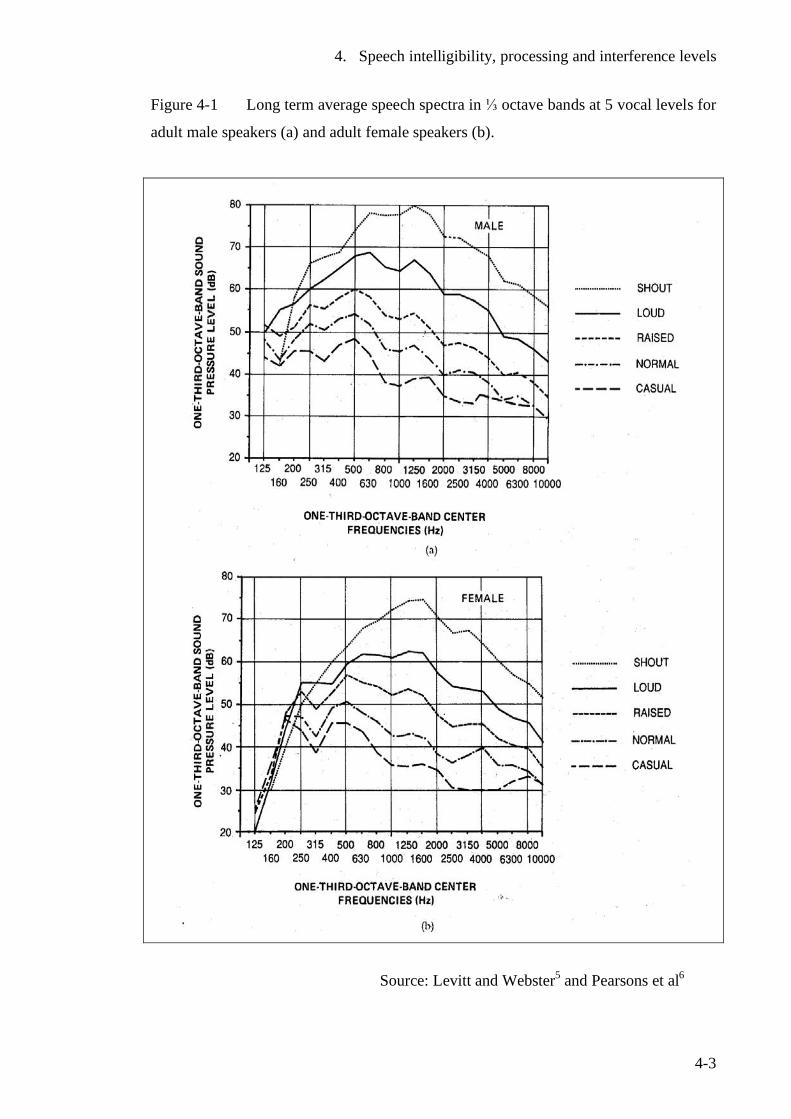
4. Speech intelligibility, processing and interference levels
4-3
Figure 4-1 Long term average speech spectra in ⅓ octave bands at 5 vocal levels for
adult male speakers (a) and adult female speakers (b).
Source: Levitt and Webster5 and Pearsons et al6
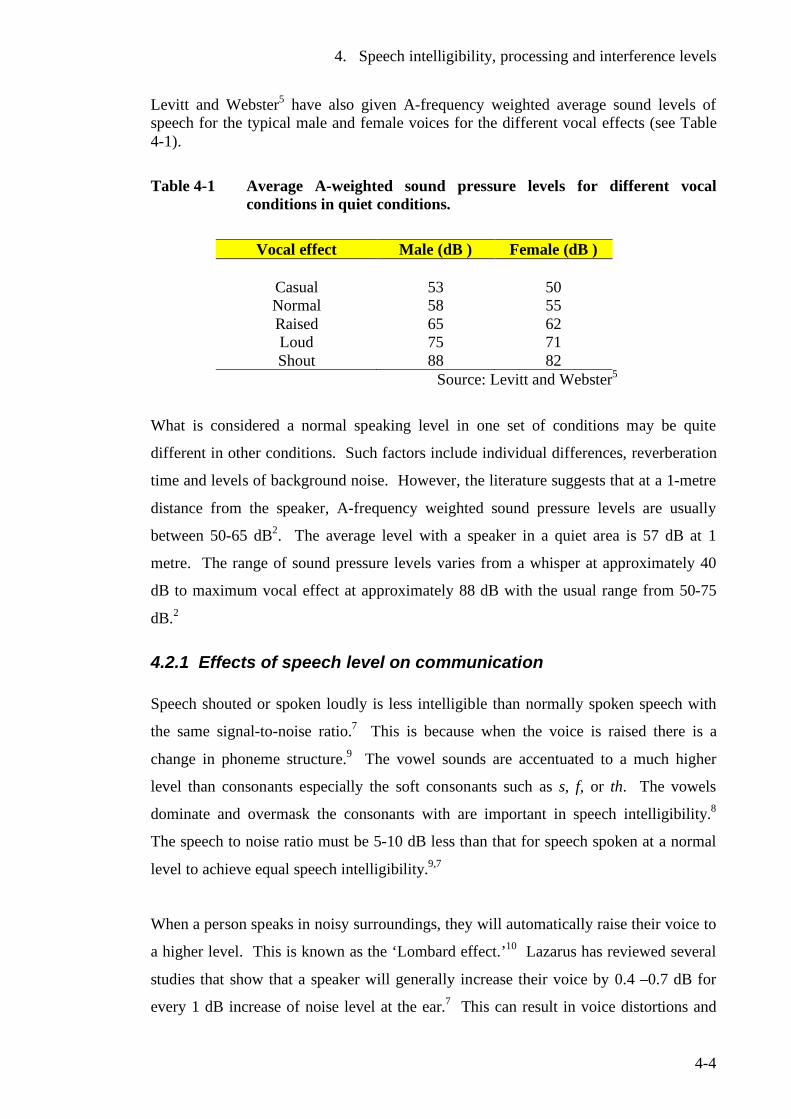
4. Speech intelligibility, processing and interference levels
4-4
Levitt and Webster5 have also given A-frequency weighted average sound levels of speech for the typical male and female voices for the different vocal effects (see Table 4-1).
Table 4-1 Average A-weighted sound pressure levels for different vocal conditions in quiet conditions.
Vocal effect Male (dB ) Female (dB )
Casual 53 50 Normal 58 55 Raised 65 62 Loud 75 71 Shout 88 82
Source: Levitt and Webster5
What is considered a normal speaking level in one set of conditions may be quite
different in other conditions. Such factors include individual differences, reverberation
time and levels of background noise. However, the literature suggests that at a 1-metre
distance from the speaker, A-frequency weighted sound pressure levels are usually
between 50-65 dB2. The average level with a speaker in a quiet area is 57 dB at 1
metre. The range of sound pressure levels varies from a whisper at approximately 40
dB to maximum vocal effect at approximately 88 dB with the usual range from 50-75
dB.2
4.2.1 Effects of speech level on communication Speech shouted or spoken loudly is less intelligible than normally spoken speech with
the same signal-to-noise ratio.7 This is because when the voice is raised there is a
change in phoneme structure.9 The vowel sounds are accentuated to a much higher
level than consonants especially the soft consonants such as s, f, or th. The vowels
dominate and overmask the consonants with are important in speech intelligibility.8
The speech to noise ratio must be 5-10 dB less than that for speech spoken at a normal
level to achieve equal speech intelligibility.9,7
When a person speaks in noisy surroundings, they will automatically raise their voice to
a higher level. This is known as the ‘Lombard effect.’10 Lazarus has reviewed several
studies that show that a speaker will generally increase their voice by 0.4 –0.7 dB for
every 1 dB increase of noise level at the ear.7 This can result in voice distortions and
4. Speech intelligibility, processing and interference levels
4-5
vocal cord stress,1 all of which will degrade speech production, clarity and therefore
compromise speech perception.
Lazarus7 found the intelligibility of speech that is shouted above a level of 75 dB to be
substantially reduced. Assuming that intelligibility up to a level of 75 dB to be
constant, for every 10 dB increase past this point, intelligibility is reduced by 15-40%
which corresponds to a SNR of 4 dB. This has major implications in the classroom
where teachers naturally raise their voices to be heard over the level of noise.7 The
greatest impact is likely to affect those children with disabilities involving speech,
hearing, auditory processing and development.
4.2.2 Effects on the listener A number of studies cited by Lazarus7 indicate that if the speech level at the ear of the
listener exceeds 80 dB A (LSA > 80dB)* with a equal signal-to-noise ratio, intelligibility
decreases slightly, which has been attributed to overloading of the hearing mechanism.
Lazarus estimates that effective SNR is reduced by 1 dB for every 10 dB increase in
speech level (LSA) above 80 dB.
4.2.3 Effects of background noise on speech communication. Webster2 indicates that it is possible to have satisfactory communication conditions (i.e.
95% or more of sentences to be correctly understood) using a normal voice level up to 5
metres with an A-frequency weighted background noise level of 50 dB. As the
background noise level rises, the speaker will normally raise their voice 3-6 dB for
every 10 dB increase in background noise level above 50 dB.
Levitt and Webster5 have described how the A-weighted sound pressure level can be
used as a measure of speech interference where these sound pressure levels can be used
to predict maximum permissible speaker to distances for ‘just reliable speech
communication’ in noise. ‘Just reliable speech communication’ is defined as where
trained listeners obtain a test score of 70% on phonetically balanced monosyllabic word *LSA is the A-weighted sound level of speech measured across speaking time at a 1 metre distance from the speaker’s mouth and expressed as a time-average level (LsAeq ,1 m).
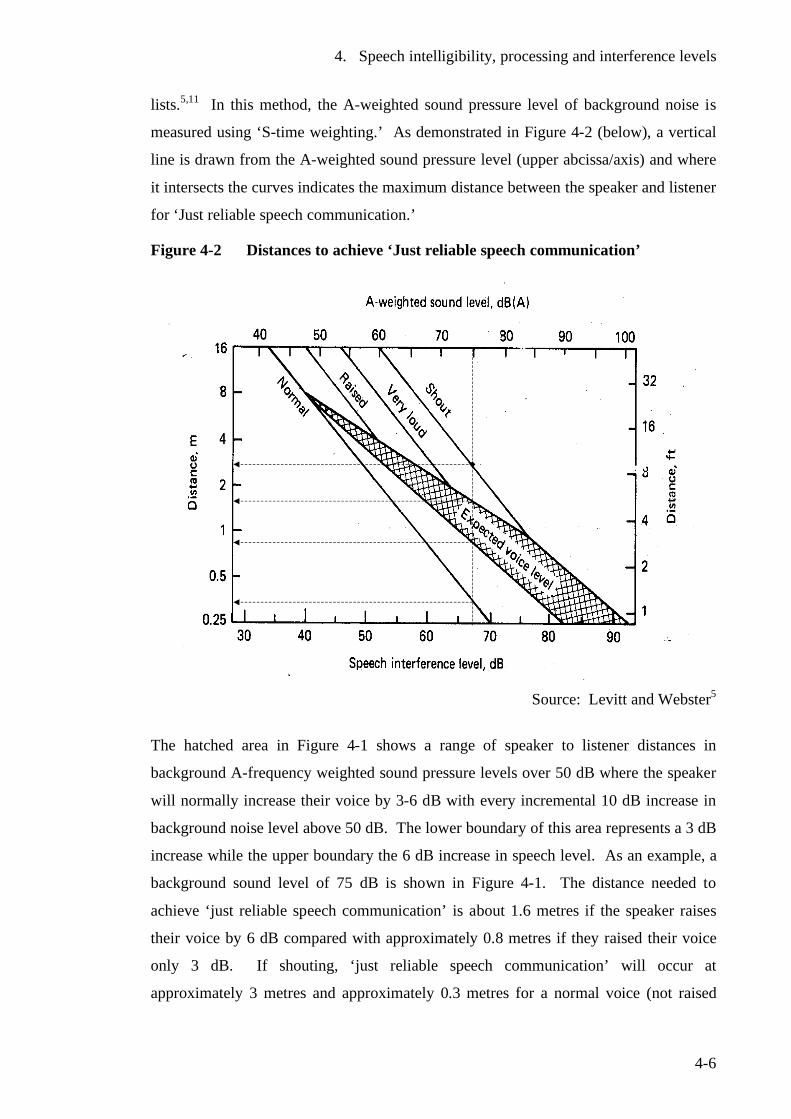
4. Speech intelligibility, processing and interference levels
4-6
lists.5,11 In this method, the A-weighted sound pressure level of background noise is
measured using ‘S-time weighting.’ As demonstrated in Figure 4-2 (below), a vertical
line is drawn from the A-weighted sound pressure level (upper abcissa/axis) and where
it intersects the curves indicates the maximum distance between the speaker and listener
for ‘Just reliable speech communication.’
Figure 4-2 Distances to achieve ‘Just reliable speech communication’
Source: Levitt and Webster5
The hatched area in Figure 4-1 shows a range of speaker to listener distances in
background A-frequency weighted sound pressure levels over 50 dB where the speaker
will normally increase their voice by 3-6 dB with every incremental 10 dB increase in
background noise level above 50 dB. The lower boundary of this area represents a 3 dB
increase while the upper boundary the 6 dB increase in speech level. As an example, a
background sound level of 75 dB is shown in Figure 4-1. The distance needed to
achieve ‘just reliable speech communication’ is about 1.6 metres if the speaker raises
their voice by 6 dB compared with approximately 0.8 metres if they raised their voice
only 3 dB. If shouting, ‘just reliable speech communication’ will occur at
approximately 3 metres and approximately 0.3 metres for a normal voice (not raised
4. Speech intelligibility, processing and interference levels
4-7
with increased background noise). Levitt and Webster5 have outlined limitations
associated with this method. For instance it cannot be used:
• Where the octave band spectrum differs from a spectrum where all frequency
bands have approximately the same value
• Where there are significant variation in the sound pressure level over time
• When communication occurs in a highly reverberant environment
• Where speech is not articulated clearly (i.e. distorted)5
4.2.4 Masking and intelligibility
Noise interference with speaking is described by Berglund and Lindvall 1 as a masking
process. The SNR will determine to what extent the signal can be perceived, but the
more intense the level of masking, the greater percentage of speech sounds that are not
discernible to the listener.1
In the usual discourse, most sentences can be understood reasonably well even when
there are a large number of individual speech sounds masked.1 This is because it is
often not necessary to understand all words to extract the meaning. Certain words
called key words are fundamental in establishing meaning. The technique of identifying
the key words in a discourse for second language speakers and formulating the meaning
without understanding everything that is said, is an important skill in second language
acquisition when they do not have the same level of proficiency as a native speaker.
The extra work in interpretation required to compensate for masking effects and /or lack
of proficiency in the target language, adds additional strain on the listener. 1
4.2.5 Estimating speech intelligibility Many attempts have been made to develop a single index to indicate the degree of
interference with speech perception of masking noise. Berglund and Linvall identified
the three most common indices as: 1
• Articulations index (AI)
• Speech interfere level (SIL)
• A-weighted sound pressure level.
4. Speech intelligibility, processing and interference levels
4-8
A satisfactory speech intelligibility is defined as 70% intelligibility of monosyllables
with an open test list.11 This corresponds to an SNR with an articulation index of 0.45.7
4.2.6 Articulation index. The articulation index (AI) is the most complicated of all indices and for a time was
rarely used.1 It was developed by French and Steinberg12 over 50 years ago and
underwent further development by Kryter13 and Cavanaugh et al.14 It is based on the
premise that some frequencies are more effective in masking speech than others. The
frequencies outside the target range of 250-7000 Hz are omitted because they do not
significantly contribute to speech intelligiblity.1 The target frequency range is divided
into 20 relatively narrow frequency bands, each of which contributes 5% to
intelligibility. The AI for a particular noise is calculated by determining the difference
in dB between the average speech level and ambient level in each band, and the results
combined to give a single index between the numerical values of 0 and 1.0.1,15
May16 and Kryter17 have discussed the work of Cavanaugh et al14 in some depth, as it
appeared the most simple method known to calculate the articulation index at that time.
In this work, the authors developed a nomograph (see Figure 4-3) to estimate the
articulation index present in a room from speech uttered in an adjacent room. Here the
30 dB range between the upper and lower curves is where normal speech usually falls.
Take the parts of speech falling on the ⅓ octave band of 500 Hz - these have a sound
pressure level in the range of 43-73 dB (30 dB difference) for the great majority of
people most of the time.16
The frequencies in the 1,500-3,000 Hz have been shown in studies to affect speech
intelligibility more than the frequencies outside this range. The number of dots in the
nomograph (Figure 4-3), reflect the relative importance to speech intelligibility of the
various frequencies.
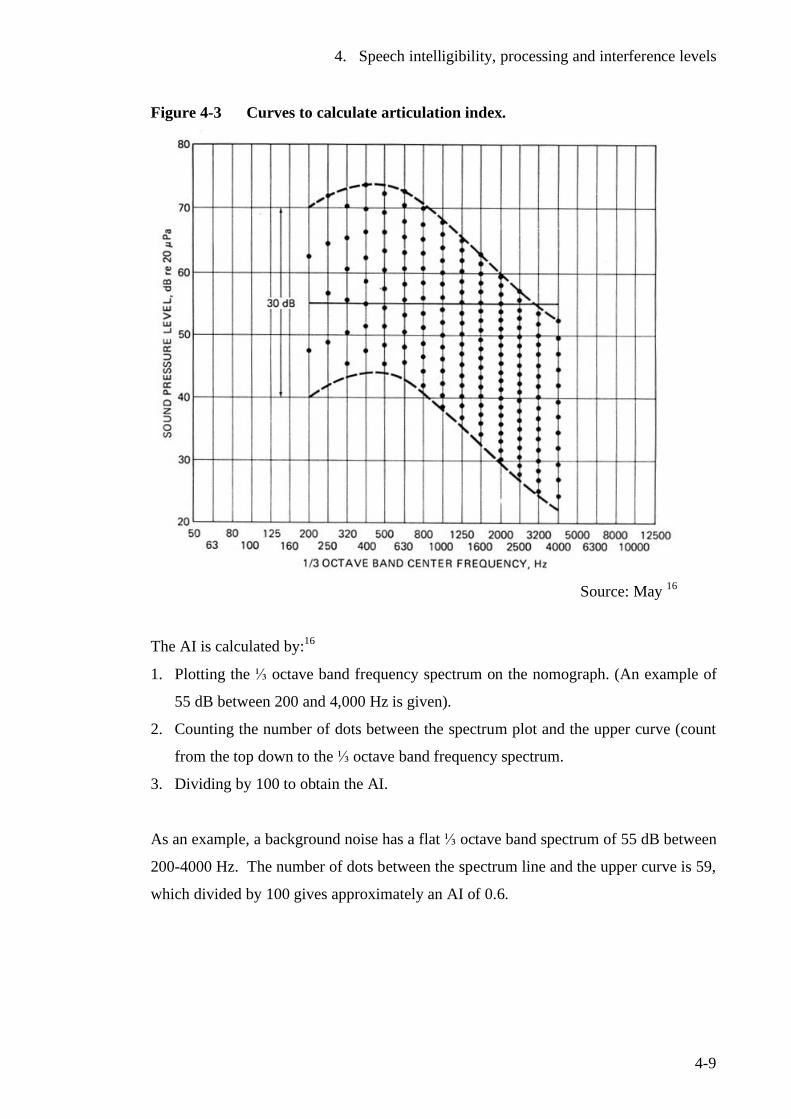
4. Speech intelligibility, processing and interference levels
4-9
Figure 4-3 Curves to calculate articulation index.
Source: May 16
The AI is calculated by:16
1. Plotting the ⅓ octave band frequency spectrum on the nomograph. (An example of
55 dB between 200 and 4,000 Hz is given).
2. Counting the number of dots between the spectrum plot and the upper curve (count
from the top down to the ⅓ octave band frequency spectrum.
3. Dividing by 100 to obtain the AI.
As an example, a background noise has a flat ⅓ octave band spectrum of 55 dB between
200-4000 Hz. The number of dots between the spectrum line and the upper curve is 59,
which divided by 100 gives approximately an AI of 0.6.
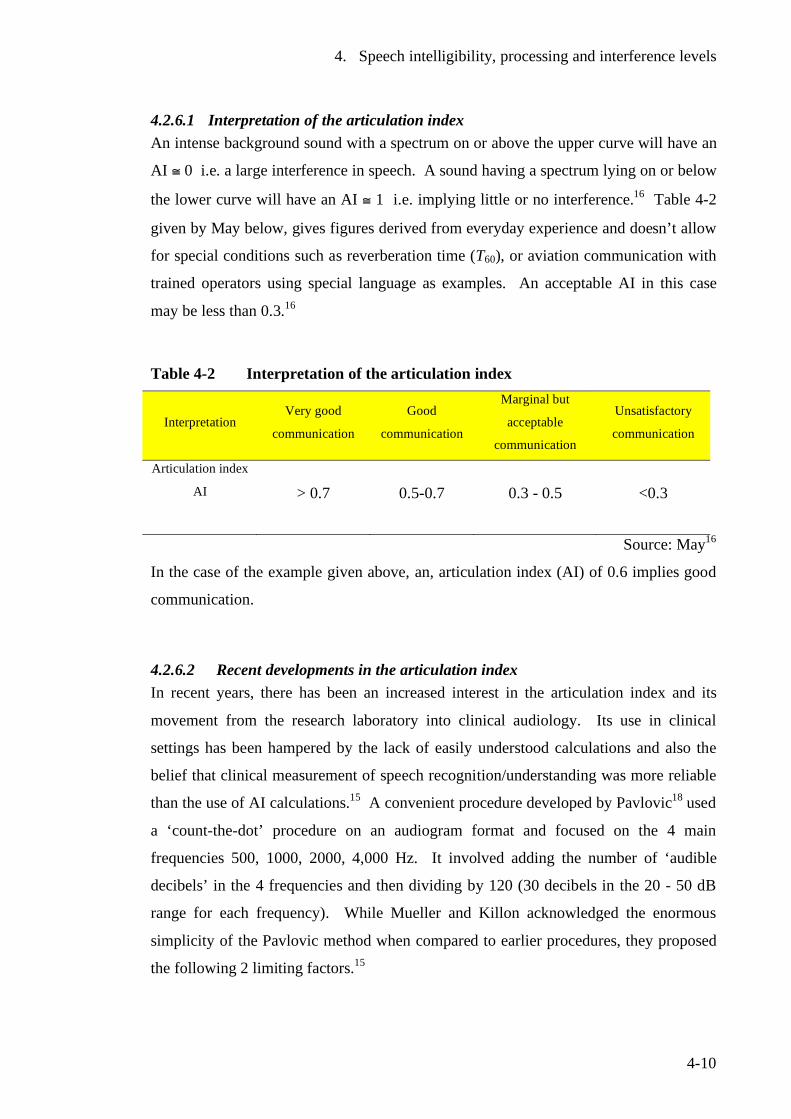
4. Speech intelligibility, processing and interference levels
4-10
4.2.6.1 Interpretation of the articulation index An intense background sound with a spectrum on or above the upper curve will have an
AI ≅ 0 i.e. a large interference in speech. A sound having a spectrum lying on or below
the lower curve will have an AI ≅ 1 i.e. implying little or no interference.16 Table 4-2
given by May below, gives figures derived from everyday experience and doesn’t allow
for special conditions such as reverberation time (T60), or aviation communication with
trained operators using special language as examples. An acceptable AI in this case
may be less than 0.3.16
Table 4-2 Interpretation of the articulation index
Interpretation Very good
communication
Good
communication
Marginal but
acceptable
communication
Unsatisfactory
communication
Articulation index
AI
> 0.7 0.5-0.7 0.3 - 0.5 <0.3
Source: May16
In the case of the example given above, an, articulation index (AI) of 0.6 implies good
communication.
4.2.6.2 Recent developments in the articulation index In recent years, there has been an increased interest in the articulation index and its
movement from the research laboratory into clinical audiology. Its use in clinical
settings has been hampered by the lack of easily understood calculations and also the
belief that clinical measurement of speech recognition/understanding was more reliable
than the use of AI calculations.15 A convenient procedure developed by Pavlovic18 used
a ‘count-the-dot’ procedure on an audiogram format and focused on the 4 main
frequencies 500, 1000, 2000, 4,000 Hz. It involved adding the number of ‘audible
decibels’ in the 4 frequencies and then dividing by 120 (30 decibels in the 20 - 50 dB
range for each frequency). While Mueller and Killon acknowledged the enormous
simplicity of the Pavlovic method when compared to earlier procedures, they proposed
the following 2 limiting factors.15
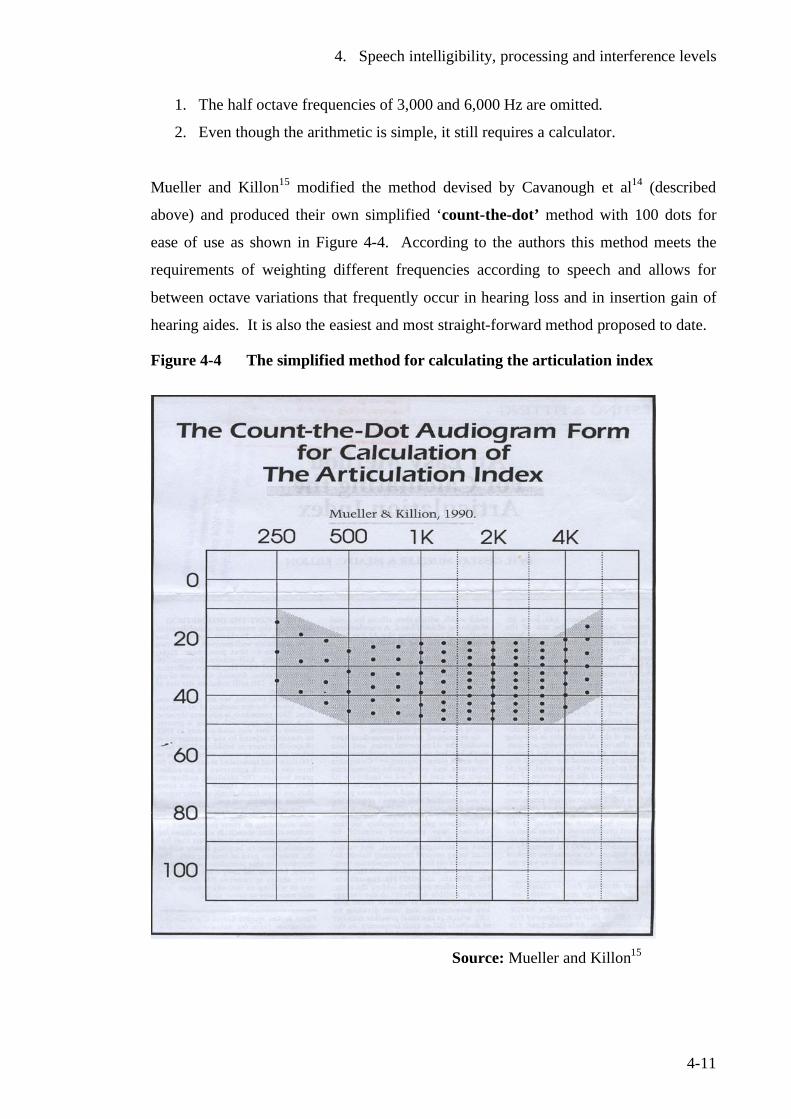
4. Speech intelligibility, processing and interference levels
4-11
1. The half octave frequencies of 3,000 and 6,000 Hz are omitted.
2. Even though the arithmetic is simple, it still requires a calculator.
Mueller and Killon15 modified the method devised by Cavanough et al14 (described
above) and produced their own simplified ‘count-the-dot’ method with 100 dots for
ease of use as shown in Figure 4-4. According to the authors this method meets the
requirements of weighting different frequencies according to speech and allows for
between octave variations that frequently occur in hearing loss and in insertion gain of
hearing aides. It is also the easiest and most straight-forward method proposed to date.
Figure 4-4 The simplified method for calculating the articulation index
Source: Mueller and Killon15
4. Speech intelligibility, processing and interference levels
4-12
The articulation index has 3 potentially important uses in the fitting of hearing aides.15
• Prediction of the patient's deficit (unaided) in normal level conversational
speech
• Prediction of the benefit of a specific hearing aid
• Comparison of potential benefits of one hearing aid to another
The Mueller and Killon method has become a valuable assessment tool in audiology. It
is widely used in clinical practice and is promoted in audiology practice manuals and
texts.
In the case of an unaided audiogram (without hearing aids), the pure tone thresholds are
plotted in the normal way on the audiogram. The dots occurring below the plot are
those audible to the patient and these are counted and divided by 100. If 40 dots are
counted below the plot, this results in an articulation index of 0.4.
4.2.7 Speech interference level (SIL)
The speech interference level was developed as a simple derivative of the articulation
index.1,16 It uses octave rather than ⅓ octave analysis of background noise.
The SIL changed with the application of the internationally adopted octave bands and
became known as the preferred speech interference level (PSIL).16
The PSIL was the arithmetic mean of the sound pressure level in the 3 octave bands
centred on 500, 1000, 2000 Hz. However the PSIL was never standardized and in 1977,
the American National Standards Institute standardized the speech interference level.19
This was the same as the PSIL with the addition of the frequencies centred on 4000 Hz.
At present, the American National Standards Institute has recommended a speech
interference level centred on frequencies 500, 1000, 2,000, 4000 Hz as providing the
best estimate of masking noise. This is often abbreviated to SIL (0.5, 1.0, 2.0, 4.0).1
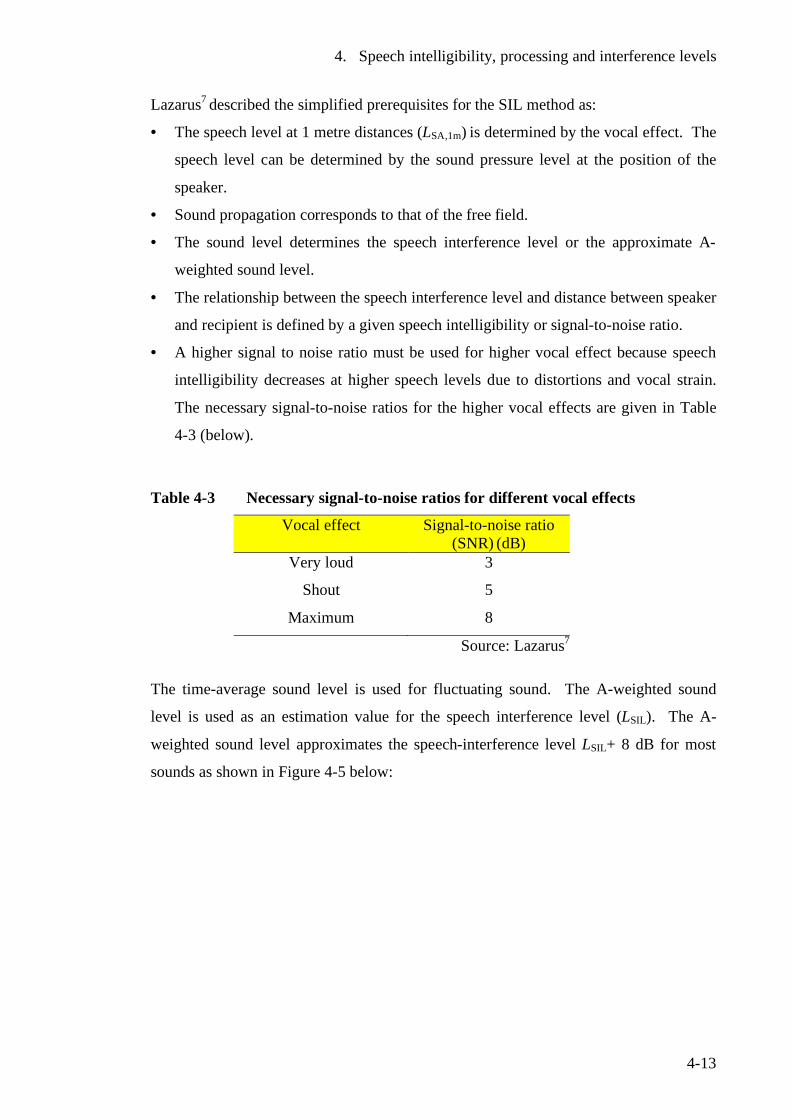
4. Speech intelligibility, processing and interference levels
4-13
Lazarus7 described the simplified prerequisites for the SIL method as:
• The speech level at 1 metre distances (LSA,1m) is determined by the vocal effect. The
speech level can be determined by the sound pressure level at the position of the
speaker.
• Sound propagation corresponds to that of the free field.
• The sound level determines the speech interference level or the approximate A-
weighted sound level.
• The relationship between the speech interference level and distance between speaker
and recipient is defined by a given speech intelligibility or signal-to-noise ratio.
• A higher signal to noise ratio must be used for higher vocal effect because speech
intelligibility decreases at higher speech levels due to distortions and vocal strain.
The necessary signal-to-noise ratios for the higher vocal effects are given in Table
4-3 (below).
Table 4-3 Necessary signal-to-noise ratios for different vocal effects
Vocal effect
Signal-to-noise ratio (SNR) (dB)
Very loud 3
Shout 5
Maximum 8
Source: Lazarus7
The time-average sound level is used for fluctuating sound. The A-weighted sound
level is used as an estimation value for the speech interference level (LSIL). The A-
weighted sound level approximates the speech-interference level LSIL+ 8 dB for most
sounds as shown in Figure 4-5 below:
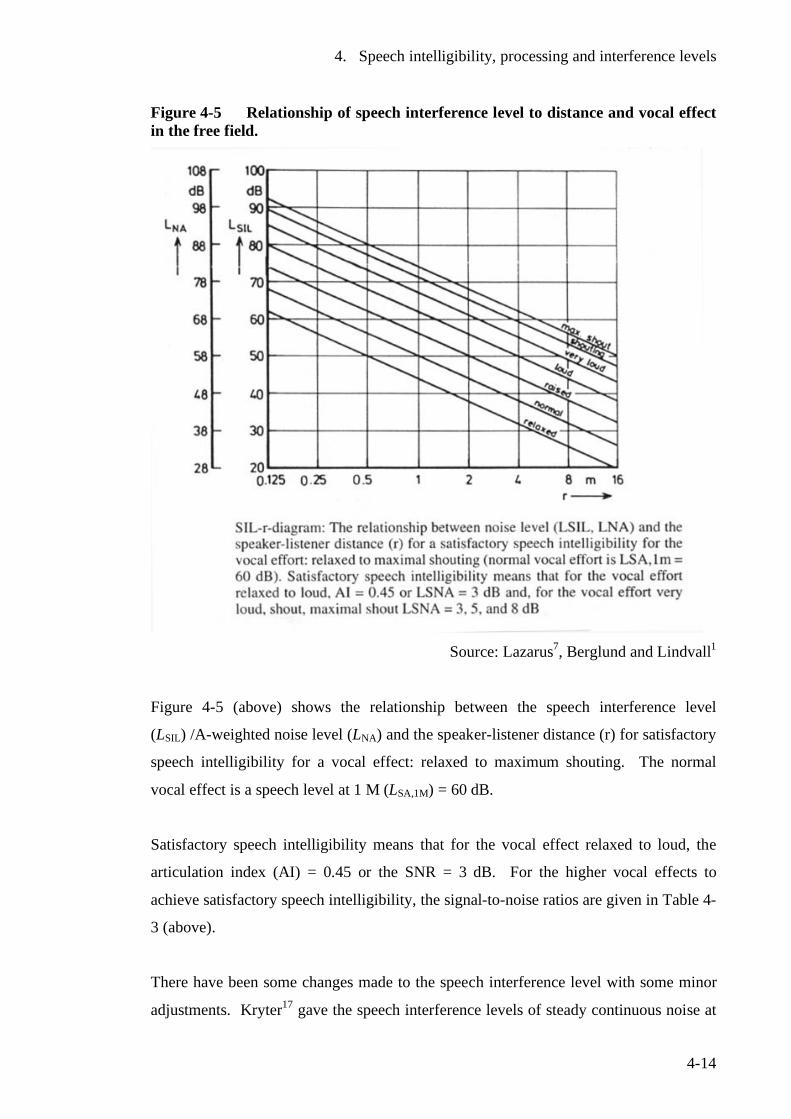
4. Speech intelligibility, processing and interference levels
4-14
Figure 4-5 Relationship of speech interference level to distance and vocal effect in the free field.
Source: Lazarus7, Berglund and Lindvall1
Figure 4-5 (above) shows the relationship between the speech interference level
(LSIL) /A-weighted noise level (LNA) and the speaker-listener distance (r) for satisfactory
speech intelligibility for a vocal effect: relaxed to maximum shouting. The normal
vocal effect is a speech level at 1 M (LSA,1M) = 60 dB.
Satisfactory speech intelligibility means that for the vocal effect relaxed to loud, the
articulation index (AI) = 0.45 or the SNR = 3 dB. For the higher vocal effects to
achieve satisfactory speech intelligibility, the signal-to-noise ratios are given in Table 4-
3 (above).
There have been some changes made to the speech interference level with some minor
adjustments. Kryter17 gave the speech interference levels of steady continuous noise at
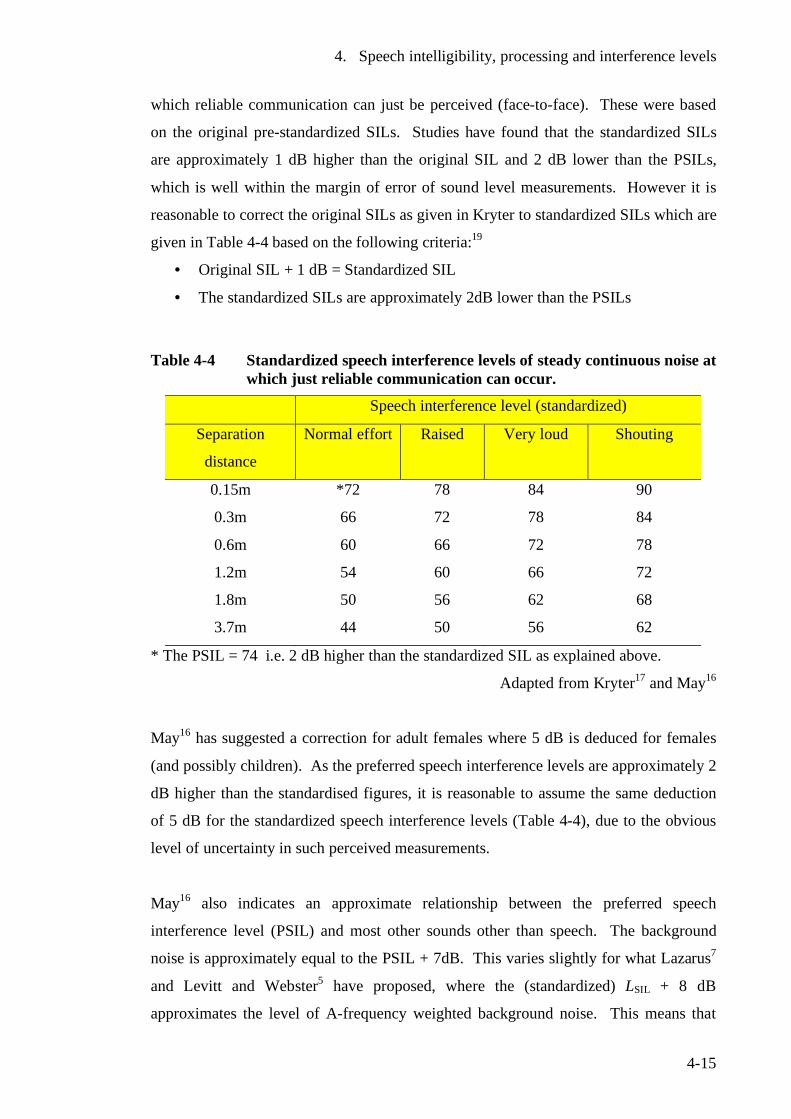
4. Speech intelligibility, processing and interference levels
4-15
which reliable communication can just be perceived (face-to-face). These were based
on the original pre-standardized SILs. Studies have found that the standardized SILs
are approximately 1 dB higher than the original SIL and 2 dB lower than the PSILs,
which is well within the margin of error of sound level measurements. However it is
reasonable to correct the original SILs as given in Kryter to standardized SILs which are
given in Table 4-4 based on the following criteria:19
• Original SIL + 1 dB = Standardized SIL
• The standardized SILs are approximately 2dB lower than the PSILs
Table 4-4 Standardized speech interference levels of steady continuous noise at which just reliable communication can occur.
Speech interference level (standardized)
Separation
distance
Normal effort Raised Very loud Shouting
0.15m *72 78 84 90
0.3m 66 72 78 84
0.6m 60 66 72 78
1.2m 54 60 66 72
1.8m 50 56 62 68
3.7m 44 50 56 62
* The PSIL = 74 i.e. 2 dB higher than the standardized SIL as explained above.
Adapted from Kryter17 and May16
May16 has suggested a correction for adult females where 5 dB is deduced for females
(and possibly children). As the preferred speech interference levels are approximately 2
dB higher than the standardised figures, it is reasonable to assume the same deduction
of 5 dB for the standardized speech interference levels (Table 4-4), due to the obvious
level of uncertainty in such perceived measurements.
May16 also indicates an approximate relationship between the preferred speech
interference level (PSIL) and most other sounds other than speech. The background
noise is approximately equal to the PSIL + 7dB. This varies slightly for what Lazarus7
and Levitt and Webster5 have proposed, where the (standardized) LSIL + 8 dB
approximates the level of A-frequency weighted background noise. This means that
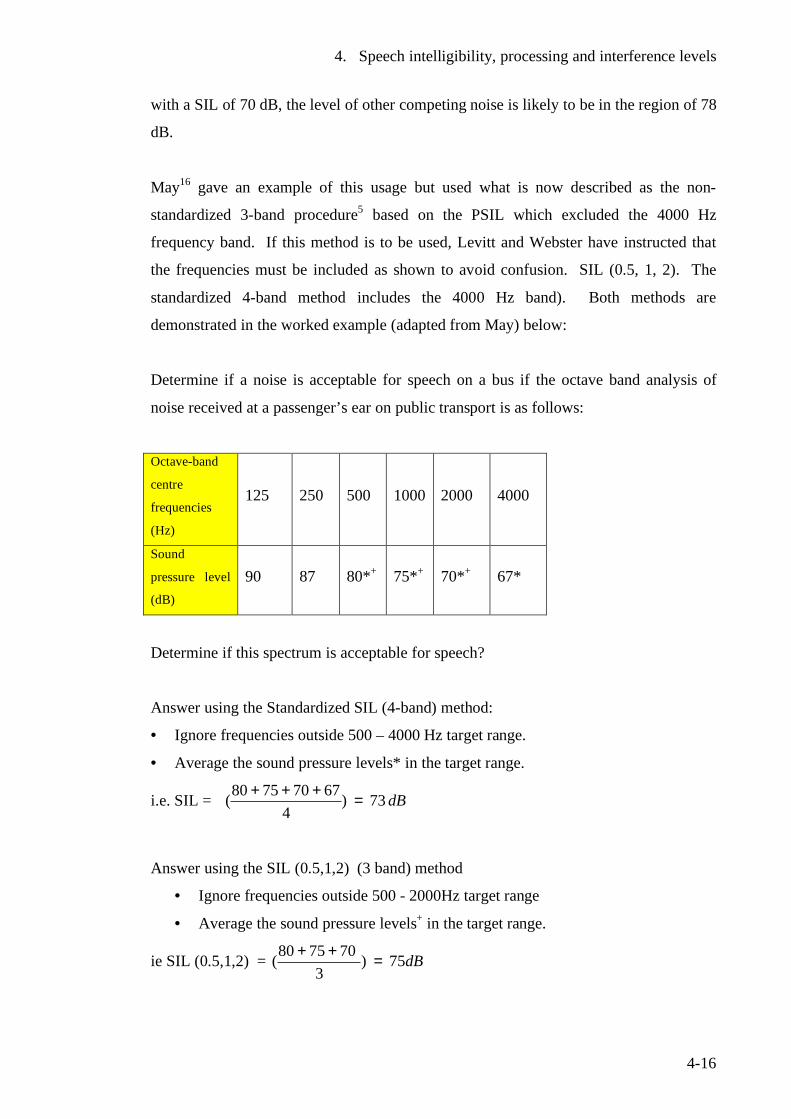
4. Speech intelligibility, processing and interference levels
4-16
with a SIL of 70 dB, the level of other competing noise is likely to be in the region of 78
dB.
May16 gave an example of this usage but used what is now described as the non-
standardized 3-band procedure5 based on the PSIL which excluded the 4000 Hz
frequency band. If this method is to be used, Levitt and Webster have instructed that
the frequencies must be included as shown to avoid confusion. SIL (0.5, 1, 2). The
standardized 4-band method includes the 4000 Hz band). Both methods are
demonstrated in the worked example (adapted from May) below:
Determine if a noise is acceptable for speech on a bus if the octave band analysis of
noise received at a passenger’s ear on public transport is as follows:
Octave-band
centre
frequencies
(Hz)
125 250 500 1000 2000 4000
Sound
pressure level
(dB)
90 87 80*+ 75*+ 70*+ 67*
Determine if this spectrum is acceptable for speech?
Answer using the Standardized SIL (4-band) method:
• Ignore frequencies outside 500 – 4000 Hz target range.
• Average the sound pressure levels* in the target range.
i.e. SIL = dB73)4
67707580( =+++
Answer using the SIL (0.5,1,2) (3 band) method
• Ignore frequencies outside 500 - 2000Hz target range
• Average the sound pressure levels+ in the target range.
ie SIL (0.5,1,2) = dB75)3
707580( =++
4. Speech intelligibility, processing and interference levels
4-17
If on a bus or train, we would expect to be able to talk in a normal voice to people one
seat away (< 1metre). At 0.6 metres, the SIL = 60 dB for a man and (60-5) = 55 dB for
a woman/child (assuming the same correction for SIL as for PSIL). Since the calculated
SIL of 73 dB [or SIL (0.5,1,2) of 75 dB], both exceed the tabulated values of 60 dB in
Table 4-4 (and 55 dB when corrected for females), this sound is unacceptably loud for
close conversation.16
Lazarus7 described the different ways the response function of the room can influence
the speech sound, the equivalent noise ratio and therefore the speech intelligibility.
These are:
• The influence of reverberation on speech and therefore intelligibility increases with
the distance between speaker and listener.
• A reverberation time of no more than 0.5 seconds can slightly improve speech
intelligibly for those with normal hearing but greater reverberation times decrease
intelligibility.
Work has been done to compare speech intelligibly measurements in rooms using the
three procedures, articulation index, speech transmission index and A-weighted signal-
to-noise ratio. Rooms including classrooms with different reverberation times and
signal receiver distances were used. Statistical analysis of all three procedures showed
them to be relatively close in prediction of speech intelligibility.20, 21
There is no simple formula for predicting the relationships for communication indoors.
Figure 4-5 (above) represents relationships in the free field (outdoors) with the
application of the inverse square law. Berglund and Lindvall1 indicate that Figure 4-5
can be used to determine permissible noise levels for a specific distance up to 2 metres
and as an estimate up to 8 metres if the reverberation time is lower than 2 seconds.
Standards can also be set on the basis of average sound pressure levels found to be
acceptable in similar settings from past experience.1
4. Speech intelligibility, processing and interference levels
4-18
4.2.8 Speech transmission index (STI)
This is a complicated model, which has a similar concept to the articulation index but
takes both background noise and reverberation into account and can therefore be used as
a model to evaluate speech communication indoors. Like the articulation index, it has a
single index with a numerical value between 0 and 1.0.1,2 The STI is based on the
principle that a transmitted signal (m=1) is smoothed or modulated across a room, and
when it reaches the listener, it will have a decreased modulation (m<1).7
Levitt and Webster gave the following key assumptions underlying the STI:5
• The effects of reverberation on speech intelligibility can be specified in terms of
equivalent background noise.
• This equivalent background noise can be added to the actual background noise
for obtaining the combined effect of background noise and reverberation on
speech intelligibility.
Berglund and Lindvall1 describe the STI model as utilising a model transfer function
(MTF), which quantifies the extent to which speech intensity fluctuations are preserved
in masking noise and reverberation when transmitted from the speaker to listener.
Due to the complexity of this procedure, a simplified version known as the rapid speech
transmission index (RASTI) has been developed which uses a reduced number of
modulation frequencies and octave bands.
4.2.8.1 Estimation of speech intelligibility in a typical domestic setting. The Office of Noise Abatement Control (USEPA) has given an estimation of sentence
intelligibility at distances greater than 1 metre in acoustical conditions typical of a
domestic living room with varying levels of background noise (see Figure 4-6 below).
To achieve the desired 100% intelligibility for this environment, an A-frequency
weighted background noise level of 45 dB or less is required.1
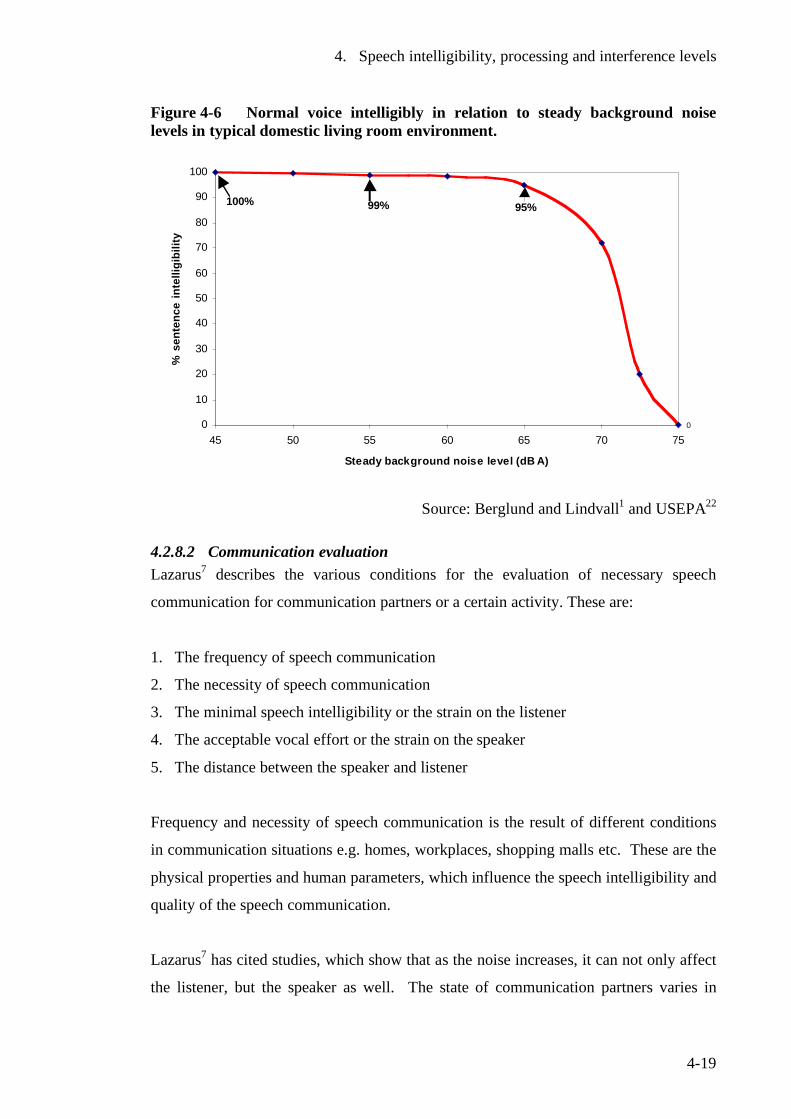
4. Speech intelligibility, processing and interference levels
4-19
Figure 4-6 Normal voice intelligibly in relation to steady background noise levels in typical domestic living room environment.
0
100% 99% 95%
0
10
20
30
40
50
60
70
80
90
100
45 50 55 60 65 70 75
Steady background noise level (dB A)
% s
ente
nce
inte
lligi
bilit
y
Source: Berglund and Lindvall1 and USEPA22
4.2.8.2 Communication evaluation Lazarus7 describes the various conditions for the evaluation of necessary speech
communication for communication partners or a certain activity. These are:
1. The frequency of speech communication
2. The necessity of speech communication
3. The minimal speech intelligibility or the strain on the listener
4. The acceptable vocal effort or the strain on the speaker
5. The distance between the speaker and listener
Frequency and necessity of speech communication is the result of different conditions
in communication situations e.g. homes, workplaces, shopping malls etc. These are the
physical properties and human parameters, which influence the speech intelligibility and
quality of the speech communication.
Lazarus7 has cited studies, which show that as the noise increases, it can not only affect
the listener, but the speaker as well. The state of communication partners varies in
4. Speech intelligibility, processing and interference levels
4-20
noise but is also subject to the type of activity. As the speaker becomes more hindered,
annoyed and strained, so the listener becomes more confused, distracted and over-
exerted. In an experimental study in which subjects were presented speech material at
different noise levels and signal to noise ratios, it was shown that annoyance can vary
with not only the noise intensity but the signal to noise ratio or the speech intelligibility.
The type of spoken speech also determines the listener’s annoyance in understanding
speech at the same sound level for speech and noise. Lazarus7 summarised the
following factors, which determine annoyance during communication. These are:
• Speaker’s vocal effect
• Signal-to-noise ratio at the listener’s position
• Noise level
• Speech quality (prosody, vocal effect) at the listener’s position
4.3 Summary
Speech intelligibility is a complex but inexact science relying on human subjective
evaluations and variations. It is, however, a critical parameter in the evaluation of
communication assistive technology such as assistive listening devices for the hearing
impaired or sound-field systems to improve signal-to-noise ratios in school classrooms.
The subjectivity of this phenomenon can be demonstrated with the variations proposed
by individual authors of the speech communication and intelligibility indices such as the
articulation index, the speech interference level and the speech transmission index.
Such difficulties are common in parameters involving human subjective assessment
such as the unpleasantness or offensiveness of an odour.
The dedicated efforts of a number of authors to develop the articulation index have
resulted in an excellent, easy-to-use and practical tool in clinical audiology. More work
following this example is warranted on the speech interference level and the speech
transmission index. If progress in development of a simple method or instrument can be
achieved for the speech transmission index, it would have the potential to become an
invaluable tool in the installation and evaluation of classroom amplification
technologies such as sound-field systems.
4. Speech intelligibility, processing and interference levels
4-21
4.4 References 1 Berglund, B., Lindvall, T ( editors), Community Noise. Archives for Sensory
Research. Vol. 2. 1995, Stockholm: Stockholm Institute and Karolinska Institute.
2 Webster, J.C., Effects of noise on speech., in Handbook of noise control,, C.M.
Harris, Editor. 1979, McGraw - Hill: USA. 3 Flanagan, J., Speech analysis, synthesis and perception. 1972, Berlin: Springer-
Verlag. 4 Hegvold, L., May, D.N., Interior noise environments, in Handbook of noise
assessment., D.N. May, Editor. 1978, Van Nostrand Reinhold: New York. 5 Levitt, H., Webster, J., Effects of noise and reverberation on speech, in
Handbook of measurements and noise control, C.M. Harris, Editor. 1998, Acoustical Society of America: New York.
6 Pearsons, K., Bennet, R., Fidell, S., Speech levels in various noise environments
- Report EPA -600/1-77-025. United States Environmental Protection Agency, May 1977.
7 Lazarus, H., New methods for describing and assessing direct speech
communication under disturbing conditions. Environment International, 1990. 16: p. 373-392.
8 Flynn, M. Personal Communication. University of Canterbury,2001. 9 Rostolland, D., Intelligibility of shouted voice. Acoustica, 1985. 57: p. 103-121. 10 Lombard, E., Le signe de l`élévation de la voix. Ann. Maladies Oreille Larynx
Nez Pharynx, 1911. 37: p. 101 - 119. 11 American National Standards Institute, American national standard methods for
measurement of speech intelligibility. S3.2-1990. 12 French, N., R., Steinberg, J.C., Factors governing the intelligibility of speech
sounds. Journal of the Acoustical Society of America., 1947. 19: p. 90-119. 13 Kryter, K., Methods for calculation and use of the articulation index. Journal of
the Acoustical Society of America., 1962. 34: p. 1689-1692. 14 Cavanaugh, W., Farrell, W., Hirtle, P., Watters, B., Speech privacy in
buildings. Journal of the Acoustical Society of America, 1962. 34: p. 475-492. 15 Mueller, G., Killon, M.,, An easy method for calculating the articulation index.
The Hearing Journal, 1990. 43(9): p. 14-17.
4. Speech intelligibility, processing and interference levels
4-22
16 May, D., Basic subjective responses to noise., in Handbook of noise assessment.,
D. May, Editor. 1978, Van Nostrand Reinhold: New York. 17 Kryter, K., The effects of noise on man. 1970, New York: Academic Press. 18 Palovic, C., Articulation index predictions of speech intelligibility in hearing aid
selection. Amercian Speech Hearing Association, 1988. 30(6/7): p. 63-65. 19 Beranek, L., Criteria for noise control in communities, buildings and vehicles.,
in Noise and vibration control, L. Beranek, Editor. 1988, McGraw-Hill: USA. 20 Bradley, J., Predictors of speech intelligibility in rooms. Journal of the
Acoustical Society of America, 1986. 80(3): p. 837-845. 21 Bradley, J., Speech intelligibility studies in classrooms. Journal of the Acoustical
Society of America, 1986. 80(3): p. 846-854. 22 USEPA- Office of Noise Abatement Control, Information on levels of
environmental noise requisite to protect health and welfare with an adequate margin of safety. Report EPA550/9-74.004 (1974), US Environmental Protection Agency.
5. The anatomy and physiology of the auditory system and processes
5-1
5 The anatomy and physiology of the auditory system and processes
5.1 Introduction Hearing and auditory processing are vital to the development of speech and
communication in young children. A short discourse on the hearing process, its
development in early childhood and conditions which affect hearing and processing of
auditory information is therefore appropriate, although not an integral part of the
research that forms this work.
5.2 The human ear
The ear is a very well developed and complex organ, which is capable of excellent
discrimination over a wide range of frequencies and sound intensities. The reception
and analysis is a complex process and is not yet completely understood. The ear
consists of three major sections, the outer ear, the middle ear and inner ear.
5.2.1 The outer ear This is the visible part made of a cartilaginous structure called the pinna or auricle,
which is located on the side of the head. It is thought to enhance reception and provide
some indication of direction of sound. On the other hand, the soft cartilage of the outer
ear could also provide some cushioning effect of sound waves on impact and may
mitigate the effects of loud noises. The pinna forms the opening of the oval shaped ear
canal, which extends approximately 25mm to terminate at the eardrum (or tympanic
membrane). The ear canal has a natural resonant frequency of approximately 3000 Hz,
which increases the sensitivity in this region.1,2,3 This could perhaps be explained as
analogous to an organ pipe closed at one end. Closing the other end will create a new
5. The anatomy and physiology of the auditory system and processes
5-2
resonant frequency. For example when the ear is closed by application of headphones, a
new resonant frequency will occur in the order of 6000Hz.4
5.2.2 The middle ear The ear canal leads to the tympanic membrane (commonly known as the eardrum),
which separates the outer ear from the middle ear. This latter section is an air filled
cavity of about 2 cm3 containing a chain of 3 articulated bones known as the ossicular
chain or auditory ossicles, which transmit acoustic energy impinging on the tympanic
membrane to the cochlea in the inner ear.1,5 The malleus (or hammer) is the largest of
the ossicles and attached to the tympanic membrane. The incus (anvil) is an
interconnecting lever between the malleus and the stapes (stirrup). The smallest of the 3
ossicles, the stapes is connected to the incus by a ball and joint type socket (known as
the incudostapedial joint). The base (or foot plate) rests in the oval window, the
entrance to the cochlea of the inner ear, and is held in place by the annular ligament.2,5
The 2 smallest muscles of the human body are the tensor tympani, (attached to the
malleus) and the tensor stapedius (attached to the stapes). The muscles themselves are
held in the bone and only the tendons are found in the middle ear space. These muscles
are activated by any loud sound and provide a protective mechanism by causing a reflex
contraction of the small muscles, which apply tension to the ossicular chain. This
limits the motion to the oval window and therefore minimises damage.1,2,3,5 As this
aural reflex can provide protection for prolonged sounds, it will not provide protection
for instantaneous sounds (peak levels) such as gunshot blasts as it takes a fraction of a
second for activation. The eustachian tube connects the middle ear with the pharynx. It
performs the following 3 functions:3,6
• To ventilate and equalise air pressure with that experienced by the outer ear
• Drain any secretions from the middle ear to the nose
• Prevent reflux of fluid into the middle ear
It is important to note that normal hearing relies on the middle ear being full of air and
being well ventilated. In the case of upper respiratory infections, the eustachian tube
may become blocked and this can lead to fluid in the middle ear cavity which decreases
the elasticity of the eardrum and ossicles to vibrate freely and therefore inhibit the
5. The anatomy and physiology of the auditory system and processes
5-3
transmission of sound energy received at the ear. The eustachian tube is normally
closed and opens when swallowing or yawning. In children, it does not function as
efficiently as in adults. The support provided by the cartilage and bone is poor and the
tensor veli palatini muscle, which opens the eustachian tube, is weaker than in adults.
As the child develops, the eustachian tube function improves, resulting in less middle
ear infections in older children and adults.7
5.2.3 The inner ear The inner ear (also called the labyrinth due to its complicated shape) is comprised of a
complex system of fluid filled cavities positioned deep in the temporal bone and located
behind the eye socket (see Figure 5-1a).8 The bony labyrinth is a system of channels
winding their way through the bone with distinct regions or cavities including the
cochlea and 3 semicircular canals positioned at right angles to each other. The
semicircular canals are part of the body’s balancing system.3,8 The bony labyrinth is
filled with perilymph, which is connected to and similar in composition to the
cerebrospinal fluid.8,9 The membranous labyrinth is a continuous series of membrane
sacs contained within the bony labyrinth and floats in the perilymph. It bounds an
extracellular fluid space, called the endolymphatic space (ELS), which contains the
endolymph, a fluid of unique ionic composition.8,9 Unlike some other non-mammalian
species, the endolymphatic space is entirely bounded by cells, with no forms of direct
communication with the perilymph.9
The cochlea is of a snail-like configuration of 2½ turns coiled around a central bone
pillar also carrying nerve fibres. If unwound, it would be about 35mm in length. The
cochlea houses the organ of Corti, which is the receptor organ for hearing. It acts as a
transducer, converting mechanical vibrations into neural impulses, which are then
transmitted to the brain. It is split in a longitudinal manner into two fluid filled
cavities.3,8 The cochlear duct and spiral lamina divide the cavity of the bony cochlea
into 3 separate scala (chambers), the scala vestibuli (SV), the scala media (SM) and
scala tympani (ST).8,9
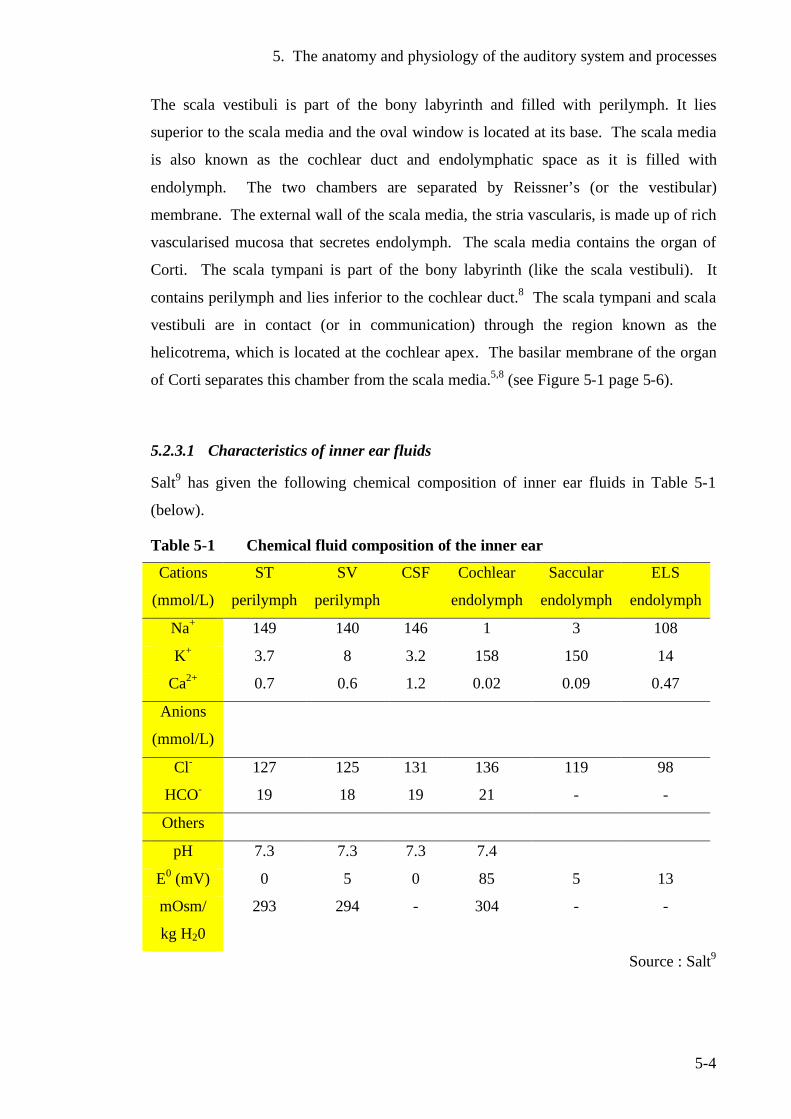
5. The anatomy and physiology of the auditory system and processes
5-4
The scala vestibuli is part of the bony labyrinth and filled with perilymph. It lies
superior to the scala media and the oval window is located at its base. The scala media
is also known as the cochlear duct and endolymphatic space as it is filled with
endolymph. The two chambers are separated by Reissner’s (or the vestibular)
membrane. The external wall of the scala media, the stria vascularis, is made up of rich
vascularised mucosa that secretes endolymph. The scala media contains the organ of
Corti. The scala tympani is part of the bony labyrinth (like the scala vestibuli). It
contains perilymph and lies inferior to the cochlear duct.8 The scala tympani and scala
vestibuli are in contact (or in communication) through the region known as the
helicotrema, which is located at the cochlear apex. The basilar membrane of the organ
of Corti separates this chamber from the scala media.5,8 (see Figure 5-1 page 5-6).
5.2.3.1 Characteristics of inner ear fluids
Salt9 has given the following chemical composition of inner ear fluids in Table 5-1
(below).
Table 5-1 Chemical fluid composition of the inner ear
Cations
(mmol/L)
ST
perilymph
SV
perilymph
CSF Cochlear
endolymph
Saccular
endolymph
ELS
endolymph
Na+ 149 140 146 1 3 108
K+ 3.7 8 3.2 158 150 14
Ca2+ 0.7 0.6 1.2 0.02 0.09 0.47
Anions
(mmol/L)
Cl- 127 125 131 136 119 98
HCO- 19 18 19 21 - -
Others
pH 7.3 7.3 7.3 7.4
E0 (mV) 0 5 0 85 5 13
mOsm/
kg H20
293 294 - 304 - -
Source : Salt9
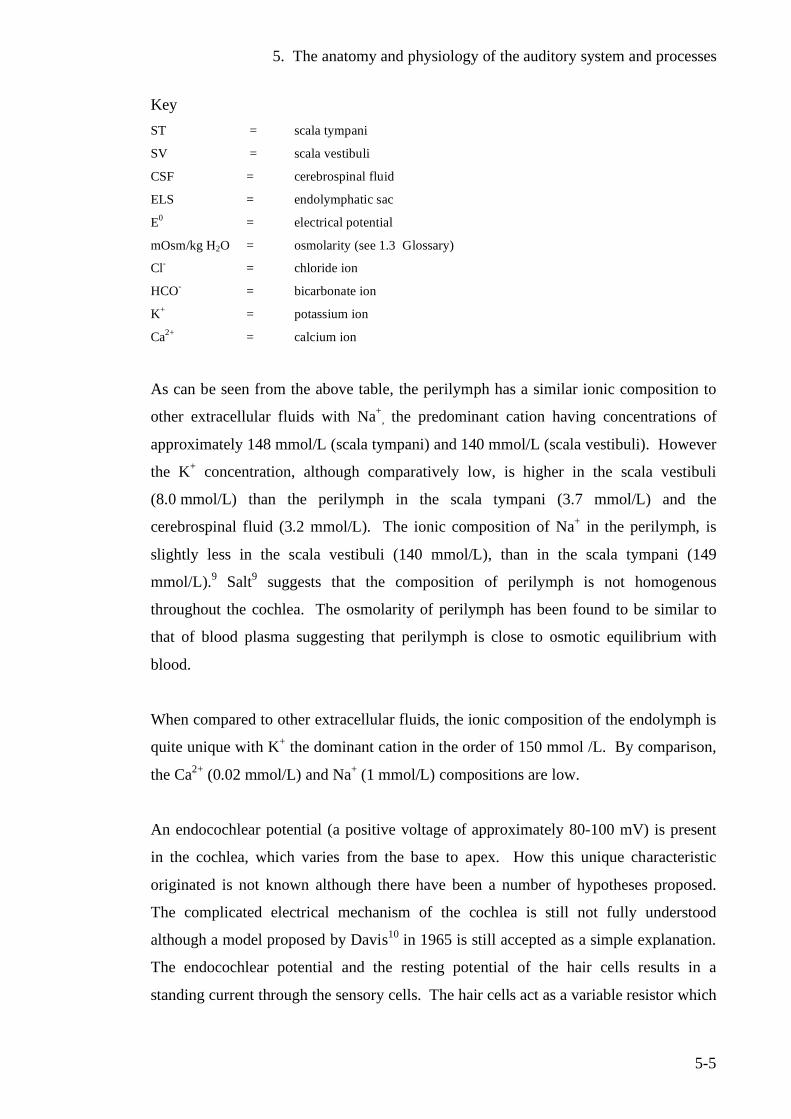
5. The anatomy and physiology of the auditory system and processes
5-5
Key ST = scala tympani
SV = scala vestibuli
CSF = cerebrospinal fluid
ELS = endolymphatic sac
E0 = electrical potential
mOsm/kg H2O = osmolarity (see 1.3 Glossary)
Cl- = chloride ion
HCO- = bicarbonate ion
K+ = potassium ion
Ca2+ = calcium ion
As can be seen from the above table, the perilymph has a similar ionic composition to
other extracellular fluids with Na+, the predominant cation having concentrations of
approximately 148 mmol/L (scala tympani) and 140 mmol/L (scala vestibuli). However
the K+ concentration, although comparatively low, is higher in the scala vestibuli
(8.0 mmol/L) than the perilymph in the scala tympani (3.7 mmol/L) and the
cerebrospinal fluid (3.2 mmol/L). The ionic composition of Na+ in the perilymph, is
slightly less in the scala vestibuli (140 mmol/L), than in the scala tympani (149
mmol/L).9 Salt9 suggests that the composition of perilymph is not homogenous
throughout the cochlea. The osmolarity of perilymph has been found to be similar to
that of blood plasma suggesting that perilymph is close to osmotic equilibrium with
blood.
When compared to other extracellular fluids, the ionic composition of the endolymph is
quite unique with K+ the dominant cation in the order of 150 mmol /L. By comparison,
the Ca2+ (0.02 mmol/L) and Na+ (1 mmol/L) compositions are low.
An endocochlear potential (a positive voltage of approximately 80-100 mV) is present
in the cochlea, which varies from the base to apex. How this unique characteristic
originated is not known although there have been a number of hypotheses proposed.
The complicated electrical mechanism of the cochlea is still not fully understood
although a model proposed by Davis10 in 1965 is still accepted as a simple explanation.
The endocochlear potential and the resting potential of the hair cells results in a
standing current through the sensory cells. The hair cells act as a variable resistor which
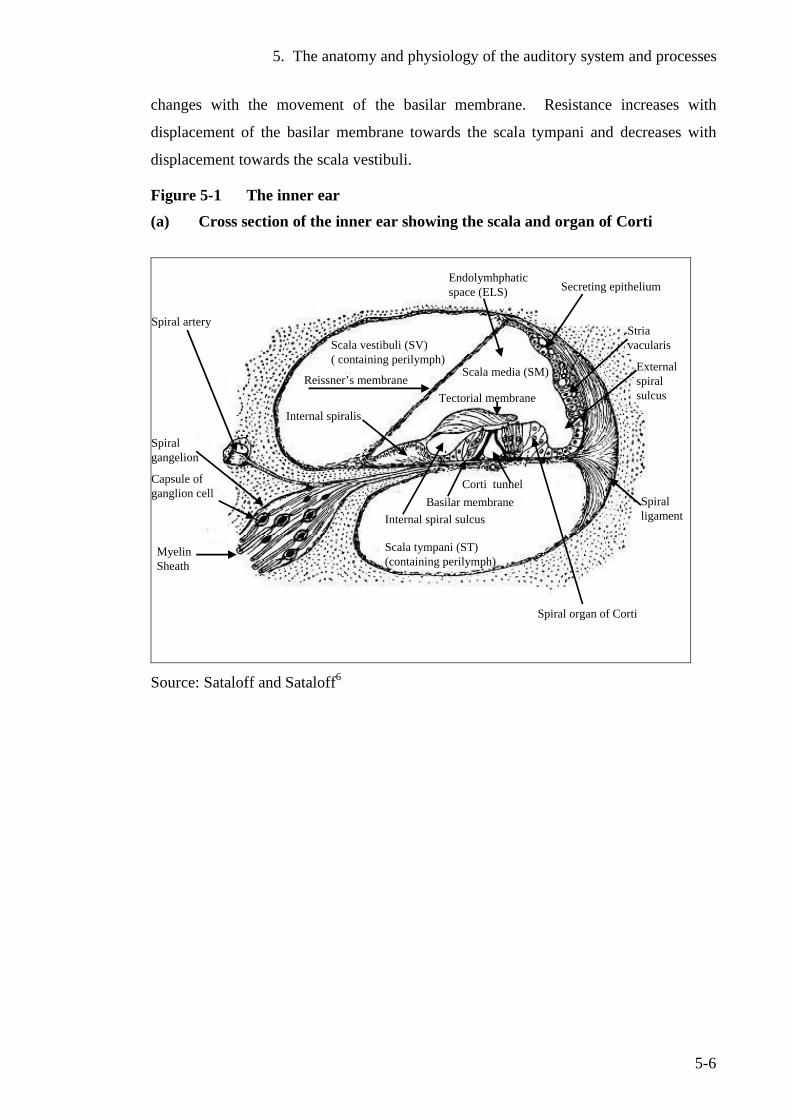
5. The anatomy and physiology of the auditory system and processes
5-6
changes with the movement of the basilar membrane. Resistance increases with
displacement of the basilar membrane towards the scala tympani and decreases with
displacement towards the scala vestibuli.
Figure 5-1 The inner ear (a) Cross section of the inner ear showing the scala and organ of Corti
Scala vestibuli (SV)( containing perilymph)
Basilar membrane
Scala tympani (ST) (containing perilymph)
Corti tunnel
Reissner’s membraneTectorial membrane
Myelin Sheath
Capsule ofganglion cell
Spiralgangelion
Endolymhphatic space (ELS)
Internal spiralis
Internal spiral sulcus
Secreting epithelium
Spiral ligament
Externalspiral sulcus
Spiral artery
Scala media (SM)
Striavacularis
Spiral organ of Corti
Source: Sataloff and Sataloff6
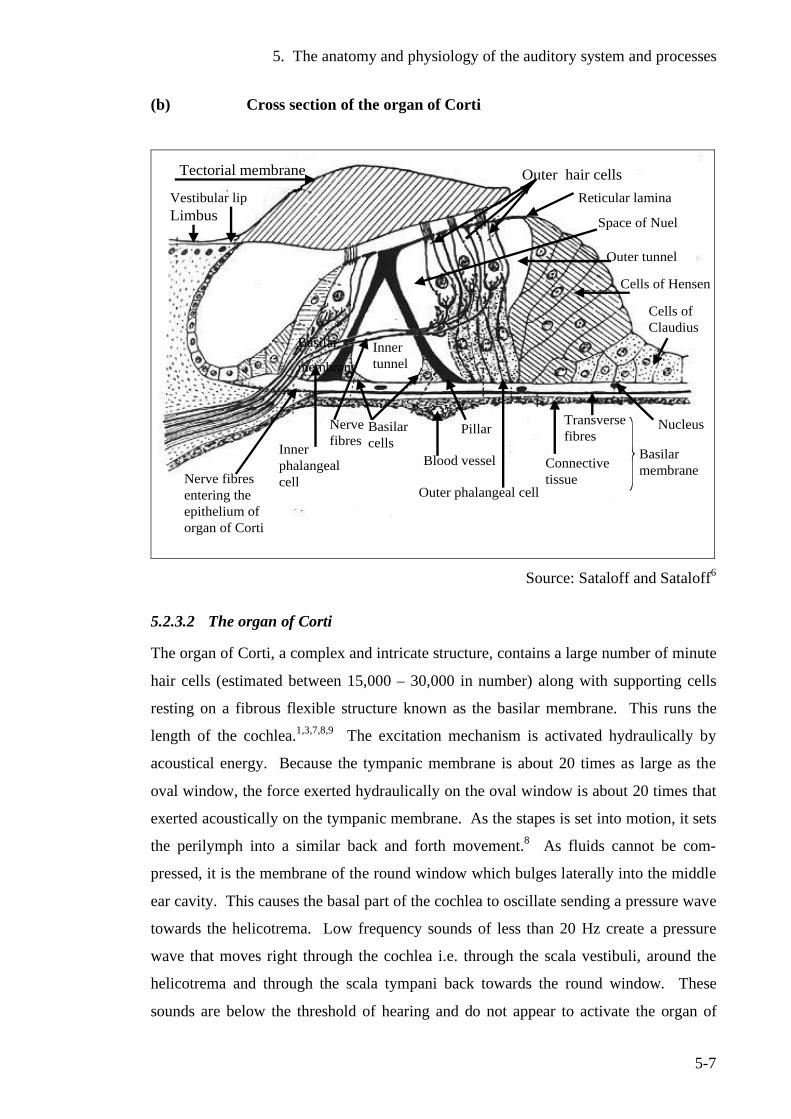
5. The anatomy and physiology of the auditory system and processes
5-7
(b) Cross section of the organ of Corti
Tectorial membrane
Limbus
Outer hair cells
Space of Nuel
Reticular lamina
Outer tunnel
Cells of Hensen
Cells ofClaudius
Nerve fibresentering theepithelium oforgan of Corti
Inner phalangealcell
Inner tunnel
Nerve fibres
Basilarcells
Pillar
Blood vessel
Outer phalangeal cell
Transversefibres
Nucleus
Vestibular lip
Basilar
membrane
Connective tissue
Basilar membrane
Source: Sataloff and Sataloff6
5.2.3.2 The organ of Corti
The organ of Corti, a complex and intricate structure, contains a large number of minute
hair cells (estimated between 15,000 – 30,000 in number) along with supporting cells
resting on a fibrous flexible structure known as the basilar membrane. This runs the
length of the cochlea.1,3,7,8,9 The excitation mechanism is activated hydraulically by
acoustical energy. Because the tympanic membrane is about 20 times as large as the
oval window, the force exerted hydraulically on the oval window is about 20 times that
exerted acoustically on the tympanic membrane. As the stapes is set into motion, it sets
the perilymph into a similar back and forth movement.8 As fluids cannot be com-
pressed, it is the membrane of the round window which bulges laterally into the middle
ear cavity. This causes the basal part of the cochlea to oscillate sending a pressure wave
towards the helicotrema. Low frequency sounds of less than 20 Hz create a pressure
wave that moves right through the cochlea i.e. through the scala vestibuli, around the
helicotrema and through the scala tympani back towards the round window. These
sounds are below the threshold of hearing and do not appear to activate the organ of
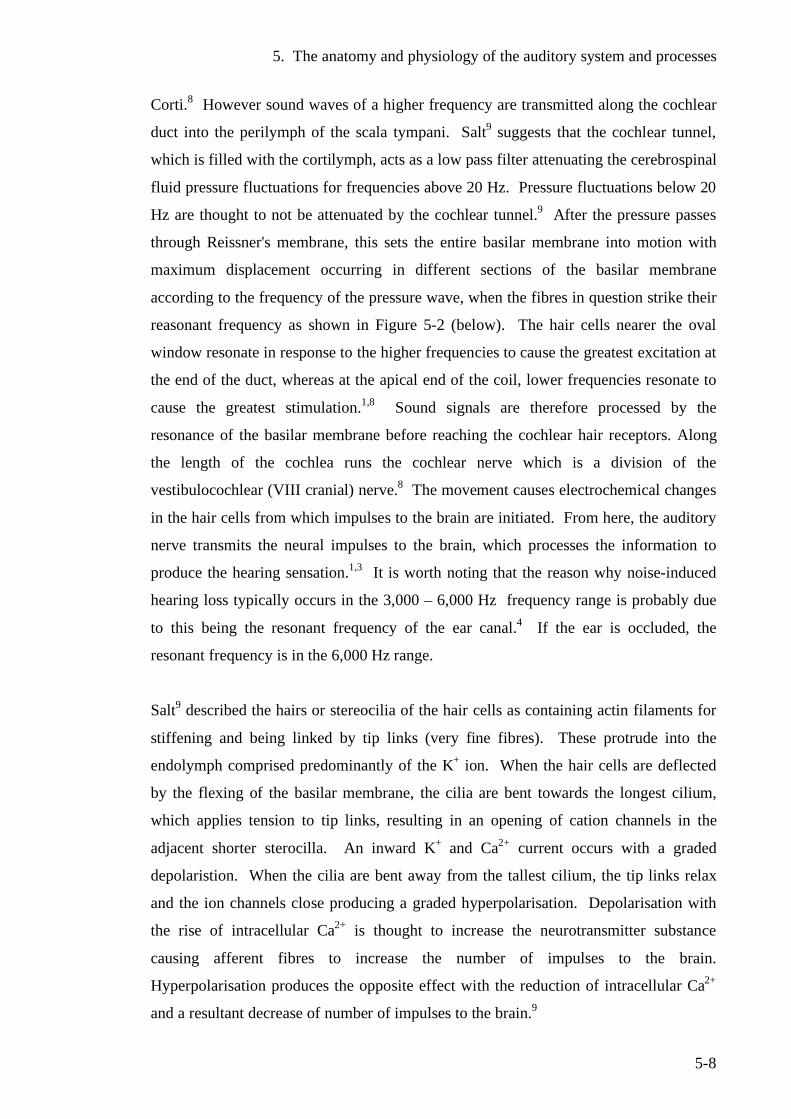
5. The anatomy and physiology of the auditory system and processes
5-8
Corti.8 However sound waves of a higher frequency are transmitted along the cochlear
duct into the perilymph of the scala tympani. Salt9 suggests that the cochlear tunnel,
which is filled with the cortilymph, acts as a low pass filter attenuating the cerebrospinal
fluid pressure fluctuations for frequencies above 20 Hz. Pressure fluctuations below 20
Hz are thought to not be attenuated by the cochlear tunnel.9 After the pressure passes
through Reissner's membrane, this sets the entire basilar membrane into motion with
maximum displacement occurring in different sections of the basilar membrane
according to the frequency of the pressure wave, when the fibres in question strike their
reasonant frequency as shown in Figure 5-2 (below). The hair cells nearer the oval
window resonate in response to the higher frequencies to cause the greatest excitation at
the end of the duct, whereas at the apical end of the coil, lower frequencies resonate to
cause the greatest stimulation.1,8 Sound signals are therefore processed by the
resonance of the basilar membrane before reaching the cochlear hair receptors. Along
the length of the cochlea runs the cochlear nerve which is a division of the
vestibulocochlear (VIII cranial) nerve.8 The movement causes electrochemical changes
in the hair cells from which impulses to the brain are initiated. From here, the auditory
nerve transmits the neural impulses to the brain, which processes the information to
produce the hearing sensation.1,3 It is worth noting that the reason why noise-induced
hearing loss typically occurs in the 3,000 – 6,000 Hz frequency range is probably due
to this being the resonant frequency of the ear canal.4 If the ear is occluded, the
resonant frequency is in the 6,000 Hz range.
Salt9 described the hairs or stereocilia of the hair cells as containing actin filaments for
stiffening and being linked by tip links (very fine fibres). These protrude into the
endolymph comprised predominantly of the K+ ion. When the hair cells are deflected
by the flexing of the basilar membrane, the cilia are bent towards the longest cilium,
which applies tension to tip links, resulting in an opening of cation channels in the
adjacent shorter sterocilla. An inward K+ and Ca2+ current occurs with a graded
depolaristion. When the cilia are bent away from the tallest cilium, the tip links relax
and the ion channels close producing a graded hyperpolarisation. Depolarisation with
the rise of intracellular Ca2+ is thought to increase the neurotransmitter substance
causing afferent fibres to increase the number of impulses to the brain.
Hyperpolarisation produces the opposite effect with the reduction of intracellular Ca2+
and a resultant decrease of number of impulses to the brain.9
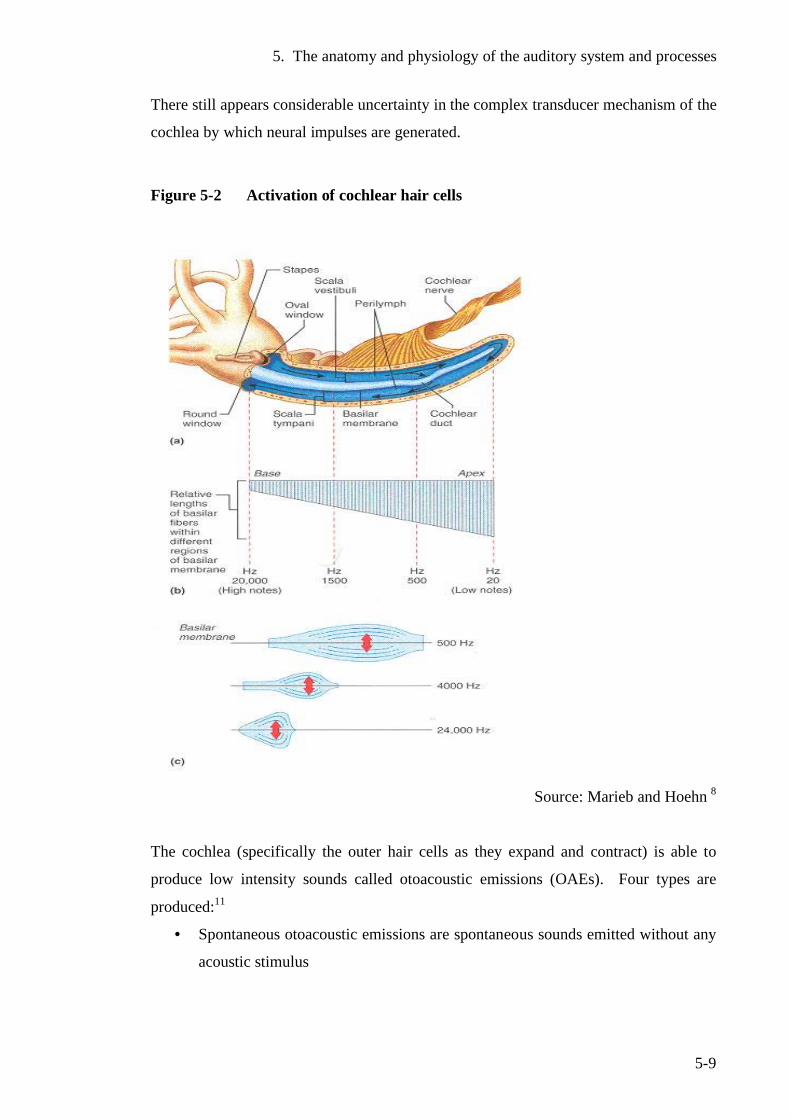
5. The anatomy and physiology of the auditory system and processes
5-9
There still appears considerable uncertainty in the complex transducer mechanism of the
cochlea by which neural impulses are generated.
Figure 5-2 Activation of cochlear hair cells
Source: Marieb and Hoehn 8
The cochlea (specifically the outer hair cells as they expand and contract) is able to
produce low intensity sounds called otoacoustic emissions (OAEs). Four types are
produced:11
• Spontaneous otoacoustic emissions are spontaneous sounds emitted without any
acoustic stimulus
5. The anatomy and physiology of the auditory system and processes
5-10
• Transient (evoked) otoacoustic emissions are sounds emitted due to acoustic
stimuli of very short duration
• Distortion product otoacoustic emissions are the sounds emitted due to a
stimulus by sounds of different frequencies
• Sustained frequency otoacoustic emissions are sounds emitted in response to a
continuous tone
While the response is emitted from the cochlea, the middle and outer ear must be able to
transmit the sound (in reverse) back to the OAE recording microphone and so OAEs
can only measure the peripheral auditory system (outer, middle and inner ear). OAEs
are often used as a neonatal screening tool to test the presence/absence of cochlear
function.11 In addition this clinical technique is used for children too young to
participate in conventional hearing tests.
5.2.3.3 The neuro-auditory pathway
Marieb and Hoehn8 described the auditory pathway to the brain. There are several
ascending auditory pathways to the brain involving various brain stem nuclei but the
most important pathway for the impulses produced by the organ of Corti ascend via the
spiral ganglion (see Figure 5-3) to the cochlear nuclei in the medulla. From here the
impulses pass to the superior olivary nucleus and through the lateral lemniscal tract to
the auditory reflex centre of the mid brain known as the inferior colliculus. From there
the impulses pass to the auditory cortex in the temporal lobe through relays in the
medical geniculate body in the thalamus. Impulses also pass from the inferior colliculus
to the superior colliculus in the midbrain. These colliculi acting together produce the
reflexes to sound such as the startle reflex and head turning.8
5.2.3.4 Processing of auditory signals.
Marieb and Hoehn8 suggested that one of the most remarkable aspects of auditory
processing is the ability to distinguish important sounds from what can be described as
auditory jumble of extraneous sound. If the discrimination of sound waves is sufficient,
two distinct tones can be heard. They described the analytical power of the auditory
cortex as being so great that it allows listeners to detect single instruments in an
orchestra.8
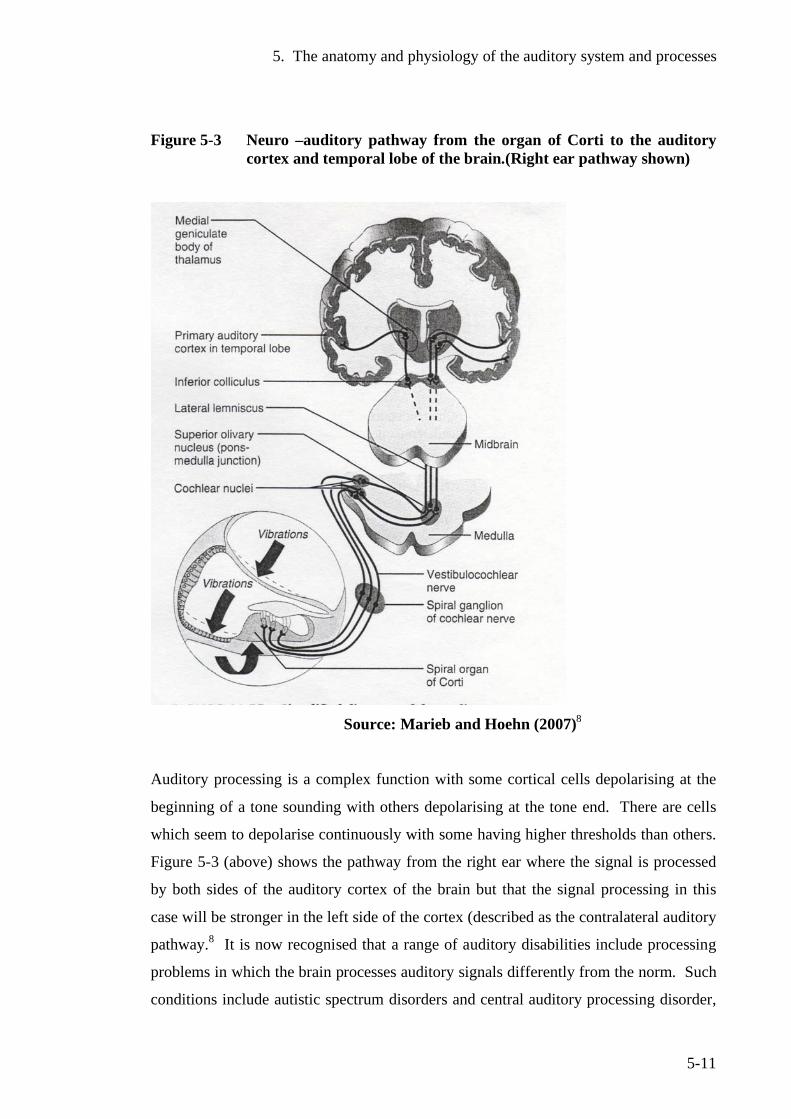
5. The anatomy and physiology of the auditory system and processes
5-11
Figure 5-3 Neuro –auditory pathway from the organ of Corti to the auditory cortex and temporal lobe of the brain.(Right ear pathway shown)
Source: Marieb and Hoehn (2007)8
Auditory processing is a complex function with some cortical cells depolarising at the
beginning of a tone sounding with others depolarising at the tone end. There are cells
which seem to depolarise continuously with some having higher thresholds than others.
Figure 5-3 (above) shows the pathway from the right ear where the signal is processed
by both sides of the auditory cortex of the brain but that the signal processing in this
case will be stronger in the left side of the cortex (described as the contralateral auditory
pathway.8 It is now recognised that a range of auditory disabilities include processing
problems in which the brain processes auditory signals differently from the norm. Such
conditions include autistic spectrum disorders and central auditory processing disorder,
5. The anatomy and physiology of the auditory system and processes
5-12
where there is reduced ability from normal processing to regulate the sensation
produced by auditory signals, such as speech from other extraneous noise.
5.3 The development of the ear in the foetus Moore describes the formation of the human ear in some detail.12 According to him, the
internal ear is the first to appear in the fourth week of gestation with a thickened plate of
surface ectoderm, the otic placode forms on each side of the developing hindbrain.
Both placodes invaginate and sink below the surface ectoderm into the mesenchyme to
form the otic pit. The otocyst loses its connection with the surface ectoderm and a
hollow diverticulum grows out from the otocyst, which lengthens to form the
endolymphatic duct and sac. Two distinct regions appear - the utricular portion and the
ventral portion. The endolymphatic duct rises from the utricular portion. Three flat
diverticual grow out and then the central portions of the walls of these fuse and
disappear. The unfused portions become the semicircular canals. The ampullae develop
at one end of the canal. Sensory nerve endings become distinct in the ampullae, utricle
and saccule. The cochlear duct grows from the ventral saccular portion of the otocyst
and coils to form the cochlea. The organ of Corti differentiates from cells in the
cochlear duct. Ganlion cells of the VIII cranial nerve migrate along coils of the cochlea
and form the cochlear ganglion from which nerve processes grow to the organ of Corti.
A cartilaginous otic capsule forms from the mesenchyme around the otocyst. The
membranous labyrinth enlarges and vacuoles form in the otic capsule which develops
into perilymphatic space, which itself develops into the scala tympani and scala
vestibuli. The otic capsule converts into the bony labyrinth of the internal ear.12
5.3.1 Formation of the middle ear
It would seem that the middle ear develops from the tubotympanic recess. The distal
portion expands into the tympanic cavity and the proximal portion becomes the
eustachian tube. With the tympanic cavity expansion, the endodermal epithelium
gradually envelops the middle ear ossicles (malleus, incus and stapes), their tendons,
ligaments and chorda tympanic nerve. The muscle attached to the malleus, known as
the tensor tympani is formed from the first branchial arch and the tensor stapedius from
5. The anatomy and physiology of the auditory system and processes
5-13
the second branchial arch.12 The development of the external, middle and inner ear all
overlap.
5.3.2 Formation of the external ear The external acoustic meatus develops from the first branchial groove. This funnel
shaped tube extends inward to become the meatal plug and late in gestation this forms a
cavity to become the inner part of the external acoustic meatus (ear canal). The
tympanic membrane begins to form from the first branchial or closing membrane, which
separates the first branchial groove and pharyngeal pouch. The mesenchyme extends
between the closing membrane and this becomes the fibrous stratum of the tympanic
membrane. The auricle develops from the 6 swellings around the first branchial groove
called the auricular hillocks. The auricle grows with the lobule being the last part to
develop. The auricles begin to develop in the upper part of the neck region. As the
mandible develops the ears move to the side of the head and to the same level as the
eyes.12 The innervation of the ectodermal cells by a branch of the vagal nerve was able
to discern minute pressure changes which were useful for hunting. This indicated an
evolutionary vestige.13
5.3.3 Chronological development of the ear There appears some uncertainty over the time periods of development during gestation
although the development of the cochlea is usually complete by the end of the second
trimester of gestation. Lerner14 indicates that while a new born’s ear looks like that of a
fully developed adult, research is continuing to determine when the ear completes
development and takes on a full adult-like function. As this could extend into puberty,
it would be prudent to limit a child's exposure to noise well below that considered an
acceptable risk for adults. An important aspect of foetal development of the ear relates
to delay in development of teratogenic influences with effects such as balancing and
walking.13
5. The anatomy and physiology of the auditory system and processes
5-14
5.4 The hearing process by air conduction. Air conduction is the most usual process by which the auditory function occurs. Sound
waves enter the ear via the pinna and travel down the ear canal to vibrate the eardrum.
From here the ossicular chain transfers the vibrations to the cochlea, which converts
these into neural impulses, which are transmitted to the brain for processing via the
auditory nerve.
5.5 The hearing process by bone conduction Acoustic energy is also transmitted by the cranial bones to the inner ear, a process
known as bone conduction. One hears their own voice partly by this method. When the
sound is sufficiently intense, a small fraction of acoustic energy in the air is converted
to solid-bone vibration in the skull. The sound may also be received by conduction
through the bone structure from other parts of the body. The same patterns of vibration
as in air conduction are set up along the basilar membrane. It is worthy to note that
pathways other than air conduction are important considerations in evaluating hearing
protecting devices such as ear plugs or earmuffs.1
5.6 Auditory response
The ear is a sophisticated and well-developed organ being able to process information
over a surprisingly wide range of sound pressure and frequencies. Figure 5-4 (below)
shows the levels in which useful acoustic responses are received, which levels usually
include speech and music. The auditory sensation range stretches from low sound
pressure levels at the threshold of hearing to high sound pressure levels in the regions of
discomfort and pain.1
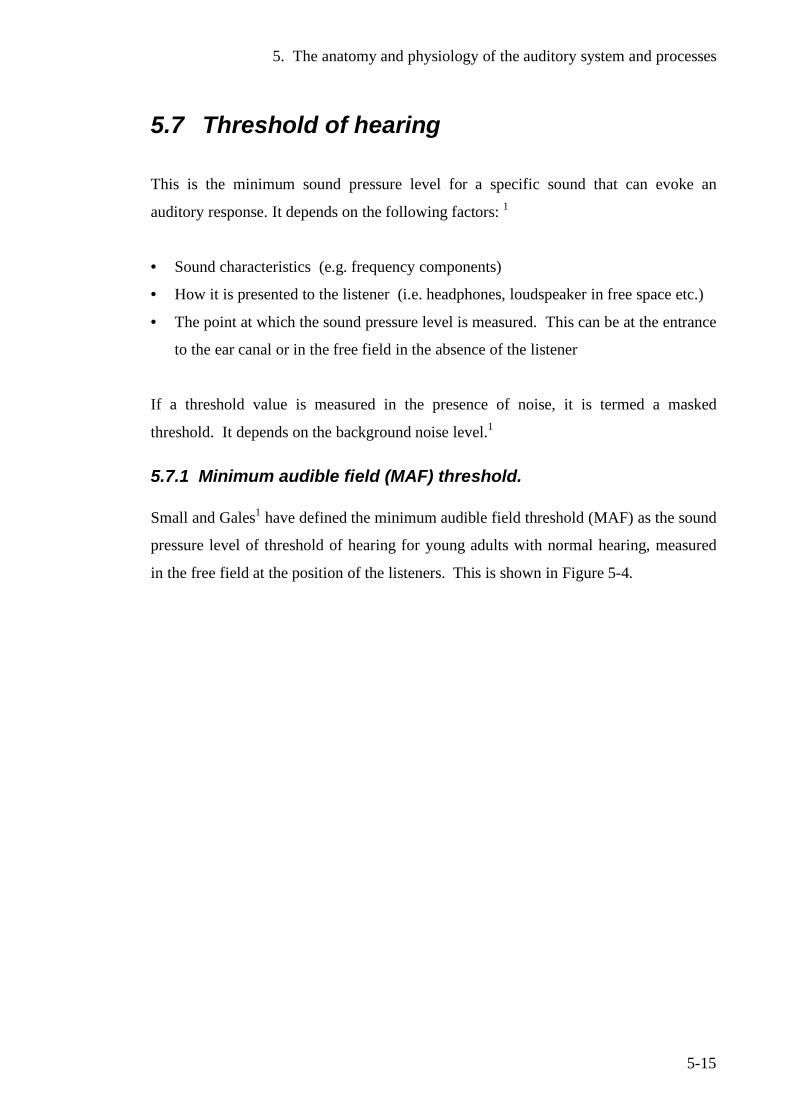
5. The anatomy and physiology of the auditory system and processes
5-15
5.7 Threshold of hearing This is the minimum sound pressure level for a specific sound that can evoke an
auditory response. It depends on the following factors: 1
• Sound characteristics (e.g. frequency components)
• How it is presented to the listener (i.e. headphones, loudspeaker in free space etc.)
• The point at which the sound pressure level is measured. This can be at the entrance
to the ear canal or in the free field in the absence of the listener
If a threshold value is measured in the presence of noise, it is termed a masked
threshold. It depends on the background noise level.1
5.7.1 Minimum audible field (MAF) threshold. Small and Gales1 have defined the minimum audible field threshold (MAF) as the sound
pressure level of threshold of hearing for young adults with normal hearing, measured
in the free field at the position of the listeners. This is shown in Figure 5-4.
5. The anatomy and physiology of the auditory system and processes
5-16
Figure 5-4 Auditory sensation area
31.5 63 125 250 500 1000 2000 4000 8000 16000
Soun
d pres
sure
level
(dB)
, re 2
0 µPa
-20
0
20
40
60
80
100
120
140
Threshold of discomfort
Threshold of pain
Minimum audible field (MAF) threshold
Frequency (Hz)
Adapted from Small and Gales 2
MAF has been developed from measurements of persons with normal hearing who have
not suffered any ear problems and from young persons aged 18-25 years where
presbycusis (loss of hearing with age) is not an issue. This is important in noise control
because many people are exposed to noise in largely free field conditions. There is
considerable variation in hearing sensitivity among normal listeners and it can even be
different for each ear of an individual.2
5.7.2 Thresholds of discomfort and pain. At sound pressure levels above 120 dB, the average listener experiences discomfort, and
at about 140 dB, the listener experiences pain. It is likely that children will experience
discomfort and pain at lower levels than adults. The World Health Organization
recommended that in the case of children sound pressure levels should never exceed
120 dB.15 A study by Freeman et al16 examined long term noise exposure on the
developing and developed ear in laboratory rats. The study was based on the auditory
development of the rat and designed to model the human foetal development of the ear.
Anaesthetised young rat pups and mature adults were exposed to long-term continuous
5. The anatomy and physiology of the auditory system and processes
5-17
white noise (15 days at 12 hours daily continual exposure) of varying intensity. The
effects were measured by electrophysiological and histological examinations. The
authors observed greater histological damage to the cochlea of young immature rats
(especially in the apical region of the basilar membrane) when compared to adult rats.
They did not find a lower threshold function or greater susceptibly for noise-induced
hearing loss in young rats when compared to adult rats by electrophysiological
examination (otoacoustic emissions, and auditory brain stem evaluation). The observed
histological damage could suggest long term rather than immediate effects on auditory
function, as the onset of noise-induced hearing loss typically occurs gradually. A study
on the long-term effects of such observed histological damage to the developing ear
would be of benefit.
5.8 Discussion
A detailed discourse of current knowledge is a vital component of this work especially
in the early development and status of the human hearing mechanism and auditory
processing systems so these can be directly related to the effects of the acoustic learning
environments of young children. The importance of early detection of hearing deficits
in new born babies has now been widely recognised in New Zealand with the
introduction of the neo-natal hearing screening programme so that early intervention
strategies can be implemented. Likewise early detection of conditions giving rise to
auditory processing difficulties such as autism enable the child to receive early
intervention and special education initiatives as soon as possible.
5.9 References 1 Small, A., Gales, R., Hearing characteristics, in Handbook of acoustical
measurements and noise control, C.M. Harris, Editor. 1998, Acoustical Society of America: New York.
2 Gales, R.S., Hearing characteristics., in Handbook of acoustical measurements
and noise control, C.M. Harris, Editor. 1979, McGraw Hill Inc.
5. The anatomy and physiology of the auditory system and processes
5-18
3 Martin, A.M., Walker, J.G., Occupational deafness and hearing conservation.,
in Handbook of noise assessment., D.N. May, Editor. 1978. Van Nostrand Reinhold Company: New York.
4 Dickinson, P. Personal communication, Institute of Food Nutrition and Human
Health, Wellington Campus, Massey University, 2005. 5 Seikel, J., King, D., Drumlight, D., Anatomy and physiology for speech,
language and hearing. 3rd ed. 2005, New York: Thomson/Delmar Learning. 6 Sataloff, R.T., Sataloff, J., Occupational hearing loss - second edition revised
and expanded. 2nd ed. 1993, New York: Marcel Dekker. 7 Allen, P., Understanding ear infections. 2002, Whangarei: Dr Peter Allen. 8 Marieb, E., Hoehn, K., Human anatomy and physiology. 5th ed. 2007, San
Francisco: Benjamin Cummings. 9 Salt, A., Dynamics of inner ear fluids, in Physiology of the ear, A.F. Jahn,
Santos, Sacchin, J, Editors. 2001, Singular: San Diego. 10 Davis, H., A model for transducer action in the cochlea. Cold Spring Harbor
Quant. Bio, 1965. 30: p. 181-190. 11 Cambell, K., Mullin, G.,, Otoacoustic emissions. 2002, Southern Illinois
University School of Medicine: Illinois. Retrieved from http:/www.emedicine.com/ent/topic372.htm on 1 May 2006
12 Moore, K.L., The developing human: clinically orientated embryology. 4th ed.
1988, Philadelphia: Saunders. 13 White, G.W. (2008) Personal communication. 14 Lerner, K.Lee .Ear, Otic Embryological Development (Retrieved from
http://bookrags.co,/other/health/ear-otic-embrylogical development- wap.html on 2 May 2006).
15 World Health Organization, WHO Guidelines for community noise, Berglund,
B., Lindvall, T., Schwela, D., Editors. 1999, Occupational and Environmental Health Unit, World Health Organization: Geneva.
16 Freeman, S., Khvoles, R., Cherny, L., Sohmer, H., Effect of long-term noise
exposure on the developing and developed ear in the rat. Audiology and Neuro-Otology, 1999. 4: p. 207-218.
6. Diseases, conditions and disorders giving rise to auditory function deficits
6-1
6 Diseases, conditions and disorders giving rise to auditory function deficits.
6.1 Introduction
While the most familiar diseases and conditions affecting auditory function are those
involving hearing loss, there is a wide range of other disorders including those on the
autistic spectrum, attention deficit disorders, central auditory processing disorders, or
any condition which impedes the person from receiving and processing auditory signals
and information. The most common of these disorders have been summarised.
6.2 Hearing impairment and deafness
Hearing impairment and deafness usually involve a malfunction of the ear and auditory
nerves as distinct from other auditory disorders, which include problems in processing
aural information received at the ear. Hearing impairment or hearing loss can be
defined as a reduction of hearing ability of variable cause, degree, duration and effect.1
One of the most common forms of hearing loss is that caused by prolonged exposure to
excessive noise. This is commonly referred to as noise-induced hearing loss (NIHL)
which is a sensorineural hearing loss usually of gradual onset and irreversible. NIHL
usually results in the degeneration of the hair cells of the organ of Corti in the region of
4000-6,000 Hz. To make the diagnosis of noise-induced hearing loss, the New Zealand
Department of Labour gives the following criteria:2
1. The shape of the hearing threshold curve should show a characteristic notch (or
V shape) at 4,000-6,000 Hz with a recovery at high frequencies required.
Because an audiogram does not match this pattern, noise-induced hearing loss
cannot be excluded. As NIHL increases, the notch widens and is lost.
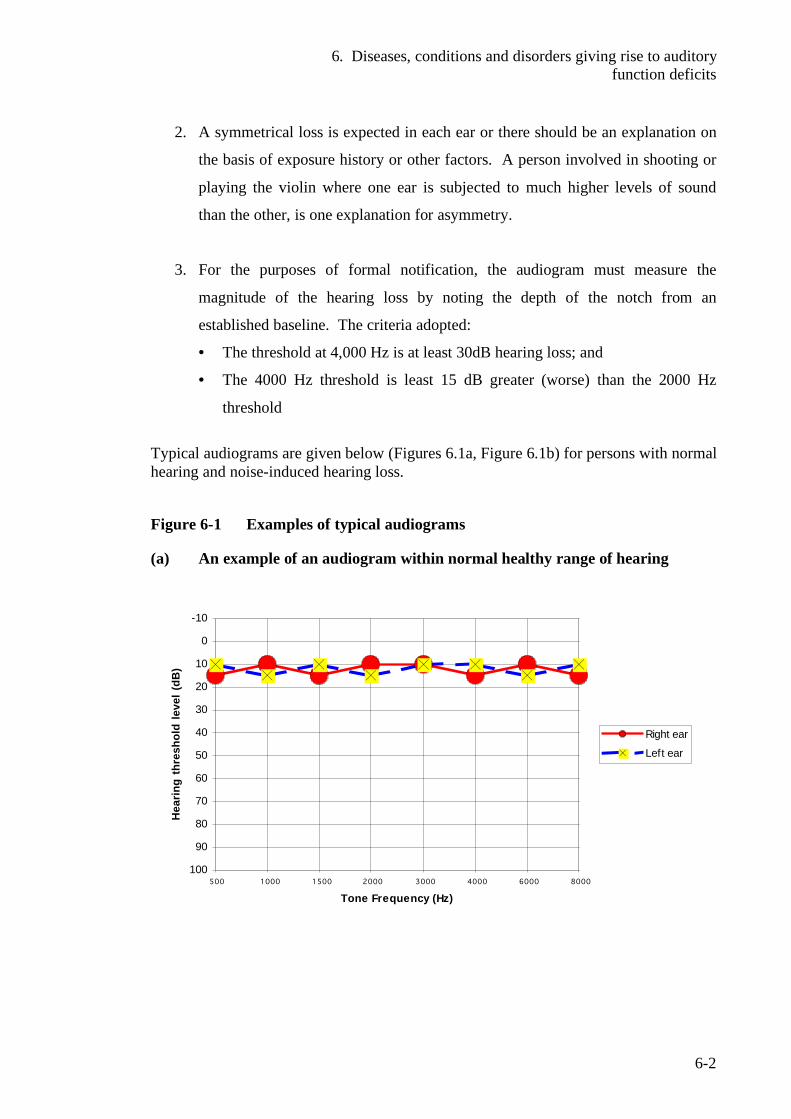
6. Diseases, conditions and disorders giving rise to auditory function deficits
6-2
2. A symmetrical loss is expected in each ear or there should be an explanation on
the basis of exposure history or other factors. A person involved in shooting or
playing the violin where one ear is subjected to much higher levels of sound
than the other, is one explanation for asymmetry.
3. For the purposes of formal notification, the audiogram must measure the
magnitude of the hearing loss by noting the depth of the notch from an
established baseline. The criteria adopted:
• The threshold at 4,000 Hz is at least 30dB hearing loss; and
• The 4000 Hz threshold is least 15 dB greater (worse) than the 2000 Hz
threshold
Typical audiograms are given below (Figures 6.1a, Figure 6.1b) for persons with normal hearing and noise-induced hearing loss.
Figure 6-1 Examples of typical audiograms
(a) An example of an audiogram within normal healthy range of hearing
-10
0
10
20
30
40
50
60
70
80
90
100500 1000 1500 2000 3000 4000 6000 8000
Tone Frequency (Hz)
Hea
ring
thre
shol
d le
vel (
dB)
Right ear
Left ear
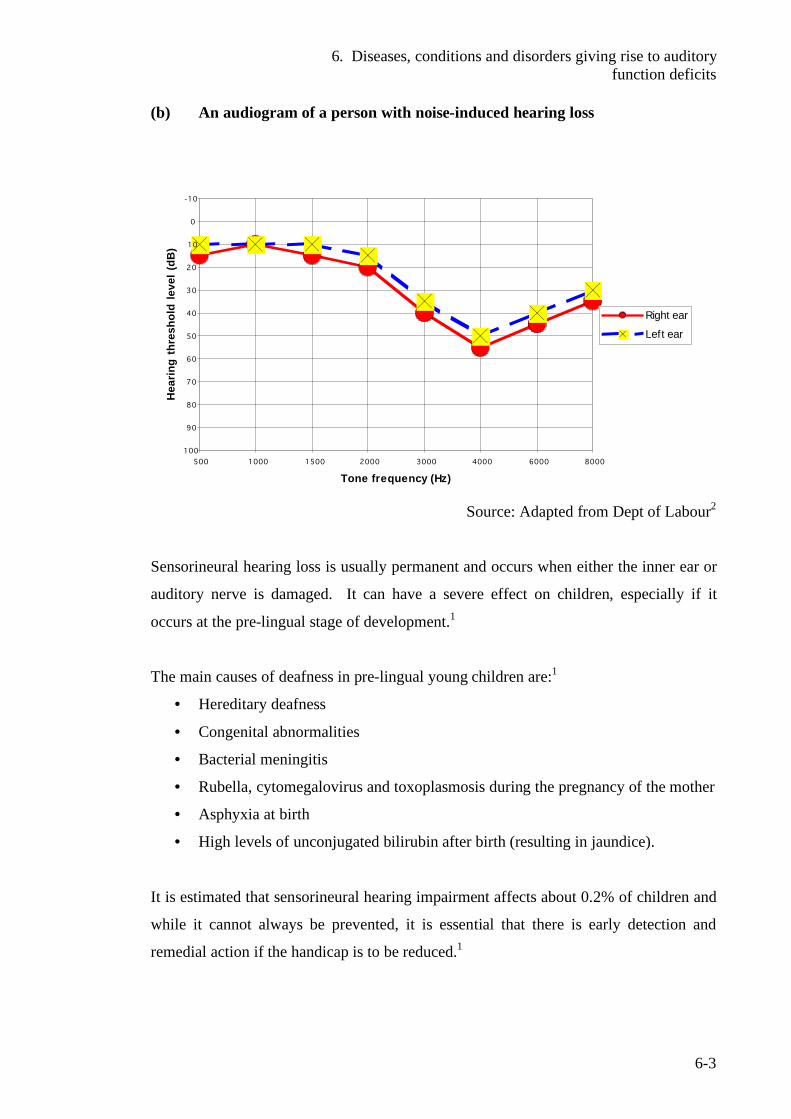
6. Diseases, conditions and disorders giving rise to auditory function deficits
6-3
(b) An audiogram of a person with noise-induced hearing loss
-10
0
10
20
30
40
50
60
70
80
90
100
500 1000 1500 2000 3000 4000 6000 8000
Tone frequency (Hz)
Hea
ring
thre
shol
d le
vel (
dB)
Right ear
Left ear
Source: Adapted from Dept of Labour2
Sensorineural hearing loss is usually permanent and occurs when either the inner ear or
auditory nerve is damaged. It can have a severe effect on children, especially if it
occurs at the pre-lingual stage of development.1
The main causes of deafness in pre-lingual young children are:1
• Hereditary deafness
• Congenital abnormalities
• Bacterial meningitis
• Rubella, cytomegalovirus and toxoplasmosis during the pregnancy of the mother
• Asphyxia at birth
• High levels of unconjugated bilirubin after birth (resulting in jaundice).
It is estimated that sensorineural hearing impairment affects about 0.2% of children and
while it cannot always be prevented, it is essential that there is early detection and
remedial action if the handicap is to be reduced.1
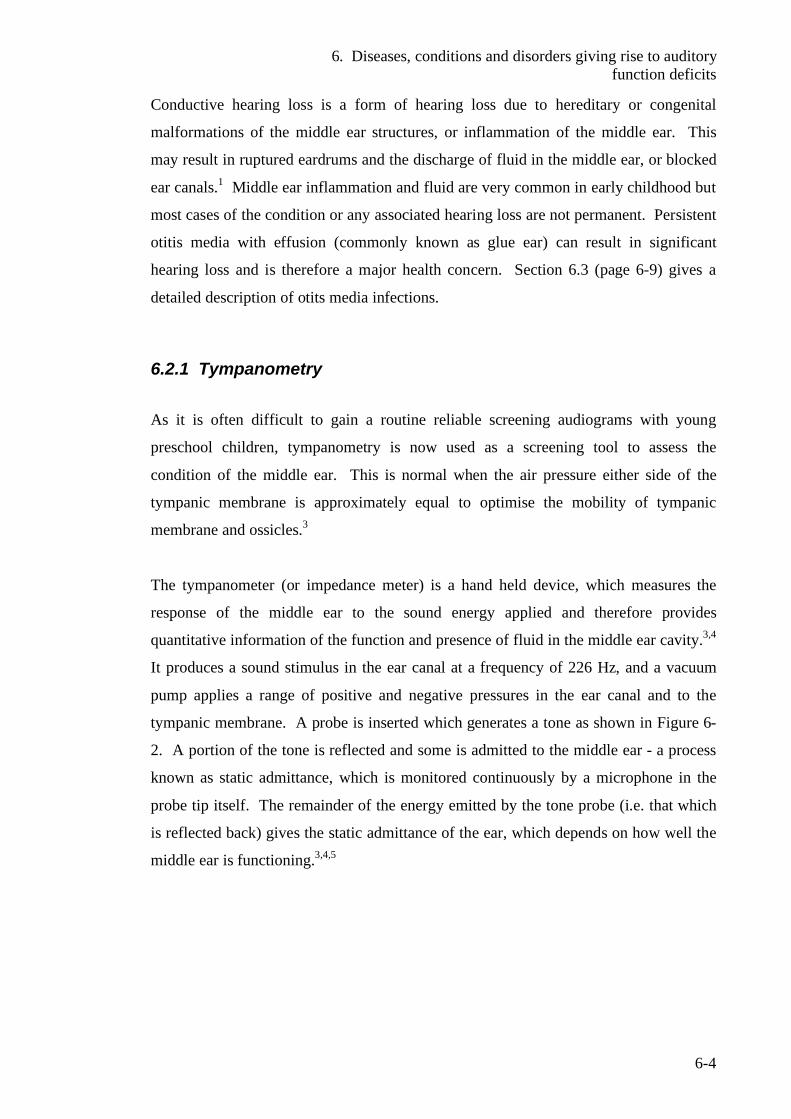
6. Diseases, conditions and disorders giving rise to auditory function deficits
6-4
Conductive hearing loss is a form of hearing loss due to hereditary or congenital
malformations of the middle ear structures, or inflammation of the middle ear. This
may result in ruptured eardrums and the discharge of fluid in the middle ear, or blocked
ear canals.1 Middle ear inflammation and fluid are very common in early childhood but
most cases of the condition or any associated hearing loss are not permanent. Persistent
otitis media with effusion (commonly known as glue ear) can result in significant
hearing loss and is therefore a major health concern. Section 6.3 (page 6-9) gives a
detailed description of otits media infections.
6.2.1 Tympanometry
As it is often difficult to gain a routine reliable screening audiograms with young
preschool children, tympanometry is now used as a screening tool to assess the
condition of the middle ear. This is normal when the air pressure either side of the
tympanic membrane is approximately equal to optimise the mobility of tympanic
membrane and ossicles.3
The tympanometer (or impedance meter) is a hand held device, which measures the
response of the middle ear to the sound energy applied and therefore provides
quantitative information of the function and presence of fluid in the middle ear cavity.3,4
It produces a sound stimulus in the ear canal at a frequency of 226 Hz, and a vacuum
pump applies a range of positive and negative pressures in the ear canal and to the
tympanic membrane. A probe is inserted which generates a tone as shown in Figure 6-
2. A portion of the tone is reflected and some is admitted to the middle ear - a process
known as static admittance, which is monitored continuously by a microphone in the
probe tip itself. The remainder of the energy emitted by the tone probe (i.e. that which
is reflected back) gives the static admittance of the ear, which depends on how well the
middle ear is functioning.3,4,5
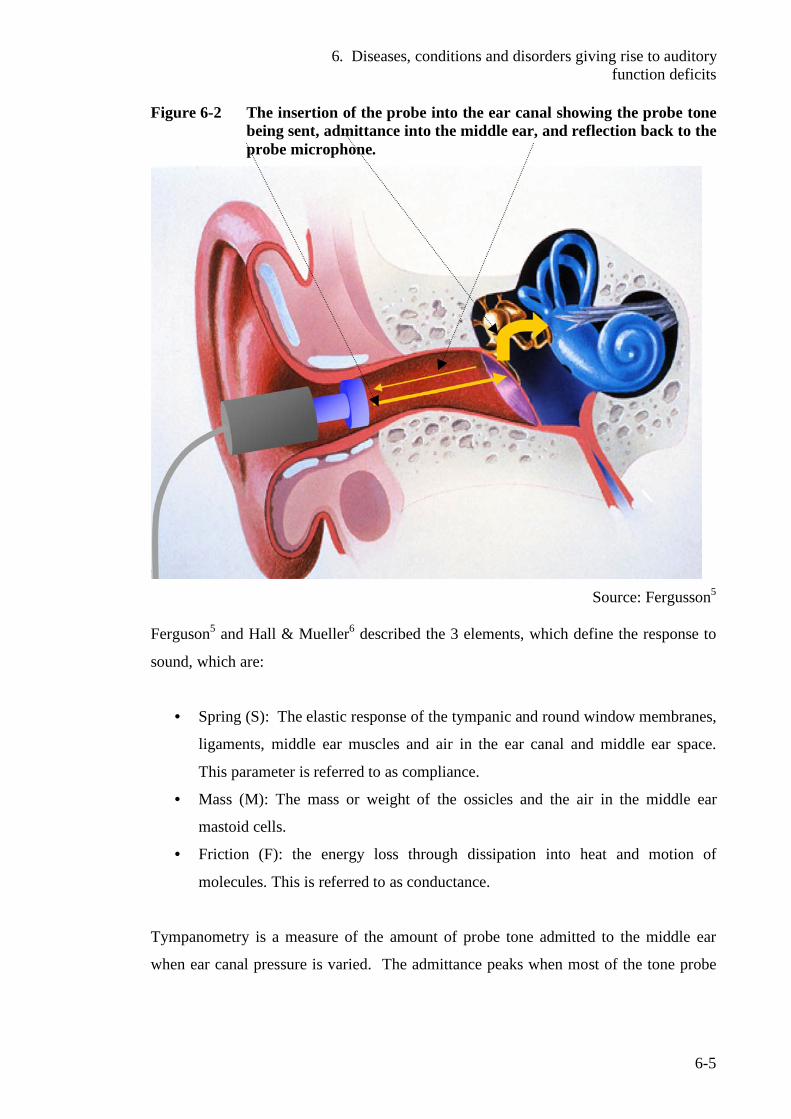
6. Diseases, conditions and disorders giving rise to auditory function deficits
6-5
Figure 6-2 The insertion of the probe into the ear canal showing the probe tone being sent, admittance into the middle ear, and reflection back to the probe microphone.
Source: Fergusson5
Ferguson5 and Hall & Mueller6 described the 3 elements, which define the response to
sound, which are:
• Spring (S): The elastic response of the tympanic and round window membranes,
ligaments, middle ear muscles and air in the ear canal and middle ear space.
This parameter is referred to as compliance.
• Mass (M): The mass or weight of the ossicles and the air in the middle ear
mastoid cells.
• Friction (F): the energy loss through dissipation into heat and motion of
molecules. This is referred to as conductance.
Tympanometry is a measure of the amount of probe tone admitted to the middle ear
when ear canal pressure is varied. The admittance peaks when most of the tone probe
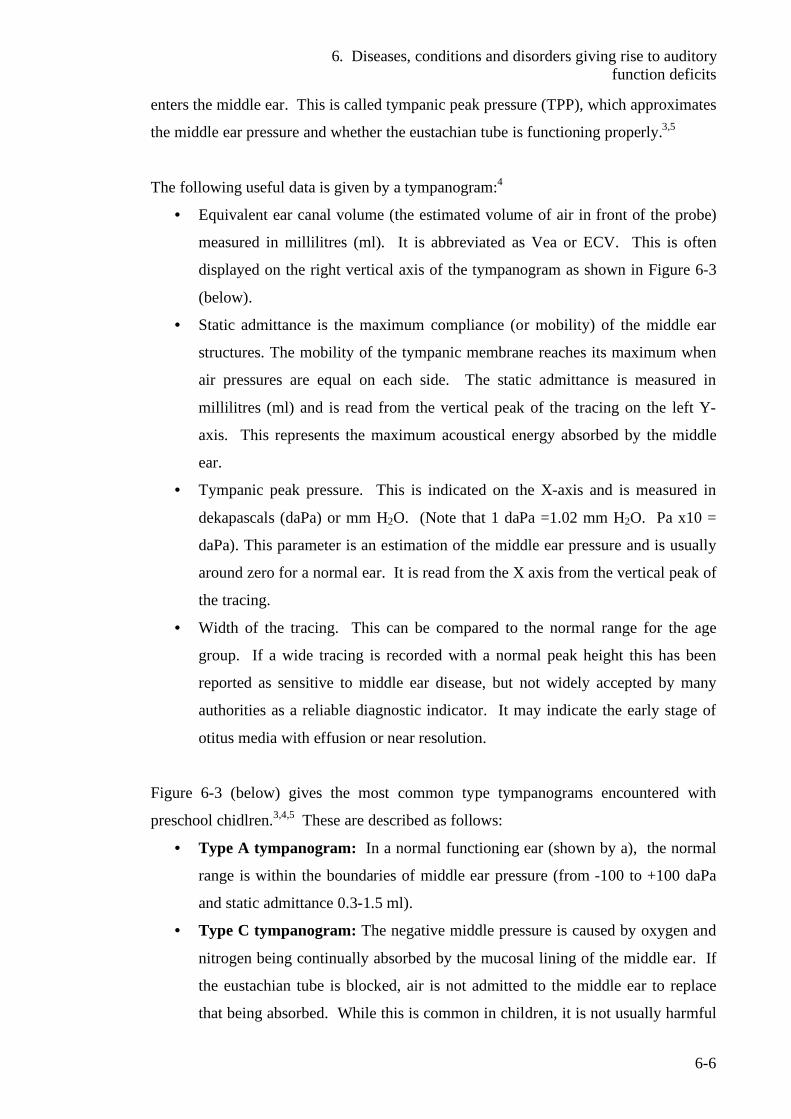
6. Diseases, conditions and disorders giving rise to auditory function deficits
6-6
enters the middle ear. This is called tympanic peak pressure (TPP), which approximates
the middle ear pressure and whether the eustachian tube is functioning properly.3,5
The following useful data is given by a tympanogram:4
• Equivalent ear canal volume (the estimated volume of air in front of the probe)
measured in millilitres (ml). It is abbreviated as Vea or ECV. This is often
displayed on the right vertical axis of the tympanogram as shown in Figure 6-3
(below).
• Static admittance is the maximum compliance (or mobility) of the middle ear
structures. The mobility of the tympanic membrane reaches its maximum when
air pressures are equal on each side. The static admittance is measured in
millilitres (ml) and is read from the vertical peak of the tracing on the left Y-
axis. This represents the maximum acoustical energy absorbed by the middle
ear.
• Tympanic peak pressure. This is indicated on the X-axis and is measured in
dekapascals (daPa) or mm H2O. (Note that 1 daPa =1.02 mm H2O. Pa x10 =
daPa). This parameter is an estimation of the middle ear pressure and is usually
around zero for a normal ear. It is read from the X axis from the vertical peak of
the tracing.
• Width of the tracing. This can be compared to the normal range for the age
group. If a wide tracing is recorded with a normal peak height this has been
reported as sensitive to middle ear disease, but not widely accepted by many
authorities as a reliable diagnostic indicator. It may indicate the early stage of
otitus media with effusion or near resolution.
Figure 6-3 (below) gives the most common type tympanograms encountered with
preschool chidlren.3,4,5 These are described as follows:
• Type A tympanogram: In a normal functioning ear (shown by a), the normal
range is within the boundaries of middle ear pressure (from -100 to +100 daPa
and static admittance 0.3-1.5 ml).
• Type C tympanogram: The negative middle pressure is caused by oxygen and
nitrogen being continually absorbed by the mucosal lining of the middle ear. If
the eustachian tube is blocked, air is not admitted to the middle ear to replace
that being absorbed. While this is common in children, it is not usually harmful
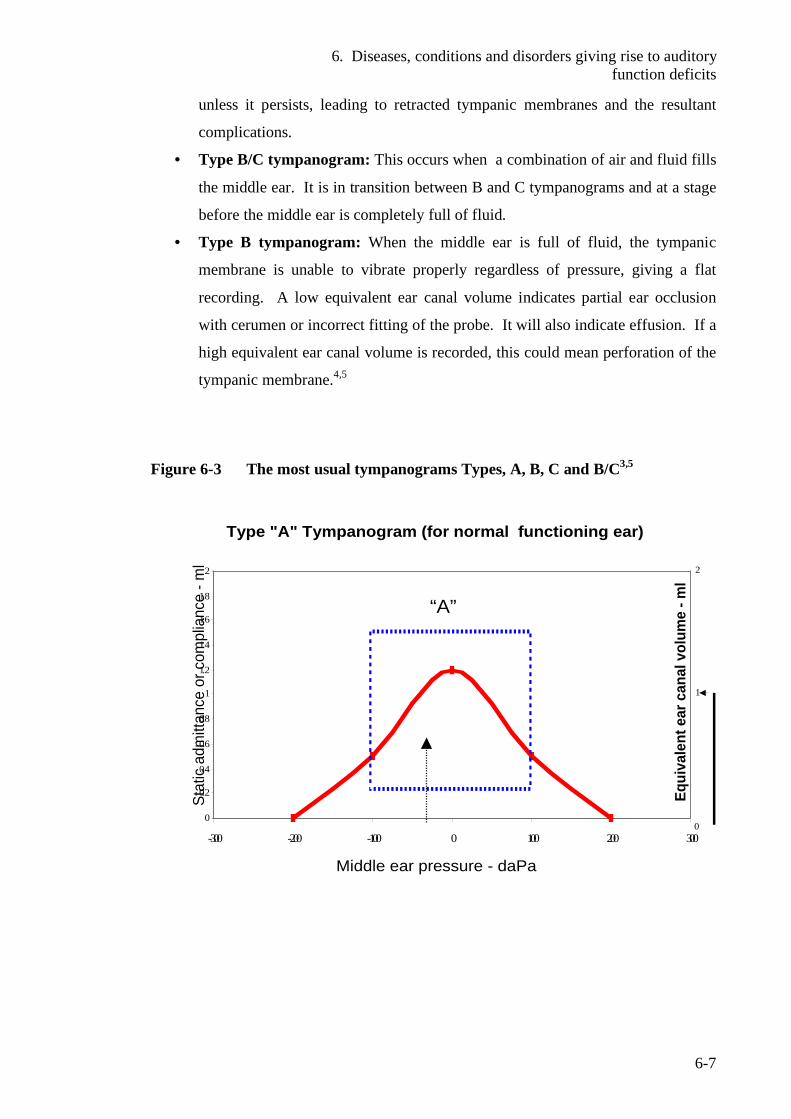
6. Diseases, conditions and disorders giving rise to auditory function deficits
6-7
unless it persists, leading to retracted tympanic membranes and the resultant
complications.
• Type B/C tympanogram: This occurs when a combination of air and fluid fills
the middle ear. It is in transition between B and C tympanograms and at a stage
before the middle ear is completely full of fluid.
• Type B tympanogram: When the middle ear is full of fluid, the tympanic
membrane is unable to vibrate properly regardless of pressure, giving a flat
recording. A low equivalent ear canal volume indicates partial ear occlusion
with cerumen or incorrect fitting of the probe. It will also indicate effusion. If a
high equivalent ear canal volume is recorded, this could mean perforation of the
tympanic membrane.4,5
Figure 6-3 The most usual tympanograms Types, A, B, C and B/C3,5
0
0.2
0.4
0.6
0.8
1
1.2
1.4
1.6
1.8
2
-300 -200 -100 0 100 200 300
Equi
vale
nt e
ar c
anal
vol
ume
-ml
0
1
2
Stat
ic a
dmitt
ance
or c
ompl
ianc
e -m
l
Middle ear pressure - daPa
Type "A" Tympanogram (for normal functioning ear)
“A”
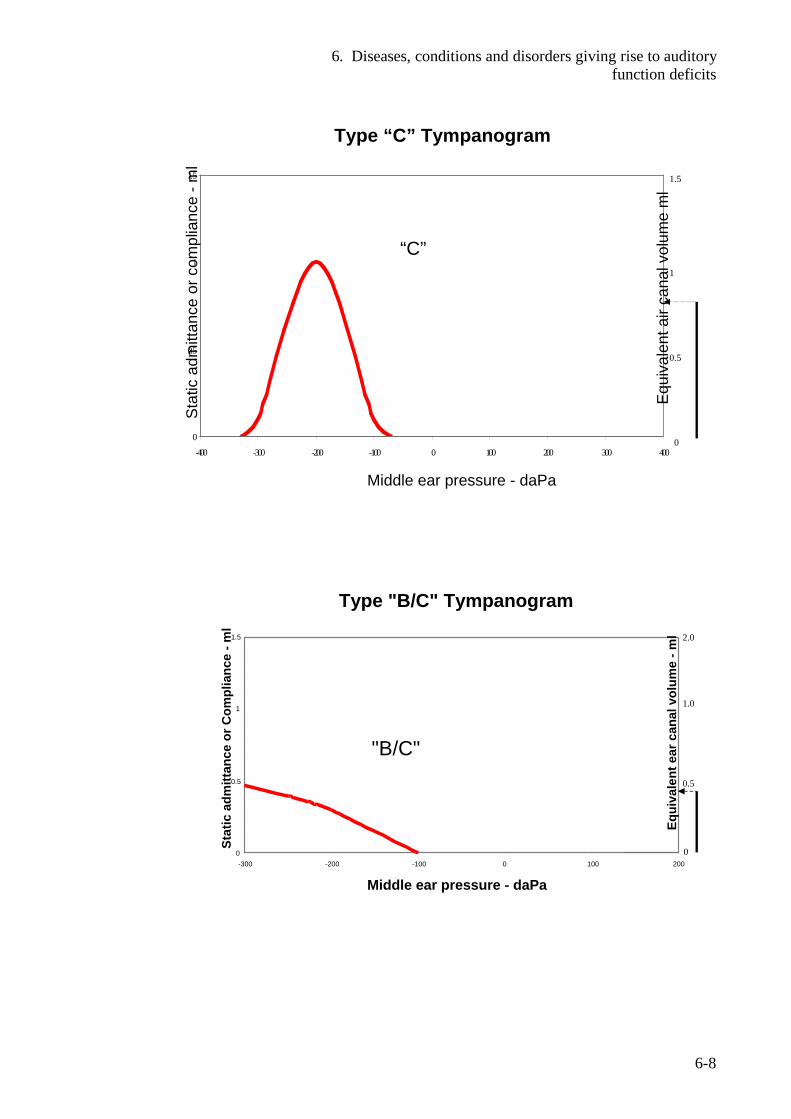
6. Diseases, conditions and disorders giving rise to auditory function deficits
6-8
0
0.5
1
1.5
-400 -300 -200 -100 0 100 200 300 400
Equ
ival
ent a
ir ca
nal v
olum
e m
l
0
0.5
1
1.5S
tatic
adm
ittan
ce o
r com
plia
nce
-ml
Type “C” Tympanogram
Middle ear pressure - daPa
“C”
Type "B/C" Tympanogram
0
0.5
1
1.5
-300 -200 -100 0 100 200
Middle ear pressure - daPa
Stat
ic a
dmitt
ance
or C
ompl
ianc
e -m
l
"B/C"
Equi
vale
nt e
ar c
anal
vol
ume
-ml
0
0.5
1.0
2.0
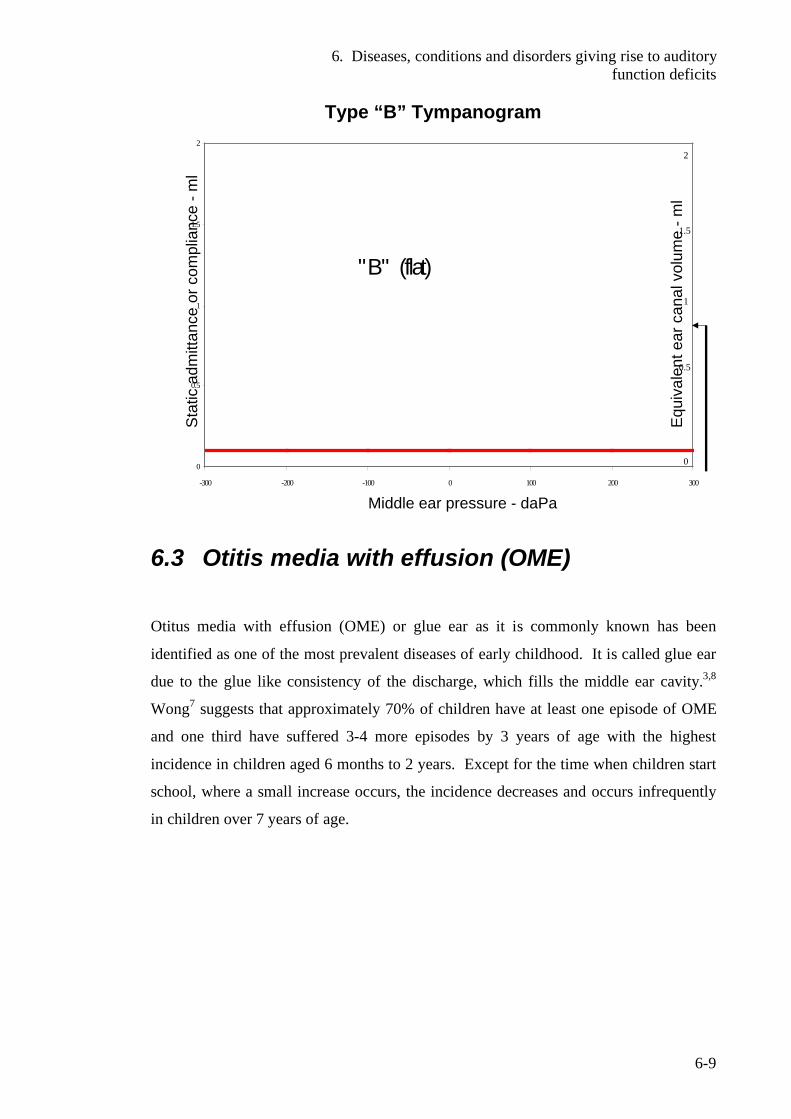
6. Diseases, conditions and disorders giving rise to auditory function deficits
6-9
0
0.5
1
1.5
2
-300 -200 -100 0 100 200 300
" B " (flat)
Equ
ival
ent e
ar c
anal
vol
ume
-ml
0
0.5
1
1.5
2
Sta
tic a
dmitt
ance
or c
ompl
ianc
e -m
l
Type “B” Tympanogram
Middle ear pressure - daPa
6.3 Otitis media with effusion (OME)
Otitus media with effusion (OME) or glue ear as it is commonly known has been
identified as one of the most prevalent diseases of early childhood. It is called glue ear
due to the glue like consistency of the discharge, which fills the middle ear cavity.3,8
Wong7 suggests that approximately 70% of children have at least one episode of OME
and one third have suffered 3-4 more episodes by 3 years of age with the highest
incidence in children aged 6 months to 2 years. Except for the time when children start
school, where a small increase occurs, the incidence decreases and occurs infrequently
in children over 7 years of age.
6. Diseases, conditions and disorders giving rise to auditory function deficits
6-10
Otitus media with effusion has been described in a variety of ways and Wong gives the
following standard terminology:7
• Otitis media (OM) An inflammation of the middle ear without
reference to aetiology or pathogenesis.
This is a general term referring to
inflammation (fluid and inflammation)
• Acute otitis media (AOM) This is active infection of the middle ear
with an inflamed eardrum. It is
characterised by a rapid and short onset of
signs and symptoms lasting 3 weeks
approximately
• Otitus media with effusion (OME). An inflammation of the middle ear in
which a collection of fluid is present in the
middle ear space. Fever is absent and ear
discomfort is minimal
• Chronic OME Middle ear effusion, which persists more
than 3 months
Wong7 describes the aetiology of acute otitis media as frequently caused by the
microorganisms, ‘streptococcus pneumoniae’ and ‘haemophilius influenzae’. The
aetiology of the non-infectious type in not known but is often the result of blocked
eustachian tubes from the oedema of upper respiratory infections, allergenic rhinitis
(hay fever), or hypertrophic adenoids. Chronic OM is often an extension of AOM.
OME is most likely associated with the common cold and other causes of nasal
congestion. It can follow silently with little or no pain. 1,7
Allen3 reports that American Indian and Inuit children have high rates of otitis media
whereas Afro-American children have low rates. Maori have approximately twice the
rate of non-Maori. Australian Aboriginal children are known to have an extremely high
rate. Allen3 suggests that such different rates are due to racial factors affecting the
shape and function of the eustachian tube, differences in response to infection, and
social factors such as tobacco smoke and lack of breastfeeding in favour of bottle-
feeding.
6. Diseases, conditions and disorders giving rise to auditory function deficits
6-11
In 1995 the former Public Health Commission reported that approximately 9% of New
Zealand 5 year old children are affected by persistent OME, with a higher prevalence
among Maori and Pacific Island children.1
Children have poorly developed immune systems and often suffer from respiratory
infections especially in their first 2 years of life. Infections are common in many
children a few days before the onset of otitis media. The mucosal lining of the
nasopharynx and eustachian tube swells to further impair its function. Children with
high levels of contact with other children will have up to seven times the normal rate of
OME due to the high levels of transmission among children. These include children in
child care facilities and those from large families.3
Environmental factors have been implicated such as passive tobacco smoke,
overcrowding, housing dampness, mould, mildew and allergens. Wong7 suggests the
theory that inhalation of smoke increases the risk of blocked eustachian tube by
impairing mucociliary function causing congestion of the soft naso-pharyngeal tissues,
or predisposing patients to upper respiratory infections. Most health authorities
including the New Zealand Ministry of Health strongly recommend that parents or
caregivers should never smoke near children.
A relationship has been established between the incidence of otitis media and feeding
practices in infants. Infants, which are breastfed, have a 50-60% lower incidence of
otitis media than those exclusively fed by bottle.3,7 This is thought to protect infants
from respiratory viruses and allergies with the presence of increased secretory
immunoglobulin A (IgA) and limits the exposure of the eustachian tube and middle ear
to pathogenic microorganisms and foreign proteins.7 Reflux of milk into the eustachian
tubes is less likely in breast-feeding due to the semi-vertical position of feeding when
compared to how babies are normally bottle-fed.7 Feeding a baby lying flat, with access
to the bottle on demand, has been associated with a high incidence of OME and tooth
decay. Therefore babies should be fed with the baby's head tilted upwards and not in
the horizontal position.3
Allen describes other high risk groups such as children with cleft palate, that are prone
to chronic OME due to the impaired muscular control of the eustachian tube. About
6. Diseases, conditions and disorders giving rise to auditory function deficits
6-12
half of children with Down syndrome are prone to chronic otitis media. Children with
mid-facial abnormality are a high-risk group.3
If the eustachian tube is blocked, normal ear secretions are unable to drain down this
tube and will build up filling the middle ear with fluid.3 Intrinsic obstruction can be
caused by infection or allergy while extrinsic obstruction is usually due to enlarged
adenoids or nasopharyngeal tumours.7 Obstruction results in a negative middle ear
pressure and, if persistent, produces a middle ear effusion. Sustained negative pressure
and impaired ciliary transport within the eustachian tube inhibits drainage.
Contamination can also be caused by reflux, aspiration, or insufflation when crying,
sneezing, nose blowing and swallowing with an obstructed nose. In the presence of
middle ear effusion, goblet cell hyperplasia of the mucosal lining of the middle ear may
result in the fluid becoming mucoid. Immunological reactions can occur resulting in
effusion if bacteria are present.3
Wong described the factors predisposing infants and young children to the development
of otitis media. These are:7
• The eustachian tubes are short, wide, straight and lie horizontally.
• The cartilage lining is undeveloped making the tubes more distensible and
more likely to open inappropriately.
• Pharyngeal lymphoid tissue readily obstructs the eustachian tube opening in
the nasopharynx.
• Immature humoral defence mechanisms increase the risk of infection.
• The lying down position of infants allows bottle fed fluid to collect in the
pharyngeal cavity rather than draining away.
One of the most serious consequences of prolonged middle ear infection is hearing loss,
although it is mild in nature. This is caused by negative middle ear pressure, effusion or
damage to the tympanic membrane. The most serious consequence is the effect on
speech development, language and cognition.7 A number of recent studies are
suggesting that hearing loss has a major impact on educational development and
performance at school.16
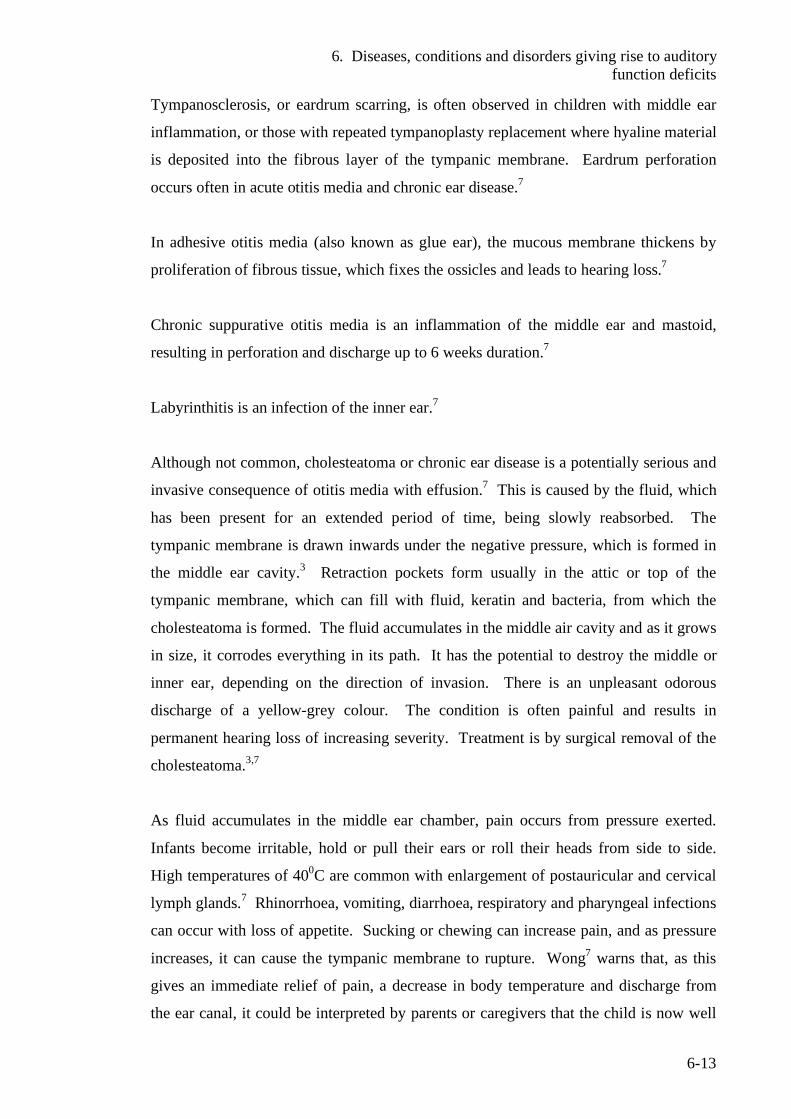
6. Diseases, conditions and disorders giving rise to auditory function deficits
6-13
Tympanosclerosis, or eardrum scarring, is often observed in children with middle ear
inflammation, or those with repeated tympanoplasty replacement where hyaline material
is deposited into the fibrous layer of the tympanic membrane. Eardrum perforation
occurs often in acute otitis media and chronic ear disease.7
In adhesive otitis media (also known as glue ear), the mucous membrane thickens by
proliferation of fibrous tissue, which fixes the ossicles and leads to hearing loss.7
Chronic suppurative otitis media is an inflammation of the middle ear and mastoid,
resulting in perforation and discharge up to 6 weeks duration.7
Labyrinthitis is an infection of the inner ear.7
Although not common, cholesteatoma or chronic ear disease is a potentially serious and
invasive consequence of otitis media with effusion.7 This is caused by the fluid, which
has been present for an extended period of time, being slowly reabsorbed. The
tympanic membrane is drawn inwards under the negative pressure, which is formed in
the middle ear cavity.3 Retraction pockets form usually in the attic or top of the
tympanic membrane, which can fill with fluid, keratin and bacteria, from which the
cholesteatoma is formed. The fluid accumulates in the middle air cavity and as it grows
in size, it corrodes everything in its path. It has the potential to destroy the middle or
inner ear, depending on the direction of invasion. There is an unpleasant odorous
discharge of a yellow-grey colour. The condition is often painful and results in
permanent hearing loss of increasing severity. Treatment is by surgical removal of the
cholesteatoma.3,7
As fluid accumulates in the middle ear chamber, pain occurs from pressure exerted.
Infants become irritable, hold or pull their ears or roll their heads from side to side.
High temperatures of 400C are common with enlargement of postauricular and cervical
lymph glands.7 Rhinorrhoea, vomiting, diarrhoea, respiratory and pharyngeal infections
can occur with loss of appetite. Sucking or chewing can increase pain, and as pressure
increases, it can cause the tympanic membrane to rupture. Wong7 warns that, as this
gives an immediate relief of pain, a decrease in body temperature and discharge from
the ear canal, it could be interpreted by parents or caregivers that the child is now well
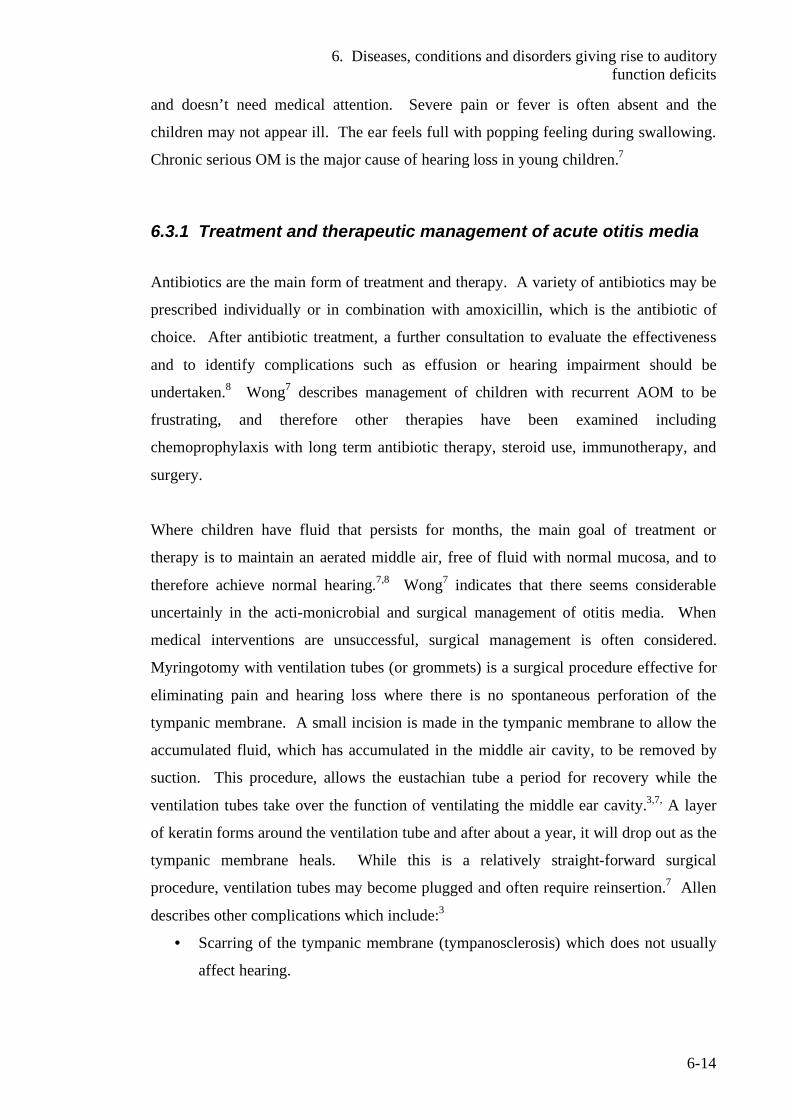
6. Diseases, conditions and disorders giving rise to auditory function deficits
6-14
and doesn’t need medical attention. Severe pain or fever is often absent and the
children may not appear ill. The ear feels full with popping feeling during swallowing.
Chronic serious OM is the major cause of hearing loss in young children.7
6.3.1 Treatment and therapeutic management of acute otitis media
Antibiotics are the main form of treatment and therapy. A variety of antibiotics may be
prescribed individually or in combination with amoxicillin, which is the antibiotic of
choice. After antibiotic treatment, a further consultation to evaluate the effectiveness
and to identify complications such as effusion or hearing impairment should be
undertaken.8 Wong7 describes management of children with recurrent AOM to be
frustrating, and therefore other therapies have been examined including
chemoprophylaxis with long term antibiotic therapy, steroid use, immunotherapy, and
surgery.
Where children have fluid that persists for months, the main goal of treatment or
therapy is to maintain an aerated middle air, free of fluid with normal mucosa, and to
therefore achieve normal hearing.7,8 Wong7 indicates that there seems considerable
uncertainly in the acti-monicrobial and surgical management of otitis media. When
medical interventions are unsuccessful, surgical management is often considered.
Myringotomy with ventilation tubes (or grommets) is a surgical procedure effective for
eliminating pain and hearing loss where there is no spontaneous perforation of the
tympanic membrane. A small incision is made in the tympanic membrane to allow the
accumulated fluid, which has accumulated in the middle air cavity, to be removed by
suction. This procedure, allows the eustachian tube a period for recovery while the
ventilation tubes take over the function of ventilating the middle ear cavity.3,7, A layer
of keratin forms around the ventilation tube and after about a year, it will drop out as the
tympanic membrane heals. While this is a relatively straight-forward surgical
procedure, ventilation tubes may become plugged and often require reinsertion.7 Allen
describes other complications which include:3
• Scarring of the tympanic membrane (tympanosclerosis) which does not usually
affect hearing.
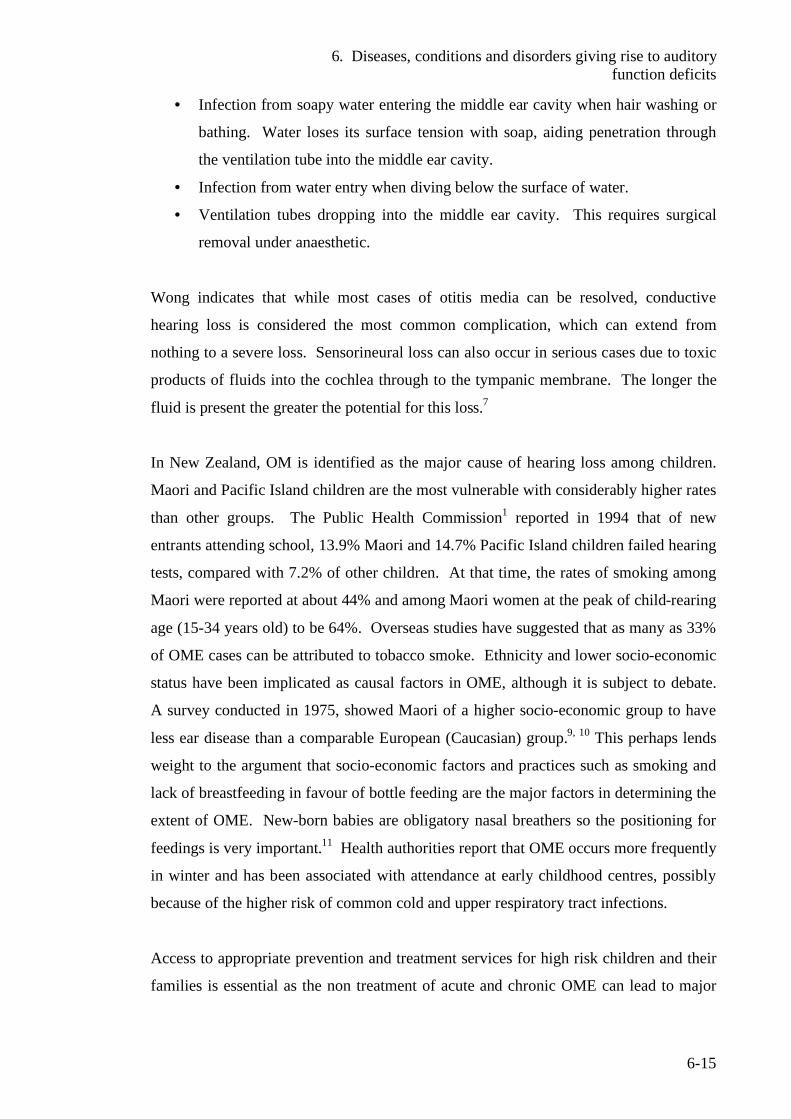
6. Diseases, conditions and disorders giving rise to auditory function deficits
6-15
• Infection from soapy water entering the middle ear cavity when hair washing or
bathing. Water loses its surface tension with soap, aiding penetration through
the ventilation tube into the middle ear cavity.
• Infection from water entry when diving below the surface of water.
• Ventilation tubes dropping into the middle ear cavity. This requires surgical
removal under anaesthetic.
Wong indicates that while most cases of otitis media can be resolved, conductive
hearing loss is considered the most common complication, which can extend from
nothing to a severe loss. Sensorineural loss can also occur in serious cases due to toxic
products of fluids into the cochlea through to the tympanic membrane. The longer the
fluid is present the greater the potential for this loss.7
In New Zealand, OM is identified as the major cause of hearing loss among children.
Maori and Pacific Island children are the most vulnerable with considerably higher rates
than other groups. The Public Health Commission1 reported in 1994 that of new
entrants attending school, 13.9% Maori and 14.7% Pacific Island children failed hearing
tests, compared with 7.2% of other children. At that time, the rates of smoking among
Maori were reported at about 44% and among Maori women at the peak of child-rearing
age (15-34 years old) to be 64%. Overseas studies have suggested that as many as 33%
of OME cases can be attributed to tobacco smoke. Ethnicity and lower socio-economic
status have been implicated as causal factors in OME, although it is subject to debate.
A survey conducted in 1975, showed Maori of a higher socio-economic group to have
less ear disease than a comparable European (Caucasian) group.9, 10 This perhaps lends
weight to the argument that socio-economic factors and practices such as smoking and
lack of breastfeeding in favour of bottle feeding are the major factors in determining the
extent of OME. New-born babies are obligatory nasal breathers so the positioning for
feedings is very important.11 Health authorities report that OME occurs more frequently
in winter and has been associated with attendance at early childhood centres, possibly
because of the higher risk of common cold and upper respiratory tract infections.
Access to appropriate prevention and treatment services for high risk children and their
families is essential as the non treatment of acute and chronic OME can lead to major
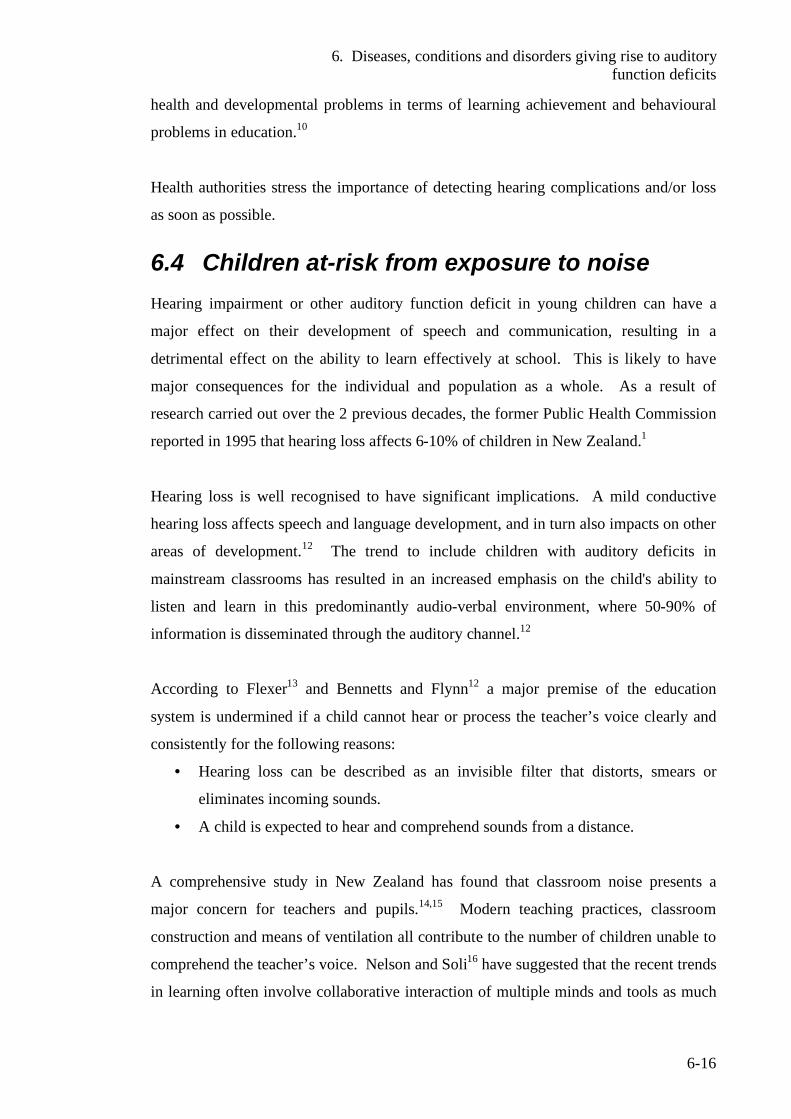
6. Diseases, conditions and disorders giving rise to auditory function deficits
6-16
health and developmental problems in terms of learning achievement and behavioural
problems in education.10
Health authorities stress the importance of detecting hearing complications and/or loss
as soon as possible.
6.4 Children at-risk from exposure to noise Hearing impairment or other auditory function deficit in young children can have a
major effect on their development of speech and communication, resulting in a
detrimental effect on the ability to learn effectively at school. This is likely to have
major consequences for the individual and population as a whole. As a result of
research carried out over the 2 previous decades, the former Public Health Commission
reported in 1995 that hearing loss affects 6-10% of children in New Zealand.1
Hearing loss is well recognised to have significant implications. A mild conductive
hearing loss affects speech and language development, and in turn also impacts on other
areas of development.12 The trend to include children with auditory deficits in
mainstream classrooms has resulted in an increased emphasis on the child's ability to
listen and learn in this predominantly audio-verbal environment, where 50-90% of
information is disseminated through the auditory channel.12
According to Flexer13 and Bennetts and Flynn12 a major premise of the education
system is undermined if a child cannot hear or process the teacher’s voice clearly and
consistently for the following reasons:
• Hearing loss can be described as an invisible filter that distorts, smears or
eliminates incoming sounds.
• A child is expected to hear and comprehend sounds from a distance.
A comprehensive study in New Zealand has found that classroom noise presents a
major concern for teachers and pupils.14,15 Modern teaching practices, classroom
construction and means of ventilation all contribute to the number of children unable to
comprehend the teacher’s voice. Nelson and Soli16 have suggested that the recent trends
in learning often involve collaborative interaction of multiple minds and tools as much
6. Diseases, conditions and disorders giving rise to auditory function deficits
6-17
as individual possession of information.17 This all amounts to increased activity and
noise levels,14 which have the potential to be particularly serious for children
experiencing auditory function deficit.16 Noise in the classrooms can only exacerbate
their ability to comprehend and process verbal communication with other children and
instructions from the teacher.
Children with auditory function deficit are potentially failing to learn to their maximum
potential because of noise levels generated in classrooms. The combination of auditory
function deficit and poor classroom acoustics cause significant learning problems.16
The effects of noise and associated conditions on the ability of children to learn
effectively in typical classroom environments are now the subject of increasing concern.
The International Institute of Noise Control Engineering (I-INCE) on the advice of the
World Health Organization, has established an international working party, which
includes New Zealand, to evaluate noise and reverberation control for schoolrooms.18
While the detrimental effects of noise in classroom situations are not limited to children
experiencing disability, those with a disability that affects their processing of speech
and verbal communication could be extremely vulnerable.16 The auditory function
deficits in question include hearing impairment, autistic spectrum disorders, Down
syndrome and attention-deficit disorders (ADD/ADHD). For children prone to middle
ear infections which result in hearing loss, and those with other auditory functions
deficits which affect their ability to receive and process verbal information, the effects
of poor classroom acoustics has become of great concern.12
The Ministry of Health53 reports that in the last two decades major advances have been
made in child and adolescent mental health with the clear diagnostic classification of
various problems and behaviours. There has been improvement on the previously large
and ill-defined categories, as well as a major paradigm shift from perceiving these
children's problems as a reflection of parenting and other environmental/ecological
factors, towards recognised disorders with a contributing genetic or biological cause.
The Ministry of Health states that these diagnostic categories have been subject to
increasing scientific scrutiny as to reliability, validity and implications for aetiology,
treatment and prognosis.53 Autistic spectrum disorders and attention-deficit/
hyperactivity disorder (ADHD) rank among those of greatest interest and concern.
6. Diseases, conditions and disorders giving rise to auditory function deficits
6-18
6.5 Pervasive development disability (PDD)
The Diagnostic and Statistical Manual of Disorders (DSM)19 describes the criteria for a
group of severe early developmental disorders, which are characterized by delays and
distortions in multiple areas of development. These include social skills, cognition and
communication. This category includes autistic spectrum disorders (ASD), Asperger’s
syndrome, Rett’s disorder and pervasive developmental disability not otherwise
specified (PDD-NOS).20
6.5.1 Autistic spectrum disorder (ASD) Autistic spectrum disorders includes a continuum of disorders ranging from severe or
classical autism, also known as Kanner’s syndrome, to the more able or high
functioning autism and Asperger’s syndrome. There is no known cause of the physical
disorder and no biological markers have been identified. Autistic spectrum disorders
are diagnosed by clinical observation and not by laboratory tests. Autism is considered
a neurological and genetic life-long disorder that causes discrepancies in the way
information is processed.20 It is characterised by interlinking deficits in social
imagination, social communication, social interaction and occupational function.21,22
According to Janzen,20 this affects the ability to understand and use language to
communicate with people, understand and relate in typical ways to people, understand
events and objects in the environment and understand or respond to sensory stimuli.
Janzen20 attempted to define high functioning, which is not clearly understood or
defined. Other terms such as more able, near normal and mildly autistic have been used
to describe this group of individuals whose have intellectual abilities at or above the
normal range. Janzen20 however describes the term ‘high functioning’ as very
misleading without further qualification, because it creates an illusion that the problems
are mild and little or no support will be needed. In reality, those who are higher
functioning, have problems and needs similar to those who are lower functioning but at
a higher level. Asperger's syndrome is presently included in the diagnostic criteria19 as
an autistic spectrum disorder and is generally considered a milder form of high
functioning autism. There is some debate as to whether it should be considered a
separate condition but according to Janzen,20 more research is needed before this can be
6. Diseases, conditions and disorders giving rise to auditory function deficits
6-19
determined. Those experiencing Asperger's syndrome are generally more able in
language than those experiencing autism. This complex disability does not allow
learning or thinking in the same way as in normal development. It can result in a range
of serious issues such as problems with language, social interaction, receiving and
processing information, making sense of the world, and inappropriate behaviour.20,21,22
There are often two major auditory issues with those experiencing autistic spectrum
disorders. These are major difficulties in comprehending verbal information and speech
processing, together with overwhelming sensory stimulation.20
Janzen20 described overwhelming sensory stimulation as painful and disorientating for
those on the autistic spectrum. This can affect all the senses resulting in extreme
sensory response to touch, certain sounds, light, smell and taste. (see 6.5.1.1. Sensory
integration disorder). Autistic individuals can find a range of sounds such as crowd
noise and certain types of machine generated noise painful and distressing.23 This is
difficult to scientifically qualify, as such extra sensory stimuli varies greatly from one
individual to another with those on the autistic spectrum. A child affected by any type
of noise in their classroom or learning space is likely to be adversely affected in their
ability to learn and process information if they find their learning environment painful
and distressing. Shields22 described such sounds which may be perceived as intense to
include:
• Sudden unexpected noises such as barking dogs, baby crying
• High pitched continuous noises such as mechanical fans, hand dryers, lawn
mowers, vacuum cleaners etc.
• Confusing, multiple or complex sounds such as crowd noise in shopping centres
school classrooms etc.
Janzen20 and Shields22 have quoted personal experiences of individuals experiencing
autism and their responses to certain sounds. One described her ears as being like an
open microphone or hearing aid on full volume and was unable to filter out irrelevant
background noises. Others described the fear they had of household appliances such as
food processors and vacuum cleaners, which were perceived as much louder than they
actually were.
6. Diseases, conditions and disorders giving rise to auditory function deficits
6-20
6.5.1.1 Sensory integration disorder Kranowitz24 defines sensory integration as the neurological process of organising
information received through sensory input. Individuals on the autistic spectrum are
well known to experience deficits with one or more of their senses.25
A lesser known group is a subset of gifted children who are also known to experience
this condition.26,27 Authors such as Mauer28 and Ottenbacher29 suggest that a wider
group of children than originally described are affected by sensory integration disorder.
Mauer describes a range of developmental disabilities, which could benefit from
sensory integration therapy:28
• Learning disabilities
• Attention-deficit/hyperactivity disorder (ADHD)
• Pervasive developmental disabilities / disorders (PDDs), which includes autistic
spectrum disorders
• Neurological impairment
• Mental retardation
• Social and behavioural problems
There have been a number of papers and increasing interest on sensory integration
disorder (also referred to as sensory integrative / modulated dysfunction). This
relatively new concept was developed by Ayres30 and based on work carried out in the
disciplines of neurosciences, physical development and neuromuscular function.28,31,,32
Bogdashina34 explained that as sensory perceptual behaviours are not included in the
current diagnostic criteria, few empirical studies of sensory difficulties in young autistic
children have been conducted. Furthermore, Bogdashina suggests that understanding of
this complex condition has been hindered by an oversimplification of sensory problems
in autism with some researchers reducing these to hypersensitivities. She suggested that
it isn’t as simple as identifying the hypersensitivities of each individual, and then either
desensitising or modifying the environment to solve all their problems. She concluded
that hypersensitivities may merely be the consequences of other sensory perceptual
differences, which may include:34
• The inability to filter sensory information (Gestalt perception)
• Mono-processing, - the use of one sensory channel at a time to limit the amount
of information and avoid distortions
6. Diseases, conditions and disorders giving rise to auditory function deficits
6-21
• Fragmented perception - the processing of fragments or bits of information
rather than the whole picture when there is too much information to be
processed
• Peripheral perception - a strategy to avoid overload by attending to items
indirectly. (e.g. looking at items out of the corner of the eye or focusing on one
part of an item such as the wheels of a toy)
• Delayed processing (a consequence of fragmented perception)
• System shut down of some or all of their sensory channels due to sensory
overload
Ayres31 described the visual and auditory processes to be the end products of many
fundamental aspects of brain function. Mauer,28 described a common symptom of
children experiencing this condition is the inability to maintain an inadequate or
appropriate state of alertness through common activities, such as focusing on and
attending to tasks. This is especially the case with vast amount of auditory information
that must be processed such as language comprehension.33 Bogdashina34 cites a number
of autistic authors, such as Grandin, who consider autism as a condition largely related
to sensory processing. A large number of autistic individuals have deficits in one or
more of their senses. One of the most common difficulties they experience, especially
in sound, is ‘Gestalt perception,’ which has been described by Bogdashina34 as a
difficulty to distinguish between foreground and background information. In the case of
auditory processing difficulties, an autistic individual will have difficulties in
distinguishing or filtering out the teacher's voice (the signal) from the background noise.
Gestalt perception also leads to rigidity of thinking and inability to generalise concepts.
Autistic individuals, especially children, are often characterised by routines and rituals,
which bring comfort and as sense of security to their daily lives.34 Tomchek and
Gies,35 cited in Mauer,28 suggest that the inability of children on the autistic spectrum to
process and integrate sensory information received, is related to the language and
behavioural manifestation experienced. It is therefore not difficult to see that apart from
the distress that some noises cause these children, the detrimental effect of excessive
noise in causing auditory overload and augmenting the problems they already have with
the receiving of information and learning. Combine the problems of auditory overload
with other sensory over stimulation of the other senses, it is evident that this condition is
a major obstacle to learning in a mainstream environment. Special provisions for these
6. Diseases, conditions and disorders giving rise to auditory function deficits
6-22
children in terms of targeted assistance and an appropriate physical learning
environment are paramount. Techniques developed as part of sensory integration
therapy such as the prescription of a sensory diet are widely used in education settings.
This will include appropriate interventions and activities when a child experiences
sensory overload.
However, caution was raised by Mauer28 in extending the principle of sensory
integration theory to explain deficits associated with conditions such as Down
syndrome. This is because deficits associated with this condition are more likely due to
abnormalities in the brain, rather than a problem of sensory processing.
Mauer28 explains that the existing research evidence for sensory integration intervention
is still controversial with criticism levelled at many studies for aspects such as small
sample size, inconsistent definition of dependant and independent variables, and
inconsistent outcomes. Griffer36 conducted a critical review of the evidence and notes
that reputable bodies such as the American Occupational Therapy Association have on
existing evidence, supported the application of sensory integration, invention and
therapies for children with learning disabilities, pervasive developmental disabilities
(autistic spectrum disorder), and psychosocial dysfunction.37 Griffer expressed a desire
for collaborative work to be done by others to further investigate the effects of sensory
integration intervention and therapy among children.36
It must be of concern that many more groups of children could be affected with varying
degrees of sensory integration disorder than first thought. All may not, however, be
affected in the same way and not all will be affected by abnormal auditory processing.
However, there may be many children with this condition struggling in educational
settings, without recognition of the difficulties they have. It is clear that much more
work needs to be done to establish the extent of sensory integration disorder among
children throughout the education system and to implement appropriate strategies to
help them.
6.5.2 Difficulties in language and communication processing with those experiencing autistic spectrum disorders
6. Diseases, conditions and disorders giving rise to auditory function deficits
6-23
Language and communication difficulties are well known in those experiencing autism.
Janzen20 described this characteristic as not being able to process auditory information
efficiently or reliably. This means that while their hearing can be very good, the deficit
lies in the processing of the auditory information transmitted to the brain. It can be very
perplexing for a parent or caregiver to have a child with excellent hearing who can show
extraordinary ability in music. This can include a true musical ear (i.e. singing in tune,
playing a musical instrument by ear at a level well beyond normal development), but yet
have the most fundamental difficulties with language. Excellent hearing does not
preclude other auditory processing difficulties.38 The lack of normal development in
language and communication is usually the first apparent sign of the disability and can
be detected in toddlers as young as 2 years old.
These individuals are unable to communicate and respond to human interactions and
situations in a normal way. They are often unable to understand the nuance of
statements such as “Pull your socks up,” or “How many times have I told you……?”
Even the most capable and verbal children with autistic spectrum disorders are concrete
and literal in their understanding and use of language.20 In the above cases, an autistic
person will literally pull their socks up and give the number of times they have been
told without understanding the underlining meaning.
The auditory channel is still the most common means of communication and imparting
of knowledge. Autistic individuals often have exceptionally good visual skills, which in
many cases is far superior to their auditory skills39. They can remember visual images
in surprising detail, and it is based upon this strength, that many new frameworks for
initiatives in communication are based.
Hodgson39 describes in detail as to why this is thought to be the case. Those
experiencing autism experience difficulty smoothly and accurately controlling the
shifting and re-establishing of attention, which current research suggests is due to
cerebellar deficits. The early acquisition of social skills and communication skills
requires an ability to rapidly select, prioritise and process of information. Their central
nervous system cannot perform this complex function adequately.39
6. Diseases, conditions and disorders giving rise to auditory function deficits
6-24
Hodgson39 also describes the difficulty in attending to foreground sounds and
disregarding or blocking out background noise. It is well known that in typical
environments many simultaneous sound sources exist (doors banging, chatter, traffic
etc) and intentional communication has to compete with such noises. A normal listener
is able to focus attention selectively on the information, which is important, such as
communication from the teacher for example, and selectively block out background
noise to a considerable extent.39 This is a particularly important skill in education and
one which creates severe disadvantages for autistic children in receiving and processing
information from the teacher. This selective processing of auditory information is a
learned process and not fully developed until adulthood.40 However some listeners are
unable to carry out such selective processing and receive all auditory information with
equal intensity.39 Communication modes such as speech, hand signals and gestures are
transient as they remain only for a short time. Individuals with autism and other forms
of communication disorders have major difficulties in carrying out tasks that require
sequential processing of transient information.39 As an example, the giving of several
discreet commands at once such as, “Eat your breakfast, then wash your face, collect
your bag and wait in the car.”
It is not difficult to appreciate the implications for a student with autistic spectrum
disorder who experiences such difficulties to try and make sense of a transient message
in a noisy environment. Often the spoken message will have passed by before the
student can focus enough to receive it.39
A key development in the communication framework is the use of visual
communication messages which give a child the opportunity to engage his/her attention
before the message disappears. Such stability permits enough time for adequate
processing, as these individuals appear to understand much better what they see than
what they hear. A student can return to a visual message to refocus as needed.39
Extensive work has already been conducted on such visual tools and strategies.
Shields22 advocates the PECs (picture exchange system) as a means of initiating a
request and expressing their needs. A child wanting something is trained to take a
picture of what they want and give it to a person such as a parent to action. During this
process language is reduced to the absolute essential.
6. Diseases, conditions and disorders giving rise to auditory function deficits
6-25
Taking the case of command to be actioned in sequence, visual schedules are prepared
showing the child what has to be done in stepwise fashion. These techniques originally
developed for autism have also been found to be very useful for a range of children with
auditory deficits and communication problems such as hearing impairment. They are
likely to be extremely useful in classroom situations where children with hearing
impairment and other auditory disorders are present.
It is now recognized that a completely different language structure and framework is
needed to communicate with autistic individuals. Efforts are now being made to
educate parents in these new techniques so that they can interact educate and positively
contribute to the development of their children.20,22,39 One such initiative, the Early
Bird Programme,22developed by Shields and the National Autistic Society (UK) was
introduced on trial in 2000 in New Zealand with joint funding by the Ministries of
Health and Education. A small number of families with autistic preschool children
were selected for an intensive programme of formal instruction, guidance and
observation in working with their children. Due to the initial success of the trial
programme, the government has committed funding to extend the programme to
families throughout the country on an ongoing basis.
6.5.3 Auditory integration training/therapy (AIT) Janzen20 reports that many parents in the USA now wish procedures or treatments such
as auditory integration training to be carried out on their children but it is something
schools feel is outside their responsibility. The authors and practitioners of this
procedure claim it will desensitise children with autistic spectrum disorders and other
pervasive developmental disabilities to the sounds that they find distracting, painful, and
distressing, but much controversy surrounds this procedure. It has been introduced to
New Zealand and promoted among parents of autistic children.
Auditory integration training (AIT) has been widely promoted as a treatment for
pervasive development disabilities including autistic spectrum disorders (ASD),
attention-deficit disorders (ADD, ADHD), and individuals with auditory sensory
problems. It was initiated by Berard43 in France, and further developed by Tomatis and
Bient, to assist people with auditory sensory problems44 and has been practiced as an
6. Diseases, conditions and disorders giving rise to auditory function deficits
6-26
alternative treatment for the last decade in many countries including the USA. It has
not been approved as a treatment or medical device by the United States Food and Drug
Administration (USFDA)42 or the New Zealand Ministry of Health.41 Since that time it
has become one of the most controversial topics in the field of communicative disorders
and at times elicits highly charged and heated discussions between advocates and
detractors of the process.42,44
Tharpe42 suggests that part of the friction seems to lie in the weak basis of AIT’s
theoretical framework and the targeting of children whose parents are considered
vulnerable. This is probably due to the limited help that established mainstream
medicine can provide.
The theoretical basis of auditory integration is not well understood and some of the
suggested theories are well outside the current knowledge and understanding of the
audiological processes and function.44 Berard, the founder of the procedure, claimed in
his book ‘Hearing Equals Behavior’,43 that auditory processing problems can lead to
different distortions in the auditory system (shown in peaks and valleys) that arise when
people perceive sounds in an atypical manner and this could result in problems in
behaviour and cognition.43,44 Berard considered threshold differences in hearing of 5-10
dB to be significant. However this is contradicted by current knowledge of the
audiological system, where variations of 5-10 dB are well within the normal range of
variability.44 Berard claimed that AIT strengthened the middle ear muscles (ossicles),
which improved the ability to respond to loud sounds.43,44 He compared his form of
auditory training to physiotherapy given on an elbow stating that he made it a rule to
follow to the best of his ability, this kind of purely mechanical orientation in auditory
retraining. Maddell states that current knowledge of the auditory system makes this
theory implausible.44 It appears from Berard's writing, that he used very loud sounds on
people he tested, as he describes in detail, patient reactions when sound intensities of
the range 100-140 dB were used. There were no details given as to the doses that were
administered during treatments but if sound exposures were excessive, there is the
strong possibility of hearing loss and in such cases, there would certainly be a reduction
in hearing sensitivity. The effects of temporary and permanent threshold shifts, which
occur when the ear is subjected to certain sound level doses, are well known.
6. Diseases, conditions and disorders giving rise to auditory function deficits
6-27
Typical AIT treatment consists of 18-20 listening sessions of 30-minute intervals over
10 consecutive days. A specially designed sound processor deletes low and high
frequencies from music at random and this modulated music is transmitted to the
patient’s ear via headphones. Audiograms are taken before, at mid-point of the
treatment period, and at the conclusion of the course of treatment.
Major concerns raised by several authors include the insufficient number of high quality
peer reviewed published articles on this topic and the calibre of some practitioners who
have little or no professional training in audition.44 Much research and information is
anecdotal as there are major problems in reporting AIT data. The ideal double blind
studies are extremely difficult to report in children with autistic spectrum disorders and
other pervasive developmental disabilities. Unless there is a large number of subjects,
the matching of subjects remains a major obstacle. This is further compounded with the
huge variety or spectrum of symptoms found in children with autistic spectrum
disorders and other pervasive developmental disabilities. Due to the complexity of
carrying out double blind studies, other forms of effectively evaluating AIT data will
probably be needed.44
Tharpe42 and Madell44 draw attention to the placebo effect, which cannot be discounted.
When significant amounts of money are paid for a service, parents, carers or clients
usually have considerable expectation that it will work to justify the expense. This can
introduce bias, as those making the investment perceive it to work irrespective of
whether it does or not. If the practitioner or clinician, as well as the client have high
expectations, an even stronger placebo effect can occur.42,45 Studies by Yancer46 and
Zollweg47 incorporated placebo control groups in evaluating the effectiveness of AIT
with children diagnosed with auditory processing disorders and multiple handicaps.
Zollweg’s47 findings indicated that AIT did not appear to give any more benefits than
listening to ‘unmodulated’ music. Yancer46did not find significantly increased benefits
from those receiving no form of auditory treatment.
Madell suggests some criteria which should be mandatory as part of this procedure. As
current practitioners deliver music at sound pressure levels reaching 85 dB, equipment
should be regularly calibrated to ensure that permanent hearing loss doesn’t occur.
There is no evidence that current practitioners intentionally exceed this level. The
6. Diseases, conditions and disorders giving rise to auditory function deficits
6-28
patient should be fully evaluated by a clinician who is competent in the fields of
audition, speech language development and developmental psychology.44
Preliminary data reported by Madell indicate that this procedure may be effective for
some children.44 Janzen20 has also reported that AIT appears to have helped individuals
with autism that have highly sensitive hearing but, as yet, the efficacy of AIT appears
inconclusive.42 There have been some questions raised as to whether AIT should be
considered an educational aid or tool rather than a form of treatment. If AIT is
promoted solely as an educational aid rather than a medical device, it probably would
not fall under the jurisdiction of the US FDA or the New Zealand Ministry of Health for
approved medical devices and treatments. However if promoted solely on this basis, it
could not be promoted as a device for treating or curing any condition associated with
autistic spectrum disorder, attention-deficit/hyperactivity disorder or any physical or
mental condition.
6.6 Central auditory processing disorder (CAPD)
Hall and Muellar48 have defined central auditory processing disorder as a deficiency in
transmitting auditory impulses to the higher brain centres while receptive aphasia
(language deficiency) is a deficiency in the interpretation of these impulses after they
have been transmitted. Assessment is carried out with a comprehensive test battery of
behavioural tests with proven sensitivity to central auditory dysfunction. These include:
• Dichotic word tests
• Dichotic sentence tests
• Speech- competition test
• Auditory sequencing test
Peripheral auditory function will normally be evaluated with pure tone audiometry,
word recognition, and aural immittance measures (eg tympanometry) and otoacoustic
emissions for cochlear function.48 For young children (up to age 7), the diagnosis of
CAPD is difficult due to the level of speech and auditory development.51
6. Diseases, conditions and disorders giving rise to auditory function deficits
6-29
Hall and Muellar list the key auditory components of auditory processing as:48
• Auditory discrimination: the ability to distinguish similarities and differences
in sounds
• Auditory memory: The ability to retain information via the auditory channel
• Auditory perception: The ability to receive, process and understand sounds
• Auditory vocal association: the ability to draw relationships over what is heard
• Auditory synthesis: The ability to combine smoothly all the sounds or syllables
of words to make them whole or to analyse a word into its separate sounds
• Auditory vocal automacity: The ability to predict future linguistic events from
past experience
• Auditory figure-ground: The ability to distinguish and process important
information by bringing it to the focus of attention while relegating other
unimportant sounds to the background
The ASHA* Task Force (convened to define and develop coherent statements on the
understanding of this condition), describe a CAPD as an observed deficiency in one or
more of a group of mechanisms and processes related to auditory behaviours49 Keith50
states that individuals with a CAPD have difficulties with all types of acoustic
distortions of auditory information including reverberation, background noise, rapid
speech and competing speech. Any speech signal such as speech presented in less than
optimal conditions is difficult for these individuals to understand. Hayes51 states that
features of conditions such as autistic spectrum disorder (ASD), central auditory
processing disorder (CAPD), attention-deficit/hyperactivity disorder (ADHD) and
dispraxia can overlap which make differential diagnosis a challenge with some children.
The problem of understanding CAPD becomes more complex when other conditions
co-exist involving language delay, learning difficulties, reading disorders etc.50 A child
presenting with ASD may also meet the criteria for CAPD. However the difficulties in
social interactions and rigidities characteristic of ASD cannot be explained by the
criteria of CAPD.51
There appears confusion with criteria for ADHD and CAPD. In the experience of Hall
and Muellar48 they stipulate that ADHD and CAPD are independent and unrelated
* ASHA = The American Speech Language Hearing Association
6. Diseases, conditions and disorders giving rise to auditory function deficits
6-30
disorders. However the following characteristics can be shared between children
diagnosed with either condition:
• Male to female ratio of 2:1
• Depressed academic performance
• Seems not to listen
• Easily distracted
For young children (up to age 7) the diagnosis of CAPD is difficult with the above
audiological procedures.
6.7 Attention-deficit/hyperactivity disorder (ADHD)
A 19th century German physician, Heririch Hoffman, is credited with the first person to
describe the condition and to prepare a case description of a child showing symptoms of
the disorder.52 It was first labelled as brain damage syndrome following an encephalitis
outbreak in the USA in 1917 –1918 where a large number of children recovering from
the condition showed symptoms of hyperactivity and short attention span. Later work
found that all children who exhibited these symptoms did not suffer brain damage so the
term was changed to minimal brain dysfunction. Various other terms followed until in
1980 when the American Psychiatric Association described the condition as attention-
deficit disorder (ADD) with or without hyperactivity. In 1987, the term was again
modified to attention-deficit/hyperactivity disorder (ADHD) along with a revision of the
diagnostic criteria. There has been some debate and criticism over the loss of
distinction between attention-deficit disorder with or without hyperactivity. In the
current Diagnostic and Statistical Manual of Mental Disorders,19 the disorder is
described as attention-deficit/hyperactivity disorder. For the purposes of this work the
terms attention-deficit disorder (ADD) and attention-deficit/hyperactivity disorder
(ADHD) are synonymous.
Diagnosis and treatment of ADHD has proved difficult, complex and subject to much
debate in New Zealand. This disorder could be described as among the most invisible

6. Diseases, conditions and disorders giving rise to auditory function deficits
6-31
of psychiatric disorders, where there is often no dysmorphic or physical appearance.
The New Zealand Ministry of Health has recently produced a set of guidelines for the
assessment and treatment of this disorder.53 Diagnosis is made by reference to the
‘DSM-1V Diagnostic Criteria for Attention-Deficit/Hyperactivity Disorder.’19
The aetiology of attention-deficit/hyperactivity disorder (ADHD) is likely to involve
neurological and genetic factors with hereditary factors thought to account for most of
the variance. The New Zealand Ministry of Health cites studies now receiving
considerable support, which suggest an organic neurological problem involving frontal
lobes and/or basal ganglia in the brain.54 The Ministry also finds that social factors
alone are now not considered an aetiological cause, but may exacerbate pre-existing
symptoms and genetic vulnerability.
The symptoms of ADHD have been divided into the following 3 subgroups:
1. Predominantly inattentive type
2. Predominantly hyperactivity type
3. Combined type
Symptoms include persistent hyperactivity, impulsiveness and inattention.53 These are
characterised by difficulties in sustaining effort and persistence, organisation skills and
disinhibition.54 Inattention items include:53
• Failure to give close attention to details and making of careless mistakes in tasks
and activities
• Difficulty in sustaining attention
• Inability to follow through on instructions and failure to complete tasks such as
schoolwork, chores, duties etc
• Difficulty in organizing tasks or activities, and forgetfulness in daily activities
• Appearance of not seeming to listen when spoken to directly
• The problem of being easily distracted by extraneous stimuli (e.g. noise)
Hyperactivity items include:
• Fidgeting and squirming
• Leaving the seat when expected to be seated
• Running or climbing excessively when inappropriate
• Having difficulty in playing or engaging in leisure activities
6. Diseases, conditions and disorders giving rise to auditory function deficits
6-32
• Talking excessively and acting as driven by a motor
Impulsiveness items include:
• Difficulty in awaiting their time (turn) for something
• Interrupting and intruding on others
The preschool years are the most difficult in the parents' life and in the management of
these children, which can also include sleeping problems, toilet training problems, and
delays in speech and motor skills. If these children enter schools they are at a higher
risk of low cognitive and academic performance, including reading skills. Overseas
research has found persistent disruptive behaviour, in children, experiencing ADHD and
other such disorders, and this is a powerful predictor of poor adjustment in adolescence
and adult hood.
ADHD in preschool age is a most important target for intervention where a severe and
persistent condition exists. One issue, which appears clinically difficult, is the
coexistence (comorbidity) of other related conditions. Comorbidity is a significant
issue for children with ADHD and it is important to identify other comorbid disorders,
which may be present. The New Zealand Ministry of Health53 estimates that 54-67% of
ADHD also experience oppositional defiant disorder, which manifests in a range of
negativistic, hostile and such anti-social behaviours. Other comorbid disorders
identified include a conduct disorder (20 – 56%), specific development disorders such
as reading disability (8-39%), speech problems (12-27%) and in adolescence, substance
abuse disorder at a rate 2-5 times that of the general population. Autistic spectrum
disorders have also been listed as a comorbid condition of ADHD. Adolescents with
comorbid oppositional defiant and conduct disorders have a higher risk of adverse
outcomes.53
Children experiencing these disorders find it difficult to screen out unimportant
information and focus on everything in the environment rather than attending to a single
activity.54 Background noise in the classroom becomes a major distraction, affecting
their ability to learn and concentrate.55
These children often become noisier as they concentrate more intently and seem to need
to self-talk or make other noise to focus on the task at hand. This can often be
6. Diseases, conditions and disorders giving rise to auditory function deficits
6-33
misinterpreted in the classroom or learning environment, when a teacher believes the
child is becoming noisier because he/she is not working. Allowances are needed for
such productive and involuntary noisiness.56
Selikowitz summarises the characteristics of children with ADHD which include:56
• Having greater difficulties with auditory rather than visual attention
• Having attention which quickly fades, with tedious tasks testing their attention
the most
• Having performance inconsistency, which is characteristic of an immature or
attention ability
• Moving from one thing to another and maybe lacking self-direction or being
unable to occupy themselves. They can quickly become bored, disruptive and
attention seeking
• Being easily distracted in classroom or similar learning environment
• Having difficulty in changing their level of attention during transitions from one
setting to another
• Often becoming noisy when attending appropriately to a task
6.8 Down syndrome Children with Down syndrome are well known to have specific deficits in language,
which are often exacerbated by conductive hearing loss caused by middle ear
infections.12 A study reported by Bennetts and Flynn12 reports that 33% of children
with Down syndrome have a fluctuating hearing loss and 33% suffer a permanent loss.
Like the children with other disabilities mentioned above, children with Down
syndrome are especially disadvantaged as their specific deficits in language are further
exacerbated by hearing loss.
6.9 Learning spaces Children experiencing an auditory problem can often find speech and communication
very difficult to isolate and process when set against high levels of background noise.
These levels come from outside activities, teaching activities and other noise generated
inside, all of which can be exacerbated by room reverberation. Strategies are needed to
obtain the optimum room construction and perhaps a change in room culture and
6. Diseases, conditions and disorders giving rise to auditory function deficits
6-34
methods of teaching. In particular the effects of noisy learning spaces and activities on
those experiencing disabilities including auditory function deficit, need thorough
investigation. There are likely to be many undiagnosed children in the education
system with ‘invisible’ disabilities. Their needs are less likely to be met than those of
children with known disabilities receiving additional resourcing and support.
6.10 The New Zealand Disability Strategy The New Zealand Government has developed ‘The New Zealand Disability Strategy
2001,’ a long-term policy document and embarked on wide ranging consultation
process in the latter half of 2000. The strategy, which is based on a social model of
disability,57 recognises that people experiencing disability face significant barriers in
achieving a full quality of life in areas such as attitudes, education, employment and
access to services. Objective 3 of The New Zealand Disability Strategy, 200158 is to
“Provide the best education for disabled people” by improving education so that all
children, youth and adult learners will have equal opportunities to learn and develop in
their local or regular education centres. As the classroom-learning environment is one
of the most important factors in education, any effort to improve this is likely to be of
great benefit to all children but especially those with auditory function disabilities.
6.11 Building standards A number of countries are already in the process of formulating standards for control of
and reducing noise in classrooms and learning spaces.18 Wilson et al15 have
recommended that all new classrooms and similar learning spaces should be designed to
meet the acoustical standards specified in ‘AS/NZS 2107:2000’.59 A proposal to require
appropriate acoustical standards for new classrooms and learning spaces in New
Zealand has been made and is now being considered as part of the current review of
New Zealand Building Code. Literature to date on noise in schoolrooms, appears to
focus on the effects on the general school children, their teachers and the hearing
impaired. Only limited attention appears to be given to those students experiencing the
other disabilities involving auditory function deficit. It is imperative that the needs of
all children experiencing auditory function deficit are investigated along with all other
6. Diseases, conditions and disorders giving rise to auditory function deficits
6-35
children, so that appropriate measures can be included in legislation, policy and
standards to be promulgated in future.
6.12 Summary While the most familiar of the conditions affecting hearing and auditory function is
probably hearing impairment, there are a number of children with other conditions, that
affect their ability to adequately process auditory information.
Otitis media with effusion (glue ear) can be a serious condition in young children if left
untreated, as the prolonged condition can cause serious damage to the middle ear and
inner ear structures resulting in hearing loss. This has major consequence for this
population in the development of speech, communication and being able to learn
effectively in educational settings.
Children on the autistic spectrum are another group seriously affected by noise as the
majority of them experience a sensory integration disorder, which is defined as a deficit
in the neurological process of organizing information through sensory input. A subset
of gifted children also experiences this condition. Children experiencing this condition
often have extreme sensitivities to certain kinds of noise along with other sensory
stimuli, which are described as painful and disorientating. In addition these children
suffer a range of other auditory processing difficulties such as ‘Gelstalt perception,’ a
difficulty to filter out important auditory information such as the teacher's voice against
background noise. They can have the most fundamental difficulties with language
which include a delayed processing of speech. They often have a literal interpretation
of what they comprehend without understanding the nuances of many common phrases
such as, "Pull your socks up."
A key development in the communication framework being used with these children is
the use of visual communication messages such as the picture exchange system (PECs),
which is now widely used, in educational settings and in the home.
6. Diseases, conditions and disorders giving rise to auditory function deficits
6-36
Other therapies have been developed such as sensory integration therapy to response to
sensory integration disorder and auditory integration training (AIT) as a treatment for
those individuals with sensory auditory problems.
Sensory integration therapy has been accepted by reputable institutions such as the
American Occupational Therapy Association, and is now widely used. On the other
hand, auditory integration training remains controversial eliciting fierce debate between
advocates and detractors of the therapy. The efficacy of this treatment remains
unresolved.
Other groups of children affected by noise include those experiencing central auditory
processing disorder, Down syndrome due to their deficits in language along with higher
than normal levels of persistent middle ear infection and attention-deficit/hyperactivity
disorder due to the major distraction that noise presents for them in a learning
environment.
The New Zealand Disability Strategy 2001, has become a cornerstone of government
policy, if not yet embodied into legislation. Objective 3 of the strategy advocates the
provision of the best education for disabled people. This would include the recognition
of children with identifiable needs and strategies put in place to facilitate their
education. It should also include the provision of appropriate acoustical learning
environments. It is imperative that the needs of all children with auditory problems are
investigated and recognised so that appropriate measures can be included in legislation,
policy and standards to be promulgated in the future.
6. Diseases, conditions and disorders giving rise to auditory function deficits
6-37
6.13 References 1 Public Health Commission, Preventing child hearing loss: Guidelines for public
health services. 1995, Wellington: Public Health Commission.. 2 Occupational Safety and Health., Noise-induced hearing loss : A guide for
medical practitioners. 1994, Wellington: Department of Labour. (Retrieved October 2006 from http//:www.dol.govt.nz )
3 Allen, P., Understanding ear infections. 2002, Whangarei: Dr Peter Allen. 4 Onusko, E., Tympanometry. American Family Physician, 2004. 70(9). 5 Ferguson, A., Tympanometry. in ANZAI Conference. 2004. Auckland: Academy
of New Zealand Audiometrists Inc.(Retrieved on 7 November 2006 from www.anzai.co.nz/tympanometry.htm
6 Hall, J., Muellar, H., Audiologists' desktop reference : Diagnostic audiology,
principles, procedures, and practices. Vol. 1. 1997: Singular Thomson Learning.
7 Wong, D., Whaley and Wong's nursing care of infants and children. 5th ed, ed.
D. Wilson. 1995: Mosby. 8 Allen, P., What is glue ear? 1981, Dr Peter Allen: Whangarei. (Audiovisual
material). 9 Hood, D.A., Elliot, R.B., A comparative survey of the health of elite Maori and
Caucasian children in Auckland. New Zealand Medical Journal, 1975. 81: p. 242-3.
10 Public Health Commission (New Zealand), Child hearing loss. The Public
Health Commission's advice to the Minister of Health. 1994, Wellington: Public Health Commission.
11 White, G.W., (2008) Personal communication. 12 Bennetts, L., Flynn, M., Improving the classroom listening skills of children with
Down syndrome by using sound -field amplification. Down Syndrome Research and Practice, 2002. 8(1): p. 19-24.
13 Flexer, C., Individual and sound -field FM systems, Rationale description and
used. Volta Review, 1997. 99(3): p. 133-162. 14 Classrooms fail noise test., Issue 3, August 2000, in Education Today.
6. Diseases, conditions and disorders giving rise to auditory function deficits
6-38
15 Wilson, O., Valentine, J., Halstead, M., McGunnigle, K., Dodd, G., Hellier, A,
Wood, J, Simpson, R., Classroom acoustics, a New Zealand Perspective. 2002: Oticon Foundation in New Zealand.
16 Nelson, P.B., Soli, S., Acoustical barriers to learning: Children at risk in every
classroom. Language, Speech and Hearing Services in Schools, 2000. 31: p. 356-361
17 Wolf, D.B., J. Glenn J., Gardener, H., To use their minds well: investigating new
forms of student assessment. Review of Research in Education, 1991. 17: p. 31-74.
18 International Institute of Noise Control Engineering (I-INCE), TECHNICAL
INITIATIVE #4 : Noise and reverberation control for schoolrooms. 2000., International Institute of Noise Control Engineering (I-INCE) (Retrieved from http://users.adol.com/iince/tech), on 8August 2000).
19 American Psychiatric Association, Diagnostic and statistical manual of mental
disorders. 4th ed. 1994., Washington, DC: American Psychiatric Association. 20 Janzen, J.E., Understanding the nature of autism. 1996, Texas: Therapy Skill
Builders. 21 Cashin, A.J., Autism: Understanding conceptual processing deficits. Journal of
Psychosocial Nursing, 2005. 43(4): p. 22-29. 22 Shields, J., NAS early bird programme - Parent manual. 1998, United Kingdom:
National Autistic Association 23 Grandin, T. An inside view of autism. Center for the Study of Autism (CSA),
Salem, USA. Retrieved May 2005 from http://www.autism.org/temple/inside.html), (undated).
24 Kranowitz, C., The out-of-sync child -recognising and coping with sensory
integration dysfunction. . 1998, New York:: Berkley Publishing Group. 25 Jackson, J. The identification of sensory preferences in children with an Autistic
Spectrum Disorder. in Awares Online Conference. 2006. Retrieved 1 October 2006 from http://www.awares.org/conferences.
26 Maxwell, E., Personal communication, 2005, Denver: Gifted Development
Centre. 27 Çronin, A., A synchronous development and sensory integration intervention in
the gifted and talented population. 2003, Davidson Institute for Talent Development (from GT Cyber-Source).
6. Diseases, conditions and disorders giving rise to auditory function deficits
6-39
28 Mauer, D., Issues and applications of sensory integration theory with children
with language disorders. Language, Speech and Hearing Services in Schools, 1999. 30(4): p. 383-391.
29 Ottenbacher, K., Sensory integration therapy: Affect or effect? American Journal
of Occupational Therapy, 1982. 36(9): p. 571-578. 30 Ayres, A., Sensory integration and learning disorders. 1972, Los Angeles, CA.:
Western Psychological Services. 31 Ayres, A., Sensory integration and the child. 1979, Los Angeles, CA: Western
Psychological Services. 32 Fisher, A., Murray, E., Bundy, A., Sensory integration: Theory and practice.
1991, Philedelphia, PA:: E. A. Davis. 33 Trott, M., Laurel, M., Wondeck, S., Understanding sensory integration. 1993,
Tuscon, AZ.: Therapy Skills Builders. 34 Bogodashina, D., Sensory Issues in Autism are recognised but…, in Awares
Online Conference, 2006: Retrieved 25 September 2006 from http://www.awares.org/conferences.
35 Tomchek, S., Geis, R., Sensory processing, communication and intervention
strategies for the child with an autistic disorder. Sensory Intergration Special Interest Newsletter, 1996. 35: p. 125-128.
36 Griffer, M., Is sensory integration effective for children with language-learning
disorders? A critical review of the evidence. Language, Speech and Hearing Services in Schools, 1999. 30(4): p. 393- 399.
37 Gorman, P., Sensory dysfunction in dual diagnosis: Mental retardation/mental
illness and autism. Occupational Therapy in Mental Health, 1997. 13(1): p. 3-22.
38 Freeman, S., Dake, L., Teach me language: A language manual for children
with autism, Asperger's syndrome and related developmental disorders. 1997, Langley, B.C.: SKF Books.
39 Hodgdon, L., Visual strategies for improving communication. 1995, Troy,
Michigan.: Quirk Roberts Publishing. 40 Stirling, P., NOW HEAR THIS: Suddenly "Listen to the teacher" makes sense., in
New Zealand Listener. 2001. 41 Searle, C. Personal Communication. Ministry of Health, 2001.
6. Diseases, conditions and disorders giving rise to auditory function deficits
6-40
42 Tharpe, A.M. Clinical forum: Auditory integration training: The magical
mystery cure. Language Speech and Hearing Services in Schools, Washington, 1999.
43 Berard, G., Hearing equals behavor. 1993, USA: Keats Publishing Inc. 44 Maddell, J., R., Auditory Integration Training: One clinician's view. Language,
Speech and Hearing Services in Schools, 1999. 30: p. 371-377. 45 Evans, F.J., Expectancy, therapeutic instructions and the placebo response., in
Placenbo: Theory, research and mechanisms., L. . White, Tursky, B, Schwartz, G.E., Editor. 1985., Guilford Press,: New York.
46 Yancer, K., The effects of auditory integration training for children with central
processing disorders. American Journal of Audiology, 1998. 7(2): p. 32-44. 47 Zollweg, W., Vance, V., Palm, D., The efficacy of auditory integration training:
A double blind study. American Journal of Audiology, 1997. 6(3): p. 39-47. 48 Hall, J., Mueller, H, Audiologist's desktop reference. 1997, San Diego: Singular
Publishing Group. 49 American Speech - Language Hearing Association Task Force on Central
Auditory Processing Consensus Development, Current status of research and implications for clinical practice. American Journal of Audiology, 1996. 5: p. 41-54.
50 Keith, R., Clinical issues in central processing disorders. Language, Speech and
Hearing Services in Schools, 1999. 30(4): p. 339-387. 51 Hayes, L., Personal communication. 2006, Group Special Education, Ministry
of Education: Wellington. 52 Braswell, L., Bloomquist, M., Cognitive -behavioral therapy with ADHD
children - child family and school interventions. 1991, New York: Guilford Press,.
53 Ministry of Health, New Zealand guidelines for the assessment and treatment of
Attention-Deficit/Hyperactivity Disorder. 2001, Wellington, New Zealand: Ministry of Health.
54 Ministry of Education, Attention deficit disorder/Attention deficit hyperactivity
disorder - A resource for teachers. (undated): Ministry of Education. 55 Wynne-Williams, R. 2001, Personal Communication, School of Humanities and
Social Sciences, Massey University: Wellington. 56 Selikowitz, M., All about ADD, understanding attention deficit disorder. 1995,
New York: Oxford University Press.
6. Diseases, conditions and disorders giving rise to auditory function deficits
6-41
57 Oliver, M., Understanding disability, from theory to practice. 1996, London:
Macmillian Press Ltd. 58 Minister for Disability Issues, The New Zealand Disability Strategy: Making a
world of difference: Whakanui Oranga. 2001, Wellington: Ministry of Health. 59 Australian and New Zealand Standard, AS/NZS2107:2000 - Recommended
design sound levels and reverberation times for building interiors. 2000.: Standards New Zealand.
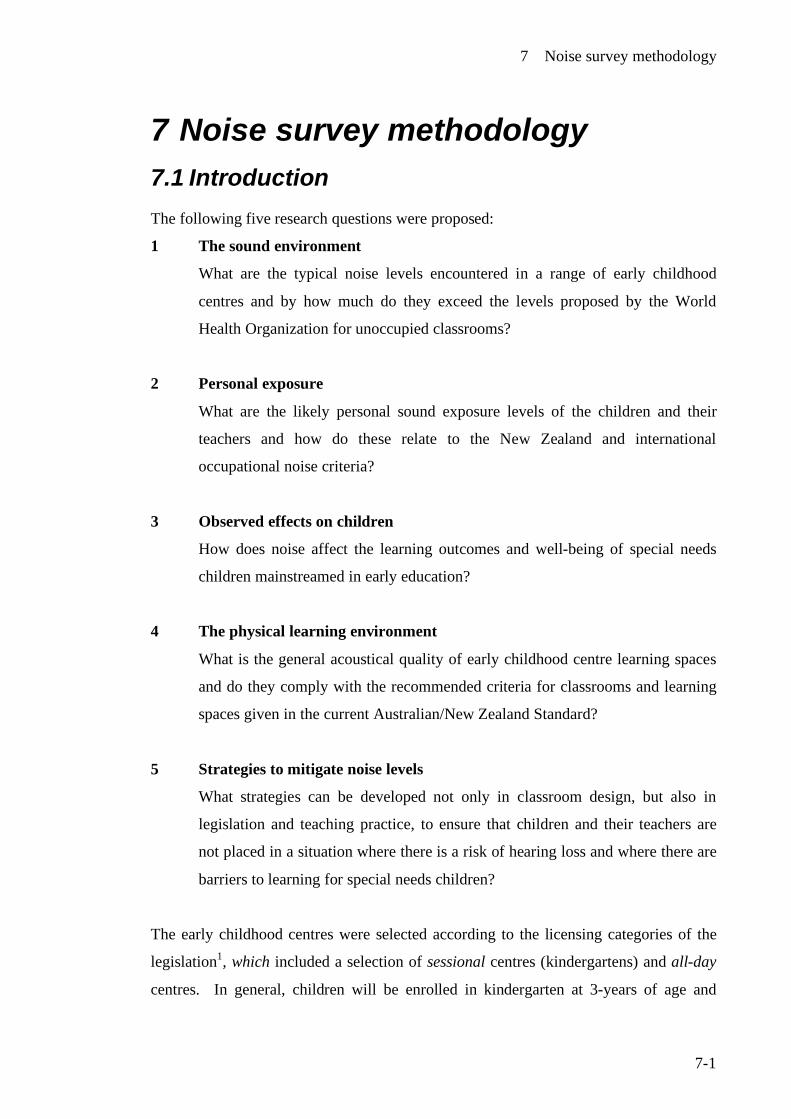
7 Noise survey methodology
7-1
7 Noise survey methodology 7.1 Introduction The following five research questions were proposed:
1 The sound environment
What are the typical noise levels encountered in a range of early childhood
centres and by how much do they exceed the levels proposed by the World
Health Organization for unoccupied classrooms?
2 Personal exposure
What are the likely personal sound exposure levels of the children and their
teachers and how do these relate to the New Zealand and international
occupational noise criteria?
3 Observed effects on children
How does noise affect the learning outcomes and well-being of special needs
children mainstreamed in early education?
4 The physical learning environment
What is the general acoustical quality of early childhood centre learning spaces
and do they comply with the recommended criteria for classrooms and learning
spaces given in the current Australian/New Zealand Standard?
5 Strategies to mitigate noise levels
What strategies can be developed not only in classroom design, but also in
legislation and teaching practice, to ensure that children and their teachers are
not placed in a situation where there is a risk of hearing loss and where there are
barriers to learning for special needs children?
The early childhood centres were selected according to the licensing categories of the
legislation1, which included a selection of sessional centres (kindergartens) and all-day
centres. In general, children will be enrolled in kindergarten at 3-years of age and
7 Noise survey methodology
7-2
attend 2-hour sessions in the afternoon for 3 days a week. Children 4-5 years of age
attend 3-hour sessions in the morning for 5 days a week. All-day centres principally
provide childcare for working parents and those who choose full time early education.
This sector caters for newborn babies right up to age 5. Centres are licensed as required
by the legislation as either all-day centres (Part 1) or sessional centres (Part 2).1 Within
each part, there are separate licensing sub-categories for children under 2-years old (all
under 2) and those 2-years old and over (all 2 or over). There is an additional licensed
category for mixed ages which in effect combines the 2 age sub-categories allowing
children from new-born to 5 years of age to be present in the same centre. This mixed
age licence will only be granted where the Secretary (of Education) is satisfied that
sufficient care and protection is provided for children less than 2-years old (Regulation
37).1 In mixed centres there is usually a physical separation of the children under 2-
years old and those 2-years old and over with separate rooms play areas etc to meet the
requirements of the Secretary.
7.2 Study development and rationale
The results of the pilot study (Chapter 3) revealed the need for a comprehensive study
measuring general noise levels inside learning spaces and the personal sound exposure
of the children and their teachers. The following research protocol was designed:
1. Fixed sound level measurements were carried out over the full day for all day
centres and for individual sessions in the sessional centres. Other areas such as
playgrounds and additional spaces such as sleep areas were separately
monitored if the centre provided separate sleeping rooms. (Details of these
measurements are presented in section 7.5 of this chapter).
2. Following an assessment of the suitability of the new lightweight doseBadges,
these device were acquired to carry out personal sound exposure of individual
children as well as teaching staff. (Details of these measurements are presented
in section 7.5 of this chapter).
7 Noise survey methodology
7-3
3. To gauge information and feedback on learning spaces, the effects of noise on
children and to identify the at-risk groups, a questionnaire was developed. (See
7-8 Questionnaire survey and 14.6 Appendices).
4. A building and environmental inspection was conducted by the researcher while
on the premises using a checklist developed for consistency. Building
construction details likely to affect acoustical quality of the learning spaces
along with activities in the vicinity significantly contributing to background
noise were recorded. The acoustical quality of each learning space was
determined by the measurement of reverberation time (T60) over the audible
frequencies and comparing to the current standard for learning spaces. The
building and environmental inspection/survey is presented in chapter 10.
5. The study appeared to raise issues with teaching staff over their aural health
resulting in the managers of 3 large inner city childcare centres requesting
hearing tests and so this was included in the study. (This is reported in Chapter
11.)
6. Finally the New Zealand Ministry of Education conducted a major revision of
the New Zealand early childhood legislation over the same period of time as
this work was carried out. Officials sought advice on how noise could be
controlled in legislation given the current level of resources and expertise
available. This resulted in a critical review of legislative frameworks, which
had precedence in New Zealand legislation. A proposal was developed and
submitted to the Ministry as part of the consultation process. (This is reported
in Chapter 12).
7.3 Ethical requirements
As the study involved preschool children as participants and hearing testing of teachers,
full ethics committee approvals were required. Details are given in 14-1 Appendices.
7 Noise survey methodology
7-4
7.4 Selection of early childhood centres
Early childcare centres in New Zealand are licensed by the Ministry of Education,
which kindly provided a list of all licensed centres in the areas where the study was
planned. The study was centred in the Greater Wellington area with centres in the
Auckland and Manawatu regions also included. Approximately 50 centres were
selected to be included in the study subject to approval being gained from the centre
managers and governing bodies. Of these, 20 all-day centres and 12 sessional centres
participated. An effort was made to select a wide variety of centres including those
with a range of demographics and in varying locations (i.e. inner city, suburban, rural).
Governing bodies were firstly approached and after consent was received, individual
centres under their jurisdiction were approached and invited to take part. After
receiving the necessary approvals, all parents of children were circulated with a notice
informing them of the project. Teachers were asked to nominate suitable children to
directly participate by wearing doseBadges. The teachers had the right to choose any
child they wished due to their knowledge of individual children and their parents.
However the following guidelines were provided:
• A mix of genders
• Varying personalities (eg the quiet v the exhuberant)
• Avoid children who may be troubled by the doseBadges
• Avoid children who may be more prone to cause damage to the doseBadges (eg
those who often are wet with water play)
• Avoid children of oversensitive parents or those likely to object
Parents of these children were sent comprehensive information sheets and consent
forms for signing. No objections were received from any parents of children at any
centres which participated. Sample letters are included in 14-1 Appendices.
All centres were evaluated over one day with evaluations in approximately half of the
centres being extended to a second and third day due to special circumstances such as a
failure of equipment, the need for more information or other activities of interest.
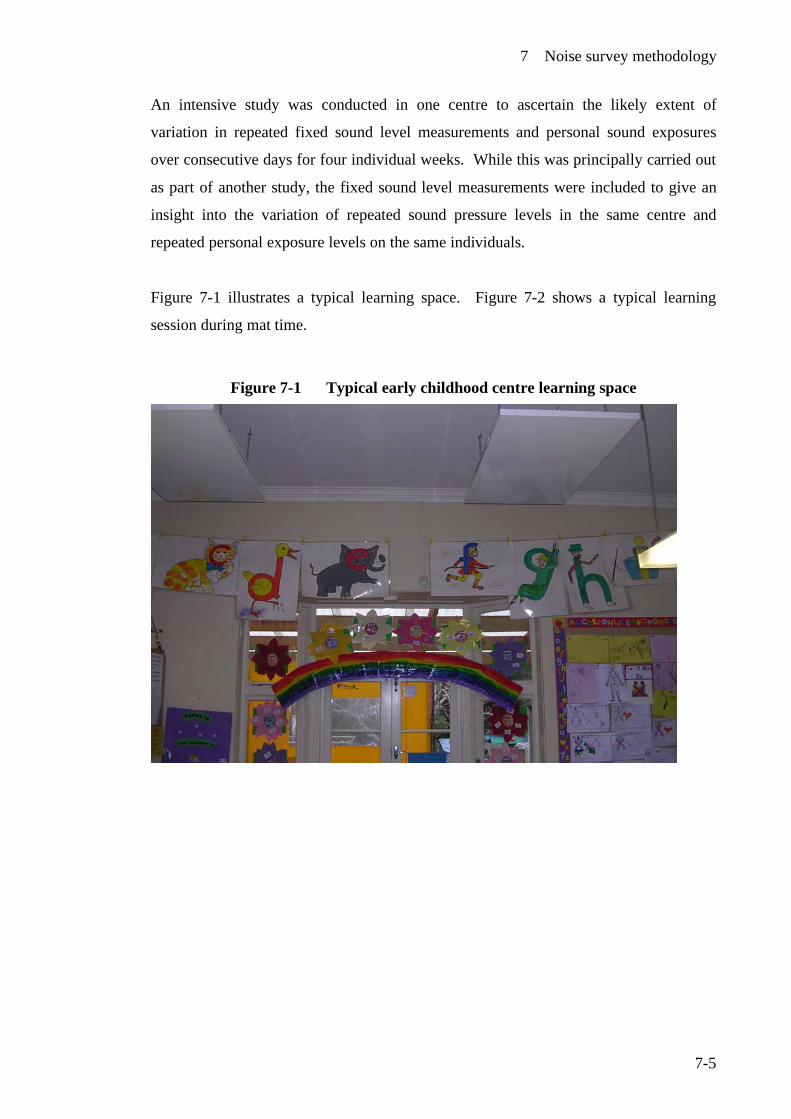
7 Noise survey methodology
7-5
An intensive study was conducted in one centre to ascertain the likely extent of
variation in repeated fixed sound level measurements and personal sound exposures
over consecutive days for four individual weeks. While this was principally carried out
as part of another study, the fixed sound level measurements were included to give an
insight into the variation of repeated sound pressure levels in the same centre and
repeated personal exposure levels on the same individuals.
Figure 7-1 illustrates a typical learning space. Figure 7-2 shows a typical learning
session during mat time.
Figure 7-1 Typical early childhood centre learning space
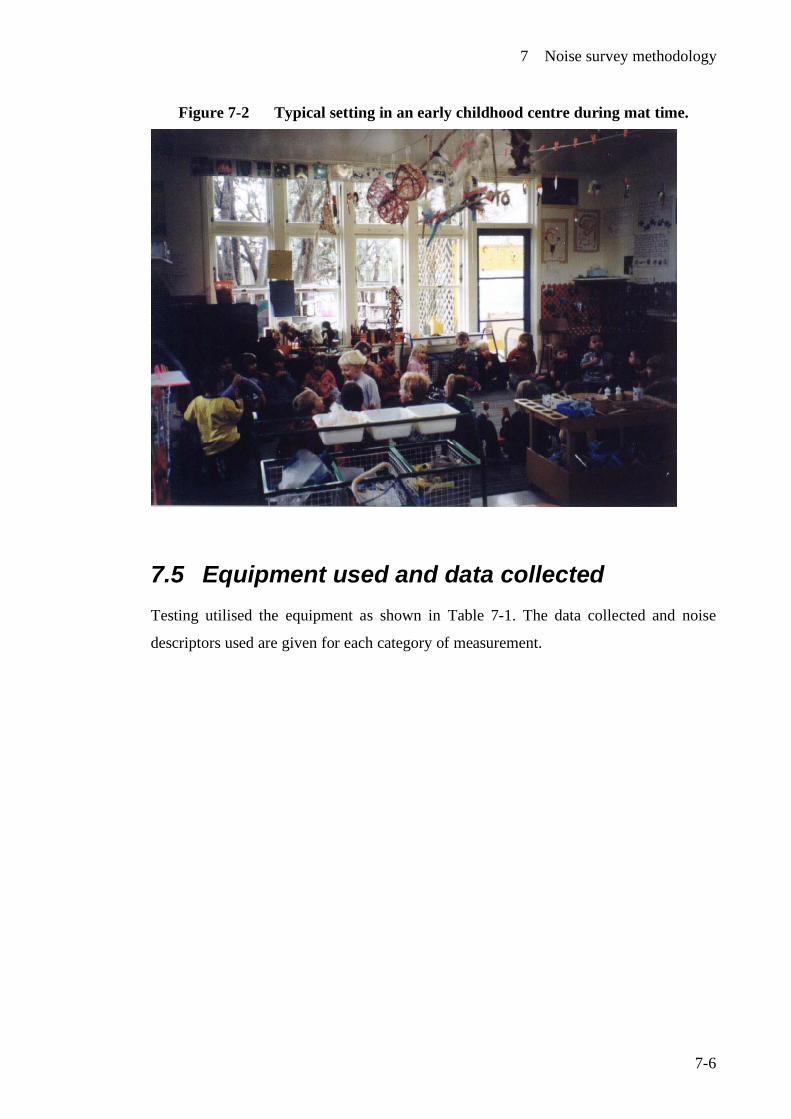
7 Noise survey methodology
7-6
Figure 7-2 Typical setting in an early childhood centre during mat time.
7.5 Equipment used and data collected Testing utilised the equipment as shown in Table 7-1. The data collected and noise
descriptors used are given for each category of measurement.
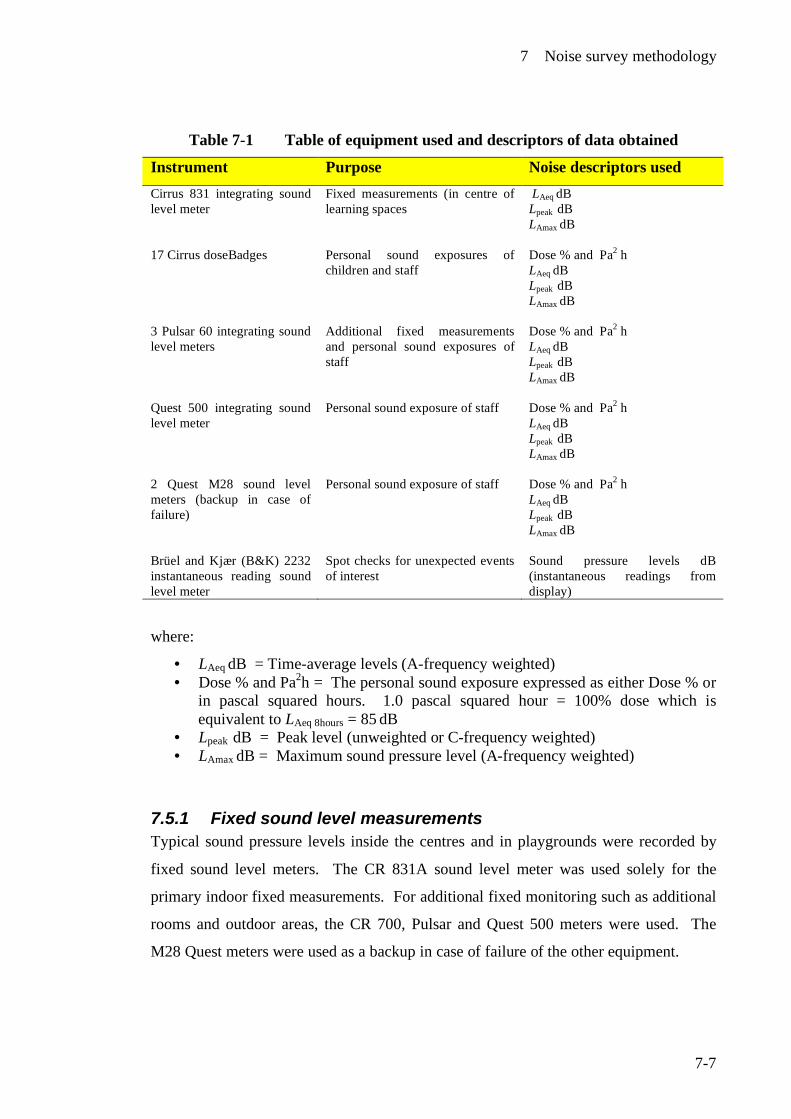
7 Noise survey methodology
7-7
Table 7-1 Table of equipment used and descriptors of data obtained
Instrument Purpose Noise descriptors used Cirrus 831 integrating sound level meter
Fixed measurements (in centre of learning spaces
LAeq dB Lpeak dB LAmax dB
17 Cirrus doseBadges Personal sound exposures of children and staff
Dose % and Pa2 h LAeq dB Lpeak dB LAmax dB
3 Pulsar 60 integrating sound level meters
Additional fixed measurements and personal sound exposures of staff
Dose % and Pa2 h LAeq dB Lpeak dB LAmax dB
Quest 500 integrating sound level meter
Personal sound exposure of staff
Dose % and Pa2 h LAeq dB Lpeak dB LAmax dB
2 Quest M28 sound level meters (backup in case of failure)
Personal sound exposure of staff Dose % and Pa2 h LAeq dB Lpeak dB LAmax dB
Brüel and Kjær (B&K) 2232 instantaneous reading sound level meter
Spot checks for unexpected events of interest
Sound pressure levels dB (instantaneous readings from display)
where:
• LAeq dB = Time-average levels (A-frequency weighted) • Dose % and Pa2h = The personal sound exposure expressed as either Dose % or
in pascal squared hours. 1.0 pascal squared hour = 100% dose which is equivalent to LAeq 8hours = 85 dB
• Lpeak dB = Peak level (unweighted or C-frequency weighted) • LAmax dB = Maximum sound pressure level (A-frequency weighted)
7.5.1 Fixed sound level measurements Typical sound pressure levels inside the centres and in playgrounds were recorded by
fixed sound level meters. The CR 831A sound level meter was used solely for the
primary indoor fixed measurements. For additional fixed monitoring such as additional
rooms and outdoor areas, the CR 700, Pulsar and Quest 500 meters were used. The
M28 Quest meters were used as a backup in case of failure of the other equipment.
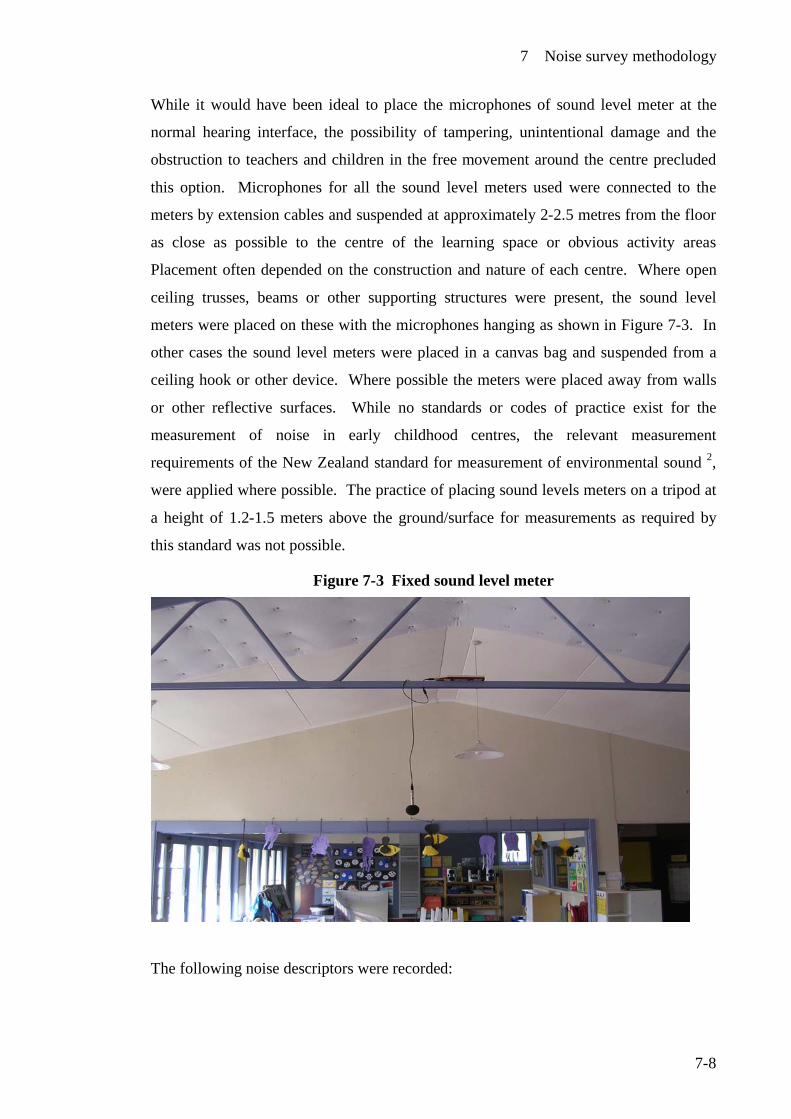
7 Noise survey methodology
7-8
While it would have been ideal to place the microphones of sound level meter at the
normal hearing interface, the possibility of tampering, unintentional damage and the
obstruction to teachers and children in the free movement around the centre precluded
this option. Microphones for all the sound level meters used were connected to the
meters by extension cables and suspended at approximately 2-2.5 metres from the floor
as close as possible to the centre of the learning space or obvious activity areas
Placement often depended on the construction and nature of each centre. Where open
ceiling trusses, beams or other supporting structures were present, the sound level
meters were placed on these with the microphones hanging as shown in Figure 7-3. In
other cases the sound level meters were placed in a canvas bag and suspended from a
ceiling hook or other device. Where possible the meters were placed away from walls
or other reflective surfaces. While no standards or codes of practice exist for the
measurement of noise in early childhood centres, the relevant measurement
requirements of the New Zealand standard for measurement of environmental sound 2,
were applied where possible. The practice of placing sound levels meters on a tripod at
a height of 1.2-1.5 meters above the ground/surface for measurements as required by
this standard was not possible.
Figure 7-3 Fixed sound level meter
The following noise descriptors were recorded:
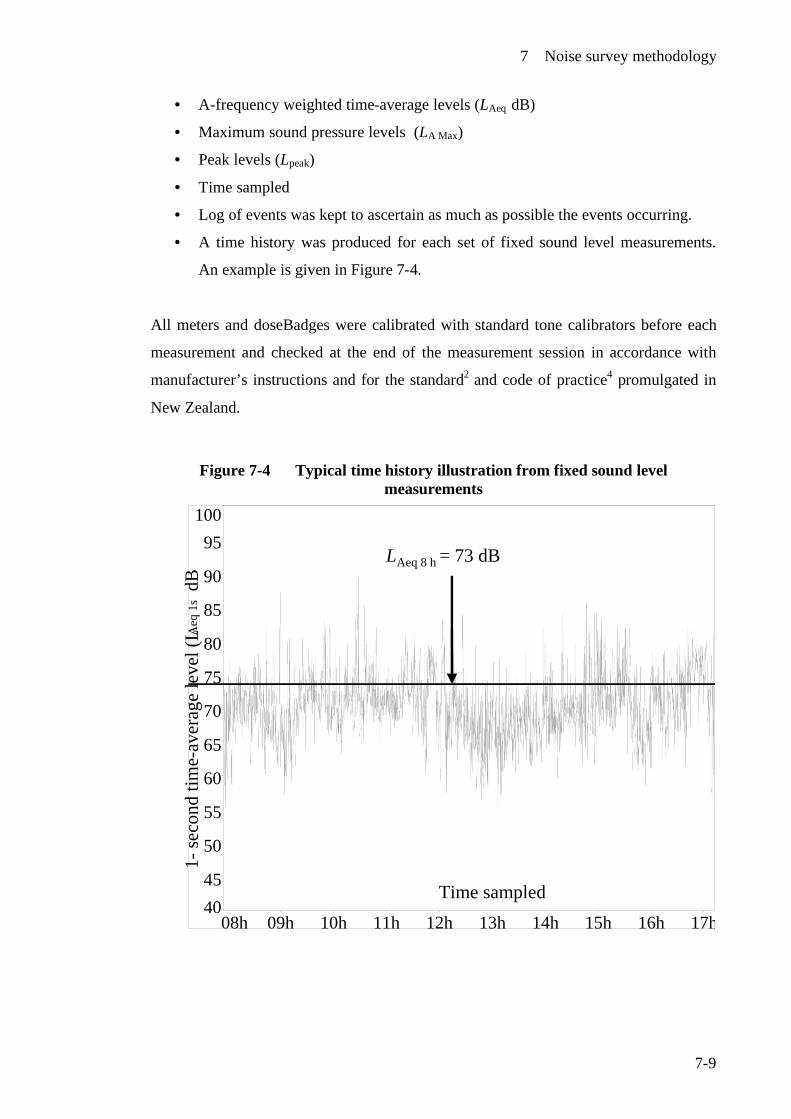
7 Noise survey methodology
7-9
• A-frequency weighted time-average levels (LAeq dB)
• Maximum sound pressure levels (LA Max)
• Peak levels (Lpeak)
• Time sampled
• Log of events was kept to ascertain as much as possible the events occurring.
• A time history was produced for each set of fixed sound level measurements.
An example is given in Figure 7-4.
All meters and doseBadges were calibrated with standard tone calibrators before each
measurement and checked at the end of the measurement session in accordance with
manufacturer’s instructions and for the standard2 and code of practice4 promulgated in
New Zealand.
Figure 7-4 Typical time history illustration from fixed sound level measurements
LAeq 8h = 73dB
4045
50
55
60
65
70
75
80
85
90
95100
08h 09h 10h 11h 12h 13h 14h 15h 16h 17h
LAeq 8 h = 73 dB
1-se
cond
tim
e-av
erag
e le
vel (
LAeq
1s
dB
Time sampled
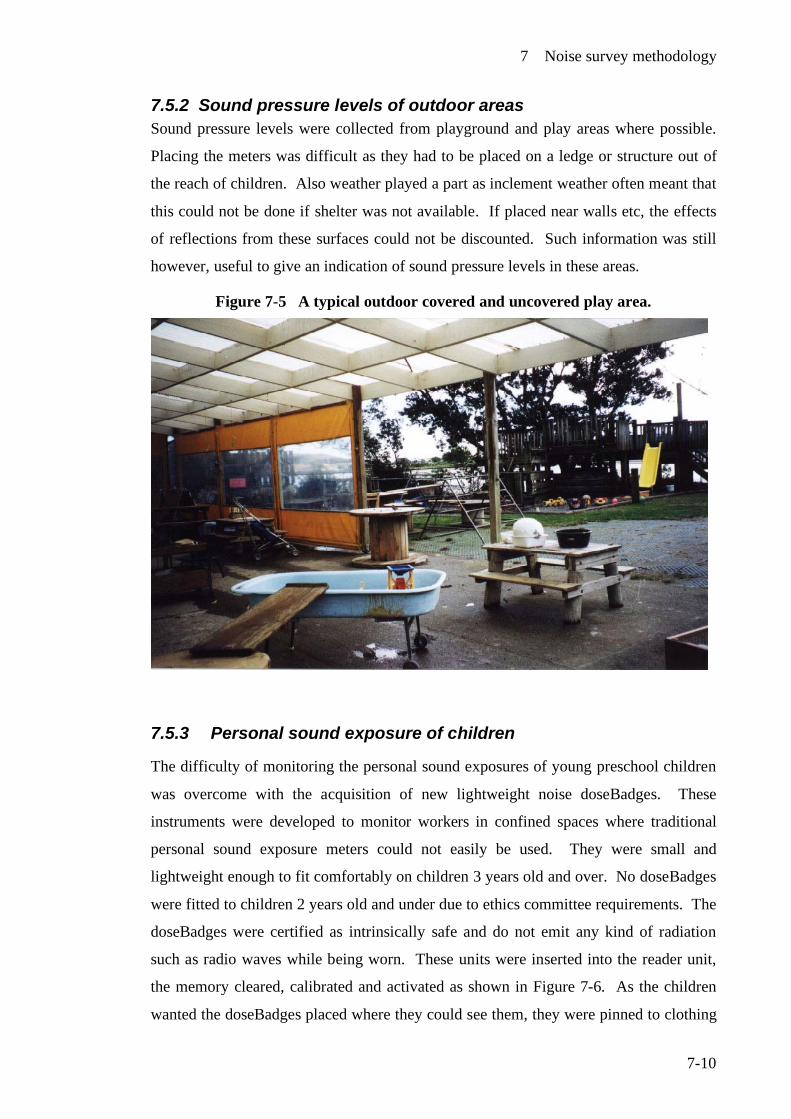
7 Noise survey methodology
7-10
7.5.2 Sound pressure levels of outdoor areas Sound pressure levels were collected from playground and play areas where possible.
Placing the meters was difficult as they had to be placed on a ledge or structure out of
the reach of children. Also weather played a part as inclement weather often meant that
this could not be done if shelter was not available. If placed near walls etc, the effects
of reflections from these surfaces could not be discounted. Such information was still
however, useful to give an indication of sound pressure levels in these areas.
Figure 7-5 A typical outdoor covered and uncovered play area.
7.5.3 Personal sound exposure of children
The difficulty of monitoring the personal sound exposures of young preschool children
was overcome with the acquisition of new lightweight noise doseBadges. These
instruments were developed to monitor workers in confined spaces where traditional
personal sound exposure meters could not easily be used. They were small and
lightweight enough to fit comfortably on children 3 years old and over. No doseBadges
were fitted to children 2 years old and under due to ethics committee requirements. The
doseBadges were certified as intrinsically safe and do not emit any kind of radiation
such as radio waves while being worn. These units were inserted into the reader unit,
the memory cleared, calibrated and activated as shown in Figure 7-6. As the children
wanted the doseBadges placed where they could see them, they were pinned to clothing
7 Noise survey methodology
7-11
in the chest area as shown in Figure 7-7. Children were invited to help turn on the
badges by pressing the buttons on the reader unit which seemed to overcome any initial
fear or apprehension. As the doseBadges look like little spaceships there was rarely any
shortage of willing participants. The manufacturer kindly supplied a number of
complimentary identical looking dummy badges so that no child need feel left out.
They were particularly useful in the case of child wanting a badge when the parents
hadn’t given consent. Despite parental consent being obtained, no child was forced or
coerced to wear a badge against their will.
The children went about their daily activities with badges removed in the sleep rooms
and kept near the child for the duration of their rest. Prior to the children leaving the
centre, the badges were turned off, removed and data transferred into the reader unit as
shown in Figure 7-6. Clearly it would have been desirable to have documented the full
24 hour exposure of the children, but this study had neither the time nor the resources to
carry out such a mammoth task. Later, all the data from the reader unit was downloaded
in duplicate and processed with the accompanying doseBadge software and the Cirrus
Acoustic Editor programme.
The data collected from the doseBadges and personal sound exposure measurements
were as follows:
• A-frequency weighted time-average levels (LAeq dB)
• Dose %
• Pascal squared hours (Pa2h)
• Maximum sound pressure levels (LA Max)
• Peak levels (Lpeak)
• Time sampled
A time history was produced for each set of personal sound level measurements. An
example is given with explanations in Figure 7-8 (p.7.11). A-frequency weighted time
average level lines have been added for the full sampling period (LAeq = 85dB) and for
the one-hour period between the cursors (LAeq 1h = 82dB). The doseBadge software has
a capacity to produce dosimetry reports where the data from each badge use in the same
sampling session can be compiled into a single report for ease of data management.
7 Noise survey methodology
7-12
Dosimetry reports were generated for each set of measurements. An example is given
in 14-5 Appendices.
The doseBadges were designed for adult use in confined spaces and for compliance
with the international occupational noise criteria of:
• A-frequency weighted time-average level of no more than 85 dB for 8 hours or
equivalent (100 % dose or 1.0 Pa2h)
• A peak level of no more than 140 dB
Data collected was compared to the above criteria, which are also a legal requirement of
Regulation 11 of the New Zealand Health and Safety in Employment Regulations 1995.
Even though the above criteria do not apply for children in learning environments, data
collected from the doseBadges was compared to these criteria, as no other standards
were available. However it is reasonable to assume that exposure of young children to
noise levels approaching the above occupational criteria is excessive.
Due to memory limitations being a very small unit, the doseBadges have a high cut-off
point where noise exposure data of less than 75 dB is discarded. This is not entirely
suitable for children giving a conservative estimate of the children’s exposure.
Information on levels of noise, which will cause damage to young children, is
problematic due to lack of information on this topic. The best guidance on this is given
by the World Health Organization3 where they estimate that time-average levels over an
8-hour day of 75 dB are unlikely to cause significant harm across the population. A
lower cut-off point at 65 dB (i.e. data of less than 65 dB is discarded) would have given
a better representation of the personal exposure of the children.
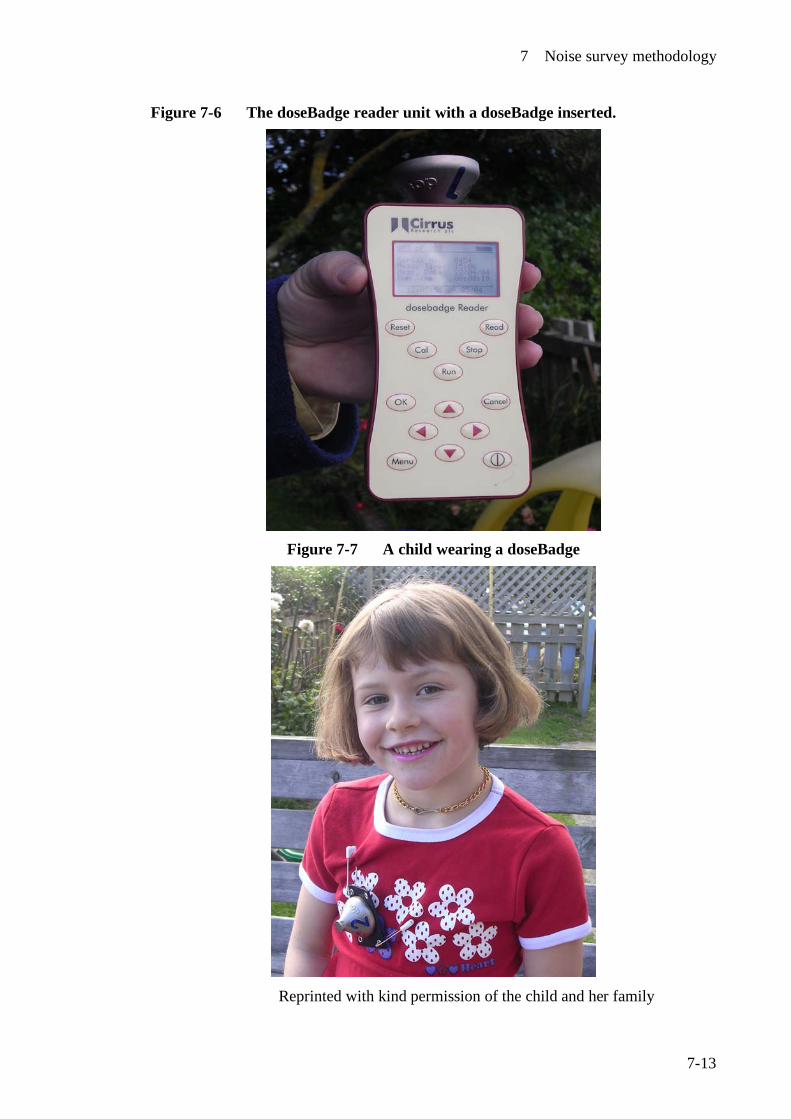
7 Noise survey methodology
7-13
Figure 7-6 The doseBadge reader unit with a doseBadge inserted.
Figure 7-7 A child wearing a doseBadge
Reprinted with kind permission of the child and her family
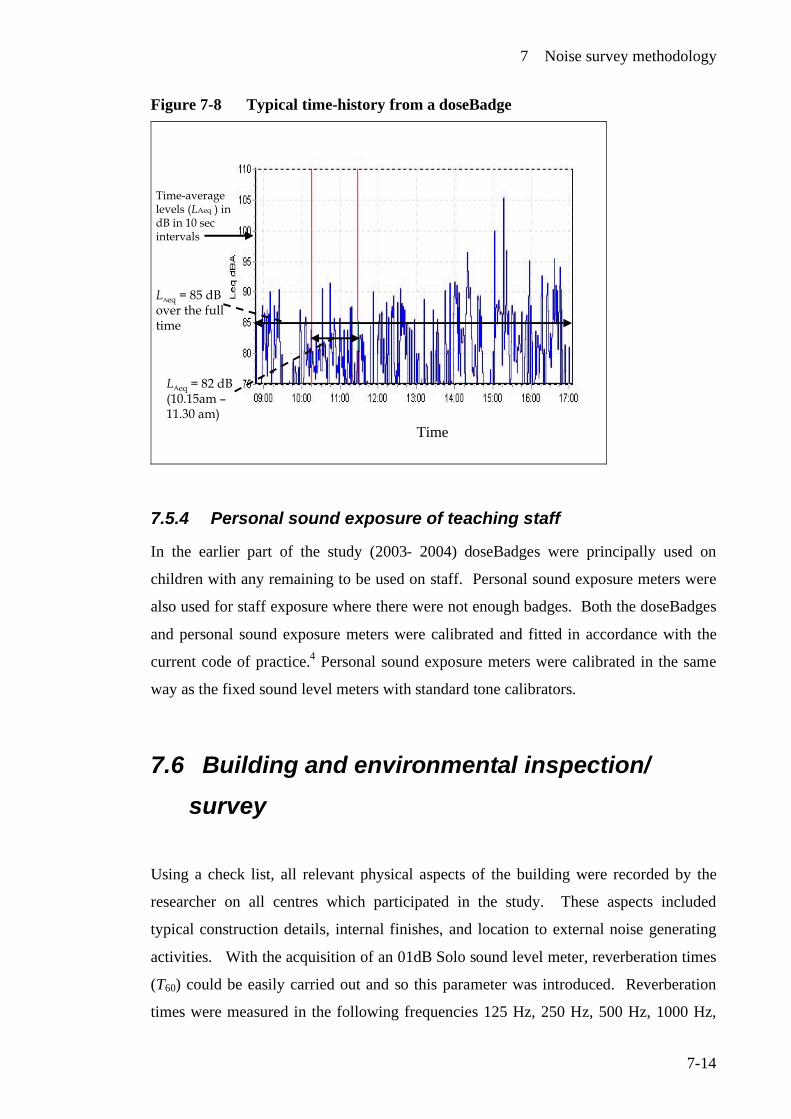
7 Noise survey methodology
7-14
Figure 7-8 Typical time-history from a doseBadge
Time-averagelevels (LAeq ) in dB in 10 sec intervals
LAeq = 85 dB over the full time
LAeq = 82 dB(10.15am –11.30 am)
Time
7.5.4 Personal sound exposure of teaching staff
In the earlier part of the study (2003- 2004) doseBadges were principally used on
children with any remaining to be used on staff. Personal sound exposure meters were
also used for staff exposure where there were not enough badges. Both the doseBadges
and personal sound exposure meters were calibrated and fitted in accordance with the
current code of practice.4 Personal sound exposure meters were calibrated in the same
way as the fixed sound level meters with standard tone calibrators.
7.6 Building and environmental inspection/ survey
Using a check list, all relevant physical aspects of the building were recorded by the
researcher on all centres which participated in the study. These aspects included
typical construction details, internal finishes, and location to external noise generating
activities. With the acquisition of an 01dB Solo sound level meter, reverberation times
(T60) could be easily carried out and so this parameter was introduced. Reverberation
times were measured in the following frequencies 125 Hz, 250 Hz, 500 Hz, 1000 Hz,
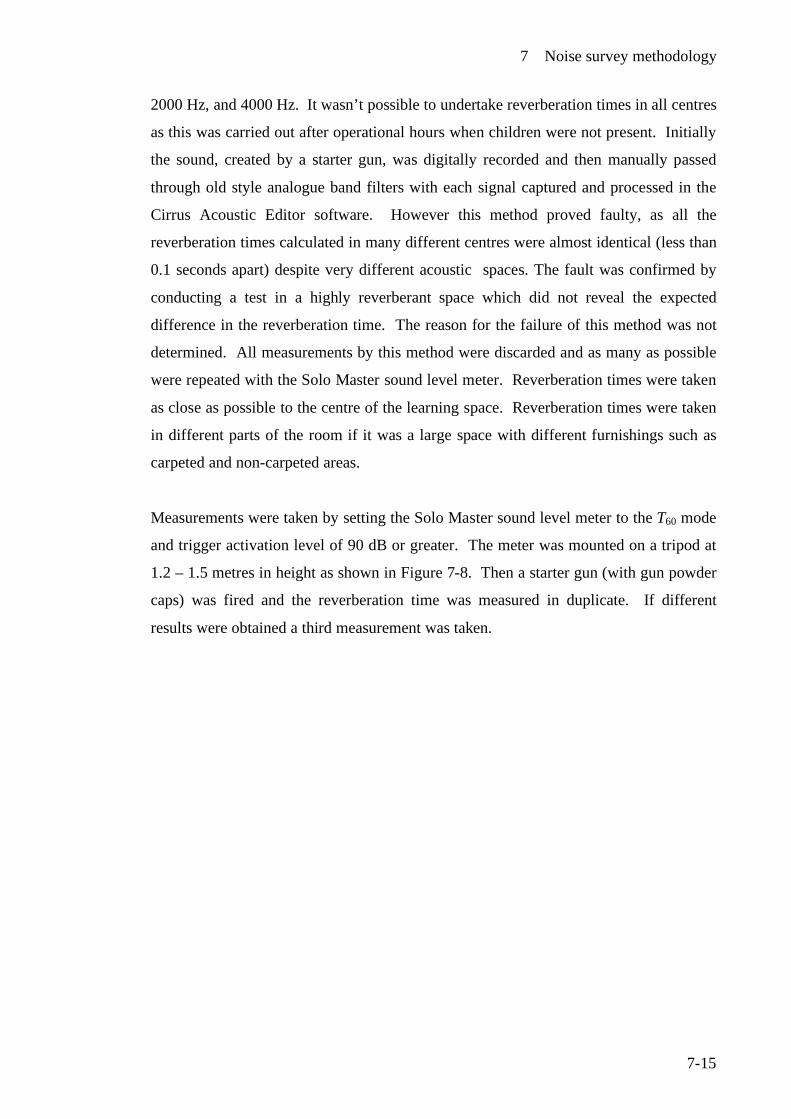
7 Noise survey methodology
7-15
2000 Hz, and 4000 Hz. It wasn’t possible to undertake reverberation times in all centres
as this was carried out after operational hours when children were not present. Initially
the sound, created by a starter gun, was digitally recorded and then manually passed
through old style analogue band filters with each signal captured and processed in the
Cirrus Acoustic Editor software. However this method proved faulty, as all the
reverberation times calculated in many different centres were almost identical (less than
0.1 seconds apart) despite very different acoustic spaces. The fault was confirmed by
conducting a test in a highly reverberant space which did not reveal the expected
difference in the reverberation time. The reason for the failure of this method was not
determined. All measurements by this method were discarded and as many as possible
were repeated with the Solo Master sound level meter. Reverberation times were taken
as close as possible to the centre of the learning space. Reverberation times were taken
in different parts of the room if it was a large space with different furnishings such as
carpeted and non-carpeted areas.
Measurements were taken by setting the Solo Master sound level meter to the T60 mode
and trigger activation level of 90 dB or greater. The meter was mounted on a tripod at
1.2 – 1.5 metres in height as shown in Figure 7-8. Then a starter gun (with gun powder
caps) was fired and the reverberation time was measured in duplicate. If different
results were obtained a third measurement was taken.
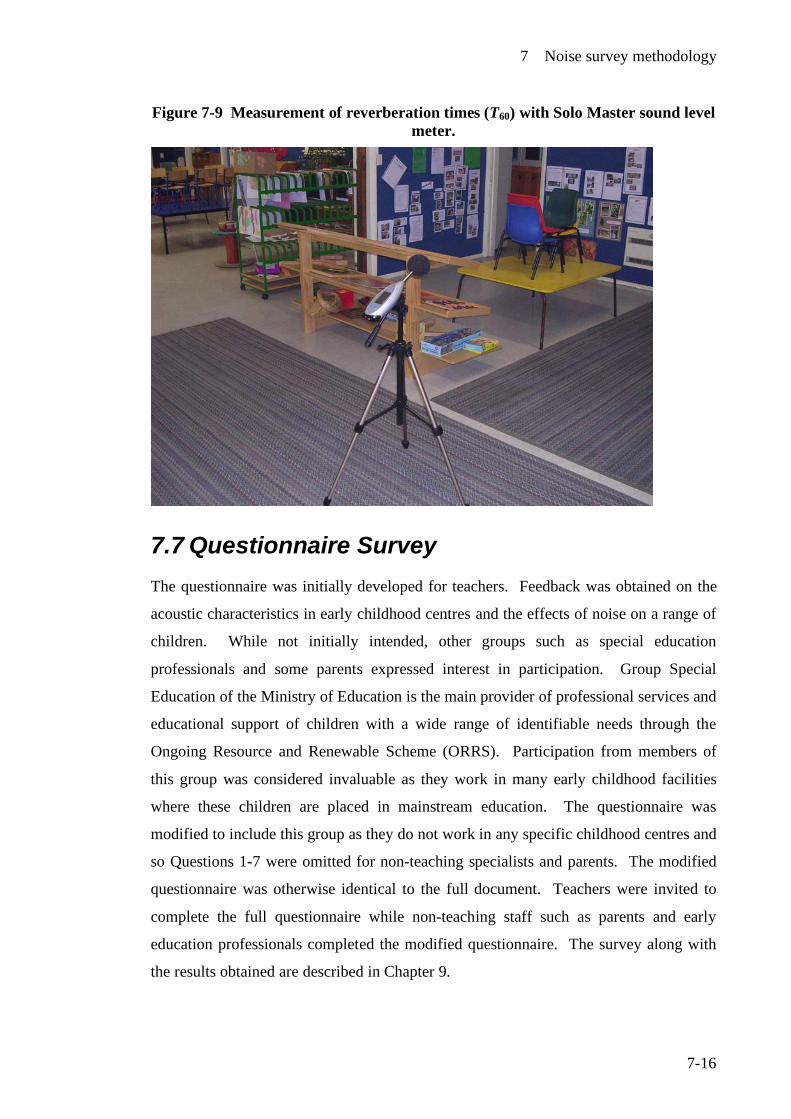
7 Noise survey methodology
7-16
Figure 7-9 Measurement of reverberation times (T60) with Solo Master sound level meter.
7.7 Questionnaire Survey The questionnaire was initially developed for teachers. Feedback was obtained on the
acoustic characteristics in early childhood centres and the effects of noise on a range of
children. While not initially intended, other groups such as special education
professionals and some parents expressed interest in participation. Group Special
Education of the Ministry of Education is the main provider of professional services and
educational support of children with a wide range of identifiable needs through the
Ongoing Resource and Renewable Scheme (ORRS). Participation from members of
this group was considered invaluable as they work in many early childhood facilities
where these children are placed in mainstream education. The questionnaire was
modified to include this group as they do not work in any specific childhood centres and
so Questions 1-7 were omitted for non-teaching specialists and parents. The modified
questionnaire was otherwise identical to the full document. Teachers were invited to
complete the full questionnaire while non-teaching staff such as parents and early
education professionals completed the modified questionnaire. The survey along with
the results obtained are described in Chapter 9.
7 Noise survey methodology
7-17
7.8 Hearing evaluations of staff Staff members from 2 centres specifically requested hearing tests and we decided to do
this as an extension of the study. An attempt was also made to measure any temporary
threshold shift in the participants' hearing as a result of the noise exposure experienced.
Testing was carried out in one instance at Massey University and for the second centre
at the childcare centre. Pure tone audiometry was conducted before the start of work on
those staff who gave consent, and their personal sound exposure monitored with a
doseBadge or personal sound exposure meter. On completion of their work, pure tone
audiometry was again conducted to assess any threshold shift changes.
We were unable to conduct this in ideal conditions and did not have access to a certified
hearing booth, which is preferable in audiometric testing. The sound of heavy rain
occurring in one session made evaluation difficult and in another, high levels of
background noise interfered with the testing procedure.
7.9 References 1 Education (Early Childhood Centres) Regulations 1998 (New Zealand
Legislation. 2 New Zealand Standard, NZS 6801:1999, Acoustics: Measurement of
Environmental Sound. 1999: Standards New Zealand. 3 World Health Organization, WHO Guidelines for Community Noise,. Berglund,
B., Schwela, D., Editor. 1999, Occupational and Environmental Health Unit, World Health Organization: Geneva.
4 Occupational Safety and Health, Approved code of practice for the management
of noise in the workplace. 2002, Wellington: Occupational Safety and Health, New Zealand Department of Labour.
8 Result of fixed time average levels taken and personal sound exposures of children and staff
8-1
8 Results of fixed time-average levels taken and personal sound exposures of children and staff.
8.1 Introduction Twenty all day centres and twelve sessional centres were evaluated over one or more
days.
Fixed sound pressure level measurements were taken in the main learning spaces over
the full day (all day centres) or over the sessions held in a day (sessional centres).
Measurements were also taken in some outdoor areas and sleep rooms. Daily sound
exposures of children were measured by fitting doseBadges to individual children.
Occupational noise exposure of staff was also measured with doseBadges or personal
sound exposure meters. Special noise generated events such as music sessions and
walking excursions were also monitored through the participants who were wearing
doseBadges or personal sound exposure meters. External noise from activities such as
major construction work in the vicinity was monitored where possible. Unexpected or
unplanned events, such as children riding noisy tricycles, were monitored with an
instantaneous reading sound level meter to estimate the sound pressure levels. Much of
the noise observed was generated inside the centres by the children and their activities
which included talking, shouting, crying, banging of wooden blocks or other
implements or noisy exuberant activities such as table soccer, rough and tumble play
etc. When children were not present, the prominent noise observed included the
background of the city, traffic when near busy roads, weather if raining or strong wind
and pets such as squawking caged birds or fish tank pumps.
The daily sound exposures for teachers and children have been summarised and listed in
their categories of sessional centres and all day centres.
8 Result of fixed time average levels taken and personal sound exposures of children and staff
8-2
8.2 Sessional Centres
8.2.1 Children’s exposure to noise A total of 130 children were evaluated by fitting doseBadges to individual children. The
daily sound exposures (DSEs) measured were:
• 82 (63.0%) received DSEs of less than 50%
• 24 children (18.5%) received DSEs between 50-100%
• 24 children (18.5%) received DSEs greater than 100%
(100% is the maximum permitted DSE for an adult worker and young children are
likely to be more susceptible to the adverse affects of noise than adults).
An evaluation of the A-frequency weighted time-average levels taken over 2-3 hour
sessions (LAeq 2-3 h) measured by the doseBadges on children was carried out. Of the 130
children:
• 18 children (14.0%) recorded time-average levels (LAeq 2-3 h) of less than 75 dB
• 51 children (39.0%) recorded time-average levels (LAeq 2-3 h) between 75-85 dB
• 37 children (28.5%) recorded time-average levels (LAeq 2-3 h) between 85-90 dB
• 24 children (18.5%) recorded time-average levels (LAeq 2-3 h) greater than 90 dB
Peak levels (Lpeak)
• 110 children recorded at least one exceedance over 140 dB*
8.2.2 Staff exposure to noise A total of 28 staff were evaluated by fitting doseBadges or personal sound exposure
meters to individuals staff members. The daily sound exposures (DSEs) measured
were:
*Due to the limitations of the doseBadges, further information on the numbers of exceedances, when they occurred or to the actual peak levels obtained could not be determined. However, from experience, exceedances are likely to have occurred several times or more in one session.
8 Result of fixed time average levels taken and personal sound exposures of children and staff
8-3
• 23 staff members (82.0%) received DSEs less than 50%
• 4 staff members (14.0%) received DSEs between 50-100%
• 1 staff member received a DSE greater than 100%
Peak levels (Lpeak)
• 11 staff members recorded peak sound levels in excess of 140dB*.
8.3 All day centres
8.3.1 Children’s exposure to noise A total of 61 children were evaluated by fitting doseBadges for the time they were
present in the centre. The daily sound exposures (DSEs ) were measured:
• 19 children (31.0%) received a DSEs of less than 50%
• 16 children (26.0 )received DSEs between 50-100%
• 26 children (43.0%) received DSEs greater than 100%
(100% is the maximum permitted DSE for an adult worker)
Peak levels (Lpeak)
• 55 children recorded at least one exceedance over 140 dB*
An evaluation of the time-average sound pressure levels taken over 6-9 hour periods
(LAeq 6-9 h) measured by the doseBadges on children was carried out. Of the 61 children:
• 2 children (3.0%) recorded time-average levels of less than 75 dB
• 27 children (44.0%) recorded time-average levels between 75-85 dB
• 24 children (39.0%) recorded time-average levels between 85-90 dB
• 8 children (15.0%) recorded time-average levels greater than 90 dB
*Due to the limitations of the doseBadges, further information on the numbers of exceedances, when they occurred or to the actual peak levels obtained could not be determined. However, from experience, exceedances are likely to have occurred several times or more in one session.
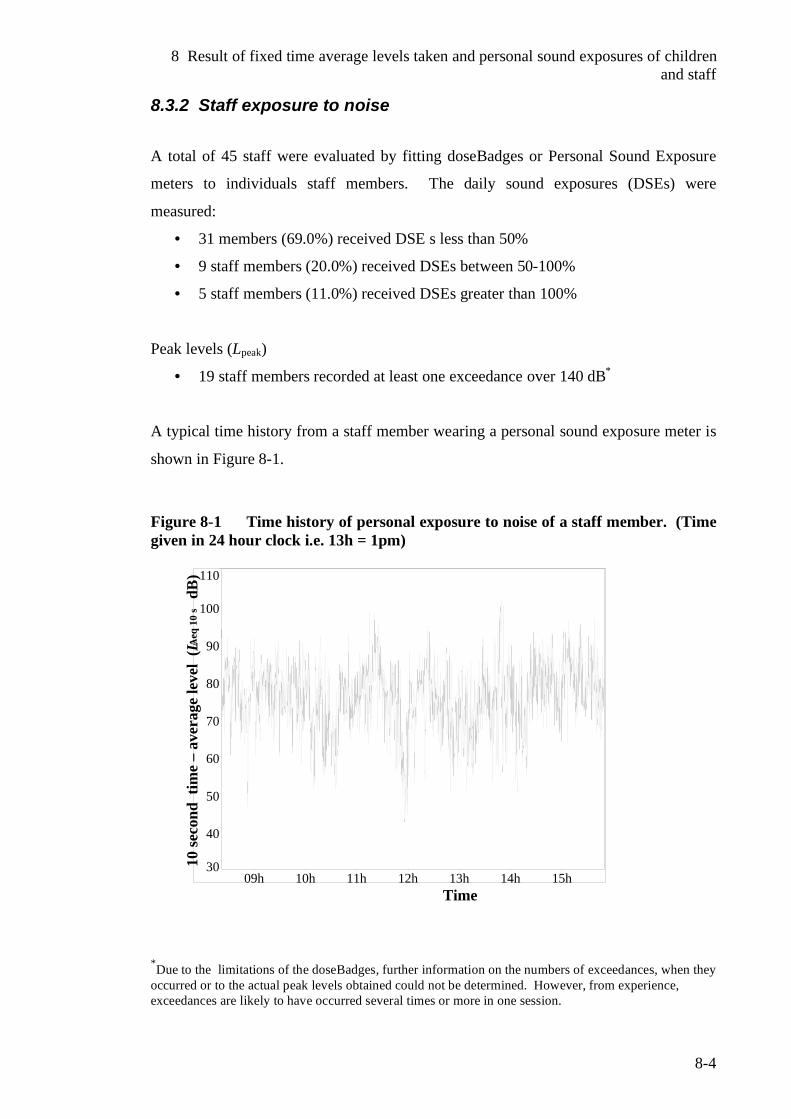
8 Result of fixed time average levels taken and personal sound exposures of children and staff
8-4
8.3.2 Staff exposure to noise
A total of 45 staff were evaluated by fitting doseBadges or Personal Sound Exposure
meters to individuals staff members. The daily sound exposures (DSEs) were
measured:
• 31 members (69.0%) received DSE s less than 50%
• 9 staff members (20.0%) received DSEs between 50-100%
• 5 staff members (11.0%) received DSEs greater than 100%
Peak levels (Lpeak)
• 19 staff members recorded at least one exceedance over 140 dB*
A typical time history from a staff member wearing a personal sound exposure meter is
shown in Figure 8-1.
Figure 8-1 Time history of personal exposure to noise of a staff member. (Time given in 24 hour clock i.e. 13h = 1pm)
30
40
50
60
70
80
90
100
110
09h 10h 11h 12h 13h 14h 15h
10 se
cond
tim
e –
aver
age
leve
l (LA
eq 1
0 s
dB)
Time *Due to the limitations of the doseBadges, further information on the numbers of exceedances, when they occurred or to the actual peak levels obtained could not be determined. However, from experience, exceedances are likely to have occurred several times or more in one session.
8 Result of fixed time average levels taken and personal sound exposures of children and staff
8-5
8.3.3 Discussion of daily sound exposure results The numbers of children and teachers monitored depended very much on the
availability of the doseBadges and the ages of the children. As most teachers preferred
the light-weight doseBadges to the heavier and more bulky personal sound exposure
meters, efforts were made to gain a fair representation of teachers and children in each
centre with the doseBadges available. Infants 2 years of age and under were not
monitored as this was not permitted by the approval given by the ethics committee, so
available doseBadges were used on teaching staff. When compared to all day centres,
higher numbers of children could be monitored in sessional centres because two
sessions are held in a single day. This enabled 2 children to be monitored with a single
doseBadge. In addition, staff numbers in sessional centres were fewer than all day
centres due to higher permitted staff to children ratios. In all day centres, individual
children were monitored throughout the time they attended. This varied considerably
with some children attending for a full 8-hour day. All day centres have higher staff-to-
children ratios than sessional centres, so there was always a higher number of staff
present in all day centres. This explains the reasons why there are differences in
numbers of children and teachers monitored in both categories.
In the latter part of the sampling programme, the receipt of a successful research grant
enabled the purchase of seven more doseBadges giving a total of 17 units. Fitting of
doseBadges was time-consuming as the children, whose parents had given informed
consent, had to be located, and the badges fitted under supervision. In addition, a
number of dummy badges were also fitted to any other children who wanted them.
One hundred and ten of 130 children in sessional centres and 55 of 61 children in all
day centres recorded peak levels (Lpeak) exceeding 140 dB on at least one occasion. Of
all the children monitored in both sessional and all day centres, this equates to 86%
recording peak levels in excess of 140 dB. Unfortunately the earlier model of
doseBadges was not able to give more information as to the number of exceedances,
when they occurred and to what levels they reached. It would have been useful to know
at what times the exceedances were occurring so as to relate back to the events
occurring at these times. Sharp impact type sounds, such as dropping blocks on a
wooden floor, door slamming and hammering nails can give rise to peak level
8 Result of fixed time average levels taken and personal sound exposures of children and staff
8-6
exceedances. However, striking the badge against playground equipment is likely to
also give false exceedances. As peak levels above 140 dB are known to cause hearing
damage, it is critical that the extent of this exposure be investigated further.
In general the higher the exposure time to noise, the greater the potential risk.
Therefore those children in all day centres, especially those who spend long hours in
childcare, are at greater risk from the adverse effects of noise occurring in childcare
centres. As would be expected, the DSEs are considerably higher in all day centres.
Forty three percent of the children monitored in all day centres received a DSE in
excess of 100% whereas 18.5% of the children monitored in sessional centres received a
DSE in excess of 100%. .
It is serious cause for concern that, when considering the total number of children
monitored (i.e. 191 children in both sessional and all day centres), 50 (26%) of these
children received DSEs in excess of 100%, the maximum permitted for adults in the
workplace. This cannot be ignored despite the limitations associated with this form of
monitoring.
A thorough evaluation is needed to determine the reasons. Child participants (wearing
doseBadges) who were observed to be active, exuberant, and playing vigorously, often
received the highest levels as would be expected. Their own voices along with the
knocking of the badges against equipment etc certainly contributed to noise and dose
levels recorded. Screaming near the badge will add significant contributions to the
levels l recorded. It is not generally the sound of one's own voice that will cause
hearing damage, as the ear’s protective mechanisms (the muscles of the aural reflex) are
activated, but the sound from other sources such as the voices of other children,
especially those close by may well contribute to hearing loss. There is, however, good
evidence that someone screaming and yelling will cause hearing damage to their own
hearing over an extended period of time. Opera singers are at higher risk of damage
from their own voices.1
It wasn’t possible to measure the full exposures for all the staff in all day centres, as
many were rostered different hours from day to day. If is of concern that 5 of the 40
8 Result of fixed time average levels taken and personal sound exposures of children and staff
8-7
staff members recorded DSEs in excess of 100% and therefore in excess of the
maximum noise dose permitted in the workplace.
While daily exposure rates are clearly of less concern for the sessional centres due to
less contact time with children, it was nevertheless of concern that in one of these
centres a DSE of 133% was recorded on a member of staff.
8.4 Fixed sound level measurements
8.4.1 Sessional centres A-frequency weighted time-average levels over 2-3½ hours (LAeq 2-3½ h) ranged from 65-
79 dB with 60% of recordings between 70-75 dB.
8.4.2 All day centres A-frequency weighted time -average levels over 6-8½ hours (LAeq 6-8½h) ranged from 69-
79 dB with a relatively even spread among all values.
A-frequency weighted time-average levels (fixed sound level measurements) were very
similar to those reported in a review by Picard and Bradley2 of time-average levels over
eight hour day in centres with a fixed microphone, ranging from 72 dB to 80 dB (LAeq 8h
=72-80 dB). This similarity is surprising, as there is no standard method available as to
how such recordings should be made. This is left to the judgment of those carrying out
the work.
The lower figures can be explained by specific events and happenings such as school
holiday times when the number of children attending was lower than usual. At one
centre, when the children left the premises for a walking excursion, the time-average
level over the hour period taken with a fixed sound level meter decreased sharply to 48
dB, as would be expected. This is graphically shown in Figure 8-6 (page 8.12). This
time-average level (LAeq 1h) of 48 dB represents the background noise of the unoccupied
learning space augmented with the sound generated by the few staff remaining at the
centre. On the return of the children and their teachers, time-average levels rose back to
the original level. The information provided by fixed sound level measurements is not
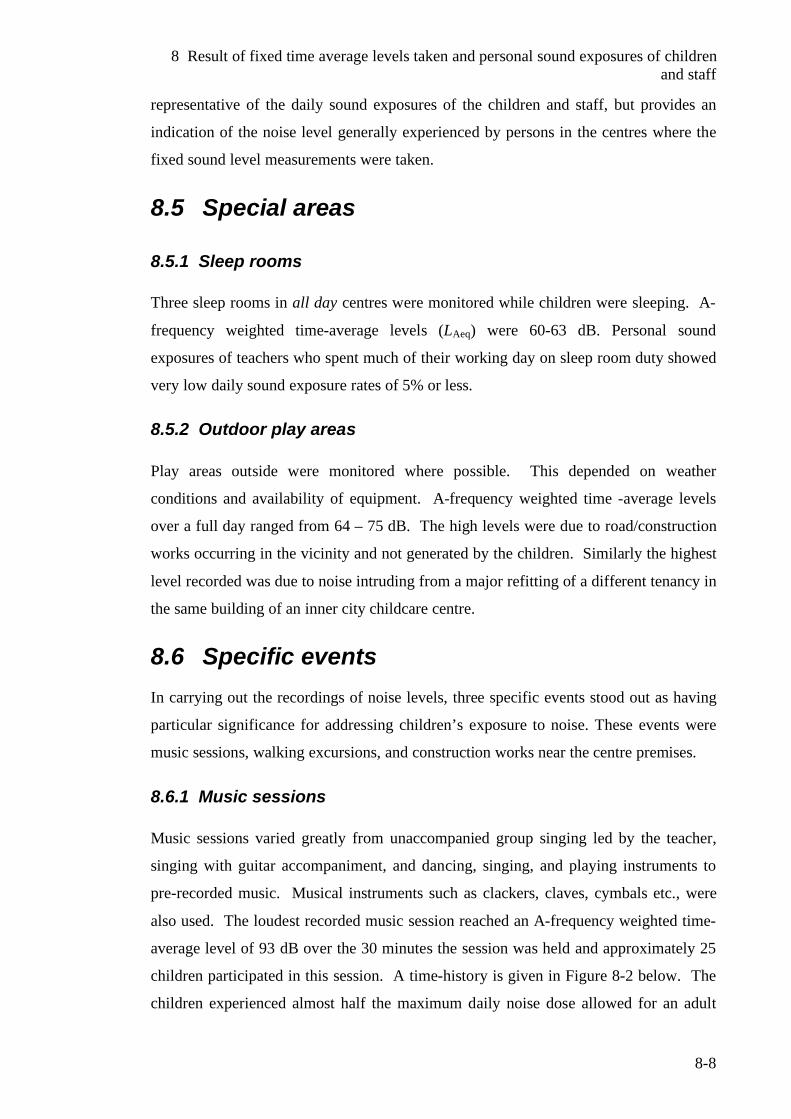
8 Result of fixed time average levels taken and personal sound exposures of children and staff
8-8
representative of the daily sound exposures of the children and staff, but provides an
indication of the noise level generally experienced by persons in the centres where the
fixed sound level measurements were taken.
8.5 Special areas
8.5.1 Sleep rooms Three sleep rooms in all day centres were monitored while children were sleeping. A-
frequency weighted time-average levels (LAeq) were 60-63 dB. Personal sound
exposures of teachers who spent much of their working day on sleep room duty showed
very low daily sound exposure rates of 5% or less.
8.5.2 Outdoor play areas Play areas outside were monitored where possible. This depended on weather
conditions and availability of equipment. A-frequency weighted time -average levels
over a full day ranged from 64 – 75 dB. The high levels were due to road/construction
works occurring in the vicinity and not generated by the children. Similarly the highest
level recorded was due to noise intruding from a major refitting of a different tenancy in
the same building of an inner city childcare centre.
8.6 Specific events In carrying out the recordings of noise levels, three specific events stood out as having
particular significance for addressing children’s exposure to noise. These events were
music sessions, walking excursions, and construction works near the centre premises.
8.6.1 Music sessions Music sessions varied greatly from unaccompanied group singing led by the teacher,
singing with guitar accompaniment, and dancing, singing, and playing instruments to
pre-recorded music. Musical instruments such as clackers, claves, cymbals etc., were
also used. The loudest recorded music session reached an A-frequency weighted time-
average level of 93 dB over the 30 minutes the session was held and approximately 25
children participated in this session. A time-history is given in Figure 8-2 below. The
children experienced almost half the maximum daily noise dose allowed for an adult
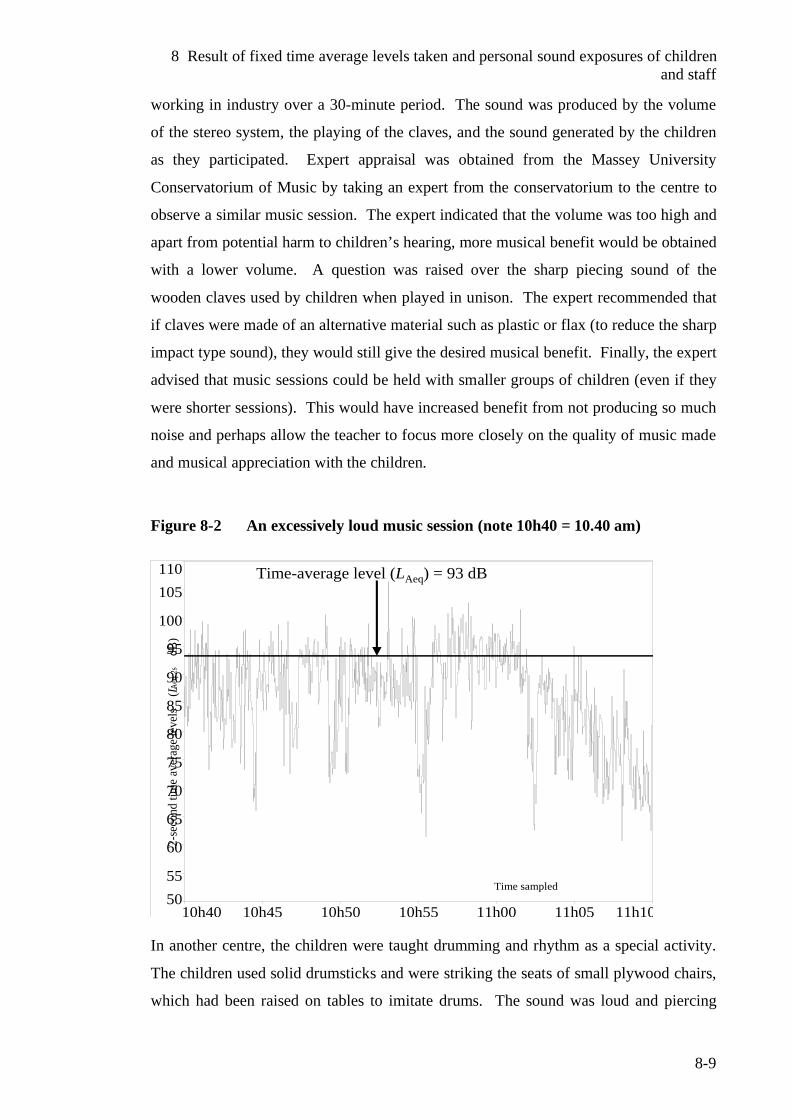
8 Result of fixed time average levels taken and personal sound exposures of children and staff
8-9
working in industry over a 30-minute period. The sound was produced by the volume
of the stereo system, the playing of the claves, and the sound generated by the children
as they participated. Expert appraisal was obtained from the Massey University
Conservatorium of Music by taking an expert from the conservatorium to the centre to
observe a similar music session. The expert indicated that the volume was too high and
apart from potential harm to children’s hearing, more musical benefit would be obtained
with a lower volume. A question was raised over the sharp piecing sound of the
wooden claves used by children when played in unison. The expert recommended that
if claves were made of an alternative material such as plastic or flax (to reduce the sharp
impact type sound), they would still give the desired musical benefit. Finally, the expert
advised that music sessions could be held with smaller groups of children (even if they
were shorter sessions). This would have increased benefit from not producing so much
noise and perhaps allow the teacher to focus more closely on the quality of music made
and musical appreciation with the children.
Figure 8-2 An excessively loud music session (note 10h40 = 10.40 am)
5055
60
65
70
75
80
85
90
95
100
105110
10h40 10h45 10h50 10h55 11h00 11h05 11h10
2-se
cond
tim
e av
erag
e le
vels
(LA
eq 2
s
dB)
Time sampled
Time-average level (LAeq) = 93 dB
In another centre, the children were taught drumming and rhythm as a special activity.
The children used solid drumsticks and were striking the seats of small plywood chairs,
which had been raised on tables to imitate drums. The sound was loud and piercing
8 Result of fixed time average levels taken and personal sound exposures of children and staff
8-10
especially when the children drummed in unison. Sound pressure levels isolated from
the doseBadges on children who were drumming, showed A-frequency weighted time-
average levels in the 88-90 dB for the duration of the activity. The peak levels
occurring at this time were estimated to be very high, but as mentioned before, the
doseBadges could only indicate an exceedance occurring, which was shown but unable
to give any further information. After some discussion with staff over the level of
sound, we were able to reduce the sound, without compromising the obvious benefits of
the activity to the children, by placing floor cushions on the seats. It was not possible to
return to the centre for further monitoring of this activity.
8.6.2 Walking Excursions At one inner-city childcare centre we recorded the noise levels experienced by children
and staff when they went on a walk. The walking excursion took just over an hour. The
children and staff walked along some of the busiest streets of the Wellington Central
Business District and through the city’s civic square and lagoon area on the waterfront.
The doseBadges recorded A-frequency weighted time-average levels (LAeq) of 82-86 dB
on children and staff for the duration of the excursion. Figure 8-3 shows the doseBadge
reading of a child who went on the walking excursion and Figure 8-4 expands the
walking excursion section of the time history. Figure 8-5 shows the fixed time-average
levels in the centre including the 1-hour period when the children and staff left the
premises. During this time the time-average levels dropped to 48 dB. This finding
suggests that noise levels on busy inner city streets can be very high particularly when
children walk close to a heavily congested road or near major road or construction
works. In a second walking excursion around major inner city road works, time-
average levels (LAeq) from the doseBadges worn by children averaged 88-92 dB, while
the children were walking along a temporary footpath right next to the works. While
such excursions can be of benefit to children in many ways, staff should, where
possible, try to avoid taking children on the busiest routes and avoid areas, which are
noticeably noisy such as major construction works.
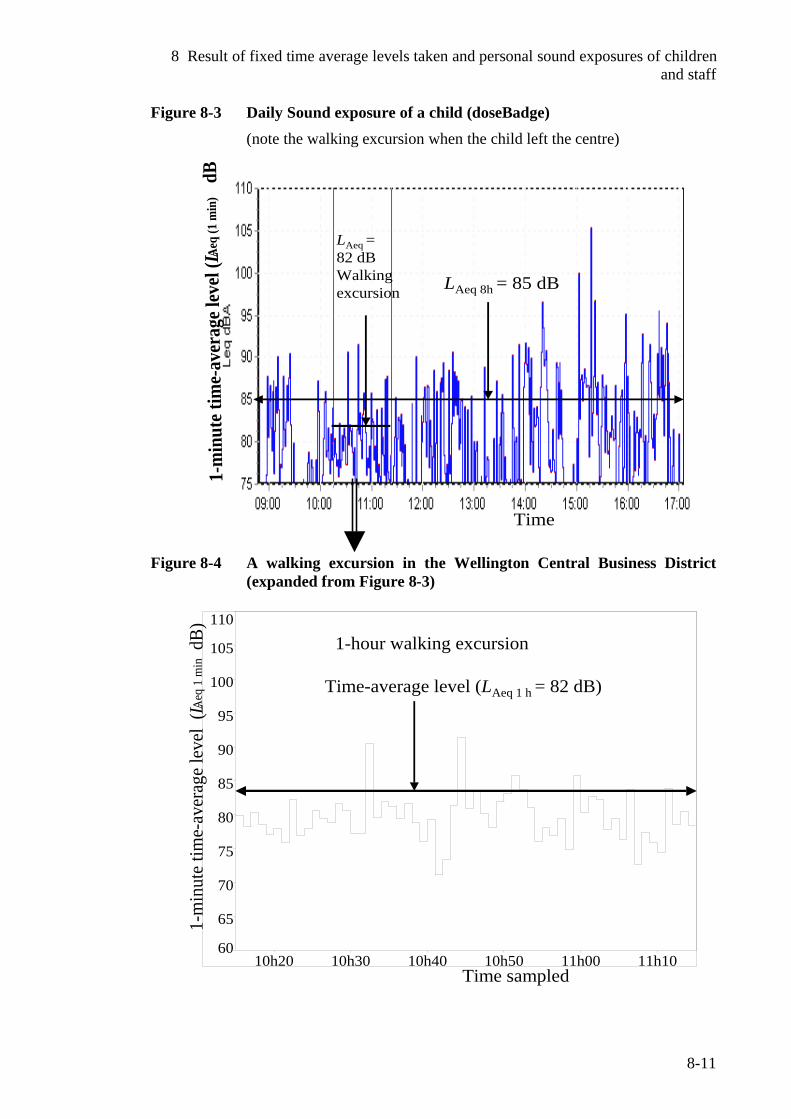
8 Result of fixed time average levels taken and personal sound exposures of children and staff
8-11
Figure 8-3 Daily Sound exposure of a child (doseBadge) (note the walking excursion when the child left the centre)
1-m
inut
e tim
e-av
erag
e lev
el (LA
eq (1
min
)dB
LAeq =82 dBWalking excursion LAeq 8h = 85 dB
Time
Figure 8-4 A walking excursion in the Wellington Central Business District (expanded from Figure 8-3)
60
65
70
75
80
85
90
95
100
105
110
10h20 10h30 10h40 10h50 11h00 11h10
1-m
inut
e tim
e-av
erag
e le
vel
(LAeq
1 m
in dB
)
Time sampled
1-hour walking excursion
Time-average level (LAeq 1 h = 82 dB)
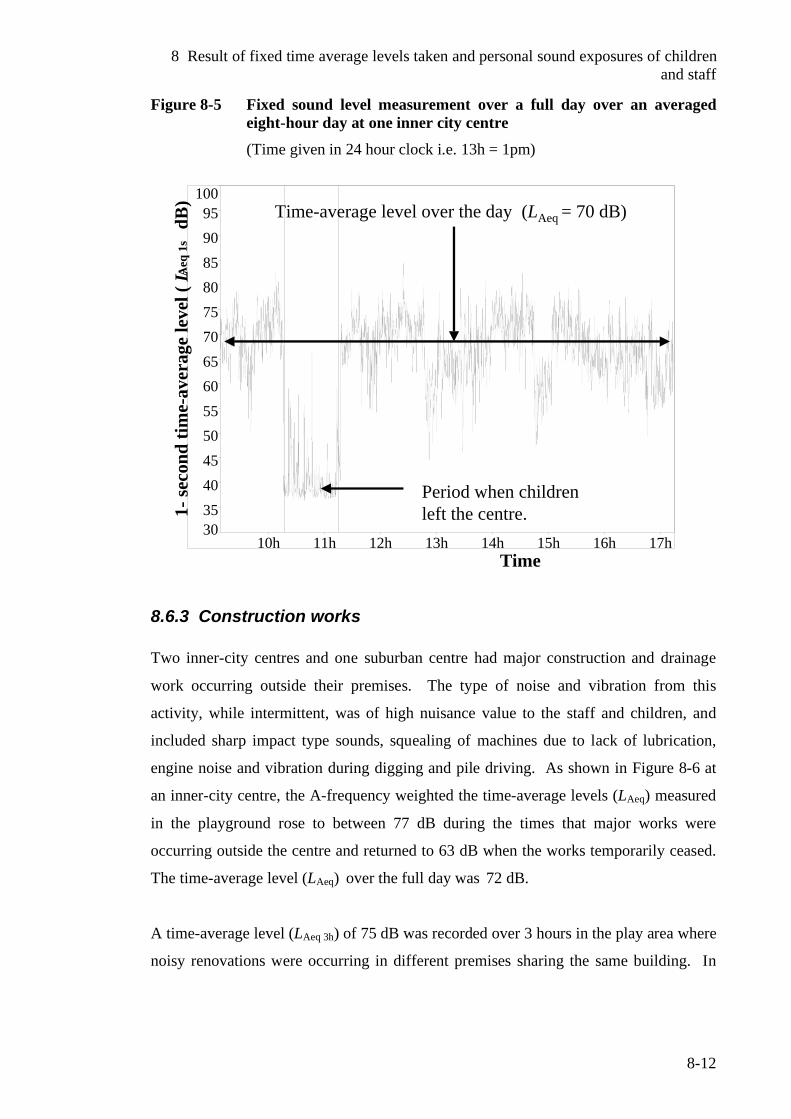
8 Result of fixed time average levels taken and personal sound exposures of children and staff
8-12
Figure 8-5 Fixed sound level measurement over a full day over an averaged eight-hour day at one inner city centre (Time given in 24 hour clock i.e. 13h = 1pm)
3035404550556065707580859095
100
10h 11h 12h 13h 14h 15h 16h 17h
1-se
cond
tim
e-av
erag
e le
vel (
LAeq
1s
dB)
Period when childrenleft the centre.
Time-average level over the day (LAeq = 70 dB)
Time
8.6.3 Construction works Two inner-city centres and one suburban centre had major construction and drainage
work occurring outside their premises. The type of noise and vibration from this
activity, while intermittent, was of high nuisance value to the staff and children, and
included sharp impact type sounds, squealing of machines due to lack of lubrication,
engine noise and vibration during digging and pile driving. As shown in Figure 8-6 at
an inner-city centre, the A-frequency weighted the time-average levels (LAeq) measured
in the playground rose to between 77 dB during the times that major works were
occurring outside the centre and returned to 63 dB when the works temporarily ceased.
The time-average level (LAeq) over the full day was 72 dB.
A time-average level (LAeq 3h) of 75 dB was recorded over 3 hours in the play area where
noisy renovations were occurring in different premises sharing the same building. In

8 Result of fixed time average levels taken and personal sound exposures of children and staff
8-13
another centre, special needs children were severely distressed by the noise of sharp
impact pile driving for a major road extension in the vicinity of the childcare centre.
Figure 8-6 Time history of daily sound levels taken in the playground next to major road works.
50
55
60
65
70
75
80
85
90
95
100
10h 11h 12h 13h 14h 15h 16h
1-se
cond
tim
e-av
erag
e le
vel (
LAeq
1s
dB)
Noisy road Construction(LAeq = 77 dB) Road works temporarily
Stopped (LAeq = 63 dB)
Time
8.7 Intensive study in one childcare centre.
A study was carried out in one childcare centre for 3 hours per day, 5 days a week, over
4 weeks within a 6 month period (60 hours in total). This work was part of a project to
investigate the use of music to improve the acoustic environment. Part of this work
included intensive monitoring of sound levels in the centre with and without musical
intervention. It provided a good opportunity to investigate the daily differences, which
can occur from one day to the next and with the same children wearing doseBadges on
multiple days. Fixed sound level measurements were recorded as before. Sampling
occurred from 9 am to 12 noon Monday to Friday. It was not possible to sample for the
full day due to time constraints and the need for sufficient time to recharge the batteries
on the doseBadges.
8 Result of fixed time average levels taken and personal sound exposures of children and staff
8-14
Fifteen children wore doseBadges multiple times along with 11 teachers. One hundred
and twenty six doseBadge recordings were made from the children and 47 doseBadge
readings taken from the teachers over the 4-week period. There were 72 (57%) of the
recordings from the children, and 20 recordings from teachers (42%), which recorded
peak levels in excess of 140 dB. As both teachers and children were not monitored for
the full day, it is reasonable to expect that the number of peak level exceedances would
be higher if full day monitoring was carried out. Such intensive monitoring over full 8-
hour consecutive days was not possible,
8.7.1 Results obtained from individual children over multiple sessions.
Results obtained by the same child on a different day were often surprisingly similar.
A-frequency weighted time-average levels received by the child (1) sampled over 14
sessions varied from <75 dB-87 dB with 12 of the 14 results falling between 81-87 dB.
Percent doses ranged from 7-57%, but differences here were due in part to the length of
time the doseBadge was worn which varied from day to day.
The second child (recorded for 9 sessions) recorded A-frequency weighted time-average
levels from < 75 dB to 86 dB except for one day where she was visibly distressed. The
time-average level on this day reached 91 dB. This was probably due to crying and
screaming near the badge. On the other days, this child was very placid, preferring the
quieter activities such as reading, finger painting etc. The same characteristics were
observed in other children, giving reasonably uniform personal exposure levels from
day to day unless they were upset or distressed, which resulted in elevated personal
sound exposure levels.
A very active child who engaged continuously in activities such as rough and tumble
play, fighting etc., caused regular staff intervention as it was distressing other children.
He generated much higher than usual levels of noise around him. His 4 results recorded
over a three-hour period showed dose levels of 309%, 139%, 96% and 79%. Assuming
that this child had received the equivalent level of exposure over a full 8-hour day, the
equivalent daily sound exposures would have been 739%, 402%, 244% and 189%.
Such levels are of great concern particularly as the dose relates to the level for an adult
8 Result of fixed time average levels taken and personal sound exposures of children and staff
8-15
A-frequency weighted time-average levels recorded over the 3-hour period with a fixed
sound level meter ranged from 69-75 dB. On the first session (Monday of Week 2)
major renovation work was carried out in the tenancy below. The time-average level
recorded was slightly higher than recorded on most other days. However it was a noise
of a high nuisance and annoyance value particularly in the outdoor play area.
Observations revealed a more difficult day than usual with a number of distressed
children often crying. Personal sound exposures of the children wearing the badges
were examined but no major differences were observed. However, the children who
were observed visibly distressed were not wearing badges. While there were a number
of interlinking factors such as very cold weather confining children indoors, some
children clearly feeling unwell with colds etc., the effects of the noise intruding from
the outside could not be discounted as aggravating the levels of distress in some
children, especially those who appeared unwell.
In the final week, the A-frequency weighted time-average levels (3-hours) recorded by a
fixed sound level meter ranged from 69-72 dB and it was noticeably quieter than earlier
weeks. Personal sound exposures of children were generally lower than they had
recorded in earlier sessions especially on the last 3 days.
While the results and observations were not conclusive, it supports the argument that
quieter environments are beneficial to the children giving a calming effect on behaviour
and a positive effect on learning.
8.8 Optimal noise levels in early childhood centres
The World Health Organization recommends a background time-average level of not
more than 35 dB for unoccupied learning spaces during the time they are in operation.3
This appears an optimal guideline value for early childhood centres. The higher the
levels above this value the higher the level of competing background noise with the
speech and communication signal by the teachers and other children. Early childhood
centres by their nature are highly interactive learning spaces where a significant
8 Result of fixed time average levels taken and personal sound exposures of children and staff
8-16
contribution of all noise energy present will be generated by the children and the
activities they perform. The optimal background time-average levels would ideally be
no more than 65 dB averaged over 1 hour. This is based on the premise that noise
levels should not be at a level to interfere with normal speech or communication nor
cause any child attending distress or harm.
8.9 Summary A significant number of children in both sessional centres and all day centres recorded
daily sound exposures in excess of 100%, which is cause for concern. More work is
needed as to the reasons for such high readings and to ascertain the extent of the
children’s own voices and play habits, which contribute to the recordings taken by the
doseBadges. A higher number of staff exceeded the maximum daily sound exposure of
100% in all day centres, as was expected, due to the long hours on contact with the
children.
A-frequency weighted time-average levels recorded by a fixed sound level meter (LAeq 2-
3½h) varied from 65-79 dB in sessional centres and (LAeq 6-8½h) 69-79 dB in all day
centres. These values were similar to those reported by Picard and Bradley.2 Time-
average levels dropped sharply in one centre when the children left for a walking
excursion.
There were specific events where sound excessive sound levels were recorded. At one
music session, the A-frequency weighted time-average level reached 93 dB in the area
where the teacher and children were gathered. In another area where children were
being taught drumming, sound pressure levels from a doseBadges of children
participating showed A-frequency weighted time-average levels in the range of 88-90
dB. Time-average levels ranged from 82-86 dB from the doseBadge readings of
children as they were taken on a walking excursion along busy streets in the central
business district. In another excursion, time-average levels ranged from 88-92 dB while
children were walking on a temporary footpath right next to major road works. In an
inner city childcare centre with major construction works right next to the playground
area, time-average levels were as high as 77 dB while the works were in operation
dropping to 63 dB when the works temporarily ceased.
8 Result of fixed time average levels taken and personal sound exposures of children and staff
8-17
In an intensive study in one centre where daily sound exposures (DSEs) for individual
children were recorded over multiple sessions, children who engaged in continuous
rough and tumble play recorded high DSEs while others who preferred the quieter
activities such as finger painting and drawing, recorded low DSEs. On days when a
child wearing a doseBadge was visibly distressed the DSEs were higher than on other
days.
Optimal noise levels have been proposed for early childhood centres. The WHO
guideline value for unoccupied learning spaces is supported as the optimal background
time-average level of unoccupied learning spaces at the times they are normally in
operation. When the learning spaces are occupied an optimal time-average level is no
more than 65 dB averaged over 1 hour. This is based on the premise that noise levels
should not interfere with normal speech or communication nor cause any child
attending distress or harm.
8.10 References 1 Sivaraj, S., Personal Communication, Team Leader-Audiology, Capital and
Coast District Health Board, 2006.Wellington, New Zealand. 2 Picard, M., Bradley, J.,, Revisiting speech interference in classrooms.
Audiology, 2001. 40: p. 221-244. 3 World Health Organization, WHO Guidelines for Community Noise, B.
Berglund, Lindvall, T., Schwela, D., Editors. 1999, Occupational and Environmental Health Unit, World Health Organization: Geneva.
9 Survey of early education staff and specialists
9-1
9 Survey of early education staff and specialists.
9.1 Introduction A survey of teaching staff in the centres evaluated was carried out either by interview
using an open-ended questionnaire as a basis of the questions asked, or by staff
completing the questionnaire in their own time. The questionnaire is given in 14.6
Appendices. Participation was completely voluntary, with participants only answering
the questions they wished. The questionnaire was broadly divided into 3 parts as
follows.
Part 1 was based on the model used by Wilson et al1 on school classrooms in
which information was sought from teachers about their particular teaching
space.
Part 2 related the effects of noise on children suspected of being at-risk.
Respondents were invited to nominate any disability they wished and with
which they had experience, and to report on how noise affected these children,
along with strategies used to assist them.
Part 3 gave the opportunity for respondents to identify any issues of concern,
perceived health effects on teachers, existing policies within their centres and
feedback on strategies already in use. The final question invited any relevant
comments the respondent wished to make.
As the study became more widely known, other groups, such as professionals working
with special needs children and parents, expressed interest in participation. As these
groups of respondents were not directly associated with any one premises, they
completed a modified questionnaire (Parts 2 and 3 only) based on their professional,
clinical or parental experience. There were 15 of these reponses received, 10 were from
the professional category and 5 were parent/carers.
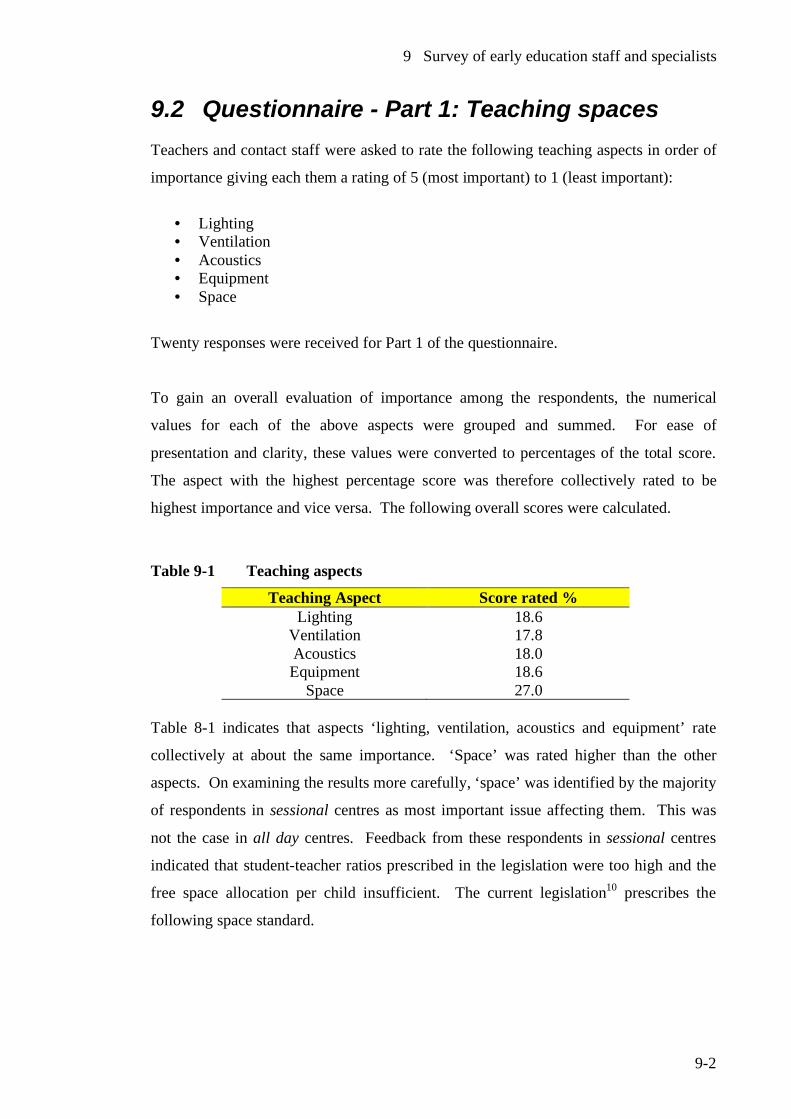
9 Survey of early education staff and specialists
9-2
9.2 Questionnaire - Part 1: Teaching spaces Teachers and contact staff were asked to rate the following teaching aspects in order of
importance giving each them a rating of 5 (most important) to 1 (least important):
• Lighting • Ventilation • Acoustics • Equipment • Space
Twenty responses were received for Part 1 of the questionnaire.
To gain an overall evaluation of importance among the respondents, the numerical
values for each of the above aspects were grouped and summed. For ease of
presentation and clarity, these values were converted to percentages of the total score.
The aspect with the highest percentage score was therefore collectively rated to be
highest importance and vice versa. The following overall scores were calculated.
Table 9-1 Teaching aspects
Teaching Aspect Score rated % Lighting 18.6
Ventilation 17.8 Acoustics 18.0 Equipment 18.6
Space 27.0 Table 8-1 indicates that aspects ‘lighting, ventilation, acoustics and equipment’ rate
collectively at about the same importance. ‘Space’ was rated higher than the other
aspects. On examining the results more carefully, ‘space’ was identified by the majority
of respondents in sessional centres as most important issue affecting them. This was
not the case in all day centres. Feedback from these respondents in sessional centres
indicated that student-teacher ratios prescribed in the legislation were too high and the
free space allocation per child insufficient. The current legislation10 prescribes the
following space standard.
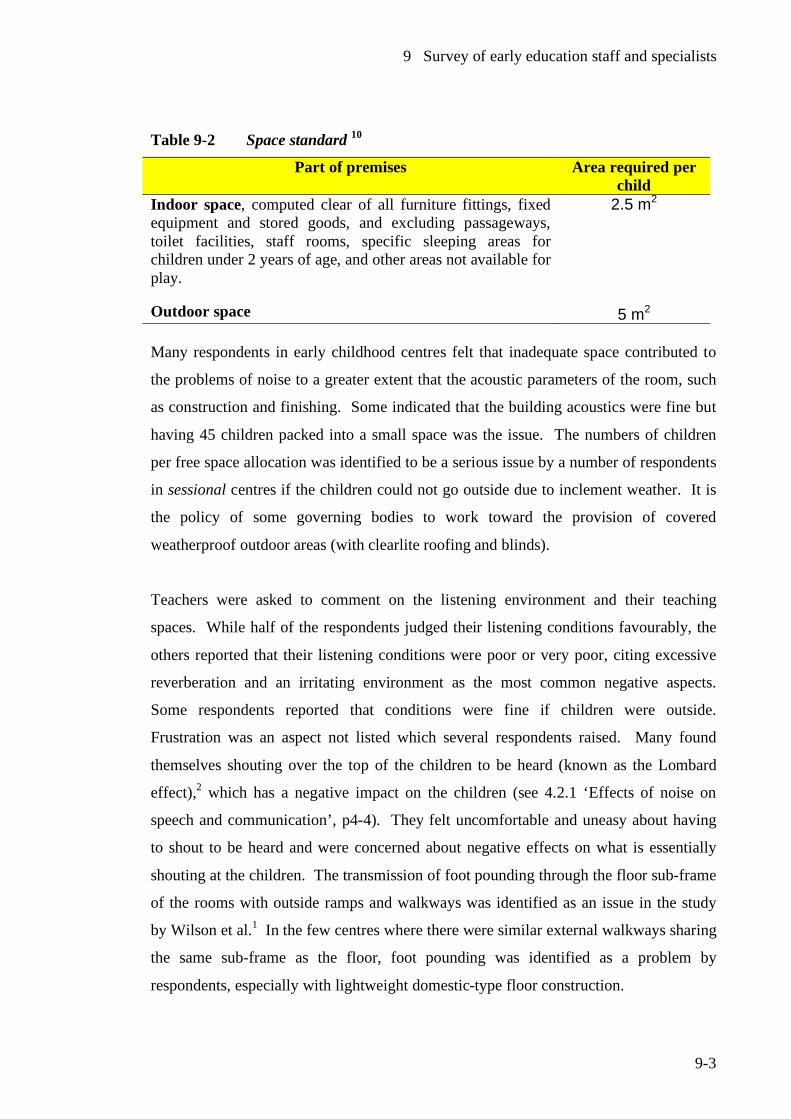
9 Survey of early education staff and specialists
9-3
Table 9-2 Space standard 10
Part of premises Area required per child
Indoor space, computed clear of all furniture fittings, fixed equipment and stored goods, and excluding passageways, toilet facilities, staff rooms, specific sleeping areas for children under 2 years of age, and other areas not available for play.
Outdoor space
2.5 m2
5 m2 Many respondents in early childhood centres felt that inadequate space contributed to
the problems of noise to a greater extent that the acoustic parameters of the room, such
as construction and finishing. Some indicated that the building acoustics were fine but
having 45 children packed into a small space was the issue. The numbers of children
per free space allocation was identified to be a serious issue by a number of respondents
in sessional centres if the children could not go outside due to inclement weather. It is
the policy of some governing bodies to work toward the provision of covered
weatherproof outdoor areas (with clearlite roofing and blinds).
Teachers were asked to comment on the listening environment and their teaching
spaces. While half of the respondents judged their listening conditions favourably, the
others reported that their listening conditions were poor or very poor, citing excessive
reverberation and an irritating environment as the most common negative aspects.
Some respondents reported that conditions were fine if children were outside.
Frustration was an aspect not listed which several respondents raised. Many found
themselves shouting over the top of the children to be heard (known as the Lombard
effect),2 which has a negative impact on the children (see 4.2.1 ‘Effects of noise on
speech and communication’, p4-4). They felt uncomfortable and uneasy about having
to shout to be heard and were concerned about negative effects on what is essentially
shouting at the children. The transmission of foot pounding through the floor sub-frame
of the rooms with outside ramps and walkways was identified as an issue in the study
by Wilson et al.1 In the few centres where there were similar external walkways sharing
the same sub-frame as the floor, foot pounding was identified as a problem by
respondents, especially with lightweight domestic-type floor construction.
9 Survey of early education staff and specialists
9-4
All respondents who completed this section indicated they sometimes had problems
with noise generated inside the centre. When asked what noise they found intrusive or
annoying, many reported the screaming and yelling of children along with the scraping
of furniture. Some identified the crashing and banging of wooden blocks, while others
found the clanking of high heel shoes when children dress up to be particularly
annoying. Noisy ride-on toys with hollow plastic wheels being ridden on a concrete pad
were identified as very annoying in centres which had these toys. In a few centres,
which had a dilapidated piano in the corner, staff found that children bashing on these
to be very annoying. A number of centres have music playing as background music.
The volume has been a source of tension with some staff objecting to how loud other
staff members wish to play the music.
Respondents reported that they had issues with noise in their centres at some time. Of
the 20 respondents, all except 2 said that most of the noise was generated by the
children themselves. Of the 2 respondents, one said all the noise was generated by the
children while the other said that children were responsible for only some of the noise
as they were on a busy road with road works occurring.
Respondents were asked to comment on times of the day or specific events where they
perceived the noise to be excessive. Many reported that noise was excessive at the start
and end of sessions with the arrival and departure of the children. Parents and carers*
have ready access to their children while at the centres and in sessional centres the noise
that parents make was identified as a problem as children arrive and depart with their
parents in the space of a short time. Some centres have sent notices home asking
parents, who arrive to collect their children, to respect that the lessons are still in
progress until the children are dismissed. In all day centres, the drop off and pick up
times varied considerably so there was not the rush of parents at the beginning and end
of the working day. Observations revealed that pick up and drop off times in sessional
centres seemed quite an enjoyable and social time for parents to meet each other– hence
the sound of chatter at these times which could be disturbing during lessons especially if
children were sitting on the mat and listening to the teacher. Transition times when
children are moved from one activity to another were reported as noisy. This may be * Guardians or approved persons, other than the parents, permitted to collect and look after the
child.
9 Survey of early education staff and specialists
9-5
due to the unsettling nature of moving children into different activities. Toileting
children and having them seated for a meal often generated noise until the children were
settled and began eating.
Respondents were asked to estimate a percentage value for the extent of times they felt
noise was excessive. Values reported ranged from less than 5% to a maximum of 50%.
This suggests that noise annoyance is a problem only at specific times. Some of the
higher values reported referred to an ‘inside day’ due to the weather. In some centres,
the weather often related to attendance. In poorer areas, inclement weather often meant
many children not attending due to sickness and infection. In addition those without
transport, who walk their children to the centre, may keep the children at home rather
than take their children to the centre in bad weather.
When asked about any environmental conditions, which have a direct affect on noise
levels, all respondents identified the weather which confines children indoors. In some
exposed centres, wind was identified as a major issue, both from the noise of howling
gales and having to keep children inside on fine but chilly days. This centre was in a
lower socio-economic area with a higher than average number of special needs children.
Respondents were asked to identify noise generated within their centre apart from that
generated by children. Furniture scrape was identified by 18 of the 20 respondents as
major source of noise. In some centres, which had ceiling fans to cope with summer
heat, these were identified as an issue. If the ceiling fans were operating, it was a source
of continual noise, which was always there and very annoying. While one centre was
unoccupied, the background sound level was measured at approximately 35 dB with the
fans off, rising to 50 dB with the fans switched on. The volume of the Hi Fi was
identified as an issue where some staff were annoyed by the volume that other staff
members wanted. The hum from fish tank pumps were identified as the sound is there
all the time and can be annoying. Similar comments were made in the study by Wilson
et al1 over the similar sound of computers. Some respondents who were in centres with
squawking caged birds, found these quite annoying. Other respondents had problems
with squeaky play equipment due to lack of lubrication. Poorly constructed toys such as
ride on tricyles, which were noisy when in use, were identified by staff as being very
annoying.
9 Survey of early education staff and specialists
9-6
In some areas, noise generated outside the control of the centres was identified as an
issue with most respondents reporting that they had problems with noise generated
outside their centres at times. Those who were in the vicinity of emergency vehicle
stations, reported that noise of sirens could be very disruptive, particularly if there were
many call outs. One respondent reported the experience in another centre of the
disruption caused by the station siren for a volunteer fire service, which they felt was
too loud and disturbing. The local Fire Service chief had argued it had to be of that
volume to be heard in the outskirts of the District’s centre. The centres next to airports
and railway lines reported issues with both of these transport activities. A centre next to
a chartered club (selling liquor) had issues with the noise of bottles being stacked and
barking dogs on the trucks, which frequently visited the premises. One centre, which
was largely encircled by roads, had issues with boy racers around the perimeter of their
centre. Another centre has issues with a motor garage with noise from engine revving,
air compressor tools, horns sounding and banging. A loud school bell from the school
next door was an issue for one centre. In Auckland, a respondent from the spray zone to
eradicate the painted apple moth, a potentially serious agricultural pest accidentally
introduced to New Zealand, reported the level of disruption caused by low flying
aircraft in the eradication of this pest. One respondent reported on a centre where she
had worked with major building extensions underway to extend the premises. It was, in
effect, a building site behind a canvas screen and barriers, with little other provision
made for the children or teachers. Many commercial gymnasiums provide childcare for
children while their parents work out. Some staff has been very concerned at the level
of noise to which the children and themselves are exposed. One centre was approved
with a childcare centre right next to the weights room with staff concerned about the
crashing and banging of weights. While it would be desirable to carry out monitoring in
such facilities, the obviously sensitivities surrounding a commercial operation and
perceived negative publicity, make it unlikely to obtain approval from management.
Teachers and staff were asked to comment on how noise affected them. All respondents
indicated that noise affects them in some way and no respondents indicated that noise
had no effects on them. Most of the respondents (about 80%) found noise to be
stressful and made them feel irritable. Several complained of leaving work with a
headache on days when they felt noise was excessive. The majority found noise tiring
and a strain on their voices. Two respondents indicated that they experienced a tinnitus
9 Survey of early education staff and specialists
9-7
type response such as ringing the ears, which can be regarded as a warning sign of
impending hearing damage. Two respondents from small special facilities such as
centres or classes for special needs children, reported that noise from students was not
an issue, due to the teacher-to-staff ratio of 1 teacher per 10 students. Some teachers
indicated that noise was a long-term issue for them, which they encountered throughout
their working lives. Half the respondents expressed concern over hearing damage as a
result of their work and in the case of 4 centres, staff requested hearing tests. (The
results of these hearing tests are reported in Chapter 11). Some staff members felt that
what they have to do to manage noise is detrimental to their teaching practice. Some
indicated that they found it difficult and tiring to try and control the environment for the
benefit of children and themselves. An equal number of respondents indicated concern
over voice strain and these seemed to be those with softer voices who had to strain them
to be heard.
9.2.1 General effects of noise on children Question 7 (Part 1 of the questionnaire) sought information on how noise affected
children in general. The conditions listed were as follows:
• No effect
• Impairing communication between teachers and children and
intercommunication with children
• Irritability
• Affects leaning ability
• Loss of concentration
• Creating behavioural problems
• Other
Not one respondent indicated that noise had no effect and all the conditions listed in the
questionnaire were indicated by 18 of the respondents. Under the “Other category,” over
stimulation (hypes them up) was listed by several respondents and two reported that
some sensitive children felt threatened by particular sounds. A specific example was
quoted by one of these respondents - a recording of "Dinosaur Rock" had caused some
distress to sensitive children. Respondents felt that noise generally had a negative effect
on children, their well-being and educational outcomes. Children are encouraged to use
their words in negotiation rather than resort to physical means. If noise levels are such
9 Survey of early education staff and specialists
9-8
that children are unable to use their words they have been observed to resort to physical
means such as grab something they want from another student or push them away to
communicate their needs. In noisy situations some respondents indicated children will
give up and not bother.
9.3 Questionnaire - Part 2: Noise and at-risk children
A number of special needs children are well known to be adversely affected by noise.
This part of the study aimed to gain more information about these children and how
typical noise and acoustic conditions affect them in early childhood settings.
Information was sought from teachers, and specialists or parents. Participants were
asked to nominate any conditions from the list below they wished to report on or they
could nominate any other condition not included:
• Partially sighted
• Hearing loss (included middle ear infections)
• Down syndrome
• Pervasive developmental disorders
• Autistic spectrum disorder
• Asperger’s syndrome
• Attention-deficit/hyperactivity disorder
• Global developmental delay
• Other conditions resulting in delay in development, speech and communication
(e.g. developmental verbal dyspraxia)
• Giftedness (added on request)
Respondents were asked to report on the effects of noise from these children and any
strategies from their practice and experience, which could be used to help these
children. To this end, some respondents submitted information sheets and made
references to published materials to support their responses. These have been included
in this work where appropriate.
9 Survey of early education staff and specialists
9-9
A number of conditions such as giftedness and central auditory processing disorder may
not usually be diagnosed until the school years and while children will experience issues
in the early years of education, the condition may not be recognised until after they start
school. In this case, valuable input was obtained from five parents of children who had
been subsequently diagnosed with a disability of interest and were able to relate back to
their preschool years.
Some respondents found it hard to make generalisations due to individual differences in
children experiencing the same condition, particularly with complex conditions such as
autistic spectrum disorder and developmental verbal dyspraxia. However with most
conditions the respondents reported that noise adversely affects learning and
communication, both with teachers and children and between the children themselves.
This was particularly the case with any child having a speech or auditory impairment.
Respondents indicated that some children experiencing conditions such as
developmental delay, Down syndrome, autistic spectrum disorder and giftedness were
often startled and distressed by loud sudden and unexpected noises such as a siren, loud
machinery or sharp impact type sounds. Some noisy loud music has also caused
children distress. For those children experiencing severe difficulties in speech and
communication, noise only exacerbates the difficulties they already face.
There were increased complexities with those children presenting with comorbid
conditions such as Down syndrome and autism for an example. However a couple of
respondents pointed out that some special needs children can be quite noisy and while
they may be affected by the noise around them, are quite unaware of the level of noise
they generate themselves. However, sudden acute loud noises seem to act a trigger for
adverse or unsettled behaviour.
9.3.1 Hearing impairment Hearing impairment (both sensorineural and conductive hearing loss) is perhaps the
most widely recognised at-risk group to noise. This is a particularly serious issue in
early years due to the adverse effects of otitis media with effusion and the numbers of
children affected. Respondents have reported that in addition to learning and
communication impairment, high levels of noise has caused distress in some of these
9 Survey of early education staff and specialists
9-10
children. The effects of sudden loud noise on those fitted with hearing aids are well
known, as these devices, unlike the auditory system, are not selective in focusing on the
target sound, and amplify everything. Inclement weather with children confined
indoors, presents a particularly difficult time for these children.
One observed response of the child in cases of excessive noise, is to turn off their
hearing aids, which in effect isolates them and defeats the purposed of having these
devices fitted. Strategies suggested included the provision of quiet times and activities
which didn’t generate high levels of noise. Modifications to the centres were suggested
by respondents with a recommendation to increase play space with outdoor covered
areas for wet and winter times. An information sheet3 prepared as a tool for specialists
and teachers was submitted by a respondent to support their responses. In the listed
strategies, the following were highlighted:
• Use of the child’s name to gain their attention
• Use of culturally appropriate eye contact
• Speak to the child from a distance within 2 metres
• Be aware of background noise
• If the child has not comprehended or heard, rephrase the sentence rather than
repeating verbatim
• Use of other non-verbal means such as face and hand gestures to enhance
communication
• Check that the child has understood by some confirmatory questions
• Use of clear voice with normal intonation. Shouting can distort the sound
• Enhance visual cues such as face to face communication and ensure that the
speakers face is in the light when speaking.
9.3.2 Central auditory processing disorder (CAPD)
One condition, which is not usually diagnosed until the school years, is central auditory
processing disorder. However, from reports of children with this condition, there were
concerns in their earlier years of education. Because there was no specific diagnosis,
the child may be denied sufficient targeted help in their early education years. A parent
respondent reported that the child experienced problems with learning and noise.
According to the respondents who reported on this condition, background noise can be
9 Survey of early education staff and specialists
9-11
major distraction for some of these children, along with visual distractions. The busy
early childhood centre with a multitude of activities, can present a major distraction
from learning and communication. Keith4 reported that these individuals have
difficulties with all kinds of acoustic distortions of auditory information including
background noise, excessive reverberation, rapid speech and competing speech.
9.3.3 Attention-deficit/hyperactivity disorder (ADHD)
A respondent reported that individual case histories indicated some particular sounds
can bring comfort (e.g. dishwasher) while others can cause distress (e.g. vacuum
cleaner). In general, respondents reported that noise can impair learning, impair
communication with the teacher and inter-child communication and cause behavioural
issues with these children. High levels of noise appear to increase hyperactivity and
decrease attention and concentration. The type of physical environment is quite
important with some environments being far more conducive than others. A large hall
with excessive reverberation and noise from the pounding of feet on a wooden floor is a
more difficult environment than activities in a quiet structured preschool classroom.
Having quiet times and plenty of outdoor space will benefit these children.
Respondents suggested that parents could be used to select a suitable (quiet and orderly)
early childhood centre for their child. Reduction of noise and movement to minimise
distractions along with creating corners with reduced stimulation were suggested.
9.3.4 Down syndrome
The effects of noise vary with individual children and with those experiencing a co-
morbid condition such as a combination of Down syndrome and autistic spectrum
disorder as one example. In addition the prevalence of middle ear infections with this
group cannot be ignored. They can be distressed by another child crying or screaming,
machine noise such as a lawnmower and particularly piercing sounds such as a fire
station alarm, if it is close by. Noise has been observed to cause irritability and
aggravating existing behaviour and been reported as impairing learning by causing
distractions from tasks and impairment of communication with other children and the
teacher. When working with these children, a quiet area needs to be found in the centre.
Noise reducing strategies such as carpeting and increased space such as covered outdoor
areas for wet weather are highly desirable. Some respondents reported that these
9 Survey of early education staff and specialists
9-12
children can be quite noisy themselves such as banging loudly on drums and other such
objects.
9.3.5 Developmental verbal dyspraxia One respondent reported on this condition and indicated issues with learning and
communication. These children need specific work on production of speech sounds and
a quiet environment is essential for them to hear target sounds being spoken and for a
speech therapist to hear the child's production of those sounds. Unless a quiet suitable
space is available, it is extremely difficult to conduct speech language therapy with
these children. If these children are placed in sessional centres, specialists will often
not have access to a quiet suitable space for one-on-one work and will need to use the
staff room or office. The respondent indicated that this is not ‘inclusive education’.*
9.3.6 Autistic spectrum disorder (autism and Asperger’s syndrome)
The respondents identified the most adverse outcomes with children experiencing
sensory integration (modulated) disorder. Children in this group can have exceptional
sensitivities to noise. As almost all of these children present with sensory integration
problems, a great many of them will experience extreme sensitivities to noise.5 Shields6
and Janzen7 verify the difficulties that autistic children have with noise. A wide range
of noises and sounds were identified as causing distress which included:
• Sirens and whistles
• Bells and cymbals
• Unexpected sudden noises
• Machinery noise such lawnmowing
• Air hand dryers
• The din (created by many people talking i.e., crowd noise, classroom noise)
• Sharp impact explosive sounds such as pile driving or jack hammering
One respondent was critical of major construction work in the vicinity, which severely
distressed and traumatised a child presenting with classical autism mainstreamed at the
* See 1.4 Glossary for definition
9 Survey of early education staff and specialists
9-13
centre. This involved drop pile driving for days on end to lay foundations for a bridge
motorway extension. No consultation had taken place between the council, who issued
the consent, and the kindergarten.
Others reported that they suspect disruptive behaviour being used by the child so that it
would be removed to a quieter and more easily managed environment. Strategies
suggested were to divert tasks such as lawnmowing etc, to outside session times and if
this couldn’t be avoided, to thoroughly prepare the child so that they know what will
happen. However, communicating or preparing young autistic children is not easy or
straightforward, but allowing the child to explore something, which is noisy without a
crowd around can help. Fire drills were an activity identified where preparation of these
children was desirable. Visuals and pictures were used to communicate these ideas.
Respondents in general reported the main or primary adverse effects of noise with these
children were:
• High levels of distress
• Aggravation of behaviour
• Putting hands over ears
• Agitation
• Self stimulating behaviours such as hand flapping or rocking
• Screaming or groaning to try and block out the sound
• Fleeing the area and refusing to go back
• Epileptic seizure in an individual case
Many respondents reported the following effects with one expert respondent
labelling these as secondary effects:
• Learning impairment
• Distraction from learning and other tasks
• Compromised communication with other children and with the teacher
As children on the autistic spectrum, especially those presenting with classical autism,
have serious impairments with speech production and communication, noise only
exacerbates the difficulties they already have. One severe case of a child presenting
with Asperger's syndrome, suffered extreme reactions to machine noise such as office
9 Survey of early education staff and specialists
9-14
equipment, photocopy machines, computer hums and even the noise created from
fluorescent lights. A family respondent described the distress of this child running
screaming from a public building after being exposed to such noise. At his school, he
was excluded for aggressive behaviour in his first year, and it was only later that his
extreme sensitivities to noise were fully recognised. The family now believe that his
extreme sensitivity to noise triggered much of his inappropriate behaviour.
The most common strategies suggested by many respondents reporting on autistic
spectrum disorders were to remove these children to a quiet area to escape the din (if
one exists) and the provision of earmuffs or headphones playing soothing music
9.3.7 Giftedness
After a request from a group of parents and teachers representing gifted children,
giftedness was included in the survey. While giftedness may be suspected in the early
years, it may not be confirmed until the school years and so some parents reported
retrospective experience as did those teaching young gifted children at school. A
subgroup of gifted children experience sensory integration disorder as experienced by
those on the autistic spectrum. Information on the types of sounds, which affected
them, were similar to those identified for children on the autistic spectrum.
Respondents reported noise such as bells, sirens and whistles, lawn-mowing and
construction noise as very distressing for these children. Hands over ears, screaming or
groaning and aggravation of behavioural issues have been similarly reported for
giftedness as for autistic spectrum disorders. One respondent reported that early
childhood centres were so noisy that her preschool child eventually refused to go.
Another respondent told of construction works on the other side of the boundary fence
to an early childhood centre in which the noise source was closer to the children than
many of the construction workers. This was especially distressing for a child later
diagnosed to be gifted and experiencing sensory integration disorder. This person noted
that the workers were all wearing hearing protectors but nothing was provided for the
children who were expected to tolerate it. In individual cases, respondents indicated
from first hand experience that excessive noise was blamed for vomiting, on-going
abdominal pain and an epileptic or epileptiform seizure. Noise is very distracting for
these children and they are unable to concentrate in environments of high background
sound levels. Information on likely numbers among gifted children is scarce. Maxwell8
9 Survey of early education staff and specialists
9-15
originally reported that as many as 25% could be affected based on an assessment of an
internal client base of a specialist gifted centre in the USA. However this figure was
later revised as the internal client base was thought to introduce bias as these individuals
and their families had identified such issues and were actively seeking help. Those
experiencing Giftedness would be less likely to seek help unless there was an identified
need. A later estimation by Maxwell suggested 5-10%. Advice was sought from a
specialist teacher at a school for gifted children as to how many children from her
experience would be adversely affected by noise. She felt about 10 % of gifted children
from her teaching experience would be affected and so this suggests that the later
estimation by Maxwell was a reasonable prediction. However there is still considerable
uncertainty which requires further investigation to establish the likely numbers affected.
It is of concern that ear muffs are often promoted as the first port of call in attending to
a child overcome by noise. It is interesting here to compare the hierarchical concept of
the New Zealand Health and Safety in Employment legislation9 in managing hazards
such as noise in the workplace. Clause 8 of the Health and Safety in Employment Act
1992 proposes the elimination of noise at the source as the first line of defence. If this
is not possible, then Clause 9 of the Act calls for isolation of the worker from the source
of the noise. If either of the two former lines of defence cannot be reasonably carried
out, only then does Clause 10 require the minimisation of the likelihood of the hazard
causing harm and the provision of hearing protectors.
To give a child, overcome by noise, hearing protectors or headphones with quiet music
should only be carried out as a last resort. This in effect withdraws them from their
auditory surroundings and cannot be construed as inclusive education. If the noise is to
a level which is distressing the child, then the first line of defence should be to reduce
the sound at source. In other words, can those making the noise be effectively
managed?
9.4 Issues and Strategies
Respondents were asked to comment on specific issues and problems, any low cost or
effective strategies they used, to identify worthwhile suggestions for research and other
9 Survey of early education staff and specialists
9-16
ways they could be assisted. Finally they were invited to make any comment on any
issue not previously covered.
9.4.1 Lack of space
Many respondents were very critical about the substandard conditions they work in and
in which they expect special needs children to effectively learn. It appeared that
sessional centres had higher numbers of special needs children. This is probably
because New Zealand’s Ongoing Resourcing and Renewable Scheme (ORRS) funding
will not cover teacher aide hours for full time care. It is in sessional centres, where
space and high staff to student ratio have been identified as an issue of concern.
Respondents suggested that centres need to have carpeted quiet corners to allow
children to escape the din as well as for one-on-one work with children who have an
identified need. Difficulties would arise over the provision of separate areas as children
must be effectively supervised and children cannot go behind locked doors where they
cannot be visually supervised. Quiet corners are probably not sufficient if they share
the same air space with a noisy area, as sound will be transmitted straight into these
areas without any attenuation apart from distance. A separate room with a full height
partition and closing door would be necessary to achieve any effective sound reduction.
Semi-permanent office type transparent partitions could be used to create a separate
quiet area/reading room which would allow effectively visual supervision on occupants
and a space for children to retreat from the noise. Such as area could be used for one-
on-one work with special needs children as well as other activities such as conducting
interviews where some privacy was desired. A specialist respondent stated that from
his/her practice all children require improved conditions for attending and listening.
While the issues of those with identified needs are better recognised and understood,
there are many other children who are disadvantaged by noisy environments.
The minimum standards prescribed by the New Zealand Education (Early Childhood
Centres) Regulations 1998,10 was the subject of frequent criticism by specialists as well
as teachers. There was widespread belief that the space standard was insufficient as it
didn’t require or allow for the centres to create quiet spaces. One respondent suggested
that it was noticeable that where centres were run as commercial enterprises, governing
bodies will only meet the minimum standard and no more.
9 Survey of early education staff and specialists
9-17
9.4.2 Excessively loud fire alarms
Excessively loud fire alarms (especially those jointly used as burglar alarms) were
identified as a serious issue by many respondents. Regional Public Health (the public
health authority of the Wellington region)11 has also raised concern. Some of the sirens
were reported as being so loud that children have been observed to be visibly distressed
in fire drills by covering their ears with their hands, wetting their pants, and in a state of
panic. Respondents raised concern that apart from the unacceptable distress that some
alarms cause, having children in such a distressed state, could severely compromise a
safe, speedy and orderly evacuation.
Clause 406.3 of the New Zealand Standard (NZS 4512:2003) for Fire Detection and
Alarm Systems in Buildings requires:
• The sound pressure level shall exceed by a minimum of 5 dB(A), the noisiest
background sound pressure level averaged over a 60s period
• The sound pressure level of audible signals shall not be less than 65 dB (A) and
not more than that 100 dB (A) measured at any normal accessible point in the
room at a height of 1.8M.
However Clause 406.5 states:
Where audible-alerting devices could cause occupants distress in areas of buildings, or
where such devices would preclude proper conduct or critical emergency function,
other suitable means of quickly alerting occupants shall be permissible in those areas
as follows.
a) In care or detention facilities in which there are on-duty staff available on a 24
hr basis, low level audible and/or visual devices shall be provided so as to alert
all such staff where ever they may be located and whatever normal duties they
may be undertaking.
In the case of early childhood centres, Clause 406.5 is applicable as loud audible alarms
have been shown to cause distress to young children and could compromise a safe and
effective evacuation. On duty staff are required to be available for the full duration that
early childhood centres are in operation and children are present. There is no need for
9 Survey of early education staff and specialists
9-18
on-duty staff to be available 24 hours a day for day facilities which cease to operate at
night and on weekends. This clause would apply to hospitals and should apply to early
childhood facilities. The present situation with excessively loud fire alarms in early
childhood centres is unsatisfactory and needs urgent attention.
Regional Public Health11 recommended that fire alarms in an early childhood centre
should be no louder than 85 dB as noise above this level can cause harm and distress. If
children are under 18 months of age, the alarm sound should be no louder than 75 dB,
but sufficient in number to be heard in all areas.
9.5 Other pertinent comments by respondents Many respondents supported this work and wished it to continue stating that more work
needs to be done in this area. A number of respondents expressed concern about their
own health and wished for more work to assess hearing loss and other related health
effects among staff. Three centres specifically requested hearing tests and so the study
was extended as is reported in Chapter 11.
A specialist respondent observed from his/her clinical practice that some centres are
extremely skilled at teaching attending and listening skills and felt that this is
something, that varied greatly from centre to centre. This included those who pay
careful, attention to the design of their centres and carefully plan quiet listening times.
The respondent recommended studies in this area.
A resource kit or handbook for teachers was also proposed. This would collate all
existing strategies in use to manage noise. It could also be incorporated into a model
noise management plan, which could then be adopted and adapted by centres to cater
for their individual characteristics. This respondent praised the resourcefulness and
innovation of many teachers and felt this is something to utilise to the full and celebrate.
9.6 Summary Respondents were invited to complete an opened ended questionnaire in three parts.
9 Survey of early education staff and specialists
9-19
9.6.1 Part 1 Individual teaching spaces Part 1 involved the individual teaching spaces of teachers where they were asked to rate
and comment on the teaching aspects of their places of work and to identify noise issues
specific to their centres. Respondents were asked to rate physical parameters in order of
importance. When these were collectively combined, space emerged as the item of
most importance with lighting, ventilation, acoustics and equipment rated about equal.
Space was identified as a serious issue in sessional centres along with the high staff to
children ratios permitted by the legislation. While half the respondents indicated
satisfaction with the acoustic environment of their teaching spaces the remainder rated
their teaching spaces as very poor citing excessive reverberation along with the numbers
of children and the noise they generated. All respondents had problems with noise
generated inside the rooms at times. When asked for comment, many respondents in
sessional centres, felt that the noisiest times were at the start and finish of the session
and some commented on the noise which parents make. This did not seem to be an issue
in all day centres as children arrive and leave with their parents at varying times.
Transition times from one activity to another were noisy as children were settled into a
new activity. Inclement weather was almost universally described as contributing to
noise by keeping children indoors. When asked to comment on noise other than that
generated by children, many indicated furniture scrape as something they found
annoying. Those next to airports, motor garages and emergency services etc were
affected by noise from these activities. When asked about the types of noise they felt
most annoying, most indicated the yelling and screaming of children. Other annoying
noise included the sound of hollow plastic wheels of ride-on-toys on the concrete pad.
The dropping of wooden blocks along with the bashing of a dilapidated piano, were also
identified as causes of annoyance.
All respondents indicated that noise affected them in some way and no respondents
indicated that they suffered no effects from noise. Several respondents complained
about leaving work with a headache on noisy days and many found noise tiring and a
strain on their voices. Half of the respondents expressed concern over hearing damage
as a result of their work. Most respondents felt that noise was of concern to the health
and welfare of children and no respondents indicated that noise does not have an effect
on children and a wide range of effects of noise on children were identified which
9 Survey of early education staff and specialists
9-20
included impairing communication between children and their teachers and with other
children, irritability, affecting learning ability, loss of concentration, over stimulation
and creating behavioural problems
9.6.2 Part 2 At-risk children Teachers, early intervention professionals and parents contributed to this section. For
those not working in a specific teaching environment, a modified questionnaire was
prepared omitting the first part of the questionnaire. Respondents were asked to
comment of specific disabilities known and identified in literature as being affected by
noise. A wide range of disabilities were identified with hearing and auditory processing
problems. Of all of these groups, children with sensory integration disorder were
estimated to be the most seriously affected by noise, due to the number of adverse
outcomes these children have been observed to experience. The vast majority of
children on the autistic spectrum along with a subset of gifted children are known to
experience this condition, which often results in extreme sensitivities to noise especially
in the very young. This finding was surprising, as these groups have not been widely
identified in literature on classroom acoustics, despite this being widely reported in
specific clinical literature on autism and sensory integration.
Many of these children become highly distressed or even traumatised by some noise
experienced in early education settings. This included excessive classroom noise,
excessive reverberation, the hum and whine from machines such as air blow hand
dryers, photocopiers, and noise generated outside the centre. The lack of quiet spaces in
many centres was identified as one of the most pressing issues affecting the integration
of children with special needs into mainstream early education. Early intervention
professionals and their education support workers often have to work on a one-on-one
basis with these children in their care, and often are severely hampered by the lack of
suitable quiet spaces in which to work. In the case of excessive noise or auditory input,
these children often have no quiet spaces into which they can retreat to escape the din.
9.6.3 Part 3 Specific issues and strategies Respondents were asked to comment on any specific issues of concern. A range of
noises such as alarms and sirens were identified as causing distress. The centres where
9 Survey of early education staff and specialists
9-21
security alarms were connected to fire alarms came in for special attention because of
the excessive volume these items generate. In the case of fire drills, planning is put in
place for the children known to be affected by the noise, but affected respondents raised
concern about a real life situation where they will have little or no warning.
Construction noise involving loud impact type sounds intruding from activities outside
one centre was found to be particularly distressing when experienced. Of concern was
the apparent lack of enforcement of such activities by territorial authorities. Childcare
centres should have been regarded as sensitive activities when consent was granted for
major construction work in the vicinity. All such consents should have been notified
consents under the New Zealand Resource Management Act 1991, and consultation
with affected childcare centres should have occurred, with appropriate conditions being
placed on such operations.
The following concluding statements made by 2 respondents were particularly pertinent.
• “Why do we expect children with serious auditory disabilities to negotiate their
way around a noisy painful environment when we never expect a child with
physical disabilities to negotiate their way up a flight of stairs?”
• “If we can get it right for our most vulnerable children, imagine how wonderful
it will be for all the others!”
9 Survey of early education staff and specialists
9-22
9.7 References 1 Wilson, O., Valentine, J., Halstead, M., McGunnigle, K., Dodd, G., Hellier, A,
Wood, J, Simpson, R., Classroom acoustics, a New Zealand Perspective. 2002: Oticon Foundation in New Zealand.
2 Lombard, E., Le signe de l’élévation de la voix. Ann. Maladies Oreille Larynx
Nez Pharynx, 1911. 37: p. 101 - 119. 3 Lascelles, J., Martin, S., Joyce, C., Farmer, J., Clark, S., More than words,
Monitoring and encouraging communication development in early childhood. 2000, Wellington: Group Special Education, Ministry of Education.
4 Keith, R., Clinical issues in central processing disorders. Language, Speech and
Hearing Services in Schools, 1999. 30(4): p. 339-387. 5 Hayes, L., Personal communication. 2004, Group Special Education, Ministry
of Education: Porirua. 6 Shields, J., NAS early bird programme - Parent manual. 1998, United Kingdom:
National Autistic Association. 7 Janzen, J.E., . Understanding the nature of autism. 1996, Texas: Therapy Skill
Builders. 8 Maxwell, E., Personal communication. 2005, Gifted Development Centre:
Denver, USA. 9 Health and Safety in Employment Act 1992 (New Zealand).
10 Education (Early Childhood Centres Regulations) 1998 (New Zealand). 11 Regional Public Health (Wellington, New Zealand), Fire and Security Alarms.
Strand 1 Well Being- Manu Atua (Regional Public Health Newsletter), 2001(6): p. 3.
10. Building and environmental inspection
10-1
10 Building and environmental inspection
10.1 Introduction The last few decades have witnessed major changes and the development of an
innovative teaching practice in early education. Increased noise is perhaps a
consequence of the interactive and inclusive approach, along with former design
criteria, which put an emphasis on hygiene with easily cleanable surfaces. This resulted
in hard reflective acoustic surfaces giving excessively long reverberation times. In
addition, the conversion of typical domestic dwellings to childcare centres rather than
purpose built centres, has not involved acoustical treatment as little practical
information or guidelines were available.
A simple survey or inspection was carried out on each of the premises while noise
levels were being monitored. There were 20 all-day centres and 12 sessional centres. It
was carried out by the researcher and did not greatly involve any staff apart from
seeking extra information about the presence of noisy activities in the vicinity or other
aspects not immediately apparent. A building and environmental inspection sheet (see
14.6 Appendices) was developed essentially as a checklist to ensure consistency. The
inspection criteria of the building was modelled on that carried out by Wilson et al1 in
their New Zealand classroom study. This would allow any comparisons between the 2
types of educational facilities (school classrooms and early childhood centres to be
explored). The licence (which must be legally displayed) was first examined and the
relevant details recorded (ie licensing category the number of permitted children and
required staff).
The inspection was carried out using the building and environmental inspection sheet
(in 14.6 Appendices) as a guide, with the aim of gathering a full profile of the physical
characteristics of the centre, its operation and location. In particular, parameters known
to contribute directly or indirectly to noise levels were carefully observed and recorded.
10. Building and environmental inspection
10-2
The criteria of the licence under the legislation2 were firstly recorded, which included
the number of children permitted to be enrolled and staff required (as well as current
numbers of children and staff members). This was followed by a brief description of
the immediate vicinity and the locality. The construction style was recorded (timber
lightweight, brick-veneer etc). The presence of skylights was noted as these can be
noisy when raining. Brief details of the play areas were noted and the prominent
background noise when occupied determined. Careful notes of the internal construction
such as ceiling type (pitched following the roof line or horizontal with an internal
ceiling space), along with floor type (suspended wooden floor on sub frame or concrete
pad) were recorded, as these parameters can affect the overall acoustics of the internal
space. Internal linings such as wall surfaces and floor covering were likewise recorded
as were the presence of any fixtures likely to influence acoustical quality. Finally,
reverberation times (T60) were evaluated where possible and compared to the
recommendations of the current standard3 across the audible frequencies. Reverberation
times for 26 of the centres were measured and often included more than one teaching
space in each centre. Because the reverberation time test involves the use of a starter
gun to generate the signal (sound pressure level in excess of 90dB), this could not be
done while any children were present. In addition, failure of the initial method meant
that all tests had to be repeated and it was not possible to retest 6 of the 32 centres,
especially if they were located outside the Greater Wellington region. Three centres
had major acoustic treatment of the walls or ceiling carried out during the period of the
study. The results before the application of treatment, and after treatment were recorded
and have been discussed. Other centres were considering acoustic treatment at the time
of evaluation. These are presented as case studies under 10.2.5.2 Examples of acoustic
treatment.
10.2 Results
10.2.1 Licence details Due to the strict conditions of the licence categories under the current legislation,2 the
numbers of the children and staff were reasonably consistent between one type of centre
and another.
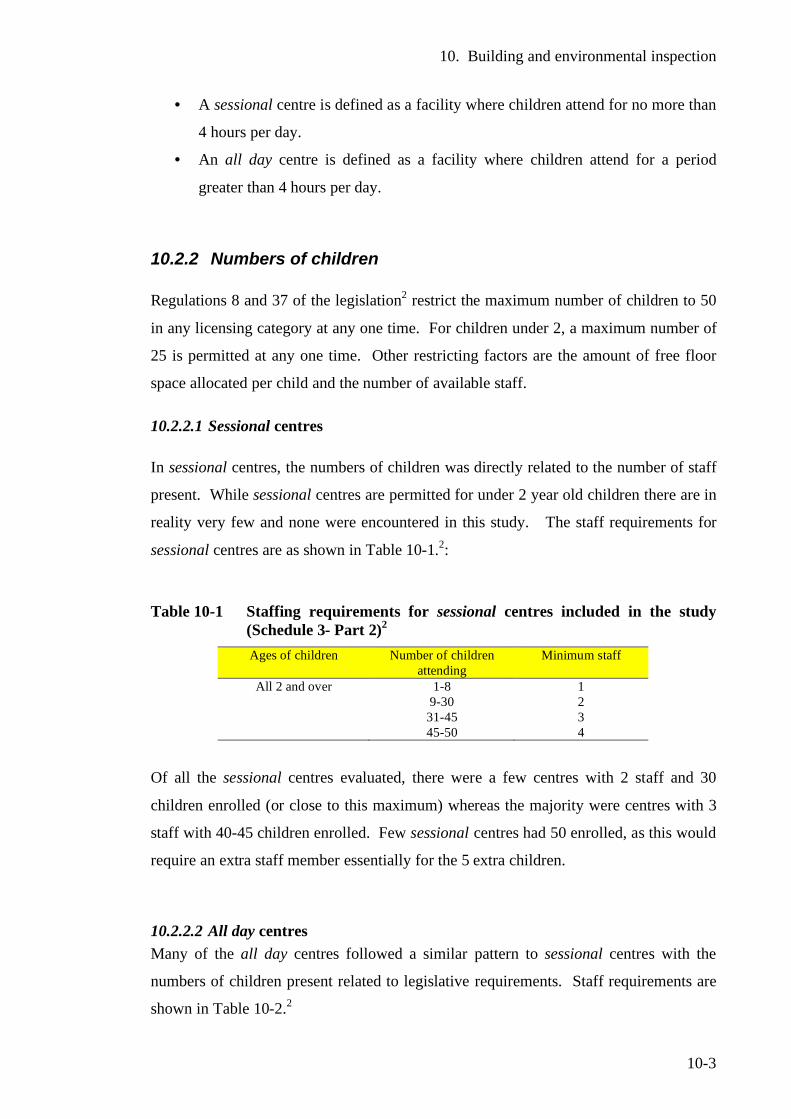
10. Building and environmental inspection
10-3
• A sessional centre is defined as a facility where children attend for no more than
4 hours per day.
• An all day centre is defined as a facility where children attend for a period
greater than 4 hours per day.
10.2.2 Numbers of children Regulations 8 and 37 of the legislation2 restrict the maximum number of children to 50
in any licensing category at any one time. For children under 2, a maximum number of
25 is permitted at any one time. Other restricting factors are the amount of free floor
space allocated per child and the number of available staff.
10.2.2.1 Sessional centres In sessional centres, the numbers of children was directly related to the number of staff
present. While sessional centres are permitted for under 2 year old children there are in
reality very few and none were encountered in this study. The staff requirements for
sessional centres are as shown in Table 10-1.2:
Table 10-1 Staffing requirements for sessional centres included in the study
(Schedule 3- Part 2)2 Ages of children Number of children
attending Minimum staff
All 2 and over 1-8 1 9-30 2 31-45 3 45-50 4
Of all the sessional centres evaluated, there were a few centres with 2 staff and 30
children enrolled (or close to this maximum) whereas the majority were centres with 3
staff with 40-45 children enrolled. Few sessional centres had 50 enrolled, as this would
require an extra staff member essentially for the 5 extra children.
10.2.2.2 All day centres Many of the all day centres followed a similar pattern to sessional centres with the
numbers of children present related to legislative requirements. Staff requirements are
shown in Table 10-2.2
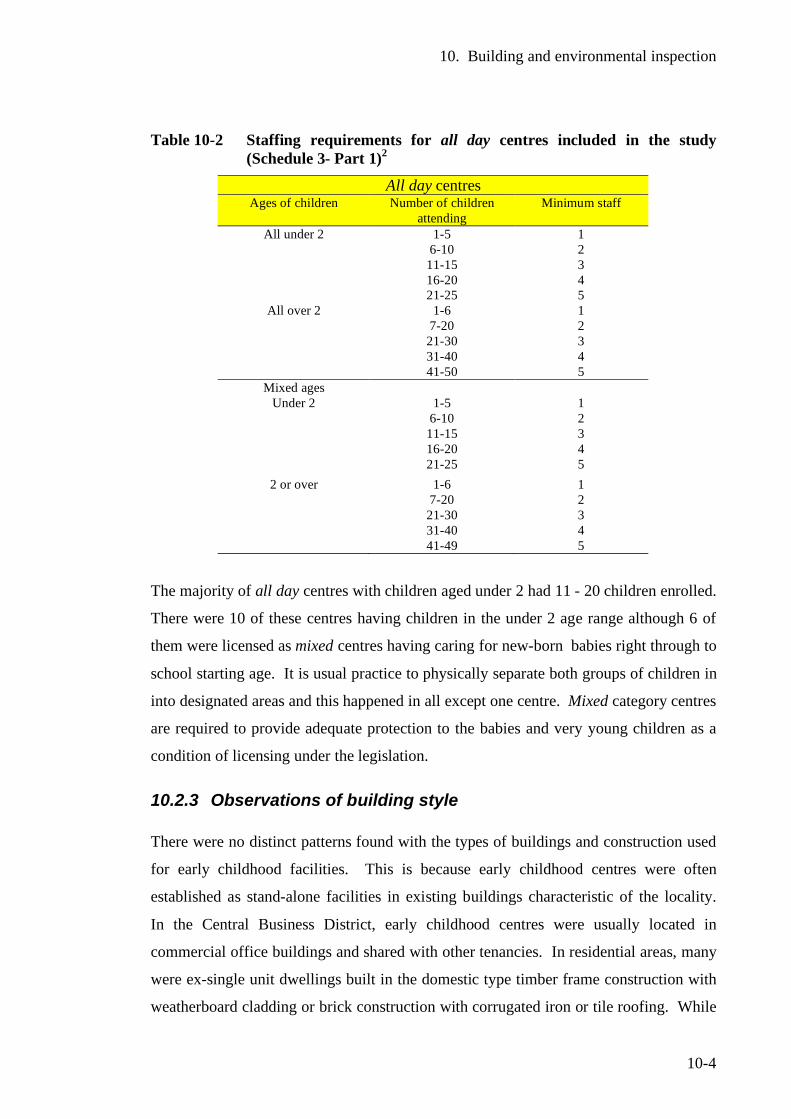
10. Building and environmental inspection
10-4
Table 10-2 Staffing requirements for all day centres included in the study (Schedule 3- Part 1)2
All day centres Ages of children Number of children
attending Minimum staff
All under 2 1-5 1 6-10 2 11-15 3 16-20 4 21-25 5
All over 2 1-6 1 7-20 2 21-30 3 31-40 4 41-50 5
Mixed ages Under 2 1-5 1
6-10 2 11-15 3 16-20 4 21-25 5
2 or over 1-6 1 7-20 2 21-30 3 31-40 4 41-49 5
The majority of all day centres with children aged under 2 had 11 - 20 children enrolled.
There were 10 of these centres having children in the under 2 age range although 6 of
them were licensed as mixed centres having caring for new-born babies right through to
school starting age. It is usual practice to physically separate both groups of children in
into designated areas and this happened in all except one centre. Mixed category centres
are required to provide adequate protection to the babies and very young children as a
condition of licensing under the legislation.
10.2.3 Observations of building style There were no distinct patterns found with the types of buildings and construction used
for early childhood facilities. This is because early childhood centres were often
established as stand-alone facilities in existing buildings characteristic of the locality.
In the Central Business District, early childhood centres were usually located in
commercial office buildings and shared with other tenancies. In residential areas, many
were ex-single unit dwellings built in the domestic type timber frame construction with
weatherboard cladding or brick construction with corrugated iron or tile roofing. While
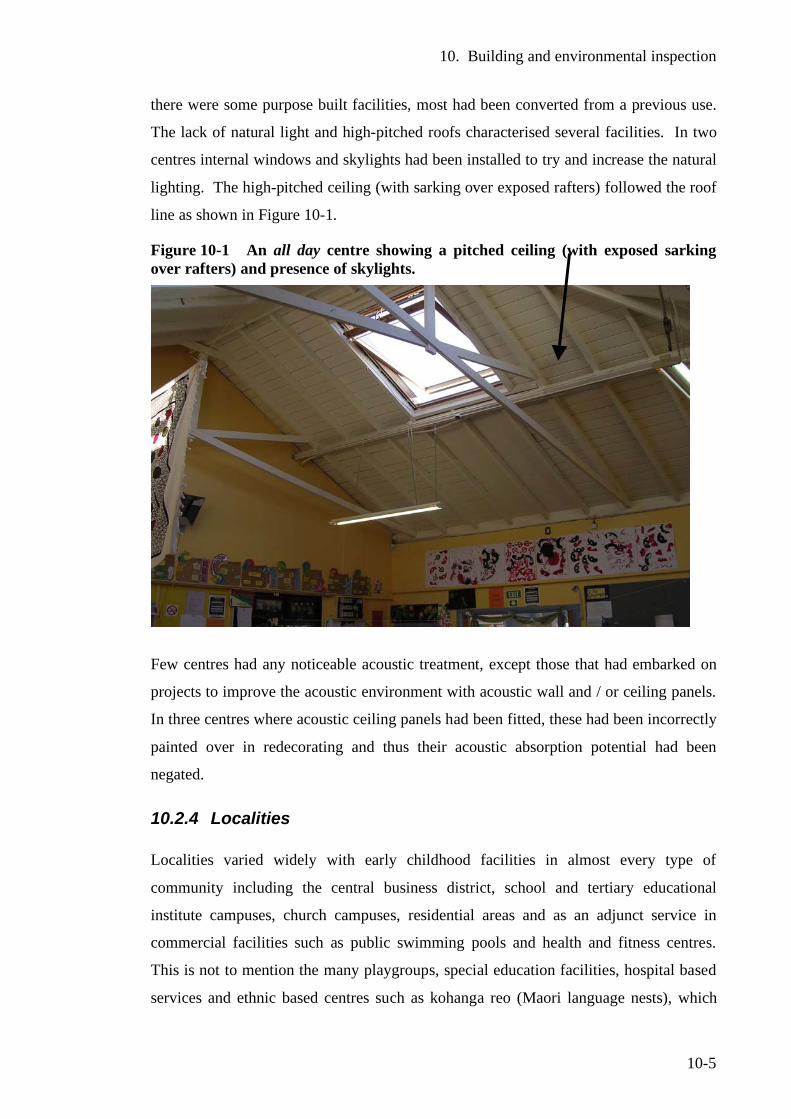
10. Building and environmental inspection
10-5
there were some purpose built facilities, most had been converted from a previous use.
The lack of natural light and high-pitched roofs characterised several facilities. In two
centres internal windows and skylights had been installed to try and increase the natural
lighting. The high-pitched ceiling (with sarking over exposed rafters) followed the roof
line as shown in Figure 10-1.
Figure 10-1 An all day centre showing a pitched ceiling (with exposed sarking over rafters) and presence of skylights.
Few centres had any noticeable acoustic treatment, except those that had embarked on
projects to improve the acoustic environment with acoustic wall and / or ceiling panels.
In three centres where acoustic ceiling panels had been fitted, these had been incorrectly
painted over in redecorating and thus their acoustic absorption potential had been
negated.
10.2.4 Localities Localities varied widely with early childhood facilities in almost every type of
community including the central business district, school and tertiary educational
institute campuses, church campuses, residential areas and as an adjunct service in
commercial facilities such as public swimming pools and health and fitness centres.
This is not to mention the many playgroups, special education facilities, hospital based
services and ethnic based centres such as kohanga reo (Maori language nests), which
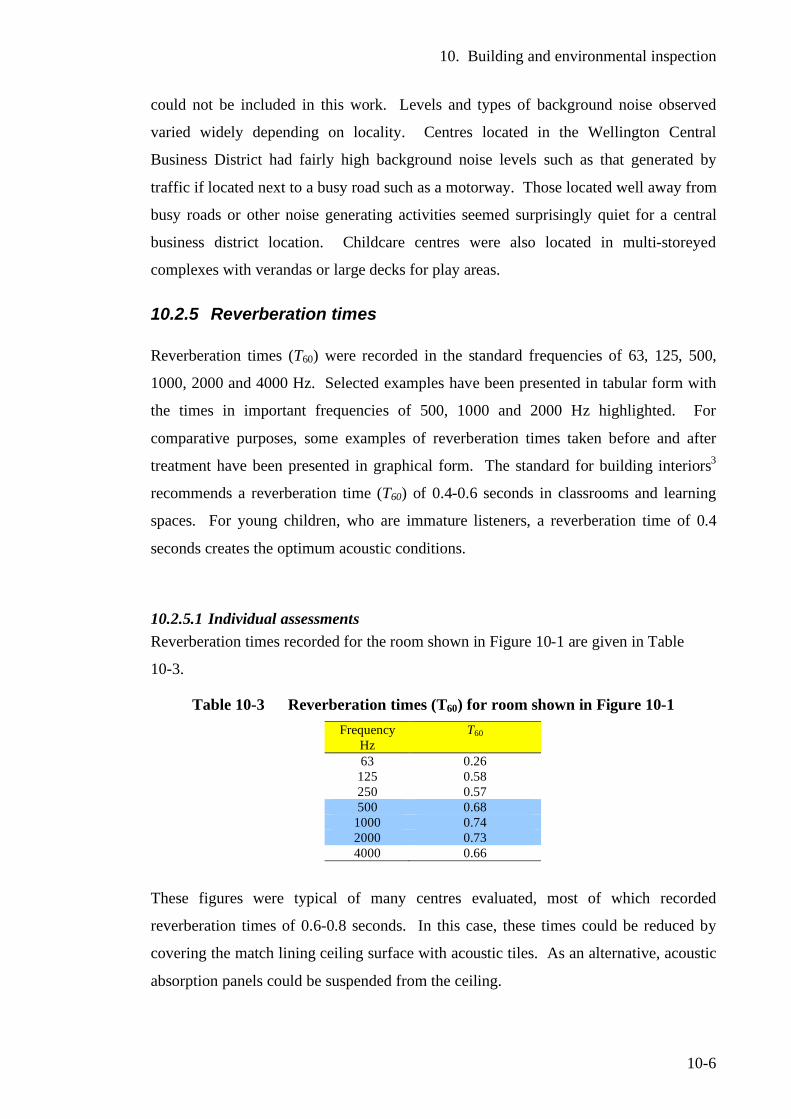
10. Building and environmental inspection
10-6
could not be included in this work. Levels and types of background noise observed
varied widely depending on locality. Centres located in the Wellington Central
Business District had fairly high background noise levels such as that generated by
traffic if located next to a busy road such as a motorway. Those located well away from
busy roads or other noise generating activities seemed surprisingly quiet for a central
business district location. Childcare centres were also located in multi-storeyed
complexes with verandas or large decks for play areas.
10.2.5 Reverberation times Reverberation times (T60) were recorded in the standard frequencies of 63, 125, 500,
1000, 2000 and 4000 Hz. Selected examples have been presented in tabular form with
the times in important frequencies of 500, 1000 and 2000 Hz highlighted. For
comparative purposes, some examples of reverberation times taken before and after
treatment have been presented in graphical form. The standard for building interiors3
recommends a reverberation time (T60) of 0.4-0.6 seconds in classrooms and learning
spaces. For young children, who are immature listeners, a reverberation time of 0.4
seconds creates the optimum acoustic conditions.
10.2.5.1 Individual assessments Reverberation times recorded for the room shown in Figure 10-1 are given in Table
10-3.
Table 10-3 Reverberation times (T60) for room shown in Figure 10-1 Frequency
Hz T60
63 0.26 125 0.58 250 0.57 500 0.68
1000 0.74 2000 0.73 4000 0.66
These figures were typical of many centres evaluated, most of which recorded
reverberation times of 0.6-0.8 seconds. In this case, these times could be reduced by
covering the match lining ceiling surface with acoustic tiles. As an alternative, acoustic
absorption panels could be suspended from the ceiling.
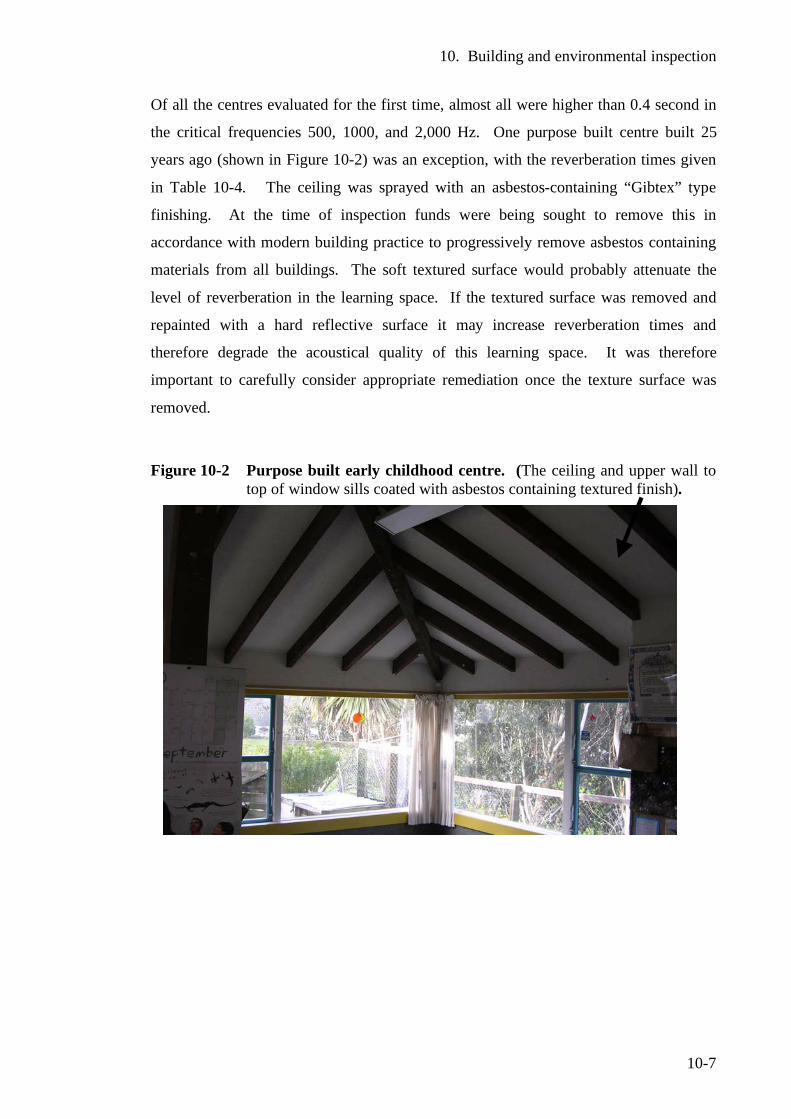
10. Building and environmental inspection
10-7
Of all the centres evaluated for the first time, almost all were higher than 0.4 second in
the critical frequencies 500, 1000, and 2,000 Hz. One purpose built centre built 25
years ago (shown in Figure 10-2) was an exception, with the reverberation times given
in Table 10-4. The ceiling was sprayed with an asbestos-containing “Gibtex” type
finishing. At the time of inspection funds were being sought to remove this in
accordance with modern building practice to progressively remove asbestos containing
materials from all buildings. The soft textured surface would probably attenuate the
level of reverberation in the learning space. If the textured surface was removed and
repainted with a hard reflective surface it may increase reverberation times and
therefore degrade the acoustical quality of this learning space. It was therefore
important to carefully consider appropriate remediation once the texture surface was
removed.
Figure 10-2 Purpose built early childhood centre. (The ceiling and upper wall to top of window sills coated with asbestos containing textured finish).
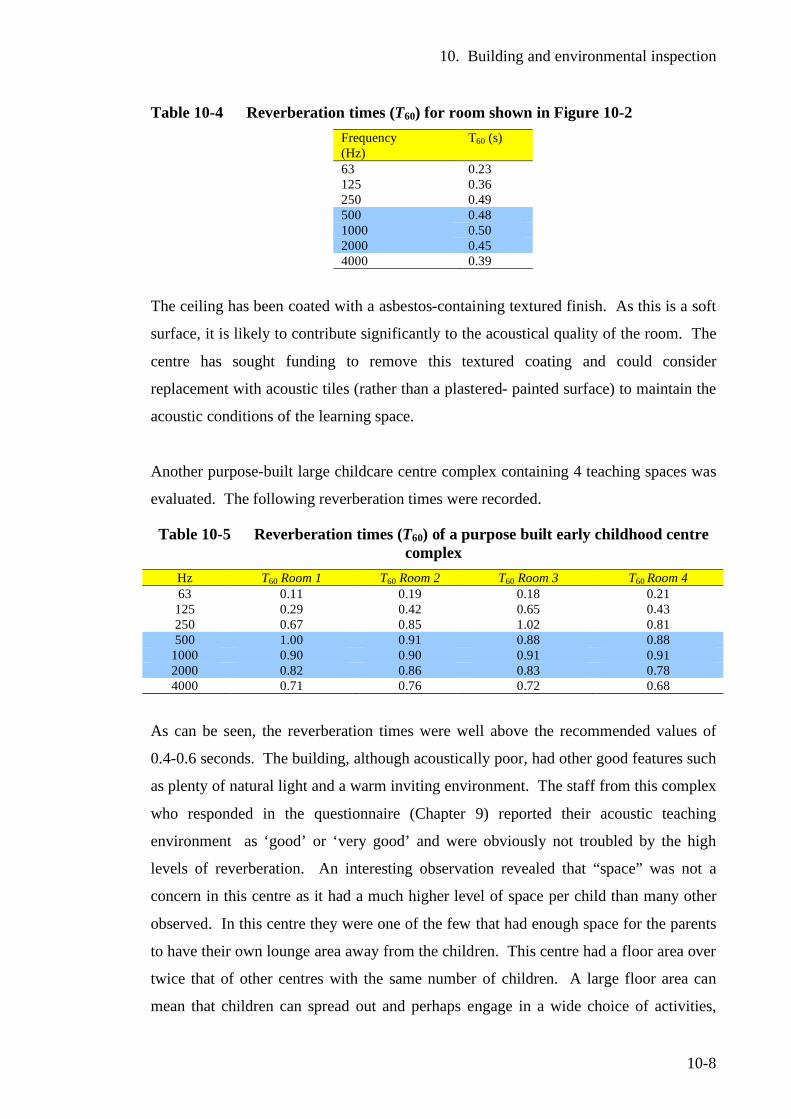
10. Building and environmental inspection
10-8
Table 10-4 Reverberation times (T60) for room shown in Figure 10-2 Frequency (Hz)
T60 (s)
63 0.23 125 0.36 250 0.49 500 0.48 1000 0.50 2000 0.45 4000 0.39
The ceiling has been coated with a asbestos-containing textured finish. As this is a soft
surface, it is likely to contribute significantly to the acoustical quality of the room. The
centre has sought funding to remove this textured coating and could consider
replacement with acoustic tiles (rather than a plastered- painted surface) to maintain the
acoustic conditions of the learning space.
Another purpose-built large childcare centre complex containing 4 teaching spaces was
evaluated. The following reverberation times were recorded.
Table 10-5 Reverberation times (T60) of a purpose built early childhood centre complex
Hz T60 Room 1 T60 Room 2 T60 Room 3 T60 Room 4 63 0.11 0.19 0.18 0.21 125 0.29 0.42 0.65 0.43 250 0.67 0.85 1.02 0.81 500 1.00 0.91 0.88 0.88
1000 0.90 0.90 0.91 0.91 2000 0.82 0.86 0.83 0.78 4000 0.71 0.76 0.72 0.68
As can be seen, the reverberation times were well above the recommended values of
0.4-0.6 seconds. The building, although acoustically poor, had other good features such
as plenty of natural light and a warm inviting environment. The staff from this complex
who responded in the questionnaire (Chapter 9) reported their acoustic teaching
environment as ‘good’ or ‘very good’ and were obviously not troubled by the high
levels of reverberation. An interesting observation revealed that “space” was not a
concern in this centre as it had a much higher level of space per child than many other
observed. In this centre they were one of the few that had enough space for the parents
to have their own lounge area away from the children. This centre had a floor area over
twice that of other centres with the same number of children. A large floor area can
mean that children can spread out and perhaps engage in a wide choice of activities,
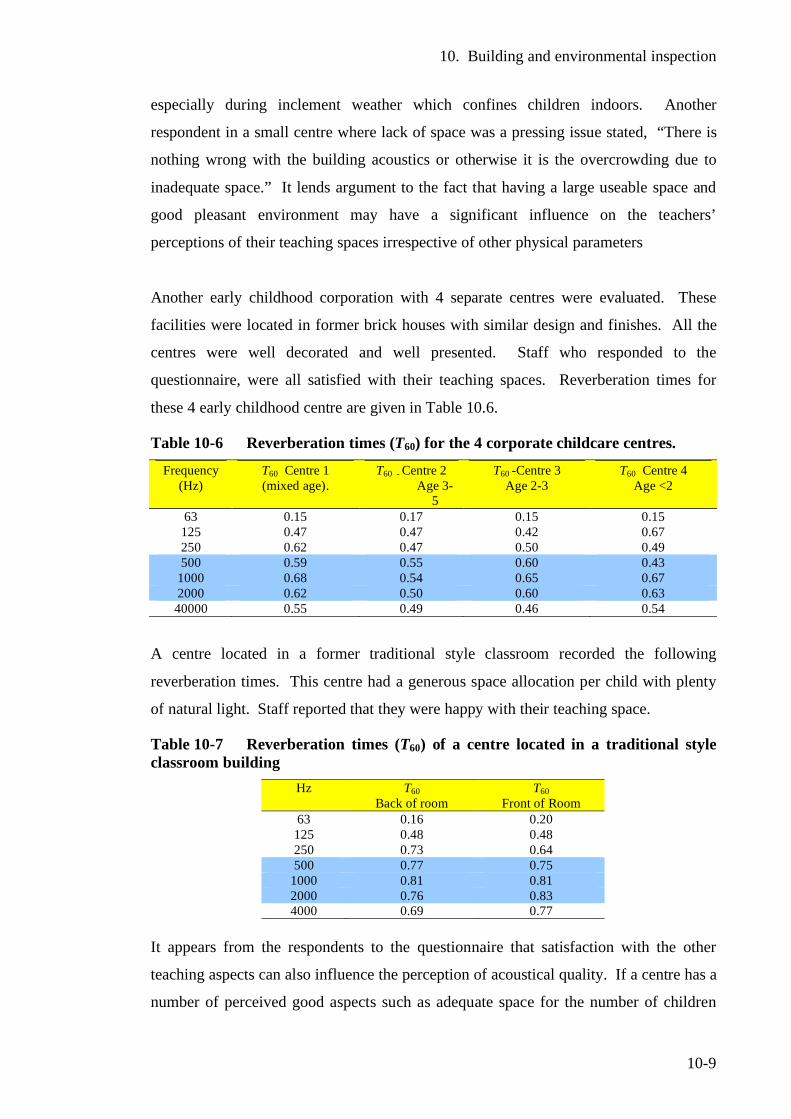
10. Building and environmental inspection
10-9
especially during inclement weather which confines children indoors. Another
respondent in a small centre where lack of space was a pressing issue stated, “There is
nothing wrong with the building acoustics or otherwise it is the overcrowding due to
inadequate space.” It lends argument to the fact that having a large useable space and
good pleasant environment may have a significant influence on the teachers’
perceptions of their teaching spaces irrespective of other physical parameters
Another early childhood corporation with 4 separate centres were evaluated. These
facilities were located in former brick houses with similar design and finishes. All the
centres were well decorated and well presented. Staff who responded to the
questionnaire, were all satisfied with their teaching spaces. Reverberation times for
these 4 early childhood centre are given in Table 10.6.
Table 10-6 Reverberation times (T60) for the 4 corporate childcare centres. Frequency
(Hz) T60 Centre 1 (mixed age).
T60 - Centre 2 Age 3-
5
T60 -Centre 3 Age 2-3
T60 Centre 4 Age <2
63 0.15 0.17 0.15 0.15 125 0.47 0.47 0.42 0.67 250 0.62 0.47 0.50 0.49 500 0.59 0.55 0.60 0.43
1000 0.68 0.54 0.65 0.67 2000 0.62 0.50 0.60 0.63 40000 0.55 0.49 0.46 0.54
A centre located in a former traditional style classroom recorded the following
reverberation times. This centre had a generous space allocation per child with plenty
of natural light. Staff reported that they were happy with their teaching space.
Table 10-7 Reverberation times (T60) of a centre located in a traditional style classroom building
Hz T60 Back of room
T60 Front of Room
63 0.16 0.20 125 0.48 0.48 250 0.73 0.64 500 0.77 0.75
1000 0.81 0.81 2000 0.76 0.83 4000 0.69 0.77
It appears from the respondents to the questionnaire that satisfaction with the other
teaching aspects can also influence the perception of acoustical quality. If a centre has a
number of perceived good aspects such as adequate space for the number of children
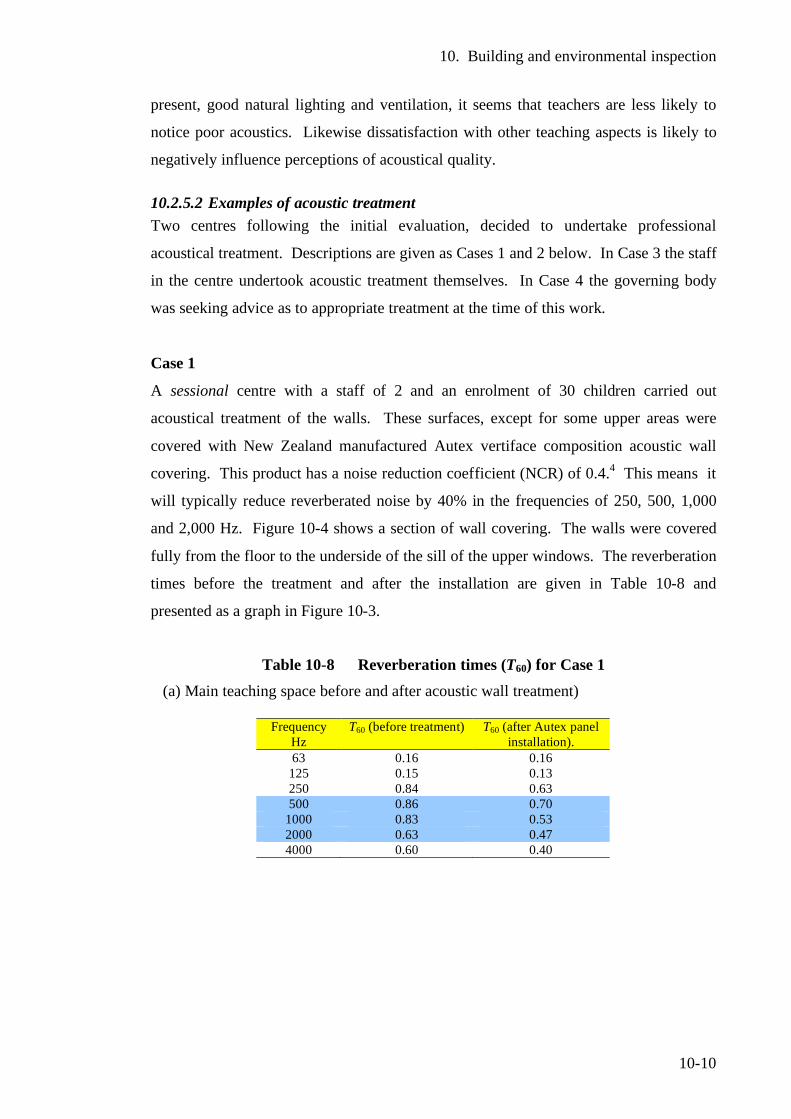
10. Building and environmental inspection
10-10
present, good natural lighting and ventilation, it seems that teachers are less likely to
notice poor acoustics. Likewise dissatisfaction with other teaching aspects is likely to
negatively influence perceptions of acoustical quality.
10.2.5.2 Examples of acoustic treatment Two centres following the initial evaluation, decided to undertake professional
acoustical treatment. Descriptions are given as Cases 1 and 2 below. In Case 3 the staff
in the centre undertook acoustic treatment themselves. In Case 4 the governing body
was seeking advice as to appropriate treatment at the time of this work.
Case 1
A sessional centre with a staff of 2 and an enrolment of 30 children carried out
acoustical treatment of the walls. These surfaces, except for some upper areas were
covered with New Zealand manufactured Autex vertiface composition acoustic wall
covering. This product has a noise reduction coefficient (NCR) of 0.4.4 This means it
will typically reduce reverberated noise by 40% in the frequencies of 250, 500, 1,000
and 2,000 Hz. Figure 10-4 shows a section of wall covering. The walls were covered
fully from the floor to the underside of the sill of the upper windows. The reverberation
times before the treatment and after the installation are given in Table 10-8 and
presented as a graph in Figure 10-3.
Table 10-8 Reverberation times (T60) for Case 1
(a) Main teaching space before and after acoustic wall treatment)
Frequency Hz
T60 (before treatment) T60 (after Autex panel installation).
63 0.16 0.16 125 0.15 0.13 250 0.84 0.63 500 0.86 0.70
1000 0.83 0.53 2000 0.63 0.47 4000 0.60 0.40
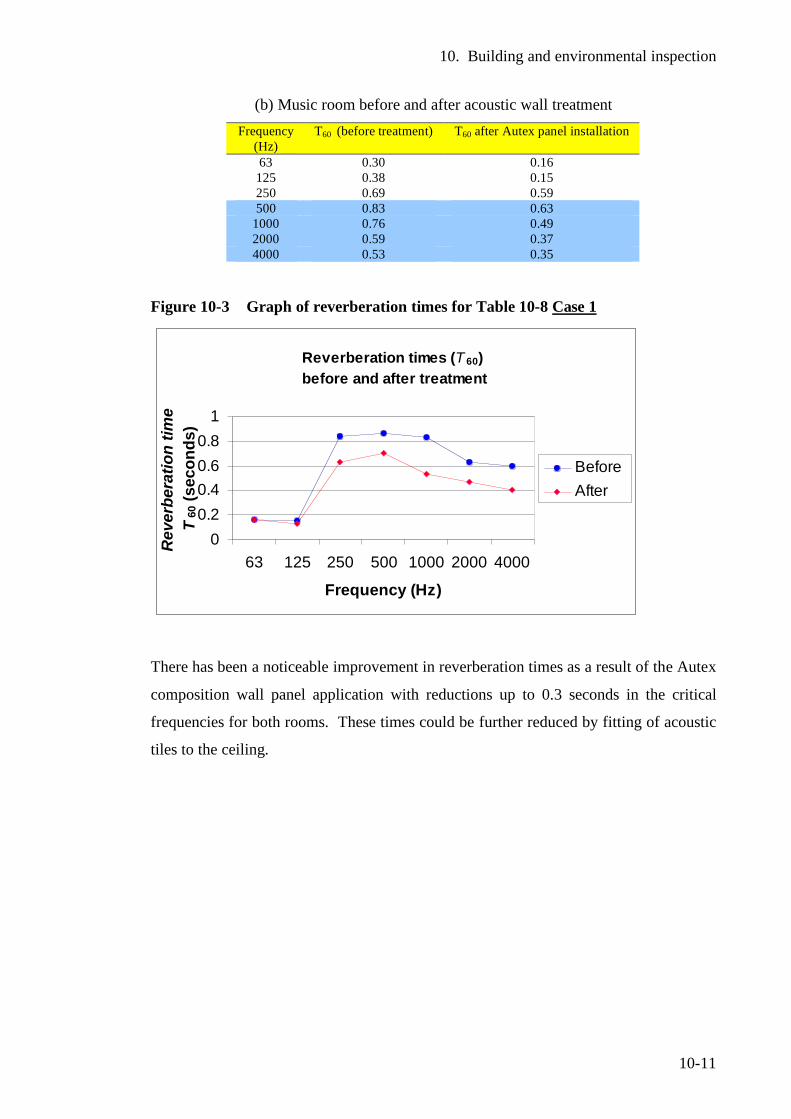
10. Building and environmental inspection
10-11
(b) Music room before and after acoustic wall treatment Frequency
(Hz) T60 (before treatment) T60 after Autex panel installation
63 0.30 0.16 125 0.38 0.15 250 0.69 0.59 500 0.83 0.63
1000 0.76 0.49 2000 0.59 0.37 4000 0.53 0.35
Figure 10-3 Graph of reverberation times for Table 10-8 Case 1
Reverberation times (T 60) before and after treatment
00.20.40.60.8
1
63 125 250 500 1000 2000 4000
Frequency (Hz)
Rev
erbe
ratio
n tim
e T
60 (s
econ
ds)
Before After
There has been a noticeable improvement in reverberation times as a result of the Autex
composition wall panel application with reductions up to 0.3 seconds in the critical
frequencies for both rooms. These times could be further reduced by fitting of acoustic
tiles to the ceiling.
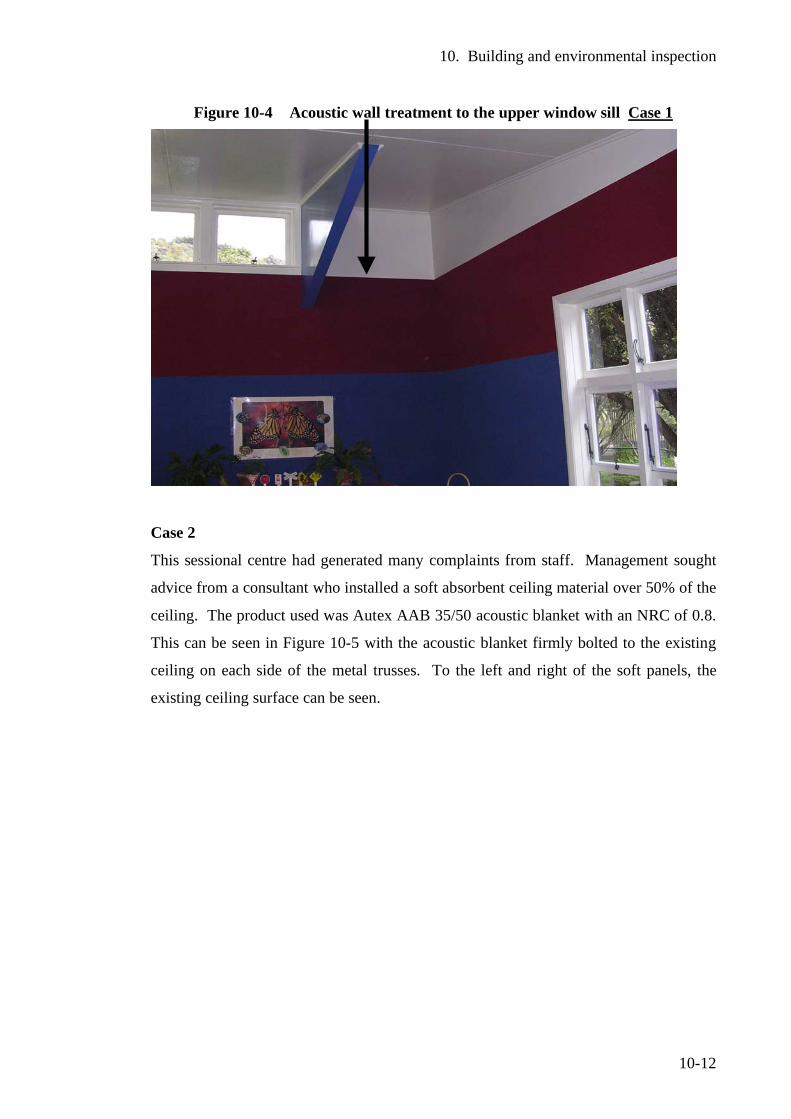
10. Building and environmental inspection
10-12
Figure 10-4 Acoustic wall treatment to the upper window sill Case 1
Case 2
This sessional centre had generated many complaints from staff. Management sought
advice from a consultant who installed a soft absorbent ceiling material over 50% of the
ceiling. The product used was Autex AAB 35/50 acoustic blanket with an NRC of 0.8.
This can be seen in Figure 10-5 with the acoustic blanket firmly bolted to the existing
ceiling on each side of the metal trusses. To the left and right of the soft panels, the
existing ceiling surface can be seen.
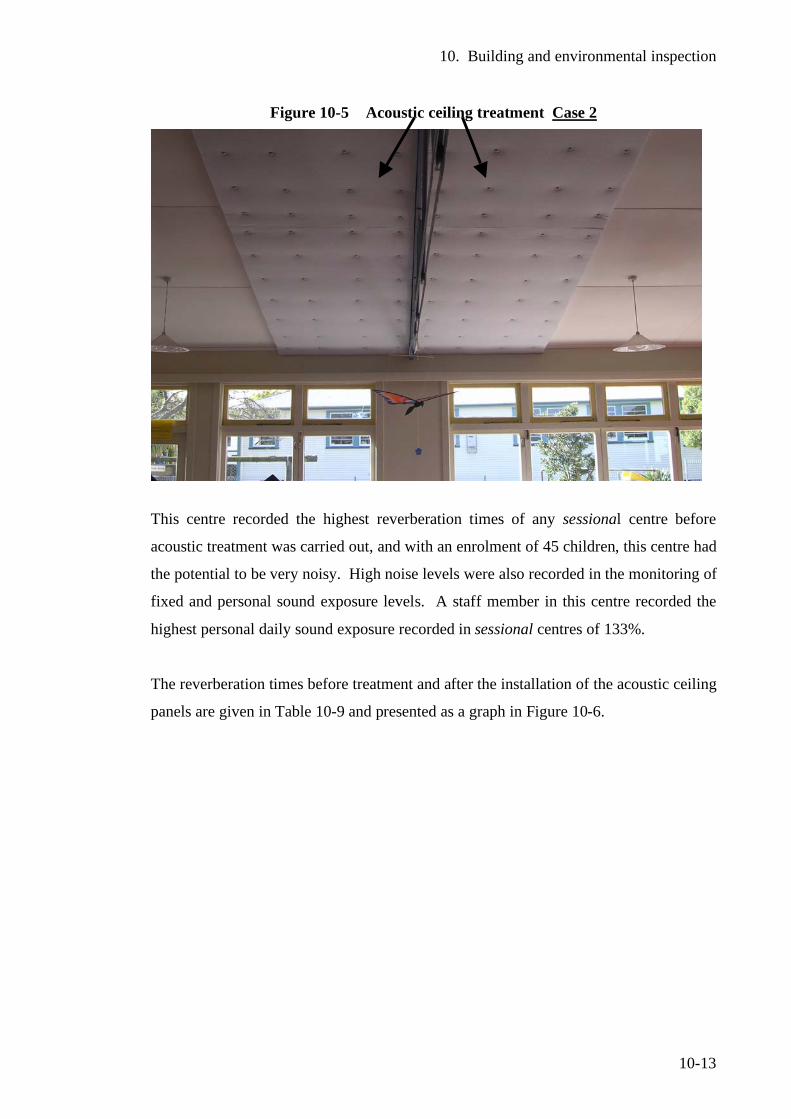
10. Building and environmental inspection
10-13
Figure 10-5 Acoustic ceiling treatment Case 2
This centre recorded the highest reverberation times of any sessional centre before
acoustic treatment was carried out, and with an enrolment of 45 children, this centre had
the potential to be very noisy. High noise levels were also recorded in the monitoring of
fixed and personal sound exposure levels. A staff member in this centre recorded the
highest personal daily sound exposure recorded in sessional centres of 133%.
The reverberation times before treatment and after the installation of the acoustic ceiling
panels are given in Table 10-9 and presented as a graph in Figure 10-6.
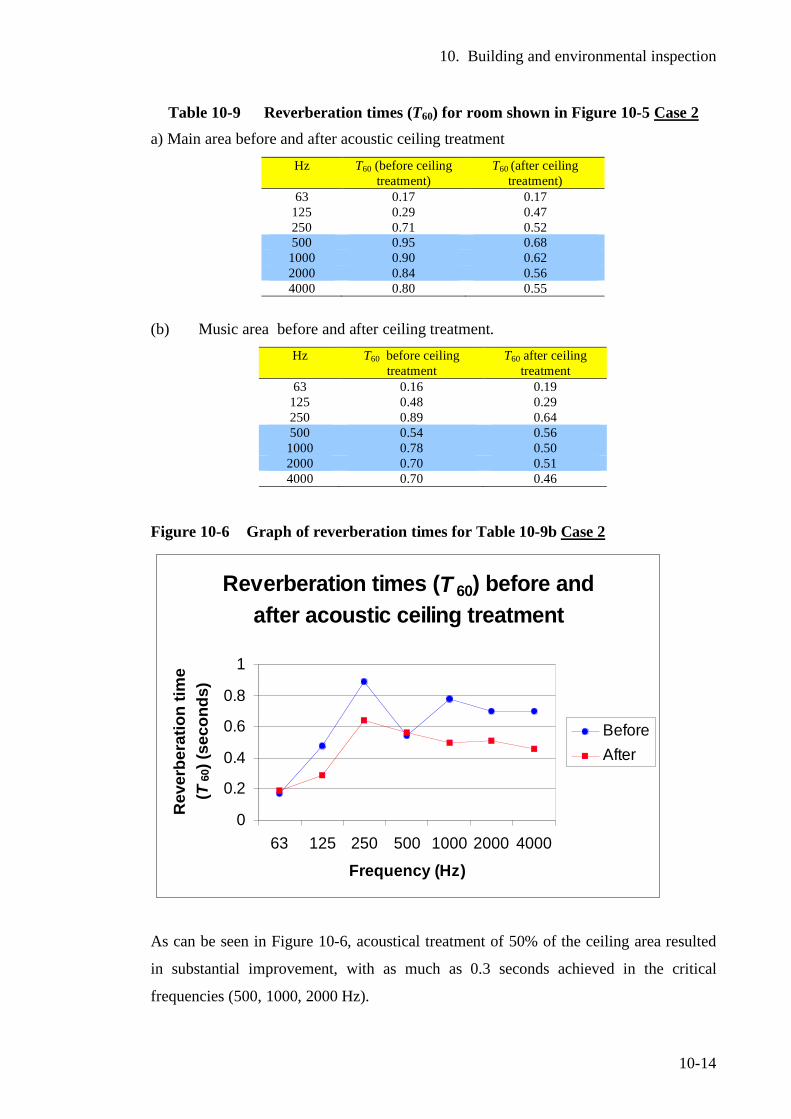
10. Building and environmental inspection
10-14
Table 10-9 Reverberation times (T60) for room shown in Figure 10-5 Case 2 a) Main area before and after acoustic ceiling treatment
Hz T60 (before ceiling treatment)
T60 (after ceiling treatment)
63 0.17 0.17 125 0.29 0.47 250 0.71 0.52 500 0.95 0.68 1000 0.90 0.62 2000 0.84 0.56 4000 0.80 0.55
(b) Music area before and after ceiling treatment. Hz T60 before ceiling
treatment T60 after ceiling
treatment 63 0.16 0.19
125 0.48 0.29 250 0.89 0.64 500 0.54 0.56 1000 0.78 0.50 2000 0.70 0.51 4000 0.70 0.46
Figure 10-6 Graph of reverberation times for Table 10-9b Case 2
As can be seen in Figure 10-6, acoustical treatment of 50% of the ceiling area resulted
in substantial improvement, with as much as 0.3 seconds achieved in the critical
frequencies (500, 1000, 2000 Hz).
Reverberation times (T 60) before and after acoustic ceiling treatment
0
0.2
0.4
0.6
0.8
1
63 125 250 500 1000 2000 4000
Frequency (Hz)
Rev
erbe
ratio
n tim
e (T
60) (
seco
nds)
BeforeAfter
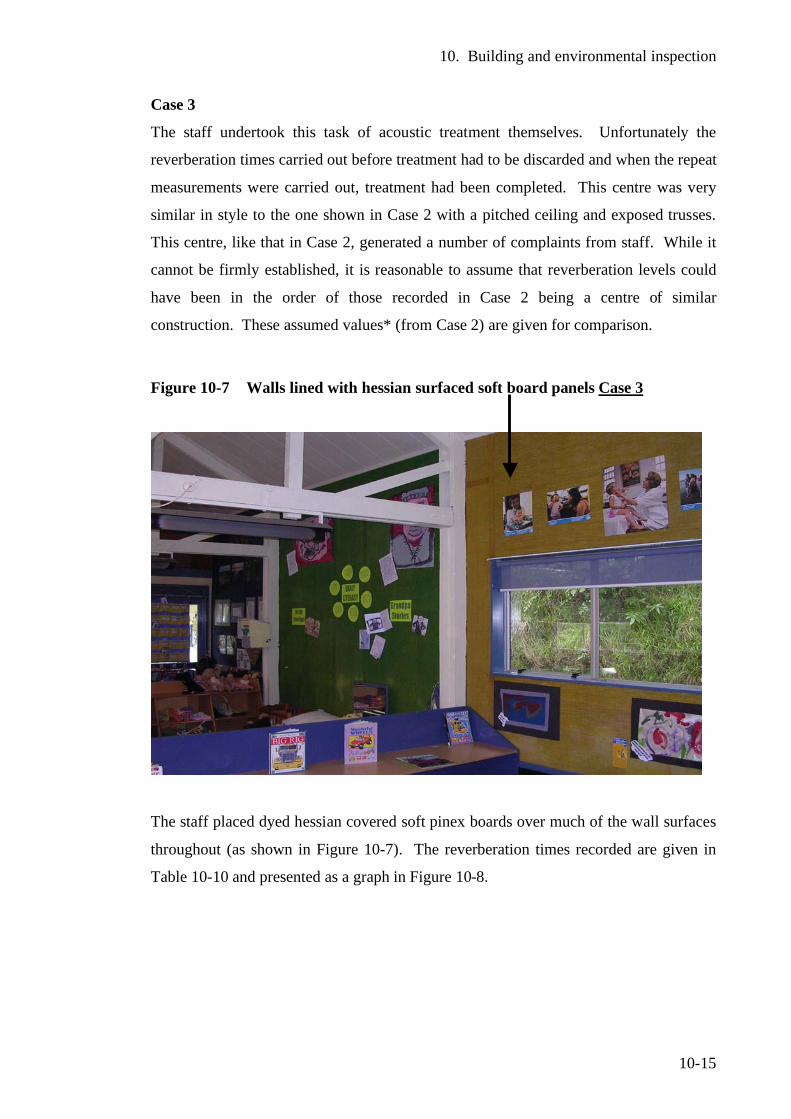
10. Building and environmental inspection
10-15
Case 3
The staff undertook this task of acoustic treatment themselves. Unfortunately the
reverberation times carried out before treatment had to be discarded and when the repeat
measurements were carried out, treatment had been completed. This centre was very
similar in style to the one shown in Case 2 with a pitched ceiling and exposed trusses.
This centre, like that in Case 2, generated a number of complaints from staff. While it
cannot be firmly established, it is reasonable to assume that reverberation levels could
have been in the order of those recorded in Case 2 being a centre of similar
construction. These assumed values* (from Case 2) are given for comparison.
Figure 10-7 Walls lined with hessian surfaced soft board panels Case 3
The staff placed dyed hessian covered soft pinex boards over much of the wall surfaces
throughout (as shown in Figure 10-7). The reverberation times recorded are given in
Table 10-10 and presented as a graph in Figure 10-8.
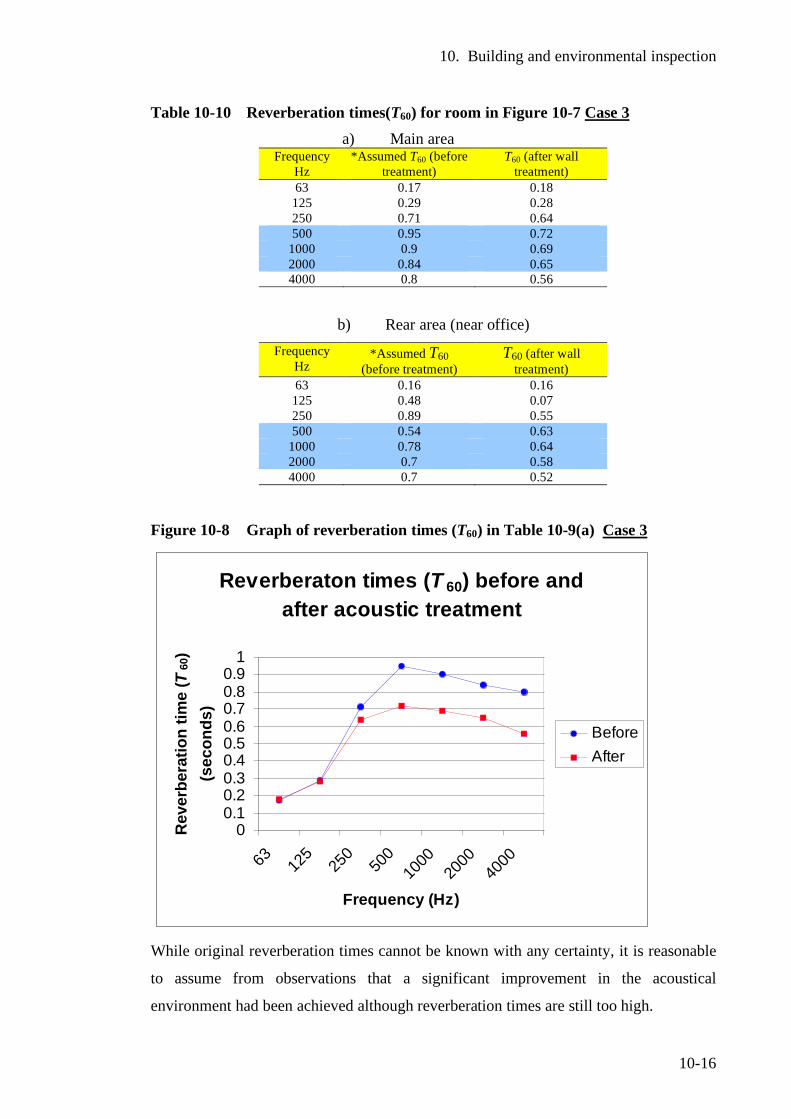
10. Building and environmental inspection
10-16
Table 10-10 Reverberation times(T60) for room in Figure 10-7 Case 3 a) Main area
Frequency Hz
*Assumed T60 (before treatment)
T60 (after wall treatment)
63 0.17 0.18 125 0.29 0.28 250 0.71 0.64 500 0.95 0.72
1000 0.9 0.69 2000 0.84 0.65 4000 0.8 0.56
b) Rear area (near office) Frequency
Hz *Assumed T60
(before treatment) T60 (after wall
treatment) 63 0.16 0.16 125 0.48 0.07 250 0.89 0.55 500 0.54 0.63
1000 0.78 0.64 2000 0.7 0.58 4000 0.7 0.52
Figure 10-8 Graph of reverberation times (T60) in Table 10-9(a) Case 3
Reverberaton times (T 60) before and after acoustic treatment
00.10.20.30.40.50.60.70.80.9
1
63 125
250
500
1000
2000
4000
Frequency (Hz)
Rev
erbe
ratio
n tim
e (T
60)
(sec
onds
)
BeforeAfter
While original reverberation times cannot be known with any certainty, it is reasonable
to assume from observations that a significant improvement in the acoustical
environment had been achieved although reverberation times are still too high.
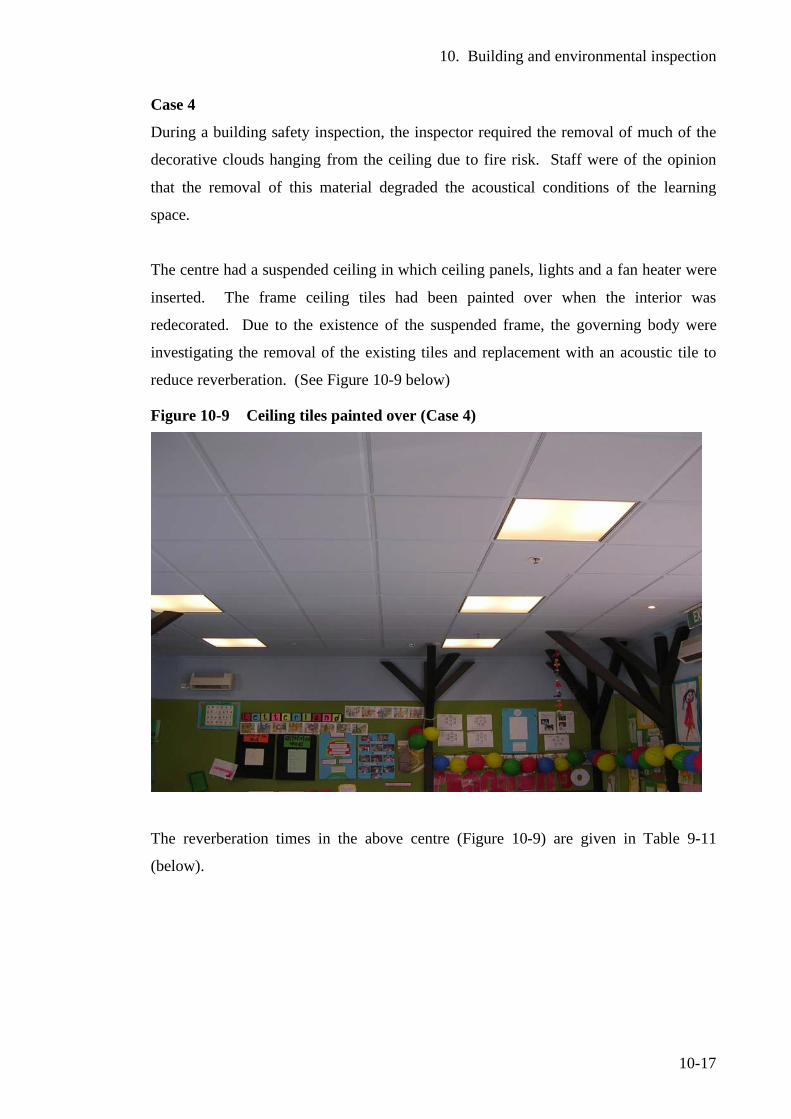
10. Building and environmental inspection
10-17
Case 4
During a building safety inspection, the inspector required the removal of much of the
decorative clouds hanging from the ceiling due to fire risk. Staff were of the opinion
that the removal of this material degraded the acoustical conditions of the learning
space.
The centre had a suspended ceiling in which ceiling panels, lights and a fan heater were
inserted. The frame ceiling tiles had been painted over when the interior was
redecorated. Due to the existence of the suspended frame, the governing body were
investigating the removal of the existing tiles and replacement with an acoustic tile to
reduce reverberation. (See Figure 10-9 below)
Figure 10-9 Ceiling tiles painted over (Case 4)
The reverberation times in the above centre (Figure 10-9) are given in Table 9-11
(below).
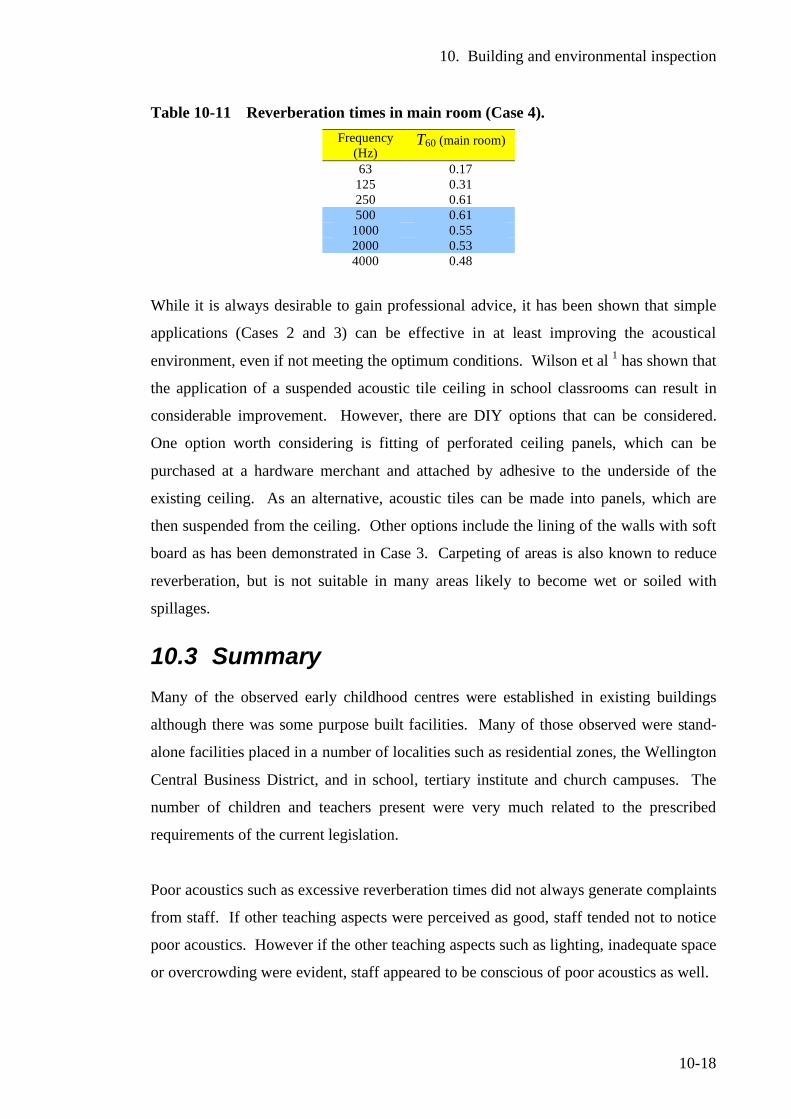
10. Building and environmental inspection
10-18
Table 10-11 Reverberation times in main room (Case 4). Frequency
(Hz) T60 (main room)
63 0.17 125 0.31 250 0.61 500 0.61
1000 0.55 2000 0.53 4000 0.48
While it is always desirable to gain professional advice, it has been shown that simple
applications (Cases 2 and 3) can be effective in at least improving the acoustical
environment, even if not meeting the optimum conditions. Wilson et al 1 has shown that
the application of a suspended acoustic tile ceiling in school classrooms can result in
considerable improvement. However, there are DIY options that can be considered.
One option worth considering is fitting of perforated ceiling panels, which can be
purchased at a hardware merchant and attached by adhesive to the underside of the
existing ceiling. As an alternative, acoustic tiles can be made into panels, which are
then suspended from the ceiling. Other options include the lining of the walls with soft
board as has been demonstrated in Case 3. Carpeting of areas is also known to reduce
reverberation, but is not suitable in many areas likely to become wet or soiled with
spillages.
10.3 Summary Many of the observed early childhood centres were established in existing buildings
although there was some purpose built facilities. Many of those observed were stand-
alone facilities placed in a number of localities such as residential zones, the Wellington
Central Business District, and in school, tertiary institute and church campuses. The
number of children and teachers present were very much related to the prescribed
requirements of the current legislation.
Poor acoustics such as excessive reverberation times did not always generate complaints
from staff. If other teaching aspects were perceived as good, staff tended not to notice
poor acoustics. However if the other teaching aspects such as lighting, inadequate space
or overcrowding were evident, staff appeared to be conscious of poor acoustics as well.
10. Building and environmental inspection
10-19
Few centres had existing acoustic treatment. In some cases acoustic ceiling tiles had
been painted over during redecoration. With the increased awareness that this work has
created, three centres undertook major acoustic treatment of the walls or ceiling
surfaces. In 2 of these cases, reverberation times measured before and after treatment
showed a marked reduction of up to 0.3 seconds in the important frequencies. In the
third centre, the staff undertook the acoustic wall treatment themselves and due to a
failure of the initial test method, reverberation times before the treatment were not
available. An estimation of the likely reverberation time before treatment suggests that
there may have been a noticeable improvement.
It is essential that all new centres are designed to an appropriate standard to create the
best acoustical learning environment for young children. With the adoption of a
proposed addition to the New Zealand Building Codes, all new centres would have to
meet the appropriate acoustical standard.
Due to scarce resources, it is not possible for many existing centres to engage
professional advice to carry out acoustic treatment. However there are DIY (do it
yourself) options, which if carried out will result in improvement even if not reaching
the optimum level as demonstrated by one centre. An information pack informing the
early education sector of options to improve the acoustic environment, which should
include DIY options, is highly desirable.
10.4 References 1 Wilson, O., Valentine, J., Halstead, M., McGunnigle, K., Dodd, G., Hellier, A,
Wood, J, Simpson, R., Classroom acoustics, a New Zealand Perspective. 2002: Oticon Foundation in New Zealand.
2 Education (Early Childhood Centres) Regulations 1998. (New Zealand). 3 Australian and New Zealand Standard, A/NZS 2107:2000, Acoustics:
Recommended sound levels for building interiors. Standards New Zealand, 2000.
4 Autex Industries Ltd., Product Specification for Vertiface Compostion Acoustic
Wall Covering. 2006, Autex Industries Ltd , (www.autex.co.nz).
11. Occupational hearing issues of staff
11-1
11 Occupational hearing issues of staff
11.1 Introduction
Occupational hearing loss is always of concern in noisy work environments. Personal
sound exposures of staff reported in Chapter 8 have showed 13% of the staff assessed
received daily sound exposures above the 100% maximum dose levels permitted by the
New Zealand health and safety in employment legislation.1
The aim of this section was to investigate the direct effects of noise encountered during
the working day on the temporary threshold shift of participants and to give an
indication of the hearing status of these individuals.
Regulation 11 of the Health and Safety in Employment Regulations 1995 requires an
employer to take all practicable steps to ensure no worker is exposed to sound pressure
levels greater than:
• A time-average level over an 8-hour working day of 85 dB A (LAeq 8h = 85 dB) or equivalent.
• A peak level (Lpeak) of not more than 140 dB
A code of practice, promulgated under the New Zealand Health and Safety in
Employment Act 19922 for the management of noise in workplace,3 gives a statement of
preferred work practices and guidance in meeting the requirements of the legislation.
While the legislation applies to all workplaces, it was never envisaged that the
provisions relating to noise in the legislation itself or the code of practice would apply
to schools and early education environments.
Noise is regarded as an occupational hazard under the Act.2 The employer is required to
identify, regularly assess and monitor hazards in the workplace (Clause 7). In the case
of hazards found to be significant to employees, the employer is required to take all
practicable steps to eliminate the hazard at source (Clause 8). If there are no practicable
11. Occupational hearing issues of staff
11-2
steps that can be taken, the Act proposes that the worker be isolated from the source of
noise (Clause 9). If either the source of noise cannot be eliminated or isolated, the
employer is required to minimise the noise hazard to employees and this includes the
provision of protective clothing (hearing protectors in the case of noise) and monitoring
of the employee's exposure to the hazard (Clause 10).
It is clear that this legislation was never designed to regulate noise exposure for teachers
in school or early education. One would see the children being isolated from their
teachers, or the teachers having to wear hearing protectors. The current legislation1,2
and code of practice3 would need major amendments to cover noise exposure for
teachers in early education and school teaching environments.
In assessing a noise hazard, the former Occupational Safety and Health Service of the
New Zealand Department of Labour stated that apart from personal and environmental
monitoring of noise levels, a simple rule-of-thumb method can be used as a general rule
(in smaller workplaces). It is generally accepted that a noise hazard exists if:4
1. There is difficulty in communication while in the noise.
(A more formal statement of this is that if the voice has to be raised to carry on a
conversation with a person about 1 metre away, then the A-frequency weighted
noise level is higher than 85 dB.
2. There is ringing in the ears (tinnitus) after exposure to the noise; or
3. Hearing seems muffled after leaving a noisy area.
Numbers 2 and 3 above relate to the response of the ear to excessive noise exposure.
Tinnitus is defined as is a subjective sensation of noise in the ears or head. It can
include various descriptions such as whistling, ringing, hissing or buzzing. Tinnitus in
this circumstance is a clear warning sign of impending hearing damage. A person does
not have to experience tinnitus to suffer noise-induced-hearing-loss.3
Temporary threshold shift (TTS) occurs after exposure to noise and is defined as the
increase in the threshold detection of sound. A person with TTS notices a dullness or
muffled effect of sound as well as experiencing a difficulty in hearing or speech
discrimination in background noise.4
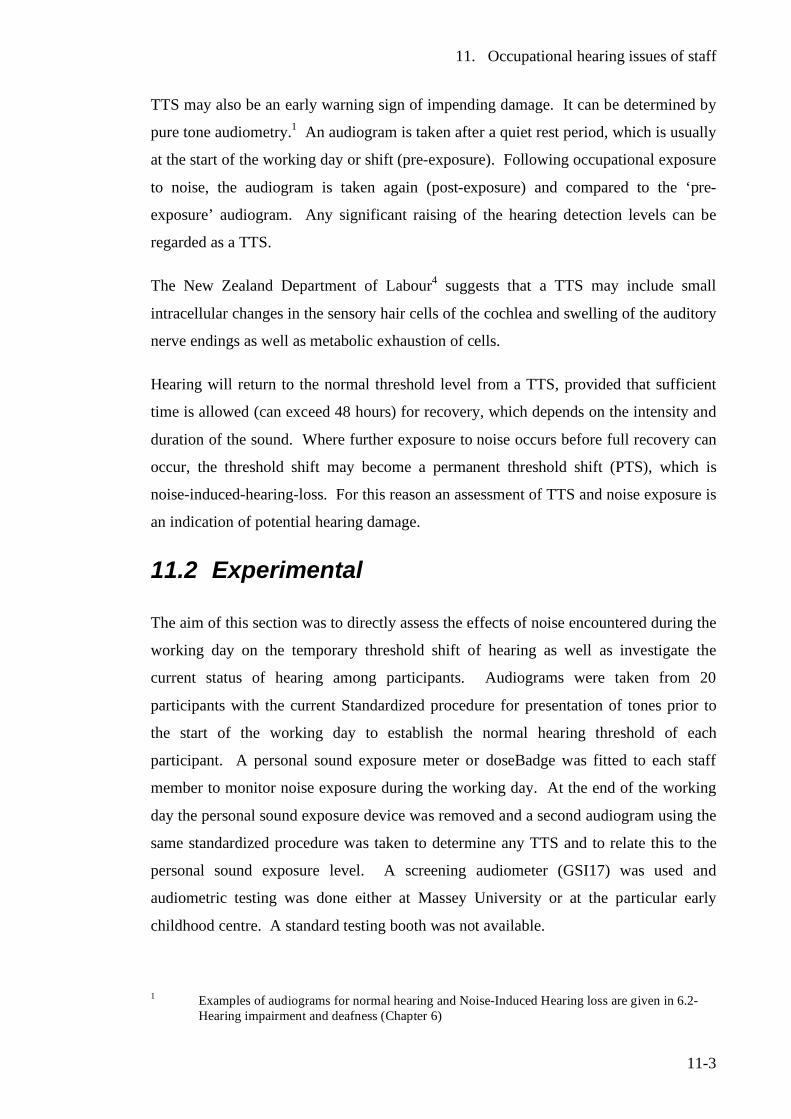
11. Occupational hearing issues of staff
11-3
TTS may also be an early warning sign of impending damage. It can be determined by
pure tone audiometry.1 An audiogram is taken after a quiet rest period, which is usually
at the start of the working day or shift (pre-exposure). Following occupational exposure
to noise, the audiogram is taken again (post-exposure) and compared to the ‘pre-
exposure’ audiogram. Any significant raising of the hearing detection levels can be
regarded as a TTS.
The New Zealand Department of Labour4 suggests that a TTS may include small
intracellular changes in the sensory hair cells of the cochlea and swelling of the auditory
nerve endings as well as metabolic exhaustion of cells.
Hearing will return to the normal threshold level from a TTS, provided that sufficient
time is allowed (can exceed 48 hours) for recovery, which depends on the intensity and
duration of the sound. Where further exposure to noise occurs before full recovery can
occur, the threshold shift may become a permanent threshold shift (PTS), which is
noise-induced-hearing-loss. For this reason an assessment of TTS and noise exposure is
an indication of potential hearing damage.
11.2 Experimental
The aim of this section was to directly assess the effects of noise encountered during the
working day on the temporary threshold shift of hearing as well as investigate the
current status of hearing among participants. Audiograms were taken from 20
participants with the current Standardized procedure for presentation of tones prior to
the start of the working day to establish the normal hearing threshold of each
participant. A personal sound exposure meter or doseBadge was fitted to each staff
member to monitor noise exposure during the working day. At the end of the working
day the personal sound exposure device was removed and a second audiogram using the
same standardized procedure was taken to determine any TTS and to relate this to the
personal sound exposure level. A screening audiometer (GSI17) was used and
audiometric testing was done either at Massey University or at the particular early
childhood centre. A standard testing booth was not available.
1 Examples of audiograms for normal hearing and Noise-Induced Hearing loss are given in 6.2-
Hearing impairment and deafness (Chapter 6)
11. Occupational hearing issues of staff
11-4
11.3 Results
Background noise presented major issues in conducting the audiometric testing. Even
though the Massey University space was normally very quiet, the noise of heavy rain on
the roof and water running down gutters became a major source of distraction. There
were major difficulties in detecting the tones in the lower frequencies probably due to
masking effects. The other 2 centres wished to have their evaluations done on the
premises, but no quiet space was available and with staff rosters, 10 of the tests had to
be done while children were present with the noise presenting a major source of
distraction. In addition, time was constrained with staff having limited time available
before commencing duties. These two environmental factors together with the lack of a
testing booth, compromised reliability. However the results were useful as participants
who had not consulted an audiologist or audiometrist, were able to gain an approximate
status of their hearing.
A participant who reported comforting distressed children close to her ear had a
noticeable increase in the hearing threshold of the left which was closest to the children
when she held them. The incidents had occurred later in the day. The audiograms are
given in Figure 11-1. The overall dose was 70% for the full working day but the time
history (shown in Figure 11-2) showed higher levels received in the latter part of the
working day. This participant, a young female worker of 20 years of age had very good
hearing from the audiogram taken at the start of the day. By the end of the day despite
the environmental difficulties, the threshold for the left ear lifted significantly in the
frequencies of 2,000, 4000, 6000, and 8,000 Hz. The was a smaller but similar rise in
the frequencies of 4000, 6000, and 8,000 Hz for the right ear.
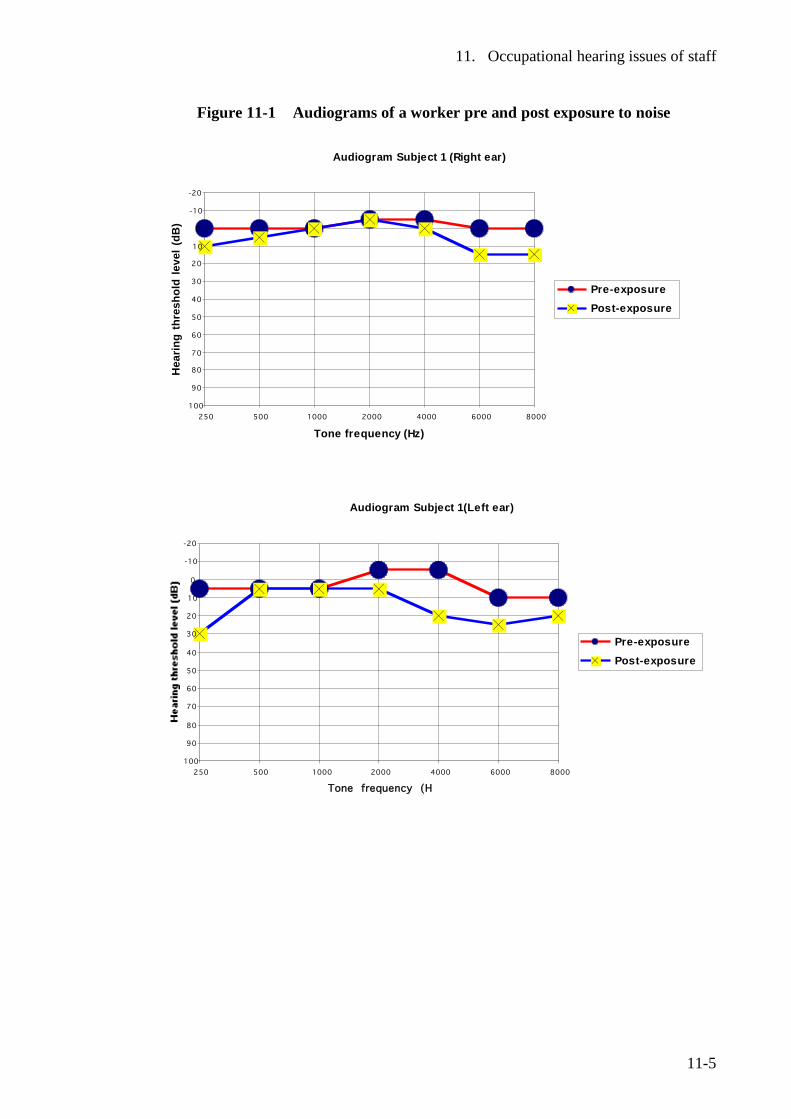
11. Occupational hearing issues of staff
11-5
Figure 11-1 Audiograms of a worker pre and post exposure to noise
Audiogram Subject 1 (Right ear)
-20
-10
0
10
20
30
40
50
60
70
80
90
100
250 500 1000 2000 4000 6000 8000
Tone frequency (Hz)
Hea
ring
thre
shol
d le
vel (
dB)
Pre-exposure Post-exposure
Audiogram Subject 1(Left ear)
-20
-10
0
10
20
30
40
50
60
70
80
90
100250 500 1000 2000 4000 6000 8000
Tone frequency (Hz)
Pre-exposure Post-exposure
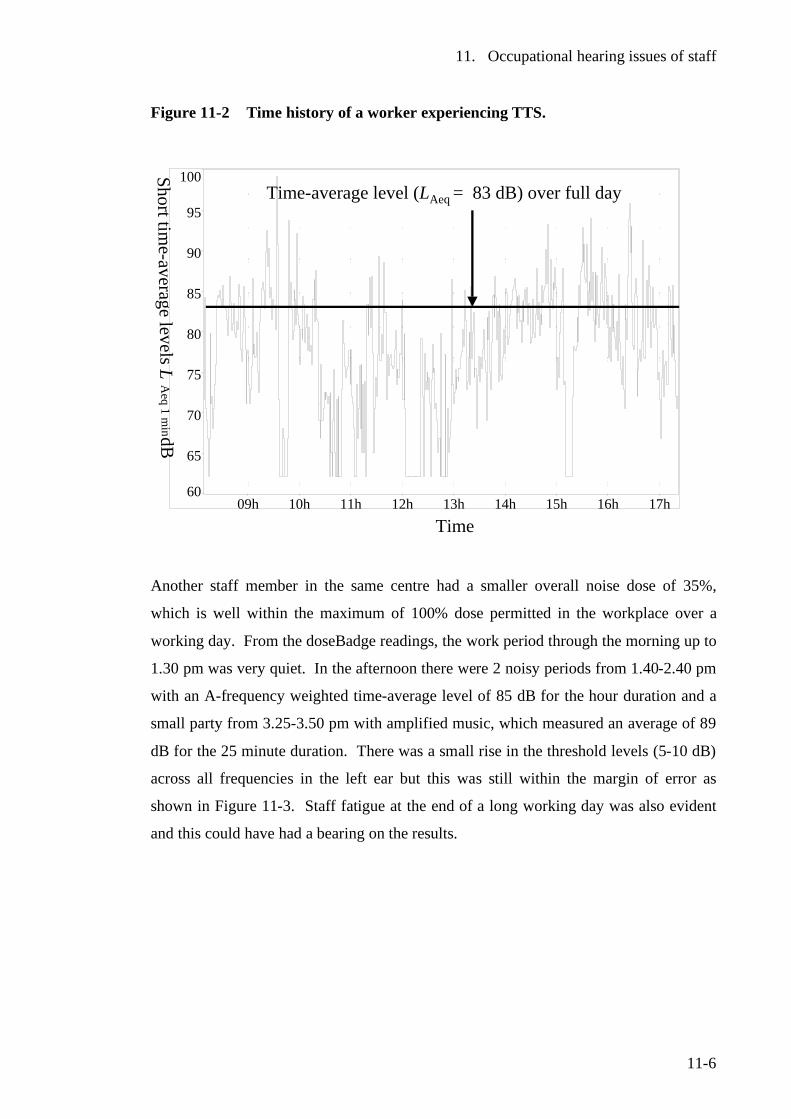
11. Occupational hearing issues of staff
11-6
Figure 11-2 Time history of a worker experiencing TTS.
60
65
70
75
80
85
90
95
100
09h 10h 11h 12h 13h 14h 15h 16h 17h
Short time-average levelsL
Aeq
1 min dB
Time
Time-average level (LAeq = 83 dB) over full day
Another staff member in the same centre had a smaller overall noise dose of 35%,
which is well within the maximum of 100% dose permitted in the workplace over a
working day. From the doseBadge readings, the work period through the morning up to
1.30 pm was very quiet. In the afternoon there were 2 noisy periods from 1.40-2.40 pm
with an A-frequency weighted time-average level of 85 dB for the hour duration and a
small party from 3.25-3.50 pm with amplified music, which measured an average of 89
dB for the 25 minute duration. There was a small rise in the threshold levels (5-10 dB)
across all frequencies in the left ear but this was still within the margin of error as
shown in Figure 11-3. Staff fatigue at the end of a long working day was also evident
and this could have had a bearing on the results.
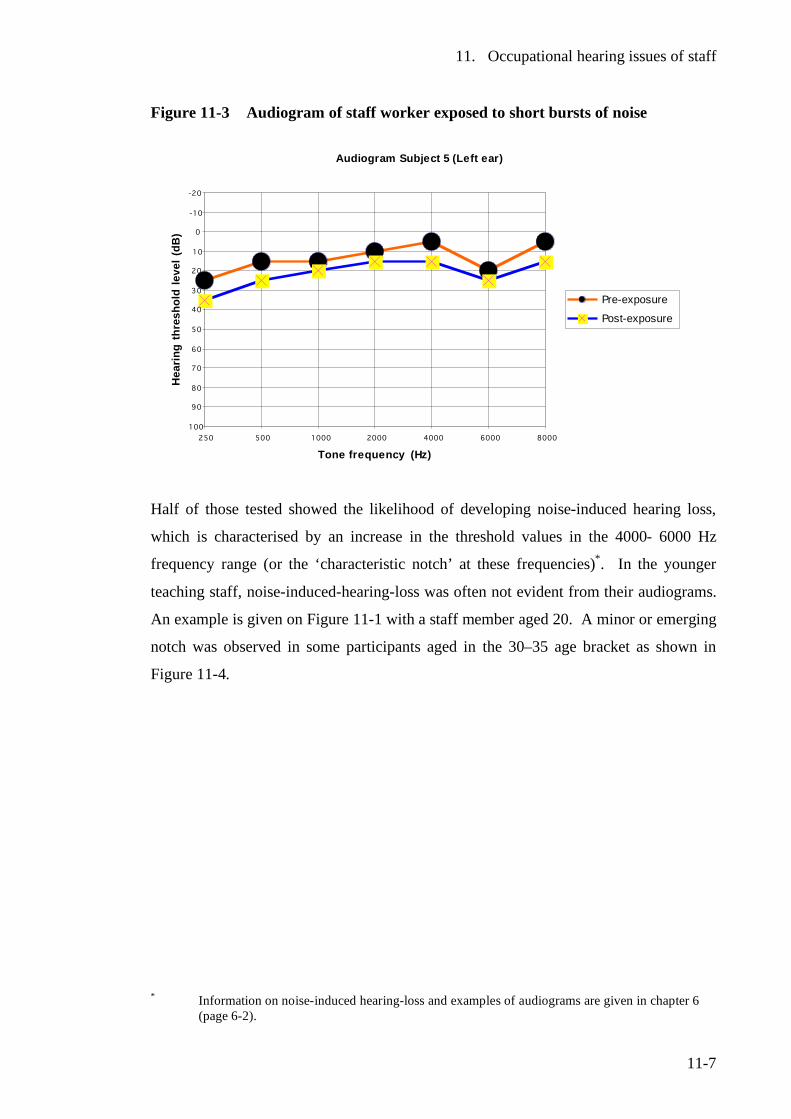
11. Occupational hearing issues of staff
11-7
Figure 11-3 Audiogram of staff worker exposed to short bursts of noise
Audiogram Subject 5 (Left ear)
-20
-10
0
10
20
30
40
50
60
70
80
90
100
250 500 1000 2000 4000 6000 8000
Tone frequency (Hz)
Hea
ring
thre
shol
d le
vel (
dB)
Pre-exposure
Post-exposure
Half of those tested showed the likelihood of developing noise-induced hearing loss,
which is characterised by an increase in the threshold values in the 4000- 6000 Hz
frequency range (or the ‘characteristic notch’ at these frequencies)*. In the younger
teaching staff, noise-induced-hearing-loss was often not evident from their audiograms.
An example is given on Figure 11-1 with a staff member aged 20. A minor or emerging
notch was observed in some participants aged in the 30–35 age bracket as shown in
Figure 11-4.
* Information on noise-induced hearing-loss and examples of audiograms are given in chapter 6
(page 6-2).
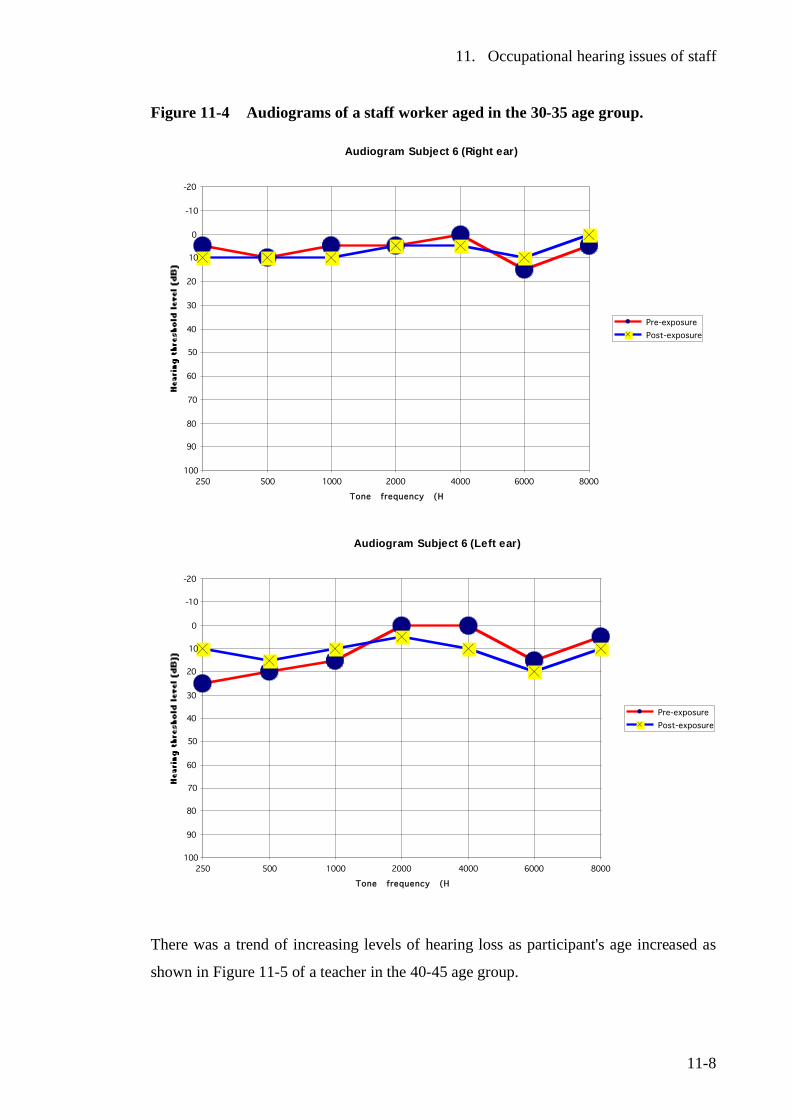
11. Occupational hearing issues of staff
11-8
Figure 11-4 Audiograms of a staff worker aged in the 30-35 age group.
Audiogram Subject 6 (Right ear)
-20
-10
0
10
20
30
40
50
60
70
80
90
100250 500 1000 2000 4000 6000 8000
Tone frequency (Hz)
Pre-exposure Post-exposure
Audiogram Subject 6 (Left ear)
-20
-10
0
10
20
30
40
50
60
70
80
90
100250 500 1000 2000 4000 6000 8000
Tone frequency (Hz)
Pre-exposure Post-exposure
There was a trend of increasing levels of hearing loss as participant's age increased as
shown in Figure 11-5 of a teacher in the 40-45 age group.
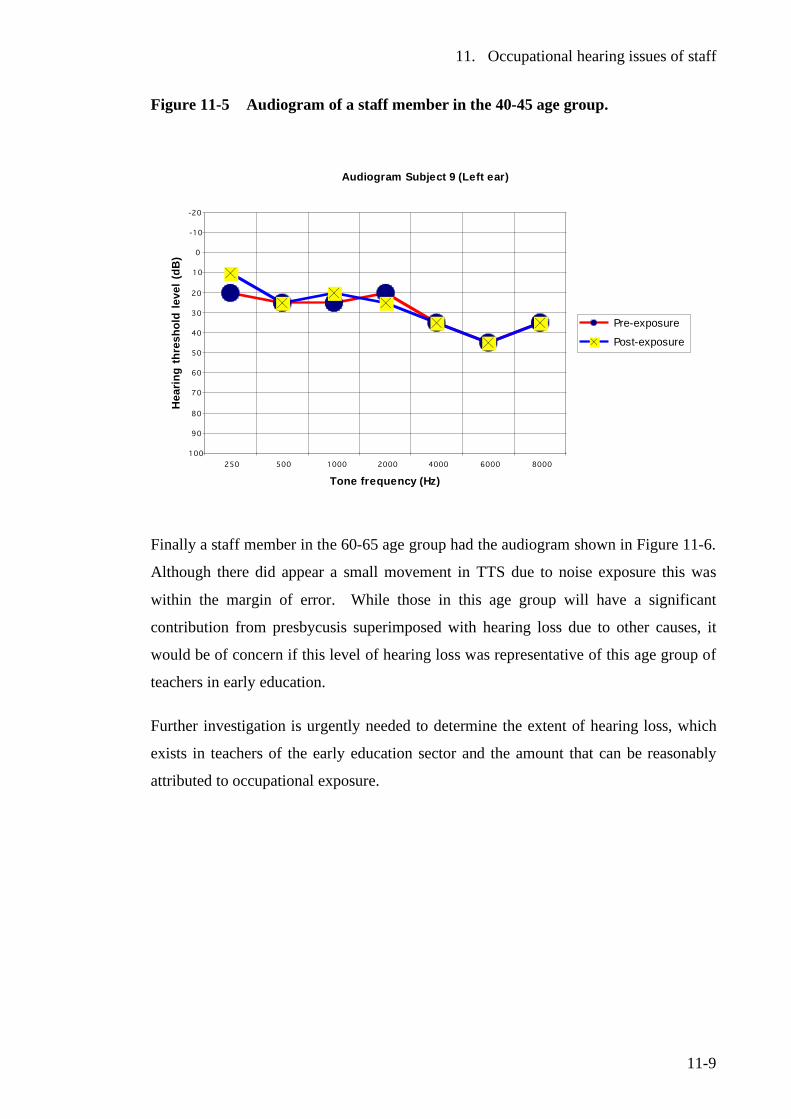
11. Occupational hearing issues of staff
11-9
Figure 11-5 Audiogram of a staff member in the 40-45 age group.
Audiogram Subject 9 (Left ear)
-20
-10
0
10
20
30
40
50
60
70
80
90
100
250 500 1000 2000 4000 6000 8000
Tone frequency (Hz)
Hea
ring
thre
shol
d le
vel (
dB)
Pre-exposure
Post-exposure
Finally a staff member in the 60-65 age group had the audiogram shown in Figure 11-6.
Although there did appear a small movement in TTS due to noise exposure this was
within the margin of error. While those in this age group will have a significant
contribution from presbycusis superimposed with hearing loss due to other causes, it
would be of concern if this level of hearing loss was representative of this age group of
teachers in early education.
Further investigation is urgently needed to determine the extent of hearing loss, which
exists in teachers of the early education sector and the amount that can be reasonably
attributed to occupational exposure.
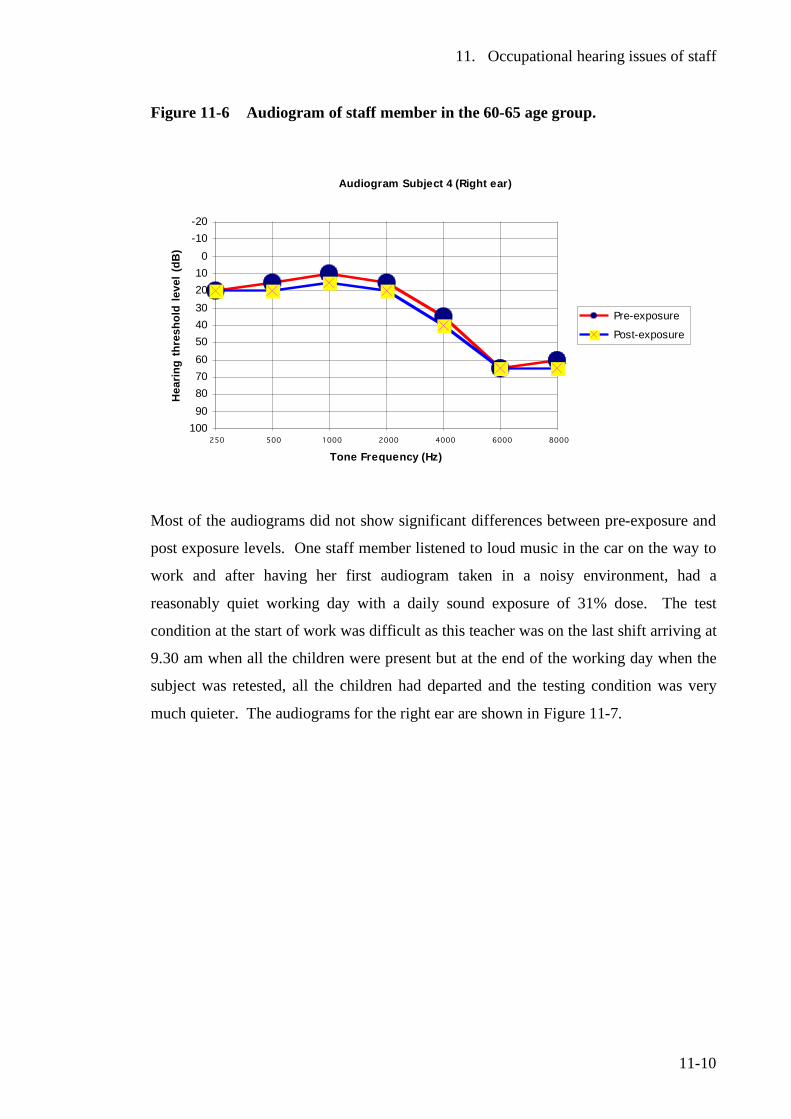
11. Occupational hearing issues of staff
11-10
Figure 11-6 Audiogram of staff member in the 60-65 age group.
Audiogram Subject 4 (Right ear)
-20-10
0102030405060708090
100250 500 1000 2000 4000 6000 8000
Tone Frequency (Hz)
Hea
ring
thre
shol
d le
vel (
dB)
Pre-exposure
Post-exposure
Most of the audiograms did not show significant differences between pre-exposure and
post exposure levels. One staff member listened to loud music in the car on the way to
work and after having her first audiogram taken in a noisy environment, had a
reasonably quiet working day with a daily sound exposure of 31% dose. The test
condition at the start of work was difficult as this teacher was on the last shift arriving at
9.30 am when all the children were present but at the end of the working day when the
subject was retested, all the children had departed and the testing condition was very
much quieter. The audiograms for the right ear are shown in Figure 11-7.
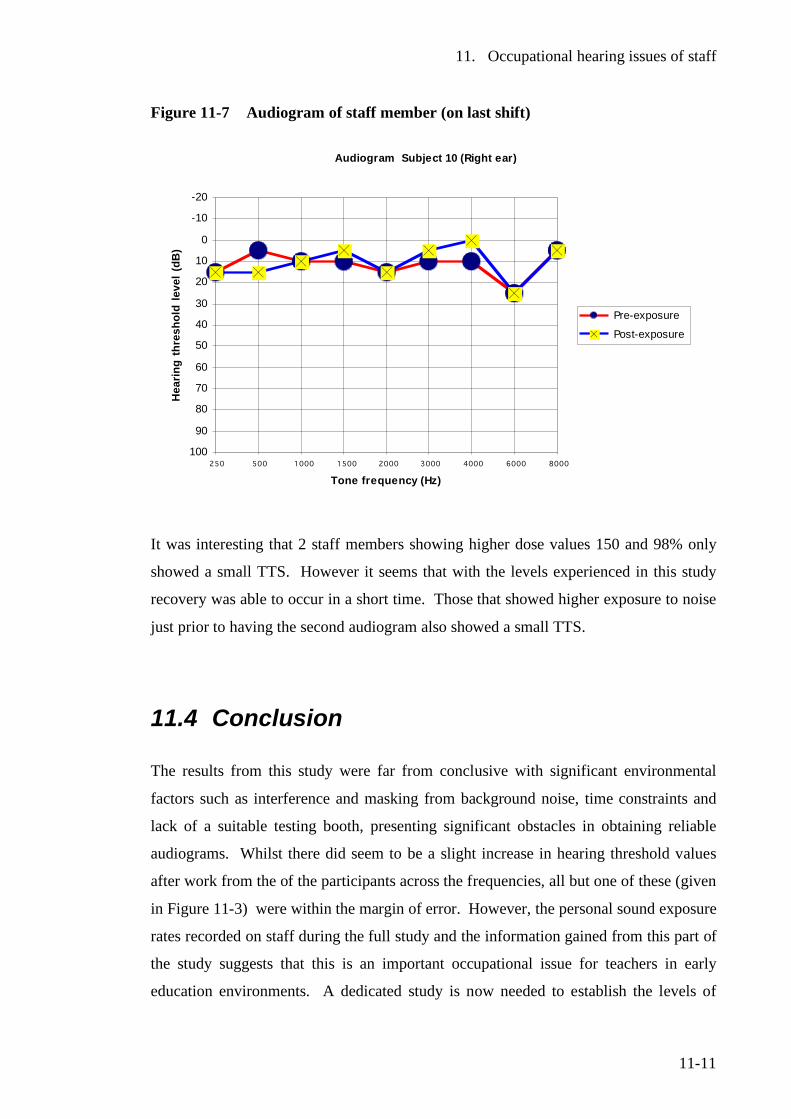
11. Occupational hearing issues of staff
11-11
Figure 11-7 Audiogram of staff member (on last shift)
Audiogram Subject 10 (Right ear)
-20
-10
0
10
20
30
40
50
60
70
80
90
100250 500 1000 1500 2000 3000 4000 6000 8000
Tone frequency (Hz)
Hea
ring
thre
shol
d le
vel (
dB)
Pre-exposure
Post-exposure
It was interesting that 2 staff members showing higher dose values 150 and 98% only
showed a small TTS. However it seems that with the levels experienced in this study
recovery was able to occur in a short time. Those that showed higher exposure to noise
just prior to having the second audiogram also showed a small TTS.
11.4 Conclusion
The results from this study were far from conclusive with significant environmental
factors such as interference and masking from background noise, time constraints and
lack of a suitable testing booth, presenting significant obstacles in obtaining reliable
audiograms. Whilst there did seem to be a slight increase in hearing threshold values
after work from the of the participants across the frequencies, all but one of these (given
in Figure 11-3) were within the margin of error. However, the personal sound exposure
rates recorded on staff during the full study and the information gained from this part of
the study suggests that this is an important occupational issue for teachers in early
education environments. A dedicated study is now needed to establish the levels of
11. Occupational hearing issues of staff
11-12
hearing loss among teachers and contact staff in the early education sector and to
reasonably establish the extent of hearing loss due to occupational exposure when
compared to other activities outside work, which contribute to noise-induced hearing
loss. This must include the availability of suitable quiet testing spaces if testing booths
are not available.
The New Zealand Department of Labour has largely ignored this group of workers as
being at-risk from excessive noise exposure at work, and this now needs immediate
attention. It is of considerable importance to investigate thoroughly the extent of
occupational noise exposure with this group of workers, and to implement regular
testing programmes as is done with other at-risk workers. It may be necessary, based on
establishing the level of risk among these workers, to propose amendments to address
occupational noise issues in the legislation1,2 and the associated code of practice3 as
applicable to this profession.
11.5 Recommendations
• A wide ranging national study be undertaken of child contact workers such as
teachers workers across the early education sector to establish levels of hearing
loss attributable to the work environment.
• The New Zealand Department of Labour and the Ministry of Education ensure
that regular testing programmes are introduced for occupational hearing loss
and noise exposure among early childhood staff.
• Governing bodies introduce appropriate policies on mitigating noise exposure
for the staff as well as children, and provide opportunities for all staff to
undertake regular hearing evaluations.
11. Occupational hearing issues of staff
11-13
11.6 References 1 Health and Safety in Employment Regulations 1995 (New Zealand legislation) 2 Health and Safety in Employment Act 1992 (New Zealand legislation) 3 Occupational Safety and Health, Approved code of practice for the management
of noise in the workplace. 2002, Wellington: Occupational Safety and Health, New Zealand Department of Labour.
4 Occupational Safety and Health., Noise-induced hearing loss of occupational
origin: A guide for medical practitioners. 1994, Department of Labour : Wellington, New Zealand.
12. A new regulatory framework
12-1
12 A new regulatory framework
12.1 Introduction The New Zealand Ministry of Education has been conducting a major review of the
Early Childhood legislation, which has progressed concurrently with this work. In the
initial consultation with stakeholders, noise was identified as a major issue which had to
be attended to.1 The Ministry of Education’s Criterion Development Team sought
advice as to how noise could be regulated in early childhood centres with current
resources and personnel. If a standard criterion was to be promulgated, it had to be able
to be assessed and with the current level of resources.
McLaren and Dickinson2 prepared a report for the Ministry of Education to discuss the
options available for regulation of noise in early education. In considering the options
available, existing legal precedents were examined, resource requirements considered,
and the effects on children in general reviewed with special consideration given to the
most at-risk children.
12.2 Noise provisions of the current legislation
Regulation 22 of the Education (Early Childhood Centres) Regulations 1998 states:
The licensee of a licensed centre must ensure that every room in the centre that
is used by children has, to the satisfaction of the Secretary, adequate natural or
artificial lighting, adequate ventilation, acoustics that ensure that noise is kept at a
reasonable level, and adequate heating.
The above regulations do not define what is considered to be a reasonable (or
unreasonable) level of noise.
12. A new regulatory framework
12-2
Legal and practical uncertainty exists when criteria are defined as meeting the
satisfaction of the Secretary if the Secretary (of Education) has not clearly documented
what outcomes will meet his satisfaction.
There are some noises intruding from outside the centre that would be completely
outside the control of early childhood centre or governing bodies. This was
demonstrated with the well known eradication of the painted apple moth in the Western
suburbs of Auckland, New Zealand with the low flying of aircraft over schools and
early education centres in the spray zone. In addition, construction sites with activities
such as pile driving and jack hammering can be very noisy, very disturbing and
distressing for some children if noise from these activities is not properly controlled.
Regulation 22 fails to address the effects of noise on special needs children, as
highlighted in Chapter 9.
The Ministry has recognised the difficulties for both its staff and practitioners in
properly interpreting descriptors frequently occurring in the current regulations such as
adequate, reasonable, suitable or to the satisfaction of the Secretary. Without a legally
enforceable set of standards or rules, judgements often have to be made on a case-by-
case basis. The Ministry of Education has proposed a third level tier to the new
legislative model to overcome these issues as discussed in Section 12.4 on page 12-7.
This will be placed under a new set of regulations and should achieve greater national
consistency in early education outcomes.3
12.3 Noise sources and issues
This issues related to noise in early childhood education centres can be divided into the
following broad categories:
• Noise transmitted through or reflected by the building structure
• Noise generated as part of the centre activities
o Noise from children themselves (while engaged in play, when distressed
etc.)
12. A new regulatory framework
12-3
o Noise from the use of equipment, fittings, toys, hi-fi, musical instruments
etc.
• Noise intrusion from activities outside the centre (over which the centre often
have little or no control)
• Protection and rights of special needs children known to be adversely affected
by noise who are mainstreamed in early childhood centres. This includes
children with middle ear infections, hearing impairment, auditory processing
disabilities and sensory integration disorder.
• Lack of quiet spaces
• Excessively noisy fire alarms
To answer these issues and to establish a protocol for providing the best practicable
environment for children and staff in early education centres, the following
recommendations are proposed:
• The building should be designed to meet an acceptable acoustical standard with
a reverberation time (T60) of 0.4-0.6 seconds in the octave-band frequencies of
250-4,000 Hz.
• Noise generated in the centre needs to be managed to achieve predetermined
outcomes. This can include the management of noise to a level which does not
interfere with normal speech or communication. In addition, provision for the
most at-risk children needs to be considered.
12.3.1 Noise transmitted through or reflected by the building structure
The building must be so designed and constructed that it will attenuate any excessive
noise generated outside to a level that inside will not be intrusive to learning. Children
usually do not have the skills to process words lost in noise. The features of building
design will be given in the New Zealand Building Code and need not be further
discussed here.
12. A new regulatory framework
12-4
12.3.2 Management of noise generated as part of the centre activities
There is precedent for 2 options in a legislative framework.
12.3.2.1 Setting of sound pressure level standards In this prescriptive approach, sound pressure level criteria using appropriate noise
descriptors are established and all centres would have to take reasonable steps to
comply with the criteria. This would include time-average level limits (measured in
decibels). To implement this strategy, considerably more resources would be needed
than are currently in use. If sound pressure level limits are to be established, it would
mean that sound pressure level measuring equipment would be required to assess
compliance, along with officers competent in noise measurement techniques. In
addition to the purchase of equipment, there are ongoing maintenance costs and regular
calibration of the equipment.
One of the most difficult obstacles to adopting this approach is the lack of an
appropriate standard for measurement and assessment of noise in early educational
settings. In developing a standard, the following would have to be considered:
• Are sound pressure levels to be measured using fixed sound level meters
mounted in such a way to obtain representative samples while not obstructing
the free flow of movement around the centre? This would usually mean the use
of a microphone on an extension cable from the sound level meter and
suspended from the ceiling, beam or other such structure in the middle of the
teaching space to minimise reflections etc., from the walls as carried out in this
work. In theory, sound should be measured in the hearing zone (height of the
children and teachers’ ears) but practicalities preclude this option due to the
obstruction of movement and the possibility of damage and interference from
tampering etc. The microphone would therefore have to be set at a height above
the normal hearing zone.
• Are individual personal sound exposure measurements to be carried on staff and
children? This work has trialled the recently introduced noise doseBadges on
staff and children in early childhood centres. Grebennikov4 has also carried out
a study on preschool teacher exposure to noise with this equipment. While the
12. A new regulatory framework
12-5
use of this equipment has given valuable information over the levels of personal
sound exposure received by children, there is a considerable amount of
preparation required including informed consent of parents to fit these devices to
the clothing of their children. Depending on the activities of children, results
can vary greatly.
• Accounting for variables such as weather will need consideration. Weather can
have an effect on sound pressure levels. During fine weather, children are likely
to spend considerable time in outdoor play areas, while inclement weather will
confine children indoors.
• Sound pressure levels do not take account of the nuisance value of particular
noises. Some sounds do not need to be loud (high sound pressure levels) to be
very disturbing. Sounds such as sirens, whistles, barking dogs and sharp impact
type sounds can be very intrusive and disturbing. Depending on the frequency
characteristics, some sounds will interfere and mask speech far more than others
at the same sound pressure levels.
• How will the special needs of children adversely affected by noise be addressed
such as those experiencing sensory integration disorder?
The main advantage with this approach is that it will give a national standard with
which all must comply. It would however, take a considerable level of consultation
to arrive at a consensus over what criteria will be ideal in order to incorporate the
large variety of early childhood facilities into such a one-fits-all standardised
approach. The other main concern is that enforcement would have to be carried out
by sound level measurement against the criteria. As enforcement obviously cannot
be done in secret, it would be natural for centre staff to manipulate activities and
sessions to minimise noise when monitoring was occurring. This would not give an
accurate assessment of the situation. It may also be detrimental if certain beneficial
activities were curtailed for fear of exceeding a prescribed limit.
12. A new regulatory framework
12-6
12.3.2.2 All practicable steps model In this framework, sound pressure level criteria are completely dispensed with. The
focus is instead on outcomes, with staff identifying noise issues within their centres and
then formulating a plan to manage these.
Rather than prescribing sound pressure level criteria, the outcomes to be achieved by
controlling noise need to be identified and built into the criteria. In addressing this, we
need to consider the negative aspects that noise is likely to have on the children and
teachers. Some of these are:
• Hearing damage to the children if personal noise exposure is excessive.
• Interference with speech and communication. This can degrade the
dissemination of information and enhancement of socialisation skills.
• Damage to teachers’ hearing if sound pressure levels exceed the internationally
accepted occupational criteria (as defined by Regulation 11 of the New Zealand
Health and Safety in Employment Regulations 1995 of:
o An A-weighted time-average level of 85 dB over an 8-hour working day
or equivalent. That is a maximum of 1.0 pascal squared hour in
acoustical terms or 100% dose (LA eq (8 hour) = 85 dB).
o A peak level (unweighted) of no more than 140 dB* (Lpeak =140 dB).
• Voice strain of teachers from having to raise voices. This is likely to affect the
most, those with softer voices, who have to raise their voices to be heard over
the noise made by children and their activity.
• The effects of noise on special needs children known to be adversely affected by
noise.
Unlike the alternative framework of setting sound pressure level criteria, the all
practicable steps model can be implemented with current resources and structures as it
is based on subjective judgments to meet a predetermined set of goals or outcomes. * ‘Peak Level’ is a specific acoustical measure and is not its maximum sound pressure level value.
12. A new regulatory framework
12-7
Requiring noise to be kept to a level that enables normal speech and communication to
occur is one such goal that can be considered. The interference with sleep is an
important issue if babies and children are sleeping. Controlling noise levels which
distress or harm special needs children is another important outcome or goal in centres
where these children are present.
Unlike the setting of sound level criteria approach, this is a far more subjective
interpretation, which may seem a disadvantage. The all practicable steps model can
however, be far more responsive to individual characteristics of centres and their
receiving environments, which obviously includes those individuals most seriously
affected by noise. The requirements could therefore be quite different for a centre in
which special needs children, who are adversely affected by noise, are present against
one where there are no such children enrolled.
12.4 The proposed legislative framework
The present legislation in New Zealand for the control of early childhood legislation
comprises of 2 levels or tiers. The primary or first level is the Education Act 1989 and
at the second level are the Education (Early Childhood Centres) Regulations 1998
which are made pursuant to the Act.
The New Zealand Ministry of Education proposes a three level framework, which in
effect adds a third level, or tier to the legislation, which will fit under the Act and
Regulations as shown in Figure 12-1.3
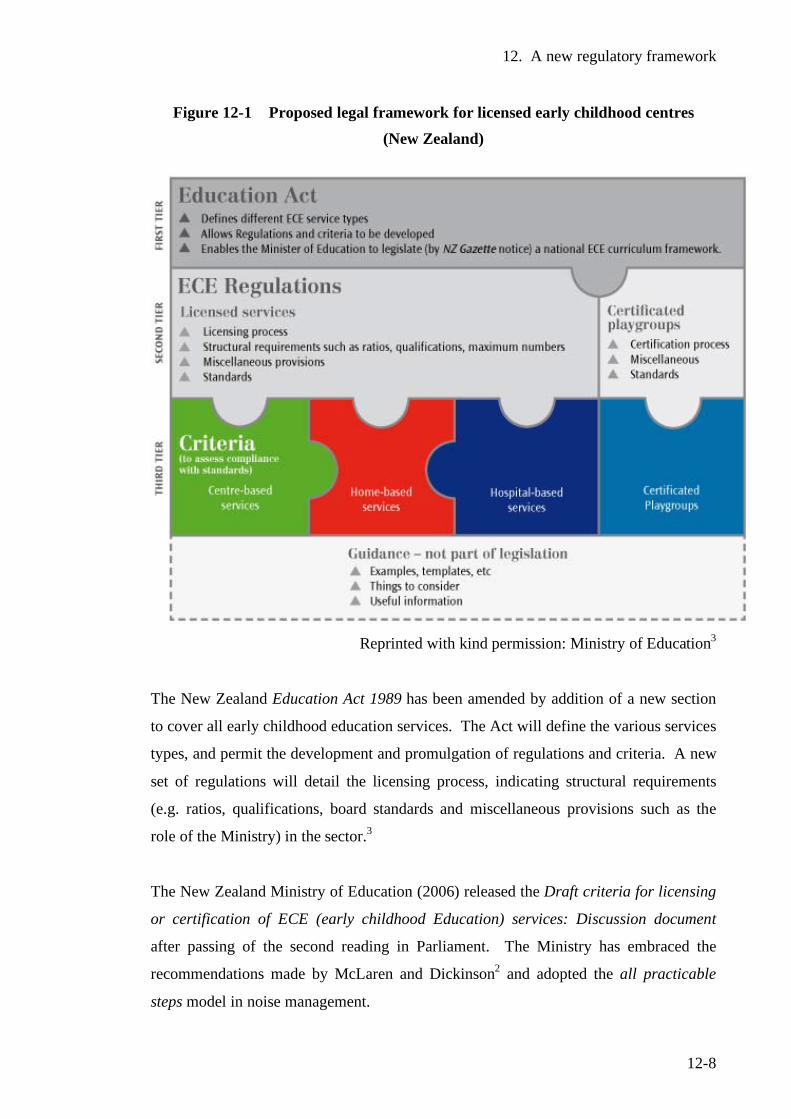
12. A new regulatory framework
12-8
Figure 12-1 Proposed legal framework for licensed early childhood centres (New Zealand)
Reprinted with kind permission: Ministry of Education3
The New Zealand Education Act 1989 has been amended by addition of a new section
to cover all early childhood education services. The Act will define the various services
types, and permit the development and promulgation of regulations and criteria. A new
set of regulations will detail the licensing process, indicating structural requirements
(e.g. ratios, qualifications, board standards and miscellaneous provisions such as the
role of the Ministry) in the sector.3
The New Zealand Ministry of Education (2006) released the Draft criteria for licensing
or certification of ECE (early childhood Education) services: Discussion document
after passing of the second reading in Parliament. The Ministry has embraced the
recommendations made by McLaren and Dickinson2 and adopted the all practicable
steps model in noise management.
12. A new regulatory framework
12-9
Three principal clauses in the above draft licensing criteria are related to noise and are
as follows3:
Clause 2.16: HEATING, LIGHTING AND VENTILATION
• Parts of the building used by children shall have acoustic absorption materials
necessary to reduce noise levels that may negatively affect children’s well-being.
Clause 2.27: SLEEP FACILITIES FOR ALL DAY CENTRES
• If children under the age of two attend, there is a room available (separate to
any activity space) to support the provision of restful sleep at any time they are
attending. This room must be able to be closed off from activity areas so that
fluctuations in temperature noise and lighting levels can be kept to a minimum.
Clause 3.20: NOISE
• All practicable steps shall be taken to ensure that noise levels do not unduly
interfere with speech and /or communication or cause any children attending
distress or harm.
A number of studies including those by Picard and Bradley5 and Nelson and Solti,6 have
found noise to be a critical element in effective speech and communication. Excessive
noise or noise which masks critical elements of speech perception can have a serious
effect on the process of children being able to understand their teacher and other
children. Effective speech intelligibility requires a signal-to-noise ratio of 15 dB. In the
case of learning spaces the teacher’s voice (the signal) needs to be 15 dB above the
background noise level. It is a good practical measure to judge noise levels against
normal speech and communication. If the teacher has to shout to be heard, then the
levels of noise are too high. In addition, the voice when shouting distorts and adds
further problems for special needs children A higher signal to noise ratio may be
required for children with hearing and auditory processing deficits. The interactive
learning space of an early childhood education centre is obviously going to generate
noise from free play and learning by interaction of children with each other and their
teacher. The challenge for all teachers is to achieve a balance between what is
excessive noise and that which is a consequence of children’s learning, the participation
12. A new regulatory framework
12-10
and enjoyment of the activities. To achieve effective speech communication a teacher
speaking at 65 dB would need a background noise level no higher than 50-55 dB. This
outcome appears a very practical way to control noise levels. There is some debate over
the safe levels of noise for children. The World Health Organization7 while recognising
that more work needs to be done in this area, believes that A-frequency weighted time-
average levels below 75 dB are unlikely to cause hearing loss in the majority of the
worldwide population. The risk of health issues concerning teachers, such as hearing
loss from excessive exposure and vocal strain, is very likely to be reduced from
effective control of noise.
Sound-field systems to enhance signal to noise ratios have often proved an effective tool
to assist learning in school settings. A number of studies in the use of sound-field
technology have found a number of positive outcomes with increased attention to tasks,
a higher level of performance against set criteria an improvement in behaviour and
benefits for special needs children.8,9,10 Sound-field systems have not been extensively
used in New Zealand mainstream early childhood education. More work and studies on
the use and effectiveness of sound-field systems in New Zealand Early Childhood
Education Centres are certainly warranted.
Clause 3.20 refers to noise, which could cause children distress or harm. This clause,
while very wide reaching, primarily addresses the issues for children with special needs
who are adversely affected by noise. The draft criteria aim to offer protection from
noise causing distress to a child with auditory problems such as sensory integration
disorder, a high-risk group (e.g. autism, Asperger’s syndrome and giftedness). This
means that practical steps must be taken to protect an autistic child who is overwhelmed
and distressed by the level of noise. This will be difficult if the noise is from an
external source where the centre has no direct control over the sound. However the
taking of all practicable steps would mean to take reasonable attempts to have the noise
nuisance abated by seeking the assistance of the noise control officer of the territorial
authority or even by direct negotiation with the person(s) or organisation making the
noise. All practicable steps would also include making representations in the consents
process under the New Zealand Resource Management Act 1991 where affected parities
are entitled to raise objection to any notified consent application, which is going to
affect them.
12. A new regulatory framework
12-11
The issue of effective measures to allow restful and adequate sleep was identified by
New Zealand Ministry of Education officials in documents and consultation meetings
held around the country. Some centres do not have adequate sleeping facilities and
when space has become a premium it has been the sleep areas that have generally
suffered by being reduced to make way for other activities. Clause 2.27 in effect
requires a fully partitioned area (with its own air space) to mitigate the effects of noise
disturbing sleeping infants and other affects such as fluctuations in temperature and
lighting are kept to a minimum.
Clause 2.16 is relevant where poor acoustic conditions exist such as excessive
reverberation times. The current ANZ standard11 recommends a reverberation time of
0.4-0.6 seconds (250-4,000 Hz octave-band frequencies) for classrooms and learning
spaces. In the case of hard reverberant surfaces giving rise to reverberation times which
would generally be greater than 0.8 seconds, there would be noticeable effect on speech
intelligibility from excessive reverberation. This clause could be used to require the
fitting of acoustic absorption or insulation materials to reduce reverberation times to the
current recommended level. If a proposed amendment to the New Zealand Building
Codes is adopted, all new centres will have to meet the new criteria as part of the
building consents process. However the code, while not mandatory for existing centres,
would provide a valuable guide in centres to meet the requirements of Clause 2.16
where an unsatisfactory acoustical environment exists.
The ‘Guidance section’ is an innovative addition to the proposed legislative framework.
While it is not part of the legislation, it could provide valuable assistance and tools to
meet the requirements of each level of the legislation. The Guidance section could be
used to provide clear instruction with examples on what constitutes all practicable
steps. Strategies to manage noise could be included in this section - such as an
innovative traffic light system for noise developed by a local kindergarten. The green
light indicates that the level of noise is satisfactory. An orange light means it is
becoming too noisy and a red light indicates that it is far too noisy and must be reduced.
A key strategy would be for centres to develop a noise management plan as part of their
operational procedures and policies. A template could be included in the guidance
section
12. A new regulatory framework
12-12
The development of a noise management plan is discussed in 14.2 Appendices.
This research identified the lack of quiet spaces and excessively noisy fire alarms as
important areas in need of attention. These 2 items have yet to be addressed in the
proposed legislation.
12.5 Conclusion Proposed new legislation for the licensing and control of early childhood education
services has recognised issues of excessive noise and the detrimental effects of noise to
all children and their teachers, especially those children at higher risk. While no one
piece of legislation can in itself fully control noise issues in childcare centres, the
proposed criteria present outcome-based solutions to control noise. This has a number
of advantages over the prescription of sound levels in terms of being able to be
implemented, and encourages staff to take ownership of the issue by incorporating
strategies to control noise as part of their teaching practice without fear that they may be
exceeding a prescribed limit. The New Zealand Ministry of Education rejected the
framework of setting prescribed limits in favour of the all practicable steps model for
noise to meet important goals such as to enable effective speech and communication
and to protect those children distressed and harmed by noise. It will be necessary to
also address external noise issues from large construction works, and the territorial
authorities, which grant consents, need to be aware of the issues such noise has on
children in childcare centres in the vicinity. Impact noise such as pile driving or jack
hammering can be very distressing to at-risk children. One way to address this is to
propose an amendment to the current New Zealand standard for construction noise12
which is extensively used in such cases. The other more important option is for early
childhood centres to ensure that they actively participate in the consultation process and
make submissions on notified consents for noisy activities that are going to affect their
children. This would allow appropriate conditions to be considered for such operations.
The draft criteria do not address the issues involving excessively noisy fire alarms nor
the lack of quiet spaces.
12. A new regulatory framework
12-13
12.6 Recommendations
The Draft Criteria for the Centre-based ECE (Early Childhood Education) services
be extended to give more defined coverage to the following:
• The provision of separate fully partitioned quiet spaces is given further
consideration as a mandatory requirement.
• That the criteria specifically address the issue of excessively noisy fire alarms.
12.7 References 1 Pairman, A., Personal communication. 2004, New Zealand Ministry of
Education: Wellington, New Zealand. 2 McLaren, S., Dickinson, P., Regulatory framework for control and monitoring
of noise in childcare centres: A discussion document. A report prepared for the Ministry of Education. 2005, Massey University: Wellington, New Zealand.
3 Ministry of Education, Draft criteria for the licensing or certification of ECE
services: Discussion document. 2005, Wellington, New Zealand: Ministry of Education.
4 Grebennikov, L., Preschool teachers' exposure to noise. International Journal of
Early Years Education, 2006. 14(1): p. 35-44. 5 Picard, M., Bradley, J., Revisiting speech interference in classrooms. Audiology,
2001. 40: p. 221-244. 6 Nelson, P.B., Soli, S., Acoustical barriers to learning: Children at risk in every
classroom. Language, Speech and Hearing Services in Schools, 2000. 31: p. 356-361.
7 World Health Organization, WHO Guidelines for community noise, Berglund, B.
Lindvall, T., Schwela, D., Editors. 1999, Occupational and Environmental Health Unit, World Health Organization: Geneva.
8 Flexer, C., Individual and sound-field FM systems, Rationale description and
use. Volta Review, 1997. 99(3): p. 133-162.
12. A new regulatory framework
12-14
9 Palmer, A., Quantification of the ecobehavioural impact of a sound-field
loudspeaker system in elementary classrooms. Journal of Speech Language Hearing Research, 1998. 41(4): p. 819-188.
10 Bennetts, L., Flynn, M., Improving the classroom listening skills of children with
Down Syndrome by using sound-field amplification. Down Syndrome Research and Practice, 2002. 8(1): p. 19-24.
11 Australian and New Zealand Standard, A/NZS 2107:2000, Acoustics:
Recommended sound levels for building interiors. Standards New Zealand, 2000.
12 New Zealand Standard, NZS 6803:1999, Acoustics - Construction Noise. 1999,
Wellington: Standards New Zealand.
13. Discussion
13-1
13 Discussion
13.1 Introduction The early years of life are critical in the development of speech and hearing. Delay or
deficits in these vital functions are well known to have major consequences for
individuals and the population as a whole. In New Zealand, there is a high incidence of
middle ear infections among children at this time of their lives. This is particularly
serious for those children who suffer persistent middle ear infections for long periods,
for this can result in hearing loss.
Noise presents major issues for all children in their learning environment at school, but
this is particularly pertinent for the very young at the time when language and speech
are under major development. Noise was found to cause a range of effects such as
impairing communication with teachers and other children, irritability, impairing
learning, loss of concentration, creating behavioural issues and over stimulation. In
noisy situations some respondents indicated that where children cannot effectively
communicate they can resort to physical means such as to snatch or grab something
rather than ask for it. It is recognised in literature that noise has the greatest adverse
impact on children with hearing impairment and a range of disorders involving speech,
communication, auditory processing and developmental delay. It is therefore most
surprising that noise in early education has received so little attention in literature, with
very few studies to date reported. Despite the worldwide trend to place special needs
children in mainstream education, very little has been reported on the adverse affects of
noise on these at-risk children and how it affects their learning capacity and well being
in their early education settings.
13.2 Research questions
Five research questions were proposed:
13. Discussion
13-2
1. The sound environment
What are the typical noise levels encountered in a range of early childhood
centres and by how much do they exceed the levels proposed by the World
Health Organization for unoccupied classrooms?
2 Personal exposure
What are the likely personal sound exposure levels of the children and their
teachers and how do these relate to the New Zealand and international
occupational noise criteria?
3 Observed effects on children
How does noise affect the learning outcomes and well-being of special needs
children mainstreamed in early education?
4 The physical learning environment
What is the general acoustical quality of early childhood centre learning spaces
and do they comply with the recommended criteria for classrooms and learning
spaces given in the current Australian/New Zealand Standard?
5 Strategies to mitigate noise levels
What strategies can be developed not only in classroom design, but also in
legislation and teaching practice, to ensure that children and their teachers are
not placed in a situation where there is a risk of hearing loss and where there are
barriers to learning for special needs children?
13.3 The sound environment To gain an understanding of the sound environment in which children are present for
long periods in their daily lives, this work firstly explored the typical noise levels in the
following 2 legal categories:
• Sessional centres – short stay centres such as kindergartens where children
attend sessions from 2 to 3½ hours per day.
• All day centres (where children attend more than 4 hours per day)
13. Discussion
13-3
Research question 1 was addressed with the establishment of typical sound levels,
which did seem to correlate well with the limited data available. A-frequency weighted
time-average levels were recorded well above the recommended time-average level of
35 dB recommended by the World Health Organization for unoccupied classrooms and
learning spaces. Sound pressure levels recorded in the centre of the learning spaces
ranged from A-frequency weighted time-average levels from 65 to79 dB for the
duration of individual sessions (for sessional centres) and the full day (for all day
centres). In situations where the time-average levels were in the range of 75-79 dB it
would be nearly impossible to gain the ideal signal-to-noise ratio of 15 dB above the
background noise level even if the teacher was shouting.
13.4 Personal exposure In assessing Research question 2 to determine the likely personal exposures of children,
no other comparable data was available to give any indication of likely levels. Personal
sound exposure levels varied greatly but it was never expected that personal dose levels
recorded by children could well exceed the occupational noise criteria of the health and
safety in employment legislation. Likewise it was surprising to record personal
exposure of some staff participants to be in excess of that permitted by the legislation.
Eighteen percent of children monitored in sessional centres and 43% in all day centres
recorded daily sound exposure levels in excess of the maximum 100% permitted in the
(adult) workplace. In addition, most of the children monitored (86% in sessional
centres and 90% in all day centres) recorded peak levels in excess of 140dB on at least
one occasion. Such levels of noise are deemed to be harmful to adults and it is
reasonable to expect greater levels of harm to young sensitive ears. Of the teaching
staff monitored, 3% of staff (sessional centres) and 11% (all day centres) recorded daily
sound exposure levels in excess of 100%. Thirty nine percent of staff in sessional
centres and 48% of staff in all day centres recorded peak levels of at least one
exceedance over 140 dB. The earlier series of doseBadges were unable to give more
specific information on the peak level exceedances.
13. Discussion
13-4
Whenever possible, children were monitored for special events and activities they
participated in both inside and outside the centre. This included music sessions, and
walking excursions in the Wellington Central Business District.
Music sessions varied greatly, but there were a few which were excessively loud. One
session recorded an A-frequency weighted time-average level of 93 dB for the duration
of the 30-minute session, a level potentially dangerous to the hearing of young children.
Quite apart from the volume of the recorded music used, expert opinion from a music
specialist suggested that percussion instruments should be made from alternative
materials to give the desired musical effect without the sharp impact type sound. She
also recommended the holding of music sessions with small groups of children, to give
increased benefit from not producing so much noise and to allow the teacher to focus
more closely on the quality of music.
High levels of noise were recorded as children went out on a walking excursion around
the busy inner city streets (LAeq 1 hr = 84-86 dB) and around major road works (LAeq = 88-
92 dB) when the children were walking along a temporary footpath right next to the
works. The benefits of the learning experience of taking children out on excursions are
not questioned, however the noise exposure is something that probably hasn’t been
considered before. Staff should where possible avoid taking children along the busiest
routes and avoid areas, which are noticeably noisy, such as large construction works.
At the request of some participating early childhood centres, the study was extended to
include some simple hearing tests on staff. Audiograms were taken of teaching staff at
the beginning and the end of the working day to assess any temporary threshold shifts as
a result of noise exposure. Their daily sound exposures were measured by fitting
doseBadges to the staff members who participated, to see if there was any identifiable
link between the threshold shifts and the noise exposures. Unfortunately in the testing
conditions, noise levels from heavy rain and the background noise on the premises,
made accurate testing extremely difficult. While some audiograms showed small
movements in hearing threshold levels, these were not enough to be considered
significant as they fell within the margin of error.
13. Discussion
13-5
The audiograms also indicated the current hearing status of each participant. Younger
staff in the 20-25 age group generally did not show any signs of damage, but the
characteristic notch was beginning to show in staff members in their mid 30s suggesting
the emergence of noise-induced hearing loss. More evidence emerged in staff members
in the 40-45 age group and moderate to severe loss was detected in a staff member in
the 60 - 65 age group. It is unlikely that presbyacusis would be the sole cause of severe
hearing loss in this age group but would certainly augment hearing loss induced by
excessive noise exposure or due to a medical condition. Up until now, this has been
given little or no attention by the regulatory agency, the New Zealand Department of
Labour. While the health and safety of teachers in their workplace is generally covered
by the New Zealand Health and Safety in Employment Act 1992 and the New Zealand
Health and Safety in Employment Regulations 1995, it is doubtful if this legislation can
successfully be applied to addressing noise as a hazard to teachers in the workplace
without the development of a comprehensive code of practice and amendment of the
legislation to cover such issues. If strategies proposed by the Health and Safety in
Employment Act 1992 (Clauses 8-10) for the management of hazards were
implemented, children (the source of noise) would need to be isolated from their
teachers, or the teachers required to wear hearing protectors.
If the findings of this limited study are representative of the hearing status of staff in the
early education sector, a considerable number will have significant levels of hearing
loss by the time they retire. Urgent investigations are now needed to assess the levels of
hearing loss in this sector group of workers along with the levels of hearing loss directly
attributable to noise exposure at work.
13.5 Observed effects of noise on children
Children known or suspected to be adversely affected by noise were identified from
literature and advice from specialists who work with these children. In addressing
Research question 3, information was sought on how noise affects children in general,
as well a range of children with identifiable needs.
The respondents consisted of teachers, special education professionals and some
parents. They reported a wide range of adverse effects of noise in general on the
13. Discussion
13-6
children’s well-being and educational outcomes. They identified effects such as
impairing communication between the children themselves and their teachers,
irritability, impairing learning ability, loss of concentration, creating behavioural
problems and over stimulation. Information was sought from children experiencing
conditions such as developmental delay, Down syndrome, attention-
deficit/hyperactivity disorder (ADHD), autistic spectrum disorder, auditory processing
disorders and giftedness. Many of these children were often startled or distressed by
loud sudden and unexpected noises. Respondents identified the most adverse outcomes
for children on the autistic spectrum as the majority of these children along with a
subset of gifted children experience a condition known as sensory integration disorder.
These children often have extreme sensitivities to certain types of noise, which can vary
considerably from one individual to the other. It appeared that primary adversary
affects included high levels of distress, aggravation and behavioural issues self
stimulating behaviours such as hand flapping or rocking, hands over their ears,
screaming or groaning to try and block out the sound and even a trigger for vomiting,
on-going abdominal pain and an epileptic or epileptiform seizure.
Secondary effects were identified as learning impairments, distraction from tasks and
compromise communication. As those experiencing classical autism already have
serious problems with speech and communication, noise only exacerbates the problems
they already have.
Respondents identified space as a critical issue for special needs children mainstreamed
in early childhood centres. The lack of quiet spaces to conduct one - on-one speech
language therapy and work with these children was strongly criticised as well as these
children having no quiet places to escape the din. The staff room is often used for one-
on-one work and in one case, the toilet lobby had to be used as no other space was
available. This is not inclusive education and an unsatisfactory situation in properly
meeting the educational and welfare needs of these children. It appears that when the
policy drive was introduced to place special needs children in mainstream early
education environments, little or no consideration was given to a conducive and an
acoustically appropriate learning environment for these children.
The study was not designed to formally assess measured learning outcomes as a result
of noise. This was beyond the scope of this work and outside the strict ethical approvals
13. Discussion
13-7
given. However a number of hypotheses and questions can be proposed as a result of
this work on the effects of noise on the educational outcomes of children with
identifiable needs. In addition, the impact of not being able to provide specialised or
individualised education in ideal educational settings is worthy of further investigation.
These hypotheses and questions need to be formally investigated and tested.
Excessively loud fire alarms were identified by a number of respondents as being so
loud that they caused young children distress and may compromise a safe and orderly
evacuation in a genuine emergency. On examination of the relevant standard, there
appears to be widespread misinterpretation, as alternative non-audible alarms systems
are permitted when audible devices could cause distress to occupants in settings such as
early childhood centres.
From the responses given, it appears that of all groups of children with identified needs,
those on the autistic spectrum may be the most adversely affected by noise of any
group. It is surprising that the problems of this group have been largely overlooked in
literature on classroom noise, which tends to focus on the hearing impaired. While
clinically based references and literature on autism clearly identifies the issues of
overwhelming sensitivities to noise and other senses, other studies on noise in education
to date have largely failed to identify the seriousness of noise to this group. It is critical
that the adverse affects of noise to this highly at-risk group be identified so that their
needs can be given primary consideration when strategies and remedial measures are
taken.
While the respondents clearly identified noise as affecting children’s behaviour and
learning from their observations, it is important to point out that dedicated research is
now needed to conclusively establish the effects of noise on the behaviour and learning
outcomes of young children.
13.6 The physical learning environment
Many early childhood centres are in premises converted from other uses such as
commercial and domestic buildings. On the whole those in residential areas are in
converted homes and schoolrooms etc., while those in the central business district are in
13. Discussion
13-8
commercial premises often shared with other tenancies. In addressing Research
question 4, the acoustical environment was assessed.
Few premises had acoustic treatment and in most cases reverberation times exceeded
those recommended for school rooms (0.4-0.6 seconds) across the standard octave
frequency bands (63-4,000 Hz). In a couple of cases, the retrofitting with acoustic wall
and ceiling tiles showed a marked reduction in the reverberation times as measured
before and after the retrofitting with acoustic panels. It is imperative that appropriate
design criteria be available during the building, change of use or major renovation
stages of such facilities, where appropriate design criteria can be appropriately planned
and budgeted. It is far less desirable to try and effect a clean up after finding serious
problems.
13.7 Strategies to mitigate noise levels This work and the high levels of public interest, which were generated through the news
media, appeared to substantially raise awareness among teachers and administrators in
the early education sector. It was fortuitous that an overhaul of the New Zealand
Education (Early Childhood Centres) Regulations 1998 was occurring at the time of
this study and giving the added incentive for developing Research question 5. In the
initial consultation by the New Zealand Ministry of Education with stakeholders in the
early education sector, noise emerged as a key issue, which needed addressing. In
answer to a request for advice as to how noise could be regulated in accordance with
current teaching practice and the current levels of resources, a discussion document was
prepared for the Criterion Development Team of the New Zealand Ministry of
Education, outlining legal precedents and the frameworks, which could be considered.
In this document, resource implications were discussed and the relative advantages and
disadvantages of each framework were presented. The Ministry of Education accepted
the recommendations of the report in full adopting the all practicable steps framework
over the setting of prescribed standards alternative. Clause 3:20 of the Draft criteria*
was a direct result of this work to control noise to a measurable outcome such as the
ability to conduct normal speech and communication. The latter part of the clause is a
recognition of the rights of all children, especially those at-risk, to protection from the
* “All practicable steps are taken to ensure that noise levels do not unduly interfere with the
normal speech and/or communication, or cause any child attending distress or harm”
13. Discussion
13-9
adverse effects of noise. The lack of quiet spaces and excessively noisy fire alarms still
remains unresolved.
13.8 Limitations of this work There were a number of limitations with the research methods.
13.8.1 Personal sound exposure of children.
The doseBadges were designed for measuring compliance with the international
workplace exposure criteria for noise (promulgated into the New Zealand health and
safety in employment legislation). Due to memory limitations being a very small unit,
the doseBadges have a high cut-off point where noise exposure data of less than 75 dB
is discarded. This is not entirely suitable for children giving a conservative estimate of
the children’s exposure. A lower cut-off point at 65 dB (i.e. data of less than 65 dB is
discarded) would have given a better representation of the personal exposure of the
children.
13.8.2 Fixed sound level measurements
Unlike the New Zealand standards for the measurements and assessment of
environmental noise or the approved code of practice for noise in the workplace, the
lack of standard methods for the measurement of noise levels in educational settings
remains a significant limitation. This means that it remains the choice of individuals
taking the measurements, which can vary greatly and significantly affect the results
obtained.
13.8.3 Responses to questionnaires The respondents gave their observations on the effects of noise on various groups of
children and educational outcomes and created. From the observations reported a
number of hypotheses have emerged that need to be formally tested. There are a
13. Discussion
13-10
number of confounding factors such as severity of the condition and individual
responses to noise within special groups such as those on the autistic spectrum, which
would need to be addressed.
The small sample sizes were a limitation, which cannot be ignored. A difficulty with
the New Zealand early childhood education sector is that it is it is diverse and that
children with special needs are generally mainstreamed which is a principle of New
Zealand educational policy. There are very few special early education centres
dedicated to specific disorders such as autism. Some disorders cannot be effectively
diagnosed until well into school age such as central auditory processing disorder and
giftedness. Reliable information on these groups is sparse. Retrospective reporting by
parents, whose child subsequently received a formal diagnosis outside the early
education years, introduces a level of unreliability.
The issues of bias introduced by respondents having their own agenda is an issue
difficult to avoid. However in all the responses received and feedback obtained, most
of the responses came with good reasoning and descriptions justifying what was said. A
number of respondents preferred to complete the questionnaire verbally due to time
constraints and in some cases staff preferred to do it as a group where 2-3 staff
completed one questionnaire. While there were obviously some positive attributes to
this with staff discussing and thinking about each question, it did introduce a negative
bias with less numbers counted than those actually responding.
13.8.4 Occupational hearing issues of staff
Hearing tests were carried out as a special request from three large inner city childcare
centres. As the staff work long hours testing was organised immediately before work
(5am to 7am) and again after work (5pm –7pm) . The staff at one centres had testing
done at Massey University before and after work. During the morning testing time
heavy rainfall occurred, the noise of which made the testing difficult. In addition a
proper testing booth was not available. Staff at the other centres preferred to have their
tests done at their place of work and again this had to be done in a noisy environment.
While it would have been preferable to do all tests in quiet surroundings, the difficulty
13. Discussion
13-11
of working around rosters, and the long working hours, meant that repeat testing in ideal
test conditions was not possible. In addition, the resources were not available to
establish any control groups.
13.9 Recommendations for future study
This study has lead to the following recommendations for future work:
1. A comprehensive study be undertaken to identify all the at risk groups of
children adversely affected by noise in early childhood centres and clearly
establish the effects of noise on the learning outcomes of these children.
2. A standard method or code of practice be established for measurements of sound
pressure levels in learning spaces which will allow valid comparisons between
studies using the same standard methods.
3. A study be carried out to examine the personal sound exposure of young
children over the full 24 hours, which would include typical exposures at home
and activities outside formal education settings.
4. A comprehensive study be undertaken of the personal sound exposures and the
hearing status of teachers and contact staff. It may also be necessary to examine
how the existing code of practice for management of noise in the workplace
could be modified to include this group of workers.
5. An on-going study be established to monitor and detail any acoustic treatment as
it occurs in childcare centres as it occurs so any improvements can be assessed
and documented.
14-1
14 Appendices
Page 14.1 Human ethics approval and correspondence 14.2 14.2 Development of a noise management plan 14.9 14.3 Peer reviewed journal articles directly attributed to this work 14.22 14.4 Conference papers directly attributed to this work 14.23 14.5 Sample doseBadge monitoring report 14.24 14.6 Survey/inspection and questionnaire forms 14.25
14-2
14.1 Human Ethics Committee approval As the project involved the direct participation of young preschool children, full Massey
University Human Ethics Committee approval was required. Approvals were given
(Wellington 03/120 and 05/34). The special conditions required of the committee were
met in full:
• The doseBadges were intrinsically safe and did not emit any kind of radiation
(like a mobile phone) or signal while they were in operation.
• A doseBadge would not be fitted to a child under 3 years old. They were
considered not suitable for babies or crawling children as falling on the badge
could hurt them. Badges would not be fitted to any children if likely to cause
distress or anxiety such as those on the autistic spectrum.
• Full parental written consent of parents was required. A letter / information
sheet was addressed to every parent explaining the project. Children were
selected by the teachers to wear a badge and a letter was sent to each parent
explaining this part of the project in full and a consent form to sign. (Copies
attached)
• No child would be required to wear a doseBadge even if parental consent was
obtained. They would be removed on request of the child.
• Researchers had to wear a name badge, be under full supervision of teaching
staff at all times, and if possible in their line of sight.
A variation was sought on the above approvals to carry out pure tone audiometry on
teachers and staff members who had contact with children.
All personal details of the participants, and the names of the early childhood centres,
which participated in this study, were kept strictly confidential and not disclosed in this
work nor in any other report.
14-3
The Massey University Human Ethics Committee approved a number of model letters,
information sheets and consent forms to be issued to the participants (i.e. governing
bodies, parents, teachers etc). Two of these documents have been included below as
examples.
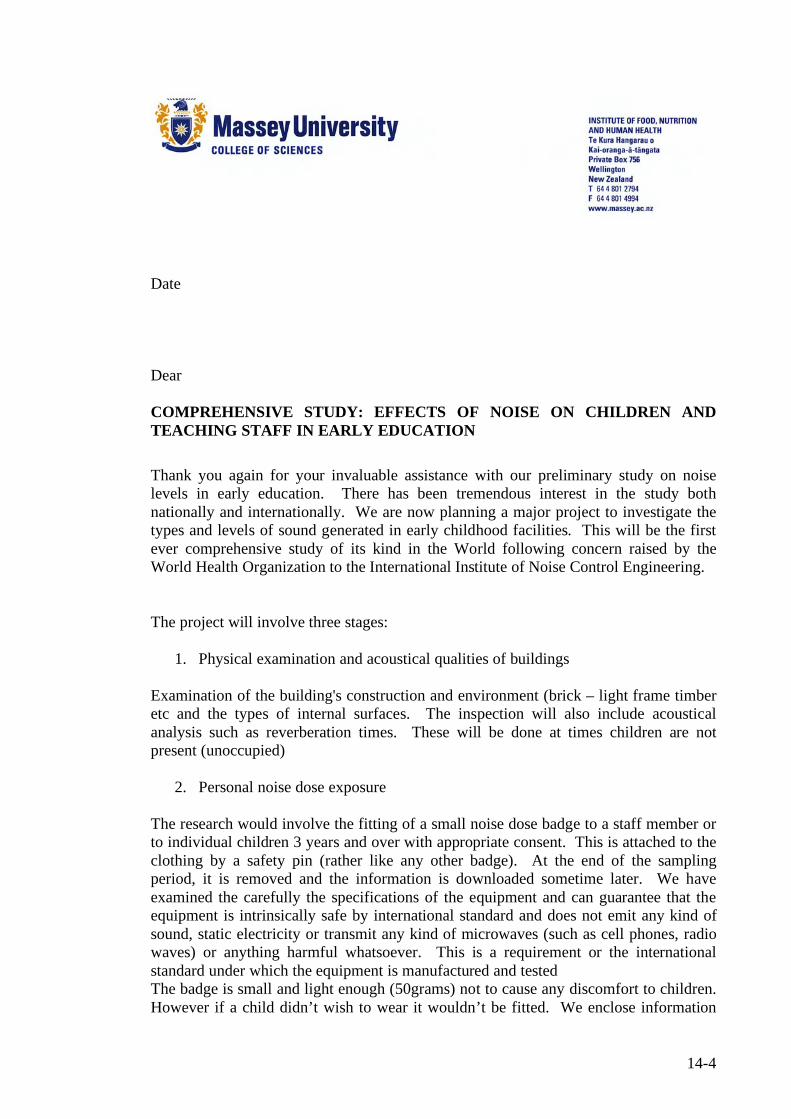
14-4
Date Dear COMPREHENSIVE STUDY: EFFECTS OF NOISE ON CHILDREN AND TEACHING STAFF IN EARLY EDUCATION Thank you again for your invaluable assistance with our preliminary study on noise levels in early education. There has been tremendous interest in the study both nationally and internationally. We are now planning a major project to investigate the types and levels of sound generated in early childhood facilities. This will be the first ever comprehensive study of its kind in the World following concern raised by the World Health Organization to the International Institute of Noise Control Engineering. The project will involve three stages:
1. Physical examination and acoustical qualities of buildings Examination of the building's construction and environment (brick – light frame timber etc and the types of internal surfaces. The inspection will also include acoustical analysis such as reverberation times. These will be done at times children are not present (unoccupied)
2. Personal noise dose exposure The research would involve the fitting of a small noise dose badge to a staff member or to individual children 3 years and over with appropriate consent. This is attached to the clothing by a safety pin (rather like any other badge). At the end of the sampling period, it is removed and the information is downloaded sometime later. We have examined the carefully the specifications of the equipment and can guarantee that the equipment is intrinsically safe by international standard and does not emit any kind of sound, static electricity or transmit any kind of microwaves (such as cell phones, radio waves) or anything harmful whatsoever. This is a requirement or the international standard under which the equipment is manufactured and tested The badge is small and light enough (50grams) not to cause any discomfort to children. However if a child didn’t wish to wear it wouldn’t be fitted. We enclose information
14-5
sheets on the dose badge, which will also be available to any staff members or parents for inspection. 3 Interview of staff on the effects that noise has on the children The interview would involve one staff member from each centre on a strictly voluntary basis. Time involved would be about 15 –20 minutes. Covering letters with detailed information and consent forms for data collection involving staff and children are enclosed. Every attempt to ensure confidentiality is given and individuals and centres will not be identified by the research team to any third party or in any report or publication. We have developed a unique coding system, which was trialed very successfully in our earlier study. This will be extended to cover individual participants as well as centres. It is a requirement that all confidential information will be kept in secure storage with restricted access. In accordance your requirements and individual managers, all parents whose children are present during the times research is carried out will be notified. Draft letters information sheets and consent forms are enclosed. The equipment used is robust but in the event or loss of damage the Centres or any individual will not be held in any way liable for what ever reason. This remains the sole responsibility of Massey University and its insurers. However in the interests of all concerned the researchers must remain on the premises at all times the equipment is in operation so as to respond to any requests of the staff. I would value the opportunity to meet and discuss the project with you in person if this is possible at a time convenient to yourself. In this way we can discuss any immediate concerns and questions you have. (04) 801 2794 x6705. The researchers agree to:
• Maintain strict confidentiality by not identifying the Centre to any third party or in any report or publication.
• Comply with all instructions of the teaching staff or management and not to interfere with any staff in the course or their duties or the children in the learning and enjoyment of the facility.
• To keep the manager fully informed of all results pertaining to this facility • Allow the manager to view and comment on any manuscripts prior to
publication • To consult the manager and governing body before any press releases are made
due to the anticipated high level of interest The Massey University Human Ethics Committee require the following participants’ rights as part of the approval process:
• As the governing body you have the right to decline to participate or withdraw any of your centres from the study at any time up to 30 November 2003.
14-6
• Provide information only on the strict understanding that your centres or participant staff and children will not be named or identified in any way (unless expressed permission is given to the researcher).
• Be given access to a summary of the project findings at the conclusion. This project has been reviewed and approved by the Massey University Human Ethics Committee, WGTN Protocol 03/120. If you have any concerns about the conduct of this research, please contact Mr Jerry Hubbard, Acting Chair, Massey University Campus Human Ethics Committee: Wellington, telephone 04 801 2794 X6583, email [email protected] . Yours sincerely, Stuart J McLaren Senior Lecturer in Health Science and PhD Candidate Institute of Food Nutrition and Human Health Wellington Campus Massey University
14-7
EFFECTS OF NOISE ON CHILDREN AND TEACHING STAFF IN EARLY EDUCATION CONSENT FORM (Governing bodies) THIS CONSENT FORM WILL BE HELD FOR A PERIOD OF FIVE (5) YEARS
I have read the Information Sheet and have had the details of the study explained to me. My questions
have been answered to my satisfaction, and I understand that I may ask further questions at any time.
I agree to participate in this study under the conditions set out in the attached letter.
Signature: Date: Full Name - printed
14-8
Notice : To All Parents and Staff MASSEY UNIVERSITY STUDY – EFFECTS OF NOISE ON CHILDREN AND TEACHING STAFF IN EARLY EDUCATION On [date], Stuart McLaren from Massey University will be conducting a research project in our centre as part of his PhD studies. The centre has been randomly selected as part of a study on noise and acoustics in early childhood learning rooms. This has originated from concerns worldwide raised by the International Institute of Noise Control Engineering (I-INCE) on the advice of the World Health Organization. INCE has established an international working party, which includes New Zealand, to evaluate noise and reverberation control for learning spaces. Some children have been randomly selected to wear little noise doseBadges as part of the study and their parents have already given consent. As these look like little space ships the staff feel many children may want to wear them. We do have a good supply of dummy badges so that other children need not feel they have been left out. The researchers will be wearing identity name badges and be discreetly taking noise measurements and relating these to the activities carried. The researchers are not permitted to interfere with the normal operation of the centre. Thank you for your cooperation in this important study. If you have any further questions or concerns, please relate these with the Centre manager/Head teacher of the centre who can directly refer these to the researchers. You are also welcome to contact me directly for more information. I can be contacted by telephone 801 2794 extension 6705 or email [email protected]. Stuart J McLaren Senior Lecturer in Health Science Massey University in Wellington
14-9
14.2 Development of a noise management plan
With the adoption of the all practicable steps model in the new draft legislation, an
effective tool to meet the requirements of the criteria on noise is to develop a noise
management plan as part of the policies and procedures of an early childhood centre. A
noise management plan is used by a variety of noise generating industries to identify
noise issues and then formulate a plan to mitigate or control these. A plan should be a
living document, which is regularly review and consulted. It could be submitted as part
of documentation for the Education Review Office evaluations of early childhood
centres. In addition prolonged exposure to noise may also be an occupational issue for
many staff.
To assist the development of this strategy a guide to preparing a noise management plan
has been developed as a point of reference for centres wishing to adopt this initiative
with a model plan. While there is no single method or format to prepare a plan, the
following guide and model development plan serves as a tool for discussion, further
development and adoption.
Essential elements of a noise management plan
The essential elements of a noise management plan can be broadly divided into 5 parts.
The most important aspects of any plan are the legal and policy directives. Policy
statements could be developed under the following themes.
Part 1- Policy statements
1 A description of the legal requirements pertaining to noise and commitment to
staff knowledge and implementation.
2 A living document that is regularly used and reviewed. A commitment to on
going review and amendments to the plan needs to be made.
3 The philosophy that the centre will adopt in managing noise. For example:
14-10
Educational and other beneficial activities which generate noise will not be
suspended or curtailed, but will be carried out to deliver maximum benefit along
with a commitment to manage noise levels as much a possible.
Mitigation of unnecessary noise, which can be curtailed. For example:
lubrication of squeaky equipment, solutions to minimise noise from actions such
as doors banging, furniture scrape etc.
Noise producing toys will be chosen carefully using those that are quiet but still
provide the children with the same benefits
4 Inclusion and protection of at-risk special needs children.
5 Noise-induced hearing loss as an occupational issue for teaching and other contact staff.
Part 2 Noise issues in general
1 A summary of the types of noise generally found in early childhood centres.
along with any noise specific to a particular centre
2 Noise issues for the most at-risk children.
3 Occupational exposure.
Part 3 Strategies and practice
1 A statement of recognition that play is an important part of a child’s learning
and development, which generates noise can be included. A commitment to
strive to achieve a balance over what noise is a consequence of play and learning
and what is excessive and detrimental. Teaching strategies may be introduced
here such as the use of quiet voices inside and any technique for teaching
attentiveness etc.
2 Any noticeable noisy times such as transition times from on activity to another
can be included and how this is to be managed.
14-11
3 Sessions generating noise by their nature should be addressed. Music sessions
such as the use of recorded music will be played to the volume for children to
experience, learn from and enjoy the music, but not of a volume to cause distress
or hearing loss. Other strategies could include the choice and type of percussion
instruments (made of plastic or flax rather than hard wood to reduce the sharp
piercing impact sound) and to teach the children to play musically and not to
bash the instruments for the purpose of making noise.
4 Specific noise issues such as furniture scrape, squeaky equipment noisy toys can
all be addressed. Simple strategies such as making sure caps are fitted to
furniture to minimise scrape, lubrication of swings etc, and the use of ride on
toys with rubber wheels rather than hard hollow plastic wheels can be outlined.
5 Avoidance of the Lombard effect where teachers addressing a noisy group will
naturally raise their voices to be heard over the din. What other more positive
strategies can be used rather than shouting at the children?
6 Any other innovative ideas adopted by the centre to minimise noise. For
example: a traffic light system for noise and ear muffs on the carpentry bench
(both developed by a local kindergarten).
7 As inclement weather often confines children indoors, the strategies for
managing children could be outlined here.
8 A plan for special needs children and/or those with high levels of sensitivity to
noise. How will these children be managed?
Part 3 Noise attenuation through the building structure
In many centres this is an issue with excessive reverberation. The centre could identify
any long terms goals to improve the acoustic environment. This could include DIY
solutions such as the fitting of self-adhesive ceiling tiles of soft board wall panels as
well as professional consulting services engaged.
14-12
Part 4 Externally generated noise intruding into the centre
Noise outside the control of the centre can be an issue and this may involve seeking
assistance from a law enforcement agency such as the city or district council’s
environmental health officer/noise control officer. Contact details should be included if
needed. Many council staff treat early childhood centres like any other commercial
activity and would not necessarily know or give due consideration to the presence of at
risk children when considering such activities as noisy construction works which are
granted consent by the council in the resource consents process. It is reasonable for the
centre to act as advocates for their children and not to assume council officers are well
informed of the issues that the centre face and the presence of special needs children
who are adversely affected by noise. The centre could formally ask council to ensure
that they notified of any noisy activities in the vicinity of the centre and to be given due
consideration in the approval process. A model letter is enclosed.
Part 5 Education The education of children at an early age is the core business of the early childhood
education centre and education about loud noise and hearing damage should be
included. The earmuffs on a carpentry bench is an excellent educational initiative. The
centre could indicate education initiatives to parents perhaps with key messages in
notices to parents or by setting the example. Education can also extend to the relevant
law enforcement agencies such as city/district council staff who would not normally be
aware of the issues of externally generated noise for the children, especially those most
at risk.
Part 6 Occupational exposure
Staff exposed to occupational noise over a working life are at-risk of hearing loss
especially in the retirement years where the natural loss of hearing with age
(presbyacusis) becomes more significant. Implementation of a strategy to alert staff to
the possibility of hearing damage and to provide information with a means for early
detection should be included. All hearing associations have hearing therapists or
hearing advisors who can conduct pure tone audiometry tests and provide counselling
for free or nominal fees. They will also refer clients to public or privately based
14-13
audiology or audiometry services if necessary. Information and contact details of theses
local services should be included in the plan.
A model noise management plan.
Policy 1
The centre staff are required to be familiar with the legal requirements regarding noise
and will ensure that these requirements are met at all times. All permanent staff to the
centre will be informed of this plan and be required to meet these requirements as part
of their duties.
Policy 2
The noise management plan will be evaluated internally at staff meetings and internal
audits. This plan will be evaluated at least once a year and necessary amendments
made.
Policy 3
The centre will not to cancel or prohibit any beneficial activities which by their nature
generate noise/sound but will strive to conduct these activities in a manner that gives the
children the full educational benefit and at the same time consciously manage noise
levels as much as possible.
Policy 4
The centre will identify, eliminate or control as much as possible any unnecessary noise
(such as squeaky equipment) by regular lubrication and /or other maintenance. Staff
will not generate unnecessary noise such as loud background music.
Policy 5
The centre will not permit toys that have the potential to cause hearing damage. Noise
from such toys will be evaluated along with other hazards before any such toys are
permitted in the centre.
14-14
Policy 6
Staff will identify and monitor special needs children known to be adversely affected by
noise. Intervention will be put in place for any known noisy activity to manage these
children as much as possible. This will include strategies to move them to a quieter area
of the centre or manage the level of noise before they become distressed.
Policy 7
The centre has a commitment to the aural and other occupational health effects of work.
Staff are encouraged to have their hearing tested by approved providers especially if
conditions such as tinnitus or other such warning signs are experienced. We encourage
and assist staff to put strategies in place to protect their hearing both inside and outside
of work.
Legislative requirements
• Clause 2:16 of the Criteria for the Licensing or Certification of ECE services
requires that parts of the building used by children have acoustic absorption
materials necessary to reduce noise levels that may negatively affect children’s
well being.
Clause 3:20 of the Criteria for Licensing or Certification of ECE services
requires that all practicable steps are taken to ensure that noise levels do not
unduly interfere with speech and /or communication or cause any children
attending distress or harm.
General types of noise sources and issues found in early childhood centres
• Noise transmitted through or reflected by the building structure
• Noise generated as part of the centre activities
o Noise from children themselves (while engaged in play, when distressed
etc.)
o Noise from the use of equipment, fittings, toys, hi-fi, musical instruments
etc.
o Noise intrusion from activities outside the centre (over which the centre
often have little or no control)
14-15
o Protection of special needs children who are mainstreamed in early
childhood centres and known to be adversely affected by noise. This
includes children with middle ear infections, hearing impairment,
auditory processing disabilities and sensory integration disorder.
o Excessively loud fire alarms.
o Occupational noise exposure
Identification of Specific issues
Noise generated by children during play
Play is an integral part of the learning and development of the child and there
will always be noise generated by children. The staff will strive to always
achieve a balance over what is necessary for the children in their learning and
enjoyment and what is excessive to the detriment of children and their teachers.
Teachers and staff will monitor noise to ensure as far a possible it doesn’t have
any adverse effects such as causing degradation of speech and communication.
Children will be reminded to use their quiet voices inside. Listening and
attentive skills will be taught at mat time with a variety of games and activities
requiring these attributes.
Immediate attention is given to children who are distressed or involved in any
unacceptable noisy activity such as fighting, inappropriate language etc.
Noise generated by children in transition from one activity to another
This is often a noisy time. The staff will focus gaining the children’s
cooperation to get these tasks done as speedily as possible. Music has been
successfully used to motivate children and set the scene and we will adopt such
initiatives.
Sound generated during music sessions.
14-16
Music will be used for specific purposes such as to create a calming atmosphere.
Music lessons will be conducted with the view to teach musicality but not of a
volume to cause distress or harm to the children. Children will be taught and
encouraged to play instruments musically and not to bash them for the purpose
of making noise. Claves and other percussion instruments will be made of
plastic or flax so as to give the musical benefit without generating sharp, piecing
and impact-type sound. Drumming and rhythm are specifically taught.
Noise generated by furniture scrape and fixtures
Scraping of furniture can be a disturbing and annoying. All rubber caps on
furniture will be regularly checked for wear and caps replaced as needed to
minimise scrape. Any wooden self-closing doors to the kitchen will be fitted
with simple rubber mounts to stop them constantly banging.
Toys and playground equipment
Toys and equipment, which make unnecessary noise, are not acceptable. Bikes
and similar ride-on toys with hard hollow plastic wheels, which are excessively
noisy, are being progressively replaced with quality rubber tyred toys. Other
noisy toys such as toy cellphones, clackers etc are not permitted. Swings and
other such moving equipment are regularly monitored for squeaks etc and will
be lubricated regularly. Grease and oil are available in the centre for this purpose
Lombard effect
Teachers will endeavour to not raise voices over the top of children (known as
the Lombard effect) but will seek other more positive ways to gain the children’s
attention and /or cooperation to quieten down. We have adopted a red flashing
light which is turned on as a signal to alert children to the noise level and to gain
their cooperation.
Carpentry bench
14-17
Policy 3 requires that such activities are not curtailed on account of noise.
Earmuffs are provided on the carpentry bench and children encouraged to wear
them. We have also carpeted the surface of the bench to reduce noise. We
encourage hearing conservation in all activities we engage the children in.
Children are strongly encouraged to use the earmuffs provided on the carpentry
bench as would happen in industry.
Inclement weather
Inclement weather confines children indoors and it is necessary to be well
prepared with a range of engaging activities such as painting, puzzles, play
dough or creative play such as building blocks. Children will be actively
encouraged to participate in the range of activities provided and tasks given to
maintain interest. Music sessions and other indoor activities will be fully
utilised on that day. Children will be reminded to use their quiet voices on such
days and to keep the noise down. We strategically use calming music to create a
serene atmosphere.
We are endeavouring to increase the available space during wet weather by the
addition of a covered play area. This is the policy of our governing body for all
their centres.
Special needs children
This centre usually has some special need children enrolled. In the case of those
known to be effected such as the hearing impaired, or those on the autistic
spectrum, the teachers and education support workers assigned to the child will
monitor the noise levels and the child to ensure that any sign of the child
becoming distressed that action is taken to remove the child to a quieter corner.
We do not have a separate quiet space. It is a long term goal, which is subject to
a successful grant, to create a quiet reading room or area in which one - on - one
work with our special needs children can be undertaken by the speech language
therapists and other professionals from Group Special Education or similar
providers of early intervention services. In the meantime headphones are
14-18
provided with quiet music of his/her choice to wear as a calming strategy. The
staff office is presently used.
Noise attenuated through the building structure
There is no acoustic treatment in the centre. Due to limited resources we are unable
to seek professional advice to improve the acoustic environment (i.e. reduce
reverberation times). However we propose to undertake the following as resources
become available.
• The fitting of self-adhesive perforated ceiling tiles which we will undertake with
the assistance of parents.
• The fitting of hessian covered soft wallboard panels through out the centre. We
are advised that with a combination of the above will greatly improve acoustics
• The provision of carpet mats over areas of the floor not likely to become soiled
or wet.
Noise generated outside the centre but causes a nuisance and obstructs the
learning and well being of the children.
Noisy neighbours with loud stereos and the testing of engines trouble the centre
from time to time. The staff will raise the matter with the Council’s
environmental health officer/noise control officer to seek intervention when the
noise is persistent loud, disturbing and causing a nuisance to the centre. The
officer’s details are given:
Environmental Health Officer
Xxxx City Council
Tel xxx
Participation in consent process for activities, which will adversely impact on out
children
14-19
The centre wishes for the council to be aware of the presence of the centre and
the effects of noise especially on our vulnerable children, when they approve
any application, which will increase the ambient noise level to our centre. A
letter has been sent to council advising them to ensure that all noise activities
which will impact on the children and the centre are given due consideration in
planning. We wish to be notified of all such activities likely to impact on our
children in the planning stages and be allowed to make submissions in the
consents process.
Child Education
We will include hearing protection and looking after our hearing in our
education to children. The earmuffs provided on the carpentry bench are a good
education initiative.
Parent Education.
Many children are subjected to excessive noise at their homes. We consider our
role to set the example and to educate parents on matters, which directly affect
their children. Through notices to parents we will issue key messages on
hearing conservation in children.
Potential occupational. hearing loss of staff
Noise can be a serious occupational hazard especially over a prolonged working life.
As being an all day centre, our staff work long hours, so length of exposure as well as
the levels of noise are a concern. To minimise this we have a range of contact and non-
contact periods and duties. Information sessions and material for staff will be provided
to ensure that they are aware of the issues surrounding their own aural health and this
centre strongly supports hearing protection and preservation. We encourage staff to
take advantage of the services below and will arrange for any staff member wishing for
a hearing test to be referred.
14-20
In this area, hearing tests are available from 2 providers:
List details here
14-21
Part 4 Letter to the City Council The Chief Executive Officer Xxxx City Council Dear Sir/Madam Resource Management Act 1991:Noise producing activities We are a childcare centre containing X children some of which are special needs
children with extreme sensitivities to noise. We have Y of these children mainstreamed
in our centre with targeted support according to their need.
New legislation now requires childcare centres to take all practicable steps to protect
our children from distress or harm caused by noise and this includes noise generated
outside our centres. Impact noise from large construction works such as jack
hammering and pile driving can be extremely distressing to these children. Children
with special needs especially those with hearing impairment or auditory disorders such
as autism are particularly at-risk to the adverse affects of such noise. It is their
fundamental human right to be fully included in education and not be subjected to what
is essentially cruel and inhumane stimulus for them. If there are to be one-off noisy
activities, we would like to be consulted well in advance as there may be visits or
alternative activities we could organise to take the children away from the premises.
We request that large works likely to impact on our centre be approved via the notified
consents process and we be informed of such proposed activities so that we can make
appropriate representation. We would like council officers to realise the difficulties that
our children face and to consider their needs when approving such activities. We will
also be happy for any council officers or applicants to consult us in the planning stages.
Yours sincerely Director
14-22
14.3 Peer reviewed journal articles directly attributed to this work
1 McLaren, S., Dickinson, P, Noise in early childhood centres and effects on the
children and their teachers. Early Childhood Folio, 2003. 7. 2 McLaren, S., Noise and at-risk children in early childhood education centres.
Early Childhood Folio, 2005. 9: p. 39-43. 3 McLaren, S., Dickinson, P, Noise in early childhood centres and how safe is the
level of noise. New Zealand Research in Early Childhood Education, 2005. 8: p. 71-79.
4 McLaren, S., Noise provisions and at-risk children in New Zealand early
childhood centres. Environmental Health, 2007. 7(1): p. 60-70.
Full papers included (~.pdf format) in CD Rom in the rear cover pocket. (File format ~ Journal Article1.pdf)
14-23
14.4 Conference papers directly attributed to this work
1 McLaren, S., Dickinson, P.,. Noise in early educational facilities and impacts on
the children and teaching staff. in Internoise 2002, The 2002 International
Congress and Exposition on Noise Control Engineering. 2002. Dearborn, MI,
USA.: International Institute of Noise Control Engineering.
2 McLaren, S., Dickinson, P,. Noise in early childhood centres and its effects on
staff and children. in Internoise 2004, The 33rd International Congress and
Exposition on Noise Control Engineering. 2004. Prague: The International
Institute of Noise Control Engineering.
3 McLaren, S., and Dickinson, P.,. Children's sound exposure. in Internoise, 2005,
The 34th International Congress and Exposition on Noise Control Engineering.
2005. Rio de Janeiro: International Institute of Noise Control Engineering.
4 McLaren, S., Rickson, D, Jones, L., Dickinson, P., Noise provisions in New
Zealand early childhood education centres and a comparison of sound pressure
levels with perceived noise assessed by trained observers. in Internoise 2006.
The 35th International Congress and Exposition on Noise Control Engineering.
The International Institute of Noise Control Enginnering.
5 McLaren, S. Noise in early education. A special problem for autistic children. in
A different way of thinking. Conference of Autism New Zealand Inc. 2006.
Wellington: Autism New Zealand Inc.
Full papers included (~.pdf format) in CD Rom in the rear cover pocket. (File format ~ Conf. Paper1.pdf)
14-24
14.5 Sample doseBadge monitoring report
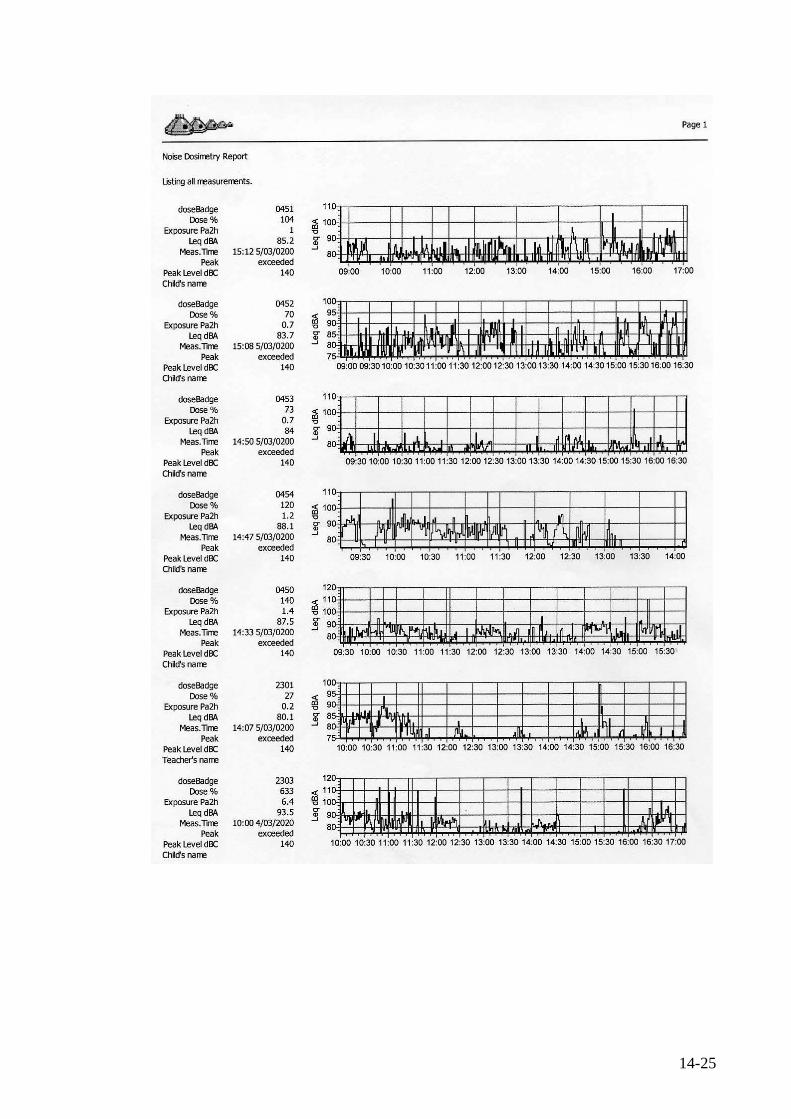
14-25
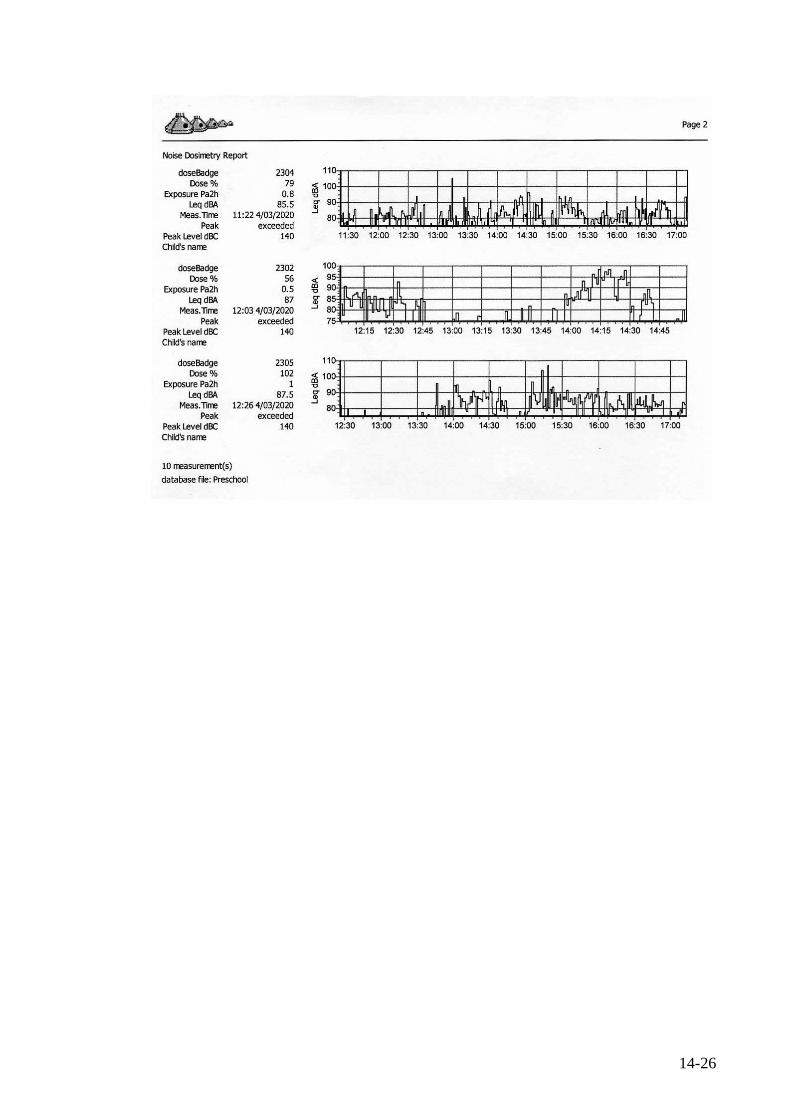
14-26
14-27
14.6 Survey and questionnaire forms 1 Interview questionnaire form 2 Building and environment survey form
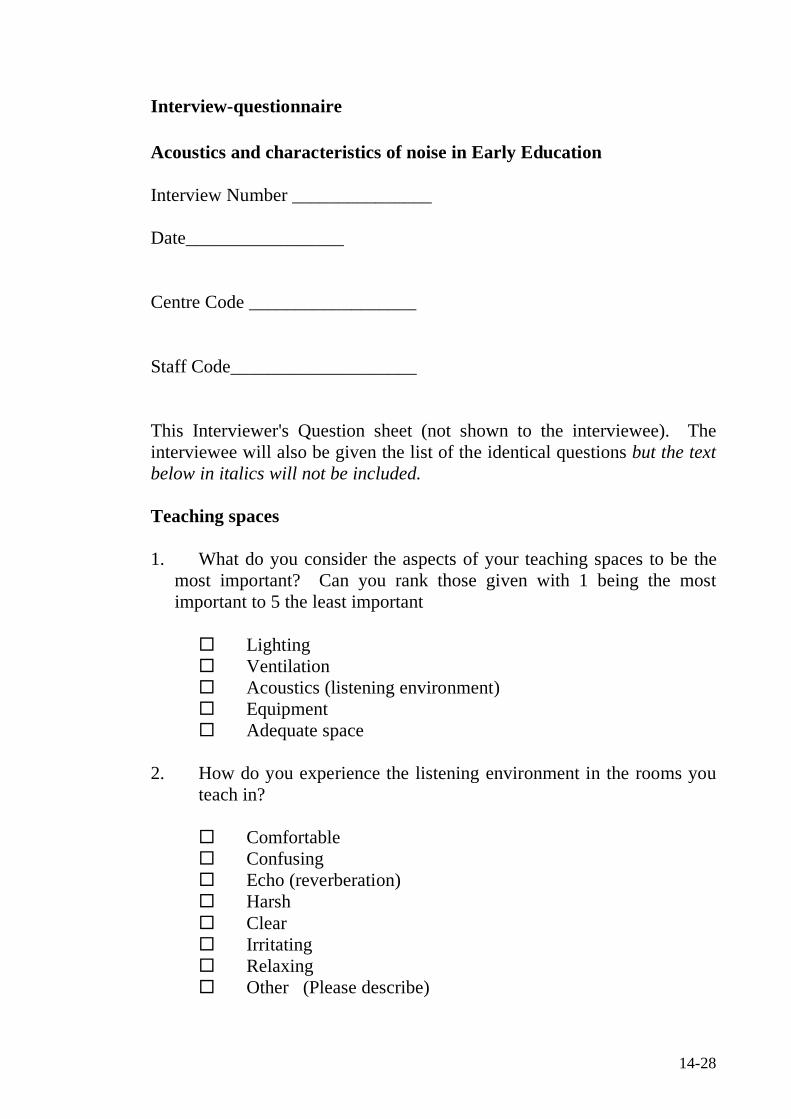
14-28
Interview-questionnaire Acoustics and characteristics of noise in Early Education Interview Number _______________ Date_________________ Centre Code __________________ Staff Code____________________ This Interviewer's Question sheet (not shown to the interviewee). The interviewee will also be given the list of the identical questions but the text below in italics will not be included. Teaching spaces 1. What do you consider the aspects of your teaching spaces to be the
most important? Can you rank those given with 1 being the most important to 5 the least important
Lighting Ventilation Acoustics (listening environment) Equipment Adequate space
2. How do you experience the listening environment in the rooms you
teach in?
Comfortable Confusing Echo (reverberation) Harsh Clear Irritating Relaxing Other (Please describe)
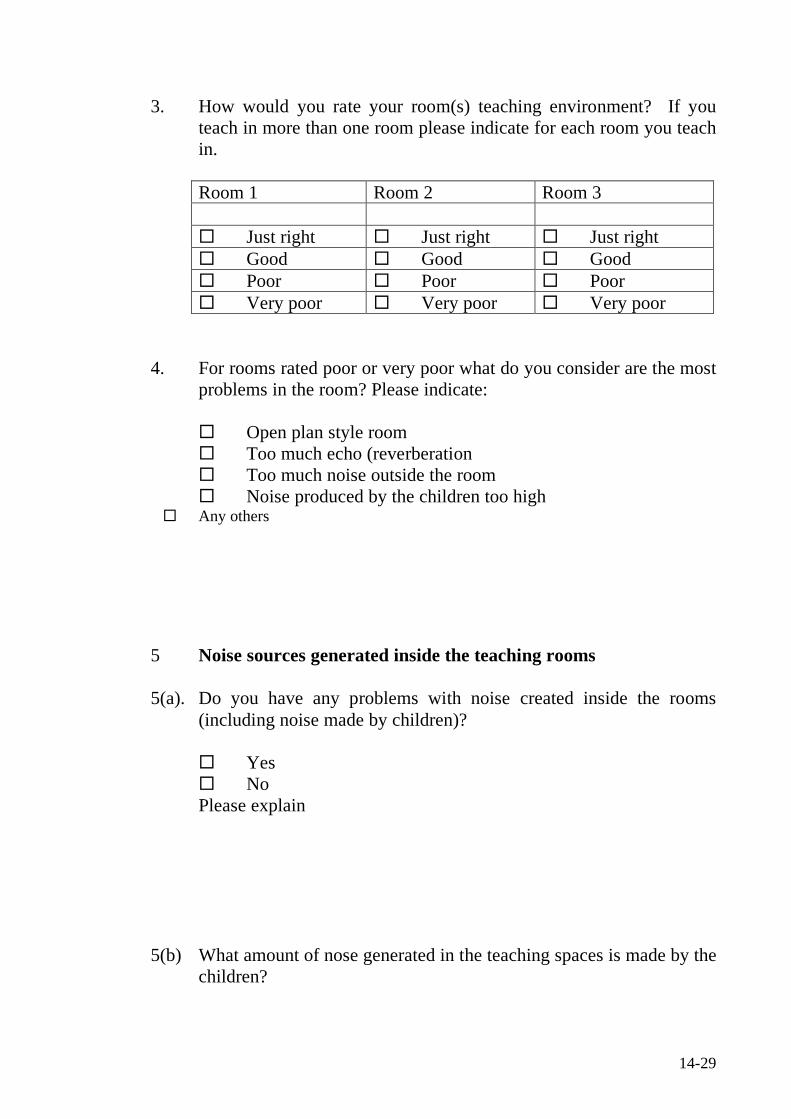
14-29
3. How would you rate your room(s) teaching environment? If you teach in more than one room please indicate for each room you teach in.
Room 1 Room 2 Room 3 Just right Just right Just right Good Good Good Poor Poor Poor Very poor Very poor Very poor
4. For rooms rated poor or very poor what do you consider are the most
problems in the room? Please indicate:
Open plan style room Too much echo (reverberation Too much noise outside the room Noise produced by the children too high
Any others
5 Noise sources generated inside the teaching rooms 5(a). Do you have any problems with noise created inside the rooms
(including noise made by children)?
Yes No Please explain
5(b) What amount of nose generated in the teaching spaces is made by the
children?
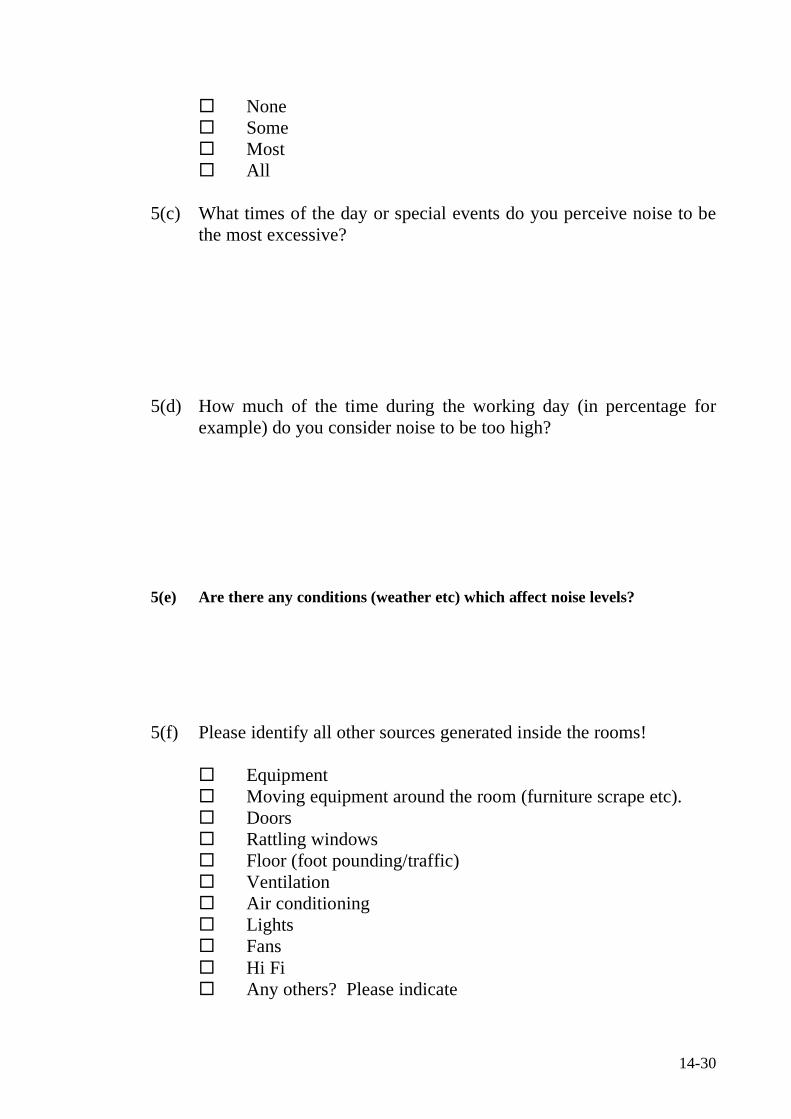
14-30
None Some Most All
5(c) What times of the day or special events do you perceive noise to be the most excessive?
5(d) How much of the time during the working day (in percentage for
example) do you consider noise to be too high?
5(e) Are there any conditions (weather etc) which affect noise levels?
5(f) Please identify all other sources generated inside the rooms!
Equipment Moving equipment around the room (furniture scrape etc). Doors Rattling windows Floor (foot pounding/traffic) Ventilation Air conditioning Lights Fans Hi Fi Any others? Please indicate
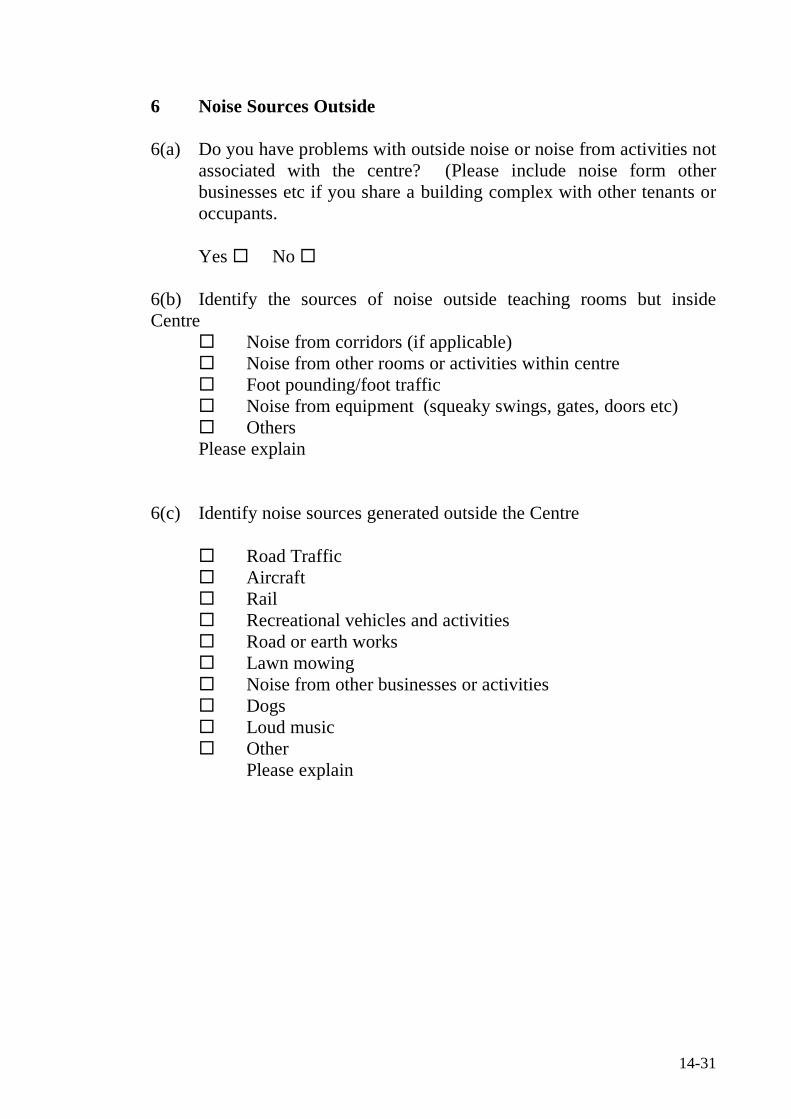
14-31
6 Noise Sources Outside 6(a) Do you have problems with outside noise or noise from activities not
associated with the centre? (Please include noise form other businesses etc if you share a building complex with other tenants or occupants.
Yes No
6(b) Identify the sources of noise outside teaching rooms but inside Centre
Noise from corridors (if applicable) Noise from other rooms or activities within centre Foot pounding/foot traffic
Noise from equipment (squeaky swings, gates, doors etc) Others
Please explain 6(c) Identify noise sources generated outside the Centre
Road Traffic Aircraft Rail Recreational vehicles and activities Road or earth works Lawn mowing Noise from other businesses or activities Dogs Loud music Other Please explain
14-32
6(d) What kind of noise do you find the most intrusive and annoying?
Why?
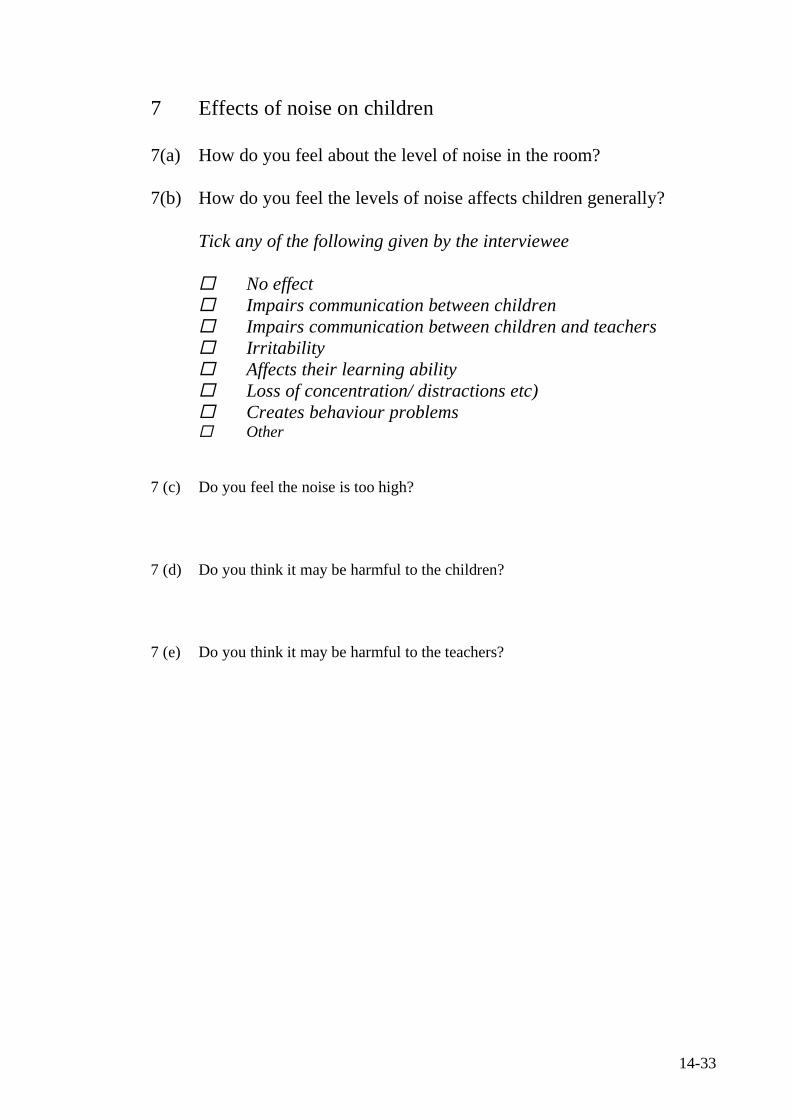
14-33
7 Effects of noise on children 7(a) How do you feel about the level of noise in the room? 7(b) How do you feel the levels of noise affects children generally?
Tick any of the following given by the interviewee
No effect Impairs communication between children Impairs communication between children and teachers Irritability Affects their learning ability Loss of concentration/ distractions etc) Creates behaviour problems Other
7 (c) Do you feel the noise is too high?
7 (d) Do you think it may be harmful to the children?
7 (e) Do you think it may be harmful to the teachers?
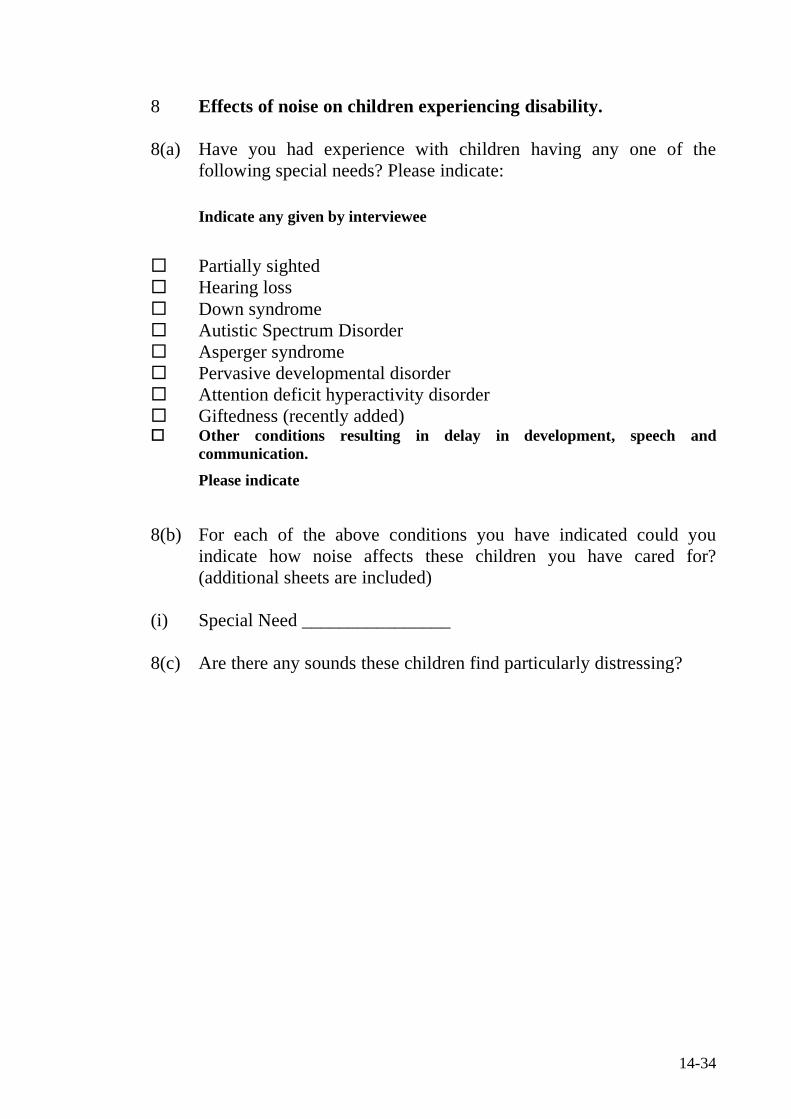
14-34
8 Effects of noise on children experiencing disability. 8(a) Have you had experience with children having any one of the
following special needs? Please indicate:
Indicate any given by interviewee
Partially sighted Hearing loss Down syndrome Autistic Spectrum Disorder Asperger syndrome Pervasive developmental disorder Attention deficit hyperactivity disorder Giftedness (recently added) Other conditions resulting in delay in development, speech and
communication. Please indicate
8(b) For each of the above conditions you have indicated could you indicate how noise affects these children you have cared for? (additional sheets are included)
(i) Special Need ________________ 8(c) Are there any sounds these children find particularly distressing?
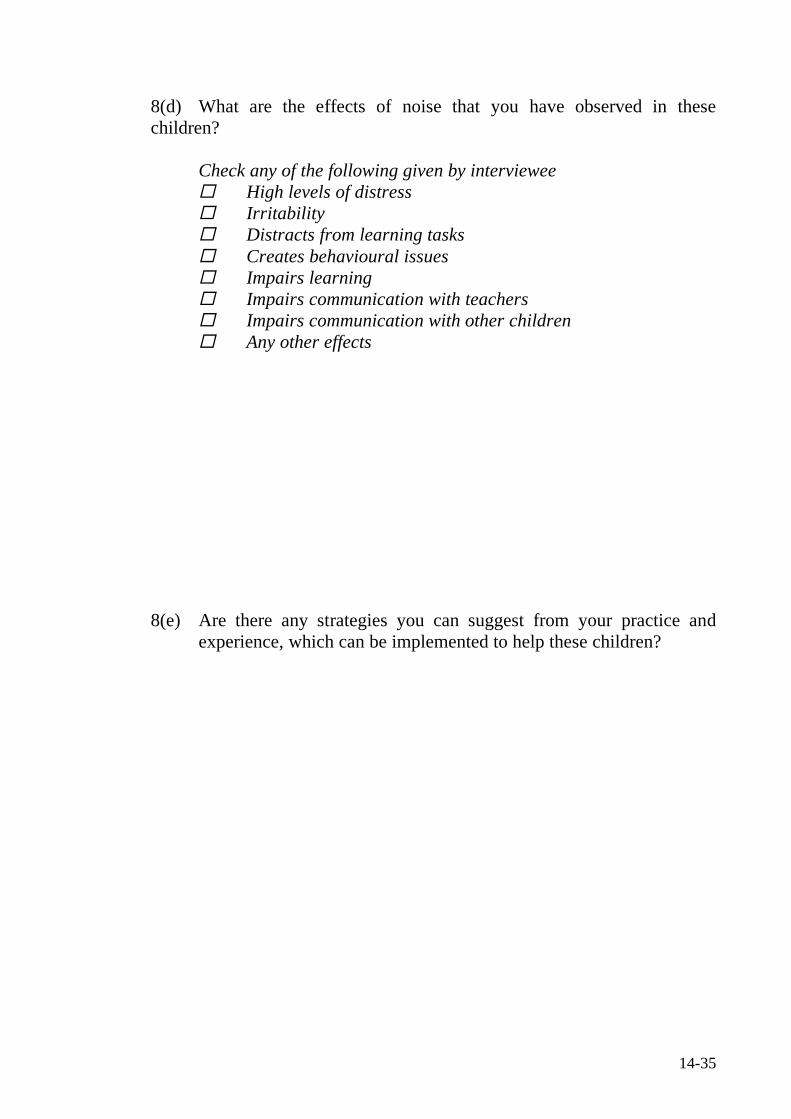
14-35
8(d) What are the effects of noise that you have observed in these children?
Check any of the following given by interviewee High levels of distress Irritability Distracts from learning tasks Creates behavioural issues Impairs learning Impairs communication with teachers Impairs communication with other children Any other effects
8(e) Are there any strategies you can suggest from your practice and
experience, which can be implemented to help these children?
14-36
8(f) In your opinion are children with special needs generally more adversely
affected by noise than other children?
Yes No
Comments
14-37
9 Effects of noise on teaching staff 9(a) How do you feel noise affects teaching staff? This can be your own
personal experience or that related to you by colleagues. Check any, which are highlighted by interviewee
No effect Creates stress Feels more irritable Tiring Uncomfortable Causes ringing in ears Feel it can adversely affect hearing Creates voice strain (from constantly raising voice over noise)
9(b) Any other comments you would like to make?
14-38
10 Policies, procedures and further work 10(a) Does your centre have any formal policies and procedures in place
regarding noise? Yes No
If yes would you mind submitting these for consideration and dissemination as part of our study? (There are likely to be excellent individual policies, the contents of which if disseminated in a generic way could be very beneficial.)
10(b) What strategies do you use to minimise noise levels in your centre?
Quiet times, Compulsory sleep/rest times, Rostering of staff between contact and non-contact duties Ban on loud music or activates generating excessive noise. Any others
Please explain
14-39
10(c) What low cost or cost effective strategies do you think could be implemented?
10(d) Is this an area, which needs more investigation and work?
Yes No
10(e) Is there any particular study or investigation you would you like to see undertaken?
10(f) What other ways can we assist teaching staff and the children?
14-40
11 Please free to make any other comments or suggestions not previously
covered.
14-41
Building and environmental inspection/survey. Data collected from Ministry of education public records and from investigations on unoccupied premises. Centre code ___________________________ Type of licence __________________________ Any conditions of licence___________________ Age of students _________________________ No of students currently enrolled No of students permitted under ECC licence No of staff Any special characteristics? Floor plan available or sketch?
14-42
Description of locational details (Comment on proximity to main roads/railway lines) Describe immediate surroundings. Socio-economic status of area
14-43
Construction details Permanent type /prefab light-weight timber construction. Cladding Roof and covering. Presence of skylights or clearlite roofing (Noisy when raining) Presence of ramps and walkways outside rooms (Foot Traffic)
14-44
Outdoor Areas Playground Description Description of predominant background noise when unoccupied
14-45
Indoor Areas Carry out for each room used by children apart from wash rooms/nappy change areas. Room 1 Description Lighting Ventilation Heating Noise from adjacent buildings or activities
14-46
Internal Surfaces Floor Type Concrete pad, wooden floor on joists Floor covering Wall surfaces Ceiling type Pitched following roof line or horizontal with ceiling space Ceiling surface
14-47
Acoustical analysis Predominant background noise
Reverberation times (T60)
Location description
T60 T60 T60
63Hz
125Hz
250Hz
500Hz
1,000Hz
2,000Hz
4,000Hz