finding locations for public service centres that compete with private centres: effects of...
TRANSCRIPT
Papers Reg. Sci. 83,631448 (2004) DOI: 10.1OO7/~l0110-004-0219-~
PaDers in -
0 RSAI 2004
Finding locations for public service centres that compete with private centres: Effects of congestion"
Vladimir Marianov', Miguel Rios2, Paulina Taborga3
Department of Electrical Engineering, Pontificia Universidad Catdlica de Chile, Vicuiia Mackenna 4860, Santiago, Chile (e-mail: [email protected]) Department of Electrical Engineering, Pontificia Universidad Catdica de Chile, Vicufia Mackenna 4860, Santiago, Chile LAN Chile, F'residente Riesco 571 1, Piso 17, Santiago, Chile
Received: 8 February 2003 I Accepted: 9 September 2003
Abstract. We propose a locational model for public service centres when they compete with private centres. Customers may be captured by the centre ogering shorter distance or lower waiting times. Both types of centres provide paid services to high-income customers, and public centres also provide subsidised services to low-income customers. Equilibrium must be found in public centres between low- income population coverage and high-income population capture. We analyse the effects of waiting times on the design of the public service and apply the model to data for Santiago, Chile.
JEL classification: C6 1, I1 8, L33
Key words: Location, health services, competition, public services, waiting time
1 Introduction
Chile's health system consists of both private and public providers. Most of the financing of the public system comes from tax contributions and compulsory con- tributions by working individuals affiliated to this system. The private system is financed by compulsory and optional health premiums from individuals who par- ticipate in this more expensive system. The public system is also responsible for providing health services to low-income individuals and persons who are unable to pay. These services are subsidised. The goal of the Ministry of Health in charge of public health policies is to promote equity, in that all citizens should have access
* This research has been partly funded by FONDECYT (Chilean Science and Technology Research Fund) Project Nr. 1020778.
632 V. Marianov et al.
to some basic minimum level of health care, while reducing individual economic risk in the event of major illnesses or expensive treatments. Another goal is to pro- vide quality services at a minimum cost (Alleyne 2000). A good description of the Chilean health system in 1999 can be found in Pan American Health Organization ( I 999). Many Latin American health systems are similarly organised.
Within the past ten years concern has increased in Chile about the existing in- equities in the provision of health care to hfferent income groups. The report by N6iiez (2002) documents the differences in various health care services (such as primary care, medical specialties, emergency) for individuals covered by public and private health insurance, and those with different family incomes. One of the re- port’s conclusions shows that public services receive delayed health interventions. Furthermore, from a customer’s viewpoint, public health services are less satis- factory than private services. User opinion polls indicate dissatisfaction with both public and private facilities, but for different reasons. In the case of public services, dissatisfaction arises due to poor and late treatment, inadequate environment, and technological obsolescence. In private facilities dissatisfaction is associated with lengthy waits in waiting rooms (Pan American Health Organization 1999).
Due to inadequate funding in the public health sector, until recently, certain expensive services such as CT scans or MRI were not formally included in the subsidised health services provided to low-income population. There was n o re- liable information on how many CT scanners or other advanced radio diagnostic equipment were being used in public services (Pan American Health Organization 1999). A recently introduced public health program has aimed to subsidise a num- ber of the more expensive services provided to low-income individuals. However, debate continues about health policies, in particular, about which features of health care should be considered essential public goods financed by the state, and those which should be considered as private goods, or more succinctly, the responsibility of each individual. Because of the insufficient budget and doubts raised about the financial sustainability of the public health system, this debate will continue.
Due to the above, since the early 1990s, Chile’s Ministry of Health has called for the participation of all sectors - public, private, NGOs (Non Governmental Organisations) - as a strategy to address health concerns. In several meetings by the Pan American Health Organization from 2000 to 2002, the Chilean government signed commitments targeted towards promoting equity, quality and efficiency in health provision. In a statement signed by the governments of Chile and Costa Rica in October, 2002, the Ministers of Health of both countries agreed, among other actions, to “Establish healthy public policies that promote quality of life and social development beyond the health sector, contributing to forming alliances between public and private sectors and civil society” (Pan American Health Organization 2002). One of the support mechanisms for this action is to establish “partnerships between public and private sectors and NGOs” (Pan American Health Organization 2002). These partnerships would have different structures, ranging from third-party schemes in which the public sector sub-contracts private health providers, to a competitive scheme where public providers compete against other public providers (Pan American Health Organization 1999). This public-private co-operation could
Finding locations for public service centres that compete with private centres 633
either apply to a full range of services, or else cover the most expensive services that may require costly equipment.
Recently, Marianov and Taborga (2001) proposed a model and a heuristic for finding the best locations of public service centres for a case where public centres compete with private centres providing the same service. Competition of public centres with private centres not only helps improve the overall quality of service of public centres, but it also allows public services to earn revenue. This revenue can then be used to partly cover the costs of the subsidised services provided to the low-income population. An example of the application of the model we propose is the location of health care centres in countries with significantly low-income pop- ulations. This is particularly important when the provision of the services requires very specialised and costly equipment or infrastructure. As in any public qervice, the model seeks to maximise the number of attended low-income customers. However, a direct goal is also sought to maximise the income obtained from the provision of paid services. The achievement of this second goal implies a philosophical change in the planning criteria for public services through the inclusion of “private” concepts such as competition, profit maximisation and market-share. These concepts are common in the private sector (Eiselt and Laporte 1989; Eiselt et al. 1993; Drezner 1995) because each competitor seeks to maximise hisher capture of paying cus- tomers. However, as noted by Ghosh and Harche (1993) and Marianov and Serra (2002), competition is not a popularly used concept when planning public services. Furthermore, existing tools and model\ are specialised: useful for either planning a competitive service, or a centrally planned (“dictatorial”) service, but never both. However, the model we propose below attempts to combine both sectors.
When there is competition, competitors seek to attract and serve, or “capture” the maximum possible number of customers. Captured customers will patronise the facilities of the competitor who captures them. Capture is sought either by just locating closer to the demand than the competitors, as Hakimi (1983), ReVelle (1986) and Serra et al. (1992) demonstrate, or by defining a utility function of several variables as Drezner (1995), Ghosh and Craig (1983), De Palma et al. (1989), and Berman and Krass (1998) have done. Such a utility function defines how customers choose a facility to patronise, based on distance to the facility, price of the service or good, differences among the facilities in terms of quality of the attention, availability of parking space, training and attitudes of the personnel, waiting times, appearance of the centre, and other dimensions.
In a public service planning setting, if social costs are not considered the location of public service centres could be anywhere, considering that low-income people can be arbitrarily assigned to centres by a central planner (which we call a dictatorial environment). However, social considerations including the minimisation of travel costs, as well as medical costs caused by an untimely emergency attention, are indeed important (for example, the effects of untimely attention, see Pel1 et al. 2001 or Detsky et al. 1996). Consequently, the location of service centres must be carefully planned to minimise these costs. This minimisation is achieved when the service centres are located such that some distance measure between centres and customers is as small as possible.
634 V. Marianov et al.
There are several location models available for public sector services, (Marianov and Serra 2002). Most investigators use distance as the primary location factor. The p-median approach of Hakimi (1 965), for example, minimises the average distance traveled by the customers on their way to the service centre. The p-centre problem minimises the maximum distance between a centre and its farthest assigned demand point. The Location Set Covering Problem (LSCP) by Toregas et al. (1971) seeks to supply all the demand points from centres located within a maximum service distance (“coverage distance”) with the minimum number of centres. ReVelle and Hogan (1 989) consider the p-centre to be a derivative model of the LSCP because when the location of centres is restricted to the nodes of a network, the LSCP can be also used to find the solution to the p-centre problem by comparing successive solutions of the LSCP obtained for decreasing values of the coverage distance (Daskin 1995). In Church and ReVelle’s (1974) Maximal Covering Location Model (MCLP), a limited number of centres is deployed to include as much demand as possible within the coverage distance from them.
Marianov and Taborga (2001) presented a model, which we use as a starting point, in which the dictatorial policy can still be applied to low-income customers. However, as a method for obtaining revenues and reducing the subsidy burden on the state, the author., propose that public services enter into competition with private services. Thus, two goals are sought: maximum coverage of low-income population within a preset distance, and maximum capture of high-income customers. In this case, a customer is captured by the public centre when it is located closer to the demand than the competing private centres. In this article we define high-income demand as captured by a public centre when this centre is located closer to the demand than the competing private centres, and when the waiting time at public centres is shorter than - or at least equal to - the waiting time in private centres. This is because waiting time is an important factor in customers’ perception of quality.
The model we present and analyse for the location of public service centres assumes that public centres engage in competition with private centres in order to partly finance their operation through revenues obtained by serving high-income in- dividuals. To cover low-income populations and obtain revenues, the public centres’ location must be planned using a combination of public and private sector crite- ria. The funds required to operate centres come from two sources. The first source is a subsidy from the state, which would depend on the number of low-income, non-paying individuals attended by the service, or on the size of the low-income population living in the geographical region served. The second source is revenue obtained from paid services provided to the high-income population. Thus, the num- ber of service centres to be located depends on the proportion of the high-income population captured.
A number of contributions can be noted from this analysis. First, we implicitly propose a public policy that promotes the operation of public services as if the latter was private in the competitive sense. This policy should lead to an improvement in the quality of public services because without competition, public services tend to behave as monopolies in relation to low-income customers, underproviding quality as shown by Spence (1975), Hoxby (2000) and other researchers. Second, we propose a simple model for including criteria related to the quality of service in

Finding locations for public service centres that compete with private centres 635
the planning of public services. Specifically, we propose several simple forms of congestion or queuing effects at the centres. Note that in practice, congestion implies that those customers who can choose will not necessarily patronise the closest centre, but will go to the centre offering the better combination of travel time and waiting time. Alternatively, if waiting times are similar, they will patronise the closest centre. Finally, we propose a simple model for strategic purposes, which takes congestion into consideration. This model has, on the one hand, the objective to maximise coverage of the low-income population within a specified distance. Conversely, a second goal is to maximise capture of the high-income population, which is achieved indirectly by the structure of the constraints rather than by adding an objective. This indirect form of maximising capture is used in the base model of Marianov and Taborga (2001), and is explained further below. An equilibrium situation is obtained between high and low-income customers so that revenues derived from paid services contribute to the financing of public centres, which in turn, serve the maximum possible number of low-income individuals.
To begin, we first review previous models. Then we explain different simple forms of including congestion and proceed to formulate the new model. Data and the computations for the location of centres with CT scanners in the city of Santiago in Chile are subsequently provided. Conclusions follow.
2 The base model for location of competitive public centres
The objective of the base Marianov and Taborga (2001) model is to maximise low- income population coverage. Coverage of a population concentration is defined as the presence of a health centre within a preset distance from the concentration. The attractiveness of the newly located public centres and the existing private centres is meant to be equal in terms of quality of service and price. Thus high-income customers patronise their closest centre. The demand for health services is inelastic. The geographic area under study is modeled as a network. The health centres can be located only on nodes of the network. Arcs represent minimum distances between nodes. Population is also concentrated at nodes. Population at each node is classified into low-income and hgh-income population. Individuals belonging to low-income groups do not pay for health service, and can receive attention only at their assigned public centres, while high-income individuals can choose between private and public service centres. All requests by the high-income population for service are satisfied either by public or private centres; meanwhile, the low-income population coverage is not mandatory. (This is because of a limited public budget, and because we focus on very specialised non-vital services, although they can improve both diagnostics and speed of recovery.)
The Marianov and Taborga (2001) model is formulated as follows:
636
x i j j t Q i
L
where :
I . z J? 3 M , rn
s K,
QZ
PZ
& nc
E SM
Y i
CC
x,3
Tllck
v,7n
V. Marianov et al.
5 1 vi E I ; (4)
= I V m E M , (5 )
= 1 tii E I , (6)
= set and index of population nodes, = set and index of nodes as candidates to location of public centres, = set and index of nodes where the private centres are located, = shortest distance between nodes *i and j , = maximum coverage distance for low-income population, = { j E J Id,, < rnin ( d i m ) } , that is, the set of location candidate nodes j that are closer to demand node i than its closest private centre m, = {j f J ( d i j 5 S}, that is, the set of location candidate nodes j that are within S of node %, = low-income population at node i, = high-income population at node a , = number of public centres to be sited, = amount paid for the service by each high-income client, = yearly cost of a public centre, = yearly subsidy paid by the state to the public service,
m t M
1, if a public centre is located at node .j 0, otherwise 1 ~ if low-income population at i is allocated to
0: otherwise 1, if high-income population at i is allocated to
O ! otherwise 1, if high-income population at ,i is allocated to =i 0. otherwise
= c the public centre located at . j ,
a public centre located at k
=i =i
a private centre located at rn.
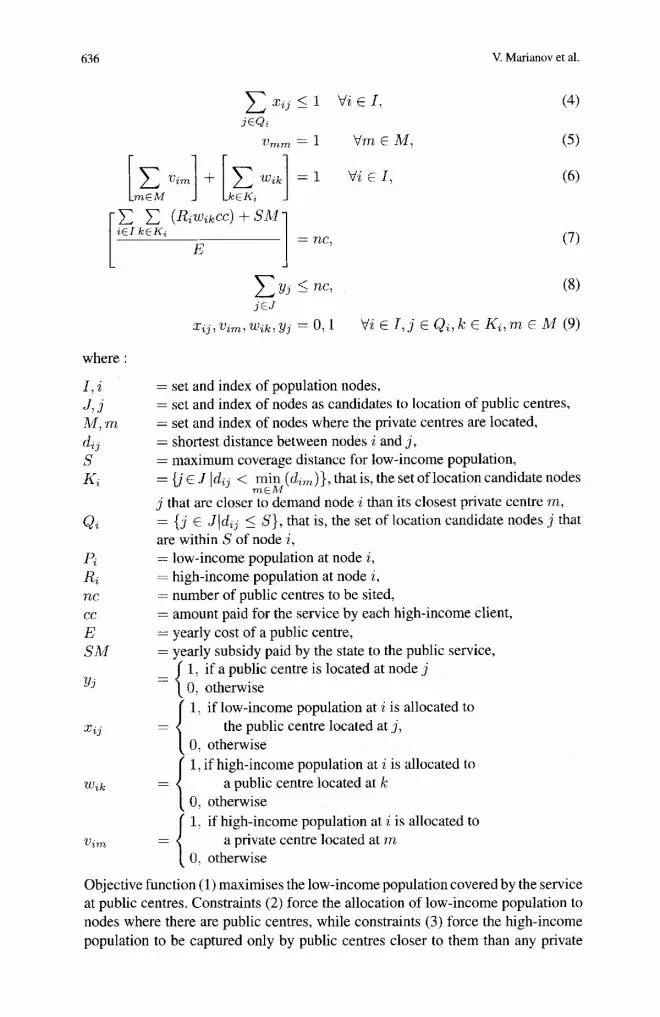
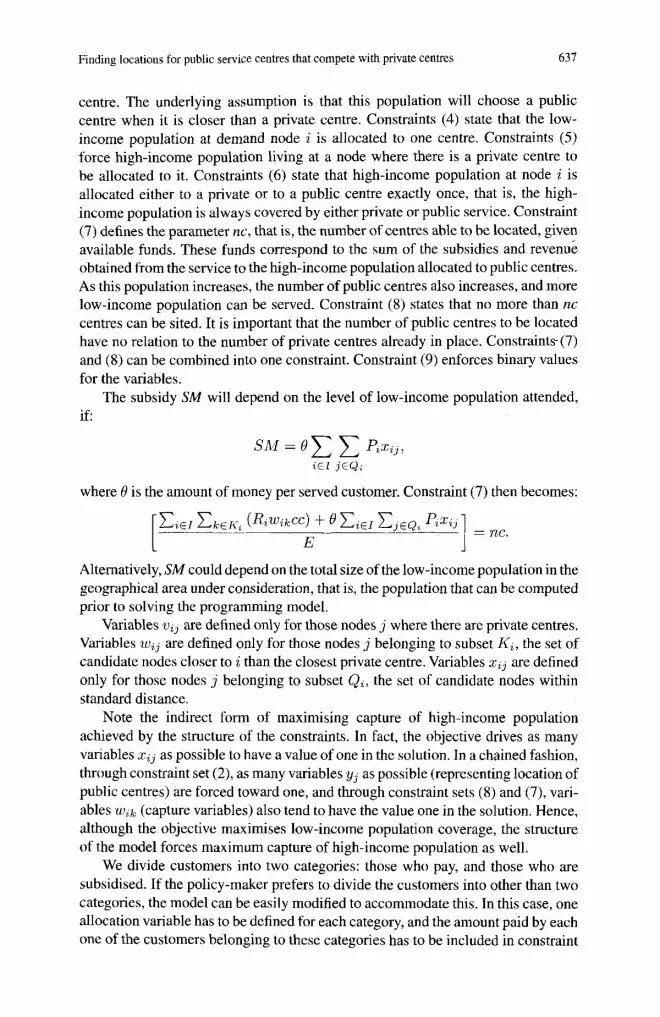
Objective function (1) maximises the low-income population covered by the service at public centres. Constraints ( 2 ) force the allocation of low-income population to nodes where there are public centres, while constraints (3) force the high-income population to be captured only by public centres closer to them than any private
Finding locations for public service centres that compete with private centres 637
centre. The underlying assumption is that this population will choose a public centre when it is closer than a private centre. Constraints (4) state that the low- income population at demand node i is allocated to one centre. Constraints (5 ) force high-income population living at a node where there is a private centre to be allocated to it. Constraints (6) state that high-income population at node i is allocated either to a private or to a public centre exactly once, that is, the high- income population is always covered by either private or public service. Constraint (7) defines the parameter nc, that is, the number of centres able to be located, given available funds. These funds correspond to the sum of the subsidies and revenue obtained from the service to the high-income population allocated to public centres. As this population increases, the number of public centres also increases, and more low-income population can be served. Constraint (8) states that no more than nc centres can be sited. It is important that the number of public centres to be located have no relation to the number of private centres already in place. Constraints- (7) and (8) can be combined into one constraint, Constraint (9) enforces binary values for the variables.
The subsidy SM will depend on the level of low-income population attended, i f
iEI j E Q i
where 0 is the amount of money per served customer. Constraint (7) then becomes:
Alternatively, SM could depend on the total size of the low-income population in the geographical area under consideration, that is, the population that can be computed prior to solving the programming model.
Variables vuv are defined only for those nodes j where there are private centres. Variables wzI are defined only for those nodes j belonging to subset Ka, the set of candidate nodes closer to i than the closest private centre. Variables zz3 are defined only for those nodes 1 belonging to subset QZ, the set of candidate nodes within standard distance.
Note the indirect form of maxinlising capture of high-income population achieved by the structure of the constraints. In fact, the objective drives as many vanables zZ3 as possible to have a value of one in the solution. In a chained fashion, through constraint set (2), as many variables y3 as possible (representing location of public centres) are forced toward one, and through constraint sets (8) and (7), vari- ables w,k (capture variables) also tend to have the value one in the solution. Hence, although the objective maximises low-income population coverage, the structure of the model forces maximum capture of high-income population as well.
We divide customers into two categories: those who pay, and those who are subsidised. If the policy-maker prefers to divide the customers into other than two categories, the model can be easily modified to accommodate this. In this case, one allocation variable has to be defined for each category, and the amount paid by each one of the customers belonging to these categories has to be included in constraint
638 V. Marianov et al.
(7). Part of the remaining constraints and the objective might need to be repeated for each category depending on the policy.
3 Including congestion in the model
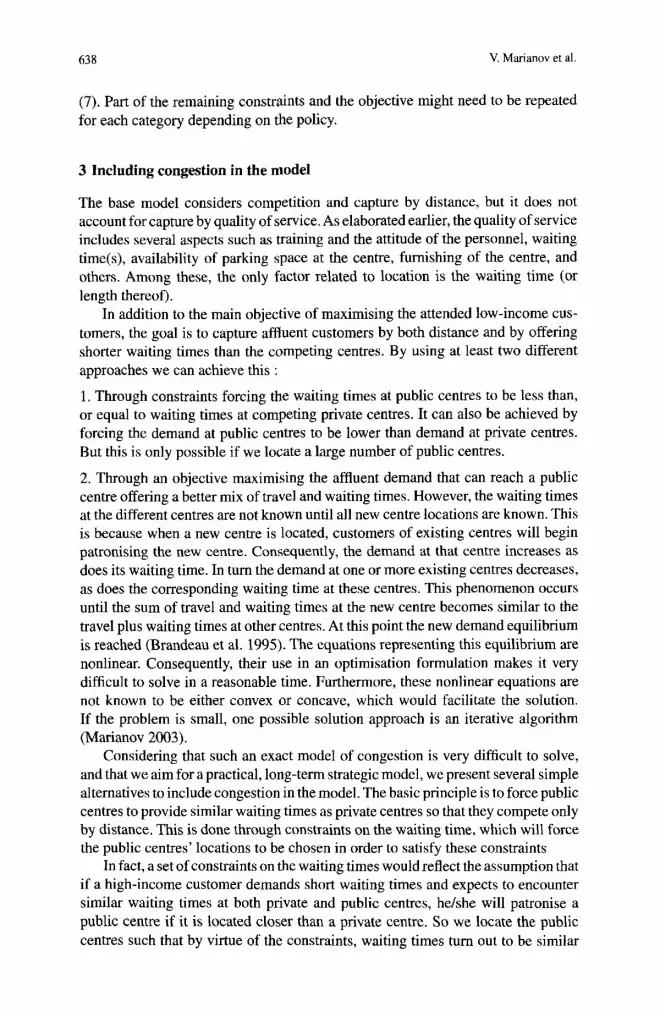
The base model considers competition and capture by distance, but it does not account for capture by quality of service. As elaborated earlier, the quality of service includes several aspects such as training and the attitude of the personnel, waiting time(s), availability of parking space at the centre, furnishing of the centre, and others. Among these, the only factor related to location is the waiting time (or length thereof).
In addition to the main objective of maximising the attended low-income CUS-
tomers, the goal is to capture affluent customers by both distance and by offering shorter waiting times than the competing centres. By using at least two different approaches we can achieve this :
1. Through constraints forcing the waiting times at public centres to be less than, or equal to waiting times at competing private centres. It can also be achieved by forcing the demand at public centres to be lower than demand at private centres. But this is only possible if we locate a large number of public centres.
2. Through an objective maximising the affluent demand that can reach a public centre offering a better mix of travel and waiting times. However, the waiting times at the different centres are not known until all new centre locations are known. This is because when a new centre is located, customers of existing centres will begin patronising the new centre. Consequently, the demand at that centre increases as does its waiting time. In turn the demand at one or more existing centres decreases, as does the corresponding waiting time at these centres. This phenomenon occurs until the sum of travel and waiting times at the new centre becomes similar to the travel plus waiting times at other centres. At this point the new demand equilibrium is reached (Brandeau et al. 1995). The equations representing this equilibrium are nonlinear. Consequently, their use in an optimisation formulation makes it very difficult to solve in a reasonable time. Furthermore, these nonlinear equations are not known to be either convex or concave, which would facilitate the solution. If the problem is small, one possible solution approach is an iterative algorithm (Marianov 2003).
Considering that such an exact model of congestion is very difficult to solve, and that we aim for a practical, long-term strategic model, we present several simple alternatives to include congestion in the model. The basic principle is to force public centres to provide similar waiting times as private centres so that they compete only by distance. This is done through constraints on the waiting time, which will force the public centres’ locations to be chosen in order to satisfy these constraints
In fact, a set of constraints on the waiting times would reflect the assumption that if a high-income customer demands short waiting times and expects to encounter similar waiting times at both private and public centres, he/she will patronise a public centre if it is located closer than a private centre. So we locate the public centres such that by virtue of the constraints, waiting times turn out to be similar
Finding locations for public service centres that compete with private centres 639
for both types of centres. Consequently, the affluent customers can continue to use the distance (or travel time) criterion when choosing which centre to patronise.
The assumptions, variables and parameters are the same as those in the base model presented in the previous section. We define new variables and parameters as needed by the different alternatives.
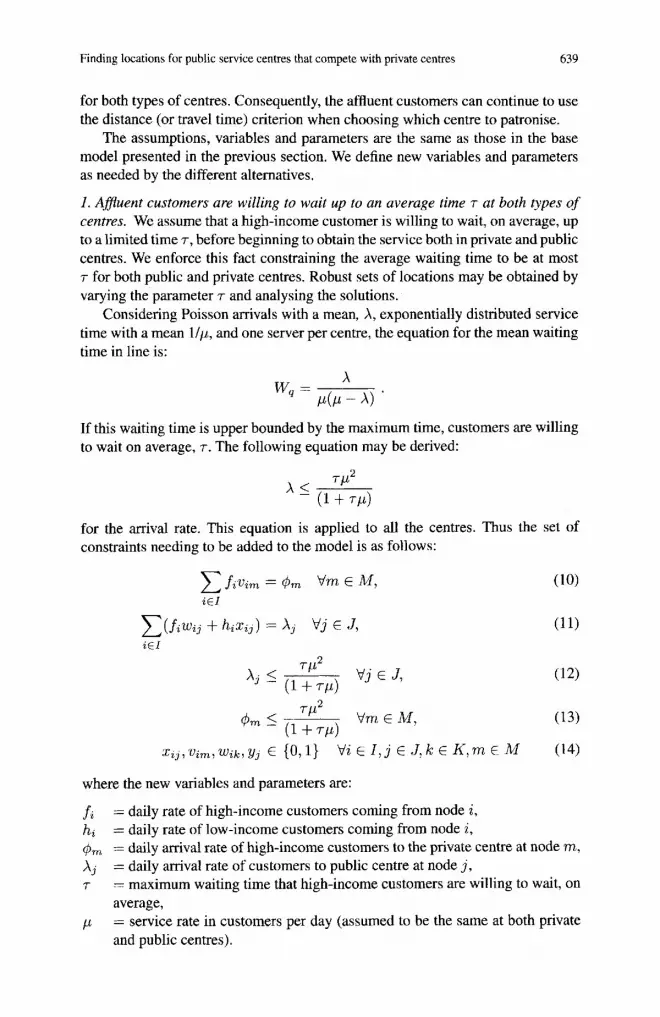
1. AfJiuent customers are willing to wait up to an average time r at both types of centres. We assume that a high-income customer is willing to wait, on average, up to a limited time r , before beginning to obtain the service both in private and public centres. We enforce this fact constraining the average waiting time to be at most 7 for both public and private centres. Robust sets of locations may be obtained by varying the parameter T and analysing the solutions.
Considering Poisson arrivals with a mean, A, exponentially distributed service time with a mean Up, and one server per centre. the equation for the mean waiting time in line is:
x w - - P(P - .
If this waiting time is upper bounded by the maximum time, customers are willing to wait on average, T. The following equation may be derived:
for the arrival rate. This equation is applied to all the centres. Thus the set of constraints needing to be added to the model is as follows:
x , ~ , 'vim, wik, yJ E (0 , l ) Vi t I , j E J , k E K , m E M (14)
where the new variables and parameters are:
fi = daily rate of high-income customers coming from node i , hi = daily rate of low-income customers coming from node i , & = daily arrival rate of high-income customers to the private centre at node rn, X j = daily amval rate of customers to public centre at node j , T = maximum waiting time that high-income customers are willing to wait, on
average, p = service rate in customers per day (assumed to be the same at both private
and public centres).
640 V. Marianov et al.
Constraints (10) and (1 1) count the rate of arrivals to public and private centres. The next constraints (12) and (13) force an upper limit on the average waiting time of customers.
This model can be easily extended for several customer servers at each centre. The model is linear and locates public centres such that they experience the same average waiting time as private centres. The model may be solved by several possible values of r , and by analysing the effects of these values on location, coverage and capture.
2. AfJluent customers are willing to stay in a line with a maximum average length of Bpeople, at both types ofcentres. If customers react to the average queue length instead of waiting time, willing to stay in a line of maximum length B, as opposed to a waiting time r, then the equation for the average queue length can be upper bounded by B:
L - < B. q- ,u ( ,u - - -x ) -
In this case, constraints (1 2) and (13) are replaced by:
V j X i + BpX, 5 Bp'
and
cp2 + BpOm 5 Bp' Vm.
The resultant model is nonlinear. However, recalling that A, 2 0 and Om 2 0, these constraints can be replaced by:
and
3. Afluent customers experience a waiting time shorter than r, with a probability that is at least a. Using the probabilistic constraints developed by Marianov and Serra (1998), we can put a lower bound on the availability of service with good quality. The constraints in the case of waiting time for public and private centres, respectively would be:
1 $m 5 ,u + - ln(1 - N) Vm E M ,
7-
where ,u is the service rate at the centre. These constraints are used instead of constraints (12) and ( 1 3 ) in the first case.
Finding locations for public service centres that compete with private centres 641
4. AfJluent customers will stay in line shorter than B people with a probability that is at least a. This case is very similar to the preceding one. For queue length B, the constraints developed by Marianov and Serra (1998) are:
X j 5 / A B+G V j E J , 4m 5 p ”+ iY iT i Vm E M .
The preceding alternatives represent different criteria used by the affluent customers to choose a facility to patronise. The first two assume that the customers react to the average waiting time or average length of the line at the centre. Alternatives 3 and 4 assume that customers react to the likelihood of encountering long waiting times or line lengths. Any of the alternatives result in similar complexity and solution times for the model because the only difference is the value of the right-hand side of the constraints.
If instead of just one server, each centre is equipped with a preset number of servers, similar equations can be derived for the arrival rates of low and high-income customers, from well-known queuing formulae. Marianov and Serra (1998) have shown the derivation of equations for alternative 4 when a preset number mJ of servers is located at each centre j . The constraints obtained in this case often result in models that are similar in complexity and solution times to the models for single servers at each centre. This is not so if the number of servers at each centre is not fixed, but it is the result of the model.
In view of the similar characteristics of the different constraints, we test the model using alternative 1.
4 An application
In order to compare and evaluate the performance of the model, we use the same 30-node network (Table 1) as in Marianov and Taborga (2001), with Euclidean distance between the nodes representing a portion of the city of Santiago. The “population” figures represent the demand for services in each node. The values of the remaining parameters in this application were made as close to real values as possible. The service we employ as an example is the use of a CT scanner. This equipment is not necessarily vital because less expensive technologies can be used for the same diagnostics or treatment, but a CT scanner helps improve the reliability of radiation treatment (Fung et al. 2003), complicated fracture detection (Simon and Dodds 20031, sleep apnea detection (Galvin et al. 2003), tumor localisation (Kluetz et al. 2000; Lunsford et al. 1985), and others (National Science Board, 1996). However, a CT scanner is expensive, and not all centres can afford to have one. The network is divided into three zones. Pricing in these zones is different and so are the revenues obtained for the service. which is due mainly to two factors. First, as there is more high-income population in a zone, there is also a greater willingness to pay higher prices; this point is recognised by service providers. The revenues do not follow exactly this tendency because costs sometimes are high too (e.g., land costs are higher or office furniture used by the centre is more expensive). Second, the number of competitors is different in these zones. The revenue in zone

642 V. Marianov et al.
Table 1.30-node network
Node Coordx Courdy Popn Zone Node Coordx Coordy Popn Zone
1 2 3 4 5 6 7 8 9
10 11 12 13 14 15
3.2 3.1 370 2 2.9 3.2 360 3 2.7 3.6 290 1 2.9 2.9 240 2 3.2 2.9 240 2 2.6 2.5 160 3 2.4 3.3 220 3 3.0 3.5 190 1 2.9 2.7 190 3 2.9 2.1 190 3 3.3 2.8 160 2 1.7 5.3 150 1 3.4 3.0 140 2 2.5 6.0 120 1 2.1 2.8 120 3
16 17 18 19 20 21 22 23 24 25 26 27 28 29 30
3 5.1 1.9 4.7 1.7 3.3 2.2 4.0 2.5 1.4 2.9 1.2 2.4 4.8 1.7 4.2 2.4 2.0 1.9 2.1 1 .o 3.2 3.4 5.6 1.2 4.7 I .9 3.8 2.7 4.1
I10 100 100 90 90 90 80 80 80 80 80 70 70 60 60
1 1 1 1 3 3 1 I 3 3 3 1 1 1 1
1 from each high-income customer is US$25.8, and 45.2% of the population are low-income individuals. In zone 2 the figures are US$ 44.0 and 31.8%, while in zone 3 they are US$ 41.4 and an 18.2%, respectively. The standard distance was set to 1.5. The estimated fixed cost of maintaining a scanner for one year (E) is US$S2,400. Note that the data required to solve the problem is in general available. The amount of subsidy is a given quantity (or it may be decided, depending on the solution of this problem). Operating costs of a scanner as well as the cost of each service (dependent on the scanner’s cost, its operation and staffing costs) are known to the decision-maker or, at minimum, the researcher can closely estimate them. The districting or zoning of the city is also part of the public policy. The price of each service can be set according to current market values.
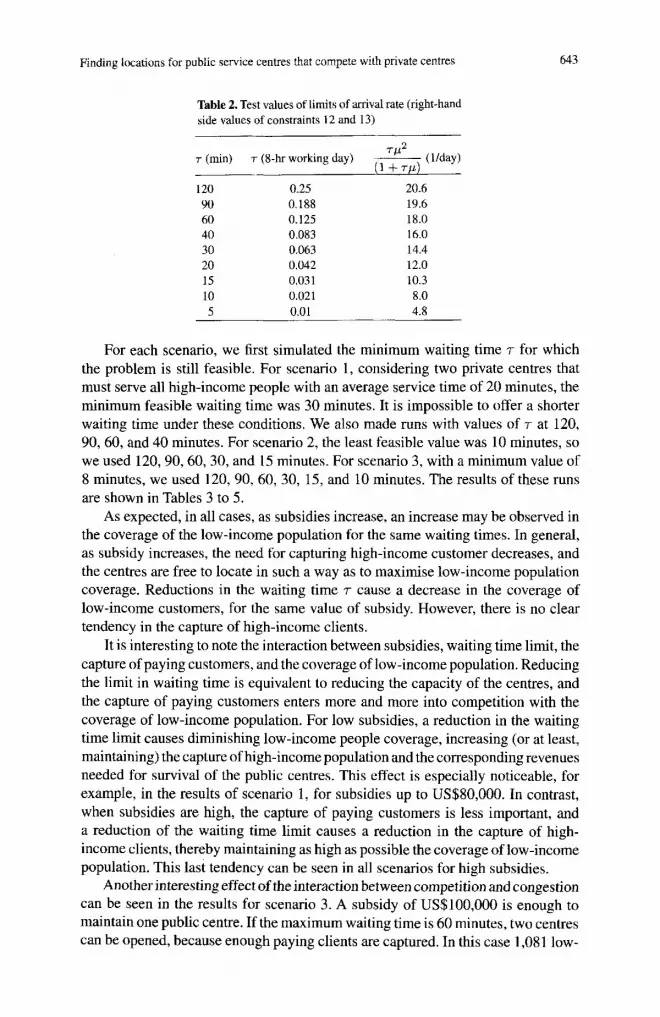
The rates of customer arrivals were set to 0.0201 arrivals per day per inhabitant in zone 1,0.0089 in zone 2 and 0.0157 in zone 3. The service rate, with an exponential distribution, has an average of 24 per day. The average waiting time was set between zero and two hours, considered by paying people as a long waiting time. Too small values of the waiting time can make the problem unfeasible. We computed the values of the right-hand side of Equations (12) and (13) resulting from various combinations of values of T and 1-1. These values, which were used for the test runs, are shown in Table 2.
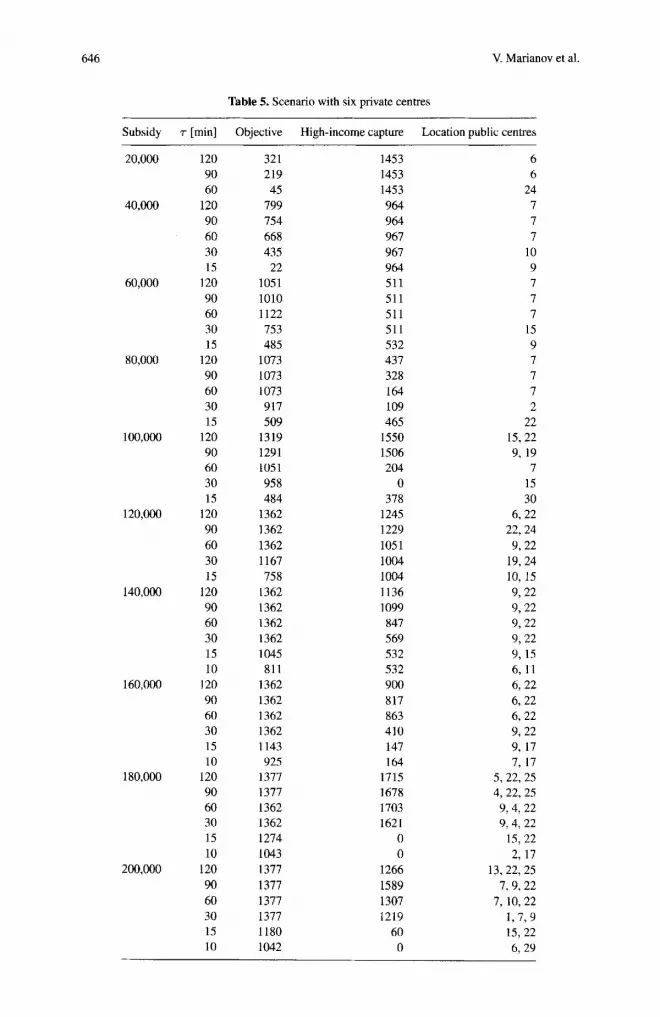
We solved several instances of the problem using different values of subsidy, and defined for three scenarios with different numbers of existing private centres. In scenario 1, public centres are located so as to capture high-income customers from two private centres located on nodes 27 and 28. Scenario 2 considers four private centres located on nodes 20, 26, 27, and 28. Scenario 3 has six private centres on nodes 3, 12, 15, 18,21, and 29.
We used the software package CPLEX, which ran on a cluster composed by eight parallel DEC 3000 700 AXP computers, and at 225 MHz. The maximum run time was 137 seconds but most of the runs took less than 60 seconds.
Finding locations for public service centres that compete with private centres 643
Table 2. Test values of limits of arrival rate (right-hand side values of constraints 12 and 13)
120 90 60 40 30 20 1s 10
0.25 0.188 0.125 0.083 0.063 0.042 0.03 1 0.021
20.6 19.6 18.0 16.0 14.4 12.0 10.3 8.0
5 0.01 4.8
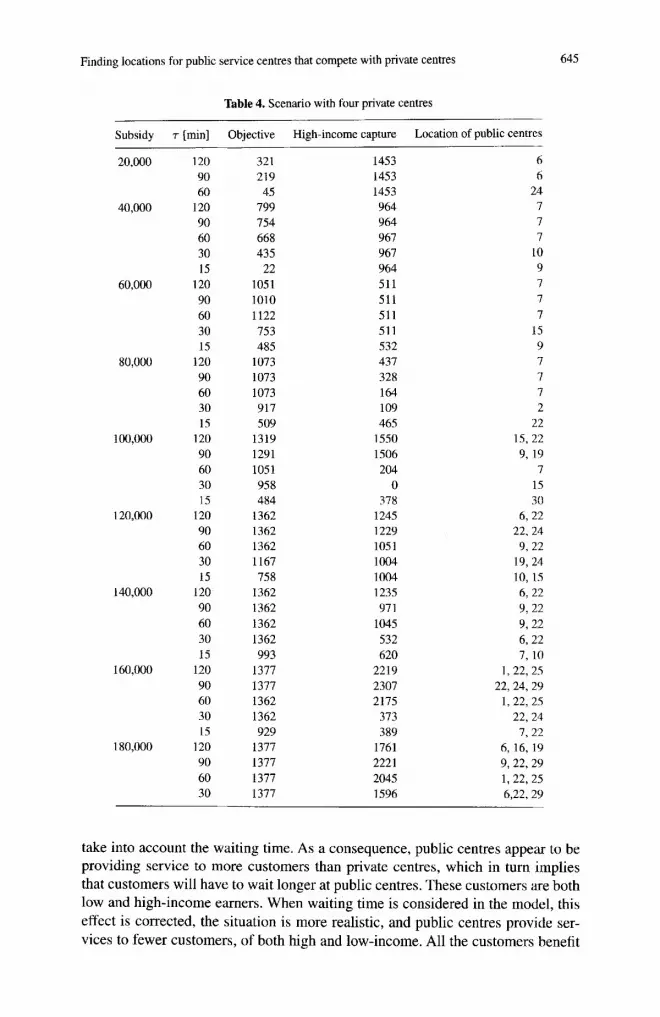
For each scenario, we first simulated the minimum waiting time T for which the problem is still feasible. For scenario 1, considering two private centres that must serve all high-income people with an average service time of 20 minutes, the minimum feasible waiting time was 30 minutes. It is impossible to offer a shorter waiting time under these conditions. We also made runs with values of T at 120, 90, 60, and 40 minutes. For scenario 2, the least feasible value was 10 minutes, so we used 120,90,60,30, and 15 minutes. For scenario 3, with a minimum value of 8 minutes, we used 120, 90,60, 30, 15, and 10 minutes. The results of these runs are shown in Tables 3 to 5 .
As expected, in all cases, as subsidies increase, an increase may be observed in the coverage of the low-income population for the same waiting times. In general, as subsidy increases, the need for capturing high-income customer decreases, and the centres are free to locate in such a way as to maximise low-income population coverage. Reductions in the waiting time T cause a decrease in the coverage of low-income customers, for the same value of subsidy. However, there is no clear tendency in the capture of high-income clients.
It is interesting to note the interaction between subsidies, waiting time limit, the capture of paying cuqtomers, and the coverage of low-income population. Reducing the limit in waiting time is equivalent to reducing the capacity of the centres, and the capture of paying customers enters more and more into competition with the coverage of low-income population. For low subsidies, a reduction in the waiting time limit causes diminishing low-income people coverage, increasing (or at least, maintaining) the capture of high-income population and the corresponding revenues needed for survival of the public centres. This effect is especially noticeable, for example, in the results of scenario 1, for subsidies up to US$80,000. In contrast, when subsidies are high, the capture of paying customers is less important, and a reduction of the waiting time limit causes a reduction in the capture of high- income clients, thereby maintaining as high as possible the coverage of low-income population. This last tendency can be seen in all scenarios for high subsidies.
Another interesting effect of the interaction between competition and congestion can be seen in the results for scenario 3. A subsidy of US$lOO,OOO is enough to maintain one public centre. If the maximum waiting time is 60 minutes, two centres can be opened, because enough paying clients are captured. In this case 1,08 1 low-
644 V. Marianov et al.
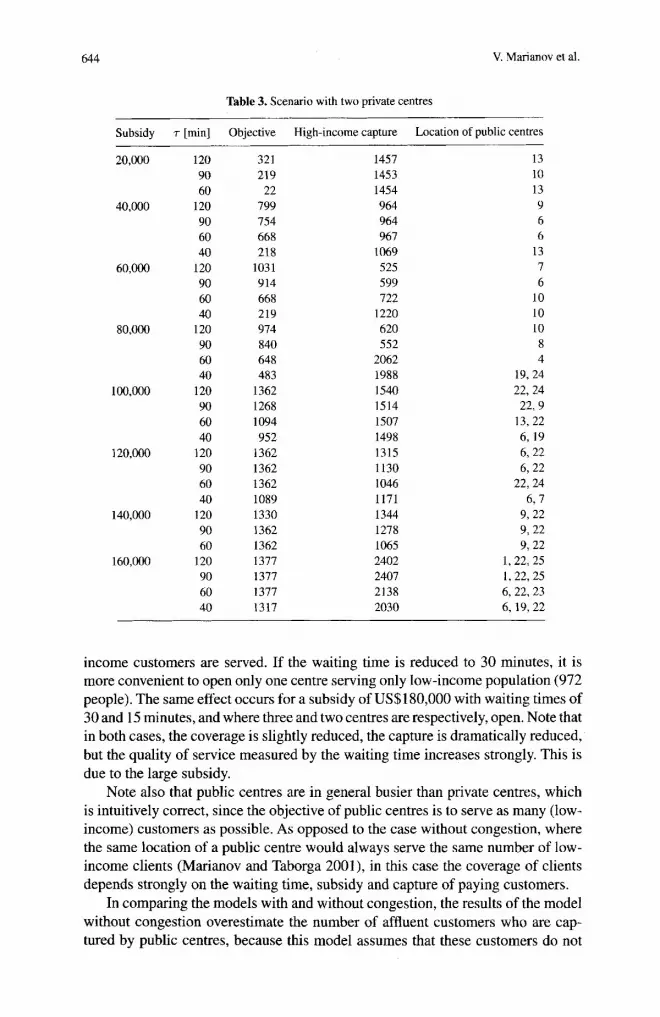
Table 3. Scenario with two private centres ~~
Subsidy T [min] Objective High-income capture Location of public centres -
20,000
40,000
60,000
80,000
100,000
120,000
140,000
160,000
120 90 60
120 90 60 40
I20 90 60 40
120 90 60 40
120 90 60 40
120 90 60 40
120 90 60
120 90 60 40 __
32 1 219 22
799 754 668 218
1031 9 14 668 219 974 840 648 483
1362 1268 1094 952
I362 1362 1362 1089 1330 1362 1362 1377 1377 1377 1317
1457 1453 1454 964 964 967
1069 525 599 722
1220 620 552
2062 1988 1540 1514 1507 1498 1315 1130 1046 1171 1344 1278 1065 2402 2407 2138 2030
13 10 13 9 6 6
13 7 6
10 10 10 8 4
19,24 22,24 22, 9
13,22 6, 19 6,22 6, 22
22,24 6.7
9, 22 9, 22 9, 22
I , 22, 25 1, 22, 25 6,22,23 6, 19,22
income customers are served. If the waiting time is reduced to 30 minutes, it is more convenient to open only one centre serving only low-income population (972 people). The same effect occurs for a subsidy of US$180,000 with waiting times of 30 and 15 minutes, and where three and two centres are respectively, open. Note that in both cases, the coverage is slightly reduced, the capture is dramatically reduced, but the quality of service measured by the waiting time increases strongly. This is due to the large subsidy.
Note also that public centres are in general busier than private centres, which is intuitively correct, since the objective of public centres is to serve as many (low- income) customers as possible. As opposed to the case without congestion, where the same location of a public centre would always serve the same number of low- income clients (Marianov and Taborga 2001), in this case the coverage of clients depends strongly on the waiting time, subsidy and capture of paying customers.
In comparing the models with and without congestion, the results of the model without congestion overestimate the number of affluent customers who are cap- tured by public centres, because this model assumes that these customers do not
Finding locations for public service centres that compete with private centres 645
Table 4. Scenario with four private centres
Subsidy T [min] Objective High-income capture Location of public centres
20,000
40,000
60,000
80,000
100,000
120,000
140,000
160,000
180,000
120 90 60
120 90 60 30 15
120 90 60 30 15
120 90 60 30 15
120 90 60 30 15
120 90 60 30 15
I20 90 60 30 15
120 90 60 30 IS
120 90 60 30
321 219 45
799 754 668 435
22 1051 1010 1122 753 485
1073 1073 1073 917 509
1319 1291 1051 958 484
1362 1362 1362 1167 758
1362 1362 1362 1362 993
1377 1377 1362 1362 929
1377 1377 1377 1377
1453 1453 1453 964 964 967 967 964 511 511 511 51 1 532 437 328 164 109 465
1550 1506 204
0 378
1245 1229 105 1 1004 1004 1235 97 1
1045 532 620
2219 2307 2175
373 389
1761 2221 2045 1596
6 6
24 7 7 7
10 9 7 7 7
15 9 7 7 7 2
22 15.22 9, 19
7 15 30
6, 22 22.24
9, 22 19,24 10,lS 6, 22 9, 22 9, 22 6, 22 7, 10
1,22, 2s 22,24,29
1, 22, 2s 22,24 7,22
6, 16, 19 9, 22,29 1, 22,25 6,22,29
take into account the waiting time. As a consequence, public centres appear to be providing service to more customers than private centres, which in turn implies that customers will have to wait longer at public centres. These customers are both low and high-income earners. When waiting time is considered in the model, this effect is corrected, the situation is more realistic, and public centres provide ser- vices to fewer customers, of both high and low-income. All the customers benefit
646 V. Marianov et al.
Table 5. Scenario with six private centres
Subsidy T [min] Objective High-income capture Location public centres
20,000
40,000
60,000
80,000
100,000
120,000
140,000
160,ooC,
180,ooO
200,000
120 90 60
120 90 60 30 15
120 90 60 30 15
120 90 60 30 15
120 90 60 30 15
120 90 60 30 15
120 90 60 30 15 10
120 90 60 30 15 10
120 90 60 30 15 10
120 90 60 30 15 10
321 219 45
799 754 668 435
22 1051 1010 1122 753
1073 1073 1073 917 509
1319 1291 105 1 958 484
1362 1362 1362 1167 75 8
1362 1362 1362 1362 1045 81 1
1362 1362 1362 1362 1143 925
1377 1377 1362 1362 1274 1043 1377 1377 1377 1377 1180 1042
485
1453 1453 1453 964 964 967 967 964 511 511 511 511 532 437 328 164 109 465
1550 1506 204
0 378
1245 1229 105 1 1004 1004 1136 1099 847 569 532 532 900 817 863 410 1 47 164
171.5 I678 1703 1621
0 0
1266 1589 1307 1219
60 0
6 6
24 7 7 7
10 9 7 7 7
15 9 7 7 7 2
22 15, 22 9, 19
7 15 30
6, 22 22,24 9.22
19,24 10,15 9,22 9,22 9,22 9,22 9,15 6, 11 6, 22 6,22 6,22 9, 22 9, 17 7, 17
5, 22,25 4, 22,25 9,4,22 9, 4, 22
15,22 2, 17
13,22,25 7,9,22
7, 10,22 1,799 15,22 6, 29
Finding locations for public service centres that compete with private centres 647
from shorter lines. It takes twice the time to run the model with constraints than the model without constraints.
5 Conclusion
We present simple models that accounts for waiting time when public service centres are located such that they compete with private centres. As a useful tool for public service planners, the model implicitly proposes a change in the criteria for public service planning. We also applied it to the case of CT scanners in Santiago, and discuss effects of congestion. Further consideration must be given to other issues, for example, congestion during travel - or more exact methods able to explicitly include congestion in the models. Future research should also extend the model to include situations where there is more than one server at each centre, heterogeneity in service times, different qualities of service for different clients or at different centres, and heuristics that are more robust.
References
AHeyne GAO (2000) A vision for health system reform in the Americas. Pan American Journal of Public Health 8(1/2): 1-6
Berman 0, Krass D (1998) Flow intercepting spatial interaction model: A new approach to optimal location of competitive facilities. Location Science 6: 4 1 4 5
BrandeauM, Chiu S, Kumar S, GrossmanT (1995) Location with marketextcrnalities. In: DreznerZ (ed) Facility location: A survey of applications and methods, pp 121-150. Springer, Berlin Heidelberg New York
Church R, ReVelle C (1974) The maximal covering location problem. Papers of the Regional Science Association 32: 101-1 18
Daskin MS (1995) Network and discrete location: Models, algorithm and applications. Wiley, New York
De Palma A, Ginsburgh V, LabbC M, Thisse JF (1989) Competitive location with random utilities. Transportation Science 23: 244-252
Drezner T (1995) Competitive facility location in the plane. In: Drezner Z (ed) Facilig location: A surve): of applications and methods, pp 285-300. Springer, Berlin Heidelbeg Kew York
Eiselt H, Laporte G (1989) Competitive spatial models. European Journal of Operations Research 39: 231-242
Eiselt H, Laporte G, Thisse JF (1993) Competitive location models: A framework and bibliography. Transportation Science 27: 44-54
Fung AY, Grimm SY, Wong JR, Uematsu M (2003) Computed tomography localization ofradiation treat- ment delivery versus conventional localization with bony landmarks. Journal of Applied Clinical Medical Physics 4(2): 1 12-1 19
Galvin JR, Rooholamini SA, Stanford W (2003) Obstructive sleep apnea: Diagnosis with ultrafast CT. Radiology 171(3): 775-718
Ghosh A, Craig S (1983) Formulating retail location strategy in a changing environment. Journal of Marketing 47: 5 6 6 8
Ghosh A, Harche F (1993) Location-allocation models in the private sector: Progress, problems and prospects. Location Science l (1 ) : 71-96
Hakimi L (1965) Optimal distribution of switching centers in a communications network and some related graph theoretic problems. Operations Research 13: 462-475
Hakimi L (1983) On locating new facilities in a competitive environment. European Journal ojOpera- rions Research 12: 29-35
648 V. Marianov et al.
Hoxby C (2000) Does competition among public schools benefit students and taxpayers? American
ILOG Products CPLEX: http://www.ilog.corn/products/cplex Kluetz P, Villemagne VV, Meltzer C, Chander S, Martinelli M, Townsend D 12000) The case for PETICT:
Experience at the University of Pittsburgh. Clin Positron lmaging 3(4): 174 Lunsford LD, Levine G, Gumerman LW (1985) Compariqon of computerized tomographic and radionu-
clide methods in determining intracranial cystic tumor volumes. Journal of,Veurosurgery 63(5): 740-744
Marianov V (2004) Location of multiple-server congestible facilities for maximizing expected demand when services are non-essential. Annals of Operations Research (special issue in honor of Kenneth Rosing) (forthcoming)
Marianov V, Serra D (1998) Probabilistic maximal covering location-allocation for congested systems. Journal of Regional Science 38(3): 401424
Marianov V, Serra D (2002) Location problems in the public sector. In: Drezner Z, Hamacker H (eds) Facility location: Applications and theory, pp I 19-150. Springer, Berlin Heidelberg New York
Marianov V, Taborga P (2001) Optimal location of public health centers which provide free and paid services. Journal of the Operational Research SocieQ 52: 391400
National Science Board (1996) Science and engineering indicators, Chapter 8, National Science Foun- dation. http://www.nsf.gov/sbe/srs/seind96/startse.htm
Nichol G, Detsky AS, Stiell IG, O’Rourke K, Wells G, Laupacis A (1996) Effectiveness of emergency medical services for victims of out-of-hospital cardiac arrest: A meta-analysis. Ann Emerg Med 27(6): 700-710
Niiiiez MA (2002) Inequity in the urilizarion of health services in Chile? Analysis of the effects of individual income and health insurance coverage on timely receipt health services. Final Report HDP/HDR/RG-T/CHU3044, Pan American Health Chganization
Pan American Health Organization (1999) CHILE: Profile of the health sewires system. Program for organization and mcinugement of health systems and .services. Division of Health Systems and Services Development. Pan American Health Organization. http://www.americas.health-sector- reform.org/english/chipren.doc
Pan American Health organization (2002) The Chile commitmentfor healthpromolion, healthpromotion forum of the Americas: Enabling and empaweringpartnerships for health. Santiago, Chile, October 2002 http://www.paho.org/English/HPP/ChileCommitmenl.pdf
Pel1 J. Sirel J, Ford I, Cobbe S (2001) Effects on reducing ambulance response times on deaths from out-of-hospital cardiac arrest: Cohort study. BMJ 322: 1385-1 388
ReVelle C (1986) The maximum capture or ‘sphere of influence’ location problem: Hotelling revisited on a network. Journal of Regional Science 26(2): 343-358
ReVelle C, Hogan K (1989) The maximum reliability location problem and a-reliable p-centre problem: Derivatives of the probabilistic location set covering problem. Annals of Operutions Reseorrh 18: 155-174
Serra I), Marianov V, ReVelle C (1992) The maximum-capture hierarchical location problem. European Journal of Operations Research 62: 363-371
Simon SD, Dodds RD (2003) The use of skull X-rays in the accident and emergency department. Annals of the Royal College of Surgeon3 of England 85(2): 12G-122
Spence AM (1975) Monopoly, quality and regulation. Bell Journal ofEronomics ($2): 407414 Toregas C, Swain R, ReVelle C, Bergman L (1971) The location of emergency service facilities. Oper-
Economic Review 90(5): 1209-1238
aiions Research 19: 1363-1373