a service-dominant logic based service productivity improvement framework
TRANSCRIPT

1
A service-dominant logic based service-productivity improvement framework
Sebastian Walther1, Torsten Eymann1, Chris Horbel1 1University of Bayreuth, Germany
This paper investigates the possibilities to improve productivity in service companies with the help of a service productivity definition which over-comes the flaws of recent service productivity paradigms. The contribution is twofold: firstly, we establish a service productivity definition which merg-es classical productivity with marketing’s service-dominant logic. Second-ly, we offer a conceptual framework to control and steer productivity ac-cording to our service-dominant logic based productivity. The performance improvement framework consists of three layers: the controlling, customer value and operations research layer, each using concepts of the referred research domains. Finally, we apply the framework schematically on a Software-as-a-Service provider. Our research field is service science, as the framework is highly interdisciplinary and based on concepts of several research streams.
1. Introduction
The literature on measurement and improvement of service productivity has been expanding rapidly (Lehmann; Koelling, 2010). However, there is still missing a genu-ine definition of service productivity as it exists for manufacturing. Accordingly, our paper can be seen as contribution to conceptualize and improve service-productivity in general.
One of the main objectives in service science is the research on service productivity, especially the conceptualization of service productivity measurement and improve-ment. Basic articles about service science (e.g. Buhl et al., 2008) build the justifica-tion for research in this novel area. Research in service science is highly interdiscipli-nary, as it applies knowledge of different areas like marketing, business administration, computer science, etc. Not surprisingly, researchers talking about service productivity use different semantics, depending on their scientific basis camp. Initially, productivity comes from manufacturing with a concrete focus on goods (Var-go; Lusch, 2004), relating a quantitative metric of output to input. When using produc-tivity in services in that sense, several problems arise. One of the main problems is the constant-quality assumption, which assumes that outputs are always of similar quality, making it possible to optimize transformation processes towards a certain output level. This doesn’t hold true for services, as a reduction of inputs can always change the perceived quality of a customer in a non-expectable way. The second pitfall is the fact, that in complex services the customer is often co-creator of a ser-vice, meaning that the output (or outcome) can widely vary among services even with an incrementally small influence by the service provider.
2
The goal of our paper is to establish a service productivity definition which over-comes these two important flaws and which is based on fundamental marketing theo-ry. The novel definition is then used to develop a conceptual framework which ena-bles the controller to steer service productivity as previously defined.
The service productivity definition is conceptually derived by merging the classical productivity definition with the service-dominant logic of Vargo and Lusch (2004). This is done by applying value-creational considerations on the classical productivity definition and on the service-dominant logic, unifying both approaches, resulting in the following equation:
Based on this definition, a performance improvement framework is introduced which aims to maximize customer value while balancing the corresponding inputs. It is very important to note that similar to Grooenroos and Ojasalo's (2004) definition, we pro-vide a function of service productivity, but not a concrete formula how to actually measure service-productivity, as we have the opinion that customer value is not measurable adequately, just controllable. This has far-reaching implications on the framework we provide which will be discussed later on.
After the introduction of the service improvement framework we apply the concept schematically on a Software-as-a-Service provider to show the different steps in a simplified example and to clarify the different development steps.
2. Background
The following chapter introduces several concepts which are applied in the context of the service productivity definition and/or in the context of the service productivity im-provement framework.
2.1. Service-Science as Research Domain According to Spohrer and Maglio (2010), service science (also known as Service Science, Management, Engineering and Design (SSMED)) is an interdisciplinary field that “combines organization and human understanding with business and technologi-cal understanding to categorize and explain the many types of service systems that exist as well as how service systems interact and evolve to co-create value… to study, improve, create and innovate in service” (Spohrer; Maglio, 2008). The interdis-ciplinary approach is also highlighted by (Buhl et al., 2008). The establishment of the term service science in Germany is still processing. For instance, this can be seen in the published discussion paper “on the way to a service science – perspectives, re-search subjects and acting recommendations from the point of view of an interdisci-plinary working group” (Satzger; Ganz, 2010). The necessity of an academic disci-pline is mainly justified by the growing importance of the service sector (Maglio; Spohrer, 2008; Weinhardt et al., 2008; Satzger; Ganz, 2010; Buhl et al., 2008). Ser-vice science has many goals which are summarized in the state-of-the-art paper pro-
3
vided by (Buhl et al., 2008), with the following statement being of utmost relevance for us:
“Without exception the multidisciplinary is highlighted, however the involved core dis-ciplines are computer science, business administration, operations research and en-gineering. Additionally, disciplines like sociology and law are integrated. Work in ser-vice science tries to use knowledge and methods out of these disciplines for the development and management of services.”
Our approach cannot be uniquely projected into one research field, as we merge methodologies of several disciplines like marketing, operations research and control-ling to solve a problem – the improvement of service productivity. Therefore we see our research domain in the field of service science as a whole.
2.2. Service Productivity – Problems and Definitions The concept of service productivity is a topic, where more and more research is con-ducted; however, there is still a huge lack of conceptual work dealing with service productivity. In the following passage, we give a broad overview, which is not exclu-sive, but highlights the most important work done in the field of service-productivity. For a more detailed list of service-productivity definitions we suggest Lehmann and Koelling (2010) , who provide a systematic literature review on service-productivity definitions.
One of the first papers dealing with the problems of service productivity measure-ment was provided by McLaughlin and Coffey (1990). They identified three core problems when discussing service productivity: measurement problems concerning inputs and outputs, tactical problems of analysis and finally the selection of an ap-propriate method to measure productivity. Especially the measurement problems can be found in several service-productivity related papers, which are linked to the intan-gibility of services. Two sub problems of the measurement issue are quality, which is more difficult to measure when intangibility applies, and timing of demand, which is connected with capacity management. The quality issue is of utmost important, as in services the quality of service delivery is highly connected to the value perceived and the co-creational potential of the customer, while in manufacturing, quality is as-sumed to be quasi-constant. This fact makes it difficult to optimize processes when referring to the classical productivity function in services, as a reduction of inputs might strongly affect the value perceived by the customer (McLaughlin; Coffey, 1990). The capacity issue reflects another problem of service-productivity measure-ment. In manufacturing, goods can be stored and therefore the output to input ratio can give a good signal whether the transformation process is efficient or not. Howev-er, in services, capacity has to be held to serve “on-demand”. This “masks” the effi-ciency of the process, as the ability to predict demand has also impact on the “ser-vice-productivity”, as the down-time is also included into the input calculation. To overcome these problems McLaughlin and Coffey (1990) suggest using different concepts in different service-types – hence offering a taxonomy which consists of the three dimensions complexity of inputs and outputs, customisation and aggregation. Within this taxonomy they suggest different approaches to measure service-productivity.
According to Johnston and Jones (2004) there is a lot of confusion connected to the concept and definition of service productivity, as productivity has been used as an umbrella concept including concepts like utilization, efficiency, effectiveness, quality,

4
predictability and other performance dimensions. However, Johnston and Jones (2004) define productivity as the ratio of what is produced by an operation or process in relation to the inputs over a period of time, whereas the outputs are goods and services. To complement the concept of service-productivity they distinguish between operational productivity and customer productivity, to overcome the difficulty induced by the fact, that customer is always a co-creator of value in service and has a certain individual value perception which is represented by experience, outcome and value.
Grooenroos and Ojasalo (2004) highlight the fact, that the productivity concept was developed to manage efficiency in manufacturing, and when applied, possibly lead to negative effects on perceived service quality, customer value and finally on company profits. They define service productivity as a function of internal efficiency, external efficiency and capacity efficiency. Finally they argue that service-productivity cannot be measured in inputs or outputs, but has to be aggregated companywide by apply-ing the ratio revenues to costs.
Summarized, the two most difficult problems to solve are the inclusion of the custom-er as co-creator of value and the proper definition of output. Both problems are rather difficult to solve, as value is very dependent on the individual receiving a certain ser-vice, or, as Johnston and Jones (2004) state, the psychological “outcome” of the ser-vice experience.
In our opinion, recent service-productivity definitions try to overcome certain symp-toms which are induced by the classical productivity definition when applied on ser-vices, however, they are lacking theoretical marketing background, or more under-standably, a more general and abstract concept undermined by marketing theory. Analogical to medical sciences, solutions should not be based on symptom-solving, but on fighting the illness itself.
2.3. Service-Dominant Logic The service-dominant logic, postulated by Vargo and Lusch (2004) is the fundamen-tal paradigm behind our service-productivity definition. Firstly, it postulated 8 founda-tional premises (FPs), which were extended and modified by two premises in 2007. Those premises are based on a fundamental shift in worldview, where goods-dominant thinking is replaced by a service-oriented approach. According to Vargo and Lusch (2004), the goods-centered view postulates following:
• “Economic activity consists of making and distributing things that can be sold, these things must be embedded with utility and value”,
• “The firm should set all decision variables to maximize profit from output-sales, including standardization to maximize production control and efficiency”,
• “Goods can be inventoried and then delivered”.
In our opinion, the shift towards the service-dominant logic is one major step for solv-ing the problem which is associated with productivity measurement of services. Es-pecially FP1, FP6, FP7 and FP10 (Vargo; Lusch, 2007) are keystones to rethink the term output (as stated before, output definition is a crucial point to define service productivity). The relevant FPs are as follows:

5
• “FP1: Service is the fundamental basis of exchange”,
• “FP6: The customer is always a co-creator of value”,
• “FP7: The enterprise cannot deliver value, but only offer value propositions”,
• “FP10 Value is always uniquely and phenomenological determined by the benefi-ciary, this means that it is idiosyncratic, experiential, contextual and meaning lad-en”.
These premises imply, that value1 is always created in the context of the customer, either while receiving a service (e.g. accessing processing capacity) or while con-suming a certain product which services have been applied on (e.g. processed). Therefore the value creation process is the process of consumption and interaction, whereas the result or output of the process is the overall customer value created, which is uniquely reliant on the perception of the customer (FP10). Hence customer value created can be defined as the output of a service, which companies have to maximize by providing value propositions (FP7).
2.4. Customer Value from Customer Perspective In general, there are two different approaches when talking about customer value in marketing (Graf; Maas, 2008): customer value from a company perspective, which can be divided into customer lifetime value or customer equity and customer value from a customer perspective, which reflects the relevant concept for our paper. With-in the customer perspective of customer value the differentiation between perceived customer value and desired customer value (Graf; Maas, 2008) can be made, which focuses more on the term customer value and what it incorporates. Besides the dis-cussion about the term customer value, three different model categories can be iden-tified: value component models, benefit/costs ratio models and means-ends models (Khalifa, 2004), which conceptualize complete models of customer value. Both con-ceptual categorizations have intersections, as the perceived customer value is part of many benefit/cost ratio models.
For our service-productivity framework we use a customer value model which com-plies with two requirements: technical fit, meaning that the model is compatible with the other elements of the framework and the service-productivity formula, as well as the fundamental fit, meaning that we support the underlying theory for comprehensi-ble reasons. Either technical or fundamental changes are made to the customer val-ue model to assure synchronization with the rest of the framework.
Our starting point is Woodruff's (1997) definition of customer value: “Customer value is a customer’s perceived preference for and evaluation of those product attributes, attribute performances, and consequences arising from use that facilitate (or block) achieving the customer’s goals and purposes in use situations”. So when we talk of value according to S-D logic, we rely on this generic definition. Our formalized view
1 Value is not explicitly defined in Vargo and Lusch (2004), therefore we need to define value our-
selves.
6
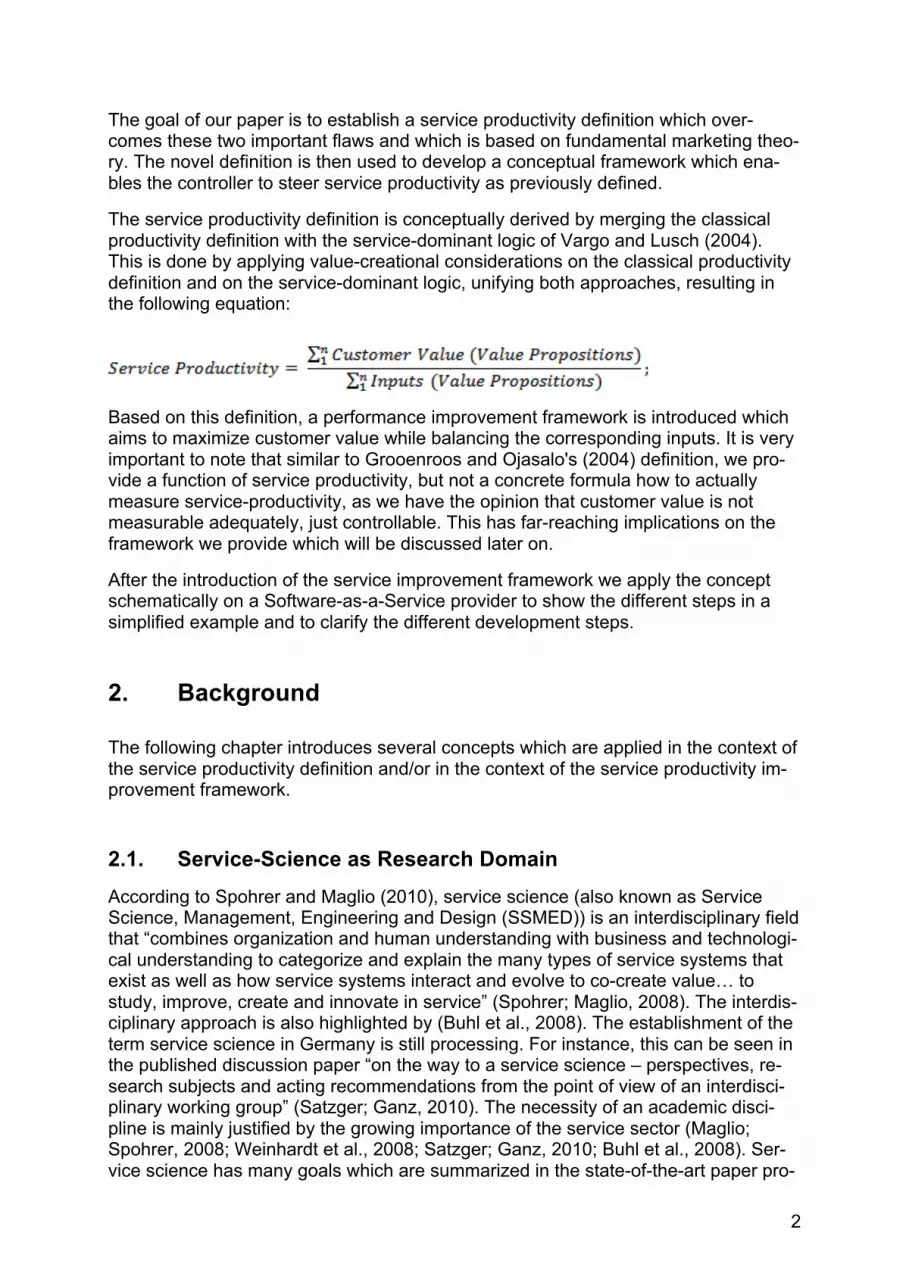
on customer value refers to the customer value in exchange model, provided by Kha-lifa (2004), which shows that the total value to customer consists of the sum of psy-chic and utility value (see Fig. 1). In our model we will only look at the cost side indi-rectly, and will not talk about prices, as prices are bound to strategy and market considerations which are not tangibles of productivity. Indirectly means, that we try to balance the total customer value and the inputs, which are cost drivers, to ensure cost efficient customer value maximization. The customer value exchange model is generic and no concrete tool for measuring is given. This has far-reaching implica-tions, which have direct impact on the service-productivity framework that will be pre-sented, as we will not measure total value to customer directly, but via indicators. In the following chapters we will use customer value synonymously to total value to cus-tomer.
Total Value toCustomer
PsychicValue
UtilityValue
Net Customer Value
Total Customer Cost Cost of Seach,Acquisition, etc.
PriceSupplier Margin
Cost toSupplier
Fig. 1: Customer value in exchange (According to Khalifa 2004)
3. Service-Dominant Logic based Service-Productivity
3.1. The classical productivity definition To talk about productivity it is necessary to understand the classical productivity defi-nitions, especially its origins and usages. The common profit maximization principle (Hoitsch, 1993), leads to several concepts, including success ratios like cost profita-bility, productivity, cost effectiveness, etc. (Zelewski, 2008; Kern, 1992), where effi-ciency can be described as an overarching concept2 (Kern, 1992) to realize profit maximization. In other words, the concept of efficiency is a tool to steer profit maxi-mization, where high efficiency should lead to high degree of profit maximization. Linked to the domain of services, the fundamental problem of the application of the classical productivity definition on services unveils - improving classical productivity will not lead to a higher profit maximization in services.
Different definitions of productivity existed which were similar, however missing a clear systematically approach (Fricke, 1961). According to (Lasshof, 2005), produc-tivity nowadays describes the quantitative yield amount of a transformation process,
2 For a detailed overview concerning productivity definitions we suggest the lecture of Lasshof (2005).

7
which is represented by the output to input ratio, where outputs are either products or services and inputs are production factors (e.g. Fig. 2). This definition will be the ba-sis for the following considerations.
Input OutputTransformation Process
OutputInput
Fig. 2: Productivity Ratio (According to Corsten (2007))
3.2. Towards an S-D Logic based service productivity Our approach tries to unify the classical productivity definition with productivity in ser-vices. As described previously, one of the major problems of the application of the productivity concept on services is the unclear definition of output (e.g. McLaughlin; Coffey, 1990). If output is simply defined as customers served, an important compo-nent is overlooked, namely the quality of the service the customers received. While quality is assumed to be constant in the classical productivity definition, in service the quality relies on several components, like the customer’s willingness to participate (customer co-creation) or capacity held. Additionally the question where value is cre-ated is not defined (Bienzeisler, 2005). While in the classical output definition the transformation process incorporates the value creation process with output being the result of value creation, in services it is unclear were value is created, hence making it difficult to catch the result, or in other words, the output. Some authors differentiate between outcome and output with output being the units served while the outcome reflects quality and customer value aspects (McLaughlin; Coffey, 1990). We will not distinguish output and outcome, as we see the outcome in the previously stated defi-nition as a part of the output.
If we take the classical output definition, we see the output as result of the transfor-mation process and therefore as incorporation of the value creation. If we apply this on services, the output should also be an incorporation of the value creation, even though often not tangible. But what is value creation? Is the small-talk of a sales-person value creation, if the customer has a higher level of overall satisfaction? Many service researchers would answer this question with a clear yes – and so do we. But which theory can back-up this construct, unifying classical productivity with service productivity? In our opinion the S-D logic provides a theory which allows transferring the classical productivity concept to services, overcoming many flaws (not all) which have risen with its application on services, especially the problems concerning quality and value of services.
If we define output as incorporation3 of value creation, we have to ask ourselves - what is value creation in services? According to S-D logic, value is always created
3 As services are usually intangible, value creation has to be defined in an adequate way

8
solely by the customer, either in cooperation or consumption of services; hence the value which is created is always dependent from the customer. We define output as the complete value created for the customer in the service deliv-ery process, beginning from the first contact with the customer and ending with the after sales process related to the received service. The value which is created for the customer cannot easily be defined, as for one customer the small-talk with the sales person might be beneficial and pleasant, while another customer might find it a waste of time. However, the generic concept of customer value is seen as output of a ser-vice process. The definition of the inputs is not based on S-D logic. It is simply de-fined as the inputs which are involved into the service delivery, including buildings, webpages, and other objects which influence the customer perception. According to FP7, companies can only offer value proposition, but not create value by themselves. Therefore the customer value is a function of value propositions offered by the com-panies, whereas the inputs are the inputs to offer certain value propositions.
Following this, the new service-productivity definition which is based on S-D logic is defined as follows:
where n reflects the number of customers receiving the service and the value propo-sitions reflecting the value propositions of a certain service offered by the company.
4. A Framework for service productivity
Based on the previously introduced service productivity definition we want to estab-lish a conceptual framework for the performance measurement of services. The framework will not measure customer value directly, but via indicators, which are evolved top-down and bottom-up as common methodology to evolve key indicator systems in the discipline of performance measurement (Gladen, 2005). According to Gladen (2005) modern performance measurement systems are used to control and steer, hence making the development of adequate key indicators an essential part of the development process of performance measurement systems.
General thoughts: Shortly described, our framework is based on two pillars – cus-tomer value maximization with best of class benchmarking to assure efficiency. In our opinion, customer value cannot be measured directly4; however indicators can be defined which influence customer value in a positive or negative manner. These indi-cators are operationalized key figures which actually can be measured and therefore are used to control the “output” (customer value) function of the service productivity definition. But only controlling or maximizing the customer value would lead to cost problems. Therefore an adequate balance of customer value and inputs has to be found. This is realized by defining the inputs of the indicators which influence cus-
4 A lot has been written about the difficulty of customer value measurement (Yang and Peterson
2004), we will not go into detail about this specific topic

9
tomer value and then balancing by benchmarking with the Data Envelopment Analy-sis, a methodology known of the Operations Research domain (Banker; Charnes; Cooper, 1984).
“Technical” aspects: The framework has three different layers. The controlling layer represents the overall context of the framework, hence is located in the conceptual level of the performance measurement development (Reichmann, 2006). This means, that the functional domain within a company where this concept is used is the controlling department, whereas the industry is not defined in this step. The industry of usage is given by the prototype in which the performance measurement is devel-oped. The second layer describes a customer value model, where the indicators are used to control customer value. The third layer is called operations research layer. Within the operations research layer specific areas of conflict can be found. In these areas of conflict indicators and inputs are balanced via DEA. Specific aspects of each layer, especially concerning marketing, operations research and controlling are de-scribed in the following chapters. The reason why we introduce different layers be-side the development steps chapter, which gives a separate instructions manual to build a prototype (hence could be used isolated without the layer structure), is that in the different layers the domain specific academic literature is discussed. As we seek to provide an interdisciplinary approach and do not rely on a “how to build” hands-on framework we back-up our steps with the academic knowledge provided in the differ-ent layers chapters.
Fig. 3: The Generic S-D Logic Based Service Productivity Framework
4.1. Development Steps – from Concept to Prototype Several steps have to be taken to transfer the concept into a concrete performance measurement system. A valid approach is going top-down. The first step is the identi-fication of the value propositions of the company which should have direct impact on the customer value. This can be achieved by exploratory interviews and literature reviews. The value propositions are equivalents to constructs known in statistics (At-
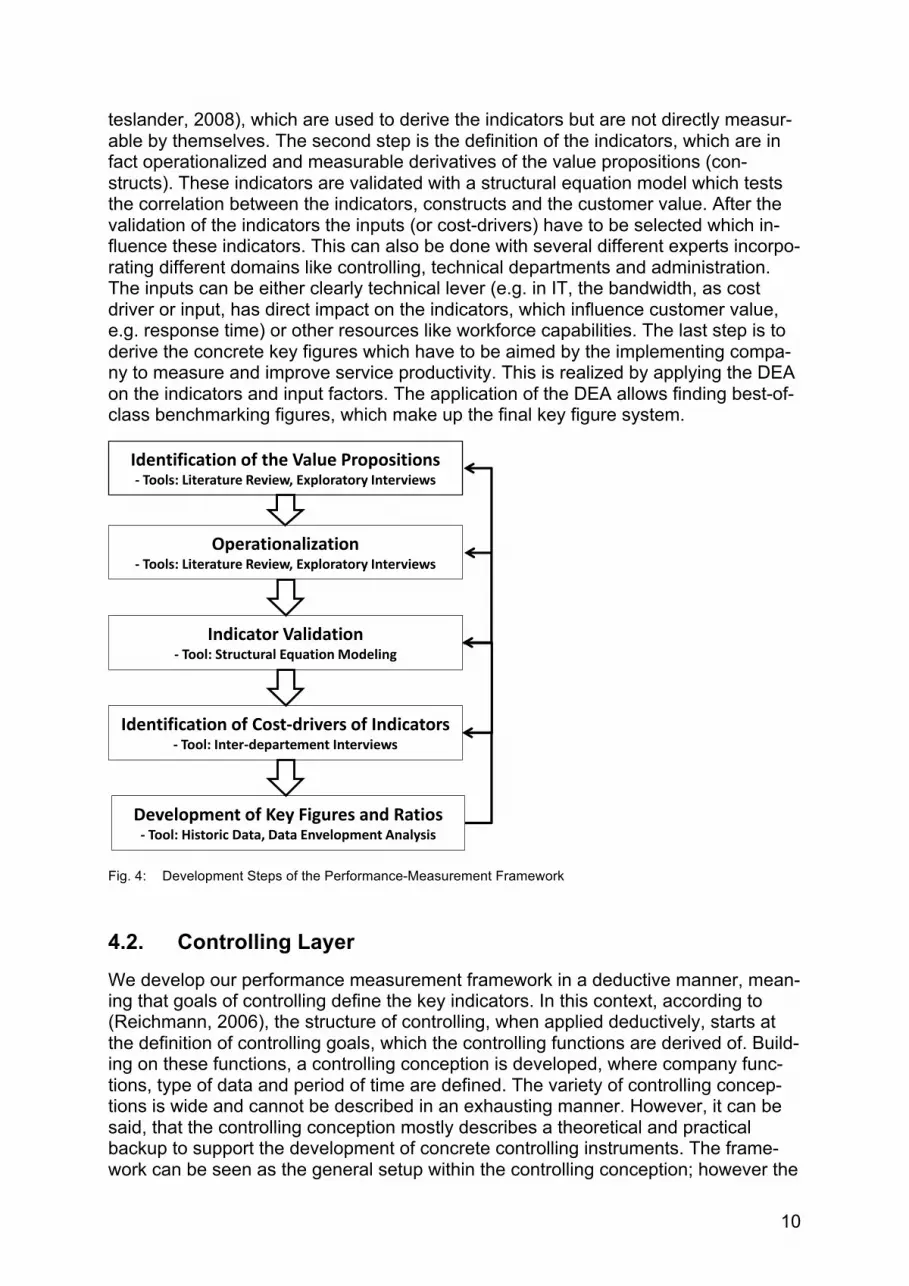
10
teslander, 2008), which are used to derive the indicators but are not directly measur-able by themselves. The second step is the definition of the indicators, which are in fact operationalized and measurable derivatives of the value propositions (con-structs). These indicators are validated with a structural equation model which tests the correlation between the indicators, constructs and the customer value. After the validation of the indicators the inputs (or cost-drivers) have to be selected which in-fluence these indicators. This can also be done with several different experts incorpo-rating different domains like controlling, technical departments and administration. The inputs can be either clearly technical lever (e.g. in IT, the bandwidth, as cost driver or input, has direct impact on the indicators, which influence customer value, e.g. response time) or other resources like workforce capabilities. The last step is to derive the concrete key figures which have to be aimed by the implementing compa-ny to measure and improve service productivity. This is realized by applying the DEA on the indicators and input factors. The application of the DEA allows finding best-of-class benchmarking figures, which make up the final key figure system.
Identification of the Value Propositions-‐ Tools: Literature Review, Exploratory Interviews
Operationalization-‐ Tools: Literature Review, Exploratory Interviews
Indicator Validation-‐ Tool: Structural EquationModeling
Identification of Cost-‐drivers of Indicators-‐ Tool: Inter-‐departement Interviews
Development of Key Figures and Ratios-‐ Tool: Historic Data, Data Envelopment Analysis
Fig. 4: Development Steps of the Performance-Measurement Framework
4.2. Controlling Layer We develop our performance measurement framework in a deductive manner, mean-ing that goals of controlling define the key indicators. In this context, according to (Reichmann, 2006), the structure of controlling, when applied deductively, starts at the definition of controlling goals, which the controlling functions are derived of. Build-ing on these functions, a controlling conception is developed, where company func-tions, type of data and period of time are defined. The variety of controlling concep-tions is wide and cannot be described in an exhausting manner. However, it can be said, that the controlling conception mostly describes a theoretical and practical backup to support the development of concrete controlling instruments. The frame-work can be seen as the general setup within the controlling conception; however the

11
concrete design is a controlling instrument which is developed for practical usage. In this paper we don’t go into detail into the several structural elements of controlling. Important is the definition of the controlling goals. Our goal is to raise service-productivity - not only measuring it; therefore our framework will be developed to fulfil this goal.
4.3. Customer Value Model Within the customer value the indicators are developed which have impact on the latent variable customer value. These indicators are used to control and steer cus-tomer value. The customer value model is built-up similarly to common structural eq-uitation models and can easily be transferred into such, where the value propositions are latent factors and the indicators are measurable, operationalized exogenous var-iables. This eases the examination whether the defined indicators, which are deter-mined by exploratory interviews or literature research, are reliable, meaning that they are significantly positively or negatively correlated to customer value. The evaluation, if certain indicators and factors influence customer value, which lead to customer sat-isfaction, has often been validated by structural equitation modelling (e.g. DeSarbo; Jedidi; Sinha, 2001; Wang; Sun; Zha, 2009; Zaim et al., 2010)
The customer value model is the core of the service-performance-measurement framework, as it identifies the levers to value-creation of the corresponding services. This is the reason why the indicators have to be chosen carefully and afterwards to be examined rigorously. Mainly two methodologies have been used to identify indica-tors, especially in Information Systems success research, namely exploratory inter-views (Atteslander, 2008) and literature research (e.g. DeLone; McLean, 1992). After identifying relevant indicators, which are derived of the value propositions (which can themselves be derived by corresponding research), these indicators have to be ex-amined corresponding to relevance in the case of customer value. This is performed by transferring the customer value model into a structural equitation formula by trans-forming value propositions to latent exogenous factors and indicators to exogenous variables. Additionally, customer value is introduced as endogenous latent factor, whereas the endogenous variable can be defined as user-satisfaction, which can be seen as a reflective variable in the context of customer value. After transferring the customer value model into a structural equitation model there are different possibili-ties to test the several indicators (exogenous variables) by applying multivariate or partial least squares analysis (Backhaus, 2008; Vinzi et al., 2010; Wold et al., 1984).
4.4. Areas of Conflict within the Operations Research Layer The areas of conflict are the element of the framework, where the customer value and inputs are balanced. This is necessary, as maximizing customer value solely would lead to a negative impact concerning the highest company goal – profit maxi-mization (except for non-profit organizations). Areas of conflict means, that the driv-ers of customer value, the indicators, have levers which have direct impact on the concrete specification of each indicator. For instance a high availability of a specific cloud computing application has its specific cost drivers, like bandwidth, number of application servers, and so on. These cost drivers, which have direct impact on the performance of single indicators, therefore indirectly on customer value, have to be
12
identified. This can be done by exploratory interviews, where technical, business and administrative experts are asked to give their insights. A technician, for example, can state that the availability of the company’s IT solution relies on several factors, like previously stated, bandwidth, application servers, processors, workspace, etc. A manager from the Sales department instead might say that good customer service as indicator for customer value might rely on the capacity utilization in the Sales de-partment, so employees can take more time to chat with customers, hence improving perceived customer service. This highlights the collaborative, interdisciplinary way, in which this framework has to be filled. After the definition of the input factors which influence the indicators, the question arises, which are the best ratios between the indicators and the input factors. Generally spoken, this is the essence of service productivity, finding the right balance between customer value (as indicators) and inputs (as cost drivers). This can even be clarified with a simple example. Let’s take the case of a cloud computing provider, assuring 97% average availability throughout the month (e.g. Spindler, 2010). He sees that customers demand for 99.99% and checks if this is possible. After rigorous cost calculations, the cloud computing pro-vider realizes that 99% availability would increase costs by 4 times of the actual amount, an increase to 99.99% would, however, cost 50 times more than planned. According to this considerations, the cloud computing provider has two options – checking the best of class competitors if a more efficient ratio of availability and costs is at least possible, giving a clear goal to evolve towards, or doing an revenue-cost analysis where the plus/minus on long-term revenues is calculated when raising the availability and compared to the additional costs. We chose the first decision making logic for one simple reason – the information deficit. It is easier to attain benchmark-ing data than exact knowledge on customer behaviour when changing certain levers incrementally. It is clear, that applying both approaches would also lead to vastly dif-ferent results.
To benchmark these indicators against their inputs we use the Data Envelopment Analysis, which is often used when benchmarking services. It has the advantage that it benchmarks specific ratios without aggregating information, so very specific indica-tor/input ratios can be set as key figures which companies have to develop towards.
5. Schematic Application of the Framework on a Software-as-a-Service Solution
In the following chapter we describe schematically how to build a prototype in the context of Software-as-a-Service (SaaS). SaaS shifts the view of software-vendors from technology providers to process-service-providers (Benlian et al., 2010), hence making SaaS interesting in terms of service provision. We go through the several steps successively, however when building a prototype an iterative approach is nec-essary to assure the best possible outcome.
5.1. Identification of the Value Propositions The identification of the value propositions is of utmost importance, as it builds the base for the steering of customer value. In this example, we provide value proposi-tions through literature research. Several possibilities exist to choose adequate value

13
propositions. One possibility is to research on academic literature like DeLone and McLean's (1992) model of information systems success factors, which provide cate-gories, in which information systems create value for the customers generically, like information quality, systems quality, service quality, and so on. These success fac-tors can be seen as value propositions of companies, as e.g. a good business intelli-gence information system is dependent on a good information quality and can only then bring value to the customer. In our application we rely on the paper A Berkeley view on Cloud Computing (Armbrust et al., 2009), which proposes following value propositions5 for cloud computing: cost savings, customization, transference of risk, security6 and no installation. These are the value propositions that are taken as con-structs which are operationalized and lead to the indicators.
5.2. Operationalization To operationalize the constructs which impact the customer value, namely the value propositions, measurable indicators have to be identified. To operationalize indicators there are several problems. Our approach includes literature research and unstruc-tured interviews to come up with the indicators listed in figure 5. This is only schemat-ic approach, however to ensure a customer value model which is robust all indicators have to be found which influence the constructs. The reason for this requirement is, that the construct-indicator system will be built into the structural equation formula. As the indicators are a formative system leading to customer value they have to be exhausting, meaning that all formative indicators leading to a certain construct have to be identified. In this simplified example we will rely on the previously defined indi-cators.
Cost Saving Customization Transference of Risk FactorSecurity No InstallationConstructs
Indicators CapacityUitilization
# Add-Ons AvailabilityReputation Speed ofApplication
Fig. 5: Indicators based on constructs (value propositions)
5.3. Indicator Validation The indicator validation is crucial to ensure that the right levers are pushed. Falsely identified indicators can lead to high costs with little customer benefits. The structural equation formula offers a possibility to validate indicators in the structure which was given in the previous paragraph, where the indicators are part of the exogenous measurement model, the constructs are factors and part of the structural model, the customer value is the factor we want to measure, and the customer satisfaction is
5 Either in relation to stand-alone information systems or among cloud computing providers them-
selves 6 Meaning that a high security level can be a value proposition for a SaaS provider
14
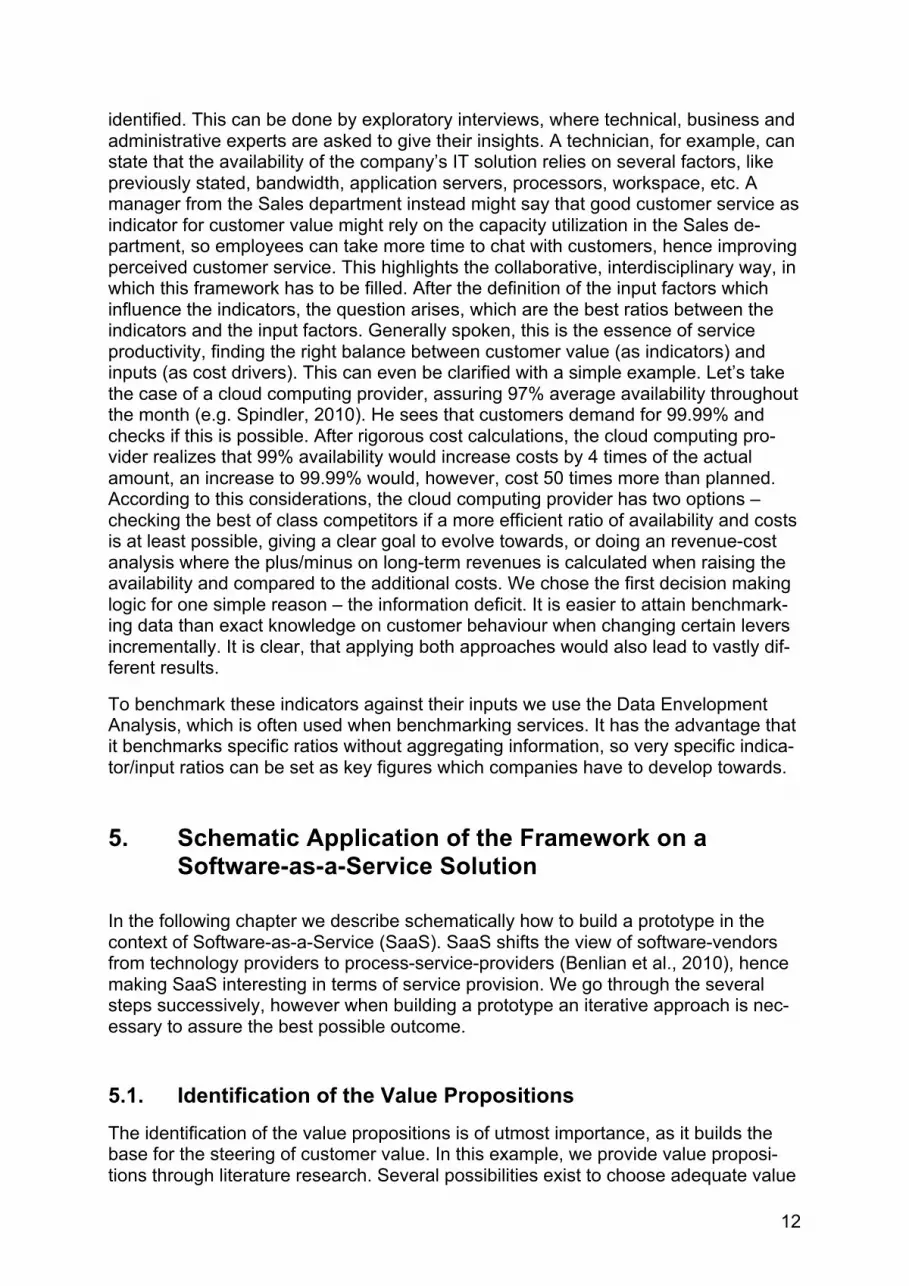
part of the endogenous measurement model. The connection between customer sat-isfaction and customer value has been widely discussed, customer satisfaction being reflective to customer value (Graf; Maas, 2008). This fact helps to validate the previ-ously defined indicator system according to figure 6. To finally validate the correla-tions between the objects, one possibility is the previously described partial-least-square approach. Other possibilities exist to solve structural equation formulas, and it depends on the complexity of the problem which solution pattern is used. To use the structural equation formulas user satisfaction and indicators have to be measured. Therefore customer surveys are necessary to calculate the correlations between the objects.
In our case we assume that the correlations are significant, therefore the indicators will be taken as previously defined.
Exogenous MeasurementModel
Endogenous MeasurementModel
E1
E2
E3
E4
E5
n1
Structural Model
Cost Saving Factor
Customization Factor
Transference of Risk Factor
Security Factor
No Installation Factor
Customer Value Factor
Capacity Utilization
# Add-Ons
Availability
Reputation
Availability
Speed of Application
g1
g2
g3
g4
g5
g6
Customer Satisfaction e1
Fig. 6: Structural Equation Formula with Indicator System
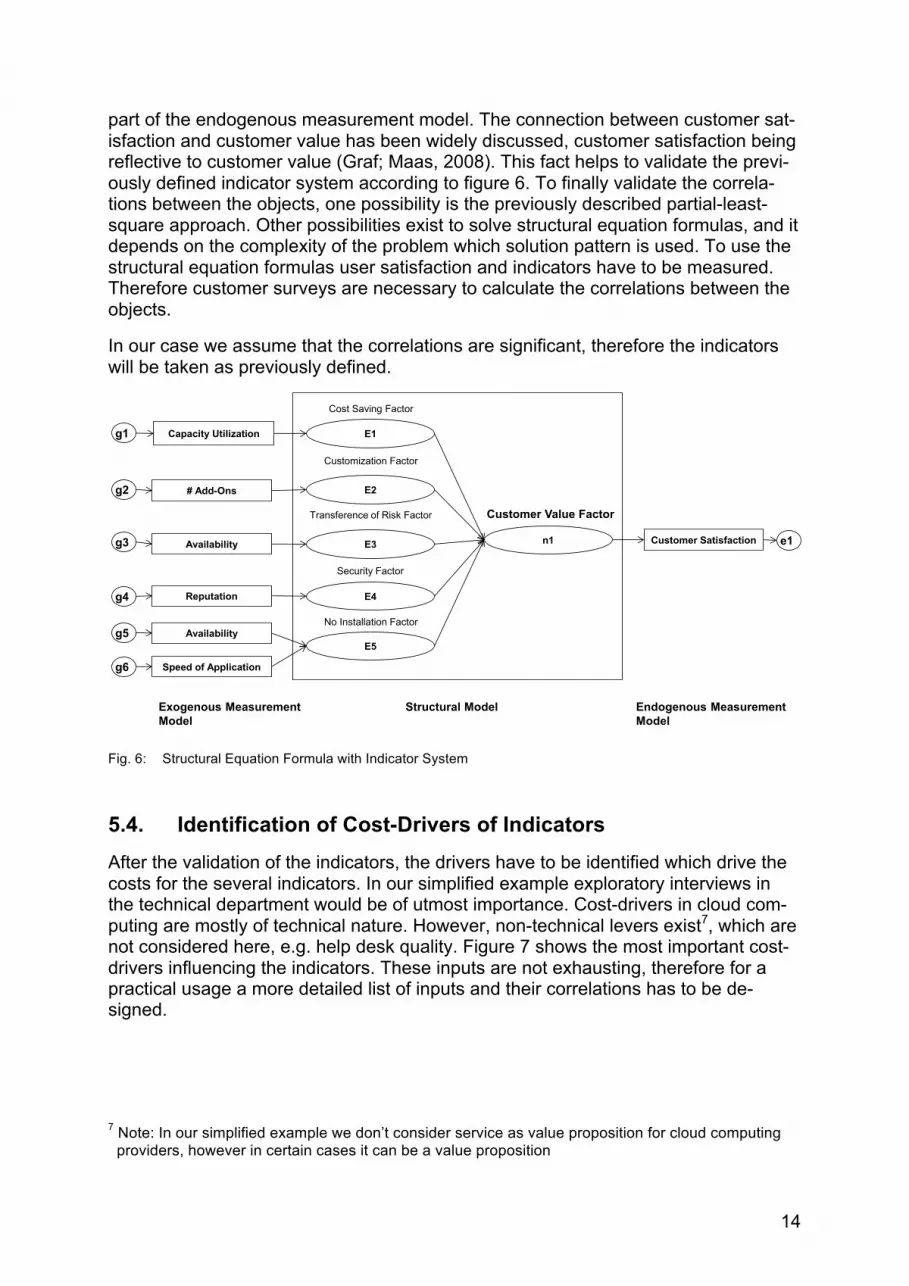
5.4. Identification of Cost-Drivers of Indicators After the validation of the indicators, the drivers have to be identified which drive the costs for the several indicators. In our simplified example exploratory interviews in the technical department would be of utmost importance. Cost-drivers in cloud com-puting are mostly of technical nature. However, non-technical levers exist7, which are not considered here, e.g. help desk quality. Figure 7 shows the most important cost-drivers influencing the indicators. These inputs are not exhausting, therefore for a practical usage a more detailed list of inputs and their correlations has to be de-signed.
7 Note: In our simplified example we don’t consider service as value proposition for cloud computing
providers, however in certain cases it can be a value proposition
15
Capacity Utilization # Add-‐Ons Availability Reputation Speed of Application
# Processors # Manhours # Processors Bandwith Bandwith# Manhourstechnical
Technical SecurityStandard
# Customers # Processors
Fig. 7: Indicators and their cost-drivers
5.5. Development of Key Figures and Ratios After the identification of the cost-drivers to ensure service productivity, the adequate balancing of customer value (measured via indicators) and costs has to be found. A sole maximization of indicators would not lead to profit maximization of the company, as described earlier. To develop key figures which represent the best-of-class solu-tions of certain indicator-input relations we use the data envelopment analysis. To simplify the example we show the application of the data envelopment analysis on one concrete indicator – availability. As previously identified the indicator availability relies on two technical levers – bandwidth and number of processors. Assuming that we have data from three competing companies concerning availability, number of processors and bandwidth, we can define best of class companies in either proces-sor/availability and bandwidth/availability, resulting in concrete ratios which the com-pany can work towards. These ratios are the final key figures which are used to benchmark the cloud computing company and hence to improve service productivity by finding the best customer value (through indicators) and input ratio.
6. Discussion
In our paper we introduced an S-D logic based service productivity definition. This definition is further used to control productivity indirectly via indicators, which can have either a positive and negative impact on customer value, and via the corre-sponding inputs which are balanced in context of the indicators. Finally we applied our service-productivity framework on a Software-as-a-Service provider.
Both, the service productivity definition and the performance improvement framework are on a conceptual level, general (that service industry independent) and have not been validated or discussed in academic literature yet. Therefore empirical validation has to be provided.
The discussion about the definition of service-productivity we provided can go into several directions. First of all it has to be discussed, if the service-dominant logic has adequately been implemented and if the steps used to come up towards an S-D logic based productivity definition are consistent and valid. As we provide a very interdisci-plinary approach, insights and inputs from academics of different disciplines are nec-essary to handle the sheer amount of basic literature connected to service science. After all a definition has to be accepted in a community, therefore discussion on a

16
high level basis is essential. On a second step it has to be investigated, if the service-productivity definition helps to improve the highest company goal – profit maximiza-tion8. In this context the tools to steer service-productivity are essential and maximiz-ing profits in the context of service-productivity will always be connected to the appli-cation of certain concepts, as customer value, in our opinion, will not be easily be measurable, hence making it necessary to approach from different angles.
The service-productivity framework itself needs also empirical evidence to overcome the conceptual stage. Therefore concrete prototypes in different domains have to be built to explore the impact on service productivity and profits. As the framework itself is generic its application in different industries can also reveal better and worse fields of application.
As our framework has been designed to solve a problem, research can be seen with-in the design science domain (e.g. Peffers et al., 2007). It will be critical to improve the framework while building prototypes in iterative steps. Therefore our next steps will include the build of concrete prototypes in different industries to incrementally improve the service-productivity framework.
References
Armbrust, M.; Fox, A.; Griffith, R.; Joseph, A.; Katz, R.; Konwinski, A.; Lee, G.; et al. (2009): Above the Clouds: A Berkeley View of Cloud Computing. Berkeley: University of California.
Atteslander, P. (2008): Methoden der empirischen Sozialforschung. Berlin.
Backhaus, K. (2008): Multivariate Analysemethoden : eine anwendungsorientierte Einführung. Berlin: Springer.
Banker, R.; Charnes, A.; Cooper, W. (1984): Some Models for Estimating Technical and Scale Inefficiency in Data Envelopment Analysis. Management Science 30 (9), pp. 1078-1092.
Benlian, A.; Hess, T.; Buxmann, P. (2010): Software-as-a-Service Anbieterstrategien, Kundenbedürfnisse und Wertschöpfungsstrukturen. Wiesbaden : Gabler Ver-lag.
Bienzeisler, B. (2005): Die Competence Card als Mess- und Steuerungsinstrument für die Dienstleistungswirtschaft. In: Praxishandbuch Controlling. Gabler.
Buhl, H.; Heinrich, B; Henneberger, M.; Krammer, A. (2008): Service Science. WIRTSCHAFTSINFORMATIK 50, pp. 60-65.
Grooenroos, C.; Ojasalo, K. (2004): Service productivity - Towards a conceptualiza-tion of the transformation of inputs intoeconomic results in services. Journal of Business Research, pp. 414-423.
8 The concept of sustainability is not discussed here
17
Corsten, H. (2007): Produktionswirtschaft : Einführung in das industrielle Produkti-onsmanagement. Munich.
DeLone, W.; McLean, E. (1992): Information Systems Success: The Quest for the Dependent Variable. Information Systems Research, pp. 60-95.
DeSarbo, W.; Jedidi, K; Sinha, I. (2001): Customer value analysis in a heterogene-ous market. Strategic Management Journal 22, pp. 845-857.
Fricke, R. (1961): Die Grundlagen der Produktivitätstheorie. Frankfurt.
Gladen, W. (2005): Performance Measurement : Controlling mit Kennzahlen. Wies-baden: Gabler.
Graf, A.; Maas, P. (2008): Customer value from a customer perspective: a comprehensive review. Journal für Betriebswirtschaft 58, pp. 1-20.
Hoitsch, H. (1993): Produktionswirtschaft : Grundlagen einer industriellen Betriebs-wirtschaftslehre. München: Vahlen.
Johnston, R.; Jones, P. (2004): Service productivity: Towards understanding the rela-tionship between operational and customer productivity. International Journal of Productivity and Performance Management 53, pp. 201-213.
Kern, W. (1992): Industrielle Produktionswirtschaft. Stuttgart: Poeschel.
Khalifa, A. (2004): Customer value: a review of recent literature and an integrative configuration. Management Decision 42 (5), pp. 645-666.
Lasshof, B. (2005): Produktivität von Dienstleistungen. Gabler.
Lehmann, C.; Koelling, M. (2010): The Productivity of Services: A systematic litera-ture review.
Maglio, P.; Spohrer, J. (2008): Fundamentals of service science. Journal of the Academy of Marketing Science 36 (1), pp. 18-20.
McLaughlin, C.; Coffey, S. (1990): Measuring Productivity in Services. International Journal of Service Industry Management 1 (1), pp. 46-64.
Peffers, K.; Tuunanen, T.; Rothenberger, M.; Chatterjee, S. (2007): A Design Sci-ence Research Methodology for Information Systems Research. Journal of Management Information Systems 24 (3), pp. 45-77.
Reichmann, T. (2006). Controlling mit Kennzahlen und Management-Tools : die sys-temgestützte Controlling-Konzeption. Munich: Vahlen.
Satzger, G.; Ganz, W. (2010): Auf dem Weg zu einer Service Science - Perspekti-ven, Forschungsthemen und Handlungsempfehlungen aus der Sicht einer in-terdisziplinären Arbeitsgruppe.
Spindler, G. (2010): Rechtliche Rahmenbedingungen des “Software a a Service”-Konzepts. In: Software-as-a-Service. Wiesbaden: Gabler, pp. 31-40.
Spohrer, J.; Maglio, P. (2010): Toward a Science of Service Systems. In: Handbook of Service Science. Springer US, pp. 157-194.

18
Spohrer, J.; Maglio, P. (2008): The Emergence of Service Science: Toward System-atic Service Innovations to Accelerate Co-Creation of Value. Production and Operations Management 17 (3), pp. 238-246.
Vargo, S.; Lusch, R. (2004): Evolving to a New Dominant Logic for Marketing. The Journal of Marketing 68 (1), pp. 1-17.
Vinzi, V.; Chin, W.; Henseler, J.; Wang, H. (2010): Handbook of Partial Least Squares: Concepts, Methods and Applications. Springer.
Wang, L.; Sun, S.; Zha, J. (2009): An empirical research on the relationship between perceived customer value and e-loyalty. In: 2009 IEEE International Confer-ence on Industrial Engineering and Engineering Management, pp. 2246-2250.
Weinhardt, C.; Studer, R.; Holtmann, C.; Schnizler, B.;Ankolekar, A.; Stojanovic, N. (2008): Service Science, Management, Engineering and eOrganisations. In: Service Science, Management and Engineering Education for the 21st Cen-tury, pp. 295-301.
Wold, S.; Ruhe, A.; Wold, H.; Dunn, W. (1984): The Collinearity Problem in Linear Regression. The Partial Least Squares (PLS) Approach to Generalized In-verses. SIAM Journal on Scientific and Statistical Computing 5 (3), pp. 735.
Woodruff, R. (1997): Customer value: The next source for competitive advantage. Journal of the Academy of Marketing Science 25 (2), pp. 139-153.
Yang, Z.; Peterson, R. (2004): Customer perceived value, satisfaction, and loyalty: The role of switching costs. Psychology and Marketing 21 (10), pp. 799-822.
Zaim, S.; Turkyilmaz, A.; Tarim, M.; Ucar, B.; Akkas, O. (2010): Measuring Customer Satisfaction in Turk Telekom Company using Structural Equation Modeling Technique. Journal of Global Strategic Management 07, pp. 89-99.
Zelewski, S. (2008): Grundlagen. In: Betriebswirtschaftslehre, Band 1, ed. H.; Reiß Corsten, pp. 1-97. Munich - Vienna.

19
Author address
Authors:
Sebastian Walther, Dipl.-Wi.-Ing. University of Bayreuth Chair of Information Systems Management Universitätsstraße 30 in 95440 Bayreuth [email protected]
Torsten Eymann, Prof. Dr. University of Bayreuth Chair of Information Systems Management Universitätsstraße 30 in 95440 Bayreuth [email protected]