phytoplankton distribution and productivity in a highly turbid, tropical coastal system (bach dang...
TRANSCRIPT

Marine Pollution Bulletin 62 (2011) 2317–2329
Contents lists available at SciVerse ScienceDirect
Marine Pollution Bulletin
journal homepage: www.elsevier .com/locate /marpolbul
Phytoplankton distribution and productivity in a highly turbid, tropical coastalsystem (Bach Dang Estuary, Vietnam)
E.J. Rochelle-Newall a,⇑, V.T. Chu b, O. Pringault a, D. Amouroux c, R. Arfi d, Y. Bettarel a, T. Bouvier a,C. Bouvier a, P. Got a, T.M.H. Nguyen b, X. Mari a, P. Navarro c, T.N. Duong b, T.T.T. Cao b, T.T. Pham b,S. Ouillon e, J.-P. Torréton a
a ECOSYM, UMR 5119 (CNRS-IRD-UM2-IFREMER), Université Montpellier II, Case 093, Place Bataillon, 34095 Montpellier, Franceb Institute of Marine Environment and Resources (IMER), 246 Da Nang Street, Hai Phong City, Vietnamc LCABIE-IPREM, UMR 5254 (CNRS-UPPA), Université de Pau et des Pays de l’Adour, Hélioparc, 2 av. Pdt Angot, 64053 Pau, Franced LOPB, UMR 6535 (IRD-Université de la Méditerranée-CNRS), Centre d’Océanologie de Marseille, 13009 Marseille, Francee LEGOS, UMR 5566 (CNES-CNRS-IRD-UPS), Université de Toulouse, 14 Avenue Edouard Belin, 31400 Toulouse, France
a r t i c l e i n f o
Keywords:Organometallic species (Hg and Sn)HydrodynamicsPrimary and bacterial productionPhytoplankton diversityTropical estuariesMercuryOrganotinPhytoplankton–bacterioplankton coupling
0025-326X/$ - see front matter � 2011 Elsevier Ltd. Adoi:10.1016/j.marpolbul.2011.08.044
⇑ Corresponding author. Present address: BIOEMCINRA-ENS-IRD-AgroParisTech-Université Paris-Est), ERue d’Ulm, 75005 Paris, France.
E-mail address: [email protected] (E.J.
a b s t r a c t
Phytoplankton diversity, primary and bacterial production, nutrients and metallic contaminants weremeasured during the wet season (July) and dry season (March) in the Bach Dang Estuary, a sub-estuaryof the Red River system, Northern Vietnam. Using canonical correspondence analysis we show that phy-toplankton community structure is potentially influenced by both organometallic species (Hg and Sn)and inorganic metal (Hg) concentrations. During March, dissolved methylmercury and inorganic mercurywere important factors for determining phytoplankton community composition at most of the stations.In contrast, during July, low salinity phytoplankton community composition was associated with partic-ulate methylmercury concentrations, whereas phytoplankton community composition in the highersalinity stations was more related to dissolved inorganic mercury and dissolved mono and tributyltinconcentrations. These results highlight the importance of taking into account factors other than lightand nutrients, such as eco-toxic heavy metals, in understanding phytoplankton diversity and activityin estuarine ecosystems.
� 2011 Elsevier Ltd. All rights reserved.
1. Introduction
Determining the factors that control diversity and function is offundamental importance if we wish to understand how ecosys-tems respond to climate and man-induced change. This is of partic-ular importance in coastal ecosystems because despite theirrelatively small total area as compared to that of the global ocean,they play an important role in the aquatic carbon cycle (e.g. Borgeset al., 2005). Moreover, with a large percentage of the world’s pop-ulation living within 100 km of the coast (Halpern et al., 2008), theimpact of human activities on aquatic biodiversity and functioncannot be ignored.
Coastal seas and estuaries are ecosystems where the mixing offresh and marine waters exerts considerable changes in physico-chemical properties and biological processes. Overlain with thisare the impacts of waste water and other effluents, such as organo-metallic species, from industrial and urban activities. All of which
ll rights reserved.
O, UMR 7618 (UPMC-CNRS-cole Normale Supérieure, 46
Rochelle-Newall).
can exert a non-negligible impact on the structure and functionof planktonic communities. Differences in phytoplankton and bac-terioplankton salinity and nutrient tolerances can induce markedshifts in community diversity along estuarine salinity gradients(del Giorgio and Bouvier, 2002; Lemaire et al., 2002; Muylaertet al., 2009), in resource utilization (Thottathil et al., 2008) andcan alter water quality through its control on nutrient export orstockage (Cardinale, 2011).
Shifting community diversity also impacts biogeochemicalprocesses and carbon fluxes. Variations in primary production,respiration and pCO2 flux along estuarine salinity gradients are re-lated to shifting community diversity, nutrient and organic carbonavailability and turbidity (Fisher et al., 1988, 1999; Smith andKemp, 2001). It is therefore probable that estuarine metabolicbalance is intimately linked to that of biological diversity (Borgeset al., 2006; Smith and Kemp, 2001). These factors combinedDOM concentration and bioavailability (Raymond and Bauer,2000; Rochelle-Newall et al., 2007) all underline the importanceof understanding the factors that control community compositionin estuarine and coastal waters.
Although many studies such as those cited above have exam-ined the links between the factors influencing phytoplankton
2318 E.J. Rochelle-Newall et al. / Marine Pollution Bulletin 62 (2011) 2317–2329
diversity and community composition and the relationship be-tween primary production and respiration in estuarine and coastalsystems in temperate ecosystems (e.g. Chesapeake Bay, ColumbiaRiver Estuary), less research has been focused on the factors thatcontrol phytoplankton diversity in tropical coastal ecosystems,nor has the role of organometallic contaminants been examined.Nutrient concentration and availability are obvious factors control-ling phytoplankton diversity and production (Ferguson et al., 2004;Jacquet et al., 2006), particularly in estuaries, and other factorssuch as heavy metal contamination are also known to be importantin sensitive coastal ecosystems (see review of Peters et al., 1997). Thehigh toxicity of mercury and methylmercury to humans is wellknown and this has spurred many of the investigations of the roleand bioaccumulation of this metal in aquatic food webs (e.g. Downset al., 1998; Duarte et al., 2007; Ullrich et al., 2001). However, fewstudies have examined the impact of mercury on phytoplanktoncommunity structure and production in tropical estuarine systems.Other metals, such as organotin compounds (tributyltin and itsderivatives) can also reach high concentrations in coastal systems,particularly around ports (Nhan et al., 2005; Oliveira and Santelli,2010). Many of the studies on the impact of these compounds onaquatic ecosystems have focused on invertebrates and some havepointed out the negative impact of TBT (tributyltin) on phytoplank-ton populations in temperate systems (Petersen and Gustavson,2000; Sargian et al., 2005; Sayer et al., 2006). However, few havelooked at the role of these and other contaminants in determiningphytoplankton community structure and microbial carbon flow intropical estuaries. In the Southwest lagoon of New Caledonia, an oli-gotrophic coral reef lagoon, it has been recently shown that elevatedheavy metal concentrations can influence phytoplankton commu-nity structure, particularly in sites that had no prior exposure to ele-vated zinc and nickel concentrations (Rochelle-Newall et al., 2008a).However, the impact of other heavy metals, such as mercury and or-ganotin on the lower levels of the food web of tropical, eutrophiccoastal ecosystems has largely been ignored despite the ecologicaland biogeochemical importance of these ecosystems in terms ofcoastal carbon fluxes (Borges, 2005).
Here we present an investigation into some of the factorspotentially controlling phytoplankton community compositionand activity during two seasons in a turbid, tropical estuarine sys-tem (Bach Dang River Estuary, North Vietnam). Although many
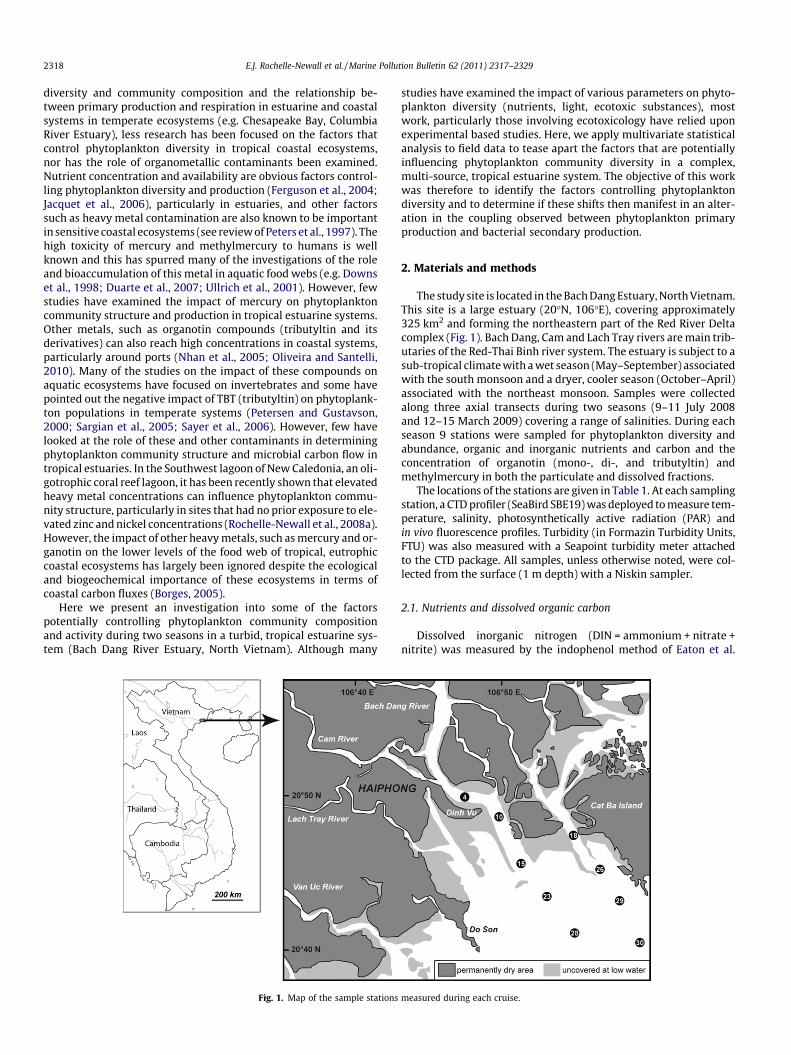
Fig. 1. Map of the sample stations
studies have examined the impact of various parameters on phyto-plankton diversity (nutrients, light, ecotoxic substances), mostwork, particularly those involving ecotoxicology have relied uponexperimental based studies. Here, we apply multivariate statisticalanalysis to field data to tease apart the factors that are potentiallyinfluencing phytoplankton community diversity in a complex,multi-source, tropical estuarine system. The objective of this workwas therefore to identify the factors controlling phytoplanktondiversity and to determine if these shifts then manifest in an alter-ation in the coupling observed between phytoplankton primaryproduction and bacterial secondary production.
2. Materials and methods
The study site is located in the Bach Dang Estuary, North Vietnam.This site is a large estuary (20�N, 106�E), covering approximately325 km2 and forming the northeastern part of the Red River Deltacomplex (Fig. 1). Bach Dang, Cam and Lach Tray rivers are main trib-utaries of the Red-Thai Binh river system. The estuary is subject to asub-tropical climate with a wet season (May–September) associatedwith the south monsoon and a dryer, cooler season (October–April)associated with the northeast monsoon. Samples were collectedalong three axial transects during two seasons (9–11 July 2008and 12–15 March 2009) covering a range of salinities. During eachseason 9 stations were sampled for phytoplankton diversity andabundance, organic and inorganic nutrients and carbon and theconcentration of organotin (mono-, di-, and tributyltin) andmethylmercury in both the particulate and dissolved fractions.
The locations of the stations are given in Table 1. At each samplingstation, a CTD profiler (SeaBird SBE19) was deployed to measure tem-perature, salinity, photosynthetically active radiation (PAR) andin vivo fluorescence profiles. Turbidity (in Formazin Turbidity Units,FTU) was also measured with a Seapoint turbidity meter attachedto the CTD package. All samples, unless otherwise noted, were col-lected from the surface (1 m depth) with a Niskin sampler.
2.1. Nutrients and dissolved organic carbon
Dissolved inorganic nitrogen (DIN = ammonium + nitrate +nitrite) was measured by the indophenol method of Eaton et al.
measured during each cruise.
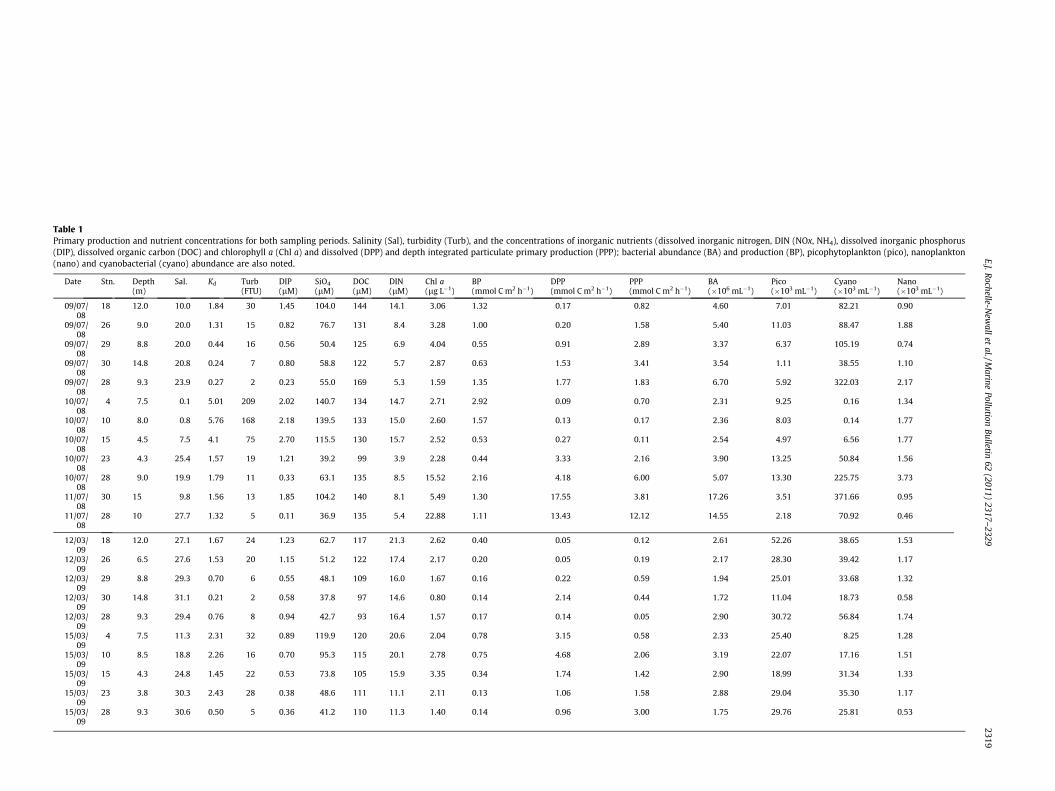
Table 1Primary production and nutrient concentrations for both sampling periods. Salinity (Sal), turbidity (Turb), and the concentrations of inorganic nutrients (dissolved inorganic nitrogen, DIN (NOx, NH4), dissolved inorganic phosphorus(DIP), dissolved organic carbon (DOC) and chlorophyll a (Chl a) and dissolved (DPP) and depth integrated particulate primary production (PPP); bacterial abundance (BA) and production (BP), picophytoplankton (pico), nanoplankton(nano) and cyanobacterial (cyano) abundance are also noted.
Date Stn. Depth(m)
Sal. Kd Turb(FTU)
DIP(lM)
SiO4
(lM)DOC(lM)
DIN(lM)
Chl a(lg L�1)
BP(mmol C m2 h�1)
DPP(mmol C m2 h�1)
PPP(mmol C m2 h�1)
BA(�106 mL�1)
Pico(�103 mL�1)
Cyano(�103 mL�1)
Nano(�103 mL�1)
09/07/08
18 12.0 10.0 1.84 30 1.45 104.0 144 14.1 3.06 1.32 0.17 0.82 4.60 7.01 82.21 0.90
09/07/08
26 9.0 20.0 1.31 15 0.82 76.7 131 8.4 3.28 1.00 0.20 1.58 5.40 11.03 88.47 1.88
09/07/08
29 8.8 20.0 0.44 16 0.56 50.4 125 6.9 4.04 0.55 0.91 2.89 3.37 6.37 105.19 0.74
09/07/08
30 14.8 20.8 0.24 7 0.80 58.8 122 5.7 2.87 0.63 1.53 3.41 3.54 1.11 38.55 1.10
09/07/08
28 9.3 23.9 0.27 2 0.23 55.0 169 5.3 1.59 1.35 1.77 1.83 6.70 5.92 322.03 2.17
10/07/08
4 7.5 0.1 5.01 209 2.02 140.7 134 14.7 2.71 2.92 0.09 0.70 2.31 9.25 0.16 1.34
10/07/08
10 8.0 0.8 5.76 168 2.18 139.5 133 15.0 2.60 1.57 0.13 0.17 2.36 8.03 0.14 1.77
10/07/08
15 4.5 7.5 4.1 75 2.70 115.5 130 15.7 2.52 0.53 0.27 0.11 2.54 4.97 6.56 1.77
10/07/08
23 4.3 25.4 1.57 19 1.21 39.2 99 3.9 2.28 0.44 3.33 2.16 3.90 13.25 50.84 1.56
10/07/08
28 9.0 19.9 1.79 11 0.33 63.1 135 8.5 15.52 2.16 4.18 6.00 5.07 13.30 225.75 3.73
11/07/08
30 15 9.8 1.56 13 1.85 104.2 140 8.1 5.49 1.30 17.55 3.81 17.26 3.51 371.66 0.95
11/07/08
28 10 27.7 1.32 5 0.11 36.9 135 5.4 22.88 1.11 13.43 12.12 14.55 2.18 70.92 0.46
12/03/09
18 12.0 27.1 1.67 24 1.23 62.7 117 21.3 2.62 0.40 0.05 0.12 2.61 52.26 38.65 1.53
12/03/09
26 6.5 27.6 1.53 20 1.15 51.2 122 17.4 2.17 0.20 0.05 0.19 2.17 28.30 39.42 1.17
12/03/09
29 8.8 29.3 0.70 6 0.55 48.1 109 16.0 1.67 0.16 0.22 0.59 1.94 25.01 33.68 1.32
12/03/09
30 14.8 31.1 0.21 2 0.58 37.8 97 14.6 0.80 0.14 2.14 0.44 1.72 11.04 18.73 0.58
12/03/09
28 9.3 29.4 0.76 8 0.94 42.7 93 16.4 1.57 0.17 0.14 0.05 2.90 30.72 56.84 1.74
15/03/09
4 7.5 11.3 2.31 32 0.89 119.9 120 20.6 2.04 0.78 3.15 0.58 2.33 25.40 8.25 1.28
15/03/09
10 8.5 18.8 2.26 16 0.70 95.3 115 20.1 2.78 0.75 4.68 2.06 3.19 22.07 17.16 1.51
15/03/09
15 4.3 24.8 1.45 22 0.53 73.8 105 15.9 3.35 0.34 1.74 1.42 2.90 18.99 31.34 1.33
15/03/09
23 3.8 30.3 2.43 28 0.38 48.6 111 11.1 2.11 0.13 1.06 1.58 2.88 29.04 35.30 1.17
15/03/09
28 9.3 30.6 0.50 5 0.36 41.2 110 11.3 1.40 0.14 0.96 3.00 1.75 29.76 25.81 0.53
E.J.Rochelle-N
ewall
etal./M
arinePollution
Bulletin62
(2011)2317–
23292319
2320 E.J. Rochelle-Newall et al. / Marine Pollution Bulletin 62 (2011) 2317–2329
(1995) and Raimbault et al. (1990) for ammonium and nitrate andnitrite, respectively after filtration (Whatman GF/F). Phosphates(DIP) and silicates (SiO4) were measured following the methodsof Grasshoff et al. (1983), after filtration (GF/F Whatman for DIPand 0.2 lm Nuclepore membrane for SiO4). Dissolved organic car-bon (DOC) analyses were performed on filtered (Whatman GF/F)30 mL samples, collected in pre-combusted (450 �C, overnight)glass tubes, sealed with a Teflon lined cap, after preservation with36 lL 85% phosphoric acid (H3PO4). Samples were stored at ambi-ent temperature and in the dark until measurement. DOC concen-tration was measured on a Shimadzu TOC VCPH analyser, usingpotassium phthalate calibration standards over the measurementrange (0–450 lmol C L�1). Certified reference materials (HansellLaboratory, University of Miami) were used to assess the perfor-mance of the instrument on and between measurement days.The machine blank was between 3 and 5 lmol C L�1 for the mea-surement days and the coefficient of variation (CV) of the measure-ment was always less than 2% of the mean of triplicate injections ofduplicate samples.
2.2. Phytoplankton and bacterial abundance and activity
Chlorophyll a (Chl a) was measured on samples collected on GF/F filters using the method of Holm-Hansen et al. (1965). Samplesfor phytoplankton diversity were collected with a 5 L Niskin bottle,following the methods described by Sournia (1978). Upon collec-tion, samples were immediately fixed with Lugol’s solution(3 mL L�1) and stored in the dark until return to the laboratory.Phytoplankton community composition was determined by epi-fluorescence microscopy (Olympus BX51) and a digital camera(Olympus DP12). Cell density was determined using an invertedmicroscope (Leica DMIL) and a Sedgewick Rafter Chamber. Phyto-plankton was identified using standard references (Balech, 1995;Fukuyo et al., 1990; Taylor, 1976; Tomas, 1997; Truong, 1993; Ya-magishi, 1992).
Subsamples for nano- and picophytoplankton, cyanobacteria andtotal bacterial abundance were fixed with buffered formalin (2% v/v)and stored immediately in liquid nitrogen until analysis by flowcytometry. Nano- (2–20 lm) and picophytoplankton (<2 lm) cellswere detected and counted as described previously (Campbellet al., 1994; Crosbie et al., 2003; Troussellier et al., 1993) using a FAC-SCalibur flow cytometer (Becton Dickinson, San Jose, CA) with an air-cooled argon laser (488 nm, 15 mW). Cells excited at 488 nm weredetected and counted using their right-angle light scattering (RALS)properties and their orange (585 nm filter) and red (465 nm filter)fluorescence from phycoerythrin and chlorophyll pigments, respec-tively. For each analysis, fluorescent beads (1, 2, 6, 10, 20 lm, Poly-sciences, Inc., Warrington, PA) were systematically added to eachsample to standardize the flow cytometer settings. Cell abundanceswere estimated by adding a known volume of fluorescent beads(True-Counts, Becton Dickinson) with known concentration.
Bacterial abundance was measured by staining with SYBR-Green I (Molecular Probes, OR, USA) as described by Marie et al.(1997) and sonication during 10 mn (Ultrasonik 300 Ney). Thestained bacterial cells, excited at 488 nm, were enumerated usingright-angle light scatter (RALS) and green fluorescence (FL1) at530 nm. Fluorescent beads (0.96 and 2 lm, Polysciences, Inc., War-rington, PA, USA) were added to each sample as an external stan-dard. True count beads (Becton Dickinson, San Jose, CA) wereadded to determine the volume analysed.
Primary production (dissolved primary production, DPP andparticulate primary production, PPP) was measured following Ro-chelle-Newall et al. (2008b). Briefly, 39 mL water samples wereinoculated with 1.2 MBq of NaH14CO3 (Perkin–Elmer) and incu-bated in a semi-continuous flowing seawater bath under neutraldensity screening (100%, 50%, 25%, 12.5%, 6%, 0% incident sunlight).
After 4 h of incubation, samples were carefully filtered at low vac-uum pressure onto 0.4 lm polycarbonate filters (Whatman Cyclo-pore). After acidification and drying of the filters, 5 mL ofscintillation cocktail (Ultima Gold, Packard Instruments) was added.The amount of 14C incorporated into the particulate phase (PPP) wascalculated using an inorganic carbon concentration of25700 lg C L�1 (Marañón et al., 2004). For the DPP measurement,duplicate 5 mL of filtrate were collected, acidified with 100 lL of5 mol L�1 HCl and left for 24 h on a horizontal agitator table. Afteragitation, 15 mL of scintillation cocktail (Ultima Gold XR, PackardInstruments) was added and the samples counted using a BeckmanCoulter LS 6500 Multi Purpose scintillation counter. For the radioac-tivity measurements, the production rate of a sample was consid-ered to be significant when the scintillation count of the samplewas at least 3 times that of the blank. Total primary production(TPP) represents the sum of DPP and PPP. Depth integrated primaryproduction was calculated using the primary production measure-ments obtained in the simulated in situ incubations using lightscreens (100%, 50%, 25%, 12.5% and 6.25%, 0%). These rates were thenrelated to the corresponding light levels and hence depths in thewater column as obtained from the CTD light profiles. Bacterial pro-duction (BP) was measured using 3H–leucine, following the methodof Smith and Azam (1992) and following the protocol detailed inRochelle-Newall et al. (2008a). The only differences were that weused 40 nM (final concentration) high specific activity 3H–leucine(Perkin Elmer) and the incubations were conducted in the dark andat in situ temperature. Leucine uptake was converted to carbon usingthe conversion factor 1.55 kg C mol�1 leu (Kirchman, 2001). As bac-terial production was only measured at two depths, the same method(trapezoidal method) was used, only with two depth sections.
2.3. Concentration of metallic species
All the vessels used for collection and filtration were firstwashed with detergent then rinsed with MQ water. They werethen cleaned in successive acid baths (nitric acid and hydrochloricacid) and rinsed with Milli-Q water before drying in a laminar flowhood. All containers were then stored in double sealed polyethyl-ene bags until use. Samples were collected by hand from thesub-surface in pre-cleaned 2 L PFA bottles (Nalgene). New shoulderlength, polyethylene gloves were used for each sampling to avoidany contamination. In order to determine the particulate and dis-solved concentration of metallic species, each water sample (0.3–1.5 L) was filtered through a pre-cleaned and labelled Durapore�
PVDF filter membrane (0.45 lm, Millipore, Bedford, MA, USA).Water samples were acidified (0.1% HCl w/v, Traceselect grade, Sig-ma Aldrich) and stored in pre-cleaned Teflon PFA bottles (Nalgene)at 4 �C until analysis. Each filter was rinsed with ultrapure waterand immediately stored at �20 �C until analysis. Daily filtrationblanks were also performed. Dissolved and particulate speciationanalysis was carried out as previously described in Monperruset al. (2005), Rodriguez-Gonzalez et al. (2005) and Martin-Doimea-dios et al. (2003), using gas chromatography-inductively coupledplasma-mass spectrometry (GC-ICP-MS, Thermo Fisher) combinedwith isotope dilution, obtaining precise and accurate data at lowconcentration levels present in the samples. For quality assurance,the certified reference materials (CRM) estuarine sedimentIAEA-405 (International Atomic Energy Agency, Monaco) formethylmercury and total mercury analysis and the marine sedi-ment PACS-2 (National Research Council Canada, Ottawa, Canada)for butyltin species were used. For isotope dilution, the speciesused were IHg enriched in 199Hg (91%), MeHg enriched in 201Hg(96.5%) and a mix of MBT, DBT and TBT enriched in 119Sn (82.4%;ISC Science, Oviedo, Spain). Procedural blanks were performedwith each batch of analyses to control for contamination duringsample preparation.
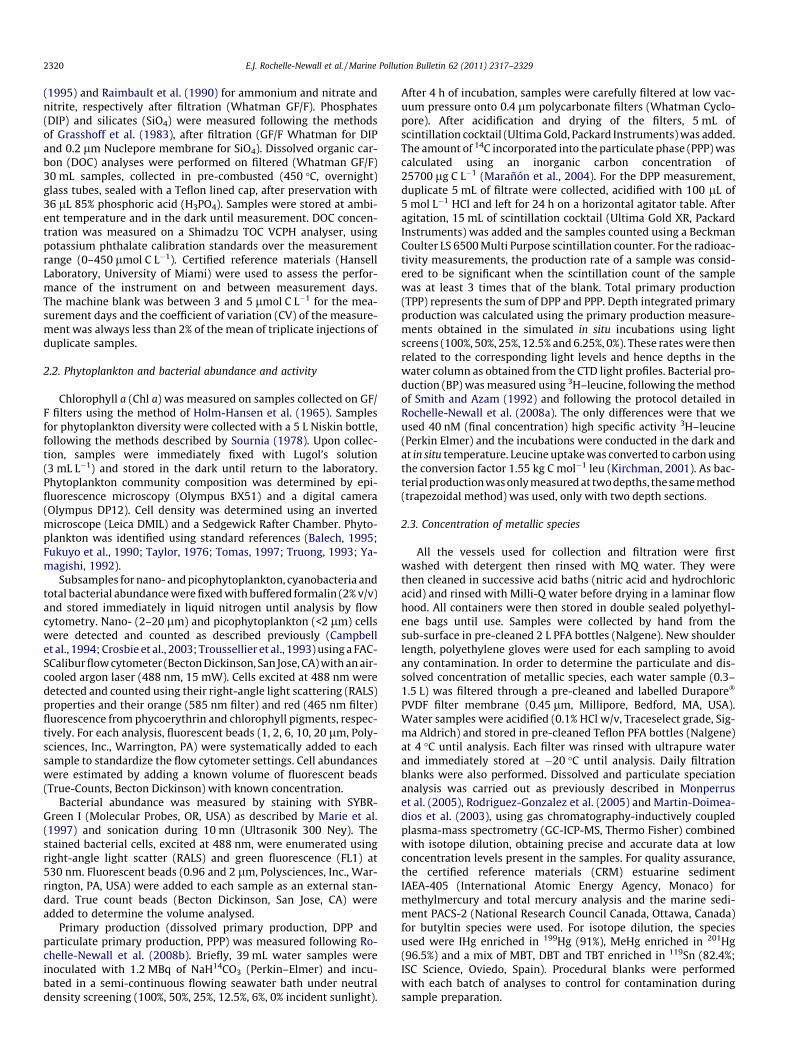
Fig. 2. Correspondence analysis (CA) of the environmental variables for eachstation and for July (wet season) and March (dry season). Black triangles (July) andwhite triangles (March).
E.J. Rochelle-Newall et al. / Marine Pollution Bulletin 62 (2011) 2317–2329 2321
2.4. Export of nutrients
The export of carbon and nutrients (organic and inorganic) wasdetermined using the flow volumes of the respective tributariesand the average low tide nutrient concentrations in the river. Riverdischarge was determined from cross-sections of velocity profilesthat were measured nine times per tidal cycle using an AcousticDöppler Currentmeter Profiler RDI Workhouse 1200 kHz (Lefebvreet al., in review). Total net flow is calculated from riverine outflowand marine inflow as calculated from transversal current measure-ments (measured from bank to back across the channel during thediurnal tidal cycle) conducted during 24 h cycles on the river. Thus,if a value is positive, i.e. the netflow is going in the seaward direc-tion, it is considered that the source is riverine. Conversely, if thenet value is negative, that is, it is going upstream, it is consideredthat the source is marine or estuarine. All samples were collectedduring the neap tide when the tidal range was a few tens of centi-metres as compared to 4 m at spring tide. This sampling methodwas chosen to minimise the impact of the tidal regime on the spa-tial distribution of biological parameters.
2.5. Statistical analyses
In order to estimate the similarity between two phytoplanktoncommunities, the Whittaker similarity index (W) was calculatedusing the following equation.
W ¼ 1�Xn
i¼1
jai1 � ai2j2
� �
where a1 and a2 are relative abundance in samples 1 and 2, respec-tively. Since this index takes into account relative abundances, itprovides a better estimate of the similarity between two communi-ties (Hewson and Fuhrman, 2006). Spatial variation of phytoplank-ton community structure, and hence diversity, at each station wasassessed by correspondence analysis (CA). The extent of the corre-lation of phytoplankton species diversity at each station with thecorresponding environmental factors was assessed by canonicalcorrespondence analysis (CCA) according to the procedure de-scribed by Fourçans et al. (2006). CA and CCA were performed withMVSP v3.12d software (Kovach Computing Service, AngleseyWales). Relative abundances of phytoplankton species were trans-formed with arcsin (�0.5) according to Legendre and Legendre(1998) to normalize the distribution of the data as it is a conditionrequired before applying multivariate statistical analysis (Dollhopfet al., 2001).
3. Results
3.1. Environmental conditions
The environmental conditions of the two sample periods dif-fered considerably (Table 1, Fig. 2). In July, temperatures werehigher (28.5–31.1 and 18.5–23.1 �C, for July and March, respec-tively) and river discharge was higher, reflecting the higher precip-itation rates observed during July (Table 2). For example, at St. 4,river outflow was 988 m3 s�1 in July as compared to 175 m3 s�1
in March (Lefebvre et al., in review). Consequently, surface salinitywas lower and turbidity was up to an order of magnitude higherduring July (Table 1). Reflecting the higher riverine inputs, cleargradients of salinity and nutrients were observed along the estua-rine gradient during July. In contrast, during March, when riverflow was lower, salinity and nutrients were relatively homogenousalong the estuary. The large physical dispersion of the stationsmeant that a large range of salinities was covered: 0.11–27.7 and11.3–31.1 for July and March, respectively (Table 1). In general,
the highest salinities were observed at Stn. 28 and the lowest wereobserved in Stns. 4 and 10. However, there was a difference of over11 salinity units at Stn. 4, the river station between the two sea-sons (0.11 and 11.3 for July and March, respectively).
3.2. Nutrient concentrations
DIN concentrations ranged from 3.9 to 15.7 lM N and 11.1 and21.3 lM N for July and March, respectively, with the concentra-tions being significantly higher during March (t-test, p < 0.05), Ta-ble 1. In general, the highest concentrations were observed in thelow salinity stations (Stns. 4 and 10) and the lowest in the highsalinity stations (Stns. 23 and 28). There was no significant differ-ence between either DIP or SiO4 concentrations between the twosamplings. Concentrations of DIP varied between 0.11 and2.7 lM PO4 and 0.36 and 1.23 lM PO4 for July and March, respec-tively. During July, the highest concentrations were observed in thelower salinity stations (2.02–2.70 lM PO4, for Stns. 4, 10 and 15;Table 1). In contrast, during March at was at Stns. 18 and 26 thatthe highest values were observed (1.23 and 1.15 lM PO4 for Stns.18 and 26, respectively. In contrast, silicate concentrations were al-ways highest in the low salinity stations (Stns. 4 and 10) duringboth seasons and lowest in the high salinity waters. Concentrationsranged from 39.9 to 140.7 lM SiO4 and 37.8 to 119.9 lM SiO4 forJuly and March, respectively and were higher during July. The gen-eral positive net seaward flows of nutrients and DOC (Table 2) anda general trend of decreasing nutrients with increasing salinity wasobserved for both sample periods, indicating their freshwater ori-gin. In contrast to the nutrient fluxes, Chl a flux was negative, indi-cating a marine or estuarine, rather than freshwater, source. Thiswas the case for both sample periods, with the net flux almost afactor of 10 higher in July (�173.92) than in March (�22.93) atthe confluence station (Table 2).
3.3. Metallic species concentrations (Hg, butyl-Sn)
Concentrations of tin (butyl-Sn) and mercury species varied be-tween stations and season and fell within the range of those ob-served in temperate estuaries. For tributyltin (TBT), theconcentrations of both particulate and dissolved forms were higherin July than in March; no significant difference of mono-butyl tinconcentration was found between the two seasons when the entiredataset was compared. There were however some differences be-tween specific stations over the two seasons. For example, at Stn.

Table 2Fluxes of dissolved organic carbon (DOC), inorganic nutrients in tons of C, N, Si and P per day and chlorophyll a in kg per day. Measurements were made at the confluence of theCam and Bach Dang Rivers, 300 m upstream of Stn. 4 (see Fig. 1). Positive values mean that the net flow is in the seaward direction and negative values indicate a net flow in thelandward direction. Total flow is calculated from the sum of the river and marine flows.
Sample period Flux DOC (tons C day�1) Chl a (kg day�1) DIN (tons N day�1) SiO3 (tons Si day�1) PO4 (tons P day�1)
July 2008 Total 199.42 �173.92 14.06 345.16 9.74Incoming (marine) �175.53 �306.10 �18.15 �317.13 �10.98Outgoing (river) 374.95 132.18 32.21 662.30 20.72
March 2009 Total 23.85 �22.93 9.68 89.23 0.57Incoming (marine) �120.79 �208.13 �31.58 �335.23 �2.63Outgoing (river) 144.64 185.21 41.25 424.45 3.20
Table 3Metal concentrations measured at each station during both sample periods. TBT, DBT, MBT: tri-, di- and mono-butyltin in the particulate (p) and dissolved (d) fractions. MeHg:methylmercury in the particulate (p) and dissolved fractions (d); IHgP: inorganic mercury in the particulate (p) and dissolved (d) fractions.
Date Station TBTp(ng L�1)
DBTp(ng L�1)
MBTp(ng L�1)
TBTd(ng L�1)
DBTd(ng L�1)
MBTd(ng L�1)
MeHgp(ng L�1)
IHgp(ng L�1)
MeHgd(ng L�1)
IHgd(ng L�1)
09/07/08 18 – – – 0.768 1.294 0.164 0.0094 1.0705 0.0139 1.220109/07/08 26 0.593 0.940 0.417 1.641 1.370 0.186 0.0031 0.6187 0.0133 0.844809/07/08 29 0.541 0.845 0.355 1.381 1.688 0.373 0.0055 0.6515 0.0133 1.561409/07/08 30 0.726 0.776 0.278 2.257 1.519 0.241 0.0034 0.7455 0.0174 0.554009/07/08 28 0.509 0.809 0.332 1.164 1.519 0.215 0.0096 0.6462 0.0089 0.544110/07/08 4 0.976 2.233 0.916 1.386 1.110 0.205 0.0150 4.4525 0.0230 0.389210/07/08 10 0.838 2.084 0.923 1.272 0.875 0.142 0.0283 5.6659 0.0213 0.585410/07/08 15 0.777 1.771 0.709 1.684 1.285 0.199 0.0701 4.4514 0.0184 1.262310/07/08 23 1.105 1.973 0.855 0.972 1.046 0.165 0.0073 1.5198 0.0108 0.403210/07/08 28 0.946 1.083 0.460 1.538 0.985 0.156 0.0098 0.8324 0.0099 0.182811/07/08 30 0.443 0.599 0.258 1.711 1.689 0.224 0.0016 0.6111 0.0120 0.986911/07/08 28 0.536 0.679 0.294 0.828 1.695 0.204 0.0087 0.7436 0.0092 0.4876
12/03/09 18 0.087 1.716 0.575 0.341 9.022 0.254 0.0154 0.9553 0.0187 0.376312/03/09 26 0.046 1.238 0.442 0.207 10.046 0.186 0.0284 0.7971 0.0148 0.288512/03/09 29 0.033 0.875 0.927 0.215 9.852 0.359 0.0067 0.3845 0.0181 0.307412/03/09 30 0.027 0.538 0.296 0.129 9.030 0.415 0.0076 0.2200 0.0142 0.249712/03/09 28 0.051 0.770 0.402 0.324 10.759 0.486 0.0118 0.4646 0.0116 0.268715/03/09 4 0.052 4.666 1.333 0.997 1.066 0.083 0.0368 1.1710 0.0108 0.276815/03/09 10 0.048 1.740 0.487 0.908 1.349 0.109 0.0176 0.7066 0.0120 0.256315/03/09 15 0.034 1.832 0.512 0.320 9.493 0.266 0.0199 0.6435 0.0156 0.229815/03/09 23 0.020 1.522 0.308 0.211 10.229 0.235 0.0108 0.6808 0.0174 0.443215/03/09 28 0.033 0.500 0.181 0.172 9.093 0.225 0.0046 0.2629 0.0097 0.2803
– : Not determined.
2322 E.J. Rochelle-Newall et al. / Marine Pollution Bulletin 62 (2011) 2317–2329
4, the concentration of particulate MBT was 0.916 ng L�1 comparedto 1.333 ng L�1 for July and March, respectively (Table 3). Fordi-butyl tin, although the concentration of the particulate form,despite small scale variability, did not vary significantly betweenseason at each station, the concentrations of the dissolved form weresignificantly higher in March for almost all the stations (Table 3). Forexample, at Stn. 26, concentrations of DBTd were 1.37 ng L�1 ascompared to 10.05 ng L�1 for July and March, respectively.
The concentrations of mercury species (dissolved and particulateinorganic and methylmercury) also varied between station and be-tween season. In general, inorganic mercury concentrations (bothparticulate and dissolved forms) were higher in July (0.61–5.67and 0.18–1.56 ng L�1 for particulate and dissolved IHg, respec-tively), than during March (0.22–1.17 and 0.22–0.44 ng L�1 for par-ticulate and dissolved IHg respectively; Table 3). Particulatemethylmercury (MeHgp) concentrations were generally low(0.003–0.071 ng L�1) during both July and March. At some stationsthe concentrations of the particulate form of MeHg were higher dur-ing July (0.028 and 0.070 ng L�1) than during March (0.018 and0.02 ng L�1) at Stns. 10 and 15, respectively. Whereas at other sta-tions (e.g. 18, 26) concentrations were higher during March (0.015and 0.028 ng L�1) than during July (0.009 and 0.0031 ng L�1; Ta-ble 3). Dissolved methylmercury (MeHgd) was also low and variedbetween 0.0089 and 0.0230 ng L�1 for July and 0.0097–0.0187 ng L�1 for March. The highest concentrations were observed
in the lower salinity stations (Stns. 10 and 15) during July and in themore offshore stations during March (Stns. 18, 23, and 30).
3.4. Phytoplankton abundance and diversity
Differences in phytoplankton abundance and diversity, as deter-mined by microscopy were also evident between the two samplingperiods (Tables 1 and 4, Fig. 3, Table 1 Supplementary materials),with total Chl a concentrations being higher during July. In July,diatoms dominated at all stations, the only exceptions were Stns.29 and 23 sampled on the 9th and 10th July, respectively. In allthe other cases, the diatom group (Bacillariophyceae) representedbetween 43% and 99% of the phytoplankton community, with thedinoflagellates (Dinophyceae), chlorophytes (Chlorophyceae) andcyanobacteria making up the bulk of the rest of the community.In Stns. 29 and 23, dinoflagellates dominated the phytoplanktoncommunity (76% and 54%, respectively), with the diatom groupbeing the second most dominant. In general, very few eugleno-phytes (Euglenophyceae) and silico-flagellates (Dictyochophyceae)were observed across the estuary. Little variation in terms of groupdominance was observed along the salinity gradient during thisseason. The only exceptions were at the lowest salinity sites(<7.6 salinity), where relatively high abundances of chlorophytesand in the case of Stn. 15, dinoflagellates were observed. In con-trast to the microphytoplankton, the abundance of cyanobacteria

Table 4Relative percentage (%) contributions of each phytoplankton group as determined from the microscope counts.
Date Station Chlorophyceae Cyanobacteria Bacillariophyceae Dinophyceae Euglenophyceae Dictyochophyceae
09/07/08 18 0.2 2.8 92.4 5.6 0 009/07/08 26 0.2 0 98.7 1.1 0 009/07/08 29 0 1.0 23.1 75.9 0 009/07/08 30 0 0 98.6 1.4 0 009/07/08 28 0 0 98.0 2.0 0 0010/07/08 4 15.2 19.5 61.3 3.1 0 010/07/08 10 22.6 7.5 63.5 3.1 0.8 0.610/07/08 15 13.7 22.3 43.6 19.9 2.5 010/07/08 23 0.8 1.6 44.2 53.5 0.5 010/07/08 28 0 0.1 95.5 3.1 0 011/07/08 30 0.1 0.1 94.4 4.7 0 011/07/08 28 – – – – – –
12/03/09 18 0 0 79.8 19.4 0 0.812/03/09 26 0 0 65.4 34.6 0 012/03/09 29 0 0 86.9 13.1 0 012/03/09 30 0 0 46.4 53.6 0 012/03/09 28 0 0 65.5 30.9 0 3.615/03/09 4 0 0 94.2 5.84 0 015/03/09 10 0 0 76.5 23.5 0 015/03/09 15 0 0 50.7 49.3 0 015/03/09 23 0 0 64.9 35.1 0 015/03/09 28 0 0 51.9 48.1 0 0
– : Not determined.
Fig. 3. Dendrogram of phytoplankton diversity for July and March. The numbers correspond to the sampling stations.
E.J. Rochelle-Newall et al. / Marine Pollution Bulletin 62 (2011) 2317–2329 2323
cells (<3 lm) as determined by flow cytometry, varied over threeorders of magnitude (Table 1). Abundances were particularly lowat the riverine stations (0.14 � 103 and 0.16 � 103 cell mL�1) withthe highest abundances observed at Stns. 28 and 30 (322 � 103
and 371 � 103 cell mL�1, respectively). Pico- and nanophytoplank-ton abundances varied by less than one order of magnitude alongthe salinity gradient, with the highest abundances occurring inthe offshore, higher salinity stations (Table 1).
During March, and similar to the situation in July, diatoms dom-inated the community with abundances of over 65–99% of total(Table 4). The only exceptions were Stns. 30, 15 and 28, whenthe diatoms and the dinoflagellates represented almost equal partsof the community. During March, very few phytoplankton cellsfrom the other groups were found and there was little clear evi-dence of a distribution varying along the salinity gradient. In sharpcontrast to the situation during July, there was little variability incyanobacterial abundance along the salinity gradient. There was
at most a factor of four difference between Stn. 4 and Stn. 28(8.2 � 103 and 56.8 � 103 cell mL�1, respectively, Table 1). This rel-ative stability was also reflected in the pico- and nanophytoplank-ton abundances, despite a factor of 5 increase in picoplanktonabundance relative to that of July.
Despite the general dominance of the diatom group between thetwo seasons, the actual phytoplankton species present differedconsiderably between the two sampling periods (Fig. 3). Indeed,the percentage similarities in diversity between July and Marchwere very low and never exceeded 2% (Fig. 3; Table 1 Supplementarymaterials). For example, the diatoms Chaetoceros subtilis,Skeletonema costatum, Melosira granulata and M. granulatav. angustissima dominated in July. At the two stations (23 and 29)where dinoflagellates dominated the community, Protoperidiniumc.f. thorianum was the dominant species in terms of abundance. Incontrast, during March, Thalassiosira spp. dominated thephytoplankton assemblage. At Stns. 15 and 30, Thalassiosira spp.
2324 E.J. Rochelle-Newall et al. / Marine Pollution Bulletin 62 (2011) 2317–2329
remained the dominant diatom, however the community assem-blage was also made up of the dinoflagellates Goniodoma polyedra,Ceratium trichoceros, and Protoperidinium spp. at Stn. 30, and of Din-ophysis caudata and Prorocentrum micans at Stn. 15. At Stn. 23, thedominant dinoflagellates were Ceratium spp. with the diatom Pseu-do-nitzschia spp. making up the rest of the community.
3.5. Primary and bacterial abundance and production
The rates of depth integrated dissolved and particulate primaryproduction (DPP and PPP, respectively) and bacterial total abun-dance and production varied between seasons and showed somepronounced differences between stations (Table 1). Bacterial abun-dance and activity were higher during July, with the highest abun-dances found at the offshore Stns. 28 and 30 concurrent with thehighest Chl a concentrations. In general, BP tended to increase withincreasing turbidity however the relationship was not significant
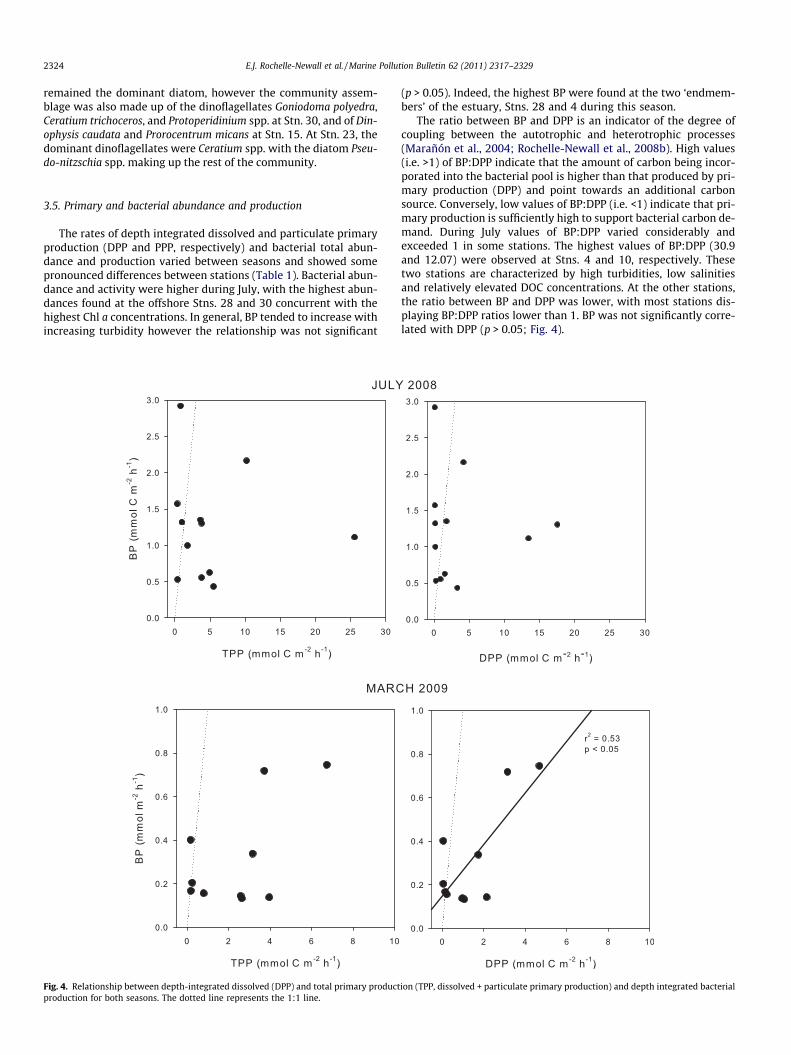
Fig. 4. Relationship between depth-integrated dissolved (DPP) and total primary productproduction for both seasons. The dotted line represents the 1:1 line.
(p > 0.05). Indeed, the highest BP were found at the two ‘endmem-bers’ of the estuary, Stns. 28 and 4 during this season.
The ratio between BP and DPP is an indicator of the degree ofcoupling between the autotrophic and heterotrophic processes(Marañón et al., 2004; Rochelle-Newall et al., 2008b). High values(i.e. >1) of BP:DPP indicate that the amount of carbon being incor-porated into the bacterial pool is higher than that produced by pri-mary production (DPP) and point towards an additional carbonsource. Conversely, low values of BP:DPP (i.e. <1) indicate that pri-mary production is sufficiently high to support bacterial carbon de-mand. During July values of BP:DPP varied considerably andexceeded 1 in some stations. The highest values of BP:DPP (30.9and 12.07) were observed at Stns. 4 and 10, respectively. Thesetwo stations are characterized by high turbidities, low salinitiesand relatively elevated DOC concentrations. At the other stations,the ratio between BP and DPP was lower, with most stations dis-playing BP:DPP ratios lower than 1. BP was not significantly corre-lated with DPP (p > 0.05; Fig. 4).
ion (TPP, dissolved + particulate primary production) and depth integrated bacterial
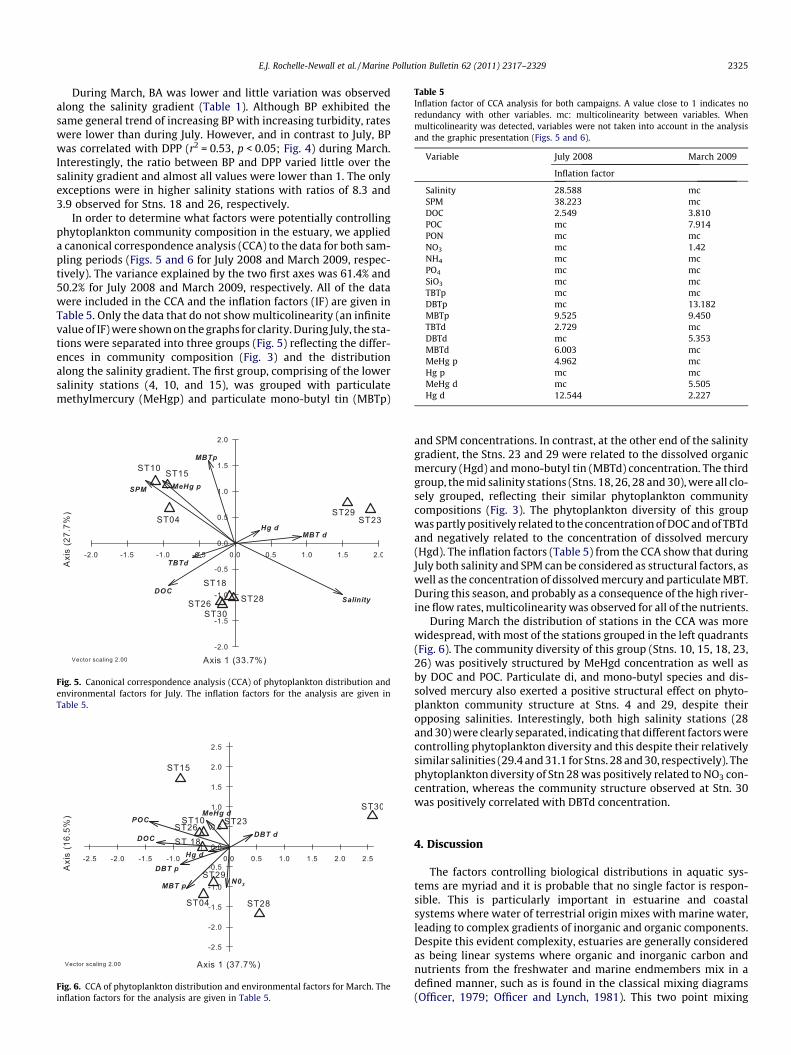
Table 5Inflation factor of CCA analysis for both campaigns. A value close to 1 indicates noredundancy with other variables. mc: multicolinearity between variables. Whenmulticolinearity was detected, variables were not taken into account in the analysisand the graphic presentation (Figs. 5 and 6).
Variable July 2008 March 2009
Inflation factor
Salinity 28.588 mcSPM 38.223 mcDOC 2.549 3.810POC mc 7.914PON mc mcNO3 mc 1.42NH4 mc mcPO4 mc mcSiO3 mc mcTBTp mc mcDBTp mc 13.182MBTp 9.525 9.450TBTd 2.729 mcDBTd mc 5.353MBTd 6.003 mcMeHg p 4.962 mcHg p mc mcMeHg d mc 5.505Hg d 12.544 2.227
E.J. Rochelle-Newall et al. / Marine Pollution Bulletin 62 (2011) 2317–2329 2325
During March, BA was lower and little variation was observedalong the salinity gradient (Table 1). Although BP exhibited thesame general trend of increasing BP with increasing turbidity, rateswere lower than during July. However, and in contrast to July, BPwas correlated with DPP (r2 = 0.53, p < 0.05; Fig. 4) during March.Interestingly, the ratio between BP and DPP varied little over thesalinity gradient and almost all values were lower than 1. The onlyexceptions were in higher salinity stations with ratios of 8.3 and3.9 observed for Stns. 18 and 26, respectively.
In order to determine what factors were potentially controllingphytoplankton community composition in the estuary, we applieda canonical correspondence analysis (CCA) to the data for both sam-pling periods (Figs. 5 and 6 for July 2008 and March 2009, respec-tively). The variance explained by the two first axes was 61.4% and50.2% for July 2008 and March 2009, respectively. All of the datawere included in the CCA and the inflation factors (IF) are given inTable 5. Only the data that do not show multicolinearity (an infinitevalue of IF) were shown on the graphs for clarity. During July, the sta-tions were separated into three groups (Fig. 5) reflecting the differ-ences in community composition (Fig. 3) and the distributionalong the salinity gradient. The first group, comprising of the lowersalinity stations (4, 10, and 15), was grouped with particulatemethylmercury (MeHgp) and particulate mono-butyl tin (MBTp)
Fig. 5. Canonical correspondence analysis (CCA) of phytoplankton distribution andenvironmental factors for July. The inflation factors for the analysis are given inTable 5.
Fig. 6. CCA of phytoplankton distribution and environmental factors for March. Theinflation factors for the analysis are given in Table 5.
and SPM concentrations. In contrast, at the other end of the salinitygradient, the Stns. 23 and 29 were related to the dissolved organicmercury (Hgd) and mono-butyl tin (MBTd) concentration. The thirdgroup, the mid salinity stations (Stns. 18, 26, 28 and 30), were all clo-sely grouped, reflecting their similar phytoplankton communitycompositions (Fig. 3). The phytoplankton diversity of this groupwas partly positively related to the concentration of DOC and of TBTdand negatively related to the concentration of dissolved mercury(Hgd). The inflation factors (Table 5) from the CCA show that duringJuly both salinity and SPM can be considered as structural factors, aswell as the concentration of dissolved mercury and particulate MBT.During this season, and probably as a consequence of the high river-ine flow rates, multicolinearity was observed for all of the nutrients.
During March the distribution of stations in the CCA was morewidespread, with most of the stations grouped in the left quadrants(Fig. 6). The community diversity of this group (Stns. 10, 15, 18, 23,26) was positively structured by MeHgd concentration as well asby DOC and POC. Particulate di, and mono-butyl species and dis-solved mercury also exerted a positive structural effect on phyto-plankton community structure at Stns. 4 and 29, despite theiropposing salinities. Interestingly, both high salinity stations (28and 30) were clearly separated, indicating that different factors werecontrolling phytoplankton diversity and this despite their relativelysimilar salinities (29.4 and 31.1 for Stns. 28 and 30, respectively). Thephytoplankton diversity of Stn 28 was positively related to NO3 con-centration, whereas the community structure observed at Stn. 30was positively correlated with DBTd concentration.
4. Discussion
The factors controlling biological distributions in aquatic sys-tems are myriad and it is probable that no single factor is respon-sible. This is particularly important in estuarine and coastalsystems where water of terrestrial origin mixes with marine water,leading to complex gradients of inorganic and organic components.Despite this evident complexity, estuaries are generally consideredas being linear systems where organic and inorganic carbon andnutrients from the freshwater and marine endmembers mix in adefined manner, such as is found in the classical mixing diagrams(Officer, 1979; Officer and Lynch, 1981). This two point mixing

2326 E.J. Rochelle-Newall et al. / Marine Pollution Bulletin 62 (2011) 2317–2329
model is appealing in its simplicity and has permitted the estima-tion of the role of physico-chemistry and biology in controlling thedistributions of various parameters along the salinity gradient bydetermining if the parameter examined exhibited conservativeand non-conservative mixing. This has been particularly usefulfor understanding organic carbon production and removal, phyto-plankton biomass and diversity as well as other biological param-eters (e.g. Fisher et al., 1998; Rochelle-Newall and Fisher, 2002).However, the use of mixing diagrams is fundamentally based onthe assumption of the presence of two, easily defined endmem-bers: one riverine and one marine. Yet, in many estuaries, particu-larly those that are found in deltaic regions, it is often difficult toaccurately determine these two endmembers. This therefore pre-sents a problem if we wish to understand how and why biologicalparameters vary over spatial distances, particularly in systems,such as this one, that are characterized by complex freshwater in-puts and hydrology during the wet and dry seasons (Lefebvre et al.,in review). The lack of a simple relationship between salinity andmany of the nutrients and DOC in this estuary further underlinesthe complexity of using simple dilution models to understandthe distribution of biological and chemical parameters along estu-arine salinity gradients (Troussellier et al., 2002). In contrast, mul-tivariate analyses such as CCA provide the possibility of identifyingthe multiple factors controlling biological processes in this type ofcomplex ecosystem.
4.1. Phytoplankton diversity and activity
We observed large differences in phytoplankton species distri-butions between wet (July) and dry (March) seasons (Fig. 3). Dur-ing July large shifts in phytoplankton community structurebetween Stns. 4, 10 and 15 and Stn. 23 were observed, despite theirbeing axially aligned. The large difference in salinity between thefirst two stations (<1 salinity unit) and the later station (25 salinityunits) probably explains the differences between the stations assalinity was determined to be one of the important factors control-ling phytoplankton diversity during this season (Fig. 5, Table 5).Salinity is a well known controlling factor of phytoplankton activ-ity and diversity in estuarine systems (e.g. Fisher et al., 1988;Quinlan and Phlips, 2007). It is therefore not surprising thatosmotic stress combined with dilution of nutrient rich riverinewater by higher salinity, more oligotrophic marine water playedsome role in determining community structure. Indeed, as recentlynoted by Bettarel et al. (2011) in the same estuary, viral diversityand life strategy also appear to vary along the salinity gradientfollowing the distributions of their potential hosts.
Although we included the entire dataset in the CCA, we selectedto only present the data that did not show multicolinearity in thegraphs. Indeed, it is here that one of the limits of the CCA is evidentas co-linearity means that we cannot determine the importance ofeach factor separately. During July, and probably as a consequenceof the high riverine inputs, salinity and SPM are strong determi-nant factors for phytoplankton distributions. It is well known thatlight, and thus SPM concentration and nutrients are important fac-tors in determining phytoplankton distributions in estuaries (e.g.Fisher et al., 1988), however, the multicolinearity of all of the nutri-ents (DIN, DIP, SiO4) during July meant that we were unable todetermine which nutrient, if any, was influencing phytoplanktondiversity. In contrast, during March, the strong structural impactof salinity observed in July was not evident and salinity and SPMwere found to be co-linear (Table 5). Moreover, during this season,although the structural impact of most of the inorganic nutrientswas also co-linear, nitrate was found to be a structural factor ofphytoplankton diversity, albeit with a relatively low inflation fac-tor (1.42). Interestingly, during both seasons the inflation factorsrelating to the influence of heavy metal species on phytoplankton
diversity point towards the potential structural role of these metalsin this estuary. This was particularly evident for dissolved and par-ticulate MBT concentration during July (IF = 9.52 and 6.0 for MBTpand MBTd, respectively), and for DBTp and MBTp during March(13.1 and 9.45 for DBTp and MBTp, respectively).
Heavy metals are also known to have a negative impact on phy-toplankton diversity (e.g. Paulsson et al., 2000; Singh and Rai,1991). Tributyltin can reduce the fluorescence yield of phytoplank-ton photosynthesis, probably through its action on the thylakoidmembranes of the photosynthetic apparatus (Sargian et al., 2005;Yoo et al., 2007) and recent evidence from shallow freshwater sys-tems has highlighted the role of TBT in inducing shifts in phyto-plankton community structure (Sayer et al., 2006). Through theiraction on photosynthetic pathways and hence on primary produc-tion, heavy metals can also negatively impact biogeochemical cy-cles even at the low concentrations of TBT similar to those foundin the Bach Dang Estuary. Sidharthan et al. (2002) found significantreductions in growth rate of a marine microalgae Nannochloropsisoculata at concentrations of TBT as low as 0.0625 nM (ca. 7.5 ng/l(as Sn)), similar to the concentrations observed in this work. Theimpact of varying salinity and pH on the toxicity of butyltin speciesand their impacts on phytoplankton community diversity has notbeen widely tested, however the LC50’s of the species that havebeen tested in culture differ by over a factor of 50 (Sidharthanet al., 2002), pointing towards differences in tolerance to TBT. Sim-ilarly, Petersen and Gustavson (2000), working in a Danish coastalsystem observed large differences in the tolerance of pico, nano-and microphytoplankton to TBT. MBT along with DBT are the deg-radation products of TBT and considered less toxic than TBT toaquatic phytoplankton (Maguire et al., 1983), although somemicroorganisms may also exhibit significant sensitivity to DBTand MBT (Gadd, 2000; Lascourrèges et al., 2000).
Moreover, it is known that, at least in culture, that certain spe-cies of phytoplankton such as Chlorella sp. can degrade TBT to DBTand MBT (StLouis et al., 1997; Tsang et al., 1999) and this may wellin part explain some of the relationships between the metallic spe-cies and phytoplankton community structure. Particularly duringMarch where significant degradation of TBT, as indicated by thehigher relative concentrations of MBT to the total butyl-tin concen-trations, may have been occurring (Table 3). Indeed the observeddistributions of the different butyl-tin species suggests that duringJuly organotin species were directly transported seaward, while,during March, various biogeochemical transformations were tak-ing place within the estuary, resulting in higher relative concentra-tions of DBT and MBT. Thus it is probable that TBT and itsdegradation products induce shifts in phytoplankton communitydiversity and productivity in coastal systems.
The impact of mercury on phytoplankton diversity and produc-tion is less clear. Although, high concentrations of mercury speciesare considered to be toxic to aquatic organisms, the lower concen-trations observed in this work are not generally found to negativelyimpact phytoplankton growth or production in cultures (e.g. Fisheret al., 1984; Pickhardt and Fisher, 2007). Indeed, the concentrationsobserved here of methylmercury and inorganic mercury are up to afactor of 10 lower than those found in the San Francisco Bay Estu-ary, a site considered to be contaminated by mercury (Conawayet al., 2003). The relationships observed between the different mer-cury species and phytoplankton diversity may well be due more tothe uptake or absorption capacity of the phytoplankton species andambient DOC concentrations, rather than any negative impact ofmercury on phytoplankton communities. Methylmercury uptakein phytoplankton is known to vary with cell size, cell numberand with DOC concentration (Pickhardt and Fisher, 2007). DuringJuly, phytoplankton community diversity at the lower salinity sta-tions where DOC and mercury concentrations were highest dif-fered greatly from that of the other stations (Fig. 3, Tables 1 and
E.J. Rochelle-Newall et al. / Marine Pollution Bulletin 62 (2011) 2317–2329 2327
2). The presence of small cryptophytes and chlorophytes at thesestations (Stns. 4, 10 and 15), with higher surface to volume ratiosthan that of the diatom cells dominating at the other, more off-shore stations seems to support this hypothesis (Table 4). Indeed,phytoplankton diversity at these three stations was correlated withparticulate methylmercury concentration (MeHgp). We were un-able to determine if this relationship was due to biotic or abioticprocesses as we did not determine if Hg was being actively takenup by these phytoplankton species or if the accumulation of Me-Hgp was due simply to the association of this organometal withthe biogenic particles. Similarly, we observed a relationship be-tween the dissolved fractions of MeHg and Hg during March forseveral of the stations. However, whether these organo-metal spe-cies (Hg and Sn) play a direct role in structuring phytoplanktondiversity at these stations or whether the distribution of organo-metal species is directly influenced through their partition andtransformation by the plankton community structure is difficultto determine with this dataset. Indeed, to answer this questionexperiments designed at comparing the direct impact of thesemetals on complex communities and the impact of phytoplanktoncommunities on organometallic species are necessary.
4.2. Phytoplankton–bacterioplankton coupling
Phytoplankton and bacterioplankton production varied be-tween the two seasons and along the transects. At the lower salin-ity stations, BP greatly exceeded DPP during July, indicating thatthe DOC fuelling BP originated from other sources than the imme-diately adjacent phytoplankton production. Indeed, the relativelyhigh particle associated bacterial production rates (data notshown) point towards a particulate organic carbon source. Highparticle attached bacterial production is a common feature of estu-aries, particularly those with high sediment loads (e.g. Crump andBaross, 1996; Crump et al., 1998) such as was observed in thiswork during July. In contrast, at the higher salinity, offshore sta-tions during July and at almost all of the stations during March,the BP:DPP ratio was much lower (Fig. 4). This means that moreDOC was being produced during primary production than was re-quired for bacterial biomass production, potentially leading to anaccumulation of DOC in the water column. This may well explainthe relatively high concentrations of DOC observed in the highersalinity stations, further underlining the difficultly of using mixingdiagrams to study distributions in this system.
There are many potential explanations as to why we observedaccumulations of DOC in these sites. Low bioavailability of thefreshly produced DOC (e.g. Renaud et al., 2005) or limitation of bac-terial production by another parameter, such as nutrient limitation(Thingstad et al., 1997) or heavy metal contamination (Fisher andReinfelder, 1995) are a few of them. Given the relatively high nutri-ent concentrations observed, it is unlikely that inorganic nutrientswere limiting bacterial production at this site (e.g. Justic et al.,1995). Heavy metals are known to induce shifts in the BP:TPP ratio(e.g. Rochelle-Newall et al., 2008a), however, it is unclear whetheror not they played a role in altering the bioavailability of DOM tothe bacterial communities present. It has already been shown thatthe chemical composition of the DOC released by different phyto-plankton differs as a function of the species or even strains present(Biersmith and Benner, 1998; Ozturk and Aslim, 2010) and that theDOM released during photosynthesis can vary in bioavailability tothe bacterial communities present as a function of the growthstage (Renaud et al., 2005). It is therefore probable that the chem-ical quality of the DOM released during photosynthesis by thecommunities present at the outer most stations was different fromthat released during photosynthesis at the other stations. Indeed,the community composition at the two stations with the lowestBP:DPP rates during July (Stns. 28 and 30) was characterized by
very high abundances of cyanobacteria. Cyanobacteria are knownto release metabolic products that limit bacterial production(Nausch, 1996; Renaud et al., 2005) and may have contributed to-wards reducing the bioavailability of the organic matter releasedduring photosynthesis available for bacterial production.
4.3. Influence of hydrodynamics
Of course, overlain with the biological and chemical interac-tions, physical processes such as wind direction and water circula-tion also play an important role in determining particledistributions and biological activities, particularly in tropical sys-tems (Mari et al., 2007; Torréton et al., 2007, 2010). Over and abovethe clear seasonal differences in phytoplankton community com-position, we also observed a relatively high degree of daily variabil-ity at the two offshore stations (28 and 30) during July. This wasdue to a shift in wind direction (westerly) and intensity over thethree day sampling period. It is probable that this increase in winddirection pushed some of the higher turbidity waters from the VanUc system into the less turbid Haiphong Bay system and this issupported by the higher nutrient and turbidity and lower salinitymeasurements observed. At the beginning of the sampling periodand typical of the south monsoon during July, the wind directionwas from the south (180–200�). This would have confined the phy-toplankton communities to the bay areas instead and reduced theirdispersal into the higher salinity, off-shore waters as would be ex-pected through classical water mixing. The short term shift in winddirection released this control and allowed the high nutrient, highbiomass waters to move out towards the higher salinity stations.Wind direction may well also explain in part the similarities inboth phytoplankton composition and in the factors controlling thatcomposition during July for the three groups observed in Fig. 5.Furthermore, recent work on the water circulation during the tidalcycle in this area (Dinh and Ha, 2008) has shown that water out-flow during the tidal cycle shifts between channels. During lowtide, water exits from the Bach Dang River (Stns. 4, 10, 15, 23)and enters via the channel adjacent to Cat Ba (Stns. 18, 26, 29). Thiscycle is reversed during high tide with the corresponding lateraltransport of the water masses between these two channels. Thus,in this estuary, the prevailing wind direction combined with tidalinfluence (here reduced because sampling was performed duringneap tides) may also play an important role the distribution ofphytoplankton.
5. Conclusion
Here we present some of the factors that potentially controlphytoplankton distribution in a subtropical estuary. It is clear thatin complex estuarine systems such as the Bach Dang estuary, sim-ple, endmember calculations at best miss a large part of the pro-cesses and at worst, ignore potentially important factors. It isalready known that heavy metals can play an important role indetermining phytoplankton community structure in coastal eco-systems. Here, using multivariate statistics applied to field data,we further highlight the importance of some ecotoxicologically tar-geted organometallic species (MeHg, butyl-Sn), their potential rolein a complex, tropical estuarine system and suggest that their im-pact may well extend to the carbon cycle by influencing the trans-fer of carbon from the autotrophic to the heterotrophiccompartments. Undoubtedly, these hypotheses need to be morerigorously tested using experimental approaches to complete theresults gained from this field study in order to better rank the rel-ative impact of all the potential factors (e.g. nutrient concentra-tions, turbidity, metal concentrations) that control phytoplanktondiversity. Nevertheless, and given the almost ubiquitous presence
2328 E.J. Rochelle-Newall et al. / Marine Pollution Bulletin 62 (2011) 2317–2329
of heavy metals in industrialised coastal ecosystems, the impact ofthese ecotoxicologically important organometallic species oncoastal carbon cycling needs to be taken into account morefrequently.
Acknowledgements
This work was financed by the EC2CO project ‘HAIPHONG’, andGrants from the French IRD, CNRS, Groupement De Recherche(GDR) 2476 Réseaux Trophiques Pélagiques, and the VietnamAcademy of Science and Technology (VAST). We thank Jean-YvesPanché and Jean-Pierre Lefebvre for their help with the physicaloceanography measurements. We thank two anonymous review-ers whose comments greatly improved this article. This article isdedicated to the memory of Dr. Do Trong Binh who passed awayduring the project.
Appendix A. Supplementary data
Supplementary data associated with this article can be found, inthe online version, at doi:10.1016/j.marpolbul.2011.08.044.
References
Balech, E., 1995. The Genus Alexandrium Halim (Dinoflagellata). Sherkin IslandMarine Station. Sherkin Island, Co., Cork, Ireland.
Bettarel, Y., Bouvier, T., Agis, M., Bouvier, C., Chu, V.T., Combe, M., Mari, X., Nghiem,N.M., Nguyen, T.T., Pham, T.T., Pringault, O., Rochelle-Newall, E.J., Torréton, J.-P.,Tran, H.Q., 2011. Viral distribution and life strategies in the Bach Dang Estuary.Vietnam. Microb. Ecol. 62, 142–154.
Biersmith, A., Benner, R., 1998. Carbohydrates in phytoplankton and freshlyproduced dissolved organic matter. Mar. Chem. 63, 131–144.
Borges, A.V., 2005. Do we have enough pieces of the jigsaw to integrate CO2 fluxes inthe coastal ocean? Estuaries 28, 3–27.
Borges, A.V., Delille, B., Frankignoulle, M., 2005. Budgeting sinks and sources of CO2
in the coastal ocean: diversity of ecosystems counts. Geophys. Res. Lett. 32,14601–14604.
Borges, A.V., Schiettecatte, L.S., Abril, G., Delille, B., Gazeau, E., 2006. Carbon dioxidein European coastal waters. Estuar. Coast. Shelf Sci. 70, 375–387.
Campbell, L., Nolla, H.A., Vaulot, D., 1994. The importance of Prochlorococcus tocommunity structure in the Central North Pacific Ocean. Limnol. Oceanogr. 39,954–961.
Cardinale, B.J., 2011. Biodiversity improves water quality through nichepartitioning. Nature 472, 86–89.
Conaway, C.H., Squire, S., Mason, R.P., Flegal, A.R., 2003. Mercury speciation in theSan Francisco Bay Estuary. Mar. Chem. 80, 199–225.
Crosbie, N.D., Teubner, K., Weisse, T., 2003. Flow-cytometric mapping providesnovel insights into the seasonal and vertical distributions of freshwaterautotrophic picoplankton. Aquat. Microb. Ecol. 33, 53–66.
Crump, B.C., Baross, J.A., 1996. Particle-attached bacteria and heterotrophicplankton associated with the Columbia River estuarine turbidity maxima.Mar. Ecol. Prog. Ser. 138, 265–273.
Crump, B.C., Baross, J.A., Simenstad, C.A., 1998. Dominance of particle-attachedbacteria in the Columbia River estuary, USA. Aquat. Microb. Ecol. 14, 7–18.
del Giorgio, P.A., Bouvier, T.C., 2002. Linking the physiologic and phylogeneticsuccessions in free-living bacterial communities along an estuarine salinitygradient. Limnol. Oceanogr. 47, 471–486.
Dinh, V.U., Ha, T.H., 2008. Model for water circulation in tidal dominated estuarineregions. J. Wat. Res. Environ. Eng N23, 33–38.
Dollhopf, S.L., Hashsham, S.A., Tiedje, J.M., 2001. Interpreting 16S rDNA T-RFLP data:application of self-organizing maps and principal component analysis todescribe community dynamics and convergence. Microb. Ecol. 42, 495–505.
Downs, S.G., Macleod, C.L., Lester, J.N., 1998. Mercury in precipitation and itsrelation to bioaccumulation in fish: a literature review. Water. Air. Soil. Pollut.108, 149–187.
Duarte, A., Rodrigues, S., Pato, P., Coelho, P., Pereira, M.E., 2007. A review on studiesof mercury contamination in the coastal lagoon Ria de Aveiro, Portugal. HouilleBlanche 4, 35–39.
Eaton, A.D., Clesceri, L.S., Greenberg, A.E., 1995. Standard methods for theexamination of water and wastewater 19th ed., Washington, DC.
Ferguson, A., Eyre, B., Gay, J., 2004. Nutrient cycling in the sub-tropical Brunswickestuary, Australia. Estuaries 27, 1–17.
Fisher, N.S., Bohe, M., Teyssie, J.L., 1984. Accumulation and toxicity of Cd, Zn, Ag, andHg in 4 marine phytoplankters. Mar. Ecol. Prog. Ser. 18, 201–213.
Fisher, N.S., Reinfelder, J.R., 1995. The trophic transfer of metals in marine systems.In: Tessier, A., Turner, D.R. (Eds.), Metal Speciation and Bioavailability in AquaticSystems. John Wiley, Chichester, pp. 363–406.
Fisher, T.R., Gustafson, A.B., Sellner, K., Lacouture, R., Haas, L.W., Wetzel, R.L.,Magnien, R., Everitt, D., Michaels, B., Karrh, R., 1999. Spatial and temporalvariation of resource limitation in Chesapeake Bay. Mar. Biol. 133, 763–778.
Fisher, T.R., Hagy, J.D., Rochelle-Newall, E., 1998. Dissolved and particulate organiccarbon in Chesapeake Bay. Estuaries 21, 215–229.
Fisher, T.R., Harding, L.W., Stanley, D.W., Ward, L.G., 1988. Phytoplankton, nutrientsand turbidity in the Chesapeake, Delaware and Hudson estuaries. Estuar. Coast.Shelf. Sci 27, 61–93.
Fourçans, A., Sole, A., Diestra, E., Ranchou-Peyruse, A., Esteve, I., Caumette, P., Duran,R., 2006. Vertical migration of phototrophic bacterial populations in ahypersaline microbial mat from Salins-de-Giraud (Camargue, France). FEMSMicrobiol. Ecol. 57, 367–377.
Fukuyo, Y., Takano, H., Chihara, M., Matsuoka, K., 1990. Red Tide Organisms in Japan– an Illustrated Taxonomic Guide. Uchida Rokakuho, Tokyo, Japan.
Gadd, G.M., 2000. Microbial interactions with tributyl tin compounds:detoxification, accumulation, and environmental fate. Sci. Total Environ. 258,119–127.
Grasshoff, K., Erhardt, M., Kremling, K., 1983. Methods of Seawater Analysis, 2nd ed.Verlag Chemie, Weinheim.
Halpern, B.S., Walbridge, S., Selkoe, K.A., Kappel, C.V., Micheli, F., D’Agrosa, C., Bruno,J.F., Casey, K.S., Ebert, C., Fox, H.E., Fujita, R., Heinemann, D., Lenihan, H.S.,Madin, E.M.P., Perry, M.T., Selig, E.R., Spalding, M., Steneck, R., Watson, R., 2008.A global map of human impact on marine ecosystems. Science 319, 948–952.
Hewson, I., Fuhrman, J.A., 2006. Improved strategy for comparing microbialassemblage fingerprints. Microb. Ecol. 51, 147–153.
Holm-Hansen, O., Lorenzen, C.J., Holmes, R.W., Strickland, J.D.H., 1965. Fluorimetricdetermination of chlorophyll. J. Cons. Int. Explor. Mer. 30, 3–15.
Jacquet, S., Delesalle, B., Torréton, J.P., Blanchot, J., 2006. Response of phytoplanktoncommunities to increased anthropogenic influences (southwestern lagoon, NewCaledonia). Mar. Ecol. Prog. Ser. 320, 65–78.
Justic, D., Rabalais, N.N., Turner, R.E., 1995. Stoichiometric nutrient balance andorigin of coastal eutrophication. Mar. Pollut. Bull. 30, 41–46.
Kirchman, D., 2001. Measuring bacterial biomass production and growth rates fromleucine incorporation in natural aquatic environments. Meth. Microbiol. 30,227–237.
Lascourrèges, J.F., Caumette, P., Donard, O.F.X., 2000. Toxicity of butyltin, phenyltinand inorganic tin compounds to sulfate-reducing bacteria isolated from anoxicmarine sediments. Appl. Organomet. Chem. 14, 98–107.
Lefebvre, J.-P., Ouillon, S., Vu, D.V., Arfi, R., Panché, J.-Y., Mari, X., Chu, C.T., Torréton,J.-P., in review. Seasonal variability of cohesive sediment aggregation in theBach Dang-Cam Estuary, Haiphong (Vietnam). Geo-Mar. Lett.
Legendre, P., Legendre, L., 1998. Numerical Ecology. Elsevier, Amsterdam.Lemaire, E., Abril, G., De Wit, R., Etcheber, H., 2002. Distribution of phytoplankton
pigments in nine European estuaries and implications for an estuarine typology.Biogeochemistry 59, 5–23.
Maguire, R.J., Carey, J.H., Hale, E.J., 1983. Degradation of the tri-n-butyltin species inwater. J. Agric. Food. Chem. 31, 1060–1065.
Marañón, E., Cermeño, P., Fernández, E., Rodríguez, J., Zabala, L., 2004. Significanceand mechanisms of photosynthetic production of dissolved organic carbon in acoastal eutrophic ecosystem. Limnol. Oceanogr. 49, 1652–1666.
Mari, X., Rochelle-Newall, E., Torreton, J.P., Pringault, O., Jouon, A., Migon, C., 2007.Water residence time: a regulatory factor of the DOM to POM transferefficiency. Limnol. Oceanogr. 52, 808–819.
Marie, D., Partensky, F., Jacquet, S., Vaulot, D., 1997. Enumeration and cell cycleanalysis of natural populations of marine picoplankton by flow cytometry usingthe nucleic acid stain SYBR Green I. Appl. Environ. Microbiol. 63, 186–193.
Martin-Doimeadios, R.C.R., Monperrus, M., Krupp, E., Amouroux, D., Donard, O.F.X.,2003. Using speciated isotope dilution with GC-inductively coupled plasma MSto determine and unravel the artificial formation of monomethylmercury incertified reference sediments. Anal. Chem. 75, 3202–3211.
Monperrus, M., Tessier, E., Veschambre, S., Amouroux, D., Donard, O., 2005.Simultaneous speciation of mercury and butyltin compounds in naturalwaters and snow by propylation and species-specific isotope dilution massspectrometry analysis. Anal. Bioanal. Chem 381, 854–862.
Muylaert, K., Sabbe, K., Vyverman, W., 2009. Changes in phytoplankton diversityand community composition along the salinity gradient of the Schelde estuary(Belgium/The Netherlands). Estuar. Coast. Shelf. Sci. 82, 335–340.
Nausch, M., 1996. Microbial activities on Trichodesmium colonies. Mar. Ecol. Prog.Ser. 141, 173–181.
Nhan, D.D., Loan, D.T., Tolosa, I., de Mora, S.J., 2005. Occurrence of butyltincompounds in marine sediments and bivalves from three harbour areas (Saigon,Da Nang and Hai Phong) in Vietnam. Appl. Organomet. Chem. 19, 811–818.
Officer, C.B., 1979. Discussion of the behaviour of nonconservative dissolvedconstituents in estuaries. Estuar. Coast. Shelf. Sci. 9, 91–94.
Officer, C.B., Lynch, D.R., 1981. Dynamics of mixing in estuaries. Estuar. Coast. Shelf.Sci. 12, 525–533.
Oliveira, R.D., Santelli, R.E., 2010. Occurrence and chemical speciation analysis oforganotin compounds in the environment: a review. Talanta 82, 9–24.
Ozturk, S., Aslim, B., 2010. Modification of exopolysaccharide composition andproduction by three cyanobacterial isolates under salt stress. Environ. Sci.Pollut. Res. 17, 595–602.
Paulsson, M., Nystrom, B., Blanck, H., 2000. Long-term toxicity of zinc to bacteriaand algae in periphyton communities from the river Gota Alv, based on amicrocosm study. Aquat. Toxicol. 47, 243–257.
Peters, E.C., Gassman, N.J., Firman, J.C., Richmond, R.H., Power, E.A., 1997.Ecotoxicology of tropical marine ecosystems. Environ. Toxicol. Chem. 16, 12–40.

E.J. Rochelle-Newall et al. / Marine Pollution Bulletin 62 (2011) 2317–2329 2329
Petersen, S., Gustavson, K., 2000. Direct toxic effects of TBT on natural enclosedphytoplankton at ambient TBT concentrations of coastal waters. Ecotoxicology9, 273–285.
Pickhardt, P.C., Fisher, N.S., 2007. Accumulation of inorganic and methylmercury byfreshwater phytoplankton in two contrasting water bodies. Environ. Sci.Technol. 41, 125–131.
Quinlan, E.L., Phlips, E.J., 2007. Phytoplankton assemblages across the marine tolow-salinity transition zone in a blackwater dominated estuary. J. Plank. Res. 29,401–416.
Raimbault, P., Slawyk, G., Coste, B., Fry, J., 1990. Feasibility of using an automatedcolorimetric procedure for the determination of seawater nitrate in the 0 to100 nM range: examples from field and culture. Mar. Biol. 104, 347–351.
Raymond, P.A., Bauer, J.E., 2000. Bacterial consumption of DOC during transportthrough a temperate estuary. Aquat. Microb. Ecol. 22, 1–12.
Renaud, F., Pringault, O., Rochelle-Newall, E., 2005. Effects of the colonialcyanobacterium Trichodesmium spp. on bacterial activity. Aquat. Microb. Ecol.41, 261–270.
Rochelle-Newall, E.J., Delesalle, B., Mari, X., Rouchon, C., Torréton, J.P., Pringault, O.,2008a. Zinc induces shifts in microbial carbon flux in tropical coastalenvironments. Aquat. Microb. Ecol. 52, 57–68.
Rochelle-Newall, E.J., Fisher, T.R., 2002. Chromophoric dissolved organic matter anddissolved organic carbon in Chesapeake Bay. Mar. Chem. 77, 23–41.
Rochelle-Newall, E.J., Torréton, J.P., Mari, X., Pringault, O., 2008b. Phytoplankton–bacterioplankton coupling in a subtropical South Pacific coral reef lagoon.Aquat. Microb. Ecol. 50, 221–229.
Rochelle-Newall, E.J., Winter, C., Barron, C., Borges, A.V., Duarte, C.M., Elliott, M.,Frankignoulle, M., Gazeau, F., Middelburg, J.J., Pizay, M.D., Gattuso, J.-P., 2007.Artificial neural network analysis of factors controlling ecosystem metabolismin coastal systems. Ecolog. Applica. 17, S185–S196.
Rodriguez-Gonzalez, P., Alonso, J.I.G., Sanz-Medel, A., 2005. Single and multiplespike procedures for the determination of butyltin compounds in sedimentsusing isotope dilution GC-ICP-MS. J. Anal. At. Spectrom. 20, 1076–1084.
Sargian, P., Pelletier, E., Mostajir, B., Ferreyra, G.A., Demers, S., 2005. TBT toxicity ona natural planktonic assemblage exposed to enhanced ultraviolet-B radiation.Aquat. Toxicol. 73, 299–314.
Sayer, C.D., Hoare, D.J., Simpson, G.L., Henderson, A.C.G., Liptrot, E.R., Jackson, M.J.,Appleby, P.G., Boyle, J.F., Jones, J.I., Waldock, M.J., 2006. TBT causes regime shiftin shallow lakes. Environ. Sci. Technol. 40, 5269–5275.
Sidharthan, M., Young, K.S., Woul, L.H., Soon, P.K., Shin, H.W., 2002. TBT toxicityon the marine microalga Nannochloropsis oculata. Mar. Pollut. Bull. 45,177–180.
Singh, A.K., Rai, L.C., 1991. Cr and Hg toxicity assessed insitu using the structuraland functional-characteristics of algal communities. Environ. Toxicol. WaterQuality 6, 97–107.
Smith, D.C., Azam, F., 1992. A simple, economical method for measuring bacterialprotein synthesis rates in seawater using 3H-leucine. Marine Microbial. FoodWebs 6, 107–114.
Smith, E.M., Kemp, W.M., 2001. Size structure and the production/respirationbalance in a coastal plankton community. Limnol. Oceanogr. 46, 473–485.
Sournia, A., 1978. Phytoplankton Manual. UNESCO, Paris.StLouis, R., Pelletier, E., Marsot, P., 1997. A mechanistic approach to tributyl tin
(TBT) sorption by marine microflagellated alga Pavlova lutheri. Appl.Organomet. Chem. 11, 543–550.
Taylor, F., 1976. Dinoflagellates from the International Indian Ocean Expedition - Areport on material collected by the R.V.’’Anton Bruun 1963 – 1964’’.Schweizerbart’sche Verlagsbuchhandlung (Nägele u. Obermiller), Stuttgart.
Thingstad, T.F., Hagstrom, A., Rassoulzadegan, F., 1997. Accumulation of degradableDOC in surface waters: Is it caused by a malfunctioning microbial loop? Limnol.Oceanogr. 42, 398–404.
Thottathil, S.D., Balanchandran, K.K., Jayalakshmi, K.V., Gupta, G.V.M., Nair, S., 2008.Tidal switch on metabolic activity: salinity induced responses onbacterioplankton metabolic capabilities in a tropical estuary. Estuar. Coast.Shelf. Sci. 78, 665–673.
Tomas, C.R., 1997. Identifying Marine Phytoplankton. Academic Press, HarcourtBrace and Company.
Torréton, J.P., Rochelle-Newall, E., Jouon, A., Faure, V., Jacquet, S., Douillet, P., 2007.Correspondence between the distribution of hydrodynamic time parametersand the distribution of biological and chemical variables in a semi-enclosedcoral reef lagoon. Estuar. Coast. Shelf Sci. 74, 766–776.
Torréton, J.P., Rochelle-Newall, E., Pringault, O., Jacquet, S., Faure, V., Briand, E.,2010. Variability of primary and bacterial production in a coral reef lagoon(New Caledonia). Mar. Pollut. Bull. 61, 335–348.
Troussellier, M., Courties, C., Vaquer, A., 1993. Recent applications of flow-cytometry in aquatic microbial ecology. Biol. Cell 78, 111–121.
Troussellier, M., Schafer, H., Batailler, N., Bernard, L., Courties, C., Lebaron, P.,Muyzer, G., Servais, P., Vives-Rego, J., 2002. Bacterial activity and geneticrichness along an estuarine gradient (Rhone River plume, France). Aquat.Microb. Ecol. 28, 13–24.
Truong, N.A., 1993. Taxonomy of Marine Diatoms in Vietnam. Technical andScientific Publishing House, Hanoi, Vietnam.
Tsang, C.K., Lau, P.S., Tam, N.F.Y., Wong, Y.S., 1999. Biodegradation capacity oftributyl tin by two Chlorella species. Environ. Pollut. 105, 289–297.
Ullrich, S.M., Tanton, T.W., Abdrashitova, S.A., 2001. Mercury in the aquaticenvironment: a review of factors affecting methylation. Crit. Rev. Env. Sci.Tech. 31, 241–293.
Yamagishi, T., 1992. Plankton Algae in Taiwan (Formosa). Uchida Rokakuho, Tokyo, Japan.Yoo, Y.H., Sidharthan, M., Shin, H.W., 2007. Effects of tributyl-tin on a marine
microalga, Tetraselmis suecica. J. Enviro. Biol. 28, 571–575.