viral distribution and life strategies in the bach dang estuary, vietnam
TRANSCRIPT

MICROBIOLOGY OF AQUATIC SYSTEMS
Viral Distribution and Life Strategies in the Bach DangEstuary, Vietnam
Yvan Bettarel & Thierry Bouvier & Martin Agis & Corinne Bouvier & Thuoc Van Chu &
Marine Combe & Xavier Mari & Minh Ngoc Nghiem & Thuy Thanh Nguyen &
Thu The Pham & Olivier Pringault & Emma Rochelle-Newall & Jean-Pascal Torréton &
Huy Quang Tran
Received: 24 November 2010 /Accepted: 17 February 2011 /Published online: 9 March 2011# Springer Science+Business Media, LLC 2011
Abstract Although the structure and dynamics of plank-tonic viruses in freshwater and seawater environments arerelatively well documented, little is known about theoccurrence and activity of these viruses in estuaries,especially in the tropics. Viral abundance, life strategies,and morphotype distribution were examined in the BachDang Estuary (Vietnam) during the dry season in 2009. Theabundance of both viruses and their prokaryotic hostsdecreased significantly from upstream to downstream,probably as the result of nutrient dilution and osmoticstress faced by the freshwater communities. The antibioticmitomycin-C revealed that the fraction of lysogenic cellswas substantially higher in the lower seawater part of theestuary (max 27.1%) than in the upper freshwater areawhere no inducible lysogens were observed. The questionof whether there is a massive, continuous induction of
marine lysogens caused by the mixing with freshwater isconsidered. Conversely, the production of lytic virusesdeclined as salinity increased, indicating a spatial succes-sion of viral life strategies in this tropical estuary.Icosahedral tailless viruses with capsids smaller than60 nm dominated the viral assemblage throughout theestuary (63.0% to 72.1% of the total viral counts), and theirdistribution was positively correlated with that of viral lyticproduction. Interestingly, the gamma-proteobacteriaexplained a significant portion of the variance in the<60 nm and 60 to 90 nm tailless viruses (92% and 80%,respectively), and in the Myoviridae (73%). Also, 60% ofthe variance of the tailless larger viruses (>90 nm) wasexplained by the beta-proteobacteria. Overall, these resultssupport the view that the environment, through selectionmechanisms, probably shapes the structure of the prokary-otic community. This might be in turn a source of selectionfor the virioplankton community via specific affiliationfavoring particular morphotypes and life strategies.
Introduction
Viruses form a ubiquitous, dynamic compartment in bothseawater and freshwater environments where they fulfillnumerous biogeochemical and ecological functions [49].They are now considered as major players in the ecologicalbalance of aquatic ecosystems. Primarily targeting prokar-yotes, planktonic viruses interact with their hosts in twomain different ways: lytic and lysogenic infection cycles[53] and, more sporadically, through chronic cycles orpseudolysogeny [57].
Although viruses are the most abundant and probably themost diverse biological entities on earth [47], relativelylittle is known about the patterns of viral distribution within
Y. Bettarel (*) : T. Bouvier :M. Agis : C. Bouvier :M. Combe :X. Mari :O. Pringault : J.-P. TorrétonUMR 5119, ECOSYM, Montpellier 2 University, CNRS, IRD,IFREMER,Montpellier, Francee-mail: [email protected]
T. Van Chu : T. T. PhamInstitute of Marine Environment and Resources (IMER),Hai Phong, Vietnam
M. N. NghiemInstitute of Biotechnology (IBT),Hanoi, Vietnam
T. T. Nguyen :H. Q. TranNational Institute of Hygiene and Epidemiology (NIHE),Hanoi, Vietnam
E. Rochelle-NewallUMR 7818 BIOEMCO, IRD,Paris, France
Microb Ecol (2011) 62:143–154DOI 10.1007/s00248-011-9835-6

and between the main types of aquatic habitat. During thelast two decades, much attention has been paid to marinecoastal and oceanic waters and, to a lesser extent, lacustrinefreshwater from a virio-ecological perspective, especially intemperate zones. However, few studies have been carriedout in transition zones such as estuaries, particularly inAsia.
Estuaries are interesting areas for research because theyare among the most productive and exploited aquatichabitats. They often have strong eutrophication and salinitygradients as a result of the dilution of nutrient-rich riverwater by seawater. Studying viral distribution along suchsteep gradients is of great interest for microbial ecologistsbecause the mixing front between marine tidal water andoutflowing river water is an area of dramatic changes whichcan trigger important physiological, genetic, and ecologicalshifts in their microbial hosts [11, 24].
Previous studies on estuarine virioplankton communitieshave shown that abundance is typically correlated with thedistribution of prokaryotes for which they can be a majorcause of mortality [1, 2, 16]. Sometimes conflictingcorrelations have been found between viral abundance andsome physical and chemical parameters such as salinity,chlorophyll a, suspended material or nutrient concentra-tions, and temperature [4, 23]. However, no clear patternhas emerged as estuaries are often characterized by aunique, complex combination of hydrodynamic, trophic,and thermal conditions.
Recent reports have shown that viral diversity andrichness observed in aquatic biomes can change rapidlyover time and space [3, 6, 19, 43, 59]. In Chesapeake Bay,for example, the virioplankton community structure, asinferred from PFGE and RAPD-PCR analyses, wasreported to exhibit seasonally and spatially dynamicpatterns of diversity [22, 60]. However, this was not thecase in the Charente Estuary (France) where the genetic andmorphological structure of the virioplankton communitywas relatively stable [5]. Unfortunately, no other reports ofviral diversity in estuaries could be found to explain whythe structure of a viral community can remain stable inenvironments where biophysicochemical characteristics areso heterogeneous. Moreover, the distribution of viral lifestrategies along estuarine gradients is still unknown.Clearly, further studies are needed to provide a betterunderstanding of the factors that govern viral abundance,proliferation, and diversity in all estuarine systems.
This study examined the distribution of viruses, theprevalence of lytic versus lysogenic strategies, and themorphological composition of the virioplankton commu-nity. It was conducted in the Bach Dang Estuary, one ofthe main tributaries in the Red River Delta, Vietnam, atropical region with rapid population growth and themain source of agricultural produce for North Vietnam
[62]. It also assessed whether the variability of theseviral parameters could be explained by the localenvironmental specificities (salinity, nutrients, tempera-ture, and dissolved organic carbon) and/or the distribu-tion and the phylogenetic composition of theirprokaryotic hosts.
Material and Methods
Description of the Study Site
Samples were collected on March 12, 13, and 15, 2009,between 07:00 and 10:00 during neap tides, throughout thesalinity gradient of the Bach Dang Estuary, one of the maintributaries of the Red River in Vietnam (Fig. 1). The Red Riveris characterized by high human pressure and by the transportof vast amounts of fine sediment during seasonal monsoons[42, 62]. Samples were taken from 15 stations along theestuary over a salinity gradient of 0 to 31 (Table 1). At eachstation (nos. 1–15, see geographical coordinates in Table 1),samples were collected in subsurface water (1.5 m depth)using a Niskin bottle. Duplicate samples were analyzed fornutrient and chlorophyll a (Chl) content, as well as forbacterial and viral parameters. Samples for dissolved inorgan-ic nutrient measurements (N-NO2, N-NO3, N-NH4, P-PO4)were filtered through precombusted Whatman GF/F fiberglassfilters, stored at −20°C and analyzed according to Eaton et al.[18]. Chl concentrations were determined by fluorometry afterfiltration onto Whatman GF/F filters and methanol extraction[24]. Dissolved organic carbon (DOC) analyses wereperformed on 30 mL subsamples filtered onto precombustedGF/F filters and stored in precombusted (450°C, overnight)40 mL glass vials with Teflon stoppers, with 35 μL 85%phosphoric acid (H3PO4). Samples were stored in the darkuntil analysis using a Shimadzu TOC VCPH analyzer.Potassium phthalate was used as a calibration standard, andcertified reference materials (Hansell Laboratory, Universityof Miami) were also used to verify the instrument. Salinityand temperature were measured in situ using a CTD probe(Seabird SBE 19+).
Counts of Viruses and Prokaryotes
Water samples were fixed with 0.02 μm filtered bufferedformaldehyde (final concentration 2% v/v) after sam-pling, immediately flash frozen in liquid nitrogen, andstored at −80°C prior to counting. The number of virusesand prokaryotes in the duplicate samples of 0.3–0.8 mLwas determined after retention on 0.02 μm pore sizemembranes (Anodisc) and staining with SYBR Goldfluorochrome (Molecular Probes, Europe, Leiden, theNetherlands) as described in detail by Patel et al. [36].
144 Y. Bettarel et al.
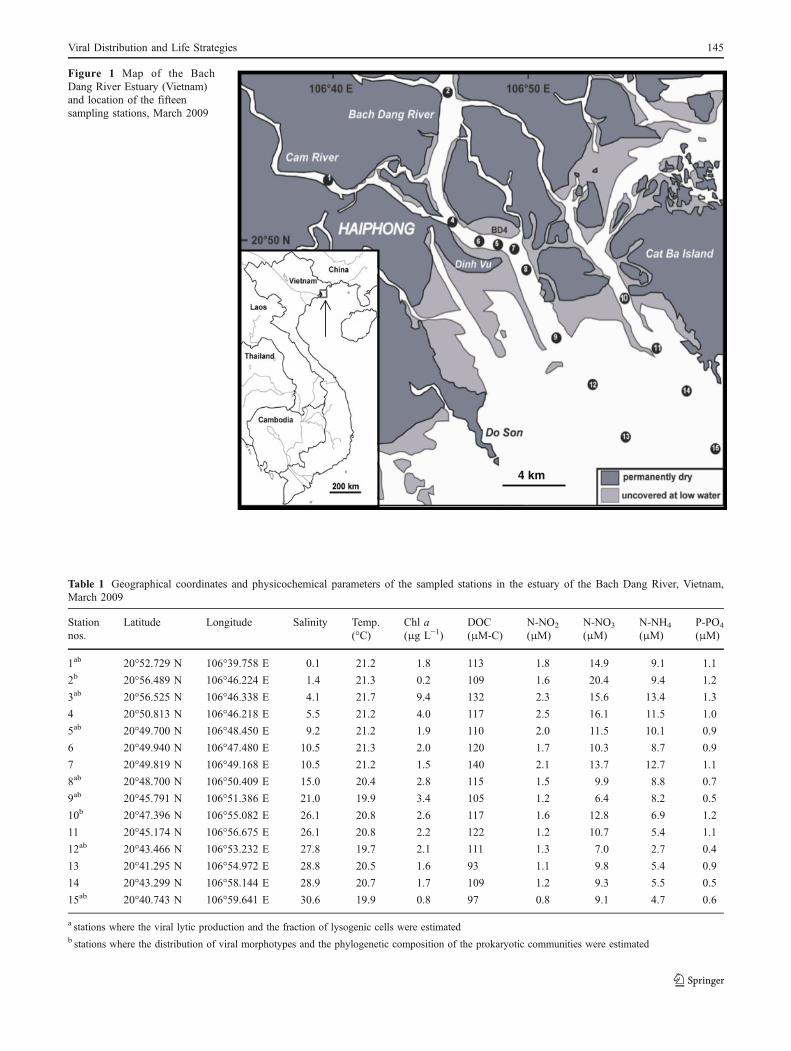
Table 1 Geographical coordinates and physicochemical parameters of the sampled stations in the estuary of the Bach Dang River, Vietnam,March 2009
Stationnos.
Latitude Longitude Salinity Temp.(°C)
Chl a(μg L−1)
DOC(μM-C)
N-NO2
(μM)N-NO3
(μM)N-NH4
(μM)P-PO4
(μM)
1ab 20°52.729 N 106°39.758 E 0.1 21.2 1.8 113 1.8 14.9 9.1 1.1
2b 20°56.489 N 106°46.224 E 1.4 21.3 0.2 109 1.6 20.4 9.4 1.2
3ab 20°56.525 N 106°46.338 E 4.1 21.7 9.4 132 2.3 15.6 13.4 1.3
4 20°50.813 N 106°46.218 E 5.5 21.2 4.0 117 2.5 16.1 11.5 1.0
5ab 20°49.700 N 106°48.450 E 9.2 21.2 1.9 110 2.0 11.5 10.1 0.9
6 20°49.940 N 106°47.480 E 10.5 21.3 2.0 120 1.7 10.3 8.7 0.9
7 20°49.819 N 106°49.168 E 10.5 21.2 1.5 140 2.1 13.7 12.7 1.1
8ab 20°48.700 N 106°50.409 E 15.0 20.4 2.8 115 1.5 9.9 8.8 0.7
9ab 20°45.791 N 106°51.386 E 21.0 19.9 3.4 105 1.2 6.4 8.2 0.5
10b 20°47.396 N 106°55.082 E 26.1 20.8 2.6 117 1.6 12.8 6.9 1.2
11 20°45.174 N 106°56.675 E 26.1 20.8 2.2 122 1.2 10.7 5.4 1.1
12ab 20°43.466 N 106°53.232 E 27.8 19.7 2.1 111 1.3 7.0 2.7 0.4
13 20°41.295 N 106°54.972 E 28.8 20.5 1.6 93 1.1 9.8 5.4 0.9
14 20°43.299 N 106°58.144 E 28.9 20.7 1.7 109 1.2 9.3 5.5 0.5
15ab 20°40.743 N 106°59.641 E 30.6 19.9 0.8 97 0.8 9.1 4.7 0.6
a stations where the viral lytic production and the fraction of lysogenic cells were estimatedb stations where the distribution of viral morphotypes and the phylogenetic composition of the prokaryotic communities were estimated
4 km
Figure 1 Map of the BachDang River Estuary (Vietnam)and location of the fifteensampling stations, March 2009
Viral Distribution and Life Strategies 145

Examination of Viral Morphotypes
Planktonic viruses were observed using transmission electronmicroscopy (TEM). Viruses from 500μL aliquots of formalin-fixed samples were harvested by repeated ultracentrifugationof 50 μL onto grids (400 mesh Cu electron microscope gridswith carbon coated Formvar film) using an A-100/30 rotor inan air-driven ultracentrifuge (Airfuge®, Beckman) at105,000×g for 70 min. The grids were then stained for 30 swith uranyl acetate (2%, w/w), and viruses were examinedand measured using a JEOL 1200EX TEM operated at80 kV and magnification from ×20,000 to ×100,000. Threemorphotypes were distinguished for shape classification oftailed viruses (Caudovirales). Tailed viruses with isometricheads and long noncontractile tails were considered to besiphoviruses. Tailed viruses with isometric heads andcontractile tails (presence of a neck) were considered to bemyoviruses. Tailed viruses with isometric heads and shorttails were considered to be podoviruses (see Fig. 4). Thedistribution of tailless icosahedral viruses in size classes <60,60–90, and >90 nm was also determined.
Fraction of Lysogenic Cells
The fraction of lysogenic cells (FLC) was determined bythe induction of prophages using mitomycin-C [52]Mitomycin-C was added to samples (final concentration1 μg mL−1) in 20 mL sterile serum bottles and untreatedsamples served as controls. Samples were incubated at insitu temperature; duplicate subsamples were taken withsyringes at the start of incubation (t0) and after 12 h (t12h)and fixed with 0.02 μm filtered buffered formaldehyde (2%final concentration) for viral and bacterial counts (see above).The FLC was estimated from viral abundances in mitomycin-C treated (VAm) versus control (VAc) incubations, as well asbacterial abundance (BAt0) and burst size (BSt0): FLC ¼100 � VAm � VAcð Þ= BSt0 � BAt0ð Þ½ � [52]. The burst sizechosen in this study (BS=24) was the mean value for aquaticenvironments calculated by Wommack and Colwell [61] andParada et al. [35].
Viral Lytic Production
Viral production was determined using the dilution tech-nique described by Wilhelm et al. [56]. Fifty milliliters ofduplicate subsamples was filtered onto a 47-mm diameter,0.2-μm pore size polycarbonate membrane at low pressure(<33 kPa), using a transfer pipette to keep the bacteria insuspension and adding ultra-filtered water (<30 kDa) tomaintain the total water volume. Ultra-filtered water fromeach station was added to the filter reservoir until threevolumes (150 mL total) had been flushed through the filter.By diluting the viruses and not the prokaryotes, it was
possible to determine viral production resulting frominfection prior to the start of the experiment. A final50 mL volume retained in the filter housing wasimmediately transferred to polycarbonate bottles andincubated in the dark at in situ temperature for 12 h.Two milliliters of these subsamples was collected every3 h and fixed with 0.22 mL filtered formaldehyde (finalconcentration of 2%) for viral enumeration. Viralproduction rates were inferred from the slope of thelinear regression line of viral abundance versus time, forduplicate incubations.
CARD-FISH Analyses of Phylogenic Diversity
Samples (5 mL) were fixed with formaldehyde (2% finalconcentration), filtered using 0.2 μm polycarbonatefilters (Whatman) and kept at −20°C until hybridization.Several oligonucleotide probes (Biomers) were used:EUB 338 I+II+III, ALF968, BET42a, GAM42a,CF319a, ARCH915, targeting bacteria, alpha-, beta- andgamma-proteobacteria, the Bacteroidetes phylum and theArchaea domain, respectively. The NON338 probe wasused as a negative control. Hybridization and mountingprocedures were carried out as described by Pernthaler etal. [37]. The selected groups were counted and expressedas a percentage relative to the total abundance of DAPI-stained bacterial cells. The error associated with replicateCARD-FISH counts ranged from 5% to 25% (mean15.3%) based on a subset of three samples for whichindependent replicate CARD-FISH counts were con-ducted. The mean error (15.3%) was taken to apply toall the CARD-FISH analyses.
Statistical Analyses
The data was log transformed to provide the normalityand homogeneity of variance necessary for parametricanalyses. Simple relationships between original data setswere tested by Pearson correlation analysis. The rela-tionship between salinity and nutrients was studied todetermine whether the distributions followed a dilutiongradient. As the variables are considered to be interde-pendent, the model II regression model method [27] wasused to estimate the slope of the regression lines for eachnutrient. The slopes of the theoretical dilution lines werecalculated using the equation:
Sth ¼ N½ �Smax � N½ �FW� �
= Smaxð Þ, where Sth is the theo-retical slope, [N]S max is the nutrient concentration forSmax=30.6 (maximum salinity along the transect) and[N]FW is the maximum nutrient concentration for S=0(freshwater). Differences were considered to be nonsig-nificant if the theoretical slopes were within the 95%confidence interval.
146 Y. Bettarel et al.

In estuarine data, variables are often internally correlatedbecause of their strong common link to physical variablessuch as salinity [40]. The relationship between bacterialphylogenetic identity and viral morphology was analyzedusing partial correlation analysis, keeping salinity constant,according to the Sokal and Rohlf [46] procedure. Thismethod allows to directly estimate the degree of anassociation between two variables with the effect of anothervariable removed, here the salinity. Considering X, Y, and Zas the bacterial phylogenetic group, the viral morphologiccategory, and the salinity, respectively, the partial correlationof X and Y adjusted for Z (ρXY.Z) was computed as follows,
rXY :Z ¼ rXY � rXZrYZffiffiffiffiffiffiffiffiffiffiffiffiffiffiffiffiffiffiffiffiffiffiffiffiffiffiffiffiffiffiffiffiffiffiffiffiffi1� r2YZð Þ 1� r2YZð Þ
p ;
in which ρXY, ρXZ, and ρYZ represent the regular correlationcoefficients of respective correlations. The partial determina-tion coefficients (the square of the partial correlationcoefficient) were used to determine what fraction of the totalvariance of the bacterial variables was explained by theircorrelation with viral morphological groups [28]. Thestatistical analyses were performed using the statisticsprogram R.
Results
Environmental Characteristics of the Sampling Site
Nutrients (NH4, NO3, NO2, PO4) and chlorophyll aconcentrations decreased steadily with decreasing salinity(Table 1). Model II linear regression between nutrients andsalinity did not show significant deviations from thestraight line between river and seawater reference stations,indicating that the concentration of the different nutrientsfollowed the linear mixing model and suggesting a simpledilution process. The temperature was relatively stable andranged from 21.2°C to 19.9°C during the sampling period.The DOC varied between 113.0 to 97.0 μM-C, with thelowest values observed in the high salinity, seawardstations. Unlike the nutrient distribution, DOC distributiondeviated from the simple mixing model and some netaccumulation was observed in the mid-salinity ranges.
Viral and Prokaryotic Abundance
Viral and prokaryotic abundances decreased sharply fromupstream to downstream (Fig. 2a). Both communities peakedat salinity 1.4 (MVIR 14.7×10⁷ vir. mL−1, MPROK 18.8×10⁶
cells mL−1) and then declined to 6.5×10⁷ vir. mL−1 and 4.2×10⁶ cells mL−1. Viral and prokaryotic abundances wereclosely correlated (r=0.79, p<0.05; Fig. 2b).
Distribution of Lysogenic Prokaryotes and Viral LyticProduction
The FLC generally varied between 0% and 5.4% overallbut rose abruptly from salinity 21 to reach 27.1% at themost seaward station (salinity 30.6; Fig. 3a). However,there was a strong negative correlation between viral lyticproduction and salinity (r=−0.91, p<0.05, Table 2), de-creasing from 52.8×10⁸ down to 3.6×10⁸ vir. L−1 h−1 asthe salinity rose from 0 to 30.6 (Fig. 3b). Viral lyticproduction was significantly (p<0.05) correlated with thenitrogen and phosphorus nutrient concentrations, as well aswith the viral and prokaryotic concentrations (Table 2).
Distribution of Viral Morphotypes
Tailless icosahedral viruses were dominant within the viralcommunity, accounting for 78.6% to 83.4% of the totalviral community. Only 16.6% to 21.4% of the communitywas comprised of tailed viruses. Based on the morpholog-ical criteria defined by the International Committee onTaxonomy of Viruses [13], tailed viruses were assigned tothe three families of the order Caudovirales (Siphoviridae,Myoviridae, and Podoviridae; Figs. 4b, d, and f). Theproportion of these morphotypes was never more than 11%of the total viral community. The proportion of Podoviridaeincreased significantly with increasing salinity (r=0.65, p<0.05, Fig. 4), whereas the distribution of the Myoviridaeand Siphoviridae did not show any clear spatial pattern.
Among tailless icosahedral viruses, those with the smallestcapsid (i.e., <60 nm) were clearly dominant, accounting for63% to 72.1% of the viral counts. Their proportion fell sharplyalong the salinity gradient (r=−0.92, p<0.005, Fig. 4) andwas positively correlated with the different nutrient concen-trations, as well as with viral abundance and lytic production.There was also a significant negative correlation between thedistribution of this group and the fraction of cells withlysogenic infection (r=−0.80, p<0.05, Table 2). Virusesbetween 60 and 90 nm and viruses larger than 90 nm were ofminor importance as they accounted for only 4% to 10% ofthe total viral community (Fig. 4).
Relationships between Viral Morphological Groupsand the Bacterial Phylogenetic Groups
To explore the relationships between morphological viralgroups and bacterial composition, we used multipleregression analysis and used the resulting partial regressioncoefficients to assess the proportion of the varianceexplained by the dominant bacterial phylogenic groupsonce the effect of salinity is removed. The gamma-proteobacteria explained a significant portion of thevariance in <60 nm and 60 to 90 nm tailless viruses (92%
Viral Distribution and Life Strategies 147

and 80%, respectively) and in the Myoviridae (73%) afterhaving removed the effect of salinity, whereas the otherphylogenetic groups explain virtually none of thesevariances (Table 3). Sixty percent of the variance of thetailless larger viruses (>90 nm) was explained by the beta-proteobacteria (Table 3). The alpha-proteobacteria and theBacteroidetes did not explain any variability in viralmorphological groups.
Discussion
Viral abundance, morphological diversity, and life strategiesall varied considerably in the Bach Dang Estuary. We triedto determine whether such spatial patterns could bepredicted by the environment and/or the distribution anddiversity of their prokaryotic hosts.
As expected, the nutrient and salinity gradients were themajor forces shaping (directly or indirectly) the prokaryotic
community, and subsequently, their viral pathogens.Changes in nutrients (NH4, NO2, NO4, PO4), as describedby a linear regression model, followed a simple dilutionprocess of the Bach Dang River in coastal waters. Suchphenomena have been reported on several occasions byTroussellier et al. [50] in the Rhone Estuary (France), in theSaint Lawrence Estuary, Canada [34], and in ChesapeakeBay, USA [41]. The only exception was DOC, where somenet accumulation was observed in the mid-salinity zones(not shown).
The decline in prokaryotic abundance may be the directconsequence of chemical changes in the water, including acombination of the decrease in nutrient concentration andan increase in salinity. Temperature, however, did notemerge as a strong determinant of prokaryotic distribution,as shown by the low spatial variability recorded throughoutthe estuary (min–max, 19.7–21.7°C). Shiah and Ducklow[44] suggested that temperature ceases to be a limitingfactor when it exceeds 20°C, which was the case in this
0
5
10
15
20
4 8 12 16
Viral abundance (107 viruses mL-1)
Pro
kary
otic
abu
ndan
ce (
106 c
ells
mL-1
)
r = 0.79*
b
0
4
8
12
16
20
0 5 10 15 20 25 30 35
rVIR = -0.70*
rPROK = - 0.90*
Viruses
Prokaryotes
Pro
kary
otic
abu
ndan
ce (
106 c
ells
mL-1
)
Vira
l abu
ndan
ce (
107 V
LPs
mL-1
)
aFigure 2 Relationshipsbetween prokaryotic and viralabundance in the Bach DangEstuary (a) and prokaryotic andviral abundance from upstreamto downstream stations (b)
148 Y. Bettarel et al.

0
5
10
15
20
25
30
35
0 5 10 15 20 25 30 35F
ract
ion
of ly
soge
nic
cells
(%
)
0
10
20
30
40
50
60
0 5 10 15 20 25 30 35
Vira
l Lyt
ic P
rodu
ctio
n (1
08 vi
ruse
s L-1
h-1)
a
b
Figure 3 Fraction of lysogeniccells (a) and viral lyticproduction (b) along theestuarine salinity gradient
Table 2 Correlation relationships between environmental parameters in the Bach Dang Estuary
Salinity [Chl a] [DOC] [NO2] [NO3] [NH4] [PO4] FLC [VIR] [PROK] VP <60 nm >90 nm
[Chl a] −0.44 1
[DOC] −0.68 0.87 1
[NO2] −0.87 0.65 0.85 1
[NO3] −0.87 0.49 0.67 0.79 1
[NH4] −0.83 0.71 0.71 0.83 0.74 1
[PO4] −0.89 0.61 0.72 0.85 0.98 0.85 1
FLC 0.65 −0.47 −0.69 −0.68 −0.28 −0.55 −0.35 1
[VIR] −0.98 0.56 0.77 0.90 0.92 0.87 0.94 −0.60 1
[PROK] −0.97 0.46 0.71 0.84 0.87 0.73 0.87 −0.65 0.96 1
VP −0.91 0.31 0.55 0.86 0.84 0.68 0.84 −0.48 0.88 0.90 1
<60 nm −0.90 0.41 0.77 0.86 0.74 0.68 0.73 −0.80 0.89 0.91 0.80 1
>90 nm 0.77 −0.51 −0.46 −0.59 −0.56 −0.87 −0.67 0.58 −0.75 −0.70 −0.59 −0.56 1
Tailless icosaehedral viruses smaller than 60 nm (<60) and larger than 90 nm (>90). Significant correlations (p<0.05) are indicated in bold
FLC fraction of lysogenic cells, VP viral lytic production
Viral Distribution and Life Strategies 149

60
65
70
75
0 10 20 30 400
2
4
6
8
10
12
0 10 20 30 40
0
2
4
6
8
10
0 10 20 30 400
2
4
6
8
10
0 10 20 30 40
0
2
4
6
8
10
0 10 20 30 400
2
4
6
8
10
0 10 20 30 40
r = -0,90*
r = -0,02
r = 0,48
r = 0,65*
r = 0,16
r = -0,04
Dis
trib
utio
n of
vira
l m
orph
otyp
es (
% to
tal v
iruse
s)
< 60 nm tailless
60-90 nm tailless
> 90 nm tailless
Podoviridae
Myoviridae
Siphoviridae
Dis
trib
utio
n of
vira
l m
orph
otyp
es (
% to
tal v
iruse
s)D
istr
ibut
ion
of v
iral
mor
phot
ypes
(%
tota
l viru
ses)
Figure 4 Distribution of the different viral morphological groups along the estuarine salinity gradient. Bar=50 nm
Table 3 Coefficient of partial determination of alpha-, beta-, and gamma-proteobacteria and Bacteroidetes (Bdetes) and viral morphologicalgroups from all stations in the Back Dang River Estuary
n <60 60–90 >90 Podo Myo Sipho
Alpha 9 0.24 0.26 0.54 0.27 0.14 0.01
Beta 9 0.07 0.51 0.60* 0.13 0.21 0.23
Gamma 9 0.80** 0.92* 0.14 0.09 0.73* 0.08
Bdetes 9 <0.01 0.41 0.24 0.19 0.09 0.61
Tailless viruses smaller than 60 (<60), between 60 and 90 (60–90), and larger than 90 nm (>90). Tailed viruses of the Podoviridae (Podo),Myoviridae (Myo) and Siphoviridae (Sipho)
n number of samples
*0.01≤p≤0.05**p≤0.01
150 Y. Bettarel et al.

study. Concentrations of DOC remained above 100 μM Cand the correlation between primary and bacterial produc-tion was weak, suggesting that bioavailable organic carbonwas not limiting [42]. Therefore, the decline in prokaryoteabundance appears to be rather the result of substantialchanges in osmolarity. Indeed, the osmotic stress faced byfreshwater prokaryotes as they pass along the estuary mightexplain most of the net loss of cells, as assessedexperimentally by Cissoko et al. [15]. Troussellier et al.[50] also showed that only a very limited number offreshwater bacteria can maintain metabolic activity undermarine conditions.
Given the high specificity of virus–prokaryotes relation-ships [9], and that prokaryote distributions are stronglyrelated to salinity distributions [30], then it is also expectedthat salinity will have a strong incidence on virioplanktondistribution, life cycle, and community structure [10]. Theconcomitant decrease in prokaryotic and viral abundancefrom freshwater to seawater seems to indicate that most ofthe viral estuarine communities comprised bacteriophages,as is the case in the vast majority of aquatic habitats [53].Similar conclusions were drawn from studies conducted inestuaries in USA, Australia, and France where there wassignificant covariance between viruses and salinity, nutrientconcentrations, and prokaryote abundance [4, 23, 25]. Onthe other hand, the metabolic cost to freshwater prokaryotesto resist osmotic stress may alter their susceptibility to viralinfection. There is now a consensus that viral activity reliesheavily on the host being healthy in order to complete theirlytic cycle (e.g., the synthesis of the viral constituents andsubsequent release of the offspring) [31, 53]. Shifts insalinity may alter the integrity of the capsid’s receptors andinhibit the binding of viruses to their hosts [26], resulting insignificant reduction of viral stocks. Alternatively, theinactivation and decay of viruses themselves could beinfluenced by changes in ionic strength [55]. Interestingly,the absence of environmental gradients in a temporarilyopen/closed South African estuary resulted in a totalabsence of temporal or spatial pattern in bacteria abundanceand viral activity [1].
Switching of Viral Life Cycle
Contrasting viral strategies were observed throughout theestuarine gradient, characterized, from freshwater to seawater, by a decrease of virulent lytically producedviruses in favor of lysogenized cells. Lysogeny istypically considered as a survival strategy for virusesthat is favored during times of low resources, low hostabundance, and low growth rate [29, 32, 38, 58]. Thus,the drop in nutrient concentrations together with that ofprokaryotic abundances might be the cause of theprevalence of lysogenic rather than lytic viral life styles
in the more saline area. Hewson et al. [23] also suggestedthat lytic infections may be less common in the seawaterthan in the freshwater part of the estuary of Moreton Bay(Australia). In this study, the spectacular rise of the FLC inthe salinity range of 22–30 raises a fundamental question:are the lysogens of river or marine origin? A river origin isunlikely as freshwater prokaryotes have very little resis-tance to strong osmotic changes [14, 51]. Conversely, ifthe lysogens are of marine origin, then the rapid decline inthe proportion of inducible lysogens with decreasingsalinity (coming from the seawater) could be partlyexplained by salinity-driven activation of the lysogensduring the mixing between seawater and freshwater.Shkilnyj and Koudelka [45] recently reported that strongshifts in salinity can trigger the switch from lysogenic tolytic cycles. Under certain circumstances, therefore,mitomycin-C may only induce the fraction of residuallysogens that had not already been induced by environ-mental factors such as light conditions [8] or osmolarity.Finally, the replacement of lytic by lysogenic pathwaysalong salinity gradients suggests that estuaries are areaswhere there are major changes in virus–prokaryoteinteractions.
Distribution of Viral Morphotypes
Although analysis of viral morphology provides lessinformation about viral diversity than metagenomicapproaches, observing viral morphotypes was useful asit showed that the communities of viruses varied alongthe whole of the estuarine gradient of the Bach DangRiver. One of the most striking findings was thedistribution of some viral morphological groups thatappeared to be closely related to both the viral lifestrategies and the phylogenetic affiliation of their hosts.In general, icosahedral tailless viruses were far morenumerous than the tailed viruses of the Myoviridae,Siphoviridae and Podoviridae families. Several otherreports have also shown a dominance of tailless versustailed phages [5, 7, 33, 47]. However, the possibility thatultracentrifugation is responsible for the tail disruption ofsome Caudovirales cannot be excluded [53], which mightlead to the substantial underestimation of the significanceof this group. In this study, the proportion of taillessviruses increased with increasing salinity while that of theCaudovirales declined (Fig. 4). The decline of the taillessviruses was most marked for the smallest viruses (<60 nm)which were the dominant fraction of the viral communityand typically dominate in natural freshwater or seawater[7, 16, 33, 60]. The significant positive correlation foundbetween this subgroup and the viral lytic production seemsto imply that most of these small icosahedral viruses arevirulent and are the main component of the virioplankton
Viral Distribution and Life Strategies 151

community controlling prokaryotes. On the other hand,from a marine perspective, the quantitative increase of thissubgroup from downstream to upstream, together withdecreasing FLC values could also be considered as theconsequence of massive salinity-initiated induction ofmarine lysogens, as mentioned above. Lastly, there maybe increased adsorption rates of these small viruses ontothe large amount of suspended matter in the river waters[42] before they are diluted with seawater [23, 54].
We observed significant relationships between theproportion of certain viral morphotypes and that of somebacterial phylogenetic groups, and partial correlationanalysis showed that these relationships are not driven bysalinity alone (Table 3). The specificity of the interactionbetween virus and host is strong and usually located at thespecies- or genus-specific level. The different main groupswithin bacteria are presently identified solely on the basisof their branching pattern in the 16S rRNA trees. Some ofthese groups are very large and include thousands ofspecies. The morphological discrimination of viruses intosize classes or families also leads to large groupscomprising several genera and species. One may thus notexpect any relationship between virus and host when hostare considered at such phylogenetic level. Using a strictlygenealogical basis, a detailed understanding of prokaryoticphylogeny has begun to emerge [20]. Phylogenetic groupsshare certain morphological and physiological character-istics that distinguish them from each other as well as fromthe organisms on the other branches. For example, uptakerates of specific fractions of DOM, membrane lipidcomposition, growth rate, protein base content, or cell sizehave been described for cells of certain bacterial phyloge-netic groups [14, 17, 21, 63]. These similarities inbiochemical processes within a phylogenetic group maywell provide the base for a group level interaction withviruses. Indeed, bacteria phylogenetic identity has beenlinked to their size and biovolume [48], which, in turn, havebeen linked to viral morphotypes [39, 51], thereby linkinghost phylogeny to viral morphology. Similarly, hostphylogeny has been related to viral life strategy [32],which is also related to viral morphotype [12], again linkingthe host phylogeny to viral morphology. The lack ofrelationship observed in some of the other groups (Alpha-proteobacteria, Bacteroidetes) underlines the fact that bioticand abiotic factors other than host identity alone can alsocontrol viral production and abundance.
Finally, our results support the view that affinities mightexist between some viral morphotypes, their replicationpathways, and the phylogenetic affiliation of their host. In theBach Dang Estuary, these affinities seem to be driven by theenvironmental conditions, and more particularly, by externalosmolarity. Further studies are now required to determinewhether these affinities can be observed in other aquatic
ecosystems and more generally to assess the role of environ-mental features in shaping virus–prokaryote interactions.
Acknowledgements This work was financed by the EC2CO-PNECproject “HAIPHONG”, and grants from the French IRD, CNRS,Groupement De Recherche (GDR) 2476 Réseaux Trophiques Pélagi-ques, and the Vietnam Academy of Science and Technology (VAST).We thank Jean-Yves Panché, Jean-Pierre Lefebvre, and Robert Arfi fortheir help with the physical oceanography measurements.
References
1. Allan EL, Froneman PW (2008) Spatial and temporal patternsin bacterial abundance, production and viral infection in atemporarily open/closed southern African estuary. Estuar CoastShelf Sci 77:731–742
2. Almeida MA, Cunha MA, Dias JM (2007) Bacterial productivitydistribution during a rainy year in an estuarine system. MicrobEcol 53:208–220
3. Angly FE, Felts B, Breitbart M, Salamon P, Edwards RA, CarlsonC, Chan AM, Haynes M, Kelley S, Liu H, Mahaffy JM, MuellerJE, Nulton J, Olson R, Parsons R, Rayhawk S, Suttle CA, RohwerF (2006) The marine viromes of four oceanic regions. PLoS Biol4:2121–2131
4. Auguet JC, Montanié H, Delmas D, Hartmann HJ, Huet V (2005)Dynamic of virioplankton abundance and its environmentalcontrol in the Charente estuary (France). Microb Ecol 50:337–349
5. Auguet JC, Montanie H, Lebaron P (2006) Structure ofvirioplankton in the Charente estuary (France): transmissionelectron microscopy versus pulsed field gel electrophoresis.Microb Ecol 51:197–208
6. Bench SR, Hanson TE, Williamson KE, Ghosh D, Radosovich M,Wang K, Wommack KE (2007) Metagenomic characterization ofChesapeake Bay virioplankton. Appl EnvironMicrob 73:7629–7641
7. Bettarel Y, Bouvy M, Dumont C, Sime-Ngando T (2006) Virus–bacterium interactions in water and sediment of West Africaninland aquatic systems. Appl Environ Microbiol 72:5274–5282
8. Bettarel Y, Arfi R, Bouvier T, BouvyM, Briand E, Colombet J, CorbinD, Sime-Ngando T (2008) Virioplankton distribution and activity in atropical eutrophicated Bay. Estuar Coast Shelf Sci 3:425–429
9. Bettarel Y, Desnues A, Rochelle-Newall E (2010) Lytic failure incross-inoculation assays between phages and prokaryotes from threeaquatic sites of contrasting salinity. FEMSMicrobiol Lett 311:113–118
10. Bettarel Y, Bouvier T, Bouvier C, Carré C, Desnues A, DomaizonI, Jacquet S, Robin A, Sime-Ngando T (2011) Ecological traits ofplanktonic viruses and prokaryotes along a full salinity gradient.FEMS Microbiol Ecol. doi:10.1111/j.1574-6941.2011.01054.x
11. Bouvier T, del Giorgio PA (2002) Compositional changes in free-living bacterial communities along the salinity gradient in twotemperate estuaries. Limnol Oceanogr 47:453–470
12. Breitbart M, Felts B, Kelley S, Mahaffy JM, Nulton J, Salamon P,Rohwer F (2004) Diversity and population structure of a near-shore marine-sediment viral community. Proc R Soc London SerB Biol Sci 271:565–574
13. Buchen-Osmond C (2003) Taxonomy and classification ofviruses. In: Manual of Clinical Microbiology, 8th ed, Vol 2.ASM Press, Washington DC, pp 1217–1226
14. Bühring SI, Elvert M, Witte U (2005) The microbial communitystructure of different permeable sandy sediments characterized bythe investigation of bacterial fatty acids and fluorescence in situhybridization. Env Microbiol 7:281–293
15. Cissoko M, Desnues A, Bouvy M, Sime-Ngando T, Verling E,Bettarel Y (2008) Effects of freshwater and seawater mixing on
152 Y. Bettarel et al.

virio- and bacterioplankton in a tropical estuary. Freshwat Biol53:1154–1162
16. Cochlan WP, Wikner J, Steward GF, Smith DC, Azam F (1993)Distribution of viruses, bacteria and chlorophyll a in neritic, oceanicand estuarine environments. Mar Ecol Prog Ser 92:77–87
17. Cottrell MT, Kirchman DL (2000) Natural assemblages of marineproteobacteria and members of the Cytophaga–Flavobactercluster consuming low- and high-molecular-weight dissolvedorganic matter. Appl Env Microbiol 66:1692–1697
18. Eaton AD, Clesceri LS, Rice EW, Greenburg AE, Franson MAH(1995) Standard methods for the examination of water andwastewater (19th Edition), Baltimore, Maryland: American PublicHealth Association. 1325 p
19. Filippini M, Buesing N, Gessner MO (2008) Temporal dynamicsof freshwater bacterio- and virioplankton along a littoral-pelagicgradient. Freshwat Biol 53:1114–1125
20. Gupta RS (2000) The phylogeny of proteobacteria: relationshipsto other eubacterial phyla and eukaryotes. FEMS Microbiol Rev24:367–402
21. Gupta RS (2005) Protein signatures distinctive of alpha proteobacteriaand its subgroups and a model for alpha-proteobacterial evolution.Critic Rev Microbiol 31:101–135
22. Helton RR, Wommack KE (2009) Seasonal dynamics andmetagenomic characterization of estuarine viriobenthosassemblages by randomly amplified polymorphic DNA PCR.Appl Environ Microbiol 75:2259–2265
23. Hewson I, O’Neil JM, Fuhrman JA, DennisonWC (2001) Virus-likeparticle distribution and abundance in sediments and overlying wateralong eutrophication gradients in two subtropical estuaries. LimnolOceanogr 47:1734–1746
24. Holm-Hansen O, Lorenzen CJ, Holmes RW, Strickland JDH(1965) Fluorometric determination of chlorophyll. J Cons IntExplor Mer 30:3–15
25. Jiang SC, Paul JH (1994) Seasonal and diel abundance of virusesand occurrence of lysogeny/bacteriocinogeny in the marineenvironment. Mar Ecol Prog Ser 104:163–172
26. Kukkaro P, Bamford DH (2009) Virus–host interactions inenvironments with a wide range of ionic strengths. EnvironMicrobiol Reports 1:71–77
27. Laws EA, Archie JW (1981) Appropriate use of regressionanalysis in marine biology. Mar Biol 65:13–16
28. Legendre L, Legendre P (1983) Numerical ecology, developmentsin environmental modeling, 3. Elsevier, New York, p 419
29. Long A, McDaniel LD, Mobberley J, Paul JH (2008) Comparisonof lysogeny (prophage induction) in heterotrophic bacterial andSynechococcus populations in the Gulf of Mexico and MississippiRiver plume. ISME J 2:132–144
30. Lozupone CA, Knight R (2007) Global patterns in bacterialdiversity. Proc Natl Acad Sci USA 104:11436–11440
31. Maurice CF, Bouvier T, Comte J, Guillemette F, del Giorgio PA(2010) Seasonal variations of phage life strategies and bacterialphysiological states in three northern temperate lakes. EnvironMicrobiol 12:628–641
32. Maurice CF,Mouillot D, Bettarel Y, SarmentoH, DeWits R, BouvierT (2011) Disentangling the relative influence of bacterioplanktonphylogeny and metabolism on lysogeny in reservoirs and lagoons.The ISME J. doi:10.1038/ismej.2010.181
33. Montanié H, Hartmann HJ, Crottereau C, Trichet C (2002) Virus-likeparticle analysis in a seston-rich coastal pond using transmissionelectron microscopy. Aquat Microb Ecol 28:105–115
34. Painchaud J, Lefaivre D, Therriault JC, Legendre L (1995) Physicalprocesses controlling bacterial distribution and variability in theupper St. Lawrence estuary. Estuaries 18:433–444
35. Parada V, Herndl GJ, Weinbauer MG (2006) Viral burst size ofheterotrophic prokaryotes in aquatic systems. J Mar Biol Ass UK86:613–621
36. Patel A, Noble RT, Steele JA, Schwalbach MS, Hewson I,Fuhrman JA (2007) Virus and prokaryote enumeration fromplanktonic aquatic environments by epifluorescence microscopywith SYBR Green I. Nat Protoc 2:269–276
37. Pernthaler A, Pernthaler J, Amann RI (2004) Sensitive multi-colorfluorescence in situ hybridization for the identification ofenvironmental microorganisms. In: Kowalchuk G et al. (eds.)Molecular microbial ecology manual, 2nd edn. Kluwer Academicpublishers, the Netherlands, 3:711–726
38. Pradeep Ram AS, Sime-Ngando T (2010) Resources drivetrade-off between viral lifestyles in the plankton: evidence fromfreshwater microbial microcosms. Environ Microbiol 12:467–479
39. Pradeep Ram AS, Arnous B, Danger M, Carrias J-F, Lacroix G,Sime-Ngando T (2010) High and differential viral infection rateswithin bacterial ‘morphopopulations’ in a shallowsand pit lake(Lac de Creteil, France). FEMS Microbiol Ecol. doi:10.1111/j.1574-941.2010.00920.x
40. Riley GA (1939) Correlations in aquatic ecology with an exampleof their application to problems of plankton productivity. J MarRes 2:56–73
41. Rochelle-Newall EJ, Fisher TR (2002) Chromophoric dissolvedorganic matter and dissolved organic carbon in Chesapeake Bay.Mar Chem 77:23–41
42. Rochelle-Newall EJ, Chu VT, Pringault O, Amouroux D, ArfiR, Bettarel Y, Bouvier T, Bouvier C, Got NTMH, Mari X,Navarro P, Duong TN, Cao TTT, Pham TT, Ouillon S, TorrétonJP (2011) Phytoplankton diversity and productivity in a highlyturbid, tropical coastal system (Bach Dang Estuary, Vietnam).Biogeosciences Discuss 8:487–525. doi:10.5194/bgd-8-487-2011
43. Sandaa RA, Skjoldal EF, Bratbak G (2003) Virioplanktoncommunity along a salinity gradient in a solar saltern. Extrem-ophiles 7:347–351
44. Shiah FK, Ducklow HW (1994) Temperature and substrateregulation of bacterial abundance, production and specificgrowth rate in Chesapeake Bay, USA. Mar Ecol Prog Ser103:297–308
45. Shkilnyj P, Koudelka GB (2007) Effect of salt shock on stabilityof λimm434 lysogens. J Bacteriol 189:3115–3123
46. Sokal RR, Rohlf FJ (1995) Biometry: the principles and practiceof statistics in biological research, 3rd edn. Freeman W. H. andCo., New York, pp 715–724
47. Stopar D, Ceme A, Zigman M, Poljsak-Prijatelj M, Turk V (2003)Viral abundance and a high proportion of lysogens suggest thatviruses are important members of the microbial community in theGulf of Trieste. Microb Ecol 46:249–256
48. Straza TR, Cottrell MT, Ducklow MW, Kirchman DL (2009)Geographic and phylogenetic variation in bacterial biovolume asrevealed by protein and nucleic acid staining. Appl EnvironMicrobiol 75:4028–4034
49. Suttle CA (2005) Viruses in the sea. Nature 437:356–36150. Troussellier M, Schafer H, Batailler N, Bernard L, Courties C,
Lebaron P, Muyzer G, Servais P, Vives-Rego J (2002) Bacterialactivity and genetic richness along an estuarine gradient (RhoneRiver plume, France). Aquat Microb Ecol 28:13–24
51. Weinbauer MG, Peduzzi P (1994) Frequency, size and distributionof bacteriophages in different marine bacterial morphotypes. MarEcol Prog Ser 108:11–20
52. Weinbauer MG, Brettar I, Höfle MG (2003) Lysogeny and virus-induced mortality of bacterioplankton in surface, deep, and anoxicmarine waters. Limnol Oceanogr 48:169–177
53. Weinbauer MG (2004) Ecology of prokaryotic viruses. FEMSMicrobiol Rev 28:127–181
54. Weinbauer MG, Bettarel Y, Cattaneo R, Luef B, Maier C,Motegi C, Peduzzi P, Mari X (2009) Viral ecology of organic
Viral Distribution and Life Strategies 153

and inorganic particles in aquatic systems: avenues for furtherresearch. Aquat Microb Ecol 57:321–341
55. Wells LE, Deming JW (2006) Effects of temperature, salinity andclay particles on inactivation and decay of cold-active marinebacteriophage 9A. Aquat Microb Ecol 45:31–39
56. Wilhelm SW, Briden S, Suttle CA (2002) A dilution techniquefor the direct measurement of viral production: comparison instratified and tidally mixed coastal waters. Microb Ecol43:168–173
57. Williamson SJ, McLaughlin MR, Paul JH (2001) Interaction ofthe ФHSIC virus with its host: lysogeny or pseudolysogeny? ApplEnviron Microbiol 67:1682–1688
58. Williamson SJ, Houchin LA, McDaniel L, Paul JH (2002)Seasonal variation in lysogeny as depicted by prophage inductionin Tampa Bay, Florida. Appl Environ Microbiol 68:4307–4314
59. Willner D, Thurber RV, Rohwer F (2009) Metagenomic signaturesof 86 microbial and viral metagenomes. Environ Microbiol11:1752–1766
60. Wommack KE, Ravel J, Hill RT, Chun J, Colwell RR (1999)Population dynamics of Chesapeake Bay virioplankton: total-community analysis by pulsed-field gel electrophoresis. ApplEnviron Microbiol 65:231–240
61. Wommack KE, Colwell RR (2000) Virioplankton: viruses inaquatic ecosystems. Microbiol Mol Biol Rev 64:69–114
62. Wösten JHM, de Willigen Tri NH, Lien TV, Smith SV (2003)Nutrient dynamics in mangrove areas of the Red River Estuary inVietnam. Estuar Coast Shelf Sci 57:65–72
63. Yokokawa T, Nagata T, Cottrell MT, Kirchman DL (2004) Growthrate of the major phylogenetic bacterial groups in the Delawareestuary. Limnol Oceanogr 49:1620–1629
154 Y. Bettarel et al.