physical forcing and nutrient conditions associated with patterns of chl a and phytoplankton...
TRANSCRIPT
ARTICLE IN PRESS
Deep-Sea Research II 55 (2008) 1745– 1760
Contents lists available at ScienceDirect
Deep-Sea Research II
0967-06
doi:10.1
� Corr
E-m
journal homepage: www.elsevier.com/locate/dsr2
Physical forcing and nutrient conditions associated with patterns of Chl a andphytoplankton productivity in the southeastern Bering Sea during summer
Raymond N. Sambrotto a,�, Calvin Mordy b, Stephan I. Zeeman c, Phyllis J. Stabeno d, S. Allen Macklin d
a Lamont-Doherty Earth Observatory of Columbia University, 61 Route 9W, Palisades, NY 10964, USAb Joint Institute for the Study of the Atmosphere and Ocean, Box 354235, University of Washington, Seattle, WA 98195, USAc University of New England, 11 Hills Beach Road, Biddeford, ME 04005-9599, USAd NOAA/Pacific Marine Environmental Laboratory, 7600 Sand Point Way NE, Seattle, WA 98115-6349, USA
a r t i c l e i n f o
Article history:
Accepted 31 March 2008Measurements of nutrients, primary (14C) productivity and new (nitrate) productivity collected in the
southeastern Bering Sea in July and August 2004 together with measurements from July 1981 are used
Available online 31 July 2008Keywords:
Nutrients (mineral)
Primary production
Phytoplankton
Frontal features
Iron limitation
Physical–biological coupling
45/$ - see front matter & 2008 Elsevier Ltd. A
016/j.dsr2.2008.03.003
esponding author. Tel.: +1845 365 8402; fax:
ail address: [email protected] (R.N
a b s t r a c t
to characterize the regional production system during summer and to analyze the major physical and
nutrient factors controlling biological patterns. The patterns of surface productivity suggested by the
two different summers were remarkably similar in the regions of data overlap and agree with recent
compilations of summer conditions from remotely sensed data. Summer was characterized by low
production in the middle and outer shelf associated with surface mixed layers that were stabilized by
heat. Elevated productivity was restricted to regions associated with the surface expression of
thermohaline fronts, as well as to tidally mixed regions adjacent to and between the Pribilof Islands.
Based on Chl a and productivity measurements, the biological impact of the shelf-break front of the
southeastern Bering Sea extends at least as far inshore as the Pribilof Islands. The existence of elevated
summer productivity associated with a recently identified shelf-partition front between the Pribilof
domain and the middle shelf domain east of St. Paul Island was confirmed, and its thermohaline nature
resulting from cumulative intrusions of slope-derived water is described. Yearly estimates of new and
primary productivity compiled for the various biophysical regimes range from 41800 mmol N m�2 yr�1
and 4170 g C m�2 yr�1 at the shelf-break front to less than 700 mmol N m�2 yr�1 and 100 g C m�2 yr�1 in
oceanic and coastal waters. We hypothesize that trace metals, rather than macronutrients or grazing,
likely restrict the seaward extent of elevated production at the shelf-break front. Iron may be supplied to
the front by isopycnal mixing from deeper shelf waters that were in contact with sediments. By
extending elevated production throughout the summer, the thermohaline and tidal fronts enhance the
coupling of primary production to epipelagic food webs for the large populations of fish, birds and
mammals in the region. Changes in the intensity or location of these frontal systems may impact
populations that forage in them from the nearby Pribilof Islands.
& 2008 Elsevier Ltd. All rights reserved.
1. Introduction
Phytoplankton productivity is elevated on continental shelvesand the adjoining slope regions in most places in the ocean(Longhurst et al., 1995). At high latitudes, the nutrients accumu-late during winter and support a spring bloom that redistributesthe nutrients in shelf waters (Riley, 1942). Following this relativelybrief period of production, vertical stability restricts the verticalre-supply of nutrients, and shelf productivity in summer is oftenlow. Primary production that is so transitory in nature typically isnot well coupled to pelagic food webs, and much of the organic
ll rights reserved.
+1845 365 8150.
. Sambrotto).
matter produced reaches the benthos. Coupling of surfaceproduction to the benthic food web is particularly apparent onhigh-latitude, ice-impacted shelves (Grebmeier et al., 2006;Schmid et al., 2006; Wassmann et al., 2006), although it maycharacterize ice-free shelves as well (Moll and Radach, 2003).Persistent elevated pelagic production is maintained at frontalregions by a variety of processes that facilitate a more or lesscontinuous supply of nutrients to surface waters (Sournia, 1994).Ocean fronts form in response to several processes (Pingree et al.,1976; Holligan et al., 1984; Horne et al., 1989). Horizontalvariability in vertical mixing by tides in shallow regions createstidal or structure fronts. Thermohaline fronts form at the interfacebetween water masses with different temperatures and salinities,such as those that occur at shelf breaks and often are associatedwith elevated summer production (Malone et al., 1983; Marra,
ARTICLE IN PRESS
R.N. Sambrotto et al. / Deep-Sea Research II 55 (2008) 1745–17601746
1990; Ryan et al., 1999). Although the supply of macronutri-ents most often has been implicated in sustaining elevatedproduction in such regions, the role of trace elements, such asiron, also has been shown to be important in the North PacificOcean (Boyd et al., 2004).
The ultimate trophic impact of nutrient supply to shelf foodwebs in subarctic seas is of particular importance because theseregions produce the bulk of the world’s fish supply (Houde andRutherford, 1993). Even when compared to other productive shelfregions, the eastern Bering Sea (EBS) supports elevated biomass invirtually every trophic level of the marine food web (NRC, 1996).Like other high-latitude shelves, the southeastern region supportshigh phytoplankton production during spring in association withthe receding ice edge (Stabeno et al., 2008a). In ice-free areas, theinitial stabilization of the upper water is due to heating, and thespring bloom occurs later, typically during April–May (Sambrottoet al., 1986; Niebauer et al., 1990; Doyon et al., 2000; Eslinger andIverson, 2001).
Within the huge shelf region (�600,000 km2) of the EBS, thePribilof Islands, a group of small islands on the outer part of thesoutheastern shelf, are home to large populations of marine birdsand pinnepeds. Although the Pribilof Islands provide breedinghabitat for these populations, they also provide access to favorablefeeding conditions and support large populations of birdsthroughout the summer that feed on small fish and zooplankton(Decker and Hunt, 1996; Hunt et al., 1996).
The relationships among hydrography, nutrients and produc-tion on the southeastern Bering shelf have been well described(e.g., Kachel et al., 2002). Tidal fronts around the Pribilofs havevertical mixing rates that are sufficient to maintain nutrientsupply to surface waters in summer (Whitledge et al., 1986;Stabeno et al., 1999; Stockwell et al., 2001). Such fronts alsosupport elevated zooplankton production (Coyle and Cooney,1993), although no direct relationship between these fronts andupper trophic level stocks has been made. In some years, thegrowth rate of age-0 walleye pollock (Theragra chalcogramma) hasbeen found to be greater outside of the tidal front around thePribilof Islands (Brodeur et al., 2002; Ciannelli et al., 2002).Recently, a frontal region called the shelf-partition front(a structure front between the middle shelf domain and thePribilof domain; Sullivan et al., 2008) has been described thatsupports elevated production outside of the tidal fronts aroundthe Pribilof Islands (Flint et al., 2002).
Another potential site for intensified trophic exchange duringthe summer is the thermohaline front that is associated withelevated production along the shelf break in the EBS (Iversonet al., 1979). Springer et al. (1996) suggested that summerproductivity at this front is a crucial factor for the large uppertrophic level stocks in this region. The communication of theshelf-break front with deeper, slope-derived water along isopyc-nal surfaces increases its access to macronutrients (Coachman,1986). Also, the proximity of the Pribilof Islands to the shelfbreak increases the likelihood that nutrient-rich water from theslope reaches this region as well (Stabeno and van Meurs, 1999;Stabeno et al., 2001; Mizobata et al., 2008). This access toslope-derived water may result in considerable summer produc-tion at the tidal fronts around the Pribilofs and even as far as theshelf-partition front. Similar tidal fronts found along the inshoreregions of the EBS derive nutrients from the bottom layer of themiddle shelf, where nutrient concentrations are considerablealthough less than at the slope (Kachel et al., 2002). In each ofthese frontal regions, the elevated phytoplankton productionduring summer stands out against the rest of the shelf that isotherwise characterized by density-stratified and nutrient-depleted surface waters after the initial, short-lived (o1 month)spring bloom.
This paper addresses the coupling between nutrient supplyand phytoplankton production during summer around the PribilofIslands and the adjacent shelf region to the southeast. The linkagebetween the dominant physical processes, such as the means bywhich nutrient-rich slope water and shelf bottom water reachesthe surface, and epipelagic production is critical to the analysis ofthe contemporary upper trophic level ecology of the region.A more detailed understanding of the mechanisms that supportextended summer production would improve the ability toanticipate the impact that variations in these mechanisms haveon shelf biogeochemical fluxes and upper trophic levels, both ofwhich appear to respond significantly to climate forcing(Hunt and Stabeno, 2002; Piepenburg, 2005). This paper focuseson the relationship between summer physical conditions andbiological productivity on the large shelf region in the south-eastern Bering Sea to help document the aspect of a system thatmay be susceptible to periodic climatic variations or longer-termwarming.
2. Methods
To assess regional patterns of productivity, we measuredprimary (14C) production, as well as new (nitrate) and regenerated(ammonium) production. Nitrogen productivity provides a usefultool in this analysis because the new (nitrate) component linksthe supply of nutrients with the biological response, and alsobecause the ratio of new to total nitrogen production (the f-ratio)provides a way to assess how well coupled surface production isto epipelagic trophic transfer (Dugdale and Goering, 1967; Laws etal., 2000). Nitrate fluxes to surface waters appear to be significantin the shelf-break front region (Hansell et al., 1989). We use datafrom two summers to characterize meso-scale (�100 s of km)spatial patterns that may be consistent from year to year for theregion and to infer the mechanisms that lead to these patterns. Inaddition to the biological rate measurements, we also havecompiled extensive hydrographic and nutrient data for thisanalysis.
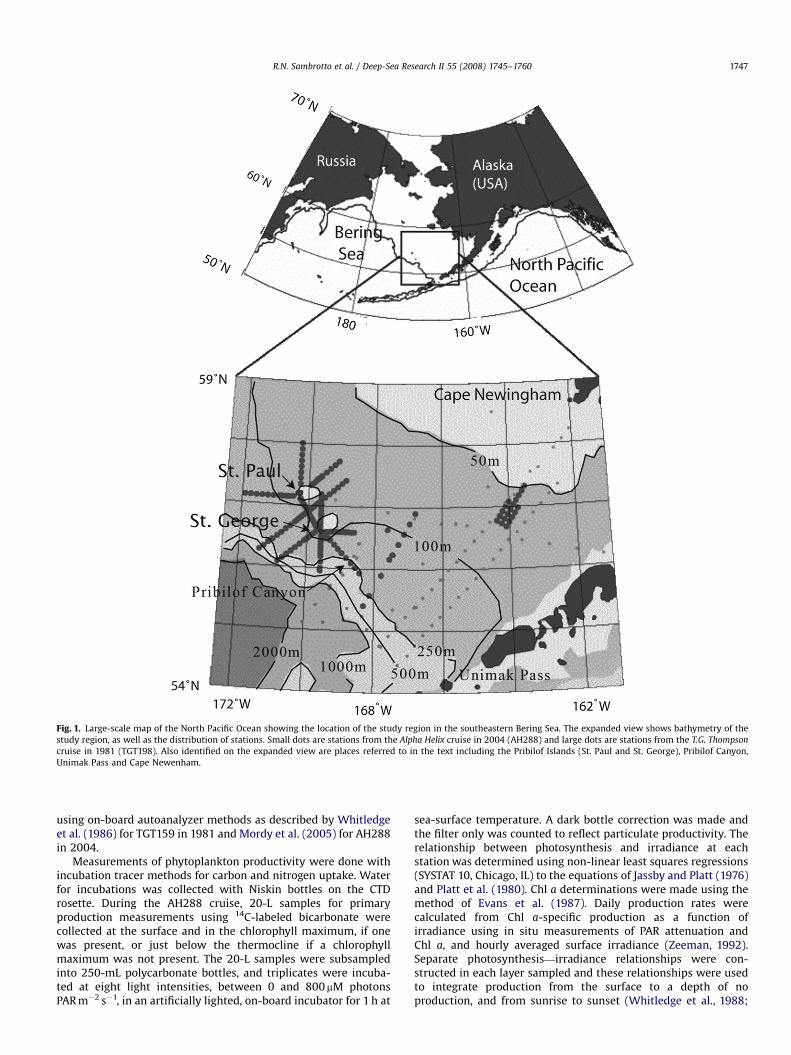
Unless otherwise specified, data come from two cruises; (1)R/V Alpha Helix cruise 288 (AH288), from July 26 to August 20,2004 and (2) R/V T.G. Thompson cruise 159 (TGT159) from June 26to July 21, 1981. We use only the July 1981 cruise data that overlapthe seasonal coverage of the 2004 data. Some of the hydrographicand nutrient data for the 1981 cruise have been presented inprevious publications (e.g., Whitledge et al., 1986), although herewe include additional spatial coverage, as well as carbon andnitrogen productivity rates. Station locations from the two cruisesare shown in Fig. 1. The spatial coverage of the two cruisesoverlaps in the regions immediately south and east of the PribilofIslands, as well as in the middle shelf region off Cape Newenham.For this unusually broad continental shelf, it is useful to refer tohydrographic domains that differ in their vertical physicalstructure and mixing regime roughly with depth (Coachman,1986). The domains will be referred to here as the inner shelf(�o50 m); the middle shelf (�50–100 m); the outer shelf(�100–150 m); and the slope and basin region (�4150 m). Theboundaries between them are the inner front, the middletransition zone and the shelf-break front, respectively. The PribilofIslands, which sit near the outer boundary of the middle shelf,have their own inner or structure front and inshore region wherewater shoals between the structure front and the island shore.Both cruises sampled all domains in adjacent parts of the EBS. Ateach station in Fig. 1, a CTD cast was made for temperature andsalinity with an instrument calibrated by the manufacturer. Waterwas collected at various depths for the analysis of nutrientchemistry and biological variables. All nutrients were analyzed
ARTICLE IN PRESS
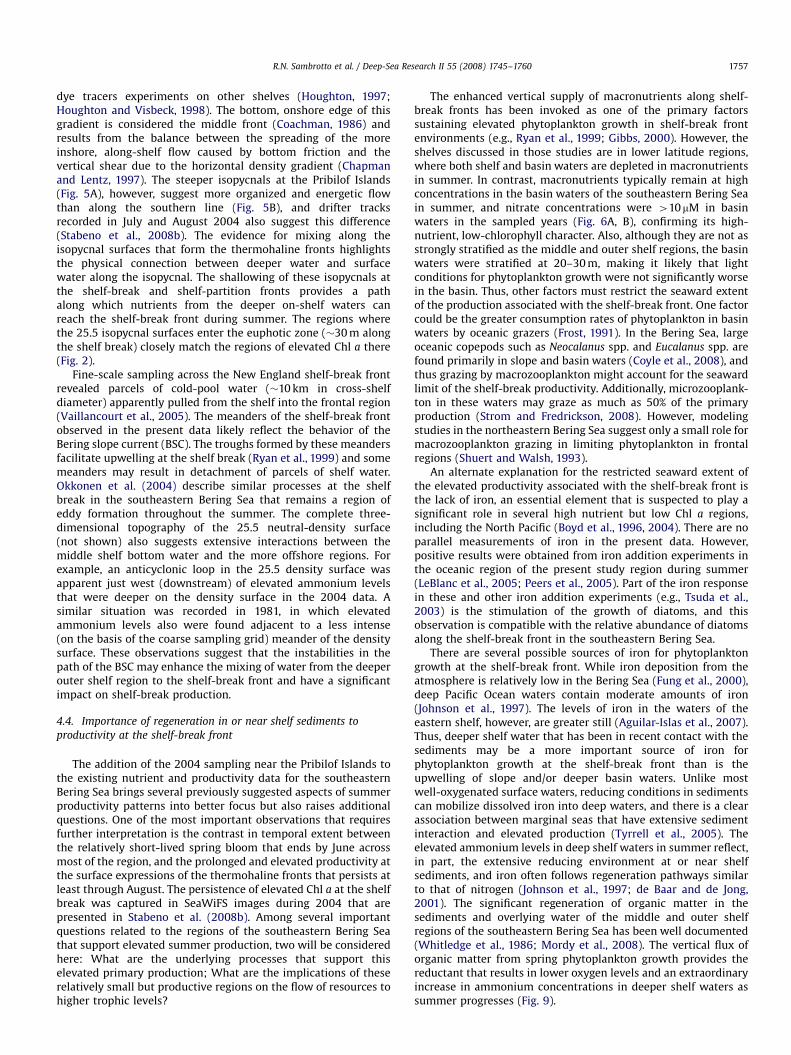
Fig. 1. Large-scale map of the North Pacific Ocean showing the location of the study region in the southeastern Bering Sea. The expanded view shows bathymetry of the
study region, as well as the distribution of stations. Small dots are stations from the Alpha Helix cruise in 2004 (AH288) and large dots are stations from the T.G. Thompson
cruise in 1981 (TGT198). Also identified on the expanded view are places referred to in the text including the Pribilof Islands (St. Paul and St. George), Pribilof Canyon,
Unimak Pass and Cape Newenham.
R.N. Sambrotto et al. / Deep-Sea Research II 55 (2008) 1745–1760 1747
using on-board autoanalyzer methods as described by Whitledgeet al. (1986) for TGT159 in 1981 and Mordy et al. (2005) for AH288in 2004.
Measurements of phytoplankton productivity were done withincubation tracer methods for carbon and nitrogen uptake. Waterfor incubations was collected with Niskin bottles on the CTDrosette. During the AH288 cruise, 20-L samples for primaryproduction measurements using 14C-labeled bicarbonate werecollected at the surface and in the chlorophyll maximum, if onewas present, or just below the thermocline if a chlorophyllmaximum was not present. The 20-L samples were subsampledinto 250-mL polycarbonate bottles, and triplicates were incuba-ted at eight light intensities, between 0 and 800 mM photonsPAR m�2 s�1, in an artificially lighted, on-board incubator for 1 h at
sea-surface temperature. A dark bottle correction was made andthe filter only was counted to reflect particulate productivity. Therelationship between photosynthesis and irradiance at eachstation was determined using non-linear least squares regressions(SYSTAT 10, Chicago, IL) to the equations of Jassby and Platt (1976)and Platt et al. (1980). Chl a determinations were made using themethod of Evans et al. (1987). Daily production rates werecalculated from Chl a-specific production as a function ofirradiance using in situ measurements of PAR attenuation andChl a, and hourly averaged surface irradiance (Zeeman, 1992).Separate photosynthesis—irradiance relationships were con-structed in each layer sampled and these relationships were usedto integrate production from the surface to a depth of noproduction, and from sunrise to sunset (Whitledge et al., 1988;
ARTICLE IN PRESS
R.N. Sambrotto et al. / Deep-Sea Research II 55 (2008) 1745–17601748
Zeeman and Jensen, 1990a, b). During the earlier TGT159 cruise,primary production also was measured with the 14C-tracerapproach, but in this case incubations were done in seawater-cooled, on-deck incubators under ambient light that simulatedthe submarine light field (Iverson et al., 1979).
Stable nitrogen (15N) isotope methods were used to measurenew (nitrate) and regenerated (ammonium) productivity. Forthese measurements, 10-L samples were collected throughout theeuphotic zone at 100%, 55%, 30%, 17%, 9%, 5% and 1% of surfacelight levels based on protocols reported previously (Sambrottoand Mace, 2000). Briefly, the incubations were done in on-board,surface seawater-cooled incubators under ambient light. Ambientnitrate and ammonium concentrations were measured beforeadding the tracer, so that a minimal perturbation (o10%) ofambient concentrations could be added. Incubations were done inbottles made of PET (in 2004) or polycarbonate (in 1981) thatwere covered with neutral-density screens to simulate subsurfacelight levels. Most incubations in 2004 lasted 4–6 h around localnoon, although in four cases (stns. 23, 49, 154 and 252) theincubations were done in the late afternoon. In 1981, some of theincubations were done for 24 h. At the end of the incubations,particulate material was collected on pre-combusted GF/F filtersand dried on-board before being returned to the laboratory in adesiccator. Isotopic ratios and total nitrogen content of thesamples from 2004 were measured using a Europa 20–20,continuous flow, mass spectrometer with an automated combus-tion system. The 1981 samples were analyzed with an emissionspectrometer (Sambrotto et al., 1986). Uptake rates were calcu-lated from the equations in Dugdale and Goering (1967). In thefollowing text, we discuss both the mass flux of nitrogen (rNO3 orrNH4) in units of moles N vol�1 time�1, as well as the specificnitrogen uptake rate (vN) in units of time�1, when we wish todiscuss the physiological rate independent from the biomass.The f-ratio (rNO3/(rNO3+rNH4)) also is used to describe therelative amount of new to total nitrogen production. Trapezoidal
59°N
58°N
57°N
56°N
55°N
54°N172°W 170°W 168°W
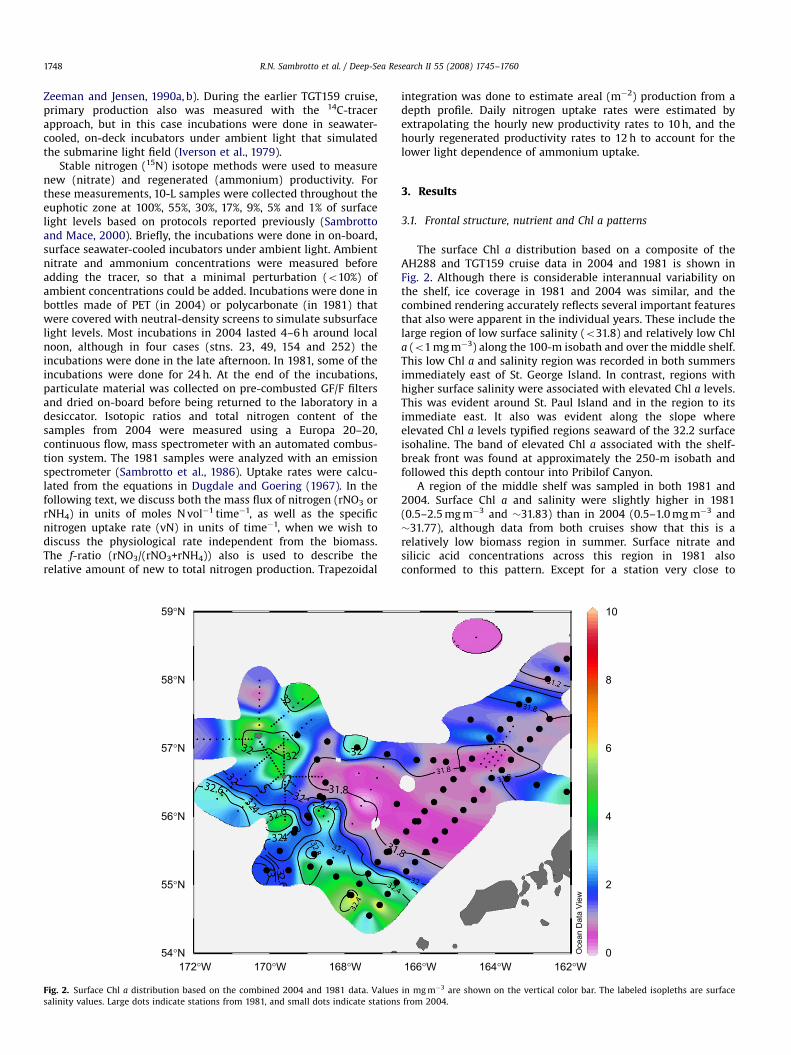
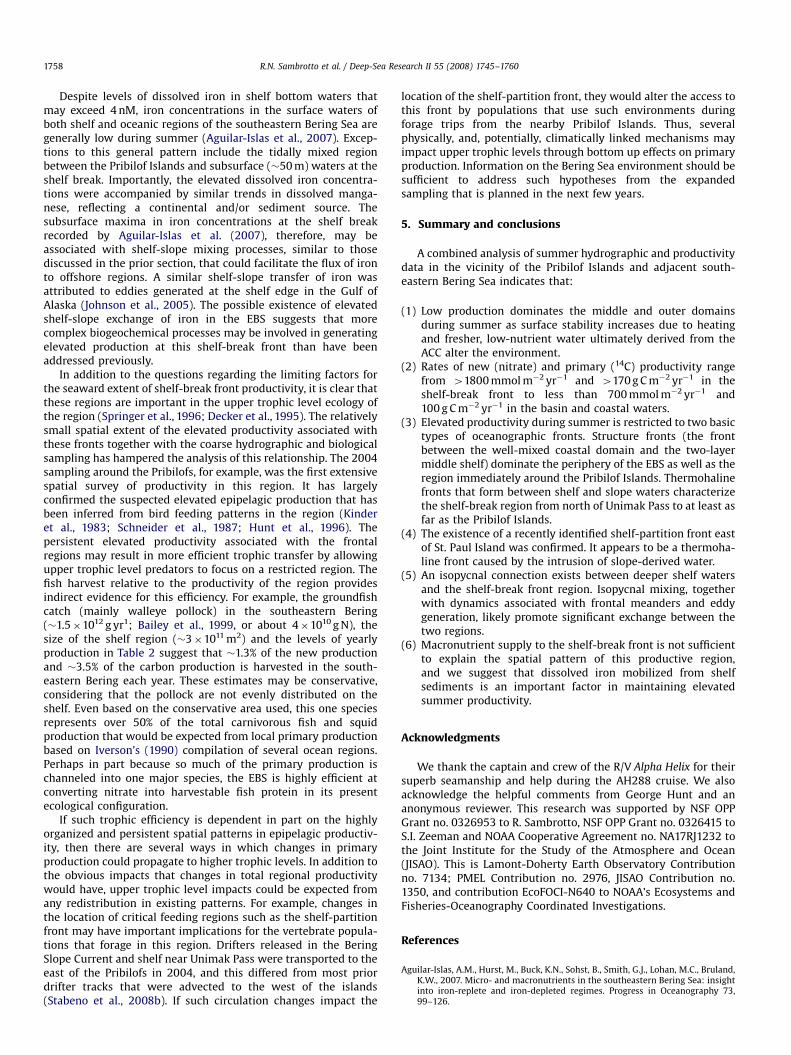
Fig. 2. Surface Chl a distribution based on the combined 2004 and 1981 data. Values
salinity values. Large dots indicate stations from 1981, and small dots indicate stations
integration was done to estimate areal (m�2) production from adepth profile. Daily nitrogen uptake rates were estimated byextrapolating the hourly new productivity rates to 10 h, and thehourly regenerated productivity rates to 12 h to account for thelower light dependence of ammonium uptake.
3. Results
3.1. Frontal structure, nutrient and Chl a patterns
The surface Chl a distribution based on a composite of theAH288 and TGT159 cruise data in 2004 and 1981 is shown inFig. 2. Although there is considerable interannual variability onthe shelf, ice coverage in 1981 and 2004 was similar, and thecombined rendering accurately reflects several important featuresthat also were apparent in the individual years. These include thelarge region of low surface salinity (o31.8) and relatively low Chla (o1 mg m�3) along the 100-m isobath and over the middle shelf.This low Chl a and salinity region was recorded in both summersimmediately east of St. George Island. In contrast, regions withhigher surface salinity were associated with elevated Chl a levels.This was evident around St. Paul Island and in the region to itsimmediate east. It also was evident along the slope whereelevated Chl a levels typified regions seaward of the 32.2 surfaceisohaline. The band of elevated Chl a associated with the shelf-break front was found at approximately the 250-m isobath andfollowed this depth contour into Pribilof Canyon.
A region of the middle shelf was sampled in both 1981 and2004. Surface Chl a and salinity were slightly higher in 1981(0.5–2.5 mg m�3 and �31.83) than in 2004 (0.5–1.0 mg m�3 and�31.77), although data from both cruises show that this is arelatively low biomass region in summer. Surface nitrate andsilicic acid concentrations across this region in 1981 alsoconformed to this pattern. Except for a station very close to
166°W 164°W 162°W
Oce
an D
ata
Vie
w
10
8
6
4
2
0
in mg m�3 are shown on the vertical color bar. The labeled isopleths are surface
from 2004.
ARTICLE IN PRESS
R.N. Sambrotto et al. / Deep-Sea Research II 55 (2008) 1745–1760 1749
Unimak Island, in 1981 surface nitrate and silicic acid levels herewere less than 1 and 2mM, respectively, and were separatedfrom nutrient-rich, deeper waters by a vertical density change of0.3–0.5st units.
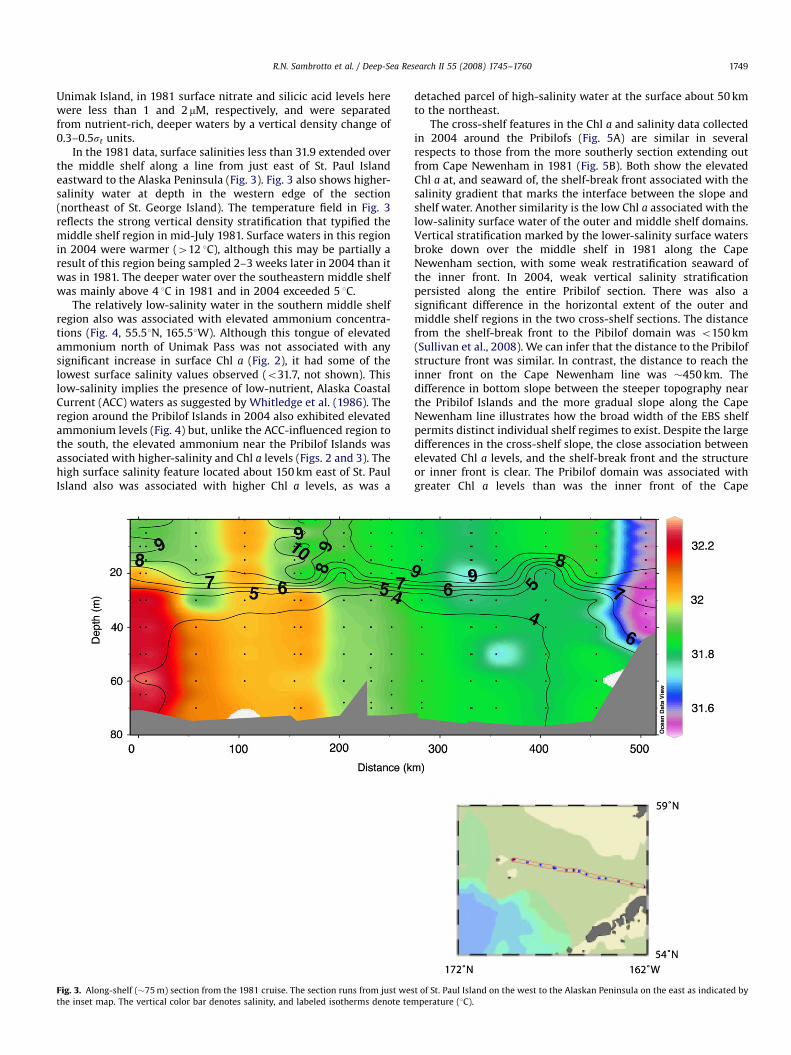
In the 1981 data, surface salinities less than 31.9 extended overthe middle shelf along a line from just east of St. Paul Islandeastward to the Alaska Peninsula (Fig. 3). Fig. 3 also shows higher-salinity water at depth in the western edge of the section(northeast of St. George Island). The temperature field in Fig. 3reflects the strong vertical density stratification that typified themiddle shelf region in mid-July 1981. Surface waters in this regionin 2004 were warmer (412 1C), although this may be partially aresult of this region being sampled 2–3 weeks later in 2004 than itwas in 1981. The deeper water over the southeastern middle shelfwas mainly above 4 1C in 1981 and in 2004 exceeded 5 1C.
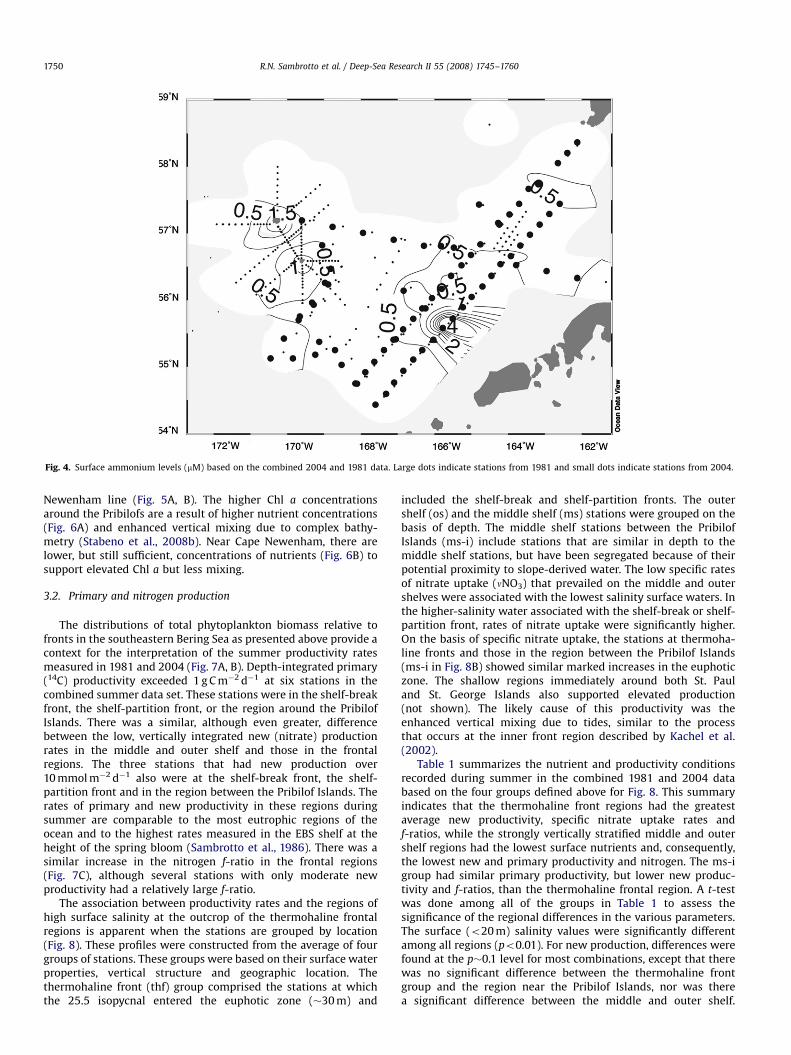
The relatively low-salinity water in the southern middle shelfregion also was associated with elevated ammonium concentra-tions (Fig. 4, 55.51N, 165.51W). Although this tongue of elevatedammonium north of Unimak Pass was not associated with anysignificant increase in surface Chl a (Fig. 2), it had some of thelowest surface salinity values observed (o31.7, not shown). Thislow-salinity implies the presence of low-nutrient, Alaska CoastalCurrent (ACC) waters as suggested by Whitledge et al. (1986). Theregion around the Pribilof Islands in 2004 also exhibited elevatedammonium levels (Fig. 4) but, unlike the ACC-influenced region tothe south, the elevated ammonium near the Pribilof Islands wasassociated with higher-salinity and Chl a levels (Figs. 2 and 3). Thehigh surface salinity feature located about 150 km east of St. PaulIsland also was associated with higher Chl a levels, as was a
Fig. 3. Along-shelf (�75 m) section from the 1981 cruise. The section runs from just wes
the inset map. The vertical color bar denotes salinity, and labeled isotherms denote tem
detached parcel of high-salinity water at the surface about 50 kmto the northeast.
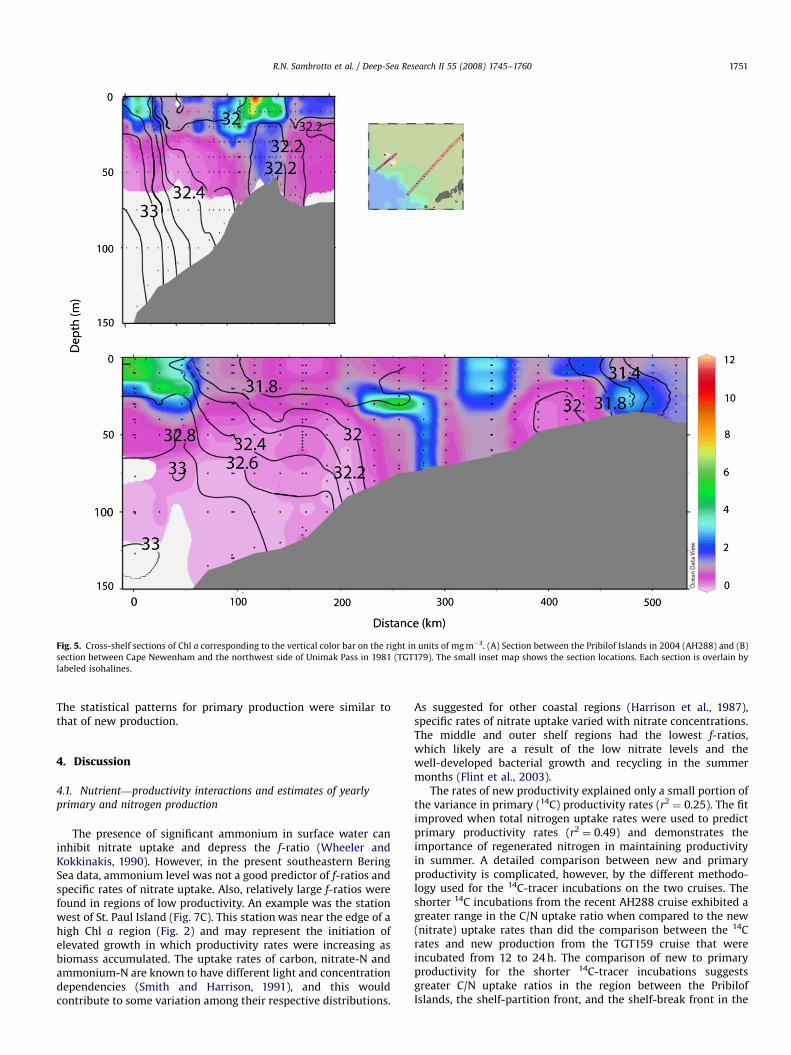
The cross-shelf features in the Chl a and salinity data collectedin 2004 around the Pribilofs (Fig. 5A) are similar in severalrespects to those from the more southerly section extending outfrom Cape Newenham in 1981 (Fig. 5B). Both show the elevatedChl a at, and seaward of, the shelf-break front associated with thesalinity gradient that marks the interface between the slope andshelf water. Another similarity is the low Chl a associated with thelow-salinity surface water of the outer and middle shelf domains.Vertical stratification marked by the lower-salinity surface watersbroke down over the middle shelf in 1981 along the CapeNewenham section, with some weak restratification seaward ofthe inner front. In 2004, weak vertical salinity stratificationpersisted along the entire Pribilof section. There was also asignificant difference in the horizontal extent of the outer andmiddle shelf regions in the two cross-shelf sections. The distancefrom the shelf-break front to the Pibilof domain was o150 km(Sullivan et al., 2008). We can infer that the distance to the Pribilofstructure front was similar. In contrast, the distance to reach theinner front on the Cape Newenham line was �450 km. Thedifference in bottom slope between the steeper topography nearthe Pribilof Islands and the more gradual slope along the CapeNewenham line illustrates how the broad width of the EBS shelfpermits distinct individual shelf regimes to exist. Despite the largedifferences in the cross-shelf slope, the close association betweenelevated Chl a levels, and the shelf-break front and the structureor inner front is clear. The Pribilof domain was associated withgreater Chl a levels than was the inner front of the Cape
t of St. Paul Island on the west to the Alaskan Peninsula on the east as indicated by
perature (1C).
ARTICLE IN PRESS
Fig. 4. Surface ammonium levels (mM) based on the combined 2004 and 1981 data. Large dots indicate stations from 1981 and small dots indicate stations from 2004.
R.N. Sambrotto et al. / Deep-Sea Research II 55 (2008) 1745–17601750
Newenham line (Fig. 5A, B). The higher Chl a concentrationsaround the Pribilofs are a result of higher nutrient concentrations(Fig. 6A) and enhanced vertical mixing due to complex bathy-metry (Stabeno et al., 2008b). Near Cape Newenham, there arelower, but still sufficient, concentrations of nutrients (Fig. 6B) tosupport elevated Chl a but less mixing.
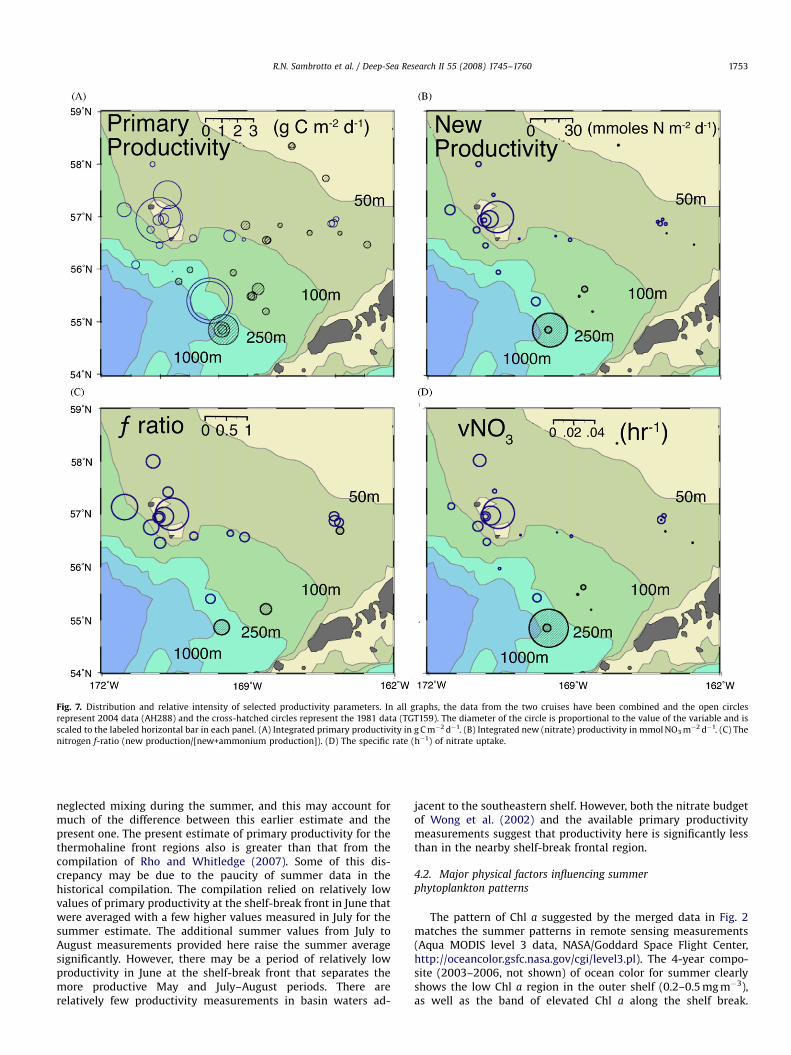
3.2. Primary and nitrogen production
The distributions of total phytoplankton biomass relative tofronts in the southeastern Bering Sea as presented above provide acontext for the interpretation of the summer productivity ratesmeasured in 1981 and 2004 (Fig. 7A, B). Depth-integrated primary(14C) productivity exceeded 1 g C m�2 d�1 at six stations in thecombined summer data set. These stations were in the shelf-breakfront, the shelf-partition front, or the region around the PribilofIslands. There was a similar, although even greater, differencebetween the low, vertically integrated new (nitrate) productionrates in the middle and outer shelf and those in the frontalregions. The three stations that had new production over10 mmol m�2 d�1 also were at the shelf-break front, the shelf-partition front and in the region between the Pribilof Islands. Therates of primary and new productivity in these regions duringsummer are comparable to the most eutrophic regions of theocean and to the highest rates measured in the EBS shelf at theheight of the spring bloom (Sambrotto et al., 1986). There was asimilar increase in the nitrogen f-ratio in the frontal regions(Fig. 7C), although several stations with only moderate newproductivity had a relatively large f-ratio.
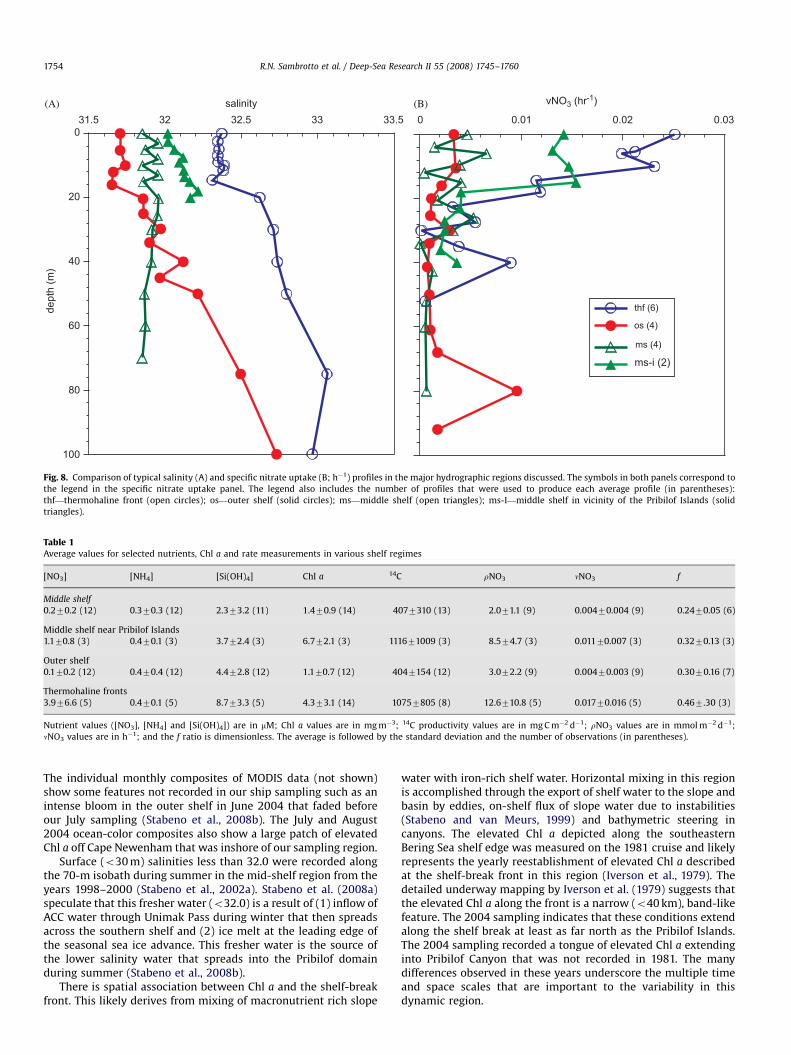
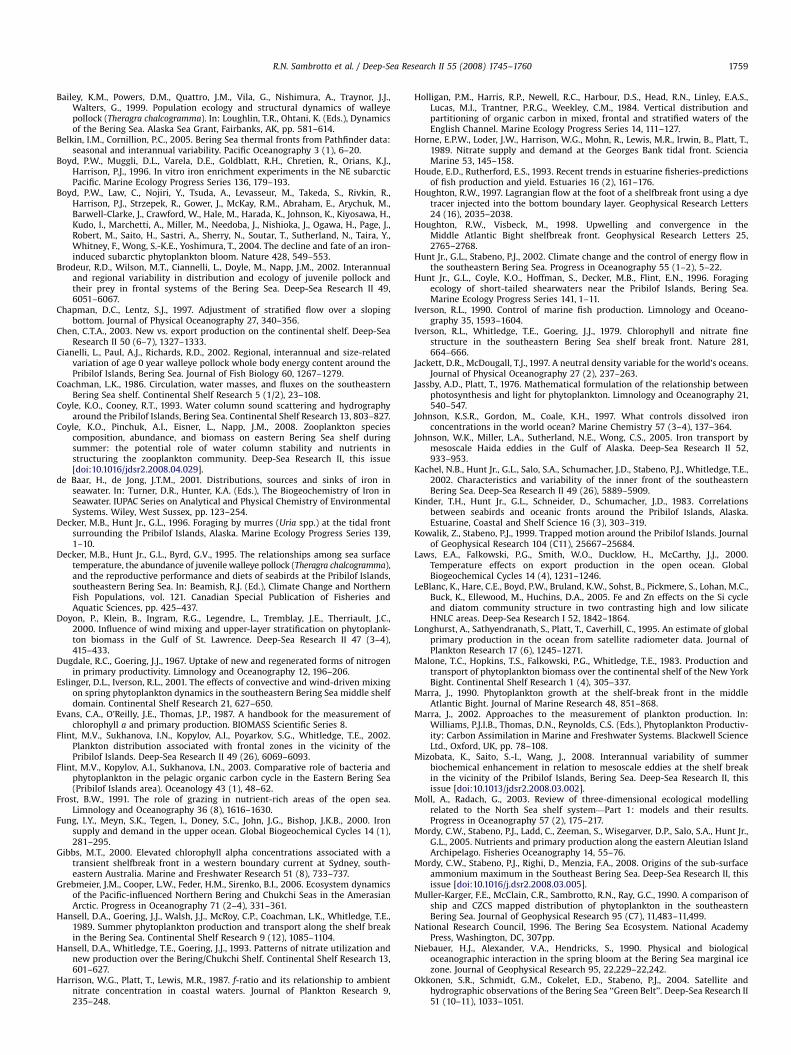
The association between productivity rates and the regions ofhigh surface salinity at the outcrop of the thermohaline frontalregions is apparent when the stations are grouped by location(Fig. 8). These profiles were constructed from the average of fourgroups of stations. These groups were based on their surface waterproperties, vertical structure and geographic location. Thethermohaline front (thf) group comprised the stations at whichthe 25.5 isopycnal entered the euphotic zone (�30 m) and
included the shelf-break and shelf-partition fronts. The outershelf (os) and the middle shelf (ms) stations were grouped on thebasis of depth. The middle shelf stations between the PribilofIslands (ms-i) include stations that are similar in depth to themiddle shelf stations, but have been segregated because of theirpotential proximity to slope-derived water. The low specific ratesof nitrate uptake (nNO3) that prevailed on the middle and outershelves were associated with the lowest salinity surface waters. Inthe higher-salinity water associated with the shelf-break or shelf-partition front, rates of nitrate uptake were significantly higher.On the basis of specific nitrate uptake, the stations at thermoha-line fronts and those in the region between the Pribilof Islands(ms-i in Fig. 8B) showed similar marked increases in the euphoticzone. The shallow regions immediately around both St. Pauland St. George Islands also supported elevated production(not shown). The likely cause of this productivity was theenhanced vertical mixing due to tides, similar to the processthat occurs at the inner front region described by Kachel et al.(2002).
Table 1 summarizes the nutrient and productivity conditionsrecorded during summer in the combined 1981 and 2004 databased on the four groups defined above for Fig. 8. This summaryindicates that the thermohaline front regions had the greatestaverage new productivity, specific nitrate uptake rates andf-ratios, while the strongly vertically stratified middle and outershelf regions had the lowest surface nutrients and, consequently,the lowest new and primary productivity and nitrogen. The ms-igroup had similar primary productivity, but lower new produc-tivity and f-ratios, than the thermohaline frontal region. A t-testwas done among all of the groups in Table 1 to assess thesignificance of the regional differences in the various parameters.The surface (o20 m) salinity values were significantly differentamong all regions (po0.01). For new production, differences werefound at the p�0.1 level for most combinations, except that therewas no significant difference between the thermohaline frontgroup and the region near the Pribilof Islands, nor was therea significant difference between the middle and outer shelf.
ARTICLE IN PRESS
Fig. 5. Cross-shelf sections of Chl a corresponding to the vertical color bar on the right in units of mg m�3. (A) Section between the Pribilof Islands in 2004 (AH288) and (B)
section between Cape Newenham and the northwest side of Unimak Pass in 1981 (TGT179). The small inset map shows the section locations. Each section is overlain by
labeled isohalines.
R.N. Sambrotto et al. / Deep-Sea Research II 55 (2008) 1745–1760 1751
The statistical patterns for primary production were similar tothat of new production.
4. Discussion
4.1. Nutrient—productivity interactions and estimates of yearly
primary and nitrogen production
The presence of significant ammonium in surface water caninhibit nitrate uptake and depress the f-ratio (Wheeler andKokkinakis, 1990). However, in the present southeastern BeringSea data, ammonium level was not a good predictor of f-ratios andspecific rates of nitrate uptake. Also, relatively large f-ratios werefound in regions of low productivity. An example was the stationwest of St. Paul Island (Fig. 7C). This station was near the edge of ahigh Chl a region (Fig. 2) and may represent the initiation ofelevated growth in which productivity rates were increasing asbiomass accumulated. The uptake rates of carbon, nitrate-N andammonium-N are known to have different light and concentrationdependencies (Smith and Harrison, 1991), and this wouldcontribute to some variation among their respective distributions.
As suggested for other coastal regions (Harrison et al., 1987),specific rates of nitrate uptake varied with nitrate concentrations.The middle and outer shelf regions had the lowest f-ratios,which likely are a result of the low nitrate levels and thewell-developed bacterial growth and recycling in the summermonths (Flint et al., 2003).
The rates of new productivity explained only a small portion ofthe variance in primary (14C) productivity rates (r2
¼ 0.25). The fitimproved when total nitrogen uptake rates were used to predictprimary productivity rates (r2
¼ 0.49) and demonstrates theimportance of regenerated nitrogen in maintaining productivityin summer. A detailed comparison between new and primaryproductivity is complicated, however, by the different methodo-logy used for the 14C-tracer incubations on the two cruises. Theshorter 14C incubations from the recent AH288 cruise exhibited agreater range in the C/N uptake ratio when compared to the new(nitrate) uptake rates than did the comparison between the 14Crates and new production from the TGT159 cruise that wereincubated from 12 to 24 h. The comparison of new to primaryproductivity for the shorter 14C-tracer incubations suggestsgreater C/N uptake ratios in the region between the PribilofIslands, the shelf-partition front, and the shelf-break front in the
ARTICLE IN PRESS
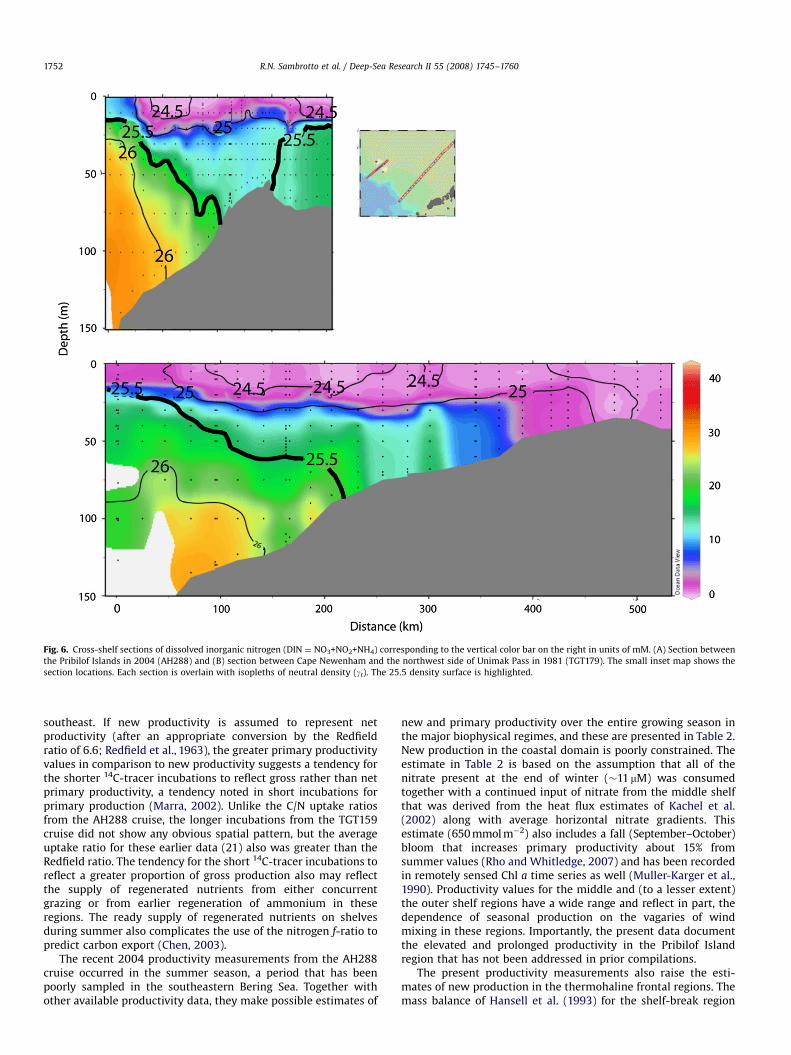
Fig. 6. Cross-shelf sections of dissolved inorganic nitrogen (DIN ¼ NO3+NO2+NH4) corresponding to the vertical color bar on the right in units of mM. (A) Section between
the Pribilof Islands in 2004 (AH288) and (B) section between Cape Newenham and the northwest side of Unimak Pass in 1981 (TGT179). The small inset map shows the
section locations. Each section is overlain with isopleths of neutral density (gt). The 25.5 density surface is highlighted.
R.N. Sambrotto et al. / Deep-Sea Research II 55 (2008) 1745–17601752
southeast. If new productivity is assumed to represent netproductivity (after an appropriate conversion by the Redfieldratio of 6.6; Redfield et al., 1963), the greater primary productivityvalues in comparison to new productivity suggests a tendency forthe shorter 14C-tracer incubations to reflect gross rather than netprimary productivity, a tendency noted in short incubations forprimary production (Marra, 2002). Unlike the C/N uptake ratiosfrom the AH288 cruise, the longer incubations from the TGT159cruise did not show any obvious spatial pattern, but the averageuptake ratio for these earlier data (21) also was greater than theRedfield ratio. The tendency for the short 14C-tracer incubations toreflect a greater proportion of gross production also may reflectthe supply of regenerated nutrients from either concurrentgrazing or from earlier regeneration of ammonium in theseregions. The ready supply of regenerated nutrients on shelvesduring summer also complicates the use of the nitrogen f-ratio topredict carbon export (Chen, 2003).
The recent 2004 productivity measurements from the AH288cruise occurred in the summer season, a period that has beenpoorly sampled in the southeastern Bering Sea. Together withother available productivity data, they make possible estimates of
new and primary productivity over the entire growing season inthe major biophysical regimes, and these are presented in Table 2.New production in the coastal domain is poorly constrained. Theestimate in Table 2 is based on the assumption that all of thenitrate present at the end of winter (�11 mM) was consumedtogether with a continued input of nitrate from the middle shelfthat was derived from the heat flux estimates of Kachel et al.(2002) along with average horizontal nitrate gradients. Thisestimate (650 mmol m�2) also includes a fall (September–October)bloom that increases primary productivity about 15% fromsummer values (Rho and Whitledge, 2007) and has been recordedin remotely sensed Chl a time series as well (Muller-Karger et al.,1990). Productivity values for the middle and (to a lesser extent)the outer shelf regions have a wide range and reflect in part, thedependence of seasonal production on the vagaries of windmixing in these regions. Importantly, the present data documentthe elevated and prolonged productivity in the Pribilof Islandregion that has not been addressed in prior compilations.
The present productivity measurements also raise the esti-mates of new production in the thermohaline frontal regions. Themass balance of Hansell et al. (1993) for the shelf-break region
ARTICLE IN PRESS
Fig. 7. Distribution and relative intensity of selected productivity parameters. In all graphs, the data from the two cruises have been combined and the open circles
represent 2004 data (AH288) and the cross-hatched circles represent the 1981 data (TGT159). The diameter of the circle is proportional to the value of the variable and is
scaled to the labeled horizontal bar in each panel. (A) Integrated primary productivity in g C m�2 d�1. (B) Integrated new (nitrate) productivity in mmol NO3 m�2 d�1. (C) The
nitrogen f-ratio (new production/[new+ammonium production]). (D) The specific rate (h�1) of nitrate uptake.
R.N. Sambrotto et al. / Deep-Sea Research II 55 (2008) 1745–1760 1753
neglected mixing during the summer, and this may account formuch of the difference between this earlier estimate and thepresent one. The present estimate of primary productivity for thethermohaline front regions also is greater than that from thecompilation of Rho and Whitledge (2007). Some of this dis-crepancy may be due to the paucity of summer data in thehistorical compilation. The compilation relied on relatively lowvalues of primary productivity at the shelf-break front in June thatwere averaged with a few higher values measured in July for thesummer estimate. The additional summer values from July toAugust measurements provided here raise the summer averagesignificantly. However, there may be a period of relatively lowproductivity in June at the shelf-break front that separates themore productive May and July–August periods. There arerelatively few productivity measurements in basin waters ad-
jacent to the southeastern shelf. However, both the nitrate budgetof Wong et al. (2002) and the available primary productivitymeasurements suggest that productivity here is significantly lessthan in the nearby shelf-break frontal region.
4.2. Major physical factors influencing summer
phytoplankton patterns
The pattern of Chl a suggested by the merged data in Fig. 2matches the summer patterns in remote sensing measurements(Aqua MODIS level 3 data, NASA/Goddard Space Flight Center,http://oceancolor.gsfc.nasa.gov/cgi/level3.pl). The 4-year compo-site (2003–2006, not shown) of ocean color for summer clearlyshows the low Chl a region in the outer shelf (0.2–0.5 mg m�3),as well as the band of elevated Chl a along the shelf break.
ARTICLE IN PRESS
100
80
60
40
20
031.5 32 32.5 33 33.5
dept
h (m
)
salinity0 0.01 0.02 0.03
vNO3 (hr-1)
thf (6)
os (4)
ms (4)
ms-i (2)
Fig. 8. Comparison of typical salinity (A) and specific nitrate uptake (B; h�1) profiles in the major hydrographic regions discussed. The symbols in both panels correspond to
the legend in the specific nitrate uptake panel. The legend also includes the number of profiles that were used to produce each average profile (in parentheses):
thf—thermohaline front (open circles); os—outer shelf (solid circles); ms—middle shelf (open triangles); ms-I—middle shelf in vicinity of the Pribilof Islands (solid
triangles).
Table 1Average values for selected nutrients, Chl a and rate measurements in various shelf regimes
[NO3] [NH4] [Si(OH)4] Chl a 14C rNO3 nNO3 f
Middle shelf
0.270.2 (12) 0.370.3 (12) 2.373.2 (11) 1.470.9 (14) 4077310 (13) 2.071.1 (9) 0.00470.004 (9) 0.2470.05 (6)
Middle shelf near Pribilof Islands
1.170.8 (3) 0.470.1 (3) 3.772.4 (3) 6.772.1 (3) 111671009 (3) 8.574.7 (3) 0.01170.007 (3) 0.3270.13 (3)
Outer shelf
0.170.2 (12) 0.470.4 (12) 4.472.8 (12) 1.170.7 (12) 4047154 (12) 3.072.2 (9) 0.00470.003 (9) 0.3070.16 (7)
Thermohaline fronts
3.976.6 (5) 0.470.1 (5) 8.773.3 (5) 4.373.1 (14) 10757805 (8) 12.6710.8 (5) 0.01770.016 (5) 0.467.30 (3)
Nutrient values ([NO3], [NH4] and [Si(OH)4]) are in mM; Chl a values are in mg m�3; 14C productivity values are in mg C m�2 d�1; rNO3 values are in mmol m�2 d�1;
nNO3 values are in h�1; and the f ratio is dimensionless. The average is followed by the standard deviation and the number of observations (in parentheses).
R.N. Sambrotto et al. / Deep-Sea Research II 55 (2008) 1745–17601754
The individual monthly composites of MODIS data (not shown)show some features not recorded in our ship sampling such as anintense bloom in the outer shelf in June 2004 that faded beforeour July sampling (Stabeno et al., 2008b). The July and August2004 ocean-color composites also show a large patch of elevatedChl a off Cape Newenham that was inshore of our sampling region.
Surface (o30 m) salinities less than 32.0 were recorded alongthe 70-m isobath during summer in the mid-shelf region from theyears 1998–2000 (Stabeno et al., 2002a). Stabeno et al. (2008a)speculate that this fresher water (o32.0) is a result of (1) inflow ofACC water through Unimak Pass during winter that then spreadsacross the southern shelf and (2) ice melt at the leading edge ofthe seasonal sea ice advance. This fresher water is the source ofthe lower salinity water that spreads into the Pribilof domainduring summer (Stabeno et al., 2008b).
There is spatial association between Chl a and the shelf-breakfront. This likely derives from mixing of macronutrient rich slope
water with iron-rich shelf water. Horizontal mixing in this regionis accomplished through the export of shelf water to the slope andbasin by eddies, on-shelf flux of slope water due to instabilities(Stabeno and van Meurs, 1999) and bathymetric steering incanyons. The elevated Chl a depicted along the southeasternBering Sea shelf edge was measured on the 1981 cruise and likelyrepresents the yearly reestablishment of elevated Chl a describedat the shelf-break front in this region (Iverson et al., 1979). Thedetailed underway mapping by Iverson et al. (1979) suggests thatthe elevated Chl a along the front is a narrow (o40 km), band-likefeature. The 2004 sampling indicates that these conditions extendalong the shelf break at least as far north as the Pribilof Islands.The 2004 sampling recorded a tongue of elevated Chl a extendinginto Pribilof Canyon that was not recorded in 1981. The manydifferences observed in these years underscore the multiple timeand space scales that are important to the variability in thisdynamic region.
ARTICLE IN PRESS
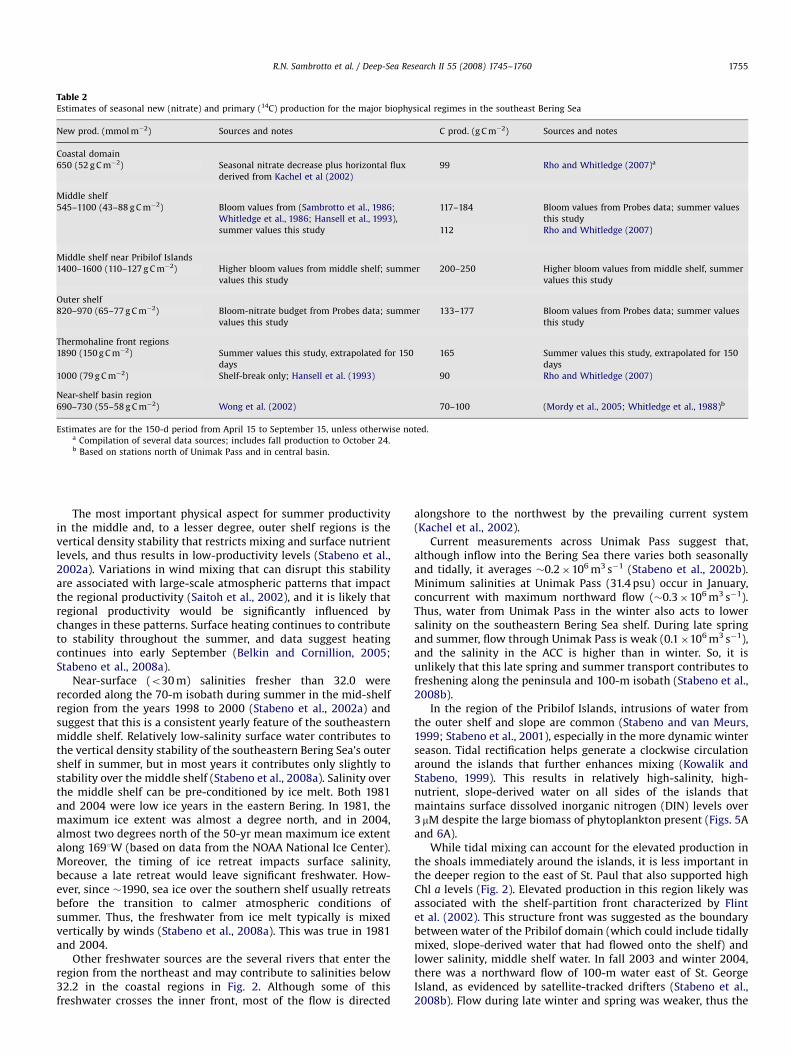
Table 2Estimates of seasonal new (nitrate) and primary (14C) production for the major biophysical regimes in the southeast Bering Sea
New prod. (mmol m�2) Sources and notes C prod. (g C m�2) Sources and notes
Coastal domain
650 (52 g C m�2) Seasonal nitrate decrease plus horizontal flux
derived from Kachel et al (2002)
99 Rho and Whitledge (2007)a
Middle shelf
545–1100 (43–88 g C m�2) Bloom values from (Sambrotto et al., 1986;
Whitledge et al., 1986; Hansell et al., 1993),
summer values this study
117–184 Bloom values from Probes data; summer values
this study
112 Rho and Whitledge (2007)
Middle shelf near Pribilof Islands
1400–1600 (110–127 g C m�2) Higher bloom values from middle shelf; summer
values this study
200–250 Higher bloom values from middle shelf, summer
values this study
Outer shelf
820–970 (65–77 g C m�2) Bloom-nitrate budget from Probes data; summer
values this study
133–177 Bloom values from Probes data; summer values
this study
Thermohaline front regions
1890 (150 g C m�2) Summer values this study, extrapolated for 150
days
165 Summer values this study, extrapolated for 150
days
1000 (79 g C m�2) Shelf-break only; Hansell et al. (1993) 90 Rho and Whitledge (2007)
Near-shelf basin region
690–730 (55–58 g C m�2) Wong et al. (2002) 70–100 (Mordy et al., 2005; Whitledge et al., 1988)b
Estimates are for the 150-d period from April 15 to September 15, unless otherwise noted.a Compilation of several data sources; includes fall production to October 24.b Based on stations north of Unimak Pass and in central basin.
R.N. Sambrotto et al. / Deep-Sea Research II 55 (2008) 1745–1760 1755
The most important physical aspect for summer productivityin the middle and, to a lesser degree, outer shelf regions is thevertical density stability that restricts mixing and surface nutrientlevels, and thus results in low-productivity levels (Stabeno et al.,2002a). Variations in wind mixing that can disrupt this stabilityare associated with large-scale atmospheric patterns that impactthe regional productivity (Saitoh et al., 2002), and it is likely thatregional productivity would be significantly influenced bychanges in these patterns. Surface heating continues to contributeto stability throughout the summer, and data suggest heatingcontinues into early September (Belkin and Cornillion, 2005;Stabeno et al., 2008a).
Near-surface (o30 m) salinities fresher than 32.0 wererecorded along the 70-m isobath during summer in the mid-shelfregion from the years 1998 to 2000 (Stabeno et al., 2002a) andsuggest that this is a consistent yearly feature of the southeasternmiddle shelf. Relatively low-salinity surface water contributes tothe vertical density stability of the southeastern Bering Sea’s outershelf in summer, but in most years it contributes only slightly tostability over the middle shelf (Stabeno et al., 2008a). Salinity overthe middle shelf can be pre-conditioned by ice melt. Both 1981and 2004 were low ice years in the eastern Bering. In 1981, themaximum ice extent was almost a degree north, and in 2004,almost two degrees north of the 50-yr mean maximum ice extentalong 1691W (based on data from the NOAA National Ice Center).Moreover, the timing of ice retreat impacts surface salinity,because a late retreat would leave significant freshwater. How-ever, since �1990, sea ice over the southern shelf usually retreatsbefore the transition to calmer atmospheric conditions ofsummer. Thus, the freshwater from ice melt typically is mixedvertically by winds (Stabeno et al., 2008a). This was true in 1981and 2004.
Other freshwater sources are the several rivers that enter theregion from the northeast and may contribute to salinities below32.2 in the coastal regions in Fig. 2. Although some of thisfreshwater crosses the inner front, most of the flow is directed
alongshore to the northwest by the prevailing current system(Kachel et al., 2002).
Current measurements across Unimak Pass suggest that,although inflow into the Bering Sea there varies both seasonallyand tidally, it averages �0.2�106 m3 s�1 (Stabeno et al., 2002b).Minimum salinities at Unimak Pass (31.4 psu) occur in January,concurrent with maximum northward flow (�0.3�106 m3 s�1).Thus, water from Unimak Pass in the winter also acts to lowersalinity on the southeastern Bering Sea shelf. During late springand summer, flow through Unimak Pass is weak (0.1�106 m3 s�1),and the salinity in the ACC is higher than in winter. So, it isunlikely that this late spring and summer transport contributes tofreshening along the peninsula and 100-m isobath (Stabeno et al.,2008b).
In the region of the Pribilof Islands, intrusions of water fromthe outer shelf and slope are common (Stabeno and van Meurs,1999; Stabeno et al., 2001), especially in the more dynamic winterseason. Tidal rectification helps generate a clockwise circulationaround the islands that further enhances mixing (Kowalik andStabeno, 1999). This results in relatively high-salinity, high-nutrient, slope-derived water on all sides of the islands thatmaintains surface dissolved inorganic nitrogen (DIN) levels over3mM despite the large biomass of phytoplankton present (Figs. 5Aand 6A).
While tidal mixing can account for the elevated production inthe shoals immediately around the islands, it is less important inthe deeper region to the east of St. Paul that also supported highChl a levels (Fig. 2). Elevated production in this region likely wasassociated with the shelf-partition front characterized by Flintet al. (2002). This structure front was suggested as the boundarybetween water of the Pribilof domain (which could include tidallymixed, slope-derived water that had flowed onto the shelf) andlower salinity, middle shelf water. In fall 2003 and winter 2004,there was a northward flow of 100-m water east of St. GeorgeIsland, as evidenced by satellite-tracked drifters (Stabeno et al.,2008b). Flow during late winter and spring was weaker, thus the
ARTICLE IN PRESS
R.N. Sambrotto et al. / Deep-Sea Research II 55 (2008) 1745–17601756
source of higher-salinity water was the �100-m isobath south ofthe islands. The observation of high-salinity (32.2) water east ofthe Pribilof Islands in 2004 supports this interpretation (Fig. 5A, aswell as Stabeno et al., 2008b).
The contrast in the vertical water structure between the shelf-partition front and that in the nearby tidally mixed region alsoimpacts the phytoplankton growth environment. For example, theshelf-partition front exhibits stronger stratification (Dst �1.3 vs.�0.9 in the more tidally mixed regions), as well as highersubsurface nutrient levels. Therefore, the shelf-partition front maybe able to supply a comparable flux of nutrients to a stable,shallow surface layer that maintains a more favorable lightenvironment for phytoplankton growth than does the tidallymixed region. The combined data sets presented here, therefore,reflect the influence of at least two important water masses tolocal hydrography and nutrient distributions on this shelf:extensive intrusions of ACC and slope water from the southduring winter, and incursions of slope-derived water around thePribilof Islands from the west during summer. These observationshelp to fill what has been a relative dearth of information on thealong-shelf biological patterns.
0
50
100
1500
50
100
150
Dep
th (m
)
0 100 200Distance
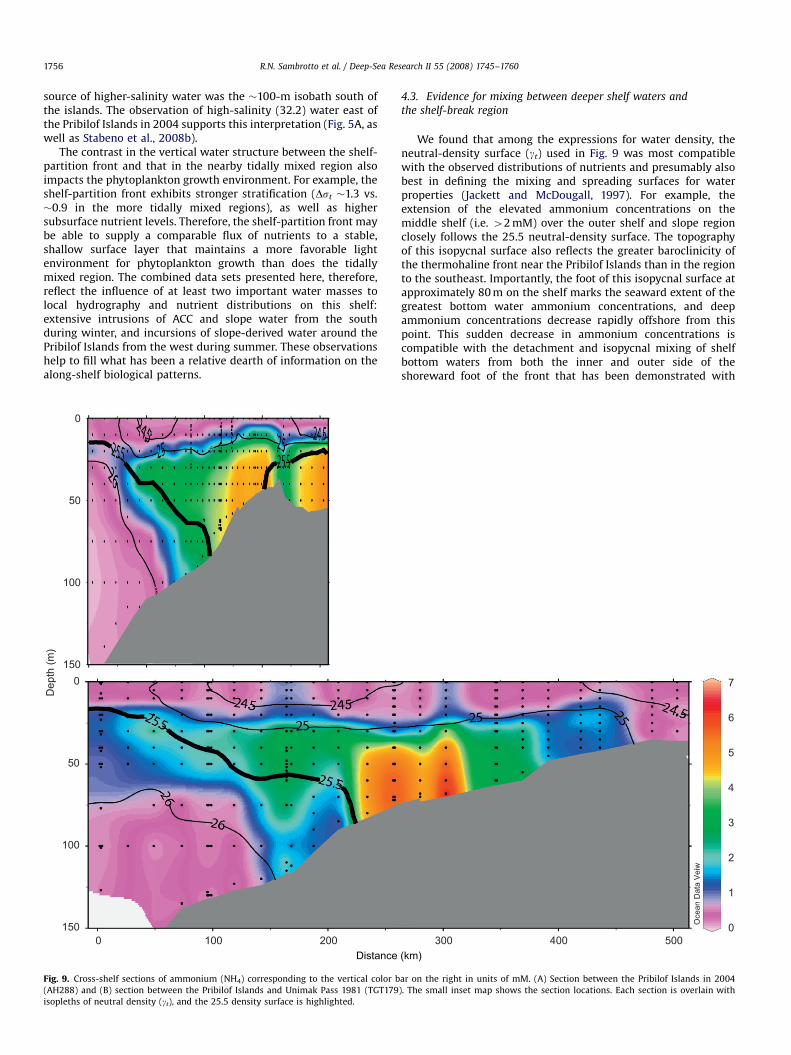
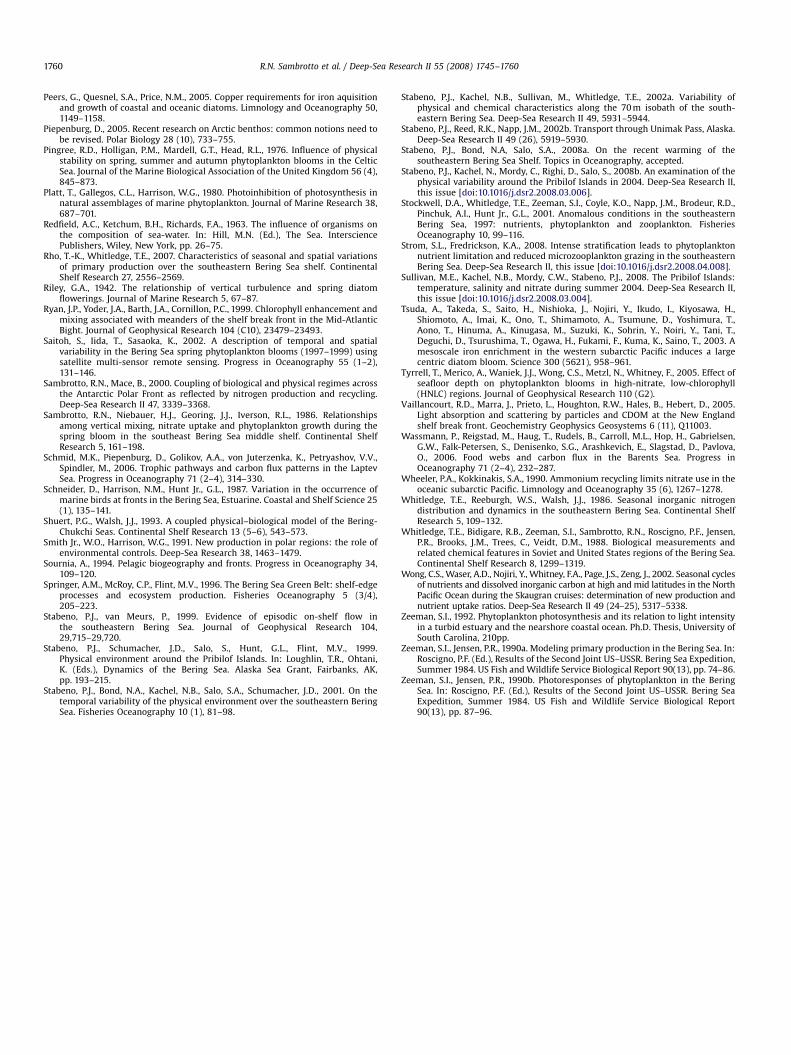
Fig. 9. Cross-shelf sections of ammonium (NH4) corresponding to the vertical color b
(AH288) and (B) section between the Pribilof Islands and Unimak Pass 1981 (TGT179
isopleths of neutral density (gt), and the 25.5 density surface is highlighted.
4.3. Evidence for mixing between deeper shelf waters and
the shelf-break region
We found that among the expressions for water density, theneutral-density surface (gt) used in Fig. 9 was most compatiblewith the observed distributions of nutrients and presumably alsobest in defining the mixing and spreading surfaces for waterproperties (Jackett and McDougall, 1997). For example, theextension of the elevated ammonium concentrations on themiddle shelf (i.e. 42 mM) over the outer shelf and slope regionclosely follows the 25.5 neutral-density surface. The topographyof this isopycnal surface also reflects the greater baroclinicity ofthe thermohaline front near the Pribilof Islands than in the regionto the southeast. Importantly, the foot of this isopycnal surface atapproximately 80 m on the shelf marks the seaward extent of thegreatest bottom water ammonium concentrations, and deepammonium concentrations decrease rapidly offshore from thispoint. This sudden decrease in ammonium concentrations iscompatible with the detachment and isopycnal mixing of shelfbottom waters from both the inner and outer side of theshoreward foot of the front that has been demonstrated with
300 400 500
7
6
5
4
3
2
1
0Oce
an D
ata
Vei
w
(km)
ar on the right in units of mM. (A) Section between the Pribilof Islands in 2004
). The small inset map shows the section locations. Each section is overlain with
ARTICLE IN PRESS
R.N. Sambrotto et al. / Deep-Sea Research II 55 (2008) 1745–1760 1757
dye tracers experiments on other shelves (Houghton, 1997;Houghton and Visbeck, 1998). The bottom, onshore edge of thisgradient is considered the middle front (Coachman, 1986) andresults from the balance between the spreading of the moreinshore, along-shelf flow caused by bottom friction and thevertical shear due to the horizontal density gradient (Chapmanand Lentz, 1997). The steeper isopycnals at the Pribilof Islands(Fig. 5A), however, suggest more organized and energetic flowthan along the southern line (Fig. 5B), and drifter tracksrecorded in July and August 2004 also suggest this difference(Stabeno et al., 2008b). The evidence for mixing along theisopycnal surfaces that form the thermohaline fronts highlightsthe physical connection between deeper water and surfacewater along the isopycnal. The shallowing of these isopycnals atthe shelf-break and shelf-partition fronts provides a pathalong which nutrients from the deeper on-shelf waters canreach the shelf-break front during summer. The regions wherethe 25.5 isopycnal surfaces enter the euphotic zone (�30 m alongthe shelf break) closely match the regions of elevated Chl a there(Fig. 2).
Fine-scale sampling across the New England shelf-break frontrevealed parcels of cold-pool water (�10 km in cross-shelfdiameter) apparently pulled from the shelf into the frontal region(Vaillancourt et al., 2005). The meanders of the shelf-break frontobserved in the present data likely reflect the behavior of theBering slope current (BSC). The troughs formed by these meandersfacilitate upwelling at the shelf break (Ryan et al., 1999) and somemeanders may result in detachment of parcels of shelf water.Okkonen et al. (2004) describe similar processes at the shelfbreak in the southeastern Bering Sea that remains a region ofeddy formation throughout the summer. The complete three-dimensional topography of the 25.5 neutral-density surface(not shown) also suggests extensive interactions between themiddle shelf bottom water and the more offshore regions. Forexample, an anticyclonic loop in the 25.5 density surface wasapparent just west (downstream) of elevated ammonium levelsthat were deeper on the density surface in the 2004 data. Asimilar situation was recorded in 1981, in which elevatedammonium levels also were found adjacent to a less intense(on the basis of the coarse sampling grid) meander of the densitysurface. These observations suggest that the instabilities in thepath of the BSC may enhance the mixing of water from the deeperouter shelf region to the shelf-break front and have a significantimpact on shelf-break production.
4.4. Importance of regeneration in or near shelf sediments to
productivity at the shelf-break front
The addition of the 2004 sampling near the Pribilof Islands tothe existing nutrient and productivity data for the southeasternBering Sea brings several previously suggested aspects of summerproductivity patterns into better focus but also raises additionalquestions. One of the most important observations that requiresfurther interpretation is the contrast in temporal extent betweenthe relatively short-lived spring bloom that ends by June acrossmost of the region, and the prolonged and elevated productivity atthe surface expressions of the thermohaline fronts that persists atleast through August. The persistence of elevated Chl a at the shelfbreak was captured in SeaWiFS images during 2004 that arepresented in Stabeno et al. (2008b). Among several importantquestions related to the regions of the southeastern Bering Seathat support elevated summer production, two will be consideredhere: What are the underlying processes that support thiselevated primary production; What are the implications of theserelatively small but productive regions on the flow of resources tohigher trophic levels?
The enhanced vertical supply of macronutrients along shelf-break fronts has been invoked as one of the primary factorssustaining elevated phytoplankton growth in shelf-break frontenvironments (e.g., Ryan et al., 1999; Gibbs, 2000). However, theshelves discussed in those studies are in lower latitude regions,where both shelf and basin waters are depleted in macronutrientsin summer. In contrast, macronutrients typically remain at highconcentrations in the basin waters of the southeastern Bering Seain summer, and nitrate concentrations were 410 mM in basinwaters in the sampled years (Fig. 6A, B), confirming its high-nutrient, low-chlorophyll character. Also, although they are not asstrongly stratified as the middle and outer shelf regions, the basinwaters were stratified at 20–30 m, making it likely that lightconditions for phytoplankton growth were not significantly worsein the basin. Thus, other factors must restrict the seaward extentof the production associated with the shelf-break front. One factorcould be the greater consumption rates of phytoplankton in basinwaters by oceanic grazers (Frost, 1991). In the Bering Sea, largeoceanic copepods such as Neocalanus spp. and Eucalanus spp. arefound primarily in slope and basin waters (Coyle et al., 2008), andthus grazing by macrozooplankton might account for the seawardlimit of the shelf-break productivity. Additionally, microzooplank-ton in these waters may graze as much as 50% of the primaryproduction (Strom and Fredrickson, 2008). However, modelingstudies in the northeastern Bering Sea suggest only a small role formacrozooplankton grazing in limiting phytoplankton in frontalregions (Shuert and Walsh, 1993).
An alternate explanation for the restricted seaward extent ofthe elevated productivity associated with the shelf-break front isthe lack of iron, an essential element that is suspected to play asignificant role in several high nutrient but low Chl a regions,including the North Pacific (Boyd et al., 1996, 2004). There are noparallel measurements of iron in the present data. However,positive results were obtained from iron addition experiments inthe oceanic region of the present study region during summer(LeBlanc et al., 2005; Peers et al., 2005). Part of the iron responsein these and other iron addition experiments (e.g., Tsuda et al.,2003) is the stimulation of the growth of diatoms, and thisobservation is compatible with the relative abundance of diatomsalong the shelf-break front in the southeastern Bering Sea.
There are several possible sources of iron for phytoplanktongrowth at the shelf-break front. While iron deposition from theatmosphere is relatively low in the Bering Sea (Fung et al., 2000),deep Pacific Ocean waters contain moderate amounts of iron(Johnson et al., 1997). The levels of iron in the waters of theeastern shelf, however, are greater still (Aguilar-Islas et al., 2007).Thus, deeper shelf water that has been in recent contact with thesediments may be a more important source of iron forphytoplankton growth at the shelf-break front than is theupwelling of slope and/or deeper basin waters. Unlike mostwell-oxygenated surface waters, reducing conditions in sedimentscan mobilize dissolved iron into deep waters, and there is a clearassociation between marginal seas that have extensive sedimentinteraction and elevated production (Tyrrell et al., 2005). Theelevated ammonium levels in deep shelf waters in summer reflect,in part, the extensive reducing environment at or near shelfsediments, and iron often follows regeneration pathways similarto that of nitrogen (Johnson et al., 1997; de Baar and de Jong,2001). The significant regeneration of organic matter in thesediments and overlying water of the middle and outer shelfregions of the southeastern Bering Sea has been well documented(Whitledge et al., 1986; Mordy et al., 2008). The vertical flux oforganic matter from spring phytoplankton growth provides thereductant that results in lower oxygen levels and an extraordinaryincrease in ammonium concentrations in deeper shelf waters assummer progresses (Fig. 9).
ARTICLE IN PRESS
R.N. Sambrotto et al. / Deep-Sea Research II 55 (2008) 1745–17601758
Despite levels of dissolved iron in shelf bottom waters thatmay exceed 4 nM, iron concentrations in the surface waters ofboth shelf and oceanic regions of the southeastern Bering Sea aregenerally low during summer (Aguilar-Islas et al., 2007). Excep-tions to this general pattern include the tidally mixed regionbetween the Pribilof Islands and subsurface (�50 m) waters at theshelf break. Importantly, the elevated dissolved iron concentra-tions were accompanied by similar trends in dissolved manga-nese, reflecting a continental and/or sediment source. Thesubsurface maxima in iron concentrations at the shelf breakrecorded by Aguilar-Islas et al. (2007), therefore, may beassociated with shelf-slope mixing processes, similar to thosediscussed in the prior section, that could facilitate the flux of ironto offshore regions. A similar shelf-slope transfer of iron wasattributed to eddies generated at the shelf edge in the Gulf ofAlaska (Johnson et al., 2005). The possible existence of elevatedshelf-slope exchange of iron in the EBS suggests that morecomplex biogeochemical processes may be involved in generatingelevated production at this shelf-break front than have beenaddressed previously.
In addition to the questions regarding the limiting factors forthe seaward extent of shelf-break front productivity, it is clear thatthese regions are important in the upper trophic level ecology ofthe region (Springer et al., 1996; Decker et al., 1995). The relativelysmall spatial extent of the elevated productivity associated withthese fronts together with the coarse hydrographic and biologicalsampling has hampered the analysis of this relationship. The 2004sampling around the Pribilofs, for example, was the first extensivespatial survey of productivity in this region. It has largelyconfirmed the suspected elevated epipelagic production that hasbeen inferred from bird feeding patterns in the region (Kinderet al., 1983; Schneider et al., 1987; Hunt et al., 1996). Thepersistent elevated productivity associated with the frontalregions may result in more efficient trophic transfer by allowingupper trophic level predators to focus on a restricted region. Thefish harvest relative to the productivity of the region providesindirect evidence for this efficiency. For example, the groundfishcatch (mainly walleye pollock) in the southeastern Bering(�1.5�1012 g yr1; Bailey et al., 1999, or about 4�1010 g N), thesize of the shelf region (�3�1011 m2) and the levels of yearlyproduction in Table 2 suggest that �1.3% of the new productionand �3.5% of the carbon production is harvested in the south-eastern Bering each year. These estimates may be conservative,considering that the pollock are not evenly distributed on theshelf. Even based on the conservative area used, this one speciesrepresents over 50% of the total carnivorous fish and squidproduction that would be expected from local primary productionbased on Iverson’s (1990) compilation of several ocean regions.Perhaps in part because so much of the primary production ischanneled into one major species, the EBS is highly efficient atconverting nitrate into harvestable fish protein in its presentecological configuration.
If such trophic efficiency is dependent in part on the highlyorganized and persistent spatial patterns in epipelagic productiv-ity, then there are several ways in which changes in primaryproduction could propagate to higher trophic levels. In addition tothe obvious impacts that changes in total regional productivitywould have, upper trophic level impacts could be expected fromany redistribution in existing patterns. For example, changes inthe location of critical feeding regions such as the shelf-partitionfront may have important implications for the vertebrate popula-tions that forage in this region. Drifters released in the BeringSlope Current and shelf near Unimak Pass were transported to theeast of the Pribilofs in 2004, and this differed from most priordrifter tracks that were advected to the west of the islands(Stabeno et al., 2008b). If such circulation changes impact the
location of the shelf-partition front, they would alter the access tothis front by populations that use such environments duringforage trips from the nearby Pribilof Islands. Thus, severalphysically, and, potentially, climatically linked mechanisms mayimpact upper trophic levels through bottom up effects on primaryproduction. Information on the Bering Sea environment should besufficient to address such hypotheses from the expandedsampling that is planned in the next few years.
5. Summary and conclusions
A combined analysis of summer hydrographic and productivitydata in the vicinity of the Pribilof Islands and adjacent south-eastern Bering Sea indicates that:
(1)
Low production dominates the middle and outer domainsduring summer as surface stability increases due to heatingand fresher, low-nutrient water ultimately derived from theACC alter the environment.(2)
Rates of new (nitrate) and primary (14C) productivity rangefrom 41800 mmol m�2 yr�1 and 4170 g C m�2 yr�1 in theshelf-break front to less than 700 mmol m�2 yr�1 and100 g C m�2 yr�1 in the basin and coastal waters.(3)
Elevated productivity during summer is restricted to two basictypes of oceanographic fronts. Structure fronts (the frontbetween the well-mixed coastal domain and the two-layermiddle shelf) dominate the periphery of the EBS as well as theregion immediately around the Pribilof Islands. Thermohalinefronts that form between shelf and slope waters characterizethe shelf-break region from north of Unimak Pass to at least asfar as the Pribilof Islands.(4)
The existence of a recently identified shelf-partition front eastof St. Paul Island was confirmed. It appears to be a thermoha-line front caused by the intrusion of slope-derived water.(5)
An isopycnal connection exists between deeper shelf watersand the shelf-break front region. Isopycnal mixing, togetherwith dynamics associated with frontal meanders and eddygeneration, likely promote significant exchange between thetwo regions.(6)
Macronutrient supply to the shelf-break front is not sufficientto explain the spatial pattern of this productive region,and we suggest that dissolved iron mobilized from shelfsediments is an important factor in maintaining elevatedsummer productivity.Acknowledgments
We thank the captain and crew of the R/V Alpha Helix for theirsuperb seamanship and help during the AH288 cruise. We alsoacknowledge the helpful comments from George Hunt and ananonymous reviewer. This research was supported by NSF OPPGrant no. 0326953 to R. Sambrotto, NSF OPP Grant no. 0326415 toS.I. Zeeman and NOAA Cooperative Agreement no. NA17RJ1232 tothe Joint Institute for the Study of the Atmosphere and Ocean(JISAO). This is Lamont-Doherty Earth Observatory Contributionno. 7134; PMEL Contribution no. 2976, JISAO Contribution no.1350, and contribution EcoFOCI-N640 to NOAA’s Ecosystems andFisheries-Oceanography Coordinated Investigations.
References
Aguilar-Islas, A.M., Hurst, M., Buck, K.N., Sohst, B., Smith, G.J., Lohan, M.C., Bruland,K.W., 2007. Micro- and macronutrients in the southeastern Bering Sea: insightinto iron-replete and iron-depleted regimes. Progress in Oceanography 73,99–126.
ARTICLE IN PRESS
R.N. Sambrotto et al. / Deep-Sea Research II 55 (2008) 1745–1760 1759
Bailey, K.M., Powers, D.M., Quattro, J.M., Vila, G., Nishimura, A., Traynor, J.J.,Walters, G., 1999. Population ecology and structural dynamics of walleyepollock (Theragra chalcogramma). In: Loughlin, T.R., Ohtani, K. (Eds.), Dynamicsof the Bering Sea. Alaska Sea Grant, Fairbanks, AK, pp. 581–614.
Belkin, I.M., Cornillion, P.C., 2005. Bering Sea thermal fronts from Pathfinder data:seasonal and interannual variability. Pacific Oceanography 3 (1), 6–20.
Boyd, P.W., Muggli, D.L., Varela, D.E., Goldblatt, R.H., Chretien, R., Orians, K.J.,Harrison, P.J., 1996. In vitro iron enrichment experiments in the NE subarcticPacific. Marine Ecology Progress Series 136, 179–193.
Boyd, P.W., Law, C., Nojiri, Y., Tsuda, A., Levasseur, M., Takeda, S., Rivkin, R.,Harrison, P.J., Strzepek, R., Gower, J., McKay, R.M., Abraham, E., Arychuk, M.,Barwell-Clarke, J., Crawford, W., Hale, M., Harada, K., Johnson, K., Kiyosawa, H.,Kudo, I., Marchetti, A., Miller, M., Needoba, J., Nishioka, J., Ogawa, H., Page, J.,Robert, M., Saito, H., Sastri, A., Sherry, N., Soutar, T., Sutherland, N., Taira, Y.,Whitney, F., Wong, S.-K.E., Yoshimura, T., 2004. The decline and fate of an iron-induced subarctic phytoplankton bloom. Nature 428, 549–553.
Brodeur, R.D., Wilson, M.T., Ciannelli, L., Doyle, M., Napp, J.M., 2002. Interannualand regional variability in distribution and ecology of juvenile pollock andtheir prey in frontal systems of the Bering Sea. Deep-Sea Research II 49,6051–6067.
Chapman, D.C., Lentz, S.J., 1997. Adjustment of stratified flow over a slopingbottom. Journal of Physical Oceanography 27, 340–356.
Chen, C.T.A., 2003. New vs. export production on the continental shelf. Deep-SeaResearch II 50 (6–7), 1327–1333.
Cianelli, L., Paul, A.J., Richards, R.D., 2002. Regional, interannual and size-relatedvariation of age 0 year walleye pollock whole body energy content around thePribilof Islands, Bering Sea. Journal of Fish Biology 60, 1267–1279.
Coachman, L.K., 1986. Circulation, water masses, and fluxes on the southeasternBering Sea shelf. Continental Shelf Research 5 (1/2), 23–108.
Coyle, K.O., Cooney, R.T., 1993. Water column sound scattering and hydrographyaround the Pribilof Islands, Bering Sea. Continental Shelf Research 13, 803–827.
Coyle, K.O., Pinchuk, A.I., Eisner, L., Napp, J.M., 2008. Zooplankton speciescomposition, abundance, and biomass on eastern Bering Sea shelf duringsummer: the potential role of water column stability and nutrients instructuring the zooplankton community. Deep-Sea Research II, this issue[doi:10.1016/jdsr2.2008.04.029].
de Baar, H., de Jong, J.T.M., 2001. Distributions, sources and sinks of iron inseawater. In: Turner, D.R., Hunter, K.A. (Eds.), The Biogeochemistry of Iron inSeawater. IUPAC Series on Analytical and Physical Chemistry of EnvironmentalSystems. Wiley, West Sussex, pp. 123–254.
Decker, M.B., Hunt Jr., G.L., 1996. Foraging by murres (Uria spp.) at the tidal frontsurrounding the Pribilof Islands, Alaska. Marine Ecology Progress Series 139,1–10.
Decker, M.B., Hunt Jr., G.L., Byrd, G.V., 1995. The relationships among sea surfacetemperature, the abundance of juvenile walleye pollock (Theragra chalcogramma),and the reproductive performance and diets of seabirds at the Pribilof Islands,southeastern Bering Sea. In: Beamish, R.J. (Ed.), Climate Change and NorthernFish Populations, vol. 121. Canadian Special Publication of Fisheries andAquatic Sciences, pp. 425–437.
Doyon, P., Klein, B., Ingram, R.G., Legendre, L., Tremblay, J.E., Therriault, J.C.,2000. Influence of wind mixing and upper-layer stratification on phytoplank-ton biomass in the Gulf of St. Lawrence. Deep-Sea Research II 47 (3–4),415–433.
Dugdale, R.C., Goering, J.J., 1967. Uptake of new and regenerated forms of nitrogenin primary productivity. Limnology and Oceanography 12, 196–206.
Eslinger, D.L., Iverson, R.L., 2001. The effects of convective and wind-driven mixingon spring phytoplankton dynamics in the southeastern Bering Sea middle shelfdomain. Continental Shelf Research 21, 627–650.
Evans, C.A., O’Reilly, J.E., Thomas, J.P., 1987. A handbook for the measurement ofchlorophyll a and primary production. BIOMASS Scientific Series 8.
Flint, M.V., Sukhanova, I.N., Kopylov, A.I., Poyarkov, S.G., Whitledge, T.E., 2002.Plankton distribution associated with frontal zones in the vicinity of thePribilof Islands. Deep-Sea Research II 49 (26), 6069–6093.
Flint, M.V., Kopylov, A.I., Sukhanova, I.N., 2003. Comparative role of bacteria andphytoplankton in the pelagic organic carbon cycle in the Eastern Bering Sea(Pribilof Islands area). Oceanology 43 (1), 48–62.
Frost, B.W., 1991. The role of grazing in nutrient-rich areas of the open sea.Limnology and Oceanography 36 (8), 1616–1630.
Fung, I.Y., Meyn, S.K., Tegen, I., Doney, S.C., John, J.G., Bishop, J.K.B., 2000. Ironsupply and demand in the upper ocean. Global Biogeochemical Cycles 14 (1),281–295.
Gibbs, M.T., 2000. Elevated chlorophyll alpha concentrations associated with atransient shelfbreak front in a western boundary current at Sydney, south-eastern Australia. Marine and Freshwater Research 51 (8), 733–737.
Grebmeier, J.M., Cooper, L.W., Feder, H.M., Sirenko, B.I., 2006. Ecosystem dynamicsof the Pacific-influenced Northern Bering and Chukchi Seas in the AmerasianArctic. Progress in Oceanography 71 (2–4), 331–361.
Hansell, D.A., Goering, J.J., Walsh, J.J., McRoy, C.P., Coachman, L.K., Whitledge, T.E.,1989. Summer phytoplankton production and transport along the shelf breakin the Bering Sea. Continental Shelf Research 9 (12), 1085–1104.
Hansell, D.A., Whitledge, T.E., Goering, J.J., 1993. Patterns of nitrate utilization andnew production over the Bering/Chukchi Shelf. Continental Shelf Research 13,601–627.
Harrison, W.G., Platt, T., Lewis, M.R., 1987. f-ratio and its relationship to ambientnitrate concentration in coastal waters. Journal of Plankton Research 9,235–248.
Holligan, P.M., Harris, R.P., Newell, R.C., Harbour, D.S., Head, R.N., Linley, E.A.S.,Lucas, M.I., Trantner, P.R.G., Weekley, C.M., 1984. Vertical distribution andpartitioning of organic carbon in mixed, frontal and stratified waters of theEnglish Channel. Marine Ecology Progress Series 14, 111–127.
Horne, E.P.W., Loder, J.W., Harrison, W.G., Mohn, R., Lewis, M.R., Irwin, B., Platt, T.,1989. Nitrate supply and demand at the Georges Bank tidal front. ScienciaMarine 53, 145–158.
Houde, E.D., Rutherford, E.S., 1993. Recent trends in estuarine fisheries-predictionsof fish production and yield. Estuaries 16 (2), 161–176.
Houghton, R.W., 1997. Lagrangian flow at the foot of a shelfbreak front using a dyetracer injected into the bottom boundary layer. Geophysical Research Letters24 (16), 2035–2038.
Houghton, R.W., Visbeck, M., 1998. Upwelling and convergence in theMiddle Atlantic Bight shelfbreak front. Geophysical Research Letters 25,2765–2768.
Hunt Jr., G.L., Stabeno, P.J., 2002. Climate change and the control of energy flow inthe southeastern Bering Sea. Progress in Oceanography 55 (1–2), 5–22.
Hunt Jr., G.L., Coyle, K.O., Hoffman, S., Decker, M.B., Flint, E.N., 1996. Foragingecology of short-tailed shearwaters near the Pribilof Islands, Bering Sea.Marine Ecology Progress Series 141, 1–11.
Iverson, R.L., 1990. Control of marine fish production. Limnology and Oceano-graphy 35, 1593–1604.
Iverson, R.L., Whitledge, T.E., Goering, J.J., 1979. Chlorophyll and nitrate finestructure in the southeastern Bering Sea shelf break front. Nature 281,664–666.
Jackett, D.R., McDougall, T.J., 1997. A neutral density variable for the world’s oceans.Journal of Physical Oceanography 27 (2), 237–263.
Jassby, A.D., Platt, T., 1976. Mathematical formulation of the relationship betweenphotosynthesis and light for phytoplankton. Limnology and Oceanography 21,540–547.
Johnson, K.S.R., Gordon, M., Coale, K.H., 1997. What controls dissolved ironconcentrations in the world ocean? Marine Chemistry 57 (3–4), 137–364.
Johnson, W.K., Miller, L.A., Sutherland, N.E., Wong, C.S., 2005. Iron transport bymesoscale Haida eddies in the Gulf of Alaska. Deep-Sea Research II 52,933–953.
Kachel, N.B., Hunt Jr., G.L., Salo, S.A., Schumacher, J.D., Stabeno, P.J., Whitledge, T.E.,2002. Characteristics and variability of the inner front of the southeasternBering Sea. Deep-Sea Research II 49 (26), 5889–5909.
Kinder, T.H., Hunt Jr., G.L., Schneider, D., Schumacher, J.D., 1983. Correlationsbetween seabirds and oceanic fronts around the Pribilof Islands, Alaska.Estuarine, Coastal and Shelf Science 16 (3), 303–319.
Kowalik, Z., Stabeno, P.J., 1999. Trapped motion around the Pribilof Islands. Journalof Geophysical Research 104 (C11), 25667–25684.
Laws, E.A., Falkowski, P.G., Smith, W.O., Ducklow, H., McCarthy, J.J., 2000.Temperature effects on export production in the open ocean. GlobalBiogeochemical Cycles 14 (4), 1231–1246.
LeBlanc, K., Hare, C.E., Boyd, P.W., Bruland, K.W., Sohst, B., Pickmere, S., Lohan, M.C.,Buck, K., Ellewood, M., Huchins, D.A., 2005. Fe and Zn effects on the Si cycleand diatom community structure in two contrasting high and low silicateHNLC areas. Deep-Sea Research I 52, 1842–1864.
Longhurst, A., Sathyendranath, S., Platt, T., Caverhill, C., 1995. An estimate of globalprimary production in the ocean from satellite radiometer data. Journal ofPlankton Research 17 (6), 1245–1271.
Malone, T.C., Hopkins, T.S., Falkowski, P.G., Whitledge, T.E., 1983. Production andtransport of phytoplankton biomass over the continental shelf of the New YorkBight. Continental Shelf Research 1 (4), 305–337.
Marra, J., 1990. Phytoplankton growth at the shelf-break front in the middleAtlantic Bight. Journal of Marine Research 48, 851–868.
Marra, J., 2002. Approaches to the measurement of plankton production. In:Williams, P.J.I.B., Thomas, D.N., Reynolds, C.S. (Eds.), Phytoplankton Productiv-ity: Carbon Assimilation in Marine and Freshwater Systems. Blackwell ScienceLtd., Oxford, UK, pp. 78–108.
Mizobata, K., Saito, S.-I., Wang, J., 2008. Interannual variability of summerbiochemical enhancement in relation to mesoscale eddies at the shelf breakin the vicinity of the Pribilof Islands, Bering Sea. Deep-Sea Research II, thisissue [doi:10.1013/jdsr2.2008.03.002].
Moll, A., Radach, G., 2003. Review of three-dimensional ecological modellingrelated to the North Sea shelf system—Part 1: models and their results.Progress in Oceanography 57 (2), 175–217.
Mordy, C.W., Stabeno, P.J., Ladd, C., Zeeman, S., Wisegarver, D.P., Salo, S.A., Hunt Jr.,G.L., 2005. Nutrients and primary production along the eastern Aleutian IslandArchipelago. Fisheries Oceanography 14, 55–76.
Mordy, C.W., Stabeno, P.J., Righi, D., Menzia, F.A., 2008. Origins of the sub-surfaceammonium maximum in the Southeast Bering Sea. Deep-Sea Research II, thisissue [doi:10.1016/j.dsr2.2008.03.005].
Muller-Karger, F.E., McClain, C.R., Sambrotto, R.N., Ray, G.C., 1990. A comparison ofship and CZCS mapped distribution of phytoplankton in the southeasternBering Sea. Journal of Geophysical Research 95 (C7), 11,483–11,499.
National Research Council, 1996. The Bering Sea Ecosystem. National AcademyPress, Washington, DC, 307pp.
Niebauer, H.J., Alexander, V.A., Hendricks, S., 1990. Physical and biologicaloceanographic interaction in the spring bloom at the Bering Sea marginal icezone. Journal of Geophysical Research 95, 22,229–22,242.
Okkonen, S.R., Schmidt, G.M., Cokelet, E.D., Stabeno, P.J., 2004. Satellite andhydrographic observations of the Bering Sea ‘‘Green Belt’’. Deep-Sea Research II51 (10–11), 1033–1051.
ARTICLE IN PRESS
R.N. Sambrotto et al. / Deep-Sea Research II 55 (2008) 1745–17601760
Peers, G., Quesnel, S.A., Price, N.M., 2005. Copper requirements for iron aquisitionand growth of coastal and oceanic diatoms. Limnology and Oceanography 50,1149–1158.
Piepenburg, D., 2005. Recent research on Arctic benthos: common notions need tobe revised. Polar Biology 28 (10), 733–755.
Pingree, R.D., Holligan, P.M., Mardell, G.T., Head, R.L., 1976. Influence of physicalstability on spring, summer and autumn phytoplankton blooms in the CelticSea. Journal of the Marine Biological Association of the United Kingdom 56 (4),845–873.
Platt, T., Gallegos, C.L., Harrison, W.G., 1980. Photoinhibition of photosynthesis innatural assemblages of marine phytoplankton. Journal of Marine Research 38,687–701.
Redfield, A.C., Ketchum, B.H., Richards, F.A., 1963. The influence of organisms onthe composition of sea-water. In: Hill, M.N. (Ed.), The Sea. IntersciencePublishers, Wiley, New York, pp. 26–75.
Rho, T.-K., Whitledge, T.E., 2007. Characteristics of seasonal and spatial variationsof primary production over the southeastern Bering Sea shelf. ContinentalShelf Research 27, 2556–2569.
Riley, G.A., 1942. The relationship of vertical turbulence and spring diatomflowerings. Journal of Marine Research 5, 67–87.
Ryan, J.P., Yoder, J.A., Barth, J.A., Cornillon, P.C., 1999. Chlorophyll enhancement andmixing associated with meanders of the shelf break front in the Mid-AtlanticBight. Journal of Geophysical Research 104 (C10), 23479–23493.
Saitoh, S., Iida, T., Sasaoka, K., 2002. A description of temporal and spatialvariability in the Bering Sea spring phytoplankton blooms (1997–1999) usingsatellite multi-sensor remote sensing. Progress in Oceanography 55 (1–2),131–146.
Sambrotto, R.N., Mace, B., 2000. Coupling of biological and physical regimes acrossthe Antarctic Polar Front as reflected by nitrogen production and recycling.Deep-Sea Research II 47, 3339–3368.
Sambrotto, R.N., Niebauer, H.J., Georing, J.J., Iverson, R.L., 1986. Relationshipsamong vertical mixing, nitrate uptake and phytoplankton growth during thespring bloom in the southeast Bering Sea middle shelf. Continental ShelfResearch 5, 161–198.
Schmid, M.K., Piepenburg, D., Golikov, A.A., von Juterzenka, K., Petryashov, V.V.,Spindler, M., 2006. Trophic pathways and carbon flux patterns in the LaptevSea. Progress in Oceanography 71 (2–4), 314–330.
Schneider, D., Harrison, N.M., Hunt Jr., G.L., 1987. Variation in the occurrence ofmarine birds at fronts in the Bering Sea, Estuarine. Coastal and Shelf Science 25(1), 135–141.
Shuert, P.G., Walsh, J.J., 1993. A coupled physical–biological model of the Bering-Chukchi Seas. Continental Shelf Research 13 (5–6), 543–573.
Smith Jr., W.O., Harrison, W.G., 1991. New production in polar regions: the role ofenvironmental controls. Deep-Sea Research 38, 1463–1479.
Sournia, A., 1994. Pelagic biogeography and fronts. Progress in Oceanography 34,109–120.
Springer, A.M., McRoy, C.P., Flint, M.V., 1996. The Bering Sea Green Belt: shelf-edgeprocesses and ecosystem production. Fisheries Oceanography 5 (3/4),205–223.
Stabeno, P.J., van Meurs, P., 1999. Evidence of episodic on-shelf flow inthe southeastern Bering Sea. Journal of Geophysical Research 104,29,715–29,720.
Stabeno, P.J., Schumacher, J.D., Salo, S., Hunt, G.L., Flint, M.V., 1999.Physical environment around the Pribilof Islands. In: Loughlin, T.R., Ohtani,K. (Eds.), Dynamics of the Bering Sea. Alaska Sea Grant, Fairbanks, AK,pp. 193–215.
Stabeno, P.J., Bond, N.A., Kachel, N.B., Salo, S.A., Schumacher, J.D., 2001. On thetemporal variability of the physical environment over the southeastern BeringSea. Fisheries Oceanography 10 (1), 81–98.
Stabeno, P.J., Kachel, N.B., Sullivan, M., Whitledge, T.E., 2002a. Variability ofphysical and chemical characteristics along the 70 m isobath of the south-eastern Bering Sea. Deep-Sea Research II 49, 5931–5944.
Stabeno, P.J., Reed, R.K., Napp, J.M., 2002b. Transport through Unimak Pass, Alaska.Deep-Sea Research II 49 (26), 5919–5930.
Stabeno, P.J., Bond, N.A, Salo, S.A., 2008a. On the recent warming of thesoutheastern Bering Sea Shelf. Topics in Oceanography, accepted.
Stabeno, P.J., Kachel, N., Mordy, C., Righi, D., Salo, S., 2008b. An examination of thephysical variability around the Pribilof Islands in 2004. Deep-Sea Research II,this issue [doi:10.1016/j.dsr2.2008.03.006].
Stockwell, D.A., Whitledge, T.E., Zeeman, S.I., Coyle, K.O., Napp, J.M., Brodeur, R.D.,Pinchuk, A.I., Hunt Jr., G.L., 2001. Anomalous conditions in the southeasternBering Sea, 1997: nutrients, phytoplankton and zooplankton. FisheriesOceanography 10, 99–116.
Strom, S.L., Fredrickson, K.A., 2008. Intense stratification leads to phytoplanktonnutrient limitation and reduced microzooplankton grazing in the southeasternBering Sea. Deep-Sea Research II, this issue [doi:10.1016/j.dsr2.2008.04.008].
Sullivan, M.E., Kachel, N.B., Mordy, C.W., Stabeno, P.J., 2008. The Pribilof Islands:temperature, salinity and nitrate during summer 2004. Deep-Sea Research II,this issue [doi:10.1016/j.dsr2.2008.03.004].
Tsuda, A., Takeda, S., Saito, H., Nishioka, J., Nojiri, Y., Ikudo, I., Kiyosawa, H.,Shiomoto, A., Imai, K., Ono, T., Shimamoto, A., Tsumune, D., Yoshimura, T.,Aono, T., Hinuma, A., Kinugasa, M., Suzuki, K., Sohrin, Y., Noiri, Y., Tani, T.,Deguchi, D., Tsurushima, T., Ogawa, H., Fukami, F., Kuma, K., Saino, T., 2003. Amesoscale iron enrichment in the western subarctic Pacific induces a largecentric diatom bloom. Science 300 (5621), 958–961.
Tyrrell, T., Merico, A., Waniek, J.J., Wong, C.S., Metzl, N., Whitney, F., 2005. Effect ofseafloor depth on phytoplankton blooms in high-nitrate, low-chlorophyll(HNLC) regions. Journal of Geophysical Research 110 (G2).
Vaillancourt, R.D., Marra, J., Prieto, L., Houghton, R.W., Hales, B., Hebert, D., 2005.Light absorption and scattering by particles and CDOM at the New Englandshelf break front. Geochemistry Geophysics Geosystems 6 (11), Q11003.
Wassmann, P., Reigstad, M., Haug, T., Rudels, B., Carroll, M.L., Hop, H., Gabrielsen,G.W., Falk-Petersen, S., Denisenko, S.G., Arashkevich, E., Slagstad, D., Pavlova,O., 2006. Food webs and carbon flux in the Barents Sea. Progress inOceanography 71 (2–4), 232–287.
Wheeler, P.A., Kokkinakis, S.A., 1990. Ammonium recycling limits nitrate use in theoceanic subarctic Pacific. Limnology and Oceanography 35 (6), 1267–1278.
Whitledge, T.E., Reeburgh, W.S., Walsh, J.J., 1986. Seasonal inorganic nitrogendistribution and dynamics in the southeastern Bering Sea. Continental ShelfResearch 5, 109–132.
Whitledge, T.E., Bidigare, R.B., Zeeman, S.I., Sambrotto, R.N., Roscigno, P.F., Jensen,P.R., Brooks, J.M., Trees, C., Veidt, D.M., 1988. Biological measurements andrelated chemical features in Soviet and United States regions of the Bering Sea.Continental Shelf Research 8, 1299–1319.
Wong, C.S., Waser, A.D., Nojiri, Y., Whitney, F.A., Page, J.S., Zeng, J., 2002. Seasonal cyclesof nutrients and dissolved inorganic carbon at high and mid latitudes in the NorthPacific Ocean during the Skaugran cruises: determination of new production andnutrient uptake ratios. Deep-Sea Research II 49 (24–25), 5317–5338.
Zeeman, S.I., 1992. Phytoplankton photosynthesis and its relation to light intensityin a turbid estuary and the nearshore coastal ocean. Ph.D. Thesis, University ofSouth Carolina, 210pp.
Zeeman, S.I., Jensen, P.R., 1990a. Modeling primary production in the Bering Sea. In:Roscigno, P.F. (Ed.), Results of the Second Joint US–USSR. Bering Sea Expedition,Summer 1984. US Fish and Wildlife Service Biological Report 90(13), pp. 74–86.
Zeeman, S.I., Jensen, P.R., 1990b. Photoresponses of phytoplankton in the BeringSea. In: Roscigno, P.F. (Ed.), Results of the Second Joint US–USSR. Bering SeaExpedition, Summer 1984. US Fish and Wildlife Service Biological Report90(13), pp. 87–96.