dietary shift and feeding intensity of stenobrachius leucopsarus in the bering sea
TRANSCRIPT
185
Journal of Oceanography, Vol. 64, pp. 185 to 194, 2008
Keywords:⋅⋅⋅⋅⋅ Ontogeneticdietary shift,
⋅⋅⋅⋅⋅ Stenobrachiusleucopsarus,
⋅⋅⋅⋅⋅ feeding intensity,⋅⋅⋅⋅⋅ Bering Sea,⋅⋅⋅⋅⋅ Alaskan stream.
* Corresponding author. E-mail: [email protected]
Copyright©The Oceanographic Society of Japan/TERRAPUB/Springer
Dietary Shift and Feeding Intensity of Stenobrachiusleucopsarus in the Bering Sea
NAOKI TANIMATA1*, ORIO YAMAMURA2, YASUNORI SAKURAI1 and TOMONORI AZUMAYA2
1Graduate School of Fisheries Sciences, Hokkaido University, Hakodate 041-8611, Japan2Hokkaido National Fisheries Research Institute, Kushiro 085-0802, Japan
(Received 18 June 2007; in revised form 26 September 2007; accepted 2 October 2007)
The food habits of the dominant myctophid Stenobrachius leucopsarus were exam-ined in the central basin of the Bering Sea in relation to oceanographic conditions, insummer 2002 and 2003 and spring 2006. S. leucopsarus exhibited an ontogenetic andseasonal dietary shift. In spring, small fish (≤40 mm) preyed mainly on Neocalanusflemingeri/plumchrus whereas large fish fed mainly on Neocalanus cristatus. In sum-mer, small fish preyed mainly on Metridia pacifica whereas large fish fed mainly oneuphausiids (Thysanoessa spp.). In the summer of 2003, when water temperature inthe epipelagic layer (≤100 m) was warmer, reflecting the prevalence of the AlaskanStream, small-sized S. leucopsarus showed a higher stomach content index, perhapsreflecting the greater abundance of M. pacifica. Thus, the present study shows thatthe physical variability in the epipelagic layer affects not only diets but also feedingperformance of micronekton.
water directly onto the eastern Bering Sea shelf (Stabenoet al., 2002). Deep passes such as Amukta Pass are toodeep to completely mix vertically, thus they do not intro-duce high concentrations of nutrients into the euphoticzone. Large passes, such Amukta Pass, Amchitka Pass,Bulduir Pass and Near Strait, contribute most of the trans-port to the Bering Sea gyre, and hence are an importantsource of heat (Stabeno et al., 2005; Ladd et al., 2005),affecting the distribution of both zooplankton and upper-level predators (Brodsky, 1957; Hunt et al., 1998). How-ever, the effect of the Alaskan Stream on the distributionof micronektonic organisms, including S. leucopsarus,remains unclear, although it would also affect the entireecosystem through its great biomass and diel verticalmigration (DVM) behavior.
In the present study we have examined seasonal andontogenetic variations of diets and feeding conditions ofS. leucopsarus collected in the Bering Sea basin in rela-tion to the oceanographic conditions, and then determinedthe key prey affecting the condition of S. leucopsarus.
2. Materials and MethodsShipboard sampling was conducted during four
cruises of R/V “Kaiyo-Maru” in the Bering Sea; during3–18 September 2002, 30 June–13 July 2003, 3–12 Sep-tember 2003 and 2–14 June 2006. During 2002 and 2003cruises, micronekton was sampled using a rectangularmidwater trawling (RMT) net with 12 m2 mouth opening
1. IntroductionStenobrachius leucopsarus is one of the most abun-
dant micronekton in the Bering Sea (Beamish et al., 1999).It is an important prey species for upper-level predatorssuch as Dall’s porpoise, sea birds, salmon and walleyepollock (Pearcy et al., 1988; Hunt et al., 1996; Yamamuraet al., 2002; Ohizumi et al., 2003). Previous studies ofthe food habits of S. leucopsarus reported that they preymainly on crustaceans, including copepods, euphausiidsand ostracods. However, these studies covered only earlysummer (June and July), and the seasonal aspects of feed-ing habits remain unclear. Furthermore, most of the pre-vious studies identified prey only to the major taxonomiclevels, and there have been few attempts to quantify preyto lower taxonomic levels (Balanov et al. , 1995;Nishimura et al., 1999; Moku et al., 2000).
The central basin of the Bering Sea and the areaaround Aleutian Archipelago are strongly influenced bythe warm Alaskan Stream flowing from the Gulf ofAlaska. This flows counterclockwise around the basin,and then flows out through the Kamchatka Strait (Reed,1984; Reed and Stabeno, 1993; Stabeno et al., 1999).Although the smaller passes provide limited nutrients andtransport into the Bering Sea, Unimak Pass introduces
186 N. Tanimata et al.
and 6 mm mesh size. During the 2006 cruise, a MOHTnet with 5 m2 mouth opening and 1.59 mm mesh size(Oozeki et al., 2004) was used. These nets were towedobliquely from a depth of either 500 m (RMT) or 300 m(MOHT) to the surface at ship speeds of 2–3 knots (3.7–5.6 km h–1). The nets were deployed 1 h after sunset.
Hydrographic observation was done at 13 to 27 sta-tions during each cruise, using either a SBE-9 plus or aSBE-19 Conductivity Temperature Depth (CTD) sensor(Sea-Bird Electronics Inc.) from 0 m to either 3000 m,1500 m or approximately to the sea bottom. To approxi-mate an indicator of density of phytoplankton in the cen-tral basin, the relative value of fluoresce measured by anElectric Plankton Counter System (EPCS; Thrner Desins,10-AU-005 fluorometer) was used each 1 h.
Fish were sorted out from the samples, and were fixedin a 10% formalin-seawater solution immediately afterthe sampling (2002 and 2003 cruises), or frozen at –40°C(2006 cruise). Specimens were brought to the laboratoryand were identified to species level and enumerated. Theywere measured to the nearest 0.1 mm in standard length(SL), and weighed to the nearest 1 mg after blotting. S.leucopsarus were then dissected; their stomach contentswere sorted to the possible lowest taxonomic groups un-der a dissecting stereomicroscope. Each prey group wascounted and weighed to the nearest 0.1 mg. Up to 30 speci-mens from each station were examined. The copepod spe-cies Neocalanus flemingeri and N. plumchrus were treatedtogether as Neocalanus flemingeri/plumchrus, due to the
difficulty of identifying digested material.The importance of each prey taxon was represented
by frequency of occurrence (F) in the total number ofstomachs excluding empty stomachs, and wet weight per-centage (WW) of each food item in the total weight ofidentifiable food items. Feeding incidence refers to thepercentage of stomachs that contained at least one fooditem.
Diversity of food resources used by each group ofpredators was measured by the Shannon-Weaver index:
H P Pi i′ = − ( )∑ ln ,
where Pi is the numerical proportion of the i-th prey itemin the stomach content.
Diets of S. leucopsarus were compared among dif-ferent body sizes, cruises and current systems using per-cent similarity index (PSI):
PSI P Pij ik= − −∑100 0 5. ,
where Pij is the percent of i-th prey in the diets of j-th andk-th predator groups. Diets overlap completely betweenj-th and k-th predators when PSI = 100 (Schoener, 1968).Using the matrix of PSI, a cluster analysis was performedusing the group average algorithm (Tanaka et al., 1984)to detect groups of subsamples representing similar di-ets. Subsamples comprising at least 10 individuals with
5
5
6 6
7
7
7 8
8
8
8
7
889
9 10
10
10
11
7
7
8
9
1010
11
11
12
50 N
60 NJuly 2003
June 2006September 2003
o
o
50 N
60 No
o7
170 E 180 170 Wo o o 170 E 180 170 Wo o o
<5
>5
September 2002
98
5
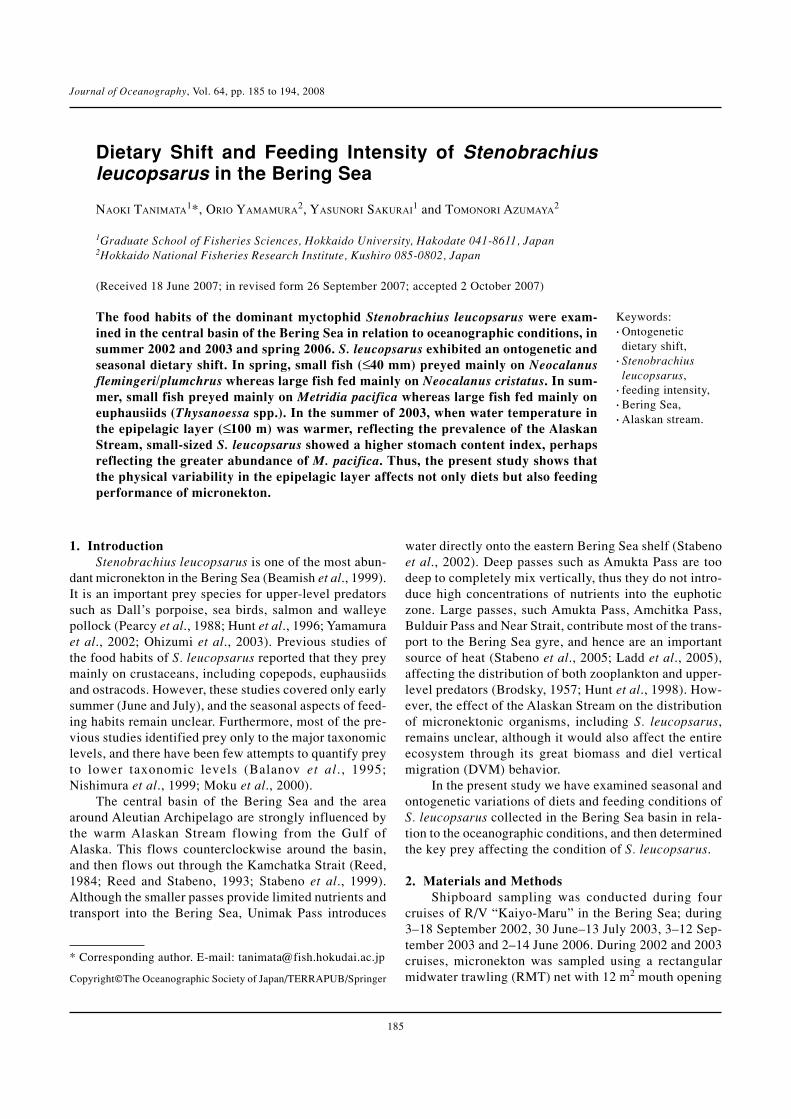
Fig. 1. Sampling stations in the Bering Sea (closed circle: CTD and net sampling, cross: CTD sampling). Isotherms of sub-surface temperature at 10 m depth are also shown.

Diets of Stenobrachius leucopsarus in the Bering Sea 187
stomach contents were included in the analysis.To assess the feeding intensity of S. leucopsarus, the
stomach contents index (SCI) was calculated for everyindividual:
SCI = (SCW/BW) × 102,
where SCW indicates wet weight of stomach contents ofa fish, and BW indicates body weight.
3. ResultsAlthough the cruises were made during different
years, sub-surface temperature (T10: water temperatureat 10 m depth) showed a clear seasonally elevating pat-tern from June through September (5.3 ± 0.4°C, 7.3 ±0.77°C, 9.7 ± 0.75°C and 9.9 ± 1.27°C during June 2006;mean ± SD: July 2003, September 2002 and September2003, respectively; Fig. 1). The relative value of fluores-cence (EPCS) in June 2006 (43.8 ± 39.9; mean ± SD)was obviously higher than the other cruises (4.2 ± 2.3,8.1 ± 5.3 and 7.7 ± 2.9 during July 2003; mean ± SD,September 2002 and September 2003, respectively;ANOVA: F3, 1120 = 275, p < 0.001). The high fluorescencevalue indicates a spring bloom during June 2006. The lowT10 and high fluorescence value indicate that the centralbasin was in its spring condition during June, whereasthe other cruises were conducted under summer condi-tions. In the Bering Sea, the Alaska current system (ACS)was distinguished from the Bering current system (BCS)
by the existence of ≥4°C water below 100 m depth(Favorite et al., 1976); six out of the 10 RMT samplingstations during September 2002 were classified as BCS,while four stations were classified as ACS (Fig. 2). Ofthe 10 RMT sampling stations during July 2003, 5 and 4were classified as BCS and ACS, respectively. However,all of the 6 RMT stations sampled during September 2003were classified as ACS, which prevailed in the BeringSea basin during September 2003. Reflecting the preva-lence of the ACS, average T10 was slightly higher in 2003(9.9°C) than in 2002 (9.7°C, Mann-Whitney’s U-test: p <0.05). Of the 6 MOHT stations sampled during June 2006,5 were classified as ACS.
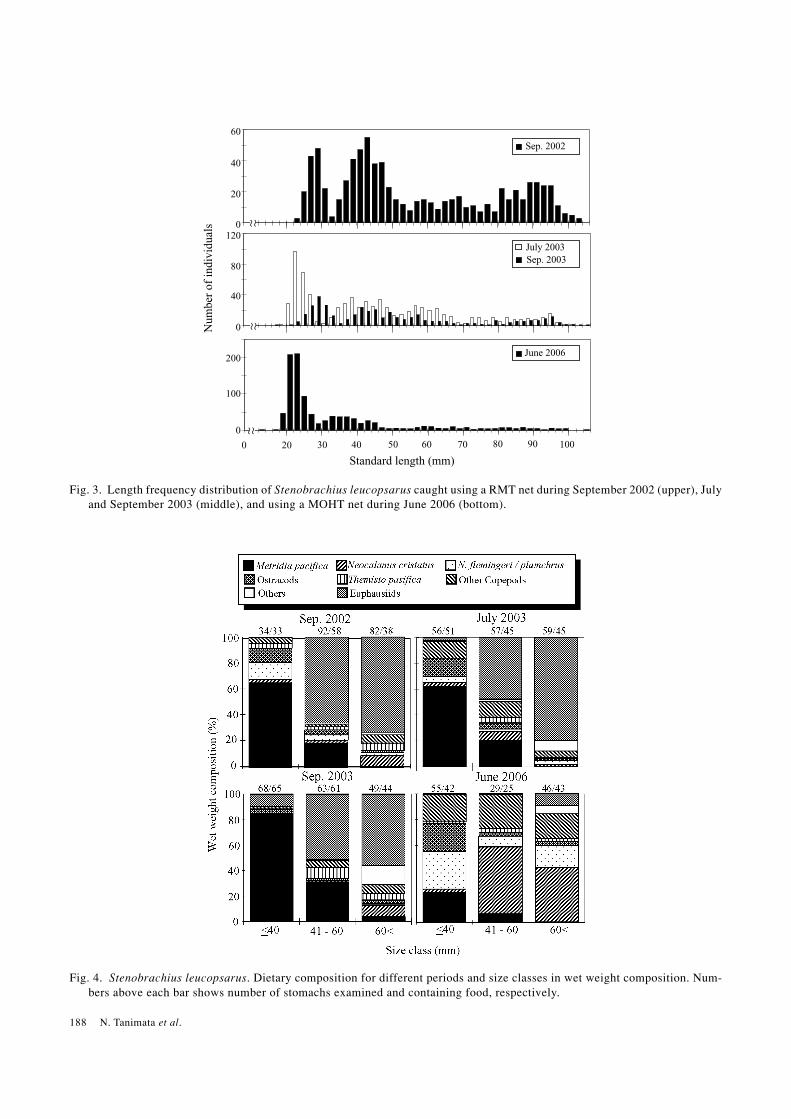
A total of 7.4 kg of micronektonic fish was caughtthroughout the study. Of these, S. leucopsarus was domi-nant, representing 66.7%, 71.3%, 79.6% and 74.7% ofthe total biomass during September 2002, July 2003, Sep-tember 2003 and June 2006, respectively. Body size of S.leucopsarus collected in the Bering Sea ranged from 12.9to 105.5 mm in standard length. Body length frequencydistributions of S. leucopsarus were polymodal with dis-tinct modes at <30 mm and 30-50 mm (Fig. 3), presum-ably representing age-1 and age-2, respectively(Nishimura et al., 1999).
We examined the stomach contents of a total of 690individuals of S. leucopsarus, ranging from 17.2 mm to99.2 mm SL. Of these, 208, 172, 180 and 130 were col-lected in September 2002, July 2003, September 2003 andJune 2006, respectively. The diet of S. leucopsarus was
44
5
56
4 4
4
4
4
5
5
5
4
4
4
4
44
July 2003
170 E 180 170 W
<4
>4
>4
<4
ooo 170 E 180 170 Wooo
50 N
60 N
o
o
50 N
60 N
o
o
September 2002
September 2003 June 2006
4
4
6
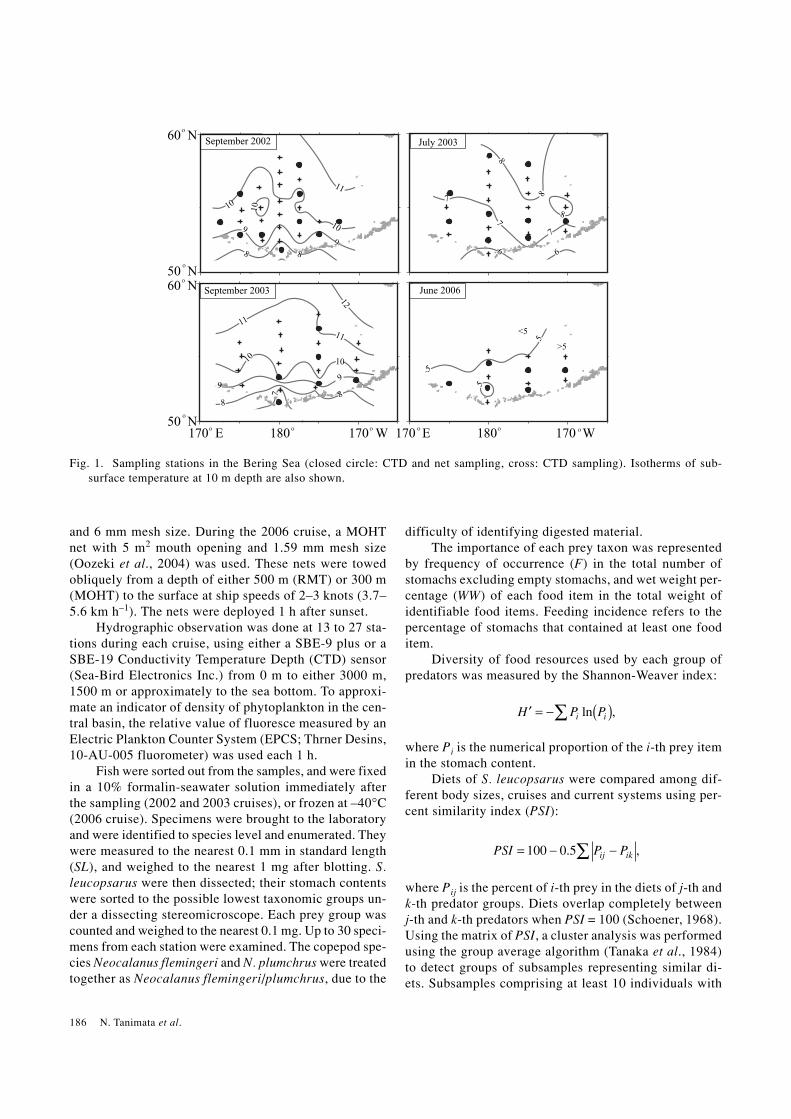
Fig. 2. Isotherms of maximum temperature below 100 meter depth in September 2002 and 2003. Bold lines indicate 4°C iso-therms.
188 N. Tanimata et al.
Num
ber
of in
divi
dual
s
Standard length (mm)
Sep. 2002
0 20 30 40 50 60 70 80 90 100
June 2006
0
100
200
July 2003Sep. 2003
0
40
80
1200
20
40
60
Fig. 3. Length frequency distribution of Stenobrachius leucopsarus caught using a RMT net during September 2002 (upper), Julyand September 2003 (middle), and using a MOHT net during June 2006 (bottom).
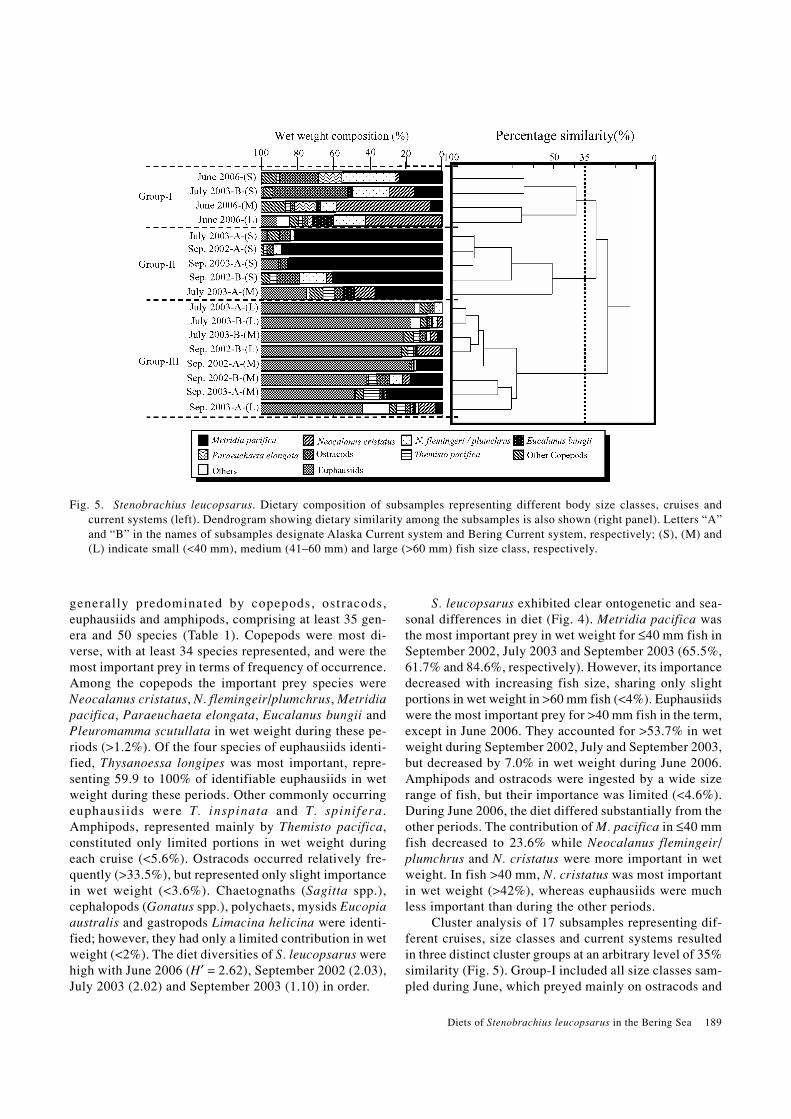
Fig. 4. Stenobrachius leucopsarus. Dietary composition for different periods and size classes in wet weight composition. Num-bers above each bar shows number of stomachs examined and containing food, respectively.
Diets of Stenobrachius leucopsarus in the Bering Sea 189
Fig. 5. Stenobrachius leucopsarus. Dietary composition of subsamples representing different body size classes, cruises andcurrent systems (left). Dendrogram showing dietary similarity among the subsamples is also shown (right panel). Letters “A”and “B” in the names of subsamples designate Alaska Current system and Bering Current system, respectively; (S), (M) and(L) indicate small (<40 mm), medium (41–60 mm) and large (>60 mm) fish size class, respectively.
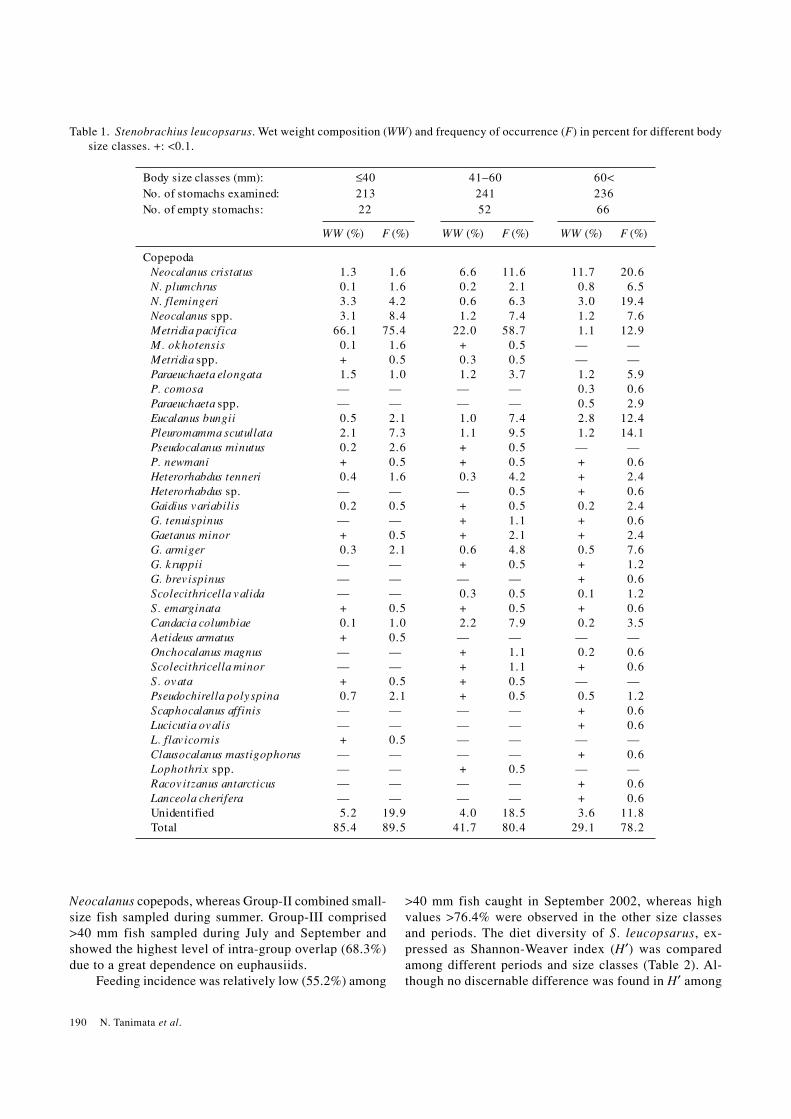
generally predominated by copepods, ostracods,euphausiids and amphipods, comprising at least 35 gen-era and 50 species (Table 1). Copepods were most di-verse, with at least 34 species represented, and were themost important prey in terms of frequency of occurrence.Among the copepods the important prey species wereNeocalanus cristatus, N. flemingeir/plumchrus, Metridiapacifica, Paraeuchaeta elongata, Eucalanus bungii andPleuromamma scutullata in wet weight during these pe-riods (>1.2%). Of the four species of euphausiids identi-fied, Thysanoessa longipes was most important, repre-senting 59.9 to 100% of identifiable euphausiids in wetweight during these periods. Other commonly occurringeuphausiids were T. inspinata and T. spinifera .Amphipods, represented mainly by Themisto pacifica,constituted only limited portions in wet weight duringeach cruise (<5.6%). Ostracods occurred relatively fre-quently (>33.5%), but represented only slight importancein wet weight (<3.6%). Chaetognaths (Sagitta spp.),cephalopods (Gonatus spp.), polychaets, mysids Eucopiaaustralis and gastropods Limacina helicina were identi-fied; however, they had only a limited contribution in wetweight (<2%). The diet diversities of S. leucopsarus werehigh with June 2006 (H′ = 2.62), September 2002 (2.03),July 2003 (2.02) and September 2003 (1.10) in order.
S. leucopsarus exhibited clear ontogenetic and sea-sonal differences in diet (Fig. 4). Metridia pacifica wasthe most important prey in wet weight for ≤40 mm fish inSeptember 2002, July 2003 and September 2003 (65.5%,61.7% and 84.6%, respectively). However, its importancedecreased with increasing fish size, sharing only slightportions in wet weight in >60 mm fish (<4%). Euphausiidswere the most important prey for >40 mm fish in the term,except in June 2006. They accounted for >53.7% in wetweight during September 2002, July and September 2003,but decreased by 7.0% in wet weight during June 2006.Amphipods and ostracods were ingested by a wide sizerange of fish, but their importance was limited (<4.6%).During June 2006, the diet differed substantially from theother periods. The contribution of M. pacifica in ≤40 mmfish decreased to 23.6% while Neocalanus flemingeir/plumchrus and N. cristatus were more important in wetweight. In fish >40 mm, N. cristatus was most importantin wet weight (>42%), whereas euphausiids were muchless important than during the other periods.
Cluster analysis of 17 subsamples representing dif-ferent cruises, size classes and current systems resultedin three distinct cluster groups at an arbitrary level of 35%similarity (Fig. 5). Group-I included all size classes sam-pled during June, which preyed mainly on ostracods and
190 N. Tanimata et al.
Neocalanus copepods, whereas Group-II combined small-size fish sampled during summer. Group-III comprised>40 mm fish sampled during July and September andshowed the highest level of intra-group overlap (68.3%)due to a great dependence on euphausiids.
Feeding incidence was relatively low (55.2%) among
>40 mm fish caught in September 2002, whereas highvalues >76.4% were observed in the other size classesand periods. The diet diversity of S. leucopsarus, ex-pressed as Shannon-Weaver index (H′) was comparedamong different periods and size classes (Table 2). Al-though no discernable difference was found in H′ among
Body size classes (mm): ≤40 41–60 60<No. of stomachs examined: 213 241 236No. of empty stomachs: 22 52 66
WW (%) F (%) WW (%) F (%) WW (%) F (%)
CopepodaNeocalanus cristatus 1.3 1.6 6.6 11.6 11.7 20.6N. plumchrus 0.1 1.6 0.2 2.1 0.8 6.5N. flemingeri 3.3 4.2 0.6 6.3 3.0 19.4Neocalanus spp. 3.1 8.4 1.2 7.4 1.2 7.6Metridia pacifica 66.1 75.4 22.0 58.7 1.1 12.9M. okhotensis 0.1 1.6 + 0.5 — —Metridia spp. + 0.5 0.3 0.5 — —Paraeuchaeta elongata 1.5 1.0 1.2 3.7 1.2 5.9P. comosa — — — — 0.3 0.6Paraeuchaeta spp. — — — — 0.5 2.9Eucalanus bungii 0.5 2.1 1.0 7.4 2.8 12.4Pleuromamma scutullata 2.1 7.3 1.1 9.5 1.2 14.1Pseudocalanus minutus 0.2 2.6 + 0.5 — —P. newmani + 0.5 + 0.5 + 0.6Heterorhabdus tenneri 0.4 1.6 0.3 4.2 + 2.4Heterorhabdus sp. — — — 0.5 + 0.6Gaidius variabilis 0.2 0.5 + 0.5 0.2 2.4G. tenuispinus — — + 1.1 + 0.6Gaetanus minor + 0.5 + 2.1 + 2.4G. armiger 0.3 2.1 0.6 4.8 0.5 7.6G. kruppii — — + 0.5 + 1.2G. brev ispinus — — — — + 0.6Scolecithricella valida — — 0.3 0.5 0.1 1.2S. emarginata + 0.5 + 0.5 + 0.6Candacia columbiae 0.1 1.0 2.2 7.9 0.2 3.5Aetideus armatus + 0.5 — — — —Onchocalanus magnus — — + 1.1 0.2 0.6Scolecithricella minor — — + 1.1 + 0.6S. ovata + 0.5 + 0.5 — —Pseudochirella polyspina 0.7 2.1 + 0.5 0.5 1.2Scaphocalanus affinis — — — — + 0.6Lucicutia ovalis — — — — + 0.6L. flav icornis + 0.5 — — — —Clausocalanus mastigophorus — — — — + 0.6Lophothrix spp. — — + 0.5 — —Racovitzanus antarcticus — — — — + 0.6Lanceola cherifera — — — — + 0.6Unidentified 5.2 19.9 4.0 18.5 3.6 11.8Total 85.4 89.5 41.7 80.4 29.1 78.2
Table 1. Stenobrachius leucopsarus. Wet weight composition (WW) and frequency of occurrence (F) in percent for different bodysize classes. +: <0.1.

Diets of Stenobrachius leucopsarus in the Bering Sea 191
Table 1. (continued).
Body size classes (mm): ≤40 41–60 60<No. of stomachs examined: 213 241 236No. of empty stomachs: 22 52 66
WW (%) F (%) WW (%) F (%) WW (%) F (%)
OstracodaConchoecia spp. 8.3 56.0 2.5 43.9 1.9 29.4
AmphipodaThemisto pacifica 1.0 3.1 5.5 13.8 2.6 12.4Primno abyssalis + 0.5 0.6 2.1 1.8 4.7Cyphocaris challengeri — — — — 0.1 0.6Scina spp. — — — — + 0.6Unidentified — — + 0.5 + 0.6
EuphausiaceaThysanoessa longipes 1.5 1.0 25.3 7.9 37.4 11.2Thysanoessa inspinata — — — — 2.2 1.2Thysanoessa spinifera — — 1.2 0.5 — —Thysanoessa spp. 3.4 2.6 22.0 18.5 17.4 16.5Euphausia pacifica — — — — 0.6 1.2Euphausiid fucilia larvae 0.1 2.6 + 1.1 0.5 1.2Total 5.0 6.3 48.5 27.0 58.0 27.6
ChaetognathaSagitta spp. — — + 1.1 1.4 2.9
CephalopodaGonatus spp. — — — — + 0.6
PolychaetaTomopteris septentrionalis — — — — 0.2 1.2Maupasia sp. — — + 1.1 + 0.6
MysidaceaEucopia australis — — — — 1.9 1.8
GastropodaLimacina helicina + 1.6 0.2 2.6 0.7 3.5
Unidentified 4.8 16.2 3.7 16.9 1.8 7.1
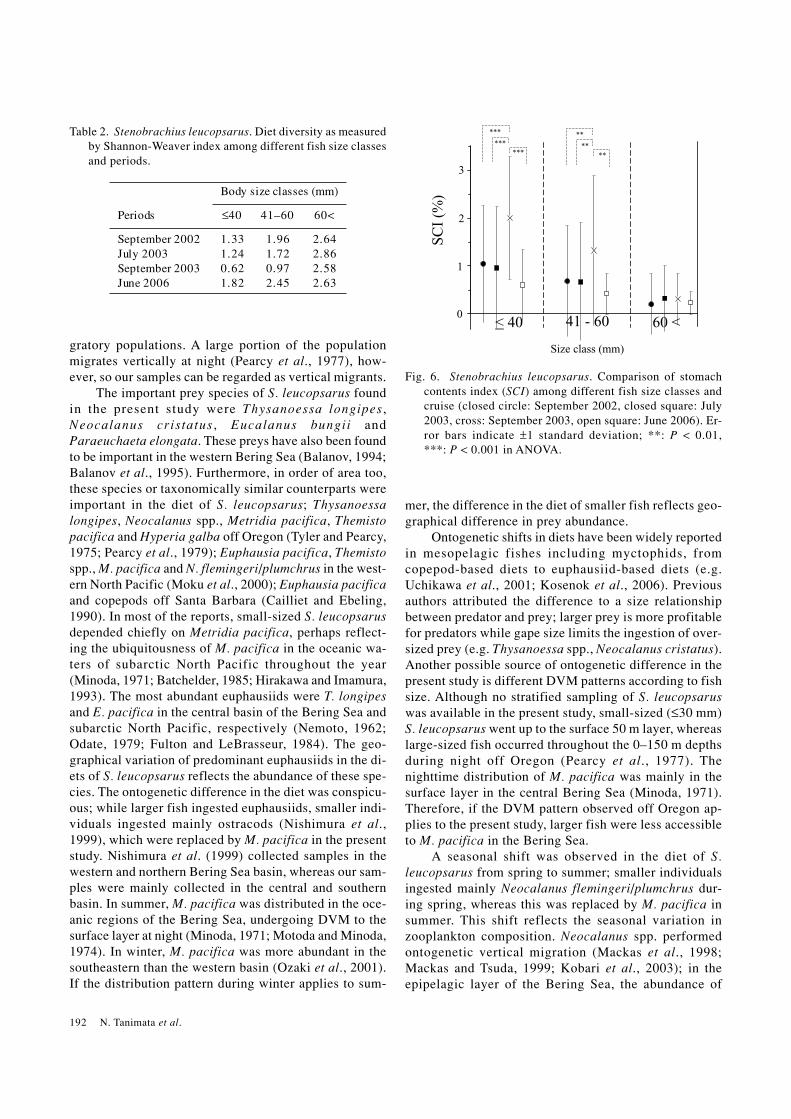
>60 mm fish, ≤60 mm fish collected during September2003 showed lower H′ values than those collected duringthe other periods. The feeding intensity of S. leucopsarus,expressed as SCI was compared among different periodsand size classes (Fig. 6). Although no significant differ-ence was found in average SCI among >60 mm fish, <60mm fish collected during September 2003 showed sig-nificantly higher SCI values than those collected duringthe other periods (ANOVA: F3, 236 = 26.6, p < 0.001 andF3, 257 = 5.9, p < 0.01 for ≤40 mm fish and 41–60 mmsize class, respectively).
4. DiscussionStenobrachius leucopsarus exhibits semi-migrant
behavior: a large portion of the population migrates froma daytime depth of 400–700 m to 20–200 m at night, anda non-migratory portion of the population remains below400 m depths throughout the day (Watanabe et al., 1999).This semi-migrant behavior also occurs in the Gulf ofAlaska (Frost and McCrone, 1979) and off the Oregoncoast (Pearcy et al., 1977). Therefore, S. leucopsarus col-lected using the RMT net towed obliquely from a depthof 500 m seems to comprise both migratory and non-mi-
192 N. Tanimata et al.
gratory populations. A large portion of the populationmigrates vertically at night (Pearcy et al., 1977), how-ever, so our samples can be regarded as vertical migrants.
The important prey species of S. leucopsarus foundin the present study were Thysanoessa longipes ,Neocalanus cristatus , Eucalanus bungii andParaeuchaeta elongata. These preys have also been foundto be important in the western Bering Sea (Balanov, 1994;Balanov et al., 1995). Furthermore, in order of area too,these species or taxonomically similar counterparts wereimportant in the diet of S. leucopsarus; Thysanoessalongipes, Neocalanus spp., Metridia pacifica, Themistopacifica and Hyperia galba off Oregon (Tyler and Pearcy,1975; Pearcy et al., 1979); Euphausia pacifica, Themistospp., M. pacifica and N. flemingeri/plumchrus in the west-ern North Pacific (Moku et al., 2000); Euphausia pacificaand copepods off Santa Barbara (Cailliet and Ebeling,1990). In most of the reports, small-sized S. leucopsarusdepended chiefly on Metridia pacifica, perhaps reflect-ing the ubiquitousness of M. pacifica in the oceanic wa-ters of subarctic North Pacific throughout the year(Minoda, 1971; Batchelder, 1985; Hirakawa and Imamura,1993). The most abundant euphausiids were T. longipesand E. pacifica in the central basin of the Bering Sea andsubarctic North Pacific, respectively (Nemoto, 1962;Odate, 1979; Fulton and LeBrasseur, 1984). The geo-graphical variation of predominant euphausiids in the di-ets of S. leucopsarus reflects the abundance of these spe-cies. The ontogenetic difference in the diet was conspicu-ous; while larger fish ingested euphausiids, smaller indi-viduals ingested mainly ostracods (Nishimura et al.,1999), which were replaced by M. pacifica in the presentstudy. Nishimura et al. (1999) collected samples in thewestern and northern Bering Sea basin, whereas our sam-ples were mainly collected in the central and southernbasin. In summer, M. pacifica was distributed in the oce-anic regions of the Bering Sea, undergoing DVM to thesurface layer at night (Minoda, 1971; Motoda and Minoda,1974). In winter, M. pacifica was more abundant in thesoutheastern than the western basin (Ozaki et al., 2001).If the distribution pattern during winter applies to sum-
mer, the difference in the diet of smaller fish reflects geo-graphical difference in prey abundance.
Ontogenetic shifts in diets have been widely reportedin mesopelagic fishes including myctophids, fromcopepod-based diets to euphausiid-based diets (e.g.Uchikawa et al., 2001; Kosenok et al., 2006). Previousauthors attributed the difference to a size relationshipbetween predator and prey; larger prey is more profitablefor predators while gape size limits the ingestion of over-sized prey (e.g. Thysanoessa spp., Neocalanus cristatus).Another possible source of ontogenetic difference in thepresent study is different DVM patterns according to fishsize. Although no stratified sampling of S. leucopsaruswas available in the present study, small-sized (≤30 mm)S. leucopsarus went up to the surface 50 m layer, whereaslarge-sized fish occurred throughout the 0–150 m depthsduring night off Oregon (Pearcy et al., 1977). Thenighttime distribution of M. pacifica was mainly in thesurface layer in the central Bering Sea (Minoda, 1971).Therefore, if the DVM pattern observed off Oregon ap-plies to the present study, larger fish were less accessibleto M. pacifica in the Bering Sea.
A seasonal shift was observed in the diet of S.leucopsarus from spring to summer; smaller individualsingested mainly Neocalanus flemingeri/plumchrus dur-ing spring, whereas this was replaced by M. pacifica insummer. This shift reflects the seasonal variation inzooplankton composition. Neocalanus spp. performedontogenetic vertical migration (Mackas et al., 1998;Mackas and Tsuda, 1999; Kobari et al., 2003); in theepipelagic layer of the Bering Sea, the abundance of
Table 2. Stenobrachius leucopsarus. Diet diversity as measuredby Shannon-Weaver index among different fish size classesand periods.
Body size classes (mm)
Periods ≤40 41–60 60<
September 2002 1.33 1.96 2.64July 2003 1.24 1.72 2.86September 2003 0.62 0.97 2.58June 2006 1.82 2.45 2.63
Fig. 6. Stenobrachius leucopsarus. Comparison of stomachcontents index (SCI) among different fish size classes andcruise (closed circle: September 2002, closed square: July2003, cross: September 2003, open square: June 2006). Er-ror bars indicate ±1 standard deviation; **: P < 0.01,***: P < 0.001 in ANOVA.
< 40 41 - 60 60 <
Size class (mm)
SC
I (%
)
***
******
**
****
0
1
2
3
Diets of Stenobrachius leucopsarus in the Bering Sea 193
copepodite C5 Neocalanus cristatus reaches a seasonalmaximum in June (Minoda, 1971; Motoda and Minoda,1974), whereas C5 of N. flemingeri/plumchrus dominatesin mid May in the southern Bering Sea (Vidal and Smith,1986), as has been observed widely in the western NorthPacific (e.g. Tsuda et al., 1999). A high abundance of M.pacifica was observed after Neocalanus spp. depart fromthe euphotic zone in July in the eastern subarctic Pacific(Batchelder, 1985). In the central and southeastern BeringSea, however, its abundance was higher in April and Sep-tember than in July (Kang et al., 2006). It is thus con-cluded that the seasonal difference found in the diets ofS. leucopsarus reflects seasonally varying abundances ofprey species in the feeding layer.
S. leucopsarus showed a better and simpler feedingcondition during September 2003 than other periods insmall- and middle-sized (≤60 mm) fish. Since their mainprey was M. pacifica, the increased ingestion may reflecthigh prey abundance during September 2003, when ACSprevailed in the Bering Sea. In summer, the abundance ofMetridia pacifica was distributed in the south-easternBering Sea (Minoda, 1971). In the northern Bering Sea,the presence of M. pacifica was a reflection of transportonto the shelf by the current (Johnson, 1963). In the south-ern Bering Sea, portions of the Alaskan Stream flow north-ward through the passes, the Aleutian North Slope Cur-rent and Bering Slope Current flow copiously in the shal-low layer (Stabeno et al., 1999, 2005), which would trans-port M. pacifica to the Bering Sea basin. In early springof 2003, the oceanographic condition in the Bering Seawas characterized by an unusually warm, shallow wintermixed layer (Wirts and Johnson, 2005). Such warm con-ditions would not only have increased the biomass of M.pacifica but also shortened the generation times(Padmavati et al., 2004), resulting in even better feedingenvironments for S. leucopsarus. Moreover, larval fishesincluding walleye pollock feed chiefly on M. pacifica(Hillgruber et al., 1995), so the increased ingestion of M.pacifica by S. leucopsarus might have affected the nutri-tion of other fishes.
The present study has shown that the physical vari-ability in the epipelagic layer affects not only diets butalso feeding performance of micronekton. In order toanalyze a complicated and detailed food-web in theeuphotic zone, more information on trophic relationshipsis needed, encompassing the Bering Sea ecosystem in-cluding the deep sea, in relation to biological and physi-cal environments.
AcknowledgementsOur thanks are due to the officers, crews and scien-
tists of the R/V Kaiyo-Maru for their help in sampling;and A. Yamaguchi for identifying zooplankton. We wouldlike to thank O. Sakai, A. Takahashi and H. Tanaka. Thisstudy was partly supported by Fishery Agency, Japan.
ReferencesBalanov, A. A. (1994): Diet of common mesopelagic fishes of
the Bering Sea. J. Ichthyol., 34(6), 73–82.Balanov, A. A., K. M. Gorbatenko and A. Y. Efimkin (1995):
Foraging dynamics of mesopelagic fishes in the Bering Seaduring summer and autumn. J. Ichthyol., 35(3), 65–77.
Batchelder, H. P. (1985): Seasonal abundance, vertical distri-bution, and life history of Metridia pacifica (Copepoda:Calanoida) in the oceanic subarctic Pacific. Deep-Sea Res.,32, 949–964.
Beamish, R. J., K. D. Leask, O. A. Ivanov, A. A. Balanov, A.M. Orlov and B. Sinclair (1999): The ecology, distribution,and abundance of midwater fishes of the subarctic Pacificgyres. Prog. Oceanogr., 43, 399–442.
Brodsky, K. A. (1957): The Copepod Fauna (Calanoida) andZoogeographical Division of the North Pacific and Adjoin-ing Waters. Izdatel’stvo Akademy Nauk Leningrad, 222 pp.
Cailliet, G. M. and A. W. Ebeling (1990): The vertical distribu-tion and feeding habits of two common midwater fishes(Leuroglossus stilbius and Stenobrachius leucopsarus) offSanta Barbara. Calif. Coop. Oceanic Fish. Invest. Rep., 31,106–123.
Favorite, F., A. J. Dodimead and K. Nasu (1976): Oceanogra-phy of the Subarctic Pacific region. International NorthPacific Fisheries Commission Bulletin, 33, 171 pp.
Frost, B. W. and L. E. McCrone (1979): Vertical distribution,diel vertical migration, and abundance of some mesopelagicfishes in the eastern subarctic Pacific Ocean in summer.Fish. Bull., 76, 751–770.
Fulton, J. and R. LeBrasseur (1984): Euphausiids of the conti-nental shelf and slope of the Pacific coast of Canada. LaMer, 22, 268–276.
Hillgruber, N., L. J. Haldorson and A. J. Paul (1995): Feedingselectivity of larval walleye pollock Theragrachalcogramma in the oceanic domain of the Bering Sea.Mar. Ecol. Prog. Ser., 120, 1–10.
Hirakawa, K. and A. Imamura (1993): Seasonal abundance andlife history of Metridia pacifica (Copepoda: Calanoida) inToyama Bay, southern Japan Sea. Bull. Plankton Soc. Jpn.,40, 41–54.
Hunt, G. L., Jr., M. B. Decker and A. Kitaysky (1996): Fluc-tuations in the Bering Sea ecosystem as reflected in the re-productive ecology and diets of kittiwakes on the PribilofIslands, 1975 to 1991. Aquatic Predators and their Prey,Chapter 19, 142–153.
Hunt, G. L., Jr., R. W. Russell, K. O. Coyle and T. Weingartner(1998): Comparative foraging ecology of planktivorousauklets in relation to ocean physics and prey availability.Mar. Ecol. Prog. Ser., 167, 241–259.
Johnson, M. W. (1963): Zooplankton collections from the highpolar basin with special reference to the Copepoda. Limnol.Oceanogr., 8, 89–102.
Kang, Y., S. Kim and W. Lee (2006): Seasonal and spatial vari-ations of zooplankton in the central and southeastern BeringSea during the mid-1990s. Deep-Sea Res. I, 53, 795–803.
Kobari, T., K. Tadokoro, A. Shiomoto and S. Hashimoto (2003):Geographical variations in prosome length and body weightof Neocalanus copepods in the North Pacific. J. Oceanogr.,59, 3–10.
194 N. Tanimata et al.
Kosenok, N. S., V. I. Chuchukalo and V. F. Savinykh (2006):The characterist ics of feeding of Diaphus theta(Myctophidae) in the northwestern part of the Pacific Oceanin the summer–autumn period. J. Ichthyol., 46, 606–612.
Ladd, C., G. L. Hunt, Jr., C. W. Mordy, S. A. Salo and P. J.Stabeno (2005): Marine environment of the eastern and cen-tral Aleutian Islands. Fish. Oceanogr., 14, 22–38.
Mackas, D. L. and A. Tsuda (1999): Mesozooplankton in theeastern and western subarctic Pacific: community structure,seasonal life histories, and interannual variability. Prog.Oceanogr., 43, 335–363.
Mackas, D. L., R. Goldblatt and A. G. Lewis (1998):Interdecadal variation in developmental t iming ofNeocalanus plumchrus populations at Ocean Station P inthe subarctic North Pacific. Can. J. Fish. Aquat. Sci., 55,1878–1893.
Minoda, T. (1971): Pelagic Copepoda in the Bering Sea and thenorthwestern North Pacific with special reference to theirvertical distribution. Mem. Fac. Fish. Hokkaido Univ., 18,1–74.
Moku, M., K. Kawaguchi, H. Watanabe and A. Ohno (2000):Feeding habits of three dominant myctophid fishes, Diaphustheta, Stenobrachius leucopsarus and S. nannochir, in thesubarctic and transitional waters of the western North Pa-cific. Mar. Ecol. Prog. Ser., 207, 129–140.
Motoda, S. and T. Minoda (1974): Plankton of the Bering Sea.p. 207–241. In Oceanography of the Bering Sea with Em-phasis on Renewable Resources, ed. by D. W. Hood and E.J. Kelley, Institute of Marine Science, University of Alaska,Fairbanks.
Nemoto, T. (1962): Distribution of five main euphausiids inthe Bering and the northern part of the North Pacific. J.Oceanogr. Soc. Japan, 20th Anniv. Vol., 615–627.
Nishimura, A., K. Nagasawa, T. Asanuma, H. Aoki and T.Kubota (1999): Age, growth, and feeding habits ofLanternfish, Stenobrachius leucopsarus (Myctophidae),collected from the near-surface layer in the Bering Sea. Fish.Sci., 65, 11–15.
Odate, K. (1979): An euphausid Crustacea exploited along theSanriku and Joban coast. Bull. Tohoku Reg. Fish. Res. Lab.,40, 15–25.
Ohizumi, H., T. Kuramochi, T. Kubodera, M. Yoshioka and N.Miyazaki (2003): Feeding habits of Dall’s porpoises(Phocoenoides dalli) in the subarctic North Pacific and theBering Sea basin and the impact of predation on mesopelagicmicronekton. Deep-Sea Res. I, 50, 593–610.
Oozeki, Y., F. Hu, H. Kubota, H. Sugisaki and R. Kimura (2004):Newly designed quantitative frame trawl for sampling lar-val and juvenile pelagic fish. Fish. Sci., 70, 223–232.
Ozaki, K., T. Takeuchi, N. Shiga and K. Mito (2001): Winterzooplankton biomass and population structure of calanoidcopepods in the Bering Sea basin. Plankton Biol. Ecol., 48,46–51.
Padmavati, G., T. Ikeda and A. Yamaguchi (2004): Life cycle,population structure and vertical distribution of Metridiaspp. (Copepoda: Calanoida) in the Oyashio region (NWPacific Ocean). Mar. Ecol. Prog. Ser., 270, 181–198.
Pearcy, W. G., E. E. Krygier, R. Mesecar and F. Ramsey (1977):
Vertical distribution and migration of oceanic micronektonoff Oregon. Deep-Sea Res., 24, 223–245.
Pearcy, W. G., H. V. Lorz and W. Peterson (1979): Comparisonof the feeding habits of migratory and non-migratoryStenobrachius leucopsarus (Myctophidae). Mar. Biol., 51,1–8.
Pearcy, W. G., R. D. Brodeur, J. M. Shenker, W. W. Smokerand Y. Endo (1988): Food habits of Pacific salmon andsteelhead trout, midwater trawl catches and oceanographicconditions in the Gulf of Alaska, 1980–1985. Bull. OceanRes. Inst. Univ. Tokyo, 26, 29–78.
Reed, R. K. (1984): Flow of the Alaskan Stream and its varia-tions. Deep-Sea Res., 31, 369–389.
Reed, R. K. and P. J. Stabeno (1993): The recent return of theAlaskan Stream to Near Strait. J. Mar. Res., 51, 515–527.
Schoener, T. W. (1968): The Anolis lizards of Bimini: resourcepartitioning in a complex fauna. Ecology, 49, 704–726.
Stabeno, P. J., J. D. Schumacher and K. Ohtani (1999): Physi-cal oceanography of the Bering Sea. p. 1–28. In The BeringSea: A Summary of Physical, Chemical and Biological Char-acteristics and a Synopsis of Research, ed. by T. R. Loughlinand K. Ohtani, North Pacific Marine Science Organization,PICES, Alaska Sea Grant Press.
Stabeno, P. J., R. K. Reed and J. M. Napp (2002): Transportthrough Unimak Pass, Alaska. Deep-Sea Res. II, 49, 5919–5930.
Stabeno, P. J., D. G. Kachel, N. B. Kachel and M. E. Sullivan(2005): Observations from moorings in the Aleutian Passes:temperature, salinity and transport. Fish. Oceanogr., 14, 39–54.
Tanaka, Y., T. Tarumi and K. Wakimoto (1984): Handbook forStatistical Analysis by Personal Computer. II. MultivariateAnalysis. Kyoritsu Shuppan, Tokyo, Japan (in Japanese).
Tsuda, A., H. Saito and H. Kasai (1999): Life histories ofNeocalanus f lemingeri and Neocalanus plumchrus(Calanoida: Copepoda) in western subarctic Pacific. Mar.Biol., 135, 533–544.
Tyler, H. R., Jr. and W. G. Pearcy (1975): The feeding habits ofthree species of lantern fishes (family Myctophidae) offOregon, USA. Mar. Biol., 32, 7–11.
Uchikawa, K., O. Yamamura and Y. Sakurai (2001): Feedinghabits of the mesopelagic fish Gonostoma gracile in thenorthwestern North Pacific. J. Oceanogr., 57, 509–517.
Vidal, J. and S. L. Smith (1986): Biomass, growth, and devel-opment of populations of herbivorous zooplankton in thesoutheastern Bering Sea during spring. Deep-Sea Res., 33,523–556.
Watanabe, H., M. Moku, K. Kawaguchi and A. Ohno (1999):Diel vertical migration of myctophid fishes (FamilyMyctophidae) in the transitional waters of the western NorthPacific. Fish. Oceanogr., 8, 115–127.
Wirts, A. E. and G. C. Johnson (2005): Recent interannual up-per ocean variability in the deep southeastern Bering Sea.J. Mar. Res., 63, 381–405.
Yamamura, O., S. Honda, O. Shida and T. Hamatsu (2002): Dietsof walleye pollock Theragra chalcogramma in the Dotoarea, northern Japan: ontogenetic and seasonal variations.Mar. Ecol. Prog. Ser., 238, 187–198.