microzooplankton grazing in the eastern bering sea in summer
TRANSCRIPT

Microzooplankton grazing in the Eastern Bering Sea in summer
Diane K. Stoecker a,n, Alison Weigel a, Joaquim I. Goes b
a University of Maryland Center for Environmental Science, Horn Point Laboratory, P.O. Box 775, Cambridge, MD 21613, USAb 10 Marine Biology, Department of Marine Biology and Paleoenvironment, Lamont Doherty Earth Observatory at Columbia University,61 Route 92, Palisades, NY 10964, USA
a r t i c l e i n f o
Keywords:Bering SeaMicrozooplankton grazingDilution methodDeep chlorophyll maximumFv/Fm
a b s t r a c t
Dilution experiments to estimate microzooplankton grazing on phytoplankton were conducted duringthe summers of 2008, 2009, and 2010 in the Eastern Bering Sea as part of the BEST-BSIERP integratedecosystem project. All three summers followed cold springs in the Bering Sea. Average microzooplanktongrazing coefficients were relatively similar among regions, ranging from 0.16 to 0.34 d�1 in simulatedin situ incubations with mixed-layer water collected from the depth of the 55% Io isolume. In Off Shelfand Outer Shelf domains, microzooplankton consumed 67–78% of phytoplankton daily growth but in theMiddle and Inner Shelf domains, microzooplankton grazing exceeded phytoplankton daily growth.Regional estimates of microzooplankton ingestion of phytoplankton carbon ranged from 4.4 to11.0 mg C d�1, with highest ingestion in the Off Shelf, Outer Shelf, and Alaska Peninsula regions and,lower ingestion in the Middle Shelf and Inner Shelf regions. On the northern Middle Shelf, a deepchlorophyll maximum (DCM) occurred at most stations. Grazing coefficients in the DCM were similar inmagnitude to coefficients in the corresponding mixed layer. However, because of the higher phyto-plankton biomass in the DCM, estimated microzooplankton ingestion and secondary production per literwere higher in the DCM than in the mixed layer. Measurements of photosynthetic quantum yields (Fv/Fm) in whole seawater and diluted treatments indicated that with some plankton assemblages, dilutionhad a negative effect on phytoplankton physiology and could have compromised their growth rates. Thiscould have also resulted in an underestimation of microzooplankton grazing. Nevertheless, it is clear thatmicrozooplankton grazing consumed most of the phytoplankton production in summer, and thatmicrozooplankton were an important link in food webs supporting larger zooplankton and in carbonflow in the Eastern Bering Sea.
& 2013 Elsevier Ltd. All rights reserved.
1. Introduction
The o200 mm fraction of zooplankton assemblages, whichincludes both microzooplankton and nanozooplankton, is animportant link between primary producers and higher trophiclevels in sub-polar and polar waters as well as in temperate andtropical waters (Levinsen and Nielsen, 2002; Calbet and Saiz,2005; Campbell et al., 2009; Sherr et al., 2013). They are importantgrazers on pico, nano and microplankton, including large diatoms(Sherr et al., 2009, 2013). Previous studies have shown that theo200 mm fraction is the major consumer of primary production insummer in the Eastern Bering Sea (Liu et al., 2002; Olson andStrom, 2002; Strom and Fredrickson, 2008). In Arctic and sub-Arctic as well as temperate and tropical seas, microzooplanktonare important prey for mesozooplankton, including both small andlarge crustacean zooplankton (Levinsen and Nielsen, 2002;Campbell et al., 2009) and hence are a significant component ofthe food web and carbon cycle.
Although microzooplankton can graze on large as well as smallphytoplankton, including chain forming dinoflagellates (Stromet al., 2007; Sherr et al., 2013), their grazing rates, particularlymicrozooplankton biomass specific rates, can be influenced byphytoplankton species composition, physiological state and cellsize (Olson and Strom, 2002; Strom and Fredrickson, 2008). In theEastern Bering Sea, phytoplankton o5 mm comprise �70% of thechlorophyll a in summer and autotrophic biomass is dominated byphytoflagellates (Lomas et al., 2012; Moran et al., 2012). Sporadicblooms of chain forming diatoms (mostly Chaetoceros and Thalas-siosira spp.) and blooms of the solitary or colonial phytoflagellatePhaeocystis pouchetti occur in response to tidal and storm mixingor intrusion of deeper water onto the shelf (Sukhanova et al., 1999;Sambrotto et al., 2008). In late spring and summer, prolongedblooms of diatoms and P. pouchetti are associated with the shelfbreak and shelf partition fronts (Flint et al., 2002). During theanomalously warm and stratified spring of 1997, a bloom of thecoccolithophorid, Emiliana huxleyi, developed on the southeasternshelf and during summers 1998–2000 the bloom was present(Stockwell et al., 2001; Merico et al., 2004). In summer, particu-larly on the northern shelf, a deep chlorophyll maximum (DCM)composed primarily of diatoms has often been encountered. It is
Contents lists available at ScienceDirect
journal homepage: www.elsevier.com/locate/dsr2
Deep-Sea Research II
0967-0645/$ - see front matter & 2013 Elsevier Ltd. All rights reserved.http://dx.doi.org/10.1016/j.dsr2.2013.09.017
n Corresponding author. Tel.: þ1 410 2218407; fax: þ1 410 221 8490.E-mail addresses: [email protected] (D.K. Stoecker),
[email protected] (J.I. Goes).
Please cite this article as: Stoecker, D.K., et al., Microzooplankton grazing in the Eastern Bering Sea in summer. Deep-Sea Res. II (2013),http://dx.doi.org/10.1016/j.dsr2.2013.09.017i
Deep-Sea Research II ∎ (∎∎∎∎) ∎∎∎–∎∎∎

not clear if the DCM is a resident low light population orphysiologically inactive settled material (Moran et al., 2012;Stabeno et al., 2012a), and to what extent it is grazed bytheo200 mm zooplankton.
Microzooplankton were sampled as part of the Bering Sea Projectecosystem study in the Eastern Bering Sea in summers of 2008, 2009,and 2010 (Stoecker et al., this issue), all part of a four year “cold”period characterized by extensive sea ice in spring (Stabeno et al.,2012b). Average summer microzooplankton (defined as �20–200 mm size range) densities ranged from 4�103 to 25�103 cells l�1
in the mixed layer in stratified shelf waters but were about half thatconcentration in less stratified waters near the shelf break. Highratios (41) of microzooplankton biomass to phytoplankton biomasswere observed when chlorophyll concentrations were below 1 mg l�1
in the mixed layer (Stoecker et al., this issue). In coastal (innerdomain) and Middle Shelf (middle domain) waters, the averagebiomass of microzooplankton in the mixed layer was often equal toor higher than that of phytoplankton. Microzooplankton were alsofound in the deep chlorophyll maxima (DCM) on the shelf; densitiesof microzooplankton in these high chlorophyll layers were usuallysimilar to in the lower chlorophyll mixed layer. Microzooplanktonabundance and biomass data from summers 2008–2010, along withresults from previous studies during both “warm” and “cold” years inthe Eastern Bering Sea (Liu et al., 2002; Olson and Strom, 2002;Strom and Fredrickson, 2008), indicate that summer microzooplank-ton population differences among domains are far greater thandifferences due to year-to-year variations in sea ice extent and watertemperature (Stoecker et al., this issue).
Dilution grazing experiments were conducted with the o200 mmfraction of plankton in conjunction with microzooplankton sampling
on the BEST-BSIERP summer cruises in 2008, 2009, and 2010.Although standard dilution experiments include grazing by bothmicrozooplankton and nanozooplankton, they are commonly called“microzooplankton” dilution grazing experiments. Herein, this con-vention was followed. Prior to our study, summer data on grazing bymicrozooplankton in the Eastern Bering Sea were limited to thesouthern shelf and the productive waters around the Pribilof Islands(Olson and Strom, 2002; Hunt et al., 2008; Strom and Fredrickson,2008). The primary goal was to conduct dilution grazing experimentsacross a spectrum of environments and to compare microzooplanktongrazing among domains. One objective was to determine if grazingand its impact on phytoplankton correlated with the biomass ofmicrozooplankton (Stoecker et al., this issue) and/or the dominanceof certain phytoplankton taxa. Low grazing by the o200 mm fractioncan occur during blooms of coccolithophorids (Olson and Strom, 2002)and P. pouchetti (reviewed in Nejstgaard et al. (2007)). Anotherobjective was to determine if grazing by the o200 mm fraction wasimportant in the DCM since this is a characteristic feature of thenorthern shelf in summer (Stabeno et al., 2012a).
2. Materials and methods
2.1. Sampling
Microzooplankton grazing experiments were conducted on BeringSea Project summer cruises in 2008, 2009 and 2010 on the USCG Healy(HLY-08-03, July 3–July 31), R/V Knorr (KNORR 195-10, June 14 to July13) and R/V T.G. Thompson 2010 (TN-250, June 16–July 14). The stationsat which dilution grazing experiments were conducted are shown in
Fig. 1. Stations where dilution experiments were performed in the eastern Bering Sea during summers 2008, 2009, and 2010. Inner shelf (coastal), middle shelf, outer shelfand off shelf areas are indicated. Refer to Table 1 for list of stations, regions and experimental parameters; experiments were not performed at all stations in all years.
D.K. Stoecker et al. / Deep-Sea Research II ∎ (∎∎∎∎) ∎∎∎–∎∎∎2
Please cite this article as: Stoecker, D.K., et al., Microzooplankton grazing in the Eastern Bering Sea in summer. Deep-Sea Res. II (2013),http://dx.doi.org/10.1016/j.dsr2.2013.09.017i

Fig. 1; the stations and depths of experiments for each year are givenin Table 1. Stations are grouped by marine regions in the Bering SeaProject area as delineated by Ortiz et al. (2012). In most cases, dilutiongrazing experiments were undertaken in conjunction with the phyto-plankton biomass and primary productivity casts with water collectedfrom the depth of the 55% of surface PAR irradiance level (Lomas et al.,2012). At all stations the 55% irradiance level was in the surface mixedlayer, with the sampling depth for mixed layer incubations rangingfrom 3 to 10m (Table 1). In 2010 we also undertookmicrozooplanktongrazing experiments using assemblages from the DCM which waslocated based on chlorophyll fluorescence profiles from the core CTDcasts. Supporting information including water temperature, salinity,chlorophyll a, inorganic nutrients and irradiance were obtained fromcore program measurements or from the productivity casts (Lomaset al., 2012). Data are archived at http://beringsea.eol.ucar.edu.
2.2. Dilution experiments
Dilution grazing experiments are the only method available forestimating community grazing by the o200 mm fraction on thewhole phytoplankton community. This method estimates phyto-plankton growth rates (μ) and mortality of phytoplankton dueto combined microzooplankton and nanoplankton grazing (g)(Landry, 1993). Dilution grazing experiments include all grazersr200 μm in size, including small heterotrophic and mixotrophic
flagellates, as well as the larger ciliates and heterotrophic andmixotrophic dinoflagellates, but are commonly referred to as“microzooplankton” grazing experiments.
Pre-screened (o200 mm) whole seawater (WSW), containingnatural assemblages of phytoplankton and microzooplankton, wasdiluted with filtered, particle free seawater (FSW) from the samesample. Dilution reduces microzooplankton encounter rates withphytoplankton prey; in highly dilute treatments net growth rate(NGR) of phytoplankton approach the intrinsic growth rate (μ).Phytoplankton mortality due to microzooplankton grazing wascalculated as μ�NGR. A modified dilution method, the two-pointmethod (Landry et al., 2008) was used because it is more efficientthan the original method. The original and the two-point methodwere compared in grazing experiments conducted in the coastalGulf of Alaska (Strom et al., 2006) and in the SE Bering Sea (Stromand Fredrickson, 2008) and were found to provide similar results.
In nutrient limited waters, which can occur in summer on theBering Sea Shelf (Strom and Fredrickson, 2008), nutrient regen-eration due to micrograzers can be important in supplyinginorganic nutrients for phytoplankton growth. This would violatethe first assumption of the dilution technique, that phytoplanktongrowth rate is not influenced by dilution (Landry, 1993). Tocircumvent this problem, inorganic nutrients can be added to allthe bottles. However, then the estimated phytoplankton growthrates are no longer similar to in situ rates. In this situation, it is
Table 1Dilution experiments, Eastern Bering Sea, summers 2008, 2009, and 2010. Stations are in following regions: Alaska Peninsula (AP), South Inner Shelf (SIS), South Middle Shelf(SMS), South Outer Shelf (SOS), Pribilof Islands (P), Mid North Middle Shelf (MNMS), Mid North Inner Shelf (MNIS), North Outer Shelf (NOS), St. Matthews (SM), North MiddleShelf (NMS), North Inner Shelf (NIS), Off Shelf North (OSN), and Off Shelf Southeast (OSSE). Station locations are shown in Fig. 1. Experiments with nutrient additiontreatments are indicated as N¼addition of nitrate, Nn¼addition of ammonium, NþP¼addition of nitrate and phosphate. “B” indicates incubation in dark at �0 1C.“CF” indicates experiment with a carbon filtration treatment. “F” indicates variable fluorescence measurements.
Region Date Station Sampledepth (m)
Watertemp. (1C)
Region Date Station Sampledepth (m)
Watertemp. (1C)
AP 07/04/08 UP-3 5 5.39 N NOS 07/05/10 ML-13 35 �1.07 BAP 06/15/09 UAP-7 3 6.08 NOS 06/27/10 SB-5 4 5.44 NþPAP 06/16/09 UAP-3 3 6.49 NOS 07/03/10 MN-16 7 5.36 BAP 06/18/10 UAP-5 5 5.02 NOS 07/03/10 MN-18 26 1.65 NAP 06/19/10 UAP-2 3 4.19 NþP SM 07/10/08 C-55 4 5.41 N, FSIS 06/17/09 CN-2 3 3.89 SM 07/23/08 MN-6 5 6.13 N, FSMS 07/05/08 CN-6 7 5.12 SM 07/28/08 70m-36 5 6.75SMS 06/20/09 CNN-6 32 4.33 SM 07/06/09 XB2-4 4 3.92SMS 06/20/10 CN 8 7 3.24 NþP SM 07/09/09 70m41 4 4.15 NþPSMS 06/23/10 CNN 4 5 2.86 NþP SM 06/30/10 70 m-40 5 4.59 NþPSOS 06/21/10 CN 17 3 5.58 SM 07/02/10 MN-9 5 5.08 CF, BSOS 06/18/09 CN-12 5 6.44 SM 07/09/10 70 m-50 36 �1.32 NþPSOS 06/24/09 SB-1 5 6.16 SM 07/10/10 70 m-39 5 5.18 NP 06/25/10 NP 9 6 3.77 NþP NMS 07/12/08 SL-8 4 5.94 N, FP 07/19/08 NP-11 3 4.26 N, F NMS 07/26/08 SL-14 6 6.57 N, FMNMS 07/14/08 NP-7 7 5.21 N, F NMS 07/27/08 70m-53 7 6.77MNMS 06/22/09 NP-7 7 5.25 Nn NMS 07/08/09 70m58 10 3.30 NþPMNMS 07/10/09 70m-25 6 4.67 NMS 07/06/10 ML-3 7 5.21MNMS 07/11/10 70m-25 3 6.53 NMS 07/07/10 SL 11 6 5.68 BMNMS 07/11/10 70 m-25 28 -0.30 B NMS 07/07/10 SL 11 33 �1.20MNIS 06/24/10 NP 1 4 3.62 NþP NMS 07/08/10 BN-3 5 5.69MNIS 07/01/10 MN-1 5 3.52 NþP NMS 07/08/10 BN-3 30 �1.22NOS 07/18/08 NP-14 5 7.41 N, F NMS 07/09/10 70m-51 6 6.04NOS 07/15/08 NP-14 4 7.32 N, F NMS 07/06/10 ML-3 7 5.21 NNOS 07/20/08 LS1–6 5 7.47 N, F NIS 07/09/08 MN-3 3 3.31 NNOS 07/22/08 P14–2 7 7.07 N, F NIS 07/11/08 W-4b 4 4.53 N, FNOS 07/24/08 MN-12 7 6.24 N, F NIS 07/01/09 MN-3 2 2.27 Nn
NOS 07/25/08 MN-19 9 7.90 N, F OSN 06/23/09 NP-15 4 6.40 Nn
NOS 07/03/09 MN-19 10 6.03 OSN 06/26/09 P14-7 3 5.86 NþPNOS 06/29/09 XB16 3 6.49 Nn OSN 06/28/10 P14N-10 10 5.77 NþPNOS 07/04/09 X-6 2 5.50 Nn OSN 06/29/10 TR3 5 6.22 NNOS 07/05/09 XB2–12 2 6.34 OSN 07/21/08 P14-4.5 7 7.72 N, FNOS 06/26/10 TD2 4 5.86 NþP OSN 06/25/09 SB-7 5 6.35NOS 06/27/10 SB-5 4 5.44 NþP OSSE 06/19/09 CN-20 7 6.31 NNOS 07/03/10 MN-16 7 5.36 NþP OSSE 07/06/08 PIT-1 6 7.09 NNOS 07/03/10 MN-18 26 1.65 B OSSE 07/07/08 sta21 5 6.92NOS 07/04/10 TM4 35 1.67 BNOS 07/05/10 ML-13 3 5.97
D.K. Stoecker et al. / Deep-Sea Research II ∎ (∎∎∎∎) ∎∎∎–∎∎∎ 3
Please cite this article as: Stoecker, D.K., et al., Microzooplankton grazing in the Eastern Bering Sea in summer. Deep-Sea Res. II (2013),http://dx.doi.org/10.1016/j.dsr2.2013.09.017i

usual to run incubations with and without nutrient addition. Insitu phytoplankton growth rate, μ, is estimated from the incuba-tion without added nutrients and, if nutrient limitation is impor-tant, g can be determined from NGR and μ in the incubations withadded nutrients.
To evaluate this, some, but not all, incubations were conductedwith and without the addition of nutrients. In 2008, nutrientadditions were 5 μM N as NaNO3. Because inconsistent resultswere observed with the addition of nitrate alone, differentnutrient additions were tried in subsequent years. In 2009,nutrient additions were as 5 μM N as NH4Cl, and in 2010 nutrientadditions were 5 μM N as NaNO3 combined with 0.3 μM P asNa2HPO4. These additions are similar to those used by Strom andFredrickson (2008) in earlier experiments in the Bering Sea whichfound no difference between N addition as NH4Cl and NaNO3.
All tubing, carboys, filter cartridges and incubation bottles werecleaned with 10% HCl, and rinsed three or more times with de-ionized water, and then rinsed with filtered seawater prior to useand between experiments (Landry, 1993). As mentioned earlier, in“mixed layer” experiments, water was collected with 30 L Niskinbottles on a CTD rosette from the depth corresponding to 55%surface irradiance level and in “DCM” experiments water wascollected from the depth of chlorophyll fluorescence maximum.Seawater was gently siphoned (using silicone tubing) from Niskinbottles into black plastic covered polycarbonate carboys in the CTDbay. During siphoning, water was prescreened through a 200 μmNitex mesh to remove larger zooplankton. This prescreened “wholeseawater” (WSW) contained phytoplankton and microzooplankton,however when phytoplankton 4200 mm (long diatom chains andlarge colonial phytoplankton) were present, the pre-screeningremoved them. Thus, the “WSW” contains a variable fraction ofthe total in situ chlorophyll. Filtered seawater (FSW) was preparedusing gravity filtration and 0.2 μm pore size sterile Pall CapsuleFilters. Treatments consisted of 100% WSW and diluted wholeseawater. In early experiments 5% WSW was used for the dilutedtreatments (95% FSW), but in low chlorophyll waters it was difficultto obtain consistent chlorophyll measurements due to the lowchlorophyll in the diluted treatment. A switch was made to 20%WSW (80% FSW and 20% WSW) when in situ chlorophyll levelswere low. Silicon tubing was used to gently transfer, withoutbubbling, water (WSW or diluted seawater) from 20 l polycarbo-nate carboys to triplicate 1 l polycarbonate incubation bottles. If anutrient addition series was included in an experiment, nutrientstock solution was added with a micropipette directly to triplicateWSW and diluted WSW incubation bottles.
At the beginning of each experiment, triplicate samples forchlorophyll (in effect, o200 mm chlorophyll because of the pre-screening) were taken from the WSW and diluted seawatercarboys. Samples for microzooplankton and Phaeocystis enumera-tion were siphoned directly from the Niskin bottles into 125 mlamber bottles and fixed with acid Lugol's solution as described(Stoecker et al., this issue). In mixed layer experiments (Table 1),the triplicate bottles for each treatment were incubated on deck inflowing sea-water with neutral density screening to approximate55% surface irradiance. In DCM experiments, the bottles wereincubated in the dark on ice in a cold room (Table 1). At the end ofthe incubations, chlorophyll samples were taken from each bottle.Chlorophyll samples were filtered onto 25 mm GF/F filters usinggentle vacuum filtration, extracted in 90% acetone at �20 1C for24 h, and then analyzed at sea with a pre-calibrated fluorometer(Turner Designs TD-700) (method modified from Parsons et al.(1984)). Total chlorophyll a for unscreened samples from the samestations and depths was available from the core measurements orfrom the primary production study (Lomas et al., 2012).
Chlorophyll a was used as a proxy for phytoplankton biomass.The intrinsic growth rate of phytoplankton (m, d�1) was calculated
from the change in chlorophyll during incubations without andwith added nutrients. Similarly, the net growth rate (NGR) ofphytoplankton in the presence of microzooplankton grazing wascalculated without and with added nutrients (Landry, 1993; Olsonand Strom, 2002). Mortality due microzooplankton grazing, g, wascalculated as μ�NGR. The fraction of phytoplankton growthgrazed per day was estimated as g/μ. Daily ingestion (I) ofphytoplankton biomass (mg C l�1 d�1) was estimated from chlor-ophyll consumption using a C:Chl ratio of 50 for the Bering Sea(Lomas et al., 2012) as I¼(Chl a)(50)(g). Assuming a gross growthefficiency of 35% for strictly heterotrophic microzooplankton,secondary production based on herbivory was estimated (Landryand Calbet, 2004).
2.3. Variable fluorescence measurements
In several studies, insignificant grazing coefficients and/orstatistically significant “negative” microzooplankton grazing rateshave been reported from a proportion of the stations in the BeringSea and also from other sub-Arctic and Arctic seas (Olson andStrom, 2002; Strom and Fredrickson, 2008; Calbet et al., 2011;Sherr et al., 2013). “Negative grazing” is impossible, but calculationof negative “g” results when the m of phytoplankton in the dilutedtreatment is lower than in the WSW. Lower growth of phyto-plankton in the diluted treatments than in the WSW is usuallyattributed to lack of regenerated nutrients due to low numbers ofmicrograzers in the diluted treatments. However, nutrient addi-tion usually did not eliminate the effect in our experiments. Toexplore the possibility that dilution itself, or chemicals releasedfrom plankton into the dilution water during preparation of FSW,have a negative effect on phytoplankton, the ratio of variable tomaximum fluorescence (Fv/Fm) of phytoplankton in the undilutedWSW and diluted treatments was determined. Fv/Fm ratio is ameasure of the potential maximum quantum yield of PSII inphytoplankton. A decrease in the ratio of Fv/Fm is usuallyassociated with a reduction in ability of the cells to photosynthe-size. From an ecological perspective, a decrease in the Fv/Fm ratiohas often been used as an indicator of physiological stress. Fv/Fmwas measured after incubation of subsamples in the dark for �1 hin a Automated Laser Fluorometer (ALF) (Chekalyuk and Hafez,2008). A more detailed description of the instrument and themeasurement protocols is available in Goes et al. (this issue). Fv/Fmwas measured in samples from the triplicate incubation bottlesin the 100%WSW, 20%WSW, 100%WSWþnutrients, 20%WSWþnutrients treatments at the end of the 24 h incubationsin mixed layer experiments at 14 stations in 2008 (Table 1).Samples were collected in 500 ml amber glass bottles, and storedin the dark for about 30 min, to minimize the impacts of non-photochemical quenching before analysis in the ALF.
2.4. Enumeration of P. pouchettii
The bloom forming phytoplankter P. pouchettii has been asso-ciated with inhibition of grazing in dilution experiments (Calbetet al., 2011). To determine if low grazing coefficients wereassociated with abundance of Phaeocystis cells, this phytoplankterwas enumerated in whole water samples fixed with acid Lugol's(refer to Stoecker et al. (this issue)) using a 1-ml capacitySedgwick-Rafter counting chamber at 400� magnification. How-ever, the actual density of P. pouchettii cells in the incubationsmust have been lower, because colonies 4200 mm in size wereremoved by screening to remove copepods before setting up thedilution experiment incubations.
D.K. Stoecker et al. / Deep-Sea Research II ∎ (∎∎∎∎) ∎∎∎–∎∎∎4
Please cite this article as: Stoecker, D.K., et al., Microzooplankton grazing in the Eastern Bering Sea in summer. Deep-Sea Res. II (2013),http://dx.doi.org/10.1016/j.dsr2.2013.09.017i

2.5. Statistical analyses
Analysis of variance (ANOVA) was used to test statistical signifi-cance (po0.05) of differences between the net growth rate ofphytoplankton in the WSW and diluted treatments in an experiment.Significantly higher phytoplankton net growth rates in the dilutedtreatment than in the WSW treatment would indicate that grazingwas significant. ANOVA was used to test for differences in coefficientsfrom incubations with and without addition of nutrients, mixed layerversus DCM incubations, and among domains. Two-tailed T-tests wereused to compare variable fluorescence measurements between dilutedand undiluted treatments within an experiment. Pearson product-moment correlation tested for statistically significant associationsbetween factors, with the square of the correlation coefficient, r2, ameasure of the variation in one variable determined by the variationin the other variable. If the data did not fulfill the assumptions forANOVA, we applied appropriate transformations. ANOVA on rankswas used if data still did not meet the assumptions. Sigmaplot version9.0 (Systat Software, Inc.) was used for all statistical analyses.
3. Results
3.1. Effect of nutrient additions
The results of paired dilution experiments conducted with andwithout the addition of nutrients were compared (Table 2). In
calculating means and standard deviations, data from all pairedincubations, whether or not grazing was statistically significantwere included; “0” was substituted for negative “g” values incalculating means. In 2008, 21 comparative experiments wereconducted, with and without the addition of 5 mM nitrogen assodium nitrate. Mean phytoplankton growth rates (m, d�1) in thecontrol (no nutrient addition) and nutrient addition treatmentswere similar, however grazing coefficients (g, d�1) were signifi-cantly lower in the nutrient treatments (Table 2). In 2009, fivecomparative experiments were conducted in which the 5 mMnitrogen nutrient treatment was attained using ammonium chlor-ide. The effects on phytoplankton growth and grazing wereboth non-significant (Table 2). In 2010, 15 experiments wereconducted in which the nutrient treatment was addition of 5 mMnitrogen as sodium nitrate in combination with 0.35 mM phos-phate as sodium phosphate. The nutrient treatment significantlyincreased mean phytoplankton growth but not estimation ofmicrozooplankton grazing (Table 2). Nutrient additions are doneto prevent greater nutrient limitation in diluted than in undilutedtreatments in microzooplankton grazing experiments; greaternutrient limitation in diluted treatments would result in anunderestimation of microzooplankton grazing (refer to Section2.2) (Landry, 1993; Strom and Fredrickson, 2008). However,microzooplankton grazing coefficients were the same or lowerwith nutrient addition than without nutrient addition (Table 2),indicating that there was no reason to use data from the nutrientaddition treatments to estimate microzooplankton grazing in ourexperiments. Based on these results, microzooplankton grazing isreported based upon the no addition dilution series. Olson andStrom (2002) also noted that nutrient enrichment sometimeresults in a decrease in phytoplankton growth rates in dilutionexperiments in the Bering Sea.
3.2. Phytoplankton growth, microzooplankton grazing, ingestion andproduction in the mixed layer
The o200 mm fraction of the total chlorophyll ranged from anaverage of 69% at the Off Shelf, 79–90% at the Outer Shelf stations,41–98% at the Middle Shelf stations, 77% at the Inner Shelf stationsand 74% at the Alaska Peninsula stations (Table 3). Grazingcoefficients were greater than “0” in 61% of the 59 dilutionexperiments conducted with mixed layer assemblages (Table 3).To avoid biasing the data against low growth and grazing rates, allcoefficients were included, whether or not they were significant,
Table 2Effect of nutrient additions (þNuts) on phytoplankton growth (m) and microzoo-plankton grazing (g) in dilution experiments, mixed layer, summer, Eastern BeringSea 2008, 2009, 2010. Mean (SD).
Year Number ofexperiments
Control þNutsa Controlvs. nuts b
2008 21 m 0.31 (0.178) 0.31 (0.204) nsg 0.24 (0.237) 0.11 (0.224) n
2009 5 m 0.17 (0.178) 0.18 (0.159) nsg 0.12 (0.114) 0.08 (0.113) ns
2010 15 m 0.28 (0.157) 0.36 (0.165) nn
g 0.21 (0.125) 0.21 (0.138) ns
n pr0.05.nn pr0.01.a 2008: 5 mM N as sodium nitrate; 2009: 5 mM N as NH4Cl; 2010: 5 mM N as
sodium nitrate þ0.3 mM P as sodium phosphate.b Repeated measures ANOVA: ns¼non-significant.
Table 3Growth coefficients of phytoplankton (m, d�1) and microzooplankton grazing coefficients (g, d�1), and roportion phytoplankton daily growth grazed by microzooplankton(g/m). Mixed layer data for 2008, 2009, 2010 combined by region. Mean (SD). For g and m, mean of all incubations without added nutrients, but “0” used for negative g.
Region Chl a o200 mm (mg l�1) % Chl a o200 mm Incubation PAR (mE s�1 m�2) m g g/m
Off ShelfSoutheast (n¼3, 1n) 0.77 (0.44) nd 742 (300.1) 0.24 (0.16) 0.16 (0.16) 0.67North (n¼6, 4n) 0.60 (0.54) 69 (32) 278 (119.3) 0.30 (0.12)a 0.23 (0.09)a 0.77a
Outer ShelfSouth (n¼3, 2n) 0.79 (0.22) 90 (14) 210 (151.6) 0.32 (0.20) 0.25 (0.15) 0.78North (n¼14, 9n) 0.89 (0.64) 79 (14) 328 (141.5) 0.25 (0.24) 0.19 (0.12) 0.76
Middle ShelfSouth (n¼3, 2n) 0.38 (0.22) 98 (2) 517 (146) 0.27 (0.11) 0.24 (0.06) 0.89Mid-North (n¼4, 3n) 0.40 (0.35) 41 (49) 241 (41.0) 0.08 (0.62) 0.19 (0.20) 1.56St. Matthews (n¼8, 6n) 0.52 (0.52) 62 (1) 344 (184.5) 0.25 (0.15) 0.28 (0.22) 1.17North (n¼8, 4n) 0.33 (0.41) 97 (25) 440 (188.4) 0.24 (0.21) 0.34 (0.28) 1.42
Inner Shelf(South, Mid-North and North combined) (n¼6, 3n) 0.47 (0.28) 77 (50) 263 (116.2) 0.19 (0.14) 0.22 (0.25) 1.16
AK Peninsula (n¼4, 2n) 0.71 (0.47) 74 (30) 334 0.45 (0.23) 0.27 (0.22) 0.60
n Number of experiments in which g was statistically significant (po0.05).a Calculated without one outlier replicate in one experiment. Nd¼no data.
D.K. Stoecker et al. / Deep-Sea Research II ∎ (∎∎∎∎) ∎∎∎–∎∎∎ 5
Please cite this article as: Stoecker, D.K., et al., Microzooplankton grazing in the Eastern Bering Sea in summer. Deep-Sea Res. II (2013),http://dx.doi.org/10.1016/j.dsr2.2013.09.017i
in our estimates of average rates. Exclusion of “0” or non-significant coefficients can inflate regional and global estimatesof both phytoplankton growth and microzooplankton grazing(Landry and Calbet, 2005). However, negative grazing coefficientswere replaced with “0” in averaging because negative grazing isnot possible; calculation of a negative “g” occurs when phyto-plankton net growth is lower in the diluted treatment thanundiluted treatment, and there are several reasons for thisphenomenon (refer to Section 3.4). In these instances, the phyto-plankton growth rate in WSW was substituted for the rate in thediluted treatment.
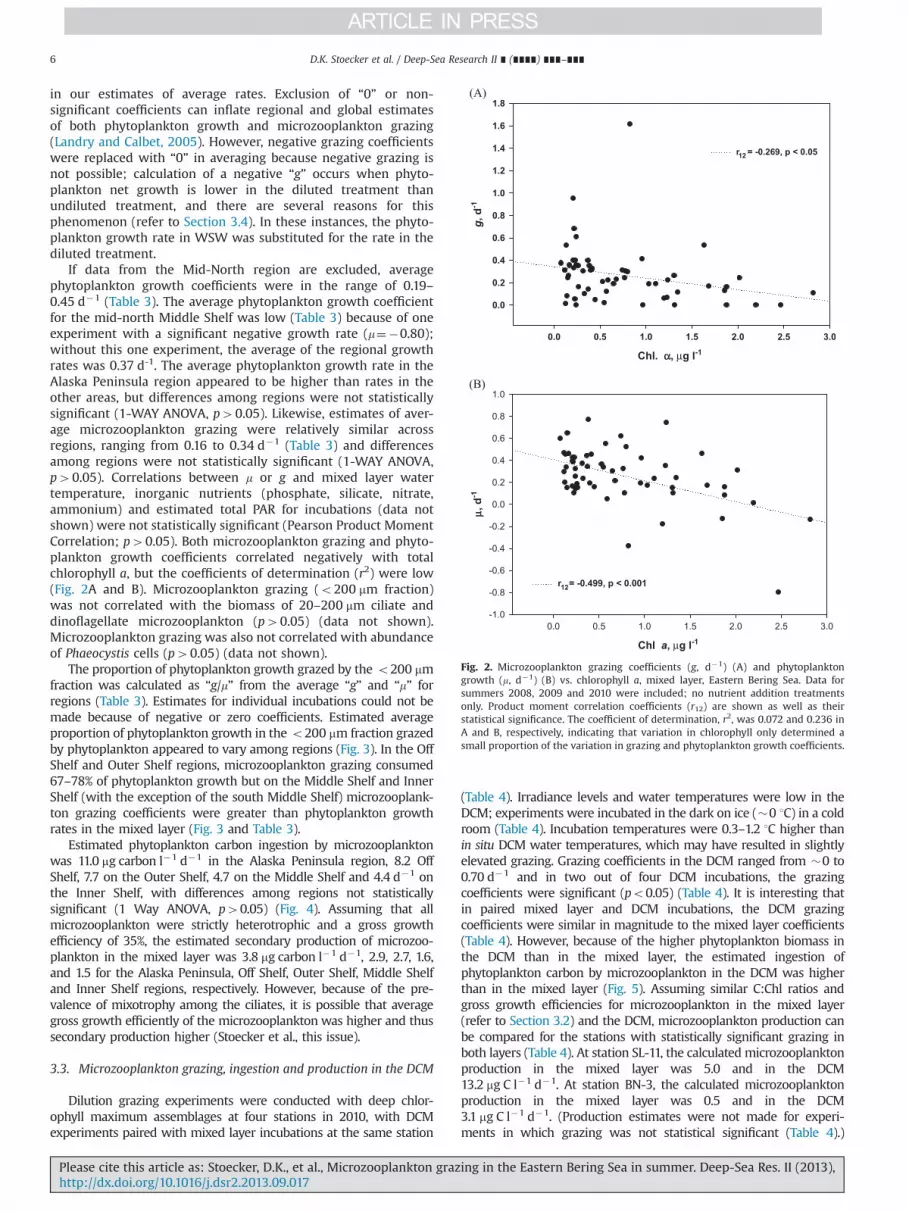
If data from the Mid-North region are excluded, averagephytoplankton growth coefficients were in the range of 0.19–0.45 d�1 (Table 3). The average phytoplankton growth coefficientfor the mid-north Middle Shelf was low (Table 3) because of oneexperiment with a significant negative growth rate (m¼�0.80);without this one experiment, the average of the regional growthrates was 0.37 d-1. The average phytoplankton growth rate in theAlaska Peninsula region appeared to be higher than rates in theother areas, but differences among regions were not statisticallysignificant (1-WAY ANOVA, p40.05). Likewise, estimates of aver-age microzooplankton grazing were relatively similar acrossregions, ranging from 0.16 to 0.34 d�1 (Table 3) and differencesamong regions were not statistically significant (1-WAY ANOVA,p40.05). Correlations between m or g and mixed layer watertemperature, inorganic nutrients (phosphate, silicate, nitrate,ammonium) and estimated total PAR for incubations (data notshown) were not statistically significant (Pearson Product MomentCorrelation; p40.05). Both microzooplankton grazing and phyto-plankton growth coefficients correlated negatively with totalchlorophyll a, but the coefficients of determination (r2) were low(Fig. 2A and B). Microzooplankton grazing (o200 mm fraction)was not correlated with the biomass of 20–200 mm ciliate anddinoflagellate microzooplankton (p40.05) (data not shown).Microzooplankton grazing was also not correlated with abundanceof Phaeocystis cells (p40.05) (data not shown).
The proportion of phytoplankton growth grazed by the o200 mmfraction was calculated as “g/m” from the average “g” and “m” forregions (Table 3). Estimates for individual incubations could not bemade because of negative or zero coefficients. Estimated averageproportion of phytoplankton growth in the o200 mm fraction grazedby phytoplankton appeared to vary among regions (Fig. 3). In the OffShelf and Outer Shelf regions, microzooplankton grazing consumed67–78% of phytoplankton growth but on the Middle Shelf and InnerShelf (with the exception of the south Middle Shelf) microzooplank-ton grazing coefficients were greater than phytoplankton growthrates in the mixed layer (Fig. 3 and Table 3).
Estimated phytoplankton carbon ingestion by microzooplanktonwas 11.0 mg carbon l�1 d�1 in the Alaska Peninsula region, 8.2 OffShelf, 7.7 on the Outer Shelf, 4.7 on the Middle Shelf and 4.4 d�1 onthe Inner Shelf, with differences among regions not statisticallysignificant (1 Way ANOVA, p40.05) (Fig. 4). Assuming that allmicrozooplankton were strictly heterotrophic and a gross growthefficiency of 35%, the estimated secondary production of microzoo-plankton in the mixed layer was 3.8 mg carbon l�1 d�1, 2.9, 2.7, 1.6,and 1.5 for the Alaska Peninsula, Off Shelf, Outer Shelf, Middle Shelfand Inner Shelf regions, respectively. However, because of the pre-valence of mixotrophy among the ciliates, it is possible that averagegross growth efficiently of the microzooplankton was higher and thussecondary production higher (Stoecker et al., this issue).
3.3. Microzooplankton grazing, ingestion and production in the DCM
Dilution grazing experiments were conducted with deep chlor-ophyll maximum assemblages at four stations in 2010, with DCMexperiments paired with mixed layer incubations at the same station
(Table 4). Irradiance levels and water temperatures were low in theDCM; experiments were incubated in the dark on ice (�0 1C) in a coldroom (Table 4). Incubation temperatures were 0.3–1.2 1C higher thanin situ DCM water temperatures, which may have resulted in slightlyelevated grazing. Grazing coefficients in the DCM ranged from �0 to0.70 d�1 and in two out of four DCM incubations, the grazingcoefficients were significant (po0.05) (Table 4). It is interesting thatin paired mixed layer and DCM incubations, the DCM grazingcoefficients were similar in magnitude to the mixed layer coefficients(Table 4). However, because of the higher phytoplankton biomass inthe DCM than in the mixed layer, the estimated ingestion ofphytoplankton carbon by microzooplankton in the DCM was higherthan in the mixed layer (Fig. 5). Assuming similar C:Chl ratios andgross growth efficiencies for microzooplankton in the mixed layer(refer to Section 3.2) and the DCM, microzooplankton production canbe compared for the stations with statistically significant grazing inboth layers (Table 4). At station SL-11, the calculated microzooplanktonproduction in the mixed layer was 5.0 and in the DCM13.2 mg C l�1 d�1. At station BN-3, the calculated microzooplanktonproduction in the mixed layer was 0.5 and in the DCM3.1 mg C l�1 d�1. (Production estimates were not made for experi-ments in which grazing was not statistical significant (Table 4).)
Fig. 2. Microzooplankton grazing coefficients (g, d�1) (A) and phytoplanktongrowth (m, d�1) (B) vs. chlorophyll a, mixed layer, Eastern Bering Sea. Data forsummers 2008, 2009 and 2010 were included; no nutrient addition treatmentsonly. Product moment correlation coefficients (r12) are shown as well as theirstatistical significance. The coefficient of determination, r2, was 0.072 and 0.236 inA and B, respectively, indicating that variation in chlorophyll only determined asmall proportion of the variation in grazing and phytoplankton growth coefficients.
D.K. Stoecker et al. / Deep-Sea Research II ∎ (∎∎∎∎) ∎∎∎–∎∎∎6
Please cite this article as: Stoecker, D.K., et al., Microzooplankton grazing in the Eastern Bering Sea in summer. Deep-Sea Res. II (2013),http://dx.doi.org/10.1016/j.dsr2.2013.09.017i

Microzooplankton secondary production in the DCM on a per literbasis may be several fold higher than in the mixed layer.
3.4. Non-significant and “negative” grazing coefficients and Fv/Fm
In 39% of our dilution grazing experiments with mixed layerassemblages the grazing coefficients were not statistically signifi-cant (p40.05) and in 3% of our experiments grazing coefficientswere statistically significant, but negative. Estimation of micro-zooplankton grazing in dilution experiments is based on theassumption that phytoplankton growth rate is the same in dilutedand undiluted treatments. To determine if dilution was having anegative effect on the physiology of phytoplankton, and poten-tially on their growth rates, variable fluorescence (Fv/Fm) wasmeasured in both the undiluted (WSW) and diluted (20% WSW)treatments at the end of paired incubations with and withoutadded nitrate (Table 1). Fv/Fm was significantly lower (T-test,po0.05) in the diluted than undiluted treatments in eight out of14 incubations without added nutrients and in seven out of 14incubations with added nutrients (Table 5). Fv/Fm was signifi-cantly higher (po0.05) in the diluted treatments with thanwithout added nitrate in three of the 14 experiments (data notshown). In only two experiments did this alleviate the negativeeffect of dilution on variable fluorescence of phytoplankton(Table 5). Low estimates of microzooplankton grazing coefficientwere associated with experiments in which dilution had a largenegative effect on Fv/Fm (Fig. 6).
µg C
arbo
n l-1
d-1
0
5
10
15
20
25
30
OFF OUTER MIDDLE INNERAK PEN
Fig. 4. Estimated microzooplankton ingestion of phytoplankton carbon in themixed layer, Eastern Bering Sea, summers 2008, 2009, 2010. Estimates of ingestionfrom stations within a domain were averaged. AK PEN¼Alaska Peninsula region;OFF¼off shelf; OUTER¼outer shelf; MIDDLE¼middle shelf; INNER¼ inner shelf orcoastal. Error bars indicate standard deviation.
Table 4Paired deep chlorophyll maximum (DCM) and Mixed layer (ML) Dilution experiments, Middle Shelf, summer 2010. P-value indicates the statistical significance of thedifference between the net growth rate of phytoplankton in the WSW and diluted treatment. ns¼non-significant.
Domain (region) Station Sample depth Temp. (1C) Avg. Incub. Irradiance Chlorophylla (t0) (mg l�1)
m g ANOVAp-value
(m) In situ Incub. m E s�1 m�2
Middle (10) SL-11 6-ML 5.6 �6 347 0.30 0.16 0.95 o0.00133-DCM �1.2 �0 Dark 1.08 �1.03 0.70 o0.001
Middle (10) BN-3 5-ML 5.7 �6 524 0.10 0.29 0.31 o0.0130-DCM �1.2 �0 Dark 0.85 0.03 0.21 o0.01
Middle(6) 70m-25 3-ML 6.5 �6 262 0.16 0.39 0.40 o0.0528-DCM �0.3 �0 Dark 1.84 �0.03 0.24 ns
Outer (8) ML-13 3-ML 6.0 �6 330 0.11 0.34 0.08 ns35-DCM �1.1 �0 Dark 5.36 0.04 0.05 ns
StationSL-11 BN-3 70m-25 ML-13
Mic
rozo
opla
nkto
n In
gest
ion
(µg
C l-1
d-1)
0
10
20
30
40
Mixed Layer DCM
Fig. 5. Comparison of estimated microzooplankton ingestion of phytoplanktoncarbon, paired mixed layer and DCM experiments, Eastern Bering Sea, summer2010.
AK PEN OFF OUTER MIDDLE INNER
g/µ
+SD
0.0
0.2
0.4
0.6
0.8
1.0
1.2
1.4
1.6
1.8
Fig. 3. Estimated fraction of phytoplankton daily growth consumed by microzoo-plankton grazing (g/m) in the mixed layer, Eastern Bering Sea, summers 2008, 2009,2010 (no nutrient addition treatments only). For each region, mean grazing (g) andgrowth (m) coefficients (Table 3) were used to calculate a regional “g/u” (refer toSection 3.2). For each of the domains (OFF, OUTER, MIDDLE) with data for severalregions (Table 3), the regional estimates were averaged to obtain a domain mean“g/m”. For the domain (AK PEN) with one region (Table 3) and for the domain(INNER) with data for only a few stations (Table 3), data from individual stationswere used to calculate average g and u for the domain and then these averageswere used to calculate the g/u for the domain. AK PEN¼Alaska Peninsula region;OFF¼off shelf; OUTER¼outer shelf; MIDDLE¼middle shelf; INNER¼ inner shelf orcoastal. Data combined for summers 2008, 2009, and 2010. Error bars indicatestandard deviation for OFF, OUTER, and MIDDLE domains.
D.K. Stoecker et al. / Deep-Sea Research II ∎ (∎∎∎∎) ∎∎∎–∎∎∎ 7
Please cite this article as: Stoecker, D.K., et al., Microzooplankton grazing in the Eastern Bering Sea in summer. Deep-Sea Res. II (2013),http://dx.doi.org/10.1016/j.dsr2.2013.09.017i

4. Discussion
During summers of 2008–2010, all “cold years” in the EasternBering Sea (Stabeno et al., 2012b), the over-all average mixed layermicrozooplankton grazing coefficient was 0.26 d�1, which is quitesimilar to the average coefficient of 0.29 d�1 observed on the SEshelf by Olson and Strom (2002) during summer 1999, anothercold year (Table 6). In 2004, a “warm year” (Ladd and Stabeno,2012), microzooplankton grazing was low on the SE Shelf (Stromand Fredrickson, 2008) (Table 6). The low grazing in 2004 wasprobably a response of microzooplankton to poor food qualitycaused by phytoplankton nutrient limitation due to intensestratification (Strom and Fredrickson, 2008), however “warm”
years are not always associated with high stratification on theBering Sea Shelf (Ladd and Stabeno, 2012), so it is unlikely thatsummer microzooplankton grazing is predictable from tempera-ture alone. During 2004, phytoplankton growth rates respondedstrongly to addition of nutrients (Strom and Fredrickson, 2008) butincreases in phytoplankton growth in response to nutrient addi-tions were only observed in one year, 2010, in our study (Table 2).Contrary to expectations, nutrient addition sometimes resultedin lower estimates of phytoplankton growth and sometimes
microzooplankton grazing. Possible inhibition of growth andgrazing due to nutrient addition has been previously reported,but the reasons for inhibition are not understood (Gifford, 1988;Olson and Strom, 2002).
Average microzooplankton grazing coefficients during springsea ice conditions are o50% of summer grazing coefficients(Table 6). The lower grazing coefficients in spring are probablydue to a combination of factors including lower ratios of micro-zooplankton biomass to phytoplankton biomass in spring than insummer (Sherr et al., 2013; Stoecker et al., this issue), differencesin size distribution and species composition of phytoplankton(Lomas et al., 2012) and lower water temperatures in spring(Rose and Caron, 2007; Rose et al., 2013).
It is interesting that both the growth rate of phytoplankton (m)and microzooplankton grazing (g) was correlated negatively withtotal chlorophyll a in the mixed layer. Negative or no correlation ofgrowth and grazing coefficients with chlorophyll have also beennoted by Olson and Strom (2002), Strom et al. (2007), and Calbetet al. (2011) in northern seas in summer. This is consistent withdomination of the phytoplankton by o5 mm cells, and a rate,rather than biomass, controlled production system dependent onnutrient recycling (Lomas et al., 2012). Based on primary produc-tion measurements, integrated phytoplankton growth rates (m)averaged 0.42 d�1 (SD, 0.17) (Lomas et al., 2012), which is withinthe wide range of phytoplankton growth rates that we estimatedin mixed layer dilution experiments (Table 6). In the north middleand inner domains, the biomass of microzooplankton to phyto-plankton was high in summer (Stoecker et al., this issue), con-sistent with the high ratios of microzooplankton grazing tophytoplankton growth. A confounding factor in estimating phyto-plankton growth and microzooplankton grazing from chlorophyllin dilution experiments on the Bering Sea Shelf is the high biomassof plastidic ciliates in summer (Stoecker et al., this issue). Theincorporation of phytoplankton chloroplasts into ciliates mayresult in underestimation of microzooplankton grazing and anoverestimate of “phytoplankton” biomass.
Comparison of the spatial distributions of phytoplankton growth,microzooplankton grazing, chlorophyll a, variable fluorescence,and phytoplankton composition from the HPLC (Goes et al., thisissue) revealed similar patterns among some of the variables andidentified the phytoplankton communities associated with differ-ent growth and grazing coefficients during summer 2008. Highphytoplankton growth (m, d�1) and moderate microzooplanktongrazing (g, d�1) were measured on the north Middle Shelf, wherediatom and cryptophytes patches, probably remnants of spring iceassociated blooms, were observed (Fig. 7). Elevated phytoplankton
Table 5Variable fluorescence (Fv/Fm) at the end of mixed layer dilution experiments in undiluted (WSW) and diluted (20% WSW) treatments without and with the addition of0.05 mM N as sodium nitrate. All experiments conducted in summer 2008. N¼2 or 3.
Station Mean (SD), no nutrient addition T-test Mean (SD), nutrient addition T-test
WSW 20%WSW p WSW 20%WSW p
C-55 0.345 (0.0071) 0.357 (0.0896) ns 0.348 (0.031) 0.353 (0.459) nsW-4b 0.237 (0.0379) 0.263 (0.0752) ns 0.245 (0.028) 0.283 (0.031) nsSL-8 0.350 (0.0433) 0.327 (0.0431) ns 0.353 (0.040) 0.426 (0.087) nsNP-7 0.330 (0.0100) 0.232 (0.0126) po0.05 0.310 (0.010) 0.357 (0.041) nsNP-14 0.183 (0.1626) 0.198 (0.0775) ns 0.317 (0.063) 0.270 (0.020) nsNP-14 0.263 (0.0115) 0.220 (0.0200) po0.05 0.268 (0.010) 0.267 (0.018) nsNP-11 0.341 (0.0136) 0.315 (0.0391) ns 0.362 (0.007) 0.300 (0.025) po0.05LS1-6 0.343 (0.0152) 0.278 (0.0202) po0.05 0.345 (0.008) 0.265 (0.007) po0.05P14-4.5 0.253 (0.0144) 0.158 (0.0126) po0.05 0.268 (0.029) 0.183 (0.023) po0.05P14-2 0.298 (0.0126) 0.233 (0.0252) po0.05 0.313 (0.005) 0.245 (0.022) po0.05MN-6 0.280 (0.0173) 0.227 (0.0058) po0.05 0.307 (0.011) 0.247 (0.005) po0.05MN-12 0.245 (0.0071) 0.153 (0.0153) po0.05 0.273 (0.028) 0.150 (0.014) po0.05MN-19 0.250 (0.0173) 0.183 (0.0289) po0.05 0.240 (0.026) 0.163 (0.032) po0.05SL-14 0.263 (0.0306) 0.210 (0.0346) ns 0.283 (0.064) 0.233 (0.010) ns
Fv/FmWSW-Fv/Fm20%WSW
-0.04 -0.02 0.00 0.02 0.04 0.06 0.08 0.10 0.12
g d-1
0.0
0.1
0.2
0.3
0.4
0.5
0.6
0.7
0.8
r12 = -0.579, p < 0.05
Fig. 6. Estimated microzooplankton grazing coefficients (g, d�1) vs. the differencein variable fluorescence (Fv/Fm) between WSW and diluted treatments in anexperiment. The product moment correlation coefficient (r12) and its statisticalsignificance are shown. Low grazing was associated with decreased Fv/Fm in thediluted compared to the whole seawater treatments. The coefficient of determina-tion (r2) was 0.335.
D.K. Stoecker et al. / Deep-Sea Research II ∎ (∎∎∎∎) ∎∎∎–∎∎∎8
Please cite this article as: Stoecker, D.K., et al., Microzooplankton grazing in the Eastern Bering Sea in summer. Deep-Sea Res. II (2013),http://dx.doi.org/10.1016/j.dsr2.2013.09.017i

growth and microzooplankton grazing were observed on theMiddle Shelf near 601N, at the border between the St. Matthewsand north Inner Shelf regions. This area was characterized byrelatively low surface chlorophyll a and moderate variable fluor-escence. Diatom patches were observed to the east and hapto-phytes to the west of 1701W in this area. Phytoplankton growthand microzooplankton grazing were also relatively high on parts ofthe north Outer Shelf and Off Shelf north regions on the inner edgeof the greenbelt. The greenbelt was characterized by low tomoderate surface chlorophyll a, moderate variable fluorescenceand dominance of phytoplankton biomass by cryptophytes andhaptophytes. The Pribilof Island area was a hot spot for phyto-plankton growth, with patches of both diatoms and haptophytes
present, but microzooplankton grazing was moderate in thisregion. In contrast, the southeastern shelf and Peninsula areatended to have lower phytoplankton growth and microzooplank-ton grazing coefficients, although small flagellates, includingcryptophytes and haptophytes, dominated (Goes et al., this issue).
In 2004, weak trophic coupling of phytoplankton growth tomicrozooplankton grazing was observed (Strom and Fredrickson,2008), but strong coupling was observed in 1999 (Olson andStrom, 2002) and in summers of 2008, 2009, and 2010 (Table 6).On the shelf, microzooplankton grazing coefficients (g) oftenexceeded phytoplankton growth coefficients (m) in the mixedlayer, but g/m was o1 in Alaska Peninsula, Off Shelf and OuterShelf waters in summer (Table 3). On average, grazing is equivalentto phytoplankton growth in the sea (Banse, 1992), with ratios of gto m exceeding 1 often found during the demise of blooms. Forexample, in the more southerly Gulf of Alaska, the ratio ofmicrozooplankton grazing to phytoplankton growth on the Middleand Inner Shelf reaches a maximum in summer with g/m41.0whereas in summer the ratio is lower on the Outer Shelf (Stromet al., 2007), similar to our observations in the Eastern Bering Sea.Another example is the Sea of Okhotsk, Liu et al. (2009) found thatmicrozooplankton grazing (g) was about three times higher thanphytoplankton growth (m) in late summer in nutrient-depletedshelf waters whereas in the higher nutrient shelf break and straitwaters, g/m estimates were o0.5. Ratios of microzooplanktongrazing to phytoplankton growth in excess of 1 may be a general,although transient, feature of highly stratified boreal and ArcticShelf ecosystems in summer.
Large copepods, such as Neocalanus spp., Calanus glacialis, andMetridia longa, have a strong prey preference for microzooplank-ton, but are largely absent from the Middle and Inner Shelf watersin summer (Vidal and Smith, 1986; Gifford, 1993; Campbell et al.,2009; Hunt et al., 2008). A reduction in top down control ofmicrozooplankton on the Eastern Bering Sea Shelf may be partiallyresponsible for the high biomass of microzooplankton (Stoeckeret al., this issue) and their high grazing impact on the Bering SeaShelf in summer. A similar phenomenon occurs on the Gulf ofAlaska Shelf, where summer populations of large copepods arelow and large cell-size microzooplankton are very abundant due todiminished top down control (Strom et al., 2007).
Although the grazing impact of microzooplankton on phyto-plankton growth (g/m) was highest in Middle and Inner Shelfwaters, estimated microzooplankton ingestion of phytoplanktoncarbon and secondary production of microzooplankton was high-est in the Alaska Peninsula, Off Shelf and Outer Shelf waters. Thiswas due to higher chlorophyll levels than on the Middle and Inner
Fig. 7. Spatial distribution of phytoplankton growth (m, d�1) (upper panel) andmicrozooplankton grazing (g, d�1) (lower panel) in the eastern Bering Sea,summer 2008.
Table 6Comparison of hydrographic conditions, phytoplankton growth coefficients and microzooplankton grazing coefficients from mixed layer dilution experiments conducted inthe Bering Sea. Years classified as warm or cold, with high or low stratification index (Ladd and Stabeno, 2012; Stabeno et al., 2012b). Phytoplankton growth rates (μ) and MZgrazing rates (g) per day. Average with SD in parentheses, or range.
Cruise dates and hydrographic conditions inSE Bering Sea
Water (1C) Growth Grazing Ref.
July 99: South Bering Sea (Off Shelf andOuter Shelf) (cold year)
5.3–7.7 0.2–0.6, 0.41 (n¼5) 0.1–0.4, 0.27, (n¼5) Liu et al. (2002)
July–August 99; SE Bering Sea (cold yearwith low stratification index)
5.8–8.4 �0.7 to 0.6, 0.33 (n¼13) 0.1–0.5, 0.29, (n¼13) Olson and Strom (2002)
July–August 04: SE Bering Sea (warmyear with high stratification index)
9.3–13.4 0.0–1.0, 0.35 (n¼18) 0.0–0.27, 0.13, (n¼18) Strom and Fredrickson (2008)
April–May, 2008, 2009, 2010-Non bloom,Eastern Bering Sea, ice edge (cold years)
�0.3 (1.4) 0.17 (0.14), n¼17 0.08 (0.12), n¼17 Sherr et al. (2013)
April–May, 2008, 2009, 2010-Bloom, EasternBering Sea, ice edge (cold years)
0.8 (1.7) 0.21 (0.12), n¼21 0.09 (0.08), n¼21 Sherr et al. (2013)
June–July, 2008, 2009, 2010-Eastern BeringSea (cold years; low stratification index in2008, stratification classification for 2009 &2010 not yet available)
2.3–7.9 �0.8–0.8, 0.26, (n¼61) 0.0–0.9, 0.26, (n¼61) This study
D.K. Stoecker et al. / Deep-Sea Research II ∎ (∎∎∎∎) ∎∎∎–∎∎∎ 9
Please cite this article as: Stoecker, D.K., et al., Microzooplankton grazing in the Eastern Bering Sea in summer. Deep-Sea Res. II (2013),http://dx.doi.org/10.1016/j.dsr2.2013.09.017i

Shelf. However, microzooplankton (20–200 mm) biomass in the OffShelf and Outer Shelf regions was about half that in the inner andmiddle domains (Stoecker et al., this issue). One reason for thisdiscrepancy may be that grazing by nanozooplankton (which arenot included in the microzooplankton biomass estimates) makes alarger contribution to grazing in the higher chlorophyll regions.Nanozooplankton have been shown to be more abundant infrontal areas on the Outer Shelf and at the shelf break than inlower chlorophyll inner and middle domains in summer (Flintet al., 2002). The relatively low biomass of 20–200 mm microzoo-plankton (ciliates and large dinoflagellates) and high biomass ofnanozooplankton in Peninsula, Off Shelf and Outer Shelf waterssuggests a trophic cascade in which top down control of largemicrozooplankton by crustacean zooplankton releases nanozoo-plankton from grazing control. Conversely, large microzooplank-ton are probably relatively more abundant on the shelf in summerdue to relaxation in top down control by large copepods which aremostly absent from the shelf in summer (Vidal and Smith, 1986;Hunt et al., 2008).
During the summer, the DCM in the northern domain can bewell developed with 410 mg chlorophyll a l�1 at some stations(Lomas et al., 2012; Goes et al., this issue). Thus, the processeswithin the DCM may be very important to carbon flux and trophictransfer. Microzooplankton biomass (Stoecker et al., this issue) wasusually similar in the DCM to that in the mixed layer above.Although grazing coefficients were also roughly similar in themixed layer and corresponding DCM, the calculated ingestion ratesin the DCM were higher than in the mixed layer (Fig. 5). Thisdifference might be partly due to differences in C:Chl a ratio in themixed layer and in the DCM. The DCM samples ranged in depthfrom 26 to 35 m (Table 4), which was near or below the averagedepth of the 1% PAR isolume, 30 m (Lomas et al., 2012). Microalgaegrown at low irradiances have lower C:Chl a than microalgaegrown at higher irradiances; C:Chl a of �25 is often observed inlight limited phytoplankton (Geider 1987). Applying an average C:Chl. of 50 for the Bering Sea (Lomas et al., 2012) to the DCM mightresult in over-estimation of microzooplankton carbon ingestion byup to �2 fold. If we assume that phytoplankton growth was low atthese depths due to the low irradiance, the ratio of grazing tophytoplankton growth must have been very high. Microzooplank-ton grazing is often important in erosion of “plankton patches”(Menden-Deurer and Fredrickson, 2010).
If we assume that microzooplankton growth efficiency wassimilar in the mixed layer and DCM, the DCM may be an importantsite of microzooplankton production during summer, particularlyon the northern shelf. The lack of accumulation of microzooplank-ton biomass in the DCM suggests that predation pressure onmicrozooplankton is high and thus that these layers may beimportant in trophic transfer to higher trophic levels. The impactof microzooplankton grazing on phytoplankton and export fluxescan be under-estimated if grazing near the base of the euphoticzone is not included (Landry et al., 2011).
The decrease in variable fluorescence during the incubationsfrom some stations suggests that dilution had a negative impacton phytoplankton photosynthetic physiology and hence poten-tially growth rate. This effect was most evident at Off Shelf andOuter Shelf “bloom” locations. This effect was not simply due to Nlimitation alone in the diluted treatments; it occurred in controland, in most cases, the paired nitrate amended dilutions. One ofthe assumptions of the dilution method is that dilution does notchange the growth rate of phytoplankton, and this assumptionlikely was violated in at least some dilution experiments. Adecrease in phytoplankton growth rate with dilution would resultin an underestimation of the grazing coefficients. This maypartially account for the low or non- significant grazing coeffi-cients. Low grazing rates of microzooplankton for the biomass of
microzooplankton have previously been reported in the SE BeringSea during intense summer stratification and nutrient limitation ofphytoplankton (Strom and Fredrickson, 2008). Non-significantmicrozooplankton grazing coefficients have also been reportedduring the spring at both non-bloom and diatom bloom ice edgestations (Sherr et al., 2013). In addition to non-significant grazingcoefficients, statistically significant negative rates occur. Negativedilution grazing results are usually not reported (Dolan andMcKeon, 2005), or the negative coefficients treated as “0” (Stromand Fredrickson, 2008). Negative rates can only occur when thegrowth rate of phytoplankton, m, is lower in the diluted treatmentthan in the whole seawater. In polar and subpolar ecosystems,non-significant and negative results in dilution experiments arecommon, particularly during Phaeocystis blooms (Calbet et al.,2011; Caron et al., 2000).
In culturing phytoplankton, a “lag” phase typically occurs aftertransfer of cells to new media, this has been ascribed to the time ittakes cells to “ramp up” to better growth conditions, the “shock” oftransfer and to lack of “conditioning factors” in the media. Perhapssomething similar happens when phytoplankton are diluted withfiltered seawater. Another possibility is that the mechanical stressinvolved in passage through filters results in release of “toxic” or“inhibitory” compounds into the filtered seawater used to makethe dilutions. Strom and Fredrickson (2008) noted that release ofdiatom extracts from filters used to prepare filtered seawater mayhave inhibited growth of phytoplankton. During certain growthphases, P. pouchetti and many bloom forming diatoms producecytotoxic aldehydes that are inhibitory to phytoplankton growth,including their own (Hansen and Eilertson, 2007; Paul et al.,2009). Mechanical stress can trigger the release of these com-pounds from cells (Hansen and Eilertson, 2007). We hypothesizethat decreases in variable fluorescence and low or negativephytoplankton growth rates in diluted treatments could be dueto presence of toxic aldehydes released from phytoplanktonduring preparation of filtered seawater. Preliminary results indi-cate that with some diatom and Phaeocystis blooms, treatment offiltered seawater with activated carbon to remove organic materialprior to its use in dilution can reverse the negative effects on both“μ” and “g” (Stoecker and Nejstgaard, unpubl. data). However,contrary to expectation, grazing coefficients were not negativelycorrelated with abundance of P. pouchetti cells in the Bering Sea.Production of inhibitory compounds by Phaeocystis varies with lifeform and bloom stage (Nejstgaard et al., 2007), thus not allPhaeocystis cells will have the same impact on water chemistry.Furthermore, diatoms are also a source of cytotoxic aldehydes andare bloom dominants in the Bering Sea (Flint et al., 2002; Lomaset al., 2012). A simple relationship between one of these factors(Phaeocystis cells) and apparent low grazing coefficients is unlikelydue to confounding factors.
Overestimation of microzooplankton grazing by the dilutiontechnique may occur due to increases in microzooplankton popu-lations because of the exclusion of mesozooplankton predatorsfrom the incubation bottles and starvation of microzooplankton inthe diluted treatments (Dolan et al., 2000; Dolan and McKeon,2005; Modigh and Franze, 2009). However, internal predation(microzooplankton predation on micro- and nanozooplankton) inincubations can lead to trophic cascades as well, decreasinggrazing on phytoplankton (Stoecker and Evans, 1985; First et al.,2007, 2009). First et al. (2007) conducted dilution experiments in arange of temperate environments (coastal lagoons to offshorelocations) and found that although microzooplankton biomassincreased or decreased over time in most dilution experiments,adjusting for the actual grazer gradient did not significantly affectthe estimated rates of microzooplankton grazing. In cold, subarcticwaters the potential daily growth rate of microzooplankton islower than in temperate waters and thus it is reasonable to
D.K. Stoecker et al. / Deep-Sea Research II ∎ (∎∎∎∎) ∎∎∎–∎∎∎10
Please cite this article as: Stoecker, D.K., et al., Microzooplankton grazing in the Eastern Bering Sea in summer. Deep-Sea Res. II (2013),http://dx.doi.org/10.1016/j.dsr2.2013.09.017i

assume that changes in grazer density and the effect on grazingcoefficients would also be lower than in the First et al. (2007)study in temperate waters.
To evaluate the potential increase of microzooplankton geo-metric mean biomass in our incubations, the increased micro-zooplankton biomass (Ct) at the end of incubations was calculatedas the average microzooplankton biomass (Co) for a domain(Stoecker et al., this issue) plus the estimated daily microzoo-plankton secondary production in that domain (Section 3.3). Thegeometric mean microzooplankton biomass, ⟨C⟩, during incuba-tions was calculated as ⟨C⟩¼(Ct�Co)/(ln Ct� ln Co) (modified fromHeinbokel (1978)). The average percent increase in microzoo-plankton biomass during an incubation was calculated as ((⟨C⟩�Co)�100)/Co). Using comparable domain data for biomass andsecondary production, the potential elevation in microzooplank-ton biomass during the incubations was 3%, 4%, 10% and 11% inmixed layer dilution experiments conducted in the Inner Shelf,Middle Shelf, Outer Shelf, and shelf break/Off Shelf domains,respectively. Given the variability in estimated grazing typicallyfound in dilution experiments, it seems unlikely that theserelatively small potential increases in microzooplankton biomasswould significantly influence estimates of microzooplankton graz-ing. In our experiments, it seems more likely that average micro-zooplankton grazing was underestimated, particularly in the OffShelf and Outer Shelf waters, due to decreased phytoplanktongrowth in the diluted treatment in some incubations.
Whether or not grazing is underestimated or slightly overestimated, it is clear that microzooplankton grazing consumesmost of phytoplankton production and that secondary productionby microzooplankton is important. Most phytoplankton produc-tion is by o5 mm phytoplankton and thus passes through themicrozooplankton link before it is available to crustacean zoo-plankton in summer. On the northern shelf, the DCM may often bea site of enhanced trophic transfer. Microzooplankton can com-prise 49% or more of the food available to larger zooplankton onthe Bering Sea Shelf in summer (Stoecker et al., this issue).
Acknowledgments
The authors thank the captain and crew of the USCG Healy,R/V Knorr and R/V T.G. Thompson for their assistance during thecruises. We thank Michael Lomas for advice and use of hisfluorometer, Dean Stockwell and Michael Lomas for chlorophylldata, Carol Feierabend for enumerating Phaeocystis cells, HelgaGomes for help with the variable fluorescence measurements andKristin Blattner for excellent technical assistance in 2008 and2009. We thank Peter Lavrentyev for his thoughtful commentsthat improved the manuscript. DKS and AW were supported byBering Sea Integrated Ecosystem Research Program (BSIERP)Project no. 55. JIG was supported by funding from the NASA. Thisis BEST-BSIERP Bering Sea Project publication no. 115, NPRBPublication no. 447 and UMCES Contribution no. 4807.
Reference
Banse, K., 1992. Grazing, temporal changes in phytoplankton concentrations, andthe microbial loop in the open sea. In: Falkowski, P.G., Woods, A.D. (Eds.),Primary Productivity and Biogeochemical Cycles in the Sea. Plenum Press,New York, pp. 409–440.
Calbet, A., Saiz, E., 2005. The ciliate-copepod link in marine ecosystems. Aquat.Microb. Ecol. 38, 157–167.
Calbet, A., Saiz, E., Almeda, R., Movilla, J.I., Alcarez, M., 2011. Low microzooplanktongrazing rates in the Arctic Ocean during a Phaeocystis pouchetti bloom (Summer2007): fact or artifact of the dilution technique? J. Plankton Res. 33, 687–701.
Campbell, R.G., Sherr, E.B., Ashjian, C.J., Plourde, S., Sherr, B.F., Hill, V., Stockwell, D.A.,2009. Mesozooplankton prey preferences and grazing impact in the WesternArctic Ocean. Deep-Sea Res. II 56, 1274–1289.
Caron, D.A., Dennett, M.R., Lonsdale, D.J., et al., 2000. Microzooplankton herbivoryin the Ross Sea, Antarctica. Deep-Sea Res. II 47, 3249–3272.
Chekalyuk, A., Hafez, M.A., 2008. Advanced laser fluorometry of natural aquaticenvironments. Limnol. Oceanogr., Methods 6, 591–609.
Dolan, J.R., McKeon, K., 2005. The reliability of grazing rate estimates from dilutionexperiments: have we over-estimated rates of organic carbon consumption bymicrozooplankton? Ocean Sci. 1, 1–7.
Dolan, J.R., Gallegos, C.L., Moigis, A., 2000. Dilution effects on microzooplankton indilution grazing experiments. Mar. Ecol. Prog. Ser. 2000, 127–139.
First, M.R., Lavrentyev, P.J., Jochem, F.J., 2007. Patterns of microzooplankton growthin dilution experiments across a trophic gradient: Implications for herbivorystudies. Mar. Biol. 151, 1929–1940.
First, M.R., Miller Jr., H.L., Lavrentyev, P.J., Pinckney, J.L., Burd, A.B., 2009. Effects ofmicrozooplankton growth and trophic interactions on herbivory in coastal andoffshore environments. Aquat. Microb. Ecol. 54, 255–267.
Flint, M.V., Sukhanova, I.N., Kopylov, A.I., Poyarkov, S.G., Whitledge, T.E., 2002.Plankton distribution associated with the frontal zones in the vicinity of thePribilof Islands. Deep-Sea Res. II 49, 6069–6093.
Geider, R.J., 1987. Light and temperature dependence of the carbon to chlorophyll aratio in microalgae and cyanobacteria: implications for physiology and growthof phytoplankton. New Phytol. 106, 1–34.
Gifford, D.J., 1988. Impact of grazing by microzooplankton in the northwest arm ofHalifax Harbor, Nova Scotia. Mar. Ecol. Prog. Ser. 47, 249–258.
Gifford, D.J., 1993. Protozoa in the diets of Neocalanus spp. in the oceanic subarcticPacific Ocean. Prog. Oceanogr. 32, 223–237.
Goes, J.I., Gomes, H., do, R., Haugen, E., McKee, K., D'Sa, E., Chekalyuk, A.M., Stoecker,D., Stabeno, P., Saitoh, S., Sambrotto, R., 2013. Fluorescence, pigment andmicroscopic characterization of Bering sea phytoplankton community structureand photosynthetic competency in the presence of a Cold Pool during summer.Deep Sea Res. II. (this issue [doi: 10.1016/j.dsr2.xxxx.xx.xxx]).
Hansen, E., Eilertson, H.C., 2007. Do the polyunsaturated aldehydes produced byPhaeocystis pouchetti (Hariot) Langerheim influence diatom growth during thespring bloom in Northern Norway? J. Plankton Res. 29, 87–96.
Heinbokel, J.F., 1978. Studies on the functional role of tintinnids in the southernCalifornia Bight. I. Grazing and growth rates in laboratory cultures. Mar. Biol. 47,177–189.
Hunt Jr., G.L., Stabeno, P., Strom, S., Napp, J.M., 2008. Patterns of spatial andtemporal variation in the marine ecosystem of the southeastern Bering sea,with special reference to the Pribilof Domain. Deep-Sea Res. II 55, 1919–1944.
Ladd, C., Stabeno, P.J., 2012. Stratification on the Eastern Bering Sea shelf revisited.Deep-Sea Res. II 65–70, 72–83.
Landry, M.L., 1993. Estimating rates of growth and grazing mortality of phyto-plankton by the dilution method. In: Kemp, P.F., et al. (Eds.), Handbook ofMethods in Aquatic Microbial Ecology. Lewis Publishers, Boca Raton,pp. 715–722.
Landry, M.R., Brown, S.L, Yoshimi, M.R., Selph, K.E., Bidigare, R.R., Yang, E.J.,Simmons, M.P., 2008. Depth-stratified phytoplankton dynamics in CycloneOpal, a subtropical mesoscale eddy. Deep-Sea Res. II 55, 1348–1359.
Landry, M.L., Calbet, A., 2004. Microzooplankton production in the oceans. ICESJ. Mar. Sci. 61, 501–507.
Landry, M.L., Calbet, A., 2005. Reality checks on microbial food web interactions indilution experiments: responses to the comments of Dolan and McKeon. OceanSci. 1, 39–44.
Landry, M.R., Selph, K.E., Yang, E.J., 2011. Decoupled phytoplankton growth andmicrozooplankton grazing in the deep euphotic zone of the eastern equatorialPacific. Mar. Ecol. Prog. Ser. 421, 13–24.
Levinsen, H., Nielsen, T.G., 2002. The trophic role of marine pelagic ciliates andheterotrophic dinoflagellates in Arctic and temperate coastal ecosystems: across-latitude comparison. Limnol. Oceanogr. 47, 427–439.
Liu, H., Suzuki, K., Nishioka, J., Sohrin, R., Nakatsuka, T.,2009. Phytoplankton growthand microzooplankton grazing in the Sea of Okhotsk during late summer of2006. Deep-Sea Res. I 56, 561–570.
Liu, H., Suzuki, K., Saino, T., 2002. Phytoplankton growth and microzooplanktongrazing in the subarctic Pacific Ocean and the Bering Sea during summer 1999.Deep-Sea Res. I 49, 363–375.
Lomas, M.W., Moran, S.B., Casey, J.R., Bell, D.W., Tiahlo, M., Whitefield, J., Kelly, R.P.,Mathis, J.T., Cokelet, E.D., 2012. Spatial and seasonal variability ofprimary production on the Eastern Bering Sea shelf. Deep-Sea Res. II 65–70,126–140.
Menden-Deurer, S., Fredrickson, K., 2010. Structure-dependent, protistan grazingand its implication for the formation, maintenance and decline of planktonpatches. Mar. Ecol. Prog. Ser. 420, 57–71.
Merico, A., Tyrrell, T., Lessard, E.J., Oguz, T., Stabeno, P.J., Zeeman, S.I., Whitledge, T.E.,2004. Modelling phytoplankton succession on the Bering Sea shelf: role ofclimate influences and trophic intractions in generating Emiliamia huxleyiblooms 1997–2000. Deep-Sea Res. I 51, 1803–1826.
Modigh, M., Franze, G., 2009. Changes in phytoplankton and microzooplanktonpopulations during grazing experiments at a Mediterranean coastal site.J. Plankton Res. 31, 853–864.
Moran, S.B., Lomas, M.W., Kelly, R.P., Gradinger, R., Iken, K., Mathis, J.T., 2012.Seasonal succession of net primary productivity, particulate organic carbonexport and autotrophic community composition in the eastern Bering Sea.Deep-Sea Res. II 65–70, 84–97.
Nejstgaard, J.C., Tang, K.W., Steinke, M., Dutz, J., Koski, M., Antajan, E., Long, J.D.,2007. Zooplankton grazing on Phaeocystis: a quantitative review and futurechallenges. Biogeochemistry 83, 147–172.
D.K. Stoecker et al. / Deep-Sea Research II ∎ (∎∎∎∎) ∎∎∎–∎∎∎ 11
Please cite this article as: Stoecker, D.K., et al., Microzooplankton grazing in the Eastern Bering Sea in summer. Deep-Sea Res. II (2013),http://dx.doi.org/10.1016/j.dsr2.2013.09.017i

Olson, M.B., Strom, S.L., 2002. Phytoplankton growth, microzooplankton herbivoryand community structure in the southeast Bering Sea: insight into theformation and temporal persistence of an Emiliania huxleyi bloom. Deep-SeaRes. II 49, 5969–5990.
Ortiz, Y., Weise, F., Greig, A., 2012. Marine regions boundary data for the Bering Seashelf and slope. UCAR/NCAR—Earth Observing Laboratory/Computing, Data,and Software Facility. Dataset. doi:10.5065/D6DF6P6C.
Parsons, T., Maita, Y., Lalli, C., 1984. A Manual of Chemical and Biological Methodsfor Seawater Analysis. Pergamon Press, New York.
Paul, C., Barofsky, A., Vidoudez, C., Pohnert, G., 2009. Diatom exudates influencemetabolism and cell growth of co-cultured diatom species. Mar. Ecol. Prog. Ser.389, 61–70.
Rose, J.M., Caron, D.A., 2007. Does low temperature constrain the growth rates ofheterotrophic protists? Evidence and implications for algal blooms in coldwaters. Limnol. Oceanogr. 52, 886–895.
Rose, J.M., Fitzpatrick, E., Wang, A., Gast, R.J., Caron, D.A., 2013. Low temperatureconstrains growth rates but not short-term ingestion rates of Antarctic ciliates.Polar Biol. 36, 645–659.
Sambrotto, R.N., Mordy, C., Zeeman, S.I., Stabeno, P.J., Macklin, S.A., 2008. Physicalforcing and nutrient conditions associated with patterns of Chl a and phyto-plankton productivity in the southeastern Bering Sea during summer. Deep-SeaRes. II 55, 1745–1760.
Sherr, E.B., Sherr, B.F., Hartz, A.J., 2009. Microzooplankton grazing impact in thewestern Arctic Ocean. Deep-Sea Res. II 56, 1264–1273.
Sherr, E.B., Sherr, B.F., Ross, C., 2013. Microzooplankton grazing impact in the BeringSea during spring sea ice conditions. Deep-Sea Res II 94, 57–67.
Stabeno, P.J., Farley Jr., E.V., Kachel, N.B., Moore, S., Mordy, C.W., Napp, J.M.,Overland, J.E., Pinchuk, A.I., Sigler, M.F., 2012a. A comparison of the physics ofthe northern and southern shelves of the eastern Bering Sea and someimplications for the ecosystem. Deep-Sea Res. II 65–70, 14–30.
Stabeno, P.J., Kachel, N.B., Moore, S.E., Napp, J.M., Sigler, M., Yamaguchi, A.,Zerbini, A.N., 2012b. Comparison of warm and cold years on the southeasternBering Sea shelf and some implications for the ecosystem. Deep-Sea Res. II 65–70, 31–45.
Stockwell, D.A., Whitledge, T.E., Zeeman, S.I., Coyle, K.O., Napp, J.M., Brodeur, R.D.,Pinchuk, A.I., Hunt, G.L., 2001. Anomalous conditions in the south-easternBering Sea, 1997: nutrients, phytoplankton and zooplankton. Fish. Oceanogr. 10,99–116.
Stoecker, D.K., Evans, G.T., 1985. Effects of protozoan herbivory and carnivory in amicroplankton food web. Mar. Ecol. Prog. Ser. 25, 159–167.
Stoecker, D.K., Weigel, A., Stockwell, D., Lomas, M., 2013. Microzooplankton:Abundance, biomass and contribution to chlorophyll in the Eastern BeringSea in summer. Deep-Sea Res. (this issue [doi: 10.1016/j.dsr2.xxxx.xx.xxx]).
Strom, S.L., Fredrickson, K.A., 2008. Intense stratification leads to phytoplanktonnutrient limitation and reduced microzooplankton grazing in the southeasternBering Sea. Deep-Sea Res. II 55, 1761–1774.
Strom, S.L., Macri, E.L., Olson, M.B., 2007. Microzooplankton grazing in the coastalGulf of Alaska: variations in top-down control of phytoplankton. Limnol.Oceanogr. 52, 1480–1494.
Strom, S.L., Olson, M.B., Macri, E.L., Mordy, C.W., 2006. Cross-shelf gradients inphytoplankton community structure, nutrient utilization, and growth rate inthe coastal Gulf of Alaska. Mar. Ecol. Prog. Ser. 328, 75–92.
Sukhanova, I.N., Semina, H.J., Venttsel, M.V., 1999. Spatial and temporal variabilityof phytoplankton in the Bering Sea. In: Loughlin, T.R., Ohtani, K. (Eds.),Dynamics of the Bering Sea. University of Alaska Sea Grant, Fairbanks,pp. 453–483.
Vidal, J., Smith, S., 1986. Biomass, growth, and development of populations ofherbivorous zooplankton in the southeastern Bering Sea during spring. Deep-Sea Res. 33, 523–556.
D.K. Stoecker et al. / Deep-Sea Research II ∎ (∎∎∎∎) ∎∎∎–∎∎∎12
Please cite this article as: Stoecker, D.K., et al., Microzooplankton grazing in the Eastern Bering Sea in summer. Deep-Sea Res. II (2013),http://dx.doi.org/10.1016/j.dsr2.2013.09.017i