patterns of microzooplankton growth in dilution experiments across a trophic gradient: implications...
TRANSCRIPT
RESEARCH ARTICLE
Patterns of microzooplankton growth in dilution experimentsacross a trophic gradient: Implications for herbivory studies
Matthew R. First Æ Peter J. Lavrentyev ÆFrank J. Jochem
Received: 7 August 2006 / Accepted: 18 January 2007� Springer-Verlag 2007
Abstract To investigate the growth and grazing pat-
terns of microzooplankton (MZP) in environments of
differing productivity, dilution experiments measuring
phytoplankton growth (l) and grazing mortality (m)
rates were performed using samples from contrasting
locations along the Texas coast. Samples were col-
lected from estuaries, coastal lagoons and offshore
Gulf of Mexico locations in the spring and summer of
2001. MZP growth rates were determined in each
dilution treatment. Although MZP biomass changed
over time in most dilution treatments, adjusting l and
m for the actual grazer gradient (represented by geo-
metric mean MZP biomass) did not cause a significant
deviation from the nominal dilution gradient. Like-
wise, these adjustments did not yield significant
regressions where none existed before adjustment. The
dynamics of MZP taxonomic groups (ciliates, dinofla-
gellates) and size categories differed suggesting that in
some cases internal predation may lead to trophic
cascades. MZP biomass was higher in productive
coastal waters and included a larger proportion of
dinoflagellates than in the oligotrophic, ciliate-domi-
nated waters of the Gulf of Mexico. The MZP bio-
mass-to-chlorophyll a ratio was lowest in the
hypereutrophic Nueces River, where MZP biomass
significantly increased in all dilution treatments (net
growth rates up to 2 day–1) suggesting a strong top–
down control. In the brown-tide dominated Upper
Laguna Madre and the oligotrophic seagrass-domi-
nated Lower Laguna Madre MZP growth was decou-
pled from that of phytoplankton. At these sites, MZP
were likely fueled by bacterial carbon and mixotrophy,
respectively. Observing the growth response of MZP in
dilution experiments can provide insight into trophic
structure and efficiency of the microbial food web.
Introduction
In aquatic systems, phagotrophic protists consume a
significant proportion of primary production (e.g.
Calbet and Landry 2004, and references therein) and
supply the bulk of regenerated nutrients in the ocean
(Legendre and Rassoulzadegan 1995). Microzoo-
plankton (MZP, mainly ciliates and dinoflagellates
20–200 lm) act as an important link between small
primary producers and larger consumers (Burkill et al.
1993). MZP respond rapidly to increases in phyto-
plankton abundance (Strom et al. 2001) and through
selective herbivory can restructure phytoplankton
communities and influence the function of the micro-
bial food web (Burkill et al. 1987; Gaul and Antia
2001). Conversely, the avoidance or deterrence of
grazing by MZP has been implicated as a factor in the
formation of algal blooms (Buskey and Hyatt 1995;
Communicated by J.P. Grassle.
M. R. First � P. J. LavrentyevDepartment of Biology, The University of Akron,Akron, OH 44325-3908, USA
F. J. JochemMarine Biology Program, Florida International University,3000 NE 151 Street, North Miami, FL 33181, USA
Present Address:M. R. First (&)Department of Marine Sciences, Marine Science Building,University of Georgia, Athens, GA 30602-3636, USAe-mail: [email protected]
123
Mar Biol
DOI 10.1007/s00227-007-0629-9
Stoecker et al. 2000; Irigoien et al. 2005). As top-pre-
dators in the microbial food web, MZP form trophic
cascades that can indirectly influence picoplankton
(Samuelsson and Andersson 2003), nitrifying bacteria
(Lavrentyev et al. 1997), and nutrient regeneration
rates (Sherr and Sherr 2002). In turn, MZP serve as a
significant energy source for mesozooplankton in the
open ocean (Calbet and Landry 1999) as well as in
coastal waters, where ciliates are selectively preyed
upon by copepods (Calbet and Saiz 2005). MZP are
also important as a food source for larval fish (Buskey
et al. 1993) and benthic invertebrates (Lavrentyev
et al. 1995).
Information about MZP herbivory is commonly
generated from serial dilution experiments (Landry
and Hassett 1982), which provide simultaneous esti-
mates of both rates of phytoplankton growth (l) and
the grazing impact (m) of MZP. In this method, natural
seawater is progressively diluted with particle-free
seawater (typically < 0.2 lm). In theory, phytoplank-
ton growth is independent of the dilution and it follows
that decreasing the herbivore-phytoplankton encoun-
ter rate will relieve grazing pressure in proportion to
the dilution gradient. Thus, the central assumption of
the dilution method is that the grazer impact is pro-
portional to the dilution factor (Landry et al. 1995).
It is well established that MZP, particularly ciliates,
can match and even exceed the growth rates of their
prey (Banse 1982; Montagnes and Lessard 1999; Lav-
rentyev et al. 2004). While accounting for herbivore
growth in undiluted samples has been suggested
(Landry 1993; Gallegos et al. 1996), few studies have
considered the variation in MZP growth along the full
dilution gradient. In one study, tintinnid and oligotrich
ciliates grew at low dilutions but declined precipitously
in highly diluted samples (Dolan et al. 2000). The ex-
tent to which uneven grazer growth along the dilution
gradient may bias MZP grazing impact estimates has
since been debated (Dolan and McKeon 2005; Landry
and Calbet 2005).
Comparison of the microbial food web structure and
dynamics suggests that the dominant groups of MZP
and their activities vary with trophic status and ambi-
ent conditions (Boissonneault-Cellineri et al. 2001;
Fileman and Burkill 2001). MZP display a variety of
trophic behaviors including omnivory, bacterivory, and
mixotrophy (i.e. the ability to switch between or com-
bine autotrophic and phagotrophic modes of nutri-
tion), which allows their communities to adapt to
changing conditions (Dolan and Perez 2000). Phyto-
plankton community structure can be an important
factor determining the composition of MZP commu-
nities (Lavrentyev et al. 2004) and the outcome of
herbivory experiments (Fahnenstiel et al. 1995; Lew-
itus et al. 1998). Furthermore, the impact of meso-
zooplankton predation and trophic interactions among
MZP can vary over a trophic gradient (Calbet 2001;
Samuelsson and Andersson 2003; Liu et al. 2005).
These considerations lead to the following ques-
tions: (1) How do the growth patterns of MZP in
dilution experiments translate into experimental esti-
mates of herbivory? (2) How does the growth of major
MZP groups and their grazing impacts vary across
natural productivity gradients? To address these
questions, serial dilution experiments were conducted
at several contrasting coastal and offshore sites repre-
senting a trophic gradient from a highly productive
river (Nueces River, TX, USA) to the oligotrophic
Gulf of Mexico. The response of different MZP
assemblages to the dilution gradient was observed to
provide insight into the function of microbial food
webs. To assess potential consequences of MZP growth
on herbivory estimates the dilution gradient was ad-
justed to account for changes in the grazer community.
Methods
Dilution experiments
Sampling and experiments were conducted at several
locations along the Texas coast and the open Gulf of
Mexico during spring and summer 2001 (Table 1;
Fig. 1). Estuarine stations varied from hypereutrophic
conditions (Nueces River) to an oligotrophic, seagrass-
dominated system (Lower Laguna Madre). High
salinity in Laguna Madre results from high evaporation
and low freshwater input. In Upper Laguna Madre, the
brown-tide forming pelagophyte, Aureoumbra laguni-
ensis, has persisted for over a decade (Buskey and
Hyatt 1995). Water from the estuarine Corpus Christi
Bay and the oligotrophic open Gulf of Mexico was
collected at several times over the spring and summer.
The average depth of Corpus Christi Bay is 3-m and
water was collected directly below the surface near the
center of the Bay. Open Gulf of Mexico water was
collected in low turbidity water, usually >50-km from
the coast. At estuarine sites, surface water was col-
lected into 20-l Nalgene polyethylene carboys. Open
Gulf of Mexico and Laguna Madre samples were col-
lected with 10-l Niskin bottles from 5-m below and at
the surface, respectively. All materials used in handling
samples were first acid-washed with 10% HCl and tri-
ple rinsed with deionized water. Laguna Madre
experimental incubations were started immediately
after sampling aboard the R/V Longhorn. All other
Mar Biol
123
experimental incubations started within 5-h of sam-
pling.
In order to remove mesozooplankton, water was
screened through a 153-lm Nitex mesh that was rinsed
with Nanopure water to remove any collected debris.
Roughly between 30 and 50-l of seawater were gravity-
filtered sequentially through two Gelman capsules (3.0
and 0.22-lm) connected by silicon tubing and collected
into 20-l Nalgene carboys. A series of dilutions were
prepared by mixing the 153-lm-screened water (from
here on called whole Seawater, WSW) with the 0.22-
lm-filtered water (100, 60, 30, 15% WSW; 100, 75, 50,
and 25% for stations C1 and G1). The reason for the
change in the dilution treatments after the C1 and G1
trials was to incorporate a higher dilution point (i.e.
15% WSW). Treatments were enriched with N (4-lM
NH4Cl for open Gulf and Lower Laguna Madre, 8-lM
for all others) while non-amended WSW was incubated
as a control (Landry et al. 1995). Treatments addi-
tionally amended with P (0.6 and 0.3-lM NaHPO4 to
C1 and G1, respectively) did not exhibit phytoplankton
growth significantly different from N-amended sam-
ples. Therefore, P was not added in further experi-
ments. Triplicates for each dilution and control were
placed into clear polycarbonate 1-l Nalgene bottles
filled to the mouth to eliminate headspace and tightly
sealed.
Prior to incubation, three samples for chlorophyll a
(CHL) were collected from each treatment. Between
25 – 300-mL of water was filtered through 47-mm
diameter 0.2-lm Nuclepore membrane filters. Filters
were placed in 14-ml Falcon tubes, filled with 10-ml of
90% acetone, and CHL was extracted at –20 ±2�C in
the dark for at least 24-h. CHL was measured with a
Turner Designs fluorometer (TD-700) by the non-
acidic method (Welschmeyer 1994). Equal aliquots
from each dilution replicate were pooled and pre-
served in Lugol’s iodine (5% final concentration) for
analysis of MZP. All preserved samples were kept
refrigerated (5 ±2�C) and dark until the time of anal-
ysis.
All experimental bottles were incubated for 24 h in
an incubator tank shaded with blue Plexiglas to reduce
ambient light. The incubator was kept within 1�C of
the station temperature by a microprocessor con-
trolled, Neslab RTE circulator bath (Jochem et al.
2004). At the end of the incubation, samples for CHL
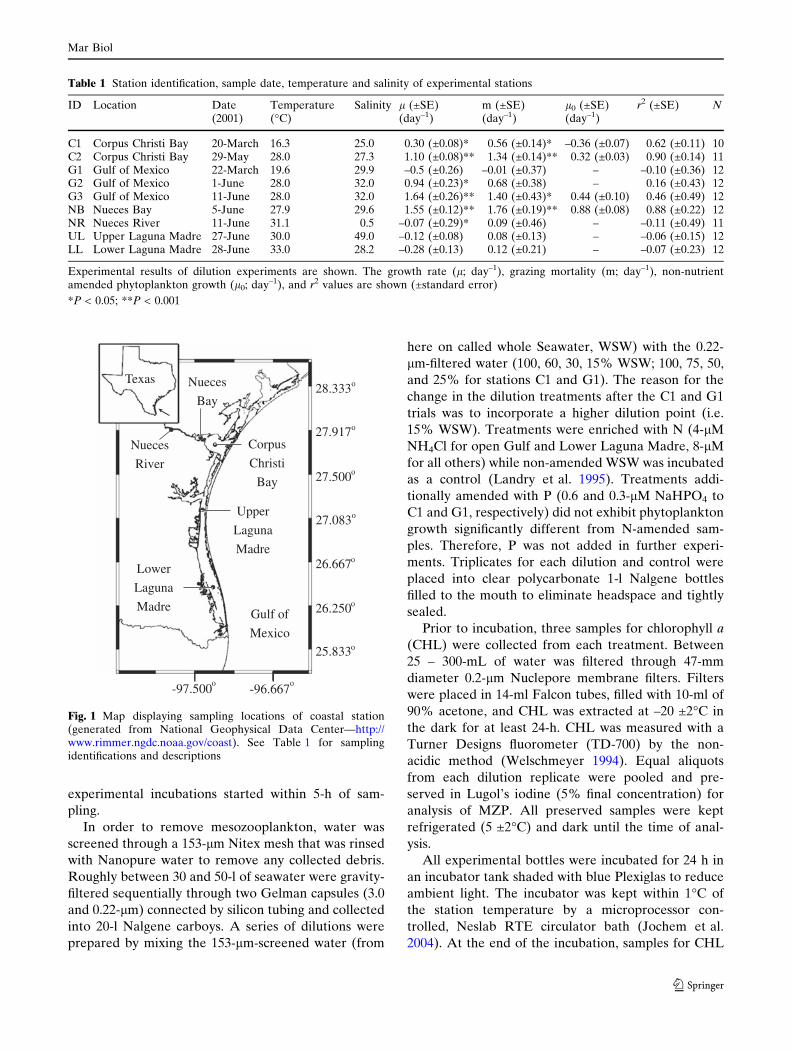
Table 1 Station identification, sample date, temperature and salinity of experimental stations
ID Location Date(2001)
Temperature(�C)
Salinity l (±SE)(day–1)
m (±SE)(day–1)
l0 (±SE)(day–1)
r2 (±SE) N
C1 Corpus Christi Bay 20-March 16.3 25.0 0.30 (±0.08)* 0.56 (±0.14)* –0.36 (±0.07) 0.62 (±0.11) 10C2 Corpus Christi Bay 29-May 28.0 27.3 1.10 (±0.08)** 1.34 (±0.14)** 0.32 (±0.03) 0.90 (±0.14) 11G1 Gulf of Mexico 22-March 19.6 29.9 –0.5 (±0.26) –0.01 (±0.37) – –0.10 (±0.36) 12G2 Gulf of Mexico 1-June 28.0 32.0 0.94 (±0.23)* 0.68 (±0.38) – 0.16 (±0.43) 12G3 Gulf of Mexico 11-June 28.0 32.0 1.64 (±0.26)** 1.40 (±0.43)* 0.44 (±0.10) 0.46 (±0.49) 12NB Nueces Bay 5-June 27.9 29.6 1.55 (±0.12)** 1.76 (±0.19)** 0.88 (±0.08) 0.88 (±0.22) 12NR Nueces River 11-June 31.1 0.5 –0.07 (±0.29)* 0.09 (±0.46) – –0.11 (±0.49) 11UL Upper Laguna Madre 27-June 30.0 49.0 –0.12 (±0.08) 0.08 (±0.13) – –0.06 (±0.15) 12LL Lower Laguna Madre 28-June 33.0 28.2 –0.28 (±0.13) 0.12 (±0.21) – –0.07 (±0.23) 12
Experimental results of dilution experiments are shown. The growth rate (l; day–1), grazing mortality (m; day–1), non-nutrientamended phytoplankton growth (l0; day–1), and r2 values are shown (±standard error)
*P < 0.05; **P < 0.001
28.333ο
ο
ο
ο
ο
ο
ο
οο
27.917
27.500
27.083
25.833
26.250
26.667
-97.500 -96.667
Texas
Nueces
River
Nueces
Bay
Corpus
Christi
Bay
Upper
Laguna
Madre
Lower
Laguna
MadreGulf of
Mexico
Fig. 1 Map displaying sampling locations of coastal station(generated from National Geophysical Data Center—http://www.rimmer.ngdc.noaa.gov/coast). See Table 1 for samplingidentifications and descriptions
Mar Biol
123
and organism counts were collected and processed as
described above. Net growth rates (r; d–1) of phyto-
plankton were calculated from the exponential growth
equation:
r ¼ 1
tln
Pt
P0ð1Þ
where Pt and P0 are the final and initial CHL concen-
trations, respectively. A linear regression model was
used to plot the best-fit relationship between r and
dilution level. Phytoplankton growth (l) and grazing
mortality rates (m) are defined as the y-intercept and
the negative slope of this relationship, respectively. For
comparison, phytoplankton growth (l0) was calculated
as the sum of net growth rate in control samples without
nutrient amendments and the grazing impact from the
linear relationship (Landry 1993; Landry et al. 1995).
This calculation accounts for the potentially higher
phytoplankton growth in nutrient amended treatments.
Microzooplankton counts
In order to quantify the MZP community, between 20
and 100-ml (depending on the plankton concentration,
water turbidity, and dilution) of Lugol’s preserved
water samples were settled in Utermohl chambers for
at least 18-h. After settling, the chamber was scanned
on an Olympus phase contrast inverted microscope
with transects at 200–400X, for small size and abundant
cells. The entire chamber was scanned to quantify
larger size and less abundant MZP. Length and width
(taken as the longest dimensions) of 3–50 cells per
group were estimated using an eyepiece micrometer
calibrated against a stage micrometer at 400 – 600X
magnification and averaged for each station.
Cell volume was calculated from these parameters
by the approximate geometric shape, usually either
ellipsoid or conical (Wetzel and Likens 1991). Cell
volume was converted to carbon biomass using pub-
lished relationships for ciliates (Putt and Stoecker
1989) and dinoflagellates (Menden-Deuer and Lessard
2000). Dinoflagellate cell volumes were corrected for
shrinkage due to preservatives (Menden-Deuer et al.
2001). Ciliates can also shrink in preservatives (Stoec-
ker et al. 1994) but their volume is already corrected in
the regression (Putt and Stoecker 1989). MZP were
identified to the lowest possible taxonomic level using
literature for ciliates (Small and Lynn 1985; Carey
1992; Lynn and Gilron 1993; Petz 1995) and dinofla-
gellates (Steidinger and Tangen 1993). Net MZP
growth rates (rz) were calculated from initial and final
biomass using Eq. 1.
Analysis
In order to gauge the effect of predator net growth or
loss rate (rz) on measurements of l and m, we used the
geometric mean predator biomass (GMPB) to reassess
the experimental outputs (Gallegos et al. 1996):
GMPB ¼ Z0 erz Dt=2 ð2Þ
where Z0 is the initial predator biomass concentration.
We measured MZP net growth rates in all dilution
treatments in this study and defined the ‘‘predator’’
(i.e. the grazer) as either ciliates or total MZP (dino-
flagellates and ciliates). These large groupings are
necessary for the inclusion of cells present in WSW but
absent or depleted in high dilutions. Also, many pop-
ulations present at low concentrations (i.e. < 100 cells-
l–1) can potentially introduce artificially high net rates
of growth or mortality and these large categories
dampened this effect. Phytoplankton growth is plotted
against the GMPB at each dilution normalized to
GMPB in 100% water.
MZP were also sorted into size categories based on
equivalent spherical diameter (ESD) derived from cell
volume. Considering the distribution of cell volumes,
we defined three size classes: < 20, 20–40, and >40-lm
ESD, each with a similar contribution to total biomass.
Typically, cells smaller than 20-lm are classified as
nanoplankton. In this study, we included small ciliates
(e.g. the choreotrich, Lohmaniella sp.) and dinoflagel-
lates (e.g. Gymnodinium sp. typically >15-lm) below
this arbitrary size cutoff. Rates of initial net phyto-
plankton productivity were calculated as the product of
initial phytoplankton biomass and net growth in each
dilution treatment.
Results
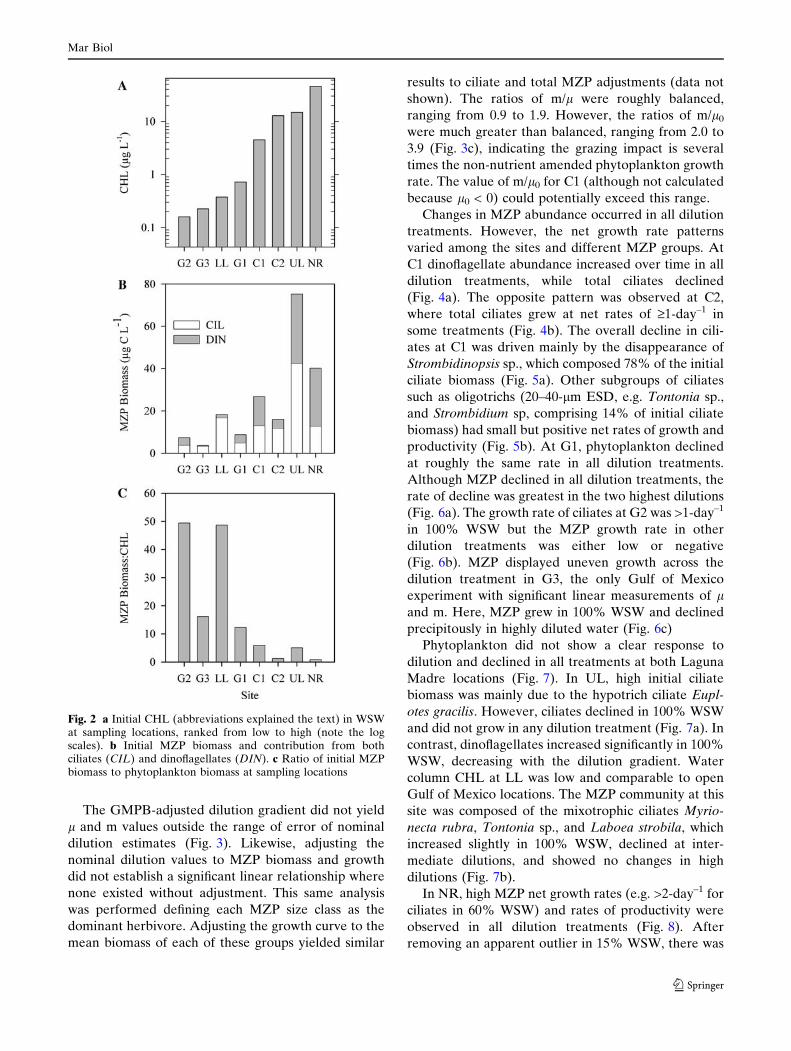
Initial CHL in WSW ranged from 0.2 to 46 lg l–1
(Fig. 2a) and total initial MZP biomass ranged from 3.6
to 75 lg C l–1 (Fig. 2b). The MZP:CHL ratio was
lowest at the hypereutrophic NR (0.9) and reached a
high of 49 at G2 and LL (Fig. 2c). In four of the nine
dilution experiments, the relationship between net
phytoplankton growth rate and the dilution gradient
was linear (Table 1). Of these four experiments, the
grazing rate ranged from 0.56-day–1 (C1) to 1.76-day–1
(NB). Estimates of l ranged from 0.3-day–1 (C1) to
1.64-day–1 (G3). In all cases, l0 < l suggesting that all
stations were nutrient limited. High concentration of
suspended detritus in NB prevented accurate MZP
counts; therefore these data are not reported.
Mar Biol
123
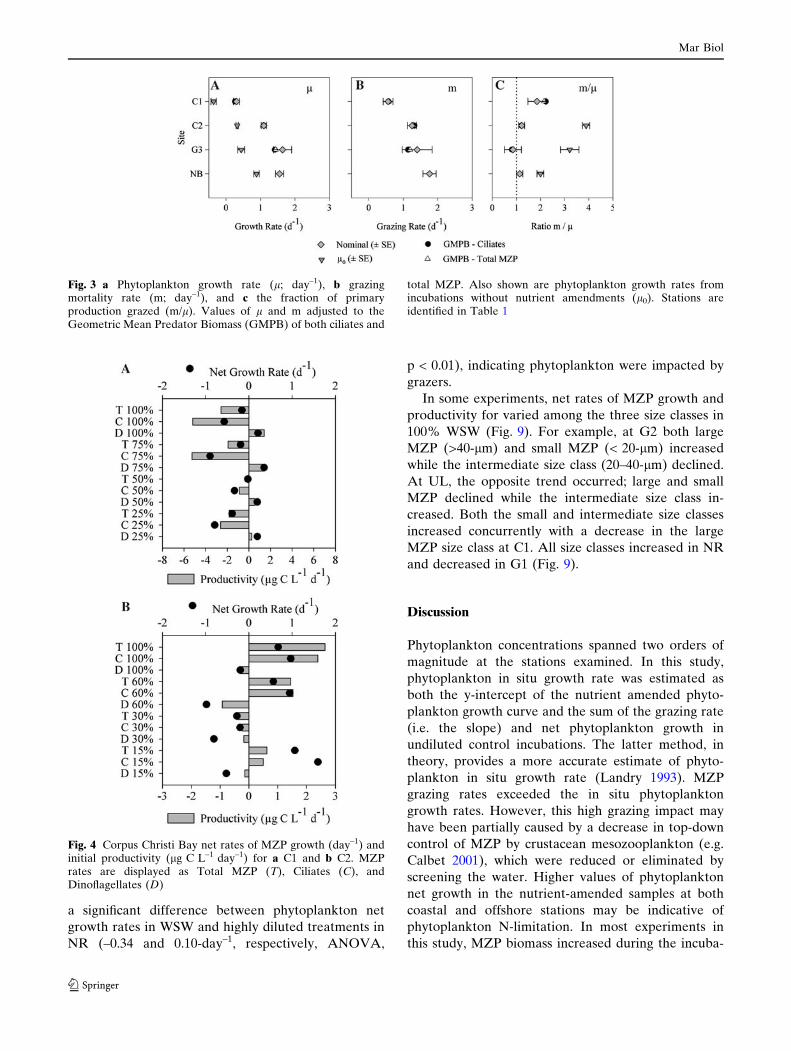
The GMPB-adjusted dilution gradient did not yield
l and m values outside the range of error of nominal
dilution estimates (Fig. 3). Likewise, adjusting the
nominal dilution values to MZP biomass and growth
did not establish a significant linear relationship where
none existed without adjustment. This same analysis
was performed defining each MZP size class as the
dominant herbivore. Adjusting the growth curve to the
mean biomass of each of these groups yielded similar
results to ciliate and total MZP adjustments (data not
shown). The ratios of m/l were roughly balanced,
ranging from 0.9 to 1.9. However, the ratios of m/l0
were much greater than balanced, ranging from 2.0 to
3.9 (Fig. 3c), indicating the grazing impact is several
times the non-nutrient amended phytoplankton growth
rate. The value of m/l0 for C1 (although not calculated
because l0 < 0) could potentially exceed this range.
Changes in MZP abundance occurred in all dilution
treatments. However, the net growth rate patterns
varied among the sites and different MZP groups. At
C1 dinoflagellate abundance increased over time in all
dilution treatments, while total ciliates declined
(Fig. 4a). The opposite pattern was observed at C2,
where total ciliates grew at net rates of ‡1-day–1 in
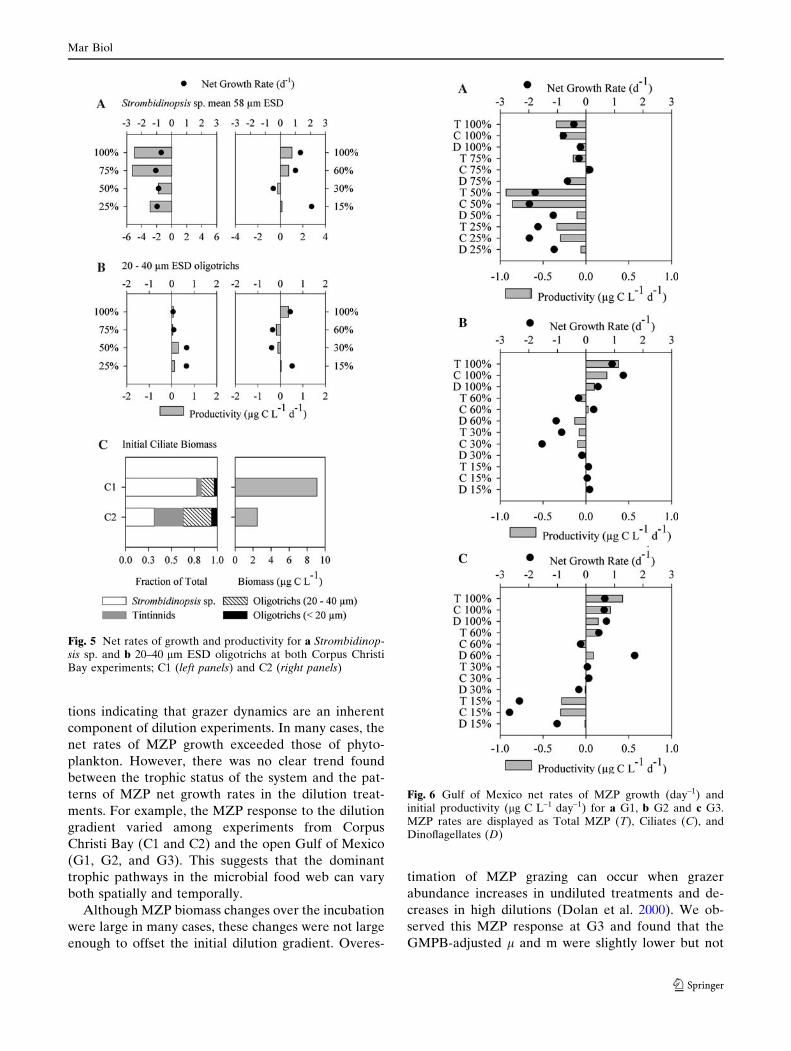
some treatments (Fig. 4b). The overall decline in cili-
ates at C1 was driven mainly by the disappearance of
Strombidinopsis sp., which composed 78% of the initial
ciliate biomass (Fig. 5a). Other subgroups of ciliates
such as oligotrichs (20–40-lm ESD, e.g. Tontonia sp.,
and Strombidium sp, comprising 14% of initial ciliate
biomass) had small but positive net rates of growth and
productivity (Fig. 5b). At G1, phytoplankton declined
at roughly the same rate in all dilution treatments.
Although MZP declined in all dilution treatments, the
rate of decline was greatest in the two highest dilutions
(Fig. 6a). The growth rate of ciliates at G2 was >1-day–1
in 100% WSW but the MZP growth rate in other
dilution treatments was either low or negative
(Fig. 6b). MZP displayed uneven growth across the
dilution treatment in G3, the only Gulf of Mexico
experiment with significant linear measurements of land m. Here, MZP grew in 100% WSW and declined
precipitously in highly diluted water (Fig. 6c)
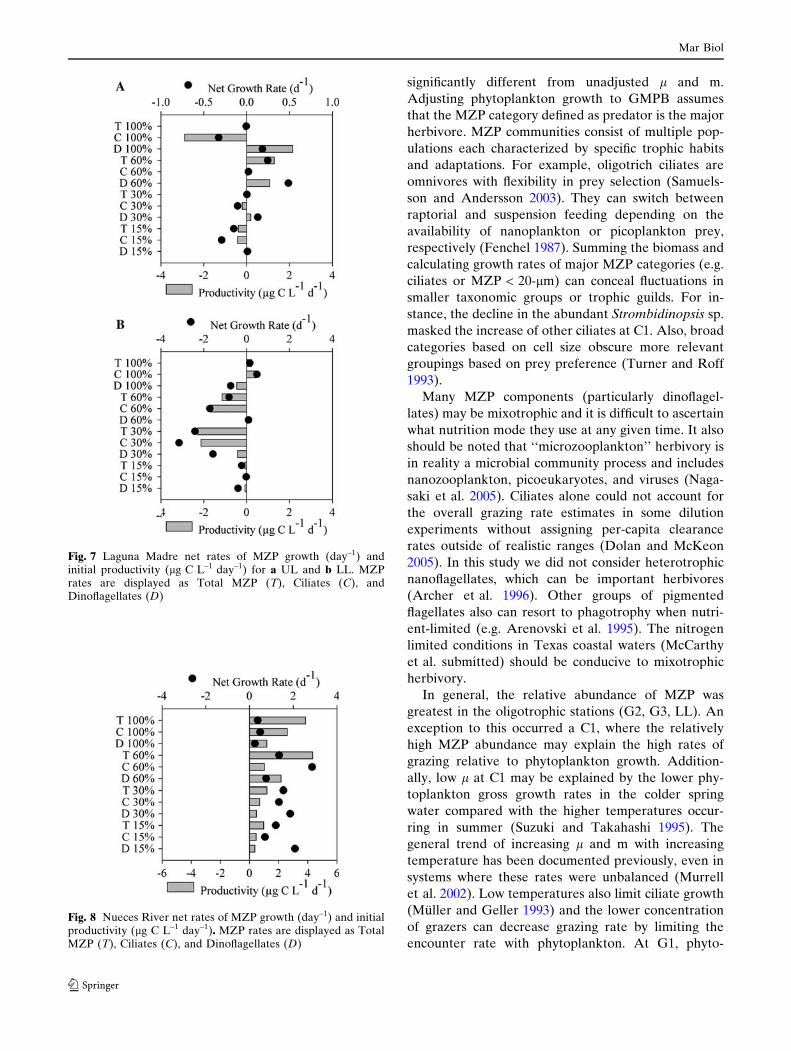
Phytoplankton did not show a clear response to
dilution and declined in all treatments at both Laguna
Madre locations (Fig. 7). In UL, high initial ciliate
biomass was mainly due to the hypotrich ciliate Eupl-
otes gracilis. However, ciliates declined in 100% WSW
and did not grow in any dilution treatment (Fig. 7a). In
contrast, dinoflagellates increased significantly in 100%
WSW, decreasing with the dilution gradient. Water
column CHL at LL was low and comparable to open
Gulf of Mexico locations. The MZP community at this
site was composed of the mixotrophic ciliates Myrio-
necta rubra, Tontonia sp., and Laboea strobila, which
increased slightly in 100% WSW, declined at inter-
mediate dilutions, and showed no changes in high
dilutions (Fig. 7b).
In NR, high MZP net growth rates (e.g. >2-day–1 for
ciliates in 60% WSW) and rates of productivity were
observed in all dilution treatments (Fig. 8). After
removing an apparent outlier in 15% WSW, there was
Fig. 2 a Initial CHL (abbreviations explained the text) in WSWat sampling locations, ranked from low to high (note the logscales). b Initial MZP biomass and contribution from bothciliates (CIL) and dinoflagellates (DIN). c Ratio of initial MZPbiomass to phytoplankton biomass at sampling locations
Mar Biol
123
a significant difference between phytoplankton net
growth rates in WSW and highly diluted treatments in
NR (–0.34 and 0.10-day–1, respectively, ANOVA,
p < 0.01), indicating phytoplankton were impacted by
grazers.
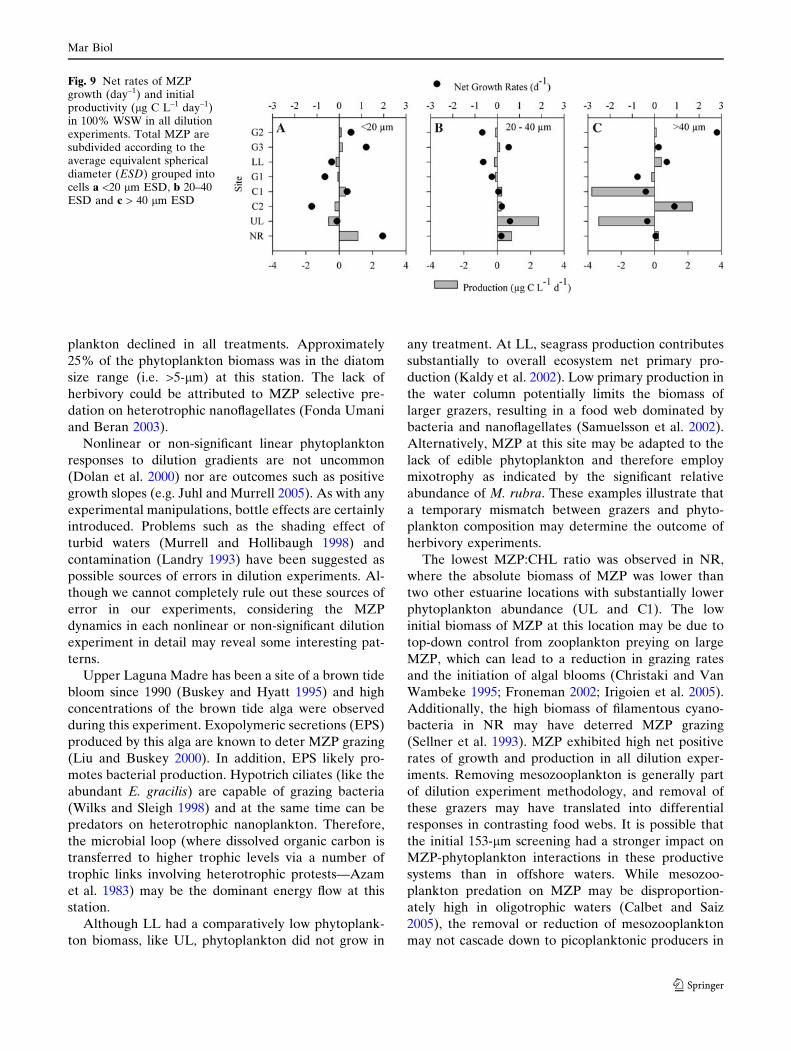
In some experiments, net rates of MZP growth and
productivity for varied among the three size classes in
100% WSW (Fig. 9). For example, at G2 both large
MZP (>40-lm) and small MZP (< 20-lm) increased
while the intermediate size class (20–40-lm) declined.
At UL, the opposite trend occurred; large and small
MZP declined while the intermediate size class in-
creased. Both the small and intermediate size classes
increased concurrently with a decrease in the large
MZP size class at C1. All size classes increased in NR
and decreased in G1 (Fig. 9).
Discussion
Phytoplankton concentrations spanned two orders of
magnitude at the stations examined. In this study,
phytoplankton in situ growth rate was estimated as
both the y-intercept of the nutrient amended phyto-
plankton growth curve and the sum of the grazing rate
(i.e. the slope) and net phytoplankton growth in
undiluted control incubations. The latter method, in
theory, provides a more accurate estimate of phyto-
plankton in situ growth rate (Landry 1993). MZP
grazing rates exceeded the in situ phytoplankton
growth rates. However, this high grazing impact may
have been partially caused by a decrease in top-down
control of MZP by crustacean mesozooplankton (e.g.
Calbet 2001), which were reduced or eliminated by
screening the water. Higher values of phytoplankton
net growth in the nutrient-amended samples at both
coastal and offshore stations may be indicative of
phytoplankton N-limitation. In most experiments in
this study, MZP biomass increased during the incuba-
Fig. 3 a Phytoplankton growth rate (l; day–1), b grazingmortality rate (m; day–1), and c the fraction of primaryproduction grazed (m/l). Values of l and m adjusted to theGeometric Mean Predator Biomass (GMPB) of both ciliates and
total MZP. Also shown are phytoplankton growth rates fromincubations without nutrient amendments (l0). Stations areidentified in Table 1
Fig. 4 Corpus Christi Bay net rates of MZP growth (day–1) andinitial productivity (lg C L–1 day–1) for a C1 and b C2. MZPrates are displayed as Total MZP (T), Ciliates (C), andDinoflagellates (D)
Mar Biol
123
tions indicating that grazer dynamics are an inherent
component of dilution experiments. In many cases, the
net rates of MZP growth exceeded those of phyto-
plankton. However, there was no clear trend found
between the trophic status of the system and the pat-
terns of MZP net growth rates in the dilution treat-
ments. For example, the MZP response to the dilution
gradient varied among experiments from Corpus
Christi Bay (C1 and C2) and the open Gulf of Mexico
(G1, G2, and G3). This suggests that the dominant
trophic pathways in the microbial food web can vary
both spatially and temporally.
Although MZP biomass changes over the incubation
were large in many cases, these changes were not large
enough to offset the initial dilution gradient. Overes-
timation of MZP grazing can occur when grazer
abundance increases in undiluted treatments and de-
creases in high dilutions (Dolan et al. 2000). We ob-
served this MZP response at G3 and found that the
GMPB-adjusted l and m were slightly lower but not
Fig. 5 Net rates of growth and productivity for a Strombidinop-sis sp. and b 20–40 lm ESD oligotrichs at both Corpus ChristiBay experiments; C1 (left panels) and C2 (right panels)
Fig. 6 Gulf of Mexico net rates of MZP growth (day–1) andinitial productivity (lg C L–1 day–1) for a G1, b G2 and c G3.MZP rates are displayed as Total MZP (T), Ciliates (C), andDinoflagellates (D)
Mar Biol
123
significantly different from unadjusted l and m.
Adjusting phytoplankton growth to GMPB assumes
that the MZP category defined as predator is the major
herbivore. MZP communities consist of multiple pop-
ulations each characterized by specific trophic habits
and adaptations. For example, oligotrich ciliates are
omnivores with flexibility in prey selection (Samuels-
son and Andersson 2003). They can switch between
raptorial and suspension feeding depending on the
availability of nanoplankton or picoplankton prey,
respectively (Fenchel 1987). Summing the biomass and
calculating growth rates of major MZP categories (e.g.
ciliates or MZP < 20-lm) can conceal fluctuations in
smaller taxonomic groups or trophic guilds. For in-
stance, the decline in the abundant Strombidinopsis sp.
masked the increase of other ciliates at C1. Also, broad
categories based on cell size obscure more relevant
groupings based on prey preference (Turner and Roff
1993).
Many MZP components (particularly dinoflagel-
lates) may be mixotrophic and it is difficult to ascertain
what nutrition mode they use at any given time. It also
should be noted that ‘‘microzooplankton’’ herbivory is
in reality a microbial community process and includes
nanozooplankton, picoeukaryotes, and viruses (Naga-
saki et al. 2005). Ciliates alone could not account for
the overall grazing rate estimates in some dilution
experiments without assigning per-capita clearance
rates outside of realistic ranges (Dolan and McKeon
2005). In this study we did not consider heterotrophic
nanoflagellates, which can be important herbivores
(Archer et al. 1996). Other groups of pigmented
flagellates also can resort to phagotrophy when nutri-
ent-limited (e.g. Arenovski et al. 1995). The nitrogen
limited conditions in Texas coastal waters (McCarthy
et al. submitted) should be conducive to mixotrophic
herbivory.
In general, the relative abundance of MZP was
greatest in the oligotrophic stations (G2, G3, LL). An
exception to this occurred a C1, where the relatively
high MZP abundance may explain the high rates of
grazing relative to phytoplankton growth. Addition-
ally, low l at C1 may be explained by the lower phy-
toplankton gross growth rates in the colder spring
water compared with the higher temperatures occur-
ring in summer (Suzuki and Takahashi 1995). The
general trend of increasing l and m with increasing
temperature has been documented previously, even in
systems where these rates were unbalanced (Murrell
et al. 2002). Low temperatures also limit ciliate growth
(Muller and Geller 1993) and the lower concentration
of grazers can decrease grazing rate by limiting the
encounter rate with phytoplankton. At G1, phyto-
Fig. 7 Laguna Madre net rates of MZP growth (day–1) andinitial productivity (lg C L–1 day–1) for a UL and b LL. MZPrates are displayed as Total MZP (T), Ciliates (C), andDinoflagellates (D)
Fig. 8 Nueces River net rates of MZP growth (day–1) and initialproductivity (lg C L–1 day–1). MZP rates are displayed as TotalMZP (T), Ciliates (C), and Dinoflagellates (D)
Mar Biol
123
plankton declined in all treatments. Approximately
25% of the phytoplankton biomass was in the diatom
size range (i.e. >5-lm) at this station. The lack of
herbivory could be attributed to MZP selective pre-
dation on heterotrophic nanoflagellates (Fonda Umani
and Beran 2003).
Nonlinear or non-significant linear phytoplankton
responses to dilution gradients are not uncommon
(Dolan et al. 2000) nor are outcomes such as positive
growth slopes (e.g. Juhl and Murrell 2005). As with any
experimental manipulations, bottle effects are certainly
introduced. Problems such as the shading effect of
turbid waters (Murrell and Hollibaugh 1998) and
contamination (Landry 1993) have been suggested as
possible sources of errors in dilution experiments. Al-
though we cannot completely rule out these sources of
error in our experiments, considering the MZP
dynamics in each nonlinear or non-significant dilution
experiment in detail may reveal some interesting pat-
terns.
Upper Laguna Madre has been a site of a brown tide
bloom since 1990 (Buskey and Hyatt 1995) and high
concentrations of the brown tide alga were observed
during this experiment. Exopolymeric secretions (EPS)
produced by this alga are known to deter MZP grazing
(Liu and Buskey 2000). In addition, EPS likely pro-
motes bacterial production. Hypotrich ciliates (like the
abundant E. gracilis) are capable of grazing bacteria
(Wilks and Sleigh 1998) and at the same time can be
predators on heterotrophic nanoplankton. Therefore,
the microbial loop (where dissolved organic carbon is
transferred to higher trophic levels via a number of
trophic links involving heterotrophic protests—Azam
et al. 1983) may be the dominant energy flow at this
station.
Although LL had a comparatively low phytoplank-
ton biomass, like UL, phytoplankton did not grow in
any treatment. At LL, seagrass production contributes
substantially to overall ecosystem net primary pro-
duction (Kaldy et al. 2002). Low primary production in
the water column potentially limits the biomass of
larger grazers, resulting in a food web dominated by
bacteria and nanoflagellates (Samuelsson et al. 2002).
Alternatively, MZP at this site may be adapted to the
lack of edible phytoplankton and therefore employ
mixotrophy as indicated by the significant relative
abundance of M. rubra. These examples illustrate that
a temporary mismatch between grazers and phyto-
plankton composition may determine the outcome of
herbivory experiments.
The lowest MZP:CHL ratio was observed in NR,
where the absolute biomass of MZP was lower than
two other estuarine locations with substantially lower
phytoplankton abundance (UL and C1). The low
initial biomass of MZP at this location may be due to
top-down control from zooplankton preying on large
MZP, which can lead to a reduction in grazing rates
and the initiation of algal blooms (Christaki and Van
Wambeke 1995; Froneman 2002; Irigoien et al. 2005).
Additionally, the high biomass of filamentous cyano-
bacteria in NR may have deterred MZP grazing
(Sellner et al. 1993). MZP exhibited high net positive
rates of growth and production in all dilution exper-
iments. Removing mesozooplankton is generally part
of dilution experiment methodology, and removal of
these grazers may have translated into differential
responses in contrasting food webs. It is possible that
the initial 153-lm screening had a stronger impact on
MZP-phytoplankton interactions in these productive
systems than in offshore waters. While mesozoo-
plankton predation on MZP may be disproportion-
ately high in oligotrophic waters (Calbet and Saiz
2005), the removal or reduction of mesozooplankton
may not cascade down to picoplanktonic producers in
Fig. 9 Net rates of MZPgrowth (day–1) and initialproductivity (lg C L–1 day–1)in 100% WSW in all dilutionexperiments. Total MZP aresubdivided according to theaverage equivalent sphericaldiameter (ESD) grouped intocells a <20 lm ESD, b 20–40ESD and c > 40 lm ESD
Mar Biol
123
these open ocean environments (Calbet and Landry
1999).
Changes in MZP abundance or grazing activity have
been cited as a potential explanation for nonlinear or
nonsignificant dilution experiments (Gallegos 1989;
Dolan et al. 2000). Modified experimental techniques
have incorporated both changes in MZP abundance
(Landry 1993; Gallegos et al. 1996) and the relative
uptake of tracer cells (Landry et al. 1995) as verifica-
tion that the nominal dilution gradient represents the
grazing gradient. Changes in grazer abundance can also
provide clues as to trophic interactions within MZP.
Factors such as the number of trophic links and the
degree of omnivory can affect overall phytoplankton
community structure and microbial food web efficiency
(Reckermann and Veldhuis 1997; Samuelsson and
Andersson 2003).
The results of this study suggest that microzoo-
plankton growth is an inherent part of dilution exper-
iments and must be taken into account. Although this
study confirms that dilution is a valid tool for assessing
MZP herbivory impacts, it also stresses the need to
examine the composition and dynamics of both prey
and grazer populations. This is particularly important
in coastal waters, where phytoplankton can include
various taxonomic and size groups. Under such con-
ditions, changes in total chlorophyll may not reveal
intense trophic interactions between MZP and subset
of the phytoplankton community. Internal trophic
interactions among MZP can also impact the dominant
herbivores, causing a non-linear grazing response as
trophic links are severed with increasing dilution. The
complexity of the coastal microbial food web can make
interpreting the results of grazing experiments less
than straightforward. It is important not to understate
this complexity as the simplifications commonly em-
ployed (e.g. size class, taxa) do not approach the actual
food web complexity (Pomeroy 2001). At the same
time, dilution can help gain valuable insights into this
intertwined system by gradually unraveling trophic
links between protists and their prey.
Increased information about the feeding and growth
patterns of predominant MZP taxa can provide insight
in the function and efficiency of the microbial food
web. Examining the response of an entire microbial
system from viruses to MZP to dilution may expose
interesting patterns. The application of microscopy and
flow-cytometry can enhance dilution experiments
(Fahnenstiel et al. 1995; Landry et al. 1995; Jochem
et al. 2004). Further work in plotting interactions and
constraining the regulatory forces in the microbial food
web promises a deeper understanding of energy flow in
aquatic systems.
Declaration
The authors declare all work presented here was con-
ducted in compliance of the laws of the United States
of America.
Acknowledgments The University of Akron Graduate Pro-gram and the Nancy Lee and Perry Bass Endowed Chair fundingto the University of Texas at Austin Marine Science Institute(UTMSI) supported this work. W.S. Gardner and M.J. McCarthygenerously assisted with logistics, sampling and analyses. We areextremely grateful for their support. MRF also received supportfrom the University of Georgia Graduate Fellowship. We thankK.H. Dunton and his students who shared space on the LagunaMadre cruise and the personnel at UTMSI and captain and crewof R/V Longhorn who assisted with this work. R.J. Duff and L.Fraser assisted much with the preparation of the thesis on whichthis work is based. A.M. Modugno was generous in her supportand editorial skills. The comments and suggestions of threeanonymous reviewers greatly improved this manuscript.
References
Archer SD, Leakey RJG, Burkill PH, Sleigh MA (1996)Microbial dynamics in coastal waters of East Antarctica:herbivory by heterotrophic dinoflagellates. Mar Ecol ProgSer 139:239–255
Arenovski AL, Lim EL, Caron DA (1995) Mixotrophic nano-plankton in oligotrophic surface waters of the Sargasso Seamay employ phagotrophy to obtain major nutrients. J Plank-ton Res 17:801–820
Azam F, Fenchel T, Field JG, Gray JS, Meyer-Reil LA,Thingstad F (1983) The ecological role of water-columnmicrobes in the sea. Mar Ecol Prog Ser 10:257–263
Banse K (1982) Cell volumes, maximal growth-rates of unicel-lular algae and ciliates, and the role of ciliates in the marinepelagial. Limnol Oceanogr 27:1059–1071
Boissonneault-Cellineri KR, Mehta M, Lonsdale DJ, Caron DA(2001) Microbial food web interactions in two Long Islandembayments. Aquat Microb Ecol 26:139–155
Burkill PH, Mantoura RFC, Llewellyn CA, Owens NJP (1987)Microzooplankton grazing and selectivity of phytoplanktonin coastal waters. Mar Biol 93:581–590
Burkill PH, Edwards ES, John AWG, Sleigh MA (1993)Microzooplankton and their herbivorous activity in theNortheastern Atlantic Ocean. Deep-Sea Res Part II-TopicalStudies Oceanogr 40:479–493
Buskey EJ, Hyatt CJ (1995) Effects of the Texas (USA) brown-tide alga on planktonic grazers. Mar Ecol Prog Ser 126:285–292
Buskey EJ, Coulter C, Strom S (1993) Locomotory patterns ofmicrozooplankton: potential effects on food selectivity oflarval fish. Bull Mar Sci 53:29–43
Calbet A (2001) Mesozooplankton grazing effect on primaryproduction: a global comparative analysis in marine ecosys-tems. Limnol Oceanogr 46:1824–1830
Calbet A, Landry MR (1999) Mesozooplankton influences onthe microbial food web: direct and indirect trophic interac-tions in the oligotrophic open ocean. Limnol Oceanogr44:1370–1380
Calbet A, Landry MR (2004) Phytoplankton growth, microzoo-plankton grazing, and carbon cycling in marine systems.Limnol Oceanogr 49:51–57
Mar Biol
123
Calbet A, Saiz E (2005) The ciliate-copepod link in marineecosystems. Aquat Microb Ecol 38:157–167
Carey PG (1992) Marine interstitial ciliates: an illustrated key.Chapman and Hall, London
Christaki U, Van Wambeke F (1995) Simulated phytoplanktonbloom input in top-down manipulated microcosms: com-parative effect of zooflagellates, ciliates and copepods.Aquat Microb Ecol 9:137–147
Dolan JR, Perez MT (2000) Costs, benefits and characteristics ofmixotrophy in marine oligotrichs. Freshw Biol 45:227–238
Dolan JR, McKeon K (2005) The reliability of grazing rateestimates from dilution experiments: have we over-esti-mated rates of organic carbon consumption by microzoo-plankton? Ocean Sci 1:1–7
Dolan JR, Gallegos CL, Moigis A (2000) Dilution effects onmicrozooplankton in dilution grazing experiments. MarEcol Prog Ser 200:127–139
Fahnenstiel GL, McCormick MJ, Lang GA, Redalje DG,Lohrenz SE, Markowitz M, Wagoner B, Carrick HJ (1995)Taxon-specific growth and loss rates for dominant phyto-plankton populations from the Northern Gulf of Mexico.Mar Ecol Prog Ser 117:229–239
Fenchel T (1987) Ecology of protozoa : the biology of free-livingphagotrophic protists. Science Tech Publishers, Madison
Fileman E, Burkill P (2001) The herbivorous impact of micro-zooplankton during two short-term Lagrangian experimentsoff the NW coast of Galicia in summer 1998. Prog Oceanogr51:361–383
Fonda Umani S, Beran A (2003) Seasonal variations in thedynamics of microbial plankton communities: first estimatesfrom experiments in the Gulf of Trieste, Northern AdriaticSea. Mar Ecol Prog Ser 247:1–16
Froneman PW (2002) Trophic cascading in an oligotrophictemperate estuary, South Africa. J Plankton Res 24:807–816
Gallegos CL (1989) Microzooplankton grazing on phytoplanktonin the Rhode River, Maryland—nonlinear feeding kinetics.Mar Ecol Prog Ser 57:23–33
Gallegos CL, Vant WN, Safi KA (1996) Microzooplanktongrazing of phytoplankton in Manukau Harbour, NewZealand. N Z J Mar Freshw Res 30:423–434
Gaul W, Antia AN (2001) Taxon-specific growth and selectivemicrozooplankton grazing of phytoplankton in the North-east Atlantic. J Mar Syst 30:241–261
Irigoien X, Flynn KJ, Harris RP (2005) Phytoplankton blooms: a‘loophole’ in microzooplankton grazing impact? J PlanktonRes 27:313–321
Jochem FJ, McCarthy MJ, Gardner WS (2004) Microbialammonium cycling in the Mississippi River plume duringthe drought spring of 2000. J Plankton Res 26:1265–1275
Juhl AR, Murrell MC (2005) Interactions between nutrients,phytoplankton growth, and microzooplankton grazing in aGulf of Mexico estuary. Aquat Microb Ecol 38:147–156
Kaldy JE, Onuf CP, Eldridge PM, Cifuentes LA (2002) Carbonbudget for a subtropical seagrass dominated coastal lagoon:how important are seagrasses to total ecosystem net primaryproduction? Estuaries 25:528–539
Landry MR (1993) Estimating rates of growth and grazingmortality of phytoplankton by the dilution method. In:Kemp PF (ed) Handbook of methods in aquatic microbialecology. Lewis Publishers, Boca Raton, pp 777
Landry MR, Hassett RP (1982) Estimating the grazing impact ofmarine micro-zooplankton. Mar Biol 67:283–288
Landry MR, Calbet A (2005) Reality checks on microbial foodweb interactions in dilution experiments: responses to thecomments of Dolan and McKeon. Ocean Sci 1:39–44
Landry MR, Kirshtein J, Constantinou J (1995) A refineddilution technique for measuring the community grazingimpact of microzooplankton, with experimental tests in thecentral equatorial Pacific. Mar Ecol Prog Ser 120:53–63
Lavrentyev PJ, Gardner WS, Cavaletto JF, Beaver JR (1995)Effects of the zebra mussel (Dreissena polymorpha Pallas)on protozoa and phytoplankton from Saginaw Bay, LakeHuron. J Great Lakes Res 21:545–557
Lavrentyev PJ, Gardner WS, Johnson JR (1997) Cascadingtrophic effects on aquatic nitrification: experimental evi-dence and potential implications. Aquat Microb Ecol13:161–175
Lavrentyev PJ, McCarthy MJ, Klarer DM, Jochem F, GardnerWS (2004) Estuarine microbial food web patterns in a LakeErie coastal wetland. Microb Ecol 48:567–577
Legendre L, Rassoulzadegan F (1995) Plankton and nutrientdynamics in marine waters. Ophelia 41:153–172
Lewitus AJ, Koepfler ET, Morris JT (1998) Seasonal variation inthe regulation of phytoplankton by nitrogen and grazing in asalt-marsh estuary. Limnol Oceanogr 43:636–646
Liu HB, Buskey EJ (2000) The exopolymer secretions (EPS)layer surrounding Aureoumbra lagunensis cells affectsgrowth, grazing, and behavior of protozoa. Limnol Oceanog45:1187–1191
Liu HB, Dagg MJ, Wu CJ, Chiang KP (2005) Mesozooplanktonconsumption of microplankton in the Mississippi Riverplume, with special emphasis on planktonic ciliates. MarEcol Prog Ser 286:133–144
Lynn DH, Gilron GL (1993) Strombidiid ciliates from coastalwaters near Kingston Harbor, Jamaica (Ciliophora, Oligo-trichia, Strombidiidae). J Mar Biol Assoc UK 73:47–65
Menden-Deuer S, Lessard EJ (2000) Carbon to volume rela-tionships for dinoflagellates, diatoms, and other protistplankton. Limnol Oceanogr 45:569–579
Menden-Deuer S, Lessard EJ, Satterberg J (2001) Effect ofpreservation on dinoflagellate and diatom cell volume andconsequences for carbon biomass predictions. Mar EcolProg Ser 222:41–50
Montagnes DJS, Lessard EJ (1999) Population dynamics of themarine planktonic ciliate Strombidinopsis multiauris: itspotential to control phytoplankton blooms. Aquat MicrobEcol 20:167–181
Muller H, Geller W (1993) Maximum growth-rates of aquaticciliated protozoa: the dependence on body size and tem-perature reconsidered. Arch Hydrobiol 126:315–327
Murrell MC, Hollibaugh JT (1998) Microzooplankton grazing innorthern San Francisco Bay measured by the dilutionmethod. Aquat Microb Ecol 15:53–63
Murrell M, Stanley R, Lores E, DiDonato G, Flemer D (2002)Linkage between microzooplankton grazing and phyto-plankton growth in a Gulf of Mexico estuary. Estuaries25:19–29
Nagasaki K, Tomaru Y, Takao Y, Nishida K, Shirai Y, Suzuki H,Nagumo T (2005) Previously unknown virus infects marinediatom. Appl Environ Microbiol 71:3528–3535
Petz W (1995) Morphology and morphogenesis of Thigmoker-onopsis antarctica Nov-Spec and T. Crystallis Nov-Spec(Ciliophora, Hypotrichida) from Antarctic sea-ice. Eur JProtistol 31:137–147
Pomeroy LR (2001) Caught in the food web: complexity madesimple? Sci Mar 65:31–40
Putt M, Stoecker DK (1989) An experimentally determinedcarbon-volume ratio for marine oligotrichous ciliates fromestuarine and coastal waters. Limnol Oceanogr 34:1097–1103
Mar Biol
123
Reckermann M, Veldhuis MJW (1997) Trophic interactionsbetween picophytoplankton and micro- and nanozooplank-ton in the western Arabian Sea during the NE monsoon1993. Aquat Microb Ecol 12:263–273
Samuelsson K, Andersson A (2003) Predation limitation in thepelagic microbial food web in an oligotrophic aquaticsystem. Aquat Microb Ecol 30:239–250
Samuelsson K, Berglund J, Haecky P, Andersson A (2002)Structural changes in an aquatic microbial food web causedby inorganic nutrient addition. Aquat Microb Ecol 29:29–38
Sellner KG, Brownlee DC, Bundy MH, Brownlee SG, Braun KR(1993) Zooplankton grazing in a Potomac River cyanobac-teria bloom. Estuaries 16:859–872
Sherr EB, Sherr BF (2002) Significance of predation by protistsin aquatic microbial food webs. Antonie Van LeeuwenhoekInternational J Gen Mol Microb 81:293–308
Small EB, Lynn DH (1985) Phylum Ciliophora Doflein, 190l. In:Lee JJ, Hunter SH, Bovee EC (eds) An illustrated guide tothe protozoa. Society of Protozoologists, Lawrence, pp 393–575
Steidinger KA, Tangen K (1993) Dinoflagellates. In: Tomas CR,Throndsen J, Heimdal BR (eds) Marine phytoplankton: aguide to naked flagellates and coccolithophorids. Academic,San Diego, pp 263
Stoecker DK, Gifford DJ, Putt M (1994) Preservation of marineplanktonic ciliates: losses and cell shrinkage during fixation.Mar Ecol Prog Ser 110:293–299
Stoecker DK, Stevens K, Gustafson DE (2000) Grazing onPfiesteria piscicida by microzooplankton. Aquat MicrobEcol 22:261–270
Strom SL, Brainard MA, Holmes JL, Olson MB (2001) Phyto-plankton blooms are strongly impacted by microzooplank-ton grazing in coastal North Pacific waters. Mar Biol138:355–368
Suzuki Y, Takahashi M (1995) Growth responses of severaldiatom species isolated from various environments totemperature. J Phycol 31:880–888
Turner JT, Roff JC (1993) Trophic levels and trophospecies inthe marine plankton: lessons from the microbial food web.Mar Microb Food Webs 7:225–248
Welschmeyer NA (1994) Fluorometric analysis of chlorophyll-ain the presence of chlorophyll-b and pheopigments. LimnolOceanogr 39:1985–1992
Wetzel RG, Likens GE (1991) Limnological analysis. Springer,New York
Wilks SA, Sleigh MA (1998) Grazing rates in Euplotes mutabilis:relationship between particle size and concentration.Microb Ecol 36:165–174
Mar Biol
123