changing grazing systems in central north namibia
TRANSCRIPT
CHANGING GRAZING SYSTEMS IN CENTRAL NORTH NAMIBIA
A. VERLINDEN1,2* AND A. S. KRUGER2
1Desert Research Foundation of Namibia, P.O. Box 20232, Windhoek, Namibia2Institute of Forestry and Nature Research, Kliniekstraat 25, B-1070 Brussels, Belgium
Received 31 January 2006; Revised 6 March 2006; Accepted 1 June 2006
ABSTRACT
Current and historical livestock movement patterns are explored in a semi-arid communal environment in central–northNamibia, placed in context of increasing population, large-scale enclosures, increased water supply and changing vegetation.Farmer’s knowledge of movements, rangeland potential, vegetation condition and plant indicators was gathered and analysedwith various methods such as Canonical Correspondence Analysis (CCA). Local rangeland units were mapped with Landsat TMimagery and analysed with a Geographical Information System (GIS). The data suggest that good grazing was previouslymaintained by low herbivore pressure and frequent fires in a management regime controlled by hunter-gatherers and limitedpermanent water supply.Population increase in settled areas starts migration tomore fertile land units in previous prime grazing areas causing a conflict
between grazing and cropping and a decrease in grazing condition triggering further migration and need for new water supply.Recent large-scale enclosures are targeting predominantly more fertile land units with the most palatable perennial grass speciesand water, causing further conflict for communal farmers.Having reached the frontier of the traditional land there is no space for further expansion, resulting in the need to adapt to
uncertainty with annual grasses more dependent on rainfall. Livestock movement patterns have changed drastically for largeherd owners from transhumance and migration to largely permanent cattle posts. Small herd owners face increasinglonger movements between kraals, water points, depending on less suitable and decreased unfenced grazing lands. Copyright# 2006 John Wiley & Sons, Ltd.
key words: livestock movements; indigenous knowledge; rangeland condition; canonical correspondence analysis; migration; Namibia
INTRODUCTION
Half of sub-Saharan Africa is semi-arid or arid, receiving less than 800mm of rain annually on averagewith rainfall
showing high spatiotemporal variability (Middleton and Thomas, 1997). Livestock are very important
agronomically, economically and culturally to rural producers in these areas (Blench, 2004). The spatial
distribution of livestock, affected by changing management practices, is a major factor determining anthropogenic
changes in savanna ecologies (Scoones, 1993). Due to sensitivity of the mostly poorly structured soils to trampling
and of annual-dominated vegetation to defoliation (Hiernaux and Turner, 1996), the seasonal pattern of grazing
pressure across agropastoral landscapes is a key factor behind land deterioration (Turner and Hiernaux, 2002).
Understanding spatiotemporal distributions of livestock and of the factors influencing these distributions is
necessary for evaluating sustainability of both grazing and agricultural systems (Scoones, 1995). Fine-scaled
information on livestock activities is still limited in semi-arid Africa (Turner and Hiernaux, 2002).
A first objective of this paper is to reach a greater understanding of the grazing component of the current
agropastoral landscape in central north Namibia through translating local producers’ detailed but non-Cartesian
accounts on rangeland condition, use, management and especially livestock movements to the quantitative
land degradation & development
Land Degrad. Develop. 18: 179–197 (2007)
Published online 7 August 2006 in Wiley InterScience (www.interscience.wiley.com). DOI: 10.1002/ldr.769
*Correspondence to: A. Verlinden, Desert Research Foundation of Namibia, P.O. Box 20232, Windhoek, Namibia.E-mail: [email protected]
Contract/grant sponsor: Oshikoto Livestock Development Project.
Copyright # 2006 John Wiley & Sons, Ltd.
extraction measures on a Cartesian plane required by resource scientists. It is accepted that such translations are
very much needed in rural Africa where land use patterns diverge greatly from western agricultural and ranching
systems (Turner and Hiernaux, 2002). At the same time local perceptions are amplified by conventional resource
assessments to allow comparison and verification following the Indigenous Land Units (ILU) approach developed
by Verlinden and Dayot (2005).
A second objective of this paper is to investigate the current livestock movement patterns, and put these in the
perspective of historical patterns and the environmental changes. Transhumance patterns are considered to be a
typical feature of livestock management but they are suggested to have changed over the years as a result of
dynamic processes in the environment, including increasing settlement (Verlinden and Dayot, 2005), enclosure
(Marsh and Seely, 1992; Tapscott and Hangula, 1994; Fuller et al., 1996; Kerven, 1997), water supply (Mendelsohn
et al., 2000) and changing vegetation (Verlinden and Dayot, 2005). These processes and their effects are
insufficiently understood, but the hypothesis in this study is that the grazing options have been seriously restricted
over time.
The area is subject to a much debated process of large-scale privatisation of range resources, mainly by enclosure
of open access and common property land, possibly forcing herders to make further adjustments as elsewhere in the
Kalahari (Perkins, 1996). Several authors working in arid to semi-arid areas suggest that where pastoralists are able
to maintain their activities on a large spatial scale by migrating to areas where key rich resources can be exploited,
negative effects of grazing on plant biodiversity do not develop (Sinclair and Fryxell, 1985; Ellis and Swift, 1988;
Behnke and Abel, 1996). This may hold in areas where livestock have been present for a long time and where no
vast changes in water supply have occurred. In large portions of the study area livestock rearing is a relatively recent
phenomenon because of previous lack of water. In a similar area just north of the present study, but with less
influence of enclosures, oral history suggests vast changes in grass cover and woody plant cover have occurred over
the past few decades (Verlinden and Dayot, 2005). The pressure on land for grazing, already high in the mid 1990s
(Fuller et al., 1996; Kerven, 1997; Strohbach, 2000a), was considered to be critical in 2004 even in the most remote
areas (NASSP, 2004), possibly preventing required livestock mobility in view of uncertainty in semi-arid
environments (Scoones, 1995; Southgate and Hulme, 2000). The paper therefore describes a grazing system in a
critical stage in a rapidly changing semi-arid environment and discusses the various grazing strategies that have
modified over time.
METHODS
Study Area
Namibia is mostly arid to semi-arid, rainfall is highly seasonal and occurs almost entirely as a single wet season in
summer. In the wetter areas the rainy season extends from October/November to April, but in the drier areas in the
west the season starts later and is shorter. The bulk of the rain falls between the months of January and March. Less
than 1 per cent of total precipitation is recorded in the June to September winter period. The median rainfall for the
semi-arid study area of about 19 425 km2 is around 400mm, decreasing towards the west (Hutchinson, 1995). Soils
are mainly arenosols, poor in nitrogen and phosphorus, especially in the inverted dune system of the eastern dry
Kalahari woodlands. These woodlands are dominated by Burkea africana and are semideciduous. In the western
part, the Cuvelai basin, there are drainage lines called oshanas with clay soils (Figure 1). The landscape there is a
mixture between saline solonetz soils, cambisols and arenosols with a hard pan at varying depth (Mendelsohn et al.,
2000).
Despite having one of the lowest overall population densities in theworld (the 1�9million people (2001) live at an
average density of about two persons per square kilometre), Namibia suffers increasing pressure on, and
consequent risks to, its land and water resources. Regionally, there are large variations in population density, with
heavy concentrations reaching 100 persons per square kilometre in parts of the northern communal areas, including
the western Cuvelai part of the study area (Figure 1). To the east of the Cuvelai the population density decreases
sharply to less than one person per square kilometre in the eastern dry Kalahari woodland portion of the study area
and to similar low densities in the open saline grasslands (Ombuga) to the south.
Copyright # 2006 John Wiley & Sons, Ltd. LAND DEGRADATION & DEVELOPMENT, 18: 179–197 (2007)
DOI: 10.1002/ldr
180 A. VERLINDEN AND A. S. KRUGER
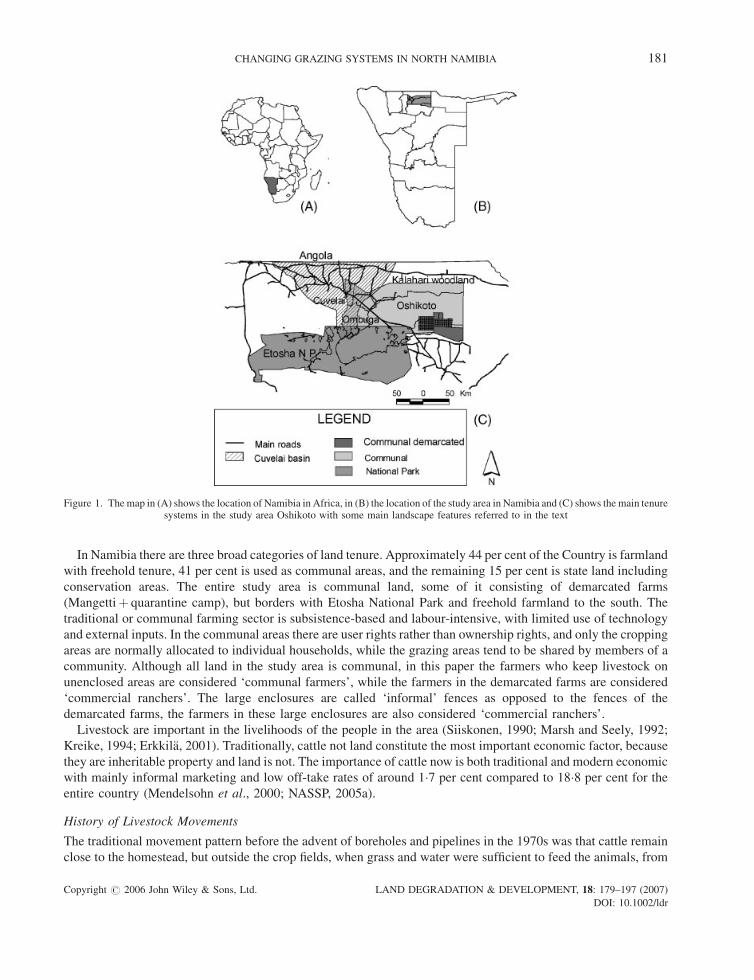
In Namibia there are three broad categories of land tenure. Approximately 44 per cent of the Country is farmland
with freehold tenure, 41 per cent is used as communal areas, and the remaining 15 per cent is state land including
conservation areas. The entire study area is communal land, some of it consisting of demarcated farms
(Mangettiþ quarantine camp), but borders with Etosha National Park and freehold farmland to the south. The
traditional or communal farming sector is subsistence-based and labour-intensive, with limited use of technology
and external inputs. In the communal areas there are user rights rather than ownership rights, and only the cropping
areas are normally allocated to individual households, while the grazing areas tend to be shared by members of a
community. Although all land in the study area is communal, in this paper the farmers who keep livestock on
unenclosed areas are considered ‘communal farmers’, while the farmers in the demarcated farms are considered
‘commercial ranchers’. The large enclosures are called ‘informal’ fences as opposed to the fences of the
demarcated farms, the farmers in these large enclosures are also considered ‘commercial ranchers’.
Livestock are important in the livelihoods of the people in the area (Siiskonen, 1990; Marsh and Seely, 1992;
Kreike, 1994; Erkkila, 2001). Traditionally, cattle not land constitute the most important economic factor, because
they are inheritable property and land is not. The importance of cattle now is both traditional and modern economic
with mainly informal marketing and low off-take rates of around 1�7 per cent compared to 18�8 per cent for the
entire country (Mendelsohn et al., 2000; NASSP, 2005a).
History of Livestock Movements
The traditional movement pattern before the advent of boreholes and pipelines in the 1970s was that cattle remain
close to the homestead, but outside the crop fields, when grass and water were sufficient to feed the animals, from
Figure 1. The map in (A) shows the location of Namibia in Africa, in (B) the location of the study area in Namibia and (C) shows the main tenuresystems in the study area Oshikoto with some main landscape features referred to in the text
Copyright # 2006 John Wiley & Sons, Ltd. LAND DEGRADATION & DEVELOPMENT, 18: 179–197 (2007)
DOI: 10.1002/ldr
CHANGING GRAZING SYSTEMS IN NORTH NAMIBIA 181
the beginning of the rainy season around October until the beginning of the dry season in May. After harvesting is
completed, livestock eat the remaining stalks of Pearl millet on the fields, afterwards they would be brought to the
cattle posts located outside settled areas. Cattle were kept at different cattle posts to spread risk of drought and
disease and also to hide wealth. Cattle post herders looked after different peoples’ cattle and received every third
calf as compensation from each cattle owner (Williams, 1991).
More recent accounts state that the majority of the cattle remained long in the cattle post areas. Once the rainy
season begins, some of the milk cows would be brought back to the villages, provided there is sufficient grazing, so
that families can have the benefit of the milk (Kreike, 1994; Kerven, 1997). Plough oxen must also be returned to
the villages as cultivation takes place at this time. The bulk of the oxen and milk cows remained at the cattle posts
and returned only briefly to the villages for the time of harvest from April to July (Kerven, 1997). How far away and
how long cattle were herded at cattle posts depended not only on the grazing quality (around the homesteads and at
the cattle posts) but also on the water supply and the availability of labour (Kerven, 1997). Around a homestead
there is a reserved piece of land that is not cultivated, called the ekove (Kreike, 1994). These ekove are increasing in
size as they become more important as a grazing reserve in emergencies (NASSP, 2005b).
The central Cuvelai had historically seasonal potable water available during the wet season with well water
becoming increasingly saline during the dry season. The amount was also limited and water-levels were (and still
are in some villages without pipeline water) used to decide when, who and how many cattle should leave for the
cattle posts, well water being prioritised for human consumption. In central Oshikoto more wells with potable water
could be found but eastern Oshikoto has fewer pans and traditional wells. Even fewer are found around theMangetti
area and these areas were not available for grazing due to shortage of water supply before the advent of deep
borehole technology.
Tapscott and Hangula (1994) suggest that a form of transhumance (ohambo) was being practiced in the Ondonga
Kingdom (largely in Oshikoto) in the 19th century, indicating that land shortage around the settled area was then
already a problem. After the rinderpest pandemic at the end of the 19th century pressure on the land was greatly
reduced (Erkkila and Siiskonen, 1992). This changed rapidly as Estermann (1976) indicated that uninhabited zones
between tribes had largely been settled in the 1950s. Oral history collected in this study is in agreement with Kreike
(1994) that central and eastern Oshikoto was used for a long time for establishing cattle posts. Increasingly graziers
have been attracted to this forested area, following water development programmes since the 1970s. This
culminated in the 1990s following a drought in 1992 with a major programme of borehole installation in eastern
Oshikoto, initiated by the Namibian Government as part of drought relief measures (Kerven, 1997).
The establishment of Etosha National Park disrupted the seasonal movement to the permanent water points in the
south and this was exacerbated by the establishment in 1969 of a veterinary cordon fence south of the survey area.
Encroachment by large fencing of farms on the eastern dry season pasture area began in the 1970s with the
establishment of the Mangetti block, an area with few, if any, traditional wells. In the late-1970s the first local
businessman managed to acquire the rights to fence communal grazing land (Tapscott and Hangula, 1994).
New boreholes since the 1970s and especially after the drought of the early-1990s have attracted the attention of
others who saw an opportunity to open up commercial ranches by privatising the rangeland around boreholes. This
started competition for grazing and water between mobile, subsistence-oriented livestock owners and town-based
commercialising ranch-owners and this process is suggested as having a major influence on availability of land for
grazing by communal farmers (Marsh and Seely, 1992; Fuller et al., 1996; Kerven, 1997), although only limited
information on the extent of enclosures was available. Enclosed fenced land prevents access to grazing for all other
communal farmers and results in less grazing land available for these farmers (Thomas et al., 2000).
Large areas with limited water supply were not grazed by livestock but visited by hunters and hunter-gatherers
historically, resulting in an ecosystem with low herbivore pressure characterised by low woody cover due to
frequent fires. These areas were calledOmbuwa (open land) and according to oral history just north of the present
study area have with increased grazing changed gradually into Ongoya (meaning one cannot pass) (Verlinden and
Dayot, 2005). Decreasing grass cover and increasing shrub cover are well-known changes in the environment as a
result of heavy grazing and decreased fire frequencies (Downing, 1978). It is unknown to what extent these
modifications of the vegetation affect livestock and the grazing systems used, but studies in similar environments
Copyright # 2006 John Wiley & Sons, Ltd. LAND DEGRADATION & DEVELOPMENT, 18: 179–197 (2007)
DOI: 10.1002/ldr
182 A. VERLINDEN AND A. S. KRUGER
suggest significant decreases in stocking rates of over 50 per cent (Dean and Macdonald, 1994). It is therefore
necessary to assess grazing condition next to grazing potential.
Interviews
In contrast to the official view, many pastoralist societies have developed elaborate systems to assess range
condition and trends (Oba and Kotile, 2001).
Verlinden and Dayot (2000, 2005) found that Owambo agropastoralists in north central Namibia use a
classification of ILUs having distinct hydrological properties, elevation, vegetation and some soil properties like
depth of hard pan. The ILUs are identified on the basis of plant indicators, elevation and soil. With specific
relevance to grazing, different ILUs have different seasonal qualities and potentials and livestock, especially cattle,
are reportedly moving between them depending on where green grasses appear first after rains, where most
palatable plants (including browse) are found at particular times of the year and where grasses are most nutritious
(Verlinden and Dayot, 2005). Verlinden et al. (2006) suggested that presence and abundance of a few specific
ILUs could be crucial because they are reported to contain the most palatable grasses and/or best browse. This
shows the importance of incorporating Indigenous Technical Knowledge (ITK) on the ILUs in understanding local
use of rangeland (Thomas and Twyman, 2004). In addition, local movement routes and herding practices can be
explained by the pattern of ILUs in the grazing system (Oba and Kotile, 2001).
Data were collected during two field trips at the end of the rainy season, one lasting 2 weeks in March and then
one lasting a month in April 2005. Field assistants spent 2 weeks in the field to plan the study with local people. The
visit started with a community meeting in a village with a Community-Based Organisation working on resource
management. The principal method of investigation during the meetings was open-ended discussions on key topics
of the research: potentials and limitations of the main land units available for grazing in the area, indicators used for
assessing grazing potential and condition, movements of livestock between seasons and over years and local range
and livestock management. After the meeting key informants were asked to join the research team to visit portions
of the grazing area to identify and describe the ILUs and to collect a total of 936 ground truthing points for mapping
the rangeland. During the field trip additional questions were asked on what was seen and on issues remaining after
the community meeting. The next day or days were continued in the same way or the research team went with the
local extension technician to visit remaining parts of the area. Ten community meetings with an average attendance
of 25 people were held and over 50 different key informants accompanied the field trips.
Mapping of Rangeland
A GIS, Arcview1, was used as a platform for bringing data together where appropriate. In the northern regions,
including Oshikoto, participatory GIS information, based on indigenous knowledge on ILUs with assessments of
potentials and limitations for grazing and cropping, has been developed and used in a series of Community-Based
Natural ResourceManagement related projects and this has beenwell received and accepted by the people (Nott et al., 2003).
Aerial photographs and available satellite imagery were used as a background to map the ILUs in the GIS. The
ground truthing points were overlaid with the imagery and on the basis of visual interpretation of the imagery the
rangeland map based on the indigenous classification was drawn. Previous experience with mapping these units
showed that although supervised classification can be carried out with good results on portions of a satellite image,
certain characteristics used for identifying the ILUs (like elevation) cannot be derived from such an image and the
conventional classification results are therefore not reliable for all units. The GISwas then used to derive proportions of
each land unit in the area and the proportion fenced to test if best ILUs for grazing were also more enclosed.
Grazing Condition
While collecting samples for mapping local land units, indicating mainly grazing potential rather than actual
condition (Verlinden and Dayot, 2005), the 936 plots were also assessed for grazing condition using a local
classification ranging from poor, medium, good to very good. The basis for the classification is shown in Table I and
was based on local knowledge.
Copyright # 2006 John Wiley & Sons, Ltd. LAND DEGRADATION & DEVELOPMENT, 18: 179–197 (2007)
DOI: 10.1002/ldr
CHANGING GRAZING SYSTEMS IN NORTH NAMIBIA 183
Vegetation Samples
Important is the distinction between actual condition of the veld and the grazing potential. The actual condition was
evaluated using the criteria of Table I while the grazing potential was based on discussions with local people on
plant indicators and the soil-water conditions of the ILUs (salinity, depth of hard pan, soil texture) during meetings.
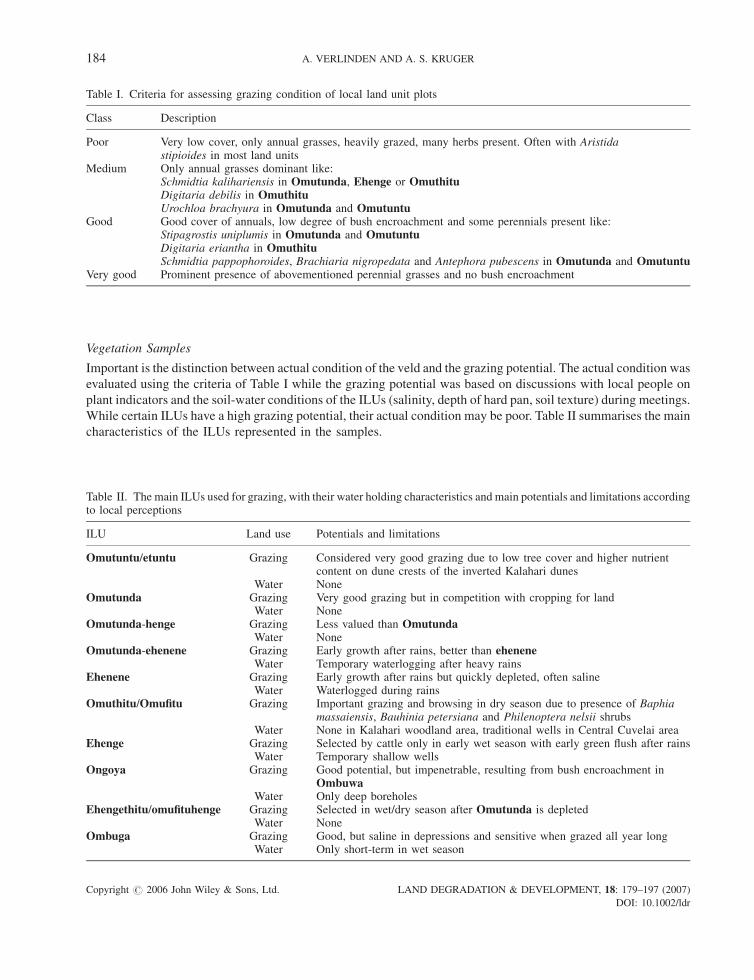
While certain ILUs have a high grazing potential, their actual condition may be poor. Table II summarises the main
characteristics of the ILUs represented in the samples.
Table I. Criteria for assessing grazing condition of local land unit plots
Class Description
Poor Very low cover, only annual grasses, heavily grazed, many herbs present. Often with Aristidastipioides in most land units
Medium Only annual grasses dominant like:Schmidtia kalihariensis in Omutunda, Ehenge or OmuthituDigitaria debilis in OmuthituUrochloa brachyura in Omutunda and Omutuntu
Good Good cover of annuals, low degree of bush encroachment and some perennials present like:Stipagrostis uniplumis in Omutunda and OmutuntuDigitaria eriantha in OmuthituSchmidtia pappophoroides, Brachiaria nigropedata and Antephora pubescens in Omutunda and Omutuntu
Very good Prominent presence of abovementioned perennial grasses and no bush encroachment
Table II. The main ILUs used for grazing, with their water holding characteristics and main potentials and limitations accordingto local perceptions
ILU Land use Potentials and limitations
Omutuntu/etuntu Grazing Considered very good grazing due to low tree cover and higher nutrientcontent on dune crests of the inverted Kalahari dunes
Water NoneOmutunda Grazing Very good grazing but in competition with cropping for land
Water NoneOmutunda-henge Grazing Less valued than Omutunda
Water NoneOmutunda-ehenene Grazing Early growth after rains, better than ehenene
Water Temporary waterlogging after heavy rainsEhenene Grazing Early growth after rains but quickly depleted, often saline
Water Waterlogged during rainsOmuthitu/Omufitu Grazing Important grazing and browsing in dry season due to presence of Baphia
massaiensis, Bauhinia petersiana and Philenoptera nelsii shrubsWater None in Kalahari woodland area, traditional wells in Central Cuvelai area
Ehenge Grazing Selected by cattle only in early wet season with early green flush after rainsWater Temporary shallow wells
Ongoya Grazing Good potential, but impenetrable, resulting from bush encroachment inOmbuwa
Water Only deep boreholesEhengethitu/omufituhenge Grazing Selected in wet/dry season after Omutunda is depleted
Water NoneOmbuga Grazing Good, but saline in depressions and sensitive when grazed all year long
Water Only short-term in wet season
Copyright # 2006 John Wiley & Sons, Ltd. LAND DEGRADATION & DEVELOPMENT, 18: 179–197 (2007)
DOI: 10.1002/ldr
184 A. VERLINDEN AND A. S. KRUGER
To test the value of the local indicators in Table I and the value of the local understanding of links between
indicator species for grazing and ILUs, 109 vegetation samples were collected throughout the study area. A
homogenous area was selected within the ILUs identified by local people. The area was walked through with key
informants and species noted until no more new species were found. Vernacular names were noted with their uses
and potentials. Plot-less sampling was used and woody plants and grasses were identified to species level. Three
structural classes were used: tree layer (woody plants taller than 3m), shrub layer (woody plants lower than 3m)
and grass and herb layer. For each species at each layer the percentage cover was estimated. The data were entered
making a distinction between structural classes: the same woody species can occur as a tree or as a shrub and are
considered as separate species in the analysis. The samples were collected inMarch and April 2005 at the end of the
wet season when the plants were still easily recognizable. Table III lists the environmental variables collected in the
field together with the vegetation data, with differentiation in actual condition and grazing potential.
Canonical Correspondence Analysis (CCA) (Hill, 1979; ter Braak and Smilauer, 2002) was used for the
ordination of species using CANOCO software (Jongman et al., 1995). CCA is probably the most widely used
direct vegetation ordination method for species and samples (Kent and Coker, 1995). CCA is based on reciprocal
averaging and assumes a unimodal model for the relationship between species and ordination axes. In CCA the
ordination axes are constrained by the environmental variables that are used to explain the variation in the
vegetation. Cover percentage was squareroot transformed and rare species were downweighted. The formula used
for downweighting is as follows: first the frequency of the most common species, AMAX is calculated. The
abundance of species with a frequency lower than AMAX/5 will be reduced in proportion to their frequency.
Species more common than AMAX/5 will not be downweighted. Due to the appearance of an arch effect,
detrending with 2nd order polynomials had to be applied, so that the ordination diagram in this study is a Detrended
Canoncial Correspondence Analysis (DCCA). The first ordination axis and all four canonical axes together were
tested for significance with a Monte Carlo Permutation test.
The location of the plant indicators in the ordination diagram should be consistent with the local perception,
otherwise the local classification or the DCCA is not valid. Plants indicating good grazing should be associated with
the environmental variables associated with good grazing and vice versa. Ordination is a standard practice in
evaluating grazing condition in southern Africa (Stuart-Hill et al., 1986) although a degradation gradient was not
used. Since the samples contained severely grazed and less grazed areas, the species ordination diagram has
sufficient variability in grazing condition to allow testing the local condition classes with published data.
Table III. Environmental variables collected in the field in 109 samples and used in the canonical correspondence analysis
Abbreviation Description
Grazlow Grazing potential is low, depending on ILU potentialGrazmed Grazing potential is medium, depending on ILU potentialGrazgood Grazing potential is good, depending on ILU potentialCondlow Actual grazing condition is lowCondmed Actual grazing condition is mediumCondgood Actual grazing condition is goodBare Percentage of estimated bare ground, not taking in account tree and shrub coverTreecov Percentage of estimated tree coverShrubcov Percentage of estimated shrub coverGrasscov Percentage of estimated grass coverHerbcv Percentage of estimated herb coverTermit Termite activity, based on a scale between 0 and 3, based on termitaria seenHard pan Depth of the hard pan (oluma)Utilise Degree of utilisation of the veld, between 0 and 4 (very high degree of utilisation)Fire Either 0 or 1 when recent fire scars were seenSalinity Based on opinions of key informants scored between 0 and 3 (high salinity)Bush encroachment 1 is 20 per cent shrub cover, 2 is 30 per cent shrub cover, 3 is over 40 per cent shrub cover
Copyright # 2006 John Wiley & Sons, Ltd. LAND DEGRADATION & DEVELOPMENT, 18: 179–197 (2007)
DOI: 10.1002/ldr
CHANGING GRAZING SYSTEMS IN NORTH NAMIBIA 185
Termite activity was included as an environmental factor as Hillyer (2004) found a link between termite activity
and higher soil nutrient status. The depth of the hard pan that is often present in the soils of Oshikoto, especially in
the west, is a very important factor in plant growth in general. When shallow, it prevents the establishment of most
woody plants, with notable exceptions of Hyphaene petersiana, Acacia arenaria and Acacia nilotica (Verlinden
and Dayot, 2005).
For the nomenclature Coates-Palgrave (2002) was used for the woody species and Gibbs-Russell et al. (1990) for
the grasses.
The value of the ILUs in assessing grazing potential was tested by selecting a set of indicators, followed by
calculating their frequencies in the main ILUs.
Fencing
The following fences, related to types of tenure, were recognised and mapped based on aerial photographs and
satellite imagery: fences erected by smallholders, often consisting originally of bush fences, gradually replaced by
wire fences in densely populated areas; large wire fences of informally fenced areas; wire fences of demarcated
farms (Mangetti) and a government quarantine camp (Figure 1).
Smallholder fences were mapped from geocorrected aerial photographs in a GIS. In areas were woody resources
are depleted these fences are not very clear and increasingly taken over by wire fences. In forested areas the fences
are very clear and often one can see a gradual increase of fencing to enlarge the grazing reserves, the ekove, around
the homestead. Inside the fences there is a larger degree of ownership, in many cases outsiders are not allowed
access to the grazing resources, unless with permission from the farmer.
The large informal fences, usually erected by more wealthy people, posed a mapping problem as the available
information was incomplete and these fences could not be seen on aerial photographs. During the field trips,
observed fences were located with a GPS and later combined with other existing information (Mendelsohn et al.,
2000). Satellite imagery was helpful where areas were fully enclosed and grazing pressure low, therefore Landsat
TM imagery available for April 2000 was used in conjunction with GPS data to map large fences. Existing data of
formally demarcated fences were mostly accurate. AGIS was used to create overlays between the different types of
fencing and the rangeland maps to investigate differences in proportions of ILUs occupied by the different fencing
types.
Bush Encroachment (BE)
For the purposes of this study, the following classification was used to identify the degree of BE in 109 samples: No
BE is an area with shrub cover<20 per cent, Low BE is an area with 20–30 per cent shrub cover, Medium BE is an
area with 30–40 per cent shrub cover and High BE is an area with >40 per cent shrub cover.
Livestock Movements
After the meetings, movement patterns were drawn on background maps and later on summarised for the whole
survey area. No quantitative data could be collected on livestock movements and livestock census data are not
reliable.
RESULTS
Grazing Condition
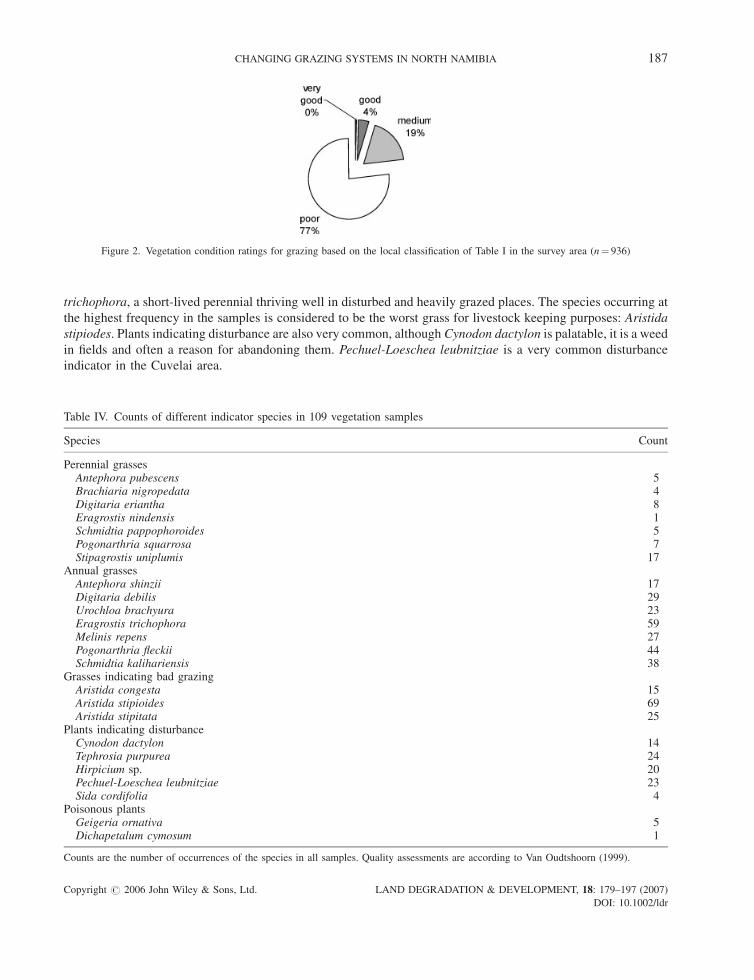
The results of the grazing condition assessment are shown in Figure 2. The overall majority of the samples were
classified as being in poor condition, less than 25 per cent were classified as medium or good. Less than 1 per cent of
the samples were considered to be in a very good condition. This suggests that overall grazing pressure is very high
and that the majority of the grazing resources consist of annuals.
Table IV lists the counts of different types of grasses and indicators in 109 detailed vegetation descriptions. The
frequency of palatable perennial grasses is very low in comparison with annual grasses, except Eragrostis
Copyright # 2006 John Wiley & Sons, Ltd. LAND DEGRADATION & DEVELOPMENT, 18: 179–197 (2007)
DOI: 10.1002/ldr
186 A. VERLINDEN AND A. S. KRUGER
trichophora, a short-lived perennial thriving well in disturbed and heavily grazed places. The species occurring at
the highest frequency in the samples is considered to be the worst grass for livestock keeping purposes: Aristida
stipiodes. Plants indicating disturbance are also very common, although Cynodon dactylon is palatable, it is a weed
in fields and often a reason for abandoning them. Pechuel-Loeschea leubnitziae is a very common disturbance
indicator in the Cuvelai area.
Figure 2. Vegetation condition ratings for grazing based on the local classification of Table I in the survey area (n¼ 936)
Table IV. Counts of different indicator species in 109 vegetation samples
Species Count
Perennial grassesAntephora pubescens 5Brachiaria nigropedata 4Digitaria eriantha 8Eragrostis nindensis 1Schmidtia pappophoroides 5Pogonarthria squarrosa 7Stipagrostis uniplumis 17
Annual grassesAntephora shinzii 17Digitaria debilis 29Urochloa brachyura 23Eragrostis trichophora 59Melinis repens 27Pogonarthria fleckii 44Schmidtia kalihariensis 38
Grasses indicating bad grazingAristida congesta 15Aristida stipioides 69Aristida stipitata 25
Plants indicating disturbanceCynodon dactylon 14Tephrosia purpurea 24Hirpicium sp. 20Pechuel-Loeschea leubnitziae 23Sida cordifolia 4
Poisonous plantsGeigeria ornativa 5Dichapetalum cymosum 1
Counts are the number of occurrences of the species in all samples. Quality assessments are according to Van Oudtshoorn (1999).
Copyright # 2006 John Wiley & Sons, Ltd. LAND DEGRADATION & DEVELOPMENT, 18: 179–197 (2007)
DOI: 10.1002/ldr
CHANGING GRAZING SYSTEMS IN NORTH NAMIBIA 187
Poisonous plants are not very frequent.Geigeria ornativa is most common and could pose a threat in some places
in the ehenene ILU. The data and observations suggest that certain plants like Croton gratissimus, Mundulea
sericea and Elephantorhiza suffruticosa are largely avoided, and are only eaten when there are absolutely no other
browse species left.
Validity of the Local Vegetation Condition Classes
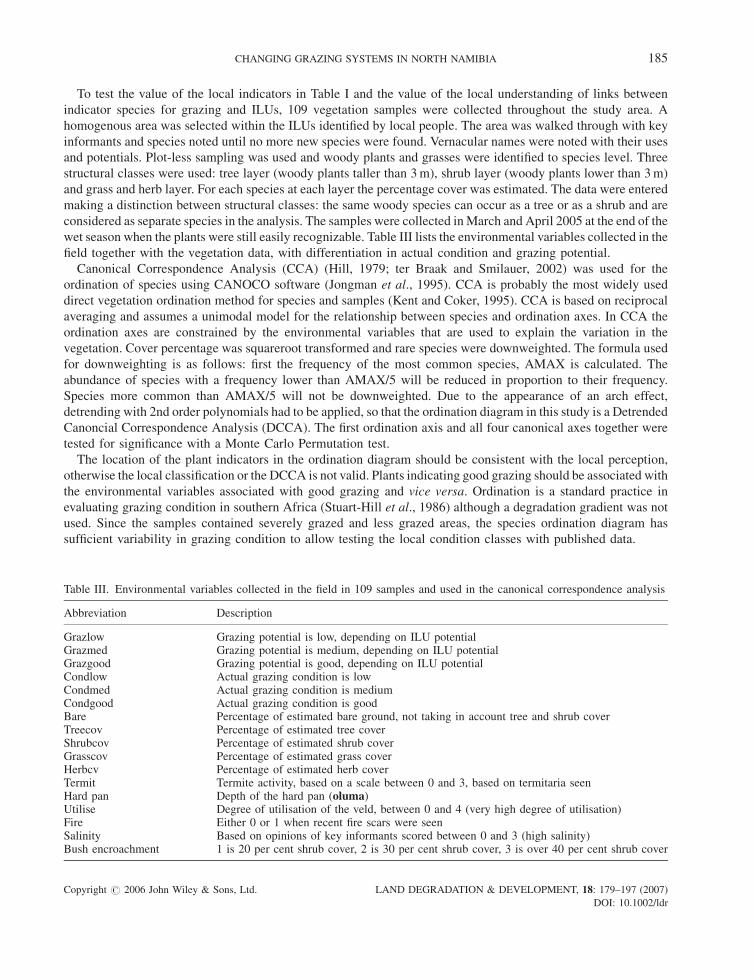
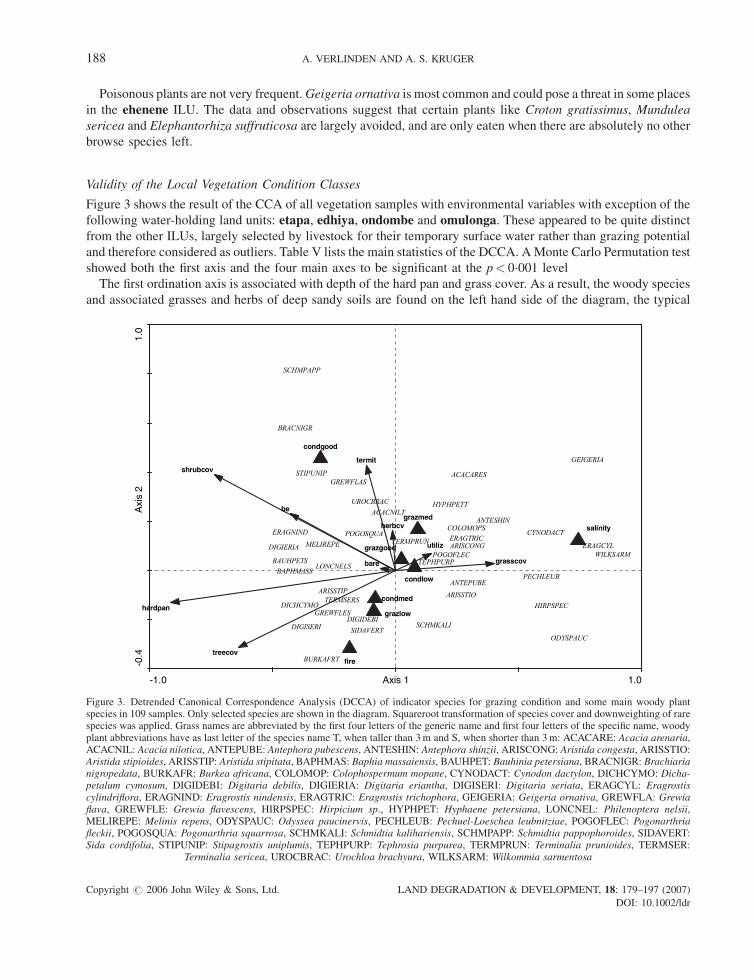
Figure 3 shows the result of the CCA of all vegetation samples with environmental variables with exception of the
following water-holding land units: etapa, edhiya, ondombe and omulonga. These appeared to be quite distinct
from the other ILUs, largely selected by livestock for their temporary surface water rather than grazing potential
and therefore considered as outliers. Table V lists the main statistics of the DCCA. AMonte Carlo Permutation test
showed both the first axis and the four main axes to be significant at the p< 0�001 level
The first ordination axis is associated with depth of the hard pan and grass cover. As a result, the woody species
and associated grasses and herbs of deep sandy soils are found on the left hand side of the diagram, the typical
-1.0 1.0Axis 1
1.0
-0.4
Axi
s 2
ACACNILT
BURKAFRT
HYPHPETT
ACACARES
BAPHMASS
BAUHPETS
COLOMOPS
GREWFLAS
GREWFLES
LONCNELS
PECHLEUB
TERMPRUN
TERMSERS
ANTEPUBE
ANTESHIN
ARISCONG
ARISSTIOARISSTIP
BRACNIGR
CYNODACT
DIGIDEBI
DIGIERIA
DIGISERI
ERAGCYL
ERAGNINDERAGTRIC
GEIGERIA
MELIREPE
ODYSPAUC
POGOSQUA
POGOFLEC
SCHMKALI
SCHMPAPP
STIPUNIP
UROCBRAC
WILKSARMTEPHPURP
HIRPSPEC
SIDAVERT
DICHCYMO
bare
treecov
shrubcov
grasscov
herbcv
termit
hardpan
utiliz
be
grazlow
grazmed
grazgood
condlow
condmed
condgood
fire
salinity
Figure 3. Detrended Canonical Correspondence Analysis (DCCA) of indicator species for grazing condition and some main woody plantspecies in 109 samples. Only selected species are shown in the diagram. Squareroot transformation of species cover and downweighting of rarespecies was applied. Grass names are abbreviated by the first four letters of the generic name and first four letters of the specific name, woodyplant abbreviations have as last letter of the species name T, when taller than 3m and S, when shorter than 3m: ACACARE: Acacia arenaria,ACACNIL: Acacia nilotica, ANTEPUBE: Antephora pubescens, ANTESHIN: Antephora shinzii, ARISCONG: Aristida congesta, ARISSTIO:Aristida stipioides, ARISSTIP: Aristida stipitata, BAPHMAS: Baphia massaiensis, BAUHPET: Bauhinia petersiana, BRACNIGR: Brachiarianigropedata, BURKAFR: Burkea africana, COLOMOP: Colophospermum mopane, CYNODACT: Cynodon dactylon, DICHCYMO: Dicha-petalum cymosum, DIGIDEBI: Digitaria debilis, DIGIERIA: Digitaria eriantha, DIGISERI: Digitaria seriata, ERAGCYL: Eragrostiscylindriflora, ERAGNIND: Eragrostis nindensis, ERAGTRIC: Eragrostis trichophora, GEIGERIA: Geigeria ornativa, GREWFLA: Grewiaflava, GREWFLE: Grewia flavescens, HIRPSPEC: Hirpicium sp., HYPHPET: Hyphaene petersiana, LONCNEL: Philenoptera nelsii,MELIREPE: Melinis repens, ODYSPAUC: Odyssea paucinervis, PECHLEUB: Pechuel-Loeschea leubnitziae, POGOFLEC: Pogonarthriafleckii, POGOSQUA: Pogonarthria squarrosa, SCHMKALI: Schmidtia kalihariensis, SCHMPAPP: Schmidtia pappophoroides, SIDAVERT:Sida cordifolia, STIPUNIP: Stipagrostis uniplumis, TEPHPURP: Tephrosia purpurea, TERMPRUN: Terminalia prunioides, TERMSER:
Terminalia sericea, UROCBRAC: Urochloa brachyura, WILKSARM: Wilkommia sarmentosa
Copyright # 2006 John Wiley & Sons, Ltd. LAND DEGRADATION & DEVELOPMENT, 18: 179–197 (2007)
DOI: 10.1002/ldr
188 A. VERLINDEN AND A. S. KRUGER
grassland species on the right hand of the diagram. Those associated with saline soils and very shallow hard pans
are found on the extreme right, those with a less shallow hard pan more to the centre of the diagram. Grass cover is
substantially higher in the saline grassland areas than in thewooded areas, a reflection of the heavy grazing pressure
in the non-saline grasslands and in the woodlands.
The second axis is associated with termite activity, grazing condition and potential grazing quality which are
high on the positive part of axis 2 and low on the negative side of axis 2. Termites are more abundant on loamy-sand
soils, the Omutunda and Omutuntu ILUs of the inverted Kalahari dunes. Most grasses known to be of
good quality, except Antephora pubescens and Digitaria seriata, are located on the positive side of Axis 2.
Antephora pubescens was also frequent outside the forested area in theOmbuga saline grasslands, while Digitaria
seriata grew only on deep sandy-soils of theOmuthitu. Most annuals and indicators of poor grazing like Tephrosia
purpurea and Aristida spp. are located near the centre of the diagram, showing that most samples contained mainly
annuals and were in poor to medium condition. It has also to be noted that the difference between grazing potential
and actual condition is very large in the class ‘good’. Many samples had good potential but their actual condition
was poor.
Good browse species like Baphia massaiensis, Bauhinia petersiana and Philenoptera nelsii are located on the
left-hand side of the diagram in the forested area. BE is as expected associated with high shrub cover and these are
also associated with the more palatable perennials which is in agreement with the finding that BE is more severe in
the more fertile land units that have larger proportions of the better grasses if in good condition. Grewia flava is
associated with good grazing on more loamy-sand soils and Grewia flavescens with low grazing potential on deep
sandy soils, since both are quite common species these might be used as indicators for grazing potential.
The indicators for disturbance like Pechuel-Loeschea leubnitziae, Cynodon dactylon and Hirpicium sp. are
associated with a high degree of utilisation in the densely settled areas, which are mostly located on the relatively
shallow soils. Odyssea paucinervis is a perennial that remains abundant in heavily grazed areas, probably because
of its low palatability. Aristida stipioides, Digitaria debilis and Schmidtia kalihariensis are also tolerant of high
grazing pressures although the latter two are selected by livestock.
Validity of ILUs With Respect to Grazing Potential and Quality
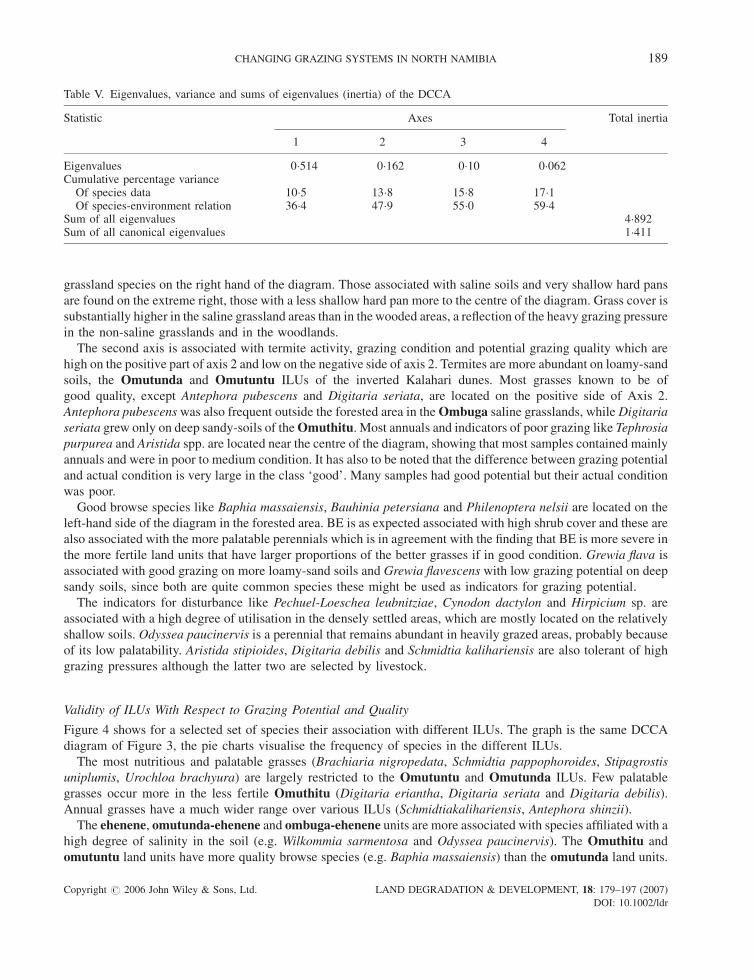
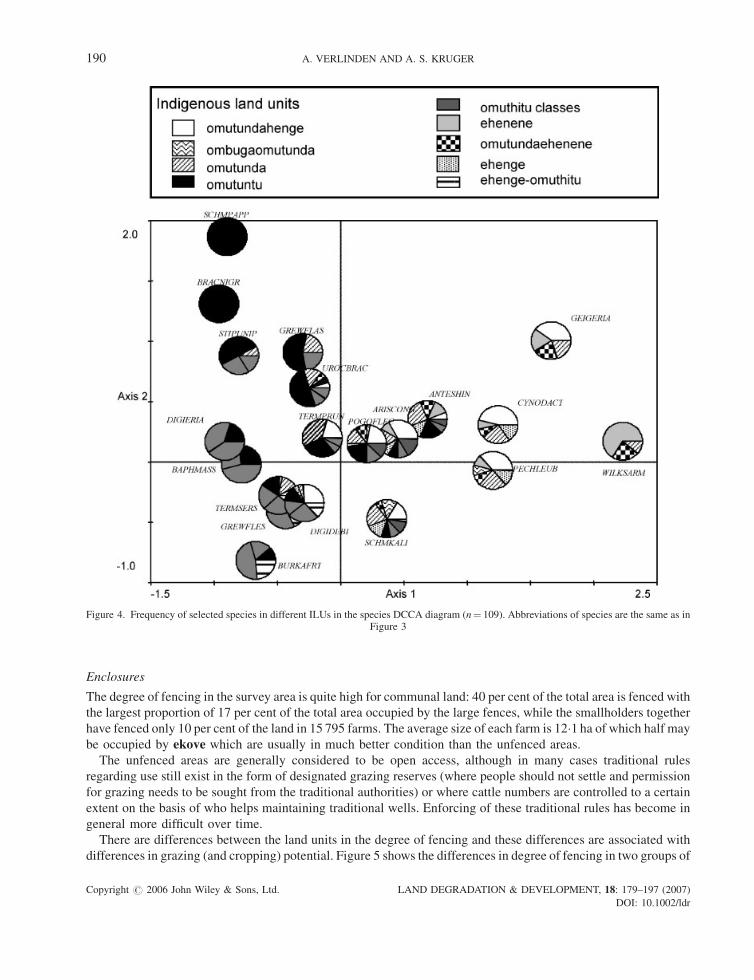
Figure 4 shows for a selected set of species their association with different ILUs. The graph is the same DCCA
diagram of Figure 3, the pie charts visualise the frequency of species in the different ILUs.
The most nutritious and palatable grasses (Brachiaria nigropedata, Schmidtia pappophoroides, Stipagrostis
uniplumis, Urochloa brachyura) are largely restricted to the Omutuntu and Omutunda ILUs. Few palatable
grasses occur more in the less fertile Omuthitu (Digitaria eriantha, Digitaria seriata and Digitaria debilis).
Annual grasses have a much wider range over various ILUs (Schmidtiakalihariensis, Antephora shinzii).
The ehenene, omutunda-ehenene and ombuga-ehenene units are more associated with species affiliated with a
high degree of salinity in the soil (e.g. Wilkommia sarmentosa and Odyssea paucinervis). The Omuthitu and
omutuntu land units have more quality browse species (e.g. Baphia massaiensis) than the omutunda land units.
Table V. Eigenvalues, variance and sums of eigenvalues (inertia) of the DCCA
Statistic Axes Total inertia
1 2 3 4
Eigenvalues 0�514 0�162 0�10 0�062Cumulative percentage varianceOf species data 10�5 13�8 15�8 17�1Of species-environment relation 36�4 47�9 55�0 59�4
Sum of all eigenvalues 4�892Sum of all canonical eigenvalues 1�411
Copyright # 2006 John Wiley & Sons, Ltd. LAND DEGRADATION & DEVELOPMENT, 18: 179–197 (2007)
DOI: 10.1002/ldr
CHANGING GRAZING SYSTEMS IN NORTH NAMIBIA 189
Enclosures
The degree of fencing in the survey area is quite high for communal land: 40 per cent of the total area is fenced with
the largest proportion of 17 per cent of the total area occupied by the large fences, while the smallholders together
have fenced only 10 per cent of the land in 15 795 farms. The average size of each farm is 12�1 ha of which half may
be occupied by ekove which are usually in much better condition than the unfenced areas.
The unfenced areas are generally considered to be open access, although in many cases traditional rules
regarding use still exist in the form of designated grazing reserves (where people should not settle and permission
for grazing needs to be sought from the traditional authorities) or where cattle numbers are controlled to a certain
extent on the basis of who helps maintaining traditional wells. Enforcing of these traditional rules has become in
general more difficult over time.
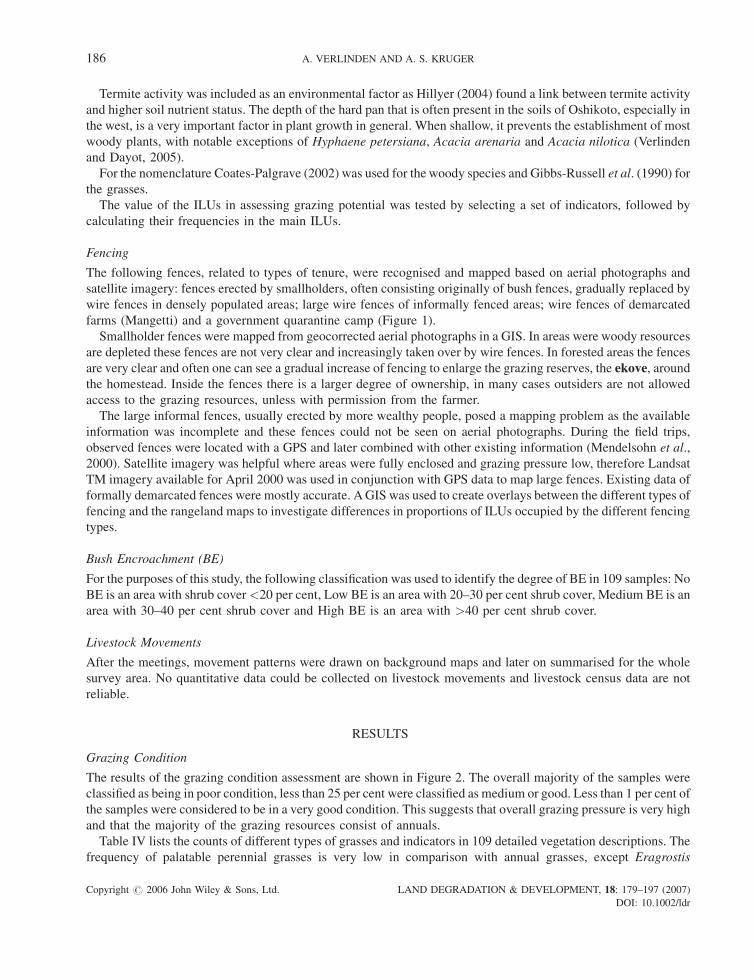
There are differences between the land units in the degree of fencing and these differences are associated with
differences in grazing (and cropping) potential. Figure 5 shows the differences in degree of fencing in two groups of
Figure 4. Frequency of selected species in different ILUs in the species DCCA diagram (n¼ 109). Abbreviations of species are the same as inFigure 3
Copyright # 2006 John Wiley & Sons, Ltd. LAND DEGRADATION & DEVELOPMENT, 18: 179–197 (2007)
DOI: 10.1002/ldr
190 A. VERLINDEN AND A. S. KRUGER
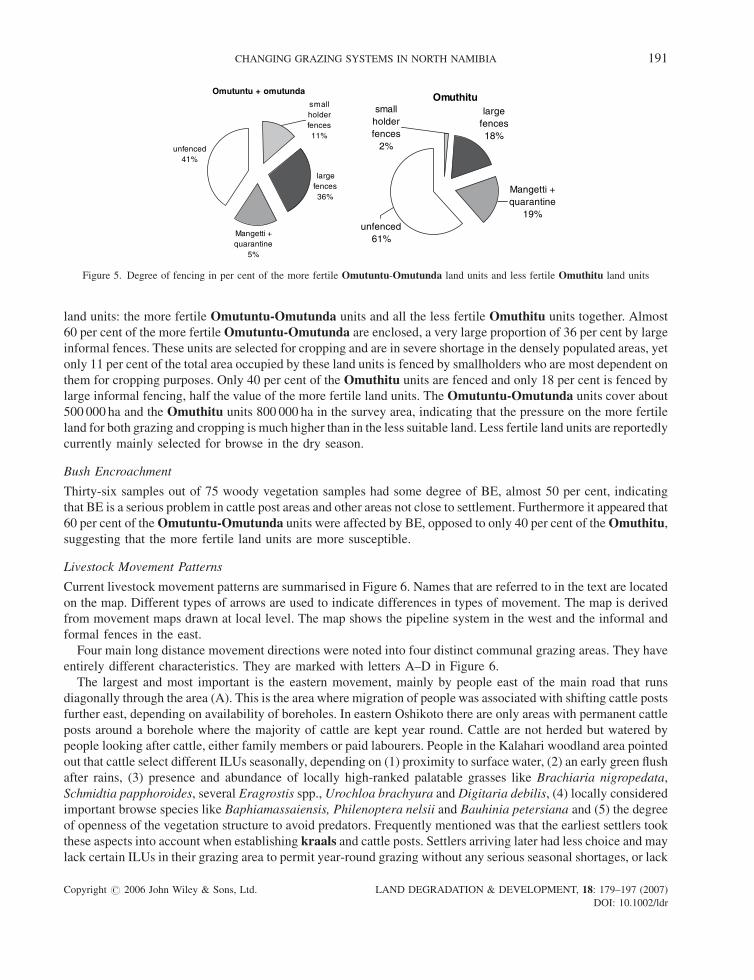
land units: the more fertile Omutuntu-Omutunda units and all the less fertile Omuthitu units together. Almost
60 per cent of the more fertileOmutuntu-Omutunda are enclosed, a very large proportion of 36 per cent by large
informal fences. These units are selected for cropping and are in severe shortage in the densely populated areas, yet
only 11 per cent of the total area occupied by these land units is fenced by smallholders who are most dependent on
them for cropping purposes. Only 40 per cent of the Omuthitu units are fenced and only 18 per cent is fenced by
large informal fencing, half the value of the more fertile land units. The Omutuntu-Omutunda units cover about
500 000 ha and the Omuthitu units 800 000 ha in the survey area, indicating that the pressure on the more fertile
land for both grazing and cropping is much higher than in the less suitable land. Less fertile land units are reportedly
currently mainly selected for browse in the dry season.
Bush Encroachment
Thirty-six samples out of 75 woody vegetation samples had some degree of BE, almost 50 per cent, indicating
that BE is a serious problem in cattle post areas and other areas not close to settlement. Furthermore it appeared that
60 per cent of theOmutuntu-Omutunda units were affected by BE, opposed to only 40 per cent of theOmuthitu,
suggesting that the more fertile land units are more susceptible.
Livestock Movement Patterns
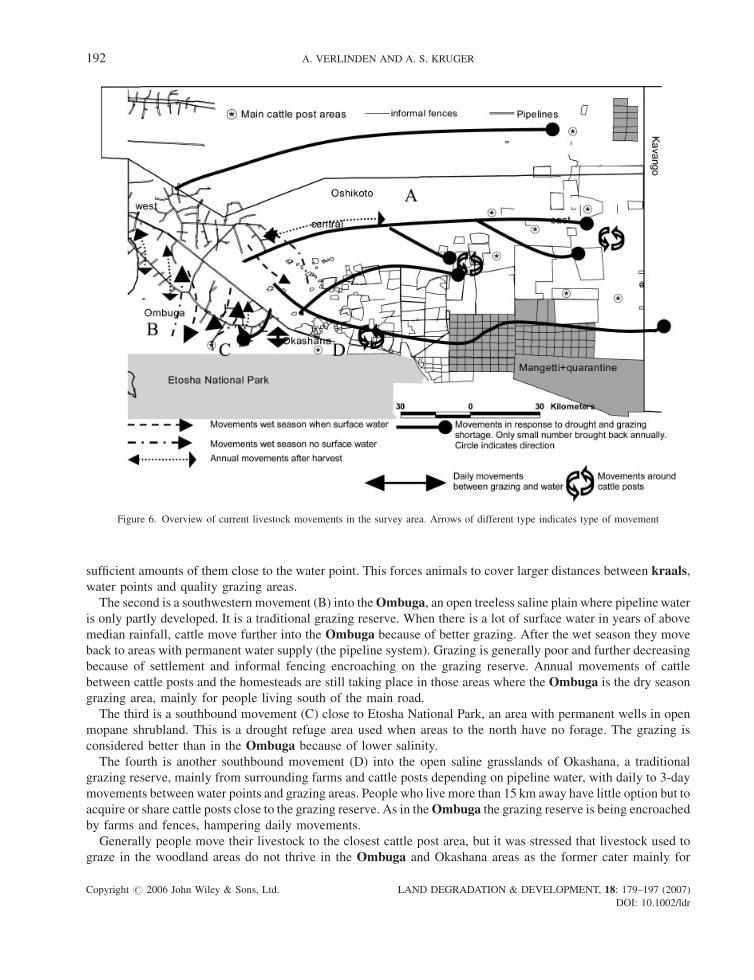
Current livestock movement patterns are summarised in Figure 6. Names that are referred to in the text are located
on the map. Different types of arrows are used to indicate differences in types of movement. The map is derived
from movement maps drawn at local level. The map shows the pipeline system in the west and the informal and
formal fences in the east.
Four main long distance movement directions were noted into four distinct communal grazing areas. They have
entirely different characteristics. They are marked with letters A–D in Figure 6.
The largest and most important is the eastern movement, mainly by people east of the main road that runs
diagonally through the area (A). This is the area where migration of people was associated with shifting cattle posts
further east, depending on availability of boreholes. In eastern Oshikoto there are only areas with permanent cattle
posts around a borehole where the majority of cattle are kept year round. Cattle are not herded but watered by
people looking after cattle, either family members or paid labourers. People in the Kalahari woodland area pointed
out that cattle select different ILUs seasonally, depending on (1) proximity to surface water, (2) an early green flush
after rains, (3) presence and abundance of locally high-ranked palatable grasses like Brachiaria nigropedata,
Schmidtia papphoroides, several Eragrostis spp., Urochloa brachyura and Digitaria debilis, (4) locally considered
important browse species like Baphiamassaiensis, Philenoptera nelsii and Bauhinia petersiana and (5) the degree
of openness of the vegetation structure to avoid predators. Frequently mentioned was that the earliest settlers took
these aspects into account when establishing kraals and cattle posts. Settlers arriving later had less choice and may
lack certain ILUs in their grazing area to permit year-round grazing without any serious seasonal shortages, or lack
Omutuntu + omutunda
unfenced41%
Mangetti + quarantine
5%
large fences36%
small holder fences11%
Omuthitu
unfenced61%
Mangetti + quarantine
19%
large fences18%
small holder fences
2%
Figure 5. Degree of fencing in per cent of the more fertile Omutuntu-Omutunda land units and less fertile Omuthitu land units
Copyright # 2006 John Wiley & Sons, Ltd. LAND DEGRADATION & DEVELOPMENT, 18: 179–197 (2007)
DOI: 10.1002/ldr
CHANGING GRAZING SYSTEMS IN NORTH NAMIBIA 191
sufficient amounts of them close to the water point. This forces animals to cover larger distances between kraals,
water points and quality grazing areas.
The second is a southwestern movement (B) into theOmbuga, an open treeless saline plain where pipeline water
is only partly developed. It is a traditional grazing reserve. When there is a lot of surface water in years of above
median rainfall, cattle move further into the Ombuga because of better grazing. After the wet season they move
back to areas with permanent water supply (the pipeline system). Grazing is generally poor and further decreasing
because of settlement and informal fencing encroaching on the grazing reserve. Annual movements of cattle
between cattle posts and the homesteads are still taking place in those areas where the Ombuga is the dry season
grazing area, mainly for people living south of the main road.
The third is a southbound movement (C) close to Etosha National Park, an area with permanent wells in open
mopane shrubland. This is a drought refuge area used when areas to the north have no forage. The grazing is
considered better than in the Ombuga because of lower salinity.
The fourth is another southbound movement (D) into the open saline grasslands of Okashana, a traditional
grazing reserve, mainly from surrounding farms and cattle posts depending on pipeline water, with daily to 3-day
movements between water points and grazing areas. People who live more than 15 km away have little option but to
acquire or share cattle posts close to the grazing reserve. As in theOmbuga the grazing reserve is being encroached
by farms and fences, hampering daily movements.
Generally people move their livestock to the closest cattle post area, but it was stressed that livestock used to
graze in the woodland areas do not thrive in the Ombuga and Okashana areas as the former cater mainly for
Figure 6. Overview of current livestock movements in the survey area. Arrows of different type indicates type of movement
Copyright # 2006 John Wiley & Sons, Ltd. LAND DEGRADATION & DEVELOPMENT, 18: 179–197 (2007)
DOI: 10.1002/ldr
192 A. VERLINDEN AND A. S. KRUGER
browsing cattle in the dry season. Heavy browsing of Baphia massaiensis and Bauhinia petersiana was observed
everywhere showing that browsing rather than grazing is indeed an important coping mechanism during the dry
season and during droughts for cattle in that area.
The saline grasslands have no browse and contain predominantly the very prickly perennialOdyssea paucinervis
that is reportedly avoided by cattle used to forested environments.
Movement patterns also depend on herd size. People with smaller herds (less than 12) do not engage in long-
distance movements throughout the region. In the central Cuvelai where people cannot settle in the waterways
people with small herds (�5, up to about maximum 10–12) keep their livestock around the farm and kraal them
daily. Cattle graze around the homestead and get water from the pipeline or from pans in the wet season. Not all
farms are fenced due to lack of fencing material and livestock are largely herded. East of the central Cuvelai,
smallholder fencing is so dense that the only available grazing land consists of corridors. These are easily depleted
and heavily trampled as those people with low numbers of livestock will herd their livestock daily between
the kraal, water points and remaining grazing land outside the densely populated areas. It is estimated that ekove
occupy about 80 000 ha in total, a considerable resource which is not sufficiently used for growing fodder like
lucerne.
People from and around the forested area with larger herds (more than 12 cattle) moved their livestock further
east even into Kavango region since the 1980s. Since this is a different tribal area, traditional authorities have
stopped this migration of Owambo farmers. Almost all cattle posts visited in the east had permanent settlements
with fields and are thus not strictly speaking cattle posts. During ameeting in the most eastern village visited, people
pointed out that in 2005 the grazing was considered exhausted and they wanted to move their livestock but they had
nowhere to go.
In central Oshikoto it appeared that people still decide on movements depending on the level of the local wells.
When the level is low, those that have access to cattle posts to the east are encouraged to leave after cattle have
finished the millet stalks on the fields. Others with large herds and no access to cattle posts are encouraged to water
and move their animals to places with permanent water points (the new pipelines in the area). The remainder is
allowed to stay, but there still are cattle coming in from further west.
DISCUSSION
This paper has described an approach, using farmer’s knowledge of the environment, through classifications, range
condition and their herd’s itineraries, to map rangeland and movements at fine and coarse spatial scales across an
agropastoral landscape. ITK on vegetation condition and land unit potential was compared with more conventional
approaches for assessing vegetation condition. The ITK was consistent with the ordination diagram of a CCA and
most species indicators were reliable and in agreement with published data based on a limited number of samples in
the survey area (Strohbach, 2000a,b,c,d). This is not to state that there are no differences with conventional range
management and range condition interpretation. It seems there is more appreciation of the quality of browse species
and annuals as was also found in a similar environment in the Kalahari of Botswana (Thomas and Twyman, 2004).
The recognition of different qualities and potentials of individual landscapes is similar to indigenous pastoralists in
a variety of countries and ecosystems (Homewood and Rodgers, 1991; Fernandez-Gimenez, 2000; Oba and Kotile,
2001). As the majority of farmers in semi-arid areas traditionally express the need for water with little concern for
grazing quality (Sweet, 1997), the socio-economic study of NASSP (2004) pointing to increasing concerns of
farmers about grazing condition suggests a different local perception that could result in opportunities for improved
range and livestock management.
Livestock in the area currently depend on vegetation in mostly poor condition with mainly annuals which are far
less available in the dry season and their biomass more variable with rainfall. In the Kalahari woodland cattle
survive mainly on browse. In a range survey carried out in 1997 just north of the present survey examples of open
areas with a large cover of good perennials calledOmbuwa could still be found without too much effort (Verlinden
and Dayot, 2000). When part of that area was revisited in 2005, no Ombuwa was observed. This conventional
image of good grazing land consisting of perennials like Schmidtia pappophoroides, Brachiaria nigropedata and
Copyright # 2006 John Wiley & Sons, Ltd. LAND DEGRADATION & DEVELOPMENT, 18: 179–197 (2007)
DOI: 10.1002/ldr
CHANGING GRAZING SYSTEMS IN NORTH NAMIBIA 193
Antephora pubescens with high cover was only seen in one fenced-off, ungrazed land during the present survey,
suggesting it is a relic of the past. It is likely that grazing at high stocking rates this range allowed herds to grow and
fatten significantly in the past, if only for a relatively brief period of a few years.
The degree of fencing (>40 per cent) is rather high for communal land. Smallholders have clearly fenced mainly
the more fertile Omutunda-Omutuntu ILUs, but their contribution (10 per cent) is small in comparison with the
17 per cent occupied by larger informal fences. These occupy predominantly more fertile land units, showing a
clear selection of good grazing land, not just land.
Based on satellite imagery from April 1997, just north of the present study area, Verlinden and Dayot (2000)
found that more than 30 per cent was heavily bush encroached, comparable to the 40 per cent found in this study.
For the lower classes of BE it can be argued that this has increased the amount of browse available for cattle. In the
categories medium and high degree of encroachment low penetrability for cattle has seriously decreased grazing
and browsing.
It appears that the frequently described transhumance (Marsh and Seely, 1992; Tapscott and Hangula, 1994;
Kerven, 1997) was actually a migration pattern, best understood by decreased availability, both in size and quality,
ofOmutunda-Omutuntu ILUs on loamy-sand, as a result of increased cultivation and permanent settlement in the
older cattle posts. This triggers the owners of larger herds to establish new cattle posts, which later on will also
become a village. This pattern of increased settlement and migration is a result of the need for people to have access
to food in cattle posts as most animals remain there when grazing is deteriorating in the older cattle posts. It is more
convenient to establish a new field in the more recent cattle post, but this triggers the process of decreased
availability of good grazing and subsequent migration. This is a push-effect as a result of competition between
grazing and cropping, not a pull-effect looking for better grazing. People have reached the end of this migration to
the east as they have reached the border of Kavango Region already in the 1980s. The increased fencing of
rangeland in Kavango by Owambo graziers caused serious political turmoil in 2005.
The traditional livestock movement patterns where livestock were moved annually between villages and close by
cattle posts have decreased to such an extent that the majority of people keep their large livestock herds
permanently at far away cattle posts, due to the lack of grazing in settled areas. It seems to be that only in central
Oshikoto, and on the periphery of the southern grazing reserves the movement patterns described previously
(Marsh and Seely, 1992; Tapscott and Hangula, 1994; Kerven, 1997; Mendelsohn et al., 2000) seem to be still in
place. Herds of cattle with herders on the move, both in eastern and western directions, were frequently encountered
in these areas during the time the survey was carried out, before the harvest. A lot of these movements are
depending on individual decisions taken by livestock owners depending on their particular circumstances, but the
remaining grazing land consists almost entirely of Omuthitu units that are, due to their poor quality in species
composition and low soil fertility (Hillyer, 2004), not likely to sustain cattle without access to Omutunda or
Omutuntu units.
Historically the majority of the cattle were brought back to the homestead for a brief period after the harvest
(Kerven, 1997), resulting in a transfer of nutrients to crop fields. None of the discussions carried out during the
present survey mentioned annual movements of large herds, all stressed that the majority of the herds now remain
year round at the cattle post due to overall lack of grazing and the predominant use of donkeys and tractors for
ploughing. Loss of soil fertility of crop fields was cited as a major problem by the majority of farmers in the area and
is confirmed by Hillyer (2004).
CONCLUSION
The present study has through a combination of ITK and more conventional analysis not only demonstrated that
different types of livestock movements and different grazing strategies exist, but that farmers have a thorough
knowledge of grazing indicators and land quality. Changes have occurred rapidly due to water development and
population increases and have taken place in the living memory of many farmers. This facilitated the historical
overview in comparison with other studies on rangeland in semi-arid environments.
Copyright # 2006 John Wiley & Sons, Ltd. LAND DEGRADATION & DEVELOPMENT, 18: 179–197 (2007)
DOI: 10.1002/ldr
194 A. VERLINDEN AND A. S. KRUGER
The study suggests that expansion of grazing into new land was the answer to the conflict between cropping and
grazing in the agropastoral landscape for many decades. Expansion of herds was possible due to the opening up, by
providing borehole water or pipelines, of a landscape with patches of high grazing quality, essential for grazing but
also suitable for cropping. This landscape was previously created mainly by hunter-gatherers and was characterised
by low grazing pressure and frequent fires. Virtually all this land has now been occupied and quality has
deteriorated rapidly with low grass cover, low frequency of perennials and high degree of BE. The movements of
livestock, thought to be strictly a transhumance, was actually mainly a migration of a segment of the population
largely, but not exclusively, dependent on livestock. This migration was possible in an environment were both
cropping and grazing were feasible. The process is similar to the ‘pioneer syndrome’ of the western United States,
where a shifting frontier not only diluted population density (Otterstrom, 2001) but allowed to occupy new fertile
land.
Informal fencing by commercial ranchers of mostly fertile areas with more nutritious grasses has exacerbated,
not caused, an increasing problem of land shortage. Further expansion into new areas is now contested as the
graziers have reached the end of their frontier, a serious challenge to the livelihoods of communal farmers who have
to adapt to a new situation with more variable biomass and higher dependence on rainfall resulting in higher
uncertainty (Ward et al., 2000). This adaptation seems to be difficult as many farmers express the wish to herd their
livestock into the larger enclosed areas. The overall shortage of land has also reduced transhumance were it was
practiced in traditional grazing reserves, as these have been reduced in size as a result of permanent water supply in
previously saline areas and as a result of enclosures of remaining farming land as emergency grazing areas in the
settled areas. Those herders without cattle posts have to move animals through corridors between kraals, waterpoints and grazing. This increases labour costs and reduces time spent on grazing.
The reduced grazing in settled areas resulted in livestock remaining at cattle posts, preventing resting of the
rangeland and reducing the quality of the rangeland and the fertility of the crop fields more rapidly than under
transhumance. The data suggest that increased population, the trade-off between cropping and grazing, fencing,
vegetation deterioration and other processes have reduced grazing options and strategies sharply. Increased
investment in land through fencing of mainly more fertile areas has been carried out only by a relative minority of
the population.
This study concludes that rangeland studies in semi-arid areas should not only take into consideration indigenous
knowledge, but also put an emphasis on the historical context and changes over time in population and
environment.
acknowledgements
The Oshikoto Livestock Development Project, part of the Namibia-EU sponsored Namibian Agricultural Support
Services Program (NASSP) project in the Ministry of Agriculture and Forestry is thanked for funding this study.
The EU is not responsible for any opinions expressed in this paper. Patrik Klintenberg and Mary Seely are thanked
for making comments on earlier drafts.
references
Behnke R, Abel N. 1996. Revisited: the overstocking controversy in semi-arid Africa. World Animal Review 87: 4–27.Blench R. 2004. ‘You Can’t Go Home Again’. Pastoralism in the New Millenium. FAO: Cambridge.Coates-Palgrave K. 2002. Trees of Southern Africa. Struik: Cape Town.Dean WRJ, Macdonald IAW. 1994. Historical changes in stocking rates of domestic livestock as a measure of semi-arid and arid rangeland
degradation in the Cape Province, South Africa. Journal of Arid Environments 26: 281–298.Downing BH. 1978. Environmental consequences of agricultural expansion of South Africa since 1850. South African Journal of Science 74:
420–422.Ellis JE, Swift DM. 1988. Stability of African pastoral ecosystems: alternate paradigm and implications for development. Journal of Range
Management 41: 450–459.Erkkila A. 2001. Living on the land: change in forest cover in north central Namibia 1943-1996. Silva Carelica 37: 1–118.Erkkila A, Siiskonen H. 1992. Forestry in Namibia 1850-1990. Silva Carelica 20: 1–245.
Copyright # 2006 John Wiley & Sons, Ltd. LAND DEGRADATION & DEVELOPMENT, 18: 179–197 (2007)
DOI: 10.1002/ldr
CHANGING GRAZING SYSTEMS IN NORTH NAMIBIA 195
Estermann C. 1976. The Ethnography of Southwestern Angola. Gordon Gibson: NY and London.Fernandez-Gimenez MA. 2000. The role of Mongolian nomadic pastoralists’ ecological knowledge in range management. EcologicalApplications 10: 1318–1326.
Fuller B, Nghikembua S, Forbes-Irving T. 1996. The Enclosure of Rangelands in the Eastern Oshikoto Eegion of Namibia. Windhoek: Universityof Namibia, Social Sciences Division; SSD Report No. 24.
Gibbs-Russell GE,Watson L, KoekemoerM, Smook L, Barker NP, AndersonHM, DalwitzMJ. 1990. Grasses of southern Africa.Memoirs of theBotanical Survey of South Africa 58: 1–320.
Hiernaux P, Turner MD. 1996. The effect of the timing and frequency of clipping on nutrient uptake and production of Sahelian grasslands.Journal of Applied Ecology 33: 387–399.
Hill MO. 1979. DECORANA—A FORTRAN Program for Detrended Correspondence Analysis and Reciprocal Averaging. Cornell University:Ithaca, NY.
Hillyer AEM. 2004. Room to Grow: Local knowledge, land use and legumes in the farming systems of northern Namibia. [PhD]. University ofEast Anglia; Norwich, 1–325.
Homewood KM, Rodgers WA. 1991. Masailand Ecology, Pastoralists Development and Wildlife Conservation in Ngorongoro, Tanzania.Cambridge University Press: Cambridge.
Hutchinson P. 1995. The climatology of Namibia and its relevance to the drought situation. In Coping with Aridity: Drought Impacts andPreparedness in Namibia—Experiences from 1992/93. Prepared for the Ministry of Agriculture, Water and Rural Development and UNEP,Moorsom R (ed.). Brandes & Apsel Verlag GmbH: Frankfurt, Windhoek; 17–37.
Jongman RHG, ter Braak CJF, van Tongeren OFR. 1995. Data Analysis in Community and Landscape Ecology. Cambridge University Press:Cambridge, UK.
Kent M, Coker P. 1995. Vegetation Description and Analysis. A Practical Approach. Wiley: New York.Kerven C. 1997. The Knife Cuts on Both Blades: Redefining Property Rights in Eastern Oshikoto Region, Namibia. Overseas DevelopmentInstitute: London.
Kreike EHPM. 1994. On the Oshimolo trail: seasonal cattle migrations as a response to environmental stress in the lower Kunene (Angola) andOvamboland (Namibia) 1915-1945. Paper presented to the Southern African Research Program. Yale University.
Marsh AC, Seely MK. 1992. Oshanas: Sustaining People, Environment and Development in Central Owambo, Namibia. Desert ResearchFoundation and SIDA: Windhoek.
Mendelsohn J, El-Obeid S, Roberts C. 2000.A Profile of North Central Namibia. Gamsberg Macmillan: Windhoek, Namibia.Middleton N, Thomas D. 1997. World Atlas of Desertification. UNEP: New York, NY.NASSP. 2004. Provision of Technical Services to Facilitate Organisational Development in Support of the Oshikoto Livestock DevelopmentProject (OLDP/2003/1), Final Report. Windhoek: Desert Research Foundation of Namibia for NASSP, supported by EU and Government ofNamibia.
NASSP. 2005a. Onyuulae Auction. European Union, Government of Namibia: Windhoek.NASSP. 2005b. Range Survey of Communal Lands in Oshikoto Region: Production of a Baseline on Grazing Areas and Condition, IncorporatingIndigenous Knowledge. Namibia Agricultural Support Services Program: Windhoek.
Nott C, Verlinden A, Kuushomwa L, Kazapua V. 2003. Participatory Natural Resource Information Systems for Community-Based NaturalResource Management. NRSC and Rossing Foundation: Windhoek, Namibia.
Oba G, Kotile DG. 2001. Assessments of landscape level degradation in southern Ethiopia: pastoralists versus ecologists. Land Degradation &Development 12: 461–471.
Otterstrom SM. 2001. Trends in national and regional population concentration in the United States from 1790 to 1990: from the frontier to theurban transformation. The Social Science Journal 38: 393–407.
Perkins JS. 1996. Botswana: fencing out the equity issue. Cattleposts and cattle ranching in the Kalahari Desert. Journal of Arid Environments33: 503–517.
Scoones I. 1993. Exploiting heterogeneity: habitat use by cattle in dryland Zimbabwe. Journal of Arid Environments 29: 221–237.Scoones I. 1995. Living with Uncertainty: New Directions in Pastoral Development in Africa. IIED. Intermediate Technology: London.Siiskonen H. 1990. Trade and socioeconomic change in Ovamboland 1850-1906. Studia Historica 35: 1–269.Sinclair ARE, Fryxell JM. 1985. The Sahel of Africa: ecology of a disaster. Canadian Journal of Zoology 63: 987–994.Southgate C, Hulme D. 2000. Uncommon property: the scramble for wetland in southern Kenya. In African Enclosures? Social Dynamics ofWetlands in Drylands, Woodhouse PHB, Hulme D (eds). James Currey: Oxford; 73–118.
Strohbach B. 2000a. Vegetation degradation trends in the northern Oshikoto Region: I. The Hyphaene petersiana plains. Dinteria 26: 45–62.Strohbach B. 2000b. Vegetation degradation trends in the northern Oshikoto Region: III. The Terminalia prunioides woodlands and Andonigrasslands. Dinteria 26: 77–92.
Strohbach B. 2000c. Vegetation degradation trends in the northern Oshikoto Region: IV. The broad-leaved savannas with associated pans.Dinteria 26: 93–112.
Strohbach B. 2000d. Vegetation degradtion trends in the northern Oshikoto Region: II. The Colophospermum mopane shrublands. Dinteria 26:63–75.
Stuart-Hill GC, Aucamp AJ, Le Roux CGJ, Teague WR. 1986. Towards a method of assessing the veld condition of the Valley Bushveld of theeastern Cape. Journal of the Grassland Society of Southern Africa 3: 19–24.
Sweet J. 1997. Towards Sustainable Range Management in Communal Areas. In AGRISSON (ed.); 56–87.Tapscott C, Hangula L. 1994.Fencing of Communal Rangeland in Northern Namibia: Social and Ecological Implications. Windhoek: Universityof Namibia, social sciences division. Report nr Discussion paper No. 6.
ter Braak CJF, Smilauer P. 2002. Canoco 4.5. Software for Canonical Community Ordination. Microcomputer Power: Ithaca, NY.Thomas DSG, Twyman C. 2004. Good or bad rangeland? Hybrid knowledge, science and local understandings of vegetation dynamics in theKalahari. Land Degradation & Development 15: 215–231.
Copyright # 2006 John Wiley & Sons, Ltd. LAND DEGRADATION & DEVELOPMENT, 18: 179–197 (2007)
DOI: 10.1002/ldr
196 A. VERLINDEN AND A. S. KRUGER
Thomas DSG, Sporton D, Perkins JS. 2000. The environmental impact of livestock ranches in the Kalahari, Botswana: natural resource use,ecological change and human response in a dynamic dryland system. Land Degradation & Development 11: 327–341.
Turner MD, Hiernaux P. 2002. The use of herders’ accounts to map livestock activities across agropastoral landscapes in Semi-Arid Africa.Landscape Ecology 17: 367–385.
Van Oudtshoorn F. 1999. Guide to Grasses of Southern Africa. Briza: Pretoria.Verlinden A, Dayot B. 2000. InWorking with Local Knowledge Systems in a GIS for Natural Resource Assessment, Planning andManagement in
North Central Namibia. Caron P, Swanepoel F, Stroebel A (eds). University of Pretoria, post-graduate school of Agriculture and development.SACCAR and the University of Pretoria; 63–78.
Verlinden A, Dayot B. 2005. A comparison between indigenous environmental knowledge and a conventional vegetation analysis in NorthCentral Namibia. Journal of Arid Environments 62: 143–175.
Verlinden A, Seely MK, Hillyer A. 2006. Settlement, trees and termites in Central North Namibia: a case of indigenous resource management.Journal of Arid Environments 66: 307–335.
Verlinden A, Seely MK, Hillyer AEM. (in press). Settlement, trees and termites in Central North Namibia: a case of indigenous resourcemanagement. Journal of Arid Environments.
Ward D, Ngaigorue BT, Apollus A, Tjiveze H. 2000. Perceptions and realities of land degradation in arid Otjimbingwe, Namibia. Journal of AridEnvironments 45: 337–356.
Williams F-N. 1991. Precolonial communities of southwestern Africa: a history of Owambo Kingdoms, 1600–1920. Archeia 16: 1–204.
Copyright # 2006 John Wiley & Sons, Ltd. LAND DEGRADATION & DEVELOPMENT, 18: 179–197 (2007)
DOI: 10.1002/ldr
CHANGING GRAZING SYSTEMS IN NORTH NAMIBIA 197