namibia - 2010 country progress report - unaids
TRANSCRIPT
Republic of Namibia Ministry of Health and Social Services
United Nations General Assembly Special Session (UNGASS) Country Report
Reporting Period 2008 –2009
Republic of Namibia Ministry of Health and Social Services
United Nations General Assembly Special Session (UNGASS) Country Report
Reporting Period 2008 – 2009
Directorate of Special Programmes Division Expanded National HIV/AIDS Coordination Subdivision: Response Monitoring and Evaluation
Private Bag 13198 Windhoek, Namibia
Tel: +264-61-203-2833 Fax: +264-61-22-4155 Email: rm&[email protected]
1
List of Abbreviations ABC Abstinence, Be Faithful, Condoms AIDS Acquired Immune Deficiency Syndrome ALU AIDS Law Unit AMICAALL Alliance of Mayors and Municipal Leaders on HIV/AIDS in Africa ANC Ante-natal clinic ART Anti-retroviral Therapy ARV Anti-retroviral BCC Behaviour change communication CACOC Constituency AIDS Coordinating Committee CBO Community based Organisation CBS Central Bureau of Statistics CC Community Counsellor CDC Centers for Disease Control and Prevention (U.S) CMS Central Medical Stores CRIS Country Response Information System DACOC District AIDS Coordinating Committee DHS Demographic & Health Survey DPP&HRD Directorate: Policy, Planning and Human Resource Development DSP Directorate: Special Programmes ePMS Electronic Patient Monitoring System ETR Electronic TB Register EU European Union FBO Faith-based Organisation FSW Female Sex Worker GAMET Global AIDS Monitoring and Evaluation Team GFATM Global Fund to fight HIV/AIDS, TB and Malaria GIPA Greater Involvement of People Living with HIV/AIDS GRN Government of the Republic of Namibia GTZ Gesellschaft für Technische Zusammenarbeit HAART Highly active anti-retroviral therapy HIS Health Information System HIV Human Immuno-deficiency Virus IEC Information, education, communication KAP Knowledge, attitudes, practices LAC Legal Assistance Centre M&E Monitoring and evaluation MFMC My Future My Choice MoE Ministry of Education MoHSS Ministry of Health and Social Services MTP II Second Medium Term Plan on HIV/AIDS MTP III Third Medium Term Plan on HIV/AIDS MGECW Ministry of Gender Equality and Child Welfare NABCOA Namibia Business Coalition on AIDS NAC National AIDS Committee NACOP Namibian AIDS Co-ordination Programme NAMACOC Namibia Multisectoral HIV/AIDS Coordinating Committee NANASO Namibia Network of AIDS Service Organisations NASOMA Namibia Social Marketing Association NBTS Namibian Blood Transfusion Service NCPI National Composite Policy Index
2
NGO Non Governmental Organisation NIP Namibia Institute of Pathology NPA National Plan of Action NPC National Planning Commission OMAs Government Offices, Ministries or Agencies OVC Orphans and Vulnerable Children PEP Post Exposure Prophylaxis PEPFAR The US President’s Emergency Plan for AIDS Relief PLWHA People Living with HIV/AIDS RACOC Regional AIDS Co-coordinating Committee RM&E Response Monitoring and Evaluation Subdivision SPM System for Program Monitoring STI Sexually Transmitted Infections TB Tuberculosis UNAIDS Joint United Nations Programme on HIV/AIDS UNDP United Nations Development Programme UNGASS United Nations General Assembly Special Session on HIV/AIDS UNICEF United Nations Children’s Fund USAID United States Agency for International Development USG United States Government VCT Voluntary Counselling and Testing WHO World Health Organization WOH Window of Hope
3
Contents 1. Status at a Glance .............................................................................................4 2. Overview of the HIV Epidemic in Namibia .........................................................7
2.1 Introduction ........................................................................................................ 7 2.2 Namibian Country Profile ...................................................................................... 7 2.3 HIV/AIDS in Namibia............................................................................................ 8
3. Overview of Progress made in the National Response.....................................11 3.1. Creating an Enabling Environment.......................................................................12
3.1.1 HIV/AIDS Policies ....................................................................................................... 12 3.1.2 Stigma and Discrimination........................................................................................... 12 3.1.3 Domestic and International AIDS Spending .................................................................. 13 3.1.4 National Composite Policy Index.................................................................................. 14
3.2. Prevention.........................................................................................................18 3.2.1 Target Vulnerable Populations ..................................................................................... 19 3.2.2 Target Behaviour Change Interventions at Young People .............................................. 20 3.2.3 Target the General Population..................................................................................... 22 3.2.4 Expand Condom Provision........................................................................................... 23 3.2.5 Strengthen STI Management....................................................................................... 25 3.2.6 Voluntary Counselling and Testing............................................................................... 27 3.2.7 Safety of Blood Transfusion Products........................................................................... 28
3.3. Access to Treatment, Care and Support Services ..................................................29 3.3.1 PMTCT+ Services ....................................................................................................... 29 3.3.2 Management of Opportunistic Infections ...................................................................... 33 3.3.3 Collaborative HIV/TB Services ..................................................................................... 34 3.3.4 Provision of HAART..................................................................................................... 35
3.4. Impact Mitigation...............................................................................................36 3.4.1 Developing the Capacity of Local Responses ................................................................ 37 3.4.2 Services for OVC and Persons Living with HIV .............................................................. 38
3.5. Integrated and Co-ordinated Programme Management .........................................40 3.5.1 Management and Coordination of the National Response to HIV/AIDS........................... 40 3.5.2 Developing HIV/AIDS Management Capacity ................................................................ 41 3.5.3 Monitoring and Evaluation........................................................................................... 42 3.5.4 Surveillance and Operational Research......................................................................... 43
4. Best Practices...................................................................................................43 5. Major Challenges, Successes and Actions to be taken .....................................44
5.1. Major Challenges ...............................................................................................44 5.1.1. Prevention ................................................................................................................ 44 5.2.2. Treatment, care and support...................................................................................... 44 5.1.3. Impact mitigation ...................................................................................................... 45 5.1.4. Coordination, Management and Enabling Environment................................................. 45
5.2. Successes .........................................................................................................46 5.2.1. Prevention ................................................................................................................ 46 5.2.2. Treatment, Care and Support ..................................................................................... 46 5.2.3. Impact Mitigation ...................................................................................................... 46 5.2.4. Coordination, Management and Enabling Environment................................................. 46
5.3. Actions to be taken ............................................................................................47 5.3.1. Prevention ................................................................................................................ 47 5.3.2. Treatment, Care and Support ..................................................................................... 47 5.3.3. Impact Mitigation ...................................................................................................... 48 5.3.4. Coordination, Management and Enabling Environment................................................. 48
6. Support from Development Partners ...............................................................49 References ...........................................................................................................50
4
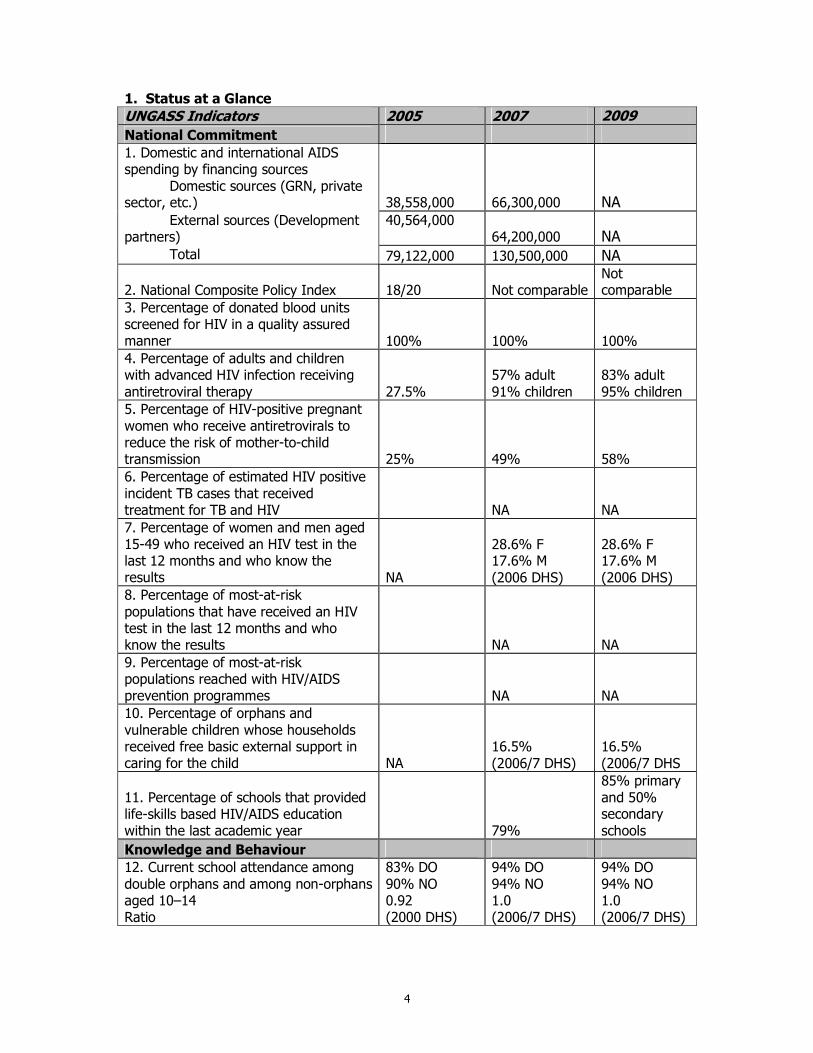
1. Status at a Glance
UNGASS Indicators 2005 2007 2009
National Commitment 1. Domestic and international AIDS spending by financing sources Domestic sources (GRN, private sector, etc.) 38,558,000 66,300,000 NA External sources (Development partners)
40,564,000 64,200,000 NA
Total 79,122,000 130,500,000 NA
2. National Composite Policy Index 18/20 Not comparable Not comparable
3. Percentage of donated blood units screened for HIV in a quality assured manner 100% 100% 100% 4. Percentage of adults and children with advanced HIV infection receiving antiretroviral therapy 27.5%
57% adult 91% children
83% adult 95% children
5. Percentage of HIV-positive pregnant women who receive antiretrovirals to reduce the risk of mother-to-child transmission 25% 49% 58% 6. Percentage of estimated HIV positive incident TB cases that received treatment for TB and HIV NA NA 7. Percentage of women and men aged 15-49 who received an HIV test in the last 12 months and who know the results NA
28.6% F 17.6% M (2006 DHS)
28.6% F 17.6% M (2006 DHS)
8. Percentage of most-at-risk populations that have received an HIV test in the last 12 months and who know the results NA NA 9. Percentage of most-at-risk populations reached with HIV/AIDS prevention programmes NA NA 10. Percentage of orphans and vulnerable children whose households received free basic external support in caring for the child NA
16.5% (2006/7 DHS)
16.5% (2006/7 DHS
11. Percentage of schools that provided life-skills based HIV/AIDS education within the last academic year 79%
85% primary and 50% secondary schools
Knowledge and Behaviour 12. Current school attendance among double orphans and among non-orphans aged 10–14 Ratio
83% DO 90% NO 0.92 (2000 DHS)
94% DO 94% NO 1.0 (2006/7 DHS)
94% DO 94% NO 1.0 (2006/7 DHS)
5
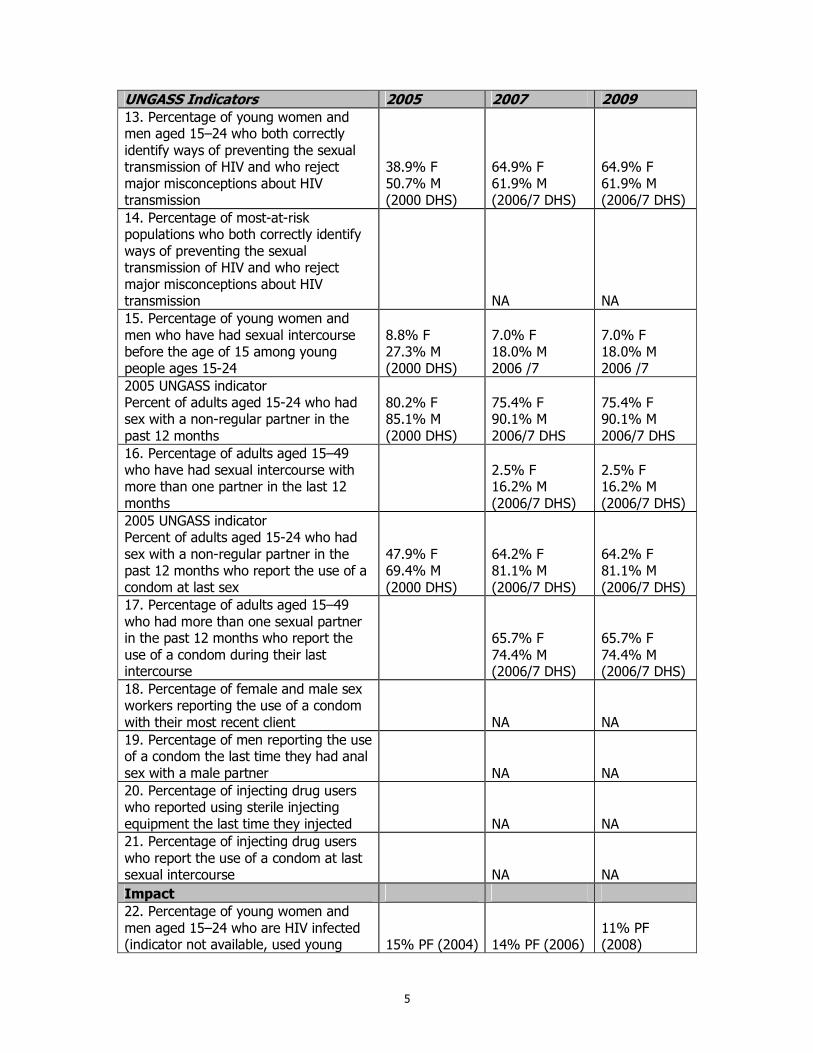
UNGASS Indicators 2005 2007 2009 13. Percentage of young women and men aged 15–24 who both correctly identify ways of preventing the sexual transmission of HIV and who reject major misconceptions about HIV transmission
38.9% F 50.7% M (2000 DHS)
64.9% F 61.9% M (2006/7 DHS)
64.9% F 61.9% M (2006/7 DHS)
14. Percentage of most-at-risk populations who both correctly identify ways of preventing the sexual transmission of HIV and who reject major misconceptions about HIV transmission NA NA 15. Percentage of young women and men who have had sexual intercourse before the age of 15 among young people ages 15-24
8.8% F 27.3% M (2000 DHS)
7.0% F 18.0% M 2006 /7
7.0% F 18.0% M 2006 /7
2005 UNGASS indicator Percent of adults aged 15-24 who had sex with a non-regular partner in the past 12 months
80.2% F 85.1% M (2000 DHS)
75.4% F 90.1% M 2006/7 DHS
75.4% F 90.1% M 2006/7 DHS
16. Percentage of adults aged 15–49 who have had sexual intercourse with more than one partner in the last 12 months
2.5% F 16.2% M (2006/7 DHS)
2.5% F 16.2% M (2006/7 DHS)
2005 UNGASS indicator Percent of adults aged 15-24 who had sex with a non-regular partner in the past 12 months who report the use of a condom at last sex
47.9% F 69.4% M (2000 DHS)
64.2% F 81.1% M (2006/7 DHS)
64.2% F 81.1% M (2006/7 DHS)
17. Percentage of adults aged 15–49 who had more than one sexual partner in the past 12 months who report the use of a condom during their last intercourse
65.7% F 74.4% M (2006/7 DHS)
65.7% F 74.4% M (2006/7 DHS)
18. Percentage of female and male sex workers reporting the use of a condom with their most recent client NA NA 19. Percentage of men reporting the use of a condom the last time they had anal sex with a male partner NA NA 20. Percentage of injecting drug users who reported using sterile injecting equipment the last time they injected NA NA 21. Percentage of injecting drug users who report the use of a condom at last sexual intercourse NA NA
Impact 22. Percentage of young women and men aged 15–24 who are HIV infected (indicator not available, used young 15% PF (2004) 14% PF (2006)
11% PF (2008)
6
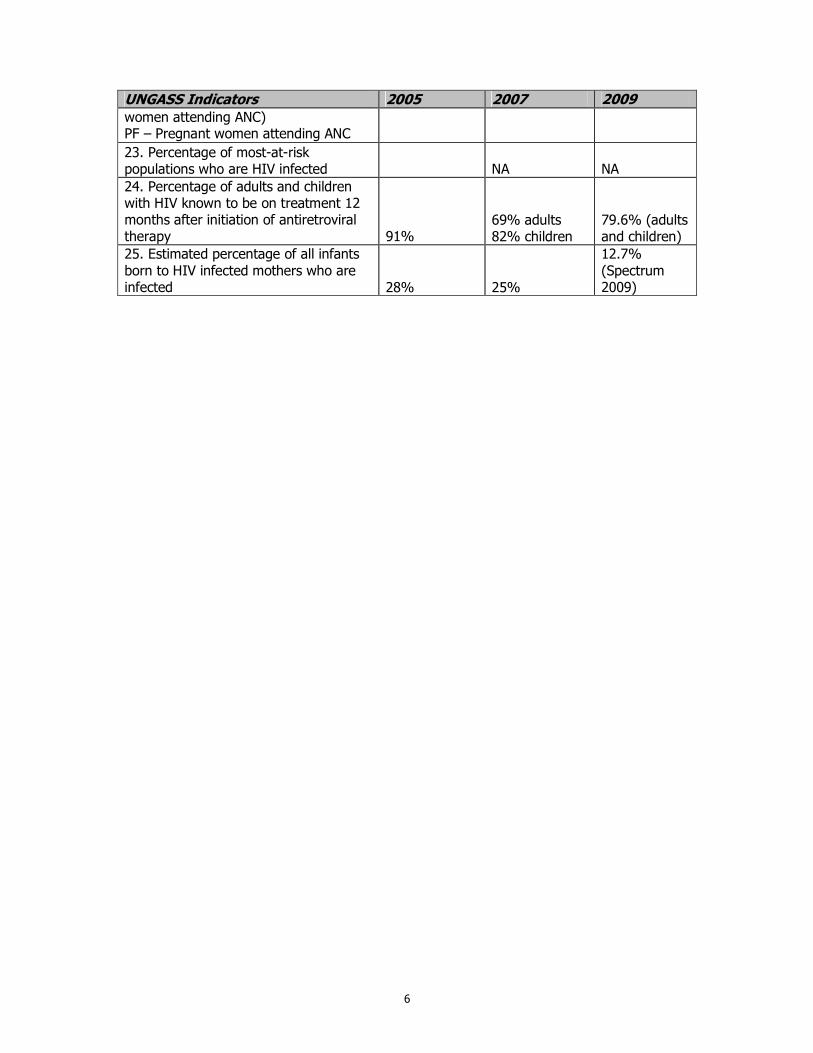
UNGASS Indicators 2005 2007 2009 women attending ANC) PF – Pregnant women attending ANC
23. Percentage of most-at-risk populations who are HIV infected NA NA 24. Percentage of adults and children with HIV known to be on treatment 12 months after initiation of antiretroviral therapy 91%
69% adults 82% children
79.6% (adults and children)
25. Estimated percentage of all infants born to HIV infected mothers who are infected 28% 25%
12.7% (Spectrum 2009)
7
2. Overview of the HIV Epidemic in Namibia 2.1 Introduction In June 2001, Namibia signed the Declaration of Commitment on HIV/AIDS developed during the UN General Assembly Special Session on HIV/AIDS (UNGASS). The commitment addresses global, regional and country-level responses to prevent new HIV infections, expand health care access and mitigate the epidemic’s impact. The declaration attempts to extend beyond governments to reach the private sector, labour groups, faith-based organizations, nongovernmental organizations and other civil society entities, including organizations of people living with HIV. Under the terms of the Declaration of Commitment on HIV/AIDS, Namibia is required to publish biennial reports on the progress toward reaching the UNGASS goals. A panel of country officers, UN agencies and other development partners has developed a list of indicators and targets against which to measure progress on the declaration of commitment. These indicators are then used by all countries to measure how they are progressing toward meeting these targets. The purpose of this report is to review the progress made by Namibia toward reaching the goals agreed to in the UNGASS Declaration of Commitment. In addition the report describes challenges, constraints and recommended actions to achieve the UNGASS targets. The report was written by the Ministry of Health and Social Services with significant contribution from civil society and other development partners. A technical advisory group constituted by the National M&E Committee was established to review the process of developing the report and reviewing the drafts. The Joint UN Team for HIV/AIDS reviewed and contributed to the drafts The NCPI questionnaire was administered to Government (Part A) and non-Government partners (Part B) by an independent consultant. In addition, special separate consensus meetings of non-government and government were held in February 2010 to review the results of the National Composite Policy Index (NCPI). A summary of the results is presented in this UNGASS 2010 report and details of the raw data are available in the NCPI report which is submitted with the narrative. A validation meeting was held on the 24th March 2010 in which the UNGASS, NCPI and Universal Access reports were presented. This report is a shortened version of the MTP III Progress Reports for 2007/08 and 2008/09. Both reports cover the same topic areas, the same time period and the same indicators. Both reports use the same process of requesting significant contribution from civil society and development partners. At this point the only difference is that the MTP III Progress Report contains more details. The financial year reporting period for Namibia is from April to March and therefore most of the annual indicators are last reported for that period unless stated otherwise. 2.2 Namibian Country Profile Namibia is located in the south-western part of Africa, hosting a population of approximately 2,000,000 (National Planning Commission, 2003). It is one of the most sparsely populated countries in Africa with an average population density of 2.5 persons per square kilometer. The country is classified as a lower-middle income country and is heavily dependent on the extraction and processing of minerals for export. Despite this good economic status the country has the highest Gini coefficient in the world at approximately 0.6 (National Planning
8
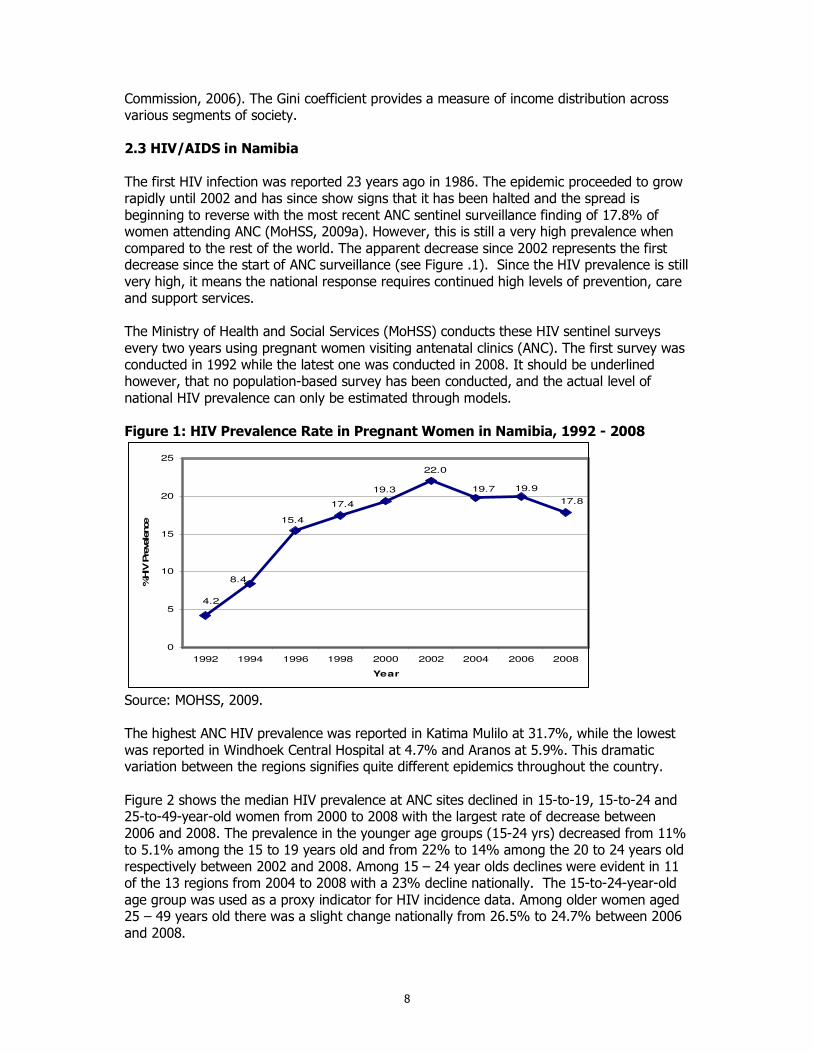
Commission, 2006). The Gini coefficient provides a measure of income distribution across various segments of society. 2.3 HIV/AIDS in Namibia The first HIV infection was reported 23 years ago in 1986. The epidemic proceeded to grow rapidly until 2002 and has since show signs that it has been halted and the spread is beginning to reverse with the most recent ANC sentinel surveillance finding of 17.8% of women attending ANC (MoHSS, 2009a). However, this is still a very high prevalence when compared to the rest of the world. The apparent decrease since 2002 represents the first decrease since the start of ANC surveillance (see Figure .1). Since the HIV prevalence is still very high, it means the national response requires continued high levels of prevention, care and support services. The Ministry of Health and Social Services (MoHSS) conducts these HIV sentinel surveys every two years using pregnant women visiting antenatal clinics (ANC). The first survey was conducted in 1992 while the latest one was conducted in 2008. It should be underlined however, that no population-based survey has been conducted, and the actual level of national HIV prevalence can only be estimated through models. Figure 1: HIV Prevalence Rate in Pregnant Women in Namibia, 1992 - 2008
4.2
8.4
15.4
17.4
19.3
17.8
19.9
22.0
19.7
0
5
10
15
20
25
1992 1994 1996 1998 2000 2002 2004 2006 2008
Year
%HIV
Pre
vale
nce
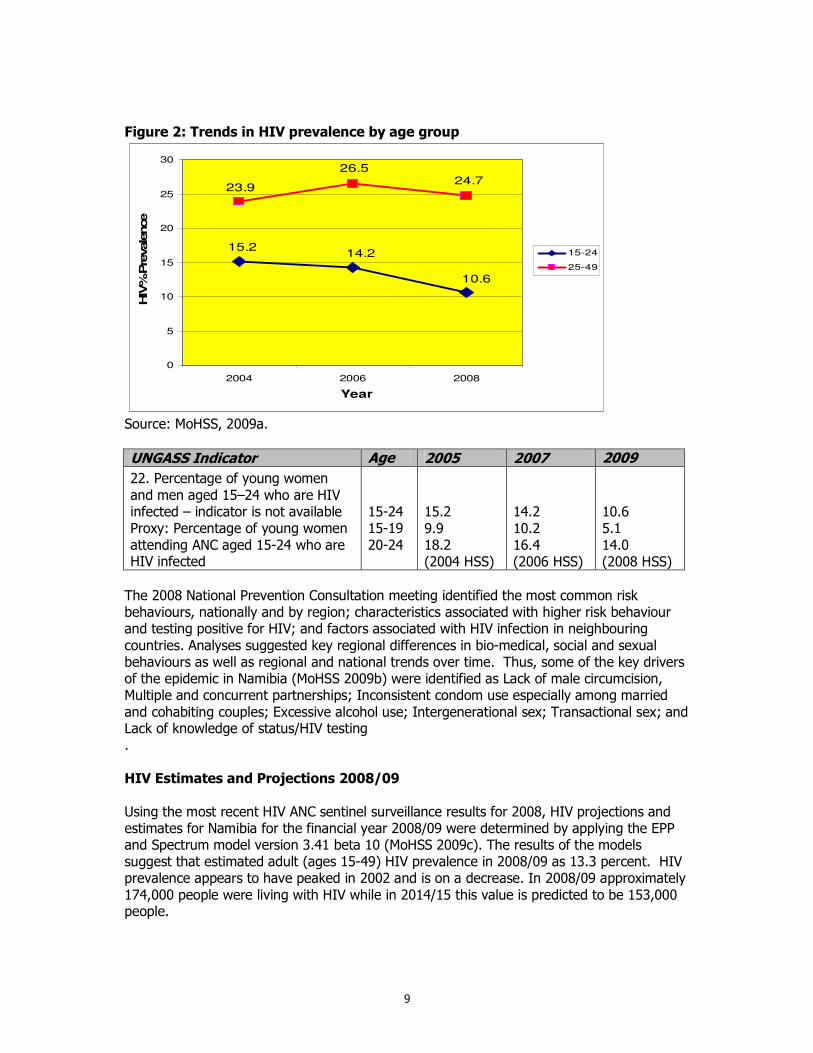
Source: MOHSS, 2009. The highest ANC HIV prevalence was reported in Katima Mulilo at 31.7%, while the lowest was reported in Windhoek Central Hospital at 4.7% and Aranos at 5.9%. This dramatic variation between the regions signifies quite different epidemics throughout the country. Figure 2 shows the median HIV prevalence at ANC sites declined in 15-to-19, 15-to-24 and 25-to-49-year-old women from 2000 to 2008 with the largest rate of decrease between 2006 and 2008. The prevalence in the younger age groups (15-24 yrs) decreased from 11% to 5.1% among the 15 to 19 years old and from 22% to 14% among the 20 to 24 years old respectively between 2002 and 2008. Among 15 – 24 year olds declines were evident in 11 of the 13 regions from 2004 to 2008 with a 23% decline nationally. The 15-to-24-year-old age group was used as a proxy indicator for HIV incidence data. Among older women aged 25 – 49 years old there was a slight change nationally from 26.5% to 24.7% between 2006 and 2008.
9
Figure 2: Trends in HIV prevalence by age group
15.214.2
10.6
23.9
26.524.7
0
5
10
15
20
25
30
2004 2006 2008
Year
HIV
% P
revale
nce
15-24
25-49
Source: MoHSS, 2009a.
UNGASS Indicator Age 2005 2007 2009
22. Percentage of young women and men aged 15–24 who are HIV infected – indicator is not available Proxy: Percentage of young women attending ANC aged 15-24 who are HIV infected
15-24 15-19 20-24
15.2 9.9 18.2 (2004 HSS)
14.2 10.2 16.4 (2006 HSS)
10.6 5.1 14.0 (2008 HSS)
The 2008 National Prevention Consultation meeting identified the most common risk behaviours, nationally and by region; characteristics associated with higher risk behaviour and testing positive for HIV; and factors associated with HIV infection in neighbouring countries. Analyses suggested key regional differences in bio-medical, social and sexual behaviours as well as regional and national trends over time. Thus, some of the key drivers of the epidemic in Namibia (MoHSS 2009b) were identified as Lack of male circumcision, Multiple and concurrent partnerships; Inconsistent condom use especially among married and cohabiting couples; Excessive alcohol use; Intergenerational sex; Transactional sex; and Lack of knowledge of status/HIV testing . HIV Estimates and Projections 2008/09 Using the most recent HIV ANC sentinel surveillance results for 2008, HIV projections and estimates for Namibia for the financial year 2008/09 were determined by applying the EPP and Spectrum model version 3.41 beta 10 (MoHSS 2009c). The results of the models suggest that estimated adult (ages 15-49) HIV prevalence in 2008/09 as 13.3 percent. HIV prevalence appears to have peaked in 2002 and is on a decrease. In 2008/09 approximately 174,000 people were living with HIV while in 2014/15 this value is predicted to be 153,000 people.
10
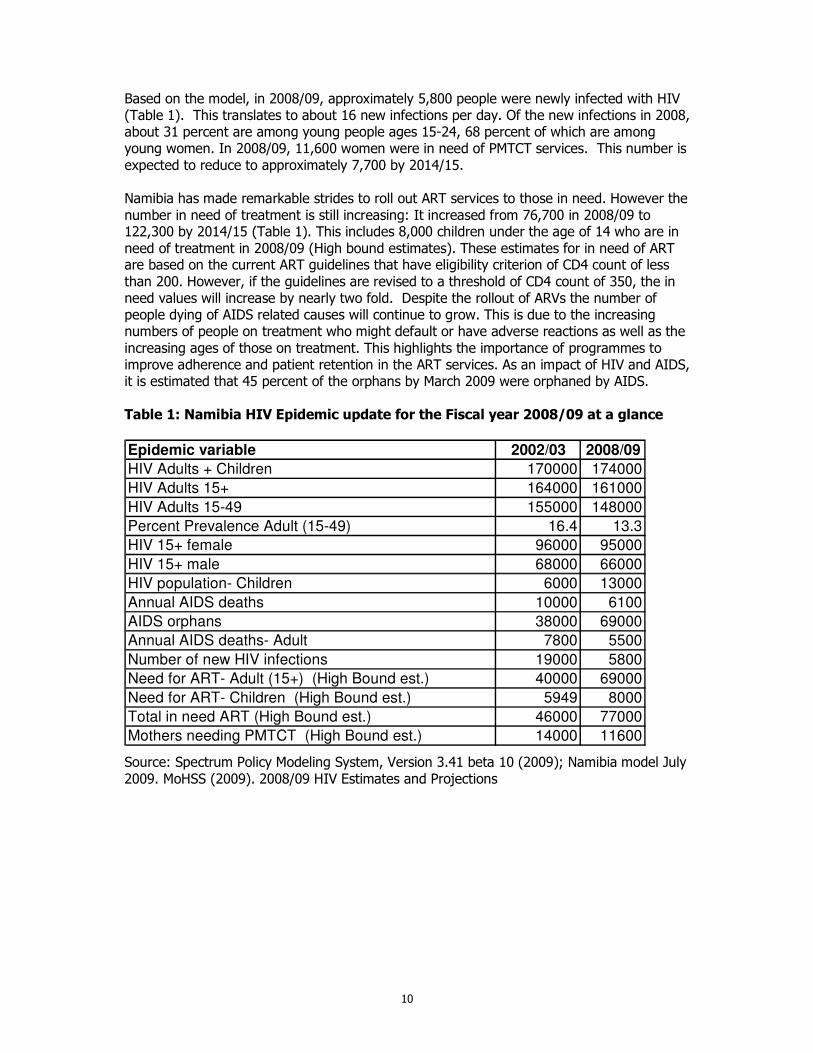
Based on the model, in 2008/09, approximately 5,800 people were newly infected with HIV (Table 1). This translates to about 16 new infections per day. Of the new infections in 2008, about 31 percent are among young people ages 15-24, 68 percent of which are among young women. In 2008/09, 11,600 women were in need of PMTCT services. This number is expected to reduce to approximately 7,700 by 2014/15. Namibia has made remarkable strides to roll out ART services to those in need. However the number in need of treatment is still increasing: It increased from 76,700 in 2008/09 to 122,300 by 2014/15 (Table 1). This includes 8,000 children under the age of 14 who are in need of treatment in 2008/09 (High bound estimates). These estimates for in need of ART are based on the current ART guidelines that have eligibility criterion of CD4 count of less than 200. However, if the guidelines are revised to a threshold of CD4 count of 350, the in need values will increase by nearly two fold. Despite the rollout of ARVs the number of people dying of AIDS related causes will continue to grow. This is due to the increasing numbers of people on treatment who might default or have adverse reactions as well as the increasing ages of those on treatment. This highlights the importance of programmes to improve adherence and patient retention in the ART services. As an impact of HIV and AIDS, it is estimated that 45 percent of the orphans by March 2009 were orphaned by AIDS. Table 1: Namibia HIV Epidemic update for the Fiscal year 2008/09 at a glance
Epidemic variable 2002/03 2008/09
HIV Adults + Children 170000 174000
HIV Adults 15+ 164000 161000
HIV Adults 15-49 155000 148000
Percent Prevalence Adult (15-49) 16.4 13.3
HIV 15+ female 96000 95000
HIV 15+ male 68000 66000
HIV population- Children 6000 13000
Annual AIDS deaths 10000 6100
AIDS orphans 38000 69000
Annual AIDS deaths- Adult 7800 5500
Number of new HIV infections 19000 5800
Need for ART- Adult (15+) (High Bound est.) 40000 69000
Need for ART- Children (High Bound est.) 5949 8000
Total in need ART (High Bound est.) 46000 77000
Mothers needing PMTCT (High Bound est.) 14000 11600
Source: Spectrum Policy Modeling System, Version 3.41 beta 10 (2009); Namibia model July 2009. MoHSS (2009). 2008/09 HIV Estimates and Projections
11
3. Overview of Progress made in the National Response Namibia’s Vision 2030 regards HIV as one of the most serious threats facing the country, and it highlights the need to mainstream HIV programmes to effectively meet the resultant development challenges. Consistent with the goals of Vision 2030, the country’s response to the epidemic has intensified considerably in recent years. The Government of Namibia is fully committed to tackling the epidemic in a multi-sectoral manner. This is reflected in the Medium-Term Plan III (MTP III) for the period 2004-2009, which places particular emphasis on the importance of effective monitoring and evaluation of the epidemic. The national goal of MTP III is the reduction in incidence of HIV infection. To realize this goal, five key strategic results have been articulated: Component 1: Enabling Environment -- People infected and affected with HIV/AIDS enjoy
equal rights in a culture of acceptance, openness and compassion Component 2: Prevention -- Reduced new infections of HIV and other STIs Component 3: Access to treatment, care and Support Services -- Access to cost effective
and high quality treatment, care and support services for all people living with or affected by HIV/AIDS.
Component 4: Impact Mitigation Services -- Strengthen and expanded capacity for local
responses to mitigate socio-economic impacts of HIV/AIDS Component 5: Integrated and Co-ordinated Programme Management at all levels -- Effective
management structures and systems, optimal capacity and skills, and high quality programme implementation at national, sectoral, regional and local levels
The first HIV/AIDS Medium Term Plan was launched in 1992 with the implementation of a Short Term Plan. To coordinate implementation of this plan, the country established the National AIDS Control Programme housed within the Ministry of Health and Social Services (MOHSS). In March 1999, Dr Sam Nujoma, the former President of the Republic of Namibia launched the Second National Strategic Plan for HIV/AIDS (Medium Term Plan II). To facilitate and coordinate implantation of MTP II, the National AIDS Co-ordination Programme (NACOP) was established in 1999, replacing the National AIDS Control Programme. This structure was designed to oversee the different sectors responding to HIV. In 2002, the Directorate of Special Programmes (DSP) was established where NACOP is housed. Additionally, a specific subdivision under DSP, “Response Monitoring and Evaluation” (RM&E) was established with the primary mandate of monitoring and evaluating the implementation of the HIV/AIDS response strategies at national and regional levels. MTP II strengthened support to HIV/AIDS prevention and control efforts and focused on mobilising all partners to reduce HIV incidence. It also addressed increased stigma and discrimination and access to quality health services to those living with the disease. The Third Medium Term Plan (MTPIII) went a step further to consolidate access to treatment with anti-retroviral medicines and ensuring the mainstreaming of HIV programmes in all sectors. It further pulls together efforts from all Government Officers, Ministries/Agencies, Regions, Non-governmental Organisations, Faith Based organisations, and Community Based Organisations, the Private Sector and various development partners to play a distinct role addressing the causes and reducing the burden of HIV/AIDS.
12
A new national strategic framework (NSF) for HIV and AIDS (MTPIV) is near completion and will be for the period April 2010 to March 2015. The NSF is guided and informed by the principle of Gender and Human rights by ensuring the mainstreaming of these principles in all aspects of the national response. 3.1. Creating an Enabling Environment Laws, financing and political commitment (or leadership) are necessary to ensure the rights of individuals infected and affected by HIV. Policies and laws are necessary to guide the response to HIV/AIDS and to ensure a legal and organizational framework on which to base actions and activities. Policies define the responsibilities and set standards for what services should be provided. Laws are necessary to enforce the policies and also to ensure that the rights of individuals affected and infected by HIV are protected. The national response to HIV requires a large financial commitment by the government and the development partners. This commitment needs to be sustained over time even if all new infections were averted the cost of supporting and caring for those currently infected or affected by HIV is significant. Finally we need the commitment of our leaders to show through their words and actions the critical importance of responding to HIV. A coordinated, government led response is the only way to ensure a healthy and productive population. This section (3.1) outlines the specific steps that have been taken since the last report to improve the legal environment (laws, law enforcement, programme to strengthen access to justice). 3.1.1 HIV/AIDS Policies Progress has been made in the development of National and sectoral policies on HIV and AIDS. A National policy on HIV/AIDS, National OVC policy, National Plan of Action on OVC, Education sector policy on OVC and HIV policy for the Polytechnic were developed and approved while a Public sector Work Place Policy was approved and is consistent with ILO Code of Practice on HIV/AIDS and the world of work. A Workplace policy for education sector and implementation plan has also been developed. PMTCT guidelines were launched in July 2008 to include a more efficacious regimen for PMTCT ARV prophylaxis. Since the implementation of MTP III there has been increased attention to the development of sectoral policies for HIV that address both workplace related issues as well as mainstreaming aspects of HIV. 3.1.2 Stigma and Discrimination The AIDS Law Unit of the Legal Assistance Centre is promoting a human rights based approach to HIV/AIDS in Namibia focusing on both the infringement of civil and political rights on the basis of HIV status and the denial of socioeconomic rights that contribute to vulnerability to HIV and negatively impact on health outcomes. The Unit made a submission to the Parliamentary Standing Committee on insurance with the purpose of raising discriminatory practices by insurance industries especially with the exclusion of people on the basis of their HIV status and the refusal to settle claims if the insured died as a result of HIV AIDS related illness.
13
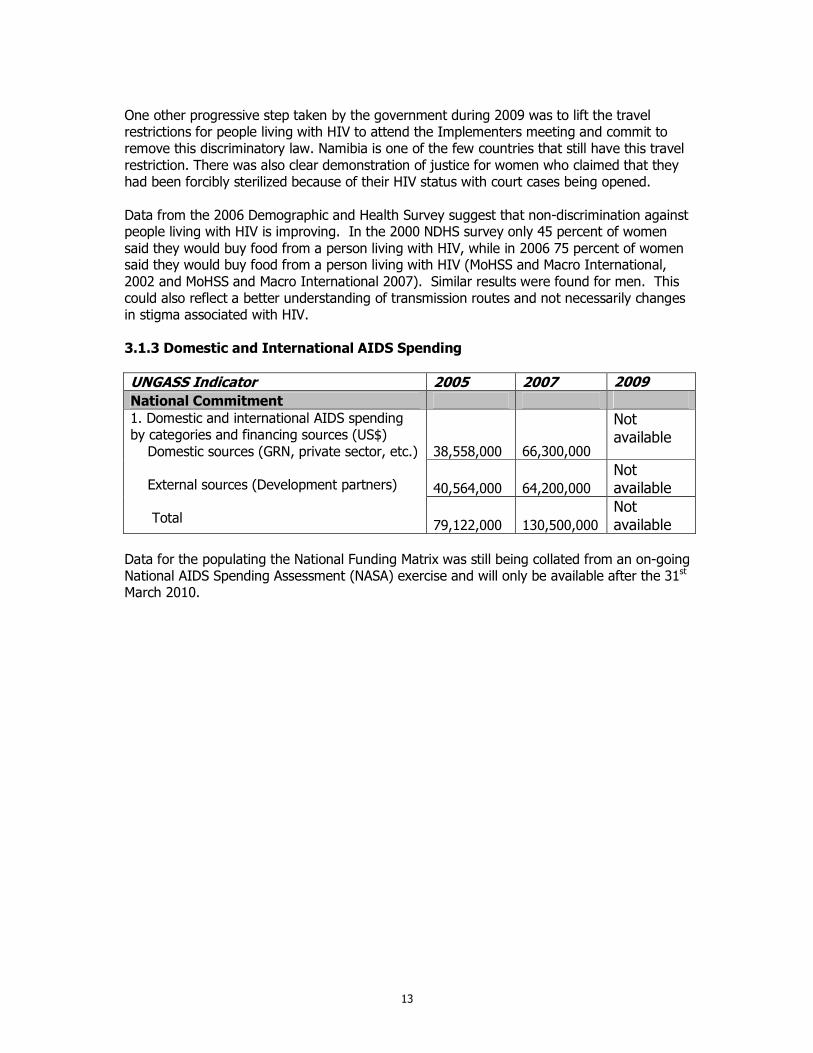
One other progressive step taken by the government during 2009 was to lift the travel restrictions for people living with HIV to attend the Implementers meeting and commit to remove this discriminatory law. Namibia is one of the few countries that still have this travel restriction. There was also clear demonstration of justice for women who claimed that they had been forcibly sterilized because of their HIV status with court cases being opened. Data from the 2006 Demographic and Health Survey suggest that non-discrimination against people living with HIV is improving. In the 2000 NDHS survey only 45 percent of women said they would buy food from a person living with HIV, while in 2006 75 percent of women said they would buy food from a person living with HIV (MoHSS and Macro International, 2002 and MoHSS and Macro International 2007). Similar results were found for men. This could also reflect a better understanding of transmission routes and not necessarily changes in stigma associated with HIV. 3.1.3 Domestic and International AIDS Spending
UNGASS Indicator 2005 2007 2009 National Commitment
38,558,000 66,300,000
Not available
40,564,000 64,200,000 Not available
1. Domestic and international AIDS spending by categories and financing sources (US$) Domestic sources (GRN, private sector, etc.) External sources (Development partners) Total
79,122,000 130,500,000 Not available
Data for the populating the National Funding Matrix was still being collated from an on-going National AIDS Spending Assessment (NASA) exercise and will only be available after the 31st March 2010.
14
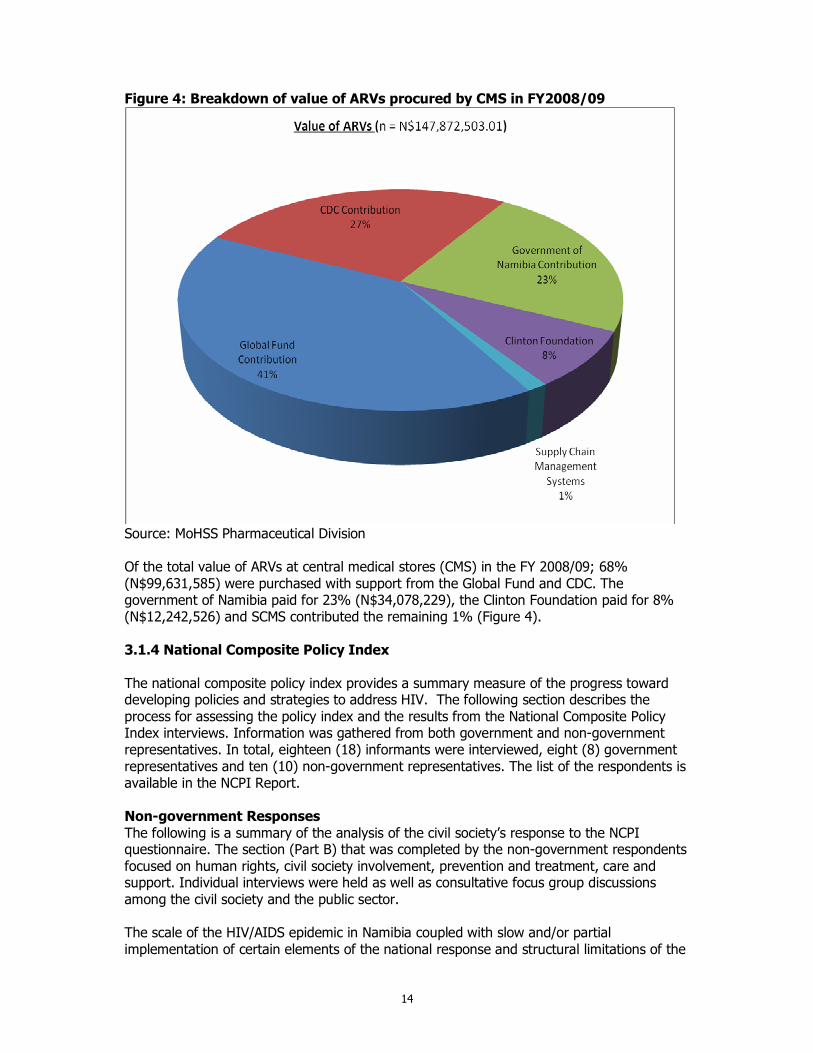
Figure 4: Breakdown of value of ARVs procured by CMS in FY2008/09
Source: MoHSS Pharmaceutical Division Of the total value of ARVs at central medical stores (CMS) in the FY 2008/09; 68% (N$99,631,585) were purchased with support from the Global Fund and CDC. The government of Namibia paid for 23% (N$34,078,229), the Clinton Foundation paid for 8% (N$12,242,526) and SCMS contributed the remaining 1% (Figure 4). 3.1.4 National Composite Policy Index The national composite policy index provides a summary measure of the progress toward developing policies and strategies to address HIV. The following section describes the process for assessing the policy index and the results from the National Composite Policy Index interviews. Information was gathered from both government and non-government representatives. In total, eighteen (18) informants were interviewed, eight (8) government representatives and ten (10) non-government representatives. The list of the respondents is available in the NCPI Report. Non-government Responses The following is a summary of the analysis of the civil society’s response to the NCPI questionnaire. The section (Part B) that was completed by the non-government respondents focused on human rights, civil society involvement, prevention and treatment, care and support. Individual interviews were held as well as consultative focus group discussions among the civil society and the public sector. The scale of the HIV/AIDS epidemic in Namibia coupled with slow and/or partial implementation of certain elements of the national response and structural limitations of the
15
public health and welfare systems, has contributed to the growing pressure on NGOs, CBOs, FBOs, and private sector to respond to various aspects of the epidemic. This includes the visible and growing need to support and care for PLWHA and others who are affected by the epidemic, particularly OVC, as well as engagement with prevention, treatment, and rights-related activities. Part B (Civil Society) of the NCPI questionnaire addresses four areas: human rights, civil society involvement, prevention, and treatment, care and support in relation to the national response to HIV/AIDS epidemic. Human Rights In summary, the policies particularly promote and protect the rights of PLWH, pregnant women and under age children, however most at risk (migrant and mobile workers, prisoners, sex workers and men who have sex with other men) and other vulnerable subpopulations are generally excluded. Key achievements observed since 2007 include the recognition and strong emphasis on human rights placed in the national HIV policy with one of the guiding principles being the reduction or stigma and discrimination. Other achievements include the reduced dismissal from work due to HIV related illnesses. Challenges however remain, of which the implementation and reinforcement of policies, laws, and regulations remain the biggest. The limited dissemination of polices and language barriers restricts the awareness of the public pertaining these polices. Other challenges include the compulsory testing for HIV for military recruitment and testing for insurance of which refusal is made if the result is positive. Civil Society Participation Overall the involvement of civil society has increased significantly. Civil society has been involved in all major planning of HIV in the country, is well represented at national committees, and is greatly involved in M&E efforts. Involving civil society in the national budgeting process and allocating funds for civil society remains a challenge and an area of concern. The following contine to remain challenges1, decentralization of national consultations during the development of national strategic documents as it is currently only based in Windhoek, 2, no clear roadmaps for implementations and recognition of civil society through resource allocation. Prevention Significant efforts have been made in implementing HIV prevention programmes. Key achievements since 2007 include the national HIV plan for implementation and monitoring, the Midterm review of MTP3 the national consultation on Prevention and the report on the Drivers of the Epidemic in the country (MoHSS 2009b), not withstanding the initiatives of male circumcision since 2008. Challenges in implementing prevention programmes include limited services for most at risk populations (migrant and mobile workers, prisoners, sex workers and men who have sex with other men). Treatment, Care and Support Overall implementation of HIV treatment, care and support has been very good with particular emphasis to free availability of treatment although access to treatment may be limited due to long distances. A major challenge and area of concern is nutritional care and support which may compromise the success of the ART programme. Decentralization of treatment to increase access to services should be accelerated. Other challenges include loss of follow up, vertical services with no linkages to prevention and mitigation services, limited access to HIV care and support services at the work place.
16
The country has a policy to address HIV-related needs of orphans and other vulnerable children and a national action plan specifically for OVCs with clearly defined operational definitions of who constitutes an OVC. In general the country is doing fairly well in meeting the HIV related needs of OVCs. This is evident through the formulation of the OVC policy and registration of OVCs countrywide. Education Sector policy for OVC was also launched during the reporting period. Approximately 60% of the OVCs are being reached. The quality of OVC services being provided is however a matter of concern. Government Perspectives on NCPI Questionnaire This section details the responses of the government to the items in the NCPI questionnaire. Part A (government officials) of the NCPI questionnaire addresses five areas: strategic plan, political support, prevention, treatment, care and support, and monitoring and evaluation. The responses to items in each of the five areas are presented below. Strategic Plan The country has developed a multi-sectoral strategy to respond to HIV which covers the period 2004-2009. With the ending of MTP3 the country is in the process of developing the next five year National Strategic Framework for HIV. Namibia has had a multi-sectoral strategy for more than 15 years since 1990 which includes sectors for health, education, labor, transportation, military, police, women, and local government. The budget mostly covers funds for the HIV/AIDS workplace programmes. The sectors are each responsible to budget for their respective HIV activities. Additionally, development partners support different sectors to implement HIV programmes. All target populations are addressed except for MSM, sex workers and IDUs. The settings cover workplace, schools and prisons, as well as crosscutting issues of PLWHA, stigma and discrimination and gender empowerment and equality. Political Support The Head of the Government alongside his officials regularly speak publicly and favorably about HIV efforts in major domestic forums. The country has a recognized multi-sectoral AIDS coordinating body that was established in 1992, chaired by the Minister of Health Honorable Richard Kamwi. The coordination body National AIDS Executive Committee (NAEC) has clear terms of reference, with active government leadership and NGO’s participation. Members consist of civil society, private sector and people living with HIV. An action plan is in place with a functional secretariat that meets bi-annually to review actions, policy decisions, promote policy decision-making and strengthens donor coordination to avoid parallel funding and duplication of efforts in programming and reporting. The country through the coordinating body has a mechanism in place to promote interaction between government, civil society organizations and the private sector for implementing HIV strategies. The main achievements to date have been the commitment and active participation of members in addressing challenges faced during implementation. HIV and AIDS mainstreaming and resource allocation however remains a challenge across the board and hinders the effective implementation of laws, policies and plans. National policies are regularly reviewed and amended to be consistent with the national AIDS Control policies. An excellent example is the review of the National Gender Policy as well as the Children’s Act which is now being incorporated into the Child Care and Protection Act in light of the National AIDS Control policies.
17
Prevention Namibia has a strategy in place for promoting IEC on HIV to the general population. The messages include sexual debut, faithfulness, reduced number of sexual partners, consistent use of condoms, fight against violence against women, greater acceptance of PLWH, safe sex, involvement of men in reproductive health programmes, importance of knowing HIV status, prevention of mother-to-child transmission of HIV. Male circumcision is receiving considerable attention as a new initiative while abstinence is underemphasized. The country does not have a specific policy for IEC targeting most at risk or other vulnerable subpopulations. The policy for Reproductive and Sexual Health for young people particularly emphasizes education on HIV related reproductive and sexual health. HIV education is now part of the school curriculum both at primary and secondary level. Teachers’ training also covers HIV education. The Reproductive and Sexual Health education is the same for both young men and women. The strategy also targets out-of-school youth. The development of policy efforts in support of HIV prevention has been generally good. The country has developed all major policies although they exclude specific most at risk populations such as sex workers and MSM. However, the country plans to do studies among most at risk populations. Treatment, Care and Support There is a policy in place for developing and using generic drugs or parallel importing of drugs for HIV. The country has access to regional procurement and supply management mechanisms for critical commodities such as ARV drugs and condoms. ART guidelines of the World Health Organization have been adapted. Implementation of treatment, care and support programmes has been very good. Namibia exceeded its Universal Access target. There is a high ART coverage in the country and all the district hospitals are currently offering ART. In addition, the MOHSS has outreach services in place as well as the introduction of IMAI and HIVQUAL. Regarding an estimate of OVC being reached by existing interventions, the respondents suggested that 50% are being reached, which is a perceived improvement from 2005. It was stated that an M&E plan for OVCs for 2006- 2010 has been developed, the number of OVCs who received social welfare grants increased from 7,000 to 40,685 from 2003-2006. Social workers have been appointed at regional and national levels to address the plight of OVCs. However, there is still insufficient geographic coverage of comprehensive OVC services. Quality assurance, supervision, and M&E of OVC programmes remain critical gap areas. Monitoring and Evaluation The country has one national M&E plan for the period 2006-2009 endorsed by all key partners in M&E. The development of the M&E plan was done in consultation with civil society including people living with HIV. Most of the partners have aligned and harmonized their M&E requirements with the national M&E plan. The M&E plan includes a data collection strategy that addresses routine programme monitoring, behavioral surveys, HIV surveillance and evaluation and research studies. The plan has a well-defined standardized set of indicators, guidelines on data collection tools, a strategy for assessing data quality and data dissemination and use strategy. The plan however lacks a data analysis strategy. The plan has a budget for implementation that is fully funded with M&E expenditure being monitored.
18
The country has a clear data flow mechanism in place for both health and non-health data. The system for non-health programmes has been recently introduced in 2008. Although a mechanism exists to ensure that all major implementing partners submit their reports to the M&E unit for inclusion in the national M&E system, timely reporting and reporting from all partners remains a serious matter of concern. At present, there is no national database for HIV-related data received from implementing partners. There is a functional Health Information System at district level to capture health related data as well as an Education Management Information System that collects education sector related data. To a large extent M&E data is used in developing or revising national AIDS strategies, for resource allocation as well as programme improvement. M&E data is published only when major studies such as HIV surveillance, DHS and Health Facility surveys are conducted. Conclusions Namibia as a country is doing well in developing policies, laws and strategies to create a favorable environment for the HIV response. Government and civil society are working together to develop and implement relevant HIV-related policies. Implementation of the policies and laws however remains a challenge nevertheless there are mechanisms in place to ensure implementation. People living with HIV are regarded as key implementing partners in the HIV response and are actively involved in planning and implementing HIV programmes in the country. The laws and policies protect and promote the rights of people living with HIV and pregnant women but omit other most at risk populations such as Men having Sex with Men and sex workers. Furthermore, organizations for MSM, sex workers and youth are poorly represented in the civil society sector. Considerable efforts have been made since 2007 and particularly in 2009 in all programmatic areas. Government is providing most of the services for treatment and prevention whereas civil society is dominating services for care and support. Although civil society is regarded as a key strategic partner of the government in the response to HIV, recognition has not necessarily translated into resource allocation in the national budget. Civil society continues with the struggle of sustainability and accessing financial and technical support from international donors due to the status of Namibia as a high-middle income country. 3.2. Prevention Prevention of the transmission of HIV remains the cornerstone of the strategy to overcome the epidemic. In the Third Medium Term Plan, the prevention component is based on processes that influence attitudes to create intentions to change behaviour. MTP III therefore sustains the awareness programmes and encourages individuals to change behaviour to reduce the risk of infection. Improved knowledge and skills contribute to behaviour change. This sub-component of the MTP III seeks to strengthen the knowledge and skills of organisations delivering prevention interventions. This is done through different training methods. Since 2004, much progress has been made in strengthening the capacity of civil society organizations, private organisations as well as line Ministries in their efforts towards prevention. The investment in prevention appears to be beginning to have impact as evidenced by the reduction of HIV prevalence seen among the 15 to 24 year old HIV pregnant women attending ANC. However, to maintain the trend and improve the efficiency and effectiveness of the efforts, it is important that evidence is used to guide planning and implementation. Knowing your epidemic in a particular region or country is the first, essential step in identifying, selecting and funding the most appropriate and effective HIV prevention
19
measures for that country or region. In this regard, Namibia carried out an assessment of the drivers of the epidemic identifying the practice of multiple and concurrent partnership, intergenerational and transactional sex, low levels of condom use and male circumcision, alcohol abuse and low levels of risk perception as some of the critical drivers (MoHSS 2009b) However, in the absence of population based estimates of HIV in the general population and high risk population with related data on behaviour, there were limitations in the assessment of the drivers despite the availability of a few studies such as that of alcohol abuse. 3.2.1 Target Vulnerable Populations Namibia has recognized military and armed services personnel as a high-risk group and has targeted prevention programming accordingly. The Ministry of Defence and the National Defence Force continued with HIV prevention activities in all their units during the period under review. These activities included awareness raising, distribution of IEC materials, HIV testing as well as condom promotion and distribution. There are a limited number of interventions that have taken place with commercial sex workers both in the capital city of Windhoek, as well as the main port city of Walvis Bay. Current activities of one NGO (Society for Family Health (former SMA)) and a Faith Based Organization (“Father Herman’s” project and King’s Daughters) include peer education, interpersonal communication activities at hot spots, condom distribution, and availability of BCC material which includes flip charts. The council of Churches in Namibia is running a project called “The King’s daughters” that is focusing on commercial sex workers. The project is a reflection of the Council of Churches desire to contribute to the reduction of prostitution in the country. The project started with empowering the commercial sex workers with basic facts on HIV, Home based care trainings as well as income generating activities. Within the reporting period, the Council has introduced the Bicycle project. The Rainbow Project NGO in Windhoek is beginning to address sex worker issues specifically among MSM. Lifeline/Childline, a local NGO, is working to link programs to provide appropriate VCT services in Windoek, Rundu and Oshikango. Current programming is limited to Windhoek (capital) and Walvisbay (sea port). However, a high number of Female Sex Workers (FSWs) operate in Oshikango, Walvisbay, Windhoek and Luderitz. FSW are also found in other areas of Namibia such as Gobabis, Katima Mulilo, Rundu, Oshakati and Keetmanshoop. Therefore programmes are needed other main cities and transit areas. Additional populations at increased risk to HIV are men who have sex with men and injecting drug users, however limited data exist on either the size of these populations in Namibia or the behaviours of these groups. Current activities are sponsored by the Windhoek-based The Rainbow Project (TRP), which provides a safe space where MSM are able to access psychosocial support services as well as health information, there is also access tailored HIV IEC materials, condoms, and lubrication. TRP has started a SMS-phone based information disseminations system. A local NGO works to provide LGBTI-friendly services at VCT clinics in the regions of Windhoek, Rundu, and Oshikango. Activities are currently only carried out in the regional capitals of Walvis-Bay and Windhoek
20
Prisoners are also considered to be at risk for HIV infection due to risky behaviors and limited access to prevention, treatment, care and support services. To address the prevention needs of prisoners, the Namibian Prison Service (NPS) within the Ministry of Safety and Security (MSS) with the support from the United Nations Office on Drugs and Crime (UNODC) has established committees with representatives from national, bilateral and multilateral stakeholders to address specifically HIV and AIDS in prison settings. Advocacy materials with HIV and AIDS messages have also been distributed in prisons during the reporting period. In addition, HIV Counselling and testing is being carried out in the prisons with the support of MOHSS, CDC and UNODC and eight community counselors (CCs) have been deployed in five prisons. There are plans to deploy CCs in the remaining 8 prisons. HIV and AIDS activities are being carried out in each prison, but a few prisons have well-elaborated activities jointly done in conjunction with other NGOs and government ministries, for example Walvis Bay prison in Erongo region. HIV Counselling and testing is being carried out in the prisons. In 5 prisons, community counsellors (CCs) have been deployed. There are plans to deploy CCs in the remaining 8 prisons. HIV/AIDS activities are being carried out in each prison, but a few prisons have well elaborated activities jointly done in conjunction with other NGOs and government ministries, for example Walvis Bay prison in Erongo region. UNGASS indicators for MARPs have no values for the current reporting period because there have been no recent Behavioural Surveillance Surveys for this populations. However, plans are underway to conduct surveys for Sex Workers and MSM. 3.2.2 Target Behaviour Change Interventions at Young People Namibia has recorded success in HIV programs targeting youth as indicated by a reduction of HIV prevalence in women aged 15 to 24 years attending ANC. This impact result has been associated with an outcome result of increased condom use at last higher risk sex (with a non cohabiting partner) among youth aged 15-24 years from 48% to 64% among young women, and from 69% to 81% among young men between the years 2000 and 2006/7. There was a notable increase in the percentage of women aged 20-24 who had sexual intercourse with only one partner and used a condom at last sex, from 24 percent in 2000 to 35 percent in 2006/07. For women age 18-19, the proportion who had sex by age 18 declined from 59% in 2000 to 50% in 2006/7 while for men declined from 74 to 61%.
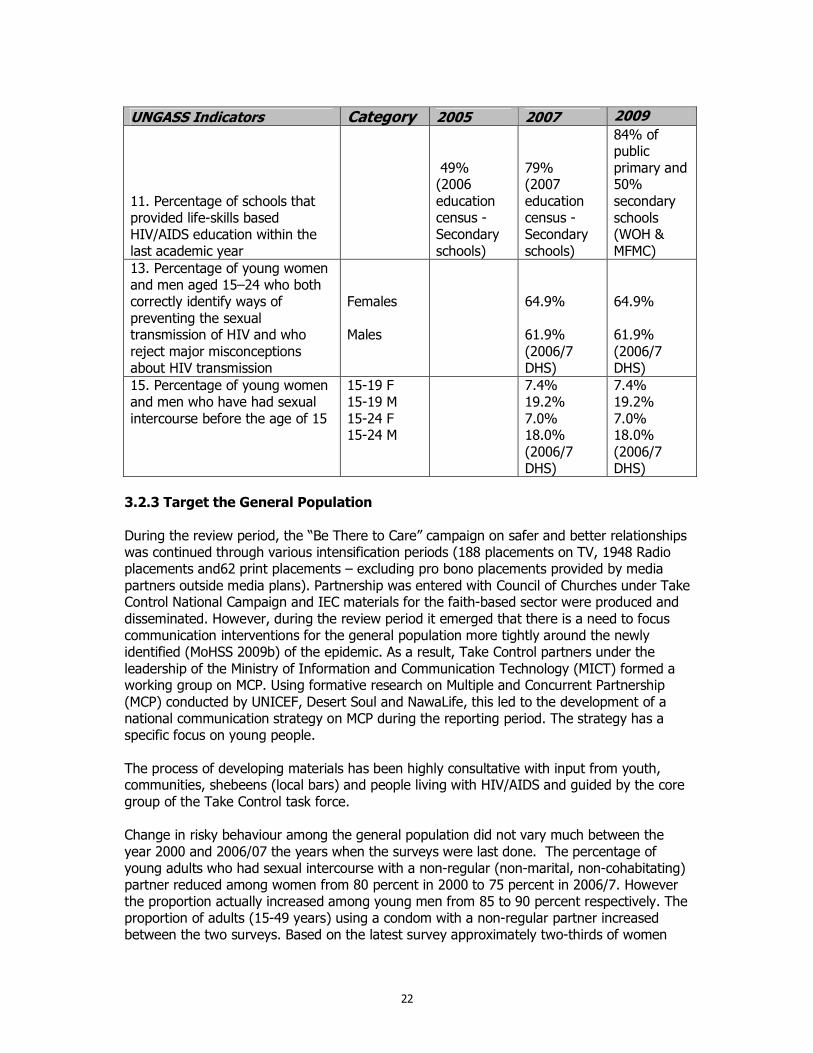
Regarding supporting schools to provide quality HIV and AIDS education, all public primary and secondary schools teach life skills education as a compulsory subject. However, there is no stand alone subject on HIV/AIDS life skills in school curriculum. The content of the subject is still to be strengthened (HIV and AIDS components are still not adequate and feature alongside career guidance for instance. There is no mention of condoms. It is not yet a promotional subject (i.e. not examinable), meaning that the subject is not taught consistently, with the seriousness it deserves in practice. 84% of primary schools and 50% of secondary schools were reached through the two official extra-curricular HIV prevention life skills programmes, Window of Hope (WOH) and My Future is My Choice (MFMC). Extracurricular HIV prevention life skills were incorporated into the pre and in- service teacher training colleges and contemporary social issues mainstreamed into UNAM curriculum for core courses. During the period under review, research has been undertaken on the needs of HIV positive learners for counselling services. Pro-youth awareness strategies were also developed for youth groups on HIV prevention. A cumulative number of
21
202,118 in and out of school youth reached with HIV/AIDS education during the financial year 2008/9. There have been some challenges in the life skills education programmes for youth in school. Tracking whether teachers trained in imparting life skills to the in-school youth did actually teach the subject is still a challenge. There has been double counting (same learners were reported every trimester) and data were corrected for double counting. Another challenge faced by the Ministry of Education is delays and non-reporting from regions. Training of teachers on life skills and HIV and AIDS has taken place so far only at in-service level. Similar efforts need to be made to introduce similar subjects in the core curriculum of teacher training institutions (i.e. at pre-service level). Achieving Universal Access to Primary education (MDG 2) and similar efforts geared towards ensuring smooth transition to secondary education remains a serious challenge for effective responses to HIV and AIDS in the education sector in Namibia. Out-of-school children (aged 7-13) are estimated to be around 45,000 (38% being females), out of a primary school age population of 375,000. Moreover, in 2008, the survival rate to Grade 8 – the first year of Junior Secondary – was 72% (females 74%, males 70%). Peer educators are trained to promote HIV/AIDS prevention through other behaviour change beyond abstinence and being faithful. According to the DHS 2006/7 results, the percentage of young women and men aged 15-24 who both correctly identify ways of preventing the sexual transmission of HIV and who reject major misconceptions about HIV transmission increased from 39 to 65 percent among young women and 51 to 63 percent among young men. Despite the improvement, over 35% of young people still do not know the basic facts about avoiding HIV infection. These activities appear to be paying off as the level of knowledge of HIV prevention among young people 15-24 years of age has increased significantly since 2000. In addition the proportion of women aged 15-19 who had sex before age 15 decreased between 2000 and 2006 from 9 to 7 percent respectively. The decrease in early sexual debut was more striking among young men aged 15-19 where the proportion decreased from 27 to 17 percent over the same time period.
22
UNGASS Indicators Category 2005 2007 2009
11. Percentage of schools that provided life-skills based HIV/AIDS education within the last academic year
49% (2006 education census -Secondary schools)
79% (2007 education census -Secondary schools)
84% of public primary and 50% secondary schools (WOH & MFMC)
13. Percentage of young women and men aged 15–24 who both correctly identify ways of preventing the sexual transmission of HIV and who reject major misconceptions about HIV transmission
Females Males
64.9% 61.9% (2006/7 DHS)
64.9% 61.9% (2006/7 DHS)
15. Percentage of young women and men who have had sexual intercourse before the age of 15
15-19 F 15-19 M 15-24 F 15-24 M
7.4% 19.2% 7.0% 18.0% (2006/7 DHS)
7.4% 19.2% 7.0% 18.0% (2006/7 DHS)
3.2.3 Target the General Population During the review period, the “Be There to Care” campaign on safer and better relationships was continued through various intensification periods (188 placements on TV, 1948 Radio placements and62 print placements – excluding pro bono placements provided by media partners outside media plans). Partnership was entered with Council of Churches under Take Control National Campaign and IEC materials for the faith-based sector were produced and disseminated. However, during the review period it emerged that there is a need to focus communication interventions for the general population more tightly around the newly identified (MoHSS 2009b) of the epidemic. As a result, Take Control partners under the leadership of the Ministry of Information and Communication Technology (MICT) formed a working group on MCP. Using formative research on Multiple and Concurrent Partnership (MCP) conducted by UNICEF, Desert Soul and NawaLife, this led to the development of a national communication strategy on MCP during the reporting period. The strategy has a specific focus on young people. The process of developing materials has been highly consultative with input from youth, communities, shebeens (local bars) and people living with HIV/AIDS and guided by the core group of the Take Control task force. Change in risky behaviour among the general population did not vary much between the year 2000 and 2006/07 the years when the surveys were last done. The percentage of young adults who had sexual intercourse with a non-regular (non-marital, non-cohabitating) partner reduced among women from 80 percent in 2000 to 75 percent in 2006/7. However the proportion actually increased among young men from 85 to 90 percent respectively. The proportion of adults (15-49 years) using a condom with a non-regular partner increased between the two surveys. Based on the latest survey approximately two-thirds of women
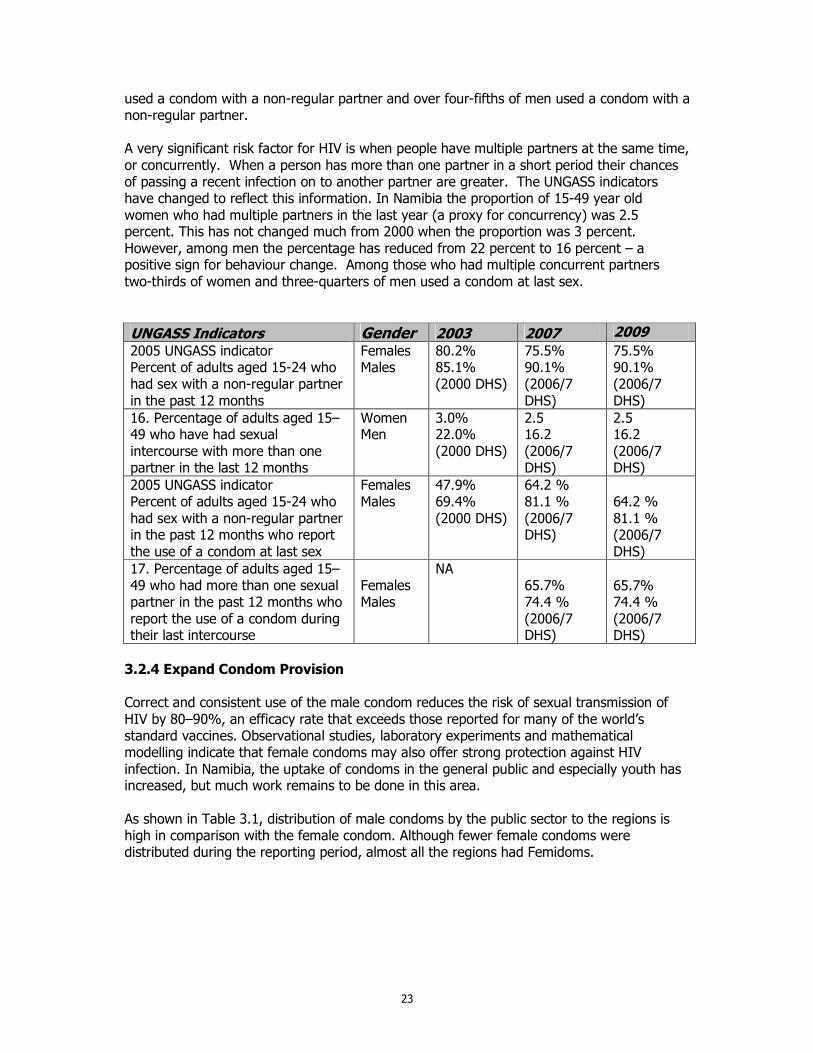
23
used a condom with a non-regular partner and over four-fifths of men used a condom with a non-regular partner. A very significant risk factor for HIV is when people have multiple partners at the same time, or concurrently. When a person has more than one partner in a short period their chances of passing a recent infection on to another partner are greater. The UNGASS indicators have changed to reflect this information. In Namibia the proportion of 15-49 year old women who had multiple partners in the last year (a proxy for concurrency) was 2.5 percent. This has not changed much from 2000 when the proportion was 3 percent. However, among men the percentage has reduced from 22 percent to 16 percent – a positive sign for behaviour change. Among those who had multiple concurrent partners two-thirds of women and three-quarters of men used a condom at last sex.
UNGASS Indicators Gender 2003 2007 2009 2005 UNGASS indicator Percent of adults aged 15-24 who had sex with a non-regular partner in the past 12 months
Females Males
80.2% 85.1% (2000 DHS)
75.5% 90.1% (2006/7 DHS)
75.5% 90.1% (2006/7 DHS)
16. Percentage of adults aged 15–49 who have had sexual intercourse with more than one partner in the last 12 months
Women Men
3.0% 22.0% (2000 DHS)
2.5 16.2 (2006/7 DHS)
2.5 16.2 (2006/7 DHS)
2005 UNGASS indicator Percent of adults aged 15-24 who had sex with a non-regular partner in the past 12 months who report the use of a condom at last sex
Females Males
47.9% 69.4% (2000 DHS)
64.2 % 81.1 % (2006/7 DHS)
64.2 % 81.1 % (2006/7 DHS)
17. Percentage of adults aged 15–49 who had more than one sexual partner in the past 12 months who report the use of a condom during their last intercourse
Females Males
NA 65.7% 74.4 % (2006/7 DHS)
65.7% 74.4 % (2006/7 DHS)
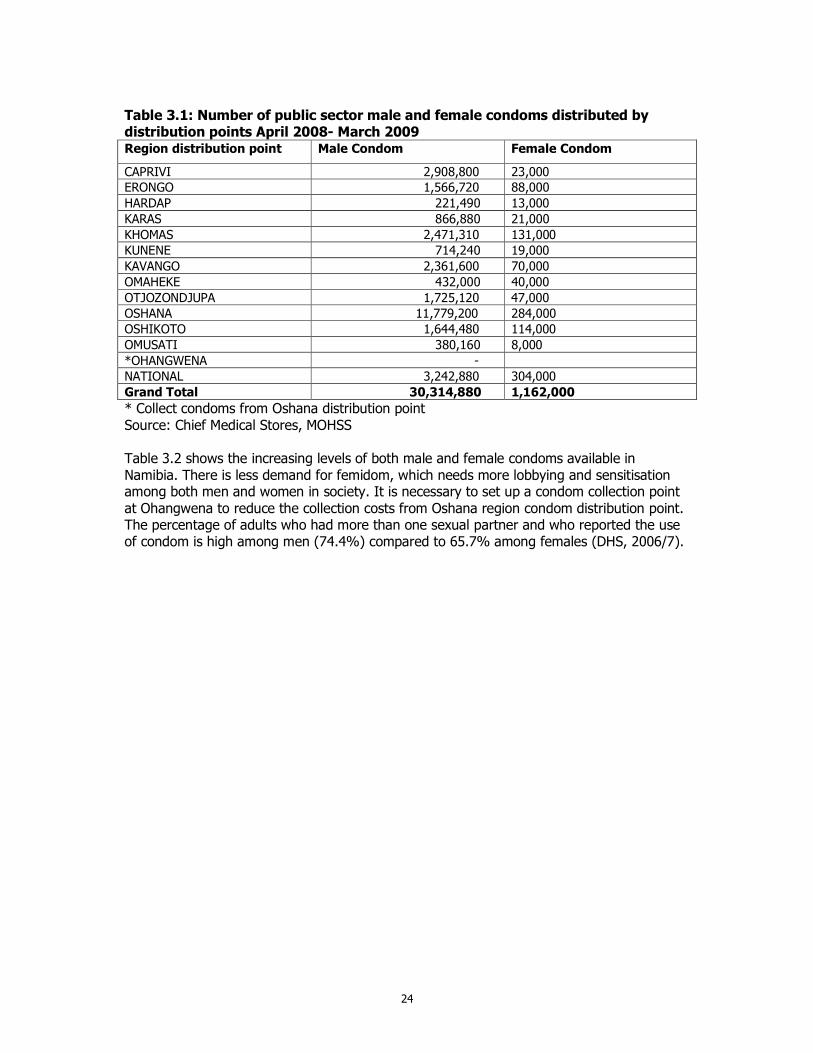
3.2.4 Expand Condom Provision Correct and consistent use of the male condom reduces the risk of sexual transmission of HIV by 80–90%, an efficacy rate that exceeds those reported for many of the world’s standard vaccines. Observational studies, laboratory experiments and mathematical modelling indicate that female condoms may also offer strong protection against HIV infection. In Namibia, the uptake of condoms in the general public and especially youth has increased, but much work remains to be done in this area. As shown in Table 3.1, distribution of male condoms by the public sector to the regions is high in comparison with the female condom. Although fewer female condoms were distributed during the reporting period, almost all the regions had Femidoms.
24
Table 3.1: Number of public sector male and female condoms distributed by distribution points April 2008- March 2009 Region distribution point Male Condom Female Condom
CAPRIVI 2,908,800 23,000
ERONGO 1,566,720 88,000
HARDAP 221,490 13,000
KARAS 866,880 21,000
KHOMAS 2,471,310 131,000
KUNENE 714,240 19,000
KAVANGO 2,361,600 70,000
OMAHEKE 432,000 40,000
OTJOZONDJUPA 1,725,120 47,000
OSHANA 11,779,200 284,000
OSHIKOTO 1,644,480 114,000
OMUSATI 380,160 8,000
*OHANGWENA -
NATIONAL 3,242,880 304,000
Grand Total 30,314,880 1,162,000
* Collect condoms from Oshana distribution point Source: Chief Medical Stores, MOHSS Table 3.2 shows the increasing levels of both male and female condoms available in Namibia. There is less demand for femidom, which needs more lobbying and sensitisation among both men and women in society. It is necessary to set up a condom collection point at Ohangwena to reduce the collection costs from Oshana region condom distribution point. The percentage of adults who had more than one sexual partner and who reported the use of condom is high among men (74.4%) compared to 65.7% among females (DHS, 2006/7).
25
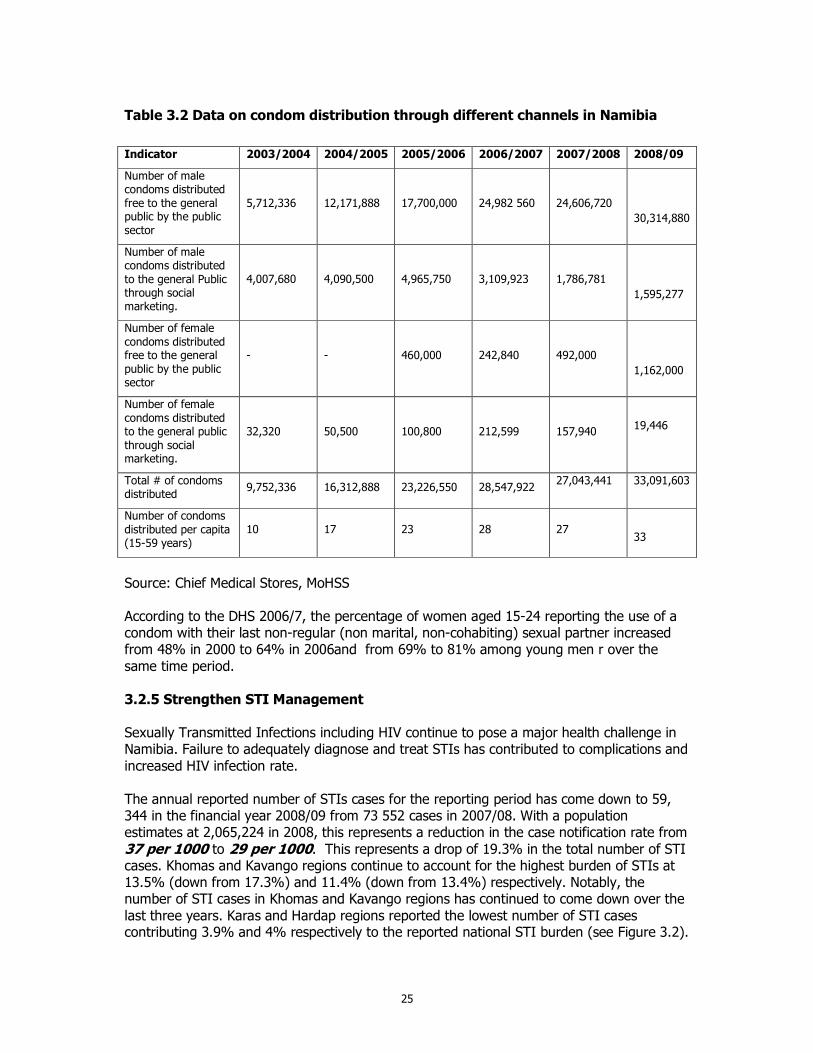
Table 3.2 Data on condom distribution through different channels in Namibia
Source: Chief Medical Stores, MoHSS According to the DHS 2006/7, the percentage of women aged 15-24 reporting the use of a condom with their last non-regular (non marital, non-cohabiting) sexual partner increased from 48% in 2000 to 64% in 2006and from 69% to 81% among young men r over the same time period. 3.2.5 Strengthen STI Management Sexually Transmitted Infections including HIV continue to pose a major health challenge in Namibia. Failure to adequately diagnose and treat STIs has contributed to complications and increased HIV infection rate. The annual reported number of STIs cases for the reporting period has come down to 59, 344 in the financial year 2008/09 from 73 552 cases in 2007/08. With a population estimates at 2,065,224 in 2008, this represents a reduction in the case notification rate from 37 per 1000 to 29 per 1000. This represents a drop of 19.3% in the total number of STI cases. Khomas and Kavango regions continue to account for the highest burden of STIs at 13.5% (down from 17.3%) and 11.4% (down from 13.4%) respectively. Notably, the number of STI cases in Khomas and Kavango regions has continued to come down over the last three years. Karas and Hardap regions reported the lowest number of STI cases contributing 3.9% and 4% respectively to the reported national STI burden (see Figure 3.2).
Indicator 2003/2004 2004/2005 2005/2006 2006/2007 2007/2008 2008/09
Number of male condoms distributed free to the general public by the public sector
5,712,336 12,171,888 17,700,000 24,982 560 24,606,720
30,314,880
Number of male condoms distributed to the general Public through social marketing.
4,007,680 4,090,500 4,965,750 3,109,923 1,786,781
1,595,277
Number of female condoms distributed free to the general public by the public sector
- - 460,000 242,840 492,000
1,162,000
Number of female condoms distributed to the general public through social marketing.
32,320 50,500 100,800 212,599
157,940
19,446
Total # of condoms distributed
9,752,336 16,312,888 23,226,550 28,547,922 27,043,441 33,091,603
Number of condoms distributed per capita (15-59 years)
10 17 23 28 27
33
26
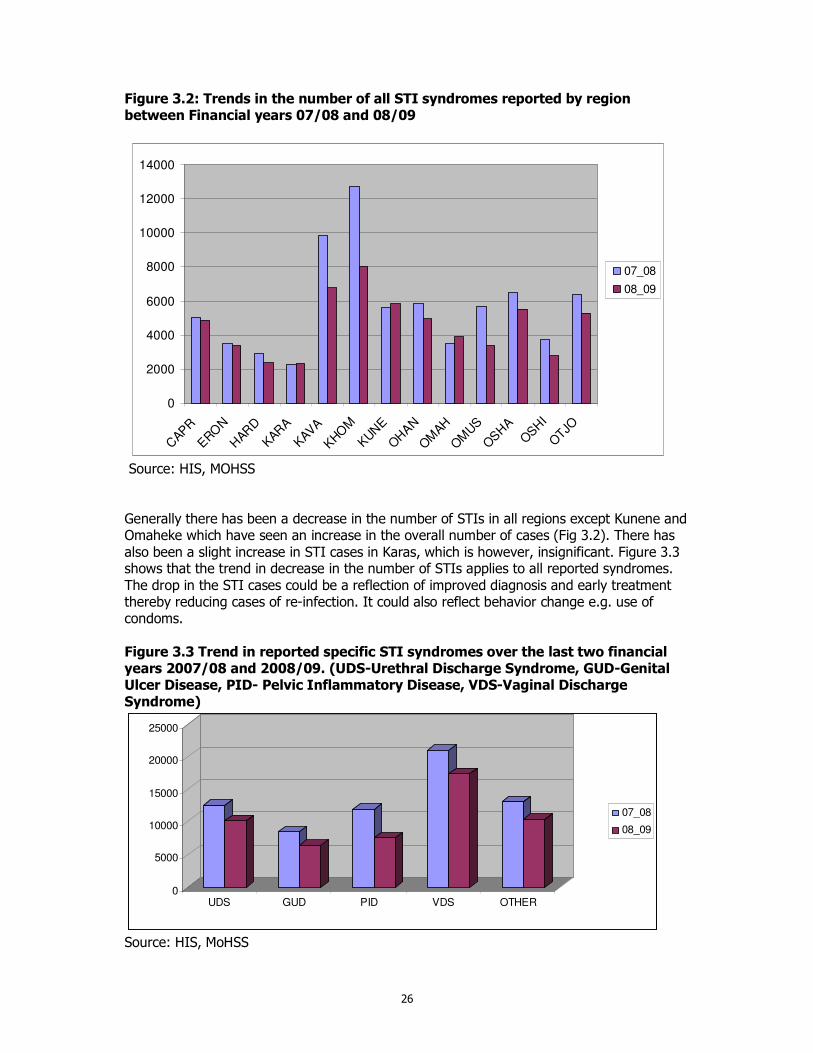
Figure 3.2: Trends in the number of all STI syndromes reported by region between Financial years 07/08 and 08/09
0
2000
4000
6000
8000
10000
12000
14000
CAP
R
ERO
N
HAR
D
KAR
A
KAV
A
KHO
M
KUNE
OHAN
OM
AH
OM
US
OSHA
OSHI
OTJO
07_08
08_09
Source: HIS, MOHSS Generally there has been a decrease in the number of STIs in all regions except Kunene and Omaheke which have seen an increase in the overall number of cases (Fig 3.2). There has also been a slight increase in STI cases in Karas, which is however, insignificant. Figure 3.3 shows that the trend in decrease in the number of STIs applies to all reported syndromes. The drop in the STI cases could be a reflection of improved diagnosis and early treatment thereby reducing cases of re-infection. It could also reflect behavior change e.g. use of condoms. Figure 3.3 Trend in reported specific STI syndromes over the last two financial years 2007/08 and 2008/09. (UDS-Urethral Discharge Syndrome, GUD-Genital Ulcer Disease, PID- Pelvic Inflammatory Disease, VDS-Vaginal Discharge Syndrome)
0
5000
10000
15000
20000
25000
UDS GUD PID VDS OTHER
07_08
08_09
Source: HIS, MoHSS
27
3.2.6 Voluntary Counselling and Testing
UNGASS Indicators 2003 2007 2009 Percentage of women and men aged 15-49 who have ever been tested for HIV
Women Men
23.7% 24.6% (2000 DHS)
54.8 34.3 (2006 DHS)
54.8 34.3 (2006 DHS)
7. Percentage of women and men aged 15-49 who received an HIV test in the last 12 months and who know the results
Women Men
NA 28.6% 17.6% (2006 DHS)
28.6% 17.6% (2006 DHS)
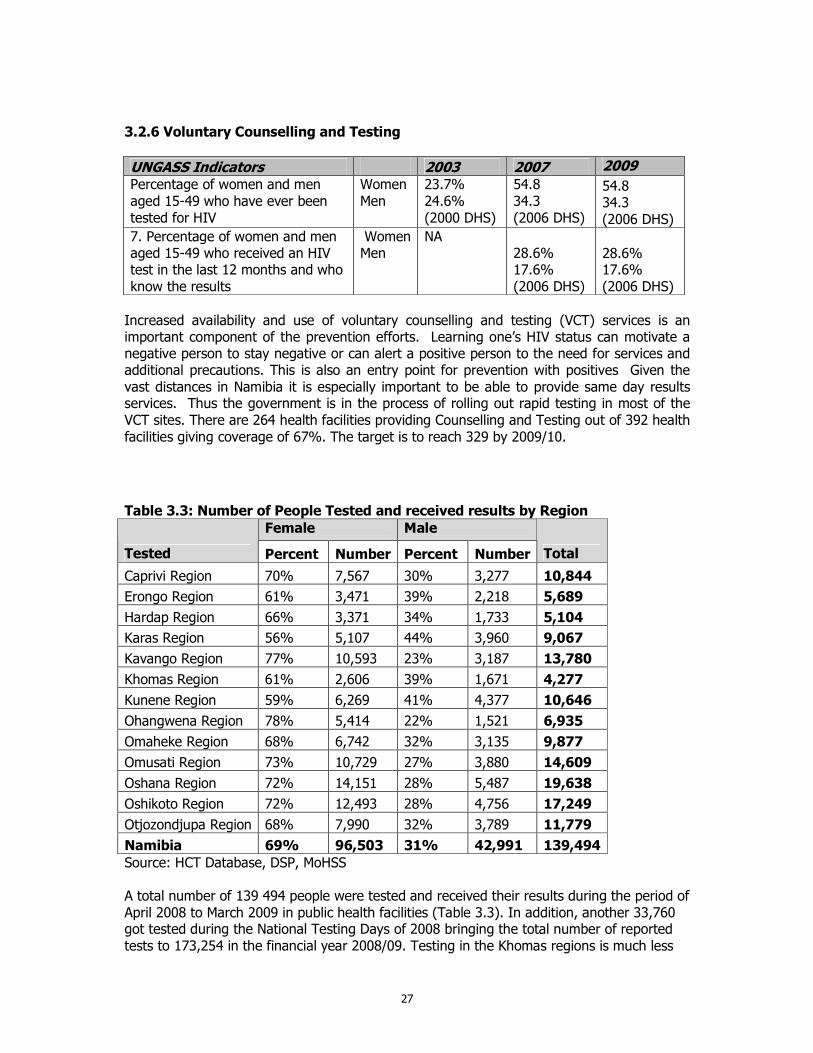
Increased availability and use of voluntary counselling and testing (VCT) services is an important component of the prevention efforts. Learning one’s HIV status can motivate a negative person to stay negative or can alert a positive person to the need for services and additional precautions. This is also an entry point for prevention with positives Given the vast distances in Namibia it is especially important to be able to provide same day results services. Thus the government is in the process of rolling out rapid testing in most of the VCT sites. There are 264 health facilities providing Counselling and Testing out of 392 health facilities giving coverage of 67%. The target is to reach 329 by 2009/10.
Table 3.3: Number of People Tested and received results by Region
Female Male
Tested Percent Number Percent Number Total
Caprivi Region 70% 7,567 30% 3,277 10,844
Erongo Region 61% 3,471 39% 2,218 5,689
Hardap Region 66% 3,371 34% 1,733 5,104
Karas Region 56% 5,107 44% 3,960 9,067
Kavango Region 77% 10,593 23% 3,187 13,780
Khomas Region 61% 2,606 39% 1,671 4,277
Kunene Region 59% 6,269 41% 4,377 10,646
Ohangwena Region 78% 5,414 22% 1,521 6,935
Omaheke Region 68% 6,742 32% 3,135 9,877
Omusati Region 73% 10,729 27% 3,880 14,609
Oshana Region 72% 14,151 28% 5,487 19,638
Oshikoto Region 72% 12,493 28% 4,756 17,249
Otjozondjupa Region 68% 7,990 32% 3,789 11,779
Namibia 69% 96,503 31% 42,991 139,494 Source: HCT Database, DSP, MoHSS A total number of 139 494 people were tested and received their results during the period of April 2008 to March 2009 in public health facilities (Table 3.3). In addition, another 33,760 got tested during the National Testing Days of 2008 bringing the total number of reported tests to 173,254 in the financial year 2008/09. Testing in the Khomas regions is much less
28
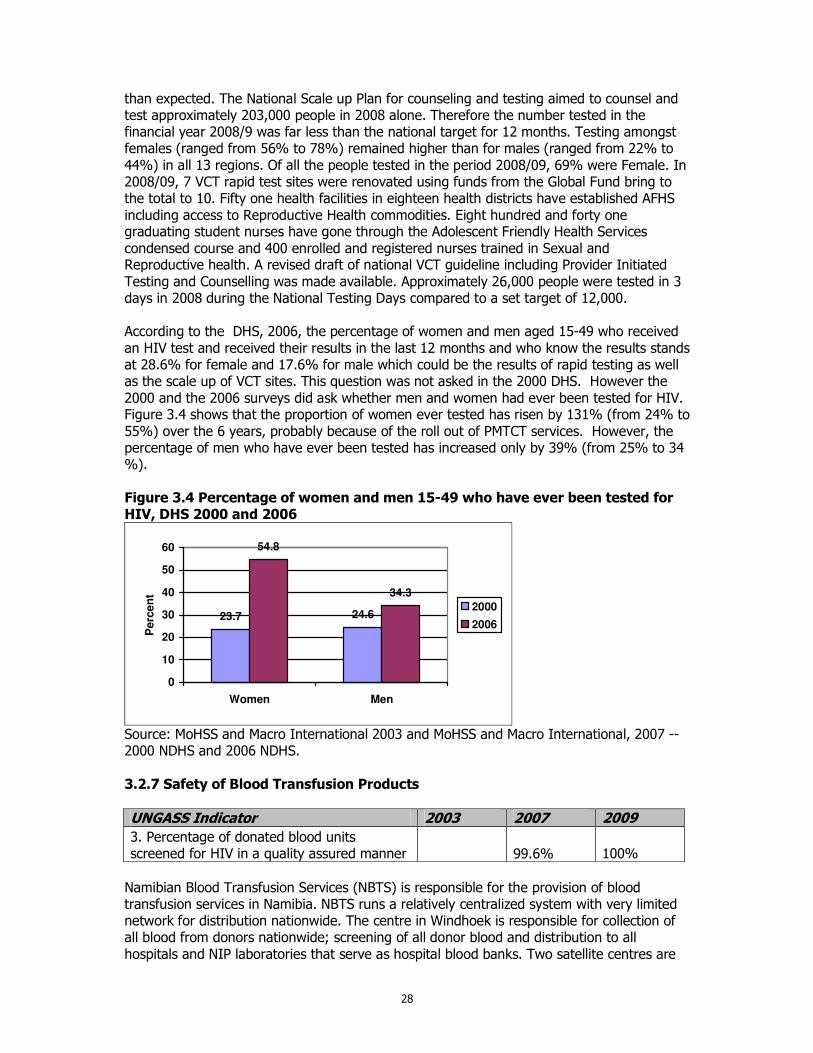
than expected. The National Scale up Plan for counseling and testing aimed to counsel and test approximately 203,000 people in 2008 alone. Therefore the number tested in the financial year 2008/9 was far less than the national target for 12 months. Testing amongst females (ranged from 56% to 78%) remained higher than for males (ranged from 22% to 44%) in all 13 regions. Of all the people tested in the period 2008/09, 69% were Female. In 2008/09, 7 VCT rapid test sites were renovated using funds from the Global Fund bring to the total to 10. Fifty one health facilities in eighteen health districts have established AFHS including access to Reproductive Health commodities. Eight hundred and forty one graduating student nurses have gone through the Adolescent Friendly Health Services condensed course and 400 enrolled and registered nurses trained in Sexual and Reproductive health. A revised draft of national VCT guideline including Provider Initiated Testing and Counselling was made available. Approximately 26,000 people were tested in 3 days in 2008 during the National Testing Days compared to a set target of 12,000. According to the DHS, 2006, the percentage of women and men aged 15-49 who received an HIV test and received their results in the last 12 months and who know the results stands at 28.6% for female and 17.6% for male which could be the results of rapid testing as well as the scale up of VCT sites. This question was not asked in the 2000 DHS. However the 2000 and the 2006 surveys did ask whether men and women had ever been tested for HIV. Figure 3.4 shows that the proportion of women ever tested has risen by 131% (from 24% to 55%) over the 6 years, probably because of the roll out of PMTCT services. However, the percentage of men who have ever been tested has increased only by 39% (from 25% to 34 %). Figure 3.4 Percentage of women and men 15-49 who have ever been tested for HIV, DHS 2000 and 2006
23.7 24.6
54.8
34.3
0
10
20
30
40
50
60
Women Men
Perc
en
t
2000
2006
Source: MoHSS and Macro International 2003 and MoHSS and Macro International, 2007 -- 2000 NDHS and 2006 NDHS. 3.2.7 Safety of Blood Transfusion Products
UNGASS Indicator 2003 2007 2009 3. Percentage of donated blood units screened for HIV in a quality assured manner 99.6%
100%
Namibian Blood Transfusion Services (NBTS) is responsible for the provision of blood transfusion services in Namibia. NBTS runs a relatively centralized system with very limited network for distribution nationwide. The centre in Windhoek is responsible for collection of all blood from donors nationwide; screening of all donor blood and distribution to all hospitals and NIP laboratories that serve as hospital blood banks. Two satellite centres are
29
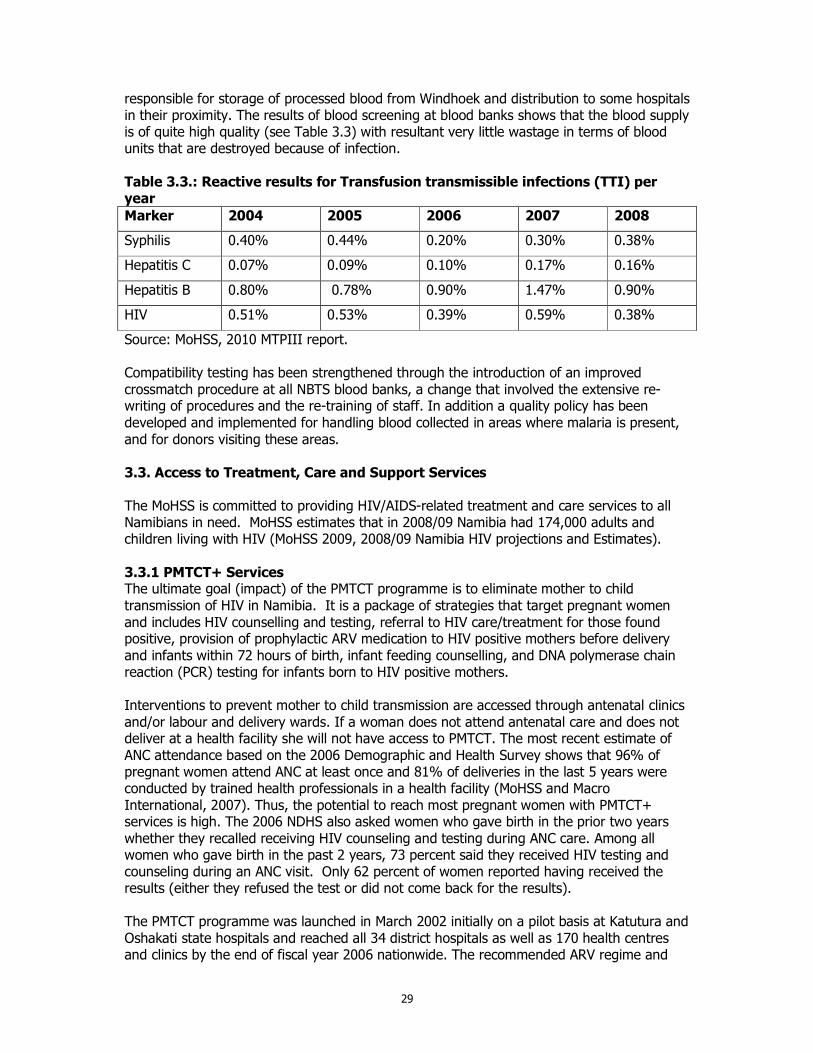
responsible for storage of processed blood from Windhoek and distribution to some hospitals in their proximity. The results of blood screening at blood banks shows that the blood supply is of quite high quality (see Table 3.3) with resultant very little wastage in terms of blood units that are destroyed because of infection. Table 3.3.: Reactive results for Transfusion transmissible infections (TTI) per year
Marker 2004 2005 2006 2007 2008
Syphilis 0.40% 0.44% 0.20% 0.30% 0.38%
Hepatitis C 0.07% 0.09% 0.10% 0.17% 0.16%
Hepatitis B 0.80% 0.78% 0.90% 1.47% 0.90%
HIV 0.51% 0.53% 0.39% 0.59% 0.38%
Source: MoHSS, 2010 MTPIII report. Compatibility testing has been strengthened through the introduction of an improved crossmatch procedure at all NBTS blood banks, a change that involved the extensive re-writing of procedures and the re-training of staff. In addition a quality policy has been developed and implemented for handling blood collected in areas where malaria is present, and for donors visiting these areas. 3.3. Access to Treatment, Care and Support Services The MoHSS is committed to providing HIV/AIDS-related treatment and care services to all Namibians in need. MoHSS estimates that in 2008/09 Namibia had 174,000 adults and children living with HIV (MoHSS 2009, 2008/09 Namibia HIV projections and Estimates). 3.3.1 PMTCT+ Services The ultimate goal (impact) of the PMTCT programme is to eliminate mother to child transmission of HIV in Namibia. It is a package of strategies that target pregnant women and includes HIV counselling and testing, referral to HIV care/treatment for those found positive, provision of prophylactic ARV medication to HIV positive mothers before delivery and infants within 72 hours of birth, infant feeding counselling, and DNA polymerase chain reaction (PCR) testing for infants born to HIV positive mothers. Interventions to prevent mother to child transmission are accessed through antenatal clinics and/or labour and delivery wards. If a woman does not attend antenatal care and does not deliver at a health facility she will not have access to PMTCT. The most recent estimate of ANC attendance based on the 2006 Demographic and Health Survey shows that 96% of pregnant women attend ANC at least once and 81% of deliveries in the last 5 years were conducted by trained health professionals in a health facility (MoHSS and Macro International, 2007). Thus, the potential to reach most pregnant women with PMTCT+ services is high. The 2006 NDHS also asked women who gave birth in the prior two years whether they recalled receiving HIV counseling and testing during ANC care. Among all women who gave birth in the past 2 years, 73 percent said they received HIV testing and counseling during an ANC visit. Only 62 percent of women reported having received the results (either they refused the test or did not come back for the results). The PMTCT programme was launched in March 2002 initially on a pilot basis at Katutura and Oshakati state hospitals and reached all 34 district hospitals as well as 170 health centres and clinics by the end of fiscal year 2006 nationwide. The recommended ARV regime and
30
infant feeding practices in the PMTCT guidelines has a potential of reducing HIV transmission dramatically. There has been a considerable expansion of PMTCT into peripheral health facilities. By March 2009, thirty four (34) state hospitals and 258 health centres and clinics nationwide were providing PMTCT bringing the total number health facilities providing PMTCT to 292 out of a total of 340 (85%). The nature of services provided varies from one facility to the other. PMTCT services include pre-test counseling, drawing of blood for HIV testing, post-test counseling, rapid testing, issuing of ARV’s to mothers and babies and drawing of blood for CD4 test, referral of eligible women for HAART, conducting of safe deliveries, infant feeding counseling and support. Figures 3.5a and 3.6b present the actual numbers of the PMTCT indicators nationally. As can be seen there is an increase in all the PMTCT indicators from one year to the next. The PMTCT coverage in Namibia is high: of the 62,028 expected pregnancies in 2008/09, 61,981 (99%) pregnant women started ANC and therefore had the opportunity to be introduced to PMTCT services. Of these women, 91% were pre-test counseled in 2008/09 compared to 95% in 2007/08 and 94% in 2006/07. Out of the women pre-test counseled 95% had an HIV test compared to 94% in 2007/08 and 92% in 2006/07. Of the women who agreed to be tested 11% were HIV positive in 2008/09 compared to 14% and 13% in 2007/08 and in 2006/07 respectively. There is a marked decline over the years in HIV prevalence which could be due to the scaling up of HIV preventive services in 2004. Ninety percent of the women tested were post-test counseled compared to 71%and 58% in 2007/08 and in 2006/07 respectively. Of the total number positive, 93% had a CD4 cell count done compared to 84% in 2007/08 and 70% in 2006/07. In FY 2008/09 of those who were found positive in the health system, about 74% of positive mothers delivering received ARV prophylaxis compared to 70% in 2007/08 and 64% in 2006/07. However, using a denominator of all HIV positive pregnant women in 2008/09 estimated by Spectrum to be 11,600, the coverage is 58% (6,744). This an increase from 49% reported in 2007. When using the population based expected number of pregnancies from the Crude Birth Rate which gives 62,028 of 2008/09, 11,040 women are expected be infected with HIV (using 2008 prevalence rate of 17.8%) only 61% are covered with the ARV prophylaxis (comparable with Spectrum estimates (MoHSS 2009)).
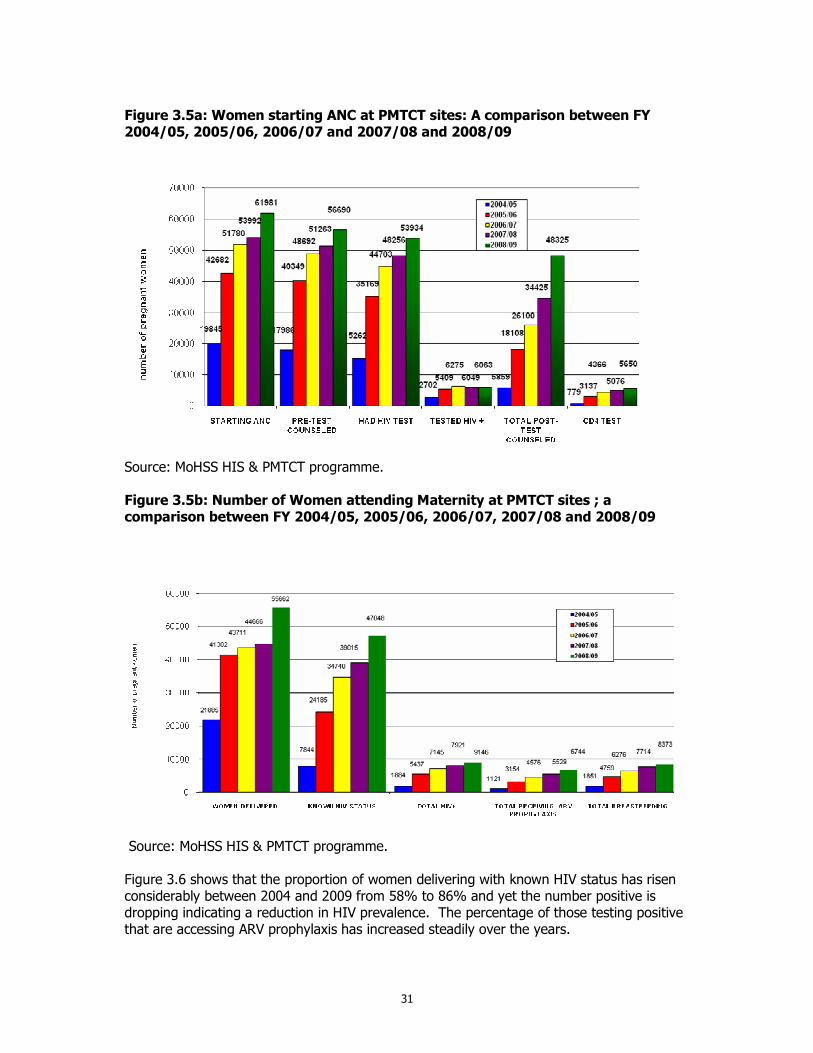
31
Figure 3.5a: Women starting ANC at PMTCT sites: A comparison between FY 2004/05, 2005/06, 2006/07 and 2007/08 and 2008/09
Source: MoHSS HIS & PMTCT programme. Figure 3.5b: Number of Women attending Maternity at PMTCT sites ; a comparison between FY 2004/05, 2005/06, 2006/07, 2007/08 and 2008/09
Source: MoHSS HIS & PMTCT programme. Figure 3.6 shows that the proportion of women delivering with known HIV status has risen considerably between 2004 and 2009 from 58% to 86% and yet the number positive is dropping indicating a reduction in HIV prevalence. The percentage of those testing positive that are accessing ARV prophylaxis has increased steadily over the years.
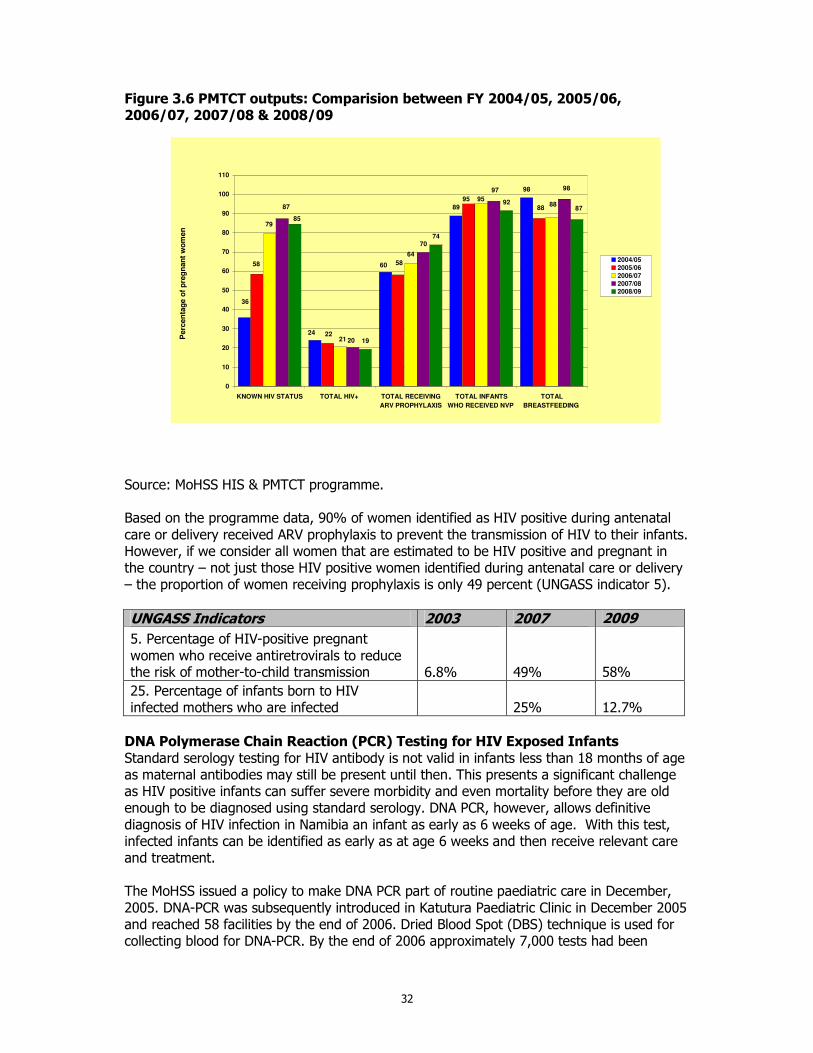
32
Figure 3.6 PMTCT outputs: Comparision between FY 2004/05, 2005/06, 2006/07, 2007/08 & 2008/09
89
98
70
19
74
92
36
24
6058
22
58
95
88
79
21
64
958887
20
97 98
85
87
0
10
20
30
40
50
60
70
80
90
100
110
KNOWN HIV STATUS TOTAL HIV+ TOTAL RECEIVING
ARV PROPHYLAXIS
TOTAL INFANTS
WHO RECEIVED NVP
TOTAL
BREASTFEEDING
Perc
en
tag
e o
f p
reg
nan
t w
om
en
2004/05
2005/06
2006/07
2007/08
2008/09
Source: MoHSS HIS & PMTCT programme. Based on the programme data, 90% of women identified as HIV positive during antenatal care or delivery received ARV prophylaxis to prevent the transmission of HIV to their infants. However, if we consider all women that are estimated to be HIV positive and pregnant in the country – not just those HIV positive women identified during antenatal care or delivery – the proportion of women receiving prophylaxis is only 49 percent (UNGASS indicator 5).
UNGASS Indicators 2003 2007 2009
5. Percentage of HIV-positive pregnant women who receive antiretrovirals to reduce the risk of mother-to-child transmission 6.8% 49%
58%
25. Percentage of infants born to HIV infected mothers who are infected 25%
12.7%
DNA Polymerase Chain Reaction (PCR) Testing for HIV Exposed Infants Standard serology testing for HIV antibody is not valid in infants less than 18 months of age as maternal antibodies may still be present until then. This presents a significant challenge as HIV positive infants can suffer severe morbidity and even mortality before they are old enough to be diagnosed using standard serology. DNA PCR, however, allows definitive diagnosis of HIV infection in Namibia an infant as early as 6 weeks of age. With this test, infected infants can be identified as early as at age 6 weeks and then receive relevant care and treatment. The MoHSS issued a policy to make DNA PCR part of routine paediatric care in December, 2005. DNA-PCR was subsequently introduced in Katutura Paediatric Clinic in December 2005 and reached 58 facilities by the end of 2006. Dried Blood Spot (DBS) technique is used for collecting blood for DNA-PCR. By the end of 2006 approximately 7,000 tests had been
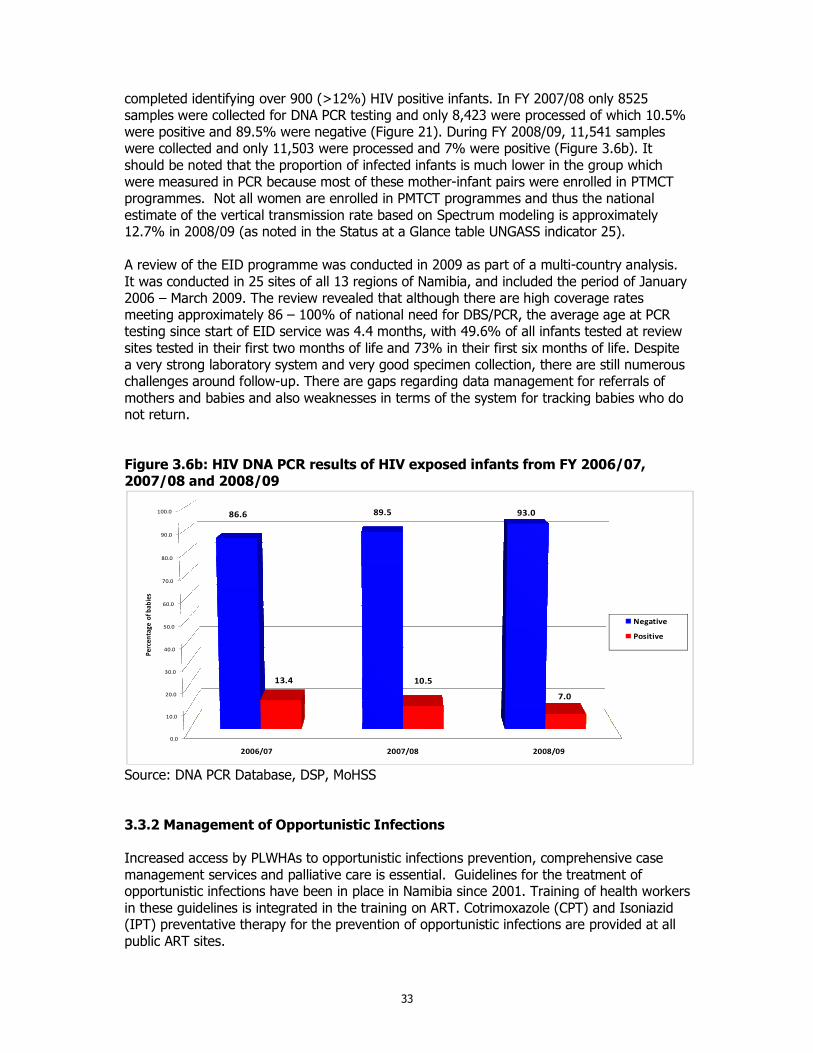
33
completed identifying over 900 (>12%) HIV positive infants. In FY 2007/08 only 8525 samples were collected for DNA PCR testing and only 8,423 were processed of which 10.5% were positive and 89.5% were negative (Figure 21). During FY 2008/09, 11,541 samples were collected and only 11,503 were processed and 7% were positive (Figure 3.6b). It should be noted that the proportion of infected infants is much lower in the group which were measured in PCR because most of these mother-infant pairs were enrolled in PTMCT programmes. Not all women are enrolled in PMTCT programmes and thus the national estimate of the vertical transmission rate based on Spectrum modeling is approximately 12.7% in 2008/09 (as noted in the Status at a Glance table UNGASS indicator 25). A review of the EID programme was conducted in 2009 as part of a multi-country analysis. It was conducted in 25 sites of all 13 regions of Namibia, and included the period of January 2006 – March 2009. The review revealed that although there are high coverage rates meeting approximately 86 – 100% of national need for DBS/PCR, the average age at PCR testing since start of EID service was 4.4 months, with 49.6% of all infants tested at review sites tested in their first two months of life and 73% in their first six months of life. Despite a very strong laboratory system and very good specimen collection, there are still numerous challenges around follow-up. There are gaps regarding data management for referrals of mothers and babies and also weaknesses in terms of the system for tracking babies who do not return. Figure 3.6b: HIV DNA PCR results of HIV exposed infants from FY 2006/07, 2007/08 and 2008/09
0.0
10.0
20.0
30.0
40.0
50.0
60.0
70.0
80.0
90.0
100.0
2006/07 2007/08 2008/09
86.6 89.5 93.0
13.4 10.5
7.0
Pe
rce
nta
ge
of
bab
ies
Negative
Positive
Source: DNA PCR Database, DSP, MoHSS 3.3.2 Management of Opportunistic Infections Increased access by PLWHAs to opportunistic infections prevention, comprehensive case management services and palliative care is essential. Guidelines for the treatment of opportunistic infections have been in place in Namibia since 2001. Training of health workers in these guidelines is integrated in the training on ART. Cotrimoxazole (CPT) and Isoniazid (IPT) preventative therapy for the prevention of opportunistic infections are provided at all public ART sites.
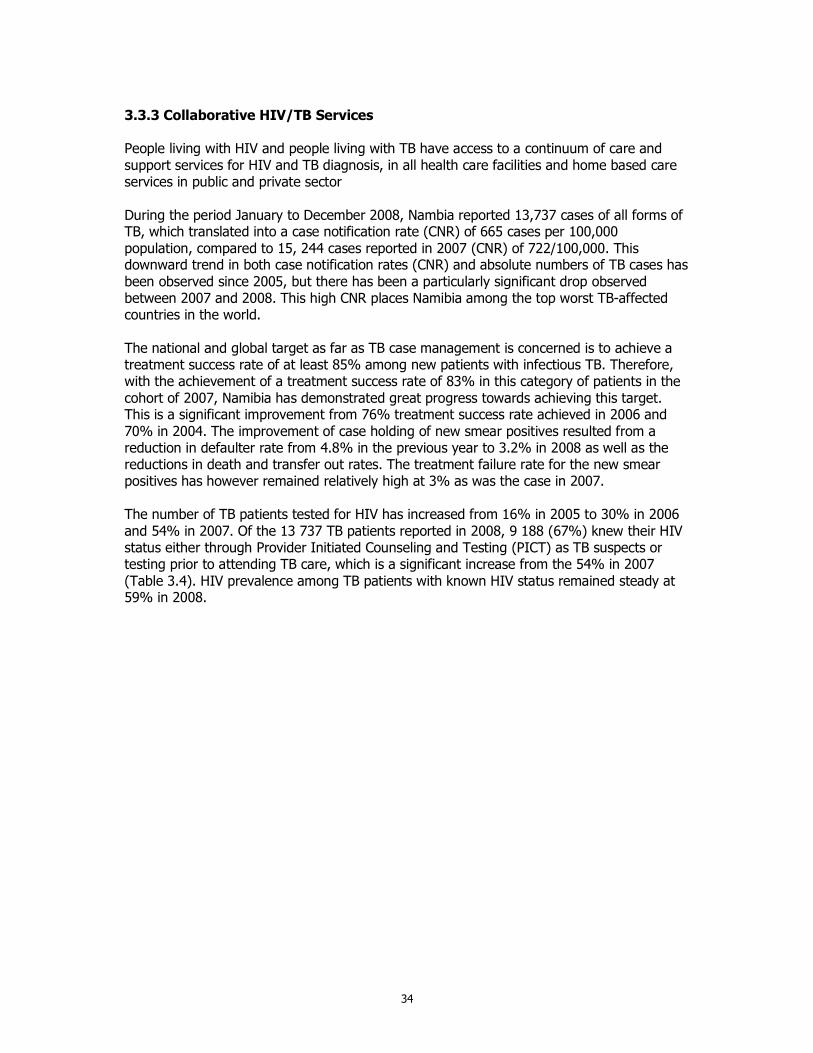
34
3.3.3 Collaborative HIV/TB Services People living with HIV and people living with TB have access to a continuum of care and support services for HIV and TB diagnosis, in all health care facilities and home based care services in public and private sector During the period January to December 2008, Nambia reported 13,737 cases of all forms of TB, which translated into a case notification rate (CNR) of 665 cases per 100,000 population, compared to 15, 244 cases reported in 2007 (CNR) of 722/100,000. This downward trend in both case notification rates (CNR) and absolute numbers of TB cases has been observed since 2005, but there has been a particularly significant drop observed between 2007 and 2008. This high CNR places Namibia among the top worst TB-affected countries in the world. The national and global target as far as TB case management is concerned is to achieve a treatment success rate of at least 85% among new patients with infectious TB. Therefore, with the achievement of a treatment success rate of 83% in this category of patients in the cohort of 2007, Namibia has demonstrated great progress towards achieving this target. This is a significant improvement from 76% treatment success rate achieved in 2006 and 70% in 2004. The improvement of case holding of new smear positives resulted from a reduction in defaulter rate from 4.8% in the previous year to 3.2% in 2008 as well as the reductions in death and transfer out rates. The treatment failure rate for the new smear positives has however remained relatively high at 3% as was the case in 2007. The number of TB patients tested for HIV has increased from 16% in 2005 to 30% in 2006 and 54% in 2007. Of the 13 737 TB patients reported in 2008, 9 188 (67%) knew their HIV status either through Provider Initiated Counseling and Testing (PICT) as TB suspects or testing prior to attending TB care, which is a significant increase from the 54% in 2007 (Table 3.4). HIV prevalence among TB patients with known HIV status remained steady at 59% in 2008.
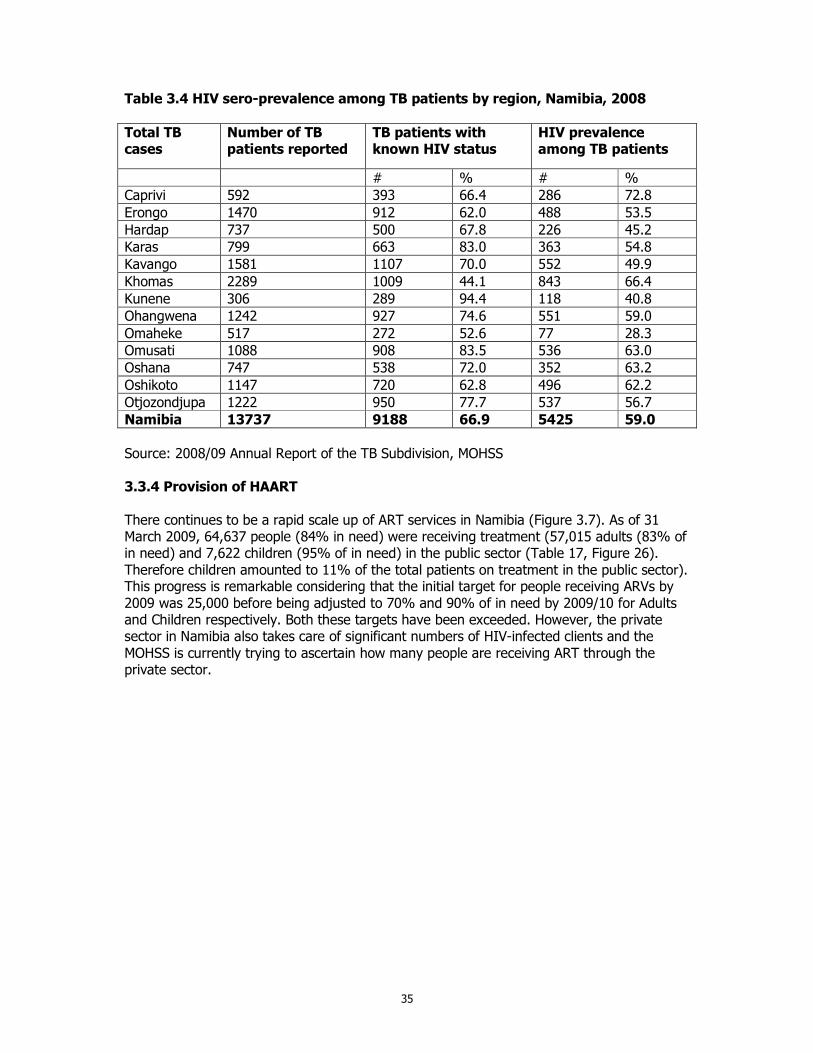
35
Table 3.4 HIV sero-prevalence among TB patients by region, Namibia, 2008
Total TB cases
Number of TB patients reported
TB patients with known HIV status
HIV prevalence among TB patients
# % # %
Caprivi 592 393 66.4 286 72.8
Erongo 1470 912 62.0 488 53.5
Hardap 737 500 67.8 226 45.2
Karas 799 663 83.0 363 54.8
Kavango 1581 1107 70.0 552 49.9
Khomas 2289 1009 44.1 843 66.4
Kunene 306 289 94.4 118 40.8
Ohangwena 1242 927 74.6 551 59.0
Omaheke 517 272 52.6 77 28.3
Omusati 1088 908 83.5 536 63.0
Oshana 747 538 72.0 352 63.2
Oshikoto 1147 720 62.8 496 62.2
Otjozondjupa 1222 950 77.7 537 56.7
Namibia 13737 9188 66.9 5425 59.0
Source: 2008/09 Annual Report of the TB Subdivision, MOHSS 3.3.4 Provision of HAART There continues to be a rapid scale up of ART services in Namibia (Figure 3.7). As of 31 March 2009, 64,637 people (84% in need) were receiving treatment (57,015 adults (83% of in need) and 7,622 children (95% of in need) in the public sector (Table 17, Figure 26). Therefore children amounted to 11% of the total patients on treatment in the public sector). This progress is remarkable considering that the initial target for people receiving ARVs by 2009 was 25,000 before being adjusted to 70% and 90% of in need by 2009/10 for Adults and Children respectively. Both these targets have been exceeded. However, the private sector in Namibia also takes care of significant numbers of HIV-infected clients and the MOHSS is currently trying to ascertain how many people are receiving ART through the private sector.
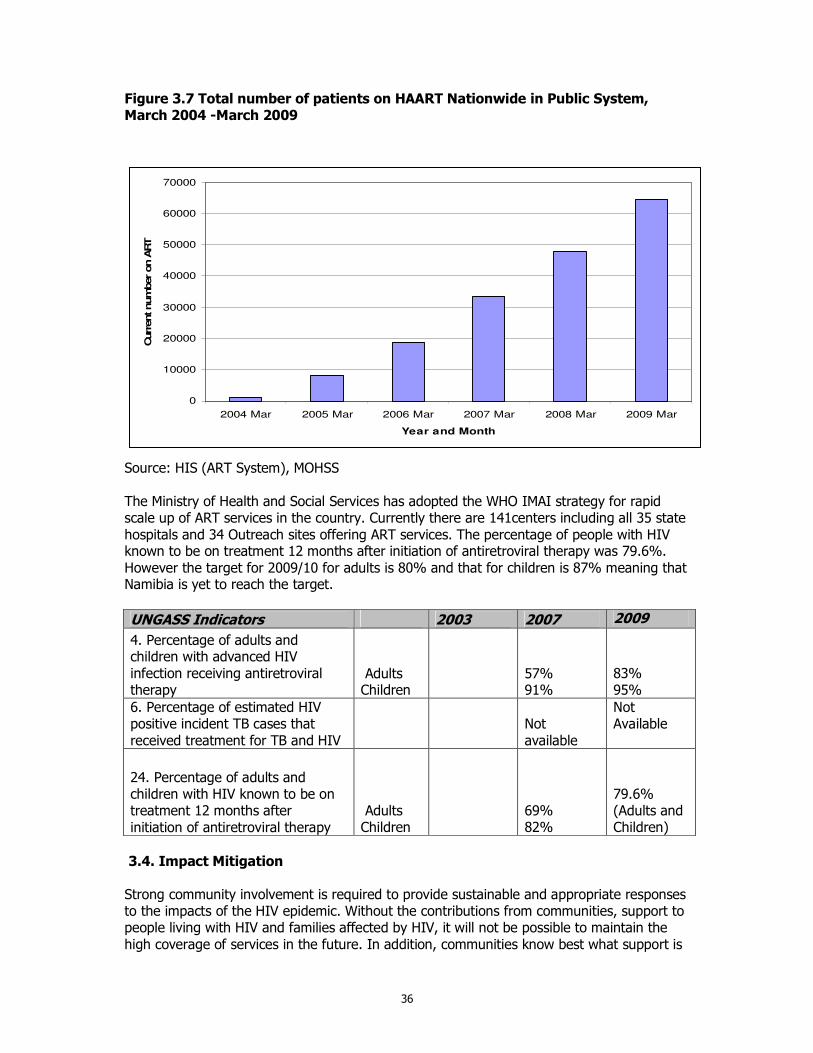
36
Figure 3.7 Total number of patients on HAART Nationwide in Public System, March 2004 -March 2009
0
10000
20000
30000
40000
50000
60000
70000
2004 Mar 2005 Mar 2006 Mar 2007 Mar 2008 Mar 2009 Mar
Year and Month
Curr
ent num
ber on A
RT
Source: HIS (ART System), MOHSS The Ministry of Health and Social Services has adopted the WHO IMAI strategy for rapid scale up of ART services in the country. Currently there are 141centers including all 35 state hospitals and 34 Outreach sites offering ART services. The percentage of people with HIV known to be on treatment 12 months after initiation of antiretroviral therapy was 79.6%. However the target for 2009/10 for adults is 80% and that for children is 87% meaning that Namibia is yet to reach the target.
UNGASS Indicators 2003 2007 2009
4. Percentage of adults and children with advanced HIV infection receiving antiretroviral therapy
Adults Children
57% 91%
83% 95%
6. Percentage of estimated HIV positive incident TB cases that received treatment for TB and HIV
Not available
Not Available
24. Percentage of adults and children with HIV known to be on treatment 12 months after initiation of antiretroviral therapy
Adults Children
69% 82%
79.6% (Adults and Children)
3.4. Impact Mitigation Strong community involvement is required to provide sustainable and appropriate responses to the impacts of the HIV epidemic. Without the contributions from communities, support to people living with HIV and families affected by HIV, it will not be possible to maintain the high coverage of services in the future. In addition, communities know best what support is
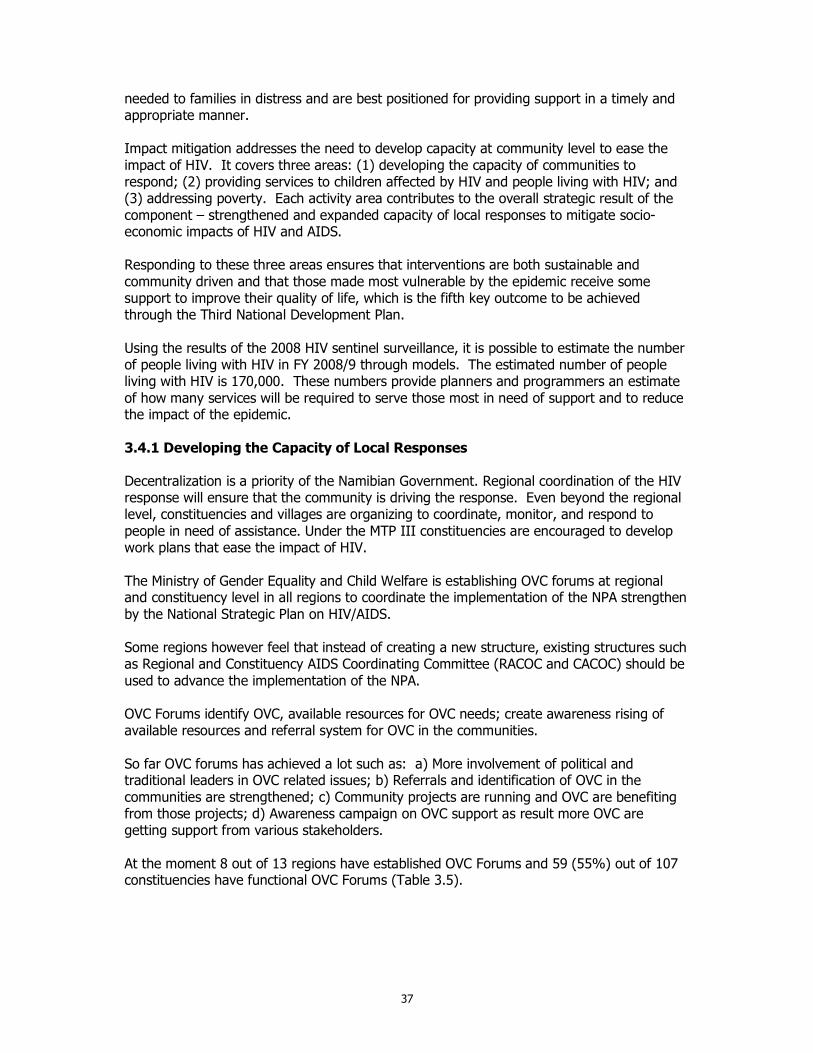
37
needed to families in distress and are best positioned for providing support in a timely and appropriate manner. Impact mitigation addresses the need to develop capacity at community level to ease the impact of HIV. It covers three areas: (1) developing the capacity of communities to respond; (2) providing services to children affected by HIV and people living with HIV; and (3) addressing poverty. Each activity area contributes to the overall strategic result of the component – strengthened and expanded capacity of local responses to mitigate socio-economic impacts of HIV and AIDS. Responding to these three areas ensures that interventions are both sustainable and community driven and that those made most vulnerable by the epidemic receive some support to improve their quality of life, which is the fifth key outcome to be achieved through the Third National Development Plan. Using the results of the 2008 HIV sentinel surveillance, it is possible to estimate the number of people living with HIV in FY 2008/9 through models. The estimated number of people living with HIV is 170,000. These numbers provide planners and programmers an estimate of how many services will be required to serve those most in need of support and to reduce the impact of the epidemic. 3.4.1 Developing the Capacity of Local Responses Decentralization is a priority of the Namibian Government. Regional coordination of the HIV response will ensure that the community is driving the response. Even beyond the regional level, constituencies and villages are organizing to coordinate, monitor, and respond to people in need of assistance. Under the MTP III constituencies are encouraged to develop work plans that ease the impact of HIV. The Ministry of Gender Equality and Child Welfare is establishing OVC forums at regional and constituency level in all regions to coordinate the implementation of the NPA strengthen by the National Strategic Plan on HIV/AIDS. Some regions however feel that instead of creating a new structure, existing structures such as Regional and Constituency AIDS Coordinating Committee (RACOC and CACOC) should be used to advance the implementation of the NPA. OVC Forums identify OVC, available resources for OVC needs; create awareness rising of available resources and referral system for OVC in the communities. So far OVC forums has achieved a lot such as: a) More involvement of political and traditional leaders in OVC related issues; b) Referrals and identification of OVC in the communities are strengthened; c) Community projects are running and OVC are benefiting from those projects; d) Awareness campaign on OVC support as result more OVC are getting support from various stakeholders. At the moment 8 out of 13 regions have established OVC Forums and 59 (55%) out of 107 constituencies have functional OVC Forums (Table 3.5).
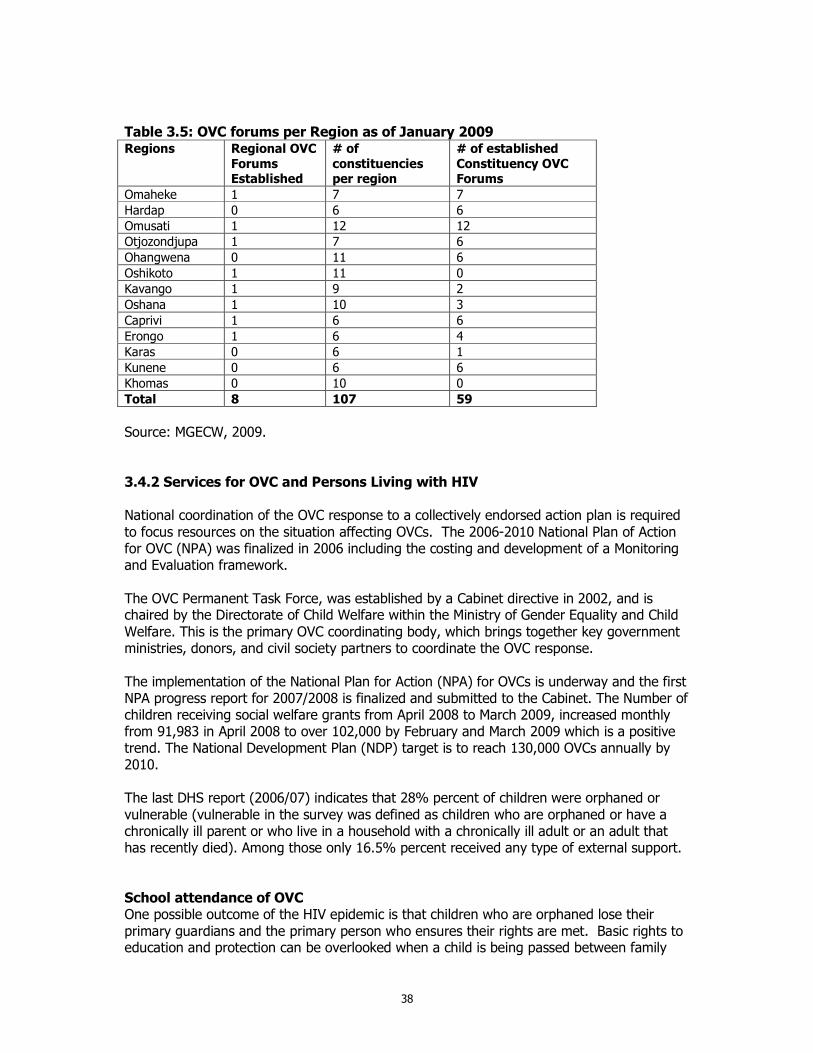
38
Table 3.5: OVC forums per Region as of January 2009 Regions Regional OVC
Forums Established
# of
constituencies per region
# of established
Constituency OVC Forums
Omaheke 1 7 7
Hardap 0 6 6
Omusati 1 12 12
Otjozondjupa 1 7 6
Ohangwena 0 11 6
Oshikoto 1 11 0
Kavango 1 9 2
Oshana 1 10 3
Caprivi 1 6 6
Erongo 1 6 4
Karas 0 6 1
Kunene 0 6 6
Khomas 0 10 0
Total 8 107 59
Source: MGECW, 2009. 3.4.2 Services for OVC and Persons Living with HIV National coordination of the OVC response to a collectively endorsed action plan is required to focus resources on the situation affecting OVCs. The 2006-2010 National Plan of Action for OVC (NPA) was finalized in 2006 including the costing and development of a Monitoring and Evaluation framework. The OVC Permanent Task Force, was established by a Cabinet directive in 2002, and is chaired by the Directorate of Child Welfare within the Ministry of Gender Equality and Child Welfare. This is the primary OVC coordinating body, which brings together key government ministries, donors, and civil society partners to coordinate the OVC response. The implementation of the National Plan for Action (NPA) for OVCs is underway and the first NPA progress report for 2007/2008 is finalized and submitted to the Cabinet. The Number of children receiving social welfare grants from April 2008 to March 2009, increased monthly from 91,983 in April 2008 to over 102,000 by February and March 2009 which is a positive trend. The National Development Plan (NDP) target is to reach 130,000 OVCs annually by 2010. The last DHS report (2006/07) indicates that 28% percent of children were orphaned or vulnerable (vulnerable in the survey was defined as children who are orphaned or have a chronically ill parent or who live in a household with a chronically ill adult or an adult that has recently died). Among those only 16.5% percent received any type of external support. School attendance of OVC One possible outcome of the HIV epidemic is that children who are orphaned lose their primary guardians and the primary person who ensures their rights are met. Basic rights to education and protection can be overlooked when a child is being passed between family
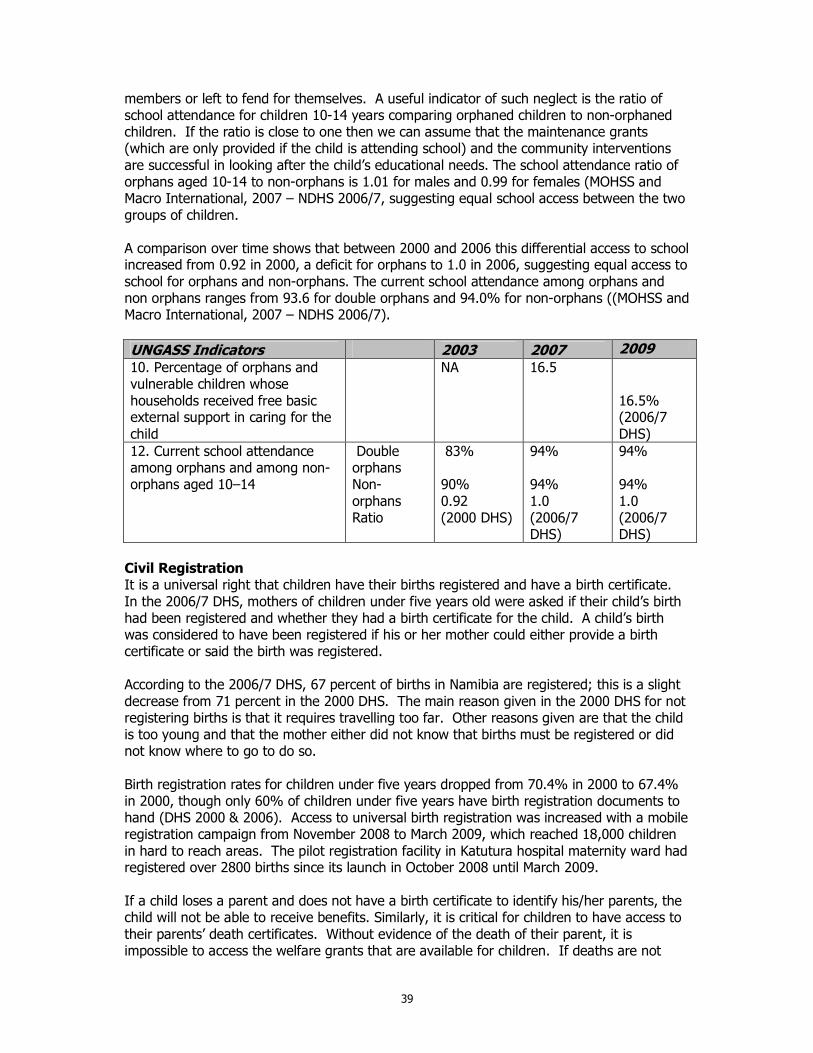
39
members or left to fend for themselves. A useful indicator of such neglect is the ratio of school attendance for children 10-14 years comparing orphaned children to non-orphaned children. If the ratio is close to one then we can assume that the maintenance grants (which are only provided if the child is attending school) and the community interventions are successful in looking after the child’s educational needs. The school attendance ratio of orphans aged 10-14 to non-orphans is 1.01 for males and 0.99 for females (MOHSS and Macro International, 2007 – NDHS 2006/7, suggesting equal school access between the two groups of children. A comparison over time shows that between 2000 and 2006 this differential access to school increased from 0.92 in 2000, a deficit for orphans to 1.0 in 2006, suggesting equal access to school for orphans and non-orphans. The current school attendance among orphans and non orphans ranges from 93.6 for double orphans and 94.0% for non-orphans ((MOHSS and Macro International, 2007 – NDHS 2006/7).
UNGASS Indicators 2003 2007 2009 10. Percentage of orphans and vulnerable children whose households received free basic external support in caring for the child
NA 16.5
16.5% (2006/7 DHS)
12. Current school attendance among orphans and among non-orphans aged 10–14
Double orphans Non-orphans Ratio
83% 90% 0.92 (2000 DHS)
94% 94% 1.0 (2006/7 DHS)
94% 94% 1.0 (2006/7 DHS)
Civil Registration It is a universal right that children have their births registered and have a birth certificate. In the 2006/7 DHS, mothers of children under five years old were asked if their child’s birth had been registered and whether they had a birth certificate for the child. A child’s birth was considered to have been registered if his or her mother could either provide a birth certificate or said the birth was registered. According to the 2006/7 DHS, 67 percent of births in Namibia are registered; this is a slight decrease from 71 percent in the 2000 DHS. The main reason given in the 2000 DHS for not registering births is that it requires travelling too far. Other reasons given are that the child is too young and that the mother either did not know that births must be registered or did not know where to go to do so. Birth registration rates for children under five years dropped from 70.4% in 2000 to 67.4% in 2000, though only 60% of children under five years have birth registration documents to hand (DHS 2000 & 2006). Access to universal birth registration was increased with a mobile registration campaign from November 2008 to March 2009, which reached 18,000 children in hard to reach areas. The pilot registration facility in Katutura hospital maternity ward had registered over 2800 births since its launch in October 2008 until March 2009. If a child loses a parent and does not have a birth certificate to identify his/her parents, the child will not be able to receive benefits. Similarly, it is critical for children to have access to their parents’ death certificates. Without evidence of the death of their parent, it is impossible to access the welfare grants that are available for children. If deaths are not
40
registered at all, the child has no chance of getting the parent’s certificate. In regions where HIV prevalence is high, there are complaints that children do not have birth certificates and that registration procedures are slow and cumbersome. Birth registration documents and death certificates are required for children to apply for child welfare grants and are an impediment to guardians accessing support to provide for children under their care. 3.5. Integrated and Co-ordinated Programme Management 3.5.1 Management and Coordination of the National Response to HIV/AIDS An expanded multi-sectoral response in the five main strategic areas requires improved management coordination. Implementing partners and coordinating bodies will need to be made responsible and accountable for achieving the desired results to which they commit themselves, at national, regional and local level. Hence the implementing partners and coordinators need to monitor performance and coverage in all regions and in each sector. MTP III articulates the national HIV/AIDS management structure as follows: The National AIDS Committee (NAC) is the highest policy decision making body on matters related to HIV/AIDS. It is attended by Cabinet ministers and Regional governors to ensure that policy and resource mobilisation is adequate. The National Multi-sectoral AIDS Co-ordinating Committee (NAMACOC) provides the leadership for multi-sectoral and regional implementation. It is attended at Permanent Secretaries of sector Ministries and regional governors, representatives of civil society and development partners. It reviews progress and adopt annual work plan and budgets. It meets at such times that fit well with the GRN budget planning cycle. The National AIDS Executive Committee (NAEC) provides the technical leadership and it will be responsible for co-ordinating implementation of the multi-sectoral response. Its membership reflects the hand-on experience required to deal with implementation issues. It will be attended by key sectors and key technical people to cover the five components of the MTP III. The Sectoral Steering Committee involves all key actors working in that sector and will thus be wider than most current Ministry HIV/AIDS committees. The Sectoral Steering Committee is responsible for the implementation of sector-specific interventions and for mainstreaming HIV/AIDS into all aspects of their organisation’s core functions. Through impact assessment and establishing appropriate policies, the committee will ensure that the sector’s core function minimise the spread of HIV/AIDS and support programmes which address the impact of the epidemic and their target groups. It actively works towards establishing workplace programmes across the sector. The Regional AIDS Co-ordinating Committee (RACOC) co-ordinates between civil society and government at regional level and between the national and regional institutions. RACOCs take responsibility to co-ordinate and supervise HIV/AIDS development in each region and support local committees to take community actions. The Constituency AIDS Co-ordinating Committee (CACOC) takes responsibility to co-ordinate and manages the multi-sectoral response at local level. Some regions have established District-level AIDS Committees or other structures which have essentially the same function and same terms of reference as the CACOCs.
41
Civil society organizations including organizations representing people living with HIV participate in the various management structures. The government Offices, Ministries and Agencies (OMA) managements need to provide more leadership and support to the Sector Focal Persons. The result is disruption of continuity of capacity building is that the trained staff members are constantly shifted. There is need for pronouncement on the permanency of the position of focal persons. 3.5.2 Developing HIV/AIDS Management Capacity Training in areas of HIV, STIs, Malaria and TB prevention and treatment is one of the central elements in the Directorate Special Programs. The dynamism and often complicated nature of these diseases and particularly HIV/AIDS makes it essential that health workers and community members are thoroughly trained and constantly furnished with new information and strategies on the prevention and treatment of the disease. Namibia is currently faced with a shortage of staff especially in the medical field as the country has not been training its own doctors, pharmacists, medical technologists etc. In spite of the country being able to provide professionals in the field of nursing, the turnover is high (especially in the public sector) which hampers the quality of care in the public health facilities. With the assistance of partners, the MOHSS is able to provide services to those who are in need especially in the rural areas. Scholarships are provided in the fields of medicine, pharmacology and medical technology with the view of filling the gap that currently exists. Namibia is also setting up a medical school to train medical doctors as well as efforts to develop a pharmacy degree course under the University of Namibia. In addition, other institutions are also being strengthened to increase their capacity to train more mid-level categories of staff like Pharmacist Assistants to address the critical shortage of medical staff through task shifting, and enhance decentralization of ART services to ensure improved quality and access. An Institutional Framework has been established for the Training Support Coordination (TSC). There are two platforms and these are the Health sector Training Coordination Committee (HSTCC) and Multi-sectoral Training Coordination Committee (MSTCC). Draft training coordination guides have been developed for both committees. The three HIV/AIDS modules: Common Module on HIV/AIDS, STI &TB, Mainstreaming HIV/AIDS and HIV/AIDS Workplace modules have been approved as part of PON curricula and awarded accreditation. There will be two systems (a) as part of full-time academic studies (b) providing certificate training combining three modules of HIV/AIDS for management targeted to civil service and NGOs. The three HIV/AIDS modules: Common Module on HIV/AIDS, STI &TB, Mainstreaming HIV/AIDS and HIV/AIDS Workplace modules have been approved as part of the Poly Technic of Namibia (PON) curricula and awarded accreditation. There will be two systems (a) as part of full-time academic studies (b) providing certificate training combining three modules of HIV/AIDS for management targeted to civil service and NGOs
42
3.5.3 Monitoring and Evaluation The Response Monitoring and Evaluation Sub-division is responsible for ensuring proper data collection, management and dissemination on all topics related to the national HIV, TB and malaria responses. The RM&E has made a number of strategic changes between 2007 and 2009 to better coordinate national monitoring and evaluation efforts. These changes are guided by the 12 components for a functional national M&E system Up to date, 45 M&E data clerks and 7 senior data clerks were recruited through Global fund and CDC while 13 regional M&E officers were also recruited through CDC support. An M&E officer for HIV and a data manager were also recruited in the reporting period as well as a systems analyst. An M&E curriculum and System for Program Monitoring (SPM) (Non facility based) were developed and have been used for capacity building of the civil society and other public sectors in the implementation of SPM. A data analysis and report writing workshop was conducted on 8-12 September 2008 in Windhoek with the assistance of World Bank/GAMET. About 27 participants made up of regional M&E officers and the regional AIDS Coordinators attended the training. JICA funded SPM training for civil society which was arranged by the umbrella organization for AIDS Services Organizations, NANASO. The target of the training was community based organizations affiliated to NANASO which are based in different regions in the country. In total, there were 25 community based implementers. In addition to the SPM trainings that were conducted, a series of ART refresher trainings were held for the doctors, nurses, pharmacists as well as data clerks. These trainings included the electronic tools as well as the paper tools. The Ministry of Health in collaboration with the University of Namibia conducted two trainings in basic M&E with the view of strengthening M&E capacity in the country. This is in addition to the trainings that the subdivision is assisting the University with the Master of Public Health Students. . The electronic TB Register has been implemented in all 13 regions and a revision of the TB data collection tools are currently under way A systems boundary document that will facilitate and guide the linkage of different electronic systems was developed and currently in a draft form. The TB M&E plan was finalized during the reporting period and currently available. Plans are currently underway to launch and disseminate the plan to all relevant partners and stakeholders. During the reporting period, the MOHSS has adopted the early warning indicator protocol (EWI). In addition, the prevention monitoring protocol was also finalized and submitted to the Institutional Review Board for approval. EWI data abstraction training was conducted The selected five recommended WHO EWIs are: prescribing practice, lost to follow up at 1 month, retention on first line ART at 12 months, on time pill pick up and drug supply continuity. Overall it was found that the existing pharmacy and medical records allowed for the collection of the EWIs. It is planned to have annual EWI reports.
43
To address the data gaps in the UNGASS reporting and other national and international reporting, an M&E plan is currently under development and will include among others provision for an AIDS Indicator Survey and Behavioural Surveillance Surveys for most at risk populations such as Commercial Sex Workers and MSMs. 3.5.4 Surveillance and Operational Research Since 1992, Namibia has been monitoring the prevalence of the HIV epidemic through anonymous unlinked sentinel surveillance of pregnant women attending antenatal clinics. The general objective was to estimate the prevalence of HIV-infection in pregnant women aged 15-49 yeas, to identify geographic and socio-demographic characteristics associated with higher prevalence, and to monitor infection trends over time. The 2008 sentinel survey was conducted for the first time in all 34 health districts. A total of 8,174 pregnant women attending antenatal clinics participated in the survey. The 2008 ANC survey report was released in December 2008 on the World AIDS day. The study was conducted in all 34 districts. The HIV prevalence for 2008 was 17.8%. However, lack of data on most at risk populations is critical and needs to be addressed by the Government. This is recognized as an urgent need and surveys for Most at Risk Populations are being planned. Development of a database on HIV/AIDS research and evaluation studies that have been conducted between 2004 and 2009 and those planned during the implementation of the new NSF for HIV and AIDS 2010 to 2015 is on-going. The challenge of the absence of data to provide evidence for targeting prevention, care and treatment services is particularly so due to the absence of a nationally representative population based AIDS indicator survey and Most at Risk Population (MARPS) surveys. 4. Best Practices Generally, the HIV and AIDS health sector response has demonstrated the possibility of rapid scale up of services. These have all been as a result of the best practice of effective partnerships between the Government of the Republic of Namibia, civil society, private sector and development partners. The continued rapid roll out of antiretroviral treatment has been seen as a significant success in Namibia. The increasing percentage of TB cases being tested for HIV is another success story. PMTCT services have continued to register improvement in all indicators over the last 4 years. Similar trends have been recorded with condom distribution and use. These successes are all despite the vast distances between major cities and towns in the country. The stakeholder partnerships are through fora such as Technical Working Groups. The joint efforts are beginning to yield results in that the epidemic appears to beginning to halt and the spread is being reversed. However, there should be no complacency given that the HIV prevalence is still high at 17.8% among women attending ANC. The partnerships include among others the National AIDS Executive Committee, AIDS treatment and Prevention Treatment Advisory committees, OVC committee and the HIV M&E committee.
44
5. Major Challenges, Successes and Actions to be taken 5.1. Major Challenges Some of the major challenges identified during the period under review are described below. 5.1.1. Prevention
• Absence of a prioritised prevention agenda: In the absence of a national prevention agenda or strategy stakeholders are implementing what they think is the best and not necessary aligned to national priorities. The new NSF and it operational plans will address this..
• Lack of focus and targeting on key epidemic drivers and most at risk population groups such as sex workers, MSM and prisoners. Focus has been on where funding is readily available and not necessarily on what drives the epidemic.
• Fragmented coordination of prevention interventions • Absence of second generation surveillance data with biological and behavioural data
for the general population at national and regional levels as well as for most at risk populations does not allow for an elaborate assessment of the epidemic and the response.
• Successes being realised in HIV prevention among the youth may become a disincentive for support for programmes for the youth and yet the achievements need to be sustained.
• Although the Femidom is seen as a female empowering tool, it is disheartening to note that the uptake of this female condom is still very low and has reduced considerably for the socially marketed ones.
• Changes in societal norms that are not in line with HIV prevention activities takes time
5.2.2. Treatment, care and support Although the expanded ARV treatment programmes were seen as a success, the medicines and supplies systems needed to be strengthened to maintain the services and cope with the workload. Specifically more trained professionals were needed, not only for pharmaceutical services but also for nurses in hospitals, health centres, and clinics. A review of the health systems indicate that current levels of human and infrastructure resources are insufficient to support the increased coverage of PLHIV, both within the Pre-ART and the ART clinics The coordination, management and reporting of the HIV/AIDS and TB programmes is critical to ensure effective collaboration. However, as of 2009 this was only found to happen at national level and not at implementation level where the adoption and implementation of the Three I’s strategy is key.
The Electronic Dispensing Tool (EDT) for ARVs could not capture data on lost to follow up patients at facilities. The tool is being revised to measure patient retention on treatment. There has also been difficulty in capturing data from ART outreach sites into the EDT- this will be addressed by use of the hand held mobile EDT devices. Regarding PMTCT systems, rapid testing is needed so women become aware of their status before delivery. A follow up mechanism is needed for HIV positive mothers and their
45
newborns through PCR testing. Finally, PMTCT+ data need to be provided more routinely to the central HIS sites. The report noted that health facilities providing ARV services needed to be renovated to adequately accommodate the ARV and PMTCT+ services. A referral system was needed between ARV clients in the health system and community HBC programmes. 5.1.3. Impact mitigation A number of challenges were identified around OVC support. Both civil society and government needed to increase their material and financial support to OVC and their caregivers. It was proposed that government should provide guidance and control the quality of OVC support services; opportunities for children to voice their opinions on their situations should be increased; and opportunities for caregivers to network and share learning experiences should be developed. Finally the government should increase the number of health workers, paralegals counselors, and other administrative personnel who implement and manage government services for OVC. There is no national vulnerability framework focusing at the level of vulnerable households. Existing interventions and strategies focusing on impact mitigation are fragmented, largely un-coordinated, under resourced, with a gap in capacity and technical skills. One area that is most affected is provision of services to OVC through CHBC and community based organisations. Services for PLWHA still needed to be expanded to include psychosocial counseling, treatment adherence and nutrition counseling, succession planning. The national PLWHA umbrella organisation needed to be strengthened to help coordinate and advocate for these services. Improvement to poverty alleviation efforts were also identified, such as increasing development assistance to Namibia, providing technical assistance, institutional strengthening, and capacity building to government, civil society and private sector. 5.1.4. Coordination, Management and Enabling Environment
• National and regional AIDS Coordination committees do not meet as regularly as expected.
• Lack of data use for decision making based on available evidence. There are also difficulties in collecting data on media campaigns and impact of behaviour change programmes especially in the short term in between DHS.
• Monitoring and evaluation structures established at the regional level to support the national response and also the community response through the regional AIDS coordinating committees (and constituency committees at their levels) need to be strengthened.
• Capacity building for M&E needed to take place at all levels and in all sectors; including training and support for stakeholders in collecting programme data, training in M&E systems development, and training in data use and report writing.
• An urgent need was identified for programme and survey biomarker and behavioural data from the general population and most at risk populations.
46
5.2. Successes 5.2.1. Prevention Given the decline in HIV prevalence and estimated incidence, Namibia’s HIV prevention efforts have been partially successful at starting to reverse the epidemic. As detailed out in the report, the partial success in HIV prevention efforts has been brought about by achievements in specific HIV programmes which include among others:
• Increases in coverage of HIV Testing and Counselling: • Increases in coverage of PMTCT for all pregnant women • DNA PCR testing for all HIV-exposed infants is now increasingly available available • Blood products in Namibia remain safe • Decline in STI prevalence: • Life skills education is being provided in schools and to out-of-school youth • Condom distribution and condom use has significantly increased:
5.2.2. Treatment, Care and Support Significant progress was made in the ensuring availability, access and utilization of treatment, care and support services. The following successes are notable:
• Antiretroviral Therapy (ART): By 31st March 2009, 64,637 PLHIV were enrolled on ART in public health and mission facilities reaching over 80% of the population in need.
• Tuberculosis: The number of TB patients tested for HIV increased from 16% in 2005 to 66.9% in 2008.
• Home bases care coverage has increased As a result of the ARV rollout, HBC is moving towards preventive and adherence support, as well as broader issues of primary health care and less towards bed-ridden care.
5.2.3. Impact Mitigation During the period of the MTP III, impact mitigation interventions focused on strengthening national and community capacity to address the socioeconomic impacts of HIV including poverty reduction, and income disparities, among others.
• External Basic Support for OVC: 16.5% of OVC were receiving at least one type of external basic support. Basic external support related to medical, emotional, social/material and educational related support.
• Cash Transfers: There were 104,438 cash transfers made to support for OVC. • OVC Permanent Task Force: Has advised, co-ordinated, and monitored the
implementation of the NPA (National Plan of Action). • Education: 94.6% of OVC were attending primary schools
5.2.4. Coordination, Management and Enabling Environment Creating an enabling environment entails development and implementation of policies and laws that enable people to access and use services without the fear of being stigmatized or discriminated against because of their health condition. Namibia has made some progress in
47
this area. As elucidated in the report, several policies and guidelines have been developed or reviewed such as the National HIV Workplace Policy and the PMTCT guidelines. 5.3. Actions to be taken 5.3.1. Prevention
• Intensify implementation of quality social and behaviour change prevention interventions targeted to high risk populations that contribute to a reduction in HIV transmission through a reduction in multiple and concurrent partnerships, reduction in the practice of trans-generational sex, reduction in the practice of transactional sex, reduction in risky sex related to alcohol use, increase in those seeking biomedical interventions (MC, HCT, condoms)
• Develop special and friendly HIV prevention programmes targeting adolescents • Expand the opportunity for HCT so that people test, receive and know their HIV
status results. • Ensure that comprehensive HIV prevention services are readily available and
accessible to most at risk (MARP) and other vulnerable populations to prevent transmission of HIV
• Ensure access to prevention, treatment, care and support for PLHIV to improve the quality of life and have PLHIV live longer and healthier lives.
• Scale up medical male circumcision and behaviour change communications so that more men and newborns are circumcised. And ensure that adult males and when newborns reach reproductive age are empowered to practice safe sexual practices to reduce the probability of HIV transmission
• Scale up the provision of comprehensive package of PMTCT services so that services are readily available, accessible and being utilised by all people in need, and to reduce the probability of HIV transmission where exposure has occurred to newborns.
• Ensure that PEP services are available and accessible so that all eligible people who have been accidentally or otherwise exposed to HIV are given drugs to reduce the risk of primary infection, and have comprehensive knowledge of HIV.
• Increase the availability of male and female condoms and the number of prevention programs promoting condom use so that HIV transmission may be reduced through improved and consistent use of condoms, particularly among those whose use is currently low
5.3.2. Treatment, Care and Support
• Enhance quality of care by scaling-up the Pre-ART programme. • Strengthen coordination between HIV and TB so that more PLHIV with TB are
successfully treated • Improve ART coverage as well as the service provision environment including
human resource and infrastructure capacities • Strengthen the pharmaceutical supply system throughout all the levels of the
supply chain • Improve coordination and harmonisation of the service delivery of Community
Home Based Care
48
5.3.3. Impact Mitigation
• Strengthen the capacity of members of vulnerable households so that they are able to cope with the impacts of HIV and AIDS
• Provide comprehensive and quality care and support for OVC and in particular ensuring equitable access to emotional, social/material, and school related support.
• Reduce stigma and discrimination against vulnerable households and reduce GBV violence.
• Improve household level food security of vulnerable populations and their access to basic food items
5.3.4. Coordination, Management and Enabling Environment
• Strengthen the capacity for coordination and management of the response at national, sector, and regional levels
• Review and formulate new policies that promote and support an enabling policy and legal environment in the context of HIV and AIDS.
• Strengthen the capacity and participation of all leaders in the design and implementation of the national multi-sectoral response at appropriate levels of the leadership.
• Strengthen strategies that expands the opportunities for PLHIV engagement and involvement in the national multi-sectoral response to HIV and AIDS
• Strengthen the capacity of sectors to absorb resources earmarked for HIV and AIDS programmes and effectively and efficiently implement prioritized programmes at all levels.
• Develop capacity for resource mobilisation, tracking and sustainability. • Develop the next national M&E plan in line with the NSF • Develop a plan for a Joint Annual Review (JAR) for all interventions. • Develop a national research and study agenda for HIV and AIDS
• Carry out population based HIV indicator and behavioural surveys for the general and most at risk populations
49
6. Support from Development Partners Despite being classified as a upper-middle income country, Namibia receives significant external assistance for its fight against HIV. The US Government and the Global Fund provide the largest amount of funding with additional technical and financial assistance coming from the United Nations and European Union. A number of other donors also provide technical and financial assistance. Namibia is a priority country for the US Government and thus receives large amounts of financial assistance through the different branches of the US Government. Namibia successfully applied for HIV funding from the Rolling Continuing Channel Round 2 of the Global Fund on AIDS, TB and Malaria. Namibia has responded to the Technical Review Panel comments and is awaiting a response from the Global Fund. In the meantime, Namibia did successfully apply for a no cost extension of the Round 2 grant in order to complete the unspent funds and bridge the gap before the start of the RCC grant implementation. The Principal recipients are the MoHSS for government and the NANASO, the umbrella organization for civil society. A National AIDS Spending Assessment (NASA) is being undertaken and has been cross-walked with the National Health Accounts (NHA). Results of these assessments will be available in 2010. The development partners meet quarterly in an HIV/AIDS Partnership Forum. The purpose of the Forum includes information sharing and policy dialogue with the government on strategic issues of the national response. Ideally such a forum makes a better contribution when led by government. Alternatively, government representation at this forum should be regular and at a level that facilitates policy dialogue and follow up action. This would enable the Partnership Forum to strengthen its role by harmonizing its advice and assistance to the country. In addition the development partners need to support the government to play the lead and coordinating role in the HIV response. Specific actions that development partners can undertake are:
• Participate in meetings on programmes that are to be implemented by government including steering committees and technical working groups
• Support coordination of multisectoral HIV and AIDS M&E and surveillance activities through the Directorate of Special Programmes: Response Monitoring and Evaluation Sub-Division and the National M&E Committee
• Ensure that prevention, treatment and care, strategies align with government priorities in order to reach national targets
• Strengthen the capacity of NGOs, CBOs, FBOs to respond to HIV • Provide technical assistance to strengthen the government’s management and
leadership capacity around HIV
50
References
1. Ministry of Gender Equality and Child Welfare. 2009. National OVC Report: 2007/08 Financial Year.
2. Ministry of Health and Social Services and Macro International. 2002. Namibian Demographic and Health Services 2000. Calverton, Maryland; 2002
3. National Planning Commission. 2001 Population and Housing Census, National Report Basic Analysis with Highlights. Windhoek; Namibia; 2003
4. Ministry of Health and Social Services. 2004. The National Strategic Plan on HIV/AIDS. Third Medium Term Plan (MTP III) 2004-2009. Directorate of Special Programmes. Windhoek, Namibia; 2004.
5. Ministry of Health and Social Services. 2006. Plan for National Multisectoral Monitoring and Evaluation of HIV/AIDS, 2006/7 – 2008/9. Directorate of Special Programmes. Windhoek, Namibia; 2006.
6. Ministry of Health and Social Services and Macro International. 2007. 2006/07 Namibian Demographic and Health Services 2006. Windhoek, Namibia.
7. Ministry of Health and Social Services. 2007 Namibia Global Fund Programme Annual Report 2006. Windhoek, Namibia; 2007.
8. Ministry of Health and Social Services. 2007 National Policy on HIV/AIDS. Windhoek, Namibia; 2007.
9. Ministry of Health and Social Services. 2009a. Report of the 2008 National HIV Sentinel Survey. Windhoek, Namibia; 2009.
10. Ministry of Health and Social Services. 2009b. Behavioural and Contextual Factors driving the epidemic in Namibia
11. Ministry of Health and Social Services 2009c. National 2008/09 HIV Estimates and Projections of HIV/AIDS. Windhoek, Namibia. Based on Spectrum 3.41.
12. Ministry of Health and Social Services 2010. 2010 MTP III Annual Progress Report 2008/09. Windhoek, Namibia.