effects of grazing pressure on efficiency of grazing on north american great plains rangelands
TRANSCRIPT

Forum
Effects of Grazing Pressure on Efficiency of Grazing on North AmericanGreat Plains Rangelands
A. J. Smart,1 J. D. Derner,2 J. R. Hendrickson,3 R. L. Gillen,4 B. H. Dunn,5 E. M. Mousel,6
P. S. Johnson,7 R. N. Gates,8 K. K. Sedivec,9 K. R. Harmoney,10 J. D. Volesky,11 and K. C. Olson8
Authors are 1Associate Professor and 6Assistant Professor, Department of Animal and Range Sciences, South Dakota State University, Brookings, SD57007, USA; 2Rangeland Scientist, US Department of Agriculture–Agricultural Research Service (USDA–ARS) High Plains Grasslands Research Station,
Cheyenne, WY 82009, USA; 3Rangeland Scientist, USDA–ARS Northern Great Plains Research Laboratory, Mandan, ND 58554, USA; 4Head andProfessor and 10Associate Professor, Western Kansas Agricultural Research Center, Kansas State University, Hays, KS 67601, USA; 5Executive Directorand Endowed Chair of the King Ranch Institute for Ranch Management, Texas A&M University–Kingsville, Kingsville, TX 78363, USA; 7Professor and8Associate Professors, Department of Animal and Range Sciences, South Dakota State University, West River Agricultural Center, Rapid City, SD 57702,USA; 9Associate Professor, School of Natural Resource Sciences, North Dakota State University, Fargo, ND 58108, USA; and 11Professor, Department of
Agronomy and Horticulture, West Central Research and Extension Center, University of Nebraska-Lincoln, North Platte, NE 69101, USA.
Abstract
Comparisons of stocking rates across sites can be facilitated by calculating grazing pressure. We used peak standing crop andstocking rates from six studies in the North American Great Plains (Cheyenne, Wyoming; Cottonwood, South Dakota; Hays,Kansas; Nunn, Colorado; Streeter, North Dakota; and Woodward, Oklahoma) to calculate a grazing pressure index and developrelationships for harvest efficiency, utilization, grazing efficiency, and animal performance and production. Average grazingpressures for heavy, moderate, and light stocking across the study sites were 40, 24, and 14 animal unit days ? Mg21, respectively.These grazing pressures resulted in average harvest efficiency values of 38%, 24%, and 14% and grazing efficiencies of 61%,49%, and 39% for heavy, moderate, and light stocking rates, respectively. Utilization increased quadratically as grazing pressureindex increased, whereas grazing and harvest efficiencies exhibited a linear increase with grazing pressure. The latter indicates thatnonlivestock forage losses (e.g., weathering, senescence, wildlife, insects) were disproportional across stocking rates. Average dailygain of livestock decreased linearly as grazing pressure index increased across study sites. Prediction equations reaffirmassumptions of 50% grazing efficiency and 25% harvest efficiency associated with moderate stocking. Novel here, however, is thatharvest and grazing efficiencies increased at high grazing pressures and decreased at low grazing pressures. Use of grazing pressureindex to ‘‘standardize’’ stocking rates across rangeland ecosystems in the North American Great Plains should improvecommunication among scientists, resource managers, and the public, and thus better achieve both production and conservationgoals on these lands.
Resumen
La estimacion de la presion de pastoreo puede facilitar la comparacion de carga animal entre sitios. Se utilizaron datos de maximabiomasa aerea en pie y carga animal de seis ensayos realizados en las Planicies Centrales de America del Norte (Cheyenne, WY;Cottonwood, SD; Hays, KS; Nunn, CO; Streeter, ND; y Woodward, OK) para calibrar un ındice de presion de pastoreo ydesarrollar relaciones de eficiencia de cosecha, utilizacion, eficiencia de pastoreo, y performance y produccion animal. Laspresiones de pastoreo promedio para cargas altas, moderadas, y leves en todos los sitios fueron de 40, 24, y 14 UAD ? Mg21,respectivamente. Estas presiones de pastoreo resultaron en valores de eficiencia de cosecha promedio de 38, 24, y 14% y eficienciasde pastoreo de 61, 49, y 39% para cargas altas, moderadas, y leves, respectivamente. Aumentos en el ındice de presion de pastoreoestuvieron asociados a un incremento cuadratico de la utilizacion, mientras que las eficiencias de pastoreo y de cosecha exhibieronun incremento lineal con el aumento de presion de pastoreo. Esto ultimo indica que las perdidas de forraje no debidas al ganado(ej., maduracion, senescencia, fauna, insectos) fue desproporcional para las diferentes cargas animales. La ganancia de pesopromedio del ganado decrecio de modo lineal a medida que aumento el ındice de presion de pastoreo en los diferentes sitios. Lasecuaciones predictivas reafirman los supuestos del 50% de eficiencia de pastoreo y el 25% de eficiencia de cosecha asociadas con elpastoreo moderado. Lo nuevo de este analisis es que las eficiencias de cosecha y pastoreo aumentaron con cargas altas ydisminuyeron con cargas leves. El uso de ındices de presion de pastoreo para ‘‘estandarizar’’ la carga animal en todos losecosistemas de pastizales naturales de las Planicies Centrales de America del Norte deberıa facilitar la comunicacion entreinvestigadores, tecnicos, y el publico para mejorar el logro de las metas de produccion y conservacion de estas tierras.
Key Words: animal performance, forage disappearance, grazing efficiency, harvest efficiency, herbage intake, stocking rate,utilization
Correspondence: Alexander J. Smart, Dept of Animal and Range Sciences, South Dakota State University, Box 2170, Brookings, SD 57007, USA. Email: [email protected]
Manuscript received 28 April 2009; manuscript accepted 23 February 2010.
Rangeland Ecol Manage 63:397–406 | July 2010 | DOI: 10.2111/REM-D-09-00046.1
RANGELAND ECOLOGY & MANAGEMENT 63(4) July 2010 397

INTRODUCTION
Selecting the appropriate stocking rate is the most importantgrazing management decision a producer can make (Holecheket al. 2004). Observations made in the late 19th and early 20thcenturies demonstrated that overgrazing caused significantvegetation deterioration on North American rangelands (Par-ker 1954). Relationships between stocking rate and productiv-ity of vegetation and livestock initially were determined fornorthern mixed-grass prairie near Mandan, North Dakota, inthe mid-1910s (Riewe 1961). Numerous stocking rate studieswere initiated in the 1940s and 1950s throughout NorthAmerica (Harlan 1958; Riewe 1961; Van Poollen and Lacey1979). These individual studies laid the foundation for ourunderstanding of how the range succession model (Dyksterhuis1949) worked in different North American Great Plainsrangeland ecosystems. In the 1950s and 1960s, researchersbegan to combine livestock and vegetation responses withapplications of economics across stocking rates. For example,Klipple and Bement (1961) analyzed three long-term stockingrate studies to determine the economic feasibility of lightstocking to improve range condition. Riewe (1961) revieweddata from nine studies and reported relationships betweenstocking rate, gain per animal, and gain per acre for eachlocation separately. Harlan (1958) combined findings from 10studies and explained animal gain per head as a doubleexponential function of stocking rate. However, the procedureused to standardize stocking rates across studies was notexplicitly reported. Hart (1972) described the limitations ofHarlan’s (1958) approach and proposed calculating forageallowance (forage yield divided by number of animal days perunit area) as a way to standardize stocking rate. Hart (1972)also calculated grazing pressure (inverse of forage allowance)and showed mathematically that the relationship betweenaverage daily gain (ADG) and forage allowance was nonlinear,and the relationship between ADG and grazing pressure waslinear. Sollenberger et al. (2005) also suggested that forageallowance would be a useful method to standardize stockingrate studies. The rationale behind using forage allowance orgrazing pressure was based on previous findings that animalweight gain can be limited by forage supply (Conniffe et al.1970). A review of the literature (Allison 1985) and predictionequations by Redmon et al. (1995) and Poppi (1996) supportthe concept that forage availability limits intake and thusshould limit animal weight gain.
Grazing efficiency (the proportion of forage consumed bylivestock compared to the total that disappears due to all otheractivities) increases as grazing pressure increases (Combellasand Hodgson 1979; Stuth et al. 1981; Allison et al. 1982;Penning et al. 1991; Mazzanti and Lemaire 1994; Nakatsuji etal. 2006). We propose that a grazing pressure index (GPI) asdefined by the Society for Range Management (SRM 1998) asan ‘‘animal to forage relationship measured in terms of animalunits per unit of weight of forage over a period of time’’ wouldbe useful to standardize stocking rate studies across a widegeographic region to better describe the relationships betweenGPI, utilization, grazing efficiency, and harvest efficiency (theproportion of forage consumed by livestock compared to theforage produced). Most grazing studies measure standing cropbiomass and stocking rate, which can then be used to calculateGPI (animal unit days [AUD] ? Mg21; AUD divided by forageweight in megagrams; where one AU equals one mature cow ofapproximately 454 kg, either dry or with calf up to 6 mo of age,or their equivalent consuming about 12 kg of forage on anoven-dry basis). A greater understanding of the influence ofGPI on efficiency of grazing across rangeland ecosystems in theNorth American Great Plains would aid decision making inthese grazing-resistant ecosystems (Milchunas et al. 1988). Inaddition, knowledge of these relationships would assist incontemporary management regarding both livestock produc-tion and conservation goals (Derner et al. 2009).
Objectives of this study were to 1) quantify GPI, utilization,and harvest and grazing efficiencies at heavy, moderate, andlight stocking rates; and 2) evaluate the relationships betweenGPI and utilization, harvest and grazing efficiencies, andanimal performance and production across six studies con-ducted in the North American Great Plains. We hypothesizedthat vegetation and animal responses would exhibit linearrelationships with GPI.
MATERIALS AND METHODS
Stocking Rate Study Descriptions and CalculationsPublished and unpublished data from six studies conducted inthe North American Great Plains (Table 1) were used in thisstudy. The six studies provided the necessary data (peakstanding crop biomass, residual biomass, and stocking rate) tocalculate GPI and utilization. However, data on foragedisappearance due to livestock intake needed to calculate harvest
Table 1. Site, latitude/longitude, vegetation type, ecological site, annual precipitation, study period, and references of stocking rate studies in theNorth American Great Plains.
Site Lat, long Vegetation type Ecological siteAnnual
precipitation (mm) Study period References
Cheyenne, WY 41u119N, 104u539W Northern mixed-grass prairie Loamy 381 2004–2007 Hart et al. (1988); Derner and
Hart (2007)
Cottonwood, SD 43u949N, 101u859W Northern mixed-grass prairie Clayey 407 1945–1955 Smart et al. (2007)
Hays, KS 38u529N, 99u199W Central mixed-grass prairie Loamy upland 582 1957–1966 Launchbaugh (1967)
Nunn, CO 40u499N, 107u469W Shortgrass steppe Loamy 341 1991–2006 Hart and Ashby (1998)
Streeter, ND 46u469N, 99u289W Northern mixed-grass prairie Loamy 454 1991–2005 Patton et al. (2007)
Woodward, OK 36u279N, 99u239W Sand sagebrush-mixed prairie Sand hills 576 1958–1961 Gillen and Sims (2002, 2004)
398 Rangeland Ecology & Management
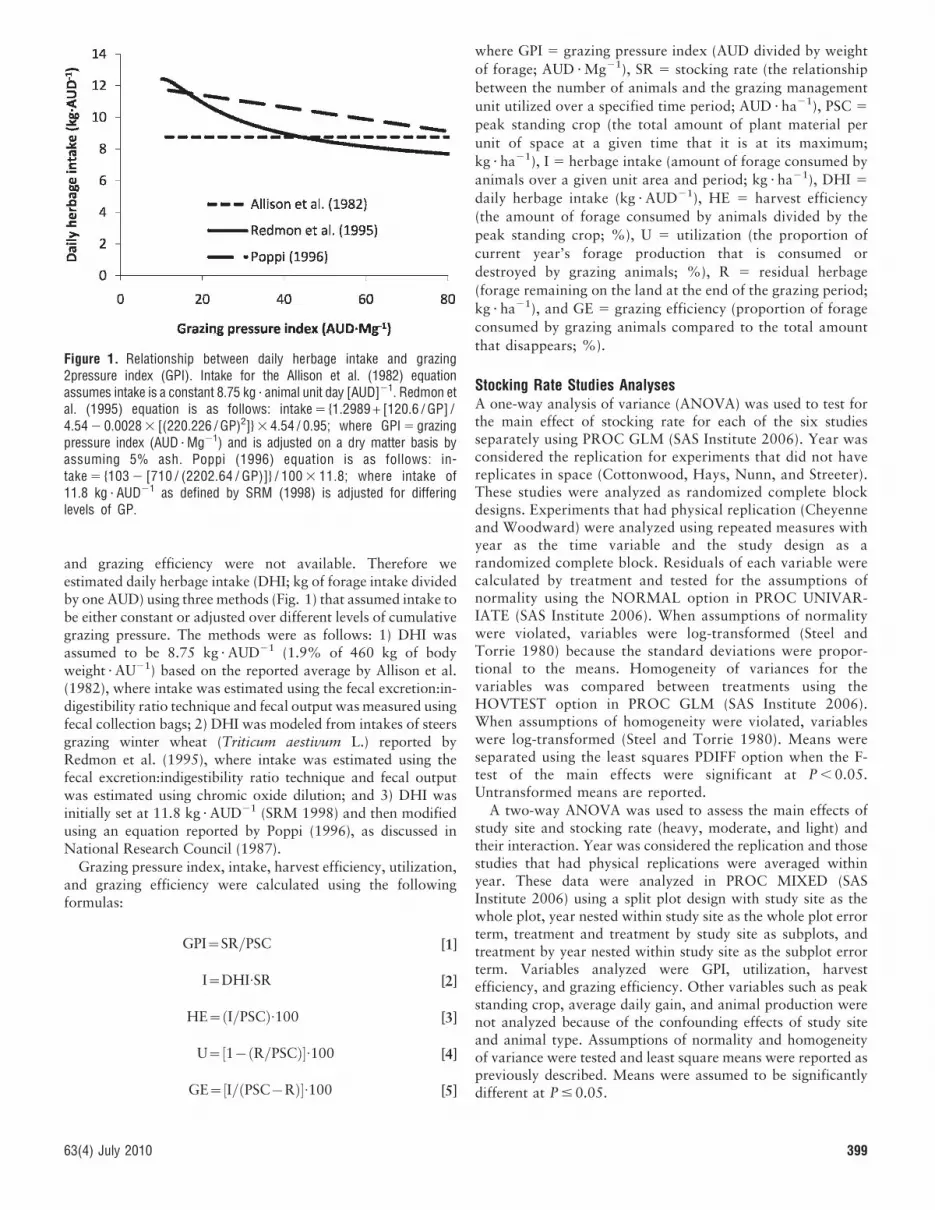
and grazing efficiency were not available. Therefore weestimated daily herbage intake (DHI; kg of forage intake dividedby one AUD) using three methods (Fig. 1) that assumed intake tobe either constant or adjusted over different levels of cumulativegrazing pressure. The methods were as follows: 1) DHI wasassumed to be 8.75 kg ? AUD21 (1.9% of 460 kg of bodyweight ? AU21) based on the reported average by Allison et al.(1982), where intake was estimated using the fecal excretion:in-digestibility ratio technique and fecal output was measured usingfecal collection bags; 2) DHI was modeled from intakes of steersgrazing winter wheat (Triticum aestivum L.) reported byRedmon et al. (1995), where intake was estimated using thefecal excretion:indigestibility ratio technique and fecal outputwas estimated using chromic oxide dilution; and 3) DHI wasinitially set at 11.8 kg ? AUD21 (SRM 1998) and then modifiedusing an equation reported by Poppi (1996), as discussed inNational Research Council (1987).
Grazing pressure index, intake, harvest efficiency, utilization,and grazing efficiency were calculated using the followingformulas:
GPI~SR=PSC [1]
I~DHI:SR [2]
HE~ I=PSCð Þ:100 [3]
U~ 1{ R=PSCð Þ½ �:100 [4]
GE~ I= PSC{Rð Þ½ �:100 [5]
where GPI 5 grazing pressure index (AUD divided by weight
of forage; AUD ? Mg21), SR 5 stocking rate (the relationship
between the number of animals and the grazing management
unit utilized over a specified time period; AUD ? ha21), PSC 5
peak standing crop (the total amount of plant material per
unit of space at a given time that it is at its maximum;
kg ? ha21), I 5 herbage intake (amount of forage consumed by
animals over a given unit area and period; kg ? ha21), DHI 5
daily herbage intake (kg ? AUD21), HE 5 harvest efficiency
(the amount of forage consumed by animals divided by the
peak standing crop; %), U 5 utilization (the proportion of
current year’s forage production that is consumed or
destroyed by grazing animals; %), R 5 residual herbage
(forage remaining on the land at the end of the grazing period;
kg ? ha21), and GE 5 grazing efficiency (proportion of forage
consumed by grazing animals compared to the total amount
that disappears; %).
Stocking Rate Studies AnalysesA one-way analysis of variance (ANOVA) was used to test forthe main effect of stocking rate for each of the six studiesseparately using PROC GLM (SAS Institute 2006). Year wasconsidered the replication for experiments that did not havereplicates in space (Cottonwood, Hays, Nunn, and Streeter).These studies were analyzed as randomized complete blockdesigns. Experiments that had physical replication (Cheyenneand Woodward) were analyzed using repeated measures withyear as the time variable and the study design as arandomized complete block. Residuals of each variable werecalculated by treatment and tested for the assumptions ofnormality using the NORMAL option in PROC UNIVAR-IATE (SAS Institute 2006). When assumptions of normalitywere violated, variables were log-transformed (Steel andTorrie 1980) because the standard deviations were propor-tional to the means. Homogeneity of variances for thevariables was compared between treatments using theHOVTEST option in PROC GLM (SAS Institute 2006).When assumptions of homogeneity were violated, variableswere log-transformed (Steel and Torrie 1980). Means wereseparated using the least squares PDIFF option when the F-test of the main effects were significant at P , 0.05.Untransformed means are reported.
A two-way ANOVA was used to assess the main effects ofstudy site and stocking rate (heavy, moderate, and light) andtheir interaction. Year was considered the replication and thosestudies that had physical replications were averaged withinyear. These data were analyzed in PROC MIXED (SASInstitute 2006) using a split plot design with study site as thewhole plot, year nested within study site as the whole plot errorterm, treatment and treatment by study site as subplots, andtreatment by year nested within study site as the subplot errorterm. Variables analyzed were GPI, utilization, harvestefficiency, and grazing efficiency. Other variables such as peakstanding crop, average daily gain, and animal production werenot analyzed because of the confounding effects of study siteand animal type. Assumptions of normality and homogeneityof variance were tested and least square means were reported aspreviously described. Means were assumed to be significantlydifferent at P # 0.05.
Figure 1. Relationship between daily herbage intake and grazing2pressure index (GPI). Intake for the Allison et al. (1982) equationassumes intake is a constant 8.75 kg ? animal unit day [AUD]21. Redmon etal. (1995) equation is as follows: intake 5 {1.2989 + [120.6 / GP] /4.54 2 0.0028 3 [(220.226 / GP)2]} 3 4.54 / 0.95; where GPI 5 grazingpressure index (AUD ? Mg21) and is adjusted on a dry matter basis byassuming 5% ash. Poppi (1996) equation is as follows: in-take 5 {103 2 [710 / (2202.64 / GP)]} / 100 3 11.8; where intake of11.8 kg ? AUD21 as defined by SRM (1998) is adjusted for differinglevels of GP.
63(4) July 2010 399

Regression AnalysesRegression analyses were conducted using GPI as theindependent variable and utilization, harvest, or grazingefficiencies as the dependent variable using PROC REG (SASInstitute 2006). Regression analysis of animal performance, asmeasured by ADG (kg ? d21) and gain (kg ? ha21), using GPI asthe independent variable, was performed for the study sitesthat had yearling cattle only (Cheyenne, Hays, Nunn, andSteeter) in PROC GLM (SAS Institute 2006). Within anindividual study site we reduced variation of dependentvariables by averaging across years. In order to account forthe variation among sites, we used a covariance analysis(Littell et al. 1991) that included separate y-intercepts for eachsite and a pooled slope: Y 5 b0 + b1x1 + b2x2 + b3x3 + b4GP,where b0 is the y-intercept for Streeter; b1 5 differencebetween y-intercept for Streeter and Cheyenne; b2 5 differencebetween y-intercept for Streeter and Hays; b3 5 differencebetween y-intercept for Streeter and Nunn; b4 5 pooled slopeacross sites; x1 5 1 for Cheyenne and 0 for other sites; x2 5 1for Hays and 0 for other sites; x3 5 1 for Nunn and 0 forother sites; GPI 5 grazing pressure index; y-intercept forCheyenne 5 b0+b1; y-intercept for Hays 5 b0+b2; and y-intercept for Nunn 5 b0+b3.
RESULTS
Stocking Rate StudiesSummary statistics for the stocking rate treatments at each ofthe six sites are presented in Table 2. Residual biomass andanimal production were different between stocking rates atevery site. At most sites, peak standing crop biomass,utilization, and ADG were different between stocking rates.
There was a significant site by stocking rate interaction forGPI and utilization; and for harvest efficiency calculated usingeach of the three intake equations, but not for grazingefficiency, regardless of intake calculation (Table 3). TheWoodward site had greater GPI than the other sites at allthree stocking rates (Fig. 2A). Grazing pressure index wassimilar at the five other sites (Cheyenne, Cottonwood, Hays,Nunn, and Streeter) for the light stocking rate. This, however,did not extend to the moderate and heavy stocking rates atthese sites (Fig. 2A). Utilization was similar among sites at themoderate stocking rate, but varied at the heavy and lightstocking rates (Fig. 2B). Grazing efficiency estimates did notdiffer by site and stocking rate regardless of the method used toestimate daily herbage intake (Figs. 3A–3C). However, harvestefficiency was greater at the Woodward site at heavy and light
Table 2. Stocking rate (SR), peak standing crop (PSC), residual biomass (R), utilization (U), average daily gain (ADG), and animal production (AP)from long-term stocking rate studies conducted in the North American Great Plains.
Site Treatment SR (AUD ? ha21)1 PSC (kg ? ha21) R (kg ? ha21) U (%) ADG2 (kg ? d21) AP3 (kg ? ha21)
Cheyenne, WY Heavy 1.22 1 171 b4 365 b 66 a 0.88 b 46.2 a
Moderate 0.91 992 b 477 b 51 b 1.03 a 39.9 b
Light 0.53 1 424 a 913 a 31 c 1.04 a 19.2 c
P value , 0.01 , 0.01 , 0.01 , 0.01 , 0.01
Cottonwood, SD Heavy 1.70 1 271 b 398 c 69 a 0.60 a 23.7 a
Moderate 1.07 1 615 ab 768 b 52 b 0.64 a 15.6 b
Light 0.80 2 053 a 1 204 a 38 c 0.71 a 13.2 b
P value 0.02 , 0.01 , 0.01 0.27 , 0.01
Hays, KS Heavy 4.11 2 900 c 984 c 69 a 0.49 a 86.7 a
Moderate 2.44 4 331 b 2 224 b 50 b 0.59 a 61.3 b
Light 1.86 5 481 a 3 536 a 36 c 0.58 a 46.7 b
P value , 0.01 , 0.01 , 0.01 0.28 , 0.01
Nunn, CO Heavy 0.70 771 340 b 54 0.76 b 21.0 a
Moderate 0.52 839 432 ab 47 0.79 b 16.5 b
Light 0.39 928 517 a 43 0.89 a 13.6 c
P value 0.54 0.04 0.08 0.02 , 0.01
Streeter, ND Heavy 3.88 2 711 b 1 132 c 58 a 0.49 b 85.2 a
Moderate 2.35 3 224 a 1 936 b 40 b 0.57 ab 58.7 b
Light 1.15 3 536 a 2 679 a 24 c 0.62 a 30.7 c
P value , 0.01 , 0.01 , 0.01 , 0.01 , 0.01
Woodward, OK Heavy 2.87 1 452 662 b 56 a 0.77 c 34.3 a
Moderate 1.97 1 472 788 ab 46 b 0.85 b 30.1 b
Light 1.48 1 540 923 a 40 b 0.90 a 20.7 c
P value 0.58 0.03 , 0.01 , 0.01 , 0.011AUD indicates animal unit days.2ADG values for Cottonwood and Woodward are for calves, whereas Cheyenne, Hays, Nunn, and Streeter are for yearlings.3AP values for Cottonwood and Woodward are for calves, whereas Cheyenne, Hays, Mandan, Nunn, and Streeter are for yearlings.4Means within a location and column with different letters are significantly different (P , 0.05).
400 Rangeland Ecology & Management

stocking rates compared to the other five sites (Figs. 3D–3F).At the light stocking rate, the other five sites had similar harvestefficiencies for all three intake equations, but were different atthe moderate and at the heavy stocking rates.
The main effect of stocking rate was significant for GPI,utilization, harvest efficiency, and grazing efficiency (Tables 3and 4). Grazing pressure index at heavy stocking was 1.7 and2.9 times greater than at moderate and light stocking rates.Utilization at heavy stocking was 1.3 and 1.6 times greater thanat moderate and light stocking rates. Harvest efficiency for allthree equations was significantly different between heavy,moderate, and light stocking rates (Table 4). When harvestefficiency was averaged across equations, heavy stocking(38%) resulted in 1.6 and 2.7 times greater harvest efficiencythan moderate (24%) and light stocking (14%), respectively.Grazing efficiency differed (P , 0.05) between stocking ratesfor the Allison et al. (1982) constant intake estimate and thePoppi (1996) equation (Table 4). The Redmon et al. (1995)equation resulted in greater harvest efficiency at heavy andmoderate rates than at light stocking rates (Table 4). Averagedover intake methods, grazing efficiency at heavy stocking(61%) was 1.2 and 1.6 times greater than at moderate (49%)and light (39%) stocking rates.
The main effect of site was significant for GPI, utilization,and harvest efficiency for the Allison et al. (1982) constantintake estimate and Poppi (1996) equation (Tables 3 and 5).However, grazing efficiencies were similar between sites foreach of the intake methods (Tables 3 and 5). Grazing pressureindices were greater at Woodward than the other sites.Utilization was least at Streeter compared to the other sites.Woodward also had greater harvest efficiencies when calculat-ed using the Allison et al. (1982) constant intake estimate orPoppi (1996) equations compared to the other sites (Table 5).
Regression AnalysisThe mathematical relationship between GPI and harvestefficiency was a linear function regardless of the method used
to estimate daily forage intake (Fig. 4). The relationship betweenGPI and utilization was best explained by a quadratic function(Fig. 5). Minimum and maximum utilizations were 23% and69%, respectively. Relationships between GPI and grazingefficiency were best explained by linear equations whether intakewas considered constant or adjusted for different levels ofcumulative grazing pressures (Fig. 6). Estimates of grazingefficiency ranged from 25% to 105% (Fig. 6A) for the constantintake estimate of Allison et al. (1982), whereas estimates ofgrazing efficiency ranged from 32% to 100% (Fig. 6B) forintakes adjusted for cumulative grazing pressure by Redmon et al.(1995). Grazing efficiency ranged from 32% to 118% using theintake model of Poppi (1996; Fig. 6C). Grazing efficiencyestimates . 100% at high GPI could be a result of over-estimating intake or under-estimating herbage disappearance.The relationship between GPI, ADG, and gain, after locationswere adjusted for their y-intercept, resulted in significant linearequations that explained 96% of the variation, respectively(Figs. 7A and 7B). Grazing pressure index and ADG had a pooledslope (20.0044 6 0.001 kg ? d21). The baseline y-intercept usedfor Streeter was 0.66 6 0.03 kg ? d21. Hays was not significantlydifferent from Streeter (P 5 0.88). Y-intercepts for Cheyenne(1.09 6 0.03 kg ? d21) and Nunn (0.88 6 0.03 kg ? d21) weresignificantly different from Streeter (P , 0.001). The pooled slopefor gain was 1.30 6 0.15 kg ? ha21. The baseline y-intercept usedfor Streeter was 31.4 6 4.13 kg ? ha21. Hays was not significantlydifferent from Streeter (P 5 0.11). Y-intercepts for Cheyenne(5.32 6 3.99 kg ? ha21) and Nunn (26.90 6 4.09 kg ? ha21) weresignificantly different from Steeter (P , 0.001).
Table 3. P values of the main effects and interaction of stocking rateand site for grazing pressure index, utilization, grazing efficiency, andharvest efficiency based on three equations1 after Allison et al. (1982),Redmon et al. (1995), and Poppi (1996).
Variable Site Stocking rate Site ? stocking rate
----------------------------P value----------------------------
Grazing pressure index 0.0283 0.0001 0.0001
Utilization 0.0073 0.0001 0.0001
Grazing efficiency
Equation 1 0.0758 0.0001 0.2573
Equation 2 0.1905 0.0004 0.5972
Equation 3 0.0773 0.0001 0.3356
Harvest efficiency
Equation 1 0.0256 0.0001 0.0001
Equation 2 0.0560 0.0001 0.0001
Equation 3 0.0340 0.0001 0.00011Intake equations: Equation 1 is a constant intake of 8.75 kg ? animal unit day [AUD]21 after
Allison et al. (1982), Equation 2 is adjusted for forage allowance using an equationdescribed by Redmon et al. (1995), and Equation 3 is 11.8 kg ? AUD21 adjusted for forageallowance using an equation described by Poppi (1996).
Figure 2. A, Grazing pressure index and B, utilization means andstandard errors for three stocking rates and six sites in the NorthAmerican Great Plains. AUD indicates animal unit days.
63(4) July 2010 401

Table 4. Grazing pressure index (GPI), utilization (U), harvest efficiency, and grazing efficiency from heavy, moderate, and light stocking ratesconducted at six sites in the North American Great Plains.
Stocking rate GPI (x [SE1]) U (x [SE])
Harvest efficiency Grazing efficiency
Eq. 12 (x [SE]) Eq. 2 (x [SE]) Eq. 3 (x [SE]) Eq. 1 (x [SE]) Eq. 2 (x [SE]) Eq. 3 (x [SE])
AUD ? Mg21 --------------------------------------------------------------------%--------------------------------------------------------------------
Heavy 40 c3 (1.3) 64 a (1.7) 36 a (1.1) 37 a (1.0) 42 a (1.2) 57 a (2.8) 59 a (3.3) 67 a (3.0)
Moderate 24 b (1.3) 50 b (1.7) 21 b (1.1) 24 b (1.0) 26 b (1.2) 43 b (2.8) 51 a (3.3) 54 b (3.0)
Light 14 a (1.3) 39 c (1.7) 12 c (1.1) 15 c (1.0) 16 c (1.2) 33 c (2.8) 41 b (3.3) 42 c (3.0)
P value , 0.01 , 0.01 , 0.01 , 0.01 , 0.01 , 0.01 , 0.01 , 0.011SE indicates standard error of the mean; AUD, animal unit days.2Intake equations: Eq. 1 is a constant intake of 8.75 kg ? AUD21 after Allison et al. (1982), Eq. 2 is adjusted for forage allowance using an equation described by Redmon et al. (1995), and
Eq. 3 is 11.8 kg ? AUD21 adjusted for forage allowance using an equation described by Poppi (1996).3Means followed by different letters within a column are significantly different (P , 0.05).
Figure 3. Grazing and harvest efficiency means and standard errors for stocking rates and sites estimated using a constant intake from (A, D)Allison et al. (1982), (B, E) intake modeled after Redmon et al. (1995), and (C, F) intake modeled after Poppi (1996).
402 Rangeland Ecology & Management

DISCUSSION
Grazing pressure index was a useful approach to effectivelycompare stocking rates across the six studies conducted in theNorth American Great Plains. Harvest efficiency for moderatestocking rates was similar to the targeted goal of 25% (Galt et al.2000). Of particular importance, however, is that harvestefficiency was not 25% at either the heavy or light stockingrates. Harvest efficiency was estimated to be 13% to 16% higherunder heavy stocking rates and 6% to 10% lower under lightstocking rates compared to moderate stocking rates. In addition,grazing efficiencies with heavy or light stocking rates were not50%. Grazing efficiency ranged from 8% to 14% higher underheavy stocking rates and 10% to 12% lower under light stockingrates compared to moderate stocking rates. Collectively, thesefindings demonstrate that both harvest (Fig. 4) and grazing(Fig. 6) efficiencies scale linearly with changes in GPI.
The linear equation that describes the relationship betweenGPI and harvest efficiency (Fig. 4) in conjunction with thequadratic response of utilization to GPI (Fig. 5) are fundamen-tal to understanding why grazing efficiency changes over arange of GPI (Fig. 6). At high GPI, a greater proportion of thetotal forage available is demanded by livestock according totheir daily intake, even if intake is restricted because ofdeclining forage quantity or quality (Combellas and Hodgson
1979; Penning et al. 1991; Redmon et al. 1995; Poppi 1996).The relationship between GPI and utilization was quadratic;thus, utilization levels off at higher grazing pressure. This canhappen only if grazing efficiency increases as GPI increases(Fig. 8A). If the response curve of utilization had been linear,grazing efficiency would not have increased.
Because grazing efficiency is a calculation of intake andutilization, the explanation for changes in grazing efficiencyacross different values of GPI is best understood by examiningthe mechanisms that affect utilization. Utilization is essentiallythe vegetation biomass that disappears from the plantcommunity, not only due to grazing by livestock, but also toweathering, trampling, fouling, senescence, and intake orclipping by insects or wildlife (Fig. 8A). Intake or destructionfrom other herbivores has not been well-documented in grazingstudies except in certain circumstances when wildlife such asprairie dogs (Cynomys ludovicianus) or grasshoppers (Aulocaraelliotti) are known to be highly competitive (Hewitt et al. 1976;Stoltenberg 2004). Losses due to herbage fouling and tramplinghave been observed to be greater under moderate and heavystocking (, 5%) compared to light stocking (1%; Quinn andHervey 1970). Therefore, we would expect forage disappear-ance caused by trampling to be very minimal unless stockingdensity is excessive. Thus, the most likely explanation forimproved grazing efficiency is a reduction in the amount of
Table 5. Grazing pressure (GPI), utilization (U), harvest efficiency, and grazing efficiency from six sites in the North American Great Plains.
Location GPI (x [SE1]) U (x [SE])
Harvest efficiency Grazing efficiency
Eq. 12 (x [SE]) Eq. 2 (x [SE]) Eq. 3 (x [SE]) Eq. 1 (x [SE]) Eq. 2 (x [SE]) Eq. 3 (x [SE])
AUD ? Mg21 -------------------------------------------------------------------------%------------------------------------------------------------------------
Cheyenne, WY 25 b3 (2.9) 51 a (3.9) 23 b (2.5) 25 a (2.4) 27 b (2.9) 43 a (6.5) 48 a (7.5) 53 a (8.0)
Cottonwood, SD 25 b (1.8) 53 a (2.5) 22 b (1.6) 25 a (1.5) 27 b (1.8) 42 a (4.1) 49 a (4.7) 53 a (5.1)
Hays, KS 23 b (1.9) 51 a (2.5) 20 b (1.6) 23 a (1.5) 25 b (1.9) 37 a (4.2) 44 a (4.8) 47 a (5.1)
Nunn, CO 21 b (1.8) 49 a (2.5) 19 b (1.5) 22 a (1.4) 24 b (1.8) 39 a (3.9) 46 a (4.5) 50 a (4.9)
Streeter, ND 25 b (1.5) 42 b (2.1) 22 b (1.3) 24 a (1.2) 27 b (1.5) 51 a (3.4) 58 a (3.9) 65 a (4.2)
Woodward, OK 37 a (4.1) 59 a (5.5) 33 a (3.6) 34 a (3.3) 39 a (4.1) 57 a (9.3) 60 a (11.0) 69 a (11.0)
P value , 0.01 , 0.01 0.02 0.06 0.03 0.07 0.19 0.081SE indicates standard error of the mean; AUD, animal unit days.2Intake equations: Eq. 1 is a constant intake of 8.75 kg ? AUD21 after Allison et al. (1982), Eq. 2 is adjusted for forage allowance using an equation described by Redmon et al. (1995), and
Eq. 3 is 11.8 kg ? AUD21 adjusted for forage allowance using an equation described by Poppi (1996).3Means followed by different letters within a column are significantly different (P , 0.05).
Figure 4. Relationship between grazing pressure index and harvestefficiency estimated using a constant intake from Allison et al. (1982):y 5 0.97x 2 0.19 (R2 5 0.99), intake modeled after Redmon et al.(1995): y 5 0.79x + 6.23 (R2 5 0.98), and intake modeled after Poppi(1996): y 5 1.02x + 3.69 (R2 5 0.99). AUD indicates animal unit days.
Figure 5. Relationship between grazing pressure index and utilizationfrom six stocking rate studies in the North American Great Plains. AUDindicates animal unit days.
63(4) July 2010 403

senescent and weathered vegetation. Penning et al. (1991)argued that increased grazing intensity would result in a greaterpercentage of leaves harvested (Bircham and Hodgson 1983;Parsons et al. 1983), which would reduce the leaf area index(LAI), photosynthesis, and the rate of gross tissue production.Penning et al. (1991) showed that perennial ryegrass (Loliumperenne L.) pastures grazed to maintain a 1.0 LAI had 27% lessdead stem mass and 45% more vegetative tillers than swards of2.0 LAI. Others also documented that grazing efficiencies aregreater on swards maintained at lower sward canopy height orLAI and attributed this phenomenon to lesser amounts ofaccumulated senescent vegetation in the shorter swards(Parsons et al. 1983; Heitschmidt et al. 1989; Mazzanti andLemaire 1994; Nakatsuji et al. 2006; Agnusdei et al. 2007).
The linear relationship between GPI and ADG (Fig. 7) wassimilar to previous findings (Bement 1969; Hart 1972; Hart etal. 1988; Hart and Ashby 1998). The linear coefficient fromour study (20.0044) was in the range of values reported byHart et al. (1988) and Hart and Ashby (1988). The goodness offit from our pooled data set (across Cheyenne, Hays, Nunn,and Streeter study sites), after adjustments in y-intercepts were
made, was greater than from a single site (Hart et al. 1988; Hartand Ashby 1998) or several sites with similar plant communities(Hart 1972). Adjustments in y-intercepts for these pooled dataset were necessary for several reasons. The response in ADGfrom the four study sites that used yearling cattle would havebeen influenced by different genetics from within- and among-breed variation. Because the data from some of the locationswere collected during the late 1950s and early 1960s ascompared to the 1990s, cattle might have had different selectionpressure applied to them for various growth traits. Lastly, foragequality might have been different at each study site. Harlan(1958) observed that the shift in plant community from tallergrasses to mid- and short grasses at heavier stocking rates at theWoodward site resulted in high forage quality, which helpedoffset any losses in animal performance. Powell et al. (1982)observed greater digestibility of forages and greater dry matterintake from steers grazing lower range condition than higherrange condition in the Nebraska Sandhills. Crude protein wasgreater in the diets of steers grazing high range conditioncompared to low range condition, and thus ADG was similarbetween the two pastures (Powell et al. 1982). Heitschmidt et al.(1989) also determined that greater forage quality occurred inheavily stocked pastures compared to moderately stockedpastures because of reduced standing dead vegetation. A reviewof the literature by Allison (1985) supports these findings.
The relationship between animal gain ? ha21 and GPI hasbeen shown to be linear to a point of heavy stocking and
Figure 6. Relationship between grazing pressure index and grazingefficiency estimated using a constant intake after A, Allison et al. (1982);B, intake modeled after Redmon et al. (1995); and C, and intake modeledafter Poppi (1996). AUD indicates animal unit days.
Figure 7. Relationships between grazing pressure index and A, averagedaily gain (ADG) of yearling cattle and B, gain of yearling cattle perhectare from four sites using a pooled slope but adjusted for different y-intercepts were significant (R2 5 0.96; P , 0.01) for both ADG and gain.AUD indicates animal unit days.
404 Rangeland Ecology & Management

curvilinear beyond heavy stocking (Harlan 1958; Hart et al.1988). Because our pooled data set did not include GPI . 50AUD ? Mg21, we did not see the curvilinear response (Fig. 7).Hart et al. (1988) described a theoretical maximum gain ? ha21
would occur at 105.5 steer-days ? ha21 (63 AUD ? Mg21) andthe optimum stocking rate, giving the greatest return ? ha21,would occur at 57.7 steer-days ? ha21 (34 AUD ? Mg21).Because cumulative grazing pressure averaged 40 AUD ? Mg21
for heavy and 24 AUD ? Mg21 for moderate stocking, optimumreturn of beef production on Great Plains rangelands shouldoccur between moderate and heavy stocking.
Others have proposed using forage allowance to standardizestocking rate studies (Hart 1972; Sollenberger et al. 2005).Hart (1972) made a significant discovery that grazing pressure(inverse of forage allowance) resulted in a linear function thatgave better fits for ADG and gain per unit area compared to therectangular hyperbola when regressed against forage allow-ance. This also proved to be true with our data set. Whenintake by livestock was plotted against forage allowance, itresulted in a decreasing exponential function (Fig 8B). How-ever, when intake of livestock was plotted against GPI, thefunction was linear (Fig. 8A). Hart (1972) stated thatconceptually ‘‘it is easier to visualize the relationship’’ between
forage allowance and ADG or gain per unit land area. Forexample, if we assume forage allowance is 36 kg ? AUD21 andintake is 12 kg ? AUD21, then forage allowance is simply threetimes intake. If GPI is 36 AUD ? Mg21, it is less clear as to whatit means on a per animal basis. Taking the inverse of GPI andmultiplying by 1 000 converts it to forage allowance. In thisexample, a GPI of 36 AUD ? Mg21 is equivalent to a forageallowance of 28 kg ? AUD21 or approximately 2.3 times intake.We agree with Hart (1972) that conceptually forage allowanceis easier to grasp because it is a multiple of animal intake;however, mathematically it is simpler to express theserelationships as linear functions of GPI. We propose thatgrazing management scientists should be analyzing andreporting their results as GPI instead of forage allowance.
IMPLICATIONS
Relationships presented here, describing harvest and grazingefficiencies across grazing pressures from six stocking rate studiesconducted in the North American Great Plains, reaffirm assump-tions about moderate stocking regarding grazing and harvestefficiencies. Novel here, however, is that grazing and harvestefficiency scale linearly with GPI so that grazing and harvestefficiencies increase as grazing pressure increases. Use of GPI to‘‘standardize’’ stocking rates across rangeland ecosystems in theNorth American Great Plains should improve communicationsamong scientists, management agencies, land managers, and thepublic regarding this primary rangeland management practice forproduction and conservation goals on these lands. Quantifyinggrazing pressure removes ambiguity associated with qualitativeterms of heavy, moderate, or light stocking rates. Average GPI forheavy, moderate, and light stocking rates across the study sites of40, 24, and 14 AUD ? Mg21, respectively, and the resulting harvestefficiency values of 42%, 26%, and 16% for heavy, moderate, andlight stocking rates provide context for land managers regardingdecision making on these rangeland ecosystems.
LITERATURE CITED
AGNUSDEI, M. G., S. G. ASSUERO, R. C. FERNANDEZ GRECCO, J. J. CORDERO, AND
V. H. BURGHI. 2007. Influence of sward conditions on leaf tissue turnover intall fescue and tall wheatgrass swards under continuous grazing. Grass andForage Science 62:55–65.
ALLISON, C. D. 1985. Factors affecting forage intake by range ruminants: a review.Journal of Range Management 38:305–311.
ALLISON, C. D., M. M. KOTHMANN, AND L. R. RITTENHOUSE. 1982. Efficiency of forageharvest by grazing cattle. Journal of Range Management 35:351–354.
BEMENT, R. E. 1969. A stocking rate guide for beef production on blue-gramarange. Journal of Range Management 22:83–86.
BIRCHAM, J. S., AND J. HODGSON. 1983. The influence of sward condition rates onherbage growth and senescence in mixed swards under continuous stockingmanagement. Grass and Forage Science 38:323–331.
COMBELLAS, J., AND J. HODGSON. 1979. Herbage intake and milk production by grazingdairy cows. 1. The effects of variation in herbage mass and daily herbageallowance in a short-term trial. Grass and Forage Science 34:209–214.
CONNIFFE, D., D. BROWNE, AND M. WALSHE. 1970. Experimental design for grazingtrials. Journal of Agricultural Science 64:339–342.
DERNER, J. D., AND R. H. HART. 2007. Grazing-induced modifications to peakstanding crop in northern mixed-grass prairie. Rangeland Ecology andManagement 60:270–276.
Figure 8. Forage intake by livestock (average of the three harvestefficiency models) and total disappearance in relation to A, grazingpressure index and B, forage allowance. Because forage intake bylivestock and total disappearance varies disproportionately over differentlevels of grazing pressure index or forage allowance, grazing efficiencyincreases from low grazing pressure to high grazing pressure or highforage allowance to low forage allowance. AUD indicates animal unit days.
63(4) July 2010 405

DERNER, J. D., W. K. LAUENROTH, P. STAPP, AND D. J. AUGUSTINE. 2009. Livestock asecosystem engineers for grassland bird habitat in the western Great Plains ofNorth America. Rangeland Ecology and Management 62:111–118.
DYKSTERHUIS, E. J. 1949. Condition and management of range land based onquantitative ecology. Journal of Range Management 2:104–115.
GALT, D., F. MOLINAR, J. NAVARRO, J. JOSEPH, AND J. HOLECHEK. 2000. Grazing capacityand stocking rate. Rangelands 22:7–11.
GILLEN, R. L., AND P. L. SIMS. 2002. Stocking rate and cow–calf production on sandsagebrush rangeland. Journal of Range Management 55:542–550.
GILLEN, R. L., AND P. L. SIMS. 2004. Stocking rate, precipitation, and herbageproduction on sand sagebrush-grassland. Journal of Range Management57:148–152.
HARLAN, J. R. 1958. Generalized curves for gain per head and gain per acre in ratesof grazing studies. Journal of Range Management 11:141–147.
HART, R. H. 1972. Forage yield, stocking rate, and beef gains on pasture. HerbageAbstracts 42:345–353.
HART, R. H., AND M. M. ASHBY. 1998. Grazing intensities, vegetation, and heifergains: 55 years on shortgrass. Journal of Range Management 51:392–398.
HART, R. H., M. J. SAMUEL, P. S. TEST, AND M. A. SMITH. 1988. Cattle, vegetation, andeconomic responses to grazing systems and grazing pressure. Journal ofRange Management 41:282–286.
HEITSCHMIDT, R. K., S. L. DOWHOWER, W. E. PINCHAK, AND S. K. CANON. 1989. Effect ofstocking rate on quantity and quality of available forage in a southern mixedgrass prairie. Journal of Range Management 42:468–473.
HEWITT, G. B., W. H. BURLESON, AND J. A. ONSAGER. 1976. Forage losses caused by thegrasshopper Aulocara elliotti on shortgrass rangeland. Journal of RangeManagement 29:376–380.
HOLECHEK, J. L., R. D. PIEPER, AND C. H. HERBEL. 2004. Range management: principlesand practices. 5th ed. Upper Saddle River, NJ, USA: Pearson Prentice Hall.607 p.
KLIPPLE, G. E., AND R. E. BEMENT. 1961. Light grazing—is it economically feasible asa range-improvement practice. Journal of Range Management 14:57–62.
LAUNCHBAUGH, J. L. 1967. Vegetation relationships associated with intensity ofsummer grazing on a clay upland range site in the Kansas 20- to 24-inchprecipitation zone. Kansas Agricultural Experiment Station Technical Bulletin154:1–24.
LITTELL, R. C., R. J. FREUND, AND P. C. SPECTOR. 1991. SAS system for linear models.3rd ed. Cary, NC, USA: SAS Institute. 329 p.
MAZZANTI, A., AND G. LEMAIRE. 1994. Effect of nitrogen fertilization on herbageproduction of tall fescue swards continuously grazed by sheep. 2.Consumption and efficiency of herbage utilization. Grass and Forage Science49:352–359.
MILCHUNAS, D. G., O. E. SALA, AND W. K. LAUENROTH. 1988. A generalized model of theeffects of grazing by large herbivores on grassland community structure.American Midland Naturalist 132:87–106.
NAKATSUJI, H., Y. NISHIMICHI, M. YAYOTA, M. TAKAHASHI, K. UEDA, S. KONDO, AND M. OKUBO.2006. Effects of grass height and milk production under rotational grazing bylactating dairy cows. Grassland Science 52:175–180.
NATIONAL RESEARCH COUNCIL. 1987. Predicting feed intake of food-producing animals.Washington, DC, USA: National Academy Press. 85 p.
PARKER, K. W. 1954. Application of ecology in the determination of range condition
and trend. Journal of Range Management 7:14–23.
PARSONS, A. J., E. L. LEAFE, B. COLLETT, P. D. PENNING, AND J. LEWIS. 1983. The
physiology of grass production under grazing. II. Photosynthesis, crop growthand animal intake of continuously-grazed swards. Journal of Applied Ecology
20:127–139.
PATTON, B. D., X. DONG, P. E. NYREN, AND A. NYREN. 2007. Effects of grazing intensity,precipitation, and temperature on forage production. Rangeland Ecology and
Management 60:656–665.
PENNING, P. D., A. J. PARSONS, R. J. ORR, AND T. T. TREACHER. 1991. Intake and
behavior responses by sheep to changes in sward characteristics under
continuous stocking. Grass and Forage Science 46:15–28.
POPPI, D. P. 1996. Predictions of food intake in ruminants from analyses of food
composition. Australian Journal of Agriculture Research 47:489–504.
POWELL, D. J., D. C. CLANTON, AND T. J. NICHOLS. 1982. Effect of range condition on
the diet and performance of steers grazing native Sandhills range in Nebraska.
Journal of Range Management 35:96–99.
QUINN, J. A., AND D. F. HERVEY. 1970. Trampling losses and travel by cattle on
Sandhills range. Journal of Range Management 23:50–55.
REDMON, L. A., F. T. MCCOLLUM III, G. W. HORN, M. D. CRAVEY, S. A. GUNTER, P. A. BECK,
J. M. MIERES, AND R. SAN JULIAN. 1995. Forage intake by beef steers grazing
winter wheat with varied herbage allowances. Journal of Range Management48:198–201.
RIEWE, M. E. 1961. Use of the relationship of stocking rate to gain of cattle in an
experimental design for grazing trials. Agronomy Journal 53:309–313.
SAS INSTITUTE INC. 2006. SAS OnlineDocH 9.1.3. Cary, NC, USA: SAS Institute, Inc.
SMART, A. J., B. H. DUNN, P. S. JOHNSON, L. XU, AND R. N. GATES. 2007. Using weatherdata to explain herbage yield on three Great Plains plant communities.
Rangeland Ecology and Management 60:146–153.
SOLLENBERGER, L. E., J. E. MOORE, V. G. ALLEN, AND C. G. S. PEDREIRA. 2005. Reporting
forage allowance in grazing experiments. Crop Science 45:896–900.
[SRM] SOCIETY FOR RANGE MANAGEMENT. 1998. Glossary of terms used in rangemanagement. 4th ed. Denver, CO, USA: Society for Range Management.
32 p.
STEEL, R. G. D., AND J. H. TORRIE. 1980. Principles and procedures of
statistics: a biometrical approach. 2nd ed. New York, NY, USA: McGraw-
Hill. 633 p.
STOLTENBERG, M. B. 2004. Effects of prairie dogs on plant community composition
and vegetation disappearance in mixed-grass prairie [thesis]. Brookings, SD,
USA: South Dakota State University. 72 p.
STUTH, J. W., D. R. KIRBY, AND R. E. CHMIELEWSKI. 1981. Effect of herbage allowance
on the efficiency of defoliation by the grazing animal. Grass and ForageScience 36:9–15.
VAN POOLLEN, H. W., AND J. R. LACEY. 1979. Herbage responses to grazing systems
and stocking intensities. Journal of Range Management 32:250–253.
406 Rangeland Ecology & Management